


- Collection:
- Georgia Government Publications
- Title:
- Hydrogeology of the Gordon aquifer system of east-central Georgia
- Creator:
- Brooks, Rebekah
- Contributor to Resource:
- Clarke, J. S. (John Stuart)
Faye, Robert E
Georgia Geologic Survey. Accelerated Ground-Water Program - Publisher:
- Atlanta, Ga. : Dept. of Natural Resources, Environmental Protection Division, Georgia Geologic Survey
- Date of Original:
- 1985
- Subject:
- Groundwater--Georgia
Aquifers--Georgia
Geology--Georgia - Location:
- United States, Georgia, 32.75042, -83.50018
- Medium:
- state government records
- Type:
- Text
- Format:
- application/pdf
- Description:
- Bibliography: p. 34-37
- External Identifiers:
- OCLC 13333643
NZ MMS ID 9910143732702931
Call Number N200.G3 S1 I5 no. 75
Call Number GB1025.G4 - Metadata URL:
- https://dlg.galileo.usg.edu/id:dlg_ggpd_s-ga-bn200-pg3-bs1-bi5-bno-p-b75
- Digital Object URL:
- https://dlg.galileo.usg.edu/do:dlg_ggpd_s-ga-bn200-pg3-bs1-bi5-bno-p-b75
- Language:
- eng
- Extent:
- vi, 41 p. : ill. (some col.) ; 28 cm.
- Holding Institution:
- University of Georgia. Map and Government Information Library
- Rights:
-

HYDROGEOLOGY OF THE GORDON AQUIFER SYSTEM OF EAST-CENTRAL GEORGIA
Rebekah Brooks, John S. Clarke, and Robert E. Faye
Prepared as part of the ACCELERATED GROUND-WATER PROGRAM
in cooperation with the DEPARTMENT OF THE INTERIOR
U.S. GEOLOGICAL SURVEY DEPARTMENT OF NATURAL RESOURCES ENVIRONMENTAL PROTECTION DIVISION
GEORGIA GEOLOGIC SURVEY
INFORMATION CIRCULAR 75
Geologic Units In this report several geologic formations of the Coastal Plain of Georgia and adjacent areas in South Carolina have been combined into regional stratigraphic units based on their similar lithology, stratigraphic position, and geologic age. Each regional unit has been assigned an informal name taken from the established geologic formations of the sQutheastern Coastal Plain that best represent the lithologic character of the unit. For example, the lower Huber-Ellenton unit of this report includes strata of the lower part of the Huber Formation of eastern Georgia and the Ellenton Formation of South Carolina.
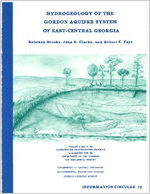
Front Cover: Schematic drawing of cross-bedded sand and clay in the kaolin district, east-centra~ Georgia.
Drawing by: Ellie Black
HYDROGEOLOGY OF THE GORDON AQUIFER SYSTEM OF EAST-CENTRAL GEORGIA By
Rebekah Brooks, John S. Clarke, and Robert E. Faye
Prepared as part of the Accelerated Ground-Water Program
in cooperation with the Department of the Interior
U.S. Geological Survey
Department of Natural Resources J. Leonard Ledbetter, Commissioner Environmental Protection Division Harold F. Reheis, Assistant Director
Georgia Geologic Survey William H. McLemore, State Geologist
Atlanta, Georgia 1985
INFORMATION CIRCULAR 75
TABLE OF CONTENTS
Abstract .............................................................
Introduction . ........................................................ .
Purpose and scope ....................................
Previous investigations .........................................
Methods of study ..........................
Well-numbering system.........................
Acknowledgments .. ...............................
Geology . .............................
Regional setting ................................................. .
Geologic units ..................................
Upper Cretaceous strata
Paleocene strata
Lower Huber-Ellenton unit
Baker Hill-Nanafalia unit
Eocene strata ..............................
Upper Huber-Tallahatta unit
Lisbon-McBean unit .........................
Barnwell unit ...........................
Relation of lithology to depositional environments
Strueture
Hydrology . .........................................
.......................... Aquifer nomenclature
Definition of the Gordon aquifer system
Aquifer system geometrY
Altitude of aquifer system boundaries
Thickness ...........................
Aquifer and well properties
Transmissivity and specific capacity
................................................ Well yields . ................................................
Recharge
Discharge .. ...................................
Ground-water levels .. ............................
Water-level fluctuations . .......................
Potentiometric surface Estimated 1934-68 potentiometric surface
November 1981 potentiometric surface
Long-term water-level declines
Water quality ........................................................ .
Water use . ........................... . Well construction
. . . . . . . . . . . . . .
........
Summary ................................................
Selected references . ....................................
...... Append! ces .................... .................. Appendix A--Record of selected wells
Appendix B--Chemical analyses of water from the Gordon aquifer
system ..............................
Page
1 1 1
2 2 5 5 7
7
7 7 7 7 9 9 9 10 10 11 11 11 11 13 13 13 15 15 15 15 15 18 21 21 21 22 25 25
28 28 28
32 34 38 38
41
iii
LIST OF ILLUSTRATIONS
Page
Figures 1-7. Map showing:
1. Location of study area, physiographic provinces,
and areas covered by investigations as part of
the Upper Cretaceous-lower Tertiary aquifer
study ........................................
3
2. Location of wells and hydrogeologic sections 4
3. Number and letter designations for 7.5-minute
quadrangles covering east-central Georgia 6
4. Structural features, outcrop area, and altitude
of the top of the Gordon aquifer system 12
5. Structural features, outcrop area, and altitude of
the base of the Gordon aquifer system 14
6. Approximate thickness of the Gordon aquifer
system............................................ 16
7. Aquifer transmissivity, and yield and specific
capacity of wells tapping the Gordon aquifer
system ............ , . . . . . . . . . . . . . . . . . . . 17
Figure 8. Schematic diagram showing head differences between the
Jacksonian aquifer and Gordon aquifer system in Jeffer-
son County; between the Gordon and Midville aquifer
systems in Burke County; and between the Gordon, Dublin,
and Midville aquifer systems in Laurens County 19
9. Map showing estimated ground-water discharge to streams
from aquifers in east-central Georgia, October-
November 1954 .... ,.................................. 20
10. Graphs showing the relation of water-level fluctuations
in wells herein assigned to the Gordon aquifer system
(wells ZW-15 and ZW-7) to pumping from a Cretaceous
well (well 35-H) and to precipitation, Aiken and
Barnwell Counties, South Carolina, November 1952 to
January 1953............................................ 21
11. Graphs showing the relation of water-level fluctuations
at observation well 31Z13 at Vogtle Nuclear Plant,
Burke County, to monthly precipitation at National
Weather Service station 9194 (Waynesboro 2 NE),
July 1971 to July 1972.................................. 22
Figures 12-14. Map showing:
12. Estimated potentiometric surface of the Gordon
aquifer system, 1934-68 23
13. Potentiometric surface of the Gordon aquifer system,
November 1981 ..... , . . . . . . . . . . . . . . . . . . . . . . 24
14. Water-level declines in the Gordon aquifer system,
1939-81............................................ 26
Figure 15. Graphs showing intermittent measurements of the water
level in the Gordon aquifer system at well 26X1 and
average daily ground-water withdrawals by the city of
Louisville, Jefferson County, 1958-82 27
16. Map showing dissolved-solids concentrations in ground
water from the Gordon aquifer system 29
iv
Figure 17. 18.
LIST OF ILLUSTRATIONS--Continued Page
Map showing distribution of hardness as CaC03 in ground water from the Gordon aquifer system 30
Diagram showing relation of well construction to geophysical and lithologic logs in well 28W4, near Midville, Burke CountY 33
Plate
PLATES
In pocket
1. Hydrogeologic sections A-A' and B-B'. 2. Hydrogeologic sections C-C' and D-D', and list of
wells on hydrogeologic sections.
TABLES
Table 1. Generalized correlation of geologic and hydrologic units of Late Cretaceous and Tertiary age in Georgia...........
2. Estimated water use for the Gordon aquifer system, 1980....
Page
8 31
v
CONVERSION FACTORS
For use of readers who prefer to use SI (metric) units, conversion factors for terms used in this report are listed below:
Multiply foot (ft) inch (in.) mile (mi)
square mile (mi2)
gallon per minute (gal/min) million gallons per day
(Mgal/d)
.!!z
0.3048 25.4
1.609 Area
2.590 Flow
0.06309 0.04381 43.81
To obtain meter (m) millimeter (mm) kilometer (km)
square kilometer (km2)
liter per second (L/s) cubic meters per second
(m3/s) liter per second (L/s)
Concentration
part per million
1
1000
milligrams per liter (mg/L) micrograms per liter (pg/L)
Transmissivity
foot squared per day (ft2/d)
0. 0929
meter squared per day (m2/d)
Specific capacity
gallon per minute per foot [(gal/min)/ft]
0.207
liter per second per meter [(1/s)/m]
Specific conductance
micromho per centimeter
1
at 25 Celsius
(llmho/cm at 25C)
microsiemens per centimeter at 25 Celsius (pS/cm at 25C)
degrees Fahrenheit (F) degrees Celsius (C)
Temperatures 5/9(F-32) 9/5(C+32)
degrees Celsius (C) degrees Fahrenheit (F)
vi
HYDROGEOLOGY OF THE GORDON AQUIFER SYSTEM OF EAST-CENTRAL GEORGIA By
Rebekah Brooks, John S. Clarke, and Robert E. Faye
ABSTRACT
Interlayered sand, silt, and clay of middle Eocene to late Paleocene age in east-central Georgia form the Gordon aquifer system which ranges in thickness from about 20 to 180 feet. Estimated transmissivities range from 620 to 13,000 feet squared per day.
During 1980, approximately 24 million gallons per day was withdrawn from the Gordon aquifer system, of which about 70 percent was used for irrigation. Water levels in the aquifer throughout the study area generally showed little change during 1934-68; however, during 1969-81, local declines as great as 33 feet have occurred in areas of increased irrigation or large-scale municipal and industrial pumping.
The Gordon aquifer system is recharged by precipitation in the outcrop area and in interstream drainage divides in and near the outcrop area, and by leakage through adjacent confining units. Discharge from the aquifer occurs predominantly as flow into streams or as leakage into underlying and overlying units.
Water from the Gordon aquifer system is generally a calcium bicarbonate type that ranges from soft to hard, and in most areas has constituent concentrations that are within the Georgia Environmental Protection Division recommended drinking water standards.
INTRODUCTION
Purpose and Scope
Recent increases in agricultural, industrial, and municipal ground-water use in the Coastal Plain of Georgia and resulting decreases in water levels of up to 33 feet since 1969, have caused concern about the availability and management of ground-water supplies. Definition of major aquifer systems and their characteristics in this area is needed to understand the effects of man's activities on the ground-water system.
This study, conducted by the U.S. Geological Survey in cooperation with the Georgia Department of Natural Resources, Environmental Protection Division, Geologic Survey, is one of a series that describes areally extensive aquifer systems within Upper Cretaceous and lower Tertiary sediments of Georgia, being done as part of the Georgia Accelerated GroundWater Program. In this series, two reports describe aquifers in southwest Georgia and this report is one of three that describe aquifer systems in eastcentral Georgia (fig. 1).
This report defines the Gordon aquifer system which consists of sediments of late Paleocene to middle Eocene age. The purpose of the report is to describe the geology and the hydrologic characteristics of the aquifer system. The general area of study covers about 9,200 mi2
1
in 26 counties in the east-central part of the Coastal Plain of Georgia, and is generally bordered on the west by the Ocmulgee River, on the east by the Savannah River, and on the north by the inner margin of the Coastal Plain (fig. 1).
Previous Investigations
The general geology and hydrology of the Coastal Plain sediments of Georgia have been discussed in early publications by Stephenson and Veatch (1915), Cooke (1943), and Herrick and Vorhis (1963). Geohydrologic reports primarily concerned with the study area include LaMoreaux (1946), LeGrand and Furcron (1956), LeGrand (1962), Siple (1967), Marine and Root (1978), Faye and Prowell (1982), and Vincent (1982).
Recent detailed geologic investigations of sediments in the study area are provided by Cramer and Arden (1980), Gohn and others (1982), and Prowell and others (1985). Stratigraphic interpretations include definition of the Huber Formation by Buie (1978), the Barnwell Formation by Huddlestun and Hetrick (1979), and the Baker Hill Formation by Gibson (1982). Time-stratigraphic interpretations from paleontological data are provided by Tschudy and Patterson (1975), Prowell and others (1985), and L.E. Edwards and N. 0. Frederickson (U.S. Geological Survey, written commun., 1982-83). Lithologic descriptions of selected wells in the Coastal Plain of Georgia are included in Herrick (1961) and Applin and Applin (1964). Studies pertinent to faulting or structural anomalies in the Coastal Plain include a discussion of the Belair Fault by Prowell and O'Connor (1978). Other publications which provided useful information in the study area include guideb~oks by Herrick and Counts (1968), P~ckering (1971), Huddlestun and others (1974), and Nystrom and Willoughby (1982) and several consultants' reports.
Methods of Study
During 1980-81, four test wells were drilled in the central part of the study area along a line approximating the strike of the inner margin of the Coastal Plain (fig. 2). The Arrowhead test well (18T1) is in northern Pulaski County, the Laurens test well 3 (21U4) is southeast of Dudley in Laurens County, the Wrightsville firetower test well 1 (24Vl) is southwest of Wrightsville in Johnson County, and the Midville test well 1 (28X1) is northeast of Midville in Burke County. Each of the wells completely penetrates Tertiary sediments and all except the Arrowhead test well completely penetrate Upper Cretaceous sediments. Each well is screened in the lower part of Upper Cretaceous strata. Drill cuttings, cores, samples for paleontologic analysis, geophysical logs, and water samples for chemical analysis were collected from each well. After well construction was completed, water-level recorders were installed, and the test wells became part of a statewide network of ground-water monitoring stations.
Geologic interpretations were based on (1) examination of drill cuttings, cores, and geophysical logs collected in the four test wells and other boreholes in the study area, (2) lithologic descriptions of drill cuttings and cores, (3) paleontological data, and (4) field observations of exposures along roadcuts and in kaolin mines. These data provided a basis for construction of the hydrogeologic sections and contour maps showing the top, base, and thickness of the aquifer system.
Hydrologic investigations utilized historical and modern water-level data obtained from wells throughout the study area. Historical water-level data for the period 1944-50 were acquired from reports by LaMoreaux (1946), LeGrand and Furcron (1956), and LeGrand (1962). Well
2
IC
VALL E Y"'
""'
A~D
,..;,
\
"
\~A~H~ON
\ CA'"tl: I
l
\
'
\
~
t&
"a.(.
,
I h U TT S
, "' '
Aj';
\ r ttuu,. " ~\ '11 171
pI r [
LJ r,,<. r M ul~ rl t l
".
' l H ;. R .. I
' , , v :: s 0 ~ "
!OXPLANA'II ON
A~EA OF RCPO~l
"" ' '"J' Hydroooo l ogy o t t he Goroon
avo t 111 ul
e,n;t - ~;onJ r nl Oco r(J r" (ltttr.. lli rJor t)
t-l y(lrool!o l og1 ul lto Uubltn .u1d Mthl l! t at~ ttiht ys terna ~f tJnut - cOnlr<~ l G 01 g1.i (CIGfkt!' a no Olh ot a, I 65)
H yd t u~1 eoiOSJ ~ o t ' "o Cl n vteu1 _., out rw ol ~t)ulhwd: ~ t L."it.~cU' cu n
(CI[Jr"'O a n~ olharr. 1 Ult}
Hvd1 ogco1Dt,IY at thu f1'rc>~ltJLWr.v aq u.U 1 o t 5n ulhw l.n t GoOt(lli\ (CI.H"-'' nnd oHturb4 t 063)
Gl1Qh~dtOIQ{1Y I lh O Jaek.:!!QI,/nlt .oqulltl ! Ill CCI'IH' I 011U c~l Cl-! l,lr I Oee1 1ctlil (Vitlcoru , I 8?)
Whm fl s pJIJ)' olU.tol~ l)vethLP. ~ ur rn OIC! tUUhH 11D 1-IIJ $ 110Wfl
.)
rHOMAS
dR~O"(.S
c
h
..,
----
.,.
a
" I
Figure 1.-Location of study a rea, physiographic provinces, and areas
covered by investigations as part of the Upper Cretaceous-lower Tertiary
aquifer study.
3
EXPLANATION
AREA OF OUTCROP OF LOWER TERTIARY AND UPPER CRETACEOUS SEDIMENTS , UNDIFFERENTIATED
A_ _A~INE OF HYDROGEOLOGIC SECTION
- 22YSO WELL AND IDENTIFICATION NUMBER FOR GEORGIA
WELL AND IDENTIFICAtiON NUMBER AND TYPE OF DA1 A AVAILABLE AT WELLS 0~ HYDROGEOLOGIC SECTIONS
-..
<!118T 1 Test well
' 9 w8 Litholo gic
- 24 x5 Geophysical
T21 u4 Pal e ontolo g ic /
W~~~r:~od~~~:i':';:r~leOyNr:~~~8ER- Corr8sponds : / '
e23 A LaMoreaux, 1946
3B
E9
LeGr a nd and Furcron, 1956
t92 1 C LeGrand, 1962
r~
o io~ dn
~" tU
t ~&.t kultlon
tar q tltlntlc" o ~ i 1'\tunbar.l tor ll outi'! o.ar
oll
o.a
.
-.r
' E L
A!;- :3~
3:1"
~
auvc
ON
, ~ . "A
.,,:i.ti::l I.S~$~111fUi
18~ ,-;.ef!J PL'.! AS
. fi AC t 6R7
. ~ORll
('";
32'
:u; x.c.
!!OWl:
30WJjl
!?w~~ w~
~~w~ -
~~ .x~:,:Y 3~\e ,
:!{X 11i.
~U:2.04p '"'
;,~-~~~~ 0. ~!)(:J"
~'ft'ffll33X#J ': -
l:J'f{!~~;;;.o:r
a:w..c e
2~ W 143:2W 1 ,l
~
e 3BVI
-~
0
(
~7Ut
)-
....
.ssu.
E r~ L o..
\, "\
HI
!0
o-Q.
&0 t.olll-ES
I
--a.u .s.e f 1-(,-ttt lJI G \!Ci ofcl!tica l S~,~r l(l" -, tll lt baee meps, 1 .lac,r)oo
83'
82'
Outcro p area from Geo log ic Map o1 Ge orgia, 1517 6
Figure 2.-Location of wells and hydrogeologic sections.
locations in those reports were taken from original field maps, field checked where possible, and plotted on 7 .5-minute topographic maps from which altitudes were estimated. These data were used to construct the estimated 1934-68 potentiometric surface. Water-level measurements collected in more than 100 wells in the study area during November 1981 (Appendix A) and data obtained from files of the
u.s. Geological Survey, and from consul-
tants' reports and kaolin companies were used to define the November 1981 potentiometric surface. Aquifer transmissivities and specific capacities were calculated from aquifer-test data in U.S. Geological Survey files and from data in Siple (1955) and Marine and Root (1976; 1978). Water-use data were obtained from municipal and industrial water-use reports submitted quarterly to the Georgia Environmental Protection Division, and agricultural water-use surveys conducted by the U.S. Soil Conservation Service during 1979-80. Water-quality data were
obtained mainly from analyses by the u.s.
Geological Survey Central Laboratory. (See Appendix B.)
Well Numbering System
In this report, wells located in Georgia are numbered according to a system based on the U.S. Geological Survey Index to Topographic Quadrangle Maps (fig. 3). Each 7. 5-minute quadrangle in the State has been given a number and letter designation according to its location based on a Cartesian pattern with the origin at the southwest corner of the State. Numbers increase eastward and letters increase alphabetically northward, excluding the letters "I" and "0". Quadrangles beginning in the northeastern part of the Coastal Plain are designated by double letters. Wells inventoried in each quadrangle are numbered consecutively beginning with 1. Thus, the third well scheduled in the Riddleville quadrangle in Washington County is designated 24X3. Additional information regarding these wells may be obtained from the District
Chief, u.s. Geological Survey, 6481-B
Peachtree Industrial Boulevard, Doraville, GA 30360.
In areas where modern water-level data were unavailable, wells were used from reports by the Georgia Geologic Survey (LaMoreaux, 1946; LeGrand and Furcron, 1956; and LeGrand, 1962). Because these wells are not included in the modern data base and, thus, were not assigned grid numbers, the sequential well numbers from the reports were retained. Additional data for these wells may be acquired from the respective reports.
Wells in South Carolina are numbered according to a county designation. The numbers consist of a county name abbreviation followed by consecutive numbers indicating the order in which wells were inventoried in the county. For example, well AK-437 was the 437th well inventoried in Aiken County. Wells at the Savannah River Plant are numbered as designated by the facility (wells MSB-34, FC-5A, ZW-7, ZW-15, 35-H and VSC-2).
Acknowledgments
The authors extend their appreciation to the numerous well owners, drillers, kaolin companies, and municipal and industrial employees for their cooperation and assistance in supplying information on wells. Appreciation is also extended to Douglas M. Dangerfield of M.R. Chasman and Associates, Athens, Ga.; Gerald S. Grainger of the Southern Company, Birmingham, Ala.; Robert Massey of LayneAtlantic Co., Savannah, Ga.; Sam M. Pickering of Yara Engineering, Deepstep, Ga.; and Dan Zeigler of Southeast Exploration and Production Co., Dallas, Tex., for providing hydrologic and geologic data. Laurel M. Bybell, Raymond A. Christopher, Lucy E. Edwards, and Norman 0. Frederiksen of the U.S. Geological Survey, Geologic Division, provided paleontological and palynological identifications of core samples from test wells in the study area. Lin D. Pollard (U.S. Geological Survey, Doraville, Ga.) organized and monitored the test-well-drilling program. The authors particularly acknowledge the assistance provided by
David c. Prowell (U.S. Geological Survey,
Geelogic Division, Doraville, Ga.), whose
5
83
15 16 17 18 19 20 21 22 23 24 25 26 27 28 29 30 31 32 33 34
Modified from index to topographic maps of Georgia U.S . Geolugicar Survey
0
ro
20
30
4.0 MILES
Figure 3.- Number and letter designations for 7.5-minute quadrangles covering east-central Georgia.
6
knowledge provided a basis for the geological framework used in this study. Special appreciation is extended to Willis G. Hester and Ellie R. Black for preparing the illustrations in this report.
GEOLOGY
Regional Setting
The Coastal Plain province of Georgia consists of a southeastward-thickening wedge of poorly consolidated sand, clay, and limestone of Late Cretaceous to Holocene age. This sedimentary sequence unconformably overlies Paleozoic crystalline rocks or lower Mesozoic sedimentary and igneous rocks throughout the study area (Chowns and Williams, 1983). In the northern part of the study area, the Coastal Plain sediments crop out in narrow belts that become progressively younger seaward.
In this report, stratigraphic correlations are based mainly on paleontological, geophysical, and lithologic data from the four cored test wells and from other wells in the study area. This information helped clarify the stratigraphic and lithologic relations between strata of the Coastal Plain in Georgia and South Carolina.
Geologic Units
Changing depositional environments in the Gulf and the Atlantic Coastal Plains resulted in a wide range of sediment types that have been divided into numerous age-equivalent geo1ogic formations. Because no formal geologic units have been previously defined in the study area, in this report several geologic formations of the Coastal Plain of Georgia and adjacent areas in South Carolina have been combined into regional stratigraphic units based on their similar lithology, stratigraphic position, and geologic age. Each regional unit has been assigned an informal name taken from the established geologic formations of the southeastern Coastal Plain that best
represent the lithologic chara~ter of the unit. For example, the lower HuberEllenton unit of this report includes strata of the lower part of the Huber Formation of eastern Georgia and the Ellenton Formation of South Carolina. These informal geologic units comprise the Gordon aquifer system and its confining units. The stratigraphic correlations of the informal units, the units comprising the Gordon aquifer system, and the established geologic formations in the Coastal Plain of Georgia and adjacent parts of South Carolina are shown in table 1.
Upper Cretaceous Strata
Upper Cretaceous sediments of Santonian through Maestrichtian age overlie Paleozoic crystalline rocks or lower Mesozoic sedimentary rocks throughout most of the study area. The sediments are well exposed near the inner margin of the Coastal Plain, but to the south they are overlain by younger sediments of Tertiary age. The sediments are of deltaic and shallow marine origin, and they attain a known maximum thickness of 1,840 ft (Clarke and others, 1985) in the southern part of the study area.
The Cretaceous sediments within the study area generally consist of poorly consolidated, kaolin-rich, fine to medium sand, sandy clay, and gravel (Faye and Prowell, 1982). In most of the area, the top of the Upper Cretaceous strata is characterized by silty, kaolinitic clay that locally contains deposits of commercial-grade kaolin. For a more de ta .iled discussion of Upper Cretaceous strata, see Clarke and others (1985).
Paleocene Strata
Lower Huber-Ellenton Unit
The lower Huber-Ellenton unit of early and middle Paleocene (Midwayan) age unconformably overlies Upper Cretaceous strata throughout most of the study area. This unit is the age equivalent of the Porters Creek and Clayton Formations in
7
Table 1.- Generalized correlation of geologic and hydrologic units of Late Cretaceous and Tertiary age in Georgia. (Modified from Prowell and others, 1985)
E"AI~ EUROPEAN STAGE
~
Undifferenlialed
PROVINCIAL STAGE Undifferenlialed
ALABAMA
W
E
III I Ill
WESTERN GEORGIA
I III
LITHOLOGIC UNIT M1
EASTERN GEORGIA SOUTH CAROLINA
W
c
GEOLOGIC UNIT
Hawlhorn Formalion Hawlhorn Formalion
THI S REPORT THICKNESS (FEET)
HYDROLOGIC UNIT
::::!:
Ed ll"l ~t:I~U.all
Post-Eocene
P".:.vn* H!llmmOc!!k_ $&1'1Pj
Cfl~nd!r Brodge
strata
LU
Chattian
~
g -?
~ Rupelian
?-
Chickasawhayan Vicksburgian
Chickasawhay Forma tion
Byram Formatio n
"'' 11 ""~'~ Llnlotlll.ll th
~'~"" e'"'' c~.>vt
'"'""" i~:~::::..
Suwanee Limeslone
Cooper Formation IHI'Ir ..,. ,n .. ~ d
O 1
I
_
Ea
[u:;;~~~~~~~~f~~,.g
Barnwell unit
---
0230
1 Jacksonian aquifer
Priabonian
.
w
Bartoman
~
0
~
Llltetian
Ypresian
Jacksonian Claibornian
Y,::.c . - """""' ,,.,., '" 13~ ~ ~ c.a!' ~" "
Ocala Limeslone li l t 111 1
E
-~
E
Lisbon Formation
Lisbon Formation
5
Ta l l<~ halta Formation
.E.ri
Tallahalta Farmali on
E3
1--- '~'-
Barnwell Formaolon / ":~w-
llill[W.~ .,. 1 II I I ..11.4111
t:>
> L1sbontMcBean
tt~oB an.
S-anUe
Form, !IDf1.t
foi"IT'.c!il~'l!ln umuton,
~ Congarew
Usbon-McBean unit
Formmtl o~~
UpperHuber:Tallahatta
II IIJII!IIIII
unol
0-80 0-140
--
~pper . con mmg umt
Gordon aquifer syslem
(X)
tl" '"''"'ll"i"'.. ilJD. ~~ ,,_., ,., ton"-.. eD.. ,n, '"!"-
__
~UJ
g
Thaneloan
~
.
~
Dan1an
Sabinian Midwayan
! .. ,,.. ..,,, ' 0""" 1'"
n~wc:an c ma For ma.tlon
"fl l tl 1r.1111 IIIII 1111 Nan.;ha lfo/ BIII.ker Hill Fms
''~"u"'u"
mt.rl'<:~11~1o1r1m<11J
1u1o1n111
111111
t'""''
iiiiiiiiiiiiiJI
!:lu L t .. u'l h
Clayton Forma11on
Cla yton Formal ion
P
If 1
p 1
Jlillll.
Huber Formation
lli'k Mtr.g Fc t mtllon
Black Mingo
1 II I Gcoop
Ell enlo"'' For m:auon
nl "''" N '"'""'"""" ' "d Col<tuhou"
Bake r Hiii-Nanatall a unit
Lower Hub~r-EIIenton
umt
0-130 0-200
Lower confining unit _ -------
Dublin aquifer system2.
Maestrichtian
Navarroan
I f---- - - ----+---- - ---1
Campanian
Tayloran
''~" ' '"' ll '11 ' t;to" 1' Rop l ey Forma ti on
Demopolis Chalk Mooreville Chalk
Providence Sand Ripley Formation
Cusseta Sand
Hll I II
UK6
UKs
uK
4
Blufflown Formallon
UK3
f .I 1
Unnamed
Peedee Formation
rocks Black Creek Formation
II III III 11111111111 U~~~~:d
Upper Cretaceous
0-1840
~------Confining unit
~- - - - -- -
Midville aquifer syslem2
~
Santonian
i ::::n~::
Austin ia n
Eutaw Formation
Eutaw Formation
UK2
Forma~ion Middendor l Forma1ion Middendort
l llllllllll lll!l l!l l llllllllllllllllll u~, lfliilillilrrllillri illrlil1il'ii" 11111\'lfil
=" 1---?
.
? _
Eagtefordian
Tuscaloosa Formalion Tuscaloosa Formalion
U~~~~;d
U~~~~sed
J-
. __
Conljnio g unll
".,.., ..,
1 Vincent, 1982, 2 Clarke and others, 1985.
oo. . . .. ,
I 11111 11111 11111 1111 111 11 1111111 11 1111 11111 11111 1111
I 11111111111 1111111111111111 11111 1111 IIIII Ill
western Georgia, the lower part of the Huber Formation (Buie, 1978) and the P1 lithologic unit of Prowell and others (1985) in central and eastern Georgia, and the Ellenton Formation (Siple, 1967) in South Carolina.
The unit includes a basal layer of fine to coarse, poorly sorted, angular, silty, quartz sand in a kaolin matrix. The remainder of the unit consists of locally carbonaceous, kaolinitic clay containing a diverse assemblage of pollen and marine microfauna of early and middle Paleocene (Midwayan) age (Prowell and others, 1985). The lithology and the presence of marine fauna indicate that the unit was deposited in a deltaic environment under marine influence.
In the southern part of the study area (well 25T2, pls. 1, 2), the basal sand grades into a relatively porous, medium-gray, very fossiliferous, glauconitic limestone interlayered with fine to coarse sand. The upper part of the unit also becomes calcareous, grading into marl and limestone. This lithofacies formed in a predominantly open marine shelf environment, largely lacking an influx of clastic sediments. In this area, the unit reaches a maximum thickness of 200ft (well 25T2, pls. 1, 2).
Baker Hill-Nanafalia Unit
The Baker Hill-Nanafalia unit of late Paleocene (early Sabinian) age overlies the lower Huber-Ellenton unit throughout most of the study area and pinches out in the subsurface north of well 20V4 in Wilkinson County (pl. 1), well 24V1 in Johnson County (pl. 2), and well FC-5A in Aiken County, S.C. (pl. 2). The unit is the age equivalent of the Tuscahoma, Nanafalia, and Baker Hill Formations in western Georgia, the P2 lithologic unit of Prowell and others (1985) in central and eastern Georgia, and the Black Mingo Formation in South Carolina.
In the northern part of the study area, the unit consists of thinly laminated, silty clay locally containing lay-
ers of medium to dark-gray carbonaceous clay. This lithology is indicative of a marginal marine (lagoonal to shallow shelf) environment of deposition. In most of the study area, the clayey part of this unit is characterized on geophysical logs as a zone of low electrical resistivity and re:atively high gamma radiation. These geophysical responses are useful indicators of the top of Paleocene strata.
In southern areas, the Baker HillNanafalia unit becomes increasingly calcareous and consists mainly of highly fossiliferous, light-gray, finely crystalline, glauconitic limestone interlayered with very coarse, well-sorted quartz sand. This lithology indicates a transition to open marine shelf deposition. At well 25T2 (pls. 1, 2), the unit reaches a maximum thickness of about 130 ft.
Eocene Strata
Upper Huber-Tallahatta Unit
The upper Huber-Tallahatta unit of early and middle Eocene age uncomformably overlies the Baker Hill-Nanafalia unit in most of the study area and crops out in the northern part of the area near well 19W6 in Wilkinson County (pl. 1) and well 22Y30 in Washington County (pl. 2). In the northernmost part of the area, where Paleocene sediments are missing, the upper Huber-Tallahatta unit directly overlies strata of Late Cretaceous age (pls. 1, 2). The upper Huber-Tallahatta unit includes sediments equivalent to the Hatchetigbee, Bashi, and Tallahatta Formations and the lower part of the Lisbon Formation in western Georgia; the upper part of the Huber Formation (Buie, 1978), and the E1, E2, E3, and E4 lithologic units of Prowell and others ( 1985) in central and eastern Georgia; and the Congaree Formation (Pooser, 1965) and Fishburne Formation (Gohn and others, 1983) in western South Carolina.
The upper Huber-Tallahatta unit consists of fine to medium, subangular to
9
subrounded, well-sorted, clayey quartz sand that locally includes thin layers of carbonaceous clay containing marine microfossils (Prowell and others, 1985). Mica, dark heavy minerals, and lignite are present in some of the sand layers. Extensive animal burrows and small- and large-scale cross-bedding characterize the unit in outcrop and in core samples. These features and the abundance of marine microfauna suggest a deltaic environment of deposition.
In the northern part of the study area, the uppermost part of the unit is characterized by beds of relatively pure, massive kaolin that has a hackly fracture. In Twiggs, Wilkinson, and Washington Counties, these kaolin deposits increase in thickness from 10 ft (well 24V1; pls. 1, 2) to about 60ft (well 20V4, pl. 1; well 23X28, pl. 2) and are of commercial value.
In the southern part of the study area, the unit has a thickness of about 140 ft and becomes more calcareous, suggesting a transition to a more open marine depositional environment. For example, at well 25T2 in Treutlen County (pls. 1, 2) the unit consists of lightgray, slightly glauconitic, fossiliferous, sandy limestone.
Lisbon-McBean Unit
The Lisbon-McBean unit is comprised of marine sediments of latest middle Eocene (Claibornian) age. The unit overlies the sandier phases of the upper HuberTallahatta unit and pinches out in the subsurface between wells 20V4 and 21U4 in Wilkinson and Laurens Counties, respectively (pl. 1), and wells 23X28 and 24X5 in Washington County (pl. 2). The LisbonMcBean unit is the age equivalent of the upper part of the Lisbon Formation in western and central Georgia, the E5 lithologic unit of Prowell and others (1985) in eastern and central Georgia, and the McBean Formation of eastern Georgia and western South Carolina.
Throughout most of the study area, the unit consists of massive, gray-green glauconitic marl interlayered with calcareous, clayey quartz sand and fossiliferous limestone. It has a maximum thickness of about 80 ft in well 24V1 in Johnson County (pls. 1, 2). The lithology and abundance of marine microfossils (Prowell and others, 1985) in this unit indicate that the sediments were deposited in an open marine, shallow shelf environment. The Lisbon-McBean unit is characterized on geophysical logs by low resistivity and high gamma radiation, probably because the unit contains more clay than the overlying and underlying units. In the southern part of the study area, the unit becomes more calcareous and consists of slightly sandy, finely crystalline fossiliferous limestone. At the Midville test well (well 28X1, pl. 1), the Lisbon-McBean unit is unusually sandy and consists largely of calcareous quartz sand and minor amounts of clay and glauconite.
Barnwell Unit
The Barnwell unit is generally continuous throughout the study area and unconformably overlies the Lisbon-McBean unit or, where the Lisbon-McBean unit is absent, older sediments of Eocene age (pl. 1). The Barnwell unit is the age equivalent of the late Eocene (Jacksonian) to early Oligocene (?) Barnwell Group of Huddlestun and Hetrick (1979), and the E6, E7, and E8 lithologic units of Prowell and others (1985) in central and eastern Georgia; the Moodys Branch Formation and Ocala Limestone in western Georgia; and the lower part of the Cooper Formation in coastal South Carolina (Hazel and others, 1977).
The Barnwell unit consists of an ascending sequence of calcareous sand, thinly bedded fossiliferous limestone, well-laminated clay, and cross-bedded sand. The sequence represents the cyclic deposition of sediments during transgression and regression of a late Eocene to
10
early Oligocene (?) sea (Prowell and O'Connor, 1978; Willoughby and others, 1984). Depositional environments vary from nearshore marine to open marine shelf (David C. Prowell, U.S. Geological Survey, oral commun., 1983). The unit has a maximum thickness of about 230 ft in the southern part of the study area (well 27U4, pl. 2). The calcareous sand and limestone at the base of the Barnwell unit is limited to the southern part of the study area. In northern areas, laminated clay marks the base of the unit.
Relation of Lithology to Depositional Environments
The geologic units defined herein were deposited either in deltaic or shallow, open marine environments. Deltaic environments occur where sediment-laden rivers or streams empty into larger bodies of water such as the sea. Sediment carried by the river is deposited along and between a complex network of small stream channels, or along the delta front in shallow marine water. The resulting deposits form a complexly interbedded network of sand and clay layers of highly variable thicknesses that commonly contain organic material. Sands are deposited along the stream channels and at the delta front; clays are deposited in interstream or bay areas. In the study area, most sediments of the upper HuberTallahatta unit and the lower HuberEllenton unit were deposited in a lower delta plain or delta front environment (Coleman and Prior, 1980; Reineck and Singh, 1980, p. 324-328), which accounts for the presence of poorly sorted sand containing local, laterally discontinuous clay layers whose vertical boundaries may be sharp or gradational.
Sediments deposited in marine environments, as characterized by the Baker Hill-Nanafalia, Lisbon-McBean, and Barnwell units, maintain a more uniform thickness and lithologic character over a larger area than do deltaic deposits. Nearshore or shallow marine sands generally are well sorted and form extensive bar-like or sheet-like beds that can be
traced for long distances. Beds of silt and clay are deposited farther offshore in deeper water. In an open marine environment, deposits are typically thicker and consist largely of limestone and carbonate-rich sand and clay, which is characteristic of most of the geologic units in the southern part of the study area.
The areal extent and lithologic character (particularly the grain-size distribution) of the strata, and thus their water-bearing characteristics, are largely determined by the depositional environments in which they accumulated. In the study area, the most permeable rocks in the Gordon aquifer system generally are the stream channel and delta-front sands of the upper Huber-Tallahatta unit. The confining units consist mainly of the interstream or shallow marine clays of the Lisbon-McBean unit and the Baker Hill-Nanafalia unit.
Structure
The study area is generally part of a southeastward-sloping homocline that has an average dip of about 15 ft/mi. A major structural feature occurring in the northeastern part of the area (fig. 4) is the Belair fault zone (Prowell and O'Connor, 1978), a northeast-trending, highangle reverse fault, upthrown on the southeast side. Maximum vertical displacement in upper Eocene sediments is about 40 ft.
HYDROLOGY
Aquifer Nomenclature
Aquifers in the Georgia Coastal Plain are generally named for stratigraphic units or given letter and number designations. For example, the Clayton aquifer (Hicks and others, 1981) was named for sediments belonging primarily to the Clayton Formation, although other sediments are included. The A1 aquifer of Faye and Prowell ( 1982) represents an aquifer of Late Cretaceous age. In the present study, formation names were con-
11
EXPLANATION
AREA OF OUTCROP OF LOWER TERTIARY AND UPPER CRETACEOUS SEDIMENTS, UNDIFFERENTIATED
-+--FAULT-U, upthrown side ; D, downthrown side ; dashed where inferred -
-a--STRUCTURE CONTOUR -Shows altitude of top of the Gordon aquifer system. Dashed where approximately located. Contour interval 100 feet. Datum is sea level
330 DATA POINT-Number is altitude of top of the Gordon aquifer system, in feet
"
. /' '\
' ...
.,.~~
..... ....._
' \..7
-,'- '"':;--...-......
'
...
33' I-'
~
~ .. ~..4
.rt~
.1 5S
"-'
ALLE ~ ;_E
"1~
w.~<.
-,.0?:"1\-:
----- -~ ~ =>EVEN,. ' ?.oo_____"_ E'-_K.,_."...'
~ .....
'
/
/
(
32'
sta1t~ -1~!~ ~:~~o~;t~;~ Gil~~"'
AS~
/
) ~
DO G'E
~>
\
....\ ...
83'
"""
"'
i J:.Q
<qh~ ~ -37 1
~400
' y- / "0
~I>."D ._._-,.n' , - --
/G
---:
-. \ .,.
__.-. . =
"'1,
;
~')..
.... _
. ..,...._
OCM '\. \.._ -\
0
10
:0
JO
:$0 MILi!S
1..
I
82'
Outcrop ar lrom Geologic Map of Georgia. 1976
Figure 4.- Structural features, outcrop area, and altitude of the top of the Gordon aquifer system.
sidered inappropriate for aquifer units, because facies changes are common throughout the study area and aquifer units do not everywhere coincide with formation boundaries. Letter and number designations are not utilized because the same symbols have been used by several authors for different aquifer units (Pollard and Vorhis, 1980; Faye and Prowell , 1982). Therefore, to avoid confusion, the Gordon aquifer system described in this report, was named for the city of Gordon, in Wilkinson County, where the sediments that typify the aquifer system are well exposed.
Definition of the Gordon Aquifer System
An aquifer system is herein defined as a body of material of varying permeability that acts as a water-yielding hydraulic unit of regional extent. Throughout most of the study area, the upper HuberTallahatta unit meets the definition of an aquifer system, and hereafter it is referred to as the Gordon aquifer system.
Although the Gordon aquifer system can generally be treated as a single water-bearing unit throughout the study area, it contains discontinuous clay layers that locally separate it into two or more aquifer units. These clay layers are not considered to be hydrologically significant in a regional evaluation, but they increase the complexity of the hydrologic framework.
Geophysical and lithologic logs show that the base and top of the Gordon aquifer system are distinguished by regionally extensive clay units. These clay units form the upper and lower boundaries of the aquifer system. The base of the Gordon aquifer system generally is marked by silty, kaolinitic clay of the Baker HillNanafalia unit. In southern areas, the Baker Hill-Nanafalia unit loses its effectiveness as a confining unit because of a lithologic transition to more permeable, calcareous, clastic sediments and limestone (well 25T2, pls 1, 2) In these areas, the basal confining unit of the Gordon aquifer system is comprised of
kaolinitic clay in the upper part of the lower Huber-Ellenton unit. In the northern part of the study area, the Baker Hill-Nanafalia unit pinches out (wells 24X5 and AK-45 7 , pl 2) , and the Gordon aquifer system may be hydraulically connected with sediments of the underlying Dublin aquifer system of Clarke and others (1985).
The clay unit overlying the aquifer system generally consists of massive, glauconitic marl of the Lisbon-McBean unit and in most areas it forms the upper confining unit. Locally, the LisbonMcBean unit is a clayey sand and does not confine the aquifer. For example, at the Midville test well (well 28X1, pl. 1), the Lisbon-McBean unit consists of glauconitic sand and is an ineffective confining unit. In this area, laminated clays of the Barnwell unit form the upper confining unit of the Gordon aquifer system. In the northern part of the study area, between wells 23X28 and 24X5 in Washington County (pl. 2), and in the central part between wells 20V4 and 21U4 in Wilkinson and Laurens Counties, respectively (pl. 1), the Lisbon-McBean unit pinches out. Here, the kaolin in the uppermost part of the upper HuberTallahatta unit increases in thickness and forms the upper confinement for the Gordon aquifer system.
Aquifer System Geometry
Altitude of Aquifer System Boundaries
Geophysical and lithologic logs of 42 wells were used to determine the approximate altitudes of the base and top of the Gordon aquifer system (figs. 4, 5). In the southeastern part of the study area, in Screven and Bulloch Counties, it was not possible to determine the altitude of the base of the aquifer system because of sparse geologic control. In this area, contours shown in figure 5 are dashed and represent an approximation of the base of the Gordon aquifer system. Depths to the
top of the aquifer system may be estimated by .subtracting the altitude of the
13
EXPLANATION
AREA OF OUTCROP OF LOWER TERTIARY AND UPPER CRETACEOUS SEDIMENTS, UNDIFFERENTIATED
--IT---FAULT -U, upthrown side; 0 downthrown side; dashed where inferred
-a--sTRUCTURE CONTOUR -Shows altitude of base of the Gordon aquifer system.
Dashed where approximately located. Contour interval 100 feet. Datum is sea level
>v>''
295 e DATA POINT-Number is altitude of base of the Gordon ci.quifer system, in feet
: otJ
33'
....
"""
32'
..J
/
"
..., 1~
.;!
_, ,:.
i t"
El L
.
.-ZT5
""\,.
\
~o::::-;;
/
,...__./ ,g.
/ ./
--- .....~Aoo-
~ 1. !;..-:--
...... ~--r.oo--- - "\ - - - ' !LIS
. . ,.....~
- .$4&
~-
;
..
/
/
/
/
"'
.~..,..~_...___soO ~
~-
.
~
0
10
20
30
40 !.AILES
U ll fMfm IJ 6 (l.e o loQiCD I CIIU r o-t
State base maps, I.!IDO.rJOO
83'
82'
Outcrop ara from Geologic Map or Gaorgla, 1976
Figure 5.- Structural features, outcrop area, and altitude of the base of the Gordon aquifer system.
top (fig. 4) from the altitude of land surface (available on U.s. Geological Survey 7 .5-minute topographic quadrangle maps).
Thickness
The thickness of the Gordon aquifer system was estimated by comparing the altitudes of the base (fig. 5) with the altitudes of the top (fig. 4). The aquifer system ranges in thickness from about 20 ft in northern Wilkinson County in the western part of the study area, to more than 180 ft in Pulaski County in the southwest, and to more than 190 ft in southern Burke and Jefferson Counties in the central part of the area (fig. 6).
Aquifer and Well Properties
Transmissivity and Specific Capacity
The transmissivity and specific capacity of an aquifer system are two properties that help define the hydraulic aspects of ground-water flow. Transmissivity is a measure of an aquifer's ability to transmit water and is derived from analysis of time-drawdown data obtained during aquifer tests or from calculations using specific-capacity data. In this study, time-drawdown data were available for only two wells tapping the Gordon aquifer system: well 18S12 in Pulaski County and well 33X37 in Screven County (fig. 7). The transmissivity of the Gordon a~uifer system was calculated as 9,800 ft /d at the Pulaski County well and as 3,500 ft2/d at the Screven County well.
Specific-capacity values for wells tapping the Gordon aquifer system range from 2.5 (gal/min)/ft at well 25Z3 in Glascock County to 50.4 (gal/min)/ft at well 32U18 in Screven County (fig. 7).
Transmissivity values from the Gordon aquifer system, as computed from specific-capacity data using Jacob's modified nonequilibrium formula (Ferris and oth-
e rs, 1962), are shown on figure 7, and
range from 620 ft2 I d in Glascock County
(well 25Z3) to 13,000 ft2/d in Screven County (well 32U18). Transmissivity values computed from specific-capacity data were 10 percent lower at well 18S12 and 30 percent lower at well 33X37 than values computed from the time-drawdown data. Accordingly, transmissivity values computed from specific-capacity data may be low throughout the study area.
The transmissivity of the Gordon aquifer system is generally greatest in the southern part of the area where the aquifer system is thickest (figs. 6, 7). Transmissivity values obtained from specific-capacity data in multiaquifer wells that tap both the Gordon aquifer system and the overlying Jacksonian aquifer (Vincent, 1982) are higher than those of nearby wells that tap only the Gordon. In these wells the transmissivity ranges from 2,400 ft2/d at well 23X34 in Washington County to 14,900 ft2/d at well 19T6 in Bleckley County.
Well Yields
Wells tapping the Gordon aquifer system have yields ranging from 87 gal/min (well 26AA3) in Glascock County to 1,815 gal/min (well 32U18) in Screven County (fig. 7). Yields exceeding 1,000 gal/min are obtained from well 26W1 near Wadley and wells 26Y2 and 26X2 near Louisville in Jefferson County, and well 32U18, north of Dover in Screven County. Yields of multiaquifer wells tapping the Gordon aquifer system and the overlying Jacksonian aquifer (Vincent, 1982) exceed 500 gal/min at Cochran, Bleckley County (well 19T6), and southwest of Waynesboro, in Burke County (well 29Y2). Some wells in the study area do not penetrate the full thickness of the Gordon aquifer system and therefore probably yield less water than a fully penetrating well.
Recharge
The Gordon aquifer system is recharged directly by precipitation in the
15
EXPLANATION
AREA OF OUTCROP OF LOWER TERTIARY AND UPPER CRETACEOUS SEDIMENTS, UNDIFFERENTIATED
7--FAULT-U, up!hrown side; D, downthrown side; dashed where inferred -0--LINE OF EQUAl THICKNESS OF GORDON AQUIFER SYSTEM-Dashed where appr ox imatel y l ocate d. Inte rval 50 feet
:s DATA POINT-Number is approximate thickness of aquife r, in feet
'-
.
;-"~ !'.... '
ss ......
0'>
---
'
<'
P c! :_ p. S r(l '\.
>
~~ L_:._;,:_~,r ~
c rr CICPI U :S., O'&OIGQjCit l $ "rny Sta le base maps, I ;.SOO..OtiC
\
~......- =--
\ ..i
t
/
"''
83'
E N
... /
/~
... ,. ...
-''1""1;,.-
B A ~ N. ;v,J ': ~ !..
--." 12
..1:! ~
3
f'' "'
150~
<12' 3
.....A.t.;.:LE.r-. ~
t,
"..._ E
,
i
., , ,. ---... ------
- l
.-~'--i'
Y. - . J EN
.. KJ
.......~
N . ......_ S
-.~.,~.
1..* '"':""' C:-1._.-.
"?~,~'.. ~
'( ' \
~'
C R E.\.' E r\ ; .
\
,.__ _
{
;~
. "'\.:
'-
"'
'.''\ ~ ' .,
"-!. .._,
""" ~~~:-.:..
/
----...
' l
\ r
- \ L L 0..._C:.J:l~
~ '\,
..
~"'-..
-.:.:;. -
.'\..
'. L....:.---
\
.J
,~
~"
0
10
IQ
~0
.~o g bAILES
I
82'
Outcrop area from Geologic Map o f Georgia, 1976
Figure 6.-Approximate thickness of the Gordon aquifer sys t em.
EXPLANATION
28:As DATA POINT-Well tapping Gordon aquifer system. Number is well identification
u~.- DATA POINT-Well tapping Gordon aquifer s ystem and Jacksonian aquifer. Number is well identification
.,_
AQUIFER CHARACTERISTICS
~ Transmissivity, in feet squared per day. All calculations based on. specific capacities except for wells 18812 and 33X37 which were determined from time-drawdown data Well yield, in gallons per minute SQ ~Ul c: capacity, in gallons per minute per foot
N
-.... ---:;
'\'
:w
......
-'1
~rm-02. .~ ~ ~ - ft'S.y
........ .
157
@
t: - 2.5
., 5 "!I c-
\ . --=~~...:~ -
--~a.)( $...
NSOf'.. ~-
JEFFERS.:
rl
!'~~J r a...e
'
. ; , /
/
ll. A R tj,,,V E L
.28Y-4
3tU\' ,
' '21 '12
.,-. U R K E
~ 0 9 28..Yf 5 I
~ 3 .
J E II
, ..N:;
\.
i., S C R -~,.'! E N .)./
,.. .>c
/'
.r~
'
H ,., ~51
~ E; ECKLEY -,,
-m:: 300 - 7.5
PULAS
-"
"\ "'
--........ J ..,'lo1NSoN ~_
~,
,,. .
EM~i'l'lJEL
' .,.
.....'.
.
32 U 16
\
" ~
~
' <;:.o.NOt..J;:fl\
_,1::>0_ e .l'l t.!. c c H
-- ., I
_.
I
)
-
___
__
'\,.
-~
- ~ ... .......
0
10
~Q;
~t:l
Jtl MIL-ES
I
32'
83'
82'
Figure 7.- Aquifer transmissivity, and yield and specific capacity of wells tapping the Gordon aquifer system.
outcrop area (fig. 2) and in interstream drainage divides in and near the outcrop area. Most recharge by precipitation occurs during January through May when rainfall is abundant and evapotranspiration is minimal. During the summer months, although rainfall is heavy, evapotranspiration is high. Therefore, most rainfall is evaporated or retained in the unsaturated zone as soil moisture and little water is available for recharge. Direct recharge to the Gordon aquifer system also occurs where it crops out near well 22Y30 (pl. 2), and between well 20V4 and the Ruby Quarry (pl. 1).
South of the outcrop area, the Gordon aquifer system is recharged by leakage from overlying and underlying aquifers. Downward leakage occurs in the area between the Midville test well (well 28X1) and well VSC-2 (pl. 1) where the upper confining unit of the Gordon aquifer system is sandy and where the hydraulic head in the Gordon aquifer system is lower than the head in the Jacksonian aquifer. Recharge also may occur where water under greater hydraulic head leaks upward into the Gordon aquifer system from the underlying Dublin and Midville aquifer systems of Clarke and others (1985). Water-level data in Burke and Laurens Counties (fig. 8) show that the hydraulic heads in the Dublin and Midville aquifer systems are higher than the head in the Gordon aquifer system.
Head differences between the Gordon aquifer system and overlying and underlying aquifers are shown in figure 8. During 1980-82, head differences of 6.3 ft were observed between the Gordon aquifer system and the overlying Jacksonian aquifer in Jefferson County, 18.8 ft between the Gordon aquifer system and the Dublin aquifer system in Laurens County, and 11.7 ft and 16.5 ft between the Gordon aquifer system and the Midville aquifer system in Burke and Laurens Counties, respectively.
In Laurens County, well 21U2 taps the Jacksonian aquifer, the Gordon aquifer system, and the Dublin aquifer system. A
comparison of water levels in this well and nearby well 21U5, which taps the Dublin aquifer system, showed a head difference of about 18 ft (fig. 8). This difference suggests that the water leve 1 in well 21U2 is more representative of the Gordon aquifer system and Jacksonian aquifer than the Dublin aquifer system. Also, well 28W4, in Burke County, taps both the Gordon aquifer system and the Jacksonian aquifer, and exact head differences between the two may be more representative of composite head values.
Discharge
Discharge from the Gordon aquifer
system occurs mainly as flow into major
streams. Ground-water discharge to these
streams was estimated from streamflow
measurements made during the drought of
October-November 1954
(Thomson and
Carter, 1955) (fig. 9). During this
drought, streams in the northeastern and
northwestern parts of the study area con-
tinued to flow. In other parts of the
area, possibly because the drought was
more severe, no discharge occurred and
streams ceased flowing, indicating that
the water level in the aquifer had de-
clined below the altitudes of the stream
beds.
Discharge from the Gordon aquifer system possibly may occur as leakage to the underlying Dublin aquifer system (Clarke and others, 1985). This leakage is most likely to occur where the basal confining unit is sandy or absent and where waterlevel declines in the underlying Dublin and Midville aquifer systems have changed the head relations between the aquifer systems and increased the possibility for downward flow. A comparison of waterlevel data (fig. 10) from observation and pumping wells near Four Mile Branch Creek in western South Carolina (Siple, 1967, p. 79) (fig. 2) indicates that water levels in strata herein assigned to the Gordon aquifer system (wells ZW-15 and ZW-7, fig. 10) responded to nearby pumping from wells tapping Cretaceous aquifers (well 35-H, fig. 10). This shows
18
JEFFERSON COUNTY
0
.. - =:= -2i-S VV3
16 8l11 15 t2l
26W1
I-"- 1'
~ ~
100 I-
200 t--- JACKSONIAN AQUIFER
,.------
I~=
UPPER CONFINING UNIT
300 r--
w
0
F= <(
GORDON AQUIFER SYSTEM
lL
a:
400 r--
::J
rJJ
t
0
z
500 1-
<(
_J
;;: 600 1-
0
_J
w m
700 r-
r-
......
w w
~
lL
-z 800 I -
I
r- 900 t--
Q_
w
0
1000 r--
1100 -
LAURENS COUNTY
.21 U 2
21 li<
21.U5
52 . 7( 1-28-62)
1--- - --
_L_
1-T-
:"
.36 . 2( 128-B2H
T
~
1---- -N
33.9(1-28-82)__
1--- ---i
~
JACKSONIAN AQUIFER
UPPER
""""' I---
CONFINING UNIT
I= GORDON AQUIFER
SYSTEM
LOWER CONFINING UNIT
f-.-f-.--
I
E=
DUBLIN AQUIFER SYSTEM
CONFINING UNIT
= =
MIDVILLE AQUIFER SYSTEM
\open hole at bottom of casing
BURKE COUNTY
.. ..... . "2!W
...29X t ~'
0
1--:L ---.- " 60 7(5-23-60)
___L_
4 9 . 0(6-4 -80)
--~
- 100
JACKSONIAN AQUIFER
- 200
I==
UPPER CONFINING UNIT
r--
'""""" GORDON
r=
AQUIFER SYSTEM ~ ~
~
CON~~~~RUNIT
DUBLIN AQUIFER SYSTEM
CONFINING UNIT
Ir===
I= =
MIDVILLE AQUIFER SYSTEM
300 w
0
<( lL
- 400 ~
rJJ
0
- 500 ~
_J
;;:
- 600 0 _J w m
- 700 rw w
!J_
- 800 ~
I r-
- 900 Q_ w
0
- 1000
- 1100
1200 -
~
- 1200
1300
1300
s
WELL SCREEN
EXPLANATION
52.7(1-28-82)
WATER LEVEL-Number outside parentheses is water level in feet below land surface; number inside parentheses is date o/ wtV.l..l.\ITe-men t
____
16. 5
-r
HEAD DIFFERENCE, IN FEET
Figure 8.- Head differences between the Jacksonian aquifer and Gordon aqu i fer system in Jefferson County; between the Gordon and Midville aquifer systems in Burke County; and between the Gordon, Dublin, and Midville aquifer systems in Laurens County.
EXPLANATION
-
AREA OF OUTCROP OF LOWER TERTIARY AND UPPER CRETACEOUS SEDIMENTS, UNDIFFERENTIATED
~ AREA IN WHICH GROUND-WATER DISCHARGE TO STREAMS EXCEEDS 0.2 CUBIC FOOT PER SECOND
~ PEA SQUARE MILE OF DRAINAGE AREA
/
~ AREA IN WHICH GROUND-WATER DISCHARGE TO STREAMS EXCEEDS 0.4 CUBIC FOOT PER ~ SECOND PER SQUARE MILE OF DRAINAGE AREA
'
AREA IN WHICH GROUND-WATER DISCHARGE TO STREAMS EXCEEDS 0.6 CUBIC FOOT PEA SECOND PER SQUARE MILE OF DRAINAGE AREA
0.01
A
-
DATA POINT-NlJ'Tiber is discharge to stream in c'ublc feet per second per square ..J
mi'e of drainage area
"'-
'
- .._..
EL L
\
~3~
BAL
~
0
32'
'
\
,,
0
,)
'""t
'-
""Y:.-/
c
"'"''0
. ~ '
' E M A N U E L
- .,.,',.
"'--._'''; --
.. ~ N' 5
~
~
'
<f_f<E.UTLE~
----- "
.. " ... I C"NCI.E?
I
..... ~~-
s
~:::
''-'-.!. -,
"' ...
{
\,
\
-.,.
-j
0
10
::o
~0
.liD MIL8
. , 1
1
ue ITOfJ1\f$- e&OiooTcti Su"*" Stata be.. ma ps. 11500,00G
82"
Outcrop r.a from Gologic Map ol Georgia. 1976
Figure 9.- Estimated ground-water discharge to streams from aquifers in east-central Georgia, October-November 1954.
that there is hydraulic connection between the Gordon aquifer system and underlying aquifers and that discharge from the Gordon aquifer system occurs in this area.
z(f)
0
:::; (f) z _J
~ 0 _J
~
_J
<(
w 0
0 lL <( 0
:C;;L;
::;) CL
1-
w w
lL
z
_J
w > w
_J
0:
w 261
1<(
5:
lL
0 w 2600
::;) I-
I-
_J
<(
I \
I \
I
\
/ I
\
\.._
I
...
I
I I I
I
I '
I / I I \ I \ I
\I
/~
Water level in well ZW-7
z ~ (f) t-w
<CI
~ 0
CL Z
~z
0: -
CL
2 . 0 ,----,-- -,- 1.5 1.0
12 19 26
NOV
,----,--- .---,-- - . - - . - -- .- -.-------.
3 10 17 24 31
DEC
1952
7 14 21
JAN
1953
Figure 10.- Relation of water-level
fluctuations in wells herein assigned to the Gordon aquifer system (wells ZW-15 and ZW-7) to pumping from a Cretaceous well (well 35-H) and to precipitation, Aiken and Barnwell
Counties, South Carolina, November 1952 to January 1953. (Modified ifrom Siple, 1967)
Ground-Water Levels
Water-Level Fluctuations
Water-level fluctuations in the Gordon aquifer system are the result of groundwater recharge to or discharge from the aquifer system. In and near the outcrop area, water-level fluctuations reflect seasonal changes in recharge from precipitation, discharge to streams, and evapotranspiration. In this area, water levels generally are highest from March through May, a period of abundant rainfall and minimum evapotranspiration, and lowest from August through November, a period of decreasing rainfall and significant evapotranspiration. Periodic water-level measurements from July 1971 to July 1972 in well 31Z13 (Appendix A) at Vogtle Nuclear Plant south of the outcrop area in Burke County showed no response to precipitation in September 1971 but nearly a direct response to rainfall during January 1972 (fig. 11). The comparatively heavy rainfall in June had no effect on the July water level, possibly owing to the high rate of evapotranspiration during the summer months and to the effects of pumping.
South of the outcrop area, the Gordon aquifer system is confined by overlying clay units, and water-level fluctuations result mainly from regional and local pumping. For example, water-level fluctuations in strata herein assigned to the Gordon aquifer system at the Savannah River Plant at the Georgia-South Carolina State line (wells ZW-15 and ZW-7, fig. 10) are more directly related to pumping from wells tapping the Cretaceous aquifer (well 35-H, fig. 10) than to recharge by precipitation (Siple, 1967). (See section on Discharge.)
Potentiometric Surface
The potentiometric surface of an aquifer is an imaginary surface representing the altitude to which water would rise in tightly cased wells that penetrate the aquifer (Lohman, 1972, p. 8). Two poten-
21
1 1 2 r -- -- - - - - -- -- - - - , - - - - - - - -- -- - - -- - - - ,
DATA POINT-Number in
tu
parenth eses is date ot measurement
w
u..
\
~
w 110
0 <u.t. 0:
::;)
C/)
ffi 108
1--
<t
~
u.. 0
w
106
I-
I-
_j
<t
J ASOND JFM A MJ J
1971
19 72
Figure 11.- Relation of water-level fluctuations at observation well 31Z13 at Vogtle Nuclear Plant, Burke County, to monthly precipitation at National Weather Service station 9194 (Waynesboro
2 NE), July 1971 to July 1972.
Potentiometric levels are highest in areas of recharge and lowest in areas of discharge. Thus, the general direction of ground-water flow is southward from recharge areas to discharge areas Locally, pumping can lower the potentiometric surface and form a cone of depression.
The potentiometric maps show that within the study area there are three major ground-water divides: (1) a western divide bordered by the Ocmulgee and Oconee Rivers, (2) a central divide bounded by the Oconee and Ogeechee Rivers, and (3) an eastern divide bordered by the Ogeechee and Savannah Rivers. These three ground-water divides generally correspond to interstream drainage divides and in and near the outcrop area are regions of greatest recharge. The major rivers bordering the ground-water divides are areas of regional aquifer discharge and form boundaries to the ground-water flow system. Naturally occurring discharge into the rivers is indicated by potentiometric contours that bend upstream in an inverted "V" pattern where they cross the rivers.
Predevelopment flow directions within the Gordon aquifer system were generally southward from the outcrop area, toward major rivers and streams. Therefore, corresponding potentiometric gradients were consistently toward the larger rivers and streams and generally were greatest within the outcrop area and near streams. Thus, the regional potentiometric surface in and near the outcrop area of the Gordon aquifer system generally was symmetrical to the major rivers and was, in effect, a subdued replica of surface topography (Faye and Prowell, 1982, P 37).
tiometric surfaces are mapped in this report: an estimated 1934-68 potentiometric surface intended to portray the approximate predevelopment surface (fig. 12), and a November 1981 surface that shows the effects of pumping stress (fig. 13).
Estimated 1934-68 Potentiometric Surface
The estimated 1934-68 potentiometric surface of the Gordon aquifer system was contoured from water-level data collected during this period (fig. 12), most of the data being collected in 1946 and 1963. This surface is thought to resemble the
22
EXPLANATION
-n---FAULT-U, upthrown side; 0, downthrown side; de.shed where inferred
-0-- POTENTIOMETRIC CONTOUR - Shows altitude at which water level would have stood in tightly cased wells. Dashed where approximately located. Contour interval 50 feet. Datum is sea level
~DATA POINT-Number on top is well identification. Number on bottom is altitude of potentiometric surface, in feet
~DATA POINT- Number on top corresponds to sequential well number in Georgia Geologic Survey reports. Number on bottom is altitude of potentiometric
surface, in feet
A lr.:Mo~:~ r O !lUA, U.!.& B LeGrarld and Furcron, 1956 c LeGrand, 1962
.... NA.r..;=:,E
WELL IDENTIFICATION BY AQUIFER
Gordon aquifer system ..,. Gordon aquifer system and Jacksonian aquifer "'~
\!J ,.... l L "<'""
:..;
!:-:>
""
-r
\ '- e: ~. D"i~E"
_.)IWA
~
~<?
f ~0 .:1 \.H- -J,l)~~ -/~ ~t."--~ ~ --'!"~~/..,,o/
I
I
\,. c; -;.;. ,_,
I
/ l !=
/ Ai...u.
/
I ~ I --,o-4-
/
()~"*,);"id. \' , ---~
[iO;:'
~"
A ..,.t;.,:;;:n \
-
JN-w
--- :10'1.
) ~ : 'IN~:.~
0
10
20
30
40 MILES
32'
n11 tron:. U::; Olll~i:iiJo-liHou r ~~r ').ll.llt tr-0-M maps, 1 !CLL0-110
83'
82'
Figure 12.- Estimated potentiometric surface of the Gordon aquifer system, 1934-68.
EXPLANATION
~ -- FAULT-U, upthrown side; 0, downthrown side; dashed where inferred
-a--POTENTIOMETRIC CONTOUR-Shows altitude at which water level would have stood In tightly cased wells. Dashed where approximately located. Contour interval 50 feet. Datum is sea level
~
e 322 DATA POINT-Number on top is well identification. Number on bottom is altitude of potentiometric surface, in feet
~#I
.e-
WELL IDENTIFICATION BY AQUIFER
Gordan aquifer system Gordon aQuifer system and Jacksonian aquifer
:... I-
' ""'.::..:--.:'\..
/
/
,,.
~~--~- --- BAL
"' \...,_. .....
A I K E ~~
-/
/
El L
33"
"
t-:1
~
-: ""' <> j 0
~-
.., !'......./ ) ~ ...; 5 T
~
I
Jn.!o!l.
.....
....... ~~-----~~W;o-o"I-"'
- ~.:..--
\.__' -
l\ k tel J
.
J
- ..-- ~, JO t- SON
/
)
l, ,
.>
/
E M .Q. ,.
E L
' ..,_
/
!
' /"
.l-
~
f'-.. -...., ll.ll 79
{\
C:A,N DL.ER
e t-"._ c ,_ {
'\
--- ) _ ..
___,;.-"-......
'\
''-..
~)
-- .. ...-
c.-
0
10
ZO
10
D ~ILS
I I II
l
t
32"
B:ll 11011"1 U-0 Ooloah:t :!Hm-V
82"
Slate bue maps, t GOO.OCO
Figure 13.- Potentiometric surface of the Gordon aquifer system, November 1981.
approximate predevelopment surface before local pumping stresses were applied. Unpublished water-level data indicate that, except in major pumping centers, potentiometric heads in the Gordon aquifer system have changed little since 1935 when man-induced stresses (pumping) were applied. This statement is supported by Siple (1967) and Root and Marine (1978) who published hydrographs for 1951-60 and 1973-77 showing seasonal fluctuations of only about 10 ft in sediments that are part of the Gordon aquifer system at the Savannah River Plant.
In the western part of the study area, potentiometric heads range in altitude from about 300 ft near the outcrop area in western and central Houston and southern Twiggs and Wilkinson Counties to about 200 ft in southern Laurens County (fig. 12). Heads in the eastern part of the area range in altitude from about 400 ft in southern Glascock County and northern Washington and Jefferson Counties to about 100 ft in eastern Burke, Screven, and Bulloch Counties.
November 1981 Potentiometric Surface
The November 1981 potentiometric surface of the Gordon aquifer system was constructed from water-level data collected from 1976 to 1982, most of the data being collected ic November 1981 (fig. 13). This surface is similar to the estimated 1934-68 potentiometric surface except in local areas affected by increased ground-water withdrawals. Declines in the potentiometric surface based on water levels measured at different times of the year may be partly attributed to seasonal fluctuations.
Water-level data indicate that localized declines, which formed small cones of depression, occurred near Hartford in Pulaski County, Eastman in Dodge County, Sandersville in Washington County, Wrens in Jefferson County, and in central Laurens County and western Burke County. Other declines that changed the configuration of the potentiometric surface occurred at Louisville in Jefferson County,
at and near Sylvania in Screven County, and at Midville and northwest of Waynesboro in Burke County (fig. 14).
Long-Term Water-Level Declines
Water levels in the Gordon aquifer system generally remained constant during the period 1934-81, as recharge and discharge maintained equilibrium. The only exceptions were local areas that had significant increases in ground-water withdrawals. In these areas, increased pumping caused reductions in compressive aquifer storage and corresponding declines in the water level (Lohman, 1972, p. 8). Water-level records for eastern Georgia show that localized declines as great as 33 ft occurred in the potentiometric surface during 1939-81 in downdip areas (fig. 14; Appendix A) Declines in water levels in or near the outcrop area may partly be attributed to seasonal fluctuations.
Water-level declines ranging from about 10 to 33 ft have formed small, localized cones of depression near cities where increased municipal or industrial pumping has occurred. (See section on November 1981 Potentiometric Surface.) For example, the decline in Sandersville in Washington County is probably due to increased pumping for kaolin processing in that area (fig. 13). Siple (1967) reported that at the Savannah River Plant, local pumping and long-term stress from 1952 to 1960 resulted in total waterlevel declines ranging from about 10 to 18 ft in sediments herein assigned to the Gordon aquifer system. Other localized cones of depression developed in central Laurens County and western Burke County mainly because of large withdrawals for irrigation. In Louisville, Jefferson County, the water level in well 26X1 remained steady from 1958 to 1975 when it began to decline (fig. 15). Because ground-water withdrawals by the city of Louisville increased only slightly during 197 5-80, it is likely that the decline was due to increased pumping for irrigation.
25
28%3
EXPLANATION
3(8146-10180)
DATA POINT-Number on top is well identification. Number on bottom outside
parentheses is water-level decline, in feet. Number on bottom inside parentheses is period of water-level decline
WELL IDENTIFICATION BY AQUIFER
Go raon aqUi fer s~stom ---...-- Gordon aquifer system and Jacksonian aQuifer
'''' ~ ~/;J'
E
~
ED::-;;;;"'-~~
--
~........ ~
E Jl
<-rl
JD ....i.
.....
"'t..
nz1
>!-('511(a~,ota o)
302.tl
-- -~ !~.~- <,!Z-(..s
i{H -461 01$0)',
-.,..
:w
JEF>F"(Sv
., ""--.....
0 J4{s1f#-Vcu~a>
s - R K E
!.,;)
a>
O'OW:2'
'
,\
:Zl&/QS - ~/lJO) ~
1(<8/C~,\~e,s
,.
.....
... 1 T(e'lil~fus 1{
'
{~ ....
.
0
so~
/
31lV1
or.c rA-!t-11i:.i.il
f'" .:. N ~
o!"
.
I' _
32'
_ EC K LE~/ ,
....u.... ~'t~ ........
'
teSS~
27(7/ 53-llJi.-1.)
"' .,.
-- ';..__,.
.-!
' - ,_!;. ' 20R3
"3->J(Q/43-11/111)
!) G 'E ..,.
I "'-
\
"'\
Bn tto<n U.S -Ge,Giog,oJ: S':i'VJ' .3tlf base maps, 1 1!100 000
83'
L-..
1'\10~'~ I
. \_ - . ;::ll'i,J ~L'~ 1:'. ~ .....
~ t. - . ,
" 1.-
0
10
20
30
40 Mfl<I!S
82'
Figure 14.- Water-level declines in the Gordon aquifer system, 1939-81.
3:
0
10
_J
w co
fw-
w
()
w <{
lL
z
laL:
::::l
20
- (/)
z _J
w
0
> w
<{
_J
_J
a: 30
w
f-
<{
3:
(5/ 11 /58)
\
DATA POINT-Number in parentheses is date of measurement
40 1 .0
(6/ 19/75)
. >- 0.8
<{
0
a: w
0...
6(/) 0.6
_J _J
<{ (')
z
0
_J _J
2 z
Blank where record not avarlable
Figure 15.- Intermittent measurements of the water level in the Gordon aquifer system at well 26X 1 and average daily ground-water withdrawals by the city of Louisville, Jefferson County, 1958-82.
27
WATER QUALITY
Chemical analyses of water from the Gordon aquifer system show that constituent concentrations in most of the study area are within the Georgia Environmental Protection Division (1977) standards and recommended limits for drinking water. An exception occurs in Jefferson County where iron concentrations exceed the 300 ~g/L standard and range from 600 ~g/L at well 26X1 in Louisville to 1,900 Pg/L at well 26W1 in Wadley. (See Appendix B.)
Generally, concentrations of dissolved solids and most other constituents increase from the outcrop area southward (fig. 16). This increase is due to material being dissolved as the ground water flows through the aquifer. Concentrations of dissolved solids range from 32 mg/1 at well 28AA1 in Richmond County near the outcrop area, to 193 mg/L at well 34W4 in Screven County.
Variations in hardness as CaC03 in the Gordon aquifer system are related to changes in the lithology of aquifer sediments. (See section on Definition of the Gordon Aquifer System). In the northeastern part of the study area, water generally has a CaC03 hardness of less than 60 mg/L and is classified as "soft" (fig. 17; Appendix B). In this area, aquifer sediments consist primarily of sand and contain low concentrations of carbonate and bicarbonate. Although waterquality analyses are unavailable for the Gordon aquifer system in the northwestern part of the study area, the aquifer lithology is similar and it is likely that water in that area also is "soft." In the central part of the study area, water has a CaC03 hardness greater than 100 mg/L and is classified as "moderately hard" to "hard." This increase in hardness probably results from higher percentages of carbonate in the aquifer material. Water having a CaC03 hardness greater than 100 mg/L may result in reduced lathering of soap and the formation of scale on cooking utensils and in boilers and hot water lines (Hem, 1970, p. 225). Hard water can be softened by ion exchange and through chemical treatment using lime and soda ash.
In this report, water-quality data are from wells tapping the Gordon aquifer system and from multiaquifer wells tapping the Gordon aquifer system and the Jacksonian aquifer. Comparison of these data may be misleading in that some of the analyses for multiaquifer wells may not be representative of the Gordon aquifer system.
WATER USE
The Gordon aquifer system supplied an estimated 24 Mgal/d during 1980, of which about 70 percent was used by agriculture, 16 percent by municipalities, and 14 percent by industries (table 2). Agriculture utilized 17.0 Mgal/d with major withdrawals occurring in Burke (7.7 Hgal/d), Pulaski (2.2 Mgal/d), Houston (1.6 Mgal/d), and Jefferson (1.5 Mgal/d) Counties. Agricultural water-use values represent estimated growing-season withdrawals averaged over a 365-day period. In recent years, agricultural use has increased dramatically and in 1980 it was almost eight times greater than in 1975 (Robert R. Pierce, U.S. Geological Survey, written commun., 1982). This increase in use is supported by water-level declines at Louisville, Jefferson County, that can be attributed to pumping for irrigation. (See section on Long-Term Water-Level Declines.)
Overall municipal and industrial water use in the Coastal Plain of Georgia gradually increased from 1960 to 1980 (Pierce and others, 1982). During 1980, municipal water use from the Gordon aquifer system totaled 4.0 Mgal/d and industrial water use was 3.4 Mgal/d. Major municipal users were Louisville in Jefferson County (1.1 Mgal/d) and Midville in Burke County (0.8 Mgal/d). The major industrial users were kaolin companies in Washington County (0.9 Mgal/d) and industries in Screven County (1.0 Mgal/d).
WELL CONST~UCTION
Wells tapping the Gordon aquifer system use open-hole or screenline construe-
28
EXPLANATION
- 100 LINE OF EQUAL DISSOLVED-SOLIDS CONCENTRATION -Dashed where approximately located. Interval 50 milligrams per liter
~ DATA POINT - Numbe-.- on top is well Identification. Number on bottom is dissolved-solids corrc.nlrtlon in milligram per liter; e , estimated from ratio of residue/specific conductance
WELL IDENTIFICATION BY AQUIFER Gordon aquifer system
.,.. Go.rdon aquifer system and Jacksonian aquifer
~v..; \
~'<
__\.,. \.'........
- . COLIJM61A -...,_
N /
--r-....~
B/ A .A f\i:M/1E L L
._.'
, I.
c~.c
sa
(-
..-~- .:~"\.,\ T:_...(-" ~. .__...""'=--~~~ i.lsoN :-;'~'-' '-~-<->-'(--.V',-
. \ '
,;
... , .._ I ., '
" ~ ~~'. 1~_?.-';41""""
. _,_
-~
-J~
,
.. -'
'"""'"
"'i \ JEF'FERSO' o I
f(~S:'"" ~ T.~O ~ -- ~~ N:\?0~ '
'
-
'
'
"~,\~-j .'
I
'
W
' ..
. \ I .. ' ; .-.,f~..1,=.."G.-,..-,.~ ....,.N~-.,' ~~ ~~j,~ '.~~ \!-..~,L'
.
I
/' l'
'....
-
'o ' ~. ~ ' w' (C.. .,,._.;..
....
,-! E'l"i~j'i.J S
"'
:f~- / ,...-'"l.\--,."...:.:;..:,,;.;/ ...l, '\.
\, j
.
...,;
,__,___ .......,,_
.
.t,..... \ , '"". y
\
, /
\ - .
l- l~.;~~ GGS~~ ~/ / -.~. r > I - \'
,
,
,/
. ("',.. l_;-
\ .. ;
.
.:..I(.>'
,:,., -::,\_ -
(-1 .,~ ~f~..J. ~ "'~- ~ -~. .-;;;.~~- ~ -~~ l:rt . ,.. .....- ' -' I '.._ .. - .. - '
-"'~ - .
.
.<:: -.ou";'- '.
;...-,.. . - . .....
~. ' i' ,,.!--' - ' :\ ( '/\< ' ""_'_' ..I ,. - "-.-.r.-.t:':' .
E M . N- u e: L
' . J..f.f..r.....
, '... . '
1
':'-~T-0 .~ ~. ~-....._ 1 J~ ~... ("
,~'... c---~. - ~. '~ I
/ -- '.,. <- \.. ~- H 0
N
C K L EY/:\ _ L ' A U R.
.' -,- '"'-.
....,. ,I
'\. :-
- I.. r- .....' - . .
/;-
/
\
. -. ....... ' - ,
~~ ..:I~E.UTLEN .~<I>NOL '>I ;:-:. -="l
C. . -f.,
"""'
'
,,
-:-' - / :/
''--j-
, >!' I
<_
' . }/ ' .~, . ...... J /
__.. ..... '
/
'I -
.....=:,:..'1.
, -
'7f-' 6 ' U_L;...L...0...;c;;-; li
~ ~..,.~,>. , - \ ' ,_ ' .-~-- )- "': ~, ' L
7
,~- . ~ - . ' ... ..... ' I P U..L AS ISI '
.
'
...
'
; rl
j
--..,{
. .. / \ . . ... .r-'
---'~-"':':- ~. . . G-~~ ~-- ~ l1,.:t.",;; ' )- t\1.,l. D 0 f) .'=-r.';.,,.'rA'
'\___
-
- -
f I
, :'".-')
'.:.;':;.
"':"
\
.- .,_
."..;' _.,--
. '--- . /
/
._
\
32'
't~
r !10 I II I I1 I I
~r
a,o
"f ~ILS
'-..... ...
._. trom u).S , Ofofo11io-tl S'T,itliij su.l. base map~;, 11100.000
83'
82'
Figure 16.- Dissolved-solids concentrations in ground water from the Gordon aquifer system.
EXPLANATION
-
AREA IN WHWH HARDNESS AS CaC03 EXCEEDS 100 MILLIGRAMS PER LITER
~DATA POINT- Number on top is w ell identifi cation . Number on bottom Is hardne ss
value as Caco3 , in milligrams per liter
WELL IDENTIFICATION BY AQUIFER
Gordon aquifer system
-r
...... Gordon aquifer system and Jackso nian aquifer
""
(
-----
\
.... .....
--oL ~. Ma A
"'
\,.
" ~ .,.-::.
c ;-.:o ~
K ~ f
. t'{,
/
~
/'
J~~r--t.RS,..'N
:'
0,1>0
.M.l':! ...J!A.!
--
: o~~~ o
I:IJ 0
'\
~
{
_ ..._. _"'L
.) 0 0-~~ i;:
- "\_,....,\.
~ ,:......,.
--:.1
r
\
32"
t,
Das.e lto.trt U.G. a..afoD1Ctl .S'oU"'t'f Srllllte. bas maps, 1 ~ !00,DIKI
83'
\
}
...
..,4NOI..E"P.
s .ll 1.1:' o c H.
, .....__
, -- -~-~I .......
w~
. _:~
-.. :..-~
.-
0
lO
20
na
.. tl MllS
1
82'
Figure 17_- Distribution of hardness as CaC0 3 in ground water from the Gordon aquifer system.
Table 2.--Estimated water use for the Gordon aquifer system, 1980 [<, less than]
County
Bibb Bleckley Bulloch Burke Columbia Dodge Emanuel Glascock Houston Jefferson Jenkins Johnson Jones Laurens Pulaski Richmond Screven Twiggs Washington Wilkinson
Ground-water use (Mgal/d)
Agricultural 1
--
0.4 .4
7.7
---
--
--
1.6
..
1.5 1.0
.4
--
.6 2.2
--
.9
--
.3
--
Industrial
----
<O.l
--
--
--
.1
--
.7 .1
--
--
.1 .3
--
1.0
--
.9 .1
Municipal
--
0.1
--
.8
--
--
.l
.1 .3 1.1 .2 .1
--
.2 .5 <.1 .3
--
.1
--
Count~
total
-o.s
.4 8.6
--
--
.1 .2 1.9 3.3 1.3 .5
--
.9 3.0 <.1 2.2
--
1.3 .1
Total
17.0
3.4
4.0
24.4
1Values are estimated growing-season withdrawals 2Toatvaelsragdoednoovt eirncalu3d6e5-ddaoymepsetriciodus. e.
31
tion (Appendix A). Open-hole construction is used where the aquifer system consists of consolidated materials, such as limestone (well 28W3, Burke County; Appendix A). Screenline construction is generally used where the Gordon aquifer system consists of unconsolidated sediments such as sand or sandy units (well 28W5, Burke County; Appendix A) Figure 18 shows an example of screenline construction ,and the relation of geophysical and lithologic properties to waterbearing zones at well 28W4 in Burke County.
In areas where the Gordon aquifer system does not provide sufficient yields, multiaquifer wells are used (fig. 18). These wells tap the Gordon aquifer system and either the overlying Jacksonian aquifer of Vincent ( 1982) or the underlying Dublin and Midville aquifer systems of Clarke and others (1985).
SUMMARY
Interlayered sand, silt, and clay of late Paleocene to middle Eocene age in the Coastal Plain physiographic province of east-central Georgia form the Gordon aquifer system. The aquifer system ranges in thickness from about 20 ft in Wilkinson County in the central part of the study area to more than 180 ft in Pulaski and Burke Counties in the western and eastern parts of the area, respectively. Estimated traasmissivities range from 620 ft2/d at well 25Z3 in Glascock County to 13,000 ft2/d at well 32U18 in Screven County. Transmissivity values obtained from multiaquifer wells tapping both the Gordon aquifer system and the Jacksonian aquifer range from 2,400 ft2/d at well 23X34 in Washington County to 14,900 ft2/d at well 19T6 in Bleckley County.
During 1980, approximately 24 Mgal/d was withdrawn from the Gordon aquifer system, about 70 percent of which was used by agriculture. Water levels in the study area generally showed little change during 1934-68. Small cones of depression on the November 1981 potentiometric
surface resulted from localized declines ranging from about 10 to 33 ft in areas of large-scale municipal, industrial, and irrigation pumping.
The Gordon aquifer system is recharged mainly by precipitation in the outcrop area and in interstream drainage divides in and near the outcrop area, and by leakage where potentiometric heads in overlying or underlying aquifers are higher. Discharge from the Gordon aquifer system occurs predominantly as flow into streams or as leakage where potentiometric heads in overlying and underlying aquifer systems are lower.
Water from the Gordon aquifer system is generally a calcium bicarbonate type that ranges from soft to hard, and in most areas has constituent concentrations that are within the Georgia Environmental Protection Division (1977) standards for drinking water
32
0
t:i 100
w
LL
z
200 w
0
<(
aLL: 300
::) (f)
0z 400
<(
_J
$: 500 0
_J
w
co 600
I 1--
a...
w 700
0
800
0
1-
0
>-
CJ 0
.....J
0
I 1-
::::)
a:
I-
z(/)
0 0
:::i
_J
w_J
5:
GEOPHYSICAL PROPERTIES
~_J 0<(
WZI-
<(Z
foz- W Ol -
a._Cl.. (f)
HYDROLOGIC UNIT
1Gamma Jog taken from nearby wel l 28X1.
EXPLANATION
~ LIMESTONE
1=-=1CLAY
Efj CLAYEY SAND
~CEMENT
~ CONFINING ZONE
I ISCREEN
Figure 18.- Relation of well construction to geophysical and lithologic logs in well 28W4, near Midville, Burke County.
33
SELECTED REFERENCES
Applin, E. R., and Applin, P. L., 1964, Logs of selected wells in the Coastal Plain of Georgia: Georgia Geological Survey Bulletin 74, 229 P
Bechtel Corporation, 1972, Applicants environmental report, volumes I and
II--Alvin w. Vogtle Nuclear Plant:
Unpublished report for Georgia Power Company, Atlanta, Georgia: Report on
file at u.s. Geological Survey, Dora-
ville, Georgia. 1982, Studies of postulated Millett ---Fault: Unpublished report for Georgia Power Company, Atlanta, Georgia:
Report on file at u.s. Geological
Survey, Doraville, Georgia. Buie, B. F., 1978, The Huber Formation of
eastern central Georgia: Georgia Geological Survey Bulletin 93, P 1-7. 1980, Kaolin deposits and the Creta----ceous-Tertiary boundary in eastcentral Georgia, in Frey, R. W., ed., Excursions in Southeastern Geology: Geological Society of America Field Trip Guide 15, Volume II, p. 311-322. Buie, B .F., Hetrick, J. H., Patterson,
s. H., and Neeley, C. 1., 1979, Geol-
ogy and industrial mineral resources of the Macon-Gordon kaolin district, Georgia: U.S. Geological Survey OpenFile Report 79-526, 2 sheets. Chowns, T. M., and Williams, C. T., 1983, Pre-Cretaceous rocks beneath the Georgia Coastal Plain-Regional impli-
cations, in Gohn, G. s., ed., Studies
related to the Charleston, South
Carolina, earthquake of 1886--Tec-
tonics and seismicity: u.s. Geologi-
cal Survey Professional Paper 1313, p. 11-142.
Clarke, J. S., Faye, R. E., and Brooks, Rebekah, 1983, Hydrogeology of the Providence aquifer of southwest Georgia: Georgia Geologic Survey Hydrologic Atlas 11, 5 sheets. 1984, Hydrogeology of the Clayton
----aquifer of southwest Georgia: Georgia Geologic Survey Hydrologic Atlas 13, 6 sheets.
Clarke, J. s., Brooks, Rebekah, and Faye,
R. E., 1985, Hydrogeology of the Dublin and Midville aquifer systems of east-central Georgia: Georgia Geologic Survey Information Circular 74. Cofer, H. E., Jr., and Frederiksen, N. 0. 1979, Paleoenvironment and age of kaolin deposits in the Andersonville District, Georgia, in Proceedings of Second Symposium on the Geology of the Southeastern Coastal Plain: Georgia Geologic Survey Information Circular 53, p. 24-37. Cofer, H. E., Jr., and Manker, J.P., 1983, Geology and resources of the Andersonville, Georgia kaolin and bauxite district: U.S. Geological Survey Open-File Report 83-580, 95 p. Coleman, J. M., and Prior, D. B., 1980, Deltaic sand bodies: American Association of Petroleum Geologists Short Course, Education Course Note Series 1115, 171 P
Cooke, c. w., 1943, Geology of the Coast-
al Plain of Georgia: U.S. Geological Survey Bulletin 941, 121 p.
Cooke, c. W., and Shearer, H. K., 1918,
Deposits of Claiborne and Jackson age in Georgia: U.S. Geological Survey Professional Paper 120, p. 41-81. Cramer, H. R., and Arden, D. D., 1980, Subsurface Cretaceous and Paleocene geology of the Coastal Plain of Georgia: Georgia Geologic Survey OpenFile Report 80-8, 184 p.
Faye, R. E., and Prowell, D. C., l982, Effects of Late Cretaceous and Cenozoic faulting on the geology and hydrology of the Coastal Plain near the Savannah River, Georgia and South Carolina: U.S. Geological Survey Open-File Report 82-156, 73 P
Ferris, J. G., Knowles, R. H., Brown, R. H., and Stallman, R. W., 1962, Theory of aquifer tests: U.S. Geological Survey Water-Supply Paper 1536E, 173 P
Freeze, R. A., and Cherry, J. A., 1979, Groundwater: Englewood Cliffs, N.J., Prentice-Hall, 604 P
Georgia Environmental Protection Division, 1977, Rules for safe drinking water: Chapter 391-3-5, 57 p.
34
Georgia Geological Survey, 1976, Geologic map of Georgia: Atlanta, Georgia, 1:500,000.
Gibson, T. G., 1979, Paleocene to middle Eocene depositional cycles in eastern Alabama and western Georgia, in Proceedings of Second Symposium on the Geology of the southeastern Coastal Plain: Georgia Geologic Survey Information Circular 53, p. 53-63.
____1982, New stratigraphic unit in the Wilcox Group (upper Paleocene - lower Eocene) in Alabama and Georgia, in U.S. Geological Survey Contributions
to Stratigraphy, 1982: u.s. Geologi-
cal Survey Bulletin 1529-H, p. H23H32.
Gohn, G. s., Bybell, L. M., Christopher,
R. A., Owens , J.P., and Smith, C. C., 1982, A stratigraphic framework for Cretaceous and Paleogene margins along the South Carolina and Georgia coastal sediments, in Proceedings of the Second Symposiuii"'" on the Geology of the southeastern Coastal Plain: Georgia Geologic Survey Information
Circular 53, p. 64-74. Gohn, G. S., Hazel, J. E., Bybell, L. M.,
and Edwards, L. E., 1983, The Fishburne Formation (Lower Eocene), a newly defined subsurface unit in the
South Carolina Coastal Plain: u.s.
Geological Survey Bulletin 1537-C, p.
C1-C16. Hazel, J. E., Bybell, L. M., Christopher,
R. A., Frederiksen, N. 0., May,
F. E., McLean, D. M., Poore, R. z.,
Smith, C. C., Sohl, N. F., Valentine,
P. c., and Witmer, R. J., 1977, Bio-
stratigraphy of the deep core-hole (Clubhouse Crossroads Corehole 1) near Charleston, South Carolina; in Rankin, D. W., ed., Studies related
to the Charleston, s. C., earthquake of 1886: u.s. Geological Survey Pro-
fessional Paper 1028, p. 71-89. Hem, J. D., 1970, Study and interpreta-
tion of the chemical characteristics of natural water: U.S. Geological Survey Water-Supply Paper 1473, p. 40-50.
Herrick, S.M., 1961, Well logs of the Coastal Plain of Georgia: Georgia Geological Survey Bulletin 70, 462 p.
Herrick, S.M., and Counts, H. B., 1968, Late Tertiary stratigraphy of eastern Georgia: Georgia Geological Survey Guidebook for Third Annual Field
Trip, 88 P
Herrick, s. M., and Vorhis, R. C., 1963,
Subsurface geology of the Georgia Coastal Plain: Georgia Geological Survey Information Circular 25, 80 P
Hetrick, J. H., and Friddell, M. s.,
1983, A geologic study of the central Georgia kaolin district, parts I, II, III: Georgia Geologic Survey OpenFile Report 83-1, variously paged. Hicks, D. W., Krause, R. E., and Clarke, J. S., 1981, Geohydrology of the Albany area, Georgia: Georgia Geologic Survey Information Circular 57, 31 p. Huddlestun, P. F., and Hetrick, J. H., 1979, The stratigraphy of the Barnwell Group of Georgia: Georgia Geologic Survey Open-File Report 80-1,
89 P Huddlestun, P. F., Marsalis, W. E., and
Pickering, S.M., Jr., 1974, Tertiary stratigraphy of the central Georgia Coastal Plain: Geological Society of America Guidebook 12, 35 p. LaMoreaux, P. E., 1946, Geology and ground-water resources of the Coastal Plain of east-central Georgia: Georgia Geological Survey Bulletin 52, 173 p. LeGrand, H. E., 1962, Geology and groundwater resources of the Macon area, Georgia: Georgia Geological Survey Bulletin 72, 68 p. LeGrand, H. E., and Furcron, A. S., 1956, Geology and ground-water resources of central-east Georgia: Georgia Geological Survey Bulletin 64, 17 4
P Lohman, S. W., 1972, Ground-water hydrau-
lics: U.S. Geological Survey Professional Paper 708, 70 p.
35
McFadden, S. S., and Perriello, P. D., 1982, Hydrogeology of the Clayton and Claiborne aquifers in southwestern Georgia: Georgia Geologic Survey Information Circular 55, 48 p.
Marine, I. w., and Root, R. W., Jr.,
1976, Summary of hydraulic conductivity tests in the SRP separation area: Savannah River Laboratory Environmental Transport and Effects Research Annual Report DP-1412, p. 21-1 to 21-4.
1978, Geohydrology of deposits of -----Claiborne age at the Savannah River
Plant: Savannah River Laboratory Environmental Transport and Effects Research Annual Report DP-1489, p. 57-60. Miller, J. A., 1982, Geology and configuration of the top of the Tertiary limestone aquifer system, southeastern United States: U.s. Geological Survey Open-File Report 81-1178, 1 sheet. Nystrom, P. G., and Willoughby, R. H., 1982, Geological investigations related to the stratigraphy in the kaolin mining district, Aiken County, South Carolina: Carolina Geological Society Field Trip Guidebook, 1982, 183 p.
Patterson, s. H., and Buie, B. F., 1974,
Field conference on kaolin and fuller's earth, November 14-16 , 1974: Georgia Geological Survey Publication, 53 p. Pickering, S.M., Jr., 1971, Lithostratigraphy and biostratigraphy of the north central Georgia Coastal Plain: Georgia Geological Survey Fieldtrip Guide, 1971, 15 p. Pierce, R. R., Barber, N. L., and Stiles, H. R., 1982, Water use in Georgia by county for 1980: Georgia Geologic Survey Information Circular 59, 180
p.
Pollard, L. D., and Vorhis, R. c., 1980,
The geohydrology of the Cretaceous aquifer system in Georgia: Georgia Geologic Survey Hydrologic Atlas 3.
Pooser, W. K., 1965, Biostratigraphy and Cenozoic ostracoda from South Carolina: University of Kansas Paleontologic Contributions (38), Arthropoda, Art. 8, 80 p.
Prowell, D. C., Christopher, R. A., Edwards, L. E., Bybell, L. M., and Gill, H. E., 1985, Geologic 'section of the updip Coastal Plain of Georgia and western South Carolina: U.S. Geological Survey MF Map 1737 [in press]
Prowell, D. C., and O'Connor, B. J., 1978, Belair fault zone: Evidence of Tertiary fault displacement in eastern Georgia: Geology, v. 6, p. 681684.
Reineck, H. E., and Singh, I. B., 1980, Depositional sedimentary environments with reference to terrigenous clastics: Heidelberg, Germany, SpringerVerlag, 2nd ed., p. 321-370.
Reinhardt, Juergen, and Gibson, T. G., 1980, Upper Cretaceous and lower Tertiary geology of the Chattahoochee River Valley, western Georgia and eastern Alabama, in Excursions in Southeastern GeologY: Volume II, Geological Society of America, 1980 Annual Meeting, Field Trip No. 20, P 385-463.
Root, R. W., Jr., and Marine, I. W., 1978, Water-level fluctuations in Coastal Plain sediments at SRP: Savannah River Laboratory Environmental Transport and Effects Research Annual Report DP-i489, p. !)5-68.
Scrudato, R. J., 1969, Kaolin and associated sediments of east-central Georgia: Chapel Hill, N.C., University of North Carolina, unpublished dissertation, 97 p.
Siple, G. E., 1955, Geology and ground water in part of Aiken, Barnwell, and Allendale Counties, South Carolina: Unpublished report prepared by the u.s. Geological Survey for the Savannah River Operations Office of the Atomic Energy Commission, 183 p.: Report on file at u.s. Geological Survey, Doraville, Georgia.
36
____1967, Geology and ground water of the Savannah River Plant and vicinity, South Carolina: U.S. Geological Survey Water-Supply Paper 1841, 113 p.
Sirrine, J. E., Company, 1980, Groundwater resource study, Sirrine Job No. P-1550, DCN-001: Unpublished report for Kimberly-Clark Corporation; J. E. Sirrine Company, Greenville, South Carolina, 26 p.: Report on file at U.S. Geological Survey, Doraville, Georgia.
Smith, R. W., 1929, Sedimentary kaolins of the Coastal Plain of Georgia: Georgia Geological Survey Bulletin 44, p. 35-44.
Stephenson, L. w., 1915, The Cretaceous-
Eocene contact in the Atlantic and Gulf Coastal Plain: U.S. Geological Survey Professional Paper 90, p. 155181.
Stephenson, L. w., and Veatch, J. 0.,
1915, Underground waters of the Coastal Plain of Georgia, and a discussion of the quality of the water, by R. B. Dole: U.S. Geological Survey Water-Supply Paper 341, 539 p. Stringfield, V. T., 1966, Artesian water in Tertiary limestone tn the Southeastern States: U.S. Geological Survey Professional Paper 517, 226 p. Thomson, M~ T., and Carter R. F., 1955, Surface-water resources of Georgia during the drought of 1954, part 1: Streamflow: Georgia Geological Survey Information Circular 17, 79 p. Todd, D. K., 1980, Ground-water hydrology, (2nd ed.): New York, John Wiley, 535 p. Tschudy, R. H., and Patterson, S. H., 1975, Palynological evidence for Late Cretaceous, Paleocene, and early and middle Eocene ages for strata in the
kaolin belt, central Georgia: U. s.
Geological Survey Journal of Research, v. 3, no. 4, p. 437-445.
Van Nieuwenhuise, D. s., and Colquhoun,
D. J., 1982, The Paleocene-lower Eocene Black Mingo Group of the eastcentral Coastal Plain of South Carolina: South Carolina Geology, v. 26, no. 2, p. 47-67.
Vincent, H. R., 1982, Geohydrology of the Jacksonian aquifer in central and east-central Georgia: Georgia Geologic Survey Hydrologic Atlas 8, 3
sheets.
Willoughby, R. H., Zullo, v. A., Edwards,
1. E., Nystrom, P. G., Prowell,
D. c., Kite, 1. E., and Colquhoun,
D. J., 1984, Oligocene (to Miocene?) marine deposits in Aiken County, South Carolina: Geological Society of America Abstracts with Programs,
v. 16, no. 3, P 205.
37
county
Georgia Geoloeie
n:~;ra I ::::~ I ~~~~~~
N_. or owner
APPENDICES
Appendix A.-R.eeord of selected -ns
(Aquifer: G, Gordon aquife:r system; J, Jllcksonilm aquifer; U, D.lblin aquifer aystem. Use: A, agricultural; D, domestic:; I, industrial; P, public filupply; 0, observation. Wace.r level: reported level& are given in faet, aeaau.red levels are given in feet and tem:hs; '1eld: F, flowing. Deptb of well: >,greater tban)
Date drilled
or modified
Depth of
well (ft.)
Depth of
casing (ft)
Diameter of
well (in.)
I Altitude
of land
surface
(It)
Aquifer(s)
Above (+) or below (-) land surface (ft.)
Yield (gal/min)
Speeific capacity
(gal/min/ft) I Use
bm.llt"kll
Blecldey Bulloch
19T4
,..,.
33T4
1015
3225440832044
32234~
0832108
3228340813513
n..o
Williaau~, Jr.
Cochran, 2 (uev)
Cardell Dyches
300
417
220
1977
800
600
372
G,J
353
G,J
1<7
Burke
28W3 28114
28Zl
28Zl
29Z3
30Z6
28115
31Z9
w
29Y2
00
29Y4
28W4
32Y4
31Zl3
31Zl2
29Z4
Dodge
20R4
~aael
27Ul
Claacock
25Z4
26AA3
3248590821401
Midville, 1
06-24-46
482
200
185
G,J
3252270821301
Midville !xpmt. Sta., 2 (Va. Supply and Well, 2)
500
292
269
G,J
321128-
0821127
Oliver C1ure
175
251
331328-
0821127
c. r. Korri111
95
330951-
r. p. Saxon (old
0820210
J. C. Scockmau)
170
2.5
241
207
331305-
0615234
Miller's Pond
92
42
117
325227-
SE Ca.E.rpru.t.Sta.
0821311
I (Laytte-Atlautie. 1) 1968('!')
535
<54
268
330821-
Ca. Pover Plaut
0814535
Vogtle e.onetr., 8
1976
251
220
255
3303100820354
Irbf Coe.bran, 1
1979
422
181
13.5
290
G,J
3207150820432
Paul Dye, 1
1979
364
244
13.5
305
3252270821301
SE Ga.!Xpnt.Sta. Va. Supply and Well, 2
500
292
Z69
G,J
330417-
0814305
WilliiJDI Cox, 2
06- -79
415
360
221
330837-
Ga. Pove-r Pbnt
0814527
VOitle obsrv., 31 I 04-03-71
200
211
330848-
Ca. Powu Plaut
0814548
Vogc.le ob8rv 32 I 04-ol-11
200
214
330853-
W. T. Stone (old
0820209
D. O. Smith)
225
127
251
3212090831047
East,...n, 2
1927
705
705
12110,
8
360
3235130821915
SvaJ.nsboro, 5
11- -63
725
320
G,J
331350-
0823538
Kent Cann.ing Co. I 06- -60
lSO
75
18
355
3315460822711
Thiele Kaolin, W-1
153
145
440
25Z3
331335-
0823604
Cibeon., 3
1970(?)
203
435
Rouaton
17Tl
3222590833718
Houaton Co. !.rd. of Co1111111.sl!lion.ers, Baylleaville
347
278
11,10
.~
425
Jeffenon
26W3
)251480822357
Wadley, 2
280
ZOl
230
26Xl
554
325947-
0822442
Louisville. 1 1
04- -58
367
70
257
26X7
3252420822408
Wadley, 3
491
233
278
G,J
-148.0 -119.0 -120.0
-67.6
+20 +3.5
-60.7 +5.9 +1.6 +6.6 +4 ... +8 +1.3
+14.9 +8.7
-59.4
-107
_,
-106
-60.7
-85 -90-5 -106.3 -106.0 -113.6 -111.0 -80 -55.5 -138-6 -171.6
-121 -31 -3'2.8 -66 -68.3
-115
-155 -155
-18.8 -14 -28.1 -63 -51.6
11-06-81
170
06-02-61
11-Q6-81
510
ll-Q3-81
400
06-24-l!6
11-17-81
oo
05-23-60
06-28-l!6 11-12-81
05-26-l!6
11-12-81
l7
07-03-l!6 ll-11-81
07-ol-l!6 lQ-23-80
09-19-68
720
10-16-76
100
01-08-79
800
01-lG-79
800
OS-23-80
06- -79 04-26-81
07-06-71 07-07-71
07-Q6-71 07-07-72
07--()3-l!6 11-11-81
03-16-l!3 11-05-81
11- -63
895
04-16-73
1Q-2D-80
60
06-10-71
10-2Q-80
87
1970
157
lQ- -64
02-1.-79
300
11-15-82
150
05-11-58
10-20-80
860
12-02-75
10-20-80
703
51.0
Screen 22Q-235 1 345-370 1 380-385, 395400 ft. Transllliuivit:y H 1900 ftlfd.
12.9 25.0 22.9 25.0
Open hole 200-482 fc. Well 67 in CCS Bulletin 64, Water-quality analysi, 08-20-81.
Screen 292-301, 395-415, 434-l!44, l!55l!65. 484-494 ft.
Well 30 in CCS Bulletin 6l!, Well 7 in. GGS Bulletin 64. Water-quality analysh 1 08-08-46.
~ I Well 13 in GGS Bulle.cin 64.
Well 16 in CGS Bullecin 64. St:reen l!54-46lo 1 474-524 ft. Translllissiv1ty 8 1%00 fc2/d. Well destroyed. Se.re.en 210-240 fc. transmissivity 61900 fc.2/d. Open hole 181-422 ft. trann.iuivic;y 51600 ft2/d. Open hole 241"-364 ft. trannd.n1v1ty .. 6,200 ft2/d. Screen 291-)02, 395-416, 434-44l!, 45l!4651 484-494 ft.
Se.run 365-415 ft.
Perforated e.asing 200-210 ft.
Perforated using ZOQ-210 ft.
.5 6.2 2.5 7.5
13.5
Water-quality analyses 1 04-11-67, 09-28-71.
Screen 75-85, 95-100, llQ-115, 145-150 ft.
Screen 145-150 ft. transissivicy 1 1 500 ftZ/d.
30 ft of sereen-spae.ing unknown. Transmissivity 620 tel/d. Water-quality analysis, 09-0l!-81.
Se.reen 278-289, 334-344 fc. Tr&nll111.hsivity 2 1 100 ttl/d.
Sere.en 203-213, 222-242 ft.
Water-quality e.nlyse.s, 03-11-63, 12-Ql-75.
Se.reen 233-253, 411-431, 461-481 ft. Tra.nsmh:sivity 5,700 ft2/d.
Appendix A.-Record of selecced wells-Concinue.d
[Aquifer: G, Gordon a<tuifer system, J, Jacksonian aquifer; D, Dublin aquifer system. Uee: A, agricultural; D, domestic; I, industrial; P, public 11upply; 0, observation. Water level: reported levels are given in feet, measured levels are given in feet and tenthllil; Yield: F, flowing. Depth of Yell: ), greater than]
County
Well numbers
Georgia
I Geologic Survey Latitude-
nUID.ber longicude
Name or ower
.,Date
drilled modified
Depth of
well (ft)
Depth of
casing (ft)
Diameter of
~11
(in.)
Aldt:ude of land surface
(ft)
Water level
Above. (+) or below (-) I I Aquifer(s) land surface (ft)
Dat:e of
Yield (gal/min)
Specific capacity (gal/min/ft:)
l u
Remarks
Jefferson I 26nO
532
26X9
3253540822322
3253230822754
Mrs. w. P.
Sm:l.ch, 1
Wally Evans
06- -57
410
165
425
266
26X2
3259450822443
Louisville, 4
308
220
26Y2 26Y5 26Z9
3300150822730
J. P. Stevena, 2
375
214
330024-
0822729
J. P. Stevena, 1
1962(?)
450
254
3311330822359
Wrens, Ga., 3 (old 4)
1978
185
135
.
13.5
265
270
G,J
238
285
310
411
G,J
-40 -68
-30
-40 -55 -112.7 -122.0
26Wl
325134-
Wadley, 1
0822419
(Ruby St. well)
lii!IU
473
370
227
'-13.6
Jenld.na
30X4
3254340815734
Perkin
-54
446
400
250
-68
30W5
324510-0815948
Johra Cleve Newton
460
200
12
195
G,J
-44.7
30W6
3245360815956
Carl Mons
1938
385
220
205
G,J
-35
1:1:> <.C
30W2
3252260815707
Magnolia State Park, 1
05- -39
357
218
G,J
-50 -57.2
30W8
3248220815608
Millen, 2 (Walnut St. well)
400
230
182
G,J
-32 -36.9
30W9
324923--
Joek.ey Inte.r-
0815700
nacional, 1
07- -74
401
155
10
169
G,J
-13.5
Johnaon
24V4
324351-
Wrightsvill,e,
0824314
Ga 3(?)
1970(?)
525
250
10
355
G,J
-130
Laurens
21Ul
317
3232150830431
Dudley, 1
1952
369
21D2
323030-
Ga. n.o.T. 87
0830246
Rest stop vell
09- -68
509
229
325
282
D,G,J
-85.-4 -87.4
-48 -52.7
21U5
323030-
0830240
USGS 'N-1
11-05-80
800
800
6,4
282
-33.9
20U1 22T3
3233420830915
3226470825955
Montrose, Ga.,
Albert s.
Mercer
353
116
420
300
10
391
G,J
220
-75 -121.4
-44.7
Pulaski.
1855
339
3217020832749
Opelika Mfg. Co.
319
150
227
G,J
+2.1 -25.3
18R6
320941-
0832529
N. J. Bozman
1910
367
350
215
+17 +3.8
18R7
320827-
0832409
Elmer Triat
397
220
+6
18Sl3
3216050832438
Old Pulaski Co. High School
385
150
252
G,J
-11 -44.5
18512
321652-
Opelika Mfg.
0832757
Co., 2
390
306
245
-12.6
18515
321652-
0832624
Hartford, 2
1973(?)
420
374
230
-3
Richmond
27AA3
3316470821747
Fort Gordon test Yell 3
41.5
265
-2.6
28AA1
331730-
0821209
Blythe, 1
1966(?)
140
120
450
-108.67
06- -57 08- -79
535 1251
09-09-77
1000
1962
1962 11-13-78 11-15-82
1200 1200
105
1951 10-20-80 07-24-79 11-13-81
ll-17-81
1938 05- -39 11-13-81 07-06-77 ll-11-81
02-04-80
04-15-70 05-29-75 ll-10-78 09-03-68 01-28-82
01-28-82 10- -46 ll-06-81
11-06-81 07-17-53 11-03-81
1910 07-20-50
08-23-51 1934
06-29-50
07-29-71
1973
02-26-57
10-21-80
75F 200
30
580 400
160
40 700 500
17.5
75-100 638 349
174
20.0 20.0 21.3
29.0 5.6
Screen 266-322, 322-425 ft. Screen 220-300 ft. Transmissivity 5,700 ft2jd. Vater-qualley analysis, 05-.oJ-78. Screen 214-219, 242-247, 290-295~ 318328, 370-375 ftr fi.&ma:d...sS'i.Jrlly 5,800 ft2/d. Screen 254-275, 315-325, 367-372, 395400, 445-450 ft.
Screeo. 135-145, 165-185 ft. Screen 370-380, 440--450, 460-465 ft. Tranam:Lsdvity 5,900 ft2/d. Waterquality analyses, 10-19-63, 10-06-70, 08-20-81.
Screen 400-440 ft.
Screen 200-360, 360-460 ft .
Screen 230-352, 352-400 ft.
Screen 50 ft. Intervals unkno~JD.
Screen 339-369 ft.
.::P I Screen 229-234, 335-346, 495-500 ft.
Broken drill stem 1n well.
Wacer-quali ty analysis, 02-18-66. A I Open hole 30~20 ft.
Screen 150-170, 285-315 ft.
Screen 150-302, 302-385 fc. Screen 306-367 ft. Transmissivicy 9,800 ft2/d. Screen 374-414 ft. Transmissivity .. 2,100 ft2/d.
0 Screen 120-140 ft. Water-quality analysis, 06-17-68.
Appendix A.-l.e.cord of selected wells--coutinued
(Aquifer: G, Gordon aquifer syst:em, J, JacltaoD.ian aquifero D, Dublin aquifer syst:em. Use: A, agricultural; D. domestic; I, indust:rial.; P, public supply; 0, observation. Water level: reported level& are given in feet, measured levels are given in feet: and teoth5; Yield: F, flowing. Dept:h of vell: ), a:reater t.ban)
County
Georgia
Geologic
u::~!ra !~:V~~ I ~:~~~~~:
Name. or o>oro.e.r
Date
drilled or
modified
Depth
of well (ft)
Depth of
casing (ft.)
Diameter of
well (in. )
A.lt:icude of land surface
(fc)
Watar l evel
Specific
I I I Above. (+) or below (-)
Dte of
Yield
capacity
I I Aquife.r(a) land surface. (ft)
measurement (gal/min) (gal/min/ft) Usnt
Remarks
Screven
32Xl9
3254220813746
Millhaven Co.
361
124
109
G,J
33W25
325009-
0813245
Louts Pfeiffer
400
74
33Vl
3244420813108
Mrs. Cassie Ba:te.>re
480
6,3
107
32X23
325723-
0813758
Millhaven Co.
375
180
33X5
3252360813600
Ralph Dixon
1942
300
33Xl8
638
325724-
w. S. Morris, Ill
0813218
(old Wade
Plantation)
1959
326
201
102
110
G,J
J4Wil
3248390812904
Ga. Dept. of Transportation
434
220
70
G,J
J3Wl9
3252320813612
Ralph Dixon
u- -62
368
220
98
G,J
3:nl23
3250410813405
s. A. Jenkins
<11
200
84
G,J
32\1'13
3245()()-
0813822
Sylvania, 1
0&-08-39
490
10.8
225
~
32XH
295
. 32451D-
0813838
Sylvania, 3
490
125
12
199
G,J
JJX27
3255040EH3005
R. ll. Taylor
400
200
73
G,J
32Xl5
lOU
3255550814008
Millhaven Co.
310
260
169
G,J
33X37
3257260813722
Millhaveo Plantat:ion Buena Vista well
565
l70
10
188
J2Ul8 33W24 33Xl0
Washington I 2SXl3
23XZ6 23X34
Wt2 23Z9 W'ilkinson l 19Wl9 20Wil6
3236120814il25
King Finishing Co., 2
670
253
149
G,J
325137-
0813409
A. S. Hilla Co.
1963(?)
535
95
325619-
0813149
Wade Plantation
1963(?)
369
205
91
3358450823635
Davisboro, 1
1966(?)
400
200
302
G,J
325858082"814
Sandersville, 7
467
140
455
G,J
32562-40824502
Holmes Canning Co., 2
335
182
385
G,J
325428-
0823954
Riddleville
408
411
330942-
0824717
Berman Snider
131
350
324954-
Yara Engineer1nc,
0831743
G-13
40
440
3248230831316
Hollincsvorth
23
24
390
+5.6 +5.8 .... 8 -+4.1 -12.8 -19.2
-54.2 F
-+0.5
F +20.7
+2.6 +1.1 .... 6 +7.4 +12.7 .... 2 -109.9 -127.2
-99.5 +12.4 +11
-45
-68
-34
.... ,
-+4.3 -50.6 -52.2 -222 -220.1 -140 -141.9 -84 -146.1
-20.5
-17.8
-3.6
07-16-63 11-09-81
08-13-63 11-lD-81
04-Q9-43 u-o3-Bl
n-o9-Bl
07-12-63 11-10-81
06~6-63
11-10-81
08-15-63 11-09-81
08-14-63 11-10-81
08-13-63 11-09-81
06-<18-39 U-o4-8I
11-QI\-81
08-13-63 11-10-81
09- -58
70
05-02-79
1000
08- -65
08-13-63
08-13-63 04-20-66 1D-!l-80 1D-2l-80 11-16-82 08-Q6-73 ll-o.4-81 12-0I-66 u-o6-S1
10-22-80
05-27-79
05-14-79
1815
175 165 183 316
9.6 50.4
19.8
Screen 12-4-209 1 209-361 ft.
Screen 220-374, 374--434 ft. Wat:erqualit:y analyda, 03-16-70.
Screen ZOQ-254. 254-411 ft:. llater-qU&lity analyda 1 05-21-45. Screen 125-151. 151-490 ft.
Screen 370-460, 477-502, SSQ-565 ft. Tranemiaaivity 3,500 ft2/d. Open bole 253-670. Transmissivity 13,000 ft2/d. Wat:er-quality ana1ysb 08-19-81.
Well no longer used. Screen 140-150, 282-287. 307-317 ft:. Screen 182-187 25D-255. 325-330 ft.. Transmissivity 2,400 tt2/d.
Appendix B.-Chemical analyses of water from the Gordon aquifer system
Well n=be
Owner or name
Aquifer(s)
[Aquifer: G0 Gordon aquifer system.; J, Jacksonian aquifer. <. less thanl
Killigrallll!il per liter
Dissolved
, f--r--.---,------,-----,---.- ,----.----r-----.-----,--l solids Hardn'r :;
~. g. ~ f~ .. .. f.l~l i .~E~..~. Date
~
~ ~ l sampled
~ 3
~
i
~ ~
~
z z
~' '
~ ~
i ~
u
c
..... ,; _g
.:: e0
]~"
" ~
~
0
-~
.;~ ~
"'
;: ~
~
~
8
I ~ 6 ~u' ~
' ~
0
~ 2~ 5'i ~
Micrograms per Utet'
e
e .
.
~
c
~
~ ii
;j :!'
u 0
3 ~
Georgia Environmental Protection Division standards for safe drinking water 1977
500
5o I 10 I 5o 11.000 I 3oo I 50 I so I 2.0 1 10
s.ooo
28W3 I Midville, Ga. 1 28AA2 I s.T. Corley
28Z1 I C.F. Morris
4
29Z1 I J. Thompson
OS-2H1 I 43 I 47
~8-46
os-oe-46 08-08-46
2.1 I 3.5 I 2.3 1140 I llS I 8.9 I 2.1 1 0.1 I 1.9
20 I 16 I 2.0 I 2.0 I .o I 4.3 3.0 I 2.0 I .1 I .oo
176 1144 I 9.0 I 3.0 I .o I .oo
183 1181 luo 1 1s I 248 I 7.7 120.6
21
11:~.5
19.S
140
18.S
4.3 I oo
(10
39 I <10 I 18 I <O.l I <1 I 240
<4
31Z21 I Vogtle Observa-
tion well 135
~ 1~14-71 I 9.2 1 28.~ I 8.3 lt6.3 I 2.8 Ills 1106 117.4 I 4.0 I .o I 1.4
106 I 106
180 I 8.2
120
27U1 I SWainsboro. Ga S
G,J
04-11~7 I 26 1 46
::g I I 4.0 I 3.8 I 2.4 1152 I 12S I
3~ :~ I .10
09-28-11
112 I 16S I 132
96
~~~ I ~::I ~i
3.9 I o
50
1~g I 1g
350
.........
25Z3 I Gibson, Ga., 3 25Z5 I Gibson. Ga., 2
I '' I . 1 I 1 09-{)4-81
1.2 2.8 .2
5 02-27-79
47
60 I 4.6 I 19.3
40
lUO
31 <10
10 I 130 I 10 I 19
(1
26
5-
56
180
26Xl I Louisville.
Ga., 1
03-ll-63 I 37 1 18 1 12-o1-7S
1.2 I 1.3 I .5 I 52 I 43 I 8.8 I 2.8 1 .2 I .oo
54
118 1 '' 1 5o 40
uz 1 6.7 1 zo.o 1 3 111
9.0
600
26Y4 I J. P. Stevens, 4
G.J
26W1 I Wadley, Ga 1
~
08-20-81 I 41 I 16
1.2 1 1.6 I .57
46
~~=i~=!~ - 146 I ~~
1 1~.0
12~.311:;
11~
I
::
22
I
4.0
9B
45
uo I 6.3 I 20.4
" 400
(1
146
190 91
I 2 174 26.9 I 21.0
18
200
<1
<10 11.200 I <10 I 37 I <.1 : <1 I 61
(10 11,900 1 <10 1130 1 <.1 1 <111SO
(4
29W1 I J. K. Johnson. 1
G.J
04-ll-67 I 39 I 40
2.1 12.s12.1 I128 I 10S 1 11
2.0 I .1 I .oo
16S I 162 I uo
245 I 7.9 I 20.0
2.6
150
30W1 I Millen. Ga.
G.J
11-17-59 I 39 I 44
2.1 I 3.6 l 2.8 I 146 1 120 I 9.6 I 3.S I .2 I .20
191 1 178 1121
2S4 I 8.0 I 21.5
2.3
20U 1 I Montrose. Ga. 2
G,J
02-18-66 I 20 I 47
2.1 I L.8 I .8 1144 1118 1 11
3.0 I .1 I .oo
157 1126
238 1 7.8
3.7
28AA1I Blythe, Ga., 1
06-17-68 1 11
1.0 I .6 I 3.6 1 .2
.o I 3.o I . 1 I 5.4
32 1 29
31 I 5.8
2.5
32W13I Sylvania. Ga., 1
05-21-45
158 1130 I s.o I 3.0 I .2
123
34W4 1 Ga. n.o.t. Roadside Parlt
03-16-70 I 3l! I 30
7.7 113 1 3.4 1 148 1121 I 9.6 I 3.0 I .2 I .oo I .01 1 193 1 174 1107
2s2 I 7.B I 19.s
3.8 I s3oo I s10
90 I 20
240 I 300
32X34I l:lilltonia, Ga.
G,J
os-04-64 I 34 I 46
s.1 I 4.9 I 2.5 I 1s2 112s I ~.o I s.o I .3 I .oo
1s2 I 181 I 136 1 12 I 250 I 7.8 1 20.0
32U18 I King Finishing Co 2
G,J
08-19-81 I 16 I 13
2.s Ill I 4.5 1 101
127
42
182 I 8.1 1 26.4
1.3 I <10
(10
30 I oo I 16 I <.1 I <1 I 270
(4
18VL41 J. H. Gettys
G,J
12-20-44
230 1189
3.0 I .2 I .10
174
18.5
1 Water having a CaC03 hardness of 0 to 60 mg/L is clanified soft""; 61 to 120 mg/L, -moderately hard"; 121 to 180 mg/L~ ""hard""; and more. than 181 mg/L, "very hard.
2 Carbon dioxide concentration calculated from ueasured values of pl:i and bicarbonate ion. 3 State standards for fluoride are set according to temperature. 4 Analysis by Bechtel Corporation, San Francisco. California. 5 Total recoverable solids. 6 Analysis by Georgia Environmental Protection Division.
GEORGIA DEPARTMENT OF NATURAL RE S OURCES ENVIRONME NTAL PROTECT IO N DIV I SI ON GEORGIA GEOLOGIC S U RVEY
sw
A
18T1
Prepared in coopera t i on with t he U NITE D S T AT E S DEPARTM EN T OF THE I NT ER I OR
GEO L O G I CA L SURV E Y
"I '
Ill
z
0
1()
w
(/)
POST-EOCENE ST RATA
BARNW ELL UNIT
" I
()
z
0
;::
()
w
(J)
24V 1
0 I 0
z o ;::
()
w
(J)
NE
A
I N F 0 R M A TIO N C I R C U L A R 7 5 P L ATE 1
TD 15 60 tt
NW
8
RU BY QUARRY
2001 SEA LEV EL
2 00 1 400 1 60 0 1 8 00 1 1000 1
ofl fi ning Uni t q ui f e r
H-+f.- - -Spo nt an eous Po t e ntia l
TD 1219 ft
LOWER HUBER- ELLENTON UNIT
T0 1685 f t
TO 1780 II
UPPER CRETACEOUS STRA TA
TD 104511
10 Ver tical sca le g rea t ly ex agge rated
20 MILES
EXPLANATION
T O 600 It
WEL L 10ENTIF I CA110N
24V 1 NUMB CO
L I TH OL OGY
t }) .j S AND
~. GR AVEL
~ LIMES TONE
t-=.:L::j MARL
l='7l CALCAREOUS
~S A N D
t=====3 CL AY
~C ARBONACEOUS
1--- 1G LAUCONITI C
0
KAO LINITIC
[YJ FO SS ILIF EROU S
H UNCONFORMITY
E1 NO SAMPLE
Mo d i f i ec f r o m Pro w e ll and othe r s ( 1985)
L OCATI ON OF HYDR OG EOL OG IC SE CTI ONS
21 U4
.<I.
z
0
10
w
(/)
I
I
I I
23T 1
- - --------?. Posr-t::o
- - ?.
CE:Nt::: ST<> A
--
" TA
BA RN WELL UN IT
- - - -:::::;.=+~-..!."--=- -
SE
s
2 5 T2
8001 6 001 4001
Vertical sca le great ly exaggera ted
10 M IL ES
TD 32 40 f t
HYDROGEOLOGY OF THE GORDON AQUIFER SYSTEM OF EAST-CENTRAL GEORG.IA.
GEORGIA DEPARTMENT OF NATURAL RESOURCES ENVIRONMENTAL PROTECT I ON DIV I Sl ON GEORGIA GEOLOGIC SURVEY
500' 4001 3 00' 200' 100 ' SEA LEVEL 100' 200 ' 300' 400'
500'
600' 70 0 '
80 0 '
9 001
NW
c
23X28
E XPL A NA TION
TD 1780 It
NW D
AK -457
500 ' 4001
Pre pared in co opera t i o n with the UNIT ED STAT ES DEP ART MENT OF THE I NT ERI OR
GEOLOGICAL SURV EY
SE
c
TD1 7B0 fl
10 Vertical sco. l o grcn lly exaggerated
TO 3240 ft 20 M ILES
LOCATION OF HYDROGEOLOG IC SECTIONS
SEA LEVEL
EX PLA NATIO N
qui f e r Con fi n ing un i t
Ve rt ical sca l e g reat l y exaggerated
MILES
INFORMATION CIRCULAR 75 PLAT E 2
Lis t of we l ls on hydrogeologic sections
County
Well number
Geor gia Geologic
Survey numbe r
La t i t u d e l ongitude
Name or owner
Date drilled
or modified
Altitude of land s urface
(ft )
Burke
28Xl
3444
32523208213 15
USGS , Midville SEXTW- 1
06- 04- 80
269
Emanuel
27U4
--
3236060822ll5
Swainsbor o , 4
07- - 67
290
J ohnson
24V l
3 453
324209- USGS , Wrigh tsville
0824302 Firetower, TW- 1
08- 29- 80
355
Laurens
21U4
3524
32303008302 43
USGS, Laurens TW- 3
12- 16- 81
282
23Tl
51
322840-
0824530 Grace McCain, 1
06- ~4 5
280
Pu l a s k i
!BTl
35 11
322245- uses , Arrowhead
0832901 TW- 1
04- 15- 81
334
Tr eutl en
25T2
730
3223 13-
0823234 Gillis , 1
Wa s h i n g t o n
22Y30
--
330142- American I nd. 0825804 Clay, M- 7
08- - 61
351
11- 12- 79
330
23X28
1050
325907-
0824814 Sandersvi lle, 9
05- 1 3 - 66
450
24X5 . --
3357180823820
Sepco SX79- l Geisbricht
1980
375
Wilkinson
19W6
1524
3251040831958
Georgia Kaolin Co . , 13
12- - 65
400
Aiken, S. C.
20V4
3 165
324257-
0831324 Willis Allen , 1
02- - 76
413
AK.- 457
--
333417081501 2
Breezy Hill Subdivision
07- 14- 69
296
MSB- 34
--
33202408 1441 5
Savannah Ri ver Plant
07- 20- 83
380
FC- 5A
--
33 18340814138
Savannah River Plant
04- 23-81
220
Barnwell,
VSC-2
--
S . C.
33081 008!3558
Georgia Power Company
06- 11- 82
590
SE
o
<
I
<(
2
Q 1u w
(/)
BARNWELL UNIT
VSC- 2
HYDROGEOLOGY OF THE GORDON AQUIFER SYSTEM OF EAST-CENTRAL GEORGIA.