


- Collection:
- Georgia Government Publications
- Serial:
- County fact sheets (Georgia Governor's Office of Highway Safety)
- Title:
- 2012 county fact sheets
- Creator:
- Georgia Governor's Office of Highway Safety
- Contributor to Resource:
- Georgia Governor's Office of Highway Safety, issuing body.
- Publisher:
- Atlanta, Ga. : Georgia Governor's Office of Highway Safety
- Date of Original:
- 2012
- Subject:
- Traffic accidents--Georgia--Statistics--Periodicals
Traffic fatalities--Georgia--Statistics--Periodicals
Crash injuries--Georgia--Statistics--Periodicals - Location:
- United States, Georgia, 32.75042, -83.50018
- Medium:
- state government records
- Type:
- Text
- Format:
- application/pdf
- Description:
- Georgia highway safety facts by county.
- External Identifiers:
- Call Number GA H575.H51 S1 T7 2012
- Metadata URL:
- https://dlg.galileo.usg.edu/id:dlg_ggpd_y-ga-bh575-ph51-bs1-bt7-b2012-belec-p-btext
- Digital Object URL:
- https://dlg.galileo.usg.edu/do:dlg_ggpd_y-ga-bh575-ph51-bs1-bt7-b2012-belec-p-btext
- Language:
- eng
- Holding Institution:
- University of Georgia. Map and Government Information Library
- Rights:
-

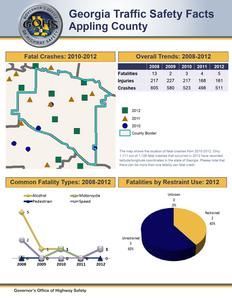
Georgia Traffic Safety Facts
Appling County
Fatal Crashes: 2010-2012
Overall Trends: 2008-2012
Fatalities Injuries Crashes
2008 13 217 605
2009 2
227 580
2010 3
217 523
2011 4
168 498
2012 5
161 511
The map shows the location of fatal crashes from 2010-2012. Only 1,111 out of 1,126 fatal crashes that occurred in 2012 have recorded latitude/longitude coordinates in the state of Georgia. Please note that there can be more than one fatality per fatal crash.
Common Fatality Types: 2008-2012
Alcohol Pedestrian
5
Motorcycle Speed
Fatalities by Restraint Use: 2012
Unknown 0 0%
Restrained 2 40%
2
0 2008
1
0 2009
1
0 2010
0 2011
1
0 2012
Unrestrained 3 60%
Georgia Traffic Safety Facts
Atkinson County
Fatal Crashes: 2010-2012
Overall Trends: 2008-2012
Fatalities Injuries Crashes
2008 2 65
114
2009 0 60
101
2010 2 98
122
2011 4 63 92
2012 3 87
128
The map shows the location of fatal crashes from 2010-2012. Only 1,111 out of 1,126 fatal crashes that occurred in 2012 have recorded latitude/longitude coordinates in the state of Georgia. Please note that there can be more than one fatality per fatal crash.
Common Fatality Types: 2008-2012 Fatalities by Restraint Use: 2012
Alcohol Pedestrian
Motorcycle Speed
2
1
Unrestrained 3
100%
Restrained Unknown
0
0
0%
0%
0
0
0
0
0
2008 2009 2010 2011 2012
Georgia Traffic Safety Facts
Bacon County
Fatal Crashes: 2010-2012
Overall Trends: 2008-2012
Fatalities Injuries Crashes
2008 3
124 240
2009 3
117 214
2010 3 89
188
2011 2
141 213
2012 1 75
125
The map shows the location of fatal crashes from 2010-2012. Only 1,111 out of 1,126 fatal crashes that occurred in 2012 have recorded latitude/longitude coordinates in the state of Georgia. Please note that there can be more than one fatality per fatal crash.
Common Fatality Types: 2008-2012
Alcohol Pedestrian
Motorcycle Speed
2
Fatalities by Restraint Use: 2012
Unknown 0 0%
Restrained 0 0%
1
1
1
1
0 2008
0 2009
0 2010
0 2011
0 2012
Unrestrained 1
100%
Georgia Traffic Safety Facts
Baker County
Fatal Crashes: 2010-2012
Overall Trends: 2008-2012
Fatalities Injuries Crashes
2008 2 31 47
2009 0 18 19
2010 2 3 5
2011 2 24 18
2012 1 23 22
The map shows the location of fatal crashes from 2010-2012. Only 1,111 out of 1,126 fatal crashes that occurred in 2012 have recorded latitude/longitude coordinates in the state of Georgia. Please note that there can be more than one fatality per fatal crash.
Common Fatality Types: 2008-2012
Alcohol Pedestrian
1
Motorcycle Speed
1
1
1
Fatalities by Restraint Use: 2012
Unknown 0 0%
Restrained 0 0%
Unrestrained 1
100%
0 2008
0 2009
0 2010
0 2011
0 2012
Georgia Traffic Safety Facts
Baldwin County
Fatal Crashes: 2010-2012
Overall Trends: 2008-2012
Fatalities Injuries Crashes
2008 6
734 1880
2009 6
753 1812
2010 3
666 1616
2011 11 745
1853
2012 3
702 2114
The map shows the location of fatal crashes from 2010-2012. Only 1,111 out of 1,126 fatal crashes that occurred in 2012 have recorded latitude/longitude coordinates in the state of Georgia. Please note that there can be more than one fatality per fatal crash.
Common Fatality Types: 2008-2012 Fatalities by Restraint Use: 2012
Alcohol Pedestrian
Motorcycle Speed
4
3
3
2
2
1
1
0
0
0
0
0
2008 2009 2010 2011 2012
Unres tra i ned 1
50%
Unknown 0 0%
Res tra i ned 1
50%
Georgia Traffic Safety Facts
Banks County
Fatal Crashes: 2010-2012
Overall Trends: 2008-2012
Fatalities Injuries Crashes
2008 11 234 513
2009 6
296 551
2010 5
248 515
2011 4
195 445
2012 4
183 396
The map shows the location of fatal crashes from 2010-2012. Only 1,111 out of 1,126 fatal crashes that occurred in 2012 have recorded latitude/longitude coordinates in the state of Georgia. Please note that there can be more than one fatality per fatal crash.
Common Fatality Types: 2008-2012 Fatalities by Restraint Use: 2012
Alcohol Pedestrian
Motorcycle Speed
3
3
Unknown 1 33%
2
1
1
1
1
0
0
0
0
0
2008 2009 2010 2011 2012
Unrestrained 0 0%
Restrained 2 67%
Georgia Traffic Safety Facts
Barrow County
Fatal Crashes: 2010-2012
Overall Trends: 2008-2012
Fatalities Injuries Crashes
2008 19 634
1527
2009 12 744
1730
2010 9
641 1737
2011 10 603
1716
2012 13 685
2005
The map shows the location of fatal crashes from 2010-2012. Only 1,111 out of 1,126 fatal crashes that occurred in 2012 have recorded latitude/longitude coordinates in the state of Georgia. Please note that there can be more than one fatality per fatal crash.
Common Fatality Types: 2008-2012
Alcohol Pedestrian
5
Motorcycle Speed
2
1
0 2008
3 2 1
2009
2
1
0 2010
3
1 0 2011
3 2
0 2012
Fatalities by Restraint Use: 2012
Unrestrained 4
33%
Unknown 0 0%
Restrained 8
67%
Georgia Traffic Safety Facts
Bartow County
Fatal Crashes: 2010-2012
Overall Trends: 2008-2012
Fatalities Injuries Crashes
2008 15
1453 3168
2009 15
1567 3569
2010 23
1528 3153
2011 19
1249 2893
2012 27
1327 3164
The map shows the location of fatal crashes from 2010-2012. Only 1,111 out of 1,126 fatal crashes that occurred in 2012 have recorded latitude/longitude coordinates in the state of Georgia. Please note that there can be more than one fatality per fatal crash.
Common Fatality Types: 2008-2012 Fatalities by Restraint Use: 2012
Alcohol Pedestrian
Motorcycle Speed
5
5
4
4
4
3
3
3
2
2
1
1
1
0 2008 2009 2010 2011 2012
Unknown 4
17%
Unrestrained 7
31%
Restrained 12 52%
Georgia Traffic Safety Facts
Ben Hill County
Fatal Crashes: 2010-2012
Overall Trends: 2008-2012
Fatalities Injuries Crashes
2008 1
155 303
2009 1 74
153
2010 1 70
134
2011 5
146 263
2012 1 46 62
The map shows the location of fatal crashes from 2010-2012. Only 1,111 out of 1,126 fatal crashes that occurred in 2012 have recorded latitude/longitude coordinates in the state of Georgia. Please note that there can be more than one fatality per fatal crash.
Common Fatality Types: 2008-2012
Alcohol Pedestrian
Motorcycle Speed
Fatalities by Restraint Use: 2012
1
<No Passenger Fatalities in 2012>
0
0
0
0
0
2008 2009 2010 2011 2012
Georgia Traffic Safety Facts
Berrien County
Fatal Crashes: 2010-2012
Overall Trends: 2008-2012
Fatalities Injuries Crashes
2008 2
139 263
2009 2
135 286
2010 4
158 270
2011 3
121 243
2012 0
194 256
The map shows the location of fatal crashes from 2010-2012. Only 1,111 out of 1,126 fatal crashes that occurred in 2012 have recorded latitude/longitude coordinates in the state of Georgia. Please note that there can be more than one fatality per fatal crash.
Common Fatality Types: 2008-2012
Alcohol Pedestrian
Motorcycle Speed
Fatalities by Restraint Use: 2012
1
1
1
<No Passenger Fatalities in 2012>
0
0
0
0
0
2008 2009 2010 2011 2012
Georgia Traffic Safety Facts
Bibb County
Fatal Crashes: 2010-2012
Overall Trends: 2008-2012
Fatalities Injuries Crashes
2008 39
2876 6527
2009 20
2921 6531
2010 26
2574 5813
2011 20
2326 6334
2012 17
2509 6095
The map shows the location of fatal crashes from 2010-2012. Only 1,111 out of 1,126 fatal crashes that occurred in 2012 have recorded latitude/longitude coordinates in the state of Georgia. Please note that there can be more than one fatality per fatal crash.
Common Fatality Types: 2008-2012
Alcohol Pedestrian 11
9
8
8
7
6
6
2008
1 2009
3 2
2010
Motorcycle Speed
6
4
3
3
2
2011 2012
Fatalities by Restraint Use: 2012
Unknown 3
21%
Restrained 6
43%
Unrestrained 5
36%
Georgia Traffic Safety Facts
Bleckley County
Fatal Crashes: 2010-2012
Overall Trends: 2008-2012
Fatalities Injuries Crashes
2008 4 88
176
2009 2 95
226
2010 2 84
255
2011 2 69
295
2012 4 91
307
The map shows the location of fatal crashes from 2010-2012. Only 1,111 out of 1,126 fatal crashes that occurred in 2012 have recorded latitude/longitude coordinates in the state of Georgia. Please note that there can be more than one fatality per fatal crash.
Common Fatality Types: 2008-2012
Alcohol Pedestrian
Motorcycle Speed
1
1
1
Fatalities by Restraint Use: 2012
Unres tra i ned 1
25%
Unknown 0 0%
0
0
0
0
0
2008 2009 2010 2011 2012
Res tra i ned 3
75%
Georgia Traffic Safety Facts
Brantley County
Fatal Crashes: 2010-2012
Overall Trends: 2008-2012
Fatalities Injuries Crashes
2008 1
169 226
2009 8
190 245
2010 5 89
133
2011 11 97 176
2012 7 97
118
The map shows the location of fatal crashes from 2010-2012. Only 1,111 out of 1,126 fatal crashes that occurred in 2012 have recorded latitude/longitude coordinates in the state of Georgia. Please note that there can be more than one fatality per fatal crash.
Common Fatality Types: 2008-2012
Alcohol Pedestrian
Motorcycle Speed
1
0 2008
3 2
0 2009
4 3
0 2010
2
1
0 2011
1
0 2012
Fatalities by Restraint Use: 2012
Unknown 0 0%
Restrained 1 14%
Unrestrained 6 86%
Georgia Traffic Safety Facts
Brooks County
Fatal Crashes: 2010-2012
Overall Trends: 2008-2012
Fatalities Injuries Crashes
2008 2
156 309
2009 4
178 361
2010 1
173 310
2011 4
179 283
2012 2
154 280
The map shows the location of fatal crashes from 2010-2012. Only 1,111 out of 1,126 fatal crashes that occurred in 2012 have recorded latitude/longitude coordinates in the state of Georgia. Please note that there can be more than one fatality per fatal crash.
Common Fatality Types: 2008-2012
Alcohol Pedestrian
Motorcycle Speed
2
Fatalities by Restraint Use: 2012
Unknown 0 0%
Res tra i ned 0 0%
1
1
1
0
0
0
0
0
2008 2009 2010 2011 2012
Unres tra i ned 2
100%
Georgia Traffic Safety Facts
Bryan County
Fatal Crashes: 2010-2012
Overall Trends: 2008-2012
Fatalities Injuries Crashes
2008 4
267 684
2009 9
355 704
2010 5
281 714
2011 10 230 670
2012 6
192 567
The map shows the location of fatal crashes from 2010-2012. Only 1,111 out of 1,126 fatal crashes that occurred in 2012 have recorded latitude/longitude coordinates in the state of Georgia. Please note that there can be more than one fatality per fatal crash.
Common Fatality Types: 2008-2012
Alcohol Pedestrian
7
Motorcycle Speed
Fatalities by Restraint Use: 2012
Unknown 1
17%
Restrained 2
33%
2 1 0 2008
0 2009
2 1 0 2010
2 1
2011
1 0 2012
Unrestrained 3
50%
Georgia Traffic Safety Facts
Bulloch County
Fatal Crashes: 2010-2012
Overall Trends: 2008-2012
Fatalities Injuries Crashes
2008 17 774
1906
2009 10 962
2149
2010 18 876
2122
2011 14 851
2073
2012 11 871
2017
The map shows the location of fatal crashes from 2010-2012. Only 1,111 out of 1,126 fatal crashes that occurred in 2012 have recorded latitude/longitude coordinates in the state of Georgia. Please note that there can be more than one fatality per fatal crash.
Common Fatality Types: 2008-2012
Alcohol Pedestrian
Motorcycle Speed
4 3
1 0 2008
1 2009
3 2 1 0 2010
1
0 2011
2
0 2012
Fatalities by Restraint Use: 2012
Unres tra i ned 3
33%
Unknown 0 0%
Res tra i ned 6
67%
Georgia Traffic Safety Facts
Burke County
Fatal Crashes: 2010-2012
Overall Trends: 2008-2012
Fatalities Injuries Crashes
2008 12 326 857
2009 4
316 933
2010 9
271 1000
2011 7
186 864
2012 12 167 667
The map shows the location of fatal crashes from 2010-2012. Only 1,111 out of 1,126 fatal crashes that occurred in 2012 have recorded latitude/longitude coordinates in the state of Georgia. Please note that there can be more than one fatality per fatal crash.
Common Fatality Types: 2008-2012
Alcohol Pedestrian
Motorcycle Speed
3 2
2008
1
0 2009
2
1
0 2010
4 3 2
0 2011
4 3
1 2012
Fatalities by Restraint Use: 2012
Unknown 1 9%
Restrained 2
18%
Unrestrained 8
73%
Georgia Traffic Safety Facts
Butts County
Fatal Crashes: 2010-2012
Overall Trends: 2008-2012
Fatalities Injuries Crashes
2008 3
226 431
2009 6
173 322
2010 2
153 195
2011 4
139 163
2012 1
130 410
The map shows the location of fatal crashes from 2010-2012. Only 1,111 out of 1,126 fatal crashes that occurred in 2012 have recorded latitude/longitude coordinates in the state of Georgia. Please note that there can be more than one fatality per fatal crash.
Common Fatality Types: 2008-2012
Alcohol Pedestrian
Motorcycle Speed
2
Fatalities by Restraint Use: 2012
<No Passenger Fatalities in 2012>
1
1
0
0
0
0
0
2008 2009 2010 2011 2012
Georgia Traffic Safety Facts
Calhoun County
Fatal Crashes: 2010-2012
Overall Trends: 2008-2012
Fatalities Injuries Crashes
2008 1 14 55
2009 0 30 47
2010 1 14 48
2011 0 31 60
2012 1 30 69
The map shows the location of fatal crashes from 2010-2012. Only 1,111 out of 1,126 fatal crashes that occurred in 2012 have recorded latitude/longitude coordinates in the state of Georgia. Please note that there can be more than one fatality per fatal crash.
Common Fatality Types: 2008-2012
Alcohol Pedestrian
Motorcycle Speed
Fatalities by Restraint Use: 2012
Unknown 0 0%
Res tra i ned 0 0%
0
0
0
0
0
2008 2009 2010 2011 2012
Unres tra i ned 1
100%
Georgia Traffic Safety Facts
Camden County
Fatal Crashes: 2010-2012
Overall Trends: 2008-2012
Fatalities Injuries Crashes
2008 7
504 985
2009 3
472 1067
2010 18 349 810
2011 7
333 828
2012 7
406 885
The map shows the location of fatal crashes from 2010-2012. Only 1,111 out of 1,126 fatal crashes that occurred in 2012 have recorded latitude/longitude coordinates in the state of Georgia. Please note that there can be more than one fatality per fatal crash.
Common Fatality Types: 2008-2012
Alcohol Pedestrian
Motorcycle Speed
2
2
2
Fatalities by Restraint Use: 2012
Unknown 0 0%
Res tra i ned 3
50%
1
1
1
1
0
0
0
0
0
2008 2009 2010 2011 2012
Unres tra i ned 3
50%
Georgia Traffic Safety Facts
Candler County
Fatal Crashes: 2010-2012
Overall Trends: 2008-2012
Fatalities Injuries Crashes
2008 3
112 188
2009 6
127 256
2010 3
135 251
2011 4
150 290
2012 3
148 244
The map shows the location of fatal crashes from 2010-2012. Only 1,111 out of 1,126 fatal crashes that occurred in 2012 have recorded latitude/longitude coordinates in the state of Georgia. Please note that there can be more than one fatality per fatal crash.
Common Fatality Types: 2008-2012
Alcohol Pedestrian
Motorcycle Speed
0 2008
4 3
0 2009
2
0 2010
1
0 2011
1
0 2012
Fatalities by Restraint Use: 2012
Unknown 0 0%
Res tra i ned 1
50%
Unres tra i ned 1
50%
Georgia Traffic Safety Facts
Carroll County
Fatal Crashes: 2010-2012
Overall Trends: 2008-2012
Fatalities Injuries Crashes
2008 28
1747 3450
2009 17
1884 3830
2010 27
1623 3437
2011 22
1455 3086
2012 13
1387 3422
The map shows the location of fatal crashes from 2010-2012. Only 1,111 out of 1,126 fatal crashes that occurred in 2012 have recorded latitude/longitude coordinates in the state of Georgia. Please note that there can be more than one fatality per fatal crash.
Common Fatality Types: 2008-2012
Alcohol Pedestrian
9
7
6
6
1 0
2008
4 3 2
2009
3 2
2010
Motorcycle Speed
8
5 4 3 2 1
2011 2012
Fatalities by Restraint Use: 2012
Unrestrained 4
36%
Unknown 0 0%
Restrained 7
64%
Georgia Traffic Safety Facts
Catoosa County
Fatal Crashes: 2010-2012
Overall Trends: 2008-2012
Fatalities Injuries Crashes
2008 9
821 1876
2009 7
960 2087
2010 8
921 1903
2011 7
766 1819
2012 7
784 1993
The map shows the location of fatal crashes from 2010-2012. Only 1,111 out of 1,126 fatal crashes that occurred in 2012 have recorded latitude/longitude coordinates in the state of Georgia. Please note that there can be more than one fatality per fatal crash.
Common Fatality Types: 2008-2012 Fatalities by Restraint Use: 2012
Alcohol Pedestrian
Motorcycle Speed
4 3 2
0 2008
2
1
0 2009
4 3 2
0 2010
2
1
0 2011
1
0 2012
Unrestrained 4
57%
Unknown 0 0%
Restrained 3
43%
Georgia Traffic Safety Facts
Charlton County
Fatal Crashes: 2010-2012
Overall Trends: 2008-2012
Fatalities Injuries Crashes
2008 5 98
174
2009 1 82
161
2010 3 64
149
2011 3 53
167
2012 3 70
172
The map shows the location of fatal crashes from 2010-2012. Only 1,111 out of 1,126 fatal crashes that occurred in 2012 have recorded latitude/longitude coordinates in the state of Georgia. Please note that there can be more than one fatality per fatal crash.
Common Fatality Types: 2008-2012
Alcohol Pedestrian
Motorcycle Speed
3
Fatalities by Restraint Use: 2012
Unknown 1
33%
Restrained 0 0%
1
1
1
0
0
0
0
0
2008 2009 2010 2011 2012
Unrestrained 2
67%
Georgia Traffic Safety Facts
Chatham County
Fatal Crashes: 2010-2012
Overall Trends: 2008-2012
Fatalities Injuries Crashes
2008 2009 2010 2011 2012
41 37
43 21
20
4102 4330 3838 3577 3838
12597 12534 11320 12130 12792
The map shows the location of fatal crashes from 2010-2012. Only 1,111 out of 1,126 fatal crashes that occurred in 2012 have recorded latitude/longitude coordinates in the state of Georgia. Please note that there can be more than one fatality per fatal crash.
Common Fatality Types: 2008-2012
Alcohol
Pedestrian 14
11
1101
76
8
2
Motorcycle Speed
1110
6
78 5
6
3
3
23
2008 2009 2010 2011 2012
Fatalities by Restraint Use: 2012
Unknown 2
14%
Restrained 7
50%
Unrestrained 5
36%
Georgia Traffic Safety Facts
Chattahoochee County
Fatal Crashes: 2010-2012
Overall Trends: 2008-2012
Fatalities Injuries Crashes
2008 1 25 56
2009 0 68 60
2010 2 20 34
2011 1 8 20
2012 0 7 16
The map shows the location of fatal crashes from 2010-2012. Only 1,111 out of 1,126 fatal crashes that occurred in 2012 have recorded latitude/longitude coordinates in the state of Georgia. Please note that there can be more than one fatality per fatal crash.
Common Fatality Types: 2008-2012
Alcohol Pedestrian
Motorcycle Speed
2
Fatalities by Restraint Use: 2012
<No Passenger Fatalities in 2012>
1
0
0
0
0
0
2008 2009 2010 2011 2012
Georgia Traffic Safety Facts
Chattooga County
Fatal Crashes: 2010-2012
Overall Trends: 2008-2012
Fatalities Injuries Crashes
2008 6
345 484
2009 4
288 503
2010 3
265 451
2011 7
270 514
2012 5
281 604
The map shows the location of fatal crashes from 2010-2012. Only 1,111 out of 1,126 fatal crashes that occurred in 2012 have recorded latitude/longitude coordinates in the state of Georgia. Please note that there can be more than one fatality per fatal crash.
Common Fatality Types: 2008-2012
Alcohol Pedestrian
2
Motorcycle Speed
Fatalities by Restraint Use: 2012
Unrestrained 1
20%
Unknown 0 0%
1
1
1
0
0
0
0
0
2008 2009 2010 2011 2012
Restrained 4
80%
Georgia Traffic Safety Facts
Cherokee County
Fatal Crashes: 2010-2012
Overall Trends: 2008-2012
Fatalities Injuries Crashes
2008 15
1582 4567
2009 11
1533 4475
2010 15
1544 4782
2011 11
1374 4925
2012 18
1527 5174
The map shows the location of fatal crashes from 2010-2012. Only 1,111 out of 1,126 fatal crashes that occurred in 2012 have recorded latitude/longitude coordinates in the state of Georgia. Please note that there can be more than one fatality per fatal crash.
Common Fatality Types: 2008-2012
Alcohol Pedestrian
Motorcycle Speed
7
5 4
2 1
2008
3 2 1 0 2009
4
2 1
2010
4 3 2 1
2011
5 2 2012
Fatalities by Restraint Use: 2012
Unres tra i ned 5
38%
Unknown 0 0%
Res tra i ned 8
62%
Georgia Traffic Safety Facts
Clarke County
Fatal Crashes: 2010-2012
Overall Trends: 2008-2012
Fatalities Injuries Crashes
2008 13
1676 4765
2009 18
1867 5044
2010 13
1615 4518
2011 16
1335 3799
2012 7
1553 3922
The map shows the location of fatal crashes from 2010-2012. Only 1,111 out of 1,126 fatal crashes that occurred in 2012 have recorded latitude/longitude coordinates in the state of Georgia. Please note that there can be more than one fatality per fatal crash.
Common Fatality Types: 2008-2012
Alcohol Pedestrian
Motorcycle Speed
11
Fatalities by Restraint Use: 2012
Unres tra i ned 1
20%
Unknown 0 0%
1203 2008
43 1
2009
45 2
2010
45 2 0 2011
32 0 2012
Res tra i ned 4
80%
Georgia Traffic Safety Facts
Clay County
Fatal Crashes: 2010-2012
Overall Trends: 2008-2012
Fatalities Injuries Crashes
2008 0 13 34
2009 0 30 27
2010 3 73 65
2011 0 51
281
2012 0 40
208
The map shows the location of fatal crashes from 2010-2012. Only 1,111 out of 1,126 fatal crashes that occurred in 2012 have recorded latitude/longitude coordinates in the state of Georgia. Please note that there can be more than one fatality per fatal crash.
Common Fatality Types: 2008-2012
Alcohol Pedestrian
Motorcycle Speed
1
Fatalities by Restraint Use: 2012
<No Passenger Fatalities in 2012>
0
0
0
0
0
2008 2009 2010 2011 2012
Georgia Traffic Safety Facts
Clayton County
Fatal Crashes: 2010-2012
Overall Trends: 2008-2012
Fatalities Injuries Crashes
2008 33
3550 9415
2009 17
3488 9301
2010 2011 2012
24 30
20
3216 3396 3678
9072 10678 11411
The map shows the location of fatal crashes from 2010-2012. Only 1,111 out of 1,126 fatal crashes that occurred in 2012 have recorded latitude/longitude coordinates in the state of Georgia. Please note that there can be more than one fatality per fatal crash.
Common Fatality Types: 2008-2012 Fatalities by Restraint Use: 2012
Alcohol Pedestrian
11
Motorcycle Speed
13
11
11
67 2008
6 342
2009
4 2
2010
45 2011
7
132 2012
Unknown 2
17%
Unres tra i ned 2
16%
Res tra i ned 8
67%
Georgia Traffic Safety Facts
Clinch County
Fatal Crashes: 2010-2012
Overall Trends: 2008-2012
Fatalities Injuries Crashes
2008 4 74
120
2009 1 43
147
2010 2 36
142
2011 2 45
138
2012 4 53
165
The map shows the location of fatal crashes from 2010-2012. Only 1,111 out of 1,126 fatal crashes that occurred in 2012 have recorded latitude/longitude coordinates in the state of Georgia. Please note that there can be more than one fatality per fatal crash.
Common Fatality Types: 2008-2012
Alcohol Pedestrian
2
Motorcycle Speed
2
Fatalities by Restraint Use: 2012
Unknown Restrained
0
0
0%
0%
1
1
1
0
0
0
0
0
2008 2009 2010 2011 2012
Unrestrained 2
100%
Georgia Traffic Safety Facts
Cobb County
Fatal Crashes: 2010-2012
Overall Trends: 2008-2012
Fatalities Injuries Crashes
2008 2009 2010 2011 2012
67 35
35 42
47
6486 7413 6497 5044 7821
23184 24154 22611 16192 22380
The map shows the location of fatal crashes from 2010-2012. Only 1,111 out of 1,126 fatal crashes that occurred in 2012 have recorded latitude/longitude coordinates in the state of Georgia. Please note that there can be more than one fatality per fatal crash.
Common Fatality Types: 2008-2012
Alcohol Pedestrian 1198
11
11
7
789
Motorcycle Speed
14
8
91101
12 10
6
6
6
2008 2009 2010 2011 2012
Fatalities by Restraint Use: 2012
Unrestrained 13 36%
Unknown 2 6%
Restrained 21 58%
Georgia Traffic Safety Facts
Coffee County
Fatal Crashes: 2010-2012
Overall Trends: 2008-2012
Fatalities Injuries Crashes
2008 7
476 880
2009 11 495
1050
2010 11 382 800
2011 9
481 996
2012 12 648 910
The map shows the location of fatal crashes from 2010-2012. Only 1,111 out of 1,126 fatal crashes that occurred in 2012 have recorded latitude/longitude coordinates in the state of Georgia. Please note that there can be more than one fatality per fatal crash.
Common Fatality Types: 2008-2012
Alcohol Pedestrian
Motorcycle Speed
3
2
2
1
1
1
1
1
0
0
0
0
0
2008 2009 2010 2011 2012
Fatalities by Restraint Use: 2012
Unknown 2 18%
Restrained 0 0%
Unrestrained 9 82%
Georgia Traffic Safety Facts
Colquitt County
Fatal Crashes: 2010-2012
Overall Trends: 2008-2012
Fatalities Injuries Crashes
2008 8
489 894
2009 8
497 952
2010 7
357 660
2011 16 369 803
2012 9
351 802
The map shows the location of fatal crashes from 2010-2012. Only 1,111 out of 1,126 fatal crashes that occurred in 2012 have recorded latitude/longitude coordinates in the state of Georgia. Please note that there can be more than one fatality per fatal crash.
Common Fatality Types: 2008-2012
Alcohol Pedestrian
Motorcycle Speed
6
2
0 2008
3
1 0 2009
3
1 0 2010
4
2
0 2011
3
0 2012
Fatalities by Restraint Use: 2012
Unknown 1
11%
Restrained 2
22%
Unrestrained 6
67%
Georgia Traffic Safety Facts
Columbia County
Fatal Crashes: 2010-2012
Overall Trends: 2008-2012
Fatalities Injuries Crashes
2008 13
1185 3240
2009 6
1367 3720
2010 12
1159 3410
2011 11
1297 3579
2012 8
1338 3653
The map shows the location of fatal crashes from 2010-2012. Only 1,111 out of 1,126 fatal crashes that occurred in 2012 have recorded latitude/longitude coordinates in the state of Georgia. Please note that there can be more than one fatality per fatal crash.
Common Fatality Types: 2008-2012
Alcohol Pedestrian
4
2 1 2008
3
0 2009
5
3
1 0 2010
Motorcycle Speed
4 3
1 0 2011
3 2 1
2012
Fatalities by Restraint Use: 2012
Unrestrained 1 20%
Unknown 0 0%
Restrained 4 80%
Georgia Traffic Safety Facts
Cook County
Fatal Crashes: 2010-2012
Overall Trends: 2008-2012
Fatalities Injuries Crashes
2008 5
213 437
2009 1
243 620
2010 3
299 665
2011 4
164 352
2012 2
160 323
The map shows the location of fatal crashes from 2010-2012. Only 1,111 out of 1,126 fatal crashes that occurred in 2012 have recorded latitude/longitude coordinates in the state of Georgia. Please note that there can be more than one fatality per fatal crash.
Common Fatality Types: 2008-2012
Alcohol Pedestrian
Motorcycle Speed
1
1
1
1
Fatalities by Restraint Use: 2012
Unknown Restrained
0
0
0%
0%
0
0
0
0
0
2008 2009 2010 2011 2012
Unrestrained 2
100%
Georgia Traffic Safety Facts
Coweta County
Fatal Crashes: 2010-2012
Overall Trends: 2008-2012
Fatalities Injuries Crashes
2008 14
1636 3718
2009 9
1615 3739
2010 17
1275 3097
2011 16
1357 3191
2012 13
1399 3034
The map shows the location of fatal crashes from 2010-2012. Only 1,111 out of 1,126 fatal crashes that occurred in 2012 have recorded latitude/longitude coordinates in the state of Georgia. Please note that there can be more than one fatality per fatal crash.
Common Fatality Types: 2008-2012
Alcohol Pedestrian
Motorcycle Speed
6
6
6
4
2
0 2008
2 1 0 2009
2 2010
3 2 1
2011
4
2
0 2012
Fatalities by Restraint Use: 2012
Unknown 1 8%
Restrained 6 46%
Unrestrained 6 46%
Georgia Traffic Safety Facts
Crawford County
Fatal Crashes: 2010-2012
Overall Trends: 2008-2012
Fatalities Injuries Crashes
2008 4
111 248
2009 5
114 305
2010 0 90
273
2011 1 81
241
2012 1 94
261
The map shows the location of fatal crashes from 2010-2012. Only 1,111 out of 1,126 fatal crashes that occurred in 2012 have recorded latitude/longitude coordinates in the state of Georgia. Please note that there can be more than one fatality per fatal crash.
Common Fatality Types: 2008-2012
Alcohol Pedestrian
2
Motorcycle Speed
Fatalities by Restraint Use: 2012
Unrestrained 0 0%
Unknown 0 0%
1
1
1
1
0
0
0
0
0
2008 2009 2010 2011 2012
Restrained 1
100%
Georgia Traffic Safety Facts
Crisp County
Fatal Crashes: 2010-2012
Overall Trends: 2008-2012
Fatalities Injuries Crashes
2008 3
468 796
2009 2
428 854
2010 6
339 751
2011 10 313 713
2012 4
322 617
The map shows the location of fatal crashes from 2010-2012. Only 1,111 out of 1,126 fatal crashes that occurred in 2012 have recorded latitude/longitude coordinates in the state of Georgia. Please note that there can be more than one fatality per fatal crash.
Common Fatality Types: 2008-2012
Alcohol Pedestrian
Motorcycle Speed
2
2
1
Fatalities by Restraint Use: 2012
Unknown 0 0%
Restrained 1
50%
0
0
0
0
0
2008 2009 2010 2011 2012
Unrestrained 1
50%
Georgia Traffic Safety Facts
Dade County
Fatal Crashes: 2010-2012
Overall Trends: 2008-2012
Fatalities Injuries Crashes
2008 7
190 428
2009 1
252 490
2010 3
187 402
2011 2
179 399
2012 7
210 423
The map shows the location of fatal crashes from 2010-2012. Only 1,111 out of 1,126 fatal crashes that occurred in 2012 have recorded latitude/longitude coordinates in the state of Georgia. Please note that there can be more than one fatality per fatal crash.
Common Fatality Types: 2008-2012
Alcohol Pedestrian
Motorcycle Speed
3
2
1
1
1
1
1
0
0
0
0
0
2008 2009 2010 2011 2012
Fatalities by Restraint Use: 2012
Unknown 0 0%
Restrained 1 14%
Unrestrained 6 86%
Georgia Traffic Safety Facts
Dawson County
Fatal Crashes: 2010-2012
Overall Trends: 2008-2012
Fatalities Injuries Crashes
2008 9
379 754
2009 7
341 760
2010 6
270 682
2011 4
307 744
2012 5
382 806
The map shows the location of fatal crashes from 2010-2012. Only 1,111 out of 1,126 fatal crashes that occurred in 2012 have recorded latitude/longitude coordinates in the state of Georgia. Please note that there can be more than one fatality per fatal crash.
Common Fatality Types: 2008-2012
Alcohol Pedestrian
4
Motorcycle Speed
Fatalities by Restraint Use: 2012
Unknown 0 0%
Unrestrained 0 0%
0 2008
2
1
0 2009
1
0 2010
1
0 2011
2
1
0 2012
Restrained 5
100%
Georgia Traffic Safety Facts
Decatur County
Fatal Crashes: 2010-2012
Overall Trends: 2008-2012
Fatalities Injuries Crashes
2008 7
401 798
2009 6
295 660
2010 7
340 765
2011 10 293 775
2012 6
313 785
The map shows the location of fatal crashes from 2010-2012. Only 1,111 out of 1,126 fatal crashes that occurred in 2012 have recorded latitude/longitude coordinates in the state of Georgia. Please note that there can be more than one fatality per fatal crash.
Common Fatality Types: 2008-2012
Alcohol Pedestrian
Motorcycle
Speed 5
Fatalities by Restraint Use: 2012
Unknown 1 17%
Restrained 1 16%
3
1 0 2008
1
0 2009
0 2010
1
0 2011
2
1
0 2012
Unrestrained 4 67%
Georgia Traffic Safety Facts
Dekalb County
Fatal Crashes: 2010-2012
Overall Trends: 2008-2012
Fatalities Injuries Crashes
2008 2009 2010 2011 2012
60 76
49 51
76
9127 9310 8145 8320 10078
26626 26928 23172 25632 32420
The map shows the location of fatal crashes from 2010-2012. Only 1,111 out of 1,126 fatal crashes that occurred in 2012 have recorded latitude/longitude coordinates in the state of Georgia. Please note that there can be more than one fatality per fatal crash.
Common Fatality Types: 2008-2012 Fatalities by Restraint Use: 2012
Alcohol
Motorcycle
Pedestrian 22
Speed
23
18
19
20
19
16
15
15
13
13
12
4
4
34
5
2008 2009 2010 2011 2012
Unrestrained 13 24%
Unknown 10 18%
Restrained 32 58%
Georgia Traffic Safety Facts
Dodge County
Fatal Crashes: 2010-2012
Overall Trends: 2008-2012
Fatalities Injuries Crashes
2008 7
136 306
2009 0
181 291
2010 2
165 255
2011 4
125 334
2012 4
127 322
The map shows the location of fatal crashes from 2010-2012. Only 1,111 out of 1,126 fatal crashes that occurred in 2012 have recorded latitude/longitude coordinates in the state of Georgia. Please note that there can be more than one fatality per fatal crash.
Common Fatality Types: 2008-2012
Alcohol Pedestrian
Motorcycle Speed
2
Fatalities by Restraint Use: 2012
Unrestrained 1 33%
Unknown 0 0%
1
1
1
0
0
0
0
2008 2009 2010 2011 2012
Restrained 2 67%
Georgia Traffic Safety Facts
Dooly County
Fatal Crashes: 2010-2012
Overall Trends: 2008-2012
Fatalities Injuries Crashes
2008 1
158 278
2009 4
174 363
2010 4
140 349
2011 3
231 384
2012 2
168 383
The map shows the location of fatal crashes from 2010-2012. Only 1,111 out of 1,126 fatal crashes that occurred in 2012 have recorded latitude/longitude coordinates in the state of Georgia. Please note that there can be more than one fatality per fatal crash.
Common Fatality Types: 2008-2012
Alcohol Pedestrian
Motorcycle Speed
1
1
1
Fatalities by Restraint Use: 2012
Unknown 1
50%
Restrained 1 50%
0
0
0
0
0
2008 2009 2010 2011 2012
Unrestrained 0 0%
Georgia Traffic Safety Facts
Dougherty County
Fatal Crashes: 2010-2012
Overall Trends: 2008-2012
Fatalities Injuries Crashes
2008 14
1483 3364
2009 11
1612 3523
2010 11
1314 2780
2011 11
1312 3083
2012 5
1446 3704
The map shows the location of fatal crashes from 2010-2012. Only 1,111 out of 1,126 fatal crashes that occurred in 2012 have recorded latitude/longitude coordinates in the state of Georgia. Please note that there can be more than one fatality per fatal crash.
Common Fatality Types: 2008-2012
3 1 2008
Alcohol Pedestrian
4
2
2
1
1
2009 2010
Motorcycle Speed
4
3
2
1
0
0
2011 2012
Fatalities by Restraint Use: 2012
Unrestrained 2
40%
Unknown 0 0%
Restrained 3
60%
Georgia Traffic Safety Facts
Douglas County
Fatal Crashes: 2010-2012
Overall Trends: 2008-2012
Fatalities Injuries Crashes
2008 19
1989 4419
2009 19
2534 5245
2010 14
1822 4195
2011 15
1827 4036
2012 21
1927 4188
The map shows the location of fatal crashes from 2010-2012. Only 1,111 out of 1,126 fatal crashes that occurred in 2012 have recorded latitude/longitude coordinates in the state of Georgia. Please note that there can be more than one fatality per fatal crash.
Common Fatality Types: 2008-2012
8
5 4
0 2008
Alcohol Pedestrian
5
3 2
0 2009
5 4 3 2
2010
Motorcycle Speed
6 5
3
2
2
1
2011 2012
Fatalities by Restraint Use: 2012
Unrestrained 4 24%
Unknown 0 0%
Restrained 13 76%
Georgia Traffic Safety Facts
Early County
Fatal Crashes: 2010-2012
Overall Trends: 2008-2012
Fatalities Injuries Crashes
2008 5 90
147
2009 2 58 95
2010 5 83
138
2011 5 56
165
2012 3 22 33
The map shows the location of fatal crashes from 2010-2012. Only 1,111 out of 1,126 fatal crashes that occurred in 2012 have recorded latitude/longitude coordinates in the state of Georgia. Please note that there can be more than one fatality per fatal crash.
Common Fatality Types: 2008-2012
Alcohol Pedestrian
Motorcycle Speed
3
2
2
1
1
1
1
0
0
0
0
0
2008 2009 2010 2011 2012
Fatalities by Restraint Use: 2012
Unknown 0 0%
Restrained 1 33%
Unrestrained 2 67%
Georgia Traffic Safety Facts
Echols County
Fatal Crashes: 2010-2012
Overall Trends: 2008-2012
Fatalities Injuries Crashes
2008 1 22 29
2009 1 38 49
2010 1 16 35
2011 0 26 35
2012 1 37 37
The map shows the location of fatal crashes from 2010-2012. Only 1,111 out of 1,126 fatal crashes that occurred in 2012 have recorded latitude/longitude coordinates in the state of Georgia. Please note that there can be more than one fatality per fatal crash.
Common Fatality Types: 2008-2012
Alcohol Pedestrian
Motorcycle Speed
1
1
1
Fatalities by Restraint Use: 2012
Unknown 0 0%
Restrained 0 0%
0
0
0
0
0
2008 2009 2010 2011 2012
Unrestrained 1
100%
Georgia Traffic Safety Facts
Effingham County
Fatal Crashes: 2010-2012
Overall Trends: 2008-2012
Fatalities Injuries Crashes
2008 7
442 1046
2009 9
302 664
2010 7
239 434
2011 7
329 711
2012 6
216 432
The map shows the location of fatal crashes from 2010-2012. Only 1,111 out of 1,126 fatal crashes that occurred in 2012 have recorded latitude/longitude coordinates in the state of Georgia. Please note that there can be more than one fatality per fatal crash.
Common Fatality Types: 2008-2012
Alcohol Pedestrian
3
Motorcycle Speed
2
2
2
1
1
1
1
0
0
0
0
0
2008 2009 2010 2011 2012
Fatalities by Restraint Use: 2012
Unknown 1
17%
Restrained 1
16%
Unrestrained 4
67%
Georgia Traffic Safety Facts
Elbert County
Fatal Crashes: 2010-2012
Overall Trends: 2008-2012
Fatalities Injuries Crashes
2008 6
178 394
2009 2
172 439
2010 7
140 361
2011 7
154 295
2012 3 95
253
The map shows the location of fatal crashes from 2010-2012. Only 1,111 out of 1,126 fatal crashes that occurred in 2012 have recorded latitude/longitude coordinates in the state of Georgia. Please note that there can be more than one fatality per fatal crash.
Common Fatality Types: 2008-2012
Alcohol Pedestrian
4
Motorcycle Speed
Fatalities by Restraint Use: 2012
Unknown 0 0%
Restrained 0 0%
1
0 2008
1
0 2009
0 2010
2
0 2011
2
1
0 2012
Unrestrained 3
100%
Georgia Traffic Safety Facts
Emanuel County
Fatal Crashes: 2010-2012
Overall Trends: 2008-2012
Fatalities Injuries Crashes
2008 7
309 424
2009 6
287 435
2010 4
245 370
2011 4
238 371
2012 2
232 411
The map shows the location of fatal crashes from 2010-2012. Only 1,111 out of 1,126 fatal crashes that occurred in 2012 have recorded latitude/longitude coordinates in the state of Georgia. Please note that there can be more than one fatality per fatal crash.
Common Fatality Types: 2008-2012
Alcohol Pedestrian 3
Motorcycle Speed
2
1
1
0
0
0
0
0
2008 2009 2010 2011 2012
Fatalities by Restraint Use: 2012
Unknown 0 0%
Restrained 0 0%
Unrestrained 2
100%
Georgia Traffic Safety Facts
Evans County
Fatal Crashes: 2010-2012
Overall Trends: 2008-2012
Fatalities Injuries Crashes
2008 5
131 162
2009 1
137 195
2010 2
118 187
2011 1 97
138
2012 2
107 162
The map shows the location of fatal crashes from 2010-2012. Only 1,111 out of 1,126 fatal crashes that occurred in 2012 have recorded latitude/longitude coordinates in the state of Georgia. Please note that there can be more than one fatality per fatal crash.
Common Fatality Types: 2008-2012
Alcohol Pedestrian 2
Motorcycle Speed
1
1
Fatalities by Restraint Use: 2012
Unknown 1
50%
Restrained 1
50%
0
0
0
0
0
2008 2009 2010 2011 2012
Unres tra i ned 0 0%
Georgia Traffic Safety Facts
Fannin County
Fatal Crashes: 2010-2012
Overall Trends: 2008-2012
Fatalities Injuries Crashes
2008 11 307 468
2009 8
312 583
2010 2
365 536
2011 10 207 479
2012 6
204 388
The map shows the location of fatal crashes from 2010-2012. Only 1,111 out of 1,126 fatal crashes that occurred in 2012 have recorded latitude/longitude coordinates in the state of Georgia. Please note that there can be more than one fatality per fatal crash.
Common Fatality Types: 2008-2012
4 3
1 0 2008
Alcohol Pedestrian
3 2
0 2009
1
0 2010
Motorcycle Speed
4
3
2
1
0
0
2011 2012
Fatalities by Restraint Use: 2012
Unknown 1 17%
Restrained 2 33%
Unrestrained 3
50%
Georgia Traffic Safety Facts
Fayette County
Fatal Crashes: 2010-2012
Overall Trends: 2008-2012
Fatalities Injuries Crashes
2008 1
912 2870
2009 6
973 2812
2010 6
897 2496
2011 5
856 2760
2012 6
789 2499
The map shows the location of fatal crashes from 2010-2012. Only 1,111 out of 1,126 fatal crashes that occurred in 2012 have recorded latitude/longitude coordinates in the state of Georgia. Please note that there can be more than one fatality per fatal crash.
Common Fatality Types: 2008-2012
Alcohol Pedestrian
2
Motorcycle Speed
1
1
1
1
1
Fatalities by Restraint Use: 2012
Unrestrained 3 50%
Unknown 0 0%
Restrained 3 50%
0
0
0
0
0
2008 2009 2010 2011 2012
Georgia Traffic Safety Facts
Floyd County
Fatal Crashes: 2010-2012
Overall Trends: 2008-2012
Fatalities Injuries Crashes
2008 10
1377 3455
2009 16
1583 3793
2010 17
1392 3397
2011 10
1253 3697
2012 16
1289 4408
The map shows the location of fatal crashes from 2010-2012. Only 1,111 out of 1,126 fatal crashes that occurred in 2012 have recorded latitude/longitude coordinates in the state of Georgia. Please note that there can be more than one fatality per fatal crash.
Common Fatality Types: 2008-2012
2
0 2008
Alcohol
Pedestrian 5
4
3
3
1 2009
0 2010
Motorcycle Speed
4
1 0 2011
4 3 2
2012
Fatalities by Restraint Use: 2012
Unknown 2
15%
Unres tra i ned 4
31%
Res tra i ned 7
54%
Georgia Traffic Safety Facts
Forsyth County
Fatal Crashes: 2010-2012
Overall Trends: 2008-2012
Fatalities Injuries Crashes
2008 13
1207 3950
2009 9
1169 3897
2010 11
1184 3957
2011 19 955
3893
2012 22
1156 4662
The map shows the location of fatal crashes from 2010-2012. Only 1,111 out of 1,126 fatal crashes that occurred in 2012 have recorded latitude/longitude coordinates in the state of Georgia. Please note that there can be more than one fatality per fatal crash.
Common Fatality Types: 2008-2012
Alcohol Pedestrian
Motorcycle Speed
7
5
1 0 2008
1 0 2009
3 1 2010
5
2 1 2011
5 4 2
2012
Fatalities by Restraint Use: 2012
Unrestrained 4 22%
Unknown 0 0%
Restrained 14 78%
Georgia Traffic Safety Facts
Franklin County
Fatal Crashes: 2010-2012
Overall Trends: 2008-2012
Fatalities Injuries Crashes
2008 4
291 668
2009 7
271 679
2010 7
499 683
2011 3
225 514
2012 8
290 454
The map shows the location of fatal crashes from 2010-2012. Only 1,111 out of 1,126 fatal crashes that occurred in 2012 have recorded latitude/longitude coordinates in the state of Georgia. Please note that there can be more than one fatality per fatal crash.
Common Fatality Types: 2008-2012
Alcohol
Pedestrian
2
2
Motorcycle Speed
1
1
1
1
Fatalities by Restraint Use: 2012
Unknown 2 29%
Restrained 3 43%
0
0
0
0
0
2008 2009 2010 2011 2012
Unrestrained 2 28%
Georgia Traffic Safety Facts
Fulton County
Fatal Crashes: 2010-2012
Overall Trends: 2008-2012
Fatalities Injuries Crashes
2008 2009 2010 2011 2012
113 101 72 61
77
14511 15650 13896 13285 15673
45790 48399 43417 44748 50047
The map shows the location of fatal crashes from 2010-2012. Only 1,111 out of 1,126 fatal crashes that occurred in 2012 have recorded latitude/longitude coordinates in the state of Georgia. Please note that there can be more than one fatality per fatal crash.
Common Fatality Types: 2008-2012 Fatalities by Restraint Use: 2012
Alcohol Pedestrian
Motorcycle Speed
30
30
2254 13
23 19
23 17
1146
Unrestrained
21
13
1167
21%
12
78
9
2008 2009 2010 2011 2012
Unknown 10 17%
Restrained 38 62%
Georgia Traffic Safety Facts
Gilmer County
Fatal Crashes: 2010-2012
Overall Trends: 2008-2012
Fatalities Injuries Crashes
2008 6
291 741
2009 10 161 346
2010 11 310 517
2011 7
197 583
2012 4
273 774
The map shows the location of fatal crashes from 2010-2012. Only 1,111 out of 1,126 fatal crashes that occurred in 2012 have recorded latitude/longitude coordinates in the state of Georgia. Please note that there can be more than one fatality per fatal crash.
Common Fatality Types: 2008-2012
Alcohol
Pedestrian 5
Motorcycle Speed
2 1
2008
2
0 2009
1
0 2010
3 2
0 2011
1
0 2012
Fatalities by Restraint Use: 2012
Unknown 1
25%
Restrained 1
25%
Unrestrained 2
50%
Georgia Traffic Safety Facts
Glascock County
Fatal Crashes: 2010-2012
Overall Trends: 2008-2012
Fatalities Injuries Crashes
2008 0 18 35
2009 1 29 50
2010 0 13 36
2011 1 13 30
2012 0 17 38
The map shows the location of fatal crashes from 2010-2012. Only 1,111 out of 1,126 fatal crashes that occurred in 2012 have recorded latitude/longitude coordinates in the state of Georgia. Please note that there can be more than one fatality per fatal crash.
Common Fatality Types: 2008-2012
Alcohol Pedestrian
Motorcycle Speed
1
1
Fatalities by Restraint Use: 2012
0
0
0
0
0
2008 2009 2010 2011 2012
Georgia Traffic Safety Facts
Glynn County
Fatal Crashes: 2010-2012
Overall Trends: 2008-2012
Fatalities Injuries Crashes
2008 23
1094 2651
2009 11
1268 2848
2010 9
1009 2590
2011 8
824 2381
2012 13 965
2552
The map shows the location of fatal crashes from 2010-2012. Only 1,111 out of 1,126 fatal crashes that occurred in 2012 have recorded latitude/longitude coordinates in the state of Georgia. Please note that there can be more than one fatality per fatal crash.
Common Fatality Types: 2008-2012
Alcohol Pedestrian 11
Motorcycle Speed
Fatalities by Restraint Use: 2012
Unknown 0 0%
Restrained 4
44%
324 2008
4 1 2009
1302 2010
321 2011
5 3 1
2012
Unrestrained 5
56%
Georgia Traffic Safety Facts
Gordon County
Fatal Crashes: 2010-2012
Overall Trends: 2008-2012
Fatalities Injuries Crashes
2008 10 721
1504
2009 10 705
1534
2010 3
672 1832
2011 8
573 1785
2012 12 609
1833
The map shows the location of fatal crashes from 2010-2012. Only 1,111 out of 1,126 fatal crashes that occurred in 2012 have recorded latitude/longitude coordinates in the state of Georgia. Please note that there can be more than one fatality per fatal crash.
Common Fatality Types: 2008-2012
3
1 0 2008
Alcohol
Pedestrian 4
2
0
0
2009 2010
Motorcycle Speed
3
2
2
1
1
2011 2012
Fatalities by Restraint Use: 2012
Unknown 1
10%
Restrained 4
40%
Unrestrained 5
50%
Georgia Traffic Safety Facts
Grady County
Fatal Crashes: 2010-2012
Overall Trends: 2008-2012
Fatalities Injuries Crashes
2008 4
263 497
2009 3
213 422
2010 3
205 404
2011 4
217 441
2012 3
181 430
The map shows the location of fatal crashes from 2010-2012. Only 1,111 out of 1,126 fatal crashes that occurred in 2012 have recorded latitude/longitude coordinates in the state of Georgia. Please note that there can be more than one fatality per fatal crash.
Common Fatality Types: 2008-2012
Alcohol
Pedestrian 2
Motorcycle
Speed
2
2
Fatalities by Restraint Use: 2012
<No Passenger Fatalities in 2012>
1
1
1
1
1
0
0
0
0
0
2008 2009 2010 2011 2012
Georgia Traffic Safety Facts
Greene County
Fatal Crashes: 2010-2012
Overall Trends: 2008-2012
Fatalities Injuries Crashes
2008 10 196 464
2009 11 211 506
2010 9
199 481
2011 3
139 471
2012 4
152 472
The map shows the location of fatal crashes from 2010-2012. Only 1,111 out of 1,126 fatal crashes that occurred in 2012 have recorded latitude/longitude coordinates in the state of Georgia. Please note that there can be more than one fatality per fatal crash.
Common Fatality Types: 2008-2012
Alcohol
Pedestrian 5
Motorcycle Speed
Fatalities by Restraint Use: 2012
Unknown 0 0%
Restrained 1
33%
1
0 2008
2
1
0 2009
0 2010
0 2011
1
0 2012
Unrestrained 2
67%
Georgia Traffic Safety Facts
Gwinnett County
Fatal Crashes: 2010-2012
Overall Trends: 2008-2012
Fatalities Injuries Crashes
2008 2009 2010 2011 2012
53 60
57 50
45
8637 8191 7404 7733 9800
25820 24403 24059 24787 31486
The map shows the location of fatal crashes from 2010-2012. Only 1,111 out of 1,126 fatal crashes that occurred in 2012 have recorded latitude/longitude coordinates in the state of Georgia. Please note that there can be more than one fatality per fatal crash.
Common Fatality Types: 2008-2012 Fatalities by Restraint Use: 2012
Alcohol
Pedestrian 24
Motorcycle Speed
18
15 75
111103 5
1124 8
1121 87
12 653
2008 2009 2010 2011 2012
Unrestrained 8
20%
Unknown 3 8%
Restrained 29 72%
Georgia Traffic Safety Facts
Habersham County
Fatal Crashes: 2010-2012
Overall Trends: 2008-2012
Fatalities Injuries Crashes
2008 8
532 1041
2009 9
475 1011
2010 12 693
1100
2011 4
477 904
2012 10 441 814
The map shows the location of fatal crashes from 2010-2012. Only 1,111 out of 1,126 fatal crashes that occurred in 2012 have recorded latitude/longitude coordinates in the state of Georgia. Please note that there can be more than one fatality per fatal crash.
Common Fatality Types: 2008-2012 Fatalities by Restraint Use: 2012
Alcohol Pedestrian
Motorcycle Speed
Unknown 1
10%
2
2
2 Unrestrained
2
20%
1
1
1
1
0
0
0
0
0
2008 2009 2010 2011 2012
Restrained 7
70%
Georgia Traffic Safety Facts
Hall County
Fatal Crashes: 2010-2012
Overall Trends: 2008-2012
Fatalities Injuries Crashes
2008 25
2135 5399
2009 21
2360 5681
2010 26
2291 5459
2011 26
1747 4833
2012 26
2019 5333
The map shows the location of fatal crashes from 2010-2012. Only 1,111 out of 1,126 fatal crashes that occurred in 2012 have recorded latitude/longitude coordinates in the state of Georgia. Please note that there can be more than one fatality per fatal crash.
Common Fatality Types: 2008-2012 Fatalities by Restraint Use: 2012
6 5 2 1 2008
Alcohol Pedestrian
9
7
5
5
2
0 2009
2
0 2010
Motorcycle Speed
6 5 3 2
2011
7 5 4
1 2012
Unrestrained 7 28%
Unknown 1 4%
Restrained 17 68%
Georgia Traffic Safety Facts
Hancock County
Fatal Crashes: 2010-2012
Overall Trends: 2008-2012
Fatalities Injuries Crashes
2008 1 95
154
2009 2 55 91
2010 2 53 49
2011 3 67 64
2012 2 52 41
The map shows the location of fatal crashes from 2010-2012. Only 1,111 out of 1,126 fatal crashes that occurred in 2012 have recorded latitude/longitude coordinates in the state of Georgia. Please note that there can be more than one fatality per fatal crash.
Common Fatality Types: 2008-2012
Alcohol Pedestrian
Motorcycle Speed
1
1
1
1
Fatalities by Restraint Use: 2012
Unknown 0 0%
Restrained 0 0%
0
0
0
0
0
2008 2009 2010 2011 2012
Unrestrained 2
100%
Georgia Traffic Safety Facts
Haralson County
Fatal Crashes: 2010-2012
Overall Trends: 2008-2012
Fatalities Injuries Crashes
2008 7
436 759
2009 8
451 827
2010 7
472 774
2011 5
322 613
2012 0
308 600
The map shows the location of fatal crashes from 2010-2012. Only 1,111 out of 1,126 fatal crashes that occurred in 2012 have recorded latitude/longitude coordinates in the state of Georgia. Please note that there can be more than one fatality per fatal crash.
Common Fatality Types: 2008-2012
Alcohol
Motorcycle
Pedestrian
Speed
4
Fatalities by Restraint Use: 2012
<No Passenger Fatalities in 2012>
1
0 2008
2
1
0 2009
2 1
2010
2
0 2011
0 2012
Georgia Traffic Safety Facts
Harris County
Fatal Crashes: 2010-2012
Overall Trends: 2008-2012
Fatalities Injuries Crashes
2008 13 279 466
2009 13 242 471
2010 5
265 453
2011 4
224 398
2012 10 241 424
The map shows the location of fatal crashes from 2010-2012. Only 1,111 out of 1,126 fatal crashes that occurred in 2012 have recorded latitude/longitude coordinates in the state of Georgia. Please note that there can be more than one fatality per fatal crash.
Common Fatality Types: 2008-2012
3
1 0 2008
Alcohol
Pedestrian 4
2 1
2009
2
1
0 2010
Motorcycle Speed
1
0 2011
3 2 1
2012
Fatalities by Restraint Use: 2012
Unrestrained 3
33%
Unknown 0 0%
Restrained 6
67%
Georgia Traffic Safety Facts
Hart County
Fatal Crashes: 2010-2012
Overall Trends: 2008-2012
Fatalities Injuries Crashes
2008 6
236 537
2009 7
325 588
2010 3
277 527
2011 7
212 496
2012 4
322 723
The map shows the location of fatal crashes from 2010-2012. Only 1,111 out of 1,126 fatal crashes that occurred in 2012 have recorded latitude/longitude coordinates in the state of Georgia. Please note that there can be more than one fatality per fatal crash.
Common Fatality Types: 2008-2012 Fatalities by Restraint Use: 2012
Alcohol Pedestrian
2
Motorcycle Speed
2
1
1
1
1
1
Unknown 2
50%
0
0
0
0
0
2008 2009 2010 2011 2012
Restrained 1
25%
Unrestrained 1
25%
Georgia Traffic Safety Facts
Heard County
Fatal Crashes: 2010-2012
Overall Trends: 2008-2012
Fatalities Injuries Crashes
2008 3 92
190
2009 2
103 173
2010 1
116 216
2011 6 80
181
2012 4 77
208
The map shows the location of fatal crashes from 2010-2012. Only 1,111 out of 1,126 fatal crashes that occurred in 2012 have recorded latitude/longitude coordinates in the state of Georgia. Please note that there can be more than one fatality per fatal crash.
Common Fatality Types: 2008-2012
Alcohol Pedestrian
Motorcycle Speed
1
1
1
1
Fatalities by Restraint Use: 2012
Unknown 1
33%
Restrained 1
34%
0
0
0
0
0
2008 2009 2010 2011 2012
Unrestrained 1
33%
Georgia Traffic Safety Facts
Henry County
Fatal Crashes: 2010-2012
Overall Trends: 2008-2012
Fatalities Injuries Crashes
2008 34
2335 6395
2009 19
2704 6920
2010 29
2422 6837
2011 18
2766 7429
2012 23
2749 7695
The map shows the location of fatal crashes from 2010-2012. Only 1,111 out of 1,126 fatal crashes that occurred in 2012 have recorded latitude/longitude coordinates in the state of Georgia. Please note that there can be more than one fatality per fatal crash.
Common Fatality Types: 2008-2012 Fatalities by Restraint Use: 2012
9
6 5
1 2008
Alcohol
Motorcycle
Pedestrian Speed
8
5 2 2009
6 4
2010
6 5 3
0 2011
5 4
1 2012
Unres tra i ned 6
33%
Unknown 1 6%
Res tra i ned 11 61%
Georgia Traffic Safety Facts
Houston County
Fatal Crashes: 2010-2012
Overall Trends: 2008-2012
Fatalities Injuries Crashes
2008 11
1052 2589
2009 18
1080 2614
2010 20 870
2247
2011 13
1115 2898
2012 15
1550 3569
The map shows the location of fatal crashes from 2010-2012. Only 1,111 out of 1,126 fatal crashes that occurred in 2012 have recorded latitude/longitude coordinates in the state of Georgia. Please note that there can be more than one fatality per fatal crash.
Common Fatality Types: 2008-2012 Fatalities by Restraint Use: 2012
5 4
1 0 2008
Alcohol Pedestrian
6
Motorcycle Speed
4
3
3
3
3
2
2
2
1
1
2009 2010 2011 2012
Unrestrained 5 42%
Unknown 1 8%
Restrained 6 50%
Georgia Traffic Safety Facts
Irwin County
Fatal Crashes: 2010-2012
Overall Trends: 2008-2012
Fatalities Injuries Crashes
2008 4
110 135
2009 3 78
139
2010 1 78
151
2011 8 56
131
2012 3 91
146
The map shows the location of fatal crashes from 2010-2012. Only 1,111 out of 1,126 fatal crashes that occurred in 2012 have recorded latitude/longitude coordinates in the state of Georgia. Please note that there can be more than one fatality per fatal crash.
Common Fatality Types: 2008-2012
Alcohol
Motorcycle
Pedestrian Speed
2
2
2
1
1
1
0
0
0
0
0
2008 2009 2010 2011 2012
Fatalities by Restraint Use: 2012
Unrestrained 1
33%
Unknown 0 0%
Restrained 2
67%
Georgia Traffic Safety Facts
Jackson County
Fatal Crashes: 2010-2012
Overall Trends: 2008-2012
Fatalities Injuries Crashes
2008 13 695
1621
2009 13 670
1617
2010 18 538
1432
2011 13 610
1803
2012 14 596
1693
The map shows the location of fatal crashes from 2010-2012. Only 1,111 out of 1,126 fatal crashes that occurred in 2012 have recorded latitude/longitude coordinates in the state of Georgia. Please note that there can be more than one fatality per fatal crash.
Common Fatality Types: 2008-2012 Fatalities by Restraint Use: 2012
Alcohol Pedestrian
Motorcycle Speed
6
3 2 1
2008
3 2
0 2009
2 1 0 2010
3 2 1
2011
4 3 2 1
2012
Unrestrained 6 50%
Unknown 0 0%
Restrained 6 50%
Georgia Traffic Safety Facts
Jasper County
Fatal Crashes: 2010-2012
Overall Trends: 2008-2012
Fatalities Injuries Crashes
2008 2
109 314
2009 2
116 303
2010 6 88
161
2011 1 92 70
2012 4 77 81
The map shows the location of fatal crashes from 2010-2012. Only 1,111 out of 1,126 fatal crashes that occurred in 2012 have recorded latitude/longitude coordinates in the state of Georgia. Please note that there can be more than one fatality per fatal crash.
Common Fatality Types: 2008-2012
Alcohol
Motorcycle
Pedestrian Speed
2
2
1
1
1
0
0
0
0
0
2008 2009 2010 2011 2012
Fatalities by Restraint Use: 2012
Restrained 0 0%
Unrestrained 1 33%
Unknown 2 67%
Georgia Traffic Safety Facts
Jeff Davis County
Fatal Crashes: 2010-2012
Overall Trends: 2008-2012
Fatalities Injuries Crashes
2008 7
144 260
2009 4
174 265
2010 3
134 177
2011 7
140 242
2012 1
173 339
The map shows the location of fatal crashes from 2010-2012. Only 1,111 out of 1,126 fatal crashes that occurred in 2012 have recorded latitude/longitude coordinates in the state of Georgia. Please note that there can be more than one fatality per fatal crash.
Common Fatality Types: 2008-2012
Alcohol Pedestrian
Motorcycle Speed
3
Fatalities by Restraint Use: 2012
Unknown 0 0%
Restrained 0 0%
1
1
1
0
0
0
0
0
2008 2009 2010 2011 2012
Unrestrained 1
100%
Georgia Traffic Safety Facts
Jefferson County
Fatal Crashes: 2010-2012
Overall Trends: 2008-2012
Fatalities Injuries Crashes
2008 3
124 215
2009 3
115 156
2010 4
118 150
2011 2 86
134
2012 5
102 160
The map shows the location of fatal crashes from 2010-2012. Only 1,111 out of 1,126 fatal crashes that occurred in 2012 have recorded latitude/longitude coordinates in the state of Georgia. Please note that there can be more than one fatality per fatal crash.
Common Fatality Types: 2008-2012 Fatalities by Restraint Use: 2012
Alcohol Pedestrian
Motorcycle Speed
3
Unknown 0 0%
Restrained 1
20%
2
1
1
1
1
0
0
0
0
0
2008 2009 2010 2011 2012
Unrestrained 4
80%
Georgia Traffic Safety Facts
Jenkins County
Fatal Crashes: 2010-2012
Overall Trends: 2008-2012
Fatalities Injuries Crashes
2008 3 72 92
2009 2 93 96
2010 2 89 87
2011 2 59 94
2012 7 81
132
The map shows the location of fatal crashes from 2010-2012. Only 1,111 out of 1,126 fatal crashes that occurred in 2012 have recorded latitude/longitude coordinates in the state of Georgia. Please note that there can be more than one fatality per fatal crash.
Common Fatality Types: 2008-2012
Alcohol Pedestrian
Motorcycle Speed
1
1
1
Fatalities by Restraint Use: 2012
Unknown 1
14%
Restrained 3
43%
0
0
0
0
0
2008 2009 2010 2011 2012
Unrestrained 3
43%
Georgia Traffic Safety Facts
Johnson County
Fatal Crashes: 2010-2012
Overall Trends: 2008-2012
Fatalities Injuries Crashes
2008 1 53 84
2009 0 66
126
2010 3 47 73
2011 1 47 76
2012 2 69
100
The map shows the location of fatal crashes from 2010-2012. Only 1,111 out of 1,126 fatal crashes that occurred in 2012 have recorded latitude/longitude coordinates in the state of Georgia. Please note that there can be more than one fatality per fatal crash.
Common Fatality Types: 2008-2012 Fatalities by Restraint Use: 2012
Alcohol Pedestrian
Motorcycle Speed
Unknown 0 0%
1
1
Unrestrained 1 50%
Restrained 1 50%
0
0
0
0
0
2008 2009 2010 2011 2012
Georgia Traffic Safety Facts
Jones County
Fatal Crashes: 2010-2012
Overall Trends: 2008-2012
Fatalities Injuries Crashes
2008 4
183 624
2009 4
231 678
2010 7
168 528
2011 6
170 574
2012 3
168 550
The map shows the location of fatal crashes from 2010-2012. Only 1,111 out of 1,126 fatal crashes that occurred in 2012 have recorded latitude/longitude coordinates in the state of Georgia. Please note that there can be more than one fatality per fatal crash.
Common Fatality Types: 2008-2012
Alcohol Pedestrian
Motorcycle
Speed 5
Fatalities by Restraint Use: 2012
Unknown 1
33%
Restrained 1
34%
1
0 2008
1 2009
2
1
0 2010
0 2011
2
1
0 2012
Unrestrained 1
33%
Georgia Traffic Safety Facts
Lamar County
Fatal Crashes: 2010-2012
Overall Trends: 2008-2012
Fatalities Injuries Crashes
2008 7
179 451
2009 4
224 380
2010 4
184 452
2011 6
145 517
2012 3
200 558
The map shows the location of fatal crashes from 2010-2012. Only 1,111 out of 1,126 fatal crashes that occurred in 2012 have recorded latitude/longitude coordinates in the state of Georgia. Please note that there can be more than one fatality per fatal crash.
Common Fatality Types: 2008-2012
Alcohol Pedestrian
Motorcycle Speed
3
3
2
1
1
1
0
0
0
0
0
2008 2009 2010 2011 2012
Fatalities by Restraint Use: 2012
Unrestrained 0 0%
Unknown 0 0%
Restrained 1
100%
Georgia Traffic Safety Facts
Laurens County
Fatal Crashes: 2010-2012
Overall Trends: 2008-2012
Fatalities Injuries Crashes
2008 7
630 1377
2009 23 738
1445
2010 20 680
1072
2011 9
449 871
2012 13 456 886
The map shows the location of fatal crashes from 2010-2012. Only 1,111 out of 1,126 fatal crashes that occurred in 2012 have recorded latitude/longitude coordinates in the state of Georgia. Please note that there can be more than one fatality per fatal crash.
Common Fatality Types: 2008-2012
Alcohol Pedestrian
9
Motorcycle Speed
7
Fatalities by Restraint Use: 2012
Unknown 1 8%
Restrained 7
54%
2 1
2008
3 2 1
2009
3 1 2010
1 0
2011
2 1 0
2012
Unrestrained 5
38%
Georgia Traffic Safety Facts
Lanier County
Fatal Crashes: 2010-2012
Overall Trends: 2008-2012
Fatalities Injuries Crashes
2008 4 65
128
2009 2 78
117
2010 1 65
115
2011 1 46 86
2012 2 62 94
The map shows the location of fatal crashes from 2010-2012. Only 1,111 out of 1,126 fatal crashes that occurred in 2012 have recorded latitude/longitude coordinates in the state of Georgia. Please note that there can be more than one fatality per fatal crash.
Common Fatality Types: 2008-2012 Fatalities by Restraint Use: 2012
Alcohol
Motorcycle
Pedestrian Speed
2
1
1
1
1
0
0
0
0
0
2008 2009 2010 2011 2012
Unrestrained 1
50%
Unknown 0 0%
Restrained 1
50%
Georgia Traffic Safety Facts
Lee County
Fatal Crashes: 2010-2012
Overall Trends: 2008-2012
Fatalities Injuries Crashes
2008 4
259 783
2009 4
284 717
2010 6
270 638
2011 3
215 583
2012 2
223 791
The map shows the location of fatal crashes from 2010-2012. Only 1,111 out of 1,126 fatal crashes that occurred in 2012 have recorded latitude/longitude coordinates in the state of Georgia. Please note that there can be more than one fatality per fatal crash.
Common Fatality Types: 2008-2012
Alcohol Pedestrian
Motorcycle Speed 2
Fatalities by Restraint Use: 2012
Unrestrained 0 0%
Unknown 0 0%
1
1
1
0
0
0
0
0
2008 2009 2010 2011 2012
Restrained 2
100%
Georgia Traffic Safety Facts
Liberty County
Fatal Crashes: 2010-2012
Overall Trends: 2008-2012
Fatalities Injuries Crashes
2008 9
786 1483
2009 12 851
1743
2010 16 604
1276
2011 6
617 1435
2012 9
563 1299
The map shows the location of fatal crashes from 2010-2012. Only 1,111 out of 1,126 fatal crashes that occurred in 2012 have recorded latitude/longitude coordinates in the state of Georgia. Please note that there can be more than one fatality per fatal crash.
Common Fatality Types: 2008-2012
3 2 1 0 2008
Alcohol
Motorcycle
Pedestrian 5
Speed
4
3
2
2
1
1
0
0
0
0
2009 2010 2011 2012
Fatalities by Restraint Use: 2012
Unknown 0 0%
Restrained 4 44%
Unrestrained 5 56%
Georgia Traffic Safety Facts
Lincoln County
Fatal Crashes: 2010-2012
Overall Trends: 2008-2012
Fatalities Injuries Crashes
2008 2 61
215
2009 1 14 35
2010 0 13 17
2011 0 15 76
2012 2 28 94
The map shows the location of fatal crashes from 2010-2012. Only 1,111 out of 1,126 fatal crashes that occurred in 2012 have recorded latitude/longitude coordinates in the state of Georgia. Please note that there can be more than one fatality per fatal crash.
Common Fatality Types: 2008-2012
Alcohol Pedestrian
Motorcycle Speed
1
1
Fatalities by Restraint Use: 2012
Unknown 0 0%
Res tra i ned 0 0%
0
0
0
0
0
2008 2009 2010 2011 2012
Unres tra i ned 2
100%
Georgia Traffic Safety Facts
Long County
Fatal Crashes: 2010-2012
Overall Trends: 2008-2012
Fatalities Injuries Crashes
2008 4
104 187
2009 4
120 194
2010 2
114 161
2011 4
101 153
2012 4
106 164
The map shows the location of fatal crashes from 2010-2012. Only 1,111 out of 1,126 fatal crashes that occurred in 2012 have recorded latitude/longitude coordinates in the state of Georgia. Please note that there can be more than one fatality per fatal crash.
Common Fatality Types: 2008-2012
Alcohol
Motorcycle
Pedestrian
2
2
2
2
Fatalities by Restraint Use: 2012
Unknown 0 0%
Restrained 2
50%
1
1
1
0
0
0
0
0
2008 2009 2010 2011 2012
Unrestrained 2
50%
Georgia Traffic Safety Facts
Lowndes County
Fatal Crashes: 2010-2012
Overall Trends: 2008-2012
Fatalities Injuries Crashes
2008 19
1352 3253
2009 16
1553 3839
2010 18
1594 3570
2011 17
1501 3655
2012 10
1479 3467
The map shows the location of fatal crashes from 2010-2012. Only 1,111 out of 1,126 fatal crashes that occurred in 2012 have recorded latitude/longitude coordinates in the state of Georgia. Please note that there can be more than one fatality per fatal crash.
Common Fatality Types: 2008-2012
6
2 1 2008
Alcohol Pedestrian
Motorcycle Speed
8
5 4
1 0 2009
5 3 1 2010
6
2 0 2011
3 2 1
2012
Fatalities by Restraint Use: 2012
Unrestrained 2 29%
Unknown 0 0%
Restrained 5 71%
Georgia Traffic Safety Facts
Lumpkin County
Fatal Crashes: 2010-2012
Overall Trends: 2008-2012
Fatalities Injuries Crashes
2008 12 313 828
2009 9
442 942
2010 5
400 899
2011 10 339 766
2012 7
305 694
The map shows the location of fatal crashes from 2010-2012. Only 1,111 out of 1,126 fatal crashes that occurred in 2012 have recorded latitude/longitude coordinates in the state of Georgia. Please note that there can be more than one fatality per fatal crash.
Common Fatality Types: 2008-2012 Fatalities by Restraint Use: 2012
Alcohol Pedestrian
Motorcycle Speed
6
Unknown 1
14%
3
1 0 2008
2 1 0 2009
4
1 0 2010
4
2 1 0 2011
3
1 0 2012
Unrestrained 2
29%
Restrained 4
57%
Georgia Traffic Safety Facts
Macon County
Fatal Crashes: 2010-2012
Overall Trends: 2008-2012
Fatalities Injuries Crashes
2008 9
297 588
2009 2
353 663
2010 3
183 321
2011 2 64
118
2012 5 89
130
The map shows the location of fatal crashes from 2010-2012. Only 1,111 out of 1,126 fatal crashes that occurred in 2012 have recorded latitude/longitude coordinates in the state of Georgia. Please note that there can be more than one fatality per fatal crash.
Common Fatality Types: 2008-2012
Alcohol Pedestrian
Motorcycle Speed
3
2
1
1
1
1
0
0
0
0
0
2008 2009 2010 2011 2012
Fatalities by Restraint Use: 2012
Unrestrained 0 0%
Unknown 0 0%
Restrained 5
100%
Georgia Traffic Safety Facts
Madison County
Fatal Crashes: 2010-2012
Overall Trends: 2008-2012
Fatalities Injuries Crashes
2008 4 93
133
2009 8
118 106
2010 3
159 184
2011 2
184 174
2012 4
220 347
The map shows the location of fatal crashes from 2010-2012. Only 1,111 out of 1,126 fatal crashes that occurred in 2012 have recorded latitude/longitude coordinates in the state of Georgia. Please note that there can be more than one fatality per fatal crash.
Common Fatality Types: 2008-2012
Alcohol Pedestrian
2
Motorcycle Speed
Fatalities by Restraint Use: 2012
Unknown 1
33%
Restrained 1
34%
1
1
1
0 2008 2009
0
0
0
2010 2011 2012
Unrestrained 1
33%
Georgia Traffic Safety Facts
Marion County
Fatal Crashes: 2010-2012
Overall Trends: 2008-2012
Fatalities Injuries Crashes
2008 3
121 180
2009 1
130 227
2010 2
120 140
2011 3 51
102
2012 3 59 92
The map shows the location of fatal crashes from 2010-2012. Only 1,111 out of 1,126 fatal crashes that occurred in 2012 have recorded latitude/longitude coordinates in the state of Georgia. Please note that there can be more than one fatality per fatal crash.
Common Fatality Types: 2008-2012
Alcohol Pedestrian
Motorcycle Speed
1
1
1
1
Fatalities by Restraint Use: 2012
Unknown 0 0%
Restrained 1 50%
0
0
0
0
0
2008 2009 2010 2011 2012
Unrestrained 1 50%
Georgia Traffic Safety Facts
McDuffie County
Fatal Crashes: 2010-2012
Overall Trends: 2008-2012
Fatalities Injuries Crashes
2008 9
314 600
2009 4
348 717
2010 12 348 508
2011 4
240 494
2012 6
291 479
The map shows the location of fatal crashes from 2010-2012. Only 1,111 out of 1,126 fatal crashes that occurred in 2012 have recorded latitude/longitude coordinates in the state of Georgia. Please note that there can be more than one fatality per fatal crash.
Common Fatality Types: 2008-2012
3 2 1 0 2008
Alcohol Pedestrian
Motorcycle Speed 4
3
3
2
2
1
1
1
0
0
0
0
2009 2010 2011 2012
Fatalities by Restraint Use: 2012
Unknown 0 0%
Restrained 3 50%
Unrestrained 3 50%
Georgia Traffic Safety Facts
McIntosh County
Fatal Crashes: 2010-2012
Overall Trends: 2008-2012
Fatalities Injuries Crashes
2008 4 76
106
2009 8 98
120
2010 2 77
106
2011 5 72 86
2012 8 70 67
The map shows the location of fatal crashes from 2010-2012. Only 1,111 out of 1,126 fatal crashes that occurred in 2012 have recorded latitude/longitude coordinates in the state of Georgia. Please note that there can be more than one fatality per fatal crash.
Common Fatality Types: 2008-2012
Alcohol Pedestrian
Motorcycle Speed
3
2
2
1
1
1
1
0
0
0
0
0
2008 2009 2010 2011 2012
Fatalities by Restraint Use: 2012
Unknown 0 0%
Restrained 1
33%
Unrestrained 2
67%
Georgia Traffic Safety Facts
Meriwether County
Fatal Crashes: 2010-2012
Overall Trends: 2008-2012
Fatalities Injuries Crashes
2008 6
218 391
2009 7
246 520
2010 6
224 434
2011 1
202 368
2012 7
194 467
The map shows the location of fatal crashes from 2010-2012. Only 1,111 out of 1,126 fatal crashes that occurred in 2012 have recorded latitude/longitude coordinates in the state of Georgia. Please note that there can be more than one fatality per fatal crash.
Common Fatality Types: 2008-2012
Alcohol Pedestrian
Motorcycle Speed
3
2
2
2
1
1
1
1
0
0
0
0
0
2008 2009 2010 2011 2012
Fatalities by Restraint Use: 2012
Unrestrained 1
14%
Unknown 0 0%
Restrained 6
86%
Georgia Traffic Safety Facts
Miller County
Fatal Crashes: 2010-2012
Overall Trends: 2008-2012
Fatalities Injuries Crashes
2008 5 57 90
2009 1 67 91
2010 1 55 89
2011 2 33 84
2012 1 65
139
The map shows the location of fatal crashes from 2010-2012. Only 1,111 out of 1,126 fatal crashes that occurred in 2012 have recorded latitude/longitude coordinates in the state of Georgia. Please note that there can be more than one fatality per fatal crash.
Common Fatality Types: 2008-2012
Alcohol Pedestrian
Motorcycle Speed
3
Fatalities by Restraint Use: 2012
Unknown 0 0%
Restrained 0 0%
1
0
0
0
0
0
2008 2009 2010 2011 2012
Unrestrained 1
100%
Georgia Traffic Safety Facts
Mitchell County
Fatal Crashes: 2010-2012
Overall Trends: 2008-2012
Fatalities Injuries Crashes
2008 5
250 480
2009 3
244 446
2010 6
176 302
2011 3
160 394
2012 3
175 356
The map shows the location of fatal crashes from 2010-2012. Only 1,111 out of 1,126 fatal crashes that occurred in 2012 have recorded latitude/longitude coordinates in the state of Georgia. Please note that there can be more than one fatality per fatal crash.
Common Fatality Types: 2008-2012
Alcohol Pedestrian
Motorcycle Speed
3
2
1
1
1
1
0
0
0
0
0
2008 2009 2010 2011 2012
Fatalities by Restraint Use: 2012
Unrestrained 1
33%
Unknown 0 0%
Restrained 2
67%
Georgia Traffic Safety Facts
Monroe County
Fatal Crashes: 2010-2012
Overall Trends: 2008-2012
Fatalities Injuries Crashes
2008 10 313 831
2009 12 360
1006
2010 1
287 706
2011 11 316 927
2012 6
244 1236
The map shows the location of fatal crashes from 2010-2012. Only 1,111 out of 1,126 fatal crashes that occurred in 2012 have recorded latitude/longitude coordinates in the state of Georgia. Please note that there can be more than one fatality per fatal crash.
Common Fatality Types: 2008-2012
Alcohol Pedestrian
4
Motorcycle Speed
2
1
0 2008
1
0 2009
1
0 2010
1
0 2011
1 2012
Fatalities by Restraint Use: 2012
Unrestrained 2
40%
Unknown 0 0%
Restrained 3
60%
Georgia Traffic Safety Facts
Montgomery County
Fatal Crashes: 2010-2012
Overall Trends: 2008-2012
Fatalities Injuries Crashes
2008 2 31 35
2009 3 58 62
2010 2 52 57
2011 2 90 90
2012 1 79 62
The map shows the location of fatal crashes from 2010-2012. Only 1,111 out of 1,126 fatal crashes that occurred in 2012 have recorded latitude/longitude coordinates in the state of Georgia. Please note that there can be more than one fatality per fatal crash.
Common Fatality Types: 2008-2012
Alcohol
Motorcycle
Pedestrian Speed
2
Fatalities by Restraint Use: 2012
Unknown 0 0%
Restrained 0 0%
1
1
1
1
0
0
0
0
0
2008 2009 2010 2011 2012
Unrestrained 1
100%
Georgia Traffic Safety Facts
Morgan County
Fatal Crashes: 2010-2012
Overall Trends: 2008-2012
Fatalities Injuries Crashes
2008 7
191 502
2009 7
297 554
2010 2
164 464
2011 8
285 539
2012 7
289 562
The map shows the location of fatal crashes from 2010-2012. Only 1,111 out of 1,126 fatal crashes that occurred in 2012 have recorded latitude/longitude coordinates in the state of Georgia. Please note that there can be more than one fatality per fatal crash.
Common Fatality Types: 2008-2012
Alcohol
Motorcycle
Pedestrian Speed
2
2
2
Fatalities by Restraint Use: 2012
Unknown 0 0%
Restrained 3 50%
1
1
1
1
0
0
0
0
0
2008 2009 2010 2011 2012
Unrestrained 3 50%
Georgia Traffic Safety Facts
Murray County
Fatal Crashes: 2010-2012
Overall Trends: 2008-2012
Fatalities Injuries Crashes
2008 5
429 765
2009 11 412 739
2010 6
426 739
2011 5
337 644
2012 6
338 590
The map shows the location of fatal crashes from 2010-2012. Only 1,111 out of 1,126 fatal crashes that occurred in 2012 have recorded latitude/longitude coordinates in the state of Georgia. Please note that there can be more than one fatality per fatal crash.
Common Fatality Types: 2008-2012 Fatalities by Restraint Use: 2012
1
0 2008
Alcohol Pedestrian
4
Motorcycle Speed
3
2
2
2
1
1
0
0
0
0
2009 2010 2011 2012
Unrestrained 3 50%
Unknown 0 0%
Restrained 3 50%
Georgia Traffic Safety Facts
Muscogee County
Fatal Crashes: 2010-2012
Overall Trends: 2008-2012
Fatalities Injuries Crashes
2008 20
2443 7253
2009 20
2703 8310
2010 13
1987 6210
2011 12
2481 9085
2012 20
2555 11646
The map shows the location of fatal crashes from 2010-2012. Only 1,111 out of 1,126 fatal crashes that occurred in 2012 have recorded latitude/longitude coordinates in the state of Georgia. Please note that there can be more than one fatality per fatal crash.
Common Fatality Types: 2008-2012
5
2 0 2008
Alcohol
Motorcycle
Pedestrian Speed
7 5 3
2009
4 3
1
2010
3 2
0 2011
7 6 4 3
2012
Fatalities by Restraint Use: 2012
Unknown 2
14%
Restrained 5
36%
Unrestrained 7
50%
Georgia Traffic Safety Facts
Newton County
Fatal Crashes: 2010-2012
Overall Trends: 2008-2012
Fatalities Injuries Crashes
2008 17
1074 2689
2009 11
1169 2507
2010 18
1121 2355
2011 19
1118 1467
2012 12 586
1058
The map shows the location of fatal crashes from 2010-2012. Only 1,111 out of 1,126 fatal crashes that occurred in 2012 have recorded latitude/longitude coordinates in the state of Georgia. Please note that there can be more than one fatality per fatal crash.
Common Fatality Types: 2008-2012
Alcohol Pedestrian
Motorcycle Speed
6
2 1 0 2008
3 2 1
2009
4 3
1
2010
4 3
1 0 2011
4 3
0 2012
Fatalities by Restraint Use: 2012
Unrestrained 2
29%
Unknown 0 0%
Restrained 5
71%
Georgia Traffic Safety Facts
Oconee County
Fatal Crashes: 2010-2012
Overall Trends: 2008-2012
Fatalities Injuries Crashes
2008 5
302 841
2009 7
465 1002
2010 1
380 1034
2011 2
383 971
2012 4
343 955
The map shows the location of fatal crashes from 2010-2012. Only 1,111 out of 1,126 fatal crashes that occurred in 2012 have recorded latitude/longitude coordinates in the state of Georgia. Please note that there can be more than one fatality per fatal crash.
Common Fatality Types: 2008-2012
Alcohol Pedestrian
Motorcycle Speed
2
2
1
1
1
0
0
0
0
2008 2009 2010 2011 2012
Fatalities by Restraint Use: 2012
Unknown 0 0%
Unrestrained 1 50%
Restrained 1 50%
Georgia Traffic Safety Facts
Oglethorpe County
Fatal Crashes: 2010-2012
Overall Trends: 2008-2012
Fatalities Injuries Crashes
2008 6
154 237
2009 5
149 276
2010 4
115 252
2011 5 88
271
2012 2
105 199
The map shows the location of fatal crashes from 2010-2012. Only 1,111 out of 1,126 fatal crashes that occurred in 2012 have recorded latitude/longitude coordinates in the state of Georgia. Please note that there can be more than one fatality per fatal crash.
Common Fatality Types: 2008-2012
Alcohol Pedestrian
Motorcycle Speed
2
2
2
1
1
1
0
0
0
0
0
2008 2009 2010 2011 2012
Fatalities by Restraint Use: 2012
Unknown 0 0%
Restrained 1 50%
Unrestrained 1 50%
Georgia Traffic Safety Facts
Paulding County
Fatal Crashes: 2010-2012
Overall Trends: 2008-2012
Fatalities Injuries Crashes
2008 21
1205 2596
2009 13
1503 3114
2010 8
1622 3936
2011 10
1426 3653
2012 8
1269 3415
The map shows the location of fatal crashes from 2010-2012. Only 1,111 out of 1,126 fatal crashes that occurred in 2012 have recorded latitude/longitude coordinates in the state of Georgia. Please note that there can be more than one fatality per fatal crash.
Common Fatality Types: 2008-2012
Alcohol
Motorcycle
Pedestrian Speed
7
3 1 2008
5
2 1 2009
1 2010
4
2 1 0 2011
1 0 2012
Fatalities by Restraint Use: 2012
Unrestrained 1 14%
Unknown 0 0%
Restrained 6 86%
Georgia Traffic Safety Facts
Peach County
Fatal Crashes: 2010-2012
Overall Trends: 2008-2012
Fatalities Injuries Crashes
2008 7
394 884
2009 8
369 965
2010 4
370 930
2011 3
342 959
2012 5
352 827
The map shows the location of fatal crashes from 2010-2012. Only 1,111 out of 1,126 fatal crashes that occurred in 2012 have recorded latitude/longitude coordinates in the state of Georgia. Please note that there can be more than one fatality per fatal crash.
Common Fatality Types: 2008-2012
Alcohol Pedestrian
Motorcycle Speed
3
3
2
2
1
1
1
1
0
0
0
0
2008 2009 2010 2011 2012
Fatalities by Restraint Use: 2012
Unrestrained 0 0%
Unknown 0 0%
Restrained 4
100%
Georgia Traffic Safety Facts
Pickens County
Fatal Crashes: 2010-2012
Overall Trends: 2008-2012
Fatalities Injuries Crashes
2008 7
308 656
2009 6
320 599
2010 9
390 829
2011 10 237 608
2012 7
354 751
The map shows the location of fatal crashes from 2010-2012. Only 1,111 out of 1,126 fatal crashes that occurred in 2012 have recorded latitude/longitude coordinates in the state of Georgia. Please note that there can be more than one fatality per fatal crash.
Common Fatality Types: 2008-2012
Alcohol Pedestrian
Motorcycle Speed
3
1 0 2008
2
1
0 2009
2
1
0 2010
4
1 0 2011
2
0 2012
Fatalities by Restraint Use: 2012
Unrestrained 3 43%
Unknown 0 0%
Restrained 4
57%
Georgia Traffic Safety Facts
Pierce County
Fatal Crashes: 2010-2012
Overall Trends: 2008-2012
Fatalities Injuries Crashes
2008 1
191 362
2009 10 185 315
2010 8
127 226
2011 5
136 274
2012 7
193 343
The map shows the location of fatal crashes from 2010-2012. Only 1,111 out of 1,126 fatal crashes that occurred in 2012 have recorded latitude/longitude coordinates in the state of Georgia. Please note that there can be more than one fatality per fatal crash.
Common Fatality Types: 2008-2012
Alcohol Pedestrian
Motorcycle Speed
1
0 2008
3 2 1
2009
2
0 2010
1
0 2011
4
2 1 2012
Fatalities by Restraint Use: 2012
Unknown 1 17%
Restrained 1 16%
Unrestrained 4 67%
Georgia Traffic Safety Facts
Pike County
Fatal Crashes: 2010-2012
Overall Trends: 2008-2012
Fatalities Injuries Crashes
2008 6
136 359
2009 5
149 406
2010 3
119 282
2011 4
125 336
2012 4
123 291
The map shows the location of fatal crashes from 2010-2012. Only 1,111 out of 1,126 fatal crashes that occurred in 2012 have recorded latitude/longitude coordinates in the state of Georgia. Please note that there can be more than one fatality per fatal crash.
Common Fatality Types: 2008-2012
Alcohol Pedestrian
Motorcycle Speed
4
Fatalities by Restraint Use: 2012
Unknown 1 25%
Restrained 1 25%
2
0 2008
2
0 2009
2
1
0 2010
2
0 2011
0 2012
Unrestrained 2 50%
Georgia Traffic Safety Facts
Polk County
Fatal Crashes: 2010-2012
Overall Trends: 2008-2012
Fatalities Injuries Crashes
2008 6
490 969
2009 2
506 995
2010 6
421 816
2011 9
383 837
2012 6
298 805
The map shows the location of fatal crashes from 2010-2012. Only 1,111 out of 1,126 fatal crashes that occurred in 2012 have recorded latitude/longitude coordinates in the state of Georgia. Please note that there can be more than one fatality per fatal crash.
Common Fatality Types: 2008-2012 Fatalities by Restraint Use: 2012
Alcohol Pedestrian
Motorcycle Speed
3
2
2
1
1
1
1
1
0
0
0
2008 2009 2010 2011
0 2012
Unrestrained 4
80%
Unknown 0 0%
Restrained 1
20%
Georgia Traffic Safety Facts
Pulaski County
Fatal Crashes: 2010-2012
Overall Trends: 2008-2012
Fatalities Injuries Crashes
2008 3 73
146
2009 4 65
126
2010 2 60 89
2011 1 53 95
2012 2 78
107
The map shows the location of fatal crashes from 2010-2012. Only 1,111 out of 1,126 fatal crashes that occurred in 2012 have recorded latitude/longitude coordinates in the state of Georgia. Please note that there can be more than one fatality per fatal crash.
Common Fatality Types: 2008-2012
Alcohol Pedestrian
Motorcycle Speed
Fatalities by Restraint Use: 2012
Restrained 0 0%
1
1
1
Unknown
1
50%
Unrestrained 1 50%
0
0
0
0
0
2008 2009 2010 2011 2012
Georgia Traffic Safety Facts
Putnam County
Fatal Crashes: 2010-2012
Overall Trends: 2008-2012
Fatalities Injuries Crashes
2008 6
230 683
2009 6
208 708
2010 2
230 717
2011 5
175 763
2012 3
167 690
The map shows the location of fatal crashes from 2010-2012. Only 1,111 out of 1,126 fatal crashes that occurred in 2012 have recorded latitude/longitude coordinates in the state of Georgia. Please note that there can be more than one fatality per fatal crash.
Common Fatality Types: 2008-2012
Alcohol Pedestrian
Motorcycle Speed
4
2 1 2008
3 2 1 0 2009
1
0 2010
1
0 2011
2
0 2012
Fatalities by Restraint Use: 2012
Unrestrained 0 0%
Unknown 0 0%
Restrained 3
100%
Georgia Traffic Safety Facts
Quitman County
Fatal Crashes: 2010-2012
Overall Trends: 2008-2012
Fatalities Injuries Crashes
2008 0 29 26
2009 1 22 21
2010 0 23 18
2011 0 14 8
2012 0 18 24
The map shows the location of fatal crashes from 2010-2012. Only 1,111 out of 1,126 fatal crashes that occurred in 2012 have recorded latitude/longitude coordinates in the state of Georgia. Please note that there can be more than one fatality per fatal crash.
Common Fatality Types: 2008-2012
Alcohol Pedestrian
Motorcycle Speed
1
Fatalities by Restraint Use: 2012
<No Passenger Fatalities in 2012>
0
0
0
0
0
2008 2009 2010 2011 2012
Georgia Traffic Safety Facts
Rabun County
Fatal Crashes: 2010-2012
Overall Trends: 2008-2012
Fatalities Injuries Crashes
2008 2
201 467
2009 6
228 440
2010 2
206 467
2011 5
214 427
2012 3
196 466
The map shows the location of fatal crashes from 2010-2012. Only 1,111 out of 1,126 fatal crashes that occurred in 2012 have recorded latitude/longitude coordinates in the state of Georgia. Please note that there can be more than one fatality per fatal crash.
Common Fatality Types: 2008-2012
Alcohol Pedestrian
Motorcycle Speed
2
2
Fatalities by Restraint Use: 2012
Unknown 1 33%
Restrained 1 34%
1
1
1
0
0
0
2008 2009 2010 2011
0 2012
Unrestrained 1 33%
Georgia Traffic Safety Facts
Randolph County
Fatal Crashes: 2010-2012
Overall Trends: 2008-2012
Fatalities Injuries Crashes
2008 1 55
102
2009 2 81
110
2010 0 63 98
2011 3 56 85
2012 1 37 72
The map shows the location of fatal crashes from 2010-2012. Only 1,111 out of 1,126 fatal crashes that occurred in 2012 have recorded latitude/longitude coordinates in the state of Georgia. Please note that there can be more than one fatality per fatal crash.
Common Fatality Types: 2008-2012
Alcohol Pedestrian
Motorcycle Speed
1
1
1
Fatalities by Restraint Use: 2012
Unrestrained 0 0%
Unknown 0 0%
0
0
0
0
0
2008 2009 2010 2011 2012
Restrained 1
100%
Georgia Traffic Safety Facts
Richmond County
Fatal Crashes: 2010-2012
!X
X X X"
" !
XX X!
"
"
" !
!
!"X!!"!X"!!X!X!"XX!""!!X!!!XXXX""XXXX""X"!!!""X!"!""X"X""X!!!"XX!!!!!X!X!"""!!"""!!!X"!"
X
"
X
!
X XX ! "
"Common Fa"tality Types: 2X008-2012
! X!
Alcohol
Motorcycle
Pedestrian Speed
13
13
10
465
76 3
7 234
465
8
4 2
2008 2009 2010 2011 2012
Overall Trends: 2008-2012
Fatalities Injuries Crashes
2008 38
2806 9143
2009 28
3013 9952
2010 19
2669 8739
2011 32
2604 8972
2012 40
2624 8451
The map shows the location of fatal crashes from 2010-2012. Only 1,111 out of 1,126 fatal crashes that occurred in 2012 have recorded latitude/longitude coordinates in the state of Georgia. Please note that there can be more than one fatality per fatal crash.
! Fat!alities by Restraint Use: 2012 !
Unknown 3 11%
Unrestrained 9 33%
Restrained 15 56%
Georgia Traffic Safety Facts
Rockdale County
Fatal Crashes: 2010-2012
Overall Trends: 2008-2012
Fatalities Injuries Crashes
2008 8
1097 2968
2009 6
1152 3006
2010 10 912
2904
2011 4
1081 3192
2012 8
1019 3247
The map shows the location of fatal crashes from 2010-2012. Only 1,111 out of 1,126 fatal crashes that occurred in 2012 have recorded latitude/longitude coordinates in the state of Georgia. Please note that there can be more than one fatality per fatal crash.
Common Fatality Types: 2008-2012
Alcohol Pedestrian
Motorcycle Speed
6
4
4
2 1
2008
2 1 0 2009
2 1 0 2010
1 0 2011
1 2012
Fatalities by Restraint Use: 2012
Unrestrained 3 43%
Unknown 0 0%
Restrained 4 57%
Georgia Traffic Safety Facts
Schley County
Fatal Crashes: 2010-2012
Overall Trends: 2008-2012
Fatalities Injuries Crashes
2008 3 37 65
2009 3 54 80
2010 0 47 52
2011 0 20 35
2012 1 13 29
The map shows the location of fatal crashes from 2010-2012. Only 1,111 out of 1,126 fatal crashes that occurred in 2012 have recorded latitude/longitude coordinates in the state of Georgia. Please note that there can be more than one fatality per fatal crash.
Common Fatality Types: 2008-2012
Alcohol Pedestrian
2
Motorcycle Speed
Fatalities by Restraint Use: 2012
Unrestrained Unknown
0
0
0%
0%
0
0
0
0
0
2008 2009 2010 2011 2012
Restrained 1
100%
Georgia Traffic Safety Facts
Screven County
Fatal Crashes: 2010-2012
Overall Trends: 2008-2012
Fatalities Injuries Crashes
2008 9
135 398
2009 3
160 402
2010 1
145 237
2011 1
117 234
2012 2
140 279
The map shows the location of fatal crashes from 2010-2012. Only 1,111 out of 1,126 fatal crashes that occurred in 2012 have recorded latitude/longitude coordinates in the state of Georgia. Please note that there can be more than one fatality per fatal crash.
Common Fatality Types: 2008-2012
Alcohol Pedestrian
Motorcycle Speed
2
Fatalities by Restraint Use: 2012
Unknown 0 0%
Restrained 0 0%
1
1
1
1
0
0
0
0
0
2008 2009 2010 2011 2012
Unrestrained 2
100%
Georgia Traffic Safety Facts
Seminole County
Fatal Crashes: 2010-2012
Overall Trends: 2008-2012
Fatalities Injuries Crashes
2008 3 96
176
2009 3 65
115
2010 1 53 64
2011 2 55 93
2012 0 84
135
The map shows the location of fatal crashes from 2010-2012. Only 1,111 out of 1,126 fatal crashes that occurred in 2012 have recorded latitude/longitude coordinates in the state of Georgia. Please note that there can be more than one fatality per fatal crash.
Common Fatality Types: 2008-2012
Alcohol Pedestrian
Motorcycle Speed
1
1
1
Fatalities by Restraint Use: 2012
<No Passenger Fatalities in 2012>
0
0
0
0
0
2008 2009 2010 2011 2012
Georgia Traffic Safety Facts
Spaulding County
Fatal Crashes: 2010-2012
Overall Trends: 2008-2012
Fatalities Injuries Crashes
2008 15 896
1995
2009 8
1028 2162
2010 7
970 2063
2011 11
1014 2017
2012 12 801
1522
The map shows the location of fatal crashes from 2010-2012. Only 1,111 out of 1,126 fatal crashes that occurred in 2012 have recorded latitude/longitude coordinates in the state of Georgia. Please note that there can be more than one fatality per fatal crash.
Common Fatality Types: 2008-2012 Fatalities by Restraint Use: 2012
Alcohol Pedestrian
Motorcycle Speed
Unknown 1 8%
4 3 2
2008
2
1
0 2009
4 3 2
0 2010
4
2 1 2011
3 2 1 0 2012
Unrestrained 4
33%
Restrained 7
59%
Georgia Traffic Safety Facts
Stephens County
Fatal Crashes: 2010-2012
Overall Trends: 2008-2012
Fatalities Injuries Crashes
2008 4
325 742
2009 3
368 765
2010 2
357 733
2011 5
301 636
2012 5
327 618
The map shows the location of fatal crashes from 2010-2012. Only 1,111 out of 1,126 fatal crashes that occurred in 2012 have recorded latitude/longitude coordinates in the state of Georgia. Please note that there can be more than one fatality per fatal crash.
Common Fatality Types: 2008-2012
Alcohol Pedestrian
Motorcycle Speed
2
2
Fatalities by Restraint Use: 2012
Unrestrained 2
40%
Unknown 0 0%
1
1
0
0
0
0
0
2008 2009 2010 2011 2012
Restrained 3
60%
Georgia Traffic Safety Facts
Stewart County
Fatal Crashes: 2010-2012
Overall Trends: 2008-2012
Fatalities Injuries Crashes
2008 3 48 93
2009 3 36 64
2010 2 39 34
2011 3 31 29
2012 2 52 62
The map shows the location of fatal crashes from 2010-2012. Only 1,111 out of 1,126 fatal crashes that occurred in 2012 have recorded latitude/longitude coordinates in the state of Georgia. Please note that there can be more than one fatality per fatal crash.
Common Fatality Types: 2008-2012
Alcohol Pedestrian
Motorcycle Speed
2
1
1
0
0
0
0
0
2008 2009 2010 2011 2012
Fatalities by Restraint Use: 2012
Unknown 0 0%
Unrestrained 1 50%
Restrained 1 50%
Georgia Traffic Safety Facts
Sumter County
Fatal Crashes: 2010-2012
Overall Trends: 2008-2012
Fatalities Injuries Crashes
2008 3
448 810
2009 4
410 763
2010 2
279 525
2011 5
279 633
2012 5
305 540
The map shows the location of fatal crashes from 2010-2012. Only 1,111 out of 1,126 fatal crashes that occurred in 2012 have recorded latitude/longitude coordinates in the state of Georgia. Please note that there can be more than one fatality per fatal crash.
Common Fatality Types: 2008-2012
Alcohol Pedestrian
Motorcycle Speed
2
2
Fatalities by Restraint Use: 2012
Unknown 0 0%
Restrained 0 0%
1
1
1
1
0
0
0
0
2008 2009 2010 2011 2012
Unrestrained 3
100%
Georgia Traffic Safety Facts
Talbot County
Fatal Crashes: 2010-2012
Overall Trends: 2008-2012
Fatalities Injuries Crashes
2008 1 95
140
2009 5 90
183
2010 5
110 142
2011 5 83
130
2012 4 94
126
The map shows the location of fatal crashes from 2010-2012. Only 1,111 out of 1,126 fatal crashes that occurred in 2012 have recorded latitude/longitude coordinates in the state of Georgia. Please note that there can be more than one fatality per fatal crash.
Common Fatality Types: 2008-2012
Alcohol Pedestrian
Motorcycle Speed
2
2
2
2
Fatalities by Restraint Use: 2012
Unknown 0 0%
Restrained 0 0%
1
1
1
1
0
0
0
0
0
2008 2009 2010 2011 2012
Unrestrained 4
100%
Georgia Traffic Safety Facts
Taliaferro County
Fatal Crashes: 2010-2012
Overall Trends: 2008-2012
Fatalities Injuries Crashes
2008 1 34 57
2009 2 40 51
2010 0 35 45
2011 4 54 63
2012 2 46 57
The map shows the location of fatal crashes from 2010-2012. Only 1,111 out of 1,126 fatal crashes that occurred in 2012 have recorded latitude/longitude coordinates in the state of Georgia. Please note that there can be more than one fatality per fatal crash.
Common Fatality Types: 2008-2012
Alcohol Pedestrian
Motorcycle Speed
Fatalities by Restraint Use: 2012
Unrestrained 0 0%
Unknown 0 0%
0
0
0
0
0
2008 2009 2010 2011 2012
Restrained 2
100%
Georgia Traffic Safety Facts
Tattnall County
Fatal Crashes: 2010-2012
Overall Trends: 2008-2012
Fatalities Injuries Crashes
2008 6
194 308
2009 3
186 321
2010 6
209 328
2011 7
148 274
2012 2
144 267
The map shows the location of fatal crashes from 2010-2012. Only 1,111 out of 1,126 fatal crashes that occurred in 2012 have recorded latitude/longitude coordinates in the state of Georgia. Please note that there can be more than one fatality per fatal crash.
Common Fatality Types: 2008-2012
Alcohol Pedestrian
Motorcycle Speed
3
2
2
1
1
1
0
0
0
0
0
2008 2009 2010 2011 2012
Fatalities by Restraint Use: 2012
Unknown 0 0%
Restrained 0 0%
Unrestrained 2
100%
Georgia Traffic Safety Facts
Taylor County
Fatal Crashes: 2010-2012
Overall Trends: 2008-2012
Fatalities Injuries Crashes
2008 0 70
112
2009 2 86
154
2010 5 85
150
2011 1 69
127
2012 1 71
118
The map shows the location of fatal crashes from 2010-2012. Only 1,111 out of 1,126 fatal crashes that occurred in 2012 have recorded latitude/longitude coordinates in the state of Georgia. Please note that there can be more than one fatality per fatal crash.
Common Fatality Types: 2008-2012
Alcohol Pedestrian
2
Motorcycle Speed
Fatalities by Restraint Use: 2012
Unknown 0 0%
Restrained 0 0%
1
0
0
0
0
0
2008 2009 2010 2011 2012
Unrestrained 1
100%
Georgia Traffic Safety Facts
Telfair County
Fatal Crashes: 2010-2012
Overall Trends: 2008-2012
Fatalities Injuries Crashes
2008 2 97
177
2009 3 99
140
2010 0 78
100
2011 1 69
136
2012 1 65 97
The map shows the location of fatal crashes from 2010-2012. Only 1,111 out of 1,126 fatal crashes that occurred in 2012 have recorded latitude/longitude coordinates in the state of Georgia. Please note that there can be more than one fatality per fatal crash.
Common Fatality Types: 2008-2012
Alcohol Pedestrian
Motorcycle Speed
1
1
1
Fatalities by Restraint Use: 2012
Unknown 0 0%
Restrained 0 0%
0
0
0
0
0
2008 2009 2010 2011 2012
Unrestrained 1
100%
Georgia Traffic Safety Facts
Terrell County
Fatal Crashes: 2010-2012
Overall Trends: 2008-2012
Fatalities Injuries Crashes
2008 6 79
123
2009 0
102 111
2010 3 76
111
2011 0 77
135
2012 1 98
142
The map shows the location of fatal crashes from 2010-2012. Only 1,111 out of 1,126 fatal crashes that occurred in 2012 have recorded latitude/longitude coordinates in the state of Georgia. Please note that there can be more than one fatality per fatal crash.
Common Fatality Types: 2008-2012
Alcohol Pedestrian
Motorcycle Speed
2
Fatalities by Restraint Use: 2012
<No Passenger Fatalities in 2012>
1
1
0
0
0
0
0
2008 2009 2010 2011 2012
Georgia Traffic Safety Facts
Thomas County
Fatal Crashes: 2010-2012
Overall Trends: 2008-2012
Fatalities Injuries Crashes
2008 8
581 1265
2009 9
484 1389
2010 7
444 1239
2011 2
407 1311
2012 9
542 1956
The map shows the location of fatal crashes from 2010-2012. Only 1,111 out of 1,126 fatal crashes that occurred in 2012 have recorded latitude/longitude coordinates in the state of Georgia. Please note that there can be more than one fatality per fatal crash.
Common Fatality Types: 2008-2012
Alcohol Pedestrian
Motorcycle Speed
3
3
3
2
2
1
1
1
1
0 2008 2009
0
0
2010 2011 2012
Fatalities by Restraint Use: 2012
Unknown 1
13%
Restrained 2
25%
Unrestrained 5 62%
Georgia Traffic Safety Facts
Tift County
Fatal Crashes: 2010-2012
Overall Trends: 2008-2012
Fatalities Injuries Crashes
2008 14 517
1104
2009 6
637 1339
2010 13 545
1306
2011 6
535 1162
2012 1
508 1168
The map shows the location of fatal crashes from 2010-2012. Only 1,111 out of 1,126 fatal crashes that occurred in 2012 have recorded latitude/longitude coordinates in the state of Georgia. Please note that there can be more than one fatality per fatal crash.
Common Fatality Types: 2008-2012
Alcohol Pedestrian
Motorcycle Speed
3
3
3
2
2
1
1
1
1
0 2008 2009
0
0
2010 2011 2012
Fatalities by Restraint Use: 2012
UnrestrainedUnknown
0
0
0%
0%
Restrained 1
100%
Georgia Traffic Safety Facts
Toombs County
Fatal Crashes: 2010-2012
Overall Trends: 2008-2012
Fatalities Injuries Crashes
2008 7
422 890
2009 7
360 763
2010 6
360 747
2011 6
390 906
2012 5
362 808
The map shows the location of fatal crashes from 2010-2012. Only 1,111 out of 1,126 fatal crashes that occurred in 2012 have recorded latitude/longitude coordinates in the state of Georgia. Please note that there can be more than one fatality per fatal crash.
Common Fatality Types: 2008-2012
Alcohol Pedestrian
Motorcycle Speed
2
2
2
Fatalities by Restraint Use: 2012
Unknown 0 0%
Restrained 2 40%
1
1
1
1
1
0
0
0
0
0
2008 2009 2010 2011 2012
Unrestrained 3 60%
Georgia Traffic Safety Facts
Towns County
Fatal Crashes: 2010-2012
Overall Trends: 2008-2012
Fatalities Injuries Crashes
2008 3 62
141
2009 2 60
125
2010 0 63
117
2011 2 38 46
2012 1 43 94
The map shows the location of fatal crashes from 2010-2012. Only 1,111 out of 1,126 fatal crashes that occurred in 2012 have recorded latitude/longitude coordinates in the state of Georgia. Please note that there can be more than one fatality per fatal crash.
Common Fatality Types: 2008-2012
Alcohol Pedestrian
Motorcycle Speed
2
Fatalities by Restraint Use: 2012
Unrestrained 0 0%
Restrained 0 0%
1
1
1
0
0
0
0
0
2008 2009 2010 2011 2012
Unknown 1
100%
Georgia Traffic Safety Facts
Treutlen County
Fatal Crashes: 2010-2012
Overall Trends: 2008-2012
Fatalities Injuries Crashes
2008 0 66
131
2009 1 64
111
2010 4 52 90
2011 3 55
131
2012 1 49 93
The map shows the location of fatal crashes from 2010-2012. Only 1,111 out of 1,126 fatal crashes that occurred in 2012 have recorded latitude/longitude coordinates in the state of Georgia. Please note that there can be more than one fatality per fatal crash.
Common Fatality Types: 2008-2012
Alcohol Pedestrian
Motorcycle Speed
Fatalities by Restraint Use: 2012
Unknown 0 0%
Restrained 0 0%
1
1
1
0
0
0
0
0
2008 2009 2010 2011 2012
Unrestrained 1
100%
Georgia Traffic Safety Facts
Troup County
Fatal Crashes: 2010-2012
Overall Trends: 2008-2012
Fatalities Injuries Crashes
2008 11 990
2238
2009 16
1053 2514
2010 12
1212 2419
2011 12
1196 3122
2012 14
1262 3322
The map shows the location of fatal crashes from 2010-2012. Only 1,111 out of 1,126 fatal crashes that occurred in 2012 have recorded latitude/longitude coordinates in the state of Georgia. Please note that there can be more than one fatality per fatal crash.
Common Fatality Types: 2008-2012 Fatalities by Restraint Use: 2012
Alcohol Pedestrian
Motorcycle Speed
5 4
2
0 2008
6
4
2
0 2009
5
1 2010
3 2 1
2011
2
0 2012
Unknown 3
21%
Unrestrained 3
22%
Restrained 8
57%
Georgia Traffic Safety Facts
Turner County
Fatal Crashes: 2010-2012
Overall Trends: 2008-2012
Fatalities Injuries Crashes
2008 3
118 255
2009 0
104 249
2010 1
107 241
2011 3 88
223
2012 3 79
176
The map shows the location of fatal crashes from 2010-2012. Only 1,111 out of 1,126 fatal crashes that occurred in 2012 have recorded latitude/longitude coordinates in the state of Georgia. Please note that there can be more than one fatality per fatal crash.
Common Fatality Types: 2008-2012
Alcohol Pedestrian
Motorcycle Speed
1
1
Fatalities by Restraint Use: 2012
Unknown 0 0%
Restrained 0 0%
0
0
0
0
0
2008 2009 2010 2011 2012
Unrestrained 2
100%
Georgia Traffic Safety Facts
Twiggs County
Fatal Crashes: 2010-2012
Overall Trends: 2008-2012
Fatalities Injuries Crashes
2008 6 86
196
2009 7
152 276
2010 4
137 285
2011 0
124 258
2012 4 74
206
The map shows the location of fatal crashes from 2010-2012. Only 1,111 out of 1,126 fatal crashes that occurred in 2012 have recorded latitude/longitude coordinates in the state of Georgia. Please note that there can be more than one fatality per fatal crash.
Common Fatality Types: 2008-2012 Fatalities by Restraint Use: 2012
Alcohol Pedestrian
Motorcycle Speed
2
Unrestrained 2 50%
Unknown 0 0%
Restrained 2 50%
1
1
1
0
0
0
0
2008 2009 2010 2011 2012
Georgia Traffic Safety Facts
Union County
Fatal Crashes: 2010-2012
Overall Trends: 2008-2012
Fatalities Injuries Crashes
2008 3
266 392
2009 2
245 388
2010 4
221 434
2011 5
153 348
2012 1
168 388
The map shows the location of fatal crashes from 2010-2012. Only 1,111 out of 1,126 fatal crashes that occurred in 2012 have recorded latitude/longitude coordinates in the state of Georgia. Please note that there can be more than one fatality per fatal crash.
Common Fatality Types: 2008-2012
Alcohol Pedestrian
Motorcycle Speed
2
2
Fatalities by Restraint Use: 2012
Unrestrained Unknown
0
0
0%
0%
1
1
1
1
1
0
0
0
0
0
2008 2009 2010 2011 2012
Restrained 1
100%
Georgia Traffic Safety Facts
Upson County
Fatal Crashes: 2010-2012
Overall Trends: 2008-2012
Fatalities Injuries Crashes
2008 6
341 636
2009 3
364 819
2010 5
280 603
2011 7
232 481
2012 2
234 370
The map shows the location of fatal crashes from 2010-2012. Only 1,111 out of 1,126 fatal crashes that occurred in 2012 have recorded latitude/longitude coordinates in the state of Georgia. Please note that there can be more than one fatality per fatal crash.
Common Fatality Types: 2008-2012
Alcohol Pedestrian
Motorcycle Speed
2
Fatalities by Restraint Use: 2012
Unknown 0 0%
Restrained 0 0%
1
1
1
1
0
0
0
0
0
2008 2009 2010 2011 2012
Unrestrained 1
100%
Georgia Traffic Safety Facts
Walker County
Fatal Crashes: 2010-2012
Overall Trends: 2008-2012
Fatalities Injuries Crashes
2008 12 684
1303
2009 10 820
1486
2010 7
713 1253
2011 8
544 1120
2012 6
626 1334
The map shows the location of fatal crashes from 2010-2012. Only 1,111 out of 1,126 fatal crashes that occurred in 2012 have recorded latitude/longitude coordinates in the state of Georgia. Please note that there can be more than one fatality per fatal crash.
Common Fatality Types: 2008-2012 Fatalities by Restraint Use: 2012
5
2 0 2008
Alcohol Pedestrian
Motorcycle Speed
4
2 1 0 2009
4 3
0 2010
2 1 0 2011
2 1 0 2012
Unrestrained 2 40%
Unknown 0 0%
Restrained 3 60%
Georgia Traffic Safety Facts
Walton County
Fatal Crashes: 2010-2012
Overall Trends: 2008-2012
Fatalities Injuries Crashes
2008 11 885
1695
2009 12 980
1643
2010 11 933
1571
2011 12
1016 1491
2012 5
720 1882
The map shows the location of fatal crashes from 2010-2012. Only 1,111 out of 1,126 fatal crashes that occurred in 2012 have recorded latitude/longitude coordinates in the state of Georgia. Please note that there can be more than one fatality per fatal crash.
Common Fatality Types: 2008-2012 Fatalities by Restraint Use: 2012
Alcohol Pedestrian
Motorcycle Speed
5
4
3
2
2
2
Unrestrained
3
2 40%
2
0
0
0
0
0
2008 2009 2010 2011 2012
Unknown 0 0%
Restrained 3
60%
Georgia Traffic Safety Facts
Ware County
Fatal Crashes: 2010-2012
Overall Trends: 2008-2012
Fatalities Injuries Crashes
2008 10 506
1246
2009 5
528 1194
2010 10 509
1140
2011 11 338 799
2012 2
195 449
The map shows the location of fatal crashes from 2010-2012. Only 1,111 out of 1,126 fatal crashes that occurred in 2012 have recorded latitude/longitude coordinates in the state of Georgia. Please note that there can be more than one fatality per fatal crash.
Common Fatality Types: 2008-2012
Alcohol Pedestrian
Motorcycle Speed
4
2 1 2008
1
0 2009
3
1 0 2010
2
0 2011
1
0 2012
Fatalities by Restraint Use: 2012
Unknown 0 0%
Restrained 0 0%
Unrestrained 2
100%
Georgia Traffic Safety Facts
Warren County
Fatal Crashes: 2010-2012
Overall Trends: 2008-2012
Fatalities Injuries Crashes
2008 6 64
101
2009 8 93
159
2010 3 87
148
2011 3 78
101
2012 4 86
125
The map shows the location of fatal crashes from 2010-2012. Only 1,111 out of 1,126 fatal crashes that occurred in 2012 have recorded latitude/longitude coordinates in the state of Georgia. Please note that there can be more than one fatality per fatal crash.
Common Fatality Types: 2008-2012
Alcohol Pedestrian
Motorcycle Speed
3
2
2
1
1
1
1
1
0
0
0
0
0
2008 2009 2010 2011 2012
Fatalities by Restraint Use: 2012
Unrestrained 1 25%
Unknown 0 0%
Restrained 3 75%
Georgia Traffic Safety Facts
Washington County
Fatal Crashes: 2010-2012
Overall Trends: 2008-2012
Fatalities Injuries Crashes
2008 6
188 368
2009 3
207 369
2010 3
177 334
2011 4
154 267
2012 3
180 345
The map shows the location of fatal crashes from 2010-2012. Only 1,111 out of 1,126 fatal crashes that occurred in 2012 have recorded latitude/longitude coordinates in the state of Georgia. Please note that there can be more than one fatality per fatal crash.
Common Fatality Types: 2008-2012
Alcohol Pedestrian
Motorcycle Speed
Fatalities by Restraint Use: 2012
Unknown 0 0%
Restrained 0 0%
1
1
1
1
0
0
0
0
0
2008 2009 2010 2011 2012
Unrestrained 3
100%
Georgia Traffic Safety Facts
Wayne County
Fatal Crashes: 2010-2012
Overall Trends: 2008-2012
Fatalities Injuries Crashes
2008 4
252 570
2009 6
303 680
2010 10 275 644
2011 6
243 675
2012 7
193 517
The map shows the location of fatal crashes from 2010-2012. Only 1,111 out of 1,126 fatal crashes that occurred in 2012 have recorded latitude/longitude coordinates in the state of Georgia. Please note that there can be more than one fatality per fatal crash.
Common Fatality Types: 2008-2012
Alcohol Pedestrian
Motorcycle Speed
3
2
2
2
2
1
1
1
1
1
0
0
0
2008 2009 2010 2011
0 2012
Fatalities by Restraint Use: 2012
Unknown 0 0%
Restrained 1
17%
Unrestrained 5
83%
Georgia Traffic Safety Facts
Webster County
Fatal Crashes: 2010-2012
Overall Trends: 2008-2012
Fatalities Injuries Crashes
2008 2 37 38
2009 0 39 50
2010 0 54 39
2011 0 21 27
2012 0 12 20
The map shows the location of fatal crashes from 2010-2012. Only 1,111 out of 1,126 fatal crashes that occurred in 2012 have recorded latitude/longitude coordinates in the state of Georgia. Please note that there can be more than one fatality per fatal crash.
Common Fatality Types: 2008-2012
Alcohol Motorcycle Pedestrian
1
Fatalities by Restraint Use: 2012
<No Passenger Fatalities in 2012>
0
0
0
0
0
2008 2009 2010 2011 2012
Georgia Traffic Safety Facts
Wheeler County
Fatal Crashes: 2010-2012
Overall Trends: 2008-2012
Fatalities Injuries Crashes
2008 5 29 38
2009 0 39 43
2010 1 57 63
2011 2 37 49
2012 2 97 96
The map shows the location of fatal crashes from 2010-2012. Only 1,111 out of 1,126 fatal crashes that occurred in 2012 have recorded latitude/longitude coordinates in the state of Georgia. Please note that there can be more than one fatality per fatal crash.
Common Fatality Types: 2008-2012
Alcohol Pedestrian
Motorcycle Speed
3
Fatalities by Restraint Use: 2012
Unrestrained 0 0%
Restrained 0 0%
1
1
0
0
0
0
0
2008 2009 2010 2011 2012
Unknown 2
100%
Georgia Traffic Safety Facts
White County
Fatal Crashes: 2010-2012
Overall Trends: 2008-2012
Fatalities Injuries Crashes
2008 3
274 650
2009 2
297 716
2010 4
235 641
2011 6
204 637
2012 8
205 651
The map shows the location of fatal crashes from 2010-2012. Only 1,111 out of 1,126 fatal crashes that occurred in 2012 have recorded latitude/longitude coordinates in the state of Georgia. Please note that there can be more than one fatality per fatal crash.
Common Fatality Types: 2008-2012
Alcohol Pedestrian
Motorcycle Speed
3
3
2
2
1
1
1
1
0
0
0
0
0
2008 2009 2010 2011 2012
Fatalities by Restraint Use: 2012
Unrestrained 4 50%
Unknown 0 0%
Restrained 4 50%
Georgia Traffic Safety Facts
Whitfield County
Fatal Crashes: 2010-2012
Overall Trends: 2008-2012
Fatalities Injuries Crashes
2008 15
1256 2917
2009 21
1339 3062
2010 4
1314 2809
2011 14
1163 2760
2012 13
1177 2631
The map shows the location of fatal crashes from 2010-2012. Only 1,111 out of 1,126 fatal crashes that occurred in 2012 have recorded latitude/longitude coordinates in the state of Georgia. Please note that there can be more than one fatality per fatal crash.
Common Fatality Types: 2008-2012
Alcohol Pedestrian
Motorcycle Speed
6
4 3
1
2008
4 2
2009
2 1 0 2010
2
0 2011
3 2
0 2012
Fatalities by Restraint Use: 2012
Unrestrained 4 36%
Unknown 0 0%
Restrained 7 64%
Georgia Traffic Safety Facts
Wilcox County
Fatal Crashes: 2010-2012
Overall Trends: 2008-2012
Fatalities Injuries Crashes
2008 4 50 61
2009 1 19 26
2010 6 30 47
2011 3 43 64
2012 1 34 72
The map shows the location of fatal crashes from 2010-2012. Only 1,111 out of 1,126 fatal crashes that occurred in 2012 have recorded latitude/longitude coordinates in the state of Georgia. Please note that there can be more than one fatality per fatal crash.
Common Fatality Types: 2008-2012
Alcohol Pedestrian
Motorcycle Speed
2
Fatalities by Restraint Use: 2012
<No Passenger Fatalities in 2012>
1
1
1
1
1
0
0
0
0
0
2008 2009 2010 2011 2012
Georgia Traffic Safety Facts
Wilkes County
Fatal Crashes: 2010-2012
Overall Trends: 2008-2012
Fatalities Injuries Crashes
2008 3
122 135
2009 2
109 162
2010 2 86
119
2011 3 73
120
2012 2 67
178
The map shows the location of fatal crashes from 2010-2012. Only 1,111 out of 1,126 fatal crashes that occurred in 2012 have recorded latitude/longitude coordinates in the state of Georgia. Please note that there can be more than one fatality per fatal crash.
Common Fatality Types: 2008-2012
Alcohol Pedestrian
Motorcycle Speed
1
1
1
1
Fatalities by Restraint Use: 2012
Unknown 0 0%
Unrestrained 1
50%
Restrained 1
50%
0
0
0
0
0
2008 2009 2010 2011 2012
Georgia Traffic Safety Facts
Wilkinson County
Fatal Crashes: 2010-2012
Overall Trends: 2008-2012
Fatalities Injuries Crashes
2008 1 80
229
2009 3 67
224
2010 5 75
218
2011 3 88
211
2012 2 68
185
The map shows the location of fatal crashes from 2010-2012. Only 1,111 out of 1,126 fatal crashes that occurred in 2012 have recorded latitude/longitude coordinates in the state of Georgia. Please note that there can be more than one fatality per fatal crash.
Common Fatality Types: 2008-2012
Alcohol Pedestrian
Motorcycle Speed
2
Fatalities by Restraint Use: 2012
Unknown 0 0%
Restrained 0 0%
1
1
1
0
0
0
0
0
2008 2009 2010 2011 2012
Unrestrained 2
100%
Georgia Traffic Safety Facts
Worth County
Fatal Crashes: 2010-2012
Overall Trends: 2008-2012
Fatalities Injuries Crashes
2008 4
179 307
2009 5
210 310
2010 7
237 352
2011 9
178 345
2012 3
214 352
The map shows the location of fatal crashes from 2010-2012. Only 1,111 out of 1,126 fatal crashes that occurred in 2012 have recorded latitude/longitude coordinates in the state of Georgia. Please note that there can be more than one fatality per fatal crash.
Common Fatality Types: 2008-2012
Alcohol Pedestrian
Motorcycle Speed
3
2
2
1
1
0
0
0
0
0
2008 2009 2010 2011 2012
Fatalities by Restraint Use: 2012
Unrestrained 0 0%
Unknown 0 0%
Restrained 3
100%