


- Collection:
- Georgia Government Publications
- Serial:
- Motorcycles (Georgia Governor's Office of Highway Safety)
- Title:
- Motorcycles, 2019
- Creator:
- Georgia Governor's Office of Highway Safety
- Contributor to Resource:
- Georgia Governor's Office of Highway Safety, issuing body.
- Publisher:
- Atlanta, Ga. : Georgia Governor's Office of Highway Safety
- Date of Original:
- 2021-07
- Subject:
- Motorcycling accidents--Georgia--Statistics--Periodicals
- Location:
- United States, Georgia, 32.75042, -83.50018
- Medium:
- state government records
- Type:
- Text
- Format:
- application/pdf
- Description:
- Fact sheet on motocycles in Georgia.
- External Identifiers:
- Call Number GA H575.H51 S1 M68 2019
- Metadata URL:
- https://dlg.galileo.usg.edu/id:dlg_ggpd_y-ga-bh575-ph51-bs1-bm68-b2019-belec-p-btext
- Digital Object URL:
- https://dlg.galileo.usg.edu/do:dlg_ggpd_y-ga-bh575-ph51-bs1-bm68-b2019-belec-p-btext
- Language:
- eng
- Holding Institution:
- University of Georgia. Map and Government Information Library
- Rights:
-

Georgia Traffic Safety Facts
2019 Data
July 2021
Key Findings
Motorcycles consistently represent
2 percent of all registered vehicles and 1 percent of all motor vehicle crashes in Georgia; however, motorcycle operators represented 21 percent of all driver fatalities and 11 percent of all traffic fatalities.
The majority of all motorcycle
crashes occur in north Georgia. Generally, there are higher motorcycle crash rates in metroAtlanta and in the rural counties in the northeast Georgia-Tennessee border.
More than half (51 percent) of
motorcycle operators involved in crashes were riding without a valid motorcycle designation (Class M or MP) on their driver's license at the time of the crash.
Motorcyclists aged 25-to-34 years
had the greatest proportion of EMS transports (25%), emergency room only visits (27%), and hospitalizations (24%) compared to other age groups.
The total motor vehicle traffic-
related hospitalization and emergency room charges among motorcyclists in Georgia was $221 million.
Helmet use (88%) among Georgia
motorcyclists involved in a crash resulted in an estimated 91 lives saved.
Governor's Office of Highway Safety
7 M.L.K. Jr Dr SE Suite #643 Atlanta, GA 30334
(404) 656-6996 www.gahighwaysafety.org
Motorcycles
As defined for this fact sheet, a motorcyclist is a general term to refer to either the rider (motorcycle operator) or passenger. A motorcycle includes two or three-wheeled motorcycles, off-road motorcycles, moped, motor scooters, minibikes, and pocket bikes.
This fact sheet contains information from the Fatality Analysis Reporting System (FARS), Georgia Department of Transportation (GDOT) crash data modified by Crash Outcomes Data Evaluation System (CODES) at the Department of Public Health (DPH), Georgia Department of Driver Services (DDS), Georgia Department of Revenue (DOR), Georgia Emergency Medical Services Information System (GEMSIS), Hospital Discharge Data, Emergency Room Data, and the Georgia Trauma Registry. Refer to the 'Data Considerations' section regarding the data and information presented at the end of this publication.
Motorcyclist Fatalities and Fatality Rates
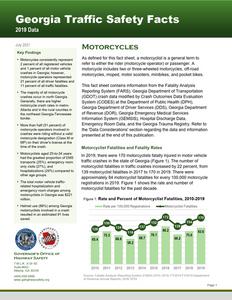
In 2019, there were 170 motorcyclists fatally injured in motor vehicle traffic crashes in the state of Georgia (Figure 1). The number of motorcyclist fatalities in traffic crashes increased by 22 percent, from 139 motorcyclist fatalities in 2017 to 170 in 2019. There were approximately 84 motorcyclist fatalities for every 100,000 motorcycle registrations in 2019. Figure 1 shows the rate and number of motorcyclist fatalities for the past decade.
Figure 1: Rate and Percent of Motorcyclist Fatalities, 2010-2019
200
180
160
140
128
120
100
65.4
80
60
Rate per 100,000 Registrations
150 134
152 137
75.3
116
76.1
66.6
68.7
58.2
Motorcyclist Fatalities
120.0
172
86.2
139
68.2
154
75.6
170 100.0
80.0
83.6
60.0
40.0
40
20.0
20
0
0.0
2010 2011 2012 2013 2014 2015 2016 2017 2018 2019
Source: Fatality Analysis Reporting System (FARS) 20102019; FY2014-FY2019 Department of Revenue Annual Reports; DOR 2019
Page 1
Although motorcyclists represented less than one percent of all persons involved in motor vehicle crashes (0.4 percent), they accounted for 11 percent of all traffic fatalities.
Table 1 presents the number of total traffic fatalities, Georgia motorcycle registrations, and motorcyclist fatalities from 2010 to 2019.
The number of total traffic
fatalities increased by 20 percent from 1,247 to 1,491.
The number of motorcyclist
fatalities increased by 33 percent from 128 to 170.
The number of motorcycle
registrations increased by 4 percent from 195,647 to 203,343.
The rate of motorcycle fatalities
increased by 28 percent from 65.4 to 83.6 motorcycle fatalities per 100,000 motorcycle registrations.
Table 1: Rate and Percent of Motorcyclist Traffic Fatalities, 2010-2019
Year
Total Traffic Fatalities
Registered Motorcycles
Motorcyclist Fatalities
Number
Percent
of All Traffic Fatalities
Rate
per 100,000
Registrations
2010 1,247
195,647
128
10%
65.4
2011 1,226
199,253
150
12%
75.3
2012 1,192
201,206
134
11%
66.6
2013 1,180
199,287
116
10%
58.2
2014 1,164
199,445
137
12%
68.7
2015 1,432
199,796
152
11%
76.1
2016 1,556
199,504
172
11%
86.2
2017 1,540
203,783
139
9%
68.2
2018 1,504
203,639
154
10%
75.6
2019 1,491
203,343
170
11%
83.6
Note: Motorcycle registrations include commercial and non-commercial motorcycles. Source: Fatality Analysis Reporting System (FARS) 20102019; FY2014-FY2020 DOR Annual Reports; DOR 2019.
Urban vs. Rural1 Motorcycle Crashes
In 2019, there were 1,941.5 motorcycle crashes for every 100,000 motorcycle registrations statewide (Table 2). Motorcycle crashes are more frequent in urban areas than rural areas.
The Atlanta Region accounted for
42 percent (1,655 out of 3,948) of all motorcycle crashes and 33 percent of all motorcycle registrations.
Other urban counties accounted for
39 percent (1,530 out of 3,948) of all motorcycle crashes and 41 percent of all motorcycle registrations.
Table 2: Motorcycle Crashes, Motorcycle Registrations, and Motorcycle Crash Rate by Region Type, 2019
Region
Motorcycle Crashes
Number Percent
Registered Motorcycles
Number
Percent
Motorcycle Crash Rate
per 100,000 Registrations
Atlanta Region2
(10 counites)
1,655
42%
67,555
33%
2,449.9
Other Urban
(31 counties)
1,530 39% 82,381 41%
1,857.2
Rural Counties
(118 counties)
763
19%
53,407
26%
1,428.7
Statewide
3,948 100% 203,343 100% 1,941.5
Source: CODES 2019, DOR 2019
1 Rural counties are counties that have a residential population less than 50,000 persons. This is different than roadway classifications where
urban road systems can be located in urban clusters (or metropolitan areas) of at least 2,500 persons within the rural counties.
2 The Atlanta Region includes the ten counties that are defined by the Atlanta Regional Commission (ARC): Cherokee, Clayton, Cobb, DeKalb,
Douglas, Fayette, Fulton, Gwinnett, Henry, and Rockdale counties.
Page 2
Figure 2 shows the motorcycle crash rate for counties with more than ten motorcycle crashes in 2019 and their deviation from the statewide percent of motorcycle crash rate (1,941.5 motorcycle crashes for every 100,000 motorcycle registrations).
Figure 2: Motorcycle (MC) Crashes per 100,000 MC Registrations and Deviation from the Statewide MC Crash Rate for Counties with 10+ MC Crashes, 2019
The majority of all motorcycle crashes occur in north Georgia. Generally, there are higher motorcycle crash rates in metro-Atlanta and in the rural counties in the northeast area, Georgia-North and South Carolina border. Nine percent of all motorcycle operators involved in Georgia traffic crashes had a license from another state five percent were licensed from a bordering state (Alabama, Florida, North Carolina, South Carolina, or Tennessee).
Four out of the ten counties within the
Atlanta Region had a higher motorcycle crash rate compared to the statewide rate. Combined, Fulton and Dekalb represent 19 percent of all motorcycle crashes statewide:
- Fulton (510 crashes and 4,918 crash rate) - Dekalb (250 crashes and 3,578 crash rate)
Ten out of the 20 rural counties that
experience more than ten motorcycle crashes had a higher crash rate compared to the statewide rate. The top three rural counties with the highest crash rate are located in northeast Georgia:
- Lumpkin (52 crashes and 4,270 crash rate) - Union (35 crashes and 2,754 crash rate) - Rabun (27 crashes and 4,569 crash rate)
In 2019, the counties with the highest number of motorcyclist fatalities were: Fulton (22 motorcyclist fatalities), DeKalb (12), Gwinnett (10), Cobb (8), and Bibb (8). Table 3 shows the motorcycle crashes, motorcyclist suspected serious injuries, and fatalities in these five counties. One-third of all motorcycle crashes (1,301 out of 3,948) and 32 percent of all motorcyclist serious injuries and fatalities (279 out of 875) occurred within these five counties alone.
Source: CODES 2019, DOR 2019 Note: The map only shows counties with 10 or more motorcycle crashes in 2019. Counties that are light to dark green have a lower motorcycle crash rate compared to the statewide rate. Counties that are light to dark brown have a higher motorcycle crash rate compared to the statewide rate.
See the "Additional Information" to access the Appendix for this document. The Appendix includes
the following information by county: Motorcycle Crashes Motorcycle Registrations Motorcycle Licensed Operators Suspected Serious Injuries
and Fatalities Suspected and Confirmed Motorcycle Operator Alcohol Involvement.
Table 3: Motorcycle Crashes and Motorcyclist
Suspected Serious Injuries and Fatalities by
Top Counties with Highest Fatalities, 2019
Counties with at Least One Motorcycle Crash
Motorcycle Crashes
Number
Percent of all Crashes
Motorcyclist Suspected Serious Injuries and Fatalities
Number
Percent of all Serious Injuries and Fatalities
Top Counties
1,301
33%
279
32%
Fulton
510
13%
115
13%
DeKalb
250
6%
42
5%
Gwinnett
230
6%
52
6%
Cobb
237
6%
50
6%
Bibb
74
2%
20
2%
Other
Counties
2,642
67%
595
(136 Counties)
68%
Total
(141 Counties)
3,948
100%
875
100%
Source: CODES 2019 Note: The five (5) motorcycle crashes and one (1) suspected serious injury that occurred in unknown counties are included in the total. Eighteen (18) counties did not experience a motorcycle crash in 2019.
Page 3
Table 4 below shows the percent of motorcycle crashes by region and roadway classification in 2019.
Forty-one percent of all motorcycle crashes occurred within the Atlanta Region compared
to 55 percent of all traffic crashes in this region.
Twenty-six percent of all motorcycle crashes occurred on minor arterial roads (other
multilane roads that supplement highways) statewide the Atlanta Region and other urban counties experience more crashes on this roadway type.
The majority of motorcycle crashes in rural counties occurred on collector roads (roads that
connect local roads and streets).
- Thirteen percent of all traffic crashes and 20 percent of all motorcycle crashes were in rural counties.
- Three percent of all traffic crashes and 6 percent of all motorcycle crashes were on collectors in rural counties.
Table 4: Motorcycle Traffic Crashes by Region and Roadway Classification, 2019
Roadway Classification
Atlanta Region
(10 counties)
Other Urban Counties
(31 counties)
Rural Counties
(118 counties)
Statewide
Interstate
5%
2%
1%
7%
Principal Arterial
9%
10%
5%
24%
Minor Arterial
12%
11%
3%
26%
Collectors
4%
6%
6%
16%
Local
9%
10%
5%
24%
Ramps
2%
1%
0%
3%
Total
41%
39%
20%
100%
Source: Numetric 2019 Note: The sum of the individual cells may not equal row or column totals due to rounding error. Principal arterials include freeways, multilane highways (e.g., Buford Highway and Hawkinsville Road). Minor arterials are other important multilane roadways that supplement the highways (e.g., Spring Street and U.S. Route 41). Collector roads connect local roads and streets with arterials (e.g., McAfee Road and McCall Road).
Manner of Collison in Multi-Vehicle3 Crashes
Sixty-three percent of all motorcycle crashes involved more than one vehicle 37 percent were single-vehicle motorcycle crashes. Passenger vehicles4 were the most common vehicle involved in crashes with motorcyclists 93 percent.
The most common manner of collision involving motorcycles in multi-vehicle crashes were rear end collisions (32 percent). The manner of collision is not vehicle specific and does not identify which vehicle or driver was at fault.
Sixty percent of all motorcyclist serious injuries and 70 percent of all motorcyclist fatalities occurred in multiple-vehicle crashes.
Figure 3: Multi-Vehicle Motorcycle Crashes by Manner of Collison, 2019
Rear End
32%
Angle (Other) *
23%
Left Angle Crash
20%
Sideswipe-Same Direction
12%
Other
8%
Collision with NonMotorist or Object
6%
Source: Numetric 2019, CODES 2019 Note: Angle (Other) includes other unknown angle crashes and right-angle crashes (2%). Other includes `head on' and `sideswipeopposite direction'.
3 Multi-vehicle crashes may include another motorcycle 4 Passenger vehicles include passenger cars, pickup trucks, vans, and sport utility vehicles (SUVs).
Page 4
Environmental Characteristics
Table 5 shows information on environmental characteristics (location of crash, land use, and light conditions) describing where and when motorcycle crashes, suspected serious injuries, and fatalities occurred in 2019. More motorcycle crashes, serious injuries, and fatalities occurred during daylight, but not at an intersection.
63 percent of all motorcycle crashes, 62 percent of all motorcyclist serious injuries, and 59 percent of
all motorcyclists fatalities did not occur at an intersection (see data considerations).
70 percent of all motorcycle crashes, 60 percent of all motorcyclist serious injuries, and 54 percent of
all motorcyclist fatalities occurred in the daylight.
92 percent of all motorcycle crashes occurred on dry roads (not shown).
Table 5: Motorcycle Crashes and Motorcyclists Injuries by Environmental Characteristics, 2019
Environmental Characteristics
Crashes
Number
Percent
Suspected Serious Injuries
Number
Percent
Fatalities
Number
Percent
Location*
Not at Intersection
At Intersection or Intersection Related
Not Reported
2,470
63%
437
62%
101
59%
1,447
37%
263
37%
68
40%
31
1%
5
1%
1
1%
Light Conditions
Dark
1,057
27%
246
35%
70
41%
Daylight
2,755
70%
426
60%
92
54%
Dawn
38
1%
9
1%
1
1%
Dusk
64
2%
18
3%
6
4%
Not Reported
34
1%
6
1%
1
1%
Source: FARS 2019, CODES 2019
Time of Day and Day of Week
Forty-three percent of all weekday motorcyclist fatalities occurred between 12:00 p.m. and 5:59 p.m., and 49 percent of all weekend motorcyclist fatalities occurred between 6:00 p.m. and 11:59 p.m.
Figure 4 shows the percent of all motor vehicle traffic fatalities that were motorcyclists by the time of day and day of the week in 2019.
27 percent of all traffic fatalities that
occurred on the weekend between 6:00 p.m. and 11:59 p.m. were motorcyclists (43 out of the 160 total traffic fatalities that occurred during that period).
Figure 4: Percent of All Traffic Fatalities that
were Motorcyclists, by Time of Day and Day
of Week, 2019
Weekday
Weekend
27%
13% 7%
13% 10%
12% 14%
15%
12:00-5:59am 6:00-11:59am 12:00-5:59pm 6:00-11:59pm
Weekday: 6 a.m. Monday to 5:59 p.m. Friday Weekend: 6 p.m. Friday to 5:59 a.m. Monday Source: FARS 2019
Page 5
Motorcycle Licensure & Vehicle Registration
Motorcycle operators with a Class M license or a Class M Instructional Permit (MP) have a valid license to operate a motorcycle or motor-driven cycle in Georgia legally. Across the decade, drivers with a Class M license only, Class MP license only, or had a Class M status assigned to another license type consistently represented about 6 percent of all licensed drivers. According to the Department of Driver Services (DDS), approximately 6,500 individuals completed the Georgia Motorcycle Safety Program in FY2019. These programs teach crash-avoidance skills to motorcycle riders of various experience levels.
Although motorcycles consistently represent two percent of all registered vehicles and one percent of all motor vehicle crashes in Georgia, motorcycle operators represented 21 percent of all driver fatalities in 2019. From 2010 to 2019:
The number of motorcycle operator fatalities increased by 34 percent from 122 to 164. The number of motorcycle crashes increased by 6 percent from 3,708 to 3,948. The number of motorcyclists with a valid license increased by 20 percent from 421,016 to 505,068. The number of registered motorcycles increased by 4 percent from 195,647 to 203,343.
Table 6: Motorcycle Operator Fatalities, Motorcycle Crashes, Licensed Motorcyclists with a Class M or MP License, and Motorcycle Registrations, 2010-2019
Year
Motorcycle Operator Fatalities
Motorcycle Crashes
Licensed Motorcyclists with a Class M or Class MP License
Motorcycle Registrations
Number
% of all Driver Fatalities
Number
% of all Crashes
Number
% of all Licensed Drivers
Number
% of all Vehicle Registrations
2010 122
18%
3,708** 1%
421,016
5%
195,647
2%
2011 143
20%
4,084*
1%
442,924
5%
199,253
2%
2012 130
20%
4,286*
1%
453,055
6%
201,206
2%
2013 113
19%
4,023
1%
455,959
6%
199,287
2%
2014 133
20%
4,112
1%
465,739
6%
199,445
2%
2015 145
18%
4,170
1%
478,915
6%
199,796
2%
2016 167
19%
4,498
1%
492,888
6%
199,504
2%
2017 135
15%
4,158
1%
497,092
6%
203,783
2%
2018 148
18%
3,049
1%
501,169
6%
203,639
2%
2019 164
21%
3,948
1%
505,068
6%
203,343
2%
Source: FARS 2010-2019, FFY2011 & FFY2012 Georgia Highway Safety Plan, CODES 2013-2019, DDS 2010-2019, FY2014-FY2020 DOR Annual Reports, DOR 2019
Notes: The crash datasets for 2010-2012 were compiled using both paper and electronic crash reports and were not verified. As such, * 2011 and 2013 motorcycle crash values were obtained from the FFY2011 & FFY2012 Georgia Highway Safety Plans ** 2010 motorcycle crash value was not available in the Highway Safety Plans; therefore, it was calculated assuming that motorcycle crashes represented 1% of all motor vehicle crashes (consistent with 2011-2019 years).
Sex
In 2019, 88 percent (3,542 out of 4,029) of the motorcycle operators involved in all crashes were male, and six percent (246 out of 4,029) were female. Seventy-seven percent (184 out of 240) of the motorcycle passengers involved in crashes were female.
Page 6
Age
In 2019, half (51 percent) of motorcycle operators involved in crashes were riding without a valid motorcycle designation (Class M or MP) on their driver's license at the time of the crash (2,060 out of 4,029 motorcycle operators).
44 percent were operating a motorcycle without a valid license designation (1,757 out of 4,029
motorcycle operators); and
7 percent were operating a motorcycle without any type of license (303 out of 4,029 motorcycle
operators); therefore, 42 percent of motorcyclists without a license (127 out of 303) also had an unknown or unreported age.
While drivers aged 25-to-34 years represent 12 percent of all riders with a valid Class M or MP license, compared to drivers in other age groups, they also represented:
23 percent of all motorcyclist operator fatalities; 25 percent of all motorcyclist operators involved in a crash; and 41 percent of all motorcyclists with invalid or no license credentials involved in a crash.
Older persons within the 55-to-64 age group represented 14 percent of all traffic fatalities (212 out of 1,491). Eight percent of all motor vehicle traffic fatalities within the 55-to-64 age group were motorcyclists (18 out of 212). Older drivers aged 55-to-64 years represent 26 percent of all riders with a valid Class M or MP license. This age group also represented:
11 percent of all motorcyclist operator fatalities; 13 percent of all motorcyclist operators involved in a crash; and 16 percent of all motorcyclists with invalid or no license credentials involved in a crash.
Table 7: Percent of Motorcycle Operator Fatalities, Motorcycle Operators Involved in Crashes, Licensed Motorcyclists, and Motorcycle Registrations by Age Group, 2019
Age Group (Years)
Motorcyclist Operators Fatalities
Motorcyclist Operators Involved in
a Crash
Children ( 14)
-
15-20
5%
21-24
9%
25-34
23%
35-44
20%
45-54
21%
55-64
11%
65-74
12%
75+
5%
Unknown
-
TOTAL
164
(100%)
Source: FARS 2019, CODES 2019, DDS 2019
1%
7% 11%
25%
17% 16% 13% 6% 0% 4% 4,029
(100%)
License Type of Motorcyclist Operator in Crash
Class M / MP
Other Classes (Invalid)
None
-
0.2%
6%
5% 11% 25% 17% 18% 16% 7% 0.8% 0.8% 1,969
(100%)
8% 13%
27%
19% 16% 10% 4% 0.3% 0.7% 1,757
(100%)
10% 5%
14%
9% 7% 6% 2% 0.3% 42% 303
(100%)
Class M or MP Licenses
0%
1% 2% 12% 15% 22%
26%
16% 6% 0% 369,871
(100%)
Page 7
Motorcyclist Injuries
The following section describes various responses to serious injuries experienced by motorcyclists involved in motor vehicle traffic crashes and non-traffic crash incidents. Injured motorcyclists can be counted multiple times for each response (e.g., an injured person may be counted as an emergency room visit, hospitalization, and/or trauma center patient). The various responses to injuries are described below.
Suspected Serious Crash Injuries are reported by law enforcement responding to a motor vehicle crash scene. Suspected serious injury is used when any injury, other than fatal injury, prevents the injured person from walking, driving, or normally continuing the activities the person was capable of before the injury occurred.
Emergency Medical Services include all ground and air transports to an emergency facility for patients who are injured and require medical care in the state of Georgia.
Trauma Center patients are identified as those with serious injuries that meet specific criteria. The State of Georgia follows the identification and treatment guidelines established by the American College of Surgeons along with the Centers of Disease Control and Prevention (CDC) Field Triage Criteria. Participating hospitals (voluntary) are designated or verified as trauma centers Level I, II, III or IV. Level I and II facilities are able to treat the most critical patients.
Emergency Room and Hospitalizations include Georgia resident discharges from Georgia non-federal acute care hospitals. Emergency room (ER) visits include individuals who were discharged directly from the ER. Hospitalizations include individuals who may have visited the emergency room.
Suspected Serious Crash Injuries
According to the police crash reports, there were 3,948 motorcycle crashes, 4,269 motorcyclists involved in motor vehicle traffic crashes, and 705 suspected serious injuries among motorcyclists in 2019 statewide.
Table 8 shows the number of motorcycle crashes, motorcyclists involved in crashes, and suspected serious injuries between 2015-2019.
Table 8: Motorcyclist Crashes and Suspected Serious Injuries, 2015-2019
Year
2015 2016 2017 2018 2019
Crashes
4,170 4,498 4,158 3,049 3,948
Motorcyclists Involved
5,552 4,899 4,551 3,391 4,269
Suspected Serious Injuries
917 1,022 961 591 705
Source: CODES 2015-2019 Note: There can be multiple motorcyclists (operators and passengers) involved in a single motor vehicle crash.
Page 8
Emergency Medical Services
In 2019, the Emergency Medical Services (EMS) transported a total of 2,069 motorcyclists involved in motor vehicle traffic crashes to a hospital facility (Table 9). Compared to other age groups:
Injured motorcyclists ages 25-to-
34 years had the highest proportions of EMS transports 25 percent of all male motorcyclists and 22 percent of all female motorcyclists transported by EMS.
Injured male motorcyclists aged
21-to-24 years had the highest rate of motorcyclist EMS transports per 100,000 population 63.3.
In 2019, the counties with the highest number of motorcyclist transports by EMS were Fulton (386 EMS transports), Cobb (130), Gwinnett (74), Chatham (62), and Bibb (59).
Emergency Room Visits & Hospitalizations
In 2019, there were a total of 4,362 motor vehicle traffic-related emergency room visits and hospitalizations5 involving motorcyclists. Motorcyclists aged 25-to-34 years had the highest rate of emergency room visits and hospitalizations compared to other age groups 60.7 emergency room visits and 16.2 hospitalizations for every 100,000 population.
The total motor vehicle traffic-related hospitalization and emergency room charges among motorcyclists in Georgia was $221 million.
Table 9: Motorcyclists with Traffic-Related Injuries Transported by Emergency Medical Services by Sex and Age Group, 2019
Age Group
Children ( 14)
Number
34
Male
Percent
2%
Rate
per 100,000 population
Number
Female
Percent
Rate
per 100,000 population
3.2
21
5%
2.1
15-20
108
6%
24.0
32
8%
7.4
21-24 25-34 35-44
181
11%
63.3
425
25%
57.3
281
17%
42.2
36
9%
12.9
84
22%
11.2
55
14%
7.7
45-54
295
18%
43.5
67
17%
9.3
55-64
221
13%
35.5
62
16%
9.0
65-74
98
6%
23.3
18
5%
3.6
75+
21
1%
8.7
7
2%
2.0
Unknown
6
<1%
--
1
<1%
--
Total 1,670 100% 32.4
383 100%
7.0
Note: Tables do not show 16 motorcyclists transported by EMS of unknown sex and/or age.
Source: Georgia Emergency Medical Services Information System (GEMSIS) 2019
Table 10: Motorcyclist Traffic-Related Emergency Room Visits and Hospitalizations by Age Group, 2019
Age Group
Children ( 14)
Emergency Room Visits
Number
Percent
Rate
per 100,000 population
155
5%
7.5
Hospitalizations
Number
Percent
Rate
per 100,000 population
--
--
--
15-20
225
7%
25.4
29
3%
3.3
21-24
482
14%
85.4
118
12%
20.9
25-34
906
27%
60.7
242
24%
16.2
35-44
591
18%
42.8
184
18%
13.3
45-54
502
15%
35.9
193
19%
13.8
55-64
337
10%
25.8
177
17%
13.5
65-74
134
4%
14.5
61
6%
6.6
75+
14
<1%
2.4
12
1%
2.0
Total 3,346 100% 31.5 1,016 100%
9.6
Note: The first valid external cause of injury diagnosis was considered. See data considerations for more information. Source: Georgia Department of Public Health, Office of Health Indicators for Planning (OHIP) Hospital Inpatient Discharge and Emergency Room Visit Data 2019; OASIS 2019 Estimated Population
5 Some hospitalizations may include emergency room visit information if the individuals were admitted into the same facility. Emergency room visits only include individuals who were discharged directly from the ER. Hospitalizations and emergency room visits include Georgia residents only, while fatalities can be a person out-of-state.
Page 9
Trauma Center Patients
According to the Georgia Trauma Registry data, motor vehicle traffic-related incidents (motor vehicle occupants, motorcyclists, pedestrians, and bicyclists) accounted for 32.4 percent of all injuries treated by designated and non-designated Trauma Centers6 in 2019 across the state of Georgia. In 2019, there were a total of 1,487 motorcyclists identified as trauma patients treated within Georgia Trauma Centers.
Twenty-three percent of all trauma center
motorcyclist patients were 25-to-34 years of age (Table 12).
Motorcyclists aged 21-to-24 years had the
highest rate of trauma care compared to any other age group 25.5 trauma patients for every 100,000 population.
Nearly one out of every three motorcyclists (35
percent) treated at the trauma centers had minor injuries, and 12 percent had very severe injuries.
Table 11: Motorcyclist Traffic-Related Trauma Center Patients by Age Group, 2019
Age Group
Children ( 14)
15-20
Number 47 128
Percent 3% 9%
Rate
per 100,000 population
2.3
14.5
21-24
144
25-34
338
35-44
254
10% 23% 17%
25.5 22.6 18.4
45-54
262
18%
18.7
55-64
223
15%
17.1
65-74
81
5%
8.7
75+
10
1%
1.7
Total 1,487 100%
Source: Georgia Trauma Registry 2019
14.0
Helmet Use
In 2019, 17 percent of all motorcyclists involved in crashes, 15 percent of all motorcyclists with serious injuries, and 7 percent of motorcyclists fatally injured were un-helmeted (based on reported known helmet use).
Table 12: Motorcyclists Involved in Crashes, Serious Injuries, and Fatalities by Helmet Use, 2019
Motorcyclists
Total
Helmeted
#
%
Un-helmeted
#
%
Unknown
#
%
Percent Based on Known Helmet Use
Helmeted Un-helmeted
Motorcyclists involved in crashes
4,269 3,225 76% 642
15% 402 9%
83%
17%
Motorcyclists with serious injuries
705 578 82% 99 14% 28 4%
85%
15%
Fatally injured motorcyclists
170 149 88% 11 6% 4 2%
93%
7%
Source: CODES 2019, FARS 2019 Note: Although not all crashes are survivable, helmet use is still effective in preventing fatalities or serious head injuries.
6 Not all hospitals are designated as Trauma Centers.
Page 10
Since 1969, Georgia's universal helmet law7 has never been repealed or changed compared to most other states that have certain specifications for helmet use or no helmet law in place. Three out of the five bordering states (Tennessee, Alabama, and North Carolina) also have not repealed or changed their helmeted law. As a result, 149 (88 percent) of fatally injured motorcyclists were reported wearing a helmet in the state of Georgia in 2019 compared to 59 percent nationwide.
Helmet use among Georgia motorcyclists resulted in an estimated 91 lives saved8. If all Georgia motorcyclists had worn helmets, an additional six lives would have been saved. Although not all crashes are survivable, helmet use is still effective in preventing fatalities or serious head injuries. According to the National Center for Statistics and Analysis, helmets are estimated to be 37 percent effective in preventing fatalities to motorcycle operators and 41 percent for motorcycle passengers.9 "In other words, for every 100 motorcycle [operators] killed in crashes while not wearing helmets, 37 of them could have been saved had all 100 worn helmets." NHTSA estimates that Georgia saved $116 million in economic costs because of helmet use in 201710.
Contributing Circumstances
In 2019, the top contributing factors among motorcycle operators involved in fatal crashes were: (1) following improperly (2) operating vehicle in an erratic, reckless, or negligent manner; and (3) passing with insufficient distance or inadequate visibility or failure to yield to overtaking vehicle. The top contributing factors among motorcycle operators involved in all crashes: (1) driver lost control; (2) following too close; (3) speeding; (4) under the influence of alcohol/drugs; and (5) change lanes improperly. This does not imply that the motorcycle operators caused the crash either by their actions or failure to act.
In 2019, a total of 2,164 motorcycle operators involved in a crash were issued at least one citation and 281 motorcycle operator convictions were reported to DDS. These convictions include the unsafe operation of a motorcycle, improper use of motorcycle equipment, and no proof of insurance.
Figure 5: Motorcycle Operators Convictions Reported to the Department of Driver Services, 2019
Winter
Spring
Summer
Fall
17% (47)
28% (78)
33% (93)
22% (63)
0% 10% 20% 30% 40% 50% 60% 70% 80% 90% 100%
32 33
33 33
23 21 25
27
18
12
12 12
The summer and spring months had a greater proportion of reported convictions compared to other seasons.
Jan Feb Mar Apr May Jun Jul Aug Sep Oct Nov Dec
Source: DDS 2019 Note: The convictions reported to DDS may not be the month the violation occurred.
7 O.C.G.A. 40-6-315 8 National Center for Statistics and Analysis (2011, March). Determining Estimates of Lives and Costs Saved by Motorcycle Helmets. (DOT HS 811 433). Washington, DC: National Highway Traffic Safety Administration. 9 National Center for Statistics and Analysis. (2020, June). Motorcycle helmet use in 2019 Overall results (DOT HS 812 936). Washington, DC: National Highway Traffic Safety Administration. National Highway Traffic Safety Administration. 10 National Center for Statistics and Analysis (2019, December). Lives and Costs Saved by Motorcycle Helmets. (DOT HS 812 867). Washington, DC: National Highway Traffic Safety Administration.
Page 11
Speeding
Speed-related crashes are when the investigating police officer reports the driver (or motorcycle operator) exceeding the speed limit, driving too fast for conditions, or racing. In 2019, motorcycle operators represented:
11 percent (35 out of 326) of all speeding drivers involved in fatal crashes; 15 percent (110 out of 751) of all speeding drivers involved in serious injury crashes; and 2 percent (365 out of 1,4645) of all speeding drivers involved in all motor vehicle crashes.
A greater proportion of motorcycle operators involved in fatal, serious injury, or motor vehicle crashes were speeding compared to other vehicle categories (Figure 6). In 2019:
18 percent of all motorcycle operators involved in fatal
crashes were speeding compared to 14 percent for passenger car drivers, and eight percent for large truck drivers.
14 percent of all motorcycle operators involved in
serious injury crashes were speeding.
8 percent of all motorcycle operators involved in all
motor vehicle crashes were speeding.
Figure 6: Percent of Drivers or Motorcycle Operators Speeding by Vehicle Category and Crash Type, 2019
18% 14%
14%
Motorcycle Passenger Vehicles Large Trucks
8%
8%
6%
3%
2% 1%
Fatal Crashes Serious Injury Crashes
Source: FARS 2019, CODES 2019
All Motor Vehicle Crashes
Table 13 shows motorcycle operators involved in speed-related crashes by crash type and age group. Compared to other age groups, motorcycle operators 25-to-34 years represented:
30 percent of all motorcycle operators involved in all speed-related crashes. 36 percent of all motorcycle operators involved in speed-related serious injury crashes. 57 percent of all motorcycle operators involved in speed-related fatal crashes.
Table 13: Motorcycle Operators Involved in Speed-Related Crashes by Crash Type and Age Group, 2019
All Motor Vehicle Crashes Serious Injury Crashes
Fatal Crashes
Age Group
TOTAL
Speeding
TOTAL
Speeding
TOTAL
Speeding
Number Percent
Number Percent
Number Percent
Children ( 14)
23
1
0%
3
1
1%
-
-
-
15-20
304
43 12%
52
9
8%
8
1
3%
21-24
510
64 18%
85
15 14%
15
3
9%
25-34
1,096
110 30%
207
40 36%
51
20
57%
35-44
751
61 17%
152
20 18%
39
7
20%
45-54
690
52 14%
142
15 14%
37
2
6%
55-64
524
22
6%
104
6
5%
19
-
-
65-74
250
5
1%
41
3
3%
21
2
6%
Unknown
158
7
2%
8
1
1%
-
-
-
TOTAL
4,306
365 100%
794
110 100%
Note: Tables do not show 16 motorcyclists transported by EMS of unknown sex and/or age.
Source: Georgia Emergency Medical Services Information System (GEMSIS) 2019
190
35
100%
Page 12
Alcohol Involvement
Alcohol involvement is defined as whether alcohol was consumed by the motorcycle operator before the crash; the presence of alcohol may or may not be a contributing factor in the crash. Under Georgia law, it is a rebuttable presumed criminal offense to operate a motor vehicle at or above a 0.08 grams per deciliter (g/dL) blood alcohol concentration (BAC) tested via blood, breath, or urine. Georgia law also states drivers cannot operate a moving vehicle while under the influence of alcohol to the extent that it is less safe to drive. 11 Under this law, drivers can be cited and convicted of impaired driving even with a BAC below 0.08 g/dL. For example, a motorcycle operator whose BAC is not tested and fails a field sobriety test may be charged and convicted of driving under the influence of alcohol.
Of all Georgia motorcycle crashes in 2019, 98 motorcycle operators were confirmed of alcohol impairment, and an additional 122 motorcycle operators were suspected of alcohol impairment. Of those motorcycle operators suspected of alcohol impairment, many did not have a BAC value reported in the police crash report; however, they were administered an alcohol test.
Table 14 shows motorcycle operators involved in a fatal crash by BAC from 2015-2019. These motorcycle operators may or may not have been fatally injured in the crash. In 2019:
34 percent (62 out of 185) of motorcycle operators had a BAC of 0.00 or no alcohol. 2 percent (4 out of 185) of motorcycle operators had a BAC between 0.01 and 0.07. 12 percent (23 out of 185) of motorcycle operators had a BAC of 0.08 or above. 52 percent (96 out of 185) of motorcycle operators had an unknown or unreported BAC.
Table 14: Motorcycle Operators Involved in a Fatal Crash by BAC, 2015-2019
Year
Motorcycle Operators
No Alcohol
BAC = 0.00 g/dL
Number Percent
BAC = 0.01 - 0.07 g/dL
Number Percent
AlcoholImpaired
(BAC = 0.08+ g/dL)
Number Percent
Unknown / Unreported
Number Percent
2015
173
62
36%
5
3%
22
13%
84
2016
185
72
39%
5
3%
21
11%
87
2017
148
45
30%
4
3%
20
14%
79
2018
169
57
34%
11
7%
21
12%
80
2019
185
62
34%
4
2%
23
12%
96
Note: Motorcycle operators may or may not have been fatally injured in the crash
Source: FARS 2019
49% 47% 53% 47% 52%
For additional information, see the Appendix for the percent of motorcycle operators involved in motor vehicle crashes that were confirmed or suspected of alcohol impairment by county for 2019.
11 O.C.G.A. 40-6-391(a)(1)
Page 13
Data Definitions and Considerations:
This fact sheet defines motorcyclists as either the rider (motorcycle operator) or passenger. A motorcycle includes twoor three-wheeled motorcycles, off-road motorcycles, moped, motor scooters, minibikes, and pocket bikes. A large truck is any medium or heavy truck, excluding buses and motor homes, and can include commercial and non-commercial vehicles. Passenger vehicles include passenger cars, pickup trucks, vans, and sport utility vehicles (SUVs).
Motorcycle registration data for 2019 was obtained from the Department of Revenue (DOR) by special request on the calendar year in lieu of state fiscal year. Although motorcycle registrations may use the terminology All-Terrain Vehicle (ATV) to describe off-road motorcycles, this fact sheet only considers any motorcycle involved in a crash on public roadways. Additionally, motorcycle registrations include commercial and non-commercial motorcycles. Commercial motorcycles include motorcycles owned by dealers or manufacturers.
A traffic crash is defined as an incident that involved one or more motor vehicles where at least one vehicle was in transport and the crash originated on a public trafficway, such as a road or highway. Crashes that occurred on private property, including parking lots and driveways, are excluded.
Fatal crashes are defined as crashes that involve a motor vehicle traveling on a trafficway customarily open to the public and that resulted in the death of a motorist or a non-motorist within 30 days of the crash.
Serious injuries are those suspected serious injuries reported by law enforcement and used when any injury, other than fatal injury, prevent the injured person from walking, driving, or normally continuing the activities the person was capable of before the injury occurred.
The National Center for Health Statistics (NCHS), the Federal agency responsible for use of the International Statistical Classification of Diseases and Related Health Problems, 10th revision (ICD-10) in the United States, has developed a clinical modification (CM) of the classification for morbidity (EMS, trauma, hospital, and ER data) purposes. ICD-10 Codes used were V20-V28 (.3 - .9), V29 (.4 - .9).
For fatal crashes only, Blood Alcohol Concentration (BAC) values are imputed to address the problem of missing blood alcohol test results in FARS data system. A multiple imputation methodology is employed to generate specific values of BAC for persons involved in fatal crashes. "No alcohol" refers to a blood alcohol concentration (BAC) of .00 grams per deciliter (g/dL). For motorists and non-motorists involved in a motor vehicle traffic crash that may or may not result in a fatal injury, many drivers confirmed or suspected of alcohol impairment will not have a BAC value reported in the police crash report. Drivers suspected of alcohol, may have an alcohol test administered; however, the results or findings were not validated or included in the final police crash report.
Contributing circumstances capture the precrash elements or improper actions of persons (motorcycle operators, pedestrians, bicyclists, and other motorists) that may have caused the crash. Contributing factors in fatal and nonfatal crashes are often underreported in the datasets. There is at least one record per person involved in a fatal crash (FARS Data) and some missing records for persons involved in motor vehicle traffic crashes (Crash Data).
Rural counties are counties that have a population of less than 50,000 according to the United States decennial census of 2010 or any future such census (O.C.G.A. Section 31-6-2). This is different than roadway classifications where urban road systems can be located in urban clusters (or metropolitan areas) of at least 2,500 persons within the rural counties.
At Intersection" is used when a person is on a roadway either (1) in the intersection, (2) in the area between a crosswalk and the perimeter of the intersection, or (3) in a crosswalk (marked or unmarked) adjacent to an intersection. "Intersection-Related" is used when a person is within the trafficway 50 feet out from the perimeter of an intersection area or if the crash is related to the flow of traffic through an intersection. "Not at Intersection" is when the person is more than 50 feet out from the perimeter of an intersection and the crash is not identified as related to the movement of vehicles through an intersection. "Non-Trafficway Locations" are crashes that occur outside the boundaries of the trafficway (i.e., driveways or parking lots).
Page 14
Additional Information: Other general information on motorcycle safety and traffic safety facts may be accessed at:
Appendix: Motorcycles Georgia Traffic Safety Facts https://www.gahighwaysafety.org/highway-safety/shsp/ References: National Center for Statistics and Analysis. (2020, June). Motorcycle helmet use in 2019 Overall results Traffic
Safety Fact Research Note. (DOT HS 812 936). Washington, DC: National Highway Traffic Safety Administration. Available at https://crashstats.nhtsa.dot.gov/Api/Public/ViewPublication/812936 National Center for Statistics and Analysis (2011, March). Determining Estimates of Lives and Costs Saved by Motorcycle Helmets. (DOT HS 811 433). Washington, DC: National Highway Traffic Safety Administration. Available at https://crashstats.nhtsa.dot.gov/Api/Public/ViewPublication/811433 National Center for Statistics and Analysis (2019, December). Lives and Costs Saved by Motorcycle Helmets. (DOT HS 812 867). Washington, DC: National Highway Traffic Safety Administration. Available at https://crashstats.nhtsa.dot.gov/Api/Public/ViewPublication/812867
The suggested APA format citation for this document is: Georgia Crash Outcomes Data Evaluation System. (2021, July). Motorcycles: 2019 data. (Georgia Traffic
Safety Facts). Atlanta, GA: Governor's Office of Highway Safety.
Page 15