- Collection:
- Georgia Government Publications
- Serial:
- ... performance measure report.
- Title:
- FY 2014 performance measure report
- Creator:
- Georgia. Governor's Office of Planning and Budget
- Contributor to Resource:
- Georgia. Office of Planning and Budget, issuing body.
- Publisher:
- Atlanta, Ga. : Georgia. Governor's Office of Planning and Budget
- Date of Original:
- 2013-02-12
- Subject:
- Government productivity--Georgia--Evaluation--Statistics--Periodicals
State governments--Georgia--Evaluation--Statistics--Periodicals - Location:
- United States, Georgia, 32.75042, -83.50018
- Medium:
- state government records
official reports - Type:
- Text
- Format:
- application/pdf
- Description:
- Performance measure report.
- External Identifiers:
- Call Number GA G620 .S1 P47 2014
- Metadata URL:
- https://dlg.galileo.usg.edu/id:dlg_ggpd_y-ga-bg620-b-ps1-bp47-b2014-belec-p-btext
- Digital Object URL:
- https://dlg.galileo.usg.edu/do:dlg_ggpd_y-ga-bg620-b-ps1-bp47-b2014-belec-p-btext
- Language:
- eng
- Holding Institution:
- University of Georgia. Map and Government Information Library
- Rights:
-

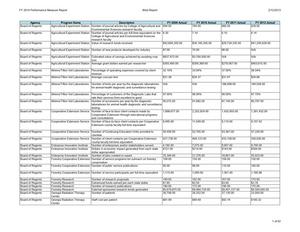
FY 2014 Performance Measure Report
Web Report
2/12/2013
Agency Board of Regents Board of Regents
Board of Regents Board of Regents Board of Regents Board of Regents Board of Regents Board of Regents Board of Regents
Board of Regents Board of Regents
Board of Regents
Board of Regents
Board of Regents Board of Regents Board of Regents Board of Regents Board of Regents Board of Regents Board of Regents Board of Regents Board of Regents Board of Regents Board of Regents Board of Regents Board of Regents Board of Regents
Program Name
Description
FY 2009 Actual
Agricultural Experiment Station Number of journal articles by College of Agricultural and 894.00
Environmental Sciences research faculty
Agricultural Experiment Station Number of journal articles per full-time equivalent on the 8.30
College of Agricultural and Environmental Sciences
research faculty
Agricultural Experiment Station Value of research funds received
$42,694,205.00
Agricultural Experiment Station Number of new products developed for industry
87.00
Agricultural Experiment Station Estimated value of savings achieved by avoiding crop loss
Agricultural Experiment Station Average grant dollars earned per researcher
$837,972.00 $393,495.00
Athens/Tifton Vet Laboratories Percentage of operating expenses covered by client revenue
Athens/Tifton Vet Laboratories Average cost per test
32.19% $31.38
Athens/Tifton Vet Laboratories Number of tests per year by the diagnostic laboratories N/A for animal health diagnostic and surveillance testing
Athens/Tifton Vet Laboratories Percentage of customers of the Diagnostic Labs that 97.00%
rate their services from excellent to good
Athens/Tifton Vet Laboratories Number of accessions per year by the diagnostic
95,075.00
laboratories for animal health diagnostic and surveillance
testing
Cooperative Extension Service Number of face-to-face client contacts made by
1,898,677.00
Cooperative Extension through educational programs
and consultations
Cooperative Extension Service Number of face-to-face client contacts per Cooperative 8,495.00
Extension county faculty full-time equivalent
Cooperative Extension Service Number of Continuing Education Units provided to clientele
Cooperative Extension Service Number of client contacts per Cooperative Extension county faculty full-time equivalent
Enterprise Innovation Institute Number of enterprises and/or stakeholders served Enterprise Innovation Institute Dollars in economic impact generated from each state
dollar appropriated Enterprise Innovation Institute Number of jobs created or saved Forestry Cooperative Extension Number of service programs for outreach on forestry
conservation Forestry Cooperative Extension Number of public service publications
50,456.00
427,736.00
4,185.00 $151.00
25,344.00 199.00
95.00
Forestry Cooperative Extension Number of service participants per full-time equivalent 1,115.00
Forestry Research Forestry Research Forestry Research Forestry Research Georgia Radiation Therapy Center Georgia Radiation Therapy Center
Number of research proposals Extramural funds earned per each state dollar Number of research publications External sponsored research funds generated Number of patients
Staff cost per patient
149.00 $1.85 190.00 $5,679,870.00 26,706.00
$81.99
FY 2010 Actual 784.00 7.10
$34,185,305.00 70.00 $3,760,000.00 $309,369.00 33.04% $34.37 N/A
96.00% 91,682.00
2,255,924.00
11,549.00
52,765.00 469,123.00 7,075.00 $214.00 21,376.00 154.00 96.00 1,000.00 162.00 $3.54 172.00 $9,984,734.00 26,252.00 $89.69
FY 2011 Actual 666.00 6.10
$29,734,335.00 88.00 N/A $270,067.00 37.00% $31.47 188,698.00
99.00% 87,140.00
1,420,955.00
8,110.00
43,361.00 433,158.00 9,957.00 $143.00 18,801.00 158.00 110.00 1,361.49 167.00 $3.60 190.00 $9,491,727.00 27,130.00 $92.14
FY 2012 Actual 628.00 6.14
$41,249,428.00 N/A N/A $403,615.00 38.54% $34.86 184,558.00
97.70% 80,797.00
1,391,432.00
9,107.42
37,226.00 330,026.00 8,795.00 $356.00 25,023.00 150.00 100.00 1,160.86 170.00 $3.76 170.00 $9,500,000.00 23,050.00 $100.32
1 of 62
FY 2014 Performance Measure Report
Web Report
2/12/2013
Agency Board of Regents Board of Regents Board of Regents Board of Regents
Board of Regents Board of Regents
Board of Regents Board of Regents Board of Regents Board of Regents Board of Regents
Board of Regents
Board of Regents
Board of Regents Board of Regents Board of Regents Board of Regents Board of Regents Board of Regents Board of Regents Board of Regents Board of Regents Board of Regents
Program Name Georgia Radiation Therapy Center Georgia Tech Research Institute Georgia Tech Research Institute Georgia Tech Research Institute
Marine Institute
Marine Institute
Marine Institute Marine Institute
Marine Institute
Marine Resources Extension Center Marine Resources Extension Center
Description Percentage of Stage I Breast Cancer Patients that are alive 5 years post-diagnosis External sponsored research funds generated
FY 2009 Actual 100.00%
$205,905,772.00
Dollars of external research funds generated for each dollar of state allocation received Estimated total economic impact of Georgia Tech Research Institute's sponsored funded research and activities Number of "Person Days" spent on research and education Number of "Person Days" delivered per state funded staff member in support of persons conducting research and education at the Marine Institute Number of publications, presentations, and theses Income from short-term visitors (research and education), includes facilities and vessels Citations in the scientific literature this year of UGAMI publications from the previous 5 years Number of interactions with Marine Extension Service coastal marine constituents Number of individuals trained by Marine Extension Services in a Hazard Analysis Critical Control Point course for the safe processing and handling of seafood
$29.00 $390,340,000.00
5,143.00 416.00
67.00 $76,615.00 245.00 53,540.00 0.00
Marine Resources Extension Total dollars generated from new commercial
$1,377,075.00
Center
aquaculture operations including hard clams and oysters
Marine Resources Extension Center
Medical College of Georgia Hospital and Clinics Medical College of Georgia Hospital and Clinics Medical College of Georgia Hospital and Clinics Payments to Georgia Military College Payments to Georgia Military College Payments to Georgia Military College Payments to Georgia Military College Payments to Georgia Military College Payments to Georgia Military College Payments to Georgia Public Telecommunications Commission
Average number of persons trained in a Hazard Analysis N/A
Critical Control Point seafood safety course per Marine
Extension Service faculty
Total senior level residency trainees
127.00
Percentage of individual residency training programs accredited Residency program graduation rate
100.00% 99.80%
Preparatory school fall enrollment
511.00
Preparatory school state appropriated dollar per student $3,385.00
Preparatory school graduation rate
76.00%
Junior college fall enrollment
6,525.00
Junior college state appropriated dollar per student
$132.00
Junior college graduation rate
21.00%
Number of listeners using Georgia Public Broadcasting 192,400.00 radio resources weekly
FY 2010 Actual 100.00% $194,727,862.00 $30.00 $472,240,000.00
6,012.00 523.00
66.00 $80,972.00 262.00 38,241.00 41.00
$1,881,505.00
20.50
109.00 100.00% 96.30% 507.00 $3,176.00 88.00% 5,764.00 $136.00 21.70% 191,000.00
FY 2011 Actual 87.50% $205,495,289.00 $35.00 $508,580,000.00
4,548.00 364.00
68.00 $90,078.00 302.00 23,239.00 40.00
$1,466,003.00
20.00
139.00 97.70% 95.50% 522.00 $3,097.00 90.00% 6,013.00 $129.00 23.50% 198,000.00
FY 2012 Actual 100.00% $306,236,727.00 $53.00 $722,718,676.00
5,765.00 490.64
30.00 $104,203.00 205.00 51,417.00 40.00
$1,668,649.00
20.00
126.00 100.00% 99.22% 513.00 $3,047.00 100.00% 7,456.00 $104.00 22.80% 193,600.00
2 of 62
FY 2014 Performance Measure Report
Web Report
2/12/2013
Agency Board of Regents
Board of Regents
Board of Regents
Board of Regents
Board of Regents
Board of Regents Board of Regents Board of Regents Board of Regents
Board of Regents Board of Regents Board of Regents Board of Regents Board of Regents Board of Regents Board of Regents Board of Regents Board of Regents Board of Regents Board of Regents Board of Regents Board of Regents Board of Regents Board of Regents Board of Regents Board of Regents Board of Regents Board of Regents Board of Regents
Program Name
Description
FY 2009 Actual
Payments to Georgia Public Number of unduplicated households viewing Georgia 1,984,200.00
Telecommunications
Public Broadcasting T.V. resources monthly
Commission
Payments to Georgia Public Number of unduplicated visitors using Georgia Public 830,036.00
Telecommunications
Broadcasting new media resources annually
Commission
Payments to Georgia Public Number of media assets downloaded/streamed by
3,445,229.00
Telecommunications
education users annually
Commission
Payments to Georgia Public Percentage of total operating expenditures supported by 56.00%
Telecommunications
state funding
Commission
Payments to Georgia Public Cost to raise a dollar
$0.49
Telecommunications
Commission
Public Libraries
Number of circulations in Georgia public libraries
47,811,748.00
Public Libraries
Percentage of Georgians with a library card
44.00%
Public Libraries
Total hours the public uses the Internet at Georgia public 15,018,105.00
libraries
Public Service/Special Funding Return on investment in terms of external grant and
1.43
Initiatives
other funding generated for each state dollar
appropriated related to the Georgia Health Sciences
University Cardiology Center Special Funding Initiative
Public Service/Special Funding Students in Nurse Anesthetist Program
55.00
Initiatives
Public Service/Special Funding GHSU/UGA Medical Partnership class size
N/A
Initiatives
Public Service/Special Funding Number of direct extension contacts made at Ft. Valley 37,250.00
Initiatives
State University
Regents Central Office
Employee turnover rate
11.00%
Regents Central Office
Average number of days to process a payment
22.00
Regents Central Office
Number of audit findings
0.00
Regents Central Office
Percentage of payments made electronically
37.00%
Regents Central Office
Total payments processed
6,624.00
Regents Central Office
Number of online database searches on GALILEO
38,486,226.00
Regents Central Office
Average percent cost increase in health benefits over 9.80%
prior year
Regents Central Office
Number of engagements (assurance, consulting and 166.00
investigation) completed by USG Internal Audits
Regents Central Office
Percentage of eligible audit organizations with a
29.00%
satisfactory peer review
Regents Central Office
Communicate Key Board Actions/USG News (number of 60.00
news releases)
Regents Central Office
Number of media inquiries
252.00
Regents Central Office
Number of page views on USG webpages (public
1,986,345.00
inquiries)
Regents Central Office
Number of open records requests
56.00
Regents Central Office
Percentage of new and under-represented service
22.00%
provider participation for design and construction
Regents Central Office
Percentage of rented space directly related to unmet 28.56%
campus needs
Regents Central Office
Number of degree programs approved
47.00
Regents Central Office
Number of degree programs terminated
5.00
FY 2010 Actual 2,002,336.00
1,049,611.00
4,195,074.00
53.00%
$0.61
47,155,895.00 43.00% 13,508,851.00 1.46
60.00 N/A 38,301.00 6.00% 19.00 2.00 55.00% 5,152.00 42,009,934.00 8.20% 259.00 88.00% 68.00 274.00 1,893,249.00 66.00 6.00% 25.14% 49.00 6.00
FY 2011 Actual 2,015,657.00
1,599,137.00
4,868,327.00
47.00%
$0.54
48,205,800.00 44.00% 12,189,724.00 2.04
59.00 40.00 38,250.00 16.00% 23.00 1.00 67.00% 4,338.00 47,812,845.00 9.20% 262.00 100.00% 58.00 194.00 1,800,473.00 60.00 3.00% 24.97% 73.00 16.00
FY 2012 Actual 1,953,164.00
2,032,291.00
4,578,744.00
42.00%
$0.52
43,529,545.00 43.60% 13,176,228.00 2.76
60.00 80.00 41,104.00 17.00% 28.00 0.00 66.00% 4,207.00 179,331,891.00 5.20% 280.00 100.00% 58.00 321.00 2,105,401.00 96.00 16.00% 26.48% 44.00 277.00
3 of 62
FY 2014 Performance Measure Report
Web Report
2/12/2013
Agency Board of Regents
Board of Regents Board of Regents Board of Regents Board of Regents
Board of Regents Board of Regents Board of Regents
Board of Regents
Board of Regents
Board of Regents
Board of Regents Board of Regents Board of Regents Board of Regents
Program Name Regents Central Office
Research Consortium Research Consortium Research Consortium Research Consortium
Research Consortium Research Consortium Skidaway Institute of Oceanography Skidaway Institute of Oceanography Skidaway Institute of Oceanography Teaching
Teaching Teaching Teaching Teaching
Board of Regents
Board of Regents
Board of Regents
Board of Regents
Board of Regents
Board of Regents
Bright from the Start: Georgia Department of Early Care and Learning Bright from the Start: Georgia Department of Early Care and Learning Bright from the Start: Georgia Department of Early Care and Learning
Veterinary Medicine Experiment Station Veterinary Medicine Experiment Station Veterinary Medicine Experiment Station Veterinary Medicine Teaching Hospital Veterinary Medicine Teaching Hospital Veterinary Medicine Teaching Hospital Child Care Services
Child Care Services
Child Care Services
Bright from the Start: Georgia Department of Early Care and Learning
Child Care Services
Description
FY 2009 Actual
Number of Georgia RCP Optometry students
4.00
completing/graduating from the program
Computer Science student credit hours taught
1,401.00
Number of sponsored projects
129.00
Student credit hours per faculty member
467.00
Number of projects per Georgia Electronic Design
8.60
Center faculty
Number of Computer Science graduates
40.00
Number of renewed sponsor projects
83.00
Number of papers and presentations presented by
111.00
faculty
Additional sponsored and other dollars generated for $3.00
each state dollar
Percentage of research grant proposals awarded in each 33.00%
fiscal year
Number of students enrolled at University System of
282,978.00
Georgia institutions
Total sponsored fund revenue (in millions)
$1,491.00
System-wide graduation rate
58.97%
System-wide retention rate
78.92%
In-state tuition affordability ranking for the University
3.00
System of Georgia's public four-year institutions among
the 16 member states of the Southern Regional
Education Board
Total extramural research funding
$12,974,890.00
Extramural research dollars generated per state dollar $4.23
Total scientific publications
333.00
Annual caseload
18,840.00
Average net income/case
$40.37
Percentage of clients surveyed who rate the services received as good or excellent Average days to respond to category one serious complaints
95.00% TBD
Percentage of licensed child care learning centers,
75.00%
group day care homes, and family day care homes that
are compliant with licensing rules
Number of licensing, monitoring, technical assistance, and complaint investigation visits to child care learning centers, group day care homes, and family day care homes each fiscal year in order to increase compliance and raise quality Number of audit findings
14,203.00 0.00
FY 2010 Actual 8.00 828.00 122.00 276.00 8.10 40.00 70.00 146.00 $3.00 43.00% 301,892.00 $1,762.00 59.19% 77.00% 7.00
$15,365,086.00 $5.56 326.00 19,696.00 $32.00 95.00% TBD
81.00%
14,667.00
0.00
FY 2011 Actual 5.00 981.00 122.00 327.00 8.10 27.00 74.00 150.00 $3.00 35.00% 311,442.00 $1,929.00 59.51% 76.59% 7.00
$17,018,986.00 $6.41 354.00 19,801.00 $66.24 95.00% TBD
88.00%
19,019.00
0.00
FY 2012 Actual 7.00 1,089.00 123.00 363.00 8.20 54.00 60.00 148.00 $3.00 37.00% 318,027.00 $1,797.00 60.47% 76.08% N/A
$17,460,592.00 $6.93 325.00 20,892.00 $36.98 97.00% 2.00
92.00%
13,045.00
0.00
4 of 62
FY 2014 Performance Measure Report
Web Report
2/12/2013
Agency Bright from the Start: Georgia Department of Early Care and Learning Bright from the Start: Georgia Department of Early Care and Learning Bright from the Start: Georgia Department of Early Care and Learning Bright from the Start: Georgia Department of Early Care and Learning Bright from the Start: Georgia Department of Early Care and Learning Bright from the Start: Georgia Department of Early Care and Learning Bright from the Start: Georgia Department of Early Care and Learning Bright from the Start: Georgia Department of Early Care and Learning Bright from the Start: Georgia Department of Early Care and Learning
Program Name Child Care Services Nutrition Nutrition Nutrition Nutrition Pre-Kindergarten Program Pre-Kindergarten Program Pre-Kindergarten Program Pre-Kindergarten Program
Bright from the Start: Georgia Department of Early Care and Learning Bright from the Start: Georgia Department of Early Care and Learning Bright from the Start: Georgia Department of Early Care and Learning Bright from the Start: Georgia Department of Early Care and Learning
Pre-Kindergarten Program Quality Initiatives Quality Initiatives Quality Initiatives
Description Percentage of weekly Child Care Subsidy Payments processed electronically
FY 2009 Actual N/A
FY 2010 Actual N/A
FY 2011 Actual N/A
FY 2012 Actual 94.00%
Number of Child and Adult Care Food Program and Summer Food Service Program agreements
919.00
900.00
911.00
880.00
Number of feeding sites per fiscal year for both the Child 5,851.00 and Adult Care Food Program and Summer Food Service Program, which is a result of further outreach and training efforts Number of meals served per year by providers in the 81,914,007.00 Child and Adult Care Food Program and the Summer Food Service Program
Percentage annual increase in the number of Child and 8.00% Adult Care Food Program feeding sites
5,956.00 86,001,243.00 7.00%
6,310.00 85,200,000.00 5.00%
6,280.00 80,667,591.00 0.00%
Georgia Pre-Kindergarten program enrollment
78,129.00
81,068.00
82,608.00
82,868.00
Number of children on Pre-Kindergarten waiting list
7,097.00
7,259.00
8,503.00
6,214.00
Percentage of classrooms implementing the Work Sampling System online in order to monitor and report student progress
5.17%
Percentage of children enrolled in a Georgia's Pre-K classroom utilizing Work Sampling Online (WSO) rated as "in process" or "proficient" on at least 80% of the Work Sampling System (WSS) Language and Literacy Indicators Percentage of children enrolled in a Georgia's Pre-K classroom utilizing WSO rated as "in process" or "proficient" on at least 80% of the WSS Mathematics indicators Number of compliant licensed early care and education programs that participate in the Quality Rating and Improvement System in order to improve quality
N/A N/A 615.00
Percentage of compliant licensed early care and
25.16%
education programs that participate in the Quality Rating
and Improvement System in order to improve quality
Number of unique early learning professionals in the INCENTIVES Program
3,345.00
9.64% N/A N/A 906.00 15.10% 3,324.00
27.00% 94.00% 91.00% 1,411.00 23.99% 1,049.00
53.34% 92.00% 92.00% 751.00 12.00% 1,508.00
5 of 62
FY 2014 Performance Measure Report
Web Report
2/12/2013
Agency
Program Name
Bright from the Start: Quality Initiatives
Georgia Department of
Early Care and
Learning
Bright from the Start: Quality Initiatives
Georgia Department of
Early Care and
Learning
Commissioner of
Enforcement
Insurance
Commissioner of
Enforcement
Insurance
Commissioner of
Fire Safety
Insurance
Commissioner of
Fire Safety
Insurance
Commissioner of
Fire Safety
Insurance
Commissioner of
Fire Safety
Insurance
Commissioner of
Fire Safety
Insurance
Commissioner of
Fire Safety
Insurance
Commissioner of
Industrial Loan
Insurance
Commissioner of
Industrial Loan
Insurance
Commissioner of
Insurance Regulation
Insurance
Commissioner of
Insurance Regulation
Insurance
Commissioner of
Insurance
Insurance Regulation
Commissioner of
Insurance Regulation
Insurance
Commissioner of
Special Fraud
Insurance
Court of Appeals
Court of Appeals
Court of Appeals
Court of Appeals
Court of Appeals
Court of Appeals
Department of
Certificate of Need Appeal
Administrative Services Panel
Department of
Certificate of Need Appeal
Administrative Services Panel
Department of
Fleet Management
Administrative Services
Department of
Fleet Management
Administrative Services
Description Percentage of early learning and education programs that have improved their level of quality in the Quality Rating and Improvement System
FY 2009 Actual N/A
Percentage of INCENTIVES Program participants who increased their education level from the initial credential/degree earned
12.50%
The number of cases closed with actions
1,163.00
Fines collected
$1,252,336.00
Number of inspections conducted
72,291.00
Percentage of mandated inspections completed (June to N/A
June)
Percentage of inspections conducted that are re-
N/A
inspections
Number of permits and approvals issued
10,398.00
Number of investigations initiated into suspected criminal fires Percentage of arson investigations closed during same fiscal year Dollar amount returned to consumers by noncompliant companies Number of lenders regulated
864.00 100.00% N/A 1,013.00
Number of licensed insurance companies
1,658.00
Funds returned to Georgia consumers through complaint $11,003,326.00
resolution (in dollars)
2013 Budget Team
Average number of days to resolve a complaint
Review
Percentage of domestic insurers that are financially
98.00%
stable
The number of investigations completed
40.00
Appellate filings Revenue from Appellate Court fees Average caseload per judge for cases filed Number of Certificate of Need appeals filed
3,260.00 $139,544.18 272.00 7.00
FY 2010 Actual N/A
10.00%
1,103.00 $1,289,750.00 66,199.00 N/A N/A 8,899.00 663.00 100.00% N/A 1,019.00 1,658.00 $10,360,877.00
Yes (BT Rec) 98.00% 36.00 3,212.00 $259,633.20 268.00 7.00
FY 2011 Actual N/A
9.26%
1,426.00 $289,256.00 58,401.00 84.00% N/A 8,719.00 779.00 100.00% N/A 1,063.00 1,632.00 $9,271,982.00
98.00% 342.00 3,312.00 $409,161.55 276.00 22.00
FY 2012 Actual N/A
10.10%
1,745.00 $2,529,805.00 56,518.00 77.00% N/A 8,212.00 546.00 100.00% N/A 1,036.00 1,550.00 $7,740,099.00
96.20% 498.00 3,299.00 $139,016.84 275.00 8.00
Number of Certificate of Need hearings held
N/A
3.00
4.00
6.00
Average preventative maintenance costs for participating $225.00 vehicles
Percentage of state-owned vehicles that participate in the Automotive Resources International motor vehicle maintenance program
16.40%
$267.00 29.80%
$274.00 30.10%
$864.00 30.00%
6 of 62
FY 2014 Performance Measure Report
Web Report
2/12/2013
Agency
Program Name
Department of
Fleet Management
Administrative Services
Department of
Fleet Management
Administrative Services
Description Number of state-owned vehicles that participate in the Automotive Resources International motor vehicle maintenance program Total savings resulting from the state's use of preventative maintenance contract
FY 2009 Actual 3,324.00
N/A
Department of
Human Resources
Administrative Services Administration
Number of state agencies and entities using the Careers 88.00 Site for job vacancy posting and applicant tracking
Department of
Human Resources
Administrative Services Administration
Number of jobs posted each year on Careers.ga.gov 2,234.00
Department of
Human Resources
Administrative Services Administration
Number of applications submitted to job requisitions on 273,323.00 Careers.ga.gov
Department of
Human Resources
Administrative Services Administration
Employee customers' overall satisfaction with the Benefits Operations Center
85.00%
Department of
Human Resources
Administrative Services Administration
Percentage of eligible employees participating in employee-paid benefits
98.00%
Department of
Office of State Administrative Number of cases
Administrative Services Hearings
36,224.00
Department of
Office of State Administrative Number of cases closed
Administrative Services Hearings
36,214.00
Department of
Office of State Administrative Average number of days to close cases
Administrative Services Hearings
28.10
Department of
Office of State Administrative Percentage of cases that closed within the 90 days
Administrative Services Hearings
Federal grants standard
97.40%
Department of
Office of State Administrative Number of cases per Judge
Administrative Services Hearings
3,018.00
Department of
Office of State Administrative Average cost per case
Administrative Services Hearings
$114.00
Department of
Office of the State Treasurer Number of active accounts in the Georgia Higher
Administrative Services
Education Savings Plan
103,824.00
Department of
Office of the State Treasurer Number of transactions in the statewide merchant card 2,635,210.00
Administrative Services
contract
Department of
Office of the State Treasurer The return on the state general obligation bond portfolio 1.16
Administrative Services
will exceed the return on GaFund 1
Department of
Payments to Georgia Aviation Total number of hours flown, public safety hours, natural N/A
Administrative Services Authority
resource hours, and passenger transportation hours
Department of
Payments to Georgia Aviation Number of Fire Suppression Mission Requests
N/A
Administrative Services Authority
Supported
FY 2010 Actual 4,183.00 N/A 72.00 2,665.00 310,747.00 76.00% 98.00% 35,129.00 27,234.00 36.40 96.90% 2,269.00 $144.00 112,265.00 2,876,312.00 1.99 N/A N/A
FY 2011 Actual 5,451.00 N/A 82.00 2,971.00 366,439.00 87.50% 93.00% 36,645.00 36,645.00 37.40 95.90% 1,106.00 $105.00 121,904.00 4,323,290.00 0.85 N/A N/A
FY 2012 Actual 7,704.00 N/A 77.00 3,298.00 377,036.00 92.00% 92.00% 40,048.00 40,048.00 39.00 94.20% 3,337.00 $97.60 131,859.00 4,987,972.00 0.51 7,663.00 575.00
7 of 62
FY 2014 Performance Measure Report
Web Report
2/12/2013
Agency
Program Name
Department of
Risk Management
Administrative Services
Department of
Risk Management
Administrative Services
Department of
Risk Management
Administrative Services
Department of
Risk Management
Administrative Services
Department of
Risk Management
Administrative Services
Department of
State Purchasing
Administrative Services
Department of
State Purchasing
Administrative Services
Department of
State Purchasing
Administrative Services
Department of
State Purchasing
Administrative Services
Department of
State Purchasing
Administrative Services
Department of
Surplus Property
Administrative Services
Department of
Surplus Property
Administrative Services
Department of
Surplus Property
Administrative Services
Department of Agriculture Department of Agriculture Department of Agriculture Department of Agriculture Department of Agriculture Department of Agriculture
Consumer Protection Consumer Protection Consumer Protection Consumer Protection Consumer Protection Consumer Protection
Description
FY 2009 Actual
Trust fund balance funding ratio for the Workers
5.20%
Compensation Trust Fund (Funding ratio=Actual funds
available vs. Actuarial recommendation of funds that
should be available)
Trust fund balance funding ratio for the Liability Trust 81.00%
Fund (Funding ratio=Actual funds available vs. Actuarial
recommendation of funds that should be available)
Trust fund balance funding ratio for the Unemployment Trust Fund (Funding ratio=Actual funds available vs. Actuarial recommendation of funds that should be available) Percentage of workers' compensation claims closed in relation to new claims received
69.50% 112.00%
Cost avoidance related to workers' compensation
N/A
settlements
Estimated benefits captured through finalizing statewide N/A contracts
Number of statewide contracts
75.00
FY 2010 Actual 2.40%
55.20%
0.04%
108.00% $13,447,046.00 N/A 82.00
FY 2011 Actual 2.00%
27.20%
0.06%
102.00% $33,199,720.00 N/A 85.00
FY 2012 Actual 3.00%
20.40%
11.30%
96.00% $10,328,313.00 $23,693,667.00 66.00
Number of agencies using the Team Georgia
5.00
Marketplace application for their procurement processes
Number of training participants for the state purchasing 2,778.00 program
Percentage of agency contracts completed within six N/A months
Total number of surplus property transactions
5,057.00
12.00 5,236.00 N/A 4,398.00
22.00 5,244.00 N/A 5,162.00
31.00 2,474.00 62.50% 5,341.00
Total number of redistribution transactions
366.00
393.00
437.00
389.00
Total value of sales transactions of state surplus property
$960,542.00
Number of establishments inspected
152,921.00
Percentage of establishments out of compliance
10.00%
warranting follow-up inspection
Number of violative samples from regulated food
209.00
products
Percentage of non-compliant establishments found to be N/A
compliant at follow-up inspection
Percentage of inspections completed
63.60%
Percentage of food establishments inspected for
N/A
regulatory compliance
$843,515.00
149,503.00 8.00% 142.00 N/A 61.40% N/A
$865,117.00
143,345.00 13.00% 154.00 N/A 60.40% 90.00%
$1,257,615.00
141,485.00 11.97% 130.00 92.01% 75.75% 87.00%
8 of 62
FY 2014 Performance Measure Report
Web Report
2/12/2013
Agency Department of Agriculture
Department of Agriculture Department of Agriculture Department of Agriculture Department of Agriculture Department of Agriculture Department of Agriculture Department of Agriculture
Department of Agriculture
Department of Agriculture
Department of Agriculture
Department of Agriculture
Department of Agriculture
Department of Agriculture
Department of Agriculture Department of Agriculture Department of Agriculture Department of Agriculture Department of Banking and Finance Department of Banking and Finance Department of Banking and Finance Department of Banking and Finance Department of Banking and Finance
Program Name Consumer Protection
Consumer Protection Marketing and Promotion
Description
FY 2009 Actual
Percentage of fuel establishments inspected for
74.00%
regulatory compliance (based on an 18 month inspection
cycle)
Percentage of companion animal establishments
62.00%
inspected for regulatory compliance
Total number of Georgia Grown participants
193.00
Marketing and Promotion
Marketing and Promotion
Marketing and Promotion
Marketing and Promotion
Payments to Georgia Agricultural Exposition Authority Payments to Georgia Agricultural Exposition Authority Payments to Georgia Agricultural Exposition Authority Payments to Georgia Agricultural Exposition Authority Payments to Georgia Agricultural Exposition Authority Payments to Georgia Agricultural Exposition Authority Payments to Georgia Agricultural Exposition Authority Poultry Veterinary Diagnostic Labs Poultry Veterinary Diagnostic Labs Poultry Veterinary Diagnostic Labs Poultry Veterinary Diagnostic Labs Departmental Administration
Percentage of total Farmers Market space leased to
97.00%
vendors
Number of farmers, retailers and wholesalers utilizing the 2,554.00
Atlanta Farmers Market
Percentage increase in total sales at the Atlanta
4.00%
Farmers' Market
Percentage increase in total users of the Atlanta
4.00%
Farmers' Market
Number of visitors to the National Fair
407,136.00
Percentage of total expenditures funded through selfgenerated funds
Gross fair revenues
81.60% $4,231,603.00
Gross event revenues
$2,177,795.00
Amount in capital reserves each fiscal year
$374,193.00
Number of visitors annually (Fair and non-fair)
777,636.00
Utilization rate
90.40%
Number of avian influenza tests provided to poultry growers and hobbyists Number of samples submitted to the poultry lab network yearly for diagnostic testing Number of reported diseases for which monitoring standards are set that are tested for Total number of tests performed
290,658.00 57,904.00 N/A 1,112,663.00
Percentage of Department vendors paid electronically 50.00%
Departmental Administration Percentage of application fees and other fees/fines
N/A
submitted to the Department electronically
Financial Institution Supervision Average examination turnaround time for bank and credit 77.00
union examinations (calendar days)
Financial Institution Supervision Average report turnaround time for bank and credit union 53.00
examinations (calendar days)
Financial Institution Supervision Number of examinations conducted of state-chartered 179.00
banks and credit unions
FY 2010 Actual 76.00%
58.00% 213.00 97.00% 2,405.00 N/A N/A 416,706.00
81.70%
$3,972,203.00
$2,036,568.00
$543,716.00
808,412.00
83.00%
298,018.00 56,992.00 N/A 1,176,705.00 51.00% 74.00% 123.00 106.00 194.00
FY 2011 Actual 64.00%
60.00% 238.00 97.00% 2,292.00 3.00% 4.00% 465,053.00
87.10%
$4,669,479.00
$2,409,693.00
$797,248.00
772,227.00
84.70%
315,954.00 61,134.00 N/A 1,298,629.00 64.00% 85.00% 100.00 76.00 205.00
FY 2012 Actual 70.00%
61.00% 150.00 97.00% 2,593.00 -1.00% 1.00% 439,931.00
87.40%
$4,564,016.00
$2,129,032.00
$480,352.00
N/A
83.50%
311,834.00 58,451.00 N/A 1,306,277.00 82.00% 85.00% 73.00 55.00 200.00
9 of 62
FY 2014 Performance Measure Report
Web Report
2/12/2013
Agency Department of Banking and Finance Department of Banking and Finance Department of Banking and Finance Department of Banking and Finance Department of Banking and Finance
Department of Banking and Finance
Department of Banking and Finance
Program Name
Description
Financial Institution Supervision Number of formal administrative actions outstanding for
banks and credit unions
Financial Institution Supervision Percentage of problem banks that showed improvement
at their next examination
Non-Depository Financial
Number of risk-based examinations and investigations
Institution Supervision
conducted
Non-Depository Financial
Number of administrative actions issued to licensed and
Institution Supervision
unlicensed entities
Non-Depository Financial
Mortgage Asset Research Institute Mortgage Fraud
Institution Supervision
Index (a value greater than 100 indicates more fraud
than expected given loan origination volume)
Non-Depository Financial
Average number of calendar days required to process a
Institution Supervision
mortgage broker, mortgage lender, or mortgage loan
originator license
Non-Depository Financial
Average number of calendar days required to process a
Institution Supervision
Money Service Business license or registration
FY 2009 Actual 48.00 12.00% 266.00 180.00 159.00
24.00
4.00
Department of Behavioral Health and Developmental Disabilities Department of Behavioral Health and Developmental Disabilities Department of Behavioral Health and Developmental Disabilities Department of Behavioral Health and Developmental Disabilities Department of Behavioral Health and Developmental Disabilities Department of Behavioral Health and Developmental Disabilities Department of Behavioral Health and Developmental Disabilities Department of Behavioral Health and Developmental Disabilities Department of Behavioral Health and Developmental Disabilities
Adult Addictive Diseases Services
Adult Addictive Diseases Services
Adult Addictive Diseases Services
Adult Addictive Diseases Services
Adult Addictive Diseases Services
Adult Addictive Diseases Services
Adult Developmental Disabilities Services
Adult Developmental Disabilities Services
Adult Developmental Disabilities Services
Number of clients served in community-based
N/A
detoxification and crisis services
Number of clients served in community-based treatment N/A and recovery services
Percentage of clients discharged from crisis or
N/A
detoxification programs who receive follow-up behavioral
health services within 14 days
Percentage of clients not returning for new services
N/A
within 90 days of discharge
Percentage of women successfully completing treatment N/A in a Ready for Work program
Percentage of clients active in treatment 90 days after N/A beginning non-crisis stabilization services
Persons served in community-based adult developmental disabilities services
14,518.00
Average Mobile Crisis Team response time (in hours) N/A
Number of Georgia consumers on waiting list for waivers 3,180.00 as of June 30
FY 2010 Actual 64.00 0.00% 224.00 287.00 115.00 36.00 5.00 7,297.00
N/A
N/A
N/A
N/A
N/A
16,657.00
N/A
4,190.00
FY 2011 Actual 75.00 2.00% 107.00 726.00 66.00 14.00 4.00 7,722.00
N/A
33.00%
N/A
N/A
N/A
17,453.00
1.50
5,972.00
FY 2012 Actual 75.00 7.00% 235.00 391.00 36.00 18.00 3.00 7,522.00
24,062.00
32.00%
89.00%
22.10%
19.00%
16,348.00
1.50
6,673.00
10 of 62
FY 2014 Performance Measure Report
Web Report
2/12/2013
Agency Department of Behavioral Health and Developmental Disabilities Department of Behavioral Health and Developmental Disabilities Department of Behavioral Health and Developmental Disabilities Department of Behavioral Health and Developmental Disabilities Department of Behavioral Health and Developmental Disabilities Department of Behavioral Health and Developmental Disabilities Department of Behavioral Health and Developmental Disabilities Department of Behavioral Health and Developmental Disabilities Department of Behavioral Health and Developmental Disabilities Department of Behavioral Health and Developmental Disabilities Department of Behavioral Health and Developmental Disabilities Department of Behavioral Health and Developmental Disabilities Department of Behavioral Health and Developmental Disabilities
Program Name Adult Developmental Disabilities Services Adult Forensic Services Adult Forensic Services Adult Forensic Services Adult Forensic Services Adult Forensic Services Adult Forensic Services Adult Forensic Services Adult Forensic Services Adult Forensic Services Adult Forensic Services Adult Forensic Services Adult Mental Health Services
Description Number of developmental disabilities consumers transitioned from Georgia's state hospitals to the community
Number of adult pretrial evaluations completed for superior or state courts
FY 2009 Actual 128.00
2,253.00
Percentage of incompetent to stand trial clients
N/A
completing restoration who were opined to be competent
Percentage of outpatient evaluations completed within 45.00% 45 days of court order
Number of outpatient evaluations completed
2,126.00
Number of inpatient pretrial evaluations, incompetent to 1,136.00 stand trail evaluations, civil commitment evaluations and annual reviews completed
Number of individuals declared incompetent to stand trial N/A who completed restoration
Median length of stay in years of civilly committed ISTS 4.80 and NGRIs in state hospital on last day of fiscal year
Number of long-term discharges as a percentage of total 28.00% long-term forensic clients on the forensic census
Number served in community integration home and supervised apartments
97.00
Number on conditional release on last day of fiscal year 111.00
Number of long-term discharges readmitted to hospital 2,253.00 within 180 days
Number adult mental health consumers served in state 7,489.00 facilities
FY 2010 Actual 246.00 2,130.00 71.00% 49.00% 2,002.00 1,189.00 363.00 4.70 26.00% 96.00 123.00 2,130.00 7,312.00
FY 2011 Actual 192.00 2,070.00 73.00% 56.00% 1,982.00 1,238.00 337.00 5.30 29.00% 97.00 136.00 2,070.00 6,331.00
FY 2012 Actual 168.00 2,064.00 72.00% 38.00% 1,927.00 1,044.00 361.00 5.50 30.00% 100.00 137.00 2,064.00 5,601.00
11 of 62
FY 2014 Performance Measure Report
Web Report
2/12/2013
Agency Department of Behavioral Health and Developmental Disabilities Department of Behavioral Health and Developmental Disabilities Department of Behavioral Health and Developmental Disabilities Department of Behavioral Health and Developmental Disabilities Department of Behavioral Health and Developmental Disabilities Department of Behavioral Health and Developmental Disabilities Department of Behavioral Health and Developmental Disabilities Department of Behavioral Health and Developmental Disabilities Department of Behavioral Health and Developmental Disabilities Department of Behavioral Health and Developmental Disabilities Department of Behavioral Health and Developmental Disabilities Department of Behavioral Health and Developmental Disabilities Department of Behavioral Health and Developmental Disabilities
Program Name Adult Mental Health Services
Description
FY 2009 Actual
Percentage of adult mental health consumers served in 9.00%
state facilities
Adult Mental Health Services
Number of homeless individuals in adult community
N/A
mental health services who obtain stable housing while
enrolled in services
Adult Mental Health Services
Percentage of homeless individuals in adult community N/A mental health services who obtain stable housing while enrolled in services
Adult Mental Health Services Number of assertive community treatment participants N/A that are re-admitted two or more times to a state psychiatric hospital
Adult Mental Health Services Percentage of people enrolled in supportive employment 34.97% who are competitively employed
Adult Nursing Home Services Persons served in adult nursing home services
165.00
Adult Nursing Home Services National Association of State Mental Health Program 0.29 Directors Research Institute, Inc. client injury rate per 1,000 inpatient days
Adult Nursing Home Services Medication error rate per 1000 inpatient days
0.39
Adult Nursing Home Services Percentage of clients with pressure ulcers
N/A
Child and Adolescent Addictive Number of youth served in community-based addictive 976.00
Diseases Services
disease services
Child and Adolescent Addictive Average number of business days from completion of N/A
Diseases Services
behavioral health assessment/referral (authorization) for
treatment, to the first day youth participates in service
(encounter)
Child and Adolescent Addictive Percentage of youth who abstained from use or
45.00%
Diseases Services
experienced a reduction in use while in treatment
Child and Adolescent Developmental Disabilities
Persons served in community-based child and adolescent developmental disabilities programs
2,518.00
FY 2010 Actual 7.00% N/A N/A N/A 29.00% 162.00 0.35 1.12 N/A 1,102.00 N/A N/A 2,427.00
FY 2011 Actual 5.00% N/A N/A N/A N/A 167.00 0.87 1.46 N/A 1,121.00 N/A 55.80% 2,748.00
FY 2012 Actual 5.00% 1,674.00 35.00% 159.00 34.00% 154.00 0.42 1.58 13.00% 1,197.00 12.00 58.00% 3,089.00
12 of 62
FY 2014 Performance Measure Report
Web Report
2/12/2013
Agency Department of Behavioral Health and Developmental Disabilities Department of Behavioral Health and Developmental Disabilities Department of Behavioral Health and Developmental Disabilities Department of Behavioral Health and Developmental Disabilities Department of Behavioral Health and Developmental Disabilities Department of Behavioral Health and Developmental Disabilities Department of Behavioral Health and Developmental Disabilities Department of Behavioral Health and Developmental Disabilities Department of Behavioral Health and Developmental Disabilities Department of Behavioral Health and Developmental Disabilities Department of Behavioral Health and Developmental Disabilities
Department of Behavioral Health and Developmental Disabilities Department of Behavioral Health and Developmental Disabilities
Program Name Child and Adolescent Developmental Disabilities
Description Number of children and adolescents receiving family support services for the first time
FY 2009 Actual N/A
Child and Adolescent Developmental Disabilities
Percentage of children and adolescents with
N/A
developmental disabilities who received family supports
for the first time
Child and Adolescent Forensic Total number of evaluations completed on juveniles in 1,280.00
Services
juvenile or superior court
Child and Adolescent Forensic Percentage of juvenile court evaluations completed
Services
within 30 days of receipt of the court order
48.00%
Child and Adolescent Forensic Percentage of juvenile judges reporting forensic
N/A
Services
evaluations were helpful to court proceedings
Child and Adolescent Mental Number of youth diverted from psychiatric residential N/A
Health Services
treatment facilities to community based alternatives
Child and Adolescent Mental Number of youth served in community mental health N/A
Health Services
clubhouses that did not escalate to intensive family
intervention services
Child and Adolescent Mental Youth served in community-based child and adolescent N/A
Health Services
mental health programs
Child and Adolescent Mental Number of days from completion of behavioral health N/A
Health Services
assessment/referral to treatment, to the first day youth
participates in service(s)
Departmental Administration - Number of class hours of training delivered to
N/A
Behavioral Health
Department of Behavioral Health and Developmental
Disabilities staff
Departmental Administration Behavioral Health
Departmental Administration Behavioral Health
Percentage of accounts payable-contract payment
N/A
requests entered into PeopleSoft within 3 business days
of the request being submitted to Department of
Behavioral Health and Developmental Disabilities
accounts payable
Number of psychiatrists recruited and hired to staff
N/A
Department of Behavioral Health and Developmental
Disabilities locations around the state
Direct Care Support Services Number of face to face admission evaluations performed 18,103.00 by the state hospitals
FY 2010 Actual N/A N/A 1,174.00 43.00% N/A N/A N/A N/A N/A N/A N/A
N/A 15,323.00
FY 2011 Actual N/A N/A 1,220.00 50.00% N/A 300.00 N/A N/A N/A N/A N/A
7.00 14,128.00
FY 2012 Actual 1,434.00 64.00% 1,232.00 39.00% 92.00% 723.00 92.00 37,019.00 13.00 195,405.00 96.00%
13.00 9,730.00
13 of 62
FY 2014 Performance Measure Report
Web Report
2/12/2013
Agency Department of Behavioral Health and Developmental Disabilities Department of Behavioral Health and Developmental Disabilities
Program Name Direct Care Support Services
Direct Care Support Services
Description Percentage of admission evaluation referrals to state hospitals that receive a disposition (acceptance or denial) response within 4 hours of receipt of referral
FY 2009 Actual N/A
Percentage of people who present for admission
N/A
evaluation at a state hospital whose hospital admission
was avoided as a result of their being served in a
Department of Behavioral Health and Developmental
Disabilities hospital 23 hour observation program
Department of Behavioral Health and Developmental Disabilities Department of Behavioral Health and Developmental Disabilities
Department of Behavioral Health and Developmental Disabilities Department of Behavioral Health and Developmental Disabilities Department of Behavioral Health and Developmental Disabilities Department of Behavioral Health and Developmental Disabilities Department of Behavioral Health and Developmental Disabilities Department of Behavioral Health and Developmental Disabilities Department of Behavioral Health and Developmental Disabilities Department of Behavioral Health and Developmental Disabilities Department of Community Affairs
Georgia Council on Developmental Disabilities
Georgia Council on Developmental Disabilities
Georgia Council on Developmental Disabilities
Number of people with developmental disabilities, family N/A members and people without disabilities involved in Georgia Council on Developmental Disabilities efforts
Percentage of people with developmental disabilities N/A who feel they are more independent, productive, included and integrated in communities and self determined in their lives as a result of Georgia Council on Developmental Disabilities initiatives Number of people with developmental disabilities who N/A feel more involved and welcomed in their communities
Sexual Offender Review Board Number of cases completed by each evaluator each month
18.00
Sexual Offender Review Board Number of sexual offender cases leveled/completed
641.00
Sexual Offender Review Board Average amount of time it takes to complete each case N/A (in hours)
Substance Abuse Prevention Number of persons served in community-based prevention programs
335,155.00
Substance Abuse Prevention Percentage of prevention payments reviewed and
N/A
processed within 5 business days
Substance Abuse Prevention
Percentage of persons served in community-based prevention programs via an evidence-based program/strategy/policy
46.00%
Substance Abuse Prevention
Percentage of adults 18-24 who report binge drinking in 11.40% the past month (based on Behavioral Risk Factor Surveillance System Survey data)
Building Construction
Number of building code clarifications/technical assistance provided to public and private sector customers per consultant
1,021.00
FY 2010 Actual N/A N/A
N/A N/A
N/A 19.00 690.00 N/A 267,514.00 N/A 61.00% 18.10% 886.00
FY 2011 Actual N/A N/A
N/A N/A
N/A 26.00 910.00 8.50 200,000.00 N/A 50.00% 16.60% 713.00
FY 2012 Actual 94.00% 37.00%
230.00 82.00%
38.00 40.00 1,427.00 5.50 600,000.00 80.00% 34.00% N/A 897.00
14 of 62
FY 2014 Performance Measure Report
Web Report
2/12/2013
Agency Department of Community Affairs Department of Community Affairs Department of Community Affairs Department of Community Affairs
Department of Community Affairs Department of Community Affairs Department of Community Affairs
Department of Community Affairs Department of Community Affairs Department of Community Affairs Department of Community Affairs
Department of Community Affairs
Department of Community Affairs
Department of Community Affairs
Department of Community Affairs
Department of Community Affairs
Department of Community Affairs
Department of Community Affairs Department of Community Affairs Department of Community Affairs
Department of Community Affairs
Program Name Building Construction
Building Construction
Building Construction
Coordinated Planning
Coordinated Planning
Coordinated Planning
Coordinated Planning
Departmental Administration
Departmental Administration
Departmental Administration
Federal Community and Economic Development Programs Federal Community and Economic Development Programs Federal Community and Economic Development Programs Federal Community and Economic Development Programs Federal Community and Economic Development Programs Federal Community and Economic Development Programs
Federal Community and Economic Development Programs Homeownership Programs
Homeownership Programs
Homeownership Programs
Payments to Georgia Environmental Finance Authority
Description Number of building insignias issued
FY 2009 Actual 6,480.00
Average number of staff consultants
4.00
Number of State Minimum Standard Codes reviewed, amended, and adopted by the State Percentage of local comprehensive plans and similar reviews completed within designated 30-day timeframe
8.00 100.00%
Number of plans reviewed
570.00
Average number of days to review local comprehensive N/A
plans
Plan Implementation Rate: Percentage of local
N/A
government work program items actually implemented
Number of audit findings
0.00
Number of rental assistance checks mailed out
82,777.00
Cycle Time - Number of days from requisition to
N/A
purchase order dispatch
Amount of private investment leveraged for Appalachian $84,500,000.00
Regional Commission economic development projects
Percentage of member slots filled
98.00%
Number of hours served
472,705.00
Percentage of earned Education Awards
70.00%
Number of member slots filled
378.00
Number of persons who benefit from local government 62,125.00 community development activities financed through the state Community Development Block Grant program
Percentage of Community Development Block Grant project recipients who are low to moderate income pursuant to the national objective Number of Georgia Dream First Mortgage loans purchased Number of people who receive pre-purchase, post purchase, or foreclosure prevention counseling Georgia Dream foreclosure rates that are lower than state's foreclosure rate as measured by the Mortgage Bankers Association of America Number of loans approved
86.00%
730.00 3,604.00 2.55%
36.00
FY 2010 Actual 6,289.00 4.00 6.00 100.00%
457.00 N/A N/A
0.00 82,889.00 N/A $105,000,000.00
97.00%
431,282.00
80.00%
409.00
62,627.00
95.00%
644.00 3,464.00 1.58%
89.00
FY 2011 Actual 3,522.00 4.00 5.00 100.00%
367.00 N/A N/A
0.00 82,152.00 N/A $171,000,000.00
100.00%
582,641.00
77.00%
523.00
52,422.00
87.00%
1,461.00 3,796.00 2.00%
53.00
FY 2012 Actual 3,332.00 3.00 6.00 92.00%
320.00 15.00 N/A
0.00 78,230.00 12.00 $89,700,000.00
89.00%
502,537.00
89.00%
947.00
50,129.00
90.00%
1,053.00 4,175.00 3.38%
51.00
15 of 62
FY 2014 Performance Measure Report
Web Report
2/12/2013
Agency Department of Community Affairs
Department of Community Affairs
Department of Community Affairs
Department of Community Affairs
Department of Community Affairs
Department of Community Affairs
Department of Community Affairs
Department of Community Affairs
Department of Community Affairs Department of Community Affairs Department of Community Affairs Department of Community Affairs Department of Community Affairs Department of Community Affairs
Department of Community Affairs Department of Community Affairs Department of Community Affairs Department of Community Affairs Department of Community Affairs Department of Community Affairs Department of Community Affairs
Program Name Payments to Georgia Environmental Finance Authority Payments to Georgia Environmental Finance Authority Payments to Georgia Environmental Finance Authority Payments to Georgia Regional Transportation Authority
Description Value of loans approved (in millions)
FY 2009 Actual $220.00
Community debt service savings realized by utilizing $35,173,549.00 Georgia Environmental Finance Authority's loan program
Number of communities assisted
44.00
Number of Xpress riders
2,324,603.00
Payments to Georgia Regional Total Xpress passenger fare revenue recovery Transportation Authority
35.10%
Payments to Georgia Regional Number of passenger miles traveled on Georgia
Transportation Authority
Regional Transit Authority Xpress buses
57,324,710.00
Payments to Georgia Regional Percentage of riders that travel more than10 miles per 97.20%
Transportation Authority
trip
Payments to Georgia Regional Number of vanpool riders Transportation Authority
1,077,332.00
Payments to OneGeorgia
Number of jobs created or retained
N/A
Authority
Payments to OneGeorgia
Total value of grants and loans awarded
N/A
Authority
Payments to OneGeorgia
Dollar amount of private investment leverage per
N/A
Authority
grant/loan dollar
Regional Services
Number of Team Georgia resource consultations
N/A
Regional Services Regional Services
Regional Services Rental Housing Programs
Number of Georgia Academy for Economic Development sessions held Information distribution/gathering activities for Georgia Housing Search, Project Homeless Count and other programs. Number of communities adopting a Community Improvement Strategy Number of Georgia residents served
15.00 N/A
15.00 4,502.00
Rental Housing Programs Rental Housing Programs
Number of jobs created (based on National Homebuilders model of 1.5 jobs per unit) Number of housing choice vouchers under contract
2,814.00 15,455.00
Rental Housing Programs
Section Eight management assessment program rating 90.00%
Research and Surveys Research and Surveys
Percentage of all cities and counties meeting all state reporting requirements Number of local governments and authorities to whom technical accounting/financial technical assistance is made available by phone, email, and onsite
91.00% 267.00
FY 2010 Actual $199.00
$24,153,632.00
92.00
2,104,938.00
33.30%
51,907,771.00
97.70%
1,146,053.00
N/A N/A N/A 90.00 15.00 96.00
12.00 6,600.00 4,125.00 15,309.00 97.00% 91.00% 546.00
FY 2011 Actual $232.00
$24,319,626.00
56.00
2,185,357.00
34.30%
53,890,904.00
97.80%
1,131,065.00
N/A N/A N/A 80.00 15.00 90.00
14.00 6,120.00 3,825.00 15,778.00 100.00% 90.00% 533.00
FY 2012 Actual $135.00
$16,853,498.00
34.00
2,371,773.00
35.70%
58,487,922.00
98.30%
1,152,049.00
3,438.00 $20,969,638.00 $33.00 156.00 15.00 138.00
12.00 5,585.00 3,491.00 15,072.00 100.00% 88.00% 562.00
16 of 62
FY 2014 Performance Measure Report
Web Report
2/12/2013
Agency Department of Community Affairs
Department of Community Affairs Department of Community Affairs
Department of Community Affairs Department of Community Affairs Department of Community Affairs Department of Community Affairs Department of Community Affairs Department of Community Affairs Department of Community Affairs Department of Community Health
Department of Community Health Department of Community Health
Department of Community Health
Department of Community Health
Department of Community Health
Department of Community Health
Department of Community Health
Department of Community Health
Program Name Research and Surveys
Description Number of city/county Report of Local Government Finance Reports Government Management Indicators surveys processed within 10 business days
FY 2009 Actual 1,252.00
Special Housing Initiatives Special Housing Initiatives
Special Housing Initiatives
Number of individuals served by the state's homeless and special needs housing programs Percentage of individuals achieving housing stability through the state's homelessness prevention and rapid re-housing program. This program ended. All federal funds have been expended. Units listed on GeorgiaHousingSearch.org
146,440.00 N/A
116,077.00
State Community Development Number of new Main Street/Better Hometown cities
3.00
Programs
State Community Development Net new jobs created in Georgia Main Street/Better
2,616.00
Programs
Hometown cities
State Community Development Customer service satisfaction rating
90.00%
Programs
State Economic Development Number of jobs created or retained
9,181.00
Programs
State Economic Development Total Value of grants and loans awarded
$3,351,948.00
Programs
State Economic Development Dollar amount of private investment leverage per
N/A
Programs
grant/loan dollar
Departmental Administration Increase the number of program integrity reviews aimed N/A
and Program Support
at identifying waste, fraud and abuse by 5%
incrementally over the next three years starting with
FY14
Departmental Administration Balance in the other post employee benefits fund. FY $170,738,260.00
and Program Support
2012 Pending
Departmental Administration Percentage of employees that received proven initials N/A
and Program Support
and annual training in required courses (ex. Ethics, Open
Records, HIPAA Privacy, and Security). Data available
September 2012
Georgia Board for Physician Percentage of payments processed within 10 days of N/A
Workforce: Board
receiving invoice
Administration
Georgia Board for Physician Number of page views of agency website for physician N/A
Workforce: Board
workforce data
Administration
Georgia Board for Physician Number of reports distributed electronically or by other N/A
Workforce: Board
means
Administration
Georgia Board for Physician Percentage of residency program graduates practicing 67.30%
Workforce: Graduate Medical family medicine in Georgia FY2012. (Data lagged by
Education
one fiscal year)
Georgia Board for Physician Total number of residents in training at Georgia's
1,963.00
Workforce: Graduate Medical Graduate Medical Education programs (filled positions)
Education
Georgia Board for Physician Percentage of residents funded under contract vs. total 59.00%
Workforce: Graduate Medical residents in Georgia's Graduate Medical Education
Education
programs
FY 2010 Actual 1,252.00
109,269.00 95.00%
155,080.00 N/A 2,400.00 95.00% 11,349.00 $56,345,193.00 $670.00 N/A
$244,000.00 N/A
N/A N/A N/A 64.70% 2,006.00 58.00%
FY 2011 Actual 1,240.00
64,780.00 97.00%
173,150.00 2.00 3,006.00 97.00% 7,604.00 $73,233,160.00 $61.00 N/A
N/A 100.00%
86.00% 10,075.00 4,651.00 63.40% 2,046.00 58.00%
FY 2012 Actual 1,385.00
78,243.00 99.00%
175,279.00 2.00 3,303.00 95.00% 8,762.00 $45,003,966.00 $64.00 N/A
N/A N/A
87.00% 13,954.00 884.00 N/A 2,069.00 58.00%
17 of 62
FY 2014 Performance Measure Report
Web Report
2/12/2013
Agency Department of Community Health
Department of Community Health
Department of Community Health
Department of Community Health
Department of Community Health
Department of Community Health
Department of Community Health
Department of Community Health
Department of Community Health
Department of Community Health
Department of Community Health
Department of Community Health
Department of Community Health
Department of Community Health
Department of Community Health
Department of Community Health
Department of Community Health
Program Name
Description
FY 2009 Actual
Georgia Board for Physician Percentage of graduates entering core specialties (family 61.00%
Workforce: Mercer School of medicine, internal medicine, pediatrics, ob/gyn, or
Medicine Grant
general surgery)
Georgia Board for Physician Number of medical students enrolled at Mercer
282.00
Workforce: Mercer School of University School of Medicine
Medicine Grant
Georgia Board for Physician State funding per medical student
$81,285.00
Workforce: Mercer School of
Medicine Grant
Georgia Board for Physician Percentage of graduates entering core specialties (family 75.00%
Workforce: Morehouse School medicine, internal medicine, pediatrics, ob/gyn, or
of Medicine Grant
general surgery)
Georgia Board for Physician Number of medical students enrolled at Morehouse
217.00
Workforce: Morehouse School School of Medicine
of Medicine Grant
Georgia Board for Physician State funding per medical student
N/A
Workforce: Morehouse School
of Medicine Grant
Georgia Board for Physician Percentage of Scholarship recipients beginning service 71.00%
Workforce: Physicians for Rural obligation (versus default rate)
Areas
Georgia Board for Physician Number of students/physicians receiving support
59.00
Workforce: Physicians for Rural
Areas
Georgia Board for Physician Percentage of rural counties with physicians in active N/A
Workforce: Physicians for Rural practice
Areas
Georgia Board for Physician Percentage of participants in country doctor scholarship N/A
Workforce: Physicians for Rural program remaining in Georgia to practice after
Areas
completing their obligation (both rural and urban areas)
Georgia Board for Physician Workforce: Undergraduate Medical Education Georgia Board for Physician Workforce: Undergraduate Medical Education Georgia Board for Physician Workforce: Undergraduate Medical Education Georgia Board for Physician Workforce: Undergraduate Medical Education Georgia Board for Physician Workforce: Undergraduate Medical Education Georgia Board for Physician Workforce: Undergraduate Medical Education Georgia Board for Physician Workforce: Undergraduate Medical Education
Number of Georgia residents enrolled in Emory medical 151.00 School
Percentage of UME graduates entering primary care residency from Emory Medical School
49.00%
Number of Georgia residents enrolled in Mercer Medical 273.00 School
Percentage of UME graduates entering primary care residency from Mercer Medical School
61.00%
Percentage of UME graduates entering primary care residency from Morehouse School of Medicine
75.00%
Number of Georgia residents enrolled in Morehouse School of Medicine
129.00
Average amount of UME funds per Georgia resident attending medical school at Emory Medical School
$5,878.00
FY 2010 Actual 55.00% 312.00 $69,283.00 64.00% 213.00 N/A 78.00% 49.00 N/A 79.00%
163.00 50.00% 312.00 55.00% 64.00% 127.00 $5,413.00
FY 2011 Actual 58.00% 351.00 $59,119.00 71.00% 223.00 N/A 100.00% 48.00 N/A N/A
164.00 56.00% 351.00 53.00% 70.00% 125.00 $4,833.00
FY 2012 Actual 55.00% 387.00 $52,119.00 66.00% 230.00 N/A
42.00 99.10%
184.00 56.00% 387.00 54.00% 48.00% 122.00 $4,033.00
18 of 62
FY 2014 Performance Measure Report
Web Report
2/12/2013
Agency Department of Community Health
Department of Community Health
Department of Community Health
Department of Community Health
Department of Community Health
Department of Community Health Department of Community Health Department of Community Health Department of Community Health Department of Community Health Department of Community Health Department of Community Health
Department of Community Health
Department of Community Health Department of Community Health Department of Community Health Department of Community Health Department of Community Health Department of Community Health Department of Community Health
Department of Community Health Department of Community Health Department of Community Health
Program Name Georgia Board for Physician Workforce: Undergraduate Medical Education Georgia Board for Physician Workforce: Undergraduate Medical Education Georgia Board for Physician Workforce: Undergraduate Medical Education Georgia Board for Physician Workforce: Undergraduate Medical Education Georgia Board for Physician Workforce: Undergraduate Medical Education Georgia Composite Medical Board Georgia Composite Medical Board Georgia Composite Medical Board Georgia Composite Medical Board Health Care Access and Improvement Health Care Access and Improvement Health Care Access and Improvement
Healthcare Facility Regulation
Healthcare Facility Regulation
Healthcare Facility Regulation
Medicaid: Aged, Blind and Disabled Medicaid: Aged, Blind and Disabled Medicaid: Aged, Blind and Disabled Medicaid: Aged, Blind and Disabled Medicaid: Aged, Blind and Disabled
Medicaid: Aged, Blind and Disabled Medicaid: Aged, Blind and Disabled Medicaid: Low-Income Medicaid
Description Average amount of UME funds per Georgia resident attending medical school at Mercer Medical School
FY 2009 Actual $6,042.00
Average amount of UME funds per Georgia resident attending medical school at Morehouse School of Medicine Percentage of Emory Medical School UME graduates entering residency in Georgia
$5,662.00 38.00%
Percentage of Mercer Medical School UME graduates 29.00% entering residency in Georgia
Percentage of Morehouse School of Medicine UME graduates entering residency in Georgia
20.00%
Number of initial licensure applications (all professions) 3,158.00
reviewed and approved
Number of complaints against licensees (all professions) 1,923.00
received
Percentage of initial applicants for physician licenses 66.60%
licensed within 70 days of receipt
Percentage of complaints against licensees resolved 60.90%
within 120 days of receipt
Number of Georgians served by Department of
282,929.00
Community Health's safety net programs and grants
Percentage of Certificate of Need applications reviewed 100.00%
within 120 days
Number of health care providers who have attested to N/A
adopting, implementing, or upgrading certified Electronic
Health Record technology in Georgia
Percentage of applicable health care facility inspection N/A
results posted to the website within 30 days of inspection
exit.
Percentage of surveys closed within the required
N/A
timeframe
Percentage of state licensed health care facilities who N/A
have survey results posted on the DCH website.
Number of Aged, Blind and Disabled enrollees
409,801.00
Cost per member per month for Aged, Blind, and Disabled enrollees Number of full benefit dual eligibles enrolled
$769.41 138,795.00
Average time for provider payment of clean claims by the 10.40
care management organizations (in days)
Percentage of Long Term Care expenditures for Home 39.30%
and Community Based Waiver Services versus
institutional expenditures
Number of full benefit dual eligibles enrolled per 1000 102.06
members
Number of Aged, Blind, and Disabled enrollees per 1000 301.34
Medicaid members
Number of low-income Medicaid enrollees
950,144.00
FY 2010 Actual $5,248.00
$6,228.00
34.00%
33.00%
27.00%
2,958.00 2,155.00 55.90% 55.60% 115,842.00 100.00% N/A
N/A
96.00% N/A 422,661.00 $787.00 136,750.00 8.00 41.10%
93.89 290.18 1,033,908.00
FY 2011 Actual $4,197.00
$5,219.00
32.00%
22.00%
28.00%
3,357.00 2,195.00 55.70% 58.00% 79,390.00 100.00% 262.00
94.00%
93.00% 57.00% 433,072.00 $807.81 135,869.00 7.50 43.00%
90.74 289.22 1,064,301.00
FY 2012 Actual $3,563.00
$5,005.00
29.00%
24.00%
22.00%
3,436.00 1,849.00 49.80% 39.90% 66,825.00 100.00% 782.00
94.00%
94.00% 65.00% 447,118.00 $834.91 135,729.00 6.70 45.00%
88.46 291.41 1,087,234.00
19 of 62
FY 2014 Performance Measure Report
Web Report
2/12/2013
Agency Department of Community Health Department of Community Health Department of Community Health Department of Community Health
Department of Community Health
Department of Community Health Department of Community Health
Department of Community Health
Department of Community Health Department of Community Health Department of Community Health
Department of Community Health
Department of Community Health
Department of Community Health Department of Community Health Department of Corrections
Department of Corrections
Department of Corrections Department of Corrections Department of Corrections Department of Corrections
Program Name Medicaid: Low-Income Medicaid Medicaid: Low-Income Medicaid Medicaid: Low-Income Medicaid Medicaid: Low-Income Medicaid
Medicaid: Low-Income Medicaid
Medicaid: Low-Income Medicaid PeachCare
Description
FY 2009 Actual
Low-income Medicaid members per 1000 Medicaid
698.66
members
Cost per member per month for low-income Medicaid $253.92
enrollees
Number of emergency room visits for selected non-
110.50
emergent care diagnoses per 1000 members
Number of Health plan Employer Data and Information 32.00
Set/National Committee for Quality Assurance quality
metrics monitored
Percentage of Health plan Employer Data and
25.00%
Information Set/National Committee for Quality
Assurance quality metrics meeting or exceeding the 50th
percentile
Percentage of Medicaid eligible population not enrolled 17.00%
Percentage of members in Georgia Families receiving recommended immunizations by their 3rd birthday (Medicaid and PeachCare) (Note: FY11 data based on claims data, instead of medical record review.)
32.80%
PeachCare
PeachCare PeachCare
Percentage of members in Georgia Families 12 months - 86.30%
19 years who had a visit with a primary care physician
(Medicaid and PeachCare)
Percentage of pharyngitis members receiving a group A 65.60%
strep test
Number of PeachCare Enrollees
205,096.00
State Health Benefit Plan
Percentage reduction in low birth weight babies in State N/A Health Benefit Plan (target = 0.9% annual reduction)
State Health Benefit Plan
State Health Benefit Plan
State Health Benefit Plan
State Health Benefit Plan
Bainbridge Probation Substance Abuse Treatment Center Bainbridge Probation Substance Abuse Treatment Center County Jail Subsidy
County Jail Subsidy
Percentage of beneficiaries of State Health Benefit Plan N/A
who have received a preventative cervical cancer
screening
Percentage of beneficiaries of State Health Benefit Plan N/A
who have received a preventative breast cancer
screening
Percentage of emergency room visits that are non-
13.50%
emergent
Number of State Health Benefit Plan members assessed 38,546.00
a tobacco use surcharge
Three-year felony reconviction rate
25.34%
Number of General Educational Development (GED) diplomas received
80.00
Number of incomplete sentencing packets returned to counties for completion Number of prisoner sentencing packets processed
1,841.00 22,580.00
Departmental Administration Number of payments processed
60,037.00
Departmental Administration Percentage of payments made electronically
66.41%
FY 2010 Actual 709.82 $242.32 126.80 34.00
35.00%
16.00% 35.50%
86.30%
66.40% 201,942.00 N/A
N/A
N/A
13.10% 33,890.00 28.62%
54.00
1,667.00 26,807.00 56,256.00 72.99%
FY 2011 Actual 710.78 $251.82 N/A 34.00
N/A
16.00% 24.80%
87.60%
67.50% 199,504.00 7.34%
N/A
N/A
13.10% 35,062.00 29.48%
115.00
1,879.00 26,282.00 57,826.00 86.74%
FY 2012 Actual 708.58 $256.72 56.57 38.00
39.00%
16.00% 79.50%
84.40%
72.20% 202,224.00 6.90%
37.73%
39.82%
N/A N/A 26.60%
67.00
2,435.00 27,277.00 54,791.00 87.79%
20 of 62
FY 2014 Performance Measure Report
Web Report
2/12/2013
Agency Department of Corrections Department of Corrections Department of Corrections Department of Corrections Department of Corrections Department of Corrections Department of Corrections Department of Corrections Department of Corrections Department of Corrections Department of Corrections Department of Corrections Department of Corrections Department of Corrections Department of Corrections Department of Corrections Department of Corrections Department of Corrections Department of Corrections Department of Corrections Department of Corrections Department of Corrections Department of Corrections Department of Corrections Department of Corrections Department of Corrections Department of Corrections
Program Name Departmental Administration Departmental Administration Detention Centers Detention Centers Food and Farm Operations Food and Farm Operations Food and Farm Operations Food and Farm Operations Food and Farm Operations Food and Farm Operations Food and Farm Operations Health Health Health Health Offender Management Offender Management Parole Revocation Centers Parole Revocation Centers Parole Revocation Centers Private Prisons Private Prisons Private Prisons Probation Supervision Probation Supervision Probation Supervision Probation Supervision
Description Number of audit findings (calendar year data)
FY 2009 Actual 2.00
Agency turnover rate
14.53%
Three-year felony reconviction rates
25.00%
Number of GED diplomas received
235.00
Cost per day per offender (food only)
$1.48
Percentage of annual food requirement produced through farm Total revenue from food and commodities produced
41.57% $3,220,780.00
Savings across state agencies from commodities
$4,317,841.00
produced vs. purchased
Profit from sales used to offset GDC food service costs $1,081,793.00
Number of offenders served medical meals.
10,195.00
Number of offenders requiring special diets.
10,195.00
Total daily health cost per inmate, including physical $11.86
health, mental health, dental care
Number of telemedicine treatment/consultation hours per 329.20
year
Number of facilities using telemedicine services
65.00
Percentage of facilities using telemedicine services
90.00%
Total number of admissions
20,737.00
Total number of releases
20,656.00
Annual occupancy rate
94.00%
Number of GED diplomas received
33.00
Percentage of security audits successfully passed by the 95.00%
centers
Annual occupancy rate. (Note: Two private prisons
99.00%
opened in FY2012.)
Three-year felony reconviction rate
31.00%
Number of GED diplomas received
312.00
Three-year felony reconviction rates
20.00%
Value of community service provided to local communities Employment rate for employable probationers
$9,217,382.70 71.20%
Number of probationers receiving residential substance 3,245.00 abuse treatment
FY 2010 Actual 3.00 14.55% 26.00% 264.00 $1.41 41.98% $4,021,939.00 $5,200,358.00 $919,160.00 9,847.00 9,847.00 $12.29 354.00 53.00 90.00% 19,366.00 20,537.00 96.00% 63.00 87.00% 93.00% 30.70% 204.00 22.00% $11,662,958.64 72.80% 3,634.00
FY 2011 Actual 3.00 17.92% 24.60% 263.00 $1.54 42.61% $4,699,021.00 $5,509,793.00 $940,980.00 9,613.00 9,613.00 $11.42 290.90 68.00 90.00% 21,113.00 21,385.00 95.00% 10.00 91.00% 97.00% 30.67% 178.00 22.11% $10,994,264.25 70.50% 3,083.00
FY 2012 Actual N/A 18.65% 26.43% 253.00 $1.57 42.00% $6,139,771.00 $6,084,818.00 $1,718,608.00 10,622.00 10,622.00 $11.27 273.90 46.00 80.00% 21,402.00 19,947.00 93.90% 19.00 97.00% 82.90% 27.81% 82.00 23.00% $11,109,358.00 65.27% 3,200.00
21 of 62
FY 2014 Performance Measure Report
Web Report
2/12/2013
Agency
Program Name
Department of
Probation Supervision
Corrections
Department of
Probation Supervision
Corrections
Department of
State Prisons
Corrections
Department of
State Prisons
Corrections
Department of
State Prisons
Corrections
Department of
Transition Centers
Corrections
Department of
Transition Centers
Corrections
Department of
Transition Centers
Corrections
Department of Defense Military Readiness
Department of Defense Military Readiness Department of Defense Military Readiness
Department of Defense Military Readiness Department of Defense Youth Educational Services Department of Defense Youth Educational Services Department of Defense Youth Educational Services Department of Defense Youth Educational Services
Department of Defense Youth Educational Services
Department of Driver Services Department of Driver Services Department of Driver Services Department of Driver Services Department of Driver Services Department of Driver Services Department of Driver Services
Customer Service Support Customer Service Support Customer Service Support Customer Service Support Customer Service Support License Issuance License Issuance
Description Number of probationers completing substance abuse treatment in Day Reporting Centers Percentage of probationers passing mandatory drug tests Three-year felony reconviction rates
FY 2009 Actual 306.00
73.00%
29.00%
Number of GED diplomas received
1,557.00
Number of inmates completing vocational training/certificates earned. Annual occupancy rate
3,673.00 97.00%
Three-year felony reconviction rates
20.00%
Successful Completion of Transition Center Programming Percentage of successful responses within 24 hours to an "Alert Notice" by the Georgia Emergency Management Agency and the Army/Air National Guard Command Post Number of State Defense Force volunteer man-days for state and community support Percentage of requests where information was successfully and accurately provided in response to inquiries from the media and other interested parties Cumulative percentage of Readiness Centers Renovated (per calendar year) Number of at-risk youth graduating from the Youth Challenge Academy Average state cost per cadet
N/A 100.00%
N/A 100.00%
65.08% 851.00 $5,265.00
Percentage of Youth Challenge Academy graduates that 73.00%
earn their General Education Diploma
Percentage of graduates that meet Department of
78.00%
Defense standard for success 6 months after graduation
Percentage of graduates who could not be contacted at 4.00%
6 months
Employee turnover rate
10.00%
Number of audit findings
0.00
Percentage of payments made electronically
12.60%
Total payments processed
14,340.00
Average number of days to process payments (vendor) 5.40
Number of Customer Service Center customers served 2,884,763.00
Percentage of Customer Service Center customers served within 30 minutes or less (target 95%)
97.00%
FY 2010 Actual 538.00 76.00% 28.00% 1,510.00 3,418.00 96.00% 18.10% N/A 100.00%
N/A 100.00%
69.35% 833.00 $5,379.00 69.00% 71.00%
16.00% 12.00% 1.00 14.80% 10,630.00 4.70 2,255,719.00 78.00%
FY 2011 Actual 657.00 79.00% 27.50% 1,620.00 3,464.00 96.80% 18.00% 79.00% 100.00%
36,704.00 100.00%
80.65% 887.00 $3,474.00 69.00% 70.00%
N/A 21.00% 0.00 15.00% 10,210.00 4.10 3,111,958.00 75.00%
FY 2012 Actual 707.00 78.40% 27.41% 839.00 3,230.00 97.10% 19.73% 67.10% 100.00%
N/A 100.00%
96.55% 870.00 $3,508.00 70.95% 79.00%
N/A 20.00% 0.00 23.00% 10,921.00 5.10 3,297,311.00 70.00%
22 of 62
FY 2014 Performance Measure Report
Web Report
2/12/2013
Agency Department of Driver Services
Program Name License Issuance
Department of Driver License Issuance Services
Department of Driver Services Department of Driver Services Department of Driver Services Department of Driver Services Department of Driver Services Department of Driver Services Department of Driver Services Department of Driver Services Department of Driver Services Department of Driver Services Department of Driver Services Department of Driver Services Department of Driver Services
License Issuance License Issuance License Issuance License Issuance License Issuance License Issuance License Issuance License Issuance License Issuance License Issuance License Issuance License Issuance License Issuance
Department of Driver Services Department of Driver Services Department of Driver Services Department of Driver Services Department of Driver Services Department of Driver Services
License Issuance License Issuance License Issuance Regulatory Compliance Regulatory Compliance Regulatory Compliance
Department of Driver Regulatory Compliance
Services
Department of
Departmental Administration
Economic Development
Department of
Departmental Administration
Economic Development
Description Percentage of permanent documents mailed to Customer Service Center customers within 14 days of issuance of the interim document Percentage of permanent documents mailed to customers within 14 days through Online services processing Total number of customer calls to the Contact Center
FY 2009 Actual N/A
N/A
1,522,020.00
Percentage of customer calls to the Contact Center
63.00%
answered within 3 minutes or less (target 85%)
Percentage of Contact Center customer calls abandoned 19.80%
Total number of citations processed by Records
N/A
Management
Percentage of citations processed by Records
N/A
Management (target is 10 days)
Percentage of audited Records Management files found N/A
to be accurate
Total number of commercial drivers license exams
830.00
monitored
Number of commercial drivers license exams monitored 3.90
per staff
Percentage of compliant commercial drivers license test 99.10%
administrators
Number of students enrolled in motorcycle safety
8,311.00
program classes
Reduction in issuance process time due to motorcycle N/A
safety class participation (in hours)
Percentage of students passing exam following
83.00%
motorcycle safety program class
Total number of License, Commercial Driver's License, 941,516.00
Motor Cycle License or Identification Card renewals
requested
Percentage of fraud cases completed within 60 days 65.00%
(target 70%)
Percentage of drivers license fraud investigations
100.00%
resulting in a fraud case
Number of drivers license fraud and internal affairs
744.00
cases investigated
Total number of driver safety programs regulated, e.g. 735.00
driver training, DUI schools
Total number of students enrolled in Online Alcohol and N/A
Drug Awareness Programs
Average number of days for Regulatory Compliance
N/A
programs that are out of compliance to become
compliant
Percentage of regulated programs in compliance
90.00%
Process all accounting, budgetary, procurement and N/A information technology requests in a timely and efficient manner Meet all regulatory reporting timelines and requirements N/A
FY 2010 Actual N/A
N/A
1,341,427.00 51.00% 27.10% 391,228.00 77.50% N/A 623.00 3.20 98.50% 6,076.00 2,851.00 88.00% 302,157.00
58.00% 91.00% 1,780.00 768.00 N/A 32.90
94.00% N/A
N/A
FY 2011 Actual 97.40%
77.00%
1,408,736.00 44.00% 28.50% 291,940.00 99.10% N/A 561.00 2.80 94.30% 6,717.00 3,044.00 85.00% 884,048.00
60.00% 91.00% 2,180.00 790.00 5,917.00 5.75
93.00% N/A
N/A
FY 2012 Actual 97.50%
78.70%
1,503,242.00 68.00% 17.00% 154,885.00 99.00% 84.00% 549.00 2.80 95.90% 7,239.00 3,359.00 87.00% 1,018,457.00
41.00% 92.00% 2,282.00 829.00 8,423.00 3.00
85.00% N/A
N/A
23 of 62
FY 2014 Performance Measure Report
Web Report
2/12/2013
Agency
Program Name
Department of
Film, Video, and Music
Economic Development
Department of
Film, Video, and Music
Economic Development
Department of
Film, Video, and Music
Economic Development
Department of
Film, Video, and Music
Economic Development
Department of
Film, Video, and Music
Economic Development
Department of
Film, Video, and Music
Economic Development
Department of
Georgia Council for the Arts
Economic Development
Department of
Georgia Council for the Arts
Economic Development
Department of
Global Commerce
Economic Development
Department of
Global Commerce
Economic Development
Department of
Global Commerce
Economic Development
Department of
Global Commerce
Economic Development
Department of
Global Commerce
Economic Development
Department of
Global Commerce
Economic Development
Department of
Global Commerce
Economic Development
Department of
Innovation and Technology
Economic Development
Department of
Innovation and Technology
Economic Development
Department of
Innovation and Technology
Economic Development
Description Amount of new direct capital investment into the state (millions)
Number of new projects initiated
FY 2009 Actual $521.00
308.00
Number of work days created by film and television production for Georgians
Number of leads scouted with producers
78,617.00 N/A
Percentage of leads scouted resulting in initiated project N/A
Value of tax credits certified by the Georgia Department $89,246,214.00 of Economic Development
Percentage of Georgia's 159 counties served by the Georgia Council for the Arts
100.00%
Number of Georgia Council for the Arts grant awards 833.00
Number of jobs created
17,467.00
Amount of new direct capital investment into the state (in $3.00 billions)
Number of brokered international transactions
219.00
Number of active projects initiated
327.00
Number of companies assisted
725.00
Percentage of active projects resulting in retention, relocation or expansion
Number of work orders
23.00% N/A
Number of jobs created
1,015.00
Amount of new direct capital investment in millions
$200.00
Number of new projects initiated
14.00
FY 2010 Actual $744.00 330.00 331,895.00 N/A N/A $171,865,421.00 100.00% 606.00 19,627.00 $4.00 235.00 337.00 832.00 26.00% N/A 1,881.00 $359.00 24.00
FY 2011 Actual $689.00 327.00 622,560.00 N/A N/A $222,211,344.00 100.00% 274.00 22,022.00 $4.00 265.00 360.00 852.00 33.00% 943.00 1,346.00 $69.00 19.00
FY 2012 Actual $880.00 333.00 585,428.00 N/A N/A $231,704,930.00 100.00% 110.00 24,713.00 $4.59 311.00 373.00 1,111.00 33.00% 973.00 4,063.00 $1,391.00 30.00
24 of 62
FY 2014 Performance Measure Report
Web Report
2/12/2013
Agency
Program Name
Department of
Payments to Georgia Medical
Economic Development Center Authority
Client revenue
Description
FY 2009 Actual $8,169,678.00
Department of
Payments to Georgia Medical Full-time employees of companies
Economic Development Center Authority
45.00
Department of
Payments to Georgia Medical Average salary (Full-time Employees) of companies
Economic Development Center Authority
$70,683.00
Department of
Payments to Georgia Medical Georgia Tax Revenues (Income & Corp.) of companies $240,845.00
Economic Development Center Authority
Department of
Payments to Georgia Medical Georgia Counties served
Economic Development Center Authority
47.00
Department of
Small and Minority Business Number of companies served
Economic Development Development
1,503.00
Department of
Small and Minority Business Number of community visits
Economic Development Development
738.00
Department of
Small and Minority Business Number of mentor protege graduates
Economic Development Development
30.00
Department of
Tourism
Economic Development
Amount of tourism expenditures (in billions per calendar $19.40 year)
Department of
Tourism
Economic Development
Number of visitors to the Visitor Information Centers
11,600,360.00
Department of
Tourism
Economic Development
Number of unique visitors to the Explore Georgia website
582,075.00
Department of
Tourism
Economic Development
Number of impressions per media dollar
N/A
Department of
Tourism
Economic Development
Number of tourists visiting Georgia (in millions) for calendar year
114.00
Department of Education Department of Education Department of Education Department of Education Department of Education Department of Education Department of Education
Agricultural Education Agricultural Education Agricultural Education Agricultural Education Agricultural Education Agricultural Education Agricultural Education
Grades 6-12 student enrollment in Extended Day/Year 28,641.00
programs
Number of schools providing Extended Day/Year
258.00
programs
Percentage of agriculture teachers meeting all required 87.00%
Extended Day/Year program standards
Average number of monthly Extended Day contact hours N/A
reported
Average number of Extended Year contact hours
N/A
reported
Percentage of performance standards met on the Area 92.00%
Teacher program of work evaluation
Percentage of classroom agriculture teachers meeting 85.00%
all required program standards
FY 2010 Actual $8,820,556.00 64.00 $78,762.00 $352,447.00 51.00 1,147.00 131.00 21.00 $21.00 12,544,629.00 846,069.00 N/A 116.00 30,269.00 274.00 92.00% N/A N/A 95.00% 88.00%
FY 2011 Actual $9,393,895.00 55.00 $82,196.00 $321,246.00 54.00 936.00 159.00 21.00 $21.04 12,223,698.00 1,194,020.00 N/A N/A 31,525.00 281.00 92.00% 33.00 340.00 98.00% 92.00%
FY 2012 Actual N/A N/A N/A N/A N/A 848.00 539.00 N/A $22.50 10,847,149.00 1,449,302.00 531,532,531.00 N/A 34,158.00 289.00 95.00% 38.00 344.00 98.00% 95.00%
25 of 62
FY 2014 Performance Measure Report
Web Report
2/12/2013
Agency Department of Education Department of Education Department of Education Department of Education Department of Education Department of Education Department of Education Department of Education Department of Education Department of Education Department of Education Department of Education Department of Education Department of Education Department of Education Department of Education Department of Education Department of Education Department of Education Department of Education Department of Education Department of Education Department of Education Department of Education Department of Education Department of Education Department of Education
Program Name Agricultural Education Agricultural Education Agricultural Education Agricultural Education Agricultural Education Agricultural Education Agricultural Education Central Office Central Office Central Office Central Office Central Office Central Office Central Office Central Office Charter Schools Charter Schools Charter Schools Charter Schools Charter Schools Charter Schools Charter Schools Charter Schools Charter Schools Charter Schools Charter Schools Charter Schools
Description
FY 2009 Actual
Average number of monthly Area Teacher contact hours N/A
reported
Number of teachers trained by Agriculture Area
383.00
Teachers
Percentage of performance standards met on the Young 84.00%
Farmer Teacher program of work evaluation.
Young Farmer participants per instructor
135.00
Average number of contact hours reported by the Young N/A
Farmer teacher monthly report
Enrollment in program events and activities at FFA
6,373.00
Youth Camp facilities
Number of FFA events held at Camp John Hope and the 101.00
Georgia FFA-FCCLA Center
Employee turnover rate
N/A
Number of audit findings
11.00
Number of payments processed
154,233.00
Turnaround time on payments processed
N/A
Percentage of payments processed electronically
N/A
Number of open records requests
197.00
Number of teachers with access to the longitudinal data N/A
system
State Central Office cost per FTE (i.e., student)
$21.32
Number of charter schools
77.00
Number of charter school petitions reviewed by the Georgia Department of Education Number of charter schools authorized
32.00 8.00
Percentage of charter school requests for renewal approved Percentage of charter schools making adequate yearly progress Number of students enrolled in charter schools
N/A 85.00% 41,582.00
Charter school student graduation rate
81.00%
Number of charter system petitions reviewed by the
2.00
Georgia Department of Education
Number of approved charter systems operating
4.00
Number of planning grants awarded
12.00
Number of contact hours reported by planning consultants Number of facilities grants awarded
0.00 20.00
FY 2010 Actual N/A 392.00 88.00% 173.00 N/A 6,740.00 113.00 N/A 8.00 163,610.00 N/A N/A 199.00 N/A $18.08 82.00 36.00 12.00 N/A 80.00% 48,344.00 81.00% 4.00 4.00 13.00 0.00 21.00
FY 2011 Actual 31.00 402.00 88.00% 192.00 31.00 6,470.00 100.00 N/A 4.00 206,809.00 N/A N/A 135.00 38,427.00 $18.31 101.00 31.00 19.00 100.00% 70.00% 59,193.00 82.00% 7.00 8.00 9.00 591.00 29.00
FY 2012 Actual 32.00 424.00 90.00% 209.00 31.00 6,798.00 111.00 N/A N/A 178,590.00 N/A N/A 116.00 56,041.00 $17.77 110.00 100.00 10.00 100.00% 77.00% N/A N/A 2.00 14.00 5.00 1,061.00 27.00
26 of 62
FY 2014 Performance Measure Report
Web Report
2/12/2013
Agency Department of Education Department of Education Department of Education Department of Education Department of Education Department of Education Department of Education Department of Education Department of Education
Department of Education Department of Education Department of Education Department of Education Department of Education Department of Education Department of Education Department of Education Department of Education Department of Education Department of Education Department of Education Department of Education Department of Education Department of Education Department of Education Department of Education
Program Name Charter Schools Charter Schools Communities in Schools Communities in Schools Communities in Schools Communities in Schools Communities in Schools Communities in Schools Curriculum Development
Curriculum Development Curriculum Development Curriculum Development Curriculum Development Federal Programs Federal Programs Federal Programs Federal Programs Federal Programs Georgia Virtual School Georgia Virtual School Georgia Virtual School Georgia Virtual School Georgia Virtual School Georgia Virtual School Georgia Virtual School Georgia Virtual School
Description Average value of facilities grants awarded
FY 2009 Actual $73,000.00
Number of Federal Charter School Program grants awarded Number of at-risk students receiving intensive services
17.00 28,911.00
Annual dropout rate for students served by Communities 4.90%
In Schools
Graduation rate for students served by Communities In 79.20%
Schools
Percentage of school districts with campuses
35.60%
participating in Communities In Schools
Average amount of state funds spent per student served $40.58
Total dollars leveraged
$21,804,821.00
Number of resources developed to support implementation of curricular standards (resources include standards, framework components, videos, and remediation support) Average cost to develop a resource
466.00 $1,147.42
Number of total unique visits to GeorgiaStandards.org 500,053.00
Number of teachers attending curriculum and instruction 15,077.00
training sessions
Number of industry specific language training courses N/A
developed
Number of Title I schools
1,342.00
Average cost per school implementing Title Programs $118,149.00
Percentage of Title I schools making adequate yearly progress Number of Title I Distinguished Schools
86.30% 770.00
Percentage of districts with a noncompliance finding for N/A
Title I federal funding requirements
Total number of courses offered
82.00
Number of advanced placement courses offered
20.00
Number of enrollments (in half-year segments)
6,647.00
Number of systems with students enrolled in GaVS courses Percentage of students completing courses
138.00 91.00%
Percentage of students passing the appropriate End of Course Test for courses that require such a test Percentage of Credit Recovery students who passed final exam Number of schools adopting blended learning models
82.00% N/A N/A
FY 2010 Actual $94,285.00 13.00 15,108.00 2.50% 81.00% 30.60% $73.99 $18,083,519.00 390.00
$936.38 776,568.00 5,943.00 N/A 1,536.00 $169,558.00 75.00% 902.00 N/A 91.00 22.00 8,893.00 142.00 91.00% 84.00% 77.00% N/A
FY 2011 Actual $62,068.00 8.00 17,570.00 2.40% 93.20% 30.00% $53.11 $16,289,161.00 320.00
$1,053.13 813,927.00 7,112.00 N/A 1,549.00 $157,193.00 69.50% 837.00 N/A 114.00 24.00 9,441.00 158.00 91.00% 88.00% 80.00% N/A
FY 2012 Actual $66,666.00 8.00 31,180.00 6.20% 82.50% 26.10% $75.62 $19,342,312.00 591.00
$815.21 908,125.00 17,875.00 N/A 1,342.00 $114,645.00 79.40% 805.00 N/A 126.00 27.00 17,346.00 169.00 92.00% 87.00% 81.00% 35.00
27 of 62
FY 2014 Performance Measure Report
Web Report
2/12/2013
Agency Department of Education Department of Education Department of Education Department of Education
Department of Education Department of Education Department of Education Department of Education Department of Education Department of Education Department of Education Department of Education Department of Education Department of Education Department of Education Department of Education Department of Education Department of Education Department of Education Department of Education Department of Education Department of Education Department of Education Department of Education
Department of Education
Program Name Georgia Youth Science and Technology Georgia Youth Science and Technology Georgia Youth Science and Technology Georgia Youth Science and Technology
Georgia Youth Science and Technology Georgia Youth Science and Technology Governor's Honors Program
Governor's Honors Program
Governor's Honors Program
Governor's Honors Program
Governor's Honors Program
Governor's Honors Program
Information Technology Services Information Technology Services Information Technology Services Information Technology Services Information Technology Services Nutrition
Nutrition
Nutrition
Nutrition
Nutrition
Nutrition
Nutrition
Nutrition
Description Number of teachers trained
FY 2009 Actual 10,373.00
Number of students served
98,950.00
Percentage of school systems with access to the
100.00%
Georgia Youth Science and Technology program
Percentage of students in Grades 3 through 8 meeting or 74.10%
exceeding the Georgia Performance Standards in
science on the Criterion-Referenced Competency Tests
(CRCT)
Cost per teacher trained
$70.00
Total dollars leveraged
$1,065,812.00
Number of students participating in Governor's Honors Program Average number of class hours provided to each participant Total cost per participant
690.00 219.00 $1,766.00
Number of students nominated from rural school districts N/A
Percentage of funding subsidized by alternative sources N/A
Total dollars leveraged
N/A
Average bandwidth allocated per school expressed in megabits per second Percentage of school systems connected to the statewide network Percentage of classrooms with internet connection
3.00 100.00% 97.42%
Average amount of local support for information technology Average school bandwidth overall (including local support) Total number of lunches served (in millions)
N/A N/A 214.00
Average number of lunches served daily
1,187,718.00
Percentage of children participating in the lunch program 75.50%
Percentage of children participating in the Breakfast Program Average cost of breakfast per student
34.30% $1.60
Average cost of lunch per student
$2.61
Percentage of local school systems, under review, that are in full compliance with the nutritional standards required by the USDA Percentage of school districts with more than 75% of students participating in the Free and Reduce Lunch Program
95.00% 16.02%
FY 2010 Actual 11,692.00 89,013.00 100.00% 75.60%
$70.00 $792,100.00 690.00 219.00 $1,920.00 N/A N/A N/A 3.00 100.00% 91.00% N/A N/A 214.00 1,178,803.00 74.50% 34.50% $1.56 $2.49 91.00%
23.24%
FY 2011 Actual 11,913.00 85,553.00 100.00% 77.00%
$70.00 $695,545.00 690.00 158.00 $1,481.00 N/A 0.00% $0.00 3.00 100.00% 97.23% N/A N/A 210.00 1,195,275.00 75.10% 34.90% $1.67 $2.63 92.00%
27.23%
FY 2012 Actual 8,489.00 82,477.00 100.00% 77.90%
$70.00 $1,077,844.00 690.00 158.00 $1,372.00 N/A 0.00% $0.00 3.00 100.00% N/A N/A N/A 212.00 1,206,000.00 74.40% 36.20% $1.62 $2.69 95.00%
29.59%
28 of 62
FY 2014 Performance Measure Report
Web Report
2/12/2013
Agency Department of Education Department of Education Department of Education
Department of Education
Department of Education Department of Education Department of Education Department of Education Department of Education Department of Education Department of Education Department of Education Department of Education Department of Education Department of Education Department of Education Department of Education Department of Education Department of Education Department of Education Department of Education Department of Education Department of Education Department of Education
Department of Education
Program Name Preschool Handicapped
Preschool Handicapped
Preschool Handicapped
Preschool Handicapped
Quality Basic Education Program Quality Basic Education Program Quality Basic Education Program Quality Basic Education Program Quality Basic Education Program Quality Basic Education Program Quality Basic Education Program Quality Basic Education Program Quality Basic Education Program Quality Basic Education Program Quality Basic Education Program Quality Basic Education Program Quality Basic Education Program Quality Basic Education Program Quality Basic Education Program Quality Basic Education Program Quality Basic Education Program Quality Basic Education Program Quality Basic Education Program Quality Basic Education Program
Quality Basic Education Program
Description Number of three- and four-year old students with disabilities served by this program Cost of program per student served
FY 2009 Actual 8,951.00
$3,268.00
Percentage of children receiving preschool handicapped N/A
services who improved functioning in acquisition and use
of knowledge and skills
Percentage of children receiving preschool handicapped 54.60%
education services who remain in their regular education
peer cohort
Number of FTEs (i.e., students)
1,630,671.00
Number of schools making adequate yearly progress 1,867.00
Statewide high school graduation rate (cohort method) 58.60%
Statewide high school dropout rate
3.80%
Number of students served by the Georgia Special Needs Scholarship Average scholarship award per student participating in the Georgia Special Needs Scholarship Average number of buses operated daily
1,596.00 $6,331.00 15,419.00
Average number of students transported daily
1,131,026.00
Average amount of state and local funds expended per $429.70
student on pupil transportation
Number of bus collisions per million miles
149.80
Number of buses used for daily student transport exceeding useful life Average number of miles driven per driver per day
592.00 53.95
Number of stop arm violations
N/A
Number of vehicles passing stopped buses
N/A
Daily miles all systems
831,852.00
Number of school nurses and school nurse assistants 1,689.00
Average number of students served by a school nurse or 922.00
nurse assistant
Number of school nurses or school nurse assistants per 0.81
school
Total number of nurse visits
N/A
Percentage of students statewide who obtained a score 53.98% of three (3) or higher on advanced placement exams
Percentage of students requiring remedial coursework in N/A college
FY 2010 Actual 8,323.00 $3,329.00 N/A
58.90%
1,641,396.00 1,718.00 64.00% 3.60% 2,068.00 $6,342.00 15,496.00 1,052,706.00 $394.54 145.60 723.00 52.20 N/A N/A 808,846.00 1,694.00 946.00 0.78 N/A 52.64%
N/A
FY 2011 Actual 8,831.00 $3,094.00 N/A
49.00%
1,650,981.00 1,633.00 67.40% 3.70% 2,529.00 $6,880.00 15,035.00 1,031,415.00 $418.21 138.00 916.00 50.99 4,629.00 8,102.00 766,635.00 1,647.00 973.00 0.75 N/A 54.53%
N/A
FY 2012 Actual 8,130.00 $3,495.00 N/A
46.50%
1,656,992.00 N/A N/A N/A 2,965.00 $6,740.00 N/A N/A N/A N/A N/A N/A 4,222.00 7,349.00 N/A 1,668.00 972.00 0.77 N/A 56.01%
N/A
29 of 62
FY 2014 Performance Measure Report
Web Report
2/12/2013
Agency Department of Education Department of Education Department of Education Department of Education Department of Education Department of Education Department of Education Department of Education Department of Education Department of Education
Department of Education Department of Education Department of Education Department of Education Department of Education Department of Education Department of Education Department of Education Department of Education Department of Education Department of Education Department of Education Department of Education Department of Education Department of Education Department of Education
Program Name
Description
Quality Basic Education
Percentage of students enrolled in post-secondary
Program
education within a year of graduation
Regional Education Service Number of teachers/ school staff earing Professional
Agencies (RESAs)
Learning Units, through courses and workshops
Regional Education Service Number of teachers/ school staff attending other
Agencies (RESAs)
professional learning activities
Regional Education Service Total number of Professional Learning Units certified
Agencies (RESAs)
statewide
Regional Education Service Total amount saved through regional contracts
Agencies (RESAs)
Regional Education Service Number of technology focused trainings conducted
Agencies (RESAs)
Regional Education Service Number of PLUs earned through RESA courses and
Agencies (RESAs)
workshops
Residential Treatment Facilities Number of students served in residential treatment
facilities
Residential Treatment Facilities Average educational cost per student served in a
residential treatment center
Residential Treatment Facilities Percentage of students enrolled in a residential
treatment facility with an Individualized Education
Program
Residential Treatment Facilities Annual retention rate of students receiving scholarships
FY 2009 Actual N/A 37,491.00 31,438.00 90,074.00 N/A N/A 37,491.00 1,077.00 $3,538.00 N/A
N/A
Residential Treatment Facilities Percentage of students served with an Independent
Education Plan
School Improvement
Number of schools on the needs improvement list
N/A 279.00
School Improvement
Percentage of schools on the needs improvement list 13.30%
School Improvement School Improvement
Percentage of needs improvement schools making adequate yearly progress Number of schools leaving needs improvement status
32.00% 74.00
School Improvement
School Improvement
Severely Emotional Disturbed (SED) Severely Emotional Disturbed (SED) Severely Emotional Disturbed (SED) Severely Emotional Disturbed (SED) State Schools
State Schools
State Schools
State Schools
Average number of schools served by each school improvement specialist Number of schools in needs improvement status 5 or higher Number of students served
3.47 46.00 5,668.00
Cost per student (to include state and federal funds)
$11,998.00
Percentage of students who meet or exceed reading and N/A
math standards on CRCT and CRTM
Percentage of students who are marked as proficient on N/A
the GAA
Number of students enrolled at Atlanta Area School for 202.00
the Deaf
Number of students enrolled at Georgia Academy for the 117.00
Blind
Number of students enrolled at Georgia School for the 121.00
Deaf
Percentage of students in grades 1-12 completing
99.00%
Individualized Education Program goals at Atlanta Area
School for the Deaf
FY 2010 Actual N/A 34,148.00 22,163.00 85,691.00 N/A N/A 34,148.00 986.00 $3,661.00 N/A
N/A N/A 278.00 13.70% 18.70% 48.00 4.34 44.00 5,412.00 $11,839.00 N/A N/A 196.00 119.00 111.00 97.00%
FY 2011 Actual N/A 25,685.00 23,706.00 69,478.00 N/A N/A 25,685.00 862.00 $4,130.00 N/A
N/A N/A 367.00 16.30% 6.70% 31.00 5.35 57.00 5,086.00 $12,360.00 N/A N/A 205.00 114.00 110.00 98.00%
FY 2012 Actual N/A 27,978.00 88,372.00 57,455.00 $22,647,388.00 66,571.00 27,978.00 821.00 $4,573.00 N/A
N/A N/A N/A N/A N/A N/A 5.75 N/A 4,871.00 $14,375.00 N/A N/A 202.00 127.00 121.00 95.00%
30 of 62
FY 2014 Performance Measure Report
Web Report
2/12/2013
Agency Department of Education
Department of Education
Department of Education Department of Education
Department of Education
Department of Education
Department of Education Department of Education Department of Education Department of Education Department of Education Department of Education Department of Education Department of Education Department of Education Department of Education Department of Education Department of Education Department of Education Department of Education Department of Education Department of Education Department of Education Department of Education
Program Name State Schools State Schools State Schools State Schools State Schools State Schools State Schools
Description Percentage of students in grades 1-12 completing Individualized Education Program goals at Georgia Academy for the Blind Percentage of students in grades 1-12 completing Individualized Education Program goals at Georgia School for the Deaf Percentage of graduates completing transition plans at all three state schools Percentage of prior year's graduates at Atlanta Area School for the Deaf that have a positive post-secondary outcome: career, schooling, job training Percentage of prior year's graduates at Georgia Academy for the Blind that have a positive postsecondary outcome: career, schooling, job training Percentage of prior year's graduates at Georgia School for the Deaf that have a positive post-secondary outcome: career, schooling, job training Cost per student at Atlanta Area School for the Deaf
FY 2009 Actual 98.00% 98.00% 100.00% 68.00% 55.00% 67.00% $40,040.00
State Schools
Cost per student at Georgia Academy for the Blind
$60,794.00
State Schools
Cost per student at Georgia School for the Deaf
$54,248.00
State Schools
Graduation rate at Atlanta Area School for the Deaf
100.00%
State Schools
Graduation rate at Georgia Academy for the Blind
93.00%
State Schools
Graduation rate at Georgia School for the Deaf
100.00%
Technology/Career Education Total student enrollment in grades 6-12
706,988.00
Technology/Career Education Total student enrollment in grades 9-12
394,985.00
Technology/Career Education Technology/Career Education Technology/Career Education
Number of high school concentrators (students with 3 or 76,721.00
more classes in a Career Pathway)
Number of professional development workshops for
389.00
teachers
Number of industry certified programs
443.00
Technology/Career Education Career and technology student organization membership 109,464.00
Technology/Career Education Cost per student served (unduplicated count)
$29.12
Technology/Career Education Technology/Career Education Technology/Career Education
Graduation rate for Career, Technology, and Agricultural 91.40%
Education concentrators
Difference of Career, Technology, and Agricultural
12.50%
Education graduation rate from the state average
Total student enrollment in grades 6-8
312,003.00
Testing Testing
Number of Criterion-Referenced Competency Tests (CRCT) administered Number of CRCT Retests administered online
4,585,220.00 408.00
FY 2010 Actual 97.00%
97.00%
100.00% 65.00%
60.00%
67.00%
$41,617.00 $67,381.00 $59,557.00 100.00% 100.00% 100.00% 708,279.00 389,515.00 78,831.00 620.00 441.00 116,792.00 $26.49 91.81% 11.01% 318,764.00 4,612,691.00 2,453.00
FY 2011 Actual 98.00%
97.00%
100.00% 70.00%
68.00%
75.00%
$38,512.00 $65,032.00 $51,025.00 100.00% 86.00% 100.00% 656,241.00 447,776.00 80,727.00 396.00 424.00 150,580.00 $21.83 90.30% 9.30% 416,453.00 3,819,099.00 3,792.00
FY 2012 Actual 96.00%
97.00%
100.00% 64.00%
50.00%
67.00%
$39,725.00 $64,256.00 $63,226.00 100.00% 100.00% 100.00% N/A N/A N/A N/A N/A N/A N/A N/A N/A N/A 3,826,136.00 9,021.00
31 of 62
FY 2014 Performance Measure Report
Web Report
2/12/2013
Agency Department of Education Department of Education Department of Education Department of Education Department of Education Department of Education Department of Education Department of Education Department of Education Department of Education Department of Education Department of Human Services Department of Human Services
Program Name Testing Testing Testing Testing Testing Testing Testing Testing Tuition for Multi-handicapped Tuition for Multi-handicapped Tuition for Multi-handicapped Adoptions Services Adoptions Services
Description Average CRCT cost per student
FY 2009 Actual $13.54
Number of End-of-Course Tests (EOCT) administered 903,174.00
Number of EOCT administered online
202,839.00
Average EOCT cost per student
$6.46
Number of Advanced Placement (AP) exams administered Number of students taking AP exams
91,395.00 59,396.00
Number of AP test fees subsidized
72,558.00
Average number of days students take tests
N/A
Number of students with disabilities served in residential 26.00
placements
Average total cost per student
$136,039.00
Percentage of all services covered by state grant funds 45.00%
Number of finalized adoptions each year
1,400.00
Percentage of children exiting foster care for adoption 27.40% within 24 months of their last removal from home
Department of Human Services Department of Human Services Department of Human Services
Adoptions Services Adoptions Services Adoptions Services
Department of Human Services Department of Human Services Department of Human Services Department of Human Services
After School Care After School Care After School Care Child Care Licensing
Department of Human Services Department of Human Services Department of Human Services Department of Human Services
Child Care Licensing Child Care Licensing Child Care Services Child Care Services
Percentage of adoptions finalized within six months of 84.40%
adoptive placement
Annual number of finalized adoptions as a percentage of N/A
total eligible children
Percentage of children with an adoption disruption (i.e., N/A
children in an adoptive home but the adoption is not
finalized)
Number of youth who participate in afterschool and
38,300.00
summer programs
Percentage of youth in foster care who participate in
N/A
after school programs
Percentage of youth whose grades improve during the N/A
academic year
Percentage of licensed facilities, agencies and
N/A
institutions who received a follow-up visit within the
required time frame following issuance of an
Enforcement Action
Percentage of surveys closed within 30 days of survey 93.24%
exit date
Number of incident reports received
3,153.00
Number of children served in subsidized childcare (average per month) The average monthly number of children served in transitional child care
53,701.00 5,256.00
FY 2010 Actual $13.47 950,029.00 221,701.00 $6.14 104,539.00 63,597.00 86,446.00 N/A 26.00 $164,039.00 35.00% 1,216.00 27.40%
87.80% 54.20% 3.00%
22,200.00 N/A N/A 90.00%
94.13% 3,534.00 64,644.00 3,971.00
FY 2011 Actual $16.41 924,887.00 254,873.00 $6.09 106,211.00 64,315.00 17,863.00 N/A 22.00 $182,859.00 37.00% 1,092.00 34.30%
90.50% 46.70% 2.54%
34,900.00 N/A 70.00% 94.00%
89.74% 3,262.00 69,823.00 2,655.00
FY 2012 Actual $16.36 967,578.00 325,930.00 $6.86 79,953.00 64,495.00 20,395.00 N/A 23.00 $161,651.00 42.00% 900.00 44.70%
93.10% 59.50% 2.80%
33,700.00 3.00% N/A 93.00%
80.78% 3,401.00 51,418.00 2,994.00
32 of 62
FY 2014 Performance Measure Report
Web Report
2/12/2013
Agency
Program Name
Department of Human Child Care Services
Services
Department of Human Services Department of Human Services Department of Human Services Department of Human Services
Child Support Services Child Support Services Child Support Services Child Support Services
Department of Human Services Department of Human Services
Child Welfare Services Child Welfare Services
Department of Human Services Department of Human Services
Child Welfare Services Child Welfare Services
Department of Human Services Department of Human Services Department of Human Services Department of Human Services Department of Human Services Department of Human Services Department of Human Services
Child Welfare Services
Child Welfare Services Special Project Child Welfare Services Special Project Child Welfare Services Special Project Community Services
Community Services
Community Services
Department of Human Council On Aging Services
Department of Human Council On Aging Services
Department of Human Services Department of Human Services
Council On Aging Departmental Administration
Department of Human Services Department of Human Services
Departmental Administration Departmental Administration
Description Percentage of children who attend quality rated programs as designated by Department of Early Care and Learning Percentage of current support being paid as ordered
FY 2009 Actual N/A
60.00%
Percentage of families/cases receiving arrears payments 69.00%
Percentage of child support orders established
85.76%
Cost effectiveness of dollars collected per dollar spent $7.22 (target is greater than National average of $4.88)
Number of substantiated maltreatment incidents
27,395.00
Percentage of children who were victims of subsequent maltreatment within 6 months (National Standard: <5.40%) Percentage of investigations of child maltreatment completed timely (within 45 calendar days) Percentage of foster children who re-enter foster care within 12 months (National Standard: less than or equal to 8.60%) Percentage of children who return home within 12 months of being removed Percentage of state served by Child Advocacy Centers
3.01%
96.00% 4.14%
65.17% N/A
Number of forensic interviews conducted by Children N/A
Advocacy Centers
Percentage of forensic interviews conducted for Sexual N/A
Abuse Allegations
Employed and maintained a job for at least 90 days
N/A
Number of low-income individuals who were assisted by N/A
Community Services Block Grant Funds
Percentage of low-income participants who obtained N/A
court-ordered child support payments leading to
becoming more self sufficient
Percentage of participants who have a better
N/A
understanding of issues that benefit elderly Georgians as
a result of council training, education, and advocacy
efforts (Target 75%)
Legislation, initiated, influenced and/or enacted each 7.00
legislative session which benefits older Georgians
(Target 10)
Forums and other events conducted which promote
13.00
issues beneficial to elderly Georgians (Target 20)
Percentage of background investigations initiated by N/A
electronic fingerprinting technicians within 14 calendar
days (Target 95%)
Number of Application Software Requests
N/A
Cost per trip for transportation services
$11.10
FY 2010 Actual N/A
60.00% 77.96% 85.82% $6.58
20,329.00 3.99%
97.00% 3.32%
72.25% 92.00% 3,219.00 72.00% 65.84% 332,418.00 91.73%
91.00%
8.00
24.00 N/A
N/A $10.90
FY 2011 Actual 5.00%
60.63% 77.93% 85.32% $7.02
32,543.00 2.20%
95.00% 4.00%
76.87% 95.00% 4,983.00 62.00% 86.40% 368,220.00 76.30%
91.00%
8.00
22.00 90.00%
N/A $10.83
FY 2012 Actual 5.00%
62.00% 66.00% 83.04% $7.02
26,747.00 2.30%
96.00% 6.80%
77.70% 95.00% 8,269.00 66.00% N/A N/A N/A
92.00%
10.00
22.00 98.00%
791.00 $11.03
33 of 62
FY 2014 Performance Measure Report
Web Report
2/12/2013
Agency Department of Human Services Department of Human Services Department of Human Services Department of Human Services Department of Human Services Department of Human Services Department of Human Services Department of Human Services Department of Human Services
Program Name
Description
Departmental Administration Number of clients receiving transportation services
FY 2009 Actual 17,907.00
Departmental Administration Number of trips provided by transportation services
2,619,447.00
Departmental Administration Total funds expended for transportation
$29,073,120.00
Departmental Administration Percentage of Application Software Requests completed N/A
by the agreed upon date
Elder Abuse Investigations and Percentage of Adult Protective Services clients
94.60%
Prevention
contacted within 10 days
Elder Abuse Investigations and Percentage of Long Term Care Ombudsman complaints 93.00%
Prevention
resolved
Elder Abuse Investigations and Consumer dollars saved through legal case
$10,780,130.00
Prevention
representation, counseling and outreach
Elder Abuse Investigations and Number of legal cases represented
2,493.00
Prevention
Elder Community Living
Number of months Community Care Service Program 49.00
Services
participants delayed admission into a more costly facility
Department of Human Elder Community Living
Services
Services
Department of Human Services Department of Human Services Department of Human Services Department of Human Services Department of Human Services Department of Human Services Department of Human Services Department of Human Services Department of Human Services
Elder Community Living Services Elder Community Living Services Elder Community Living Services Elder Community Living Services Elder Community Living Services Elder Community Living Services Elder Support Services
Elder Support Services
Elder Support Services
Department of Human Services Department of Human Services Department of Human Services Department of Human Services Department of Human Services Department of Human Services
Elder Support Services Elder Support Services Elder Support Services Elder Support Services Elder Support Services Energy Assistance
Number of months Non-Medicaid Home and Community 35.00
Based Services program participants delayed admission
into a more costly facility
Community Care Service Program clients served
12,599.00
Non-Medicaid Home and Community Based Services clients served Average cost per Community Care Service Program client Average cost per Non-Medicaid Home and Community Based Services client Number of applicants served
36,049.00 $9,184.00 $1,734.00 48,648.00
Total dollars saved as a result of clients remaining in the $215.00 community (in millions) Amount of financial savings for GeorgiaCares clients $20,604,792.00
Consumers contacting Aging Disability Resource Connections for service Percentage of Senior Community Service Employment Program participants who retained unsubsidized employment for six months or longer Number of senior center meals served
216,480.00 80.00%
2,580,760.00
Number of seniors served at senior centers
14,492.00
Number of home delivered meals
1,472,770.00
Number of seniors served home delivered meals
14,325.00
Percentage of Aging Disability Resource Connections crisis calls followed up within 14 days Total households assisted with energy assistance
N/A $217,118.00
FY 2010 Actual 16,726.00 2,491,572.00 $27,161,839.00 N/A 94.40% 94.00% $10,500,859.00 2,556.00 48.00
39.00
12,762.00 36,116.00 $8,569.00 $1,729.00 48,878.00 $254.00 $35,415,462.00 222,845.00 83.00%
2,663,536.00 14,891.00 1,551,776.00 15,164.00 N/A $252,097.00
FY 2011 Actual 15,644.00 2,609,611.00 $28,268,022.00 N/A 92.20% 94.00% $10,083,092.00 2,310.00 49.00
40.00
12,421.00 35,163.00 $9,006.00 $1,821.00 47,584.00 $210.00 $19,315,193.00 264,870.00 76.00%
1,462,168.00 14,802.00 2,559,037.00 13,995.00 81.00% $212,849.00
FY 2012 Actual 23,864.00 2,648,133.00 $29,199,015.00 74.59% 92.40% N/A $8,699,359.00 2,269.00 47.00
44.00
12,825.00 35,684.00 N/A $1,853.00 48,509.00 N/A $29,546,247.00 281,896.00 71.00%
1,455,900.00 14,660.00 2,530,109.00 14,258.00 98.00% $158,955.00
34 of 62
FY 2014 Performance Measure Report
Web Report
2/12/2013
Agency Department of Human Services Department of Human Services Department of Human Services Department of Human Services Department of Human Services Department of Human Services Department of Human Services Department of Human Services Department of Human Services Department of Human Services Department of Human Services Department of Human Services Department of Human Services
Department of Human Services
Department of Human Services
Department of Human Services
Program Name Energy Assistance
Energy Assistance
Energy Assistance
Family Connection
Family Connection
Family Connection
Family Violence Services
Family Violence Services
Family Violence Services
Federal Eligibility Benefit Services Federal Eligibility Benefit Services Federal Eligibility Benefit Services Georgia Vocational Rehabilitation Agency: Business Enterprise Program Georgia Vocational Rehabilitation Agency: Business Enterprise Program Georgia Vocational Rehabilitation Agency: Business Enterprise Program Georgia Vocational Rehabilitation Agency: Disability Adjudication Section
Description Percentage of households authorized for assistance within 11 days from date of application Number of elderly households authorized for assistance in order to retain heating services Average amount of LIHEAP funds paid per household.
FY 2009 Actual N/A
N/A
N/A
Number of counties with working Family Connection collaborative Family Connection collaboratives' training satisfaction rate. Average dollar leveraged per appropriated dollar by county collaborative (FY 2012 value is an estimate) Number of shelter bed nights
159.00 N/A $207,700.00 203,000.00
Percentage of domestic violence victims with an increase in knowledge of community resources Percentage of domestic violence victims receiving help with safety planning Number of food stamp cases
N/A N/A 568,542.00
Food stamp eligibility accuracy rate (maintain error rate below national average) Percentage of individuals receiving Right from the Start Medicaid within 45 days of application Increase in the number of blind vendors
97.90% N/A 3.00%
Amount collected in total sales
$9,900,875.00
Number of vendors
88.00
Percentage of disability benefit determinations found to 92.70% be correct
Department of Human Georgia Vocational
Average number of days to determine claims (federal
Services
Rehabilitation Agency:
standard is 134 days)
Disability Adjudication Section
95.00
Department of Human Georgia Vocational
Number of claims adjudicated
Services
Rehabilitation Agency:
Disability Adjudication Section
121,000.00
Department of Human Georgia Vocational
Percentage of total labor hours performed by individuals 80.00%
Services
Rehabilitation Agency: Georgia who are legally blind
Industries for the Blind
Department of Human Georgia Vocational
Number of blind persons employed by GIB
Services
Rehabilitation Agency: Georgia
Industries for the Blind
111.00
FY 2010 Actual N/A N/A N/A 159.00 85.30% $216,635.00 225,231.00 94.00% N/A 705,734.00 98.00% 94.70% 6.00%
$9,101,733.00
82.00
96.90%
139.00
144,412.00
81.30%
104.00
FY 2011 Actual 75.00% 82,097.00 N/A 159.00 87.44% $243,446.00 218,844.00 94.00% 87.00% 780,719.00 97.70% 93.90% 6.00%
$8,931,925.00
82.00
94.80%
133.00
154,116.00
87.80%
100.00
FY 2012 Actual 56.00% 74,276.00 $344.00 159.00 91.38% $243,446.00 229,453.00 96.00% 98.00% 860,085.00 97.00% 94.80% 1.00%
$8,205,928.00
77.00
96.40%
115.00
144,807.00
87.30%
91.00
35 of 62
FY 2014 Performance Measure Report
Web Report
2/12/2013
Agency Department of Human Services
Program Name
Description
Georgia Vocational
Total income generated from products and services
Rehabilitation Agency: Georgia
Industries for the Blind
FY 2009 Actual $11,310,481.00
Department of Human Services
Department of Human Services
Department of Human Services
Department of Human Services
Department of Human Services
Department of Human Services
Department of Human Services Department of Human Services Department of Human Services Department of Human Services Department of Human Services Department of Human Services Department of Human Services Department of Human Services
Georgia Vocational Rehabilitation Agency: Roosevelt Warm Springs Institute Georgia Vocational Rehabilitation Agency: Roosevelt Warm Springs Institute Georgia Vocational Rehabilitation Agency: Roosevelt Warm Springs Institute Georgia Vocational Rehabilitation Agency: Vocational Rehabilitation Program Georgia Vocational Rehabilitation Agency: Vocational Rehabilitation Program Georgia Vocational Rehabilitation Agency: Vocational Rehabilitation Program Out-of-Home Care
Out-of-Home Care
Out-of-Home Care
Out-of-Home Care
Out-of-Home Care
Out-of-Home Care
Out-of-Home Care
Refugee Assistance
Department of Human Services Department of Human Services Department of Human Services Department of Human Services
Refugee Assistance
Refugee Assistance
Refugee Assistance
Support for Needy Families Basic Assistance
Percentage of patients discharged from the
95.00%
Rehabilitation Hospital demonstrating a functional gain
Percentage of patients from the Longer-term Acute care N/A Hospital to home
Percentage of students completing Vocational
N/A
Rehabilitation plans that graduate as work-or school-
ready
Percentage of Vocational Rehabilitation participants that 61.00%
commit to a work plan and obtain and retain
employment for at least three months during the fiscal
year
Total Vocational Rehabilitation clients served
N/A
Average caseload per Vocational Rehabilitation
N/A
counselor
Number of licensed foster homes
7,824.00
Number of children in the legal custody of DFCS
16,860.00
Percentage of siblings placed together in out-of-home 22.50%
care
Percentage of children in care for 12-24 months with two N/A
or fewer placement settings
Percentage of children placed with relatives
26.87%
Percentage of children in congregate care
15.73%
Percentage of children who do not experience maltreatment while in foster care Percentage of Refugees who terminate Refugee Cash Assistance/Temporary Assistance for Needy Families due to employment Number of Refugees initially resettled in Georgia
99.12% 51.00%
3,518.00
Number of Refugees who entered full time employment 480.00
Number of Refugees who entered U.S. and received English Language instruction within 60 months Number of adults receiving cash assistance
1,773.00 2,797.00
FY 2010 Actual $12,467,661.00
95.00%
41.00%
N/A
62.30%
N/A
N/A
7,658.00 14,328.00 23.39% 29.00% 25.45% 18.52% 98.89% 93.00% 3,102.00 396.00 1,797.00 3,412.00
FY 2011 Actual $10,959,233.00
100.00%
47.00%
N/A
59.60%
39,738.00
123.00
6,857.00 13,534.00 21.92% 26.00% 23.64% 19.60% 99.21% 89.00% 2,804.00 529.00 2,058.00 3,314.00
FY 2012 Actual $10,807,934.00
95.00%
66.00%
64.00%
59.30%
41,551.00
126.00
6,361.00 13,921.00 21.76% 29.00% 23.02% 19.22% 99.19% 75.00% 2,600.00 537.00 1,900.00 3,471.00
36 of 62
FY 2014 Performance Measure Report
Web Report
2/12/2013
Agency Department of Human Services Department of Human Services Department of Human Services Department of Human Services
Program Name Support for Needy Families Basic Assistance Support for Needy Families Basic Assistance Support for Needy Families Work Assistance Support for Needy Families Work Assistance
Description
FY 2009 Actual
Percentage of individuals receiving assistance within 45 N/A
days of application
Percentage of applications completed online
N/A
Percentage of single parent households who are in qualified work activities Percentage of households who return to Temporary Assistance for Needy Families in 1st year following exit
69.00% N/A
Department of Human Support for Needy Families -
Services
Work Assistance
Department of Juvenile Community Services
Justice
Department of Juvenile Community Services
Justice
Department of Juvenile Community Services
Justice
Department of Juvenile Community Services
Justice
Department of Juvenile Community Services
Justice
Department of Juvenile Community Services
Justice
Department of Juvenile Departmental Administration
Justice
Department of Juvenile Departmental Administration Justice Department of Juvenile Departmental Administration Justice
Department of Juvenile Secure Commitment (YDCs) Justice Department of Juvenile Secure Commitment (YDCs) Justice
Department of Juvenile Justice Department of Juvenile Justice Department of Juvenile Justice Department of Juvenile Justice Department of Juvenile Justice
Secure Commitment (YDCs) Secure Commitment (YDCs) Secure Commitment (YDCs) Secure Commitment (YDCs) Secure Commitment (YDCs)
Percentage of cases renewed online
N/A
Percentage of DJJ youth days served in Community Services Cost per day of non-residential supervision
81.84% $12.90
Percentage of youth with no new offense while under community supervision Daily average of youth supervised by Community Services Community Services average caseload per officer
82.74% 18,475.00 37.20
Percentage of youth re-offending after completion at one- 49.40%
year interval
Number of annual transactions performed within the
142,076.00
PeopleSoft Human Capital Management and Financial
System
Average turnover rate of departmental employees (all job 22.42%
titles)
Percentage of employee survey respondents who rate N/A
strongly their employment satisfaction with Department
of Juvenile Justice
Number of youth served
4,216.00
Percentage of long-term youth discharged from commitment that are re-adjudicated or resentenced within one year of release Number of Short Term Program days served
45.16% 151,654.00
Number of Short Term Program youth served
3,830.00
Youth Development Campus juvenile corrections officer 45.20%
turnover rate
Youth Development Campus average cost per day
$209.86
Percentage of eligible youth receiving General Education 32.96% Diploma/High School Diploma/Vocational Certificate
Department of Juvenile Secure Detention (RYDCs) Justice Department of Juvenile Secure Detention (RYDCs) Justice Department of Juvenile Secure Detention (RYDCs) Justice
Number of youth served
13,816.00
Percentage of youthful offenders successfully detained 99.98% until the end of their court proceedings Regional Youth Detention Center average cost per day $216.26
FY 2010 Actual 82.00% N/A 83.00% 14.00%
N/A 82.86% $13.45 82.91% 16,474.00 33.70 50.50% 139,506.00
19.15% 63.00%
2,308.00 41.10%
63,053.00 2,883.00 41.10% $195.58 18.89%
12,664.00 99.99% $233.93
FY 2011 Actual 73.00% N/A 86.00% 12.00%
N/A 83.00% $14.68 85.50% 15,398.00 32.00 48.80% N/A
25.91% 71.00%
1,294.00 39.47%
60,369.00 2,516.00 54.20% $230.26 42.12%
11,290.00 99.98% $257.90
FY 2012 Actual 90.00% 55.00% 87.00% 9.30%
50.00% 82.00% $11.47 87.00% 13,002.00 27.80 48.30% N/A
25.19% 67.00%
1,515.00 41.65%
49,677.00 2,190.00 49.60% $258.11 29.34%
10,747.00 100.00% N/A
37 of 62
FY 2014 Performance Measure Report
Web Report
2/12/2013
Agency Department of Labor
Department of Labor
Department of Labor
Department of Labor
Program Name Department of Labor Administration Department of Labor Administration Department of Labor Administration Labor Market Information
Department of Labor Department of Labor
Labor Market Information Labor Market Information
Department of Labor Unemployment Insurance
Department of Labor Department of Labor
Department of Labor
Unemployment Insurance Unemployment Insurance
Unemployment Insurance
Department of Labor Unemployment Insurance Department of Labor Workforce Solutions
Department of Labor Workforce Solutions
Department of Labor Department of Labor Department of Law Department of Law Department of Law Department of Law Department of Law Department of Natural Resources Department of Natural Resources Department of Natural Resources Department of Natural Resources Department of Natural Resources Department of Natural Resources Department of Natural Resources Department of Natural Resources
Workforce Solutions Workforce Solutions Medicaid Fraud Control Unit Medicaid Fraud Control Unit Medicaid Fraud Control Unit Medicaid Fraud Control Unit Medicaid Fraud Control Unit Coastal Resources
Coastal Resources
Coastal Resources
Coastal Resources
Coastal Resources
Coastal Resources
Coastal Resources
Environmental Protection
Department of Natural Environmental Protection Resources
Description
FY 2009 Actual
Total number of mail pieces processed during the year N/A
Number of employees that enrolled in and completed the N/A
EXCEL Leadership Development Program
Number of documents digitized and stored through the N/A
department's enterprise imaging application
Accuracy rate of non-agricultural employment estimates 99.40%
by Georgia's Current Employment Statistics (internal
target 98%)
Georgia's survey response rate for the Occupational 85.90%
Employment Statistics survey (federal target 75%)
Accuracy rate of industrial codes to which employers are 99.80%
assigned in Georgia's Employment and Wages Report
(federal target 99.5%)
Percentage of unemployment insurance benefit
96.00%
recipients paid accurately, as determined by a federally-
prescribed sample methodology
Number of Child Labor Certificates issued to minors
36,238.00
Number of initial unemployment insurance claims filed 1,010,261.00
Percentage of new employer accounts for which
87.30%
unemployment insurance obligation is determined within
90 days (federal target 88.7%)
Number of employers determined to have tax liability 214,839.00
Percentage of customers retaining employment following 78.00%
services
Percentage of customers obtaining employment
59.00%
following services
Number of customers served at Career Centers
705,511.00
Number of job orders received from businesses
67,115.00
Number of investigations concluded
N/A
Percentage of cases resolved within a year
N/A
Dollar value of recovery
N/A
Number of cases opened
N/A
Average collections per auditor
N/A
Number of participants in coastal education programs or N/A
outreach events
Acres certified for public shellfish harvest
11,365.00
Average days to process a Coastal Marshlands and Protection Act (CMPA) permit Average days to process a Shore Protection Act (SPA) permit Number of unauthorized activities resolved to a compliance standard within 90 days Number of Coastal Marshlands Protection Act (CMPA) permits Number of Shore Protection Act (SPA) permits
N/A N/A N/A 28.00 11.00
Percentage of customers seeking stream bank variances 80.00%
who rate the service they receive as timely, more easily
understood, and courteous
Annual water withdrawal for municipal and industrial
160.00
water use (measured in gallons per capita per day)
FY 2010 Actual N/A N/A N/A 99.10%
83.00% 99.70%
97.40%
38,580.00 899,267.00 88.00%
208,379.00 72.00% 44.00% 701,470.00 69,132.00 N/A N/A N/A N/A N/A 28,628.00 8,532.00 78.00 32.00 27.00 13.00 7.00 80.00%
155.00
FY 2011 Actual 11,800,000.00 34.00 N/A 99.80%
83.40% 99.60%
94.30%
31,368.00 775,089.00 89.10%
204,821.00 73.00% 46.00% 657,838.00 76,823.00 N/A N/A N/A N/A N/A 33,543.00 8,532.00 57.00 26.00 101.00 18.00 6.00 N/A
158.00
FY 2012 Actual 10,084,326.00 29.00 3,600,000.00 98.60%
81.80% 99.50%
93.40%
47,684.00 669,429.00 88.90%
204,409.00 77.00% 47.00% 599,775.00 69,507.00 N/A N/A N/A N/A N/A 30,194.00 8,532.00 45.00 36.00 84.00 14.00 5.00 74.00%
158.00
38 of 62
FY 2014 Performance Measure Report
Web Report
2/12/2013
Agency Department of Natural Resources Department of Natural Resources Department of Natural Resources Department of Natural Resources Department of Natural Resources Department of Natural Resources
Department of Natural Resources Department of Natural Resources Department of Natural Resources Department of Natural Resources Department of Natural Resources Department of Natural Resources Department of Natural Resources Department of Natural Resources Department of Natural Resources
Department of Natural Resources Department of Natural Resources Department of Natural Resources
Department of Natural Resources Department of Natural Resources
Department of Natural Resources
Program Name Environmental Protection
Description Number of air permit applications processed
FY 2009 Actual 692.00
Environmental Protection Environmental Protection
Particulate matter reduction (tons) associated with school bus retrofit projects Number of Notice of Violations issued
N/A 3,962.00
Environmental Protection
Number of consent orders executed
956.00
Environmental Protection
Settlement dollars collected for executed consent orders $3,687,542.00
Environmental Protection Environmental Protection
Percentage of population served by drinking water systems that meet National Primary Drinking Water regulations Number of days above ozone standard
96.30% 5.00
Hazardous Waste Trust Fund Hazardous Waste Trust Fund Hazardous Waste Trust Fund
Number of sites removed from the Hazardous Site Inventory in a fiscal year Total dollars collected in hazardous waste fees, hazardous substance fees, and civil penalties Percentage of total private party cleanups under review
11.00 $15,852,057.00
Hazardous Waste Trust Fund Hazardous Waste Trust Fund
Total dollar amount reimbursed to local governments for $2,170,260.00 cleanups Number of abandoned sites undergoing corrective action 17.00
Hazardous Waste Trust Fund Total number of abandoned sites on the HSI list
Historic Preservation Historic Preservation
Historic Preservation
Number of historic properties in Georgia that are listed in 71,201.00
the National Register of Historic Places
Number of historic properties that are being preserved 91.00
as documented by the use of the Federal Rehabilitation
Investment Tax Credit and State Preferential Property
Tax Assessment Program for Rehabilitation Historic
Property
Number of renovation projects reviewed
366.00
Parks, Recreation and Historic Average annual occupancy at state park cottages
47.00%
Sites
Parks, Recreation and Historic Percentage of customer comments indicating their
87.00%
Sites
overall park experience was good, very good, or
excellent
Parks, Recreation and Historic Number of park, recreation, and historic site visitations 10,270,601.00
Sites
Pollution Prevention Assistance Percentage of on-site assessment clients that implement 70.00%
at least one waste reduction or natural resource
conservation recommendation
Solid Waste Trust Fund
Percentage of regulated solid waste facilities operating 93.00%
in compliance with environmental standards
Department of Natural Resources Department of Natural Resources
Solid Waste Trust Fund Wildlife Resources
Number of new or modified solid waste permits issued 12.00
Number of dollars generated for Georgia's economy per $242.00 dollar of state funds spent on fisheries management and fishing
FY 2010 Actual 643.00 2.02 3,515.00 727.00 $3,810,327.00 93.50%
11.00 15.00 $16,956,195.00
$1,381.00 5.00
75,081.00 81.00
462.00 45.00% 97.00%
9,722,243.00 83.00%
91.00%
12.00 $275.00
FY 2011 Actual 659.00 2.65 3,861.00 785.00 $2,017,732.00 97.30%
15.00 11.00 $13,551,871.00
$1,410,755.00 4.00
75,745.00 95.00
367.00 43.00% 97.00%
8,858,751.00 N/A
90.00%
6.00 $296.00
FY 2012 Actual 694.00 28.40 3,639.00 787.00 $1,489,298.00 98.30%
N/A 11.00 $13,615,384.00
$1,145,414.00 1.00 64.00 76,591.00 94.00
233.00 42.00% 93.00%
9,013,624.00 N/A
85.00%
10.00 $407.00
39 of 62
FY 2014 Performance Measure Report
Web Report
2/12/2013
Agency Department of Natural Resources Department of Public Health Department of Public Health Department of Public Health Department of Public Health
Program Name Wildlife Resources
Adolescent and Adult Health Promotion Adolescent and Adult Health Promotion Adolescent and Adult Health Promotion Adolescent and Adult Health Promotion
Department of Public Adolescent and Adult Health
Health
Promotion
Description
FY 2009 Actual
Percentage of hunters who rate their hunting experience 87.00%
as satisfactory or better
Number of school systems that adopt the evidence-
N/A
based, 100% Tobacco Free School policy
Number of students protected from secondhand smoke N/A
Number of registered callers to the Georgia Tobacco N/A
Quit Line
Number of adolescents ages 10-19 that complete
N/A
evidenced based programs focused on adolescent
health and youth development
Percentage of federally funded screening mammograms 86.50%
provided to women between 50-64 years of age
Department of Public Health Department of Public Health
Adolescent and Adult Health Promotion Adolescent and Adult Health Promotion
Number of adolescents ages 10-19 that receive teen N/A center services Percentage of Temporary Assistance for Needy Families N/A supported teen centers that implement evidence based programs focused on adolescent health and youth development (target of at least 50%)
Department of Public Health Department of Public Health Department of Public Health Department of Public Health
Department of Public Health Department of Public Health Department of Public Health
Department of Public Health
Adolescent and Adult Health Promotion Adolescent and Adult Health Promotion Adolescent and Adult Health Promotion Adolescent and Adult Health Promotion
Adolescent and Adult Health Promotion Adult Essential Health Treatment Services Adult Essential Health Treatment Services
Adult Essential Health Treatment Services
Percentage of average risk new clients screened for
N/A
colorectal cancer who are aged 50 years and older
Percentage of abnormal colorectal screening test results N/A
with diagnostic follow-up treatment
Percentage of colorectal cancers diagnosed with
N/A
treatment initiated
Percentage of initial pap tests provided to individuals N/A
who have never or rarely been screened for cervical
cancer
Percentage of final diagnosis of breast cancer where N/A
treatment has been started
Percentage of eligible enrolled patients served by the 91.00%
Cancer State Aid program
Of the 18 public health districts, the number of districts 10.00
with hospitals that have participation agreements with
the Cancer State Aid Program to foster program
outreach and access
Of the 18 public health districts, the number of districts 17.00
with hospital-based and free-standing radiation centers
providing access to radiation treatment services
Department of Public Health Department of Public Health Department of Public Health Department of Public Health
Department of Public Health
Brain and Spinal Injury Trust Fund Brain and Spinal Injury Trust Fund Brain and Spinal Injury Trust Fund Emergency Preparedness/Trauma System Improvement Emergency Preparedness/Trauma System Improvement
Number of complete applications received
Average number of days from application submission to award date Percentage of total annual budget dedicated to awards
Average processing time for new medic license applications (in days)
Strategic National Stockpile proficiency score
247.00 183.00 75.00% N/A
73.00%
FY 2010 Actual 88.00% 61.00 944,931.00 4,748.00 N/A
85.60%
45,597.00 N/A
N/A N/A N/A 24.80%
97.20% 90.00% 12.00
17.00
275.00 218.00 75.00% 14.00
90.00%
FY 2011 Actual 87.00% 72.00 1,018,764.00 5,835.00 N/A
86.60%
55,678.00 N/A
N/A N/A N/A 26.50%
97.60% 86.00% 11.00
17.00
205.00 157.00 75.50% 3.00
95.00%
FY 2012 Actual 87.00% 83.00 1,165,500.00 10,481.00 N/A
90.00%
35,928.00 100.00%
N/A N/A N/A 27.00%
95.00% 87.00% 10.00
17.00
172.00 N/A 67.70% 2.00
96.00%
40 of 62
FY 2014 Performance Measure Report
Web Report
2/12/2013
Agency Department of Public Health
Department of Public Health Department of Public Health
Program Name Emergency Preparedness/Trauma System Improvement Epidemiology
Epidemiology
Description Number of trauma centers
FY 2009 Actual 15.00
Percentage of cases captured by active laboratory
95.00%
surveillance for nine top foodborne pathogens
Percentage of infectious disease outbreak investigations 95.00%
that contain all minimal elements, including a final report
Department of Public Health
Department of Public Health
Department of Public Health
Department of Public Health Department of Public Health
Department of Public Health
Epidemiology
Georgia Trauma Care Network Commission
Georgia Trauma Care Network Commission
Georgia Trauma Care Network Commission Georgia Trauma Care Network Commission
Immunization
Percentage of reports of selected reportable diseases for 100.00%
which public health control measures were initiated
within the appropriate timeframe
Number of Emergency Medical Service Regions (out of N/A
10 possible) participating in Trauma System
Regionalization activities
Average time in minutes and by Injury Severity Score for N/A
a Trauma System Patient to reach definitive care from
scene of injury
Number of First Responders trained from funding
N/A
provided by the Commission
Percentage increase in the number of trauma system N/A
patients whose transport to a definitive care hospital was
facilitated by the Georgia Trauma Communications
Center
Percentage of children who are up to date on
N/A
recommended immunizations by their second birthday
(based on National Immunization Survey data)
Department of Public Immunization Health
Department of Public Immunization Health
Department of Public Health Department of Public Health Department of Public Health Department of Public Health
Infant and Child Essential Health Treatment Services Infant and Child Essential Health Treatment Services Infant and Child Essential Health Treatment Services Infant and Child Essential Health Treatment Services
Department of Public Infant and Child Essential
Health
Health Treatment Services
Percentage of Vaccines For Children program enrollees 2.10%
that are Ob/GYN, HIV, STD and Family Planning
providers
Number of public and private provider organizations that 5,701.00
actively utilize Georgia Registry of Immunization
Transactions and Services
Number of children receiving assessment from
13,141.00
Children's 1st program
Number of children receiving services through the
5,412.00
Babies Can't Wait program
Number of children receiving services from the
8,767.00
Children's Medical Services program
Percentage of screen positive newborns who receive 100.00%
timely follow up to definitive diagnosis and clinical
management for condition(s) mandated by their State
sponsored newborn screening programs
Percentage of third grade children who have received 39.00%
protective sealant on at least one permanent molar tooth
Department of Public Infant and Child Essential
Health
Health Treatment Services
Department of Public Infant and Child Health
Health
Promotion
Percentage of very low birth weight infants (<1500 grams) delivered at facilities for high-risk deliveries and neonates Percentage of Women, Infants, and Children program children ages 2 to 5 with a Body Mass Index at the 85th percentile or greater (per federal fiscal year)
73.30% 30.60%
FY 2010 Actual 16.00 95.00% 95.00% 100.00% N/A N/A N/A N/A
76.30%
2.40% 7,810.00 13,261.00 5,371.00 8,747.00 100.00%
39.80% 73.50% 38.41%
FY 2011 Actual 19.00 95.00% 95.00% 100.00% 2.00 N/A 750.00 N/A
82.40%
2.64% 8,957.00 14,938.00 6,015.00 8,925.00 99.60%
39.00% 73.50% 32.22%
FY 2012 Actual 23.00 95.00% 96.00% 100.00% 3.00 N/A 338.00 N/A
N/A
1.78% 9,439.00 12,590.00 6,082.00 8,990.00 N/A
37.40% 72.50% N/A
41 of 62
FY 2014 Performance Measure Report
Web Report
2/12/2013
Agency Department of Public Health
Program Name Infant and Child Health Promotion
Description
FY 2009 Actual
Percentage of Women, Infants, and Children program 56.33%
infants who were ever breastfed (per federal fiscal year)
Department of Public Health Department of Public Health Department of Public Health
Department of Public Health Department of Public Health Department of Public Health Department of Public Health Department of Public Health Department of Public Health Department of Public Health Department of Public Health
Infant and Child Health Promotion Infectious Disease Control Infectious Disease Control
Infectious Disease Control Infectious Disease Control Infectious Disease Control
Number of infants and children served by the Women, 386,126.00
Infants, and Children program
Percentage of early syphilis cases interviewed within 7 84.60%
calendar days from date of assignment
Percentage of refugees that receive initial domestic
84.10%
health screenings within 90 days of their arrival into the
U.S.
Percentage of eligible Tuberculosis (TB) patients
90.00%
completing TB treatment in 12 months
Number of eligible TB clients completing treatment in 12 378.00
months
Number of qualified ADAP applicants on waiting list
0.00
Infectious Disease Control
Number of Tuberculosis cases
418.00
Infectious Disease Control
Number of STD cases
61,465.00
Infectious Disease Control
Number of Syphilis cases
3,161.00
Infectious Disease Control
Number of HIV cases
1,385.00
Inspections and Environmental Number of food service inspections per establishment 1.97 Hazard Control
Department of Public Inspections and Environmental Percentage of inspections with primary food-born risk N/A
Health
Hazard Control
factor violations
Department of Public Inspections and Environmental Number of inspections per public pool
1.74
Health
Hazard Control
Department of Public Inspections and Environmental Percentage of residential pool inspections with
N/A
Health
Hazard Control
disinfection violations
Department of Public Inspections and Environmental Number of swimming pool closures
Health
Hazard Control
1,245.00
Department of Public Inspections and Environmental Number of inspections per tourist accommodations
1.78
Health
Hazard Control
Department of Public Inspections and Environmental Percentage of tourist accommodations inspections with N/A
Health
Hazard Control
critical tourist violations
Department of Public Inspections and Environmental Number of tourist complaints
Health
Hazard Control
358.00
Department of Public Health Department of Public Health Department of Public Health
Public Health Formula Grants to Counties Public Health Formula Grants to Counties Public Health Formula Grants to Counties
Number of services provided Average dollars spent per capita County funds leveraged above required amount
N/A $7.85 N/A
FY 2010 Actual 52.67%
380,898.00 83.90% 85.00%
88.00% 319.00 251.00 364.00 58,798.00 2,839.00 1,236.00 1.90
N/A
1.76
N/A
1,069.00
1.84
N/A
395.00
N/A $6.72 N/A
FY 2011 Actual 56.66%
373,802.00 63.67% 94.00%
90.00% 322.00 1,421.00 359.00 71,637.00 2,667.00 1,252.00 1.90
4.40%
1.70
8.00%
1,069.00
1.84
13.20%
395.00
N/A N/A N/A
FY 2012 Actual N/A
363,412.00 67.32% 83.00%
88.00% 268.00 223.00 332.00 67,578.00 2,751.00 1,075.00 2.00
5.10%
1.64
24.97%
715.00
1.91
9.76%
399.00
N/A N/A N/A
42 of 62
FY 2014 Performance Measure Report
Web Report
2/12/2013
Agency Department of Public Health Department of Public Health Department of Public Health Department of Public Health Department of Public Health Department of Public Health Department of Public Safety Department of Public Safety
Program Name Vital Records Vital Records Vital Records Vital Records Vital Records Vital Records Aviation Aviation
Department of Public Safety Department of Public Safety Department of Public Safety Department of Public Safety Department of Public Safety Department of Public Safety Department of Public Safety Department of Public Safety Department of Public Safety Department of Public Safety Department of Public Safety Department of Public Safety Department of Public Safety Department of Public Safety Department of Public Safety Department of Public Safety
Capitol Police Services Capitol Police Services Executive Security Services Executive Security Services Field Offices and Services Field Offices and Services Field Offices and Services Field Offices and Services Field Offices and Services Field Offices and Services Field Offices and Services Field Offices and Services Field Offices and Services Field Offices and Services Field Offices and Services Firefighters Standards and Training Council
Department of Public Firefighters Standards and
Safety
Training Council
Description Number of certificates issued
FY 2009 Actual 68,071.00
Average number of days to fill a certificate request
N/A
Amount of revenue collected
$1,820,250.00
Number of corrections, amendments, court orders and adoptions processed Percentage of vital events entered within 15 days
8,094.00 N/A
Number of vital events registered
213,013.00
Number of missions flown
1,323.00
Percentage of individuals found through general searches (both criminal and search and rescue combined) Number of Security Events within the fiscal year
38.00% N/A
Number of incidents responded to
110.00
Number of detail hours
43,909.00
Number of training hours
3,296.00
Number of vehicle stops performed
481,345.00
Total number of fatalities
1,299.00
Percentage of accident reports completed within 5 days 86.00%
Number of accidents in Georgia worked
40,333.00
Number of SWAT team call outs
38.00
Percentage of Computer Aided Dispatch (CAD) calls N/A
validated
Number of fleet operations vehicles serviced
N/A
Total department training hours
N/A
Number of CIU agency assists
N/A
Number of Nighthawks DUI stops
850.00
Number of marijuana plants located on task force missions Percentage of fire stations found to be operating in violation of state requirements and placed in noncompliant status Percentage of career firefighters in violation of annual training and certification requirements placed in noncompliant status
N/A 12.00%
2.00%
FY 2010 Actual 57,600.00 60.60 $1,596,575.00 6,732.00 51.00% 206,970.00 1,344.00 51.00%
121.00 2,787.00 39,042.00 1,009.00 502,195.00 1,250.00 54.00% 42,252.00 35.00 N/A N/A 162,561.00 N/A 941.00 67,163.00 14.00%
1.00%
FY 2011 Actual 188,896.00 41.00 $2,615,406.00 9,514.00 58.00% 203,232.00 N/A N/A
130.00 2,864.00 42,278.00 906.00 380,766.00 1,236.00 83.00% 47,635.00 33.00 70.00% N/A 123,976.00 N/A 2,571.00 23,556.00 11.00%
2.00%
FY 2012 Actual 99,144.00 32.00 $2,643,794.00 15,028.00 73.00% 198,365.00 1,388.00 52.00%
140.00 3,091.00 39,527.00 839.00 447,442.00 N/A 88.00% 43,950.00 40.00 86.00% 4,032.00 163,992.00 1,534.00 2,008.00 26,000.00 17.00%
2.60%
43 of 62
FY 2014 Performance Measure Report
Web Report
2/12/2013
Agency Department of Public Safety Department of Public Safety Department of Public Safety Department of Public Safety Department of Public Safety Department of Public Safety Department of Public Safety Department of Public Safety Department of Public Safety
Department of Public Safety Department of Public Safety Department of Public Safety Department of Public Safety Department of Public Safety Department of Public Safety Department of Public Safety Department of Public Safety Department of Public Safety Department of Public Safety Department of Public Safety Department of Public Safety Department of Public Safety Department of Public Safety Department of Public Safety Department of Public Safety Department of Public Safety
Program Name Firefighters Standards and Training Council Motor Carrier Compliance
Description Number of certified firefighters
Number of commercial vehicle inspections
FY 2009 Actual 12,100.00
93,000.00
Motor Carrier Compliance Motor Carrier Compliance Office of Highway Safety
Percentage of vehicles weighed and found to be in compliance Percentage of school buses found to have serious defects as a result of inspections Fatality rate per 100 million miles driven
99.00% 13.00% 1.19
Office of Highway Safety
Percentage of safety belt usage (observational survey) 88.90%
Office of Highway Safety
Peace Officers Standards and Training Council Peace Officers Standards and Training Council
Peace Officers Standards and Training Council Peace Officers Standards and Training Council Peace Officers Standards and Training Council Peace Officers Standards and Training Council Public Safety Training Center
Percentage of child safety seat usage (observational survey) Percentage of cases resulting in sanctions
Percentage of cases in which external review of POST actions led to a decision upholding the Council's sanction of an officer's certification Number of cases per investigator
Average number of open records requests completed per month Total number of certifications awarded.
Number of individuals awarded certifications that are supervisory, managerial, or executive certified. Average cost per law enforcement candidate
88.00% 69.00% 100.00%
149.00 351.00 11,966.00 249.00 N/A
Public Safety Training Center Average cost per fire fighter candidate
N/A
Public Safety Training Center Number of basic training courses taught
119.00
Public Safety Training Center Public Safety Training Center Public Safety Training Center Public Safety Training Center
Number of candidates attending police or fire specialized 28,595.00
training
Number of candidates attending police or fire basic
2,135.00
training
Percentage of candidates graduating from police or fire 76.00%
basic training
Percentage of all courses taught off-campus
41.00%
Specialized Collision Reconstruction Team Specialized Collision Reconstruction Team Specialized Collision Reconstruction Team Troop J Specialty Units
Troop J Specialty Units
Number of traffic accidents investigated
249.00
Percentage of cases investigated resulting in convictions 97.00%
Number of days to complete a full Specialized Collision Reconstruction Team case investigation Number of students attending the Basic 5000 course initially and for recertification Number of intoxilyzer devices inspected and/or serviced
195.00 2,453.00 2,426.00
Troop J Specialty Units
Number of Portable Breath Test (PBT) machines
N/A
repaired
FY 2010 Actual 12,500.00 98,716.00 99.00% 12.00% 1.09 89.60% 95.30% 60.00% 100.00%
167.00 401.00 11,433.00 227.00 N/A N/A 95.00 32,024.00 1,652.00 78.00% 47.00% 238.00 99.00% 245.00 2,212.00 2,224.00 221.00
FY 2011 Actual 13,000.00 100,877.00 99.00% 14.00% N/A 93.00% 98.20% 67.00% 100.00%
209.00 426.00 10,298.00 235.00 $3,421.51 $2,604.80 67.00 27,753.00 1,440.00 77.00% 41.00% 298.00 95.00% 259.00 1,884.00 2,050.00 322.00
FY 2012 Actual 13,014.00 85,768.00 99.00% 13.35% N/A 97.50% 98.60% 64.00% 100.00%
214.00 404.00 9,493.00 241.00 $3,421.51 $2,604.80 64.00 25,607.00 1,437.00 81.00% 39.00% 304.00 100.00% 194.00 2,115.00 2,037.00 350.00
44 of 62
FY 2014 Performance Measure Report
Web Report
2/12/2013
Agency
Program Name
Department of Revenue Customer Service
Department of Revenue Customer Service
Description
FY 2009 Actual
Percentage of persons surveyed who attended taxpayer 95.00%
education workshops who reported that the program was
beneficial
Number of in-bound calls
1,160,000.00
Department of Revenue Customer Service
Number of calls answered
557,000.00
Department of Revenue Industry Regulation
Total number of inspections (Alcohol)
4,192.00
Department of Revenue Industry Regulation
Percentage in compliance (Alcohol)
91.00%
Department of Revenue Industry Regulation
Total number of inspections (Tobacco)
3,178.00
Department of Revenue Industry Regulation
Percentage in compliance (Tobacco)
94.00%
Department of Revenue Industry Regulation
Total number of inspections (Games)
1,482.00
Department of Revenue Industry Regulation
Percentage in compliance (Games)
93.00%
Department of Revenue Industry Regulation
Total number of inspections (UCRA)
2,494.00
Department of Revenue Industry Regulation
Percentage in compliance (UCRA)
80.00%
Department of Revenue Industry Regulation Department of Revenue Industry Regulation
Average Alcohol/Tobacco/COAM inspections per sworn 316.00
Alcohol and Tobacco Division officer
Total underage alcohol investigations
3,678.00
Department of Revenue Industry Regulation Department of Revenue Industry Regulation
Percentage of investigated vendors making illegal underage alcohol sales Total underage tobacco investigations
18.00% 1,740.00
Department of Revenue Industry Regulation
Percentage of investigated vendors making illegal
underage tobacco sales
Department of Revenue Local Tax Officials Retirement Amount of Employee Retirement System benefits paid
and FICA
for local retirement
Department of Revenue Local Tax Officials Retirement Number of officials and staff participating in Employee
and FICA
Retirement System
Department of Revenue Motor Vehicle Registration and Amount of revenue from motor vehicle registrations (in
Titling
millions)
Department of Revenue Motor Vehicle Registration and Number of motor vehicle titles processed (in millions)
Titling
Department of Revenue Motor Vehicle Registration and Total number of motor vehicle registrations processed
Titling
Department of Revenue Motor Vehicle Registration and Number of motor vehicle registrations renewed online
Titling
Department of Revenue Motor Vehicle Registration and Salvage inspections completed statewide
Titling
Department of Revenue Motor Vehicle Registration and Percentage of each private contractor's inspection
Titling
reports reviewed by state salvage inspectors
Department of Revenue Motor Vehicle Registration and Percentage of each private contractor's inspections that
Titling
are visually inspected by state salvage inspectors
8.00% $3,614,173.77 1,285.00 $236.00 2.40 8,515,900.00 199,149.00 16,545.00 N/A N/A
Department of Revenue Motor Vehicle Registration and Percentage of compliant contractor salvage vehicle
N/A
Titling
inspections
FY 2010 Actual 95.00%
1,053,000.00 370,000.00 3,820.00 85.00% 3,126.00 84.00% 1,413.00 89.00% 2,282.00 97.00% 360.00 4,356.00 16.00% 3,372.00 9.00% $4,414,746.92 1,302.00 $214.00 2.40 8,527,790.00 304,705.00 18,865.00 N/A N/A
N/A
FY 2011 Actual N/A
990,058.00 345,000.00 4,746.00 85.00% 3,940.00 90.00% 4,280.00 86.00% 4,656.00 99.00% 381.00 4,365.00 18.00% 2,227.00 11.00% $5,289,184.55 1,283.00 $253.00 2.70 8,581,400.00 275,766.00 18,826.00 N/A N/A
N/A
FY 2012 Actual 88.00%
1,019,827.00 740,934.00 7,556.00 81.00% 5,823.00 89.00% 3,201.00 86.00% 5,351.00 99.00% 487.00 5,343.00 12.00% 1,763.00 9.00% $5,382,039.47 1,185.00 $240.00 2.80 8,619,297.00 589,956.00 21,609.00 5.00% 3.00%
N/A
45 of 62
FY 2014 Performance Measure Report
Web Report
2/12/2013
Agency
Program Name
Department of Revenue Revenue Processing
Description Total returns processed
FY 2009 Actual 6,371,815.00
Department of Revenue Revenue Processing
Total returns processed by tax type - Withholding
926,251.00
Department of Revenue Revenue Processing
Total returns processed by tax type - Corporate
284,155.00
Department of Revenue Revenue Processing
Total returns processed by tax type - Sales
1,244,403.00
Department of Revenue Revenue Processing
Total returns processed by tax type - Individual
3,917,006.00
Department of Revenue Revenue Processing
Average cost to process tax returns - paper
$1.75
Department of Revenue Revenue Processing
Average cost to process tax returns - electronic
$0.50
Department of Revenue Revenue Processing
Percentage of individual tax returns filed electronically 73.10%
Department of Revenue Revenue Processing
Percentage of withholding tax returns filed electronically 33.60%
Department of Revenue Revenue Processing
Percentage of corporate tax returns filed electronically 14.80%
Department of Revenue Revenue Processing
Percentage of sales tax returns filed electronically
23.00%
Department of Revenue Revenue Processing
Percentage of total tax returns filed electronically
55.00%
Department of Revenue Tax Compliance Department of Revenue Tax Compliance Department of Revenue Tax Compliance Department of Revenue Tax Compliance Department of Revenue Tax Compliance Department of Revenue Tax Compliance
Department of Revenue Tax Compliance
Number of telephone calls seeking assistance in the 11 Regional Offices Number of walk-in taxpayers seeking assistance in the 11 Regional Offices Average number of hours per audit by tax type - Sales and Use Tax Average number of hours per audit by tax type Individual Income Tax Average number of hours per audit by tax type Withholding Tax Average number of hours per audit by tax type Miscellaneous Taxes including IFTA, IRP, Tobacco, Alcohol, Unclaimed Property Number of audits completed
400,305.00 66,639.00 71.00 1.00 8.00 104.00
27,214.00
Department of Revenue Tax Compliance
Percentage of audits found to be in compliance
45.00%
Department of Transportation Department of Transportation Department of Transportation Department of Transportation
Department of Transportation
Airport Aid Airport Aid
Percentage of airports meeting state airport licensing standards. Percentage of airports with instrument approaches.
Airport Aid Capital Construction Projects
Capital Construction Projects
Percentage of airports with runway lengths meeting system plan development goals. Percentage of construction funds authorized on schedule per the approved State Transportation Improvement Program (target 80%) Percentage of projects completed on budget
91.00% 84.00% 79.00% 24.00%
80.80%
FY 2010 Actual 6,644,199.00 1,209,522.00 390,588.00 1,529,112.00 3,514,977.00 $1.50 $0.50 77.70% 50.00% 18.50% 33.30% 59.00% 449,958.00 72,000.00 85.00 2.00 4.00 35.00
12,173.00 42.00% 88.00% 85.00% 80.00% 89.00%
96.80%
FY 2011 Actual 7,367,044.00 1,021,074.00 216,001.00 1,679,964.00 4,450,005.00 $1.50 $0.50 75.70% 62.70% 40.30% 53.40% 68.00% 481,494.00 71,922.00 99.00 4.00 3.00 55.00
39,829.00 45.00% 89.00% 85.00% 81.00% 64.00%
97.40%
FY 2012 Actual 6,600,000.00 1,000,000.00 200,000.00 1,400,000.00 4,000,000.00 $1.50 $0.50 81.00% 77.00% 61.00% 73.00% 78.00% 426,719.00 60,789.00 64.00 4.00 4.00 37.00
94,609.00 45.00% 88.00% 87.00% 82.00% 71.00%
97.30%
46 of 62
FY 2014 Performance Measure Report
Web Report
2/12/2013
Agency Department of Transportation
Department of Transportation Department of Transportation Department of Transportation Department of Transportation Department of Transportation Department of Transportation Department of Transportation
Department of Transportation Department of Transportation
Department of Transportation
Department of Transportation Department of Transportation
Department of Transportation
Department of Transportation
Department of Transportation Department of Transportation Department of Transportation
Department of Transportation
Department of Transportation Department of Transportation
Program Name Capital Construction Projects
Capital Maintenance Projects
Capital Maintenance Projects
Capital Maintenance Projects
Data Collection, Compliance and Reporting Data Collection, Compliance and Reporting Data Collection, Compliance and Reporting Local Maintenance and Improvement Grants
Local Maintenance and Improvement Grants Local Maintenance and Improvement Grants
Local Road Assistance Administration
Local Road Assistance Administration Payments to State Road and Tollway Authority
Payments to State Road and Tollway Authority
Payments to State Road and Tollway Authority
Planning
Planning
Description
FY 2009 Actual
Metro Atlanta highway morning peak hour speeds (6 38.70
a.m. to10 a.m.) on selected Key Performance Indicator
corridors
Percentage of interstates meeting maintenance
78.20%
standards
Percentage of state-owned non-interstate roads meeting 76.00%
maintenance standards
Percentage of state-owned bridges meeting Georgia 87.00%
Department of Transportation standards
Percentage of miles in the public road system
3.30%
inventoried (includes all roads).
Percentage of reports filed on time that assist in
100.00%
establishing Georgia's Federal funding level.
Number of reports (State and Federal) provided by
27.00
specified dates.
Percentage of off-system projects in the Statewide
26.00%
Transportation Improvement Program advanced/let to
construction in the year programmed
Percentage of locally requested resurfacing projects
N/A
advanced/let to construction within the fiscal year
Number of days occurring between the receipt of Federal N/A
Transit Authority funds and the execution of Local
Transit contracts
Percentage of off-system projects in the Statewide
26.00%
Transportation Improvement Program advanced/let to
construction in the year programmed
Percentage of let local road and bridge construction
98.76%
projects completed on schedule
Percentage of Guaranteed Revenue Bonds,
N/A
Reimbursement Revenue Bonds, or Grant Anticipation
Revenue Bonds payment schedules reviewed prior to
the 1st monthly payment
Number of Guaranteed Revenue Bonds, Reimbursement N/A
Revenue Bonds, or Grant Anticipation Revenue Bonds
Bond payments made to State Road and Tollway
Authority annually
Percentage of Guaranteed Revenue Bonds,
N/A
Reimbursement Revenue Bonds, or Grant Anticipation
Revenue Bonds payments made in accordance with the
agreed upon payment schedule
Number of fatalities annually (per calendar year) (target 1,299.00
=reduction of 41 per year)
Annual congestion costs (in billions)
$2.73
Planning Ports and Waterways Ports and Waterways Ports and Waterways
Metro Atlanta highway evening peak hour speeds (3 p.m. to 7 p.m.) on selected Key Performance Indicator corridors Percentage of funds provided and/or project management provided to the Corps of Engineers for work sponsored by GDOT. Percentage of funding provided to the Corps of Engineers versus requested. Number of Corps of Engineers assignments completed.
41.20 N/A N/A N/A
FY 2010 Actual 40.50
72.30% 73.00% 87.00% 18.34% 100.00% 21.00 85.00%
N/A N/A
85.00%
100.00% N/A
N/A
N/A
1,250.00 $2.49 42.70
N/A
N/A N/A
FY 2011 Actual 43.20
75.50% 73.00% 87.00% 22.82% 100.00% 19.00 35.00%
N/A N/A
35.00%
96.64% N/A
N/A
N/A
1,236.00 N/A 41.50
N/A
N/A N/A
FY 2012 Actual 41.70
75.90% 71.00% 89.00% 8.70% 100.00% 19.00 27.00%
48.80% N/A
27.00%
94.62% 100.00%
2.00
100.00%
N/A N/A 38.20
100.00%
100.00% 15.00
47 of 62
FY 2014 Performance Measure Report
Web Report
2/12/2013
Agency
Program Name
Description
FY 2009 Actual
Department of
Rail
Number of track miles on hand
540.00
Transportation
Department of
Rail
Number of track miles rehabilitated to provide for
N/A
Transportation
increased alternative transportation to other travel
modes
Department of
Routine Maintenance
Percentage of interstates meeting maintenance
78.20%
Transportation
standards.
Department of
Routine Maintenance
Customer satisfaction with welcome centers
N/A
Transportation
Department of
Traffic Management and
Number of fatalities annually (per calendar year)
1,299.00
Transportation
Control
Department of
Traffic Management and
Number of Highway Emergency Response Operator
115,098.00
Transportation
Control
motorist assists
Department of
Traffic Management and
Average Highway Emergency Response Operator
13.00
Transportation
Control
response time tracked monthly
Department of
Transit
Number of total riders, including MARTA on urban and 180,029,340.00
Transportation
rural transit systems
Department of
Transit
Average age of fleet vehicles
4.60
Transportation
Department of
Transit
Number of transit-related contracts executed by June 224.00
Transportation
30th
Department of
Transit
Percentage of counties covered by transit contracts
N/A
Transportation
Department of Veterans Administration
Number of payments processed
N/A
Service
Department of Veterans Administration
Percentage of payments processed electronically
N/A
Service
Department of Veterans Administration
Number of audit findings
N/A
Service
Department of Veterans Administration
Average number of days to process payments
N/A
Service
Department of Veterans Administration
Agency turnover rate
11.52%
Service
Department of Veterans Georgia Veterans Memorial Total interments at state veterans cemeteries
1,358.00
Service
Cemetery
Department of Veterans Georgia Veterans Memorial Total interments per year
270.00
Service
Cemetery
Department of Veterans Georgia Veterans Memorial State maintenance cost per interment
$1,717.00
Service
Cemetery
Department of Veterans Georgia Veterans Memorial State cost per interment
$1,935.00
Service
Cemetery
Department of Veterans Georgia Veterans Memorial Percentage of graves marked timely (Veterans Affairs N/A
Service
Cemetery
Standard 95% in 60 days or less)
Department of Veterans Georgia War Veterans Nursing Total patient days at state veterans homes, less hospital 61,137.00
Service
Home - Augusta
and leave days
Department of Veterans Georgia War Veterans Nursing State cost per patient day
$91.51
Service
Home - Augusta
Department of Veterans Georgia War Veterans Nursing Number of patients
168.00
Service
Home - Augusta
Department of Veterans Georgia War Veterans Nursing State cost per patient day
$83.00
Service
Home - Milledgeville
Department of Veterans Georgia War Veterans Nursing Number of patients
317.00
Service
Home - Milledgeville
FY 2010 Actual 540.00 N/A
72.30% N/A 1,250.00 122,350.00 12.00 166,781,989.00 4.60 284.00 N/A 1,621.00 27.00% 2.00 1.00 13.83% 1,666.00 308.00 $1,234.00 $1,770.00 N/A 61,301.00 $78.26 168.00 $91.00 280.00
FY 2011 Actual 540.00 N/A
75.50% 78.20% 1,236.00 120,535.00 14.00 166,496,787.00 4.60 151.00 N/A 1,789.00 31.00% 0.00 0.00 12.80% 1,969.00 303.00 $874.00 $1,877.00 98.35% 53,159.00 $94.59 159.00 $81.71 227.00
FY 2012 Actual 540.00 0.00
75.90% N/A N/A 119,839.00 12.00 153,861,490.00 4.90 200.00 N/A 2,161.00 56.00% 0.00 0.00 13.58% 2,272.00 304.00 $1,088.00 $1,785.00 98.47% 65,021.00 $95.82 164.00 $84.70 230.00
48 of 62
FY 2014 Performance Measure Report
Web Report
2/12/2013
Agency
Program Name
Department of Veterans Veterans Benefits
Service
Department of Veterans Veterans Benefits
Service
Department of Veterans Veterans Benefits
Service
Employees' Retirement Deferred Compensation
System of Georgia
Description Number of veterans in Georgia (per calendar year)
FY 2009 Actual 772,832.00
Veterans compensation and pension dollars into Georgia $1,638.00
(in millions) (per calendar year)
Veterans compensation and pension dollars per Georgia $2,119.93
veteran (per calendar year)
Number of participants
36,393.00
Employees' Retirement Deferred Compensation System of Georgia
Millions of dollars of assets under management
$799.00
Employees' Retirement Deferred Compensation System of Georgia
Cost per participant per year
$77.00
Employees' Retirement Georgia Military Pension Fund Number of retirees and beneficiaries currently receiving 386.00
System of Georgia
benefits
Employees' Retirement Georgia Military Pension Fund Total benefit payments made during fiscal year System of Georgia
$382,000.00
Employees' Retirement Georgia Military Pension Fund Retiree on-time processing rate
N/A
System of Georgia
Employees' Retirement Public School Employees
System of Georgia
Retirement System
Number of retirees and beneficiaries currently receiving 13,804.00 benefits
Employees' Retirement Public School Employees
System of Georgia
Retirement System
Total benefit payments made during fiscal year (in millions)
$52.20
Employees' Retirement Public School Employees
Retiree on-time processing rate
N/A
System of Georgia
Retirement System
Employees' Retirement System Administration System of Georgia
Number of retirees and beneficiaries currently receiving 37,049.00 benefits
Employees' Retirement System Administration System of Georgia
Total benefit payments made during fiscal year (in millions)
$1,117.00
Employees' Retirement System Administration
Retiree on-time processing rate
N/A
System of Georgia
Employees' Retirement System Administration System of Georgia
Average speed to answer incoming calls (in seconds) 39.00
Georgia Bureau of Investigation Georgia Bureau of Investigation Georgia Bureau of Investigation Georgia Bureau of Investigation
Bureau Administration Bureau Administration
Accounts payable transactions processed for the fiscal year Percentage of electronic payments for the fiscal year
20,656.00 12.40%
Bureau Administration
Total amount of payments processed for the fiscal year $121,732,438.00
Criminal Justice Coordinating Number of victims served by grant funded programs Council
177,327.00
FY 2010 Actual 773,858.00 $1,723.00 $2,226.43 40,533.00 $868.00 $73.00 480.00 $489,000.00 N/A 13,995.00 $53.20 N/A 38,518.00 $1,131.00 N/A 44.00 21,265.00 16.80% $118,900,434.00 159,207.00
FY 2011 Actual 773,337.00 $2,135.00 $2,761.00 42,965.00 $993.00 $73.00 568.00 $579,000.00 94.00% 14,613.00 $54.00 99.00% 40,250.00 $1,169.00 99.00% 49.00 22,223.00 24.80% $134,453,076.00 132,784.00
FY 2012 Actual N/A N/A N/A 47,320.00 $987.00 $64.00 660.00 $678,000.00 90.00% 15,106.00 $54.20 98.00% 42,053.00 $1,217.00 99.50% 56.00 22,760.00 32.60% $123,198,403.00 233,384.00
49 of 62
FY 2014 Performance Measure Report
Web Report
2/12/2013
Agency Georgia Bureau of Investigation Georgia Bureau of Investigation Georgia Bureau of Investigation Georgia Bureau of Investigation Georgia Bureau of Investigation Georgia Bureau of Investigation Georgia Bureau of Investigation Georgia Bureau of Investigation Georgia Bureau of Investigation Georgia Bureau of Investigation Georgia Bureau of Investigation Georgia Bureau of Investigation Georgia Bureau of Investigation Georgia Bureau of Investigation Georgia Bureau of Investigation Georgia Bureau of Investigation Georgia Bureau of Investigation Georgia Bureau of Investigation Georgia Forestry Commission Georgia Forestry Commission
Georgia Forestry Commission Georgia Forestry Commission Georgia Forestry Commission Georgia Forestry Commission Georgia Forestry Commission Georgia Forestry Commission
Program Name Criminal Justice Coordinating Council Criminal Justice Coordinating Council Criminal Justice Information Services Criminal Justice Information Services Criminal Justice Information Services Criminal Justice Information Services Criminal Justice Information Services Forensic Scientific Services
Description Total victim compensation paid
FY 2009 Actual $19,300,000.00
Average number of days to process a Georgia Crime 73.00
Victim Compensation Program application
Percentage of criminal history background service
88.00%
requests processed within 24 hours of receipt
Percentage of manually reported final disposition data 38.00%
processed within 30 days of receipt
Percentage of reported arrest data processed within two 92.00%
hours of receipt
Number of applicant fingerprint-based background
N/A
checks completed annually
Average daily message traffic for the Criminal Justice N/A
Information Services system
Total number of reports released
90,441.00
Forensic Scientific Services Percentage of reports released in 45 days
62.40%
Forensic Scientific Services Combined DNA Index System matches
884.00
Forensic Scientific Services Overall average cost per report
$261.31
Forensic Scientific Services Reports per full-time equivalent
358.90
Forensic Scientific Services Average number of scientists in training
7.00
Regional Investigative Services Number of criminal investigations opened
7,451.00
Regional Investigative Services Number of criminal investigations closed
7,393.00
Regional Investigative Services Agent turnover rate
5.80%
Regional Investigative Services Number of arrests by the Investigative Division
1,786.00
Regional Investigative Services Value of contraband seized
$100,938,900.00
Commission Administration Number of audit findings within fiscal year
0.00
Commission Administration
Finish fiscal year with surplus in all program areas and $80,207.00 adhere to all budgetary compliance rules and regulations
Commission Administration Maximize Federal dollars coming to Georgia
$13,925,240.00
Forest Management Forest Management
Number of water quality exams conducted on logging and forestry operations Number of acres covered by forest management plans
564.00 537,529.00
Forest Management
Number of forested acres in the state
24,805,700.00
Forest Protection
Number of acres burned by wildfires
21,033.00
Forest Protection
Average fire response time in minutes
28.77
FY 2010 Actual $18,200,000.00 41.00 95.00% 100.00% 93.00% N/A N/A 87,667.00 71.60% 795.00 $286.63 342.40 25.00 7,408.00 7,799.00 5.00% 1,649.00 $98,137,305.00 0.00 $7,683.00
$9,373,260.00 570.00 497,848.00 24,785,100.00 12,792.00 26.91
FY 2011 Actual $18,100,000.00 47.00 97.00% 100.00% 93.00% N/A N/A 85,523.00 73.70% 894.00 $303.38 313.30 40.00 7,779.00 7,723.00 3.50% 1,233.00 $102,589,783.00 0.00 $745.00
$11,423,937.00 530.00 605,253.00 24,785,100.00 151,329.00 29.16
FY 2012 Actual $15,881,514.00 49.00 94.00% 100.00% 85.00% 310,384.00 1,587,012.00 89,597.00 62.00% 783.00 $309.09 325.80 22.60 8,440.00 8,522.00 4.50% 1,305.00 $86,740,671.00 0.00 $2,141.00
$9,216,489.00 715.00 824,494.00 24,768,235.00 27,163.00 32.61
50 of 62
FY 2014 Performance Measure Report
Web Report
2/12/2013
Agency Georgia Forestry Commission Georgia Forestry Commission Georgia Forestry Commission Georgia Forestry Commission Georgia Forestry Commission Georgia Forestry Commission Georgia Forestry Commission Georgia Forestry Commission Georgia Forestry Commission Georgia Student Finance Commission Georgia Student Finance Commission Georgia Student Finance Commission Georgia Student Finance Commission Georgia Student Finance Commission Georgia Student Finance Commission Georgia Student Finance Commission Georgia Student Finance Commission Georgia Student Finance Commission Georgia Student Finance Commission Georgia Student Finance Commission Georgia Student Finance Commission Georgia Student Finance Commission Georgia Student Finance Commission Georgia Student Finance Commission Georgia Student Finance Commission Georgia Student Finance Commission
Program Name Forest Protection Forest Protection Forest Protection Forest Protection Forest Protection Forest Protection Tree Seedling Nursery Tree Seedling Nursery Tree Seedling Nursery Accel Accel Accel Accel Engineer Scholarship Engineer Scholarship Engineer Scholarship Georgia Military College Scholarship Georgia Military College Scholarship Georgia Military College Scholarship HERO Scholarship HERO Scholarship HERO Scholarship HOPE Administration HOPE Administration HOPE Administration HOPE GED
Description Number of online and automated burn permits issued
FY 2009 Actual 459,864.00
Percentage of burn permits issued online and thru automated call in Number of acres per fire fighter
67.00% 58,229.00
Dollar value of property destroyed/damaged by forest fires Number of wildfire arson investigations conducted
$5,128,718.00 111.00
Number of fire fighters trained and certified in wildland firefighting Amount of revenue generated through seedling sales
98.00 $1,003,809.00
Number of seedlings sold
12,609,000.00
Percentage of seedlings sold as compared to total seedlings grown and available in inventory for sale Number of awards granted per year
86.36% 6,775.00
Average dollar amount per award
$866.53
Number of semester credit hours
40,262.00
Number of quarter credit hours
5,202.00
Number of students awarded scholarships per year
195.00
Average dollar amount per student
$3,376.36
Percentage of students repaying loans through service 55.00%
Number of students awarded scholarships per year
72.00
Average dollar amount per student
$13,134.26
Percentage of students repaying loans through service 47.00%
Number of awards granted per year
713.00
Average dollar amount per award
$852.39
Number of students receiving Helping Educate Reservists and their Offspring (HERO) scholarships Number of visits to the GAcollege411.org website
432.00 3,787,687.00
Average amount of time spent at the GAcollege411.org website (in minutes) Number of accounts created at the GAcollege411.org website Number of students receiving the Helping Outstanding Pupils Educationally General Education Diploma grant
10.00 366,216.00 4,884.00
FY 2010 Actual 505,985.00 75.00% 62,118.00 $3,347,443.00 82.00 83.00 $949,046.00 11,108,000.00 66.92% 7,048.00 $926.80 42,303.00 5,620.00 201.00 $3,102.51 47.00% 72.00 $12,938.21 60.00% 784.00 $850.53 434.00 3,096,716.00 11.00 452,637.00 5,689.00
FY 2011 Actual 606,782.00 83.00% 66,448.00 $10,219,695.00 111.00 68.00 $1,074,480.00 13,399,000.00 96.40% 7,856.00 $978.21 46,688.00 4,871.00 172.00 $3,265.99 44.00% 74.00 $13,212.82 63.00% 913.00 $865.22 482.00 3,833,323.00 15.00 931,494.00 5,276.00
FY 2012 Actual 714,153.00 75.00% 66,225.00 $4,179,190.00 83.00 175.00 $814,102.00 10,477,739.00 70.80% 9,030.00 $1,005.56 55,478.00 1,845.00 172.00 $3,205.00 40.00% 74.00 $13,136.00 78.00% 772.00 $928.35 462.00 4,897,086.00 10.00 836,053.00 3,877.00
51 of 62
FY 2014 Performance Measure Report
Web Report
2/12/2013
Agency Georgia Student Finance Commission
Georgia Student Finance Commission Georgia Student Finance Commission Georgia Student Finance Commission Georgia Student Finance Commission Georgia Student Finance Commission Georgia Student Finance Commission Georgia Student Finance Commission Georgia Student Finance Commission Georgia Student Finance Commission Georgia Student Finance Commission Georgia Student Finance Commission Georgia Student Finance Commission Georgia Student Finance Commission Georgia Student Finance Commission Georgia Student Finance Commission Georgia Student Finance Commission Georgia Student Finance Commission Georgia Student Finance Commission Georgia Student Finance Commission Georgia Student Finance Commission
Georgia Student Finance Commission Georgia Student Finance Commission Georgia Student Finance Commission Georgia Student Finance Commission
Program Name HOPE GED
HOPE GED HOPE Grant
Description Award Rate: Number of Helping Outstanding Pupils Educationally (HOPE) General Education Diploma vouchers redeemed/total number of HOPE General Education Diploma vouchers issued Number of General Education Diploma vouchers issued by Technical College System of Georgia Number of awards granted per year
FY 2009 Actual 28.00%
17,410.00 239,231.00
HOPE Grant
Average dollar amount per award
$538.00
HOPE Grant
Number of students receiving the HOPE Grant
114,288.00
HOPE Scholarships - Private Schools HOPE Scholarships - Private Schools HOPE Scholarships - Private Schools HOPE Scholarships - Private Schools HOPE Scholarships - Private Schools HOPE Scholarships - Private Schools HOPE Scholarships - Public Schools HOPE Scholarships - Public Schools HOPE Scholarships - Public Schools HOPE Scholarships - Public Schools HOPE Scholarships - Public Schools HOPE Scholarships - Public Schools Low Interest Loans
Number of awards granted per year
30,755.00
Average dollar amount per award
$1,407.00
Number of private school students receiving the HOPE 13,983.00 scholarship Number of Zell Miller Scholar awards granted per year
Average dollar amount per Zell Miller Scholar award
Number of private school students receiving the Zell Miller Scholarship Number of awards granted per year
N/A 192,400.00
Average dollar amount per award
$1,809.68
Number of public school students receiving the HOPE scholarship Number of Zell Miller Scholar awards granted per year
89,963.00
Average dollar amount per Zell Miller Scholar award
Number of public school students receiving the Zell
Miller Scholarship
Number of loan applications processed
N/A
Low Interest Loans
Average dollar amount of loan
N/A
Low Interest Loans
Number of students obtaining student access loans
N/A
Nonpublic Postsecondary Education Commission
Nonpublic Postsecondary Education Commission Nonpublic Postsecondary Education Commission Nonpublic Postsecondary Education Commission North Ga. Military Scholarship Grants
Percentage of authorized colleges and schools that meet 75.00%
prescribed academic and financial standards annually
without remediation
Average number of schools assigned to each full-time 88.00
Standard Administrator
Average number of working days to fill student transcript N/A
requests
Number of complaints received
N/A
Number of students awarded scholarship
119.00
FY 2010 Actual 33.00%
17,525.00 299,502.00 $611.98 138,982.00 31,010.00 $1,498.97 14,953.00
N/A 206,846.00 $1,965.56 96,205.00
N/A N/A N/A 70.00% 89.00 N/A N/A 115.00
FY 2011 Actual 40.00%
13,224.00 308,169.00 $667.31 141,887.00 31,799.00 $1,701.52 15,354.00
N/A 219,772.00 $2,210.96 102,311.00
N/A N/A N/A 68.00% 95.00 N/A N/A 122.00
FY 2012 Actual 41.00%
9,531.00 166,268.00 $559.51 98,790.00 25,986.00 $1,516.77 12,705.00 2,984.00 $1,911.06 1,528.00 189,407.00 $1,729.52 92,043.00 20,507.00 $3,121.22 10,809.00 8,870.00 $6,092.50 2,745.00 82.00%
100.00 11.00 45.00 132.00
52 of 62
FY 2014 Performance Measure Report
Web Report
2/12/2013
Agency Georgia Student Finance Commission Georgia Student Finance Commission Georgia Student Finance Commission Georgia Student Finance Commission Georgia Student Finance Commission Georgia Student Finance Commission Georgia Student Finance Commission Georgia Student Finance Commission Georgia Student Finance Commission Georgia Student Finance Commission Georgia Student Finance Commission Office of the Governor
Program Name North Ga. Military Scholarship Grants North Ga. Military Scholarship Grants North Georgia ROTC Grants
North Georgia ROTC Grants
North Georgia ROTC Grants
Public Memorial Safety Grant
Public Memorial Safety Grant
Public Memorial Safety Grant
Tuition Equalization Grants
Tuition Equalization Grants
Tuition Equalization Grants
Child Advocate, Office of the
Description Average dollar amount per student
FY 2009 Actual $7,889.39
Percentage of students repaying loans through service 80.00%
Number of awards granted per year
623.00
Average dollar amount per award
$814.57
Number of students receiving the Reserve Officers' Training Corps grant Number of awards granted per year
399.00 55.00
Average dollar amount per award
$4,332.67
Number of students receiving the Public Memorial Safety 28.00
grant
Number of awards granted per year
68,001.00
Average dollar amount per award
$459.45
Number of students receiving the Tuition Equalization Grant Percentage of identified eligible child deaths reviewed within a 12 month period (per calendar year)
34,465.00 92.00%
Office of the Governor Office of the Governor Office of the Governor Office of the Governor
Office of the Governor Office of the Governor Office of the Governor
Child Advocate, Office of the
Children and Families, Governor's Office for Children and Families, Governor's Office for
Emergency Management Agency, Georgia
Emergency Management Agency, Georgia Emergency Management Agency, Georgia Georgia Commission on Equal Opportunity
Percentage of cases that are closed within 6 months of 80.00% opening Number of communities implementing a System of Care 5.00 framework Percentage of customers satisfied with Governor's Office 84.00% for Children and Families training and technical assistance Percentage from a composite satisfaction score from all 96.00% customers and stakeholders for the provision of customer service rated good to very good for the customer service values of being courteous, helpful, and accessible Percentage of all requests for state assets and mutual 100.00% aid assistance handled successfully Number of Georgia counties with an approved Annual 142.00 County Emergency Management Work Plan Percentage of employment discrimination complaints 64.00% against a state agency investigated within 90 days
Office of the Governor Office of the Governor
Georgia Commission on Equal Opportunity
Georgia Commission on Equal Opportunity
Number of education, training, and outreach activities performed throughout the state in order to inform state agencies, housing-related groups and industry entities, and the general public of the coverage of the Georgia Fair Employment Practices Act and the Georgia Fair Housing Act Percentage of successful performance evaluations by the U.S. Equal Employment Opportunity Commission
3.00 100.00%
FY 2010 Actual $9,427.83 75.00% 716.00 $961.94 463.00 52.00 $4,260.21 25.00 72,324.00 $336.28 36,373.00 92.00%
80.00% 14.00 84.00%
99.00%
100.00% 158.00 42.00%
5.00
100.00%
FY 2011 Actual $10,706.65 74.00% 818.00 $975.55 502.00 66.00 $5,344.89 33.00 71,230.00 $324.05 36,537.00 93.00%
12.00% 32.00 93.70%
100.00%
100.00% 149.00 0.09%
5.00
100.00%
FY 2012 Actual $11,855.00 73.00% 817.00 $997.85 488.00 58.00 $6,428.40 30.00 68,342.00 $302.10 34,903.00 N/A
N/A 44.00 93.00%
N/A
100.00% 159.00 3.00%
16.00
100.00%
53 of 62
FY 2014 Performance Measure Report
Web Report
2/12/2013
Agency Office of the Governor
Office of the Governor
Office of the Governor Office of the Governor Office of the Governor Office of the Governor Office of the Governor Office of the Governor Office of the Governor Office of the Governor Office of the Governor
Program Name Georgia Commission on Equal Opportunity
Georgia Professional Standards Commission
Georgia Professional Standards Commission Georgia Professional Standards Commission Georgia Professional Standards Commission Georgia Professional Standards Commission Georgia Professional Standards Commission Georgia Professional Standards Commission Georgia Professional Standards Commission Georgia Professional Standards Commission Georgia Professional Standards Commission
Description
FY 2009 Actual
Percentage of successful performance evaluations by 0.00%
the U.S. Department of Housing and Urban
Development
Total number of Professional Standards Commission- 708,206.00
issued certificates, licenses, and other credentials held
(excluding credentials issued for LIFE)
Percentage of ethics cases cleared after an investigation 5.60%
Average processing time in days for certification cases submitted with all necessary documentation Certification cases completed
4.00 51,212.00
Calls handled by the Professional Standards
101,520.00
Commission Call Center
Number of educators certified for the first time in Georgia 9,331.00
in a teaching field
Total number of educators credentialed for the first time 14,614.00
in Georgia
Total number of educator certificate renewals
27,042.00
Total number of certificate upgrades as a result of
9,942.00
educators earning advanced degrees
Total number of educators receiving performance-based 13.00
educational leadership certificates for the first time
Office of the Governor Office of the Governor Office of the Governor Office of the Governor Office of the Governor Office of the Governor Office of the Governor Office of the Governor Office of the Governor Office of the Governor Office of the Governor Office of the Governor Office of the Governor Office of the Governor
Georgia Professional
New ethics complaints including student loans
1,621.00
Standards Commission
Governor's Office of Consumer Total number of telephone calls placed to the "1-800- 575,000.00
Protection
Georgia" call center requesting assistance
Governor's Office of Consumer Average consumer savings and restitution per state
$4.82
Protection
dollar appropriated
Governor's Office of Consumer Total dollar value of savings and restitution
$17,252,361.00
Protection
Governor's Office of Consumer Number of Lemon Law requests for information and
786.00
Protection
assistance
Governor's Office of Planning Number of State Agency Strategic Plans reviewed
57.00
and Budget
Governor's Office of Planning Number of budget amendments approved
695.00
and Budget
Governor's Office of Planning Average number of days to process amendments (from 6.45
and Budget
submittal to approval)
Governor's Office of Planning Number of allotments processed
437.00
and Budget
Governor's Office of Planning Average number of days to process allotments (from 3.20
and Budget
submittal to warrant)
Office of the State Inspector Number of complaints received by the Office of the State 150.00
General
Inspector General
Office of the State Inspector Average time to complete an investigation (in days)
61.00
General
Office of the State Inspector Percentage of Inspector General recommendations
100.00%
General
accepted by state agencies
Student Achievement, Office of Average number of days to complete an audit
216.00
FY 2010 Actual 0.00%
724,037.00
7.20% 4.40 44,610.00 103,614.00 7,550.00 10,145.00 31,709.00 9,865.00 131.00
1,350.00 815,000.00 $3.75 $13,554,692.00 847.00 65.00 717.00 5.70 773.00 2.90 145.00 20.00 100.00% 130.00
FY 2011 Actual 0.00%
739,070.00
8.10% 6.40 39,916.00 74,106.00 7,786.00 10,543.00 31,208.00 7,922.00 257.00
1,227.00 545,000.00 $5.63 $23,858,708.00 673.00 46.00 833.00 4.95 846.00 3.00 165.00 6.00 100.00% 197.00
FY 2012 Actual 0.00%
786,739.00
10.90% 8.50 40,572.00 81,267.00 9,864.00 13,000.00 31,789.00 7,311.00 399.00
1,354.00 470,000.00 $8.48 $35,123,557.00 625.00 60.00 822.00 6.40 632.00 4.90 203.00 12.74 100.00% N/A
54 of 62
FY 2014 Performance Measure Report
Web Report
2/12/2013
Agency Office of the Governor Office of the Governor Office of the Governor Office of the Governor Office of the Governor Office of the Governor
Program Name
Description
Student Achievement, Office of Number of elementary and middle schools audited
statewide
Student Achievement, Office of Percentage of elementary and middle schools audited
statewide
Student Achievement, Office of Number of Criterion-Referenced Competency Tests
monitored by the state
Student Achievement, Office of Percentage of Kindergarten through 12th grade report
cards posted to the website by December
Student Achievement, Office of Number of elementary and middle schools flagged for
testing irregularities
Student Achievement, Office of Number of unique visits to GOSA website
FY 2009 Actual 1,857.00 100.00% N/A 100.00% 369.00 N/A
Office of the Governor Student Achievement, Office of Number of research studies published
N/A
Office of the Governor
Office of the Governor
Office of the Governor
Public Defender Standards Council Public Defender Standards Council Public Defender Standards Council Public Defender Standards Council Public Defender Standards Council Public Defender Standards Council Public Service Commission Public Service Commission Public Service Commission Public Service Commission
Public Service Commission Public Service Commission Public Service Commission Public Service Commission Public Service Commission Public Service Commission Secretary of State
Student Achievement, Office of Number of policy briefings on educational developments N/A
published on GOSA website
Student Achievement, Office of Percentage of students in schools served by mentors N/A
reading at grade level
Student Achievement, Office of Percentage of schools appearing on the "severe and N/A
moderate concern" lists after erasure analysis
Public Defender Standards Employee turnover rate
27.00%
Council
Public Defender Standards Number of audit findings
3.00
Council
Public Defender Standards Number of trainings offered
14.00
Council
Public Defender Standards Number of new capital cases handled
12.00
Council
Public Defender Standards Percentage of clients contacted at least once per month N/A
Council
Public Defender Standards Percentage of clients contacted within 5 days of
N/A
Council
notification of a death notice being filed
Facility Protection
Number of pipeline safety inspections
1,029.00
Facility Protection Facility Protection Utilities Regulation
Utilities Regulation
Number of people trained on Georgia Utility Facility Protection Act requirements Number of Georgia Utility Facility Protection Act inspections per investigator Number of valid telecommunications, natural gas, and electric complaints resolved by the Public Service Commission Average call wait time in seconds
2,905.00 865.00 8,035.00
21.00
Utilities Regulation
Percentage of total calls abandoned
3.00%
Utilities Regulation
Number of rate cases processed
N/A
Utilities Regulation
Average number of days to process a major rate case 180.00
Utilities Regulation
Number of orders issued
2,700.00
Utilities Regulation
Number of active cases worked
N/A
Archives and Records
Hours open weekly to the public
43.00
FY 2010 Actual 1,889.00 100.00% 97.00 100.00% 248.00 N/A N/A N/A N/A N/A 19.00% 0.00 13.00 20.00 N/A N/A 824.00 3,469.00 1,040.00 7,209.00
28.00 5.00% N/A 180.00 2,460.00 N/A 26.00
FY 2011 Actual 1,834.00 100.00% 51.00 100.00% 188.00 N/A N/A N/A N/A N/A 16.00% 1.00 13.00 17.00 N/A N/A 627.00 2,600.00 657.00 7,146.00
36.00 5.00% N/A 180.00 2,400.00 N/A 17.00
FY 2012 Actual N/A 100.00% 52.00 100.00% N/A N/A N/A N/A N/A N/A 16.00% N/A 14.00 25.00 99.30% 100.00% 543.00 2,339.00 650.00 8,103.00
29.00 7.00% N/A 180.00 1,413.00 N/A 17.00
55 of 62
FY 2014 Performance Measure Report
Web Report
2/12/2013
Agency Secretary of State Secretary of State Secretary of State Secretary of State Secretary of State Secretary of State Secretary of State Secretary of State Secretary of State Secretary of State Secretary of State Secretary of State Secretary of State Secretary of State Secretary of State Secretary of State Secretary of State
Secretary of State
Secretary of State Secretary of State Secretary of State Secretary of State Secretary of State
Secretary of State Secretary of State Secretary of State
Secretary of State
Secretary of State
Program Name Archives and Records Archives and Records Archives and Records
Archives and Records Archives and Records
Description
FY 2009 Actual
Number of reference questions answered
7,759.00
Number of on-site visitors served
8,245.00
Number of scanned images available to the public on the 677,157.00
Internet (Archives Virtual Vault)
Number of records stored at Archives per cubic ft.
75,576.52
Number of records stored at Record Center per cubic ft. 185,134.00
Archives and Records Corporations Corporations Corporations Corporations Corporations
Number of unique visitors to the web site Number of total corporation filings processed Number of new corporations filings completed Number of Corporations call center calls offered Number of Corporations call center calls answered Percentage of Corporations call center calls abandoned
705,329.00 653,828.00 86,237.00 N/A N/A N/A
Corporations
Elections Elections Elections
Elections Georgia Commission on the Holocaust
Average speed of Corporations call center calls answered in seconds Number of elections Number of registered voters Number of training classes offered online through ELearn system Number of E-Learn users trained Number of docent training sessions, docent enrichment courses, courses at local libraries, permanent Anne Frank exhibit and traveling exhibits provided
N/A
758.00 5,624,790.00 N/A
N/A 20.00
Georgia Commission on the Holocaust
Georgia Commission on the Holocaust Georgia Commission on the Holocaust Georgia Commission on the Holocaust Georgia Commission on the Holocaust Georgia Drugs and Narcotics Agency
Georgia Drugs and Narcotics Agency Georgia Drugs and Narcotics Agency Georgia Government Transparency and Campaign Finance Commission Georgia Government Transparency and Campaign Finance Commission Georgia Government Transparency and Campaign Finance Commission
Number of educators attending Commission programs 402.00
and training sessions requesting materials to incorporate
into their lesson plans
Number of citizens attending Commission programs
52,000.00
Number of speakers bureau and performance events N/A
Number of Holocaust trunks displayed
N/A
Total funds raised for Commission programming
N/A
Number of inspections conducted for the Board of
2,436.00
Pharmacy for all of its registrants who purchase,
distribute, dispense, and sell pharmaceuticals
Number of Administrative Investigations of complaints of N/A
Board registrants
Number of Criminal Investigations of complaints of
N/A
Board registrants
Total complaints received
164.00
Number of cases actually closed/removed from the docket
Number of cases accepted
39.00 89.00
FY 2010 Actual 4,522.00 7,476.00 891,612.00 76,027.50 180,056.00 2,613,853.00 849,039.00 84,783.00 N/A N/A N/A N/A 220.00 5,736,319.00 10.00 820.00 17.00
450.00
65,000.00 N/A N/A N/A 1,776.00
N/A N/A 78.00
50.00
70.00
FY 2011 Actual 3,595.00 6,354.00 1,449,304.00 77,469.88 184,106.00 1,419,947.00 915,174.00 89,183.00 N/A N/A N/A N/A 650.00 5,696,083.00 41.00 1,266.00 20.00
402.00
300,000.00 30.00 33.00 $50,000.00 1,790.00
295.00 343.00 83.00
52.00
36.00
FY 2012 Actual 3,139.00 5,145.00 1,472,476.00 80,212.38 173,431.00 1,435,682.00 853,281.00 96,071.00 210,770.00 179,652.00 15.00% 205.00 536.00 5,904,789.00 41.00 1,381.00 25.00
750.00
300,000.00 50.00 20.00 $25,000.00 1,518.00
354.00 332.00 115.00
17.00
74.00
56 of 62
FY 2014 Performance Measure Report
Web Report
2/12/2013
Agency Secretary of State
Secretary of State Secretary of State Secretary of State Secretary of State
Secretary of State
Secretary of State
Secretary of State
Secretary of State
Secretary of State
Secretary of State
Secretary of State
Secretary of State
Secretary of State
Secretary of State
Secretary of State
Secretary of State
Secretary of State
Secretary of State
Secretary of State
Secretary of State Secretary of State Secretary of State Secretary of State Secretary of State Secretary of State Secretary of State Secretary of State
Secretary of State Secretary of State
Secretary of State
Secretary of State
Program Name Georgia Government Transparency and Campaign Finance Commission Office Administration Office Administration Office Administration Professional Licensing Boards
Description Number of cases rejected
Number of completed investigations Number of regular inspections Fines collected Number of licensed professionals regulated
FY 2009 Actual 75.00
944.00 8,465.00 $1,538,225.00 1,024,165.00
Professional Licensing Boards Number of license renewals processed
173,142.00
Professional Licensing Boards Number of new applications processed
45,113.00
Professional Licensing Boards Average number of days to process new applications 69.00
Professional Licensing Boards Average number of days to process renewal applications 3.00
Professional Licensing Boards Number of licenses renewed online
172,457.00
Professional Licensing Boards Percentage of licenses renewed online
95.00%
Professional Licensing Boards Percentage of new applications approved
83.00%
Professional Licensing Boards Total number of license revocations
17.00
Professional Licensing Boards Number of PLB call center calls offered
N/A
Professional Licensing Boards Number of PLB call center calls answered
N/A
Professional Licensing Boards Percentage of PLB call center calls abandoned
N/A
Professional Licensing Boards
Real Estate Commission
Real Estate Commission
Real Estate Commission
Real Estate Commission Securities Securities Securities Securities Securities Securities Securities
Securities Securities
Securities
Average speed of PLB call center calls answered in
N/A
seconds
Agency investigations resulting in imposing a disciplinary 413.00
action on a license
Percentage of Georgia passing rates on qualifying real 8.00%
estate salesperson examinations that surpass the
national average
Percentage of all completed applications processed
98.00%
within 5 business days of receipt
Agency investigations completed in a fiscal year
2,128.00
Fines collected
$1,961,599.00
Number of securities offerings processed
N/A
Number of Charities filings
N/A
Number of registered Broker-Dealers
N/A
Number of registered Broker-Dealer Agents
N/A
Number of registered Investment Adviser firms
N/A
Number of registered Investment Adviser
N/A
Representatives
Number of securities investigations closed
N/A
Number of completed examinations of registered
N/A
Investment Adviser firms
Average number of examinations conducted per auditor N/A
Securities
Number of Administrative Orders
N/A
FY 2010 Actual 8.00
1,322.00 9,091.00 $1,186,174.00 1,023,062.00
196,366.00
45,824.00
66.00
2.00
209,477.00
92.00%
84.00%
26.00
N/A
N/A
N/A
N/A
559.00
7.00%
98.00%
2,181.00 $1,973,157.00 N/A 4,838.00 N/A N/A N/A N/A
N/A N/A
N/A
N/A
FY 2011 Actual 47.00
1,309.00 9,459.00 $1,375,142.00 1,121,905.00
187,873.00
58,871.00
57.00
6.00
187,694.00
96.00%
83.00%
11.00
N/A
N/A
N/A
N/A
505.00
8.00%
98.00%
2,157.00 $3,000.00 N/A 4,012.00 2,266.00 149,240.00 2,232.00 10,291.00
N/A 29.00
14.50
N/A
FY 2012 Actual 41.00
1,355.00 8,866.00 $1,434,482.00 1,147,033.00
204,095.00
57,920.00
69.00
15.00
191,105.00
94.00%
89.00%
49.00
480,209.00
344,762.00
28.00%
351.00
415.00
6.00%
99.00%
1,961.00 $4,661,919.00 4,050.00 3,145.00 2,333.00 163,239.00 2,324.00 12,861.00
146.00 62.00
20.67
31.00
57 of 62
FY 2014 Performance Measure Report
Web Report
2/12/2013
Agency
Program Name
State Accounting Office State Accounting Office
State Accounting Office State Accounting Office
State Accounting Office State Accounting Office
State Accounting Office State Accounting Office
State Accounting Office State Accounting Office
State Accounting Office State Accounting Office
State Board of Pardons Board Administration and Paroles State Board of Pardons Board Administration and Paroles
State Board of Pardons Board Administration and Paroles State Board of Pardons Board Administration and Paroles State Board of Pardons Board Administration and Paroles State Board of Pardons Board Administration and Paroles State Board of Pardons Clemency Decisions and Paroles
State Board of Pardons Clemency Decisions and Paroles State Board of Pardons Clemency Decisions and Paroles State Board of Pardons Clemency Decisions and Paroles State Board of Pardons Clemency Decisions and Paroles State Board of Pardons Clemency Decisions and Paroles State Board of Pardons Clemency Decisions and Paroles State Board of Pardons Clemency Decisions and Paroles
State Board of Pardons Clemency Decisions and Paroles
State Board of Pardons Clemency Decisions and Paroles
Description
FY 2009 Actual
Days from prior fiscal year end to publish the
199.00
Comprehensive Annual Financial Report
Days from prior fiscal year end to publish the Budgetary 226.00
Compliance Report
Submit Annual Schedule of Expenditures of Federal
1.00
Awards within 60 days of Comprehensive Annual
Financial Report (1=Meet; 2=Did Not Meet)
Receipt of Government Finance Officer's Association N/A
Certificate of Achievement for Excellence in Financial
Reporting (1=Meet; 2=Did Not Meet)
Percentage of Financials issues responded to,
N/A
diagnosed and resolved within Service Level Agreement
parameters
Percentage of Human Capital Management issues
N/A
responded to, diagnosed and resolved within Service
Level Agreement parameters
Total number of Board clemency votes
75,245.00
Percentage of new Parole Officer candidates
N/A
successfully completing the Basic Parole Officer Training
course
Total number of clemency hearings held
N/A
Total number of compliance audits completed
N/A
Numbers of training hours delivered to agency by agency N/A
training staff
Percentage of invoices paid within 30 days
N/A
Percentage of parolees acceptably completing parole supervision, based on the methodology used in the Bureau of Justice Statistics annual report Percentage of parolees discharging from parole supervision (i.e. not revoked) Number of offender files initiated in Clemency
66.00%
74.00% 21,520.00
Number of inmates released by Board action
12,938.00
Prison population as a percentage of capacity (population/capacity) Number of Board preconditions of parole imposed on inmates before release from prison Number of investigations completed
103.00% 40,102.00 54,157.00
Percentage of Board Visitors' Day participants who rate their entire experience as good or excellent - This decrease from the previous year is due to a change in the visitation process. Annual cost avoidance of offenders in the community under supervision versus prison costs for incarceration
92.00% $353,541,510.00
Number of inmates in the county jails over and above prison capacity
2,155.00
FY 2010 Actual 183.00 153.00 1.00
2.00
98.00%
94.00%
79,922.00 N/A
N/A N/A N/A N/A 69.00%
77.00% 21,227.00 13,926.00 100.00% 42,105.00 58,250.00 92.00%
$366,527,300.00
3,635.00
FY 2011 Actual 190.00 167.00 1.00
2.00
89.44%
98.50%
70,261.00 N/A
N/A N/A N/A N/A 71.00%
80.00% 21,416.00 13,940.00 105.00% 16,170.00 48,376.00 85.00%
$298,299,469.00
3,735.00
FY 2012 Actual 183.00 141.00 1.00
2.00
98.62%
98.22%
63,665.00 92.80%
6.00 4.00 22,419.00 99.94% 72.00%
80.00% 20,844.00 12,544.00 105.00% 10,479.00 44,108.00 58.00%
$351,168,318.00
1,117.00
58 of 62
FY 2014 Performance Measure Report
Web Report
2/12/2013
Agency
Program Name
State Board of Pardons Clemency Decisions
and Paroles
State Board of Pardons Clemency Decisions
and Paroles
State Board of Pardons Clemency Decisions and Paroles State Board of Pardons Clemency Decisions and Paroles State Board of Pardons Parole Supervision and Paroles State Board of Pardons Parole Supervision and Paroles State Board of Pardons Parole Supervision and Paroles State Board of Pardons Parole Supervision and Paroles State Board of Pardons Parole Supervision and Paroles State Board of Pardons Parole Supervision and Paroles State Board of Pardons Parole Supervision and Paroles State Board of Pardons Parole Supervision and Paroles State Board of Pardons Parole Supervision and Paroles
State Board of Pardons Victim Services and Paroles State Board of Pardons Victim Services and Paroles State Board of Pardons Victim Services and Paroles State Board of Pardons Victim Services and Paroles State Board of Pardons Victim Services and Paroles State Board of Pardons Victim Services and Paroles State Board of Pardons Victim Services and Paroles State Board of Pardons Victim Services and Paroles State Board of Pardons Victim Services and Paroles State Board of Pardons Victim Services and Paroles State Board of Pardons Victim Services and Paroles State Board of Pardons Victim Services and Paroles
Description Number of Parole Notifications sent to Judges, District Attorneys, Sheriffs and Clerks Number of visitor contacts - This decrease from the previous year is due to a change in the visitation process. Number of inmate case files requiring additional processing Number of valid appeals of success factors and crime severity levels from inmates Percentage of parolees completing parole supervision
FY 2009 Actual 82,378.00 3,078.00
17,704.00 37.00 66.00%
Average caseload size
74.00
Number of parolees under supervision (cumulative)
36,216.00
Average monthly rate of parolees employed
78.00%
Number of parolees referred to drug treatment
12,161.00
Number of parolees completing drug treatment once begun Number of face-to-face contacts per parolee
8,689.00 447,234.00
Daily cost of supervision per parolee
$4.00
Annual cost avoidance of offenders in the community $353,541,510.00 under supervision versus prison costs for incarceration
Percentage of Victims' Visitor Day participants who rate 98.00%
their overall experience as good or excellent
Number of victims who received restitution
1,403.00
Amount of restitution disbursed to victims during the year $89,174.00
Number of phone calls logged
2,515.00
Number of people registered in the Georgia Victim Information Program system Number of correspondence sent out to victims
1,616.00 10,930.00
All impact statements and notifications filed by the public 2,355.00 with the Office of Victim Services Number of victims and their family members spoken to in 262.00 person on visitors days and through the year Number of hits on the Office of Victim Services web site 41,262.00
Number of direct face to face contacts with District
N/A
Attorney Victim-Witness staff
Number of Georgia Victim Information Program
873.00
notification calls to victims
Number of calls to the Georgia Victim Information
11,192.00
Program automated phone system by victims and others
FY 2010 Actual 122,929.00 3,527.00
9,049.00 26.00 69.00% 78.00 37,396.00 73.00% 12,127.00 10,018.00 477,527.00 $5.00 $404,412,290.00
97.00% 2,338.00 $132,080.00 2,588.00 3,856.00 15,118.00 2,325.00 231.00 19,890.00 19.00 832.00 12,958.00
FY 2011 Actual 109,514.00 3,274.00
7,065.00 35.00 71.00% 85.00 38,905.00 69.00% 15,350.00 8,975.00 389,762.00 $5.00 $298,299,469.00
99.00% 3,123.00 $179,391.00 3,593.00 3,221.00 13,179.00 2,623.00 233.00 23,842.00 53.00 1,149.00 17,585.00
FY 2012 Actual 112,438.00 596.00
9,415.00 9.00 72.00% 84.00 38,423.00 65.00% 8,205.00 4,973.00 312,123.00 $5.00 $351,168,317.00
100.00% N/A $14,141,158.42 5,125.00 3,894.00 12,516.00 2,068.00 45.00 30,914.00 15.00 392.00 11,061.00
59 of 62
FY 2014 Performance Measure Report
Web Report
2/12/2013
Agency
Program Name
State Board of Workers' Administer the Workers'
Compensation
Compensation Laws
Description Percentage of cases disposed of within 60 days of the hearing date
FY 2009 Actual 50.00%
State Board of Workers' Administer the Workers'
Compensation
Compensation Laws
Percentage of cases successfully resolved through mediation
73.00%
State Board of Workers' Administer the Workers'
Compensation
Compensation Laws
Percentage of stipulated settlements resolved within 10 98.00% days of notice
State Board of Workers' Administer the Workers'
Compensation
Compensation Laws
Number of mediations held
2,491.00
State Properties Commission State Properties Commission State Properties Commission State Soil and Water Conservation Commission State Soil and Water Conservation Commission State Soil and Water Conservation Commission State Soil and Water Conservation Commission State Soil and Water Conservation Commission State Soil and Water Conservation Commission State Soil and Water Conservation Commission State Soil and Water Conservation Commission State Soil and Water Conservation Commission State Soil and Water Conservation Commission State Soil and Water Conservation Commission State Soil and Water Conservation Commission
State Properties Commission State Properties Commission
Percentage of surplus property sold at or above market 100.00% rate Percentage of property acquired at or below market rate 100.00%
State Properties Commission Commission Administration
Percentage of leases executed at or below prevailing market rate Percentage of agency's vendors converted from paper check payment to automated clearing house method
100.00% N/A
Commission Administration
Percentage of state funds as compared to agency total 36.00% funds
Commission Administration
Total number of newly elected/re-elected conservation 52.00 district supervisors positions
Conservation of Agricultural Water Supplies
Number of agricultural water meters installed
952.00
Conservation of Agricultural Water Supplies
Number of agricultural irrigation systems audited for application uniformity
189.00
Conservation of Agricultural Water Supplies
Average maintenance/repair cost per agricultural water N/A meter
Conservation of Agricultural Water Supplies
Number of million gallons of potential water saved by mobile irrigation lab contracted audits
367.00
Conservation of Soil and Water Number of individuals certified or recertified in erosion 14,620.00
Resources
and sedimentation control
Conservation of Soil and Water Number of erosion control plans reviewed Resources
2,443.00
Conservation of Soil and Water Average cost per plan to review an erosion control plan
Resources
by Georgia Soil and Water Conservation Commission
staff
Conservation of Soil and Water Number of agricultural acres protected and benefited by
Resources
conservation plans
N/A 321,259.00
Conservation of Soil and Water Number of citizens educated through district sponsored 271,373.00
Resources
events
FY 2010 Actual 80.00% 80.00% 80.00% 2,280.00 100.00% 100.00% 100.00% N/A 36.00% N/A 810.00 175.00 $98.88 1,150.00 15,675.00 1,957.00 N/A 302,337.00 156,115.00
FY 2011 Actual 88.00% 81.00% 91.00% 2,022.00 100.00% 100.00% 100.00% 13.00% 29.00% 97.00 179.00 178.00 $46.78 1,532.00 6,341.00 2,118.00 $103.00 424,322.00 174,171.00
FY 2012 Actual 89.60% 78.00% 91.00% 2,260.00 100.00% 100.00% 100.00% 44.00% 26.00% N/A 103.00 206.00 $43.34 1,121.00 10,075.00 2,707.00 $105.00 377,045.20 152,239.00
60 of 62
FY 2014 Performance Measure Report
Web Report
2/12/2013
Agency State Soil and Water Conservation Commission State Soil and Water Conservation Commission
State Soil and Water Conservation Commission
Program Name U.S.D.A. Flood Control Watershed Structures
U.S.D.A. Flood Control Watershed Structures
U.S.D.A. Flood Control Watershed Structures
State Soil and Water Conservation Commission State Soil and Water Conservation Commission State Soil and Water Conservation Commission Teachers Retirement System Teachers Retirement System Teachers Retirement System Teachers Retirement System Teachers Retirement System Teachers Retirement System Teachers Retirement System Technical College System of Georgia Technical College System of Georgia
Water Resources and Land Use Planning Water Resources and Land Use Planning Water Resources and Land Use Planning Local/Floor COLA Local/Floor COLA Local/Floor COLA System Administration System Administration System Administration System Administration Adult Literacy Adult Literacy
Technical College System of Georgia Technical College System of Georgia Technical College System of Georgia
Technical College System of Georgia
Technical College System of Georgia
Adult Literacy Departmental Administration Departmental Administration
Quick Start and Customized Services Quick Start and Customized Services
Description
FY 2009 Actual
Number of Georgia Soil and Water Conservation
112.00
Commission/United States Department of Agriculture
watershed dams maintained
Average cost per linear foot of Georgia Soil and Water $34.00
Conservation Commission/ United States Department of
Agriculture watershed dam maintained with state funding
Number of Georgia Soil and Water Conservation
8.00
Commission /United States Department of Agriculture
watershed dams rehabilitated to meet safe dam criteria
and to provide continued flood control
Number of total acres metered (cumulative)
575,028.00
Number of hits on program website
N/A
Confidence level of monthly metering prediction tool for N/A predicting annual water usage
Number of individuals receiving Floor or Cost of Living Adjustment payments Percentage of on-time payments made to retirees
117.00 100.00%
Average monthly state-funded payment amount per recipient Current number of retirees and beneficiaries receiving benefits Percentage of accurate responses in processing member service requests New retiree on-time processing rate
$803.00 82,382.00 99.00% 95.00%
Total benefit payments made during fiscal year (in millions) Number of Adult Basic Education graduates
$2,534.49 33,123.00
Passage rate of adult learners who enrolled in an Adult 70.20% Basic Education course with the goal of obtaining a General Educational Development diploma
Enrollment in adult education
95,218.00
Number of requests for new reports submitted to the N/A Data Center State funds per square foot as measured by Technical $281,999,095.00 Education state appropriations divided by total square footage (BLLIP) in the technical colleges Number of companies that receive company-specific 2,177.00 training from the Customized Business and Industry Services program Number of jobs created in Georgia with the assistance of 6,038.00 the Quick Start New and Expanding Industry program
FY 2010 Actual 113.00 $48.00
8.00
627,757.00 N/A N/A 97.00 100.00% $795.00 87,017.00 99.00% 89.00% $2,800.42 24,721.00 66.00%
91,704.00 107.00 $281,583,287.00 2,232.00 8,880.00
FY 2011 Actual 114.00 $28.00
13.00
633,013.00 N/A N/A 76.00 100.00% $755.00 92,180.00 98.00% 91.00% $3,041.50 22,661.00 63.70%
82,428.00 119.00 $277,907,415.00 2,445.00 9,507.00
FY 2012 Actual 116.00 $79.00
15.00
635,799.00 1,225.00 93.00% 62.00 100.00% $784.00 97,323.00 98.00% 90.00% $3,277.55 26,379.00 72.00%
77,432.00 101.00 $281,175,814.00 2,844.00 8,622.00
61 of 62
FY 2014 Performance Measure Report
Web Report
2/12/2013
Agency Technical College System of Georgia Technical College System of Georgia
Technical College System of Georgia Technical College System of Georgia
Program Name Quick Start and Customized Services Technical Education
Technical Education
Technical Education
Description Number of individuals trained by Quick Start
FY 2009 Actual 73,787.00
Two-year graduation rate of students who are enrolled in 57.90% an award program and have 12 hours and at least one vocational course in their enrollment history
Technical education retention rate
66.90%
Total enrollment in credit programs
163,655.00
FY 2010 Actual 97,560.00 56.30%
66.50% 197,059.00
FY 2011 Actual 98,544.00 53.60%
67.70% 195,366.00
FY 2012 Actual 57,993.00 53.80%
65.30% 170,860.00
62 of 62