- Collection:
- Georgia Government Publications
- Serial:
- Georgia physician workforce: county reports ... Worth County physician demographic summary statistics.
- Title:
- Georgia Physician Workforce county reports - 2008: Worth County physician demographic summary statistics [2009]
- Creator:
- Georgia. Department of Community Health. Georgia Board for Physician Workforce
- Contributor to Resource:
- Georgia. Department of Community Health. Georgia Board for Physician Workforce
- Publisher:
- Atlanta, Ga. : Georgia. Department of Community Health. Georgia Board for Physician Workforce
- Date of Original:
- 2009
- Subject:
- Georgia
- Location:
- United States, Georgia, 32.75042, -83.50018
- Medium:
- publications (documents)
- Type:
- Text
- Format:
- application/pdf
- Description:
- Began in 1990s?
2002 (harvested on March 25, 2015 from gbpw.georgia.gov); title from PDF caption (Georgia Government Publications database, viewed June 23, 2020).
2008 (Georgia Government Publications database, viewed June 23, 2020). - External Identifiers:
- Call Number GA C910 .S1 W61 2008
- Metadata URL:
- https://dlg.galileo.usg.edu/id:dlg_ggpd_y-ga-bc910-b-ps1-bw61-b2008-belec-p-btext
- Digital Object URL:
- https://dlg.galileo.usg.edu/do:dlg_ggpd_y-ga-bc910-b-ps1-bw61-b2008-belec-p-btext
- Language:
- eng
- Holding Institution:
- University of Georgia. Map and Government Information Library
- Rights:
-

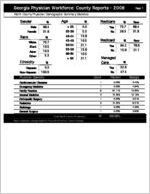
159 Georgia Physician Workforce: County Reports - 2008
Worth County Physician Demographic Summary Statistics
Page 1
Gender
%
Male Female
68.4 31.6
Race
White Black Asian Other
% 73.7 10.5 10.5
5.3
Ethnicity
%
Hispanic Non-Hispanic
0.0 100.0
Physician Specialty
Age
< 35 35-39 40-44 45-49 50-54 55-59 60-64
> 64
%
0.0 5.3 15.8 10.5 21.1 15.8 10.5 21.1
Cardiovascular Diseases Emergency Medicine Family Practice Internal Medicine Orthopedic Surgery Pediatrics Radiology General Surgery
Total Worth County Physicians
Report created by Georgia Board for Physician Workforce, State of Georgia
Medicare
Yes No
% 73.7 26.3
New 68.4 31.6
Medicaid
Yes No
% 84.2 15.8
New 78.9 21.1
Managed Care
Yes No
% 52.6 47.4
Count
Percent
Georgia
1
5.26%
3.40%
1
5.26%
4.84%
8
42.11%
13.25%
3
15.79%
13.13%
1
5.26%
3.61%
3
15.79%
8.31%
1
5.26%
4.32%
1
5.26%
3.83%
19 100.00%