- Collection:
- Georgia Government Publications
- Serial:
- Georgia physician workforce: MSA reports ... Macon physician demographic summary statistics.
- Title:
- Georgia Physician Workforce MSA reports - 2002: Macon physician demographic summary statistics [2003]
- Creator:
- Georgia. Department of Community Health. Georgia Board for Physician Workforce
- Contributor to Resource:
- Georgia. Department of Community Health. Georgia Board for Physician Workforce
- Publisher:
- Atlanta, Ga. : Georgia. Department of Community Health. Georgia Board for Physician Workforce
- Date of Original:
- 2003
- Subject:
- Georgia
- Location:
- United States, Georgia, 32.75042, -83.50018
- Medium:
- publications (documents)
- Type:
- Text
- Format:
- application/pdf
- Description:
- 2008 (Harvested on December 12, 2013 from dch.georgia.gov); title from PDF running title (Georgia Government Publications database, viewed December 6, 2022).
2008 (Harvested on December 12, 2013 from dch.georgia.gov); (Georgia Government Publications database, viewed December 6, 2022). - External Identifiers:
- Call Number GA C910 .S1 M33 2002
- Metadata URL:
- https://dlg.galileo.usg.edu/id:dlg_ggpd_y-ga-bc910-b-ps1-bm33-b2002-belec-p-btext
- Digital Object URL:
- https://dlg.galileo.usg.edu/do:dlg_ggpd_y-ga-bc910-b-ps1-bm33-b2002-belec-p-btext
- Language:
- eng
- Holding Institution:
- University of Georgia. Map and Government Information Library
- Rights:
-

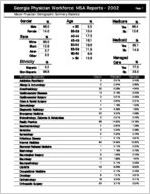
Georgia Physician Workforce: MSA Reports - 2002
Page 1
Macon Physician Demographic Summary Statistics
Gender
%
Age
Male 86.0
< 35
Female 14.0
35-39
Race
White Black Asian Other
Ethnicity
% 80.0 12.8
3.7 3.5
%
40-44 45-49 50-54 55-59 60-64
> 64
Hispanic Non-Hispanic
3.2 96.8
Physician Specialty
Addiction Psychiatry Allergy & Immunology Anesthesiology Cardiovascular Diseases Cardiovascular Surgery Colon & Rectal Surgery Dermatology Diagnostic Radiology Emergency Medicine Endocrinology, Diabetes & Metabolism Family Practice Gastroenterology Geriatrics Gynecology Infectious Disease Internal Medicine Neonatal-Perinatal Medicine Nephrology Neurological Surgery Neurology Neuropathology OB/GYN Occupational Medicine Oncology Opthalmology Orthopedic Surgery
% 3.5 10.4 17.3 16.1 18.6 11.9 6.6 13.8
Count
3 2 30 13 3 4 7 14 20 3 86 4 2 2 1 80 1 7 9 10 1 49 1 6 18 22
Medicare
Yes No
% 86.4 13.6
Medicaid
Yes No
% 85.1 14.9
Managed
Care
%
Yes 77.0 No 23.0
Percent
0.51%
Georgia
0.40%
0.34%
0.65%
5.06%
4.64%
2.19%
2.23%
0.51%
0.35%
0.67%
0.31%
1.18%
1.50%
2.36%
1.65%
3.37%
4.58%
0.51%
0.42%
14.50%
13.18%
0.67%
1.09%
0.34%
0.38%
0.34%
0.72%
0.17%
0.81%
13.49%
15.22%
0.17%
0.37%
1.18%
0.75%
1.52%
0.72%
1.69%
1.67%
0.17%
0.05%
8.26%
6.90%
0.17%
0.42%
1.01%
0.91%
3.04%
2.41%
3.71%
3.57%
Georgia Physician Workforce: MSA Reports - 2002
Macon Physician Demographic Summary Statistics
Otolaryngology Pathology Pediatric Radiology Pediatrics Plastic Surgery Preventive Medicine Psychiatry Pulmonary Diseases Radiology Therapeutic Radiology General Surgery Thoracic Surgery Urology Other
Total Macon Physicians
Report created by Georgia Board for Physician Workforce, State of Georgia
9 14 1 46 6 5 30 5 20 4 35 7 7 6
593
1.52% 2.36% 0.17% 7.76% 1.01% 0.84% 5.06% 0.84% 3.37% 0.67% 5.90% 1.18% 1.18% 1.01%
100.00%
Page 2
1.50% 2.31% 0.10% 9.07% 1.11% 0.49% 5.43% 0.87% 2.68% 0.55% 4.40% 0.56% 1.59% 1.21%