- Collection:
- Georgia Government Publications
- Serial:
- Georgia physician workforce: PHD reports ... 4.0-LaGrange physician demographic summary statistics.
- Title:
- Georgia physician workforce: PHD reports 2008 4.0-LaGrange physician demographic summary statistics
- Creator:
- Georgia Board for Physician Workforce
- Contributor to Resource:
- Georgia. Department of Community Health. Georgia Board for Physician Workforce
- Publisher:
- Atlanta, Ga. : Georgia Board for Physician Workforce
- Date of Original:
- 2009
- Subject:
- Medicine--Specialties and specialists--Georgia--Statistics--Periodicals
Physicians--Georgia--Statistics--Periodicals - Location:
- United States, Georgia, 32.75042, -83.50018
- Medium:
- state government records
official reports - Type:
- Text
- Format:
- application/pdf
- Description:
- LaGrange physician demographic summary statistics.
- External Identifiers:
- Call Number GA C910 .S1 L3 2008
- Metadata URL:
- https://dlg.galileo.usg.edu/id:dlg_ggpd_y-ga-bc910-b-ps1-bl3-b2008-belec-p-btext
- Digital Object URL:
- https://dlg.galileo.usg.edu/do:dlg_ggpd_y-ga-bc910-b-ps1-bl3-b2008-belec-p-btext
- Language:
- eng
- Holding Institution:
- University of Georgia. Map and Government Information Library
- Rights:
-

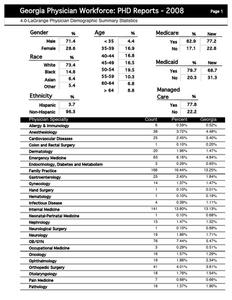
Georgia Physician Workforce: PHD Reports - 2008
4.0-LaGrange Physician Demographic Summary Statistics
Page 1
Gender
%
Age
Male 71.4
< 35
Female 28.6
35-39
Race
White Black Asian Other
Ethnicity
% 73.4 14.8
6.4 5.4
%
40-44 45-49 50-54 55-59 60-64
> 64
Hispanic Non-Hispanic
3.7 96.3
Physician Specialty
Allergy & Immunology
Anesthesiology
Cardiovascular Diseases
Colon and Rectal Surgery
Dermatology
Emergency Medicine
Endocrinology, Diabetes and Metabolism
Family Practice
Gastroenterology
Gynecology
Hand Surgery
Hematology
Infectious Disease
Internal Medicine
Neonatal-Perinatal Medicine
Nephrology
Neurological Surgery
Neurology
OB/GYN
Occupational Medicine
Oncology
Ophthalmology
Orthopedic Surgery
Otolaryngology
Pain Medicine
Pathology
%
4.4 16.9 16.8 16.5 19.5 10.3
6.8 8.8
Medicare
Yes No
% 82.9 17.1
New 77.2 22.8
Medicaid
Yes No
% 79.7 20.3
New 68.7 31.3
Managed
Care
%
Yes 77.8 No 22.2
Count
6
Percent
0.59%
Georgia
0.52%
38
3.72%
4.48%
25
2.45%
3.40%
1
0.10%
0.20%
20
1.96%
1.47%
63
6.16%
4.84%
3
0.29%
0.65%
168
16.44%
13.25%
25
2.45%
1.84%
14
1.37%
1.47%
1
0.10%
0.01%
1
0.10%
0.19%
4
0.39%
1.11%
141
13.80%
13.13%
1
0.10%
0.68%
15
1.47%
1.32%
1
0.10%
0.69%
19
1.86%
1.71%
76
7.44%
5.47%
3
0.29%
0.51%
16
1.57%
1.29%
19
1.86%
2.34%
41
4.01%
3.61%
18
1.76%
1.54%
7
0.68%
0.66%
16
1.57%
1.90%
Georgia Physician Workforce: PHD Reports - 2008
4.0-LaGrange Physician Demographic Summary Statistics
Pediatrics Plastic Surgery Psychiatry Public Health Pulmonary Diseases Radiology Rheumatology Therapeutic Radiology General Surgery Thoracic Surgery Urology Other Physical Medicine & Rehabilitation Specialty Not Specified
Total 4.0-LaGrange Physicians
Report created by Georgia Board for Physician Workforce, State of Georgia
89 6 43 2 13 41 2 6 50 1 18 2 6 1
1,022
8.71% 0.59% 4.21% 0.20% 1.27% 4.01% 0.20% 0.59% 4.89% 0.10% 1.76% 0.20% 0.59% 0.10%
100.00%
Page 2
8.31% 1.19% 5.54% 0.62% 1.43% 4.32% 0.44% 0.67% 3.83% 0.36% 1.53% 0.74% 0.66% 0.18%