- Collection:
- Georgia Government Publications
- Serial:
- Georgia physician workforce: county reports ... Bartow County physician demographic summary statistics.
- Title:
- Georgia Physician Workforce county reports - 1998: Bartow County physician demographic summary statistics [1999]
- Creator:
- Georgia. Dept. of Community Health. Georgia Board for Physician Workforce
- Contributor to Resource:
- Georgia. Dept. of Community Health. Georgia Board for Physician Workforce
- Publisher:
- Atlanta, Ga. : Georgia. Dept. of Community Health. Georgia Board for Physician Workforce
- Date of Original:
- 1999
- Subject:
- Georgia
- Location:
- United States, Georgia, 32.75042, -83.50018
- Medium:
- publications (documents)
- Type:
- Text
- Format:
- application/pdf
- Description:
- Began in 1990s?
2008 (harvested on December 12, 2013 from dch.georgia.gov); title from PDF caption (Georgia Government Publications database, viewed April 14, 2020).
2008 (Georgia Government Publications database, viewed April 14, 2020). - External Identifiers:
- Call Number GA C910 .S1 B39 1998
- Metadata URL:
- https://dlg.galileo.usg.edu/id:dlg_ggpd_y-ga-bc910-b-ps1-bb39-b1998-belec-p-btext
- Digital Object URL:
- https://dlg.galileo.usg.edu/do:dlg_ggpd_y-ga-bc910-b-ps1-bb39-b1998-belec-p-btext
- Language:
- eng
- Holding Institution:
- University of Georgia. Map and Government Information Library
- Rights:
-

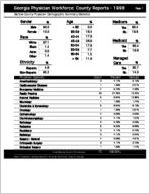
8 Georgia Physician Workforce: County Reports - 1998
Bartow County Physician Demographic Summary Statistics
Page 1
Gender
%
Age
%
Male 90.0
< 35
0.0
Female 10.0
35-39
16.4
Race
White Black Asian Other
Ethnicity
% 97.1
1.4 0.0 1.4
%
40-44 45-49 50-54 55-59 60-64
> 64
17.9 26.9 17.9
7.7 1.5 11.9
Hispanic Non-Hispanic
4.8 95.2
Physician Specialty
Anesthesiology Cardiovascular Diseases Emergency Medicine Family Practice Internal Medicine Neurology Obstetrics & Gynecology Oncology Opthalmology Otorhinolaryngology Pathology Pediatrics Psychiatry Radiology Surgery - General Orthopedic Surgery Urological Surgery
Total Bartow County Physicians
Count
3 1 7 20 5 1 5 1 4 3 2 6 3 3 4 3 1
72
Report created by Georgia Board for Physician Workforce, State of Georgia
Medicare
Yes No
% 80.4 19.6
Medicaid
Yes No
% 80.4 19.6
Managed
Care
%
Yes 85.7 No 14.3
Percent
4.17% 1.39% 9.72% 27.78% 6.94% 1.39% 6.94% 1.39% 5.56% 4.17% 2.78% 8.33% 4.17% 4.17% 5.56% 4.17% 1.39%
Georgia
5.10% 2.51% 4.36% 13.75% 13.38% 1.74% 6.13% 0.81% 2.55% 1.57% 2.29% 8.68% 5.72% 2.54% 4.81% 3.73% 1.77%
100.00%