


- Collection:
- Georgia Government Publications
- Serial:
- ... Expenditures for municipal police departments / Georgia Department of Community Affairs Office of Research.
- Title:
- 2007 expenditures for municipal police departments [Nov. 17, 2009]
- Creator:
- Georgia. Department of Community Affairs. Office of Research
- Contributor to Resource:
- Georgia. Department of Community Affairs. Office of Research
- Publisher:
- Atlanta, Ga. : Georgia. Department of Community Affairs. Office of Research
- Date of Original:
- 2009-11-17
- Subject:
- Georgia
- Location:
- United States, Georgia, 32.75042, -83.50018
- Medium:
- publications (documents)
- Type:
- Text
- Format:
- application/pdf
- Description:
- Description based on: 2007 (harvested on February 4, 2014 from www.dca.ga.gov); title from PDF caption (Georgia Government Publications database, viewed July 24, 2017).
Latest issue consulted: 2011 (Georgia Government Publications database, viewed July 24, 2017). - External Identifiers:
- Call Number GA C495.E5 S1 M82 2007
- Metadata URL:
- https://dlg.galileo.usg.edu/id:dlg_ggpd_y-ga-bc495-pe5-bs1-bm82-b2007-belec-p-btext
- Digital Object URL:
- https://dlg.galileo.usg.edu/do:dlg_ggpd_y-ga-bc495-pe5-bs1-bm82-b2007-belec-p-btext
- Language:
- eng
- Holding Institution:
- University of Georgia. Map and Government Information Library
- Rights:
-

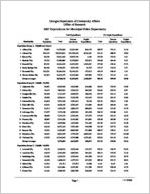
Georgia Department of Community Affairs Office of Research
2007 Expenditures for Municipal Police Departments
Municipality
2007 Population
Population Group A ( 50,000 and Above)
1 Albany City
75,825
2 Atlanta City
519,145
3 Macon City
93,076
4 Marietta City
67,021
5 Roswell City
87,312
6 Sandy Springs City
83,166
7 Savannah City
130,331
8 Warner Robins City
60,392
Group Averages
Population Group B ( 25,000 - 49,999)
1 Alpharetta City
49,662
2 Dalton City
33,401
3 Douglasville City
30,098
4 Duluth City
25,953
5 Gainesville City
34,818
6 Hinesville City
30,504
7 Kennesaw City
31,613
8 LaGrange City
27,977
9 Lawrenceville City
28,969
10 Newnan City
28,857
11 Peachtree City
34,516
12 Rome City
36,463
13 Smyrna City
49,534
14 Statesboro City
26,610
15 Valdosta City
47,567
Group Averages
Population Group C ( 10,000 - 24,999)
1 Acworth City
19,130
2 Americus City
16,545
3 Bainbridge City
12,108
4 Brunswick City
16,235
5 Buford City
11,532
6 Calhoun City
14,520
7 Canton City
21,464
Total
Total Expenditures
Current
Capital
Operations Expenditures
14,070,963 209,942,811
15,911,330 12,980,884 15,461,000
9,736,091 53,364,616 10,613,472 42,760,146
13,224,484 201,726,349
15,907,176 12,375,822 13,912,000
9,674,376 53,194,001 10,345,483 41,294,961
846,479 8,216,462
4,154 605,062 1,549,000
61,715 170,615 267,989 1,465,184
8,239,266 7,802,504 7,144,307 5,526,044 7,671,048 5,639,150 4,542,379 7,172,438 7,174,173 5,744,936 5,679,566 8,071,123 9,330,967 8,604,205 10,746,949 7,272,604
7,602,580 7,516,212 6,955,972 5,193,799 7,591,612 5,520,067 3,853,473 6,990,920 6,703,394 5,422,082 4,945,083 7,574,565 8,829,082 4,775,169 9,719,588 6,612,907
636,686 286,292 188,335 332,245
79,436 119,083 688,906 181,518 470,779 322,854 734,483 496,558 501,885 3,829,036 1,027,361 659,697
3,048,213 3,034,505 4,202,731 4,698,245
132,111 3,241,864 3,089,054
2,615,466 2,849,904 3,720,946 4,077,710
117,573 3,027,081 2,820,785
432,747 184,601 481,785 620,535
14,538 214,783 268,269
Per Capita Expenditures
Total
Current
Capital
Operations Expenditures
185.57 404.40 170.95 193.68 177.08 117.07 409.45 175.74 306.45
174.41 388.57 170.91 184.66 159.34 116.33 408.15 171.31 295.95
11.16 15.83 0.04 9.03 17.74 0.74 1.31 4.44 10.50
165.91 233.60 237.37 212.93 220.32 184.87 143.69 256.37 247.65 199.08 164.55 221.35 188.37 323.34 225.93 211.19
153.09 225.03 231.11 200.12 218.04 180.96 121.90 249.88 231.40 187.89 143.27 207.73 178.24 179.45 204.33 192.03
12.82 8.57 6.26 12.80 2.28 3.90 21.79 6.49 16.25 11.19 21.28 13.62 10.13 143.89 21.60 19.16
159.34 183.41 347.10 289.39 11.46 223.27 143.92
136.72 172.25 307.31 251.17 10.20 208.48 131.42
22.62 11.16 39.79 38.22 1.26 14.79 12.50
Page 1
11/17/2009
Georgia Department of Community Affairs Office of Research
2007 Expenditures for Municipal Police Departments
Municipality
2007 Population
Population Group C ( 10,000 - 24,999)
8 Carrollton City
22,880
9 Cartersville City
18,553
10 Chamblee City
11,040
11 College Park City
20,113
12 Conyers City
13,343
13 Cordele City
11,456
14 Covington City
14,712
15 Dallas City
10,045
16 Decatur City
19,168
17 Doraville City
10,352
18 Douglas City
11,209
19 Dublin City
17,463
20 Fairburn City
10,786
21 Fayetteville City
15,126
22 Forest Park City
21,806
23 Griffin City
23,504
24 Jesup City
10,181
25 Kingsland City
13,266
26 Lilburn City
11,526
27 Loganville City
10,242
28 McDonough City
18,443
29 Milledgeville City
20,039
30 Monroe City
13,442
31 Moultrie City
15,199
32 Norcross City
10,490
33 Perry City
12,661
34 Pooler City
13,526
35 Powder Springs City
15,380
36 Richmond Hill City
10,132
37 Riverdale City
15,345
38 Snellville City
20,076
39 St. Marys City
16,666
40 Stockbridge City
14,123
41 Sugar Hill City
16,725
42 Suwanee City
14,878
Total
Total Expenditures
Current
Capital
Operations Expenditures
Per Capita Expenditures
Total
Current
Capital
Operations Expenditures
4,628,890 4,490,219 3,783,831 9,110,812 2,917,137 2,396,261 6,194,874 1,202,027 4,054,509 6,393,618 2,403,826 3,577,736 2,962,005 3,876,834 5,192,685 7,529,628 2,142,657 2,786,576 3,113,074 1,874,574 3,363,991 3,019,583 3,364,945 2,743,318 3,888,750 2,959,284 2,221,523 3,193,314 2,397,435
0 4,290,760 2,889,720
155,793 163,824 3,423,590
4,433,917 4,174,964 3,432,825 8,893,315 2,894,072 2,227,310 6,062,301 1,093,593 3,966,249 5,616,723 2,356,613 3,184,177 2,743,735 3,753,627 5,192,685 7,097,321 1,839,693 2,568,247 2,643,643 1,817,030 3,102,405 2,768,903 3,262,712 2,623,826 3,454,257 2,675,118 2,038,468 2,670,899 2,397,435
0 3,948,170 2,571,760
124,953 163,824 2,969,866
194,973 315,255 351,006 217,497
23,065 168,951 132,573 108,434
88,260 776,895
47,213 393,559 218,270 123,207
0 432,307 302,964 218,329 469,432
57,544 261,586 250,680 102,233 119,492 434,493 284,166 183,055 522,415
0 0 342,590 317,960 30,840 0 453,724
202.31 242.02 342.74 452.98 218.63 209.17 421.08 119.66 211.52 617.62 214.45 204.88 274.62 256.30 238.13 320.36 210.46 210.05 270.09 183.03 182.40 150.69 250.33 180.49 370.71 233.73 164.24 207.63 236.62
0.00 213.73 173.39 11.03
9.80 230.11
193.79 225.03 310.94 442.17 216.90 194.42 412.07 108.87 206.92 542.57 210.24 182.34 254.38 248.16 238.13 301.96 180.70 193.60 229.36 177.41 168.22 138.18 242.73 172.63 329.29 211.29 150.71 173.66 236.62
0.00 196.66 154.31
8.85 9.80 199.61
8.52 16.99 31.79 10.81 1.73 14.75 9.01 10.79 4.60 75.05 4.21 22.54 20.24 8.15 0.00 18.39 29.76 16.46 40.73 5.62 14.18 12.51 7.61 7.86 41.42 22.44 13.53 33.97 0.00 0.00 17.06 19.08 2.18 0.00 30.50
Page 2
11/17/2009
Georgia Department of Community Affairs Office of Research
2007 Expenditures for Municipal Police Departments
Municipality
2007 Population
Population Group C ( 10,000 - 24,999)
43 Thomasville City
19,000
44 Tifton City
16,486
45 Union City
16,771
46 Vidalia City
11,224
47 Villa Rica City
12,375
48 Waycross City
14,765
49 Winder City
13,599
50 Woodstock City
22,965
Group Averages
Population Group D ( 5,000 - 9,999)
1 Adel City
5,399
2 Auburn City
7,447
3 Austell City
6,984
4 Barnesville City
5,954
5 Blakely City
5,328
6 Bremen City
5,564
7 Cairo City
9,697
8 Camilla City
5,703
9 Cedartown City
9,886
10 Centerville Town
7,106
11 Clarkston City
7,591
12 Commerce City
6,323
13 Cumming City
5,842
14 Eastman City
5,634
15 Eatonton City
6,766
16 Fitzgerald City
9,151
17 Fort Oglethorpe City
9,559
18 Fort Valley City
8,163
19 Garden City
9,504
20 Glennville City
5,166
21 Grovetown City
8,744
22 Hampton City
5,206
23 Hapeville City
5,971
24 Holly Springs City
7,956
25 Jefferson City
7,513
Total
Total Expenditures
Current
Capital
Operations Expenditures
Per Capita Expenditures
Total
Current
Capital
Operations Expenditures
5,264,800 4,197,728 4,263,849 1,727,276 2,548,157 4,045,502 4,021,163 3,484,555 3,394,147
4,831,174 3,874,184 3,985,545 1,560,214 2,466,265 3,849,274 3,718,452 3,262,493 3,150,834
433,626 323,544 278,304 167,062
81,892 196,228 302,711 222,062 243,313
277.09 254.62 254.24 153.89 205.91 273.99 295.70 151.73 222.53
254.27 235.00 237.65 139.01 199.29 260.70 273.44 142.06 206.58
22.82 19.63 16.59 14.88 6.62 13.29 22.26 9.67 15.95
1,609,399 1,510,953 2,469,623 1,173,379 1,203,823 1,369,112 1,662,825 1,121,799 2,218,650 1,366,034 1,270,617 2,049,569 1,782,932
733,633 1,151,349 1,855,163 2,128,338 2,315,067 2,750,023
645,028 1,613,465 1,015,337 3,844,674 1,006,025 1,714,454
1,448,824 1,321,895 2,241,153 1,141,094 1,185,574 1,338,645 1,587,342 1,061,661 2,218,650 1,282,959 1,220,449 1,727,710 1,782,932
675,473 1,121,335 1,746,773 1,886,454 2,104,260 2,733,678
645,028 1,416,119 1,005,583 3,444,063
983,052 1,594,930
160,575 189,058 228,470
32,285 18,249 30,467 75,483 60,138
0 83,075 50,168 321,859
0 58,160 30,014 108,390 241,884 210,807 16,345
0 197,346
9,754 400,611
22,973 119,524
298.09 202.89 353.61 197.07 225.94 246.07 171.48 196.70 224.42 192.24 167.38 324.15 305.19 130.22 170.17 202.73 222.65 283.60 289.35 124.86 184.52 195.03 643.89 126.45 228.20
268.35 177.51 320.90 191.65 222.52 240.59 163.69 186.16 224.42 180.55 160.78 273.24 305.19 119.89 165.73 190.88 197.35 257.78 287.63 124.86 161.95 193.16 576.80 123.56 212.29
29.74 25.39 32.71 5.42 3.43 5.48 7.78 10.54 0.00 11.69 6.61 50.90 0.00 10.32 4.44 11.84 25.30 25.82 1.72 0.00 22.57 1.87 67.09 2.89 15.91
Page 3
11/17/2009
Georgia Department of Community Affairs Office of Research
2007 Expenditures for Municipal Police Departments
Municipality
2007 Population
Population Group D ( 5,000 - 9,999)
26 LaFayette City
6,890
27 Morrow City
5,499
28 Palmetto City
5,035
29 Rincon City
7,454
30 Sandersville City
6,173
31 Stone Mountain City
7,651
32 Summerville City
5,004
33 Swainsboro City
7,535
34 Sylvester City
5,726
35 Thomaston City
9,165
36 Thomson City
6,793
37 Toccoa City
9,133
38 Tyrone Town
6,415
39 Waynesboro City
5,774
Group Averages
Population Group E ( 2,500 - 4,999)
1 Abbeville City
2,560
2 Adairsville City
3,205
3 Alamo Town
2,617
4 Alma City
3,494
5 Ashburn City
4,280
6 Avondale Estates Cit
2,829
7 Baldwin City
2,935
8 Baxley City
4,492
9 Blackshear City
3,478
10 Bloomingdale City
2,669
11 Braselton Town
3,072
12 Byron City
4,112
13 Chatsworth City
4,157
14 Cleveland City
2,582
15 Cochran City
4,857
16 Cornelia City
3,870
17 Cuthbert City
3,492
18 Dacula City
4,636
19 Dahlonega City
4,939
Total
Total Expenditures
Current
Capital
Operations Expenditures
Per Capita Expenditures
Total
Current
Capital
Operations Expenditures
1,577,456 2,636,440
930,198 893,634 1,142,232 1,253,588 1,271,854 1,724,918 3,296,233 1,856,523 870,968 1,915,547 1,163,232 1,202,899 1,623,513
1,526,072 2,408,408
882,615 843,692 1,109,245 1,142,248 1,207,551 1,427,062 1,462,694 1,766,238 850,488 1,666,460 1,049,478 1,130,264 1,471,491
51,384 228,032
47,583 49,942 32,988 111,340 64,303 297,856 1,833,539 90,285 20,480 249,087 113,754 72,635 152,022
228.95 479.44 184.75 119.89 185.04 163.85 254.17 228.92 575.66 202.57 128.22 209.74 181.33 208.33 232.44
221.49 437.97 175.30 113.19 179.69 149.29 241.32 189.39 255.45 192.72 125.20 182.47 163.60 195.75 210.67
7.46 41.47 9.45 6.70 5.34 14.55 12.85 39.53 320.21 9.85 3.01 27.27 17.73 12.58 21.76
221,680 896,489 201,430 648,907 1,245,495 779,762 796,736 1,177,024 570,915 925,321 1,729,469 1,513,875 1,180,287 602,223 1,156,059 1,364,130 487,030
0 0
211,070 868,653 201,430 636,365 1,143,575 779,762 710,711 1,149,640 475,820 859,892 972,472 1,222,325 1,093,444 573,926 1,004,431 1,199,654 487,030
0 0
10,610 27,836
0 12,542 101,920
0 86,025 27,384 95,095 65,429 756,997 291,550 86,843 28,297 151,628 164,476
0 0 0
86.59 279.72 76.97 185.72 291.00 275.63 271.46 262.03 164.15 346.69 562.98 368.16 283.93 233.24 238.02 352.49 139.47
0.00 0.00
82.45 271.03 76.97 182.13 267.19 275.63 242.15 255.93 136.81 322.18 316.56 297.26 263.04 222.28 206.80 309.99 139.47
0.00 0.00
4.14 8.69 0.00 3.59 23.81 0.00 29.31 6.10 27.34 24.51 246.42 70.90 20.89 10.96 31.22 42.50 0.00 0.00 0.00
Page 4
11/17/2009
Georgia Department of Community Affairs Office of Research
2007 Expenditures for Municipal Police Departments
Municipality
2007 Population
Population Group E ( 2,500 - 4,999)
20 Dawson City
4,603
21 Donalsonville City
2,719
22 East Dublin City
2,735
23 Elberton City
4,568
24 Euharlee City
4,094
25 Flowery Branch City
3,966
26 Folkston City
3,227
27 Forsyth City
4,637
28 Grantville City
2,608
29 Greensboro City
3,332
30 Hartwell City
4,301
31 Hawkinsville City
4,294
32 Hazlehurst City
3,806
33 Hephzibah City
4,434
34 Hogansville City
2,914
35 Homerville City
2,813
36 Jackson City
4,411
37 Jasper City
3,123
38 Jonesboro City
3,911
39 Lake City
2,713
40 Lakeland City
2,804
41 Leesburg City
2,876
42 Locust Grove City
4,511
43 Louisville City
2,641
44 Lyons City
4,480
45 Madison City
3,895
46 Manchester City
3,808
47 McRae City
4,379
48 Metter City
4,272
49 Millen City
3,472
50 Montezuma City
3,860
51 Monticello City
2,594
52 Nashville City
4,824
53 Oakwood City
4,063
54 Ocilla City
3,166
Total
Total Expenditures
Current
Capital
Operations Expenditures
Per Capita Expenditures
Total
Current
Capital
Operations Expenditures
1,078,907 739,496 346,443
1,420,242 728,205 595,086 495,757
1,425,054 693,022
1,219,477 1,667,267
578,741 909,123 265,562 916,764 557,244 1,308,219 788,977 1,892,578 1,270,767 333,490 621,151 1,661,384 364,367 806,881 877,175 881,602 665,128 883,228 449,727 698,573 745,783 937,847 1,054,203 594,070
1,078,907 730,609 324,848
1,325,228 622,980 547,191 463,257
1,418,254 583,787
1,203,450 1,460,592
578,741 865,090 261,856 916,764 557,244 1,212,091 738,569 1,720,891 1,153,122 312,422 603,880 1,458,393 350,902 785,636 823,140 855,595 635,161 828,165 409,849 698,573 706,098 937,847 967,166 594,070
0 8,887 21,595 95,014 105,225 47,895 32,500 6,800 109,235 16,027 206,675
0 44,033
3,706 0 0
96,128 50,408 171,687 117,645 21,068 17,271 202,991 13,465 21,245 54,035 26,007 29,967 55,063 39,878
0 39,685
0 87,037
0
234.39 271.97 126.67 310.91 177.87 150.05 153.63 307.32 265.73 365.99 387.65 134.78 238.87 59.89 314.61 198.10 296.58 252.63 483.91 468.40 118.93 215.98 368.30 137.97 180.11 225.21 231.51 151.89 206.75 129.53 180.98 287.50 194.41 259.46 187.64
234.39 268.71 118.77 290.11 152.17 137.97 143.56 305.86 223.84 361.18 339.59 134.78 227.30 59.06 314.61 198.10 274.79 236.49 440.01 425.04 111.42 209.97 323.30 132.87 175.37 211.33 224.68 145.05 193.86 118.04 180.98 272.20 194.41 238.04 187.64
0.00 3.27 7.90 20.80 25.70 12.08 10.07 1.47 41.88 4.81 48.05 0.00 11.57 0.84 0.00 0.00 21.79 16.14 43.90 43.36 7.51 6.01 45.00 5.10 4.74 13.87 6.83 6.84 12.89 11.49 0.00 15.30 0.00 21.42 0.00
Page 5
11/17/2009
Georgia Department of Community Affairs Office of Research
2007 Expenditures for Municipal Police Departments
Municipality
2007 Population
Population Group E ( 2,500 - 4,999)
55 Pelham City
3,896
56 Port Wentworth City
4,167
57 Quitman City
4,591
58 Ringgold City
2,769
59 Rockmart City
4,486
60 Rossville City
3,448
61 Royston City
2,714
62 Senoia City
3,244
63 Social Circle City
4,535
64 Soperton City
3,243
65 Statham City
2,820
66 Sylvania City
2,509
67 Tallapoosa City
3,082
68 Temple City
4,382
69 Thunderbolt Town
2,650
70 Tybee Island City
3,912
71 Unadilla City
2,908
72 Vienna City
2,867
73 Walthourville City
3,886
74 Washington City
4,037
75 Watkinsville City
2,825
76 West Point City
3,373
77 Wrightsville City
3,751
Group Averages
Population Group F ( 1,000 - 2,499)
1 Aragon City
1,072
2 Arcade Town
1,941
3 Arlington City
1,515
4 Baconton City
1,001
5 Berkeley Lake City
2,064
6 Bethlehem Town
1,054
7 Blue Ridge City
1,042
8 Bogart City
1,075
9 Boston City
1,436
10 Bowdon City
2,044
Total
Total Expenditures
Current
Capital
Operations Expenditures
Per Capita Expenditures
Total
Current
Capital
Operations Expenditures
833,953 1,783,018
920,547 536,228 1,048,628 724,354 982,243 737,098 1,543,078 229,662 417,871 1,019,665 995,075 1,085,713 604,529 1,762,189 381,498 446,179 256,326 1,236,749 476,893 1,430,790 345,457 854,105
833,953 1,659,661
870,274 532,770 1,048,628 674,537 878,137 677,373 1,318,516 206,947 388,026 988,680 965,776 910,301 599,435 1,694,577 283,603 441,819 232,917 1,115,049 455,696 1,378,734 344,602 789,878
0 123,357
50,273 3,458 0
49,817 104,106
59,725 224,562
22,715 29,845 30,985 29,299 175,412
5,094 67,612 97,895
4,360 23,409 121,700 21,197 52,056
855 64,228
214.05 427.89 200.51 193.65 233.76 210.08 361.92 227.22 340.26 70.82 148.18 406.40 322.87 247.77 228.12 450.46 131.19 155.63 65.96 306.35 168.81 424.19 92.10 237.23
214.05 398.29 189.56 192.41 233.76 195.63 323.56 208.81 290.74 63.81 137.60 394.05 313.36 207.74 226.20 433.17 97.53 154.10 59.94 276.21 161.31 408.76 91.87 219.39
0.00 29.60 10.95 1.25 0.00 14.45 38.36 18.41 49.52 7.00 10.58 12.35 9.51 40.03 1.92 17.28 33.66 1.52 6.02 30.15 7.50 15.43 0.23 17.84
81,191 589,740 175,183
0 85,212
0 733,450
32,000 234,819 569,240
79,242 587,863 147,492
0 85,212
0 694,564
32,000 206,819 569,240
1,949 1,877 27,691
0 0 0 38,886 0 28,000 0
75.74 303.83 115.63
0.00 41.28 0.00 703.89 29.77 163.52 278.49
73.92 302.87 97.35
0.00 41.28 0.00 666.57 29.77 144.02 278.49
1.82 0.97 18.28 0.00 0.00 0.00 37.32 0.00 19.50 0.00
Page 6
11/17/2009
Georgia Department of Community Affairs Office of Research
2007 Expenditures for Municipal Police Departments
Municipality
2007 Population
Population Group F ( 1,000 - 2,499)
11 Brooklet City
1,309
12 Buchanan City
1,124
13 Buena Vista City
1,658
14 Butler City
1,825
15 Cave Spring City
1,015
16 Chester Town
1,513
17 Chickamauga City
2,491
18 Clarkesville City
1,647
19 Claxton City
2,403
20 Clayton City
2,169
21 Colquitt City
1,901
22 Comer City
1,272
23 Darien City
1,788
24 Davisboro City
1,768
25 Dawsonville City
1,418
26 Demorest City
1,790
27 Edison City
1,252
28 Ellaville City
1,776
29 Ellijay City
1,582
30 Emerson City
1,372
31 Fort Gaines City
1,042
32 Gordon City
2,118
33 Gray City
2,218
34 Grayson City
1,471
35 Guyton City
1,907
36 Hagan City
1,045
37 Hahira City
2,261
38 Harlem City
1,899
39 Helena City
2,428
40 Hiram City
1,988
41 Homer Town
1,077
42 Hoschton City
1,563
43 Ivey City
1,078
44 Jeffersonville City
1,154
45 Lavonia City
2,060
Total
Total Expenditures
Current
Capital
Operations Expenditures
Per Capita Expenditures
Total
Current
Capital
Operations Expenditures
263,800 550,001 226,690 442,452 192,006
319 348,812 370,490 599,072 876,586 636,600 137,825 261,076
98,116 129,000 483,269 171,860 245,646 757,553 483,581 252,507 620,476 563,352
40,460 162,665 161,331 348,618 607,541 218,396 1,166,196
0 462,410 154,205 226,128 1,000,262
216,057 505,411 226,690 360,193 192,006
319 328,233 370,490 570,380 789,889 509,697 137,825 261,076
96,553 129,000 483,269 171,860 245,646 703,276 409,634 252,507 583,483 547,772
40,460 162,665 150,956 348,618 573,613 161,289 923,593
0 462,410 154,205 204,478 837,277
47,743 44,590
0 82,259
0 0 20,579 0 28,692 86,697 126,903 0 0 1,563 0 0 0 0 54,277 73,947 0 36,993 15,580 0 0 10,375 0 33,928 57,107 242,603 0 0 0 21,650 162,985
201.53 489.32 136.72 242.44 189.17
0.21 140.03 224.95 249.30 404.14 334.88 108.35 146.02 55.50 90.97 269.98 137.27 138.31 478.86 352.46 242.33 292.95 253.99 27.51 85.30 154.38 154.19 319.93 89.95 586.62
0.00 295.85 143.05 195.95 485.56
165.06 449.65 136.72 197.37 189.17
0.21 131.77 224.95 237.36 364.17 268.12 108.35 146.02 54.61 90.97 269.98 137.27 138.31 444.55 298.57 242.33 275.49 246.97 27.51 85.30 144.46 154.19 302.06 66.43 464.58
0.00 295.85 143.05 177.19 406.45
36.47 39.67 0.00 45.07 0.00 0.00 8.26 0.00 11.94 39.97 66.76 0.00 0.00 0.88 0.00 0.00 0.00 0.00 34.31 53.90 0.00 17.47 7.02 0.00 0.00 9.93 0.00 17.87 23.52 122.03 0.00 0.00 0.00 18.76 79.12
Page 7
11/17/2009
Georgia Department of Community Affairs Office of Research
2007 Expenditures for Municipal Police Departments
Municipality
2007 Population
Population Group F ( 1,000 - 2,499)
46 Lincolnton City
1,509
47 Lookout Mountain C
1,550
48 Lovejoy City
2,443
49 Ludowici City
1,595
50 Lula City
2,347
51 Lumber City
1,192
52 Lumpkin City
1,216
53 Marshallville City
1,240
54 Maysville Town
1,633
55 Meigs City
1,080
56 Midway City
1,068
57 Milan City
1,023
58 Morgan City
1,548
59 Mount Vernon City
2,188
60 Mount Zion City
1,557
61 Nicholson Town
1,913
62 Oglethorpe City
1,105
63 Omega City
1,375
64 Oxford City
2,498
65 Pearson City
1,955
66 Pembroke City
2,484
67 Pine Mountain Town
1,263
68 Porterdale Town
1,812
69 Reidsville City
2,423
70 Remerton City
1,018
71 Reynolds City
1,004
72 Richland City
1,590
73 Rochelle City
1,383
74 Sardis City
1,188
75 Shellman City
1,074
76 Sparks Town
1,792
77 Sparta City
1,312
78 Springfield City
2,085
79 Tennille City
1,461
80 Trenton City
2,370
Total
Total Expenditures
Current
Capital
Operations Expenditures
Per Capita Expenditures
Total
Current
Capital
Operations Expenditures
299,422 294,019
0 530,233
0 304,680 166,068 285,412 369,778 142,376 168,726
57,190 0
82,375 261,720
0 283,422 310,589 310,876 301,774 823,507 773,772 378,065 480,932 511,476 332,199 153,295 255,135 288,403 146,989 287,867 331,454 404,094 643,827 608,300
274,972 239,587
0 502,226
0 304,680 166,068 285,412 264,359 142,376 168,726
57,190 0
82,375 202,114
0 283,422 258,589 284,150 292,735 727,812 506,616 378,065 447,167 448,878 275,845 125,739 255,135 264,274 137,669 276,384 331,454 360,990 541,646 514,807
24,450 54,432
0 28,007
0 0 0 0 105,419 0 0 0 0 0 59,606 0 0 52,000 26,726 9,039 95,695 267,156 0 33,765 62,598 56,354 27,556 0 24,129 9,320 11,483 0 43,104 102,181 93,493
198.42 189.69
0.00 332.43
0.00 255.60 136.57 230.17 226.44 131.83 157.98 55.90
0.00 37.65 168.09 0.00 256.49 225.88 124.45 154.36 331.52 612.65 208.65 198.49 502.43 330.88 96.41 184.48 242.76 136.86 160.64 252.63 193.81 440.68 256.67
182.22 154.57
0.00 314.88
0.00 255.60 136.57 230.17 161.89 131.83 157.98 55.90
0.00 37.65 129.81 0.00 256.49 188.06 113.75 149.74 293.00 401.12 208.65 184.55 440.94 274.75 79.08 184.48 222.45 128.18 154.23 252.63 173.14 370.74 217.22
16.20 35.12 0.00 17.56 0.00 0.00 0.00 0.00 64.56 0.00 0.00 0.00 0.00 0.00 38.28 0.00 0.00 37.82 10.70 4.62 38.52 211.52 0.00 13.94 61.49 56.13 17.33 0.00 20.31 8.68 6.41 0.00 20.67 69.94 39.45
Page 8
11/17/2009
Georgia Department of Community Affairs Office of Research
2007 Expenditures for Municipal Police Departments
Municipality
2007 Population
Population Group F ( 1,000 - 2,499)
81 Trion Town
2,059
82 Twin City
1,775
83 Union Point City
1,551
84 Varnell City
1,584
85 Wadley City
1,944
86 Walnut Grove City
1,214
87 Warrenton City
1,955
88 Willacoochee City
1,540
89 Winterville City
1,152
90 Woodbine City
1,357
91 Woodbury City
1,074
92 Wrens City
2,222
93 Zebulon City
1,234
Group Averages
Population Group G ( 500 - 999)
1 Adrian City
567
2 Ailey City
541
3 Alapaha Town
685
4 Allenhurst City
731
5 Alto Town
909
6 Ball Ground City
931
7 Blairsville City
709
8 Blythe Town
807
9 Bowman City
965
10 Canon City
814
11 Carnesville City
667
12 Clermont Town
765
13 Cohutta City
602
14 Colbert City
527
15 Collins City
545
16 Coolidge City
553
17 Crawford City
813
18 Crawfordville City
522
19 Dasher City
830
20 Dexter Town
541
Total
Total Expenditures
Current
Capital
Operations Expenditures
Per Capita Expenditures
Total
Current
Capital
Operations Expenditures
467,771 289,358 408,515
0 364,808
73,561 481,478 180,970 177,926
3,960 333,381 651,030 351,208 324,001
467,771 283,458 382,653
0 364,808
73,561 475,978 147,830 176,636
3,960 329,597 651,030 321,652 296,706
0 5,900 25,862
0 0 0 5,500 33,140 1,290 0 3,784 0 29,556 27,295
227.18 163.02 263.39
0.00 187.66 60.59 246.28 117.51 154.45
2.92 310.41 292.99 284.61 201.44
227.18 159.69 246.71
0.00 187.66 60.59 243.47 95.99 153.33
2.92 306.89 292.99 260.66 184.47
0.00 3.32 16.67 0.00 0.00 0.00 2.81 21.52 1.12 0.00 3.52 0.00 23.95 16.97
79,671 16,698 81,791
0 209,150 224,134 458,215 117,752
0 35,252
0 0 48,116 81,207 36,464 132,727 0 6,338 10,000 0
47,275 16,698 49,221
0 188,168 193,627 458,215 117,752
0 35,252
0 0 48,116 81,207 36,464 132,727 0 6,338 10,000 0
32,396 0
32,570 0
20,982 30,507
0 0 0 0 0 0 0 0 0 0 0 0 0 0
140.51 30.87 119.40 0.00 230.09 240.75 646.28 145.91 0.00 43.31 0.00 0.00 79.93 154.09 66.91 240.01 0.00 12.14 12.05 0.00
83.38 30.87 71.86 0.00 207.01 207.98 646.28 145.91 0.00 43.31 0.00 0.00 79.93 154.09 66.91 240.01 0.00 12.14 12.05 0.00
57.14 0.00 47.55 0.00 23.08 32.77 0.00 0.00 0.00 0.00 0.00 0.00 0.00 0.00 0.00 0.00 0.00 0.00 0.00 0.00
Page 9
11/17/2009
Georgia Department of Community Affairs Office of Research
2007 Expenditures for Municipal Police Departments
Municipality
2007 Population
Population Group G ( 500 - 999)
21 Doerun City
843
22 Dudley City
520
23 East Ellijay City
703
24 Enigma City
875
25 Fairmount City
808
26 Flovilla City
683
27 Franklin City
866
28 Franklin Springs City
799
29 Gibson City
754
30 Glenwood City
888
31 Greenville City
923
32 Hamilton City
566
33 Helen City
791
34 Hiawassee City
866
35 Hoboken City
518
36 Homeland City
807
37 Irwinton City
585
38 Lake Park City
594
39 Leary City
628
40 Lenox Town
897
41 Luthersville Town
827
42 Lyerly Town
519
43 Mansfield City
572
44 McCaysville City
946
45 McIntyre Town
716
46 Menlo City
529
47 Milner City
649
48 Morven City
619
49 Mount Airy Town
976
50 Mountain City
746
51 Mountain Park City
560
52 Nahunta City
979
53 Nelson City
900
54 Newborn Town
773
55 Norman Park City
862
Total
Total Expenditures
Current
Capital
Operations Expenditures
Per Capita Expenditures
Total
Current
Capital
Operations Expenditures
187,369 0
519,020 97,518
158,735 57,885
398,288 122,464
10,000 139,012
0 61,448 672,435 306,205 88,930 18,607 72,019 118,230 50,550 146,743 119,961
2,817 665
206,679 368,065
30,278 242,178 178,869
74,267 84,319 24,278 158,882 104,467
0 231,645
187,369 0
490,627 97,518
158,735 57,885
390,060 122,464
10,000 139,012
0 61,448 672,435 273,179 88,930 18,607 72,019 118,230 50,550 108,207 119,961
2,698 665
206,679 283,066
30,278 210,524 178,869
74,267 83,943 24,278 158,882 73,481
0 231,645
0 0 28,393 0 0 0 8,228 0 0 0 0 0 0 33,026 0 0 0 0 0 38,536 0 119 0 0 84,999 0 31,654 0 0 376 0 0 30,986 0 0
222.26 0.00
738.29 111.45 196.45 84.75 459.92 153.27 13.26 156.55
0.00 108.57 850.11 353.59 171.68 23.06 123.11 199.04 80.49 163.59 145.06
5.43 1.16 218.48 514.06 57.24 373.16 288.96 76.09 113.03 43.35 162.29 116.07 0.00 268.73
222.26 0.00
697.90 111.45 196.45 84.75 450.42 153.27 13.26 156.55
0.00 108.57 850.11 315.45 171.68 23.06 123.11 199.04 80.49 120.63 145.06
5.20 1.16 218.48 395.34 57.24 324.38 288.96 76.09 112.52 43.35 162.29 81.65 0.00 268.73
0.00 0.00 40.39 0.00 0.00 0.00 9.50 0.00 0.00 0.00 0.00 0.00 0.00 38.14 0.00 0.00 0.00 0.00 0.00 42.96 0.00 0.23 0.00 0.00 118.71 0.00 48.77 0.00 0.00 0.50 0.00 0.00 34.43 0.00 0.00
Page 10
11/17/2009
Georgia Department of Community Affairs Office of Research
2007 Expenditures for Municipal Police Departments
Municipality
2007 Population
Population Group G ( 500 - 999)
56 North High Shoals T
555
57 Ochlocknee Town
613
58 Patterson City
679
59 Pavo City
701
60 Pendergrass Town
565
61 Pine Lake City
718
62 Pineview Town
521
63 Plains City
608
64 Portal Town
611
65 Poulan City
891
66 Ray City
772
67 Resaca Town
771
68 Riceboro City
726
69 Roberta City
749
70 Rutledge City
762
71 Screven City
778
72 Smithville City
951
73 Stillmore City
760
74 Sycamore City
528
75 Talbotton City
998
76 Talmo Town
603
77 Tignall Town
628
78 Toomsboro City
619
79 Ty Ty City
770
80 Uvalda City
550
81 Waco Town
501
82 Waleska City
856
83 Waverly Hall Town
797
84 Whigham City
609
85 White City
703
86 Whitesburg City
588
87 Young Harris City
591
Group Averages
Population Group H ( Less than 500)
1 Aldora Town
90
Total
Total Expenditures
Current
Capital
Operations Expenditures
Per Capita Expenditures
Total
Current
Capital
Operations Expenditures
1,625 38,988 100,560 181,250 256,255 198,210 50,578 95,493 107,766 588,259 106,027 116,139
0 274,836
20,499 105,909 303,694
53,493 96,302 174,672
0 55,524 34,408
0 51,754
0 0 110,789 140,486 136,448 211,635 0 117,264
1,625 38,988 100,560 132,370 256,255 198,210 50,578 95,493 107,766 534,873 69,911 116,139
0 249,479
20,499 105,909 224,913
45,764 71,147 174,672
0 55,524 34,408
0 51,754
0 0 110,789 128,015 136,448 211,635 0 109,670
0 0 0 48,880 0 0 0 0 0 53,386 36,116 0 0 25,357 0 0 78,781 7,729 25,155 0 0 0 0 0 0 0 0 0 12,471 0 0 0 7,594
2.93 63.60 148.10 258.56 453.55 276.06 97.08 157.06 176.38 660.22 137.34 150.63 0.00 366.94 26.90 136.13 319.34 70.39 182.39 175.02 0.00 88.41 55.59 0.00 94.10 0.00 0.00 139.01 230.68 194.09 359.92 0.00 164.06
2.93 63.60 148.10 188.83 453.55 276.06 97.08 157.06 176.38 600.31 90.56 150.63 0.00 333.08 26.90 136.13 236.50 60.22 134.75 175.02 0.00 88.41 55.59 0.00 94.10 0.00 0.00 139.01 210.21 194.09 359.92 0.00 153.44
0.00 0.00 0.00 69.73 0.00 0.00 0.00 0.00 0.00 59.92 46.78 0.00 0.00 33.85 0.00 0.00 82.84 10.17 47.64 0.00 0.00 0.00 0.00 0.00 0.00 0.00 0.00 0.00 20.48 0.00 0.00 0.00 10.62
0
0
0
0.00
0.00
0.00
Page 11
11/17/2009
Georgia Department of Community Affairs Office of Research
2007 Expenditures for Municipal Police Departments
Municipality
2007 Population
Population Group H ( Less than 500)
2 Allentown City
284
3 Alston Town
168
4 Ambrose City
326
5 Andersonville City
338
6 Arabi Town
451
7 Argyle Town
151
8 Arnoldsville City
329
9 Attapulgus City
467
10 Avalon Town
275
11 Avera City
202
12 Bartow Town
281
13 Barwick City
439
14 Bellville City
140
15 Between Town
150
16 Bishop Town
163
17 Bluffton Town
113
18 Bostwick City
354
19 Bowersville Town
334
20 Braswell Town
124
21 Brinson Town
215
22 Bronwood City
468
23 Buckhead Town
220
24 Byromville Town
409
25 Cadwell Town
366
26 Camak Town
151
27 Carl Town
305
28 Carlton City
246
29 Cecil City
333
30 Centralhatchee Town
389
31 Chauncey City
303
32 Climax City
288
33 Cobbtown City
321
34 Concord City
398
35 Culloden City
229
36 Daisy City
136
Total
Total Expenditures
Current
Capital
Operations Expenditures
Per Capita Expenditures
Total
Current
Capital
Operations Expenditures
0 0 0 0 32,459 0 0 59,109 0 0 20,763 46,052 0 0 0 0 0 0 25,845 0 0 0 34,247 0 0 0 0 2,685 0 26,502 73,835 0 1,216 120 0
0 0 0 0 32,459 0 0 56,988 0 0 20,763 46,052 0 0 0 0 0 0 22,245 0 0 0 34,247 0 0 0 0 2,685 0 20,502 57,606 0 1,216 120 0
0 0 0 0 0 0 0 2,121 0 0 0 0 0 0 0 0 0 0 3,600 0 0 0 0 0 0 0 0 0 0 6,000 16,229 0 0 0 0
0.00 0.00 0.00 0.00 71.97 0.00 0.00 126.57 0.00 0.00 73.89 104.90 0.00 0.00 0.00 0.00 0.00 0.00 208.43 0.00 0.00 0.00 83.73 0.00 0.00 0.00 0.00 8.06 0.00 87.47 256.37 0.00 3.06 0.52 0.00
0.00 0.00 0.00 0.00 71.97 0.00 0.00 122.03 0.00 0.00 73.89 104.90 0.00 0.00 0.00 0.00 0.00 0.00 179.40 0.00 0.00 0.00 83.73 0.00 0.00 0.00 0.00 8.06 0.00 67.66 200.02 0.00 3.06 0.52 0.00
0.00 0.00 0.00 0.00 0.00 0.00 0.00 4.54 0.00 0.00 0.00 0.00 0.00 0.00 0.00 0.00 0.00 0.00 29.03 0.00 0.00 0.00 0.00 0.00 0.00 0.00 0.00 0.00 0.00 19.80 56.35 0.00 0.00 0.00 0.00
Page 12
11/17/2009
Georgia Department of Community Affairs Office of Research
2007 Expenditures for Municipal Police Departments
Municipality
2007 Population
Population Group H ( Less than 500)
37 Damascus City
260
38 Danville Town
353
39 Dearing Town
442
40 Deepstep Town
129
41 Denton City
288
42 Dillard City
245
43 Dooling Town
163
44 DuPont Town
139
45 Edgehill City
33
46 Ellenton City
354
47 Ephesus City
384
48 Eton City
487
49 Fargo City
379
50 Flemington City
360
51 Funston City
431
52 Garfield City
157
53 Gay Town
133
54 Geneva Town
112
55 Gillsville City
210
56 Girard Town
226
57 Good Hope City
263
58 Gum Branch City
262
59 Harrison Town
482
60 Higgston Town
333
61 Hiltonia City
390
62 Hull Town
162
63 Ideal City
477
64 Ila City
332
65 Iron City
299
66 Jacksonville City
117
67 Jakin City
151
68 Jenkinsburg Town
229
69 Jersey City
168
70 Junction City
176
71 Keysville City
241
Total
Total Expenditures
Current
Capital
Operations Expenditures
Per Capita Expenditures
Total
Current
Capital
Operations Expenditures
13,937 1,298 0 0 0
123,846 0 0 0 0
13,869 121,626
0 49,484
0 51,206
0 0 0 0 0 0 29,626 0 60,282 0 39,700 0 0 0 0 0 0 0 20,837
9,675 1,298
0 0 0 123,846 0 0 0 0 13,869 121,626 0 49,484 0 51,206 0 0 0 0 0 0 28,095 0 60,282 0 39,700 0 0 0 0 0 0 0 20,837
4,262 0 0 0 0 0 0 0 0 0 0 0 0 0 0 0 0 0 0 0 0 0
1,531 0 0 0 0 0 0 0 0 0 0 0 0
53.60 3.68 0.00 0.00 0.00 505.49 0.00 0.00 0.00 0.00 36.12 249.75 0.00 137.46 0.00 326.15 0.00 0.00 0.00 0.00 0.00 0.00 61.46 0.00 154.57 0.00 83.23 0.00 0.00 0.00 0.00 0.00 0.00 0.00 86.46
37.21 3.68 0.00 0.00 0.00 505.49 0.00 0.00 0.00 0.00 36.12 249.75 0.00 137.46 0.00 326.15 0.00 0.00 0.00 0.00 0.00 0.00 58.29 0.00 154.57 0.00 83.23 0.00 0.00 0.00 0.00 0.00 0.00 0.00 86.46
16.39 0.00 0.00 0.00 0.00 0.00 0.00 0.00 0.00 0.00 0.00 0.00 0.00 0.00 0.00 0.00 0.00 0.00 0.00 0.00 0.00 0.00 3.18 0.00 0.00 0.00 0.00 0.00 0.00 0.00 0.00 0.00 0.00 0.00 0.00
Page 13
11/17/2009
Georgia Department of Community Affairs Office of Research
2007 Expenditures for Municipal Police Departments
Municipality
2007 Population
Population Group H ( Less than 500)
72 Kite City
235
73 Leslie City
437
74 Lexington City
230
75 Lilly City
220
76 Lone Oak Town
96
77 Manassas City
105
78 Martin Town
307
79 Maxeys Town
214
80 Meansville City
186
81 Midville City
457
82 Mitchell Town
191
83 Molena City
477
84 Montrose Town
164
85 Moreland Town
428
86 Morganton City
268
87 Newington Town
319
88 Norwood City
286
89 Nunez City
136
90 Oak Park Town
380
91 Oconee City
289
92 Odum City
459
93 Offerman City
444
94 Oliver City
238
95 Orchard Hill Town
237
96 Parrott Town
134
97 Payne City
166
98 Pinehurst City
371
99 Pitts City
300
100 Plainville City
267
101 Pulaski Town
301
102 Rebecca Town
238
103 Register Town
167
104 Rentz City
323
105 Rest Haven City
146
106 Rhine Town
432
Total
Total Expenditures
Current
Capital
Operations Expenditures
Per Capita Expenditures
Total
Current
Capital
Operations Expenditures
6,000 146,531
0 3,331
0 0 0 0 0 85,021 0 60,720 0 0 0 82,854 0 0 0 10,633 0 0 201,647 0 0 0 12,044 0 0 0 0 37,203 0 0 0
6,000 142,003
0 3,331
0 0 0 0 0 85,021 0 60,720 0 0 0 82,056 0 0 0 10,633 0 0 200,603 0 0 0 12,044 0 0 0 0 37,203 0 0 0
0 4,528
0 0 0 0 0 0 0 0 0 0 0 0 0 798 0 0 0 0 0 0 1,044 0 0 0 0 0 0 0 0 0 0 0 0
25.53 335.31
0.00 15.14 0.00 0.00 0.00 0.00 0.00 186.04 0.00 127.30 0.00 0.00 0.00 259.73 0.00 0.00 0.00 36.79 0.00 0.00 847.26 0.00 0.00 0.00 32.46 0.00 0.00 0.00 0.00 222.77 0.00 0.00 0.00
25.53 324.95
0.00 15.14 0.00 0.00 0.00 0.00 0.00 186.04 0.00 127.30 0.00 0.00 0.00 257.23 0.00 0.00 0.00 36.79 0.00 0.00 842.87 0.00 0.00 0.00 32.46 0.00 0.00 0.00 0.00 222.77 0.00 0.00 0.00
0.00 10.36 0.00 0.00 0.00 0.00 0.00 0.00 0.00 0.00 0.00 0.00 0.00 0.00 0.00 2.50 0.00 0.00 0.00 0.00 0.00 0.00 4.39 0.00 0.00 0.00 0.00 0.00 0.00 0.00 0.00 0.00 0.00 0.00 0.00
Page 14
11/17/2009
Georgia Department of Community Affairs Office of Research
2007 Expenditures for Municipal Police Departments
Municipality
2007 Population
Population Group H ( Less than 500)
107 Riddleville Town
122
108 Riverside Town
60
109 Roopville Town
203
110 Santa Claus City
247
111 Sasser Town
347
112 Scotland City
288
113 Shady Dale City
244
114 Sharpsburg Town
329
115 Siloam Town
337
116 Sky Valley City
219
117 Stapleton City
308
118 Summertown City
145
119 Sumner Town
299
120 Sunny Side City
131
121 Surrency Town
247
122 Talking Rock Town
105
123 Tallulah Falls Town
159
124 Tarrytown City
104
125 Taylorsville Town
224
126 Tiger Town
316
127 Turin Town
395
128 Vernonburg Town
136
129 Vidette Town
112
130 Warm Springs City
472
131 Warwick City
404
132 Williamson City
366
133 Woodland City
408
134 Woodville City
420
135 Woolsey Town
200
136 Yatesville Town
388
Group Averages
Total
Total Expenditures
Current
Capital
Operations Expenditures
Per Capita Expenditures
Total
Current
Capital
Operations Expenditures
0 0 0 0 0 0 0 0 0 284,405 92,561 0 0 0 0 0 86,395 0 0 0 0 3,000 0 192,996 32,260 0 56,116 0 0 0 16,487
0 0 0 0 0 0 0 0 0 281,061 60,634 0 0 0 0 0 86,395 0 0 0 0 3,000 0 183,965 32,260 0 27,632 0 0 0 15,657
0 0 0 0 0 0 0 0 0 3,344 31,927 0 0 0 0 0 0 0 0 0 0 0 0 9,031 0 0 28,484 0 0 0 830
0.00 0.00 0.00 0.00 0.00 0.00 0.00 0.00 0.00 1,298.65 300.52 0.00 0.00 0.00 0.00 0.00 543.36 0.00 0.00 0.00 0.00 22.06 0.00 408.89 79.85 0.00 137.54 0.00 0.00 0.00 61.09
0.00 0.00 0.00 0.00 0.00 0.00 0.00 0.00 0.00 1,283.38 196.86 0.00 0.00 0.00 0.00 0.00 543.36 0.00 0.00 0.00 0.00 22.06 0.00 389.76 79.85 0.00 67.73 0.00 0.00 0.00 58.01
0.00 0.00 0.00 0.00 0.00 0.00 0.00 0.00 0.00 15.27 103.66 0.00 0.00 0.00 0.00 0.00 0.00 0.00 0.00 0.00 0.00 0.00 0.00 19.13 0.00 0.00 69.81 0.00 0.00 0.00 3.08
Page 15
11/17/2009
Municipality
Georgia Department of Community Affairs Office of Research
2007 Expenditures for Municipal Police Departments
2007 Population
Total
Total Expenditures
Current
Capital
Operations Expenditures
Per Capita Expenditures
Total
Current
Capital
Operations Expenditures
Source: DCA, Annual Report of Local Government Finances
Page 16
11/17/2009