- Collection:
- Georgia Government Publications
- Title:
- Dimensions: measuring Georgia's workforce, Vol. 39, no. 6 (June 2013)
- Creator:
- Georgia. Department of Labor
- Contributor to Resource:
- Georgia. Workforce Information and Analysis
- Publisher:
- Atlanta, Ga. : Georgia Dept. of Labor, 2013-06
- Date of Original:
- 2013-06
- Subject:
- Labor market--Georgia--Statistics
Wages--Georgia--Statistics
Hours of labor--Georgia--Statistics - Location:
- United States, Georgia, 32.75042, -83.50018
- Medium:
- state government records
- Type:
- Text
- Format:
- application/pdf
- External Identifiers:
- Call Number GA L200.E46 P1 T7 39/6
- Metadata URL:
- https://dlg.galileo.usg.edu/id:dlg_ggpd_i-ga-bl200-pe46-bp1-bt7-b39-s6-belec-p-btext
- Digital Object URL:
- https://dlg.galileo.usg.edu/do:dlg_ggpd_i-ga-bl200-pe46-bp1-bt7-b39-s6-belec-p-btext
- Language:
- eng
- Holding Institution:
- University of Georgia. Map and Government Information Library
- Rights:
-

June 2013 Data
June 2013 Employment Situation
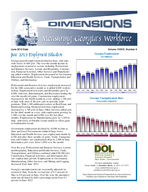
Georgia payroll employment declined in June, with statewide losses of 600 jobs. The over-the-month decline in employment occurred as sectors including Professional and Business Services, Leisure and Hospitality, Construction, Financial Activities, Other Services and Manufacturing added workers. Employment decreased in Government, Education and Health Services, Trade, Transportation and Utilities, and Information.
Professional and Business Services employment increased for the fifth consecutive month as it added 8,000 workers in June. Employment in Leisure and Hospitality grew by 4,000, with Arts, Entertainment, and Recreation leading the over-the-month job gains. Construction employment increased for the fourth month in a row, adding 1,700 jobs in June with most of the new jobs in specialty trade positions. With 1,300 additional workers in Real Estate and Rental and Leasing, Financial Activities employment increased by 1,700 jobs in June. Other Services added jobs for the third month in a row, with employment growing by 1,200 over the month and 4,000 over the last three months. Employment in Manufacturing grew by 1,200 in June, with losses in Durable Goods unable to offset gains in NonDurable Goods.
Government employment declined by 10,000 in June as State and Local Governments endured large losses. Education and Health Services saw employment shrink by 4,100 and after three months of gains, Trade, Transportation, and Utilities saw employment drop by 2,400 in June. Information jobs were down 1,900 over the month.
Over the year, Professional and Business Services, Leisure and Hospitality, Education and Health Services, Trade, Transportation, and Utilities combined added 88,300 jobs. Construction, Financial Activities, and Information also saw employment growth. Employment in Government, Manufacturing, Other Services, and Mining and Logging decreased from June 2012.
Georgia's unemployment rate (seasonally adjusted) increased in June, from the revised rate of 8.3 percent in May to 8.6 percent in June. Over the year, the unemployment rate declined by half a percentage point from 9.1 percent in June 2012.
Volume XXXIX, Number 6
Georgia Employment
(In Millions)
3.958
3.930
3.963
3.953
3.993
4.004
4.004
3.956
3.973
3.996
4.025
4.044
4.044
Jun Jul Aug Sep Oct Nov Dec Jan Feb Mar Apr May Jun
2012
2013
Georgia Unemployment Rate
(Seasonally Adjusted)
9.1%
9.1%
9.0%
8.9%
8.8%
8.7%
8.7%
8.7%
8.6%
8.4%
8.2%
8.3%
8.6%
Jun Jul Aug Sep Oct Nov Dec Jan Feb Mar Apr May Jun
2012
2013
Workforce Statistics & Economic Research Mark Butler, Commissioner
For more information, contact Corey Smith or Jonathan Roche at (404) 232-3875
corey.smith@dol.state.ga.us jonathan.roche@dol.state.ga.us
Equal Opportunity Employer/ProgramAuxiliary Aids and Services Available upon Request to Individuals with Disabilities
GEORGIA Nonagricultural Employment (000s)
Change in Jobs
Change in Jobs
Preliminary Revised
Revised
JUN 2013 MAY 2013 JUN 2012
from MAY 2013 Net %
from JUN 2012 Net %
Total Nonfarm
4,043.5
4,044.1
3,958.3
-0.6 0.0
85.2 2.2
Total Private
3,374.3
3,364.9
3,277.4
9.4 0.3
96.9 3.0
Goods Producing
507.7
504.8
505.0
2.9 0.6
2.7 0.5
Service-Providing
3,535.8
3,539.3
3,453.3
-3.5 -0.1
82.5 2.4
Private Service-Providing
2,866.6
2,860.1
2,772.4
6.5 0.2
94.2 3.4
Mining and Logging
8.5
8.5
8.6
0.0 0.0
-0.1 -1.2
Construction
144.9
143.2
141.2
1.7 1.2
3.7 2.6
Construction of Buildings
31.0
30.8
30.3
0.2 0.7
0.7 2.3
Heavy and Civil Engineering Construction
22.2
21.7
20.2
0.5 2.3
2.0 9.9
Specialty Trade Contractors
91.7
90.7
90.7
1.0 1.1
1.0 1.1
Manufacturing
354.3
353.1
355.2
1.2 0.3
-0.9 -0.3
Durable Goods
165.8
166.4
167.5
-0.6 -0.4
-1.7 -1.0
Computer, Electrical Equip and Appliance Mfg
21.8
21.7
22.4
0.1 0.5
-0.6 -2.7
Transportation Equipment Manufacturing
44.2
44.2
43.9
0.0 0.0
0.3 0.7
Non-Durable Goods
188.5
186.7
187.7
1.8 1.0
0.8 0.4
Food Manufacturing
62.1
62.1
62.5
0.0 0.0
-0.4 -0.6
Textile Mills
18.7
18.5
18.6
0.2 1.1
0.1 0.5
Textile Product Mills
26.5
26.4
26.9
0.1 0.4
-0.4 -1.5
Trade, Transportation, and Utilities
843.5
845.9
831.2
-2.4 -0.3
12.3 1.5
Wholesale Trade
203.6
204.8
201.5
-1.2 -0.6
2.1 1.0
Merchant Wholesalers, Durable Goods
96.2
97.2
98.8
-1.0 -1.0
-2.6 -2.6
Merchant Wholesalers, Nondurable Goods
61.4
61.9
59.2
-0.5 -0.8
2.2 3.7
Wholesale Electronic Markets and Agents and Brokers 46.0
45.7
43.5
0.3 0.7
2.5 5.8
Retail Trade
449.8
448.7
442.1
1.1 0.3
7.7 1.7
Food and Beverage Stores
83.9
83.7
83.2
0.2 0.2
0.7 0.8
General Merchandise Stores
101.3
100.8
102.1
0.5 0.5
-0.8 -0.8
Miscellaneous Store Retailers
20.2
20.3
20.2
-0.1 -0.5
0.0 0.0
Transportation, Warehousing, and Utilities
190.1
192.4
187.6
-2.3 -1.2
2.5 1.3
Utilities
19.6
19.5
19.9
0.1 0.5
-0.3 -1.5
Transportation and Warehousing
170.5
172.9
167.7
-2.4 -1.4
2.8 1.7
Air Transportation
40.2
40.3
40.4
-0.1 -0.3
-0.2 -0.5
Truck Transportation
44.6
45.9
45.5
-1.3 -2.8
-0.9 -2.0
Couriers and Messengers
18.2
18.2
18.6
0.0 0.0
-0.4 -2.2
Warehousing and Storage
28.3
28.3
27.6
0.0 0.0
0.7 2.5
Information
102.1
104.0
99.4
-1.9 -1.8
2.7 2.7
Telecommunications
48.4
48.2
46.5
0.2 0.4
1.9 4.1
Wired Telecommunications Carriers
29.6
29.3
28.5
0.3 1.0
1.1 3.9
Wireless Telecommunications Carriers
12.0
12.0
11.4
0.0 0.0
0.6 5.3
Internet Service Providers, Search Portals, and DP
5.9
5.9
6.3
0.0 0.0
-0.4 -6.4
Financial Activities
230.6
228.9
226.9
1.7 0.7
3.7 1.6
Finance and Insurance
171.9
171.5
168.7
0.4 0.2
3.2 1.9
Insurance Carriers and Related Activities
81.5
81.2
79.3
0.3 0.4
2.2 2.8
Real Estate and Rental and Leasing
58.7
57.4
58.2
1.3 2.3
0.5 0.9
Professional and Business Services
604.5
596.5
566.8
8.0 1.3
37.7 6.7
Professional, Scientific, and Technical Services
241.6
238.2
230.5
3.4 1.4
11.1 4.8
Accounting, Tax Prep, and Bookkeeping Services
41.0
40.6
37.4
0.4 1.0
3.6 9.6
Architectural, Engineering, and Related Services
37.5
37.6
36.0
-0.1 -0.3
1.5 4.2
Computer Systems Design and Related Services
57.7
56.7
55.7
1.0 1.8
2.0 3.6
Management and Technical Consulting Services
33.8
32.3
32.5
1.5 4.6
1.3 4.0
Management of Companies and Enterprises
60.1
59.0
58.0
1.1 1.9
2.1 3.6
Admin and Support, Waste Mngmnt and Remediation
302.8
299.3
278.3
3.5 1.2
24.5 8.8
Employment Services
146.4
144.1
132.5
2.3 1.6
13.9 10.5
Education and Health Services
507.4
511.5
488.8
-4.1 -0.8
18.6 3.8
Educational Services
67.3
71.2
65.5
-3.9 -5.5
1.8 2.8
Colleges, Universities, and Professional Schools
31.5
33.8
31.5
-2.3 -6.8
0.0 0.0
Health Care and Social Assistance
440.1
440.3
423.3
-0.2 -0.1
16.8 4.0
Ambulatory Health Care Services
174.2
173.7
163.7
0.5 0.3
10.5 6.4
Hospitals
149.2
147.6
144.7
1.6 1.1
4.5 3.1
Nursing and Residential Care Facilities
59.5
59.0
58.4
0.5 0.9
1.1 1.9
Social Assistance
57.2
60.0
56.5
-2.8 -4.7
0.7 1.2
Leisure and Hospitality
424.1
420.1
404.4
4.0 1.0
19.7 4.9
Arts, Entertainment, and Recreation
48.6
46.0
46.1
2.6 5.7
2.5 5.4
Amusement, Gambling, and Recreation Industries
36.3
33.4
34.3
2.9 8.7
2.0 5.8
Accommodation and Food Services
375.5
374.1
358.3
1.4 0.4
17.2 4.8
Accommodation
41.5
40.8
40.9
0.7 1.7
0.6 1.5
Food Services and Drinking Places
334.0
333.3
317.4
0.7 0.2
16.6 5.2
Other Services
154.4
153.2
154.9
1.2 0.8
-0.5 -0.3
Repair and Maintenance
33.5
34.2
33.6
-0.7 -2.1
-0.1 -0.3
Personal and Laundry Services
31.9
32.4
33.9
-0.5 -1.5
-2.0 -5.9
Religious, Grantmaking, Civic, Professional, and Similar
89.0
86.6
87.4
2.4 2.8
1.6 1.8
Government
669.2
679.2
680.9
-10.0 -1.5
-11.7 -1.7
Federal Government
98.3
98.5
102.3
-0.2 -0.2
-4.0 -3.9
Department of Defense
40.0
39.9
41.8
0.1 0.3
-1.8 -4.3
State Government
168.2
174.6
173.7
-6.4 -3.7
-5.5 -3.2
State Government Educational Services
95.3
101.7
98.6
-6.4 -6.3
-3.3 -3.4
Local Government
402.7
406.1
404.9
-3.4 -0.8
-2.2 -0.5
Local Government Educational Services
239.9
246.2
243.0
-6.3 -2.6
-3.1 -1.3
Note: These not seasonally adjusted estimates were prepared in cooperation with the U.S. Department of Labor, Bureau of Labor Statistics, based upon monthly reports submitted by selected
employers throughout Georgia. The estimates include all full- and part-time wage and salary workers who were employed during or received pay for any part of the pay period that includes the twelfth of the
month. Proprietors, domestic workers, self-employed persons, unpaid family workers and personnel of the armed forces are excluded. Estimates based on 2012 benchmark.
2
Source: Georgia Department of Labor, Workforce Statistics & Economic Research
ATLANTA MSA Nonagricultural Employment (000s)
Preliminary
Revised
JUN 2013 MAY 2013
Revised JUN 2012
Change in Jobs
from MAY 2013
Net
%
Change in Jobs from JUN 2012
Net %
Total Nonfarm Total Private Goods Producing Service-Providing Private Service-Providing Mining and Logging Construction
Construction of Buildings Specialty Trade Contractors Manufacturing Durable Goods
Transportation Equipment Manufacturing Non-Durable Goods
Food Manufacturing Trade, Transportation, and Utilities
Wholesale Trade Merchant Wholesalers, Durable Goods Merchant Wholesalers, Nondurable Goods Wholesale Electronic Markets and Agents and Brokers
Retail Trade Food and Beverage Stores General Merchandise Stores Miscellaneous Store Retailers
Transportation, Warehousing, and Utilities Utilities Transportation and Warehousing Air Transportation Truck Transportation Couriers and Messengers
Information Telecommunications Wired Telecommunications Carriers Wireless Telecommunications Carriers Internet Service Providers, Search Portals, and DP
Financial Activities Finance and Insurance Insurance Carriers and Related Activities Real Estate and Rental and Leasing
Professional and Business Services Professional, Scientific, and Technical Services Accounting, Tax Prep, and Bookkeeping Services Architectural, Engineering, and Related Services Computer Systems Design and Related Services Management and Technical Consulting Services Management of Companies and Enterprises Admin and Support, Waste Mngmnt and Remediation Employment Services
Education and Health Services Educational Services Health Care and Social Assistance Ambulatory Health Care Services Hospitals Social Assistance
Leisure and Hospitality Arts, Entertainment, and Recreation Accommodation and Food Services Accommodation Food Services and Drinking Places
Other Services Repair and Maintenance Personal and Laundry Services
Government Federal Government State Government Local Government
2,412.8 2,097.2
239.0 2,173.8 1,858.2
1.1 91.4 18.2 60.3 146.5 73.5 14.0 73.0 24.4 539.5 146.1 72.7 40.3 33.1 261.8 51.4 54.4 13.2 131.6 10.1 121.5 39.2 27.6 14.4 86.1 40.1 24.6 10.5
5.4 157.1 115.6
56.0 41.5 440.8 189.2 27.9 25.4 49.3 30.1 47.7 203.9 96.1 290.7 46.8 243.9 97.5 84.3 34.8 249.4 32.5 216.9 22.2 194.7 94.6 19.5 23.5 315.6 44.3 69.9 201.4
2,408.5 2,089.4
237.9 2,170.6 1,851.5
1.1 90.9 18.1 59.3 145.9 73.6 14.3 72.3 24.4 539.8 146.6 72.5 40.5 33.6 261.0 51.0 54.3 13.2 132.2 10.1 122.1 39.1 27.7 14.4 85.1 39.8 24.4 10.4
5.5 154.9 114.7
55.3 40.2 436.4 187.0 28.3 25.4 48.6 29.3 46.1 203.3 97.1 293.8 49.3 244.5 97.2 82.6 37.6 246.8 30.3 216.5 22.1 194.4 94.7 19.6 23.7 319.1 44.5 71.2 203.4
2,356.5 2,036.7
236.8 2,119.7 1,799.9
1.2 87.2 17.8 57.2 148.4 75.6 14.8 72.8 24.5 528.7 147.6 73.6 39.5 34.5 253.1 50.7 54.9 13.4 128.0 10.4 117.6 39.7 27.7 14.6 81.3 38.4 24.1 10.0
5.9 153.8 112.2
52.8 41.6 420.6 183.3 27.2 25.2 48.6 29.0 45.5 191.8 91.9 280.7 47.2 233.5 92.8 79.3 35.4 241.1 31.9 209.2 21.9 187.3 93.7 19.6 23.5 319.8 45.3 70.8 203.7
4.3 0.2 7.8 0.4 1.1 0.5 3.2 0.2 6.7 0.4 0.0 0.0 0.5 0.6 0.1 0.6 1.0 1.7 0.6 0.4 -0.1 -0.1 -0.3 -2.1 0.7 1.0 0.0 0.0 -0.3 -0.1 -0.5 -0.3 0.2 0.3 -0.2 -0.5 -0.5 -1.5 0.8 0.3 0.4 0.8 0.1 0.2 0.0 0.0 -0.6 -0.4 0.0 0.0 -0.6 -0.5 0.1 0.3 -0.1 -0.4 0.0 0.0 1.0 1.2 0.3 0.8 0.2 0.8 0.1 1.0 -0.1 -1.8 2.2 1.4 0.9 0.8 0.7 1.3 1.3 3.2 4.4 1.0 2.2 1.2 -0.4 -1.4 0.0 0.0 0.7 1.4 0.8 2.7 1.6 3.5 0.6 0.3 -1.0 -1.0 -3.1 -1.1 -2.5 -5.1 -0.6 -0.2 0.3 0.3 1.7 2.1 -2.8 -7.5 2.6 1.1 2.2 7.3 0.4 0.2 0.1 0.4 0.3 0.2 -0.1 -0.1 -0.1 -0.5 -0.2 -0.8 -3.5 -1.1 -0.2 -0.4 -1.3 -1.8 -2.0 -1.0
56.3 2.4 60.5 3.0
2.2 0.9 54.1 2.5 58.3 3.2 -0.1 -8.3
4.2 4.8 0.4 2.2 3.1 5.4 -1.9 -1.3 -2.1 -2.8 -0.8 -5.4 0.2 0.3 -0.1 -0.4 10.8 2.0 -1.5 -1.0 -0.9 -1.2 0.8 2.0 -1.4 -4.1 8.7 3.4 0.7 1.4 -0.5 -0.9 -0.2 -1.5 3.6 2.8 -0.3 -2.9 3.9 3.3 -0.5 -1.3 -0.1 -0.4 -0.2 -1.4 4.8 5.9 1.7 4.4 0.5 2.1 0.5 5.0 -0.5 -8.5 3.3 2.1 3.4 3.0 3.2 6.1 -0.1 -0.2 20.2 4.8 5.9 3.2 0.7 2.6 0.2 0.8 0.7 1.4 1.1 3.8 2.2 4.8 12.1 6.3 4.2 4.6 10.0 3.6 -0.4 -0.8 10.4 4.5 4.7 5.1 5.0 6.3 -0.6 -1.7 8.3 3.4 0.6 1.9 7.7 3.7 0.3 1.4 7.4 4.0 0.9 1.0 -0.1 -0.5 0.0 0.0 -4.2 -1.3 -1.0 -2.2 -0.9 -1.3 -2.3 -1.1
Note: These not seasonally adjusted estimates were prepared in cooperation with the U.S. Department of Labor, Bureau of Labor Statistics, based upon monthly reports submitted by selected
employers in the Atlanta Metropolitan Statistical Area, which includes Barrow, Bartow, Butts, Carroll, Cherokee, Clayton, Cobb, Coweta, Dawson, DeKalb, Douglas, Fayette, Forsyth, Fulton, Gwinnett, Haralson, Heard, Henry, Jasper, Lamar, Meriwether, Newton, Paulding, Pickens, Pike, Rockdale, Spalding and Walton counties. The estimates include all full- and part-time wage and salary workers who were employed during or received pay for any part of the pay period that includes the twelfth of the month. Proprietors, domestic workers, self-employed persons, unpaid family workers and personnel of the armed forces are excluded. Estimates based on 2012 benchmark.
Source: Georgia Department of Labor, Workforce Statistics & Economic Research
3
ALBANY MSA Nonagricultural Employment (000s)
Preliminary
Revised
Revised
JUN 2013 MAY 2013 JUN 2012
Change in Jobs from MAY 2013
Net %
Change in Jobs
from JUN 2012
Net
%
Total Nonfarm Total Private
61.0
60.8
60.7
48.0
47.4
46.9
0.2 0.3 0.6 1.3
0.3 0.5 1.1 2.4
Goods Producing
6.5
6.4
6.6
0.1 1.6
-0.1 -1.5
Service-Providing Private Service-Providing
54.5
54.4
54.1
41.5
41.0
40.3
0.1 0.2 0.5 1.2
0.4 0.7 1.2 3.0
Manufacturing
4.3
4.3
4.3
0.0 0.0
0.0 0.0
Trade, Transportation, and Utilities Retail Trade
12.4
12.4
12.4
7.6
7.6
7.6
0.0 0.0 0.0 0.0
0.0 0.0 0.0 0.0
Government
13.0
13.4
13.8
-0.4 -3.0
-0.8 -5.8
Federal Government State Government
3.0
3.0
3.2
0.0 0.0
-0.2 -6.2
2.8
3.2
3.2
-0.4 -12.5
-0.4 -12.5
Local Government
7.2
7.2
7.4
0.0 0.0
-0.2 -2.7
Note: These not seasonally adjusted estimates were prepared in cooperation with the U.S. Department of Labor, Bureau of Labor Statistics, based upon monthly reports submitted by selected
employers in the Albany Metropolitan Statistical Area, which includes Baker, Dougherty, Lee, Terrell and Worth counties. The estimates include all full- and part-time wage and salary workers who were employed during or received pay for any part of the pay period that includes the twelfth of the month. Proprietors, domestic workers, self-employed persons, unpaid family workers and personnel of the armed
forces are excluded. Estimates based on 2012 benchmark.
ATHENS - CLARKE MSA Nonagricultural Employment (000s)
Preliminary
Revised
Revised
JUN 2013 MAY 2013 JUN 2012
Change in Jobs
from MAY 2013
Net
%
Change in Jobs from JUN 2012
Net %
Total Nonfarm
87.8
88.1
86.3
-0.3 -0.3
1.5 1.7
Total Private
57.3
57.6
56.1
-0.3 -0.5
1.2 2.1
Goods Producing
9.5
9.4
9.2
0.1 1.1
0.3 3.3
Service-Providing
78.3
78.7
77.1
-0.4 -0.5
1.2 1.6
Private Service-Providing
47.8
48.2
46.9
-0.4 -0.8
0.9 1.9
Trade, Transportation, and Utilities
13.3
13.1
12.7
0.2 1.5
0.6 4.7
Retail Trade
9.2
9.2
9.1
0.0 0.0
0.1 1.1
Professional and Business Services
7.3
7.2
6.4
0.1 1.4
0.9 14.1
Leisure and Hospitality
9.2
9.2
8.3
0.0 0.0
0.9 10.8
Government
30.5
30.5
30.2
0.0 0.0
0.3 1.0
Federal Government
1.3
1.3
1.3
0.0 0.0
0.0 0.0
State Government
21.5
21.2
21.2
0.3 1.4
0.3 1.4
Local Government
7.7
8.0
7.7
-0.3 -3.8
0.0 0.0
Note: These not seasonally adjusted estimates were prepared in cooperation with the U.S. Department of Labor, Bureau of Labor Statistics, based upon monthly reports submitted by selected employers in
the Athens - Clarke County Metropolitan Statistical Area, which includes Clarke, Madison, Oconee and Oglethorpe counties. The estimates include all full- and part-time wage and salary workers who were employed during or received pay for any part of the pay period that includes the twelfth of the month. Proprietors, domestic workers, self-employed persons, unpaid family workers and personnel of the armed forces are excluded. Estimates based on 2012 benchmark.
Source: Georgia Department of Labor, Workforce Statistics & Economic Research
4
AUGUSTA-RICHMOND MSA Nonagricultural Employment (000s)
Preliminary Revised Revised JUN 2013 MAY 2013 JUN 2012
Change in Jobs from MAY 2013
Net %
Change in Jobs from JUN 2012
Net %
Total Nonfarm Total Private Goods Producing Service-Providing Private Service-Providing Mining, Logging and Construction Manufacturing Trade, Transportation, and Utilities
Wholesale Trade Retail Trade Transportation, Warehousing, and Utilities Information Financial Activities Professional and Business Services Education and Health Services Leisure and Hospitality Other Services Government Federal Government State Government Local Government
217.2 171.0
30.8 186.4 140.2
11.0 19.8 37.7
4.7 25.7
7.3 2.6 7.8 31.1 30.1 22.8 8.1 46.2 9.2 16.1 20.9
216.9 170.7
30.6 186.3 140.1
10.9 19.7 37.5
4.7 25.4
7.4 2.7 7.7 30.9 30.5 22.7 8.1 46.2 9.2 16.1 20.9
213.1 166.7
31.2 181.9 135.5
11.3 19.9 35.7
4.8 24.0
6.9 2.5 7.6 30.9 29.5 21.3 8.0 46.4 9.2 16.1 21.1
0.3 0.1 0.3 0.2 0.2 0.6 0.1 0.0 0.1 0.1 0.1 0.9 0.1 0.5 0.2 0.5 0.0 0.0 0.3 1.2 -0.1 -1.4 -0.1 -3.7 0.1 1.3 0.2 0.6 -0.4 -1.3 0.1 0.4 0.0 0.0 0.0 0.0 0.0 0.0 0.0 0.0 0.0 0.0
4.1 1.9 4.3 2.6 -0.4 -1.3 4.5 2.5 4.7 3.5 -0.3 -2.6 -0.1 -0.5 2.0 5.6 -0.1 -2.1 1.7 7.1 0.4 5.8 0.1 4.0 0.2 2.6 0.2 0.6 0.6 2.0 1.5 7.0 0.1 1.2 -0.2 -0.4 0.0 0.0 0.0 0.0 -0.2 -1.0
Note: These not seasonally adjusted estimates were prepared in cooperation with the U.S. Department of Labor, Bureau of Labor Statistics, based upon monthly reports submitted by selected employers in the
Augusta - Richmond County Metropolitan Statistical Area, which includes Burke, Columbia, McDuffie and Richmond counties in Georgia and Aiken and Edgefield counties in South Carolina. The estimates include all full- and part-time wage and salary workers who were employed during or received pay for any part of the pay period that includes the twelfth of the month. Proprietors, domestic workers, self-
employed persons, unpaid family workers and personnel of the armed forces are excluded. Estimates based on 2012 benchmark.
BRUNSWICK MSA Nonagricultural Employment (000s)
Preliminary Revised Revised JUN 2013 MAY 2013 JUN 2012
Change in Jobs from MAY 2013
Net %
Change in Jobs from JUN 2012
Net %
Total Nonfarm Total Private Goods Producing Service-Providing Private Service-Providing Trade, Transportation, and Utilities
Retail Trade Government
Federal Government State Government Local Government
40.7
40.9
41.1
-0.2 -0.5
30.7
30.8
31.1
-0.1 -0.3
4.9
5.0
4.7
-0.1 -2.0
35.8
35.9
36.4
-0.1 -0.3
25.8
25.8
26.4
0.0 0.0
8.0
7.9
7.7
0.1 1.3
5.3
5.3
5.4
0.0 0.0
10.0
10.1
10.0
-0.1 -1.0
1.6
1.6
1.8
0.0 0.0
1.8
1.8
1.8
0.0 0.0
6.6
6.7
6.4
-0.1 -1.5
-0.4 -1.0 -0.4 -1.3 0.2 4.3 -0.6 -1.6 -0.6 -2.3 0.3 3.9 -0.1 -1.8 0.0 0.0 -0.2 -11.1 0.0 0.0 0.2 3.1
Note: These not seasonally adjusted estimates were prepared in cooperation with the U.S. Department of Labor, Bureau of Labor Statistics, based upon monthly reports submitted by selected
employers in the Brunswick Metropolitan Statistical Area, which includes Brantley, Glynn and McIntosh counties. The estimates include all full- and part-time wage and salary workers who were employed during or received pay for any part of the pay period that includes the twelfth of the month. Proprietors, domestic workers, self-employed persons, unpaid family workers and personnel of the armed forces are excluded. Estimates based on 2012 benchmark.
Source: Georgia Department of Labor, Workforce Statistics & Economic Research
5
COLUMBUS MSA Nonagricultural Employment (000s)
Preliminary Revised Revised JUN 2013 MAY 2013 JUN 2012
Change in Jobs from MAY 2013
Net %
Change in Jobs from JUN 2012
Net %
Total Nonfarm
120.6
120.6
120.2
0.0 0.0
0.4 0.3
Total Private Goods Producing
95.8
95.4
95.1
15.1
15.0
14.9
0.4 0.4 0.1 0.7
0.7 0.7 0.2 1.3
Service-Providing
105.5
105.6
105.3
-0.1 -0.1
0.2 0.2
Private Service-Providing Trade, Transportation, and Utilities
80.7
80.4
80.2
0.3 0.4
18.6
18.9
18.7
-0.3 -1.6
0.5 0.6 -0.1 -0.5
Retail Trade
13.4
13.6
13.2
-0.2 -1.5
0.2 1.5
Information Financial Activities
1.4
1.4
1.4
13.0
13.0
12.7
0.0 0.0 0.0 0.0
0.0 0.0 0.3 2.4
Finance and Insurance
11.0
11.0
10.7
0.0 0.0
0.3 2.8
Insurance Carriers and Related Activities Professional and Business Services
4.6
4.6
4.6
13.0
12.8
12.3
0.0 0.0 0.2 1.6
0.0 0.0 0.7 5.7
Leisure and Hospitality
14.6
14.5
14.2
0.1 0.7
0.4 2.8
Government Federal Government
24.8
25.2
25.1
-0.4 -1.6
6.8
6.9
7.1
-0.1 -1.4
-0.3 -1.2 -0.3 -4.2
State Government
4.5
4.8
4.5
-0.3 -6.2
0.0 0.0
Local Government
13.5
13.5
13.5
0.0 0.0
0.0 0.0
Note: These not seasonally adjusted estimates were prepared in cooperation with the U.S. Department of Labor, Bureau of Labor Statistics, based upon monthly reports submitted by selected
employers in the Columbus Metropolitan Statistical Area, which includes Chattahoochee, Harris, Marion and Muscogee counties in Georgia and Russell County in Alabama. The estimates include all full- and part-time wage and salary workers who were employed during or received pay for any part of the pay period that includes the twelfth of the month. Proprietors, domestic workers, selfemployed persons, unpaid family workers and personnel of the armed forces are excluded. Estimates based on 2012 benchmark.
DALTON MSA Nonagricultural Employment (000s)
Preliminary Revised
Revised
JUN 2013 MAY 2013 JUN 2012
Change in Jobs from MAY 2013
Net %
Change in Jobs from JUN 2012
Net %
Total Nonfarm Total Private Goods Producing
63.6
63.5
63.6
56.5
56.4
56.7
22.1
22.1
22.1
0.1 0.2 0.1 0.2 0.0 0.0
0.0 0.0 -0.2 -0.4 0.0 0.0
Service-Providing Private Service-Providing Manufacturing
41.5
41.4
41.5
34.4
34.3
34.6
20.8
20.7
21.0
0.1 0.2 0.1 0.3 0.1 0.5
0.0 0.0 -0.2 -0.6 -0.2 -1.0
Textile Mills Textile Product Mills Trade, Transportation, and Utilities
2.1
2.1
2.0
0.0 0.0
14.1
13.9
14.6
0.2 1.4
16.0
16.1
16.0
-0.1 -0.6
0.1 5.0 -0.5 -3.4 0.0 0.0
Retail Trade Transportation, Warehousing, and Utilities Professional and Business Services
7.5
7.5
4.3
4.3
6.4
6.3
7.5
0.0 0.0
4.1
0.0 0.0
6.1
0.1 1.6
0.0 0.0 0.2 4.9 0.3 4.9
Government Federal Government State Government
7.1
7.1
0.2
0.2
1.0
1.1
6.9
0.0 0.0
0.3
0.0 0.0
0.9
-0.1 -9.1
0.2 2.9 -0.1 -33.3 0.1 11.1
Local Government
5.9
5.8
5.7
0.1 1.7
0.2 3.5
Note: These not seasonally adjusted estimates were prepared in cooperation with the U.S. Department of Labor, Bureau of Labor Statistics, based upon monthly reports submitted by selected
employers in the Dalton Metropolitan Statistical Area, which includes Murray and Whitfield counties. The estimates include all full- and part-time wage and salary workers who were employed during or received pay for any part of the pay period that includes the twelfth of the month. Proprietors, domestic workers, self-employed persons, unpaid family workers and personnel of the armed forces are excluded. Estimates based on 2012 benchmark.
Source: Georgia Department of Labor, Workforce Statistics & Economic Research
6
GAINESVILLE MSA Nonagricultural Employment (000s)
Preliminary Revised
Revised
JUN 2013 MAY 2013 JUN 2012
Change in Jobs from MAY 2013
Net %
Change in Jobs from JUN 2012
Net %
Total Nonfarm
75.1
75.9
75.2
-0.8 -1.1
-0.1 -0.1
Total Private
65.5
66.0
65.4
-0.5 -0.8
0.1 0.2
Goods Producing
19.9
19.9
19.4
0.0 0.0
0.5 2.6
Service-Providing
55.2
56.0
55.8
-0.8 -1.4
-0.6 -1.1
Private Service-Providing
45.6
46.1
46.0
-0.5 -1.1
-0.4 -0.9
Trade, Transportation, and Utilities
14.8
14.8
14.5
0.0 0.0
0.3 2.1
Retail Trade
7.9
7.9
7.7
0.0 0.0
0.2 2.6
Government
9.6
9.9
9.8
-0.3 -3.0
-0.2 -2.0
Federal Government
0.4
0.4
0.5
0.0 0.0
-0.1 -20.0
State Government
2.1
2.2
2.2
-0.1 -4.5
-0.1 -4.5
Local Government
7.1
7.3
7.1
-0.2 -2.7
0.0 0.0
Note: These not seasonally adjusted estimates were prepared in cooperation with the U.S. Department of Labor, Bureau of Labor Statistics, based upon monthly reports submitted by selected
employers in the Gainesville Metropolitan Statistical Area, which comprises Hall county. The estimates include all full- and part-time wage and salary workers who were employed during or received pay for any part of the pay period that includes the twelfth of the month. Proprietors, domestic workers, self-employed persons, unpaid family workers and personnel of the armed forces are excluded. Estimates based on 2012 benchmark.
HINESVILLE - FT. STEWART MSA Nonagricultural Employment (000s)
Preliminary Revised
Revised
JUN 2013 MAY 2013 JUN 2012
Change in Jobs from MAY 2013
Net %
Change in Jobs from JUN 2012
Net %
Total Nonfarm
19.6
19.8
19.8
-0.2 -1.0
-0.2 -1.0
Total Private Goods Producing Service-Providing
12.1
12.1
11.8
0.0 0.0
2.7
2.7
2.4
0.0 0.0
16.9
17.1
17.4
-0.2 -1.2
0.3 2.5 0.3 12.5 -0.5 -2.9
Private Service-Providing Government
Federal Government
9.4
9.4
7.5
7.7
4.0
4.0
9.4
0.0 0.0
8.0
-0.2 -2.6
4.4
0.0 0.0
0.0 0.0 -0.5 -6.2 -0.4 -9.1
State Government Local Government
0.3
0.3
3.2
3.4
0.3
0.0 0.0
3.3
-0.2 -5.9
0.0 0.0 -0.1 -3.0
Note: These not seasonally adjusted estimates were prepared in cooperation with the U.S. Department of Labor, Bureau of Labor Statistics, based upon monthly reports submitted by selected
employers in the Hinesville - Ft. Stewart Metropolitan Statistical Area, which includes Liberty and Long counties. The estimates include all full- and part-time wage and salary workers who were employed during or received pay for any part of the pay period that includes the twelfth of the month. Proprietors, domestic workers, self-employed persons, unpaid family workers and personnel of the armed forces are excluded. Estimates based on 2012 benchmark.
Source: Georgia Department of Labor, Workforce Statistics & Economic Research
7
MACON MSA Nonagricultural Employment (000s)
Preliminary Revised
Revised
JUN 2013 MAY 2013 JUN 2012
Change in Jobs from MAY 2013
Net %
Change in Jobs from JUN 2012
Net %
Total Nonfarm Total Private Goods Producing Service-Providing Private Service-Providing Trade, Transportation, and Utilities
Retail Trade Transportation, Warehousing, and Utilities Financial Activities Professional and Business Services Education and Health Services Leisure and Hospitality Government Federal Government State Government Local Government
99.2
99.2
84.1
83.9
8.9
8.9
90.3
90.3
75.2
75.0
20.2
20.0
13.2
13.1
3.5
3.5
9.4
9.3
11.9
11.6
20.9
21.1
9.9
9.8
15.1
15.3
1.1
1.1
4.0
4.1
10.0
10.1
98.1
0.0 0.0
83.0
0.2 0.2
8.9
0.0 0.0
89.2
0.0 0.0
74.1
0.2 0.3
19.5
0.2 1.0
12.8
0.1 0.8
3.5
0.0 0.0
9.3
0.1 1.1
10.8
0.3 2.6
20.4
-0.2 -1.0
9.5
0.1 1.0
15.1
-0.2 -1.3
1.2
0.0 0.0
4.1
-0.1 -2.4
9.8
-0.1 -1.0
1.1 1.1 1.1 1.3 0.0 0.0 1.1 1.2 1.1 1.5 0.7 3.6 0.4 3.1 0.0 0.0 0.1 1.1 1.1 10.2 0.5 2.5 0.4 4.2 0.0 0.0 -0.1 -8.3 -0.1 -2.4 0.2 2.0
Note: These not seasonally adjusted estimates were prepared in cooperation with the U.S. Department of Labor, Bureau of Labor Statistics, based upon monthly reports submitted by selected
employers in the Macon Metropolitan Statistical Area, which includes Bibb, Crawford, Jones, Monroe and Twiggs counties. The estimates include all full- and part-time wage and salary workers who were employed during or received pay for any part of the pay period that includes the twelfth of the month. Proprietors, domestic workers, self-employed persons, unpaid family workers and personnel of the armed forces are excluded. Estimates based on 2012 benchmark.
ROME MSA Nonagricultural Employment (000s)
Preliminary Revised
Revised
JUN 2013 MAY 2013 JUN 2012
Change in Jobs from MAY 2013
Net %
Change in Jobs from JUN 2012
Net %
Total Nonfarm Total Private Goods Producing Service-Providing Private Service-Providing Manufacturing Trade, Transportation, and Utilities
Retail Trade Education and Health Services Government
Federal Government State Government Local Government
38.6
38.6
32.6
32.5
6.1
6.2
32.5
32.4
26.5
26.3
5.6
5.6
6.4
6.5
3.9
3.9
9.9
9.8
6.0
6.1
0.2
0.2
1.7
1.7
4.1
4.2
39.0
0.0 0.0
32.7
0.1 0.3
6.4
-0.1 -1.6
32.6
0.1 0.3
26.3
0.2 0.8
5.7
0.0 0.0
6.4
-0.1 -1.5
3.9
0.0 0.0
9.5
0.1 1.0
6.3
-0.1 -1.6
0.2
0.0 0.0
1.9
0.0 0.0
4.2
-0.1 -2.4
-0.4 -1.0 -0.1 -0.3 -0.3 -4.7 -0.1 -0.3 0.2 0.8 -0.1 -1.8 0.0 0.0 0.0 0.0 0.4 4.2 -0.3 -4.8 0.0 0.0 -0.2 -10.5 -0.1 -2.4
Note: These not seasonally adjusted estimates were prepared in cooperation with the U.S. Department of Labor, Bureau of Labor Statistics, based upon monthly reports submitted by selected
employers in the Rome Metropolitan Statistical Area, which comprises Floyd county. The estimates include all full- and part-time wage and salary workers who were employed during or received pay for any part of the pay period that includes the twelfth of the month. Proprietors, domestic workers, self-employed persons, unpaid family workers and personnel of the armed forces are excluded. Estimates based on 2012 benchmark.
Source: Georgia Department of Labor, Workforce Statistics & Economic Research
8
SAVANNAH MSA Nonagricultural Employment (000s)
Preliminary Revised
Revised
JUN 2013 MAY 2013 JUN 2012
Change in Jobs from MAY 2013
Net %
Change in Jobs from JUN 2012
Net %
Total Nonfarm Total Private Goods Producing Service-Providing Private Service-Providing Mining, Logging and Construction Manufacturing Trade, Transportation, and Utilities
Wholesale Trade Retail Trade Transportation, Warehousing, and Utilities Information Financial Activities Professional and Business Services Education and Health Services Leisure and Hospitality Other Services Government Federal Government State Government Local Government
159.4 135.4
21.1 138.3 114.3
5.6 15.5 35.1
5.7 18.6 10.8
1.4 6.0 18.0 23.8 23.3 6.7 24.0 2.9 6.0 15.1
159.5 135.5
21.3 138.2 114.2
5.6 15.7 35.0
5.6 18.6 10.8
1.4 5.9 17.8 24.0 23.3 6.8 24.0 2.9 6.3 14.8
158.3 134.5
20.9 137.4 113.6
5.5 15.4 34.4
5.4 17.9 11.1
1.5 6.0 18.7 23.9 22.4 6.7 23.8 3.2 6.1 14.5
-0.1 -0.1 -0.1 -0.1 -0.2 -0.9 0.1 0.1 0.1 0.1 0.0 0.0 -0.2 -1.3 0.1 0.3 0.1 1.8 0.0 0.0 0.0 0.0 0.0 0.0 0.1 1.7 0.2 1.1 -0.2 -0.8 0.0 0.0 -0.1 -1.5 0.0 0.0 0.0 0.0 -0.3 -4.8 0.3 2.0
1.1 0.7 0.9 0.7 0.2 1.0 0.9 0.7 0.7 0.6 0.1 1.8 0.1 0.6 0.7 2.0 0.3 5.6 0.7 3.9 -0.3 -2.7 -0.1 -6.7 0.0 0.0 -0.7 -3.7 -0.1 -0.4 0.9 4.0 0.0 0.0 0.2 0.8 -0.3 -9.4 -0.1 -1.6 0.6 4.1
Note: These not seasonally adjusted estimates were prepared in cooperation with the U.S. Department of Labor, Bureau of Labor Statistics, based upon monthly reports submitted by selected
employers in the Savannah Metropolitan Statistical Area, which includes Bryan, Chatham and Effingham counties. The estimates include all full- and part-time wage and salary workers who were employed during or received pay for any part of the pay period that includes the twelfth of the month. Proprietors, domestic workers, self-employed persons, unpaid family workers and personnel of the armed forces are excluded. Estimates based on 2012 benchmark.
VALDOSTA MSA Nonagricultural Employment (000s)
Preliminary Revised Revised JUN 2013 MAY 2013 JUN 2012
Change in Jobs from MAY 2013
Net %
Change in Jobs from JUN 2012
Net %
Total Nonfarm
53.7
55.2
54.1
-1.5 -2.7
-0.4 -0.7
Total Private Goods Producing Service-Providing
40.6
41.1
6.6
6.7
47.1
48.5
40.4
-0.5 -1.2
6.3
-0.1 -1.5
47.8
-1.4 -2.9
0.2 0.5 0.3 4.8 -0.7 -1.5
Private Service-Providing Trade, Transportation, and Utilities
Retail Trade
34.0
34.4
9.9
10.1
7.5
7.6
34.1
-0.4 -1.2
10.4
-0.2 -2.0
7.4
-0.1 -1.3
-0.1 -0.3 -0.5 -4.8 0.1 1.4
Government Federal Government State Government
13.1
14.1
1.2
1.2
3.8
4.8
13.7
-1.0 -7.1
1.2
0.0 0.0
4.3
-1.0 -20.8
-0.6 -4.4 0.0 0.0 -0.5 -11.6
Local Government
8.1
8.1
8.2
0.0 0.0
-0.1 -1.2
Note: These not seasonally adjusted estimates were prepared in cooperation with the U.S. Department of Labor, Bureau of Labor Statistics, based upon monthly reports submitted by selected
employers in the Valdosta Metropolitan Statistical Area, which includes Brooks, Echols, Lanier and Lowndes counties. The estimates include all full- and part-time wage and salary workers who were employed during or received pay for any part of the pay period that includes the twelfth of the month. Proprietors, domestic workers, self-employed persons, unpaid family workers and personnel of the armed forces are excluded. Estimates based on 2012 benchmark.
Source: Georgia Department of Labor, Workforce Statistics & Economic Research
9
WARNER ROBINS MSA Nonagricultural Employment (000s)
Preliminary Revised
Revised
JUN 2013 MAY 2013 JUN 2012
Change in Jobs from MAY 2013
Net %
Change in Jobs from JUN 2012
Net %
Total Nonfarm Total Private Goods Producing Service-Providing Private Service-Providing Trade, Transportation, and Utilities
Retail Trade Government
Federal Government State Government Local Government
59.5
59.3
34.4
34.5
6.1
6.1
53.4
53.2
28.3
28.4
8.3
8.3
6.6
6.6
25.1
24.8
15.4
15.3
1.1
1.1
8.6
8.4
59.7
0.2 0.3
34.2
-0.1 -0.3
6.1
0.0 0.0
53.6
0.2 0.4
28.1
-0.1 -0.4
8.1
0.0 0.0
6.4
0.0 0.0
25.5
0.3 1.2
16.2
0.1 0.6
1.0
0.0 0.0
8.3
0.2 2.4
-0.2 -0.3 0.2 0.6 0.0 0.0 -0.2 -0.4 0.2 0.7 0.2 2.5 0.2 3.1 -0.4 -1.6 -0.8 -4.9 0.1 10.0 0.3 3.6
Note: These not seasonally adjusted estimates were prepared in cooperation with the U.S. Department of Labor, Bureau of Labor Statistics, based upon monthly reports submitted by selected
employers in the Warner Robins Metropolitan Statistical Area, which comprises Houston county. The estimates include all full- and part-time wage and salary workers who were employed during or received pay for any part of the pay period that includes the twelfth of the month. Proprietors, domestic workers, self-employed persons, unpaid family workers and personnel of the armed forces are excluded. Estimates based on 2012 benchmark.
Source: Georgia Department of Labor, Workforce Statistics & Economic Research
10
Georgia Statewide Hours and Earnings
All Employee
Average Weekly Earnings
Preliminary JUN 2013
Revised MAY 2013
Revised JUN 2012
Total Private ........................................................................................... $776.65 ........................ $779.10 ................... $742.98 Goods Producing .............................................................................. $912.83 ........................ $903.07 ................... $861.49 Private Service Providing ................................................................... $751.90 ........................ $758.20 ................... $721.05 Construction .................................................................................... $914.12 ........................ $895.06 ................... $842.01 Manufacturing .................................................................................. $912.73 ........................ $907.22 ................... $870.57 Trade, Transportation, and Utilities ................................................ $696.26 ........................ $694.14 ................... $690.62 Financial Activities ........................................................................ $1,095.94 ..................... $1,092.24 ................... $954.58 Professional and Business Services ............................................. $943.32 ........................ $954.45 ................... $926.93 Educational and Health Services .................................................... $797.60 ........................ $811.57 ................... $762.58 Leisure and Hospitality ................................................................... $315.86 ........................ $319.20 ................... $324.79 Other Services ................................................................................. $562.10 ........................ $561.22 ................... $522.44
Average Weekly Hours
Preliminary JUN 2013
Revised MAY 2013
Revised JUN 2012
Total Private .................................................................................................. 35.0 .............................. 35.0 ......................... 34.8 Goods Producing .....................................................................................41.1 .............................. 40.9 ......................... 39.7 Private Service Providing .......................................................................... 33.9 .............................. 34.0 ......................... 33.9 Construction ...........................................................................................40.7 .............................. 40.3 ......................... 39.0 Manufacturing ......................................................................................... 41.3 .............................. 41.2 ......................... 40.1 Trade, Transportation, and Utilities .......................................................34.4 .............................. 34.5 ......................... 34.6 Financial Activities ..................................................................................37.0 .............................. 36.9 ......................... 35.9 Professional and Business Services ....................................................37.3 .............................. 37.4 ......................... 36.9 Educational and Health Services ........................................................... 34.1 .............................. 34.2 ......................... 34.6 Leisure and Hospitality .......................................................................... 26.3 .............................. 26.6 ......................... 26.6 Other Services ........................................................................................29.2 .............................. 29.2 ......................... 29.4
Average Hourly Earnings
Preliminary JUN 2013
Revised MAY 2013
Revised JUN 2012
Total Private ............................................................................................. $22.19 .......................... $22.26 ..................... $21.35 Goods Producing ................................................................................ $22.21 .......................... $22.08 ..................... $21.70 Private Service Providing ..................................................................... $22.18 .......................... $22.30 ..................... $21.27 Construction ...................................................................................... $22.46 .......................... $22.21 ..................... $21.59 Manufacturing .................................................................................... $22.10 .......................... $22.02 ..................... $21.71 Trade, Transportation, and Utilities .................................................. $20.24 .......................... $20.12 ..................... $19.96 Financial Activities ............................................................................. $29.62 .......................... $29.60 ..................... $26.59 Professional and Business Services ............................................... $25.29 .......................... $25.52 ..................... $25.12 Educational and Health Services ...................................................... $23.39 .......................... $23.73 ..................... $22.04 Leisure and Hospitality ..................................................................... $12.01 .......................... $12.00 ..................... $12.21 Other Services ................................................................................... $19.25 .......................... $19.22 ..................... $17.77
Read more about the hours and earnings series at http://www.bls.gov/sae/home.htm
Source: Georgia Department of Labor, Workforce Statistics & Economic Research
Georgia Department of Labor, Mark Butler, Commissioner
11
Equal Opportunity Employer/Program Auxiliary Aids and Services Available Upon Request to Individuals With Disabilities
Georgia MSA Hours and Earnings
All Employee Total Private
Average Weekly Earnings
Preliminary JUN 2013
Revised MAY 2013
Revised JUN 2012
Albany MSA ............................................................................................ $560.12 ........................ $549.73 ................... $553.10 Athens-Clarke County MSA ................................................................... $572.83 ........................ $578.73 ................... $614.61 Atlanta MSA ............................................................................................ $853.93 ........................ $862.69 ................... $822.39 Augusta-Richmond County MSA ........................................................... $780.08 ........................ $780.71 ................... $757.17 Brunswick MSA ...................................................................................... $515.71 ........................ $583.44 ................... $422.82 Columbus MSA ..................................................................................... $678.25 ........................ $681.66 ................... $672.17 Dalton MSA ............................................................................................ $651.45 ........................ $638.18 ................... $558.44 Gainesville MSA .................................................................................... $771.06 ........................ $803.51 ................... $756.39 Hinesville-Fort Stewart MSA .................................................................. $792.48 ........................ $718.41 ................... $677.90 Macon MSA ............................................................................................ $713.82 ........................ $747.68 ................... $708.38 Rome MSA ............................................................................................ $750.83 ........................ $732.17 ................... $655.32 Savannah MSA ...................................................................................... $676.70 ........................ $676.68 ................... $674.68 Valdosta MSA ......................................................................................... $605.16 ........................ $614.89 ................... $571.89 Warner Robins MSA .............................................................................. $585.68 ........................ $572.89 ................... $576.54
Average Weekly Hours
Preliminary JUN 2013
Revised MAY 2013
Revised JUN 2012
Albany MSA ................................................................................................... 33.4 .............................. 32.8 ......................... 33.1 Athens-Clarke County MSA .......................................................................... 30.6 .............................. 30.8 ......................... 30.7 Atlanta MSA ................................................................................................... 34.6 .............................. 34.8 ......................... 34.7 Augusta-Richmond County MSA .................................................................. 35.8 .............................. 35.6 ......................... 35.8 Brunswick MSA ............................................................................................. 30.3 .............................. 33.0 ......................... 29.1 Columbus MSA ............................................................................................34.1 .............................. 34.1 ......................... 35.1 Dalton MSA ................................................................................................... 38.8 .............................. 38.1 ......................... 33.3 Gainesville MSA ...........................................................................................36.2 .............................. 37.6 ......................... 36.4 Hinesville-Fort Stewart MSA .........................................................................44.1 .............................. 38.5 ......................... 39.9 Macon MSA ................................................................................................... 38.9 .............................. 38.8 ......................... 37.5 Rome MSA ................................................................................................... 35.5 .............................. 34.7 ......................... 34.4 Savannah MSA ............................................................................................. 33.5 .............................. 33.4 ......................... 33.4 Valdosta MSA ................................................................................................ 36.0 .............................. 37.7 ......................... 33.9 Warner Robins MSA .....................................................................................37.4 .............................. 36.7 ......................... 34.4
Average Hourly Earnings
Preliminary JUN 2013
Revised MAY 2013
Revised JUN 2012
Albany MSA .............................................................................................. $16.77 .......................... $16.76 ..................... $16.71 Athens-Clarke County MSA ..................................................................... $18.72 .......................... $18.79 ..................... $20.02 Atlanta MSA .............................................................................................. $24.68 .......................... $24.79 ..................... $23.70 Augusta-Richmond County MSA ............................................................. $21.79 .......................... $21.93 ..................... $21.15 Brunswick MSA ........................................................................................ $17.02 .......................... $17.68 ..................... $14.53 Columbus MSA ....................................................................................... $19.89 .......................... $19.99 ..................... $19.15 Dalton MSA .............................................................................................. $16.79 .......................... $16.75 ..................... $16.77 Gainesville MSA ...................................................................................... $21.30 .......................... $21.37 ..................... $20.78 Hinesville-Fort Stewart MSA .................................................................... $17.97 .......................... $18.66 ..................... $16.99 Macon MSA .............................................................................................. $18.35 .......................... $19.27 ..................... $18.89 Rome MSA .............................................................................................. $21.15 .......................... $21.10 ..................... $19.05 Savannah MSA ........................................................................................ $20.20 .......................... $20.26 ..................... $20.20 Valdosta MSA ........................................................................................... $16.81 .......................... $16.31 ..................... $16.87 Warner Robins MSA ................................................................................ $15.66 .......................... $15.61 ..................... $16.76
Read more about the hours and earnings series at http://www.bls.gov/sae/home.htm
Source: Georgia Department of Labor, Workforce Statistics & Economic Research
12
Dimensions - Measuring Georgia's Labor Force
Unemployment rates -- Georgia and U.S.
11.0%
10.0%
9.0%
8.0%
7.0%
Ge orgia
U.S.
6.0%
Jun Jul Aug Sep Oct Nov Dec Jan Feb Mar Apr May Jun
2012
2013
WA 6.8
OR
7.9
ID
6.4
NV
9.6
UT
CA
4.7
8.5
AZ 8.0
AK 6.1
State unemployment rates
June 2013
National Unemployment Rate: 7.6% Rates are seasonally adjusted
MT 5.4
WY 4.6
CO 7.0
NM 6.8
ND 3.1
SD 3.9
NE 4.0
KS 5.8
MN 5.2
WI 6.8
IA 4.6
IL 9.2
MO 6.9
OK 5.2
TX 6.5
AR 7.3
MS 9.0
LA 7.0
NH
5.2 ME
VT
6.8
4.4
MI 8.7
OH
IN
7.2
8.4
KY 8.4
TN 8.5
PA 7.5
WV
6.1
VA
5.5
NC 8.8
SC 8.1
AL
GA
6.5
8.6
FL 7.1
MA 7.0 NY 7.5
RI 8.9 CT NJ 8.1 8.7 DE 7.3 DC 8.5
MD 7.0
Unemployment rate 10.0% or greater 7.0% to 9.9% 6.0% to 6.9% 5.0% to 5.9% 4.0% to 4.9% 3.0% to 3.9% Less than 3.0%
HI 4.6
13
Georgia Labor Force Estimates (not seasonally adjusted) Place of Residence - Persons 16 Years and Older
Georgia
(Seasonally adjusted)
Georgia
(Not Seasonally adjusted)
Albany MSA
Athens-Clarke County MSA
Atlanta MSA
Augusta-Richmond County MSA
Brunswick MSA
Columbus MSA
Dalton MSA
Gainesville MSA
Employment Status
Civilian labor force Employed Unemployed Rate
Civilian labor force Employed Unemployed Rate
Civilian labor force Employed Unemployed Rate
Civilian labor force Employed Unemployed Rate
Civilian labor force Employed Unemployed Rate
Civilian labor force Employed Unemployed Rate
Civilian labor force Employed Unemployed Rate
Civilian labor force Employed Unemployed Rate
Civilian labor force Employed Unemployed Rate
Civilian labor force Employed Unemployed Rate
JUN 2013
4,817,416 4,405,309
412,107 8.6
4,833,701 4,385,042
448,659 9.3
73,982 66,450
7,532 10.2
112,867 104,749
8,118 7.2
2,766,961 2,521,477
245,484 8.9
266,292 241,438
24,854 9.3
50,794 45,579
5,215 10.3
131,849 119,647 12,202
9.3
59,566 52,661
6,905 11.6
90,914 83,985
6,929 7.6
MAY 2013
4,818,757 4,418,127
400,630 8.3
4,828,685 4,417,894
410,791 8.5
73,661 66,667
6,994 9.5
113,128 106,079
7,049 6.2
2,762,900 2,536,438
226,462 8.2
264,562 242,499
22,063 8.3
50,921 46,057
4,864 9.6
131,698 120,479
11,219 8.5
59,384 53,028
6,356 10.7
91,414 85,138
6,276 6.9
JUN 2012
4,801,324 4,362,194
439,130 9.1
4,815,964 4,356,900
459,064 9.5
74,740 67,141
7,599 10.2
111,851 103,551
8,300 7.4
2,740,176 2,486,572
253,604 9.3
264,130 239,128
25,002 9.5
51,805 46,506
5,299 10.2
132,871 119,959 12,912
9.7
60,007 52,880
7,127 11.9
91,053 83,834
7,219 7.9
Change From
MAY 2013
JUN 2012
-1,341 -12,818 11,477
16,092 43,115 -27,023
5,016 -32,852 37,868
17,737 28,142 -10,405
321 -217 538
-758 -691
-67
-261 -1,330 1,069
1,016 1,198 -182
4,061 -14,961 19,022
26,785 34,905 -8,120
1,730 -1,061 2,791
2,162 2,310 -148
-127 -478 351
-1,011 -927 -84
151 -832 983
-1,022 -312 -710
182 -367 549
-441 -219 -222
-500 -1,153
653
-139 151 -290
Note: MSA data are not seasonally adjusted. Employment includes nonagricultural wage and salary employment, self-employment, unpaid family and private
household workers and agricultural workers. Persons in labor disputes are counted as employed. The use of unrounded data does not imply that the numbers are exact. Georgia and Metropolitan Statistical Area data have not been seasonally adjusted.
Albany MSA: Baker, Dougherty, Lee, Terrell, and Worth counties. Athens - Clarke County MSA: Clarke, Madison, Oconee, and Oglethorpe counties. Atlanta MSA: Barrow, Bartow, Butts, Carroll, Cherokee, Clayton, Cobb, Coweta, Dawson, DeKalb, Douglas, Fayette, Forsyth, Fulton, Gwinnett, Haralson, Heard, Henry, Jasper, Lamar, Meriwether, Newton, Paulding, Pickens, Pike, Rockdale, Spalding, and Walton counties. Augusta - Richmond County MSA: Burke, Columbia, McDuffie, and Richmond counties in Georgia and Aiken and Edgefield counties in South Carolina. Brunswick MSA: Brantley, Glynn, and McIntosh counties. Columbus MSA: Chattahoochee, Harris, Marion, and Muscogee counties in Georgia and Russell County in Alabama. Dalton MSA: Murray and Whitfield counties. Gainesville MSA: Hall County. Hinesville - Fort Stewart MSA: Liberty and Long counties. Macon MSA: Bibb, Crawford, Jones, Monroe, and Twiggs counties. Rome MSA: Floyd County. Savannah MSA: Bryan, Chatham, and Effingham counties. Valdosta MSA: Brooks, Echols, Lanier, and Lowndes counties. Warner Robins MSA: Houston County.
Source: Georgia Department of Labor, Workforce Statistics & Economic Research
14
Georgia Labor Force Estimates (not seasonally adjusted) Place of Residence - Persons 16 Years and Older
Hinesville-Ft. Stewart MSA Macon MSA
Rome MSA Savannah MSA
Valdosta MSA Warner Robins MSA
Employment Status
Civilian labor force Employed Unemployed Rate
Civilian labor force Employed Unemployed Rate
Civilian labor force Employed Unemployed Rate
Civilian labor force Employed Unemployed Rate
Civilian labor force Employed Unemployed Rate
Civilian labor force Employed Unemployed Rate
JUN 2013
33,379 29,966
3,413 10.2
114,274 103,069
11,205 9.8
47,853 43,142
4,711 9.8
182,756 166,653
16,103 8.8
67,447 61,322
6,125 9.1
71,195 65,272
5,923 8.3
MAY 2013
33,339 30,252
3,087 9.3
114,041 103,788
10,253 9.0
47,801 43,362
4,439 9.3
182,750 168,376
14,374 7.9
68,732 63,196
5,536 8.1
71,095 65,796
5,299 7.5
JUN 2012
33,478 30,240
3,238 9.7
114,545 103,069
11,476 10.0
48,858 43,815
5,043 10.3
183,544 167,386
16,158 8.8
68,256 62,074
6,182 9.1
71,486 65,710
5,776 8.1
Change From
MAY 2013
JUN 2012
40 -286 326
-99 -274 175
233 -719 952
-271 -271
52 -220 272
-1,005 -673 -332
6 -1,723 1,729
-788 -733
-55
-1,285 -1,874
589
-809 -752
-57
100 -524 624
-291 -438 147
United States Labor Force Estimates Place of Residence - Persons 16 Years and Older
Area
United States
(Seasonally adjusted)
Employment Status
Civilian labor force Employed Unemployed Rate
JUN 2013
155,835,000 144,058,000
11,777,000 7.6
MAY 2013
155,658,000 143,898,000
11,760,000 7.6
JUN 2012
155,163,000 142,415,000
12,749,000 8.2
Change From
MAY 2013
JUN 2012
177,000 160,000
17,000
672,000 1,643,000 -972,000
United States
(Not Seasonally adjusted)
Civilian labor force Employed Unemployed
Rate
157,089,000 144,841,000
12,248,000 7.8
155,734,000 144,432,000
11,302,000 7.3
156,385,000 143,202,000
13,184,000 8.4
1,355,000 409,000 946,000
704,000 1,639,000 -936,000
Note: Employment includes nonagricultural wage and salary employment, self-employment, unpaid family and private household workers and agricultural
workers. Persons in labor disputes are counted as employed. The use of unrounded data does not imply that the numbers are exact. Georgia and Metropolitan Statistical Area data have not been seasonally adjusted. Seasonally adjusted data for Georgia available upon request.
Albany MSA: Baker, Dougherty, Lee, Terrell, and Worth counties. Athens - Clarke County MSA: Clarke, Madison, Oconee, and Oglethorpe counties. Atlanta MSA: Barrow, Bartow, Butts, Carroll, Cherokee, Clayton, Cobb, Coweta, Dawson, DeKalb, Douglas, Fayette, Forsyth, Fulton, Gwinnett, Haralson, Heard, Henry, Jasper, Lamar, Meriwether, Newton, Paulding, Pickens, Pike, Rockdale, Spalding, and Walton counties. Augusta - Richmond County MSA: Burke, Columbia, McDuffie, and Richmond counties in Georgia and Aiken and Edgefield counties in South Carolina. Brunswick MSA: Brantley, Glynn, and McIntosh counties. Columbus MSA: Chattahoochee, Harris, Marion, and Muscogee counties in Georgia and Russell County in Alabama. Dalton MSA: Murray and Whitfield counties. Gainesville MSA: Hall County. Hinesville - Fort Stewart MSA: Liberty and Long counties. Macon MSA: Bibb, Crawford, Jones, Monroe, and Twiggs counties. Rome MSA: Floyd County. Savannah MSA: Bryan, Chatham, and Effingham counties. Valdosta MSA: Brooks, Echols, Lanier, and Lowndes counties. Warner Robins MSA: Houston County.
Source: Georgia Department of Labor, Workforce Statistics & Economic Research
15
Georgia Labor Force Estimates by County (not seasonally adjusted)
Georgia
Place of Residence - Persons 16 Years and Older
June 2013
May 2013
Labor Force
Employment
Unemployment Number Rate
4,833,701 4,385,042 448,659 9.3
Labor Force
Employment
Unemployment Number Rate
4,828,685 4,417,894 410,791 8.5
Appling Atkinson Bacon Baker Baldwin
9,656 2,952 4,549 1,351 17,587
8,530 2,556 4,083 1,236 15,312
1,126 11.7 396 13.4 466 10.2 115 8.5
2,275 12.9
9,624 2,931 4,539 1,349 17,698
8,631 2,578 4,104 1,240 15,609
993 10.3 353 12.0 435 9.6 109 8.1 2,089 11.8
Banks Barrow Bartow Ben Hill Berrien
10,473 35,008 49,395
6,624 7,722
9,770 32,126 44,864
5,786 6,874
703 6.7 2,882 8.2 4,531 9.2
838 12.7 848 11.0
10,515 35,004 49,329
6,553 7,744
9,872 32,317 45,130
5,811 6,958
643 6.1 2,687 7.7 4,199 8.5
742 11.3 786 10.1
Bibb Bleckley Brantley Brooks Bryan
74,891 4,921 7,679 7,288
16,342
67,362 4,073 6,850 6,676
15,007
7,529 10.1 848 17.2 829 10.8 612 8.4
1,335 8.2
74,849 4,896 7,711 7,466
16,434
67,832 4,123 6,922 6,880
15,162
7,017 9.4 773 15.8 789 10.2 586 7.8
1,272 7.7
Bulloch Burke Butts Calhoun Camden
33,785 10,057 10,269
2,180 21,234
29,921 8,743 9,056 1,917
19,190
3,864 11.4 1,314 13.1 1,213 11.8
263 12.1 2,044 9.6
33,883 10,021 10,097
2,156 21,320
30,628 8,793 9,110 1,909
19,473
3,255 9.6 1,228 12.3
987 9.8 247 11.5 1,847 8.7
Candler Carroll Catoosa Charlton Chatham
4,604 4,082
522 11.3
53,452 47,853 5,599 10.5
34,563 31,997 2,566 7.4
4,544 4,005
539 11.9
138,628 125,966 12,662 9.1
4,685 4,205
480 10.2
53,370 48,137 5,233 9.8
34,519 32,423 2,096 6.1
4,544 4,039
505 11.1
138,394 127,268 11,126 8.0
Chattahoochee Chattooga Cherokee Clarke Clay
2,199 10,336 115,872 68,660
1,298
1,765 9,223 107,399 63,347 1,179
434 19.7 1,113 10.8 8,473 7.3 5,313 7.7
119 9.2
2,154 10,381 116,042 68,656
1,290
1,778 9,317 108,036 64,152 1,176
376 17.5 1,064 10.2 8,006 6.9 4,504 6.6
114 8.8
Clayton Clinch Cobb Coffee Colquitt
131,867 117,334 14,533 11.0
2,672 2,371
301 11.3
380,793 350,191 30,602 8.0
15,020 12,991 2,029 13.5
19,895 17,731 2,164 10.9
131,160 118,031 13,129 10.0
2,676 2,407
269 10.1
380,913 352,269 28,644 7.5
15,004 13,102 1,902 12.7
19,630 17,593 2,037 10.4
Columbia Cook Coweta Crawford Crisp
67,240 6,398
64,573 6,193 9,342
62,232 5,654
59,396 5,596 8,040
5,008 7.4 744 11.6
5,177 8.0 597 9.6
1,302 13.9
67,192 6,416
64,672 6,162 9,343
62,587 5,737
59,749 5,635 8,103
4,605 6.9 679 10.6
4,923 7.6 527 8.6
1,240 13.3
16
June 2012
Labor Force
Employment
Unemployment Number Rate
4,815,964 4,356,900 459,064 9.5
9,835 3,046 4,618 1,384 17,848
8,733 2,616 4,143 1,249 15,670
1,102 11.2 430 14.1 475 10.3 135 9.8
2,178 12.2
10,297 34,684 48,831
6,912 8,102
9,584 31,681 44,243
5,981 7,243
713 6.9 3,003 8.7 4,588 9.4
931 13.5 859 10.6
75,193 5,125 7,909 7,373
16,374
67,362 4,393 6,989 6,757
15,073
7,831 10.4 732 14.3 920 11.6 616 8.4
1,301 7.9
32,901 9,901
10,042 2,186
21,089
29,115 8,667 8,930 1,936 19,097
3,786 11.5 1,234 12.5 1,112 11.1
250 11.4 1,992 9.4
4,526 52,619 34,480
4,494 139,144
4,039 47,191 31,960
3,948 126,520
487 10.8 5,428 10.3 2,520 7.3
546 12.1 12,624 9.1
2,223 10,379 114,493 68,009
1,317
1,775 9,253 105,912 62,623 1,186
448 20.2 1,126 10.8 8,581 7.5 5,386 7.9
131 9.9
130,832 2,717
377,668 15,373 20,261
115,710 2,418
345,343 13,295 18,334
15,122 11.6 299 11.0
32,325 8.6 2,078 13.5 1,927 9.5
66,697 6,497
64,457 6,256 9,327
61,691 5,757
58,574 5,596 8,179
5,006 7.5 740 11.4
5,883 9.1 660 10.5
1,148 12.3
Georgia Labor Force Estimates by County (not seasonally adjusted)
Dade Dawson Decatur DeKalb Dodge
Place of Residence - Persons 16 Years and Older
June 2013
May 2013
Labor Force
Employment
Unemployment Number Rate
Labor Force
Employment
Unemployment Number Rate
8,187 7,510
677 8.3
11,524 10,629
895 7.8
11,013 9,690 1,323 12.0
373,018 338,505 34,513 9.3
8,827 7,567 1,260 14.3
8,267 7,610
657 7.9
11,444 10,692
752 6.6
11,097 9,885 1,212 10.9
372,644 340,514 32,130 8.6
8,714 7,634 1,080 12.4
Dooly Dougherty Douglas Early Echols
4,505 42,660 69,377
5,386 1,996
3,867 37,826 62,959
4,919 1,877
638 14.2 4,834 11.3 6,418 9.3
467 8.7 119 6.0
4,461 42,448 69,200
5,361 2,054
3,853 37,949 63,332
4,952 1,934
608 13.6 4,499 10.6 5,868 8.5
409 7.6 120 5.8
Effingham Elbert Emanuel Evans Fannin
27,787 8,958
10,140 4,853
10,441
25,681 7,928 8,721 4,409 9,451
2,106 7.6 1,030 11.5 1,419 14.0
444 9.1 990 9.5
27,922 9,012
10,122 4,850
10,462
25,946 8,003 8,910 4,439 9,524
1,976 7.1 1,009 11.2 1,212 12.0
411 8.5 938 9.0
Fayette Floyd Forsyth Franklin Fulton
54,182 49,730 4,452 8.2 47,853 43,142 4,711 9.8 95,246 88,694 6,552 6.9
9,816 8,760 1,056 10.8 469,413 423,549 45,864 9.8
54,040 50,025 4,015 7.4
47,801 43,362 4,439 9.3
95,298 89,220 6,078 6.4
9,815 8,853
962 9.8
468,140 426,062 42,078 9.0
Gilmer Glascock Glynn Gordon Grady
12,344 1,119
37,357 25,954 11,848
11,118 978
33,605 23,306 10,903
1,226 9.9 141 12.6
3,752 10.0 2,648 10.2
945 8.0
12,327 1,124
37,423 26,100 11,660
11,168 991
33,957 23,595 10,804
1,159 9.4 133 11.8
3,466 9.3 2,505 9.6
856 7.3
Greene Gwinnett Habersham Hall Hancock
7,250 6,562
688 9.5
443,921 408,670 35,251 7.9
19,554 17,761 1,793 9.2
90,914 83,985 6,929 7.6
2,855 2,410
445 15.6
7,209 6,528
681 9.4
443,737 411,095 32,642 7.4
19,681 18,020 1,661 8.4
91,414 85,138 6,276 6.9
2,848 2,457
391 13.7
Haralson Harris Hart Heard Henry
12,901 16,990
9,906 5,130 108,244
11,634 15,787
8,788 4,566 98,250
1,267 9.8 1,203 7.1 1,118 11.3
564 11.0 9,994 9.2
12,899 16,992
9,869 5,086 107,757
11,703 15,901
8,837 4,593 98,833
1,196 9.3 1,091 6.4 1,032 10.5
493 9.7 8,924 8.3
Houston Irwin Jackson Jasper Jeff Davis
71,195 3,536
28,145 6,489 5,314
65,272 3,102
25,682 5,924 4,516
5,923 8.3 434 12.3
2,463 8.8 565 8.7 798 15.0
71,095 3,548
28,019 6,473 5,250
65,796 3,115
25,782 5,959 4,538
5,299 7.5 433 12.2
2,237 8.0 514 7.9 712 13.6
June 2012
Labor Force
Employment
Unemployment Number Rate
8,194 11,430 11,094 368,980 8,835
7,502 10,482
9,834 333,819
7,748
692 8.4 948 8.3 1,260 11.4 35,161 9.5 1,087 12.3
4,557 43,068 68,794
5,395 2,072
3,952 38,219 62,087
4,918 1,900
605 13.3 4,849 11.3 6,707 9.7
477 8.8 172 8.3
28,026 9,239 9,968 4,933
10,644
25,794 8,117 8,761 4,485 9,580
2,232 8.0 1,122 12.1 1,207 12.1
448 9.1 1,064 10.0
53,611 48,858 94,165 10,020 464,920
49,041 43,815 87,466
8,891 417,686
4,570 8.5 5,043 10.3 6,699 7.1 1,129 11.3 47,234 10.2
12,559 1,130
37,986 26,027 12,063
11,256 996
34,289 23,291 11,111
1,303 10.4 134 11.9
3,697 9.7 2,736 10.5
952 7.9
7,404 439,267
19,673 91,053
2,991
6,682 403,013
17,858 83,834
2,467
722 9.8 36,254 8.3
1,815 9.2 7,219 7.9
524 17.5
12,812 17,279 10,196
5,111 106,969
11,473 15,872
9,049 4,503 96,890
1,339 10.5 1,407 8.1 1,147 11.2
608 11.9 10,079 9.4
71,486 3,631
28,095 6,468 5,381
65,710 3,207
25,530 5,842 4,579
5,776 8.1 424 11.7
2,565 9.1 626 9.7 802 14.9
17
Georgia Labor Force Estimates by County (not seasonally adjusted)
Jefferson Jenkins Johnson Jones Lamar
Place of Residence - Persons 16 Years and Older
June 2013
May 2013
Labor Force
6,959 2,521 3,564 14,614 8,735
Employment
Unemployment Number Rate
5,774 2,061 3,053 13,424 7,677
1,185 17.0 460 18.2 511 14.3
1,190 8.1 1,058 12.1
Labor Force
6,831 2,474 3,531 14,598 8,595
Employment
Unemployment Number Rate
5,790 2,077 3,084 13,518 7,723
1,041 15.2 397 16.0 447 12.7
1,080 7.4 872 10.1
Lanier Laurens Lee Liberty Lincoln
4,771 20,280 15,381 25,723
3,677
4,356 17,861 14,187 22,923
3,275
415 8.7 2,419 11.9 1,194 7.8 2,800 10.9
402 10.9
4,869 20,321 15,356 25,721
3,641
4,490 18,041 14,233 23,142
3,280
379 7.8 2,280 11.2 1,123 7.3 2,579 10.0
361 9.9
Long Lowndes Lumpkin McDuffie McIntosh
7,656 53,393 13,167 10,245
5,757
7,043 48,413 11,889
9,177 5,124
613 8.0 4,980 9.3 1,278 9.7 1,068 10.4
633 11.0
7,618 54,343 13,243 10,190
5,788
7,110 49,892 12,082
9,229 5,178
508 6.7 4,451 8.2 1,161 8.8
961 9.4 610 10.5
Macon Madison Marion Meriwether Miller
4,857 16,206
3,928 9,333 3,299
4,113 15,115 3,620 8,143 3,075
744 15.3 1,091 6.7
308 7.8 1,190 12.8
224 6.8
4,806 16,346
3,928 9,128 3,346
4,114 15,307
3,646 8,191 3,132
692 14.4 1,039 6.4
282 7.2 937 10.3 214 6.4
Mitchell Monroe Montgomery Morgan Murray
9,806 14,486
4,718 9,382 16,814
8,821 13,103
4,151 8,617 14,894
985 10.0 1,383 9.5
567 12.0 765 8.2 1,920 11.4
9,706 14,407
4,729 9,305 16,850
8,801 13,195
4,187 8,594 14,998
905 9.3 1,212 8.4
542 11.5 711 7.6 1,852 11.0
Muscogee Newton Oconee Oglethorpe Paulding
85,643 48,977 19,653
8,348 73,708
77,340 43,916 18,511
7,776 67,562
8,303 9.7 5,061 10.3 1,142 5.8
572 6.9 6,146 8.3
85,523 77,895 7,628 8.9
48,712 44,177 4,535 9.3
19,748 18,746 1,002 5.1
8,379 7,875
504 6.0
73,668 67,963 5,705 7.7
Peach Pickens Pierce Pike Polk
12,551 14,520
8,503 8,313 20,738
10,961 13,377
7,686 7,588 18,931
1,590 12.7 1,143 7.9
817 9.6 725 8.7 1,807 8.7
12,412 14,629
8,589 8,309 20,712
11,038 13,456
7,865 7,633 19,030
1,374 11.1 1,173 8.0
724 8.4 676 8.1 1,682 8.1
Pulaski Putnam Quitman Rabun Randolph
4,386 8,760
847 6,473 2,567
3,904 7,848
748 5,707 2,221
482 11.0 912 10.4
99 11.7 766 11.8 346 13.5
4,385 8,754
848 6,353 2,521
3,930 7,886
749 5,622 2,199
455 10.4 868 9.9
99 11.7 731 11.5 322 12.8
June 2012
Labor Force
Employment
Unemployment Number Rate
6,876 2,579 3,560 14,727 8,485
5,854 2,098 3,104 13,424 7,571
1,022 14.9 481 18.7 456 12.8
1,303 8.8 914 10.8
4,804 20,723 15,495 25,793
3,719
4,410 18,157 14,335 23,133
3,325
394 8.2 2,566 12.4 1,160 7.5 2,660 10.3
394 10.6
7,685 54,006 13,127 10,209
5,911
7,107 49,007 11,798
9,097 5,228
578 7.5 4,999 9.3 1,329 10.1 1,112 10.9
683 11.6
5,013 16,141
3,955 9,431 3,396
4,258 14,942
3,640 8,030 3,165
755 15.1 1,199 7.4
315 8.0 1,401 14.9
231 6.8
10,073 14,285
4,659 9,563 16,969
9,121 13,103
4,192 8,770 14,956
952 9.5 1,182 8.3
467 10.0 793 8.3 2,013 11.9
86,186 48,525 19,453
8,248 73,016
77,753 43,308 18,299
7,687 66,627
8,433 9.8 5,217 10.8 1,154 5.9
561 6.8 6,389 8.8
12,634 14,383
8,532 8,210 20,771
11,163 13,191
7,677 7,483 18,866
1,471 11.6 1,192 8.3
855 10.0 727 8.9 1,905 9.2
4,400 8,976
885 6,593 2,693
3,973 8,041
779 5,779 2,298
427 9.7 935 10.4 106 12.0 814 12.3 395 14.7
18
Georgia Labor Force Estimates by County (not seasonally adjusted)
Richmond Rockdale Schley Screven Seminole
Spalding Stephens Stewart Sumter Talbot
Taliaferro Tattnall Taylor Telfair Terrell
Thomas Tift Toombs Towns Treutlen
Troup Turner Twiggs Union Upson
Walker Walton Ware Warren Washington
Wayne Webster Wheeler White Whitfield
Wilcox Wilkes Wilkinson Worth
Place of Residence - Persons 16 Years and Older
June 2013
May 2013
Labor Force
Employment
Unemployment Number Rate
Labor Force
Employment
Unemployment Number Rate
89,895 42,196
1,915 6,838 3,684
79,997 38,113 1,697
6,011 3,319
9,898 11.0 4,083 9.7
218 11.4 827 12.1 365 9.9
88,896 42,135
1,896 6,831 3,794
80,454 38,340
1,707 6,083 3,468
8,442 9.5 3,795 9.0
189 10.0 748 11.0 326 8.6
29,200 13,274
2,273 12,938
3,162
25,848 12,104
1,996 11,171 2,839
3,352 11.5 1,170 8.8
277 12.2 1,767 13.7
323 10.2
29,102 13,378
2,271 12,862
3,142
26,002 12,292
2,002 11,234 2,853
3,100 10.7 1,086 8.1
269 11.8 1,628 12.7
289 9.2
719 9,565 3,332 4,630 4,037
641 8,524 2,904 3,661 3,643
78 10.8 1,041 10.9
428 12.8 969 20.9 394 9.8
688 9,471 3,316 4,548 4,032
638 8,504 2,927 3,844 3,655
50 7.3 967 10.2 389 11.7 704 15.5 377 9.4
22,430 19,044 13,987
5,863 2,778
20,580 17,128 12,318
5,389 2,367
1,850 8.2 1,916 10.1 1,669 11.9
474 8.1 411 14.8
22,235 18,958 13,900
5,855 2,765
20,577 17,197 12,428
5,423 2,383
1,658 7.5 1,761 9.3 1,472 10.6
432 7.4 382 13.8
35,691 4,152 4,089 11,112 11,692
32,098 3,752 3,584
10,305 10,373
3,593 10.1 400 9.6 505 12.4 807 7.3
1,319 11.3
35,803 4,076 4,027 11,183 11,665
32,589 3,702 3,609
10,395 10,442
3,214 9.0 374 9.2 418 10.4 788 7.0
1,223 10.5
33,104 41,303 14,790
2,491 7,421
30,450 37,923 13,043
2,121 6,502
2,654 8.0 3,380 8.2 1,747 11.8
370 14.9 919 12.4
33,285 41,319 15,024
2,468 7,407
30,855 38,148 13,347
2,121 6,560
2,430 7.3 3,171 7.7 1,677 11.2
347 14.1 847 11.4
12,192 1,223 2,960
13,214 42,752
10,741 1,121 2,604
12,058 37,767
1,451 11.9 102 8.3 356 12.0
1,156 8.7 4,985 11.7
12,129 1,212 2,944
13,218 42,534
10,827 1,119 2,631
12,134 38,030
1,302 10.7 93 7.7
313 10.6 1,084 8.2 4,504 10.6
3,105 4,233 4,343 10,553
2,680 3,739 3,891 9,558
425 13.7 494 11.7 452 10.4 995 9.4
3,054 4,231 4,364 10,475
2,658 3,759 3,938 9,589
396 13.0 472 11.2 426 9.8 886 8.5
June 2012
Labor Force
Employment
Unemployment Number Rate
89,565 42,101
1,989 6,920 3,738
79,302 37,586
1,748 6,064 3,363
10,263 11.5 4,515 10.7 241 12.1 856 12.4 375 10.0
28,775 13,204
2,216 13,288
3,185
25,490 11,953 1,955 11,502 2,849
3,285 11.4 1,251 9.5
261 11.8 1,786 13.4
336 10.5
734 9,585 3,408 4,466 4,129
653 8,587 2,939 3,734 3,681
81 11.0 998 10.4 469 13.8 732 16.4 448 10.9
22,080 19,362 13,984
5,588 2,917
20,216 17,296 12,441
5,094 2,503
1,864 8.4 2,066 10.7 1,543 11.0
494 8.8 414 14.2
34,894 4,377 4,084 11,104 11,618
30,594 3,945 3,584
10,248 10,286
4,300 12.3 432 9.9 500 12.2 856 7.7
1,332 11.5
33,137 41,090 14,695
2,548 7,759
30,415 37,398 13,030
2,134 6,845
2,722 8.2 3,692 9.0 1,665 11.3
414 16.2 914 11.8
12,151 1,221 2,962
13,021 43,037
10,679 1,117 2,651
11,815 37,924
1,472 12.1 104 8.5 311 10.5
1,206 9.3 5,113 11.9
3,127 4,357 4,388 10,666
2,743 3,871 3,949 9,658
384 12.3 486 11.2 439 10.0 1,008 9.5
19
New Developments
PulteGroup Inc., one of the largest homebuilders in the nation, recently announced that in 2014 it is moving its headquarters from the Detroit suburb of Bloomfield Hills, MI, to the city of Atlanta. With the move, PulteGroup will create over 300 jobs in the area and invest $10 million. The state of Georgia has offered PulteGroup $1.5 million in incentives to relocate while the city of Atlanta is also considering offering incentives of $1.5 million.
A $30 million medical office park is planned for Oconee County, near Athens. As the healthcare industry continues to grow in the area, Resurgence Park, a 30-acre development is looking to attract physicians and medical offices. The development will include about 10 buildings including medical offices, a hotel, and an assisted living facility. Construction on Resurgence Park is expected to begin in summer 2013 with the first medical office opening in April 2014.
Construction of the $652 million Savannah Harbor deepening has been cleared. The fiscal 2014 Georgia state budget was recently signed that includes $50 million in bonds for the project, bringing the state's total commitment to $231 million. The Savannah project is due to be finished by the end of 2016. The harbor will be deepened from 42 feet to 47 feet to better accommodate the larger container ships that will pass through the Panama Canal when its expansion is completed in 2015.
Atlanta's new, 20-story-high ferris wheel will add 50 jobs to the local economy. Skyview, will open to the public in the parking lot adjacent to The Tabernacle opposite Centennial Park in July 2013. With the World of Coke and the Georgia Aquarium already attracting huge crowds, Skyview is expected to add one more reason to visit downtown Atlanta.
Hitachi Automotive Systems has planned an expansion of its plant in Monroe. The Walton County facility currently employs about 300 full-
time and 75 part-time workers and will undergo an expected $80 million in upgrades as it creates 250 new jobs. The plant is expected to increase from its current 230,000square-feet and grow by 290,000-square-feet when adjacent space is added. The Hitachi plant produces valve timing mechanisms, propeller shafts and power steering systems for various automakers.
Walmart is poised to open its newest store in Norcross. The retail giant based in Arkansas is scheduled to hire about 200 people for the Gwinnett County location that will open for business in summer 2013.
Effingham County is preparing for a boost in the entertainment industry as a production company is making plans to join the area. Medient Studios Inc., a movie production and distribution company based in California, will build a $90 million production and entertainment complex in the county. Prime Focus Limited, a visual entertainment, creative, and technical services provider, would contribute production and post-production equipment and other elements for the planned megastudio as it invests more than $40 million in the project. Medient's agreement with the Effingham County Industrial Development Authority calls for the movie studio to add nearly 1,000 jobs when it's developed on 1,500 acres near Old River Road and Interstate 16.
A Starbucks Coffee Co. manufacturing facility being constructed in Augusta remains on schedule to be completed in early 2014. Plans call for the building to be 180,000square-feet. The $172 million facility is located inside Augusta Corporate Park, off Mike Padgett Highway. The Starbucks facility will take up about 100 acres of the Augusta Corporate Park and produce Starbucks VIA Ready Brew, the coffee base for its Frappuccino beverages and many Starbucks ready-to-drink products. More than 140 workers will be hired for the plant.
Note: Information in New Developments are from a variety of public sources and by no means are a comprehensive listing of new and expanding business in Georgia
20
Source: Georgia Department of Labor, Workforce Statistics and Economic Research
Georgia Unemployment Rates by County
June 2013
Dade 8.3
Catoosa 7.4
Walker
Whitfield
Murray 11.4
Fannin 9.5
Union 7.3
Towns 8.1
Rabun 11.8
8.0
11.7
Chattooga 10.8
Gordon 10.2
Floyd 9.8
Bartow 9.2
Gilmer 9.9
Pickens 7.9
Cherokee 7.3
Lumpkin 9.7
Dawson 7.8
Forsyth 6.9
White Habersham
8.7
9.2
Stephens
8.8
Banks Franklin
Hall
6.7
10.8
7.6
Jackson 8.8
Madison 6.7
Hart 11.3
Elbert 11.5
10.0% or greater 86 counties (54%)
9.0% to 9.9% 26 counties (16%)
8.0% to 8.9% 27 counties (17%)
Polk 8.7
Paulding
Cobb 8.0
Gwinnett 7.9
Barrow 8.2
Clarke Oglethorpe
7.7
6.9
Less than 8.0% 20 counties (13%)
Haralson 9.8
Carroll 10.5
Heard 11.0
8.3 Douglas 9.3
Coweta 8.0
Fulton 9.8
DeKalb 9.3 Rockdale
Walton 8.2
Oconee 5.8
Clayton
9.7 Newton
11.0
10.3
Fayette
Henry
Morgan 8.2
8.2
9.2
Spalding 11.5
Butts 11.8
Jasper 8.7
Putnam 10.4
Wilkes 11.7
Lincoln 10.9
Percentages of number of counties may not total 100 due to rounding
Greene
9.5
Taliaferro
10.8
McDuffie
Warren 10.4
Columbia 7.4
14.9
Richmond
Hancock
11.0
15.6
Glascock
12.6
Troup 10.1
Meriwether 12.8
Pike 8.7
Lamar 12.1 Monroe 9.5
Jones 8.1
Baldwin 12.9
Washington
Jefferson 17.0
Burke 13.1
Upson
12.4
Harris 7.1
Talbot 10.2
Muscogee 9.7
Marion Chattahoochee 7.8
11.3
Taylor 12.8
Crawford 9.6
Bibb 10.1
Wilkinson
Twiggs
10.4
12.4
Peach
12.7
Macon 15.3
Houston 8.3
Bleckley 17.2
Laurens 11.9
Johnson 14.3
Emanuel 14.0
Jenkins 18.2
Screven 12.1
Treutlen 14.8
Candler 11.3
Bulloch 11.4
Effingham 7.6
19.7
Stewart 12.2
Schley 11.4
Webster 8.3
Sumter 13.7
Quitman
11.7 Randolph Terrell
Lee
13.5
9.8
7.8
Clay
Dooly 14.2
Pulaski 11.0
Dodge 14.3
Crisp 13.9
Wilcox 13.7
Turner 9.6
Ben Hill 12.7
Montgomery
Wheeler 12.0
12.0
Toombs 11.9
Evans 9.1
Tattnall
Telfair
10.9
20.9
Jeff Davis 15.0
Appling 11.7
Long 8.0
Bryan 8.2
Liberty 10.9
Chatham 9.1
9.2
Calhoun
Dougherty
12.1
11.3
Early 8.7
Miller 6.8
Baker 8.5
Mitchell 10.0
Worth 9.4
Colquitt 10.9
Irwin
12.3 Tift
10.1
Coffee 13.5
Berrien
Atkinson
11.0
13.4
Cook
11.6 Lanier
Bacon 10.2
Wayne 11.9
Pierce 9.6
Ware 11.8
Brantley 10.8
McIntosh 11.0
Glynn 10.0
Seminole 9.9
Decatur 12.0
Grady 8.0
Thomas 8.2
Brooks 8.4
8.7
Lowndes 9.3
Clinch 11.3
Charlton 11.9
Camden 9.6
Echols
6.0
Georgia's Unemployment Rate: 9.3%
(Not Seasonally Adjusted)
21
Georgia Unemployment Insurance Claims by County
County
June Average Average Initial Weekly Duration Claims Benefit Weeks
County
June Average Average Initial Weekly Duration Claims Benefit Weeks
County
June Average Average Initial Weekly Duration Claims Benefit Weeks
Georgia
39,777 ...... $257 ..... 12.1
Appling
92 ...... $240 ..... 12.8
Atkinson
42 ...... $229 ....... 8.4
Bacon
60 ...... $230 ..... 10.7
Baker
9 ...... $225 ....... 8.8
Baldwin
128 ...... $187 ..... 13.7
Banks
58 ...... $230 ..... 11.4
Barrow
206 ...... $243 ..... 12.9
Bartow
398 ...... $238 ....... 9.2
Ben Hill
99 ...... $205 ....... 9.4
Berrien
89 ...... $231 ..... 13.2
Bibb
657 ...... $192 ..... 14.2
Bleckley
84 ...... $196 ..... 15.7
Brantley
62 ...... $235 ..... 13.8
Brooks
36 ...... $187 ..... 12.3
Bryan
90 ...... $253 ..... 13.8
Bulloch
393 ...... $226 ..... 11.4
Burke
201 ...... $214 ..... 12.3
Butts
178 ...... $221 ..... 12.9
Calhoun
18 ...... $194 ....... 9.6
Camden
118 ...... $217 ..... 13.7
Candler
84 ...... $223 ..... 11.3
Carroll
542 ...... $219 ....... 9.7
Catoosa
198 ...... $241 ..... 10.2
Charlton
29 ...... $238 ..... 15.0
Chatham
1,556 ...... $216 ..... 14.3
Chattahoochee 17 ...... $195 ..... 17.3
Chattooga
67 ...... $227 ..... 15.2
Cherokee
470 ...... $267 ..... 13.4
Clarke
356 ...... $199 ..... 12.7
Clay
11 ...... $207 ..... 12.2
Clayton
1,407 ...... $220 ..... 14.6
Clinch
12 ...... $200 ..... 10.5
Cobb
2,211 ...... $249 ..... 14.7
Coffee
193 ...... $211 ..... 10.9
Colquitt
220 ...... $230 ..... 11.1
Columbia
276 ...... $251 ..... 12.7
Cook
51 ...... $207 ..... 14.1
Coweta
407 ...... $240 ..... 11.9
Crawford
51 ...... $236 ..... 12.9
Crisp
127 ...... $196 ..... 12.7
Dade
26 ...... $236 ....... 9.9
Dawson
60 ...... $256 ..... 13.8
Decatur
186 ...... $194 ..... 11.4
DeKalb
3,051 ...... $232 ..... 14.3
Dodge
188 ...... $194 ..... 13.1
Dooly
66 ...... $206 ..... 11.5
Dougherty
425 ...... $177 ..... 12.6
Douglas
503 ...... $244 ..... 14.1
Early
57 ...... $197 ..... 12.3
Echols
4 ...... $284 ..... 15.6
Effingham
153 ...... $257 ..... 13.4
Elbert Emanuel Evans Fannin Fayette Floyd Forsyth Franklin Fulton Gilmer Glascock Glynn Gordon Grady Greene Gwinnett Habersham Hall Hancock Haralson Harris Hart Heard Henry Houston Irwin Jackson Jasper Jeff Davis Jefferson Jenkins Johnson Jones Lamar Lanier Laurens Lee Liberty Lincoln Long Lowndes Lumpkin Macon Madison Marion McDuffie McIntosh Meriwether Miller Mitchell Monroe Montgomery Morgan Murray
90 ...... $232 ....... 7.9 340 ...... $191 ..... 12.3
53 ...... $223 ..... 11.2 57 ...... $240 ..... 11.3 223 ...... $255 ..... 14.3 478 ...... $225 ..... 10.6 293 ...... $270 ..... 14.5 89 ...... $213 ....... 9.9 3,512 ...... $227 ..... 14.7 67 ...... $238 ..... 11.3 22 ...... $201 ..... 10.8 265 ...... $212 ..... 13.4 366 ...... $238 ....... 8.6 101 ...... $199 ....... 8.8 54 ...... $227 ..... 11.9 2,373 ...... $255 ..... 14.3 174 ...... $214 ....... 9.4 661 ...... $234 ..... 10.6 42 ...... $205 ..... 10.4 71 ...... $235 ..... 10.2 101 ...... $216 ..... 11.5 105 ...... $222 ....... 9.2 39 ...... $221 ....... 9.4 959 ...... $242 ..... 14.1 541 ...... $222 ..... 13.6 31 ...... $222 ..... 11.1 178 ...... $237 ..... 11.5 39 ...... $259 ..... 11.2 106 ...... $214 ..... 10.6 222 ...... $190 ..... 14.8 78 ...... $200 ..... 11.4 54 ...... $175 ..... 13.4 70 ...... $223 ..... 14.4 85 ...... $218 ..... 11.2 27 ...... $224 ..... 12.6 298 ...... $192 ..... 12.0 97 ...... $247 ..... 11.2 158 ...... $221 ..... 14.3 46 ...... $245 ....... 9.1 43 ...... $248 ..... 14.1 347 ...... $176 ..... 13.4 78 ...... $222 ..... 11.3 94 ...... $194 ..... 12.7 76 ...... $234 ..... 11.0 42 ...... $195 ..... 10.7 143 ...... $221 ..... 11.2 38 ...... $205 ..... 13.6 225 ...... $218 ....... 8.7 23 ...... $199 ..... 10.6 110 ...... $185 ....... 8.9 120 ...... $249 ..... 12.2 64 ...... $204 ..... 11.6 57 ...... $212 ..... 14.0 234 ...... $237 ....... 7.6
Note: Initial claims include intrastate initial and additional claims, as well as agent state initial and additional claims for regular UI only.
Average duration of benefits is represented in weeks. Data does not include state or federal extended benefits for those unemployed for 27 weeks or more.
22
Muscogee Newton Oconee Oglethorpe Paulding Peach Pickens Pierce Pike Polk Pulaski Putnam Quitman Rabun Randolph Richmond Rockdale Schley Screven Seminole Spalding Stephens Stewart Sumter Talbot Taliaferro Tattnall Taylor Telfair Terrell Thomas Tift Toombs Towns Treutlen Troup Turner Twiggs Union Upson Walker Walton Ware Warren Washington Wayne Webster Wheeler White Whitfield Wilcox Wilkes Wilkinson Worth
654 ...... $214 ..... 12.3 427 ...... $230 ..... 13.1
49 ...... $245 ..... 13.5 49 ...... $229 ..... 12.4 381 ...... $252 ..... 14.0 210 ...... $176 ..... 12.6 75 ...... $235 ..... 11.0 77 ...... $217 ..... 12.9 65 ...... $260 ..... 12.2 162 ...... $222 ....... 9.3 52 ...... $220 ..... 13.7 58 ...... $228 ..... 10.8
3 ...... $225 ....... 9.2 21 ...... $220 ..... 14.0 34 ...... $173 ....... 7.1 1,138 ...... $207 ..... 12.6 382 ...... $238 ..... 14.5
8 ...... $204 ..... 11.8 145 ...... $227 ....... 8.5
38 ...... $223 ..... 11.8 419 ...... $214 ..... 12.6 126 ...... $218 ....... 9.3
22 ...... $209 ..... 12.8 150 ...... $178 ..... 12.5
48 ...... $204 ....... 9.4 7 ...... $181 ....... 9.0
72 ...... $231 ..... 12.1 19 ...... $240 ..... 13.6 276 ...... $173 ....... 9.4 43 ...... $178 ....... 9.8 211 ...... $206 ..... 11.7 158 ...... $182 ..... 13.1 195 ...... $222 ..... 11.6 22 ...... $252 ..... 14.6 44 ...... $216 ..... 12.0 425 ...... $219 ....... 9.6 45 ...... $196 ..... 12.5 46 ...... $223 ..... 15.9 53 ...... $202 ..... 12.9 102 ...... $206 ..... 11.3 222 ...... $238 ....... 8.7 212 ...... $229 ..... 13.6 155 ...... $207 ..... 12.6 45 ...... $202 ..... 11.6 83 ...... $193 ..... 12.9 144 ...... $223 ..... 13.2
6 ...... $149 ..... 11.7 62 ...... $178 ....... 9.2 69 ...... $225 ..... 12.6 751 ...... $230 ....... 7.5 53 ...... $174 ..... 12.2 87 ...... $212 ..... 10.5 48 ...... $229 ..... 15.0 69 ...... $225 ..... 12.2
Mark Butler, Commissioner
148 Andrew Young International Boulevard, N.E. Atlanta, Georgia 30303-1751
Return Service Requested