- Collection:
- Georgia Government Publications
- Title:
- Dimensions: measuring Georgia's workforce, Vol. 37, no. 9 (Sept. 2011)
- Creator:
- Georgia. Department of Labor
- Contributor to Resource:
- Georgia. Workforce Information and Analysis
- Publisher:
- Atlanta, Ga. : Georgia Dept. of Labor, 2011-09
- Date of Original:
- 2011-09
- Subject:
- Labor market--Georgia--Statistics
Wages--Georgia--Statistics
Hours of labor--Georgia--Statistics - Location:
- United States, Georgia, 32.75042, -83.50018
- Medium:
- state government records
- Type:
- Text
- Format:
- application/pdf
- External Identifiers:
- Call Number GA L200.E46 P1 T7 37/9
- Metadata URL:
- https://dlg.galileo.usg.edu/id:dlg_ggpd_i-ga-bl200-pe46-bp1-bt7-b37-s9-belec-p-btext
- Digital Object URL:
- https://dlg.galileo.usg.edu/do:dlg_ggpd_i-ga-bl200-pe46-bp1-bt7-b37-s9-belec-p-btext
- Language:
- eng
- Holding Institution:
- University of Georgia. Map and Government Information Library
- Rights:
-

September 2011 Data
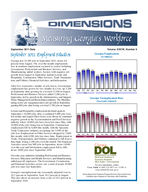
September 2011 Employment Situation
Georgia lost 15,100 jobs in September 2011, down 0.4 percent from August. The over-the-month employment loss in nonfarm employment occurred as sectors including Government, Professional and Business Services, and Manufacturing added workers. Sectors with negative job growth from August to September include Leisure and Hospitality, Construction, Other Services, Trade Transportation, and Utilities, Financial Activities, and Information.
After five consecutive months of jobs losses, Government employment has grown for two months in a row, up 5,200 in September after growing by a revised 11,500 in August. Professional and Business Services added 3,200 jobs in September, led by growth in the Administrative and Support, Waste Management and Remediation industry. The Manufacturing sector saw marginal positive job growth in September, gaining 400 jobs after losing a revised 1,700 jobs in August.
Leisure and Hospitality employment declined again in September (-10,900 jobs) after a combined 5,400 jobs were lost in July and August.These losses were driven by continued negative growth in the Accommodation and Food Services industry where 14,000 jobs have been lost since May, with 10,900 of the jobs being lost in September. Construction employment fell by 6,600 this month, with the Specialty Trade Contractors industry accounting for 5,900 of the jobs lost. Employment in Other Services dropped by 2,600 this month, with 4,200 jobs lost since June. Employment in Trade, Transportation, and Utilities continued to fall from a June high, losing 2,200 jobs over-the-month. The Financial Activities sector lost 900 jobs in September, down 10,900 over-the-year and Information employment fell by 600, down 3,600 jobs since September 2010.
Over-the-year, industries including Professional and Business Services, Education and Health Services, and Manufacturing added payroll employees. The Government, Construction, and Financial Activities sectors saw a total of nearly 45,000 jobs lost since last September.
Georgia's unemployment rate (seasonally adjusted) rose to 10.3 percent in September, from 10.2 percent in August. This also shows an increase from a rate of 10.2 percent in September 2010.
Volume XXXVII, Number 9
Georgia Employment
(In Millions)
3.824
3.851
3.859
3.841
3.770
3.797
3.804
3.831
3.833
3.820
3.794
3.808
3.793
Sep Oct Nov Dec Jan Feb Mar Apr May Jun Jul Aug Sep
2010
2011
Georgia Unemployment Rate
(Seasonally Adjusted)
10.4% 10.4%
10.3%
10.3%
10.2%
10.2%
10.0%
9.8%
9.8%
10.3% 10.2% 10.1%
9.9%
Sep Oct Nov Dec Jan Feb Mar Apr May Jun Jul Aug Sep
2010
2011
Workforce Statistics & Economic Research Mark Butler, Commissioner
For more information, contact Corey Smith at (404) 232-3875 ext. 21299 or
corey.smith@dol.state.ga.us
Equal Opportunity Employer/ProgramAuxiliary Aids and Services Available upon Request to Individuals with Disabilities
GEORGIA Nonagricultural Employment (000s)
Change in Jobs
Change in Jobs
Preliminary Revised
Revised
SEP 2011 AUG 2011 SEP 2010
from AUG 2011 Net %
from SEP 2010 Net %
Total Nonfarm
3,793.2
3,808.3
3,824.2
-15.1 -0.4
-31.0 -0.8
Total Private
3,144.7
3,165.0
3,156.5
-20.3 -0.6
-11.8 -0.4
Goods Producing
493.2
499.5
505.3
-6.3 -1.3
-12.1 -2.4
Service-Providing
3,300.0
3,308.8
3,318.9
-8.8 -0.3
-18.9 -0.6
Private Service-Providing
2,651.5
2,665.5
2,651.2
-14.0 -0.5
0.3 0.0
Mining and Logging
9.0
9.1
9.4
-0.1 -1.1
-0.4 -4.3
Construction
136.1
142.7
150.5
-6.6 -4.6
-14.4 -9.6
Construction of Buildings
30.7
31.2
32.0
-0.5 -1.6
-1.3 -4.1
Heavy and Civil Engineering Construction
21.7
21.9
23.2
-0.2 -0.9
-1.5 -6.5
Specialty Trade Contractors
83.7
89.6
95.3
-5.9 -6.6
-11.6 -12.2
Manufacturing
348.1
347.7
345.4
0.4 0.1
2.7 0.8
Durable Goods
163.4
163.4
157.0
0.0 0.0
6.4 4.1
Computer, Electrical Equip and Appliance Mfg
21.5
21.5
21.4
0.0 0.0
0.1 0.5
Transportation Equipment Manufacturing
39.2
38.9
38.3
0.3 0.8
0.9 2.4
Non-Durable Goods
184.7
184.3
188.4
0.4 0.2
-3.7 -2.0
Food Manufacturing
60.7
60.5
61.7
0.2 0.3
-1.0 -1.6
Textile Mills
18.4
18.3
19.1
0.1 0.6
-0.7 -3.7
Textile Product Mills
27.7
27.8
29.1
-0.1 -0.4
-1.4 -4.8
Trade, Transportation, and Utilities
804.6
806.8
806.4
-2.2 -0.3
-1.8 -0.2
Wholesale Trade
193.0
193.7
196.7
-0.7 -0.4
-3.7 -1.9
Merchant Wholesalers, Durable Goods
96.5
97.2
96.8
-0.7 -0.7
-0.3 -0.3
Merchant Wholesalers, Nondurable Goods
55.0
55.4
58.6
-0.4 -0.7
-3.6 -6.1
Wholesale Electronic Markets and Agents and Brokers 41.5
41.1
41.3
0.4 1.0
0.2 0.5
Retail Trade
427.6
428.5
430.0
-0.9 -0.2
-2.4 -0.6
Food and Beverage Stores
81.4
81.2
80.1
0.2 0.3
1.3 1.6
General Merchandise Stores
98.1
98.7
96.4
-0.6 -0.6
1.7 1.8
Miscellaneous Store Retailers
19.0
19.4
19.6
-0.4 -2.1
-0.6 -3.1
Transportation, Warehousing, and Utilities
184.0
184.6
179.7
-0.6 -0.3
4.3 2.4
Utilities
20.5
20.6
19.7
-0.1 -0.5
0.8 4.1
Transportation and Warehousing
163.5
164.0
160.0
-0.5 -0.3
3.5 2.2
Air Transportation
39.3
39.7
38.9
-0.4 -1.0
0.4 1.0
Truck Transportation
44.2
44.7
43.7
-0.5 -1.1
0.5 1.1
Couriers and Messengers
18.1
18.1
18.2
0.0 0.0
-0.1 -0.6
Warehousing and Storage
26.6
26.4
26.4
0.2 0.8
0.2 0.8
Information
97.7
98.3
101.3
-0.6 -0.6
-3.6 -3.6
Telecommunications
47.8
48.1
49.6
-0.3 -0.6
-1.8 -3.6
Wired Telecommunications Carriers
27.4
27.7
28.1
-0.3 -1.1
-0.7 -2.5
Wireless Telecommunications Carriers
10.3
10.3
10.5
0.0 0.0
-0.2 -1.9
Internet Service Providers, Search Portals, and DP
4.9
4.9
5.5
0.0 0.0
-0.6 -10.9
Financial Activities
191.7
192.6
202.6
-0.9 -0.5
-10.9 -5.4
Finance and Insurance
141.0
140.9
147.7
0.1 0.1
-6.7 -4.5
Insurance Carriers and Related Activities
64.4
64.1
64.1
0.3 0.5
0.3 0.5
Real Estate and Rental and Leasing
50.7
51.7
54.9
-1.0 -1.9
-4.2 -7.7
Professional and Business Services
538.2
535.0
523.4
3.2 0.6
14.8 2.8
Professional, Scientific, and Technical Services
224.5
225.0
211.1
-0.5 -0.2
13.4 6.4
Accounting, Tax Prep, and Bookkeeping Services
32.9
33.5
32.7
-0.6 -1.8
0.2 0.6
Architectural, Engineering, and Related Services
37.3
37.5
34.2
-0.2 -0.5
3.1 9.1
Computer Systems Design and Related Services
54.3
54.0
48.6
0.3 0.6
5.7 11.7
Management and Technical Consulting Services
31.3
31.2
30.8
0.1 0.3
0.5 1.6
Management of Companies and Enterprises
54.2
53.6
53.5
0.6 1.1
0.7 1.3
Admin and Support, Waste Mngmnt and Remediation
259.5
256.4
258.8
3.1 1.2
0.7 0.3
Employment Services
114.3
112.6
116.5
1.7 1.5
-2.2 -1.9
Education and Health Services
492.9
492.9
487.4
0.0 0.0
5.5 1.1
Educational Services
92.9
90.9
90.4
2.0 2.2
2.5 2.8
Colleges, Universities, and Professional Schools
55.6
55.1
56.6
0.5 0.9
-1.0 -1.8
Health Care and Social Assistance
400.0
402.0
397.0
-2.0 -0.5
3.0 0.8
Ambulatory Health Care Services
153.1
156.0
149.8
-2.9 -1.9
3.3 2.2
Hospitals
133.7
133.5
131.9
0.2 0.2
1.8 1.4
Nursing and Residential Care Facilities
56.3
57.1
56.5
-0.8 -1.4
-0.2 -0.4
Social Assistance
56.9
55.4
58.8
1.5 2.7
-1.9 -3.2
Leisure and Hospitality
372.3
383.2
376.5
-10.9 -2.8
-4.2 -1.1
Arts, Entertainment, and Recreation
39.5
42.2
39.2
-2.7 -6.4
0.3 0.8
Amusement, Gambling, and Recreation Industries
28.1
30.6
28.8
-2.5 -8.2
-0.7 -2.4
Accommodation and Food Services
332.8
341.0
337.3
-8.2 -2.4
-4.5 -1.3
Accommodation
40.2
41.9
40.4
-1.7 -4.1
-0.2 -0.5
Food Services and Drinking Places
292.6
299.1
296.9
-6.5 -2.2
-4.3 -1.5
Other Services
154.1
156.7
153.6
-2.6 -1.7
0.5 0.3
Repair and Maintenance
32.1
32.9
33.3
-0.8 -2.4
-1.2 -3.6
Personal and Laundry Services
32.6
33.8
33.0
-1.2 -3.6
-0.4 -1.2
Religious, Grantmaking, Civic, Professional, and Similar
89.4
90.0
87.3
-0.6 -0.7
2.1 2.4
Government
648.5
643.3
667.7
5.2 0.8
-19.2 -2.9
Federal Government
101.9
101.8
102.2
0.1 0.1
-0.3 -0.3
Department of Defense
44.1
43.9
42.4
0.2 0.5
1.7 4.0
State Government
149.7
148.1
158.0
1.6 1.1
-8.3 -5.3
State Government Educational Services
74.4
72.5
79.6
1.9 2.6
-5.2 -6.5
Local Government
396.9
393.4
407.5
3.5 0.9
-10.6 -2.6
Local Government Educational Services
244.1
239.5
249.2
4.6 1.9
-5.1 -2.1
Note: These preliminary estimates were prepared in cooperation with the U.S. Department of Labor, Bureau of Labor Statistics, based upon monthly reports submitted by selected employers throughout
Georgia. The estimates include all full- and part-time wage and salary workers who were employed during or received pay for any part of the pay period that includes the twelfth of the month. Proprietors,
domestic workers, self-employed persons, unpaid family workers and personnel of the armed forces are excluded. Estimates based on 2010 benchmark.
2Source: Georgia Department of Labor, Workforce Statistics & Economic Research
ATLANTA MSA Nonagricultural Employment (000s)
Preliminary
Revised
SEP 2011 AUG 2011
Revised SEP 2010
Change in Jobs
from AUG 2011
Net
%
Change in Jobs from SEP 2010
Net %
Total Nonfarm Total Private Goods Producing Service-Providing Private Service-Providing Mining and Logging Construction
Construction of Buildings Specialty Trade Contractors Manufacturing Durable Goods
Transportation Equipment Manufacturing Non-Durable Goods
Food Manufacturing Trade, Transportation, and Utilities
Wholesale Trade Merchant Wholesalers, Durable Goods Merchant Wholesalers, Nondurable Goods Wholesale Electronic Markets and Agents and Brokers
Retail Trade Food and Beverage Stores General Merchandise Stores Miscellaneous Store Retailers
Transportation, Warehousing, and Utilities Utilities Transportation and Warehousing Air Transportation Truck Transportation Couriers and Messengers
Information Telecommunications Wired Telecommunications Carriers Wireless Telecommunications Carriers Internet Service Providers, Search Portals, and DP
Financial Activities Finance and Insurance Insurance Carriers and Related Activities Real Estate and Rental and Leasing
Professional and Business Services Professional, Scientific, and Technical Services Accounting, Tax Prep, and Bookkeeping Services Architectural, Engineering, and Related Services Computer Systems Design and Related Services Management and Technical Consulting Services Management of Companies and Enterprises Admin and Support, Waste Mngmnt and Remediation Employment Services
Education and Health Services Educational Services Health Care and Social Assistance Ambulatory Health Care Services Hospitals Social Assistance
Leisure and Hospitality Arts, Entertainment, and Recreation Accommodation and Food Services Accommodation Food Services and Drinking Places
Other Services Repair and Maintenance Personal and Laundry Services
Government Federal Government State Government Local Government
2,235.0 1,925.1
232.9 2,002.1 1,692.2
1.4 84.6 19.8 50.9 146.9 74.6 13.9 72.3 22.8 514.0 143.6 74.3 37.2 32.1 243.5 48.3 51.7 12.0 126.9 10.7 116.2 39.2 27.0 14.1 75.1 36.4 22.6
9.2 4.5 127.8 93.9 44.4 33.9 388.2 173.2 22.2 25.8 45.7 28.2 40.9 174.1 75.3 278.6 62.1 216.5 82.8 72.4 35.1 216.9 25.6 191.3 22.0 169.3 91.6 18.0 22.1 309.9 46.2 63.8 199.9
2,239.6 1,934.9
235.7 2,003.9 1,699.2
1.4 87.1 19.8 53.3 147.2 74.9 13.8 72.3 22.8 512.9 143.8 74.2 37.5 32.1 241.1 48.1 52.1 12.1 128.0 10.7 117.3 39.6 27.1 14.1 75.5 36.6 22.8
9.2 4.6 129.3 94.2 44.1 35.1 385.7 172.4 22.5 25.8 45.3 28.1 40.6 172.7 74.7 278.7 61.2 217.5 84.3 72.1 35.0 223.9 26.9 197.0 22.4 174.6 93.2 18.2 22.6 304.7 46.1 61.0 197.6
2,260.9 1,941.7
236.5 2,024.4 1,705.2
1.4 92.4 18.9 59.5 142.7 71.0 13.7 71.7 23.7 510.3 144.2 72.5 38.9 32.8 243.1 47.9 50.8 12.8 123.0 10.5 112.5 38.3 26.2 14.2 78.3 37.0 23.5
8.8 5.1 140.2 100.5 43.5 39.7 382.7 164.9 22.6 24.6 40.7 27.4 40.4 177.4 79.3 277.1 61.2 215.9 83.1 71.3 36.4 223.4 27.0 196.4 22.3 174.1 93.2 19.0 22.4 319.2 47.7 66.2 205.3
-4.6 -0.2 -9.8 -0.5 -2.8 -1.2 -1.8 -0.1 -7.0 -0.4 0.0 0.0 -2.5 -2.9 0.0 0.0 -2.4 -4.5 -0.3 -0.2 -0.3 -0.4 0.1 0.7 0.0 0.0 0.0 0.0 1.1 0.2 -0.2 -0.1 0.1 0.1 -0.3 -0.8 0.0 0.0 2.4 1.0 0.2 0.4 -0.4 -0.8 -0.1 -0.8 -1.1 -0.9 0.0 0.0 -1.1 -0.9 -0.4 -1.0 -0.1 -0.4 0.0 0.0 -0.4 -0.5 -0.2 -0.6 -0.2 -0.9 0.0 0.0 -0.1 -2.2 -1.5 -1.2 -0.3 -0.3 0.3 0.7 -1.2 -3.4 2.5 0.7 0.8 0.5 -0.3 -1.3 0.0 0.0 0.4 0.9 0.1 0.4 0.3 0.7 1.4 0.8 0.6 0.8 -0.1 0.0 0.9 1.5 -1.0 -0.5 -1.5 -1.8 0.3 0.4 0.1 0.3 -7.0 -3.1 -1.3 -4.8 -5.7 -2.9 -0.4 -1.8 -5.3 -3.0 -1.6 -1.7 -0.2 -1.1 -0.5 -2.2 5.2 1.7 0.1 0.2 2.8 4.6 2.3 1.2
-25.9 -16.6
-3.6 -22.3 -13.0
0.0 -7.8 0.9 -8.6 4.2 3.6 0.2 0.6 -0.9 3.7 -0.6 1.8 -1.7 -0.7 0.4 0.4 0.9 -0.8 3.9 0.2 3.7 0.9 0.8 -0.1 -3.2 -0.6 -0.9 0.4 -0.6 -12.4 -6.6 0.9 -5.8 5.5 8.3 -0.4 1.2 5.0 0.8 0.5 -3.3 -4.0 1.5 0.9 0.6 -0.3 1.1 -1.3 -6.5 -1.4 -5.1 -0.3 -4.8 -1.6 -1.0 -0.3 -9.3 -1.5 -2.4 -5.4
-1.2 -0.9 -1.5 -1.1 -0.8 0.0 -8.4 4.8 -14.5 2.9 5.1 1.5 0.8 -3.8 0.7 -0.4 2.5 -4.4 -2.1 0.2 0.8 1.8 -6.3 3.2 1.9 3.3 2.4 3.1 -0.7 -4.1 -1.6 -3.8 4.6 -11.8 -8.8 -6.6 2.1 -14.6 1.4 5.0 -1.8 4.9 12.3 2.9 1.2 -1.9 -5.0 0.5 1.5 0.3 -0.4 1.5 -3.6 -2.9 -5.2 -2.6 -1.4 -2.8 -1.7 -5.3 -1.3 -2.9 -3.1 -3.6 -2.6
Note: These preliminary estimates were prepared in cooperation with the U.S. Department of Labor, Bureau of Labor Statistics, based upon monthly reports submitted by selected employers in the
Atlanta Metropolitan Statistical Area, which includes Barrow, Bartow, Butts, Carroll, Cherokee, Clayton, Cobb, Coweta, Dawson, DeKalb, Douglas, Fayette, Forsyth, Fulton, Gwinnett, Haralson, Heard, Henry, Jasper, Lamar, Meriwether, Newton, Paulding, Pickens, Pike, Rockdale, Spalding and Walton counties. The estimates include all full- and part-time wage and salary workers who were employed during or received pay for any part of the pay period that includes the twelfth of the month. Proprietors, domestic workers, self-employed persons, unpaid family workers and personnel of the armed forces are excluded. Estimates based on 2010 benchmark.
Source: Georgia Department of Labor, Workforce Statistics & Economic Research
3
ALBANY MSA Nonagricultural Employment (000s)
Preliminary
Revised
Revised
SEP 2011 AUG 2011 SEP 2010
Change in Jobs from AUG 2011
Net %
Change in Jobs
from SEP 2010
Net
%
Total Nonfarm Total Private
60.9
61.3
60.5
-0.4 -0.7
47.2
48.1
46.8
-0.9 -1.9
0.4 0.7 0.4 0.9
Goods Producing
6.6
6.7
7.0
-0.1 -1.5
-0.4 -5.7
Service-Providing Private Service-Providing
54.3
54.6
53.5
-0.3 -0.6
40.6
41.4
39.8
-0.8 -1.9
0.8 1.5 0.8 2.0
Manufacturing
4.3
4.3
4.4
0.0 0.0
-0.1 -2.3
Trade, Transportation, and Utilities Retail Trade
11.1
11.5
12.1
-0.4 -3.5
7.2
7.3
7.3
-0.1 -1.4
-1.0 -8.3 -0.1 -1.4
Government
13.7
13.2
13.7
0.5 3.8
0.0 0.0
Federal Government State Government
3.4
3.3
3.5
0.1 3.0
-0.1 -2.9
3.1
2.8
2.9
0.3 10.7
0.2 6.9
Local Government
7.2
7.1
7.3
0.1 1.4
-0.1 -1.4
Note: These preliminary estimates were prepared in cooperation with the U.S. Department of Labor, Bureau of Labor Statistics, based upon monthly reports submitted by selected employers in the
Albany Metropolitan Statistical Area, which includes Baker, Dougherty, Lee, Terrell and Worth counties. The estimates include all full- and part-time wage and salary workers who were employed during or received pay for any part of the pay period that includes the twelfth of the month. Proprietors, domestic workers, self-employed persons, unpaid family workers and personnel of the armed forces are
excluded. Estimates based on 2010 benchmark.
ATHENS - CLARKE MSA Nonagricultural Employment (000s)
Preliminary
Revised
Revised
SEP 2011 AUG 2011 SEP 2010
Change in Jobs
from AUG 2011
Net
%
Change in Jobs from SEP 2010
Net %
Total Nonfarm
80.9
80.6
80.3
0.3 0.4
0.6 0.8
Total Private
56.6
56.7
56.4
-0.1 -0.2
0.2 0.4
Goods Producing
9.1
9.2
9.6
-0.1 -1.1
-0.5 -5.2
Service-Providing
71.8
71.4
70.7
0.4 0.6
1.1 1.6
Private Service-Providing
47.5
47.5
46.8
0.0 0.0
0.7 1.5
Trade, Transportation, and Utilities
12.9
12.9
12.9
0.0 0.0
0.0 0.0
Retail Trade
9.1
9.2
9.2
-0.1 -1.1
-0.1 -1.1
Professional and Business Services
6.7
6.6
6.6
0.1 1.5
0.1 1.5
Leisure and Hospitality
7.8
7.9
7.9
-0.1 -1.3
-0.1 -1.3
Government
24.3
23.9
23.9
0.4 1.7
0.4 1.7
Federal Government
1.4
1.4
1.5
0.0 0.0
-0.1 -6.7
State Government
15.1
14.6
14.5
0.5 3.4
0.6 4.1
Local Government
7.8
7.9
7.9
-0.1 -1.3
-0.1 -1.3
Note: These preliminary estimates were prepared in cooperation with the U.S. Department of Labor, Bureau of Labor Statistics, based upon monthly reports submitted by selected employers in the Athens -
Clarke County Metropolitan Statistical Area, which includes Clarke, Madison, Oconee and Oglethorpe counties. The estimates include all full- and part-time wage and salary workers who were employed during or received pay for any part of the pay period that includes the twelfth of the month. Proprietors, domestic workers, self-employed persons, unpaid family workers and personnel of the armed forces are excluded. Estimates based on 2010 benchmark.
Source: Georgia Department of Labor, Workforce Statistics & Economic Research
4
AUGUSTA-RICHMOND MSA Nonagricultural Employment (000s)
Preliminary Revised Revised SEP 2011 AUG 2011 SEP 2010
Change in Jobs from AUG 2011
Net %
Change in Jobs from SEP 2010
Net %
Total Nonfarm Total Private Goods Producing Service-Providing Private Service-Providing Mining, Logging and Construction Manufacturing Trade, Transportation, and Utilities
Wholesale Trade Retail Trade Transportation, Warehousing, and Utilities Information Financial Activities Professional and Business Services Education and Health Services Leisure and Hospitality Other Services Government Federal Government State Government Local Government
206.9 164.7
30.7 176.2 134.0
11.1 19.6 34.1
4.7 23.0
6.4 2.4 7.5 31.0 29.8 20.1 9.1 42.2 8.4 13.2 20.6
207.5 166.0
31.4 176.1 134.6
11.5 19.9 34.4
4.7 23.3
6.4 2.4 7.5 30.9 29.8 20.5 9.1 41.5 8.5 13.1 19.9
210.0 167.2
31.6 178.4 135.6
11.6 20.0 35.8
4.8 24.8
6.2 2.6 7.5 30.4 29.6 20.5 9.2 42.8 8.3 13.3 21.2
-0.6 -0.3 -1.3 -0.8 -0.7 -2.2 0.1 0.1 -0.6 -0.5 -0.4 -3.5 -0.3 -1.5 -0.3 -0.9 0.0 0.0 -0.3 -1.3 0.0 0.0 0.0 0.0 0.0 0.0 0.1 0.3 0.0 0.0 -0.4 -2.0 0.0 0.0 0.7 1.7 -0.1 -1.2 0.1 0.8 0.7 3.5
-3.1 -1.5 -2.5 -1.5 -0.9 -2.9 -2.2 -1.2 -1.6 -1.2 -0.5 -4.3 -0.4 -2.0 -1.7 -4.8 -0.1 -2.1 -1.8 -7.3 0.2 3.2 -0.2 -7.7 0.0 0.0 0.6 2.0 0.2 0.7 -0.4 -2.0 -0.1 -1.1 -0.6 -1.4 0.1 1.2 -0.1 -0.8 -0.6 -2.8
Note: These preliminary estimates were prepared in cooperation with the U.S. Department of Labor, Bureau of Labor Statistics, based upon monthly reports submitted by selected employers in the Augusta -
Richmond County Metropolitan Statistical Area, which includes Burke, Columbia, McDuffie and Richmond counties in Georgia and Aiken and Edgefield counties in South Carolina. The estimates include all full- and part-time wage and salary workers who were employed during or received pay for any part of the pay period that includes the twelfth of the month. Proprietors, domestic workers, self-employed
persons, unpaid family workers and personnel of the armed forces are excluded. Estimates based on 2010 benchmark.
BRUNSWICK MSA Nonagricultural Employment (000s)
Preliminary Revised Revised SEP 2011 AUG 2011 SEP 2010
Change in Jobs from AUG 2011
Net %
Change in Jobs from SEP 2010
Net %
Total Nonfarm Total Private Goods Producing Service-Providing Private Service-Providing Trade, Transportation, and Utilities
Retail Trade Government
Federal Government State Government Local Government
40.0
41.2
40.3
-1.2 -2.9
29.9
31.1
30.3
-1.2 -3.9
4.3
4.4
4.5
-0.1 -2.3
35.7
36.8
35.8
-1.1 -3.0
25.6
26.7
25.8
-1.1 -4.1
7.5
7.5
7.5
0.0 0.0
5.4
5.4
5.4
0.0 0.0
10.1
10.1
10.0
0.0 0.0
1.9
1.9
1.9
0.0 0.0
2.0
2.0
1.8
0.0 0.0
6.2
6.2
6.3
0.0 0.0
-0.3 -0.7 -0.4 -1.3 -0.2 -4.4 -0.1 -0.3 -0.2 -0.8 0.0 0.0 0.0 0.0 0.1 1.0 0.0 0.0 0.2 11.1 -0.1 -1.6
Note: These preliminary estimates were prepared in cooperation with the U.S. Department of Labor, Bureau of Labor Statistics, based upon monthly reports submitted by selected employers in
the Brunswick Metropolitan Statistical Area, which includes Brantley, Glynn and McIntosh counties. The estimates include all full- and part-time wage and salary workers who were employed during or received pay for any part of the pay period that includes the twelfth of the month. Proprietors, domestic workers, self-employed persons, unpaid family workers and personnel of the armed forces are excluded. Estimates based on 2010 benchmark.
Source: Georgia Department of Labor, Workforce Statistics & Economic Research
5
COLUMBUS MSA Nonagricultural Employment (000s)
Preliminary Revised Revised SEP 2011 AUG 2011 SEP 2010
Change in Jobs from AUG 2011
Net %
Change in Jobs from SEP 2010
Net %
Total Nonfarm
119.3
118.3
117.8
1.0 0.9
1.5 1.3
Total Private Goods Producing
96.2
95.6
94.8
0.6 0.6
14.8
14.9
15.3
-0.1 -0.7
1.4 1.5 -0.5 -3.3
Service-Providing
104.5
103.4
102.5
1.1 1.1
2.0 2.0
Private Service-Providing Trade, Transportation, and Utilities
81.4
80.7
79.5
19.1
18.9
18.3
0.7 0.9 0.2 1.1
1.9 2.4 0.8 4.4
Retail Trade
12.9
12.9
12.9
0.0 0.0
0.0 0.0
Information Financial Activities
5.3
5.3
5.5
0.0 0.0
8.1
8.2
8.3
-0.1 -1.2
-0.2 -3.6 -0.2 -2.4
Finance and Insurance
6.1
6.3
6.6
-0.2 -3.2
-0.5 -7.6
Insurance Carriers and Related Activities Professional and Business Services
4.3
4.3
4.4
14.2
14.1
13.3
0.0 0.0 0.1 0.7
-0.1 -2.3 0.9 6.8
Leisure and Hospitality
13.3
13.6
13.3
-0.3 -2.2
0.0 0.0
Government Federal Government
23.1
22.7
23.0
6.3
6.3
5.6
0.4 1.8 0.0 0.0
0.1 0.4 0.7 12.5
State Government
4.2
4.0
4.1
0.2 5.0
0.1 2.4
Local Government
12.6
12.4
13.3
0.2 1.6
-0.7 -5.3
Note: These preliminary estimates were prepared in cooperation with the U.S. Department of Labor, Bureau of Labor Statistics, based upon monthly reports submitted by selected employers in
the Columbus Metropolitan Statistical Area, which includes Chattahoochee, Harris, Marion and Muscogee counties in Georgia and Russell County in Alabama. The estimates include all full- and part-time wage and salary workers who were employed during or received pay for any part of the pay period that includes the twelfth of the month. Proprietors, domestic workers, self-employed persons, unpaid family workers and personnel of the armed forces are excluded. Estimates based on 2010 benchmark.
DALTON MSA Nonagricultural Employment (000s)
Preliminary Revised
Revised
SEP 2011 AUG 2011 SEP 2010
Change in Jobs from AUG 2011
Net %
Change in Jobs from SEP 2010
Net %
Total Nonfarm Total Private Goods Producing
63.7
64.5
66.4
-0.8 -1.2
57.0
58.0
59.6
-1.0 -1.7
23.6
23.8
24.4
-0.2 -0.8
-2.7 -4.1 -2.6 -4.4 -0.8 -3.3
Service-Providing Private Service-Providing Manufacturing
40.1
40.7
42.0
-0.6 -1.5
33.4
34.2
35.2
-0.8 -2.3
22.9
22.9
23.2
0.0 0.0
-1.9 -4.5 -1.8 -5.1 -0.3 -1.3
Textile Mills Textile Product Mills Trade, Transportation, and Utilities
2.5
2.5
2.6
0.0 0.0
15.5
15.8
16.2
-0.3 -1.9
16.0
16.1
16.2
-0.1 -0.6
-0.1 -3.9 -0.7 -4.3 -0.2 -1.2
Retail Trade Transportation, Warehousing, and Utilities Professional and Business Services
7.5
7.5
4.8
4.8
6.9
6.9
7.6
0.0 0.0
-0.1 -1.3
4.7
0.0 0.0
0.1 2.1
6.6
0.0 0.0
0.3 4.6
Government Federal Government State Government
6.7
6.5
0.3
0.3
1.2
1.2
6.8
0.2 3.1
-0.1 -1.5
0.3
0.0 0.0
0.0 0.0
1.1
0.0 0.0
0.1 9.1
Local Government
5.2
5.0
5.4
0.2 4.0
-0.2 -3.7
Note: These preliminary estimates were prepared in cooperation with the U.S. Department of Labor, Bureau of Labor Statistics, based upon monthly reports submitted by selected employers in the
Dalton Metropolitan Statistical Area, which includes Murray and Whitfield counties. The estimates include all full- and part-time wage and salary workers who were employed during or received pay for any part of the pay period that includes the twelfth of the month. Proprietors, domestic workers, self-employed persons, unpaid family workers and personnel of the armed forces are excluded. Estimates based on 2010 benchmark.
Source: Georgia Department of Labor, Workforce Statistics & Economic Research
6
GAINESVILLE MSA Nonagricultural Employment (000s)
Preliminary Revised Revised SEP 2011 AUG 2011 SEP 2010
Change in Jobs from AUG 2011
Net %
Change in Jobs from SEP 2010
Net %
Total Nonfarm
71.9
71.6
73.0
0.3 0.4
-1.1 -1.5
Total Private
61.6
61.6
62.7
0.0 0.0
-1.1 -1.8
Goods Producing Service-Providing
17.6
17.8
54.3
53.8
18.1
-0.2 -1.1
54.9
0.5 0.9
-0.5 -2.8 -0.6 -1.1
Private Service-Providing
44.0
43.8
44.6
0.2 0.5
-0.6 -1.4
Trade, Transportation, and Utilities Retail Trade
12.8
13.0
7.5
7.6
13.7
-0.2 -1.5
7.6
-0.1 -1.3
-0.9 -6.6 -0.1 -1.3
Government
10.3
10.0
10.3
0.3 3.0
0.0 0.0
Federal Government State Government
0.5
0.5
2.7
2.5
0.5
0.0 0.0
2.5
0.2 8.0
0.0 0.0 0.2 8.0
Local Government
7.1
7.0
7.3
0.1 1.4
-0.2 -2.7
Note: These preliminary estimates were prepared in cooperation with the U.S. Department of Labor, Bureau of Labor Statistics, based upon monthly reports submitted by selected employers in the
Gainesville Metropolitan Statistical Area, which comprises Hall county. The estimates include all full- and part-time wage and salary workers who were employed during or received pay for any part of the pay period that includes the twelfth of the month. Proprietors, domestic workers, self-employed persons, unpaid family workers and personnel of the armed forces are excluded. Estimates based on 2010 benchmark.
HINESVILLE - FT. STEWART MSA Nonagricultural Employment (000s)
Preliminary Revised Revised SEP 2011 AUG 2011 SEP 2010
Change in Jobs from AUG 2011
Net %
Change in Jobs from SEP 2010
Net %
Total Nonfarm
19.4
19.5
19.5
-0.1 -0.5
-0.1 -0.5
Total Private Goods Producing Service-Providing
11.7
11.8
11.7
-0.1 -0.9
2.2
2.2
2.2
0.0 0.0
17.2
17.3
17.3
-0.1 -0.6
0.0 0.0 0.0 0.0 -0.1 -0.6
Private Service-Providing Government
Federal Government
9.5
9.6
7.7
7.7
3.9
3.9
9.5
-0.1 -1.0
7.8
0.0 0.0
4.0
0.0 0.0
0.0 0.0 -0.1 -1.3 -0.1 -2.5
State Government Local Government
0.3
0.3
3.5
3.5
0.4
0.0 0.0
-0.1 -25.0
3.4
0.0 0.0
0.1 2.9
Note: These preliminary estimates were prepared in cooperation with the U.S. Department of Labor, Bureau of Labor Statistics, based upon monthly reports submitted by selected employers in the
Hinesville - Ft. Stewart Metropolitan Statistical Area, which includes Liberty and Long counties. The estimates include all full- and part-time wage and salary workers who were employed during or received pay for any part of the pay period that includes the twelfth of the month. Proprietors, domestic workers, self-employed persons, unpaid family workers and personnel of the armed forces are excluded. Estimates based on 2010 benchmark.
Source: Georgia Department of Labor, Workforce Statistics & Economic Research
7
MACON MSA Nonagricultural Employment (000s)
Preliminary Revised
Revised
SEP 2011 AUG 2011 SEP 2010
Change in Jobs from AUG 2011
Net %
Change in Jobs from SEP 2010
Net %
Total Nonfarm
96.3
96.3
94.7
0.0 0.0
1.6 1.7
Total Private Goods Producing
82.0
81.9
9.2
9.3
80.0
0.1 0.1
9.5
-0.1 -1.1
2.0 2.5 -0.3 -3.2
Service-Providing
87.1
87.0
85.2
0.1 0.1
1.9 2.2
Private Service-Providing Trade, Transportation, and Utilities
72.8
72.6
70.5
18.8
18.8
18.8
0.2 0.3 0.0 0.0
2.3 3.3 0.0 0.0
Retail Trade
12.1
12.1
12.1
0.0 0.0
0.0 0.0
Transportation, Warehousing, and Utilities Financial Activities
3.3
3.3
8.7
8.6
3.2
0.0 0.0
8.3
0.1 1.2
0.1 3.1 0.4 4.8
Professional and Business Services
12.1
11.9
11.2
0.2 1.7
0.9 8.0
Education and Health Services Leisure and Hospitality
19.2
19.3
8.3
8.5
19.1
-0.1 -0.5
8.4
-0.2 -2.4
0.1 0.5 -0.1 -1.2
Government
14.3
14.4
14.7
-0.1 -0.7
-0.4 -2.7
Federal Government State Government
1.1
1.2
3.4
3.4
1.3
-0.1 -8.3
3.5
0.0 0.0
-0.2 -15.4 -0.1 -2.9
Local Government
9.8
9.8
9.9
0.0 0.0
-0.1 -1.0
Note: These preliminary estimates were prepared in cooperation with the U.S. Department of Labor, Bureau of Labor Statistics, based upon monthly reports submitted by selected employers in the
Macon Metropolitan Statistical Area, which includes Bibb, Crawford, Jones, Monroe and Twiggs counties. The estimates include all full- and part-time wage and salary workers who were employed during or received pay for any part of the pay period that includes the twelfth of the month. Proprietors, domestic workers, self-employed persons, unpaid family workers and personnel of the armed forces are excluded. Estimates based on 2010 benchmark.
ROME MSA Nonagricultural Employment (000s)
Preliminary Revised
Revised
SEP 2011 AUG 2011 SEP 2010
Change in Jobs from AUG 2011
Net %
Change in Jobs from SEP 2010
Net %
Total Nonfarm Total Private Goods Producing Service-Providing Private Service-Providing Manufacturing Trade, Transportation, and Utilities
Retail Trade Education and Health Services Government
Federal Government State Government Local Government
37.7
37.5
38.6
0.2 0.5
31.4
31.4
31.6
0.0 0.0
6.6
6.7
6.9
-0.1 -1.5
31.1
30.8
31.7
0.3 1.0
24.8
24.7
24.7
0.1 0.4
6.0
6.0
5.9
0.0 0.0
6.1
6.1
6.1
0.0 0.0
3.8
3.8
3.9
0.0 0.0
8.8
8.7
8.7
0.1 1.2
6.3
6.1
7.0
0.2 3.3
0.2
0.2
0.2
0.0 0.0
2.0
1.9
2.6
0.1 5.3
4.1
4.0
4.2
0.1 2.5
-0.9 -2.3 -0.2 -0.6 -0.3 -4.4 -0.6 -1.9 0.1 0.4 0.1 1.7 0.0 0.0 -0.1 -2.6 0.1 1.2 -0.7 -10.0 0.0 0.0 -0.6 -23.1 -0.1 -2.4
Note: These preliminary estimates were prepared in cooperation with the U.S. Department of Labor, Bureau of Labor Statistics, based upon monthly reports submitted by selected employers in the
Rome Metropolitan Statistical Area, which comprises Floyd county. The estimates include all full- and part-time wage and salary workers who were employed during or received pay for any part of the pay period that includes the twelfth of the month. Proprietors, domestic workers, self-employed persons, unpaid family workers and personnel of the armed forces are excluded. Estimates based on 2010 benchmark.
Source: Georgia Department of Labor, Workforce Statistics & Economic Research
8
SAVANNAH MSA Nonagricultural Employment (000s)
Preliminary Revised
Revised
SEP 2011 AUG 2011 SEP 2010
Change in Jobs from AUG 2011
Net %
Change in Jobs from SEP 2010
Net %
Total Nonfarm Total Private Goods Producing Service-Providing Private Service-Providing Mining, Logging and Construction Manufacturing Trade, Transportation, and Utilities
Wholesale Trade Retail Trade Transportation, Warehousing, and Utilities Information Financial Activities Professional and Business Services Education and Health Services Leisure and Hospitality Other Services Government Federal Government State Government Local Government
148.6 125.9
19.4 129.2 106.5
5.7 13.7 32.0
5.8 16.3
9.9 1.6 5.4 17.6 23.1 19.6 7.2 22.7 3.0 5.5 14.2
148.7 126.2
19.6 129.1 106.6
5.9 13.7 32.2
5.8 16.5
9.9 1.6 5.2 17.5 22.9 20.0 7.2 22.5 3.0 5.5 14.0
148.7 126.3
19.8 128.9 106.5
6.1 13.7 32.9
5.9 17.2
9.8 1.5 5.4 17.2 22.9 19.8 6.8 22.4 3.0 5.4 14.0
-0.1 -0.1 -0.3 -0.2 -0.2 -1.0 0.1 0.1 -0.1 -0.1 -0.2 -3.4 0.0 0.0 -0.2 -0.6 0.0 0.0 -0.2 -1.2 0.0 0.0 0.0 0.0 0.2 3.9 0.1 0.6 0.2 0.9 -0.4 -2.0 0.0 0.0 0.2 0.9 0.0 0.0 0.0 0.0 0.2 1.4
-0.1 -0.1 -0.4 -0.3 -0.4 -2.0 0.3 0.2 0.0 0.0 -0.4 -6.6 0.0 0.0 -0.9 -2.7 -0.1 -1.7 -0.9 -5.2 0.1 1.0 0.1 6.7 0.0 0.0 0.4 2.3 0.2 0.9 -0.2 -1.0 0.4 5.9 0.3 1.3 0.0 0.0 0.1 1.9 0.2 1.4
Note: These preliminary estimates were prepared in cooperation with the U.S. Department of Labor, Bureau of Labor Statistics, based upon monthly reports submitted by selected employers in the
Savannah Metropolitan Statistical Area, which includes Bryan, Chatham and Effingham counties. The estimates include all full- and part-time wage and salary workers who were employed during or received pay for any part of the pay period that includes the twelfth of the month. Proprietors, domestic workers, self-employed persons, unpaid family workers and personnel of the armed forces are excluded. Estimates based on 2010 benchmark.
VALDOSTA MSA Nonagricultural Employment (000s)
Preliminary Revised
Revised
SEP 2011 AUG 2011 SEP 2010
Change in Jobs from AUG 2011
Net %
Change in Jobs from SEP 2010
Net %
Total Nonfarm
51.3
51.2
52.6
0.1 0.2
-1.3 -2.5
Total Private Goods Producing Service-Providing
39.1
39.1
40.2
6.0
6.0
6.2
45.3
45.2
46.4
0.0 0.0 0.0 0.0 0.1 0.2
-1.1 -2.7 -0.2 -3.2 -1.1 -2.4
Private Service-Providing Trade, Transportation, and Utilities
Retail Trade
33.1
33.1
34.0
10.4
10.4
10.5
7.4
7.4
7.5
0.0 0.0 0.0 0.0 0.0 0.0
-0.9 -2.7 -0.1 -1.0 -0.1 -1.3
Government Federal Government State Government
12.2
12.1
12.4
1.1
1.1
1.0
3.5
3.5
3.6
0.1 0.8 0.0 0.0 0.0 0.0
-0.2 -1.6 0.1 10.0 -0.1 -2.8
Local Government
7.6
7.5
7.8
0.1 1.3
-0.2 -2.6
Note: These preliminary estimates were prepared in cooperation with the U.S. Department of Labor, Bureau of Labor Statistics, based upon monthly reports submitted by selected employers in the
Valdosta Metropolitan Statistical Area, which includes Brooks, Echols, Lanier and Lowndes counties. The estimates include all full- and part-time wage and salary workers who were employed during or received pay for any part of the pay period that includes the twelfth of the month. Proprietors, domestic workers, self-employed persons, unpaid family workers and personnel of the armed forces are excluded. Estimates based on 2010 benchmark.
Source: Georgia Department of Labor, Workforce Statistics & Economic Research
9
WARNER ROBINS MSA Nonagricultural Employment (000s)
Preliminary Revised
Revised
SEP 2011 AUG 2011 SEP 2010
Change in Jobs from AUG 2011
Net %
Change in Jobs from SEP 2010
Net %
Total Nonfarm Total Private Goods Producing Service-Providing Private Service-Providing Trade, Transportation, and Utilities
Retail Trade Government
Federal Government State Government Local Government
59.0
59.9
33.5
34.3
6.3
6.4
52.7
53.5
27.2
27.9
8.1
8.1
6.3
6.3
25.5
25.6
16.6
16.7
1.1
1.1
7.8
7.8
60.3
-0.9 -1.5
35.0
-0.8 -2.3
6.5
-0.1 -1.6
53.8
-0.8 -1.5
28.5
-0.7 -2.5
8.1
0.0 0.0
6.3
0.0 0.0
25.3
-0.1 -0.4
16.1
-0.1 -0.6
1.2
0.0 0.0
8.0
0.0 0.0
-1.3 -2.2 -1.5 -4.3 -0.2 -3.1 -1.1 -2.0 -1.3 -4.6 0.0 0.0 0.0 0.0 0.2 0.8 0.5 3.1 -0.1 -8.3 -0.2 -2.5
Note: These preliminary estimates were prepared in cooperation with the U.S. Department of Labor, Bureau of Labor Statistics, based upon monthly reports submitted by selected employers in the
Warner Robins Metropolitan Statistical Area, which comprises Houston county. The estimates include all full- and part-time wage and salary workers who were employed during or received pay for any part of the pay period that includes the twelfth of the month. Proprietors, domestic workers, self-employed persons, unpaid family workers and personnel of the armed forces are excluded. Estimates based on 2010 benchmark.
Source: Georgia Department of Labor, Workforce Statistics & Economic Research
10
Georgia Statewide Hours and Earnings
All Employee
Average Weekly Earnings
Preliminary SEP 2011
Revised AUG 2011
Revised SEP 2010
Total Private ........................................................................................... $754.63 ........................ $754.73 ................... $748.13 Goods Producing ................................................................................ $864.47 ........................ $863.04 ................... $802.20 Private Service Providing .................................................................... $734.66 ........................ $733.99 ................... $737.12
Construction .................................................................................... $854.19 ........................ $846.13 ................... $795.47 Manufacturing .................................................................................. $866.71 ........................ $863.35 ................... $780.81 Trade, Transportation, and Utilities ................................................ $699.90 ........................ $697.25 ................... $694.86 Financial Activities ........................................................................... $871.49 ........................ $864.82 ................... $878.35 Professional and Business Services ............................................. $954.95 ........................ $954.44 ................... $929.25 Educational and Health Services .................................................... $769.74 ........................ $770.09 ................... $768.13 Leisure and Hospitality ................................................................... $324.54 ........................ $324.82 ................... $322.14 Other Services ................................................................................. $554.84 ........................ $553.00 ................... $611.99
Average Weekly Hours
Preliminary SEP 2011
Revised AUG 2011
Revised SEP 2010
Total Private ..................................................................................................34.6 .............................. 34.7 ......................... 34.7 Goods Producing ....................................................................................... 39.6 .............................. 39.9 ......................... 38.2 Private Service Providing ........................................................................... 33.7 .............................. 33.7 ......................... 34.0
Construction ........................................................................................... 39.4 .............................. 39.3 ......................... 37.7 Manufacturing ......................................................................................... 40.2 .............................. 40.4 ......................... 38.2 Trade, Transportation, and Utilities ....................................................... 34.7 .............................. 34.5 ......................... 34.9 Financial Activities .................................................................................. 35.6 .............................. 35.4 ......................... 34.8 Professional and Business Services .................................................... 35.5 .............................. 35.6 ......................... 35.0 Educational and Health Services ........................................................... 35.1 .............................. 35.1 ......................... 35.3 Leisure and Hospitality ..........................................................................26.3 .............................. 26.8 ......................... 26.8 Other Services ........................................................................................ 31.4 .............................. 31.8 ......................... 33.7
Average Hourly Earnings
Preliminary SEP 2011
Revised AUG 2011
Revised SEP 2010
Total Private ............................................................................................. $21.81 .......................... $21.75 ..................... $21.56 Goods Producing .................................................................................. $21.83 .......................... $21.63 ..................... $21.00 Private Service Providing ...................................................................... $21.80 .......................... $21.78 ..................... $21.68 Construction ...................................................................................... $21.68 .......................... $21.53 ..................... $21.10 Manufacturing .................................................................................... $21.56 .......................... $21.37 ..................... $20.44 Trade, Transportation, and Utilities .................................................. $20.17 .......................... $20.21 ..................... $19.91 Financial Activities ............................................................................. $24.48 .......................... $24.43 ..................... $25.24 Professional and Business Services ............................................... $26.90 .......................... $26.81 ..................... $26.55 Educational and Health Services ...................................................... $21.93 .......................... $21.94 ..................... $21.76 Leisure and Hospitality ..................................................................... $12.34 .......................... $12.12 ..................... $12.02 Other Services ................................................................................... $17.67 .......................... $17.39 ..................... $18.16
Read more about the hours and earnings series at http://www.bls.gov/sae/home.htm
Source: Georgia Department of Labor, Workforce Statistics & Economic Research
11
Georgia MSA Hours and Earnings
All Employee Total Private
Average Weekly Earnings
Preliminary SEP 2011
Revised AUG 2011
Revised SEP 2010
Albany MSA ............................................................................................ $629.85 ........................ $609.55 ................... $502.61 Athens-Clarke County MSA ................................................................... $617.27 ........................ $622.69 ................... $674.52 Atlanta MSA ............................................................................................ $844.23 ........................ $845.64 ................... $836.20 Augusta-Richmond County MSA ........................................................... $749.99 ........................ $739.63 ................... $718.83 Brunswick MSA ...................................................................................... $449.10 ........................ $447.47 ................... $483.56 Columbus MSA ..................................................................................... $605.74 ........................ $581.05 ................... $568.38 Dalton MSA ............................................................................................ $549.13 ........................ $540.54 ................... $565.54 Gainesville MSA .................................................................................... $843.65 ........................ $828.75 ................... $829.93 Hinesville-Fort Stewart MSA .................................................................. $522.48 ........................ $553.02 ................... $488.05 Macon MSA ............................................................................................ $759.49 ........................ $762.00 ................... $766.21 Rome MSA ............................................................................................ $636.61 ........................ $643.34 ................... $724.91 Savannah MSA ...................................................................................... $672.97 ........................ $684.03 ................... $690.14 Valdosta MSA ......................................................................................... $576.20 ........................ $557.74 ................... $496.94 Warner Robins MSA .............................................................................. $580.94 ........................ $580.67 ................... $666.90
Average Weekly Hours
Preliminary SEP 2011
Revised AUG 2011
Revised SEP 2010
Albany MSA ................................................................................................... 33.7 .............................. 33.4 ......................... 33.8 Athens-Clarke County MSA ..........................................................................31.9 .............................. 31.9 ......................... 33.0 Atlanta MSA ................................................................................................... 34.9 .............................. 34.8 ......................... 34.9 Augusta-Richmond County MSA .................................................................. 37.0 .............................. 37.0 ......................... 37.4 Brunswick MSA ............................................................................................. 30.0 .............................. 29.4 ......................... 30.8 Columbus MSA ............................................................................................34.3 .............................. 33.9 ......................... 33.2 Dalton MSA ................................................................................................... 33.1 .............................. 32.8 ......................... 34.4 Gainesville MSA ........................................................................................... 37.1 .............................. 37.5 ......................... 37.3 Hinesville-Fort Stewart MSA ......................................................................... 33.3 .............................. 33.7 ......................... 32.3 Macon MSA ................................................................................................... 38.3 .............................. 38.1 ......................... 39.7 Rome MSA ................................................................................................... 34.3 .............................. 34.7 ......................... 35.5 Savannah MSA ............................................................................................. 32.7 .............................. 33.4 ......................... 33.6 Valdosta MSA ................................................................................................ 33.5 .............................. 33.1 ......................... 30.6 Warner Robins MSA ..................................................................................... 33.6 .............................. 33.2 ......................... 35.1
Average Hourly Earnings
Preliminary SEP 2011
Revised AUG 2011
Revised SEP 2010
Albany MSA .............................................................................................. $18.69 .......................... $18.25 ..................... $14.87 Athens-Clarke County MSA ..................................................................... $19.35 .......................... $19.52 ..................... $20.44 Atlanta MSA .............................................................................................. $24.19 .......................... $24.30 ..................... $23.96 Augusta-Richmond County MSA ............................................................. $20.27 .......................... $19.99 ..................... $19.22 Brunswick MSA ........................................................................................ $14.97 .......................... $15.22 ..................... $15.70 Columbus MSA ....................................................................................... $17.66 .......................... $17.14 ..................... $17.12 Dalton MSA .............................................................................................. $16.59 .......................... $16.48 ..................... $16.44 Gainesville MSA ...................................................................................... $22.74 .......................... $22.10 ..................... $22.25 Hinesville-Fort Stewart MSA .................................................................... $15.69 .......................... $16.41 ..................... $15.11 Macon MSA .............................................................................................. $19.83 .......................... $20.00 ..................... $19.30 Rome MSA .............................................................................................. $18.56 .......................... $18.54 ..................... $20.42 Savannah MSA ........................................................................................ $20.58 .......................... $20.48 ..................... $20.54 Valdosta MSA ........................................................................................... $17.20 .......................... $16.85 ..................... $16.24 Warner Robins MSA ................................................................................ $17.29 .......................... $17.49 ..................... $19.00
Read more about the hours and earnings series at http://www.bls.gov/sae/home.htm
Source: Georgia Department of Labor, Workforce Statistics & Economic Research
12
Dimensions - Measuring Georgia's Labor Force
Unemployment rates -- Georgia and U.S.
11.0%
10.0%
9.0%
8.0%
7.0%
Ge orgia
U.S.
6.0%
Sep Oct Nov Dec Jan Feb Mar Apr May Jun Jul Aug Sep
2010
2011
WA 9.1
OR
9.6
ID
9.0
NV
13.4
UT
CA
7.4
11.9
AZ 9.1
AK 7.6
State unemployment rates
September 2011
National Unemployment Rate: 9.1% Rates are seasonally adjusted
MT 7.7
WY 5.8
CO 8.3
NM 6.6
ND 3.5
SD 4.6
NE 4.2
KS 6.7
MN 6.9
WI 7.8
IA 6.0
IL 10.0
MO 8.7
OK 5.9
TX 8.5
AR 8.3
MS 10.6
LA 6.9
NH
5.4
ME
VT
7.5
5.8
MI 11.1
OH
IN
9.1
8.9
KY 9.7
TN 9.8
PA 8.3
WV
8.2
VA
6.5
NC 10.5
SC 11.0
AL
GA
9.8
10.3
FL 10.6
MA 7.3 NY 8.0
RI 10.5 CT NJ 8.9 9.2 DE 8.1 DC 11.1
MD 7.4
Unemployment rate 10.0% or greater 7.0% to 9.9% 6.0% to 6.9% 5.0% to 5.9% 4.0% to 4.9% 3.0% to 3.9%
HI 6.4
13
Georgia Labor Force Estimates (not seasonally adjusted) Place of Residence - Persons 16 Years and Older
Georgia
(Seasonally adjusted)
Georgia
(Not Seasonally adjusted)
Albany MSA
Athens-Clarke County MSA
Atlanta MSA
Augusta-Richmond County MSA
Brunswick MSA
Columbus MSA
Dalton MSA
Gainesville MSA
Employment Status
Civilian labor force Employed Unemployed Rate
Civilian labor force Employed Unemployed Rate
Civilian labor force Employed Unemployed Rate
Civilian labor force Employed Unemployed Rate
Civilian labor force Employed Unemployed Rate
Civilian labor force Employed Unemployed Rate
Civilian labor force Employed Unemployed Rate
Civilian labor force Employed Unemployed Rate
Civilian labor force Employed Unemployed Rate
Civilian labor force Employed Unemployed Rate
SEP 2011
4,732,219 4,244,748
487,471 10.3
4,749,540 4,260,318
489,222 10.3
76,844 68,510
8,334 10.8
108,233 99,558 8,675 8.0
2,682,727 2,406,854
275,873 10.3
261,187 236,073
25,114 9.6
51,518 46,098
5,420 10.5
133,969 120,822
13,147 9.8
61,861 54,101
7,760 12.5
89,754 82,041
7,713 8.6
AUG 2011
4,708,533 4,227,365
481,168 10.2
4,719,400 4,231,332
488,068 10.3
76,530 68,345
8,185 10.7
106,792 98,449 8,343 7.8
2,666,700 2,390,770
275,930 10.3
260,332 235,213
25,119 9.6
52,311 46,916
5,395 10.3
131,947 119,091 12,856
9.7
61,677 54,222
7,455 12.1
88,605 81,015
7,590 8.6
SEP 2010
4,680,786 4,201,082
479,704 10.2
4,683,260 4,206,511
476,749 10.2
74,872 66,772
8,100 10.8
104,894 96,986 7,908 7.5
2,654,289 2,381,790
272,499 10.3
258,937 235,997
22,940 8.9
50,553 45,565
4,988 9.9
128,638 116,827
11,811 9.2
62,400 55,086
7,314 11.7
89,349 81,503
7,846 8.8
Change From
AUG 2011
SEP 2010
23,686 17,383
6,303
51,433 43,666
7,767
30,140 28,986
1,154
66,280 53,807 12,473
314
1,972
165
1,738
149
234
1,441 1,109
332
3,339 2,572
767
16,027 16,084
-57
28,438 25,064
3,374
855
2,250
860
76
-5
2,174
-793
965
-818
533
25
432
2,022 1,731
291
5,331 3,995 1,336
184 -121 305
-539 -985 446
1,149 1,026
123
405 538 -133
Note: MSA data are not seasonally adjusted. Employment includes nonagricultural wage and salary employment, self-employment, unpaid family and private
household workers and agricultural workers. Persons in labor disputes are counted as employed. The use of unrounded data does not imply that the numbers are exact. Georgia and Metropolitan Statistical Area data have not been seasonally adjusted.
Albany MSA: Baker, Dougherty, Lee, Terrell, and Worth counties. Athens - Clarke County MSA: Clarke, Madison, Oconee, and Oglethorpe counties. Atlanta MSA: Barrow, Bartow, Butts, Carroll, Cherokee, Clayton, Cobb, Coweta, Dawson, DeKalb, Douglas, Fayette, Forsyth, Fulton, Gwinnett, Haralson, Heard, Henry, Jasper, Lamar, Meriwether, Newton, Paulding, Pickens, Pike, Rockdale, Spalding, and Walton counties. Augusta - Richmond County MSA: Burke, Columbia, McDuffie, and Richmond counties in Georgia and Aiken and Edgefield counties in South Carolina. Brunswick MSA: Brantley, Glynn, and McIntosh counties. Columbus MSA: Chattahoochee, Harris, Marion, and Muscogee counties in Georgia and Russell County in Alabama. Dalton MSA: Murray and Whitfield counties. Gainesville MSA: Hall County. Hinesville - Fort Stewart MSA: Liberty and Long counties. Macon MSA: Bibb, Crawford, Jones, Monroe, and Twiggs counties. Rome MSA: Floyd County. Savannah MSA: Bryan, Chatham, and Effingham counties. Valdosta MSA: Brooks, Echols, Lanier, and Lowndes counties. Warner Robins MSA: Houston County.
Source: Georgia Department of Labor, Workforce Statistics & Economic Research
14
Georgia Labor Force Estimates (not seasonally adjusted) Place of Residence - Persons 16 Years and Older
Hinesville-Ft. Stewart MSA Macon MSA
Rome MSA Savannah MSA
Valdosta MSA Warner Robins MSA
Employment Status
Civilian labor force Employed Unemployed Rate
Civilian labor force Employed Unemployed Rate
Civilian labor force Employed Unemployed Rate
Civilian labor force Employed Unemployed Rate
Civilian labor force Employed Unemployed Rate
Civilian labor force Employed Unemployed Rate
SEP 2011
33,626 30,325
3,301 9.8
115,097 103,166
11,931 10.4
48,780 43,270
5,510 11.3
176,994 160,488
16,506 9.3
66,459 60,283
6,176 9.3
72,013 66,284
5,729 8.0
AUG 2011
33,357 30,162
3,195 9.6
114,034 102,195
11,839 10.4
48,190 42,663
5,527 11.5
175,956 159,253
16,703 9.5
65,807 59,699
6,108 9.3
72,142 66,524
5,618 7.8
SEP 2010
32,453 29,584
2,869 8.8
111,022 99,529 11,493
10.4
48,213 43,107
5,106 10.6
172,657 157,192
15,465 9.0
66,483 60,797
5,686 8.6
71,223 65,858
5,365 7.5
Change From
AUG 2011
SEP 2010
269
1,173
163
741
106
432
1,063 971 92
4,075 3,637
438
590
567
607
163
-17
404
1,038 1,235 -197
4,337 3,296 1,041
652
-24
584
-514
68
490
-129
790
-240
426
111
364
United States Labor Force Estimates Place of Residence - Persons 16 Years and Older
Area
United States
(Seasonally adjusted)
Employment Status
Civilian labor force Employed Unemployed Rate
SEP 2011
154,017,000 140,025,000
13,992,000 9.1
AUG 2011
153,594,000 139,627,000
13,967,000 9.1
SEP 2010
154,124,000 139,378,000
14,746,000 9.6
Change From
AUG 2011
SEP 2010
423,000 398,000
25,000
-107,000 647,000 -754,000
United States
(Not Seasonally adjusted)
Civilian labor force Employed Unemployed
Rate
154,022,000 140,502,000
13,520,000 8.8
154,344,000 140,335,000
14,008,000 9.1
153,854,000 139,715,000
14,140,000 9.2
-322,000 167,000 -488,000
168,000 787,000 -620,000
Note: Employment includes nonagricultural wage and salary employment, self-employment, unpaid family and private household workers and agricultural
workers. Persons in labor disputes are counted as employed. The use of unrounded data does not imply that the numbers are exact. Georgia and Metropolitan Statistical Area data have not been seasonally adjusted. Seasonally adjusted data for Georgia available upon request.
Albany MSA: Baker, Dougherty, Lee, Terrell, and Worth counties. Athens - Clarke County MSA: Clarke, Madison, Oconee, and Oglethorpe counties. Atlanta MSA: Barrow, Bartow, Butts, Carroll, Cherokee, Clayton, Cobb, Coweta, Dawson, DeKalb, Douglas, Fayette, Forsyth, Fulton, Gwinnett, Haralson, Heard, Henry, Jasper, Lamar, Meriwether, Newton, Paulding, Pickens, Pike, Rockdale, Spalding, and Walton counties. Augusta - Richmond County MSA: Burke, Columbia, McDuffie, and Richmond counties in Georgia and Aiken and Edgefield counties in South Carolina. Brunswick MSA: Brantley, Glynn, and McIntosh counties. Columbus MSA: Chattahoochee, Harris, Marion, and Muscogee counties in Georgia and Russell County in Alabama. Dalton MSA: Murray and Whitfield counties. Gainesville MSA: Hall County. Hinesville - Fort Stewart MSA: Liberty and Long counties. Macon MSA: Bibb, Crawford, Jones, Monroe, and Twiggs counties. Rome MSA: Floyd County. Savannah MSA: Bryan, Chatham, and Effingham counties. Valdosta MSA: Brooks, Echols, Lanier, and Lowndes counties. Warner Robins MSA: Houston County.
Source: Georgia Department of Labor, Workforce Statistics & Economic Research
15
Georgia Labor Force Estimates by County (not seasonally adjusted)
Georgia
Place of Residence - Persons 16 Years and Older
September 2011
August 2011
Labor Force
Employment
Unemployment Number Rate
4,749,540 4,260,318 489,222 10.3
Labor Force
Employment
Unemployment Number Rate
4,719,400 4,231,332 488,068 10.3
Appling Atkinson Bacon Baker Baldwin
9,599 3,224 4,592 1,588 18,503
8,495 2,746 4,126 1,424 15,866
1,104 11.5 478 14.8 466 10.1 164 10.3
2,637 14.3
9,608 3,135 4,601 1,574 18,332
8,417 2,726 4,119 1,421 15,670
1,191 12.4 409 13.0 482 10.5 153 9.7
2,662 14.5
Banks Barrow Bartow Ben Hill Berrien
10,117 34,260 45,115
6,975 7,770
9,395 31,005 40,195
5,983 6,903
722 7.1 3,255 9.5 4,920 10.9
992 14.2 867 11.2
10,079 34,037 44,714
6,831 7,732
9,341 30,798 39,927
5,891 6,853
738 7.3 3,239 9.5 4,787 10.7
940 13.8 879 11.4
Bibb Bleckley Brantley Brooks Bryan
75,827 5,429 7,276 7,831
16,862
67,736 4,651 6,395 7,076
15,532
8,091 10.7 778 14.3 881 12.1 755 9.6
1,330 7.9
75,062 5,344 7,385 7,748
16,750
67,098 4,613 6,508 7,007
15,413
7,964 10.6 731 13.7 877 11.9 741 9.6
1,337 8.0
Bulloch Burke Butts Calhoun Camden
32,676 9,724
10,039 2,359
20,275
29,006 8,729 8,788 2,103
18,222
3,670 11.2 995 10.2
1,251 12.5 256 10.9
2,053 10.1
32,702 9,794 9,907 2,318
20,227
29,219 8,676 8,729 2,063
18,206
3,483 10.7 1,118 11.4 1,178 11.9
255 11.0 2,021 10.0
Candler Carroll Catoosa Charlton Chatham
4,329 3,847
482 11.1
51,926 46,204 5,722 11.0
35,444 32,546 2,898 8.2
4,460 3,939
521 11.7
131,789 118,910 12,879 9.8
4,408 51,567 35,080
4,415 131,027
3,924 45,895 32,110
3,878 117,995
484 11.0 5,672 11.0 2,970 8.5
537 12.2 13,032 9.9
Chattahoochee 2,822
Chattooga
10,486
Cherokee
108,432
Clarke
65,486
Clay
1,411
2,287 9,258 98,954 60,031 1,286
535 19.0 1,228 11.7 9,478 8.7 5,455 8.3
125 8.9
2,738 10,403 107,647 64,592
1,374
2,248 9,181 98,292 59,362 1,248
490 17.9 1,222 11.7 9,355 8.7 5,230 8.1
126 9.2
Clayton Clinch Cobb Coffee Colquitt
132,665 115,691 16,974 12.8
2,610 2,277
333 12.8
370,559 335,504 35,055 9.5
15,779 13,599 2,180 13.8
20,430 18,448 1,982 9.7
131,947 114,918 17,029 12.9
2,587 2,254
333 12.9
368,487 333,262 35,225 9.6
15,768 13,500 2,268 14.4
20,353 18,344 2,009 9.9
Columbia Cook Coweta Crawford Crisp
61,154 6,469
60,351 6,092 9,386
56,478 5,666
54,462 5,494 8,080
4,676 7.6 803 12.4
5,889 9.8 598 9.8
1,306 13.9
60,764 6,434
60,124 6,055 9,358
56,134 5,621
54,098 5,442 8,093
4,630 7.6 813 12.6
6,026 10.0 613 10.1
1,265 13.5
16
September 2010
Labor Force
Employment
Unemployment Number Rate
4,683,260 4,206,511 476,749 10.2
9,453 3,033 4,561 1,534 18,551
8,474 2,608 4,096 1,388 15,759
979 10.4 425 14.0 465 10.2 146 9.5 2,792 15.1
10,153 34,203 45,163
7,112 7,999
9,427 30,682 39,777
6,123 7,060
726 7.2 3,521 10.3 5,386 11.9
989 13.9 939 11.7
73,192 5,395 7,123 7,796
16,602
65,348 4,708 6,321 7,136
15,213
7,844 10.7 687 12.7 802 11.3 660 8.5
1,389 8.4
31,049 9,721 9,838 2,318
19,665
27,973 8,667 8,696 2,101
17,756
3,076 9.9 1,054 10.8 1,142 11.6
217 9.4 1,909 9.7
4,141 51,217 34,471
4,307 128,256
3,728 45,723 31,737
3,810 116,468
413 10.0 5,494 10.7 2,734 7.9
497 11.5 11,788 9.2
2,598 10,450 107,299 63,288
1,460
2,209 9,184 97,923 58,480 1,339
389 15.0 1,266 12.1 9,376 8.7 4,808 7.6
121 8.3
130,905 2,727
368,084 15,684 20,214
114,486 2,404
332,010 12,914 18,297
16,419 12.5 323 11.8
36,074 9.8 2,770 17.7 1,917 9.5
60,223 6,747
59,426 5,933 9,311
56,077 5,904
53,895 5,300 8,032
4,146 6.9 843 12.5
5,531 9.3 633 10.7
1,279 13.7
Georgia Labor Force Estimates by County (not seasonally adjusted)
Dade Dawson Decatur DeKalb Dodge
Place of Residence - Persons 16 Years and Older
September 2011
Labor Force
Employment
Unemployment Number Rate
8,156 7,492
664 8.1
10,923 9,981
942 8.6
11,103 9,614 1,489 13.4
377,821 337,961 39,860 10.5
8,967 7,970
997 11.1
August 2011
Labor Force
Employment
Unemployment Number Rate
8,187
7,391
796 9.7
10,946 9,915 1,031 9.4
11,058 9,558 1,500 13.6
376,176 335,702 40,474 10.8
8,877 7,870 1,007 11.3
Dooly Dougherty Douglas Early Echols
4,540 42,653 64,365
5,492 2,122
3,940 37,397 57,260
4,932 1,973
600 13.2 5,256 12.3 7,105 11.0
560 10.2 149 7.0
4,505 42,413 64,174
5,429 2,098
3,905 37,307 56,877
4,888 1,954
600 13.3 5,106 12.0 7,297 11.4
541 10.0 144 6.9
Effingham Elbert Emanuel Evans Fannin
28,343 9,080
10,158 4,951
10,746
26,046 7,707 8,883 4,455 9,681
2,297 8.1 1,373 15.1 1,275 12.6
496 10.0 1,065 9.9
28,179 9,103
10,152 4,893
10,677
25,845 7,711 8,874 4,412 9,618
2,334 8.3 1,392 15.3 1,278 12.6
481 9.8 1,059 9.9
Fayette Floyd Forsyth Franklin Fulton
50,780 46,072 4,708 9.3 48,780 43,270 5,510 11.3 86,448 79,598 6,850 7.9 10,223 9,030 1,193 11.7 483,211 431,156 52,055 10.8
50,272 45,764 4,508 9.0 48,190 42,663 5,527 11.5 86,003 79,067 6,936 8.1 10,161 8,936 1,225 12.1 480,986 428,275 52,711 11.0
Gilmer Glascock Glynn Gordon Grady
12,882 1,127 39,154 25,693 11,885
11,427 995
35,194 22,703 10,875
1,455 11.3 132 11.7
3,960 10.1 2,990 11.6 1,010 8.5
12,759 1,123
39,788 25,464 11,746
11,324 992
35,818 22,537 10,732
1,435 11.2 131 11.7
3,970 10.0 2,927 11.5 1,014 8.6
Greene Gwinnett Habersham Hall Hancock
7,419 6,665
754 10.2
412,385 374,372 38,013 9.2
19,747 17,757 1,990 10.1
89,754 82,041 7,713 8.6
2,956 2,349
607 20.5
7,394
6,619
775 10.5
409,766 371,870 37,896 9.2
19,667 17,647 2,020 10.3
88,605 81,015 7,590 8.6
2,897
2,320
577 19.9
Haralson Harris Hart Heard Henry
12,266 16,869 10,458
4,737 97,213
10,974 1,292 10.5
15,586 1,283 7.6
9,227 1,231 11.8
4,191
546 11.5
86,561 10,652 11.0
12,200 16,447 10,397
4,741 96,415
10,901 1,299 10.6
15,320 1,127 6.9
9,143 1,254 12.1
4,163
578 12.2
85,982 10,433 10.8
Houston Irwin Jackson Jasper Jeff Davis
72,013 3,860
27,284 6,303 5,522
66,284 3,362
24,516 5,566 4,735
5,729 8.0 498 12.9
2,768 10.1 737 11.7 787 14.3
72,142 3,802
27,157 6,189 5,529
66,524 3,310
24,354 5,529 4,727
5,618 7.8 492 12.9
2,803 10.3 660 10.7 802 14.5
September 2010
Labor Force
Employment
Unemployment Number Rate
7,990 10,968 10,922 374,139
8,796
7,305 9,877 9,448 334,441 7,759
685 8.6 1,091 9.9 1,474 13.5 39,698 10.6 1,037 11.8
4,680 41,327 63,744
5,413 2,118
4,147 36,448 56,663
4,921 1,990
533 11.4 4,879 11.8 7,081 11.1
492 9.1 128 6.0
27,799 9,385 9,785 4,798
10,641
25,511 8,082 8,634 4,368 9,550
2,288 8.2 1,303 13.9 1,151 11.8
430 9.0 1,091 10.3
49,704 48,213 85,562 10,062 477,570
45,592 43,107 78,770
8,927 426,666
4,112 8.3 5,106 10.6 6,792 7.9 1,135 11.3 50,904 10.7
13,192 1,105
38,352 25,330 11,535
11,848 974
34,787 22,319 10,534
1,344 10.2 131 11.9
3,565 9.3 3,011 11.9 1,001 8.7
7,242 408,132
19,597 89,349
3,016
6,442 370,473
17,729 81,503
2,333
800 11.0 37,659 9.2
1,868 9.5 7,846 8.8
683 22.6
12,391 16,157 10,168
4,706 95,547
10,860 15,057
9,048 4,147 85,659
1,531 12.4 1,100 6.8 1,120 11.0
559 11.9 9,888 10.3
71,223 3,965
27,135 6,226 5,311
65,858 3,441
24,275 5,508 4,568
5,365 7.5 524 13.2
2,860 10.5 718 11.5 743 14.0
17
Georgia Labor Force Estimates by County (not seasonally adjusted)
Jefferson Jenkins Johnson Jones Lamar
Place of Residence - Persons 16 Years and Older
September 2011
August 2011
Labor Force
6,832 2,514 3,437 14,460 7,987
Employment
Unemployment Number Rate
5,890 2,018 2,973 13,163 6,925
942 13.8 496 19.7 464 13.5 1,297 9.0 1,062 13.3
Labor Force
6,800 2,459 3,478 14,310 7,856
Employment
Unemployment Number Rate
5,856 1,996 2,949 13,039 6,879
944 13.9 463 18.8 529 15.2 1,271 8.9 977 12.4
Lanier Laurens Lee Liberty Lincoln
3,991 21,697 18,181 26,780
3,665
3,632 18,791 16,702 24,041
3,254
359 9.0 2,906 13.4 1,479 8.1 2,739 10.2
411 11.2
3,952 21,447 18,037 26,551
3,657
3,597 18,635 16,662 23,912
3,242
355 9.0 2,812 13.1 1,375 7.6 2,639 9.9
415 11.3
Long Lowndes Lumpkin McDuffie McIntosh
6,846 52,515 13,091 10,715
5,089
6,284 47,602 11,739
9,528 4,510
562 8.2 4,913 9.4 1,352 10.3 1,187 11.1
579 11.4
6,806 52,008 13,025 10,730
5,139
6,250 47,140 11,689
9,469 4,590
556 8.2 4,868 9.4 1,336 10.3 1,261 11.8
549 10.7
Macon Madison Marion Meriwether Miller
5,160 15,898
3,406 9,391 3,605
4,360 14,608
3,060 8,025 3,343
800 15.5 1,290 8.1
346 10.2 1,366 14.5
262 7.3
5,135 15,706
3,328 9,327 3,479
4,364 14,445
3,008 7,971 3,213
771 15.0 1,261 8.0
320 9.6 1,356 14.5
266 7.6
Mitchell Monroe Montgomery Morgan Murray
10,044 13,955
4,549 9,154 19,193
9,012 12,613
4,031 8,252 16,687
1,032 10.3 1,342 9.6
518 11.4 902 9.9 2,506 13.1
9,951 13,924
4,521 9,130 18,985
8,902 12,494
4,015 8,228 16,724
1,049 10.5 1,430 10.3
506 11.2 902 9.9 2,261 11.9
Muscogee Newton Oconee Oglethorpe Paulding
88,599 46,712 18,945
7,904 67,018
80,185 40,711 17,668 7,251 60,146
8,414 9.5 6,001 12.8 1,277 6.7
653 8.3 6,872 10.3
87,203 46,207 18,693
7,800 66,761
78,819 40,439 17,472
7,170 59,744
8,384 9.6 5,768 12.5 1,221 6.5
630 8.1 7,017 10.5
Peach Pickens Pierce Pike Polk
12,542 14,661
8,447 7,940 20,797
11,086 13,294
7,639 7,084 18,674
1,456 11.6 1,367 9.3
808 9.6 856 10.8 2,123 10.2
12,380 14,537
8,527 7,798 20,571
10,933 13,206
7,687 7,036 18,470
1,447 11.7 1,331 9.2
840 9.9 762 9.8 2,101 10.2
Pulaski Putnam Quitman Rabun Randolph
4,468 9,671
951 6,595 2,796
4,057 8,577
843 5,807 2,407
411 9.2 1,094 11.3
108 11.4 788 11.9 389 13.9
4,447 9,575
955 6,654 2,771
4,037 8,477
833 5,819 2,372
410 9.2 1,098 11.5
122 12.8 835 12.5 399 14.4
September 2010
Labor Force
Employment
Unemployment Number Rate
6,724 2,449 3,372 13,938 7,873
5,798 2,007 2,985 12,699 6,853
926 13.8 442 18.0 387 11.5 1,239 8.9 1,020 13.0
4,041 21,557 17,724 25,821
3,699
3,663 18,868 16,278 23,453
3,308
378 9.4 2,689 12.5 1,446 8.2 2,368 9.2
391 10.6
6,632 52,526 12,843 10,447
5,077
6,131 48,007 11,527
9,460 4,457
501 7.6 4,519 8.6 1,316 10.2
987 9.4 620 12.2
5,092 15,507
3,291 9,039 3,473
4,357 14,230
2,956 7,941 3,216
735 14.4 1,277 8.2
335 10.2 1,098 12.1
257 7.4
9,955 13,436
4,366 8,905 19,274
8,909 12,168
3,971 8,018 16,991
1,046 10.5 1,268 9.4
395 9.0 887 10.0 2,283 11.8
85,438 45,999 18,365
7,735 66,503
77,463 40,287 17,212
7,064 59,520
7,975 9.3 5,712 12.4 1,153 6.3
671 8.7 6,983 10.5
11,894 14,512
8,598 7,783 20,334
10,430 13,156
7,704 7,010 18,217
1,464 12.3 1,356 9.3
894 10.4 773 9.9 2,117 10.4
4,480 9,755
963 6,636 2,716
4,089 8,582
847 5,898 2,390
391 8.7 1,173 12.0
116 12.0 738 11.1 326 12.0
18
Georgia Labor Force Estimates by County (not seasonally adjusted)
Richmond Rockdale Schley Screven Seminole
Spalding Stephens Stewart Sumter Talbot
Taliaferro Tattnall Taylor Telfair Terrell
Thomas Tift Toombs Towns Treutlen
Troup Turner Twiggs Union Upson
Walker Walton Ware Warren Washington
Wayne Webster Wheeler White Whitfield
Wilcox Wilkes Wilkinson Worth
Place of Residence - Persons 16 Years and Older
September 2011
August 2011
Labor Force
Employment
Unemployment Number Rate
Labor Force
Employment
Unemployment Number Rate
91,485 39,875
1,801 7,101 3,856
81,748 35,143
1,574 6,156 3,431
9,737 10.6 4,732 11.9
227 12.6 945 13.3 425 11.0
91,023 39,660
1,786 7,035 3,855
81,249 34,908
1,575 6,078 3,436
9,774 10.7 4,752 12.0
211 11.8 957 13.6 419 10.9
28,271 13,348
2,268 13,704
3,201
24,424 11,989 2,041 11,862 2,862
3,847 13.6 1,359 10.2
227 10.0 1,842 13.4
339 10.6
27,897 13,198
2,244 13,691
3,093
24,261 11,803 2,017 11,876 2,813
3,636 13.0 1,395 10.6
227 10.1 1,815 13.3
280 9.1
803 9,672 3,476 4,228 4,455
705 8,739 3,011 3,530 3,944
98 12.2 933 9.6 465 13.4 698 16.5 511 11.5
794 9,666 3,424 4,228 4,436
700 8,703 2,972 3,525 3,934
94 11.8 963 10.0 452 13.2 703 16.6 502 11.3
21,945 18,873 14,081
5,923 2,886
19,981 16,611 12,376 5,376 2,449
1,964 8.9 2,262 12.0 1,705 12.1
547 9.2 437 15.1
21,746 18,746 14,092
5,911 2,879
19,805 16,505 12,328
5,377 2,460
1,941 8.9 2,241 12.0 1,764 12.5
534 9.0 419 14.6
33,567 4,398 4,764 11,048 11,689
29,787 3,888 4,161
10,170 10,282
3,780 11.3 510 11.6 603 12.7 878 7.9
1,407 12.0
33,304 4,319 4,682 11,034 11,583
29,558 3,797 4,122 10,111
10,196
3,746 11.2 522 12.1 560 12.0 923 8.4
1,387 12.0
32,438 41,070 14,707
2,584 7,525
29,459 36,606 12,896
2,122 6,494
2,979 9.2 4,464 10.9 1,811 12.3
462 17.9 1,031 13.7
31,980 40,360 14,792
2,532 7,535
29,065 36,361 12,977
2,103 6,488
2,915 9.1 3,999 9.9 1,815 12.3
429 16.9 1,047 13.9
12,297 1,156 2,936
12,707 42,668
10,717 1,048 2,615 11,463
37,414
1,580 12.8 108 9.3 321 10.9
1,244 9.8 5,254 12.3
12,235 1,145 2,937
12,557 42,692
10,638 1,037 2,617 11,327
37,498
1,597 13.1 108 9.4 320 10.9
1,230 9.8 5,194 12.2
3,144 4,467 4,444 9,967
2,736 3,914 3,949 9,043
408 13.0 553 12.4 495 11.1 924 9.3
3,100 4,371 4,433 10,070
2,690 3,832 3,931 9,022
410 13.2 539 12.3 502 11.3 1,048 10.4
September 2010
Labor Force
Employment
Unemployment Number Rate
90,440 39,422
1,786 6,884 3,903
81,167 34,777
1,529 5,942 3,503
9,273 10.3 4,645 11.8
257 14.4 942 13.7 400 10.2
27,874 13,444
2,263 13,283
3,021
24,170 12,084
2,028 11,531 2,768
3,704 13.3 1,360 10.1
235 10.4 1,752 13.2
253 8.4
774 9,415 3,452 4,059 4,349
682 8,550 2,973 3,300 3,844
92 11.9 865 9.2 479 13.9 759 18.7 505 11.6
21,493 18,798 13,633
5,699 2,841
19,550 16,552 12,193
5,192 2,480
1,943 9.0 2,246 11.9 1,440 10.6
507 8.9 361 12.7
31,569 4,386 4,522
10,958 11,426
28,040 3,824 4,014
10,028 10,011
3,529 11.2 562 12.8 508 11.2 930 8.5
1,415 12.4
32,074 40,455 14,679
2,524 7,495
28,727 36,225 13,005
2,099 6,361
3,347 10.4 4,230 10.5 1,674 11.4
425 16.8 1,134 15.1
11,798 1,136 2,826 12,396 43,126
10,334 1,029 2,517 11,207
38,095
1,464 12.4 107 9.4 309 10.9
1,189 9.6 5,031 11.7
3,071 4,386 4,380 9,938
2,681 3,877 3,884 8,814
390 12.7 509 11.6 496 11.3 1,124 11.3
19
New Developments
GAF will open a manufacturing facility in Bulloch County. The Statesboro site will produce polyisocyanurate, an insulation material used with commercial roofing. The new plant will result in 50 full-time jobs in the community.
Another retail outlet will be built on Memorial Drive in DeKalb County where the company already has an established location. Wal-Mart will erect a 148,000 square foot store at the corner of Hairston Road that will feature a grocery department, a pharmacy and a garden center. The new store will create some 300 jobs for the area.
A convention center in Douglas County will be built to enable the county to reap some of the benefits of the crowded metro Atlanta convention business. The Douglas County Convention Center, an $11.6 million meeting facility, will allow Douglasville to host multiple conventions simultaneously and attract business from nearby Paulding County and the Hartsfield-Jackson International Airport area. The 35,000 square foot facility will create about 160 new jobs.
A new distribution center in Floyd County will account for 600 new jobs by 2016. Lowe's decision to build a regional distribution center in the Rome area was based on several factors, but one of the big ones was logistics. The North Carolina-based home improvement products retailer expects to construct the $125 million, 1.4 million square-foot facility in 18 months. Georgia's network of transportation, material handling and warehouse services allows for the efficient movement of goods and will allow this center to service 130 to 150 stores in six states.
A new Meriwether County manufacturing operation expects to hire 450 employees by 2016. The new Mando America plant will produce electric power-steering gears and anti-lock brakes for vehicle manufacturers including Chrysler, General Motors, Hyundai and Kia, among others. This site will be the company's third location in the U. S. and will be located in the Meriwether Park near Hogansville and represent a $200 million investment. The operations are expected to begin sometime in 2013 and the company will hire 200 people initially then gradually increase the employment number to 450 by 2016.
Sumter County has had some good economic news as it has been announced that a new online call center will create 100 jobs. PetCareRx will fill 60 positions immediately and these employees will undergo training for their new Americus facility. The new facility should have a total employment of 100 by the end of the year. The company sells pet medications at a discounted price on the internet.
A Carroll County employer will expand its corporate headquarters and add 400 jobs over the next three years while creating $12 million in new capital investment. Greenway Medical Technologies, Inc. provides electronic health records, ambulatory health care and clinical research business solutions and services to more than 27,000 healthcare providers nationwide. The expansion allows for the construction of two new buildings creating a five-building corporate campus. The plans add 80,000 square feet to the Carrollton campus and will include a new corporate headquarters and training facilities.
20
Georgia Unemployment Rates by County
September 2011
Dade
Catoosa
Murray
Fannin
Towns
Union
Rabun
Whitfield Walker
Gilmer
White Habersham
Chattooga
Gordon
Pickens
Lumpkin
Stephens
Floyd
Dawson
Banks Franklin Hart
Bartow Cherokee Forsyth
Hall
14.0% or greater 12.0% to 13.9% 10.3% to 11.9%
Jackson Madison Elbert
Polk Haralson
Paulding Cobb
Barrow Gwinnett
DeKalb
Walton
Douglas Fulton
Rockdale
Clarke Oconee
Oglethorpe Wilkes
Lincoln
Carroll
Clayton
Newton Morgan Greene Taliaferro
Columbia
Fayette
Henry
McDuffie
Coweta Heard
Spalding
Butts Jasper Putnam
Warren Hancock Glascock
Richmond
Less than 10.3%
Troup
Meriwether Pike Lamar Monroe
Jones Baldwin
Jefferson Washington
Burke
Upson
Harris
Talbot
Muscogee
Bibb Crawford
Taylor
Peach
Wilkinson Twiggs
Johnson
Jenkins Emanuel
Screven
Marion Chattahoochee
Macon
Schley
Stewart Webster Sumter
Quitman
Terrell Lee Randolph
Houston Bleckley
Laurens Treutlen
Candler Bulloch
Effingham
Dooly Crisp
Pulaski Wilcox
Dodge
Montgomery
Wheeler
Toombs
Telfair
Evans Tattnall
Bryan
Chatham
Turner
Ben Hill
Jeff Davis Appling
Liberty Long
Clay Calhoun Dougherty
Early
Baker
Miller
Mitchell
Worth
Irwin Tift
Coffee
Colquitt
Berrien Atkinson Cook
Seminole Decatur
Grady
Thomas
Brooks
Lanier
Clinch
Lowndes Echols
Bacon
Wayne
Pierce
Ware
Brantley
McIntosh Glynn
Charlton
Camden
Georgia's Unemployment Rate: 10.3%
(Not Seasonally Adjusted)
21
Georgia Unemployment Insurance Claims by County
County
September Average Average Initial Weekly Duration
Claims Benefit Weeks
County
September Average Average Initial Weekly Duration
Claims Benefit Weeks
County
September Average Average Initial Weekly Duration
Claims Benefit Weeks
Georgia
51,267 ...... $260 ..... 13.4
Appling
129 ...... $242 ..... 14.6
Atkinson
79 ...... $197 ....... 8.3
Bacon
93 ...... $207 ..... 10.5
Baker
16 ...... $200 ..... 16.5
Baldwin
204 ...... $184 ..... 13.1
Banks
106 ...... $224 ..... 11.8
Barrow
322 ...... $244 ..... 15.2
Bartow
743 ...... $238 ..... 13.9
Ben Hill
299 ...... $198 ..... 12.0
Berrien
82 ...... $232 ..... 10.4
Bibb
766 ...... $192 ..... 15.2
Bleckley
45 ...... $225 ..... 13.8
Brantley
110 ...... $231 ..... 14.7
Brooks
87 ...... $182 ..... 14.9
Bryan
109 ...... $247 ..... 15.9
Bulloch
360 ...... $207 ..... 12.3
Burke
167 ...... $212 ..... 12.1
Butts
138 ...... $206 ..... 14.8
Calhoun
19 ...... $224 ..... 11.3
Camden
184 ...... $236 ..... 14.7
Candler
75 ...... $204 ..... 11.4
Carroll
579 ...... $235 ..... 11.6
Catoosa
255 ...... $237 ..... 10.6
Charlton
41 ...... $215 ..... 17.3
Chatham
1,071 ...... $223 ..... 15.6
Chattahoochee 21 ...... $225 ..... 13.8
Chattooga
81 ...... $218 ..... 16.6
Cherokee
668 ...... $261 ..... 15.8
Clarke
481 ...... $199 ..... 13.8
Clay
21 ...... $226 ..... 11.6
Clayton
1,530 ...... $221 ..... 15.7
Clinch
30 ...... $175 ..... 10.2
Cobb
2,492 ...... $253 ..... 16.7
Coffee
353 ...... $195 ..... 10.3
Colquitt
207 ...... $213 ..... 12.9
Columbia
360 ...... $249 ..... 13.9
Cook
86 ...... $215 ..... 12.0
Coweta
570 ...... $243 ..... 13.1
Crawford
60 ...... $218 ..... 14.5
Crisp
203 ...... $185 ..... 14.4
Dade
33 ...... $215 ....... 9.7
Dawson
89 ...... $246 ..... 14.8
Decatur
172 ...... $206 ..... 12.9
DeKalb
3,428 ...... $234 ..... 16.1
Dodge
109 ...... $189 ..... 12.9
Dooly
82 ...... $201 ..... 13.7
Dougherty
586 ...... $185 ..... 14.3
Douglas
662 ...... $241 ..... 15.5
Early
40 ...... $233 ..... 13.8
Echols
9 ...... $206 ..... 13.7
Effingham
196 ...... $254 ..... 15.0
Elbert Emanuel Evans Fannin Fayette Floyd Forsyth Franklin Fulton Gilmer Glascock Glynn Gordon Grady Greene Gwinnett Habersham Hall Hancock Haralson Harris Hart Heard Henry Houston Irwin Jackson Jasper Jeff Davis Jefferson Jenkins Johnson Jones Lamar Lanier Laurens Lee Liberty Lincoln Long Lowndes Lumpkin Macon Madison Marion McDuffie McIntosh Meriwether Miller Mitchell Monroe Montgomery Morgan Murray
211 ...... $183 ..... 13.1 333 ...... $173 ..... 12.0
45 ...... $215 ..... 11.9 121 ...... $231 ..... 11.5 242 ...... $259 ..... 16.1 799 ...... $223 ..... 12.1 419 ...... $270 ..... 16.2 164 ...... $229 ..... 11.1 4,116 ...... $232 ..... 16.2 174 ...... $240 ..... 10.3
22 ...... $221 ..... 11.2 382 ...... $213 ..... 14.0 778 ...... $244 ....... 8.9 101 ...... $192 ..... 10.7
96 ...... $213 ..... 13.0 2,897 ...... $255 ..... 16.1
344 ...... $222 ....... 9.6 980 ...... $240 ..... 12.8
69 ...... $172 ..... 12.7 137 ...... $235 ..... 12.2 134 ...... $231 ..... 11.7 202 ...... $224 ..... 10.9
59 ...... $232 ..... 11.3 857 ...... $244 ..... 16.0 467 ...... $211 ..... 13.5 104 ...... $209 ..... 13.4 260 ...... $244 ..... 13.8 124 ...... $240 ..... 14.6 206 ...... $230 ..... 14.1 158 ...... $187 ..... 10.2 105 ...... $184 ..... 10.2
75 ...... $194 ..... 14.0 116 ...... $236 ..... 15.1 129 ...... $198 ..... 13.3 35 ...... $228 ..... 11.6 390 ...... $196 ..... 14.7 166 ...... $236 ..... 12.4 244 ...... $228 ..... 14.7 43 ...... $223 ..... 12.1 42 ...... $231 ..... 14.7 491 ...... $206 ..... 14.4 127 ...... $247 ..... 12.4 169 ...... $195 ..... 10.2 175 ...... $226 ..... 12.3 55 ...... $207 ..... 12.1 183 ...... $193 ..... 10.6 59 ...... $233 ..... 13.6 160 ...... $226 ....... 9.7 25 ...... $183 ..... 11.0 64 ...... $181 ..... 15.0 99 ...... $224 ..... 14.7 101 ...... $217 ..... 11.9 86 ...... $215 ..... 12.7 669 ...... $249 ....... 8.1
Note: Initial claims include intrastate initial and additional claims, as well as agent state initial and additional claims for regular UI only.
Average duration of benefits is represented in weeks. Data does not include state or federal extended benefits for those unemployed for 27 weeks or more.
22
Muscogee Newton Oconee Oglethorpe Paulding Peach Pickens Pierce Pike Polk Pulaski Putnam Quitman Rabun Randolph Richmond Rockdale Schley Screven Seminole Spalding Stephens Stewart Sumter Talbot Taliaferro Tattnall Taylor Telfair Terrell Thomas Tift Toombs Towns Treutlen Troup Turner Twiggs Union Upson Walker Walton Ware Warren Washington Wayne Webster Wheeler White Whitfield Wilcox Wilkes Wilkinson Worth
1,083 ...... $215 ..... 12.6 622 ...... $231 ..... 15.2 78 ...... $253 ..... 14.2 66 ...... $227 ..... 13.4 549 ...... $255 ..... 16.2 121 ...... $194 ..... 13.3 129 ...... $232 ..... 14.0 99 ...... $222 ..... 12.7 147 ...... $209 ..... 12.8 384 ...... $235 ..... 10.8 32 ...... $177 ..... 12.8 192 ...... $206 ..... 13.7 3 ...... $182 ..... 14.6 263 ...... $212 ..... 10.4 36 ...... $189 ....... 9.4 981 ...... $204 ..... 13.6 412 ...... $237 ..... 15.7 26 ...... $190 ..... 13.9 111 ...... $207 ....... 9.2 54 ...... $189 ..... 12.9 562 ...... $206 ..... 13.3 145 ...... $211 ..... 10.6 30 ...... $184 ..... 13.0 250 ...... $170 ..... 12.9 62 ...... $215 ....... 9.6 12 ...... $232 ..... 10.9 100 ...... $229 ..... 11.5 50 ...... $205 ..... 11.3 111 ...... $188 ..... 13.1 62 ...... $180 ..... 13.6 195 ...... $199 ..... 13.7 199 ...... $206 ..... 16.1 256 ...... $218 ..... 12.4 39 ...... $227 ..... 13.9 78 ...... $219 ..... 13.1 388 ...... $224 ..... 11.5 61 ...... $198 ..... 16.3 65 ...... $194 ..... 13.2 95 ...... $229 ..... 13.1 353 ...... $224 ..... 10.9 454 ...... $219 ..... 10.1 429 ...... $231 ..... 14.7 260 ...... $181 ..... 11.9 109 ...... $174 ..... 11.8 73 ...... $171 ..... 13.9 187 ...... $222 ..... 14.3 9 ...... $220 ..... 12.6 57 ...... $193 ..... 11.7 152 ...... $219 ..... 12.5
1,838 ...... $242 ....... 8.0 55 ...... $187 ..... 14.4
117 ...... $192 ..... 11.8 43 ...... $215 ..... 13.6
104 ...... $226 ..... 14.1
Mark Butler, Commissioner
148 Andrew Young International Boulevard, N.E. Atlanta, Georgia 30303-1751
Return Service Requested