- Collection:
- Georgia Government Publications
- Serial:
- Broiler hatchery news release / United States Department of Agriculture National Agricultural Statistics Service.
- Title:
- Georgia broiler hatchery news release, 2012 November 21
- Creator:
- Georgia Crop Reporting Service
- Contributor to Resource:
- United States. National Agricultural Statistics Service. Southern Regional Field Office, issuing body.
Alabama. Department of Agriculture and Industries, issuing body.
Florida. Department of Agriculture and Consumer Services, issuing body.
Georgia. Department of Agriculture, issuing body.
South Carolina. Department of Agriculture, issuing body. - Publisher:
- Athens, Ga. : Georgia Agricultural Statistics Service
- Date of Original:
- 2012-11-21
- Subject:
- Poultry--Hatcheries--Georgia--Statistics
Eggs--Production--Georgia--Statistics - Location:
- United States, Georgia, 32.75042, -83.50018
- Medium:
- state government records
- Type:
- Text
- Format:
- application/pdf
- Description:
- Began with: August 28, 2013.
Effective March 12, 2014, name of issuing body appears as Southern Regional Field Office.
August 28, 2013; title from caption (Georgia Government Publications database, viewed January 19, 2018).
January 17, 2018 (received via e-mail on January 18, 2018 from Georgia Department of Agriculture); (Georgia Government Publications database, viewed November 22, 2017). - External Identifiers:
- Call Number GA A400.C7 P1 H2 2012/11-21
- Metadata URL:
- https://dlg.galileo.usg.edu/id:dlg_ggpd_i-ga-ba400-pc7-bp1-bh2-b2012-s11-h21-belec-p-btext
- Digital Object URL:
- https://dlg.galileo.usg.edu/do:dlg_ggpd_i-ga-ba400-pc7-bp1-bh2-b2012-s11-h21-belec-p-btext
- Language:
- eng
- Holding Institution:
- University of Georgia. Map and Government Information Library
- Rights:
-

United States Department of Agriculture National Agricultural Statistics Service
GA Broiler Hatchery News Release
In Cooperation with the Georgia Department of Agriculture Georgia Field Office 355 East Hancock Avenue, Suite 320 Athens, GA 30601 (706) 546-2236
www.nass.usda.gov
November 21, 2012
Media Contact: Douglas G. Kleweno nass-ga@nass.usda.gov
BROILERS PLACED IN GEORGIA UP 2 PERCENT BROILER EGGS SET UP 1 PERCENT
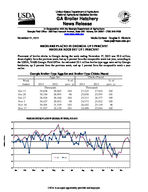
Placement of broiler chicks in Georgia during the week ending November 17, 2012 was 25.0 million, down slightly from the previous week, but up 2 percent from the comparable week last year, according to the USDA, NASS Georgia Field Office. An estimated 32.1 million broiler type eggs were set by Georgia hatcheries, up 2 percent from the previous week, and up 1 percent from the comparable week a year earlier.
Georgia Broiler-Type Eggs Set and Broiler-Type Chicks Placed
Eggs Set
Chicks Placed
Week
% of
% of
Ended
2011
2012
prev. yr. 2011
2012
prev. yr.
Thousands
Thousands
Oct 13
29,658 30,865 104
27,225 27,814 102
Oct 20
30,356 28,995
96
25,656 25,953 101
Oct 27
28,924 30,168 104
25,311 26,577 105
Nov 3
30,427 29,852
98
24,573 25,812 105
Nov 10
30,501 31,559 103
26,102 25,119
96
Nov 17
31,927 32,130 101
24,488 25,014 102
BROILER CHICKS PLACED IN GEORGIA BY WEEK, 2011-2012
30
29
28
27
26
25
2011
2012
24
23
Jan
Feb
Mar
Apr
May
Jun
Jul
Aug
Sep
Oct
Nov
Dec
Million Chicks
USDA is an equal opportunity provider and employer.
Broiler-Type Eggs Set 19 Selected States: 2012
State
Alabama .............................................. Arkansas ............................................. Delaware ............................................. Florida ................................................. Georgia ................................................ Kentucky .............................................. Louisiana ............................................. Maryland .............................................. Mississippi ........................................... Missouri ...............................................
October 13, 2012
(1,000 eggs)
26,053 17,697
3,158 1,353 30,865 7,014 3,304 7,471 16,543 7,606
North Carolina ..................................... Oklahoma ............................................ Pennsylvania ....................................... South Carolina ..................................... Texas ................................................... Virginia ................................................ California, Tennessee,
and West Virginia ..............................
17,382 6,287 3,647 4,924
13,034 6,019
9,461
19 State total .......................................
181,818
Previous year total ...............................
181,852
Percent of previous year .....................
100
October 20, 2012
(1,000 eggs)
26,218 18,329
3,162 1,088 28,995 6,483 3,298 7,071 16,364 7,210
17,924 6,416 3,353 5,654
12,609 5,543
8,418
178,135
183,537
97
Week ending
October 27, 2012
November 3, 2012
(1,000 eggs)
(1,000 eggs)
25,961 20,507
3,240 1,353 30,168 7,210 3,183 6,766 16,365 7,867
24,787 20,132
3,284 1,351 29,852 7,330 2,956 6,803 15,168 6,859
November 10, 2012
(1,000 eggs)
26,932 21,045
3,389 1,353 31,559 7,094 2,956 7,136 17,223 7,258
November 17, 2012
(1,000 eggs)
27,513 21,688
3,415 1,351 32,130 7,517 3,288 7,158 16,865 8,040
19,331 6,622 3,246 5,252
13,381 6,195
19,266 6,662 3,167 5,156
12,996 4,780
20,202 6,553 3,546 5,129
13,980 5,127
19,553 6,830 3,678 5,402
14,128 6,275
10,563
10,261
10,414
10,883
187,210
180,810
190,896
195,714
185,172
186,594
194,224
195,158
101
97
98
100
Broiler-Type Chicks Placed 19 Selected States: 2012
State
Alabama .............................................. Arkansas ............................................. Delaware ............................................. Florida ................................................. Georgia ................................................ Kentucky .............................................. Louisiana ............................................. Maryland .............................................. Mississippi ........................................... Missouri ...............................................
October 13, 2012
(1,000 chicks)
19,778 18,906
3,509 935
27,814 6,718 2,845 6,386
13,545 5,327
October 20, 2012
(1,000 chicks)
18,660 18,637
3,720 1,023 25,953 5,762 2,700 6,331 13,616 4,770
Week ending
October 27, 2012
November 3, 2012
(1,000 chicks) (1,000 chicks)
19,380 19,282
4,232 1,291 26,577 5,910 2,703 5,259 14,142 5,543
18,979 17,289
4,164 1,276 25,812 5,544 2,949 5,712 13,994 4,996
November 10, 2012
(1,000 chicks)
18,543 17,258
4,095 1,035 25,119 5,247 2,981 5,246 13,869 4,849
November 17, 2012
(1,000 chicks)
19,054 20,306
4,371 1,326 25,014 5,659 2,891 5,307 13,993 5,265
North Carolina ..................................... Oklahoma ............................................ Pennsylvania ....................................... South Carolina ..................................... Texas ................................................... Virginia ................................................ California, Tennessee,
and West Virginia ..............................
14,407 4,782 2,675 3,704
10,751 4,877
9,020
15,158 4,854 2,972 4,127
11,684 4,495
9,802
14,988 4,356 2,945 3,818
11,148 4,494
10,666
14,505 3,706 2,901 4,251
11,027 4,526
10,090
15,055 4,181 2,634 3,726
10,769 4,349
8,560
15,679 3,680 2,647 4,365
11,234 4,507
10,729
19 State total .......................................
155,979
154,264
156,734
151,721
147,516
156,027
Previous year total ...............................
155,108
151,134
153,311
149,126
152,174
152,567
Percent of previous year .....................
101
102
102
102
97
102
Average hatchability for chicks hatched in the 19 selected States during the week was 85 percent. Average hatchability is calculated by dividing chicks hatched during the week by eggs set three weeks earlier.