- Collection:
- Georgia Government Publications
- Serial:
- Georgia farm report.
- Title:
- Georgia farm report, vol. 96, no. 08 (1996 April 16)
- Creator:
- Georgia. Department of Agriculture
- Contributor to Resource:
- United States. Department of Agriculture
United States. National Agricultural Statistics Service
United States. National Agricultural Statistics Service. Georgia Office - Publisher:
- Athens, Ga. : United States Department of Agriculture, National Agricultural Statistics Service, in cooperation with the Georgia Department of Agriculture, Georgia Field Office
- Date of Original:
- 1996-04-16
- Subject:
- Agricultural productivity--Georgia--Statistics
Crop yields--Georgia--Statistics - Location:
- United States, Georgia, 32.75042, -83.50018
- Medium:
- state government records
- Type:
- Text
- Format:
- application/pdf
- Description:
- Began in 1975?; ceased with vol. 10, no. 02 (Feb. 26, 2010).
"Agricultural statistician and Georgia Department of Agriculture."
Numbering began again with Vol. 11, no. 1 (Jan. 14, 2000).
Vols. for Aug. 31, 2005- issued by: USDA-NASS Georgia Field Office.
Description based on: Vol. 94, no, 1 (Jan. 4, 1994); title from caption.
Latest issue consulted: Vol. 10, no. 02 (Feb. 26, 2010). - External Identifiers:
- Call Number GA A400.C7 P1 F2 96/8
- Metadata URL:
- https://dlg.galileo.usg.edu/id:dlg_ggpd_i-ga-ba400-pc7-bp1-bf2-b96-s8
- Digital Object URL:
- https://dlg.galileo.usg.edu/do:dlg_ggpd_i-ga-ba400-pc7-bp1-bf2-b96-s8
- Language:
- eng
- Holding Institution:
- University of Georgia. Map and Government Information Library
- Rights:
-

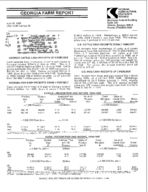
GEORGIA FARM REPORT
April 16, 1996 Volume 96-Number 08
GEORGIA AGRICULTURAL STATISTICS SERVICE
Stephens Federal Building Suite 320 Athens, Georgia 30613 Phone: (706)546-2236
$148.5 million in 1994. Marketings at 353.2 million pounds, were 4 percent less than 1994. The average
price rose 1 percent to $39.70 per cwt.
U.S. CATTLE CASH RECEIPTS DOWN 7 PERCENT
GEORGIA CATTLE CASH RECEIPTS UP 6 PERCENT
Cash receipts from marketing of cattle and calves in Georgia totaled $284.9 million in 1995. This is 6 percent higher than the $269.5 million in 1994. Cattle prices averaged $42.30 per cwt. in 1995 compared to $51.80 per cwt. in 1994. Calves averaged $66.30 in 1995, down from the 1994 price of $75.60. Marketings in 1995 totaled 582.9 million pounds, up 27 percent from the 459.7 million pounds in 1994.
GEORGIA HOG CASH RECEIPTS DOWN 4 PERCENT
Cash receipts from hogs and pigs in Georgia totaled $143.2 million for 1995, down 4 percent from the
Cash receipts from marketings of cattle and calves decreased from $36.4 billion in 1994 to $34.0 billion in 1995, a 7 percent decline. All cattle and calf marketings totaled 56.2 billion pounds in 1995, up 4 percent from the 54.1 billion pounds in 1994. The U.S. annual average price per 100 pounds live weight for cattle was $61.80, a decline of $4.90 from the $66.70 in 1994. For calves, the annual average price fell $14.10 to $73.10.
U.S. HOG CASH RECEIPTS UP 2 PERCENT
Cash receipts from hogs and pigs totaled $10.1 billion during 1995, up 2 percent from 1994. Marketings increased to 24.6 billion pounds in 1995, slightly above the previous year. The U.S. annual average price per 100 pounds live weight rose from $39.90 in 1994 to $40.50 in 1995.
CATTLE4'RODUCTION AND INCOME, 1994-1995
Production 1 1
Marketings 21
Average Price
per 100 Pounds
Cattle
Calves
Value of Produc-
tion
Cash Value of
Receipts Home Con-
31
sumption
Gross Income
G A 1994 1995
-1,000 Pounds-
693,185 502,416
459,690 582,870
-Dollars-
51.80 42.30
75.60 66.30
402,747 241,921
-1,000 Dollars-
269,535 284,887
4,889 3,930
274,424 288,817
-1,000,000 Pounds-
-Dollars-
-1,000,000 Dollars-
US
1994
42.095 8
54 092 6
66 70
87 20
26 861 4
36 394 8
349 6
36,744 4
1995
42,722 1
56,244 3
61 80
73 10
24,822 0
33,983 2-
305 7
34,288 9
11 A d j u s t m e n t s m a d e f o r c h a n g e s I n I n v e n t o r y a n d f o r i n s h ~ p m e n t s 21 E x c l u d e s c u s t o m s i a u 3 h t e r f o r u s e o n f a r m s w h e r e p r o d i c e d a n u ( n t e r f a r m s a l e s w i t h l n t h e
S t a t e 31 R e c e ~ p t sf r o m m a r k e t i n g s a n d s a l e o f f a r m s l a u g h t e r
Prod uction 1 /
-1,000
HOGS--PRODUCTION AND INCOME, 1994-1 995
Marketings 21
Average Price per 100 Pounds
Value of Production 31
Cash Receipts
41
Pounds-
Dollars
-1,000
Value of Home Consumption
Dollars-
Gross Incorn2
-1,000,000 Pounds-
Dollars
-1,000,000 Dollars-
US 1994 1995
24,434.8 24,120.8
24,504 9 24,577.6
39.90 40.50
9,691 .O 9,750.1
9,875.0 10,067.3
50.1
9,925.1
48.3
10,115.6
I 1 A d j u s t m e n t s m a d e f o r c h a n g e s I n I n v e n t o r y a n d f o r ~ n s h ~ p m e n t s21 E x c l u d e s c u s t o m s l a u o h t e r f o r u s e o n f a r m s whece p r o d u c e d a n d i n t e r f a r m s a l e s w i t h ~ nt h e S t a t e 31 I n c l u d e s a l l o w a n c e f o r h ~ g , h e ra v e r a g e p r l c e o f S t a t e ~ n s h l p m e n t sa n d o u t s h ~ p m e n t s - o ff e e d e r pigs 41 R e c e ~ p t sf r o m m a r k e t l r l g s a n d s a l e o f f a r m slaughter Includes ailowance for hlgher average price o f State outshipments of feeder pigs
AGRICULTURAL STATISTICIANAND GEORGIA DEPARTMENT OF PGRiCULTURE
Crop
SNAP BEANS
FL G A NJ SC
SELECTED FRESH MARKET VEGETABLES AND MELONS, AREA FOR HARVEST BY CROP, STATE AND TOTAL, SPRING SEASON, 1995 AND PROSPECTIVE AREA, 1996
Usual
Harvest Period
Area
Harvested 1995
Area for
Harvest 1996
1996
as O/O 1995
Crop
Usual
Harvest Period
Area
Area for
Harvested Harvest
1995
1996
Apr-Jun Apr-Jun
Jun-Jul May-Jun
-Acres-
11,700 5,000 900
1,300
12,900 6,500 1,000
1.300
CANTALOUPES
110
AZ
Apr-Jun
130
C A
Apr-Jun
11 1
G A
Apr-Jun
100
TX
Apr-Jun
-Acres-
8,900 16,000 2,700 9,900
10,200 17,000
3,400 9,000
TOTAL
18,900
21,700
115 TOTAL
37,500
39,600
CABBAGE
FL G A N J TX
TOTAL
Apr-Jun Apr-Jun Jun-Aug Apr-Jun
2,000 4,000 1,200 1,500
8,700
2,200 4,400 1,100 1,500
9,200
WATERMELONS
110
AL
Jun-Jul
2,500
2,600
104
110
AZ
Apr-Jun
6,800
7,000
103
92
C A
Apr-Jun
5,100
6,000
118
100
FL
Apr-Jun
33,000
34,000
103
TX
Apr-Jun
34,000
30,000
88
106 TOTAL
81,400
79,600
98
UNITED STATES SPRING VEGETABLES
.Snap bean acreage for spring harvest is estimated at 21,700 acres, up 15 percent from last year. In Florida,. planting was virtually complete. Frosts during February burned leaves and strong winds during March damaged some plants. Freezing temperatures are expected to have adversely affected the spring crop in Georgia.
Cabbage intended acreage for spring harvest, estimated at 9,200 acres is an increase of 6 percent from last year. The Florida crop received no major damage from the freezes in February and March. However, the freezes may have adversely affected the crop in Georgia. The start of major planting in New Jersey has been delayed at least 10 days due to adverse weather conditions.
Cantaloupe acreage intended for harvest is estimated at 39,600 acres, up 6 percent from 1995. The crop in California was progressing better than normal, but the crop in Georgia was probably hurt by freezing temperatures.
Sweet corn intended acreage for harvest is estimated at 37,200 acres, up 6 percent from 1995. Favorable conditions caused the California crop to progress better than normal. Producers around Lake Okeechobee in Florida started planting after mid-January with some acreage killed by freezing temperatures during early February. Zellwood producers began planting after mid-February with a considerable amount killed by an early March freeze. The Zellwood and Everglades growers are replanting most of the affected acreage.
Spring onion acreage for harvest in the four producing States (AZ,CA,GA,TX) is estimated at 37,500 acres, up 5 percent from a year ago and 6 percent above 1994. Production in Georgia is forecast at 1.70 million cwt., down 28 percent from 1995. Harvested acreage is expected to be 13,600
acres, up 9 percent from the previous year. Due to adverse weather conditions, the crop is mostly in poor to fair condition and yield is projected to average 125 cwt. per acre. Texas production is
forecast at 4.10 million cwt., up 9 percent from last year. Area for harvest, at 14,400 acres, is 1 percent greater than last year. The average yield of 285 cwt. per acre is up 20 cwt. Arizona's acreage is up 600 acres from last year, but California's acreage was unchanged. Crop development in California looked good and was on schedule. Wet fields and blight were concerns in some areas.
State
AZz CA~ G A TX
ONIONS--SPRING SEASON, BY STATE, 1995 AND FORECAST 1996 "
Harvest 1995
For Harvest 1996
Yield per Acre
1995
1996
Production
1905
1996
-Acres-
-Cwt.-
-1,000 Cwt.-
1,400
2,000
480
7,500
7,500
440
12,500
13,600
190
14,200
14,400
265
672
3,300
125
2,375
1,700
285
3,763
4.104
TOTAL
35,600
37,500
11 Primarily fresh market. 21 First forecast will be published July 10, 1996
284
155
10,110
5,804
GEORGIA REVISED 1995 PEANUT CROP
Georgia's 1995 final revised peanut crop estimate of 1.41 billion pounds o f production is 24 percent less than 1994's production of 1.86 billion. Planted acres decreased 9 percent from 1994's level of 652,000 acres to 595,000 acres. Yield per harvested acre averaged 2,390 pounds, 480 pounds less than 1994. Prices for 1995 averaged 29.5 cents per pound, compared with the 1994 price of 28.6 cents per pound.
U.S. 1995 PEANUT PRODUCTION
U.S. peanut production totaled 3.46 billion pounds in 1995, down 19 percent from the 1994 crop. Area planted to peanuts totaled 1.54 million acres, down 6
percent from 1994 and the smallest planted acreage since 1985. Harvested area, at 1.52 million acres, fell 6 percent from a year ago. The U.S. yield per harvested acre averaged 2,282 pounds, down 342 pounds from 1994. Every peanut State, with the exception of Alabama, showed a decrease in yield and production from a year ago.
Production in the Southeastern States (AL,FL,GA,SC) totaled 2.12 billion pounds, down 17 percent from 1994. The decrease in the 4-State area resulted from a 7 percent decline in harvested acreage combined with crop yields averaging 2,369 pounds, 269 pounds less per harvested acre than last year. Georgia remained the leading peanut producer with 41 percent of the total production.
PEANUTS FOR NUTS-1 994-1995
State
Area Planted
1994
1995
Area Harvested
1994
1995
Yield 1994
1995
-1,000 Acres-
-Pounds-
AL
223.0
21 3.0
222.0
21 2.0
2,010
2,280
FL
92.0
89.0
84.0
81 .O
2,470
2,390
G A
652.0
595.0
649.0
592.0
2,870
2,390
N M
21 .O
20.0
21 .O
20.0
2,460
2,150
N C
151.O
144.0
151.0
144.0
3,215
2,410
0 K
102.0
100.0
100.0
98.0
2,610
2,060
SC
13.0
11.5
12.5
11.O
2,900
2,800
TX
295.0
275.0
287.0
270.0
2,110
2,000
VA
92.0
90.0
92.0
89.0
3,165
2,325
State
AL FL G A N M NC OK SC TX VA
Production
1994
1995
-1,000 Pounds-
446,220 207,480 1,862,630
51,660 485,465 261,000
36,250 605,570 291, I80
483,360 193,590 1,414,880
43,000 347,040 201,880
30,800 540,000 206,925
11 1995 Revised
Price per Pound
1994
1995
-Dollars-
0.323 0 281 0.286 0.317 0.276 0.310 0.274 0.285 0.275
0.288 0.271 0.295 0.336 0.298 0.298 0.298 0.287 0.300
Value of Production
1994
1995
-1,000 Dollars-
144,129 58,302 532,712 16,376 133,988 80,910
9,933 172,587 80,075
139,208 52,463 41 7,390 14,448 103,418 60,160
9.1 78 154,980
62,078
FARM MARKETINGS OF PEANUTS FOR NUTS--BY STATES AND MONTHS, 1994-1995 CROP YEAR
State and
Crop Year
Aug .
Sept.
Oct.
Nov.
De- c. - Jan.
-Percent-
1994 CROP
PL
0.3
59.1
36.2
4.2
0.2
F L
1.6
63.1
32.0
2.9
0.3
0.1
G A
0.1
51.8
39.3
8.1
0.7
N C
2.1
71.6
19.0
4.8
2.5
TX
0.7
5.1
33.4
46.1
13.4
1.3
VA
4.3
51.3
22.8
16.4
5.2
F- eb.
1995 CROP
AL
0.3
59.4
35 8
3.8
0.7
FL
1. I
56 8
36 8
4.2
0.9
0.2
G A
1.6
59.8
34 2
3.9
0.4
0.1
N C
4.4
55.9
27.4
6.8
4.3
0.2
TX
1. I
3.8
47.6
40.7
6 6
0.2
VA
4.8
55.0
32.7
4.8
2.7
GEORGIA QUARTERLY MILK PRODUCTION DOWN 5 PERCENT
Milk production in Georgia during January-March 1996 totaled 413 million pounds, 20 million pounds less than the comparable period a year ag- o.
The number o f milk cows On Georgia farms averaged 97,000 head during January-March, 5 percent less than the same quarter last year.
per
averaged 41260 pounds during
January-March, 15 pounds less than January-March
1995.
U.S. JANUARY-MARCH MlLK PRODUCTION UP 1 PERCENT
The quarterly production of milk for the U.S. was 39.1 billion pounds, 1 percent above the January-March
period last year. The increase is due to February 1996 having an extra day because it was leap year. On a
daily basis, milk production declined during the first auarter. The averaae number o f milk cows in the U.S.
during the ~anuary- arch quarter was 9.40 million
head, 68,000 head less than the same period last year,
Grain and other concentrates fed to milk cows on A p r i l 1 , 1 9 9 6 , a v e r a g e d 1 8 , ~p o u n d s p e r c o w , unchanged from April I , 1995, but down 0.2 pounds per day from January.
The value of grain and other concentrates fed to cows on April 1 averaged $9.1 5 per hundredweight, $1.58 more than the price on April 1, 7995.
MlLK COWS AND MlLK PRODUCTlON4ANUARY-MARCH 1995-1996
Georaia
1996 as %
United States
Item
Unit
1995
1996
of 1995
1995
1996
M i l k Cows 'I Milk per Cow Milk Production
Thous. Head Pounds Mil. Lbs.
102 4,245
433
9 7 4,260
41 3
1 1 I n c l u d e s d r y c o w s , e x c l u d e s h e ~ f e r sn o t y e t f r e s h 21 E x c l u d e s m i l k s u c k e d b y calves.
9 5 100
95
9,470 4,112 38,941
9,402 4,163 39,140
1996 as O h of 1995
99 101 101
NURSERY, GREENHOUSE AND SOD SALES INCREASE
Gross sales of nursery, greenhouse and turf products grown in Georgia in 1995 totaled nearly $207 million. This was 8 percent above 1994 and 54 percent above 1991. Gross sales of bare root, balled and burlap, and container grown plants continued as the leading sales category in 1995 with 45 percent of total sales. Greenhouse grown plants and materials contributed
39 percent followed by sod and sprig with 15 percent of total sales. Sales for each of these three categories established record high sales in 1995 while the "other" category equaled the previous
record hiq- h established i n 1993.
NURSERYIGREENHOUSEITURF GROSS SALES BY PLANT MATERIAL-1 991-1995
Plant
Material
1991 1992 1993
1994 1995
-1,000 Dollars-
Bare Root,
Balled Burlap,
Contamer
62,920
Greenhouse Sodand/or
49,810
sprigs
20,702
67,278 59,292
24,550
73,900 65,000
27,400
85,500 74,100
29,400
93,900 80,100
30,900
Other Total
1,031 1,122
1,700
134,463 152,242 168,000
1,500
1,700
190,500 206,600
I E A G e o r g i a F a r m R e p o r t (ISNN 0 7 4 4 - 7 2 8 0 IS p u b l ~ s h e dsemi-monthly by t h e G e o r g ~ aA g r i c u l t u r a l S t a t t s t l c s S e r v ~ c e .A t h e n s GA 3 0 6 1 3 - 5 0 9 9 S e c o n d c l a s s p o s t a g e p a ~ dat A t h e n s G A S u b s c r p t ~ o nf e e 2 1 0 p e r y e a r e x c e t free t o d a t a i o n t r ~ b u t o r s POSTMASTER S e n d a d d r e s s c h a n d e s t o G e o r g t a A g r ~ c u l t u r aS t a t ~ s t ~ c s S e r v ~ c e .~ t e p h k n sF e d e r a l B u l l d i n s . S u t t e 3 2 0 . A t h e n s . 3 0 6 1 3 - 5 0 9 9 I
GEORGIA AGRICULTURAL STATISTICS SERVICE
SECOND-CLASS POSTAGE PAID AT ATHENS, GA 30613
STEPHENS FEDERAL BLDG. SUITE 320 ATHENS, GEORGIA 30613