- Collection:
- Georgia Government Publications
- Serial:
- Georgia farm report.
- Title:
- Georgia farm report, vol. 00, no. 23 (2000 December 19)
- Creator:
- Georgia. Department of Agriculture
- Contributor to Resource:
- United States. Department of Agriculture
United States. National Agricultural Statistics Service
United States. National Agricultural Statistics Service. Georgia Office - Publisher:
- Athens, Ga. : United States Department of Agriculture, National Agricultural Statistics Service, in cooperation with the Georgia Department of Agriculture, Georgia Field Office
- Date of Original:
- 2000-12-19
- Subject:
- Agricultural productivity--Georgia--Statistics
Crop yields--Georgia--Statistics - Location:
- United States, Georgia, 32.75042, -83.50018
- Medium:
- state government records
- Type:
- Text
- Format:
- application/pdf
- Description:
- Began in 1975?; ceased with vol. 10, no. 02 (Feb. 26, 2010).
"Agricultural statistician and Georgia Department of Agriculture."
Numbering began again with Vol. 11, no. 1 (Jan. 14, 2000).
Vols. for Aug. 31, 2005- issued by: USDA-NASS Georgia Field Office.
Description based on: Vol. 94, no, 1 (Jan. 4, 1994); title from caption.
Latest issue consulted: Vol. 10, no. 02 (Feb. 26, 2010). - External Identifiers:
- Call Number GA A400.C7 P1 F2 2000/23
- Metadata URL:
- https://dlg.galileo.usg.edu/id:dlg_ggpd_i-ga-ba400-pc7-bp1-bf2-b2000-s23
- Digital Object URL:
- https://dlg.galileo.usg.edu/do:dlg_ggpd_i-ga-ba400-pc7-bp1-bf2-b2000-s23
- Language:
- eng
- Holding Institution:
- University of Georgia. Map and Government Information Library
- Rights:
-

c'l A
A400.c7
Pi
Y-i
--------------
-
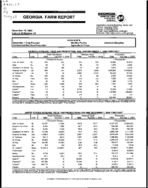
2ooc/ 13 GEORGIA FARM REPORT
-----
December 19, 2000 Volume 00-Number 23
Stephens Federal Building, Suite 320 Athens, Georgia 30601 Phone: (706)546-2236
E-mail: nass-ga@nass.usda.gov
Website: http://www.nass.usda.gov/ga
December 1 Crop Forecast Commercial Red Meat Production
HIGHLIGHTS Monthly Poultry Agricultural Prices
Livestock Slaughter
GEORGIA ACREAGE, YIELD AND PRODUCTION, 1999, AND DECEMBER 1, 2000 FORECAST11
Area Harvested
Yield per Acre
Production
Cro
Unit
1999
Ind Dec 1, 2000
1999
Ind Dec 1, 2000
1999
Ind Dec 1, 2000
--Thousand Acres--
--Thousands--
Com for Grain
Bu.
300
340
Oats
Bu.
25
35
103
103
30,900
35,020
55
72
1,375
2,520
Soybeans for Beans Bu.
190
Peanuts for Nuts
Lbs.
544
All Tobacco21
Lbs.
33
180
19
24
3,610
4,320
507
2,575
2,800
1,400,800
1,419,600
30
1,940
2,310
64,020
69,300
All Wheat
All Hay
Rye
Cotton
3 '
Sweetpotatoes
Ap
p
l
e
s
5 '
P e a c h e s 51
Grapes51
Pecans
Bu. Tons Bu. Bales Cwt. Lbs. Lbs. Tons Lbs.
225 600
50 1,300
0.6 1.3 18 1.2
71
200 600
45 1,300
0.6 61 61 61 71
43 2.5 21 579 100 9,230 6,110 2.8
71
54
9,675
10,800
2.2
1,500
1,320
26
1,050
1,170
594
1,567
1,610
4/
60
4/
61
12,000
13,000
61
110,000
~05,000
61
3.3
3.4
71
120,000
80,000
1/Data are the latest available, either from current reP.Qrt or from previous reports. Current Year Estimates are for the full 2000 crop?Jear. 21 Type 14. 3/ CottXn yield in pqunds per harvested acre, production in 480 pound bales. '4/ Yield and Rroduction estimates will be released in Annual Crop Summary. I Bearing age acres. 6/ creage and yield estimates will be released in Noncitrus Fruits and Nuts, January 2001. 71 Not Available.
UNITED STATES ACREAGE, YIELD, AND PRODUCTION-1999 AND DECEMBER 1, 2000 FORECAST11
Area Harvested
Yield per Acre
Production
Cro
Unit
1999
Ind Dec 1, 2000
1999
Ind Dec 1, 2000
1999
Ind Dec 1, 2000
--Thousand Acres-
-Thousands-
Corn for Grain
Bu.
70,537
73,009
133.8
137.7
9,437,337
10,053,942
Sorghum for Grain Oats Soybeans for Beans Peanuts for Nuts All Tobacco All Wheat All Hay Rye All Cotton21 Cottonseed
Bu. Bu. Bu. Lbs. Lbs. Bu. Tons Bu. Bales Tons
8,544 2,453 72,446 1,436.0 647.2 53,823 63,160
383 13,424.9
7,665 2,324 73,024 1,395.5 492.3 53,028 61,591
302 13,499.0
69.7 59.6 36.6 2,667 1,997 42.7 2.52 28.8 607
60.4 64.2 38.0 2,517 2,289 41.9 2.48 28.5 622
595,166 146,193 2,653,758 3,829,490 1,292,692 2,299,010 159,077
11,038 16,968.0
6,354.0
463,251 149,195 2,777,036 3,512,800 1, 1 2 6 , 6 9 8 2,223,440 152,651
8,619 17,398.8
6,558.0
Barley
Bu.
4,734
5,201
59.2
61.1
280,292
317,865
Sweet potatoes Apples'' Peaches4' Grapes" Pecans
Cwt. Lbs. Lbs. Tons Lbs.
83.1 461,500 157,380 904,710
6/
93.3 5/ 51 51 6/
147 22,900 16,000
6.89 61
3/
12,234
3/
5/
10,579.6
10,677.1
51
2,525.4
2,677.1
5/
6,230.4
7,487.1
61
406, 100
209,300
1/ Data are the latest available, either from current report or fr9m ~reviQ.US reP!JrtS. Current Year Estimates are for the full 2000 crop year. 21 Cotton yield in ppunds per harvested acreilfroduction in bales. 3/ Yield and production estima es will be released in Annual Crop Summary. 4/ Bearing age acres. 5/ Acreage and yield estimates will be released in e Noncitrus Fruits and Nuts, January 2001. 6/ Not Available.
USDA/NASS COOPERATING WITH THE GEORGIA DEPARTMENT OF AGRICULTURE
State
AL AZ. AR CA GA LA MS MO NM NC OK SC TN TX VA
ALL COTTON-DECEMBER 1, 2000, FORECAST BY STATES AND U.S.
Acres for Harvest --Thousand Acres--
Yield --Pounds--
Ind.
Pr
od
u
c
t
i
on
1 '
--Thousand Bales21--
540.0
489
550.0
285.0
1,264
750.3
950.0
743
1,470.0
909.0
1,352
2,560.0
1,300.0
594
1,610.0
700.0
627
915.0
1,280.0
649
1,730.0
400.0
648
540.0
91.0
731
138.5
930.0
748
1,450.0
200.0
420
175.0
290.0
629
380.0
570.0
606
720.0
4,816.0
412
4, 131.0
109.0
722
164.0
2000 as % of 1999
--Percent-88
102 103 117 103 102 100 114 116 178 122 135 121
81 115
us
13,499.0
619
17,398.8
103
1/ Production ginned and to be ginned. 2/ 480 lb. net weight bales. 3/ Estimates for current year carried forward from previous forecast.
POULTRY HATCHING AND PLACEMENT--OCTOBER 1999-2000
Item
Oct 1999
see 2000
Oct 2000 % of Year Asa
January thru October
1999
2000
% of Year Asa
--Thousands--
--Percent--
--Thousands--
--Percent--
Pullet Chicks Placed
Domestic & (U.S.)11
Broiler Type
7, 121
6,469
6,694
94
71,784
68,961
96
Egg Type
277
277
283
102
2,500
2,811
112
Chicks Hatched - Broiler Type
Georgia
105,417
104, 162
107,333
102
1,097,878
1,095, 156
100
United States
697,434
704,901
711,012
102
7,290,497
7,369,134
101
Chicks Hatched - Egg Type
Georgia
2,044
2,220
1,916
94
19,651
19,308
98
United States
39,044
36,290
35,231
90
384,991
362, 180
94
Turkeys Poults Placed
United States
22,313
23,016
23,697
106
21
3/
44, 107
46,713
106
1/ Domestic placements as reported bY. leading breeders include e'3'ected P.Ullet reP.lacements from eigs sold during thecrcreceding month at the rate of 125 pullet chicks per 30 dozen case of eggs. 21 Turkey poults placed September 1999- ctober1999. 31 Turkey poults pla ed September 20 0-0ctober 2000. Revised.
GEORGIA Hatching Table Total Georgia
30 STATES Hatching Table Total 30 States
UNITED STATES Hatching Table Total U.S.
NUMBER OF LAYERS AND EGG PRODUCTION-OCTOBER 1999-2000
Number of Layers
1999
2000
Eggs per 100 Layers
1999
2000
Total Eggs Produced
1999
2000
--Thousands--
--Number--
--Millions--
9,258
8,776
1,998
1,983
185
174
11, 773
11,860
2,217
2,074
261
246
21,031
20,636
2,121
2,035
446
420
53,514 252,232 305,746
51,673 255,263 306,936
1,878 2,255 2,189
1,883 2,226 2,168
1,005 5,689 6,694
973 5,682 6,655
57,951 267,321 325,272
56,217 270,928 327,145
1,884 2,259 2,192
1,900 2,229 2,172
1,092 6,039 7,131
1,068 6,038 7,106
2
COMMERCIAL POULTRY SLAUGHTER11--0CTOBER 1999-2000
Item
Oct 1999
Oct 2000 % of Year Ago
Young Chickens
--Thousands--
--Percent--
Georgia United States Mature Chickens
94,396
93, 108
99
667,154
699,749
105
Light Type, U.S.1
7,506
6,896
92
Heavy Type, U.S.
6,601
5,889
89
Total U.S.
14,107
12,785
91
Percent Condemned Young Chickens
--Percent--
Georgia
1.6
1.5
United States
1.5
1.3
1/Federally inspected slaughter data as collected by Meat and Poultry Inspection Program.
January thru October
1999
2000
--Thousands--
977,702 6,796, 128
950,917 6,939, 130
88,901
80,266
59,208 148, 109
59,721 139,987
--Percent--
1.7
1.5
1.6
1.5
% of Year Ago --Percent--
97 102
90 101 95
LIVESTOCK SLAUGHTER, UNITED STATES11--0CTOBER 1999, 2000
s ecies
Cattle Calves Hogs Sheep & Lambs
Number Slaughtered
1999
2000
2000 as% of 1999
--Thousand Head--
--P.ercent--
3,094.2
3,141.5
102
104.6
97.1
93
8,943.2
8,881.1
99
304.9
278.7
91
Average Live Weight
1999
2000
--Pounds--
1,214 298 259 130
1,231 311 262 134
1/ Includes slaughter under Federal Inspection and other commercial slaughter, excludes farm slaughter.
Total Live Weight
1999
2000
-Thousand Pounds--
3,754,963 3,867,280
31,114
30,241
2,316,042 2,328,946
39,769
37,306
COMMERCIAL RED MEAT PRODUCTION-UNITED STATES11
Kind
Beef Veal Pork Lamb & Mutton
Total Red Meat
Oct 1999
Oct 2000
--Million Pounds--
2,265
2,345
19
18
1,698
1,715
20
18
4,001
4,097
2000 as % of 1999 --Percent-104 98 101 94 102
January-October21
1999
2000
-Million Pounds--
22,128
22,609
185
180
15,866
15,611
198
190
38,376
38,590
1/ Based on packers dress weights and excludes farm slaughter. 2/ Accumulated totals and percentages based on unrounded data.
2000 as % of 1999 --Percent-102 97 98 96 101
INDEX NUMBERS--UNITED STATES
Oct 1999
Nov 1999
UNITED STATES (1990-92= 100) Prices Received Prices Paid Ratio 11
91
93
116
116
78
80
1/ Ratio of index of prices received by farmers to index of prices paid.
3
Oct2000
93 121 77
Nov 2000
97 121 80
PRICES RECEIVED BY FARMERS-NOVEMBER 15, 2000 WITH COMPARISONS
Georgia
United States
Com modit
Nov 1999
Oct 2000
Nov 15, 2000
Nov 1999
Oct 2000 Nov 15, 2000
Winter Wheat
2.42
2.63
2.61
Oats
1.12
1.12
1.05
Corn Cotton
$/Bu. /Lb.
2.27
1.90
45.2
57.9
2.06
1.70
1.74
1.83
11
60.0
44.3
55.9
11
58.2
Cottonseed
$/Ton
73.00
88.00
87.00
94.00
104.00
108.00
Tobacco
$/Lb.
1.665
1.750
1.740
1.830
1.815
1.775
Soybeans Peanuts, ln-Shell21 All Hay, Baled31 Milk Cows41
$/Bu. /Lb. $/Ton $/Head
4.49
4.31
27.0
27.2
4.39
4.45
4.45
23.7
24.1
26.5
74.70
85.20
1,350.00
4.51 24.0 85.00
Hogs
$/Cwt.
31.60
33.40
41.40
35.90
Sows Barrows & Gilts
$/Cwt. $/Cwt.
26.60 32.20
24.10 33.80
33.70 41.80
28.00 36.30
Beef Cattle51 Cows61 Steers & Heifers
Calves All Milk71 Turkeys31 Chickens
$/Cwt. $/Cwt. $/Cwt. $/Cwt. $/Cwt. /Lbs.
42.80 32.10 67.90 82.50 17.50
49.60 36.00 74.80 93.00
51.00 36.60 77.80 99.00
66.20 33.60 70.90 93.00 14.40 45.3
66.70 36.20 70.50 102.00 12.50 45.9
69.50 36.90 74.30 106.00
81
12.20
47.0
Exel. Broilers31
/Lbs.
11.0
4.4
5.1
Com'! Broilers"' Eggs, All31101
Table31 H a t c h i n ! l 31
/Lbs. /Doz. /Doz. ~/Doz.
38.0 88.5 46.9 150.0
90.4 49.1 150.0
38.0
33.0
38.0
94.9
66.0
68.5
74.0
55.9
49.0
51.7
58.4
150.0
oIP1nf/rciaBclulealdsseeegpsdgusqboulnsiasolhsliea~dlebqsJyuafdaanunr,mrAtiin&egrr,s,tahJinune~cflioOurstdchtiten.hgra5Pl/hf.Caroetofcmwthhiuisenm,gsmste.eogenEgrtsxsh,c.alaun2ndd/delneshcgelhugiafdseuelrisnssoP. acC6dls/aduBtitbeiroseenitfdaaceillo.swl.osa8na/ nPpdereaclnuimull tidnsaaairryty.loc9aonw/ Esvnaftoliurrees.lma3uo/gnMhthti.edr-U.m..So7n.1 tlBihveegforwirceeeid.geh4dt/ueAcqntuioimivnaaflloesrnshtoapludrilcifneogsr
dairY herd replacement only. and government withholding. except AR, TX. 10/ Average
3n1VJ\ 311111.l ~3dVd SM3N
"660>-!090 VD 'suoq1v 'AV '{OOOUBH ISB3 'OZ Ol!flS 'llu!pJ!ng ll!l>pO:f suoqdo1s '001AJS s011s111'1s 1Bm11nopllv VD '.L110d311 W11V" 01 solluBqo SSOlppB pus :JOjSBIUjSOd "SOO!lJO llu'l!BW IBUO!llPpB puB 'VD 'suoq1v IB p1Bd olll!jsod SjBO!po!Jd "660>-!090 VD suoq1v 'OAV '{OOOUBH ISB3 'O!AJS SO!!Sll1'JS IBltlllnoullv VD oq1 ,<;q f;1q1uow -lWOS poqs1iqnd Sl (O&ZL-vvl NSSJ) .L110d311 W11V:I
9l:l:-9ts-90L 3NOHd ~090 '11m:I03!> 'SN3Hl'1
"3A'1 >IOOONVH !S'13 SS
Ol: 3llnS
"!>018 l'ln:l303~ SN3Hd3!S
"1 r\r "~~ - ~---{,._\ -S3 0O-W U-S: lU-3YS-. L S
\;;-
\ "1Y1:1n.L1n::>H:IDY
\, \YIDl:IO::ID .:____]