- Collection:
- Georgia Government Publications
- Title:
- Georgia farm report, 1984
- Creator:
- Georgia. Department of Agriculture. Crop Reporting Service
- Contributor to Resource:
- Georgia. Department of Agriculture. Crop Reporting Service
- Publisher:
- Athens, GA : Georgia. Department of Agriculture. Crop Reporting Service
- Date of Original:
- 1984-12-26
- Subject:
- Georgia
- Location:
- United States, Georgia, 32.75042, -83.50018
- Medium:
- publications (documents)
- Type:
- Text
- Format:
- application/pdf
- Description:
- Began in 1975?; ceased with vol. 10, no. 02 (Feb. 26, 2010).
"Agricultural statistician and Georgia Department of Agriculture."
Numbering began again with Vol. 11, no. 1 (Jan. 14, 2000).
Vols. for Aug. 31, 2005- issued by: USDA-NASS Georgia Field Office.
Description based on: Vol. 94, no, 1 (Jan. 4, 1994); title from caption.
Latest issue consulted: Vol. 10, no. 02 (Feb. 26, 2010). - External Identifiers:
- Call Number GA A400.C7 P1 F2 1984
- Metadata URL:
- https://dlg.galileo.usg.edu/id:dlg_ggpd_i-ga-ba400-pc7-bp1-bf2-b1984
- Digital Object URL:
- https://dlg.galileo.usg.edu/do:dlg_ggpd_i-ga-ba400-pc7-bp1-bf2-b1984
- Language:
- eng
- Holding Institution:
- University of Georgia. Map and Government Information Library
- Rights:
-

GEO RGIA
FAR REP
J anu ary 17, 1984 GFR- 84-Vol ume
GA
AYDO.C.1-
GEORGIA
I PI
---'-- - - CROP
. F'L
XW"P' " Ul
T 'I,q8~/J\lIJ\1I
~
G~.
t
"r
'J
. -
El}
RE PO RT I NG SER VIC E
e phens Feder al Bldg
_ _ c: .' r ~' 0 5 I':' :' ;~. (., .!. I. '..
te 320 he ns, Georgi.a 30013
Pho ne : ' (404) 546-2236
HIGHLIGHTS Crop S~ry
Fruits " ffuts S~ry Agricultural Prices
Turkeys
1983 PRODllCTI mJ Dm-IN FORMOST GEORGIA CROPS
Yie ld s f r om mos t of Geor g i a ' s 1983 fiel d crops we re ge ne r a l ly above pr e har ve s t e xpectat ions. The r e cov ery f rom the dr y a nd hot J u l y a nd August weat her was gr eater t han ear I ie r a nti ci pate d. Howe ve r , pr oduct ion for most c r ops was down s har p ly from 1982 due to lo wer y ields and redu ced har ve s t e d acreage. Mu ch of
'li e r e auce o ac reage fo r gra i n crops a nd cottor is at t ri buted t o the Pa yment- i n-Ki nd prog r am.
CORN PRODUCTI ON DROPS 20 PERCENT
The c omb i nat io n of a 10 percent reducti on i n acres harvested an d a 10 bus he I drop in y i e Id cut Ge or g i a ' s co rn crop t o 55 .1 million bushe ls, a r e duction of 20 percent f r om 1982 . Ac r es harvested for gr a in fel I 80 , 000 acres t o tot al 735,000 acres, which se t s a r ecord low ac rea ge for r e cor ds dat ing back t o 1866 . The 1983 y i eld averaged 75 bushels per ac r e , which is the second best y ie l d e ver atta in e d I n Georgia . Las t ye ar's y iel d of 85 bushe ls pe r acre Is t he record yi el d.
Cont in ue d on Page 2
GEORGIA ACREAGE AND PRODUCTI ON 1982 AND 1983
Acreaqe
YIeld De r Acre
Planted
Har-
Har-
ProductIon
for All
vested vested
1982
1983
1982
1983
Cr op
- - Un It Purp ose s 1983
1982 -11 1983 -11
-Tho us a nd Ac r es -
- - Thousands- -
Corn
Bu.
830
815
735
85.0
75.0
69,275
55,125
Wheat
Bu. 1,150
1,480
980
33. 0
34 .0
48 , 840
33,320
Oats
Bu .
155
90
85
61. 0
61.0
5,490
5,185
. Rye
Bu.
400
70
70
21 .0
21.0
1,470
1,470
Sorghum
Bu.
11 8
135
68
42 .0
41. 0
5 , 6 70
2 , 7 88
Cot t o n 21
Ba l es 120
158
115
714
480
235
115
Hay, alT
Ton
NA
500
500
2.40
2. 00
1,200
1,000
Soybea ns
Bu . 2,100
2,500
2,000
27 . 0
21 .0
67 ,500
42,000
Pe anut s
Lb.
567
472
562 3,215
2 ,770 1, 517 , 480 1,556,740
Sweetpotatoes Cwt.
6.0
6 .3
5 .8
130
125
819
725
Tobacco, Type 14 Lbs.
NA
50. 0
45 .0 2,110
2,120
105 , 500
95,400
Apples 31
Lbs .
14,000
19,000
Grapes 31
Ton
2.6
2.3
Peaches--31
Lbs .
110,000
92,000
Pecans 37
Lbs ,
125 ,000
105,000
IRRIGATED CORN ACRES AND YIELD DOWN
COTTONCROP HALVED
GFR-84 -Vo' . 1
The acres o f Irrigated co
ar es +~e~~~"I--~~rg r a's 1983 cotton crop to taled 115,000
gra in declined 7 pe rcen t In 1983, t o tot a l
bales , 51 pe r cent be l ow t he 1982 o ut put due to
140 , 00 0 acr es. The acreage deOl6.l ne 1.
both acreage and y i e l d drops. Onl y 115,000
I r rI gat ed corn , at 11 perce nt , was eve n sh ar p-
ac r es we re har v e ste d , which ti e s th e pr e vi o us
e r t han f or I rr igate d . As a resu l t, t he per cent o f t he t o t a l co r n acreag' for g~
r ec or d low set in 1978 . Y ie ld aver aged 480 pou nd s pe r acre , a s har p drop o f 234 po unds
th at received Irrigation r os e f r o m 18. 4 pe r-
pe r ac re fr om t he record yie l d o f 714 pounds
c ent In 19 82 , t o 19.0 percent I n 19 83. Est l-
obt a ined In 1982.
mated yIel d f o r t he I r r ig ate d portion o f t he
crop dec II ned fr om 140 bu s he I s per ac re la st
ye ar to 115 bu she l s pe r acre I n 1983 . Non-
Irri ga te d yIe lds we r e lower al so . The combI nat Ion o f l es s ac r eage an d lower yield l owered
SOYBEANS OFF 3RPERCENT
pr od uct i on from I r rig ated acres to 16 .1 mI l l Ion bushel s compared wI th 2 1 .0 rnl I lI o n bus he ls In 1982 . Thes e I r ri gate d cor n estIma tes are not part of t he Fe der al e st imat in g pr ogr am, but ar e made possl b Ie th rou gh cooperat I ve ef forts wIth t he Geo rg I a Depar t men t o f Agr icu l tu r e .
With a ha I f - ml II ion f ewer ac res har ve st ed an d a 6 bu s he l red uc t ion i n y i eld, Geo r g i a ' s 1983 soybea n c rop was a I ittl e less t han tw o-th ir d s t he si ze of the 1982 cr op. Pr oduc t ion f e I I f r om 67. 5 mi II Ion bushel s in 1982 to 42 .0 mIll i on in 1983 . One o ut of e ver y fi v e acres tha t produced soybeans In 1982 did not pr od uc e
'so y be an s in T983, as ac res harvested drop ped
f r om 2. 5 million to 2. 0 mi ll ion . Y ie l d pros-
pe cts impr ov e d late in t he c rop year d ue to
adequa t e moI st ur e and mi I d temper atur e s .
IRR IGATED & NON - IRRIGATED CORN , GA. , 1983 1/
Harv' d
YIe ld
Pro-
Y i e I d av er aged 2 1 bus he I s per acr e c ompar ed with 27 bushe ls pe r acre the previ o us year .
Trea tment for Grain 1,000
per Acre
ductJo n 1 ,000
Ac r e s
Bus he l s
Non-Ir ri -
gated
595
65 .6
39 , 025
I r r i g a ted
140
115 .0
16, 100
Tota l
735
75.0
55 , 125
II Not avaIl ab l e f or ye ar s pr I o r t o 19 82 .
TOBACCO SLIPS 10 PERCENT
F l ue-cur ed t ob acco output o n Georg i a fa rm s tot a l ed 95.4 mIl lion poun ds in 1983, making it
t he sma llest t obacco crop si nc e 195 8 . The
sl ight improveme nt in y i e l d whi c h ave r age d
2, 120 poun ds pe r acre, was more th an off se t by
t he 10 pe rcen t drop in ac r es harvested.
Har ve st e d acres t otaled 4 5 ,000 i n 1983, com-
par ed with 50 , 000 i n 1982.
WHEAT CROP ONE-THI RDSMALLER
Geo r g i a 's 1983 wheat ou t put was 32 pe r ce nt I e s s t han t he 1982 crop . Product io n in 19 83 amou nt ed t o 33 .3 mil lion bu s hel s compared wit h 48. 8 mil l i o n bu sh e ls f o r t he prev i ous ye ar . In 1983, an es t i mated 980 , 000 ac r es were har ves ted for gr a i n , compared with 1 , 480 ,000 ac r es in 1982 . Aver age y iel ds of 34 . 0 bu s he l s pe r acre i n 1983 and 33 . 0 bus he l s pe r acre In 1982 we r e obtained .
2
I lThC , J.eo rg I a j:: ~ ri.l Rc po r r ( I SS ~1 -0 7 4 L-7 2e. C ) j s
Ir ut I ! shod .sool - oro nt bt v t't The Ge or y l 3 Cr'op ] l R e r~ ~'t l n 9 So r v i c e , S top r.e n ~ Fode r a l Bll iid- I i W; , :'1~o r.s , Ga.. 306 13 , Lll.r r-y t , Sn i pe s , l
l i S t a t i s t l cl ~ n - l n -C t'l i:l r:J e , Se-c ond I C lass DC's to::: gf.J
j ;J ~ i ~ e r Ather- s,~ . ~t. t-sc ~ ! p t fc:': toe ~ : O
! ;,!;"" veer ex cop t f r ~ 7 C ce r e cc nt r : ~ utc r S . ,
IS;' :b S t. :-j ~. ~ io ;r:to rr.,a r i o n eve l t ac l e t r-o-i: I ;,oor ..;! ;) C r :::.~, . ;:' ~por T in ~ 5 0 ; ,, 1r e , ') 1c;. he n s I ! f l')~ e r Q I f'l,;i I cdn :) . Sul t e 3 20 , At ht-ns , G A' I
llQ_LL--l~~o n e_: (" r.! )..-2..!.c'i=.lli...- _ _ ---l
GEORG IAPEACHES SET RECORDHIGH VALUE OF PRODUCTI ON
The value o f Geor g i a ' s 19 83 peach crop t o ta l e d $23.1 mi l l ion , 3 per ce nt ab ove 1982 and 2 pe rcent a bove t he 0 Id rec ord va I ue of $ 2~.6 mi lli o n s et in 197 5 . The 1983 ave rage pr ice r e c e i ve d by pr oduc e r s i ncreased 23 pe rcent to 25 . 1 ce nt s pe r po und . Util ized pr od uct io n , at 92 mi II ion pounds , wa s o f f 18 mi I I io n from
t he 198 2 c r op .
U.S. PEACHVALUE DROPS 15 PERCENT
Va lue of ut il ized pr oduc t io n at $258 . 9 mil l ion wa s 15 pe rce nt be low 1982. Ut i I ized peach productio n, at 1.75 b il l ion po un ds, was 17 perc en t below t he prev io us ye ar 's uti l i ze d t otal a nd 34 percent le s s than 19 81 . Exc l udin g Ca l if or n i a Cl in gs t o ne peac hes , U. S. peach prod uc t io n t ot aled 1. 13 b illion po und s , down 3 pe rce nt from 1982 a nd o f f 27 pe r ce nt f rom 19 81 .
PEACH ES
To t a l
Ut II Ized
State
Production
Prod uc t ion
19 82
198 3
1982
- ~~ il li on Pound s -
1983
AIa .
15.0
14 .0
15 .0
14 .0
Ga.
120 . 0
10 0. 0
110.0
92 . 0
N. J .
80.0
95 .0
80 . 0
90 . 0
Pa.
90.0
94. 0
90 .0
94 .0
S . C.
210. 0
95 . 0
20 0 . 0
80 . 0
Othe r Sta t e s 676 . 5
772 . 7
6 71.8
763 . 2
Ca I I f.
CIi ngs t on e 1 , 102 . 0
6 19 . 0
94 3.0
619 .0
U. S.
2,293 .5
1 , 789 .7 2 , 109 .8 1 , 752 .2
Pr Ice pe r
Pound 19 82
Ce nt s 23.8 2 0 .4 27 . 6 21. 4 23 . 2
15. 4
198 3
19. 6 25 .1 25.4 16 .8 20 . 1 16 . 1
9 .2 14. 4
9.0 14. 8
VaI ue of
Ut II Ized
Prod uc tion
19 82
198 3
1 ,000 Dol la rs
3,570
2,744
22 ,460
23,083
22, 084
22 ,85 1
19 , 252
15 ,834
46,3 18
16,11 5
103 ,197 122 ,578
86 ,820 303, 70 1
55 , 710 258, 915
GEORGIAGRAPE PRODUCTI ONDOWN
The State ' s 1983 grap e crop tot a led 2 , 300 t o ns , a 12 per ce nt dec rea se fr om 1982. Des pite a $6 1 pe r ton price increase to $534 ,
t he va l ue o f uti l ized pr-oduc t lo n , at $1.2
1'0 i I I io n de cre a s e d s li gh t Iy f rom t he 198 2 Ie ve I .
U.S. GRAPE PRODUCT IONDOWN 19 PERCENT
Ut ilized pr od uc tion o f grapes in the U. S. tot a led 5.28 mill io n tons i n 19 83 , down 19 percent from the r e cor d high of 6 . 55 mi I I ion t ons set in 19 82, but up 18 percent fr om 19 81 . Value o f ut i l iz e d production fo r 1983 at $1 .35 b i I I ion is 1 percent be l ow 1982 but 2 pe r cent above 1981 .
St at e
Ar iz. Ark . Ca II f. Ga. ~~ lch , Mo . N.Y . N.C . Oh 10 Pa . S .C . Wa s h. U. S.
GRAPE S
Tot a l
Uti lized
Pr od uc t io n
Produc tion
1982
19 83
1982
- 1,00 0 To ns - -
19 83
15 .1
14.6
15. 1
14 . 6
10 .5
10 . 0
10 .5
10 .0
6 ,076.0 4 , 695 . 0 5 ,386.0 4,695.0
2.8
2.5
2 .6
2.3
58.5
60 . 0
58. 5
60 .0
2 .5
3.6
2.5
3. 6
157 . 0
191 . 0
15 7 .0
191 .0
4 .5
3.0
4 .5
3 .0
9.0
11. 5
9.0
1 1. 5
47. 0
62 . 5
47. 0
6 2.5
2.4
1 .5
2. 4
1.5
168 . 9
2 26 . 0
16 8. 9
224. 7
6 , 554 . 2 5,281 . 2 5 ,86 4 . 0 5 , 279 . 7
3
PrIce
per Ton
19 82
19 83
Do l l ar s
991 .00 1 ,050 . 00
2 38 . 00 25 2 .00
231 . 00 26 1 . 00
4 73 . 00 534 .00
201. 00 194.00
320 .00 3 4 7. 00
2 34. 00 226 .00
32 1 . 00 324.00
22 7 .00 199 . 00
225 .00 170.00
289 .00 303 .00
185. 00 15 5 .00
23 2 .00 255 . 00
Va l ue of
UtI lIzed Prod ucti on
19 82
1983
1,000 Do I l ars
14,964
15 ,330
2 , 504
2 , 520
1 , 246 ,827 1 ,224, 352
1 , 23 1
1 , 229
1 1 , 758
1 1 , 66 2
800
1 , 249
36 , 77 7
4 3 , 228
1 , 444
97 3
2 ,040
2 ,285
10 ,585
1 0 , 6 46
693
45 5
3 1 ,299
34 ,773
1, 360 ,922 1 , 348 , 702
GEORG IAPR ICES RECEIVED
Ave r age pr Ices rece Ived by Geor gIa farmer s a t mId-December f or most l Ivestock a nd pou lt r y Items we re above I ast month and Iast year . Mos t c rop commod It Ie s sh owe d an Increase over last year but were gene rally be lo w l ast month's prices . The on ly maj or c r op t o show an Increase from Novembe r was soybeans , wh i le t he o n ly lIve s t ock I t em to dr op I n pr l ce f r om Iast mont h wa s mil k , The Geor g1a Pr lees Rece 1ved AI I- Commod Ity Index for Dec ember wa s 140 percent o f th e 1977 average, 4 pe rce nt above last month an d 20 percent above a ye ar ago.
GFR-84-Vo I. 1
U S. PR ICES RECEI VED INDEXUP 5 PTS.
The De cembe r a l I farm pr oducts Index o f prIces r ece Ived by f armers 1ncreased 5 po Ints (3.7 pe r ce nt ) f rom Novembe r t o 140 percent o f Its January-December 1977 ave rage. Higher pr lees f or cattl e, hogs, or ange s , eggs a nd onIons we re part Ially of fset by lower prIces for soy be ans , t omatoes, whe at , mI l k and cor n . The Inde x was 13 poin ts ( 10 percen t) abo ve a ye ar ag o .
Commod ltv W1nter Wheat
Oat s
PRICES RECE IVED BY FARMER S DECEMBER 15
Pr Ice
Oeor-q I a
I per Unit $/B u.
Dec.
Nov .
Dec . 15 ,
1982
1983
*
*
1983...
$/Bu .
-
-
-
1983 WITH COMPAR ISONS
Un ited States
Dec .
Nov. Dec . 15,
1982 3.54
1983 3 .46
1983 3.4 1
1. 44
1. 67
1. 71
Corn
$/Bu .
2.69
3.74
3 . 62
2 . 26
3. 17
3. 14
Cotton
i!Lb .
52 .8
69 .1
1/68 .0
57.3
67.6
1/67.3
Cotto nseed Soybea ns
-2-1
$/Ton $/Bu .
67. 00 5 . 36
187. 00 7. 51
-186 .00 7. 58
86 .00 5 .46
168.00 7.80
- 168 . 00 7. 61
Pea nut s
Swee t pota t oe s
Al l Hay, Hogs
ba le d,
-21
i lL b. $/Cwt. $/Ton $/Cwt.
23 . 3
6 .85
-
53 . 00
23 . 2 2114.60
--
37.00
-1/2125..
0 90
-
43 .40
25 . 5 7. 28 68 . 10 53 .60
24 . 6
-2 /
11 . 10
76.4 0
37 . 50
-1/2144
.2 .30
77 .9 0
44 .80
Sows
$/ Cwt.
43 . 90
31.00
32 .60
45 .7 0
32. 00
35 .30
Barrows & GI lts
$/ Cwt.
54.70
38 . 10
45 .40
54 . 80
38.30
46 .2 0
Beef Cat t le , ~
$/Cwt .
43. 30
38 . 10
39. 30
52 . 50
51 . 20
54 .60
Cows 41
$/ Cwt.
37.40
32. 80
33.30
34 . 90
33 .80
33 .50
St e ers & HeI fers
$/ Cwt.
50 .50
46.2 0
47 .5 0
57 .50
56. 90
60. 90
Ca Ives
$/Cwt.
51.5 0
51. 30
54.4 0
58 .8 0
59 . 20
60 .60
All MI lk Turkeys 21
$/ Cwt . ClLb.
14 .6 0
-
14. 80
-
-5/
14
.
70
-
13.90 33.5
13. 90 39.9
-5/
13 .80 45.4
Ch lcken s-
Exc l . Br o Il e rs
Com ' l Bro Iler s
Eggs , Al Table
l
-71
-61
Hatc h l nq
OLb . ClLb. ClDoz. i lDoz . C1Doz .
12. 0 23.5 64 . 6 50.7 117. 0
-2
/29 . 31.
5 5
2/86 .6
2179 .6
27 110 .0
30 .0 5/ 33 . 5 - 100 .0
89 . 3 140.0
-
-
24.3
33. 0
55 .4 2175 .8
49.3
-
-2-171.
8
-
-
5/33 .7 - 83 . 4
79 . 3
-
1/ FIrst ha l f of mon t h. :u MI -month pr 1c eo 5/ "Cows and "s t ee r s a nd he Ifers cO'!1b l ned wit h
al lowanc e where nece ssar y for s la ught e r bu I Is .- 41 Inc Iudes da Ir y co ws so I d for slau ghte r.
51 Entir e month. 61 Ll vewel ght eq u Iva le nt pr ice- fo r Georg Ia . 71 Average of al I eggs so ld by
ifar mer s IncludIn g l1atchlng e ggs sold at re t aI l. *Insuff lcle ntsales .
4
U. S PRICES PA ID INDEX UNCHANGED
The Inde x of pr Ices pa Id by f a r me r s for commodIt Ies and servI ces, Interest, taxes and i arm wage rates f or De cember wa s 162 percent o f t he 1977 base . The Index was unchanged f r om No vembe r but 6 po Ints (3 .8 pe r ce nt ) above a year ear I I er , Pr I ce Increase s s I nee November for feed e r ca t t le and calves a nd feeder pl gs were offset by lowe r fuel pr Ices .
CONSUMER PRI CE INDEX
The November una dj usted Cons ume r Pr le e Index for al I urban consumers (CPI-U) at 303.1 (1967=1 00) was 0 .2 percent hIgher than In October and 3 . 2 percent above Novembe r 1982 . On a seasona I Iy adj usted bas Is , the CP I-U was 0 . 3 percent above Oetobe r . The other goods and serv Ices I ndex reg I st ere d a 0 . 6 percent Inc r ease fol lowed by the hous I ng I ndex wIth a 0 . 5 pe r cent Increase . Med 1ca I ca re and e nter t a Inme nt Indexes Inc r e as e d 0.4 pe r cent and 0 . 3 percent, respectIvely
Commodltv DaIry Fee d 16:t
PRI~v ES PAI D BY F A~~ E R S
PrI ce
per
Dec. 15,
UnIt
1982
$/Ton
176 . 0 0
DECEMBER 15 Georqla
Nov . 15,
1983 220 .00
1983 WITH COMPARISONS
II
UnIted states
Dec. 15, Dec. 15, Nov. 15 , Dec. 15,
1983
1982
1983
1983
205 .00
174 . 00
205 .00
205 .00
DaIry Feed , 18%
$/T on
177. 00
225 .00
215 .00
180 . 0 0
22 1. 0 0
2 19 . 0 0
DaIr y Conet . 32%
$/Ton
225 .00
280 .00
285 .00
257 .00
305 . 00
297 .00
Hog Feed 14%-1 8% $/Cwt .
10. 50
12. 50
12 . 50
10 . 4 0
12.1 0
11. 90
Hog Conct . 38%- 42% $/Cwt .
14. 00
17.50
17 . 00
14. 60
17 . 1 0
16 .80
Beef Cattle Conct .
32%-36%
$/Cwt .
11 . 50
13 . 5 0
13 . 0 0
11 .60
13 .20
13 . 4 0
Cottonseed Meal 41% $/Cwt .
13 .50
16.00
16 .00
13. 30
15 .80
16 .00
Soybean Meal 44%
$/Cwt .
13 . 0 0
16 .00
15 .00
13 .00
15 .80
15 . 6 0
Bran
$/Cwt.
11.00
12 .00
12. 00
9 .78
10 . 3 0
10 .60
Mldd II ngs
$/Cwt.
9.40
10.50
10.50
9 .35
9.98
10.10
Corn Meal
$/Cwt.
7.90
9.90
10.00
7 . 10
8 .91
8 . 74
BroIler Gr ower
$/Ton
185. 00
210 .00
215 .00
201 . 00
243 .00
240 .00
Lay I ng Feed
$/Ton
176 .00
215.00
215 .00
185 .00
220 .00
219 .00
Ch Ick Starter
$/Ton
195 .00
250 .00
245 .00
208 .00
250 .00
244 .00
Bro I ler-Feed
Rat Io 1/
Lbs .
2.5
3.0
3. 1
2 .4
2. 7
2 .8
Hog-Co rn RatI o 21 Bu.
19. 7
9 .9
12. 0
23 .7
1 1 . 8*
14 .3
MI lk- Fe ed Ratlo--3/ Lbs .
1.66
1.35
1.43
1.60*
1.36
1.35
E g-Feed Rat Io 41' Lbs .
7.3
8 .1
9 .3
6 .0
6.9
7 .6
17 Pounds of broIler gr owe r equal In value to I lb. broI ler lIve weIght . 21 Bus he ls of corn
equal In val ue to 100 l bs , of hog lI ve weIght . 3/ Pounds of 16% da Iry feed equa I I n va Iue to
lb. whole mI lk. 4/ Pounds of layIng feed equal -rn value to 1 doze n e ggs . * RevIsed .
1977=1 00 GeorgIa
INDEX NUMBERS- - GEORGI A AND UNITED STA TES
November 1982
December 1982
November 1983
December 1983
Pr Ic es Rec e l ved
AI I Commod 1t ie s
119
120
136
140
Crops
117
117
140
136
LI ve stock & Produc ts
121
122
132
143
UnI t ed States
Pr Ices ReceIved
128
127
135
140
Pr Ic es PaId I I
156
156
162
162
Rat Io 2/
82
81
83
86
17 MId- month Index Inc ludI ng I nterest, taxes and farm wage rates. 27 Rat Io of I ndex of Pr Ices
Ffece l ve d t o Index of Pr Ice s PaI d: Int e r es t , Taxes and Farm Wage Rate s .
5
GFR-84-Vo I . 1
GEORG IA PECANVALl JE DOWN
U.S. PECANVALLIE llP
The a ve r ag e pr ic e recei ve d f or Ge o r gia pe ca ns, a t 64 .9 cents pe r po und , was 1.2 cen t s per poun d hi gher t ha n 1982 . Howeve r , the 16 pe rce nt de c l i ne in production mo r e t ha n o ffset t he pr ic e increase and the over a I I va I ue of t he 1983 crop dr o ppe d t o $6 8 . 1 ml II io n, a 14
pe r cent dec r ease .
The v al ue o f t he U. S. pe c a n cro p In creased 15 percent to $16 7. 1 mi l I io n de s pite a n 8 .5 c ents per poun d de crease I n the a ve rage pr ice . The i nc r ease wa s d ue t o a 32 pe r cent Increase In pr od uc t io n . U. S . prod uc t io n t o ta led 283.5 mi lli o n po un ds, a 32 per cent Inc rea s e f rom la s t ye ar.
PECAN S
Ut i I Ized Produc t io n
Price pe r Po und
Va lue o f Ut i l ize d Produ cti o n
S t a te
19 8 2
1983
19 82
1983
19 82
19 83
1, 000 Poun ds
Ce nt s
1 ,000 Do I l ar s
Ala.
23,000
30,000
62.6
59 . 6
14, 401
17, 890
Ar k .
500
3 ,000
83 . 2
70 . 0
41 6
2 , 100
F la.
4 ,500
4 ,000
55 . 4
5 7.2
2, 49 5
2 , 28 8
Ga.
125 , 000
105, 00 0
63. 7
64 .9
79,625
68 , 100
La.
10, 000
28 ,000
52. 0
40 . 4
5,200
11, 30 0
Mis s .
4 ,000
8,000
75.8
62 .2
3 ,030
4,97 5
N. Mex.
25,000
28 , 500
83. 0
70.0
20 ,750
19 , 950
N. C. Ok l a .
1,900 2 , 000
2, 000 8 ,000
57. 1 6 9. 0
68 . 0 48 . 0
1 ,085 1 , 380
1,390 3,840
S . C.
2 , 200
2,000
70 .7
62 .2
1 , 556
1,244
Tex .
17, 000
6 5 , 000
88. 4
52.3
15, 027
34, 000
U.S.
2 15. 100
283 500
67. 4
58.9
14 4 96 5
167 .077
GEORGIA APPLES UP 36 PERCENT
Ut i I ize d produc t io n o f Ge o r g i a a ppl es in 1983 was 19 . 0 mi I I io n pou nds, up
36 pe r cen t f rom t he 14 . 0 mi I li on po und s of 1982 . Of t he 19 mill ion pou nds
uti I i ze d , 10 mi Ilion we re from nor t hern orc h ar ds a nd 9 mill i on f r om the
south . The t ota l crop was va lu ed at $1.5 mi ll i o n , up 2 per ce nt f r om t he
1982 cro p . Pri ce per po und dur i ng 19 83 ave r aged 10 .9 c e nts per po und I n
t he nort h . I n t he so uth It wa s 5.1 ce nt s, a nd state wid e it wa s 8. 1 ce nts
pe r po u nd.
,AP PLES
Price
St at e
To tal
Ut iIi zed
Pr od uc ti o n
Pr od uc t io n
1982
19 83
1982
- - Mi II ion Po unds -
1983
pe r
Pou nd
1982
19 83
Ce nts
Ca I i f .
480 .0
460. 0
480 . 0
4 60. 0
11 .2
10.7
Geo rgia Nor t h Sout h Tota l
rH c h .
N. Y.
N. C. Pa .
5.5 9.5 15. 0 9 80 . 0 1,130. 0 170. 0 525.0
10 . 0 10 . 0 20 .0 7 50 . 0 1 , 100 .0 400. 0 440 . 0
5. 0 9 .0 14. 0 9 80 . 0 1 ,1 30 . 0 170.0 52 5.0
10 . 0 9 .0 19 . 0
7 50 .0 1 ,1 00 . 0
400.0 44 0 .0
16 . 2 7.8
10 .8 6. 9 8 .9 8. 1 9. 3
10 .9 5.1 8. 1 8 .9 8 .7 6. 7 8.7
S. C.
6.0
24 .0
6 .0
23 . 0
11 . 4
8. 3
Wash .
2 ,6 15 .0
3 , 000.0 2,6 15 .0 3 , 000 .0
9 .7
10 . 4
Othe r
State s U. S.
2 , 194 . 0 8 , 115.0
2 ,003 . 5 8 ,1 97. 5
2 , 18 1 . 2 8 , 101. 2
1 .985. 7 8 , 177 . 7
12. 3 10 .0
13. 3 10 .5
6
Va Iue of
Ut i l ize d
Pr od uc t io n
1982
19 83
1, 000 Do l l a rs
53 , 84 7
49,19 7
81 0 70 6 1 ,51 6 6 8, 000 10 0 , 490 13 ,770 48,908 6 82 252 , 8 95
1 , 086 459
1 , 545 6 7,000 95 ,600 26 ,740 38 , 455
1, 915 3 11,608
267, 600 80 7 , 708
263, 994 856 ,054
us 1983 PRODUCTIONHIGHLIGHTS
Corn for Gra In : ProductIon of corn for graIn In 1983 wa s estImated at 4.20 bIl lion bush e l s , hal f as I arge as t he r e cord h Igh 8.36 b I I l Io n bushe I s pr oduc ed I ast ye ar and t he smal le s t crop sI nce 1970. Har ve s t e d area was 51.5 mIl l Ion ac r es , dow n 29 pe r cent from 1982. The yI e l d wa s 81.6 bushels per acre , down f rom the record hIgh 114 . 5 bus he l s l ast year .
Oat s : Pr oduc t Ion In 1983 !s estImated at 477 ~ on bus he ls, 23 percent less t han the 1982 c rop.
Al l Hay : Product Ion was 143 mI l lIon t ons , down 6 pe r cent f r om l as t ye ar 's r ecord h l qh . Are a harvested In 1983, at 60 . 5 mII lIon acres, was on ly s l Ight ly bel ow 1982 , but ave rage y I e I d , at 2. 36 t o ns pe r ac re, was down 6 percent from la st ye ar ' s record hI gh.
Whe at : All whe at prod uct Ion t ot a le d 2 .43 DTllTon bushels, down 14 percent from 1982 . Area harvested was 61. 5 mII I ron acres, 22 perce nt l ess than In 1982 . YIe l d per acre a ve r age d a r ecor d hI gh 39 .4 bushe l s .
Tobacco: All tobacco product Ion tota led 1. 41 bIll Ion pounds , 29 perce nt be low 1982 a nd the s mal lest pr oductI on s Ince 1943. Ar ea har ves t e d t ot a le d 784 t hous and acres, down 14
percent from la st year . YIe ld avera ged 1 ,8 00 pounds per ac re , down 383 pounds fr om last ye ar ' s record hIgh yIel d.
Soybeans: ProductIo n, at 1. 60 bIll Ion bushel s , was 28 pe rcent les s th an t he 1982 crop. Harv e s t e d area , at 62 . 2 mI I l Ion ac r es, was down 11 pe rce nt , and the y Ie l d, at 25.7 bus he ls per acre, was down 6 .2 bus hel s from 1982 .
Al l Cotton: Prod uct Io n estI mated at 7 .72 mI llIo n bales , wa s 35 percent be low the 1982 product Ion .
Peanuts: ProductIon t ot a le d 3.27 b ll l Io n pounds , 5 pe rce nt les s t han In 1982 . Growe rs harvested 1. 38 mI ll Ion acres, 8 percent above 1982 . Ave r age y Ield per acre, at 2,380 pounds , was 316 pounds be low 1982' s r ec or d h Igh yield.
GEORGIA FRESH ~ARKET TOMATOES
Pr oduct Ion of t omat oes I n 1983 t ota led 206, 000 hundr e dweIght , 3 pe r cent l arger than the 1982 cro p a nd t he l argest c rop s I nce 1976, de spIte a 14 percent decr ease I n yIel d to 86 cwt. per acre. A 20 pe r cen t 1ncre as e In harvested acres to 2, 400 acres an d a $1 .20 Inc rease In s easo n aver age prI ce to $24.5 0 per cwt. r esulted In a record hIgh value of productIon t otalIn g $5 ,047 , 000 .
Cr
Un It
Co r n fo r gr aI n
Bu.
Sorg hum for gr aI n Bu.
AII Wheat
Bu .
Soybe ans fo r beans Bu.
Pean ut s fo r nut s , Lb .
Up l a nd Cot t o n 1/ Bal e
Cottonseed -
Ton
A' I Hay
To n
Swee t potatoes
Cwt .
To ba c c o
Lb.
Ap pl es , com ' I
Lb .
Peac he s
Lb.
Gr ape s
Ton
Pec ans
Lb.
Oat s
Bu.
Rye
Bu.
Almo nds (Ce l l f s ) Lb.
Wa I nut s
To n
1/ YIe l d In pounds .
Area 1982
,0 73, 030 14, 248 78 , 9 81 69 ,82 1 1,275 . 4 9,658.0
60 ,679 11 1. 1 907.8
6 0 ,461 99.9 783.8
114. 5 59.1 35.6 31.9 2 ,6 96
590
2.5 1 129
2 , 183
10, 618
721
9 , 098 923
58 . 4 29 .1
7
81 . 6 48. 8 39 .4 25. 7 2,380
504
2. 36 118
1, 800
52 . 5 30 .5
8, 359, 364 84 1 , 3 69
2,812, 297 2 , 229 , 486 3 ,438 ,330
11,863.9 4 , 744
152,5 34 14,290 1,982,245 8 , 115, 000 2 , 293 , 500 6,554 .2 215,1 00 620 , 509 20 ,954 347,000 234 .0
4, 203,777 483,056
2,425, 408 1, 595, 437 3 ,273 ,495
7, 634.3 3 , 105
142, 979 11,786
1 , 41 0, 868 8, 197, 500 1,789 , 700
5 , 281 .2 283, 500 477 , 303
28 , 152 235,000
190.0
,n r'
XH
"tJ UJ m7.l A ll>H 7.l J;;. -<
'T'
Z -l
L,J
o,
.....
'"
C;) (".)
l:> +' r",
mn
x
\)
.....
M1 LV
o
1- .. ....... 0
:-:' 0
, l1 r",
2NO
-1 ~U
I
VI .... \" -l OO Vl
"I> r" I
\.O N
1'-'
O -J
O '-=-
-J
VI
o
o
GA. TURKEY INTENTION S IJP 13 PERCENT
Georg! a tu rkey growe rs Inte nd t o rai s e 13 per cen t more t ur key s In 1984 t han t hey raI sed In 1983 . The 2.5 7 mJ I I Ion bi r ds Inte nded are all he avy br ee ds . Tur key breede r he ns o n December 1, 1983, tot aled 60 ,000 , up 3 percent f rom December 1 , 1982 . The t ot al va l ue of t ur ke y breeder hens was $1 .0 mIl l Ion , 12 pe rcent Ies s t han the tota I va Iue f or 1982 . Turkey growers In Geor g Ia r e l sed 2 . 27 m! l l lon tur keys In 1983 , 15 pe r ce nt I ess t ha n 1982.
U. S. TURKEYS
Turk ey gr owe rs In 20 maj or pr oduc I ng states Intend t o r e Ise 167 ml I I Ion t urk e ys In 1984 , up 2 pe rcent from 1983. Tur key br eed e r he ns on December 1, 1983 , In 24 s ta tes totaled 3. 16 mI l lI on, down 8 percent fr om Decembe r 1, 1982. Turkeys r aI se d In the UnIted St ates dur Ing 1983 , at 170 mI l l Ion , I ncre as ed 3 pe r ce nt fr om t he 1982 level of 165 mIl l Ion.
TURKEYS - AL L BREEDS
NUMBER RA ISED , 7 SELECTED STATES, 1982-1 984
Stat e
1982
1983
1984 1984 as %
1/ 1, 000 Head
o f 1983 Pe rcen t
Ark .
13,000 12,850 12 ,850
100
Cal l f. 20 , 000 20 , 200 19 ,800
98
Ga .
2,680 2,266 2 ,5 68
113
MInn .
26 ,000 27 ,000 26,000
96
N. C.
27 ,000 28 , 700 30,600
10 7
S. C.
2 ,6 16 2 , 159 2 , 150
100
Va .
10, 081 11, 388 12, 299
108
Othe r
States l! 57 ,542 59,59 1 60 ,523
10 2
TOTAL 158,919 164 ,154 166 ,790
102
TURKE Y BREEDER HENS: 7 SELECTED STATES AND OTHER STATES, ALI BREEDS, D ~C . 1, 1981-1 9 8~
cs ru.
1,000 He ad
525
525
4 20
Percent 80
Ga .
56
58
60
103
MInn.
567
523
443
85
Mo.
244
290
300
104
N.C.
690
750
700
93
Tex.
450
310
155
50
Va.
166
182
16 2
89
Other
Sts.l/ 816
79 1
915
116
TOTAL-- 3 514 3,429 3 155
92
1/ AR,Co,fc, IA,KS,MI,NB,NY,6R,OR,PA,SC,SD,UT,
WV,WI. S
\'
GEORGIA
FA M E
J anuar y 27 , 1984 GFR-84-Vol ume 2
HIGHLIGHTS Grain Stocks Live s t ock Slaughter Annual Crop SIDBarY Monthly Poult ry
GA At.I 00 .L"l-
PI
R ...--- F::L.
J t <. J4~~ J_:A1 'NT
,,
,.,'
R
Jh,. 0
GEORG IA CROP RE PORT I NG SERVICE
stephens Federal Bldg.
S" uite 320
Athens, Georgia 30613 Phone: (404 ) 546- 2236
Milk Produc tion
DOCUM Ef. lT S Cat t le o n Feed UGA LIBRARIES Cold Storage
GA . CORN STOCKS DOWN37 PERCENT) SOYBEANS DOWN33 PERCENT
St ocks o f c orn s t-ored i n al l po sitio ns o n
J anu ar y 1, 1984 , I n Geor g I a t o taled 26 , I 77 , 00 0
bu she l s , 37 per cen t les s than t he 4 1, 718 , 000 bu s he ls on ha nd Ja nuary 1, 19 83 . ~os t o f the dec r e as e ... as a tt r i buted to co rn sto re d o n
fa rm s, wh i c h at 18 , 74 3 , 000 bus he l s , was 44
percent les s th a n a yea r ago.
Of f - f ar m
st-o cks amount-ed t o 7 , 434 ,000 bushe ls , 12
perce nt be t ow l as t year.
Soy be an stock s j n a I I pa s i t i o ns rot a I e d 28 ,521 , 000 bus hel s , down 32 perce nt fr om a ye ar ago . Soyb e ans hel d on f arm s amou nt ed to 7 ,980 , 000 bus he l s , 62 pe r ce nt less th an t he 20,925, 00 0 bushels stored o n fa r ms last ye ar . Of f - farm s to ck s t ot-a led 20 ,5 41 , 000 bu she l s , on ly 2 pe rce nt be l ow a yea r ago .
S t oc k s o f wheat i n al l positi o ns o n Ja nuar y 1, 19 84 t o t al ed 4, 6 76, 000 bu s hel s, 27 pe rce nt l ess t han the 6 , 373 , 000 bushels a year e ar l ier . Farm s tor age amoun t e d t o 2 , 332 , 000 bus hel s , do wn 3 2 pe r ce nt , whil e of f -farm st-ocks were down 2 1 percen t at 2 ,34 4 ,000 bus he ls .
Gr a in sor ghum he ld i n a l l pos it i ons t o t-a l ed o n l y 1, 220, 000 bushels , 66 pe rcent les s t han the 3 , 55 1,000 bushe I s on ha nd a yea r ago . Far m st o ck s amount ed to 1, 032, 000 bu she l s , 69 pe r c e nt I es s t han th e 3 , 345 , 000 bushe Is he I d o n f arms la st year . Off- fa rm so rghum sto cks tota l ed 188, 000 bus hels, down 9 pe rcen t f r om a year ear l ier. Oats st o r e d i n all po s i t i o ns amount e d t o 1,423,000 bus he ls , 35 percen t less t han the 2,17 7,000 bus he l s on hand J anuar y 1, 1983 .
Grai n
GEORGI A GRA I N STOCKS- - JANUARY 1 , 1984 WI TH COMPARI SONS
On Far ms
1983
19 84
- Off Farms 1/
19 83
19 84
All Positi ons
19 83
19 84
- - 1, 000 Bus he l s - -
Cor n ,
33 ,252
18 , 74 3
8 , 466
7 , 434
4 1, 718
26 , 177
Oats
1 ,3 18
I ,244
8 59
179
2 , 177
1 ,423
Barl ey
38
7
38
7
Wheat
3, 419
2 ,332
2 , 954
2,344
6,373
4 , 676
So rghu m
3,34 5
1,032
20 6
188
3,551
1 , 220
Soybe ans
20,925
7 ,980
20 ,9 70
20 ,541
41 , 895
11 I nc l ude s stock s at mi I I s, elevators, war e ho use s , t erm i na l s and pr oces so r s .
28, 521
Agricultural. Statistician and Geor gia Depart:aent o f Agricult~re
U.S. GRAIN STOCKS DOWN SHARPLY
Stoc k s o f corn I n a I I po s I t I on s o n Januar y 1 , 1984 are est i mat ed at 4.93 bl l l i o n bu s he l s , 4 1 pe rcen t l e ss tha n on Janua ry 1 , 1983 . Cha nge s
GFR-84 -Volume 2
of ot her gr a i ns were as f o r lows: whea t do wn 8
pe r cen t ; soy beans down 28 percent, gr a f n so r ghum down 20 percent; o ats down 20 perce nt and bar ley do wn 10 pe rce nt .
U. S. GRA I N STOCKS- -J ANUARY I , 1984 WI TH COMPARIS ONS
On Farms
Off Farms 17
A ll Po si tions
Gr ai n
19 83
19 84
- -1983
- 19 84
-
Mi l li o n Bushe ls
1983
19 84
Corn Oats
6, 0 16 .9 399 . 8
3, 099 . 0 3 22 . 5
2, 267 . 3 75. 8
1 , 829 .4 56.0
8 ,284 . 2 475 . 6
4 , 928 . 5 3 78.5
Bar l ey
293. 9
256. 8
124. 2
12 1 .4
4 18. I
3 78.2
Wheat
1 , 166.2
1, 01 0. 9
', 354 . 5
1, 313 .6
2 ,5 20 .7
2 ,324. 5
So r ghum
267 .9
147 .8
542 . 6
502. 7
8 10 . 5
6 50.5
Soybeans
1, 051 .7
63 1. 3
75 2 . 2
659 . 4
1 ,803 . 9
17 Includes s ro cks at mI I Is, el e v a t ors, wa r e houses, t er mI ne l s and pr oc e sso rs.
1 ,290. 7
GEORGI A RED ~1EAT PRO DUC TI m~
Geo r g i a r ed meat pr oduc!"io n to t a l ed 38 .8 mI I li on pou nds dur i ng Decembe r 19 83, do wn 4 pe r c en t f r om November 19 83. Janua ry - Dec embe r red me at product i o n t01-a l ed 463 mi Ili o n pounds.
u.S RED MEAT PRODlJCTI mJ
Commerc ia l red meat pr-odu c t I o n i n ihe Un ite d States f or Dec ember 1983 t o t al e d 3 . 39 b i Ili o n pou nds . Produ ct ion duri ng 1983 t ota led 38 . 9 bi I I Ion po un ds.
Spec i es
Georg ia Cat t l e Ca l ve s
GE ORGI A AND UN I TED STATES LIVE STOCK SLAUGHTER 1/ Ave r-age
L ivewei ght
Dec .
Dec .
1983
1983 Po unds
15 . 5 1.9
18 7. I
9 10
i 4 , 110
34 9
667
23 3
43, 6 79
Pou nds 1, 070
227 24 3 11I
196, 180 6 , 452
498,499 55
Po unds- 39 ,248 .6 7 29 ,4 21 ,202. 7 74 0.9 ar m
COMM=:RC I AL RED MEAT AND LARD PROD UCT I ON: UNiTED STATES WITH COMPARIS ONS 1/
Dec ember
January-December 2/
Kind
19 83
19 83
-
Mi l l io n Pounds
Mi l l i o n Pounds
Be ef
1,970
23, 058
Vea l
37
429
Pork
1, 35i
15 , 060
L amb & Mutto n
30
368
Tot al Red Meat
3 , 388
38,915
L ard 3/
88
974
1/ Based on packers dr e s s we i ght s and ex cludes f arm s laughter. 2/ Ac c umu l at ed t o t als based on
unround ed da t a. 3/ Pre l imin ary l ard production inc lu des r en dereCi po r k f at.
2
POULTRY HATCHI NG AND PLACEMENT- -DECEMBER 1983
Duri ng
%of
% of
Item
De c .
Nov .
Dec .
year
Jan. t hr u Dec.
year
1982
1983 Tho us ands
1983
ago
1982
1983
ago
- - Thous a nds- -
Pul le t Chicks Placed
Domest ic ( U. S. ) 1I
Br o i ler Type
3,25 5
3, 126
3, 590
110
39 ,833
38,068
96
Egg Type
243
232
2 28
94
3 , 768
3 ,307 88
Ch ick s Hatched
Br o i le r Type
Geor g i a
54, 2 11
47 ,693
54 ,344
100
645 , 168 643 ,201 100
United St ates
373,949
335 , 983
374 ,960
100
4 ,445 ,583 4 ,448 , 772 100
Egg Type
Georgia
1,706
1 , 748
2 ,618
153
32,018
24 , 190 76
Un it e d Sta tes
31 ,140
29 ,370
34 ,229
11 0
444 ,42 0 4 10 , 321 92
Tur k e y s
Poults P l aced
U. S.
12,1 33
10, 964
12.5 73
104
41, 414
40 ,8 39
99
1/ Reported by l ead in g br eeders , includ es expected pu l le t rep l acements from eggs so Id dur Ing
1'he pr ec edi ng month at the rate of 125 pul le t c h icks per 30 doze n case of eggs . 21 Tur ke y
poults placed Se pt embe r 1983-De cember 1983 .
NO. OF LAYER S & EGG PRODUCTI ON, DECEMBER 1983
Laye r s
Eggs per
Dec. Egg
Dec . 1
Thous -
100 Layers Numbe r
Prod uct ion Mi l I Ion s
Geo r g i a
Hatch i ng
4 , 9 16
1,888
93
Ot he r
13 , 952
2 , 133
298
Tot a l Ga . 18, 868
2 ,072
39 1
Total U.S . 277 , 651
2 , 077
5, 767
EGGS IN INCUBATORS , JANUARY 1, 1984, U. S.
Item
1983
1984 %of Yr . Ago
Tho us ands
Ch ic ke ns
Egg Type
28,373 31 , 658
112
Broi le r Type 311,368 308 ,842
99
Tur key s
1/18 ,068 2/ 16 ,59 1
92
1/ I nc lude s
l i ght breeds.
21 Inclu des
li ght breed s .
Item Young Chickens
Dec. 1982
COMMERCIAL POULTRY SLAUGHTER 1 /~ DECEMBER 1983
Dur i ng
. of
Nov .
Dec .
ye a r
Jan. th r u Dec.
1983
1983
ago
1982
1983
Thousand s
- - Thousand s- -
% of ye a r ago
Geo r g i a Uni t ed Sta tes Mature Ch ickens
46 ,883 324 ,325
43 ,756 308 , 385
44 ,352 3 10, 555
95
581,1 91
588 ,42 1 101
96 4 ,068 ,1 15 4 , 128, 414 101
Li ght Type U.S . Heavy Type U.S. Tota l U. S. Tot a l Al l Type s , Ga . Pe r ce nt Co ndemne d
16,101 3 , 023 19,1 24 4,389
9,092 2 , 124 11, 216 2 , 567
9 , 484
59
2 ,269
75
1 1,7 53
61
2 ,5 52
58
165,064
142 , 155
86
36,779
35, 184
96
201 , 845
177 , 339
88
41, 654
35,677 86
Young Ch ic ke ns
Geor gi a
1.2
80
211 .4 93
2!Un ited States
1. 4
93
2/ 1. 4 93
Federally inspected slaughter data as collected by Meat and Poultry Inspection Program .
Cur r e nt mo nt h data est imated by ~~ark et Ne ws Se r v ice. 21 Ja nua r y- November 1983 co ndem na t ion s .
3
Cr op
Year
Cotton Li nt 2/
19 83 1982
Cottonseed
1981 1983
19 82
1981
Corn , for Gr a i n
1983
1982
1981
Sorghum, fo r Gr a i n 1983
1982
Whe at
198 1 1983
19 8 2
Oats
1981 1983
1982
1981
Rye
1983
1982
Sweetpot atoes
1981 1983
1982
19 8 1
Tobac co 57
1983
198 2
Hay 57
1981 1983
1982
Pe anut s for Nut s
19 81 1983
1982
1981 Soybean s for Bea ns 1983
1982
App les, Utilized
19 8 1 1983
Product ion
19 82
19 8 1 Peac hes, Ut i l iz ed 1983
Producti o n
1982
Pe ca ns, Utl l ized
19 8 1 19 83
Producti on
1982
198 1 Tot al Above Cr op s 1983
(Exc I. Acreage
198 2
of Fr uits & Pec ans ) 1981
GFR-84- Volume 2
GEORGI A ANNUAL CROP SUMMARY 1/, 1981, 1982 , 1983
Planted
Harvested
Yie ld per
Acres
Acrea ge
Ac re
Unit
Prod uc t Ion
1, 000 Acres
1 ,000
120
115
480
Ba l e
115.0
163
158
714
Bale
235 .0
180
175
436
Bale
159 .0
Ton
42
Ton
85
830
735
To n
75
Bu .
62 55 ,125
900
815
85
Bu .
69 , 275
1 , 600 118
1 , 380 68
50
Bu.
41
Bu.
69 , 000 2 , 788
200
135
42
Bu.
5 , 670
225
135
1, 150
980
33
Bu.
34
Bu.
4 , 455 33, 320
1, 590
1, 480
33
Bu .
48 , 840
1 , 150 155
1 ,070 85
43
Bu .
61
Bu .
46 ,010 5,1 85
160
90
61
Bu .
5,490
160
75
60
Bu.
4,500
400
70
21
Bu .
1 , 4 70
450
70
21
Bu .
1,470
450 6 .0
105 5. 8
26
Bu.
125
Cwt .
2 ,73 0 725
6. 5
6.3
130
Cwt .
819
6.0 45
5.6
115
Cwt .
644
45
2,120
Lb.
95,400
50
50
2, 110
Lb .
105 , 500
55
55
2, 200
Lb.
12 1 , 000
500
500
2 .00
Ton
1, 000
500
500
2 . 40
Ton
1, 200
475
475
2 . 15
Ton
1 ,021
567
562
2 , 770
Lb .
1 , 556,74 0
475
472
3.215
Lb.
1,5 17 , 480
570
565
2 ,9 30
Lb.
1 ,655,45 0
2, 100
2, 000
21
Bu .
42, 000
2 , 700
2 ,500
27
Bu .
67, 500
2 ,300
2 , 100
19
a .
Lb.
39 ,900 19 ,000
Lb.
14 , 000
Lb .
40,000
Lb .
92,000
Lb .
110 , 000
Lb .
125,000
Lb .
105 ,000
Lb .
125, 000
5,991 . 0
5,1 65.8
Lb .
120 , 000
7, 194 .5
6 , 276 . 3
7, 171 . 0
6,140. 6
4
Unit Pr ic e Dollars 3/ . 676 4/ .5 66
4/.543 190. 00
66 . 50 97 .00
3.70 2.62 2. 84 3.22 2.05 2.17 3. 20 3.05 3 . 32 1. 45 1.5 6
1.84 2 . 40 2. 34
3.19 12 . 50 7.95 13.30 1. 803 1.796
1. 625 62 . 50
60 . 00 66 . 00
.231 . 246
. 270 7.75 5.45
6 . 09 . 081
.108
.093 .251
. 2 04 . 118 . 549
. 637 . 558
Tot a l Va l ue $ 1,000 ' s
37,3 15 63 ,845 41 , 442
7, 980 5 ,653 6 ,01 4
8 , 977 11, 624 9 .667 106 , 624 148 ,962 152, 753
7,518 8 ,56 4 8 .2 80 3,528 3 , 440 8 ,709 9 ,063 6, 511 8 ,5 65 172 , 006 189 ,4 78 196, 625 62 ,500 72 , 000 67 , 386 359,607 373,300 446 ,972 325,500 367, 875 242 , 991 1,545 1,516 3 ,729 23 ,083 22 , 460 14 ,805 68, 100 79, 625 66 ,960 1 , 397, 309 1, 536 , 354 1, 470 , 858
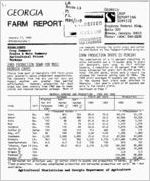
GEORGIA 198 3 CROP VALUES AS A PER.CEHrAGE OF TOTAL CROP VALUE
Georgia
~ crop 'Reporting Service
******************* * ** ****** * Pie chart perce ntage s computed from crops i ncluded *
* in t able . Excludes vegetables and othe r crops not *
* l isted . Pou lt r y and livestock income dat a wi I I be *
* avai la bl e in Apr i l 1984 .
*
* * * * * * * * * * * * * * * * * * * * * * * 4 ... * * '*
1/ Inc ludes a l lo wa nce f or loans out sta ndi ng and I)urchases by the Gover nme nt va lued at t he average loan a nd pur ch as e r at e for corn , wheat , sor ghum, oat s , r ye an d soybean s . Al l 1983 dat a are pr e l im i na r y. 2/ Cotton y ie ld is In pou nds and price is pe r pound .
3/ Average t o January 1, 1984 , wit h no a l lowa nce for
Ulnredeeme d loans . 4/ Includes a l lowance fo r unredeemed loa ns. 5/ Har vested acr e s s ubst ituted fo r p lanted acres.
5
GFR-8 4-Vo lu me 2
CROP VALUE DECLI NES DESPITE RIS ING PRI CES
The 1983 av er age prices r ec e ive d by Georgia f arme r s fo r most o f the major c rops were abo ve the 19 82 l ev el. Howeve r, the o ve ra l I v a l ue of produc ti on for c rop s covered i n the Fe der al est imat i ng prog ram fe l l 9 pe r cent fr om 1982. The stronge r prices we r e mo r e tha n offset by red uc ed product ion f rom sma I l er ac r eage and, in many c ases , lower y i e Ids. T he v a I ue of pr od uc t i o n o f Geor gia's major cr ops totaled $1 , 397 mil l i o n for 1983 , down $139 mi l li o n from the same c rops in 1982, an d do wn $74 mi II ion f rom the 19 81 va lue .
T he estimate s on v alue of produ ct i on do not ad dr es s marketings , profit o r los s but deal o n l y wi t h 'r he a ver a I I v a I ue o f crops pr odu ced. Es t imat e s on cash rece i pt s and pr odu c t ion cost s for 1983 wi I I be avai l ab le at a l ater date .
PEANIJTS HOLD TOP VALUE
COTTONVAllIE DROPS 35 PERCENT
Pe anuts rema i n t he mos t va I uab I e c rop I n the State . The 198 3 peanut crop has a gross va l ue of $3 59. 6 mi II i on, wh ic h accoun t ed f o r 25 . 7 pe r ce nt o f t he v a I ue of a I I maj o r cr o ps . Pr oduc ti on In 1983 was up 3 pe r ce nt f r om 198 2, but t hat increa se was mor e t han off se t by a c e nt and a half dec l i ne in the av e r age pr i c e . The r es u l t was a 4 percent declin e in t he a ve r a I I v a I ue when compared wi th 19 82. The 19 83 valu e was down $87. 4 million, or 20 percen t, f r om t he t ot al v alue o f th e 1981 crop.
The va l ue o f Geor gia ' s 19 83 c ot ton cro p, at $45.3 mi llion , is down 35 perce nt f r om last ye ar , despi t e a 19 perc ent in cre ase In ave r aoe
price . T he p rice r i se was comp l ete ly over>
sh adowe d by a prec i p i t aus 5 1 per ce nt drop In prod uct i o n . The s harp produ c ti on decl ine was due t o the combi nat ion o f a 27 pe r ce nt dec l i ne i n harves t ed ac r e s an d a 3 3 percen t drop in
y ie l d.
TOBACCO VALUE SLIPS 9 PERCENT
SOYBEANS ACLOSE SECOND
Des p I te a 12 pe r c ent de c I i ne i n t he a vera I I v a l ue o f the soybean crop i n 1983 , soyb e ans st i I I remain in se cond p iace . With a va lu e of $32 5 . 5 mi l l i on, soyb eans co ntr i bu t ed 23 . 3 percent of the t o t a I e I I c r op va I ue , The sma l l e r v a lu e i s dir- ect ly attributable to a pr oduct ion decl ine o f 25 .5 mi I l i o n bushels , o r 38 perce nt , due to a r e duc t i o n i n both acreage a nd yi e l d. The pr oduc t i o n dec line more th an o f fset a 42 pe r c en t I nc r e ase i n th e average p r I ce pe r b u s he I, wh i ch I I fted the 1983 ave r age pr ice to $7 .75 comp ared with $5 .4 5 la st ye ar .
CORN VAllIE UP 12 PERCENT
Despite a r ecor d l ow number of acres harveste d for grain, and a 10 bu shel declin e in y i e l d , Geor g i a ' s 1983 cor n c rop was worth 12 percent mo r e tha n t he 1982 crop. The rea so n was a 41 percen t I ncrea se I n the ave r age pr ice , wh i c h reac he d $3 . 70 per b us he l , compa red wi t h $2 .62 last yea r . The aggr ega t e va l ue o f t he c r o p i s $204. 0 mi Ili on , compared with $ 181 .5 ml II ion i n 19 82 . The se v a I ues f or cor n e x c I ude a I I Payme nt- i n-Ki nd a t locations .
Geo r g i a ' s 1983 t o b ac co c rop dec l i ned 9 perce nt in valu e f r om the 1982 l evel. At $1 72. 0 million , tobacco i s the fourth most v al uable crop i n the State, contr i but i ng 12.3 pe rce nt o f th e total value .AII of the decl ine In va I ue i s at tr i but ab I e t o the drop I n producTion , as t he 198 3 ave ra ge price , at $1 .80 3 pe r po und , is fract i ona l l y above 19 82.
WHEAT VALlJE LOSES 2RPERCENT
The overa l I v a lue o f Georg ia 's 1983 whe at crop th at was har vested fo r gr a in amo un ted t o $106 .6 mi l l i o n, wh ich i s 28 perc e nt l e ss than the prev i ous ye ar . A 15 c ent s pe r bu s he l r i se i n t he ave r age pri ce, to $3 .20 , was more than overcome b y a 32 percent drop in product ion. A II o f th e produc t ion dec line was due t o declining ac r eage . Yiel d was up' bu shel, t o 34 bus he ls pe r acre.
T ~-
I
ITho r,oo r g i a Farm Repo r t ( ISSN-07 4 4-7280 l i s I
BUi ld- I ! ~ U D l l s hod
Ik f'! ~o rt j n~
sor,j -m n t~dv bv t r,a Georgia Cr c r I
Se r v i ce , St ephe ns Fede r e l
'I i n~ , A.t he ns , Ga.. 306 13 , Larr y s. Sr1 i pe s ,
St ..,t i s t Jc l a n- l n-C nc:r ge , Second C I ~ 5:; DC s t agl:
[ pe i c et At be n-,, Ga . ~- ubs crlpr l :..n f oe ! ! O
I ce p e r . e er e x c c p r f ~ ee 7 0
te c o r. t r i o u r o r s ..
I S u ~ ~(. r i ;; t j o r. i r. f c r-met l cn eve i l a t !e f r o-i:
iSE:to r g i e Cr o p KPO!""1! ng So r v l ce , St e phe n s
I Fed ' r ~ 1 5u i I t.:i n9 , S ", i "'t ~ 320 , At he ns , G.A"
12G61 3 Te l 9 p ,~ r. e : B.Q4,,-,1~~ 4"6,'.<::.,';.2;,.3<",-6~.
--'
6
GEORGIAMILKPRODUCTI ON
Georgi a da i r y herds pr oduced 120 mi I I i o n po und s of mi l k dur ing Decembe r 19 83 , up 6 pe r c ent f rom t he prev i o us month. Th i s bri ng s t he ac cu muI ate d mi l k prod uct i o n f o r Janua ryDecember i -a 1, 4 14 In i I l ion po und s .
Mi lk c ows on d a ir y f ar ms duri ng December a ver aged 129, 000 hea d , unc h ange d f rom t he p rev ious mont h .
Mil k pe r cow aver-ag e d 9 30 po unds i n Decemb er, 55 po und s more tha n Nov ember 19 83 .
U. S. MILK PRODUCTION
Mi l k pr od uct i on dur in g Decembe r to t-al ed 11 .3 b i I I i o n po un ds, 3 pe rce nt more th an November 1983 and 4 per cen t abov e Dece mber 19 81 .
Ac c umu l ate d mil k produc t i o n dur i ng the ye ar at 139 b I I I i o n poun ds , was 2 pe l- cent above t he 19 82 p r od uct i o n .
Prod uc t Io n per cow ave r aged 1, 020 po un ds durin g December 1983, 30 po und s above Dec ember 19 81 . The t a la I nu mber of mi l k cows av e rage d 1 1 .1 mi l I i o n head dur i ng Decembe r , down s l i gh t ly from November .
MI LK COWS AN D MI LK PHODUC TION. DECEMBEH 19 83 Ge o r g i a
Un l i ed St at e s
I t ern
Un i t
Novemb er
Dec ember
Nov e m b e r
Dec embe r
Mi lk Cows
Thous . Head
19 83 129
..:.179~8:3<-
129
---.,-1;-9:8-3~:;-11 , 13 7
....,.-:;1--9,-,8;'i3S
_
1i , 106
Mi l k pe r Cow
Po unds
875
930
9 84
1,020
r,ij I k Prod uc i i o n._ _ I -M'-'.:....i I i on Lbs.
11 3
120
10 , 960
.l.1J..3,-2.:...5. _
CATTLE ONFEED DOWN 4 PERCENT
Catn e and c a I ve s o n fee d Ja nuar y 1, 1984 , f o r s l au ght er mark et i n t he 13 quer r er l v st at e s , i 'oi-a l ed 9. 9 1 mill i o n he ad, 4 pe r c en t l e s s i ha n I a s j ve ar b ut 10 pe r'cerrt abov e 1982 .
The c at t Ie on feed ! nv e rrr o r v in c I uded 6 . 75 mi II i o n s te er-s a nd s teer c a l ve s , up 1 pe rcent
t r om l a st ye ar- and 9 per ce nt fr om l wo year -s
e go . Th i s grou p r ep r e se nt e d 68 percen t o f th e tot a I J an ue r v 1 number o n f eed comp ar ed wi th 6 5 pe r cen t i n 19 83 . He i f ers and he ifer ca l ve s ac cou nte d f or 3 . 12 mi " io n, down i 2 perce nt 1rom I a sr y ear but 13 per cent abov e 1982.
P l aceme nt s o f c at1 le and cal ve s on f e ed dur i na
t he Oc to be r -December qua r ter t oh'l 1ed 7. 25 mi l lio n , f r ac ti o na l l y above i-he same q ua r ter- a
year ear' I i er an d 16 pe rc ent mo r -e ih en t he same
q uar-te r f o r 196 1.
Dur i ng l he f I r s 1 qua:- i-er- 01 i 984 , 5 . 75 mI I I i en he ad o f fed ce ttl e ere expc c re d t o come t o mar k e t. T h I s wou I d be a 1 pe rcenf Incre as e fr om fi r s l q ua r rer mar ke t i ngs I n 19 83 and 6
pe rce nt above 1982 .
I t em
CATTLE AND CAL VE S ON FEED OC TOBER 1 19 81 - 1983 - J.~A~N ~U,~A R~Y~~~7r~~~~~~ __ lot a l 1 j ~ 1 'a 1"es
Numbe r
1983 as "
19 82
19 83
o f 19 82
1 , uu u He ad
t-'e r ce nt
1, OUU He ad Pe r ce nt
8 , 800 7 , 2 16 5, 374
371
8,465
7,25 2
5,4 16
393
96
7 J 153
6 , 951
100
5 ,909
5 , 90 7
101
4 , 432 4 , 510
106
3 14
3 42
96 los ses,
7
Commod i t y
But t e r Che ose , Nat ur a l Eggs , Fr oz e n Fr u i t s , Fr ozen Fr u i t Ju i ces , Froz en Me a t s , Red
Bee f , Fr oze n Po rk, Froze n Po u l t r y , Frozen Turk e ys , Froze n Ve geta bl e s, Fro ze n Po ta toes , Fr oze n Pe a nut s, She l led Pea nuts , In She ll Peca ns , She l led Pec a ns . In She ll
COLD STORAGE STOCKS . UN ITED STA TES. DECEMBER 31. 198 3
De c. 31 ,
No v . 30 ,
Dec . 31 ,
19 82
19 83 1 , 000 Pounds
19 83
466 , 822
508,6 10
496,657
963 ,54 9
1 , 210 , 3 10
1,200 ,095
25, 426
12 , 682
11 , 343
623 ,560
6 58 , 216
64 3, 116
1,1 58 , 424
886 ,877
93 8 ,0 78
5 53 ,7 78
667 ,5 74
6 78 ,610
294 , 37 5
316 , 023
32 4 ,60 1
2 19,017
295 , 193
30 0 ,82 7
344 , 756
376 , 46 7
28 1 ,813
203 , 906
25 1,560
163 ,302
2 , 008 ,279
2 , 052 , 977
1 , 88 8 ,5 75
767, 309
8 17 ,35 0
7 77 , 48 1
302, 699
259 , 182
29 5, 33 4
3 4 , 486
12 ,92 0
17 , 824
20 , 770
14,478
22 ,699
76,1 22
15, 931
54 , 505
Pe r cent of
Dec . 1982 No v . 1983 Pe rcent
106
98
125
99
45
89
103
98
81
106
123
102
1 10
103
137
102
82
75
80
65
94
92
101
95
98
11 4
52
138
109
157
72
342
co
Georgia
~ c ro P Repo rting Service
Stephens Federa l Bldg. Suite 320 Athen s, Geo rgia ) 0 6 13
0 4 2F0 1 1 3 0 0 0 00 25 -22 7 0 75020
404 /2 2Q -1 8 29
0 0 8 405
~A t X P~R IM cN T STA
LsIx:>3RcARRI Y,',1E;.JT
G I\ 3 0 Z1 2
SECOND -CLASS POSTAGE PAID AT ATHENS, r.A 30613
\'
GA
GEORGIA
~~OD.C.1
GEORGI~RO P
r FARM REPORT iq~,"~-J Joo.
ephe~~:~~:l REPORTING Bldg.
I c :.:- f ' k GEI \f ~. 0 SUite 320
Februar y 1,1 984
~
~thens , Georgia 30613
.
[J,?R 2 1. ~O G 5 (Phone: (404) 546-2236
GFR-84-Volume 3
- - - - - - -- - -- - -- - - -- - DOC UrJiEr:~~(S
HIGHLI GHTS
I 1(:;A UBRARIES
Annual Layer Nmabers & Egg Production Catt le un treed
Nuaber & Value of Chickens by State
Nuaber of Cattle & Kil k Cow Ope r a tions
Cat t l e & Calves
Agricul t u r a l Prices
Calf Crop
GEORGI AEGGPRODUCTI ON DOWN
Egg pr oduct ion In Georg ia dur ing the ye ar e nd i ng Novembe r 30 , 1983 , t ota I ed 4 . 7 b i I I io n comp ar e d to 5 . 4 b i II io n In 1982. Prod uct ion was at its lowe s t point since 1966 .
EGGPRODUCTIONDECLINES NATIONALLY
U.s . eg g product io n duri ng the yea r endi ng No vembe r 30 , 1983, to ta I ed 68 . 1 b j " Io n eg gs, 2 pe r ce nt Iess th a n the 69 . 7 b I I I i o n pr oduced i n 1982 .
Laye r numbers duri ng 1983 aver age d 19. 2 ml I li on c ompar e d t o 22 . 1 million for 1982 . This
was t he lowest figure for the a nnua I a ver age number o f layers for Geor gia sin ce 1965.
Layer numbers duri ng 1983 average d 276 mil li on c ompar e d with 286 mi l l io n dur ing 1982 . The ann ual aver age productio n pe r la yer on hand in 1983 was 247 e ggs c omp ar e d with 243 eg gs in 1982.
TOTAL EGG PRODUCT ION : ANNUAL AVERAGE NUMBER OF LAYERS, EGGS PER LAYE R AND TOTAL EGG PR ODUCT ION,
STATES 1982 AND 1983 1/
Eggs pe r
Tot a Egg
state
La ers 2/
Pr oduc t io n
ggs
Ala.
239
245
2 ,8 13
Ark.
242
242
3 , 758
Ca l i f . Fl a .
241
24 5
24 7
249
8 , 173 2 , 959
Ga . Ind. ,
2 43
243
52
5
4 671 ,6
Iowa
8 ,2 13
7 ,692
2 42
23 7
1, 985
1,826
Mis s .
6 , 625
5 , 509
230
2 33
1,524
1 , 285
N. C.
13, 050
13,111
241
24 0
3,1 40
3,149
Pa.
16,552
18,059
261
26 1
S.C.
6 , 645
6 ,302
249
2 53
Tenn.
3, 649
3, 232
242
254
Tex .
13,290
12, 745
234
242
Va.
3,929
3,474
23 6
24 2
U.S.
286 299
276 096
243
247
1 Annual estimates cover the period Dec. 1, prev ious year thru Nov. 30.
4, 324
4,716
1,656
1,594
884
82 2
3,113
3,089
929
84 0
69 706
6 8 108
2 Total egg pr oduc-
1'ion divided by average number of layers on hand.
Agricultural Statistician and Georgia Depar~nt of Agriculture
GFR-84-Vo l. 3
State
CHICKENS : TOTAL NUMBER. VALUE PER HEAD AND TOTAL VALUE. DECEMBER 1 1982- 83 1/
Number
Val ue pe r Head
Total Value
1982
1983
1 , 0~ """
.".,...........,..
1982
Do llar s
1983
1982
19 83
1, 000 Dol la r s
AIa .
17 ,350
Ala s .
81
Ar iz .
500
Ar k .
25 ,030
Ca lit .
41,600
Co lo .
3 ,450
De l . -Md.
5,291
F la . Ga .
16 ,600 28 ,5 64
Haw .
1 , 148
Id aho
1 ,405
I II
6 ,050
I nd ,
23,450
Iow a
10,300
Kans .
2 ,230
Ky .
2 , 940
La.
2 , 800
Mich .
7 , 800
Mi n n .
13,300
Mi ss .
8 ,6 19
Mo .
7, 700
Mont .
97 0
Nebr .
4 , 050
Nev .
15
N. J .
1,21 8
N. Mex .
1,548
N. Y.
9 , 500
N. C.
19 ,300
N. Dak.
510
Oh io
15 , 600
Okla .
4,700
Oreg .
3,400
Pa,
22 , 500
S. C.
8, 550
S. Dak .
2 ,050
Te nn.
4,700
Te x.
17 ,200
Ut ah
2 ,3 26
Va .
5 ,57 6
Wa sh .
6 , 213
W. Va.
800
Wis .
4, 800
Wyo .
57
New England 2/
16 , 818
U. S.
378, 609
1/ Exc lud e s commercia l bro i lers .
16,650
1. 75
7:>'
4 . 70
400
1 . 50
22,195
2 .65
00-
5
3 , 020
1 . 75
5 ,72 2
2.00
14,700
1 . 85
25 , 525
2 .00
1, 140
3 .05
1 , 26 5
1 . 50
4 ,910
1 .75
23, 900
1 . 30
10 , 200
1 . 70
2 , 350
1 . 70
2 , 300
1. 80
2 ,5 50
2 . 30
7 , 550
1 . 45
13 ,900
1. 65
8 , 000
2 .30
7 , 000
1. 75
940
2 . 25
3 , 850
2 . 05
13
2.00
1,220
2 . 35
1,544
1 . 90
9 ,000
1.90
20 , 000
2 .05
625
1 .80
16 , 150
1 . 45
4 , 750
2.50
3 , 200
2 .05
23 ,800
1.60
7,36 5
1. 50
1 , 90 0
1 . 70
3,900
1 . 45
17 ,400
1. 75
2, 345
2. 05
4 ,781
1 . 95
6 , 132
1 . 60
8 70
3 . 85
4,450
1.65
41
2 .50
15 ,558
2 .26
3..!364+584
1. 85
C , ME, MA , NH , RI , VT.
1. 75 4 .30 1.95 2.10 1 . 80 2 .05 2 .88 1.60 2 . 15 3 . 00 2.10 1. 65 1.50 1. 90 1 . 45 1.35 2 .25 1. 60 1. 60 2 . 15 1.70 1. 95 1 . 90 2 . 55 2.00 2. 45 2 .00 2 .90 2 .00 1. 60 3. 30 2.1 0 1. 85 1 . 55 1.85 1. 75 2 .00 2 . 00 2 . 85 1 .70 4 . 00 1.90 2 . 75 2. 34
1 . 96
30 ,363 381 750
66 ,330 72 ,800
6 ,038 10 , 582 30 , 710 5 7, 128 3 ,501 2 ,108 10, 588 30 , 485 17,5 10 3 , 791 5 , 292 6 ,440 11,31 0 2 1 ,945 19,824 13,475
2,1 83 8 , 303
30 2,862 2 ,941 18,050 39 ,565
918 22,620 11,750 6 , 9 70 36 ,000 12 , 825 3,485 6 ,815 30 , 100
4 , 768 10 , 873 9 , 94 1 3 , 080 7 , 920
143 37 ,985 701 . 474
29 ,138 314 780
46 ,610 74 , 520 6 , 191 16,482 23,5 20 54 ,879 3 ,420
2 ,657 8 , 102 35 , 850 19 , 380 3 ,408 3,105 5 , 738 12 , 080 22 , 240 17 ,200 11 , 900 1 , 833 7 ,3 15
33 2 ,4 40 3 , 783 18 ,000 58,000 1 ,250 25 , 840 15 ,675 6 , 720 44 ,030 11 , 416 3 ,515 6 , 825 34 , 800 4 ,690 13 , 626 10 , 424 3 , 480 8 , 455
11 3 36, 419 716 ,1 92
2
GEORGIA CATTLE &CALF INVENTORY LOWEST SINCE 1980
Cat t le and ca lve s on Georgia f ar ms dec l i ned 8 pe rcent during 1983 . The 1,725,000 ca tt le and c a Ives on ha nd Jan uary 1, 1984 Is the smaI 'est in ventory o n Geor g i a f ar ms since Ja nuary 1, 1980 .
The c ur re nt Inve nt or y c ons i st s of 885 ,000 beef and da iry c ows , dow n 7 pe r ce nt fr om Ja nua ry 1, 1983 . Beef c ow s , at 756 , 000, are down 8 pe r ce nt and the 129 ,000 da Iry c ows are 1 per cent be lo w a ye ar e ar l ier.
The inve ntory va Iue o f c att Ie and ca Ive s In Geor gi a on J anu ary 1, 1984 , to t a led $543 .4 mi l l Io n, down 16 perce nt f rom t he $646 .9 ml I li o n on Ja nuar y 1, 1983 . Ave r age value per head was $315 compa red to $345 a year e ar l ie r.
U. S. CATTLE INVENTORY CONTINUES DOl1NWARD
AI I cat t le and ca lve s in t he Un it e d s t ate s as o f Ja nua r y 1, 1984 , tota led 114 mi I I ion head, down 1 pe r ce nt f rom t he 115 mi l I Ion as o f January 1, 1983, and 116 mi llion two year s a go . Th is co nti nue s t he recent down wa r d ~r end i n catt Ie Invento r i es be gun a ye ar ago .
Al l cows a nd he if ers t hat ha ve c a lved , 48 . 8 mi l li on , were dow n 1 percent fr om 49 .2 mi l l io n a ye ar ago , a nd down 3 perce nt fr om 50 . 3 mi l li on t wo year s ago.
Beef co ws, at 37 . 7 million, are 1 pe r ce nt be low Jan uar y 1, 1983. Mi lk cows, at 11. 1 mI I I Ion, are up pe r ce nt fr om J anua r y 1, 1983 .
The in ve ntor y va Iue of a I I ca n Ie and ce Ive s on ha nd J anua ry 1,1 984, tota le d $45 . 1 b il I Ion , down 4 pe r ce nt fr om a ye ar ago . The avera ge valu e pe r hea d wa s $396 i n 1984 down $1 0 from 1983 .
CATTLE AND CALVES: NUMBER ON FARMS AND RANCHE S, BY CLASSES, JANUARY 1
GEORGIA AN D UNI TED STATES 1983 AND 1984 or la
Class Cattle ~ Cal ves
1984 Hea d
1 , 725
of 1983 Perce nt
92
1983
1984
,0 Head
115, 199 114 ,04 0
Cows & He Ife rs t hat have ca l ved
953
88 5
93
49 , 154
48 ,80 0
Beef Cows Mi Ik Cows
823
756
130
129
92
38 ,0 79
37 , 660
99
11, 076
11, 140
He i fe r s 500 Pounds & Ove r For Bee f Cow Rep l acement For Mi Ik Cow
Rep l acement Ot he r He ifers
245
231
122
114
41
40
82
67
94
18, 830
18 , 598
93
6 , 343
6 , 195
98
4 , 533
4 , 541
82
7, 954
7, 862
St eer s 500 Pounds &Ove r 116
105
Bul Is 500 Pound s & Ove r
62
57
Ca l ve s unde r 500 Pounds
499
457
91
16 ,225
16 ,39 1
92
2 , 615
2,5 50
92
28 ,375
27 , 701
The Geor g i e Fa r m R"po r t (I SSN- 0 744- 72e Ol Is pub li shed seml -"",nth ly by the Georg i e Crop Repor ting Se r vice, Step ha ns Fed er a l Bui l ding , IIt he ns , Ga . 306 13 , l.er rv E. Snipes, Sta t l s tlc l en In Cha r ge . Socond c la s s pos ta ge pa id a t Athe ns , GA . Subs c r i pt io n t e e S10 pe r year ex cept tree t o dota cont r Ibuf o r s , Su bs cr Ip+ Io n Int o,""",t Io n a vo lI a b Ie tr"",: Georg I" Crop Report 109 Serv Ic e , Step he ns Fed erel Bul ldlnQ Su i t e 320 At hen s GA . 306 13 Tel e ohon e : (40 4 ) 546-2236
3
as of 1983 Pe r ce nt
99
99
99 101
99
98
100 99
101 98 98
GEORGI ACALF CROP DOWN
u.s. CALF CROP DOWN
GFR-84-Vol. 3
Calves born dur i ng 1983 totaled 780, 000 i n Georgia. Th is calf c rop i s 7 percent below t he 1982 c r op and the smal le st s i nce 1978 , but equals t he 1979 calf crop.
The 1983 cal f crop is estimated a t 44. 1 milI ion, down 1 percent from 1982 and 2 percen t from 1981. Th i s c a l f crop is down f ract iona I I y f r om the expected ca I f crop pub I i s hed las t July. Ca lve s born dur ing the first half of the year were estimated at 71 .0 per cent o f t he annual t otal.
SELECTED STATES 1982-83
State
St at e ea
Ala .
900
8 70
97
N. C.
460
460
100
Ca Ii f.
',700
1,730
102
Ok l a .
2, 100
2,000
95
Fla .
1, 150
1,100
96
S. C.
275
245
89
Ga.
840
780
93
S. Dak.
1,780
1,800
10 1
Io wa
1, 900
1, 800
95
Te nn.
1,1 80
1,220
103
Kans.
1, 525
1,610
106
Tex .
5 ,650
5,450
96
Mo .
2 ,340
2,320
99
Wi s.
2, 000
1, 980
99
Mo nt .
1, 570
1,640
10 4
Oth . St s . 17 , 120
17,1 38
100
Nebr.
', 930
' ,950
101
U.S.
44 ,420
44 ,093
99
GA. CATTLE ON FEED DOWN 32 PERCENT
Catt Ie o n f u I I fe e d fo r the s laughter ma r ke t in Georgia to t a le d 26 ,000 hea d on January' , 1984 Ge or g i a i s a minor cat t Ie fe ed i ng stat e. Th is is the l~we st number o f cat tl e on fee d f o r t h i s date s i nce rec or ds began i n 1961
u. s. CATTLE ON FEED DROPS 4 PERCENT
AI I catt Ie and c a Ive s o n f e e d o n Ja nua rv 1, 1984 f or s Ieuqht e r i n 50 s t ates t o t a Ied 11 .6 mI I I Ion head, down 4 perce nt from 1983 but up 9 pe r ce nt from 1982 .
CP,TTLE AND CALVES - SELECTED STATE S NUMBER ON FEED JANUARY 1 1983-84 1/
1984 as %
1984 as ,
State
1983
1984
o f 1983 St at e
1983
1984
of 1983
1 , 000 Head
Pe r cent
1, 000 Head
Pe r ce nt
Ar i z .
385
407
106
Ala .
30
40
133
Ca I If .
581
589
10 1
F la .
90
80
89
Colo.
1, 020
980
96
Ga.
38
26
68
I I I
530
510
96
Mo .
10O
90
90
Iowa
1,2 10
1, 000
83
N.C.
26
25
96
Ka ns .
1, 320
, , 320
100
S. C.
20
20
100
~~ inn.
405
375
93
Te nn.
22
15
68
Nebr .
, , 880
i ,760
94
Oth. Sts. 7,7 09
7, 228
94
Tex .
1, 920
1,95 0
102
U. S.
12 , 040
11 ,609
96
17 Catt le a nd ca lves o n feed ar e an imal s fo r s l aughter mar ke t bein g fed a f u I I r at ion of gra in
or other co nce nt ra tes and are expe c t ed t o produ c e a c arca s s t hat wil l gr ade good or better .
Catt le and ca l ve s on fe e d ar e i nc luded i n the c att le and calf i nve n"rory e s t imates by c Iasses.
4
State
Cows 2 19 3
Ala .
44,000
4 2, 000
3 , 300
2 ,500
Ar iz.
5 , 200
5 ,000
770
800
Ark.
45 ,000
4 3 ,000
5 , 500
5 ,000
Ca Ii f.
35, 000
36, 000
5,500
5,500
Co lo .
19 ,000
18 ,500
4, 100
3 , 800
Fla.
22 , 500
22 , 500
2 , 000
1,700
Ga .
40 ,000
38,000
2 , 900
2 , 700
Ha w.
75 0
750
70
70
Ida ho
19, 500
2 1, 000
4 , 600
4 , 500
I"
50 ,000
47, 000
6 , 200
6 , 100
Ind .
48 ,000
49,000
8,100
8 , 100
Iowa
70,000
68,000
13,000
12,000
Ka ns .
51,000
49 ,000
5 ,500
5 , 000
Ky .
64 ,000
66,000
9,500
9 , 500
La.
29 , 000
26,000
3,800
3 , 700
Md . Mic h .
8 , 100 33,000
8, 100 32,000
2,500 9,500
2,300 9 , 000
Minn.
62,000
61,000
26,000
25 , 000
Mi ss .
40,000
38,000
3,500
2,800
Mo .
100,000
100,000
12 ,000
11,500
Mo nt .
16, 000
16 ,300
3, 300
3 , 300
Nebr .
41, 000
40, 000
5 , 000
5 ,000
Ne v .
1,700
1, 700
400
400
N. J
2 ,900
2,800
900
900
N. Mex .
9, 500
9 , 000
1, 700
1 , 600
N. Y.
33,000
34 ,000
18 , 000
18 , 000
N. C.
45 ,000
42 ,000
6 , 000
6,000
N. Dak.
19 , 500
19 , 300
4 ,000
3 ,900
Ohio
47 , 000
46 ,000
12 ,000
11 , 700
Okla .
56 , 000
66 , 000
6 , 000
6 ,000
Oreg .
3 1, 50O
31,500
4 ,800
4 , 800
Pa.
47 ,000
47,000
2 1, 000
2 1,000
S. C.
20 ,000
19 , 000
2,200
2 , 200
S. Dak .
25, 000
25 ,000
6 , 400
6 , 400
Te nn.
77 , 000
77 ,000
8 , 500
8 , 500
Tex .
159 , 000
156 ,000
10, 000
10,000
Ut a h
9 ,800
9,600
2 , 800
2 , 800
Va.
40 , 000
39,000
8 , 500
8 , 000
Wa s h.
24 ,000
24, 000
4 , 00 0
3 ,600
W. Va.
18,5 00
18,500
3 , 900
3 ,800
Wis .
69 , 000
68 ,000
4 4 , 000
44 , 000
Wyo .
5,500
5 , 500
1 ,300
1 , 200
Ot he r St ates 3/
17 , 070
17 ,150
9 ,060
9 , 040
U.S . 1/ An ope r a t io n
Is
1, 611, 020 a ny pl ac e haVi ng o ne
or
1 , 585,200 mor e he ad of
the
31 2 , 100 speci es o n hand
at
any time
303 ,7 10 dur ing
t he year . 2/ Incl ude d in ope r at io ns with catt le . 3/ AK , CT , DE, Me , MA , NH , RI , VT.
5
GEORG IA PR ICES RECEIVED
Average pr ic e s r ece ived by Georg ia f ar mers at mi d- J a nuary f or most major commod it ie s were above the ave r age o f December 1983. Pou I t r y an d e gg commodit ie s l ed the way, with Incre as e s of 15 percent for othe r ch I cke ns , 13 pe rcen t fo r al I e ggs, and a 7 percent inc reas e f or broi l er s- 8ee f ca tt le prices a l so avera ge d I I percent above l ast mo nth . Compared t o a year ago , most c ommod it Ies were we I I above J anuary 1983. Be e f c at t le , hogs and mi Ik cows were the on I y commod It ies ave rag i ng be I ow 3 ye ar ago. The Geo rg i a Pr Ices Rec e I ved AI I Commod i t y Inde x fo r Ja nua ry was 146 pe r cen t o f t he 1977 ave rage , 7 po i nts ab ove I as t mo nt h an d 25 points above a ye ar ago.
GFR - 84- Vo I . 3
U.S. PRICES RECEI VED INDEX UP 3 PTS.
The Jan ua ry a I I fa r m pr od uct s i ndex o f pr Ice s r ece i ved by f arme rs Inc r e ased 3 po I nt s f r om Decemb er t o 143 pe r ce nt of i t s Ja nua ry - Dec embe r 1977 aver age . Higher prices f o r c at t le , eg gs , toma t oe s , hogs a nd bro i l ers we r e par ti a l ly o f f se t by lowe r price s fo r orange s, le tt uce, soybe ans, cott o n and mi lk . The inde x was 15 po int s above a ye ar ago .
I
Commod It v Wi nt er Wheat
Oat s Cor n
Cot to n
Cotto nseed 21 Soybeans Pe anuts
Sweetpot at oes
AI I Hay , ba le d, 21
Mi Ik Cows , 31 4/-
Hogs
--
Sow s
Bar r ows & G I Its
Beef Cat t Ie , 51
Cows 61
-
Steers & He i fers
Ca Ive s
All Mi lk
Tur ke ys 21 Ch Icke ns-
PR ICES RECEIVED BY FARMER S,
Pr ice pe r
Geo r qla
Ja n.
De c .
Un it
szsu,
19.8.,3
1983
$/Bu .
$/B u.
2. 75
3 .68
alb .
51. 7
67.8
$/Ton
66 .00 186 .00
$/Bu.
5. 56
7.62
C/lb .
24 . 3
20.5
$/Cwt.
8.00 2/1 5 . 90
$lT o n
$/Head 1060 . 00
$/C wt .
54. 20
42 .60
$/Cwt .
46 .1 0
33 . 70
:t/Cwt .
55 . 50
43 .9 0
$/Cwt.
47 . 20
39.50
$/C wt .
37. 40
33 . 50
$/Cwt .
54.70
49 . 70
$/C wt .
55 . 30
54 . 30
$/Cwt .
14 . 70
14. 00
a l b.
JANUARY 15
J a n. 15 ,
1984..,
3 . 72 1/ 65 . 7 - 186 . 00
7.67 11*
'-6.20
850. 00 46 . 00 37. 70 47 .50 43. 90 35 .20 52. 60 55. 40
7/ 14 . 70
1984 WITH COMPAR ISONS
Un It e d State s
Ja n.
Dec . Jan . I 5,
1983 3 .60
1983 3.43
198 4 3.39
1. 46
1.73
1.76
2.36
3. 15
3.15
56 .0
67 . 3
1/ 63 . 9
87.00 169 .00 -17 1 .00
5 .56
7.74
7.49
26 .6
25 . 9
1/27 . 1
8 . 78 2/1 3 .90
16 . 50
70.50
77 . 90
80 . 00
1050 . 00
8 70 . 00
55 .30
44 . 20
47 . 30
48 . 30
36.30
41 .40
56 .30
45 .60
48 . 20
54.30
54 . 20
56.50
37.00
33 .80
34 . 10
59. 00
60. 80
63 .2 0
62 .4 0
60 . 60
61.40
13 .80
13 . 80 7 /1 3.70
31. 9
45 . 4
46 .6
Exc l . Broi le r s
i/lb .
11. 0 2/30.0
34 .5
Com ' l Bro i le rs 81
i lLb .
24.0
33 .5
7 / 36. 0
25 .8
33 .7
713 6 .9
Eggs , Al l 91
aDoz .
63 .0 2/100.0
- 113. 0
52 .6 2183.4
96 . I
Tab le -
i lDo z .
47. 8 - 2/ 89. 3
10 5 . 0
46 . 2 2/79. 3
92 .8
Hatch in
a Doz. 120 . 0 2/ 140 . 0
140. 0
11 Fi rs t ha l f o f mont h. 2 Mi d-month pr ice . 31 An imal s so l d for dai ry he rd repl ac ement o n l y . ~ Price s e s t imated quar terl y . 51 "Cows " and " s t ee rs and heife r s" comb i ned with allowance wher e
neces sary fo r s l aug hter bul Is . lSI Inc ludes da iry cows sol d fo r sl augh ter. 71 Ent ir e mont h.
SI Li ve we i ght equiv a le nt pr ic e for Georg i a. ::! Aver age of al l eg gs so l d by f armer s i nc lud i ng
l1at c h l ng eg gs so l d at re t ail. * Ins uf f ic ie nr sal es.
6
U.S PRICES PAID INDEXUP 1 POINT
The Index of prices paid by far mers fo r commodities and services, Interest, taxes an d fa rm wage r ates for Ja nuary 1984 was 164 percent o f the 1977 base. The Index wa s up 1 point from December and 6 points above Jan uary 1983. The an nua I updat Ing of t he Indexes for farm services and cash rent, interest o n the f arm rea I estate debt and f arm rea I estate taxes cau sed most of the Inc rease from a mo nth ear l ler ,
CONSUMER PRICE INDEX
The December unadj usted consumer pr Ice Inde x for all urban consumers (CPI-U) at 303.5 (1967=100) was 0.1 percent higher t ha n In
November and 3 .8 percent above December 1982." On a seasona I Iy adj usted bas Is , the CP I-U was 0.3 percent above November. The other goods a nd se r v ice s i ndex registered a 0.6 pe r ce nt Increase foll owed by medical care with a 0.5
percent Increase. The food and beverage Index and t he transportation Index both Increased 0.3 percent . The hous Ing and enterta i nment Inde xes increased 0 . 2 percent and 0.1 percent ,
respectively.
Commod Ity
PRICES PAI D BY FARMERS , JANUARY 15, 1984 WITH COMPARISONS
Price
pe r
Ja n. 15,
Unit $/Ton
1983 181 .00
$/Ton
181.00
$/Ton
215.00
$/Cwt.
10 .50
$/Cwt.
14.00
Dec. 15, 1983
205 .00
219 .00 29 7 . 0 0
11.90 16.80
$/Cwt. $/Cwt. $/Cwt . $/Cwt. $/Cwt. $/Cwt. $/T on $/T o n $ /To n
11. 50 13.50 13.00
9.90 9.30 8.20 185 .00 172 .00 191.00
13 . 00 16.00 15 . 00 12.00 10 . 5 0 10 . 0 0 215.00 215.00 245.00
13 . 5 0 16.50 15. 50 11. 50 11.00 9 .90 220.00 215 .00 240. 00
11. 60 13.50 13 .10 9.77 9.37
7.13 202 . 00 186.00 207. 00
13.40 16.00 15 .60 10.60 10.10 8.74 240 .00 219. 00 244.00
13 . 9 0 16.30 15 . 6 0 10.70 10.30
8. 81 24 3 . 0 0 219 .00 246 . 00
3.3
2.6
2. 8
3.0
12.4
23 .4
14 . 0
15.0
1. 37
1. 58
1.35
1.34
10.5
5.7
7.6
8.8
1 Pounds of br o i le r grower eq ua l in val ue to lb . broiler live wei ght . 2 Bush e ls of cor n
e qual in value t o 100 lbs . of hog I ive weight. 3/ Pounds of 16% dairy feed equal in va lue t o 1
l b. whole mil k. ~ Pounds of layi ng fe ed equal !In value t o 1 dozen eggs .
1977 100
Georgia
INDEX NUMBERS--GEORG IA AND UNITED STATES
December 1982
January 1983
December 1983
Ja nuary 1984
Pri ces Received
AI I Commod I ti es
120
12 1
139 *
146
Cr ops
124
124
134*
135
Livestoc k & Produc t s
117
119
143
135
Un Ited St ates
Pr ices Rece ived
127
128
140
143
Prices Paid 1/
157
158
163*
164
Rat io 2/
81
81
86*
87
1/ Mid-Iro nt h index inclUdin g inter es t , taxes and farm wage rate s. 2/ Rati o of Inde x of Pr lees
Ffeceived to Index of Pri c es Pa id , Interest, Taxes and Farm Wage Rate s . * Revised.
7
rn r
XH -0 LP
rn ;.J 7 ) J:>
H Al
::;.-<
III
Z -!
1; . 0
J:> +'
IV
n
X0
"U I \I .f' ;oO f-'
H+'VJ
3: 11 ' 1":"
ZNO - l o,J) ,::;>
10
19R4 ACREAGE INTENTIONS
A sample of Georgia farmer s is cu rren t ly be ing
sur veyed to obtai n ea rly ind ic ation s o f p l ant i ng p l ans for 1984 spr I ng seeded crop s. Resu I ts of th i s survey for Geo r g i a and the Un i t e d States wi I I be r eleased o n Februar y 16 , 1984 and wi I I be incl ude d i n t he next issue o f t he Georgia Farm Report .
Th i s survey sh o ul d ai d f arme rs i n the i r dec i s-
i on making .
Actual p l anted ac reage wi I I
prob ab ly d i ffe r from t his i nt en tion re po rt due
to t he ch anging ec onomic s itu ation an d r eac-
t io n to the inte nt i ons t o p la nt r epo r t.
AGRIClILTURAL EXPORT FACTS11
*F ar m export s ac cou nt f or abo ut o ne- f i ft h o f t otal U. S. ex po r t ea r nin gs .
* FAS est i mat e s U. S. agr i c u lrur e I ex po r t s f or f i scal 1983 at $3 4 . 8 b ill i on , and agr icu ltura l Imports from o t he r nati o ns at $16.4 bi II i o n . Th is g ives the United s t at e s a net agri cultura l trade surplu s of an esti mat ed $18 .4 b ill ion .
* U. S. fa rm product ion far ex ceed s domest ic nee ds , whic h means t hat Ame r i c an fa r mers gr eat I y depen d on export mar ket s. T he crop produc t i o n of about 1 o f ev ery 3 ac res har vested i n the Un i ted Stat e s i s so I d abr o ad .
-Today , lout of every 6 fa rmworke rs depend s on exports for a job .
- Agricultural expo r t s acco unt f or one- fifth of U. S. f ar m i ncome.
* The Un ited States exports more than th reefifths of I t s wheat prod uct ion, he I f of its soybean s and r i ce , and more than o ne-third of Its c or n and co t t on.
- I n f I see I 1982, t he Un i ted St ate s prov i ded
w
-0 :>
<:->-l
w
nearly 90 percen t of the world 's soy bea n ex po r t s ; about 55 percen t o f coars e grain exports; more than 4 5 pe r cent of wheat ex -
ports; and 2 2 percent of ri ce exports.
"E ve r v dollar' s worth o f U.S. f arm exports gener ates an addit ional $1 . 05 I n economi c ac tivi ty I n ot her ar e as such as t r ansp or t ert ion, wareh o us I ng, f in ane I ng , and produc t Ion o f suppl i es sol d t o f armers.
1/ Forei gn Agr icu ltur al Service.
8
\'
GEORGIA FARM
GEORGIA CROP REPORTING SERVICE
ephens Federal Bl dg .
Fe br uar y 17, 1984
'te 320 ~hens , Georgia 30613 2hone: (404) 546-2236
GFR- 84- Vo l ume 4
- - -- - - - - - - - - - - - -- - - - - - - - DO - fi"k ::l j"tS
llIGlILIGHTS
UGA L1BRJl,R1ES
Prospective Plantings
Milk Production-
Cat tle on Feed
Turkey Hatchery
P LANTI NG INTENTIO NS CHEC KE D
COTTO N ACRE S UP 38 PER CENT
A su rv ey o f t h e pl a n t i n g i n ten ti o n . o f
Geo r g i a
f a r mer s
was conduct e d
a b o ut
Fe b r ua r y
1.
T h e s u r v ey sho ws
s ome
dram a t ic ch a nge s a re e x p e c t ed for 198 4
pl ant ing s . Sh ar pl y h i gher pl an t i n g lev e l s
ar e i n d i ca te d f o r cor n . c o t t o n a n d s o r g h u m
f r o m the l ow 198 3 PIK lev e l s. Mod e s t
acreage incre a s es ar e pl a n n e d f o r 8 0yb ean s
and o a ts, b u t dec l i ne s are i nd i c a t e d f o r
pean uts , t ob a c co and ha y.
Re b o un d i ng f rom t he ac reage r e du c t ion s f o r l a s t yea r ' s PI K p rog r a m, Geor gia ' s co tt o n p rod u c e r s e x p e c t t o expa n d t h e i r p l a nt i n g s t o 16 5, 0 00 a c r e s , a 3 8 perce n t in c rease f r o m l a s t y e ar ' s rec o r d l o w 1 2 0, 0 0 0 a cr e s . Cur r e n t p lan t in g ex p ect at ion s a l so ex ceed th e 1 9 82 pla nt i n g s of 163 ,000 a c r es b y ab o u t 1 p e r c e n t .
SO RG HUM UP TO 19 82 LE VE L
C O ~N UP 3 3 P~~C ~NT
So rgh u p l a n t i n g s would h ave t o increa s e
69 p e r c e n t t o get b a c k to Ge o rg i a ' s 19 82
If Ge o rgia growe r s fo l low th ro u g h o n t hei r
l e vel , a n d t ha t 's ex ac t l y wh a t g ro we r.
ear l y plan t i ng plan s fo r 1 9 84 , cor n
indicat ed t h e y i n t end t o d o i n 198 4.
acr e ag e will cli.b 3 3 per c ent abo ve t he
T ot al plantin g s o f 2 0 0,000 acre s
a re
198 3 l eve l to to tal 1, 100,000 a c r es. Las t
i ndicat ed, c o mp a r e d with 1 18,0 0 0 a cre s i n
year'. corn p la ntin&_, at 830,000 acres,
1983, a n d 2 00 ,000 acr e s in 198 2 .
estab l ish ed a re cord low for since records be&an in 1866 . p l a n t i n g in t e n t i o n s are also above the 1 98 2 corn planting s acree.
th e Stat e The 1 9 8 4
2 2 percent of 900,000
Continued on Page 2
**************** * Survey Exp l anat io n - Page 4 * * *** *~* * ** * * ** **
1984 GEORGI A PROSPECTIVE PLANTINGS
Planted Acrea ell
Indicated
1984 all %
Cro
1982
1983
1984
of 1983
Thousandll
Percent
Corn, All
900
830
1,100
133
Oatil 1/
160
155
180
116
Cotton
163
120
165
138
Sorghum, All
200
118
200
169
Soybeanll
2,700
2 ,100
2,200
105
Peanuts
475
567
550
97
Hay, Al l 2/
500
500
490
98
Tobacc o 2/
50
45
40
89
Sweetpota toell
6.5
6.0
6.0
"10 0
1/ Include ll acreage planted p r e c e d i n g fall. 2/ Acreage harvested.
Agricultural Statistician and Georgia Depart.ent of Agriculture
SOyaEANS UP 5 PERCENT
SFR-8 4- Vo I. 4 PL ANNED PEANUT ACREAGE DOWN
Crower. reported a 5 percent 1ncrea ae 1n
Peanut grower. 1n Georgia cur rently plan
expected soybean plantings . If realized~'~~.~OM.plant 550,000 acres in 1984, a 3
planted acreage would total 2. 1 ~ i l l i o n
pent reduction from the 1983 level. At
acres, up 100 thousand acrea from the 2 . 1
the time of the survey mu c h uncertainty
million acres planted laat year. The
exiated among growers aa to the actual
estimated 1984 plantinga are 19 pez~.~
acreage that will be pl ant ed.
The
below the 1982 record high plantinga of
atrength of the export market and th e
2.7 million acrea.
availability of favorable contracts are
OATS 16 PERCENT HIGHER
. .~,,~. ~~. .o of th e factors that may influence the reage actually aeeded.
Oat aeedinga last fall and Winter , plua
those intended for apring plantings are
expected to total 180 ,000 acres, up 16
percent from the 155,000 acres planted
laat year. Many of the ~all and winter
planted oat a we r e dam aged or killed by the
record cold tem p er atu res in
Dece mb er.
TOBA CCO DROPS II PERCENT
Tobacc o a h o wed t he large st perc e n t age drop
o f al l crop a s u r v e y e d wi t h a n elev e n
perc e n t cutb a c k i n int end e d a c rea for
h a rv es t i n 1984 .
T h i s wou ld redu c e
tob a c co ac r e a g e t o 4 0 , 0 0 0 a c r ea , t h e
low e st l ev e l Binc e 1932 . The Co op e r o ti ve
Ext e n e 10 n S e r v ice reports t o b a c co be ds are
cu r ren t ly i n f a ir c o n d i t i o n .
L ES S HAY ACREAGE
Ha y pr o du c e r s ind ic ate t h e y p lan to re d uc e a cr e a t h ey will c ut b y about 2 perc e nt . T h i s wou l d l o we r hay a c r e a g e t o 490 , 0 00 ac r e s c o mp a r ed wit h 5 0 0 , 0 0 0 l as t yea r.
UNITED STATES HIGHLIGHTS
Corn growers intend to plant 81 .8
million acres in 1984, up 36 pe rcent
from last year , but virtually the same
as 1982. So ybean prospective pl antings ,
at 65 .2 million acres, are up 3 pe rcent
f r o m 1 9 8 3 but down 9 percent from 1982.
Sorghum i n t en d e d for all pu r p os es , at
14 .8 mil lio n a c res, i s u p 26 p e r cen t
f r om a ye ar ea rlie r b u t 8 pe r c en t b elow
1982 . Ba r l e y in t e n ded a cre a g e for 1 9 84
i s 1 0 .6 mi ll i o n ac re a , d o wn l e a a t h an
o n e- h alf of 1 perc e n t f r o m 1 9 8 3 b u t u p
10 pe r ce n t f r o m 19 8 2 .
Al l c o t to n
p ro a p e ct ive p l an ti ngo t o t al 10 . 8 mi l l i on
a crea, up 35 p e r ce n t fr o m 1 9 8 3 b u t 5
p e r c e n t b e l o w 1 9 8 2. P e a n u t pro d u c e r o
i n t e n d t o pl an t 1.41 mil li on a cre a,
u n c h a n ge d fr om 19 83 but 8 per cen t a b ov e
1982 .
Al l tobac c o gr o wers i n t e n d t o
ha r ves t 7 94 th ou s a n d a c r e s in 19 8 4 , 1
percent ab o v e 1 98 3 b ut 12 p e r c e n t b e lo w
1 9 8 2-
1 9 8 4 UN I T ED S T AT E S P RO S PEC T IV E PL AN TIN G S
P l an t e d Acre s
I nd icat e d
198 4
C ro p
1982
1 983
1984 I I
19 8 3
- -Th ou san d s - -
Pe r c en t
Al l Co rn
81 , 779
6 0,194
8 1, 766
13 5.8
Al l S orgh u m
16 , 138
11, 7 8 2
1 4 ,816
125. 8
Oa t .
1 4, 26b
20,308
1 3,6 1 6
67 . 0
Bar l e y
9,6 3 4
10 , 606
1 0,5 6 5
99. 6
A l l Whe at
87 ,4 2 7
76 , 817
8 2 , 60 7
10 7 . 5
Wint er
66,SOl
6 2,S03
64 ,920
103 .9
Duru m
4 , 3 50
2,565
3 ,850
1 50. 1
Other Spri ng
16 , S76
11,749
13,83 7
117 . 8
Soybe ans
71 ,530
63 , 480
65 , 240
102.8
Peanu ts
1,309.4
1 ,411 .0
1 , 4 1 1.0
100 .0
S unf lowers
4 ,8 1 5
3 , 10 5
3 , 375
108 .7
All Co t ton
11 , 339 . 9
7,960 .6
10, 759 .1
13S . 2
Hay 21
60,679
60,461
6 2 ,5 3 5
103.4
Sw e et pot a toes
1 14 .7
102 .8
106. 1
10 3 . 2
Tobacco 21
907 .8
783 .8
794 .4
101. 4
1/Intended plant ings in 1984 as i n d i c a t e d by report s from far mers, except for
winter wheat seedings which were published Dec. 22, 1983 in the "Small Grains"
report.
2/Area harvested.
2
CATTLE ON F EED IN 7 STAT E S DOWN 2 PE RCENT FR OM A YEAR EARLI ER
Cattl e and c a l v e s on f p. e d F e bruary I, 1984, for slaugh ter mark et i n th e i stat es p repari ng monthly e s t i ma t es t ota l ed 7 .92 million head, down 2 p er -
c e n t from a y ear ago b ut 1 2 per c ent
a b ov e F ebru a r y I , 1 9 8 2 .
Market i ngs of f ed c a t t le during J a n u a r y t ota led 1 . 5 7 m iL'l f o n , dO \o1 n 4 percent f r o m 1 9 8 3 but 3 p er cent ab o ve 1 9 8 2 .
Pl a cements o f c a t t l e a nd c al ves o n f e ed dur i ng Ja nu ar y w e r e 1 .5 7 milli on, 5 per cent more than last yea r anrJ 7 p erc e nt gre at er than January 1982 . Net place me n t s o f 1. 48 milli on ar e 9 p er cent mo re t h a n l ast ye a r a n d 8 pe rcen t abo v e Ja n uar y 19 82 .
CATTLE AND CAL VES ON FEED , JANVARY I 1984 as x
It e m
On Feed J an.
1/
Placed on Feed
during Jan .
198 3
1984
I . ODD He ad
8, 3 I 6 8 , 00 6
I ,49 4 1 . 56 6
o f 1983 96
105
Fed Cattle
!1ar k eted during
J an.
I ,62 8 I , 5 6 9
96
Other Di sap pea r -
a n ce dur ing
J an. 2 /
130
86
66
On F eed Feb. i ] 8, 052 7 , 9 17
98
11 Ca t t le a n d ca lv e s on feed a re a n i ma ls
f or s la ughte r mark et being fed a full
r ati on of grai n o r o t h e r c o n c e n t r a t e s and
are ex pec t ed t o pr odu c e a carcas s that
w i l l gr ade goo d o r be t t e r~
2 1 In clud es
dea t h l o sse s. mov em ent fro m f eedl ots t o
p a s t u r e s a n d s hipmen t s t o o t h e r fee d l o t s
fo r fu r t he r f eed i n g.
O t her dis a p p e ar a rl e e t ot a l e d 8 6 tho u s a nd h e ad c o mp a r ed wi th 13 0 t h ou sand d uri ng Ja n u a ry 1 983 an d 81 t ho u sa n d tw o years ago .
GA. MILK P RODUCT I ON DOWN 6%
Ge o rg ia's d eiry herd s pro d u c e d e s t i ma t e d 1 2 0 milli on p o u n d a o f d u rin g J a n u a r y 198 4 , 6 p e rcent l es s las t yea r a n d 4 p e r c ent belo w 1 9 8 2.
an mil k t h an
Mi lk c ows on Ge o rgia' s d air y f arms
a ver aged
12 7 ,0 00 he ad ,
3 ,000 b elo w
J an u a r y a ye a r ago a nd 4 ,0 0 0 l e s e t ha n
J a n u a ry 1982 .
Mi lk produ ction p er c o w
av erage d 9 4 5 po u n d s f or J anu ary ,
c ompa re d t o 9 80 pound s l ast y e ar a n d 95 5
po u nds i n Janu a ry 1982 .
GA . 1 9 83 ANNUAL MI LK PR ODUCTI ON DOWN 1%
Ge or g i a 's ann u al milk p r o d u c t i o n t o ta led
1, 3 95 ~ il l i on p o u nd s in 1 9 8 3, 1 7 mi l l i o n
pou nds less than 1982 . Mi lk co ws on
Ge org i a dair y farm s in 1 9 8 3 averaged
12 9, 0 00 head, c o mpare d to 130,00 0 h e ad
i n 1 982 .
P ro d u c t ion p er c ow a vera ge d
10,8 14 in 19 83, 4 8 p ounds le ss than the
ave r a g e productio n in 1 9 8 2 .
U .S. J ANUARY MIL K PRODUCTION
Mi l k pr o ducti o n d urin g Ja n ua ry 1 9 84 t ota l e d 1 1 . 5 bill i on pou nd s, Vi rtuall y u ncha ng e d f r om the pr eviou s ye a r.
Ja nua ry p r o d uc tio n pe r 1 ,03 9 p ounds, 3 p o unds e a r li e r a n d 31 p oun d n 1 98 2.
cow a bove a b ov e
a vera ge d a ye a r Januar y
T o ta l .i l k c o ws av erage d 1 1 .1 mi l l i o n
hea d ,
Vi r tual ly
u nc h anged f r o .. th e
pr e v io us ye a r .
U .S. 1 983 MIL K PR ODUCTION A REC ORD HI GH
Milk p ro du cti o n dur ing 198 3 to t a l e d a rec or d hig h 1 4 0 billio n p o unds , 3 perce n t mo re tha n the p r e v iou s r ec o rd hig h o f 13 6 bi llion po u n d s s e t in 19 8 2. Out p ut p er c o w in 1 983 , a t 12 . 6 t housa n d pou n d s, was al s o a re c o r d h i g h 278 pounds abo v e t h e pr e viou s r eco rd s e t in 1982 . Th e an nual ave r ag e n um b e r o f cows was 11 .1 milli on head , 1 pe r c e n t ab ove the 1 98 2 average o f 11 .0 million h ead.
DAI RY PRO DUCTI ON, J ANUARY 1 9 8 3 - 1 9 8 4
Ge orgia
Ite ..
Un i t
1 983
1984
No. Mi lk Cows on Farms
Thous . Hea d
1 30
127
Mi lk P ro d uc t ion per Co w
Po u nd ..
980
94 5
T otal Milk Pr o ducti o n
Mil. Lbs.
127
1 20
Ann ual Milk Pr o ducti o n 1 / Mil. Lbs .
I , 412
1 ,3 95
I / To t al s p ert ain to a n nu al pr o du c ti o n, 1982 and 19 8 3.
Un i t e d 1983 1I ,075 1,036 11,4 7 3 13 5 ,8 02
States 198 4
11,064 1 , 039
11, 490 13 9,968
3
1 '; f -
X~~
L Jq 0 AJ_ H ::1 -'. 000<
",
C.)
l.>
"C'"'
.[.'.o.J.
[ ...;
.....
,J , fl ,
X
u
"U .....
.,1 r-
;;ry .::J I -
,
1..'"
~,
, I i"....0
Z NO - I..:.: L:>
10
U , t.....AW
-I CC
J.>; "";I "\oJ \il \-1)
I N
,'oJ
-.j
0~
c . -."
0
...... , ,J .... C
'-'
V
************** **** * The February I, 1984 Prospective *
* Plantings report is based on *
* voluntary responses from about *
* 40,000
growers
nationwide. *
* Questlonnairea were mail ed about *
* Januar y 25 with most questionnaires *
* r eturned f o r t a b u l a t i o n by Februa ry *
* 3.
*
*
*
* The r e po r t is int ended to ass i s t *
* growers
in formulat ing th e i r *
* acreage plans for 198 4 .
Actua l *
* acreage p la nt ed ma y v a ry fro m t h a t *
* in d ic ate d be c a us e o f t h e e ff ects o f *
* weather ~ a v a il a b il i t y of p ro d u c t io n *
* inputs, c h a n g es in e x pec te d pr ic es *
* f o r 1 9 84 c r ops , a n d t h i s r e p ort .
*
********* ******
> ""': U1
o-l O t'l :tI'l: "o-'l0O
~~ S t ' l lo
'" C> "l;"1>dt:">"-
..... 0 ..... '"
0 :>-
<...:,' o-l
EGGS IN INCU8ATORS FE8RUARY
The turkey egg. in incubators on February I, 1984, totaled 19.9 mi llion, 3 percent below the 20.6 .iliion a year earlier.
POULTS PLACED DURING JANUARY
The 13.7 .11110n poult. placed during
January in the United States were 1
percent less than placemen ts a year ago.
-_.------- - - ---- ---1 IThe Cor,rg iil r,1m R" por t ( ISStJ-0744-72aO) 'S
l p ut, l l s neo semi -e norrr b l v by the Ge o r g Ia Cr op
I ' Repo r t i n ~ Ser v i c e . St ep he ns Fodera l Bu l l c!-
; i nq , Athen s , Ga. 30613 , Ldrr y E. Sn ipe s ,
' S ta T i s t ic i a ~- l n -C h a rg o , Seco nd C fe s s po s t e qe
I pi'3!d ;, t At ae ns , Ga . Sub sc r l pt i o n t e o Sl C
! pe r ve er e xce pt t r ail t o da ta con t r i buror s ,
j Subsc r l pt io n Inf ormat ion J va i t eb Ie fran:
Ga o q ; I a Cr o p Rep c r t i n9 Ser v i ce t St ep ne rvs
If ederal Bu l f d l nq , Su l r e 32 0 , ~. 1' he n 5 , GA
J 1306 13 Te1ep roO ne: (404 ) 546-2236 .
.__
4
\\
~~
GEORGIA
.-A1./ bQ .(,1PJ
iIII
F'L
- FARM REPORT: Jo,~4/3-(P
Mar ch 6 , 1984 GFR-84 -Vo I ume 5
- - - ,GEORGIA CROP REPORT ING SERVIC E
Stephens Federal Bldg. Suite 320 Athens, Georgi a 30613 Phone: ( 404 ) 546-2236
HI6H...IGHTS
POOI...1RY SUMMt\Ry AOUaLTlRAl. PRICES <XI..D STmAGE LlYESTOCK Sl...AlJGHTm FARM INCOME FmECAST
f-;"( ? 2 ~ ;:L' G5
DOCUf,!/ENTS UGA LIBRARIES
GEORGIA LAYERS AND EGG PRODUCTION DOWN
Georgia;s :aying i lccks oroduced 384 mi I I ion eggs dur ing Januar y 1984, 12 percent less than a yea r a90. Product ion incl udes 269 2i I I Ion t able or co mmer cial type eggs and 95 I i i i ion hatchi ng eggs .
: ne average nUlber of layers in Georg ia dur ing January 1984 was 18.9 , 10 percent less than a yea r 3g0. E99 S i aid per 100 iaye rs dur :n9 january ave raged 2,028 co mpa red to 2,085 a year a90.
U.S. EGG PRODUCTION AND LAYER NUMBERS OOYN
ess = c ~ r !n s J an ~ a ~y 1 9 3~ ; : G W ~ 4 ~e r : e n~ f ~ : ~ ~ ~e 5.91 ~ i I ~ :: n ~ r :dL: :=c 2 vsar asc. ?rcdu::~ :: n included 5. 11 bi ll ion tor tab le or cOl!llerc iai type 259S and 559 ~ i IIion tor na:ch ing eggs.
The total numbe r at iayers dur ing January ave rage d 277 mi ! I :on, dow n 3 oe rcer. : t romthe 284 mi !! ion a year age. Ai i layers on Fe brua ry 1, 1984, tota :ec 276 :n i ! ! ;en, 3 pe rcsnt ~ e ille r t han the 283 :r, j I! j en a year ear I i er . The 276 ill ii i ion ! aye rs ccnsi s:ed "t 245 mi ; i ion tor ta o:e ar :::nme rc ial tYpe eggs and 30.9 mi i i ion for hat chins e:s s.
Geo rg ia Hatchi ng Other Tot al Georg ia Tota l U.S.
NUMBER OF LAYERS AND EGG PRODUCTiON, JANUARY1984
No. Layers on
Eggs pe r 100
Hand-Jan. 1
Lay er s-J an.
1983 1984
1983
1984
Th ousands
Num ber
5,337 15,623 20 ,960 284,470
5,090 13, 849 18 ,939 276,551
1,894
2.151 2,085 2,079
1,869 2,086 2,028 2,051
Total E99s Pr oduced
Du ring Jan .
1983
1984
Mi I I ions
101
95
336
289
437
384
5,914
5,672
It em Chi ck ens
EGGS IN INCUBATORS , FEBRUARY 1984 , UN ITEDSTATES
1983
1984
1. of Year Ago
E99 Tyee
30,089
33,598
112
Bra i ! er Tyee
311 ,693
312 ,641
100
Tur keys
1/20,598
2/19,930
97
l /ln ciud es 19 ,835 heavy and 763 Iight breeds . 2/Brea kdo~ n by breeds not
shew n t ~ avoid disclosure of individual operat ions.
Agricultural Statistician and Georgia Depart.ent of Agriculture
GFR-84-Vo I. 5
COMMERC1AL POULTRYSLAUGHTER 1/, JANUARY1984
1. 01
7. 01
It e.
Jan.
Dec.
. Jan.
year
Jan . thru Dec .
year
1983
1983
1984
ago
- - -Th~s
1982
1983
ago
- - -Thousa nds- - -
Young Ch i ck ens Georgia Un ited States
46,899 ' 339,491
44,2 ~ 310,405
103
581,345
587,985 101
99 4,068,116 4,130,032 102
Mat ure Ch i eke ns Light Type U.S. Heavy Type U.S.
15,71 7 31229
9,629 2,14 7
9,984 2,652
64
165 ,066
82
36,779
14 2,347
86
35,062
95
Total U.S. Total AII Typ es, Ga .
18,946
11 ,776
12, 636
67
201,845
177 ,409
88
3,897
2, 587
2,821
72
41, 654
35 ,677
86
Percent Co noeQned
Youn g Ch i d en s
Georg ia
1.4
100
2/1.4 93
Un ited States
1.5
94
2/1.5 100
1/ Federal ly inspe ct ed slaughter data as co l lected by Me at an d Poul try Ins pec t ion Prog r a ~. Curren t ~o n th
data est imat ed by Market Ne ~ s Se rvice. 2/ January-De ce mbe r 1983 conde ~na t io ns.
POULTRYHATCHIN G AND PLACEMENT- - JANUA RY 1964
Durin g
1. 0 f
7. of
It e:.
Jan .
De: .
Jan .
>'ear
Jan. thru Dec.
year
1963
1983
199"
ag o
--Thousanos --
1982
1983
aDO
--Thous ands--
Fu l let Chicks Placed
~:rn e s t ic (U ,S. ) :I
Br oi ier hp e
311 69
3,590
3,202
101
39 ,833 36,068
9b
::99 Tyo e
188
228
194
103
3,765
3,307
66
Chi ck s :-lat ched
Br ai ler Ty pe
Gears ia
::,692 : 4,344 54,847
95
645,168 60 ,201
100
Un ited States
382 ,665 374,960 370,016
97
4,"45 ,583 4,448,772
100
t.:: T>' pe
Ge orgia
2,020
2,6~B
3,727
185
32 ,018 2411 90
76
Un it ed States
33 ,324 34,229 36 ,947
111
444 ,420 41 0,321
92
Fou lts Placed
U,3.
13 ,775 12,573 13 ,669
99
2/551189 2/54,508
99
1/ REPort ed by leading Dreede rs , includes expec ted pul let rep lac ements fromeggs so ld du r ing the prece ding mo nth
at the rat e of 125 ou l let : hids pe r 30 doze n case of eggs. 2/Turkey poults placed Sept. 1983-Jan. 1984.
The Georgi . F.r~ Report (IS SN-D 74.-7280) Is pUbli s hed semi -mont hly by the Georgi. Cr ap Repo rting Ser v ic e, St ephen s Feder. I BuI ld i ng , At he ns , Ga . 30613, l.r ry E. Snipes. St a tlstlc l .n In Charg e. S&Cond c l. s s POs t oge pold . t At he ns . GA. Subsc ri pt ion fee SIO per yee r exc*p t free to dete c ont ri buto rs. Subs cr ipt ion Inf or MOtlon . v. l la ble fr~ : Georg ie Cr op Reporting Serv ice. St ep hens Fede r a l Bulld l nQ, Sui te 320, At hens, GA. 30613 Tel ephone : (404 ) '46-2236.
2
FARM INPUT DEMAND TO INCREASE 1/
WORLDOILSEEDSITUATION 1/
;3 rmdemand for fert i i izers, pest lclaes, machinery, ana ene rgy i s exp ected ta r ise s ignif ican t ly th is year ) pr imar i i y bscause of :ncreases ' n cIante d
acreage result ins froma sca:ec-down PIKand ot he r
acreage reduct ion prog ram s and reiat ively +avorac:e crop pri ces . Purchased input pr ices are i ikely t o ri se mod est ly: 6 t o 8 percent tor fert i Iizers i percer.t for pe stic ides; ma ch inery 5 to 8 pe rcent ; and energy 1 to 2 pe rcent . Sup pl ies of most :t ems are exp ected to be adequat e,
Fert i I i ze r use in 198LL wi j i be ~ p substa nt iai iy art er t he large drop last year. Total plant nut r : snt consumet i on is l ike!y t o be 20 eercent greater t han last year !s ievel and may s l ight ly exce ed t otal 1982 use. Nit rogen con sumpt ion for t he current CrOp year is expected to be abo ut 11 mi I i ion t ons, up 20 percent over 1983. Po t as ~ use s ho ~ i d be up about 22 percent t o 5.9 mi i i i on tons ana pho sphat e use should r ise 18 percent to LL .9 mi ! i ion t ons. Su ppl ies of a! i fer t l I izer materi al s should be adequat e.
r arm cest ic ide use is ex pect ed t o r ise In 1984 In response to increases in f ield CrOC acreage. As gregate use Is projected to cl imb 15 ;>erce nt Dr mO re and reach Dr SI Ight Iy exceed 1982 i eveis. Pest icide suee l i as should be ame!e wit h large inventory carryo ve rs from last ye ar and excess orodu ct ion caeacit y in tne indust ry.
Fa rm machinery sales are l ikely to increase t his year , pO SS IOly 10 eercsnt or mo re , fOl lowi ng a st eady 4-year dec l ine. Un it sales of many mach inery it ems in 1983 were hal f the 1979 !evel s .
PetroieUII sueeI Ies are exoe ct ed to De aci e q ~ a t e for t he 1984 cr~D season, ~ i t ~ oniy m~d e st or ice cha nges ant icieat ed. Gas oi i ne er i css aav cr ae about 5 cs nt s a ga l ion, w~ i i e di ese ' ue i pr ices are 'i kely to r ise abo ut 3 cents . 1/ Ec onomic Resea rch Se rvice, ~ . S . Department of Agr icu ltur e . 105-3, Feb ruary 1984.
Wor ld oi lseed ercdu ct ion rose to 165.6 mi l l ion met r ic tons , 300,000 tons mor e than last mo nth's aS5essmen t . ~a jD r aDjUStme nts were made in seve ra l accounts. Argent ine soybe an out;> ut was raised t o 5.0 mi ! I ion t OT' S, based on cnnt i nuins excel lent growins condit ions in the major produc ing res ions of that count ry. Arge nt ine sunf !owe rs eed orodu ct ion was upeed to 2.7 mi l I ion tons . Wo r i d rapeseec outpu t also Increased, wi th t he ent ire exe an s lon OCCUrr i ng in India. These increases more than off set the 300 ,000-t on reduct ion : n USSR sunf iowe r seed output ,
Est imat es ci scr id 0 i !seed t rad e were ad justed ucward only s l ight iy t his mo nt h, \I: ; t h a 200 ,OOO-to n increase ' 1' soybean exc arts fr om Argent ina ( ioca! marketi ng year bas is) offset t ln: a 200 ;000-ton decrease in U.S. sunf lowerseed exports. Ihe only ot he r s ign if icant chan ges in the tr ade a : cc ~ n t s were for pean uts , and a s ~ I rt i ng of sou rces ror some sunf i owerseec imo orts . Est i mated Br azi i ian ana Argen t ine exeor tS of ;> eanut s are increased Sl ;9ht ty in respon se to expanded output and reduc ed supply now expected fromAfr ica. Ar gent ina has made sales of sunf iowe rseed ta Mex ico, Ita ly, and Portuga l , :aptu r ins what were ear i isr exeected t o be sa i es fr omthe Un it ed St at es.
The wor i d 0 i Iseed crush account shawed on Iy a s i ig~ t ove ral l expans ion! whi ch lIias ke d several int ernal changes . Es t ima ted soybean crush ~ a s raised s l ight iy, wit :' the? increase occurr ing on ly in Ar gent ina. Su nf low erseed cr usb wi ; ! be lower in t he So viet Union than orevicus iy est ima ted, bu t U.S. crush was ra ised t his m8nth. The "ed~ct io n in Sa viet crush wi I! not t ran s i ate to increased Sov i st sunf lowerseed oi i :m;>ort s ; the Sov iet s are more I ikely t o compensa te for t his lass with impor t ed ,soybea n 0 i !. 11 r are:9" Agr i cu Iture CI rcu i ar, Fore ign Agr icult ure: Se rv;ce, U.S. O e e a rt~ ent of Agr Icult ure, FOP 2-a~ .
3
GEORGIA PRICES RECEIVED
GFR-84- Vo I. 5
U.S. PRICES RECEIVED INDEX OOUN 2 POINTS
Averag e pr ices rece ived by Geor: ia farmer s at rnlc February were mixed from t he ave rage ot january 1994. The commoditi es that regist ered a gain ;n or ice fr om t he previous month were ca lve s , bee f cattl e, sweetpo tatoesl ~ at chin9 eggs , cow s , cot t on, broi lers and sows . Mi Ik an d cottonseed ~ er e unchanged from the previous month. (orn, soybe ans, hogs a n ~ t ab le egg s were commodit ies ave raging below a m ont ~ age. Th e Georgia Pr ices Receivee Ai I (ommec i t v index for February wa s 145 percent of t he 1977 avera:e , 1 po int be:ow last month but 20 coints abD ve 12st year .
The February ai ! farm oroduct s index of pri ces rece ived by far~ers decreased 2 points f rom january to 142 percent of it s January-December 1977 average . Lower pr ices for soybeans, COrn , sorghum , wheat , hogs , t ur keys an d eggs were par t ial ly offset by higher pr ices for cottonse ed, tomat oes, ri ce, catt le and broi iers.
PRICES RECEIVEDBY FARMERS , FEBRUARY 15, 1984 WITH COMPARISONS
Price
Gearqia
United States
De r
Fe b.
Jan.
Feb. 15,
Feb .
Jan.
Feb. 15,
CCModi tv
Un it
1983
1964
1964
1963
1984
1984
Winter Wh eat
S/Bu.
2.60
S/Bu.
*
*
3.64
3.44
3.29
1.48
1.82
1.76
S/Bu .
2.94
3.76
3.71
2.56
3.16
3.06
Cot ten
Ct ./Lb. 55 .2
65 .1
1/66.8
57 .7
62 .7
1/64.2
Cot ton seed 21
$lTon
70 .00
186 .00
186 .00
84 .00
171. 00
172 .00
Soybea ns
S/Bu .
5.74
7.67
7. 11
5.66
7.85
7.02
Peanu t s Suee tpotatoes
Ct./Lb . $I Cwt.
8.08
* 2/16 .20
1/* 17 .60
*9.29
29 .2 2/ 16 .50
1/* 18 .60
AI ! ~2Y ' ~a le G 21
SlTan
73 .50
80.00
81. 20
Hi Ik C01;! S 3/41
$ / Hea~
65 0. 00
870.00
;-kc: s
S/Clti t .
5:. 40
47 .50
44. 40
56.10
48 .50
45.10
SOIJ!S
S/ ewt .
50 .00
39 .70
40 .00
51 .70
42 .90
41 .70
32" O1;!= & Gi It s
$ / C~t .
56. 1 ~
49.00
~S .2 Q
56. 70
49 .30
45 .60
Beef Ca ttl e 51
S/ Cli't .
50.60
43 .30
47 .00
57. 10
57 .10
57 .70
[ou s 61
S/ C_t .
39.80
34. 30
37.00
41.40
35 .00
38 .40
Steers & Hei t ers
SIC::: : .
57.00
53 .40
55.20
60 .80
63.90
63.40
Caives
S/C w:.
59 , 10
53 .10
59.0 0
66.50
60.90
63 .40
Al l Mi i k
S/Cltt .
14 .40
14.70
7/14. 70
13.80
13.60 7/13.50
T~, k ey s 21
Ct./L b.
32 .8
46 .6
41.3
Ch icke ns
t xc iud ins Broi lers Ct ./Lb. 14.5
2/34 .5
29 .5
Com ll Broi lers al [t./Lb . 26.5
36 .0
7/ 36.5
27.7
36.9
7/37.4
Egss, All 91
CUOcz . 62.2
2/1 13 .0
106.0
51;,,7
2/96. 1
92. 9
Tao ie
Ct. / Dez. 51.6
2/ 105.0
95.5
48.6
2/92.8
68 .8
Ha::h in:
[t . /Dez . 100 .0
2/1 40 .0
150 .0
11 Firs t half ot mont h. 21 Mid-month price. 31 Animals so ld for da iry herd replacement only. 41 Prices
est imated quarter iy. 51 Cow s and "st eers and hei fers comb ined wi th al iowance where necessary for siaughte r
nu / Is. 61 Includes dairy co ws sold lor s laus hter. 71 Ent ire mont h. 81 Livewe ight equiva lent pr ice for Geor gia.
* 91 Averag e of al I eggs so ld by farmers inc ludins hatching eggs sold at reta i I. Insuff icient saies.
4
U.S. PRICES PAID INDEX DOWN 1 POINT
T~ e Februar y Index at Prices Pa id by F a r~ e r s Tor Ccmmoci it !es and Se rvices, Int erest , Taxes and Farm Wage Rat es was 165 percent at it s 1977 base. Th e ' noex was UP 1 po int tr am January and 6 po ints tr ama year ear ! ier .
CONSUMER PR ICE INDEX
Th e January un adjust ed Consuler Pr ice Index for a i i urban consu me rs (CPI-U ) at 305 .2 (1967=100) was 0.6 percent higher than in DeceMber and 4.1 percent abo ve J a~ u ary 1983 . On a seasona l ly adjuste c ~ a s is , , ~ e CFI -U wa s 0.6 per: erot above Decemb er .
PRI CES PAI DBYFARMERS, FEBRUARY 15, 1984 WITH COMPAR ISONS
Pr ice
Ge or Qia
Unit ed States
Der
Feb. 15,
Jan. 15, Feb. 15,
Feb . 15, Jan. 15, Feb . 15,
Commod!t v
Un it
1983
1984
1984
1983
1984
1984
Dairy Feed 16Y.
$/Ton
174.00
21 5.00 205.00
177. 00
205 .00
201.00
Da iry Feed 181.
S/To n
173 .00
21 5.00 210.00
185.00
22 0. 00
213.00
Dair y Conct . 321.
SlTon
215.00
285.00 285.00
265 .00
300.00
286 .00
Ho g Feed 141.-181.
$/ClIt .
10 .50
12.50
12 .50
10 .40
12 .00
11.80
Hog Ce nc t . 381.-421.
$/C llit.
14 .00
17 .00
16 .50
14 .90
16 .80
16 .10
Bee t Cat t le Conct.
321.-36Y.
$/ Clli t .
11. SO
13.50
13. 50
11.90
13 .90
13 .40
Cottonseed Meal 411.
$/ClI t .
13.50
16 .50
16 .50
13.50
16 .30
16.00
Soybean Meal 441.
$/ClIt.
13 .00
15 .50
14.50
13 .20
15 .60
14 .80
Br an
$/Cllt .
11.00
11. 50
12 .00
9.76
10 .70
10.80
Middl ings
S/ClIt .
9.50
11.00
10.50
9.28
10.30
10.30
Corn Meal
$/ClI t .
8.00
9.90
10 .00
7.27
8.81
8.83
8roi Ier Gr ow er
$/ Ton
185 .00
220 .00 215.00
206.00
243.00
243 .00
Lay ing Feed
$/Ton
163.00
215.00 215.00
188. 00
219 .00
217 .00
Ch ick Sta rter
SlTo n
191. 00
240.00 240.00
210.00
246. 00
243.00
Bro i ler-Feed Rat io II Lb s.
2.9
3.3
3.4
2.7
3.0
3.1
Hog- Cern Rat io 21
Bu.
18 .8
12 .6
12 .0
21.9
15. 3
14.7
Mi ik-Feed Rat io 31
L~ s.
1.66
1.37
1.43
1.56
1.33
1.34
Egg-Feed Rat io 41
Lb s.
7.6
10 .5
10.0
5.8
8.8
8.6
II Pound s at bro i ler grolle r equa l in value to 1 lb. b-oi ler I i ve weight. 21 Bushels at co rn equal in value
te 100 Ib s. of hog I ive weigh t. 31 Pounds of 161. dairy feed equa l in value t o 1 lb. IlIhoIe 1:1 i lk. 41 Pounds
of lay ing teed equa l in va lue to 1 do z. eggs .
1977=100
INDEXNU~BE RS- -GEORGI A AND UN ITEDSTATES
January 1983
Feb ruary 1983
January 1984
February 1984
GeorQ ia
?r ices Rec eived
AII Conod i ti es
i21
125
ere;s
12L
12 b
11 9
124
14b
145
135
134
156*
154
Jni t ed States
"r ices Ke: eived
125
132
F~ ; : :s Paid 1/
158
159
14 4*
1L2
lbL
165
~a t i : 21
51
83
88*
3b
lI M !c -m ~ nt h index includinc: interest ' tax es and i are liI ase rates. 2/ Rat io of index at Pr ices Rec eived to Index of
* ?r ;C25 Paic, Interest , Taxes an~ Fc r~ Wa5e Rates. Re vised .
5
GFR-8 4- Vo l . 5
COLD STORAGE HIGHLI GHTS, JANUARY 31, 1984
percent above the orevious year. Stock s of pork
bel ! ies ~ e r e dOllln 9 oercent from iast mont h but
F ~ 02e n stacks in r e f~ i 3 er a t e ci ~ ar e ~ c ~ s e s : n
January 31 sere sreat er t han year ear i ; e- i eve i s
uere 11 3 oercent abo ve the 1983 hoidings .
for :lcrk., ~ ;:.; it SI beef , ; ~d but t s r . C: : 1e" :: er.; s
:c: a! frozen pou ltr y supe i i as were :.;nchan sec Tr am
with st ock: abo ve tnose 01 t he ~ re v ! ~ "s vear
December 1983 but were 15 pe rcent be iow iast yea" .
in:i uded natura! : ne ese, and ~ ' e sh fr uits,
Ict a] st ocks of chick ens cec!!neo 1 percent durin::
t he month and ~ er e 14 percent be low 1983. To t a l
Tota l red meat s in freezers increasec 2 ~ c - ~ c e+
from December 1983 and were 21 oercent more t han
oounds of t urke Ys ;n freezers were UP 1 oe rcent
t he January 1983 hoidinss , ~ r Gze n oorr S to: ~ s :~ 8 P p eci 2 =er: ent ~u r ;n ~ : he mont h ~ ut ~ e ~ e 31
year ,
COLDSTORAGE STOCKS , UNITEDSTATES, JANUARY 31, 1984
Jan. 31,
Dec, 31 ,
Jan . 31,
Perc ent af
C o n cd i~ v
198 3
1983
1 98~
Jan. 1953
Dec. 1983
1,000 Pounds
Pe rcent
Butter
~ B 5,44 5
499,372
494,283
102
99
Chee se, N a ~ u r a l Eggs, Frazer.
1 , 015 , ~ 8 3
L 2 0 6 , 3Q~
1.178,0 93
116
98
28,054
11 ,081
10 ,619
38
96
Fruits , Frczen
546,320
644 ,705
616 ,304
113
96
Fru i ~ Juices, Fro zen
1,368 ,282
92 4,856
1,08818 17
80
118
Meats , Red
573 ,363
679 ,337
69 1,373
121
102
3ee ! , Fro zen
303,077
325 ,033
338 ,085
112
104
Pork, Frozen
22 4d5 3
300,570
293,749
131
98
Poult ry, Fro ze n
326,9a
280,605
279 ,914
85
100
Turk eys, Fraze n Vesetabies, Frozen Potatoes , Fro zen
193 ,832
161 .753
163,490
84
101
1,812d 40
1,882 ,496
1,678, 373
93
89
800, lH
772 .962
754,895
94
98
Peanut s, She l led
34 7,739
299,918
330 .189
95
110
Peanut s, In Sh el l
42,435
1 8 ,5 ~5
21,500
51
11 6
Pecans, SheIIEd Pe cans , In Shel l
24,076
20 ,160
22 ,285
93
111
90,210
5 8, 6~6
94,233
104
161
GEORG IA RED MEATPRODUCTION UP
U.S. RED MEAT PRODUCTION UP
Co m m e ~ : ; a : red ~ e at or cdu c ~ ic 0 !n GeJr; ie 39.1 !Iii ! ! :: :-: :J : t.: r.::: : :2; i :1 s Jar: :.: ary : 95~ . -' ,:"".:.s . s 7 percent "CrE t han janu ary last year ,
Co mme -c ial red meat produc t ion fer t he Unit ec St at es du r ins january 1984 tot aled 3.22 bi II ion pou nd s, 2 percent more thar. january 1983 .
The number of cat t ie s laug htered ~ y camme- c ia :
Beef product ion tot aIed 1.91 bi i i ion pou nds ,
piants in Geo rg ia dur ing janua ry was 20: 400 . ThiS
percent less than a year ago. Live weisht
was 3,600 ~ e ad more : han a year ago ,
averaged 1,066 pounds oer head, comoare: to !as:
Jan uary;s 1,077 Dou ne s oe - head.
There werE 177,500 ~ e a d of hoss s ! a Us ~:ErE: "
Sears ia : s : o ~ m e r : ia ! ~ ia nt ; :n ~ an u = r y . ! hi S ' : 9,300 QOr e t han t he ~ re v io u s y e a ~ l s 169,200 heac.
PC :'K e-c cuct ion dur i n; t he rn ~ r:! ; ; tat a !ec' 1. 23
0- erevi cus Janu ary. ~v e r a ge : .ve Ul e i s~:
t hE
~ c~ t h was 242 ~o und s , como are: to 244 Doune s
du r ing january 1963 .
6
Sce c ies
Geo rgia Catt Ie Calves Hogs Shee p ~ Lambs
GEORG IA AND UNITED STATES LIVESTOCKSLAUGHTER1/
Number
Average
Slaughte r
Live We ight
January
-January
1983
1984
1983
1984
1,000 Head
Pound s
16.8
1.4
169 .2
ZD .4
1.2
177 .5
.1
91 1
902
340
357
232
229
84
Tota l
Live Weigh t
Janu ary
1953
1984
1,000 Pou nds
15,319 471
39 ,314
18, 41 J 420
40,574
4
Un ited StatEs
MiI. Head
Pound s
Hi I . Pounds
Catt le
3.1
3.1
1,077
1,066
3,298.2
3,313.7
Calves
Hogs
Sheep &Lambs
.2
.3
6.7
7.2
.5
.6
237
240
244
242
113
113
57.8 1,625.t.
59 .0
66 .6
1,738. 62.3
1/ Inc lude s slaughter und er Fede ra l inspect ion and ather com me rcial slaug hter , exc ludes tarm s laughter .
COMMERC IAL REDMEAT AND LARDPRODUCTION: UNiTED STATES WITHCO~PARISON5 1/
Kind
January 1953
Janua ry 1984
r. of Year Ago
-- Hi I I ian raunds- -
Bee f
1,927
1,913
99
VeaI
3t.
39
115
Po rk
1, 159
1,234
106
~ a~b a ~i M~ t t ~ n
30
31
103
Tot al Re d Mea t
3,151
3,218
102
Lard 2/
'n:
79
107
1/ Basec on packers dress WEigh t s anG Exc ludes farm slaughter . 2/ Prel i ei na-v lard product ion includes
~ e r.d er e c ?C i K rat.
U.S. AGRICULTURAL EXPORT FOR~CAST HOL DS AT$37.5 BILLION 1/
t X?C rt unit va lU ES may 2 V E~ a ~2 a b o ~ t a t ent h
highe r , l ed by steeper CO rn a o ~ s0ycean pr ices .
The v=lue : 7 ~ . : . =s ri: ur:ui c! = X~D i:5 in +;5[ 21 198L is fcre:,: st at S37.S Ji : ; ;: nJ !.! !l: ha r; :e ~ 7: Gt
Last year ' s U.S. drousht and acreage reduct ion programs a c: c ~ n t f ~ r thE !ucrease . So ybea n pri ces are est imat ed to ~ e _u ~ almost one-t hird, earn
pr ices up one-f ift n, and uh eat pr ices up s l ight ly.
However, much pr ice un cert aint y re"ains, and
t: ns ) as iaw er S~ I O ~ = ~ : : G7 s: y ~e o ~: a ~ c ~ r G : J : : : ~ c~ e ~ h2 ~ cff se: i ~ : ~ ~ = s e c ::;~3= ; r2in, ~~ ~ a : )
yi elds or Sopthe .- r. Hemi schE!"' E : r2 :11 end oi l sss:' Cr8?5 ane the size s f : ~E u . ~ . =~ r i ttS ? i2nt inss e i l l at fe:: : pr i:!?: : ~ ,..; ~ : : ~ e se:~ ;1 ci M2! f or t he
year . 1/ OUTLOOK f ~ r ~ . S . Agr icult ural Expo rts,
~:o ncffi ic Re SEar ch Se rviCE and Fore ign Agr icul t ural
Ser vice , U.S. D e :J 2 r ~ ;n e ii : : ~ Asr i :: :.: i : !.: r 2J reb . 21 ,
1984 .
7
U.S. FARM INCOME STATISTICS 11
--_.._._----------- -- -1-97-4 -- - -1975
1976
1977
1978 1979
s Bi I .
1980
1981
1982
1983F
1984;:
Rece iots
Cash ~ e :::E ,::; :
C"~;lS
?I
.1
...... .
~5 .E
~ 9 .0
4B .6 53 .7 63.2 72 .7
73 .1
74.4 71 to 73 74 t e 76
l i vest cr i
~i.3
4] .1
46.3
47.6
59 .2 68.6
67 .5
69.2
70 .2
69 to 71 6e t o 72
:: t al
12 .4 88 .9 95 .4 96 .2 112 .9 131. 8 140.5 1~ 2 .3 144 .6 141 te 143 144 te 148
Ot her C as ~ income 31
i.4
1.8
1.8
3.0
4.3 2.9
2.9
3.9
5.6 10 to 12 9 te 13
Ict a I Cash i ncc ae
93.8 90.7 97.1 99.2 117 .2 134.7 143 .4 146.2 150 .1 152 te 154 155 to 159
Nc ~~ o r. e y i ": o ~e 4/ ~ eal i zee Gress income
6.1 99 .9
~' .c-.
7.3
8.4
9.2 10.7 12.1 13.3 13 .9 13 to 15 13 t o 15
97 .2 104.4 107 .6 126 .4 145. u 155 .5 159.4 IbU 166 to 1ba 169 to 173
Value oi irventcry Chs . -1. 6
3.4 -1.5
I.;
.8
~. 9
-5.3
7.6
-1.9
-6 to - 10
6 t o 10
Tet.i Gress ! n c c~ e
98.3 100 .6 102 .9 i08.7 127.2 150.4 150.1 167.1 162.2 lS7 to 159 177 te 181
Tctel excenses I ct el Ijet r a r ~ Inc:,e
71.0 75 .0 82.7 88 .9 99 .5 118 .1 128 .6 137 .0 140.1 135 to 137 145 to 149
27.3
25 .6
20 .1
19 .8
27.7 3?3
21 .5
30 .1
22.1
22 to 24 29 to 34
1/ A: r : c ~ i t u r a i O~ t iD o k, E c c n e ~ i: Re searCh Se rvice , U. S. De car t ment of A5 r i: ult ure, Jan. l;:eo. 1 98~ . 2/ Incl ud es net CCC loans .
3/ I ~ L ~ ~ e ~ .. : ] ~a~ ~ i ~ e hire and custom~ ork , f ar~ r e: re2~ i c n 2 ! i n c : ~ e anc d j~e:t s ~ v e r ~ ~ 2 nt ~ a yrne~~5. 4/ !~cu t E d 5ross renta l value of far m
dw~ f 1i r. s= aj;C vai us :Jf hom e ::nS iJlfict i an. F=r orecas: .
co
Georgia
~ c ro p Reporting Service
Stephens Federal Bldg. Suite 320 Athens, Georgia J 0&13
0 42 80 1 1 3 0 00 0 0 2 5-22 70 75 02 0
4 04 / 22 3-1 8 29
00 84 05
- A E X P ~R I ME N T STA
LIB RA RY EXP ERIM ENT
GA 302 12
SECOND -CLASS POSTAGE PAID AT ATHENS , GA 30613
~\
GEO RGIA
~~ ~r c h 21 , 19 84 GFR-84-V oiume 6
HIGHLIGB't'S Hogs Pigs
K:ll.k Production
C>A
AltDD ,'-1-
f\
F.)....
'
19 ~Ll/.~ -;2.1
GEORGIA
n 7 \ :" .
CROP REPORTI NG
SERVI CE
R ~ G E I VED
stephens Feder al t e 320
Bldg .
t hens , Georgia 30013
I~ ~ R 2 1 20 05 L hone : ( 404) 546-2236
n CUME ITS UGA LIBRARIES
Cattle on Feed Peaaut St:ocka
10 STATE HOG AND PI G IN VENTORY DOw~ 57.
GA . HOG AND P I G I N ~ ENTO RY RECORD LOW
I n v e n to ry of a l l ho g s a nd pi g s o n
Hog s a n d pig s on Ge o r gi a f a r ms o n
Ma rc h 1 , 198 4 , t ot a l e d 1,1 9 0 , 0 0 0 h e a d ,
the sm a l l es t inv e nto r y on r ec o r d d at i n g
ba ck t o 192 6 . Th is i s 8 pe r c e nt bel ow
t he prev i ou s r e c o r d l ow o f 1 , 290, 0 00 set
j u s t l a s t y ear , and 9 perc e n t l e s s t h a n
De c em ber 1 , 19 8 3 . Hogs k e pt f o r br eed -
i ng, at 170 ,000 h ead , ar e 8 p e rc e n t
b e l o w Ma rc h a y ea r ag o, a nd 2 p e r cen t
l e ss t han t h e p r e v i ous l ow o f 174,00 0
h ead o n Mar c h 1 , 19 8 2.
Mar k et ho gs
t o t a led 1,020 ,000 , 8 pe rc e n t l ess t han a
year e a r l ae r ,
Th e De c em b e r 1983 - F ebr u ary 198 4 p i g
cr o p, a t 43 4 , 0 0 0 , is d o wn 7 per ce nt from
l a st y e ar . Du rin g t he De c embe r-F eb r u a r y
q uar t er 6 2, 0 0 0 s o ws f a r r ow e d , a decr e a s e
o f 9 p e r c ent f rom a v e ar ago . Th e
a ver a g e l i t t e r s i z e of 7 . 00 p i g s pe r
litter , is u p from t he 6 . 90 p igs s a ve d
d u ri ng th e wi nt e r q~ar~ er la s t ye a r .
Duri n g Ma r.ch -Ha y of 19 8 4 , Ge o r g ia
fa rm er s i nt end t o h a v e 7 5, 0 00 sow s
f a rr ow .
I f t hei r int entions a r e
r eali zed , f a r r o wi ngs will b e do wn 7
p e r cent fr om the spring quart e r of a
year a go .
Al s o, 68 ,0 0 0 s ow s a re
e xp ect ed t o f a rr o w J u n e - Au gu s t o f 198 4 ,
6 perce n t le s s th a n th e a ctua l n umb e r
t h a t f a r r owe d during th e same p e r i o d of
1983 .
Ma r c h ;, 1984, i n t he 10 st ate s co nduc t -
in g q u a r t e r l y h o g s u rv e y s , i s es t i ma t e d
a t 3 9 . 5 mi l lio n h e a d, 5 p e r ce n t b e l o w
l as t Ha r c h a nd th e lo west Ma r c h i n v en-
t o r y s i n c e 1976.
Br e e d in g i nven tor y, a t 5 . 3 5 mi l l i o n
h ead , is 10 perc e n t les s tha n a yea r
a g o . Thi s is t he l o we s t Mar c h b reedin g
h e rd sin c e 1 9 73 wh e n e s ti ma t e s f o r
t h e s e co mpa ra b le 10 s t at es b e c am e
avai l ab l e .
Mar k e t h og s , a t 3 4 .2 mi l l i o n h e a d ,
was 5 p e r cen t be l o w l as t y e a r.
Th e De c em b er J9 8 3 - F e bru a r y 1 9 8 4 pi g
c r o p was 1 3. 5 mil lio n h e a d, 13 p e r c e n t
l e s s than la st ye a r . Th e r e were 1 . 8 6
mi l l i o n s ow s t h a t fa r r ow e d d u r ing th e
q ua r t e r, d o wn 1 1 p e r c e nt f r o m a yea r
a go.
Sow f ar rowi n g s a v e r a g e d 7 .26 pigs
p er l i t t e r c om p a red wit h 7. 4 4 l a s t y e a r.
Hog prod uc ers i n the 10 qua r te r l y sta t e s
i n te nd t o f ar row 2 . 4 8 mi l l ion s ow s
du r i ng Mar c h - May o f t his y e ar . This is
1 1 pe rcen t less than a ct u al f ar r owi ng s
dur in g t he c o mp a r a b l e pe ri od i n 19 8 3.
Fa r r ow i n g int e nt ion s f o r Ju n e -A u g u s t a r e
2 . 10 mi l l i o n h e a d , 13 per c ent b e l o w t h e
same pe riod l a st y e a r .
I f these
i nten tion s a r e r e al i z e d, th is wil l be
th e lo we s t J u n e - Au g u s t fa r r o wi n g s s in ce
197 5 .
Agricult:ural St a tist:iclan and Geor gia Depart.en t of Agricult:ure
GFR-84 - Vo l.6
HOGS AND PI GS : NmlBER ON FARM S , SOWS FARROWI NG AN D P I G CROP
GEORGI A AND 10 QUARTERLY STATES 1/ , 19 8 3 AND 198 4
- ; ;j"'S t t~~
Geo r Qi a
1 9~ a s ;(
I t em
1983
19 84
1 , 000.
of J983 Pe rce n t
198 3
1984
1, 000 He ad
Nu mb e r on Fa rm s-Marc h
All Hog s a n d P igs
41, 84 0
39 , 540
9':>
1 , 290
1 ,190
Kep t f or Breedi n g
5,9 28
90
184
170
Ma rke t
35 ,9 12
3 4 , 18 7
95
1 ,1 06
1, 0 20
19 84 a s :::: of 1983 Pe r c ent
92 92 92
Mar k e t Hog s an d P i gs ~eigh t Groups
Un d e r 60 Pou n d s 60 -1 19 Po u nd s 1 20 - 179 Pound s 18 0 Po u nd s [, Ove r
1 3, 6 72
12, 02 6
94
8, 9 79
8 ,5 10
97
7 ,6 97
7 , 77 4
99
5 , 564
5,877
103
44 8
411
92
30 5
270
89
2 31
2 14
93
12 2
12 5
10 2
So ws Fa rr o.,ing Dece mber 2 /- Fe b rua r y Marc h-May Dec e mbe r 2/ - Ma)' J u ne - Au gus t Se p te mb e r - No v e mbe r June-November
2 , 090
1 , 8 64
89
2 ,768
3/ 2 , 47 5
89
4 , 8 58
4/ 4,339
89
2 ,400
3/ 2 , 098
87
2 , 370
4 , 770
68
62
91
81
3 /75
93
14 9
4/ 13 7
92
72
3 / 68
94
70
14 2
~p
De c ember 2 / - Fe b r u a r y
15,5 43
13 , 536
87
Mar ch-May
2 1,063
De c e mb er 2 / -~ja y
36 , 60 6
J un e-Aug u s t
17 , 6 75
Se pt e mb e r- Nov e mber
1 7 , ;,J)
Jun e- No v e mb er
35, 28 6
469
43 4
93
583
1 ,052
5 11
504
1 , 0 15
Pi g s pe r Lit te r
Nu mb e r
De c emb e r 2 /-F eb r u a ry
7 .4 4
!'1 a r c h - ~ a y
7 .61
Dec emb er 2/ - Ma y
7 .5 4
J u n e - Aug us t
7 .3 6
Se p t e mbe r - Nove mb e r
7. 43
Ju n e - No v e mbe r
7 .4 0
1 / G A ,I L , I N , I A . KS , M~ , MO . N B , N C . O H. 2 / De c e mb e r
Febr u a r y pl us i. n t ent i o ns fo r Mar c:h -Na y .
prec e di ng y ea r~
Numb e r
6 . 90
7 . 00
10 1
7 . 20
7 . 06
7. )0
7. 20
7 . 15
3 / I nt e nt i o ns . 4 / De c e mb e r -
The Geo r g ie For.. Repor t (I SSN-0 7H -7280 1 Is publis hed ~,,", I - mon t h . 1 by the Geor glo Cr Oll Report ing Serv i ce , St e ph" ns Fedore l Bu ild i ng, Atha ns, Go . 306 13 . Ler r y E. Sn i pe s , St ot l . t lcl en In Cha r ge . Sec o nd c le s s pos toga po ld e t Athe ns . GA. SUbsc r I pt ion t S10 pe r y"" r 8XC8Ilt t r ... to dete c ont r i butors . Subsc r i pt io n Inf or "",t lo n ev e l l eb Ie tr Clll : Geo rg i a Cr Oll Report i ng Serv i ce . St"llh ans Fed e ro l Bu II~ lnQ. Su ite 320 At hen s GA. 306 13 Te l eo ho n.. : (4 04) 546-2236 .
2
GEORGIA MILK PRODUCTION DOWN 3 PERCENT
U. S. MILK PRODUCTION UP 2 PERCENT
Georgia 's dairy herds produ ced an e st im ated 113 mi l lion po unds of milk during February 198 4, 3 perc ent les s
Milk production dur ing February 1984 to ta l e d 10.9 b illion po und s , 2 percent mor e than Februar y 1983 and 5 pe r c e n t
than last ye a r and 7 percent below Feb-
above February 1982. The e xt r a day in
ruary 1982 .
Feb ruary 1984 inc r ea s e s r at e per cow and
Milk averaged February
cows on Georgia 's dair y farms 124,000 head, 5,000 less than a yea r ago and 6,000 below
t o ta l milk production about 3 . 5 pe r c e n t . February product i on per cow averaged
995 pounds, 26 pound s above a year
February 1982. Milk production per cow
earlier.
av e r a g e d 915 po u n ds for February, c o m-
To t a l milk c ow s av e r ag e d 11. 0 mil-
pa red to 900 pound s las t yea r and 930
l ion head , 1 pe r cen t l e ss than a year
po u n d s in Febr uar y 19 8 2.
earl ier .
DAIRY PRODUCTION, FEBRUARY 1983 ~ 198 4
Geo r g i a
United States
It em
Uni t
198 3
1984
1983
1984
No . Mi l k Cow s o n Farms
Thou s. He a d
129
12 4
11 ,0 72
10 ,958
Mi l k Prod uctio n p er Co w Po un d s
900
9 15
9 69
995
Tota l Milk Pr o d u c t io n
Mil. Lbs .
1 16
113
10,7 25
10 , 9 05
CATTLE ON FEE D IN 7 STATES DOWN 1 PERCENT
Ca t tl e a n d c alves o n fe ed March f o r sl aught er ma r k et in t h e 7 state s preparing mo nth l y est ima t e s to tal ed 7.5 2 million head , down 1 pe rcen t f r om a year ag o b ut 9 percent above March I , 19 8 2.
Mar k e t i n g s o f fed c a t t l e du ring Fe brua ry t otaled 1. 62 mill i o n, up 9 percent from l a s t yea r a nd 15 percent abov e Fe br u ary 1 98 2 .
Pl a c eme n t s of c a t t le a nd calv e s o n f e e d d ur i n g Febr uary we r e 1 .30 mil l i o n , 12 pe rc en t a bo ve l ast ye ar bu t 1 perc e nt below Fe b ru a ry 1982. Net p lac emen ts o f 1 . 2 2 mi llion we re u p 17 p e rcent f rom la st ye a r but d o wn 1 per c e n t f rom Febr uary 19 8 2 .
Ot he r d i sappea r a n c e to t al e d 82 thousa n d c omp ar e d with 1 21 tho us and d uri n g Fe bruary 19 83 and 93 thousand two y ea rs ag o .
CATTLE AND CALVES ON FEED, MARCH 1
1984 as
7. o f
I tem
198 3
19 84
19 83
1,000 Head
On Feed Feb . 1 1 / 8, 052 7,917
98
Pl a ced on Feed
duri ng Feb.
1,164 1 ,301
112
Fed Cat t le
Mark et ed d uring
Feb.
1 , 49 1 1 ,62 1
109
Oth e r Disa p p ear-
a nce du r i ng
Feb. 2 /
12 1
82
68
On Fe e d Mar.l 1/ 7, 6 04 7 ,515
99
1/ Cat t l e and c a l v e s on fe e d a r e animals
f o r s l aug hte r market be ing f e d a f u ll
rat ion o f gra in or othe r concent ra t es
a nd are ex pected t o p r o d u ce a c a r c a ss
that wi l l g rad e good or bet t er. 2 /
I n c l u d e s d eath lo ss e s , mo vem en t from
feedlot s to pas tures a nd s hipments t o
ot her f e e dl ot s f or f urther f eeding .
Spec ie s
Cat t le Ca lves Hog s
ANNUA L COMMERCIAL LIVES TOCK SLAUGHTER , GEO RGIA AND UNITED STATES, 1983
GEORGIA
UNITED STATES
Number
Ave ra ge
Total
Numbe r
Ave rag e
Total
of
Liv e
Live
of
Live
Li ve
Head
We ight
Wei g h t
Hea d
Weight
We i ght
1 .000
Pound s
1,000 Lbs .
1, 000
Po unds
1 , 000 Lbs .
216. 5
906
196,180
36 ,6 48.9
1 ,0 71
39,2 47 ,5 90
19 . 2
337
6,45 2
3,076.7
2 37
729, 472
2, 163.3
230
498,499
87,584.3
2 43
21, 28 4,616
3
J ANUARY PEANUT STOCKS DOWN 9 PERCENT Pe anut stock s in commerci a l storag e on J a n ua r y 3 1 , 1984, to t a l e d 2 . 30 bi l l ion po u n ds o f e qu i v a l e n t f a r me r stoc k , 9 pe r c e n ~ l e s s t h a n t h e amo un t o n hand y e a r e a r l i e r . Augu st 198 3-January 198 4 mi l l i n g s t ota led 1.6 6 bi l li on poun d s , up 2 per ce nt fr om t h e s ame pe riod a y ear ago . Commerci al pro cessor s u tili zed 66 6 mil lion pounds o f she l l e d edib le g rade peanuts d ur i n g Aug u s t- J a n u a r y , c ompar ed with 662 mil lion pounds a yea r earl ier .
J
U. S . VISIBLE SUPP LY OF PEANUTS
AT MONTH' S END 11
Jan.
Ju l y
Jan .
Cl a ss
1983
1983
1984 21
Farmers
Stoc k
1 ,60 7
51
1, 50 7
She ll ed
Peanuts 31
628
557
563
Ro a sti ng
St ock 41
89
72
49
To t a l 51
2 ,53 1
86 4
2 ,30 4
1/ Exc ludes stocks on f ar ms. Includes stoc ks owned by or he l d fo r account of CCC i n commer c ia l s tor ages . 2/ Pr e l iminar y. 3/ Inclu des s he l led edibl e and s he l led a ll stock . 4/ Cle aned and unshe l led . 5/ Act ual fa r mers stoc k, p lus roas t i ng st ock , pl us s he l le d pea nuts X 1. 33 .
GEORGI A BROILER HATCH DOWN Br o i l e r t y pe c h i c ks h atc h e d in Ge o r g i a for 19 8 3 wa s s l i gh tly less t h an t h e 6 4 5. 2 million h a t ch ed i n 19 8 2 . Ha t c h o f broiler t y p e c h i c k s in t h e 19 s t a t e s wa s 4 .32 billion s l igh t ly mor e t h a n t he 1982 t o t a l o f ~.~1 bi l l i o n.
ANNUA L HATCHERY PRODUCTION ,
GA. AND 19 STATES , 198 3
Tvpe
Ge or g i a
19 S ta te s 11
Tho u s a nd s
Egg
Chicks Ha t c h e d
24 .656
406 , 935
Br oi l e r
Ch i c k s Hatc h ed
64 3 , 2 2 9
4 , 3 24. 56 5
Chi c ks Pl a ced 2 1 6 48. 76 8
4 , 19 0, 28 3
Eg g s Se t 2 1
7 7 1, 8 54
5.182 , 8 53
Turke ys
Poults Placed
3/
182, 22 2
1/ Ni ne tee n pri nc ipa l bro i le r s t ates- - AL, AR,
C A , D E , F L ,GA ,L A , ~JO ,MO ,MS , NC ,OR , PA , S C , T N,TX ,VA ,
WA, WV . 2/ Inc l ude s week s e ndi ng Nov . 20 , 1982Nov . 12 , 1983 . 3/ at pub l i s he d t o avo i d dls~I osu re of I ndi v idua l ope r ati o ns .
4
Apr I I 3 , 1984
GFR- 84-Vo l ume 7
Hi.gblights PouIt ry S1DRary Lives tock Sl aughter Agri cuItural Prices
ORGIA CROP RE PO RT I NG SERVICE
ephens Federal Bldg . te 320 thens, Georgia 30613
!~2R 2 i 20 05 Phone: (404 ) 546-2236
DO . M _5 UGA LIBRARIES
We ekly Hatc hery Production 1983 Prelt.inary Cash Rece i pts Cold Storage
GEORGI A LAYERS AND EGG PRODUCT ION DOWN
Georgia 's l a y ing f l o c k s produced 3 59 mil lion eggs dur ing Fe bruary 19 8 4 or 7 perc ent le s s t han a year ago . Th is is the l o we st Fe bruary e g g p ro du c ti on since 196 6 . Pro du ction i n c l u d~s 2 67 mi l li on t abl e o r commerc ia l t y pe e gg s a n d 9 2 mi llion ha tchi n g egg s .
The a verag e n umbe r o f layer s in Ge o r g i a duri n g Feb rua r y 1984 wa s 18 . 7 8 mi l li o n, 8 perc en t les s t ha n a year a g o . The 18 . 78 mi lli on c onsis t ed o f 13. 7 1 milli on for table egg s and 5 . 0 7 mi ll i on f or hatching eggs.
Eg g s lai d pe r 100 l a y e r s du ring Februar y ave rage d 1, 9 12 compared to 1,905 a year a go . Febr uary 1984 c on s i s ted of 29 days c ompa r e d wi t h 28 d a y s a y e a r a g o.
u. s. LAYER NUMBERS AND EGG PRODUCTI ON
DOWN
Th e Na t i on 's lav i n g flock s prod uced 5 . 33 b i l lion e gg s during Fe brua r y 198 4 , a bo u t t he same as pr oduc ed a year ear li e r . The Februar y egg product ion i nc luded 4 .8 b i l l i o n t a b l e e gg s a n d 554 million ha tching e gg
F e br uarv egg produ c t ion per 100 l ave r s averaged 1,925 egg s c ompared wit h 1:899 eggs a year e arlier . Fe b ruary 1984 consis ted o f 29 days c ompared with 28 d ay s a yea r ago .
Th e tota l n u ber o f l aye rs d u ri n g Febru ary 1984 wa s 2 7 6.8 million , 2 per cent l e s s than t he 281.9 mil lion a ye ar earl ier.
Georgia Hatch ing Other
Total Georgia
Total u.s.
NUMBER OF LAYERS AND EGG PRODUCTION, FEBRUARY 1984
No . Layers o n
Hand-Feb .
198 3
1984
Thous and s
5,22 5
15.145 20 . 370 281 ,874
5 ,066
13. 714 18.780 276,781
1,758 1,952 1,905 1,899
1 ,807 1 ,946
1.91 2 1. 925
92 296 388 5,353
92 267 359 5,328
EGGS IN INCUBATORS. MARCH 1984. UNITED STATES
Item
198 2
1983
1984
7. of Year Ago
---Thousands---
Chickens
Egg Type
39.529
32,17 5
40, 110
125
Broiler Type
317.1 8 7
322,898
323.716
100
Tu rkeys
22.840
22.919
22.360
98
Agricu1tura l Sta t i stician and Georgia Depart:aent of AgricuIture
GFR-84-Vol. 7
GEORGIA BROILER HATCH UP
S. BROILER HATCH UP
The February hatch of broiler t pe ch i c ks , at 52.5 mill ion, was 4 perc l es s than the prev iou s mon th b u t 4 perc ent mor e t h an a year earl ier when Feb r ua r y cons is ted of 28 days .
The Febr ua r y hatch of broi ler type ch icks , a t 3 56 . 4 mil lion, was 4 pe rc en t less t han l a st month but 2 percent more
an a year earl ier . This is the l arge st February b r o i l e r t y pe hatch o f r ecord.
POULTRY HATCHING AND PLACEMENT- - FEBRUARY 1984
Duri ng
4 of
4 of
Item
Fe b. 1983
Jan . 198 4
Fe b . 198 4
year ago
Jan . t hr u Fe b.
19 8 3
198 4
ye ar a go
- - Tho u s and s - -
- - Thou s a nd s --
Pu l l e t Chic ks P l a ced
Dome s t i c ( U.S .) II
Br o i l er Ty pe Egg Ty pe
3, 310 19 9
3, 202 194
2 . 97 7
90
20 9
10 5
6 , 479 3 87
6, 179
95
40 3
10 4
Chic k s Ha tc h e d
Br oi l er Ty pe Ge o rg ia
50, 329
54,847
52,520
10 4 10 6, 221
107, 367
10 1
Uni te d St at e s
3 48. 287
370 , 0 16
356 , 38 6
102 730 ,89 1
72 6 ,4 10
99
Egg Type
Geo rg i a
1, 90 3
3 , 727
3 , 942 207
3 ,923
7 , 669
19 5
Un it e d Sta t es
32 , 9 56
36 , 947
3 7 , 69 9 1 14 6 5 , 58 6
74, 504
114
Tur kevs
Pou lts Plac e d
u. S.
15 , 18 5
13 . 669
15 ,3 16
10 1 2/7 0 ,494
2/ 70 ,087
99
II Re po r ted b y lea d ing b ree d er s, inc l ude s e xp ec t ed pu l let r e p lac e me n t s f r om egg s s ol d
d u r i n g the pre c e d i n g mon t h at t he ra te o f 12 5 pulle t c h i c k s pe r 30 d o z e n case of e ggs.
2/Turkey poultg pl a c ed Se p t . 1983-Fe b. 1984 .
COMMERCIAL POULTRY SLAUGHTER II. FEBRUARY 19 8 4
:~ o f
/. o f
I t em
Fe b .
Jan.
Fe b .
yea r
J a n . thru Feb.
yea r
19 83
1984
1984
ago
19 8 3
198 4
ago
- Tho us an ds-
- - - Tho u s a nds - - -
Yo ung Ch ick en s
Georg i a
45 , 605
49, 4 45
47, 11 8
10 3
9 3 , 3 2 5 96, 56 3
103
Uni t e d St a tes
312,466 3 38 , 0 9 9 32 2 ,1 3 0
10 3
6 52,7 18 660 ,2 29
10 1
Ma t u r e Chickens
Li ~h t Type U. S .
1 1 , 9 48
10 , 0 5 4
9 , 57 2
80
27 .665
19 . 626
71
He avy Ty pe U. S .
2,758
2 , 646
3 , 112
11J
6, 004
5,758
96
Tota l U. S .
14. 706
12 . 700
12, 684
86
33 , 6 6 9
2 5 , 38 4
75
To t al Al l Ty pes , Ga .
2 , 919
2, 88 7
2 , 9 10
100
6 ,900
5 ,797
84
Pe r c e n t Co n d e mn e d
Yo ung Chi c k ens
Georgia
1. 6
10 8
Unit e d Stat e s
1. 6
99
II Federa ll y i n s pe ct e d sla ug h te r data as c o l lec t e d by Me a t a nd Po ul t ry I n s pe ct i o n P ro g ram .
Cur r en t mo n th d ata es t i mate d by Mar ket News Se rvic e.
i n.. G<>o r g l. Fa r m Repo rt ( I SS'~-0144-12 80) I s published s _ l- nr:>nthly by th e Georg i. Cr op Report ing Ser . lc o, St o pne ns Feder al Bui l d i ng , Ath e ns , Ge . 306 1', L.r ry E. Snipes , St . t l s t lc l a n In Charge. Sec o nd c le s s po st age p<o ld et ', t he ns, GA . Su bs cri pt ion tee SIO per ye e r excep t t r e .. to de t. contr ibu t o r s. SUbsc r ip t io n I nfo r~ t l on a . a lla ble f rOM' Georg ia Crop Report i ng Ser. lce , St ep h ns Fed e r . 1 Bu i ld i ng, Su ite '20 , At hens , GA. ~061' re l echone: (4 04) 546 - 2 236 .
2
GEORGIA RED MEAT PRODUCTION
U. S. RED MEAT PRODUCTION UP
Comme rcial red me a t p roduction in Georgi a t o tale d 37.3 i llion pounds during Fe bruary 1984 . This i s down 5 pe rcent f rom January 1984 but up 12 percent f rom Febr uary 1983 .
The number of c at tl e slaughtered by commercial plan t s i n Georgi a du ring Fe bruary t o tal ed 19. 1 t hous and head. This i s 6 percent le s s t h n t he prev i ous mont h bu t 24 percen t more than Februar y 198 3. The total li ve we i g h t wa s 17.3 mi l i l i on pounds with an a ve r a ge o f 904 pounds pe r head .
There wer e 16 9.8 t h o usand he a d of hog s s l a ugh t e r e d in Georgi a 's comme r cial p lan ts du ring Februa ry. Th is i s 4 pe r cent l ess t h an th e prev io u s mo n th but 10 percent more tha n Fe brua ry 1983. The t ot al l ive we i g ht was 3 9 .0 3 mi ll ion pounds a nd an ave r age o f 230 pounds per hea d.
Commercial r ed mea t pr od uc t i on for the
United States duri ng February 1984 to-
tal ed 3.09 bill ion pounds, up 11 p e r c e n t
f rom last ye ar . (Commercial red meat
production
i nclud e s
s laughter
in
Fed eral l y ins pected and o ther plants, but
e xc l ud e s a n i ma ls s l a u ght e r ed on f a r ms. )
Beef production to taled 1.86 b illion pounds . Total he ad k i l l e d was 2 .97 mil-
l ion and li v e we ight aver aged 1,074 pounds per head.
Veal product ion was 36 mi l li o n pounds.
Calf slaughter of 255 t ho u s a nd head a ver-
a g e d 240 pounds li v e we i g h t .
Pork
production during the month totaled 1.17
billion pounds. Hog s kill ed t o t a l e d 6.81
mill i on head . Average live we ight fo r
t he mont h wa s 2 4 1 pound s . La mb and
mu tt on p roductio n was 3 2 mil l ion po un d s.
Head kil l a t 561 t housa nd was up 20 per -
cent and average l i ve weight wa s
unchanged at 115 pounds .
Speci es
Georgia Ca t t l e Ca lve s Ho g s Shee p & Lambs
GEORGIA AND UNITED STATES LIVESTOCK SLAUGHTER 11
Numbe r Slaught e red
Ave rage
1984 Jan.-Feb.
Liv e We igh t
Feb ruar y
a s /. o f '84 as /. of
Fe brua r y
1983
1984
1983
1983
19 83
1 9 84
1,000 Head
Percent Percent
Po u n d s
15. 4
19 .1
124
123
910
90 4
.9
1.3
144
109
3 41
342
155 . 0
169.8
110
107
231
230
100
To t al
Live We i gh t
February
1983
1984
1, 000 Pounds
14,046 31 1
35, 742
17 , 29 5 452
39, 02 7
United States
Ca tt le
2, 691. 3 2 , 970. 5
1 10
10 6
1,084 1,074 2, 91 8,256 3,1 9 1,084
Cal ves
22 3 .5 255 . 1
114
11 4
239
240
53 , 439
61 ,24 4
Hogs
5 ,964 . 4 6,811.8
114
11 1
240
24 1 1,4 33,2 97 1 , 64 1 , 0 20
Sh eep & Lamb s
468 . 5
56 1.3
120
113
11 5
115
54, 03 2
64,478
11 I nclude s s la ug h t e r under Federal Insp e c tion and o th e r c ommercial s laug h t er , e xclud es fa rm
slaughter.
COMMERC I AL RED MEAT AND LARD PROD UCTION : UNI TED STATES WI TH COMPARISONS 11
February
Jan .-Fe b. 21
1984 as x
19 84 as /.
Ki n d
1983
198 4
of 1983
1983
198 4
of 1983
Mi l l i o n Pounds
Percent
Mi l lion Pound s
Per c e n t
Bee f
1, 707
1 ,858
109
3,63 4
3 , 772
104
Ve a l
32
36
1 13
66
76
115
Pork
1,021
1 , 165
114
2,180
2 , 399
110
Lamb & Mu tton
27
32
119
57
63
III
Total Red Meat
2,787
3,092
111
5,9 37
6 ,309
106
Lard 31
66
74
112
141
153
109
11 Based on packers dress weights and exc ludes farm slaughter . 21 Accumulated totals based
on un rounded da ta . 31 Preli minary lard production i n cl ud e s rend e red pork fa t.
3
GEORGIA PRICES RECEIVED
Georgia farmers saw littl e p r i c e mov ement f r o m Februa r y to mid-Ma r ch for most crop c o mmodities. Live stock c ommod itie s an d products showed an ove r a l l dec line . Soybeans pos ted the best gain a mon g t he c rops adva nc ing from $7.61 per bushel to $7.81. Li ve stock items we r e mixe d wi t h hog pr ices declining f r o m $ 4 4. 00 p e r c wt. to $ 42 .20 ' a nd b ee{ c a t t l e pr i ce s advancing f rom $ 48. 70 p e r cwt . to S50. 40 . The Georgia Prices Rec e ived Al l Co mmodities Index for Marc h 198 4 wa s 144. down fr om February's 146 b u t a b o v e the 1 2 6 f or last Ma r ch .
GFR- B4- Vo l . 7 U. S . PRICES RECEIVED INDEX UP 2 POINTS
The March All Farm Products Index o f
Pr i ce s Re ceive d b y f arme r s inc reased 2
po i n t s f r om February to 146 percent of
its
J a nuar y- Dec emb e r 197 7 av e rag e.
Hi g h e r pric e s f o r catt le, co r n . s o yb eans,
c o t t o n . and on i ons were par t i a l l y o f f s et
b y lowe r pri c es for eggs , mi lk . c e l e r y ,
ho g s a nd c a r r o t s . Th e I ndex was 12
points a bove a year ago .
PRICE S RECEI VED BY FARMERS MARCH 1 5 1984 WITH COMPARI SONS
Pri ce
Geor~ ia
Un i ted' St a tes
pe r
Mar .
Fe b .
Mar. 15 ,
Mar .
Feb .
Mar . 15,
Commodi t v
Uni t
198 3
19 84
19 84
1983
1 9 84
1984
Winte r Whea t
S/ Bu .
*
*
*
3 .71
3. 33
3 . 38
Oa t s
S/ Bu .
1. 49
1. 88
1. 79
Co rn
S/Bu .
3. 11
3 . 68
3. 70
2 .7 1
3 .1 1
3 . 25
Cot t on
Ct. /Lb . 58 . 2
66 .6
1/66 . 5
62 . 2
65 . 7 1/69. 3
Cot t on se ed Soybe a n s
S/ Ton S/Bu .
5. 90
186 . 00 7. 61
*
7 .81
*
5. 8 2
172. 00 7 .2 9
*
7. 65
Sweetpo ta toes
S/C wt .
8. 50 2/17 .60
17.60
9 .2 4 2/18 .60
19 . 00
Al l Hay , ba led 2 /
S/Ton
70 .10
81. 20
8 0 . 50
Hogs
S/C wt.
49. 50
44.00
42.20
50.40
45 .40
45.00
So ws
S/Cwt .
45.7 0
38 .50
38 .50
4 7 .40
4 2. 30
42. 40
Ba rrows & Gi lts
S/Cwt .
50 .10
44.90
42 .80
50. 80
4 5 . 90
45 .40
Be e f Ca t t l e 5/
S/ Cwt.
52 . 40
48 .70
50 . 40
59 . 70
59 . 70
61.40
Cows 6 /
S/ Cwt .
41 . 20
38 .90
42.40
42.7 0
39.70
4 1.80
St eer s & Heifers
S/Cwt .
59 .10
56.40
55. 80
63 . 20
64 .60
66 . 30
Ca l ve s
S/Cw t.
61. 50
57 . 10
58. 40
68 . 40
63 . 90
65 . 00
All Milk
S/Cw t .
14. 40
14 . 60 7 / 14. 40
13 . 60
13 .40 7/13.20
Turke ys 2/
Ct. /Lb .
33 .0
4 1. 3
41. 6
Ch icken s
Exc l uding Br o i l e r s Ct . / Lb . 14 . 5
2/29 .5
32 .0
Com' l Br o i l e rs ,8/ Ct . / Lb . 2 4 . 5
36 .5
7 / 36 .5
2 5.4
37 . 4 7/3 7 . 8
Eggs. Al l 9/
Ct. / Doz 74. 8 2 / 108 . 0
98. 3
58 . 2 2 / 92 . 9
79. 4
Tab le
Ct ./Doz 66 .3 2/ 95 . 5
83 .6
52 . 1 2/ 88 . 8
73 .5
Hatc h ing
Ct . /D o z . 10 5.0 2 / 150 .0
140. 0
1/ Fi r st half o f mon th . 2/ Mid-month pri c e . 3 / An imal s o l d f o r d a iry h e r d r epla c e me nt
o n l y . 4/ Pr ice s e st imated q u a r t e r l y . 5/ " Cows " a nd " s t e e r s and he i f e r s " combi ned wit h
a l l owance whe r e n e ce ssary fo r s l au g h t e r b u l l s . 6 / I nc l ud e s da iry cows s o ld for s la ug h t er .
7 / En t i r e mont h . 8 / Livewei gh t e q u iva l e n t pri ce f or Ge o rg i a . 9 / Av e r a ge of a ll e gg s s old
by f a rmer s i nc l ud i ng hatc h i ng e gg s s old a t r e t ai l . * I nsu ff ici en t s a l e s.
4
PRICES PAID INDEX UP 1 POINT FOR U. S.
CONSUMER PRICE INDEX
The Ind ex of Pri c e s Pa id by f a r me r s f or
c o mmo d i t i e s and s e rvi ces . in t e r es t ,
taxes, and far m wage rate s for Mar c h was
16 6
percent o f its 1977
ba se .
Contr ibuting most t o the 1 point i n c r e a s e
were h igher pr i ces f o r f er tilizer, feeder
li ves t o ck , far m machinery and fami l y
li v ing it em s . The ind ex wa s 7 po i n t s
highe r t ha n in March 198 3 .
The Febr uary unadj ust ed cons ume r p ri c e
index f or al l u rba n consume rs ( CP I-U ) at
3 0 6.6 ( 1967 - 100 ) was 0 .5 pe rcent hi ghe r
than in January and 4 . 6 percent a bove
Fe bruary 198 3 . On a s easonally adju sted
bas is, the CP I-U was 0 . 4 p e r c e nt a b ove
Januar y. The me dic a l car e index was up
0. 8 percent an d the food and beverages
i ndex was 0.6 percent highe r .
Th e
housin g and othe r good s and s e rv i c e s
i nde xe s bo th i nc r ea s ed 0 . 5 percent.
PRICE S PAID BY FARMERS . MARCH 15 198 4 WITH COMPARISO NS
Priee l---------G=e=o:rJl:l.>i ,a;=-------l-----~U~:n:..i:t:.e.:d~:::S..=t:a;=te=s-----
per
Mar . 15, Feb . I S, Ma r . 15, Mar. I S , Feb . I S, Mar. 15.
Commod i t y
Un i t
19 83
19 8 4
1984
1983
1984
198 4
Dai ry Feed 167.
S/Ton
178 . 00
20 5. 00
21 5 .00 17 5 .00
20 1 .00
19 9.00
Dair y Fe e d 18 7-
S / To n
186 .00
2 10 . 00
220 . 00 18 4 . 00
21 3.00
210. 00
Dairy Cone t . 32 7.
S/ Ton 22 5 .00
285 . 00
2 65 .00 26 4 . 00
286 .00
283. 00
Hog Fe ed 14 7.-18 7.
S/Cwt.
11. 00
12 . 50
12 .5 0
10. 30
11.80
11.80
Hog Co n e t . 38 7.- 4 21.
S/ Cwt .
14.50
16 . 50
17 . 00
14 .9 0
16.1 0
16 . 00
Bee f Cattle Co n e t .
32 i.-3 6 i.
S / Cwt .
12 .00
13 . 50
14 . 00
11 .70
13 .40
13 . 40
Co t ton s e ed Mea l 4 11. S/ Cwt .
13. 00
16. 50
16. 00
13 . 60
16. 00
15 .90
Soybean Meal 44 1.
S/Cwt .
13. 50
14 . 50
14 .50
13.2 0
14 . 80
14. 50
Bran
S/ Cwt.
11. 00
12.00
11. 00
9 . 73
10 . 80
10. 60
~i d dl i n g s
S/Cwt .
8.90
10 . 50
9. 90
9 . 29
10 . 30
10.20
Corn Mea l
S/Cw t .
8 . 20
10 . 00
10. 00
7. 42
8.8 3
8. 79
Bro i l e r Gr o wer
S/Ton 195 . 00
215 . 00
20 5 . 00 2 10 . 00
243 .00
2 42 .00
Layi ng Feed
S/To n 17 5.00
21 5 . 00
2 10 .00 18 9 . 00
2 17 . 00
214 .00
Ch i e k St a r t er
S/Ton 193 . 00
240 . 00
240. 00 212 . 00
243. 00
2 39 . 00
Br oi le r -Fe e d Ra t io 1/ Lbs .
2 .5
3. 4
3 .6
2 .4
3. 1
3. 1
Ho g- Corn Ra ti o 2/
Bu.
15 .9
12 . 0
11. 4
18 .6
14 .6
13 . 8
Mi l k -Feed Ra t io 31
Lbs .
1. 62
1 . 42
1. 34
1.55
1. 33
1 .33
Egg- Fe e d Ratio ~ I
Lb s.
8. 5
10 . 0
9.4
6.2
8.6
7. 4
1/ Pounds o f bro il er g rower e qu a l i n va l ue t o 1 l b . bro i l e r l i ve wei ght . 2 / Bu s h e l s of corn
e qu al in va l ue t o 10 0 Ibs . o f h o g live we i ght . 3/ Pound s o f 16% da i r y f eed equal in va l ue
to 1 lb . wh ol e milk . 41 Po un ds o f l a y i ng fee d equal i n value t o 1 do z . e gg s .
1977 -1 00 Geo rg i a
I NDEX NUMBERS--GEORGI A AND UNITED STATES
February 1983
Ma r c h 198 3
Fe brua rv 198 4
Pr i c e s Rec e ived
All Commo d i t i e s
1 25
Cr o p s
12 6
Lives t ock & Prod ucts
12 4
Unit ed States
126
146*
12 7
13 5*
125
1 55*
Pr ice s Received
132
13 4
144*
Price s Pa id II
159
15 9
16 5
Ratio 2/
83
84
87*
I/Mid-month ind e x i n c lud ing i n t e r e s t , taxes a nd f a rm wage ra tes. 21 Rat io o f
Pr i ces Re c e i ved t o I nd ex of Pri ces Pa i d, I n te r est, Taxe s and Farm Wage Rat es.
5
Mar ch 19 84
144 135 151
146 166
88 i ndex of
* Re vi sed.
Wee k En d i ng 198 3
Jan . 1 8
15
22 29
Feb. 5
12
19 26
Har. 5 12 19 26
Apr. 2 9
16
23 30
Hay
7
14
21
28
J une 4 11 18
25
July 2 9
16 23
30
Aug. 6 13 20 27
Sept . 3 10 17
24
Oct. I 8 15
22 29
Nov . 5 12 19 26
Dec . 3 10 17 24 31
TOTAL
Egg s Set
15,326 15,130 15,247 14,890 15,030
15,266 15 , 388 15,266 15,520
15, 636 15,611 15,538 14 , 80 1
15 ,53 2 15 , 393 15 ,530 15, 328 14,758
15 , 88 1 15, 265 15, 363 15 , 310
15,344 15 ,372 15,006 14,651
14,693 15, 440 14,664 15,112 14,841
1 5, 0 13 14 , 877 14 ,44 7 14 ,194
14 ,034 13,163 13, 05 6 14, 263
14,652 14,603 12 ,367 12,399 13 , 9 51
14,195 14 , 973 14 ,584 14 , 70 9
15 , 0 44 14,930 14 ,534 1 5 , 13 1 14 , 943
786,194
["0
Tota l Hatche d
12 . 6 65 12 ,411 12,736 12 , 73 5 12,550
12 , 760 12,260 12, 535 12,725
12 , 92 9 12,900 13, 115 13,2 0 8
13 , 193 13 ,100 12 , 53 6 12 , 902 12,7 98
13, 2 41 13 , 0 20 12,447 12 , 8 6 6
12 , 92 1 13 ,0 14 12, 973 13,049
13,007 12,85 7 12,235 11,862 12,722
12 ,339 12,474 11 , 9 2 5 11, 8 68
12 ,099 11 ,793 11 , 6 31 1 1 , 2 64
10,82 3 10,58 3 11 ,725 12 ,0 21 12,307
10 , 217 10,15 7 11,440 11,70 I
12 ,435 11,987 12,169 12,438 12 , 41 5
65 4, 083
12, 40 5 12, 21 1 12 , 4 74 12 , 469 12,323
12,52 3 11 , 990 12 , 236 12 , 459
12 , 688 12, 675 12 , 8 3 0 12,896
12 , 853 12,7 9 9 12 ,2 35 12, 592 12,563
12 ,994 12 , 76 1 12 ,13 1 12, 611
12, 6 60 12 , 6 75 12, 615 12, 7 18
12 , 769 12 ,71 6 11 ,985 11,620 12, 4 43
12 , 0 82 12,18 1 11 , 662 11, 607
11,824 11, 510 11 ,283 11, 075
10 , 543 10, 336 11, 480 11, 719 11, 989
9,989 9,980 11, 122 11,508
12 ,280 11,734 11 , 920 12 , 161 12,236
64 0, 140
8 77 77 3 864 8 86 8 59
929 872 80 7 9 19
873 9 47 944 92 9
1, 200 988 85 6 872 8 15
91 8 903 86 1 1, 000
1 , 0 99 8 46 908 900
951 1,0 16
8 91 6 19 1 , 131
8 29 833 78 6 8 46
725 915 746 666
890 7 18 717 683 681
6 69 9 13 798 73 4
8 45 94 1 780 800 930
45 .700
6
4 28 4 81 470 448
462 452 4 98 4 62
496 466 50 5 506 4 72
393 42 2 4 07 43 3
419 4 34 445 452
426 404 4 10 45 1 496
468 458 497 5 16
487 351 5 45 486
389 4 18 505 463 515
465 489 508 472
566 53 5 572 535 498
24,982
GFR-84-Vol. 7
12 , 7 75 12,467 12,856 12,802 12,735
13,024 12,381 12, 573 12 ,930
13 ,099 13, 170 13 ,2 7 6 13 ,36 3
13 ,55 7 13,32 1 12,586 12 ,958 12 ,906
13,519 13,2 42 12,585 13,178
13,340 13 ,087 13,078 13 ,166
13,294 13,328 12 , 466 11 ,788 13,078
12, 443 12,556 11,951 11,937
12, 062 12,074 11 , 48 4 11 ,255
1 1,04 4 10,636 11,692 11,939 12,155
10,193 10,404 11,412 11,770
12, 559 12, 140 12,128 12,426 12,668
660 , 856
Eggs Se t
629 7 51 475 66 1 536
579 5 99 48 9 3 41
359 3 94 393 469
625 489 44 4 5 24 349
530 634 557 829
843 869 540 765
534 839 443 609 509
467 472 714 650
715 606 565 58 4
867 771 213 398 587
583 870 562 678
884 79 7 1,071 1,036 969
32,666
e
Chic ks Pl aced
292 507 293 5 13 551
399 5 54 4 49 48 3
462 42 6 295 282
335 336 423 579 418
364 427 362 4 17
522 459 650 643
656 426 619 420 715
343 495 387 339
342 513 505 548
488 455 481 711 599
184 298 477 463
670 436 559 717 619
24 ,906
GEORGIA 1983 CASH RECEIPTS UP
Th e forecast estima te of 1983 Georgia c a s h rece ipts from producers sales o f a gr icu l t ura l products is 2 percent above 1982, exclud i ng government payments. This 1983 cash receipt estimate i s s l ight l y bel ow t he record h igh set i n 1981. Of th e commodit y groups, onl y p ou ltry and e ggs we r e at a re c o r d h igh l e v e l . Thi s moved t he l i v e stoc k produ c t s gr oup ing to a r ecor d h i gh but t he crops grou ping wa s wel l b eh i n d bot h 19 81 a n d 1982. Commodi t y g r oups a bove 1982 i n c a sh r ece i pt s include d dai ry prod uct s, pou l try a nd eggs , feed grain s, o i l crops a nd vegetable s . Pre limina ry 1983 c a sh re c e i p t s f r om the s a le of f a rm products includ ing g o v e r nme n t paym e nts t o fa r me r s wi ll be a va i l a bl e i n the fa l l of 1984 . Go v e r nment pavmen t s a re ex p e c t ed t o b e ab o v e 19 8 2 due-t o P I K a n d othe r com mod ity p r o gr a ms.
CASH RECEIPTS FROM FARMI NG, 1980 - 1983 1/
Comm od ~ty
Ge orgia
On~ted St at e s
Gr ou ps
1980
1 9 81
19 82
1983F
19 80
198 1
198 2
1983F
( 00 0 )
(000 )
Mea t Ani mal s
37 9
503
490
48 7
40 , 8 55 39, 779 40,963 . 40 , 149
Dai r y Produc t s
18 8
20 2
:WI
202
16 ,5 87 18 ,1 2 8 18 , 3 54 18,5 7 2
Po u lt ry [, Egg s
929
1, 020
953 1,0 51
8,949
9 ,676
9, 2 92 10 , 2 10
Misc e l l ane o u s
Li vestock
14
14
16
14
1, 404
1 ,6 19
1,589
1,337
Li vest ock [,
Produc t s
1 , 51 0
1 , 739
1 , 6 60
1 , 754
67,7 95 69 ,2 02 70, 198 70,268
Food Gr a i ns
63
145
160
12 3
10 ,386 11 ,616 1 1 , 516 9 ,908
Feed Gr a in s
133
130
10 4
13 9
18 ,318 17,14 7 18 , 2 2 6 17,14 5
Cotton
43
52
82
51
4,4 78
4,5 15
4, 884
4,845
To bac co
15 4
19 1
189
16 4
2,67 3
3 ,250
3,3 42
2 ,7 54
Oil Crops
48 8
668
651
66 6
15,49 7 13 , 8 6 8 13,82 6 13 ,36 6
Ve ge t a b l es
123
138
150
154
7,28 5
8.451
8,08 9
8 ,011
Fru its 6< Nuts
104
87
95
95
6 , 5 32
6,617
6, 6 69
6, 010
All Oth er Cro ps
III
11 7
11 9
119
7,537
7,607
7 ,801
7,634
Cro ps
1 ,219
1 ,5 28
1,550
1 , 511
72,706 73, 071 74, 3 53 69, 674
All Commodi ti es 2 ,729
3,267
3 , 210
3, 26 5
140,501 142,273 144 551 139 941
1/ Exclude s Government paym ents . F- Forecast, pr el i mi na r y cash receipt s wil f be avaifable
fall 1 98 4 .
u. S . CASH RECEIPTS TO RI SE IN 19 8 4 1 /
The USDA Ec o n o mic Research Se r vi c e pred ic t s t ha t cash recei pt s will advance 3 t o 5 pe r cen t in 19 84, fo ll OWi ng t h e s mal l dec line i n 19 8 3. The ri se wil l ma i n l y refl ect h igh er c o mmodity pri ce s . Crop rece ipts a re f or e c as t to ri se 5 t o 7 perc ent; a 5 to 7 pe r c e n t increase in pr ice s rece ived should outweigh a s l ight de c line in expect ed mar keting s . Assuming an abs e n ce o f we a t her ex t r e me s d ur i ng the growing s e ason , crop out put could rebound to n ear th e s t ron g 198 1 a n d 19 8 2 l e vel s. Such o ut p ut woul d li ke ly resu lt i n consi derab ly hi gh e r mar ke ting s du ri ng t h e last ha lf o f 198 4 t ha n a ye ar earlie r , and wo uld n e a rly offset the dro ught reduction i n first-hal f vo l ume.
Cu rren t p r o spe c t s i nd i c a t e that far m in-
c ome wi ll likel y b e more e v e n l y dist ri-
buted a mong commodity li n e s and regi ons
of t h e c o untry t han dur ing 1983 , when the
dr ough t
c aus ed
unusual
inc ome
d is parities.
Net far m i ncome, which
i n cludes c a s h a n d n on-c ash income a nd
e xp e ns es, is foreca st a t $ 31 to $ 3 6 bil -
l i o n , u p fr om the $2 0 to $2 2 b i llion
es ti mated f o r 1983 . Higher commoditv
pr i ces , delay ed disbur sements fr om the
198 3 PIK p rog r a m, and a g re a t e r va lue o f
c r op inv e n tories wi ll of fse t s teeper f arm
p r o ducti o n co sts . 1/ Eco n omi c Re sear ch
Se r vi c e .
7
Commo d i t y
Bu tter Ch eese, Na tu r a l Eg g s , Frozen Fr ui ts , Froze n Frui t Juices, Frozen Mea t s , Red
Bee f , Fr ozen Po rk , Fr o z e n Poult r y, Frozen Turkeys , Frozen Veg e t abl e s , Frozen Potatoes , Frozen Peanu ts , Sh el l e d Peanu t s , In Sh e ll Pecans , Shelled Pecan s , In Sh el l
COLD STORAGE STOCKS, UNITED STATES,
Feb . 29 ,
J a n. 3 1,
1983
19M 4
1 ,000 Po un d s
522,0 33
510 ,638
1, 088 , 186
1, 20 2 , 2 16
25 ,70 2
10,972
482,8 53
6 16, 46 7
1,380,238
1 ,088,224
576 ,269
692,899
307,045
338 , 014
215 ,823
295,1 14
312,637
2 76 ,6 4 6
187 , 68 8
16 1,4 67
1,64 5,5 8 7
1,676 ,2 98
879 ,8 90
754 ,803
380 ,700
309,582
53, 713
22,194
25, 269
22 , 0 54
94 ,767
94,5 69
F EBRUA RY 29, Feb . 29, 19 84
528 ,4 47 1,217 ,486
11, 734 53 6 , 68 9 1 ,309, 0 06 70 3 , 7 50 328, 268 311, 481 253 ,915 147, 05 9 1, 449,622 785 ,271 316,61 6
21,255 26,2 3 6 1 12 , 40 9
1984
Percent of
Feb. 1983
Jan. 1984
Pe r c e n t
101
103
112
10 1
46
10 7
111
87
95
120
122
102
10 7
97
14 4
106
81
92
78
91
88
86
89
104
83
102
40
96
104
119
119
119
en
Geor gia
~crop Reporting Service
Stephens Federal Bldg.
Suite 320
Athe ns. Geo rgia J 061 )
SECOND-CLASS POSTAGE PAID AT ATHENS, GA 30613
~4ZF01 1 3 OOa DJ l5 -22 7 J 75 020
404 /221 -1 329
00 340 5
., 4 EX P ~R IM~ NT S T ~
L l i'R.1 R Y
-:: X r' E R H, :: ~n
GA 3 02 12
GA-
' C EO RGIA
P, 400(,1
GEORGIA
PI
- - -- I ~ CROP
FARM
REPO
F:L
Jo,'8~/4-13
REPORT I NG SERVI CE
'"'1 REeEl V ED stephens Federal Bldg.
SUite 320
Apr I I 13 , 1984
2 I Iii \.
p
~
i)
t\
J_
?nOI:;
~. ~ v
Athens, Georgia 30613
Phone: ( 404 ) 546-2236
GFR-84 -Vofume 8
oocu v'i r.NrS
BIGHLICHrS
UGA LIBRARIES
Livestock Inventory & Value
Ga. Egg Production & I n c OIlIe
Cattle & Calf Prod., Disp. & Inco-e
Peanut Production
Ga . Br o iler I nCOBe & Production
Food & Agricultur e Council s
Ga . Pou.1try Cash Receipts
- GEORGI A LIV ESTOCK A~ D POULTRY I~VE~TORY VALUE S DROP SHAR PLY
Th e va lue o f li vestock (ex cl ud ing s heep and lambs ) and poult ry ( e xcluding c ommerc ial bro ilers) on Geor g i a f a r ms o n Jan ua ry I, 198 4 , was $6 70 . 7 mi ll i on , a dec rease o f 19 pe r cent f r om 19 8 3 . Hogs cont r ib uted most t o the d ecline with a 43 pe r c en t d r o p in t otal va l ue f r om the previous year .
U~ ITE D STATES I~VENTORY VALUES DROP 6 7.
The val ue o f al l lives t o ck and poult r y ( e x c l udi n g b ro i le r s ) on the Nat i o n ' s f a r ms o n J a nuary I, 19 8 4 , was $49. 8 bil l i on , 6 pe rcent l e ss t h a n a ye ar ago . Hog s were 3 2 perce n t below J a n u a r y 1 . 1983, a s the drop i n ave rage va l ue pe r hea d mo r e t ha n of fs e t the increas e in i nv e nt ory.
LIVESTOCK A~D PO ~LTR Y ISV ENTORY AND VALUE
NL~BE R OF F A R~ S , S L~B E R OS FAR~S ASD VALU E OF LIVE STOCK ASD POULTRY, J AS UARY 1 , 1982 , 1983 , 198 4
Xo . o f Farms 1/
Xo . on Fa r ms
Averag e Val ue
Tot a l Va lue
Spec i e
19 82
1983
1983
1 9 84
1983
1984
198 3
198 ..
Xumbe r
1 , 000 Head
Dolla rs
1 ,000 Dol l a r s
GEORGIA
Cat tle So Ca lv es
Hogs 2/
Chic kens 2/
Tu rk e y Breeder
Hen s 21
TOTA L
40,000 16 ,000
38, 000 14 ,600
1 , 875 1 , 40 0 28 ,5 64
58
1, 72 5 1 ,31 0 25, 525
60
3 4 5.00 89 .00 2 . 00
20 . 00
315 . 00 54 .50 2. 15
17 .00
646,875 12 4, 600
5 7, 128
1 , 160 829, 763
54 3 , 3 7 5 71, 395 54 ,8 79
1, 020 6 70,6 6 9
t:XITED STATES
1 , 00 0 Fa r ms
:-fill ion He a d
Do l l ars
Mi ll ion Dol la r s
Cattl e & Ca lves
1.6 11.0 1 , 5 8~>' 2
113.2
114 . 0 40 6 .00
396 .00 46,769 .2 45, 119.3
Hog s 2/
482 .2
466.4
53.9
55 . 8
90.00
58.90 4 ,852.9 3 ,288.8
Sheep
128.1
126.5
12 . 0
11. 4
51. 80
52.10
622.5
59 4.5
Chi ckens 2/
378 .6
364. 6
1. 85
1.96
701. 5
7 16 .2
Turk e y Br e ed e r
I Hen s 2/
I
TOTAL
3. 4
3 .2
14 . 60
17.59
50.1
55.5
52,996.2 49,7 74.3
1/ An ope rat ion is any place hav ing o ne or more of the spec ies on hand at any time during the
y ear . 2 / Number on far1ll5. averag e val u e and total va l ue , December 1 prev1o u. year .
i
Agricultural Statistician and Georgia Depart:.ent of Agriculture
GFR-84-Vol.B
~.S. CATTLE CASH RECEIPTS DECLI~E
During 1983 , lower cattle marketings and ~ower annual average prices for cattle led to a 4 percent decline in cash receipts froDl .198.. Fo r 198 3 , cash r e ce ip ts fr om the
s ale o f cattle and calves t o tal ed 528.7 bill ion compar e d wit h 529.9 bil li on i n 1982 .
All c a tt le ma rke t i n g s d ur i n g 198 ~ 53. 5 b i ll i on pounds in 1982. The 100 pounds l i ve weight was down 2 $61.70 was up 3 percen t .
.0 bil lion poun d s, d own 3 percent from pric e fo r c a t t l e at $55.50 per Th e ca l f pri c e f o r 198 3, a t
CATTLE: PRODCCTIO ~ A~ D I ~COME 198 2 - 198 3
Average Price
Val ue
Val ue o f
Pr oduct i on Ma r ket i n g s pe r 100 Pound s
of
Ca s h
Home
Cat tle Ca l ves Produc tion Rece ipts Consumpti on
--1,000 Po un ds --
--Dol1ars- -
- - 1,000 Dollar s--
Gro ss I n c o me
Ga . 19 82 1983
439, 680 417 ,870
505,130 525 , 920
46.00 46. 00
53 . 10 54. 60
2 12 ,1 59 203 , 729
242 ,359 25 4 ,4 10
4, 788 5, 58 0
24 7 ,14 7 259,990
u. s .
198 2 1 9 83
--Mil l ion Po un ds --
40 , 972 . 5 40,383.7
53,459 .3 5 1 , 98 4 .5
56. 70 55.50
59 .80 61 . 70
22 , i 61 . 2 22,073 .7
--- - Mi IIi o n Do1lars----
29 ,906. 2 28,693.9
57 6 .0 55 4.0
30 , 482 . 1 29,2 48.0
u . S. HOG AND PIG CASH RECE IPTS DOWN 8 PERCENT
Cas h r e c e i p t s fo r ho g s and pi g s wa s 5 9 .71 billion d u r ing 1983 , an 8 pe rc en t decline f r om the 198 2 reco rd high l e v e l . Ma r k e t i n g s of 20. 7 b il li o n pound s du rin g 19 8 3 were 3 pe rc e n t more th a n i n 198 2. The i n c r e a s e d mar k et i ngs were more than o f f s e t by a dec l ine i n the u. S. annual a ve r a g e p r i c e per 10 0 pounds o f li ve weight f rom 552.30 i n 198 2 to $ 4 6 . 8 0 i n 19 8 3 .
HOGS : P RO DUCT I O~ AND INCOME 1982-198 3
Value
Va l ue o f
Produ c t io n Market i ngs Ave ra g e Pri c e
of
Ca sh
Ho me
pe r 10 0 Pounds Pr od u c t i on Receipts Cons umpti on
- - 1 , 000 Pounds--
-- Oolla rs - -
- - - 1 , 0 0 0 Ooll a r s ---
Gross I n c ome
Ga. 19 8 2 198 3
469 ,130 47 3,5 8 6
476 , 660 47 8, 21 8
51.90 45.90
2 41 , 0 2 5 21 4 ,8 48
24 7 ,4 83 219 , 602
7, 640 5 , 06 7
15 5 , 123 224,6 69
U.S . 198 2 19 8 3
--Mi l l ion Pound s--
- - - Mill i on Dol1 ar s -- -
19,446 .3 2 1,000 .4
20 ,0 16. 4 20,68 1. 7
52. 30 46. 80
10 ,186.2 9,808 . 4
10 , 586. 5 9 , 714 .1
177. 9 116 .7
The Goorq l o For.. Report (I SSN-0 744- 7280l Is pub llsl>ed ...1-/lIOnth l y by t he Georgl o Crop Repo rting Servi ce , St ephens Federol Buil d ing, Athens, Go. 30613, L. rry E. Sni pes, Stottstlcl.n In Ch.rge . Seco nd c los s oostoge po ld ot At hens, GA . SUbscription f.... S10 per yo.r except fr ee to det. cont ri but or s . Subscription In/orme t lon ovollobl e frOOl : Geo rgl o Crop Ropor tlng Se r v ice , St ..phens Foderol Build i ng, Su ite 320, At hens GA . 3061 3 Telephone : (404) 546- 2236.
2
10 , 7 64 . 3 9 , 830. 8
GEORGIA COMMERCIAL BROILER INCOME RECORD HIGH
Gross income earned by Georgia's commercial broiler producers totaled $676.7 mil lion in 1983. This was 11 percen t above 1982 a nd 7 percent greater than t he previous r ecord high gross income set in 1981.
Numbe r of broilers at 626.6 million wa s al s o a record h i gh . Numbers produced t o t a l e d 610. 7 mi l li o n in 1982 and 614 .7 mi l l i o n i n 198 1 .
Price per pound averaged 27.0 cents for 1983 which equaled the record high price set in 1980. In 1982 price per pound averaged 25 .0 cents and 26.5 cents in 1981 .
Per C8plta ConeumptkJn of Poultry,' U.s.
Pounda of poullty 7ll
50
1o1 11110 n
o
1971 73
75
77
81
PRODUCTION &GROSS INCOME OF GEORGIA BROILERS
SELECTED YEARS 1960-1983 11
- - Year
800-
Value WOOl
- - - Number
WOO l
1960 171.206 320.250
111111111111111 VIII ue , Do llars r<tlW:i\t~ Number Bro ilers
1970
196.987 453.886
1980 588.820 573 . 899
198 1 635 .279 6 14.687
1982 6 10.735 610.735
600- 1983 616.675 626.551
~~~
~
~~\;.I~
40 0 -
~
X~
200-
t,~,~~
N
~
~,
:\\
'---
~
.\
,~
(
~~. -~<\...
~t"~~
'*~.~r~.\.,
"~.-..r
~~\,~'
~\~j,
l~
~.;
'\ ~\
~{ \ ."
.~1!: ','f;r\,.
~~
({.,~
)
~i
~~.
~~
~~.)~,.
'~f'!
~,'".t\''
('.~t'.
\.
r .' \
1,\";.'1;:'\.
f~\~~
~~ '~,'
-. '
1960
1970
1980
1981
2! The production yellr Is December I through November 30.
~ :.;.;:':
r~ f1
"/
\ 1'
;-t
t'\)'
\\~
'.,~.\..
~~.,
KJ~:
~",If\(.
~~~,~.,' .-
r.fr~\,'
~~~
1982
~...'.\ ~
...,.-.',..,\..":~
. .
. ~~
'"I~.,.,
~..\I':.
", ,')l
"". ~A~
~~' \ '
:;.: \~
-'' '\.~v.:
\'t,
i\ \ .
~-;;;:
, 1\
I ~ .'"
:~~~
-\."f..\
:.:J\
1983
3
83
Million - 800
-600
- 400
-200
POULTRY INCOME UP IN 1983
Georgia's gross income from poultry including commercial broilers, eggs and turkeys in 1983 totaled $995.7 million. This was $45.2 million more than 1982 but $24.9 million less than the record high established in 1981. Income from the sale of commercial broilers and chickens was above 1982. but decreases were registered for eggs and turkeys.
GFR-84-Vol.8
Georgia _intained its rank as the second leading commercial broiler producing State, exceeded only by Arkansas. Only California ranked ahead of Georgia in income earned from the sale of eggs. However, Georgia maintained the title of the leading poultry State, ranking number one in the combined income from all chickens, broi lers and eggs.
GEORGIA POULTRY PRODUCTION AND INCOME BY YEARS, 1978-1983 1/
Commercial Broilers
1978
531,889
2,021.178
26.0
525,506
1979
561,268
2,132.818
26.0
554,533
1980
573,899
2,180 ,816
27.0
588.820
1981
614,687
2.397,279
26 .~
635,279
1982
610.735
2,442.940
25.0
610,735
1983
626.~~1
2.506 .204
27.0
676,675
Hatching Egg Flocks
1978
4.801
36,968
20.8
7,689
7.738
1979
7,680
59.904
19.4
11 .621
11 ,674
1980
7,500
57,550
15.1
8,692
8 .735
1981
9 ,297
66,915
15.0
10.002
10,047
1982
7,934
62.904
14.4
9.071
9,218
1983
7. 112
55,900
19.5
10.901
11,107
Other Flocks
1978
15,107
56,600
10.0
5,785
5.981
1979
16 .320
60,096
12.6
7,579
7,806
1980
16 .000
57,600
8.9
5,126
5.293
1981
13 .000
46,800
9.0
4,212
4.397
1982
13.509
50,744
9.0
4,567
4.641
1983
10 .893
41,327
11.3
4,655
4.743
All Chickens Including
Commercial Broilers
1978
551.797
2,11 4, 746
539,225
1979
585,268
2,252 ,818
574,013
1980
597,399
2,295,966
602.848
1981
636.984
2.5 10.994
649.723
1982
623.178
2.556.588
624,594
1983
644,556
2.603,431
692,525
Turkeys
1978
1.799
41,197
39.6
16,314
1979
2.516
61 ,894
40.0
24,758
1980
2.380
54,502
42.0
22.891
1981
2,734
65 ,343
39.0
25.484
1982
2.680
62, 176
41.0
25.492
1983
2,266
60,276
40.0
24.110
All Poultry Including
Broilers, Eggs, Chickens
and Turkeys
1978
839.111
1979
934 ,984
1980
929 ,667
1981
1,020.~78
1982
950,5 26*
198 3
99~,728
17 The produc tion ye ar begin s Dec e mber 1 p r ev iou s year a n d end s November 30 current
year, except tu rkey s ba sed o n Se pt e mber 1 th r o ugh Augus t 3 1 h a t c h. 2/ Number and
po 4/
unds I ncl
produced ude s home
for broiler s consumption
.
and*
tur keys. Revised.
3/ Li vewe i gh t equ i va l e n t pr i c e .
4
GEORGIA EGG PRODUCTION AND INCOME DOWN
Nu.ber of eggs produced in Georgia totaled 4,671 .illion, 13 percent less than the 5,36~ .illion in 1982. Value of egg production was $279.1 million, down 7 percent from 1982 . In 1983 eggs averaged 71.7 cent. per dozen, 4.~ cents .are than in 1982.
Year
Hatching Eggs 1978 1979 1980 1981 1982 1983
Other Eggs 21 1978 1979 1980 1981 1982 1983
All Eggs 1978 1979 1980 1981 1982 1983
GEORGIA EGG PRODUCTION AND INCOME BY YEARS, 1978-1983 11
Average
Egg.
NU1llber
per
Eggs
E~8s Sold
LaOers
Layer
Produced
Comm.
atching
All
I , 00
No.
Millions
----Millions
4,210
228
961
4,967
222
1,105
5,318
222
1,178
5,348
223
1,195
5,435
224
1,219
5,080
226
1,146
57
903
960
66
1,039
1,105
71
1,106
1,177
72
1,123
1,19~
85
1,133
1,218
69
1,077
1 ,146
19,602
240
4,701
4,695
20,100
247
4,962
4,955
17,8~2
250
4,459
4,453
17,407
252
4,383
4,377
16,671
249
4,146
4,141
14,143
249
3,525
3,519
4,695 4,955
",453 4,377 4 ,141 3,519
23,813
238
5,662
4,752
903
5,655
25",067
242
6,067
5,021
1 ,039
6,060
23,170
243
5,637
4,524
1,106
5 ,630
22,755
245
5 ,578
4,449
1,123
5,572
22,106
243
5,365
4,226
1,133
5,359
19,223
243
4,671
3,588
1,077
4,665
Price per Dozen
Com..
Hatch.
All
---Cents---
Hatching Eggs
1978
50.8 109.1
2,411
82,098
84,509
1979
57.0 112.4
3,135 97,320 100,455
1980 1981 "
53.0 59.8
112.4 131.8
3,138
3,~86
103.~95
123.358
106.733 126,944
1982
~5.2
111.8
3,910 105,558 109.468
1983
60.6
108.7
3,485 97,558 101 .043
Other Eggs 21
1978
50.8
198 .712
198 ,712
1979
57.0
235,370
235,370
1980
53.0
196 .818
196,818
1981
~9.8
218,056
218 .056
1982
55.2
190,636
190,636
1983
60.6
177 ,691
177 , 6 91
All Eggs
1978
50.8
109.1
60.1
201,123 82,098 283, 22 1 283.572
1979
57.0
112.4
66 .5
238,505
97,320 33~,825 336 .213
1980
53.0
112 . 4
64. 7
199 , 956 103.595 303 .551 303 ,928
1981
59.8
131. 8
74.3
221,642 123,358 345,000 345 ,372
1982
55.2
111. 8
67 .2
194,546 1 0 5. 5 ~ 8 300,104 300 . 440
1983
60.6
108.7
71 .7
181.176 97,558 278 ,734 279,093
II The production year begins December I pr eVious year and ends November 30 current
ye a r . 21 Includes both commercial and f a r m flocks- -eggs pr incipally for human con-
sumption. 31 Includes home consumption .
5
GFR-84-Vol.a
19 STATES BROILER PRODUCTION UP
In 19 selec t ed States, which produc ed 96 pe rcen t o f the Na ti o n' s broilers, prod u ct i o n wa s 4 .04 b illion b ir ds d ur i ng t he ma r k et i n g y e ar December I, 19 8 2 -No v e mb e r 3D , 19 8 3 , u p 1 percent from t he 4 . 0 0 billion produced the previous vear . Va l ue of produ ct ion, a t $ 4.70 b i l l ion , was up 8 percent from t h e $4 .34 bil lion i n 19 8 2 . The 19 States produced 16 .4 billion po u n d s of broilers in 1983, c o mpared wi th 16 . 2 billion pound s a year ear l i er .
U. S. VALCE OF BROILER PRODUCTION UP 8 4
The value of production for broilers, a r eco r d h igh of $4.87 b ill ion , was up 8 pe rc en t f r om t he $4.51 b ill ion i n 198 2 and 4 percen t a bove 198 1 . To t a l number o f broi l e r s prod uc e d in 198 3 was 4.1 8 b i l lio n b i rds , up 1 pe rcent f rom 1982. Pri ces i n 1983 a ve r a g e d 28.6 cents per pound on a live weigh t equ ivalent bas is, c o mp a r e d with 26 .9 cents p er pound in 1982 and 28.5 in 1981.
3ROILERS : ? ROOt:CTTO); A);O VALt:E 19 WEEKLY STATES A);O OTHER STATES 198 -198 3 11
Dec. 1 1981 -Sov . 30 1982
Dec.
1982 -l'ov. 30 1983
Price Val ue
Pric e
Value
Numb e r
Po u nds
per
of
Numbe r
Po un ds
per
of
State
Pr oduced Produced Pound Produc t i on Prod uced Pr odu c e d Po und Pr oduc ti on
21
31
21
31
Ala . Ark . Ca l i f . Del.
Thousands
50 0 ,23 2 1 , 9 50 , 90 5
668, 49 7 2 , 4 7 3 , 439
167 , 400
786 , 780
177 .799
817.87 5
Ce nt s 25.0 27. 0 33.0 30 . 0
1 , 000 Doll ars
487 , 7 26 66 7 ,829 259, 637 24 5 , 3 6 3
Th ousands
5 15,7 29 2,011,3 43
6 73 ,136 2, 55 7 ,917
17 1 ,6 22
789 ,46 1
18 1 , 86 2
872,938
Cents 27 .5 28. 5 32. 0 31.0
1,000 Dollars
553, 119 72 9, 0 06 2 52, 62 8 270 , 6 11
Fl a . Ga. :-rd . Mis s.
97, 24 6 61 0,7 3 5 26 7, 17 4 298 ,587
3 98,7 0 9 2, 442,940 1, 095, 413 1,224 ,20 7
25. 0 25 . 0 30. 0 27 .5
99 , 677 6 10 , 735 328 ,624 336 ,65 7
97 , 378 626,55 1 260, 47 7 316 , 30 4
389,5 12 2,506,20 4 1,067,956 1,265,216
27. 5 27 .0 31. 0 29.5
107, 116 676 .675 331, 066 373 , 239
~.C.
Or eg. Pa. 41 S .C .
4 18 , 6 20 16,000
11 4 ,889 47 ,97 3
1, 758,20 4 72 ,000
471,045 182, 29 7
24. 0 34 . 5 27 .0 25. 5
421 ,969 2 4 , 8 40
12 7 , 182 46 ,486
41 9 ,74 0 13 ,000
1 0 2 , 6 42 52, 167
1 , 80lo , 8 8 2 58 , 500
420 , 832 193 , 0 18
27 .0 35 . 5 28 . 0 27 .5
lo87 ,318 20 , 768
11 7 ,833 53, 080
7ex . Va . lJa s h . 1.'. Va.
222 , 500 140 ,072
21 , 805 26, 140
890 , 000 588,30 2
93 ,7 6 2 9 4 , 10 4
29. 0 25. 5 32. 5 28 .5
258, 10 0 150,017
30 , 47 3 26,820
212 ,600 144,041
20 ,500 28,5 94
87 1,660 6 19, 376
90,2 0 0 105 ,7 98
30. 0 27 . 5 33.0 32. 0
2 6 1, 4 98 170 , 32 8
29 , 766 33, 855
Othe r St a t es 51
3 55 ,60 6
1, ':'29,989
26.8
383,':'':'4 3 47,3 17 1 , 4 13 , 18 6 28 . 6
404 ,800
To tal
4, 15 1 , 27 5 16 ,769,9 71 26. 9 4 ,5 0 5 , 57 9 4 ,1 8 3 , 6 60 17 , 0 3 7 , 9 9 9 28. 6 4,872, 70 6
19 IJkl y .
Sts . 61 4,00 1 ,5 52 16 , 15 4,82 1 2 6 .9 4 ,3 3 9 ,07 8 4 , 0 3 6 , 48 1 16, 428,21 5 28 .6 4 , 6 97 ,2 29
11 Bro i l er p roduction i nc ludi ng o th e r me at-t yp e br e e ds . 21 Livewe ight e q u i va len t pri c e . 31 Gr o ss i nc o me i nc ludi ng home c on sum pti on. 41 Includ ed a r e br o i lers dest royed due to the ou t b r e a k o f Avian inf luenza in 1983 . 51 Exclud es sta tes pr od u c ing less th an 500 , 000 b ird s
and i nclude s broi lers destroyed due to the outbreak of Avian influe n za in 1983. 61 19
st ate s i n th e weekl y est imating prog r am : AL,AR , CA, DE , F L , G A, LA, MD,M S , :-rO ,N C , O R, P A, S C ,T~ ,TX , VA,IJA,IJV.
6
GA. PEANUTS INCREASED 3 PERCENT IN 19 83
Pe a nu t product ion i n the Nation's top pe a nut producing state i ncre a s e d bv 3 per c en t last year . Georgia's t otal peanut production climbed to 1.57 billion pounds i n 1983 , an expans ion of 3 percent o ve r the 1 . 52 bill ion pound c rop i n 1982 . All of th e i n c r e a s e c ame f r o m a c r e a g e ex pan si o n , whi ch jumped 19 percen t . Peanut plantings in 1983 utilized 567,000 acr es o f Ge o r gi a ' s cropl and, com pa red with 47 5 , 0 0 0 i n 1982 . Th e a creage i nc re a s e mor e than o f f s e t a shar p de cline in yield which a ve r a ge d 2 , 790 pound s per ac re, 42 5 pounds pe r acre l e s s t h a n the g o o d 198 2 cr o p yiel d o f 3 , 21 5.
U. S. PEANul OUTPul OFF 4 PERCENT
The u.S. peanut crop t o t a l ed 3.30 billi on pounds in 1983, o f f 4 per cent f rom the 1982 crop of 3.44 b illion pounds. All of the decl ine is attributable to we a k e r y ields in 1983 , which ave rag ed 2 .399 pounds per acre. Th i s c o mpa r e d with t h e record-high 1982 y ield of 2,696 pounds pe r ac re , a drop of 11 per c e nt.
Produc t ion decl ine s we r e v ery signific ant
in Al abama, No r t h and Sou th Ca ro l ina , and
Virgin i a.
Nationally , the ac reage
p l an t ed to p eanu t s to ta l ed 1 .41 mi ll i on ,
up 8 pe rcent f rom t he 1 . 3 1 million a c res
plant ed in 1982.
Sta te
Al aba ma Florida Georgia Ne w Mexico ~o r t h Carolina Oklahoma South Carolina Texas Virginia
Un i t e d St ates
Al a b a ma F lorida Georgia New Me x i c o ;-.lort h Ca rolina Ok lahoma South Caro li na Te xa s Vi r g i n i a
l1n i t e d Sta tes
Alabama Flor ida Ge o r gi a Ne w Mexi c o ;';o r t h Carol ina Ok lahoma Sou th Carolina Texa s Vi rg i n i a
Cni t e d States
PEANl1TS
Area Planted
1982
1983
1,000 Acres
17 9 .0
182 .0
59.0
6 9.0
475.0
567 .0
10.4
11.0
150 .0
150.0
88 .0
93 .0
12 .0
13 .0
240 .0
230 .0
96 .0
96.0
Area Harvested
1982
1983
177.0 51.0
47 2 . 0 10 .4
147.0 8 6. 0 12 .0
225.0 95.0
18 0 .0 60.0
562.0 11.0
147 .0 91.0 12.5
215.0 95.0
1,309.4
1 ,411.0
1 , 27 5 . 4
1,373 .5
Yield
Pounds
2, 95 0
2,525
3 , 000
2,7 80
3,215
2,7 90
2 ,425
2,330
2 ,825
2,1 65
2, 030
1,940
2,500
2,000
1 ,4 45
1 ,685
2,900
2,090
Producti on
1 , 00 0 Pounds
522,150
454 , 500
153,000
16 6 , 8 0 0
1,517 ,480
1,567,980
25,220
25 ,630
4 15, 275
31 8,255
174,5 80
176 ,5 40
30, 000
25,000
325 , 125
362 ,2 75
275,5 00
19 8 , 5 50
2, 696
2 ,399
3 ,438 , 330
3,295,530
Price per Pound
Cents
2 4. 7
24 . 0
2 4 .0
24 .4
24. 6
23 .1
30 . 2
29 .2
27.1
24.7
23.4
26.3
27.1
25.0
25.6
24. 6
25. 7
26.7
Value of Pr oduc t i on
Dol lars
128 , 97 1
10 9, 080
36,720
40 ,699
373,300
362 ,203
7,616
7,484
112,540
78 , 609
40 , 8 52
4 6,4 3 0
8 ,130
6,250
83,232
89,120
70,804
53 , 013
25.1
24.1 7
862,165
792,888
G
DE " ARTMENT 0" AG"ICULTU" E
cw orP1CC T.... 8"1tC1'AII'T
WAe HINnlll. II. Colono
~
Spedal laue
..-y"'" TheN _ h te R>OO I AQRICUl.TVRI!
COUNC\l.S (P'AC8) In
end
. . . Ie a local FAC In a l - ' ell countIM.
The llete FAC8 _ c:ompoeed of ....,.,. of U.I. DepeI1menl of Agric:ufture ~ In the SteIN; the local FAC8 _ compoeed of USDA egency IMdere In .,. counlleL
Tah_e aFAeCn8docooounnftlIMMte10UhSeDlpAmKetlIlvettUJMSDIAn
pog __ ..mclent and man
...poM to Iocel people and local condltIonL
FACTS IF~CC F.J" (1_ -1__1-
Arl<-'- eo.dIJ
The FAC8 ere open 10 lcSua, augg.alloM, Of concerna Irom any ctttz.l Of group.
The FAC8 he lp the Sectetary of Agrlcultu,. and S _ GovemonI kMp
Informed ebout the COMOfN of local
peop le for lhe purpoM of Improvlng'
-
USDA progrema.
The ' ACa a,. ccmmilled 10 advancInllthe
apeelal goala of the Department 'If
-
Agrlcultun, auch aa :
,
- BeIng prwpe red 10 . .alI I In food end
egrlcultu,. ..-getlClM.
Informi ng _ Amaricana aut .,.
nalu,. of U.S. egrlcultura end Ita c:ontrtbutlon to the hN/lh end IIlMM of peopIL
~tering and IINIelIftg nnI
deve lopmenl to _
queL'ty In nnI
Ule and ~ In.,. nnl - - ,.
Acfyenclng -.ld ........ _ _ conMrntJon end _ ~ coonSlnelecl action willi ... ~ MClor, ~ IIIl1MernrnerI, end
other orvenbatIona.
eom.ct -.,y IoaIII .. ~ oflIoe III __
USDA ~ lot __ 1ntonMIIol.
~1ervtDe
Ex-.Ion IervtDe
Sol Coi_ NIIon . . . .
Food end NolCrlIoolIervtDe
EconomIc "--dI . . . .
~ ....... 1ervtDe
F.".,. Home AIMIIl . . .
Aa.nrI&icb"'CEla .Ada,
,
Food lletety end InepedIon IervtDe
,..... Crcp" -CorpcInIIIn
81.........,.,.., AnInwI end .............. ~ IervtDe
AgrIcuIIanI
Coi_1AiIIIIoIt IervtDe
The FAC8 wort! wtth S_ and tcx.I ofIIcIel.. _ I t y Otpnlzatlone, lnete
deper1, te of egrlculture. other llate egenc: end wtlIl other ,....., ~
on food end egrk:&l!tln rnetten.
- En ourtng lhat e ll larm end .-.nch operalora a,. . . .,. of USDA programa a nd how they wort!.
co
Georgia
~crop Reporting Service
Stephens Federal Bldg.
Suite 320 Athens, Georgia J 061 J
SECOND- CLASS POSTAGE PAID AT ATHENS , GA 30613
9 4 2FO l 1 3 OOJ OO 2 5- 2 2 7 0 750 2 0
40 4 /2 2 9-1 8 29
J O H40 5
E X0 ERIr''1 f. rH S T A
lI 3R.\R .
t X:;.1 E :: I ": E\J T
G.n. 3021 2
~.
GEORGIA
FARM EPO
Gf\
AI../DO (,1
PI
F2. I q'84/'-1-;)/0
GEORGIA CROP REPO RTIN G SERVIC E
hens Federal Bldg.
Apr I I 26, 1984
S
.. e 320
1 ns , Georgia 30613 ne : (404) 546-2236
GFR- 84- Vo l ume 9
EGEIVED
HIGHLIGHTS
Grain Stocks
Poultry ~ry
0 hi 1 rnj ~"!', .ni'J, --I fl (~.~ I Jh
Cattle on Feed Co1d Storage
Li.vestock S1augbter
Crop Progress
H:l.1k Production
GEORGIA SOYBEAN STOCKS DOWN 3 6 %, CORN DOWN 3 47.
So ybe a n s t o cks in a l l po si tion s on Apr i l
I, 1984 in Geor g i a to ta l e d 15 ,617 ,000
bu s he l s , 36 pe rcen t l e s s than the
24,525 ,00 0 bu she l s on hand Apri l I, 1983.
Al l of t h e decrea s e came fr om s o ybea ns
stored o n fa rm s at 2 ,1 0 0,000 b us he l s ,
c ompa r e d t o 1 1,4 75,00 0 bus h e l s on farms
l a st ye a r .
Of f - f arm s toc k s tota l e d
13 ,5 17,000 bu s hel, up 4 percent f r o a
ye ar ago .
Stocks of corn stored in a ll positions totaled 18,528 ,000 bushels, 34 percent less than a year ago. Corn on farms amounted to 11,576,000, down 46 percent from last year, while off-farm stored corn increased 4 percent to 6,952,000 bushels.
St o c ks of wh e a t i n a ll pos i ti ons total e d 3, 49 5, 000 bu s hel s , d own 15 pe r c ent from the 4,1 13 , 000 a year e arl ier. Whea t st ored o n f a r ms to t a l ed 1 , 499,000 bus hel s , down 3 2 p e rce n t b u t o f f - f a r m s tock s a mo u n t e d t o 1, 996 ,00 0 b u she ls , an i ncrea s e of 4 perc ent .
Gr a i n s org h um st o r ed in a ll position s t o t a led 6 98 ,000 bushels , 44 percen t l e s s than last year . Of f far storage at 669 ,00 0 b u shel s wa s 4 4 per cent be low l a s t 1 yea r . Sorghum s to r ed o n - farms s howed a dro p of 41 percent f rom 49,000 bu s h e l s a year ago to 29 ,000 bushels this year. Oats stored in a ll positions tot aled '7 11 , 0 0 0 bushels, down 48 percent from the 1,371,000 bushels last year.
GEORGIA GRAIN STOCKS--APRIL 1~ 1984 WITH COMPARISONS
Grain
1983
1984
1983
1984
1983
1,000 Bushels -
Corn
21,475 11,576
6,660
6,952
28,135 18,528
Oats
714
519
657
192
1,371
711
Barley Wheat
*
2,198
*
1, 499
*
1,915
*
1,996
*
4,113
*
3,495
Sorghum
1 , 19 1
669
49
29
1,240
698
Soybeans
11,475
2, 100
13,050 13,517
24 525 15,617
T7 Includes stocks at mills, elevators, warehouses, terminals ana processors.
* ~ot published to avoid disclosing individual operations.
Agricultural Statistician and Georg:l.a D1epart.ent of Agricul.ture
u. s . CORN AND SOYBEAN STOCKS DOWN SHARPLY
Corn st o r e d i n a ll positi on s on April
I,
1984 is es timated a t 3 . 26 bi llion
bushels , 48 per cen t less t han las t year !s .
rec o r d high 6 .2 ~ bill ion bu she ls. Of t he
tot al corn on hand Apri l I, 1984, 6
pe rcent, or 1. 94 bil lion bushels was
s t o r e d on fa r ms. This is 55 perc ent less
than t he April 1 f a r m s t ocks a ye a r ago.
~f f-farm sto c ks , at 1.31 bi l l ion b ushe ls,
we re d own 3 3 perc ent f r om l as t yea r' s
l evel.
GFR-84-Vol . 9 off 13 perce n t f r o a year a g o . ' Off-fa~m stocks, a t 981 mi l l i o n bushels, we r e d own
r percent f r om April 1 l ast y ear .
Soybeans i n all po s i t ion s on April I , 198 4 to t a l e d 7~3 mi ll io n b us hel s, down 36 per c e nt f rom Apri l 1 a year ago and 28 p e rce n t less t han Apr il I , 19 8 2 . Fa r m st ocks o f 33 9 mil li on bu shels , were 50
pe r c e nt bel ow Apr i l I , 19 83 . Off-f a r m
st o c k s t otaled 414 mi l l ion bushe ls , down 18 p e r c e n t f r o m Apri l 1 a y ear e a r l i e r .
Al l wheat s t o re d in a l l positions on April I , 1984 totaled 1.75 bil l i o n bushels , 7 perc en t less t ha n l a s t year ' s r e c or d hi gh 1.88 bi l l i on bushe l s . Farm s t o c ks amo u nt e d to 77 2 mi l l i o n bu s h e l s,
St o ck s of othe r gr ain s wer e: Gr a i n s or ghum 4 6 5 mil l ion b u s h e l s , down 2 5 pe r c e n t ; o a ts 26 9 mi l li on .b u s h e l s , d own 19 percent ; and barl e y 273 mil lion bushel s, down 8 pe r c e nt f r o m a yea r a go .
u. s. GRAI N STOCKS- - APRIL I, 19 B4 WITH COMPAR I SONS
Grain
Corn Oa ts 3arle v Wheat' Sorghum So vbe a n s
1/ Includes
2/ Ap r i I I, i nd icates a
1 ,000 Bu she l s
4 ,2 9 2
1,944
1, 955
1, 31 4
6, 247
3,258
274
2 27
60
42
3 34
269
198
174
98
10 0
297
273
BB6
772
991
9B 1
1 ,B 77
1 ,753
149
B7
471
378
62 0
465
674
339
50 3
4 14
1 ,177
2/753
s tock s a t mi l l s , e l e v a t o r s, wareho u s es, t erminals a n d p r o ce s sors.
19 B4 soy b e an s t o c k s e s tima te com pa r e d wit h Septemb er - Marc h usage
la rge r th a n nor ma l imb~lance .
COLD 'STORAGE STOCKS, UNITED STATES , MARCH 3 1 ,
Ma r . 31,
F eb. 29 ,
Mar . 3 1 ,
C01llJllOd i t y
198 3
19 84
1984
1. 00 0 Po unds
But t er
52 9 .050
532, 499
~27 . 1 42
Chee.e, Natu ra l
1 , 117, 892
1,21 9, 808
1 . 220, 8 15
Eggs, Frozen
23 , 076
11 ,3 6 1
11, 907
FrUi ts, Fro z en
430 ,269
534, ~ 1l
478 ,349
Fruit Jui ce., Fr ozen 1,326. 00 5
1, 3 0 9, 8~2
1 ,386,~51
Meat s, Red
~86 .3 44
70 7.66 5
736,50 5
Be e f , Fro zen
299, 075
332, 460
326,888
Por k, Fr o z e n
234. 744
3 1 1 , 70~
348,456
Po ultry , Fro z e n
32 5 .7 17
2~ O, 746
259. 831
Tur ke y. , Fro zen
185 , 328
145, 767
14 9 , 39 8
Ve g e t a bl e , Fro z e n
1 , 439 . 141
1 ,4 64 , 7~7
1,306,1 02
Po ta toe . , Froz en
911, 88 9
783 , 90 5
827 ,780
Pe anut s, Sh e lled
399.398
316.5 65
332, 88 1
Pe a nu t s, In Shell
~8 .099
2 1 , 25 ~
2 4. ~ 3 ~
Pe c a n s , Shelled
29 . 753
26 , 537
30. 696
Peca n I n She l l
8 2, 2 67
11 5 , 40 9
11 7 , 923
2
1984
Percent of
Ma r . 1983 Feb . 1984
Pe r cent
100
99
10 9
100
52
105
I II
89
10 5
10 6
126
10 4
109
98
148
11 2
80
10 4
81
10 2
91
89
91
10 6
83
1 0~
42
115
103
1 16
143
102
GEORGIA EGG PRODUCTION DOWN FROM LAST YEAR
The State's laying flock. produced 385 mi l l i on eggs during March 1984, down 9 percent from last year. March production included 282 million table eggs and 103 million hatching eggs.
The average number of all layers for March wa s 18.7 million, 6 percent less than a year ago. Th e total cons isted of 13.5 million layers f o r ta ble e gg s and 5 .2 mi ll i on for hatch ing e gg s . Eggs laid per 100 lay er s du ring Ma rch a verag e d 2, 0 60 co.pa red with 2,1 26 f or the previous year.
All l a y e r s on Apr i l I, 198 4 , to taled 18.6 mil l ion, d own 6 percent f r om 19 . 7 million a y e a r ago. Th e rate of l ay on April I , 1984, f or a l l layers averaged 66 . 9 eggs per 100 layers compare d wi th 68.2 on April 1,1 983.
U.S. EGG PRODUCTION AND LAYER NUMBERS DOWN
The Nation's laying flocks produced 5. 80 billion eggs during March 1984 , down 2 percent from the 5.93 billion produced a year ago. Production i nc l uded 5.19 billion of table or commercial type eggs and 611 ~illion hatching eggs. The total number of layers during March ave r aged 278 million , down fra ctionally from the 279 million a year ago . Mar ch egg production per 100 layers f o r t he tota l laying floc k wa s 2 ,085 eggs comp ared with 2,127 eggs f or March 1983.
All laye r s on April 1, 1984 , totaled 279 mi llion, up 1 percent from 2 77 million a year earlier . Rate of lay on April I , 1984, for al l layers a ve rage d 67.6 eggs per 10 0 l aye r s , c ompa r e d wit h 68.7 on April I, 1983 .
Georgia Hatching Other
Total Ge orgia Total U.S.
NUMBER OF LAYERS AND EGG PRODUCTION , MARCH 19 8 4
No . La y e r s on
Eggs per 100
To t a l Eggs Produced
Hand-Mar ..
Layers-Mar.
During Mar.
1983
1984
1983
1984
1983
1984
Thousands
Number
Millions
5.192 14.656 19.848 2 78 . 65 4
5.158 13.527 18.685 278.146
1.975 2.179 2.12 6 2 ,127
2.003 2.083 2.060 2 . 0 85
103 319 422 5,928
10 3 282 385 5.7 98
Item
Chickens Egg Type Broiler Type
Turkeys
EGGS IN INCUBATORS, APRIL 1984, UNITED STATES
1983
1984
~ of Year Ago
- Tho u s a nd s - - -
33.294
42.415
127
325,579
333.384
102
26.537
25.161
95
The G>rg I a Far.. Repor t (I SSN-0744-7280) I s pub II shed s.... I-OIOnthl y by the Georg I a Cr op Report 1119
Service, Stephens Federal Building . Athens, Ga. J06I3. Larry Eo Snipes, St . t l st l c l an In Charge. Second class postage pa id at Athens, GA. Subscription fee S10 per year IlXC8llt fr. . to data
co ntri butor s . Subs cription Informati o n av ai labl e fr om: Georgi a Crop Report ing Ser v i c e, Step he ns Fed eral Bu l l d t nq. Sui t e J20 At hens . GA. J06U Tel epho ne : ( 404) '46-22:)6.
3
GA. BROILER HATCH DOWN, EGG HATCH UP
GFR-84-Vo'. 9
u.s. BROILER HATCH DOWN , EGG HATCH UP
The Ma r c h hatch of b ro iler-type c h i c k s at 57. 7 illion wa s slightly le s s tha n a year e arlier. Egg-type chicks hat c he d during March totaled 4.8 mil l ion , an i nc rease of 200 percent f rom a yea r ago.
The March 1984 hatch of br o ile r - t ype c hi ck s at 3 9 8 milli on, was down frac t i o n a l l y fr om a yea r earl i e r . Eg g ty pe c h i c k s ha t c h e d during Ma r c h 198 4 tota l ed 45. 1 illion, a n inc r ea se of 15 percent f r om a year ago.
POULTRY HATCHING AND PLACEMENT- -MARCH 1984
During
7. of
% of
Item
Mar.
Feb.
Ma r.
year
Jan. thru Mar .
year
1983
1984
19 84 ago
19 8 3
1984 ago
- - Th o u s a n ds - -
--Thousands--
Pullet Chicks Placed
Domestic ( U. S. ) 1 /
Broiler Type
3 , 299
2 , 977
3, 451 10 5
9 ,778
9 , 630
98
Egg Type
2 12
209
29 5 139
599
698
117
Chicks Hatched
Broiler Type
Georgia
57 ,874
52 , 520
57,698 100
164 ,095
16 5 , 0 65
101
Uni t e d S t ate s
3 9 9 , 7 48 3 56 , 38 6
397 , 9 42 10 0 1, 130 ,63 9 1 , 124 , 3 72
99
Eg g Ty p e
Ge o r gi a
1, 572
3 , 942
4 , 8 01 30 5
5 ,495
12 , 470
227
Unit ed Sta t es
39,281
3 7,699
45 , 136 1 15
104, 8 67
119 , 6 40
1 14
Tu r ke y s
Po u lt Pl a c e d
U. S . '
18 , 8 2 2
15 , 316
18 , 286
97
2/89, 316
2 /8 8,3 73
99
1/ Reported b y l e a d i n g br eed e r s , i n c l ud e s e xpec ted pu llet r e p l a c e men t s fr o m e g g s
s old during t h e pre c eding mon t h at t h e rat e o f 12 5 pu l l e t chi c ks per 30 d o z e n ca se
o f egg s . 2/Turke y pou l ts placed Sep t. 1983-Ma r . 1984.
COMMERCI AL POULTRY SLAUGHTER 1 / , HARCH 19 84 7. o f
7. o f
I t em
Mar .
Fe b .
19 8 3
1984
- - - Thousand s-
Mar . 19 84
yea r ago
Jan. t h r u Ma r.
1983
19 8 4
- - -Thous and s -
ye ar ago
Yo u ng Ch icken s Geo rg i a Un i t e d S tat es
53,5 38 3 68 , 25 0
47 , 527 3 19 . 908
51,9 57 357,847
97
14 7 ,2 3 3
14 8, 92 9 10 1
9 7 1 ,0 2 2 , 18 2 1 , 0 17 , 4 4 2 100
Mat u r e Chicke ns
Ligh t Ty pe U. S .
15 , 650
9 , 687
11, 735
75
43, 315
Heavy Ty pe U.S .
3 , 420
3 ,022
2 , 655
78
9 , 593
To t a l u .S .
19, 070
12 , 709
14 ,3 90
75
52 ,908
To t al Al l Ty p e s , Ga . 4, 18 9
2 ,768
2 ,7 42
65
11 , 1 28
31 , 7 98
73
8 ,323 8 7
40,1 2 1 76
8, 397
75
Pe r cent Co nd e mned
Youn g Chi cke ns
Geo r g ia
1 .4
93
2/1 . 5 10 0
United S tates
1. 5
88
2/ 1 .5 88
1 / Fe d e r a l l y i n spe c t ed sl a ugh t e r da t a as c ol l e c t e d by Me a t a n d Pou l t r y Ins pec tion
Pr o gr a m. Cu rr en t month d a ta estimated by Market News Servi c e . 2 / J an u a r y -F e b r u a r y
cond e mn a t i o n s .
4
GEORGIA'S RED MEAT PRODUCTION UP
Georgia's red meat production totaled 4 1 . 9 million pounds during March 1984, 2 percen t abo ve March 1983 a nd 12 percent above t he previous month.
The number of cattle s laughtered by commercial plants in Georgia duri ng March 1984 was 21, 000 head o r 2 , 400 h ead mo r e than March 1983 and 1,900 more t ha n the 19,100 head slaughtered t he previous month. Calves slaughtered dur ing Ma r c h totaled 1,600 head, 300 head more than the previous month but 300 head less than March 1983.
There were 192 ,100 head of hogs slaughtered in Ge orgia 's commercial plants during March 1984. This was 3,100 head ore than March 1983 and 22 ,300 more than the previ ous month.
UNITED STATES RED MEAT PRODUCTION UP
Commercial red meat production for the United States in March 1984 totaled 3 .35 billion pounds, up 2 percent from March 1983. January-March red meat production, at 9.66 bil lion pounds, was up 5 percent from l ast year.
Beef production , at 1.94 billion pounds was up 2 percent. Head ki ll, at 3 .09 million, was up 4 percent, while average live weight decreased 7 pounds to 1,072.
Veal production, at 40 million pounds, increased 8 percent. Calf slaughter of 285 t hous a nd head was up 7 percent, but average live weight decreased 1 pound t o 237.
Pork production tot aled 1.34 billion pounds, up 3 percent . The 7 .80 mill ion head killed was up 3 percent , howeve r, the average live weight declined 1 pound to 24 0.
Spec i e s
Georg ia Ca tt l e Cal ves Ho gs She e p & Lambs
GEORGIA AND UNITED STATES LIVESTOCK SLAUGHTER 1/
Numbe r Slaughtered
Average
198 4
Jan. - Mar. : Li ve Wei g ht
March
as i. of ' 84 a s i. of
March
1983
198 4
1983
1983
: 1983 198 4
1, 000 Head
Percen t
Perc ent
Pound s
Tot al
Live Weight
Ma rc h
1983
19 84
1, 000 Po und s
18. 6
21.0
1 13
1.9
1. 6
84
18 9.0 192 . 1
102
1 19
9 17
895
17 ,102
18 , 8 15
100
3 48
34 0
646
53 3
105
232
231
43 , 897
44 ,295
United States
Cattl e
2 , 979 .6 3, 090. 1
104
10 5
1 ,07 9 1, 07 2 3 , 21 5 , 5 15 3 ,3 13 ,9 15
Ca l v e s
266 .8 285.0
10 7
11 2
238
23 7
63 , 572
67 ,435
Hogs
7 , 58 3 . 3 7 , 80 2. 5
103
108
24 1
24 0 1 , 826 ,042 1, 870,6 78
Shee p & Lalllbs
633. 5
600. 5
95
106
11 5
116
72,938
69 , 382
1/ Inc ludes slaught er unde r Feder al I n s pec ti on and other comme r ci a l slaught e r , e xc l ude s
f a rm slaug hter .
COMMERCI AL RED MEAT AND LARD PRODUCTI ON: UNI TED STATES WI TH COMPARISONS 1 /
Ma r c h
1984 a s 7.
Jan. -Ma r. 2 /
198 4 as 7.
Kind
198 3
1984
of 1983
: 1983
198 4
of 1983
Mi llion Pound s
Percen t
Million Po unds
Percent
Beef
1,892
1 ,937
10 2
5, 526
5 , 709
10 3
Ve a l
37
40
108
10 3
1 16
11 3
Po rk
1 ,303
1 , 338
10 3
3, 484
3 , 737
10 7
La mb & Mu t t o n
36
35
97
93
98
105
To ta l Red Meat
3, 2 69
3,350
10 2
9 ,206
9,659
10 5
Lard 3/
84
86
102
2 25
239
10 6
1/ Bas ed o n packers dress weights and e x cl ud es fa r m sl au g ht er . 2 / Acc umu l a ted total s
bas ed o n unround ed data . 3 / Prel im inary lard produc tion inc l ud e s r e n d e r e d por k f at .
5
FOOD PRIC ES IN 198 3 AND 1984 1/
Last year. a coabination of greater livestock production. limited increases in food processing and distribution costs. and weak consumer demand led to the smallest increase in food prices in 16 years--only 2.1 percent. The forecast for 1984. in contrast. indicates that the Consumer Price Index (CPI) for food is likely to rise 4 to 7 percent.
1983--A SMALL RISE IN FOOD PRICES
GFR-84-Vol . 9
two-thirds of the retail price of the market basket. smaller increases play a major role in holding down food prices.
The portion of disposable personal income allocated to food in the third quarter of 1983 was 15 .9 percent. down slightly from the 16 perce nt share reported in the previous quarter. In 1983. the portion of DPI allocated for food averaged 16 .0 percent. 1/ National Food Review. Winter 1984.
In 1983 . the f arm va lue of food decl ined
an average o f 2 t o 3 percent bel ow 1982 ,
the f i rst d ecreas e i n 20 y e a r s . Th is
resu lted i n part because record c rop
produc t i on . par tic ularly of graina. i n
J98 1 and 1982 created surpluses and
l owered f a r m price s. Feed grain pri ce
decline s encour aged i nc reased l i ves t ock produc-
tion l a st year, result i ng
in larger supplies o f meat and lower prices .
CHANGES I N FOOD PRI CE I NDICATORS . u. s . 198 1 THROUGH
19 81
1982
1983P
Consumer Price I ndexes
Percent
All food
7.9
4.0
2.1
Food away from h ome
9 .0
5. 3
4.4
1984 19 8 4F
4-7 4-7
We a k d ome s ti c and foreign
demand f u r t h e r dampened
far. price s . A worldwide
recession
discouraged
farm pr oduct sales here
and abroad . Furthermore,
the strong u.s. dollar
overseas meant higher
prices for u.s. products
relative
to
other
e xpor t i ng
countries,
forcing the loss of some
f oreign
markets to
c ompetitors.
Fo od a t home
7.3
Meat. p ou l t ry a nd fish
4.1
Me ats
3 .6
Beef a nd veal
.9
Pork
9.3
Poultry
4.1
Fish and seafood
8.3
Eggs
8.3
Dairy products
7. 1
Fats and oils
10.7
Fruits and vegetables
12.0
Sugar and sweets
7.9
Cereals and bakery products 10.0
Nonalcoholic beverages
4.2
P preliminary. F forecast.
3.4 4 .0 4.8 1. 4 12 .9 -1.8 3.6 -2 .8 1.4 -2 .8 5.5 -.2 4.5 2.8
1.1 - .7 -1.1 -1.5 -.9 1.2 1.2 4.7 1.2 1 .3
.3 1.9 3.2 1. 9
3-6 3-6 3-6 2-5 5-8 5-8 1-4 15-20 0-3 5-8 5-8 3-6 4-7 2- 5
While the farm value of f ood declined in 1983. marketing costs increased by only 3 percent. less than half as much as 2 years ago and below 1982's increase o f 5. 1 percent. Since marketing costs account for about
Ca tegory
MARKET BASKET Re la t i v e
wei ht 1979
Retail cost
100
Farm value
33
Far.-to-retail
price spread 67 P prel.iminary. F
6
11. 7 7.2 10.7 5.5
12.3 8 .3 forecast.
Percent 7.7 3.8 2.8 1.0
10 .5 5.1
ear 1983P 1984F
1.1 3-6 -2.3 4-7
3.0 2-5
GEORGIA'S MILK PRODUCTION DOWN 3 PERCENT
U.S. MILK PRODUCTION
Georgia's dairy herds produced 128 million pounds of milk during March 1984 , 3 ' percent less than las t yea r and 5 percent below March 1982.
Mi lk cows on Georgia 's da i r y farms d uri ng Ma r c h ave r aged 124,000 head, 4 percent l e s s t han a year ago a nd 5 percent below March 198 2 . Production per cow averaged 1 ,030 pounds , 5 pounds above last year, but the same a s March 1982.
Milk production during March totaled 11.7 billion pounds , 3 percent les8 than March 1983 but v irtually unchanged from March 1982.
Accumulated milk production during the first quarter of 1984 totaled 34 .1 blllion pounds , fract ionally below the comparable period in 1983.
Production per cow averaged 1 ,078 pounds during March, 8 pounds less than March 1983 but 13 pounds more than March 1982.
The total number o f mi l k cows averaged 10.9 million head du ring March, 68 thousand less than the Fe br ua r y a ve r age .
I t em No . Milk Cows o n Farms Mi l k Pr o d u c t i o n per Cow Total Mi lk Pr oduction
DAIRY PRODUCTION, MARCH 1983-1984
Georgia
Uni t
1983
1984
Thous . Head
129
124
Pounds
1,025
1, 030
Mi l. Lbs.
132
128
Uni t e d S t a t es
19 8 3
1984
11 ,090
10,890
1 , 086
1,078
12, 049
11 , 7 41
CATTLE ON FEED UP 2 PERCENT IN 13 QUARTERLY STATES
Cattle and c a l ve s on feed Apr i l 1 for the slaughter marke t in t h e 13 q ua rt er ly st at es total ed 9 .34 mi l lion head, up 2 percent fr om a y e a r e arl ier a n d u p 6 percent f rom 1982 .
Ma r k e t i n g s of f ed c a tt l e for slaught e r duri ng the J anua r y - Ma rc h quar ter t o ta l e d 5 .71 mill ion head, up less than one-hal f o f 1 percent f rom last year and 5 perc ent more t han the c o mpa r a b l e 1982 quart er .
Placements o f ca t t le a nd ca l ve s i nto
An unu suall y co ld January a nd a c loUdy,
feedlots during the J anuary-Mar ch 1984
c oo l , and wet March complicated ca t tl e
quarter t o t a l e d 5. 5 1 mi l l i o n h ead, u p 10
f eeding i n co r n be l t and plains s tates
pe r c ent f r om the same quarter las t year,
a n d limited wei g h t gain s . Muddy fee dl o t s
but 1 percent below t he first quar t er o f
have r educed placement s and res ul ted in
19 82. Other d isap p eara n c e t ot a led 365
docka g e f o r e x c e ssively mudd y c at tl e i n
thousand lea v i ng ne t placements of 5.15
some a r e a s .
mi ll i on hea d .
CATTLE ON CALVES ON FEED
To ta l 13 States
To tal 7 S ta t es
Numbe r
1984 as %
Number
1984 a s %
I t e lll
1983
198 4 of 19 8 3
19 83
1984 of 19 8 3
1,000 Head
Percent
1, 000 Head
Percent
On Fe ed Jan . 1
10,271
9,908
96
8,3 16
8 , 006
96
Plac ed on Feed Jan. I-Ma r . 3 1 1/
5,027
5,511
110
4,062
4, 631
1 14
Fe d Cattle Marketed J an . I-M ar. 3 1 1/ 5 ,694
5,71 4
100
4,722
4 , 784
10 1
Ot h e r Di sappearance J a n. I -Mar . 31 2 /
451
365
81
388
285
73
On Feed Apr . 1
9 , 153
9 ,340
102
7 ,2 68
7,568
10 4
Mar k e ti n g s Apr.-June
3/ 5 , 527 4/ 5 , 690
10 3 3/4,6 18 4 /4 , 745
103
1/ I n cludeo c a t t l e p laced on feed afte r beginn i ng o f qu arte r a nd mar k e ted befo re end o f
Qua r ter. 2/ I n clude s de a th 10Roes, movement f r om f e edlo t s t o past ure a n d s hi pme n t s to
o t h e r f e edlot s f or f ur the r f e edi ng. 3 / Total ma r ke ti n g s i n c l udi ng t h o se placed on
fee d a f t e r Apri l 1 and ma r k e t e d be fo r e Jun e 30. 4/ Ex pect ed t o t a l ma rketings includ i ng
n allowanc e for tho s e placed o n f e e d a f te r April 1 a nd marketed be f ore Jun e 30 .
7
ltl r-
XH
-U l ~
r T1 ~(J
....J "..-
H Al
~ ..<
r!i
_.: .1
\J .....
i ll +'-
-0 0 ''''
H .j:' \J-J
=-~
If1 N t::.
ZNO -1 ,,-, 0
i c-
V1 ......C
-1 '::0
;;. r-J1'-' -D \J1
,'I-'
r'ol
--I 0":'0 --1
\To
o --e N
~o
o
\JI
NATI ONA L AGRICULTURAL SUMMARY APRIL 16 TO 22 , 198 4
Highl i g ht s : La nd p rep a r a t i on a n d pl ant ing
progres s wa s p ushed further b e h ind
s chedu l e by mo de r a te to h eavy s h owe r s
from t he centra l plains t h rough much o f
t h e e as te rn half of the Nati on . Co l d er
than normal t e mpe r a t u r e s retarded growth
a nd development o f c r o p s and pastures
t h rou g h much of thi s re g i o n .
Soi l
.cistur e supp l ies were ade qua t e to
surplus ,
except from port ions of
Ca l i f o r n i a to we s t Te x a s wher e dry l a nd
s u ppl ies were short. Farmers generally
had 2 to 4 d a y s suitable for f ieldwork.
e xce pt in portions o f t he eastern c orn
be lt whe re less than 1 day wa s a v ailab le.
Winter wheat c onti nue d i n mo s tly f a i r to
good condi tion.
St and were i n the
heading sta ge a c r oss the s outh. Corn
plant ing was 2 percent finished in t he 17
ma jo r p rodu c ing stat es . 3 po i nt s be h ind
normal. Cot ton was 22 percent planted in
t he 14 major pr od uc ing states, 1 po int
beh i nd a v e r a g e . Sorghum plant ing wa s 2 0
percent co plete. trailing t he 2 1 pe rcen t
progress for last year and the average .
Peanut planting ranged from 5 percent
finished in Texas to 11 pe rcent c o p l e t e
in Georgia. Tobacco tra n splant i ng in t he
southeast ranged fro 5 per cent comp l ete
in North Carol ina to virtually c o plete
i n F l o r i d a . Peaches were bl oomi ng a s fa r
north a s New Jer sey.
CRO P PROGRESS
FOR WEEK ENDING APRIL 2 2 , 1984
S tat e Col o. Ga. Ill.
I nd.
Iowa Kans .
AVf ' Corn Pe rcent Planted
1984
198 3
1
1
82
o o o
72
o o o
84 2
o o
1
2
10
Ky. Mich. Minn.
Mo. Nebr.
N. C.
Ohio Pa. S. Oak.
Va.
Wi s .
3
o
2
o
11
o
o
1
o
o
o
o
o
12
o
13
20
n
o
2
5
o o
oo
2
o
18
o
12
o
28
o
17 States
2
2
5
These 17 States produced 90 percent of
the 1983 corn crop.
8
\'
GEO RGIA
GA A'-I oo .<.:1PI
RGIA CR OP
FL
FARM
REPORT lq<g~/S-Jl
Lt RECEIVED
RE PORT I NG SERV ICE
hens Federal Bldg . e 320
May 11, 1984
ens, Georgia 30613
'2 .ur-.,\-"1-"' Li.\l IJ ._ ') \\ 0" ~._ '... J Phone : (404) 546-2236
GFR- 84- Vo l ume 10
DOCUME.N1"5
HIGHLIGH'rS
UGA LIBRARIES
Wheat Forecast
Peach Forecast
1983 Tobacco & Cotton EstI.at e s
Hay Stocks
Agricu1tura1 Prices
GEORG I A WHEAT UP
U. S . WI NTER WHEAT OFF 1 P ERCE~~
Whe at produc t ion in Ge o r g i a in 19 8 4 will
be 35. 0 mi ll ion b u s h el s , u p 5 pe r cen t
f r om la st y e a r 's crop o f 3 3 .3 mi l l i o n
b us hels. Ac r e age for ha rves t , at 1 .00
mi ll ion , i s up 2 per c ent fr om la s t ye ar .
I
:'
;
The es ti ma ted y i eld, a t 35 bushels acre , i s up 1 bushel from last year .
per
.,Jo- 19 8 3 GEORGIA COTTON PRODUCT I ON DOWN
, Cotton produc t ion at 112, 000 ba l e s ( 480 pounds n et we i g h t ) i s 52 percent be low the 235,000 bale s produced i n 1982. The 115 ,000 a cre s ha r vest e d i n 198 3 wer e 2 7 percen t lower than for t he 1982 c r o p . Yield per acr e a verag e d 4 67 po und s, 2 47 po unds per acre below the record br e ak i ng 19 82 yi eld.
1 98 3 GEORGIA TOBACCO CROP DOWN
U. S . win te r whea t produ ct i o n f o r 19 84 is fo r e c a st a t 1 . 98 bill i o n b u s he l s . Thi s i s 1 percent less than l a s t year' s product ion o f 1.99 bil l i o n b ush e ls. An e sti mat e d 5 1 . 8 mill ion a cre s i s e xpe c t e d t o be harveste d for grain , a 9 pe r c e n t i n c r e a s e fr om l a st year 's 4 7 . 7 mil li on a c r es . Yield pe r harves ted ac re is f ore. c a s t a t 38. 2 bushel s .
19 83 COTTON PRODUCTI ON DOWN 3 5 PERCENT
United Sta tes c ott on p r odu c t ion t o t a l e d 7 . 8 mi lli on ba l e s in 19 8 3 , 35 perc e nt less than in 1982 a n d 50 pe rce nt l e s s than the 19 81 pro duct i o n . Uplan d c o t t o n a ccoun t e d for 7.7 mi l l ion ba le s and Ame ri can - P im a co tton 94 . 7 thousand bale s. The U.S . y i eld per har ves t e d acre o f all cot ton d e creased t o 506 pound s , compared with 590 po u n d s per acre in 1982 .
The 1983 Georgia t o ba c co crop at .9 6 , 3 6 0 , 0 0 0 pounds i s 9 pe rcen t b e low 198 2' s 105 ,500 ,000 pound c rop. Acr e s ha r vested fo r 1 983 wer e est im a ted a t 44,000 acres , 6,000 ac res be l ow t he previous year. Yield, at 2 , 190 pounds per acre, was up 80 pounds per acre from the 2 ,110 pounds recorded in 1982.
U. S. 19 8 3 TOBACCO PRODUCT IO N DOWN
Produc tion of al l tobac c o in the United States in 1983 totaled 1.43 bill ion pounds, 28 percent less than in 1982. The d e c r e a s e was caused by the combination of a reduction in acres and a decrease in y i e l d .
GEORGIA ACREAGE AND PRODUCTION 1983 AND 1984
Acrea~e
iel d per Acre
Production
Planted
Ind1
Indi-
Crop
Unit
for all Har-
Fo r
cated
cated
Pu rposes vested Har v e s t
May 1 ,
May 1 ,
1984
1983 1/ 1984 1/ 1983 1984
1983
1984
- --Tnou sand Acres ---
- -Tnousands---
~:; Cott on 2/
Ba l e s
NA
115
NA
467
NA
112
NA
To bacco ,
Ty pe 14
Lbs.
NA
44
NA
2 ,190
NA
96 ,360
NA
Whea t
Bu.
1 , 250
980
1 , 000
34.0
35 .0
33 320
35.000
I I Harvested fo r principal use . 21 Cotton yie ld in pounds and production in Gale s.
Agricultural Statistic1fUl and Georgia Depart:.ent of Agriculture
GEORGIA PRICES RECEIVED
ONSUHER PRICE INDEX
GFR-84-Vol. 10
Average pr ices received by Geor gia The Harch Una d jus t e d Consumer Price Index
fa rm ers at mid-April for most ~ c r
for a l l urban consumers (CPI-U) at 307.3
commodities were generall y above last
(1967- 100) was 0.2 percent higher than i n
month and a y e a r ago. Pr i c e s fo r mo"s~~~__February and 4 . 7 p ercent above Ha rch
livestock commodi t ies and products showed . 1983 . On a s easona lly adju s ted ba si s,
an i ncrease from March with t h e exc e pt ion
t he CPI-U wa s 0. 2 percent a b o v e Feb r u a r y.
of mil k cows , beef cows and cal ves , com-
Th e trans portat i o n ind ex increas ed 0.9
mer c ia l b ro i l e rs a nd mil k .
p er c ent wh i l e t he med i c a l care and o ther
goods a nd ser v i ce s we re b o t h up O. S pe r -
The Ge o rgia Prices Rec eived All Co mmodi t y
cent . The appa r e l a n d upkee p i nde x i n-
Index f or Apr il wa s 145 per cent o f the
c r e a s e d 0 . 1 perc e nt whil e hous i n g wa s
1 9 7 7 av erage, 1 pe rcent a b o v e las t mo n th
unchanged . Foo d a n d beve r a g es and enter-
and 17 percent abov e a y ear ago .
tainment decr eased 0 . 1 and 0 . 2 pe r c ent , r e s pe c tive ly.
PRI CES RECEI VED BY FARMERS . APRI L 15 1984 WI TH COMPARISONS
Pr ice
Ge orlli a
United St a tes
per
Ap r .
Mar .
Apr . 15 ,
Ap r .
Ma r .
Apr. 15 ,
Commodit y
Un i t
19 8 3
19 8 4
19 8 4
1983
19 84
198 4
Winter Wheat
S/ Bu .
"
"
3. 71
3 . 42
3.5 1
Oats
S/ Bu .
1. 54
1.82
1.77
Co r n
S/Bu .
3. 45
3. 83
3 . 93
2. 95
3. 21
3. 36
Co t ton
Ct ./ Lb . 59 .0
66. 6
1/6 9 .3
60 .4
70 . 5
1/ 6 8. 6
So ybe a n s
S/Bu .
6.1 7
7 .63
7 . 65
6 .09
7.68
7.65
Swee t po t at o e s
S/Cwt.
8. 50
2/17 . 60
17. 50
9. 17 2/19.00
20. 40
Al l Hay, bal ed 21
S/ Ton
74 . 20
80.50
82.50
Mil k Co ws , 3/4 1
S/Head 1 , 0 60 . 00
850 .00 1,060 . 00
91 0 .00
Hog s
S/Cwt .
45. 80
[,3 . 2 0
4 5 . 40
46 . 9 0
45. 80
47.40
Sows
S/Cwt.
4 1. 90
39 . 40
40 . 30
43 . 7 0
43 . 00
44 .1 0
Ba rro ws & Gi l t s
S/Cwt.
46 . 50
43 .8 0
46 . 30
47. 30
4 6. 20
47. 80
Bee f Ca t tl e 51
S/Cwt .
51 .60
50. 90
51 .6 0
6 1. 00
6 1.70
60 . 30
Cows 61
S/Cwt.
4 1. 40
4 1. 50
41. 20
42 . 4 0
4 1 .80
41. 60
St ee rs & He i f e rs
S/Cwt.
57.00
56. 40
57 .2 0
64. 80
65 .80
64 .50
Calve s
S/ Cwt .
59.1 0
54. 60
52.90
66 .70
63 .70
63.60
All Milk
S/Cwt .
14. 40
14 . 60
7/14 . 40
13. 60
13.20 7/13.1 0
Tu r ke y s 21
Ct . / Lb.
32 .3
4 1. 6
43. 3
Chi cke n s , Exc l ud ing
Br oi lers 2 1
Ct ./Lb. 12 .5
32 . 0
20 .5
Com' l Br oil e r s 8 1 Ct./ Lb. 24 . 0
36. 5
7/34 .0
2 4.6
37.8
7 / 34 . 8
Eggs, Al l 2/ 91
Ct ./Doz 67.5
98 .3
109 . 0
57. 4
79 . 4
91. 4
Ta bl e 21
Ct . /Doz 56 . 0
83 .6
98. 4
51. 2
73. 5
87. 4
Hat c h i ng 2 1
Ct. /Doz. 1 10 . 0
140. 0
140 .0
II First ha l f of month. 2 1 Mid-month price . 31 Anima ls sold for dairy herd replacement
onl y . 4 / Price s est imated quarterl y. 51 "Cows" a nd "steers and heifers" combined wi th
a llowanc e whe re ne cessa r y for s la ug hter bul ls . 61 I n cl ud e s da iry cows sold fo r s laugh ter .
71 En t i r e mon th . 81 Livewe ight eq u i va l e n t pri c e f o r Ge o r gi a . 91 Ave rage o f all eggs
so ld by f armer s i n c l u di ng h a t c hi ng eggs sold at r e t a i l. " I n s u f f i c i e n t sales.
IThe Geor q l e Ee r-m Re po r -t ( 155 N-0 744- 72 80) Is pub l l s bed sam l -mo n t h l y by t ne Geo r9 1. Cr op Reporting
Is e r YiCe , Ste p~ens Feder al 8 ulld l nq , Athens . G~ . 3061 ~ , la rry E. Sn i pe s , St e tl s tl cl an In Charg e . Sec o nd cl a s s oos t a q e pa lo at .~ t h e n s , GA. SUbs c r i pt i o n foe S I D pe r y e a r exce pt f re e t o d~ tlJ i.: o r ~ ri ~ U "" ,:) "" S . Sucs c r l or lon In f Or"'nl!r l o n ,-~ .... a l l ab l e f rom : Geo r g i a Cr op Rec c r-t l no Se r v i c e , Step he n s ~~.::.:.~ ~ "!~ _ Su i l ': i na , Sui t e 3 20 , '; t he~ s . GA. . 3061 3 Telephon e : ( 40 4 ) 54 6 - 2 2 36 .
2
PRICES PAID INDEX UP 1 POINT FOR U.S.
The Index of Prices Paid by Farmers for Commodit ies and Services, Interest, Taxes and Farm Wage Rates for April was 166 percent o f its 19 7 7 base . Contributing mos t t o the 1 point ri se were inc r e a ses i n feed and seed prices . Lowe r prices for feeder cattle a nd calves were part ia l l y offset t ing . Compared wi t h a y e ar e a r l ie r, the i ndex wa s 6 po int s .
U.S. PRICES RECEIVED INDEX UP 1 POINT
The April All Farm Products Index of Prices Rece i ved by Farmers increased 1 point from Ma r c h to 146 percent of its January-December 1977 average . Higher prices fo r e g g s , cor n, hogs, wheat and onions were partially o f fset by lower price s f or cattle, broilers, tomatoes , sw e et corn a n d l ettuce. Th e I n d ex was 10 points above a ye a r ago.
PRICES PAI D BY FARMERS APRI L 15 1984 WITH COMPARI SONS
Pr i c e4-
-G.e:o:r:ll.=i~a~~
__l'------~Un~it~ ed~~ St~ a t~e s~----
pe r
Apr. 15, Ma r . 15 , Apr . 15, Apr. 15, Mar . IS, Apr . 15,
Commodi t v
Unit
19 83
19 8 4
1984
19 83
1984
19 84
Dai ry Feed 16 7-
S/Ton 18 4 . 0 0
21 5 .00
2 10 .00
18 2 . 0 0
199 . 00
199.00
Dairy Fee d 18 %
S/To n
190 .00
220 .00
2 15.00
194 .00
210 .00
21 2 . 00
Dairy Con c t. 32 7-
S/Ton 23 5. 00
265 .00
25 5.0 0
2 72 .00
283.00
28 3 . 0 0
Hog Feed 14 %-187-
S/Cwt .
11 . 50
12.50
12.50
11. 00
11. 80
11.70
Hog Conc t. 38 %-4 2% S/Cwt .
15 .5 0
17 . 00
16 .00
15.50
16.00
15. 90
Beef Ca t tl e Co nc t .
3 2%- 3 6 %
S/C wt.
12 .50
14 .00
13 . 00
12 .00
13 .40
13. 10
Co t tonseed Me a l 41% S/Cwt .
13. 50
16.00
16 . 00
13.80
15 .90
16.00
Soybean Meal 4 4i.
S/ Cwt .
14.00
14 . 50
13 . 50
13 .60
14.50
14.50
Bran
S/Cw t.
11.00
1 1.00
10 .50
9 . 83
10 . 60
10.50
Middli n gs
S/Cwt .
9. 70
9. 90
9 .20
9. 40
10. 20
10.10
Co r n Mea l
S/ Cwt .
8. 90
10. 00
9 .80
7.88
8 . 79
8.92
Broil e r Growe r
SI To n
197. 00
20 5.00
21 5.00
215 .00
242. 00
2 46 .00
Laying Fe ed
SI Ton
17 5 .0 0
21 0.0 0
210.00
198. 00
214 .00
214 . 00
Ch i ck Starter
S/ To n
200. 00
2 40 .00
245.00
21 9.00
23 9. 0 0
2 4 1.00
Br o iler - Fe e d Ratio 11 Lb s .
2. 4
3 .6
3 .2
2. 3
3. 1
2. 8
Hog-Co rn Ra tio 21
Bu.
13. 3
11.4
11. 6
16.0
14 .3*
14 .1
Milk-Feed Ratio 31 Lbs.
1.55
1. 34
1.37
1. 49*
1. 33
1 .3 2
Egg-Feed Ratio 41
Lb s .
7.7
9.4
10. 4
5.8
7. 4
8 .5
11 Poun d s of bro iler grower equal i n value to 1 l b. broiler li ve we i g h t. 2 1 Bushels o f corn
e q ual i n va lue to 10 0 l b s . of ho g live we igh t . 31 Pounds of 16 i. da iry feed equal i n val u e
t o 1 l b. whole mil k. 41 Po un d s of laying feed equa l in value to 1 doz . egg s . * Re v ised .
INDEX NUMBERS--GEORGIA AND UNITED STATES
1917- 100
Mar ch 1983
April 1983
March 1984
Georgia
Prices Received
All Commodities
126
124
1 44
Crops
127
130
13 6
Li v e s t o c k & Products
125
119
151
Uni t e d States
Prices Received
134
136
145*
Prices Paid I I
159
160
165*
Ratio 21
84
85
88
I!Mid-month index including interest , taxes and farm wage rates. 2/ Ratio of
Pr i c e s Received to Index of Prices Paid, Interest, Taxes and Farm Wage Rates.
Apnl 1984
14 5 137 151
14 6 166
88 index of
* Revised.
3
I i . r " ( ",(
~..,
. ... ~.-
~
~,
-u ~ .,
.,/"J
:":1 ..., 8
1 -"
\.,; _" r x
~...X ' ~ 0
~
:~ -<.
I T. .....
" r A' O ~
r- ~~ 1: 1 ....-1 t,.tJ
--l C"1 -..t <,
11 : . 1f J C:";;
(12,-' 0
:.. --11..0 (:>
rJ I 0 - V ' L)
-t f'..'.
L>LU I -'
ro vn
I
~
N
0
r.......:
00
' .J
vi
0
w: J
\l10 ,e;,
111
GEORGIA PEACH CROP UP 55 PERCENT
Ge o rgia 's 19 8 4 peach c ro p esc aped d amag e fr o m spring ~reezes that sha rp l y redu ced p roduc t ion 1n e a ch of the previ ous two
yea r s. As a r e su lt, Geo rg ia pr o duc ti on i s expe cte d to ue 155 mi llion pounds , a 55 percent inc rease over the freezedamaged 1983 crop. The 1984 forecas t, as of May I, covers total peach production, including that part o f the c r o p produced but not pa c ke d and s h i pped .
9 SOUTHERN STATES PEACH CROP UP 164 7.
The f irst forecast in nine Southern
States for 1984 is 783 million pounds ,
over two and a half times last year's
crop and almost double 1982. An inc rease
from 1983 is expect ed for all sou thern
states except Texas where ra in is need ed.
Hail , high winds and l e a f cur l have pre-
sented problems in parts o f the
s o u th e ast. ~ i n ter damage wa s g e n er a l l y
light .
The southeast escaped fre e ze
damage. Fa rmers a r e cur rent l y t hinning,
and anticipat ing a more normal produc t i on
than t he free z e-damag ed crop s o f the past
tw o yea r s .
PEACH PRODUCTION
SOUTHERN STATESp 198 2 - 1984
Sta t e
19 8 2 srrrrss Pounds
Ala .
15.0
14. 0
19.0
Ar k. Ga.
. 32 .0
120.
30 .0 10 0. 0
35.0 155.0
La.
5. 0
6.0
7.0
Mi s s .
4.0
4.0
6. 0
N.C.
2. 0
12 .0
45. 0
Okla .
9.0
9.0
13.0
S.C .
210 .0
95. 0
480 .0
Tex .
16.0
27. 0
23. 0
9 Southern
States
413. 0
29 7. 0
783. 0
17 Include s unha r vested p r oduc t i on a nd
harvest ed no t so ld (m i l lion pounds) : 9
Southern States , 1982-24 .0, 1983-28 . 0 .
GEORG I A HAY STOCKS VERY LOW
Georgia 's May
hay stocks, at onl y
70 , 0 0 0 t o n s , are 77 percent below l as t
yea r's May 1 s t o c k s o f 3 00,000 tons .
Last year 's stocks were r ecord high while
this yea r's l evel is the lowes t since
1960 . Di sappea ranc e sinc e J anuary 1,
1984 was 570 ,000 ton G.
May 1 h ay s toc k s on U. S . f a rms to ta l ed 20.6 mi ll ion to n s , 29 pe rce n t l e ss tha n the May 1, 1983 s t o c k s. Di sappea r a nc e fr om J anua r y 1 th r o u g h April total e d 70.2 million ton s i n 19 8 4 c ompared with 77 .6 million tons dur ing the comparable peri od last year .
4
C,A
\CEORGIA ~tO.C1
GEORGI~ROP
FARM
May 30, 1984
REPORt
FJ.~:~L4)5-3D
-~ - - . .7~ ~
REPORT I NG SERVICE
L R - eElVE
stephens Federal Bldg. Suite 320
. --S~ . . . . . . .
Athens, Georgia 30013
APR 2 1 20 05 Phone: (404) 546-2236
GFR-84-Vol ume 11
DOCu ME':. ~S
HIGHLIGHTS
UGA LIBRARIES
Poultry Sm-ary
Milk Production, Disposition & Inco.e
Cattle on Feed
Turkey Eggs in Incubators
Milk Production (Monthly)
Cold Storage
Livestock Slaughter
Livestock Cash Receipts
Layers & Egg Production
Faraland Values
GEORGIA BROILER HATCH UP
u .s. BROILER HATCH UP 2 PERCENT
The April hatch of broiler type chicks . at 57.0 .illion, was 1 percent Ie than last month but 3 percent .are than last year.
The April 1984 hatch of broiler-type chi ck. . at 395 .illion. was 2 percent above a year earlier. There were 334 .ill ion eggs i n incubators o n May I, 1984, up 4 percent from a year earlier.
POULTRY HATCHING AND PLACEMENT--APRIL 1984
During
% of
% of
Apr.
Mar .
Apr. year
Jan. thru Apr.
year
1983
1984
1984 aso
1983
1984 ago
--Thousands--
--Thou.and.--
Pullet Chick. Placed
Do_.Uc (U.S.) 1/
Broiler Type
3.143
3.451
4.012 128
12.921
13.642 106
Egg Type
349
311
309 89
948
1,023 108
Chick. Hatched
Broiler Type
Georgia
55,109 57.698
56.985 103
219.204
222.050 101
United State.
388.781 397.942 394,842 102 1.519.420 1,519,194 100
Egg Type
Georgia
1,852
4,801
4,505 243
7,347
16.975 231
United State.
36.663 45,136
47,227 129
141.530
166,867 118
Turkey.
Poult. Placed
U.s.
19.764 18.286
19.088 97 2/109,080 2/107,461
99
,II Reported by leading breeder., include. expected pullet replaceaent. fro. egg.
sold during the preceding aonth at the rate of 125 pullet.chick. per 30 dozen ca.e
of egg 2/Turkey poult. placed Sept. 1983-Apr. 1984.
Agricnl.taral Sutf.stician and Georp. Depart.eut of Api.co.lture
GFR-84-V o I. 11
COMMERCII\L POULTRY SLAUGHTER 1 / , APRIL 1984
7. of
7. of
Item
Apr.
Mar.
Apr.
yea r
Jan . thru Apr .
y e ar
1983
1984
1984 a go
1983
1984 ago
- Th o u s a n ds-
- - -Thousands-
Young Chickens
Ge o r g i a
50,889
50, 870
48, 23 9
95
198 ,1 22
196 ,08 1 99
Un i t e d States
345,740
348,611
337., 8
9 8 1 ,3 67 , 9 2 3 1 , 350,113 99
Mature Chickens
Light Type U.S .
14,654
11,541
11,627
79
57,970
43,491
75
Heavy Type U.S.
2,844
2,595
2,692
95
12,437
10,955
88
Total U.S.
17 ,498
14,136
14 ,319
82
70,407
54,446
77
Total All Types, Ga. 3,619
2,569
3, 25 1
90
14,747
11,475
78
Percent Condemned
Young Chickens
Georgia
1.4
93
2 / 1. 4 93
Un i ted States
1 .5
94
2/1.5 94
1/ Federall y inspected slaught er data as collec t ed by Meat and Poultry Inspection
Program. Curr ent mon t h dat a e s t im a ted by Mar k e t Ne ws Ser v i ce. 2/ January-March
c o n d e mna t i o n s.
G~ . FARM REAL ESTATE VALUES DECLINE
Ge o r g i a ' s average va lue per acr e o f farmland and bui ldings o n Apr il I , 198 4 , at $80 1 pe r a c r e, was 2 percen t be l ow 198 3 . This is the t h ird year in a r ow that l a n d values have dropped a n d marks the lowes t estimated ave r a ge per a c r e va l u e inc e Fe b r u a r y I, 1979. However, the rate of decline i s dimini s hing , ha ving dropped 8 perc e n t fr o m 19 81 t o 1982, 3 pe rcent .from 1982 t o 1983 and only 2 pe r c e nt f r om 198 3 t o 1984 .
U.S. FARMLAND VALUES DECLI NED SLIGfITLY I N 1983
On Apri l I, the va lue o f farm land and bUi ldings averaged $739 a n acre . Average values ranged from a low of $ 16 5 an acre in Wyo ing to $3 ,148 in New Jersey. Inc reases we r e greatest in Penn sy lvan i a a n d Te xa s at 8 and 9 perce nt, respect i vely . Th e l a r g e s t declines occurred i n I o wa and Ne bras ka a t 11 and 12 p ercent.
La st yea r 's I-pe r c e n t d e c l ine i n f a r ml a n d value s, coupled wi t h a 4 . 8- pe r c en t rise i n t h e Co n s umer Pri c e Inde x , i mpli e s a 5. 8- pe r c e n t drop in the real value of U. S . f armlan d . Farmland val ue s ha ve dec l i ned i n real t erms e ach year since 19 8 1.
The decline in U.S. farmland value s slowed appr ec i a b ly in t he year ending April I, 1984.
State
1976
S. C.
515
Ga.
507
F l a .
763
Ala .
425
48 States 39 7
FARM REAL ESTATE VALUES , U.S. & SELECTED STATES :
AVERAGE VALUE PER ACRE OF LAND AND BUILDINGS,
FEB. 1 , 19 76- 8 1 ; AND APRIL I , 1982-84 1/
1977
1978
1979
1980
198 1
1982
Do l l a r s
600
653
773
879
930
91 8
581
685
777
868
915
842
861
981
1 ,1 49
1,352
1 , 507
1 , 432
477
527
639
7 92
93 5
922
474
53 1
628
725
79 5
78 9
19 83
8 63 8 17 1 , 4 61 87 6 743
19 84
8 46 80 1 1, 490 8 58 739
The Geo rgie Fer.. Report (ISSN-Q 744-7280 ) Is pub t l shed s .... l- ront h l y by the Georgi e Crop Reporting Se r vice , Stophens Federe l Bu ild ing, Athens , Ge . 30613, Le r ry E. Snipes, Stet l stlclen In Charge. Sec ond c ra s s postege P8ld et At hens , GA . Subscription fee S10 per yeer ex cept free to dete c o nt r i but o rs . Subscr iption Inf orm8 tlon eve lleble f rom : Georg ie Crop Reporting Service. Stephens Fed e r el Building Su ite 320 At hens GA . 306 13 T"leo ho ne : (40 4 ) 546-2236
2
CATTLE ON FEED IN 7 STATES UP 2 PERCENT
Cattle and calves on f eed May 1 for the slaughter market in the 7 s t ates preparing monthly estimates totaled 7. 38 million he ad , up 2 percent from a year
ago and 4 pe rcent more than May I , 1982.
~arketings of fed cattle during April totaled 1.52 million, a 4 percent increase from last year and 8 percent above April two years ago.
Placements of cattl e and c a lve s on feed i n the 7 states during April total~d 1.52 million, 3 percent below hoth l ast ye a r and 1982. Net placements of 1.33 mil lion f o r April are down 6 percent from last year and 9 percent from 1982.
Other disappearance totaled 184 thousand c o mpa r e d with 143 thousand during April 1983 and 109 thousand two years a go .
CATTLE AND CALVES: NUMBER ON FEED, PLACEMENTS, MARKETED, AND OTHER DISAPPEARANCE,
7 STATES, APRIL 1 TO MAY 1
1984 as %
Item
1983
1984
of 1983
1,000 Head
7,~68
104
1,~15
97
April
1,523
104
April 2/
184
129
7 376
102
mar et e ng
to produce a carcass that
wi l l grade good or better. 2/ Includes d eath losses, movement f rom f eedl o ts to
pastures and shipments to other feedlots for further feeding.
GEORGI A ' S MI LK PRODUCTION DOWN 5 PERCENT
u . S . MILK PRODUCTION DOWN 2 PERCENT
Georg ia 's dairy herds produced 118 million pound s of milk during April 1984 , 5 percent less than l a s t year, and 8 perc e n t below March.
Milk cows on Georgi a's dairy farms during April averaged 122,000 head, 5 percent less than a year ago and 2 percent below last month. Production per cow averaged' 970 pounds for the month, 10 pounds above last year.
Milk production dur ing April t o t a l ed 11. 7 bill ion p o u n d s , 2 percent l ess than Apr il 1983 and down 1 percent f rom March.
Accumulated milk product ion during the first 4 months of -19 8 4 totaled 45.8 billion pounds, 1 percent below the comparable period in 1983.
Production per cow averaged 1,075 pounds during April, four pounds less than April 1983.
Item No. Milk Cows on Farms ~ ilk Produ ct ion per Cow Total Milk Production
The total number of milk cows averaged 10.9 million head during April, 34 thousand less than March 1984 and 238 thousand less than April a year earlier.
DAIRY PRODUCTION, APRIL 1983-1984
Georgia
Unit
198 3
1984
Thous. Head
129
122
Pounds
960
970
Mil. Lb s .
124
118
3
Un i t e d States
1983
1984
11 ,09 4
10,856
1, 079
1,075
11,966
11,674
,GEORGI A RED MEAT PRODUCTION
Georgia's red meat production totaled
37,523 million pounds during April 1984,
up 6 percent from April 1983.
Th e
January-April 1984 red meat production of
155,844 million pounds was 3 percen t mor e
than the 151,280 million pound s p r o d uced
during the comparable period of 1983 .
The number of cattle slaughtered by com mercial plants in Georgia dur ing Apr il was 19 , 900 head, an increase o f 1, 800 head from April 1983. Calves slaughtered in April totaled 1,300 head, the same number as in April 1983.
There were 170,600 hogs slaughtered in
Georgia's c ommercial plants during April
1984. Th is amounted to 14,400 head less than were slaughtered during Apr il 1983.
U.s. RED MEAT PRODUCT IO N
GFR-84-V ol. 11
Commercial red meat production for the United States i n April 1984, totaled 3.08 billion pounds , up 1 pe r c e n t from Apr il 1983. J a n uar y- Ap r i l red me a t production , at 12 . 7 bil lion pounds, wa s u p 4 pe rce n t from las t year .
Beef production, at 1.78 b il lion po unds, was u p 3 p e rc e n t . Head kil l wa s 2 . 85
mi llion, up 4 percent , wh i le average li ve weigh t de c line d 2 pbunds t o 1,067.
Veal production, at 36 million pounds, i n c r e a s e d 13 percent. Calf s l aughter of
249 thousand head was up 11 perc ent and
average live weight increased 2 pounds to 246.
Pork production t otaled 1.23 billion
pounds, down 2 percent. The 7.16 million
head killed was down 2 percent, while
average live weight remained unchanged at
242.
'
Species
Georg ia Catt l e Calves Hogs Sheep & La mb s
GEORGIA AND UNITED STATES LIVESTOCK SLAUGHTER 1/
Number Slaughtered
Average
1984
Jan . -Apr. : Live Weight
April
as 7. of '84 a s 7. of
April
1983
1984
1983
1983
: 1983 1984
1,000 Head
Perc e nt Percent
Po unds
Total
Live Weight
April
1983
198 4
1 ,000 Pou nds
18.1
19.9
11 0
1.3
1. 3
10 0
185 .0 17 0 .6
92
1
117
916
906
16 ,585
17, 979
98
333
343
42 9
438
10 2
232
230
42, 95 8
39 , 191
200
101
6
United Stat e s
Catt le
2 ,755.5 2, 8 54 . 3
Calve s
223.6 248 .6
Hogs
7 ,297.8 7 , 160. 6
Shee p & Lambs 523.5 6 15 .7
1/ Incl udes sl aughter u nd e r Fe dera l
farm s laughter .
10 4
10 5
1 ,069 1, 0 67 2, 945 , 33 6 3 , 0 46 ,439
III
I II
244
24 6
54 ,663
61,090 ,
98
105
242
242 1 ,768, 79 7 1 , 73 4 ,298
1 18
109
115
112
60 ,384
68 ,730
I nspec t ion and o the r commerc ia l s l augh te r , e xc l ud es
COMMERCIAL RED MEAT AND LARD PRODUCTION: UN ITED STATES WITH COMPARISONS 1/
April
1984 as 7.
Jan . -Apr. 2/
1984 as %
Kind
1983
1934
of 1983
: 1983
1984
o f 1983
Mi l li o n Pounds
Pe rcent
Million Pounds
Percent
Beef
1,727
1, 77 6
103
7,253
7,485
103
Veal
32
36
113
135
152
113
Pork
1 ,262
1,233
98
4,746
4,970
105
Lamb 6r Mutton
30
34
113
123
132
107
Total Red Meat
3 ,051
3,079
101
12,257
12,738
104
Lard 3/
81
79
98
306
319
104
1/ Based on packers dress weight s a nd excludes farm slaughter. 2/ Accumulated totals
based on unrounded data. 3/ Preliminary lard production includes rendered pork fat .
4
GEORGIA LAYER AND EGG PRODUCTION DOWN
Georgia' s laying f locks produced 368 mi l l i o n eggs during April 1984. 7 percent le s s t h a n produced d u r i ng April 1983. Pro d uct ion cons i t e d of 266 mi l lion tabl e o r co.-ercial t y pe egg and 10 2 million hotching eggs.
The average number of l a ye rs i n Georgia d u r i n g April 1984 was 18 .5 mil lion. 6 percent l e s s than April 1983. The 18. 5 million consisted of about 13.3 million for t a b l e eggs and 5 .2 mil lion layers fo r hatching eggs.
Eggs laid per 100 layers during April 19 84 ave raged 1 , 9 9 0 compared to 2.016 for Apr il 1983.
U.S. EGG PRODUCTION AND LAYER NUMBERS UP
The Nation's laying flock s produced 5 . 6 4. billion e g g s during Ap r i l 1984, up fractionally from the 5 .62 bi llion pr oduc e d a year ago. Production included 5 . 05 billion o f table or co ercial type egg s and 597 mi llion hatching eggs . The to tal number of layers duri ng April average d 27 8 million, 1 percent abo ve the 275 mi llion a y ear ago . Apr i l production per 100 layers for the total l a ying flock wa B 2.030 e ggs compared with 2.04 5 eggs for April 1983.
All layer s on Hay 1. 1984. totaled 277 mill i on, up 1 percent f r om the 273 million a year earlier. The 277 million layers consisted of 24 5 i l l i o n for table or co. .ercial type eggs a nd 3 1.4 mill ion for hatching eggs . Rate of lay on Hay 1. 1984, for a l l layers a ve r a ge d 67.7 eggs per 10 0 laye rs, co pared wi t h 67.3 o n Ha y 1 , 1983.
Georg ia Hatching Other
Total Georgia Total U.S.
Item
Chickens Egg Type Broiler Type
Turkeys
NUMBER OF LAYERS AND EGG PROD UCTION, APRI L 198 4
No . Layers on
Eg gs pe r 100
To t a l Egg s Prod u c e d
Ha n d - Ap r .
Layers-Apr.
Dur i ng Apr.
198 3
1984
1983
198 4
1983
198 4
Thousands
Number
Mi l l i ons
5,245 14, 3 46 19 , 591 274,963
5,223 13,274 18,497 2.77,981
1,887 2,064 2,016 2,045
1,947 2,004 1,990 2,030
99 29 6 395 5, 622
102 2 66 368 5,644
EGGS IN INCUBATORS, MAY 1984, UNITED STATES
1983
1984
/. of Year Ago
---Thousands---
33,539
43,799
131
320,184
333,984
104
26,896
27,125
101
5
GA. ANNUAL MILK PRODUCTION AND CASH RECEI PTS
Ge o r gia's annua l milk production t ot a l e d 1.395 mill ion pounds dur ing 1983. 17 mi l l i on pounds less than the 1982 p roduct ion. The average number o f mi l k cow o n Georgia farms in 1983 was 129.000 he ad. 1.000 l e ss than the a ve r a ge i n 1982. Milk production per cow averaged 10 .814 pounds , compared to 10 , 862 pounds in 1982 .
Cash receipts f rom marketings of al l mil k t o t a l e d $200. 1 mil lion in 1983 , compared to $200 .9 mi l li o n in 1982 . Pr od u c e r s received a n av e r age of $1 4 .50 per hund r e d pounds of mi lk so ld dur ing 19 83.
GFR-84-Vol . 1j
Ca sh rece i p ts from marke ti ng s o f milk a nd cream duri ng 1983 were a l s o at a reco rd hig h $18 . 8 bill ion. 3 pe rcent above 19 8 2 . Pr oducer re t urns a ve r a ged $13 .67 pe r hund r e d we igh t. 2 cen ts b e l ow the 1982 average . Marketi n g s to t al ed 138 b i l l ion pounds milk e qui va l ent. 3 percent a bove 1982 . Mar k eti n g s i ncl u de . whole milk a n d produce r -sepa r ated c r eam sold to plants and dealers a s well as milk sold di r ectly to consumers.
An estimat ed 2.35 billion pounds of milk were used on f a rms where produced. abo ut the same a s i n 1982. Calves were f ed 64 percent of t h i s milk wi t h the rema inder being consumed in producer households a s f luid milk. cream and butter.
U.S . 1983 MI LK PRODUCTI ON AND CASH RECEIPTS
A r e c o rd h igh 140 bi l l ion po und s of mi lk wa s p r o d u c e d du ring 1983, 3 per c e nt more than the prev ious recor d output i n 1982 . Th is r e c o r d ou t put i s at tri buted to a recor d 12 . 587 pound rate pe r cow . 278 pounds a bove t he previous year ' s r ecord h igh . Th e a n nua l average number of cows was 11 . 1 mill ion hea d , 1 pe r ce n t above the 198 2 a ve r age of 1 1.0 mill i o n head.
MILK PRODUCTI ON AND INCOME . 198 2-198 3
Item No. MIlk Cows on Farms Mil k Pr odu c t i o n per Cow Total Mi l k Production Cash Receipts Value of Home Consumption Gross Inco_
Unit Thous. He a d
Pounds Mi l. Lbs. Mil. Dols . Mil. Dols .
Mil. 00115.
130
10 . 8 6 2 1. 4 12 200.9 1.0 201.9
1983 129
10 . 8 14 1.395 200 .1 .9
201.9
United States
1982
1983
11,033
11 120
12.309
12 , 587
135.802
139.968
17.985.1
18.529.7
115.8
115 .1
18. 388 .6 18.922.6
ANNUAL QUANTITY AND VALUE OF GRAIN AND OTHER CONCENTRATES FED TO MILK COWS
GEORGIA AND U.S 1982 AND 1983 11
Annual Average Annual Average
Value of
Feed Value
State and Year Annual
Feed per
per Cwt .
Total
Cwt.
of Milk
1 .000
- - Poun s - -
- - - Dollars
Tons
Georgia
1983
377
5.840
54
8.90
4.81
1982
395
6.080
56
8.34
4.67
United States
1983
30.229
5.440
43.2
7.88
3.40
1982
17 Estimates
29 661 for afl places
5{;380 were
milk
43.7 produced.
eIther
for
7. 45 sale
or
for
3 .26 home use.
6
TURKEY EGGS IN INCUBATORS, MAY I , U.S.
Turk e y e g g in incuba t ors o n May I , 19 8 4 , t otal ed 27.1 mil l i on, 1 percent above t h e 26. 9 mill i on a year earli e r . The West Nor th Ce ntral ge o g r a phi c d i v is i on had the mos t e g g s i n i n c u bat ors on Ma y I , 1984 , a t 10 . 4 mi l l i on , a 9 p e r c e n t i ncrease f r om a year ear l i e r. The South Atlantic was second with 6.1 mi llion, a dec reas e of ~ percent fr om a yea r earl ier.
POULTS PLACED DURING APRIL, U.S.
Th e 19 .1 mi l l i o n poul ts placed during Apri l 198 4 in t h e Uni ted Stat es we r e 3 percent bel ow the p l a c eme nts during the s ame mon th a year ago. The West North Central geogra ph i c divis ion placed the largest number of poults, which at, 7.0 . i ll i on, wa s a 3 percent decrease from April a year ago. The South Atlantic division was s econd with 4.4 million, 2 percent bel ow a year ago.
Geograph ic Div i sion
N. At l a n ti c E. N. Central W. N. Cen tra l S . At lan ti c S . Ce ntr a l We st
ALL TURKEYS
Eggs in Incubators
1984
May 1 11
as /. o f
1983
198 4
1983
Thousands
Percent
946
745
79
2,922
2,807
96
9,512
10 ,359
10 9
6, 429
6 , 0 77
95
2,3 18
2,359
10 2
4,7 69
4 , 778
100
Poults Pl a ced
During Ap r . 21
1983
19 84
Thous and s
670
560
2 , 128
1 , 997
7 , 21 6
6 , 973
4 ,554
4,441
1, 8 20
1,869
3,376
3 ,248
1984 as /. of
1983 Percent
84 94 97 98 103 96
u. s .
26, 8 96
27, 12 5
10 1
19,764 19,088
97
11 Breakdo wn by br e e d s n o t shown to avoi d d isclo s u r e o f i n d i v idua l op e r a tions.
21 Ex c lud e s expo rt ed p o u lt s.
COLD STORAGE STOCKS, UN ITED STATES, APRIL 30 ,
Apr. 30,
Mar . 31 ,
Apr . 30 ,
Commodi ty
1983
1984
1 9 84
1,000 Pounds
But t e r
555, 716
529,332
53 1 ,18 1
Cheese, Natural
1,132,326
1,217,438
1,171 , 596
Egg s , Frozen
22 , 481
11, 999
1 2 , 2 28
Fru its, Frozen
387,310
479,933
444,0 15
Fru it Juices , Frozen 1,553,412
1,396,187
1, 408, 036
Meats, Red
607,636
738,1 38
775,332
Beef, Fr o z e n
27 7 ,334
325,704
324,989
Pork , Frozen
272,717
350,727
388,263
Poultry, Frozen
333,307
259,684
263,929
Turkeys , Frozen
192,271
149,358
141,876
Vegetables , Frozen
1,314,861
1,311,003
1,232,891
Potatoes, Frozen
957,969
827,579
803,063
Peanuts, Shelled
434,230
332,868
333,140
Peanuts , In Shell
48,981
24,535
21 ,645
Pecans, Shelled
29,824
30 ,711
34,222
Pecans, In Shell
74,4 74
117,856
103,873
1984
Percent of
Apr. 1983 Mar . 1984
Percen t
96
100
10 3
96
54
102
11 5
93
91
101
128
10 5
117
100
142
III
79
102
74
95
94
94
84
97
77
100
44
88
115
III
139
88
7
J I l l ( ) (. ,
(.;
XHl=-;r,. l='
l.o \,.. ) N
r"
rrJ .xJ "j r : 1 'n
r ~ l,, ') A- ~ _':"<. G
-f :;l <0 I ; ""t:' ...-.
~-
r ( I
"
r "71. -.)"
<0. _
t...,J ~ : , . .....
-i D;: ......
.. . 1 : 11 r J -.>
l . j e: r' } , .:.'
. ".J - -t Q.) t..)
.~.J I "='
VI . '-'
t ....,
- H """
;..-
..:,..;aWl
(l) \ .'1
I
N
W 0
'"
i-v
u 'o
0 -.1
rJ
\J;
0
UJ , ....
,~="- c >
'J !
GEORGIA'S 1983 LIVESTOCK AND POULTRY CASH RECEIPTS UP 2 PERCENT
The sale of livestock, poultry and associated products brought Georgia farmers Sl.67 billion in 1983, up 2 percent from the Sl.64 billion in 1982. Other chickens had the largest change from a year earlier with an increase of 14 percent to Sl~.9 million. Commercial broilers again lead the way in cash receipts with S676.7 million, an increase of 11 percent from the previous year. Cash receipts from the sale of cattle and calves were up 5 percent to S2~4 .4 million. Hogs had the largest decline in cash receipts from a year ago, at S219.6 million, a drop of 11 percent from the S247.~ million in 1982. Eggs were down 7 percent from last year with cash receipts totaling $278.7 million and turkeys were off 5 percent to S278.7 million . Milk and cream cash receipts were down fractionally to S200~1 million
GA. LIVESTOCK & POULTRY CASH RECEIPTS 1/
Item
1982
1983
Thousand Dollars
Hogs
247,483 219,602
Cattle & Calves
242,359 254,410
Milk & Cream
200,880 200,100
Commercial Broilers 610,73~
676,675
Other Chickens
13,859
15,850
Turkeys
25,492
24,110
Eggs
300,104 278,734
TOTAL
1,640,912 1,669,481
1/ The fiscal year for hogs, commercial
broilers, other chickens and eggs ends
Nov. 30. Others are on calendar year
basis. Total does not include products
or species not in the Federal Estimating
program.
8
\~
' GEORGIA
FARM REPOR
C:>A
Ayoo.ct
PI
~.L
J'lg~/h-/~ J' ItJ t 1 lSB4
GEORGIA CROP REPORTING SERVICE
Stephens Federal Bldg.
S"Uite 320
Athens, Georgia 30613
June 12,1984
Phone: ( 404 ) 546-2236
GFR-84-Volume 12
- - - - - - - f{ [ GE I
HIGHLIGHTS:
Wheat
Peaches
Agricu1tura1 Prices
DOCU M E 'TS
UGA LIBRARIES
GEORGIA ~lE A T PROD UCTION UP
GEORGIA PEACH PROSPECTS
I Based on conditions as of June 1, the 1984
I Georgia wheat crop is est im at ed a t 35. 0
milli on bushels, unchanged from the May 1
Ifo rec a s t but 5 percent or 1:7 million bushels more than the 1983 crop. Grain : harvest is expected from 1.0 million acres
with an a verage yield of 35 bushels per
i a c r e .
For c o mp a r i s o n , l ast year's
harvested acres were slightl y less at 980
thousand acres. Yield was 34 bushels per
acre for the 1983 crop .
Har vesting
progress through June 10 reached 57 per-
c e n t compl et ion wh ich is slightly ahead of
last year's 52 percent for the same date,
but behind the 5-year average of 64 per-
cent.
The June
forecast of Ge orgia's 198 4
oeach c r o o is placed at 15 0 million
pounds. A crop of this size would be 50
.mi l l i o n pounds above t h e 1983 total
production, but 5 million pounds below the
May I, 198 4 forecast. Harvest t hrough
June 10 was 28 percent comple te compa red
with 25 per c ent last year. Har v e st will
likely continue later this year than last
since' the north Georgia crop was lost to
freez e-damage last year.
**See table on page 4.**
U. S. PEACH CROP SOARS
U. S. WnnER WHEAT CROP DOWN SLIGHTLY
The June 1 winter wheat production forecast for the un ited States is 1.97 b illion bushels, down 1 percent from the 1.99 billion bushels of the previous year. Acreage for harvest is expected to be up 8 percent f r om last year. The expected I yield is 38. 2 bushels per acre, down 3.6 bushels f r om last year's record high yield.
The Un i t e d States peach crop f or 198 4 is
forec ast a t 2.53 bi llion pounds, 4 1
per c ent a bove the weathe r d amag ed 1 . 7 9
bill ion pounds 198 3 c ro p . Freestone pro-
duct i on i s up 35 per cent,
wh il e
Cl ingstones a r e up 53 perc ent. Production
from the nine southern peach states is now
forecast at 758 million pounds, up 155
percent from the 1983 crop, but 3 percent
less than was forecast a month ago. Much
of that reduction was due to hail damage.
State
Area 1983
1,000 Acres
WHEAT, SELECTED STATES, JUNE 1, 1983-1984
'held
E'roducE~on
1983 Ind. 1984
1983
Ind. 1984
Bushels
1,000 Bushels
Ala.
460
Ga.
980
N.C. 1/
480
., S. C.
375
Tenn .
640
..i
425 1,000
650 395 600
33.0 34.0 34.0 28.0
33.0
34.0
35 .0 38.0 36.0
35.0
15,180 33,320 16,320 10,500
21,120
14,450 35,000 24,700 14,220 21,000
, U. S .
47,686
51,583
41.8
38.2
1,993,888
1,972,776 .
17 Estimates for current y~ar carried forward from earlier forecast.
i:1
Agrl.cu1t:ara1 Statf.stf.c:I.an and Georg:f.a Deparment of Agrlcu1ture
GEORGIA PRICES RECEIVED
GFR-84 -Vo I. 12 U.S. PRICES RECEIVED INDEX DOWN 2 POINTS
Georgia farmers saw a decline from April to mid-May for all livestock commod ities and products. Soybeans and cotton showed the only increases among the crop commodit ies.
The Georgia Prices Received All Comodity Index for May was 135 percent of the 1977 average, 6 percent below last month but 7 percent above a year ago.
The May All Farm Products Inde x of Prices Received by farmers decreased 2 points (1 .4 ercent) from April to 144 percent of its January-December 1977 average. Lower prices for eggs, cattle, onions,
omatoes and milk were partially offset by higher prices for oranges, soybeans and cotton. The index was 7 points (5.1 percent) above a year ago .
PRICES RECEIVED
MAY 15
Pric e
Per
Commod it
Unit
1nter eat
~ u.
Oats
S / Bu .
1. 54
1.82
1. 88
Corn
S/Bu.
3. 51
3.83
3. 82
3.03
3 . 32
3.36
Cotton
Ct./Lb. 58 . 4
68.5 1/72.0
3 .6
68.1 1/74 .5
Sovbeans
S/Bu .
5.91
7 .93
8 . 50
6 .06
7.82
8 .24
Sweet potatoes
S / Cwt.
8 . 50 2/1 7.50
12.70
7 .43 2 /20. 40
23.50
Al l Hay, Baled 2/
S/ Ton
83.90
82.5 0
84.90
Milk Cows , 3 /4 /
S / He a d
850 .00
9 10.00
Hogs
S / Cwt .
4 5 . 10
45 .70
45 . 20
45. 90
4 7.5U
4 / .~O
Sows
S / Cwt .
39. i 0
40.70
40 . 40
4 1 .00
44 . 10
43 . 30
Bar r o ws Eo Gil t s
S / Cwt .
4 6 . 30
46 .60
46 .00
46 . 60
47 . 90
48.30
Be e f Cat t l e 5/
S/ C,,' t.
48 .70
48 .1 0
4 6 . 40
59 . 90
60 .1 0
58.10
Co ws 6 /
S/Cwt .
4 1 . 10
41 .30
40. 70
4 1. 90
4 0.8 0
40 . 20
Ste er s Eo Hei fers
S / Cwt .
54 .50
52 ..80
5 1. 00
63.60
6 4.6 0
62.30
C" lves
S / Cwt.
56 . 90
53. 30
5 ] . 10
6 6 . 20
62. 30
6 1. 60
All Milk
S/ Cl.'t.
14 . 20
14.20 7/14. 10
1 3 . 30
13. 10 7/12 . 90
Tu r kevs 2/
Ct ./Lb.
35. 0
43 . 3
42.7
Chic k en s , Exclu d i n g
Bro i l ers
13 .5
2/20. 5
Co m'l Br o i l e r s 8 /
2 5 .5
3 4. 0
26.4
34 . 8 7 /3 3 . 5
Eg g s , Al l 9 /
69. 3 2/109 .0
60 .8
2 / 91 . 4
68. 9
Tab le
57 .i
2 /98 .4
55. 0
2/8 7 . 4
62 . 3
Ha tc h i n
T F i rs t na r or mon t
110 . 0 2/1 40 . 0 M1d -m o n tn p ric e .
me n t o nly. 4 / Pr i c e s est im at e d qu art e rly . 5/
c o mbi ned' wi th all owance where nec e ss ary f o r sl a u ghter bulls. 6 / I n c l u d e s dair y c o ws
sold for slau g hter. 7 / En tire mon th. 8/ Li ve wei g h t e q u i v al e n t pr ice for Georgia.
9/ Ave rage of a ll eggs sold by f ar me r s i n c l u d i n g hatching eggs sold at reta il.
* I n s uffi c i en t sales.
INDEX NUMBERS--GEORGIA AND UNITED STATES
1977=100
April 1983
May 1983
_ _-=-A:,op;.,;r;.,;1';.,1;=--=-1=-9.::.8....;4
~:M::.a.yl..-=1-.9..8:.4.-=-'-_
Georgia
Prices Received
All Commod ities
124
126
144
135
Crops
130
13 0
136
136
Livestock Eo Pr oduct s
119
122
150
135
United States
Prices Received
136
137
146
14 4
Prices Paid 1/
160
161
166
166
Ratio 2/
85
85
88
87
I/Mid-month index includi ng interest, taxes and f a r m wage rates . 2/ Ratio of index of
Pr ices Received to Index of Price s Paid, Interest, Ta>;es and Farm Wage Rates .
2
u.s. PRICES PAID INDEX UP 1 POINT
CONSUMER PRICE INDEX
The May Index of Prices Pa id by Farmers
for Commodities and Services , Interest ,
Taxes and Farm Wage Rates was 166 percent
of i t s 1977 base.
The index was
unchanged from April but 5 points (3.1
percent) above Maya year earlier.
The April unad justed consumer price i n d e x
f o r all urban consumers (CP I- U) a t 308.8
(1967 al00) was 0 .5 percent higher than i n
March and 4.5 percent above April 1983.
On a seasonally adjusted basis, the CPI-U
was 0 .5 percent above March. The enter-
t ainment index increased 0.8 percent.
Both the housing and transportation i n-
dexes were u p 0.6 percent. The med i cal
care index i n c r e a s e d 0.5 percent and t he
other goods and services i nd exe s in-
c reased 0 . 4 percent .
The food and
beverages i n d e x was un c h a n ge d but the
appare l and upkeep i nd e x e s decreased 0. 1
percent .
PRI CES PAI D BY FARMERS MAY 15 198 4 WITH COMPARISONS
Price
Geor i a
United State s
pe r
May 15 , Ap r. 1 5 May 15 : Ma y 15 , Apr . 1 5 ,
May 15 ,
Co mmo di t y
Unit
1983
198 4
198 4
1983
19 84
198 4
Dairy Feed 1 67.
S/Ton
188 . 00
2 10.00
200 .00
18 4. 0 0
199 .00
19 7 . 0 0
Da ir y Fee d 18 7.
S/Ton
19 1 . 00
2 15 .00
205 .00
19 7 . 0 0
21 2 . 0 0
20 7 .00
Dair y Conct. 3 2i:
S/ To n
2 35 . 00
255.00
265.00
277 . 00
283 .0 0
283 .00
Hog Feed 14 7.-18 7.
S/ Cwt .
11. 50
12.50
12.00
11 . 10
11.70
11 .50
Hog Co nc t . 387. -427.
S/Cwt .
15 .00
16 .00
16 . 60
15 .40
15.90
15. 60
Be ef Ca t tl e Conc t .
32 7.-36 7.
S / Cwt.
11.50
13 . 0 0
13.50
12 .20
13.10
12 .70
Co t t o n s e e d Me al 41 7. S/ Cwt .
13 . 50
16.00
17.00
14.00
16 .0 0
15 .80
Soybean Mea l 44 7.
S / Cwt.
14. 00
13. 50
14. 00
13.70
14.50
14 .20
Bran
S / Cwt.
11. 00
10. 50
11.50
9.87
10.50
10 .40
Mid dli ngs
S / C wt .
10 . 00
9 . 20
10.00
9 .47
10.1 0
9 . 99
Cor n Mea l
S/Cw t .
9 . 30
9 .80
9 .90
8 .04
8.92
8. 8 7
Broi ler Gr owe r
S/ To n
197 .00
2 15.00
24 0.00
220. 00
24 6 . 0 0
24 6 .00
Layi ng Feed
S/ To n
175.00
210 .00
225 . 00
202.00
21 4 .00
2 14 .00
Chick Star t e r
S/Ton
200.00
245 .00
235 . 00
223 .00
241 .00
233 .00
Br oil er -Fee d Ra ti o 1/ Lb s.
2.6
3 .2
2 .6
2.4
2.8
2.7
Hog - Corn Rat io 2/
Bu .
12 .8
11 . 8
11. 8
15 .1
14 .3
14.2
Milk-Feed Rati o 3/
Lbs.
1.5 1
1.35
1.41
1.45
1 .32
1 .31
Egg-Fe e d Ra t io 4/
Lb s.
7. 9
10 .4
7.6
6 .0
8.5
6. 4
1/ Po uh d s o f broiler g rowe r e q u a l in value to 1 lb . b r o i ler l i v e weigh t . 2/ Bush el s o f
corn e q ua l i n val ue to 10 0 lbs. of h o g l i ve weight . 3 / Po un d s of 16 7. dair y fee d eq ua l
i n value to 1 lb . whole mi lk . 4 / Po u n d s of la y ing f eed e q ual i n valu e t o 1 do~ . eggs .
I t em
Un i t
Mar.
Fee d e r s and St oc k e rs
Cat t le and Ca lve s
Cwt .
6 6. 50
66. 0 0
Pigs 1/
cve .
112. 00
94.00
Bro ile r Ch i ck s
Per 10 0
16 . 80
16.80
Egg-Type Chi cks
Pe r 100
50.20
50 . 90
Turke v Poults
Ea ch
.90 6
.94 1
17 Ba s ed on dat a de r i v e d from re po rt s f rom fa rm ers Price s Pa i d f o r Feeder Pigs. * Re v ised.
.3
May
58. 50 92.50 17 . 2 0 50.50
.9 40
.. < _ ,. "r
;:.
J
Jt -;: .. "
... _.' j ....<. .
-'I ~ ...I'- t,;
~.....
'<. r -r ,-' ....
t - I ... ' r- .~ ,
,.J I I ' I ... J?l ~
l} ..IV "
t- I <.:~
v . --., ..J
(, 1
~ "J
l ~ ~ \J I ......
,~ )
.-.
\..
> ",en
'-')Ot'l
::cenn
t'l.-,)O
.tJi~s t ' l nl
~~r;
Hen t:l en '
...w0>-
a-.-,)
w
PEACH PROD UCT I O:\.,..l- SELECT ED STATES L-J C:\E 1
-.
- -totarPr oCfiJ;":-ETon -IT - -
:;-i..a -LC-----~j_g8 2
l g-ID---Yna :-T~ - -
Mill ion Pound s
-
Ala. Ark .
G a. ..
La . 2/ ~l iss . 2/ N. C. Ok l a . 2 / S .C .
15 . 0
32. 0 120 .0
5.0
4.0
2. 0 9.0 21 0. 0
14 . 0
30 . 0 100 .0
6.0 4.0 12. 0
9 .0 95.0
19. 0 35 . 0 150 . 0
7 .C 6. 0 4 5 .(,
13 .C
460 .C
Te x as
16 .0
27 .0
23. 0
9 Sou thern Sta te s
4 13 .0
297.0
758 .0
Cal ifornia
Fr e estone
4 15 . 0
Cl ings tone 1 , 102 . 0
43 5 .0 6 19. 0
440. 0 9 50. 0
U. S . Fr e e st on e 1 , 19 1. 5 1 , 170. 7 1,5 7 7. 0 Al l Pe a c h e s 2, 293 .5 1 , 789 . 7 2, 52 7. C
17 In c lud e s un n a r vested p r o duc t i o n ana
har v est e d not sold ( mi l l io n pou nds ) : Uni te d St at es , ex c l u di n g Cal i f or n i a c l i ngs tones , 1982 -24 .7 , 198 3-3 7.5. 2/ Es t i ma te fo r c u r r e n t vea r ca rr ied fo r ward f r o m earlier forecast.
FI VE YEAR REVISIO NS SCHEDULED
The USDA's Stat i stical Reporting Servi ce
(SRS) will issue a s er ies o f sta t ist i c al
bu l l e ti n s
containi ng a n y ne ce ssary
r e v i s i o n s in i t s c u r r e nt e s ti ma t e s f or
t he vears 197 9- 8 3 . SRS will use data
fr om' the 1982 Census o f Agriculture and
other che ck da t a sources i n its rev iew of
197 9 -83 es t i ma te s . Th e a gency r e gu lar l y
r ev iews i t s current est imates and i s s u e s
bulletins after a Ce nsus o f Ag ri c u l t u r e
i s c o mp l e t e d . The a p pro x i ma t e release
dates f o r the bulletins are :
198 4 June 15 , F ield Crops
June 2 1, Stocks o f Grai n s June 28, Sweetpotatoes Dec . 18, Hogs (,
Pigs
1985 Jan. 11 , Fru its a nd
Nut s Jan. 18, She ep (, Goats Jan. 25, Cattle Jan. 28, Ch i ckens and Eggs Feb. 12, Milk Production June 6, Vegetables
The Georg ia Farm Repo r t ( ISSN-Q 744- 7280 1 I s pu blis hed semi-mont hl y by t he Georg ia Cr op Repo rt i ng Ser v ice, St ephens Federal Bu l l d-
I i ng , Athe ns , Ga. ~O6 13, Lar ry E. Sn ip es, I Stat i st i c l an-I n-Charge, Seco nd Cl as s pos t age
pa i d at Athe ns , Ga. Subsc r ipti o n f ee SI O per year ex c ept f r ee tc data c on t r I butors , SUbscr ipt i on Info r mation avail ab l e f r om: Geo r gi a Crop Repo rt ing Ser v i c e , Stephen s Feder al Buil d i ng , Sui te 320, Athe ns , GA 3061 3 Tel ephono : ( 404 ) 546-2236.
4
\'
GA
GEORGIA
Pt.YOD.t,7
. P\
GEORGIA
CROP REPORTING
FARM
REPORT
FI ':LH?-~ )lo-).{P I '98 '
S
ERV ICE
~ phens Federal Bldg.
L Stlite 320
5r'"
5
Athens, Georgia 30013
June 26, 1984
~ ? h_~~ Pone: (404) 546-2236
_ GFR-_ 84-13_ _ _ _ . [ GEl D
HIGHLIGHTS Grain .Stocks Poultry S..-ary Hog & Pig Inventory Livestock S1aughter
S r. --;.'0 '/
: - ... [ 1 \ hJ
'-J~
"(',~..'. l~1 -
DOCUM E i1-S UGA LIBRARIES
Catt1e on Feed Killt Production Co1d Storage
GEORGIA SOYBEAN STOCKS DOWN 25 PERCENT; CORN STOCKS DOWN 54 PERCENT
Soybean stocks in a ll positions on June
I, 1984 in Georgia totaled 10.9 million
bushel s, 25 percent less than the 14 .6 mill ion bushels on hand June I, 1983, according to the Georgia Crop Reporting Service. All of the decrease occurred in on f arm stocks at 1,024, 000 bushels. On farm stocks were down 85 percent from the June 1, 1983 level. Off-farm stocks totaled 9,880,000 bushels, up 30 percent f r om a year ago.
Corn stored in all positions on June I, 1984 totaled 9,473,000 bushels, less than
one half of last year's level of 20,651,000 bushels. Of the total corn on hand June 1, 1984, 58 percent or 5,513,000, bushels were stored on farms.
Old crop wheat stocks in all pos it ions on J une I, 1984 totaled 1,673,000 bushels, 20 percent more than the 1,392,000 bushels in storage a year earl ier .
Stocks of grain sorghum on farms at 251,000 bushels were down 45 percent and all .oa t s in storage at 510,000 bushels were 30 percent below the June 1, 1983 level.
GEORGIA GRAIN STOCKS--JUNE I, 1984 WITH COMPARISONS
On Farms
Off Farms 1/
All Positions
Grain
1983
1984
1983
1984
1983
1984
Corn
14,548
Oats, Old Crop
439
Barley, Old Crop
Wheat, Old Crop
904
Rye, Old Crop
29
Sorghum
454
Soybeans
6,980
5,513 415
774 103 251 1,024
1,000 Bushels -
6,103 3,960
288
95
*
*
488
899
*
*
*
*
7,600 9,880
20.651
727
*
1.392
* *
14,580
9.473 510
*
1.673
* *
10,904
1/ Includes stocks at mills, elevators, warehouses, terminals and processors.
* Not published to avoid disclosing individual operations.
Agrleu1mra1 SbltisU.clan and Georgia Depart.ent of Agrleu1mre
Gf"R-84-!3
u.s. FEED GRAINS, SOYBEANS, AND WHEAT
Soybean stocks in all positions on June
BELOW LAST YEAR
I, 1984 totaled 456 million bushels, down
42 percent from a year ago, and 29
Nationally, corn stored in all posit ions
percent below June I, 1982. Farm stocks
on June I, 1984 totaled 2.14 billion .
164 million bushels were down 61 per-
bushels, 57 percent less than last yer's
cent from June I, 1983. Off-farm stocks
record high level of 4.92 billion
totaled 292 million bushels, down 20
bushels. Of the total corn on hand June
percent from June 1 a year ago.
I, 1984, 57 percent or 1.21 bil jbl ~W-~.
bushels was stored on farms. Farm socks
Stocks of other grains were: grain
were 61 percent lower than June I, 1983
sorghum , 367,196 busnels, down 31 percent
farm stocks. Off-farm stocks, at _~~ 9 Bi~",. .d oats, 181,056 bushels, down 18
million bushels were down 49 percent
percent.
last year's level.
Old crop wheat stored in all positions on June I, 1984 totaled 1.39 billion bushels, down 8 percent from the 1.52 billion bushels on hand June 1 a year ago, but 20 percent more than two years
ago.
u. S. GRAIN STOCKS--J UNE I, 198 4 WITII COMPARISONS
On Farms
Off Farms 1/
All Positions
Gra in
1983
1984
1983
1984
1983
198 4
- Million Bushe ls
Corn
3,093.5 1,210.6
1,830.4
926.5
4,923.9 2 , 137 .1
Oats, Old Crop
181.2
151.3
38.7
29.8
219.8
18 1.1
Barley, Old Crop
136.8
116.8
79.9
72.0
216.7
188. 8
Wheat, Old Crop Rye, Old Crop 2 /
668.9 3.2
591.7 6.5
846 .1
*
802. 7
*
1 ,515 .1 1,394.3
*
*
Sorghum
96.0
60.3
433.1
306.9
529.1
367.2
Soybeans
424.7
164.4
366.0
292.1
790.6
456.5
1/ Includes stocks at mills, elevators, warehouses, terminals and processors.
2/ Four State Total: Ga, Minn., N.D.,S.D . * Not published to avoid disclosing
individual operations.
COMMERCIAL POULTRY SLAUGHTER 1/ MAY 198 4
Item
May 1983
April 1984
May 1984
i. of year ago
Jan. thru May
1983
1984
i. of year ago
Young Ch ickens
- - Thousands
- - Thousands - -
Georgia United States Mature Chickens
53,168
49 , 203
53,927 101
251,290
250,972
100
364,275
340,071
375 , 275
103
1,732,199 1,730,373
100
Light Type U.S.
9,755
11,053
13,292
136
67,725
56,244
83
Heavy Type U.S . Total U.S.
3,764 13,519
2,772 13,825
2,863
76
16,155 119
16,201 83 ,926
13,898
86
70,142
84
Total All Types, Ga.
2,792
2,830
3, 491
12 5
17,539
14,545
83
Percent Condemned
Young Chickens
Georgia
1.4
100
2/1.4 93
United States
1 .4
93
2/1 .5 94
1/ Federally inspected slaughter data as collected by Meat and Poultry Inspection Program.
Current month data estimated b y Market News Service . 2/ January - April condemnations .
2
GA . BROILER HATCH UP FROM 1983
The May hatch of br oiler type chicks at 58.3 million was 2 percent more t h a n last ye ar a n d 2 percent more t han last month .
U.S . BROILER HATCH UP FROM A YEAR AGO
Nationally, the May h atch of broiler type chicks at 40 9 million was up 3 percent from May 19 83 and u p 4 percent fro m last month.
POULTRY HATCHI NG AND PLACEMENT- -MAY 1984
Dur ing
:r. of
:r. o f
I t em
May
Ap r.
Ma y year
Jan . t hr u Ma y
year
19 83
1984
1984 ago
1983
198 4
ago
- -Thousand s - -
- - Tho usands--
Pul l et Chicks Pl aced
Domest ic (U.S. ) 1/
Br o i l e r Type
3 ,5 41
4, 01 2
3 ,520 99
16 , 46 2
17 , 16 2
10 4
Egg Ty p e
382
309
437 11 4
1, 330
1 ,460
110
Ch ick s Ha t c h e d
Bro i l e r Type
Geo r g i a
57,117
56,985
58 , 32 1 102
276, 3 21
280 , 37 1
10 1
Unit ed Sta t e s
395, 46 0 3 94, 8 4 2
408, 567 103 1 ,914 ,880 1, 927, 76 1
101
Egg Ty pe
Ge o rgia
1, 7 94
4, 50 5
4 , 795 267
9,1 4 1
21 , 7 70
23 8
Uni ted Sta t e s
38 ,330
47 , 2 2 2
48 , 78 1 12 7
17 9 , 8 60
21 5, 64 8
1 20
Tu r keys
Po ults Plac e d
U.S .
20 , 8 85
19 ,088
21 ,1 29 10 1 2/1 29, 96 5 2/ 128 ,590
99
1/ Reported b y l eading breede r s, includ e s e xpect ed p ullet r ep lacement s f r o m e gg s
s ol d during the p re ced i ng mont h at t he ra t e o f 12 5 pu l le t c hi c k s per 30 d o z e n cas e
of eggs. 2/Tu r k ey pou l t s p l a c e d Se p t . 19 83 - May 198 4.
I tem
Chic k e n s Eg g Type Br oi l e r Type
Turkeys
EGGS I N I NCUBATORS , J UNE 1984, UNI TED STATES
1983
1984
i. of Yea r Ago
---Thousands- --
33 ,88 7
43 , 27 9
128
3 17,621
335 , 492
106
27,651
27, 087
98
Ge orgia Hat ch i n g Ot her
To t al Georg ia To t a l U. S .
NUMBER OF LAYERS AND EGG PRODUCTION , MAY 1984
No . Layers on
Eggs per 100
Total Eggs Produced
Hand-May
Layers-May
Duri ng May
1983
1984
1983
198 4
19 8 3
198 4
Thousands
Number
Mi l l i ons
5,088 13 , 956 19 , 04 4 2 72,244
5,259 13,090 18 , 34 9 276,319
1,956 2,117 2,074 2,097
3
1,987 2 , 0 12 2,000 2,077
100 295 395 5,710
10 4 263 367 5,738
GEORGIA HOG INVENTORY DOWN 4 PERCENT
Inventory of all hogs and pigs on Georgia farms on June I, 1984, totaled 1,350,000 head, 4 percent less than a year ago. This is the lowest June 1 inventory since 1965, but is 12 percent above March I, 1984 . Hogs kept for breeding totaled 210,000 head, slightly less than the 211,000 kept for breeding last year. Market hog inventory, at 1 , 140 , 000 head is 4 percent less than a year ago but 10 percent more than the previous quarter.
The Decembe r 198 3 - Ma y 198 4 pig crop
totaled 1,016, 00 0 head, 3 percent less
than l a st year. So ws f a r rowi ng du ring
th is 6 month per iod , a t 143 ,000 , a r e 4
percent less than t he c o mpar a b l e pe riod
last ye a r.
Pigs saved per litter
average d 7 .10 c o mpa r e d with 7. 0 6 las t
year. The December-February pig c rop, at
462,000 head , is down 1 per c ent and the
March-May to ta l of 554, 000 head is down 5
percent f r om t he year earl i e r per iod.
Georgia prod ucers intend to have 72, 000
sows t o far row June-August. If t h e s e
intentions are rea lized, farrowings will
be t he same a s t he comparabl e quarter a
year a go.
Dur ing Septembe r-November,
7 0, 0 0 0 s o ws ar e expect e d to fa rr ow, a l s o
the same as the ac tual farrowings the
previous year.
GFR-B4-13
u.S. INVENTORY DOWN 9 PERCENT
Inventory of all hogs and pigs in the
u.S. on June 1 is estimated at 52.0 mil-
l ion head. This is 9 percent below a
year ago and the lowest June 1 inventory
since 1975. Breeding inventory, at 7.34
million head, was 9 percent less than a
year ago and 1 percent below two years
ago.
Market hog inventory, at 44. 7
million head, was 9 percent below a yea r
ago but about the s ame as two years ago.
The December 1983-May 1984 pig crop was 4 1 . 5 million head, an 11 per cent de creas e fr om t h e co rres ponding period last y ea r b ut 1 pe rc ent a b ov e two years ago . So ws f a r r owi n g dur i ng this 6 mont hs pe riod, a t 5.56 mil lion , we r e 1 1 percent l e s s than t he comparable pe riod last year. Pigs saved per li tter was 7 .46 compared with 7 . 52 l ast year and 7. 34 two ye ars ago.
u . S . pr o d uce rs i n t end to ha v e 5.61 mi lli on sows f arr o w durin g t he J u ne-No v e mb e r period , a dec rease o f 9 pe r c e nt from the same period i n 1983 and 3 pe r cent below 1982 .
The Georgi a Farm Report ( ISSN-Q744-7 280) Is pub l ished semi-monthly by the Georgia Crop Reporting Ser vi ce, Stephans Federal Bui ld i ng, Athens, Ga. 30613, Larry E. Snipes , Statistician In Charge. Second c lass postege paid at At hens, GA. Subscription tee SIO per year except tree to data contributors. Subscription Inf ormation avai lable t rom : Georgia Crop Reporting Service, Stephens Federa l BulldlnQ, Suite 320, Athens, GA. 30613 Teleollone: (404) 546-2236.
4
Item
HOGS AND PIGS: NUMBER ON FARMS, SOWS FARROWING AND PIG CROP
U.S., GEORGIA AND 10 QUARTERLY STATES 1/, 1983 AND 1984
United States
10 States
Georgia
1983
1984
1983
1984
1983
1984
(000)
(000)
(000)
Number on Farms-June All Hogs and Pigs Kept for Breed ing Market Hogs
57,450 8,074
49,376
52,030 7,335
44,695
45,250 6,224
39,026
41,330 5,735
35,595
1,400 211
1,189
1,350 210
1,140
Market Hogs and Pigs
by Weight Groups
Un d e r 60 Pounds
21,855
18,997
17,335
15,197
530
502
60 -119 Pounds
11 ,915
11,224
9,415
9 ,024
32 4
308
120-179 Pounds
8 ,764
7,981
6,864
6 ,231
224
216
180 Pounds & Over
6,842
6,493
5,412
5,143
111
114
Sows Farrowing Dec e mber 2/-February March-May December 2/-May J une-August September-November June-November
2,742 3,480 6,221 3,149 2 ,992 6,140
2,501 3,062 5,563
3/5,609
2,090 2,768 4,858 2,400 2,370 4,770
1 ,926 2,462 4,388 3/2,209 3/2,200 3/4,409
68
66
81
77
149
143
72
3/72
70
3/70
1 42
3/142
Pig Crop December 2/-February March-May December 2/-May June-August September-November June-November
20,365 26,400 46 ,765 23,178 22,301 45,479
18,272 23,206 41,478
4/41 ,500
15,543 21,063 36,606 17,675 17,611 35,286
13,988 18,677 32,665
469 583 1,052 511 504 1,015
462 554 1,016
Pigs per Litter
Number
Numb e r
Number
December 2/-February
7.43
7.31
7.44
7.26
6.90
7 .00
Ma r c h - Ma y
7.59
7.58
7 .61
7.59
7.20
7.20
December 2/-May
7.52
7.46
7.5 4
7 .44
7.06
7.10
June-August
7.36
7.36
7.10
September-November
7.45
7.43
7.20
June-November
7.41
4/7.40
7 .40
7.15
1/ GA,IL,IN,IA,KS,MN,MO,NB,NC,OH. 2/ December preceding year. 3/ Intentions. 4/ Average
number of pigs per litter with allowance for trend used to compute indicated June-November
pig crop.
5
GEORGIA RED MEAT PRODUCT I ON UP
Georg ia's red meat prod u c ti o n to tal ed 4 0 .9 milli o n pounds dur ing May 19 84 , up 6 perc e n t fr om May 1983. The Ja nu ary -May 19 8 4 red meat prod u cti o n o f 196 .8 million pounds was 4 percent more t ha n the 189 .7 mi lli o n p o u n ds prod u ced dur ing the comparab le per iod of 1983 .
The number of c at tle sl augh t e r ed by comme rc ia l p lants i n Geo r g i a d u r ing May was 22 , 2 0 0 h e a d , an i n c r ea s e o f 3 , 60 0 he ad f r o m May 19 83. Calves slaught er e d in May t o t a l e d 1 , 20 0 he ad, the same a s May 19 83 .
T here we re 18 4 ,200 ho gs s laught er ed in Georgia's c ommercial p lan t s d ur ing May 198 4 . Th i s wa s 7 ,60 0 head more t h an wa s sl a u g h t e red d u r i n g May 1983.
U. S . RED MEAT PRODUCTIO N
GFR-B4-13
Co mme r c i a l red meat p r o duc ti on f or the Un i t e d S t ate s i n Ma y 1984 t o t aled 3.41 bi ll i on po u nds , u p 8 pe rc ent fr o m May 1983 . J anuary-Ma y r ed me at p r oduction, a t 16 . 1 b i l l ion po und s , wa s u p 5 pe rcent from last year.
Bee f produ ct i on, a t 2.06 bil lion po unds , u a s up 1 1 p e r c e n t . Head kil l wa s 3 .3 0
mil l ion , u p 12 perc e n t, whi l e aver ag e live wei ght dec line d 3 pounds t o 1 , 063.
Vea l pr o d u cti o n , at 39 mi lli o n pou n ds , incre a sed 22 percent. Cal f slaug h t e r o f
255 th ou sand h ead wa s u p 19 pe rc e n t a nd
ave rage l ive weight i ncre ased 3 po und s to 25 7.
Po r k pr oduction to t a led 1.28 bi ll i on
po u n d s , up 3 p er cent . The 7.37 million
head ki l le d wa s up 3 p er cent , howe ve r,
th e a v e r ag e l i v e we ight
remained
uncha nge d a t 245.
Sp e c ie s
Ge org ia Ca tt le Cal ves Ho gs She e p . Lambs
GEORGIA AND UNI TED STATES LIVESTOCK SLAUGHTER 1/
Numbe r S lau g h t e red
Ave r a g e
19 84
J an .-Ma y : Liv e We i g h t
May
as i. o f '8 4 a s i. of
May
198 3
198 4
1983
198 3
:198 3 1984
1,000 Head
Perc e nt
Pe r c e n t
Pound s
To tal
Li ve Wei gh t
May
1983
198 4
1,000 Po un ds
18 .6
22 .2
1 19
1. 2
1. 2
10 0
176 .6 184.2
104
1
1 17
913
9 14
16 , 990
20 , 311
99
33 5
32 4
40 8
394
10 2
23 1
231
40 , 777
42 , 606
1 50
84
8
Uni t e d S t a te s
Ca t t l e
2 ,9 56 .7 3 ,3 0 0.1
Calv e s
214 . 0
25 4 .7
Hogs
7 , 117 . 9 7 , 365. 7
Sheep . Lamb s
526. 8
573 . 6
1/ Includes slaughter unde r Fede r a l
farm s l aught er .
112 119 10 3 10 9 Ins pec t i on
10 6
I ,0 6~ 1 , 063 3,151, 3 30 3 , 50 8 ,3 20
113
254
257
5 4 , 40 3
65, 386
10 5
245
24 5 1 ,744 ,4 42 1 ,80 1 ,0 56
10 9
11 3
1 10
59 , 6 4 2
63 , 00 0
a nd ot he r commer ci a l s l aughter, e x cludes
COMMER CIAL RED MEAT AND LARD PRODUCT I ON: UNITED STATES WITH COMPARISONS 1 /
Kind
198 3 Million
Bee f Vea l Pork
1, 8 59 32
1, 243
Lamb . Mu tton
30
Tot al Re d Mea t
3 ,163
La rd 3/
79
1/ Ba sed on pa cker s dr e ss we i ght s and excl udes farm s l au g h t e r . 2/ Ac cum u l a te d t o t al s
based on un r o u n d e d dat a . 3 / Pr e li minary l a r d prod u cti o n i nclude s re n d e red po r k f at.
6
CATTLE ON FEED IN 7 STATES DOWN FRACTIONALLY
Cattle and calves on feed June
for
slaughter market in the 7 states
preparing monthly estimates totaled 7.32
million head, dow n fractionally from the
7.33 million head on hand a year ago, and
1 percent below June I, 1982.
Marketings of fed cattle during May totaled 1.64 million, a 4 percent increase from last year and up 16 percent from May tw o years ag~.
Placements of cattle and calves on feed
during May totaled 1.80 million, a 2
percent decrease from last May and 3
percent less t han May 1982.
Net
placement of 1.58 million for May were 6
percent below May 1983 and 8 percent
below two years ago.
CATTLE AND CALVES: NUMBER ON FEED, PLACEMENTS, MARKETED, AND OTHER DISAPPERANCE,
7 STATES, MAY 1 TO JUNE 1
1984 as 7. of
Item
1983
1984
1983
1,000 Head
On Feed May 1 11
7,221
7,376
102
Placed on Feed during May
1,838
1,798
98
Fed Cattle Marketed during Mav
1, 57 8
1,637
104
Ot h e r Disappearance during May 21
150
219
146
On Feed June 1 11
7,331
7,318
100
GEORGIA MILK PRODUCTION DOWN 3 PERCENT
U.S. MILK PRODUCTION DOWN 2 PERCENT
Georgia dairy herds produced 115 million pounds of milk during May 1984, 3 percent less than April and 7 percent less than May 1983. Less milk per cow and fewer milk cows accounted for the decrease.
Milk c ows o n Georgia 's dairy farms during May averaged 12 0,000 head, down 2,000 head from April 1984 and 8,000 head from May 1983.
Production per cow averaged 960 pounds for the month, 10 pounds less than the previous month and the previ ous year.
Milk production during May 1984 totaled 12 .3 billion pounds, 5 percent more than April 1984 but 3 percent below May 1983.
Production per cow averaged 1,132 pounds during May 1984, 6 pound s less than May 19 83.
The total number of milk cows averaged 10.9 million head during May, down 5,000 head from April 1984 and 2 percent below May 1983.
DAIRY PRODUCTION, MAY 1983-1984
Georgia
United States
Item
Unit
1983
1984 Percent
1983
1984 Percent
Milk Cows 1/
Thous . Head 128
120
94
11,107 10,851
98
Milk per Cow 2/
Pounds
970
960
99
1,138
1 ,132
99
Milk Production 2/ Mil. Lbs.
124
115
93
12,642 12 ,283
97
1/ Includes dry cows, excludes heifers not yet fresh . 2/ Excludes milk sucked by
calves.
7
~
COLD STORAGE STOCKS, UNITED STATES, MAY 31, 1984
I ~ ~ Commodity
E
~ Butter
May 31, 1983
576,078
Apr. 30, 1984
1,000 Pounds 532,356
May 31, 1984
535,257
Cheese, Natural
1,138,101
1,182,416
1,205,261
Eggs, Frozen
21,200
12,674
12,721
Fruits, Frozen
356,225
444,440
387,386
Fruit Juices, Frozen
1,775,181
1,374,694
1,429,556
Meats, Red
619,240
777,537
810,858
Beef, Frozen
265,162
324,578
304,332
Pork, Frozen
293,001
390,403
439,467
Poultry, Frozen
345,323
265,004
301,600
Turkeys, Frozen
210,463
142,224
181,006
Vegetables, Frozen
1 ,183,092
1,226,398
1,096,147
Potatoes, Frozen
986,649
808,168
842,051
Peanuts, Shelled
438,795
333,497
342,129
Peanuts, In Shell
48,811
21,697
23,375
Pecans, Shelled
32,496
34,207
35,317
Pecans, In Shel l
58,377
103,951
88,577
Percent of
May 1983 Apr. 1984
Percent
93
101
106
102
60
100
109
87
81
104
131
104
115
94
150
113
87
114
86
127
93
89
85
104
78
103
48
108
109
103
152
85
ro
Georgia
~c ro p Reporting Service
Stephens Federal Bldg. Suite 320 Athens, Georgia J 061 3
53 OK 1 3 0 00 00 25 -22 7 07502 0
4 0 4 /22 8-7 23 8 00
A EXPERIME NT ST
CA :-: OLE L E D F O ~ O
Ll d RARY
EXPER IMEN T
GA 302 12
SECOND-CLASS POSTAGE PAID AT ATHENS, GA 30613
I,
GA
GEORGIA
AYDD .C.3-
Pi
GEORGIA CROP
FARM
June 29, 1984
REPORT .~--* F~
REPORTING
i /qS5o/b~~
SERVICE
li1
ephens Federal Bldg.
te 320
a ft..... nv' :'~ A hens, Georgia 30013
one: ( 404 ) 546-2236
GFR-84-Vo lume 14
- - -- R[!G EP/ ED -----
HIGHLIGHTS
Acres P1anted & Harvested Georgia & U.S. Peanut Acres P1anted & Harves ted Georgia & Se1ected States Percent of Soybeans Doub1e Cropped Se1ected States
GEORGIA CROP ACRES REPORTED
Georgia farmers have indicated some major shifts in crop acareages f r om last year . These changes were revealed by surveys conduc ted during late May and ear l y J u n e. Some of the current increases appear large due to substantial reductions last year under the Payment In Kind proRram.
CORN UP 30 PERCENT
Corn acres planted, at 1 ,080,000, are 30 percent above the 830,000 acres in 1983, and 20 percent above the 1982 plantings. Corn acres for harvest as grain, at 930,000, are 27 percent above last year and 14 percent above the 1982 crop. As of June 24, the c r op was slightly behind average development for the date, but was far ahead of last year 's progress. Condition of the crop has declined since the f irst week of June due primarily to moisture shortages.
ACRES PLANTED AND HARVESTED, GEORGIA, 1983 AND 19 84
Planted Acres
Harvested Acres 11
Crop
Indicated
19841
Indicated
1984/
1983
1984
1983
1983
198 4
1983
1,000 Acres
Percent
1,000 Acres
Percent
Corn
830
1,080
130
735
930
127
Sorghum
118
180
153
68
110
162
Oats
155
125
81
85
65
76
Wheat
1,060
1,000
94
910
880
97
Rye
400
430
108
70
80
114
Soybeans
2,000
2 ,050
103
1,950
1,950
100
Peanuts
567
624
110
562
620
110
Cotton
120
200
167
115
2/
Hay
500
470
94
Sweetpota Loes
6.0
7.0
117
5.8
6.8
117
Tobacco, Ty pe 14
44
39
89
1/ Harvested for principal use of each crop. Corn, sorghum and small grains are "For
Grain" only. 21 Harvested acres will be issued August 10, 1984 .
Agr.lcul.tural StaU.stic:lan and Georgia Depart.ent of Agrlcul.t:ure
GEORGIA COTTON UP SHARPLY
GFR-84-Vo'. 14 GEORGIA SORGHUM JUMPS 53 PERCENT
Rebound ing from last year's PIK induced
Sorghum ac res planted and to b e planted
reduction , Georgia's cotton plantings are are est i mated at 180,000, up 53 percen t estimated at 200,000 acres , " up 67 perce 'Wnt~~~from last y e a r ' s PIK-reduc e d p lan t i n g s
from last year. Acres for ha rve st will
of 1 18 , 0 0 0 acres. The sharp i n' :re a s e for
be surveyed about August 1 a
1984 d i d not r a i s e sorgh um a c r e s t o t he
est imate re l e a s e d on Augus t 10 ,
pr e -PIK leve l of t he 198 2 plantings of
Cotton p lant ing started l a t e and made
2 0 0, 0 0 0 a c r e s , however. Approx i mat e l y
very slow progress throughout th
n e - h alf o f t h ~ curr e n t cr op wa s s eeded
planting s e a s on due to wea the r-rel at e d
at th e t im e of th e s urv ey .
problems . At th e e nd of t he t h ird we e k
in June , a muc h s mal ler p ercen t age o f the crop had r eached t he fru iting s t age than
GEORGIA PEANUT ACREAGE CLI MBS 10 PERCENT
u sual and c o n d i t i o n rat i ng s wer e weake r due to d ry s o il s .
Acreage of p eanu t s , Geo r gia' s le a d i ng c ash c r o p , i s e s t i mat e d a t 62 4, 00 0 ac r e s ,
a 10 per cent i n c r e a s e o ve r l a s t year ' s
TOBACCO OFF 11 PERCENT I ~ GEORGI A
pla nti n g s. Acres f o r h arves t , a t 62 0,00 0
a c res, a re also es timated a t 10 pe rcent
Toba c co a c re s for h a r ve s t in Geor g i a is
abo v e t h e 19 8 3 harves ted a c r es .
est imated at 39 ,000 acr e s , a d rop of II
percent f rom las t yea r ' s 44,000 acre s .
Peanu t p l anti ng b e g a n at a nor ma l da te
Thi s is the sma llest to bac co acreage f o r
bu t q Uic kl y f el l behind normal progress
Georg i a s in ce 19 32 . Th e d e cl ine fo llows
du e to we athe r pr obl ems.
Pl a n t i ng
very clos e ly the reduc tion in poundage
pr ogre s s t r a iled no rma l prog r ess fo r the
quota f o r the State.
Tr ansplantin g
r ema ind e r o f t h e plan t ing s eason . As a
prog r es s was ve r y s l ow thi s yea r due to
r e su lt of the l at e p l a n t i ngs a nd
weat he r prob lems . Ha r v e s t h a d a l a t e
su bseque n t we a th er pr ob lems,
crop
star t a lso . Thro ugh J u ne 2 4 , 19 8 4 , a bo u t
de v e lo pment i s behind n o r mal. Ov e ra ll
7 per c ent of t he crop had been harves t e d ,
c o n di t i on o f th e cro p s howed a mode ra te
wel l behind t he 5-yea r ave r age pr ogress .
we a ke n i n g d u r i n g the t h i r d week of J une,
but i s st i l l most l y good t o fa ir.
A PEANUT ACRES PLANTED 6. HARVESTED, MAJOR STATES 1982-1984
Area Pl a nted
'""Ai~ea arvested
St a t e
Alabama Fl orida Ge o r g i a New Mexico North Carol ina Okl ahoma South Carolina Texas Virginia
198 2
179.0 59.0
475 .0 10.4
152 . 0 88 .0 12 . 0
240.0 96 .0
198 3
182.0 69 .0
567 .0 11.0
150 .0 93.0 13 .0
23 0.0 96.0
198 4
1982
1, 000 Acres
220.0
177.0
85.0
51.0
624 .0
4 72 . 0
13 .0
10 . 4
156.0
149 . 0
100.0
86. 0
14.0
12. 0
235. 0
225.0
99.0
95. 0
1983
180.0 60.0
562.0 11. 0
147.0 91.0 12.5
215.0 95 .0
I nd . 1984
218 .0 76 . 0
62 0.0 13 .0
153.0 98 .0 14.0
225 .0 99.0
United States 1,311. 4
1,41 1. 0
1,546. 0
2
1 ,277 .4
1,373 .5
1,516.0
WH EAT ACRES DOWN
U. S. CORN AND SOYBEAN PLANTINGS UP
Wheat harve sted f or grain i ~ e s t i ma t e d at 880 , 000 ac r es, 3 percen t be low the 91 0 , 0 0 0 acres h arve st e d la s t yea r and the small est ha rves ted acreage i n four years. Acres p l a nt e d, a t 1 , 000 . 000, are down 6 percen t from t he 1,060, 000 a cres pl an ted in 1983. On J une 24, ha rve s t p rogr e ss a t 89 pe rc ent complete , wa s t h e same as last ye a r bu t slight ly be hi nd ave r a ge.
HAY BELOW 1983
Hay fa rm e r s a gai n rev i s e d p l ans d ownwa rd and now intend t o harves t only 470,000 ac r es . Th is c omp a r e s wi t h t h e 50 0 , 0 0 0 ac r es harve s t ed last year and t he Feb r ua r y i n t enti ons of 490 , 000 a c res. Condi t i o n o f hay c r o p s was 2 2 pe r cent g ood, 47 pe rc e nt f air, and 2 6 pe rcen t poo r at th e end o f t h e t h i rd we e k of June.
Co r n planted fo r all pu . po s e s is es timated at 79 . 9 mill ion a cres, up 33 pe rcent from l a s t y e ar , when p lanted a creage was the l o we s t since re cords bega n, but down 2 pe rc e n t f r om the 198 2 plan tings. Growers e x pe c t to harvest 7 1 .6 mi l l ion a c re s for g rain , u p 39 pe rcent f r o m 1983 b ut d own 2 p e rcent fr o m 1982. So r ghum p lant e d for all pu rpo s e s i s estimated a t 16 . 2 mi l l i o n acres, an increa se of 38 p e rcent f r om 1983 and u p 9 perc ent f rom the Febr ua rv i n ten t i on s . Gr owe r s ex pect to har v e st - 14 . 6 mill ion acre s f or gr a i n , u p 4 9 pe rc en t f r om l ast year.
Cott o n ac r e age pl an ted i s e sti ma t e d a t 11 . 3 milli on a cr e s, 43 pe r c e n t mor e t ha n last year and vi r tu a l l y the s a me a s t he 1982 plan ted a cres . sor bean a rea planted i s e stima ted a t 68 . 0 mi li on acr e s, u p 8 percen t f r om a year earlie r bu t 4 percent less than 1982 . Oat see di n gs for t he 19 84 c rop tot ale d 12~mi l lion a cr e s, a 40 per ce nt d e crea s e f r om 19 83 , but o n l y 12 p e r c e n t be l ow 1982 . Acr e a ge f o r g r a in h a rv e s t at 8 . 1 mi l l ion acres i s 11 pe r ~ e n t bel ow 1983 .
OTHEI< CROPS
Oats harvested f or grain a r e e xpe cted t o t ot a l 6 5 , 0 0 0 acres , 24 p e r c e nt less t h a n the 85 , 000 a c r e s har ve s t e d last yea r . ~ ha r v e s t ed fo r grain is e s ti mated a t 8 0 , 0 0 0 ac re s, 14 percent ab o v e th e 70 , 0 0 0 a c r e s harve st ed i n 1983 . Swee tpo tato acre a g e planted, at 7,000 , i s 1 ,000 acres more t ha n las t ye a r . Har vested a c r e a ge at 6,800 acres i s a l s o 1 , 000 acr e s more t han 198 3 .
Ha v product i on is expec t ed f rom 62 .3
mi l li o n a cre s, 4 p e r c e nt abov e 198 3 an d
1982. All tobac co produce rs e x p e ct t o harves t 798 thousand a c r e s , 1 pe r c en t mor e th a n 19 83 bu t 13 pe rcent below 1 98 2.
Fl ue c ured t o bacc o a c r e a ge is es timated a t 363 thous a n d a cre s , d own 3 per c e nt
f rom 19 8 3 . sw eetfota to plant ed acr eag e i s e sti ma te d a t 1 1 th o usand ac re s, 5 per cent g r e ate r tha n 1983 but 7 pe r c ent less th a n 19 8 2. Pe an ut g r owe rs ha ve again i nc rea sed p lant ed a c r e a ge . The 1984 esti ma t e d a cr es p lan te d to tal ed 1 . 5 5
milli on, 10 perc en t a bove las t ye a r a nd 18 perc e n t a b ove 1982 .
UN I TED STATES JUNE ACREAGE SUMMARY, SELECTED CROPS
Area Pl a n t e d fo r All Purposes
Ar ea Harves t ed 1{
198 4/
Ind .
Cr op
1 9 83
198 4
1983
1983
19 84
1 , 000 Acre s
Pe rcent
1, 000 Acr e s
All Co rn
60, 177
79 ,940
132 .8
51 , 443
71, 55 4
All Sorghum
11 ,695
16, 194
138 . 5
9, 836
14, 6 19
Oat s
20 ,290
12,229
60.3
9.0 76
8,095
Win te r Wheat
62 ,1 05
6 3 , 82 9
10 2 . 8
47,5 84
51, 147
Rye
2 , 707
2,956
109 .2
89 6
958
Soy b e a n s
63 ,139
68,02 5
10 7 .7
61 ,815
66 ,7 33
Pe a n u t s
1,41 1.0
1, 546. 0
109 .6
1 ,373.5
1,51 6. 0
Upland Co t ton 7,883 . 3
11 ,25 2.0
142.7
7 , 304. 8
All Hay
59 , 697
62 ,251
Swe etpo t a t o e s
10 5 . 3
110.7
10 5.1
10 2.4
107 . 9
Tobacco
789.0
797. 6
1/ Harves ted for principal use o f each crop, t , e. , gr a i n , beans. nut s, etc .
3
1984/ 198 3 Pe rcen t 139 .1 148 . 6
89 .2 107 . 5 106.9 108 .0 11 0 . 4
10 4 . 3 105.4 101 .1
c-
r
"1
rt
, .'
1 ;": '
.. ,-.. "'-
..,...,
I
v C . r~
\' c
SOYBEAN PLANTINGS UP
Soybean plantings at 2,050 ,000 acres a re 3 percent above the 2,000,000 acres planted last rear. Acres for harvest are estimated at , 950 , 000 , the same as last year but we ll below the record 2,35 0 ,000 acres harvested in 1982.
Wet soils and below normal temperatures c o mb i n e d to slow early season plantings. Planting progress continued behind a ve r age the entire spring with dry soils the main reason for the late spring delay. Rainfall in many areas on June 20 and after provided needed moisture for seeding soybean s f o l l owi n g small g rains . Additional moistu re is needed before planting can be completed.
Condition of the emerged portion of the crop is currently rated as mostly fair to good
PERCENT OF SOYBEAN ACREAGE PLANTED FOLLOWING
ANOTHER CROP, SELECTED STATES 1/
1980-1984
STATE 1980
1981
1982
1983
19H4
Ala.
15
26
37
18
21
Ark.
18
33
35
33
25
Del.
36
45
43
44
31
Fla.
16
16
50
42
49
Ga.
38
52
59
40
31
Ill.
3
7
4
6
5
Ind.
3
4
5
3
6
Kans.
24
24
12
11
19
Ky.
18
35
33
35
34
La.
1
5
16
8
9
Md.
24
43
47
41
38
Miss.
6
12
25
18
15
Mo.
13
19
16
15
14
N.J .
32
32
29
19
23
N.C.
24
35
37
31
32
Ohio
0
1
1
2
(I
Okla.
20
45
52
27
39
Pa.
9
10
17
9
7
S.C.
15
36
44
32
32
Tenn.
24
34
32
29
27
Tex.
9
14
18
3
3
Va.
37
51
43
46
38
U.S.
9
15
16
12
11
17 Data as obtained from area frame samples.
These data do not represent offical esti-
mates of the Crop Reporting Board but pro-
vide raw data as obtained from survey re-
spondents. The purpose of these data is
to portray trends in soybean production
practices.
The Georg ia Farm Repo r t (ISSN-0744-7280) I s pub l lshad SOl:\I-mon t h ly by the Geo rgi a Crop Report Ing Servi c e , Step hens Fede r a l Bull dIn g , Athens, Ga. 306 D, Lar ry E. Sn ipes , Stet lst lcl an-ln,.Char g e , Secon d Cla ss pos t age pa i d at Athe ns , Ga. SUbs cri pt i o n f ee S10 per year ex cept free to da t a contr I butors. Subscr I pt Io n i nformat Ion ave l I ab Ie fran: Geor gia Cr cp Repor t i ng Ser v i c e , Stephens Federal Bu l r d l nq , Su i t e 320, Athens, GA 3061 Tel e han: 4 4 4-
4
\'
GEORGIA
_ ... ---
FARM REPORT
J u Iy 12, 1984 GFR-84-15
R' J
BIGllLIGIlTS :
July 1 Crop Forecast
DOCUM ENTS UGA LI BRARIES
Initial 1984 Tobacco Forecast
Agricu1tural Prices
GEORGIA TOBACCO CROP DOWN 13 PERCE NT ; SMALLEST SINCE 1957
The first for e cast of Georgia's 1984 tobacco c r o p places e xpected production
a t 83.9 mill ion pounds, a 13 percent
decline from last ye a r ' s 96.4 mil lion pound c r o p . The 1984 tobac co c r o p is expected to be the smallest Georgia product ion s ince 1957. Growers are expected to harve st 39 .00 0 acres this year c o mpared with 44 , 0 0 0 acres last year. Yi e l d p rospects , at 2,150 pounds per acre , are 40 pound s below last ye a r ' s yiel d . The crop got off to a s low s tart and harvesting progress, at 16 percent, is much slower than a verage.
1983 Pecan Kstt-ates Initial 1984 App1e Forecast
Georgia's 1984 o a t crop was h a rvested from an estimatea- 65,00 0 ac res , and vielded 59 bushels per acre . Tot a l product ion, a t 3 .8 4 mill ion bushels. is off 26 perc ent from last y e a r . A 24 percent drop i n a cre s harvested and a lowe r yield bo t h c o nt r i but ed t o t h e d e cline .
~ Y~ p ro d u c tion i n Georg i a f o r 1 9 84 , at
1 . , 6 mi ll ion b us hels , is 20 per cen t abo ve
the pr o du ct ion in both 1 9 81 and 1982.
~o st of the i n c r e a s e c a me fr o m a 14 o er-
c e n t incre a s e i n a c r e s h ar vested, whic h
total ed
80 , 000
for
1984 .
Also
contr ibuting wa s a one bushel i ncr ease in
a ver a g e y ield , wh ich i s 2 2 bu sh els p e r
acre f o r the current ye a r .
Se e pa ge s 3 a n d 6.
Crop
Unit
GEORG IA ACREAGE AND PRODLCT IO N 1983 A~D 198 4
Acrea2e
'fie d per Ac re
Pl ant ed
For All
Har-
For
Indi-
Purposes
vested
Ha r v e s t
ca t ed
198 4
1983 1/
1984 1/
19 8 3
1984
---Thousand Acres- --
Prod uctlon
Indi-
cated
1983
1984
--ThousandS -
Wheat
Bu.
1,000
910
Oats
Bu.
125
85
Rye
Bu.
430
70
Tobacco.
Type 14
Lbs.
44
Apples, All
Commercial
Lb s .
Peaches
Lb s .
Corn
Bu.
1,080
735
Soybeans Pe~nuts
Bu. Lbs.
2.050 624
1.950 562
Sorghum Grain Bu .
180
68
Cotton 3/
Bales
200
115
Hay, All
Ton
50 0
Sweet otatoes Cwt.
5 .8
arveste or prlnclpa use.
re leased at 3 :00 P.M., August 10 .
product ion in bales.
880
34. 0
35.0
30,940 30,800
65
61. 0
59.0
5,185
3 ,835
80
21.0
22.0
1 ,470
1,760
39
2.190
2,150
96,360 83,850
20,000
. 100.000
75.0
2/
55,125
21 .0
2/
40.950
2, 790
2/ 1,567,980
41 .0
2/
2,788
4 67
2/
112
2 .00
2/
1.000
125
2/
725
an pro uctlon orecast Wl
in pounds per harvested acre,
45,000 150,000
2/
2/ 2/ 2/ 2/ 2/ 2/ e
qrlcul.t ara1 St:atlaticlan and Georpa Deparmeat of Ap'icu1t:.re
CNI TED STATES HIGHLIGHTS
GFR-84-15
Winter wheat product ion i s fore c ast a t
1. 02 b ill i on bu shels, u p 2 per c en t from
Na t i o n ' s ~~~ c r o p is forecast at bil l i o n po u~ , 1 perce n t l e ss t han
las t ye ar ' s 1.99 bill ion bushe l s, a nd
als o 2 perc ent above t h e Jun e I, 1984
t yea r, b u t 1 pe r c e nt more tha n 1982. Sta te estima t es ar e on page 6.
forecast.
Har vesting
progre5s
sl ightl y mor e than o n e-hal f c o mp l e,
Peach product ion is estimated at 2.50
which i s sl ight ly ahead o f the 5- year OTTTIon poun ds , down 1 percent from the
~ ve r a ge f o r th e s ame date.
J une 1 fore c a s t but u p 40 perc ent f r om
~lc.". l ast y ear. Th e Frees ton e c r o p , whic h
Barlev produ c tion is fore cast a t a rec o r d ex clude s Ca l i f o r n i a c l i n g s t o n e peaches
high t23 mill ion bush els, up 2 3 percent
that a r e mos tly c a nn e d, i s expe c t e d to
from the pre v ious re co rd -high 1983 c r o p.
tota l 1 .55 b illion pound s, down 2 percent
Th e e s t i ma ted yield of 5 4 . 8 b us h e l s p e r
from the June 1 fore cast but 33 perc en t
a cre i s 2.5 bushels h igher than the 1983 more than l ast ye a r .
yield .
F lue-cur e d toba cco (t y pes 11 t hrough 14)
Oat production is f o recast at 455 milli on
oushe ls , 5 percent less t han l a s t year
a nd 23 percent below the 1982 nronuctfon . Yield fo r t h e c u r r e n t y e a r is' e st i ma t e d at 56.2 bushel s per a cr~ , up 3.6 bu shel s f ro m las t y ear. Ho weve r, t h e i ncr eased yi el d wa s mo r e th an off set bv t h e 1 1 perc ent dec l ine in ha rve s ted "ac res to
producti on IS expec te d t o total 7 91 mill i on pounds , 4 perc e n t bel ow l as t vear a n d 2 1 p e rcen t bel ow 19 82 . Thi s would
plac e flue -cur ed pr oduction a t i ts lowe s t le v el s i n ce 1943. P roduc tion is d ow n i n
all stat es, e x c e p t Vi r gini a . Yi eld is f o recas t at 1, 99 7 pound s pe r acr e , 7 pounds b e low 1983 .
8.09 millio n .
~ produc t i o n i s f o re cas t a t 29 .9
mfTli o n bu sh els, 10 p er cen t mor e than
19 8 3 .
Area f or ha r ve s t , a t 958, 0 00
a cres, is up 7 pe r cen t f r om 1983 .
Av erage yield, a t 3 1 . 2 bushel s pe r acr e,
is almo st 1 bu shel above the 1983 c r o p .
. eX I TED STATES ACREAGE A~ D PRODUCTI ON 19 8 3 AND 1984
Ar ea Harve s te a
11ela Per Acre
Produc 10n
Ind 1 -
~n d1 -
I nd icated
ca ted
c a ted
Jul y I ,
Cron
Ln it
1983
198 4
19 83
1984
19 8 3
198 4
I,U UU Ac re s
- -Thousands--
Win t er Whea t
Bu.
47 , 5 8 ':'
51 , 109
" 1. 8
39 . 6
1 , 988 ,304 2,021 ,91 8
Oa t s
Bu .
9, 0 76
8 ,088
52~ 6
56 .2
4n , l33
45 4, 7 4 7
Rve
Bu.
896
958
30 . 3
3 1.2
27,116
2 9 , 90 3
Bar 1e v
Bu.
9 , 727
11 ,364
52 .3
54 .8
50 8, 3 44
622,7 46
Toba c co, F l u e - Lbs .
40 9 .8
396 .0
2 ,004
1,997
8 21,288
790 , 740
c u r e d , Typ es
1 1- 14
Ap ple s ,
Lb s .
8 , 3 14 ,500 8 , 199, 500
Commer c ia l
Pe ac h es
Lb s .
1,789, 700 2, 502, 500
Corn , For
Bu.
51 , 443
7 1 , 5 54
8 1. 0
1/
4 , 16 6 ,108
1/
Gr ain Soybean s ,
B....
61 ,3 15
.,.,., LvvL , ~ ..J .J
25.3
1/
1 ,5 6 6, 6 84
1/
Fo r Bean s
Peanut s
Lbs.
1,373 .5
1 ,5 16 .0
2 ,399
1/
3, 295 , 530
1/
Sorghum Grain Bu.
9,836
14, 619
48 .7
1/
" 7 9 , 23 1
1/
[ p l a n a Cotton Bal es
7 , 30" . 8
1/
504
1/
7 , 676 .7
1/
All Ha v
To n
59 ,6 97
62, 251
2.36
1/
140 , 734
1/
17 Th e f i rs t yl eld a na p r o auc t l o n r oreca s t Wl] l be r el e as ed at 3 :0 0 P.M. , Aug u s t 10.
The Georg ie Fer~ Repo rt ( ISSN-D 744- 7280 ) Is pub l ished s~l-monthly by t he Georg ie Crop Repor ting Ser vi ce , Step hens Fede r el Bui ld i ng. Athens . Ge . 30613, larry E. Snipes. Stat istic ian In Charge. Seco nd cl e s s postege pai d at Athe ns, GA. Subscript ion tee SIO per yea r except tree to dete contri but or s. Subsc ripti on Intor mat lon evelleb le tr~ : Georg ia Crop Reporting Serv ice, Stephens Feder al Bul ldlnq, Su i te 320 Athens GA. 30613 Telephone: (404) 546-2236.
2
GEORGIA PEACHES UP
The July
forecast of Georgia peach
production, at 150 million pounds , is 50
percent larger than last year's freeze-
reduced crop. The current forecast is
unchanged f rom June 1. This estimate
covers total production, i n c l ud i n g unhar-
v e s t e d production and any harvested but
not sold . Harvest of the current c ron rea ched 70 percent c o mp l e t i o n as of Jul~
8, 1984, compared with 77 per cent on th~
same date last year and a 5-year av e rag e
fo r that dat e of 74 percent.
SOUTHERN STATES PEACH CROP CP SHARPLY
Peach production in the nine southern
states i s fore ca st at 7 41 million p o u n d s,
u p 149 per.ce n t fro m las t vea r 's free zeravage d cr op o f o nl y 297 ~ i llion oound s .
Th e curren t f o r e c ast i s 2 percent le s s
t h an wa s tor ecaste d for J u n e I , lY ~ 4.
r rospc~ t s
i ~p~G ve d
i~
A l ao~~u
~~ t
det e r i orated in South Ca r oli na . Th e mai n
cau ses fo r th e d e c lin e in So u th Ca ro lina
were hail , and th e fa ilu re o f so me
peaches to si z e p rope rly due t o imprope r
thinning a n d h ot, dry weat h er.
PEACH PRODUCTION, SELECTED STATES, JULY 1
State
!h 11 ion Pounds
Ark. Ga.
La.2/ Mis s.2/ N.C. Okla.2/ S.C. Te x.
15.0 32 .0 120.0
5.0 4.0
2.0 9.0 210.0 16.0
1 4 ..0
30.0 100.0
6.0 4.0 12.0 9 .0 95. 0 27.0
:22.0 35.0 150 .0
7 .0 6.0 45.0 13.0
10 100. 0
23.0
9 Southern States
4 13. 0
297. 0
7 10'1 .0
Ca l. Freestone
4 15.0
435 . 0
4 40 . 0
Cal. Cling-
st one 3/
1,1 02.0
6 19.0
950. 0
U.S. Fr ees t on e
1 ,191.5
1, 170 . 7
1,552. 5
All Peach es 2 , 29 3 .5 1 , 7 89 . 7
2 ,502 .5
! J Inc l ude s unhar ve sted produc t lon a na har-
ve s t e d n ot s old ( mi l l i o n po un ds): U. S . ,
ex c l u di ng Ca lif . Cling ston e peac hes , 198 2-
24. 7 ' 1983-3 7 .5. 2/ Est im a t es f o r c ur r e n t
vear'carri ed forw ard fr om e a rl i e r f or e-
~ a s t . 3/ Ca l i f . Clings tone i s ove r th e
s c ale t onn a g e an d i nc l ude s c lllis a nd
c an nerv di v er si ons ( mil li on po und s):
1982-1 59 .0.
GEORGIA WHE AT OFF SLIGHTLY
Wh e at p ro d uc t i on i n Georgia is e stimat e d a t 30 .8 mill i o n b u shels , of f les s tha n 1 p e rc ent fro m t h e 30 .9 mil l io n bus he l s produ c e d i n 19 8 3. A 3 pe r cen t d e cl ine in ac res for h ar v est, f ro m 91 0,0 0 0 acre s las t yea r t o 88 0, 0 0 0 th is y e a r, wa s a l most o ff s e t b y a on e bu sh el inc rease in yield . Yie ld is es t i mated at 35 .0 ~ u s he ls pe r ac re .
Stat e Ala bama Georgia Mi s s i s s i p p i North Carolina So uth Carolina Tennessee
United St a t e s
a WINTER WHEAT, SE LECTED STATES J ULY 1 , 1983-19810
Ar e a Har v e sted
Yiel
Product ion
Indi cated
Indicated
Indicated
1983
198 4
19 8 3
1984
1983
198 4
460
380
33.0
34.0
l S,l80
12,920
910
880
34 .0
35.0
30,940
30 ,800
600
640
34 . 0
38 .0
20,400
24,320
470
600
34 .0
40 . 0
15,980
24 , 000
375
380
28.0
37.0
10,500
14,060
60 0
520
33.0
38.0
19,800
19,760
47 , 584
51,109
41.8 3
39.6
1,988,304
2 , 021,918
GEORGIA PRICES RECEIVED
Average prices received by Georgia farmers at mid-June were mixed compared to ~ay 19 84 prices. Commodities registering a gain in price from the previous month were corn, barrows and gilts, and commercial broilers. Milk orices remained unchanged but prices for cotton, soybeans, sows, beef cattle, calves, and all eggs 'a v e r a ge d
below a month ago.
The Georgia Prices Index for June was
Received Al 134 percent
l
o f Ctohmem o1d9i7t v~
average, 2 points below last month but 8
points above last year.
GfR- 84-15
U. S . PRICES RECEIVED INDEX DOWN 1 POINT
The June All Farm Products Index of Prices Recei ved by far mers decreased 1 point (0.7 p ercent) fr o m Mav t o 143 percent of its January-December 1~77 average. Lower prices for cattle, sovbeans, e 33s, wheat, and milk we r e partially offse t by higher prices for oranges, hogs, lettuce, lemons, and potatoes. The Index was 10 points (7.5 percent) above a year ago .
.. PRICES RECEIVED BY FARMERS J r NE 15 1984 WITH COMPARISONS
Commodi t v
Price
per t:n i t
June 1983
GeorRia May 1984
June 15, 1984
June 1983
United States
May
June IS,
19 8 4
1984
Winter Wheat Oats
S/Bu. 3/3u.
--
--
--
3.39 1. 51
3.57 1.84
3.36 1. 93
Corn
S/Bu.
3.53
3.88
3 .94
3.04
3.34
3.36
Cotton
Ct./Lb.
66.5
72 .7
1/ 70.4
62.6
73.6
1/72.4
Soybeans Sweet potatoes All Hay, bal ed 2/
S/Bu. S/Cwt. S/Ton
6--.03
8.26
2/12 -.70
8--. 06
5.90 12 . 50 75.30
8.12 2/23.50
84.90
7.65 12 .5 0 78.70
Hogs
S/Cwt .
44 .20
46 . 20
47.30
43.90
47 .20
48.40
Sows
S/Cwt .
34.50
40.90
38.40
35.70
42.60
41.10
Barrows it Gilts
S/Cwt.
46.10
47.00
48.70
45.30
47.70
49 .40
Beef Cattle 3/
,S/ Cwt .
47 .3 0
45.90
45.20
58 .30
58.60
56.50
Cows 4/
S/ Cwt.
40 .70
41.10
40 . 90
41 . 20
39.50
39.60
Steers it Heifers
S/Cwt.
53. 00
49 .80
48.80
62 .20
62.60
60.60
Calves
S/Cwt.
55 . 70
52 .40
50.80
64.30
60.80
58.90
All Milk Turkevs 2/
S/ Cwt . Ct ./Lb.
14. 20
-
14.3 0
-
5/14 .30
-
13 .20 36 .5
13.00 5/12.80
42.7
42. 5
Chickens, Exc luding
Br o i l e r s
Ct./Lb.
12. 5 2/17.0
10.0
-
-
-
Com'l Broilers 6/ Ct ./Lb.
27 . 0
31.0
5/31.5
28.5
33 .5 5/33.2
Eggs, All 7/
Ct ./Doz. 65 .9 2/85.6
75.2
2/58. 7 2/68.9
61.0
Table Hatch i n)!,
Ct ./Doz. 2/56.9
2/68.3
Ct . / Do z. 9(, . 0 2 / 1J3 . 0
57 .5
1~5 .G
2/53. 4
-
2/62.3
-
53.8 -
1/ First halt ot month. _ I Mid-month price. 31 'Cows a n d steers a nd he 1fers como ined
with all owance where neces sa ry f o r slaughter bu lls. 4/ In cludes dairy c ows sold for
slaughte r. 5/ En tire mon th. 6/ Liveweight equivalent price for Georgia. 7/ Average
of all eggs sold by far mers including hatching eggs sold at retail.
197/=100
I~DEX ~UMBERS--GEORGIA A ~D UNI TED STATES
Mav 1983
June 1983
Mav 1984
June 1984
Ge orgia
Prices Re c e i v ed
All Commodities
126
126
136*
134
Crops
122
121
137*
137
Livestock it Products
130
132
135
131
United States
Prices Received
136
133
144
143
Prices Paid 1/
161
161
166
166
P..=tio '2./
8t.
83
87
86
1/Mi d-mon t h i ndex incl ud Jng interest , taxes a n d f arm wage r a t es . 2/ Ra tio of index of
Prices Received t o Index of Prices Paid, Interest, Taxes a nd Farm Wage Races .
*Revised.
4
~.S. PRICES PAI D I~DEX L~CHA~GED
The Index of Prices Pa id ~v Farmers for
Commodities and Services, Interest, Taxes,
and Fa rm Wage Rates for June was 166
percent o f its 1977 base. The Index was
un changed fr om Mayas price increases
since Ma r c h for farm machinerv were offset
by lower pr ic es f or feed,' replacement
livestock,
and
building material s.
Compared with a year earlier, the Index
was up 5 poin~s (3.1 percent).
CONSUMER PRICE INDEX
The Mav unadjusted c o n su me r p r i c e index
for ali urban c o n s u me r s (CPI- V) at 309.7
(1967 2100) was 0 . 3 percent higher than i n
Ap r i l and 4.2 percent above ~av 1983. On
a seasonally adjusted basis, the CPI-U was
0 .2
percent
above
April .
The
transportation and med ical care indexes
increased 0.5 percent. The other good s
and serv ices index i nc r e a s e d 0 . 3 percent
fo ll o we d b y t h e h o us ing i n d e x wi t h a 0 . 2
percent inc r e a s e . Th e apparel and upkeep
i ndex i nc r e a s e d 0 .1 per c en t, but the f o od
and beverages and entertainment i nd e x e s
decreased
0.2
and
0. 1
p e r cent ,
respectively.
PRICES PAID BY FARMERS J UNE 15 198 4 WI TH CO1MPARISONS
Commod itv
Pr ice pe r Uni t
J u n e 15 , 1983
Geor2 ia
Ma y 15, June 15,
1984
1984
June 15, 1983
Un i t e d States
May 15 , June 15,
1984
1984
Dair y Fe ed 16 /.
S/Ton
185.00
200 . 00 190 .00
18 4.00
197.00
195.00
Da iry Feed 18 4
S/Ton
18 7. 0 0
205.00 196.00
193.00
207. 00
205. 00
Da ir y Con ct . 32 /.
S/ Ton
235 .00
265 .00 255. 00
2 71 .00
283. 00
27 7. 0 0
Hog Feed 14/. -18 /.
S / Cwt .
11. 00
12 .00
12.00
10 .90
11. 50
11. 30
Ho g Conct . 38:4- 4 2/.
S/ Cwt .
15.00
16 . 60
15 .50
15 .20
15 . 60
15.30
Bee f Ca ttl e Conct.
32/.- 364
S / Cwt .
12 .00
13.50
14.00
11 .90
12 . 70
12.60
I Cottons eed Meal 4 17. S/ Cwt .
Soybean Meal 4 4 4
S / Cwt .
13 .0 0 D . 50
17 .00 14 . 00
16.50 14. 00
13.90 D. 50
15.80 i 4 . 20
15.40 13.60
Br a n
S/Cwt.
11.00
11 .5 0
11 .50
9.8 5
10 .40
10. 40
Middlings
S /Cw t.
10 . 00
10 .00
10.50
9. 49
9.99
9. 83
Co r n Meal
S/ Cwt .
9. 00
9.90
10. 50
8 . 12
8 .87
8.96
Broil er Growe r
S/ Ton
190 .00
240 . 00 245. 00
2 17 .00
24 6 .00
243. 00
Lay ing Feed
S/ Ton
17 9 .00
2 2 5.00 20 5 .00
20 1 . 0 0
2 14 .0 0
212 . 00
Chic k Starter
S/ Ton
200.00
23 5 .00 220. 0 0
222. 00
23 3.00
2 29. 00
Broiler-Feed Ratio 1/ Lb s .
2.8
2 .6
2.6
2.6
2. 7
2 .7
Hog-Corn Ratio 2/
Bu.
12 . 5
11. 9
12. 0
14 . 4
14 . 1
14 . 4
Mil k-F eed Rat io 3/
Los.
1. 54
1. 43
1. 51
1. 43
I. 32
1. 3 1
ERR- Fe e d Rat i o 4 /
Lbs .
7 .4
7.6
7.3
5. 8
6. 4
5. 8
1/ Pounds o f bro il er g rowe r eq u a l i n v a l ue to 1 lb. bro iler l i v e we ig ht . 2/ Bushe ls o f
co r n equal i n v alue to 10 0 l b s . o f h o g liv e we ig ht. 3/ Po unds of 16 Z dairy fee d e qu a l
in v al ue t o 1 l b . who le mi l k. 4 / Po un ds o f laying feed e q u a l in v a l ue to 1 do z. eggs .
State Georgi a Ill ino is Indiana Iowa Kansas
FEEDER PIGS : PRICES Dollars per Cwt.
66.00 94. 00 99.00 97 .00 95.00
PAID,
BY STATES, MAY 1984
State
Do llars per Cwt.
Minnesota
102.00
~issouri
85.00
Ne b r a s k a
101.00
:-.Iorth Carolina
84.00
Ohio
80.00
5
GEORGIA APP LES REBOUND
F ollow i n g t wo v e ars o f f r e e ze d amag e , Ge o rgia ' s 198 4" apple p r o du ct i on is eX De c t ed t o r e tur n to a le ve l more in lin e with pre-freeze yea r s and eq u a l t o ~h e r e cord h i gh pr odu cti on o f 1 9 8 1. The f irst fo r e ca st f or the 19 84 cro p p r e d i c t s a t otal p r o duc t ion of 4 5 mill ion pounds , up 1 2 5 pe r ce nt fr om l ast y e ar and triple th e 19 82 c r OD. So me Dol l ina tio n Dro bl e ms wer e en co u nter ed bv the 19 8 4 cro p"d u e t o frequ ent r ai ns . Ap p r ox i ma t e ly 2 7 mil l ion pounds a re e xpec ted from North Georg ia , with the r ema in ing 18 mill ion from t he South . Se e i n se t f o r delineat ion o f " :-Iorth Ge orgia " a n d " So u t h Ge orgia " a pp le a rea s.
U.S. APPL E CROP SMA LLER
Th e Natio n ' s ap p 1p. c ro p : a t 8.20 bi ll i o n pound s, i s forecas t 1 p er c ent lowe r than l as t vear's 8 .31 b i l l i on pound s. Eastern stat e s c o l l e c t i ve l y a r e o f f 2 perc e n t . Ce n tr a l sta tes a r e e x pe c t ed to be up 7 p e r c e nt. We s te r n s tates ar e f orec as t 3 per c e n t lo wer d u e to poor we a t h e r cond i tion s during pol lination.
GFR-84-15
\
(
~------
APP LES , CO~E R CIAL
ST ATE
Georgia ~ew York Nor t h Ca ro li n a Sou t h Ca r ol i n a Tenne ssee Vi rg i ni a Wa sh in g t o n West Vi rgi n ia
1/ , PRODCCT I O ~ , SELE CTED STATES A~ D UNIT ED STATES,
TOTAL 2/
PRODUCT I OK om.
198 2
19 83
198 4
MIL LI ON P O C~DS
15. 0
20 . 0
45.0
1, 130.0
1 , 100 . 0
1,0 40.0
170 . 0
4 15. 0
37 5 .0
6.0
18. 0
40.0
4.5
8 .5
9.0
500. 0
455 . 0
480 .0
2 , 6 15. 0
3 ,000 .0
2,900 .0
230 .0
2 10. 0
22 5 . 0
198 2-1 98 4
I:-ID . 1 9 8 4 AS /. OF 1983
"__,, J-
95 90 222 106 10 5 97 107
Ot he r Stat es 3 /
3 , 4 4 4.5
3,088 .0
3 ,085.5
100
C.S .
8, 115. 0
8,3 14.5
8 ,199.5
99
1/ In o rch ar ds ot 100 o r mo re b ea ri ng a g e t r e e s . 2/ Includes unha r v e s t ed production and
ha r vest e d n ot s old ( mi l l io n po unds) : Un i t e d St ate s 1982 -1 3 . 8 , 198 3 - 2 1 . 1 . 3/ In cl u d e s AR,
CA, CO, CT , DE, lA , 1 0 , IL , IN , KS , KY, MA, MD, ME, MI, MN , MO , NH, NJ , NM, OH, OR , PA,
RI, UT, VT , WI.
19 8 3 MI~K PRODCCTION
Mi n k pel t pr o d u ct i o n in t h e Un i t e d States in 1983 t ot a l ed 4. 1 1 mill i o n pelts, co mpa r e d to 4 . 0 9 mill i on pel ts in 19 8 2 . Mi nk pel t s p r o d u ce d in Georgia i n 198 3 t ota led 5 4,200 , co mpared to 4 4,800 i n 1982 . wisc o n s i n , t he l e a d in g mi n k s ta t e , p r o du c e d 1 . 17 mi l l i on pe l ts i n 1983 . Mi n k f emal es br e d t o prod u ce kit s i n 19 8 4 i n th e Un i t e d S t ates to tal ed 1 . 1 1 mil lion, c o mpa red to 1.13 mill i o n bred to p rod uc e k i ts i n 198 3. Fema l e s b red t o prod uce k it s i n 198 4 in Ge orgia a mou n te d t o 11,200 , c o mp a r e d to 16 ,300 b r e d f o r 198 3 p r od ucti on. Na tio na lly, there were 1 , 0 6 7 mi nk far ms pr o ducing pe lts in 198 3 . Le a d ing st at es we re Wi s c ons in wi th 2 52 f a r ms , Minnesota wi th 148 far ms , an d Ut a h wi t h 1 45 . Min k pelts s ol d d ur i ng t h e 19 8 3 c ro p vear in the Un i t e d Stat e s we re v a lu e d a t $ 120. 1 mill i o n. The a verage pr ic e per pel t f o r t he 1983 c r o p ye a r was $ 2 9 . 20 , compared with $2 8.90 in 1982 and $ 32.20 in 19 81.
6
PECANS, l'TILIZED PRODUCTION, PRICE AND VALUE, SELECTED STATES & UNITED STATES, 1981-1983
Variety & State
Utilized Production 1/
1981
1982
1983
1,000 Pounds
Price Per Pound
1981
1982
1983
Cents
Value of Utilized Prod.
1981
1982
1983
1,000 Dollars
IMPROVED VARI ETI ES 21
Ala.
21 ,0 00 14,000
Ark.
1,25 0
300
Fla.
2 ,000
2,000
Ga.
96,000 105,000
La.
4,500
2,500
Miss.
5,500
3,000
~. Hex.
20,000 25,000
N.C.
2,000
900
Okla.
2,500
300
S.C.
4,800
1,200
Tex.
15.000 14,000
17,000 1,75 0 1,500
85,000 3 , 000 5,500
29,000 500
1 ,000 1 , 000 22,000
c.s.
174,550 168,200 167,250
64.0 58.7 67 . 0 59.0 65 .0 60 .0 86.0 60.0 66.5 62.4 77.0
64. 7
71.3 108.0
61.0 66.5 70.0 87.0 83.0 65.0 137.0 79 .5 95.4
72.4
52.0 85.0 70.3 66.0 65.0 65.0 73.0 75.0 86.0 84.6 77 .0
67.7
13 , 440 734
1,340 56,640
2,925 3 ,300 17 ,200 1,200 1,663 2,995 11,550
9,982 324
1,220 69,825
1,750 2,610 20,750
585 411
~54
13,356
112 ,987 121,767
&,&40
1 , 4 88 1,055 56,100 , 1,950 3,575 21,170
375 860 846 16,940
113,199
:-JATIVE & SEEDLING
Ala .
13 ,000
Ark.
4 ,250
Fla.
3 ,000
Ga.
2 4,000
La.
19,500
Hiss.
3,000
!'<.c .
2,200
Okla.
44,500
S.c.
4,100
Tex .
47.000
9,000 20 0
2,5 00 20 ,000
7,500 1.000 1,000 1,700 1 ,000 3.000
7,000 750
1.900 15.000 19,000
2,500 1,100 7,000
500 48.000
46 .0 44. 5 45. 0 43. 0 39.0 45.0 45.0 44.5 46.0 44.0
49.1 46.0 51.0 49.0 46.0 42.0 50 .0 57.0 60.2 55.7
38.0 50 .0 46 .5 45.0 39.0 41.0 50.0 43. 0 50.7 46 .4
5,980 1 ,891 1,350 10,3 20 7 ,605 1, 350
990 19,803
1,886 20,680
4,4 19 92
1, 275 9,800 3,450
420 500 969 602 1,671
\l.S.
164,550 46,900 102,750
43.7
49.5 44.0
71,855 23,198
ALL PECANS
Ala.
34,000
Ark.
5,500
Fla.
5,000
Ga.
120,000
La .
24,000
Hiss.
8 , 50 0
N. Hex.
x , c.
20, 000 4,200
Okla.
47,000
s.c .
8.900
Tex.
62,000
23,000 500
4,500 125,000
10,000 4,000
25,0 00 1,900 2,000 2 ,200
17,000
24,000 2,500 3,400
100,000 22,000 8 , 000 29,000 1, 600 8 , 000 1 ,500 70,000
57 .1 47.7 53.8 55.8 43.9 54.7 86. 0 52.1 45.7 54.8 52.0
62 .6 ' 8:1.2 55.4 63.7 52.0 75.8 83 .0
5r . 1
69.0 70 .7 88.4
47 .9 74.5 57.0 62.9 42 .5 57.5 73.0 57 .8 48.4 73.3 56.0
19,420 2,625 2,690
66,960 10,530
4.650 17,200
2,190 21 ,466
4.881 32,230
14,401 416
2,495 79,625
5,200 3.0 30 20 ,75 0 1 , 0 85 1,380 1,556 15 ,027
U.S.
339,100 215 , 100 270,000
54.5
67.4 58.7
184 ,842 144, 965
1/ In-shell basis. 2/ Budded, grafted, or top worked varieties.
2 ,660 375 884
6,750 7, 410 1, 025
550 3.010
254 22,272
45,190
11 ,500 1,863 1,939
62,850 9,360 4 , 600
2 1.170 925
3, 870 1,100 39,212
15 8,389
7
I II
(, .....)
XHl'=> P ~
'0 ~ 1:1
r"-'
m o cirn -n
up r X ,-'
H "XJ rn -0 .....
-"-
' 1\ +-
In
.z.
r
f
H"" AJ O ''.~.,.,
4 0 ='= '
- nt tlf"-J O
O ZN O
;:t:J-4W""""
o 10
Vt -.,J 0
.~,
N
P
.... w /'-'
CO \11
1
N
l .>J
N
-l
''-I
00
.....
o -l
N
, 11
o
001 '-1
VlO :.::"
\ 11
GFR-84-15 GEORGIA RE~AI~S ~UMBER 1 IN PECANS
In 1983 , Georgia again led the nation in
pecan production with a 100 million pound
crop.
Georgia's
1983
production
accounted for 37 percent of all pecans
grown in the United States surpassing the
next largest pecan producing state b y 30
million pounds.
Georgia's 198 3 crop was down 20 percent, or 25 million pounds, from the year earlier crop and 20 million pounds, or 17 percent below the 1981 crop. The 1983 crop registered the smallest product ion s ince the shor t 197 9 crop.
An end-of-se ason survey of growers, shellers and buyers revealed that the crop was 5 percent or 5 mill ion pounds smaller than had been forecast during the growing and harvesting s eason. The average pr i ce received by producers for Georgia's 1983 crop was 62.9 cents per pound, .8 cent less t ha n the 1982 average price, but up 7.1 cents f r om that rec eived for the 1981 c r o p . Overall value of the 1983 c r o p totaled $62.9 million, 21 per cent below the pr e vious year and 6 percent below t he 1981 crop.
19 8 3 U. S. PECAN CROP UP 26 PERCENT
The 1983 Un i t e d States pecan c r o p totaled
270 million pounds, 26 percent more than
the 1982 crop, but well below the 339. 1
million pounds produced in
198 1.
I mp r ov e d va r i e t i e s accounted for 62 per-
cent of the total pounds.
w0 >
The average price received by producers
a...-. o-l
w
for the 1983 crop was 58.7 cents per
pound, down 8.7 cents from the 1982
price, but up 4 . 2 cents from the 1981
price. Even with the price falling from
the previous year, the overall value of
the 1983 crop rose 9 percent to $ 158
million due to the increase in
production. Please see page 7 of this
publication for estimates of individual
8 states.
GA
GEORGIA
AI-laD .'-'9PI
GEORGIA CROP
l R~~~2E:'200~ FARM
~'l~L/17-.21 :In' m'PERtMf N
REPORTING SERVICE
REPOFt I
St phens Federal Bldg. te 320
At ens, Georgia 30613
July 27,1984
one: (404) 546-2236
GFR-84-Volume 16
- - - -- - - - -- - -- - - -
DOCUM EN'r s UGA LIBRARIES
-
HIGHLIGHTS:
Cattle Inventory Livestock S1augbter Hil.k Production Cattle on Feed.
Cold Stor a ge Pou1try Su-.ary Fara Production Expendit ure s Vegetables
JULY 1 ALL CATTLE AND CALVES IN VENTORY DOWN 1 PERCENT
Al l c attle a nd c al v es on hand in t h e Uni t ed Stat es on Ju ly 1 . 1984. are es ti mated at 122 million head. down 1 percent from July 1 a yea r ago and 2 per cent below July 1. 1982.
Cows and heifers that have calved . at 49 . 0 million. are down pe r c en t f r om 198 3 and 2 percent below July 1 two years ago.
The 1984 calf crop is expected to be 43.4 million . down 2 percent f rom both 1982 an d 1983. Calves born during the first half of the year (January through J une) a r e estimated at 30.6 million, down 2 percent from the first half in 1983.
is report provi es .S. estimates 0 mi -year catt classes. I nd i v i dua l states are not available.
inventor
CATTLE AND CALVES: NUMBER BY CLASS AND CALF CROP, UNITED STATES
JULY 1. 1982-1984
1984 as i::
Class
198 2
1983
1984
of 1983
1,000 Head
Percent
Cattle and Calves
124 ,140
123.540
121.950
99
Cows and Heifers that have Calved
49 ,990
49 . 600
48,950
99
Beef Cows
38.970
38 .480
38 .100
99
Milk Cows
1 1 . 0 20
11.120
10,850
98
Heifers 500 Pounds and Over
18 .550
18.570
18,600
100
For Beef Cow Replacement
6,120
5.800
5,600
97
For Milk Cow Replacement
4.780
4.880
4.950
101
Other Heifers
7,650
7,890
8,050
102
Steers 500 Pounds and Over
16,340
16,840
16.400
97
Bulls 500 Pounds and Over
2 .610
2,560
2,500
98
Calves under 500 Pounds
36,650
35.970
35.500
99
Calf Crop 1/
44,420
44,093
43,400
98
1/ For the current year, the calf crop is the number of calves born before July 1 plus
the number expected to be born on and after July 1.
Agricultural Statistician and Georgia epart:.ent of Agricult:ure
GEORGIA MILK PRODUCTION DOWN 9 PERCENT
GFR-84-Vol . 16 U.s. MI LK PRODUCT I ON DOWN 4 PERCENT
Milk p roduct ion during Ju n e i n Ge org i a Mi l k prod ucti o n during J u n e t o t a l e d 11 . 8
to t a l e d 102 million pounds , 1 1 p ercent b i l l ion po unds , 4 p e r c e nt be l o w June
less tha n the previous month and 9 pe r -
19 8 3.
cent below la st y ea r. Ac c umu l at ed milk~. .. .
produ ction during th e Ap ril-J u n e 198 4 Ac c umulat e d mi l k produ c tion du ring t h e
q uarter tota l e d 335 mi l lion po und s, 7 p ercent less than the comparable pe
sec ond qu a r ter o f 1984 tot aled 35 . 8 b i l l ion pound s, 3 perce n t below the
in 1983 .
c o mpar a ble pe riod i n 1983 .
Th e numbe r of milk cows o n Ge org ia far ms averaged 120, 000 hea d dur i ng J un e, t s ame as l a s t mo n t h , bu t 7 per c en t below June 1983 .
Product ion pe r c ow a v e r a ged 85 0 pounds dur i ng June , 20 pound s less than J une 1983.
Pr od uc t ion per c ow averaged 1 ,09 1 po unds d uring Ju n e, 13 po u n d s b e l o w Jun e 1983 .
Th e tot al n u mb e r o f mi l k cows aver a g e d 10.8 mi l l ion he a d , d u r i n g June, 3 t h o usand le s s t h a n th e May ave rag e .
DAIR Y PRODUCTI ON , JUNE 1983- 198 4
Geo rgia
Un i te d Stat e s
It em
Un i t
1983
1984 Pe rcent
1983
1984
Perce nt
Mil k Cows I I
Tho u s . He a d 129
120
93
1 1 , 116 10,848
98
Mi l k per Cow 21
Po u n ds
870
8 50
98
1 ,104
1 ,091
99
Mi lk Pro duc tion 2 1 Mil. Lb s .
lI 2
102
91
12,273 II , 832
96
II Incl u des dry c o ws , e xc lude s he i fer s no t yet fre sh. 2 1 Exc ludes milk s u c k e d b y
calves.
CATT LE ON FE ED DOWN 4 PERCENT IN 13 QUARTERLY STATES
Ca ttle a nd c a lve s on fe ed Ju l y I , 19 8 4 , f o r slaugh ter ma rk e t in t h e 13 q u ar t e r l y
sta t es t ot aled 8 . 70 mi l l ion h ead, 4 p e r cen t below l a s t yea r a nd 3 perc en t l es s than two year s a go .
Ma r ke tings o f fed ca t tle fo r s l aught er
du r i n g Ap r i l- June t o ta l ed 5 .6 3 mi l l i o n , u p 2 p erc en t fr om t h e same qu art er la s t ye a r , and 8 perce nt a bo ve the s ame
quarter i n 1982.
Pl a c e me nts of c at t l e a n d c a lve s o n f e e d
d u r i n g t h e Ap r il - J u n e q ua rt e r t o t a l e d 5.57 mi l li on , 5 per c ent be low t h e same qu ar ter on e ye a r ago , a nd 4 pe rcen t ~e l ow t h e comp a r a bl e p eri o d i n 1982 . Ot her d is a ppearanc e of 582 thou s a nd head l e a ve s ne t pl a c e me n t s a t 4. 99 mill i o n .
Catt l e fe ed er s ex pec t to ma rk e t 6.00 mil l ion he ad d ur ing t he J u l y - S e p t e mb e r qu a rt e r of 19 8 4 . This wo u l d be 2 percen t
g r e ate r t h a n th e t h i r d q u a r t e r ma rke ti n g s in 19 8 3, and 4 pe r cen t a b o v e 19 8 2 .
CATTLE ON FEED: NUMBER, Pl. ACEMENTS , MARKETED AND OTHER DI SAPPEARANCE APRI L 1 TO J ULY 1
To tal 13 St a tes
To t a l 7 S ta tes
Nu m b e r
198 4 a s 7-
Numb e r
198 4 as 7-
I t em
19 83
19 8 4
o f 1983
19 8 3
198 4
of 198 3
1 .00 0 Head
Perce nt
1, 0 00 Head
Pe r cen t
On Feed April 1
9, 1S 3
9 ,3 40
10 2
7,268
7,S 68
10 4
Pl a c ed on Fe e d Ap r . I - J une 30 1/
5,894
5,5 7 2
95
4,9 9 9
4, 768
95
Fe d Cat tle Mar k eted Ap r . I - J u ne 30 1 / 5,527
5,6 30
102
4 ,6 18
4 , 714
10 2
Ot h e r Di s a p pe a r a n c e Apr . I - Ju ne 3 0 2 /
4 S0
582
1 29
371
497
134
On Fe e d July 1
9, 070
8 ,700
96
7,278
7 ,125
98
Marketi ngs Jul y-Sep t .
3 / S, 89 1 4/5, 995
102
3/4,830 4/4,980
103
1/ Includes cattle pl a c e d on fee d af t er beg inning of quar ter and marke ted be fo r e e nd of
quart er . 2/ Includes death l osses , movement from feedlot s to pastures and s hipment s to
other f eedlots for fu rther feeding . 3/ Total marketings includ ing those pl a c ed on
feed a fter July 1 and markete d b e fo r e Sept . 30 . 4/ Expec t ed t o tal ma r keti n g s in cluding
an all o wa nce for t ho se p l a c e d o n feed after July 1 a n d ma rket ed b e f or e Sept. 30.
2
FARM PRODUCTION EXPENDI TURES FOR THE
SOUTHE AST REG IO N DOWN
F. .d
Farm product i on expendi t ur es in 1983
tot aled $7.0 bi lli on for the Southeast
reg ion , 6. 6 per cent belo w the $7. 5
billion in 1982 . In compari son, expendit ur es for t he U.S . in crea sed to
SHdI . Plana . F. rlllizer & ChemICAl.
$131. 3 billion , 0. 2 perc ent above
1982. The Sou t heast accounted for 5. 4
perce nt of th e U. S. t ota l . Reduced
expendi t ur es for live st ock & poul t ry and fe r t iliz er & soi l condi t i oner s
were the ma jor contribu t ors t o t he
AulOi. rrueh, TraclO" & M ach.,~e f '(
F ~r m S. Motor Supp lin
decrease. The average expenditure for f armer s in th e Southeast was $38, 912
L iw u oc lt & Poul try
some $16,546 l ess t han t he U. S. and
$1,002 below t he 1982 aver age fo r thi s
re gion . However , t he r egio nal aver age expenditur e per fa rm was hi gher than the U. S. fo r
f ert iliz er & soil conditioners , chemical s and wages & contr act l abor. Feed was the
largest expense item fo r t he Sout heast r egi on accounting for 17 percent of t he tot al.
Wa ges & cont r act l abor r epr esented 14 percent wh ile farm services includ ing rent
accounted for 12 per cent of th e tot al. In the So ut heast , 15 percent of the f arms had
sa l es great er than $100,000. They accounted fo r 76 percent of the expenses . The f arms
with s ale s between $20, 000-$1 00,000 had 15 per cent of the expenses and 21 per cent of t he
f arms. The re mai ning 9 perc ent of the t ot al expendit ures fo r the r egion came from 64
percent of the f arms wi th sal es of les s than $20, 000.
SOUTHEAST REGIO N 1/
EXPE NDITURES FOR SEL ECTED ITEMS BY VALU E OF SALES, 1983
SE LECTED ITEMS
UN DE R $20,000
$20, 000 TO
$100 ,000
$100,000+
1, 000 DOLLARS
FARM SE RVI CES
76, 616
141, 386
614, 644
FEED
LI VESTOCK &POULTRY &OTHER RELATED
58, 816
94, 461
1,038, 77 8
EXPEr.iES
42,79 0
37,9 21
380, 121
INTEREST
WAGES &CO NTR ACT LABOR FUELS &ENERGY FERTILIZER , LIME &SOIL CONDITIONERS FARM&MOTOR SUPPLIES BU ILDING, FE NCING, FARM &LAND
57,690 32,958
66,953
80, 652 53, 123
113,2 48 120, 343 94, 042
134,361 61, 75 7
448,106 843,663 350,026 455,139 325,946
IMPROVEME NTS
TRACTORS &SELF-PROPE LLE D MACHINERY OTHER FARM MACHINERY &EQUIPMENT
50, 990 9,324
13,910
19,455 50,4 10
18,581
126,210 105, 342 67,4 67
SEEDS AND PLANTS PURCHASED AGRICULTURAL CHEMICALS TAXES
AUTOS , TRUCK S, &OTHER MOTOR VE HI CLES
21,930 15, 222 39, 91 2 53, 675
51 ,036 54,874 25, 170
28, 837
179,848 249 ,412 70,802 66,345
---- -- ------------- ------- -- ----------------- --- -- ------------ ----- --------- -- -- --------- -
1/ INCL UD ES : AL, FL, GA, AND SC .
3
COLD STORAGE HIGHLIGHTS
Frozen s tocks in refrigerated wa re h ou s e s o n June 30 were greater than year e arlie r le vels for pork and beef. Cooler it e ms with s t oc k s above those o f the pre vious year included fresh f ruits, evapo r ated and condensed milk and natural chee se .
GFR-84-Vol. 16
To t al r e d me a t s in fr eezers declined 5 perc e n t f r om May 1984 but were 3 1 percent mor e than the May 1983 ho ld ings . F r ozen por k s t o c k s dropped 7 percent du ring the mon th but we re 45 percent above the previous year. Stocks of pork bell i es we re down 10 perc ent from l a s t mo n t h b u t wer e 81 p e r c e n t abov e th e 1983 hold ings.
COLD STORAGE STOCKS, UNITED STATES,
June 30,
Ma y 3 1 ,
Commodity
1983
198 4
1,000 Pounds
Butter
589,648
538,489
Cheese , Natural
1,162, 441
1,207,993
Eggs, Frozen
21,137
12,836
Fru its, Frozen
470 ,464
406 ,500
Fruit Juices, Frozen
1,666,288
1,462 ,403
Meats, Red
595 ,468
818 ,851
Beef, Frozen
253,960
312,801
Pork, Frozen
280 ,449
437,718
Poultry, Frozen
405 , 60 1
301 , 777
Turkey s, Frozen
2 55,736
18 0 , 93 5
Vegetables , Frozen
1,188,081
1 ,093,388
Potatoes, Frozen
1,015 ,273
843 ,309
Pe a n u t s Shelled
412,137
3 42 ,99 7
Peanut s In Shell
4 1 , 22 1
23 ,506
Pecans Shelled
3 4,921
35,40 1
Pecans In Shell
47, 595
88,7 60
Almonds Shelled
87 ,258
Almonds In Shell
4,585
Filberts Shelled
3,758
Filberts In Shell
32 3
En glish Walnuts Shelled
19 , 417
English Walnu ts In Shell
47,967
Other Tree Nuts Shelled
10,979
Ot h e r Tre e Nuts In Shell
57 ,09 6
55,837
JUNE 30, 19 84
June 30,
Percent of
19 84
June 1983 May 19 84
Percent
511,725
87
95
1, 184,918
102
98
14,497
69
113
455 , 123
97
112
1 ,339,878
80
92
778,352
131
95
303,921
120
97
406,425
145
93
352, 997
87
117
226,603
89
125
1,080,721
91
99
835,321
82
99
308 ,0 77
75
90
17 , 18 3
42
73
35 ,611
10 2
101
75,774
159
85
4 1, 139
47
1 ,378
30
1,380
37
431
133
19,501
100
39,892
83
10,139
92
43 ,130
76
77
The Geo r g i . Form Repo rt ( ISSN- 07 44- 72BO) Is published s.... l-monthly by the Georgi . Crop Report ing Service, St.phens Feder.1 Building, Athens, G 30613, Lorry E. Snipes, Stet lstlcl an In Charge . Second c l es s postoge pa ld e t Athe ns, GA. Subs cript ion fee S10 per yeer except free to dete contributors. SUbscription In formation ove lleble frOM: Georgie Cr op Reporting Service, Stephens Federo l Bu l Id l nq Suite 320 Athens GA . 30613 Teleohone : (404) 546-2236.
4
GEORGI A LAYER AN D EGG PRODUCTION DOWN
Georgia's laying f l o c k s p r o duced 3 44 million eggs duri ng J une 1984. 9 percent l e s s than pr oduce d during J une 1983 . Produc t ion con s isted o f 245 mill ion tabl e o r comme rci al t ype eggs a n d 99 mill ion hatchi ng e ggs.
The a ve r a g e number of layers in Georg ia during June 1984 was 18.2 million. 2 percent less than June 1983. The 18.2 milli on consisted of about 13.0 million f o r table eggs and 5.2 million layers for ha tching eggs.
Eggs la id per 100 layers during June 1984 averaged 1.887 compared with 2 .014 for June 1983.
UNITED STATES EGG PRODUCTION DOWN
The n a tion' s l a yi ng fl o ck s prod uc ed 5 . 52
billion e ggs dur ing Jun e 1984 . down fra c -
t ional l y from the 5. 53 bi l l i on produced a
yea r ago .
Produc t ion i n c l uded 4. 93
bi l li o n o f t abl e or c omme r ci al t y pe eggs
a n d 588 mill i on ha tc h i n g eggs . Th e to t al
number of l ayers dur i ng June ave r a ge d 277
million. 2 p e r c ent a b ove t h e 271 mill ion
a year ago. June e gg product ion per 100
layers for the total laying flock was
1.996 eggs compared wi t h 2.943 eggs for
June 1983 .
All layers on Jul y 1. 1984. t o tale d 277 million. up 3 percent from the 270 million a ye ar earlier . The 277 million layers consisted of 2 46 million f or t a b le or commercial type e g g s and 30.8 million f o r hatching eggs. Rate of l ay on July 1 . 1984. for all layers averaged 66 .9 eggs per 100 layers. compared with 68 .2 on J ul y 1.1983.
Georgia Hatching Other
Total Georgia Total U.S.
NUMBER OF LAYERS AND EGG PRODUCTION, JULY 19 8 4
No . Layers on
Eggs per 100
To ta l Eg gs Pr od uc e d
Hand-June
Layers-June
Du r i n g Jun e
1983
1984
1983
1984
1983
198 4
Thousands
Number
Mill ions
4.910 13.762 18.672 270.718
5 .212 13.014 18.226 276.571
1.920 2.046 2.014 2.043
1.893 1.884 1.887 1.996
94 282 376 5.530
99 245 344 5,521
Item
Chickens Egg Type Broiler Type
Turkeys
EGGS IN INCUBATORS. JULY 1984, UNITED STATES
1983
1984
i. of Year Ago
---Thousands---
28,122
35,091
125
306.556
324.198
106
26.836
24,798
92
5
GEORGIA BROILER HATCH UP
GFR-84-Vo l . 16 UN ITED STATES BROI LER- HATCH UP
The J une 19 84 hatc h o f b roiler type c hi c ks a t 57.3 mil l ion was 3 p er c e n t abo ve t h e 55. 7 mi l lion rec orded f or a y ea r earl i e r . Whe n c omp ared to May of 19 8 4 , the h a t c h wa s d own 2 percent. The Janu ary t h r u June 198 4 h a tch was 337,5 37 , 2 pe rce nt mo r e tha n t he s a me p er i od la s t
year .
The J une 1984 hat c h of broil e r - t ype chi ck s , at 3 97 mill ion, wa s up 4 perc e n t fr o m a year ago . There we re 3 24 mill ion eggs i n incubato rs on J uly I, 1984 , up 6 per cen t from a ye a r a go.
POULTRY HATCHIN G AND PLACEMENT--J UN E 19 84
Du ri ng
Z of
Z of
It em
June
May
June
yea r
Jan. t h ru J une
yea r
1983
198 4
198 4
ago
19 83
1984
ago
- - Th o us a n d s--
--Thousands--
Pulle t Ch ic ks Pl ac e d
Domest i c (U.S. ) 1/
Broi l er Type
3 , 147
3 ,5 20
3,399 108
19,609
20 .561
10 5
Eg g T yp e
4 35
437
42 4
97
1 , 765
1 , 884
10 7
Ch i cks Ha t c h ed
Broiler Type
Ge o rgi a
55 , 7 01
58, 32 1
57 ,2 66 10 3
332 , 022
337. 637
102
llni te d S ta tes
382,1 8 9 40 8. 567
3 97, 0 7 1 10 4 2,297 , 0 6 9 2. 324 , 83 2
10 1
Eg g Type
Georgia
2,518
4 , 795
4 ,378 174
11,659
26, 148
22 4
Uni ted St a tes
3 7. 487
48, 78 1
46, 5 16 124
2 17 , 34 7
26 2 .16 4
121
Tu r keys
Po u lt s Plac ed
U.S .
21,02 7
21 , 12 9
20 , 449
97 2/150 ,992 2/149, 039
99
1/ Re port e d by lead i ng b r eeder s , inc ludes ~xp e c ted p u ll et repl aceme n ts from e g g s
sold d u rin g the p re c e di n g mo n t h a t t he r a t e o f 12 5 pull e t chi ck s per 3 0 d oz en c ase
of eggs . 2/Turke y pou lt s pl aced Sep tember-June.
I tem Young Chickens
June 1983
COMMERCI AL POULTRY SLAUGHTER 1/ JUNE 198 4
Z of
May
June
yea r
J an . thru J une
1984
1984
ago
1983
1984
Thous ands
- - Tho us a nds - -
Z of ye a r ago
Georg i a Uni t e d States Ma ture Ch i cken s
54,587 3 73 , 732
52.4 43
5 1 , 93 2
37 6.380 3 66, 4 19
95
305,8 77
301. 38 0 99
98
2.105 ,9 31 2. 100 . 80 6 100
Li ght Ty pe U.S .
11 . 142
13 .165
13 .870
124
He av y Typ e U.S .
3,656
2.8 79
3 ,15 5
86
To ta l U.S.
14 .7 98
16 .044
17 ,0 2 5
1 15
Tota l All Type s , Ga.
3.070
3.063
3.375
11 0
Percent Cond e mned
78 .86 7 19.85 7 98 ,7 24 20 .6 09
70,624 90 17,069 86 87,69 3 89 17. 49 2 85
Young Ch i ckens
Georgia
1.3
1.3
2/ 1.5
2/1. 4
United Stat e s
1. 4
1. 4
2/ 1.6
2/1.5
11 Federa ll y i n s pe c t e d slaughter data as collected by Meat and Poul tr y I ns pe c ti o n Program .
:u rrent month data estimated by Market News Serv ice . 2/ January - May c o nd e mn a t i o n s .
6
GEORGIA RED MEAT PRODUCTION DOWN
Geo rg i a red meat produc t i o n tot aled 33 .2 million pounds du ring J u n e 19 84 , down 19 pe r c ent fr om May 1 9 8 4 a nd 16 p e r c en t f r om June 198 3 .
The Janua ry -June r e d me a t p r o d u c t i o n tot a led 230 . 0 mil li o n pounds , sli g ht l y mo r e t han t he s a me per iod last y e a r .
T he n u mb e r o f c a tt l e slau g htered b y c o mme rc i a l p l a n t s in Ge orgia d ur ing Ju ne wa s 20 , 200 he ad , a dec reas e of 2 ,000 fr o m the previ o u s mo n th but a n i n cr e a s e of 2 ,600 h ead fro m th e s a me p e r i o d la s t y e ar . Ca l ves s l a ugh t e r e d i n June to tale d 90 0 head, down 300 h e a d f r om t he p r e v iou s mont h a n d 1 , 0 0 0 head from Ju n e p r eviou s ye a r .
Th ere we r e 149,70 0 ho g s s l a u g h t e r e d in Ge or g i a ' g comme rc i al plan ts d u r i n g June 198 4 . Thi s wa s 3 4,5 0 0 h ead l e ss tha n t h e p r e v i o u s mon th a n d 37 , 500 head l e s s t h a n J une 198 3 .
UNITED STATES RED ME AT PRODUCTION DOWN
Commerc i al r ed mea t prod ucti o n for th e
Un i t ed S tates in Ju n e 1984 t o taled 3 . 2 0
b i l lion po u n ds, down 3 p e rc e n t from June
198 3. January-June red mea t prod ucti on ,
a t 19 . 4 b i l lion po unds , i s up 3 pe r c e n t
fro m la s t y ear . Th e 19 84 a c cumul a t ed
prod uc t ion percent changes by i ndividual
c o mpo n e nt s we r e: b e e f , up 4 pe r c e n t;
v e a l, up 13 pe rc ent ; pork , u p 2 p er c ent;
lamb a nd mut ton ,
up 5 per cent.
Be e f prod uc ti o n, a t 1. 98 bil l i o n pounds,
wa s up 1 pe rc e n t . He ad k i l l wa s 3. 19
mi l l i o n , up 2 p e r c e nt , however , t he average li ve we i ght declined 2 pou n d s t o 1 ,0 59 .
Ve a l prod u ction , a t 38 mi l l i o n po un d s wa s up 12 pe r cent . Cal f s la ug h t er of 242 t housand h e a d was u p 4 per c e n t and
a v e r a g e live we i ght i n crea sed 19 po u nd s t o 264.
Po r k produc t i on , to t aled 1.16 bi ll ion
po un ds , down 9 p e rc e nt. The 6.59 mi lli on
h e ad kil led wa s a l so d o wn 9 p e r c en t, wh i l e t h e a v er a ge li v e we ig ht in~ rca s ed 1 po und to 2 47 .
Species
Geo r g i a Ca t t l e Ca l v e s Hogs Sh eep Ii. La mbs
GEORGI A AND UNIT ED STATES LIV ESTOCK SLAUGHTER 1 /
Number Slaughter ed
Ave rag e
19 8 4
J a n. - June : Li ve Weight
June
as I. o f '8 4 as I. of
June
1983
198 4
1983
19 83
: 1983
19 84
1, 000 Head
Percent
Pe r c e nt
Po und s
To ta l
Li v e Weigh t
June
19 83
198 4
1, 000 Pounds
17 .6
20.2
115
1. 9
.9
47
18 7 .2
14 9 . 7
80
.1
.1
10 0
117
9 15
8 78
16 , 08 2
17, 767
87
325
3 18
63 1
300
98
22 9
22 7
42 , 87 9
33, 916
13 3
91
10 8
11
9
Uni t e d St ates
Ca t tle
3 , 138 . 9 3 , 18 7 . 0
Ca l ve s
231. 6 24 2 .0
Hogs
7 , 250 .6 6.594.2
Sh e e p & Lamb s
525 . 5
516.6
1/ I nc l udes s laught er under Fede r a l
f arm s la ug h t er .
102 10 4
91 98 I n spec tion
10 5
1 ,061 1,0 59 3 , 330 , 0 30 3 , 3 76 , 0 0 6
I II
245
2 64
56 ,7 3 1
63 ,838
102
2 46
24 7 1 , 78 3, 6 15 1 ,62 7, 930
10 7
1 12
10 7
58,77 5
55 , 408
a n d other c ommerci a l slaug hter , e xc lud es
COMMERCI AL RED MEAT AND LARD PRODUCTION : UNITED STATES WITH COMPARIS ONS 1/
June
1984 as ?
Januar y - June 27 1984 as ?
Ki nd
1983
198 4
o f 1983
1983
1984
of 1983
Million Po unds
Perc ent
Milli on Po un ds
Percent
Beef
1,970
1,984
101
11,082
11,527
104
Ve a l
34
38
112
201
228
113
Pork
1,266
1,156
91
7,255
7, 407
102
Lamb & Mutton
29
27
93
182
19 1
105
Total Red Meat
3,299
3,204
97
18 , 7 19
19,352
103
Lard 3/
79
72
91
464
473
102
17 Based on packers dress weights and excludes farm slaughter. 2/ Accumulated totals
based on unrounded data. 3/ Preliminary lard production includes rendered pork fat.
7
JANUARY-JUNE FRESH MARKET VEGETABLE PRODUCTION UP 5 PERCENT
The 1984 January-June production of 7
fresh
market vegetables in major
producing states is estimated at 70.1
million cwt. compared with the 67.0
million cwt . produced in the same period
of 1983. Harvested acres for the 7 crops
is estima ted at 310 thousand acres, 1
percent above January-June last year.
January-June production was above l a s t
I,
year for broccoli, cauliflower, celery
and lettuce. Production was below a year
a g o for car rots, s we e t corn a nd tomatoe s .
VEGETABLES, PROSPECTIVE AREA FOR HAR VEST,
SUMMER QUARTER 1/, U.S.
AREA
FOR
HARVEST
CROP
1982
1983
1984
Acres
Winter
134,300 145,300 149, 400
Spring
166,600 161,700 170,950
Summer
Broccoli 21 18,600
19,200
17,900
Carrots 21 25,400
23,800
25,300
Cauli-
flower 21 14,200
13 ,900
13,800
Celery 21
8,430
8,030
9 ,120
Sweet Corn 99, 800 10 4,200 106,900
Lettuce
46,400
47,500
44,800
Tomatoes
52,200
51,900
53,600
Total 7
Vegetables 26 5,030 26 8,530 271,420
11 July, Aug. and Sept. 21 Includes total for fresh market & procesing uses.
FRES H MARKET VEGETABLE ACRES UP 1 PERCENT
Prospective acreage for harvest of 7 fresh market vegetables during the summer quarter (July, August and September 1984) in major producing states is estimated at 27 1 thousand acres, 1 percent above a year ago. The vegetables included are broccoli, carrots , c auliflower, celery, sweet corn, lettuce and tomatoes. 8
II
GA
r GEORGIA
Al..IOD .C-,.
PI
FARM REPORT ;~~;-;~
GEORGIA CROP REPORTING SERVIC E
ephens Federal Bldg .
'te 320
Augu st 14, 1984
RE CEI ED
A hens , Geor gia 30613
21' LIE ' RY P one: (404 ) 546- 2236
GFR-84- Volume 17
'2 20 05 1 L:. 0 Q t i ~ . J _
HIGHLIGHTS :
DOCUM ENT S
August 1 Cro p Fo recast UGA LIBRARiES Agri cu1t ura1 Prices
F Numbers & Land In Farms
Wheat Si tuati on
CROP PROSPECTS GOOD
Yi e ld pro spec ts fo r Ge o r g i a ' s spr i n g planted crops are gene r al l y t he be t s ince 198 2. The Aug u st 1 s u r v ey ind i c a t e d very f a vor abl e pro spec t s due inly to f r equent ra i n and mod e r a t e te perat u res d uring J u l y . The a bove no r aal J u ly r a i nfal l of f s et mos t o f t h e ef f e c t s o f v ery d ry weat her i n J une e xcept for uch of t h e ear ly p l ant ed corn . Ma n y weather s tations had r e co rd . o r nea r r e cord, ra i n fal l t otals for the mon th of J uly a n d t hat he lped boost both pa s ture and hay c rop s , but suitab l e hayi n g weather wa s scarce .
CORN YIELD TIES RECORD
Yi e ld prospec t f o r Geo r g i a ' s 198 4 c o r n c r o p are for ecast t 85 bu s he l s per acre , equa l t he previou r ecor d hi gh y ield se t in 198 2. Consi derab le dry land corn in c ent r a l a nd sout he r n areas s u f f e red y i e l d reduction duri ng the J une dr ought . Howe ve r , these l ower y ie ld s were e xpected t o be of f s e t by irrigat ed f ields a nd o t h e r la t e r pl ant e d dr y l a nd corn. Re po r t s i ndi c a te so e pheno e oal yiel d s a re i n pro spe ct . Product ion fro t he 93 0 ,000 acres expected t o be ha r ve sted f or g rain should tot al 79.1 milli o n bus h el s , u p 43 per c en t from la t yea r 's PI K reduced crop.
(Contin ued on Page 2)
Crop
Un i t
Corn Sorghum Cotton 2/
Hay, All Soybeans Peanuts Sweet potatoes
Tobacco, Type 14
Apples, All Commercial 3/
Peaches 3/ Grapes
Wheat 3/ Oats 3/
Re 3 arveste
3/ Estimates
Bu. Bu. Bales Tons Bu. Lbs. Cwt.
Lbs.
GEORGIA ACREAGE AND PRODUCTION 198 3 AND 1984
crea e
ae
e r ere
ro uc 10n
Indi-
Indi-
Fo r
cat ed
cated
Harves t
Aug. 1 ,
Aug. 1 ,
1984 1/
1983
1984
1984
cres--
ousan s--
930
75 .0 85.0
55,125
79,050
11 0
41. 0 45 . 0
2,788
4,950
19 5
467
554
112
225
470
2 .00
2.40
1,000
1,128
1,950
2 1.0 27 . 0
40,950
52,650
636
2 ,790 3,300 1,567,980 2 , 098 , 800
6 .8
125
130
725
884
39
2,190 2,200
96,360
85,800
45,000 150,000
2.9 30,800
3,835 1 760
of Agricn1ture
(Continued from Pege 1) RECORD PEANUT PRODUCTION FOR GEORGIA
GFR-84-Vo'. 17 TOBACCO CROP DOWN 11 PERCENT
Ge o r g i a ' s August 1 tobacco product ion
Peanut production fro the Na t i on ' s
f o r eca s t , at 85.8 mi l l i o n pounds, is up 2
l eading peanu t State is e xpect e d to total ~.~~~cent fro t h e J u l y 1 f o rec a st b u t
2 .10 bi l l ion pounds , a n incre ase o f 34
sti l l 11 percent below t he 198 3 produc -
percent fro l as t year' s crop and a re-
ti on a Th i f o rec a st mar k o the l o we s t
c ord h i g h for Georgia. Th e s e a
product i on in 27 ye r s. The c u r r e n t
firs t yie l d est i ma t e is 3 , 300 pou n d per
yiel d for eca s t, t 2, 200 pounds per a c re ,
a c re , wh i c h is 510 pou nd s h i g he r t h a n
i s 10 po und s mor e t han 1983 , bu t mor e
las t year and 5 pounds a bove the previ ou
han off set by reduced a c r e a ge. Acre t o
rec ord hi gh y i e ld set i n 19 7 5. An e t i -
be harves ted , a t 39 , 000 are of f 5 , 000
mated 6 36, 0 0 0 ac r e s a r e e x pe c t e d t o be
from l a s t yea r . Fr equen t r a i n s have
harves t e d thi s ye a r , 13 percent a bove a
d e l aye d h ar v e s t wi t h o nl y 51 perc e nt of
ye ar ago .
the cro p pu l l e d b y Aug u st 5, c o mpa r e d
GEORGIA SOYBEAN CROP UP 29 PERCENT
wi t h a n orma l pr o g r ess of 71 p ercen t .
Georgia' s s o y bean c r o p i s expe c ted to t o t a l 52 .7 i l l i o n bu s he l s , an i ncrea e o f 29 percen t f rO ll1 l a s t ye a r ' c r o p . Thi s i nc r ea e i t he resu lt of A 29 pe r c e nt j u p i n y ield f r o 21 b ushe l s per acre last year t o the e sti .at ed 27 b u she ls per acre t h i s yea r. An esti ted 1 , 95 0 , 000 a c re a r e expe c t e d t o be harvested in 1984, unc hange d f r o l a s t year ' s ha rve sted ac r e s .
GRAIN SORGHUM TO SET RECORD YIELD
COTTON PRODUCTI ON UP SHARPLY
Ge o r gi ' s c otton g rowe r s are e x pect e d t o h arv e s t the Dec ond be st y i e ld in the St a t e 's his t o r y . At 5 54 poun d s p e r ac r e , yie l d wo ul d be 16 pe rc e n t ove r l a s t yea r 's 467 pound , bu t s ti l l f a r s ho r t of the r e co rd 714 pou nd s se t i n 198 2 . Co tton pr oduct ion i s forec t at 225 , 000 b l e s, more tha n dou b le I st yea r 's 1 12 ,000 b l ea . Co tt o n h arve t i p l a n n ed f ro 19 5 , 0 0 0 c re c o p r e d with 11 5 , 000 l a s t year , a 70 per cen t ju. p .
Grain s o r ghum i n 1984 io expected to pr oduc e 4. 9 5 i l l ion bus h e ls fr o 110 ,000 ha r vested a cre s , for an est i a t e d r e cord y ie ld of 45 bushels per a cre . The pr ev i o u s re c o r d yi el d wa s 4 3 bush e l s pe r acre set in 1976.
HAY VOLUME UP 13 PERCENT
De p i t e a reduct ion in a cr es to b e harves t ed , e xpe c t e d pr oduc t i on o f ha y i s 1.1 3 il l i on tons, a 13 percent inc rease f r om l a s t ye ar' s 1 mi lli o n t o ns . A t o t a l o f 47 0 t hou sand a c r e s are exp ec t e d t o be ha r ves t ed , a 6 percent r educ t i o n from last year . A yield of 2. 4 t on s per a c r e i s fo r e c a s t , c o mpa r e d wi t h 2.0 tons i n 1983.
The Geor g i a Farm Repo r t (I SSN-0 744-7280 ) I s pub l ished semi -mon t hly oy the Georg ia Cr op Repo rt Ing Ser v I ce , Step hen s Fed era I Bu I I dI ng , Athens, Ge, 30613 , Lar r y E. Sni pe s , STat l sTi ci an-l n-Ch ar ge , Seco nd Cl as s pos tag e pai d at Athe ns , Ga . Subsc r i pT i on f ee SI O per ye ar except f r ee t c data co nt r I but o r s , Subsc r ip tion i n f o r mat i o n ava i labl e frar. : Georgi a Cr op Repo r t i ng Serv i ce , Stephe ns Fede ra l Bu il d i ng , Su i te 320, Athen s , GA 30613 Telephon e : (4 04 ) 546-2236.
2
UNIT ED STATES HIGHLIGHTS, AUGUST I, 1984
All wheat produc tion is forecast at 2.53 b illion bu s he l s , 4 percent more than 1983. Winter wheat production is plac ed at 2 .05 b ill ion bushels, up 3 percent from 1983. Othe r spring wh e a t prod u c t ion is forecast at 386 million bushels , up 8 percent. Durum wheat i s forec ast at 97. 1 million bushels, up 33 percent f rom the 1983 crop .
Food ~rain production (wheat, rice , rye) is expected to t o tal 75 . 7 million metri c tons in 1984, up 7 pe r c ent f rom a year ago.
Co rn f o r grain produc t ion i s forecas t at 7.67 billion bushel s, 84 percent above last year's drought-stricken c r o p.
Fee d grain produc tion (corn, s orghum , oats and barley) i s expected t o total 235 million metric t on s , up 73 percent from a ye a r earl i er.
Soybean production forec~st a t 2.04 billion bu s h e l s is 30 percent larg er than 1983 but 7 percent smaller than 1982.
Hay production is forecast at a record hi gh 153 million tons, up 9 percent from 1983 and 3 percen t a bove t he previous record production set i n 1982. Pasture . and range feed cond i tion on August 1 averaged 75 percent, 1 poin t below a year ago.
All cotton production forecast at 12 . 6 million bales, i s 62 percent above the 1983 production.
All tobacco produc tion is forecast at 1.68 billion pounds, 18 percent below the 1.43 billion pounds prod uc ed in 1983.
Peanut p r o d u c t ion is es t i mat e d at a recor d high 4. 25 billion pounds, 2 9 percent above l a st year .
UNITED STATES ACREAGE AND PRODUCTION 1983 AND 1984
Area Harvested
Yield per Acre
Produc t ion
Indi-
I nd i-
I nd icated
ca t ed
ca ted
Aug . 1 ,
Crop
Un it
19 83
1984
1983
1 9 84
1983
1984
1,000 Acres
Thou sands
Corn for Grain
Bu.
51, 443
71 , 064
81.0
10 7 . 9 4 , 166 , 10 8 7,667,721
Sorg hum for Gra in Bu.
9 ,836
14,209
48.7
57 .8
47 9,2 3 1
820,8 82
Oa ts
Bu.
9, 076
8,088
52 .6
56. 3
47 7 , 13 3
455,190
Bar le y
Bu .
9,727
11,359
52 .3
52.9
508 ,34 4
601 , 0 52
Al l Whea t
Bu.
6 1,390
66 ,194
39 .4
38.2 2 ,4 19 , 824 2,527 ,834
Rye
Bu .
896
953
30 .3
31. 7
27 , 116
30, 184
Soybe an s for Beans Bu.
61,815
66,833
25. 3
30.5 1 ,566 ,684 2,035,370
Peanuts f o r Nuts Lbs . 1 ,373.5
1 , 530 . 0 2,399
2 ,7 78
3,295,5 30
4,249,950
Upl a n d Cot ton 11 Bal es 7,304.8 10,276.3
504
582
7 ,676 . 7
12,461.1
Co tt ons e e d
Tons
3 ,076
5 , 022
All Hay
Tons
59 ,6 97
62 ,251
2. 36
2. 46
140,734
153,356
Swe e t p o t a t o e s
C"" t .
102.4
105. 9
118
12 1
12,083
12, 825
Tobacco
Lb s .
789.0
796.9 1, 8 11
2,113 1 , 428 , 48 3 1 , 683 , 626
Apples, Com'l
Lbs .
8, 314,5 00 8,333,500
Peaches
Lbs.
1 , 789 , 700 2,546,000
Grapes
Tons
5,494.2
5,406.1
Walnuts (Calif.) Tons
199.0
210 .0
11 Yield in pounds.
3
GEORGIA PRICES RECEIVED
Th e Jul y Al l Co mmodi t y Ind e x of Pr i c e s Re c e i v e d by Georgia f a rm e r s at 13 4 p erce nt of t he 19 77 a ve rage , wa s u nc hang e d from t h e p r e v i ou s mo nth b ut th e i n dex wa s 7 po in t s above a yea r ago. Com p ar e d wi th" a month e a r l ier , p ric es wer e u nchanged for ca lves and all mi lk , lower f o r wh ea t, corn, so y be a ns, c o ws and all eggs . Hi g h e r p r i c e s we re re c ord e d fo r sows, b arr o ws and g i l t s , ste e r s a n d heifers a n d c o mmer c i a l b r o il e r s.
GFR-84-Vo I. 17
u.s. PRICES RECEIVED INDEX DOWN 1 POINT
The Jul v Al l Farm Products I nde x of
Price s Re c ei v ed b y Farmer s de creased 1
point f r om June to 143 percent o f its
Janua r y- De c ember 19 77 averag e. T he i n d ex
was 1 2 po int s ab ove a ve a r ago . Com p a r ed
wi t h a mo nt h e a rli er , - pr ices were lowe r
f o r s o y b ea n s, wh e at, p eac hes, h a y a nd
grap e f r u it. Part ial l y o f fs et t i n g wer e
h i gh er pr i ces for h ogs ,
or a nges,
bro il e rs, a pples and milk.
PRI CES RECEI VED BY FARMERS J ULY 15 1984 WITH COHPARISONS
Pr i c e
Geor"i a
Un it ed S t a t e s
per
Ju ly
J une
July 15 ,
J uly
J une
Ju l y 15 ,
Co mmod i tv
Uni t
198 3
1984
198 4
198 3
198 4
198 4
Wi n t er Wh e a t
S/Bu.
3. 16
3 .22
3 . II
3.2 9
3 .36
3. 27
Oat s
S/ Bu .
1. 46
1. 80
1 . 77
Corn
S/ Bu .
3 . 45
3. 94
3.69
3.1 3
3. 37
3 .32
Cott on
Ct ./Lb. 6 1.4
6 7.1
69. 5
1/ 67.7
So yb e a ns
S / Bu .
6 . 45
8 .00
6. 77
6 .2 7
7 .99
6.81
Sweet po tatoes
S / Cwt.
9 . 00
9 . 4 6 2 /1 2. 50
14. 10
All Ha y, b al e d 2 /
S/ Ton
72. 70
7 8.7 0
71 .80
Mi lk Co ws , 3 / 4 /
S/Head 1, 040. 00
885 .00 1 , 0 60 .00
91 0. 00
Ho g s So ws
S /C", t.
s/ cv e .
41. 90 3 1 .30
48 . 60 38 . 10
52 . 20 40.9 0
43 .4 0 3 3 . 90
49. 00 42. 10
52 .2 0 43. 70
Barro,,", s Eo Gil ts
S /C,,t .
43.80
50.50
54 . 10
45 .40
50. 10
53 .60
Beef Ca t t l e 5 /
S/Cw t.
44 .2 0
43. 00
43 .60
55.80
57 .60
5 7.4 0
Cows 6/
S/ C"' t .
39.30
38 .5 0
37.1 0
39.50
3 9 . 10
38. 20
S teer s [. H,"if er5
SleW'::: .
50. 30
!.ti .7 D
50. 00
5'] . 90
61. 50
52 .50
C::I ': c :;
_ S /Cto.~ ~
52. 80
1! 9 . /~ 0
49 .40
60.30
59 . 20
59 .20
All Milk
S/ Cwt .
14 . 30
14 .20
7/14.20
13.20
12 .80 7/12 .90
Turke ys 2/
Ct. /Lb.
34. 3
42 .5
44 . 0
Ch i c k e n s, Exc l uding
Br o il ers
Ct . /Lb. 14 . 0
2/ 10 .0
7 .0
Com 'l Br o ilers 8/ Ct ./ Lb. 29.5
31 .5
7/34 .6
30. 9
33 .2
7/3 5 . 5
Eg g s, Al l 9/
Ct./ Do z 64 . 6
2/75.2
70 . 4
57 .7
2/ 61 . 0
59 .9
Tab l e
Ct . / Doz 55 . 6
2/5 7 .5
57 .6
51. 8
2/ 53.8
52. 8
Ha tching
Ct./Do z. 105 . 0
2/ 125. 0
10 5. 0
1 / F i r s t h alf o f mo nth. 2/ Mid -mon th pri ce . 3/ Ani mals so l d for dair y h er d r e pl a c e me n t
o nly . 4 / Pri ce s e s t i ma t e d q ua r ter ly . 5/ "Cows " a n d " st e er s a n d h e if er s" c omb i n e d wi t h
a ll owanc e wh e r e n e c ess a r y for s l au g ht er bul ls. 6/ Inc lud e s d ai ry c ows so l d f o r sl au g h t e r .
7 / Entire month. 8/ Li v ew ei gh t equiva len t pri c e f or Geo rg ia . 9/ Avera ge o f a ll eggs
sold b y fa r mer s i nc l u d i ng h a t ch ing eggs so l d a t r et a il. * Insuffi cient s al es .
FUELS : PRI CES PAID , UNIT ED ST ATES , J ULY 1984, WITH COM PARIS ONS
1983
198 4
It em
Jul v
Jun e
Jul v
Dollars per Gallon
Gasoline, Service Stat ion, (Unleaded) 1/
1.26
1.21
1.20
Gasoline, Bulk Deliver y, (Le ad ed Re gular ) 1/
1.22
1.17
1 .15
Diesel Fuel, Bulk Delivery 2/ 3/
.989
1.01
1.00
L.P. Gas, Bulk Deliverv 2/ 3/
. 772
.754
.7 47
1/ Includes federal, st ate and loc al per gallon ta xes. 2/ Ex clude s st ate r o a d t a x e s.
3/ Includes state and local per gallon taxes where appli cable.
4
U.S . PR I CES P AID I NDEX UNCHANGE D
Th e Index of Pri ces Pai d by Farmers f or Commodities, Services, Intere st , Ta xes , and Farm Wage Rates for July was 166 percent of its 1977 base. The index was unchanged from June but it was 6 points above a yea r earlier. Pr i ce increase s sinc e Jun e for f eed e r cattle and calves were offs et by lower feed and f u e l pr i ces.
CONS UMER PRICE I NDEX
The J u ne un adjust ed con s ume r pr i ce i n d ex fo r all urban c o n s u me r s ( CPI- U) a t 31 0 . 7 (1 9 6 7 = 100 ) was 0.3 p er c ent higher than in Ma y a n d 4.2 p ercent above June 1983 .
On a seas onal ly ad jus t e d basis, t he CP I - U
was 0 .2 percen t a bove May.
The
transportation index was down 0 .2 percent
refl ecting lower gas oline prices and
sm a ller incre ases in used car prices .
The appare l a n d upkeep index was 0 .3
p erc ent lower. Offs etting were i nc rea s e s
in the other goods and se r v ice s
component, u p 0. 7 perc ent; the medi cal
c a re and e n t e r t a i n me n t c o mp o n e n t s . each
0 . 5 percent higher; and the housing i n dex
up 0 . 2 percent . The 0 .1 percent i ncrease
in foo d and beverages i ndex , due largel y
to higher fresh f r ui t and vegetabl e
pr ic es, wa s the f i rs t i nc r e a se i n this
co mp o ne n t s i nce Febr u ar y .
PRI CES PAI D BY FARMERS, J ULY I S, 19 8 4 WITH COMPARISON S
Pri ce LI
...G...:e;=o~:r:.g=.i.:a::..-
__=_
_"U_~ni..t::..e::.:d::....._=Sc::t:.a.::.t.:e:..:s::...._
_
per
July 15, J u n e IS, Ju I Y 15 . : July 15 . Jun e I S,
J u l y IS,
Commodi t y
Unit
1983
1984
1984
1983
1984
1984
Dair y Fe e d 16 %
S/Ton
186 .00
19 0.0 0
187. 00
182.00
195.00
192 . 00
Dairy Fee d 18 7.
S/ Ton
194.00
196 . 00
19 2 . 00
193. 00
205 .00
197 . 00
Dair y Con c t . 32 7.
S/ Ton
245.00
25 5.00
250 . 00
269.00
277 .00
266.00
Hog Fe ed 14 7.-18 7.
S/ Cwt .
11 . 50
12. 0' )
11.90
10. 90
11.30
I I . 10
Hog Conc t . 387.- 4 27. S / Cwt .
15 .00
15.5 0
15 .0 0
15 .00
15 .3 0
14.5 0
Be e f Cattl e Conct.
32 i:: -36 i::
S/Cwt.
12 . 50
14 . 00
14. 00
12 . 00
12. 60
12 . 40
Co t to nsee d Meal 4 1% S/Cwt .
13. 0 0
16 . 50
16. 0 0
14 . 0 0
15 . 40
15 . 20
So y be a n Mea l 4 4 %
S/Cwt .
13. 50
14 . 00
13 . 0 0
13.50
13 .6 0
13 .00
Bran
S/Cwt.
11. 00
11.50
12. 00
9.80
10.4 0
10. 20
Mi ddlin g s
S/ Cwt .
10. 00
10.50
10. 50
9. 41
9.83
9 .52
Co rn Mea l
S/ Cwt .
9 .40
10.5 0
10 . 50
8.16
8 . 96
8 .87
Br oil er Growe r
S/ Ton
200 . 00
245. 00
255. 00
2 17. 00
243 .00
23 3 .00
Laying Fe e d
S/Ton
19 5. 0 0
20 5. 00
215. 0 0
202 .00
2 12 .00
209 . 00
Chick S ta r te r
S/To n
2 25 . 0 0
220 .00
230 .00
222 .00
229 .00
23 5 .00
Br oiler-Fe ed Rati o 1/ Lb s .
3.0
2. 6
2. 7
2 .8
2. 7
3.0
Hog-Corn Ra ti o 2 /
Bu.
12 .1
12 . 3
14.1
13 .9
14.5
15 . 7
Milk-Fe ed Ratio 3/
Lbs .
1.54
1 .51
1. 52
1.4 5
1.31
1. 3 4
Egg-Fe ed Ra t i o 4/
Lbs.
0 .6
7 .~
0.)
)./
5. 0
5. /
1/ Po und s o f broil er gr o we r equal in v a l ue t o 1 lb . br o il e r l i v e weigh t . 2 / Bushe l s of
c or n e q ua l in va l ue to 10 0 Ib s . of hog li v e we igh t . 3/ Pou n ds o f 16 % dair y f e ed eq ua l
i n v a lue t o 1 lb. whol e mil k . 4 / Pounds o f la ying f e e d e qu al i n v a l u e to 1 d o z. eggs .
_ _ __ _ _ _ __
I ND E X ~ ! !:-1 REll. S - -G EORGI A A1_!) U.:.Nc.I::...;T;--E=D=-::-=S:..T.;f-'A"'T7r,:E"'S'---
T ~tii}
.J u n e i'1-if3
J u ly 19B3
Ju ne 19,34
r.:..,....,.,---rrr"lr.',...-J u ly [ 9 84
l;co rgiil
P rice s Re c e i v e d
Al l Commoditi es
126
1 '_) ~ I
134
13 4
Crops
132
133
1J 7
13 3
Li v e st ock & Pr oduct s
121
122
131
13 5
United S t a t es
P r ices Ke ce i v e d
13 3
13 1
14 4*
143
Pr ic e s Paid 1/
1 61
160
ItG
1 66
Ra ti o TIMid
-
2.' mon
th-:--:-I::\-d:Te::-x:-:--,i---:-lcc---l-.-u--d-,.~i-.n..g:':;8..:3:~l\tej-
\.~s
tJ
t axes
8~
a nd r a r iu
~ ."3. ge
87* r a t es . - 2/
Ra t io 0:
86
in d e }.. 01
P r ices Re c e i v e d t o Inde x of ~ri c e 5 Pa id, I n=eres t , Tax e s and Farm wage Rat es.
.. Revis ed.
5
Prices Received by Farmers ,U S
D;.o.:.:I1.:..:.:r,~p:.:':.;.r...:b...:u~.
10
8
'----,
GFR-84-Vot. 17
Doll.,. pl r cwt .
100~---------------------,
Wh."a t
._ ._.- ."'\.
/ .;r-._._ .
.. /
---.._. -........../
2
C~rn
, ,,1. ,,,1,,1,,1,, 1,,1 ..
19 8 0
19 6 1
19B 2
19 63
1984
4, 000 GEORGI A FARMS DI SAPPEAR
The d ownward spir al of t h e n umber o f
Georgia fa r ms c on tinue s wi t h
t he
disappea r ance o f 7 perc e n t , or 4.0 00 o f
it's 1983 f a r ms .
Wi t h 5 1, 000 f a rms
o perating i n 19 8 4 , t h e de cl ine was dou b l e
t h e 2. 00 0 fa r ms lost in the pre v iou s
yea r .
Land in f a r m i s also de c l i n ing , but a t a
slowe r pac e , indi c a ti n g t he c on solida t ing
and s hifti ng of lan d a mo ng fa rms . La nd used for a g r i c u l t u r a l pu r poses d ec line d b y 1 perc e nt t o 13 . 5 mill ion a c res . The
a v e ra ge Ge o r g i a farm inc re ased i n s i z e fro m 24 9 a cr es in 19 8 3 t o 265 a c r e s in 198 4.
19 80
19 B1
15183
FEWER U. S . FARMS
Th e n umb e r o f f a r ms i n t h e Unit e d Stat es i n 198 4 is e st imate d at 2. 33 mill ion , down 2 pe r cent from t he 2 .37 mill ion i n 1983 and down 4 per c ent from the 2 . 43 mi l l i o n in 1979 . Th e n u mber o f f a r ms gradually decl ined dur ing t he 1975- 79 pe r iod . showed a s light i ncrease in 1980 and 198 1 , then de clined between 1 and 2 perc ent pe r y ear f r om 198 2 to 198 4.
Tota l land in fa rm s f o r 1984 i s 1 .020 mi ll i o n ac r es . down fr a c ti o n a lly f r o m a yea r e ar lier but de c r e asing 2 percent fr om 19 79 . Land in f a r ms ha s d e c lined e very year since reaching i ts pe a k a t 1.206 mi ll ion a cr es in 1954. The a ve r a g e si z e o f fa r ms i n c r e ased ' f r om 428 ac re s in 197 9 t o 437 ac r e s in 1984 .
Yea r
19 79 1980 19 8 1 198 2 1983 1984
NUMBER OF FARMS. LAND IN FARMS
Geor R. i a
Number
La n d
Ave r a g e
of Fa r ms
in Farms
S ize
Thou san ds Mi l. Acre s
Ac re s
59
15. 0
25 4
59
15 . 0
2 54
60
14 . 5
242
57
14 . 0
246
55
13. 7
249
51
13 . 5
26 5
AND AVERAGE SIZE . 19 7 9 - 198 4
Un i t e d S t a te s
Nu mber
Lan d
Av e ra ge
o f Fa r ms
in Fa r ms
Si ze
Thous ands Mil. Ac res
Acre s
2 ,432
1,042 . 0
4 28
2 ,4 33
1.038. 9
427
2 .434
1,034 . 2
42 5
2,401
1, 027 . 8
4 28
2, 370
1,024. 2
432
2 , 333
1 , 019. 5
437
PERCENT OF FARMS BY ECONOMIC CLAS S UNITED ST ATES 198 0- 19 8 4
Economic Class
Pe r c e n t o f Tota l Farms
Gross Value of Sales
1980
19 8 1
198 2
198 3
$ I , OOO- S9 , OOO
49 . 3
50 . 8
51. 3
50 . 2
S1 0 , OOO- S9 9 ,99 9
39. 1
37 . 0
35. 8
36 .6
SI00,OOO+
11. 6
12 . 2
12. 9
13.2
TOTAL
100 .0
100.0
100.0
100.0
6
1984 50.5 35. 6 13.9 100.0
U.S. ONIONS STEADY
Production of &umme r , non- storage onions is fo r e c a &t a t 3.38 mi l l i o n c wt . , vir tually the same a s las t yea r, a nd 6 pe rc e nt below two ye ar s a g o .' Area for ha rve s t remains at 11. 2 thousand ac r e s , but i down 100 ac res f r o l a s t year . The average yiel d is pred i cted at 30 2 c wt. per a cre, a lit t le better tha n >a c h of t h e l a t two yea r s. Two o f t h e t h r e e producing sta t e. h ave lowe r p r o s p e c t
than a month a go .
In the Texas H ig~ Plai n , ha rve s ting of
t r a n&p l anted o n10n contin u es . Qua l i ty
i s gener a l ly good , however, s i ze s are
s mall er t ha n no r mal .
Direct seeded
on i ons are showing good izing in
irriga ted fields.
Harvest of direc t
s e eded o nions shou l d begin s oo n. Harvest
con ti nues i n the Tra n s - Pe c o s a rea , bu t i s
c o plet e in t he Pr esidio a r e a . Qual i t y
and y i e ld are good .
In New Mexico, harves t o f the Grand
variety, which account. for about 40
percent of the c ro p, is cONplete . Mid-
summer Hy b r i d vari et ie s are currently
be ing ha r ves t e d , wi t h Swe e t Sp an i sh ha r -
ve s t inc rea i n g d ail y. F i e l d s r elll8 i ning
t o be ha r ves t e d are i n good to excellent
c o nd i t i o n . In Wa s hi n g t o n , harvesting of
t he f all-see ded crop i
l most o ve r .
Growers sho uld star t h rve sting spr i ng-
seeded onions around August 8 .
U. S . SNAP BEAN PROCE SSING UP 9 PERCENT
Co n t r a c t e d pr oduct ion for proc essing s nap bean s in 1984 i fo r e c a t at 608 t housand t on , a gain of 9 pe rcent ove r last year. Ar ea fo r harvest is s et at 197 t ho u s and ac r es , up 6 percent fr om l as t year. The ave r a ge yi eld i s expec ted t o reach 3.09 t ons per acre, up . 11 tons from las t year. Mo st majo r states expect l arger crop s than last year , wi th the exc e p ti o n of
Arkan a s , Wa h ingt on, and Wi scon i n.
U.S. WHEAT STOCKS TO BUI LD SLIGHTLY 1/
Al t h o ugh to t al 19 84 program en ro l l me n t was s malle r t h an in 19 83, i t inc rea e d a f t e r progra m mod i fi c at i on s, and ros e to 6 1 percent from the e a r li er 53 pe rcen t o f the t o t al whea tl and bas e . To ta l 19 84 wheat prod uction i s f o r e c a st at 2 .55 b il l i o n b u shel s , up 5 perc en t f r o m 198 3 , but 262 mi llion und e r 198 2 ' s a l l-time h igh.
The he i g h t ened o ut put , wh en added to nea r - r ec o rd car ry in st oc ks , means f urt her b u il d i ng o f U.S. s toc k s, g i v en e x pe c t e d d ec l ines in d o mestic u s e a nd e xpo rt s . On the dome st i c si d e , h eavy wheat use fo r lives t o ck feed may c ont inue i n to t h e a u e r, but s l a c ke n therea fte r i f the 190 4 corn ha r vest r eaches o r exceeds t he for eca st 7 . 8 b i l l i on b u s hels . U. S . wh e a t expo rts f or 19 84/85 wi l l likely e n c ount er the sa e f ac tors that red uced sh i pments fo r t he last 2 year s : larger uppl i e s i n f ore i gn expo rti ng na ti on s, a gg r essive ma r ke t ing by t h e s e nations , anot h er r e c ord wor ld wh e a t h a rvest, c on t i n ued fin anci al c o nstraint s in many marke t s , t h e im p a c t o f a s t rong do l lar , a nd pr ic es be ing suppor t ed by the l oan rate for a t l east par t o f t he season. On ba l ance , tot a l 1985 / 8 5 U.S . whe a t d i s ap pea r a nc e ma y n o t e x cee d t he e xpec ted cro p , cau s i ng y ea r end s toc k s (Ma y 31 , 198 5 ) t o r ise sli g htly . I/ Sour ce : Wh e a t Outlook and S itu ati on Report, June 198 4 , ERS .
THE WHEAT SITUATION AT A GLANCE
ALL WHEAT: UNITED STATES SUPPLY AND DISApPEARANCE 1/
Yea r beginni n g
1981
1982
1983
1984
June 1
Es timated
Projected
Million BU!lh~ls
Beg i n n i ng st o cks
989
1, 164
1 , 541
1, 392
Production
2 , 799
2, 81 2
2 ,425
2,5 50 + 19 0
I mpor ts
3
8
3
3
Su p p ly , t o t a l
3,79 1
3 , 98 4
3 , 969
3,945 + 190
Domest i c
Fo o d
Seed Feed 2/ Domest ic , total
Exports Di s a p pe a r a n c e, total
Ending s t ocks
602 112 142 856
I , 771 2,627 1,164
616 97
221 934
1, 509 2,443 1 ,54 1
625 10 2 425
1,152 1, 425 2,577 1 ,392
630 95
400 1, 125 1, 350 2,475 1 , 470
++++
5 5 75
80
+++
150 175
17 5
1/ Includes flour and products in wheat equivalent.
use .
7
2/ Residual, approximates fe ed
i ' l ("'\ 0 0
X H l>l> ~
""':IU1 :Q
m :;oom "'Tl
;>OJ I>r x 0
H ;Qm -U ~
3: -< mc-
rn r ;l:J O ~
z
nJH ~ W
-i 0 ::'::' Il r ll N O
OZ NO
:V -i (;O 0
o 10
V. -.l O
C'I
...... N
l>
P WN
(XlV!
I
N
W
N
a
-.I
N
CC
~
C ....
"
0 "CIJ
\J C
C
I.
>'"Cl OO o-iOt'l :::00 0
.~ ~
OO c) t'll 0
c)'"Clt'" >
H OO
...., tloo
0>
.a.......-,. o-i
GEORGIA WHEAT VARIETIES SURVEYED
Coker 7 9 7 was the most popula r 1984 wheat
var iet y planted in Georgia, account ing
f o r 3 1. 8 percent of the total a creage
s eede d . Howe v e r, F l o r i da 3 01 was t he
mo s t f requ e n tly r e por t ed var i ety wi t h
2 7. 8 pe r c ent o f the f a rm s
r eport ing
havi ng pl an t ed F l o r i d a 301 . Cok er 79 7
wa s second a s the mo s t f requen tly
repor t e d va r i e t y and F lo r i d a 30 1 was
s e c o n d in t o t a l a c r e age wit h 2 7 .4 percent
of the r epor ted ac r es .
Th e s e two
va ri e t ies accounted f or ove r half o f the
a c r e s a n d nu mber o f fa rms repor t i n g . I n
a d is t a nt t h i rd plac e f or both acreage
and f r e qu enc y wa s Co k e r 7 47 ~ith 10 . 5
pe rc ent o f the acrea ge an d 10 . 7 per cen t
o f t h e wh e a t f a rms .
A sampl e o f Geo r g i a 's whe a t g r owe r s wa s
s u r v e yed abo u t Ma y I , 198 4 , t o d e te r mi n e
whic h v a r i e tie s had b e e n s ele ct e d fo r
plan t ing t he 198 4 crop .
The s urvey
cove r e d a s imp l e r a n d o m s amp l e o f k n own
wh e a t pro duc ers a nd ma k e s n o st a teme n t o r
cl a im o f s tat i s t ica l ac c urac y .
WH EAT VARI ET I ES , GEORGIA, 1984 CROP
Percent Indicated Pe r c e n t
Va r i e t y of Ac res
Acres
of Farms
Planted
Planted Reporti ng
Coker 797 31.8
318 ,000
23.3
Florida 301 27 . 4
274,000
27 .8
Coke r 7 47
10.5
105 ,000
10.7
Coker 762
10.0
100, 000
8.1
Coker 916
2.8
28,000
4.2
Omega 78
2.3
23,000
3. 5
McNa ir 100 3 2.0
20,000
3 .0
Hunter
1.9
19,000
1.6
Georgia 1123 1.5
15,000
1. 9
Stacy
1. 4
14,000
1.6
Mc Na i r 1813 1.3
13,000
1.6
Othe r Kn own
Va r i e t i e s 11 2 .7
27 ,000
4.8
Variety
Unknown
4.4
44,000
7 .9
TOTAL
100.0 1, 000 , 000
10 0.0
11 All less than 1 percent of reported
acres.
8
\GEORGIA FARM
Augus t 28, 1984
GFR- 84- Vo I ume I ~
Gf\
A~()D ,t.1
PI
F.2-
I ~~y/8 -d-ca _
GeORGIA CROP
-="
REPORT I NG
Cif
ephens Federal Bldg.
uwrr 2 WB?
te 320 thens, Georgia 30613
hone: (404 ) 546-2236
REC EI VEO: .-.- 2.15c.1.:.:1.':.9:.:Y.:.=.- - - - -__
HIGHLIGHTS Fara Labor & Wages Pou1try Sua.ary
APH 2 1 2005 DOCUMENTS
UGA LIBRARIES
FARM LABOR PAY RAT E UP 18 CE~TS
During t h e s u r v e y we ek o f J ul y 8 - 1 4 , 19 8 4 , Georgi a h i re d f arm work er s wer e pa i d an a ver a g e h o u rl y wa g e of $3 . 41 . This c o mp a r e s with $ 3. 2 3 p aid during the co r r e s po n d i n g surve y week of July, 19 83, a n inc re ase o f 18 cents ,
Al l farm workers i n Ge orgi a number e d 8 0 , 0 0 0 fo r t h e surve y week . This i s down
Co1d Storage Milk Production
2. per c e nt fr om th e 82, 0 0 0 wo r k e r s f o r t h e we e k of J u ly 10 - 17, 19 8 3 . Th e av er a ge we e kl y h o u r s wo r ked b y hir e d wo rk ers w ~ re u p f r om 2 9.7 in 198 3 t o 33 .0 i n 1984 . We e k l y hours worked by th e s el f - em pl o y e d , a t 4 1 . 8 h ours, wer e d own f rom l a st yea r 's 46.0 a v e r q ge h ours , whi l e unpaid wo r ke rs wo r ke d 4 4 . 0 h our s durin g t h e s u rv ey we ek t h is y e a r co mpa re d with 41.2 h our s l ast ye ar .
St a te a n d Re gi o n
Ark a n s a s Flori da Ce o r g La Lo u i s i a n a Mi ssissipp i ~. Ca ro l i na So u t he a s t 2 /
-= RATE S~U---L'Yt'vpe8-o1r4,p1-il-9j:m84woS...E!.:TLeElC'"TsE-D -ST-A- TES,
REGIONS
At-iD U>: I TED STATES Methoa--'of-Pa \'
1/
F 1 cla
Liv e Sto c k
Su n er vI sor v
Oth er
Hour lv .
Pi e ce Ra t e
Ot h e r
- - "b o l l .:l r s ner Hour - - - -
3 . 62
4.40
5 . 14
3 .90
3 .95
3/
3 . 96
4 . 09
4 . 20
7 .1 4
5 .69
4.5 1
3/
5 . 18
3. 0 7
3 .79
3/
3.61
3 .47
3/
3.34
3.89
4.08
6 . 30
4 .37
4.10
3/
4 .78
3.32
3.42
3/
3.45
3 .46
3/
3. 65
3 .40 3 .4 2
4.19 3.88
3/ 5 . 89
3 . 70 4 .0 5
3 .-4 7 3 .72
3/ 3. 1 1
4 .2 6 3.84
;';o r t h e a s t
3 . 58
3 .27
5.63
4 .78
3 .78
4 .07
3 .55
t-iorth Central
3.77
3 . 53
6 . 16
4.13
3 .89
3 .82
3.7 9
Pl ains
3.93
4 .24
6. 11
4.43
4 . 18
5.86
4 . 25
In termou n tai n
3.63
4. 18
5 . 85
3.85
3.81
4. 24
4.00
Pac i f ic
4 .7 5
4.8 5
(, .8 8
5 . 55
4 .84
5 .64
5 .76
C. S . (49 Sts .)
3.9 3
3 .93
6 .2 8
4.4 5
4 .12
4.60
4 . 17
V Zx clunes ag r lcult ura l s e r v i c c work e rs. 27 L1stcd ~a te s p l us Ala . , S.C . and Tenn .
3/ In s u f f i c i en t data for t h is category . Dat a i n c lud e d i n all h ir ed fa rm workers a n d
in region and U.S . wage rates .
Agrleultural St:atf.stf.c:lan aDd Georgf.a Depart:.ent of Agricu1t:ure
St ate a nd
~~ o n
GFR-84-Vol . 116
\,IO RKERS O ~ FAR:-1S
Al l Fa r m Wor ke r s i /
BY ST ATE . REGI ON AND UNI T ED STAT ES ,
Self Eml'l oved
; "Nilmh e r
: of
lJnaid : Wor k ers - nou sands - -
JULY H1red
8 -14J
1984
Expected t o be Empl oved
hO Davs
149 Davs
o r :-1ore
or Less
Ar k . F l a. Ga .
La ~
Y1is s . :\ . C .
-7/ 1.-,
38 20
12
21
15
6
46
38
6 8
80
28
9
43
17
26
37 57 163
.1, 7. -43'"
18
1I
24
14
25
95
19
7 10 76
Southeast 2 /
71 0
26 2
3 38
146
192
Ill. Ind .
I o "'.a Kv . Mi ch . ~li n n ,
Mo .
Ohio Wis.
1 ':'0
69
26
45
12
33
91
50
18
23
8
15
186
90
48
':' 8
11
37
9G
52
21
23
12
11
12 2
50
29
43
11
32
208 14 7
90 79
7 :)
,',-..,
43
21
26
9
22 17
120
54
27
39
17
22-
170
64
60
46
28
18
No r t h
Ce n t ra l
1, 280
:'98
34 6
33 6
12 9
207
x. v.
Pa . Va.
10:'
34
25
46
27
19
107
3:'
38
34
20
14
68
37
12
19
6
13
No rth e a st 3/
':'38
1 57
111.
170
98
72
Kans .
98
5I
24
23
7
16
Ne b r .
102
44
?_ -/
31
16
15
Te x .
22 0
10 1)
30
90
50
40
Plai ns 4/
63 6
28 4
1 :'7
195
97
98
A~" i z . Col o . I da ho
29. 5
3. s
11
15
11
4
50 51
22
?_ 1.
15
13
7
7
23
8
6 15
In te r -
238
86
67
85
47
38
mou n t a i n 5/
Ca l i f .
273
55
12
2 06
119
87
Ha"".
16
2.4
1.6
12
10
2
Ore8
81
23
11
47
15
32
Wa sh .
78
20
12
46
i7
29
Pa c i f ic
':'48
10 0.4
36 . 6
311
161
1 50
C.S . (49
S t a tes )
3 , 75 0
1 .487 .4
8 2] .6
1.4 3 5
678
7 :'7
TiEx c 1 ude s ag rI c u l tu r a l serv i c e 1No rk el" s. 2 / Li st ed S ta tes p lus 7 iT a . S . C . and Tenn.
3/ Lis t en St a tes plus Co n n . Del.. Main e, ~ln . ~lass ., ~ . H . , ;-l.J ., R .I., Vt., and W. Va.
4/ L isted S t a te s p lus N. Da k . Ok La ,. , a n d S . Dak . 5/ L isted Stat es plus Mont .
Nev . , N. He x. ~ e t a h , and Wyo.
2
GO RG:: .:\ 3 RO 1 !-ER E.\ TC : ! rr
T :-: ::- .J u Ly 1 9 S ~ h a tch o f b r o i l e r t ype
;- :,:i L: ;{ S :l ~ :.. 7 .0 m i L l f o n wa s 1 p c r c e u t,
ab o ve t i,e 55 .2 milli o n ~ e c o ~ d e d 3 v ~ ~: -
~~ ~- ~ i c ; ~ b i i t s Li g h t Ly l e s s t h a n r e c o r d e d
i. n .]t; n ~ 1 9 ,<:. ;.. .
~h e .La n u a r y t h r o ug h ";l: : y
:--. :~ :. . :'! ~ ';,.".::!s 3 9 ':' , &6 ~ , :::0 0 ~ p e r c e n t ~ 0 1- e ~ :~.~_Hl
: ~ ~ e s~ nl C per i o d 1 3 s t ye a r .
~ . S . BROILER HATCH UP 4 PERCENT
Th e J u l v 1984 hatch o f broiler -t ype c h i ck s , at 3 93 million, wa s 4 p e rce nt g re a t e r t h a n " du ring J u ly la st yea r. As o f Augu s t 1 th er e wer e 328 milli o n e g 8 s i n incubat or s, 6 percent more than a year e a r l ier .
_ _ _ _ _ _ _ _ _ _ _ ..P:...O:::.:U::.:L::..T::..:Rc:.l:... _H~" T C H I NG A!\'D PL ACEMENT - - JULY 19 84
Du ring
:.~
:; o f
I tem
Ju lv
1 9 8~
Ju n e
J u ly
y e a :~
Jan . t hru Ju1v
- - Th1o9u8 4s and s _ _ 1 9::8.4::::~----.::a:cug.:o::.-----=-.:.1..9::8:--3=-:T-"h"co-u--s-a-n.:a1.s9.~~-:.-.4::...-
yea r =acg:::o...._ _
Pul let Ch ic ks Placed
Do me s t i c ( U . s--:)"l-Y--
Br o i l er Tv pe
~,48 5
Egg T yp e '
36 7
3, 399 424
3,1 3 ) 126
35 9
98
22, 0 9 4 2,132
2 3 ,696
107
2,243
10 )
Ch ic k s !l at che d
P,r oi r e r TvpeGe o r g i a Un i ted Sta tes
, 160
) 7 ,2 66
57,0 28 10 3
38 7 , 18 2
3 94 , 6 6 5
10 2
37 7 ,988 3 9 7 ,07 1
3 9 3 , 3 2 7 104 2,67 ) ,0)7 2 , 718 ,159
10 2
Egg Type Geo r g i a Un i t e d State s
') 4 1 7 30: )0
4 ,378 4 6 ,51 6
3 , 14 0 130 37 ,84 1 J 24
14 , 076 247,877
29 ,2 88
208
300 ,005
121
Tu rk ev s
Po ult s Plac e d
LS .
17 Repo l- te d
by
19 le ading
'-~5 r~e ~ e2~ 0
4 ,, 9 i n clud es
18, 7 )1\ expe c
t
ed
9r>8U_IG~:t! /1r7~0a22c)ement2s/1t62r-o1":7'~m97e-g-g-s-~:"9"9""'
s old d u r in g th e p r eced in g mo n th a t t h e r at e o f 125 pu Ll e r; ch i cks per 3 0 d o z e n case
o f eggs . 2/T ur k e y poults pla c e d Se pt em b er-J uly.
It em
Chi ckens Egg Type Broile r T y p e
Turkevs .
EGG S I N INC UBATORS , AUG UST 1984 , ~N I T E D STATES
198 3
19 8 4
% o f Year Ago
---Thou s and s---
27 ,628
30 ,888
1 12
3 0 7, 81 6
327 ,740
10 6
1.0 2 1:...0=--
-C1:..7:...,J.5-::4-.:7..:-.
102
XU ~BER OF LAYERS AND EGG PRO DUC T I O~ , J ULY 1984
Ko . Laye rs o n
Eg gs per 10 0
Tot al Eg gs Produ ced
Ha n d - J u 1 y
..:L.:.:.'l=.v.-..:.c:..r:: s - J u~'y"--
::.D..l::l:.:r:...i..=.n:.:sg.2.-.J:::..u.:~l .1.y
_
198 3
19 8 4
19 8 3
1984
19 8 3
198 4
Thou sand s
Numb er
~li llion s
GC0 1-g i a
Hi1 t c h i n g
4 , 893
5 , 099
1 ,9 34
1 ,947
95
99
Othe r
13 ,44 3
13 ,270
2,0 37
1,98 9
274
264
Tot al Ge o r g i a
18 ,33 6
18 ,3 6 9
2,01 2
1, 976
369
363
To t a l L. S .
269, 73 2
275 , 5 75
2, 0 9 6
2 ,08 3
5, 6 5"
5 , 739
The Georg i. F. r .. Report lI SSN- 0744- 7280) Is published .... I-lIIOnthly by t he Georgi. Crop Reporting Serv ice, Stephens Fed. r . 1 Bui ld ing, Athens , G 30613, lorry E. Snipes, Sto tl stl c l.n In Chorgo. Second c loss post.go pa id . t At hens, GA. SUbscription fee S10 per yeor except fr_ to cleto contr ibutors. Subscr ipt ion Info r ...t lon .volleb le fre- : Georgie Crop Reporting Serv ice, Stephens Federo l Bul ld lnQ, Sui te 320 At hens GA. J06 13 Teleahane : (4~ ) 546-2236
3
GFR-84-Vo I If
Cm-e-1ERCI AL POljLTRY SLAuGHTER 1/ , J ULY 1 9 8 4 ,.., of
I. of
It em
Jul y
J une
198 3
198 4
- - - Thou sa nd s -
Jul y 198 4
yea r a go
Jan . th ru July
1983
19 84
- - - Thou s a nd s-
year a go
Young Ch icken s
Geor gia
47,97 3
50 , 264
52 , 789
110
3 53 , 8 50
3 52, 50 1 100
Un i te d Sta tes
332,128
3 6 1 ,3 01
36 9 ,598
1 1 1 2 ,438 ,060 2,476 , 178 10 2
~l ature Ch ic ke ns
Ligh t Type U.S .
10, 8 1 (I
13, 14 8
12 , 594
1 17
8 9 ,679
82 ,88 9
92
He a v y Typ e U.S .
2,61 I)
3,3 37
2 ,8 48
109
22 ,46 7
20 , 099
89
To t a I C.S .
13, 4 20
J 6, 48 5
1 5 ) 4~2
J 15
112,146
10 2 , 9 8 8
92
To tal All Ty pe s, Ga . 2, 8 4 2
3 ,34 3
3, 0 62
108
23,451
20 ,522
88
-P -~-_r._c-p-n t- -Co -nd-e-m-n e-d Yo u n g Ch i c k e ns
Gco rgia
1~ 3
: .3
2/1. 4
2/1 .4
Cn i t e d S t a t es
i .4
1. 4
2/1 . 5
2/1 .4
1 / Fe d e rally in s p e c ted s l a u g h te r d a t a a s c o l l e c t e d h y ~ eat and Poultry Inspec tion
P r o gr am . Curr ent month da ta e s t i ma t e d b y Ma rk et Ne ws Ser vi ce . 2/ J a n u a r y-Ju n e
co n d e mn a t i o n s .
Wha t a Dollar Sp ent on Foo d Paid for in 1983
~~ en yo u s ?e ~ d ~ doll ar o n f oe d n: t he s e p e r~ a= k 2t o r r e s t au r an t , t.:h,] ~ do e s y o u r i;:cne:: p a y f o r ? The c ha rt b e !c~ S ~~~~ S t ~ ~ : ~ ~ 1933 , 2 7 C~ ~ = ~ ~c n : ~~ck : 0 t he f a rme r , 33 cen t s pai d f e r l .Jb o:- co s ts , and t he r ~ na i n i n g 40 c e n ~ s c o ve re d ~ ,] ~ y o t h e r ~a ,:"k et ing c o s c s -- f: o ~ pil ck~g i n~ t o pr of i t .
. ~ . t n l ,~ . "
~
~.
3l ~ ,
8 2 11 0 "..,, J~ l ~
1:
, _lt l
FI.'~ ::
\~ ...
~
~"\:
~ ll ~. "
~
"' \
Y
2
27e
33c
Be
5c
4C
4C
9c
Fa rm Va iue
Market ing om
If'ch.;ces rooc at home and away hom ~orr.e Ctle~ C05 :5 Ir:C;UCe properly ta xes and .nsurar-ce. account.nq aoc profe ssIona l services aromoi -oo. bac -jeCts . ana many rn.sce uaneous ue-ns
1983 prehmlnary
4
CATT L E ON FEED IN 7 ST AT E S D O~N PERCENT
Ca t tle and c a lves o n fee d Aug us t
for
sl au ghter marke t i n t h e 7 s tates
p repari ng mon thl y est imat e s t ot al e d 6. 8 1
mi l l io n h e ad, down 1 p er c e n t f rom a v ea r
ago and f r ac ti o n a ll y below Au gust' I ,
198 2 .
~ ark et inBs of fed ca t t le d ur in g Ju ly t ot al e d 1 . 55 mi l l io n , 4 per ce nt ab ove l a st ye ar a n d 5 p e rc e n t mo re t h an J u ly
two ye a r s ago .
P l a c e me n t s o f cat t le a nd ca lves on f ee d i n t h e 7 s ta tes during J u l y t ot al e d 1. 32 mi l l i o n , u p 13 oe r cen t from l a st v ear and 10 p er c e n t ab o ~ e J u l y 19 82 . ~ e t p l ac e ments o f 1. 24 mi ll io n f o r .Ju l v a re 15
pe rc e n t above l ast year and up 9 percent
f rom two yea rs a go .
Othe r disa ppea ranc e total e d 84 thou s and h e ad, co moa re d wit h 9 4 t h ou s and d u r i ng
.rui 19 8 3 ' an d 68 thous a n d dur i ng Ju l y
1982. .
CAT T LE A~:D CAL VE S : :-:C:--IBE R 0 :\ FE ED , P LAC E ~l EN T S , ~I A F. KETED, AND OTHER DIS APPEARANCE,
_ _ __ _ _ _ __ _ _ _ _ _ _ _ __ _ 7_"s-~T..A:..'_T''_E'::cS:..,.L_J..:.U._LY 1 T O _A_U_G.;...U"-' 'S'-~T____'I'__
__n'nl"" 7:__::_::;___Oi:'
1984 as %
I tem
198 3
19 8 4
l ,u OO Hea d
o f 1983
On Fe e d, .Iu l v 11 /
7 ,278
7,1 25
98
Pl a c e d on Fe e d dur ing July
1, 174
1, 323
1 13
Fed Cattl e Mark eted during J u l v
1,49 7
1,553
104
Oth e r Disa ppe a ra nce d ur in g .Ju l Y 2/
94
84
89
On F e ed Au g u s t 1 1 /
6 861
6, 81 1
99
1/ CaLtle a n d ca lv e s o n f eed a r c an i ma ls t or s la u g h te r ma r ke t b ein g fe d a full
r a t i o n o f g ra in or o t h e r c oncen t r a te s a nd ar e e x pec t e d t o produc e a c a rc a s s that
wi l l p., ra d e good o r be t ter . 2/ I n clu des dea t h Lo s s e s , mo v e ment f r o m fe e d lo t s t o
pas t ur es a nd s hipme n ts t o o t he r fe e d l o ts f o r f u r t h e r f eeding .
.
GEORG I A MI LK PR ODlJCTI O" DOW:\ 1 3 P ERC E:-<T
~ . s . MI LK PR ODUCT I ON DOWN 4 PER CE:\T
Geo rg ia 's dai ry h e r d s produc ed 9 1 mill i on ",oun ds o f mil k d u r i n g July 191\4, I I pe r c e n t le s s th a n l as t mont h a n d 1 3 pe rce n t be low a ye a r ago .
T h e numbe r o f milk c ows o n Geo rg ia fa ~ m s a ve r a g e d 1 17 , 0 0 0 he ad dur i n g July , co mpa red t o 12 0 , 0 0 0 du r i n g Jun e and 128,0 0 0 J u ly l a s t ye ar .
Produc ti o n pe r co ~ a v eraged 7 8 0 po und s du r i ng J ul y, ~O p o u n d s less t tl an July 198 3 .
DAI RY
:--I i 1k prod u c t i o n d urin g Ju l y 198 4 t o t a l e d 11 . 6 b i l l i o n pound s , 4 p e r cen t l ess t ha n J u l y 198 3 .
Ac cu mu la Led mi l k p r od uc t t o n ci u r i ng t h e fi rs t seven mo nt hs of 1984 tota led 81 .5 b i 11 i o n p ounds , do wn 2 p e r c en t f r o m t h e s am e peri od in 1983 ,
F ro d uc t i o n pe r c o ~ av~ ra ged 1 , 0 69 p ounds duri ng J u l y 19 8 4 , 15 pou nd s beI o~ J u ly 198 3 .
The to tal n u mh e r of milk co~ s av e ra g ed 10. 8 mi l l io n h e a d d u r in g July , 3 p er c e n t l e s s t h a n a yea r e arli e r.
1 tp.m
l:n i t
Per c e nt
198 3
~li 1 k Co ws 1 /
T'h o u s . He a d
91
11 ,12 6
:-!ilk pe r Cow '2/
Pound s
78 0
95
1,08 4
Mi lk Pr o du c t i on 2 / Mi l. L b s .
105
91
87
12 . 061
1 / In clud e s d rv co ws , e xc l u de s h eif e rs n o t yet f re s h . 2/ Ex cludes milk s u c k e d b y
ca l ve s . 5
GEORe I A R: n ~! ~~/\ T PRO Dl:CT 1 O ~~
c . s . RED ~EAT P R O D U C T !O ~
GFR-84-Vol. 18
Ge o r g ia l- e d mea t p r o d u c t t o n t ot al ed 3 1 .3
m i Ll Lo n po u nds d u r t u g .iu l y 1 9 8':' , down <)
p e rc en t f rom a ye2 l- ago .
Th e .Le nu a r y >
..: : 11 v 1 9 8 4 r e o mo a t p r o d u c t i on t o t a I e d
::(,] . 9 m iLl Lo n p o u n d s .
"!" ~ ~ e
n u mb c r o f (";I t. L l e s l n u g h t c r c d hy
c o mme r c i a l pla n ts in Geo l- ~ ia c u ri n e .I u l y
'..; () S 19 ~ 200 hC :l C1 ~ 2. 1\ in cr C(l s e o f 2 , BOO
h e a d f r om Jul y t h e p r e vi o u s y(~.1r . Ca lv es
fi} :i ~':8h tcre!: : i ~ , Y~j1 v t.o :.: ::.; r ,: ~ ,'1 0 (l heild,
Th c rl~ \..- ( : ~- P. : 4 3 ~ () O CI h o e s
s ;~Jt i ~ h t e l .; d
in
c o mrnc r I c a l. p lan ts a c r o s s L ! H ~ SLa Le d u r i ri g
.Lu l y 1Y84 .
This wa s 2() ,{~ O() h e a d l e s s
th a n ti le s a m," p c r Lo d l a s t yea t- .
Cornmcrc ia l ' r e d mea t p~ o d u ~ t i o n fo r t il e
L n i t. c d St at es i n .Iu l v i9 8 ~ t o t a Le d 3.04
b :'11 i on p o u u d s , u p "i p e t-ce n t f r orn J u l y
19 8 3 . .Ja nua r v -e.J u l v r e d mo a t, p r od uc t t o ri , 3t 2~ .4 b i l l io~ pou~ds , is up " 3 p e rc e n:
f rnm1 a s t yea r .
C {)m:r:~ rc -i.:.1 1 r- e d m e a ;
pr oduc t i on
i n c l ud e s
s laugh te r
in
Fe ue r nI ly !:1 sp e cted a:ld o t h e r plan ts, b u t
e x cl u d e s a nima ls sl a ug ilterc cl on fa r ms .
Bc pf !lroductjon, ~! t 1 .94 b i J.lio n pC) lJ!\ ds ,
wa s u p 7 percen t. Head kill wa s 3.1 3
rni Ll
L
o
n
,
up 9 per c ent ;
th(~ a ve r a g e
Li v
e
we i g ht wa s 1 , 0 5 5 pounds p e r h ead .
Vea l :l ro d lJc t i on l a L 39 mi ll i o n pou n d s , ....a s up 18 p er c ent . C ~lf s laug h t e r of 2 7 5 t!\ousa nd head ~ a s :J Il ]6 per cent an <i a ve rage live we i gh t remai n cd u nchange d a t
24 0 .
Pork p rod uc tion , t ot a led 1 . 0 4 bi l lion p o u n d s, d o wn 8 p crc en t . Th e 6 . 0 0 mi l lio n h e ad k i I le d wa s d o wn 9 pe rce n t ) wh i I. e th e ~ ~ ~ ra g e liv e wei gh t r e :na i n e d u tlc ha n ge d a t
.:... .. .
G~ ol- .~ i .:.
C .:! ~ t :' f'!
Ca l ve s
! ~0 0 S
S
il
e
c
p
S
Larnb s
J u 1 v 19B4
1 , 0 0 0 Hc a d
l6~ . 2
19.2 1. 5
14 3. 6
a s i~ 0 f :<)8 3
Pe r ccn ~
5 T :\ T S LI VESTO CK S U\ UGlr!'ER 1 /
Av e r e g e
: L i ve Wei ght
' 8 4 as :;; o f
July
19 83 _ _ --:.:.. :1...9.:.c8::..:3:..._ --:1:...9.:..8.:...4:...._ _
Pe rcen t
Po unds
To ta l
Live We i gh t
July
--.:1c.9::..8:::..3:.:-.
......1:..9.::8..:4:-'-
1 ,000 Po u nd s
11 7
1 17
906
886
14 ,817
16,990
63
83
3:! 3
34 4
70 ::!
5 13
87
97
22 8
227
37 ,462
32 ,648
1 67
96
11
C i1 } .. S
::n g s
Sl ~ e c: p &..
Lam ':J ~
:.::. ~-~ slaugh ter.
_i<.. 1_.n d--- -- - -
T O:'::l: ~ C {: :43 !-C J.:/.
i ! 3 :J, s c d 0 :1
2 3 6. :\ 5j ~ _3
(. ~ 0 (' ~ . :; 528 . 6
109 : 16
91 103 In spe c t ion
10 6
10 1 l06 a nd
1 , 0 67 1 ,0 5 5 3 , 058 ,9 (,2 3 ,297 ,089
2~ (:
24 0
56 , 73 2
66.17 0
244
244 1 , 599 ,8 20 1 ,4&6 ,26 1
1 10
10 7
56 , 754
56 ,4 3 3
~ t t l e r comme rc i a l sl au g hter, excludes
R E ~ ~!!-~ ,,\:. _:\ ~~ D !.. ~\~D rR Or.L'C!' r o ~;: L'y } T ED ST ATE S \.JI TH CC ~~?/\R 1 so~s 1 /
.) , :] y
1')f\ 4.:.
198 4 as :
.si 1'ilL!
~a l~ . - J u l y 2 /
198:1
1 'J1l4
19 3~ as -, of 198 3
:! i 1 J
B :~: 7
on
POl,:
:H..! ,9
S J
3
E' t~l- L C ~ : .
] 0 ;-
~! i. 1 l i o n Po un d s
12 ,888
13, 4 6 3
Perce n t 10 4
3 ;.
:\ 9
j 18
23 4
267
1 14
12 .::.
i , O':'U
92
0 , 3 \9
8 ,4'::' ;-
10 1
~ .S
2 .:1
10 8
2~O
c:3
i0 4
3 , (:(12
3 , 0 -'<3
101
2 1 , -I ~_ 1.
...:...--=-
(.::..6.::..
_n
53 6
{i :-ess ~ r.i ;: ~ : :':'s a n d c x c l u d e s f a r r.: ~ l .:lt ;z h t c r .
2 2, ) <) 5
103
538
! 00
2/ A c c urnu L a t e d t o t a ls
}/ ?:.-.c l i I:::'n ,:n- y l ard p ro duc t I o n in cl ud e s r e n d e r e d po r k fat .
6
1983-84 MUSHROOM PRODUCT ION AND VALUE UP
Mushr oom produ ct ion i n t h e Unite d Stat e s
r eac h ed a n ew re c or d h ig h 54 3 mill i on
pounds d u r i n g the 198 3- 8 4 ma r ke t ing
s eason. This i s 11 perc ent h i gher t h a n
19 8 2 - 8 3 , and 5 p e r cent above t h e 1981 - 3 2
cr op.
This yea r ' s s urv e y i nc lude s
gr owe rs wit h p r o du ct i on in 25 S t a t es .
Pennsylvania , the l eading State, with ne arly 52 perc ent o f the U.S. 1983-84 crop. grew 28 0 million pounds, up 13 pe rcen t from the prev iou s s eason. Ea s te r n Stat es a c c ount ed f or 63 p er c e nt of the total U.S. p rod u ct ion ; Ce nt ral States, 12 p e r c e n t ; a nd West e rn St at es, 25 per cent .
MUSHROOMS: ARE A, PROQUCTI 0N, PRI CE AN D VALU E JULY I , 1981 TO JUNE 30, 1984
AREA IN PR ODUCT ION
STATE
:-------------------------------------------- ----:
PR ICE
VAL UE
AND
: FIRST : SECON D : ADDITIONAL:
: PR OD UCTION
PER
OF
YEAR
: FILLI NG : FILLING : FILL INGS : TOTAL
PO UND
PROD UCTI ON
-- --- -- ---- ---- -- ------ --- -- -- -- ------- --- ----------- ------ -- ---- ----- ---- ---- ----- ----- ---- --- --- ---- -------- --
1, 000 SQUAR E FE ET
1, 000 PO UN DS
CEN TS
1, 000 DOLLAR S
CALIF
1981-82
5,4 70
5, 492
12, 884
23, 846
87, 543
102. 0
RR ,907
1982-83
5, 039
5,0 39
13,699
23, 777
89, 414
111.0
99, 415
1983- 84
5, 085
5,09 1
10, 583
20,759
89, 677
103. 0
92,01 1
DEL
1981- 82 1982-83 1983-84
965
949
250
2, 164
5, 546
64.1
1,1 13
1, 094
487
2, 694
7,2 23
67.9
1, 073
943
483
2, 499
7, 289
71. 9
3,557 4 ,9 02 5, 239
MD 1981-82 1982-83 1983-84
376
256
176
355
284
191
372
261
126
80A
2,31 6
61.1i
830
2,29 1
67 .6
759
2, 146
71.5
1, 426 1, 548 1, 535
MIC H
1981-82 1982-83 1983-84
1, 598
1, 598
2,096
5,2 92
19, 044
70.6
1,559
1, 594
2, 758
5,911
18 ,86 5
83.0
1,4 20
1, 398
1, 891
4,7 09
17, 506
93. 5
13, 436 15,6 61 16,3 65
NJ 198 1- 8 2 1982-83 1983- 84
14 6
82
2
230
586
50.2
294
101
79
16
196
586
62 . 8
368
101
86
28
215
592
60. 6
359
NY
1981-8 2 1982-83 1983-84
938
926
172
2, 036
4, 995
78. 8
528
51 4
263
1,305
2, 431
89.4
515
494
193
1, 202
2, 340
84. 9
3, 936 2, 173
1, 986
PA
1981-82 1982- 83 1983- 84
25,9 02 22,606
23,92 6
23, 960
_?2?.1. ,,.a3... o_71.0..
25, 498 24, 644
27,4 80
75,3 60 68, 620
'711 ? Q O
, ' J _ ... ....
273,048
246 ,5 82
27 9 J5 5 ~
65. 8 70. 0
73. ~
179,557 172, 607
205,19 5
OTH STS 1/
1981-82 1982-83 21 1983-84
10,466 7,0 39 6,914
6, 709 6, 944 6,5 22
14, 415
18 , 079 20, 400
31, 590 32,06 2 33, 836
124, 068 123, 434 143, 529
102. 8 109. 0 104. 0
127, 593 134, 747
148, 741
US 1981-82
1982-83 2/ 1983- 84
45,86 1 38, 340 39,4 06
39, 972
36,918 37, 678
55,49 3
60, 137 61,18 4
141, 326
135,3 95 138, 26R
517,146 490, 826 542,733
81.0 87. 9 86. 9
41 8,7 06 431, 421 471, 432
1/ COLO, CONN , FLA, GA , ILL, IND , lA, MINN , OHIO , OKLA, OREG , TE NN, TEX, UTAH, VA , WASH, WVA , AND WI S. 21 REV ISED .
7
___ _ ____
_ ______ __ _ __ _ ._
C O~')
STC?I3 AGE STOCKS ,
U);I TED ST ;\TES J---:J::...U;::'.;L::,.Y=--=3.:..:.1 .---..:1...9.:....:8:.-4.:....J,
July 3 1 ,
Jun e :I I ,
Ju l y 3 1 ,
_ Pe rcen t of
~ommo rl i t _v
.
198 3
1984
198 4
Jul v 1983 J un e 1984
1 , 000 Poun ds
Perc e nt
B utL ~r
588 ,3 98
51 6 ,7 i3
487 ,430
83
94
C h eese , ~ <1t LJ I-a I
1, 19 4 , 234
1 , 19 3 , 3 59
1, 186 ,9 62
99
99
EP'8 s, Froze n
20,4 18
16', 3(i 5
2 1 , 13 6
10 4
129
F I- U i t s , F I- a Z C' n
54 9 , 7 90
45 1 ,4 72
581 ,9 43
106
12 9
F r u i t .Lni c e s , Fr o ze n
1 ,5 28,22 1
1 , 303, 8 59
1,1 41, 928
75
88
Me a.ts, Red
5 69 , 8 25
77 6 ,34 9
7 17 , 322
126
92
Beef , Fr o z en
2 52 ,27 8
30 3 , 150
303 ,748
120
100
Pork , Fro z en
252 ,98 5
40 5 , 213
34 8,271
1 38
86
Pou ltry , Froz<: n
480 , 195
352 , 220
40 8 , 40 3
85
116
Tu r k c ys , F'r o c c n
323 ,463
226 ,296
269 ,944
83
119
Veg et a bl e s, F roz en
1 , 399 ,63 1
1 , 08 0 ,9 74
1 ,311,3 45
94
121
Pot at o e s, F r oz en
8 23 ,1 58
8 40, 438
626 ,3 56
76
75
P c a n u t s , S h ( ~ l le d
.1 6 1 , 9 0 2
308 , 0 63
22 5,394
62
73
Pe a n u t s , I n S hel l
3 5 ,7 30
1 7, 18 2
13 ,46 3
38
78
Pecalls , Sh e l l e d
32 ,5 10
35, 607
35 ,38 3
109
99
Pe c a n s , I n S h e l l
.
4...c:G.161
75 ,795
69 , 140
1 68
91
co
Georgia
~crop Reporting Service
Stephens Federal Bldg. Suite 320 Athens. Georgia ) 061 )
0 4 2 F0 1 1 3 000 00 2 5 - 2Z ( U / ~ v ~ v
40 4/2 2 3- 72 3 8
UU O~V J
0, EX PER IME NT ST A
CAKO LE L E D ~ O ~ D
L I 3RA RY
~ XPERIMfN T
Go, 3 02 1 2
SECOND-CLASS POSTAGE PAID AT ATHENS, GA 30613
\'
GEO RGIA
FARM RE
september 14 , 1984
-GFR- 84- Vo l ume 19
~~ Al.foDt t-
GEORGIA
PI
- ORT F.:L ~ 199Lj/~-/~
RECEIVE D
CROP REPORT ING SERVIC E
ephe ns Fede ral Bl dg .
te 320
ens, Georgia 30013
ne : ( 404 ) 546-2236
HIGHLIGHTS:
Septe.ber 1 Cr op Forecast
Initia1 1984 Pecan Forecast:
Prelbdnary 1983 Fara Lncoee Agricu1tural Prices
t o da t e has caused soil moi s t u r e supplies to p l ung e to the lowe st level s s ince mid -
J u n e. Thus far. ha rv e st prog r ess ha s
YI ELD PROSPECTS C O~TI ~CE GOO D
been slowe r than u s u a l due t o pl anti n g
de l a y s i n t he s pri ng and hi gh s o i l
The favorabl e pros pec ts heralded on
moi stur e s u p p Lf e s i n J u l y a n d Al~g US':.
August 1 c o n t i n u e d th r ough much o f t he
whi c h encou rage con t i n u ed p l a n t growt h.
mon t h an d by September 1 wer e a bou t un-
All
sur ve y resu l ts reflect
crop
changed . However. spo t t y r a infa l l the
c o nd i t i o n s as o f S e p t e mb e r 1 .
last p a r t of Aug ust and th rou gh S e pt emb er
(Cont Inued on P8ge 8 , Pec ans Page J)
-= _ _ _ ____ - - -- - - - --.-- - -G-'-O-.R-.G....T0.:A---:~. CRE AGE .AX. D PRODCCTIOX l QS 3 .A.XD ' 9 8 4
.Ac r e a z e
Yie l d ~ e~ Ac r e
Prod uct ion
r' l a n tp. d
Ind i -
I nd i -
Crop
unit
f o r all
Har-
Fo r
cated
c atec
Purpose s ve s ted
Ha r v es t
Se p t . I ,
Sept . 1.
19 84
198 3 1/ 19 84 II
198 3
19 8 4
1983
198 4
Corn
---Thousand Acres- - -
- --Th o u s a nd s - - -
Bu .
i , 080
7 35
93 0
75. 0
85 . o
55, 1~5
79 ,0 50
Co ~ t on 2/
Bales
~OO
115
19 5
467
554
11 ~
~~5
So yb eans
B:;.
~ . O5 0
1 , 9 50
1 , 9 50
2 1. 0
27 . 0
40 ,95 0
5~ . 650
:>eanu t s
:'bs.
6 '+0
56 2
636
~ t 790
3,300
1 . 5 6 7 . 9 8 0 ~.09 8. 800
Swe e':. po tat oes
Cwt .
7 ..0
5.8
6.8
1 25
130
725
884
Tobacco , :-:v pe 1 4
!"':'s ..
~:A
4 ...
39
a , 19O
~ )2 0 0
96 , 36 0
1\5 ,800
Pe ca n s
Lo s .
100 ,000
130, 000
Ap pl e s . ...1 1
Co mme rci al 31 Lb s .
20 , 000
45, 000
Peaches 31
Los.
100, 000
150 ,000
Grapes 31
Ton s
2. 5
2. 9
Whea l: 31
B:;.
1,00 ')
9iO
880
34.0
35. 0
30 , 94 0
30,800
Oa t s 31
Bu.
12 5
85
65
61. 0
59.0
5 .1 85
3 .835
Ry e 3/
Bu.
430
70
80
2 1. 0
2 2 .0
1, 470
1,760
Sor~hum 3 /
Bu.
180
68
11 0
41.0
45. 0
~ ,78 8
4. 9 50
Hay, All 31
Tons
~A
500
4 70
2. 00
2. 40
1, 000
1 , 128
II Harv es ted f o r princi pal use. ~I Co tt o n y ield i n pound s a n d produ c t ion i n bales. 31 Es ti mat e s
b rought for ward f r o m e a r l i e r s urveys.
Ap-f.cu1tural Statistlclan and Georg1.a Depart:.ent of qrlcu1mre
-ClFR-84-Yo'. 19
c . S . HIGHLIGHTS, SEPTEMBER I, 1984
All wheat production is forecast at 2.57
billion bushels, 6 percent above 1983 but
~ for grain production is forec ast a t
7 percent below the 1982 total. Winter
7.55 bill ion bushels, down 2 perce nt fr om
wheat production is placed at 2 .04
the August 1 forecast but 81 per cent
billion bushels, up 2 percent from l ast
above last y ear's drought-str icken c r o p . - .. .~e~ar . Other spring wheat p roduction is
A crop of th is s ize is 8 percen t be l ow
ecast at 430 million bushels, 20
the record high crop of 198 2.
percent more t ha n 1983 . Durum wheat is
s e t at 105 ~illion bushels, 4 4 percen t
SorghuI.~in product ion i s fo r e c a s t at 817 million b~ s h e l s, down one - ha lf of
a bo ve last ye a r ' s cro p .
percent f r o m Augu s t 1 but u p 70 from las t yea r .
ood ra in production (wheat, r ice , a nd r y e ) now t ot als 7 6 . 9 million metr i c ton s
i n 1984 , up 8 percent from last y e ar.
Feed g ra in pr oduc tion ( c orn , sorghum,
o a t s, a nd b a r l e y co mb in e d) is expect e d t o t ot al 2 3 3 mi l l ion me t r i c t on s, up 71 percen t f r o m 19 8 3 but d o wn 7 p er cent f ro m
All cotton pro ducti on is fore cast a t 13 . 3 milli o n bal e s , 7 1 pe r cent above las t yea r a n d 11 per c en t more th an t h e 1 982
1982 .
p roduc tion.
So y be a n prod uc ti o n is fore c as t a t 2 . 0 3 bi l l i o n bUShel s , 2 9 pe r c e n t large r t han th e 1 9 83 c r o p b ut 7 p er cent s ma l ler t han 198 2 .
All t o bacc o p r od u c tion i s f o r ecast a t 1 .7 4 b i ll i on pound s, 2 2 pe r c e n t above th e 1 .41 b i l l i on po un ds produced in 1983 and 3 percen t above t h e Augu s t 1 fo r e c ast .
Pecan p r od u c t i on i s expec ted to t ota l
Peanut prod uct i o n i s e s t i mat ed at a
25 0 . 9 mi l l i o n p ound s , down 7 perc ent fr om
r e c o r d high 4. 2 5 billion pounds , 29
the 198 2 crop of 27 0 .0 mil li on pounds .
percen t above 198 3 a n d u p f rac t ion a lly
.- . .
_. - .. fr o m las t mon t h . . . PRO D UC~T O~ 19 83 A ~ D 1984
Area Harve s t ed
Yi e l d Der Acre
Product i on
Indi-
Ind i-
Ind icat ed
ca t e d
c a ted
Sept . 1 ,
Cro o
t:n i t
19 8 3
198 4
198 3
1984
198 3
198 4
1 ,0 0 0 Ac re s
Thousands
Co r n fo r Gra in
Bu.
5 1 , 443
7 1 , 06 4
81. 0
10 6 . 3
", 166 , 10 8
7 ,'; 51 , 9 9 1
Sor ghum for Gra i n Bu .
9, 836
14 ,2 0 9
48. 7
57.5
479,23 :
816,982
Oats
Bu .
9 ,076
8,088
52.6
58 .4
4 77 , 13 3
4 72, .. 6 0
Ba rl e y
Bu.
9, 727
11 ,2 2 9
52 .3
53.9
508,34 4
6 05 , 70 0
All Whea t
Bu.
6 1,390
66 , 19 4
39. 4
38 . 8
2, 419,82 4
2 , 57 1,060
Rye 1/
Bt..: .
896
953
30.3
31. 7
27,116
30,184
So ybe an s f o r Beans Bu.
6 1,815
66,8 33
25.3
30 .3
1 ,5 66 , 684
2 ,027,56 5
Pe a nu t s f or Nu t s
L~ s.
1, 3 73. 5
1 , 528 . 0
2,399
2, 784
3,295,530
4 . 2 54 . 250
[ p la ne Co t t on 2/
Bal es 7 ,304 . 8
10, 2 86 . 3
504
6 14
7 , 676 . 7
13,168 . 1
Cottonseed
Ton s
3,076
5,302
Sweetpotatoes
Cwt .
10 2.4
105 . 9
11 8
125
12 , 083
13,279
Tobacco
Lbs.
789 . 0
796. 9
1,8 11
2 ,179
1 ,4 28 ,48 3
1 , 7 3 6 , 1 20
All Hay 1/
Tons
5 9 , 6 97
62,25 1
2 .36
2 .46
140,734
153,356
Grapes
Ton s
5 , 49 4 .2
5 , 031.1
Ap p l e s , Com '1 1/
Lbs.
8 ,314,500
8,333,500
Pecans
Lbs .
270,000
250 ,900
Walnuts (Calif.)
lons
199.0
225.0
1/ EstimateS carried forward f r o m ear ~ier :orec~;~. 2/ Yiel~ ~ n pouncs.
2
GEORGIA ?ECA~S CP 30 PERCE~T
The f i r s t fo r ec a s t o f Ge o r g ia 's 198 4
pec an crop pegs p r o d u c t io n a t 1 30 mill i o n
pound s . Thi s i s 30 mill ion pound s a bov e
la st ye ar' s we a ther r e d u c ed c rop and t h e
s e cond l a r ge st c r o p of re c o r d . Th e i o r e ~
ca s t c o n s i s t s o f 1 10 mil l ion poun ds of
improved var ie ties an d 2 0 mil lion po un ds
o f s e e d lings .
Soil
mo is t~ re
was
p lentif ul in most g rove s duri ng July a nd
August and condi ti on o f t he t r ee s on
September 1 was hig h. ~ i mb b re a k a g e ha s
been a minor problem bu t heavy weev i l
pop ~ l ations h a ve n e ces s ita te d a c t i v e
s pr a y p r o g rams f o r control . Xut sheddi ng
h as b e e n repo rte d a b o v e n ormal i n a f e w
va r ieti e s f r om s o me areas .
U.S . PECA~S D~
The season's first forecast for the 1984 U.S . pecan crop i s 2 5 1 million pounds , i n- s h e l l basis, 7 percent l e s s than last yea r' s c r o p but 17 perce nt above 198 2 . About 74 per cent o f th e c r o p is expected to be from i mproved v a r i e t i e s compared with 62 pe rcent in 19 8 3, and 78 p e r c e n t in 1982 .
The pe c an c rop i n Alabama i s fo re c as t at
2 0 . 0 mil l i o n po un d s, 17 pe rcen t b elow
l a s t yea r. Lo uisiana exp e c ts a c r op o f
8.0 mi l li o n pounds, 64 per cent less tha n
l a s t year.
The Oklahoma pr o duc t i o n
f o r e c a s t is 20 . 0 million pound s compare d
with 8 . 0 mi llion pounds i n 19 8 3. Th e
Texas cro p fore c a s t is 2 5.0 mil lion
pounds , 64 per ce n t sma l l er than last
ye a r. Ne w Me x i c o ' s f orec ast i s 2 7 . 0
mi l l ion pou n d s , 7 p er cent be l ow l a st
yea r .
St a te
1982
.~ l a .
14,0 0 0
Ark .
300
Fl a.
2 , 000
Ga .
105, 000
La .
2, 500
:1i s s.
3,00 0
~ . ~ ex . 25, 0 0 0
N.C.
900
Okla .
30 0
S. C.
1,2 0 0
Tex.
14 ,000
- PECAN PROD UCTIO N 1 98~ 198 3 AND 19 84
I mnr o ve d 1I
Se e d Lt nz
Ind.
Ind .
198 3
19 8 4
198 2
1983
1984
- - Thou s a nd Pound s- -
17 ,000 14, 00 0
9,0 0 0
7, 000
6,0 0 0
1 ,75 O 1 , 400
200
750
6 00
1 ,500
2, 200
2, 500
1,90 0
2 ,800
8 5,00 0 1 10 , 0 0 0 20 , 0 0 0 15, 0 00 20, 0 00
3, 000
1 , 500
7 ,500 19, 000
6 , 500
5 , 500
3,50 0
1, 000
2 , 500
1,500
29,000 27,000
50 0
1,700
I , 000
1,1 00
1 , 200
1, 000
2, 000
1 , 700
7 , 000 18 ,000
1, 000
3 , 600
1 ,000
500
2 , 400
22,000 20,000
3,000 48 ,000
5, 000
198 2
23, 000 500
4 ,5 00 12 5,000
10, 000 4 , 000
25, 000 1,900 2 , 000 2,2 00
17,000
Total
198 3
24 , 000 2, 500 3,400
100, 000 22, 000 8, 000 29, 000 1 ,600 8,000 1,500 70,000
Ind . 198 4
20 , 0 00 2,000 5,000
130, 000 8,000 5 ,000
27,000 2, 900
20,000 6,000
25,000
U. S . 168 ,200 16 7,2 50 186 ,9 0 0 4 6 , 9 00 102,75 0 I I Budded , graf ted or t o p wo r k eri v arieties .
6 4, 0 0 0 215, 10 0 27 0,0 00 2 50 , 90 0
The Georq la Farm Report (I SSN-0 744-7260 ) I s pub I I She d s emi-mont h Iy by the Geo r g l e Crop Repo rt Ing Ser v ic e . Step hens Fe de r al BUi l di ng , ...t hen s, Ga . 306 13, Larry E. Snipes , St atisti ci a n In Cna r qe , Second cl a s s postage paid at ...thens, GA . Sub s c r I pt ion fee S IO pe r ye llr except f r e e t o data ' co nt r I bu r o r s , Sub s cr Ipt Ion I nformat Io n ev a l Ieb Ie f ran : Georg l a Crop Re po r t Ing Se rv Ice , Step he ns Fed e r a l Bull dln a Su i te 320 M he ns G.... 306D Telenhon e : (404) 546-2236.
3
GEORGIA PRICES RECEIVED
The August All Commodity I n dex of Pr i c es Received by Georg ia farme rs at 12 5 pe r cent of the January-Dec ember 1977 3verage wa s do~~ 8 point s fr o m last mon t h a n d 5 points bel o w Augus t 1983 . Compa r e d wi th July , pr ices were lower f or corn , soybean s , ba r rows and gilts , st eers and h e i f e r s , comme rci a l broilers, a n d t a b l e eggs; hi gh e r f or wh eat , sows, cows , calves, other c hi c k e n s and all eggs .
GRF~VoI. 19 U. S. PR ICES RECEIVED INDEX UNCHANGED
The Aug u s t All F a r m Prod ucts Index of Prices Rec eived by Farmers wa s unchanged f r om J u ly a t 144 percent of its J a n ua r yDe c e mb e r 1977 average. The ind e x was 5 po i n t s (3 . 6 percent) above a year a go. Hi g h e r p r ices fo r oranges, lettuc e , t o ma t o es , milk and tobacco we r e of fset b y lowe r pr i ce s fo r cattle, corn, s o ybeans , b r oiler s and h og s .
PRICES RECEI VED BY FAR~R S , AUGUST IS , 1984 WITH CO~PARISONS
Price
Geo rgia
United St a te s
pe r
Aug.
J uly
Aug . 15 ,
Aug .
July
Au g . 15 ,
Co mmod i ty
Un i t
198 3
19 84
19 84
198 3
1984
198 4
Winte r Whea t
S/Bu .
3 .69
3 . 16
3 .1 7
3 . 48
3 . 26
3.3 1
Oat s
S/ Bu.
1. 45
1. 71
1.67
Co r n
S/Bu .
3. 57
3. 49
3.16
3.35
3. 30
3 . 13
Cotton
Ct./Lb. 64 .5
*
1/ *
67. 0
68 . 2
1/68 . 1
Co t t ons e ed 2 /
S/Ton
14 3 . 0 0
115.00
To bacco
Ct . / Lb . 17 4 .3
3/1 8 4.0
169 .7
3/175 . 0
So yb e a ns
S/Bu.
7 . 68
6 . 86
6 .34
7 .57
6. 95
6 . 46
Swe et po t a to e s
S/ Cwt .
10 . 40
2/-
16. 20
12 .00 2 /1 4 . 10
13 .90
Al l Hay , b a l e d 2 /
S/Ton
72 . 60
7 1.80
7 1. 70
Mi l k Cows, 4 / 5/
S/He a d
885. 00
910.00
Hogs
S/ Cwt .
45 .70
51. 50
49. 80
46 . 70
52.00
50 . 60
S o ws
S / Cwt .
34 . 40
40 . 9 0
4 1 . 20
36 .70
42.90
42 . 7 0
Barro ws [, Gilt s
S/ Cwt .
47 . 40
53.00
51. 30
48 . 90
53. 70
52. 30
Bee f Ca t tle 6/
S/Cwt .
40 . 50
42 . 0 0
42 .90
54. 20
57. 60
5 6. 10
Cows 7/
S / Cwt .
35. 20
37. 00
38 .1 0
37 . 70
37.80
38. 10
Ste e rs [, He if e r s
S/ Cwt .
47.20
49. 30
48 .8 0
58.1 0
62.30
61 .00
Calves
S/Cwt .
50 . 40
52 . 0 0
5 3 . 00
57 .40
58 .50
58 . 10
All Mi lk
S/Cwt .
14 . 50
14. 10
3/1 4.10
13.30
12 . 90 3/13 . 10
Turkeys 2/
Ct./Lb .
35 . 2
44. 0
45. 2
Chick e ns, Ex cl ud ing
Broilers
Ct ./Lb . 18. 5
2/ 7 . 0
15 .0
Co m' l Broile r s 8/ Ct./Lb. 30.5
34. 6
3 / 28 .0
3 2.0
35.5
3/30 . 6
Eggs, All 9/
Ct ./Do z 74 .2
2/ 70 . 4
71 .0
63 . 1 2/5 9. 9
58. 6
Table
Ct . / Do z 63. 2
2/57. 6
54 . 7
57 . 8 . ' 2 / 5 2 . 8
51.5
Hatchi ng
Ct ./Do z. 11 0~0
2/1 0 5. 0
12 0 . 0
-.
1/ F i rst h alf of mo n t h. 2 / Mid-mo n t h price. 3 / En ti r e mo n th . 4 / An i mal s sol d fo r da i r y
herd repl a cement only. 5 / Pr ices estimated qu arter l y. 6 / "C ows " a n d " s t e e r s a n d he i f e r s "
c ombined with allowance wh e r e n e c e s s a r y for sl aughter bulls . 7 / Incl u d e s dair y c ows sold
f o r slaughter . 8/ Liveweight equ ivalent pri c e f o r Georgia. 9 / Avera ge o f all eggs sold by
f armers including hatching eggs sold at retail . * I n s u f f i c i ent sales.
4
U.S. PRICES PAID INDEX UP FROM A YEAR AGO
CONS~~R PRI CE I NDEX
The August Index of Pr ices Paid by Farme rs fo r Commodit ies a n d Se r v ice s , Int eres t, Taxes a n d Fa rm Wag e Rat es wa s 165 percent o f i ts 197 7 ba se . Th e i ndex wa s un c h a n ged fr om Ju l y bu t 4 points ( 2 . 5 pe r c ent ) abo v e a y e a r e ar l ier . Compa r e d with Jul y, the pr oduct i on inde x o f i n put pr ic e s wa s down 1 point t o 155 . Thi s was a d ec li n e of 0.6 percent. Compar ed wi t h a year earlier , t h e i nd e x was 2 po i n t s ( 1 . 3 pe r c e n t ) h igher . Lower f e ed a nd
f u el pri c e s we r e o nly part i al l y o ffset by the higher prices f o r replacement l ivestock .
The July unadjus ted consumer price i nd e x
f or al l urban c onsume r s ( CPI-U) i n c r e ased
0 . 3 percent from J une to
3 11.7
( IQ 6 7- 10 0 ) . The i n d e x was 4 . 1 percent
a bo v e July 19 8 3 .
On a s ea s onal Iv
adj u sted ba sis , t h e CP I -U rose 0 .2 pe r:
cen t f r o J une . For t h e s eco n d mo nth in
a r ow, t he tra nsportati on i ndex decl i ned
ref lecting l ower pri c e s for used a utos
a nd ga s oline. The ind ex was down 0 .3
percent. The inde x for other good s and
s e r vices e xh i bit ed t h e largest increase ,
up 0.9 percent . Ot h er increases were:
medical c a r e , up 0.6 percent; apparel &
upkeep, housing, and entertainment, all
up 0.5 percent. The food and beverages
i n d e x was up 0.3 perc ent.
PRICES PAID BY FML~ERS , AUGUST 15, 1984 WITH COMPARISONS
Pr i ce pe r
--:-::--_G~e::o.r:g:_i.a:..c.~'------:_:.._...:..---__:__=_U~~n:.i::t.e.:d:...S..t.a:~t:e:.s=.:::..:=.--_-_AU~ . 15, J u ly IS , Aug . 15,: Aug. IS , J u l y I S, Aug. 15,
Commod it v
l.:n i t
1983
19 84
1984
198 3
198 4
1984
Dairy Feed 16%
S/Ton 200 .00
18 7.00
18 1.00
189.00
19 2 .00
188.00
Da ir y Fe ed 18 i.
S/Ton 200. 00
192 . 00
189.00
203.00
19 7 . 0 0
19 4 . 0 0
Dairy Conc t . 32 i.
S/ Ton 245.00
250 .00
240.00
280.00
266.00
260 . 00
Hog Feed 14i. - 18 i.
S/Cwt.
11.50
11.90
11 . 40
11 . 60
11 . 10
10.90
Hog Conc t. 387.- 4 2i.
S/ Cwt .
15 . 50
15 . 00
14 . 50
16 .1 0
14. 50
14. 20
Bee f Cattl e Conc t .
3 27. - 367.
S/Cwt .
13 . 00
~ 4 . 00
12 .50
12 . 20
12 .40
12.10
Cot t ons eed Me a l 41i. S/ Cwt .
14 . 50
16 .00
16 .00
14 . 50
15 .20
15.00
Soy bean Me a l 44%
S/ Cwt .
14 . 50
13 . 00
13 . 50
14 . 70
13 . 00
12. 60
Br a n
S/Cwt.
11 .00
12 . 00
11. 50
9. 80
10 .20
10.20
Midd l ings
S/Cwt .
11 .00
10 . 50
1 1 .00
9 . 48
9. 52
9.5 6
Corn Meal
S/ Cwt .
9. 80
10. 50
10. 50
8 . 55
8. 87
8 .70
Br oil er Grower
S/Ton 210 . 00
255. 00
24 5.00
22 8 .00
233.00
225. 00
La y ing Feed
$/Ton 200 .00
2 15.00
19 5 .00
208. 00
209 . 00
20 2 . 00
Ch i c k St ar t e r
S/ Ton 22 5 . 0 0
230. 00
2 25 . 0 0
235 . 00
235. 00
223 .00
Br oiler- Fe ed Rat io 1/ Lbs .
2.9
2. 7
2.3
2 .8
3 .0
2.7
Hog-C orn Ra ti o 2/
Bu .
12 .8
14 . 8
15. 8
13 .9
15 .8
16. 2
Milk-Feed Ra t i o 3/
Lb s .
1. 45
1 . 51
1 .56
1 . 41
1 . 34
1. 39
Egg - Fe e d Ra ti o 4/
Lbs.
7. 4
6. 5
7.3
6.1
5. 7
5. 8
1/ Pound s o f bro iler growe r eq ua l i n va l ue t o 1 lb. bro ile r li ve we i ght. 2/ Bus he l s o f
corn equa l in val ue to 100 l b s . o f hog l ive we i gh t . 3/ Pound s of 16% da i r y f e ed e qua l
i n va lue to 1 lb . whole mil k . 4 / Pounds o f laying fe e d eq ual in value t o doz . e ggs .
1977- 10 0
ISDEX NUMBERS- -GEORGI A AND UN ITED STATES
Jul v 1983
August 1983
Ju ly 1984
August 19 84
127
130
133
132
122
129
133*
125
131 *
12 5
134*
125
131
139
144
160
161
16 5
82
86
87
I / Mi d - mont h i nd e x including i n t e r e s t , taxes and farm wa ge r ates . 2/ Ratio of index of
Pri c e s Rece ived t o Index of Prices Paid, Inter est, Taxe s and Farm Wa ge Rates. * Revised.
5
1983 FARM INCOME AND CASH RECEIPTS
Georgia farmers' gross farm income for 1983 totaled 33.68 bi llion. 1 perce nt above 1982. Farm product ion e x penses decreased 2 percent to 32 . 93 b il l ion. However. ne t farm income fell 8 percent to 3600.3 million due to the un u s u~ l l y large n et reduct ion in t h e change i n far m inventories. Farmers - equit y al so f e l l and at the beginning o f 198 4 was at t he lowes t l eve l s in ce 197 8.
Total c ash re c e ip t s f r o m f a rm ma r ketings and g o vernment p a y me nt s ros e 1 p e rc ent from 1982 t o $ 3.39 b i l lion . Th e i ncre a s e was du e e n t i re l y to gov ernmen t pa y me n ts o f 5 52 . 2 mi llion wh ic h was n e a rl v 3 tim e s t h e 19 8 2 l ev el. Li v est o c k . l ive st ock products and poultry accounted f o r 50 . 3 p e r c e nt of t h e 19 8 3 cash rec e ip ts whi le c r o p s a ccount e d for 4 7 . 3 . Go v ernment pa vme nts c o mpr i s ed 2.4 per cent of th e 1983 t ota l . Co mmer cial b r o i l e r s g r os sed a re co rd 5676 .7 mi l li o n o r 20 perc e n t o f t he tot al to again r a nk a s th e lea d i ng gr oss s al es far m e n t e r p r i se in Geo r g i a .
~-Yol. 19
Eggs were the fourth most important in
total rece ipts with 8.2 percent of the
total or S278.7 mill ion.
Following
c l o s e l v in f i f t h place was c a t t l e and
c a l ve s' at 7.5 percent of the total o r
S254 .4 million. Sal es from br o ilers ~nd
c a t t l e and calves in 1983 were we l l above
1982. Egg receipts i n 1983 were o f f
sha rply f r o m 1982 fall ing to the lowes t
leve l since 1975.
Crop s a l e s to tal ed SI .60 b il li o n in 198 3, d o wn 2 p e r c e n t f r om 1982. Ca sh re ce ip ts fr om t he s a le of c r op s compr ised 4 7.3 pe r c e n t o f th e total. Peanu t s moved ba ck
ahead o f sov beans a s t he s ales l e ader wi th 3 3 67 . 7" mi l l i o n o r 10 .8 p e r c e nt of t he t o t a l . Receipts f r om s oy b ea n s fel l sha r p ly fr om t he r e c o rd 198 2 l e v e l
t o t a li ng 5 298 . 2 million a nd a ccount ing fo r 8.8 p e r cent o f t h e t o ta l . De sp ite
t he s h a r p d ecrease, soybean s s t i l l ranked t hi r d a mon g al l c o mmo d i t i e s . Go v er n ment
pa y me n t s . at 58 2 . 2 mi l l i on o r 2 .4 p erc e n t
of the t o t a l . we r e 280 p e r c e n t a bo v e 198 2.
FAR~ CASH RECEI PTS AXD GO VER~~ENT PAYMENTS FOR GEO RGIA. 198 1- 19 8 3
1981
198 2
1983 1/
CROPS Cor ll Co tt o n , Total
Co t t o n Li n t Co t to ns eed
P f;"A. nllt s
Soybeans Tobacco Wheat
? " :leh " s Pecan s Ot h e r Frll i t s a nd Nu t s Tr u c k Cr op s Fo r e s t Pr oduc ts All Other Cr o p s To t;,l Cro p s LIVESTOC K Ho g s Cat t le and Cal ves rJ",i ry Produc ts Commercial Broilers Ot h er Ch i c k e n s Tll rk", ys
Ee e s
Oth "'r To t a l Live s t o c k ;,nd Prod u ct s Government Payments
To tal Cn s.!' R e=.:c=-('=.-.:.i.o.:pc::tc::s'--
I / Preliminary.
1 1 2 .~ 1 9
45 , 75 3 4 1 , 897
3,8 36 436, 79 6 2 32 ,63 2 190 , 8 48 14 1, 7 71
14 ,4 79 63,11 9
6, 37 0 113,89 2
57 .13 5 11 7 , 99 6 1 ,53 5,3 10
28 9,5 4 3 2 13,1 78 20 2,2 72 6 3 5,2 79
14 , 2 14 25 ,484 1 4 4.938 24 , 0 12 1.748 ,920 38, 05 5 ...3::..,.L3::.2=J2c:,::2"O8::':5'--
6
94,522 78, 574 74 , 6 68
3 , 90 6 352 , ')'; 9 35 2,6 99 18 9 ,1 19 15 5 ,461
21 , 9 9 1 67 ,7 9 9
4, 80 2 133 , 64 5
5 (, , 700 13 ', ,806 1. 644 . 677
247 , 483 242 ,359 20 0,880 610 ,7 35
13, 638 25 ,49 2 100 , 10 4 32, 467 1, 673,158 29,342 -=:.3.L:,::3..4..:.7:..,.1..L7.::7..:.~
1 2 4 . 9 69 7 7,10 3 70 ,1 62 6, 941
167 ,693 298 ,1 8 2 16 4. 06 4 120,2 65
24 . 166 66 ,13 4
5 ,129 14 0 , 199
69.706 146,921 I ,604.531
219.602
2 54 , 4 10
200.100
676,675
15, 556
24, 1 10
278,7 34
36 ,38 1
1, 70 5 . 568
82,240
..3:::,..3Jc9=:.2.=L,:3:..3=.9.:
_
DISTIlIaUTIOR 0 .. GEORGIA
,.AIlM CASH UC&IPTS. 1'83
:t of
Total
Lv.tk. Prod. SI.705.6
50.3
Crop.
1.604.5
47.3
Gov't Pats.
82.2
2.4
Total
3.392.3 100 . 0
FARM I XCO ~E AXD EXPE~ S E S, GEORGIA , 19 81 -1983 1/
ITEM
1 981
198 2
1983
~i1l ion Doll a r s
Cas h Re c e ipts from Far m Mar k et i ng s
3,28 4.2
3 ,31 7 . 8
3 , 310 . 1
Gove rnmen t Payments
38.1
29 .3
82.2
Total Ca s h Rec e i pt s
3 , 3 22 . 3
3 ,347. 1
3 ,392.3
Xo n- ~ oney I n c o me
273.6
264 . 6
260. 4
Oth e r Fa rm Income
3 1 .7
32 .9
2 5 .9
Realized Gr o s s Farm Income
3 , 627 . 6
3 ,6 4 4 . 7
3 , 67 8 . 7
Far m Production Expenses
3,111.8
3, 002. 3
2 , 9 28 .3
Rea l i z e d Xe t Farm Income
5 15.8
64 2 .4
750 . 4
Xe t Chang e i n Fa r m In ve nt o r ie s
+62 .7
+ 7.8
- 150 . 1
Total Xet Farm I n c o me
578.5
6 30 .2
600 . 3
Realize d Gr o s s In come pe r Fa rm 2 /
60, 460
6 3,9 4 2
66,886
Real i ze d ~et Income per Far m 2 /
8 , 597
11,270
13 , 644
1 / Some items ma y no t add to totals due to rounding . 2/ Dollars, rather than mi ll i o n dollars .
7
rn
\,- ) ~ l
Q
X HP P ::-
\J c o ;V
,"-.>
rn Al o rr-. on
'..J ~ r :..:o<,
.::l
l -i ;'.} rn "'0 ....
,:: -< : 11 .. -
m r "o
L
I .P -i
u
-i LJ? ' .1 .1 1C"JO
OZ NO
,',J -1 lJU
(;) I
V , -..,jO
Cl
-i r",
p
~"" W N
rtl Ul
I
N
I")')
1"'oJ
o
-.l
N
00
....
0 -./
N
Vl
o
(,O N
Vl O
o
\Jl
Continued from Page 1
SOYBEA~S I;P 29 P E R C E ~ T
Indi cations as of September 1 po inted to
a soybean y i e ld of 27 bushels per a c r e , 6
bushe ls bett er than last year . Acres f o r
harves t are estimated a t 1.95 mi l l ion,
t h e same as l a s t year . Product ion i s
esti ma t e d a t 5 2 .7 mi llion bushels , u p 2 9
pe r c en t f rom last year' s d ry weather
r educed crop.
Cr o p d evelopme n t i s
slightl y behind normal. Decreased so i l
mo is ture sinc e early Septemb e r ha s c au sed
c onc e r n fo r much o f the ac r e a g e i n t he
c r i t i ca l b loomi ng a n d pod se t t i n g s t a ge .
CORN AND TOBACCO UNCHANGED
Yi el d and p ro d uc t ion f o r eca s t s r e ma i n t he
s a me a s t h e Augu s t 1 f o r e c a s t f o r bot h c orn and tob a c c o . An a v e rage o f 8 5 bushe ls ' per a c r e i s e xpec ted for corn i nd ica ting a tota l produc tion of 79 . 1
mi l lion b u s h el s , up 43 pe r c e n t from l a st vear's PIK reduced c r o p . A lit t le over half of the c r op had b een h a r v e s t p. d o n Se p t emb er 1 .
Tobacco produ c tion i s agai n f o re cas t at 85 . 8 mil l i o n po unds , a n 11 perc en t dr o p f r om las t yea r . Al l o f t h e d ecre a se i s a c c ounted f or bv the 1984 red uct i on in
acr eage t o 39,boo a c r e s . Thi s ye ar ' s
y i e l d , at 2 , 200 pound s per a cre , i s sl ight ly h i gher tha n las t ye a r .
COTTON PRODUCTION DOUBLES
Co tton p roduc t ion is f or e c a s t a t 22 5 , 0 0 0 bales , more tha n doub l e last yea r ' s crop. An av e r a ~ e y ie ld of 554 pounds pe r ac r e , t he State s s e cond best e ver, i s f ore c a s t from the 19 5, 000 a cres f or ha rves t . Dev e l o pme n t i s beh ind last year a n d f ar beh ind normal.
PEAN UT PRODUCTION RECORD HI GH
Yi e ld prospects fo r peanut s are agai n
est ima ted a t a r e cord 3, 300 POUDd s per a c r e . . The y i e l d al o n g wi th a 13 pe rc en t increase i n acres for harves t , at 6 36,000, gives a f or e c a st production of a
record 2.1 bi ll ion pounds. White mold and some we e d y fields are causi ng some conc e r n . Harvest got underway the last few d a ys of Au g u s t and is currently r unni ng sli gh t l y beh ind last year's pace and muc h s l ower than the normal pace. Pea k harves t act ivity is expected the l ast two we eks of September wi th the large , crop and short op t imum harvest period expected to severely test ha r ve s t i ng and handl ing facilities.
8
GEORGIA
GA
'A'-10 0 c
Pl
. . ~ .. .~ ~
ORGIA CROP
FARM
REPORT
F:L l'lld~/9-~
4
REPORTING SERVICE
st phens Federal Bldg.
REC EIV ED "SUite 320
Athens, Georgia 30613
September 25, 1984
P, PR 2 1 Z005 Phone: (404) 546-2236
GFR-84-Volume 20
DOCUM NTS
BIGllLICHrS:
UGA LIBRARIES
Septeeer 1 Bog l: Pig Inventory
Hilk Product i on
Soybean & Peanut Stocks
Livestock Slaugh t er
Kont h1y Poo.ltry
Co1d Storage
Catt1e on Feed
GA'S HOG AND PI G I NVENTORY DOWN 8 PERCENT
Hog s nd p i g s on Ge o r g ia fa r B to t a l e d 1. 200 . 000 as of Septemb er 1 . 198 4 . This is 8 percent bel ow t he Sept e ber 1 . 1983 i n ve n t o r y and 11 per c e n t be l ow t he previous qua r t er , aaking t his t he s malles t invento ry on record . ~a t i ng back t o 19 26 . Ho g s kep t f o r b~eeding at 180. 000 are down 5 pe r c ent from a ye ar e a r lie r and market hogs a t 1.020 .000 a r e down 8 percent . Co par ed to June 1 o f thi s year . a rket ho g s a re down 1 1 pe r cent and b reeding stoc k down 14 percent .
The J une- Augus t 198 4 pig c r op t o ta led
497.000 head . a d e c l ine of 3 percent fr om
a year a go .
Sows f a r r owi ng to t a l e d
70.000 during t he J un e - Aug u s t per i o d , 3
percent be low a r e ar ago . The avera g e
li tt e r s i z e of 7. 0 is unchange d f r om the
saae pe riod o f 1983.
Geo rg ia f a r .ers int end to ha ve 68. 0 0 0 sows far r ow during September-November. If these intentions are r eal i zed, far rowings will be down 3 percen t from the same period of l ast year. Presen t l y . i ntentions are f o r 64.000 o ws to farrow during December 1984-February 19 8 5 , which would be a decrease of 3 percen t f rom the actual farrowings of the comparabl e
quarter ~ year earlier.
10 QUARTERLY STATES DOWN 7 PERCENT
I nventory of all hogs and pig s on Septe be r I , 1984. i n t he 10 states c o ndu c ting quarter ly hog s ur ve y s i E esti t ed at 42.8 .i11 i on head , 7 pe r c e n t below las t Septe ber 1 but 3 per c en t morE than Se pt e mbe r I, 1982 . Bree di ng i nvent ory t 5. 52 i 11 i on h e a d, was 5 perc ent less t h a n c yea r a go . and 1 pe r c e nt be l o~ two year ~ ear 1 i e r . Mar k e t ho g invent o r y , at 3 7 . 3 mi l l ion he a d, wa s 7 pe rcent be 10~ l a s t year, but 3 per c ent mor e t h a n 19 8 2 .
The June-Aug ust 1984 p i g cro p was 16 .~ mi l l i on he ad , 4 per cen t bel ow las t year bu t 4 per cent a bove t wo y ear s a go. Th erE were 2 .23 i l1 i o n sows th~t far roweo duri ng June-Aug u st , a dec r ease o f i percent f r om a yea r ago b u t 1 percent ac r e t han t he S8 e pe r iod tw o ye r s a g o .
Sows far ~ owing during J un e-August 198 1 ave rag e d 7 . 60 p igs per l itte r comparee with 7 . 36 l ast year a nd 7 .39 during thE c ompar a ble pe r iod two ye ar s a go.
Hog produc e r s i n the 10 q uar t erly sta tel int end to f a r r o w 2. 2 6 million BOWS durin~ Sept embe r -Novembe r of this year. This it 5 percent f ewer than during the co parable period in 1983, and 4 percent fewer than two years ago.
Farrowing intentions for December 1984February 1985 are 1.91 million head, I percent below a year earlier and 9 percent below t wo years earlier.
Agrieul.tural Statistician and Georgia Depart:.ent of Agricu1t:ure
GFR-84-Vol. 20
I tem
HOGS AND PIGS : NUMBER ON FARMS , SOWS FARROWING AND PIG CROP
GEORGIA and 10 qUARTERLY ~TE S II , SELECTED YEARS
10 Sta t e s
:
Geo rg ia
198 4 a s %
198 3 1984 ...... 98 3
19 8 1 1982 1983 1984
1, 000 Head Pe r c ent
- - 1 . 0 00 Head - -
1984 a s % of 1983 Percent
Numbe r on Farms-Sept.
Al l Hog s a nd Pigs
45 , 880 42 , 780
Kept fo r Br e e d i ng
5,8 29 5, 51 5
95
Mar k e t
40 , 05 1 37, 265
93
1 ,700 1. 380 1 ,300 1 ,200
92
250
2 10
190
180
95
1,450 1, 170 1, 110 1. 0 20
92
Ma r k e t Hog s a nd Pigs
by Wei gh t Grou ps
Under 60 Po und s
15 ',804 14, 85 7
94
60 -119 Pou nd s
10,1 69 9, 348
92
120-179 Po und s
8, 303 7,608
92
180 Po unds & Ove r
5 ,775 5, 452
94
638
B8
494
4 49
91
33 8
289
2 94
27 4
93
28 7
20 5
200
18 5
93
187
138
122
112
92
Sows Farrowing
December 2/-Febr ua r y 2,090 1 , 926
92
March-May
2.768 2,462
89
Decembe r 2 / - May
4.858 4, 388
90
Jun e -August
2 ,400 2, 225
93
September-Nove ber
2 ,370 3/2 ,261
95
J une-Novembe r
4,770 4/4 . 486
94
100
69
68
66
97
88
76
81
77
95
188
145
149
143
96
88
77
72
70
97
69
72
70
3/ 68
97
1 57
14 9
142 4/1 38
97
Pi g Cr o p
Dece er 2/ -Febr uary 15,543 13. 988
90
March- May
21,063 18 ,67 7
89
De c e lllb e r 2/-May
36, 606 32, 66 5
89
June-Augus t
17 , 6 7 5 16, 901
96
~ e p t emb e r -No vemb er
17. 611
June-Npve ber
35,286
725
476
469
46 2
99
629
551
58 3
5 54
95
1,354 1 ,027 1 , 0 52 1.016
97
638
54 7
5 11
4 97
97
490
511
50 4
1, 128 1 ,058 1, 015
Pi gs Per Li tter
Numbe r
December 2/ -Fe brua r y
7. 44 7. 26
98
Mar ch-May
7 . 61 7. 59
10 0
Decembe r 2/ - Ma y
7.54 7 . 44
99
June-A ug ust
7.36 7 . 60
103
Sep t e mbe r-Nove mber
7. 43
J une-Novem ber
7.40
- - Number - -
7 . 25 6.90 6 .90 7. 00
101
7 .15 7.25 7 .20 7.20
10 0
7 .20 7. 0 8 7.06 7 . 10
101
7 .25 7 . 10 7 .1 0 7.1 0
100
7.10 7 .1 0 7 .20
7 .1 8 7 . 10 7. 15
Farrowing I nt ent ions
1984
1985 as % 198 5 of 1984
1984
1985 a ll % 1985 of 1984
Dec e mbe r 2/-February 1 ,926 1 ,909
99
66
64
97
I I GA , IL. I N. IA . KS , MH , MO, NE, NC. OH. 21 Dec e mbe r pr eced ing year. 31 I n t enti o n s .
41 Ac t ual f arrowings for J une- Aug us t p i u ll inten ti o n s f or Sept e mb er-Novemb e r .
2
GA SEPTEMBER 1 HOG AND PIG INVENTORY
Z.f . , - - - - - - - - - - - -- - - - - - - ,
1.1 1.1
)o ~
11:. U OC
1:1:':0: 1.2
~i
M~
0.1
O.S
O.t
o.a
Ill"
UII
lila
1l1li3
111M
r.:.a
~ . U WI. O
~ IIAiIIT
GEORGI A SOYBEAN STOCKS
St ocks o f soy beans i n Ge o r g i a st o r e d of f t he farm were not publ ished sepa rate l y t o a void d i s clo i ng i ndi v idual ope r a tion s . On- far stocks in Geor gia t o t a led 4 10 ,00 0 b us h els c o mpa r e d t o 1 , 2 6 9 ,00 0 b ushel o o n Se p t e mbe r I , 1983.
u. S. SOYBEAN STOCKS DOWN 49 PERCENT
Th e September I, 1984 carryover of old
crop s o ybe a n . into the 1984-85 marketing
ye a r t o t a l e d 17~ million bushels, 49
pe rce nt belo w last ye a r a nd 31 percent
be low SepteBber I, 198 2 . So y beans stored
on -fa r m tota l 68 .3 i l lion b u s hel s, down
42 percent fr om both l ast ye a r and
Sept emb e r I , 1982 .
On- far m s tocks
a c counte d fo r 39 perc ent o f the s oybean s
s tored in a l l pos i t ions .
Of f - f arm
s t o c ks, at 107 million bu she l s were down
~3 . percent fro l a s t ye a r and 22 perc e n t
be l ow t wo years a go.
Th e d i f f e re~c e be twe en t he d e r ive d Se p t e mb e r 1 ' B t ock ~ l e v e l of 1 20 million b ushels and the o ff ic ia l USDA s toc k s e s t i mat e o f 17 5 il l i o n bushe l s based on Se p t e mbe r I , 198 4 st o c k e s ur ve y d ata, i n d i c a t e s t h e curr e n t 19 8 3 produc t ion estima t e of 1. 6 b i l l i o n bu s he l s may be l ow by 3-4 percent . Re vi s i o n s for t h e 1983 Nat i o nal a nd S t a t e pro d uction es timat es wi l l b e pu b l i s h e d in the Oc tober II , 198 4 , Cro p Pr oduct ion Repor t.
Da te
198 2 J an . Apr . June Sep .
UNI TED STATES SOYBEAN STOCKS (OLD CROP)
On - Fa rm.
Off-Fa r ... 11
1, 000 Bushel s
88 2, 826 56 5 ,79 2 354,097 117,749
727 , 47 8 460 ,128 292 ,268 136 ,732
Total Al l Po.itions
1,610 ,304 1, 025 . 920
64 6,365 254,481
1983 Jan. Apr. J une Sep .
1, 008, 13 9 643, 134 424 ,658 118 ,574
754 , 560 504 ,529 365,966 226,060
1 , 762, 699 1 ,1 47,663
79 0 , 6 24 344 , 634
1984
Jan.
593,237
670,724
1,263 ,961
Apr .
33 3,636
415,765
749 ,401
June
164,382
292,085
456,467
Sep. 1
68,274
106,524
174,798
1/ Includes stocks at mills , elevators, warehouses , terminals , and processors.
3
GEORGIA BROILER HATCH UP 7 PERCENT
GfR-84-Vol. 20 U.S. BROILER HATCH UP 6 PERCENT
The August hatch of broiler type chick. in Georgia, at 57.6 _1l110n was 7 percent more than that for August 1983. There were 46.2 _illion eggs in 1ncubators on September I, up 8 percent fro_ . a year earlier.
Nationally, the August 1984 hatch of
broiler type chicks totaled 394 million, 6 percent more than August 1983. There were 319 million eggs in incubators on Sept ember I, up 7 percent f rom a year earl ier .
POULTRY HATCHING AND PLACEHENT--AUGUST 1984
During
% of
% of
Item
Aug .
July
Aug.
year
Jan. thru Aug.
year
1983
198 4
1984
ago
1983
1984
ago
- -Thousands--
--Thousands--
Pullet Chicks Placed
Domestic (U.S .) 11
Broiler Typ e
3,347
3, 075 92
25 ,441
26,771
105
Egg Type
220
283 129
2 ,352
2,526 107
Chicks Hatched
Broiler Type
Georgia
57,028
107
440, 933
452,314 103
Uni ted S t a te s
3 93,32 7
10 6 3 , 04 7 , 303 3 , 112,632
10 2
Egg Type
Georgia
1,710
3, 140
2 , 571 150
15 , 786
3 1, 85 9 20 2
United St ate
30 ,92 9 3 7 ,841
3 5 , 096 113
27 8, 80 6
33 5, 10 1 120
Turke ys
Pou lt s Placed
U.S.
12,5 78 18 , 758
13,507 10 7 2/182 , 803
99
11 Reported by lead i ng br e e de r s , i n clude s expected pullet re p lace ents fro eggs
s ol d du ring the preceding mont h at the rate of 125 pullet chi cks per 30 dozen cas e
of eggs. 2/ Turkey pou l t s placed Septembe r-Augus t .
Item
Chi c kens Eg g Ty pe Broi l e r Type
Tur k e ys
- - -Thousands - - -
29 ,632
29,294
99
299 ,2 16
3 19,086
107
11 , 12 5
12 , 4 18
11 2
NUMBER OF LAYERS AND EGG PRODUCTIO N, AUGUST 198 4
No . Lay e r s o n
Eggs per 100
To ta l Eg g s Pr o d uc e d
Ha n d-Au .
Laye r S- AU.
Du r ing AU.
Georgia Hatching
Other To t a l Georgia Total U.S .
4,989 12 .966 17,955 270,343
5, 097 13 .735 18 ,832 275 .986
1,872
2 .0 15 1,972 2,08 4
1 , 9 10
2.068 2.023 2,08 5
93 261 354 5. 63 5
97 284
381 5,753
The Geo rgia Fo r'" Rep or t ( ISSN-074 4- 72BO) Is published seml - rronthly by t ho Geor g ia Cr op Repo rting Sen Ice , Stepne ns Fed eral Bu i ld i ng , Athen s , Ge. 30613, Le r ry E, Snipes, Statistician In Charge . Second cl as s postege pe l d a t Ath en s , GA. Sub scription tee S10 per yeer 9XClljlt tree to dete c ontr i butors . Su bs c ri pt io n Int ormetlon avelleb le trom : Ge o r g i e Crop Reporting Service, Stephens Federa l Bu ll d lno . Suite 320, At he ns , GA. 30613 Te l e pho ne : (4 04) 546-2236.
4
COMMERCIAL POULTRY SLAUGHTER 1/, AUGUST 1984
% of
% of
Aug.
July
Aug.
year
Jan. thru Aug.
year
1983
1984
1984 ago
1983
1984 aso
- - -Thousanda-
- - -Thousands- - -
Young Chickena
Georgia
56.212
50,043
57.228 102 410.062
406.983 99
United States
380,313
35 8 ,992
38 7 ,7 45
102 2.818,373 2,860 ,198 101
Mature Chickens
Light Type U.S.
11 ,784
12.519
14.052 119 101,463 .
97,917 97
Heavy Type U.S.
2,853
2 . 836
2, 88 6 101
25 .320
22.973 91
Total U.S.
14.637
15 .355
16, 93 8 1 16 126 . 78 3
120 .890 95
Total All Types , Ga. 2,730
3,034
3, 443
126
26 . 181
23 .926 91
Percent Condemned
Young Chickens
Georgia
1.3
1.4
2/ 1. 4
2/1.4
United States
1.4
1.4
2/ 1.5
2/1.4
1 / Fed e r a l l y inspected slaughter data a s co llec ted by Meat and Poul t ry I n s p e c t i on
Progra m. Curr e n t month data estima t ed by Mar k et News Serv ice. 2 / J a n u ary-July
condemnations.
J ULY PEANUT STOCKS DOWN 29 PERCENT
U. S. peanut s t ocks i n comme r c i a l s t o rag e on July 31 , 1984 , t ota led 61 1 milli o n po u nd s of equi valent f armer s t o ck. 2 9 percen t l ess t ha n t he amount on hand a year ear l i e r. Th is t o t a l i nclude s 8 . 76 mi l lion po unds of ac t u al fa r mer s t ock co pa red wi t h 5 1 . 4 mi l l i o n pounds o n h a nd a year ago .
Sh e lled pean u t s on h and t o t a l e d 579 il l ion poun ds o f e q u i va lent f armer
s t o ck . compar e d with 741 mil l i on pound s o n h a nd a y ear ago . Roa stin g s t o c k
to t al e d 23 . 3 mi l 11 0n pounds , down 68 percen t f ro the 7 1. 8 Mi l110n pounds o n hand a ye a r a go . There we re n o Commod i t y Cr e di t Cooperat ion unc o itt e d s t oc k o n hand a s of J u ly 3 1 , 19 8 4 .
She l l ed pe anut s t oc ks on Jul y 31, 1984, tota l e d 436 i l 1 i on pounds o f which 402 mil l i o n pounds we r e ed i ble gra d e s and 3 3 . 1 il110n poun d s were oil s t oc k . Ed i ble g r ade s t ock by ty pe we re Vi rg i n i a , 8 7.2 mi l l i o n po u nd s ; Runn e r s, 28 9 mi ll i on po und s ; and Spanish , 26.7 mi lli o n po un ds.
UNITED STATES STOCKS OF PEANUTS AND SPEC rF IED PRODUCTS
AT THE END OF J ANUARY AND J ULY, 198 3-84 1/
Per i od
Fa r mer
She lled
Roa s t ing
Far e r Stock EqUi va l ent
Ending
Stock
Pe a nuts
Stoc k
She l l ed
To t a l
2/
(In Shell )
Peanuts
3/
1, 000 Pounds
J anuary
1983
1.607,022
62 7 ,612
88 ,870
834,724
2,530,6 16
1984
1,50 7, 18 7
562,786
48,688
748.505
2,30 4, 380
July
1983
51,440
557,063
71 ,799
740 .894
86 4.133
1984
8,758
435,512
23,322
579,231
611,311
1/ Excludes st oc k s on f arms . Includes stocks owned by or held fo r a ccount o f
CCC in c o-.erc1al storages. Far.er stock on net weight basis. 2 / Includ es s he l l e d
edible and shelled oil stock. 3/ Actual farmer stock. plus r oa s t i ng stock. plus
shelled peanuts X 1.33.
5
CATTLE ON FEED IN 7 STATES UP 1 PERCENT
GFR-84-Vol. 20
Cattle and calves on feed September 1 for slaughter ..rket 1n the 7 states preparing monthly estimates totaled 6.7~ million head. up 1 percent from a year ago but 1 percent less than Sept ember 1. 1982.
Marketing s of fed cat t le d u r ing Augu s t totaled 1 . 67 million . 1 per c e n t a bo v e l a s t yea r bu t 1 percent less t han Au gu st two ye ars ago .
Placements of cattle and calves on feed in the 7 states during August totaled 1.67 million. up ~ percent from last year but 4 percent less than the same mon t h in 1982. Net plac e me nts of 1. 60 mi l l i o n head d uri ng Augu s t were 7 percent more than last year but 4 per c e n t less t han tw o year s ago .
Ot h er d i s a ppe a r anc e t ot a l e d 6 1 thou sand hea d c o . pared wi th 88 tho usand dur i ng Aug u st 1983 a n d 6 1 thousand d ur i n g Au gu st 1982 .
CATTLE AND CALVES : NUMBER ON FEED. PLACEMENTS . MARKETED. AND OTIJER DIS APPEARANCE.
7 STATES. AUG UST 1 TO SEPTEMBER 1
1984 a %
Item
1983
1984
of 19 8 3
1. 00 0 Head
On Feed . Augu s t 1 1/
6 . 861
6. 8 11
99
Pl ac ed on Feed during August
1.582
1. 665
10~
Fed Cattl e Mar ke t ed during August
1.651
1. 668
101
Ot h e r Di s a p pe a r a nc e during August 2 /
88
61
69
On Feed Se pt e be r 1 1/
6 . 70 4
6 . 747
10 1
1/ Cat t l e a nd c alves on fee d are ani a ls fo r
r ket being fed a full
r at ion of grain or other conc e n t r a t e s and are expected to produce a carca s that
will grade good o r better . 2/ I ncl udes dea t h los ses. movement f rOM feedl ots to
pastures and s hip~en t8 t o other feedlot s for furthe r feeding.
GEORGI A MILK PRODUCTI ON
U. s. MILK PRODUCTION
Geo r g i a da iry herds prod uce d 9 2 ill i on po u nds of milk d u ri ng Aug u s t 198 4. d o wn 12 percent from l ast year but up 1 pe r c ent from l a t mon th. The n umbe r of mi l k c ows on Georgia 's f a r s d ur ing August ave raged 117. 000 head. 9 perce nt l ess tha n a year a go and equal ing t he previous month' s count .
Production per cow averaged 790 pound 4 percent be l ow last ye a r and 1 perce nt above last month.
Milk producti on d ur ing Au g u s t 1984 totaled 11.2 bill ion pounds . 4 per cent les s than August 19 8 3.
Product ion per cow a veraged 1. 038 po unds during Aug u s t 1984 . 13 po un d s below August 1983 .
The tot al number of ilk cows a vera g ed
10 . 8
il lion head during August . 3
pe r c en t less t han a year earlier..
DAIRY PRODUCTION. AUGUST 198 3- 1984
Geo rgi a
United States
Item
Unit
1983 1984 Percent : 1983
1984 Percent
Milk Cows 1/
Thous. Head 128
117
91
11.129 10. 833
97
Milk per Cow 2/
Pounds
820
790
96
1.051 1.038
99
Milk Production 2/ Mi l. Lbs .
10~
92
88
11.692 11 .243
96
1/ Includes dry cows. excludes heifers not ye t fresh ~ 2/ Excludes milk sucked by
calves.
6
GEORGI A RED HEAT PRODUCTION DOWN
Georgia red meat production t otaled 31.7 million pounds during August 1984. an i n crea s e of 20 perc e nt fr om the s a e period last year. The January-August 1984 red .eat produc tion t o t a l e d 293. 6 million pounds . a decr ease of 3 pe r c en t from l a t year.
The n UDb e r of cat t l e s l a ghtcred b y co erc ial plants in Georg i a during Aug u t wa s 20 . 7 0 0 h e a d . a n i n c rea se o f 400 head f ro the pr e v i ous year . Calves slaught e r e d i n Au gu s t t otaled 1. 8 0 0 h e ad . down 300 h e a d f rom a yea r a g o .
There were 136 .800 hogs s l a ugh t e r ed in c ommerc i a l pl ant s ac ros s t h e S t a t e during Au g us t 198 4 . Th is amo unted to 48.20 0 hea d less t han l a st year .
U.S . RED MEAT PRODUCTION
Commer c i a l red meat production in the
United States for August 19 84 t otaled
3. 36 billion pounds.
January-August
a ccumu l a t e d red meat production totaled
25 . 8 billion pounds. u p 2 percent from
l a st
year.
Commer c ial red .eat
pcoduc t Lon
.Lnciudes
slaughter
in
Fe de ral ly i nspected and oth e r plants . but
exc l ud e s ani ~l s l augh t e red on faras.
Be e f pro duction dur i n g August t o t a l ed 2.1 1 bi l l ion po unds . Total h ea d killed nu ber~d 3.39 il l ion and live weight averaged 1 . 060 pounds per head .
Veal producti on waD 4 4 mi l lion pounds .
Cal f olaug h t e r of 314 t ho u s a n d head a v era g e d 233 pounds l ive we ight.
Pork produc tion tot ale d 1.18 b i ll i on pounds. Hogs ki l led tot a led 6 .84 mi l li o n
head. wi t h an a vera g e li v e weig h t of 2 42 pounds.
Spec i e s
Geo r g i a Catt l e Ca l ve e Hog s Shee p & La bs
GEORGI A AND UN I TED STATES LI VESTOCK SLAUGHTER 11
Nu be r Slaught e r ed
Ave rage
1984
J an . -Au gust: Live We igh t
Aug ust
as % of '84 a s % of
August
198 3
1984 1983
1983
198 3 1984
1,000 Hea d
Pe rce nt Percen t
Pou nd s
Tota l
Li ve Weig h t
Au g u .. t
198 3
1984
1.000 Po unds
20. 3
20 .7
102
2. 1
1. 8
86
185 . 0 136. 8
74
1
115
90 0
90 1
18 .264
18 , 6 18
84
328
342
6 76
6 20
94
226
228
41, 792
31 , 193
150
93
7
Un i t e d States
Cattle
3 , 368 .9 3 ,394. 3
Calve s
28 6 . 1 31 3.6
Hogs
7, 311.2 6,844.2
She e p & Lambs 608.3 583 .0
1/ Includes slaughter under Federal
f arm slaughter.
10 1
10 5
1 . 06 4 1 , 0 60 3 , 585, 083 3 , 599. 3 17
110
1 12
230
233
65.83 1
73, 163
94
100
241
24 2 1, 763 , 167 1 . 6 56 , 574
96
105
11 0
108
67 ,081
62, 728
Ins pec t ion and other cOlllDlercial slaugh t e r. e xcl ud es
COMMERCIAL RED HEAT AND LARD PRODUCTION: UNITED STATES WITH COMPARISONS 11
Aug us t
1984 as %
Jan. -August 2/
1984 as %
Kind
1983
1984
of 1983
1983
198 4
of 1983
Hillion Pounds
Percent
Hillion Pounds
Percent
Beef
2,118
2 . 111
100
15 .006
15 ,574
104
Vea l
39
44
113
273
311
114
Pork
1.250
1,175
94
9,639
9, 622
100
Lalllb & Hutton
33
31
94
243
249
102
To t al Red Heat
3.440
3,360
98
25,161
25.756
102
Lard 31
81
76
94
617
614
100
11 Based on packers dress weights and excludes farlll slaughter. 2/ Accumul ated total.
based on un rounded data. 31 Preli inary lard produc tion includes rendered pork fat .
7
~nln CTORAGE STOCKS , UNITED STATES,
August 3 1.
July 31,
CollllftOd ity
1963
1964
1,000 Pound
Butter
56 1 . 6 16
46 9, 595
Cheese. Natural
1 . 231 ,396
1.165,51 5
Eggs. Frozen
19 ,030
17 , 53 4
Fruits , Frozen
609 , 272
587 . 796
Fruit Juices, Fr o zen
1,252, 956
1. 138 . 0 13
Meats, Red
54 3 . 3 4 1
7 13 , 8 33
Beef. Fr o zen
267 . 37 9
301 .663
Po r k , Fro z e n
2 14, 069
345 ,008
Poul t ry, Frozen
53 2 , 308
418, 368
Turkeys , Fr o zen
384. 304
278 .246
Vegetables , Fr ozen
1.764 ,2 14
1.314,7 13
Potatoes, Frozen
603, 806
626, 831
Peanuts, Shel l ed
258 , 550
225 , 462
Peanuts, In Shell
26 , 464
13 ,463
Pecans , Shell e d
30 ,481
35 , 277
Pecan s . I n Shell
29 . 36 /3
69, 552
460.111 1.146, 198
16 . 738 70 4, 540 1 , 061. 772 627 ,833 290 , 20 8 270 , 0 23 474 , 106 3 28, 0 70 1, 735 , 338 512 ,206 124 . 465
7 ,1 8 6 30 , 360 54.47 3
Pe rcent of
Aug u st 1983 July 1984
Percent
79
94
93
97
88
95
116
120
65
93
1 16
88
10 9
96
126
78
89
113
85
118
96
132
85
82
48
55
27
53
10 0
86
185
78
ex>
Georgia
~crop Reporting Service
Stephens Federal Bldg.
Suite 320 Athen s, Georgia J 06 13
SECOND- CLASS POSTAGE PAID AT
ATHENS, GA 30613
0 4 2 H0 1 1 3 00 0 00 2 5 - 22 70 7502 0
04 / 2 23 -723 8
00 8505
GA EXPc RIM: Ni STA
C A ~ O LE L E O ;= O ~ D
LI 3 RARY
EXP ERI ME NT
SA 30 2 12
I
GEORG IA
FARM REP
October 12, 1984 GFR-84-Vo I ume 21
CPt ~4o~~
~ ~r\'-~- PfIIC~j~~/JD-n-
GEORGIA
~ CROP
REP ORT ING SER VI CE
\
stephens Feder al Bldg .
'\ _~c ~~~~~~thtenes 3, 2G0eor gia 30613
Phone : (404 ) 546-2236
",G I E
HIGtLIGHTS
f.;,\ r'"'' R\ n~ 1A . "inUO :rJ
OcrOBER 1 CRoP FORECAST
AGR ICULTURAL. PRICES
COCUrJk8"l S
PEANUT foRECAST BY STATE UGA UBRARIES
PECAN FoRECAST BY STATES
1983 SwEETPOTATO REv ISIONS
FALL VEGETABLES
DRY WEATHER HURTS
The peri od o f d r y weather t ha t st re t c h e d ba~ k th r o u g h Septembe r into p a r t o f Aug u s t c a us e d late ma t u r ing crop s , l i k e so ybe ans, t o suf f e r y i eld loss. Pa stur e s also d e clined r a p i d ly . Ot he r c r o p s tha t ma tu r e e a r l i e r s h owe d li ttl e c hange i n prospe cts. The Sta te r e ma i n s in n eed of r a in despi te limited r e l i e f i n ear ly Oc tob e r .
( Co nti nue d on page 2)
GEORGIA ACREAGE AN D PRODUCT ION 1983 AND 198 4
AcreaRe
Yie ld Der Acre
Produc tion
Planted
Indi -
Indi-
Crop
Unit
for all
Har-
For
cated
cated
Purposes ves ted Harvest
Oct. 1,
Oct. 1,
1984
1983 11 1984 11 1983
1984
1983
1984
--Thousand Acres--
--Thousands--
Corn
Bu.
1,080
735
930
75.0 85.0
55,12 5
79,050
Cotton 21
Bales
200
115
185
467
584
112
225
Soybeans
Bu .
2,050
2,000
1,950
21.0 21.0
42 , 000
40,950
Peanuts
Lbs.
640
562
636
2 ,790 3 ,300 1,567,980 2,098,800
Sweetpotatoes Cwt.
7.0
5.8
6.8
125
120
725
8 16
Tobacco,
Type 14
Lbs.
NA
44
39
2,190 2,250
96,360
87,750
Hay, All
Tons
NA
500
470
2. 00
2 .90
1,000
1,363
Pecans
Lbs.
100,000
125, 000
Apples, All
Commercial 31 Lbs.
20,000
45, 000
Peaches 31
Lbs.
100,000
15 0 , 0 0 0
Grapes 31
To ns
2 .5
2. 9
Whea t 31
Bu .
1,000
910
880
34.0 35 .0
30,940
30 , 800
Oata 31
Bu.
12>
85
65
61.0 59 . 0
5,185
3,835
Rye 31
Bu.
430
70
80
21 .0 22.0
1,470
1,760
Sorghum 31
Bu.
180
68
110
41 .0 45 .0
2,788
4,950
11 Harvested for principal use. 21 Cotton y ie ld in pounds and production in bales.
31 Estimates brought forward from earlier su rveys. NA - Not available.
Agrlcu1tura1 Stati.stidan and Georgia Depart:.ent of Agricn1t:ure
(Continued from page 1)
CORN UP 4 3 PERCENT
GFR-84-Vol. 21
Ge o r g i a ' s 198 4 co rn crop conti n ues to b e
fo recasted a t 79 .1 million b u s he l s , u p 4 3
SOYBEAN PROSPECTS FALTER
e n t fr o m the P I K- r e d u ced 19 8 3 c rop .
t e d a c r e s is u p 27 pe rcent , to
The f o recas t of Georg i a 's s o ybean
0 ac re s . Yiel d i s a ls o f o rec a s t
pro s pect s fe l l 6 bus he l s per ac r e
l a st year , by 10 bu h e l o per a c re
Se pt emb e r 1 to Octobe r I , a n d i s
rec ord- t y ing 85 bus hel s pe r acre .
expected t o avera g e 2 1 bushe ls pe r a c r e .
Abou t 9 3 pe r cen t of t h e c r op h a d b e e n
Thi s l owers a n t i c ipated product i on t o ha r ves ted on October 7 , sl i ght ly ahead o f
4 1.0 mi ll ion b u s hel s , a 22 p e rcen t;lJrapi ,.,,~.~r age for t hat d a t e.
f r om l as t mo n th ' s f o recas t , a nd 2 pe r c en t
be low l a st ye a r 's c r o p . The d ry weat her d u r i n g Aug us t a n d Se p t e mbe r hur t " d o u b l e -
RECORD PEANUT YIELD AND PRODUCTI ON
cr op ped" bean s muc h wo r s e t h a n t he " f u l l -
s ea son " be a ns.
Harve st i ng progr e ss,
thr ough October 7 , i s about e qual t o t he
5-y ear averag e at 6 pe r cen t c o mp l e t e .
Th e d r y we a t h~r i n Aug us t and Se p t e mbe r t h a t hu r t some o t h er cro p s was ve r y
f a v o r a b l e f or peanut h a rv e s t . Ha r v e s t i n g
l o ss e s we r e r e d u c e d f or mo s t grower s, b ut
some ar e expe ~ i encing de la y s d u e t o s o i ls
n ow b e i n g t o o h ard t o r i s k d i g g i n g . Th e
Oc t o be r 1 yi e l d f or e ca s t of 3, 30 0 pound s
per a cre is unc ha nge d from t he reco r d
h i g h f o r ecast B mont h ago.
Re cord
p r oduc t ion i s a l so f o re cas t a t 2 . 10
COTTON ACRES CHANGED
b i l l ion pound s , 34 pe r c e n t g rea t er t han
l ast year' s produc ti on o f 1. 57 billion
Cott on p r o d uct ion wa s agai n i n d ic a t e d at
pounds. Thr ough Oc t o b e r 7 , 87 percent of
t he leve l of t h e p r ev i o u s mo n t h' s
t he a c r e a g e ha d been dug a nd 75 per c e n t
fo r e c a s t of 2 2 5 ,000 bales . Th i s i s mor e
h a d b e e n th r eshe d . Bo th we re ahe ad of
than doub le Georgia's out put l a st y e ar .
last ye a r a nd a v e r a ge.
Ch e ck d at a th a t rece n t ly became ava il a ble
shows le ss cotton a c re s f or har ves t t han
was p reViou sl y thought .
Ac r e s f o r
TOBACCO ESTIMATE RAI SED
h arve st f or 19 84 we r e l owe r e d 10 , 000 a c r e s t o 18 5 , 000 ac r es. The indica t ed y i e l d i s 584 pounds pe r acre , second only t o t he r e cord yi eld o f 71 4 po u n d s fr o m t h e 198 2 c rop . Onl y 15 pe r c en t of the c r o p was p icked, th r oug h Oc t o be r 7 , which was l e s s t h a n h a l f o f the u s u a l progre s s f o r t ha t da te .
Sale s r eco r d s t h at c ove red mos t of the
19 8 4 t obacco crop market ing s i nd ic at e
t h a t Ge o rgia ' s tobac co cr o p is a bo u t 2
pe r c en t mo r th n wa s f o r eca s t e a r l i e r ,
but i s st i l l 9 perc e n t less t ha n l a s t
year .
The Oct o ber 1 est im at e shows
3 9 , 0 0 0 a cre s h a r v e s t ed , y i el ding 2 , 25 0
pounds pe r acre fo r a t o ta l produc t i on of
87. 8 mi llion pound s .
RECORD HA Y YI ELD
Much o f Ge o rg ia ' s 198 4 hay crop wa s ma d e prior t o t h e Aug u s t - Se p t e mber d r o ugh t. Condi t ions we r e v e r y f avo ra bl e f o r hay produc t ion d u r ing s p r i n g and mu c h o f t h e summe r. As a r e s u l t, y i e l d i s es t i ma ted a t a r e c o r d 2 . 9 tons p er a cr e . Th i s h a s mo re t h an offs et the 6 pe rc ent decli n e i n har ve st ed ac r e s , t o 470 , 000 a c res , a nd l ift e d to ta l produc t i on to 1. 3 6 mi l l i o n t o n s , a l so a r ecord a nd 36 per c e n t mor e than l as t year .
ThO Geor g ie Fer m Report ( ISSN - 0 744-72 80 ) Is pub lished seml-ll'Onth ly by t he Georg ie Crop Repor ti ng Se rv i ce , St e phe ns Fede r e l Sui Idl ng, Athe ns, Ge. 30613, Le rry E. Sn ipes , St etlstl cl en In C he~ e. Seco nd c le s s pos t ege pe Id e t At hens, G..... Subscr Ipt Ion te e SI0 per yoe r except t r ee to det e co ntr ib uto rs. Subscr i pt ion In formetlon eve lle b le tr om : Georgie Cr op Repor t i ng Ser v ic e , Stephe ns Foderel Sui Idlng , Su ite 320, ....thens , G.... . 30613 Tel ephone: (404) 546-22 36.
2
UNIT ED STATES HIGHL I GHTS, OCTOBER I, 19 8 4
Corn f o r g r a i n pr oduc t i on is f orec ast a t i:)U bi ll ion bu she l s, down 1 percen t fr om
Se p t e mbe r I, bu t up 80 pe r c ent from las t
year' s drought - str icken crop . A c r o p o f this s ize i s 9 pe r cent below the reco rd
hi gh c ro p of 19 82.
Sorghum grain produc t i on is forecas t a t 8 0 7 milli o n b ushels , down 1 perc e n t from
Se ptembe r I , but u p 68 p e r c e n t from l ast
year .
Feed g rain product ion ( c o rn , sorghum, oat s and barley combin e d) is expe c t e d to t ota l 2 31 mil l ion me t ri c tons, up 70 pe rc en t f r om 1983 b ut d o wn 8 pe rcent f r o m
198 2 .
SOy be a n pr o d u c t i o n is f orec as t a t h i l ion bus he ls, 3 pe r c e n t less Sept emb e r I , 21 percen t a b ove las t but 10 p erc ent below 198 2 .
1. 97 t han
year
Oi lseed pr o d u c t i o n (so ybeans, co t ton seed , p eanut s, f l a x s e e d a n d s u nflower combined) i s expec ted t o t ota l 62.3 million metric
tons, up 23 perc ent from last y ear.
Food grain produc t i on ( wheat, ri c e and ry e ) now tot al s 77 . 1 mil l i o n me tri c ton s f o r 19 84, up 9 percen t from l a s t y ear .
All c ot t o n produc tion is f ore c a s t a t 13 .3 mi l l i o n ba l e s , 71 p ercent abo v e la st yea r a n d 11 p e r c e n t mor e t han 19 82 production.
Peanu t product ion i s f orec a s t at a reco rd high 4.30 b ill i on pounds, 3 1 percent abov e 198 3 and 1 p e r c e n t a b o ve t h e Se p t e mb e r 1 fo re c a st .
Hat pro d ucti on i s fo recas t at 154 .1
mi li on t o n s , 9 pe r c ent more th a n las t year ' s 140 . 7 mi l lion t o ns .
All Tobac co produ c t i o n is f or e c a s t at 1 .7 4 bill ion pounds , up 22 p erc e nt from t h e 198 3 crop .
Pecan produc t ion is f orecast a t 250 .4 iiiITITon pound s , . d own l e ss t ha n percent from th e Septembe r est i ma t e, a nd 7 p e r c e n t b elow the 2 7 0 . 0 mill i o n po un ds p r o d uced in 19 8 3.
- - --
UN I TED STA.T_""-S -AC.. REAGE AND PRODUCTI ON , 198 3 AND 1984
Ar e a Harv e sted
Yiel d er Acre
Producti on
Indi -
Indi -
I nd i ca ted
c a t ed
cat ed
Oct. 1 ,
Cr o p
Unit
19 83
1984
191\3
1984
198 3
198 4
1 ,000 Acres
Thousands
Co rn f or Gra in
Bu .
51, 443
71,064
81.0
10 5 . 5 4 , 166 , 10 8 7 ,497 , 831
Sorghum for Grain Bu.
9 ,836
14 ,209
48.7
56 .8
479,2 31
806,6 32
All Wheat
Bu .
61 ,390
66 ,1 94
3 9 .4
38. 8 2 , 419 , 824 2 , 570 ,300
Soybeans for
Beans 1/
Bu .
62,525
66 ,833
26.2
29 .5 1,6 53,7 7 2 1,9 71,700
Peanuts f or Nuts Lbs. 1,373.5
1, 528 . 0 2,399
2 ,81 7
3 ,295 ,5 30
4 ,304,550
Upland Cotton 2/ Bal es 7 , 30 4 . 8 10, 19 1 . 3
50 4
620
7, 676. 7
13,160.1
Cottonseed
Tons
3,076
5,296
All Hay
Tons
59,697
62,251
2.36
2. 47
140,734
154,051
Sweet pota toes
Cwt.
102.4
10 5 . 9
118
124
12, 083
13,090
Tobacco
Lbs.
789.0
797 .3 1,811
2,179
1,428, 483
1,737,668
Apples, Com'l
Lbs .
8 ,314,500 8,233,500
Grapes
Tons
5,494 .2
5,019 .1
Pecans
Lbs.
270,000
250,400
Oats
Bu.
9,076
8,088
52.6
58. 4
47 7,1 33
472,460
Ry e
Bu .
896
953
30.3
31.7
27,116
30,184
Almonds (C a l if . )
Lbs.
240,000
520,000
Walnuts (Calif. ) Tons
199.0
225.0
1/ 1983 revised. 2/ Yield i n pounds.
3
GEORGIA PRICES RECEIVED
Average pr ices received by Georg i a
farmers at mid-September for most crop
and livestock commodities were genera lly
below the previous month.
Prices
received f o r wheat, corn, soybeans,
sweetpotatoes, barrows and g il ts , cows,
steers and heifers, c a l ve s and other
chickens s h o we d a dec rease from last
month. Tobacco, milk, broilers and eggs
we re the only commodi ti es to i ncrease in
price from August . The Georgia Prices
Received
All Commodi ty Index for
September was 131 perc e nt of t h e 19 77
average , 7 points above last month a nd 4
points above a year ago . The increase i n
the index is the r e sult of the i t ems
showing an i nc rease in p ri c e carry ing a
large r percentage of the weight than the
items showing a decrease.
GFR-84-Vol. 21
PRICES RECEIVED INDEX DOWN 4 POINTS PRICES PAID INDEX UNCHANGED
The September All Farm Products Index of
Prices Received by Farmers decreased 4
points fro m Aug u s t to 139 percent of its
Januar y - De c ember 1977 average.
Lower
prices f or potatoes, hogs, cattl e ,
oranges , soybeans and corn were partiall y
offset by higher pr ices for milk .
tobacco, peaches, broilers and apples.
The Se ptember i n d e x wa s 3 points above a
yea r ago .
PRICES RECEIVED BY FARMERS SEPTEMBER 15 198 4 WI TH COMPARISONS
Price
G e o n~ i a
Un i t e d States
per
Sept .
Aug.
Sept . 15 ,
Se pt .
Aug .
Sept. 15 ,
Commodi ty
Un i t
1983
1984
1984
1983
19 84
1984
Winter Whe a t
S/Bu .
3 .83
3 .22
3. 12
3.58
3.34
3 .38
Oats
S/Bu.
1. 55
1. 67
1.65
Corn
$/Bu.
3 .60
3.09
3. 00
3.32
3.12
3.00
Cotton
Ct. /Lb. 64.5
59.0
1/*
63.1
67.2
1/ 67. 0
Cottonseed 2/
$/Ton
147.00
115. 00
131.00
Tobacco
Ct./Lb. 195.6
184. 0 3/1 90.0
189 . 3
175 .0 3/188 .0
Soybeans
$/Bu.
7.8 2
6.5 5
6.25
8.28
6.50
6.03
Peanuts
Ct. /Lb. 24. 4
1/27 .8
24 .8
27.3 1/27 .6
Sweet potatoes
$/Cwt.
13.60
2/ 16 .20
12.50
11.00 2/13.90
11.30
All Hay, baled 2/ S/Ton
75 .40
71.70
71.90
Hog s
S/Cwt.
42.50
49 .00
45.80
44.10
50.40
46.60
Sows
S/Cwt.
36.90
41.20
41.50
38.50
42.70
41.20
Barrows & Gilts
$/Cwt .
43.40
50. 10
46.60
45.20
51.90
47.60
Beef Catt le 4/
$/Cwt.
39.70
42.70
42. 10
52.30
56 .60
55.00
Cows 5/
$/Cwt.
35.60
36.10
33.20
36.00
37.30
35.50
Steers & Heifers
$/Cwt.
45 .90
49 . 80
49 . 30
56.20
61.30
60.10
Calves
S/Cwt.
48.60
51.50
49.70
56.10
59.10
57.80
All Milk
S/Cwt.
14.50
14.30 3/14.60
13.50
13 .10 3/13.40
Turke ys 2/
Ct. /Lb.
39.5
45 .2
46.6
Chi ckens, Excluding
Broilers
Ct./Lb. 20.5
2/15.0
14.5
Com'l Broilers 6/ Ct./Lb. 30.5
28.0
3/31.0
32.8
30.6 3/32.1
Eggs, All 7/
Ct ./Doz 77.0
2/7 1.0
73.0
65.6 2/58.6
58.4
Table
Ct./Doz 66.6
2/5 4.7
54 .8
60.6 2/51. 5
51.0
Hat ch ing
Ct./Doz. 110.0 2/120.0
120 . 0
1/ First half of month. 2/ Mid-month price. 3/ Entire month. 4/ "Cows" and "steers and
heifers" combined with allowance where nec e s sary for slaughter bulls. 5/ Incl udes dairy
cows sold fo r slaughter. 6/ Liveweight equ ivalent price f o r Georgia. 7/ Average of all
eggs sold by farmers includ ing hatching eggs sold at retail. * Insufficient sales.
4
CONSUMER PRICE INDEX
The August unadjusted Consumer Price
Index for all urban consumers (CPI-U)
increased 0.4 percent from July to 313.0
(1967-100). The index was 4.2 percent
above August 1983.
On a seasonal ly
adjusted basis, the CPI-U rose 0.5
percent above July. Both t he food and
beverages and housing indexes we re up 0. 6
percent, accounting for a bout three-
fourths
o f the August
increase.
Increases were also realized for: apparel
and upkeep, 0.9; entertainment, 0.5;
other goods and services, 0.4; and
medical care,
0.3 percent.
The
transportation i nde x was unchanged f r om
July as declines in fuel prices were
offset by price increases f o r new cars.
PRICES PAID
The September Index of Prices Paid by Farmers for Commodities and Services, I n t er e s t , Taxes and Farm Wa g e Rates was 165 percent of its 1977 ba s e . The index wa s unchanged from Aug ust but 3 points higher than a year ear lier.
PRI CES PAID BY FARMERS SEPTEMBER 15, 1984 WITH COMPARISONS
Price
Geor ia
United States
per
Sept. IS, Aug. IS, Sept. 15, : Sept. 15, Aug. 15, Sept. 15 ,
Commod it
Uni t
1983
1984
1984
1983
1984
1984
Dairy Feed 167-
S/Ton 205.00
181.00
184.00
198.00
188.00
187.00
Dairy Feed 187-
S/Ton 210.00
189.00
185.00
214.00
194 . 00
190.00
Dairy Conct . 327-
S/Ton 250.00
240.00
230.00
296.00
260.00
253 .00
Hog Feed 147.-187-
S/Cwt.
12 .50
11.40
11.00
12.10
10.90
10.70
Hog Conct. 387.-427- S/Cwt .
17. 00
14.50
14.00
17.20
14 . 20
13.80
Beef Cattle Conc t .
327.-367.
S/Cwt.
13.50
12.50
12.50
12.90
12.10
12.00
Cottonseed Meal 41% S/Cwt.
15.50
16.00
15.50
15.30
15.00
14.90
Soybean Meal 4 4%
S/Cwt.
16.00
13.50
13.50
15.70
12.60
12.30
Bran
S/Cwt.
11.00
11.50
11.00
10.00
10 .20
10 .20
Middlings
S/Cwt.
9.90
11.00
10.50
9.64
9.56
9.50
Corn Meal
S/Cwt.
9.80
10.50
9.80
8.87
8 .70
8.50
Broiler Grower
S/Ton
220.00
245.00
255.00
240.00
225.00
221.00
Laying Feed
S/Ton 200.00
195 .00
192.00
218.00
202.00
198.00
Chick Starter
S/Ton 250 .00
225.00
245.00
248.00
223.00
224.00
Broiler-Feed Ratio 1/ Lb s ,
2.8
2.3
2.4
2.7
2.7
2.9
Hog-Corn Ratio 2/
Bu.
11.8
15.9
15 .3
13.3
16.2
15.5
Milk-Feed Ratio 3/
Lbs.
1.41
1.58
1.59
1.36
1.39
1.43
Egg-Feed Ratio 4/
Lb s ,
7.7
7.3
7.6
6 .0
5.8
5.9
1/ Pounds of broiler grower equal in va l ue to 1 lb. broiler live weight . 2/ Bushels of
corn equal in value to 100 lbs. of hog l ive weight. 3/ Pound3 of 16% dairy f eed equal
in value to I lb. whole milk. 4/ Pounds of laying feed equal in value to I doz. eggs.
1917=-100 Georgia Prices Received
A
INDEX NUMBERS--GEORGIA
ugust 1983
September
1A9N8D~~U~'NAIT~EuD~gS~TuA7sT~EtS~I~9n8rS.e4prte-m--b~e~r~~1~9~8~4~T
All Commodities
130
135
124*
131
Crops
132
139
124*
134
Livestock & Products
129
131
125
129
United States
Prices Received
139
136
143*
139
Prices Paid 1/
161
162
165
165
Ratio 2/
86
84
87
84
1/Mid-month index including interest, taxes and farm wage rate~, 2/ Ratio of Index of
Prices Received
* Revised.
to
Index
of
Prices
Paid,
Interest,
Taxes
and
Farm
Wage
Rates.
5
1983 UN I TE D STATES SWE ET POTATO CROP SMALLER
GFR- 84- Vo l . 21
Swe e t pot ato p roduc t ion in th e United Sta t e s t o t a l e d 12 .1 mi ll i o n c wt . i n 19 8 3 , d own 19 pe rcent from 1982, and 6 pe r c e n t be l ow 198 1 . Area ha r ve s ted, a t 10 2 t housand a c re s , declined 11 per cen t wh i le yiel d s a v e r a g e d 118 c wt . per acre, d o wn 9 per cen t fr om 1982 . The 198 3 v a lu e of p r o d uc ti o n , at $165 mil li o n, jumped 3 9 perc en t from 19 8 2 . Th e av e r a g e pr i ce of $ 13. 60 pe r c wt. c o mpares with $ 8 . 0 3 i n 1982.
SWEETPOTATOES : ACRES. 1982
YI ELD AND PRODUCTI ON,
BY STATES,
1982 AND 198 3
~l.::.9::8:.:3::.
Yie ld Cwt .
_ Production 1 , 0 0 0 Cwt .
105
515
19 5
1 , 7 16
125
725
95
2 ,280
16 5
182
95
447
90
2 16
120
4 ,440
1 15
4 60
80
112
120
8 52
1 15
138
1 18
12,083
State
'. I SWEETPOTATOES : PRODUCTI ON, FARM DISPO SITION, SEASOII AVERAGE PRIC E RECEIVE D
BY FARMERS AND VALU E" BY STATES 1 48 1 CRO P Fa r m Dis po sition
To t al
Use d o n Fa r m Whe r e Gr own
Value o f
Pr od-
Used
Fo r Se e d ,
Shri nka ge
So l d
Prod-
Sal es
uc t i on for
Feed and
a nd
' dpeere
uct i on
Seed
Hou s e hol d
Los s
Cwt .
Use
1 . 0 00 Cwt .
Hollar s
1,000 Dol lar s
Al a.
515
24
32
10
4 73
13.30
6, 8 50
6,2 91
Ca lif . 1 ,7 1 6
45
51
137
1 , 528
13. 60
2 3,3 38
20 ,78 1
Ga .
72 5
42
80
20
625
16 .40
11,890
10,250
La.
2 , 280
192
187
68
2 , 025
7 . 05
16,074
14,276
Md .
182
7
10
7
165
10.50
1 ,91 1
1,7 33
Mi s s .
447
55
58
31
358
12.50
5,588
4,47 5
N.J .
216
16
11
23
182
15.40
3,326
2 ,803
N.C.
4 ,440
527
577
222
3,6 41
15.70
69 ,708
57,164
S. C.
4 60
40
50
20
390
17.50
8 .050
6,825
Tenn .
I 12
13
23
5
84
14 . 20
1 , 590
1,193
Te x.
8 52
91
88
9
755
18 . 40
15, 6 77
13,892
Va.
138
10
9
12
1 17
9.15
1 , 26 3
1,07 1
U.S.
12,083
1,062
1 ,176
56 4
1'0,343
' 13 . 6 0
165,265
140,754
6
U.S. AND GEORGIA PEANUTS RECORD HI GH
U.S. pe a nu t production i s for e ca s t a t a
r e c o r d high 4 .30 billi o n po und s , 31
percent a bov e 1983 and 1 percen t above
the Septembe r 1 fo r e c as t .
Yield is
expec t ed to ave rag e a record h i gh 2 , 8 17
pound pe r ac r e , 418 po und s above 19 8 3
and 33 pounds above l ast mOt t h 's
for eca st. If t his yield is r eal ized, i t
wi ll Bu r ps s the re c o rd high y ie l d of
2 , 6 9 3 po unds pe r a cre se t i n 1 98 2 . Bo th
production and yield a re up f r om 198 3 in
a ll St te s , e xce p t Te xas .
PEANUTS FOR NUTS
Har -
vested Yield
Production
I nd.
Ind .
Ind.
198 4 as
Sta t e 1984
19 8 4
1984
? of
19 8 3
1 , 0 0 0 Po und s
1 ,000
Ac r e s
Po unds
Al a.
2 18. 0 2 , 95 0
64 3, 100
14 2
Fl a .
76.0 3 , 200
243 ,200
146
Ga .
636. 0 3, 300 2 ,098,800
134
!'lew
Mex . 1/ 13 .0 2 , 50 0
32 , 50 0
12 7
N. C.
154.0 2,900
446 , 600
140
Ok l a .
9 5 .0 2 ,000
190 , 000
108
S.C.
14 .0 2 , 60 0
36, 400
14 6
Tex.
22 5 .0 1 , 500
337 ,500
93
Va.
97 . 0 2,850
276 , 4 50
139
U.S. 1 , 5 28. 0 2,81 7 4 , 304 , 5 50
13 1
1/ Est imates for cur r ent ye a r c a r r i e d
fo r war d fr o m ea r l i er fo rec a st.
Sou the aste r n growers (Ala., F la ., Ga . , S.C .) expect t heir product i on to t o t a l 3. 0 2 bil li on pound s , 36 per cent a bove t he previous year . Produc t ion i n t h i s a r ea is up 1 percent f rom t he September 1 fo r e c a s t . Yi e l d f o r the 4- S t a t e a r e a is
expe c ted t o averag e 3 , 201 poun d s p e r a c r e , 48 2 poun d s above 198 3 . Yi e ld is up 43 pound s fr o m Se pt embe r 1.
Pro d u ction in Geo r gia i s set at 2.10
billi o n pou nds , u nc h a n g ed fr o m Se ptemb er
I, bu t 34 percen t a bove 198 3 . Yield per
ac r e a t 3, 300 po u n d s compares wi t h 2,7 9 0
pound s i n 19 8 3 .
Bo th yie ld and
produc ti on, a s curren t ly f or e ca s t , a r e
n e w re c o r d s for Ge orgi a. The c r o p i s in
mo s tly g o od t o fair con dit ion wit h
ha rve s t slightly ahe ad o f no rmal.
U.S. PECANS DOWN 7 PERCENT GA. UP 25 PERCENT
The Octobe r 1 f or e c as t for the 1984 U. S .
pecan c r o p i. 250 mi ll i o n pounds (in-
sh~ 11 basis) , Virt u a ll y u n c ha ng ed fr om
th e Sep te mb e r 1 f or e c a ~ t , bu t d own 7
perc ent f r om l a st y ear ' s c r o p . Abou t 7 2
pe r c en t of t he crop i5 expected t o be
produ ced
fr om im pr o v e d
va riet ies ,
com pa r e d with 62 p e r c e n t i mpr o v e d last
ye a r a n d 78 perc e n t impr oved i n 19 8 2.
Ge o rg ia 's c r o p , whi c h will c o n t ri b u t e
ha lf of the Nat i on's output thi s vear , is
n ow f o r e c a s t a t 12 5 mil li on po un ds . Tha t
i s 5 mill i on po un ds o r 4 pe r cent , les s
than was pre dict e d a month ago, bu t i s
s t i l l 2 5 per c en t mor e t ha n la s t v e ar ' s
p roduction . ~u c h o f t h e b lame f or th e
we ake ned pros pec t s was given t o t h e ve ry
d r y weat h e r in Se p t e mb e r a nd the latte r
part of Aug us t .
A 5 mi ll i o n poun d
a d d i t i o n t o OkJah omR ' s Dec a n fo reca st
of f set Ge or g i a 's d e c l i n e i n the Na t i ona l
t o t a l s . Okl ahoma e xpects a c r o p of 25
mi llion po un ds compa r e d wi t h B mi ll i on
l a s t yea r .
Al a bama' s forec ast , a t 18 mi l l ion pound s
is 2 5 per c e n t bel ow l a s t vear . Th e Te xa s fo r e c as t , a t 25 mi ll ion ~ ounds compar es wi t h 70 mi lli o n po und s l a5 t ye ar , a drop o f 64 perc e nt. New Me xi c o' s c r o p is forec a s t at 27 mi l l ion po u nd s , 7 pe r c e nt b e low 1983 . Lo u i s iana ' s c rop i s expect ed to t ot a l 10 mi l li on pound s c o mpar e d wi th 22 mil li o n la st y e a r .
PECA~ PRODUCTI ON
I m-
prove d Se e d-
Total
State
1/ Ind . 1984
lin2 Ind . 1984
T Ind. 1984 a s
1984 % of 1983
Thousand Po u n d s
Al a .
13 ,000 5 ,000
18, 000
75
Ar k .
1, 400
60 0
2 ,000
80
Fl a.
2 , 20 0 2,800
5, 0 0 0 147
Ga.
10 5 ,000 20 ,00 0
12 5 , 00 0 125
La.
2,000 8 , 000
10 , 00 0
45
Mi s s .
3 ,500 1 , 500
5 , 000
63
N. Me x. 27 , 000 N.C . 2/ 1,700
1, 200
27, 000 93 2, 90 0 18 1
Okla . S . C.
2 ,000 23 , 000 3 ,300 2, 200
25,000 313 5 , 50 0 3 67
Te x .
20 , 000 5, 000
25, 000
36
U. S .
181,1 00 69 , 300
250,400 93
1/ Budded, g raf t ed or t opworked va ri e-
t i e s. 2 / Esti mat e s for c u r r e n t year
c a r r i ed fo rward fr om ear lier forecast .
7
,n r c c. .
X H )::> l:> ~
"tl CP .o
'"
rI1AJOm " ;Q~r X 0
H Al r11 \) f-O
3: -< nt~ rrt r ::IJo .... :2: I H~ LU
-i 03:
' 1Irll'VC) ZNO
7J - i <XlO
o 10
Vl .....O
(,.
-iN
J::>
l .> L U N
00 VI I
N
UJ
/'.j
o
.....
N
00
f-O
O -J
r"
VI
o
OON
Vl O
.::>
VI
FALL QUARTER FRESH MARKET VEGETABLES AREA UP 3 PERCENT
The pros pect i ve a r e a for harvest of 7
f res h
mar k e t v e ge table s in ma jor
produc ing s t a t es du ri ng t he fall qu a rter
( October, Nov e mber a n d De c e mber o f 19 84 ),
is es ti mate d a t 15 4 t hous and a cr e s , 3
perc e n t mor e tha n t h e area harv est ed
dur i ng the f al l quart e r o f 1983.
Pro j ected product ion du r i n g the s econd
ha l f of 1984 for these 7 crops , base d on
the a verage yie l d fo r the last three
yea rs , i s 82.9 mill ion c wt . Th e 7 cr o p s
i nclude d i n t his group are broc coli,
c a r rot s, ca u lifl o wer , cele r y, swe e t c orn,
l e t tuce , and t omatoes.
Th e h o neydew me l on are a for h a r v es t in the f a l l qua r t er o f 198 4 i s es t im a t ed a t 2, 600 a cres, 24 percent l ess t han i n 198 3 . Pr ojected prod u c t ion du r ing Ju lyDecember , based on the a verage yield fo r the la st th re e year s, i s 3.07 mi l li o n cwt ., a 2 perce nt dec r ease f r om t he same pe ri od i n 1983 .
Su mme r st o r age oni o n s are f o r ecast at 21. 2 mil l ion c wt ., u p 10 pe r cent fr o m l a s t ye a r and 3 perce nt a bo ve 1982 .
Spr ing onion planting i nt en t i on s for 1985
harv es t i n Texas are es t im ated at 2 0 . 0 tho us and a cr e s, d own 3 p e rc e n t fro m 19 8 4 p l a nted a c reag e .
Toma toe s fo r pr oces sing are e x pe c t e d t o total 7.64 million tons, a jump of 1 1 percent f r om l a st ye a r a nd 2 perc ent above the September 1 f o r e c a st .
u . S. PROJECTED P ROD UCTI ON ~ J ULY-DEC EMBER
Crop
I 198/;~~~!:~~:~~ed 1984 1/
Jan.-June
67,743
71,004
Jul y-Dec.
Br o c col i 2/
4, 05 1
4,23 9
Ca rrots 2/
10,843
11,6 19
Cauli-
flower 2/
2,903
2,948
Cele ry 2/
8,983
9,855
Swe e t Corn
8,381
8,605
Le t t u ce
34,102
31,166
To ma toes
14,570
14,475
Tota l 7
Ve g e t a b l e s
83,833
82,907
Honeydew
Me l o n s
3,148
3,071
Tota l July-De c . 86,98 1
85 978
17 Based on a three ye ar (1981 -A3) a v
erage yield per acre. 2/ Includes total
f o r fresh market and processing uses.
8
GEORGIA
r:GA
F:2..
GEORGIA
-.IT I
CROP REPORTING
FARM REPOF l~gVJt>~t1
SERVICE
RECEI _EDstephens Federal Bldg.
I
SI ' T -II.
Suite 320
APR21 20 05 Athens, Georgia 30613
October 24, 1984 GFR-84-Volume 22
Phone: (404) 546-2236 DOCUM ENTS UGA LIBRARIES
HIGHLlUD..Li:J
Grain Stocks
Co1d Storage
Catfish Proc::essing
Catt1e on Feed
Livestock Slaughter
111ft Production
Hontb1y Pou1try
Cotton Situation
GEORGIA CORN STOCKS 43 PERCENT BELOW A YEAR AGO
Stocks of old crop corn (1983 and earlier year' s crops) stored i n all positions on October 1 , 1984, i n Georgia, tota led 2,866 ,000 b u s h e l s , down 43 percent f r om the 5,059,000 bushels on hand a ye a r earlier. Corn stored on farms amounted to 2,756,000 bushels, 34 percent less than last year. Corn stocks held in offfarm positions to taled 110,000 bushels , 88 percent less than the 902,000 bushels stored a year ago .
Stocks of wheat in all positions totaled 6,987,000 bushels, a decrease of 23 percent from the 9,022,000 bushels on hand last year. On- farm stocks totaled 4,004,000 bushels, down 8 percent and
wheat stored off the farm amounted to 2,983,000 bushels, 36 percent below a year ago .
Oats stor ed i n al l positions a t 2 , 418 , 000 bushels, were down 15 percent from the 2,853,000 bushels on hand October 1, 1983. Farm stocks amounted to 2,109,000 bushels, 5 percent less than last year, while oats ~ald off-farm were 50 percen t less at 309,000 bushels. Barley stored in all positions totaled 60,000 bushels, almost 2 1/2 times the level of a year ago. Stocks of old crop grain sorghum stored on farms amounted to 139,000 bushels, compared to 284,000 bushels held on farm last year.
GEORGIA GRAIN STOCKS--OCTOBER I, 1984 WITH COMPARISONS
On Farms
Off Farms 1/
All Positions
Grain
1983
1984
1983
1984
1983
1984
-1,000 Bushels -
Corn, Old Crop
4,157
2,756
902
110
5,059
2,866
Oats
2,230
2,109
623
309
2,853
2,418
Barley
25
60
25
60
Wheat
4,332
Sorghum, Old Crop 284
4,004 139
4,690
*
2,983
9,022
*
6,987 139
1/ Includes stocks at mills, elevators, warehouses, terminals and processors.
* Included in unallocated to avoid disclosing individual operations.
Agricultural Statistician and Georgla Departamt of Agriculture
GFR-84-Vol. 22
U.S. CORN STOCKS LOWEST SINCE 1976
stored in 'all positions on October
4, totaled 474 million bushels,
Old crop corn in a ll pos itions on October
ercent from October I, 1983.
I, 1984 , totaled 722 mi llion b us h e ls, 77
percent below the r ecord h igh Oc tober 1 .c_ ~ ~_ l e y sto red i n all positions o n Octobe r
stocks of l ast year .
I, 1984 , tot aled 583 million bushels , 13
percen t mor e t h a n on October 1 a year a g o
Of the t o t a l corn stocks on October I, '~'-~~1~. 1 8 perc e nt gr e ater than on t h e same
1984, 48 percent, or 347 mi l l i o n bushels d a te in 19 82 .
were stored on the farm and 52 pe rcent ,
or 375 million bushels, were st ore d off Al l whea t st ored i n all positions on
the farm. Both t he on-farm a n d off - f a rm October I, 1984 t ot a l e d 2 .72 b illion
stocks are down 77 percent from October 1 bush els, 8 percen t less than the 2.96
a year ago.
billion bushels stored on October 1 a
year ago. Farm stocks of 1.20 billion
Old crop s o r ghu m in al l posit ions on bus hel s acco unted for 44 percen t of t he
October I, 1984, totaled 25 0 mil lion bushe ls , d own 38 pe r cent f rom a y ear
t o t a l . Wh e a t s tored of f-farms totaled 1. 52 b il l i on bushels. Farm stock s a r e 3
ear l i er a nd 16 pe r c ent lowe r than Oc t o be r
pe r c e nt b elow Octob e r 1. 1983. whi le of f -
I, 1982 .
Farm s tocks to t al e d 37. 2 far m s toc ks a re d own 1 1 pe rc ent f r o m l a s t
mill i o n b us h e ls , 38 per c e nt l e s s t han a
yea r.
y e ar earl ie r. Off-f a r m ho lding s , a t 2 13
mil l ion bushe ls we r e down 37 pe rcent f rom
a year e a r l i e r .
u. s. GRAIN ST OCKS- -OCTOBER 1 . 19 84 WITH COMPARIS ONS
On Farms
Of f Farms 1/
All Posit ions
Grain
19 8 3
198 4
19 8 3
198 4
1983
1984
Mill i o n Bu s h els
Corn . Old Crop
1 , 5 10 .4
346.9
1 ,609 .5 375 . 4
3 .1 19.9 722. 3
Oa ts
426 . 1 397 . 6
79 .1
76 .6
505 . 2
4 74 . 2
Barl ey
3 43 .9 41 0 . 9
171. 6
172.5
515.5
583 .5
Whe at
1 ,2 35 . 9 1 , 20 0 .0
1 , 7 19 .3 1, 5 23.8
2, 9 55 . 2 2 , 7 2 3 ~ 8
So r ghu m, Old Crop
59. 9
37 .2
3 40 .3 21 2 .8 "
400 .2 25 0 .0
1/ Inc lud eo s toc ks at mi lls , e l evato rs , wa r e ho u s e s , t ermina l s a n d p roc e s s o r s .
CATFISH PROCESSING UP 8 PERCENT
Domest ic
p r odu cti o n of f arm-ra is ed
catfish d u r i ng Se ptembe r to t a led 12. 2
million poun ds ro und we ight , a n i n crea s e
of 8 percent from Se pt e mbe r 198 3 .
The September ave r age pr i c e paid to growe r s was 69 cen ts per pound, 5 c en ts above Se ptember l a s t yea r .
Net pounds of pr oc es s ed f i s h so ld du r ing Se p t ember t ot al e d 6. 56 mi l l i on po u nd s , an i n cr ea se of 11 perc en t from the c o mparabl e mo nt h in 19 8 3 . Ice pack sal es we r e 48 pe r c en t of t he total amoun t s o ld .
The Septembe r a ve rag e price s re cei v ed by p roc e ssors f or wh o l e f ish we r e $ 1 .60 per pound f o r ice pack a nd $ 1.66 for f rozen f i sh.
The Geo rg i. Fe r-m Re po r t (I SSN- 0744 - 7280 ) Is publis hed s emi- mont h l y by t he Geo r g i . Cr op Re po rti ng Se rv ic e , St e phen s Fode ra l BUi ld i ng , At ho ns , Ga , 306 13 , Lar r y E, Snl po s , St a ti stic i a n In Charge . Sec o nd c la ss posta ge pa id a t At he ns, GA . Subs c r i pti o n t e e SI D per ye a r ox cep t f ree t o da ta c on t ributors. Subscr i pt io n Inf ormat ion a va i lab le t rom : Georg i. Crop Repo rt i ng Se r v ice, Stephons Fed e r a l Bu l l d l nq, Su ite 32 0 Athe ns GA . 30613 Tel eo hon e : ( 40 4 ) 54 6-2236 .
2
GEORGI A RED MEAT PRODuCTIO N
U.S . REO MEAT PRODUCTION
Georgia red meat produ cti on totaled 2 7.9 million p ound s d ur ing S e ptem ber 1984, down 30 p e r cent f r om Se p t e mb e r 1983 . The Janua r y -S e p t embe r r ed mea t p r o d u c t i o n totaled 32 1. 5 mill ion pound s, 6 pe r cent l e s s t h a n t he c ompa ra b le pe r i od o f 19 8 3 .
Ca t t l e sl a ug h t e re d by commer c ia l pl ants
i n Ge o r g i a dur ing Se pt ember to taled
18, 30 0 h ead , a dec r ea se o f 1 ,300 head
fro m the pre vi o u s yen r.
Ca l v e s
s l aught er e d in Se pt e mb e r t ota led 1,500
h e ad , down 100 head f r om a year ago .
There we re 119 ,6 00 hogs sla ug h t e red in c o mme r c i a l pl an t s ac r o s s the S t a te d ur i n g Sept e mber 1 9 8 4 . Th is a mounte d to 66. 200 head l e ss t h a n la st year .
Co mm e r ci a l re d meat prod u c t ion f o r the
un i ted States i n Sep te mb er 19 8 4 to t aled
3 .1 1 bi ll ion p o u n d s . down 9 pe r cen t f r o m
Se ptemb e r 19 8 3.
Janu a ~ y -S e p t e mb er re d
me a t p r o d uc t i o n , at 28.9 b ill io n pound s
i s u p I p e rc e n t f r o m l a st y e a r . Bee f
pr o d u ction, at 1 . 9 0 b i l l i o n p o unds was
down 9 pe rcent . He a d k i ll was 3 .04
million, down B pe rc e n t , a nd av e rage l i v e
we i g ht dec l i ned I p o u n d to 1066 . Ve al
p r od u ct io n, at 3 9 mi ll i on p o u n ds wa s u p 3
percen t . Cal f s l a ug h t e r o f 2 6 7 thousand
head was d ow n 6 p e r c e n t , b u t a ver a ge l ive
we i g h t i nc r e a s e d 10 p o unds to 2 4 1 . Pork
product ion , to t a led 1 . 14 billion pound s ,
down 11 perc e n t . The 6.65 milli on head
ki lled wa s do wn 11 percen t. howeve r ,
ave rage l i ve wei g h t increas ed 2 pounds t o
24 2 .
Spec i es
Ge o r gia Cat t le Calve s flog s Sheep [, La mb s
GEORGIA AN D UN I TED STATES l.I VESTOCK Sl.AUGHTER 1/
Number Sl a u gh t ered
Av e r ag e
19 8 4
J an . - Se pt .
Li v e We ight
Se pt .
as 7. o f ' 8 4 a s /. o f
Sept.
19 8 3
19 8 4
1 9 83
19 8 3
19 8 3
19 84
1 , 000 !lead
Pe r cen t
Pe r c ent
Po unds
Total
Li ve Weigh t
Sept .
198 3
19 8 4
1,000 Po unds
19 . 6
18 . 3
93
1.6
1.5
94
18 5 . 8
119 .6
64
.I
.1
100
112
898
890
17 , 565
16, 3 17
85
334
340
532
5 13
90
229
232
42 ,5 20
2 7 , 7 35
150
96
108
5
10
I:ni t e d S t a t es
Ca tt le
3, 312. 6 3 , 0 38. 8
Ca l v e s
282 .8
266. 9
Ho gs
7,4 9 9 . 0 6 , 64 6 . 2
She e p [, Lamb s
6 17 .0
547. 2
1/ In cl u d e s s la ug h t er u nde r Fe d er al
fa r m sl augh t e r.
92
103
1. 06 7 1, 066 3 . 5 3 5 , 0 2 2 3 , 239,357
94
109
23 1
241
6 5 , 34 4
64 ,243
89
99
24 0
242 1 ,8 0 0 . 48 9 1 ,6 07 ,1 21
89
10 3
109
107
67 , 0 58
58 ,554
I n sp e ct ion a n d o t h e r c omme rci a l slaugh te r , exc l u d e s
COMMERCIAL RED MEAT ANn l.ARD PRODUCT I ON: l.'NITED !;TATES WITH COM PARI SONS 1/
Sep t emb e r
1984 as ;~
Ja n . - Se p temb e r 2/
198 4 a s x
Ki nd
1983
198 4
o f 1983
1')8 3
1984
o f 1983
Mill io n Po unds
Pe r c e nt
Mi Ili on Po un ds
Pe r cen t
Be e f
2, 029
1,903
91
17 , 09 6
17 ,4 77
10 2
Ve a l
38
39
10 3
311
35 0
1 13
Pork
1 , 273
1,1 39
89
10, 913
10 , 7 6 1
99
l. amb [, ~ut t o n
33
29
88
2i6
27 8
101
To t al Re d Mea t
3, 4 35
3 , 111
91
28 ,596
28, 866
101
La r d 3/
84
74
88
701
688
98
1/ Ra sed o n pac k e r s dr ess weigh ts and exclud e s f arm s la u ghte r . 2/ Ac cumul ated to tal s
ba s e d o n un r oun ded d at a . 3 / Pre li mi n a r y l a rd prod u ction i n c l u de s r ender ed po r k fa t .
3
GEORGIA BROILER HATCH UP 8 PERCENT
GFR-84-Vo I. 22 U.S. BROILER HATCH UP 5 PERCENT
The September hatch of broiler-type
chicks i n Ge orgia, at 53.1 million, was 8
percent more than that for Septemb er
1983 .
The 505 million broil er-type
chi cks hatched Januar y-September was 3
percent more than the same period last
year .
Na t i o n a l l y , the September 1984 hatch of bro il er-type chi cks, at 362 million, was 5 p'ercent more than September 1983. The 3 , 4 75 million hatched dur ing JanuarySeptember was 2 percent above the same period last year.
POULTRY HATCIlI NG AND PLACEMF.NT--SEPTEMBER 1984
/. of
/. of
Item
Sept.
Aug.
Sept.
Jan. thru Sept .
year
1983
1984
198 4
1983
1984
aRO
- - Thou s a nd s - -
- - Thous a nd s - -
Pullet Chicks Placed
Domestic (U.S .) 1/
Broiler Type
2,897
3 , 07 5
3,078 106
28,338
29,849
105
Egg Type
176
283
323 18 4
2.528
2,849
113
Chicks Hatched
Broiler Type
Georgia
49 , 153
57,649
53,062 10 8
490 , 086
505 ,3 76
103
Un i t e d States
343,63 4 394,4 73
362, 083 1O; 3.390,93 7 3,474,715
102
Eg g Type
Ge o r g i a
2 ,131
2,571
1 , 919
90
17,917
3 3,778
189
Uni ted States
31,796
35 , 096
32,565 102
310 ,602
367,666
118
Turke vs
Po ult s Placed
13 . 5 .
8 ,08 6
1 3~0 7
8, 7 93 109
2/8 , 086
2/8, 79 3
109
1/ Re port e d b y l eadi ng breed ers, i nc lud e s ex pec t e d p ull.et replacements from eggs
s ol d during th e pr e c edin g month a t th e r at e of 125 pu ll et ch ic k s per 30 d oz en cas e
of e g g s . 2/Turk e y po ul ts pla c ed Se pt. 19 84 .
Item
Chickens Egg Type Broiler Type
Turkeys
EGGS IN INCUBATORS, OCTOBER 1984, UNITED STATES
198 3
19 84
/. of Year Ago
---Thousands ---
29,648
27, 580
93
286,354
306,702
107
12 , 214
13,312
109
Georgia Hatching Other
Total Georp,ia Total U. S .
XUMBER OF LAYERS AND EGG PRODUCTION SEPTEMBER 1984
Eggs per 10 0 Lavers-Se t .
Total Eggs Produced Durin Se t.
1983
1984
19 8 3
19 84
1983
1984
Thous ands
:II umbe r
Millions
4,960 12 ,969 17,929 271 ,629
5 ,05 8 13,83 1 18,889 279,364
1,803 2 ,007 1,947 2, 0 25
4
1,7 82 2,052 1,980 2,010
89 260 349
5..zl01
90 284 374 5,616
I COMMERC IAL POULTRY SLAUGHTER 1/ SEPTEMBER 1984
Sept .
Aug.
Sept.
7. of year
Jan. thru Sept .
7. of year
It em
1983
1984
198 4
a20
198 3
1984
allo
- - -Thousands-
-Thous a n cis-
Yo u n g Chickens
Georg ia
50 .038
56 , 7 4 0
5 1 . 0 35
102
4 60, 100
457. 530
99
United States
3 49,9 47
392, 372
350.25 0
10 0 3. 168.322 3 .2 2 2 .262 102
Ma t u r e Ch ickens
Li gh t Ty pe u.S.
11,28 7
13 , 978
12, 40 1
110
112,751
110.27 4
98
Heav y T ype U.S .
3 ,03 2
2 .956
3.074
101
28 ,35 2
26.117
92
Total U.S .
14,319
16,934
15 , 4 7 5
108
141 ,103
136 ,391
97
Tota l Al l Type s. Ga. 2,738
3 . 487
3 .250
119
28, 9 19
27. 220
94
Percent Condemned
Young Ch ic k e n s
Georgia
1.3
1.5
2/ 1.4
2/ 1 .4
Un ited States
1 .4
1.5
2/ 1.5
2/ 1. 5
1/ Feder al ly inspe cted slaughte r data as c o l le c t e d by Me a t and Poultry Inspect ion
Program. Cu rr e n t month dat a estimated by Ma rke t New s Serv ic e . 2/ January-August 1984
c o n demnati o n s .
. COLD STORAGE HIGH LIGH TS, S EP TE:-lBER 3D, 1 984
Froz en st o c k s in re f r ige rated wa reho uses
on September 30, 1984 were g reater t h an
vear earlier l e ve l s for po r k, beef, a nd
f r uits . Coole r i tems with s t oc k s ab ove
t hose of t he pr evious vear i nc luded fres h
vege t abl es .
~
Tota l red meats in freezer s incre a s e d 2
per cen t f r om Aug u s t 198 4 a nd we re 20 p e r ce n t mo re t han t he Sep tembe r 1 983 holdings. Frozen pork stock s d r o pp e d 5 per c ent dur ing the mon th b u t were 22
pe r c e n t above t h e pr e v i ou s year . St o c k s
o f pork bellies we r e d o wn 48 p er ce nt fro m l a s t month bu t we re 4 4 percen t a bo v e t h e 1983 h ol d ing s.
To t a l fro zen poult r y sup pl ies inc r e as e d 10 pe rcent from Augu st 1 9 8 4 b u t were 9 percen t be low l a s t year. To t a l s t ocks o f c hic kens d e cl i n e d 7 percent du ring th e mon th a n d wer e 8 pelc e~ ~ b e l ow 19 S 3 . Tota l poun d s of tur k e y s in fre ezers were up 18 p e r c en t fro m la s t mo n t h bu t do wn 9
p c~ccnt f~o~ !~st y ca~.
Commodi tv
Butte r Cheese, Na tural Eggs, F r o z e n Fru it s , Frozen Frui t Juices, Frozen Me at s, Re d
Beef , Frozen Pork , Fr o ze n Poult ry , Frozen Turkeys. Fro ze n Vege table s , Frozen Po ta t oe s , Frozen Peanu ts . Shell ed Peanu ts, I n She l l Pecan s . Shel l ed Pecans, I n Sh e l l
COLD
STORAGE STOCKS Se pt . 30. 1983
UNITED STATES , SEPTEMBER 30 ,
Aug. 31 ,
Sept. 30 ,
198 4
1984
1,000 Po unds
552, 263 1 , 248,2 45
46 2 , 7 16 1, 147,647
430 .404 1,112, 924
16, 432
16 , 5i5
16. 106
625,1 72
7 15 , 8 19
70 1.282
1 ,089, 689
1, 065 ,859
9 13,866
53 5, 30 7 268,2 10 209,9 53 57 8 .0 14 432 ,185
627 , 626 290,045 269 , 483 476 . 096 331,007
64 1 ,928 317,05 5
:!5611 :2
52 5 , 3 9 7 3 9 1. 17 7
2.053 ,201 637,16 7 190, 285 18 ,892 2 4. 46 3 21, 167
1, 755 , 657 5 16,5 29 124 ,626 7 ,2 5 ':' 30, 3 36 54,473
2.0 34 ,41 7 635, 512 111, 463 7 .062 26 , 63 3 40 ,372
5
198 4
Perce,nt of
Se t , 1983 Au
Percen t
78
93
89
97
98
97
112
98
84
86
12 0
102
1 18
109
122
95
91
110
91
1 18
99
1 16
10 0
123
59
89
37
97
10 9
88
19 1
74
1984
CATT LE ON FEED UP 6 PERCENT
GFR-84-Vol. 22
Cattle and c alve s on f e e d Oc tob e r I, 1 984 , f or slaughter mar ket in t h e 13 quar terly states , t o t a l e d 9 .0 0 mi l l i o n h e .. d, 6 p er c ent more th a n la s t ye .. r and 2 percent a bove 1982.
Pl ac e men t s o f c a t t l e a n d c a l v e s o n f e e d
du r i ng t he July-September quart er to tal ed 6 . 2 4 mil l i o n , 12 p e r ce nt more t h an th e same q uar te r a vear a g o and 7 perc e n t ab ove t h e comp a r a b l e pe ri o d i n 19 8 2 .
The c a ttl e on fee d i nven to r v i ncl ud e d
5 .61 mill ion st e e r s and s teer c a l v e s, u p
3 pe r c e n t f r om l a s t yea r .
Thi s
g r o u p r epr e sen ted 62 pe rce n t of t he t o t a l
Oct oh e r I n umb er o n f e ed , 2 p er ce nt a ge
p o in t s l e s s t h a n i n 1983 . He if e r s a n d
h~ i f er c a l ves acc o u n t e d for 3 .3 6 millio n ,
u p 12 percen t f rom l a s t year .
Ca t t l e f ee de r s ex p ec t to mar k e t 5 . 70 mi l li o n head d u rin R the Oc t ob e r - De cemb e r q u a r t e r o f 198 4 . Th i s wo u l d b e 5 per c e nt mor e t han th e f ou r t h qu art er mark et in g fl in 198 3 and 6 per c en t abo ve 198 2 .
19 83 AND 19 8 4
To ta l 7 S t a t es 2/
Nu mb e r
198 4 as 7-
I tem
198 3
198 4 of 19 8 3
1 , 0 0 0 He a d
Pe r cen t
On Fe e d J uly 1
7 , 278
7 , 125
98
P l .. ce d on Fe ed J ul .
4 ,7 56
5 , 253
I 10
Fe d Ca t tle Mar k e t e d
4 , 8 30
4 , 710
98
Se pt. 30 3 /
Other Oi s a p pe a r a ric e .Jul. 1-
297
268
90
253
2 26
89
Sept . 30 4 /
On Fee d Oc t . J
8, 4 65
9 , 000
J06
6, 95 1
7 , 442
10 7
1/ AZ., CA. , CO. , I L . , r n , , LA. ,K S. ,M~ . ,:\B. , OK. , S . D. , TX. , WA. 2 / AZ . CA. , CO. , I A. ,K S. ,NB . , TX.
3 / In clude s ca t t le p la c e d O Il feed af te r b e g in ning of q lla rt er a n d ma r k e t e d b ef o r e e n d
o f q u a r t e r. 4 / I nc l udes d e ath loss es , mov e men t fr o m f ee d l o t s t o p a s ture s an d s hipmen ts
t o o t he r f e ed l o t s f or fur ther f eed i ng.
GEORGI A MI LK PROOUCT IO S
Geo r g ia da i ry h e r d s p r o dll c ed 93 mi l l i o n p o u n ds o f mi l k d u r in g S ep t e mb er 1984. <:low n 7 pe r c e n t f r o m l as t y e a r bu t up p er c e nt fro m l ast mon th . Th e numb e r o f m! lk cows on Ge o r g i .. ' s farm fl du r i n g S e p t e mb e r a ve r ag ed 1 18 , 00 0 h e a d , 8 p" r ,en l l es s t h a n a ye a r <l e O bu t 1 p er ~ e n t mo r e t h a n th e previ o us mo nth ' s
c o uri t, ;
Pr od uc t i on pe r c ow a ve rag e d 790 po und s , S p e r c ent bel o w l a s t ye a r bu t t h e s a me as l a st mo nth .
C. 5 . MIL K PRODUCTIO N
~ j lk p r od u c t ion du ring Se p t e mb e r 1984 t o t a led 10 . 8 billion pounds , 4 per c e n t le s s th an S e p t e nilie r 19 8 3 .
Pr oduc t i o n pe r c ow a ve r a g e d 998 pound s d n r t n g S e ptembe r, 1 2 po unds b el o w Se p t e mb e r 19 83.
Th e t o t a l n umb e r of mi l k c o ws in h e r d s av e r ag e d 10 . 9 mi ll i o n head d u r i ng Se p t e mber, 3 p e r cen t bel o w Se p t emb e r a year ago .
I tem ~i l k Co ws 1/ ~i l k pe r Cow 2 / Mi l k P rodu ction 2 /
DA IR Y P RO O VC T IO ~ , SE P TE ~BE R 19 8 3-1 98 4
Ge o rgi a
Un i t e d S tat e s
Cn it
198 3
1984 Pe r cen t
198 3
19 8 4
Pe r cent
Tho u s . Head 128
1 18
92
1 1 ,150 10, 853
97
Poun ds
835
790
95
1 ,0 10
9 98
99
Mi l . Lb s .
107
93
87
11,26 2 10 , 827
96
1/ In cl udes d r y c o ws , exc l u de s h e i f er s n o t y et fr e s h . 2 / Ex c l ud e s mi lk su cked b y
calve s . 6
RECORD COTTON PRODUCTION IN CHINA PROJECTED; WORLD STOCKS TO RISE 1/
Wo r ld c o t t o n p r o d u c t i o n is f ore c ast t o e x c eed 7 7 million ba les in 1984-85, up f rom 67 milli on l a s t season. l arg el y becaus e of i n c reased p r o du c ti o n in Ch i na. Pa k ist a n. a nd t he Un i t e d St a t es. A rec or d 22-mil l i o n - b Bl e c r o p i s fo re c as t fo r Ch ina . Wi t h wo rl d c on sum pt i on r i s i ng les s t h an 2 milli on b a l e s t o a bo u t 70 mi l lion , wo r l d co t t o n s toc ks wil l ri s e f rom 24 mil l i on b a l e s t o 31 mil l i o n d ur ing th is s e a s o n . Wo r l d c on s u mpti o n is risi n g due t o bette r e cono mic gr owt h a n d inc r e as e d suppli es o f c o t t o n . Also , ma n y c oun trie s are replen ish ing i nv e n t o rie s whic h wer e dep le ted by the po o r ha rvests of r e cent y e a r s . Consequent l y. wor l d e x po r ts t h is s eason a re fo recast to e xc e e d 20 mi l l ion bales. t h e h igh e st s i nce 198 1- 8 2 . Ho wever, t h e r ise i n s tocks will ~ush the wor ld en d i ng stocks-to-consumpt i on r atio up from 0 .36 i n 1983-84 to 0.45. The Out look "A " index o f cot ton pr i ces i n northern Europe cur r ently i s down f rom 88 cents a pound i n October 1983 t o 73 cents.
The ma j or ch an g e s s i n c e l a s t mo nth in e s ti ma te s of wo r l d supp l y an d us e o c cu rre d in Chi na . Ch i n a 's c ot to n st oc k s are exp e c t e d to e x c e ed 12 mi lli on b a l e s at t h e e n d of the 1 98 4-8 5 s ea s o n, rep res e n t ing a bout two- f ifths of f o r eca s t wo rl d ending s t ock s. Ch ina expor ted 75 0.000 b a le s f r o m 1983 -8 4 , a n d e x ports in 1 984 - 85 a r e t e nt a t i vely estimat ed at 1 . 1 mi ll i o n b al e s . Prob l e ms wi t h q ua l ity and e x p o r t in f r a s truc t u r e, a nd a de si r e t o ex po rt tex tiles rat h e r th a n c o tt on , are e xpe c t e d to l i mi t ex po rt g ains th i s s e a s on .
Ch i na's mi ll use i n 19 8 4 - 85 is for e c as t at 1 6 . 5 mi l li on ba le s- -about the s a me as i n 1982 -8 3 b u t above l a s t s e ason . Mi l l u s e fell i n 198 3-8 4 because c o ns u mer s i n Ch ina appar e n t ly pre fer man-mad e f ib er p rod u cts, a nd be caus e t e x t i l e mil l s are f orced to buy co t t on a t p r o c u r e me n t p rice s whic h a re a bo ve p r ices f or wo r ld c o t t o n and in t ern a l man-made fib ers . A lowerin g of procurement prices du r ing 19 84-85 is ex pe c t e d , which wi l l al low mill u s e to reb o und .
Ot h e r min or c h a ng es we re ma d e t o th is mo n t h ' s wo rl d su ppl y. Est i mat e s of p r odu c ti o n i n Col omb i a , Sp ain . and Isr ae l rose a combi ne d 16 0, 000 b ales . Co nsu mpt i on wa s raised in Japan, Ta i wa n. Indones ia , a nd Ta nzania by 2 4 5 ,000 bale s . E s timate s o f U. S . pr od u ction , mill u s e . and ex port s c h a n g e d not at al l . 1/ USDA-Ec o nomic Re se a r c h Ser v ic e , Wo r ld Ag ri c u l tu ral Sup p l y and Demand Es timat es , October 13, 19 8 4.
7
GFR-84-Vo l . 22
l1, rnG) 0
X .-i l:>p "'"
"\) 'J) ;';l
r-.l
ru xi cam 'Tl
AJPr X 0
H;Qrn-o ~
.:>:: -< In"" rn r , O f-'
Z
i I H -1 .f' W
--i 03: ......
IlrllNO
O ZNO
.Q -I w o
o 10
Vl CJ
C)
-I N
P
J > l..JN
(Xl Vl
I
N
l ..J
N
o
-.j
N
00
.....
O -.j
r",
Vl
o
co r"
VlO
o
Vl
SURVEY ANNOUNCEMENT
The Georg ia Cr o p Re porti n g Servi c e wil l c o nt a ct tho u s a n d s o f Ge org i a f ar me r s d ur ing th e n ex t f ew we e ks t o obta i n e n d o f - year data on crops and live s tock. Se veral majo r surveys wil l be conduc t ed t o obtain ind iv idual fa rm information on acreage a nd pr od uc t i on f o r 198 4 crops, 1985 wheat and rye s e edings , hog and c a t tle inventory numbers, and the size of the current pig and calf c r o ps.
Farmers will be c on t ac t ed either by mail, telephone or personal i n t e r v i e w. If you a re asked to part icipate i n one of these surveys, your c oo pe r a ti on in completing the ques tionnaire will be g reatly ap p reciated. As with all of our surveys, individual data will be he ld i n co n f i de nc e and only used in developing county, Stat e and National estimates.
The estimates obtained from these surveys wi l l pr o v i de unbiased information to f a r me rs to aid i n mak ing their 198 5 production plans. State and National est im ates will be i n c l u d e d in future issues of the "Georgia Farm Report" .
8
GEO RGIA FARM REPORT
GA
[140D.L 7-
PI F:J-.I 1~l64JJl-l~
GEORGIA CROP REPOR TI NG SERV ICE
ECEI VED Stephens Federal Bldg .
Suite 320
Athens, Geor gia 30013
No vember 14, 1984 GFR-84- Vo l ume 23
Phone : (404 ) 546-2236 DOC rr,;; -: _.
- -- - - -- - - -- - - - - - UGA LIBRARIES
HIGHLIGHTS: Nove r 1 Crop Fo r e cast Agricul t ural Prices Peanut s by States Georgia No vellber 1 Pecan For e cas t Land Rent, Sele c t e d Sta t es Forwar d Con t r a cting of Co t t on
DRY OCTOBER AI DS HAR VEST
Weat h e r
dur i ng
Oc t obe r.
altho ugh
e x t r e me ly d r y , wa s ve r y f a vor a b le f or
ha rvest ing late s easo n row c rops .
Unus uall y h igh y ie l d s a r e b e i n g re p ort e d
f or most c r op s , e x c e p t soy bean s. wh i c h
we r e a d v e r s e l y a f fe c t e d b y t he l a t e
s u mmer and e ar ly f a l l dr o u g h t .
The
r e s u l t s of t h e No vemb er 1 surve y, a lon g
with mar k et i n g r ec ords th a t h a ve b e c o me
a va ila b l e , ind icat e y ie lds fo r s e ve r n l
c r o ps that either tie o r e xceed pr evi o L 9
r ec ord y ie ld
( Co n t i n u e d on page 2 )
GEORGI A ACREAGE AND PRODUCT ION" 19 8 3 AND 1984
Ac r e a Re
Yiel d pe r Ac r e
Product i on
Pla n t ed
Indi -
Ind i -
Crop
Un it for al l
Ha r -
Fo r
c~ ted
ca ted
Pu r po s es vested Har ve s t
No v . 1 ,
No v . 1 ,
1984
1983 1/ 1984 1/
1983
19 8 4
1983
1984
--Thousand Ac res--
- - Thousand s --
Corn
Bu.
1, 080
735
930
75.0
8 5 .0
55 , 12 5
79 ,050
Cotton 2/
Ba les
200
115
180
467
72 0
112
270
Soybeat\s
Bu.
2,050
2,000
1, 950
21. 0
21.0
42,000
40,950
Peanuts
Lbs.
640
562
636
2,790 3,400 1,567,980 2,162,400
. Tobacco,
Type 14
Lbs .
NA
44
39
2,190 2, 2')0
96,360
85,800
Sweetpotatoes 3/ Cwt.
7.0
5.8
6 .8
125
120
725
816
Hay, All 3/
Tons
NA
500
470
2 .00
2.90
1 ,000
1,363
Pecans
Lbs.
100,000
115,000
Apples. All
Commercial 3/ Lbs.
20.000
45.000
Peaches 31
Lbs.
100 ,000
150,000
Grapes 3/
Tons
2.5
2.9
Wheat 3/
Bu.
1,000
910
880
34 .0 35.0
30,940
30,800
Oat s 31
Bu.
125
85
65
61.0
59 .0
5.185
3,835
Rye 3/
Bu.
430
70
80
21.0
22.0
1 .470
1,760
Sorghum 31
Bu.
180
68
110
41.0
45. 0
2 ,788
4,950
11 Harvested f o r principal use. 2/ Cotton yi e l d in pounds and production in bales.
31 Estiaates b rought forward from earlier ~urveys. NA - Not available .
Agrleu1tural Stat::1stic:1an and Georgia Depart:8ent: of Agri.cu1ture
COTTON YI ELD TOPS RECORD
Ge o r gia's 1984 c o tt o n c r o p pr omis e s t o be the bes t y ielding crop t he St at e ha s e ve r p rod u c e d . Th e Nov embe r 1 y i e ld f or e c as t , a t 720 po und s pe r ac r e , is up 136 po und s from l a s t mont h 's f o r e c a s t a nd 253 pound s be tt e r than t h e 1983 y i e l d . Produc t ion i s e x p ec t ed t o r ea c h 2 70, 0 0 0 b a l e s , 14 1 perc en t a bove last yea r 's cro p . Thro ugh Nov e mbe r 4, abo u t t wo- t hir d s o f t he c r o p had be e n p ic k e d , sl i g h t l y sl owe r t han u sual progr ess .
CORN YIELD T I ES RECORD
Georgia's corn y ield wa s a g a i n indi c a t e d
a t a record- tieing as bushel s per a c r e ,
equa l ing t he mar k s e t b y t h e 198 2 c r o p .
Th e c u r r e n t y i e ld i s 10 b us h e l s a bo v e
last ye a r 's yie l d .
The good yie l d ,
coupled wi th a n i ncre a s e i n a c r e a g e
f oll owi n g l a~ t yea r ' s PI K pro g r am . r a i s e s
expec te d p r o d u c t i o n to 7 9. 1 mi l l i o n
bushe l s , an inc r e a s e o f 43 perce n t 'a bo ve
t h e 19 8 3 c r o p . As o f Novemb e r 4, a bo u t 2
perc e nt o f the cro p wa s y e t t o be
harve s t e d .
TOBACCO OFF 11 PERCENT
Th e 19 8 4 tobac co c rop . at 85 . 8 mil li on pounds, is down 2 p e r c e nt f r o m las t mont h 's f ore cast and 1 1 perc e n t be l ow
l a s y e a r . Yi e l d. at 2 , 20 0 po und s p e r
a c r e , compares wi t h l ast y e a r ' s 2.1 90 p ound . Ac r e s h a rves t ed . at 39 . 000 , is ~ , OOO a c r e s l e ss tha n the 44.000 i, -r ve s t e d in 1983.
GFR-84-Vol. 23
SOYBEAN FORECAST UNCHANGED
Ge orgi a ' s so v bean produc t i o n i s ag ain
f o r e c a s t at 41 .0 mi l l ion b u s h e l s , d o wn 2
per c ent from l ast ye a r. A y i e l d of 2 1
bu s h e l s pe r acre, t h e same a s l a s t yea r ,
is a n ti c i p a t e d fr om t he h a r v est of 1 .9 j
million a c r e s .
Ha r v e s t i n g p r o g ress,
throu gh Novem b e r 4, a t 46 p e r c en t
c o mp l e t e wa s ahe a d o f the pre vi o u s y e a r 's
38 per c e n t an d t h e 5-ye a r av e r a g e o f 44
pe rc e nt . Dry we a t h er du ri n g Au g u s t and
Se p t e mb e r c a u s e d a 6 bus h e l d r op i n y i el d
f rom t he Se ptember I f orecast to t he
October I f ore c a s t .
Ea r l y p lan t ed
soybean s t hat have al ready be e n harves ted
h a v e re po r t edly y i e l d ed bett er tha n wa s
e x pec t ed , wh i l e man y d oubl e - cropped b e a n s
we r e y ie ld i ng poo rly.
RECORD PEANUT CRO P
Ge o r g i a 's pean u t pr o d u c t i o n forecast. a s
of Novembe r I, at 2. 1~ bi lli on po u n ds , i s
3 p e r c e n t h i g h e r t h a n l ast month 's f o r e -
ca t and es t a b li s hes a r e co r d h igh l evel
o f p r o du c t ion . Th e r e cor .d pr o ducti on can
be a t t r i bu t e d t o 'a c omb i n a t i o n o f a
reco rd h igh y ield o f 3 .400 pounds pe r
a c r e, and a 13 pe r c e n t increa se in
a c r eag e . The c~r r en t y i e l d i s 10 0 poun d s
highe r than wa s foreca st a month ago and
B who p p i n g 6 10 p ounds pe r a c r e h igh e r
than l a s t yea r 's y i e l d .
Ha rves t i s
vir tua lly c ompl e t e b u t SOMe i nspecting
a n d ma r k et i n g rema i ns .
PEANUTS FOR NUTS
Are a Ha r v e s t e d
Yi e l d
Produc t ion
Sta te
I 1983
Ind . 1984
I 198 3
Ind . 198 4
I 198 3
Ind . 19 8 4
1,000 Ac r e s
Pounds
1 , 000 Fo un ds
Al a .
180 . 0
21 8 . 0
2 ,5 25
2,9 50
454 , 500
64 3 , 100
Fl a .
60 .0
76 . 0
2 , 78 0
3,200
166, 8 00
243 , 20 0
Ga .
562. 0
636.0
2, 790
3 , 40 0
1,56 7 , 980
2 , 162 , 400
N. He x . 1/
11.0
13.0
2, 330
2, 500
25 , 63 0
32 ,500
N. C.
147 . 0
15 4 . 0
2 , 16 5
2 , 900
3 18 ,25 5
446 , 600
Ok l a .
91. 0
95.0
1, 940
2 , 10 0
176 , 540
199 ,5 00
5. C .
12 . 5
14 .0
2 , 00 0
2 ,600
25 ,000
36 , 400
Tex .
215 . 0
22 5 .0
1 , 68 5
1 , 600
362,2 75
3 60 , 00 0
Va .
95. 0
97.0
2 ,0 90
2 , 900
198 , 550
281 ,300
U.S .
1 ,3 73.5
1 , 528. 0
2 , 39 9
2 , 883
3,295 , 530
4 , 405 , 000
11 Es t i mate s for c ur r e n t yea r c a rr ied fo rwa r d f r om e a r l i e r fo r e c a s t.
The Geo r g i " Fo r m Repo r t (I SSN-0 74 4- 7280 l Is oub l I s hed semi-mo nt h l y by the Georg i a Cr op Re port i ng Se r v ice , Ste ph ens Fede r " 1 Build i ng , Athe ns, Go. 306 13 , Lor ry E. Sn i pe s , St a tisti ci an I n Cho r go . Second c t e s s pos t age pa id a t .~ t h " n s , GA. SUbscript io n fee S10 ocr ye a r except t ree t o do t o c o nt r i but o r s . Su bsc r i ption Info rmot lo n avo l l " b le t r om: Georgl o Cr op Repor t in g Se rv ice, Ste ph e ns Fe de r "' Bu llc l nq , Suite 320 , Ath o ns , GA . 306 13 Te t e nhone r ( 404 ) 546- 22 36 .
2
u.s. HIGHLIGHTS, NOVEMBER I , 1984
Corn for g rain product ion i s forecast at 7 .53 billion bushels, up fract ionally from October 1 and up 8 1 percent from last ye a r ' s drought-stricken crop . A c rop of this s ize i 5 9 percent below the record high crop o f 1982.
Sor ghum g r a i n production i s forecast at 8 13 mill ion bushels, up 1 percent from Oc tob e r , 1 and 70 percent above last year.
Fe ed ~ra in pr od uction (co rn, sorghum, oat s and barley combined ) is expected to to ta l 232 million metr ic tons, up 71 percent f r om last year but 7 percent below the record high production in 198 2 .
Soybean production i s forec ast at 1 . 90 billion bus he ls , 4 per c ent less than
Octobe r I , 13 percen t b e l o w 19 8 2 b u t 16
percent above l a st ye a r .
Cotton production is forecast at
mill ion bales, 71 percent above l a s t
and
11 percent -mo r e than
production .
13.3 yea r 1982
Peanut production is for ecast at a record high 4 .4 1 billion pounds, 34 percent a bov e 1983. Product ion i s up 2 percent from the October 1 forecast.
All tobacco product ion is forecast at 1.74 billion pound9 , 22 percent above 1983, but down f r actionally from the October 1 foreca st.
UNI TED STATES ACREAGE AND PRODUCTI ON 1983 AND 198 4
Are a Harvested
Yie ld per Acr e
Pr oduc t i on
Ind i -
Indi -
I nd i c t e d
cated
ca t ed
Nov . 1 ,
Cr op
Un i t
1983
198 4
1983
19 84
1983
198 4
1,000 Ac res
Tho u sand s
Cor n f or Gra i n
Bu.
51 ,44 3
7 1 , 0 64
8 1. 0
10 5.9 4 , 166 ,1 08 7, 527, 206
So rghum f or Gr a i n Bu .
9, 836
14 ,209
48 . 7
57. 3
479 , 231
8 13,4 72
All Wheat 1/
Bu .
6 1, 390
66 , 19 4
39. 4
38. 8 2 ,4 19 , 8 24 2 ,570 , 300
So ybea ns for
Be ans
Bu .
62 ,525
66 , 833
26. 2
28.5 1 , 63 5 , 772 1 , 901 ,5 6 5
Peanuts f or Nuts Lbs. 1,373 .5
1 ,5 28 . 0 2 , 399
2 , 88 3 3 , 29 5 , 530 . 4 , 40 5 , 00 0
Upl a nd Cot ton 1/ 2/ Ba l e s 7 , 30 4. 8 10, 31 6 . 3
50 4
6 12
7, 676 .7
13 , 160 .1
Cot tonseed
Ton s
3 ,0 76
5,303
Al l Hay 1/
Ton s
59, 697
62, 251
2. 36
2.47
140 , 734
154,0 51
Swee t po t a t o e s 1/ Cwt .
10 2 .4
105 .9
118
124
12 , 083
13,090
Tob a cco
Lbs .
789. 0
797. 4 1,811
2 ,179 1, 428,483 1 ,737,668
Appl e s , Com'l 1/ Lbs .
8,31 4,500 8 ,233 ,500
Pe a c hes 1/
Lbs .
1 , 789 ,700 2,546 ,000
Gr apes 1/
Tons
5 ,494.2
5,019.1
Pecans 1/
Lb s .
270, 000 3/240, 400
Oat s 1/
Bu.
9, 076
8 ,088
52 .6
58 . 4
477, 133
472.460
Rye 1/
Bu.
896
953
30.3
31.7
27 , 11 6
30 ,184
Al mo nd s (Calif . )I/ Lbs.
240 , 000
520,000
Wa l n u t s (Calif.)I/ Ton s
199.0
225 .0
1/ Es timates carr i e d f orward fr om earli e r f orec as t . 2/ Yield in pounds. 3/ Revised.
3
GEORGIA PRICES RECEIVED
Average prices r e ceived b y Ge orgia
farmers at mid-October for most c rop and
livestock commod ities were g e n e r a ll y
below the prev ious month .
Pri c e s
received for wheat . corn. toba cco .
soybeans . peanu t s. hogs. broi l e rs , and
table egg s showed a d ecrease f rom l ast
month .
Co tton , sweetpotatoes , beef
cattle. calves. milk. other chickens and
hatching eggs were items that increased
in price from September. The Georgia
Prices Received All Commodity Index for
October was 121 percent of the 1977
average. 8 points below last mont h and 9
point~ below a yea r ago.
GFR-84-Vo l . 23 U.S. PRICES RECEIVED INDEX DOWN 1 POIN T
The Oc to b e r All Farm P roduc ts I ndex o f Pri c e s Rec ei v e d by Farme r s d e c r e as e d 1 po i n t f rom Se ptember t o 138 pe r cen t o f i t s J a nua r y-December 1977 a ve rage . Lower pr i c e s for cattle. hogs, corn . broi l ers , and eggs wer e part ial ly off s et b y hig h er p r i ce s f o r oranges. grapef ruit. mi l k , let tuce , a n d strawbe r ries . The I ndex wa s 4 poin t s above a ye a r ago.
PRICES RECEIVED BY FARMERS OC,O BER 15 , 19 84 WITH COMPARISONS
Price
Gear i a
United S t ate s
per
Oct.
Sept.
Oct . 15,
Oct.
Sept . Oc t , 15,
Commoditv
Unit
1983
1984
1984
1983
1984
1984
Winter Wheat
S/Bu.
3.88
3.30
3 . 15
3.52
3 .38
3.38
Oa ts
S/Bu .
1.62
1.67
1.62
Corn
S/Bu.
3 .7 1
2. 91
2 .76
3.15
2.90
2.72
::: o t t o n
Ct./Lb . 65 . 7
58.5
1/6 1. 0
63 .1
64. 6 1/ 65. 0
:::ottonseed 2/
S/Ton
194 . 00
98 .50
16 6.00
131 . 00
10 1 . 00
Tobac c o
Ct ./Lb .
19 0.0
3/1 77 . 5
174. 4
188 .0 3/1 8 4 . 5
50ybeans
S/BlI .
7.71
6.5 8
6 . 46
7.96
6 . 09
6. 04
Peanuts
Ct./Lb. 22.9
26.0
1/24. 0
23.6
26 .3
1/2 5 .6
Sw(" .. tpotatoes
S/ Cwt.
11 . 60
2/12 .50
13.00
9.91 2/1 1.30
11. 20
All Hay , baled 2 /
S/ To n
78.50
71 .90
71. 60
Milk Cows, 4 /5 /
S/Head 950 .00
895 .00
'16 0 . 0 0
890 . 00
HORS
S/Cwt.
38.80
44 .80
41. 90
40 . 40
46 .30
43 .20
Sows
S/Cwt.
33 . 60
39 .50
37. 50
35.70
40 . 20
38.60
Barrows & Gilts
S/Cwt.
39 .90
45. 80
42. 70
41.40
47.10
43 .80
Beef Ca t t l e 6 /
S/Cwt.
37.40
38 .80
39.00
51.70
55 .70
54.30
Cows 7 /
S/Cwt.
33 .40
33 . 30
33 .70
34. 40
3 4.9 0
3 5 .20
Steers & Hei f e r s
S/Cwt.
44.30
46. 00
45.50
56 .60
60.30
59 . 40
Calves
S/ Cwt.
47 . 60
46. 30
47. 50
57. 20
56.60
58. 40
.\' 11 Mi lk
S/ Cwt.
14 . 70
14 .40
3/1 4. 70
13 .80
13.60 3/1 3.90
Turkeys 2/
Ct./ Lb .
39 .9
46 . 6
51. 1
Chickens, Excluding
Broil ers
Ct./ Lb. 2 4. 0
2/1 4.5
18 .0
Com'l Broilers 8/ Ct./Lb. 28.0
31.0
3/27 .5
29 . 7
32 . 1 3/29.5
ERgs , All 9/
Ct./Doz 79.1
2/73.0
67 .5
68 .1
2/ 58. 4
55.3
Table
Ct ./Doz 69 . 3
2/54 .8
49.9
63.7
2/51.0
47.8
Hatching
Ct./Doz . 110. 0
2/120 .0
13 0 . 0
1/ First half of mon th . 2/ Mid-mon th pri c e . 3 / En ti r e mon th . 4 / Anima l s s o ld f or da iry
herd r e p lac e me n t o nl y . 5/ Pri ce s e s ti ma ted q uarterl y . 6 / " Cows " and " s t ee r s and h e if e r s"
co~ bined with allowa n ce where ne c e s s a r y fo r slaught er b u l l s. 7 / Includes d a iry cows s o l d
for s l a ug h t e r . 8/ Li veweigh t e qUival e n t price fo r Geor g ia. 9/ Average o f all eggs so ld by
farmers including hatching eggs s o l d at retail.
4
u.s . PRICES PAID INDEX DOWN 1 POINT
Th e Oc to b er Index of Prices Pa i d by Fa rm e r s for Co mmod it ie s a nd Servi c e s , I n te re s t, Taxes and Farm Wag e Ra t es wa s 16 4 p er c e n t of i ts 197 7 ba s e . Th e ind ex was down 1 po i nt f rom Sep t e mbe r but 3 p o in ts (1 .9 percen t) h ighe r th a n a y ea~ earl i er.
CONSUMER PRICE INDEX
The September unadjuste d consumer price
ind e x for all urban con sumer s (CPI-U)
incre a s e d 0. 5 percen t f r o m Au gu st t o
314 .5 (1 967- 100 ) .
Th e index was 4 . 2
p e rce nt abo v e Se ptemb e r 19 83 .
On a
sea s o na l ly a dj u s t e d ha s i s , the CP I- U rose
0.4 perc e n t from Aug u t . All componen t s
i nc r eas ed e xcept t he f ood a nd beve rages
i n d e x wh ich post ed a 0 . 1 per c e nt de cli n e.
Th e appar e l a n d u pkee p i ndex s howed the
largest
i ncre ase fo r the
seco n d
consecut i v e mon t h , up 0. 6 per c e n t. The
t r a n s po r t a t i on index was u p 0.5 pe rcent .
Hous ing , en t e r t a i nment, a n d o the r good s
and s erv ices ind e xe s a l l i nc reased 0 . 4
p e rcen t a n d the med i c al c a r e i nde~
inc r e ase d 0. 3 percent .
PRICES PAID BY FARMERS OCTOBER 15 198 4 WITH COMPARISONS
Price
Ge or ia
Uni t e d St t e e
per
Oct. IS, Se pt. I S, Oct. IS , : Oct. IS , Sept. I S, Oc t . I S ,
Commodi t
Unit
1983
1984
1984
1983
198 4
19 84
Dairy Fe e d 164
SITon 2 10. 00
184.00
175 .00
199 . 00
18 4 .00
179 .00
Dairy Fe ed 184
S/Ton 2 15 .00
185 . 00
178 . 00
2 16. 00
19 0 . 0 0
18 5 . 0 0
Dair y Conct. 324
S/Ton 280. 00
230 .00
210 .00
293 .00
253 . 00
246. 00
Hog Fe e d 14%- 18 %
S/Cvt.
12 . 50
11 .00
10 . 80
12.00
10 .70
10 .2 0
Hog Conc t. 38%-42% S/Cwt .
17.00
14. 00
14.00
16 . 90
13 . 80
13 .5 0
Beef cattle Conct .
32 %-3 6%
S/ Cv t .
13. 00
12. 50
13 . 0 0
12. 80
12 .00
11 .5 0
Cot ton s eed Me 1 4 1% S/ Cv t .
15 . 50
15.50
13.50
15 . 80
14.90
14.20
S oyb ~ an Heal 4 4%
S/Cv t .
15 . 50
13 . 50
12 . 50
15. 80
12 .30
11 .80
Bran
S/Cv t. _ 1 1 . 50
11. 00
11.00
10 .2 0
10.20
10 . 00
Mi dd ling s
S/Cvt .
10. 50
10. 50
11. 00
9 .7 6
9. 50
9 .46
Corn Hea l
S/Cvt .
9.90
9 . 80
9 .60
8 .84
8 .50
8.15
Bro i l er Gr ower
SI Ton 220 . 00
2 55 . 00
25 0.00
237 .00
22 1 .00
221. 00
Laying Feed
S/Ton 210.00
192 .00
185 .00
218.00
198 .00
194 . 00
Chick St a rte r
S/Ton 250. 00
24 5. 0 0
2 25 .00
245. 00
224 . 00
220 . 00
Bro i l e r- Feed Rati o I I Lb
2. 5
2 .4
2 .2
2. 5
2.9
2. 7
Hog -C orn Ratio 21
Bu.
10 .5
15.4
15. 2
12. 8
16 . 0*
15 . 9
Mi lk-Feed Ra t i o 31 Lbs .
1. 40
1 .57
1 .68
1.39
1 .48*
1. 55
Egg - Fe ed Ra ti o 4/
Lb s .
7 .5
7. 6
7 .3
6. 2
5.9
5. 7
I I Pounds of bro i l er g r ower e q ual in val ue to 1 lb. broi l er live weigh t. 21 Bushe ls of c o r n
e q ua l i n va l ue to 10 0 l bs . of hog live wei gh t. 31 Poun ds of 16% dai r y feed equa l i n va lue to
1 lb. whole mil k. 41 Po und s o f la y i ng f e e d equal in va lue t o 1 doz . eggs . * Revi s ed .
IN DEX NUMBERS- - GEORGI A AND UNITE D STATES
1977-100
Septe ber 1983
October 1983
Sep tember 1984 October 1984
Ge org i a
Pr i ceu Re c e ived
Al l Co di tie s
135
130
129*
121
Cro p .
139
139
13 2 *
124
Live. tock & Products
131
123
127*
1 19
Un ited S ta t e .
Price. Received
136
134
139
138
Prices Pai d 1/
162
161
165
16 4
Ratio 2/
84
83
84
84
17Rid-.anth index inc l Udi ng i n te r e s t , taxes a n d fa r m wa ge rate s . 21 Ratio of I nde x o f
P* r
ic Re
e v
. i
Re c aed.
ei
v
e
d
to
Inde x
of
Pr i ce s
Paid,
Inte r e s t,
Taxes a nd Fa rm Wage
Ra t ~ s .
5
GEORGI A PECAN S RES URVEYED
A No ve mbe r 1 sur vey of Georg ia's peca n growers s u pports a current pr oduct i on fo recast of 1 15 million pounds . The Geor g i a Cr op Report ing Ser v i ce s a vs this is 10 milli on pou nd s less than wa s fore ca s t o n Oc to b e r I, bu t 1 5 pe r c ent ab o ve the 19 8 1 c r o p o f 10 0 mi l l io n
po unds.
The Novemher fo r eca s t is ba sed o n
summarized r epo r t s f r o m 3 19 Ge orgi a pecan
prod u cers.
The s pec ia l unsche d u led
Nov e mbe r \ surv ey wa s p r om pt ed by an
e xtende d p e r iod of drv we a th e r t h a t
stre tched fr om l at e - Au gus t t h r o u g h
October in ma jo r pec a n p r o duc ti o n a r e a s
of t he St at e . This e xtended drought
whi ch fo l lowed a r e c o rd we t Ju ly r e s ult ed
in a re por t e d l y lar g er tl .a n normal tr ee
dr o p o f i mmat ure nut s , in s ec t d ama g e a n d
p rob abl y lower t h an n o rm a l meat y ie lds.
GFR-84-Vol. 23
Th e s e n e g a tive fa c to r s were offset h y a l ar g e nu t s et l a s t spr ing and a c o n t i n u ing ex pa n sion i n bear ing sur face, due mo s t l y t o yo ung t rees c o ming i n t o production .
A revi ew o f t h e Cr o p Rep o rt i n g Se rv i ce's Octo ber 1 fo r e cast f or Georgia pecans b ack to 197 0 s hows th r ee ye a r s when the f o re c as t wa s abo v e t h e final estimate; e i gh t years when it wa s b e low the final es t ima t e; a nd three ve ar s when i t equaled t h e fina l esti ma te : For th e 1 4 yea r period, t he Oc t o b e r 1 fore cast ave raged 4 perc ent l ess t han t he f i na l produc ti on est i ma t e. Co mpa ri son s ar e not av a ilable f o r Nov e mb er 1 si nce a s urve y i s n orma lly no t condu ct ed i n Nov em b er. Plea s e s e e th e t ahle b el ow fo r c o mpari s o n s of i ndi vi d ua l month's f o rec a s t wi th the f i nal es tima te.
GEORGIA PECAN PRODUCTION
COMPA RISONS OF MONTH LY FORECAST WITH F I NA L EST I MATES , 19 7 0 - 198 3
Se p t e mbe r
Oc t o be r
1.
:
1.
1. :f o l10w1ng J Ul y
Year : \ , 000 I bs , : o f Fina l I ,000 1b s , :of Fi na l 1 , 000 lbs . : of Fina l
1 , 000 l bs.
19 71)
48 , 000
89
48 ,000
89
45, UOO
\97\
87 ,000
97
87, 000
97
87,000
19 7 2
57 , 000
119
55 ,000
1 15
52 , 000
197 3
85 ,0 0 0
85
90,000
90
8 6 ,000
19 74
55 ,000
95
58 , 000
100
58 , 000
\ 975
80 , 000
10 7
75 , 000
10 0
75 , 0 0 0
1976
50,00 0
96
50, 000
96
50, 000
J9 77
60 ,0 00
68
70 , 000
80
75 ,0 0 0
19 / 8
110 ,000
82
105 ,000
78
10 5 , 0 0 0
E 79
65 , 0 0 0
10 0
70,000
108
65 , 0 0 0
\ 9 \0
95, 000
91
100 , 000
95
105 ,00 0
1') <\ 1
115 , 000
96
120 , 000
10 0
12 0 , 000
198 2
1 10, 000
88
1 10 , 0 00
88
lO S , 0 00
1 ') ID
110, 000
1 10
110 ,000
1 10
10 5 ,000
Ave ra g e :
95
96
Over
3
'3
Und e r
10
.Q
Eve n
1
J
~ E CAN PRODUCT ION , SELECTE D STATES AND U. S . , 198 2, 19 83 , AND OCTOBER 1 , 19 8 4 FORECAST
Ind1cated 19 8 4
;tat e
198 2
1983
Oc t . 1
Nov .
1 ,0 00 Po unds
\1 1 Pe c an s
Ala b am a
23 , 0 0 0
Arkan s as
500
Florida
4,5 00
Geo r gi a
125, 000
Lou i si a na
10 ,00 0
Mis s i ssi p p i
4, 000
New Me x i c o
25 , 000
North Ca r o li na
1 ,900
Oklahoma
2 , 000
South Carol ina
2 , 200
Texas
17,000
Un ited States
21 5 , 10 0
17 Es t i ma t e s for current year c a r r i ed
r e s u rve yed.
24 ,000 2, 500 3,40 0
10 0 ,000
22 ,000 8 , 000
29 , 000
1,600 8 ,000
1,500 70 ,000
270 , 000
18 , 000 2 ,000 5 ,000
125 ,000 10, 000 5 , 000 27 ,000
1/ 2 , 900 25,000 5, 500 25.000
250 .400
f.ore c ast.
".
".
*
11 5 . 0 0 0
***
* * * *
240 ,400 " No t
6
AVERAGE
Stat e
So uthe as t South Car o l ina Georgia Al a b a ma
Nor the ast Ve r mont Mas s achuse tts New York Ne w J e r s e v Pennsyl va n i a De laware Ma r y l and
Lake S t a tes Mi c h i g a n Wi sc o n s in Min ne sota
Cor n Be l t Ohio Indiana Ill i no is Io wa Mi.ssour i
No r t he r n Pl a i n s Nor t h Dako t a So u t h Da k o t a Neb ras k a No n i r r iRa t ed Irriga t e d Ka n sa s Nonirr i g a t e d Ir rigat e d
Ap p a l a c h i a n Vi r g i ni a No r t h Ca r o l i n a Ke n t u c k y Tenn es s ee
De lt a S t a t e s
~ i s s i s s ipp i
Ar kan s as Sou the r n Pl a i n s
Ok l a homa No n i r r ip,a t e d Ir r i ga t e d
Texa s Non i r r i ga ted Ir r i a t e d ase on
26.60
3 .9
3 1.10
4 .3
28. 80
4.2
47.60
1. 7
40 . 30
2 .7
6 1. 70
3. 8
56.90
3.3
55.90
4. 9
58.70
6 .2
70.20
6. 1
77 . 80
5 .4
98 . 90
6. 2
114 . 10
5. 8
10 5. 80
6 .5
5 1 .10
6 .7
2 8 . 50
6. 4
22 . 70
6 .6
28 .50
3 .0
40 . 60
4.0
49 .50
5. 1
40 . 20
4. 7
39 .50
4 .6
43.10
4. 8
rom c r o p repor t e r s .
28 .80 32. 60
35. 40
25 .60 36 .80 34 .10 48 .80 40 .40 61 .6 0 54.7 0
60 . 80 60 . 60 73 . 50
83 .00 104 . 00 119 .50 11 6 . 50
67 . 80
34 .40 31 . 30
52 . 00 10 4 . 90
33 . 8 0 63 . 80
37 .50 46 . 80 58.40 48. 10
46 . 80 51 . 20
31. 50 48 .10
3 .8 4 .4
4.6
4. 4 2.6 6. 7 1.7 2 .7 3.6 2 .9
5. 1 5. 9 6.3
5.6 6.3 5. 9 6 .7 7. 4
6.8 7.0
7. 4 8 .2
5. 7 7.8
3. 5 3 .6 5. 3 5 .2
4. 8 4 .9
4. 1 4 .9
17.00 20 . 0 0
8 . 20
15. 00
16 . 70
24 .00 22 . 40 29 .20 36. 40 43 . 60 40 . 70 25. 80
9 .30 9 . 00 13 . 10
13. 10
18 . 50 22 . 00 26 . 50 23 .80 15 . 70 17 . 10
11. 50
8. 30
2 .9 3 .1
3.2
3 .3
1. 7
5. 1 4.8 3.e 4 .2 5 .3 5.4 5. 1 4 .8 5. 1 5. 9
4. 0
2 .5 2 .7 3. 5 3. 1 2. 9 2.8
2. 5
1.4 a t a.
,...,
FORWARD CONTRACT I NG OF UPLAND COTTON BY GROWERS, AS OF NOVEMBER I , CROPS OF 1975-1984
N
AND ACR F.S FOR HARVEST, 1984 CROP 1/
Cotton Crops
o
Stat e
>
I
"d"
Ala ba ma 2 /
19 7 5 19 76 1977 197 8 1979 1980 1981 1982 1983 1984
- - - - Percen t - - - - -
4
68
9
15
23
32
6
13
24
26
CO
aI:: ou,
Ge o r g f a
North Car ol ina So u t h Car ol ina
1
33
1
</<
8
14
10
7
13
30
4
38
16
27
13
43
8
17
28
36
16
42
18
3 1 33
55
24
36
62
53
So u th e a st e rn Stat es
5
52
9
1 5 21
33
10
15
27
33
Arka n sas
17
82
17
38
27
55
16
18
24
40
Lou i s i ana
2
72
7
29
23
41
8
18
21
23
Mi s s i s s i pp i
17
67
27
49
50
80
28
24
25
31
Mi s sour i
11
84
24
46
40
78
25
23
38
53
Te n n e s see
1
65
2
16
13
46
9
28
33
35
So u t h Ce n t r al S t a t e s Okl ah oma
1*3
73 1<)
19 19
39 27
35 21
63 4
19 2
22
25
1
-
32 18
Texa s So ut hwe st e r n State s
*</<
24 23
19 19
9 10
14 14
22 20
7 7
5 4
7
19
6
19
Ar iz o n a
23
62
49
34
30
46
7
21
19
16
Ca l i f o rni a New Me xi c o
34
73
30
53
27
42
10
16
33
30
..
45
18
13
10
7
1
*
-
1
We st er n S ta t e s
29
69
34
46
27
41
9
17
28
25
Uni t ed St at e s
8
49
21 24
2 1 34
10
12
16 _n~
1/ Co n tr acti np, est ima te s do n o t i nc l ud e c o t t o n c o ns ign e d to marketing organizations but
does i nc lude c ot t on cont ra ct ed wi th mar k et ing organizations. 2/ Includes Florida, 1984
c r op . </< Les s t h a n 0.5 p e r c ent .
co
Georgia
~crop Reporting Service
Stephens Federal Bldg. Suite 320 Athens, Georgia JOb1J
SECOND - CLASS POSTAGE PAID AT
ATHENS, GA 30613
04 2F 01 13 0 0 0 00 25-227 075020
GA EXP4ER04I M/2E2N8T-7S2TA38
00 8 50 5
LCIARBORLAREYLEDF ORD
EXPERIM ENT
GA 30212
,I
FARM
December 3, 1984 GFR-84-Volume 24
.,. O(
GEOR GIA
~ CROP REPORTING SERV ICE
Stephens Federal Bldg. Suite 320 Athens, Georgia 30613 Phone: (404) 546- 2236
HIGHLIGHTS Poultry Su..ary Cold Storage Cattle on Feed Milk Prochction
APF( 2 1- 20 05
DOC M S
UGA liBRARIES
r.EORGI A BROILER HATCH UP 5 PERCENT
The October hatch of broiler-type chicks i n Georgia , at 53.7 million was 5 percent more than that for October 1983. The 559 million bro iler-type chicks hatched January-October was 3 percent more than the same period last year.
Agricultural Prices Fertilizer Consu~tion Li~stock Slaughter
V.S. BROILER HATCH UP 6 PERCENT
~ at ionally t h e Oc t o b e r 1984 hatch of bro iler-type chicks , a t 3 67 million, wa s 6 percent more than October 1983 . The 3,842 million hatched during JanuaryOr.tober was 3 percent above the same period last year.
POULTRY HATCHINr~ . AND PLACEMENT--OCT 1984 -, of
i. of
It em
Oct. 1983
Sept . 1984
Oc t. 19 84
year aRO
Jan . thru Oct.
1983 T 1984
year al!.O
- - Thousands--
- -Thousands--
Pullet Chick s Placed
~omestic ( U. S. ) 1/
Broiler Type
3 ,014
3,078
3,063 102
31.352
32,912
105
Egg Type
319
323
243
76
2,847
3 ,092
109
Ch i c k s Hatched
Broiler Type
Georgia
51 , 106 53,062
53 ,701 105
541,192
559,077
103
United States
345,253 362,083
367, 397 106 3,736,190 3,842,112
103
Egg Type
f;eorp.,ia
2 ,369
I ,919
1 ,42 1 60
20,28 6
35,199
174
United States
32 ,343
32,565
31 ,382
97
342 ,9 45
3 9 9,048
1 16
I.ur k~
Poults Placed
U. S .
9 ,202
8 ,793
10,741 117 2/17 ,288
2/19,534
113
1/ Reported by leading breeders, includes expected pullet replacemen ts from eggs
sold dlJrin~ the preceding month at the rate of 125 pu llet chicks per 30 dozen case
o f eggs. 2/Turkey poults placed Sept. 1984-0ct." 1984.
Agricultural Statistician and Georgia "Depart:.ent o f Agri cultQre
Georgia Hatching Other
Total Georgia Total U.S.
~UMBER OF LAYERS AND
No. Layers on
Hand-Oct.
1983
1984
Thousands
EGG PRODUCTION. OCT.
Eggs per 100
'_ Layer.s 4lc t
1983
1984
~!2!. .mber
GFR-84-Vol. 24
1984
Total Eggs Produced
During Oct.
1983
1984
Millions
4.974 13,177 18,151 274 ,432
4,982 13,643 18 , 6 2 5 281, 910
1, 860 ,077
2,022 2,07 1
1,829 2 , 16 1 2 ,072 2 , 076
93 274 367 5 ,683
91 295 386 5,852
COMMERCIAL POCLTRY SLACGHTER 1/, OC-TO BER 1984
I. of
I. of
Oct .
Sept .
Oc t .
year
J an. thru Oct.
ye a r
Item
1983
1984
1984
ago
1983
1984
ago
- - -Thousands- - -
- - -Thousands- - -
Young Chic ken s
Ge o rg ia
48,0 36
.. 3 ,58 6
5 4, 73 0
1 14
508 , 136
50 4, 8 1 1
99
Un it e d St at es
341,530
33 6,9 6 5
38 5 , 28 7
11 3 3 ,50 9 , 8 52 3, 60 4 , 7 5 2 103
~ature Ch i ckens
Li g h t Type U. S.
10, 13 9
11 ,7 8 2
15 ,535
153
12 2, 8 90
125 , 58 4 10 2
Hea v y Ty p e C. S .
3, 1 27
2 ,896
3,12 5
100
31, 4 79
29 ,064
92
To tal U. S.
13,266
14 ,6 78
18,6 60
14 1
154 ,369
154,648 100
Total Al l Types, Ga. 2,520
3 ,041
3,727
148
31, 439
30, 738
98
Per c e n t Co n d e mned
Young Chi c kens
Georgia
1.2
1.4
2/1.4
2/1. 4
United States
1. 3
1.4
2 /1 .5
2/ 1. 5
1/ Fede rall y inspe ct ed sl aughter dat a a s coll e ct e d by ~eat a nd Poul t r y I ns pec tion
Program . Cu rrent mo n t h data estimated by Ma r k e t News Serv i c e . 2/ Janua r y - Se p t . 19 8 4
condemnations.
C;ommodi t v
CO LD STORAGE STOCK S , UN I TED STATES , OCTOBER 31, 19 84
Oct obe r 3 1 , Se p t e mbe r 30,
Oc tober 3 1,
Pe r c e nt o f
1983
198 4
198 4
Oc t 1983
Sep t 19 84
Butt er Ch ee s e , Natura l Ep,gs, Frozen Fruits, Frozen Fruit Jui ces, Frozen Meats, Red
!leef, Frozen Po rk, Fr ozen Poultry, Froz en Turkeys, Frozen Vep,etables, Frozen Potatoes , Frozen Peanuts, Shelled Peanuts, In Shell Pecans, Shelled Pecans, In Shell
523 , 927 1 , 234 ,850
14,229 70 0 , 9 57 980,290 576 ,562 277,972 239,993 60 1,04 4 46 0,076 2,1 30,515 77 5 , 170 18 7,4 03
14,605 18,67 7 10 , 107
1,000 Pounds 42 6,3 15
1,11 5,0 00 16,723
704,8 01 913,2 0 5 646,193 319 ,581 256, 625 5 26 , 67 2 390 ,558 2, 030 ,721 635 ,332 113,053
6,513 26,790 40 ,316
3 71 ,405 1, 07 5 ,49 4
17,685 752,574 880,102 667, 708 323,327 271,495 54 9 , 2 78 411,727 2,078 ,674 823,779 214,376
21 , 46 9 20 ,13 6 27 ,446
Perc ent
71
87
87
96
124
106
107
107
90
96
116
103
116
101
113
106
91
10 4
89
105
98
102
106
130
1 14
190
14 7
330
10 8
75
272
68
2
CATTLE O~ FEED I N 7 STATES UP 7 PER CE~T
Cat t l e a nd ca l ves on fee d ~ov e m be r 1 f o r sl a u g ht er ma rk e t i n t h e 7 stat es pre pari n g mont h l y est i mates t o tale d 8.22 mi l l i on , a 7 p e rce n t inc r e as e fr o m a year ago a n d 1 p e r cen t ab o v e Nov e mb e r I , L9 8 2 .
~ar ketings o f f e d c at tl e d urin8 October total ed 1.66 million, an inc r ease of 2 pe rc e n t from l ast year a n n u p 9 percent fr om October 19 82 .
P l a c e me n t s o f ca t t l e a nd ca l v e s o n feed i n the 7 st a t es wer e 2. 55 mill i on , up 3 pe rc e n t f r o m Oc t o b e r 1 9 8 3 bu t 2 pe rce n t b e l o w two y e ars a g o . ~ e t pl a ce men ts o f 2. 4 4 millio n we r e u p 3 p e rc en t fr om 1983 but 3 percent bel ow 1 982.
Other d isappearan ce to t al ed 110 thousand compared with 102 thousand during Oc t o b e r 1983 and 83 tho us a nd two ye a rs ago.
r.ATTL E AND CALVES ; ~ UM B E R ON FEED, PLACEMENT S , MARKETED, AND OTHER DIS APPE ARANCE,
7 STATES, OCTOBER 1 TO NOVEMBER 1
1984 as r-
Item
1983
198 4
o f 198 3
1,00 0 Head
On Feed, Octobe r 1 1 /
6,951
7 ,44 2
107
Pl a c ed o n Fe e d d u r i ng Oc tober
2 ,460
2, 546
103
Fe d Cattle Mar k et ed during Octob e r
1,6 26
1,6 57
102
Ot h e r Disappearan c e d urin g Octob er 2/
102
110
108
On Fe ed No v e mbe r 1 1 /
7 ,683
8 , 221
10 7
1/ Ca t t l e a nd c a l v e s on fee d a re a ni ma l s for sl aughter ma r k e t b e i n g f ed a fu l l
ra t i o n of g ra i n or o the r c on c e n t r a tes and are expected to produc e a c a r c a s s that
will g rade go o d or be t t er . 2/ Inc lud e s de a t h l o s se s , mov em e n t f r o m f eed l o t s t o
pa s t u r e s and sh ipmen t s to o t he r f e e d lo t s for fu r ther fe ed i n g.
GEORGI A ~ I LK PRODUCTI ON
U. S . MI LK PRODUCT I ON
Ge o r g i a dai r y he r d s p r o du c ed 10 0 mi l lio n po u n d s o f mi l k du r ing Oc to b e r 1 9 8 4 , d o wn 1 1 per c e nt fr om l ast year b ut up 8 pe rcen t f r o m la st mon th . Th e n u mb e r o f mi l k c o ws o n Ge or g i a ' s far ms d u ri n g Octo be r a veraged 1 18, 00 0 h e ad , 8 pe rcen t l es s th a n a y e a r a go b u t t h e s a me as t h e pr e v i o u s month 's c o u n t .
Produc t i on pe r c ow aver a g ed 85 0 pou nds, 3 pe r c e n t be l ow l ast year bu t 8 pe r c en t a b ov e la s t mont h.
Mi l k produ ct ion duri n g Oc t o be r 19 8 4 t o t a l ed 10 .9 b i lli o n po unds , down 4 pe r cen t f ro m Oc t o b e r 1 9 8 3 .
Produ c tion per c ow a v e r a g e d 1 , 0 10 pound s during Oc t o b e r 198 4 , 1 4 po un d s below Oc t obe r 1 9 83 .
Th e t o ta l nu mb e r o f mi l k c o ws ave r a ge d 10 .8 mi lli o n he a d d u r ing Oc t o be r . 3 pe rc en t b e l o w Oc t o b e r 19 8 3.
I tem Milk Co ws 1 / ~ilk pe r Co w 2/ Mi l k P ro du c t io n 1/ I nc l ude s d r y c a lve s.
r1AIRY PRODUCT I ON , OCTOBER 1 983 -1984
Ge o r g ia
Un i t e d S tat e s
Cn i t
19 8 3
19 84 Percen t
Th o u s. Head 128
11 8
92
Pound s
87 5
85 0
97
2/
Mi l . L b s . 1 1 2 _ _-:----::-'-'"~
_
1 0 0 _ "-"-~
89
__=~
c o ws , ex cl udes h e ifers not ye t f r e s h . 2/
198 3
198 4
Pe rc e n t
1 1 ,1 59 10,838
97
1, 024
1 ,0 10
99
1 1 , 4 3 0 10 , 9 4 2_ __ .9: :6. . ; = _ _ _ .:.....:...L..:...:~_....:....::_ L..:.....:...:: Ex cludes mi lk s u ck e d by
3
GEORGI A PRI CES RECEIVES
Ave rage prices r e c e i v e d by Georgi a
fa rmers a t mid ~ovember f o r most c r o p and
livest ock i tems we r e mixed f r om th e
pr e v i o u s mo n th and previous ye a r . Pr i c e s
received f or c o r n , c o t t o n , s we e t p o t a toes,
hogs, steers and h e i fe r s , c a l ve s, mi l k ,
o ther c h ic k e n s , b r o i le r s and table e ggs
were i t e ms th at incre ased i n p r ice fr o m
Oct o b e r . The Ge org ia Prices Re c e i ve d All
Commod i ty I ndex for Nove mber wa s 1 2 0
percent o f t h e 1977 av erage,
po i nt
b e l o w l ast mont h and 1 6 po i nts b e l o w a
year ago.
GFR-84-Vol. 2 4 C. S . PR ICE S RECE IVED I~D EX DO ~~ 1 PO I ~T
T h e No vemb e r All Farm Products I ndex of Pr i c e s Re ce i v ed by Farmer s de c reas ed 1 po in t ( 0 . 7 perc e n t ) from Oc t ob er t o 1 37 p e r cen t of i ts Jan u a r y -De cember 19 77 aver age . I n t h e I nd e x, lower pr i ces f o r o rang e s , le tt u ce, c o r n , grape f r ui t a n d t o mat oe s were pa r t i ally off s e t by h i g h er prices f o r hogs, e ggs , cat tle , potatoe s a nd tu r k e ys. The i ndex wa s 2 po i n t s ( 1 . 5 pe rcen t ) above a y ea r a go .
PR ICES RECE I VED BY FAR ~ER S, ~O VEM B ER 15 , 198 4 WI TH COMP ARIS ONS
Pric e
Uni t e d S t at es
per
~ov .
~ov .
Oc t .
No v . 15,
Commod itv Winter Whp at
Un i t S/ Bu .
198 3 3 . 3A
1983 3 . 46
1984 3 . 38
198 4 3 . 39
O'lt s
Eo / Bu .
1. 6 7
1. 74
1.66
Cor n
S / Bu.
3.7 4
2.8 3
2. 84
3.17
2. 65
2. 59
Co tton
CL / Lb . 69 .1
64. 5
1/66 .5
67 . 0
6 4 .6
1/6 6 . 0
Co tton s eed 21
SI Ton
18 7 . 0 0
98 . 50
A7 . 00
166 . 00
10 1. 0 0
10 4 . 0 0
Tobac co
Ct /Lb .
177 .5
3/ -
17 9 .1
18 4 . 5 3/1 8 8 . 0
So y b e a n s Pl?anuts
SI Bil. CL / Lb .
7 . :; 1 23 . 2
6. 16 22. 5
6 .09 1/16 . 7
7 .8 1 24. 0
6. 08 24. 8
6.05
i zza.
Swee t po t a to",s
S/ Cwt .
14. 00
2 /13 . 0 0
15 .40
1 1.40 2/1 1 . 20
12 .80
All Hay, bale d 21
SITon
76 .60
71. 60
73 .0 0
Hoes
S/ Cwt .
37 .00
4 1.5 0
44. 50
37 . 50
43. 60
4 7. 20
S ows
R"rr ow s & Gilts
S/Cwt . S/Cwt .
3l . 00
3/l . 1o
37 .40 42 .40
38 .10 4 5. 60
32. 00 38 . 30
38. 60 44 . 30
40 .70 48 . 10
ke e f Cattle 41 Cows ') 1 S t ee rs & He ifers
Ca lves Al l Mil k Tl: r k e y s 2/ Ch i c k e n s , Exc l u d i n g
S/Cwt . S / Cwt . S / Cwt. S/ Cwt. S/Cwt . Ct . / Lb .
38 .10 32 . 80 46 .20 5 1 . 30 l 4 . 80
39 .40 34 .')0 47 . 40 47 . 90 14.90
39 . 10 34 .00 47 .50 49 . 90 3/15. 30
51 . 2 0 33 . 80 56 . 9 0 59 . 40 13 .90 40 .7
54 . 10 35. 10 59.20 58 . 20 14 .0 0 51. 1
54 .6 0 32.90 61.4 0 58 .90 3/14. 10 57 .3
Br o il er s
Ct . / Lb . 29 .0
2 / 18 .0
23.0
Co m' l Br o il er s 61 Egg s , Al l 7 1
Table
Ct./Lb. C L / Doz CL/Do z
32 .5 87 . 9 8 1.7
27. 5 2 /67. 5 2/49 . 9
3/ 28. 5 70 . 7 56. 8
3 3.7 76. 4 72 .4
29 . 5 2/ 5 5 . 3 2 / 47.8
3/30 . 8 61.3 54.4
Jlatching
Ct./Doz . J 10. 0
2/130 .0
120 .0
11 First half of month. 21 Mid-month p r i ce. 3/ Ent ire month . 4/ " Cows a n d " s tee r s and hei fer~" co mhi n e d with allowan c e wher e ne ce ssa r y for s l auRhte r bulls . 51 In cludes dair y
co ws sold f or slaughter. 61 Liveweig ht e qu i v a l e n t p rice for Georgi a . 7/ Average o f all
I e Rg s sold b y farmers in cluding hat ch;np., e g g s sold a t retail. Tne Geo r o Ia Fa r m-Repo~t ( ISSN-O7-4-4---72--80-)' - 1-, - P-U-b-'-s-h-e-d-s-e-m-'---no-n-t-h-Iy--b-y-t-h-e-Ge-o-rg-~,a-C-ro--p R- e-p-o-r -t -In~g---r
I SerVi ce, St e phe ns Fed e ra l Bu i l ding, At hens , Ga . 306 13 , La rry E. Sn i pe s, St ati s t ici an In Cha rg e .
I Se co nd clas s po s t ag e pa id at Athens, GA . Subsc ri pt io n te e SI D pe r y a~ r except free t o d8te
Icont rIbutors. SUbsc ription Inf o rmo t lo n ava i l ab le from: Geo r~1 8 Crop Reporting Se rv ic e , Stephens
I Feder a l Buil ding, Su ite 320 , Athe ns , GA . 306 13 Tel e pho ne: (40 4) 546-2 236.
4
C.S . P RI CE S PAID INDE X UNCHANGED
t he Index of Pr i ces Paid by Farmers fo r Commodi ties an d Services, I n t e r e st , Taxes , a n d Fa rm Wage Rates fo r ~o vember wa s 16 4 per c en t o f i t s 197 7 ba s e . The I n d e x was un changed f rom Octo b e r . Decline s in the f e ede r l i ve stock and f ue l s and energ y i nd exe s were of fset by i ncrea s es in t he fam i ly living and au t os a n d truck s compo nen ts . Co mpa r ed wi t h a ye a r e a r l i e r the ind e x was up 2 poi nts (1 . 2 p er c e n t ) .
CO NSUME R PR ICE INDEX
The Oct obe r un a d j us t e d consumer n r i c e
i ndex fo r all urba n c ons u mers ( CPI - C)
incr eas ed 0.3 per cen t fr o m a mon th
e a r l i e r t o 3 15 . 3 ( 1 9 6 7 ~ I OO ) . The index
wa s 4 . 2 pe r c e nt a bo v e Oct ober 19 8 3 . On a
s ea sonal ly adj u s t e d basi s , t he CP I - U rose
0.4 pe r c en t f r o m Sep te mber .
Al l
c o mpo n e n t s inc rea sed. Th e t ransp or tation
c o mpo n e n t was up 0.7 p e r c e n t .
The
indexes f o r a pparel and upke e p and
medica l care i nc r ea sed 0 .5 perc e n t . Th e
fo od a n d be v e ra ges , e n t e rt a i nme n t , and
o the r goods a n d servi ce s i nd ex e s a l l
inc reased 0 . 4 percen t . Hou s ing showed
the smallest increas e rising on l y 0.1
pe rcent .
PRIC ES PAI D BY FARMERS NO VEMBER 1 5 1984 WI TH COMPARI SONS
Nov . IS , 198 3
220 . 00 22 5 .0 0 28 0 . 0 0
12.50 17.5 0
Nov. 15 , : 1984
17 5 .00 176 .00 2 15 .00
10 . 50 13 .50
No v . I S , 1984
177 .0 0 18 2.00 2 4 5.0 0
9 .93 13 .3 0
3 2 :: -1 6 1::
S / Cwt .
13 .5 0
13 .00
12 .50
13.20
11 . 50
11. 30
Co t t o n see d ~Ie a 1 4 1% S/ Cwt .
16 . 00
1 3 . '> 0
13 . 0 0
15. 80
14 . 2('
13 . 50
So y b e a n ~e a l 4 4%
S/ Cwt .
16 .00
12.50
12 .00
15 .8 0
11 . 8 0
11 .60
Br a n
S / Cwt .
12. 00
11.00
1 1. SO
10 . 30
10.0 0
9.98
:-1 i d d lin gs
'>/ Cwt .
10. 50
11. 00
10 . 50
9 .98
9. 46
9. 5 1
Co rn Mea l
S/ Cwt .
9. 90
9 .60
9 . 20
8. 91
8 . 15
7 .88
Rro i l p r Grow pr
l. ay i n e Fe ed
S/ Ton S / To n
210 .00 215 .00
250 .00 18 5 . 0 0
250 .00 18 3 .00
2 43 . 00 2 2 0.00
22 1 . 0 0 194 .00
220.00 190. 00
e l>i .:k S t a r t f' r
; / To n
250 . 00
2 25 . 0 0
2 25 . 0 0
250 .00
22 0.00
21 9 .00
Bro i 1f? r-Fef?d Rati o 1/ Lbs.
1. 1
2 .2
2 .3
2.8
2. 7
2. 8
Hog -Corn Ra t i o 2/
Bu.
9 .9
14.7
15 . 7
11.8
16 . '>
18.2
~ i J k- F eed Ra tio 3 /
Lb s .
1. 35
1 . 70
1. 75
1. 36
1. 56
I. 59
~gfL-F~_ed Ra tio 4/
Lbs .
8. 2
7.3
7 .7
6. 9
5 .7
6.5
1/ Pounds of b roi le r g r owe r e qual in v al ue t o 1 1b. bro i le r live weigh t . 2/ Bushe ls o f c o rn
<>'1" '11 i n v alue to 100 lbs. of ho g liv e we ight . 3 / Pounds of 16 % dairy f e ed e qu a l in value to
1 1b . who le mil k. 4/ Pounds of l a yi n g f e ed e qua l in v a l ue t o 1 do z. eggs.
"
C1e')oi7r
g=
j i
lal.O
-'-J'~DEX K 1j~ R ERS - - GE ORG J A A K D L'_N_' r_T_E_D_-,S--,-TA_~T;..;::E:.;:S.......~-=-
_
O (" t~-.E~ ~
~ ~mber
1
9
R1
O::to be r 19 8 4
" ----- ;:.~-'=-':..:;..-"-_'___
__:'_-_''::.o...v...=e.m.:.:.:bc:e.::.r.:::..:__..1:...9;:..8:::.4:::.._
P r i cF' s R p.c e l v P c:
.1\ 11 Co mmon it i e s
110
Cr ops
139
L iv f' s Lo ("k .s. Pr o d u ct s
121
ln : tpn Sta tes
136
121
140
123*
112
1 19
rTi cl?s Rpc e iv pd
P r i I:~S Paid j.'
__. ~ :!..::i.:)_ ~.L
: /~id - m()n ~ h i n d e x
1 ]4
i 61
_2,3
i n c l ud i ng i n t e r e s t ,
tax e s
13 5 16 2
A3 and f a r m wag e
138 164 84 rates. 2/ Rat i o of
! 'r': I '~s Rp ce lvp d to In d e x of Pri ces Pain , Inter est) Ta xes And Farm Wag e Rate s .
5
120 1 15 124
i 3i 164
R4 Index of
* Re vised.
r.EORGIA FERTILIZER CO~S~MPTIO~ ~P 21 ~
Georgia ferti lizer c ons u mp ti o n f o r th e
ye a r e n o r ng June 30, 1984, totaled
1,91 4,583 tons , an increase of 2 1 perc e n t
from last y e a r ' s 1 , 577 , Ql1
tons.
Fertilizer mixtur es amount ed to 1, 058,65 1
tons , up 16 p e r c e n t trom 198 3. Dire c t
applic ation materials totaled 668,571
tons of prima ry n utr i ents and 18 7, 361
tons of s eco nda ry and micronut r ien t s.
-:-O TAL F !'::R TE..I ZER C O~ S L~ ?T IO:-; I;P 20 :~
Fertilizer consumption in the ~ .S. and Pu e r t o Rico during the year ended June 3 D, 198 4, tota led 50.2 million t o n s , u p 20 percent from the 41.8 mill ion t o ns consumed during the 1982-8 3 ye a r.
?rimary nutri ent cont ent ( n i t r oge n , phosphate, and potash ) was 21.9 mi l l i o n
GFR-84-Vol. 24 tons, up 21 percent from a year earlier. Ki t r o g e n c o n s ump t i o n increased 22 perce nt to 11.1 million tons; phosphate usage , a t 4 . 9 million tons ~ and potash con sumpt ion, at 5.8 mil lion tons, were u p 19 and 20 pe r c e nt, re spectively.
Th e f ive leading State s in order o f total consumption and the change in consumption f r om t he year ended June 30, 1984 were: Illinois , up 29 percent; Ca li forn ia, u p 23 percent; Iowa, up 42 percent; Texas, up 22 p er cent ; and Indiana, up 18 pe r c ent: .
Fertilizer consumption represents all
commercial fertilizer tonnage sold or
shipped for farm and non-farm use as
fe rt il i zer.
Ma t e ri a l s u sed in the
man ufa cture o f r egistered mi x e s o r for
use i n other fertilizers are excluded.
PLAN'T NUTRIEN ,. CON5UMPT! ON
Mi l. Tons of Prod uct
25
Nitrogen
1 : J 20
15
Pot tlsh
:0
5
o
1975 1976 1977 1976 1979 1960 1981 1982 1983 198 4 Yetlr EndIng June 30 6
GA. RED ~EAT PRODUCTIO~
u.s. RED ~EAT PRGD UCTIO~
Georgia red me at p r o d u c t io n totaled 35. 4
million pounds during Oc t o b e r 1984, down
13 per cent f r o m Oct ob er 19 8 3 .
The
Ja nua ry -O c t o b e r red me a t pr o ductio n
tot aled 3 56.9 mil li on p o un d s, 7 perc e n t
less than the c o mp a r a ble p er iod o f 19 8 3 .
Ca t tle s l aught e red b y commer ci al plan t s in Georgia d u rin g Oc t o b e r to ta l e d 23,2 0 0 ~e ad , an in c rea s e o f 2, 6 0 0 h e a d fro m the pre v ious year. Cal ves s laugh t e r e d in Oc tob e r to ta l e d 1,5 0 0 h ead , abollt th e s ame as a year ago.
Th er e wer e 1 51,6 0 0 hogs sl aught er e d i n c o mme r c i a l plan t s a c r o s s t h e S t at e dur ing Oc t o b e r 198 4 . Th i s amounte d to 3 8, 3 0 0 h e ad l e ss than l a st year .
Commercial red meat production for the
Un i t e d States in October 1984 totaled
3.67 billion pounds, up 4 percent from
October 1983 . January-October r ed meat
production , at 32.5 bi l lion pounds. was
up 1 percent f r om last year.
Beef
production. at 2.18 billion pounds, was
u p 6 p e rc e n t . Head k ill was 3. 48 mil-
lion, up 6 per ~ent. and average live
weigh t i nc r e a s ed 2 pou nd s to 1,072 . Veal
production. at 4 5 mill ion po u n d s wa s u p
10 percent .
Calf sl aughter of 308
thousand head was up 6 pe rcent and
average live weight wa s u p 9 pounds to
248.
Pork product ion t o tal e d 1. 41
billion poundS , u p 2 pe r cent. The 8.15
mi llion head k illed was u p 1 percent,
however. ave ra ge li v e wei g h t wa s up 1
pound to 244.
Sp ecie ,;
Ge o r gi a Ca t tl e Ca l ve s
Hogs
Sh ee p Ii. Lambs
GEO RGIA AND mU TED STATES LI VESTOCK SLAUGHTER I I
Numb e r Slaug ht e r ed
Ave r a g e
198 4
J an.- Oc '.: .
Li v e Wei g h t
Oc t o be r
as 7. of ' 8 4 as I. of
Oct ober
198 3
1984
19 8 3
1 9 83
198 3
1984
I, 0 0 0 Head
Per cent
Perc ent
Po u n d s
20.6
23. 2
1 13
I .5
1. 5
100
189. 9
)') I. (,
80
.I
.1
100
112
88 5
81\3
87
3 45
35 1
89
23 0
234
140
103
111
Tot al
Live Wei g h t
Oc t o b e r
19 83
198 4
1. 000 Po unds
18 , 2 4 7 502
43 ,65 0 7
20.506 539
35 ,5 20 10
rn i ted Stat e,;
Ca t t le
3 ,2 77 .7 3 , 4 7 5. 9
Cal ve s
289 . 8
30 7 .5
Hogs
8 , 0 85 .6 8,1 50. 3
Sheep Ii. Lamb s
600. 6
60 7 .6
1/ Includes sl auRht er und er Fede ra l
farm slaughter.
10 6
10 4
1 , 07 0 1 , 07 2 3 ,507 , 90 1 3 .7 2 5 , 90 9
J 06
10 9
239
248
69. 381
76.2 11
101
99
243
2 4 4 1 , 9 6 4, 7 56 1,988,943
! oi
!03
109
11 0
65 . 6 18
66.996
Inspe c t ion and o t he r commerci al sl augh t er, excludes
COMMERCIAL RED MEAT AND LARD PRODUCTION: UNITED STATES WITH COMPARISONS 1/
October
1984 as 7.
Jan.-October 2/
1984 as 7.
Kind
1983
198 4
of 1983
1983
1984
of 1983
Million Pounds
Percent
Million Pounds
Percent
Be e f
2, 062
2,181
106
19,157
19,658
103
Veal
41
45
110
352
396
113
Pork
1,188
1,411
102
1 2 . 3 01
J 2 , 172
99
Lamb Ii. Mutton
32
33
103
309
311
101
Total Red Meat
3 ,5 23
3,67 0
104
32,J19
32,536
101
Lard 3/
90
90
100
791
778
98
JI Bas ed on packer,; dr e,;,; weip,hts a nd p xcludes farm slaughter . 2/ Accumulated totals
based on unrounded data. 3/ Preliminary lard prod uction includes rendered pork fat.
7
I'
GEORGIA FARM REPO
December 11. 1984
GA
P.400.C t-
PI
F~
}qg'-J1/~- II
GEORGIA CROP REPORTING SERVICE
"
RECEI E[J stephens Federal Bldg.
S" uite 320
f.\ PR 2 1 2005 Athens, Georgia 30613
?hone : ( 404 ) 546-2236
GFR- 84-Vo lu me 25
DOCUM EN'r s
-HIG-HL-IGH- TS:- -- - - - -- -- - UGA LIBRARIES
Cotton and Pecan Forecasts
COTTON CROP UP
Reinstatement o f Reports Changes in Re l ease Schechl.es
The December 1 forecast of Geo r gia's 1984 cotton crop. at 275 .000 bales, is up
PECAN FORECAST UNCHANGED
5 , 0 0 0 bales from November 1 . and 163, 000 bal es. o r 146 percent, larger than l a s t
The Decemb e r 1 f o r e cas t o f Geo r g i a ' g 198 4
y ear's crop. Abo ut 96 percen t of the c rop had bee n picked b y Decembe r 9 , ver y
pecan p r o d uc tion , at 1 15 mi l lion po u n d s ,
c lose t o a vera g e pr ogres s f or that dat e.
i s unchanged f r om the spe c i al November 1
The De cember 1 yie ld fore cast , at 733
sur vey .
Th e cu r rent fo recast is 15
pounda per acre , is 13 pounds above the
mi l l i o n p o und s . o r 15 pe r c ent . l ar g e r
Nov e mb e r 1 projected yi eld a nd 19 pound s
t han last - yea r 's crop .
Ha rv es ti ng
above the previous reco rd s et i n 1982 .
progress on December 9 stood a t 79
Th e c u r r e n t foreca st is 266 pounds per
p ercent comp le t e. compared wit h 82
ac r e better than th e 19 83 y ie ld.
percent f o r the 5-year ave r a ge f o r that
date .
GEORGI A ACREAGE AN D PRODUCTIO N 1983 AND 1984
--XCreaRe
~~eJ.a e r Ac r e
t' r o a uc t l o n
Planted
I nd ~
Indi -
Crop 1/
Un i t
for all
Ha r -
Fo r
ca ted
ca ted
Pu rpo s es ve sted Har ves t
Dec . I ,
De c. I ,
198 4
1983 2/ 1984 2/
19 83
1984
19 83
1984
- -1. ousana Ac res --
- -T oUlla no ll--
Pec an s
Lbs.
100.000
In , OOO
Co tton 3 /
Bal e s
200
115
18 0
467
733
112
2H
Co r n
Bu .
1, 080
73 5
930
75.0 85 . 0
5 5 , 12 5
79,050
Soybeans
Bu .
2 ,0 50
2,000
1 , 950
21. 0 21.0
42 , 000
40 .950
Pe a nu t s
Lbs.
64 0
562
636
2, 790 3,400 1, 567 , 980 2.162 . 400
To bac c o,
Type 14
Lbs.
NA
44
39
2.1 90 2,200
96 ,360
85, 800
Sweet pota toe s Cwt .
7.0
5. 8
6 .8
125
120
725
816
I Hay, All
Ton ll
NA
500
47 0
2. 00 2. 90
1 ,000
1.363
Apples, All
Comme r cial
Lb s .
20,000
45 , 000
Peac hes
Lb s .
100,000
150 . 000
Gr ape s
To n s
2.5
2.9
\lh e at
Bu .
1 ,000
91 0
880
3 4 .0 35 .0
30 ,940
30 ,800
Oa t il
Bu.
125
85
65
61.0 59 .0
5.185
3 ,835
ferRye
Bu.
43 0
70
80
2 1.0 22 .0
1 , 470
1 ,760
~ ehcuranns a nd co t Btoun resur vey1e8d0 fO I Dece68m=o-e=-r:--I",,-~a1T1l T0l -=o-t=h=-e::-:r::4-:c1:"r.:0o~=-p=--.~:::sc=4t""5~ 1r.n'0a=t-r-~::-:s:,.....b.,=ro~u2g.!7ih:-8ito-8=-,f.-o=r==w.,a.r..d.4.:1t+9:r=a5m0:-
earl ier s ur veys . 2/ Harvested f or pri ncipal use . 3/ Cot t on yi e l d i n pounds and pr oduction in
ba le s. NA - Not availabl e.
Agrl.cultural Statist i cian and Geor gia Depart:.ent: of Agricu1ture
UNITED STATES PECAN PRODUCTI ON
GFR-84-Vo l. 25
Th e Nation 's p e can pr o d u c ti o n o n December 1 is f or ec as t at 2 2 8 .7 mi ll i on pounds .
Th i s is d own 9 p e r cen t from th e Oct o b e r 1 f o r e c a s t nd is 15 p e rc e n t be l o w the 1983
c r op . Th e t otal p r oduc tion f ore c a st con si s t s o f 1 .2 mi ll ion pou n d s o f imp r o v ed
v a r i e t i e s a n d 6 3. 5 mil li o n p ounds of nati ve and s eed l ing p e c ans . On Oc t obe r 3 1,
1984 , c o ld s t o r ag e hold ings i n t h e U. S . ~ ta
0 . 1 mi lli on pounds of she lled pecan s
and 27. 4 mil l i o n poun ds of in- shel l p e c a n .
Stat e
All Pec ans Al a . Ark . Fla . Ga . La . Miss . N. Me x . N. C. 1/ Ok l a .
s . C.
Tex . U. S . 1/ Estimates fo r
cur r ent
1982
---1 ,00 0 Pound s---
23,000 50 0
4, 50 0 125 , 000
10 ,00 0 4 ,00 0
2 5, 000 1 ,900 2, 000 2 ,20 0
17 , 0 00 2 15,100 year carri ed
forw rd
24 , 000 2,5 00 3 , 400
100, 000 22 , 000 8 ,000 29, 000 1,60 0 8 ,00 0 1 , 500 70 , 0 00
2 70, 00 0 from e arl ier
fo recast .
MONTHLY PEANUT STOCKS AND PROCESS I NG REPORT REI NSTATED
Ind . 19 8 4
13 . 000 1, 800 5. 0 00
1 15 ,000 8 .000 5 ,000
24 .000 2 , 900
2 <+ ,000 5 , 000
25 , 0 00 228 , 700
Th e U.s . Depa r t men t o f Ag r i c u l tu r e ' s St a ti s t i cal Re po r t i ng Se r vi c e (S RS ) wi l l r e i n state fo ur c r op e s ti mati ng pr o g r a ms t ha t we r e d i s c n t i nu e d o r c u r t a i l e d i n 198 2. Agen c y a d minist r at or Wi l l i a m E. Ki ble r said tha t 198 5 f u nd i n g l e g i 3 l a t i o n r e q u ir e s h i s agency t o a gai n i s s ue estimates on pe a n u t stocks a nd proc e s s i ng , floricul tur e , a s pa r a g u s , a n d c ucumbe r s f o r p ick l e s .
SRS wi l l is sue t h e Pe a n u t S t o c k s and Pr o ce ssing re po r t s mo n th l y in 19 8 5 . Proc essi ng da t a f o r t h e Aug u st 198 4-J a n u a r y 19 8 5 pe r iod a n d pe a n u t s t o c k s in c o mme rc i a l storag e on Jan u a r y 3 1 wi l l be r e l e as e d o n Friday , Mar ch 1 . Th e firs t mon th l y re po r t , whi c h Ni l l inc l ude st o c k s a s o f Fe b r ua r y 28, a l s o wi l l be r el e a s e d o n Friday , Mar c h 1 .
SRS wi ll releas e i t s a nn ual F lo r i cu l t ur e Cr op s re port, wit h e s t i ma te s of 198 4 product ion and p r od uc e r s ' in t ent i o n s f o r 19 8 5, a t 3 p . m. , Fr i day, Mar c h 1 5. Ki b l e r said his a g e n c y wi l l c oll ect dat a dur i n g J an u a r y a nd Feb r u a ry .
The a genc y will i n c l ud e final 198 4 d a ta on a spa rag us and c uc umb e r s fo r p i c k l e s in a special Ve g e t a b l e report to be releas e d on Th u r s d a y, Fe b r u a r y 28 . There a f t e r , SRS will publish estimates for these produc ts in it s regular Ve g e t a b l es r e po r t s .
Highlights from these report s will be included in the firs t issue of the Georg ia Farm Report follOWing the release date. The data can also be obtained by calling the Georgia Crop Reporting Service after 3:30 p.m. on the release date.
2
USDA ANNOUNCES I MPROVEMENTS IN STATIST I CAL AND ECONOMIC REPORTI NG PROCEDURES
Se cr etary of Ag r i cu l t u r e J o h n R . Bl o c k has announ c e d t wo a c t i o n s t o imp r o v e the c rop a n d l ives t o ck s tat i s ti c a l and e c o n o mi c r e po r t s i s s u e d by t he U.s. De pa r t me n t o f Agr i c ulture .
" I n r e s pon s e t o use r s ' c onc erns a bou t the qua l i t y and time l i ne ss o f t he se r e port s , USDA wi l l f o r m a n ou t s i d e r e v i ew pan el of r ecog n iz e d e x pe rts i n s t a t i s t i c a l meth o d o l o g y a n d e c onomi c ana l ys is , " Bl o c k s a i d. The 12 - me mb e r p n el, t o be n a me d b y De c embe r 1 7, wi l l i n c l ud e r e pr e s e n ta t i v e s f r o m unive r si t i e s , a g r i b u s i ne ss, commod i ty or f a r m o r gani z a t ions and similar gr oups .
Bl o c k s a id t he pa ne l wi l l f o c us o n revi e wi n g t h e sta t i sti cal me t h o do logy u sed f o r cr op an d live s toc k e s t i ma t e s a n d USDA's e c o nomi c a n al y s is and o ut look wo r k . "Th e ou t si d e r e v i e w g ro u p wi ll ma ke fin al r e commendatio n s t o me r e g a r d ing th e pro cedu r e s
u s e d in ob t ai n i n g , s ummari z i n g a n d int er p r e ting data by Ma y I," h e s ai d .
Bl o c k a l s o sa i d t h a t b e g i nn i n g i n J an ua r y , USDA wi l l im p l e me n t a ne w s ys tem f o r r e l e a s i n g ma j o r s t a t i s t ic a l a n d economi c re po r t s . Thi s i s in r espon s e t o s ome f armer s ' c oncerns t hat the c ur r e n t s y stem--whic h r e l e a ses t he s e r e ports a t vari ous ti me s t h r o u g h o u t e a c h mont h-- h as c reat e d c onfu s ion e n d u n c e r t a i n t y i n ma rket s .
Ac c o r d i n g t o Bl o ck , all mo n th ly r e por ts deal ing wi t h d o me s t i c a nd wo r l d crop pr od u c ti o n , s toc ks o f U.s . cr o p s , a n d worldwide s u p p l y and d e ma n d e st im a te s wil l be i s sued o n t he same day dur i ng t he se c o n d wee k o f each mon th . St atis t i c a l Re port ing Se r v ic e r e p o r t s - -i n c l ud i ng Catt le o n Fe e d , Ho g s a nd Pi gs , Ca t t l e Inv e n t or y, Co l d Storage , and Li ve s t o c k S l a u g h t e r--wi l l be i ssued o n t h e s ame day d ur ing t h e th i r d we e k of the mo n t h .
" Th i s n e w sy s t e m wi l l s t re a ml i n e t he fl ow o f ma rke t - s e nsiti v e inf o r ma t i o n and t h e r e fo r e lim i t pote nt ia l d i s r u pti o n s t o c o mmo d it y ma rkets ," Bl o ck s a i d .
CALENDAR OF SE LECTED CROP REPORTI NG BOARD REPORTS FOR DECEMBER, J ANUARY AND FEBRUARY
Cro p Production Ca t t l e on Feed
- Dec. 10 - Dec. 14
Milk Produc tion Cold Storage Sma ll Gr ain See d i ng s
"" - Dec . 19
- Dec . 20
Hogs & Pigs
"
II
Livestoc k S l a ugh t e r
- Dec. 21
- Eggs , Ch i ck e ns . Turke ys
II
II
Ag ricul tur a l Pr i ces
- Dec. 31
Crop Product ion
- Jan. 11
Nonci t r us F ru i t & Nuts Milk Produc t ion Lives t ock Slaughter
- J a n . 14
- J an . 17
- Jan . 25
Crop Produ cti on, An n u al
""
Cat tl e on Feed
""
Co l d S torage
II
"
- Laye r s & Egg Prod . , Annual Jan . 28
Cr o p Val u e s
- J an . 30
Ag r i c ultural Pr ic e s Prospect ive Plant ings
- J a n . 31
- Feb. 15
3
Crop
UNITED STATES ACREAG E AND PRODUCTION ,
Are a a r ve s te
e
I n c1 l.-
ca ted
Un i t
1983
1984
1983
1, UUl Ac res
1983 AND 198 4 e r Acre
I nOl cated 198 4
Pr o uc t l on
I nOlc a t e O
Dec. 1,
1983
1984
Thousa nOs
896
953
30. 3
3 1.7
27 ,11 6
30,184
240, 000
~ 2 0 , OOO
19 9 .0
22 5 .0
ore l;ast .
- e: : B III Co. 1 .. Q.l O VIc( ~ g'::; ~ ~ C)
re-o
u
- c......
::J .- , ,., 0
OL..c -t ~ - 0.
..
~ CD ~ 2. ~ ~ ~ ~
~ ~ -;; l/l c 'L.. !: Vl l
8 ' O I.. ~ lI) o +- 'O +-
;!. ~ ~ ~:;: ~ 0" <
t Ixf z~ ~
u a. U ~ ~ ..
I,..'U L:!O O
~ +-Jl 55 ~ ~tO~~ ,
ss t o .. g ~ln ~ ~ :' -- >-IlC>
U .cv Vl lD ::J C
"v
V'
R~t;~ s. . ~ j ;~ ~
~~ .. ~ <3;: ~~ ..~
~ l ~j~ ~. ~ ~~r ~~' E; ~ ~ ~ = l! I: uI,C VHn ~llJ +-Q) <O: L :J Q)
-
(1)- < .- rJ L -
~ -g gr. ::: .~ L "a. ~ g ~ ~: -< ~ ~ ~ 'L: .~ ';0
0 _ 1..
.-
I,) ':]'l L I"'l
. "' -Cl 8. ,-~.. ~ ", .u _ ..o';l oL- 1Cilll :_g
l':= 5. ~ ": ;j; ~~~ t.9; ~ "'t
~
Georgia
~crop Rep o rting Service
Stephens Federal Bldg .
Suite 320 Athens, Georgia ) Db13
SECOND-C LA:; S POSTAGE PAID AT ATHENS, GA 30613
4 2 R0 1 1 3 0 0 0 0 25 - 22 7J 7 5 02 0
404 / 2 8-72 33
00 3 5 0 5
GA EX PERI M NT S T~
C A ~C l E L-= D ORC
L. I =)R4 R Y
: x o= ~ I M EN T
GA 3 02 1 2
~A
v A4l)O .c:1-
PI
GEORGIA f:L
- -- --G4Ei ORGIACROP
REPORTING
REPOE:)T ,IQ1j JJ.-:J..t"
SERVICE
FARM REC EIV ED
stFphens Federal Bldg. 'te 320
December 26 , 1984
2 1[-\. D. R\ 1_ '";or,J' I'J" ')
At ens, Georgia 30613 one: (404) 546-2236
GFR-84-Volume 26
DOCUME: l t S
HIGHLIGHTS
UGA LIBRARIES
Dece.JJer 1 Pig Crop wit:h Revisions
U.S. INVENTORY DOWN 5 PERCENT
Wheat: and Rye Seedlngs Month1y Poultry
Livestock Slaughter
Cattle on Feed Hi.1.k ProclJction
Cold Storage
GEORGIA HOG IN VENTORY RECORD l.OW
The invento r y o f all hogs a nd pigs o n Georp,ia f a r ms on De cem b er j, 1984 , totaled 1, 200 ,000 head, 11 perc e nt l e s s than a year a go . Thi s i s the s mallest i nvento r y o n r e cord ba ck t o 1926, b r eaking t h e previous reco rd l ow of 1 ,240,00 0 r eached i n Sep te mber 1975 . Hog s kept tor breedi ng tota led 163 ,000 he ad, 16 percent less th an la st y e a r a nd 9 percent below la s t qu a rter. Ma r ke t hogs, at 1,037,000 head , are 10 per c ent less than a ye a r ago and 3 per c e nt below September 1 , 1984.
U.S. inventory of all hogs and pigs is
estimated at 54.0 million head on
December I, 198 4. This is 5 percent
below a year ago a nd 1 percent les s than
December I, 19 8 2 . Breeding inventory, at
6.93 million, 1S 6 percent below las t
y ear and down 7 percent from 2 ~e a ~s ag~ .
Market hog inventory, at 47.1 m1l11on, 1S
4 percent below a year ago but s l i g h t ly
above 2 years ago. The U.S. pig crop f o r
Decembe r' 1983-May 198 4 to t a l e d 42 .3
million h e ad, 11 perc ent b e l ow a y e a r
earl i e r. The June-November 198 4 pig crop
t o t a l ed 44 .2 million head , 3 percent
below a year ago. A total of 5.86
mill ion sows fa r r o we d dur in g Jun e-
No ve mbe r 198 4, 5 p e r c e n t b e low a year
e a r l i er . The lit ter s ize during this
pe r i od averaged a record 7. 54, up from
the 7 .41 t he prev ious ye a r.
U. S .
produc e rs i nt end to hav e 5.39 mill ion
s o ws f a rrow d u ri n g De cember 1984 -May
1985, 5 percent below a year ago .
The Se p temb er - Nov e mbe r 19 84 pip, c r op
to taled 483 , 000 he a d, 7 percent l ess tha n
the same p eriod a year ago . The r e wer e
68,000
sows that farrowed during
September-November , 6 pe r cent l e s s than
last year.
Pi gs s a ved per l itte r
ave r aged 7.10 , d o wn f r o m the 7 . 20 pi~s
s a ved per l itter a year ago .
Dur i ng Dec ember 19 84 -Fe b ru a ry 1985 ,
Ge o rg i a producers intend t o have 60,00 0 sows f ar r ow. If these intentions a re realized, farrowings wi ll be 9 perce n t less than the actua l f a r rowi ng s o f Decembe r 1 9 8 3 - Fe b~ua ry 1984. P roduce rs expect 6 8 , 0 00 s o ws to f a r r ow d ur in g March-Ha y 1985, 12 percent be low t he ac t ua l f arrowings a year a go.
10 STATES DOWN 4 PERCENT
The 10 quarterly stat es totaled 4 2 . 4
million h e ad on De cember I, down 4 percen t from a y e a r earlie ~. The . Ju~ e Au g u s t 198 4 pig cr op to talea 17.2 m1l1 10n
head
down 4 percent, wh i l e the
Sept~mber-November pi g cro p to tal ed 17.4
million, 1 percent below th e same period
i n 1983. Intentions for the 10 states
f o r De cember 198 4-February 1985 were 1.94
mil l ion s o ws to farrow, down 1 pe rcent.
The Mar c h - May 1985 in tentions, a t 2.35
mill i o n, a re 5 p er cent b e l o w t h e Ma rch -
May 19 84 qu arter.
(See Pages 4 & 5)
Agricult ural St:aU.sticlan and Georgia Depart.ent of Agricultu re
CATTLE ON FEED IN 7 STATES UP 9 PERCENT
GFR-84-Vo l. 26
Cattle and c alves on feed De cember 1 f or
mo n t h l v estimates t ot aled 8 .5 5 milli o up 3 percen t from December I , 1982 .
aught er market in the 7 states preparing a 9 perce nt inc rease from a ye a r ago and
Market ings of fed c a t t le during No~ percent f r om last year and 1 percen
e r to t a led 1. 49 milli on, an i n c r e a s e of 2 t h a n Nov embe r 1982.
Placements of catt le and calves on pe r cent f rom November 1983 and up 9
1.82 mi llion were up 15 per cent from
the 7 st a t e s were 1.94 million, up 13 f r o m t wo yea rs ago. Net placement s of
a nd 10 perce nt above 1982.
Other d isappearance totaled 12 0 thousand comp ar ed wi th 12 1 thousand dur ing November 1983 and 119 thousand two year s a go .
CATTL E AND CALVES: NUMB ER ON FEED, PLACEMENTS , MARKETED, AND OTHER DISAPPEARANCE,
7 STATES, NOVEMBER 1 TO DECEMBER 1
1984 as 7-
I tem
1983 1, 000 Head
19 84
of 1983
On Feed, November 1 1/
7,683
8 ,221
107
Pl aced on Feed duri ng No v e mb e r
1 ,711
1 ,9 41
11 3
Fe d Catt le Mar keted d u r i n g Nov ember
1,459
1,491
102
Oth e r Di s appe a rance during November 2 /
121
120
99
On Fe ed De c emb er I 1/
7 , 8 14
8 ,551
109
1 / Ca ttl e and c a l v es o n f eed ar e a n im a l s f o r s l a u ~h t er mar k e t b e ing fe d a full
rat i on of gra i n or othe r c o nc en t rat e s a nd a r e e x pe c t ed to produce a c a rcas s t hat
will g rade g o o d o r b e t te r . 2/ I n c l u d e s d e a t h l o sses , movement fr om feed l o ts to
pa s t ure s a nd shipments t o othe r feedlot s f o r fu r the r f eedi ng.
GEORG I A MILK PRODU CTI ON
Ge o r g ia d a i ry he rd s p r o duced 10 0 mill i o n pou nds o f mil k dur i ng No v e mb e r 19 8 4 , d ow n 10 p er c en t from las t ye ar but u n cha n ged fro m l a s t month. Th e nu mbe r o f mi l k c o ws o n Geo r g ia's fa r ms du r i n g Nov e mb e r averaged 1 18 ,00 0 h ead, 9 pe rce n t l e s s than a yea r ago but the same as the pre vious month's count. Produc ti on per c ow a veraged 850 pounds, 10 pounds less than la st year bu t unchanged f rom last month.
u .S . NOVEMBER MI LK PRODUCTION TOTALED 10 . 6 BI LLI ON POUND S
Mil k pr o d uct i on dur ing No v em ber 198 4 to ta le d 10 .6 bill ion pound s , down 4 p e rce n t f rom Nov e mbe r 19 8 3 . Ac cumula ted milk producti o n d u r i ng t h e f ir st 11 mon t h s of 1984 t ota l ed 125 b illi o n po und s , do wn 3 p er c e nt f r o m the same pe riod in 1983.
Production per c ow averaged 974 po unds d u ring Novembe r 1984, 11 pounds below November 1983. The to tal number of milk c o ws averaged 10.8 milli on head during November, 3 pe rcent bel ow November 1983.
DAIRY PRODUCTION, NOVEMBER 19 8 3 - 198 4
Geo rgia
Unite d St ates
1t_e_m .
.U::..n:..:.i.::t...:=-
--':..1:..9.:::8..:3:'--_-..:::c-:..1.::9:...8:._4--=:...::::.P.:.e...:r:cc::::e..:n.:..:t:._ _'--.1:.9..8c:3~::__ __..1:.~ 9 8:.4.::.._ _.P.:.e..r:~= c e:.:n..:.:t=__
Mi l k Cows 1/
Th ous . He a d 129
118
91
11 , 17 0 10 ,8 4 1
97
Mil k per Cow 2/
Po un ds
8 60
8 50
99
985
97 4
99
Milk Pr od u ct i on 2 / Mi 1. Lbs.
111
100
90
11 , 0 0 0 10 , 5 64
96
1/ Includes d ry c o ws, excludes he ifers n ot yet fresh . 2/ Ex r.llldes milk sucked b y
c a l ve s .
The Geor g i a Far m Repor t ( ISSN- 0 744- 7280 > Is published se mi-mont h ly by t he Georgia Cr op Reporting Ser vice, St ephe ns Fede r a l Bu i ld ing , Athe ns , Ga . 306 13, Larry E. Snipes, Statist ician In Charge. Second c la ss DOs t age pa id at At he ns, GA . Subscription fe e SI O per yeer except fr ee to data cont r ibutors . SUbscr i pt ion Inf o r mat io n avai la bl e fr om: Georg ia Crop Reporting Servi c e, Stephens Federa l Bu lld i na . Su ite 320, Athen s , GA. 306 13 Tel epho ne : (404 ) 546 -2236 .
2
? OULTRY IIATCHI :-lG AND Pl. ACEMENT- -NOVEM BER 19 84
1. o f
I tem
Nov. 1983
Oc t . 1984
Nov . 19 84
year ago
J a n . th r u No v .
198 3
198 4
-Thou sands- -
- Thous a nds- -
Pul l e t Ch i ck s P lace d
Domes tic ( U.S . ) 17
Br oi l e r Ty p e
3 ,126
3 ,0 63
2,94 3
94
34 , 478
3 5 , 85 5
Eg g Type
232
241
203
88
3 ,0 79
3,29 5
Chic k s Ha tc hed
Broil er Ty pe Ge o rgia
47,6 1})
;3, 701
50,816 107
588,885
60 9 ,893
Uni ted State s
33 5 , 92 8 367 ,3 97
35 6 , 59 4 106 4,072,1 18 4, 19 8 ,706
Egg Type
Geo rgia
1,752
1,42 1
1,569
90
22,038
36,768
Un i t e d St at e s
29 ,639
31 , 382
30,062 101
372,584
42 9,11 0
Tur ke ys
Poults Pl a c ed
U.S .
10 , 9 6 9
10 , 74 1
11 .7;7 10 7
2/28 ,2 57
2/ 3 1 ,2 9 1
1. of year ago
10 4 107
104 10 3 167 11 5
111
Georgia :Ia t c h i n g Ot her
-:-o tnl Ge or ~ia Tot a l U. S .
~UkB E R OF LAYERS AN D EGG PRODUCTION . ~ O V EMR ER 1984
No. Laye r s o n
Eg gs per 10 0
To tal Eg gs Produ ce d
:iand- Nov.
Lav e r s - No v .
Duri n ~ Nov .
198 3
19 8 4
1983
198 4
19 8 3
1984
Th o usands
~umbe r
~il l ions
4 , 8 60 13 ,66 7 18, 52 7 277 ,1 60
5,17 8 13,i27 18 , 905 284 ,12 9
1 ,827 2,046 1,9 9 2 2,00 8
1, 800 2 ,103 2 , 0 21 2 ,020
89 280 369 5 , 56 6
93 289 382 5 ,740
COMM ERCI AL POIlLTRY SLAUGHTER 1 / , NOVEMBER 1984
Y- of
Y- of
I tem
Nov.
Oct.
No v .
yea r
J a n . thru Nov.
year
19 83
1984
i9 84
ago
-Tho u s a nd s-
1983
1984
ago
- Thousand s- - -
Yo u n g Chicken s
(; p o r~i ;1
44 , 10 9
48,199
48,4 80
1 10
547 , 8 18
54 6,760 10 0
Uni t e d Sta tes
309,77 3
388,879
326,005
105 3,819,626 3 , 934 ,3 50 10 3
~a tll rp Ch ic k e ns Li p, h t T y nr- U. S .
s , 139
15, 962
]1, 792
129
134,0 3 2
137,803 103
Hpavy Type U.S.
2,12 4
1 , 175
2,3 68
111
33 ,603
31 ,4 82
94
Total Il. S .
j 1 ,263
19, 13 7
14 , 160
126
167, 635
169, 285 101
To t a l All Type s , Ga. 2,567
3, 8 63
2 ,999
117
34,006
33 , 87 3 10 0
Pe r cent Co n d e mn pd
You n~ Ch i c k e n s
(;e o r p'ia
1. 2
1.4
2/1 . 4
2/1.4
Un i ted State s
1. 4
1. 5
2/1.5
2/1 .5
il F pd er a lly inspected slau~hte r data as c o l l e c t e d by Meat and Po ult ry I n s pec ti o n
Pr o g ra m. Curren t mon th da ta esti mated b y Marke t New s Ser v i c e . 2 / Ja n u a ry - Oc t.
roncipmnations . 3
GFR- 84- Vol. 26
------r---~.:!..0. __(;_S:...-:A..N.-.D-- P! GS :
1:11 VE)liTO RY , S Ol.' S F i\R R01.' 1 NC , Gear t a
A N lJ r T
I tem
MARCil 1 INVENTORY
Al l lIoes & Pip,s
Ke p t for Breeding
Market
Market Hogs and Pigs
by wei~ht Cro u p s
lln n e r () Pounrls
60-119 Pounds
i 20- i 79 Pounds
180 Pounds & Over
J UNE 1 INVENTORY
All Hoes and Pigs
Kept for Breed in g
Market
Market Hogs and Pi gs
by Weight Groups
Un d e r 0 Pou nds
60-119 Pounds
120-179 Pounds
180 Pounds & Over
SEPTEMBER 1 I NVENTORY
All Hogs and Pi~s
Ke p t f o r Br e ed ing
:-1 a r k e t
Market Hogs and Pig s
bv Weight Gr o up s
Un d e r 0 Po u nd s
60 - 11 9 Pounds
120-1 79 Pounds
180 Pounds & Over
DECEMBER 1 I NVENTORY
Al l Hog s a n d P i g s
Ke p t f or Br e edi n g
Ma r k e t
Market Hogs and Pigs
bv wei~ht Grou~
Un d e r 0 Po u n d s
60-11 9 Pounds
120- 179 Pounds
180 Po unds & Ov er
SOWS FARROWING
De c e mb e r 2/-Febr u ar y
Mar ch-Ma y De c e m be~ 2/ -Ma v
June-Augus t
.
September-November
June-November
PIG CROP
De c ember 2/-Februar y
March-May
December 2/-Mav
June-August
.
September-November
June-November
II Ga , Ill, I n d . , Iowa,
i ,8 10 312
1 , 498
68 5 4 01 2 :>=)" 157
2,180 3 53
1,825
8 59 476 330 16 0
2, 2 50 333
1 , 9 17
8 82 48 1 155 19 9
2 ,360 342
2, 0 18
842 56 1 389 224
1 10 120 230 125 120 2 45
737 8 62 1,599 878 854 1 , 73 2 Kans.,
2 , 1')0 12 7
1 ,82 3
767
v51)06
190
2 ,180 32 7
i ,8 ') 3
826 51 9 343 165
2, 100 30 5
1 , 79 5
78 1 449 359 20 6
2, 2 50 3 50
1 , 900
783 498 39 5 2 24
115 120 235 115 120 235
8 17 864 1 ,681 794 798 1, 59 2
1 , 900 300
1 , 600
688 440 1 01
1 71
1,65 0 231
1 ,4 19
603 396 25 3 16 7
1,7 0 0 25 0
1 ,450
6 38 338 287 187
1 ,5 20 20 4
1, 3 16
526 375 250 16 5
i OO 88
i 88 88 7 f>
16 6
725 6 34 1,3 59 638 554 1 , 19 2
1 , 3 ")0 190
1 ,160
464 125 22 6 14')
1 , 390 215
1 , 17')
502 315 218 140
1 , 400 2 15
1 , 18 5
5 31 293 22 1 140
1 ,4 50 220
1 ,230
529 351 221 129
74 76 15 0 80 78 158
511 5 55 1 , 0 66 568 55 4
1~ 12 2
1 , 1 50 200
1 , 150
466 317 2 3 :) 13 2
1 ,400 215
1,18 5
52 9 320 213 123
1 ,350 20 0
1 , 15 0
512 30 5 207 126
1, 3 50 19 5
1 , 1 ') 5
49 1 3 12 219 133
75 81 15 6 74 72 146
5 18 58 3 1 ,10 1 525 51 8 1, 0 43
i ,2 50
69
180
58
1 ,070
71
431
63
289
72
221
Hi
12 7
81
1 ,320
61
200
56
1 , 120
61
493
57
302
63
202
61
123
77
1, 25 0
56
180
54
1,07 0
56
471
53
288
60
19 3
54
1 18
59
1 , 200
'i l
1 63
48
1, 0 37
51
442
52
285
51
193
50
1 17
52
66
60
77
64
143
62
72
58
68
57
140
57
462
63
554
64
1 ,016
64
511
58
4 83
57
9 94
57
Dec em her p re
4
GEORGIA COMMERCIAL RED HEAT PRODUCTION
GFR-84- Vo l. 26
U. s. RED MEAT PRODUCTION DOWN
Geo rgia red meat p roducti on total ed 31 .9
mil l i o n po und s d u r i n g ~ov e ber 19 84, down
21 p e r ce n t f rom Nov e mber 19 83 .
The
Janu a r y- No vem b er red mea t pro rlu cti on
total ed 38 8.8 mil l i on pound s , 8 p er ce nt
le ss th an th e c o mp a r a b l e pe r i o d of 1983 .
Commercial red meat production f o r t h e Un i t e d S l a te s in Nov ember 1984 to t a l e d
3 . 12 b i ll i o n pou nds, d o wn 4 perce nt fro m ~ov e m ber 198 3 . Ja nu arv-Novembe r re d me at product ion , a t 35.9 b ii l i on po unds , i s u p I percen t fr om l a s t year . Commerci a l r e d
me a t produ c t ion includes sl aug hter in
Fed e ra l ly i n spec t e d a nd o t h e r plan t s , bu t e x c lud e s a n i ma l s sl au gh t e red o n fa r ms .
Sopcies
GcOr~ i a
Ca t t e Cal ves flog s She e p (, La mbs
GEORGIA AND UNI TED STATES LI VESTOCK Sl.AUGHTER II
Nu mo e r Slaug h t e r e d
Ave r a ~ e
1984
J an .- ~ov .
Live We i ght
Nove mber
as Z o f ' 84 as % o f
Nove mbe r
j <)8 3
198 4
1983
19 113
19 83
1984
I , QOO Head
Percen t
Pe rce n t
Pou nas
19 . 0
21 .7
1 14
1.4
1. 5
10 7
189 .3
13 3 .7
71
.I
.I
100
I 12
8 98
8 73
89
350
356
88
232
235
160
96
1 14
To ta l
Live We i ght
No ve mber
1983
19 84
1, 0 00 Pounds
17,05 2 47 8
43 , 8 28
6
18 ,98 4' 528
31 , 386
8
States
3,079 .2
29 4 . 3 8 ,436.0
528. 2
3,084 .5
298 . 4 7 ,5 99.5
540 .2
100
103
i , 07 7 1 ,07 2 3, 3 17,71 8 3 ,30 5,869
10 1
108
229
24 2
67,308
72 ,125
90
98
246
246 2,073 , 70 8 1,868, 40 11
10 2
10 3
III
113
58 ,629
60,98 4
n s pe c t i on a na o toer c omme r c I a l sl a u ~ ht er , exc l ud es
,!OGS A~ D P I GS : ::-iVE:-;TORY NUM BER, DECEMBER 1 , SOWS FARROWING AND PI" CROP
UNI T ED STATES, 1983 - 1984
1984
1984
Item
1983
19 8 4
as Z of I t em
1983
1984 a s Z of
\983
1983
1, 000 Head
I , 000 Head
::lec . j I n v e n t o r v
Sows Farr o win g
AI l Hogs <. Pig s 56 ,6 9 4 '> 4,0 43
95
June-Aug .
3,174
2,95 5
93
Ke:J t fo r a reedjn ~ 7 , 1 91
6,93 0
94
Se pt . - Nov .
3,00 3
2,9 01
97
Ma ;' ke t
49,303 47,11 3
96
J u n e - Nov .
6 , 17 6
5 , 85 6
95
~ a rket Hog s <. Pigs
Pig Cro p
bv wei~ht Groups
De c. II -Feb .
20,87 7 18,735
90
IJnCier 0 Po u n d s 19, 028 18 . 0 3 5
95
:-la r c h - Ma v
26, ')]2 23 ,587
1\9
6 0 - 1 19 pOlJnds
12 ,626 12, 0 2 1
9')
Dec. I I - Ma y
47 ,40 9 42 , 3 22
89
120 - 17 9 Pound s
9,985
9 , 605
96
18 0 Pound s & Ove r 7 ,664
7 ,4 52
97
Jun e- Aug .
23 ,3 6 1 22 ,346
96
Sep t . -Nov.
22 , 3 85 2 1, 80 8
97
So ws Farr o wing
J une -Nov .
45 ,7 46 44 , 154
97
Dec . il Feb .
2,808
2 , 560
91
Mar ch- Md v
3,49 4
3 ,12 6
89
Year
93, 15 5 8 6,476
93
Dec . l/-Mav
6,3 01
5 . 6 1'16
90
I 7 Decemoer pr e ced I ng ye a r .
EGGS IN INC UBATORS, DECEMBE R 1984 , U.S .
It em
1983
19 8 4
Z of
Yr . Ago
Chic k ens
--TholJsano s - -
Egg Type
30 , 280
25,4 75
84
Broiler Type 309,7 9 1 330 , 4 14
107
Turke vs
1 '> , 13 2
i5 , 602
103
6
U. S . EGG PRODUCTI ON UP
Egg prod uc tion f o r Nov e mb e r tot aled 5 .7 4 bil l ion a nd included 5 . 18 b ill i on t able o r commercia l ty pe e g g s a n d 55 9 mil lion hatchi ng eggs . Al l l a yer s on Dec e mbe r 1, 198 4 , total e d 286 milli on, 3 perc en t g re a t er tha n the 27 8 mill ion a ye a r ago . La v e r s on De c em b er I consi sted o f 254 mil lion f o r t a b l e e g g s and 32 .0 mi ll i on l a y~r s f or hat ch ing t ype e ggs . Rate of l a y on De ce mbe r 1 f o r a ll la y er s av e r a ged 67 .7 eg gs p e r 10 0 layer s, com pare d with 67 .4 a yea r e a r l i e r .
GEORGIA WHEAT PLANTINGS SHRINK
Fall and winter seedings of wheat in
Georp,ia for the 1985 c r o p a r e estimated
at 850,000 acres .
The Georgia Crop
Reporting Service, wh ich prepared and
issued the e stimate, says this is a 15
percent, or 150,000 s r r e drop f r om the
acreage planted to wheat for the 1984
crop.
The 1984 crop produced 31,150,000
bushels, an increase of less than 1 percent over the 1983 crop. An average yield of 35 bushels per acre was obtained in 1984 from the 890,000 acres harvested
for grain. The 1983 yield was 34 bushels per acre.
u.S. WINTER WHEAT SEEDINGS DIP
Nationally, winter wheat plantings f o r the 1985 crop are estimated at 57.6 million acres, down 9 percent from the
63.4 million acres seeded last year. This is the smallest acreage since 1979.
RYE ACREAGE IN GEORGIA EXPANDS
Seedings of rye i n Georgia for all purposes this fall and winter are estimated a t 450, 000 acres, or 5 percent mo r e than th e 4 30 , 0 00 a cres planted last y e a r . Of the 430,000 acres planted for the 1984 cro p, Georgia farmers harvested 80,000 acres f or grain, obtaining an average yield of 22 bushels per acre, for a total production of 1,760,000 bushels. Acres harvested in 198 4 was 10,000 acres above 1983. Yield was up 1 bushel per acre and production was up 20 percent.
U.S. RYE ACRES OFF 14 PERCENT
The Nati on' s 1985 ry e c ro p plantinBs this f all and winter will total 2.56 million acres, down 14 percent from the previous year's plantings. These seedings include rye planted for winter grazinp" grain production , and all o ther purposes.
WINTER WH EAT RYE AND OATS UNITED STATES AND GEORGI A
Tt e m
United States
1984
1985
Ge o r i a 1984
WI NTER WHEAT
Area Seeded (1,000 Acres ) Ha r ves ted Acr es ( 1 , 0 0 0 Acr e s) Yield pe r Harv. Ac re (Bu .)
6 3 , 41 9 5 1,5 13
40 . 0
57 ,5 99
1 , 000 8 90 35. 0
Produ ction ( 1, 0 00 Bu.)
2,060,64 6
31,1 50
Ar e a Se e ded as I. of Pr e v o Yr .
102 . 1
90.8
94 .3
19 8 5 85 0
85.0
RYE Ar e a Se eded (1,000 Acr es) Harvested Acres (1,000 Acres) Yi eld per Harvested Acre (Bu.) Production (1,000 Bu.) Area Seeded as 7. of Prevo Yr.
2 ,97 1 98l 33 . 0
32,392 109.8
2 ,55 5 86 .0
4 30 80 22 . 0
1, 760 10 7 . 5
450 104.7
OATS lIar vesterl Acres (1,000 Acres) Yield per Harvested Acre (Bu.) Production (1,000 Bu.)
8,123 58.1
471,921
60 55.0 3,300
HOGS AND PIGS: FARROWING IN-,-T:;...E:;...N:.:..T~IO..:..N:.:...:;,.S
_
Georgia
10 States II
United States
Farrowing Intentions 21 1984
1985
1984
1985
19M
1985
- - - 1,000 Head -
December 3/-February
66
60
1,964
1,940
2,560
Ma1" ch-Mav
77
68
2 ,48l
2,353
3,126
December 3/-Mav
l4 3
II GA,IL,IN,IA,KS,MN,MO,NE,NC,OIl .
128
4,445
4,293
21 Actual farrowings for 1984.
5 1686
5 1393
31 December
pre ceding year. 7
Commodi ty
.. OLD STORAGE STOCKS, November 30, 198 3
Butt er Cheese , Natural Eggs, Fr o z e n Fru its, Frozen Fruit Jui c e s, Frozen Meats , Red
Beef, Frozen Pork, Frozen Poultry, Frozen Turkeys, Frozen Vegetables , Froz en Potatoe s, Frozen Peanuts, Sh e lled Peanu ts , In Sh ell Pe cans, Shelled Pe cans, In Shell
506 ,710 1,214,800
13,398 658, 296 886 ,877 667,57 4 316 ,023 295,193 375,967 2 51 , 56 0 '2 , 0 53 ,4 48 817,350 2 59,18 2
14 ,520 14 , 4 78 1_5_19 31
UNI TED STATES , Octob e r 3 1 , 198 4
1 , 000 Pounds 3 74 ,276
1,078, 411 17, 9 21
771, 430 87 3 , 4 54 6 74, 9 32 325,9 6 3 275, 589 553, 932 4 15,431 2 ,0 7 0 , 68 1 8 21 , 3 4 4 214 , 347
15 , 292 20 ,124 27,4 46
NO VEMB ER 3 0 , 198 4
Nov ember 30,
Pe r cen t o f
1984
Nov . 19 8 3 Oct. 19 8 4
Pe r c e n t
333 ,997
66
89
1 , 0 2 7 , 9 52
85
95
16 ,307
12 2
91
7 34 ,017
1 12
95
86 9 , 75 6
98
100
70 0 , 6 5 4
10 5
10 4
345, 493
10 9
106
282 ,569
96
103
33 2 , 5 14
88
60
200,442
80
48
1,997,232
97
96
88 1, 76 1
108
107
2 68 ,9 4 5
10 4
125
22 ,555
1 55
147
18,502
12 8
92
36 ,6 56
230
134
co
Georgia
~crop Report ing Service
Stephens Federal Bldg.
Suite 320 Athens , Georgia J 0613
SECOND- CLA:> :; POSTAGE PAID AT ATHENS , GA 30613
042RO l 13 00000 25-2 27 075 020
404 / 22 3-72 3 8
00 3 50 5
GA EX PERIMENT ST4
CA ROLE U: D.=ORD
Ll i3RAR Y
~ X?~ R I~=N T
G~ 3 02 12