- Collection:
- Georgia Government Publications
- Title:
- Georgia crop reporting service, 1967
- Creator:
- Georgia. Department of Agriculture. Crop Reporting Service
- Contributor to Resource:
- Georgia. Department of Agriculture. Crop Reporting Service
- Publisher:
- Athens, GA : Georgia. Department of Agriculture. Crop Reporting Service
- Date of Original:
- 1967-12
- Subject:
- Georgia
- Location:
- United States, Georgia, 32.75042, -83.50018
- Medium:
- publications (documents)
- Type:
- Text
- Format:
- application/pdf
- Description:
- 1940/1941-1974.
Issued in various sections.
U.S. Dept. of Agriculture Agricultural Marketing Service, University of Georgia College of Agriculture, Georgia Agricultural Extension Service, cooperating.
Split into: Weekly hatchery; Georgia farm report; Farm labor; Monthly poultry summary; and: Livestock report, weekly hatchery. - External Identifiers:
- Call Number GA A400.C7 P1 C7 1967
- Metadata URL:
- https://dlg.galileo.usg.edu/id:dlg_ggpd_i-ga-ba400-pc7-bp1-bc7-b1967-bfolio
- Digital Object URL:
- https://dlg.galileo.usg.edu/do:dlg_ggpd_i-ga-ba400-pc7-bp1-bc7-b1967-bfolio
- Language:
- eng
- Holding Institution:
- University of Georgia. Map and Government Information Library
- Rights:
-

ll. c? G
..
l
ATHENS, GEORGIA
January 4, 1967
Y
GEORGIA CHICK HATCHERY REPORT
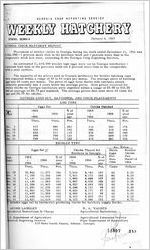
Placement of broiler chicks ifi Georgia during the week ended December 31, 1966 was 8, 546, 000--1 percent more than in the previous week and 3 percent more than in the comparable week last year, according to the Georgia Crop Reporting Service.
An estimated 11, 615, 000 broiler type eggs were set by Georgia hatcheries-Zpercent less than in the previous week but 2 percent more than in the comparable week a year earlier.
The majority of the prices paid to Georgia producers for broiler hatching eggs were reported within a range of 50 to 65 cents per dozen. The average price of hatching eggs was 60 cents per dozen. The price of eggs from flocks with hatchery owned cockerels generally was 2 cents below the average price. Most prices received for broiler chicks by Georgia hatcheries were reported within a range of $7.00 to $10.00 with an average of $8. 7 5 per hundred. The average prices last year were 65 cents for eggs and $9. 7 5 for chicks.
GEORGIA EGGS SET, HATCHINGS, AND CHICK PLACEMENTS
EGG TYPE
Eggs Set
Chicks Hatched
Wsk En ed
1965
-
1966
1966
o/o of
year ago
1965
-
1966
1966
o/o of
year ago
Thou.
Thou.
Pet.
Thou.
Thou.
Pet.
Dec. 3 Dec. 10 Dec. 17 ~ec. 24 ~c. 31
Week ~nded
437 529 620
599 748
Eggs Set lJ
-1965
1966 Thou.
1966 Thou.
886
203
312
753
142
306
711
115
436
790
132
355
914
122
412
BROILER TYPE
o/o of
year ago
Pet.
Chicks Placed for Broilers in Georgia
-1965
1966
1966
'
o/o of
year ago
Thou.
Thou. Pet.
543
174
514
168
645
148
605
170
561
136
Ay. Eric~
Hatch
Broiler
Eggs
Chicks
Per
Per
Doz.
Hund-r~d
1966
1966
Cents
Dollars
let. 29
10,822 11,275 104
7,633
8, 141 107
62
lov. 5
11, 166 11, 142 100
7,921
8, 171 103
62
ov. 12
11, 151 11, 220 101
7,905
8,449 107
62
ov. 19
11, 136 11 , 203 101
7, 897
8,376 106
63
ov. 26
11,396 11,433 100
8, 027
8,203 102
63
~c. 3
11, 201 11,276 101
8, 280
8, 151
98
63
~c. 10
11, 563 11, 729 101
8, 423
8, 171
97
62
ec. 17
11,697 11,908 102
8, 602
8, 417
98
62
lee. 24
11, 642 11' 83 5 102
8, 323
8,435 101
62
. ~c. 31
11,421 11,615 102
8, 323
8, 546 103
60
Includes eggs set by hatcheries producing chicks for hatchery supply flocks.
9.25 9.25 9~ 25 9.50 9.50 9.50 9.25 9.25 9.25 8.75
ARCHIE LANGLEY
W. A. WAGNER
cricultura1 Statistician In Charge
Agricultural Statistician -;
------------------------------------------------------------------- -----------
, 5, Department of Agriculture
Agricultural Extension Se vice
/J "tistical Reporting Service
State Department of Ag rj ulture
315 Hoke Smith Annex, Athens, Georgia
\
~~' . $~7
J--~0~~
~~ ..,.~ ~~~
~-
-=
- ~ - -
--
E GGS SE T
CHICKS PLACE D
ST ATE
Week ~~ nded
Dec.
Dec.
17
24
J o/o of
. I Dec.
31
year
ago 1/
Dec.
17
Week nded
Dec.
Dec.
24
31
THOUSANDS
THOUS ANDS
Maine Conn e cti cut Pennsylvania Indi ana Illinois Missouri Dela ware Mar yland Virgini a West Virginia North Carolina South Ca1r olina
1,84 2 433
1, 181 594 3 652
2, 175 4,061 1, 330
154 6,380
329
1, 869 355
943 606
6 600 2,259 4, 301 1, 385 157 6,603 323
1, 860 104
1, 398 1, 413
390 1, 104
121 88
I
245 745
171 698
713 103
305
327
1 41
1
9
643 100
352
338
2,315 93
2,238 2,304
4,313
100
! I
3,287
1, 357 150
92 89
I
I
859 307
2, 960 673 235
6,349 100
4, 915 . 4,793
401 101
310
288
1, 366 222
797 333
2 329 2, 110 3,096 903 267 4, 574 271
GEORGIA
11, 908 11, 835 11,615 102
8, 417
8,435
8, 546
Florida Tennessee Alabama Mississippi Arkansas Louisiana Texas Washington Oregon California
TOTAL 1966 (23 States)
546 1, 114 7,805 4, 539 9,296 1, 251 3,931
560 . 312
2,096
554 1, 095 7,734 4,505
9, 289 1, 09 3 3,796
532 4 00 1, 797
533 223
387
1,004 95
892
7, 871 99
5, 727
4,394 107
3,678
I 9,065 104
1, 005 110
6, 713 785
3,798 104 I 2, 915
659 131 I 438
377 107
21 4
1, 801 101
1, 4 82
430 876
5,8~9
3, 596 6,822
766 2,967
437 261 1, 396
345 876 5, 972 3,623
6,799 791
2, 812
379 274 1,362
62,492 62 , 037 61 , 724 102 46,610 46,044 46,049
TOTAL 1965* (23 Stat es)
61, 784 61 , 095 60,665
45, 784 44,618 46, .133
% of Last Year
101
102
102
1/ Current week as percent of same week last year.
* Revised.
102
103
100
o/o of
year
ago 1/
98 119 102 81 67 82 92 97 96 71 93 86
103
130 99 96 108 106 118 98 105 120 99
100
Q)
1-1
..:.;.j.
...-I :;j
..u...
'tl 1-1
..... tiD
<II<(
A....,
CJl 0
QQ)J+os>::
~ Q)
'tsrol::+8~>
bQ()) pQ).. ..r..o. O
. OCJl U)
. p.. ::>
Q)
1-1
..:.;.j.
...-I :;j
..u...
1-1
tiD Q)
.0....
s::.
<X!
'+-1
0
.>u....
1-1
.~..,S...:.:UQ)Q)~J
U) U)
z l0lQCr>:Ji)ol -P.r.81QQ.-.1)).o...otpb.sQ.::.O:.)....<~.ss8::,(,::...oIb.rQ.o-.O.I):rUr::1>Q)l
Q)O,:x:;U)d...:l
~..>..~cQun).~o-.~S~Q~J:cn :.. u;$
r: J-1+->:C::X::~
Q)U)
.:: 'tl
~ CJl
.....
<(
.~.... ~
<(_3~f'"l 0
-~ U)
::>
HDrao7
G~t-113
1%7
Qn O ID@ lli~@L11rlliffir1
December 15, 1966
rPlli~@~~
Released 1/5/67 GEORGIA CROP REPORTING SERVICE
GEORGIA PRICES RECEIVED INDEX SAME AS LAST MONTH
The Georgia Prices Received Index during the month ended December 15 was the same as during month ended November 15 at 244. This was 14 points below December 15, 1965.
There were numerous changes in the various components of the Index as most 1 ivestock and try items were the same or lower and most crop items were the same or higher.
UNITED STATES PRICES RECEIVED INDEX DOWN 1 POINT PARITY II~ DEX UNCHANGED, PARITY RATIO 77
The Index of Prices Received by Farmers declined 1 point (1/3 percent) during the month December 15, to 258 percent of i ts 1910-14 average. Lower prices for oranges and lettuce ibuted most to the decline. Price increases for tobacco, corn, tomatoes, and cattle ted the decrease. The index also was 1 point below December 1965.
The Index of Prices Paid by Farmers for Commodities and Services, including Interest, , and Farm Wage Rates, remained unchanged from the previous month. At 337, the index was
nt above a year earlier.
prices paid by farmers averaging unchanged from November, and farm product prices percent, the Parity Ratio was 77, unchanged from Novembe r and 3 points below a year The annual average parity ratio was 80, compared with 77 for 1965.
INDEX NUMBERS -- GEORGIA AND UNITED STATES
Index 191 0- 14 :: 100
December 15 :November 15
1965
1966
Decem19b6e6r 15: ------ln_Rd_eec_oxrd~~~H~i~gDh~a-te----~
258 ll
244
264 l/
251
244
310
March 1951
254
319
March 1951 1:/
259
259
258
313
:February 1951
324
337
337
337 2/ : September 1966
ised. so Ap r i 1 19 51 ices Paid, Interest, Taxes, and Farm Wage Rates based on data for the indicated dates.
The Parity Ratio is computed as in the past. The Adjusted p._rity Ratio, reflecting Government payments, averaged 82 for the year 1965 compared with 77 for the Parity Ratio. Also October, November and December 1966.
ARCHIE LANGLEY icultural Statistician In Charge
WILLIAM A. WAGNER Agricultural Statistician
----------------------------~------------------
Georgia Crop Reporting Service, USDA, 315 Hoke Smith Annex, Athens, Georgia in cooperation the Cooperative Extension Service, University of Georgia and the Georgia Department of iculture.
PRICES--RECEIVED AND PAID BY
DECEMBER
Commodity and Un i t PRICES I~ECE IVED:
Dec. I 5
1965
Wheat, bu. Oats, bu,
Corn, bu. Barley, bu. Sorghum Gra i n, cwt, Cotton, I b. Cottonseed, ton Soybeans, bu. Peanuts, I b. Sweet Potatoes, cwt. Hay, Baled, ton:
.l\ I I
Alfalfa Lespedeza Peanut Mi I k Cows, head Hogs, cwL
Beef Cattle, All, cwt. ll Cows , cwt. 1/
Steers and Heifers, cwt. Calves, cwt. Milk, Wholesale, cwt.:
Fluid Market Manufactured
AI I 11
$ I. 55
$
.~1
$ I. 22
$ I ,06
$ 2.00
26.0
$ 45.00
$ 2.35
11 .'-+
$ 5.40
$ 27.50 $ 38.00 $ 30.00 $ 25.00 $ 170.00
$ 25.60 $ 16.80 $ 13.60 $ 19.40 $ 21.00
$ 6, I0
$ 3.80 $ 6.10
Turkeys, lb.
24.0
Chickens, lb., Excl. Broilers 12.8
Commercial Broilers
14.0
All
13.9
Eggs, All, dozen
5I . I
Nov. 15 Dec, 15 Dec. 15
1966
1966
1965
1.80 .88 I .47
I. I 0
2.25 19.5 68,00 2.80
I I2
5.25
26.50 38.00 29.50 23.50 200.00 19.80 18.40 15.50 21.20 23.00
6.60 4.35 6.60
24.0 11 -5 12.5 12.4 50.7
J. oO
91 1.48
I. I 2
2.25 18.5 69.00 2.80 11.0 7.20
27.50
3~.00
30.00 24.50 200,00 19. I 0 19.00 16.00 21.40 23.20
!16.60
25.0 11.0
11 .o
I I .0
48.0
1.40 .633 I. 08 I. 03 I. 79 27.93 47.80 2.48 11.3 4.68
23.90 24.50 24.80 23. I 0 217.00 26.90 20.30 13.40 23.30 23. I 0
5.02 3.64 4.62
23.8 9.6 14.6 13.9 41.2
I ,60 .663 1.26 1.06 1.81 2 I .89 65.60 2.80
I I 2
4.79
2L~. so
25.20 24.70 23.70 256.00 19.20 20.90 15.40 23.00 25.20
5.79 4.35 5.39
23.8 9.1 13.6
13 .o
41.6
I.!
J
I .l
J. (
I,! 22. (
65.
2 I I.
5
25. 25.! 25 .! 24. j 257 ,( 18.! 21, ( I 5. 23. 25.1
!I 5,;
PRICES PAID, FEED:
Mixed Dairy Feed, cwt,:
All Under 29% Protein 14% Protein 51 I6% Prote in -
$ 3.95
$ 3.95 $ 3.90
4.15 4.05
4.20 3.90
l3l1
3.70 3.46
3.93 3.66
4.15
4.20 31 3.75
3.98
43.;
18% Protein
$ 4.15
4.45
4.50 31 3.89
4.14
20% Protein
$ 4.20
4.50
4.55 31 4.02
4.34
4.
Cottonseed Meal, 41%, cwt. $ 4. I0
5.20
5.30 - 4.46
5.31
s.
Soybean Meal, 44%, cwt.
$ 4.85
5.60
5.60
5.01
5.56
s.
Bran, cwt.
$ 3.60
3.90
4. I 0
3.30
3.62
3.
Middl ings, cwt.
$ 3.70
4.15
4. 30
3.35
3.75
3.
Corn Meal, cwt.
$ 3.25
3.60
3.70
3.24
3.49
3.
Broiler Grower Feed, cwt.
$ 4.80
5.20
5.40
4.80
5.05
s.
Laying Feed, cwt.
$ 4.70
5.00
5.10
4.42
4.68
4.
Scratch Grains, cwt.
$ 4.15
4.40
4.45
3.88
4.08
4.
Alfalfa Hay, ton
$ 45.00
44,00 44.00 33.00
35.20
35.
All Other Hay, ton
$ 35.00
36.50 36.00 32.00
33.00
33.
l l "Cows'' and "steers and heifers" combined with. allowance where necessary for slaughter 11 Includes cull dairy cows sold for slaughter, but not dairy cows for herd replacement. 11 Rev i sed. !I Pre! iminary est imate. 21 U. S. price is for under 16 percent
After Five Days Return to United States Department of Agriculture
Statistical Reporting Service
315 Hoke Smith Annex Athens, Georgia 30601
Postage and Fees Paid U. S. Department of Agricultu
D'i CJ?
411 3
96 7
GE0 RGI A CR0 P REP0 RT I NG SERV I CE
am. 1/
w~~rnlhw rnill~rnl]rnt?
ATHENS, GEORGIA
January 11, 1967
GEORGIA CHICK HATCHE RY REPO.I:\ T
GEORGIA CROP REPORTING SERVICE
AGRICUL.TURAL. EXTENSION SERVICE UNIVERSITY OF" GEORGIA AND TME STATE DEPARTMENT OF AGRICULTURE
Athens, Georgi a
U.S. DEPARTMENT OF AGRICULTURE STATISTICAL REPORTING SERVICE
315 HOKE SMITH ANNEX. ATHENS. GA .
January 11, 1967
LESPEDEZA SEED PRODUCTION IN GEO RGIA DOWN 9 PERCENT NAT ION DO\-JN 29 PERCENT
The 1966 Georgia lespedeza seed production is estimated at 1,800,000 pounds compared
with 1,980,000 pounds in 1965, according to the Georgia Crop Reporting Service. The 5-year
(1960-64) average production is 2,620,000 pounds. The 9,000 acres harvested in 1966 is the
5.3 same as last season but 29 percent below the 1960-64 average of 12,600 acres. Yield per
acre of 200 pounds in 1966 is 20 pounds below the 1965 yield. Weather conditions were very
5.o irregular during the growing season and yield varied widely by areas.
9.2
1 .9
1.6
UNITED STATES LESPEDEZA SEED PRODUCTION
f0.9
Lespedeza seed production in the Nation is estimated at 48,270,000 pounds, 29 percent ~low both l~st year and average. The decrease from 1965 resulted from a 25 percent dec! ine in acres harvested and a 5 percent dec! ine in yield.
All of the 15 producing States harvested the same or less acreage than in 1965, and all but 2 States harvested less acreage than average. Yields were down from 1965 in 10 of the 15 States. The lower yields were because of the hot and dry conditions during 1966. Weather conditions during harvest were good in most States.
Korean lespedeza accounted for 57 percent of 1966 production compared with 63 percent
in 1965. Striate Kobe was 35 percent of total production in 1966, against 30 percent in
1965. Comparative production of each species, with estimates for last year in parenthesis
are: Korean, 27,555,000 pounds (42,562,000); Striate Kobe, 16,69b,OOO (20,456,000);. Striate
Common
and
Tennessee
]6 11 11 ,
169,000
(189,000);
Sericea,
3,831,000
(4,346,000);
and other
varieties, 17,000 (134,000) pounds.
The largest producing State in 1966 was Kentucky, with II ,000,000 pounds. Missouri was the second ranking State with 9,240,000 pounds, followed by Tennessee, Arkansas, and North Carol ina~ Harvest of lespedeza seed began later than last year in most States, with >U JJ harvesting dates ranging from 2 weeks earlier 1n Oklahoma to 9 days later in Tennessee and
Alabama.
Carryover of lespedeza seed as of June 30, 1966 from 1965 and previous years' crops
is estimated at 8,276,000 pounds (2,438,000 held by growers and 5,838,000 by dealers).
ltur
Holdings a year earlier were ealers). Initial supply of
4,380,000 lespedeza
pounds (2,195,000 by growers and seed (1966 production, plus June
2,185,000 by 30, 1966 carry-
ver) is indicated at 56,546,000 pounds, 22 percent less than the beginning supply of
2,067,000 pounds a year eurl ier.
Please Turn Page
tl
PRICES--RECEIVED AND PAID BY FARMERS, DECEMBER 15, 1966 WITH COMPARISONS
:
GEORGIA
UNITED STATES
Commodity and Un i t
: Dec. 15 : 1965
Nov. 15 : Dec. 15 : Dec. 15 : Nov. 15
1966
1966
1965
1966
PRICES I{ECE IVED:
Wheat, bu.
Oats, bu.
Corn, bu.
Barley, bu.
Sorghum Grain, cwt.
~ -
'' -
$ 1. 55
$
~ 1
$ 1. 22
$ 1.06
$ 2.00
...
a
1..a8&0
1.47 l 10
2.25
)() c
1.~0
91 : 1.48 1.12 2.25
JQ h
1.40
.633 1. 08 1. 03
1. 79
27 O'l
1.60 .663 1. 26 1.06 1.81
21 8Q
Dec. 1 196_f
1.! .1
1. 1
].(
1.1 n .JI
LESPEDEZA SEED
State : Acreage harvested
: Average
: 1960-64
1965
1966
:
:
Acres
:
Ind. : 24,800 18,000
10,000
Ill. : 16,600 18,000
10,000
Mo.
: 64,800 57,000
44,000
Kans.
11 ,000 16,000
15,000
Md.
: 10,600 10,000
7,000
Va. N. C.
s. c.
: 7' 100 : 55,600
: 9,600
4,000 30,000 9,000
2,000 19,000 7,000
GEORGIA : 121600
Ky.
48,800
9 1000 55,000
9 1000 44,000
Tenn. : 37,600 38,000
30,000
Ala. : 5,000
3,500
3,500
Miss. : 4,000
3,000
3,000
Ark. : 16,600 19,000
14,000
Okla. : 5,200 10,000
8,000
:
u. s. : 329,900 299,500 225,500
:
:
. Yield per acre
:Average
: 1960-64 1965 1966
:
:
Pounds
:
: 206 180 160
: 171 220 160
198 235 210
: 216 255 225
: 209 180 120
: 147 170 125
: 152 175 180
: 217 195 185
: 210 220 200
: 236 240 250
: 212 195 205
194 175 200
: 154 180 180
: 352 415 370
: 170 190 160
:
: 206 226 214
:
:
: Production-clean seed
:Average
: 1960-64
1965
1966
:
:
1,000 pounds
:
: 5,386 3,240 1,600
: 3,079 : 12,804
: 2,436 : 2,218
3,960
13,395 4,080
1 ,800
1 ,600 9,240
3,375 840
: 1'108 : 8,458
680 5,250
250 3,420
: 2,105 : 2,620
1'755 1 ,980
1, 295 1 ,800
: 11 ,542 13,200 11 ,000
: 7,976 7,410 6,150
: 981
612
700
: 624
540
540
: 5,858 7,885 5, 180
: 882 1,900 1,280
:
: 68,077 67,687 48,270
C. L. CRENSHA\.J Agricultural Statistician
Ai~CH IE LANGLEY Agricultural Statistician in Charge
After Five Days Return to United States Department of Agriculture
Statistical Reporting Service 315 Hoke Smith Annex Athens, Georgia 30601 OFFICIAL BUSINESS
Postage and Fees Paid U. S. Department of Agriculture
4.-
D1 CJ/
~4 11 3
967
Jam. 1/
GEORGIA CROP REPORTING SERVICE
Wl]~ITSLL'L? illiDtp@illl]ffi'L?
ATHENS, GEORG I A
January 11, 1967
GEORGIA CHICK HATCHERY REPORT
Placement of broiler chicks in Georgia during the week ended January 7 was 8, 891, 000--4 per ce nt more than in the previous week and 4 percent more than in
the comparable week last year , according co the Georgi a Cr op Reporting Service.
An estimated 12, 359, 000 broiler type e gg s w e r e s e t by G e orgia hatcheri e s-6 percent more than in the previous week and 9 percent more than in the comparable week a . year earlier.
The majo rity of the p i c e s paid to Georgia p roduce rs for broile r hatching eggs were r e po rte d within a r a n ge of 50 to 65 c e nts p er doz en. T h e average pri ce of hatching egg s was 60 cents p e r do zen. The pric e of eggs from flocks with hatc hery
owned cockerels generally w as 2 c ents below th e a v e rag e pr ice . Most pr ices r e ceived for broiler chi cks by G e orgi a hatcheries w e re report ed within a range of $7.00 to $10.00 with an average of $8.75 per hundr ed. The a verage prices last year wer e 65 cents for e ggs and $9.7 5 for chicks .
Week Ended
G~ ORGIA E GGS S E T , HATCHINGS, A ND CHI C K PLACE M ENTS
E GG TYPE
E ggs Set
1965
-
1966
196 6
-
1967
o/o of
year ago
Chicks Hatched
19 6 5
-
196 6
1966
-
1967
Thou.
T hou.
P et.
Thou.
Thou.
o/oo f
I yea r
I ago P et
Dec. 10 Dec. 17 Dec. 24 Dec. 31 Jan. 7
Week Ended
529 620
599 748 701
. Eggs Set];_/
1965
-
1966 Thou.
1966
-
1967 Thou.
753
14 2
711
115
790
132
914
122
969
138
3 06
514
168
436
645
148
355
605
170
412
561
136
496
513 I 103
BROILE R TYPE
o/o of
year ago
,-
Chicks Placed for
Broilers in Georgia
1965
-
1966
1966
-
1967
o/o of
year ago
- Av. Pric e
Hatch
B railer
Eggs
c hicks
Per
p er
Doz.
H undred
1966-67 1966-67
Pet.
Thou.
Thou. Pet. Cents
D ollars
Nov. 5 11, 166 11,142 100
7,921
8, 171 103
62
9.25
Nov. 12 11, 151 11, 220 101
7, 905
8,449 107
62
9.25
Ne,v. 19 11, 136 11,203 101
7,897
8,376 106
63
9.50
Nov. 26 11, 396 11,433 100
8,027
8,203 102
63
9.50
Dec. 3 11, 201 11, 276 101
8, 280
8, 151 98
63
9. 50
Dec. 10 11, 563 11,729 101
8,423
8, 171 97
62
9.25
Dec. 17 11,697 11,908 102
8,602
8, 417 98
62
9.25
Dec. 24 11, 642 11, 835 102
8, 323
8,435 101
62
9.25
Dec. 31 11,421 11,615 102
8,323
8, 546 103
60
8.75
Jan. 7 11,364 12,359 109
8, 585
8,891 104 I 60
8.75
ll Includes eggs set by hatcheries producing chicks for hatchery supply flocks.
ARCHIE LANGLEY
W. A . WAGNER
Agricultural Statistician In Charge
Agricultural Statistician
------------------------------------------------------------------------ --------
U. S. Department of Agriculture
Agricultural Extension Service
Statistical Reporting Service
State D ~ partment of Agriculture
315 Hoke Smith Annex, Athens, Georgia
EGGS SET AND CHICKS PLACE D IN COMMERCIAL AREAS BY WEEKS - l9c6-67
Page 2
STATE
E GGS SET
--
We ek Ended
Dec.
Dec.
24
31
-
THOUSANDS
Jan.
7
% yeoafr
!J
CHI:.:;Ks PLAC ~ D
t
Week .~:,nded
Dec.
Dec.
Jan.
ago 1/ . 24
31
7
I
I
THOUSANDS
!.
..J %of
I year ago 1/
Maine
1, 869
1, 860
I l, 953 110
1, 413
1, 366
1, 406
101
Connecticut Pennsylvania
355
390
348 90 ~ 171
222
189
97
943
1, 104
1, 265 92
598
797
682
91
Indiana
606
713
610 88
327
333
357
82
Illinois
6
7
9
2
Missouri
600
643
621 76
338
329
332
76
Delaware
2, 259
2,315
2,320 92
2,304
2, 110
2, 035
89
Maryland
4,301
4,313
4,282
98 r: 2,960
3,096
2,879
87
Virginia
1, 385
1, 3 57
1, 265 83 i 673
903
878
90
West Virginia North Carolina
157 6,603
150 6, 349
146 91 6,425 96
235
267
280
105
4,793
4,574
4,787
100
.
South Carolina
323
401
4 24 101
288
271
343
97
::::>
GEORGIA
E
11, 835 11,615 12,359 109 ~ 8,435
8, 546
8, 891
104
Florida Tennessee Alabama Mississippi Arkansas Louisiana Texas Washington Oregon California
TOTAL 1966-67 (23 States)
554 1, 095 7,734 4, 505 9,289 1, 093 3,796
532 400 1, 797
62,037
533 1,004
7' 871 4,394 9, 065 1, 00 5 3, 798
659 377 1, 801
61,724
504 185 956 85 7,914 99 4, 555 108 9,279 103 1, 045 109 3,970 108 626 118 461 106 1, 819 103
63, 147 2/ 102
I
430 876 ' 5, 849 3, 596 ' 6,822 766 f 2,967
l 437
_, 261
1, 396
!46, 044
345 876 5,972 3,623 6, 799 791 2, 812 379 274 1, 362
46,049
431
157
904
107
6,078
101
3,857
116
6,994
107
777
115
2,965
102
444
99
191
73
l, 438
103
47, 138 -2/ 101
TOTAL 1965-66* (23 States)
61,095 60,665 62, 122 2/
o/o of Last Year
102
102
102
l I Current week as percent of same week last year.
*2/ Beginning January 7, data pertain to 22 States. Revised.
.44, 618
I
~
~ 103
46, 133 100
46, 456 -2/
101
GEORGIA CROP REPORTING SERVICE
ATHENS, GEORGIA
December 1966 Released 1/l o/67
Georgia Milk Production Up 2 Mil 1ion Pounds
Total mi lk production on Georgia farms amounted to 80 mill ion pounds during December 1966 1 accord ing to the Georgia Crop Reporting Service. This compared with 78 mill ion pounds produced during the same month a year earlier.
Product io n per cow i n herd was up 45 pounds at 520. The 1960-64 average production for December was 399 pounds.
The estimated December pr ice received by producers was placed at $6.60 per hundredwe ight for all mi l k . This wou l d be $.50 above the previous year but the same as the November average.
Prices paid for da iry feed averaged about $.25 per hundredweight above a yea r ago and $.05 above November. Hay prices were mostly unchanged from the previous years level but were up $1 00 per ton from November.
MILK PRODUCTION AND PRICES RECEIVED AND PAID BY DA~RYMEN
Item and Unit
Dec. 1965
Milk Production, Mil. lb.
78
Production Per Cow, lb. l l
475
Number Mi 1k Cows,
thous. head
165
CES RECEIVED - DOLLARS ]j:
1-' ~1 wholesale milk, cwt.
~
~
Fluid milk, cwt.
aI -
._J
Manufactured milk, cwt. Hllk Cows, head
6. 10 6. 10 3.80 :170.00
All Ba 1ed Hay, ton
27.50
'U CES PAID - DOLLARS 2/
Ill
JQ
ixed Da i ry Feed:
(\) 2/14 percent protein,cwt.: 3.95
N
16 percent protein,cwt.: 3.90
18 percent protein,cwt.: 4.15
20 percent protein,cwt.: 4.20
All under
29 percent protein,cwt.: 3.95
GEORGIA Nov. 1966
79 510
154
Dec. 1966
80 520
153
31 6.60 - 6.~0
4. 35 200.00
26.50
!I 6.60
200.00 27.50
4.05 4.15 4.45 4.50
4.15
3.90 4.20 4.50 4.55
4.20
Dec. 1965
9,556 635
4.62 5.02 3.64 :217.00 23.90
:}/3.46 :l/3. 75 :3/3.89 :}/4.02
:}/3.70
UNITED STATES
Nov.
Dec.
1966
. 1966
9' 108 636
9~552
668
ll 5. 39
5.79 4.35 256.00
24.50
4/ 5.33
257.00 25. 10
3.66 3.98 4.14 4.34
3.93
3.66 4.04 4.21 4.44
3.98
Monthly average.
Dollars per unit as of the 15th of month except wholesale milk which is average for month.
Revised .
Pre 1imina ry.
""
United States price is for under 16 percent.
Archie Langley ricultural Statistician In Charge
R. L. Sandifer Agricultural S,,tatistician
Georgia Crop Reporting Service, U. S. D. A., 315 Hoke Smith Annex ~ ration with the Cooperative Extension Service, University of Ge~f.
rtment of Agriculture.
(J
UNITED STATES MILK PRODUCTION
Production of milk in the United States during December is estimated at 9,552 mill ion pounds. This is about the same as December 1965 and is the third successive month in which production has been close to year earlier levels. A number of States in the West North Central and Western Regions reported increases from a year earlier. Production in most States in the North Atlant ic and East North Central Regions were lower. Mixed changes were shown in other regions. Average daily production increased about I percent from Novem ber to December. Milk production per capita during December was 1.56 pounds compared with 1.58 pounds in December 1965.
Preliminary estimates of monthly milk production for the year 1966 totaled 121,461 mill ion pounds. This is 3 percent less than the 1965 total and the 1960-64 average. Compared with 1965, production was lower for all months of the year except November. The larger decreases occurred in the earlier months of the year.
Monthly estimates for 1966 are preliminary and will be reviewed in late January. Revised estimates of the numbe r of milk cows, production per cow and total production months for 1965 and 1966 wil I be published by States in the February 13 issue of this
Mi lk Per Cow and Milk Production by Months United States 1966, with Comparisons
Month
January February March Apri I May June July August September October November December
Annual
Milk per cow
Average
1960-64
1965
1966
Pounds
Average 1960-64
Mi 1k Production
1965
1966
Mi 11 ion Pounds
Change from 1965
Percent
587
658
658
10,028 10,419
9,b65
565
622
620
9,634
9,820
9, 25L~
-5.3 -5.8
642
709
716
10,932 11 '155 10,645
659
722
735
11 '197 11,305 10,874
728
782
794
12,347 12,206 11 '707
701
756
780
11 '872 11 ,742 II, 397
644
702
722
10,888 10,856 10,506
-4.6 -3.8 -4. I -2.9 -3.2
602
653
676
10,158 10,046
9,799
567
615
646
9,555
9,404
9,328
-2.5 -0.8
573
621
655
9,L34
9,446
9,426
-0.2
-- 551
602
636
9,252
9,106
9,108
0
fl
:- - -58-4 - - - -63-5 - - - -66-8 - -: - _~ ,_78-8 - - _9,_55-6 - - 9 55-2 - - - - - -0 - --
7,407
8,080
6" ,310
125,285 125,061 121 ,461
-2.9
After Five Days Return to United States Department of Agriculture
Statistical Reporting Service 315 Hoke Smith Annex Athens, Georgia 30601 (OFFICIAL BUSINESS)
Postage and Fees Paid U. S. Department of Agricultur
r\ -r -r H09oo') 'tAJ
,1,. ~
ON
January 1, 1967 Released l/18/67
Cattle on Feed Down 35 Percent
GEORGIA CROP REPORTING SERVICE
There were 51, 000 cattle and calves on grain feed for slaughter market in Georgia on January 1, 1967. This was 35 percent below the number on feed January 1 last year, and 4 percent below the 53, 000 head on October 1, 1966.
The number of grain-fed cattle s old for slaughter during the October-through-December quarter totaled 34, 000 . This compared with 22,000 during the same peri od last yE.nr and 26,000 during the July-September 1966 quarter. There were 32,000 cattle and calves placed on feed October through December. This was 2, 000 head above placements during the previous quarter but 20, 000 below placements during the same period of 1965.
Cattle feeders in Georgia indicate they will market 33, 000 head during January, February, and March. The remaining 18,000 ' head on feed January 1 will be marketed after March 31.
Of the 51,000 cattle and calves on feed January 1, 41,000 were steers, and 10,000 were heifers. A total of 32,000 head had been on feed less than 3 months, 16,000 had been on feed 3 - 6 months, and the remaining 3, 000 had been on feed more than 6 months .
Major Feeding States
Cattle on Feed U~ 7 Percent
The 32 major feeding States had 11,136,000 head on feed for slaughter market compared with 10,436,000 head on January 1, 1966.
Fourth Quarter Placements and Marketings Up
In the 32 major feeding States the number of cattle and calves placed on feed during the fourth quarter of 1966 was 7, 720,000 head, a 5 percent increase over the same period in
1965. Placements were 6 percent larger in the North Central States but 1 percent lower in
e Western region. Recorded shipments of stocker and feeder cattle into the 8 C( rn Belt States during October and November were up 3 percent from the same period of 1965.
Marketings of grain fed cattle for slaughter from the 32 States during the Octobercember quarter totaled 5,008,000 head, 8 percent more than a year earlier. North Central gion marketings were up 10 percent from last year, but marketings in the Western region re down 1 percent.
Marketing Intentions
Cattle feeders in the 32 major States intend to market 5,245,000 head during the This would be 8 percent more than actual marketings for the same
riod a year earlier. Intentions in the Western States point to a 4 percent increase in anuary-March marketings. Feeders in the North Central States plan 9 percent more market-
s. A breakdown of anticipated marketings during the January-March quarter shows 32
rcent to be marketed during January, 33 percent in February, and 35 percent in March . ected marketings, as published, are based on the usual relati onship between survey data actual marketings .
Cattle and Ca l ves : Invent ori es, Pla cements, and Ma rketi ngs, Oct nt.er 1 t o January 1
32 States
Item
. 1,000 head
1966 as
% ~1-=-96.,..:5:-:--:-~~1~9"'766~
of 1965
ttle and Calves on feed October 1
ttle and calves placed on feed
October 1-December 31 y
ed cattle marketed October 1-December 31
7,738
8,424
109
7,325
7,720
105
4,627
5 ,008
108
1967 as
%of 1966
ttle and ca lves on feed January 1
10,436 11 136
107
fucludes cattle placed on feed after beginning of quarter and marketed before end of _~aE_t~_r.:.. _ _ _ _ _ _ _ _ _ _ _ _ _ _ _ _ __ _ _ _ _ _ _ _ _ _ _ _ _ _ _ _ _ _ _ _ _ _ _ _
e Georgia Cr op Reporting Service, USDA, 3l5 Hoke Smith Annex, Athens , Georgia, in cooper -
tion with the Cooperative Extension Service, University of Ge orgia e.nd the Georgia
partment of Agriculture .
/__ _ - - - - - - - - - -:::_C_-a_.-ttl~-e ~-a'nI-~d_-oC~a-l:v-.eEs~-DB_o-ny_-FQ_e-ue_ad-r,::t_e-Pr_sl-a_c-eNy_mU-M0e~B-nEtFRs-EaP-ELnAQd-C?EM-)D_a-r_k-e_t-i_ng-::_s-_-_-_-_I-:JNU~-M~!B-EERQ- - - -
STATE
: Oct.- :July- Oct.- : Oct.-: July- : Oct,,
: Jan.l : Oct.l : Jan. l : Dec. :Sept. : Dec. : Dec. : Sept. : Dec.
- - - - - - - - - _:_ !92.6_:_ 192.6,:_ !92.7__ :_12.62. -=~(2_6__:_ !92.6_.:.. !92.5_.:.. ~1(2_62_ _:_ 19~6.
:
(000)
:
000)
:
000)
GEORG IA Al abama Flor i da Mis s i s:;> ippi Te n n e s s e e Kentucky Oklahoma Texas Pennsylvani a 12 N. Cent. Sts. ll Weste rn Sts.
78
-
37
73
23
39
70
129
538
85
:. 6,687
2,677
53 22
53 21 26
39 123 509
56 5,064 2,458
51 44
76 25
39 59 170 674 82
7,142
2,774
52 29
55 20
32 45
97 361
62
4,877 1,695
30 17 48 18
15 20
94
357 40 2, 719 1,397
32
33 69 17 26
37 132 488
54 5,159 1,673
22 ll
25 17 10
15
75 257
21 2,809
1,365
26 13 23
7 14 20
94 360
39 3,203 1,390
31
I
~
1: 1;
r
8~
3Z: 2 3, o8: 1, 35'
32 St ate Tot a l
10,436 8,424 11,136
7,325 4,755 7,720 4,627 5,189 5,oo
Cattle and Calves on Feed by Weight Groups, Kind of Cattle
and Length of Time on Feed, Georgia and 32 ~jor Feeding States,
----------------. -by-Q-u-ar-ter-s,-1-96-6 -an-d -19-67--~----------------
.. . . GEORGIA
32 MAJOR STATES
Breakdown of Cattle on Feed : Jan. l ~ Oct. l
Jan. l : Jan. l
Oct. l
Jan. 1
_______________ .:.. _J.9.66. _:_ J.96.6__:_ _19.6I _ .!. _ .196.6__:__ l9.6.6__:__ l9.6.7_
(000)
(ooo)
Total on Feed Weight Groups
Under 500 lbs. 500-699 lbs. 700-899 lbs. 900 -l, 099 lbs. l,loo lbs.and over
78
53
21
l2
28
24
18
l2
ll
4
l
51
10,436
8,424
ll
1,836
548
18
2,791
1,732
17
3,327
3,156
5
2,090
2,565
392
423
ll, 136
1,872 2, 730 3, 699 2,381
454
Kind of Cattle: Steers and Steer Cal ves Heifers and Heifer Calves Cows and Others
62
43
15
9
l
l
41
7,302
5,962
10
3,072
2,438
62
24
7,853 3, 222
61
Time on Feed:
Under 3 Months
50
28
32
7,122
4,543
7' 521
3 - 6 Months
26
9
16
2,711
2,303
2, 912
-O-ve-r -6 -Mo-nt-hs------------2 ----16------3-----60-3----1,5-7-8 -----7-03
"}} Cattle and calves on feed are animals being fattened for the slaughter market on grain or
other concentrates which are expected to produce a carcass that will grade good or better.
?J Includes cattle placed on feed after beginning of quarter and marketed by end of quarter.
Aft er Five Days Return to United St at es Department of Agriculture
Statistica l Reporting Service
315 Hoke Smith Annex Athens, Ge orgia OFFICIAL BUSINESS
Postage and Fees Paid U. S. Department of Agricult~
s
GEORGIA CROP REPORTING SERVICE
ATHENS, GEORGIA
January 18, 1967
GEORGIA CHICK HATCHERY REPORT
Placement of broiler chicks in Georgia during the week ended January 14 was 8, 783, 000 -- 1 percent less than in the previous week but 2 percent more than in the
comparable week last year, according to the Georgia Crop Reporting Service.
An estimated 12, 392, 000 broiler type eggs were set by Georgia hatcheries --
slightly more than in the previous week and 3 percent more than in the comparable week a year earlier.
The majority of the prices paid to Georgia producers for broiler hatching eggs
were reported within a range of 50 to 65 cents per dozen. The average price of hatching eggs was 60 cents per dozen. The price of eggs from flocks with hatchery owned
cockerels generally was 2 cents below t~e average price. Most prices received for
broiler chicks by Georgia hatcherie's '-were . reported within a range of $7.00 to $10.00 with an average of $8.75 per hundred. The average prices last year were 65 cents for eggs and $9. 75 for chicks.
Week Ended
GE ORGIA EGGS SET, HATCHINGS, AND CHICK PLACEMENTS
EGG TYPE
Eggs Set
1965
-
1966
Thou.
-1966
1967
Thou.
o/o of year ago
Pet.
Chicks Hatch~d
-1965
1966
Thou.
-1966
1967
Thou.
o/o of
year ago
Pet.
Dec. 17 Dec. 24 Dec. 31 Jan. 7 Jan. 14
1 Week 12 Ended 3
620
599 748 701 818
Eggs Set l./
1965
1966
1966
Thou.
1967
Thou.
711
115
436
790
1'32
355
914
122
412
969
138
496
1, 085
133
479
BROILER TYPE
o of year a o
Pet.
Chicks Placed for
Broilers in Geor ia
19 5
196
o of
1966
1967
year a o
Thou.
Thou. Pet.
645
148
605
170
561
136
513
103
652
136
Av. Price Hatch Broiler Eggs Chicks
Per
Per
Doz. Hundred
1966-67 1966-67
Cents Dollars
Nov. 12
11, 151 11, 220
101
7, 905 8,449 107
62
Nov. 19
11, 136 11, 203
101
7, 897 8,376 106
63
Nov. 26
11,396 11,433
100
8,027 8,203 102
63
Dec. 3
11, 201 11, 276
101
8,280
8, 151 98
63
Dec. 10
11' 563 11, 729
101
8, 423 8, 171 97
62
Dec. 17
11, 697 11,908
102
8,602 8,417 98
62
Dec. 24
11,642 11, 83 5 102
8,323
8,435 101
62
Dec. 31
11, 421 11, 615
102
8,323
8, 546 103
60
Jan. 7
11, 364 12,359
109
8,585
8, 891 104
60
Jan. 14
11,996 12,392
103
8,614
8, 783 102
60
ure 1 Includes eggs set by hatcheries producing chicks for hatchery supply flocks.
9.25 9.50
9.50 9.50 9.25 9.25 9.25 8.75 8.75 8.75
ARCHIE LANGLEY
W. A. WAGNER
Agricultural Statistician In Charge
Agricultural Statistician
--------------------------------------------------------------------------------
U. S. Department of Agriculture
Agricultural Extension Service
stical Reporting Service
State Department of Agriculture
315 Hoke Smith Annex, Athens, Georgia
EGGS SET A ND CHICKS PLACE D IN COMMERCV\L ARE AS BY W -i:EKS - 1966-67
Page 2
EGGS SET
II
CHICKS PLAC~D
STATE
Week End= ed=---:::------J1 u;o of ~-:::------=-W:__:e::..~:;:.:"k:.:.....::E::..:n==-d=-e=-d=--: _ _ _] % of
Dec.
Jan.
Jan. !I year
Dec.
Jan.
Jan.
year
31
7
14
ago l/ 31
7
14
1 ago 1/
THOUSANDS
THOUSANDS
Maine
1, 860
l, 953
1, 920 114
1,366
1, 406
1, 467
104
Connecticut
390
348
285 77
222
189
213
101
Pennsylvania
l, 104
l, 265
1,265 99
797
682
510
75
Indiana
713
610
609
87
333
357
338
77
Illinois
7
2
Missouri
643
621
578 67
329
332
421
91
Delaware
2,315
2,320
2,490 96
2, 110
2,035
2, 122
79
Maryland Virginia
4, 313
4,282
4,293
99
"1, 357
l, 265
1, 396 87
3,096
2, 879
3, 266
105
903
878
847
90
.
West Virginia
150
146
146 90
267
280
260
89
U)
North Carolina
6,349
6,425
6,392
96 I 4, 574
4,787
4,788
95
South Carolina
401
424
422 103
271
343
326
97
GEORGIA
11, 615 12,359 12,392 103
8, 546
8, 891
8, 783
102
Florida Tennessee Alabama Mississippi Arkansas Louisiana Texas Washington Oregon California TOTAL 1966-67
(23 States }
533 1, 004 7, 871 4,394 9,065 l, 005 3,798
659 377 l, 801 61,724
504
517 262
956
1, 009 89
7, 914
8, 166 97
4, 555
4,609 105
9,279
9,391 103
1, 045
1, 058 110
3,970
4,104 107
626
567" 105
461
444 116
1, 819
1, 874 99
63, 147 ~/ 63,927 ~/ 101
TOTAL 1965-66* (23 States)
60,665 62, 122 2/ 63, 564 2/
o/o of Last Year
102
102
101
l/ Current week as percent of same week last year.
*2/ Beginning January 7, data pertains to 22 States. Revised.
I 345 876 I 5, 972
1 3,623 1 6,799
791 2, 812 . 379
274 i 1, 362
146, 049
I
I
146, 133 I
I
I 100
431
411
139
904
902
100
6, 078
6, 067
98
3, 857
3, 841
113
6, 994
6, 967
106
777
791
117
2, 965
2, 966
104
444
497
123
191
217
130
l, 438
1, 269
97
47, 138 -2/ 4 7, 269 -2/ 101
46, 456 ~/ 46, 995 !:_/
101
101
~'7oo7
mLbt? 't-~3
1,?
~.n~
~~
GEORGIA
CROP
REPORTING
SERVICE
ATHENS, GEORGIA
January 23, 1967
Item
Broiler T ype
Pullets Placed (U.S. ) 3 I
Total Dom e stic Chickens T e ste d: Broiler Type Geor gia United State s Egg Type Georgia United Sta t e s Chicks Hatched:
DECEMB :S R 1966
j During Dec.
I 1965 11
Thou.
1966 21 Thou.
o/o of
last year Pet.
3, 186 2, 7 57
3, 114 98 2,769 100
610 2,625
23 1, 006
735 120 2, 716 103
49 213 l, 126 112
j Jan. thru Dec.
o/u of
1965 11
I 1966 21
last year
Thou.
Thou.
Pet.
39,617 33, 892
45,216 114
39,712 117
6 , 16 7 26,080
324 7,637
6,971 113 28, 120 108
380 117 7, 527 99
Broiler Type
Georgia
39,495
39,937 101
455, 338
519, 166 114
United States
209,873 216, 894 103 2, 513, 881 2, 739, 052 109
Egg Type
Georgia
l, 629
2,558 157
26, 715
37,933 142
United States
26,927
35, 656 132
4 88,965
574,796 118
Commercial Slaughter:4/
Young Chickens
Georgia
27,760
31,434 113
360,448
393,855 109
United States Hens and Cocks
163,380 186,734 114 2,059,867 2,235,661 109
!
Georgia United States Egg Production:
l, 135 13, 502
Mil.
1, 076 13,675
Mil.
95 j 101
10, 207 134, 574
Mil.
10, 389 102
i48, 248 110
Mil.
./~
Georgia
South Atlantic United States
-5/
297
342 115
3, 546
3, 825 108
904 5, 402
980 108 5, 601. 104
10, 588 64, 588
11, 156 105
64, 564 100
,:,!
1/ Revised. 2/ Preliminary. 3/ Pullets for broiler hatchery supply flocks, includes
expected pullet replacements from eggs sold during the preceding month at the rate of
I
lZS pullet chicks per 30-doz. case of eggs. 4/ .r... ederal-State Market News Service -
Slaughter reports only include poultry slaughtered under Federal Inspection. 5/ South
'
Atlantic States: Del., Md., W.Va., N.C., S.C., Ga., Fla., Va.
I
YOUNG CHICKENS: SLAUGHTERED UNDER FEDERAL INSPECTION
BY SELECTED STATES, 1965 and 1966
State
Number Inspected
During Nov.
Jan. thru Nov.
I Indicated Percent Condemned
I' During Nov.
Jan. thru Nov.
1965
1966
1965
1966
11965
1966
1965
1966
Thou.
Thou,
Thou. Thou. I!Pct.
Pet.
Pet.
Pet.
Maine 4, 519
4, 577
60, 220
64, 162 2.3
4.0
2.4
3.3
~a.
6, 332
7, 056
77,707
80, 190 3.8
4.9
3.2
4. 1
!Mo.
2, 667
2, 843
34, 469
33, 123 2.8
5.9
2.9
5.0
~e l.
6, 589
6, 825
82, 279
84, 788 3.6
4.3
3.0
4.2
~d.
9,081 11,300 110,814 127,590 3.8
4.6
3. 3
4.2
~a.
3, 082
2, 930
40, 971
39, 210 2.7
4. 1
3. l
3.3
;
N.C. 16,738 19,477 207,630 232,958 2.8
4.2
2.4
3.9
i
aa.
25, 114 27, 947 319, 882 348, 865 2.7
4. l
2. 5
3.6
fenn. 3, 963
4, 352
51, 142
56, 705 2. 1
4.2
2. 1
3. 1
Ma. 16, 4 38 18, 693 206, 14 7 23 2, 009 2.6
3.6
2.3
3. 1
I
~iss. 11,661 12,509 141,419 146,362 2.5
3.2
2.4
3. 1
~rk. 23, 238 26, 109 266, 874 292, 633 3.0
4.4
2.7
3.8
i: ::1 ~exas 8,733 10,124 107,525 119,979 2.8
D~~~- --1-5;~ ~6;---:;:,-:; -- 89;: 88 i- :~: ::~: 2.8
3. l
2.7
4. 1
2.6
3.3 3.6
3
he Georgia Crop Reporting Service, USDA, 315 Hoke Smith A nnex, Athens, Georgia, ~cooperation with the Cooperative Extension Service, University of Georgia and the ~eorgia Department of Agriculture.
~ nd-of-Month Stocks of Poultry, Poultry Products, Meat and Meat Products United States-December 1966
Shell eggs: Incr eased by 7 thousand cases; December 1965 decrease was 41 thousand case s; Ave rage De cember decrease is 39 thousand cases. Frozen eggs: Decreased by 3 million pounds; December 1965 decrease was 13 million pounds; Average Decemb decr e ase is 14 million pounds. Frozen poultry: Decreased by 29 million pounds; Dec e mb e r 196 5 decrease was 76 million pounds; Average December decrease is 57 million pounds. Beef: Increased by 30 million pounds; December 1965 increase was 24 million pounds; Average December increase is 10 million pounds. Pork: Increased by 34 million pounds; December 1965 increase was 10 million pounds; Average Decemb increase is 15 million pounds. Other meats: Decreased by 4 million pounds; December 1965 de crease was 4 million'pounds; Average December decrease is 9 million pounds.
Commodity
Unit
Dec. 1960-64 av.
Dec. 1965
Nov. 1966
Dec. 1966
Thou.
Thou.
Thou.
Thou.
Eggs :
Shell
Case
72
85
23
30
Frozen eggs , total
Pound
60,054
51,056
38,831
36, 161
Total eggs ]_/ Poultry, fro zen
Case ----1-, -5-9-2-----------1-, -3-7-8-------1-,0-0-6---------9-4-5---
Broilers of frye rs
Pound
28,697
24,647
34, 836
38,463
Hens, fowls
do.
60,387
36,685
48, 567
53, 596
Turke ys Othe r & Unclassified Total Poultry
Beef: Pork:
Frozen in C ure and C ured Frozen in Cure and Cured
do. do. do.
I do.
I I
do.
210, 283
200, 116 312,082 272,999
I 58,245
53, 638
72,986
74, 126
357,612
315,086 468,471 439, 184
----------------------------------------------
229,792
259,668 272,643 302, 516
232,008
151, 883 205,745 239,404
Other meat and meat products
Total all red meats
do.
I 91,796
do.
I 553, 596
72, 547 484,098
86, 174 564, 562
82,307 624, 227
MID-MONTH PRICES RES..I;IV,i!;D AND P.l:U::;~s PAID
Item
Dec. 15 1965
Geor~ia
United States
! Nov. 15 Dec. 15 Dec. 15 Nov. 15 Dec. 15
1966
1966
1965
1966
1966
Cents
Cents
C ..:nts
Cents Cents
Cents
Prices Received:
Chickens, lb. excluding
broilers 2/
12.8
11.5
ll.O
9.6
9. 1
9.2
Com '1 Broilers (lb.)
14. 0
12. 5
ll. 0
14.6
13.6
ll. 9
All Chickens (lb.)
13.9
12.4
11.0
13.9
13.0
ll. 6
All Eggs, (dozens)
51. l
50.7
48.0
41.2
41.6
40.9
Prices Paid: (pe r__lOQ_lQ_.j
Dol.
Dol.
Dol.
Dol.
Dol.
Dol.
Broiler Grower Laying Feed
I
4. 80 4. 70
5. 20 5. 00
5. 40 5. 10
4.80 4.42
5.05 4.68
5. 11 4.70
Scratch Grains
4. 15
4. 40
4. 45
3.88 4.08
4.09
]_/ Frozen eggs converted on the basis of 39.5 pounds to the case. '!:_! Designated as
Farm Chickens previous to January 1966.
************************************************
This report is made possible through the cooperation of the National Poultry Improve me
Plan, Official State Agencies, the Animal Husbandry Research Division of the Agricultu
Research Service, the Inspection Branch of the Poultry Division, Consumer and Marketir
Service and the A gricultural Estimates Division of the Statistical Reporting Service and ~
many breeders, hatcheries, poultry processors and the poultry farmers that report to
these agencie s.
ARCHIE LANGLE Y
W. A. WAGNER
Agricultural Statistician In Charge
Agricultural Statistician
After Five Days Return to:
Postage and .t<~ees Paid
Unite d States Department of Agriculture
U. S. Department of Agriculture
Statistical !~e porting Service
3 15 Hoke Smith Annex
Athe ns, Georgia
OFFICIAL BUSINESS
sso
. . .
Ac g uisi~ions .Dlvl ~lon
unlv e r slty L l b rar le~
University of Georg1a
Athens Georgia 30601
GEORGIA CROP REPORTING SERVICE
ATHENS, GEORGIA
January 2 5, 1967
GEORGIA. CHI C K HA T C HE RY R S PO.K T
Plac ement of broiler chicks in Georgia during the we e k e nde d January 21 was 8, 843, 000-- 1 p e rc e nt more than in the previous week and 4 p 3 rcent mor e than in th e
comparable w e e k last yea r, according to the Georgia Crop B. e p orting Se rvice.
An estimated 12, 56 2,000 broiler typ e ~ ggs wer e set by Georgia hatche ri es --
1 perc e nt mor e than in the pr e vious we e k anci 3 perc ent mo re than in the comparable week a year e a r lier.
The majority of the pric e s paid to G eorgia produce r s for broiler hatching eggs
were reported within a rang e of 50 t o 65 cents per dozen. Th e ave rag e pric e of hatching eggs was 60 cent s pe r dozen. The price of eggs from flocks with hatche ry
owned cocke r e l s g e n er ally was 2 cents below the average price. Most pr ices receive d
for broiler chicks by Geor g ia hatcheries wer e reported within a range of $7. 00 to $10.00 with an average of $8. 7 5 per hundred. The average prices last year were 66 cents for eggs and $1 0.00 for chicks.
Week Ended
G:60R GIA E GGS SZ T, HATC HINGS, AND CHICK PLACE M Z NTS
E GG TYPE
'
Eggs 3et
1965
-
-1966
I I
i
% of
I
I year I
I
Chicks Hatched
-1965
1966
-
1966
1967
ago
. 1966
1967
Thou.
Thou.
Pet.
Thou.
Thou.
i o/o of year ago
Pet.
Dec. 24 Dec. 31 Jan. 7 Jan. 14 Jan. 21
Week Ended
599 74 8
790 91 4
I
132 122
355 412
701
969
130
496
818 837
1, 085 1, 194
i 133
1Li:3 I
479 598
605
170
561
136
I 513
103
652
136
I 619
104
BROILER TYPE
Eggs Sat l_/
1965
-
1966
1966
-
1967
I
I
o/o of !
year
ago
Chicks Placed for
I
I
I Broilers in Georgia
-1965
1966
-
o/o of I
year
1966
1967
ago
Av. Price
Hatch
Broiler
Eggs
Chicks
Per
Per
Doz.
Hundred
1966-67 1966-67
Thou.
Thou.
Pet.
Thou.
Thou. Pet. Cents
Dollars
Nov. 19
ll, 136 11,203 101
1, 897
8, 376 106
63
Nov. 26
Dec. 3
ll, 396 11, 433 100 ll, 20 l 11, 276 101
8,027 8,280
I 8,203 102
63
8, 151 98 I 63
Dec. 10
Dec. 17
11, 563 11,729 101 11,697 11,908 102
8, 423 8,602
8, 171 8, 417
I 97
62
98
62
Dec. 24 Dec. 31
11, 642 11,835 102
8, 323
8,435 101
62
11,421
11,615
102
I
I
8,323
8, 546 103
60
Jan. 7
Jan. 14 Jan. 21
ll, 364 ll, 996 12, 208
12, 3 59 12,392 12, 562
I 109
103
I"
8,585 8, 614
103
8, 531
8,891 104 8,783 102 8, 843 104
60 60 60
1/ Includes e gg s set b y hatcheries p roducing chicks for hatcher y suppl y flocks.
9 . 50 9. 50 9.50 9.25 9.25 9.25 8. 75 8.75 8.75 8.75
ARCHIE L .A. NGLEY Agricultural Statistician In Charge
W. A . WAGNER Agricultural Statistician
U. S. Department of Agriculture
Agricultural Extension Service
Statistical Reporting Service
State Department of Agriculture
315 Hoke Smith Annex, Athens, Georgia
...
EGGS SET AND CHICKS PLA CE D IN COMMERCIAL AREAS BY WE L:KS - 1967
Page 2
EGGS SET
l
CHICKS PLAC:~D
STATE
Week E nded
Jan.
Jan.
7
14
---
Jan. 21
o/o of I
year
I Ja.n.
J
ago 1/ 7
Week Ended
Jan.
Jan.
14
21
o/o of
1 year ago 1/
THOUSANDS
I
THOUSANDS
Maine Connecticut Pennsylvania Indiana Missouri
1, 953 348 _
1, 920 285
1, 931 323
113 85
I 1, ~06
I 189
1, 467 213
1,473 191
106 90
1, 265
1, 265
1,288
88 ' 682
510
569
84
610 621
609 578
619 526
82 65
i
I
357 332
338 421
413
95
382
79
Delaware
2,320
2,490
2, 518
97
2,035
2, 122
2, 510
94
Maryland
4,282
4,293
4,585 112
2, 879
3,266
3, 002
95
Virginia West Virginia
1, 265 146
1, 396 146
1, 492 150
94 93
I
!
I
878 280
847 260
86S
99
221
57
North Carolina South Carolina
6,425 424
6,392 422
6,476 434
I 97
4, 787
99
3-'1:3
4,788 326
4,766 352
99 114
.
::J
GEORGIA
-
12, 3 59 12,392 12, 562 103
8, 891
8,783
8, 843
104
Florida Tennessee Alabama Mississippi Arkansas Louisiana Texas Washington Oregon California
TOTAL 1967 (22 States)
504 956
517 1,009
543 1, 008
236 87
I
431 904
411 902
448
194
860
95
7,914 4, 555
8, 166 4,609
8,348 4,644
97 104
I 6,078 3, 857
6,067 3,841
6, 195 3,684
103 105
9,279
9,391
9,637 103 : 6,994
6,967
6, 941
106
1,045
1, 058
1, 087 114
777
791
785
114
3,970 626 461
1, 819
4, 104 567 444
1, 874
4, 194 113
586
95
424 105
1, 917 109
2,965
2,966
2,950
109
44~
497
393
102
191
217
281
136
1, 438
1, 269
1, 331
104
63, 147 63,927 65,292 102
47, 138 47,269 47,455
102
TOTAL 1966* (22 States)
62, 122 63, 564 64, 160
46,456 46,995 46,398
o/o of Last Year
102
101
102
1I Current week as percent of same week last year.
>lC Revised.
101
101
102
---=..J..966_ January 2 5, 1967
GEORGIA HONEY CROP SMALLEST IN OVER l 0 YEARS
Honey production during 1966 totaled 4,128,000 pounds, 41 percent below the 1965 of 6, 97 0, 000 pounds. Weather 'conditions were very unfavorable during the peak
flow causing yields per colony to be below the past 5-year average. Total colonies hand at the beginning of the 1966 season has been revised to 172 1 000 compared with 70,000 in 1965.
Prices received by beekeepers for all honey sold during 1966 averaged 18.8 cents per compared with the average of 2 0. 7 cents in 19 65.
Beeswax production totaled 74,000 pounds and was valued at $35,000.
UNITED STATES HONEY PRODUCTION SLIGHTLY HIGHER IN 1966
Honey production duri ng 1966 totaled 246,972,000 pounds, l percent above the 1965 , The 1966 production per colony averaged 51.8 pounds, compared with 51.1 pounds in 965. The 1966 honey crop was produced by 4,770, 000 colonies, just slightly below the ,783,000 colonies in 1965. Beeswax production of 4,728,000 pounds for the 1966 season slightly smaller than the 1965 crop of 4,749,000 pounds.
In mid-December producers reported 57 million pounds of honey on hand for sale red with 58 million pounds a year earlier and the 1960-64 average of 59 million pounds. _,,.,..,,.~in mid-December represented 23 percent of the 1966 crop compared with 24 percent in
The 1966 season was generally favorable throughout the United States except in the Atlantic and Southwestern areas 1 and in California. Production was generally curin these areas by drought and high temperatures during summer months. In North
South Carolina, and Georgia, beekeepers reported that 1966 was one of the most years on record for honey production. California, the number one honey
State, }).ad the lowest yield per colony since 1961.
Production of honey was higher than, or the same as 1 last year in 31 States and in 18 States. In the top honey producing States 1 only California and Texas had producticn in 1966 than in 1965.
Honey producers received an average of 17. 4 cents per pound for honey sold during . This compares with the 1965 average price of 17.8 cents and is the second consecutive that the price has declined. These prfces relate to all wholesale and retail sales of cted, chunk, and comb honey from both large and small apiaries owned by farmers and farmers.
ARCHIE LANGLEY _,,,..,,utural Statistician In Charge
L. H. HARRIS I JR. Statistical Assistant
Georgia Crop Reporting Service, USDA, 315 Hoke Smith Annex, Athens, Georgia in n with the Cooperative Extension Service, University of Georgia and the Georgia
nt of Agriculture .
HOl'.JBY Bi!:l.!:S : Number of Colonies and Production of Honey, 1965 and 1966
STATE AND DIVISION
~aine
N. H. Vt. Mass. R.I. Conn. N. Y. N. J. Pa.
Col onies of bees
11965
I 1966
!
I
Thousands
I
I
5
5
I
5 8
5 8
10
10
2
2
10
10
178
164
35
36
119
117
Yield
I
per colony
I i
1965
i
I
1966
I
Pounds
19
31
29
40
41
47
21
22
23
22
18
18
42
54
35
34
30
32
Honey
I
production
\
1965 ! 1966 '
1,000 Puunds
95 145 328 210 46 180
7,476 1,225
3,570
155 200
376 220 44 180 8,856 1,224
3,744
Value of production
1965 I 1966
1, 000 Dollars
41
59 108 82 17 69 1,204 404 785
66 82 123 88 17 70 1,461
395 839
Ohio Ind . Ill. Mich. Wis .
160 103 96 115
I 136
Minn. I owa Mo . N. Dak . S . Dak . Nebr . Kans .
191
133
97 I 41 I 92
96 49
Del. Md . Va. W. Va . N. C.
s . c.
GEORGIA Fla.
Ky. Tenn. Ala . Miss . P.rk. La. Okla . Texas
5
33 112
97
I
I
209 60
i 170
I 294
i 95 149
I 105
I
I
65 86
I 85
49
230
Mont .
80
Idaho
209
Wyo.
33
Col.
54
N. Mex.
13
Ariz . Utah Nev. Wash . Oreg .
96
;o
I 9
I
9 1
64
Calif.
553
48 States! 4, 777
Hawa ii
6
UNITED 1
STATES . 4 783
149 98 91 116 142
195 137 102 44 95 99 49
5 32 106 89 213 60 172 294
88 142 99 65 90 86 49 239
80 210 31 53 14 96 51
9
9 l
67 55 9 4,764
6
4,770
40 57 65 63 73
83 85 68 98 98 85 68
30 28 27 20 28 25 41 55 22 19 26 36 27 35 46 56
72 43 35 68 71 70 44 60 45 41 62 51.1 61
\. 1.1
41
6,400
62
5,871
67
6,240
74
7,245
105
9,928
92
15,853
104
11,305
65
5,626
105
4,018
112
9,016
95
8,160
65
3,332
37 '
150
40
924
18
3,024 -
12 ' 1,940
10 :' 5,852
~l
1,500
24
6,970
68
16,170
22
2,090
20
2,831
27
2,730
32
2,340
26
2,322
39
2,975
37
2,254
51
12,880
80
5,760
50
8,987
71
1,155
82
3,672
73 I
923
68 ' 6, 720
51
2,200
68
540
44
4,095
47
2,624
38
34,286
51.8 : 244,183
58
366
51.8 244,549
6,109 6,076 6,097 8,584 14,910
17,940 14,248 6,630 4,620 10,640 9,405 3,185
185 1,280 1,9G8 1,068 2,130
660 4,128 19,992
1,936 2,840 2,673 2, 080 2,340 3,354 1,813 12,189
6,400 10,500 2,201 4,346 1,022 6,528 2,601
612 4J 004 3,149 21,242 246,624
246,972
1,184 1,139 1,273 1,181 1,688
?,552 1,854 1,255
563 1,235 1,273
646
52 265 862 648 2,130 471 1,443 2,846
723 844 642 468 525 485 509 1,880
870 1,294
158 602 134 867 330 79 59 8 491 4,594 43,422
53
43 475
1,173 1,209 1,238 1,425 2,565
2,763 2,365 1,518
610 1,532 1,336
567
65 380 557 372 6C9 206 776 3,359
693 900 631 443 521 550 439 1,914
986 1,596
321 717 142 796 403 86 5 0 5 617 2,846
55
42 927
After Five Days Return to
United States Department of Agriculture
Statistical Reporting Service
315 Hoke Smitp Annex
Athens, Georgia OFFICIAL BUSINESS
Postage and Fees Paid U. S. Department of Agriculture
9CIJ 7
~A 3
\;7 ffi~~~
0~@[3~
January 1, 1967
Released 1/27/67
by GEORGIA CROP REPORTING SERVICE
ea!.! ~~.2~.. Up ~harply
YE~~ stocks in all positions on January 1, 1967, totaled 6,768,000 bushels- sharply ave the 2, 772 , 000 bushels on hand a year ago. Stored ..2!!l on January 1, 1967 in Ge orgia aled 34,735,000 bushels compared with 38,991,000 bushels on hand a year ago. Oats stocks at 495,000 bushels were up from 1, 128,000 bushels at the same date last year. Holdings of ,000 bushels of ~rgh_U!!! grain wer e down from 333,000 bushels. At the beginning of 1967 t~al of 771,000 bushels of ~~1 were stored in all positions, compared with 614,000 bushels January l, 1966. S tored~~ at 122,000 bushels, was 17,000 bushels above holdings a year
o,
Total rated capacity of off-farm commercial storage establishments in Georgia was
,000,000 bushels on January 1, 1967 compared with 20,000,000 bushels last year.
Georgia Grain Stocks -- January 1, 1967
with comparisons
- --- - - - - - - - - - - - - - - - - - - - - - - - - - - -.- - - - - - - - - - - - -
ON FARIVJS
OFF FARNS
ALL POSITIONS
GRAIN .
1966
1967 . __1_96_6______19_6_7 __..:.,.____19_66______19.6_7____
-----~--- ----------.!.-
1,000 bushels
1,000 bushels
1,000 bushels
31,505
27,647
7,486
7,088
38,991
828
1,205
300
290
1,128
99
104
6
18
105
183
176
431
595
614
33*2
10 242
* 1
2 37
~~
333
ot
1,457
------- published to avoid
-------------------- . 2,700 . 1,315
disclosing individual operations.
4,068
---
-
-
-.--
2,
-
772
34,735 1,495
122 771 12 279 6,768
-------
Soybeans
Soybean stocks on January 1, 1967 totaled 725 million bushels, exceeding the previous high u earlier by 17 percent. Stocks of all other grains were down from a year earlier. Hold-
of each of the four feed grains were less than January 1 a year ago. The combined total
143.2 million tons was 10 percent less than last year. Wheat in storage totaled 1,046 milbushels, the lowest January 1 stocks since 1952. Durum wheat stocks were 36 percent below u earlier, Rye holdings were down 2 percent and flaxseed about a third less than last
Capacity of off-farm commercial storage establishments in the United States was 5,494 on bushels on January 1, 1967. This total represents a net increase of 32 million bushels
a year earlier as new storage facilities exceeded the capacity of storages dismantled or d from use.
ARCHIE LANGLEY cultural Statistician In Charge
A. J. BGRDELON Agricultural Statistician
~orgia Crop Reporting Service, USDA, 315 Hoke Smith Annex, Athens, Ge orgia, in cooperation
the Cooperative Extension Service, University of Georgia and the Georgia Department of ulture .
(Please turn page)
Stocks of Grains, January 1, 1967 with comparisons (In thousand bushels)
---------- -- -----------Jin:-1-x;:--J~uary'l--octo~~-January
Qr~irL~!2.9...E~i~io~-----
__.1:261 -2____.1:2L______;k96______.J:967
ALL WHEAT
On Farms/
359,501
405,314
543,737
408,73
Commodity Credit Corp. f/
47,647
10,650
7,661
3,92
Mills , El ev . &Whses. 17]/
TOTAL
r.1,378 , 911
920,026
889,552
633,40
- 786.os9- - -l:\3s:-99o- - - - 1.!!45. 9s5 - - - l.o46.o6
RYE ------------ ----------------------------------------------------------.=~
On Farms 1/
10,072
13,141
15, 610
9,4
Commodity- Credit Corp. 2/
Mills, El ev . &Whses. 17 ]/
165 10,768
585 15,092
683
6
21,505
18,0
CORN------T-O-T-A-L-----------------------2-1,-5-o-5----------2-8~-8-1-8-------------3-7-,7-9-8---- -~-----2-8,-D
On Farms 1/ Commodity-Credit Corp. 2/
Mills, El ev. &Whses. 17 ]/
3,019,877 546,647
3,084,863 299,291
*
529,705 134,369
108,49
_ 182 ,22~ ____627~1~4- ____ !7~,!6~ ____ ~62,~
o.Ars---T-O-TA-L--------------4-,-34-7-,4-4-6-----4,-04-1-,3-3-8 ------8-4-0,-243 -3-,6-6-2,-59-
on Farms 1/
692,797
659,865
675 , 361
554,8
Commodity-Credit Corp. 2/
Mills, El ev. & Whse s. 17 ]/
2,664 80,438
9,406 93,199
9,636 147,915
7,23 98,3
TOTAL
- - 775,899--- -762:4"70- - - - - 13J2,9Y2---- 665,34
BARLEY-------------------------------------------------------------------------------------
On Farms 1/
Y Commodity-Credit Corp. 2/
lViills, El ev. & "\r.Jhses. J/
198,886 10,857 126,700
184,514 6,058
110,240
245,252 5,118
135,731
177,19 4,7
108,54
-SO-RG-HU-M----TO-T-AL--------------------J3-6-,4-4-J ---------3-0-0-:8-1-2-----------)8-6-,-lO-l----------2-95-,52
On Farms 1/
177,878
212,918
50,614
239,21
Commodity Credit Corp. 2/
4,781
4,703
4,722
4,~
Ivlills, El ev. & Whse s. 17 3/
831,688
760,439
335,865
580,34
-SO-Y-B-EA-N-S--T-O-TA-L------------------1-,0-1-4-,3-4-7-- -- -- ---9?-8-:o-6o-----------
391,2o1- - - - 824,1
-------------------
On Farms 1/
Commodity Credit Corp. 2/
Mills, Elev. &Whses. 17 3/
TOTAL
--*--C-o-r-r-e-c-te-d---C-CC---b-i-n--s-i-te---h-o-l-d-in--g-s--s-u-p-p-l-ie-d---b-y--A-g--ri-c-u-l-t-u-r-a-l--S-t-a-b-i-l-i-z-a-t-io--n--a-n-d--C-o-n--se-r-v-a-t-i-o-n--
Service.
1/ Estimates of the Crop Reporting Board.
2/ CCC -owned grain at bin sites.
3/ All off-farm storages not otherwise designated , including terminals and processing plants
Includes CCC-owned grain in these storages. ~/ September 1 estimate.
After Five Days Return to United States Department of Agriculture
Statistical Reporting Service 315 Hoke Smith Annex
Athens, Georgia 30601
-OF-FI-C-IA-L B-U-SI-N-ES-S
Postage and Fees Paid U. S. Department of Agricultm
FEB --
RT
GEORGIA CROP REPORTING SERVICE
ATHENS, GEORGIA
January 30, 1967
GEORGIA TURKEY GROWERS INTEND TO RAISE 2 0 PERCENT MORE TURKEYS IN 1967
Georgia: Turkey growers in Georgia expect to produce 2, 048,000 head in 1967 compared with 1, 7 09, 000 in 1966 or an increase of 2 0 percent. Growers are expected to
uce 1,928, 000 heavy breeds and 12 0, 000 light breeds compared with 1, 629,000 and 80, 000 spectively last year . The majority of heavy breeds in 1967 will be heavy whites.
UNITED STATES GROWERS I NTEND TO RAISE MORE TURKEYS IN 1967
United States: Turkey growers intend to raise 8 percent more turkeys in 1967 than last year according to the Crop Reporting Board. Present plans of growers are
increase heavy breeds 8 percent and light breeds 9 percent . Assuming growers carry out ir intentions, the 1967 turkey crop for the Nation would be about 125.2 million, a new record, pared with the revised estimate of 115.7 million turkeys raised in 1966. Increased productnis planned in all regions except the North Atlantic. Increases are : South Central 15 percent, th Atlantic 12 percent, West 10 percent, West North Central 5 percent, and East North ntral 3 percent. In the North Atlantic region production i~ expected to be down 5 percent.
Growers plan to produce 107.7 million heavy breed turkeys in 1967, an increase of 8 rcent from last year. Present plans indicate that heavy breed turkeys will account for 86
nt of the total turkeys raised in 1967, the same as in 1966. The total heavy breeds ude both heavy white and other heavy or bronze birds.
Producers intend to raise 17.5 million light breed turkeys in 1967, up 9 percent from last
ar. The number of lights to be raised in 1967 is up in all regions except the East North
ntral which is down 10 percent and the North Atlantic which is the same as raised in 1966. ases are 16 percent in the West, 12 percent in the South Atlantic, 10 percent in the West Central, and 6 percent in the South Central.
The number of turkeys actually raised in 1967 may vary somewhat from the January 1, 1967 ntions of growers. Such changes depend on growers reactions to this report, price of , supply and prices of hatching eggs and poults, and prices received for turkeys during next few months
Testings of all heavy breeds July through December were up 12 percent from the spending period in 1965. The July-December testings of light breeds were up 5 percent the same months last year. Testings of breeders indicate that hatching egg supplies be more than adequate to permit growers to increase output this year.
C. L. CRENSHAW cultural Statistician
ARCHIE LANGLEY Agricultural Statistician In Charge
(Please turn page)
AFTER FIVE DAYS RETURN TO Dited States Department of Agriculture
Statistical Reporting Service 315 Hoke Smith Annex Athens, Georgia OFFICIAL BUSINESS
Postage and Fees Paid U. S. Department of Agriculture
1, 000 1, 000 head hEoe.d
1,000 head
1,000 head
1,000 head
1, 000 head
Percent
Maine N.H.
45
2
47
74
6
80
49
2
51
109
74
6
80
100
Vermont Mass. R. I.
Connecticut
New York New Jersey Pa.
N. Atlantic
33
0
33
35
0
35
106
243
11
254
236
12
248
98
19
0
19
21
0
21
111
153
4
157
176
4
180
115
352
26
378
345
26
371
98
: 592
18
610
298
17
315
52
_!_ _ !,.4~ ___ g62_ ___l.z.913_____l.z..7.4____2.5___2.z..O~- ____ 10.
_!_ _ }.,!52. ___ 3.3g ___3.z..42.1_____2.z..92_8____3}.2___3.!...3}.0_____ _92. _
Ohio Indiana Illinois Michigan WiscLnsin
E.N.Central
2,991
745
3,736
3,895
670 4,565
122
3,911
289
4,200
3,925
306 4,231
101
1,276
60
1,336
1,158
58 1,216
91
1,208
96
1,304
1,031
77 1,108
85
_!_ _ 2_,l5Q. ___ 171 ___5.z..5g7____ ....5.z..4!7____lg4___5.z..5~1- ____ !OQ.
.!.. _l~,I3. __ 1,161 __ 16.z..lQ.3____ 15.z..4g6___l.z..2.3.5__ 16.z..6.1_____ 10.3.
Minnesota : 11,165 5,274 16,439
12,431 5,907 18,338
112
Iowa
Missouri N. Dakota S. Dakota Nebraska Kansas
6,895
328
7,223
7,000
387 7,387
102
9,457
533
9,990
8,771
458 9,229
92
1,044
77
1,121
1,307
95 1,402
125
587
444
1,031
660
488 1,148
111
: 902
19
921
1,000
10 1,010
110
_!_ __ 2_6g ____4~ ____610______7Q.4____ g,9____73.3_____ 122.
W.N. Central _!_ _3Q.,.lg __ ..,12.3. __ 3.7.z..335____ 3.l.z..813___7J314__ 19.z..2~7- ____ 102. _
Delaware
102
216
318
92
214
306
96
Maryland
182
48
230
173
50
223
97
Virginia
2,764 3,470
6,234
2,96o 4,164 7,124
114
West Virginia
663 1,264
1,927
694 1,239 1,933
100
N.Carolina
4,453
828
5,281
5,049
828 5,877
111
S. Carolina
1,130
0
1,130
1,390
0 1,390
123
GEORGIA
: 1,629
80
1,709
1,928
120 2,048
120
=-'tJ2-- - - - F~~r!~~aotic
Kentucky
~-
:-
I-o:1- ~~2------6.J-.. ~l~9~----
-i7
- -'
~~~
588
- - - -12
----
-;~
-
-
6
;;:.,z
!79B5g--
--~2-'
f~~-
417
-
-
-
-
-i~~-
- 71-
Tennessee
42
0
42
41
0
41
98
Alabama
1,257
21
1,278
1,070
20 1,090
85
Mississipli
85
1
86
94
l
95
110
Arkansas
6,055
420
6,475
6,659
630 7,289
113
Louisiana
ll
1
12
8
l
9
75
Oklahoma Texas
: 1,298
111
1,409
1,541
33 1,574
112
_!_ _ ..,3.21 ___ ~0~ ___6.z..4g7_____8.z..2.8____ g7___8.z..225_____ 122. _
S. Central , 7- 15.z..6~o- ___oi7___1..,,111 ____l~Q9.3. ___ 111 __l~~lQ. _____115
Mont. & Idaho .k 222
l ~
235
294
lb
310
132
Wyoming
4 - 0
4
- 4
0 .. 4
100
Colorado New Mexico Arizona
Utah Nevada Washington Oregon California Western
2,287
12
2,299
2,454
8 2,462
107
ll
1
12
11
1
12
100
93
1
94
111
1
112
119
3,346
36
3,382
3,816
41 3,857
114
457
49
506
439
200
639
126
: 1,410
315
1,725
1,536
299 1,835
106
.!.. _l.,I33. ___ ~5~ __ 17.!...1.7____ 18.z..310____42_4__ .!8.z..8g4_____ 11.Q_
: 24,563
881 25,444
27,035 1,020 28,055
110
UNITED STATES: 99,655 16,067 115,722
107,733 17,474 125,207
108
!/ Montana and Idaho combined to avoid disclosing individual operations.
GEORGIA CROP
E
ATHENS, GEORGIA
February 1, 1967
GEORGIA CHICK HATCHE R Y R E PORT
Placement of broiler chicks in Georgia during the week ended January 28 was
8,929, 000 -- 1 perc ent more than in the previous week and 3 percent more than in the compar ble week l ast year, according to the Georgia Crop Reporting Service.
An estimated 12, 892,000 broiler type eggs were set by Georgia hatcheries -3 percent more than in the previous week and 4 percent more than in the comparable
week a year earlier.
The m a jority o f the prices paid to Georgia producer s for broiler hatching eggs
were repor ed within a range o f 50 to 65 cent s per dozen. The average price of hatching eggs was 60 cents p e r do z e n . T he pric e of eggs from flocks with hat chery o ne d
cockerels gene rally was 2 cents below the average price. Most prices re ceive d for
broiler chicks by Georgia hatcheries were reported within a range of $7. 00 to $ 10.00 with an ave rage of $8. 7 5 per hundred. The average prices last year were 66 cents for eggs and $10.00 for chicks.
Week Ended
GEORGIA EGGS SET, HATCHINGS, AND CHICK PLACEMENTS EGG TYPE
Eggs Set
1965
--
1966
Thou.
1-9-66
1967
Thou.
o/o of
year ago
Pet.
Chicks Hatched
1-9-65
1966
Thou.
1-9-66
1967
Thou.
% of
year ago
Pet.
Dec. 31 Jan. 7 Jan, 14 Jan. Z1
Jan. zs
Week Ended
748 701 818 837 975
Eggs Set!:_/
1965
--
1966
Thou.
1966
--
1967
Thou.
815 1/ 109
412
969
138
496
1, 085
133
479
1, 194
143
598
1, 178
121
570
BROILER TYPE
Ufo of year ago
Pet.
Chicks Placed for
Broilers in Georgia
1-9-65
1966
1-9-66
1967
%of year ago
Thou.
Thou. Pet.
561
136
513
103
652
136
619
104
760
133
Av. Price
Hatch Broiler
Eggs Chicks
Per
Per
Doz.
Hundred
1966-67 1966-67
Cents Dollars
Nov. Z6
11, 396 11,433
100
8,027
8,203 102
63
Dec. 3
11, 201 11,276
101
8, 280
8, 151 98
63
Dec. 10
11, 563 11,729
101
8,423
8, 171 97
62
Dec. 17
11, 697 11,908
102
8,602
8,417 98
62
Dec. Z4
11,642 11, 83 5 102
8,323
8, 435 101
62
Dec. 31
11, 421 11,615
102
8,323
8, 546 103
60
Jan. 7
11,364 12, 3 59
109
8, 585
8,891 104
60
Jan. 14
11,996 12,392
103
8, 614
8,783 102
60
Jan. Z1
12, 208 12, 562
103
8, 531
8, 843 104
60
Jan. Z8
12,392 12,892
104
8,664 8,929 103
60
!I1/ Revised. Includes eggs set by hatcheries producing chicks for hatchery supply flocks.
9.50 9.50 9.25 9.25 9.25 8.75 8.75 8.75 8.75 8.75
ARCHIE LANGLEY Agricultural Statistician In Charge
W. A . WAGNER Agricultural Statistician
U. S. Department of Agriculture
Agricultural Extension Service
Statistical Reporting Service
State Department of Agriculture
315 Hoke Smith Annex, Athens, Georgia
c-
~-... ........ ~
STATE
~....~ ~ ..L
...n. .a. "C .J,....,.I
v ' - x x::a.. ~~----o ..r--..l.....I..M: "CTJ!... J....J :t:l.-<till
c:r.LVJ::rv.J.--:e::;-:f{ ~~~.A: ~s ~
E .K::S - ~967
:P'a.~e .:::;.
EGGS SET
We.ek :Snded
Jan.
Jan.
Jan.
- r l Jl CHICKS PLACED
o/o of I! year 1 Jan.
week Ended
Jan.
Jan.
o/o of year
14
21
28
ago 1/ 14
21
28
ago 1/
THOUSANDS
THJUSANDS
Maine Connecticut Pennsylvania Indiana Missouri Delaware Maryland Virginia West Virginia North Carolina South Carolina
GEORGIA
Florida Tennessee Alabama Mississippi Arkansas Louisiana Texas Washington Oregon California TOTAL 1967
{22 States )
TOTAL 1966* (22 States)
1,920
1, 931
1, 874 103
1, 467
1, 473
1, 503
109
285
323
316 91
213
191
192
94
1, 265 609 578
1, 288 619 526
1, 411 654 545
108
91 67
I
I
510 338 421
569 413 382
701
86
380
91
369
67
2,490
2, 518
2, 515 97
2, 122
2, 510
2,374
107
4, 293
4,585
I 4, 597 104
3,266
3,002
3, 199
93
1,396
1, 492
1, 580 108
847
865
763
79
146
150
153 94
260
221
238
71
6,392
6,476
6, 504 98
4,788
4,766
4,792
95
422
434
414 97
326
352
341
95
12,392 12, 562 12, 892 104
8,783
8,843
8, 929
103
i
517
543
630 235
411
448
473
191
1, 009
1, 008
893 80
902
860
818
89
8, 166 4,609
8, 348 4,644
8,327 4, 527
100 103
I 6,067 3, 841
6, 195 3,684
6, 178 3,836
97 109
9, 391 1, 058
9,637 1, 087
9,961 106 i 6,967
I 1,046 105
791
6,941 785
6,963 761
104 105
4, 104 4, 194 4,291 113
2,966
2,950
3, 121
113
567 444
586 424
I 753 119
497
270 56
2.17
393 281
463
110
339
123
1,874
1, 917
1, 973 101
1, 269
1, 331
1, 371
105
63,927 65,292 66, 126 103 47,269 47,455 48, 104
101
63, 564 64, 160 64, 513
146, 995 46,398 47,577
o/o of L ast Year
101
102
103
1/ Current week as percent of same week last year.
* Revised.
l 101
102
101
-
(!)
1-4
::l .'"..d. .!::::!
Pr-o4 ..u.. 1-4 (/) tl.O
(!)<
I])
~'0
'"rso::d..s(!:,):
(!) 6
tl.O..,
.r.o, r1o-4
(/) p.. 0 (!)
. Pd::) U)
~
(!)
..,1-4
::l
~
..u:.:.!
0
1-4 0.0
(!)
.., < -~
s:: ...... >
H
.:.:!, (!)
.
0
.s,::[
/
)1(!-:4)>< (!)
U)
~ (!) ~ ~
(>/) ...6, ......, <!! ..r..oz
Crolr01-o4..oHp.......s,,.::.:.: l0o-.4o~~
(!)1])1])6(!)1=Cl
-~ Cl ~ (/) 0 ~
(x.,(/)rol]) ~<!!
1-4
~(!)
-~
~(/)H
0 s:: u
<l).j..>.j..>::r::i])H
..;: U) -~
.;; ~
c:t:'"d~~<~
<l).j..>rt)
0
.;: U)
s::
~
_j
JANUARY 15, 1967
Released 2/2/67
GEORGIA CROP REPORTING SERVICE
GEORGIA PRICES RECEIVED I NDEX DECLINES l POINT FROM LAST MONTH
~e Georgia Prices Received Index de clined l point during the month ended January 15, 1967 This is 18 points below that on January 15, 1966.
~e All Crops Index was the same as a month ago at 254 as ther e was very little change in
price of the crops used to compute this Index.
L~er prices for hogs, beef cattle and eggs more than offset i ncreases for broilers, and
Uvestock Index was down 3 points from a month ago to 217.
UNITED STATES PRICES RECEIVED INDEX DONN 3 POINTS
PARITY INDEX UP 3. POINTS, PARITY RAT I O 75
~ing the month ended January 15, the Index of Price s Re ceived by Farmers declined 3 points ) to 255 percent of its 1910-14 average . Contributing most to the decline wer e lower
for cotton, wholesale milk, and eggs. Higher prices for cattle, broilers, and potatoes
p~tially offsetting. The index was 3 percent below January 1966.
~e Index of Prices Paid for Commodities and Services, including Inter est, Taxes, and
Wage Rates, rose 3 points (l percent) during the month to 340, a new record high.
With prices of farm products l ower and prices paid by farmers higher, the Parity Ratio
2 points to 75.
INDEX NUMBERS
GEORGIA AND UNITED STATES
- - - - - - - - - - - - - - ~-------------------------------------------------------------
Index
1910-14 ... 100
January 15 :Decemb er 15 : January 15 _____Re c~_High_ __
1966
. 1966
. 1967
Index
Date
--~-------~------~--------------
261 1/
267 1/
244 254
243
310 :March 1951
254
319 :March 1951 gj
_!_~2_-
220
217
_292_ :Sept. 1948 .I
262
258
255
313 :Feb. 1951
327
337
340
340 :Jan. 1967
80
77
75
- - - - - 123 :Oct . 1946
April 1951.
Paid, Interest, Taxes, and Farm Wage Rates based on data for the indicated dates.
Parity Ratio is computed as in the past. The Adjusted Parity Ratio, reflecting Govern-
payments, averaged 86 for the year 1966 compared with 80 for the Parity Ratio.
Statistician In Charge
WILLIAM A. lrJAGNER Agricultural Statistician
...u.-...i .. Crop Reporting Service, USDA, 315 Hoke Smi th Annex, Athe ns, Georgia, in cooperation
~e Cooperative Extension Service, University of Georgia and the Georgia Department of
- - - - - -- -FR-IC-ES----R-EC-E-IV7ED-A-ND- -PA-ID- -BY- G FARMEOERRSG.iAJA--N-U-A-R-Y-l-!)-.;-19-6-7-.-W-I-'r-H"ClJNOMITPAEDRI-SSTOANSTES --
Commodity and Unit
:--Jan:-15--;---15~-15 ::ra:;::--15~ Jan. -15--;---n~:--Is:-- Jan.
-PR-IC-ES- R-E-CE-IV-ED- - - -
: 1966 : 1966 : 1967 : 1966 : 1966
ll
---------------------------------------~
Wheat, bu.
$ 1.65
l. 80 1.80
1.41
1.61
1
Oats, bu. Corn, bu.
$
. 95
$ l. 28
. 91
89
. 644
1.48 1.50 3/ 1.19
. 677 1 . 29
Barley, bu.
$ 1. 04
1.12 1.12
1.03
1.06
1
Sorghum Grain, cwt.
$ 1.99
2. 25 2. 25
l. 79
l. 89
1
Cotton, lb.
26 . 50
18 . 5 18. 5 1/26. 62
22.03
19
Cottonseed, ton
$ 45 . 00
69 . 00 69 . 00 - 47 .80
65.90
65
Soybeans, bu.
$ 2. 50
2. 80 2. 80
2. 67
2. 82
2
Peanuts, lb. Sweetpotatoes, cwt.
11.5
11.0 ll.O
11.3
11.3
ll
$ 5. 60
7.20 6. 90
4. 58 3/ 5. 38
5
Hay, baled, ton:
All
$ 28 . 00
27 .50 28 . 50
24.40
25 . 10
25
Alfalfa
$ 39 . 00
39 . 00 36.00
25 . 10
25.90
26
Lespedeza
$ 29 . 50
30 . 00 31 . 00
24 . 80
25 . 80
26
Peanut
$ 24.50
24 . 50 25 . 50
23 . 40
24 . 30
25
Milk Cows, head
$ 170. 00 200 . 00 200.00 221.00
257.00
256
Hogs, cwt.
$ 25 . 50
19. 10 18.30
27 . 30
18. 80
18
Beef Cattle, all, cwt. 1/ $ 17.90
19 . 00 18.70
21.10
21.00
21
Cows, cwt. ?}
$ 14.80
16. 00 16.00
14.40
15. 40
1
Steers and Heifers, cwt. $ 20.50
21. 40 21.00
23.80
23 . 10
2]
Calves , cwt.
$ 23.20
23.20 23.70
24.70
25. 30
2
Milk, wholesale, cwt.:
Fluid Market
$ 6.30
4.95
5. 68
Ma n u f a c t u r ed
$ 3.80
3.61
4.31
All }/
$ 6.30
~ 6.70
4.54
5.30
Turkeys, lb.
23.0
25.0 24.0
23 . 7
25.0
22
Chickens, lb., Excl. Broilers 13 .5
11.0 10.0
9. 9
9.2
9
Commercial Broilers
15.5
11.0 12.5
16.4
11.9
1
All
15.4
ll.O 12 .3
15.6
11.6
1
Eggs, All, doz.
45.9
48.0 43.1
37 . 5
40.9
31
PRIGES PAID, [~:
Mixed Dairy Feed, cwt.:
All Under 29% protein
$ 3.95
4.20 4.25 3/ 3.71
3. 98
14% protein C::,/
$ 3.85
3.90 4.00 1/ 3.46
3. 66
16% protein -
18% protein 20% protein
.<;!<p
3.90
$ 4.15
$ 4.20
4 .20 4.25 1/ 3. 75 4.50 4.50 1/ 3. 88 4.55 4. 60 1/ 4.02
4.04
4. 21 4.44
Cottonseed meal, 41%, cwt. $ 4.20
5.30 5.30 - 4.54
5.39
Soybean meal, 44%, cwt.
$ 4.85
5.60 5.50
5.06
5.55
Bran, cwt.
$ 3.65
4.10 4.15
3. 33
3. 80
Middlings, cwt.
$ 3.70
4.30 4. 30
3. 39
3. 90
Corn Me al, cwt.
$ 3.30
3.70 3. 65
3. 28
3.54
Broiler Grower Feed, cwt.
$
4.90
5.40 5.30
4.80
5.11
Laying Feed, cwt.
$ 4. 75
5.10 5.10
4.45
4.70
Scratch Grains, cwt.
$ 4.20
4.45 4.50
3.90
4.09
Alfalfa Hay, ton
$ 44.50
44 . 00 44.00
33. 60
35.90
3
All Other Hay, ton
$ 34.50
36.00 35.50
32.50
33.60
lTii'Cow'Sii-aildiiSteers andheifer~ii7o;bined with allo~an-;~rene~~sary f o; slaughter b
2/ Includes cull dairy cows sold for slaughter, but not dairy cows for herd r eplacement .
jj Revised . ~ Preliminary estimate . 2/ U. S. price is for under 16 percent.
After Five Days Return to United States Department of Agriculture
Statistical Reporting Service 315 Hoke Smith Annex
Athens, Georgia 30601
OFFICIAL B-U-SIN-ES-S
Postage and Fee s Pai d
U. s . Department of Agricu1
ill@ill~@l]]Lb~illiDLb LPill~@~~
FEBRUARY 15, 1967
Re l eas ed 3/3/67 GEORGIA CROP REPORTING SERVICE
GEORGIA PRICES RECEI VED I NDEX UP 1 POI NT LAST MONTH
~e Georgia Prices Re ceived Ind ex for the month end ed February 15, 1967 was 1 point that for a month ago but was 20 points below that for February 15, 1966.
The All Crops Index increased by 1 point to 255 as cotton prices were up about one-
cent from last month. Price changes for most other crops were rather minor.
hices of eggs wer e down sharply during the month, and hog prices wer e down 50 cents per
uu ~uwc~~~ut, but increas es in pric es of bee f cattle and broilers were sufficiently offsetting
the livestock Index showed no change during the month at 217. This was 38 points below
Index for February 15, 1966.
UNITED STATES PRI CES RECEIVED INDEX DOWN 3 POI NTS
PARITY I NDEX DOWN 1 POI NT, PARITY RATI O 74
The Index of Pric es Re ceived by Farmers declined 3 points (1 percent) during the month February 15 , to 252 percent of its 1910-14 average, Lower prices for eggs, wheat, and -cwav milk contributed most to the decline. Partly offsetting were price increases for
The index was 7 perc ent below February 1966.
The Index of Prices Paid for Commodities and Services, including Interest, Taxes, and
Wage Rates declined 1 point (1/3 percent) during the month to 339.
With the Prices Re ceived Ind ex down 3 points, and the Parity Index down 1 point , the Ratio declined 1 point to 74.
INDEX :!ITUHBERS -- GEORGIA AND UNITED STATES
-------------------------------------------------
Index
February 15 January 15 February 15:_~:-~!:2...High _ _
1910-14 - 100
1966
1967
1967
. Index
Date
~..---------------------~----------------~------------~-----------~---------------------
264 267
1y /
243 254
244 255
310 : March 1951
319 : l'1arch 1951 g/
270
255
252
313 :Feb. 1951
329
340
339
340 :Jan. 1967
82
75
74
123 :Oct 1946
April 1951.
Paid, Inter est, Taxes, and Farm Wage Rates based on data for the indicated dates. Parity Ratio is computed as in the past. The Adjusted Parity Ratio, reflecting Governpayments, averaged 86 for the year 1966 compared with 80 for the Parity Ratio .
I n Charge
WILLIAM A. WAGNER Agricultural Statistician
---------------------------------------------
orgia Crop Re porting Servic e, USDA, 315 Hoke Smith Annex , Athens, Ge orgia, in cooperation
~e Cooperative Extension Servic e , University of Georgia and the Georgia Department of
t ure,
PRICES --RECEIVED AND PAID BY FAffivJERS. FEBRUARY 15. 1967. WITH COiviPARISONS -------------~------~~----------------------G-E-O-R-G~IA-- -~-----------. -----------U-N-IT--E-D--ST-A--T-E-S----
:-~~:-yg~:-Jan:-is-;~;t:ls-~-Feb:-i~-:--Jan: -15--~Feb.
------------------- Commodity and Unit
: 1966 : 1967 : 1967 : 1966 : 1967 : 19
EE~Q~:-ff~cE!f------ ---------7------------- ----- ------ ----
\IITheat, bu.
$
Oats , bu.
$
Corn, bu.
$
Barley, bu.
$
Sorghum Grain, cwt.
$
Cotton, lb .
Cottonseed, ton
$
Soybeans, bu.
$
Peanuts, lb.
Sweetpotatoes, cwt.
$
Hay, baled, ton:
All
$
Alfalfa
$
Lespedeza
$
Peanut
$
lVJilk Cows, head
~~
Hogs, cwt.
~
Beef Cattle, all, cwt. 1/ (i
Cows, cwt. 2/
dI ft~:
Steers and heifers, cwt. $
Calves, cwt.
~
Milk, wholesale , cwt.:
Fluid market
$
Manufactured
~P
All J/
$
Turkeys, lb.
Chickens, lb. Excl . Broilers
Commercial Broilers
All
Eggs, all, doz.
1.65
95
1.33 1.04 2.05 26.50
45 . 00 2.70
ll.S
5. 60
28.00
40.00
31.00
25 . 50
170.00
'3/ 26. 50 3/ 19.00
3/ 16.10
3l!/
21.60 24 .10
6. 35
3. 60 6. 30 24.0 12 .0
15.5 15.3 51.4
1. so
89 l.SO 1.12 2. 25 18.5 69 .00 2. 80
11.0
6.90
1.80 .88
LSl 1.12 2.25 19 .0 67.00 2.80 ll.O
6.90
28.50 36.00 31 .00 2S.SO 200.00
18. 30 18.70 16.00 21.00
23.70
27.50 3S.So
30.50
24 .50 200.00
17.80 18 . 9 0 16.20
21.20
24.20
6. 65
4.25 6.65 24.0 10.0 12.5 12.3 43.1
!d.l 6.60
23.0 9.0
14.0 13.7 38.8
1.43 649
1.20
1.07 1.80 26. 89
47 .so 2. 77
12.0
4.73
24.60
25.30
25.30
24.20
227.00
J/. 27.20
1y /
22.60 16.30
1'3/'
25.00 26.40
4.96 3.66
4.ss 24.1 10.1 16.2 15.6
41.3
1.57
l .
682
l. 28
l.
1.04
1.
1.92
l.
19.81
20,
65 .30
6],
2. 77
2.
11.4
ll.
5.46
5.
25.50
25.
26.40
26.
26.10
26.
25.50
25.
256.00 257.
18.90
18.
21.70
21.
16.30
17.
23.90
2].
26.10
26.
5.57
4.22
5.15 !!/ 5.
22.6
21.
9.1
B.
13.9
15.
13.3
14.
37.4
32.
Mixed dairy feed, cwt.: All under 29% protein
14% protein 5/
16% protein -
18% protein 2afo protein Cottonseed meal, 41% cwt. Soybean meal, 44%, cwt. Bran, cwt. Middlings , cwt.
Corn meal, cwt. Broiler grower fe ed, cwt. Laying fe ed, cwt. Scratch grains, cwt. Alfalfa hay, ton All other hay, ton
4.05
3.95 4.00 4.20
4.25 4.35 5.00
3.70 3. 75 3.40 s.oo
4. 85 4. 20
45.00 37 .00
4. 25
4.00
4.25 4.50 4.60
5.30
s.so 4 . 15 4.30 3.65
S.JO S.lo
4.so 44.00
3S.So
4. 25
4.00
4.25 4.so 4.60 5.20 5.40 4.10
4. 20 3. 65
5.20 s.oo
4.45 45.00
37.00
3.75 3.49 3. 79 3.94 4.06
4.67
5.17
3.43
3.50
3.32
4.93 4.51
3.95 34.40 33.20
4.03
J,
3.68
J,
4.09
4.
4.23
4.
4.46
4.
5.46
5.
5.60
5.
3.91
J,
3.99
J,
3.53
J,
5.14
5.
4.73
4.
4.12
4.
36.30
35.
34.00
34.
l7-"cows 11-and-"Stee;5-and heirers"-~bi~d-;ith-a11owanc;-wh8~8-neces~y-ror-siaughter Eu
2/ Includ es cull dairy cows sold for slaughter, but not dairy cows for herd replacement.
}/ Revised. !d./ Preliminary estimate . 2/ U. S. price is for under 16 percent.
After Five Days Return to United Stat es De partment of Agriculture
Statistical Reporting Service 315 Hoke Smith Annex
Athens, Georgia 30601
-O-F--FIC-I-A-L -BU-S-IN-E-S-S
Postage and Fees Paid U. S. Department of Agricultur
GEORGIA CROP REPORTING SERVICE
ATHENS, GEORGIA
F.EB - 9 1967
February 8, 1967
GEORGIA CHICK HAT HERY IR~P~RT
Placement of broiler chicks in Georgia during the w ek ende d February 4 was 8, 909,000 slightly less than in the pr eviou s w ee k but sli ghtly more than i n the comparable week last year, according to the Georgia Crop Re porting Ser vic e .
An estimated 13,096,000 broiler type e ggs were set by Georgia hatche ries-- 2
percent more than in the previous week and 5 percent m o r e t han in t he comparable week a year earlier.
The majority of the prices paid to Geo rgia producers for b ro "ler hat ching e ggs
were reported within a range of 50 to 65 cents per do z e The av rage p n ce o f atching
eggs was 60 cents per dozen. The price of e g gs from fl o c k w i.t h h a t c h er own d
cockerels generally was 2 cents below the average pric o t p rice s _ c eiv d for
broiler chicks by Georgia hatcheries were repo rt d wit i n a range o $ .
0. 00
with an average of $8.75 per hundred. The average pri e as t year we
cents for
eggs and $10. 00 for chicks.
Week Ended
GEORGIA EGGS SET, HATCHINGS , AND CH C:K PLACEME T
EGG TYPE
Eggs Set
1966
1967
Thou.
Thou.
I o/o of
year ago I
Pet.
Chicks Hatched
1966
1967
Thou.
Thnu.
I o/o of
year ago
Pet.
J"an, 7 J"an. 14 J"an. 21 Jan. 28 Feb. 4
701 818 837 975 941
Eggs Set 1../
1965
1966
1966
Thou.
1967
Thou.
969
138
1, 085 133
1, 194 143
1, 178
121
1,365
145
496
513
103
4 79
65 2
136
598
619
104
570
76 0
133
699
872 1 125
BROILER TYPE
o/o of
year
Chicks Placed for
A v. Price
~- ch
Broiler
Broilers in Geor
Eggs
Chicks
1965
1966 o/o of Per
Pe r
1967
year Doz.
Hundred
1966-67 1966-67
Thou.
Thou. Pet. Cents
Dollars
11, 201 11,276 101
8, 280
8, 15 1 98
63
11, 563 11, 729 101
8,423
8, 171 97
62
11, 697 11,908 102
8,602 8, 417 98
62
11, 642 11,835 102
8, 323
8,435 10 1
62
11,421 11, 615 102
8, 323
8, 546 10 3
60
11, 364 12, 359 109
8,585
8,891 104
60
11,996 12,392 103
8,614
8,783 102
60
12,208 12, 562 103
8, 531
8, 843 104
60
12,392 12, 892 104
8, 664
8, 9 29 103
60
12,432 13,096 105
8, 897
8,909 100
60
Includes eggs set by hatcheries producing chicks for hatche ry s upply flocks.
9.50 9.25 9.25 9.25 8.75 8.15 8.75 8.75 8.75 8. 75
ARCHIE LANGLEY
W. A. WAGNE R
Agricultural Statistician In Charge
Agricultural Statistician
----------------------------- -------------------- --------------------------------
U, 5. Department of Agriculture
Agricultural Extension Service
cal Reporting Service
State Departmm t of Ag riculture
315 Hoke Smith Annex, Athens, Georgia
c
" -
:I<;~Ci<:; "='=
......_NL> =~cc
. ~
-
.
......t
E GGS SET
I
CHICKS PLAC.!; ...:J
Q)
STATE
! We e k ~; n~ed_____ _
J an.
Jan .
Feb.
% of year
I, J an.
Week _; nded
Jan.
Feb.
- %of year
~
.;.:.1,
..-i
I
21
28
4
T HO USA NDS
ag o l/ II 21
28
4
li
li
THOUSAND3
ago 1/
;:1
'"d
~
.u. . .
n:l ~
();bD
Maine
I
l , 931
1, 874
2,0 04 10 5 1,,: 1, 4 73
1, 503
1, 525
109
en~
QQ))'+-0<
Connecticut P ennsylvania Indiana Mis souri
3 23 1, 288
6 19 526
31 6 1, 411
6 54 54 5
242 l , 20 4
68 5 59 8
56 84
93 81
,II' ,II,
,,
191 569 4 13 382
192 701 3 80
369
193
109
79 5
109
291
69
390
84
~...,
'"d QQ)
8 Qn:~....,
Q) ~
Delaware Maryland Virginia West Virginia
2, 5 18
2, 51 5
2,73 2 107 :! 2, 510
2,374
2,6 72
101
4, 585
4, 597
4,461 104 ,I 3,002
3, 19 9
3, 13 5
97
1, 4 92 150
1, 58 0 153
1, 57 0 153
10 2 96
IIII
865 22 1
763 238
835
91
261
69
b1ln:l
.n.e.:,lnopQ).
0
P;
U)
North Carolina 3outh Carolina
6, 476
6, 504
7' 149 111
4, 766
4, 792
4,988
103
434
414
417
97 ' 352
341
341
100
::J
'
GEORGIA
12, 562 12, 892 13 ,09 6 105 ! 8, 843
8,929
8,90 9
100
F lorida Tennes see Alabama Mis si s sippi Arkansas Louisiana Texas Washington Oregon
Cali~Tnia
TOTAL 1967 (22 States)
543
6 30
633 161 :, ~48
473
467
148
1, 008 8,348
89 3 8,32 7
98 0 8, 271
83 98
II
6,
860 195
818 6, 178
901 6,480
90 101
4,644 9,637
4, 527 9,9 61
4,691 9,937
106 106
il
3,6 84 6, 941
3,836 6,963
3, 881 7, 055
108 102
1, 087
l , 046
1, 097 112
785
761
803
111
4, 194
4 , 291
4,431 125
2, 950
3, 121
3, 189
113
586
753
675 114 IJ 39 3
463
434
111
424
2 70
438 83
281
339
300
108
l, 917
1,9 73
1, 89 5 102
1, 331
1, 3 71
1,392
105
65, 292 66, 126 67,359 105 47,455 48, 104 49, 237
102
TOTAL 1966* {22 States}
64, 160 64, 513 64,384
146, 398 47,577 48, 230
% of Last Year
102
103
105
}_/ Current wee k as percent of same week last year.
* Revised.
102
101
102
Q)
~
.;.:.1,
..-i
;:1
.u. .
~ Q)
s: . ~b1l u
+0-'<+-<
Q0 ~
Q) ~...., U) ~
;:1 Q
U) U)
soomt5 ~Q)tlDQ t:il
o::; ...,......,. ~ ..t.lD.
nC>:ll.n)p:~.!~Op............d,oQ~):U:p)J:)
o 0 ~so...:l
Q)
> en
U)
";d Q)
~ ::S
:r: .~...n. :~~ .u... ~oQ)Q,..0_.
~ cr; t; -B r~
Q) ~1.{)~~
<.:X::;: '"Qd) +n:-l>r..r-')i 0
.<;::! U)
Q
::J
GEORGIA CROP REPORTING SERVICE
AGRICUI.TURAL. EXTENSION SERVICE UNIVERSITY OF" GEORGIA ANO Tt-4E STATE DEPARTMENT OF AGRICUI.TURE
U.S . DEPA"TMENT OF AGRICUI.TURE STATISTICAL REPORTING SERVICE
315 HOKE SMITH ANNEX. ATHENS, GA .
THE POULTRY A ND E GG SITUATICN
Approved by the Outlook and Situation Board, February 10, 1967 SITUATION AND OUTLOOK (BROIL Z RS )
Broiler p roducers did not make the usual seas onal cut in fourth quarter broiler marketFede rally inspected broiler slaughter during the period ran 12 percent above a
earlier, while third quarter output rose only 8 percent. Since the turn of the year the upin slaughter has been slackening. Slaughter during the first 6 weeks of 1967 totaled 16
above a ye ar earlier, Recent broiler chick placement and egg settings in 22 important indicate that expa nsion in broiler production will be cut back sharply over the next 3 , Chick placements in those States in the 9 weeks through F ebruary 4 ran 2 percent a year earlier. Egg settings in the 3 weeks ended February 4 were up 3 percent, Thus, production during the next few months is likely to total only slightly above the 1966
Also, the broiler industry clearly has begun to take steps to moderate growth in its propotential in recent weeks. Pullet chicks placed for broiler hatchery supply flocks were from 32 p ercent above a ye ar earlier in August-Octo be l' t o 8 percent above in NovemDecembe r placements were back down to the 1965 level. This will affect the supply of
eggs in the second half of 19 6 7. In addition, broiler firms have stepped up the of breeder flocks in recent months. This has been reflected in the increased
r of hens and cocks of broiler breeds and in sharply falling prices for these heavychickens. In the 5 weeks ended February 1, 2. 7 million broiler breeders were slaughterFederally inspected plants . This was 63 percent more than a year earlier.
The cutback in the rate of production expansion has been mainly in response to the relow broiler pric es during the fourth quarter of 1966. U.S. live broiler prices averaged cents per pound in October-December 1966--l. 6 cents per pound below a year earlier the lowest price on record for the period. But, higher prices for feed and other producitems also greatly reduced the profitability of broii er product ion. The broiler feed price during the fourth quarter was 2. 5- -down 17 percent from both the preceding quarter and
)
au.1c quarter a year earlier.
Potential Still Lar e
However, the potential still exists for a substantial expansion in broiler production, -\;u.Lculy during the late spring and early summer because of the large number of layers
will be entering hatchery sup ply flocks over the next several months. Pullet chick placefor hatchery supply flocks in recent months indicate that the Nation's broiler breeder during the first half of 1967 would be 15 to 20 percent above a year earlier if there was
...,._T''-year change in the average age of hatchery supply flocks. However, less favorbroiler-feed price relationships in recent months are expected to continue at least midyear, This probably will continue to e ncourage a more rapid sell-off of older r flocks in 1967 than in 1966. This suggests that the actual number of broiler breeders first half of 1967 will be up less than the inflow of new pullets would indicate. But the r breeder flock could easily support a 5 t o 10 percent increase over 1966 levels in r production during late spring and summer .
Recover
Broiler prices broke sharply during the fourth quarter of 1966 to the lowest levels on for the period. Average U.S. prices for live birds were 12.9 cents per pound in Octocember compared with 15. 5 cents the preceding quarter and 14. 5 cents in the same
a year earlier , Prior to the break, prices (in relation to a year earlier) had been
upward almost uninterruptedly since mid-1964 . The price weakness resulted mostly the sharp upsurg e in production during a p eriod o f seasonally w eak demand and from in-
competition from pork. An 8 million-pound reduction in exports in October-Decema year earlier was also a fa tor in the weak market.
After Christmas , however, broiler prices recovered much of the loss as retailers advantage of the low prices to feature broilers more aggressively. Stepped-up USDA
s of young chickens for the National School Lunch Program also helped to strengthen during this period. U. S . live broiler prices rebounded to 13.9 cents per pound
y from 11.9 cents in Decembe r but still remained 2. 5 cents below a year earlier.
the week b eginning February 13, the pri ce for ready-to-cook broile rs in Chicago d Z8. 6 cents p er pound, compared with 25 . 7 cents in mid-January and 28. 3 cents in ruary 1966,
{ OVER )
A s broiler pric e s continued to weaken, U;5 DA purchases were stepped up from a ly average rate of 2. 0 million pounds in Octobe r-November to 3. 0 million pounds in Dzce and 2. 5 million pounds in early January. The purchase program was terminated on Janu 19, 1967. Cummulative purchases from A ugus t 19, 1966 when buying began through Jan 19 totaled 54 million pounds or about 1 percent of total slaughter during the period. Tot cost of the purchases delivered to points of destination was $16.9 million.
Over the ne x t 4 months broiler prices are expected to fluctuate around current lev This would put them below the relatively high prices of March-June 1966. Although broil supplies during the period may well be only slightly to moderately above a year earlier, c petition will be more intense from larger supplies and lower prices for turkeys, pork and In addition, with over production of poultry in Europe, competition for foreign markets be more intense and broile r exports may continue to run below a year earlier.
Volume Reduced in 1966
The United 3tates exported 163 million pounds of fresh and frozen poultry in 1966down from 182 million pounds in 1965 and the record 263 million pounds in 1962. Larger ports of broiler and turkey parts partially offs et smaller exports of whole broilers, fowl turkeys.
All poultry export s were up sharply in January-February from those months in 196
when volume had been reduced sharply by the maritime strike. But, as the year progres
exports of whole birds--turkeys, broilers and ste wing chickens--fell sharply below the 19
levels. Total turke y exports, however, finished the year by spurting above November-De ember 1965 leve ls .E x ports of whole broilers and broiler parts on the other hand, hovere slightly above the 1965 level in March through .S e ptember, but failed to register the usual
seasonal rise during the fourt h quart er . Fourth quarter broiler exports in 1966 totaled 26
million pounds, compared with 34 million in that pe riod of 1965.
West G ermany continued th e largest fo reign market for U.S. poultry in 1966. U,S broiler exports (Fractically all in the form of parts) to West Germany last year totaled 21 lion pounds--slightly above a year earlier. Exports of whole turkeys and turkey parts to Germany were 31 million pounds in 1966--down from 37 million in 1965. West Germany year accounted for 24 percent of our total broiler exports and 66 percent of our turkey ex ports--about the same percentages as in 1965. Other important foreign markets for U.S, fresh and frozen poultry in 1966, with the volume of exports in parentheses, were: Hong Kong ( 12. 8 million pounds), Japan ( 10. 3 million pounds), and the Netherlands (9. 0 million pounds.)
A number of factors contributed to the decline in U.S. poultry exports in 1966. Ex ports to West Germany were adversely affected by: (1) The continuation of high levies a gainst U.S. exports; (2) uncertainty about the enforcement of new grading regulations that went into effect on July 1; (3) a tight credit situation in Germany; and (4) the strong U.S. demand and price situation for poultry in 1966 which made it difficult for exporters to obt supplies at prices low enough to compete in world markets.
The latter factor appears to have been more important for turkeys than for chicke VVest German imports of turkey rose in 1966, but Denmark and the Netherland rather than the United States provided the increase. Finally, broiler production in Europe--especiall in West Germany and the Netherlands--continued to expand rapidly in 1966. This not only duced our access to the West German market, but also intensified competition in internati poultry trade .f or instance, West Germany began to subsidize broiler exports outside the EEC for the first time in November of 1966. Other European countries--especially theN lands, France, Belgium, and Denmark- -have been subsidizing exports since late 1962..
Variable Levies Scheduled to Fall
On July 1, of this year a system of unified grain prices is scheduled to go into effe in the Common Market. This will result in a substantial reduction in the level of feed gr prices in West Germany and consequently a substantial reduction--nearly 40 percent--in variable levies against poultry imports from outside countries. The hoped-for favorable pact of this reduction on the total levies against U.S. poultry, however, conceivably could offset by changes in EEC policy on poultry. In addition, the United States still hopes that Kennedy Round of tariff negotiations currently underway in Geneva among members of the General Agreements on Tariffs and Trade (GATT) also will contribute to mode rating theE protection on poultry.
After Five Days Return to: United States D epartment of Agriculture
Statistical Reporting Service 315 Hoke Smith Annex
Athens, Georgia OFFICIAL BUSINESS
Postage and Fees Paid U.S. Department of Agriculture
REPORTING SERVICE
ATHENS, GEORGIA
February 15, 1967
GEORGIA CHICK HATCHER Y REPORT
Placement of broiler chicks in Georgia during the week ended Fe bruary 11 was 9,063,000 -- 2 pe rcent more than in the previous week but slightly l ess than in the comparable wee k last year, according to the Georgia Crop R eporting Se rvice.
An estimated 12, 971, 000 broiler type eggs were set by Georgia hatche ri e s -- 1 rcent less than in the previous week but 5 per cent more than in the com parable week
a year earlier.
The majority of the prices paid to Georgia producer s for broil e r hatching eggs re reported within a range of 50 to 65 cents per dozen. The averag e price o f hat cheggs was 60 cents per dozen. The pric e of eggs from flocks wit h hat chery owne d
els generally was 2 cents below the average price. Most prices received for chicks by Georgia hatcheries were reported within a range of $ 7. 00 to $10. 00
an average of $8.75 per hundred. The average prices last year were 66 cents eggs and $10.00 for chicks.
GE ORGIA E GGS SET HATCHINGS, AND CHICK PLACEME NTS
EGG TYPE
E s Set
Chicks Hat ched
1966 Thou.
1967 Thou.
year a o
Pet.
1966 Thou.
1967 Thou.
year a o
Pet.
818 837 975 941 1, 051
1,085
133
479
1, 194
14 3
598
1, 178
121
570
l, 365
14 5
699
1,245
118
699
BROILER TYPE
652
136
619
104
760
133
872
125
919
131
E ggs Set],_/
1 66 Thou.
1967 Thou.
Chicks Placed for
Thou.
1967 Thou.
Pet.
Hate E ggs Per Doz. 1966-67
Cents
Chicks Per Hundred 1 66-67
Dollars
c. 10
11, 563 11, 729
101
17
11,697 11,908
102
Z4
11,642 11' 83 5
102
31
11, 421 11, 615
102
7
11,364 12,359
109
14
11, 996 12,392
103
Zl
12, 208 12, 562
103
Z8
12,392 12,892
104
4
12,432 13,096
105
11
12 298 12 971
105
8,423
8, 171
97
62
8,602
8,417
98
62
8, 323
8,435 101
62
8,323
8, 546 103
60
8, 585
8, 891 104
60
8, 614
8,783 102
60
8, 531
8,843 104
60
8,664
8,929 103
60
8, 897
8,909 100
60
9 102
9 063 100
60
9.25 9.25 9.25 8.75 8.75 8 .75 8. 7 5 8.75 8.75 8. 75
ARCHIE LANGLE Y cultural Statistician In Charge
W. A . WAGNER Agricultural Statistician
S. Departm e nt of Agricultur e
Agricultural E xtension Se rvice
cal Reporting Service
State Department of Agriculture
315 Hoke Smith Annex, Athens , Georgia
EGGS SET A ND CHICKS P LAC:D IN COMMERCIA L AREA ~ BY vVE >~ KS - 1967
::~ GG S SE T
II
C HICKS PLA <:::ED
STATE
i
I
We e k E n ded
Jan.
E'e b.
28
4
o/o of II
4 Feb .
11
year ~~ Jan.
ago 1/1 28
W .:!ck :2 nded
?eb.
Feb.
4
11
I
THO US A ND3
I' ,I
TH-.)USANDS
I
!
Maine
1,874
2, 004
2,044 107 ! 1, 503
1, 525
1, 558
I
Ccr.:r.e cticut
3 16
242
361 124
192
193
172
P ennsylvania Indiana
1, 411 6 54
1, 204 68 5
1, 403 710
105 92
I!
701 380
795 291
857 337
Missouri Delaware
545 2, 515
598 2, 732
701 94 I 369
2, 884 117 i 2,374
390 2,672
459 2, 731
Maryland
4, 597
4 ,461
4,399 105
3, 199
3, 13 5
3,216
Virginia
1, 580
1, 570
1,606 103
763
835
873
West Virginia North Carolina
153 6, 504
153 7, 149
155
i
238
7,207 1 ,I 4,792
261 4,988
352 5,067
South Carolina
414
4 17
I 419 105
341
341
434
G E ORGIA
12,892
13,096
12, 971
I 105 I 8,929
8,909
9,063
Florida
630
633
605 152 I 473
467
429
Tenness ee Alabama Mississippi
893 8,327 4, 527
980 8, 271
4 ,691
I 964 87
8,762 105
813 6, 178
4,784 108 I 3, 836
901 6, 480
3, 881
943 6,645 3, 781
Arkansas Louisiana T e xas Vv ashington Oregon California
TOTAL 1967 {22 S tates )
9,961 1,046 4,291
753 270 1,973 66, 126
9,93 7 1, 097 4 ,431
675 4 38 1, 895 67 ,359
10, 168 1, 094 4, 555 629 380 1, 794
68, 595
II 113
6,963
108
761
126
95 128
ilI 3, 121 463 339
96
1, 371
109 48, 104
I I
7,055 803
3, 189 434 300
1, 392 49,237
7' 201 833
3,295 455
419 l, 466 50, 586
TOTAL 1966* {22 States)
64, 513 64,384 63, 186
i47, 577
I
48,230
43,908
o/o of Last Year
103
105
109
l/ Cur rent week as percent of same week last year.
I 101
102
103
* Revised.
Page 2
I % of
year
ago 1/
110 83 97 71
100 119 93 92 96 97 120
100
125 97 104 105 104 120 119 109 140 112 103
Q)
H :l
.'"..{.j.;:-:1>
PC-1il ..u..
H Ul b.O
~~
.~ 4-< 0
"~d -~ C1l Q)
8 Q)
00.;->
C1l f.i .;..> n:l Ul 0..
0 Q)
. P-i~ U)
:::>
Q)
H :l
.;..>
~
:l
u
r-4
0 H <lJ
.. . .;..> 00 u
~
~
>
H '+-< H
:lO<lJ~
"Q:;.;..>(/)(1)
U)
z oU:l:sv;~..~o..~o~r~or. .... iUl)
a....,o::> (>1, .j;..>H~.;...>.!:!0H0UH)
~ro
0 0.. 0..
Q)Q)Q)
Q) 11:1
:>QI-!:i (f) ~
Jt r.!~.J Ul ro,-4
<t: .. .
Ul
Q) U
~ H
J.-<~.,..~(1)\J
Q)
.;..>
..!:!H
.;..> .;..> Ul
.;..> ~
0 4~-<'"Ud) C~1ll~{) ~ ~
(1).;..>('1')
.+....>(/)
~
:::>
I
D , Georgia
FEB 2 2 1~57
;-\~I D ~.19 66
GEO~G J;-\ F;-\I<};\ S
February 20, 1967
All Hogs and Pigs
1 ,
1,
4,400 1, 350 1, 700 1'1 00 4,650 5,450 3,350 2,350 2,200 4,900 2,150
33,600
1,300 2,900
2,550
2,150 1,400 2,950 I ,950 1 ,450 2,350 3,100 1 ,300 3,350
r Counties
1 ,400 3,950 4,900 1 ,500 3,200
41,700
1,100 2,300 1,950 3,400 2,050
2,300 1, 700
4,300 1,250 1,800 I ,000 4,600 5,300 3,250 2,300 2,000 4,800 2,000
32,600
I, I00 2,600
2,200
1,900 1,250 2,700 I, 750 1,250 2,000 2,750 1 1 150 3,000
1, 250 3,800 4,500 1, 350 2,950
37,500
1-;-CJ59-2,200 1,900 3,250 2,000
2,200 1,600
3,300
3,000
TOTAL
18,100
17,200
DISTRICT IV Carroll Chattahoochee* Clayton* Coweta Douglas* Fayette Haralson Harris Heard* Henry Lamar* Macon Marion Meriwether Muscogee* Pike* Schley Spalding Talbot Taylor Troup* Upson* Other Counties
TOTAL
DISTRICT v
Baldwin Bibb Bleckley Butts* Crawford Dodge
Greene'~'
Hancock Houston Jasper* Johnson Jones* Laurens Monroe* Montgomery Morgan Newton* Peach Pulaski Putnam* Rockdale* Ta 1iaferro* Treutlen Twiggs Washington Wheeler ~~ i 1k i nson Other Counties
All Hogs and Pigs
1'
Jan. 1'
I 66
3,200
3' 100
I ,950
I, 150 1 ,300 1,300
I, 150
8,900 5,300 2,400
I ,900
I ,000 I, 350 I ,200
I, 150
9,000 5,350 2,300
3,950 2,400 2,000
6,350
3,800 2,200 2,000 6,400
5,950 47,300
5,650 46,400
3,400 2,450 14,700
1 ,050 19,900
2,150 5,300
10,500
38,700
10,900 I, 350
2,550 4,250
3,250 2,400 14,500
1 ,000 19,700
2,000 5,000
10,000
38,100
10,700 1,200
2,400 4,000
1O, I00
4,750 11 ,900 13,600 3,700 5,450
9,800 4,300 II ,500 13,000 3,600 5,250
TOTAL
166,700
J'ess thun-1 , 000 head included in 11 0ther Counties''.
161 700
-
HOGS AND PIGS ON FARMS JAN. l, 1965 AND 1966
DISTR ICT VI Bulloch Burke Candler Columbia Effingham Emanuel Glascock Jeffer son Jenkin s McDuffie Richmond Screven Warren
TOTAL
DISTRICT VI I Baker Calhoun Clay Decatur Dougherty Early Grady Lee Mi 11 er Mi tche 11 Quitman Randolph Seminole Stewart Sumter Terre 11 Thomas Webster
TOTAL
Jan. l, 1965
61 ,000 12' 100 15,700
1 ,350 11 ,800 24,400 3,300 10,100 6,900
I ,600 4,150 24,600 2,600
179,600
Jan. l , 1966
59,500 ll, I00 14,400
I, 200 10,700 23,200 3,250 10,200 7,050
l ,500 4,000 23, I 00 2,500
171,700
8,300 9,050 3,350 34,000 5,000 22,000 31,700 5,050 21 ,500 20,300 2, l 00 8,300 14,300 ll ,200 14,500 7,750 21 ,000 7,900
247,300
8,100 8,400 2,850 32,300 4,700 19,800 29,500 4,850 20,300 19,300 I ,800 7,900 12,900 l 0, l 00 12,800 7,200 20,000 7,200
230,000
DISTRICT VI I I Atkinson Ben Hill Berrien Brooks Clinch Coffee Colquitt Cook Crisp Dooly Echols Irwin Jeff Davis Lanier Lowndes Telfair Tift Turner Wi I cox Worth
TOTAL
DISTRICT IX Appling Bacon Brantley Bryan Camden* Charlton Chatham Evans Glynn Liberty Long Mcintosh* Pierce Tattnall Toombs Ware Wayne Other Counties
Jan. l , 1965
8,600 9,750 27,200 40,700 l ,950 49,300 42,600 14,700 10,800 9,800 2,850 27,500 15,600 7,150 14,000 18,500 19,300 13,700 9,500 26, I 00
369,600
28,400 14,500 4,350 2,450
1 ,850 1,950 8 ,300 I ,800 I ,500 2,150
14,700 29,600 17,700 7,600 20,500
750
Jan . 1, 1966
8,000 9,000 25,300 40,700 1'750 49,800 41 '800 14,400 10,500 9,300 2 ,700 25,600 15 ' l 00 6,850 12,900 18 ,700 19,900 14,000 8,900 25,300
360,500
29,000 14,200 3,900 2,200
l ,600 l ,650 7,500 l ,800 1,350 I ,900
14,000 30,000 17,900 6,700 20,000
700
TOTAL
158, I 00
154,400
STATE TOTAL I .262.000 l 212 .ooo
*Co unties with l ess than 1, 000 head included in "Other Counties".
The Georgia Crop Reporting Service, USDA, 315 Hoke ' Smith Annex, Athens, Georgia in cooper
tion with the Cooperative Extension Service, University of Georgia and the Georgia Depar~ _!!!e~t_o_f ~g_!Jult~r~- _ _ _ _ _ _ _ _ _ _ _ _ _ _ _ _ _ _ _ _ _ _ _ _ _ _ _ _ _ _ _ _ _ _
ARCHIE LANGLEY Agricultural Statistician In Charge
R. L. SAND IFER Agricultural Statistician
After Five Days Return to United States Department of Agriculture
Statistical Reporting Service 315 Hoke Smith Annex Athens, Georgia 30601 OFFICIAL BUSINESS
Postage and Fees Paid U. S. Department of Agricultur
L j\/
January l, 1967
Released 2/21/67 GEORGIA CROP REPORTING SERVICE
1 Cattle ~tory Do~ Perg~nt
GEORGIA
All cattle and calves on Georgia farms January 1, 1967 totaled 1,797 ,000 head -- l percent the 1,815,000 head on farms a year earlier, according to the Ge orgia Crop Re porting Ser-
Cows two years old and older kept for milk declined 4 perc ent to 163 , 000. Heifers l - 2 old amount ed to 42,000 and heifer calves kept for herd replac ement were placed at 45,000. animals being kept for milk, excluding dairy type bulls, were estimated at 250,000 head
with 259,000 the previous year.
~e number of other cattle in Georgia (all cattle except milk cows and dairy replacement ) decreased nearly l percent to 1,547,000. The number of beef-type brood cows was at 754,000 compared with 765,000 a year earlier. Heifers l - 2 years old increased to 196,000.
~e inventory value of all cattle and calves was estimated at $203,061 ,000 compared with 000 on January 1, 1966.
in Georgia January l, 1967 was placed at 1,333,000 head - 10 above the 1,212,000 on hand at the beginning of the previous year. The value of hogs
- 7 percent below a year earlier.
- - - - - - On Farms Up Sharply
~ere were 34,335,000 chickens, excluding commercial broilers, on hand January l, 1967. vas 20 percent above the previous year and the largest increase shown by any State. In
years, Georgia has ranked second only to California in chickens on farms. The total of chickens, excluding broilers was $37,768,000 compared with $32,813,000 on January 1,
~ere were 86,000 turkeys valued at ~ 413,000 on Georgia farms compared with 62,000 valued 000 a year earlier .
of all cattle, hogs, sheep and lambs, turkeys and chickens (excluding farms January l, 1967 was $280,276,000 compared with $ 256,790,000 the
LIVESTOCK Olil GEORGIA FARMS, Head and To
head 1,815 1,212
6 .8 28,533
62
Dollars
lCO.OO 34.70 15.40 1.15 5.10
dollars 181,500
42,056
105 32,813
316
head 1,797 1,333
6.8 34,335
86
:Collars
113 .oo
29.20
16.20
1.10 4.80
dollars 203,061 38,924
110
37 '768 413
280 276
and Calves
Hogs :Sheep and : and Pigs :Lambs
Chickens
!I
Turkeys
- 1,000 head -
230
526
1 ,566
21
14, 287
47
218
579
1,519
18
16,6 03
61
205
620
1,580
14
20,246
49
195
688
1,485
10
24,126
65
183
750
1,262
7.6
26 , 833
55
170
765
1,212
6 .8
28 ,533
62
163
754
1 333
34
broilers.
---------------------------------------------------
Georgia Crop Reporting Servic e, USDA, 315 Hoke Smith Annex, Athens, Georgia, in coopera vith the Cooperative Ext ension Service, University of Georgia and the Georgia Department
UNITED STATES
On Ja nuary 1, 1967 there were 108.5 million cattle and calves on farms and ranche s, a slightly smaller number than the revised l evel of 108.9 million head a year earlier and the
s econd year of de cline . An increase of 1 percent in beef cattle was more than offset by t
5 percent de cre ase in dairy cattle . The number of cows and heifers 2 years old and older
for milk decreas ed 5 percent to 15.2 million head--the smallest numb er since 1893. The in
ventory of hogs and pigs on f arms January 1 was 51.0 million head, an increase of 8 percent All sheep and lambs tot aled 23.7 million head, 4 percent below the r evised l evel of a year ear lier , and t he smallest inventory since r ecords began in 1867 The number of chickens on farms increased 9 percent to 427 . 6 million head on January 1, 1967 while the number of tur increased 6 p r cent to 7. 3 million head.
The total v al ue of livestock and poultry on the Nation's farms and ranche s Januar y 1,
1967 was ~18 . 9 billi on, an increas e of 7 percent from the $17. 6 billion a ye ar earlier. ~ cur r ent i nventory value of cattle and calves was $16.2 billion, up 12 per cent. Hogs and p' wer e valued at $1.7 billion, down 20 per cent . The value of all sheep, at $469 . 6 million, down 4 perc ent . Th e poultry inventory value consisted of $511. 8 million for chickens and $36. 4 mill i on f or turkeys compared with $474.9 million and $36.3 million, r espectivel y, a
earlier.
NUMBER ON FARMS AND RANCHES JANUARY 1
- - - -- - - - - - - - - - - - - - - -U-NI-TE-D-ST-AT-ES- - - - - - - - - - - - - - - - 1967
Class of live stock
Average
as %~
------~gd p~ltrv______:__.1961-i__:____ 1965
1966___;___ 1921__.:..__1926
~QOO~
~~~~~
Cattle
103, 892 109,000
108, 862
108,491
100
Hogs
55,544
50,792
47 ,414
51,035
108
All sheep
29,023
25,127
24,734
23,727
96
Ch i c k e ns
379,086 394,118
393,019
427,619
109
Tur_k_ey_s------------=---~~-___&.:l:OO_ __h2Q5_ _ ___,7~.:iliQ_---.106
VALUE OF LIVESTCCK AND POULTRY JANUARY 1. UNITED STATES
- - - c ia:;;c;:fli~stoc~-----xwage-
------
----~--Eul!:rv_ _ _ __:___196~:6.5_
1965
1966
1.ooo dorrars-----
Ca t t l e Hog s
:!:~~
13,601,131 1,447,672
12,359,756 1,243,712
14,442,853 2,143,507
All Sheep
417,165
401,044
490 , 686
Aggregate livestock
15,465' 968
14,004,512
17,077,046
16 ,151,486 1, 719 ,57)
469' 63~
18,340,696
Chickens Turkeys
446,793 27,844
461,515 26,813
474,876 36,303
511,798 36,351
Aggregat e livestock and
- -.- _-..E1!1try_ _ _
15.940.605
14.49~840
17.588. 222___1.:.888.851
ARCHIE LANGLEY Agricultural Statistician In Charge
ROBERT L. SANDI FER Agricultural Statistici
After Five Days Return to
United State s Department of Agriculture
Statistical Reporting Servic e
315 Hoke Smith Annex Athens, Ge orgia 30601
Q;[FICJ!b ~__,
Postage and Fee s Paid U. S. Department of Agricult
,f"
GE ORG IA CROP REPORTIN G SERVICE
ATHENS, GEORG IA
February 23, 196 7
GEORGIA CHI CK HATCHERY REPOR T
Placement of broiler chicks in Geor gia during the week ended Febr uary 18 was 9, 393, 000- -4 p e rc e nt mor e than in the previ ous week and 4 p ercent more than in the
comparable week last year, acc ording to th e Georgia Crop Re po rting Se rvice .
An e stimated 13, 221, 000 broiler type eggs were set by G eorgia hatcheries- -
2percent more than in the previous week and 7 percent more than in the comparabl e week a year earlier.
The majority of the prices p aid to G e orgia producer s for broiler hatching eggs
were r eported within a rang e of 50 t o 65 c ents p er doz en . The a verage price of hatching eggs was 60 c ents p er dozen . The pric e of eggs from floc ks wi t h hatchery
owned cockerels generally was 2 cents below the average p rice. Most pr i ces received
for broiler chicks by Georgia hatcher ie s were re po rted within a rang e of $ 7. 00 t o 10.00 with an average of $8 .7 5 per hundred. The average pric es las t y e a r were 67 cents for egg s and $ 10.2 5 for chicks.
GEORGIA EGGS SET
AND CHICK PLACE MENTS
1966
Thou.
837 975 941 1, 0 51 895
1967
Thou.
o/o of
year a o
Pet.
l, 194
143
1,241 1/ 127
1, 365
145
1,245
118
1,358
152
1966
Thou.
598 570 699 699 766
1967
Thou.
619 760 872 919 993
o/o of year
0
Pet.
104 133 125 13 1 130
Eggs Set!:_/
1965
1966
Thou.
1966
1967
Thou.
o/o of
year
0
Pet.
Chicks Placed for Broilers in Geor
196 5 1966
1966 1967
o/o of
year
Thou.
Thou. Pet.
Av. Price
Hatch
B r oiler
Eggs
Chicks
Per
Per
Doz.
Hundred
1966-67 1966-67
Cents
Dollars
17
11, 697 11,908 102
8, 602
8, 417
98
62
24
11,642 11,835 102
8, 323
8,435 10 l
62
31
ll, 421 ll, 615 102
8,323
8, 546 103
60
7
11,364 12,359 109
8~ 585
8~ 891 104
60
14
11,996 12,392 103
8, 614 8, 78 3 102
60
21
12,208 12, 562 103
8, 531
8, 843 104
60
28
12,392 12, 892 104
8, 664
8,929 103
60
4
12, 43 2 13, 096 105
8, 897
8,909 100
60
11
12,298 12, 9_71 105
9, 102 9,063 100
60
18
12 302 13, 221 107
9 049
9 393 104
60
9.25 9.25 8. 75 8.75 8.75 8.75 8. 75 8.75 8.75 8.75
2/ Includes egg s set by hatcheries producing c hicks for hatchery supply flocks.
al Statistician In Charge
W. A . WAGNE R Agricultural Statis tician
S. Department of Agricultu r e
Agricultural E xtension Service
stical Reporting Service
State Department of Ag riculture
315 Hoke Smith Annex, Athens, G e orgia
STATE
Feb. 4
THOUSANDS
Feb. 18
% of
year
0 1/
Feb.
4
ll
Feb. 18
THOUSANDS
Maine Connecticut Pennsylvania Indiana Missouri Delaware Maryland Virginia West Virginia North Carolina South Carolina
2,004 242
l, 204 685
598 2,732 4,461 l, 570
153 7, 149
417
2,044 361
l, 403 710 701
2,884 4,399 1,606
155 7,207
419
l, 972
99
258 74
l , 464 126
721 101
672 90
2,806 109
4,605 109
l, 603 106
142 115
7,630 117
469 113
l, 525 193 795 291 390
2,672
3, 135
835 261 4,988 341
1, 558 172 857 337 459
2, 731 3, 216
873 352 5,067 434
1, 505 147
1, 002 346 435
2,862 3,023
926 317 5, 351 379
GEORGIA
13, 096 12,971 13,221 107
8, 909
9,063
9,393
Florida Tennessee Alabama Mississippi Arkansas Louisiana Texas Washington Oregon California
TOTAL 1967
{22 States)
633 980 8, 271
4,691
9,937 l, 097 4,431
675 438 l, 895
605 964 8,762 4,784 10, 168 1,094 4, 555 629 380 1,794
577 158 963 84 9,093 109 4, 879 105 10, 172 112 l, 140 109 4,743 128 642 89 382 96 2 076 114
67' 3 59 68,595 70,230 110
467 901 6,480 3, 881 7,055
803
3. 189 434 300
1,392
49.237
429 943 6,645 3,781 7,201 833 3,295 455 419 1, 466
50, 586
413 1, 059 6, 621 3,814 7,456
797 3,408
529 265 1
51, 487
TOTAL 1966*
{22 States)
64,384 63, 186 63,914
8,230 48,908 49,509
ofLastYear
105
109
110
*1/ Current week as percent of same week last year. Revised.
102
103
104
% of
year
0 1/
100 65 128 73 92 112 94 107 94 103 107
104
134 107 101 102 105 117 120 116 76 103 104
I
.
~
GEORGIA C R 0 P REPORT I NG S ERVICE
ru! ~ UJffi[b~ [p@l]J[b GJ ffi~ 0~ ~ill m~
ATHEN S, GEORGI A
F e bruary 23 , 1967
JANUARY 19 67
an .
Item
1966 1I
19 67 2 /
ou.
Thou.
Broiler T~pe
Pullets Pla c e d (U. S .) 3 /
Total
3,076
3,028 98
39,61 7
45,216 114
Domesti c
2,623
2,6 07 99
33 , 892
39 , 7 12 117
Chickens Teste d:
Broiler Type
Geor gia
548
586 107
6, 167
6, 971 113
United State s
2,3 99
3 , 0 85 12 9
26 ,080
28, 120 10 8
Egg Type
Geor gia
38
62 163
3 24
380 11 7
United State s
1,072
1, 192 11 1
7, 63 7
7,527
99
Chicks Hatche d:
Broile r Type
Georgia
40,860
42, 397 104 4 55,338
519, 166 114
United States
218, 156
221, 4 84 10 2 2, 51 3, 881 2,739 ,052 109
Egg Type
Georgia
2,402
2,91 8 121
26, 7 15
37 ,933 142
Unite d States
36,904
40, 579 110
488,9 65
574, 796 118
Commercial Slau hter:4/
Georgia United States Hens and Cocks Georgia United States
28,498 163,925
1' 116 12,478
MIL. 341 965
5 506
32,283 113
360,448
393,855 109
187, 89 8 115 2, 05 9, 867 2, 235, 661 109
1, 414 127 16,718 134
MIL. 4 11
1, 099 5 91 6
10, 207 13 4 , 574
MIL. 3, 546 10, 58 8 64 ,588
10 , 389 102 148,24 8 11 0
MIL. 3,825 11, 156 64 , 564
YOUNG CHICKENS: SLAUGHTERED UNDER FEDERAL INSPECTION BY SELECTED STATES 1965 and 1966
State
c.
hou.
ct.
ct.
Maine 5, 474
5, 639
65,694
69, 801 2.8
3.6
2. 5
3.3
6, 567
7, 132
84, 274
87,322 4 .5
4 .9
3.3
4. 1
2,988
3,052
37,457
36, 175 3.6
6. 8
2. 9
5.2
7, 37 5
7,895
89,654
92, 6 83 4 .0
4 .7
3. 1
4 .3
10, 181 12, 557 120,995 14 0, 147 4 .3
5.0
3. 4
4. 3
3,350
3,657
44,321
42, 867 3.3
4. 3
3.2
3. 3
17, 569 19,214 225, 199 252, 172 3. 5
5.0
2.5
3.9
26, 744 29,900 346,626 378,765 3. 1
5. 4
2. 6
3. 7
4,82.3 4,971
55,965
61, 676 3. 2
8.7
2. 2
3.6
18,254 20,924 224 ,401 252,9 33 3 . 1
5. 1
2. 4
3.2
11,009 13,956 152,428 160,318 3. 3
4. 1
2.5
3.2
23, 75 2 27,093 290,626 319,726 3. 7
5. 4
2.8
3. 9
--1-0-,1-1-2-----1-1-,-6-9-6-- ---1-1-7-,6-3-7------1-3-1-, 6-7--5 -3--.6------ --4-.-0------2-. -8---- ---3-.-4-----
164, 758
2,057 ,639
3. 5
5.0
2.7
3. 7
185 42 8
Georgia Crop Repo rting Service, USD A, 315 Hoke Smith Annex, Athens , G e orgia,
cooperation with th e Cooperative :S xtension Se r vice , Universi t y of G e orgia an d th e
Department of Ag r iculture.
E nd-of-Month Stocks of Poultry, Poultry Products, Meat and Meat Products United States - January, 1967
Shell e gg s : Inc r e ase d by 36 thousand cases; January 1966 change was a de crease of 9 t hous and cases; average J a nuary change is an increase of l thousand cases. Frozen egg s: Incr eased by 6 million pounds; Januar y 1966 change was a decr e ase of 13 million pounds; a ve r age January change is a de cr e ase of 10 million pounds. Frozen poultr y: Decreased by 6 million pounds; January 1966 decr ea s e was 30 m illion pounds; ave rag e January d ec r ease is 10 million pounds. Beef: Incr eas e d by 16 million po unds; Januar y 1966 change was a de crease of 8 million pounds; average J anuar y change is a decre ase of 13 million pounds. Pork: Incr e as e d by 21 million po unds; January 19 66 increas e was 4 million pounds; a verage January increase is 28 million pounds. Other Meats: Increased by 8 million pounds; January 1966 increas e was 2 million pounds . Ave rage Janua ry incre as e is 3 million pounds.
Commodity
Unit
Jan. 1961-65 av.
Jan. 1966
Dec. 1966
Jan. 19 67
E ggs:
!
Thou.
Thou.
Thou.
Thou.
Shell
Case
73
76
27
63
Frozen eggs, total
Pound
49,661
37,976
36,2 2 8
36,927
Total eggs ];_/
Case -----l-,-3-3-0---------1-,-0-3-7------ -----9-4-4------ --9-9-8- --
Poultry, fr ozen Broile rs or fryers
I Pound
27,443
21,469
42,07 5
44, 178
Hens, fowls
do.
58,956
33,599
53, 466
55, 137
Turkeys
do.
206,689
182,412
267,10 1 269,731
Other & Unclassifie d
do.
54,710
47, 896
73, 431
60, 569
Total Poultry
do. ---3-4-7-,-7-9-8-------2-8-5-,-3-7-6-------4-3-6-,0-7-3-----4--2-9-,-6-1-5--
Beef: Frozen in Cure
and Cured
do.
216, 535
251,639
306, 558 322, 559
Pork: Frozen in Cure
and Cured
do.
260, 157
155,437
234 , 233 254,768
Other meat and meat
products
do.
95,238
75,033
80, 694
88,974
Total all red meats
do.
'
571,930
482, 109
621,485
MID-MONTH PRICES RECEIVED AND PRICES PAID
666,301
Georgia
United States
Item
Jan. 15 Dec. 15 Jan. 15 Jan. 15 Dec. 15 Jan. 15
1966
1966
1967
1966
1966
1967
Cents
Cents
Cents
Cents Cents
Cents
Prices Received:
Chickens, lb. excluding
broilers
13.5
ll.O
10.0
9.9
9.2
9. 1
Com'lBroilers (lb.) All Chickens (lb.)
15.5 15.4
ll.O ll.O
12.5 12.3
16.4 15.6
ll. 9 ll. 6
13.9 13. 3
All Eggs, (dozens)
45.9
48.0
43. l
37. 5 40.9
37.4
Prices Paid: (per 100 lb.
Dol.
Dol.
Dol.
Dol.
Dol.
Dol.
Broiler Grower
4. 90
5. 40
5. 30
4. 80
5. ll
5. 14
Laying Feed
4. 7 5
5. 10
5. 10
4. 45
4.70
4 . 73
Scratch Grains
4. 20
4. 45
4. 50
3. 90
4.09
4 . 12
1/ Frozen e ggs converted on the basis of 39. 5 pounds to the case,
******************************************* * * * **
This report is made possible through the cooperation of the National Poultry Improveme
Plan, Official State Agencies, the Animal Husbandry Research Division of the Agricu1tu
Research Service, the Inspection Branch of the Poultry Division, Consumer and Marketi
Service and the Agricultural E stimates Division of the Statistical Repor ting Servic e and
many breeders, hatcheries, poultry processors and the poultry farm ers that r e port to
these ag encies.
ARCHIE LANGLEY
W. A . WAGNER
Agricultural Statistician In Charge
Agricultural Statist ician
After Five Days Return to:
Post age and F e es Paid
United States Department of Agriculture
U. S. Department of Ag riculture
Statistical Reporting Se rvice
315 Hoke Smith Annex
Athens, Georgia
OFFICIAL BUSINESS
GEORGIA CROP REPORTIN G S ERVIC E
ATHENS, GEORG I A
- ____ January 1967 Released 2/24/67
, - -special-in this issue --,
t MILK CONS AND MI LK PRODUCTION r ____B~~.?:~~9..:._1962 -1966------
Total milk production on Georgia farms during January 1967 is estimated at 86 million , according to the Georgia Crop Reporting Service. This was 2 million pounds above
on during the same month a year ago but 1 million pounds below the December 1966 Milk per cow for the month was placed at 590 pounds - 40 pounds above January 1966 and pounds above the 1961-65 average of 439 pounds .
MILK
_______ _ Q~rgi:~--------=______.J!E.?:~~ St at e~------
Item and Unit
Jan.
Dec.
Jan. : Jan.
De c .
Jan .
9, . . ~-=--~--:----~-~~-----
.;.--
19
1
-'"~----- -'"'"-:':
7 -
-
-
-
-
-
-1-9-687 6
--:
9
,1"986o65
__ ___19)66l l - - - 9 ; 18956 75 --
550
590
590
678
687
715
152
147
146 14,464 13, 836
cwt.
6. 30 2/6.55
6. 30
6. 55
3.80
4. 45
- 1!:/ 6. 70- :
4.54 4. 95
: 3. 61
11 5. 30
5. 68 4.31
w 5 . 15
170. 00 200. 00
200 . 00 221. 00 257 . 00 256. 00
28. 00 27.50
28. 50 24 .40
2) . 10
25.50
Percent Protein, cwt . 21
3. 85
3. 90
Percent Protein, cwt.
3. 90
4. 20
Percent Protein, cwt.
4.15
4.50
Percent Protein, cwt .
4.20
4.55
Under
4. 00 '3/3 .46
3. 66
3. 68
4.25 l/3 . 75
4. 04
4. 09
4.50 ~/3 . 88
4.21
4. 23
4.60 }/4.02
4.44
4.46
Average. 2/ Dollars per for month.-}/ Revised.
uni
k/
t as of the Preliminary.
152th1
of U.
month except wholesale milk which S. price is for under 16 percent.
Number
218 217 216 215
209 209
213
208 207 207 206
200 199
204
198 198 197 196
189 188
193
I 187 186 185 184
177 176
182
175 174 173 172
165 164
170
163 162 161 160
153 152
158
152 152 151 151 150 150 149 149 148 148 147 147
1)0
Milk production per cow (pounds) 2/
390 365 380 410 415 390- 385 400 410 415 - 410 415
4,790
415 385 440 440 450 420 '420 425 430 425 405 415
5, 070
415 390 450 460 460 425 425 440 430 430 415 435
5,180
425 385 435 475 480 455 465 445 440 450 435 435
5,310
440 430 480 485 490 465 480 480 460 455 460 490
5,600
500 475 530 545 540 515 530 535 520 530 520 555
6,270
550 490 560 575 580 540 545 550 560 575 570 590
6,670
T-soatal
milk 89
production (million pounds) 83 82 ---85 87_---s?__
2/ 86
87
1,020
91 92 86 86 86 87 85 ..~1 - 83
1,034
90 90 82 82
87 88 83 84 83 84 79 81
84 82 80 79 81 77
82 _J. B,. 82
80 77 77 76 ; 76... 80
. 1,000 ~ 966 952
87 86 81 83 83 81 82 80 84 "''"'' 991
8
8
81
81 82 81 on farms dur ing
- 8S
year.
-
-8h-
-
-
8-7 -
-
-
-
---]-,0-00---
-
-
, USDA, 3l5Hoke-SmithAnne~:-Athens, Georgia:inc o;pe:;a-- -
Universi ty of Georgia and the Georgia Department
UNITED STATES MI LK PRODUCTION
January 1967 milk production in the United States i s estimated at 9,855 million pounds,
half of 1 percent more than the 9,805 million pounds produced a year earlier. This is the s consecutive month that milk production was higher than the corresponding month a year earlier Average daily production was up 4 per cent from December 1966. Production averaged 1.60 pound per person per day in January compared wi th 1.61 a ye ar earl i er .
Milk Cows and Milk Production by Months, United State s, average 1960- 64, 1965, and 1966(Revised)
Month --Mi-lk--co-w.-s -on farms -11--: --M-il-k-.-pe-r-c-ow-: -?-} ----: -----M..--ilk--p-ro-duc: t-ion ?J :Ch
: Average : 1965 : 1966 :Average : 1965 : 1966 :Average : 1965
1966
------------ _____.:.._1.2.Q:64_.:.._ _ _.:.._____.:_1 _ 960_:.~.:._ ___:.______:19Q.:4 :
Th ousands
Pounds
lViillion Pounds
January
16,920 15,349 14, 464 597 684 678 10,099 10,494 9,805
February 16,881 15,290 14,393 573 641 635 9, 670 9,795 9,137
March
16, 842 15,226 14, 326 651 734 736 10 ,968 11, 177 10, 537
April
16,800 15,151 14,262
668
743
752 11,219 11,264 10,725
May
16,761 15, 078 14,188 736 802 812 12 ,337 12, 100 11,525
June
16,723 14,998 14,124 708 771 798 11 ,839 11,567 11,269
July
16,686 14,918 14,068
650
718
736 10, 852 10,704 10,350
August
16,649 14,839 14, 021 610 669 696 10,158 9,929 9,763
September 16,613 14,764 13,968
574
628
663
9,529 9,272 9,263
Oc t o b e r
16,577 14,689 13,923 582 636 670 9,652 9,343 9,333
November 16,541 14,606 13,878 : 561 618 649 : 9,276 9,029 9,012
December 16.5oh_.lk.:.,229___:J:1.816_:._ _297____21!__ 687_!___.2.:..u9_---2..tu99 _2.:.51L:
- . - Am.!__:.__;!;.!-101__1~. 9')4__14 . 121 : 7.509
~Excludes heifers not yet fresh.
a.1ou
:
8.513 : 12S. 447 12u.l7L1gQ.g3o --~
[/ Excludes milk sucked by calves .
~timate8-of:monthly milk-pr0duction ~milk cows on farms for 1960-66-save--T
r been r evised, where necessary, based on review of data from the 1964 Census r of Agriculture and other data which have become available since original es- t r timates were made. Revised estimates for 1965 and 1966 are shown above; ' similar data for 1960-64 are available gpon request.
ARCHIE LANGLEY Agricultural Statistician in Charge
R. L. SANDIFER Agricultural Statistici
After Five Days Return to United States Department of Agriculture
Statistical Reporting Servic e 315 Hoke Smith Annex
Athens, Georgia 30601 OFFICIAL BUSINESS
Postage and Fee s Paid U. S. Department of Agricult
CALF C?O J
tVI ~: ED ES-f r M!-\TES 196o-6~
2/27/67
The calf crop estimates for 1960 through 1964 have been revised in conjunction with the
r rev ision program for all cattle and calves. These revisions resulted from a review ~alysis of the 1964 Census of Agriculture and other data which have become available
the original estimates were made.
Included herein are revised estimates of calves born and cows 2 years old and older for breeds.
Data for 1965 and 1966 are published in the usual Annual Calf Crop Keport by the Georgia ~porting Service.
STATE
CALF CROP: NuMBER CALVES BORN , BY STATES , 1960- 64
- - - ---
1963
1964
96 53 245 88 13 82 1,212 117
918
97 53 250 87 12 80 1,204 114
941
94 52 244 85 11 78 1 ,2?3 114
947
882 718 1,158
709 2,272
876 721
1,158 719
2,272
880 713 1,160 719 2,309
1,568 1,742
1,654 848
1,424 1,689 1,395
1,599 1,755
1,683 886
1,452 1,714 1,492
1,618 1,777 1,740
910 1,485 1,746 1,620
27
26
26
232
234
230
633
652
670
255
255
258
390
398
399
233
233
240
612
646
~
-
947
1,000
1,059
881
920
963
761
754
780
925
939
959
644
642
681
843
870
904
1,461
1,518
1,603
4,078
4 ,137
4,386
1,081 539 509 810 564 297 317
225 473 624 1,524
1,107 553 512 816 586 317 305
226 5C8 630 1,529
1,115 583 525 848 622 332 320
242 526 668 1,530
39 ,355
40.114
41,375
3.5
3 .7
61
62
62
39 416
40
41 441
for cows 2 years old and older on fanns J anu ar y 1.
90 48 237 82 10 74 1,183 1C8 9?5
847 703 1,145 703 2,319
1, 636 1,810 1,798
963 1,539 1,802 1,655
24 225 675 252 396 256
1,117 1,003
802 1,011
720 901 1,702 4 ,517
1,190 595 560 892 646 337 319 234 535 688
1,526
42,201
3 .8
63
42 268
86 47 231 79 10 71 1,181 104 9 21
825 709 1,162 697 2,313
1,684 1,911 1,895 1,071 1,653 1,917 1,726
22 218 648 258 413 254
1,181 1,041
833 1,059
749 953 1,820 4,638
1, 266 626 595 916 663 352 325 246 542 724
1,597
43,739
4 .0
66
43 809
After Five Days Return to United States Department of Agriculture
Statistical Reporting Service 315 Hoke Smith Annex Athens, Georgia 30601
OFFICIA.L BUSJNE SS
Postage and Fees Paid
U. s . Department of Agriculture
Re l eased 2/28/67
. .:.~~ ~: \::: .:~~;* i~
r y
\ \II~~/il)i II ~'-'/f/1( 1;I ~~ '' II
I
I .
GEORGIA CROP REPORTING SERVICE
Calves born on Georgia farms during 1966 totaled 739,000 head--2 percent below the ,~born in 1965, but 13 percent above the 1960-64 averag e calf crop, according to the rgia Crop Reporting Service.
~e number of cows and heifers 2 years old and older on farms at the beginning of the year estimated at 935,000 head compared with 933,000 on January 1, 1965.
crop for the United States was 43 , 473,000 head compared with 43,928,000 for first decline in number of calves born from the previous year since 1958.
~e decrease in the 1966 calf crop was the result of fewer cows and heifers 2 years old older on farms January 1, 1966. There wer e 50,420,000 cows and heifers 2 years old and on farms January 1, 1966 compared with 51,219,000 a year earlier.
~e number of calves born in 1966 expressed as a percentage of cows and heifers 2 years ~d older on hand at the beginning of the year was 86 percent, the same as a year earlier. ~rcentage is not strictly a calving rate be cause the January l inventory of cows and ers 2 years old and older doe s not include all heifers that calve during the year and ine some cows that died or were slaughtered before calving.
In the ~~h C e ntr~ States, 9 State s had smaller calf crops than a year earlier, one had same number and 2 had more calves born. Michigan--down 7 percent--had the greatest percent-
Nebraska and South Dakota each showed a 1-percent increase.
Of the 8 South Atlantic States, 7 had smaller calf crops and l was larger. In the South
al region 4 States had smaller calf crops than a year earlier and 4 States showed an
ase over the previous year. Texas, the largest cattle State in the Nation, had a 1-per-
In the 11 We stern States, 6 had smaller calf crops and 5 were larger than in 1965. ado with 4 percent more calves than a year earlier had the greatest percentage increase. a was down the most with a 5-percent decrease.
The 1966 calf crop was smaller in all Not!:h_!!lantic States with the decline ranging from
10 percent below a year earlier.
,-------------
-,
The calf crop estimates for 1960 through 1964 have been revised in conjunction with the 5-year r evision program for all cattle and calves. ' Revised estimates by States for the years 1960-64 are shown in the r eport, 11 Calf Crop, Revised Estimate s 1960-6411 , issued by the Georgia Crop Re porting Service, February 27 , 1967.
ARCHIE LANGLEY ultural Statistician I n Charge
-------------------------------
R. 1. SANDIFER Agricultural Statistician
----------------
~orgia Crop Re porting Servic e , USDA, 315 Hoke Smith Annex, Athens, Georgia, in cooperawith the Cooperative Ext ensi on Servic e , University of Georgia and the Georgia De partment iculture.
------------~--------------------~C~~~l~f~C~ro~p~~~l~9~6~5 and 1966, by States : Calve s born a s
Cows an d he ifer s
:percent of c ows
St ~ te
2 yrs. & older
: and he ifers 2 +
5-year
Janu-a-ry--1----------------J-anuary 1 ;!._/
average
1965
1966
1965
1966
Ca l ve s born
s:ye~a~r~--------------------:-19~
average
1 9 65
1956 : %o
1960-1964
19 60-19 64
t 19B
1 , 000 head
Pe r c e n t
-- ----T, ooohead
Perc
Ma ine N. H.
Vt. Mass . R. I. Conn.
N y
N J
Pa .
112 59 286
102 14 95
1 , 419
139 1,075
99 53 27 0 93 13
87 1 ,365
120 1, 033
92
81
80
50
85
83
249
80
82
88
80
78
12
75
75
84
82
80
1 ,311
84
83
113
79
81
988
86
86
93 51 241 84 11
77 1,201
111 930
80 45 21 6 74 10
71 1 ,147
95 888
74 42 204 69
9
67 l,C88
92 850
Ohie
Ind. Ill.
Mich. Wi s .
l,OG9 815
1,314
817 2,535
934 8 C8 1,286 789 2 ,561
890
86
86
773
88
87
1,248
88
87
750
85
83
2,449
87
88
862
713 1 ,157
709 2,297
803 711 1,132
671 2,228
765 673 l,C86 622 2,155
Minn. Iowa Mo. N. Dak .
s. Dak.
Ne b r .
Kans .
1,809 1,964 1 , 948 1,016
1,624
1,938 1,744
1,870 2 , 114 2,163 1, 215
1,899 2 ,133 1,891
1,776
86
85
2,044
91
93
2,115
89
91
1,207
89
88
1,830
89
93
2,149
91
90
1,906
92
88
1,621 1,799 1,754
936 1,511
1,774 1,578
1,6C8 1,924 1,925
l,C81 1,690 1,932 1,740
1,510 I g
1,901
g
1,925
1
1,062
g
1,702
1
1,943
1
1, 677
9
Del.
Md .
wV<..
Va
.
N . C.
s. c.
Ga .
rra ~
32
25
24
79
77
25
20
18
9
274
252
248
85
85
228
214
211
9
779
756
735
83
83
656
627
610
9
299
292
282
86
85
256
251
240
g
512
523
530
80
81
399
418
429
lC
306
319
321
84
82
243
268
263
g
802 992
933
- =rs 935 :
- r-;-c89-:-
81 - - .7i49 :I ---6-59575 --
756 813
--873~069,__.I:---_,_!
Ky . Tenn. Ala . Miss.
Ark .
La . Okla . Texa s
1,183
1,108 965
1,290 834
1,144
1,885 5,235
1 ,3 29
1, 257 1 , 048 1, 41 0
937 1, 216
2,167 5,692
1, 292
88
91
1, 274
86
84
1 , 042
80
80
1 ,439
77
81
925
79
83
1,184
78
78
2,173
87
86
5,589
82
84
1 , 061 962 786 981
~87
894 1,621 4,351
1,170 l,C81
838 l,C86
740 948 1,885 4,667
1,175
1(
1,070
9
834
1
1,166
1
7 68
1
924
1,869
4,695
Mont. Idaho Wyo . Colo. N. Mex . .Ar i z .
Utah
Nev.
Wash. Oreg. Calif .
1,262 642 611
953 725 414 366
292
578 759 1,754
1,479
712 688 1,025
750 444 390 328
612
835 1,814
1,511
90
91
699
89
90
719
91
89
1,043
91
93
750
84
86
417
77
83
395
90
88
320
79
77
585
87
89
813
88
89
1,853
90
87
1,152 579 540 856 616
327
317 235 517 667 1,541
1,331 634 626 933 630
342
351 259
532 735 1,627
1,375 629 640 970
645 346
348 246 521
724 1,617
48 States
47,830
51,113
50,311
86
86
41,357
43,8~5~3~--~4~3~~39~5~~~~
Al a ska Hawa ii
4.6
4.6
89
87
90
101
105
70
70
4.1
4.0:
63
71
74
United
States
51,219
50 ,420
86
86
43,928
43 ,473
~a calving rate. Figure represents calves born expr essed as percentage of the number of 0011
- and heifers 2 years old and over on f arms and r anches January 1.
Aft er Five Days Re turn to Unit ed St ate s Department o f Agriculture
Statistical reporting Service 315 Hoke ~mith Annex Athen s, Georgi~ 30601 OFFIC I!.L BUSINESS
Postag e and Fee s Pa id U. S. Depa rtment of Agr icult~
r
~0 /
~
GEORGI A CROP REPORTING SERVICE
~w~~rnL!Jw rnm~rn~mw (.
ATHENS, GEORG IA
March l, 1967
GEORGIA CHICK HATCHE RY RE POR T
Placement of broiler chicks in Georgia during the week ended February 25 was 9,421, 000 -- slightly more than in the p revious week and 6 p er cent more than in the comparable week last year, according to the G e orgia Crop Reporting Service.
An estimated 13, 346, 000 broiler type e ggs were set by Georgia hatcheries -1percent more than in the previ ous week and 6 p ercent more than in the comparable
week a year earlier.
The majority of the prices paid to Georgia producers for broiler hatching eggs
were report ed within a range of 50 to 65 cents per doz en. The average price of hatch-
~
ing eggs was 60 cents p e r doz en. The pric e of eggs from flocks with hatchery owned
cockerels gene rall y was 2 cents below th e av::! r age pric e . Most prices received for
broiler chicks by G e orgia hatcheries were repo rted within a range of $ 7.00 to $10 .00
with an averag e of $8 .75 p e r hundred . The ave rage pric es last year were 67 cents
!oreggs and $ 10. 25 for chicks.
;,
GE ORGIA E GGS SET, HATCHINGS , AND CHICK PLACEM:SNTS EGG TYPE
.l
'
Week Ended
Eggs Set
j
Chicks Hatched
1
I '1o of
i '1o of
1966
I I 1967
y e ar
ago l
1966
1967
i
I
year
I ago
Thou.
Thou.
Pet.
Thou.
Thou.
Pet.
Jan. 28
Feb. 4 Feb. 11 Feb. 18 Feb. 25
975 941 l, 051 895 945
1, 241
127
l, 36 5
14 5
l, 245
118
l, 3 58
152
1,328
14 1
570
760
133
699
872
125
699
919
131
766
993
130
706
l, 082 I 153
Wee k Ended
BROILER TYPE
Av. Price
B ggs Set]._/
Chicks Placed for
Hatch
Broiler
I
Broilers in Georgia
Eggs
Chicks
1-9-65
1966
1-9-66
1967
'1o Of
year ago
1965
--
1966
1966
--
1967
o/o of Per
year Doz.
ago I 1966-67
Per Hundred 1966-67
Thou.
Thou.
Pet.
Thou.
Thou. Pet. Cents
Dollars
'
I
Dec. 24
11,642 11' 83 5
102
8, 323
8,435 101
62
9. 25
I,
Dec. 31
11,421 11,615
102
8,323
8, 546 103
60
8, 7 5
Jan. 7
11,364 12,359
109
8, 585
8, 891 104
60
8.75
Jan. lei
11, 996 12,392
103
8, 614
8, 783 102
60
8.75
Jan. 21
12,208 12, 562
103
8, 531
8, 843 104
60
8.75
Jan. 28
12,392 12,892
104
8,664
8,929 103
60
8.75
Feb. 4
12, 432 13,096
105
8, 897
8,909 100
60
8.75
Feb. 11
12, 298 12,971
105
9, 102
9,063 100
60
8.75
Feb. 18
12,302 13, 221
107
9, 049
9,393 104
60
8.75
Feb. 25
12,616 13,346
106
8, 916
9,421 106
60
8.75
!I Includes eggs s et by hatcherie s producing chicks for hatche ry supply flocks.
l :o<
ARCHIE LANGLEY
W . A . V\ AGNER
Agricultural
------ ----
Statisti
---- - - -
cian
- - --
In
--
Charge
-------
-
-
-
-
-
-
-
--
-
-
-
-
-
-
Agricultural
---- - ---- ---
Statist
--- ---
ician
-----
-
-
-
-
-
-
-
-
-
-
-
-
U, S. Departm e nt of Agricultur e
Agricultural Ext en sion Service
Statistical Reporting Service
State Department of Agriculture
315 Hoke Smith Annex, Athens, G e orgia
ECiCiS S E T . A N D G.fci:IGI<S F"L...AGED I N GC>~~E.RGI.AL.. .ARE.A.S B Y "W . ..:#EI<S - 1 9 6 7
EGGS SET
CHICKS PLACED
P'a._g_e Z.
STATE
Week Ended
Feb.
Feb.
11
18
Feb. 25
I u/o of
year
Feb.
ago 1/ 11
I Week Ended Feb.
Fe~-f
u/o of year
18
25
ago 1/
THOUSANDS
THOUSANDS
Maine Connecticut Pennsylvania Indiana Missouri Delaware Maryland Virginia West Virginia North Carolina South Carolina
GEORGIA
Florida Tennessee Alabama Mississippi Arkansas Louisiana Texas Washington Oregon California TOTAL 1967
{22 States)
2,044 361
1, 403 710 701
2,684 4,399 l, 606
155 7, 207
419
l, 972 258
l, 464 721 672
2,806 4,605 1, 603
142 7,630
469
2,089 108
243
63
l, 480 116
713
90
648
83
2,975 115
4,527 103
1, 760 109
134 89
7, 387 111
456 114
l, 558
l, 505
l, 560
108
172
147
152
58
857
1, 002
775
93
337
346
323
71
459
435
428
124
2, 731
2, 862
2, 761
122
3, 216
3,023
3, 316
102
873
926
921
100
352
317
247
58
5,067
5, 351
5, 408
108
434
379
381
96
12, 971 13,221 13,346 106
9,063
9,393
9,421
106
605
577
892 219
429
413
454
143
964
963
950
85
943
1, 059
1, 098
108
8, 762
9,093
9,462 110
6,645
6,621
6,707
103
4,784
4,879
4,938 104
3,781
3, 814
3, 951
108
10, 168 10, 172 10, 3 72 114
7,201
7, 456
7, 377
105
1,094
l, 140
l, 187 116
833
797
811
112
4,555
4,743
4, 736 126
3,295
3,408
3, 506
132
629
642
795 116
455
529
499
111
380
382
376 102
419
265
362
100
1,794
2,076
2, 189 104
1, 466
l, 439
1, 372
101
68,595 70,230 71,655 109
50, 586 51, 487 51, 830
106
TOTAL 1966* {22 States)
63, 186 63,914 65, 516
48,908 49,509 48,676
o/o of Last Year
109
110
109
*1/ Current week as percent of same week last year. Revised.
103
104
106
7
AMJ C?OJ
tVISED E ~~TI/\1\ AT E S 196o -.64
3/1/67
GEORGIA CROP REPORTING SERVICE
The lamb crop estimates for 1960 through 1964 have been revised in conjunction with the r revision program for all sheep and lambs. These revisions resulted from a review and is of the 1964 Census of Agriculture and other data which have become available since original estimates were made.
Included herein are revised estimates of lambs born and ewes 1 year old and older.
Data for .1965 and 1966 are pub! ished in the usual Annual Lamb Crop Report by the Georgia Reporting Service.
state
' s
s
1.'-: ::3 CROP:
l9b0
26 5.2 9.0 8.0 2.0
s.o
119 12
161
NUMBER LAHE S S..~VE D, BY STATES, 1960-64
s sa
~-- -
- ---
---1-9-6-2r,cfo6Te-ad_--:_ r9b_ .:l ____
25 4.1 7.0 7.0 1.8 4.6
110 11
156
25
4.7 6.7
7.8 1.6
4.8
1C8 9.2
154
25 4.2 6.2
7.4 1.5 4.6
99
8.2 139
_____ .LYM
23 4.1 5.7 7.4 2.0 4.5 102 7.5 137
703
655
612
589
535
358
356
347
292
258
469
458
451
381
356
258
238
244
214
216
185
187
169
165
147
709 943 . 548 534
1,257 297
371
750 933 486
535 1,309
313 411
706 875 446
512 1,231
301 410
632 782 352
476 1,212
268 4(J7
564
750 320 418 1,105
243 369
4.5 30 272 240 41
5.8
4.
3.3 28 271 236 43
5.8 11
4 .2
3.0 23 25 3 219 40 5.1 10
3.6
2.8 22 232 209 32
4.0 8.2
4.7
2.1 21 219 187 25 3 .4
5.6
4.0
47 6 185
22 35 31 41 1 61
3~ 075
416 1 69
19 34 30
43. 158 3,116
323 140
14
24
24
35 132 2,963
249 122
10 21 19 29
128 2,745
206 88
7.7 18 15 24 113 2,580
1, 225
1,010 1,560
1,212
690 286
927 233 262
685 1 ., 303
1,201
999 1,512 1,164
755 278
89 9 215 254
692 1, 263
1,092 927 .
1,448 1,164
703 278 901 217 246 630 1,263
1,060 889
1,470 1,128
7CJ7 298 872 204 215 603 1,162
1, 037
7 61 1,355
974 606
287 8 01 196 190
55 0 1 ,139
21,01 2
20,777
19 ,7 C6
18,511
16,989
5.0
5 .0
5.0
5. 0
18 516
16 ,994
STATE
Maine New Hampshire Vermont Ma ssa c husetts Rhode Island Connect icut New York New J ersey Pe n n s y l v a n i a
Ohio Indiana illinois Michigan Wisc onsin
Minnesota Iowa Missouri No rth Dakota South Dakota Nebraska Kan sas
Delaware Ma r y l a n d Virginia VTe st Virginia North Carol ina South Carolina Geo r,r:ria Fler ida
Kentucky Tenne ssee A l a b ama Mi s s i s s ip p i Arkansas Louisia na Oklahcma Texa s
Mo ntana Idaho Wyoming Co l o r a do New Mexico Arizona Utah Nevada Washington Oregon Cal ifornia
48 St ates
Alaska Hawai i
United States
NUMBER OF Eii!E S 1 YE.ltR OLD AND OLDER Jill-TUARY 1, BY STATES , 1960- 64
: :
Ewes 1 year old and older January 1
: : :
1960
: :
1961
: :
1962
:
'
1963
: :
:
1,000 head
:
26
24
c4
25
:
5.0
s.o
5.0
4.5
s
9
8
7
7
:
8
8
8
8
: :
s2 .. o0
1.7
s.o
1.7
1.7
5.0
5.3
:
116
102
99
94
:
11
11
10
9
:
1 69
162
156
144
:
I
757
689
641
590
:
350
343
333
281
:
437
437
415
361
:
258
237
232
209
:
165
163
160
152
:
I
614
651
638
564
:
922
894
858
757
:
540
497
437
358
:
480
490
470
442
:
1,207
1,286
1,191
1 ,154
:
29 5
295
283
255
:
422
447
447
420
:
:
4.0
3.1
3 .0
2.5
:
30
27
23
21
:
257
249
232
211
:
227
222
204
192
:
42
42
37
30
:
8.0
7.0
6.4
4.5
:
19
15
12
10
s
s.o
5.2
4.9
5.3
s
:
420
361
303
236
I
199
168
150
123
:
25
21
14
12
I
49
40
29
30
:
35
32
25
19
:
65
57
47
43
:
166
163
134
125
:
3 ,942
4,100
4 ,059
3,978
:
:
1 ,331
1,291
1,162
1,116
:
902
884
813
780
I
1,773
1,738
1,703
1,652
:
1,200
1 ,164
1 ,141
1,095
:
874
914
890
867
:
347
342
331
349
I
1,065
1,033
1,012
1,002
:
274
247
249
232
I
234
225
216
190
I
699
699
636
591
:
1,416
1,388
1,388
1,263
:
:
22,406
22,193
21,245
20,021
:
: :
------
6
---
- -7
- -7
:
'
22,406
22,199
21,252
20,028
1964
22 4.2 6 .1 8 1.8 4 .5 93
8
132
543 247 329 199 138
497 727 329 398 1,061 237 374
2. 0 19 192 173 24
4.0 7 5.2
194 91 9 22 1.5 36
111 3,7:<9
1,127 686
1,652 964 816 351 942 22 0 167 550
1- ,-238-'"-
18,715
--8
18 ,723
ARCHIE Lilli! GLEY Agricul tura l St a tisticia n In Charge
R L. SAN DIFER Agricultural Statistician
The Georgia Crop Reporting Servic e , USDA, 315 Hoke Smith Ann ex, Athen s, Ge orgia, in cooperation with the Coo ~t~v~ ~x!e ~s~o ~ eE_v~c~ ,_Ui:y:eE_s~ty ~f_G~oE_g~a_ad_t~e_G~o E_g~a_D~~r,!.m~n ! ~f_Ag_r,icl!_l!UE_e_ _ _ _ _ _ _ _ _ _
After Five Days Return to
United States Department of Agriculture
Stat istical Reporting Service 315 Hoke Smith Annex Athens , Geo rgia 30601 OFFICIAL BUSINESS
Postage and Fees Paid U. S. Department of Agricul
l9t (.
--- ...--{)
r ,_
\
l
Released by GEORGIA
CKOP REPORTI NG SERVICE
March 3, 1967
GEORGIA 1 S LAMB CROP DOWN 700 HEAD
~orgia 1 s 1966 lamb crop is estimate d at 3,300 head -- 700 below the previous year rply below the 1960-64 average of 10,000 lambs,
The number of breed i ng ewes 1 year and older on farms January 1, 1966, at 4,700 c~pared with the previous years total of 5,300 and the 5-year average of 13,000,
LAMB CROP DOWN l PEKCENT IN UNITED STATES
The 1966 lamb crop totaled 15,879,000 head, 3 percent less than the 16,312,000 head in 1965. The number of breeding ewes one year old and older on farms and ranches 1, 1966 was 4 percent below a year earlier, The 13 \t/estern sheep States (ll \tJest,
hkota, and Texas) produced 2 percent fewer lambs than in 1965. The lamb crop in ~tive sheep States (excludes 13 ~estern States and Alaska) was 4 percent smaller In 1965. In Texas, which produces nearly one-sixth of the Nations lambs, the lamb
3 percent below 1965.
lamb crop percentage (number of lambs saved per 100 ewes 1 year of age or older and ranches January l) for 1966 was 94, up 1 point from the 1965 percentage.
States lambing percentage, at 91, was up 2 points from the 1965 percentage, Native States lambing percentage, at 104, was the same as the previous year.
13 Western States produced a lamb crop of 10,993,000 head, 2 percent below 1965. IM in the number of breeding ewes more than offset the increase in the lambing
, The January 1, 1966 number of breeding ewes 1 year old and older on farms was 12,134,000 head, 4 percent less than a year earlier, Only four of the
reported an increase in the lamb crop compared with a year earlier. The number lambs (dropped before March 15) in the Western States was 2 percent greater than earlier.
1966 lamb crop in the 35 Native States totaled 4,880,000 head -- 4 percent below saved in 1965. The smaller lamb crop resulted from a 4 percent drop in the
of ewes 1 year old and older January 1, 1966, as the lambing percentage was unchanged. 1, 1966 number of breed i ng ewes l year old and older on farms and ranches was
head.
The lamb crop estimates for 1960 through 1964 have been revised in
conjunction with the 5-year revis ion program for all sheep and lambs.
Revised estimates by States for the years 1960-64 are shown in the
report, 11 Lamb Crop, Rev i sed Estimates 1960-6411 , issued by the Georgia Crop Reporting Service, March 1, 1967
.L -
- - - - - J.
ARCHIE LANGLEY In Charge
R, L, SANDIFER Agricultural Statistician
Ia Crop Reporting Service, USDA, 315 Hoke Smith Annex, Athens, Georgia, in cooperath the Cooperative Extension Service, University of Georgia and the Georgia Department
lculture,
STATE
Ma ine New Hampshire Vermont Mas sac husetts Rhode Island Conne cticut New York Ne:w J ersey Pennsylvania
L.AMB CROP: 1965 .AND 1966
5- year aver age 1960- 64
Br ee ding ewe s 1 year and older
January 1
1965
1966
1, 000 head
: Lambs saved per
1 00 ewe s ~ ..:
Januarz 1 i/_
7 5- year
1965
1966
average
1960- 64
Nu n b e r
24 5
17 4.0
14
1 06
107
3 .s
92
94
25 4
7
6.0
6.0
1 05
95
7
8
7.0
7.0
86
96
8
2
1 .5
1.5
100
100
2
5
3 .8
3.3
95
100
5
101
87
80
1 C8
1 08
1 C8
10
7
7
91
89
10
153
133
130
102
105
149
-- - - - - - -Lamb s saved 1./
1 9 65
1 'm:mneaa--
18 3 .7 6.3 6 .0 1.5 3.6
9<, 6 .4
136
: l~
: J 1966 1 reJ
15 3.3 5.7 6.7 1.5 3.3
86 6 .2
137
Ohio Indiana Illinois Michigan
Wisc onsin
644
538
532
99
98
619
535
521
311
247
230
1 06
107
322
262
245
396
293
284
1 06
1 06
423
313
302
227
195
189
107
llO
234
2C8
207
15 6
130
1 29
115
1 08
171
149
139
Minne sota Iowa Missouri North Dakota South Dako ta Ne b r a s k a Kansas
Del awar e Maryland Vir ginia West Virgin i a North Carolina Sout h Carolina
G eo r~ia
Florida
593 832 43 2 456 1,180 273 4 22
3 24 228 204 35
6 13 5
46 6 743 303 354 1,007 242 333
2 .0 18 180 163 20
3.3 5 .3
s.s
447
113
llO
684
101
1 01
291
96
103
333
1 05
104
983
103
104
242
100
102
353
97
96
2.0
110
llO
16
111
100
176
119
120
155
ll2
109
19
1 C6
100
3.0
82
80
4 .7
75
70
4.6
84
74
672 857 430 495 1,223 284 394
3 25 249 218 36 48 10
4
5 27 750 291 370 1,040 243 324
2.2 20 215 183 21
2 .7 4.0
4.6
490 693 299 346 1,026 248 339
I
2.2 I 16 211 170 19 I
2.4 I 3 o3 I
3.4 :
Kentucky
Tennessee Alabama Mississipp i Arkansas
Louisiana Okla homa Texa s
303 146
16
34 25
50 140
3,964
151 78 8 18
11
30 92
3,290
137 70 7 17 9
27 93 3,158
112
109
99
96
94
83
78
88
1 00
89
73
63
1C6
104
81
82
334 141
15 26 24
34
138 2,896
169 77
7 .s
14 11 22
97 2, 665
149 67 5,8 I
15 I 8 o0 I
17 97 2,590
Montana Idaho Wyom i n g Colorado New Mexico Arizona Utah Neva da Washington Or egon Cal ifornia
48 St ates
Ala ska Hawa ii
1, 205 813
1,704 1,113
872 344 l , Oll 244 2 06 635 1 , 339
20,916
1,093 665
1 ,602 906 744 366 876 202 147 512
1,188
17,493
9
1,006 645
1,538 906 687 349 890 200 118 466
1,188
16 ,841
9
92
92
113
112
81
87
100
101
75
79
83
83
85
86
92
95
112
114
98
101
91
91
1,123 917
1,469
1,128
692 285 880 213 233
632 1,226
1,006 751
1,298
906
560 303 745 186 165
502 1,081
926 725 1,338
916
540
291 765 190
135 470 I 1 ,eel __!_
I
93
94
19,399
16,306 15,873 I
67
67
I
6 .0
6o0 I
Un i ted Sta tes
17 ,502
16 ,850
93
94
16 ,312 15,879 I
I7 Lambs saved defined as lambs living July 1, or sold befo re July 1 1I n the Native ~es and lambs docked
- branded in t he Western States .
After Five Days Return to United States Department of Agriculture
Statist ical Reporting Servic e 315 Hoke Smith Annex Athens , Georgia 30601 OFFICIAL BUSitlfE SS
Po st age and Fees Paid U. S . Department of Agric~
Di s t r i ct and County
DISTRICT IV
Ca r roll Chattahoochee Cla yton Cowet a Dougl a s fayette Ha ra lson Ha r r i's Hea rd He nry Lamar Ma con Mar ion Meri wether Mus cogee Pike Schl ey Spald i ng Ta l bot Ta ylor Troup Upson
TOTAL
DISTRICT v
Ba I dwi n Bi bb Bleck ley Butts Crawford Dodge Greene Hancock Houston Jasper Johnson Jones Laur e ns Monroe Montgomery Morgan Newton Peach Pulask i Putnam Rockd a l e Ta liaferro Tr e u t l e n Twiggs 1.Va sh i ngton
\~ h e el e r
Wi Ik i nson
TOT AL
GEORGIA v/HEAT
196S-l966 County Est ima t e s-- Acrea ge, Yiel d, and Production (l96 S Re v i sed, 1966 Preliminary)
I
Harveste d Ac res
,- :- - 1965- -l
1966
Yie ld Per Acre
l 96 S
1966
Bu shel s
Production
196S
1966
Bushels
I SO
60 10 30 100
30 30
~- 30
180 I ,900
100 10 40
660 130 600
I 0 120 30 tsO
4, 700
140
29 .0
31.0
so
28 .0
26.0
10
18 .0
18 .0
30
19 . 0
22.0
90
27.0
2S.O
4,3SO
I ,680 180 S70
2,700
30 30
21.0
22.0
30 . 0
31 .o
630 900
400
29 .0
29.0
12,470
II,
160
26 .0
30.0
4,680
4,
I, 740
3S .O
36 .S
66,900
63,
90
32 .S
32.S
3,2SO
2,
10
29.0
27.0
290
30
3S .O
30.0
l ,400
600
24 .0
28 .0
IS,b80
16,
120
34 .0
32.0
sso
28 .0
30.0
4,420 16,800
3, 16,
10
30 .0
29.0
300
II 0
2S .O
27.0
3,000
2,
30
20.0
20.0
600
70
30.0
31.0
2,400
2,
4,300
30 .S
32.0
143,400
137,
l 0 910 620 290 760
40
so
60 4,680
110 320
10
9SO 180 220 220
so
I, 7SO 4SO 90 70 l 0
so
170 2,2SO
240 40
14,600
10 860
S90 270 730 40 40 40 4,4SO 100 300
10 900 170 210 210
so
I ,6SO 420 80 60 10
so
160 2 ,1 20
230 40
13, 800
27.0
27.0
270
30.0
32.0
27,300
27 ,
30.S
30.0
18,900
17 J
29.0
30.0
8,400
8,
30.0
31 .o
22,800
22,
20.0
23.0
800
19.0
20.0
9SO
IS.O
18.0
900
38 . 0
36.S
177 ,bOO
162,
26.S
2S.O
2,910
2,
26.0
26.0
8,320
7,
18 .0
19.0
180
32.0
32.S
30,400
29,
26.0
26.0
4,680
4,
32.0
32.0
7,040
6,
2S.O
28 . 0
s.soo
5,
24.0
21+. 0
I, 200
I,
34.0
34.0
S9,SOO
56,
33.S
34.0
IS,OSO
14,
20.S
21.0
I ,840
I,
16.0
20.0
I, 120
I,
21.0
22.0
210
23. 0
24.0
I, ISO
I,
32 .S
33.0
S,S20
5,
30 .0
32 .0
67,SOO
67,
3l. S
32 .0
7,560
7,
27 . S
2S.O
1,100
I,
32 . 8
33. 0
478,900
455,
istrict County
GEORGIA WHEAT
1965-1966 County Es t imates-- Acreage, Yield, and Product ion (1965 Revised, 1966 Preliminary)
Harvested
- -- 1 965
1
Bushels
Bushels
510 770 l ,600
90 120 350 40 6,050 40 90 120 520 600
10,900
680 l ,020 2,130
120 160 470 50 8 ,050 60 120 150 690 800
14,500
28 .0
28 .0
14,280
24.0
29.0
18 ,4c 0
32.0
30.0
51 ,000
28.0
27.0
2,520
21 .o
22.0
2,520
30.0
31 .o
10,500
26.0
27.0
l ,040
28.0
2b .5
169,400
2&.0
27.0
l '120
28.5
28.0
2,570
23 .0
26.0
2,760
27.0
27.0
14,000
25.0
28 .0
15,000
28 .0
28.6
305,200
19,000 29,580 63,900
3,240 3,520 14,600 l ,350 229,400 l '620 3,360 3,900 18,630 22,400
414,500
TOTAL STRICT VI I I
TOTAL
170 320
140 950 280 390 250 180
50
280 180 150 l '150 50 340 120
5,000
40 40 250 580
150 100 80 2,240 3,550
120 30
200 140 60 540 80 900
9,100
200 370
160 1100 320 450 290 210
60
320 210 180 1,330 60 390 150
5,800
40 40 250 570
150 100 80 2,210 3,510
120 30
200 140 60 530 80 890
9,000
24.0 30.0
26.0 23.5 25.0 24.5 26.0 24.0 27.0
25.0 27.0 26.0 32.0 32.5 25.0 30.0
27.0
30.0 30.0 25.0 26.0
28.0 30.0 23.5
31 .o
31.5
29.0 25.0
21.0 33.0 28.5 32.0 29.0 29.0
30.2
30.0 34.0
31.0 33.0 28.0 29.0 33.0 29.0 33.0
35.0 32.0 33.0 36.0 34.0 33.0 35.0
33.0
30.0 30.0 2b.O 26.5
32.0 33.0 25.0 34.0 35.0
27.0 26.0
25.0 33.0 30.0 32.0 33.0 33.0
33.0
4,080 9,600
3,620 22,500 7,000 9,540 6,500 4,320
l ,350
7,000 4,860 3,900 37,000 l ,630 8,500 3,600
135,000
l '200 l ,200 6,300 15,000
4,200 3,000 l ,880 69,500 lll ,800
3,480 750
4,200 4,620 l, 7l 0 17,340 2,320 26, l 00
274,600
6,000 12,580
4,960
36,300 8,960 13,050 9,570
l
6,090
l ,980
ll '200 6, 720 5,940 47,880 2,040 12,880
5,250
191,400
l ,200 l '200 7,000 15' l 00
4,800 3,300 2,000 75,140 122,850
3,240 780
5,000 4,620 l ,800 16,960 2,640 29,370
297,000
Distr ict and County
DISTRICT IX
App I i ng Bacon Brantley Bryan Camden Charlton Chatham Evans Glynn Liberty Long Mcintosh Pierce Tattnall Toombs
~f are
Wayne
TOTAL
GEORG IA v/HEAT
1965-1966 County Estimates-- Acreage, Yield, and Production (1965 Revised, 1966 Preliminary)
Harvested Acres
1965 I
1966
Yield Per Acre
J 1965
1966
Bushels
Product ion
1965 I
1966
Bushels
40
-
40
-
35.0
-
-30.0
--
-
-
-
--
--
-
-
--
- I ,400 ---
-
..I,2~
.
. . .
10
-
10
--
23.0
-
28--.0
230
. 21
--
20
-
20
24.0
28.0
--
--
--
48--0
~..
60 150
60
30.0
31.0
150
34.5
30.0
I ,800 5,190
~:~
20
-
-20
20.0
30.0
-
-
400
-
~
300
300
31.7
30.0
9,500
9. ~
STATE TOTAL
63,000
65,000
29.0
30.0 1,827,000
1,950, ~
ARCHIE LANGLEY Agricultural Statistician In Charge
A. J. BORDELON
Agricultural Statistician
GEORGIA CROP REPORT!
ATHENS, GEORG IA
March 8, 1967
GEORGIA CHL_,K HATCHERY REPORT
Placement of broiler chicks in Georgia during the week ended March 4 was
9, 706,000--3 percent more than in the previous week and 10 percent more than in
the comparable week last year, according to the Georgia Cr op Reporting Service.
An estimated 13, 174, 000 broiler type eggs were set by Georgia hatcheries-! percent less than in the previous w e ek but 1 percent more than in the comparable week a year earlier.
The majority of the prices paid to Georgia producers for broiler hatching eggs were reported within a rang e of 45 to 6 5 c e nts per dozen. The average price of hatching eggs was 58 cents p e r dozen. The price of eg gs from flocks with hatchery owned cockerels g e nerally was 2 cents b e low the average price. Most prices received for broile r chicks by Georgia hatcheries were report e d wit hin a rang e of $7.00 to
10.00 with an average of $8 .25 per hundr ed. The average prices last year were 67 cents for eggs and $10.25 for chicks.
Week Ended
G~ ORGIA EGGS SET, HATCHINGS, AND CHICK PLACEM:2NTS
EGG TYP:t.:
Eggs Set
1966
1967
%of I
year I
ago
Chicks Hatched
1966
1967
Thou.
Thou .
Pet.
Thou.
Thou.
o/o of
year ago
Pet.
Feb. 4 Feb. 11 Feb. 18 Feb. 25 War. 4
941 1, 051
895 945 1, 181
Eggs Set}:_/
1965
1966 Thou.
1966
1967 Thou.
1, 365
145
699
872
125
1, 245
118
699
I l, 358
152
766
I l, 328
14 1
706
l, 198
! 10 l
I
I
761
919 993 1,082 l, 025
131 130 153 I 13 5
BROIL:S R TYPE
I
i
_ ____A_v_. Price
Chicks Placed for
I I
Hatch
Broiler
Broilers in Gear a
Eggs
Chicks
o/o of
year
0
1965 1966
1966 1967
o/o of
year a o
Per Doz. 1966-67
Per Hundred 1966-67
Pet.
Thou.
Thou. Pet, Cents
Dollars
Dec. 31
11, 421 11,615 102
8, 323
8, 546 103
60
Jan. 7
11, 364 12,359 109
8, 585
8, 891 104
60
Jan. 14
11, 996 12,392 103
8,614
8,783 102
60
Jan. 21
12,208 12, 562 103
8, 531
8, 843 104
60
Jan. 28
12,392 12,892 104
8,664
8,929 103
60
Feb. 4
12,432 13,096 105
8 , 897
8,909 100
60
Feb. 11
12, 298 12, 9 71 105
9, 102
9,063 100
60
Feb. 18
12,302 13, 221 107
9' 049". 9,393 104
60
eb. 25
12,616 13,346 106
8, 916
9,421 106
60
4
13, 001 13, 174 101
8 826
9,706 110
58
Includes eggs s et by hatcheries producing chicks for ha tchery supply flocks.
8.75 8 .75 8.75 8. 75 8.75 8.75 8.75 8.75 8.75 8. 25
ARCHIE LANGLE Y
W. A . INAGNE R
&ric u1tural Statistician In Charge
Agricultural. Statistician
------------------ ----------- ----------------------------------------- --------
S, Departm ent of Agricultur e
Agricultural Extension Service
stical Reporting Service
State Department of Agriculture
315 Hoke Smith Annex, A thens, Georgia
STATE
Maine Connecticut Pennsylvania Indiana Missouri Delaware Maryland Virginia West Virginia North Carolina South Carolina
GEORGIA
Florida Tennessee Alabama Mississippi Arkansas Louisiana Texas Washington Oregon California
TOTAL 1967 (22 States)
Feb.
18
E GGS SET
Week E nded Feb.
25
Mar.
4
THOUSANDS
l, 972 258
l, 464 721 672
2, 806
4, 605 1,603
142 7,630
469
2, 089 243
l, 480 713 648
2,975 4,527 1,760
134 7,387
456
2,022 370
l, 437 606 631
2,970 4, 594 l, 777
157 7,480
476
13, 221 13,346 13, 174
577 963 9,093 4, 879 10, 172 1, 140 4,743 642 382 2,076
70,230
892 950 9,462 4,938 10,372 l, 187 4,736 795 376 2, 189
71, 655
839 956 9. 180 4,991 10, 346 1, 105 4, 756 763 337 2, 159
71, 126
CHICKS PLACED
o/o of
year I Feb.
ago 1/ 18
Week Ended
Feb.
Mar.
25
4
THOUSANDS
I
I llt:l
l, 505
1, 560
1, 610
105 I 147
152
210
107 77
I
I
I
1, 002 346
775 323
891 383
79 114
I
I
435 2, 862
428 2,761
388 2,718
104
3,023 3,316 3, 184
113
926
921
1, 095
101
317
247
342
110 I 5, 351
111 I 379 I l '
101 i 9, 393
5, 408 381
9, 421
5, 504 375
9, 706
I
189 I 413
88
I
I
1, 059
103 i 6,621
454 1, 098 6, 707
470 1, 042 6, 893
105 i 3,814 3, 951 4, 140
110
109 120
I
i
7,456 797
I 3,408
7,377 811
3,506
7,690 857
3,638
97
529
499
514
82
265
362
250
101
1, 439
1, 372
1,466
106 151,487 51, 830 53,366
TOTAL 1966* (22 States)
63,914 65, 516 67,052
49,509 48,676 48,332
o/o of Last Year
110
109
106
1I Current week as percent of same week last year.
* Revised.
I 104
I
106
110
o/o of
year
ago 1/
110 95 96 85 128 110 103 108 110 111 112
110
154 120 103 113 113 123 126 106 118 106
110
..Jiiil..
Q)
:J:-1s
"'-+>
.... ::s
ro u
~ - ;:::
CJ) 00
Q)~
Q) ....
~ 0
"0+>
r!=o:
!=:
Q)
8 Q)
+Ctr>oiJ)ll+Jrp>o..l.
0 Q)
. ~~
.U)
::J
Q)
-a:J:.sl
+>
. ... Q)
u J.l
.8 l:l() . ...
~~ ~
::sJ.i'QQ)>< U)Q)
U) U)
.s z ~~oo r~
fr " 8 ~ Q) ~ -~
~C~QJ))1:~Q:)~+oJ>U.l ).+l.c>)..oOJQ.)l.I::):Uf:HQlJ)
f...>..:t~.t-rCoi~ lQu) oo~o-O;:s
Q) .... :r:Q)H
Ja..>!+ro>C+J>)
..c~
+>
........ . ... 1.()~~
.~'.1.j.+U>r)<~'-l 0
....Q)U)
+>
~
::>
r<oouc-r ;-\ I"IJ'l U;-\ L ('j I ? ~~. :_.,/
.rI :\;
:._/
--'
~
-J
JS'J\
J001
Athens, Ge orgia
March 10, 1967
GE OR GIA' S C OMME RCIAL B ~OIL 2R INC OME $224 , 9 0 3,000 IN 1966
Commer cial broiler production in G eorgia for 1966 set a n e w r e cord high with a total of 456, 192, 000 birds. This was the 16th consecutive y ea:r that G e orgia has led the Dation in broiler production.
Gross income from broile rs produced in G eo rgia in 1966 amounted to $ 224, 903, 000. This is an incr ease of $ 26,337,000 from the 196 5 incom e of $ 19 8 , 566,000 and still exceeds the income from any other agricultur a l commodi t y in the Stat e . A verage liveweight per bird was 3. 4 pounds, the same as the 3 . 4 pounds last y e ar. A v e rage price per pound in the year was 14. 5 c e nts th e same as last ye ar and compa red with 13. 7 cents in 1964. The price in 1966 ranged from a high of 16. 5 c e nts in March to a low of 11. 0 in December.
475- PRODUCTION AND VAL-U- E - O F-G-E_O_R_G_I_A_B_R_OI__L.t-_~_R_S_..:...(eP_r_i_o_d._l9.;_4_7_-_6_6..!.)_
475
Year
Numbers (000)
Value (000$)
I I Numbe r Broilers
450-
450
1947 19 4 8
28, 717 33,025
24, 191 29, 108
p:i~~#:J Value , Dollars
1949
45, 574
32,977
1950
62,892
45,433
1951
88,678
68, 530
400- 1952
112,621
88,6 10
400
1953
121,631
93,826
1954
154 ,471
101,951
1955 1956 1957
177,642 222,780 261,000
125,700 129, 836 150, 336
II
350- 1958 1959
292, 119 303,031
164,521 153,000
I
350
1960 320, 250
171,206
300-
1961 1962 1963 1964 1965 1966
348,200 353,600 359,760 373,880 4 02,770 456, 192
156,272 168, 031 168,799 174,153 198,566 224, 903
n
I II I I
I II
- 300
Z50-
zoo-
250 ~..,,.................... :0:;
Ul
200
150-
150
100-
100
so-
50
1966 C OMME RCIAL BR O ILER PRODUCTION IN 23 STATES
Commercial broil e r production during 1966 in the 23 States covered by the weekly chick placem ent r e ports totaled 2, 480 million birds, up 10 percent from the 2, 249 million produced in 1965 and t h e l a rg e st of record for these States. These 23 States produced 96 percent of the Nation's b roil ers in 1965. Four of these States produced fewer broilers than in 1965, but increases in other States, particularly Alabama, Arkansas, Georgia and North Carolina r e sulted in the overall incr e as e of 231 million birds.
The average pric e received for the 1966 production was 15.2 cents per pound live
weight, O. 3 cent above the average price r e c e ive d in 196 5. The gross income from br production in the 23 States was $1, 310 million compared with $ 1, 163 million during 1965. Georgia, the l eading broiler producing State, had a gross income of $224, 903, 000 from broilers--an all time high for any State. The 1966 average liveweight per bird produced was 3. 5 pounds. The number of pounds produced in the 23 States totaled 8, 631 million pounds, up 11 p e rcent from 1965.
The leading State in the number of chicks placed in 1966 was Georgia with 471, 703, 000, followe d by Arkansas with 374,269,000, Alabama 337, 599,000, North Carolina 277, 017, 000, Mississippi 19 5, 421, 000, Maryland 167, 130, 000, Texas 161,140,000, Delaware 128,908,000, Maine 75, 4 17,000, and California 71,104,000. Placements of 2, 259, 708,000 in these 10 States accounted for 87 percent of all the bra chicks placed in the 23 S tat e s last year.
tate and Total
Commercial Broiler Producti on and Gro s s Income in 23 States,
1966
Maine C onn. Pa. Ind. Ill. Mo. Del. Md. Va.
Miss. Ark. La. Texas Wash. Oreg. C alif.
68,357 11, 806 42,9 62 23,829
620 30,700 109, 293 144,759 47,884 18,605 234, 4 77 16,448 402,770
44, 893 285,077 167, 867 320, 135
31, 579 142, 2 17
21,030 11,200 59, 852
273,428 44,863 167' 552 78,636 2, 356 98, 240
415,313 550, 084 148,440
63,257 820,670
57,568 1,369,418
152,636 969,262 570, 748 1,024,432 107,369 4 83, 538
75,708 40, 320 227,438
17.3
l 7. l
17.6 15.4 15.9 14.7 16.2 16.2 15. 6 15.7 14.4 14.4 14. 5
14.6 14.3 14.2 14.0 14.0 14.9 17.3 17. 5 16.9
47,303 7,672
29,489 12, 110
375 14,441 67,281 89, 114 23, 157
9, 931 118,176
8,290 198, 566
'33 22,285 138,604 81,046 143, 420 15,032 72,047 13,097
7' 056 38,437
72,458 10, 271 43,983 21, 208
542 21,965 117,963 154, 615 50,278 18, 605 264,959 17,486 456, 192
50, 325 324, 124 183,734 361,753
3 5, 317 152, 918
22,412 13, 263 67,034
289, 832 38,003
171, 534 76,349 2, 168 74,681
448,259 587, 537 155, 862
63,257 927,356
61' 20 1 1, 551, 053
171, 105 1, 134,434
606,322 1, 193, 785
120, 078 519,921
82, 924 47,747 248,026
18.2 17.9 16. 5 15. 9 16.0 15. 0 15.9 15.9 15. 5 15.6 15. 3 14. 5 14. 5
15.4 14.2 14.6 14.7 14.5 15.2 18.0 18.0 17.8
11, 71, 93, 24, 1 9, 141,
8,
26, 161, 88, 175,
17, 79, 14,
8, 44,
Total 2, 249, 215
14.9 7 784,983
15. 2 631 082
The Georgia -=:rop Reporting S ervic e , USDA, 315 Hoke Smith A nnex, Athens, Georgia,
in cooperation with the Coope rative E xtension Se rvice, University of Georgia and the Georgia Departme nt of Ag riculture.
ARCHIE LA NGLE Y A gricultural Statisticia n In Charge
A fter F ive Days Return to: United 3tate s De partment of Ag riculture
Statisti cal He porting Servi ce
315 Hoke Smith A nnex
Athens, G e orgia OFFICIAL BUSINE SS
W. A , WAGN!~ R Ag ricultur e.! Statistician
Postage and Fee s Paid U.S. Department of Agriculture
qo 1
A3
~1
ID GEORGIA CROP REPORTING SERVICE
AGRICULTURAL. EXTENSION SERVICE UNIVERSITY OF" GEORGIA AND THE STATE DEPARTMENT OF AGRICULTUAI!:
U . S . DEPARTMENT OF AGRICULTURE STATISTICAL REPORTING SERVICE
315 HOKE SMITH ANNEX, ATHENS, GA .
March 10, 1967
VEGETABLES FO R FRE SH MARKET March I , 196 7
'
Watermelon In tentions: Excessive rains and cold weather are delaying Jan pr paration in central areas. Planting is underway in southern counties.
r conditions, land preparation and other factors could affect the final planted acreage.
Early Sprin q Cabbaqe: Cold temperatures and excessive rains have been unfavorable for best grcwth and development of spring cabbage. It is too early
damage, if any, caus e d by freezing temperatures in late February.
Snap Beans: Production of winter snap beans in Florida is estimated at 600,000 cwt., 32 percent above last year but 3 percent below average. Practically all of the
ge is grown along the Lower East Coast, whe re temperatures on February 26 were not below ing. Generally, the month of February was favorable for development. Volume supplies of varieties are expected during March from the Pompano area , supplemented by I ight amounts south Dade County. Pole beans in Dade County are in volume supply, which should continue ing most of March.
Winter cabbage production is forecast at 6,838,000 cwt., I percent above 1966. Volume supplies are expected to continue during March from most Florida areas. were reduced by the February 25-26 freeze. There were scattered frosts on northern and central areas but I ittle additional damage is indicated . In the ings area, harvest was well advanced and damage to the remaining acreage by the cold in late February is not expected to be extensive. In the central area, mature heads in them and some young pla nts were flattened, but are expected to recover. The west counties also were adversely affected. The Everglades muckland cabbage and south sandland crops sustained no significant damage. Harvest in Texas was active in all areas during February . Cabbage made good growth alt hough yields on some of the late are expected to be below normal because of freeze damage early in the season. Shipare expected to be moderate in March and April with supplies available into May.
The~ sprinq crop is est imated at 11,100 acres for harvest compared with 11,750 acres ted in 1966. In South Carol ina the crop was reported in very good condition prior to hard freezes of February 24 and 25 when temperatures dropped to the mid-teens in the ton-Beaufort area. For the most part, freeze damage was confined to outer leaf burn; r, considerable damage may show up later. The full extent of the damage will not be
until near harvest. Movement is now expected to begin around mid-April. Growth and in Georgia are reported to be good. It is too early to determine damage if any from freeze in late February. Light, local movement has been underway in southern counties Ma~ma since early December. Th e main southern c rop is developing nicely and volume tis expected about Apri I 1. Damage from the late February freeze was I ight. In issippi, the crop is making good growth . In the Breaux Bridge area of Louisiana, the is generally in good cond ition . /arm, dry weather is now needed for normal crop opment. First s h ipments fr om this area are expec..ted about April 1. In California, tin the coastal districts will be underwa y in Apri l and peak in t1ay.
The early spri nq tomato crop is estimated at 17,000 acres for harvest in 1967 compa red with 23,600 acres harvested in 1966. In Florida, the crop was ly affected by subfreezing temperatures February 25-26. In north central areas most of Kreage planted was frozen. A small amo unt of plants were saved but more will be needed all the lost acreage is to be transplanted. In west central counties (Manatee-Ruskinla), considerable acreage was lost and extensive resetting wi ll be necessary. At Ft. Immokalee, scattered I ight to heavy damage occurred and a few f ields were lost. Light occurred near Naples and plant development was de l ayed . Ft. Pierce had spotty plant reducing stands. Early plants have set fruit while late fields are at thinning stage. ~unty plants are in good condition. The small spring crop of vine ripes sustained ~mage in east Palm Beach County. Seeding in Texas wa s nearly completed by Ma rch I. continued slow dur ing February, but prospect s were improv i ng at the end of the month.
\.Jatermelons: Growers intend to harvest 179 ,900 acre s of early summer watermelon this ye
compared wit h 184,900 acres harvested last year and the 1961-65 average o 195,020 acres . In North Carol i na, plants are not expected to be act i ve until the last halfc April. Plantings in South Carol i na are expected to begin around March 10, and become active around April 1. Early indications point to an increase in acreage in the Allendale area of~ s~t by reported acreage decl i nes i n the Barnwell and Chesterfield areas. Land preparation in Georgia is making good progress an d some plant i ng has begun in the extreme southern counties, Charleston Greys are expected to continue to lead in varieties planted. Wet fields in Alabari have prevented seedbed preparat ion i n most areas. General planting is expected to get unde~ around mid-March. Planting in Missi ssipp i should start about March 15. In Arkansas, moistu supply, part i cularly i n the subsoil, is short in most watermelon growing counties, and needs be replenished before the plantin g season gets underway in April. In Oklahoma, it is very d over most of the produc i ng areas. The acreage to be planted will depend considerably upon t~ timing of rains during the next 60 days. Cold, wet weather in Louisiana has delayed land p~ paration somewhat, but growers in the major commercial area are expecting to begin planting~ mid-March. A decline i n acreage i s expected in the important Saline area but an offsetting i crease i s indicated in t he Allen Parish growing area. Other major producing centers indica~ 1ittle change from 1966. South Texas watermelon growers started planting in late December. Freez i ng te~ peratures in Ja nuary and Feb r uary caused widespread replanting to be necessary. other areas, land is be ing prepared for pl9nting. First supplies are expected from the Valle around May 15. In Arizona , planting is near i ng completion, with early planted acreage makin! satisfactory growth. Pla nt i ng should be compl eted by the middle of March. The first of the watermelon harvest shoul d be gin in early J une .
ACREAGE AN D EST IMATED PRODUCT ION H.E PORTE D TO DATE, 1967 ~:J ITH COMPARISONS
Crop a nd State
I I I I 1----Ha-;=-;;s~~~a_g_i_To~- j;--__v_ie_l.,.d._ P_e_r--..A_c_r_e_--lr-- - Production
I Average
jharvestl Av.
lind. Average
In
' 1961-65 1966 ' 1967 61-65 1966 1967 1961-65 1966 ]q
Acres
Hundredweight
1,000 Hundredweight
CABBAGE 1/
Winter: Florida Texas Arizona Californi a Group Total
15,600 20,480
1, 320 5 ,3 00 42,700
14,500
10,000
1 ,500 4,1300 38,800
15, 700 176 215 195 19,000 116 135 120
1. 700 206 160 250 5 , 100 222 200 210
41,500 154 174 165
2,746 2,331
273 1 ,182
6,532
3.118 3, 2,430 2
240 960 i 6,748 6
Early Sprinq:
South Carol ina Georgia Alabama Mississippi I Lou i siana Cal iforn i a
Group Total
2,640 3,040
470
960 2,120 3 020 12,250
2,900 2,400
550 700 2,300 2.900 11,750
2,400 102 100
2,300 116 125
500 111 130
700 135 135
2' 100
91 100
3 100 241 240
11. 1oo 141 143
268
354 52 130 192 729
1,725
290 300
72 ~~ 94 230 696 1 ,682
WATERMELONS Late Sprinq ]/:
65,900
71 ,600
68,000 15!{. 161
10,094
Earlv Summer 2/:
North Ca rolfna 8,940
6,500
6,300
60
54
534
South Carol ina 23,600 22,000
21.000
75
75
1 '767
Georgia
32,400 33, 500
30,000
88
80
2,848
Alabama
13,740 13,000
13,000
93
95
Mississippi I 7,040
7,200
7,300
74
5)
1 '278 518
Arkansas
6' 160
6,000
6,100
89
80
546
Louisiana
2,840
3,000
3,000
85
90
240
Oklahoma
8,340
9,000
10,000
70
70
586
Texas
78,000 72,000
72,000
62
60
4,790
Arizona
4,480
3,600
2,900 153 175
685
California
9, 480 9' 100
8,3 00 165 175
1. 567
Group Total I 195,020 184,900 179, 900
79
77
15,358
1/ Includes process i ng. Z/ 1967 acreage for harvest is prospective acreage.
11 ,548 Hi
351 1 ,650 2,680 1 '235
396 Jll 480 270 630 4,320 630 1 ,592 14,234
ARCHIE LANGLEY 1. Agricultural Statistician In Charge
After Five Days Return to United States Department of Agriculture
Statistical Reporting Service 315 Hoke Smith Annex Athens, Geor gia 30601 OFFICIAL BUSINESS
L. H. HARRIS, JR, Vegetable Crop Estima
'Postage and Fees Pa i U. S. Department of Agri a
~I ~ - I
GEORGIA CROP REPORTING SERVICE
AGRICULTURAL EXTENSION SERVICE UNIVERSITY OF" GEORGIA AND TI-4E STATE DEPARTMENT OF AGRICULTUA
U . S . DEPARTMENT OF AGRICULTUFfE STATISTICAL REPORTING SERVICE
315 HOKE SMITH ANNEX, ATHENS, GA .
March I0, 1967
VEGETABLES FOR FRE SH MARKET Marc h I, 1967
Watermelon Inten tions: Excessive rains and cold
land preparation
in central areas. Planting is underway in sou
counties.
ther conditions, land preparation and other factors could affect the final planted acreage.
Early Spr inq Cabbaqe: Cold temp erat ures and excessive rains have been unfavorable for be st growth and development of spring cabbage. It is too early
damage , if any, caus ed by freezing temperature s in l ate February.
Snap Beans: Production of winter snap beans in Florida is estimated at 600,000 cwt., 32 percent above las t year but 3 percent below average. Practically all of the
reage is grown along the Lower East Coast, where temperat ures on February 26 were not below eezing. Gene rally, the month of February was favorable for development. Volume supplies of h varieties are expec ted during March from the Pompano area , supplemented by 1 ight amounts ~south Dade County. Pole beans in Dade County are in volume supply, which should continue ringmost of March.
Cabbaqe: Winter cabbage production is fo recast at 6,838, 000 cwt., 1 percent above 1966. Volume supplies are expec t ed to continue during March from most Florida areas.
prospects were reduced by the February 25-26 freeze. There were scattered frosts on ruary 27 in northern and central areas but 1ittle additiona l damage is indicated. In the stings area, harve st was well advanced and damage to the remaining acreage by the cold
in late February is not expected to be extensive. In the central area, mature heads in them and some young plants were flattened, but are expected to recover. The west counties also were adversely affected. The Everglades muckland cabbage and south orida sandland crops sustained no s i gnificant damage. Harvest in Texas was active in all th areas during February . Cabbage made good growth alt hough yields on some of the late ~age are expected to be below normal because of freeze damage early in the season. Shiptsare expected to be moderate in Ma rch and April with supp li es ava ilable into May .
The early sprinq crop is esti mated at 11,100 acres f or harvest compared with 11,750 acres rvested in 1966. In South Carol ina the crop was reported in very good condition prior to
hard freezes of February 24 and 25 when temperat ures dropped to the mid-teens in the rleston-Beaufort area. For the mos t part , freeze damage wa s confined to outer leaf burn; ver, considerable damage may show up later. The f ull extent of the damage will not be l~nt until near harves t. Movement is now expected to begin around mid-April. Growth and ands in Georgia are reported to be good . It is too early to determine damage if any from rd freeze in late February. Light, local movement has been underway in southern counties Alabama since early December. The main southern crop is developing nicely and volume rvest is expected about Apri I I. Damage from the late February freeze was I ight . In ssissippi, the crop is making good growth. In the Bre.aux Bridge area of Louisiana, the
is generally in good cond i tion. Warm, dry weather is now needed for normal crop elopment . First ship me nts from th i s a rea a re expected about Apri l I. In California, rvest in the coastal distr icts will be underway in Apri l and peak in t~ay.
Tomatoes: The~ sprinq tomato crop is e s timated at 17,000 acres for harvest in 1967 compared with 23 , 600 acres harvested in 1966. In Flo r ida, the crop was
rely affected by subfreezing temperatures February 25-26. In north central areas most of acreage planted was frozen. A small amount of plants were saved but more will be needed all the lost acreage is to be transplanted. In west central counties (Manatee-Ruskin~ula), considerabl e acreage wa s lost and extensive resetting will be necessary. At Ft. ~-Immokalee, sca ttered 1 ight to heavy damage occurred and a few fields were lost. Light rn occurred near Naples and plant development was delayed. Ft. Pierce had spotty plant s, reducing stands. Early plants have set fruit while l ate fi elds are at thinning stage. County plants are in good condition. The sma ll spring crop of vine ripes sustained d damage in eas t Palm Beach County. Seeding in Texas was nearly completed by March 1. th continued slow during February, but p rospects were improvi ng a t the end of the month .
Watermelons: Growers intend to harvest 179,900 acres of early summer watermelon this
compared with 184,900 acres harvested last year and the 1961-65 average 195,020 acres . In North Carol ina, plants are not expected to be active until the last half April. Plantings in South Carol i na are expected to begin around March 10, and become active around April I. Early indications point to an increase in acreage in the Allendale area of~ S.:!t by reported acreage dec] i nes i n the Barnwell and Chesterfield areas. Land preparation in Georgia is making good progress and some planting has begun in the extreme southern countiet Charleston Greys are expected to continue to lead in varieties planted. Wet fields in AI have prevented seedbed p reparation in most areas. General planting is expected to get unde around mid-March. Planting in Mississippi should start about March 15. In Arkansas, mois supply, particularly i n the subso i l, is short in most watermelon growing counties, and needs be replenished before the planting season ge t s underway in April. In Oklahoma, it is very over most of the producing areas. The acreage to be planted will depend considerably upon timing of rains during the next 60 days. Cold, wet weather in Louisiana has delayed land p paration somewhat, but growers in the major commercial area are expecting to begin planting mid-March. A dec] ine in acreage is expected in the important Saline area but an offsatting crease is indicated in the Allen Parish growing area. Other major producing centers indi~h I ittle change from 1966. South Texas watermelon growers started planting in late December, Freezing te~peratures i n January and February caused widespread replanting to be necessary. other areas, land is being prepared for planting. First supplies are expected from the Vall around May 15. In Ar izona, plant i ng is near i ng completion, with early planted acreage maki satisfactory growth. Planting should be comp leted by the middle of March. The first of the watermelon harvest should be g in in earl y June.
Crop and State
ACREAGE AND ESTIMATED PRODUCTION REPORTED TO DATE, 1967 ~.-J ITH COMPARISONS
Yield Per Acre
Production
CABBAGE _!/
Winter: Florida Texas Arizona Ca I i fo rn ia Group Total
Ear y Sprinq:
South Ca ro I ina Georgia Alabama Mississippi Louisiana Ca I i forn ia
Group Total
WATERMELONS Late Sp r i nq ]/:
Earlv Summer 2/: North Ca ro ITna South Ca ro I ina Georgia Alabama Mississippi Arkansas Louisiana Oklahoma Texas Arizona California Group Total
_.!/ Includes
15,600 20,480
I, 320
2,640 3,040
470 960 2,120 020 12,250
65,900
8,940 23,600 32,400 13 ,740
7,040 6' 160 2,840 8,340 78,000 4,480
480
Acres
14,500 10' 000
I, 500 4 80 38,800
71 ,600
6,500 22,000 33,500 13,000
7,200 6,000 3,000 9,000 72,000 3,600
100
2,400 2,300
500
700 2 I I 00
100 II, I 00
68,000 IS~ 161
6,300
60
54
21 1000
75
75
30,000
88
80
13,000
93
95
7,300
74
5.?
6, I00
89
80
3,000
85
90
10,000
70
70
72,000
62
60
2,900 153 175
8 00 16
I
268
290
354
300
52
72
130
94
192
230
6
10,094 II ,548
534 I I 767 2,848
I I 278 518 546 240 586
4,790 685
351 I ,650 2,680 I, 235
396 480
270 630 4,320 630
2
acreage.
ARCHIE LANGLEY Agricultural Statistician In Charge
After Five Days Return t o United States Department of Agr i culture
Statistical Reporting Serv ice 315 Hoke Smith Annex Athens, Georgia 30601 OFFICIAL BUSINESS
L. H. HARRIs I JR. Vegetable Crop Esti
Postage and Fees U. S. Department of Agr
:: -
c~
~- -
-
GEORGIA C R0 P REPORT ING SERVICE
ATHENS, GEORG IA
Marc h 15, 1967
GEORGIA CHI CK HATCHERY REPORT
Placement of broiler chicks in Georgia during the wee k ended March ll was
9,914, 000 -- 2 p ercent more than in the previous week and 12 p e rcent more than in the
comparable week last year, according to the Georgia Crop Reporting Se rvice.
An estimated 13, 027, 000 broiler type eggs were set by G e orgia hatcheries -- l
percent less than in the p revious we e k and 3 p e rcent l es s tha n in the comparable week a year earlier.
The m ajo rity of t he prices paid to Georgia produce r s for broiler hatching eggs
were reported within a r a ng e of 45 to 65 cents per dozen . The average pric e of hatching eggs wa s 57 cents p er dozen. The price of eggs from flocks with hatchery owned
cockerels gen erally was 2 cents b e low the average price . Most prices received for
broiler chicks by Georgia hatcheries were reported within a range of $7.00 to $9.25 with an aver ag e of $ 8.00 p e r hundr ed . The average prices last year were 67 cents for
eggs and $10,25 fo r chicks.
Week Ended
Gi-ORGIA EGGS SET, HATCHINGS , AND CHICK PLACEME NTS
E GG T YPE
E ggs Set
I
I.
Chicks Hatched
I
o/o of
1966
1967
year
1966
1967
Thou .
I I ::.g o
Thou. ! Pet,
T hou.
Thou.
o/o of
year ago
Pet.
Feb. 11
Feb. 18
Feb. zs
Mar. 4
Mar. 11
Week Ended
1, 051 895 945
1, 181
950
E ggs Set ]_I
1966
Thou ,
1967
Thou.
l, 245
11 8
1, 3 58
152
1, 328
14 1
1, 198
101
1, 225
129
699
919
131
766
993
130
70 6
1, 082
153
761
1, 025
135
677
1, 060
157
BROILER TYPE
Vfo of I
I yea r
ago Pet . I
C hicks Placed for
B railers in Georgia
Vfo of
1966
1967 year
ago
Thou,
Tho u. Pet . I
Av. Price
Hatch
B railer
E ggs
Chicks
Per
Per
Doz.
1967
Hundred
1967
Cents
Dollars
Jan. 7
11,364 12, 359
109
8, 585
8, 891 104
60
Jan, 14
11, 996 12 , 392
103
8, 614
8, 783 102
60
Jan. Zl
12,208 12, 562
103
8, 531
8, 843 104
60
Jan. 28
12, 392 12,892
104
8, 664 8,929 103
60
Feb. 4
12, 432 13 , 096
105
8, 897
8,909 100
60
Feb, 11
12, 298 12,971
105
9, 102 9,063 100
60
Feb. 18
Feb. zs
12,302 13, 221
107
12,616 13,346
106
9,049 9,393 104
60
8, 916
9,421 106
60
Mar. 4
13 ,001 13. 174
101
8, 826 9,70 6 110
58
!fMar. 11
13,467 13,027
97
8, 87 5 9,91 4 112
57
Includes eggs set by hatcheries producing chicks fo r hatcher y supply flocks.
8.75 8.75 8.75 8.75 8.75 8.75 8.75 8. 75 8.25 8.00
ARCHIE LANGLE Y
. . . . . : a' ' .
W, A , WAGNER
Agricultural Statistician In Charg e
Agricultural Statistician
--------------------- --- --------------- --------------------------------------
0, S. Departm ent of Agriculture
Agricultural Extension Service
Statistical Re po rting Service
State Depart ment of Agriculture
315 Hoke Smith Annex, .At h ens , G eorgi a
;GGS SE"_L'
J.
~ .ao-.LA'V~~
STATE
ll r----F:::e:-:-b-.--vv~ ' ee~kM-:::.!-:.-:a.n:r:=.-:d=..:::e:..::d::__--:M :--::-a- -r. -
o/o of
year
~~-.t'~-e -b.- -~e~M k aEr .n d e d
_
M
__
ar.
_)!
2 5
4
11
ago 1I ! 25
4
11
l
- - - - - - - -l--------;:yT'i"'TH7 0AT'U."3""A-,N:T;Dr.S;::;------'---'-''---,II
THO U.S A NDS
u/o of
year ago 1/
I
Maine Connecticut P e nnsylvania
2,089 243
1, 480
2,022 370
l , 437
1, 942 235
1, 174
II 99
64
1:
1, 560 1S2
88 ,; 77 5
1, 610 210 891
l , 53 5 145 894
100 64
121
Indiana
713
606
567 72
323
383
333
84
Missouri
648
631
642 80
~ 23
388
4 79
105
Delaware
2,975
2,97 0
2, 850 109 I 2,761
~. 718
2, 717
114
Maryland Vir ginia
4, 527 1, 760
4, 594 1, 777
4,54 1 1, 635
I! 99 ;: 3, 316
94
921
3, 184 1, 09 5
3, 120 1, 031
104 108
West Virginia North Carolina
134
157
150 85 ij 247
342
373
94
7, 387
7, 480
7' 150 100
5, L2,08
s, 504
5, 725
102
.
South Carolina
4 56
476
510 11 7
381
375
364
97
U)
G EOR GIA
13,346 13 , 174 13,027 97
9, 4 21
9,706
9, 914
112
Florida
892
839
864 188
4: 5L.:0
4 70
477
137
Tenne ssee
950
956
999
92
1,098
1,042
960
103
Alabama
9,462
9, 180
9, 158 101
6,707
6 , 89~
7' 145
106
Mi ssissippi
4,938
4 ,991
5, 157 109 ,, 3, 951
4 , 1<0
~ .25 5
112
Arkansas
10, 372 10,34 6 10, 53 8 109 i! 7, 37 7
7,690
7' 768
114
Louisiana Texas
1, 187 4,736
1, 105 4, 756
1, 071 4,743
104 115
',: ,i 3, 851061
857 3 , 63 8
872 J , 7 51
125 120
Washington Or eg on California
TOTAL 1967
(22 State s )
795
763
831 13 7
'i9 9
514
4 86
97
376 2, 189 7 1,655
33 7 2, 159 71 J 126
32 5 1, 934 70, 043
92 98 102
362
!l1
511,,
372 83 0
250 1, L.J:6 6 53,366
281 1, 483 54 , 108
97 109 109
TOTAL 1966* (22 States)
65, 516 67, 052 68, 565
~ 4B, 676
i
48,332
4 9, 530
o/o of Last Y e ar 1.
109
106
102
*1/ Current w ee k as percent of sam e w ee k last year. Revised.
I
i 106
110
109
GEORGIA CROP REPORTING SERVICE
/~THENS, GEORGIA
February 1967 Released 3/16/1967
February Milk Pr oduction Up 2 Million Pounds
Total milk produced on Georgia farms during February is estimated at 76 million pounds 2million from the same month last year, but the same as the 1961- 1965 average production the month.
ffilk per cow was placed at 520 pounds compared with 490 in February last year. The 1965 average for the month was 413 pounds per cow.
rrices paid by dairymen for feed were generally unchanged from January, but averaged about
20 above the previous year. Hay prices were down slightly.
;tlp\ '' ..1
'
' ',}.'!.,'.
production, mil. lb. ction per cow, lb , 1/ er milk cows, thousand head
74
86
76 9,137 9,855
9,217
490
590
520
635
715
670
152
146
146
- DOLLARS 2/ whoiesale-;;ilk:-~wt~ -
milk, cwt. actured milk, cwt. cows, head baled hay, ton
6.30
6.35
3.60
170.00
28.00
3/6.65
- 6.65
4.25 200.00
28.50
g/6.60
200.00 27.50
4.55 4.96 3.66 227.00 24.60
'3/5.15
- 5.57
4.22 256.00
25.50
257.00 25.30
~=Y
.
d Dairy Feed :
Yili percent protein, cwt.
3.95
4.00
4.00
3.49
3.68
3.66
16 percent protein, cwt.
4.00
4.25
4.25
3. 79
4.09
4.03
18 percent protein, cwt.
4. 20
4.50
4.50
3.94
4.23
4.16
20 percent protein, cwt.
4.25
4.60
4.60
4.06
4.46
4.46
under
29 percent protein, cwt.
4.05
4.25
4.25
3.75
4.03
3.95
------- ---------------.------------------------.------..-------------------
onthly average.
Dollars per unit as of the 15th of month except wholesale milk which is average for month.
Rev-ised. Freliminary.
\
I nited States price is for under 16 percent.
. .'
ARCHIE LANGLEY cultural Statistician In Charge
R. 1. SANDIFER Agricultural Statistician
------------- ------------ --- ------- - --- - --- --
Georgia Crop Re porting Servic e, U.s . D. A., 315 Hoke Smith Annex, At-hens, Georgia, in ration with the Cooperative Extension service, University of Georgia, and the Georgia Dent of Agriculture .
UNITED STATES MILK PRODUCTION
Febr uary milk produc tion is estimated at 9,217 million pounds, about 1 percent more t
the 9,137 million pounds produced during February last year but 5 percent less than the 19
average for the month.
Milk production per day during February was about 4 percent more than in January, c~ pared with a 3-percent increase between these months in 1966. February milk production~ 1.66 pounds of milk per person daily, the same as a year earlier and just slightly more th January averag e of 1. 60 pounds.
February milk output averaged 670 pounds per cow, 6 percent more than the 635 pounds a
year earlier. On a daily basis, February production per cow averaged 23.9 pounds, up sli from January. Output per cow in February was at a record high level in all but 4 States Michigan, Minnesota, South Dakot a, and Nebraska.
California's February production per cow averaged 835 pounds --to le ad the Nation; Other high-ranking States were Hawaii with 830 pounds, Arizona with 825 pounds, Massachuset
New Jersey and Minnesota each with 810 pounds and Connecticut with 785 pounds.
Milk Per Cow and Milk Production by Months _________gg~~ed_~tate~--1961~-~~~h-Q~~i~g ___ ________________ _
Month
January February
Average : 1961- 65 : 1966
Po unds
1967
Average :
1961-65 : 1966
1967
l-vii-l-l-i-o-n--P-o-u-n-d-s
621
678
715
10,222
9,805
9,855 :
-----~21_______ ~}2_______1Q__l----~222______~1Jl______~g1]_~----!~9
Jan. -Feb. Total
March April May June July August Se p t emb e r October Novemb er De cember
19' 918
18' 942
19' 072 : +0. 7
- 676_____736________:: J:l,062---15"J37-----=: ----II
690
752
11,260 10, 725
757
812
12,310 11,525
729
798
11, 816 11,269
671
736
10,849 10,350
629
696
10,148
9,763
592
663
9, 522
9,263
602
670
9,643
9,333
_____52811~ _ _ _ _ _6649] _ _ _ _ _ _ _ _ _:_ _ _ 29.:,.28848!_ _ _29.,:.021112_________:_- -
-
Annual
-----
-
-----..---7-,7-5-9-----8,-5-1-3 ----------.--1-2-5-,6-6-0-
-
120,230
----
-
-
-
-
-
-
. -
-
-
After Five Days Ret urn to Unit ed States Department of Agriculture
Statistical Reporting Service 315 Hoke Smith Annex
Athens, Georgia 30601 OFFICIAl; ~!!SINE~~
Post age and Fee s Paid U. S. De partme nt of Agricult
7
7
GEORGIA CROP REP ORTING SERVICE
w~~lliLb'l? ffiffilr@m~mw
ATHENS, GEORGIA
Ma rch 22, 1967
GEORGIA C HICK HATCHERY REPORT
Plac ement of broil e r chicks in Geo rgia during the week e nded March 18 was 9, 968, 000--1 p ercent mo re than in the p revious week and 10 perc e nt more than in the compa rable w e ek last year, according to the Georgi..a Cro p Re porting Service.
An estimated 13, 185, 00 0 broiler t yp~ eg gs were set by Georgia hatcheries-1 percent mor e than in the previous week but 1 percent l es s than in the comparable week a year earlier .
The majority of the prices p a id to Georgia producers for broile r hatching eggs were r epo rted within a rang e of 45 to 65 cents per dozen. The average price of hatching eggs was 56 c ents p er dozen. The pric e of eg gs f:rom flocks with hatchery
owned cockerels generall y was 2 c e nts below the average p r i ce . Most prices received for broiler chicks by G e orgia hatcheri es were reported withi n a range of $5.00 to $9.25 with an averag e of $ 7. 7 5 p e r hundred . The average prices las t year were 66 cents for eggs and $ 10 .00 for chicks .
Week Ended
G:20RGIA E GGS SET , HATCHINGS , AND CHICK P:LA -::EMENTS E GG TYPE
E ggs Set
1966 Thou.
1967 Thou.
I o/o of
I ye ar
ag o Pci:.
Chicks Hatched
1966 Thou,
1967 Thou.
I o/o of year ago
Pet.
Feb. 18 Feb. 25 Mar. 4 Mar. 11 Mar. 18
895 945 1, 181
950 l, 065
l, 3 58
152
1,328
14 1
1, 198
101
l , 225
129
1' 16 0
109
766
993
130
706
1, 082
153
7 61
1, 025
135
677
1, 060
157
788
l, 0 50
133
BROIL:;:~>' TYPE
Week Ended
Z ggs Set!._/
I
1966
1967
o/o of
year ago
Chicks Placed for
-- - -- Av- .- P=-r-=ic-=e=---- - -
Hatch
B railer
Broilers in Georgia
E ggs
Chicks
1966
1967
o/o of
year ago
Per Doz. 1967
Per Hundred 1967
Thou.
Thou.
Pet .
Thou.
Thou. Pet. Cents
Dollars
Jan. 14
11,996 12, 392 103
8, 614
8, 783 102
60
Jan. 21
12,208 12, 562 103
8, 531
8,843 104
60
Jan. 28
12,392 12,892 104
8, 664
8,929 103
60
Feb. 4
12, 4 32 13,096 105
8, 897
8,909 100
60
Feb. 11
12,298 12,971 105
9, 102
9,063 100
60
Feb, 18
12, 302 13, 221 107
9,049
9,393 104
60
Feb. 25
12,61 6 13,346 106
8, 916
9 , 4 21 106
60
Mar. 4
13 ,001 13,174 101
8, 826
9, 70 6 110
58
Mar. 11
13,467 13,0 27
97
8, 875
9,914 112
57
Mar. 18
13,315 13, 185
99
9,025
9,968 110
56
Y Includes eggs set by hatcheries producing chicks for hatchery supply flocks.
8.75 8.75 8. 75 8.75 8.75 8.75 8.75 8.25 8.00 7.75
ARCHIE LANGLEY Agricultural Statisticia n In Charge
W. A , WAGNE R Agricultural Statistician
U, S. Departm ent of Agriculture 1
Agricultural Extension Service
Statistical Reporting Se rvi ce
State Department of Agriculture
315 Hoke Smith Ann ex, Athens , G e orgia
....
STATE
..,.
.......,.L.> .!.!.; ...... ..r..
~.-.~
-
E GGS 3E T
M~l We e k Ended
Mar .
Mar .
% of
y ear
'I C HICK3 PLACED
Ir -- ---- vVee k ~~ nded _
11 Mar .
Mar .
Mar .
4
ll
18
ago 1/ 4
11
18
Main e Connecticut Pennsylvania Indiana Missouri Delaware Maryla nd V ir ginia West Virginia North Carolina South Carolina
GEO.t{GIA
Florida Tennessee A l abama Mi ssissippi Arkan s a s Louisiana Texas Washington O r eg on California
TOTAL 196 7 (22 States )
TOTAL 1966* (22 S tat e s )
THOUSA NDS
2,022 3 70
l, 43 7 606 631
2, 9 70 4, 594 1, 777
157 7, 480
476
1,94 2 235
l, 174 567 642
2, 85 0 4, 541 1, 63 5
150
7' 150 510
2, 061 3 55
1,398 6 57 683
2,891 4, 570 1, 770
143 7, 329
527
13, 174 13,027 13, 185
;j
THOUSA NDS
II
102
l, 6 10
1, 535
l, 605
90
210
145
186
I
94 !! 891
894
971
89
383
333
340
., 88
105
:I
. I
388
2,718
479 2, 717
414 2, 739
99
3, 184
3, 120
3, 19 5
I 89
l, 095
85
3.<.:.: 2
10 0
I
i
5, 504
118 ;
37 5
l, 031 373
5, 725 364
l, 116 31 1
5,622 343
I
I
99 II 9, 70 6
9,914
9,968
839 95 6 9, 180 4 ,9 91 10, 346
l ' 10 5 4, 756
763 33 7 2, 159
864
999 9, 158 5, 157 10 , 538 l, 071 4, 743
83 1 325 1, 93 4
" 8 3 8
1,006
185 89
!I
470 l, 042
8,943 5, 05 3
98 106
.; !I
6, 893 4, 1~0
10, 384 104 ! 7, 69 0
l, 049 105 !, 857 4, 819 111 I 3 , 63 8
663 10 5 I 514
346 88 :I 25 0
2, 05 3 121 II' l, 4 66
4 77 960
7' 14 5 4, 255 7,7 68
872 3, 751
486 281 l , L} 83
506 l, 00 l 7, 265 4 , 269
7' 868 893
3, 740 4 80 284
1, 60 2
71' 126 70,0 4 3 70, 72 3 102 !1 53, 366 54, 108 54, 71 8
II
67, 4 74 68, 565 69 , 623
ll 49 ' 208
!
49, 530
50,61 3
o/o of Last Y ear
105
102
102
1/ Cur rent we ek as p e r cent of s ame week last ye ar .
* Revised.
li 108
109
108
K
% of
year
ago 1/
111 78
121 78 99
118 93 106 97 100 94
110
161 101 107 110 11 2 121 121 100 110 106
108
Q)
:'":J'
.-..+..-.'
::J
.'".d... ...u.....
ro OD P-t<t:
C/J'+-< Q) 0
(Q~)
-+-'
$:1
0)
'"d r~o
..8.._...
v ro
OOP,.
ro v
...,Q en
0
P-tU)
0
Q)
I-<
::J
.-..+..-.'
::J
..u...
... Q)
0
-+-'
~
<Ot;D ..U... :>
'+-< ...
U) ... 0 Q) :><:
::J ...,
Q)
UU))
z ~ $:1 on q ri1
~ er>on-
-+Q8->)
._.
....oS__,.
$:1
<t: ......c,
_tr.,_.lo.D.. o>U-<)
O~ro pv... -'8"'ovl11
OJ Q P:: U)l)~
r":'~">'
Ov l.r-.oV_v,
<i.;
en~>0-<
~--<
-+-'
ro
U
..:;
:I0!
$:1
v
Hr~
,2._. ci) -.~..,,L..()...-<Bt;rO~
<t;'"dro,..,-.,
.-Q.+..).->U-+-)'
~
0
? ? 5
7 GEORGIA CROP J AGRICULTURAL EXTENSION SERVICE UNIVERSITY OF" GEORGIA ANO TME ST~TE DEPARTMENT OF AGRICULTURE
REPORTING SERVICE
U. S. OEPA"TMENT OF AGRICULTURE STATISTICAL REPORTING SERVICE
315 HOKE SMITH ANNEX, ATHENS, GA .
March 22 , 1967
PROSPECTIVE PLANTINGS 1967
Geor gia
Based on fa rmers ' p lans as of March 1, the t ot a l a creage planted and t o be planted to in Ge or gia this year will be lar ger than 1966. Sharp increases in soybeans, corn and ~-~'-u and a s l i ght incr ease in sor ghum a creage more than offset the acreage decline in , barley, cot ton and Irish potat oes . The a creage of sweetpotatoes, peanuts and hay are
at the same level as 1966 .
The purpose of this report i s t o a ssist gr owers generally in making such changes in t heir a creage plans as may appear desir ab le . Acreages a ctua lly planted this year can be more or less than indicated for such r eas ons as weather or economic cond i tions , labor supp l y, farm programs , and how this report affe cts farmers ' actions.
CR O P
PROSPECT IVE PLANTINGS FOR PLANTED 1966
ACREAGES
Thous ands
Thousands
Potatoes , all .. Spring .....'
Summer ......
1,836 .0 321. 0 20 . 0
664. 0 1.2
.4 .8
14. 2
67.9 47. 0 156.0
506.0 482.0
1,593.0 206.0 14.0
403. 0
9 3 .6
12.0
63.4 45.0 324.0 500.0 460.0
Harvested. g/ Grown alone for all purposes.
Thousands
1,752.0 196.0 12.0
375.0
7 3 .4
12.0 74.8 46.0 486.0 500.0 460.0
Percent
110
95 86
93 78 100 70 100 118 102 150 100 100
IF~~~~~~l=O~P~e~r~c~e~n~t~: Georgia farmers have indicated they intend to plant 1,752,000 acres of corn for all purposes this year. If these intentions
the 1967 acreage will be 10 percent above last year but about 5 percent below of 1,836, 000 acres.
The State's 1967 cotton acreage is indicated at 375,000 a cres, 28, 000 acres below the 403,000 planted last year and 65 average of 664,000 acres. If these intentions are followed, ,:f record.
The r egular t obacco allotment plus an allowance for undermarketings in 1966 will permit Ge orgia farmers to plant an indicated 74,800 in 1967, compared wi th 63,400 a cres l a st year.
Peanut s planted alone this year are expected t o total 500,000 a cres, the same as last year.
The acreage seeded t o oats for the 1967 crop is indicated at 196,000 - 10,000 a cres less than planted in 1966.
~~~~~~~~~-P~e~r~c~en~~t: Ge or g ia gr owe rs indicated they would plant 486, 000 acres of soybeans f or a l l purposes in 1967. This would be an increase
over last year.
A tot al of 46,000 a cre s i s expected to be planted in 1967, compared with 45, 000 acre s l ast year.
Pleast turn page f or United States information.
UNITED STATES PROSPECTIVE PlANTINGS FOR 1967
Planting int ent ions f or the 17 crops included i n the March l survey t otal 257 million a cres --3 percent mor e than last year .
If growers carr y out their plans f or the 17 crops, a nd an allowance is made for the other cr ops not surveyed in Mar ch the indicated p lanted acr eage for all crops in 1967 is 316 milli on acr es - - 18 million mor e than last year .
1f FLANTED ACREAGES, UNITED STATES
.CR 0 P
Ave rage 1961- 65
1966
Indicated 1967
1967 as percent of 1966
Thousands
Thou s a nd s
Corn , all .. . . . .. ... ..... . Durum Wheat . ......... . .. . Other Spring Wheat . ... .. . Cats ..... ... .. . . ....... . . Barley ...... . .. .. ...... . . Cott on . . ... . .... . . .. . . . . Sorghums, all ...... . .. . .. . Irish Pot atoes , all .. . Sweetpot at oes . . . ... . .... .
Tobacco ?:./ ... . ... .. .... ..
Soybeans - 3) . ............ .
Peanuts 'if ......... .... .
H~y ?:.} .. . .
66 ,130 2,231
9,355 27, 902 13,041 15 , 342 16,144
1, 413 206
1, 126
30, 500 1, 507
67,285
66,255 2, 511 9, 106
23, 181 11,171
10,353 16,346
1, 513 191
9 76 37,388
1, 507 65, 192
1./ Does not include Alaska and Hauaii . g/Acreage Harvested .
Th ou s a n d s
Percent
70 ,638 3,287
10 ,616 21,162 10 ,182
9,975 18,346
1,470 180
985 40,602
1,494 63,865
106.6
130 .9 116 . 6
91.3 91.1 96 .3 112 . 2
97.1 94.1 101.0 108 . 6
99 . 1 98 .0
}/ Grown alone f or
Feed Grain Acreage 3 Percent l ar ger : Producers ' p l a ns on March 1 indicate a t otal feed g acreage of 120 . 3 milli on -- 3 percent mor e than l ast y
but 2 percent belovl average . Subst ant ial increases i n corn and s orghums more than offset declines in oats and barley . Corn acreage is expect ed t o incre ase 7 percent 1\'i th all r egie of the country shmring a n increa se except the South Centr al. A 12 pe rcent increase is indi cat ed in sorghum acreage . All m~jor producing States expect sorghum plantings to be abo~ last year. A maj or fact or in the increase in corn and sorghum a creage is the elimination fr om t he 1967 Feed Grain Progr am of the provi s i on f or voluntary acr eage diversion f or pa except on small f arms . Als o7 oarley is not included i n the Program. Oat s acr eage is e~ ed t o be 9 percent smalle r , continuing a downward trend . Most Stat es indicat e a de crease fr om last year . Barley a creage is also expected t o be down 9 percent. The decrease is due partly t o increased planting of wheat .
Cotton: Growers p lan t o plant 9,975,000 acres of cotton this year, 4 percent less than year. If these plans mat erialize , the U. S . cot ton acreage vrill 11break be l ow'' the
10 million level f or the first t i me in nearly a century . The Domestic Allotment program, begun last yea r , is in effect again this year and even heavier a creage diversi on is expec Participation in the progr am was general last ye ar and the acreage dropped t o 10) 353,000 acres , 27 percent les s than the 14,152, 000 planted in 1965. Pri or t o pladng this program operation , the planted acreage ave r aged 15, 342, 000 acres (1961-65) .
Soybeans : For the seventh consecutive year gr Jwers intend t o plant a record high a creage soybeans. Prospective soybean acreage planted alone f or all purposes t otals
40 ,602 ,000 acres, almost 9 per cent more than 1966 and 33 percent above ave r age . All regie expe ct a creage increases from a year earlier, largest in South Central St ates at 16 perce
The other indicated in creases are : South Atlantic , li percent j North Centra l , 6 percent;
the minor producing North Atlantic , 9 percent .
Tobacco : Grower s intend t o set 985,200 acres of all types of tobacco f or harvest in 1967,
slightly above the 975 , 500 harvested last year. Acres harvested averaged 1, 125,
f or 1961-65 . Flue -cur ed is the only class of t obacc o for which an increase above 1966 is
expected. Burley acreage is expe cted t o show no change . All types of t obacco except
Mary land, Pennsylvania Seedleaf , Shade-grown , and Perique are under quot as thi s year and
bas ic allotments are unchanged fr om 1966 .
ARCHIE LANGLEY Agricultural Statistician In Charge
C. L . CRENSHAW Agricultural Statistician
Aft er Five Days Return t o United St ates Department of Agriculture
Statistical Reporting Ser vice 315 Hoke Smith Annex Athens, Ge orgia OFFI CIAL BUSINESS
Postage and Fees Paid U. S . Department of Agriculture
GEORGIA CROP REPORTING SERVICE
ATHENS, GEORGIA
March 23, 1967
1967
Item
1967 21
o/o of
last year
Jan. thru Feb.
1966 1I
1967 21
o/o of
last year
Broiler Type
Pullets Placed (U.S. )3 I
Total
Thou.
Thou.
Pet.
3,372
3,415 101
Thou.
Thou.
Pet.
6,448
6,443 100
Domestic Chickens Tested:
2,990
2, 938 98
5, 613
5, 545
99
Broiler Type Georgia United States Egg Type Georgia United States Chicks Hatched:
42 7 2,056
27 647
600 141 2,388 116
27 100 639 99
974 4 ,456
65 1, 719
1, 187 122 5,473 123
89 137 1, 831 107
Broiler Type Georgia United States
3 8, 761 207,420
40,360 104 216,853 105
79, 621
86,689 109
427,079 484,782 114
Egg Type Georgia United States
2,888 41,178
3,932 136 46,445 113
5, 290 77,380
6, 850 129 87,024 112
Commercial Slaughter:41
Young Chickens Georgia
27,875
28,449 102
56,373
60,732 108
United States
159,307 162,048 102
323,232 349,946 108
Hens and Cocks
Georgia
United States
E~g Pr~duction:
eorg1a
5outh Atlantic 51
1, 162 11,995
Mil. 312 885
1, 287 111 14, 528 121
Mil. 374 120
1, 005 114
2, 278 2~, 473
Mil. 653
1, 850
2, 701 119 31,246 128
Mil. 785 120
2, 104 114
United States
5, 032
5, 4 10 108
10, 537
11, 326 107
Revised. 2 Preliminary. 3 Pullets for broiler hatchery supply flocks, includes
expected pullet replacements from eggs sold during the preceding month at the rate of
lZS pullet chicks per 30-doz. case of eggs. 41 Federal-State Market News Service-
Slaughter reports only include poultry slaughtered under Federal Inspection. 51 South
AtlanticStates: Del,, Md., W.Va., N.C., S.C., Ga., Fla., Va.
-
YOUNG CHICKENS: SLAUGHTERED UNDER PEDERAL INSPECTION BY SELECTED STATES, 1965,66 and 1967
Number Inspected
Indicated Percent Condemned
State
During Jan.
Jan. thru Dec.
During Jan.
Jan. thru Dec.
1966
1967
1965
1966
1966
1967
1965
1966
Thou.
Thou.
Thou, Thaj
Pet.
Pet.
Pet.
Pet.
Maine
5,623
5,929
65,694 69, 801 2.9
3.5
2. 5
3.3
Pa.
5, 817
:r,449
84,274 87,322 4. 1
4 .9
3.3
4. 1
Mo.
2,747
3,321
37,457 36, 175 6.2
7.0
2.9
5, 2
Del,
6,672
7,4~
89,654 92,683 4,4
4.9
3. 1
4.3
Md.
9,745 12, 687 120,995 140, 147 4. 5 .
5.4
3.4
4.3
Va,
3,073
3,856
44,321 42, 867 3.3
5.0
3.2
3.3
N. C. 17,811 21,227 225, 199 252,172 4.2
5. 5
2.5
3.9
Ga.
26, 552 31,602 346,626 378,765 3.4
5.6
2.6
3.7
Tenn. Ala.
4,484 17,885
5,025 19,718
55,965 61,676 3.3 224,401 252,933 3.3
7.7
2.2
5.0
2.4
3.6
:
3.2
Miss. ll; 728 13,285 152,428 160,318 3.7
5. 1
2.5
3.2
Ark.
23, 262 27, 136 290,626 319,726 3,8
6. 1
2.8
3.9
------ Texas
u. s.
- _19!_1}~----
161,390
J)_,_~~l----!! ?!.. ~~?-
2, 057,639
!~
!!..-~??-
--4-.-0-------4-.-2------2-.-8--------3-.4-------
3.8
5.3
2.7
3.7
188, 531
2,236,04 1
The Georgia Crop Re p orting Service, USDA ' 315 Hoke Smith Annex, Athens, Geor gia, in cooperation with the Cooperative E xtension Service, Unive rsity of Georgia and the
Georgia Department of Agriculture.
End-of-Month Stocks of Poultry, Poult ry Products, M eat and M eat Products Unite d State s - Fe bruary 1967
Shell eggs : D e cr ea s e d by 10 t housand cases; Fe bruary 196 6 chang e was a decrease of 56 thousan d cases; ave rage February d e cr e ase is 26 thousand cases. Frozen eggs:
Increased by 4 million pounds; February 196 6 c hange was a d e crease of 10 million pounds; ave rage Februa ry change is a de crease of 6 million pounds. Frozen poultry: Decreas ed by 36 million p ounds; Fe brua r y 1966 de crease was 36 million pounds; average February d ecrease is 44 million pounds . Be e f: Decreased by 7 million pounds; February 19 66 decr ease was 4 million pounds; av e rage February decrease is 14 million pounds. Pork : Increas ed by 37 million pounds; Fe bruary 1966 increase was 28 million pounds; ave rag e Fe bruary i n creas e is 29 million pounds. Other meats: Increased by 3 million pounds; February 1966 change was a dec reas e of. 7 million pounds; average F e b r uary change is an increase of 7 million pounds.
Commodity
E ggs: Shell Frozen eggs, total
Total eggs }:_/
Unit
Cas e Pound Case
Fe b . 196 1-65 av.
Thou.
47 44, 03 6
l , 162
Feb. 1966
Thou.
J an. 1967
Thou.
20 28, 166
733
64 37,081
1,003
Feb. 1967 Thou.
54 41,367
l, 101
Poultry, frozen Broilers or fryer s Hens, fowls Turkeys Other & Unclassified
Total Poultry
Pound do. do . do. do.
23 ,376 53,358 180,891 46 ,439 304 ,064
18,624 28,940 156, 4 71 4 5, 196 249,231
44,255 56,005 274,761 61, 654 436,675
41, 535 55, 051 246, 598 57, 9Z6 40 l, 110
Beef: Frozen in Cure and Cured
Pork: Frozen in Cure and Cured
Other meat and meat products
Total all red meats
do.
do.
I
do.
j
do.
202, 738
289,418
102, 152 594 ,308
24 7,937 319,362
183, 4 80 256,244
74 , 322 92, 230 505, 739 667, 836
312,564
293, 31Z
94, 855 700, 731
MID-MONTH PRICE S RECZ IVE D AND PRICES PAID
Item Prices Received:
Feb. 15 1966 C e nts
G e orgia
J an. l 5 Feb. l 5
1967
:::: ~ nts
1967 Cents
I 1 Feb . 15 1966
1 Cents
United States
Jan. 15 Feb. 15
1967
1967
Cents Cents
Chickens, lb. excluding
broilers Com 11 Broilers (lb.)
12.0 15. 5
10.0 12 . 5
9.0 14.0
10. l 16.2
9. l
13.9
8.8 15.4
All Chickens (lb. )
15. 3
12 .3
13.7
15.6
13.3
14.6
All Eggs (dozens)
51. 4 43 . 1 38. 8
41.3
37.4
32.4
Prices Paid: (per 100 lb.)
Dol.
Dol.
Dol.
Dol.
Dol.
Dol.
Broiler Grower
5.00
5. 30
5.20
4.93
5. 14
5.07
Laying Feed
4.85
5. 10
5.00
4.51
4.73
4.70
Scratch Grains
4.20 4 .50 4.45
3.95 4. 12 4. 10
1/ Frozen eggs converted on the basis of 39.5 pounds to the case.
*This *re*p*or*t *is*m*a*de*p*o*ss*ib*le*t*hr*ou*g*h *th*e *co*o*pe*rati*o*n *of*th*e*N*a*ti*on*al*P*o*u*ltr*y*Im*p*ro*ve*m
Plan, Official State Agencies, the Animal Husbandry Research Division of the Agriculb
Research Service, the Inspection Branch of the Poultry Division, Consumer and Marke
Service a1d the Agricultural E stimates Division of the Statistical Reporting Service and
the many breeders, hatche ries, po ultry p rocess ors and th e poultry farmers that report
these agencies.
ARCHIE LANGLEY
W. A. WAGNER
Agricultural Statistician In Charge
Agricultural Statistician
After Five Days Return to:
Postage and Fees Paid
United States Department of Agriculture
U. S. D e partment of Agriculture
Statistical Reporting Service
315 Hoke Smith Annex
Athens, Georgia
OFFICIAL BUSINESS
1 { I '-
WOOL
PRODUCTION, PRICE AND VALUE -- 1966
i.Vi:arch 27, 1967
1966 WCOL PRODUC TION DGWN 7 PERCENT
Wool production in Ge orgia during 1966 totaled 38,000 pounds, 7 percent below the previous Is revised';estimate of 41,000 pounds, according to the Crop Reporting Service.
of sheep shorn was placed at 6,100 head, 700 below the 1965 total. Weight per 6.2 pounds compared with 6.1 a year earlier.
~e average price per pound r eceived by producers was down $ .11 at $ .44. Total value ted to $17,000 compared with $23,000 in 1965.
of shorn and pulled wool in the United States in 1966 amounted to 218 million s, grease basis. This was 3 percent below 1965 production of 225 million pounds
Shorn wool production in _l966 totaled 194 million pounds, a 4 percent decline from the revised production of 201 million pounds. Shorn wool production in 1966 is equivalent to mllion pounds, clean basis, compared with 96 million pounds in 1965, using a conversion
or of 47. 7 percent
~e number of sheep and lambs shorn in 1966 totaled 22.9 million head, a 4 percent dee from the 23.8 million head shorn in 1965. The 1966 fleece weight averaged 8.49 pounds fleece compared with 8.48 pounds in 1965.
fulled wool production in 1966, at 24.1 million pounds, was 3 percent above the 1965 proion of 23.3 million pounds. Production of pulled wool in 1966 was equivalent to 17.6 on pounds, clean basis, compared with 17.0 million pounds in 1965, using a conversion facof 72.9 percent. Commercial slaughter of sheep and lambs during 1966 was 2 percent below 1965 slaughter. The average weight of wool pulled per skin was 3.43 pounds compared with 37 pounds in 1965.
Farmers and ranchers in the Unit ed States in 1966 received an average price of 52.1 cents p~nd for shorn wool. This was 5.0 cents a pound higher than the average price of wool in 1965. In the native sheep States (which account for most of the "fleece" wool producing of the country) the price received averaged 51.8 cents per pound in 1966. For the 11 rn States, Texas, and South Dakota (which produce most of the 11 territory" wool) the 1966 ~e price was 52.2 cents per pound. The total value of shorn wool produced in 1966 was million, an increase of 6 percent from the 1965 value of $95 million.
ARCHIE LANGLEY ultural Statistician In Charge
R. L. SANDIFER Agricultural Statistician
~orgia Crop Reporting Servic e , USDA, 315 Hoke Smith Annex, Athens, Georgia, in cooperation Extension Service, University of Ge orgia and the Georgia Department of
WOOL PRODUCTION 1\l\ID VALUE BY STATES 1965 AND 1966
STATE
~
Maine N. H. Vt. Mass. R. I .
Conn . N.Y.
N J Pa. Ohio
Ind.
ill.
Mich. Wis. Minn . Iowa;
Mo. N.Dak . S. Dak.
Nebr. Kans. Del. Md. Va.
w. Va.
N. C.
s. c.
GEORGIA. a.
Ky Tenn . Ala . Miss . Ark . La . Okla . Texas Mont . Idaho Wyo . Colo. N. Mex .
Ariz. Utah Nev. Wash.
Oreg. Calif.
21
7.2
5.4 7.0
7.5
8.1
9.4 7.4
2.1
7.0
7.2
8.1
7.6
151
57
38
55
61
54
70 55
15
55
35
54
807
56
73
58
56
157 83 10 23 12 42
117
789 1,910 1,198
922 570 1,018 219 206 662 1
7.4 5.6 6 .0
5.0 6.7
7,856
50
18,945
46
11,001 46
8,669
40
4,068
37
9,595
45
2,075
45
1,894 48
5,053
52
14 741
48
86
18
21
33
38
8
19 :
452
42
639 : 260
32
62 36 I 100 :
387
3,928 : 8,715 : 5,060 3,468 1,505 4,318
934 9C9
2,628 : 7 076
751 1 ,859 1,346
916
5C6 991 226 171
613
7.6
65
7.2
62
8.1
61
7 .s
62
7.2
64
61
59
50
57
6.0 5.7 6.2 6.7
57..3a
1,066
54
423
55
6.0
52
50
5.1
102
51
6.7
67
46
4.6
156
48
8.4
1,012
42
7
38
7,813 19,300
11,940
8,712
3,627 9,895 2,241
1,567 4,905
48 Statesr
. ..
Alaska Hawaii
23 2738 18
8.48 201,254 47.1
11.6
209
53.1
N 0 T AVA ILAB LE
111 :
19
11.3
N0 T
u. s. : 23,756
8.48 201,463
47.1 94,999 22,875
8.49 194 149
:!TIIicludes shearing at comnercial feeding yards . .
~ For Texas and California the weight per fleece is the amount of wool shorn per sheep and
y year. For each State, monthly price weighted by monthly sales of wool , January through December.
price is State prices weighted by sales.
~/Production multiplied by January-December average price.
u. s.
After Five Days Return to
United States Department of Agriculture Statistical Reporting Service 315 Hoke Smith Annex Athens, Georgia- 30601 OFFICIAL BUSINESS
Postage and Fees Paid
u. s. Department of Agricultlll't
GEORGIA CROP REPORTING SERVICE
ATHENS, GEORGIA
March 29, 1967
GEORGIA CHICK HATCHERY REPORT
Placement of broiler chicks in G e orgia during the week ended March 25 was 9, 965, 000 -- slightly less than in the previous we-ek but- 7 percent more than in the
comparable week last year, according to the Georgia Crop Reporting Service.
An estimated 13, 167, 000 broiler type eggs were set by Georgia hatcheries --
slightly less than in the previous week and 3 p er cent less than i~ the comparable week a year earlier.
The majority of the prices paid to Ge orgia producers for broiler hatching eggs
were reported within a range of 45 to 65 cents p e r dozen. Th3 average price of hatching eggs was 56 cents per dozen. The pric e of eggs from flocks with hatchery owned
cockerels generally was 2 cents below the ave rage price. Most prices received for
broiler chicks by Georgia hatcheries were reported within a range of $5. 00 to $9. 25 with an average of $ 7. 7 5 per hundred. The average prices last year were 6 5 cents for eggs and $10. 00 for chicks.
G:60RGIA EGGS SET, HATCHINGS , AND CHICK PLACEM NTS EGG TYPE
Week Ended
Eggs Set
1966
Thou.
1967
Thou.
o/o o f
year ago
Pet.
Chicks Hatched
1966
Thou.
1967
Thou.
o/o of
year ago
Pet.
Feb. 25
Mar. 4 Mar. 11
Mar. 18 Mar. 25
Week Ended
945 1, 181
950 1, 065 1,273
Eggs Set}:_/
1966
Thou.
1967
Thou.
1, 328
14 1
706
1, 198
101
761
1, 225
129
677
1, 160
109
788
1' 191
94
945
BROILEH. TYPE
%of year ago
Pet.
Chicks Placed for
Broilers in Georgia
1966
1967
% of year
ago
Thou.
Thou. Pet.
1, 082
153
1, 025
135
1, 060
157
1, 050
133
905
96
Av. Price
Hatch Eggs
Broiler Chicks
Per Doz.
1967
Per Hundre d
1967
Cents
Dollars
Jan. 21
12,208 12, 562
103
8, 531
8, 843 104
60
Jan. 28
12,392 12,892
104
0,664
8,929 103
60
Feb. 4
12,432 13,096
105
8, 897
8,909 100
60
Feb. 11
12, 298 12,971
105
9, 102
9,063 100
60
Feb. 18
12,302 13,221
107
9,049
9,393 104
60
Feb. 25
12,616 13, 346
106
8, 916
9,421 106
60
Mar. 4
13,001 13, 174 101
8,826
9,706 110
58
Mar. 11
13,467 13,027
97
8, 87 5 9,914 112
57
Mar. 18
13,315 13, 185
99
9,025 9,968 110
56
Mar. 25
13, 594 13, 167
97
9,276
9,965 107
56
1/ Includes eggs set by hatchenes producmg ch1cks for hatchery supply flocks.
8.75 8. 75 8.75 8. 75 8.75 8.75 8.25 8.00 7.75 7.75
ARCHIE LANGLEY Agricultural Statistician In Charge
W. A . WAGNER Agricultural Statistician
U. S. Department of Agriculture
Agricultural E xtension Service
Statistical Reporting Service
State Department of Agriculture
315 Hoke Smith Annex, Athens, Georgi
STATE
Mar. ll
THOUSA NDS
Mar.
25
% of
year
a 1/
Mar.
11
THOUSANDS
Mar.
25
Maine Connecticut Pennsylvania Indiana Missouri Delaware Maryland Virginia West Virginia North Carolina South Carolina
1,942 235
l, 174 567 642
2, 850 4, 541 1, 635
150 7, 150
510
2,061 355
1, 398 657 683
2, 891 4,570 1, 770
143 7,329
527
1,947 96 289 64
1, 489 108
580 75
740 92 2, 865 103 4, 542 98 1, 805 93
160 92 7, 589 105
495 108
l, 535 145 894 333 479
2, 717 3, 120 1, 031
373 5, 725
364
l, 605 186 971 340 414
2,739 3, 195 1, 116
311 5,622
343
1, 607 162 872 356 418
2, 771 3,364 1, 211
303 5, 708
377
GEORGIA
13, 027 13, 185 13, 167 97
9,914
9,968
9,965
Florida Tennessee Alabama Mississippi Arkansas Louisiana Texas Washington Oregon California
(22 States)
* TO~AL 1966 (2 States)
864
999 9, 158 5, 157 10, 538 l, 071 4,743
831 325 l, 934
838 1, 006 8,943 5, 053 10,384 1,049 4,819
663 346 053
3
842 168
986 84
8,979 96 5,054 107 10,478 104 l, 171 119 4,762 109
858 114 449 124 992 102
1
477 960 7, 1L15 4,255 7,768 872
506 l, 001 7,265 4,269 7,868 . 893
3,740 480 284
1,602
399 1, 146 6, 988 4,223 7,924
869 3,765
583 294
8
68, 565 69,623 70,473
49, 530 50, 613 51, 998
% of Last Year
rrent wee
* Revised.
102
as percent
102
101
same week last year.
109
108
106
o/u of
114 70
100 78
108 112
99 127 92 98 102
107
100 112 99 106 109 121 115 101 101 10 10
Q.l
:":"3
.".0.....:!:::3:
P~-t ..u..
H
{/) tlO
<I) .:X:
<I) ~
.....
0
"0 ~ s:l s:l
~ <I)
E <I)
tl.O~
~ H ~ ~ {/) p..
0 <I)
. P-tO
.Cf)
:::::>
<I)
H ::::1
~ ~
...:u:.:.:1.
.0....
H tlO
~
u<I) ......
s:l ..... ~ ~ 0 <I) ><
~ .... {f)<!) Cf)
Q)Qoos:l (I)
E ~<I) ..s.:l. ~s:l .~... zr~
til ~ ~
tlOH
~ > -~HoH~. . o . C:H:U>' )
q ~~-<I)~
~o~ u)o .....:l
.~~.<H..<CI..) If~ .).~~)...~.'-,.lu .:~ ..{~/.;)!.o ::<..I.<:::I)1.1...Q<r..d.I).)i~lUHH~~~
~~2~ 0
.~ .....U)
s:l
:::::>
3 15
I
I I
I
I \
i\ ( (1\J- l 1 , . I\ .
_, I~ II i_J, / 1-\ -- -
,I I
-; '- f' ; -. . \
I ' \ I, II /--
' -- I I I
II~\.II~\\ \___.
.../
\ /
, __ ; \1,'
'
I
I--
I . (
I
I
I j
'~ "'
I
I
l
March 1967
J AN UAR Y 1, 1965
years
&
old & older
Cattl e &
Kep t
Kept Calve s
for
for
Milk
Bee f
13,100 11 , ooo
9 ,700 5 , 000 19 , 500 16 ,400 6 ,700 6 , 600 10,700 18,400 14 , 600
131,700
1 ,800 2 ,950
870 300 3,2 00 2 ,100 73 0 1, 000 1,900 2,850 2, 800
20 ,500
5,750 3,200 5 , 000 2 , 400 7, 600 6 ,650 2, 500 2,350 4, 050 7 , 000 4,900
51,400
5,550 4 , 850 3 ,830 2, 300 8,7 00 7, 650 3 , 47 0 3 , 250 4 ,750 8,550 6 ,900
59,800
10,400 15,3 00
5,000 8 ,300 2,950 4,850 4 ,9CO 14 ,2CO 14,000 5,150 12 ,500 19,000 1 2 , 8 00 5 ,400 7,750 4 ,650 3,250 5,900 14 ,200 6 ,500
177 ,ooo
720 1,850
780 930 49 0 1,300 1,550 1,200 1,500 1,100 1,050 3,950 1,050 780 1,200 350 700 1,000 1,950 750
24,200
4,550 6 ,200 1,900 3,450
950 1,500 1,300 6 ,300 6 ,200 1,850 5,250 6 ,400 5, 6 00 2,150 3,050 2,250 1 ,150 2 ,300 5 , 600 2,350
70,300
5,130 7,250 2,320 3,9 20 1,510 2,050 2,050 6 ,700 6 ,300 2,200 6 ,200 8,650 6 ,150 2,470 3,500 2,050 1,400 2,600 6 ,650 3,400
82,500
6 ,000 11,200 14 ,100 11,800 10,6 00
6 ,750 8 ,500 12,100 3 ,250 4 , 200 21,600
110,100
850 1,450 1,950 1, 050 2,000
400 800 1,450 850 900 3,700
15,400
2 , 250 4 ,450 6 , 000 4 ,500 3,550 3 ,750 3 ,650 5 ,400
950 1,450 9 ,550
45,5 00
2 ,900 5 ,300 6 ,150 6 , 250 5 ,050 2,600 4 , 050 5 ,250 1,450 1,850 8 ,350
49,200
J A NUA RY 1, 1966
& Cal ves
years
old & older Ke pr----Kept
for
for
Milk
Bee f
Ca ttle & Calves
13,000 11, 000
9,8 00 4,900 19 ,3 00 16 ,200 6 ,800 6 ,400 10,900 18,300 14 ,400
131,000
1,650 2 , 800
800 300 3 , 000 1,950 650 850 1,700 2 ,700 2, 600
19,000
5,850 3,300 5,100 2 ,4 00 7,7 00 6 , 600 2,450 2,400 4,200 7,200 4,800
52,000
5,500 4,900 3 ,900 2,2('0 8 , 600 7 ,650 3 ,7 00 3,150 5,000 8,400 7,000
60,000
10,200 15,000
5,000 8 ,ooo 2,800 4,700 4,800 14,000 13,900 5,000 12,500 19,000 12,800 5,400 7,700 4, 6 00 3,200 5,900 14,000 6 ,500
175, 000
700 1,750
750 900 450 1,250 1,450 1,100 1,400 1,000 1,000 3,800 1,000 750 1,150 300 650 900 1,800 700
22,800
4,700 6,200 2,000 3,500
900 1,450 1,400 6 ,500 6,200 1,950 5,400 6,350 5,800 2,300 3,200 2,400 1,300 2,300 5,900 2,450
72,200
4,800 7,050 2,250 3,600 1,450 2,000 1,950 6,400 6,300 2,050 6 ,100 8,850 6 ,000 2,350 3,350 1,900 1,250 2,700 6 ,300 3,350
80,000
5,800 10,800 14 ,000 11 ,600 10,400
6 ,7 00 8 ,3 00 11,800 3, 250 4,050 21,300
108, 000
800 1,350 1,800
950 1,850
350 750 1 ,350 750 850 3,500
14,300
2 ,450 4, 600 6 ,200 4, 600 3 ,700 3,900 3,700 5,550
900 1,550 9,850
47 ,ooo
2,550 4,850 6 ,000 6,050 4 ,850 2,450 3,850 4,900 1,600 1,650 7,950
46 ,700
------------------------------------------------------ Georgia Crop Reporting Service, USDA, 315 Hoke Smit h Annex, Athens , Georgia in cooperation with the Coopera-
E:t~n~i~n_S~r!i~e.! ~2:_v~r~i!y_of ergi~ ~n~ !h~ e_rgi~ Qe,a~e!!t_of Agr icultur~.
____ _
UNIVE RS ITY OF GEORGIA
JU L 19 1967
Lli3flARIES
District
&
Co
DISTRICT IV Carroll -
Chattahoochee
Clayton Cowe t a Dougla s Faye t t e Haral son Ha r r i s Heard Henry Lamar Ma c on i'.!ar i on Meriwe t her Mu s c o g e e Pi ke Schley Spalding Talbot Taylor Troup Upson
Total
DISTRI CT V
Baldwin Bibb Bleckley But t s Crawford Dodge Gr eene Hanco ck Hou st on J a sper Johnson J ones Lauren s Monroe Mon t g omer y Morgan Newton Peach Pul a ski Putnam Ro ckdale Taliaferro Treutlen Twigg s Washingt on Vlheeler Wilkinson
Total
-BDIu-SlTl-oRcI-ChT-V-I
Burke candler
Columbia Effingham Emanuel Glascock Jefferson J enkins McDuffi e Ricbnond Screven Warren
Total
CATTLE AriD CJ.LVE S ON GEORGIA FLRHS BY COLN TY
JA NUAR Y 1' 1965
year s
&
old & ol der
Cattle &
.Kept
.Kept Calve s
f or
for
Milk
Beef
21 , 100 65 0
3 , 650 15 , 900
3 , 250 10,000
5,700 9 ,900 6 ,350 1 2 , 900 7 ,750 24 ,800 7,700 14 , 400 3 , 000 9 , 550 4 ,400 11 ,800
7, 300 7 , 350 11 , 600 8,950
208 , 000
1,700 20
760 1 ,900
640 460 850 1 , 050 460 1,850 840 2, 000
410 2 ,400
360 320 370 890 330 320 2 , 650 720
21,3 00
9 ,800 350
1,150 6 ,800 1 , 200 4,550 2,200 5 , 050 3,200 5,050 3,400 12,800 3 ,850 6 ,000 1 , 200 4, 600 1 ,750 4 ,550 3 ,750 3, 600 4 , 250 4 ,100
93 1 2CO
9,600 280
1 ,740 7,200 1 ,410 4 ,990 2,650 3, 800 2 , 690 6 , 000 3,510 10, 000 3 ,440 6,000 1 , 440 4 , 630 2 , 280 6 ,360 3 , 220 3 ,430 4 ,700 4 ,130
93 , 500
8 ,800 6 ,400 11 , 300 6 ,450 5 ,950 11 , 600 15,100 8 ,400 14 , 200
11 , 600 10, 500 1 0 , 1 00
23 , 900 13 , 900
6 ,700 21,300 13 ,7 00
6 , 850 8 , 3 00 13,100 4,700 5 , 250 5 ,700 5,150 18 , 300 6 ,550 3 ,7 00
277 , 500
1 , 250 2 , 350
47 0
910 7 CO 600 4 ,750 1 , 250 1, 250
2 , 950 3 00
2 ,150 980
6 ,150 310
9,450 2,800
420 140 7,950 550 1,3 00 150 480 1,850 250 290
52 , 000
3 , 650 1 ,700 3,450
2 , 800 2,450 5 ,100 4,950 3 ,400 5 ,650
4 ,400 4 ,950 3 ,700 9 ,850 2 ,450 3, 050 4 ,400 5 , 050 2,7 00 3, 550 1,700 1 , 650 2 ,100 2 ,850 2, 000 7, 600 3 , 050 1 ,500
99 ,800
3 ,900 2 ,350 7 ,380 2 ,740 2 ,800 5 ,900 5 ,400 3 ,750 7,3 00
4 , 250 5 , 250 4 , 250
13 , 070 5,300 3,340 7, 45 0 5,850 3,730 4 , 51 0 3 ,450 2 ,500 1,850 2 '7 00 . 2 , 670 8 ,850 3 ,250 1,910
125 ,700
29 ,7 00 21 , 7 00 8 ,650
9 , 200 8 ,600 19 , 100 2 , 550 14,600 11,400 7,500 3 ,7 00 27 , 3 0 0 10, 200
174, 200
1,900 1 ,900
210 1 , 450
580 960 120 1 ,400 4 , 200 790 55 0 1,550 790
16 , 400
11,300 7,5 00 3 ,600 3,800 3,550 8 ,450 1,050 4 , 5 00 2, 300 3 , 250 1,3 00
n ,ooo
4,700
66 , 300
16 , 500 12,3 00
4 ,840 3, 950 4 , 470 9 ,690 1 , 380 8 ,7 00 4 , 900 3 ,460 1,85 0 14,750 4,710
91 ,500
JANU/: B. Y 1, 1966
& Calves
years
old & older
Kep t
Kep t
for
f or
f
Cattle & Calves
20,300 600
3 ,550 15 ,500
3,100 9 ,800 5 ,400 9,400 6 ,200 1? ,400 7,550
23 ,ooo
7,500 14 , 000
2,750 9 ,400 4 ,100 11,500 7,150 7,3 00 10 , 800 8 ,700
200, 000
1 ,550 20
730 1 ,750
600 440 800 1,000 430 1,700 800 1,850 380 2 , 200 340 300 350 870 310 300 2 ,400 680
19,800
9 ,7 00
350 1,100 6 ,900 1,100 4,350 2 ,2 00 4 ,900 3,100 5,000 3 ,350 12 , 400 3,800 5 , 800 1,250 4,700 1,700 4 ,700 3, 800 3 , 500 4 , 300 4 ,2 00
92,300
9 ,C60 230
1,720 6,850 1,400 5,010 2,400 3,500 2,670 5 ,7 00 3,400 8,750 3,320 6,000 1,160 4,400 2,C60 5,930 3,040 3,400 4,100 3,B20
87,900
8,800 6 ,300
n,ooo
6 ,400 5 ,850 11 ,700 15 , 000 8 ,100 13,800 11 , 500 10 , 300 9,800 23 , 000 13,500 6 ,500 21, 000 13 , 600 6 ,800 8 , 250
13 , ooo
4 , 65 0 5,300 5,7 50 5,100 18 , 300 6 , 500 3 ,700
273,500
1,150 2 ,2 00
450 850 650 560 4,300 1 ,150 1 ,150 2,7 00 280 2 , 000 900 5 , 65 0 290 8 ,800 2, 550 400 130 7,3 00 500 1, 200 130 440 1 ,7 00 220 250
48 , ooo
3,850 1 ,750 3,600 2,850 2 , 600 5,400 5,150 3 ,600 5, 800 4 , 600 5,100 4,000 10,000 2,550 3,200 4 , 650 5,150 2,9 00 3,700 1,800 1,700 2,250 3,000 2, 200 7,9 00 3,100 1,600
104,000
3 ,BOO 2,350 6 ,950 2,700 2,600 5,740 5,550 3,350 6,850 4,200 4,920 3 ,BOO 12,100 5,300 3,010 7 ,550 5,BOO 3,500 4,420 3,900 2,450 1 ,B50 2,620 2,460 8,700 3,180 l,B50
121 ,500
28 ,8 00 20 ,800 8 , 400 9 ,000 8 ,300 19 , 000
2, 300 14 ,300
n ,ooo
7,400 3 ,500 27, 000 9,700
169 ,500
1,7 00 1 ,750
190 1 , 400
540 900 110 1,300 3 ,900 750 500 1,500 760
15 , 300
1 0 , 9 00 7, 200 3 ,500 3 ,700 3 ,500 8 , 500 1,100 4,600 2,400 3,300 1, 200 11,200 4 , 500
65, 600
16,200 ll,B50 4,710 3,900 4,260 9,600 l,C90 8,400 4,7 00 3,350 1,800 14,300 4,440
88 ,600
CATTLE Ju'TD CALVES ON GEORG IA FARMS BY COuNTY
J A NUA RY 1, 1965
All Cattle & Calve s
Cows--"2" yea rs
k e p to_l d_&_ _o l dKe re pt
f or Milk
fo r Be e f
A ll Other
Cattle &
Calve s
1 1 , 2 00 13,7 00
8,150 25,100 21,3 00 27 , 5 00 19,800 26 , 000 23,800 37,500
3,000
13 ,ooo
19,100 6,700
61,000 13,300 2 6 , 2 00
3,650
360,000
50 150 250 1,300 560 330 640 430 3 00 1,150
50 270 310 460 2,700 260 1,450 140
10,800
5,950 7, 350 4,3 00 11, 000 7,800 13, 6 00 8 ,700 8,2 00 1 0 , 6 00 14,900 1,750 6 ,550 9,200 3,300 10, 000 6,200 10,900 1,700
142,000
5,2 00 6 ,200 3 ,600 12,800 1 2 ,94 0 13, 570 10, 46 0 17 ,370 12,900 21,450 1,200 6,180 9,590 2,940 48,300 6,840 13,850 1,810
207,200
s,ooo
9,350
18,700 22,700 1,450 21,500 38,200 10,500 13,400
13,400 2,100
17,900 7,450 3,450 14 ,700 10 ,100 16,800
19,200
13 ,coo
27, 600
150 410
450 1,150
20 1,900 1,800
340
310 420
90 5 00 37 0
no
2,350 690 480
480 680 1,400
2, 6 00
4,150
8,500 10,500
790 9, 200 18,300 4,850 6 ,250
7 ,ooo
960 8 , 550 3,400 1,450
5 , 350 4 , 450 8,150
8 ,3 00 6 ,550 12,200
2, 250
4,790 9,750 11,050
640 10,400 18,100
5,310 6,840 5,980 1,050 8,850 3,680 1,890 7,000 4,960 8 ,170
10 ,420
5, 770 14,000
286,500 14,100
1 3 1 , 5 00
140,900
IX
17,700 1,400
5,700
10,600
12,100
420
4,850
6,830
5,300
280
2,350
2,670
2,500
40
1,200
1,260
1,700
40
1,000
660
2,550
50
6,350 1,600
1,350 1,800
1,150 2,950
7,650
530
3,000
4,120
2,500
380
1,050
l,CJ70
2,500
290
1,250
960
2,000
140
900
960
1,400
250
800
350
15,600
780
17 ,ooo
570
11,700
570
5,200 7,300 4 , 55 0
9,620 9 ,130 6 ,580
5,850
4 00
12,600
560
2,400 5,3 00
3,050 6,740
127 ,ooo 8,3 00
50, 000
68 ,7 00
1,852,000 183 ,000
750 , 000
919,000
J A NUARY 1, 1966
All Cillle ___Cows 2 year s
& Calves
K eopltd_&_ _o l_dKe re p t
f or Milk
for Beef
All Other
Cattle &
Calves
10,500 13,3 00
7,800 24,500 20,000 26 ,600 19,400 25,200 22,500 37,800 3,100 12,800 18,500
6,600 61,500 13,100 26,200
3,600
353,000
40 140 230 1, 250 500 300 550 400 280 1,000
40 260 300 440 2,600 240 1,300 130
10,000
6,000 7,500 4,500 ll ,300 7,900 14,000 9,000 8,300 10,600 15,300 1,900 6,650 9,400 3,450 10,200 6,300
n,ooo
1,700
145,000
4,460 5, 660 3,(570 ll ,950 11,600 12,3 00 9,850 16,500 11,620 21,500 1,160 5,890 8,800 2,710 48,700 6,560 13,900 1,770
198,000
4,600 9,100
18 ,ooo
22,200 1,250 21,400
38 ,coo
10,000 13,500 13,600
2,000 17,400
7,250 3,200 14,400 9,700
17 ,ooo
19,300 12,800 27,800
282,500
130 370 400 1,050
20 1,800 1,700
310 290 390 80 460 340
90 2,200
650 450 440 630 1,300
13,100
2,750 4,300 8,750 10,900
800 9,600 18,800 5,100 6,450 7,400 1,000 8,800 3,700 1,550 5,500 4,800 8,500 8,550 6 ,750 13,000
137,000
1,720 4,430 8,850 10,250
430 10,000 17,500
4,590 6,760 5,810
920 8,140 3,210 1,560 6,700 4, 250 8,050 10,310 5,420 13,500
13 2,400
17,200
11,200 5,250 2,350 1,550 2,350 6,200 7,600 2,350 2,400 1,900 1,300
15,000 16,800
n,soo
5,750 11,800
1,300 380 240 30 30 40
1,500 500 360 250 120 240 730 550 540
360 530
1 22,500 7,700
1, 815,000 170,000
5,800 4,900 2,400 1,200
950 1,300 1,800 3,100 1,000 1,150
850 750 5,150 7,350 4,600 2,400 5,200
49,900
7 65,000
10,100 5,920 2,610 1,120 570 1,010 2,900 4,000 990 1,000 930 310 9,120 8,900 6 ,360 2,990 6 ,070
64,900
880, 000
ARCHIE LANGLEY tural Statistician In Charge
R. L. Slu\lDIFER Agricultnra1 Statistician
GEORGIA CROP REPORTING SERVICE
ATHENS, GEORG IA
Data from Georgia 1966 Weekly Hatchery Reports on Broiler Chicks (Revised March 1967)
Week Ending
1966
Eggs Set Thcu.
Hatchings and Cross State Movement
Total Hatched
Thou.
Placed : ShiEEed For : into out of
Broilers : State
State
Thou. Thou. Thou.
Placed in
Georgia
Thou.
Jan. 1 Jan. 8 Jan. 15 Jan. 22 Jan. 29
11, 421 11,364
11, 996 12,208 12,392
8,939 9, 109 9,347 9,090 9,303
8, 792 8,927 9, 173 8,900 9, 172
278
747
367
709
268
827
341
710
312
820
8,323 8, 585 8,614 8, 531 8,664
Prices
Paid Hatch. Eggs
Cents
Received Broiler Chicks
Dollars
65
9.75
65
9.75
65
9.75
66
10.00
66
10.00
Feb. 5 12,432 9,555
9,362
447
912
8, 897
66
10.00
Feb. 12 12, 298 9,764
9, 562
362
822
9, 102
66
10.00
Feb. 19 12,302 9,745
9, 522
350
823
9,049
67
10.25
Feb. 26 12,616 9,636
9,458
378
920
8,916
67
10.25
Mar. 5 13, 001 9,769
9, 550
288 1, 012
8, 826
67
10.25
Mar. 12 13,467 9,840
9, 599
311 1, 035
8, 875
67
10.25
Mar. 19 13, 315 9,920
9,680
410 1, 065
9,025
66
10.00
Mar. 26 13, 594 10, 297 10,035
342 1, 101
9,276
65
10.00
Apr. 2 13,742 10, 588 10,318
341 1, 018
9,641
64
10.00
Apr. 9 13, 868 10,623 10, 350
418 1,049
9, 719
64
10.00
Apr. 16 13, 922 10,708 10, 43'8
437 1, 220
9, 655
64
10.00
Apr. 23 13, 841 10, 883 10,619
482 1, 375
9,726
64
9.75
Apr. 30 14,447 11, 183 10,930
484 1, 504
9,910
64
9.75
May 7 14, 228 11, 099 10, 840
534 1, 353
10, 021
64
May 14 14,206 11,087 10, 858
480 1, 432
9;906
64
May 21 14, 133 11, 206 10,939
385 1, 169
10, 155
64
May 28 14,082 11, 119 10, 859
430 1, 376
9, 913
64
9.75 9.75 9.75 9.75
June 4 14,026 11' 092 10, 854
471 1, 240
10, 085
64
June 11 13, 998 11,014 10, 766
471 1, 211
10, 026
64
June 18 13, 820 11,047 10,831
416 1,364
9,883
64
June 25 13, 859 10, 930 10, 700
439 1, 202
9,937
64
9.75 9.75 9.75 9.75
July 2 13, 63 1 10, 813 10, 583
354 1, 129
9,808
65
9.75
July 9 13, 670 10,746 10,495
371 1, 200
9,666
65
10.00
July 16 13, 614 10,696 10,431
328 1, 200
9, 559
65
10.00
July 23 13, 235 10, 552 10, 333
440 1, 145
9,628
66
10.25
July 30 13, 124 10, 507 10, 261
306 1, 118
9,449
66
10.25
Data from Ge orgia 1966 Weekly Hatch8 ry Reports on Broiler Chicks (R evis e d Ma rch 1967}
Wee k
E nding: 1966 :
E ggs Set
Thou.
Hatchin s and Cross State Movement
Total Hatched
Place d
Shipped
for
int o
out of
Broile rs St ate
State
Placed in
G 8or
Thou.
Thou. Thou. Thou.
Prices
Aug. 6 12,690 10, 518 10,297 285
1,058
9, 524
66
Aug. 13 12,780
9, 972
9,806 285
l, 153
8,938
66
A ug. 20 12, 780 10,068
9, 870 319
l, 110
9,079
67
A ug. 27 12, lll
9,731
9, 550 301
1,006
8, 845
67
Sept. 3 12, 454
9,854
9,632 299
1, 051
8, 880
67
Sept. 10 12,342
9,770
9,557 271
1, 066
8,762
67
Sept. 17 12, 43 7
9,439
9,230 321
1, 139
8, 412
67
Sept. 24 12, 493
9,338
9 , 113 254
1,029
8,338
67
Oct. 1 11, 584
9,658
9,448 342
1, 019
8,771
66
Oct. 8 ll, 733
9,943
9, 739 312
l, 0 53
8,998
65
Oct. 15 11,277
9,633
9,440 318
983
8, 775
65
Oct. 22 11,981
9, 132
8,932 216
874
8,274
64
Cct. Z9 11,275
8, 859
8,669 270
798
8, 141
62
Nov. 5 11, 142
8,758
8, 577 373
779
8, 171
62
Nov. 12 11, 220
9, 161
8,935 277
763
8,449
62
Nov. 19 11, 203
8,987
8,819 250
693
8,376
63
Nov. 2.6 11,433
8,797
8,634 262
693
8,203
63
Dec. 3 11,276
8, 870
8,650 218
717
8, 151
63
Dec. 10 11,729
8,903
8, 713 263
805
8, 171
62
Dec. 17 11,908
9,094
8, 890 256
729
8, 417
62
Dec. 24 11,835
9,000
8,832 275
672
8, 435
62
Dec. 31 11,615
9, 135
8,987 310
751
8, 546
60
---------6-7-3-, -1-5-0-------------5-1-5-,-4-5-7-----------5-3--,7-4-9--------------------------
TOTAL
526, 827
18,318
480,02.6
ARCHIE LANGLEY Agricultural Statistician In Charge
W. A. 1NAGNER Agricu ltura1 Statistician
After F ive Days Return to: United State s Department of Agriculture
Statistical Repo rting Se rvice 315 Hoke Smith Annex Athens, Georgia OFFICIAL BUSINE SS
Postage and Fees Paid U. S. Department of Agriculture
GEORGIA CRO~ R.E~O.RTINC SERVICE
AGRICUI.TURAL EXTENSION SERVICE UNIVERSITY 0,- GEORGIA ANO TME STATE DEPARTMENT OF AGRICUI.TURE
L ~ J.V .1
.L-0. J U . S . DEPAftTMENT OF AGRICUL.TURE 5 ATISTJCAL REPORTING SERVICE
1967315 H KE SMITH ANNEX, ATHENS, GA .
, Georgia .
___________________________________ L
1 ,
GEORGIA I~D~C OU~TY_ S -
1966
lviarch 1967
.
--- --- - ---- --------------~_...
:
: __________________g~y~~~g_f~r_Qr~in____________________
Planted for
:
Yi e l d
:
---...... IDd Countv
: All Purposes :
Acreag e
:
Per Acre
: Production
--~------ie~~;-------- - -~c-~;---------------IiU:"Si1~Is------- - Bu:8h818-
4, 400 820
3,000
1,280 4, 62 0 7,000 3, 220 1,530 1,980 2, 970 2, 380
33,200
3,800 600
2,700 1,250 4 , 080 6 , 3 00
3,090
1,500 1,800 2, 670 2, 210
30,000
35.0
40.0 39 .6
35 .2 35.5
37. 8 40.8 34.0 38.9 37.1 42 .1
37.7
133,000 24 , 000
107 , 000 44, 000 145,000 238,000 126,000 51 , 000 70,000 99,000 93,000
1,130,000
1,250
1,120
610
600
710
780
1,220
1,620
1,640
960
1, 940
1,630
1,460
840
1,250
490
850
1 , 800
2,400
1,230
24,400
1,160 1 , 010
400 510 700 430 1 , 180 1,520 1 , 250 960 1,810 1,360 1,360 700 1 , 050 490 780 1,700 2,020 1 , 210
21,600
33.6
32.7
32.5
39.2
30.0
46.5 51.7
30 . 3 36. 5
45.8
30.9 39.0 33.8
41.4 23. 8 38.8
53.8 55.3
32.7
33.9
37.7
39,000
33, 000
13,000 20,000 21,000 20,000 6l,COO 46,000 46 , 000 44,000
56,000 53 ,000
46, 000 29,000
25,000
19 , 000 42,000 94,000 66,000 41 , 000
814,000
1, 480 1,570 2,820 1 , 190 2,450 1,060 2,760 1,940 1,380
960 1 , 490
19 , 100
1,420 1,430 2 , 360
930 2, 330
950
2,700 1 ,860
940
930
1,150
17 ,000
29 . 6 27.3 25.4 41.9 28 . 3
25.3
26.7 27.4 51.1 33.3 29 . 6
29 . 8
42,000 39,000 60,000 39,000 66, 000 24 , 000 72,000 51,000 48,000 31,000 34 , 000
506,000
(Issued iviarch
- --------------.------------- . GEORGIA CORN COUNTY ESTniATES . 1966 ... -- ------------ ---------------------~-----
District
Planted for
------------------~2r~~ e d_for~,G~~r~a,~i:~n------------~ Yie ld
-an-d -C-ou-n-tv - - - - - - -: - - -A-l-l APcurrpeoss-e-s----:-----AAc~rreeag;-e------:---BusiPie;r;:ALc:rse---- ~ --:~;;~;P;.r;;.:;..;=-
Carroll Chattahoochee Clayton Coweta Douglas Fayet t e Haralson Harris Heard He n r y Lamar Hac on Harion Me r i we t he r Nuscog,;;e Pike Schley Spalding Talbot Taylor Troup Upson
TOTAL
DISTRICT 2
Baldwin Bibb Bleckley Butts Crawford Dodge Gr eene Hancock Houston Jasper Johnson Jones Laurens Monroe Montgomery Morgan Newton Peach Pulaski Putnam Rockdale Taliaferro Treutlen Twiggs \rJashington Wheeler \rlilkinson
5,810 170 400
3,420 980
1,860 2,070 2,040 1,830 2,900 1,740 12,500 7,800 5,160
360 3,030 5,040 1,810 1,060 9,900 2,540 1,580
74,000
2,160 1,830 10,800
980 2,200 19,400 1,560 4,210 9,900 1,010 15,000 1,730 43,500 1,250 12,600 3,400 2,200 4,230 6,700 1,060
770 510 11,400 5,700 13,400 11,600 4,900
194,000
5, 000
150
300
2,740
590
1,690
1,950
1,630
1, 720
1,940
1, 580
9,800
5,800
4,900
150
2,880
4,210
1,320
1,010
:~ ,.,
7,900
2,080
1,060
60,400
1,510 1,610 8,400
890 1,410 14,200 1,140 3,960 8,600
700 11,400
760 34,300
390 9,400 2,410 1,010 3,980 5,900
360 640 500 8,760 4,540 11,700 9,300 2,930
150,700
26.0 20.0 30.0 37.6 30.5 33.7 28.7 25.2 30.8 34.5 32.3 39.5
2h.c
30.4 20.0 39.6 30.9 41.7 29.7 33.4 25.5 32.1
32.2
33.8
42.2
44.4
39.3
30.5
ho .: ;
28.9
25.8
50.3
35.7
40.4
35.5 44.4
33.3
40.0
26.6
39.6
48.2
46.3
22.2
34.4
26.0
31.1
30.6
43.0
39.5
33.1
40.7
(Issued March 1967)
---------.--------------G-E-O-R-G-I-A--C:-O-R-N--C--OU--N-T-Y--E.S..-T--JY-.L-A-T-E-S--1-9-6-6-------------------------------
District
-- and Countv
-
-------.-----.
Planted for
A--ll--AP-uc-rrpe-os-s-e-s--
-
-.-----------A--Ac----r-c-er--ea-gs--e------------H-.:-..a--r--v--e--s--t--eP--Bd-e--uYr--fsi-oAh-e-elr-c-dl-r-sGe--~-r-a--i--n------..--------P--roB--d-u--us--hc--et-i-l-os--n------
~Q12
Bulloch Burke Candler Columbia Effingham F.unuel Glascock Jefferson Jenkins cLuffie
chmond Screven
-Warren
torAL
58,800
26,300 1 7 , 400
1,410 9, 800 28,700 3, 010 12, 600 15 ,000 2,610 2,560 29, 700 3,110
211 ,000
47, 800 24 , 900 14,000 1,100
8,800 24,000 2,440 10,600 12 ,900 2,160 2,140 25 ,700
2, 1_,_60
179,000
47 .5 44 . 8 31.5
25 . 5
31.0 41.5 41.4 45 . 0
39.5
23 . 1 39 .7 43 . 3 31.,. 6
42 . 1
2,, 270' 000 1,ll5,ooo
441,000 28,000 273,000 996,000
101.000 4n : ooo 510,000
so , ooo
85, 000
l,ll2 1 0CO
85 ,000
7,543,000
- - - DISTRICT 7
Baker Calhoun
Clay Decatur Dougherty
Early Grady Ise
ller tchell Quitman iandolph Seminole Stewart bter !errell !han as
-bater
!Ol'AL
15,500 13,400
6,900 44, 900 11,000 30,200 39,400 13,300 29,900 41,500
2,200 16 , 2 00 19,700
7,700 25 , 200 17 ,300 41,500
6,200
382,000
14, 600 12,800
6,600 40, 100 10 ,000 27, 500 36,500 12 , 000 27 , 000 37 , 500
2,100 l5,3CO 18,000
6, 400 20,400 16, 700 38,800 5, 700
348,000
37.9 39 . 3
36 .5
35 . 4 34. 6 37.5 51.2 39 . 8 38 . 0 44 . 6 40.5 39 . 9 38 . h 34 . 7 44 . 6 41.5
5o. 6
30 . 9
41.6
554,000 504,000 241 , 000 1,420, 000 346,000 1,031,000 1, 870,000 478,000 1, 025, 000 1, 672,000
35, 000 610}000 692 ,000 222,000 910, 000 693,000 1,963,000 176, 000
14, 492,000
DISTRICT
9,900 11,900
34,000 40 ,100 1,800
49,200 51 , 500 24,800 19, 400 21,000
4,100 34,600 19,700
7, 900 28,600
18,000 20,900 15,200
13,200
35,200
8,600 10,100 29,300 35,400
1, 300 40,800 46,400 23, 100 18,800 19 ,500
3,000 29,800 16,900 6,600
24,400 14,400 18,200
13,700 11 , 200 32 ,500
50. 5
47 . 9
58. 8
39. 0 )6. 9
52 . 9
44.5
54 . 3
55 . 3
42 . 0
J8. 3
59. 3
47. 4
49. 4 50 . 4
44.9
59 . 3 52 . 3
49. 4
43.0
434 ,000 47 9 , 0 0 0 1,722,000 1,381,000 48,000 2,157 , 000 2,063 , 000
1, 255,000 1,040 ,000
819,000
115 ,coo 1, 766,000
801 ,000 32fi , OOO 1,229, 000
64 7,000 1, 079,000
717 ,ooo
553,000
1,397,000
461,000
404,000
49 . 6
20,02 8,000
(Issued March
- - - - - - - - - . . . - =----------G-EO-R-G-IA:-C-O-R-N--CO-U.N.T.Y.-E-S-T-Ti-vi-AT-E-S-1-9-6-6---------. . . . . c. .--------......
District
Planted for
Ha
rves
te
d fo Yie
r
~~G-~r~a~in~----------~
and Countv : All Purpos es : Acr e age : Pe r Acre _ ----------------------A~;;;-----------A c re s---~------ -Bti;h~ls ___ -
DI!EIQ! 2
Appling Bacon Brantley Bryan Camd en Charlton Chatham Evans Glynn Liberty Long lvicintosh Pi erce Tattnall Toombs V.J a r e ltJayne
TOTAL
30,900 20 , 8 00 4,400 1,800
30 1,290 1, 210 12,800
140 930 2,400 300 30,500 36,000 19,700 9,900 21,200
194 , 300
27 , 200 17,700
3,300 1,380
20 580 800 10,500
60 720 1, 580 60 26,800 26 , 400 15 ,8CO 9,100 15, 300
157,300
39.4 37.6 28. 2 40 . 6 50.0 36.2 38.8 34.7 33.3
3L . 7
~1. R
_.J -+ . '-
50.0 37. 6 39.5 47.2 41.4
L.L. 3
39.7
1 21
31 364,
2,
25,
55 , 3, 1,007 1,042
74 377 678
STATE TOTAL
1,593,000
1,368,000
43.0
-----------------------------------------------------------------------------------------------------------------
C. L. CRENSHA~v Agricultural Statistician
ARCHIE LANGLEY
Agricultural .Statistician In c
GEORGIA CROP REPORTING SERVICE
AGRICUI.TURAL EXTENSION SERVICE UNIVERSITY 0,- GEORGIA ANO THE STATE DEPARTMENT OF AGRICUI.TUAE
U.S. DEPARTMENT OF AGRICUL.TURE STATISTICAL. REPORTING SERVICE
15 HOKE SMITH ANNEX, ATHENS, GA .
, Georgia
7
GEORGIA ORN COUNTY tili&TIYillTES 1965,REVISED
Jvlarch 1967
. . ---------------------------------~------------------------------
Planted for
Harvested for Grain
:
Yield
:-------
~~.:~-------.;...__.A:;1:=1 PurE_2ses :
Acreage
:
Per Acre
: Production
-A~~e s-------------A~;~--------------B~8i~----------Bu5h;1;----
4,590 860
3,110 1, 330 4,870 7, 300 3,350 1,590 2,050 3,090 2,470
34,610
3,950 630
2, 800 1,300 4,240 6, 600 3,220 1,560 1,870 2,780 2,300
31,250
46.)
183,000
39.7
25,000
46.4
130,000
43.8
57,000
49.5
210,000
53.5
353,000
50.6
163,000
33.3
52,000
43.3
81,000
56.8
158,000
50.9
117,000
48.9
1,529,000
1,460 1,320
710 700 840 910 1,420 1,910 1,930 1,150 2,330 1,950 1, 720 990 1,480 590 990 2,150 2,820 1,450
28,820
1,530 1,640 2,900 1,230 2,530 1,090 2,890 2,040 1,430 1,000 1,570
19,850
1,360 1,190
470 600 820 500 1,380 1,780 1,470 1,130 2,120 1,600 1,600 820 1,230 580 910 2,000 2,370 1,420
25,350
1 , 470 1,480 2, 440
960 2,400
980 2, 770 1, 920
970 960 1,190
17,540
36.0
49,000
43.7
52,000
46.8
22,000
28.3
17,000
29.3
24,000
52.0
26,000
56.5
78,000
33.1
59,000
38.1
56,000
46.0
52,000
34.4
73,000
39.4
63,000
31.9
51,000
53.7
44,000
35.8
44,000
39.7
23,000
53.8
49,000
59.5
119,000
34.2
81,000
37.3
53,000
40.8
1,035,000
25.9
38,000
31.1
46,000
39.8
97,000
50.0
48,000
38.8
93,000
34.7
34,000
39.4
109,000
34.4
66,000
55.7
54,000
40.6
39,000
42.0
50,000
38.4
674,000
------
.______..m;QEm!_.QQlliLQQilli:IT.J~TI~~~-1965 . _ .JlliYI~!L _ _ _
____________________________________ ________ District
and Count:.v..,.
Planted for
: All Purposes :
Acr e age
:
n
Acres
Acres
DISTRIC:f b
Carroll
5,900
5,100
42.0
Chattahoochee
170
150
26.7
Clayton
410
310
41.9
Coweta
3,500
2, 800
40.0
Douglas
970
600
36.7
Fayette
1,910
1, 720
45.9
Haralson
2,140
1,990
30.2
Harris
2,080
1,660
27.7
He a r d
1,880
1,750
42.3
Henry
2,960
1,980
34.8
Lamar
1, 770
1, 610
39.8
Macon
12,800
10,000
52.9
lVIarion
6,200
5,900
40.0
l"leriwether
5,300
5,000
42.0
Muscogee
320
150
33.3
Pike
3,070
2,920
42.1
Schley
5,100
4,300
41.9
Spalding
1,880
1,350
43.7
Talbot
1, 080
1,030
35.9
Taylor
10,100
8,100
46.8
Troup
2,590
2,120
33.0
Upson
1,590
1,080
42.6
TOTA1
73,720
61,620
42.7
!2l.1IUQ! .2
Baldwin Bibb Bleckley Butts Crawford Dodge Greene Hancock Houston Jasper Johnson Jones Laurens Monroe lviontgomery Morgan Newton Peach Pulaski Putnam Rockdale . Taliaferro Treutlen Twiggs Washington Whee l e r Wilkinson
TOTAL
2,170 1,820 10,800
970 2,150 19,300 1,550 4,200 9,700 1,010 14,900 1,670 43,200 1,110 12,600
3:440 2,100 4,200 6,700 1,000
770 510 11,300 5,600 13,500 11,500 4,850
1,500 1,600 '8, 400
880 1,400 14,100 1,130
3,950 8,500
700 11,300
750 34,100
390 9,300 2,440 1,030 3,950 5,900
360 640 500 8, 700 4,510 11,600 9,200 2,910
.
.:I
38.7
48.7
45.6
38.6
36.4
~~. ~
41.6
.~~~.
28.3 25.3
52.7
35.7
36.5
34.7
43.6
33.3
46.7
35.2
38.8
56.7
43.5
19.4
34.4
24.0
37.6
29.5
41.6
.-
45.6
28.2
192,620
149,740
41.8
6,
(Revised March 1967)
:
Planted for
----------~~~9_for_.Qr&E____~ --------
:
Yield
58,500 26,coo 17,300 1,360 9,700 28,700 3,020 12,600 14,800 2,560 2,470 29,300 3,160
209,470
15,800 13,700
6,900 45,100 11,100 30,700 40,300 13,600 30,500 42,500
2,360 16,400 20,100
7,700 25,700 17,800 42,400 6,200
388,860
9, 770 11,800 34,000 40,000 1,800 49,400 51,700 25,000 20,000 21,400 4,170 34,400 19,500 7 ,950 28,400 17,900 20,800 15,300 13,000 35,100
461,390
March 1967)
48,000 25,000 14,000 1,100 8,800 24,100 2,450 10,700 13,000 2,200 2,150 25,800 2,5oo
179,800
14,600 12,800
6,600 40,200 10,000 27,600 36,600 12,000 27,000 37,600
2,100 15,300 18,000 6,400 20,400 16,700 38,800 5,700
348,400
8,500 10,000 29,200 35,200 1,300 40,500 46,100 23,000 18,700 19,400
3,000 29,600 16,800
6,600 24,200 14,300 18,100 13,600 11,100 32,300
401,500
52.9 47.5 48.4 30.0 52.3 41.6 41.2 42.5 42.1 24.5 38.6 5o.5 34.8
47.4
53.8 54.3 49.1 38.5 48.7 51.3 50.7 50.2 48.7 47.2 43.8 51.2 48.7 46.1 55.3 54.3 54.3 40.0
49.4
58.8 53.9 53.8 50.8 43.1 54.9 52.7 56.7 57.8 45.8 36.7 55.8 52.3 53.9 48.8 39.9 53.8 51.6 49.0 49.8
52.2
2,541,000 1,187,000
678,000 33,000 460,000 1,002,000 101,000 455,000 547,000 54,000 83,000 1,302,000 87,000
8,530,000
786,000 695, 000 324,000 1,546,000 487,000 1,415,000 1,857,000 602,000 1,315,000 1,773,000
92,000 784,000 876,000 295,000 1,129,000 907,000 2,107,000 228,000
17,218,000
500,000 539,000 1,570,000 1,788,000 56,000 2,223,000 2,430,000 1,305,000 1,081,000 888,000 110,000 1,651,000 878,000 356,000 1,180,000 570,000 973,000 702,000
541~,000
1,609,000
20,~53,000
---------------------------------------------
STATE TOTAL
1,598,000
1,368,000
49.0
-----------------------
C. L, CRENSHAW
Agricultural Statistician
ARCHIE LANGLEY Agricultural Statistician In Char~
(Revised March 1967)
ID@ffi~@L!J~ffillit!J
[i)ffi~@~0
HARCH 15, 1967
Released 4/5/67
GEORGIA CROP REPORTING SERVICE
GEORGIA PRICES RECEIVED TI~DEX SA~ill AS A MONTH AGO
The Georgia Prices Received Index for the month ended Harch 15, 1967, was the same as month, - but w-as again 20 points below that for the same month last year.
~e All Crops Index increased by 3 points to 258 as the price of cotton increased by 1
per pound and of corn by 1 cent per bushel.
~e price of hogs, beef cattle, broilers, turkeys and milk were all below the previous
md the Index of Price s Received for live stock and live stock products declined 3 points which was 34 points below a year ago.
UNITED STATES PRICES RECEIVED Il\IDEX DO'hlN 2 POINTS
PARITY INDEX UP 1 POINT, PARITY RATIO 74
~ing the month ended March 15, the Index of Prices Received by Farmers declined 2 points percent) to 250 percent of its 1910-14 average . Lower prices for hogs and wholesale milk
-~~u~ most to the decline. Price increases for wheat and eggs limited the decrease.
index was 7 percent below March 1966.
~e Index of Prices Paid for Commodities and Services, including Interest, Taxes, and
Wage Rates rose 1 point (1/3 percent) during the month. At 340,. the index was 9 points
percent) above a year earlier.
ibe Parity Ratio remained unchanged from February at 74.
INDEX Nill-1BERS
GEORGIA AND UNITED STATES
Index
Narch 15 :February 15 !.Larch 15 : -----~QE!!_High_____
1910-14 101 100
1966
1967
1967
..... .. :
:
:
: Index :
Date
---~ ..._.---------------------~---------------------------------
264 270
1y /
244 255
244
310 : llarch 1951
258
319 : March 1951 g/
269
252
250
313 :Feb. 1951
331
339
340
340 :Jan. 1967 }./
81
74
74
123 :Oct 1946
April 1951, March 1967.
Prices Paid, Interest, Taxes, and Farm Wage Rates based on data for the indicated dates.
!be Parity Ratio is computed as in the past. The Adjusted Parity Ratio, reflecting Govern-
payments, averaged 86 for the ye ar 1966 compared with 80 for the Parity Ratio.
Statistician In Charge
WILLIAM A, WAGNER Agricultural Statistician
-------------------------------- - -------------
Georgia Crop Reporting Service, USDA, 315 Hoke Smith Annex, Athe
~e Cooperative Extension Service, University of Georgia and the
PR
LtB- IES
-------
-- -
PRI CES --RECEIVED AND PA ID
------------:- --
-B- Y-FA-lG li'iEEROSRG. IAlA--R-C~H-- lS-.-1-9- 6= 7-.-
-W-I
-TH-
-ru:OMi\T:PrA-R-I-S -O-N-STES
i s- : : lviar~h"15-7 :F~ti:- 1:s-7f.iar~i1-15~March
PRICES _________ _____ ______________________ ..... Commoditv and Unit
:
R EC E IVED - ~- -------- :
1966
: 1967 : 1967 : 1966
: 1 .;..__a_.~ . ~ -- - - - - .;...--
Wheat, bu.
$
1. 6.5
Oats , bu.
$
. 90
Corn, bu.
1. 37
Barl ey, bu .
1. 04
Sorghum Gr ain, cwt .
2. 0.5
Cott on, l b .
27. .5
Cottons eed, ton
Soybeans, bu.
2. 67
Peanuts , lb.
11..5
Sweetpotat oes, cwt.
.5 . 60
Hay, baled, t on:
Al l
~
26 .50
Alfal fa Le s pe deza
$
f;
3297..5s0o
Peanut
$ 24 .50
Ivlilk Cows , head
$ 170. 00
Hogs , cwt .
Beef Cattle , all , cwt. 1/
Covm, ctvt . 2/
$ 3/ 23 . 00
t 1/ 20 . 70
$ - 17. 60
St eers and Heifers, cwt. ~
23 . 40
Calves, ct.rt.
~
2.5 . 30
Milk, whol es ale , cwt .:
Fluid Market
~
6. 20
Aanuf actured
'~
3. 60
All ]/
$
6. 1.5
Turkeys, lb.
24.0
Chickens, lb.: Excl . Broilers 12 . 5
Commercial Broilers
16.5
Al l
16. 3
Eggs , all, dozen
.52. 0
1. 80 88
1. .51 1.12 2. 2.5 19 . 0 67 . 00 2. 80
11.0
6. 90
1. 80 . 89
1. .52 . 1. 12
2. 2.5 20 . 0 64. 00 2.7.5 11. 0 6. 90
27 .50
3.5 .50 30 .50 24 .50 200. 00 17. 80 18. 90 16. 20 21 . 2 0 24.20
27. 30
3.5 .50 30 . 00 23. 00 2CO. OO
17 . 40 18. 70 16. 00 21. 00 24 . 20
6. 60
4 . 1.5 6. 60
23 .0 9. 0 14.0 13.7 38. 8
~/6 ..50
22 . 0 10. 0 13 . 0 12 .8 41.0
1.41 646
1.17 1. 06 1. 78 27 . 61 47. 60 2. 71 11. 9 4.87
24.20 24 . 90 24 .60 24 . 20 238. 00 24 . 00 24 . 0 0 17.70 26.20 27. 60
4. 93 3. 73 4 .54 24.7 10.7 17.4 16.7 41.6
1. 49 .674
1. 26 1. 03 1. 93 20.70 63.30 2. 71 11. 6 .5. 72
2.5.30 26.20 26. 20 2_5. 60 2.57. 00 18. 80 21. 60 17.00 23 . 30 26. 60
.5.49 4.12 .5 . 06 21.4 8. 8 1.5.4 14. 6 32 .4
Ni xed dairy fee d, cwt . :
All und er 29% protein
~
3. 9.5
4. 2.5 4. 2.5
3.73
3. 95
14% protein .S/
16% protein -
- :~
3. 80
4 . 00 4.10
3. 48
~
3. 9.5
4. 2.5 4.20
3.79
3. 66 4.03
18% protein
$
4 .0.5
4.50 4.50
3.96
4.16
20% protein
$
4.2.5
4. 60 4.5.5
4.08
4.46
Hog f ee d, 14%-18% prot e in,cwt. ~
4.20
4.4.5
4.33
4. 60
Cottonseed ms al, 41%, cwt. $
4.40
.5.20 _5.20
4.70
5.46
Soybean meal,44%, cwt.
$
5.00
.5.40 .5. 30
5.08
.5 .51
Bran, cwt.
$
3.70
4.10 3. 90
3.41
3.80
Middlings, cwt.
$
3.7.5
4.20 4.10
3.4.5
3.86
Corn meal, cwt.
$
3.40
3. 6.5 3. 6.5
3.30
3.52
Broiler grower f eed, cwt.
~
.5. 00
.5. 20 .5 .10
4.87
5.07
Laying f eed, cwt.
$
4.70
5. 00 5.00
4.47
4. 70
Scratch grains, cwt.
$
4.15
4.45 4.45
3.92
4.10
Alfalfa hay, ton
$ 4.5.00 45.00 44.00: 33.70
35.90
A1l~l co~th-erah~a"v.Sttone~rs-and~~~ersn-~ojm6bi.5n0e d:~it3i71-.0a0110;~3;6~e.-0~;0w~h-~:e~jr;e~-n~;e~c~e8~0~s~s-ar_y.--f--o--r~s.l~a~~u~g._ht_e_r-"
2/ Include s cull dairy cows sold for slaught er , but not dairy cows for herd r eplacement.
- - - ~/ Revise d. 4/ Preliminary estimate . .5/ U. S. price is for unde r 16 percent. '
After Five Days Return to United States Department of Agriculture
Statistical Repor ting Service 315 Hoke Smith Annex
Athens, Ge orgia 30601
.QruQill ~us i~~
Postage and Fee s Paid U. S. Department of Agriculture
GEORGI A CR OP REPORTING SERVICE
ATHENS, GEORG IA
- J.;p il 5, 1967
ORGIJ. C HICK HA T C HErt Y R E PORT
LISRARl S
Plac e m e n t of b r oi l e r chi cks in G e orgia uring t h e w e ek e n d e d -A pril l was 10,016,00 0-- l p e rc e n t mor e t han in the p:c3 vi o us w ee k a n d 4 p e rc e n t mor e than in the comparabl e w e ek las t y e ar , ac cording to t h e G e o rgia C rop Re porting S e rvice .
An e stimat e d 13 , 0 6 2, 00 0 b roi l e r t ,rp e egg s wer e s e t by G e o r g i a hatcheries-lpercent less t han i n t he pr eviou s week a n d 5 p e r c e nt l e ss t han in the comparable week a year earlier.
The majo rit y o f the p rices pai d t o G e orgia prod u c e rs for broile r ha t ching eggs were report e d w it hi n a r a n g e o f 45 to 65 c~mt s p er doz e n. The ave rag e pri c e of . hatc h illg eggs was 56 c e nt s p e r oze n . T h e p ri ce o f eg gs f ro m flocks wit h hatche ry own e d
cockerels ge n er ally w as 2 c e n t s be l ow t h e a ver ag e p ric e . !v.ios t p r ice s rec e ive d for broiler chi c k s by G e or gia hat che ri e s we re re p o r ted withi n a range o f $ 5.00 to $9 . 25 with an ave rag e of $ 7. 7 5 p e r h un dr e d . Th ~ a v e r a ge p r i c -=s l a st y e a r wer e 64 c e nts for eggs and $10.0 0 for c hi cks .
G..~ OnGIA ~ G GS S ET, HA T S HI NG.:' , A ND ~ HI C K P L A CE M ::<:.: N T S
.S GG TYP:2
leek Ended
War. 4 War. 11 War. 18 War. 25 A r. 1
E ggs Set
1966
19 6 7
Thou .
l, 181 950
l, 065 l, 273 1, 08 3
T hou.
l' 19 8 l , 225 l , 160 l' 19 1 1' 166
o/o of
ye a r
a p;o
P et.
10 ! 12.9 10 9 94 108
BRO I L .i~ _,_ T YP
Chi cks Hatche d
196 6
1967
Thou.
761 677 788 94 5 819
Thou .
l, 025 1, 060 l, 050
905 956
% of
year ago Pet.
135 157 133 96 117
leek Ended
~~ggs Set 1 I
196 6 Thou.
1967 Thou.
%of
yea r ag o
P et.
Av. Price
Chicks Placed for j Hatch
Broiler
Broilers in Georgia
Eggs
I %of P er
1966
1967
year j Doz.
I ago 1967
,.~ h ou .
Thou. Pet. Cents
Chicks Per Hundred
1967 Dollars
1an, 28 12,39 2 12, 892 104 feb. 4 12,432 13,096 10 5 l'eb. 11 12, 298 12,971 105
3, 664 [) , 897 9, 102
3,929 8,90 9 9,0 63
103
60
100 I 60
100
60
8.75 8. 75 8. 75
Feb, 18 12, 302 13 , 221 107
) ,049
9, 393 10L.J:
60
8.75
Feb, 25 12,616 13,346 10 6
8, 9 16
9,421 106
60
8. 75
War, 4 13, 00 l 13 , 174 101
8, 826
9,706 110
58
8. 25
War . 11 13,467 13,027
97
8, 87 5
9,914 112
57
8.00
War . 18 13,315 13, 18 5
99
9,025
9,968 110
56
7.75
War. 25 13, 594 13, 16 7
97
9, 276
9,96 5 107
56
7.75
Apr. 1 13,742 13, 0 6 2
95
9, 64 1 10, 016 104
56
7.75
!/ Includes eggs set by h a t che ri e s p r o d u cing chicks for hatchery supply flocks.
ARCHIE LANGLEY Agricultural Statistician In Cha rg e
W. A . WAGNE R Ag ricultural Statistician
U, 5, Department of A g ricultur e
A gricultural E xtension Service
- ~n.-u<:>tical Re por ting S e rvic e
Stat e D e partment of Ag ricult u:c e
315 Hoke Smit h Annex , A thens , G eo r gia
STATE
f----------~~~~~=-------~ % of
Mar.
Apr.
year
18
25
1
0 1/
THO USA N DS
I-Aar. 18
Mar.
25
TaOUSANi>S
year
0 1/
Maine
2,061
1,947
2,002 98
1, 605
1,607
1, 519
101
Connecticut
355
289
324 74
186
162
145
69
Pennsylvania
1,398
1, 489
1,349 87
971
872
700
88
Indiana
657
580
580 77
3L_i: 0
356
356
76
Missouri
683
740
759 96
4:1~
418
385
91
Delaware
2, 891
2,865
2, 780 99
2,739
2, 771
2, 537
106
Maryland
4, 570
4, 542
4, 596
99
3, 195
3,364
3,419
95
Virginia \!\<.est Virginia
1, 770 143
1, 805 160
1, 720 83 159 89
1, 116
1, 211
1, 081
108
311
303
370
95
.
North Carolina
7,329
7,589
7,360 100
5,622
5,708
5, 560
94
~
South Carolina
527
495
503 107
343
377
372
101
GEORGIA
13, 185 13, 167 13,062 95
9,968
9,965 10, 016
104
Florida Tennessee Alabama Miss issippi A rkansas Louisiana Texas Washington Oregon California
TOTAL 1967
(22 States)
* TOTAL 1966 (22 States)
838
842
835 170
50 6
399
458
114
1, 006 8,943 5, 053 10, 384
986 8,979 5, 054 10, 4 78
1,004 82 8,933 95 5, 142 108 10,380 100
1, 00 l ' 7,265
I'I 4, 269
I 7,868
1, 146 6, 9d8 4,223 7,924
1, 014 7,058 4,349 7, 910
95 97
112
107
1,049
1, 171
1, 126 109 i! 893
869
856
116
4, 819
4 ,762
4,740 109
3, 740
3,765
3, 806
114
663
858
892 123
480
583
534
121
346
449
445 92
284
294
310
140
2,053
1, 992
1, 822 97
1, 602
1, 598
l, 451
101
70,723 71, 239 70,513
99
~4,718 54,903 54,206
102
I
I
69,623 70,473 71, 544
r0.613 51,998 52,941
o/o of Last Year
102
101
99
*.!1 Current week as percent of same week last year. Revised.
I
I 108
106
102
3 \S
OOl
\~34\a~G~~VEGETABLE REPORT
Georgi a Crop Repor ting Service
Athens , Georgia
GEORGIA
Re l e ase d April 7, 1967
~le ather conditions during f arch wer e v er y favorable for planting spring and sunrrner Ra ins are new nee de d ove r the State to attain good stands and favorable
h. Light supplies of ~~~~~ wer e available in late March from e arly plantings . Dry her is r etard ing gr owth of late pl antings , but volume ,- supplie s are expected t o incre ase g April. Planting of ~~~~~19E~ and ~E~~1~E~ has b een complet e d in southern ar e as. s are generally good in e arly plante d fi e l ds .
U--N-I-T-E-D S-T--A-T-E-.S.
The ~~lv ~Ering snap b e an cr op is e stimate d at 457 , 000 hundre dwe ight, 13 percent
b e low last ye ar and 1 per c ent b elow average .
The m19=Er.ing acr e ag e of snap b eans is expected to total 10, 600 acre s for har-
in 1967, which compares with 12,200 acr e s harvested last year. Planting is ne aring com-
tion in Ge orgia. Cold t emperature s around mi d -Harch caus e d considerabl& r eplanting . In ama, plantings are up in southern countie s . In South Carolina, planting should b e com-
ted by April 10. In Nississippi, planting started about a week e arlier than usual. In
siana, planting was active on April l in the Gre e nsburg-Amite are a. Early planted beans developing rapidly and first pickings should start about Nay l. In Florida, high winds the Sanford are a injured young plant s. In Gadsden County, pole b e ans are mostly plante d.
GE: Production of winter cabb age is place d at 6, 857,.900 hundredwe ight, 2 perce nt mor e
than last year:--Harve st in Fl or ida is expected '~o continue active during April with 'shing supplies expe cted in l11iay .
The ~1y-~pring cabbage crop is fore cast at 1,621,000 hundredweight, 4 pe rcent be-
In South Carolina , harvest is expe cte d to get under way about mid-April and pe ak the end of the month. Harve sting got under way in Georgia the last of lV!arch and is exd to reach the pe ak in lat e Apr il. Additional moisture is nee ded for normal deve lopment late plantings. Harvest in Alabama is at t he pe ak in southern countie s. The Mississippi is about a week e arly in devel opme nt . Plants are making good deve lopment.
Forecast at 3,150 ,000 hundredweight, production of ~~lv~ing sweet corn is 10 percent l e ss than 1966 . Suppli e s from Florida ar e expecte d to incre ase
April. Early April volume will c ome primarily from the Pompano and Dade County are as.
supplies are expe cted from the Ev erglade s area in late April and continuing through lIay.
st harvest is expe cte d from the Zell wood are a in mid - Nay. Statewide volume is expe cte d to in ay, but will b e r e lative l y h e avy through most of June.
Earlv ~riug cucumbers ar e e stimated at 998,000 hundre dwe ight, placing 1967 produc tion 17 perc ent b e l ow las t year .
The acr e age of lat e spring 1-ratermelons for harve st in 1967 is e stimat e d at 65 , 800 acre s, whi;h-~pa;e s with 71 ,600 acre s harve ste d in 1966. In Florida,
est is expe cted to b e c ome general by mid -month with volume supplie s available by late
Freezing t emperatur es on February 25 -26 cause d only light damag e to acr e ag e in the
alee area. Early acre age in the south ce ntral area northward was he avily damage d and
rs had to r eplant .
Pl e ase turn page
ARCHIE LANGLEY ultural Statistician In Charge
L. H. HARRIS, JR .
Ve getable Crop Estimator
Georgia Crop-R~porting-Servi;-e ~ USDA~ }15 Hoke-Smith-Annex~ Athe ns~ Georgia, -in coopera--
with the Cooperative Exte nsion S ervic e, Univers ity of Ge orgia and the Georgia Department Agriculture .
APR II I
LI IJRAR IES
Crop and State
SNAP BEANS
Mid-Spring: South Ca ro I ina Georgia Alabama Mississippi Louisiana
Grou
CABBAGE J./
Early Sp r ing: South Ca ro I ina Geor g ia Alabama Mississippi Louisiana Ca I i forn ia
Gr CANTALOUPS
Spring: FIori da Texas Arizona Ca I iforn ia
5,820 2,900
980 I ,340
I, 500 8,420 16,820
I, 200 9,500 15,000
26
25
..
20 22
Late Spring: North Carol ina Georgia Texas Arizona California
tal
~/ATERMELONS
Late Spring: Florida California
Group Total
240
250
370
30
1 ,060
1 ,640
160 160
145 160
54
30
375 365
60,000 67,000
62,000 I 51 160
Early Summer '1:/
195,020 I IJI~, 900 179,900 79
77
ll Includes processing. '1:.1 1967 acreage for harvest is prospective acreage.
s
ISO
138
72
76
19
15 May
30
20
I
90 428 May
I ,800
38
40
56
5
55
I 5 May
600
694
9,026 10,720 May 15,358 14,234
After Five Days Return to United States Department of Agriculture
Statistical Reporting Service 315 Hoke Smith Annex
Athens, Georgia 30601 OFFICIAL BUSINESS
Postage and Fees Paid
U. s. Department of Agricul
Week Ending Apri 1 10, 1967
Released 3 p.m. Monday
SPRING PLANT lNG PROGRESS AHEAD OF LAST YEAR
Athens, Ga., April 10, 1967 -- Open weather for the past several weeks allowed rapid
with spring planting which is well ahead of last year, according to the Georgia Crop
However, lack of soi I moisture has become critical in most areas, and
of the remaining acreage w ill not be seeded until soil moisture is replenished, Rains
needed to germinate seed already planted,
Over 70 percent of the intended tobacco acreage had been transplanted at the end of the
compared with 29 percent last year. Irrigation was active throughout the week. Some re-
ing was reported.
Nearly 50 percent of the ..2...!:.!J. acreage has been planted in the southern areas. Statewide, ~~ent of the acreage has been seeded, compared with only 14 percent last year.
~er 16 percent of the cotton acreage has been planted, compared with 8 percent last year.
rth of the acreage has been planted in southern areas, while seeding in most northern getting under way.
Eighteen percent of the peanut acreage has been seeded. This is well ahead of the less one percent planted during the comparable week last year. Small grains and pastures are need of r a i n.
condition remained mostly fair to good in the southern producing areas and poor to in the northern areas of the State, Weather conditions have allowed for a good spraying
no insect and disease problems have been encountered.
'
The lack of soil moisture is delaying growth and planting of vegetable crops. Irrigation being used where available. The cabbage harvest is well under way. Practically all of the
~an and melon crops have been planted in the south.
- Little or no rain fell over Georgia during the past week and only very I amounts have been recorded during the last four weeks. Most areas of the State were very and the forest fire haz<3 rd was high at the end of the week. The high percentage of sun-
and low relative humidities have increased the drying rate.
~orgia temperatures continued unseasonably warm during the week. New records were set on ormore days at several places as highs reached the high eighties and low nineties.
for the week were 6 to 10 degrees above normal. This was the fifth straight week
Georgia temperatures have been warmer than normal.
In sharp contrast to 1966, most of Georgia was quite dry at the beginning of the 1967
January had above normal rainfall in the southern half of the State but was be-
north Georgia. February was slightly below normal in most areas and was followed
1nunusually dry March. By climatological divisions, March rainfall ranged from only 16% normal in the southeast to 68% of normal in the east central. There hasn 1 t been a drier
in north Georgia since 1937 and, for south Georgia, it was the driest March since 1955.
a temperatures were cooler than normal du ri ng January and February but were much above
1 in March. For the State as a whole, it was Georgia 1 s warmest March since 1946. It was ~e first month since November 1965 that temperatures have been above normal over the en-
State,
The five-day forecast for the period Tuesday through Saturday, (April 11-15) calls for
ures to average 6 to 12 degrees above normal, Rainfall will be I ittle to none in
ia except widely scattered afternoon showers near the end of the period amounting to
than I /2 inch.
.*TH IS~ IS~ THE~FIRSTVI*EEK~L Y C* R* *O*P*.*AN*~D*~W*EATHERREPORTOF
.THE 1967 SEASCN FOR GE ORGIA . RELEASES WILL BE lv!.ADE
* iviCNDAY, 3. p.m. EACH WEEK THROUGH OCTOBER
*
u
- - -- -....
* ** ************** ***** *** * *****~*~ ~ ** **
The Geo rg ia Crop Reporting Service, At hens, Georgia; in coope
the
Cooperative Extension Service, Univer sity of Georgia; Georgia
Agr i cuI tu re; and the Weat her Bureau, ESS 1-'\ , U. S. Dc pa rtment o,'r"~iiTii~~-=-----J
r
U. S. DEPAR TME NT OF COMMERCE
WEATHER BUREAP
Athens,s Georgia
Precipitat ion or The . ~ek Ending hpril 7 , 1967
GEORGIA
Temperat ure e xt remes for week endi ng April?, 1967 (Provisional)
Highe s t ! 92 at Fort Ste\-Ja:-t on the 7th.
35 at Blairsville and Helen oa
the 1st .
* For period April 8-10, 1967
T Less t han .oo5 inch
After Five Days Retur n to United States Department of Ag ricu ture
Stat istical Reporting Service 315 Hoke Smith An nex Athens, Georgia 30601 OFFICIAL BUSIN ESS
IMMEDIATE - U. S. WEATHER REPORT
This report will be treated in al
Respects as Letter Mai l
-I I
(See Sec. 34.17, P. L. & R. ) ! 0 1_Tp-i'r Llbrary
~ Ga ns Ga 30601
Postage and U. S. Department
l
GEORGIA CROP REPORTING SERVICE
ATHENS, GEORG IA
GEORGIA CHICK HATCHERY REPORT
April 12, 1967
Placement of broiler chicks in Georgia during the week ended April 8 was
9,9Z7, 000--1 percent less than in the previous week but 2 p ercent more than in the
comparable week last year, according to the G e orgia Crop Reporting Service.
An es.timated 12,981, 000 broiler type eggs were set by Georgia hatcheries-! percent less than in the previous week and 6 p ercent l ess than in the comparable week a year earlier.
The majority of the prices paid to G eorgia producers fo r broiler hatching eggs were reported within a range of 45 to 65 cents per dozen. The average pric e of hatching eggs was 56 cents per dozen. The pric e o f eggs from flock s with hatche ry owned cockerels generally was 2 cents below the ave rage pric e . Most pric es r ece ive d fo r broiler chicks by Georgia hatcheries were re port e d within a range of $5 . 00 to $9 . 00 with an average of $7.7 5 per hundred. The av~r ag e p rices last yea r w e r e 64 cents for eggs and $10.00 for chicks.
GEORGIA EGGS SET, HATCHINGS , AND CHIC K PLACE M~ NTS E GG TYPE
leek Ended
War.11 War.l8 War. ZS Apr. 1 Apr, 8
Eggs Set
1966
1967
Thou.
Thou.
950 1, 065 11 273 1, 083 11 217
1, 22s 1, 160 1, 191 1, 166
1,155
i
i
: u7o of
' year
i
i
ago
I
1 Pet.
!
I 129
! 109 I 94
108
I 95 I
Chid;~s HatC t1ed
1966
1967
Tho u.
Thou.
677
1,060
788
1, 050
94 5
905
819
956
834
950
!Ifo of
1 year
! ago
1
I
Pet.
I
I I
157
I 133 96
i' 111174
BROILER TYPE
leek Ended
EBgs Set_!_/
1966
I Thou.
1967 Thou,
'fo of i
year i' ago Pet. ;
,_____j\__y_._ J?...r.i~J~ - ------
C hick s Plac ed. for
Hatch
Broiler
Broilers in Georgia
Eggs
Chicks
%of P er
Per
1966
1967
year Doz. ago 1967
Hundred 1967
Thou.
Thou. Pet. ! Gents
Dollars
I I feb. 4
12, 432 13, 096 105
8, 897
8, 909 100
60
Feb. 11
12, 29 8 12, 9 7 1 10 5 I 9, 1o2
9, 063 100
60
Feb. 18
12,302 13, 221 107 I 9, 049
9, 393 104
60
8. 75 8.75 8.75
feb. ZS 1 _ 121 616' 13, 346 106 ! 8, 916
9,421 106
60
8.75
War, 4
13 1 00 1 13 , 174 10 1
8, 8 2 6
9,706 110
58
8.25
War. 11
13 1467 13,027
97
8, 875
9, 914 11 2
57
8.00
War, 18
131 3 15 13, 18 5
9 9
9, 0 2 5
9,968 110
56
7.75
War. ZS Apr. 1
13, 594 131 167
97
13, 742 13 1 062
95
9, 276
9, 641
9, 965 10, 016
I 107
56
104
56
7.75 7.75
Apr. 8
13,868 121981
94
91 719
9, 927 102
56
7.75
~t lncludes eggs set by hatcheries producing chicks for hatchery s uppi_y_=1-o-c.,...k-s-.- - - - - -
ARCffiE LANGLEY
W. A . WAGNER
Aaricultura1 Statistician In Charge
Agricultur al Statistician
-------------------------------------------------------------------------------
U, S, Department of Agriculture
Ag ricult ural Extension Service
~tatistica1 Reporting Service
State Departm ent of Agriculture
315 Hoke Smith Annex, Athens, Georgia
.APR 13 1967
LI BRARIES
STATE
Maine Conne cticut P ennsylvania Indiana Missouri Delaware Maryland Virginia We st Virginia North Carolina South Carolina
1,94 7
2 ,00 2
2,027 102
1, 607
1, 519
l, 574
104
289
324
4 07 100
162
14 5
222
99
1, 489
1, 349
1,370 96
872
700
772
85
580
580
591
87
356
356
4 18
107
740 2, 86 5 4, 54 2
7 59 2, 780 4, 596
730 2,891 4,661
87 I 4 13
!I 102 i! 2, 77 1
99
3, 364
385 2,537 3,419
385 2, 579 3,384
95
99 101
1, 805
1, 720
1, 880
95 1. 1, 2 11
1, 081
1, 245
106
160
159
155
91 l,,1 30 3
370
250
57
7, 589
7, 360
7,357
99
5, 70 8
5, 560
5, 788
93
495
503
,, 476 103 II 37 7
372
347
89
GE ORGIA
Florida Tenness ee Alabama Mississippi Arkansas Louisiana Texas Washington Oregon California TOTAL 19 7
(22 States)
* TOTAL 1966
(22 States)
13, 167 13,062 12,981
li 94
9,96 5 10,016
9,927
102
I
842
835
841
150
.I
li
399
458
461
139
986
1,004
1, 073
89 ;, 1, 14 6
1, 014
1,042
89
8,979 5,054
8,933 5, 142
8,900 5, 197
.. 97 j: 6,988
108 ' 4, 223
7,058 4,349
7, 136 4,302
98 111
10,478 1, 171 4,762
10,380 1, 126 4 ,740
10, 578 1, 117 4, 641
l 103
7,9{:.4
105
869
106 :i 3, 765
7,910 856
3,806
3,020 811
3,748
107 113 112
858
892
873 109 ll 583
534
522
106
449
445
503
99
294
310
317
138
1,992
1, 822
1,885 100
1, 598
1, 451
1, 502
118
71,239 70, 513 71, 134 100 , 54,903 54,20
54,752
102
70,473 71,544 71,370
j!
1151, 998 52,941 53, 537
o/o gf Last Year
1
101
99
100
*];_/ Current week as percent of same week last year. Revised.
I
!I
:I 106
102
102
3tS
GEORGIA CROP REPORTI NG SERVIC
UNIVERSITY O.F Gf:ORGIA
APR 25 1967
ATHENS, GEORG I A
LI BRAR IESM.. arcn, 1 967 Re l eased 4/18/1967
March Mi l k Prod uctio n Up 4 Mill io n Po un ds
Tot a l mi l k produced on Geo r gia f arms during March i s estimated at 89 mil 1 io n pounds4mil1ion from the sa me mo nth l ast year, a nd 3 mi ll io n priu nds above the 196 1 - 1965 average
ion fo r the month .
Milk pe r cow was p laced at 6 15 pou nds compared with 560 i n Marc h l ast yea r. The - 1965 average for the mont h was 467 po un ds per cow .
Prices pa id by da i rymen for feed we re ge neral 1y unchanged from February, but averaged $.30 above the pre v ious year . Ha y prices were slightly higher.
Ml K PROD UCTI ON
Itern and Un i t
Mar . 1 66
Georq ia Feb. 1
Mar . 1 66
Un ited States Feb . 1
lk production, mi 1. 1b. ction per cow, 1b.J._/ r m1! k cows ,
thousand head
85
76
560
520
151
146
[;9 10,537
615
736
145
9,217 670
10 , 510 766
RECEIVED- DOLL ARS Jj cwt.
6. IS 6 . 20 3.60 170. 00 26 . 50
} /6. 60 6. 60 4. 15
20 0.00
27.50
!16 . 50
200 . 00 27.30
4 . 54
4 . 93 3. 73 23 0 .00 24 .20
}/5 . 06 5 1-+9 4 .1 2
257 . 00
25 . 30
!14. 96
256 . 00 25. l 0
PAl D - DOLL ARS ']/
Dairy Feed:
il 14 percent prote i n, cwt.
16 percent prote i n, cwt. 18 percent protein, cwt . 20 percent protein, cwt .
under 29 percent prote i n, cwt.
3. bo
3. 95 4.05 4 . 25
3.95
4 . 00 4 .25 4.50 4.60
4.2 5
4 . 10 4.20 4.50 4.5 5
4.25
3.48 3. 79 3 . 96 4 . oe
3 . 73
3 . 66 4 . 03 4 . 16 4 . 46
3 . 95
3.6 5 3 . 99 4. 11 4 . 33
3. 91
Honthly average. ~liars per unit as of the 15th of mo nt h ex cept wh ol esa l e mi lk wh i ch is average for mon th.
Revised . Pre! iminary. United States price is for under 16 perce nt.
ARCHIE LANGL EY icultural Stat isticia n In Charge
R L S.A.NDI FE R
Agricultural Statistician
----------------------- ------------------------
Georgia Crop Kepo rting Serv ice , USDA , 315 Hoke Smi t h Annex , Athe ns, Georgia, i n cooperation ~the Cooperat i ve Ex tension Service , Un ive r sity of Georg ia , and the Georgia Depa rt me nt of iculture .
UNITED STAT ES MILK PRODUCT ION
March milk output sliq htly be low a year aqo
Milk product io n i n the Un it ed Stat es dur i ng March is estimated at 10,510 mill ion slightly below t he 10,53 7 mi 11 ion pou nds produce d l ast l"tarch and 5 per ce nt below the 1961 ave rage for the mon t h. Produc tion was the l owest for March since 1955. Total prod uct ion milk during the Jan ua ry-March period t h is year wa s 29,582 mi 11 ion pou nds, s l ight ly above comparable 19 66 peri od . On a da ily basis , milk pro duction increased 3 percent from Fe b r ~ to March, compare d with an i ncrease of 4 percent between these mont hs last year . March oo put provided 1.71 poun ds per person daily, compared with 1.73 pounds in March 1966 .
March rat e per cow up 4 percent from year earl ier
Milk output per cow averaged 766 pounds fo r th e United States during Ma r ch, 4 percent more th a n a year ear l ier a nd 13 per cent above the 5-year average for March . On a dai ly March output ave raged 24 .7 pou nds per cow, compared with 23 .9 pounds a month earlie r and pounds in March 1966 . Marc h product io n per cow was at a record level in 45 State s.
Mi lk Per Cow and Milk Production by Months Untt ed States , 1967, with Comparisons
Month
January February March
Jan.-Mar. total
Apr i 1 May June July August September October November December
Annual
Mi 1k er cow
66
Pounds
621
67&
715
591
635
670
676
6
766
90 757 729 671 629 59 2 602 581 618
7,759
752 812
79~
736 696 663 670 649 68
8 , 513
Mi 1k red uction
66
Mi I 1 ion Pounds
10,222
9 , oos
9,&55
9,696
9, 137
9,217
11 ,062 I0 , 37
10 10
30, 980 29 ,479
29,582
11 '2&0 12 , 310 11 ,816 10,ts49 10,148
9,522 9,643 9 , 2BS
84 1
10,7 25 11 ,525 11 , 269 10,350
9,7 63 9 , 263
9,333 9 ,012
11
125,660 120,230
Cha nge from I
tO.l
After Five Days Return to United States Depa rt ment of Ag ricu lture
Statistical Repor t in g Servi ce 315 Hoke Smit h Anne x
Athens , Geor gia 30601 OFFICI AL BUSI NES S
Po stag e a nd Fees Paid U. S. Departme nt of Agricul
900 7
.~?
"
GEORGIA CROP REPORTING SERVICE
,w~~rnrhw
ATHENS, GEORG I A
A pril 19 , 1967
GEORGIA CHI CK HATCHERY REPORT
LIB RAR IES
Place m ent of broiler chicks in Georg1a
nded A pril 15 was
9,92.9, 000- - about the same as in the previous week but 3 p ercent more than in the
compara ble w eek last year, according to th ~ G orgia Crop ,_={eporting Service.
An estimated 13, 2.02, 000 broiler type egg s wer e set by Georgia hatcheries -Zperc ent mo re t han in the p revious week but 5 percent l ess than in the compara ble week a yea r earli e r.
The majority of the prices paid to Georgia producers for broile r hatching eggs were r e p orted within a rang e of 45 to 65 cents p er dozen. The averag e price of hatching eggs was 56 cents per dozen. Th e price of eggs from Hocks with hatche ry owned c ocke r ~ls generally was 2 cents below the average pric;__, Most prices receiv d for broiler chicks by Georgia hatcheries wer e re port ed within a range of $5 .00 to
$9.00 wit h an average of $7 . 7 5 per hundred. T h e average prices last year were 64
cents for eggs and $1 0.00 for chick s .
\\ eek Ended
G ,~ ORGIA GGS SET , HAfCHINGS , AND CHICK PLACEMENTS
S ggs Set
1966
1967
.C::GG TYPE
7o o f
~' .:!ar
ago
ChicKs Hatche d
1966
1967
Thou.
Thou.
Pet.
Thou.
Thou.
o/o of
year ago
Pet.
Mar. 18 Mar . 25 Apr. l Apr. 8 Afr o 15
Week Ended
l , 065 l, 273 l, 083 l, 217 l , 227
:ri; ggs Set}_ /
1966 Thou.
1967 Thou.
l, 160
109
l, 191
94
l, 166
108
1, 155
95
999
81
788 9i5
819
83~
l, 018
l, 0 50
133
905
96
9 56
117
950
114
887
87
BROILE ...;. TYP
o/o of
year ago
Pet.
Chicks Placed for
B railers in G eorgia
%Of
1966
1967
year
ago
T Cl.OU .
Thou. Pet.
Av. Price
Hatch
Broiler
Eggs
Chicks
Per
P er
Doz.
Hundred
Do C19e6n7ts___ 196l7iars
Feb, 11
12,298 12,971 105
9, 102
9,063 100
60
Feb. 18
12, 302 13,221 107
9,049
9,393 104
60
Feb. 25
12, 61 6 13 ,346 106 ' 8, 916
9, 421 106
60
Mar . 4
13, 001 13, 174 101
8, 826
9, 706 110
58
Mar . 11
13,467 13,027
97
8,875
9,914 112
57
Mar. 18
13 , 315 13, 185
99
9,025
9,96 C 110
56
Mar. 25
13, 594 13, 167
97
9,276
9,965 107
56
Apr. 1
13 , 74 2 13,062
95
9,641 10, 01 6 104
56
Apr. 8
13 , 868 12,981
94
9, 719
9,927 102
56
!fApr. 15
13, 9 22 13,202
95
9,655
9,929 103
56
Includes eggs set by hatcheries producing ch1cks for hatchery supply flocks .
8 .75 8. 75 8.75 8. 25 8.00 7,75 7.75 7.7 5 7.75 7. 75
A RC HI~ L A NGLZ Y
Vv . A . WAGN ~R
Agricultural Statistician In Charge
Agricultural Statistician
----- ------- ---------- ----------------- ---------------------------- --------- --
U.S De partme n t of Agr icultur e
Agricultural Extension Service
Statistical Repo rting Service
State Department of Agriculture
315 Hoke Smith Annex, Athens, Georgia
STATE
Apr.
A pr.
'7o of year
W ~ek _:!: ndcd
Apr-; - - -.Ap-r-. -- A pr.
year
------------------~----l ~--------~-------15-~----a~g~o--l ~I ----l --
THO U3AND3
T~-:I .-)U-8S-A-N-D--3 ---1-5 ------a~g~o ~1~I-
Maine Connecticut Pennsylvania Indiana Missouri D e laware Maryland Virginia West Virginia North Carolina South Carolina
2,002
2. , 027
2, 00 4 96
1, 519
l, 574
l , 530
100
324
4 07
319 87
145
222.
1" 9
71
1, 349
1, 3 70
1, 468 97
700
77 2
8'15
93
580
591
600 78
356
418
327
73
759
730
699 92
385
385
445
105
2, 780
2, 891
2,992 104
2, 53?
2, 579
2, 624
96
4, 596
"' 661
4 , 567 97 1: 3, 4 19
3,384
3,328
101
1, 720
1, 880
1, 983 100
1, 0 81
1, 2.t.::5
1, 14 7
109
159
155
167 94
370
2~0
368
78
7,360
7, 357
7,387 103
5, 56 0
5, 78 8
5, 779
92
503
476
505 113 . ! 372
347
359
90
GEORGIA Florida Tenne ssee Alabama Mississippi Arkansas Louisiana Texas Washington Oregon California
TOTAL 1967
(22 States)
13,062 12 ,981 13,202 95 10,0 16
9,9 27
9,929
103
835
841
823 163
461
487
111
1, 004
1, 073
1, 050
8.5
1, 0 l L~
1, 042
984
87
8, 933
8,900
8,785 96
7,058
7, 136
7,036
98
5, 142
5, 197
5,250 109
4, 3L.::9
4,302
4,28:
110
10, 380 10, 57 8 10,335 101 :; 7,910
8,020
7, 873
103
1, 126
1, 117
1, 144 107 :: 350
811
832
116
4, 740
.<:.::, 64 1
4, 520 100 ,. 3, 806
3,748
3, 697
107
892
873
707 86
53 ~
522
559
108
445
50 3
485 144
310
317
349
144
1, 822
1, 885
1, 796
95 j 1, 45 1
1, 502
l, 496
109
70, 513 71, 134 70,788
99
54, 206 54, 7 52
101
I.
TOTAL 1966*
{22 States)
71, 544 71,370 71,324
% of Last Year
99
100
99
*1/ C urrent week as - percent of sarn e we e k last year. Revised.
: 52,9~::.
I 102
53,537 102
54,056 101
7c;-\-r -r L
I I :5
ON F D
-.
CROP
Cattle on Feed Down 29 Percent
Cattle and calves on grain fe ed for slaughter market in Georgia o
head. This was 29 percent below the number on feed April 1 last year ~e 51, 000 head on January 1, 1967 .
~e number of grain-fed cattle sold for slaughter during the J anuary-Mar ch quarter totaled This compared with 46, 000 during the same period l ast year and 34, 000 during the
cember 1966 quarter. There were 23, 000 cattle and calves placed on f eed January March. This was 9, 000 head below placements during the previous quarte r and 13, 000 p~cements during the same peri od of 1966 .
Cattle feeders in Ge orgia indicate they will market 28, 000 head during April, May, and ~e remaining 20,000 head on feed April l will be marketed after June 30 .
Ot the 48, 000 cattle and calve s on f eed April 1, 43, 000 we r e stee r s, and 5, 000 were . A t otal of 22,000 head had been on fe e d less than 3 months, 20, 000 had been on feed months, and the remaining 6, 000 had been on fe ed more than 6 months.
Cattle on Feed Up ~ Percent
~e 32 major feeding States had 10,496,000 head on feed for slaughter market compared
10,226,000 head on April 1, 1966.
Placements Down ~ Percent--Marketing Up 6 Percent
4,634,000 cattle and calves placed on feed in January-March in the 32 States, of 3 percent from the same peri od in 1966 . Compared with a year earlier, placements
down 3 percent in the North Central States and down 7 percent in the He stern States .
of stocker and feeder cattle into 8 Corn Belt States during J anuary and February down 4,000 head, about l/2 percent lower than for the same peri od in 1966 .
~ketings of fed cattle for slaughter during the first ~uarter this year t ot aled head in the 32 States , 6 percent higher than in the same peri od in 1966 . Fed cattle in the North Central States were up 8 percent fr om a year earlier while marketings l percent.
Marketing Intentions
~the cattle on feed April 1, 5,202, 000 head are expect ed t o be marketed during the
period. This would be 4 percent higher than comparable marketings for the same a year earlier. Intentions in the Western States point to a 3 percent increase in
marketings. Feeders in the North Central States a lso plan 3 percent more marketA-breakdown of anticipated marketings -during t:qe April~June quarter _shows 34 percent to
during April, 32 percent in May,and 34 percent in June. Expect ed marketings, as
are based on the usual relationship between survey data and a ctual marketings .
Cattle and Calves: Inventories Placements and Ma rketi
l t o il l
Item
and calves on feed January l
and calves placed on feed
1-March 31 y
cattle marketed January 1-March 31
y
4,773
4, 634
97
4, 983
5,274
106
il l
10 226 10 6
on feed after qeginning of quarter and marketed before end of
~orgia Crop-Reporti;g-Ser;ice~ USDA~ 315 Hoke-Smitb-A;nex~ Athe;s~ Georgia, -i; coopera---nth the Cooperative Extension Service, University of Ge or gia and the Ge orgia Department Jsriculture .
,..
STATE
Cattle
and
Calves
on By
Feed, Pla Qu a r t e r s
ceyme
nts
and
Marketings
CATTLE ON FEED
NUMBER
ON FEED 2
:April l:Jan. l April l
1966 : 1967 1967
GEORGIA Alabama Florida Mississippi Tennessee Kentucky Oklahoma Texas Pennsylvania
12 N. Cent . Sts
ll Western Sts .
2 State Total
68
29 45 12 28 62
132
530 77 6,847 2,396
51 42
76 25 41
59 170 674 82 7,142 2,774
48 23 45 14 28
50 15 0
653 76 6,985 2,424
36 13 28
7 7 16 101
374 21 3,038 1,132
32 32 69 17 29
37 132 488
54 5,164 1,666
23 14
32
5 7 14 103 406 21
2,954 1, 055
46 21
56 18 18 24
98 382 29 2,878 1,413
34 12 46
13 14
17 85 323 28 3,086
1, 350
Cattle and Calves on Feed ty We ight Groups, Kind of Cattle
and length of Time on Feed, Ge orgia and 32 Maj or Feeding St at es by Quarters, 1966 and 1967 ))
Breakdown of Cattle on Feed
Total on Feed
I.Jeight Groups
Under 500 lbs. 500-699 lbs. 700-899 lbs. 900-1,099 lbs.
l,lCO lbs . and over
68
48
10,226
14
ll
2
813
1, 868
26
18
21
3,519
2,73 0
19
17
17
3,306
3,700
9
5
8
2,232
2,383
356
455
Kind of Cattle:
Steers and Steer Calves
52
Heifers and Heifer Calves
15
Cows and Others
l
41
43
7,102
7,853
10
5
3,085
3,222
39
61
Time on Feed:
Under 3 months
3-6 Months Over 6 Months
35
32
22
30
16
20
6
Cattle and calves on feed are animals being fattened f or the slaughter market on grainor
other concentrates which are expected to produce a carcass that will grade good or better.
?} Includes cattle placed on feed after beginning of quarter and marketed by end of quarter.
ARCHIE LANGLEY Agricultural Statistician In Charge
C L. CRENSHAI~ Agricultural S
After Five rays Return t o
United States De~artment of Agriculture
Statistical Reporting Service
315 Hoke Smith Annex Athens, Ge orgia 30601
OFFICIAL BUSI1~SS
Pos t age and Fees Paid U. S . De:r-artment of Agr iculture
L! ~ ~ I
G e orgia - Firs t in Broiler Production
R e leased April 21, 1967
First in Income from Chickens and E ggs
Second in Egg Production
Commercial Broiler production in Georgia in 1966 set a new re cord high with a total of 456 million birds, according to th e G e orgia Cro p Reporting Service . Thi s is the 16th consecutive year Ge o rgia has led the nation in broiler p roduction . The 1966 production was 13 p e rcent more than in 1965 .
Egg production in Georgia also set a n e w r ecord high of 4 , 501 million egg s in 1966 . Nationally, G eo rgia now ranks s ec ond to C alifornia in e gg production. The 19 66 production w a s 11 perc e nt above that in 1965 .
Cash r e c e ipts for all chickens and eggs including Comme rcial Broile rs is estimated to be about 409 million dollars whic h was 42 p er cent of the total of all farm marketings in the 3tate in 1966 . This was the lOth year G e or gia has l e d i:h z N ation in cash receipts from all chickens and eg gs .
GEORGIA CHICKEN PRODU C l' IO N AND IN COME 19 62 -1966
No . Produced
No. Sold
I
Po unds Sold
I P ri -::e P er L b.
I
Cash
Rece ipts
Thot..s.
Tho us .
Tho us .
Cent s
Thous . Dol.
Commercial
Broilers 1962 1963 1964 1965 1966
353,6 00 359, 760 373,880 402,770 456, 192
l , 166, 880 l, 223, 184 1,271, 192 1, 569 , 4 18 1,55 1,053
14 . 4 l:) . 8 13.7 14 . 5 1L!: . 5
168,0 31 168,799 174, 153 19 8, 566 224, 903
Commercial i~gg
./locks l I
1962
8, 51"1
5, 74 0
22,960
7. 5
1963
10, 801
7, 530
30, 120
8. 2
1964
11 ' 77 i
8, 686
3s: , 744
7. 0
1965
11,062
9,6 43
38,572
6. 4
1966
15,477
10,487
41 , 948
7. 3
1, 712 2,470 2, 432 2,468 3,062
Hatching Egg
Flocks 2/
1962 1963 1964 1965 1966
5, 630 5, 411 4,952 5, 567 6, 592
4,352 4,452 4, 807 4,935 5, 481
32,640 33 , 390 36,052 37,012 41 , 108
16.9 17. 5 15 . 3 16 . 0 15.0
5, 516 5,850 5,70 (j
5,922 6, 157
All Chickens
Including
Comm . Broilers 3 I
1962 1963
1~64
1965 1966
363,842 371,872 387 , 707 41 7,677 4 72,360
1, 223, 080 l, t.87,214 1, 343 , 324
1, 4 ~ 6 ,318
l, 63 4 ,909
14 .3
13 . 8
u . 6
14 . 5 14.3
175, 33 7 177, 187 182,448 207 , 10 2 234,211
All Chickens and Eggs Including Broilers
1962 1963 1964 1965 1966
271,997 294, 547 308,284 348,698 409,384
1/ Commercial E gg F locks - 400 birds or more p er flo c k - eggs principally for human consumption. 2/ Hatching Egg Flocks - ,~ ggs used principally for hatching broiler chicks.
11 Farm flocks not shown .separately t o cons e1. ve space but included in total .
Over for Data on 3 gg Production
Ave . No.
E ggs p _, r
._;:;ggs
_J:;:; ggs So_l~
_ J.~:r;:_icP~.>er Q o z .
c,.,.h R. .-,c<.d n t s _
_______________________j_____L~a~y~e~r~s~-----=L~a~y~-~r~----~P~r~o~d~u~c~e~d=-1~_C~o~rn~rn~----H~a~t~c~h~~-A_-~ll~-~~C~o~rn~rn~.---H~a~t~c-h~.~-E--1-l__~c--c_rn__rn_.-L, __H_a_t~c-h~.--'~-J-.~-ll____
Thous .
No.
Milli o ns
- - M illions - -
- - Cents - -
- - Thous . D ollars - -
Comme rcial
Zlocks 1/
1962
19 63 19 64 19 65 196 6
8, 273
217
11, 24 7
217
12, 845
221
13,948
222
16, 088
216
l, 794 2,440 2, 842 3,094 3,479
1, 791 2, 43 7 2,839 3,0 91 3,476
1' 791 2,437
2,839 3,091 3,476
38. 1 38.0 37.0 38. 1
56, 397 77, 157 87, 54 9 98, 187 124,993
56, 897 77,157 87, 549 98, 187 124 ,99 3
Hatchi ng ;~ gg
Flocks 2/
1962 1963 19 64 1965 1966
3,409
201
3,458
192
3, 650
19 6
3,909
20 1
4,428
200
686
69
615
684
38. 1 60.3
663
64
597
66 1 38.0 66.4
717
70
645
715
37.0
59.3
785
76
707
783
33. 1 62.9
884
88
794
882
Ll3. l
65. 4
2, 191 2,027 2, 158 2, 4 13 3, 161
30,904 33, 04 6 31,874 37,059 43,248
33,095 3 5,07 3 34,03 2 39, 472 4 6, 4: 09
F a rm F locks 3/
19 62 19 63 1964 1965 19 66
1, 595
174
l, 294
168
1,096
168
935
174
782
17 6
277
210
218
16 2
184
138
163
124
138
105
210
38. l
162
38.0
138
37.0
124
38. l
105
43 . l
6, 668 5, 130 4, 255
3, 937 3, 771
6,6 68 5, 130 4,255 3,937 3,771
A ll C hi c k e n and :.!:: gg s Excluding Comme rcial Broile r s
1962 1963 1964
19 6 5 19 66
13, 277
208
15,999
208
17' 591
213
18, 792
215
21,298
211
2, 757 3,321
3,743 4,042 4 , 501
2,070 2. , 66 3 3,04 7 3,29 1 3,669
615 2,685 597 3,260 645 3,692
707 3,998 794 4,463
38. l
38. 0
37.0 38. 1 43. 1
60.3 66.4
59. 3
62.9 65.4
43 . 2 43.2
4 0.9 42 .5 47 .1
6 5, 7 56 84,314 93,962 104 , 537 131 , 925
30,904
33' 046 31, 874 37,059 43 , 248
96,6 6 0 117,3 60 125, 836 14 1, 596 175,173
1/ C omm er cial Egg F l ocks - 400 birds or mor e p ::! r flo cks - E gg s p r incipa lly for human consumptio n. 2 / Hat ching E gg .!:.~' locks - E ggs used principa lly for hatching broile r chicks. 3 / Farm F locks - L ess t ha n 4 00 bir ds per flock- E ggs used pr1ncipally for human consumption.
fh~ G e o_rgia C r o p d e porting Service , US DA, 3 15 Hoke Smith A nnex, Athens, G e orgia in cooperation with the c
Unlv z rslty of G eorgia and the G e orgia De partm ent of A griculture.
1
ooperative Extension Service,
AR CHIE LANGLE Y Agricultural Statistician In Charge
W. A. WAGNE R Agricultural Statistician
--) ,.- - '
.1- , ( /
y I:. / ,,_ : I ,, 1\ " 1 L I~
I
'---' tV /\;,; .
Re l e as ed A pril 21 , 1967
G e orgia - Firs t in Broile r Produ ction
First in Income from Chickens and E ggs Second in Egg Production
Comme rcial Broiler production in Ge orgia in 1966 set a new re cord high with a total of 456 million birds, according to th e G e orgia C rop Reporting S e rvice. This is t he
16th consecutive year G e orgia has l e d the n ation in broiler producti on . The 1966 production was 13 p e rc e nt more than in 1965.
E gg pr oduct ion in G e orgia al s o set a n e w r e cor d high of 4, 501 million egg s m 1966. Nationally, G e orgia now ranks s e cond to C alifornia in e gg production. The 19 66 production w as 11 p e rc e nt above that in 196 5.
Cash r e c eipts for all chickens and eggs including Commercial Broile rs is e stimate d to be about 4 09 million d ollars whic h was 42 p cor c e nt of the total of all farm marke ting s in the 3tate in 1966 . T his was th e lOth year G e orgia has l e d i:h := Nation in cash rec e ipts from all chickens and egg s.
GEO R GIA C HICKE N PRODU CT I O N AND IN COME 19 62 -1966
No .
No.
, Pounds
P ri Cc
I
Cash
Produced
Sold
Sold
P e r Lb .
Rece ipts
ThoL..s.
Tho us .
Thous .
Cents
Tho us. Dol.
Commercial
Broilers 1962 1963 1964 1965 1966
353,600 359, 760 373,880 402,770 4 56, 192
1, 166, 880 1, 223, 184 1,271,192 1, 56 9 , 418 1, 55 1, 053
14 . 4
1:) . 8
13 .7 14 . 5
1~. 5
168,031 168,799 174,153 198, 566 224,90 3
Commercial gg
llocks 1I
1962
8, 577
5, 74 0
22,960
7.5
1963
10, 80 1
7, 530
30, 120
8. 2
1964
11,771
8,686
3<:': , 744
7.0
1965
11,062
9,643
38, 572
6. 4
1966
15, 4 77
10, 4 87
41 ,948
7.3
1, 71 2 2,470 2, 432 2, 468 3,062
iiatching Egg
Flocks 21
1962 1963 1964 1965 1966
5, 630 5, 411 4,952 5, 567 6, 592
4,3 52 4,452 4,807 4, 935 5, 481
32,640 33 ,390 36,052 37,012 4 1, 108
16.9 17. 5 15. 8 16 .0 15. 0
5, 516 5, 850 5, 70 9 5,922 6, 157
All Chickens Including
Comm. Broile r s 3 I
1962 1963 1964 1965 1966
363,84 2 371,872 387,707 417,677 472,360
1,223,080 1, 28 7,214 1, 343 , 324
1, 4~6 ,318
1, 634,909
14 .3 13. 8 13.6 14 . 3 14. 3
175,337 177, 187 182,448 207,10 2 234, 211
All Chickens and Eggs Including Broilers
1962 1963 1964 1965 1966
271,997 294, 547 308, 284 348,698 409,384
1/ Commercial E gg F locks - 400 birds or more p e r fl ock - eggs prin cipally for human
consumption. 21 Hatching E gg Flocks - ~ ggs used principall y for hatching broiler chicks.
11 Farm flocks not shown separat e ly to cons eJ. ve space but include d i n total.
Over for Data on 3 gg Production
_j
Av e: . No.
L ayer s
Thous.
E..g gs F ..o r
Laye r
No.
..!:; g gs
Produc ed
Milli o ns
_ E g gs Sols!
Comm. Hatc h. A ll - - Millions - -
_ --~j. c e P e r _ OQ.~ -
t Com m . Hat c h. .f-_11 - - Cents - -
--
/ \.11
- - Thous . Dollars - -
C omme rcial
Z locks 1/ 1962 1963 1964 1965 196 6
81 27 3
217
ll, 24 7
217
12, 84 5
221
13 1 9 4 8
222
16,088
216
11 794 2,440 21 842 3,094 3,479
11 791 214 37 21839 3,091 3, 476
l' 791 21437
21 839
31091 3,476
38. l 38.0 37.0 38. l
4: 3 . l
56,397 771 157 87, 549 98, 187 124,993
56, 897 77,157
871 549 981 187 124 ,993
Hat c hing ~~g g
.flocks 2/ 1962 1963 19 64 1965 1966
31409
201
31458
192
31 650
19 6
31909
201
41428
200
686
69
615
684
38. l
60.3
663
64
597
661
38.0 66.4
717
70
645
715
37 .0 59.3
785
76
707
783
33. l
62.9
884
88
794
882
43. 1 65.4
2, 191 2,027 2, 158 2, 4 13 31 161
30,904 331 04 6 311874 371059 43,248
3310 9 5 35,073 34,032
391 4 72 4 6, 4 09
F arm F locks 3/ 19 6 2 196 3 1964 1965 19 66
l, 59 5
174
11 294
168
11096
168
935
174
782
176
277
210
218
16 2
184
138
163
12Ll
138
105
210
38. l
162
38.0
138
37 .0
124
38. 1
105
43 . l
6, 668 5, 130 4, 255
3, 937 3, 771
6,6 68 5, 130 4,255 3,937 3,771
A ll C hi c k e n and : ~ g gs Zxcluding Comme r cial B roilc r s
1962 19 63 19 64 1965 19 66
131 277
208
151999
208
171 591
213
18,792
215
211298
2 11
21 757 3,321
31 743 41042 4 1 50 l
21070 2., 663
3,04 7
3, 291 3,6 69
615 2,685 597 31260 645 3,692 707 3,998 794 4, 4 63
38 . l
38.0 37.0 38. l
LB . l
60.3 66 . 4
59. 3 62 .9 65. 4
43. 2 43. 2
40. 9 4 2.5 47.1
65, 7 56 84,31 4 93,962 104, 537 131, 925
30,904 331 046 311 874 371059 43, 248
9616 6 0 117,360 125, 836
1411596 175, 173
1/ C omm e rcial E gg F locks - 400 birds or mor ::! p e r flo c ks - E ggs p r incipa lly for human consumption. 2/ Hat ching E gg l:'~locks - E ggs used princi p a lly for hat ching broile r chicks . 3/ F a r m F locks - L es s than 400 birds per flock- E gg s us e d pr1ncipally for human consumption.
f h ..~.. G eo.r g ia C r o p rte porting Se rvice, USDA , 315 Hoke Smith A nne x,
Un1v .e rs1ty of G e orgia and th e G e orgia D e partm e nt of A griculture .
Ath ens,
G e org1a1
1 n coopera tion with th e
Cooperative Extension Service,
ARCHIE LANGLE Y Agricultural .Statistician In Charge
llv . A . WAGNER Agricultural. .Statistician
-y.-
I 1L !
I
) \.
R eleased A pril 21, 1967
G e orgia - First in Broiler P r oduction
First in Income fr om Chickens and E ggs
Se cond in Egg Production
Commercial Broiler production in Ge o r gia in 1966 s et a n ew re cord high with a total of 456 million birds, according to the G e orgia C rop Reporting Se rvice . This is th e 16th consecutive year Georgia has l e d the nation in broiler production . The 1966 production was 13 p e rcent more than in 1965.
Egg production in G e orgia also set a n ew r e cord high of 4 , 50 l million egg s in 1966. Nationally, G e orgia now ranks s e cond to S alifornia in e g g product ion . Th e 19 66 production w as 11 perce nt above t hat in 196 5.
Cash r e c eipts fo r all chickens and eggs including Comme rcial Broile rs is estimate d to be about 409 million d ollars whic h was 42 p er c e nt of the tot al of all fa rm marketing s in the 3tate in 1966 . This was th e lO th year G orgia ha:s l e d 1:1. ::: Nation in cash receipts from all chickens and eg gs .
GEORGIA CHICKEN PRODU CL' I ON AND IN COM:S 1962-1966
No.
, Pounds
F ri :::e
I
Cash
Sold ,
Sold
P e r Lb.
Re c e ipts
T hOL.S .
Tho us .
Thous .
C::: n ts
Tho us . Dol.
Commercial
Broilers 1962 1963 1964 1965 1966
Commercial c!::gg
ilocks 1I
1962
8, 577
1963
10, 80 1
1964
11 , 771
1965
11,062
1966
15, 4 77
353,6 0 0 359, 760 373,880 402,770 456, 192
1, 166 , 880 1, 223, 184 l, 271, 192 1, 56 9,418 1, 55 1, 053
5, 74 0 7, 530 8,686 9,643 10, 4 87
22,960 30, 120 3 ~\ 744 3 8, 572. 41 , 948
14 . 4 13 . 8 13. 7 14 .5 l L!: . 5
7. 5 8. 2 7. 0 6. 4 7. 3
168,031 168,799 17 4 ,15 3 198,566 224, 90 3
1, 712 2,470 2, 432 2, 468 3,062
iiatching Egg Flocks 21
1962 1963 1964 1965 1966
5, 63 0 5, 41 1 4 ,952 5, 567 6, 59 2
4,352 4 ,452 4, 807 4,935 5, 481
3 2,640 33 , 390 36,052 3 7,012 41 , 108
16.9 17. 5 15. 8 16 . 0 15. 0
5, 516 5, 850 5,70 9 5,922 6 , 157
All Chickens Including
Comm . Broilers 3 I
1962 1963 1964 1965 1966
363,842 371,872 387, 707 41 7, 677 472,360
l, 22 3, 080 1, 287 ,214 1, 343 , 324 l ' 4L2:6 , 3 18 1, 63 4 ,909
14 . 3 13 . 8 13 . 6 14 . 3 14. 3
175, 337 177 , 187 182,448 2 0 7,102 234,211
All Chickens and Eggs Including Broilers
1962 1963 1964 1965 1966
271, 997 294, 547 3 0 8 ,2 84 348,698 409,384
1/ Commercial E gg F locks - 400 birds or mor e p e r fl ock - eggs principally for human
consumption. 21 Hatching E gg Flocks - ..i: ggs used principally for hatching broiler chicks .
3/ Farm flocks not shown separately to cons ei ve space but includ e d i n total.
Over for Data on ~ gg Production
Ave . No.
Laye r s
T hous.
E ggs F:>r
Lay:::: r
No .
...!; gg s
_ E g gs So_l q
Produc ed I Comm. Hatc h. A ll
Millions
- - Millions - -
1
.. 1-~Li _ e
Comm .
J
?e r_
Hat
:P o_.
c h.
,;. -
. f...
l
l
- - Cents - -
I c~ a h R ~C ain t: s ~
Ccmm. Hatch. 1
.A ll
- - Tho us. Dolla rs - -
C ommercial
..nocks 1/ 1962 1963 1964 1965 196 6
8, 273
217
11, 24 7
217
12, 845
221
13,948
22 2
16,088
216
1, 794 2,440 2,842 3,094 3,479
1, 791 2, 437 2, 839 3,091 3, 4 76
1,791 2,437 2, 839 3,091 3, 476
38. 1 38.0 37.0 38. l
4: 3 . l
56, 397 77, 157 87 , 54 9 98, 187 124, 993
56, 897 77, 157 87, 549 98, 187 124 ,99 3
Hatching ~~ gg
Flocks 2/ 1962 1963 19 64 1965 1966
3,409
201
3,458
192
3, 650
196
3,909
20 l
4,428
200
686
69
615
684
38. l
60 . 3
663
64
597
661
38.0
66 . 4
717
70
645
715
37 .0 59.3
785
76
707
783
33. 1 62.9
884
88
794
882
43. l
65.4
2, 191 2,027 2, 158 2, 4 13 3, 161
30,904 33, 04 6 31,874 37,059 43,248
33,095 35, 073 34 ,032 39, 4 72 4 6, 4 09
F arm F locks 3/ 1962 196 3 1964 1965 1966
1, 595
174
l , 294
168
1,096
168
935
174
782
176
277
210
218
16 2
184
138
163
124
138
105
210
38. l
162
38.0
138
37 .0
124
38. l
105
43 . l
6, 668 5, 130 4, 255
3,937 3, 771
6, 668 5, 130 4,255 3,937 3, 771
A ll C hi c k e n and :~ ggs Zxcluding Comme rcial
Broi L~ r s
1962 1963 1964
.. 1965
196 6
13, 277
208
15,999
208
17, 591
213
18,792
215
21,298
211
2, 757 3,321 3,743 4,042 4 , 50 l
2,070 2.,663 3,04 7 3,291 3,669
615 2,685 597 3,260 645 3,692 707 3,998 794 4, 4 63
38. l 38.0 37 .0 38. l 43. l
60.3 66.4
59. 3 62.9 65. 4
43 . 2 43.2
40.9 42. 5 47 .1
65, 7 56 84, 31 4 93,962 104, 537 131 , 925
30,904 33, 046 31, 874 37,059 43, 248
96,6 6 0 117,3 60 125, 836 141, 596 175, 17 3
1/ C omm e rcial E gg F lock s - 400 birds or mor 8 p e r flo c ks - E g gs principa lly for human consumption. 2/ Hat ching E gg .!:.~' locks - E ggs used principally for hatching broiler chicks 3/ Farm F locks - L e ss ban 400 birds per flock- E gg s us e d principally for human consumption.
.f U
nh1.cvGz reso1rtgyioaf
CGreooprgKieapaonrtdi
ng th
Se rvice, e Georgia
USDA, 315 Hoke
De partment of A
Smith A nnex, griculture .
Athens,
G e orgia 1
in coopera1-~1 0 n W.lth the
C ooperatl ve Extension Service,
ARCHIE LANGLE Y Agricultural Statistician In Charge
W. A . WAGNER Agricultural Statistician
r
ATHENS, GEORG I A
A p ril 21, 1967
L
LIBRARIES
MAHCH 1967
I
Dur ing Mar .
I o/o o f 1 Jan . thru Mar.
o/o o f
-----It-e-m--------------~~1 ~.l~r~~h6~o6~u-.l~/----~1Mt~~~~~.2-~/~Il--lpnae~cs~att~--l~I--~1~t~~~~~.-l~/----~i-~t~~-~-:~/~-~--lpnae~scatrt~----
Broile r Typ e
1
.
Pullets Pla ced (U. S . )3 /
1
Total
4, 302
4, 060
94
10,750
10 , 50 3
98
Domestic
3, 843
3, 623
94 1 9, 4 56
9, 168
97
Chickens T este d :
Broiler Type
Georgia United States Egg Type
640 2, 219
692 2, 821
10 8
121 I
1, 6 14 6,6 74
1' 879
116
8 ,2 75
124
Georgia United .3tat e s
26
3L1: 131 : i
91
123
135
507
594 11 7 I ! 2,22 7
2, 426
109
Chicks Hatc hed :
Broiler Type Georgia United Sta tes
I
I
I
i 44, 592
1237,387
46 , 562 2 55, 520
I 10 4
124 , 2. 13
10 8
66.S: , 4 6 6
12 9,319 693 , 857
104 104
Egg Type
I
!
Georgia
1 3, 538
I United States
1 64, 74 1
Commercial .S laught e r :4 /
4 , 4 19 66 , 62 1
I 125 I j e , 8 28
103
142, 12 1
I
11,269 153,645
12 8 10 8
Young Chicken s
HG~:e!otr:g~iads~~~~s
Georgia UnitedStates
Et~t Pr~duc t i on :
i 31, 63 1
34, 20 8 10 8 I 88, 004
94, 940
10 8
117 6 , 5 66
186, 11e 105 1 499 , 79 8
536, 064
107
1
I 704 9,953
l , 052 13, 642
149 I!
137 jj
3L2~ ,, 49?8..26
3, 7 53 44,888
126 13 0
1
1 Mil.
M i.l.
!! Mil.
Mil.
Georg1a South Atlantic 5/
i
366
l 1, 025
42 3 1, 137
'I 11 6 , .
111
1,019 2, 875
1, 208
119
3, 24 1
113
United StaL~s -
~ 5, 7 55
6 , 127 106 1 ' 16 , 2 9 2.
17, 45 5
107
Ill Revised. f:../ Pr e liminary. ]_I P ull e ts for or oiler hatchery s upply flocks , includes
expected pullet re plac ement s from eg gs s old. d uring the pr ec e ding month at the rate of
125 pullet chick s p e r 3 0-doz. cas e of eggs . 4 / Federal-S tat e M arke t News 3e rvic e -
Slaughter reports on ly include poultry slaughte r e d under Federal In s p e ction . !:_/ South
AtlanticStates : D el., Md., W , Va., N.C., S . C ., Ga., Fla.,Va.
YO UNG CHI CKENS : SLA UGHT E RED UNDER P:D;:;:; ~~A L INSFE CTI ON
BY SELECTED STAT !~S , 1966 c. nd 19 6 7
Number Inspected
I Indicated P e rc ent Conde mned
State
During Fe b.
! Jan . t hru Feb .
During ~?eb ,
Jan. thru Feb .
~~~:. ~9h~7u, ~~~:. ~~~' I ~9c~~ 19c~~ ~9c~~ b9c~~
Maine
5, 334
4, 76 6 10, 957 10, 69 5 3. 3
4. 1
3. 1
3. 8
Pa.
6, 268
6, 295 12, 085 13, 744 4 . 6
5. 5
4. 4
5. 2
Mo.
2, 493
2, 819
5, 240 6, 14 0 8 . 8
4. 9
7. 5
6. 0
Del.
7, 2 17
6, 045 13,889 13, 534 4 . 9
4. 8
4. 7
4. 9
l&.:i.
10, 258 10, 08 8 20, 003 22, 77 5 4 . 9
5. 0
4. 7
5. 2
Va.
3, 348
3 ,067
6, 4 21 6, 923 3 . 5
4. 4
3. 4
4. 7
[H. C. . 18, 010 18,425 35 , 82 1 39, 652 5 .0
5. 4
-4 . 6
5 . 4:
Ga.
27, 302 27,519 53,854 59,121 4 . 2
5. 5
3. 8
5. 6
Tenn.
4, 43 0
4 ,071
8,9 14 9,096 3 . 6
5. 3
3. 4
6. 6
__ ___ _!tm__ _______U____ _ _t I_______ ~la.
18, 444
Mis s. 10, 689
~;~! -~.U~!-
17, 234 11, 382
I 36 , 329 36 , 9 S2 3 . 8
22,417 24, 66 7 3. 8
tt_~~L
~t~;~_-I- ~;;
4. 6
3. 6
4. 8
4. 5
3. 8
4. 8
t~ -~--
U, S, 160, 6 6 0
3 22, 0 50
l 4, 3
L_i, , 9
4, 1
5, 2
162, 214
350 , 74 S I
The Georgia Crop Re porting Service , USDA , 3 15 Hoke S mith A nn _x , A th e n s, Georgia,
a cooperation with the Cooperati ve Extension 3e rvice , Unive rsity of G e orgia and t he
~eorgia De part m ent of A gricultur e .
E nd-of- Month Stocks of Poultry, Poultry P roducts, Meat and Meat Products United States - March 1967
Shell e ggs : Decreas ed by 16 thousand cases; Ma rc h 1966 change was an increase of
8 thous and cas e s ; average March increase is 1 million cases. Frozen eggs: Increased
by 4 million pounds ; March 1966 increas e was 4 million pounds ; average Marc h incr
is 4 million pounds , F rozen poultry: Decr ea.se d by 56 million p ounds ; Mar ch 1966
decre ase w a s 4 8 million pounds ; a v e rage March decr ease is 44 million pounds . Beef:
D e cr eased b y 9 million po unds; March 1966 decrease was 2.0 million pounds; ave rage
March change i s an inc r ease of 1 m illion po unds . Pork: Inc rease d by 4 7 m illion poundsi
March 1966 increase was 34 million pounds; ave rage March increas e is 31 million
pounds. Other m eats: Increas ed by 3 m illion pounds; March 1966 increase was 9
million pounds aver e March increas e is 5 million pounds.
March
C ommo dit
Unit
1961-65 av
u.
E gg s:
She ll
Case
48
28
55
39
F rozen eggs , total
Pound
48 , 21 6
24,039
40, 814
4 5, 09 4
Total eggs }) Poultry froz en
Case
1,269
637
l, 088
l , 18 1
-- ----- -- ---- ------ ----- --------------- -----
Broilers or fryers
Po und
2 1, 339
17,312
43 , 164
39,405
Hens, fowls
do .
4 6, 331
22, 801
55, 372
50, 738
Turkeys
do .
151,663
122, 044 253,882 20 8, 762
Other & Unclassified
do .
4 0 ,613
39,264
56,755
53 , 91 0
Total Poult r ;
do .
259 ,9 51
201 , 421 4 09, 173 352,8 15
-- - --- ---- - --- - ---------------- -- --- --------
B e ef: Froze n in Cure
and Cured
do.
204,040
227,946 312., 527 3 03, 573
Pork: Froze n in Cure
and Cured
do.
32.0, 389
21 7,0 53 29 0, 340 336, 923
Other meat and rneat
products
Total all r e d m e ats
Item
e nts
e nts
Prices Received:
Chickens, lb. excluding
broiler s
12.. 5
9.0
10.0
10. 7
8.8
8.8
Com 11 Broil e rs (lb . )
16. 5
14 . 0
13. 0
17.~
15. 4
14.3
All Chickens (l b. )
16 .3
13 . 7
12 .8
16.7
14.6
13.7
A ll Eggs (dozens )
52 .0
38. 8
4 1.0
4 1. 6
3 2.. 4
34.6
Prices Paid: (pe r 100 lb.)
Dol.
~ ol.
Dol.
D ol.
Dol.
Dol.
Broiler Growe r
5.00
5. 20
5. l 0
4 .87
5.07
5.05
Laying F eed
4 .70
5, 00
5. 00
4 . 4 7 4 .70
4. 72
Scratch Grains
4 . 15
4 , 45
4 . 45
3 .9 2
4 . 10
4 . 13
ozen egg s conve
case ,
~********************** ************ ***************** ********************* ***
This report i s made possj_bl e throug h the cooperati on of the National Poult r y
0
I
Plan, Official State A gencies , the Animal Husbandry Research Division of the Agri
Research Service, t he Ins p e ction Branch of the Poultr y Di visi on, Consume r and
Service and th e A gricultural E stimates Divi sion of the Stati stical Re porting Service and
th e many br eeders , hatch e ri e s, p oultr y pro cesso r s and the poultry farmers that report
these agen cies .
(
ARCHL~ L A NGLE Y
....p<
<
..tl
Agricultural Statistician In Charge After Five Days Return to:
Unite d State s Depa rtment of Agriculture
.r .
- Statis tical R e p o'r tj.ng Servic e
~
315 Hoke Smith A nnex
vV . A . WAGNZH.
Agricultural Gtatis tician Posta.g ~ a nd Fees Paid
U. S. Department of Agricult ure
Athens , G e o r gia
OFFI C!l_L B USIN SS
5JS
GEORGIA CROP REPORTING SER V ICE 315 Hoke Sm ith Ann ex Ath ens, Georg ia
24, 1967
Releas ed 3 p .m. Monday
FURTHER DECLINE I N CROP PROSPECTS
Athens , Ga . , Apr il 24 -- The c ont inued shortage of rainfa ll throughout most of the State
planting operations and slotved t he pr ogre s s of crops. Stands are irregular, and some
1-rill be ne c e ssary i n local ar eas . Shov-rers over the v-reek e nd were v ery bene fi c ial
State , but much of t he area in the southern hal f of the
recei ved no rain, and moist ure is needed badly . Planting ope rat i ons i n nor t h ern dis -
gain momentum during the coming week, according to the Georgia Cr op Re porting
close of t he ~rreek County Age nts re port ed 75 perc ent of the corn acr eage ha d been Cotton planting r eached 5 7 perc e nt, and farmers Her e about 50 percent complet e tvith peanut plantinz .
moi stur e has reduced yi eld prospects for smal l g~2:~ !'~E~ The major i t y that the wheat and oat crops are p oor to fa i r wi th very fetv r eporting
of moi sture has delayed planti ng of the ~~ c r op, e spe c i all y in the norther n
s out hern di strict, ab out 85 perce nt of the ac reage hc:.s been p lanted, v-ri th pros -
reported as mostly fair t o g ood .
?rogr ess of 0~_!,,9.Q plant i ng vari e s f rom 30 perc e nt in the northern distri ct s to 80 per compl ete in the southern are a s . Ab out 40 perc c1t of the crop is up to a s t and in
districts ; 10 perc ent in t he c e ntr al area; and l es s t han l perc e nt in t he norther n
The planti ng of E~QEt S is ab out 50 perc e nt compl ete . Gr01rer s ar e waiting for rai n b ef or e
planting operations . The shorta ge of moisture is damaging the ~ ~2~~ crop that be i rr i gated . Dry s oil s de layed r eplanting .
~~~ nee d mois t ure in most ar eas - c ondi tion is mostly p oor t o f air . Gr owers carry out an intens i v e s pray progr am on p~~ch crop . Nany areas need rai n . Conditi on of most .,......,;;.;;;;;::;. veg~~ ~21~ reduc ed by sh ortage of moisture . Cabb age harvest is past pe ak . Snap
and squash are movi ng i n s mall v olume .
ISATHE1:. ~.:....:.~. ~.X -- There was litt l e or no rain over Georsi a dur ing t h e lrJeek e ndi ng Fri day, 21. However , thundersh owers mov ed into t he Stat e dur i ng the vreelc end and br ought badl y
rainfall to large are as of t he State . The rains He re heavi er in t he nor th , e ast and ast secti ons where s ev eral tve ather ob s ervers r ecor ded r,10r e than an i nch . S ome of t he severe t hunder s t or ms produced damaging hai l and high t.rinds . Two or t!1ree small tor nad oe s reporte d in c entral Ge or gi a but the r e '\Jere appare nt l y no injuri e s . Ha i l up to l l/2 i n diame t er c aused h e avy damage i n the Sav annah area anc1 l inch h ail t...ras observed near Hith some damage to peache s . The shor-rer s were app arent l y l i ghter a nd more s c attered i n southwest quadrant of the St ate and much of this section c ontinues extr emely dry . Some have had no s i gnific ant rai nf all i n seven or e i ght wee:cs .
Temperature s continue d unseasonably vJarm during the past ueek . There was a br i e f peri od cild \veather at mi dweek and i n north Georgia at t he enc; of t he peri od . Averages f or the
~1ere 4 to 8 deg r ee s above norma l.
t he period Tue s da y through Saturday (April 25 - 29 ) calls f or ~D~~rn~es t o ave r age ne ar normal. Rainfal l i s expe ct ed to aver age ab out one inc h and occ ur
scattere d showe rs and thundershowers near t he end of the p eriod .
---- -'I'he --- - Geor gia -- - - - - - Crop Reporting --- - Service, A-t-he-ns-, -- -- Georgia; -i -n ----- cooper ati -on -wi -th-t-he-- -
Cooperative Ext e nsion Servi ce, University of Georg i a; Georgia Department of Agr i-
cult ur e; and the 1:. eather Bureau , ESSA, U. s . Depar tment of Comme rce .
C:", S. DE P ARTMENT OF GOMMERCE WEATHER RUREf!.F
Athens , Georgia ?C:SA
Pre c i:;:i::<)1, lor. ~ oL "Lhe wt:ek endi ng April 21 ~ 1967
GEORGIA
Te .pe r aT-ure eY remes for week e ding p !1 21,.1967 (Provisional
f.t i ches ~ 94 a lennville on the 16th
17 h and aHkinsville on the 11
0
33 at B ue Rid P:e on the 20t h,
0
I
* For period April 22~2L 1967
..pc
- CJ ,..
T, le ss han oOOS nch
.r...
l....l..
United
Sta
p
u.
IMMED IATE -
Th is re po r w i Respe c - a
(See Sec . 34. 17
R.EPO 1 d i" a 1!
.,a i I ~ ~. )
-IJ
o... r: Tniv L brary
1 .- :_,,
Ga
nns Ga 30601
d Fee Pa id 01 g r i <.UI u
3JS
~G\A
REP ORT ~() . FARM
APR 27
LIBRARI
GEORGIA CROP REPORTING SERVI CE
ATHENS, GEORGIA
TURKEYS - I NCONE AND PRODUCTI ON, 1966
April 25 , 1967
Turkey grot-Jers in Georgia gross ed t.:i 7, 439 , 000 i n 1966, according to the Ge orgia Cr op Reporting Servic e . This is 33 perc e nt above t he ::~5 , 5 76 ,000 gros s inc ome i n 1965 . The growers produc ed l, 706 , 000 bird s i n 1966 compar e d vJith 1 ,333 , 000 one ye ar
Turkey pr i c e s aver aged 23 . 4 c e nt s per pound live we i ght during 1966 -- l. 5 c ents
the 1965 pric e of 21. 9 c ent s .
Gross income from turkeys in 1 966 r eache d a nevr h i ,1h for the fo urth cons e cutive totaling ')483 . 3 million --15 percent above th e 1965 gr oss i ncome of :::,421. 3 milli on .
Turkeys rais ed in 1966 t otaled 11.5. 5 mi lli on b ird s , )' perc ent mor e t han the 1965
and a record high . Tur key gr owe rs rais ed 99 . 6 million heavy breel.i '.J i r ds in 1966 compared
9).6 million during 1965 --an increa s e of 6 j_Jerc ent . Light bre ed tur keys rai s e d totaled
mllion birds, an incr e as e of 29 perc ent from t he 1965 total of 12 . 3 mi l l ion .
average pric e re ceived during 1966 f or turl~eys mar ket ed was 23 . 0 c ent s per pound 22 . 2 c ents per pound in 1965.
Sales of turkeys dur ing 1 966 tJerE: 9 perc ent h i gher t h an i n 196.5 and t ot aled ll4 . 8 birds compared Hith 104.9 milli on bir ds sold in 1965.
Growers reported t hat 6 7 perc e nt of t he light bre e ds and 8 p ercent of the he avy were sold as fryer - roas ters . The total p ounds of live ~,Jeight turkeys sold in 1966
to 2,097 million pounds c ompare d vrith 1 , 901 rr:illion p ound s in 1965 --an i ncr eas e of 10
'i,/
T..o.ta.l..1./.............................
(( 1,000
1, 000
h e ad) he ad)
)/ ... .. .. ( l, 000 head )
k/... .. ............. (1,000 head ) Jl..... .. ... ... .. . ... (l' 000 lbs )
1 , 336
3
1 , 333
1 ,32 6
25 ,578
1 , 709
3
l , 706
1, 682 32, 198
l 05 , 91h 211
105,703
104 , 890 1 >915,3 31
115,507 2.53
115, 254
114 , 819 2, 10.5, 156
25,459
.
21. 9
31 , 790 23 . 4
1 , 900,703 2 , 09 7, 410
22 . 2
23 . 0
-==~:~. ~!..!.!.!.!..!.!_~.!.~:...!-!.t!:.!.OOQ_d o1.J _.:.____2.:21____L.ll2._.:____!gl, 2.2.~____1:!:8"3-"J40
not includ e young tur keys los t . g_TLos s during the ye ar of turkey s on hand January l.
~stments made for change s in inv entory. !:!:/ I nclud e s cons umption in hous eholds of
than l perc e nt of pr oduc t ion f or t he United States .
ARCHI E IANGLEY Agricultural S t atis t ici an In Charge
) I
After Five Days Return to United States Department of Agriculture
Statistical Reporting Service 315 Hoke Smith Annex
Athens, Georgia 30601
QEflQIAf ~QSINES~
Postage and Fees Paid U. S. Department of Agriculture
~c quisitions Div i si on 1Jni ":;rsi t of Georgia n i vcrsl y Libraries Athans Go gi a 30601
GEORGIA CROP REPORTING SERVI
.3!S
ATHENS, GEORG IA
A pril 26, 1967
-.
Placement of broiler chicks in Georgia during the we e k e nde d A pril 22 was
022, 000--l perc e nt more than in the pr evious week but 3 percent more than in comparable week last year, according to the Georgia Crop Reporting Service.
An estimated 12, 736, 000 broiler type eggs were set by Georgia hatcheries--"'.,. r ..,n,.less than in the pr e vious week and 8 p e rcent less than in the comparable
a year earlier .
The majority of the prices paid to G e orgia producer s for broile r hatching eggs
reported within a range of 45 to 65 cents p e r dozen. The ave rag e price of eggs was 56 cents per dozen . The price of eggs from flocks with hatche ry
cockerels gen e rally was 2 cents below the average pri c e . Most prices r e c e ived
broiler chicks by Georgia hatcheries were reported within a range of $ 5. 00 to 00 with an average of $7 . 7 5 per hundred. The average prices last y ea r were 64
for eggs and $9 . 7 5 for chicks .
GEORGIA EGGS SET, HATCHINGS , AND C HICK PLACEME NTS
E GG TYPE
1966 u.
1967
year
0
1966 u.
1967
ye ar
0
1,273 l, 0 83 l, 217 1, 22 7 l 310
l, 191
94
l, 166
108
l, 155
95
999
81
988
75
BROILER TYPE
945 819
83 ~:
l , 01 8
899
E ggs Set 1/
1966
Thou .
1967
Thou.
year a o
Pet .
Chicks Placed fo r Broilers in Geor
1966
1967
Thou.
Thou.
905
96
956
117
950
11 4
887
87
l 002
111
Doz.
1967
Cents
ce Broiler Chicks Per H undred
19 67
Dollars
12, 302 13,221 107
12, 616 13, 346 106
13,001 13, l 74 10 1
13,467 13,027
97
13, 315 13, 185
99
13 , 594 13, 16 7
97
13, 74 2 13, 062
95
13, 868 12, 981
94
13 , 922 13,202
95
13 84 1 12, 736
92
Statistician In Charge
9,049 8, 916 8, 826 8, 87 5 9,025 9,276 9,641 9, 719 9, 655 9, 726
9,393 104 9, 421 106 9,70 6 110 9,91 4 11 2 9,968 110 9,965 107 10, 016 104
9,927 102 9,929 103 10,022 103
60 60 58 57 56 56 56 56 56 56
s.
w. P~. WA GNER
A gricultural Statistician
8. 75 8. 75 8.25 8.00 7.75 7.75 7.75 7. 7 5 7.7 5 7.7 5
S. Department of A griculture
Ag ricult ural Extension Service
al Reporting Service
State Departme nt of A gr iculture
315 Hoke Smith A nnex, A the ns, G e orgia
STATE
Apr. 8
...;c::; c::;s sn;-.L-
W e e k ;~ nd e d
A pr.
A pr.
15
22
THO USA N DS
J '7o I
I
ot:
y e ar
I j
ago 1/i
Apr. 8
-~~~ = D>
Week .E nded
A pr.
A pr.
15
22
THOUSAN0S
Maine Connecticut P enns ylvania Indiana Missouri D elaware Maryland Virginia West Virginia North Carolina South Carolina
G EORGIA
2,027 407
1,370 591 730
2,891 4,661 1,880
155 7,357
4 76
12,981
2,004 319
1, 468 600 6 99
2,9 92 ~. 567 l, 983
16 7 7, 387
505
13 , 202
2, 105 3 24
1, 671 531 633
3,056 4, 594 1, 910
147 7,309
505
12,736
100
l, 574
66
222
97
772
78
4 18
73 I
305
d 111
2, 579
96 .I 3, 384
97 , I 1, 24: 5
!I 86
250
10 l
5, 7 81J
:I 107
3{7
92
9, 927
l, 530 139 875 327 44 5
2,624 3,328 l, 147
368 5, 779
359
9,929
l, 534 197 907 29 4 4 .33
2, 801 3, 436 1, 053
.373 5, 708
359
10 ,022
Florida
841
82 3
825 161
461
T enn essee A labama Mississippi
1, 073 8,900 5, 197
1, 050 8,785 5, 250
1, 07 5 8,933 5, 108
87
99 104
I I
i l
1, 042
7, u s
4, 302
Arkansas
10, 578 10, 33 5 10, 637 102
8,020
Louisiana
1, 117
1, 144
l, 181 117
811
Texas
4 ,641
4, 520
4,571 101
3,7~ 8
Wa shington
873
707
802 116
52 2
Oregon
503
485
450 104
3l 7
California
TOTAL 1967 (22 State s)
1, 885 71, 134
1, 796 70,788
1,992 71,095
113 ! I 1, 50 2 99 54,75 2
i
TOTAL 1966* (22 States)
71,370 71,324 71, 611
% of Last Year
100
99
99
1/ Current week as' percent of same w eek last year.
i 53, 537
II
:I 102
* Revised.
487 984 7,036 4, 281 7,873 832 3,697 559 349 1, 496 54,444
54,056
101
397 1, 024 6,998 4,342 7,985
852 3, 652
621 318 1, 399
5~ ,705
54,467
100
,-ryoe oa tr
ago 1/
99 10 3 98 61 96 115 95 94 66 93 95
103
94 88 95 110 103 117 107 121 99 106 100
0)
1-<
.....:...:....l
~
.,.."0 u . ,.-~ ro H
P.,.tlD
(/J<t:
I
(!) '+-'
Q) 0
fz.l ..p.... "0 Q)
rpo...8., aJ H
l i
tlllro ro o..
~_, 0)
rl
s::: o:l O
UlQ
0 rt.lrltD
0
rl 0 bOO
. P-t (f) ::J
rt.l rl rl s:..t
H o
l'0
? ctl (l)
rl s:..t d o:l
c::1 ..0 r-l
~
rll
r-l
r-::1
'Ho
till s:..t
s:::
0
!
0 ?> P.-.><D
ri -P -Pd
-P rl r-l
rl Cl) I'll
l'll s:..ts:..t l'll
rl 0 (l) s:::
Q)
H
.c :;j ??CD
'::) 0'-rlrl
I') O ~ S:::-P
:::l
...;.......>.
]) C.: i->:::>
::l
I '
..u. .
\
H
0
..... H p
tlD
~
'+-'
-
~>Q)
H
~::.l;.0.p.>(Q/))(!Xp)
((ff))
< snz ~aJ~pcU ~il
OUr>,l.op;..Hr8..>o.~o..;........>.....C.......,.o(aHJfH:):J
QJQ)aJ 801Ll :> Cl~(f) ~.-4
.~.....rnr.o..-4~s::Ul ~
.,_,...,en QH) ~aJ-.u;,...>....~.a.,_.J,cHHU
4-4(/) ...... 1.{) <t:r.~
<t:'U~ .... ~
aJ.;...lrr'l 0
...;.... .>(/)
p
::J
~ -- -- --- .... -..A. "-'"C&.\.Lo:JLI.LJ.rt. rl
APRIL 1, 1967
Released 4/26/67
by
GEORGIA CROP REPORTING SERVICE
-.
___,~- stocks in all positions on April 1, 1967, totaled 22 , 535,000 bushels, compared with
bushels on hand a year ago. Oats stored in all positions totaled 698 , 000 bushels
with 555,000 bushels t he pr evious April. - ~~eat holdings of 411,000 bushels were up
~e 325,000 on hand a year earlier . Soybeans stored on April 1 totaled 5, 796;000 bushels. of sorghum grain totaled 188 ,000 bushels -- 47, 000 bushels mor e than on hand a .year
Ge orgia Grain Stocks -- April 1, 1967
-----------~---------------------- ~.i~fL.2!!!E~ris g~--------- --:.------ - ----------------
ON FARHS
OFF FARNS
ALL POSITI ONS
....--
-
--
--
1966
1967
----1-, 0-0-0--bu--sh--e-ls---
---
-..-
-
1966
-----1-,
1967
-00-0--b-u--sh-e-l-s--
-
-
-
-..-
---
1966
- -1-,00-0
1967
-b-u-s-h-e-l-s --
-
-
21,450
17,647
4,671
4,888
26,121
22 , 535
331
522
224
176
555
698
40
14
1~
~~
{~
1 ~-
55
58
270
353
325
411
8
5
1{-
1~
5
138
137
3
51
141
188
942
2, 077 ..
1~
3,719 ..
1*-
5,796
to avo:c;r'CH'SCICislng-InCiividuar operationS.--- ---------------------
Stocks of the four fe ed grains on April 1, 1967 totaled 103 million tons -- 10 perc ent
~an a year earlier and 19 perc 8nt below average. Record high April 1 soybean stocks
22 percent more than on last April 1 and more than one-third above average. Stocks of
were 23 percent belotv a year earlier; Durum holdings dotm 45 percent. Although down 2 ~om April l , 1966, r ye stocks wer e the second largest since April 1, 1944. Stocks of were down 29 percent from a year earlier but 11 percent above average.
ARCHIE LANGLEY ~u.~~u~a.L Statistician In Charge
C L. CRENSHAH Agricultural Statistician
The Georgia Crop Reporting Service, USDA, 315 Hoke Smith Annex, Athens, Georgia,
in cooperation with the Cooperat ive Ext ension Service, University of Ge orgia and the Georgia Departme nt of Agriculture .
Pl eas e t urn page
UNIVERSITY OF GEORGIA
MAY 3 1987
LIBRARIES
Stocks of grains, April 1, 1967 with comparisons (In thousand bushels)
----- ~--- ------------------Ap~ii-:r-a:; :--- --Apri 11~------:r
l
Q!'ai~ESLE~si~~2!!~ _______________.__6__1-~6~--------------"----6-~---------------""C.""-'-------~
ALL 'WHEAT
On Farms 1/
216,477
255,582
408,733
Commod ity-Credit Corp. 2/
40 , 668
10,467
3, 926
fiills , Elev . & Whses . if]/ __!_,!_8}, 1_02_ _____62_1.:._216_____6}6.=-0.3 __ _ _
______._1'QTA_L___________________}:.!ggQ . 8Sl _ ____ __ __ 91]~25_______1-:.:.Qu8~gg___________,....
RYE
On Farms 1/
6, 369
9,945
9,479
Commodity-Cred it Corp. Hills, Elev. & Uhses .
y
2]/ /
___ 158
585
605
~,;J-4f ___ __ 1_4.:_2_4_____ 1_8.:_21-:_3 ____ _
___ _ ____TOT~_L______ ------- _____J-:2.:.69________f/h1_g________28.:..?_97 _______..,...
CORN
On Farms 1/
Commodity Credit Corp . ?/
IIills, Elev. & ~Jhs e s 'J:/ ]/
2,078, 169
2,122,751
506,127
262,0 73
__ 2_5f!,b!:B~ _____418.=-49_____69.:.7
TOTAL
3.238.785
2.863.293
3.662
-OATS-------- - ------------ - -----~--- -------- - -- - ---~ - -- - - ----
On Farms 1/
433, 648
41.~8 , 355
55L~, Boo
Commodity Credit Corp. 2/
2,513
9,388
7,232
Hills, Elev . & Whses . J:-7 ]/ ____62_,1_62_ _ ~- ___ 17.:_81_0_____ 2_8'"-..0~2- __ _
TOTAL 501- ,92-7 535.613 660,054 BARlEY------------------~ --- -- - -- - -
-- -----~ ---~---------~-----
On Farms J-:/
116,683
99,1 74
177,193
Commodity Credit Corp. 2/
9,910
5, 769
4, 736
Iills , Elev . & ~fuse s. J:-7 )_/
97,751
88 ,192
ll0.3uG
-- --- -- -- ------------------------ TOTAL
- - 22[,:,31~4 - - - - --l93713S--- - -- -292:-327-----
soRamrrr---- - -------~ -~-- --- -- - ---~-- -
on Farms 1/
100,475
133 ,587
239,218
Commodity Credit Corp. 2/
llills, Elev. & 1fu ses. '}-r]J
4,556
4,721
4,632
__ }2~h g62 ____ _5_5.!_8].5__ ___ _..5.Qf_;?_4Q ___ _
_________ TO~AL_________ _____ - -- --~29.!g2.2._. ________]_?_i.:.lu]_________ ~2_6.._- _- "'---'--"------~_.......
SOYBEANS
On Farms 1/
131,996
149,747
. 347,060
Commodity Credit Corp. 2/
6
0
0
liills, Elev. & lJhses. 1r 3/
2 0 4 , 5 89
225.088
376.911
______:!:Q1:AL ------=---=--=--:~_]36.~~1 =--~-=--= -172-:6]'5- -_:_=-~-=]237"9]1_=-=--------~.._...
1/ Estimates of the Crop Reporting Board.
2/ c.c.c.-owned grain at bin sites. ]/ All off-farm storages not otherVJise designated, including termii1als and processing
Includes C.C.C.-owned grain in these storages.
After Five Days Re turn to United States Department of Agriculture
Statistical Reporting Service 315 Hoke Smith Annex
Athens, Georgia 30601 OFFICIAl:_ ~~D~SS
Postage and Fees Paid U. S. Department of Agric~
GEOR GIA CROP REPORTING SERVICE
315 Hoke Smith Anne x
A the ns, Geo rgi a
-.
Released 3 p.m. Monday
SOUTHERN AREAS STILL DRY
Athens, Ga., May 1 --Bene f ici al ra i ns north of the fall line improved crop and pasture
tions while most of the southe r n areas continued dry, according to the Georgia Crop
ing Serv i ce. Cool, wi ndy wea th er hampered seed ge rmination and crop growth throughout
State. Some co r n, cotton a nd t oba cco we re re p lan t ed as the result of adverse weather.
general crop cond i tion i s ve ry spo t ty t hroughout the south.
end of the week, County Agents repo r ted 82 percent of the corn acreage had been The crop i s generally i n fa ir to good cond i tion.
Statewide, 68 percent of co t ton acreage has been seeded. The cool, windy weather conhave been unfavorable for good seed ge rmi nat ion. Thirty-five percent of the crop is
a stand.
qrain condi t ion imp roved somewhat over the previous week. However, y ields are ted to be reduced. A small acreage of tobac..9. was reset where plants were still
Irr i gat i ng was act ive throughout the week in most areas. The peanut crop remained in fair to good condit ion. About {0 percent of the State acreage had been seeded by end of the week. The peach c 1op remained i n f air to good condition.
~stures in northern areas are mostly in good condit ion following the recent rains but lnpoor to fa i r cond i tion i n tne south. Some f rost damage to the apple crop was reported.
~~table and melon crops are ma k i ng slow progress in southern areas due to dry soils and t~peratu res. Li ght frost dama ge was reported i n the mounta in area. Strong wi nds damaged
and watermelon vines. Ve ry good qual i ty snap beans, onions and squash are being har' A light volume of cabbage i s expected throu gh mid-May. Irrigation is be i ng used ava i1ab 1e.
- -Heavy ra i nfall was recorded over the northern third of Georgia during ~st week. Amounts were gene rall y moderate in central sections but decreased to 1 ight rost southe r n coun ti es. Seve ra l weather observers in the extreme south reported no
ble ra i n for th e week. Much of south Georg ia, especially the extreme south and southcont inues extremely dry. Several p laces received less than one-half inch of rain April and this followed an un usually dry March. Totals for the week ranged from 6.02 at Cedartown to ze ro at four o r f i ve weather stations in the southern border counties.
coole r than normal last week after 7 or 8 weeks of unseasonably
Early morning temperatures drop ped below freezing on one or two days in the north and several weather observers reported frost. Some damage to early vegetation
Averages for the wee k ra nged from 2 to 6 degrees below normal.
The five-day for eca st for the pe r i od Tuesday th rou gh Saturday (May 2-6) calls for tern-
to average near normal over t he southern half of Georgia and 2 to 5 degrees below
1 over the northern half. Coo l er per iods should occur in the north about \4ednesday and , Rainfall i s e xpected to average about~ i nch i n the southern half of the State
ito 1 inch, o r more, in the nort her n half. Oc cas ional periods of rain should occur the
of the per iod and near the l a st of th e wee k.
-- - - - - - - - - - - - - - - - - - - - - - - - - - - - - - - - - - - - - - - - - - - - The Geo rgi a Crop Re por t i ng Se rvice, Athens, Georgia; in cooperation wi th the Cooperat ive Extension Service , University of Georg ia; Georgia Department of Agri culture ; and t he Weat her Bure a u , ESSA, U. S. Department of Commerce.
-- I
C:, S. DEPARTMENT OF COMMERCE WEATHER BUREA'L7 Athe11s, Georgia
ESSA
Precipitation For The "tleek Endi ng April 28, 1967
GEORGIA
Temperature extremes for the week ending Apr il 28, 1967 (Provisional)
Hi ghest; 94 at Bainbridge on the 22nd.
0
Lowest: 27 at Blairsville on the 28th.
I
0
I
* For period April 29-May 1~ 1967
T, less than .oo5 inch.
c
.p~
~
CJ
..<.".
r.
After F ive Days Re t ur n to United States Departmen t of Ag r icultu re
..p.....
Statistical Repor ti ng Service
315 Hoke Smit h Annex
Athens, Georg ' a 30601
OFFICIAL BUS INESS
Postage and Fees U. S. Department of
IMMEDIATE- U. S. WEATH ER REPORT This report will be trea ed in a ll
Respects as Lette r Mail (See Sec. 34. I7 , P. L. & R. )
The Univ Library Univ Of." Ga Athens Ga 30601
00 /
~,j
lID mn L!Jtr mllil!J
t:
rPmn~~
APRIL 1.5 , 1 967
Released .5/ 2/ 67 GEORGIA CROP REPORTI NG SERVICE
GEORGIA PRICES RECEI VED I NDEX DECLIHES 2 POI NTS
The All Commod ities Index declined 2 points from last month to 242 as a small incr ease in prices were more than offset by lower pric es for livestoc k products.
1he All Crop Index incr eased by 1 point from a month a go as an i ncr e ase in c otton prices declines in all small grain and hay prices.
Prices of meat animals, poultry, poultry products a nd dalry products all registered de from ,larch 1.5 to April 1.5. The Index of Pric es Re ceived for Li ve stock and Li vestock at 204 v1as 10 poi nts below last month and 3.5 points be l ot-J April 1.5, 1966 .
UNI TED STAT: S PRIC:i::S RECEIV~D I NDEX DO:JJ:T 4 POINTS
PARITY TIIDEX UP 1 POINT , PARITY RATIO 72
The Index of Pric e s Re c eived by Far mers de cli ned 4 poi nts (1 1/2 percent ) dur ing the ended April 1.5 to 246 percent of its 1 910-14 average . Contributing most to the decrease lower pric es for e ggs, hogs , and whol esal e milk . Partly offs etting TtJere h i gher pric e s
and cattle . The index was 7 percent belot-r April 1966 .
e Index of Pric es Paic1 for Commodities and Servic e s , including Interest, Taxes, and .age Rates rose 1 point (1/3 per cent) during the month , as a result of an increase in t he
ad justed i ndex of fan1 vlHge rates . At 341, the inde:: Has S poi nts ( 2 perc ent ) a year earli er.
e Parity Rat io declined 2 points to 72 .
Index
1910-14 = 100
April 1.5 1966
iiar ch 1.5 1967
A. prL.,. lc:;;' ----- R~1'9~tligb~-----
1967
----~------------.-~.;.._ -~--- -~---- --~----~~- - -- .-----!.~-~-~~---!.--lQ~_!__ _!2~~--
and Livestock
!I 261 1/
2 70
244 2.53
242
310 : Earch 19.51
2.59
319 : 11arch 19.51 ?)
26.5
2.50
246
313 : Feb . 1 9.51
33so3
340
341
341 :Apr . 1967
7h
72
123 : Oct. 1946
. -- - -. :
:
:
:
--=- --~-~-~---~- ~--------_._----~----~------------~-
:
~---~------
Taxe s , and Farm v,Jage Rates based on data for th e indicated dates.
Statistician In Charge
1rHLLIAi'I A. HAGNER Agricultural Statistician
Crop Repor t ing Servic e, USDA , 31.5 Hoke Smith Annex, Athens, Georgia, in cooperation Cooperative Extension Service , University of Georgia and the Ge orgia Department of
f , . ..; ,: t ""F ;., .: 0;:(~' 1.
MAY 5 1967
LIBRARIES
'\rJheat, bu.
Oats; bu .
Corn, bu.
Barley , bu.
Sor ghum Grain, ctJt .
Cotton, lb .
Soybeans, bu.
Peanuts, lb.
SVJeetpotatoes , ctrJt .
Hay, baled , ton :
All
Alfalfa
Lespedeza
Pe a n u t
I1ilk Cotrs, head
Hogs, ct-Jt .
Beef Cattle, all, ctJt . 1/ Cot.vs , c~rJt. 2/
Steers and 1-Ieifers, ct-Jt .
Calves, cwt .
llilk, Uholesale, cVJt . :
Fluid Harket
' anufactur ed
All J/
,....'
Turkeys , l b .
Chickens, lb . : Excl. Broilers
Co~mercial Broilers
All
Eggs, all , dozen
1. 60 . 88
1.36 1.04 2 . 05 27. 5 2. 67
5 . 20
26 . 00 36. 00 29 . 00 23 . 50 180. 00 22 . 10 20. 60 1 8. 00 22 . 70 24 . 40
6 . 10 3. 65 6 . 05
25 .0
14. 0 15. 0 15 . 0 47. 0
1. so
89 1.52 1.12 2. 25 20. 0
2 .75 11. 0
6. 90
l. 78 87
1.51 1.10 2. 25 20. 5 2 . 80 11.0 6. 90
1. 39 . 648
1.19
1. 03 1. 79 28. 24 2 . 78 11.4 4 . 88
27.30
35 .50
30. 00
23 . 00 200 . 00
17. 40 18. 70 16. 00 21. 00 24. 20
27. 20 36. 50 31.00 24 . 00 200 . 00 16. 00 18. 60 15. 80
20 . so
24 . 20
6. 40
6. 40 22 . 0 10. 0
13. 0 12. 8 l~l. 0
4/ 6. 30 - 21. 0
9. 0 12.5 12 . 4 35. 1
23 . 40 24. 00 24. 50 23. 80
2L~2 . oo
22 . 10 .3/ 23 . 60 ~ 18. 00
25. 50 J./ 26 . 90
3/ 4. 82 1/ 3. 67 -- L~ . L6 3/2L~ . 4
?/10. 9 -- 15. 8
15. 3
]/30. 6
1.59 682
1. 28 1.02 1.96 20. 50 2.74 11.5
5. 85
25 . 10 26 . 00 25 . 80
25 . 80
256'. 00 17. 90 21.50 16.70 23 . 00 26. 20
5 . 36 4. 07 4. 95 20 . 5
B. 8
1~ . 3
13. 7 34. 6
~RIC~-~~~;@, [ I:;ED
r-lixed Dairy Feed, ct-Jt . :
All under 29% protein
G 3. 95
4 . 25
4 .15 3/ 3. 71
3. 91
14% protein 5/ 16% protein
::~
3. 90
Lf. 10 4 . 00 '"i/ 3. 47
3 . 65
~)
3. 95
4 . 20
4 . 15 1/ 3. 74
3. 99
1 8~s prote in
~?
4. 10
4. 50
4 . 30 3/ 3. 88
4.11
20% protei n
.,
4. 30
h . 55
4 . 50 *'i/ 4. 06
h . 33
Hog feed, lh% -1 8~b protein, cut .:.
h . 25
4 . 45
4 . 55 - 4. 31
4. 55
Cottonseed meal, 41%, ct-Jt .
::)
4.hO
5. 20 5 .10
4. 67
5 . 42
Soybean meal , 44%, ct.vt .
(;
5. 10
5.30 5 . 10
5 . 03
5 . 45
Bran, c Ht ~
~;',
3 . 65
3 . 90
3. 95
3 . 3C
3. 72
Hiddlings , c ~rJt .
~)
3. 65
4. 10
4. 15
3. 42
3 . 78
Corn meal, cwt .
0 3. 35
3 . 65
3. 65
3. 30
3. L!.9
Broiler grouer feed, cut .
:_; 4 . 90
5 . 10
5 . 00
L. 88
5. 05
Lay:hng f6ed, cwt .
~)
4 . 70
5. 00 5.00
4 . 44
4. 72
Scratch grains, ct-Jt .
::~
h . 20
Lf. 45
4 . L~5
3. 94
4 . 13
Alfalfa hay, ton
0 44 . 00
44 . 00 42 . 00
33 . 20
36 . 00
Al l other hav . ton
(; 33 . 00
36 . 00
0 :
. ~0
3
yncow'Siland~11 steersand-heifers0-co~inecfwith allot.vanc e t-Jhere necessary for s laughter
Y Includes cull dairy coVJs sold for slaughter, but not dairy coVJs for herd replacement . ]/ Revised . k/ Preliminary estimate . 2/ u. s. price is for under 16 percent .
After Five Days Return to United States Department of Agriculture
Statistical Reporting Servic e 315 Hoke Smith Annex
Athens, Georgia 30601 .QEEICIAL BU~INESS
Postage and U. S . Department
GEORG I A CROP REP ORTIN G S ER VI CE
3-/S
-.
May 3, 1967
CHICK HA T C H EH. Y R E PORT
Placem e nt of broil e r chicks in G eorgia during the we e k ended A pril 29 was 000--1 pe rce nt mor e than in the pr e vio us w e ek and 2 percent more than in the
e we e k last y e ar, ac c ording t o the G e orgia Crop B.~ porting Service .
An estimated 12, 899, 000 broil e r typ e eg gs w e r e s e t by Georgia hatcheries- more than in th e p revious w eek a n d 11 p e rcent less than in the comparable
a year earlie r .
The majorit y of t he p rice s p a id to G e orgia producers for broiler hatching eg gs
reporte:i wit hin a rang e of 45 to 65 c e n ts p e r dozen . Th ~ ave rag e pric e of
eggs was 56 ce n ts p er doz e n. The pr ice of e ggs from flocks with hatchery
cockerels g e n e rally was 2 c e nts below i: he ave rage price . Most prices rec e ived
r chicks by Georgia hatche ri es w e ;_ ::; reported within a rang e of $5 . 00 to
with an aver ag e of $ 7. 7 5 p e r hundr ed. T he average price s last year wer e 64
for eggs and $9.75 for chicks.
GEOR GIA Z GGS SET , HA TCHi l\f -2 A ND CHICK 2 LAC:S MNTS E GG TY:?E
1966
u.
19 67
ye2.r
0
1966
hou.
1967
hou .
year a o
ct.
1, 083 1, 21 7 1, 227 1, 310 l, 134
1, 16 6
1' 155 999 988
l , 201
108 95 81
., r:., ,J
10 6
T YPE
819 834 1, 018
899 1 009
956
117
950
114
887
87
1,0 02
111
906
90
Zggs S e t !}
1966
1967
Chicks Place:l for B railers in Geor a
1966
196 7
Eggs Per
ents
r C hicks Per Hundred
1967
rs
12,616 13, 346 10 6
13, 001 13, 174 101
13, 467 13,027
97
13,315 13, 185
99
13, 594 13, 167
97
13 , 742 13, 062
95
13, 868 12, 981
94
13,922 13, 202
95
13, 841 12,7 36
92
14,447 12,899
89
e, 916
3, 826 8, 875
9,025 9,276 9,641 9, 719 9,655 9,726 9,910
9,421 106
60
9,7 06 110
58
9,914 112
57
9,968 110
56
9,965 107
56
10, 0 16 104
56
9,927 10 2
56
9,929 103
56
10,022 103
56
10, 12 5 102
56
atche ry supply Hocks .
8. 75 8. 25 8.00 7. 75 7.7 5 7.7 5 7. 75 7. 75 7. 75 7. 75
w. A . WAGN..:::; .K
Statistician In Charge
Agricultural Statistician
---------- ----- -------------------------------- ---------- --- -------------- -
Department of Agriculture
Agricultural j~xte nsion Service
Reporting Servic e
State Department of Agricultur e
315 Hoke Smith Annex, Athens, G e orgia
UNIVERSITY OF GEORGIA
MAY 5 1987
LIBRARIES
STATE
T H CUS P. ND3
Maine Connecticut Pennsylvania Indiana Missouri Delaware Maryland Virginia West Virginia North Carolina South Carolina
GEORGIA
Florida Tennessee Alabama Mississippi Arkansas Louisiana T exas Washington Oregon California
TOTAL 1967 {22 States)
2,004 319
l, 468 600
699 2,992 4, 567 1, 983
167 7,387
505
2, 105 324
l, 671 531 633
3,056 4, 594 l, 910
147 7,309
505
2,092 101 375 76
1, 489 109 526 66
672 77 2,981 111 4,623 99 l, 871 98
147 95 7' 411 101
487 107
l, 530
l, 534
1,. 580
100
139
197
179
84
375
907
876
95
327
294
294
70
4LJ: 5
433
481
104
2,6 2-1
2,801
2, 781
105
3,32. 8
3,436
3,448
102
1, i L.l,7
l, 053
1. 096
91
368
373
367
90
5,779
5,708
5, 713
101
359
359
351
94
13,202 12, 736 12, 899 89
9,929 10,022 10, 125
102
823
825
867 176
~ 87
397
467
102
1, 050
1,075
l, 007 78
984
1,024
1, 005
83
8, 785
8,933
9,009 100
7,03 6
6,998
6,999
95
5, 250
5, 108
5, 120 102
4, 2. 81
4,342
4, 44 1
111
10,335
10,637
10,177
100
.:
i
7, 873
7,985
8, 124
104
l, 144
1, 181
l, 115 106
032
852
876
113
4, 520 707 485
4 , 571 802 4 50
4, 579 654 419
98 91 98
II 3, 697
I
-5 -'' Q7
J{9
3,652 621 318
3, 655 583 433
105 101 117
1 796
1, 992
1, 875 101
1 .:.., 96
1, 399
i, 4 55
101
70)788 71,095 70,395
98
54. ~44 54, 705 55,329
101
TOTAL 1966* (22 States)
71,324 71,611 71,966
54,056 54,467 54,642
of Last Year
99
99
98
1/ Current week as percent of same week last year.
* Revised.
101
100
101
Q)
H
..:.:.:.1,
.-I
:::l
.".d.
u
~
C1l OJ)
P.. .:r.;
m..., <lJ 0 <lJ
r.I.i ~
"d Q)
r~o...8.,
H Q) C1l
ODp.. cU Q)
"t;Q
0
P..u)
:::::>
Q)
H
..::.:1,
.-I
..:u.:.:.l
H
.0..., -O<D .u.<l.J
~ :>
H '+-< H
:::l 0 Q) ><
...., ...., ({) <lJ
({)
-< ~mr>o.~..,_8Q.,o)....,.n.~_..,.~..,... c..orHo..o.(n[fH.Z)2
. g. 8 0
C1l
0~pl-..~'-'"''
0<lJ
:::::> !!)
r') ~Q)
(:)
rY.
. -1
.r..I...i.
m
~rio
~)
~
t~l~) H <..Jt:,
<ll uo<llo
M~ .-<:r:...C::H
2....,t; ~~
-< . . , - ...... (f) . .... ll)
"'m!"')
.2.... ri)
~
0
~
:::::>
SJS
Georgia Weekly Crop and Weather Bullet
~
GEORGIA CROP REPORTING SERVICE 315 Hoke Smith An nex Athens , Georgia
1967
.m. Mo day
, Ga., May 8 --Soil moisture var ied from adequate in the centra l and south central
in northern areas and short along the extreme southern border counties,
Georgia Crop Reporting Serv ice . Cool, ra in y weather allowed limited planting
throughout the week . Some corn and cotton acreage, es pecia lly in the northern areas,
as soon a s so i l moisture conditions perm it .
to County Agents reports, nearly 90 percent of the cot t on acreage in southern seeded, compared with under 50 percent i n northern counties. Statewide, 79 acreage has been planted and 48 percent is up to a stand. Heavy rains in a~as washed out fields which will result in the re plan tin g of some acreage.
the end of the week, 87 percent of the corn acreage had been seeded compared with 82 the previous week. The crop rema ined in fa i r to good condition.
in fair to good condit ion. About 80 percent of the State acreage had of the week.
ranges from poor to good. Yield prospects are below normal. Recent the tobacco condition; hcwever, irrigation is still necessary in some areas. rs remained on schedule with their spraying program. The crop is in fair to good Some frost damage to the apple crop was reported. Pastures in northern areas are In good condition but are in mostly poor to fair cond i tion in the south.
rcial vegetables and melon crops made fair to good progress during the week, according ~nagers. Li ght rains in most southern areas should imp rove plant growth. Light harvest is expected this week. Snap beans, tomatoes and sweet potatoes need moisture. lies of cabbage continue to be available in the Moultrie-Thomasville area.
SUMMARY-- Most of Georgia received beneficial rains during the past week. Howsouthern border counties and the extreme southeast were missed, or received only
s, and continued very dry at the end of the week. Most of the previously dry sections received an inch, or more, of rain during the week. Heaviest amounts were in the west central section where several places had over two inches.
ia temperatures continued cool for the second straight week, with averages 1 to 5
Hlow normal. Freezing temperatures and 1 ight frost were reported in the extreme part of the State. Strong winds caused some damage in the western part of Georgia the weekend.
was below normal in all sections of Georgia. Heavy rains during the of the month brought averages up to near normal in the northern third, but most of
ia received less than 30 percent of the normal April rainfall. Several places than! inch of rain during the entire month. The total March-April ra i nfall was
40 percent of normal over most of south and central Georg ia .
five-day forecast for the period Tuesday through Saturday (May 9-13) calls for ~s to average 6 to 12 degrees below normal. Mi ld temperatures on Tuesday and Wed-
ld be followed by cooler weather for the remainder of the peri od. Rainfall is to occur mainly on Thursday and Saturday and shoul d average 3/4 to 2 i nches.
The Georgia Crop Reporting Service, Athens, Georg ia; i n cooperation with the Cooperative Extension Service, University of Georgia; Georgia Department of Agriculture; and the Weather Bureau, ESSA, U. S. Department of Commerce .
cr. s.
GEORGIA
Athens Georgia
..-:.SS.."_ . ~ J. ' .,. .,
. "!.\,.-...
t.ba 2nd of Hay,
__._.. r::. s<-, ~ 2'/ Q..t, ~1.:.1 .:r;.;lil l :=- and Clayt ::m on
0
I
~~ For period May 6-8, 1967 T, less than o005 inch
After Five Da ys Ret ur n t o
-
l
United States Depar tment of Agri c u l ture Statistical Reporting Service
:
315 Hoke Smith Annex
Athens, Georgia 30601
OFF ICIAL BUSINESS
, IMMEDIATE - U. S. WEATH ER REPORT This report wi l l be t rea t ed i n a lI respects a s let t e r mail (See Se c . 34 . 17 , P. L. & R. )
The Univ Library Univ Of. Ga Athens Ga 30601
Po s tage and Fees Pa U. S. Department of ~r
GElABLE REP
Georgia Crop Repo rtin g Se rvice
Ath-en s, Georgia
--GEO.....R.__G__I_A_
Released : May 9, 1967
iost vegetable and melon crops l-Jere making slow progr ess in southern areas due to dr y and cool temperatures as of Nay 1. Light frost damage in the mountain areas was reported
April, Spring cabbage harvest is past peak, Snap beans moving in volume . Older of cantaloups , watermelons, and tomatoes are expected to move in l i ght volume earlier Acreage and production of spring crops are expe cted to be smaller this year, due
to lack of moisture and belo-vJ normal temperatures .
~ ~~~: Production of mid-spring snap beans for 1967 is fore cast at 264,000 hundred wei ght, 17 percent belm-J last year. In South Carolina and Georgia, the crop
in fair condition because of lack of moisture . Li ght harvest is under way in Georgia is 10 days to two weeks earlier than usual. In Alabama, re cent rains have i mproved
In Nississippi, harvest is expected to begin in late 1-Iay vJith peak supplies about Heavy rains in mid-April damaged the crop in the Amite -Greensburg ar ea of Louisiana. pickings should peak around mid-Nay .
Peak supplies are expected after mid -1-:Iay of spring cantaloups in Florida. Estimated at 9,350 acres for harvest in 1967:-the ~~ lv ~~~ cantaloup is 10 percent less than last year and 18 percent bel ow average . In Georgia, dry and strong tJinds damaged early plantings, Vines are beginning to run and some are in southern areas. In South Carolina, rain the l atter part of April improved crop The crop in central Arizona is getting off to a slow start because of cool weather April. Harvest should begin after mid -June with shi pments continuing into late July.
'I'he first forecast of late spring sweet corn production is 516,000 hundred weight, down 8 percent~rom 19Db: In South Carolina, the crop is generally condition; however, some replanting was necessary. In Alabama, dr y weather in early caused poor stands, but recent rains have been beneficial. In California, adverse has retarded growth. Harvest is expected to start later than normal this year. supplies should be available from the desert areas i n late Nay with peak movement exin June from both the desert areas and the San Joaquin Valley.
The late spring tomato crop is forecast at 954,000 hundredweight, 15 percent below last year and 10 percent below average . In South Carolina, dry weather ~nds caused considerable damage and some fields were replanted. Light harvest is to get under way the last of May with volume marketing by mid-June. In Georgia, ~ts and dry weather caused slow development, Harvest is expected to begin about June ~ssissippi crop was helped by April rains. Harvest should b egin about June 1. Harahould start around mid-May in the New Orleans area but peak volume is not expected unlll'ly June. Harvest in the Oak Grove area should begin in late May. In central and east early fields are blooming and setting fruit with f irst picking expected in late Nay, supplies should be available through June and early July.
The ~arly ~~ watermelon crop is for ecast at 183,700 acres for harvest in 1967, 1 percent below the 185,200 acres harve sted in 1966. Most of the Carolina acreage was planted during the last half of April . Good rains the last week relieved the dry soil condition. In South Carolina, condition of the crop is good although stands ar e spotty. Good stands are reported in most ar eas of Georgia, is needed in southern areas, Plants are beginning t o bloom and set fruit. Li ght .nDwu~ is expected in early June. In Alabama, lat e April rains improved crop prospects .-~er during most of April caused poor stands and consider able replanting was necessary. ~mhElas1Gern Mississippi , the crop is up to a go od stand and older plants have started out runners. In Arkansas, early planted fields are up, but cool weather has slowed In the Saline area of Louisiana, the crop is about t wo weeks earli er than last year first pickings expected by mid -June. In t he Downsville area, harvest should start about 1, In Oklahoma, moisture is adequate and prospects ar e generally fav orable . However, a acreage was replanted becaus e of heavy rains . Harvest i s expected to get under way Texas about May 10, Dry soil conditions have limited growth in some areas. In Md east areas, prospects are generally good . Harvest should get under way in these ~out mid-June with go od volume in late June and July . In Ari zona, cool weather during slowed growth . Harvest is expected to begin around mid -June, a few days later than
Acr ea~e and estimat e d product i on r eport e d to da t e , 1967 with c omparisons
A cre a~e
I
CROP AND STATE
. Harve sted Average 1961 65 : 1966
For harvest
1967
_,.._Y::.:::.i:::.el::.d:::-.P!::.e:::.:r:..._:a::.:c:::::r:..;e:;;~.----=:....---,_Product ion
Av. :
Ind. : Av er age :
1 .1111J
: 61-65 : 1966
1967 :1961-65: 1966 : 1.91
Acres
Cwt.
- 1,000 cwt
SNAP BE.Al\T S
M id-Sprin ~ :
South Ca rolina!
5,8 20
5,100
4 , 000
26
27
23
150
138 -1
Georgia
2 , 900
2,800
3,000
25
27
26
72
76
Al abama
980
7 00
7 00
20
22
18
19
15
Mississippi
1,340
9 00
700
22
22
25
30
20
~~GL~ro~uoi~su~ipa~nTaro~ta~~l_ _ _ _ _ _ _ _ _~---~~l~32~~,~,66~4~8 0~o~~---~l~22~,.72~~0000~--~l~20 ~,,15~'0o~0o~-~22~75----~22~66;-----~32~05~----3~7~4 2l~---~3~17~09---J
CABBAGE 1/ Early Sprin~
South Carolina Georgia Alabama Mi s s i s s i p p i Louisiana California
To l
Early Sun:mer: South Carolina Georgia Arizona , Other Tota l
La te Sprin~: South Carolina Georgia Al abama Ca lifornia Tota l
57
57
:?5
43
Late S prin~:
Nort h Carolina South Carolina Georgia Alabama Louisia n a: California
Gro Total
4,920
5,500
5,500
55
7, 48 0
7,5 00
7,5 00
45
770
650
550
45
450
500
500
45
700
550
550
60
Late Spring: South Carolina Georgia Mississippi Louisiana Texas
7,000 2 ,000
650 1,400 5
Late Sprin~: Florida California Group Total
Early Sun:mer: North Carolina South Carolina Georgia Al abama Mississippi Arkansa s Louis ian~
Oklahom ~
Texas Arizona: California
Tot a
8,940 23,600 32,400 13,740 7,040
6 ,160 2,840 8,340 78,000 4,480 9 0
6,500 22,000 33,500 13,000 7,500
6,000 3,000 9, 000 72, 000 3, 600 9 00
6 ,500
60
54
23,000
75
75
33,000
88
80
12 ,500
93
95
7, 600
74
55
5,9 00
89
80
3,000
85
90
9,500
70
70
70,000
62
60
3,1 00 153
175
9 600 165
175
534 1,767 2 ,848 1,278
518 546 240 586 4,790 685 l 567
351 1 , 650 2,680 1, 235
412 480 270 630 4 ,320 630
ARCHIE LANGLEY
L. H. HARRIS, JR.
Agricultural Statistician In Cha rg e
Ve~e tabJ..e Grop E
The Georgia Crop-Reportiii'g-Service-; USDA-; 3t5 Hoke-~mithAnnex-; Athens-; Georgia ,-in c oopera tion with-tiie
Cooperative Extension Service, Unive rsity o f Geo rgia , a nd t he Ge orgia B.epartment o f Agriculture .
~ c
<'
~
.C.J.
..('
After Five Days Return to
.p.......
United Stat e s Department of Agriculture Sta tistical Reporting Service
Po stage and Fees Paid U, S . Dflpartment of Ho r1cw.-
315 Hoke Smith Annex
Athens, Geo rgi~ 306 01
OFFICIAL BUSTI\IESS
ur tVE RSITY OF Gl: Ol~GI ,
GEORGIA CROP REPORTI G SERVICE
MAY 12 1961
315
ATHENS, GEORG IA
May
Placement of broiler chicks in Ge orgia during the week ended May 6 was 949,000--2 percent less than i n the pr e vious week and 1 percent less than in comparable w e ek last ye ar, according to the Georgia Crop R eporting Se rvice .
An estimate d 12, 523, 000 broiler type eggs were set by G e orgi a hatche ries-cent less than in the previous week a nd 12 perc ent l ess tha n in the comp a rable a year earlier.
The majority of the pri c es p aid to Ge orgia producers fo r broiler hatching were reported within a range of 4 5 to 65 cents pe r dozen. The average price
hing eggs wa s 56 cents p e r doze n. The p r ic e of eggs from flocks with hatchery cockerels generally was 2 cents below the ave rage price. Most prices r e ceived broiler chicks by Georgia hatcheries were r eporte d within a r a nge of $ 5.00 to 00 with an averag e of $ 7.75 p e r hundred. The average p rices last yea r we r e 64 for eggs and $ 9.75 for chicks.
GEORGIA EGGS SET , HATCHINGS AND CHICK PLACEMENTS
1966
1967
year
1966
19 6 7
Thou.
l, 217 l, 227 l, 310 l, 134 1 218
Thou.
Pet.
1, 155
95
999
81
988
75
l, 201
106
1, 145
94
BROILER TYPE
Thou.
834 l , 01 8
899 1, 009
978
Thou.
950
114
887
87
l, 002
lll
906
90
854
87
Eggs Set}:__/
1966 Thou.
1967 Thou.
year a
Pet.
Chicks Placed for Broilers in Gear ia
1966 Thou.
1967 Thou.
year
0
Pet.
Egg s Per Doz. 19 67
Cents
r Chicks Per Hundred 1967
Dollars
4
11 18
zs
1 8 . ,15
zz
l9
6
13, 001 13,467 13,315 13, 594 13, 742 13, 868 13,922 13, 841 14,447 14 228
13, 174 101
13,027
97
13, 185
99
13, 167
97
13,062
95
12,981
94
13,202
95
12,736
92
12, 899
89
12 523
88
chenes pro
8, 826 8,875 9,025 9,276 9,641 9,719 9,655 9,726 9,910 10 021
9,706 110
9,914 112
9, 96 8 110
9,965 10 7
10,01 6 104
9,927 102
9,929 103
10,022 103
10, 125 102
9,949
99
58
8.25
57
8.00
56
7.75
56
7. 7 5
56
7.75
56
7.75
56
7.75
56
7.75
56
7.75
56
7.75
s.
w. A . WAGNER
ral Statistician In Charge
Agricultural Statistician
---------------------------------------------- ---------------------------- --
S. Department of Agriculture
Agricultural Extension Service
Reporting Service
State D epartment of Agriculture
409A North Lumpkin Street, Athens, Georgia
STATE
Maine Connecticut Pennsylvania Indiana Missouri Delaware Mar yland Virginia West Virginia North Carolina South Carolina
GE ORGIA
Florida Tenness ee A labama Mis sissippi A rkansas Louisiana Texas Washington Ore gon California
TOTAL 1967 {22 States)
TOTAL 1966* {22 S~ate s)
2, 10 5 324
1, 671 531 633
3,0 56 4, 594 1, 910
147 7, 309
505
2,092 375
1, 489 526 67 2
2,981 4,623 1, 871
14 7
7' 4 11 487
1, 980 96 425 90
1, 566 99 543 63
62 9 73 2, 88 7 105
4 , 679 101
1, 908 106
147 9 1 7,465 103
501 107
1, 534
] , 580
1, 526
96
197
179
158
73
907
876
1, 018
110
2.9 4
294
3 51
80
~3 3
48 1
428
85
2, 801
2,781
3,092
119
3, 43 6
3,448
3, 150
90
1, 053
1, 096
1, 19 5
98
373
367
400
101
5, 708
5, 71 3
5, 575
102
3 59
351
388
10 3
12, 736 12, 899 12, 523
88
10, 022 10, 125
9,949
99
825 1,075 8,93 3 5, 108 10, 637
1, 181
4, 571 802 450
1, 992
867 1, 007
9,009 5, 120 10, 177 1, 115 4 ,579
654 4 19 1 875
860 169 997 76 8, 514 93 5, 162 104 10, 493 103 1, 13 2 108 4, 440 98 813 117 361 86 1, 866 96
397
467
403
96
1,024
1, 005
991
91
6,998
6,999
6,958
95
4,342
4, 441
4,375
107
7,985
8, 124
7,968
103
8 52
876
855
111
3,652
3,655
3, 516
102
621
583
450
85
318
433
403
152
1 399
1, 455
l 380
96
71,095 70,395 69, 891
97
54,705 55, 329 -54 ,529
100
71,611 71, 966 71,937
54,467 54,642 54, 27,1
99
98
s percent o same we e
97
st year.
100
101
100
UNIVERSITY OF GIt.EtrO:mJUa:1'S4 e 3 p . m. Monday
DELAYED NOR'I'H
Ga., May 15, 1967 -- Rains and wet soils
crop
in the northern part of the State, according to the Georgia Crop Reporting Service .
excessive in most areas except the southern quarter of the State,
several counties reported soil moisture to be very short.
Agents reported Etton planting 88 percent compl eted Statewide . Practically all
has been seeded in southern and central counties , but less than two-thirds has been ~ the north. The cool temperatures existing until the week end retarded plant developConsiderable replanting continues. Cultivation and early season insect control moved as weather permitted.
:~~~ cultivation was active during the week. Older plantings were being sidedressed Budworm infestations were reported heavy in many areas and c ontrol practices were
vay. Peanut planting moved forward and 93 percent of the acreage was seeded at the end
wek.--sidedressing, cultivation, and applying post-emergence sprays continued in older
planting was well advanced in central and southern areas, but little more than onerMY~~~u in northern districts. Soybean planting moved for ward slowly. Small grain
got under way during the period.Dry weather has reduced yields in many areas:- Some cut during the week. ~.~ improved slightly, but the lack of rain retarded growth south. Cattle condition was mostly fair to good.
prospects remained mostly fair to good. Light harvest from southern producing areas The May 1 production forecast for the State was placed at 2, 700,000 bushels.
Managers reported cool nights and the need of additional soil moisture retarding ~maturity of most vegetable crops in southern areas. Harvest of snap beans, squash ~~Da continued in light volume. First harvest of tomatoes is expected around June 1. ~est has past peak. Cantaloups and watermelons made fair to good progress, and first is expected earlier than usual. Growth of snap beans and cabbage.was go od in the
~~~SUMMARY--Showers and thunderstorms occurred over most of Georgia during the week , May-r2, but rainfall totals were highly variable. The largest amounts were re-
in the extreme northern part of the State , where several place s had more than 2 inches.
observer at Dalton measured over 4 inches during the vmek . Amounts decreased to
than one inch over most of central Georgia and to less than one-fourth inch in much of the Several south Georgia observers recorded no measurable rain during the entire trmek .
areas of the southeast and extreme south continued very dry at the end of the period.
~ratures were mild at the beginning of the period, turned cooler at midweek, and be~ ~mer during the week end. Early morning lows dropped to the 30's in the extreme
on Wednesday and scattered light frost was reported in the mountain counties . In contrast,
temperatures reached the high 90's in south Georgia during the week end and a few b~ 100 degree readings. Most areas of the State had their highest temper atures of the Saturday and Sunday.
the period Tuesday through Saturday, (May 16-20), calls for
nn:.ttrE!s to average 3 to 5 degree s below normal, except in the southeast, where near normal
are expected. The cooler t<Veather should occur near the end of the period . Rainfall to average about normal and occur near the middle of the per i od . Normal for this
year ranges from one -half to one inch.
---------------- .... ---------------------------
The Georgia Crop Reporting Service, Athens, Georgia; in cooperation with the Cooperative Extension Service, University of Georgia; Georgia Department of Agriculture; and the Weather Bureau, ESSA, U. S. Department of Commerce .
tT. S. DE.;PAR TME NT O F :;OMMERCE
WEATHER BURE At.' Athens, Georgia
"'SSA
Precipita i on For 'The Week Ending May 12, 1967
GEORGIA
Temperature extremes f or t he week ending
May 21 1967 (Provisional )
Highes g 01 at Bainbr idge on the 12th
owe s t ~ 3L0 a C ayton and Tallapoosa o. the 10 h
* For p~riod ~4Y 13~15s 1967
T1 l ess t han o005 inch
Af ter Fi ve Days Re u Un i ted Sta tes Depa me
Statis t .i ca Reporting 409 A- No r.,! h -rnp k in S Athe ns, Geor gi a 060 OrF ICI Al BUS I ESS
IMMEDIATE - S. WEA This report wil be trea e d i
Respect s a- Le ter Ma i l (See Sec . 34. 17, P " ~.
Po s ta ge a d Fee s Paid U. S. Depa t m n o Agr i cu 1ture
The Univ Library Univ 0 Ga A.thens Ga 30601
GE ORGI A CROP REPORTING SE RVI CE
ATHENS, GEOR GIA
SPECIAL PEACH REPORT AS OF MAY 1, 196 7 GEORGIA
PRODUCTI ON PROSPECTS DOWN:
UNIVERSITY OF GEORGIA
MAY 22 19ftl
LIBRARIES
Athens , Ga . , May 16 --Geo r gia's 1967 peach crop is f o recas t at 2, 700,000 bushels, sharp l y below the 3,800,000 bushe l crop i n 1966.
A good crop was set in the extreme southern producing areas but t he l ac k of rain is ing sizin g. In the central producing areas, some varieties we re damage d by cold r but the crop outlook i s generally favorable. North Georgia peache s s uffered heavy damage and p roduction f rom this area will be 1ight .
The pea ch estimates, 1ike those for practically all other crops , ne ces sa r i ly relate ~tal produ cti on . Therefore, they include not only insp ected rai l a nd t ruck shipments, also local sales, non-inspected truck shipments to points in Geo r gia an d a djoining
, quan ti tie s used on farms where produced and any quantities not uti l ize d because of ~~c~ic con diti ons. The follow ing table shows the relationship betwee n the Department's
produ ction es tima tes and the inspected rail and truck shipment s f or the years 1960 h 1966. The pe r centage of the total production moving in i ns pe cted sh i pments during s period has var ied from 41 to 68 percent except in 1965 whe n only 23 perce nt of proion was i ns pec ted . An unusually high perce nt of that year ' s c ro p was no t utilized e of excess ive rains .
Production
Not Tot al Uti 1 i zed _.!_/
1 ,000
~
5,000
1, 000
~
395
GEORGIA PEACHES
Unr ecorded :
sales and Processed
farm use ']./ :
:Equi v.
: Ca r s l /
1, 000 bu .
1,419
1,0 00 bu.
854
Number 4 , 240
Inspected Rail and
Truck ShiEments
1 ,000
Percent of
bushels : Total Prod .
2 ,332
47
5,000
21 0
1 ,449
945
4, 356
2, 396
48
4,000
210
1, 032
843
3 ,483
1, 915
48
4,900
240
1 ,2 70
1 ,030
4, 072
2,360
48
1,400
0
3 26
124
1, 728
9 50
68
4,500 1, 4 10
85 3
1, 182
1, 915
1,055
23
3,800
290
1, 209
748
2 , 824
1, 553
41
4,086
394
1,080
818
3, 231
1,794
44
!! 2,700
util ized on a ccoun t of e conomic cond itions . ~cal sales, non- ins pe cted t r uck sh ipme nts t o poi nts ~ntit i es used on farms where produced. Average load 550 bus hels per car . Kay 1 forec ast.
in Geor gia a nd a dj o i n i ng States and
ARCHIE LANG LEY icultural St atis ti c ian In Charge
C. L. CRENSHA\-1 Ag ri cul t u ral Stat i stician
SPECIAL PEACH REPORT AS OF MAY 1, 1967 - UNITED STATES
The peach crop in 9 Southern States is forecast at 456.1 mi 11 ion pounds, 39 percent less than last season and 38 percent below average. Only Alabama and Mississippi expect
larger crops than last year. Most of the decrease is in the Carolinas where mid-March
freezes seriously damaged the crop.
In the Sandhills area of North Carol ina there is a good set on early var iet ies, mid-season varieties are practically all destroyed, and late season varieties have about one-half of a crop. The crop in South Carol ina is about two-fifths of average. The crop is spotty by locality, Early maturing varieties appear to have escaped with least injury , but the late crop appears to be a complete loss.
In the northern areas of Georgia, the crop was mostly wiped out by mid-March f~ez~ and some varieties in the central area were damaged. Weather conditions during March and April favored an effective spray program. Rainfall has been I ight since early March and May I some areas needed moisture. Movement of early varieties from the southern counti~ was expected active by May 10, In Alabama, the March freeze damaged early varieties but prospects for other varieties are good. Light harvest will start about June I,
Peach prospects in Mississippi are the best in several years. Harvest is expected to get underway in early June. In Louisiana freeze damage was I ight and most varieties re~ heavy thinning. Because of ample moisture, the fruit is sizing well. Harvest is expected to get underway about 2 weeks earlier than normal. Some early varieties should ripen by May 10.
Production in Oklahoma is down slightly from last year due to a freeze in the St~ area. Moisture supplies are ample in the major producing area. In Texas, most producing areas have adequate moisture and peaches are progressing well. Harvest of early varieties is expected to get underway in late May.
Prospects in California for both Clingstones and Freestones are uncertain due to tM cool, wet spring. Conditions did not favor pollinization, however, a reasonably good set prevails in most orchards, Light harvest of the earliest varieties is expected to begin in southern San Joaquin during late May.
Colorado's Western Slope producing area was seriously damaged by subfreezing tempe~ tures in late April. The full extent of the damage still is indefinite but losses appa were heaviest in Mesa and Delta Counties, Spring freezes have caused an undetermined of damage to the crop in Utah.
Late spring freezes have caused a variable amount of damage to the peach crop in Pennsylvania, West Virginia, Virginia, Maryland, and Delaware. Some buds were also aama~ in New York and the crop is expected to be down sharp 1y in New Eng 1and. It is too early assess the full extent of the damage in these States.
PEACHES
State
Pounds
Mi 11 ion Pounds
6 1 ,000 Bushels
Mi 11 ion Pounds
1 ,000 Bushels
North Ca ro 1 ina South Ca ro 1 ina Georgia Alabama Mississippi Arkansas Lou isiana Oklahoma Texas
61.3 314.7 196.3 46.5
14. 1
58.8 6.5 8.0
77.1 339.0 188.5
27.5 13.2 49.4 9.0 10.8
6
1 '550
35.0
700
6,600
129.0
2,500
3,800
133.9
2 '700
550
47.5
950
265
17.0
340
950
46.8
900
1~0
e>.o
160
225
10. 1
210
00
.8
9 States
732.5
748.1
14,820
456.1
l l Includes quantities unharvested on account of economic conditions, and excess
harvested fruit.
After Five Days Return to United States Department of Agriculture
Statistical Reporting Service 409A North Lumpkin Street Athens, Georgia 30601 OFFICIAL BUSINESS
Postage and U. S. Department
~G\A
~() FARM REPORT
GEORGIA C ROP REPORTING SERVICE
ATHE
GErffiRAL CROP REPORT AS OF :!'lAY l, l 67
eather during Apr il was quite variable with the f i rst half warm and unusuall y dry. rains fell in the upper half of the State during the l atter part of the month, but
of South Georgia remained dry.
J.s of 11ay 1, practically all tobacco had been transplanted, four-fifths of the corn, two~ the cotton and peanut acr eage had been seeded, and soybean planting had start ed .
temperatures and adverse moistur e conditions during the latter part of April to mid - Nay retarded grotvth of early- se eded crops and de layed planting in the northern part of the
: Georgia ' s 1967 peach crop is forecast at 2,700,000 bushels compared with ~~~- ls in 1966. 'Ihe e stimate include s both farm and commercial producti on. Li gh t
started in early Nay in extreme South Georgia .
Production of ~~heat in Ge orgia is currently forecast at 2, 756 ,000
than produced last year . The increase in production results from a
Yie ld per acre i s estimated at 26 bushels compared
A total of 91 million pounds of milk was produced on Georgia farms
5 percent above production in April 1966 and 3 percent above the
e stimated 418 million eggs during on h and totaled 21,679,000 compared
. ---------------- PEACH~S
-----~-------------- ------- ...;..=..;;;,;:;:.;;.: ;=-~-------- ------~-
Production J./
Average
1961-65
1966
1967
~------------H--il-l-i-o--n--------------H-i-l-l-i-o-n---------1--,0-0--0-~---------:rvi-i-l-l -io--n--------1-,-0-0-0------
E2~-
~nd__
bushels
!22~!2._
b-u-s-h-e-ls-
61.3
77 . l
1,550
35 .0
700
314. 7
339.0
6,600
129 . 0
2,500
196. 3
188.5
3,800
133. 9
2, 700
46. 5
27.5
55 0
47. 5
950
14. 1
13 . 2
265
17. 0
340
58. 8
49. 4
950
46. 8
900
6.5
9. 0
180
8. 0
160
8. 0
10. 8
225
10. 1
210
26 . 2 ________}}.:.______ __ 70Q__~ _.1..:.._______oo___
732.5
748 . 1
14,820
456. 1
9,060
Statistician In Charge
C. L. CRENSHAH Agricultural Statistician
The Georgia C(ProlepaRseeporting Service, USDA,
North Lumpkin Str-e-e-t ,--A-t-h-en-s-,--G-a-. -, -
in cooperation wi th the Georgia Depa-rt:rter-t of Agricultur e .
UNITED STATES GENERAL CROP REPORT AS OF NAY 1~ 1967
Winter whe at prospects i mproved slightly during April and the 1967 crop is expected to larger than last year and average . Spring fi eld work is laggi ng across the Northern and Hestern parts of the country where wet soils and cool temperatures have slowed progress , spread rains April 11-13 over much of the critically dry Central and Southern Great Plains halted deterioration of winter wheat and late April rains r elieve d the i mmed iate threat of s er ious drought over most of the Southeast . Peach prospects are sharply below last year in Southern States. Pasture and hay crop prospects are slightl y below a year earlier , These improve when warmer weather arrives because tops oil moisture supplies are ge nerally April milk production was about the same as a ye ar earlier, but egg production was 6 percent above April 1966,
Winter Wheat Prospects Brighten: Prospective production of winter wheat increased during-April-and the-196 7-crop~;-~ow expe cted t o be 13 per cent larger than last ye ar and 23 percent above average . V.Ji despread ra.i ns April 11-13 i n the cr itically dry Central and S Great Plains halted det eriorati on and i mproved prospects i n Kansas, Okl ahoma , and parts of Texas , However, for many fi el ds, the rains came too late . Noisture supplies , especially in the subsoil, are still critically short i n parts of west ern Kansas , tve stern Oklahoma, Colorado, and New Hexico. On April 21 to 24 sub-freez i ng temper atur es in the Central Great Plains caused some damage to Hinter tvheat in parts of Kansas and Colorad o, Prospects in winter t>Jh eat producing areas, exc ept the Southeast, continue good to excellent . The expected yield is 26. 8 bushels per harvested acre, c ompared Hi th 27 . 4 bushel s i n 1966.
Southern Peach Prospects Down Sharply: Peach production in the 9 Southern States is cast at 4~6:1milli0n-poun&-;-39-pe;::'Ce;t- bel oH last year and 38 bel ot-J average , The reduced duction is mostly due to short cr ops in the Carolinas and north Georgia, from freez i ng temperatures when trees were nearing full bloom, The first 1967 fore cast for California apricots, cherries, and plums, places production belot-J last s eason due to cool, wet vreather critical stages of development .
l'1ilk Production: April milk production in the United States is esti mated at 10,732 million poundB;-a-bout the same as a year earlier and 5 percent bel ow the 1961-65 average f~ month. On a daily average basis, milk production increas ed 6 percent from .r-Tarch to April, compared uith 5 percent a year earlier ,
foulk.Y_~g3_]g_g_: April egg production is estimated at 5, 999 million eggs , 6 percent above both April 1966 and the 1961-65 average, but 2 percent bel ow March 1967, This is the largest April production since 1950. 'Ihe average number of layers for April 1967 is at 314 million, up 5 percent from a ye ar earlier and up 6 percent from the 5 - year April Egg production per layer averaged 19. 09 dur ing April 1967 compared with 18. 95 eggs in April last year and the 5-year April average of 19. 03 eggs .
The number of layers on Nay 1, 1967 is esti mated at 311,742,000 - 5 percent above a yert earlier and 6 percent above average , Estimated layer numbers were up 8 per cent in the . and South Ce ntral regions, 4 percent in the East North Central and South Atlantic regions, 2 percent in the Hest North Central, and about the same as a year earlier in the Horth Atlantic region.
After Five Days Return to United States Department of Agricultur e
Statistical Reporting Servic e 409A North Lumpkin Street
------- ___ __ Athens, Georgia 30601 OFFIC IAL BUS_IN_.E.,SS
Postage and Fees Paid U. S. Department of Agricul
00'}
3
ATHENS, GEORG IA
GEORGIA CROP REPORTING SERVIC UNIVERSITY OF GFO'Ai:J~
LPill@lfilil~~ . ,
LIBRARIES
Apr i 1 1967 Released 5/16/1967
April Milk Production Up 4 Mill ion Pounds
Total milk produced on Georgia farms dur i ng April is estimated at 91 mill ion poundsup4million from the same month last year, and 3 million pounds above the 1961- 1965 average production for the month.
Milk per cow was placed at 630 pounds compared with 575 in April last year. The 1961 - 1965 average for the month was 481 pounds per cow.
Prices paid by dairymen for feed were about 10 cents per hundred weight below March,
but averaged about 20 cents above the previous year. Hay prices were slightly higher.
MILK PRODUCTION AND PRICES RECEIVED AND PAID BY DAIRYMEN
I tern and Unit
Apr. 1966
Georgia Mar. 1967
Apr. 1967
Apr. 1966
United States Mar. 1967
Apr. 1967
tlllk Product ion, mi I. lb.
Product ion per cow, I b. l l
b ber mi I k cows,
thousand head
87
89
91
l 0 '725
10,510 I0, 732
575
615
630
752
766
785
151
145
145
~RECEIVED- DOLLARS 11
All wholesale milk, cwt. lui d mi I k, cwt. Manufactured milk, cwt. Milk cows, head All ba I ed hay, ton
6.05
6. I0
3.65
1~0.00
26.00
6.40 6.40
200.00 27.30
~/6. 30
200.00 27.20
4.45
3/4.82
313.67
242.00
23.40
4.95 5.36 4.07 256.00 25. l 0
~/4.84
257.00 24. l 0
~ PAID - DOLLARS 11
Mixed Dairy Feed:
2./ 14 percent protein,
16 percent protein,
18 percent protein,
20 percent protein,
Al l under
29 percent protein,
cwt. cwt. cwt. cwt.
cwt.
3.90 3. 95 4.10 4.30
3.95
4. l 0 4.20 4.50 4.55
4.25
4.00 4. 15 4.30 4.50
4.15
1/3.47 113.74 3/3.88 }!4.06
113.71
3.65 3.99 4. II 4.33
3.91
3.64 3.96 4.09 . 4. 33
3.90
!I Monthly average. UDollars per unit as of
j1 Revised. !I Pre I imi na ry
~United States price is
the 15th of month except wholesale milk which for under 16 percent.
is average
for month.
ARCHIE LANGLEY Agricultural Statistician In Charge
C. L. CRENSHA~/ Agricultural Statistician
The Georgia Crop Reporting Service, USDA, 409A North Lumpkin Street, Athens, Georgia, in cooperation with the Georgia Departmtnt of Agriculture .
..
UNITED STATES MILK PRODUCTION
April milk output about the same as a year aqo
April 1967 production of milk in the United States is estimated at 10,732 million pounds, about the same as production in April 1966 but 5 percent below the 1961 - 65 average for the month.
Total production of milk during the January- April period th i s year was 40,314 mill ion pounds--slightly above the comparable 1966 period. On a daily average basis, milk production increased 6 percent from March to April, compared with a 5-percent increase a year earlier. April output provided 1.80 pounds per person daily, compared with 1.82pounds inApri11966.
April rate per cow up 4 percent from a year earlier
Milk output per cow averaged 785 pounds for the United States during April, 4 pe~
cent more than a year earlier and 14 percent above the 5-year average for the month.
Milk Per Cow and Milk Production by Months United States, 1967, with Comparisons
Month
January February March Apr i 1
Jan.-Apr. total
May June July August September October November December
Annual
Average 1961-65
621 591 676
1966
Pounds 678 635 736
757
729
798
671
736
629
696
592
663
602
670
581
649
1967
715 670 766
Average 1961-65
1966
Mill ion Pounds
10,222
9,805
9,696
9' 137
11,062 10,537
11 260 10
42,241 40,204
1967 40,314
11 ,816 10,849 10,148
9,522 9,643 9,2b8
1 1 ' 11 ,269 10,350 9,763 9,263
9,333 9,012
12 660 120 0
After Five Days Return to United States Department of Agriculture
Statistical Reporting Service 409A North Lumpkin Street Athens, Georgia 30601 OFFICIAL BUSINESS
Postage and Fees Paid U. S. Department of Agricu
GEORGIA CROP REPORTING
~I$
. ...........
'v'JfllfSSIT\' OF GEORGIA
ATHENS, GEORG IA
May 17, 1967
GEORGIA CHICK HATCHERY REPORT
Placement of broiler chicks in Georgia during the week ended May 13 was 9.471,000--5 percent less than in the previous week and 4 p~rcent less than in le comparable week last year, according to the Georgia Crop Reporting Service.
An estimated 11, 919, 000 broiler type eggs were set by Georgia hatcheries-Spercent less than in the previous week and 16 percent less than in the comparable week a year earlier.
The majority of the prices paid to Georgia producers for broiler hatching eus were reported within a range of 50 to 65 cents per dozen. The average price
hatching eggs was 56 cents per dozen. The price of eggs from flocks with hatchery ftlled cockerels generally was 2 cents below the average pric~. Most prices received
r broiler chicks by Georgia hatcheries were reported within a range of $5. 00 to ,00 with an average of $7. 75 per hundred. The average prices last year were 64 ts for eggs and $9. 7 5 for chicks.
GEORGIA EGGS SET, HATCHINGS, AND CHICK PLACEMENTS
EGG TYPE
Eggs Set
Chicks Hatched
1966
1967
o/o of
year
ago
1966
1967
Thou.
Thou.
Pet.
Thou.
Thou.
o/o of
year ago
Pet.
15
zz
l, 227 1, 310
999
81
988
75
1,018 899
887
87
l, 002
lll
Z9
l, 134
1, 201
106
1,009
906
90
6
1, 218
1, 145
94
978
854
87
13
l, 386
1,000
72
l, 076
766
71
Eggs Set !J
1966
1967
BROIL '=<:~~ TYPE
% of
year ago
Chicks Placed for
Broilers in Georgia
% of
1966
1967
year
ago
Av. Price
Hatch
Broiler
Eggs
Chicks
Per
Per
Doz.
Hundred
1967
1967
Thou.
Thou.
Pet.
Thou.
Thou. Pet. Cents
Dollars
11
13,467 13, 027
97
8, 875
9,914 112
57
18
13,315 13, 185
99
9,025
9,968 110
56
Z5
13, 594 13, 167
97
9,276
9,965 107
56
1
13, 742 13,062
95
9,641 10,016 104
56
8
13, 868 12,981
94
9, 719
9,927 102
56
15
13,922 13, 202
95
9,655
9,929 103
56
zz
13, 841 12,736
92
9,726 10,022 103
56
Z9
14,447 12, 899
89
9,910 10, 125 102
56
6
14,228 12, 523
88
10, 021
9,949
99
56
13
14, 206 11,919
84
9,906
9,471
96
56
Includes eggs set by hatcheries producing chicks for hatchery supply flocks.
8.00 7.75 7.75 7.75 7.75 7.75 7. 7 5 7. 7 5 7.75 7.75
ARCHIE LANGLEY ricultura1 Statistician In Charge
W. A. WAGNER Agricultural Statistician
, S, Department of Agriculture
Georgia Department of Agriculture
Statistical Reporting Service
409A North Lumpkin Street, Athens, Georgia
STATE
Maine
2,092
1,980
2,063 100
1, 580
1, 526
l, 590
102
Connecticut
375
425
274 72
179
158
146
51
Pennsylvania
1, 489
1, 566
1, 538 97
876
1, 018
l, 111
98
Indiana
526
543
549 60
294
351
310
76
Missouri
672
629
632 73
481
428
487
114
Delaware
2,981
2, 887
2,966 106
2, 781
3,092
3, 214
123
Maryland
4,623
4,679
4,781 102
3,448
3, 150
2,906
84
Virginia
l, 871
1, 908
1, 908 104
1,096
1, 19 5
l, 252
107
West Virginia
147
147
152 83
367
400
307
62
North Carolina
7J 411
7,465
7,426 102
5, 713
5, 575
5,660
106
South Carolina
487
501
488 90
351
388
324
83
.
GEORGIA
12, 899 12, 523 11,919
84
10, 125
9,949
9, 471
96
::J
Florida Tennessee Alabama Mississippi Arkansas Louisiana Texas Washington Oregon California
TOTAL 1967 (22 States)
867
860
771 156
467
403
476
107
l, 007
997
997 76
l, 005
991
1, 000
87
9,009
8, 514
8,952 98
6,999
6,958
7,030
98
5, 120
5, 162
5,041 103
4,441
4,375 4,301
106
10, 177 10,493 10,365 103
8, 124
7,968
8,079
103
l, 115
1, 132
1' 122 110
87 b
855
935
121
4, 579 654
4, 440 813
4, 543 100 689 109
3,655 583
3, 516 450
3, 582 497
99 95
419
361
320 80
433
403
348
122
1, 875
1 866
2,034 110
1, 455
1,380
1
112
70,395 69, 891 69, 530
97
55,329 54, 529 54, 525
100
TOTAL 1966* (22 States)
71,966 71,937 71, 719
54,642 54,271 54,400
98
as percent same we
97
st year.
101
100
100
...---""""=~===~--=~==--=.2...;:::-- ---
Georgia Weekly Crop and Weather Bulletin
~
GEORGI\(sROP REPOR TING SERVI CE
J~~
1967 ADVERSE VJEATHER CONDITI ONS RETARD
MAY 23
LIBRARIES
Re l eased l p .m. Mo nday
Mhens, Ga ., May 22, 1967 - -Much of the f ie ld work cont i nued at a slower t han normal
aswet soils in northern areas and a shortage of soil mcisture in the south hampered
ac cord ing to the Georgia Crop Reporting Serv ice . General rain s
and Monday (May 21-22) throughout most of the St ate have helped relieve drought
southern areas.
~unty Agents reported 95 percent of the cotton acreage ha d been planted by the end of Cool nights and wi ndy wea ther caused poo r stands i n some area s. The crop is i n poor r condi tio n. Some replant i ng of cotton to soybean s was reported .
remained mo s tly in f a ir condition. Late-week rai ns in sou thern a rea s we re ve ry ial. Ninety-six percent of t he crop was planted by the e nd of the week; v i rtu ally all acreage in southern areas has been seeded .
lrrigat ion, suckering and insect cont ro I of t obacco contin ued active th roughout the week. condition declined fr om last week. Pean ut pla nti ng was 95 percent completed . Insect and post-emergence herb icide appl ic tions contin ued active. Small qrai n harves t was
in the south. Dry weathe r has reduced yields i n many areas. Soybean p lan t i ng was 29 complete by the end of the week. Dry soils i n southern areas hampere d furt her progress. condition declined cons ide rably from last week, especiall y in the south. Su p9lemental feeding was reported in the dr ier locations. Peach growers remai ned on schedule with
ive spraying program. Light harvest be gan i n the southce ntral area .
~rket Managers reported t hat harvest of the spring s nap bean c rop has passed the peak areas, which was mu ch ea r l ier than usua l. Light supplies of cucumbers and squash are to market. Growth of tomatoes has bee n slow due to dry weat her but I ight harvest i s The condition of cant a loup s a nd watermelons was reported fair to good. Li ght har-
5 expected the last week in May i n ex t reme southern areas.
rainfa ll was recorded in t he sout hern two-th i rd s of Georgia the week ending Fr i day, May 19. Light to locally heavy amounts f ell i n the northern ring this period. Much of t he ex t reme south and southeast was cr iti cally dry at the
the week. However, an area of general ra i ns move d i nto the State from the wes t and t Sunday night and by Monday morning, May 22 , ra i n was fa! I i ng over most of the State,
the southeast. From t to l t i nches of rain had been recorded by 7 o 1 cloc k Mo nday
over most areas north and we s t of a 1 ine from Valdosta to Augus ta . Th i s rain wa s needed in southern counties where some places had received less than an i nch of rain
Apri I I.
at the beginning of the period gave way t o much coole r temperatures a t midIt was warm again by the end of the week, except in north Georg ia . Averages for the ranged from near normal in the southeast to 6 degrees below normal i n the northwest. experienced its first 100 weat her of the year on May 13 and 14.
period Tuesday through Saturday (Ma y 23 - 27) calls f or tures to average 3 to 5 deg rees below norma l. The cooler temperatures sho ul d occur the early part of the pe riod . Rainfall is expected to average near to slight ly be low
t , except in the southeast where abo ve normal amo unt s are indicated. To ta l s should range
near inch in the northwest to 1 inch i n the southeast and occur as wi dely scattered during the latter part of the period .
The Georgia Crop Reporting Service, Athens, Georgia; i n cooperat io n with t he Cooperative Extens ion Se rvice, Un iversity of Georgia; Georgia Departme nt of Agriculture; and th e Wea ther Bu rea u, ESS A, U. S. Department of Corr.merce .
.
.
- ...\ _"::~ -~-~..::::.!'..-..:..:-~.: .:.. .'- --
U, S. DEPARTMENT OF COMMERCE
WEATHER BUREAU
Athens, Georgia
I "' 0".!'~
.
?r-ec lp:: t a t ion '"''o! 'l'r e >eek Endi ng May 19, 1 967
GEORGIA
Tc pe rat'l :-...;.; :-:t:t'8l.- . ~:r~ t,,_ _ r:~/ 19 J 96i ( r:r :,vi !: _ ~ :!:L. \
1 (,).00 ~,~ a1r. r 1. -.
14t;~ and ::: . o
0 :1 , .: .1. o
* For period .ay 20 -~ 2 , 1967
T, l e ss than . 005 inch
After Five Days Return to United States Department of Agriculture
Statistical Reporting Service 409A North Lumpkin Street Athens, Georgia 30601 OFFICIAL BUSINESS
IMMEniATE - U. S. WEATHER REPORT This report will be treated in all
Respects as Letter Mail (See Sec. 34. 17, P. L. & R.)
The Univ L brary Univ Of Ga Athens Ga 30601
Postage and
U. s. Department
GEORGIA CROP REPORTING SERVICE
t~~1f[l[h~
ATHENS, GEORG IA
May 23, 1967
Item
1966 1I
Thou.
1967 21
T hou.
1966 1I
Thou.
1967 21
Thou.
4,420
3,993
90
15, l 70
14, 4 96
96
Domestic
3,920
3, 4 80
89
13,3 76
12,64 8
95
Chickens Tested:
Broiler Type
Georgia
46 1
495 107
2,075
2,373
114
United State s
2, 214
2, 338 106
8, 888
10,614
119
Egg Type
Georgia
20
6
30
112
129
115
United State s
348
533 153
2, 574
2,959
115
Chicks Hatched:
Broiler Typ e
Georgia
46, 4 25
44, 512
96
170,638 173,831
102
United State s
246, 138 24 9,7 85 10 l
910, 604 943 ,642
104
Egg Type
Georgia
3,994
4,004 100
12, 822
15, 273
119
United State s
81,036
76,00 8
94
2 23 , 157
229 , 653
10 3
Commercial Slaughter:41
!oung Chickens
Georgia
32,724
32, 887 100
120,728 127,827
106
United State s
184,713 183,209
99
684 , 511 719,273
105
Hens and Cocks
Georgia
709
160
3, 691
4,888
132
United States
11,262
131
45,688
59,661
131
Mil.
Mil.
Mil.
387
l, 4 06
1, 626
l, 041
3, 916
4 ,357
5,679
21,97 2
23,456
- r..n inary.
ro
ry sup
oc , in
s
pullet replacements from eggs sold during the pre ce ding month at the rate of
pullet chicks per 30-doz. case of eggs. t':.: l Federal-State M arke t News Service-
reports only include poultry slaug hter ed under Feder al Inspec tion. 51 South
_ ...... States: Del., Md., W . Va., N. C., S . C., Ga., Fla ., Va.
YOUNG ~HICKENS: SLAUGHTERED UND ER FED .S.c~ A L INSP E CT I ON BY SELE CT ED STAT i~S 1966 and 196 7
5,482 7,238
6,373 7,119
16,439 17,068 19,323 20, 863
3, 015 7,769 11, 135
3, 282 7,080 11, 138
8, 255 9, 42 2 21,658 20, 6 14 31, 138 33, 913
3, 557 20, 529
3, 570 20, 820
9, 978 10, 49 3 56, 3 50 60, 4 72
30,306 4, 636
18, 524
33, 526 4, 789
21, 195
84, 160 92, 647 13, 550 13, 885 54 , 853 58, 14 7
12,470 13, 678
34 , 887 38, 34 5
25,938 28, 599
71, 723 80, 2L1: 6
-9.! 999_---~~._"!_"!_~---- ~ 2!. ~! ~-- ~ ~!. ?i~ --
500, 187
54 1, 652
4 .2
4 .0
3.5
3.9
4. 7
5. 4
4. 5
5. 3
7.4
4. 9
7. 4
5.6
4. 6
6. 1
4. 6
5.3
4. 5
5. 3
4. 7
5. 2
2.6
4. 3
3.1
4.6
4 .2
4 .9
4 .5
5.2
3.9
5.7
3. 8
5.6
2.9
5.2
3.3
6.1
3.2
~ .0
3.4
4 .5
3.2
3 .7
3.6
4. 4
3 .8
4 .9
3.9
5. 4
_3_._~------ ~ !. Q----- ~ !.!------ _:1.! .9----
3.9
4. 8
u
ure
e org1a
Statistical Reporting Service
409A North Lumpkin Street, Athens, G
LIBRARIES
E nd-o f -Month Stocks of Po ultry, Po u ltry Products, Meat and Meat Products Unit e d State s - A pril 1967
Shell eggs: Increas e d by 58 t housand cas es; A prill966 increase was 14 thousand cases; average A p r il inc r e ase is 16 thousand cas es . Frozen eggs: Incr ea s ed by 11 million pounds; A p ril 1966 inc r ea se wa s 9 million pounds; ave rage A pril increase is 13 million pounds. Froz e n poult ry : De cr ea s ed by 30 million pounds; A p ri l 1966 d e cre ase was 32 million p o unds ; average April decrease is 35 milli on pound s . B ee f: D e creased by 16 million p ounds ; A pril 1966 decrease was 11 million pounds; average A p r il d e crease is 6 million poun s . Pork: Inc r e as e d by 55 m illion pounds ; i:. p ril 19 66 increase was 55 million pounds ; av rage A pril incr ease i s 33 million pounds . Other meats : Increased by 9 million pounds ; A pril 1966 increase was 13 million pounds; average A pril increase was 8 m illi on ounds .
Commo
E ggs: She ll Frozen eggs, total
Total eggs lJ
Unit
C ase Pound
Cas e
av ou .
6~
60, 794 1,60 3
42 32, 652
86 9
41 43 , 6 72
1, 147
99
54,407
1,476
Poultry fro zen : Broilers o r fryers He n s, fowls Turkeys - whole Turkeys - othe r Other & Unclassifie d
Total Poultry
Pound do. do. do. do. do.
22, 185 41 , 10 7 121,904
39,760 22 4,95 6
16,207 20,051 92,3 46
40, 437 169, 041
4 1, 136 49,636 170,742 3 5, 883 53, 338 350, 735
42, 803 4 7, 445 141,407 33, 307 55,343 3 20 , 305
B eef: Frozen in Cu re
and Cur d
do.
Pork: Frozen in Cur e
and ~ured
do .
Other m e at a nd m eat
products
do .
Total all r ed m e ats
do .
197,77 5
3 53 , 70 5
115,2 26 666,706
216, 899
272,294
96,22 5 585,41 8
299,9 84
331,197
96 ,191 727,372
284 , 136
38 6 ,388
10 5, 551 776,075
Item
Prices Received: Chickens, lb. excluding broilers Com 11 Broil e rs (lb .) All Chickens {l b.) All Eggs (doz ens)
Prices Paid: (pe r 100 lb.) Broiler Growe r Laying Fee d Scratch G rains ozen eggs converte
pr. 15 1966
e nts
... e:tts
ents
ents
14 .0 15. 0 15.0 47 .0 Dol. 4 .90 4 .70 4.20
10 .0 13 .0 12.8
41. 0
Dol. 5. 10
5.00
4. 45
9.0 12. 5 12.4 3 5. 1 Dol. 5.00 5.00 4.45
10.9 15. 8 15 . 3 38. 6 D ol. 4 .88 4 . 44 3 .94 case .
8 .8 14 .3 13. 7 34 . 6 Dol. 5. 05 4 .72 4 . 13
8.6
13.8 13.3
29.9 Dol,
5.06
4. 68
4 .11
****************************************************************************
This report is made possible throug h the coope ration of the National Poultry Improve
Plan, Officia l State Agencies, the Animal H us bandry Researc h Division of the Agri
Research Se rvice, the Inspection Branch of t he Poultry Division, Consume r and
Service and the Agri cultural E stima t es Divi s ion of the S tatistical Re porting Service and
the many br eede r s , hatcheries, poultry pro c es sors and the poultr y farme r s that report
these age ncie s .
ARCHIE L A NGLE Y
W . A , WAGNER
Agricultural 3tatistician In C harge
Ag ricultural Statistician
After Five Days R e turn to :
Postage and Fee s Paid
United States Departme nt of Agric ulture
U. 3 . Department of Ag riculture
Statistical Reporting S e rvice
409A No rth L umpkin Str eet
Athens, Georgia
OFFIC IAL BUSINE SS
31
GEORGIA CROP REPORTING SERVICE
W~~llirbTI illffi1rill~ffiTI
ATHENS, GEORG IA
May 24, 1967
GEORGIA CHICK HATCHERY R E PORT
Placement of broiler chicks in Georgia during the week ended May 20 was 9,587, 000--2 percent more than in the previous week but 6 percent less than in
the comparable week last year, according to the Georgia Crop Reporting Service
An estimated 12,414, 000 broiler type eggs were set by Georgia hatcheries-4 percent more than in the previous week and 12 percent less than in the comparable
week a year earlier.
The majority of the prices paid to G e orgia producers for broiler hatching
eggs were reported within a range of 50 to 65 cents per doz e n. The ave r age pric e of hatching eggs was 56 cents per dozen. The price of eggs from flocks w ith
hatchery owned cockerels generally was 2 cents below the ave rag e price . Most prices received for broiler chicks by Georgia hatcheries were reported within a
range of $5.00 to $8.75 with an average of $7 .75 per hundred. The average prices last year were 64 cents for eggs and $9. 75 for chicks.
GEORGIA EGGS SET I HATCHINGS, AND CHICK PLACE MENTS EGG TYPE
1966
Thou.
1967
Thou.
o/o of
year
0
Pet.
1966
Thou.
1967
Thou.
% of
year
Pet.
Apr. ZZ Z9
6
13
zo
1, 310 1, 134 1, 218 1, 386 l 029
988
75
1, 201
106
1, 145
94
1,000
72
923
90
899 1,009
978 l, 076
907
l, 002
111
906
90
854
87
766
71
921
102
BROILER TYPE
Week Ended
Eggs Set};_/
1966
1967
% of
year ago
Chicks Placed for
Broilers in Georgia
% of
1966
1967 year
ago
Av. Price
Hatch
Broiler
Eggs
Chicks
P er
Per
Doz.
Hundred
1967
1967
Thou.
Thou.
Pet.
Thou.
Thou. Pet. Cents
Dollars
Uar. 18
13,315 13, 185
I 99
9,025
9,968 110
56
War. ZS
13, 594 13, 167
97
9,276
9,965 107
56
7.75 7.75
Apr. 1
13, 742 13,062
95
9,641 10,016 104
56
Apr. 8
13, 868 12,981
94
9,719
9,927 102
56
Apr. 15
13, 922 13,202
95
9,655 9,929 103
56
Apr. ZZ
13, 841 12, 736
92
9,726 10,022 103
56
7.75 7.75 7.75 7.75
Apr. Z9
14,447 12, 899
89
9,910 10, 125 102
56
7.75
Yay 6
14,228 12, 523
88
10,021
9,949
99
56
Yay 13
14,206 11, 919
84
9,906
9,471
96
56
Uay zo
14, 133 12,414
88 10, 155
9,587 94
56
7.75 7.75 7.75
1/ Includes eggs set by hatcheries producing chicks for hatchery supply flocks.
ARCHIE LANGLEY
W. A . WAGNER
Agricultural Statistician In Charge
Agricultural Statistician
-----------------------------------------------------------------------------
Department of Agriculture
Georgia Department of Agriculture
Statistical Reporting Service
409A North Lumpkin Street, Athens, Georgi UNIVERSITY OF GEORGIA -:"P
NAY 26 1987
LIBRARIES
STATE
-
..........._-; .I.._
-- -
- .._
'
-
--
~
May
6
May 13
THOUSANDS
May
20
~
...
o/o of year
a l/
May
6
May 13
T .-IOUSANDS
May
20
Maine Conne cticut Pennsylvania Indiana Missouri Delaware Maryland Virginia we st Virginia North Carolina South Carolina
1, 980 4 25
1, 566 543 629
2, 887 4,679 1,908
147 7,465
501
2,063 274
1, 538 549 632
2,966 4 ,781 1, 908
152 7, 426
4 88
2,019 99 356 113
1,643 117 600 70 510 59
2, 802 100 4,779 102 1, 786 96
155 89 7,574 103
428 79
l, 526 158
1, 018 351 4 28
3, 092 3, 150 1, 195
400 5, 575
388
1, 590 146
1, 111 310 487
3,214 2,906 1, 252
307 5,660
324
1, 634 188 988 306 488
2,705 3, 313 1, 220
323 5, 781
384
GEORGIA
12, 523 11,919 12,414 88
9,949
9,471
9, 587
Florida Tennesse e Alabama Mississippi Arkansas Louisiana Texas Wa:> hington Oregon California
TOTAL 1967 {22 States}
860
997 8, 51 4 5, 162 10,493 1, 132 4, 522*
813 361 1 866
771 997 8,952 5,04 1 10,365 1, 122 4 , 543
6 89 320 2 034
842 154 1,037 83 9,061 102 5,032 99 10, 181 100 1, 148 116 4 , 584 103
656 97 382 105 1 939 103
69,973 69, 530 69,928 98
403 991 6,958 4,375 7,968 855 3, 516 450 403 1,380
54, 529
476 1, 000 7,030 4,301 8,079
935 3,582
497 348 1, 499
54, 525
478 975 7, 120 4,322 7,762 897 3, 589 476 305 1 351
54, 192
TOTAL 1966* {22 States}
71,937 71,719 71,236
271 54,400 54,791
of Last Year
98
97
98
1/ Current week as percent of same week last year.
* Revised.
100
100
99
% of
year
a 1/
104 62
104 73
108 104
99 113
76 102 106
94
109 91 97
105 99 117 98 89 106 98
99
\
,Q..J
.....::..::..ss..
(.)
'd
.C...'d.
..'."..'
00
~~
rJJ ......
Q) 0
Q).j..)
~ s::
sQ)
'sd::....,
C'd '"' Q) C'd
o.oO..
C'd Q)
. ~Q
0
. ~(/) ::J
Q)
....::.'.".::..ll,.'
.(.....).
.0., ~.O'.".'OQ(>J.)...Q.,)
s:: 0 '"' ~
:'":'lS....:.:UQ)) U...)..
(/)
o~:;Q)..8..o, o..s.s.:=. =...:.x.:.
(/)
ro(z.il
8 rJl '"'...., 0.. '"' ~
r>.o. fC'dr8'".' ::l~0:.0:(J/)
OoQ).....:lQ)I=Q
Q) p;:f...cl) ,~
;:.oo.....,4-> <t!
.~..J......<.crQo.i)).....C,,.'..d u..o'z"'
s00~:=~u
Q)~
a (/) ,~;Q:):Q'".)d..r.z.roJ.l<oo.-.....,.~ttco.~. "<:t4
::J
o-- -------- - . . u. ... .a.o~.o&.\...&.d.!!
UNIVERSITY OF GEORGIA
31$
Released 3 p.m. Monday
CR~ CONDIT ION IMPROVED
Athens, Ga., May 29, 1967 Crop condition, with the exception of cotton, showed
rable improvement as rains during the early part of the week helped relieve drought
southern areas, according to the Georgia Crop Reporting Service. Field work
until mid-week but good progress, especially in soybean planting, was made
permitted.
According to County Agents reports, the cotton crop remained mostly in poor to fair Heavy rains and below normal temperatures, especially in northern areas, have considerable replanting - some to soybeans.
in southern areas improved considerably. Cultivation, sidedressing, and insect were active durifig the latter part of the week. Suckering and insect control of continued active. First harvest began in a few areas. Peanuts remained mostly in mdition. Land plastering and insect control were active.
Soybean planting was 3~ percent completed by the end of the period. Land preparation ing moved forward rapidly during the last days of the week. About 23 percent of the
sorghum acreage has been seeded. Small qrain harvest was interrupted during the early ~the week but good progress was made by the end of the week. About 30 percent of the ~and oat acreage has been harvested.
~stures improved considerably after the rains. Cattle are mostly in good condition. remained in fair to good condition. Harvest of early varieties increased during the part of the week in the south central area.
~rket Managers reported that recent rains will result in a marked improvement in and quality of all vegetable and melon crops. Light supplies of cantaloups and expected this week in southern areas. Cucumber a~d tomato harvests were Vegetable crops in the mountain areas made good progress.
General rains on May 21-23, brought relief to the previously dry and central sections of the State. Total amounts for the period were mostly bel and 3 inches but several places in middle Georgia received more than 4 inches. The de average was over 2 inches. For many areas in the extreme southern and southsections this was the first rainfall of much significance since early February. 1 weather observers measured more r.~infall in two days than they had in the previous ths. No rain was recorded in the Sta.te from ~Jednesday through Sunday, May 24-28.
Georgia temperatures were unusually cool during the period of rainy weather. Highs in the fifties over north Georgia and in the sixties and low seventies in the
for two or three days early in the week. A warming trend began at midweek and, by , it was hot throughout the State. Afternoon temperatures reached the 100
It a few places in south Georgia on Sunday, May 28, and readings in the nineties ooonon in the north. Averages for the week ranged from 3 to 6 degrees below normal.
The five day forecast for the period Tuesday through Saturday (May 30- June 3) for temperatures to average 2 to 5 degrees above normal. The warm weather is foreto continue through Saturday. Rainfall is expected to be 1ight and occur as widely
showers near the end of the week.
The Georgia Crop Reporting Service, Athens, Georgia; in cooperation with the Cooperative Extension Service, University of Georgia; Georgia Department of Agriculture; and the Weather Bureau, ESSA, U. S. Department of Commerce.
U. S. DEPARTMENT OF COMMERCE WEATHER BUREAU Athens, Georgia
.>..:~' v C::~.::JJ>ll.
Precipi t.' tion For The vleek Ending l'Zay 26, 1967
GEORGIA
Temperatu r e extre~r.es for t he week ending Nay 26, 1 967 (Provi sional)
Hi ghest : 97 a t !1ars1iall vi.lJ.e on the
Lowest: L2 at Clayton and Helen on
24th
~For period May 27-29, 1967
T, less than .oo5 inch.
After Five Days Return to United States Department of Agriculture
Statistical Reporting Service 409A North Lumpkin Street Athens, Georgia 30601 OFFICIAL BUSINESS
Postage and Fees Paid U. S. Department of Agricu
IMMEDIATE - U. S. WEATHER REPORT This report will be treated in all
Respects as Letter Mail (See Sec. 34.17, P. L. & R.)
..-' ( I
The Un j_v Library rniv O.i.' Ga ':1-~--wns Ga 30601
~~~G\AFARM
.. ...~~
REPO
UNIVER SIT
JUN 12 1 J
T LIBRARIES
GEORGIA CROP REPORTING SERVICE
ATHENS, GEORGIA
GEORGIA SOYBEANS
County Estimates - Acreage, Yield, and Production - 1965 and 1966
]\Jay 1967
110 1,110 1:,940 2,930
770 280 1,280 80
8,500
160 1; 600 2,800 4; 230 1,550
410 1,850
100
12,700
180 220 170 320 210 1,100
5oo
600
200 1, 300
240 110 300 300 240 1,740 170
3,100
1,260
580
1:,650 1,500
580
330 100
6,000
160 5oo 10,550 190 240 . 860 1,820 280
14,600
110 230 720 10,760 . 710 1:,480 1, 240 3, 950 300
19,500
l?. J
28. 0
29 .5
30 .0
27 . o
25 . 5
25 . 0
22 . 5
21.5
25.5
29. 5
28. 0
20 . 5
23 .5
24. 5
26.0
25 .1
24. 9
27 .0
26. 0
18.0
18.0
16.0
20.5
15.0
30.0
21.5
26 . 0
19. 0
22 .0
20.2
24. 3
22 .0
19. 5
24.5
20. 0
23 . 5
23 . 0
17. 0
28 . 0
21 . 0
22 .0
20. 9
22 . 2
25. 0 15. 5 22 . 0 24 . 5 22 . 0 15. 5 20. 0 20. 0
21. 2
23 . 0 18.0 22 . 5 24. 0 26. 5 28. 0 25 . 0 19.0 21.~ . 0
23 . 3
1 , 8 70 32, 745 52,380 73 ,250 16,555
8,260 26,240 1,960
213,260
4, 480 48 ,000 71 ,400 95,175 39, 525 11,480 43,475 2,600
316,135
4,060
3,960
2,550 6; 880 3, 990
22, _240
6,240 1,980 4,800 6;150 7,200 45,240 3,740
75,350
11,000 12, 000
4,200 27,200
24;570 14,210 30., 775 34,500
9,860 9; 240 2,200
133,355
4;000 7, 750 232; 100 4,655 5;200 13;330 36 ,Lfoo 5 ,600
309,115
2, 530 L~ , 140 16, 200 258 ; 240 18;,815 41,440 31, 000 75;05J 7,200
L!-54 , 615
GEORGIA SOYBEANS
County Estimates -Acreage, Yield, and Production - 1965 and 1966
--- -----~-----
--
District and C
~~~TRIC1'_ 2_
Baldwin Bibb Bleckley Butts Crm.;ford Dodge Hancock Houston Johnson Laurens Montgomery Peach Pulaski Treutlen Twiggs Hashington \r>Jheeler Filkins on Other Counties
TUrAL
~~TR;J;Q! .
Bulloch Burke Candler Columbia Effingham Emanuel Glascock Jefferson Jenkins McDuffie Richmond Screven Warren
TOTAL
QISTRIC:!'_ l
Baker Calhoun Clay Decatur Dougherty Early Grady Lee r1iller Mitchell Randolph Seminole Stewart Sumter Terrell Thomas \ll[ebster Other Counties
TOTAL
130 4,250 1,970
250 3, 750
440 130 20,960 1;080 3,560 2,410 10,130 830 130 250 10,800 130 250 50
61,500
180 4,910 2,840
370 4,260
640 180 23,660 1,560 5:,120 2,920 11,520 1,190 180 370 13,500 180 720 100
74,400
10,890 23,240 3,230
230 5,160 2,900
100 10,570
3,870 170 650
19,450 1,040
81,500
18,870 25,850 3,540
220 7,440 4,180
300 15,220 5,580
230 930 21,400 2,340
106,100
130 200
500 990 250 1,530 2,030
1,290
270 140 5,390 350 1,850
80
15,000
480 820 100 730 2,880 360 2,200 2;930 2,000 1,880 500 650 200 7,000 1,000 2,670 100 100
26,600
22.0
18.0
19.5
19.0
22.0
26.0
22.0
18.0
18.5
20.0
15.5
27.0
27.0
21.5
23.0
22.0
15.5
17.0
22.0
26.5
18.5
20.0
20.5
28.0
17.5
23.0
16.5
26.0
22.0
28.0
16.5
18.5
19.5
22.5
15.5
16.5
18.0
24.5
2, 860
82,875
43,340 5,500 69,375 6, 820 3,510 480,000 16,740 78,320 44,585 207,665
1L~ ,525
2,145 5,500 178,200
2:,535 3, 875
900
20.3
22.3
1,249,270
20.5
28.0
20.0
23.0
20.5
27.5
18.0
18.0
19.5
21.5
21.0
22.0
22.5
21.5
21.5
21.0
16.5
19.0
17.5
17.0
19.5
16.0
21.0
24.0
20.0
21.5
223,245 464,800 66,215
4,140 100 ,62 0
60,900 2,250
227,255 63,855 2,975 12,675
408,450 20,800
20.3
23.5
1,658,180
22.0
23.0
19.5
20.0
20.0
19.0
18.0
18.5
25.5
23.0
15.0
20.0
25.0
19.0
19.5
20.5
24.5
29.5
18.0
23.0
24.5
18.0
24.0
20.5
25.5
20.5
28.0
22.0
18.5
20.0
21.5
25.5
20.7
23.3
2,860 3,900
9,500 18, 315 5, 750 30, 600 38,570
31,605
6,210 2,520 110,495 7,175 40,700
1 .~ 720
309,920
~a~G\AFARM
REPO /
UNIVEr. SITY OF GEORGIA
JUN 26 1961
T LIBRARIES
GEORGIA CROP REPORTING SERVICE
ATHENS, GEORGIA
GEORGIA PEANUTS PICKED AND THRESHED - 1966 CROP estimates are based on the latest available data and are
Harvested Acres
Yield Per Acre
20
0
20 5, 315 2,685 2,430
80 1,905
15 12,450
1,050
0
400 1,389 1,147 1, 678 1,138 1, 312 1,333 1,378
2,165 6,040
5
5,340 270
7,210
965
450 8,120
30 1,100
925
780
540 33,940
1, 735 1,500
200
1,679
1,307 1,550 1,226
1,51~2
1,808
733 1,553 1,829
1,763 1, 720
1,638
13,860 5,180 1,400
390 2,675
15 1,525 2,690
145 4,835
5
32,720
Please turn page
1,775 1,493 1,659 1,146 1,296
733 1,552 . 1,414
1,124 1, 773 1,000
1,635
May 1967
Production
21
0
8 7,382 3,080 4,078
91 2,500
20 17,159
3, 756 9,063
1
8,965
353 11,178 1,183
694 14,682
22 1,708 1,692 1,375
929 55,601
24,595 7,732 2,322 447 3,467 11 2,367 3,804 163 8,573
5
53,486
---------------- ucurtU-CL Crop Rep~o~rt-in-g-=S-e-r-v-i- ce,-US- DA- , 4- 09~ A N- ort h Lumpkin Street, Athens, Ga.,
in cooperation with the Georgia Department of Agriculture.
GEORGIA PEANUTS PICiffiD AND THRESHED - 1966 CROP
--- - -_ (These ~.~~.~~-2~.~.-.::;.;--.!!~.-;l~::a~~t.~es~t.~a'::v.!:a.l=.;.l=~a~b;:~.:':l:~e-~.::~::::_:::;~_..:::;!;...:::.....I::..~. =~~=~~;;..'!....L...-....
District and
:
9.9.~nty ----~-
PJ.:I.:E~IQ! 1
Baker
13,740
1,529
21,015
Calhoun
15,055
1, 208
18,182
Clay
10,305
1, 301
13,402
De c a t u r
16,475
1,703
28,063
Dougherty
6, 135
1, 605
9,845
Early Grady
30,710 8,630
1,556 1,599
47' 770 13, 799
Lee
15,020
1,708
25,659
Niller
20,040
1,898
38,040
Hi t c h el l Quitman
Randolph Seminole
20,570 3,270 19,200 12,385
1,620 1,212
1,352 1, 695
33,329 3,963 25,950 20,989
Stet-rart Sumter
Terrell Th omas \;;Jebster
TOTAL
5,885 13,955 20,870
4,700 7,730 241-+ , 6 75
1,110 l, 775 1, 426 1,744 1,282
1,550
6,530 24,769 29,767 8,197 9,906
379,175
~J.!!lJQ! Atkinson Ben Hill Berrien Brooks Coffee Colquitt Coole Crisp
Dooly Irwin Jeff Davis Lanier
LotoJ nd es Telfair Tift Turner vJilcox Worth
TOTAL
255 6,845 2,075 Lf, 875 3,635 8,550 2,480 14,110
17,695 15,655
75 10 600
2:,930 12,540 19,630 12,380 29,515
153,855
1:,663 2,042
1,843 1,880
1,707 1, 786
2, 079 2,177 1,891 2,201
1, 947 2,400
1,417 1,364 1, 987 2,009 1,828
1,785
1, 933
424 13,979 3, 824 9,165 6,204 15,269
5,157 30,722
33,457 34,462
146 24 850
3,997 24,918
39,445 22,630 52,677
297,350
fJJSTE!Q! ~ Appling
Bacon Bryan Evans Tattnall Toombs vJayne
TOTAL
225 10 205 1,015 1,105
l, 775
5 4, 340
1,244 1,000
1,478 1,654
1,843
1,494 1,400 1,606
280 10 303 1,679 2,037 2,652
7 6, 968
-----~TA!~J~A1----------=~~~---------------------;~-"~~--------~-----~~~---.
ARCHIE LANGlEY Agricultural Statistician In Charge
C. L. CRENSHAH
Agricultural Stat
After Five Days Return to United States Department of Agriculture
Statistical Reporting Service 409A North Lumpkin Street Athens, Georgia 30601
QFFm ~!L~IIJ.
Postage and Fees Paid
U. s. Department of Agric
7
GEORGIA CROP REPORTING SERVICE
3;s
ATHENS, GEORG IA
1966 ANNUAL SUMMARY
May, 1967
GEORGIA MILK PRODUCTION UP 9 MILLION POUNDS PRODUCTION PER COW RECORD HIGH
Total milk production o n Georg ia farms in 1966 was estimated to be 1,000 mill ion pounds, with 991 mill ion the previous year, accord i ng to the Georgia Crop Reporting Service.
estimates of product ion relate to milk from all cows kept for mi lk, i nclud i ng those held ily to produce milk for home consumption.
Hilk produced per cow in herd dur i ng 1966 was placed at 6,670 pounds, a record h i gh. This ~d with the previous record level of 6,270 pounds in 1965.
The number of cows kept for mi lk on farms i n the State averaged 150,000- the lowest these estimates were begun i n 1937.
MILK RECEIPTS AT PLANT HIGHEST OF ~ECORD
Hilk sold wholesale to plants and dealers i n 1966 totaled 915 mill ion pounds-- 30 lion pounds above the 1965 annual total. Milk used on farms where produced cont i nued to lne. The 65 mill ion pounds in this category during 1966 compared with 81 the previous
and was less than half the amount used on farms 5 years ago.
~sh receipts from compined ma r ketings of milk (Grade A, manufacture, and mi lk sold II by farmers) amounted to 58,599,000 dollars in 1966. This compared with 55,558,000 rs in 1965. The farm value of all mi lk produced was placed at 62,700,000 dollars-- 3.5
above the 60,550,000 dollars the previous year.
GEORGIA MILK COWS, PRODUCTION PER COvl, TOTAL MILK PRODUCTION AND UTILIZATION, 1962-65, REVISED - 1966 PRELIMINARY
1,000
193 182 170 158 150
Pounds
5,180 5,310 5,600 6,270 6,670
Total Production
2 Mi 11 ion
Pounds
1,000 966 952 991
l ,000
Mi 1k Marketed b:t Farmers
Sold to
Reta i 1ed
Plants
by
Pounds
820
40
810
35
~20
30
885
25
915
20
Milk used on Farms where Produced Mi 11 ion Pounds
140 121 102 81 65
~ge number on farms during year, excluding heife r s not yet fresh. 11 Excludes milk by calves. ll Includes sales by producer-distr i butors and other farmers on own route~
t farms.
UNIVERSilV Of GEORGIA
The Georgia Crop Reporting Service, USDA, 409A North Lump in S~e~1 At~Jns, G orgia
in cooperation with the Georg ia Department of Agriculture
UNITED STATES MILK PRODUCTION, DIS ?OSITION, AND INCOME
Milk Production Down 3 Percent in 1966
Milk production in 1966 was 120.2 b i ll ion pounds, down 3 percent from 1965. Th e 1966
output was produced by an annual average of 14.1 mill ion milk cows, t he smallest of record
and 6 percent below the annual average in 1965. Output per cow set a new high of 8,513 pounds
in 1966, up 3 percent from the prev ious record of 8,304 pounds i n 1965. Nearly al 1 of the
reduct ion in milk production from 1965 occurred in 3 regions - - North Atlantic, down 3 percent;
East North Central, down 5 percent ; and West North Central, down 6 percent. Output was about
equal to a year earlier in the South Atlantic, South Central, and West.
Record Hiqh Cash Receipts
Farmers' cash receipts from market i ngs of milk and cream totaled a record h i gh of $5,516 mill ion in 1966, 10 percent more than the previous record of $5,037 mil I ion in 1965. Cash receipts from market i ngs were above 1965 in all regions, with gains ranging from 5 percent in the North Atlantic to 15 pe rcent i n the South Central. Wisconsin led all States in cash receipts from milk marketings, followed by New York, California, Minnesota, and Pennsylvania. These five States accounted for 44 percent of the total cash rece ipts for the Un i ted States in 1966.
Returns for combined marketings of milk and cream averaged $4.81 per hundredweight in 1966. This is a record high and 3 percent more than the previous high of $4.68 i n 1952.
Cash receipts from milk sold to plants and dealers totaled $5,259 mill ion i n 1966, an increase of 10 percent from 1965. Returns from sale of cream were $69.5 mill ion in 1966, down 14 percent from the 1965 total of 80.7 mi ll ion. Sales by farmers directly t o consumers produced $187.8 mill ion of receipts in 1966, compared wi th $189.9 mi ll ion in 1965. The farm value of all mi lk produced in 1966 was $5,785 mi ll ion, a 9-percent increase over 1965.
ARCHIE LANGLEY Agricultural Statistician In Charge
C. L. CRENSH~ J Agricultural Statistician
After Five Days Return to United States Department of Agriculture
Statistical Reporting Service 409A North Lumpkin Street Athens, Georgia 30601 OFFICIAL BUSINESS
Postage and Fees Paid U. S. Department of Agriculture
OJ
UNI VERSITY OF GEORGIA
GEORGIA CROP REPORTING SERVI E
ATHENS, GEORGIA
June 1, 1967
GEORGIA CHICK HATCHERY REPORT
Placement of broiler chicks in Georgia during the week ended May 27 was 10, 001, 000--4 percent more than in the previous week and 1 percent more than in the comparable week last year, according to the Georgia Crop Reporting Service.
An estimated 12, 535,000 broiler type eggs ~ere set by Georgia hatcheries-! percent more than in the previous week but 11 percent less than in the comparable week a year earlier.
The majority of the prices paid to Georgia producers for broiler hatching eggs were reported within a range of 50 to 65 cents per dozen. The average price of hatching eggs was 55 cents per dozen. The price of eggs from flocks with hatchery owned cockerels generally was 2 cents below the average price . Most prices received for broiler chicks by Georgia hatcheries were reported within a range of $5. 00 to $8. 7 5 with an average of $7. 7 5 per hundred. The average prices last year were 64 cents for eggs and $9 . 7 5 for chicks.
Week Ended
GEORGIA EGGS SET, HATCHINGS, AND CHICK PLACEMENTS
EGG TYPE
Eggs Set
1966
1967
Thou.
Thou.
o/o of
year ago . Pet.
Chicks Hatched
1966
1967
Thou.
Thou.
o/o of
year ago Pet.
Apr. 29 May 6 May 13 May 20 May 27
Week Ended
1, 134 1, 218 1,386 l, 029 1,066
1, 201
106
1, 145
94
1,000
72
923
90
741
'70
BROILER TYPE
1, 009 978
1,076 907 941
Eggs Set !J
1966 Thou.
1967 Thou.
o of year a o Pet.
Chicks Placed for
Broilers in Georgia
o of
1966
1967
year
ago
Thou.
Thou. Pet.
906
90
854
87
766
71
921
102
853
91
Av. Price
Hatch
Broiler
E ggs
Chicks
Per
Per
Doz .
Hundred
1967
1967
Cents
Dollars
Mar. 25
13, 594 13, 167
97
9,276
9,965 107
56
Apr. 1
13,742 13,062
95
9,641 10, 016 104
56
Apr. 8
13, 868 12,981
94
9,719
9,927 102
56
Apr. 15
13,922 13,202
95
9,655
9,929 103
56
Apr. 22
13, 841 12, 736
92
9,726 10,022 103
56
Apr. 29
14,447 12, 899
89
9, 910 10, 125 102
56
May 6
14,228 12, 523
88
10,021
9,949
99
56
May 13
14,206 11,919
84
9,906
9,471
96
56
May 20
14, 133 12,414
88
10, 155
9,587
94
56
May 27
14,082 12, 53 5
89
9,913 10,001 101
55
1 Includes eggs set by hatcheries producing chicks for hatchery supply flocks.
7.75 7.75 7.75 7.75 7.75 7.75 7.75 7.75 7.75 7.75
ARCHIE LANGLEY
W. A. WAGNER
Agricultural Statistician In Charge
Agricultural Statistician
---------------------------------------------------------------------------------
U. S. Department of Agriculture
Georgia Department of Agriculture
Statistical Reporting Service
409A North Lumpkin Street, Athens, Georgia
EGGS SET AND CHICKS P LACED IN C OM MERCIAL AR EAS BY W~....SKS - 1967
Page 2
STATE
May
13
E GGS SET
Week E nded
May
M ay
20
27
i
%of ''
I year i ago 1/
CHICKS PLACED
Week Ended
May
May
May
13
20
27
% of
year ago 1/
1
THO US ANDS
I
THOUSA NDS
Maine
2,063
2, 01 9
2, 081 101 I' 1, 59 0
1, 634
1, 559
98
Conne cticut P ennsylvania Indiana Missouri
27 4 1, 538
549 632
356 1,643
600 510
357 . 1, 335
579 635
83 93
IiIi
146 1, 111
65 II
31 0
64
487
188
224
91
988
1, 009
96
306
325
67
488
4 25
92
Delaware
2,966
2, 802
2, 823 104 'I 3, 21 4
2,705
2,992
115
Maryland
4, 781
4, 779
4 ,818 104
2,90 6
3, 313
3, 129
89
Virginia West Virginia
1,908 152
1, 786 155
1, 720 155
I 93
1, 252
92
307
1, 220 323
1, 269 362
130 81
North Carolina South Carolina
GEORGIA
7,426 488
7, 574 428
7,318 43 1
101 83
,!
tj
5, 66 0 324
5, 781 384
5, 717 364
108 91
. 11,919 12,414 12, 535
I
89
!: ij
9, 4 71
9, 587 10, 001
101
.
:::J
Florida Tennessee Alabama Mississippi Arkansas
771
997 8,952 5,041 10,36 5
842 1,037 9, 06 1 5,032 10, 181
880 1,023 9,077 5,042 10,073
~ 183
4 76
79 100 104
99
~
ij
~
l
1,000 7,030 4 , 3 01 8,079
478 975 7, 120 4,322 7,762
467 984 7,032 4,3 57 7, 749
110 88 97
108
98
Louisiana Texas
1, 122 4, 543
1, 148 4 , 584
1, 135 4, 589
114 100
:
!
935 3, 582
897 3,589
896 3, 569
11 6 98
Washington
689
6 56
676 101 ., 4 97
476
552
114
Ore gon
320
382
28 5
87 l
348
305
240
75
California
2,0 34
1,939
1, 950 95 I 1, 4 99
1, 3 51
1, 476
107
TOTAL 1967 {2 2 Sta tes)
69, 530 69,928 69, 517 97 ~ 54, 525 54, 192 54,698
101
.,';
TOTAL 1966*
71,719 71, 236 71, 508
1' 54, 4 oo 54, 791 54, 313
{22 States)
l
i ~
-
o/o of Last Year
97
98
9i
l 100
99
101
*_!/ Curr ent week as percent of same week last year. Revised.
Re7l eaf9s6e7a
i.Vlonday
SOYBEAN PlANTI NG ACTI VE
Athens, Ga., June 5, 1967
LIBRARIES
Georgia farmers were planting soyb eans at a r ap{d pac e dur-
except where we ather and soil conditions interferred, according to the Georgia
Crop Reporting Service.
County Agents reported about 55 perc ent of the Staters soybean acreage s eeded by the end
of the week. This equals last year 's progress for the date, but is slightl y behind the normal planting schedule . Soil mois t ure was reported adequate to excessive over much of the State, but a few counties in the south need rain. Heavy we ek-end rains over the northeastern part of the State caused considerabl e crop damage .
The cotton crop remained i n fair to poor condition. Plants conti nued to di e in many sections, andSo;e reseeding ~-.as done. Soybeans have been planted in many f i elds where cotton vJas destroyed. Cotton was squaring mostly in the southern half of the State, and insect c ontrol practices vrere under way.
Corn improved and is generally i n good to fair condition. Cultivati ng and sidedre ssing remainecf"active, and additional acreages uer e laid by in souther n counties . Q_S,lLgh~ planting moved forward and Has ab out 40 :r-::.rc ent cm,plste at t~1.c end of the period .
Cropping tobacco t-;as started in s everal areas, but remains light. Bud1rorms continued to cause trouble, and control measur es were active. The crop was reported in mostl y fair to good condition. Dusting peanuts for thrips control and landplastering remained active . The crop is generally in good condiiTOrl.
~ gr~harvest advanced in central and southern Georgia and was progre ssing upstate . \fueat harvest is more than half finished, and three-fifths of the oats have been combined. Haying, moved for ward during the t-veek, but rain curtailed t his activity in many are as. Picking and packing E~~ became more common during the period. The condition of the crop showed some improvement over the previous week .
According to Market Managers, the additional moisture received during the week has i mproved uowth and quality of vegetable and melon crops in southern areas. Temperatures have bee n too cool for good plant gro~in-Gentral-and northern areas. Light supplies of snap beans, cabbage , and squash are stili available. Tomato, watermelon, and cantaloup harvests are well under way. Limited supplies of lima beans, southern peas, cucumbers, and okra were marketed .
WEATHER SU}WillRY -- Rainfall was moderate to heavy over most of Georgia during the week ending Friday, June 2, 1967. However, several counties in the south central and southwest sections received only light amounts and wer e becoming dry again at the end of the week . Extremely heavy rains fell over northeast Georgia during the week end Hhile most other areas of the State had light to moderate amounts. The Athens Airport received 9.93 inches in 24 hours and 2,62 inches in a 40-minute period on Sunday, both new records for the area. The excessive rainfall caused flash flooding over much of the northeast and resulted in extensive damage to streets, roads, bridges, farm land and other pr operty. Early estimates of damage in t he Athens area alone total ~1, 000, 000.
It was hot during the early part of t he week but the cloudy, rainy s ki es held daytime readings to unusually low levels during the last half of the period. Averages for the week ending
June 5 ranged fr om 3 degrees belot-J normal in the south to 7 degrees be lovJ normal in the north.
Rainfall during Hay ranged fr om more than 2 inches above normal in the north~re st section to an inch below normal in the southeast. Host of the northern t vJo-thirds had above normal for the month while totals vrere generally near normal , or below in the southern third . Nuch of South Georgia's Hay rainfall occurred during t he last week, follot-Jing a prolonged peri od of unusually dry weather. Temperatures were cooler than normal during Jvlay.
The five-day forecast for the per i od Tuesday through Saturday (June 6-10 ) calls for temperatures to average near normal with warmer vJe ather likely toward t he end of the period. Rainfall ~ expected to be light in isolated afte rnoon and evening showers t hroughout the period.
IsSuED-BY:- The Georgia Cr op- Reporting-Service"; ithens"; Georgia; -in cooperation with-the- - - -
Cooperative Extension Service, University of Georgia; Georgia Department of
Agriculture; and the Heather Bureau, ESSA, U. s. Department of Commerce .
u. s.
Athens, Georgia
.. . ~-, \
~o-o --
GEORGIA
Hi~hes ;. :
lod') a t ~-\a~i-::"'..ns.r' l e and Jesup
::,.__ ?-1a:,- 290
l.i8"-' a t rlr:.:-,:-ton and Cornelia on
June 2 ..
* Fo:c pc~ r i a .:une 3-5', 1 9~7
T, less than .OOS inch
After Five Days Rettirri to United State's Department of AgricUlture
Statistical Reporting Service 409A North Lumpkin Street Athens, Georgia 30601 OFFICIAL BUSINESS
Postage and Fees Paid
U. s. Department of Agriculture
IMMEDIATE - Uo S., WEATHER REPORT This report will be treated in all
Respects as Letter Mail
(See Sec., 34ol7, PeL &R.)
A ~guisiti ons Division Unlversity of Georgia Un iv ersity Libraries Athans Georgia 30601
l
1q~r --ID@ ill~@l1!fil illlliLh
LPill~@~ ~
15
r-
May 15, 1967
UNIVERSITY Of
I
JUN 12 1967 Rele ased 6/6/67
- GE ORGIA CRO REPORTING SERVICE LIBRARIES
GEORGIA PRICES RECEIVED INDEX 4 POINTS HIGHER
The Index of Prices Received by Georgia farmers for all commodities increased 4 points duri~ the month ended May 15, 1967 to 245. This was 16 points below the May 15, 1966 index of 261.
Increases in meat animal prices more than offset declines in poultry, dairy products, grains and soybean prices. The All Livestock and Livestock Products Index at 214 was 11 points ~ave last month, but 23 points below May 15, 1966.
The All Crop Index at 259 was unchanged from last month.
UNITED STATES PRICES RECEIVED INDEX UP 6 POINTS PARITY INDEX UP 1 POINT, PARITY RATIO 74
During the month ended May 15, the Index of Prices Received by Farmers advanc ed 6 points (2 percent) to 252 percent of its 1910-14 average. Higher prices for hogs and cattle were main-
zy responsible for the increase. Partially offsetting were price declines for lettuce, tomatoes,
cotton, and eggs. The index was 4 percent below liay 1966.
The Index of Prices Paid for Commodities and Services, including Interest, Taxes, and Farm Wage Rates increased 1 point (1/3 percent) during the month to 342, a record high. The index was 9 points (3 percent) above a year earlier.
The Parity Ratio increased 2 points to 74.
______ ___________________ -------------------- Index
1910-14 = 100
Hay 15 1966
: .
April 15
1967
:
:
:
:
Eay 15 1967
: --g~~-High --
:.__.. Index :
Da t e
:
:
Prices Received All Commodities All Crops
261 272
1y /
241 ~/
245
259
259
310 319
-f--- Livestock and Livestock Pr~~--..L-2.a.17..___ _
20'3 1/ __ 214~-f-- 295
.
:r.Iarch 1951
:tIarch 1951 gj
:Sept:._!94~--
.
Prices Received
263
246
252
313 :Feb. 1951
Parity Index 3/
333
341
342
342 : JViay 1967
Parity Ratio
iJ Revised. -
. .
79
--
--.
-
72
. .
74 ---.--1-2-3--..:-Oc-t-. -1-9-46---
YJ/
Also April 1951. Prices Paid, Interest,
Taxes,
and
Farm ~fage
Rates
based
on
data
for
the
indicated
dates.
ARCHIE LANGlEY Agricultural Statistician In Oharge
A. ~VILLIAH
~fAGNER
Agricultural Statistician
----------------------~~----------- - --------~--
The Georgia Crop Reporting Service, USDA, 409A North Lumpkin Street, Athens, Ga., in cooperation with the Georgia Department of Agriculture.
_-.-..:,:;_________ --------- PRICES -- RECEIVED AND PAID BY FAR!1ERS. lVJ:a:v 15. 1967 "lrJITH CCNPARISONS ------ - ------------- -----------~-
:
GEORGIA
:
UNITED STATES
Commodity and Unit
: May-15--';A:pril i~ : Hay-15-:-May15:.,.__A:pri1I>":Mayl5-
_ _ _ _ _ : 1966 ..L 1967 _:..__];961____:__!~ 1961_-=._!26_7-
~Ricf.-REcEIVED-
Wheat, bu. Oats, bu. Corn, bu,
Barley, bu. Sorghum Grain, cwt. Cotton, lb, Soybeans, bu. Peanuts, lb, Sweetpotatoes, cwt.
1.60 .91
1.38 1.02 2.10 28.0 2.75
5.50
1,78
.87 1.51 1.10 2.25 20,5 2.80 11.0 6.90
1.69 84
1.48 1.00 2.20 20.5 2, 75
6.90
1.44 .655
1.21 1.06 l. 79 28.41 2.90
4.48
1.55 . 680
1,26
1.02 1.98 20.40 2.71 11.2
5.99
1.58 .693
1.25 1.05 2.00 19.70 2.69
6.36
Hay, baled, ton: All Alfalfa Lespedeza Peanut
26.00
34.50 28.00 22,00
27.20
36.50 31,00 24,00
27.60
36.50 30.00 24.00
23,30
23.90 23.80 23.00
24.10 24.90 25.40 24 .80
23.70 24.50 24.80 24 .10
Nilk COt-IS, head
Hogs, cwt.
Y Beef cattle, all, cwt, Co:ws, cwt.
1/
Steers and heifers, cwt,
Calves, cwt,
l-1ilk, wholesale, cwt.:
Fluid harket
Manufactured
All J}
~~ 190.00 ~~ 22.50 (~ 20,90
0 18.50
~~ 22.80 ~~ 25.70
6.oo
3.60 6,00
Turkeys, lb,
Chickens, lb., excl. broilers
Commercial broilers
All
Eggs, all, dozen
24.0 12,0 16.0 15,8
39.9
200,00 16.00 18,60 15.80 20,80 24.20
6,25
6.25
21.0 9.0
12.5 12.4 35.1
200.00 19.40 19.40 16,10 21.90 25.70
w6.15
21.0 8.0
12.0 11.8 34.4
243.00 22.30 23.00 18.10 24.70 26.80
4.69 3.67 4.34
22.9 10.5 16.7 16.1 33.4
257.00 17.00 21. 60 16.70 23.20 26.10
5.13 4.01
4. 77
19.1 8.6
13.8 13.3 29.9
259.00 21.70 22,20 17.00 23.80 26.80
!J 4. 73
19.5 8.1 13.3 12.8 28.9
fRICES E!JQ, ~
Mixed Dairy Feed, c\-rt,:
All under 251% protein
~? 4.00
4.15
4.20 3)3. 72
3.90
3.86
14% protein 2/
~ 3,90
4,00
4.05 1/3.49
3.64
3.62
16% protein
~~ 4.00
4.15
4.15 1/3.76
3.96
3.93
18% protein
0 4.10
4.30
4.40 1/3.90
4.09
4.05
20% protein
~ 4.30
4.50
4.50 1/4.10
4.33
4.27
Hog feed, 14%-18% protein,cwt. $
4.55
4.55
4.61
4.54
Cottonseed meal, 41%,cwt. ~ 4.45
5.10
5.10 4.73
5.38
5.33
Soybean meal, 44%, cwt.
$ 5.00
5.10
5.10 5.21
5.35
5.26
Bran, cwt,
~ 3.65
3.95
3.95 3.37
3. 70
3.59
11Iiddlings, cwt.
~;; 3. 70
4.15
4.00 3.42
3. 79
3.66
Corn meal, cwt.
~v 3.40
3.65
3. 70 3.30
3.52
3.51
Broiler grower feed, cwt,
::~ 5.00
5.00
5.00 4.86
5.06
4.97
Laying feed, ctort.
$ 4. 75
5.00
5.00 : 4.50
4.68
4.65
Scratch grains, cwt,
$ 4.20
4.45
4.40 : 3.94
4.11
4.~
Alfalfa hay, ton
~ 44.00
42,00
45.00 : 32.10
35.60
34.80
All other ha:v. ton
::~ 12. 00
.12. 50
36.00 : 11. SO
13.40
T~ .10
Fc'QWsiland'-iiSteers and h~fer'Sil;;)mbin;IwithallawarWe~he~e;es;a::;y for-sla~ghte:rb~nB:"
g/ Includes cull dairy cows sold for slaughter, but not dairy cows for herd replacement.
l( Revised, k/ Preliminary estimate, ~ U. S, price is for under 16 percent.
After Five Days Return to United States Department of Agriculture
Statistical Reporting Service 409A North Lumpkin Street Athens, Georgia 30601 O;[FICIAL BUJNE_2
Postage and Fees Paid
U, s. Department of Agriculture
i~~uisitlons Divi sion unlversi ty of Geo r gia Dnivorsi -y Libraries Athons Goorgia 30601
. .. . . ... <4
UNIYERSI'n OF GEORGIA
GEORGIA CROP REPORTIH SERVICE
w~~ffii!J'{J rn~ ~~'{] _...,...._up.~"'""-'961
ATHENS, GEORGIA
June 7, 1967
GEORGIA CHICK HATCHERY REPORT
Placement of broiler chicks in Georgia during the week ended June 3 was
9, 277,000--7 percent less than in the previous week and 8 percent less than in
the comparable week last year, according to the Georgia Crop Reporting Service.
An estimated 12, 288, 000 broiler type eggs were set by Georgia hatcheries--
zpercent less than in the previous week and 12 percent less than in the comparable
week a year earlier.
The majority of the prices paid to Georgia producers for broiler hatching eggs were reported within a range of 50 to 65 cents per dozen. The average price of hatching eggs was 55 cents per dozen. The price of eggs from flocks with hatchery owned cockerels generally was 2 cents below the average price. Most prices received for broiler chicks by Georgia hatcheries were reported within a range of $5. 00 to $8.75 with an average of $7. 50 per hundred. The average prices last year were 64 cents for eggs and $9.75 for chicks.
Week Ended
GEORGIA EGGS SET, HATCHINGS, AND CHICK PLACEMENTS
EGG TYPE
Eggs Set
1966
1967
11fo of year ago
Chicks Hatched
1966
1967
Thou.
Thou.
Pet.
Thou.
Thou.
Ufo of year ago
Pet.
May 6 May 13 May 20 May 27 June 3
'
Week Ended
1, 218 1, 386 1, 029 1, 066 1, 065
-=-
' Eggs Set !J
1966 Thou.
1967 Thou.
1, 145
94
1,000
72
923
90
741
70
680
64
BROIL:6R TYPE
978 1, 076
907 941 1, 073
'Jo of year ago Pet.
Chicks Placed for
Broilers in Georgia
11fo of
1966
1967
year
ago
Thou.
Thou. Pet.
854
87
766
71
921
102
853
91
836
78
Av. Price
1 Hatch Eggs
Broiler Chicks
Per
Per
Doz.
Hundred
1967
1967
Cents
Dollars
Apr. 1
13,742 13, 062
95
9,641 10,016 104
56
Apr. 8
13, 868 12,981
94
9, 719
9,927 102
56
Apr. 15
13,922 13,202
95
9,655
9,929 103
56
Apr. 22
13, 841 12,736
92
9,726 10,022 103
56
Apr. 29
14,447 12,899
89
9,910 10, 125 102
56
May 6
14, 228 12, 523
88
10,021
9,949
99
56
May 13
14,206 11, 919
84
9,906
9,471
96
56
May 20
14, 133 12,414
88
10, 155
9,587
94
56
May 27
14,082 12, 53 5
89
9, 913 , 10,001 101
55
June 3
14,026 12,288
88
10,085
9,277
92
55
1/ Incluc es e ggs set by hatcheries producing chicks for hatchery supply flocks.
7.75 7.75 7.75 7.75 7.75 7.75 7.75 7.75 7.75 7.50
ARCHIE LANGLEY
W. A. WAGNER
Agricultural Statistician In Charge
Agricultural Statistician
---------------------------------------------------------------------------------
U. 5. Department of Agriculture
Georgia Department of Agriculture
Statistical Reporting Service
409A North Lumpkin Street, Athens, Georgia
EGGS SET AND CHICKS PLAC.2D IN COMMERCIAL AR~AS BY W.~:..EKS - 1967
STATE
E GGS SET
Week Ended
May
May
June
% of
year
-::;HICKS PLAC.6D
Week Znded
May
May
June
20
27
3
ago 1/ 20
27
3
THOUSA NDS
THC USANuS
Maine Connecticut Pennsylvania Indiana Missouri Delaware Maryland Virginia West Virginia North Carolina South Carolina
GEORGIA
Florida Tennessee Alabama Mississippi Arkansas Louisiana Texas Washington Oregon California
TOTAL 1967 (22 States)
2,019 356
1,643 600 510
2, 802 4,779 1,786
155 7,574
428
12,414
842 1,037 9,061 5,032 10, 181 1, 148 4, 584
656 382 1,939
69,928
2,081 357
1, 335 579 635
2, 823 4, 818 1,720
155 7,318
431
12, 53 5
880 1,023 9, 077 5,042 10,0 73 1, 135 4, 589
676 285 1, 9 50
69 ,517
2,024 405
1, 419 544 670
2,839 4,816 1, 740
153 7,384
434
12, 288
854 1,030 8, 811 5, 091 10, 250 1, 145 4,692
743 407 1, 977
69,716
97
1, 634
106
188
111
988
64
306
72
488
104
2,705
104
3, 313
I94
1, 220
91
323
101
5, 781
81
~
~
384
i 88
9, 537
~
200 f 478
74 ~ 975 96 ~ 7, 120 107 fl 4,32.2
101
7,762
111
897
104
3, 589
113
:.: 76
82
305
102
l, 3 51
98 54, 192
1, 559 224
1, 009 325 425
2,992 3, 129 1, 269
362 5, 717
364
10, 001
467 984 7, 032 4,357 7,749 896 3, 569 552 240 1, 476
54,698
1, 54 8 177 995 300 382
2, 821 3, 281 1, 224
416 5,770
356
9,277
437 938 7,023 4, 187 7, 432 88 1 3, 510 508 230 , , 499
53, 192
TOTAL 1966* (22 States)
71,236 7 1, 508 71,326
o/o of Last Year
98
97
98
1/ Current week as percent of same week last year.
* Revised.
1 54, 791
I~ ,
99
54 , 313 101
54 ,461 98
Pa~e Z
% of
year ago 1/
93 85 105 63 86 112 93 123 92 104 81
92
113 83 97
104 94 118 97 120 72 109
98
Q)
.:1.:-,<l
...:..:.l.
(.)
"0 .....
..... 1-<
ro bD
~<G
CJl'+-<
QQ) )._0, r"-i r:::
Q)
"r0:::.E.,
ro
Q)
'r"u'
. .bro.D,Oq<1>..
C/l
0
. ~(/)
::>
Q)
.:1.:-,<l
...:..:.l.
..(....).
1-<
0
<bGD
(Q.))
..,
.., ..... . .... Q)
r::: 0 > Q)
1-< ....,
1-< 1-<
Q) ..,
::lr::l (/)CI)
...., Q)
(/)
Q)EbDo (/)
z o:;
C:;:/.l..,
...., ~=:
t: r10-o<.. ......
]o..'"ro' r.il
E bDI-i 1-< (/)
ro w &::lo::>
C!Qo;...:lt)l!l
>Q<)C!)/l,(.:.:.t.:.;....C., ~...:1
z .~1...-.r<.(...o./.,,)ru..o....,.O.'"'OC>i.l.Q-C<) tuGi-i
.Q.,) "0 .C..../l<G<.G.,~
E en '<<-G<<.1..),4r--o>o0' '<t4
~
0
::>
r-1
~ Cll O
0 rt.lrl~
rl ~ tillO
rt.l rl rl H
o H
1:0
:> m <D
rl H Cl Cl1
r:::1 ..0 rl
<HbO
rt.l H o H
~
0
.P o 0 ~~<D
rl
.p rlr-J
rl u: :r.l
rt.l f...H rt.l
rl () 0 ~
;j P. <D
~ u...,rlri..d f) () r-' ~ -1-1
><I! DP .::t:
GEORGIA CROP REPORTING SERVICE
STATE DEPARTMENT OF AGRICULTUAI:
U. S . DEPARTMENT OF AGAICULTUAE STATISTICAL REPORTING SERVICE
THE POULTRY AND EGG SITUATION
Approved by the Outlook and Situation Board, June 8, 1967 SITUATION AND O~TLOOK, (BROILERS) '
Uptrend in Broiler Production Arrested
Broiler producers have taken steps to slow production expansion in recent weeks. Broilers slaughtered (liveweight) in Federally inspected plants during January-May were up a tenth from the like period of 1966. But, chick placements or egg settings in 22 states in the 9 weeks ended June 3 ave raged about the same as in corresponding period of 1966, indicating that broiler slaughter will total around year-earlier levels during June-August.
The cutback is producers 1 response to an extended period of low profitability. Broiler firms have been caught in a severe price-cost squeeze since last fall; broiler prices have fallen sharply, while costs for feed, labor, and other inputs have remained above a year earlier. The price of a pound of live broiler in the 8 months through May was equal in value to only 2. 7 pounds of broiler feed--16 . percent less than a year earlier, and 13 percent below the aver:age for the period during the preceding 5 years.
Because the broiler industry in earlier months had prepared for much larger production, the recent curtailment of broiler chick placements has been extremely costly. It has involved the diversion of a larger proportion of hatching eggs to be lower-valued food use and the disposition of hatchery supply flocks at an earlier age than usual. During the first 5 months of 1967, 11. 5 million heavy type hens and cocks (mostly broiler parent stock) were slaughtered in Federally inspected plants, 3. 0 million above the same period of 1966.
Broiler firms also have halted the expansion in broile r hatchery supply flocks. Pullet chicks placed for breeder flocks in January-April totaled 12.6 million--0. 7 million, or 5 percent fewer than during the same period last year. However, because pullet chick placements were much larger last fall, the indicated potential size of the Nation 1s broiler breeder flock is still about a fifth above a year earlier. The recent cut in flock replacements indicates that by November the potential number of broiler breeders will be up around 5 percent from November 1966.
Since the number of broiler breeder hens actually supplying broiler hatchery eggs
has been limited by increased slaughter of older flocks over the past few months, hatching egg supplies could be increased considerably in coming months simply by an easing in the rate of slaughter and by more fully utilizing eggs from younger flocks. This means that the broi~:; :.:' industry will have the ability to rapidly expand egg settings and chick placements for fall and winter broiler marketings, if such an expansion seems warranted by current or prospective price-cost relationships.
But, because hatching egg supplies will be tighter beginning late this year, broiler firms will be in a much better position to keep production in line with demand at profitable prices during the early part of 1968.
Broiler Prices to Recover
The U. S. average live broiler price was 13.3 cents per pound in May, compared with 13. 8 cents in April and 16. 7 cents in May 1966. In January-May, prices averaged 14.1 cents per pound--down 2. 4 cents from a year earlier to the lowest prices of record for the period. The second week in June, prices in Chicago for ready-to-cook broilers averaged 23 1/2 cents per pound--down 2 cents from mid-May, and 5 cents below a year earlier.
The low broiler prices during the first half of 1967 reflect a number of factors. Broiler production during most of the period was up substantially from a year earlier. Supplies of competing products also showed large gains. January-April increases in output over a year earlier were: 34 percent for turkeys; 19 percent for po!"k,. 5 p ..:: rc e nt for beef;' and 7 p ~rc.cnt for e g gs . May 1 cold ~~ o r a e ~ hol C.inG::J wer e up fr om a year .cc: r l L: r by: 89 pe rc e1t for tu rk e ys; 33 percent for red meats; and 70 percent for eggs.
(OVER)
I ',
I
.. -. ~
. . . .. ~ ....4 - '
.~ ~0
w-" .__,. ......... .....
0 . '0-
0\
... ..
. , - .. r , J'
""'J
0
.... -.P~
'
. .
\)
tU'. 4l~t\11
f 0
Gt01tC\._
J~\. ~ ' 1
In recent weeks, the uptrend in red meat production has been losing momentum. During May, Federally inspected slaughter was above a year earlier by only about 3 percent ~ for pork and beef. In coming months, increases over a year earlier for turkey, fowl, and eggs also are expected to shrink. By year 1s end, turkey and red meat production may be about the same as a year earlier. In addition, overall economic activity is expected to pick up during the second half.
These factors, together with the tapering off in broiler production, are expected to lend strength to the broiler market in coming months. Third quarter live broiler prices likely will climb above those in May. Even if the uptrend in broiler production resumes late in 1967, fourth quarter prices probably would average significantly above the record low lZ. 9 cents per pound received in October-December 1966.
C ' i
!
...,~
...
f.
After Five Days Return to: United States Department of Agriculture
Statistical Reporting Service 409A North Lumpkin Street
Athens, Georgia OFFICIAL BUSINESS
Postage and Fees Paid U. S. Department of Agriculture
~ vo
~c g uisi~ions.Divisio n
vn 1ver s1ty L1 brar ies Un ive rsity of Georgia Athens Georgia 30601
/S
~G\A
UNIVERSIT
~() FARM REPOR LIBRARIES
GEORGIA CROP REPORTING SERVICE
ATHENS, GEORGIA
GEORGIA CASH RECEIFTS FRGM LIVESTCCK AND POULTRY
UP 83 YilLLION DOLLARS I N 1966
June 8, 1967
Cash receipts ~ to Georgia farmers for livestock and poultry in 1966 reached an all-time Mgh of $631,133,000 - up ~~83,539,000 from the 1965 revised receipts of ~547,594,000, accord-
~ to the Georgia Crop Reporting Service. All species of livestock and poultry were up,
IICept sheep, lambs, and wool. The total cash receipts from livestock and poultry have in-
creased each year since 1961.
Eggs had the larg'est increase in 1966 with a gain of 33 million dollars. Commercial l'oilers vrere up 26 million dollars, and cattle and calves advanced 12 million dollars. Turkeys Ml the largest percentage increase tvith a gain of 33 percent above the 1965 receipts.
Cash receipts from individual crops will not be available until August 1967.
- ... Livestock
and Poultry
_.
R
ece --
i
p
t_s....f.,o..
r
Georgia
-~~
1962
--
1963
1964
1965
1966
~-----_EreliminaEY..._
- - - - l.TiiousanddOllars)
53,054
Calves
62,047
Tliry Products
52,901
tcmercial Broilers
168,031
other Chickens
7,306
!Dr keys
2,797
Jcgs
96,660
Sheep and Lambs
95
\ool ---------- 47
!otal
r---~-
- - - .._~g2. 918
53,432
53,292
61,131
66,446
56,336
57,140
76,582
89,232
52,119
52,104
55,558
58,599
168,799
174,153
198,566
224,903
8,388
8,295
8,536
9,308
4,827
6,199
5,576
7,439
117,360
125,836
141,596
175,173
87
60
26
16
16
15 _ _ __g__ 1 _~_
17
_46h].illL___J!77.11L. _ _2L.7.:22!!___ 611.:,1.11__
ARCHIE lANGLEY Agricultural Statistician in Charge
The GeOrgiaCrop-Reporting Service:;Dsn.A";Ti09A-N'Ortii Lumpkin Street, Athens, Ga.;--in cooperation with the Georgia Department of Agriculture.
oecause or excensive repiarrt:.lng . c oo.L, v-nn y we a er :. e 1rs - part of ay, retarded growth
and prevented normal fruit set. However, recent warm weather has been ideal for growth .
Ught harvest is expected to get under way around June 20. Harves ; is under way in southern
areas of Georgia--about 15 days earlier than usual. Recent rains are expected to increase
yields and size in central areas. Alabama watermelon prospects are good. Harvest in extreme
southern counties is expected to begin around June 10 with volume supplies after mid-June. In
the central areas, vines are making good growth and fruiting freely. In J.VIississippi, the crop
u in fair to good condition. Some melons will be ready for harvest the last of June, and
supplies from the southeastern area is expected to be ready for the July 4 market. In Arkansas,
cool weather since late April caused considerable replanting and has slowed growth. Cool
wather, particularly nights, during May in Louisiana has held bac k growth and development of
the crop.
(Continued on next page)
In Tex-as, supplies from the Rio Grande Valley and the Falfurrias-Hebbronville ar ea were
expected to reach peak production about June l. Harvest should start in central and east Texas about mid-June and get under t'lay in north Texas in early July.
Acreai!e and e st~at e d production r eport ed to da t e, 1967 with compa _ ris~o~n~s ____________
Acreai!e
CROP
Harve sted
For
Yield per acre
P r o d u c t ion
.AND
1 Average
harvest Av. ;
Irid. Average
Ind.
------~S~TA~~TE~----------~~1~96~1~-~6~5~:---~!r~~~~~~s-------~1~9_6~~7_ _ _ _:_6~1_-6~~5 _:_~~~~~6~~------1~9~6_7~----1_9_6~1~=-6,i-,o~Ol~~~~6~.:~_-=1~96~7-
SNAP BEAN S
Mid-SprinEt: South Caro l ina Georgia Alabmna
Mississippi Louisiana
Group Total
CAl'I TALOUPS Early Sumner:
South Carolina Georgia
Arizona, Other
~iEEGTroucpor<Total
Late SprinEt: South Carolina Georgia Alabama
California
Group Total "1'61'\i!ATOES Late SprinEt:
South Carolina Georgia Mississippi L o u i s ian a: Texas
Group Total
~>JELCNS
Early Sumner:
Tort~ina
South Carolina Georgia Alabama Mississippi Arkansas
Louisiana Oklahoma Texas Arizona California
Group Total
5,8 20 2,900
980 1,340 2,640 13 ,680
4,640 5,800 1,030 11,470
5 ,100 2 .800
700 900 2,7 00 12,200
4,200 5,500
650 10,350
4,000
26
27
26
3,000
25
27
23
7 00
20
22
20
700
22
22
28
2,100
27
26
30
10,500
25
26
26
3,800
28
37
28
5,000
59
40
45
1,100 123
145
1 25
9,900
51
45
47
150
138
104
72
76
69
19
15
14
30
20
20
71 342
3 7190---,.:276~30
---"~--
129
155
106
343
220
225
122
94
138
594
469 ~
1,260
1,200
1,200 50
57
55
63
68
66
2,C80
1,500
1,100 32
25
25
67
38
28
3,220
2,500
2, 600
40
48
43
1 28
120 112
~~6~~3~4~0_____~4~~8~0~0______~4~,0~0~0~---7~2____~7~0______70________~45~2
336
280
12,900 10,000
8,900
55
5 6~_ _ _ _55
709 ___..::.5.6.::.2~- 486
7,420
7,800
7,000 75
80
65
558
624
455
3,120
2,500
2,000
46
60
45
143
150
90
880
700
650
39
50
55
34
35
36
1,260
1,100
1,400
49
60
55
62
66
77
5 , 600
6 ,000
--r~s~,2~s~o~--~1~s~.roo
5,800
48
41
16,850
58
62
45 55
268
246
261
1,064 1,121 919
8,940 23,600 32,400 13,740
7,040 6 ,160
2,840 8,340 78,000 4,480 9,480 195,020
6' 500
6 ,5 00
60
54
55
534
351
358
22,000
23 ,0CO 75
75
70
1,767 1,650 1 1610
33,500
33,000 88
80
80
2,848 2, 680 2,640 '
13,000
12,500
93
95
95
1, 278 1, 235 1,188
7,500
7,600 74
55
68
518
412 517
6,000
5,900
89
80
70
546
480 413
3 ,ooo
3 ,ooo
85
90
85
240
270
255
9,000
9,5 00
70
70
70
58 6
630 665
72 ,ooo
70,000
62
60
60
4 ,790 4 , 320 4,200
3, 600
J ,300 153
175
160
685
630 528
9,100 185, =-2o.::..o:;_____
_=-ls;:.;93::.,.:.;g6,;.0..0;o'"'o~---'71;.6..5;9.;.,-_-_-______1_"':77:.;.::5 ...7~----1~76;56:o...-::::::::::=-l;-';'5;_-1'.:.,c'5"3"';:5'5"7s",;:~.:::l'"14"_~,,'5-2"~95:..2.o;~""---=-l3""1',,"'5"98.;-4.58
ARCHlE LANGLEY
L. H. HARRIS, JR.
~g!:i_u;!,_t1,!_r~l_Sia~i~t_!c_!a!! in_C]!ar.g~ _ _ _ _ _ _ _ _ _ _ _ _ _ _ _ _ _ _ _ _ _ _ _ _ ~e g_e!_a~l _ frp_E !tiro~t~r-
ISSUED BY: The ueorgia Crop Reporting Service, USDA, 4C9A North Lumpkin street, Athen s , Geo r g i a ,
in cooperation with the Georgia Department of Agriculture.
Aft er Five Days Return to United States Department of Agriculture
Statistical Reporting Service 409.f\_ North Lumpkin Street
Athens, Georgia 30601 OFFICIAL BUSlNESS
Post age and Fees Pa id U. S. Department of Agriculture
__ __ - ..,........_
._,' ...
Released 3 p.m. Monday
CROPS IMPROVE
.1
r..
Athens, Ga.; June 12 -- The condition . of most crops in ,Georgia- S,howed considerable improve-
~nt during the week, according to the Crop ~eporting Service. Soil moisture was adequate to
mreessive except in a few counties in the southern part of the State. The heavy rains in the
~heastern part of the State the previous week caused much crop damage through erosion and
soil packing.
County Agents reported. little improvement in cotton. Plants continued t o die, and additionuacreages were destroyed and planted to soybeans:-:MUCh of the cotton in southern areas was squaring, and ,older plantings were setting bolls. Cultivating and insect contr ol were active .
Cult:i..vat~ng : and sidedressing oi ~moved f9;rwB.!,'d., 'a.l1ld...th_e_~ ~JOndition .of this crop continued
to improve .' Planting- was resumed the latter part of the week in the northern districts where
~eather conditions have cause,d. considerp.ble delay:. ' . 6 ,.
')
.
1' ~ - ..
t
.I
J :-:c.
.. ~ w
~
t .... )~..
...
Peanuts have show!?- ~opd response- 1to. tlw imJ?rov.ed. growing conditions. The crop is generally good, Landplastering, cultivation, disease and insect control measures were active. Soybean
ud sorghum planting . ~qv,anced rapidly. Seven-tenths of the soybean and half of sorghum
seeded .by. - ~h~ e;n~ of tl}e: period. .. -,-,
,-;
;
t !
Tobacco harvest increased as additional fields were cropped. Most of the tobacco belt ha&
ived rain, and yield prospects are much improved. Topping, sucker and insect control were
~or activities for this crop,
Rains and ~et . ~ oils slowed small ~ll harvest in several areas . Combining is nearing com~
~etion in the south, about two-thirds complete in central Georgia and becoming active in the
DOrthern districts. Huch hay was saved in central and southern areas during the period. Pas-
_....,. \..
' '"'!
tlll'es generally are gq?d. .r. ~ ' , . ,
;)< , - A.' 1 ,,_,
1 : , , 1
I
, 0T ,:
11
I:
l
"I .f ( o'' I f
Peach harvest 'incree:s.ed during _.the , wee.k. N.6..unusual ,J%1sect or disease pr oblems developed. '
Cwoner-and Keystone were the major varieties moving from several counties. Through May 8, a
of 841 carlot equivalent.s had been .ship,ped compared with 761 last year.
;_:.,.~.:,..
.~ r -1 'l :- T, :::>~t~-.n -Tr~ Tgnr.=t.ry:J:r 01 .r:u,; f'E'G- T,J !'~ >r r , ..,-~ ,~
Vegetable and melon harvest made very good progress, according to JI'Iarket Nanag ers. Cucumber
~est was nearing completion. Cantaloup, watermelon, and tomato harvest increased. Sweet-
~atoes are in good condition and vine cuttings were being transplanted.
WEATHER S~~J.ffiy ~- Extremely heavy rains occurred in northeast Georgia and parts of the
southwest during the weekend of June 4. Host other sections of the State received light to
a~erate amounts during this period. The heaviest rains in the northeast were apparent ly cen-
Z.ed in the Athens area. Slightly more than 10 inches were measured at the Athens Airp ort and
ID unofficial measurement a few miles northeast of Athens showed 14 inches. r1ost weather re.~ing stations north and east of Athens recorded more than 4 inches from the weekend storm.
Jhe largest total reported in southv1est Georgia was at Fort Gaines where 7. 90 i nches f ell. Of
Uds total, 7.50 inches occurred in a 24-hour period. Several other observers in the southwest
r~rted over 2 inches. In contrast, several places in northwest and southeast Georgia had
Jess than 1/2 inch of rain during the week. Little or no rain occurred anytvhere in the State ~er Monday, June 5. Parts of south central Georgia were quite dry at t he end of t he period.
,,
.
"
Temperat.ures ' were unseasonably mild throughout the week with a slight warmi ng trend during
e latter half. Highs'. were in the 70's and SOts with just a few 90 r eadings in s outh Georgia
at the end of the period. Averages for the week ranged from 3 to 8 degrees belotv normal.
The five-day for~cast for the period Tuesday through Saturday (June 13-17) calls f or t emperatures to average near normal with only minor day to day changes ~~ Rainfall is expe cted t o Hlight to locally moderate and to occur mainly as afternoon and evening thund ershower s through -
tilt the period.
ISSUED BY: The Georgia Crop-Reporting Service, Athens, Georgia; in cooperation with t he Cooperative Extension Service, University of Georgia; Georgi ~~~~~~~------~
Agriculture; and the 1rleather Bureau, ESSA, u. s. Department
JUN 14 1961
LI BRARIES
U. S. DEPARTMENT OF COMMERCE WEATHER BUREAU Athens, Georgia ESSA
Precipitation For The Week Ending June 91 1967
GEORGIA
Temperature extremes for the week ending June 9, 1967 (Provisional)
Highest: 91 at Bainbridge on June 9th. Lowest: 480 at Blairsville on June 6th
and ?tho
"lltAO'r
T~
* For the period June 10-12, 1967
T, less than .005
After Five Days Return to United States Department of Agriculture
Statistical Reporting Service 409A North Lumpkin Street Athens, Georgia 30601 OFFICIAL BUSINESS
Postage a~d Fees Paid U. S. Department of Agricultu~
IMMEDIATE - U. S. WEATHER REPORT
This report wil 1 be treated in all
Respects as Letter Mail (See Sec. 34 . 17, P. L. & R. )
10guisitions Division Dnl rJrsity of Ge orgia 1Jn.lV .~.~, ... .J Libraries Athens Geo r gia 30601
G
3Js
H
c;;, ::)
GEORGIA CROP REPORTING SERVICE
tqbl
J U~ "3
ATHENS, GEORGIA
June 13, 1967
SPECIAL PEACH REPORT AS OF JUNE 1, 1967
Georgia's 1967 peach crop was forecast at 3,000,000 bushels, 300,000 bushels above the May 1 estimate but 800,000 bushels below 1966 production. Average production for the 196165 period was 3,958,000 bushels.
Weather during May was favorable for carrying out an effective spray program and no unusual disease or insect problems developed. Sizing was affected by dry weather but most areas received rains the latter part of May. Shipments through June 11 totaled 957 carlot equivalents compared with 929 to the same date last year. Some varieties moving to market are Coronet, Keystone, Maygold, Redcap, Dixigem and Redhaven.
The peach estimate relates to total production which includes rail and truck shipments, local sales, non-inspected truck shipments to points in the State and adjoining states, quantities used on farms where produced, and in some years quantities not utilized because of economic conditions.
STATE
PEACH PRODUCTION 1/ SELECTED STATES
Average
1961-65 Mi 11 ion Pounds
1966 Mi II ion Pounds
1 ,000 bushels
Indicated
1967
Mi 11 ion
1 ,000
Pounds
bushels
North Ca ro 1 ina South Ca ro I ina GEORGIA Alabama Miss i s s i pp i
. Arkansas Lou is iana Oklahoma Texas
61.3
77.1
I, 550
35.0
700
314.7
339.0
6,600
129.0
2,500
196.3
188.5
3,800
148.8
3,000
46.5
27.5
550
52.5
1,050
14. 1
13.2
265
17.5
350
58.8
49.4
950
46.8
900
6.5
9.0
180
8.5
170
8.0
10.8
225
I0. 1
210
:_ - _2. ..f. - - - - _3]. . - - - - - - ZOQ - - - - _2..! - - - - - ~5Q - - -
9 States
732.4
748.1
14,820
474.6
9,430
ll Includes quantit i es unharvested on account of economic conditions and excess cullage of
harvested fruit.
ARCHIE LANGLEY Agricultural Statistician In Charge
C. L. CRENSHAW
-1\~j'ri c-ult~.i 'ra 1 Statistician
UNIVERSITY OF CE:ORGIA f''
JUN 17 1967
(Please turn page for United States informat on)
LI BRA RIES
UNITED STATES- SPECIAL PEACH REPORT AS OF JUNE I, 1967
The Nation's 1967 peach crop i s forecast at 2,9 53.1 mi ll ion pounds, 13 percent less than last season and 17 percent below average, Excluding California Clingstone ; mostly a canning crop, a production of 1,353. I mi ll ion pounds i s forecast, 22 percent less than last year and 35 percent below average.
In the 9 Southern States, production i s expected to total 474.6 mill ion pounds, 37 per-
cent less than last season and 35 percent below average. Only two of the 9 States - Alabama
and Mississippi, expect larger crops, Most of the decrease from last season is in the
Care~ inas, where mid-March freezes seriously damaged the crop. In Georg ia, early var ieties
are moving .in volume, In South Carol ina, harvest i s underway but i t wi II be mid-June before
volume increases apprec iably, Harvest i n North Carol ina began on May 25 and was expected to
advance sharply during the week start i ng June 5. In Alabama, harvest of early var ieties began
about May 10. The Arkansas crop is early this year and fruit i s sizing well. In Louisiana,
a week of rainy weather early i n June slowed harvest and caused some loss of . r ipe fruit. In
Texas, I ight harvest of early variet ies began in the Hill country and in northeast Texas about
mid-May.
In New England, New York, New Jersey, and Pennsylvania, cool, rainy weather retarded
bloom and caused poor poll i nation. Larger crops than a year earlier are forecast for Ohio,
Indiana, Michigan, Mi ssouri, and Kansas. The Illinois crop is expected to be 4 percent smaller than last year. In Ohio, winter i njury, poor pollination, and late sprin g frosts
.
lowered production prospects, In Michigan, winterkill of buds was heavy in the west central
area. In Missouri, fruit prospects vary by areas because of late April freezes.
In Maryland and Delaware, the peach crop was hurt by adverse winter and spring weather. Virginia's crop is expected to be unusually light, In West Virginia, freezes in March and Apr i l caused heavy damage to buds and bloom.
Idaho's crop is forecast about SO percent above average, but prospective production in
Colorado is for a record low because of severe freezes on Apr i l 20 and April 21 over the
entire Western Slope, In Wash i ngton, trees set a good crop of fruit. Bloom of the crop in
Oregon extended over a relat i vely long period of t ime but with generally poor pollinating
weather.
The Freestone crop in California i s expected to total 500.0 mill ion pounds, 3 percent
less than last year. Harvest of earliest var i eti~s began May 23, about 10 days later than normal. Fruit sizes appear to be quite good,
After Five Days Return to United States Department of Agr iculture
Stat istical Keporting Service 409A North Lumpkin Street Athens, Georgia 30601 OFFICIAL BUSINESS
Postage and Fees Paid U, S, Department of Agr iculture
' s;s
REPORT
GEORGIA CROP REPORTING SERVICE
ATHENS, GEORGIA
GENERAL CROP REPORT AS OF JUNE 1, 1967
June 13, 1967
Qeorgia: 1rJeather during ~1ay was not too good for farming in Georgia. At the beginning of the
month, North Georgia was wet and central and southern areas were dry. Rains on
, May 21 and 22 relieved the dry conditions in southern areas, but further delayed progr'ess in
the north. Temperatures duxing the month were unusually cool and advers ely affected seed germination and early plant growth. Much reseeding was necessary and many uneve0 stands gtill exist.
Since June 1, crop conditions have shown considerable improvement, especially in the central and southern portions of the State. The northeastern area suffered further set-back from very heavy rains in early June.
~each~~: Georgia's 1967 peach forecast on June 1 was placed at 3,000,000 bushels. The estimate is up 300,000 bushels from last month, but 800,000 bushels below last
year ts production.
Wh~: The June 1 forecast placed Georgia's 1967 wheat production at 2,862,000 bushels; compared with 1,950,000 bushels in 1966. Yield per acre is estimated at 27.0
bushels - 3 bushels below last year Is average.
)
Hav Egg_J'r~:12.ion UJ2: Egg production on Georgia farms during Hay t-Jas estimated at 421 million - 13 million above production in May last year. Number of
. layers on farms during Hay averaged 21,494,000 compared with 20,892,000 a year ago.
k!llk.Productiop Up: Hilk production on Georgia farms during May totaled 91 million pounds - 4 million pounds above production a yea~ ago, but the same
, as produced the previous month.
1):_git~9 States S~;Y
\!linter wheat prospects improved 4 percent during liay as timely showers and a lack of high
temperatures more than offset early 11ay freeze damage in the Central Great Plains. The current
estimate for winter wheat is 17 percent above last year and 28 percent above average. Estimated spring wheat production is 23 percent above last year. The all vJheat total for 1967 is 18 percent above last year and 28 percent above average. Corn and soybean planting generally
lagged behind last year and normal in the eastern Corn Belt and South Central areas, but was about normal in the western Corn Belt. Hay and pasture prospects declined in the North Central , and Northeastern areas but improved in most other sections. Non-citrus fruit prospects are
not as good as a year earlier. Citrus production for 1966-67 is expected to be 31 percent
l~ger than a year earlier. Spring vegetables supplies are expected to be 2 percent greater than last year but total production of winter, spring, and early sUJrl.mer potatoes is forecast
~percent below last year. May milk production was about the same as last year, but egg pro-
duction was up 5 percent from May a year ago.
~~~!:_Prospects Impr~~: Indicated 1967 winter tvheat production improved during Hay
as cool weather and timely moisture in most areas ~ore
than offset early Hay freeze damage in the Central Great Plains. 1rJheat in IVIontana, the Pacific
Northwest, and the Corn Belt continued to make excellent progress. Dr y we ather and freeze
damage reduced yield prospects in Texas, New Mexico, and South Dakota. In the East and South,
prospects changed only slightly during Hay. The June 1 indicated production of 1,237 million
bushels of winter wheat is 4 percent above the forecast of a month earlier, 17 percent more
than the 1966 total, and 28 percent above average.
Spring wheat seeding was practically complete in spite of delays c~used by wet fields and
cool temperatures. Early growth has bee n .slovr because of generally cold, wet we ather , although
soils are dry in parts of Hinnesota and South Dakota. The forecast for 1967 production of all spring wheat is 313 million bushels, 23 percent more than last year and 28 percent above
Please turn page
UNIVERsrry Of:' ~Ia
JUN 17 1911
LIBRARIES
-2-
Peacpes: The Nationls 1967 peach crop is forecast at 2,953.1 million pounds, 13 percent
less than last season and 17 percent below average. Excluding California Clingstone, mostly a canning crop, a production of 1,353.1 million pounds is forecast, 22 percent less than last year and 35 percent below average.
In the 9 Southern States, production is expected to total 474.6 million pounds, 37 percent less than last season and 35 percent below average. Only two of the 9 States - Alabama and Hississippi, expect larger crops. Most of the decrease from last season is in the Carolinas,
where mid-Harch freezes seriously damaged the crop. In Georgia, early varieties are moving in volume. In South Carolina, harvest is undert-J"ay but it Hill be mid-June before volume increases
appreciably. Harvest in North Carolina began on riay 25 and t-1as expected to advance sharply
during the week starting June 5. In Alabama, harvest of early varieties began about May 10.
'l'he Arkansas crop is early this year and fruit is sizing well. In Louisiana, a week of rainy ~reather early in June slot-Jed harvest and caused some loss of ripe fruit. In Texas, light harvest of early varieties began in the Hill country and in northeast Texas about mid~1ay.
N!!~r~uction: May milk production in the United States is estimated at 11,508 million
_
pounds, about the same as a year earlier but 7 percent belot-J" the 1961-65
average for the month. On a daily basis, n1ilk production increased 4 percent from April to
lVIay which is the same as a year earlier. Although Hay is usually the peak month for milk pro-
duction, seasonal peaks have become les s pronouncec in recent years.
f2!!1kY and Egg_: Egg production during l-iay totaled 6,125 million eggs, 5 percent above
May 1966 and 6 perc ent ab ove the 1961-65 l'~a:" average. This is the largest Hay production since 1946. The average nwnber of layers for ~'Iay is estimated at 310. 8
million, up 5 percent from a year earlier but dot-m seasonally by l percent from a month earlier.
Production per layer averaged 19.70 eggs during nay 1967 compa.red with 19.65 eggs in Hay last year. Aggregate egg production from January throug:1. :i/iay 1967 totaled 29,583 million eggs com-
pared with 27, 795 million during 1966, a 6 percent i :1crease.
May egg production was up from a year earlier in all regions reaching a record high in the
South Atlantic and vJestern regions, and the highest since 1944 in the South Centra~ region.
Sharpest regional increases from a year earlier were in the South Central, up 8 percent and in
the \rJest, up 7 percent.
'
The number of layers on June 1, 1967 totaled 309.9 million, 5 percent more than a year
earlier and 7 percent above average. 3stimated layers uere up 9 percent in the South Central region, 8 percent in the Western region, 6 perc ent in the South Atlantic, 3 percent each in the East North Central and \rJest North Central regions, and slightly above a year earlier in
the North Atlantic region.
ARCHIE lANGLEY Agricultural Statistician In Charge
C. L. CRBNSHJIJJ Agricultural Statistician
---------------------------r------------------- ISSUED BY: The Georgia Crop Reporting Service, USDA, L~.09A North ltunpkin Street, Athens, Ga.,
in cooperation with the Georgia Department of Agriculture.
After Five Days Return to
United States Department of Agriculture
Statistical Reporting Service
409A North Lumpkin Street
Athens, Georgia 30601
- - -- OFFICIAL BUSINESS
- ..1 : ~
Acguisitions Divis ion Unlvers ity of Geor~ia
University Libraries
Athans Georgia 30601
Postage and Fees Paid
u. s. Department of Agriculture
I I GEO:t}GIA CHICK HATCHER Y .REPORT
I 5
'
l~i
I f
1 ~
l.l}- '-"
r
l.
~ ' - J
::., -
4
-
...
! n
: c ~, 1 Pl~c~ru._ept_o .:b i <?.fl_e.. rcvc id;s in ~.eorgl.a,.::,dur,{ng t_he ,we ~ k ~de d J 'tne 10 was
. 9 ~ 49~. ooo:: -~ ~e;r.:<r1~ n:t }ll:P r~~ Ih~n i R) theg p :t Yt~tf..s ~..e.e~1:_>uj ,5 p ~ rc ~nt 1ep than in the
::e lomp~rable we~k last year, according to th e G e orgia Crop Reporting Service.
l "" .>
I~
->
,) l ' 1 -:
!:~1~
1
r '
: ..'
An
__~
stimatect
1~,_
155,__000
b'~oi1er
tyye . ~ggs
wer e
I set
oy
Georgia
~'.q1.tcheries--
) r, j) l ~er1 t1 nt ,l_ess.~h?-n in ~e' P.r ~":~ou ~week ;.a~~-} }1 per c;~ nt ~-e' ss tha~ . in th ~ 's._omparable
1_.
v l1
1...wl:e;ek
~_a.. yea-r
cea;rller.
t )
...
-.~ Cv
.,...,,,_ ....
-~ J ..; .,.
"v
C
'
.;.. :;;t .. ..~
',!;:1 _-r c
_
~.
i " " ...
~
"'
J
---1;..
C~-- i ;)
.,r! l-'1! ( 1 I
!
The
majority
of
the
price s
paid
to
G ~ orgia
producEfrS
for
broile
r:
,_Jaatching eggs
hI were 1reported within a rang e of 50 -.to 65 cents per dozen. : The average ~ric e of
~~ ; hatchi-ng eggs was 55.- c 'en s per doze n. The p ri c e :Of eggs if~om flocks w t!f hatchery
... ownred cocke;re'ls ;geri_e :t'c;~.l'~ y ;w"'ti s_2 ~'Emt ~: ' ei.ow. t he a .verage price ..; Most pnices received
!with' : for broiler- chi-cks by Ge'orgia fi at che rie s were reported within a range - 0. ~$5. 00 to $8.75 an average of $7. 50 per hundred. Th e average pricels last year w r e 64 cents
..for e{ggs aan....d... $~. -7.. 5, foor-"")c(.h.(1 ioc. kcs.
...()
~
J -
c
. -'
I
, 1
t. ... ~..- -VJ:"'
,_,_l
"''
'
-~co
,_
GEORGIA EGGS SET, HATCHINGS, AND CHIFK PLACEMEjNTS
Thou.
Vl tl) -i
rt.)
... cv ; 1:: ~ 3-so 4 ~..- ;
. . . ., "~
,<j
I.-
r.-
Cv
tl)
C) 0
('J l>/1 0~ 9'1 V1 , , ' " ~
r.- r,_,
r> 0 '.)
1, 066
Thou.
Pet.
0/
,/' 4 I.-
1;.-() 0 0414 ""' c -7 'V<
~~23~ ci J .o.
741
70
c.., t.' ,.)
-T1.~.o::'lou.
} p7 6
I o ~ :;) p jo7
941
1, 065 .... 9A2.. ru
680 c:-069
64 I.- 7,.l r-
I1; 073 u 858 I)
THou. I
(
166
-~ i921
53 . 36
770
o/o of
year ago Pet.
71 102
91
I ~~
1 !
1
I
: ,W e e k i
i 1
E
n
d d
e_l
I
~.
rr
Eggs Set !J
_. ~ ~,_,-. :l-:;:.::o ~%0 r~ ~ 0 ~. ~ ... :~-:;o
o -1-<196{1 C: v.. t....~1-96'7 :X) -;.> year 1 1966' ./l => 9617
ago
I
Thou.
Thou.
Pet.
Thou.
Th u.
()d
year ago Pet.
1 Av. Price
Hatch
~ ggs
Broiler Chicks
!fer J:?oz.
11967
Per Hundred
1967
ents
Dollars
IApr. 8 !Apr. 1! 15
13,868 12,981
94
13,922 13,202
95
9,719
9,927 102
156
9, 655
9, 929 103
56
7.75 7. 75
1Apr. ,22
13, 841 12, 736
9 2
9, 726 10, 02 2 103
56
7. 7 5
Apr. 29
14,447 12, 899
89
9, 910 10, 125 102
56
7. 75
May 6
14,228 12, 523
88 ' 10,021
9, 949
99
56
7. 75
May 13
14, 20 6 1 1, 9 19
84
9, 906
9, 4 7 1 96
56
7. 7 5
May 20
14, 133 12, 4 14
8 8
10, 155
9, 587
9 4
56
7 75
May 27
14,082 12,535
89
9,913 10,001 101
55
7.75
June 3
14, 026 12, 288
88
10, 085
9, 277
92
55
7. 50
June 10
, 13, 998, 12, 155,, 87 110, 026
9, 495
95
~5
7. 50
1
Includes 'eggs set
' J 1J I 1 ,~
J f. )
tl ty- hat H.e -.. es
d (~ (l ~ 0
producing
chicks
I '
I
for
liatche 'ry
1 r ) 1 ,(
supplY.
1 q ( l >
cks. ~ 1 n
t ;-: h j
f flu
ARCHIE LANGLEY
jc W 1 ft!..' Vtf<-A<S-I'Q'i!.iR~ il 1 ..JI .. J
Agricultural Statistician In Charge
Agricu1fU:r1ilf S"tahsrt:ida -:r vr "" '
--
U.
---
S.
--
D
--
ep
-
a
---
rtm
-
e
--
nt
-------------
of Agr1cu1ture
-
-
-
-
-
-
-
-
-
-
-
-
-
-
-
-
---
Ge
-
o
---
rg1a
-D-et-:-;d.:>-r.)~-mIe..f-l~'' :t-r:t'J,i.TOC_ O~ ~~:.-:i ~A;,.,g'.-:'t:.:i l:r.rc.:-U,...-\h,l.-i-r
-
e
-
-
-
-
409A
Statistical Reporting Service North Lumpkin Stre et, Athens,
Gee
UNIVER
rgia SITY
OF
G::oR~fA
Fj
JUN 17 1967
LIBRARIES
-
-
EGGS SET A ND CHICKS PLACE D IN COMMF~ RCIA L AR".~ .- A>' BY WEEK~ c:: - 1967
E GGS SE T
::;HICKS PLAC...!;D
-STATE
Week E nded
May
June
June
I u;o of
year
Week Ended
May
June
June
27
3
10
ago 1/ 27
3
10
THOUSA NDS
THOUSANDS
Page 2
.1% of
year
ago 1/
Maine
2,081
2,024
1, 998 95
1, 559
1, 548
1, 513
96
Connecticut
357
405
383 114
224
177
166
67
.Pennsylvania ' Indiana
1, 335 579
1, 419 544
1, 594 117 542 67
1, 009 325
995 300
1, 007 375
114
84 .
Missouri
635
670
640 72
~25
382
453
116
Delaware
2,823
2, 839
2,776 100
2,992
2, 821
2, 811
107
(Maryland Virginia West Virginia North Carolina South Carolina
4,818
4,816
4, 713
104
I
I
3, 129
3, 281
3,429
98
1, 720
15~
7,318 431
1, 740 153
7,384 434
1,656 153
7, 333 474
86 92 101 93
I 1, 269
I ' I
362 5, 717
364
1, 224 416
5, 770 356
1, 138 391
5, 771 357
93 143 106
88
-
GEORGIA
12, 535 12,288 12, 155 87
10, 00 l
9,277
9, 495
95
.
:::::>
Florida Tennessee A labama Mississippi A rkans as L ouisiana Te xas
Washington pre gon C alifornia
T OTAL 1967 (22 State s)
880 1, 023 9,077 5,042
854 1,030 8, 811 5, 091
818
907 8,784 5, 015
I 196
467
68
984
98 106
I
I
I
7, 032 4, 357
437
93~
7, 023 4, 187
458
970 7, 197 4,333
107 91 103 106
10,073 10, 250
9, 901
97
7,749
7,432
7' 551
96
1, 13 5
1, 145
1, 123 108
896
881
888
114
4, 589
4,692
4, 589
98
3, 569
3, 510
3,612
102
676
743
766 102
552.
508
507
110
285
4 07
334 81
24 0
230
261
110
1, 950
1, 977
1, 936 106
1, 476
1, 499
1, 475
108
69, 517 69 ,716 68,590 96
54,698 53, 192 5~. 158
101
(PTAL 1966* 22 States)
71, 508 71,326 71, 108
I
54, 313
54,461
53, 838
o/.o of Last Year
97
98
96.
1-/ Current week as p ercent of sameweek last year.
Revised.
101
98
101
I
GEORGIA CROP REPORTING SERVICE
GEORGIA
May 1967 UNIVCRSlTY OF GEORGI"R_e eased 6/l6/ 67
JUN 21 1961
1'11\Y MILK PRODUCTI ON UP 4 NILL ON POUNDS
dlk production on Georgia farms during May totaled
LIBRARIES
ording to the
Georgia Crop Reporting Service. This compares with 87 million pounds produced in Hay last
year and 91 million during April 1967. The 1961-65 May average production was 88 million
pounds.
Production per cow in herd averaged 630 pounds -- 50 pounds above the previous year, but
the same as the April output. The 5-year average production per cow for the month t1as 484
pounds.
The estimated average price received by producers for all wholesale milk during 11ay v.ras ~6.15 per hundredweight. This would be ~ .15 above the previous year, but ::? .10 below the
April average.
Prices paid by dairymen for feed were about 5 cents per hundredweight above April and
averaged about 20 cents above the previous year .
Item and Unit
--------------------------- GEORGIA
------------~-
.
UliTTED STATES
Ilay April
l-1ay : !:Iay
April
Hay
-------------------------:---1-9-66-----19-6-7 ---1-9-67--:----19-6-6-----1-9-67-----1-9-6-7
Milk Production, mil. lb.
Production Per Co-v1, lb. !_/
Number Hilk Co-vm, .thousand head
87
91
91 11,525 10,732 11,508
580
630
630
812
785
844
150
145
145
y ffilQ~ !illQL.~ - 1?.QYA~
All wholesale milk, cwt. Fluid Milk, cwt. Hanufactured l\1ilk, cwt. 11ilk Cows, head All Baled Hay, ton
6.00 6.00 3.60 190.00 26.00
6.25 6.25
200.00 27 . 2 0
200.00 27.60
4.34 4.69 3.67 243.00
23.30
4. 77
5.13 4.01
257.00 24.10
b/4. 73
259.00 23.70
PRICES PAID - DOLLARS 2/
Mixed Dairy Feed: - -
14 Percent Protein, cwt. 2/
3.90
4.00 4.05 J/3.49
3.64
3.62
16 Percent Protein, cwt.
4.00
4.15 4.15 J/3.76
3.96
3.93
18 Percent Protein, cwt. 20 Percent Protein, cwt~
4.10
4.30 4.40 J/3.90
4.09
4.05
4.30
4.50 4.50 3.../4.10
4.33
4.27
All Under
__________________ _______________ . 29 Percent Protein, cwt.
--~~::--------------:..
4.00
4.15
. 4.20 1/3.72 -.:...
3.90
3.86
~---
1/ Honthly average. 2/ Dollars per unit as of the 15th of the month except wholesale milk .
which is average for ;onth. 3/ Revised. ~ Preliminary. 2/ U. S. price is for under
16 percent.
ARCHIE LANGLEY Agricultural Statistician in Charge
~'J" . PAT PARKS Agricultural Statistician
ISSUED BY: The Georgia Crop Reporting se;;i~: USDA, 409A Norlh-LumpidnStre;.:Ailiens:Ga., in cooperation with the Georgia Department of Agriculture.
UNITED STATES HILK PRODUCTI ON
Eay production of milk in the United States is estimated at 11,508 million pounds, about the same as output in r1ay 1966 but 7 percent belou the 1961-65 average for the month. May is usually the peak month in milk production, but the seasonal peak has become less pronounced in recent years .
Total milk production during the January - May period this year is 51,822 million
po~nds -- slightly above the comparable 1966 period. On a daily basis, milk production in-
creased 4 percent from April to May, which is the same seasonal gain as a year earlier.
r1ay output provided l. 87 pounds of milk per person daily, compared with 1. 80 pounds in
I
April and 1.89 pounds i n Nay 1966 .
~~~te p~ cow up_4 ~rceg1_~~_1~t year
l'1ilk output per cow for the U. s. averaged 844 pounds during Hay, 4 percent more than
a year earlier and 11 percent ab ove the 5-year average for the month. On a daily basis,
May output averaged 27.2 pounds per cow, compared with 26.2 pounds in both April 1967 and
May 1966. lliay production per cotv was at a record high rate in 41 States.
.
Milk Per CovJ and Milk Production by 11onths United States, 1967, tvith Comparisons
------~------Milkpe0ow --------===--:=-_frilk::J?roductiog==-==---- '
Nonth
Average
: Average
Change
______________.;;1._96._1_-6_5 .. 1966 .. 1967 ..: 1961~65
1966
. 1967
from 1966
-'-----~---!...----
-POUnds-----~------1'1illion Pounds
.. -Pe-r-ce-n-t
January February March Apr i l Hay
621
678
715
10,222
9,805 9,855
+0.5
591
635
670
9,696
9,135 9,217
+0.9
676
736
756
11,062 10,537 10,510
-0.3
690
752
785
11,260 10,725 10,732
+0.1
757
812
844
12,310 11,525 11,508
-o.l
Jan. -Hay total June July August September
72 9
798
671
73 6
629
696
592
663
54,551 51,729 51,822
+0.2
11, 816 11,269
10,849 10,350
10, 148
9,763
9,522
9, 2 63
October November December
602
670
9,643
9,333
581
649
9,2 88
9,012
:
- 618______.87 _____;_~ 8L.l__~9......211__________,;__~--
_]~ 7.S9_ 8. Sll___ __.;..,.::=l.f5. 6.Q___120~]Q_ _ _ _ _ _.:.___ _
After Five Days Return to United State s Department of Agriculture
Statistical Reporting Service 409A North Lumpkin Street Athens, Geor gia 30601 OFFICIAL ~~
t.J ) 1 .1
Ac guisitions Div ision Un1versi ty of Geo r g ia
Tnivcrsity Libraries Athans Georgi a 30601
Postage and Fees Paid
u. s. Department of Agriculture
Georgia Weekly Crop and Weather Bulle
~ GEORGIA CROP REPORTING SERVICE
Athens, G oruULNaIVERSITY OF lo.;:C.,\..
~leek Ending June 19, 1967
JUN 21 1967
eased 3 p.m. Monday
FI ELD WORK VERY ACTIVE
LIBRAR IES
Athens, Ga., June 19 -- Georgia farmers had a busy week of field work, according to the
Crop Reporting Service. Open skies during most of the period permitted farmers to make big
_gains in a variety of field activities. Soil moisture remained mostly adequate in northern
~eas and short in many southern counties.
~~ton showed a slight improvement over the previous Heek . Several County Agents reported additional acreage of cotton tvith poor stands being ploHed up, hotvever, and replanted to other crops -mostly soybeans. StateHide, about half of the cotton tvas squaring and one-sixth v1as setting bolls. The bulk of the fruiting v.1as in the southernmost third of the State.
The condition of the Staters corn crop continued to show improvement. ' Additional acreage , particularly in central and southern-ireas, received final cultivation and sidedressine as fields tvere laid-by.
Activity in ~eanuts was high wi th weed, insect and disease control receiving much attention. The crop was mostly reported as good. Soybean and sorghum planting had another good v1eek of progress. About eighty percent of the iritend'ed soybean acreage has been planted and sorghum planting was about 70 percent complete .
Tobacco cropping increased during the week. Sucker and insect control and topping were activein-iiio.st fields. The condition of the crop, mostly good, was unchanged from the previous week.
Harvest of small grains advanced very rapidly, particularly in northern counties. About half of the crop was cora"Sined by the week end in northern areas' about 80 percent in central sections, and about complete in lower State. ?av}ng was very active over most of the State. Pastures remained ih mostly good condition.
About one-third of the expected E~ch volume has been harvested . Brown rot presented problems in several areas, but controls were proving effective. Through June 15, 1,226 carlot equivalents had been Shipped compared vrith 1,205 through the same date last year.
Harket llianagers reported !-_omat~, ~oups, and li~~~9.~ v;ere marketed in good quality and volume. Lima beans and field peas also moved in volume. Dry, hot weather has shortened the harvest season forearly planted-veget'ables.
'HEATHER SUl1HARY :""- Scattered sho~.vers and thundershov1ers occurred over the southern third of Georgia and in the extreme north during the wee!<: ending Friday, June 16. Amounts were mostly less than one-half inch, but a few south Georgia observers recorded more than an inch. Little or no rainfall was reported in Hiddle Georgia, and northuard to the mountains. Nany areas have had no significant rain in the past two tveeks and some sm-face soils were becoming quite dry by the end of the v1eek. . Practically no rain occurred in the State during the tveek end.
Georgia temperatures continued unseasonably mild for the fifth straight ueek. Averages
were 3 to 5 degrees higher than for the previous tveek, but tvere still l to 3 degrees beloH nor-
mal. A warming trend during the last half of the week brought readings up to normal by the end
of the period . Afternoon highs tvere generally in the low and middle nineties during the week
end in all areas except the mountains.
. The five-day forecast for the period Tuesday through Saturday (June 20-24) calls for temperatures to average near to a few degrees below normal. It will be rather warm during the first half of the week, turning cooler the last half. Rainfall is expected to average 1/211 to 111 , or more, and occur as widely scattered afternoon and evening thundershowers during the ueek. The showers should become more numerous about Thursday and Friday.
, issbED-BY:- The Georgia crop-Reporting- Service7 Athens; Georgia;-in cooperation with- the- - -
Cooperative Extension Service, University of Georgia; Georgia Department of
Agriculture; and the Weather Bureau, ESSA, u. s. Department of Commerce.
U. S. DEPARTMENT OF COMMERCE WEATHER BUREAU Athens, Georgia
ESSA
Precipitation For The Week Ending June 16, 1967
GEORGIA
Temperature extremes for the week ending June 16, 1967 (Provisional)
0
.
Highest: 96 at Irwinton on the 16th.
0
49 at Blairsville and Clayton on the lOth.
* For the period June 17-19, 1967
T, less than .005 inch
After Five Days Return to United States Department of Agriculture
Statistical Reporting Service 409A North Lumpkin Street Athens, Georgia 30601 OFFICIAL BUSJNESS
ll1MEDIATE - U. S. WEATHER REPORT
This report will be treated in all Respects as Letter Mail
(See Sec. 34.17, P.L. & R.)
Postage and Fees Paid .
U. s. Department of AgricultJ1fe ~ . '
~
\D'loOl
UNIVERSITY or.
/ .5
4 A'~
I bl
GE0 RG I A cR0 p RE p 0 RT I NG
~ ~ wl]l]ffiLhTI rnm~
ATHENS, GEORGIA
June 21 , 1967
G E ORGIA CHI CK HATCHERY R.t.;PORT
Placement of broiler chicks in Georgia d uring the w eek e nde d J une 17 was 9, 457, 000--l ess than one p ercent below the pr e vious w eek b u~ 4 p e rc e n t l ess than in the comparable w eek last yea r , according to the Georgia Crop l{ e port ing ~e rvice .
An estimated 12, 179,000 broiler type eggs were s et by Georgia hatche rie s-about the same as in the previous we e k but 12 p e rcent l ess than in the c omparable week a ye ar e a Tlier.
The majority of the prices paid to Georgia producer s for broiler hatching eggs were reported within a range of 50 to 65 cents per dozen. The average price of hatching eggs was 56 cents per dozen. The p r ice of eggs fro m flocks with hatchery owned cockerels generally was 2 cents below the average p rice . Most p r ices r e ceived for broiler chicks by Georgia hatcheries were reported within a range of $5.00 to $8.75 with an average of $7.75 per hundred. The average price s l ast year w e r e 64 cents for eggs and $9. 7 5 for chicks.
Week Ended
G!~ORGIA EGGS SET, HATCHINGS, AND CHICK PLA C2 MENTS
E GG TYPE
Eggs Set
1966
1967
I % yeoafr
a. g o
Thou.
Thou.
Pet.
Chicks Hatched
1966
1967
Thou.
Thou.
% of
year ago
Pet.
May 20 May 27 June 3 June 10 June 17
Week Ended
1, 029 1,066 1, 065
942 762
Eggs Set !.}
1966 .1..nou.
1967 .1 nou
923
90
907
921
l 0 2.
741
70
94 1
853
91
680
64
669 543
I 71 71
BHOIL ..i!;J-:<. 'fYP ~
1,073 8 58
86 4-: ~
836 770
I 78 90
I 630
73
% of
year
lI Av. Price
Chicks Placed for ! Hatc h
Broiler
Broilers in G eorgia
Eggs
Chicks
1o of Pe r
P er
1966
1967
year Doz.
Hundred
ago
l:"'Ct
'i'hou.
ago 1967 I fiou. Pct:- Gents
196 7 Dollars
Apr. 15
13,922 13, 202
95
9,655
9,929 103
56
Apr. 22
13, 841 12, 736
92
9,726 10,022 103
56
Apr. 29
14,44:7 12, 899
89
9,910 10, 12 5 102
56
May 6
14, 228 12, 523
88
10,021
9,949
99
56
May 13
14,206 11, 919
84
9,906
9,471
96
56
May 20
14 , 133 12,414
88
10, 155
9,587
94
56
May 27
14,082 12, 535
89
9,913 10,001 101
55
June 3
14,026 12,288
88
10,085
9,277
92
55
June 10 June 17
13,998 13, 820
12, 155 12, 179
87 88
10,026 9,883
9, 495 9,457
I 95
55
96
56
1/ Includes e gg s set b y hatcheries p roducing chicks for hatcher y supp1y flocks.
7.75 7.75 7.75 7.75 7.75 7.75 7.75 7.50 7. 50 7.75
ARCH!~ LANGLEY Agriculture.! Statistician In Charge
W. A . WAGNE R Ag ricultural Statistician
U. S . Department of Agriculture
Georgia Department of Agriculture
Statistical Reporting Service
409A North Lumpkin Street, Athens, Georgia
'
EGGS SET A ND CHICKS PLACED IN COMMERCIAL AREAS BY VIEE KS - 1967
Page 2.
E GGS SET
CHICKS PLACE D
STATE
Week Ended
June
June
3
10
June
17
%of II-..,.,----V_If_e,e,k_E_n_d_e_d_-:;:-----l % of
year
June
June
June
year
ago 1/ 3
10
17
ago 1/
THOUSA NDS
THOUSANDS
Maine
2,024
1, 998
1,927 96
1, 548
1, 513
1, 537
98
Connecticut
405
383
368 116
177
166
205
84
Pennsylvania
1, 419
1, 594
1,300 113
995
1, 007
899
94
Indiana
544
542
537 66
300
375
301
66
Missouri
670
640
559 59 1 382
453
368
82
Delaware
2, 839
2,776
2,836 100
2, 821
2, 811
2, 856
118
Maryland
4,816
4, 713
4,743 105
3, 281
3, 429
3,317
96
Virginia
1,740
1, 656
1, 598 93
1, 224
1, 138
1, 082
102
West Virginia
153
153
150 87
41 6
391
377
93
North Carolina
7,384
7,333
7,048 97
5,770
5, 771
5, 776
102
South Carolina
434
474
557 106
356
357
327
85
GEORGIA
12,288 12, 155 12, 179 88
9, 277
9,495
9,457
96
.
::J
Florida
854
818
799 177
437
458
530
129
Tennessee
1, 030
907
906 68
938
970
1, 013
81
Alabama
8, 811
8,784
8, 691 96
7,023
7, 157* 7, 191
102
Mississippi
5, 091
5, 015 4,984 104
4, 187
4,333
4,371
108
Arkansas Louisiana
"10, 250 1, 145"
9, 901 1, 123
10, 144 98 1, 152 115
7,432
7, 551
7,676
98
881
888
844
117
Texas Washington Oregon California
TOTAL 1967 (22 ?tates)
TOTAL 1966~ .. (22 states)
4, 692' 4, 589
4, 577 100
3, 510
3, 612
3, 597
98
743 '
766
581 91
503
507
411
81
407
334
;'.) 352
91
230
261
249
104
I 1,977 1, 936 ' 1, 882 108
1, 499
1, 475
1, 441
98
.69, 716 6B, 590
96 153, 192 54, 118* 53, 825
99
I
.
71,326 I 71, l OS - I 70, 382
I
54,461 53,838 54, 210
I
% of Last .Year
t
!
98 ;
-_.:_
.-96-- ~..:
:.:
96
*1/ _Cl,lrrent week as percent' 'Of same week ~ast year. Revised. -'
98
101
99
GEORGIA CROP REPORTING SERVICE
3!
i .
ATHENS, GEORGIA
June 22, i967~
MAY 1967
During May
% of
Jan. thru May
% of
Ite m
1966 1I
last
1967 21 year
1966 1I
1967 21
last year
Thou .
Thou.
Pet.
Thou.
Thou.
Pet.
Broiler Type
Pullets Placed(U.S. )3/
Total Domestic Chickens Tested:
4,309 3, 787
3, 646 85 3,336 88
19,479 17,163
18, 142 15,984
93 ' 93
Broiler Type
Georgia
381
520 13 6
2,456
2,89) 118
United States
l, 788
2,06 4 11 5
10, 677
12, 677 119
Egg Type
Georgia United States
20
6 30
131
135< 103
251
2 50 100
2, 826
3,209 114
Chicks Hatched:
-
Broiler Type
Georgia United States
49,269
44,729 91
219,907 218, 560
99
258,015 256, 523 99 1,168,619 1, 200, 165 103
Egg Type
Georgia United States
4,362 77,042
3,749 86 70, 167 91
17 J 184
. 19, 022
111
300, 199
z'99.~20
100
Commercial Slaughter:4/
Young Chickens
Georgia
33,464
37, 112 111
154, 192 164,939 107
United States
186, 898 211, 569 113
871 ,409 930, 842 107
Hens and Cocks
Georgia
738
1,088 147
4 ,429
5,976 135
United States
12,348
14,075 114
58,036
73,736 127
Egg Production:
Mil.
Mil.
Mil.
Mil.
Georgia
408
4 21 103
l, 814
2,047 113
. South Atlantic
United States
-5/
1,072 5,823
l, 13 7 106 6, 125 105
4,988 27,795
. 5, 494 110
2~. 583
l06
-1/ Revised. 2/ Preliminar y 3/ Pullets for broiler hatcher y supp1y flo.cks, includes
expected pullet replacements from eggs sold during the precedin~'mth at the..u. e of
125 pullet chicks per 30-d oz. case of eggs. 4/ Federal-State Mark.tetr~- ~J,;.vi e-
S1aughter reports only include poult ry slaughtere d under Fe eral Inspection. S/ outh
Atlantic States: Del., Md., W.Va., N.C., S.C., Ga., .8 a., Ytm 27 l96 i -
State
YOUNG CHICKENS: SLAUGHTER ED UNDER FEDERAL. ImJ~~lON
BY SELECTED STATES , 1966 and 19b 7
Number Inspected
Indicated Percent Condemned
During Apr.
Jan. thru Apr.
During Apr.
Jan. thru Apr.
1966
1967
1966
1967
1966
1967
1966
1967
Thou.
Thou.
Thou. Thou.
Pet.
Pet.
Pet.
Pet.
Maine Pa.
6, 165 7, 153
6,030 22,604 23,098 3.8 6,362 26,476 27, 225 4.2
4 .0
3.5
. 5. 8
4:4
3. 9 '.. 5.4
Mo.
2,904
3, 109 11 , 159 12,531 5.6
3. 9
6.9
5. 2
Del.
7,894
7,035 29, 552 27, 64 9 4 .6
5. 9
4.6
5.4
Md.
10, 897 11, 654 42,035 45, 567 4 .8
5.6
4~7
5. 3
Va.
3,453
3,779 13,431 14, 272 3.8
3.5
3 .3
4.3
N. C.
20, 552 19,073 76,902 79, 545 4 . 4
3. 5
4. 4 .
4.8
Ga.
30,942 31,041 115,102 123, 688 4 .2
4 .8
3.9
5.4
Tenn.
4,824
4,990 18,374 18,875 3 . 3
4 .1
3.3
5.6
Ala.
21, 031 20,985 75,884 79, 132 3. 8
3. 1
3. 5
4. 1
Miss.
12, 834 12,470 47,721 50, 815 3.2
3.2
3 .5
4. 1
Ark.
25,664 26,288 97,387 106, 534 3. 9
4 .0
3.9
5.0
Texas
9, 854 11,460 39,267 44,706 3.5
3.2
3.9
3.8
------
u. s.
----------------------- -----------
180, 143
680,330
---
----4 .0
------- -4. 1
-----------------------
4. 0
4 .8
182,015
723, 66 7
U
~
.:>.
Department
of Agnculture
Georgta Department of Agnculture
Statistical Reporting Se rvice
409A North Lumpkin Street, Athens, Georgia
End-of-Month Stocks of Poultry, Poultry Produc ts, Mea t and Meat Products United States - May 1967
Shell eggs: Increased by 134 thousand cases; May 1966 in c r ease was 34 thousand cases;
average May increase is 186 thousand cases. F rozen e ggs: Increased by 16 million
pounds; May 1966 increase was 10 million pounds; average May increase is 22 million
pounds. Frozen poultry: Decr.eased by 24 million pounds; M ay 1966 d e crease was 18
million pounds; average May decrease is 27 million pounds. B ee f: Decreased by 11
million pounds; May 1966 de crease was 11 million poun d s ; aver age M ay decrease is
6 million pounds. Pork: Decre ased 46 milli on pounds ; May 1966 decre ase was 4
million pounds; avzrage May decrease is 9 million pounds. Othe r m e at s: Decreased
by 3 million pounds; May 1966 change was an increase of 1 million pounds; average
May change is a decrease of 3 million pounds.
May
May
April
May
Commodity
Unit
1961-65 av
1966
1967
1967
Thou.
Thou.
Thou.
Thou.
Eggs:
Shell Frozen eggs, total
Total eggs !J
Case Pound Case
250 82,477
2,338
7S
4 2, 11a
1, 144
120 55, 464
1, 524
254 71,774
2,071
Poultry frozen: Broilers or fryers Hens, fowls Turkeys-whole Turkeys-other Other &t Unclassified
Total Poultry
Pound do. do. do. do. do.
------------------------------------------------~
20, 581 37,223 100,812
39,083 197,699
15, 50 l 24 ,393 69,398
4 1, 3 2:$ 150,61 5
4 1,967 47,748 141,788 34 ,279 54,986 320,768
40,709 48,217 113, 578 36,788 57, 747
297,039
Beef: Frozen in Cure
and :::ure d
do.
191, 336
20 5,77B
290, 100 279,453
Pork: Frozen in Cure
and Cured
do.
344,819
268,33 6
386,010 340, 106
Ot~er meats and meat
products
do.
112,651
97,51 7
106, 4 36 103,653
Total all red meats
do. . 648, 856
57 l , 6 3 J.
782, 546 723,212
MID-MONTH PR.ICES R;:t; C:. IVE D AND P R I C1:!: S P A ID
Geor gia
United States
Item
May 15 April 15 May 15 May 15 A prill5 May 15
----------------------------C1-9-e6~n6-ts-~~~-C-19-e6-n7~t s~~----C1~9e~6n7~ ts
1966
1967
S ents Cents
1967 Cents
Prices Received:
Chickens, lb. excluding
broilers
12..0
9.0
8.0
10. 5
8.6
8. 1
Com'l Broilers {lb.)
16.0
12..5
12.
16.7
13.8
13.3
All Chickens (lb.)
15. 8
12, Li
11.8
16. 1 13.3
12.. 8
All Eggs (dozens)
39.9
35. 1
34.4
33. 4
29.9
28.9
Prices Paid: (per 100 lb.)
Dol.
Dol.
Dol.
Dol.
Dol.
Dol.
Broiler Grower
5.00
5.00
5.0
4 .86
5.06
4.97
Laying feed
4.75
5.00
5.00
4 . 50 4.68
4.65
Scratch Grains
4.20
4. ~ 5
4. 40
3 .94
]J Frozen eggs converted on the basis of 39. 5 pounds to the ca s e .
4. 11
4.09
************************************************** ~ * ** ** * *************************
This report is made possible through the coope ration of the National Poultry Improvement
Plan, Official .State Agencies, the Animal Hu s bandry R e s e arc h Division of the Agricultural
Research Service, the Inspection Branch of t h:~ Poultry Di vision, Consumer and Marketing
Service and the Agricultural Estimates Division of the Sta ti stical R eporting Service and
the many bree ders, hatcheries, poultry proc zs sors and the poult ry farmers that report to
these agencies.
ARCHI2 L ANGLE Y
W. A. WAGNE R
Agricultural Statistician In Charge
Agri c ult ur al Statistician
After Five Days Return to:
P ost age and F e e s Paid
United 3tates Department of Agriculture
U. S. De pa rtment of Agriculture
Statistical Reporting Service
409A North Lumpkin Street Athens, Georg1a
OFFICIAL BUSINESS
~oO
Ac g ui si ~i on s. Divi ~ i on
un1vers1ty Ll bra r le s Uni versity of Geo r gia Athens Georgia 3 0 6 01
GEORGIA CROP REPORTING SERVICE Athens , Georgia
Week Ending June 26, 1967
Released 3 p.m. Monday
""I
CROP CONDITION UNCHANGED
Athens, Ga., June 26 -- .General crop conditions were about the same as the previous week,
agcording to _the Georgia Crop Reporting Service. Farmers were very ~ctive cultivating crop's, applying contrql measures for insects and diseases, applying herbicides, harvesting grain, planting soybeans and sorghums, and haymaking. Only four County Agents reported soil moisture as being very short.
Q~ condition deteriorated still further during the week. County Agents estimated the condition as mostly fair. About half of the cotton was setting bolls in southern districts, but practically none was this advanced in northern counties.
Additional soil moisture improved ~ condition slightly. Crop prospects are good in most areas.
_.
....
""" -r , . , J
..., .. ~
-
Pean~ prospects were better than any other major crop. Farmers were busy with insect and
disease controls, application of land plaster, and cultivation.
Tobacco harvest. continued to increase and cropping was reported as 10 percent complete. The condition of the crop was mostly good with a slight improvement over the previous week. Suckering, insect control, and topping were still ~ctive.
Small ~harvest was virtually complete in southern areas, past the 90 percent mark
in central counties, and well over two-thirds complete in northern districts. State-wiqe, over 90 percent of the wheat and 94 percent of the ~ have been harvested.
About 90 percent of the intended soybean acreage and 75 percent of the sorghum acreage have been planted. Haymaking has been very active. Pastures were reported _as mostly good.
~~ . harvest was nearing completion in southern counties, about one-half complete in
central counties and just beginning in the northern part of the State. Through June 22,
1
,
744.'
c
a
r
lo .
t
equivalents .
had 'been
shipped
compared
to
1,667
through
the
same
date
last
year.
Market Managers reported most yegetable crops have passed peak harvest, and melons are
nearing peak in central and southern areas. High temperatures damaged cantaloup and tomato
vines. Through June 23, 2,439 carlot equivalents of watermelons had been shipped compared with 352 through the same date last year.
WEATHER SUMMARY -- Rainfall over Georgia was highly variable in showers during the week ending Friday, June 23. The showers were generally light to moderate in the north and moderate
to locally heavy in the south. Several south Georgia weather stations, and Dalton in the extreme nortnwest, had more than 3 inches during the week. The observer at Colquitt measured
5.74 inches for the largest weekly total. Of this amount, 4.46 inches fell in a 24-hour period.
In contrast, only a trace of rain was recorded at West Point and several other places had less than one-fourth inch. The showers were more frequent during the last half of the week and con-
tinued to occur through the weekend.
The past week was the warmest of the summer in Georgia as temperatures averaged near nor-
mal, or slightly above, over most of the State. This was the first week in the last six that
had been as warm as normal. Highs were in the upper 90's in south Georgia and lower 90's over
most of the north on one or more days. However, there was considerable variation from day to
day, depending on whether or not showers occurred in the area. e week was also quite humid due .tb. the flow of moist air from the Gulf and the frequent show~~r~~~,;::~----~........0
The
five-day
forecast
for
the
period
Tuesday
through
Satur
ay
ER
(June
ITY OF
27 -
GJEuOlRGyI ~
)
calls
for
temperatures to average near normal with little day to day chan e. N~a)3 h~tJ6-f for ate June
range from 87 to 93 degrees and normal lows from 65 to 72 degre s. Rainfall 1s expe ted to be
moderate to locally heavy with totals ranging from l/2 to l 1/ inches The rainfal trill occur as widely scattered showers and thundershowers mainly in -"""-olilolo..l;t:.~eWf1~"1o~ B~ru:~~--_j
issuED-BY:- The Georgia crop-Reporting-service-; Athens-; Georgia; -in cooperation wit11-ti1e- - Cooperative Extension Service, Univers~ty of Georgia; Georgia Department of Agriculture; and the Weather Bureau, ESSA, U. S. Department of Commerce.
U. S. DEPARTMENT OF COMMERCE WEATHER BUREAU Athens, Georgia
ESSA
Precipitation For 'The Week Ending June 23, . ~967
GEORGIA
Temperature extremes for the week ending June 23, 1967 (Provisional)
Highest: 100 at Bainbridge on the 2oth and 21st.
560 at Blairsville, Helen and Talla-
poosa on the 17th.
* For the period June 24-26, 1967
T, less than .005 inch
After Five Days Return to United States Department of Agriculture
Statistical Reporting Serv ice 409A North Lumpkin Street Athens, Georgia 30601 OFFICIAL BUSINESS
Postage and Fees Paid U. S. Department of Agriculture
IMMEDIATE - U. S. WEATHER REPORT This report will . be treated in all
Respects as Letter Mail (See Sec. 34. 17, P. L. & R. )
The Univ L brary
Univ Or' a A' ltrms Ga 30601
H~cfoo1
G-L\ 3
? cr-<.o? 1~61
.JU Y\.t. ~(R
J G
r-< E?o;<-r
GEORGIA
LIBRARIES
315
June 1, 1967 Released 6/26/67 by
GEORGIA CROP REPORT ING S.ERV ICE
Sprinq Piq Crop Up 6 Percent
Georgia's 1967 spring pig crop (December 1966- May 1967) is estimated at 1,150,000 head, 6 percent above the 1966 spring crop of 1,086,000 head. A total of 162,000 sows farrowed during the period-averaging 7.1 pigs per 1itter.
1967 Fall Intentions Steady
Sows farrowing during the fall of 1967 (June-November) on Georgia farms are expected to number 140,000- equal to the 1966 fall 'farrowings~ If these intentions are realized (and assuming an average of 7.1 pigs per 1itter), the fall pig crop would total 994,000 head.
SO\.JS FARRO~IING, PIGS PER LITTER, AND PIGS SAVED, SPRING AND FALL GEORGIA AND UNITED STATES, 1962-67 .
Spring (December through May)
Fall (June through .November)
Year
Sows
Pigs per
Pigs
Sows
Pigs per
Pigs
farrowed
1 i tter
Saved
farrowed
1i tter
Saved
1 ,000 head
1,000 head
1,000 head
1,000 head
GEORGIA
1962
166
7.0
1, 162
157
7.0
1,099
1963
169
7.0
1 '183
149
7. 1
1,058
1964
152
7.0
1 ,064
130
7.0
910
1965
144
7.0
1,008
125
7. 1
888
1966
153
7. 1
1,086
140
7. 1
994
1967
162
7. I
1 '150
140 l/
UN ITED STATES
6,996
7.08
49,535
6,080
7.23
44,073
7,099
7.15
50,749
5,987
7.23
43,307
6,596
7.23
47,682
5,525
7.21
39,862
5,890
7.22
42 , 525
5,006
7.27
36,415
6,219
7.32
45,552
S,648
7.25
40,965
6,263
7.34
45,949
5,452 ll
7. 27 1/ 39,600 1/
!I Number to farrow indicated from breeding intentions reports.
11 Average number of pigs per 1itter with allowance for trend used to compute indicated number
of fall pigs. Number rounded to nearest 100,000 head.
The Georgia Crop-R;porti-;;g-S;r~ i~e: 4o9A-North-L~mpkln-Str;et .-Athens ,-G;orgTa: Tn-cooperatiOn
with the Georgia Department of Agriculture.
(Over)
UNITED STATES:
DECEMBER 1966-HAY 1967 PIG CROP UP I PERCENT
The U. S. pig crop for December 1966 - Hay 1967 totaled 45,949,000 head, I percent more than .in the same period a year earl ier. Each region showed an increase except the East North Central which was down 3 percent. Increases were: North Atlantic, 4 percent; \.Jest North Central, I percent; South Atlantic, 7 percent; South Central, 6 percent, and the West, 5 percent.
The December-Hay farrowings were 2 percentage points less than indicated by farmers' intentions last December. By regions, December-Hay farrowings compared with intentions reported last December as percent of a year earlier are: North Atlantic, 101 percent now and 103 percent in December; East North Central, 97 and 102; West North Central, 101 and 101; South Atlantic, 107 and 107; South Central, 104 and 110; and West, 106 and 103.
The average number of pigs per I itter was a record high of 7.34 for December-Hay compared with 7.32 a year earlier.
JUNE-NOVEMBER INTENTIONS
June I reports from farmers on breeding intentions indicate that 5,452,000 sows will farrow in the United States during June-November 1967. This is a 3-percent decrease from the 5,648,000 sows farrowing during the corresponding period of 1966 and is 4 percent below average.
If intentions for June-November farrowings materialize and the number of pigs per litter equals the average plus an allowance for trend, the pig crop for the period will total 39,600,000, a decrease 3 percent from a year earlier. The combined 1967 pig crop at 85,549,000, would be I percent below the 1966 pig crop.
ARCHIE LANGLEY Agricultural Statistician In Charge
W. PAT PARKS Agricultural Statistician
After Five Days Return to
United States Department of Agriculture Statistical Reporting Service 409A North Lumpkin Street Athens, Georgia 30601 OFFICIAL BUSINESS
Postage and Fees Paid
U. s. Department of Agriculture
Cmlil uo~EORGIA CROP REPORTING SERVICE
GA 3
. \q bJ STATE DEfiAATMENT OF AGRICULTURE
.Ju _q, /, 7
U. S. DEPARTMENT OF AGRICULTURE STATISTICAL AEPOATING SERVICE
UNIVERSITY OF GEORGIA
315
Athens, Georgia
JUL 11 1967
June 27, 1967
CRIMSON CLOVER SEED FORI~~ll..~..c::..,_T_LI_ BRA_ RIES_ _...J
Q~ia
Crimson Clove~d Production Smallest in 26 Years
Tbe 1967 crimson clover seed production in Georgia is forecast at 595,000 pounds compared
nth 600,000 pounds in 1966. This is the smallest crop since 1941. The acreage harvested is 7,000 compared with 6,000 last season, but is only 67 percent of the 1961-65 ~yerage of ,10,400 acres. Yield per acre in 1967 of 85 pounds is equal to the record low in 1955.
Little rainfall was received from March to mid-May in the southern half of the State and ~eld prospects were reduced. Some acreage intended for seed was not harvested due to the ' lower yield. In the northern districts, heavy rains during the harvesting season damaged the crop in some areas and reduced yields by heavy shattering.
- - - United S......t..a_t...e....s...
Crimson clover seed production in the Southern States this year is estimated at 1,912,000 pounds, 19 percent less than the 1966 crop. Reseeding varieties such as Dixie, Autauga, and Auburn are expected to total 1,145,000 pounds compared with the 1,370,000 pounds produced from
.these varieties last year.
Favorable weather conditions last fall permitted newly planted and volunteer stands of ~r~on clover to become well established. Development during the winter months in southern producing States was generally good. However, very little rainfall from March to mid-Nay in ~orgia and Alabama reduced seed production. In Tennessee, excessive rainfall :during the blooming period resulted in poor seed set and additional rainfall during the harvest period caused shattering and heavy vegetative growth. With a generally favorable season in
Mssissippi and Arkansas, yields were above average. The five.State total of 17,300 acres is U percent below the 19,900 acres harvested last year, and 46 percent below the 1961-65 average.
!
Yield per acre in the five-otate area is estimated at 111 pounds, a decrease of 8 pounds from the 119 pound yield in 1966. Yields were below 1966 in Georgia and Tennessee. Yields
~ualled or exceeded last year in ~rkansas, Mississippi, and Alabama.
Harvest of crimson clover seed was generally earlier than last year. Average beginning
4ates of harvest this year were: Hay 15 in Georgia and Alabama; Hay 16 in Hississippi,
May 31 in Tennessee; and June 2 in Arkansas.
Carryover of old-crop crimson clover seed by growers in the five Southern States is es-
~ted at 55,000 pounds, 30 percent less than last yearts carryover of 79,000 pounds. A
report covering June 30, 1967 stocks of old-crop seed held by dealers will be issued August 3.
There has been no crimson clover seed imported since September 1963 when 44,000 pounds
118l'e imported.
An estimate of the late harvested crimson clover seed crop in Oregon is scheduled for release August 9.
(OVER)
. . ... 2 . -
' . .
CRIMSONCLOVER SEED : Acreage harvested, yield per acre, and production, Average 1961 -65, annual 1966 and 1967
-:---:--A--'C-res-:iia-r-v--e-s-:t-e-aln--d-i-:-.:.---:-yre-r-;::r-i-J-e-ra:Icnredi:-::--P-r-o-ductio:n-( c-le-a-n-seIenddTi:--
---- ------------- --- State
11 Average 1966
1961-65
Gated :Average: 1966 : cated : Average : 1966
11 : 11 : 1967 :1961-65:
1967 : 1961-65 :
--..-.....
cated 1967
Acres
PoundL.
Thou~nd pounds
Ga. Tenn. Ala.
Hiss . Ark.
10,400 6,000
7,000 127 100
85
1,354
600
595
7,400 4,000
2,500 168 150 140
1,187
600
350
9,700 6,500
4,500 135 100 100
1,319
650
450
3,060 2,800
2,800 118 130 140
360
364
392
1,140
600
500 174 250 250
200
150
125
Total 5
. States
32,060 19,900
17,300
139 119
111
4,480 2,364 1,912
,iTRev.,...is_e_d~.---~-------- --------~-~~---- - ----------
C. L. CRENSHAW Agr~cultural Statistician
_, ._t. , ,,...J.
ARCHIE LANGLEY
Agricultural Statistician In Charge
ISSUED BY: TheGSOrgia CropReporting Service, USDA, 409AIJorthLUmpkinstreet:--nens, Ga:-;in cooperation with the Georgia Department. of Agriculture.
After Five Days Return to United States Department of Agriculture
Statistical Reporting Service 409A North Lumpkin Street Athens, Georgia 30601 OFFICIAL BUSINESS
Postage and Fees Paid
U. s. Department of Agriculture
)~ ;
I
Acquisitions Division
Unl ve rsity of Georgia
University Libraries
Athens Georgia 30601
k
I Id
l
&~fY
\4bl
00 :
J..cg
GEORGIA CROP
u :' '" ':: "SITY OF GEC1GIA
3 /S
ATHENS, GEORGIA
...,
June 28, 1967
GEORGIA CHICK HATCHERY REPORT
Placement of broiler chicks in Georgia during the week ended June 24 was 9, 226,000--2 percent less than in the previous week and 7 percent less than in the comparable week last year, according to the Georgia Crop Reporting Service.
An estimated 12, 179, 000 broiler type eggs were set by Georgia hatcheries-the same as in the previous week but 12 percent less than in the comparable week a year earlier.
The majority of the prices paid to Georgia producers for broiler hatching eggs were reported within a range of 50 to 65 cents per dozen. The average price of hatching eggs was 56 cents per dozen. The price of eggs from flocks with hatchery owned cockerels generally was 2 cents below the average price. Most prices received for broiler chicks by Georgia hatcheries were reported within a range of $5.00 to $8.75 with an average of $7.75 per hundred. The average prices last year were 64 cents for eggs and $9.75 for chicks.
Week Ended
GEORGIA EGGS SET, HATCHINGS, AND CHICK PLACEMENTS
Eggs Set
1966
1967
EGG TYPE
Ufo of year ago
Chicks Hatched
1966
1967
Thou.
Thou.
Pet.
Thou.
Thou.
% of
year ago
Pet.
May 27 June 3 June 10 June 17 June 24
Week Ended
1, 066 l, 065
942 762 695
Eggs Set !J
1966 Thou.
1967 Thou.
741
70
680
64
669
71
543
71
674
97
BROILE~ TYPE
941 l, 073
858 864 851
Ufo of year ago Pet.
Chicks Placed for
Broilers in Georgia
Ufo of
1966
1967
year
ago
Thou.
Thou. Pet.
853
91
836
78
770
90
630
73
571
67
Av. Price
Hatch
Broiler
Eggs
Chicks
Per
Per
Doz.
Hundred
1967
1967
Cents
Dollars
Apr. 22
13, 841 12,736
92
9,726 10,022 103
56
Apr. 29
14,447 12, 899
89
9,910 10, 125 102
56
May 6
14,228 12,523
88
10, 021
9.949
99
56
May 13
14,206 11, 919
84
9,906
9,471
96
56
May 20
14, 133 12,414
88
10, 155
9, 587
94
56
May 27
14,082 12, 535
89
9, 913 10,001 101
55
June 3
14,026 12,288
88
10,085
9,277
92
55
June 10
13, 998 12, 155
87
10,026
9,495
95
55
June 17
13, 820 12, 179
88
9, 883
9. 457 96
56
J11ne 24
13, 859 12, 179
88
9,937
9,226
93
56
1/ Includes e gg s set b y hatcheries p roducing chicks for hatcher Y suPP1Y flocks.
ARCHIE LANGLEY Agricultural Statistician In. Charge
W. A . WAGNER Agricultural Statistician
7.75 7.75 7.75 7.75 7.75 7.75 7.50 7.50 7.75 7.75
U, S. Department of Agriculture
Georgia Department of Agriculture
Statistical Reporting Service
409A North Lumpkin Street, Athens, Georgia
EGGS SE'l.' AND
STATE
June 10
Week J:!., nded June 17
THOUSA NDS
June 24
Maine
Connecticut
l'
Pennsylvania
Indiana
Missouri
Delaware
Maryland
Virginia
West Virginia
North Carolina
South Carolina
1,998 383
1, 594 542 640
2, 776 4, 713 l, 656
. 153
7,333 474
1, 927 368
1,300 537 559
2, 836 4, 743 l, 598
150 7,048
557
2,098 357
1,622 556 574
2, 844 4,699 l, 7 82
153 6,970
519
GEORGIA
12, 155 12, 179 12, l 79
Florida Tennessee Alabama Mississippi Arkansas Louisiana Texas Washington Oregon California TOTAL 1967 (22 States}
818 907 8, 784 5,015 9,901 1, 123 4, 589 766 334 1, 936 68, 590
799 906 8,691 4 , 984 10, 144 1, 152 4 , 577 581 352 1, 882 67,870
818 883 8, 572 4,846 10,071 1, 147 4,499 614 269 1, 807 67,879
TOTAL 1966* (22 States}
71, 108 70,382 70,883
o/o of Last Year
96
96
96
*1/ Current week as p ercent of same week 1a s t year. Revised.
"!o of year ago 1/
-
June 10
Week Ended
. June
17
June 24
THOUSANDS
age Z
%of year ago 1/
103
1, 513
80
166
120
1,00'7
67
375
I
59 I 453
101
2, 811
104
3,429
103
l, 138
92
391
94
5,771
107
35'7
1, 53 7 205 899 301 368
2,856 3, 317 1, 082
377 5,776
327
1, 555
99
192
89
903
104
293
66
368
86
2, 625 '
99
3, 567
113
l , 129
102
419
103
5,666
102
344
90
88
9,495
9, 457
9, 226
93
187
458
530
518
126
68
970
1, 0 l3
1, 032
81
95
7, 157* 7, 191
7, 019
97
105
4,333
4,371
4,434
111
99
7, 551
7,676
7, 739
99
102
888
844
896
123
99
3,612
3, 597
3,654
99
103
50'7
411
540
100
63
261
249
270
90
95
1, 475
1, 441
1, 478
108
96
54, 118* 53,825 53, 867
100
53,838 54,210 54,079
101
99
100
-
.
0
f"\f
-'-'C\. \-\ DDjOOl
~t;\A
FARM G-4 3
l. 1 c}()
REPORT
GEORGIA CROP REPORTING SERVICE
ATHE
JUL 13 1961
une 1967
GEORGIA COTTON: ACREAGE, YIELD AND PRODUCLI~O~~~. ~. ~~-~
.._ _ __(TI!~~~t~~~,e_!?ed_~~~lat~~L~~ilable d~ta2&~~...Ereliminar:yl_______
:
:
: PRODUCTION
District
_ _ _ _ _ _ACRES_
_.:.__Yl~..11NU~RE- _: $00 Pound
and
:Gross Weight
c..,ou..,n._.tv..___ _ _ _ _ __:_ _ _r~~~2!:~
Harvested : Planted
- - Acres ------pounds
Harvested : Bales ~~ --- Bales - - - - - -
DISTRICT ! . I
Bartow Catoosa
Chattooga
Dade
Floyd Gordon Hurray
Paulding Polk Walker Whitfield
10,670
350 2,330
120
4,750 5,080
990 90 3,340 660 320
10;100
364
340
249
2,250
215
110
250
4;590
351
4,910
234
950
181
90
211
3,220
327
630
227
310
147
385
8,110
256
180
223
1,050
273
60
363
3,480
242
2,480
188
380
211
40
339
2,280
238
310
152
100
TCTAL
28,700
27,500
308
322
18,470
DISTRICT g
Barrow
Cherokee Clarke Cobb
Dawson De Kalb Forsyth
Fulton Gvinnett
Hall
Jackson
Oconee Pickens
Walton
'white
TCTAL
1,610 50 320 40
5
45 75 310 "840 220 1,300 3, 750 20 8,200 15
16,800
1,540
266
45
180
310
197
40
150
5
200
45
222
70
240
300
300
800
181
210
141
1,250
297
3,590
337
20
100
7,860
336
15
200
16,100 .
311
278
890
2CO
20
203
130
150
13
200
2
222
21
257
40
310
194
190
315
148
65
309
810
352
2,630
100
4
351
5,760
200
6
324
10,900
I
Page 2
' . June 1967
GEORGIA COTTON : ACREAGE, YIElD AND PRODUCTION., 1966
,
---------lt~~~~~
:
are
based-- on-t- he-l~a- t e: st-a~va-il-a- bl- e -d~ at-a-a-n-d-a7rPe RpOreDlUimCiTnaI~~v)ON~---~
District and
Countv
ACRES
YIEb9 LINT PER ACRE : 500 Pound
:Gross Weight
Planted
- - Acres
Harvested
Planted : Harvested : .. B~rle s
-!c-res.;;..;;..._.;:....__. Pou~~- Pounds --g;;.a;.;;;l;;.;e~s----l
Banks Elbert Franklin Habersham Hart Lincoln Hadis on Oglethorpe Stephens \r\filkes
DISTRICT /!
Carroll Chattahoochee Clayton Coweta Douglas Fayette Haralson Harris Heard Henry Lemar Macon rviarion Meriwether Muscogee Pike Schley Spalding Talbot Taylor Troup Upson
TGTAL
500 3,740 3,400
20 5,200
290 3,820 2,600
150 580
20,300
1,170
5
85 2,120
70 270 130 660 280 3,110 620 6,840 1,600 4,150 10 .2, 890 1,2-90 680 400 4,410 710 200
31,700
480 3,560 3,230
20 4, 940
280 3,630 2,470
140 550
19,300
1,110 5 80
2,010 65 260
120 620 260 2,940 590 6,480 1,510 3,930 10 2,740 1,220 640 380 4,170 . 670 190
30,000
354
369
370
367
386
2,870
252
266
1,790
350
350
15
311
327
.3,370
238
246
140
265
279
2,120
262
275
1,420
160
171
50
345
364
415
296
312
12,560
193
204
470
200
200
2
365
388
65
337
356
1,490
200
215
29
330
342
185
223
242
60
373
397
510
329
354
190
371
392
2,410
318
334
410
369
389
5,270
376
399
1,260
344
363
2,980
200
200
4
401
423
2,420
377
398
1,010
369
392
530
280
295
230
463
490
4,260
276
293
410
205
216
85
367
388
24,280
~G\A
~a FARM REPORT
GEORGIA CROP REPORTING SERVICE
ATHENS, GEORGIA
June 1967
GEORGIA FLUE -CURED TOBACCO: 1966 COUNTY :L!;STIIviATES
----------- - - - - . . , - - - - - - -
v~ ....., ;-.::;------------ ~-----
Page 3
District 1 and
~untv
June 1967
GEORGIA COTTON: ACREAGE, YIELD AND PRODUCTION, 1966
(These estimates are based on the latest avai!able data and~ Ereliminary)
- - : PRODUCTION
. .
---!QRES
YIELD LINT PER ACR~ 5oo Pound
.. :Gross Weight
Planted .....L ...l!~llited :.__fla!_!ted
H~~d
~les
- - Acres
Acres
- - Pounds
~!!lli!2.
Bales
DISTRICT. 2_ Baldwin Bibb Blackley Butts Crawford 'Dodge Greene Hancock 41ouston
Jasper Johnson .Jones laurens Monroe Montgomery Morgan Newton j each Pulaski Putnam Rockdale 'laliaferro Treutlen Twiggs .ashington
Wheeler Wilkinson
750
370 3,820
660 800 6,580 360 2,960
2,470 800
9,290 50
15,000
170 1,870 6, 770 1,500 1,050 5,000
270 510 180
1,800
1,580
8,250 1,350
690
720 350 3,690 640
770 6,350
350 2,860 2,380
770 8,970
50 14,500
160 1,810 6,530 1,450 1,010
4,830 260
490 170 1,740 1,520 7,960 1,300'
670
320
333
500
441
466
340
520
53 8
4,140
356
367
490
258
268
430
413
428
5,670
197
203
150
263
272
1,620
294
305
1,520
386
401
640
380
394
7,370
400
400
40
442
457
13,840
241
256
85
302
312
1,180
305
317
4,320
347
359
1,090
319
332
700
488
505
5,090
270
281
150
171
178
180
172
182
65
334
345
1,250
546
567
1,800
475
492
8,170
316
328
890
270
278
390
TorAL
74,900
72,300
397
412
62,110
' !STRICT .
Bulloch Burke andler Columbia Effingham
fmanuel Glascock Jefferson
i enkins lk:Duffie Riclunond Screven
~arren
7,860 21,000
3,950 310 810
9,460 2,060
11,100
6,090
2,240
940 7,890 4,690
7,290 19,500 3,660
290 ?50 8, 750 1,910
10,300 5,650 2,080
870 7,300
4,350
355
383
5,830
437
470
19,130
298
322
2,460
287
307
180
177
191
300
353
382
6,970
338
364
1,450
438
472
10,150
315
404
4,760
402
433
1,880
440
476
860
362
392
5,910
389
420
3,810
TGrAL
78,400
72,700
390
420
63,750
. ,
Page 4
June 1967
GEORGIA COTTON: ACREAGE, YIELD AND PRODUCTION, 1966
(These estimates are based on the latest available data and are preliminary)
--.----------- --------------- : PRODUCTION
. District
-~-.-!QEE..L_
YIELD !;;_IN!_RER A~- 500 Pound
and
:
:Gross Weight
Q.~~y
_ _:_Pl~~Acres
Harvested
- - Acres
Planted : Harvested : Bales
- - - - - - - - Pounds--POUnds-- ~~
DISTRICT 1
Baker
Calhoun Clay Decatur Dougherty Early Grady Lee Miller Mitchell Quitman Randolph Seminole Stewart Sumter Terrell Thomas Webster
1,130
3,230 1,570 1,070
1,140 6,340
1,670 2,060
3,020
6,030
410 3,260 2,550 1,180
5, 720 6,990 2,900
530
1,070 3,060 1,490 1,010 1,080 6,000 1,580
1,950 2,860
5,700
390 3,090 2,410 1,120
5,420 6,620
2,750 500
288
305
680
436
460
2,940
465
490
1,520
255
270
570
301
318
720
426
450
5,640
273
289
950
437
462
1,880
378
399
2,380
309
327
3,890
427
449
370
467
493
3,180
276
293
1,470
452
476
1,110
553
584
6,600
491
519
7,160
315
332
1,910
377
400
420
TCJrAL
50,800
48,100
409
432
43,390
DISTRICT 8
A:tk:inSOn -
Ben Hill Berrien Brooks
Clinch Coffee Colquitt Cook Crisp Dooly Echols Irwin Jeff Davis Lanier Lowndes Telfair
Tift Turner vJilcox vJorth
195
2,760
1,790
4,570
45
3,300
13,500
2,020
6,650
16,700
20
4, 730
'
1,280 330
1,380
2,360
3,510
4,610
6,500
10,650
180
2,570 1,670
4,250 40
3,070 12,700
1,880 6,200
15,600 20
4,400 1,190
310 1,290 2,200
3,270 4,300 6,060
9,900
256
278
100
419
450
2,410
284
304
1,060
181
194
1,720
200
225
20
265
285
1,830
370
393
10,420
253
272
1,070
571
612
7,920
562
602
19,600
500
500
20
397
427
3,920
283
304
760
170
181
115
144
. 154
415
184
198
910
308
331
2,260
401
430
3,860
380
408
5,160
394
424
8, 770
TOTAL
86,900
81,100
399
427
72,340
~G\A
u v ~a FARM REPORT
GEORGIA CROP REPORTING SERVICE
ATHENS, GEORGIA
3!5
June 1967
GEORGIA FLUE-CURED TOBACCO: 1966 COUNTY ESTIIqATES
- - - - - - - -....- - - - - - - - -
v; t:l;-~-------- ~-----
,. "
, , . 1 ..
., . '. I ., l '
', LO,
r
".'.' 't, , ..1 t":-
' 1 '"
Page 5
June 1967
GEORGIA COTTON: ACREAGE, YIElD AND PRODUCTION, 1966
(These est!m!tes are based on the latest ava~~-9!~~ and are prel!minarvl__________
1
:
: PRODUCTION
District
a...~c
ACRES,.
: YIElD LINT PER ACRE : 500 Pound
and
:
:
:Gross Weight
C__o.u_n_t_v____ ...... - .t.
Planted
..{1~~~~
-Tares------ Harvested : Planted
Acres
~ ... POund~
Harvested : Bales Po~pq~
.. DISTRICT 9
~
~
Appling Bacon Brantley , Bryan Charlton Evans , Liberty Long Pierce
Tattnall Toombs
vJare
\vayne
TarAL
2,260 1,050
20 95
5
1,5lO 15 95 810
3,170 4,290
230 950
14,Soo
2,010
930
20 85
5
1,340 15 85 720
2,820 3,820
200
6So
12,900
215
241
1,010
187
211
410
200
200
10
147
165
30
200
200
2
325
366
1,025
200
200
6
116
129
22
177
199
300
252
284
1,670
375
421
3,360
130
lSO
65
147
165
290
271
304
8,200
STATE TCII'AL
403,000
380,000
376
398
316,000
C. L. CRENSHAW Agricultural Statistician
ARCHIE LANGLEY Agricultural Statistician In Charge
isSufn-BY:- lfhe Georgia crop-Reporting service,-uSDA,-:~-rorth-Lumpkin-street,..Athens, -Ga.7 - --..: :tn cooperat.ion t-rl.th t.he Georgia Dep~rtment of Agriculture.
G~-~
3!5
HD 07
t1 A3
~G\A
~a 1Clb1
u
FARM REPORT
GEORGIA CROP REPORTING SERVICE
A T HEN S, GEORGIA
,DIStrict-
and Count:v
,[fsTRICTS b
land~
June 1967
_ __ Q:~EQJ! FLII:Q!l.BEIL..TOBACCO: 1.966_Q_OUNTY l!;e_TI_~~~---------
Yield
Harvested
Per Acre
Production
~'- -
_ _..fu;!.~~ge --~---- Lb..:.__ _ _
(QQQ_l:~l -
0
0
0
DISTRICT 5_ Dodge
Johnson Laurens ~ !1ontg omery Treutlen !heeler Hlilkinson
340
1,024
348
75
1,079
81
225
1,026
231
800
1,119
895
700
1,085
760
450
932
419
5
992
5
TOTAL
2,595
1,056
2, 739
DISTRIC:;. _ Bulloch , .candler Effingham Emanuel
Jenkins Screven
2,800
1,450 160
1,400 140 100
1,214 1, 230
856 1,107
975 927
3,398 1, 783
137 1,550
136
93
TOTAL
6,050
1, 173
7,097
DISTRICT 1
Baker Decatur Dougherty Grady
litchell Stewart Thomas
5 320
20
1,300 2, 100
10 1,600
1,688
1,442 1, 348 1,599 1,887 1,667 1, 779
8 461
27 2,079
3,963 17
2,847
TGrAL
5,355
1, 756
9,402
.. errien
oaks linch offee olquitt ook
TOTAL
-
..,........,..~
UNIVERSITY OF GEO RGIA
JUN 14 1967
1,000 725
3,220 2,200
225 3,550 4,800 2,450
25
5 300 1,800 1,560 1,100 3, 750 650 2,300 160 200 1,550
31,570
LIBRA RIES
(continued on back of page)
1,944 1,519 2,000 1, 751 1,506 1,635 1,815 1,842 1,594 1,686 1,936 2,042 1,605 1, 877 1,690
971 1, 971 1,621 1,084 1,584
1,774
1,944 1,102 6,438 3,853
339 5,805 8,712 4,513
40 8
581 3,675 2,504 2,065 6,33B
631 4,533
259 217 2,455
56$012
June 1967
District----------G-E-O-RG-IA-.F-LU-E--c-U-R-ED--T-OB-A-CC-O-: --19-6-6-CYOUiNT8Y lEdST.H....I..-AT-ES------------ - -
and
Q.~~iY"--
Harvested
-~E~e
Per Acre Lbs.
Production
--~~{000 lb~.L-
;QJ~TRICT 2_
1;-
Appling Bacon Brantley Bryan Camden Charlton Chatham Evans Liberty Long Pierce Tattnall Toombs \Tare '\'Jayne
2,000
1,700 850 250
5
130
5
900
70 250 2,550 2,500
1, 725 1,275 1,220
1,380 1,648
865
873 1,043
1,053 1,281 1,001 1,111
978 1,387 1,457 1,395 1,556 1,369
2,761 2,802
735 218
5
137 6
901 78
. 245
3,537 3,643 2,407 1, 984 1,671
TGTAL
15,430
1,369
21,130
STATE TOTAL
61,000
1,580
96,380
--------- - - - - - - - ----..-...-..-------------.-----=-=-=-=-=-=====-=--=-=--=-:-:-.-- -----~
ARCHIE LANGLEY Agricultural Statistician In Charge
C. L. CRENSHAVJ Agricultural Statistician
rsUEr5BY: The GeorgiaCrop ReportingServic8";USDA, 409A Nor thLumpkinStreet, Athens, -Ga~;
in cooperation with the Georgia Department of Agriculture
After Five Days Return to United States Department of Agriculture
Statistical Reporting Service 409A North Lumpkin Street Athens, Georgia 30601
- - OFFICIAL BUSINESS
Postage and Fees Paid
U. s. Department of Agriculture
A~ guisi~ions Division Cn1 ve r s ity of Georgia r niv ~ ~ulJy Li braries Ath ens Ge orgia 30601
Ueek Ending July 3, 1967
CROPS IMPRGVE
JUL 11 1967
Athens, Ga._, JuLy J -- The condi.tion of crops
-the past lileek, ac-
cording to the Georgia Crop Reporting Service. Increased soil moisture
gely responsible
for the brighter outlook. Between showers, farmers were very busy with cultivation and fertili-
zation practices. Herbicide treatments, insect and disease controls, soybean and sorghum plant-
ing, haying, and grain harvest also received considerable attention.
Cotton showed the least improvement of all row crops. Frequent thundershowers made insect contror-difficult, and infestations were reported on the increase. Over two-thirds of the crop ~ setting bolls in southern areas, less than half in central sections, but boll setting was just beginning in most northern counties.
Prospects for corn continued to improve with most sections reporting the condition as good. S~eral additional county Agents judged corn in their counties to be excellent.
A busy schedtiie o~ insect 'aKd. disea~e control, laridpl~stering and cultivation was evident on E!lanuts. Prospec;s for . ~he crop showed a no~able_ improvement.
Tobacco harvest was reported almost one-fifth complete. In a few localities, cropping had t~lowed as the increased moi-sture retarded the ripening process. Sucker and insect control and topping continued active. r
Harvest of ~ grains was about over in the lower two-thirds of the State and about 90 ~rcent complete in northern counties.
Soybean planting pushed ahead and about 95 percent of the intended acreage had been seeded
by week's end. Sorghum planting was almost nine-tenths complete. Haying continued active, but
mmerous showers caught much hay on the ground and delayed cutting of other fields. Pastures
remained in mostly good co, nditJion.
~ "'
--
Peach harvest had a week of numerous interruptions by frequent rains. Statewide, about 6o percent of the cPop has been ' gathered. Thrbugh June 29, 2,237 carlot equivalents had been shipped compared with 2,195 through the same date' 'last year. '
Market Managers reported vegetable and melon harvest active with good quality. Shipments of
watermelons totaled U,363 carlot equivalents~hraugh June 29, compared with 1,473 for the same
period last year.
Several outbreaks of Japanese beetles were reported in northern counties on a variety of plants. USDA applied controls in some areas.
WEATHER S~~Y -- Almost daily showers and.thundershowers occurred over much of Georgia ~ing the week ending Friday, June 30. Rainfall was recorded in all sections of the State, but there were large variations in the ~ounts.The largest totals were generally in the south where sane places had over six inches for the week. The Columbus Airport had 6.42 inches for the wek ending Friday morning. This statio~ has ~ad ~eas~a~le . rain ~or. the+~~~ 13 day~. Ha~l was reported fn some areas as a few of 'the thunderstoriris were quite- severe. The showery conditions continued over the State durj ng the week end and most areas had ample moisture by the end of the
period.
Georgia temperatures were cooler than normal during the week. The cloudy skies and frequent ~ernoon showers kept maximum readings in the mid and high 80is on most days. The temperature tUled to reach 80~ on one or more days in north Georgia, while a few highs in the 901s were re-
pnted in the south .Averages ranged from slightly below normal in the south to several degrees
below normal in the north.
The five-day forecast for the period Tuesday through Sathrday (July 4-8) calls for tempera-
tures to average 3 to 5 degrees below normal with little day to day changes. The normal maximum
88-93, normal minimums 66-72. Precipitation will generally be about double the normal amounts
ud will total about 1 to 1 3/4 inch with locally heavy showers producing 2 inches or more. The
precipitation will be mostly associated with thundershower activity and will occur throughout the
~a
BeYri:odT. hme oGsetol~ygiaas
afternoon and Crop Reporting
eSveenrviniCg et,huAntdheernssh,owGeoerr-.sg.~i-a-;-l.~.n_c_o_o_p_e_r-at-:-J.'="'o~n-withthe--
Cooperative Extension Service, University of Georgia; Georgia Department of
Agriculture; and the Weather Bureau, ESSA, U. S. Department of Commerce.
U. S. DEPARTlv1ENT OF COMMERCE WEAT~R BUREAU Athens, Georgia '
ESSA.
Precipitation For The Week Ending June 30, 1967
GEORGIA
Temperature extremes for week ending
June 30, 1967 (Provisional)
Highest: 98 at Newington on the 24th.
530 Lumpkin on the 26th.
*"For the period July 1-3, 1967
T, less than .005 inch .
After Five Days Return to
United States Department of Agriculture
Statistical Reporting Service
409A North Lumpkin Street
Athens, Georgia 30601
OFFICIAL BUSINESS
IMMEDIATE - U. S. WEATHER REPORT
This report will be treated in all
Respects ~s Letter Mail
(See Sec. 34.17, P.L. & R.)
,_,(~J
Thn niv Library
rrn :v Of Ga A-'- ' Ans Ga 30601
Postage and Fees Paid U.S. Department of Agriculture
3..f Ol
~4 '3
( ~ \ J~~~~~,~
GEORGIA CROP REPORTING SERVICE
w~~rnlb~ rniDtrrn~rn~
ATHENS, GEORGIA
- JUL 11 1961~ .
Placement of broiler chicks in Georgia durin the week ended Jul
9, 177,000--1 percent less than in the previ_ous wee and 6 i~.~:~~p~ less t
comparable week last year, according to the Georgi
or'tln Ser ice.
An estimated 12, 354, 000 broiler type eggs were set by Georgia hatcheries-! percent more than in the previous week but 9 percent less than in the comparable week a year earlier.
The majority of the prices paid to Georgia producers for broiler hatching eggs were reported within a range of 50 to 65 cents per dozen. The average price of hatching eggs was 56 cents per dozen. The price of eggs from flocks with hatchery owned cockerels generally was 2 cents below the average price. Most prices received for broiler chicks by Georgia hatcheries were reported within a range of $5. 00 to $8.75 with an average of $7. 7 5 per hundred. The average prices last year were 65 cents for eggs and $9. 7 5 for chicks.
Week Ended
GEORGIA EGGS SET, HATCHINGS, AND CHICK PLACEMENTS
EGG TYPE
Eggs Set
Chicks Hatched
1966
1967
o/o of
year ago
1966
1967
Thou.
Thou.
Pet.
Thou.
Thou.
% of
year ago
Pet.
June 3 June 10 June 17 June 24 Jul 1
Week Ended
1, 065 942 762 695 729
Eggs Set}_/
1966 Thou.
1967 Thou.
680
64
669
71
543
71
674
97
589
81
BROILi;R TYPE
1, 073 858 864 851 754
% of
year ago
Pet.
Chicks Placed for
Broilers in Georgia
% of
1966
1967 year
ago
Thou.
Thou. Pet.
836
78
770
90
630
73
571
67
527
70
Av. Price
Hatch Broiler
Eggs Chicks
Per
Per
Doz. Hundred
1967
1967
Cents Dollars
Apr. 29
14,447 12,899
89
9,910 10, 125 102
56
May 6
14,228 12, 523
88
10,021
9,949 99
56
May 13
14,206 11,919
84
9,906
9,471 96
56
May 20
14, 133 12,414
88
10, 155
9, 587 94
56
May 27
14,082 12, 535
89
9,913 10,001 101
55
June 3
14,026 12,288
88
10,085
9,277 92
55
June 10
13,998 12, 155
87
10,026
9,495 95
55
June 17
13, 820 12, 179
88
9, 883
9,457 96
56
June 24
13, 859 12, 179
88
9,937
9,226 93
56
Julx: 1
13, 631 12, 354
91
9,808
9, 177 94
56
1/ Includes eggs set by hatcheries producing chicks for hatchery supply flocks.
7.75 7.75 7.75 7.75 7.75 7. 50 7.50 7.75 7.75 7. 7 5
ARCHIE LANGLEY Agricultural Statistician In Charge
W. A. WAGNER Agricultural Statistician
u. s. -------------------------------------------------------------------------~-------
Department of f..griculture
Georgia Depa.rtment of Agriculture
Statistical Reporting Service
409A North Lumpkin Street, Athens, Georgia
EGGS SET A ND CHICKS PLACED IN COMMERCIAL AREAS BY WEEKS - 1967
EGGS SET
CHICKS PLACE D
STATE
f
June
17
Week Ended June
24
THOUSANDS
July _
1
o/o of year
ago 1/
June
17
Week Ended June
24
THOUSAND3
July
1
Page 2
I o/o of
I year ago 1/
Maine
1, 927 2,098 2, 011 99
1, 537
1, 555
1, 551
95
Connecticut
368
357
326 104
205
192
195
98
Pennsylvania
1, 300
1, 622
1, 517 104
899
903
962
111
Indiana
537
556
574 78
301
293
356
84
Missouri
559
574
573 60
368
368
359
77
Delaware
2, 836 2,844 2,764 97
2, 856
2,625
2,927
115
Maryland
4,743 4,699 4,727 106
3,317 3, 567 3, 152
96
Virginia
1, 598
1, 782
1, 790 101
1,082
1, 129
1, 128 . 101
West Virginia
150
153
146 90
377
419
412
91
North Carolina
7,048 6,970 7, 134 99
5,776
5, 666
5, 613
103
South Carolina
557
519
524 104
327
344
442 118
.
GEORGIA
12, 179 12, 179 12,354 91
9,457 9,226 9, 177
94
~
Florida Tennessee Alabama Mississippi Arkansas . Louisiana Texas Washington Oregon California
TOTAL 1967 (22 States)
799
818
850 182
906
883
862 66
8,691
8, 572' 8,666 100
4,984 4,846 4,752 105
10, 144 10, 071 10,070 102
1, 152
1, 147
1, 083 99
4,577 4,499 4,385 99
- 581
614
594 82
352
269
301 86
'
1, 882
1, 807
1, 801 90
530
1, oq
518 1, 032
475 130
890
73
7. 191 7,019 6,884
99
4,371
4,434 4,319
105
7,676 7,739 7,610
97
844
896
848 115
3, 597' 3, 654
3, 547
101
411
540
549
96
2491
270
254
99
1, 441
1, 478
1, 473
113
67,870 67, 879 67,804 97 53,825 53,867 53, 123
99
TOTAL 1966* (22 States)
70,382 70,883 69,578
54, 210: 54,079 53,498 I
o/o of Last Year
96
96
97
_.._
99
100
99
*1I Current week as percent of same week last year. Revised.
-
315
JUNE 15, 1967
Released 7/7/67 GEORGIA CROP REPORTING SERVICE
GEORGIA PRICES RECEIVED INDEX l POINT HIGHER
The Index of Prices Received by Georgia farmers for all corr~odities increased l point dur-
i~ the month ended June 15, 1967 to 247. This was 15 points below the June 15, 1966, index of
262.
-
Increases in meat animal and broiler prices more than offset declines in egg, grain, and soybean prices. The All Livestock and Livestock products Index at 219 was 3 points above last month, but 19 points below June 15, 1966,
The All Crop Index at 259 was unchanged from last month.
UNITED STATES PRICES RECEIVED INDEX UP 3 POINTS PARITY INDEX UP l POINT, ADJUSTED PARITY RATIO 80
The Index of Prices Received by Farmers advanced 3 points (l percent) during the month
ended June 15 to 255 percent of its 1910-14 average. Higher prices for cattle and lettuce con-
~ibuted most to the increase, Partially offsetting were price declines for hogs, wheat, and , eggs. The index was 3 percent below June 1966.
The Index of Prices Paid for Commodities and Services, including Interest, Taxes, and Farm Wage Rates increased l point during the month to 343, a record high. The index was 10 points ' (3 percent) above a year earlier.
With prices of farm products higher and prices paid by farmers increasing, the Parity Ratio remained unchanged at 74.
The Preliminary Adjusted Parity Ratio, reflecting Government payments, rose l point from May to 80,
Index Numbers
Index
June l
~G~E~OlR9G;I.A;;l~o-~l4-=-.lo.;..;;;o_ _~_ __1266 _ ---------~-----,_;;:.;--..; _..__.=;.-..;;._...__ _--...,;~--
Prices Received All Commodities All Crops
Livestock and Livestock Products
262 272
y y
238 y
~U~N~IT~ED~-S~T-A-TE-S----------------------------------------
'
Prices Parity
RInedceexivedJl
264
252
255
313 :Feb. 1951
333
342
343
343 :June 1967
IV Parity Ratio
Adjusted Parity Ratio
79
74
74
: 123 :Oct. 1946
eliminarv
8S
79
80
:
1 Revised, 2 Also April 19 1. .3 Prices Paid, Interest, Taxes, and Farm Wage Rates based on data for the indicated dates, ~The Adjusted Parity Ratio, reflecting Government payments,
weraged 86 for the year 1966, compared with 80 for the Parity Ratio. Preliminary Adjusted
Parity Ratios for the current year, supplied by the Economic Research Service, are based ones-
timated cash receipts from marketings and estimates of Government payments for the current calen-
dar year,
ARCHIE LANGlEY Agricultural Statistician In Charge
WILLIAM A, WAGNER
, - - - - - - - -Agri~ultural Statistician UNIVERSITY OF GEORGIA
JUL 11 1961
LIBRARIES
IsSuED-BY:- The Georgia Crop-Reporting-Service:- USDA,
or
in cooperation with the Georgia Department of Agriculture.
Street,-Athens, -Ga.:--
Corr@odity and Unit
~RICES RECEIVED
Wheat, bu. Oats, bu. Corn, bu. Barley, bu. Sorghum Grain, cwt. Cotton, lb. Soybeans, bu. Hay, baled, ton:
All Alfalfa Lespedeza Peanut
:
$ 1.55
$
.77
$ 1.39
$
.96
$ 2.10
27.0
$ 2.80
26.00 35.00 28.00 22.00
Milk Cows, head
Hogs, ct-rt. Beef cattle, All, cwt.
1/
Cows, cwt. ?}
Steers and Heifers, cwt.
Calves, cwt.
190.00
23.50 19.90 17.50 22.00
24.20
Milk, wholesale, cwt.:
Fluid Market
5.85
Manufactured
3.70
All ]/
5.80
Turkeys, lb.
24.0
Chickens, lb., excl. broilers 11.0
Commercial Broilers
15.5
All
15.4
Eggs, all, dozen
41.5
1.69 .84
1.48 1.00 2.20 20.5 2. 75
27.60 36.50 30.00 24.00
200.00 19.40 19.40 16.10 21.90 25.70
6.40
6.40
21.0 8.0
12.0 11.8 34.4
1.55 80 :
1.48 :
.96 2.20 :
20.5 :
2.70:
1.59 .669
1.20 1.08 1.80
29.34 3.04
27.60 22.60
36.50 23.10 29.50 23.20 24.00 : 22.50
195.00 : 242.00 20.60 : 23.20
19.40 : 22.50
16.40 : 17.60 21.80 : 24.10 25.00 26.00
1.58 .693
1.25 1.05 2.00 19.70 2.69
23.70 24.50 24.80 24.10
259.00 21.70 22.20 17.00 23.80 26.80
1.49 717
1.26 1.06 1.99 19.91 2. 71
23.20 23.90 24.50 23.70
259.00 21.00 22.90 17.40 24.50 26.80
.
!!/6.30 :
21.0 23.0 7.5 10.0 12.5 16.1 12.3 15.6 33.6 33.1
5.12 3.98
4. 74
19.5 8.1
13.3 12.8 28.9
!!/4. 73
20.1 7.8
13.5 13.0 27.4
11ixed Dairy Feed, cwt.:
All under 29% protein
14% protein E/
16% protein
$ 4.00
4.20
~:;
3.95
4.05
0 4.00
4.15
4.25 .3. 71
3.86
3.85
4.00 : 3.47
3.62
3.61
4.20: 3.75
3.93
3.92
18% protein
8 4.15
4.40
4.50 : 3.90
4.05
4.03
20% protein
$ 4.30
4.50
4.55 : 4.10
4.27
4.30
Hog feed, 14%-18% protein,cwt. ~? 4.30
4.55
4.55 : 4.36
4.54
4.58
Cottonseed meal, 41%, cwt. $ 4.45
5.10
5.20: 4.77
5.33
5.36
Soybean Meal, 44%, cwt.
\~
5.10
5.10
5.00 : 5.33
5.26
5.31
Bran, cwt.
$ 3. 60
3. 95
3. 95 : 3. 35
3.59
3.59
Middlings, cwt.
$ 3. 70
4.00
4.15 : 3.42
3.66
3.67
Corn meal, cwt.
0 3.35
3. 70
3. 70 : 3. 32
3.51
3.50
Broiler grower feed, cwt.
$ 4.90
5.00
5.20 : 4.92
4.97
5.03
Laying feed, cwt.
0 4.85
5.00
5.00 : 4.50
4.65
4.66
Scratch grains, cwt.
0 4.25
4.40
4.40 : 3.97
4.09
4.11
Alfalfa hay, ton
0 41.50
45.00
40.00 : 31.50 34.80
32.70
All other hav. ton
~~ .'31.00
36.00
35.50 : 30.70 .33.10
31.10
1TiiC'OWs'iiaridiiSteers andheifers11 combined withallot-ranee where n~sary for slaughter bulls. ,.
27 Includes cull dairy cows sold for slaughter, but not dairy cows for herd replacement.
~ Revised. gj Preliminary estimate. 2/ u. s. price is for under 16 percent.
After Five Days Return to United States Department of Agriculture
Statistical Reporting Service 409A North Lumpkin Street Athens, Georgi~ 30601
.QFFICIA~ ill!!t1e
Postage and Fees Paid
u. s. Department of Agriculture
3tS
UN IVERS
JUL.
GEORGIA CROP REPORTING SERVICE - ATHENS,
RGI&IBRARIES
Smallest Georgia Co~on Acreage of Record
July 10, 1967
The 1967 acreage of cotton planted in Georgia is estimated- at 350,000, according to the Georgia Crop Reporting Service. This is 53,000 less than the 403,000 acres planted in 1966 and ' is the smallest acreage planted since estimates were . started in 1866.
The decline in acreage is due to the multiple-choice program in effect this year. Most
~ewers elected to divert up to 35 percent of their allotment. Some intended acreage was not
planted due to unfavorable weather during the planting season. There will be a higher percent-
age of abandoned acreage this year than usual due to poor stands.
Planted acreage for the United States is estimated at 9,724,000 compared with 10,349 ,000"
last year - or a decrease of 6 percent.
, .
The first 1967 production estimate will be made on August 8.
C. L. CRENSHAvf Agricultural Statistician
ARCHIE LANGLEY Agricultural Statistician In Charge
- ~ ----- - ~ - -- - - - : - !961-=65 - -=CO-T-TON- A-CR~EA-G-E B-Y-ST-APTlaESnted-acres- - - - - - - - - - : average :-- - -- -- -=-- - - - - - ~:-- - - - :-: -1967 a s-
-- -
State
-----
-
-
-
-
:
- ::
h-pa~er vr c-ees-tnetd-n-JoJt-:: -
1961-65
-arv,e0ra0g0e-
-
-
-
1966
- l;ooo-
-
~
--
1967
.
-1:-oco-
: percent . :. of 1966
-------
I 1 North Carolina South Carolina Georgia Tennessee Alabama Hissouri
Percent
- 4.2
2.4 2.6 2.4
. 2.4 2.5
-a-c4r<e5s 1
558 664 529 877 367
acres
-244
355 403 398 589 255
acres . ~25
330 350 325 525 240
Percent
~-
93 87 82 89 . 94
l1ississippi Arkansas Louisiana Oklahoma Texas
3.3
1,551
1,032
990
96
3.3
1,322
930
875
94
4.4
552
367
355
97
6.~
640
447
435
97
6.6
6,460
4,265
4,050
95
' New Nexico
5.5
200
142
. 136
96
' Arizona
1. 8
387
255
252
99
California
2.3
782
632
605
96
------ Other States -g-j -----.---5-. 3--------5-1-------35------30-.6------87--
~~t~d_S!!_aie~ ______ .:._ __ !.1- ____ 1.5'.0!!2_____1Q,].42 ___ _9.1.74_____ 2.4__
other States
:
Vllginia
4.9
15.0
10.8
8.5
79
Florida
5.0
24.0
15.5
14.0
90
Illinois
8.9
2.3
2.1 .~ ~ .r ~... 1:6
76
. Kentucky
_ !!_eya2_a_ _ _ _ _ _ _ _ _
: .:..
__
,62_..1;!.
_____
...,.
6.7
_;3!.4 _ _ _ _ _ _
4.6.l
_ _ _ _ _42!...32 _ _ _ _ _
93
2._6__
Total American-Egyptian J/:
3.1
97 .9
80.1
69.5.
87
i From all causes:- inctuding removed for compliance:- - - - - - - - - - - - - - - - - - - - - -
YYSums for 11 other States" rounded for inclusion in United States totals. Included in State and United States totals.
iSsUED BY: The Georgia Crop-Reporting Service, USDA, 4o9A North Lumpkin Street, .Athens, Ga.,
in cooperation tvith the Georgia Department of Agriculture.
GEORGIA MAP. SHOWING CROP REPORTING DISTRICTS
Cotton Acreage Planted by Districts
:
: ! . .... '. : l9b7 .as percent
pistrict: 1966 : 1967
of 1966
(ooo acres)
1
29
26
90
2
-17
15
88
3
20
17
85
4
32
26
81
5
75
64
85
6
78
69
88
7
51
47
92
8
87
. 75
86
__2__ _ _ _ ,...;:1:;::4:-._.._._~1::.;:1:..... _ _ _ _ ..:,7~9 __
State
403
.350
87
\ Non-Cotton
'
-4
I
Macon
0
.Columbus
Albany
7
Valdosta
After Five Days Return to United States Department of Agriculture
Statistical Reporting Service 409A North Lumpkin Street Athens, Georgia 30601 OFFICIAL BUSINESS
Postage and Fees Paid
u. s. Department of Agriculture
I
Ending July 10, 1967
IBRARIES
Released 3 p.m. Monday
RAINS INTERRUPT FARM WORK
Athens, Ga., July 10 --Frequent showers ~ver mu~b of the State and heavy rains in some
sections during the week interrupted farm work, according to the Georgia Crop Keporting Service.
As conditions permitted, however, farmers were busy harvesting peaches, tobacco, hays, ~getables and melons. Insect and disease control received much attention as these activities ~remade much more difficult by the frequent showers.
County Agents noted 1ittle improvement in cotton. Boll weevil numbers continued to build up in spite of frequent applications of insecticides. Nearly two-thirds of the cotton is setting bolls- mostly in southern and central counties. Most of the cotton in northern districts is below this stage of development and somewhat later than usual.
Corn continued to respond to the good moisture situation. Eighty-five percent of the ~porters judged crop prospects as good to excellent, with 28 percent in the latter category.
Peanut prospects remain good. Insect and disease control measures continued. Soybeans ~de good growth. Some late plantings were made during the period.
Tobacco harvest advanced slowly because of the rains. About 23 percent of the crop had ~en gathered by the end of the week. Topping, suckering, and insect control continued to ~ceive considerable attention.
Hay crops made rapid growth, but cutting and curing was slow. Pastures are generally ,in good condition.
Peach harvesting moved forward and was about 70 percent completed. Through July 6, 2,400 carlot equivalents had been shipped compared with 2,658 last year.
Market Managers reported heavy rains and hot sun caused volume and quality of veqetable and melon crops to drop very fast during the period. ' Growth of sweetpotatoes was good and ~Nest of early varieties was gE t ting under way.
~lEATHER SUMMARY-- Showers continued to occur at frequent intervals over most of Georgia
1during the past week. Rainfall amounts were highly variable, ranging from 1 ight at a few
places to excessive in several areas. More than 4 inches of rain was recorded at some
weather stations in north and south Georgia during the week ending Friday, July 7. The observer at Milledgeville measured only .01 of an inch during the same period. The showers
continued over the State during the weekend and were quite heavy in some areas. A tornado
~s reported on the western edge of Macon on Sunday, July 9, with damage to trees and power I ines.
Temperatures continued mild for the season under mostly cloudy skies. Averages ranged
,from about 2 degrees below normal in the extreme south to 6 degrees below normal in north-
~st Georgia. This was the second consecutive week and the seventh out of the last eight
that Georgia temperatures have averaged cooler than normal.
June rainfall was above normal in all sections of Georgia except the east central and
southeast, and was only slightly below . normal in these areas. The northcentral, northeast and southwest divisions had more than 3 inches above normal for the month. In most areas,
the heaviest rains occurred during the first and last weeks of the month. June temperatures
averaged be 1ow norma I in a 11 areas.
The five-day forecast for the period Tuesday through Saturday (July 11-16) calls for temperatures to average a few degrees below normal in the north and near normal in the south. There should be only minor day to day changes except possibly a 1 ittle cooler in the north by the end of the week. Rainfall is expected to be moderate to heavy in afternoon and evening thundershowers that should be more numerous the latter part of the week.
ISSUED BY: The Georgia Crop Reporting Service, Athens, Georgia; in cooperation with the Cooperative Extension Service, University of Georgia; Georgia Department of Agriculture; and the Weather Bureau, ESSA, U. S. Department of Commerce.
U. S. DEPARTMENT OF COMMERCE WEATHER BUREAU Athens, Georgia
ESSA:
Precipitation For The Week Ending July 7, 1967
GEORGIA
Temperature extremes for the week ending
July 7, 1967 (Provisional)
Highest: 950 at Newington on the 1st
Lowest:
0
49 at Blairsville on the 4th
* For period July 8-10, 1967
T, less than .005 inch
After Five Days Return t o United States Department of Agri culture
Statistical Reporting Ser~ice 409A North Lumpkin Street Athens, Georgia 30601 OFFICIAL BUSINESS
IMMEDIATE - U. S. WEATHER REPORT This report will be treated in al I
Respects as Letter Ma i I (See Sec. j4. 17, P. L. & R. )
Postage and Fees Paid U. S. Department- of Agriculture
.~f~.
~ DqOQ l
Gr4A3
\~(, 1
Juk, l
EGETABLE R
3!5
r
Georgia Crop Reporting Service
July 1, 1967
July 11, 1967
GEORGIA
Production of summer vegetables and melons is expected to be about 8 percent above a
year ago, according to the Georg ia Crop Report ing Service. Ample to excessive moisture was
rece ived i n most areas of the St ate during June. The harvesting season for most crops was
2 to 3 weeks earlier than normal in southern areas. Quality and demand have been very good.
Supplies are dec] in ing from central areas, but increas i ng i n mountain counties. Through
1 June 30, shipments of most vegetable and melon crops were running considerably ahead of a
year ago. A total of 4,354 carlot equivalent of watermelons have been shipped, compared with
1,470 for the same period last year.
UNITED STATES
LIMA BEANS: Production of summer 1 ima beans is placed at 257,000 hundredweight, 3 percent more than last year. In New Jersey, rainfall has been adequate, and recent warm
temperatures have been beneficial. Harvest is expected to begin after mid-July, ten days later thari usual, and extend th rough August. In North Carol ina, harvest started i n early July. Early plantings are maturing about one week later than usual. In southern areas of Georgia, harvest neared completion in early July. In southern and central counties of Alabama, harvest was in full swing on July 1. In northern counties, the crop was making good growth.
SNAP BEANS: A summer snap bean crop of 894,000 hundredweight is forecast, Jown 11 percent from 1966. In New England, active harvest is expected about mid-July. The New
York harvest is expected to sta r t by mid-July with volume supplies available i n August. In 1 Pennsylvania, development is about 10 days later than normal. In southern Ohio, peak harvest
is expected about mid-July. Suppl ies from northern Ohio should be available in late July with peak harvest by mid-August. Crop prospects are favorable in Illinois. In Mi chigan, development has been delayed by wet weather. In southwest Virg i nia, harvest is expected to start in late July with peak volume by mid-August. The North Carol ina crop i s in good condition. Peak harvest is expected after mid-July. Light volume is expected from the mountain areas of Georgia by mid-July. Unfavorable weather caused considerable replanting. In Tennessee, recent rains improved crop prospects. In Alabama, harvest was active in most areas on July 1. In Colorado, harvest is expected to start by late July. Cool weather has delayed the crop. Hail damage has been heavy on some acreage in northern areas.
The forecast of early summer cantaloups is for a production of 683,000 hundred 7
' weight, up 6 percent from last year. Harvest in South Carol ina began i n late June. The bu 1k of the crop is 1 to 2 weeks 1ate r than norma 1. In centra 1 Georgi a, 1 ight harvest is expected through July. Harvest began in Alabama on July 1. Harvest started in south-central Oklahoma during the first week of July. In Ar izona, harvest began on June 20 1 with peak movement expected a round mid- Ju 1y.
WATERMELONS: Production of~ summer watermelons is placed at 14,487,000 hundredweight, 2 percent above last year. In North Carol ina, the crop developed well during
June although in the northeast area, 1 imited rainfall has reduced growth, Harvest is expected to start about ten days later than usual. Harvest should be active in the Allendale-Barnwell area of South Carol ina before mid-July, and a few days later in the Pageland-Chesterf ield area. Vines are in good condition and there is a heavy set of late melons. In Georgia, harvest is nearing completion in southern areas, while supplies are increasing daily from central areas. L1ght volume is expected through July in the Cordele area. Harvest was nearing the peak in south Alabama on July 1. Light harvest was beginning in central areas but northern areas were later than usual because of poor weather at planting time. The Mi ss i ssippi early crop is in excellent condition but dry weather is beginning to hurt the late acreage. Harvest is expected to peak about mid-July.
Supplies of late summer watermelons, at 3,009,000 hundredweight, are 5 percent less than in 1966. Indiana watermelons are in good condition, although about a week late in development. In Illinois, late plantings followed by persistent showers have resulted in slow growth. In Missouri, excessive rain delayed development. In Delaware and Maryland, recent rains have improved crop prospects. Harvest is expected to start in early August, about two weeks later than norma 1
isSUED-BY:- Th~ Ge~rg i :; Cr~p-R~p~rti-,:;g-S~r~i~e-; USDA-; 4o9AN~rth-L~mpkln-Str~et,-Ath~ns,-G:;.-; in cooperation with the Georgia Department of Agriculture.
Acreage and Estimat ed Production Reported to Date , 1967 with comparisons
CROP .AND STATE
ACREAGE HARVESTED
1965
1966 _Acres -
For Harvest
1967
YIELD PER ACRE
Ind.
1965 1cw96t.6. _ 1967
LIMA BEANS
Sllii'mer:
New J ersey
1,200
1,000
1,000
34
33
30
North Carolina
1,200
1,100
1,000
30
30
20
South Carolina
1,700
1,700
1, 600
22
22
19
Georgia
3,400
3,100
3,000
24
23
26
Alabama
3,200
3,300
3,300
24
23
30
GrouE Total
10,700
10,200
9,900
26
25
26
SNAP BEANS
Surrmer:
New Hampshire
160
150
130
40
40
35
Mas saohusett s
900
850
800
35
36
35
Rhode Island
140
140
140
35
35
35
Con n e c t i c u t
500
600
650
35
35
35
New York
8,400
7,700
7,000
42
38
40
Pennsylvania
1,000
900
850
40
40
40
Ohio
1,900
1,600
1,800
50
50
45
illinois
1, 300
1,200
1,200
28
25
30
Michigan
2,100
2,300
2,400
32
33
20
Virginia
450
450
450
45
35
40
North Carolina
6,000
5,600
5, 600
45
49
35
Georgia
1,200
1,200
1,300
43
37
36
Tennessee
1,000
950
900
48
45
45
Alabama
900
850
800
30
25
30
Colora do
600
650
65 0
50
49
45
Group Total
26,550
25,140
24,670
41
40
36
CABBAGE 1/ Late Surrmer:
Pennsylvania
2 ,7 00
2,400
2,300
200
190
200
Indiana
1,100
1,200
1,200
260
215
240
illinois
2,300
2,300
2,400
190
165
175
Iowa
450
300
230
160
160
150
No rth Ca rolina
3,600
3,200
3,000
185
160
175
Geo rgia C o l o ra do Wa shington
450 1,700 1,300
450 1,900 1,300
450
110
115
105
2,100
250
230
230
1,400
260
215
240
California Group Total
2,800
!f),40('5
2,900 I5,\:l50
2,800
215
230
215
!S,risCl 2cs !94 20!
CANTALOUPS
Earlv Sumner:
South Carolina
3,300
3,600
3,300
41
43
35
Georgia
6,000
5,500
5,000
60
40
50
Alabama
1,500
1,500
1,500
50
50
55
Oklahoma
1 ., 7 0 0
1,700
1,900
55
60
60
Arizona, Other Group Total
600
I3,Io0
650
I2,950
1,100
110
145
110
I2,SOO
55
50
5~
TO!viATOES
Lat e Spr in);!:
South Carolina
8,200
7,800
7,000
85
80
90
Georgia
2,500
2,500
2,000
50
60
55
Mississippi
750
700
650
58
50
50
Louisiana
1,200
1,100
1,400
55
65
60
Texa s ~ou:-e Total
6,000 18,650
6,000 !8,100
5,800 16,850
47 65
o421
45 66
WATERHELON S
Early Sumne!":
North Carolina
7,900
6,500
6,500
68
54
60
South Carolina : 22,000
22,000
23,000
85
75
75
Georgia Alabama
34,000
33,500
33,000
80
80
90
13,700
13 ,ooo
12,500
95
95
100
Mississippi
7,500
7,500
7,600
75
55
65
Arkansas Louisiana
6,400 3,600
6,000
3 ,oco
5,900
85
80
75
3,000
80
90
85
Oklahoma
9,900
9,000
9,500
80
70
70
Texas
74,000
72,000
70,000
65
60
60
Arizona
4,500
3, 600
3,300
140
175
160
California
8,200
9,100
9,500
180
175
165
Grou:-e Total 1 191,700
185,200
183,800
81
77
79
~/ Includes processing.
ARCHIE LANGlEY Agricultural Statistician In Charge
Aft er Five Days Return to United States Department of Agriculture
Statistical Reporting Service 409A North Lumpkin Street
Athens, Georgia 30601
- - - - OFFICLII.L BUSlliESS
;;.)0
Acguisitions Division UnlV Jrsi t of Ge o r gia Unlv 'rsit Libraries
Athens Georgia 30601
PRODUGriON
Ind.
1965
,o1o9o6c6wt.
1967
41
33
30
36
33
20
37
37
30
82
71
78
77
76
99
273
250
257
6
6
5
32
31
28
5
5
5
18
21
23
353
293
280
40
36
34
95
80
81
36
30
36
67
76
48
20
16
18
270
274
196
52
44
47
48
43
40
27
21
24
30
32
29
1,099
l,OCB
894
540 286 437
72 666
50 425
338 602 3,4!6
456 258
380 48
512 52
437
280 667 3,090
460 288 4 20
34 525
47 483
33 6 602 l!_l95
135
155
116
360
220
250
75
75
82
94
102
114
66
94
121
7~0
o4o
68 3
697 125
44 66
282 I,2I4
624 150
35
72 246 1.127
630
110 32
84 261 -r.IT7_
537 1,870 2,720 1,302
562
544
288 792 4,810 630 1,476
15,531
351
390
1,650
1,725
2,680
2,970
1,235
1 , 25 0
412
494
480
442
270
255
630
665
4,320
4,200
630
528
1,592
1,568
14,250 - - 14,487
L. H. HARRIS, JR. Vegetable Crop Estimator
Postage and Fees Paid
u. S. Department of Agriculture
315
ATHENS, GEORGIA
July 12, l 96i
GEORGIA CHICK HATCHERY REPORT
Placement of broiler chicks in Georgia during the week ended July 8 was 8, 980,000--2 percent less than in the previous week and 7 percent less than in the comparable week last year, according to the G eorgia Crop Reporting Service.
An estimated 12, 281,000 broiler type eggs were set by Georgia hatcheries-! percent less than in the previous week and 10 percent less than in the comparable week a year earlier.
The majority of the prices paid to Georgia producers for broiler hatching eggs were reported within a range of 55 to 65 cents per dozen. The average price of hatching eggs was 57 cents per dozen. The price of eggs from flocks with h~tchery owned cockerels generally was 2 cents below the average price. Most prices received for broiler chicks by Georgia hatcheries were reported within a range of $7. 00 to $9. 00 with an average of $8. 00 per hundred, The average prices last year were 65 cents for eggs and $10. 00 for chicks.
Week Ended
GEORGIA EGGS SET, HATCHINGS, AND CHICK PLACEMENTS
EGG TYPE
Eggs Set
Chicks Hatched
1966
1967
o/o of
year ago
1966
1967
Thou.
Thou.
Pet.
Thou.
Thou.
% of
year ago
Pet.
June 10 June 17 June 24 July l July 8
Week Ended
942 762 695 729 804
Eggs Set];./
1966 Thou.
1967 Thou.
669
71
858
543
71
864
674
97
851
589
81
754
467
58
609
BROILER TYPE
% of
year ago
Pet.
Chicks Placed for
Broilers in Georgia
1966
1967
% of
year
ago
Thou.
Thou. Pet.
770
90
630
73
571
67
527
70
457
75
Av, Pdce
Hatch Broiler
Eggs Chicks
Per
Per
Doz.
Hundred
1967
1967
Cents Dollars
May 6
14,228 12, 523
88
10, 021
9,949
99
56
May 13
14,206 11,919
84
9,906
9,471
96
56
May 20
14, 133 12,414
88
10, 155
9, 587
94
56
May 27
14,082 12,535
89
9, 913 10,001
101
55
June 3
14,026 12,288
88
10,085
9,277
92
55
June 10
13, 998 12, 155
87
10,026
9,495
95
55
June 17
13, 820 12, 179
88
9, 883
9,457
96
56
June 24
13, 859 12, 179
88
9,937 . 9, 226
93
56
July l
13, 631 12,354
91
9,808
9, 177
94
56
Ju1r 8
13,670 12,281
90
9,666
8,980
93
57
lJ Includes eggs set by hatcheries producing chicks for hatchery supply flocks.
7.75 7.75 7.75 7.75 7.50 7.50 7.75 7.75 7.75 8.00
ARCHIE LANGLEY
W. A. WAGNE R
Agricultural Statistician In Charge
Agricultural Statistician
~
r
--------------------------------------------------------------------- ~ ----------
U. S. Department of Agriculture
.
Georgia Department of Agriculture
Statistical Rep.orting Service
409A North ~~~pkin St:t;e~t .Athens, Georgia
....
.
EGGS SET AND CHICKS PL- ACED IN COMMERCIAL AREAS BY WEEKS - 1967
EGGS SET
CHIC .:<:S PLACED
STATE
Week Ended
June
July
24
1
lJ% of
July
year
June
8
ago 1/ 24
Week Ended
July
July
1
8
.
THOUSANDS
THOUSAND3
Maine Connecticut Pennsylvania I Indiana Missouri Delaware Maryland Virginia West Virginia North Carolina South Carolina
2,098 357
1, 622 556 574
2,844 4,699 1, 782
153 6,970
519
2,011 326
1, 517 574 573
2,764 4,727 1, 790
146 7, 134
524
1, 667 94
1, 555
251 69
192
1, 391 105
903
659 644
87 69
I
293 368
2,778 100
2,625
4, 716 108
3,567
1, 660 104
1, 129
151 96
419
6, 826 99
5,666
547 106
344
1, 551 195 962 356 359
2,927 3, 152 1, 128
412 5, 613
442
1, 504 206 790 320 394
2, 741 3,400 1,000
372 5, 329
440
Page 2
I o/o of
I year ago 1/
95 134 104 74 77 104 110 91 98 98 139
GEORGIA
Florida Tennessee Alabama Mississippi )Arkansas Louisiana Texas Washington Oregon California
:TOTAL 1967 (22 States)
12, 179 12,354 12; 281
90 ' 9, 226
9, 177
8,980
93
818
850
838 199
518
475
477
115
883
862
793 64
1, 032
890
1, 044
106
8, 572
8,666
8, 579 101
7,019
6,884
6, 722
96
4,846
4,752
4,714 103
4,434
4,319
4,266
106
10,071 10,070 10, -011 98
7,739
7,610
'7, 107
90
1, 147
1, 083
1, ,107 103
896
848
866
124
4,499
4,385
4,291 102 I 3, 654
3,547
3, 580
104
614
594
638 92 ' 540
549
475
97
269
301
302 86
270
254
244
93
1, 807
1, 801
1, 871
88 ' 1, 478
1, 473
1, 384
108
67,879 67,804 66,915 97 153, 867 53, 123 51, 641
98
TOTAL 1966* {22 States)
. 70, 883 69, 578 68,735
% of Last Year
96
97
..":."...97
r! Current week as percent of same week last y1~ar. 'f' Revised.
54,079 53,498 52, 582
100
99
98
j.
I
< .
.. ::
Gl; ,
i-tD 0 l
r,..L\ A-~
~a \qb1
d~ L
~G\A
FARM
REPORT
GEORGIA CROP REPORTING SERVICE
ATHENS, GEORGIA
GENERAL CROP REPORT AS OF JULY 1, 1967
July 12, 1967
QEE ~orgia
~aspects I~~:
General rains on May 21-22, and mostly adequate rainfall since
that time, have resulted in much improvement in the condition
of Georgia crops, according to the Crop Reporting Service. Cotton shows the least improvement
1mile the peanut, corn, soybean, and tobacco crops are very promising. Dry weather in April
and most of May reduced yields of small grains below year-earlier levels.
~ Productio~ Up: Corn production in 1967 is forecast at 69,230,000 bushels, 18 percent more than last year's crop of 58,824,000 bushels. Acreage to be harvested for
grain is estimated to be 1,5o5,ooo, compared with 1,368,000 in 1966. Yield per acre is indi-
cated at 46 bushels per acre - 3 bushels above last yearts average.
Tobacc2 ~duction 2: Georgia's flue-cured tobacco production is estimated at 147,000,000
pounds, sharply above the short crop of 96,380,000 pounds last year . Acreage for harvest at 73,500 is 12,500 above 1966. Yield per acre is indicated at 2,000 pounds, compared with 1,580 pounds last year.
~-~ ~duction: Sharp increases in acreages of wheat and rye harvested for grain more than offset acreage declines in oats and barley and low yields and resulted in a
total grain production 9 percent above last year.
The acreage of soybeans to be harvested for beans is indicated
at 542,000, 80 percent more than the 301,000 harvested last
year.
~~h Production ~: Production of peaches in Georgia this year is estimated at 3,000,000 bushels compared with 3,800,000 bushels in 1966. Shipments through
July 6 total 2,400 carlot equivalents compared with 2,658 to the same date last year.
Crop and Unit
Tor--:-- Acreage 1/
-...:....--
Yield Per Acre
:
?reduction
-~:-----:---~--
:Harvested : harvest 1966
Indicated
: 1966 : 1967 :
:__1961___
- - - - - - - -ThousalliCA:cre~- -
1966
Indicated
_ _ _..:.__1967__ _
Thousands
Corn, for grain
bu.
'1-Jheat
bu.
Oats
bu.
Rye
bu.
Barley
bu.
Tobacco, Type 14 lbs.
Sweetpotatoes
cwt.
y Hay, all
tons
Peanuts, Alone
Soybeans, for beans
1,368
65
98
43 11 61 8.0 460
498 301
1,505
124
93
70
9
73.5 8.0 462
493 542
43.0 30.0 41.0 22.5 41.0 1,580
85,..
1.88-
46.0 27.0 37.0 18.0
30.0 2,000
85.0+
1.81-
Peaches, total crop bu.
Cotton
1/
403
350
1TPla~acr~age for-cotton-and peanuts, harvested acreage-for-others
58,824 1,950 4,018
968 451 96,380 680 867
69,230 3,348 3,441 1,260
270 147,000
680
837
3, 800
3,000
UNI'Jii:R-lm; 9f" ti '!!OPIGrJt
JUL 19 1007
ARCHIE lANGLEY Agricultural Statistician in Charge
Please turn page
LIBRARIES -
c 1:;-. REHSB'AVJ
Agricultural Statistic~in',
UNITED STAT~S CROP SU1'll1ARY AS OF JULY 1, 1967.
Crop prospects on July 1 wer e slightly better than a year earlier, although development was behind normal pace . Total crop acreage planted for 1967 harve st increased 7 percent to the highest level since 1960. Feed grain production is expected to be up 8 percent from last year and food grain production 19 perc ent above 1966. Milk production during June was 1 percent less than a year earlier and 6 percent below average. Egg production was up 6 percent from a year ea~lier , and 8 percent above average .
1~1 Crop Acrea~ Incre~~
Crops planted for 1967 harvest total 318 million acres -- up 7 percent or 19.7 million acres from last year, and the largest total in 7 years . Total acreage of food grains increased 22 percent from last year and both feed grains and oilseeds increased 4 percent. Despite .some delays in planting, farmers were able to s eed most of their intended acreage, except for cotton, Some abandoned cotton acreage in southern areas and wheat in the central and southern Plains were replanted to soybeans and sorghums.
Indicated acreage for harvest increased slightly less than planted acreage. Acreage losses after planting are expected to be above last year -- especially for winter ~lhe at, cotton, and
corn. The current estimate of 304 million acres for harvest is 5 percent more than last year
and the largest total since 1960.
QQB~: Prospective 1967 production of corn for grain, at 4.5 billion bushels, is 10 percent larger than the record 4 . 1 billion bushels produced last ;y-ear ;20 percent above the 1961-65
average . This would be the Nation's fourth 4-billion bushel corn crop --the first tvas in 1963, the others, in 1965 and 1966.
~~~AT: Production of All Whe at is for ecast at a record 1,596 million bushels, 139 million bushels above the previous high established in 1958. The yield per harvested acre
is 26.6 bushels--second highest in history. The acreage of all wheat for harvest as grain is 60.0 million, the largest since 1953.
SOYBEANS : Soybeans planted alone for all purposes in 1967 are estimated at 41. 0 million acres,
about 10 percent more than last year's record of 37.4 million acres, and 34 percent
above the average of 30.5 million acres. Growers expect to harvest 40.1 million acres, up 9 percent from last year and 35 percent above average.
. U. S. ACREAGE HARVESTED AND PRODUCTION. 1966 AND 1967
--------~---------------~---------------------
-~~~--------~----
Crop and Unit
Acreage
: Yield Per Acre ~-------Eod~ti~------
--~----~~-----:--
Harvested : harvest : 1966 : Indicated : 1966
Indicated
: 1966 : 1967 :
: 1967 :
:
1967
--------~~~------ThousandS---~---------
- - 1'b:ou~~gds - - - - -
Corn, for grain bu.
vfueat, all
bu.
56,888
61,315
72.1
49, 843
59,950
26.3
73.5 4,103,323 4,508,525 26.6 1,310,642 1, 596,070
Oats
Cotton 1/
bu.
17,848
16,215
44.7
47.7
798, 089
774,208
10,349
9,724
Tobacco
lbs.
973
989 1,942
2,006 1,890,320 1, 983, 408
Hay, all
tons
65,192
64,151
1.85
1.85
120,863
118,433
Soybeans, for beans
36,644
40,123
Peanuts g/
1,490
1,467
Potatoes, Irish ct-1t.
1,464
1,461
210 Aug . 10
306,902
Aug . 10
1S.w/ ePeltapnotteadto. esgj
cwt. : Grown alone
for
973 all
989
87
88
13.697
11.189
plirposes.------------------------------ -
Isst1Ef5BY:The GeorgiacropReportingservice;-usf)A;4o9AN'Orth'EUIDpkinstreet:Ailiens;-(}a:::--
in cooperation with the Georgia Department of Agriculture .
After Five Days Return to
Postage a~d fee s ?~id
United States Department of Agriculture
U. S. Department of Agr iculture
Statistical Reporting Servic e
409A North Lumpkin Street
Athens, Georgia 30601 OFFICIAL g~SINE~~
'::10 0
Acguisitions Division Un1versity of Georgia
University Libraries
Athens Georgia 30601
c
3 ;$
\-\D 001
C:r4 A3
GEORG I A CROP REPORTING SERVICE
IC\01 uJ~ \~
LP~ill@[!~~
ATHENS, GEORGIA
SPECIAL PEACH REPORT AS OF JULY 1, 1967
July 13, 1967
Prospects on July 1 indicated the 1967 Georgia peach crop to be 3,000,000 bushels. The estimate is unchanged from last month, but 21 percent below last yearls crop of 3,800,000
bushels.
Weather during June was mostly favorable for harvest and good quality fruit was marketed. However, some interruptions were caused by scattered shower activity over the belt.
County Agents report harvest well advanced on July 7 and some sheds are closing in the
Fort Valley area. Varieties going to market the first week in July were Blake, Shippers Late,
Dixieland, Sullivan Elberta, Redskin, Southland and Halehaven. Elberta harvest is expected to
be active by mid-July. Shipments through July 10 from Georgia total 2,528 carlot equivalents compared with 2,862 for the same date last year.
The peach estimate relates to total production which includes rail and truck shipments,
1 local sales, non-inspected truck sales to points in the State and adjoining states, quantity
~ed on farms where produced, and in some years quantities not utilized because of economic
conditions. Normally, inspected rail and truck shipments account for about half of the produc -
, tion estimate.
PEACH PRODUCTION 1( SELECTED STATES
-----------------------Average
_ _ _ _ _ -----~~---~-..-,.I-n~dicated
'
STATE
1961-65
11illion
1966
11ilrron-. ---~l-,~oo~o:o--
1967 Million 1,000 -~~~~~-
~~
Pounds
- - - bushels
~unds
pushels
North Carolina South Carolina
~ GEORGIA
Alabama Nississippi Arkansas Louisiana Oklahoma
Texas
. 61.3 314.7
77.1 339.0
1,550
6,600
35.0
129.0
700 2,500
196.3
188.5
3,800
148.8
3,000
46.5
27.5
550
57.5
1,150
. 14.1 58.8
13.2 49.4
265
17.5
350
950
49.4
950
6.5
9.0
180
8.5
170
:
8.0
10.8
225
9.6
200
: 26.2 --------..- --
33.6
-~---
-
-
-
-
10Q -
-
-
-
_2.~
-
-
-
-
~ 2_5Q_ --
9States
81.4
748.1
14.~
481.7
9.570
yrincludes-quantities unharvested on account of ec8~~T condi~~ d excess cullage ~ar-
vested fruit.
JUL ~..- I 67
ARCHIE !.ANGLEY ~icultural Statistician In Charge
C L. CRENSHA1rJ 1-------~~o.:Lcultural Statistician
(Please turn page for United States information)
ISSUED BY: The Georgia Crop ReportingService, USDA, 4I>9A North Lumpkin Street, Athens, Ga., in cooperation with the Georgia Department of Agriculture .
UNITED STATES - SPECIAL PEACH REPORT AS OF JULY 1, 1967
The Nation's 1967 peach crop is forecast at 3,058 million pounds,lO percent less than last
season and 14 percent below average. Excluding California Clingstones, mostly a canning crop, a production of 1,382 million pounds is forecast, 20 percent less than last year and 34 percent below average. Smaller crops than last year are indicated for all of the North Atlantic and Middle Atlantic States, some of the Rocky Mountain States and most of the 9 Southern States. For most of the North Central States, production is above the short 1966 crop but below average,
California's Clingstone peach crop, used primarily for canning, is estimated at 1,676 million pounds, nearly the same as the 1,678 million pounds harvested in 1966 and 12 percent above average. Growing conditions were reasonably good in the Clingstone peach producing districts during June. Some warmer temperatures prevailed toward the end of the period but ample foliage on trees was expected to protect the fruit from damage. The season is later than last year and harvest of the extra early varieties i~ not expected until shortly after mid-July.
California's Freestone crop of 500 million pounds is 3 percent less than the 1966 crop and 19
percent below average. Harvest of early Freestone varieties is lagging far behind last year. Start of harvest of most varieties is about 2 weeks late.
The July 1 forecast for the 9 Southern States--48.2 million pounds--is 36 percent less than
the 1966 crop and 34 percent below average. Good crops in Alabama and llississippi only partial~ ly offset sharp reductions in the Carolinas and Georgia.
In Alabama, harvest of early and mid-season varieties was nearing completion by the end of June. Harvest of Elbertas was expected to be active from July 10 to July 25. Harvest of late peaches in Ivlississippi is expected to continue into August.
I.
After Five Days Return to
United States Department of Agriculture
Statistical Reporting Service
409A North Lumpkin Street
Athens, Georgia 30601
OFFIQI!1 BUSINEe.
I
Postage and Fees Paid
u. s. Department of Agriculture
Georgia Weekly Crop .and Weather Bulle
'
~ GEORGIA CROP REPORTING SERVICE
Athens, Geo li!J NIVERSITY OF
JUL 1
Re eased 3 p.m. Monday 7
FIELD WOKK DELAYED BY RAINS
LIBRAR IES
' ..
Athens, Ga., July 17 --Frequent and sometiines"'m!m'T'.,.,ew~i....C::.a.l.i,U;ti armers to .reschedule
I
many field operations during the week, according to the Georgia Crop Reporting Serv ice.
Nearly all sections were affected by delays in insect, disease and weed controls. Between
rains, harvest of peaches, tobacco, vegetables and melons was active.
Condition of the cotton crop showed I ittle change from the previous week. Most of the County Agents reporting described the crop as fair or poor. About 70 percent of acreage had
set bolls with the bulk of the fruiting occurring in central and southern counties.
Corn remained in mostly good condition. A number of reporters judged prospects to be excellent.
Both peanuts and soybeans were in good condition with soybeans showing the most improvement. A variety of insects caused damage to both crops as rains either washed ,off
or delayed insecticide treatments.
About one-third of the tobacco crop had been gathered by the weekend. This was below expectations due to the rains.
Much hay was caught on the ground during the week. Growth on that still standing was lush but many fields had passed the usual cutting stage.
Peach harvest reached about 80 percent completion. Through July 13, 2,659 carlot equivalents had been shipped, compared with 2,991 last year.
,
Market Managers reported harvest of vegetables and melons nearing completion in
southern areas. Frequent rains reduced both volume and quality in all areas. Shipments of
watermelons totaled 6,340 carlot equivalents through July 14, compared with 5,249 last year.
~/EATHEI{ SUMMARY-- Showers and thundershowers occurred almost daity over most of Georgia during the week ending Friday, July 14. Many of the showers were unusually heavy and excessive rainfall amounts were recorded over much of the State. The weather observer at Monticello " measured slightly more than 7 inches during the week and several other places had over 5 inches. The statewide average for the week was nearly 3 inches. Totals were generally smallest in the extreme west central and southwest sections where several observers reported less than one inch. For many areas, this was the third straight week with heavy to excessive rainfall. The rains ended on Friday and the weekend of sunshine was a welcome change in all
sect ions.
The frequent showers and cloudiness continued to hold daytime temperatures below normal through Friday. An unusually cool mass of air moved over the State at the beginning of the weekend and brought record low temperatures for this time of year to most areas. Lows dropped to the low 50 1 s as far south as Savannah and to the 40 1 s in the mountains. Averages for the week ranged from 2 to 8 degrees below normal from southeast to northwest
The five-day forecast for the period Tuesday through Saturday {July 18-22) calls for .
temperatures to average 3 to 6 degrees below normal. It will be slightly warmer Tuesday
and Wednesday with 1 ittle day to day change thereafter. Rainfall is expected to be moderate
to heavy in showers mainly the latter half of the period. Totals should range from~ to
li inches.
ISSUED BY: The Georg1a Crop Reporting Service, Athens, Georgia; in cooperation with the Cooperative Extension Service, University of Georgia; Georgia Department of
Agriculture; and the Weather Bureau, ESSA, U. s. Department of Commerce.
U. S. DEPARTMENT OF COMMERCE
WEATHER BUREAU
Athens, Georgia
'
ESSA
Precipitation For The Week Ending July 14 , 1967
GEORGIA
Temperature extremes for the week ending July 14, 1967 (Provisional)
0
Highestz 98 at Camilla on the 11th
550 at LaFayette on the 14th
*For the period July 15-17, 1967
T, less than .oo5 inch
After Five Days Ret u rn to United States Departmen t of Agri cu l t ure
Statistical Repo r ting Serv ice 409A North Lumpk i n St reet Athens, Georg ia 30601 OFFICIAL BUSINESS
IMMEDIATE - U. S. WEATHER REPORT This report will be trea t ed in al l
Respects as Letter Mail (See Sec. 34.17 ; ~ L. & R. )
-'l"*
Pos t age and Fees Paid
U. s. Depart ent of Agriculture
G8.,
HD~ OO/
Q!'\Pt3
\'1b1
~\8
ATHENS, GEORGIA
GEORG I A CROP REPORTING SERVICE
June 1967 Released 7/18/67
JUNE _MILK PRODUCTION UP 4 MILLION POUNDS
Milk production on Georgia farms during June totaled 85 million pounds, according to the Georgia Crop Reporting Service, This compares with 81 million pounds produced in June last year and 91 million during May 1967. The 1961-65 June average production was 82 million pounds.
Production per cow in herd averaged 590 pounds --50 pounds above the previous year, but 40 pounds below the May output. The 5~ear average production per cow for the month was 456 pounds.
The estimated average price received by producers for all wholesale milk during June was $6.30 per hundredweight. This would be $.50 above the previous year, but $.10 below the May 1 average.
Prices paid by dairymen for feed were about 5 cents per hundredweight above May and
, averaged about 25 cents above the previous year.
__________l1!LK PRODUCTION AND PRICES RECEIVED AND PAID BY DAffiYl1EN
1
Item and Unit
GEORGIA
UNITED STATES
June---- May - June
June-
May
June
1966
1967 ----!--96;...:7--.:_...;;1~9.;;.66;;.__ _;;1=9.-..67.:.___ _1. 967
l1ilk Production, million lbs.
hoduction Per Cow, lbs. 1/
Number lliilk Cows, thousand head
81 540
91 630
. 85 11,269
590
798
11,508 844
11,161 821
150
144
144
PRICES RECEIVED - DOLLARS 'ij
Ail tiD.olesale milk, ctvt.
1 Fluid Milk, cwt.
Hanufactured Milk, cwt.
Milk Cows, head , All Baled Hay, ton
5.80
5.85
3.70 190.00
26.00
.
6.40 6.40
200.00 27.60
!!/6.3~
4.36
-- .. 4.69 3.76
. 195.00 . 242.00
27.60 22.60
4. 74. 5.12
3.9.8 259.00
23.70
k/4.73
259.00 23.20
~
PRICES PAID - DOLlARS 2/
Mixed Dairy Feed:
-
14 Percent Protein,cwt, 2/
3.95
4.05 4.00
3.47
3.62
3.61
16 Percent Protein,cwt.
4.00
4.15 4.20
3. 75
3.93
3.92
18 Percent Protein,cwt.
4.15
4.40 4.50
3.90
4.05
4.03
20 Percent Protein,cwt.
4.30
4.50 4.55
4.10
4.27
4.30
All Under
29 Percent Protein, cut.
4.00
4.20 4.25
3. 71
3.86
3.85
Y - - Monthly average.
' y Dollars per unit as of the 15th of the month except wholesale milk which is average f.9r month.
3/ Revised,
A 2~// UP,resli.mpinriacrey. is for. under 16 percent.
~l'l'YE-:f!.,I'J';f tW :G~
JUL 21 1987
ARCHIE lANGLEY Agricultural Statistician in Charge
-LIIRARIES
W. PAT PARKS Agricultural Statistician
ISSUED BY: The Georgia Crop Reporting Service,-USDA;4o9A North Lumpkin Street, Athens, Ga. in cooperation with the Georgia Department of Agriculture
UNITED STATES MILK PRODUCTION
June mil~_putput 1 percent elow 1~66
June milk productiQn in the Unit~d States is estimated at ll~l6l million pounds, l percent less than a year earlier and the smallest output for the month since 1937. The relatively low June production was partly due to a leveling off of the seasonal peak in milk production in recent years. June production was 6 percent less than the 5-year average for the month. On a daily average basis, production increased three-tenths of a percent from May to June this year, compared with an average decrease of eight-tenths of a percent. June output provided 1.87 pounds of milk per person daily, compared with 1.91 pounds a year earlier. For the first half o. the year, milk -production was about the same as for the comparable period a year earlier.
~!!!Lrate per cow up .'3 perent from a year earlier
Milk production per cow during June averaged 821 pounds -- up .3 percent from a year earlier and 13 percent more than average. Production per cow was at a record level for the month in 44 states. On a daily basis , June output per cow averaged 27.4 pounds, which is slightly more than in May and compares with 26.6 pounds in June 1966.
11ilk Per Cow and Milk Production by 1'1onths United 'States, 1967, with Comparisons
- - -- -. - . . - - Month
__ Hilk E9rco~:__
Average
1961-65 1966
1967
~~
-M.i...l..-k. - , E-r o-d- u c- t i o-n------_~ __
Average
:Change
1261 ... 65
1966
19L :from 1966
Hilgon Po~
Percent
January
February
March April May June Jan.-June total July August September October November December
. . . . . . .
621
591 _676 690
757
.7.2..9..
671
. 629 592
..:.
602
581 618
678
635
736 752 812 798
736 696 663 670 649 687
715
10,22-2 .. 9,- 80,5
670 766 785 844
. . .
9;696 11;062 11;260
12;310
9;137 10;.537 10;72.5
11;525
--821
.....:
11;816
66;368
10;849 10,148
.9;522
9,643
11;269
62,998
10;350
9;763 9;263
9;.333
.: 9,288 9.841
9,012 9:511
9;855 . : +0.5
. 9;217
+0.9
10;510
-0.3
10;732
+0.1
.. 11;508
..0.1
. 11;161
-1.0
62,983
0
. . :
.: .
- -Annual
: L:z5.9 8.213
: .125_,660 . lgg_,_g,2p
After Five Days Return to United States Department of Agriculture
Statistical Reporting Service 409A North Lumpkin Street Athens, Georgia 30601 OFFICIAL ill!SINE..
Postage and Fees Paid
u. s. Department of Agriculture
,__
GEORGIA CROP REPORTING SERVICE
ATHENS, GEORGIA
I
GEORGIA CHICK HATCHERY REPORT
July 19, 196 7
Placement of broiler chicks in Georgia during the week ended July 15 was 9, 113, 000--1 percent more than in the previous week but 5 percent l e ss than in the comparable week last year, according to the Georgia Crop Reporting Service .
An estimated 12,031,000 broiler type eggs were set by Georgia hatcheries-2 percent less than in the previous week and 12 percent less than in the comparable week a year earlier.
The majority of the prices paid to Georgia producers for broiler hatching eggs were reported within a range of 55 to 65 cents per dozen. The average price of hatching eggs was 58 cents per dozen. The price of eggs from flocks with hatchery owned cockerels generally was 2 cents below the average price. Most prices received for broiler chicks by Georgia hatcheries were reported within a range of $7.00 to $9.00 with an average of $8.25 per hundred. The average prices last year were 65 cents for eggs and $10.00 for chicks.
Week Ended
GEORGIA EGGS SET, HATCHINGS, AND CHICK PLACEM:SNTS
EGG TYPE
Eggs Set
1966
1967
u;o of year ago
Chicks Hatched
1966
1967
Thou.
Thou.
Pet.
Thou.
Thou.
% of
year ago
Pet.
June 17 June 24 July 1 July 8 July 15
Week Ended
762 695 729 804 753
Eggs Set !}
1966 Thou.
1967 Thou.
543
71
864
674
97
851
589
81
754
467
58
609
590
78
556
BROILZH TYPE
rifo of year ago Pet.
Chicks Placed for
Broilers in Georgia
rifo of
1966
1967
year
ago
Thou.
Thou. Pet.
630
73
571
67
527
70
457
75
510
92
Av. Price
Hatch
Broiler
Eggs
Chicks
Per
Per
Doz.
Hundred
1967
1967
Cents
Dollars
May 13
14,206 11,919
84
9,906
9,471
96
56
May 20
14, 133 12,414
88
10, 155
9, 587
94
56
May 27
14,082 12, 535
89
9,913 10,001 101
55
June 3
14,026 12,288
88
10,085
9,277
92
55
June 10
13, 998 12, 155
87
10, 026
9, 495
95
55
June 17
13, 820 12, 179
88
9,883
9,457
96
56
June 24
13, 859 12, 179
88
9,937
9,226
93
56
July 1
13, 631 12, 3 54
91
9,808
9, 177
94
56
July 8 July 15
13, 670 12,281
90
9,666
8,980
93
57
13,614 12,031
88
9, 559
9, 113
95
58
1/ Includes e gg s set b y hate he rie s producing chicks for hatchery supp1y flocks.
7.75 7.75 7.75 7. 50 7.50 7.75 7.75 7.75 8.00 8.25
ARCHIE LANGLEY Agricultural Statistician In Charge
W. A . WAGNER Agricultural Statistician
U. S. Department of Agriculture
Georgia Department of Agriculture
Statistical Reporting Service
409A North Lumpkin Street,
Athens,
-, '"1 Georgi~----------
UN!' : ':> ) !TY OF GEORG IA F
JUL 21 1967
LIBRARIES
-
--
E GGS SET A ND CHICKS PL-ACE D IN C OMMERCIAL AREA3 BY WE .:!:KS - 1967
STATE
~.
July
1
E GGS S2 T
i
Week Ena:ea:
J o/o of !~
July
8
I July I
15
aygeoar1/11
.:;HICKS PLAC,.!:D
~ eek .t- nded
July
1
July
8
July
15
THOUSANDS
THOUSANDS
Page 2
t
"/o ot year
ago 1/
Maine
2, 011
1, 867
1,976 103
1, 551
1, 504
1, 531
100
Connecticut Pennsylvania
..
326 1, 517
251 1, 391
331 73 1, 545 130
195
206
183
119
962
790
1, 050
115
Indiana
574
659
543 74
356
320
315
73
Missouri
573
644
603 72
359
394
402
76
Delaware Maryland
2,764 4,727
2, 778 4,716
2,670 4,367
97 97
j
I
2,927 3, 152
2, 741 3,400
2, 777 3,307
108 105
Virginia
1, 790
1, 660
1, 672 102
1, 128
1, 000
1, 005
93
West Virginia
146
151
134 99
412
372
368
87
North Carolina
7, 134 6,826 6,973 102
5, 613
5, 329
5, 433
100
South Carolina
524
547
545 128
442
440
434
115
.
GEORGIA
12, 354 12, 281 12,031 88
9, 177 8,980 9, 113
95
::J
Florida
Tennessee
Alabama
Mississippi
Arkansas
i'
Louisiana
Texas
Washington
Oregon
California
TOTAL 1967 {22 States)
850
838
903 190
862
793
738 61
475
477
890
l, 044
556
138
8'54
so
8,666 4, 752 10_, 070 1,083 4,385
594 301 1, 801
8, 579 4,714 10, 011 1, 107
4,291 638 302
1, 871
8,274 99 4,795 105
9,846 98 1, 107 101 4,344 101
648 98 270 87 1, 906 99
6,884 6, 722 6,664
96
4,319
4,266
4, 153
105
7,610 7. 107 7, 629
97
848
866
831
114
3, 547 3, 580 3,329
96
549
475
452
102
254
244
261
86
1, 473
1, 384
l, 416
101
67,804 66,915 66,221 97 53, 123 51, 641 52,063
99
TOTAL 1966* (22 States)
69,578 68,735 67,946
53,498 52,582 52,758
o/o of Last Year
97
97
97
1/ Current week as percent of same week last year.
* Revised.
99
98
99
H qoDl
,..r~ 4f\'3
1~b1 GEORGIA CROP REPORTING SERVICE 1 1\ U . S . OEPAfltTMENT OF AGRIClJLTUPE STATIST1CAL REPORTING SERVICE STATE DEPARTMENT OF AGRICULTURE
Athens, Georgia
July 19, 1967
GEORGIA FESCUE SEED PRODUCTION DOWN 19 PERCENT
Qeorgi~: The 1967 production of fescue seed in Georgia is forecast at 2,050,000 pounds, 19 percent below the 1966 crop of 2,520,000 pounds, according to the Georgia Crop Re-
porting Service. The acreage harvested for seed is estimated at 10,000 compared with 12,000
last year, and the yield per acre is off 5 pounds. Frequent rains during June delayed harvest-
i~ operations. Some intended acreage was not harvested.
This yearls production of tall fescue seed in nine Southern States is estimated at
43,926,000 pounds. This is 23 percent less than the revised 1966 crop of 57,195,000 pounds, , but 12 percent above the 1961-65 average.
Production was below 1966 in all Southern States except South Carolina, Mississippi, and Oklahoma. In Missouri and Kentucky, the leading tall fescue seed producers, production v1as 32 percent and 26 percent, respectively, below 1966.
A total of 211,300 acres was harvested, compared with 261,000 acres last year and the average of 203,920 acres. Acreage cut for seed was below 1966 in Missouri, Georgia, Kentucky, Tennessee, Alabama, and Arkansas, and was the same as a year earlier in South Carolina and mssissippi. Acreage cut for seed was above 1966 in Oklahoma.
This yearls indicated yield is 208 pounds per acre compared trith 219 pounds in 1966 and the average of 191 pounds. In most States t.;eather ~vas dry early in the season. Harvest ~reather was generally favorable, except for rain, which delayed harvest in Arkansas, Georgia, and Kentucky.
Harvest of this year's tall fescue seed ranged from five days earlier than last year in Alabama to four days later in Georgia. Average beginning dates of harvest were: June 15 in Alabama and Mississippi, June 21 in South Carolina and Tennessee, June 22 in Georgia, Kentucky, Arkansas, and Oklahoma, and June 24 in Missouri.
Carryover of old-crop seed by growers in the 9-State area totaled 5,354,000 pounds
c~pared with last yearls holding of 2,461,000 pounds. Dealers' carryover for the U. s. vnll
be published in the August 3 report.
There were 600 pounds of tall fescue seed imported between July 1, 1966 and May 31,1967. ~ere was no tall fescue seed imported in fiscal year 1966. Export data are not available.
The forecast of the late harvest tall fescue seed crop in the P
st vnlL be
included in a report scheduled for release on August 17.
UNIVERSITY OF GEORGIA
(Please turn page)
JUL 21 1967
LIBRARIES
TALL FESCUE SEED: Acreage harvested, yield per acre and production,
- - - - - : average 1961-65. annual 1966 and 1967 _--li:creaiieiia"rve'Stecr-:--~-ire.!2...E~ acre-:-T_:-~Prf>9_ucfu:onJlean se.ecn---
:
:
: Indi- :
:
:Indi-:
:
: Indi-
State
Average : 1961-65 :
119166
-Acres
y cated
1967
:Average: :1961-65:
19-y66
:cated: Average 1967: 1961-65
: :
1966
cated 1967
-------- - . . - Pounds
Thousand pounds
Mo.
: 70,000 108,000 81,000 181
210 190 12,588 22,680 15,390
s. c.
-GE ORGIA
Ky.
9,200 12,000 12,000 168
185 190
: 8.200 12.000 10.000 187
210 201)
:-t;~:"Boo -67, ooo 53, coo-~20~9--s:s-240
1,599 1. IJ96
13,791
2,220 2.520
2,280 2.050
'
17,0tl~l2,720
Tenn.
32,600 J8,ooo 34,ooo 190
210 210 6,248 7,980
7,140
Ala.
6,260 10,000 8,000 207
210 225 1,292 2,100
1, 8CO
l1iss.
2,700 3,000 3,000 137
150 160
378
450
480
Ark.
: 6,900 8,000 1,000 17.5
210 215 1,210 1,680
1,50.5
Okla.
2,260 3,000 3,300 171
160 170
313
480
561
Total
---
9 States 203,920 261,000 211,300 191
219 208 39,07.5 57,195 43,926
- - -!?i~~R-e-v~is-e~d~:.---------------.._-------.--------------.--------.-.-
----
C. L. CRENSHAW Agricultural Statistician
ARCHIE LANGLEY Agricultural Statistician In Charge
ISSUEB BY: The Georgia Crop Reportrng-8ervice' USDA, 4o9A.North-Lumpkin-street,-xt:hens, Ga::--
in cooperation with the Georgia Department of Agriculture.
A~ter Five .Days Return to United States Department of Agriculture
Statistical Reporting Service
409A North Lumpkin Street Athens, Georgia 30601 OFFICIAL BUSI~ffiSS
Postage and Fees Paid
u. s. Department of Agriculture
CROP REPORTING SERVICE
5;5
ATHENS, GEORGIA
. June 1967
July 2 l , l 967
Item
During June
1966 l/
1967 2/
!
o/o of II
last ~ year U
Jan. thru June
1966 1/
1967 2/
o/o of
last year
Thou.
Thou. Pet. I Thou.
Thou.
Pet.
Broiler Type
I
Pullets Placed(U. S. )3/
Total
4, 413
3, 935 89
23,892
22,077
93
Domestic
3,937
3, 590 91
21, l 00
19, 574
93
Chickens Tested: Broiler Type
Georgia
408
I 386 95
2, 864
3,279 114
United States
1,735
2, 110 122
12,412
14,788 119
Egg Type Georgia
37
0
I
169
135
80
United States
294
339 115
3, 120
3, 547 114
Chicks Hatche d:
Broiler Type
Georgia
47,045
42,764 91
266,952
261,324
98
United States
246,626 244,810 99 1,415,245 1,444,975 102
Egg Type
Georgia
3, 724
2,'782 75
20,908
21,804 104
United States
53,915
48,251 89
354, 114
348,071
98
Commercial Slaughter:4/
Young Chickens Georgia United States
Mature Chickens
36,708
1 37,780 103
190. 900
202,719 106
203,681 213, 193 105 1,075,090 1, 144, 035 106
li
I
Light Type Georgia
I
I
378
605 160
3, 607
4,754 132
United States
9, 518
11,500 121
59, 195
73,968 125
Mature Chickens
Heavy Type
Georgia
202
?..14 106
1, 4 02
2,042 146
United States
1, 739
1, 723 99
10,098
12,991 129
Egg Production:
Mil.
Mil .
Mil.
Mil.
Georgia
379
4 07 107
2, 193
2,454 112
. South Atlantic
United States
-5/
1,004 5,493
1, 086 108 5,815 106 j
5,992 33,287
6, 580 110 35,396 106
-1/ Revised. 2/ Preliminar y 3/ Pullets for broiler hatcher y suppl y flocks, includes
expected pullet replacements from eggs sold ciuring the preceding month at the rate of
125 pullet chicks per 30-doz. case of eggs. 4 / Federal-State Market News Service-
Slaughter reports only include poultry slaughtered under Federal Inspection. 5/ South
Atlantic State s: Del., Md., W.Va., N.C., S. C., Ga., Fla., Va.
YOUNG CHICKENS: SLAUGHTERED UNDER FEDERAL INSPECTION
BY SELECTE D STATES, 1966 and 1967
Number Inspected
Indicated Percent Condemned
State
During May
Jan. thru May
During May
Jan. thru May
1966
1967
1966
1967
1966
1967
1966
1967
Thou.
Thou.
Thou.
Thou.
Pet.
Pet.
Pet.
Pet.
Maine
5, 712
6,687 28,316 29,785
3.2
3. 5
3.5
3 .8
Pa.
7, 4 10
6,987 33,886 34,212
4. 1
4 .9
4.4
5. 3
Mo .
2,944
3~747
14, 103
16,278
4. 1
4.5
6.3
5.0
Del.
7, 864
8,448 37,416 36,097
4.7
6.4
4.6
5. 7
Md.
11, 286 13, 176 53, 3 21 58, 743
4.7
6. 1
4.7
5. 5
Va.
3, 731
5,066 17, 162 19,338
3.3
3.7
3.3
4. 1
N. C.
21,695 23,350 98, 597 102, 89 5
3. 7
3.6
4.3
4.6
Ga.
32,466 3 7, 114 147, 568 160, 802
3.4
5.2
3.8
5. 4
Tenn.
5, 808
6,000 24, 182 24,875
2. 5
4 .2
3. 1
5. 3
Ala.
21,705 25,767 97, 589 104, 899
3. 1
3.4
3.4
4 .0
Miss.
13, 833 14, 589 61,554 65, 4 04
2.8
2.6
3.3
3. 8
Ark.
26,382 31,841 123,769 138,375
3.8
3.9
3.9
4 .8
u.Texas
s.
10, 614 14, 145 49,881 188,974 217,440 869,304
U. S. Department of Agriculture
58,851 941, 107
3.2
2.9
3.8
3.6
n. 3.5
4. 1
7
Georgia Department ~
~. v
c"'"'~tT
Statistical Reporting Service, 409A North Lumpkin Street, Ath ens, Geor ia 30601
JUL 27 1967
li5RA.11ES !
End-of-Month Stocks of Poultry, Poultry Products, Meat and Meat Products United States - June 1967
Shell egg holdings totaled 423 thousand cases on July 1 .and frozen eggs totaled 83 million pounds. Stocks of both commodities were larger than a year earlier, but frozen eggs were
below average for the date. Holdings of meat were 652 million pounds, 73 million less thar. on June l. On July 1, 1966, stocks totaled 518 million pounds and the average is 590 millio pounds. Holdings of beef were down to 266 million pounds afte r a June reduction of 22 million pounds. A 45-million pound decline in pork brought July l stocks down to 291
million pounds. Frozen poultry stocks on Julyl,Were 306 million pounds, 10 million
pounds more than a month earlier and 146 million more than a year earlier. Average
July l holdings are 193 million pounds. Turkeys, whole birds, totaled 122 million pounds on July 1 compared with 113 million on June l. Turkey parts amounted to 37 million
pounds, about the same as a month earlier. Total turkey holdings were more than double July l, 1966 stocks and two-thirds more than average.
Commodity
Unit
June 1961-65 av
June 1966
May 196(
Jn~
1967
Eggs: Shell Frozen eggs, total
Case Pound
Thou.
352 103, 252
Thou.
101 55,486
Thou.
265 71' 170
Thou.
423 83,021
Poultry frozen: B railers or fryers Hens, fowls Turkeys Other & Unclassified
Total Poultry
Pound Pound Pound
Pound
Pound
20,991 35,014 94,969 42, 266 193,238
16,385 26,403
69,652
47,254
159,694
39,277 49, 827 149,418
57, 038
295, 560
3 5, 017 50, 483
159,282 61, 103
305,885
Beef: Frozen in Cure
and Cured
Pound 185,464
211,911 288,007 266,419
Pork: Frozen
and Cooler
Pound 298,758
214, 134 336,033 291,438
Other meat and meat
products
Pound 105, 857
92,300 100,954
94, 171
Total all red meats
Pound 590,079
518,345 724,994 652,028
- MID MONTH PRICl<~'S R".A~-J <'~CEIV.1!~- D AND PRI""''-'~~s PAID
I
Georgia
United States
-
Item
June 15 May 15 June 15 June 15 May 15 June 15
1966
1967
1967
1966
1967
1967
Cents
Cents
Cents
Cents Cents
Cents
Prices Received:
Chickens, lb. excluding
broilers
11.0
8.0
7. 5
10.0
8. l
7.8
Com 11 Broilers {lb.)
15. 5
12.0
12. 5
16. 1
13. 3
13. 5
All chickens (lb. )
15.4
ll. 8
12.3
15. 6
12.8
13.0
All Eggs {dozens)
41.5
34.4
33.6
33. 1 28.9
27.4
Prices Paid: {per 100 lb.)
Dol.
Dol.
Dol.
Dol.
Dol.
Dol.
Broiler Grower
4.90
5.00
5.20
4 .92 4.97
5.03
Laying feed
4.85
5.00
5.00
4. 50 4.65
4 .66
Scratch Grains
4.25
4.40
4.40
3.97
4.09
4. ll
***********************************************************************************
This report is made possible through the cooperation of the National Poultry Improvement Plan, Official State Agencies, the Animal Husba_ndry Research Division of the Agricultural Research Service, the Inspection Branch of the Poultry Division, Consumer and Marketing Service and the Agricultural Estimates Division of the Statistical Reporting Service and the many breeders, hatcheries, poultry processors and the poultry farmers that report to these agencies.
ARCHIE LANGLEY Agricultural Statistician In Charge
W. A . WAGNER Agricultural Statistician
After Five Days Return to: United States Department of Agriculture
Statistical Reporting Service 409A North Lumpkin Street
Athens, Georgia 30601 OFFICIAL BUSINESS
Postage and Fees Paid U. S. Department of Agriculture
" ....
h the ns , Ge or ~_-ia
ESSl\
Pr e c i pitation ::Tor Te ele ;;.1diig Jul ~-. 2-1_ ,. 1 967 .
.G.EO.RGIA
. ( 1 \PE
~ t .l 0 If
., .;
* f or 1:.c-riod Jul;: 2'2 ~24, 1967
T, l e s s thc:m ... 00) :.i_nch
Afte;r. Five Day s Ret~lr,il t .o United Stat~s De.parirncnt of Agriculture
St-atistical Report :i,.ng Serv.ice 4C9AN orth Lumpkin street Athens, Georgia 306Cl . OFFICIAL BTJS]JE SS
:Go -_ DIATE _ u. s. ''F..A'F>-ER REPORT
'.1.'~:..; .r-eport will be treated in al,l . R'? spe cts a s Letter +l!a il .'.:ee Se c. 34~17 _, P . L. & R.)
... ..
The Univ Library Univ Of. Ga Athens Ga 30601
Posta 6e and Fees Paid -
u. s. Depa rtme:nt of Agricultu~e
': ' f
:: , ..:......
....
,1NIVERS!TY (Jf e,::ORGIA
S IS
JUL. 14 1967
----------U-E-E-KL-Y--C-R.O,P...A.N.D.. W. A.THE R BULL .... --
1967' \rJ'eek Ending Jul'y-' '24,
, ., ... j .}
----mm~m~'!:alm-!.n street
RGl~ased 3 p. mo Monday
Athens, Georgia
------~ ... -~-------------
D
___ U. _ _ _ _ . . . . _ _ _ _ _ ..,.
i .
AMPLE ~'iOISTURE SUPPLIES
Athens, Ga., July 24 Excellent vegetative growth of crops and pastures
is resulting from ample moisture throughout the State, accOrding to the Georgia
~~! cp Reporting Service. Effectiveness of disease and insect controls is being
:~)~ sened by frequent showers, and SOI)le. :Qay crops are .becoming overly mature,
,_-..;; cording to reports from County Agents.
-Condition of the $i9tton ~r6p imp~m;ed on:i.y sllghtiy. and .is. now jud.ged as b-e .., ing mostly fair. There is a builq up in boll weevii infestation that could be- "?- t.Yme serious. open weather that would permit effective control me.asures is very desirable.
Corn condi"tibrt is about the same as last week and is mostly .good. Prospec-1:-s
.g_e fora better yield than t~st year in most sections. i.rhe majority of the . .s ._..u.th Georgia crop is already "made".;
~~have made excel~en~ v~getative growth and ha~e the possibility of a good crop. Disease .control . is yery difficult due to frequent showers.
' Soypeans -~earl.y pl~nti~s: .lJa~ ~de . e~cel;J.ent ~Qwth --~~ are 'Qlo0mi~. . There are some reports that plantings are still being made. Crop prospects are mostly good to very good.
Tobacco harvest i~ reported to be 46 percent complet~. Markets are to open this week. There are reports of heavy infestations of tobacco lice that are res i sting control by recommended measures.
Hay crops have made'e~cellent growth, but lack of good harvest weather has allowed some to become overly mature. Daily showers in some areas have caused d ~~age to hay cut during the period.
Peach harvest is 88 percent complete; 2,797 carlot equivalents had been
sh~-?ped through July .20. This comp~es with 2,972 last year.
.
Market Managers reported h~est 'of em.ly sununer vegetables and melons about
r. J~plete. Harvest of lima beaps and .southern peas active as weather permits. Wa termelon harvest active in central districts.
1-JEATHER SUMMARY: _MQst..p.t: Nqrth ?pQ CentrB.l_. Georgi~ ~njoyed . ~ few d~y,s of fair weather and only light ~ r aJ.nfafi during the week ending Friday, JUiy' 21: Several weather observers ~n these areas recorded no measurable rai~ during the week. Showers were frequent and amQunts moderate to excessive in much of the south. The weekts heaviest r~ins occurred in the lower coastal area where Sapelo Island had over 6 inches for the week and 4.52 inches in one 24-hour period. The
observer at Brunstdck measured more than 5 inches of rain during the week and re-
ported waterspouts of~ shore on the 2oth. ThUndershowers increased toward the end of the week and were general over most of the State during the weekend. High winds and hail accompanied some of the more severe \-leekend thunderstorms.
Temperatures were unusually cool early in the week but i .ncreased to near nor-
mal by the end of the period~ . A-large nunmer of weather sta~ions reported riew
record lows for this time of year during the previous weekend.- Averages for the
week were 3 to 7 degrees below normal. Ttis was the fourth straight week that
te-mperatures over the State have averae;ed much below normal.
The five-day forecast for the period Tuesday through Saturday (July 25-29)
~ r,JI.:=J for temperatures to average near normal except slightly cooler than normal
rJ'''?' midweek. Rainfall is expected to average 1/211 in the north and . 3/4n to ! 11
: ~:.- i:'1).e south in scattered thundershowers. The showers should be more numerous
.t~ : r the middle of the period.
The Georgia Crop Reporting Service, Athens, Georgia in
cooperation with th~ Cooperative Extension Service, Univers~:t.y
of Georgia; Georgia Department of Agriculture; and the Weather
:Bttreau, Ess~, Uo s. Department of Conunerce.v
1-'--
. '
~.
]~
0 t01
~4fr;,
\ b"1
GEORG I A CROP . REPORTING SERVICE
WJt~~rn~w rn&Jtrrn~m't?
ATHENS, GEORGIA
July 26, 19 67
GEORGIA CHICK HATCHERY REPORT
Placement of broiler chicks in Georgia during the week ended July 22 was 9, 110, 000--about the same as in the previous week but 5 percent less than in the comparable week last year, according to the Georgia Crop Reporting Service.
An estimated 12,061,000 broiler type eggs were set by Georgia hatcheries--
slightly more than in the previous week but 9 percent less than in the compar<.lble
week a year .earlier.
The majority of the prices paid to Georgia producers for broiler hatching eggs were reported within a range of 55 to 65 cents per dozen . The average price of hatching eggs was 58 cents per dozen. The price of eggs from flocks with Q.atchery owned cockerels generally was 2 cents below the average price. Most prices received for broiler chicks by Georgia hatcheries were reported within a range of $7.00 to $9.00 with an average of $8. 25 per hundred. The average prices last year were 66 cents for eggs and $10.25 for chicks.
Week Ended
GZORGIA EGGS SET, HATCHINGS, AND CHICK PLACE ME NTS
EGG TYPE
Eggs Set
I
1966
I
1967
o/o of
year ago
Chicks Hatched
1966
1967
Thou.
Thou.
Pet.
Thou.
Thou.
II % of year ago
Pet.
June 2.4 July 1 July 8 July 15 July 2.2.
Week Ended
695 72.9 804 753 804
Eggs Set};_/
1966 Thou.
1967 Thou.
674
97 ,.
851
589
81
754
467
58
609
590
78
556
668
83
583
571
' 67
52.7
70
457
75
510
92
475
81
BROILER TYPE
% of year ago
Chicks Placed for
Broilers in Georgia
%of !
1966
1967
year
ago
Av. Price
Hatch. Broiler
Eggs Chicks
Per
Per
Doz. Hundred
1967
1967
Pet.
Thou.
Thou. Pet. Cents Dollars
May 2.0
14, 133 12,414
88
10, 155
9, 587 94
56
7.75
May 2.7
14,082. 12, 535
89
9,913 10,001 101
55
7.75
June 3
14,02.6 12.,288
88
10,085
9, 277 92.
55
7.50
June 10
13,998 12.,155
87
10,02.6
9,495 95
55
7. 50
June 17
13', 82.0 12., 179
88
9,883
9,457 96
56
7.75
June 2.4
13, 859 .12, 179
88
9,937
9,2.26 93
56
7.75
July 1
13, 631 12.,354
91
9,808
9, 177 94
56
7.75
July 8
13, 670 12,281
90
9,666
8,980 93
57
8,00
July 15
13,614 12,031
88
9, 559
9, 113 95
58
8.25
Jul~ 22
13,235 12,061
91
9,628
9, 110 95
58
8~25
]_/ Includes eggs set by hatchenes producmg ch1cks for hatchery supply p.ocks.
' "'
ARCHIE LANGLEY Agricultural Statistician In Charge
W. A. V.TAGNER Agricultural Statistici~:m
U. S. Department of Agriculture
Georgia Department of Agriculture
Statistical Reporting Service
409A North Lumpkin Street, Athens, Georgia
UNIVERSITY OF GEORGIA
~Ul 27 1967
li~~ARIES
--~-- r
_,
EGGS SET AND CHICKS PLACED IN COMMERCIAL AREAS BY WEEKS- 1967
EGGS SET
I
CHICKS PLAC~:!:..l)
Page 2
STATE
'
Week E nded
July
July
8
15
July 22
Io/o of year ago 1/
July 8
Week Ended
July
July
15
22
I o/o of
l year ago 1/
THOUSANDS
THOU.:>A NDS
..
Maine Connecticut
1, 867 . 251
1, 976 331
2,057 104 285 81
1, 504
1, 531
1, 484
96
206
183
188
144
Pennsylvania .
1, 391
1, 545
1, 671 121
790
1, 050
930
102
Indiana
659
543
584 93
320
315
329
82
Missouri
644
603
523
59
394
402
432
95
Delaware .
2,778
2,670
2,723 102
2, 741
2,777
2, 657
105
Maryland
4,716
4,367
4,238 93
3, 4001 3,307
3,264
101
Virginia
1, 660
1, 672
1, 590
97
1, 000
1, 005
l, 053
89
West Virginia North Carolina South Carolina
151 6,826
547
134 6,973
545
137
94
6,781
99
557 159
372
368
446
104
5,329
5, 433
5,442
98
440
434
428
123
.
.U)
:::>
GEORGIA
12,281 12,031 12,061
91
8,980
9, 113
9, 110
95
Florida
-
. Tennessee
Alabama Miss is sippi Arkansas Louisiana
Texas Washington
Oregon California
TOTAL 1967 (22 States)
838
903
879 213
477
556
556
151
793
738
697
59
1,044
854
926
85
8, 579
8,274
8, 231 103
6,722
6,664
6,789
101
4,714
4,795
4,809 111
4,266
4, 153
4,016
106
10, 011
9,846
9,471 106
7, 107
7, 629
7,424
98
1, 107
1, 107
1, 066 106
866
831
834
119
4,291
4,344
4, 114 102
3, 580
3,329
3,288
97
638
648
642 91
475
452
413
81
302
270
276 17
244
261
276
92
1, 871
l, 906
1, 941 103
1,384
1, 416
l, 331
92
66,915 66,221 65,333 100
51,641 52,063 51,616
99
TOTAL 1966* (22 States)
68, 735 67,946 65, 544
Ofo of Last Year
97
9-7
. 100
*1/ Cu~re~t week as percent of same week last year.
Revised.
-
.52, 582 ' I
;
'
98
52,758 99
52, 193 99
~
- - - -
- .-
~ ~
-
. -- -- .
-
-:-~---~- -:_______
1967
CALF CROP
Releaseq 7/26/67 by GEORGIA CROP REPORTING SERVICE
Georgia Calf Crop Expected to be Down 1 Percent
The 1967 calf crop in Georgia is expected to total 734,000 head, according to the Crop Reporting Service. 'Ihis would be 1 percent below the 1966 calf crop of 734,000, but 7 percent ~ove the 1961-65 average of 686,000 ~ead.
On January 1, 1967, there were 917,000 cows and heifers 2 years old and older (for all p~poses) on Georgia farms compared with 935,000 a year earlier. The ratio of calves born and
to be born to cows and heifers 2 years old and older is 80 percent compared with 79 percent in 1966.
- - - - UNITED STATES
Calf Crop Declines 1 Percent
The 1967 calf crop for the United States is expected to total 43,056,000 head, 1 percent less than 1966.
Cows and heifers 2 years old and older on January 1, 1967, at 49,793.,000 head, also were 1 percent less than a year earlier.
The number of calves born and to be born in 1967, expressed as a percentage of cows and heifers 2 years old and older the first of the year, is 86 percent, the same as in 1966. This ~rcentage is not strictly a calving rate because the January 1 inventory of cows ahd heifers 2 years old and older does not include all heifers that give birth to calves during the year ~d includes some cows that die or are slaughtered before calving.
. - - - - - ------- North Central States Down 1 Percent
...-.... .
The expected calf crop in the North Central States ranges from 8 percent lower in JI'Iichigan to 2 percent higher in South Dakota. The East North Central States are down 3 percent while the West North Central States are unchanged from last year.
Of the 16 Southern States - 10 show smaller calf crops than last year, but these decreases
are partially offset by increases in 5 States. One State was unchanged. The calf crop in the
South Atlantic is slightly smaller than a year earlier.
Westerp States Unchanged
Year to year changes in Western States c'alf crops range from an increase of 5 percent
fwWashington to a decline of 6 percent for Wyoming. Of the eleven States represented in
the region 5 show an increase in number while 6 indicate a smaller 1967 calf crop.
---.
-~--
...
....... .l'i";"
The 9 North Atlantic States expect some 88,000 fewer calves born this year than last.
~ery State in the region is estimated below 1966, with the largest decline - 11 percent -
expected for Rhode Island.
ARCHIE LANGLEY Agricultural Statistician In Charge
-------------------------------
ISSUED BY: The Georgia Crop Reporting Service, USDA, 409A No in cooperation with the Georgia Department of Agr
W. PAT PARKS Agricultural Statistician
, At ens, Ga.,
A.. I ES
Calf Crop , 1966 and 1967, by States
State
Maine N . H. Vt. Ma ss . R. I. Conn. N.Y. N .T Pa .
Cows and heifers 2 yrs. & older
.Tanuary 1
S: year
average 1961-65
1966
l,OCO -h-efaod g
58 282 100
13
93 1,410
134 1,068
1,000 head
--g2
50 249 88 12
84 1,311
113 988
1967
1,000 head
- - 86 47 237 82 11 81
1,246 109 950
Calves born as 1
percent of cows : and heifers ? ~ : .Tn.nuary 1 1/ 1
1966 I 1967
I
-P-erscoen-t
83 82 78 75
80 83
81 86
Percent a1
85 83 79 76
82 85 78 86
5- year
average 1961-65
1,000 hea d
--89
49 236 81 11 75 1,188 107 924
Calves born ?:./
1966
1, 000 head
--74 42 204 69 9 67
1,C88 92
850
1967
:19 6 7~
of 1966
1,000
-h-e=adro
Percent --95
40
95
197
97
65
94
8
89
66
99
1,059
97
85
92
817
96
Ohio
Ind.
ill. J.,.iich. Wis.
991
890
870 86
85
846
765
740
97
812
773
741
87
88
711
673
652
97
1 13C8
1,248
1,168
87
88
1,151
l,C86
1,028
95
810
750
689
83
83
702
622
572
92
2,543
2,449
2,374
88
90
2,288
2,155
2,137
99
Hinn.
Iowa Mo. N.Dak .
s. Dak.
Nebr. Kans.
1,835
1,776
1,687
85
87
1,999
2,044
2,061
93
92
2,009
2,115
2,151
91
90
1,068
1 ,2(JJ
1 ,182
88
87
1,698
1,830
1,871
93
93
1,994
2,149
2,110
90
92
1,8C5
1,906
1,872
88
89
1,629
1,510
1,468
97
1,835
1,901
1,896
100
1,808
1,925
1,936
101
982
1,062
1,028
97
1,564
1,702
1,740
102
1,822
1,943
1,941
100
1,647
1,677
1,666
99
Del.
30
24
21 77
82
24
18
17
94
M
268
248
242 85
85
224
211
206
98
Va .
779
735
727
83
84
654
510
611
100
W. Va.
298
';>82
265
85
87
255
240
231
96
N. C.
s. c.
515
530
528
81
82
310
321
320 82
82
405
4 29
43 3
101
250
263
262
100
FGl' ~eao~r~f!.i~a~----~--~1-.~or~8a3~9----~r~.~c9~3a5~9----~l~,9c1~7--~~47-9-----7~48T0--------~7~64R~60--------;783096 -------~8703~64 ~----r9a9)
Ky. Tenn. Ala.
},~l iss.
Ark. La.
Okla. Texas
1,234
1,292
1,.315
91
91
1,155
1,274
1,260 84
83
987
1,042
1,007
80
81
1,325
1,439
1,414 81
82
862
925
945
83
82
1,171
1,184
1,125
78
78
1,983
2,173
2,115
86
88
5,402
5,589
5,670 84
83
1,105
1,176
1,197
102
1,002
1,070
1,046
98
801
834
816
98
1,013
1,166
1,159
99
7C6
768
775
101
915
924
878
95
1,706
1,869
1,861
100
4,469
4,695
4,706
1CO
Mont. Idaho Wyo.
Colo.
N . iv1ex.
Ariz. Utah 1-Tev. \'la sh. Oreg. Calif.
1,318
1,511
1,521
91
91
662
699
684
90
91
632
719
683
89
88
978
1,043
l,C88
93
90
740
750
737
86
86
423
417
436
83
76
372
395
393
88
87
301
. 320
301
77
85
591
585
594
89
92
779
813
798
89
90
1,766
1,853
1,866
87
87
1,202
1,375
1,384
101
598
629
622
99
564
640
601
94
881
970
979
101
629
645
634
98
336
346
331
96
324
348
342
98
241
246
256
1C4
529
521
546
105
689
724
718
99
1,562
1,617
1,618
1CO
48 States Alaska
Hawaii
48,878
50,311
49,686
86
87
42,256
43,395
42,980
99
4.5
4.6
4.4 87
86
3.8
4.0
3 .8
95
93
105
103
70
70
65
74
72
g']
United States
48,976
50,420
49,793
86
86
42,325
43,473
43,056
99
1/ Not strictly a calving rate. Figure represents calves born expressed as percentage of the number of cows and - heifers 2 years and over on farms and ranche s .Tanuary .l. ~/Calves born before .Tune 1 plus the number
expected to be born after .Tune 1.
Jlfter Five Days Return to
~nited States Department of Agriculture Statistical Reporting Service 4C9A North Lunpkin Street Athens, Georgia 30601 OFFICIAL BUSmESS
Postage and Fees Pa id U. S. Dep~rtment of Agricul ture
fcc D"' J7
'f-
1~~,_7 @rniDn~
01!@lli 0
GEORGIA:
JULY l, 1967
Re leased 7/27/67 GEORGIA CROP REPORTING SERVICE
Corn stocks in all positi0ns on July 1, 1967, totaled 10,124,000 bushels, compared with
13,76),000 bushels on hand a year ago. Oats (old crop) stored in all positions totaled 289,000
bushels compared with 291,000 bushels the previous July. ovbeans stored on July l totaled
1,828,000 bushels.
Georgia Grain Stocks -- July 1, 1967
---~----~'"'::':":~.--------wi~!!!~ri~!?E~--
:
ON FARMS
:
OFF FARMS
ALL PO-SIT-IO- NS - - -
. GRAIN
196(, .
1967
: 1966
1967 _l__ 196___ _1,2.1__
- - 1,000 bushels------~l,Oci'ObuShels
1,000 bushels
Corn
11,395
7, 647
2,370
2,477
Oats
207
241
84
48
Barley
10
7
-X--
tlheat
37
39
~
4
2
orghum
26
46
Sovbeans :
171
ul5
~(i(-
1.411*
* Not puhlishedtoavoicfcfisci'oSingindiVI'dual operations.
13,765 291
10,124 289
4
-----~-_1~2 8 __
UNITED STATES:
\rJheat stocks on July 1, 1967 were 20 percent beloH a year earlier and the smallest since 1952. Durum holdings were about half as much as on last July l. Record high soybean stocks totaled 49 percent above last July l and 46 percent above average. Stocks of the four feed grains on July 1, 1967 totaled 65 million tons - 10 percent below a year earlier and 30 percent below average. Stocks of rye were 3 percent less than a year earlier, but were the sec ond largest for the end of a crop year since 1944. Flaxseed stocks were about 40 percent below a year earlier.
All wheat in storage on July l totaled 426 million bushels--the smallest carryover since i952.--R.ve-stocks totaled 18.4 million bushels, 3 percent below a year earlier, the second _largest yearendlholdings since 1944. ~stocks in all storage positions on July l totaled 1,735 rillion bushels--3 percent less than a year earlier and 26 percent below the average July holdings. Corn stored on farms totaled 1,330 million bushels, slightly above the 1,324 million ushels a year earlier. ~stocks in all positions totaled 268 million bushels, 15 percent a.ess than July l holdings a year ago and 8 percent below average. ~le;y stored in all positions on July l totaled 120 million bushels, 15 percent more than a year ago but 8 percent less than the average for July l. Sorghum grain stocks in all positions on July l totaled 336 million ushels, 37 percent less than a year earlier and 53 percent below average.
Soybean stocks in all storage positions on July 1, 1967 totaled a record 199 million ushels~percent above a year earlier and 46 percent above average. The incr ease from a
e~ earlier was due to record high farm holdings of
hels. Stocks in off-farm
positions totaled 114 million bushels, down l perc ent frWtnla!'lm\i:r~u--er;f~a t 14 percent above
average. July l stocks indicate a disappearance duri g the period, Sep~em r 1966-June 1967,
f 768 million bushels from a supply of 967 million b shel~tJ'lc~fY~ of 6 million bushels
plus 1966 production of 931 million bushels). During the perioa46'0'inilli n bushels were
rocessed for oil and 223 million bushels wer e export d. Soybeans used fo seed and feed are
ected to total about 48 million bushels.
LIBRARIES
ARCHIE LANG lEY icultural Statistician In Charge
Please turn page
A. J. BORDELON Agricultural Statistician
Stocks of grains, July 1, 1967 with comparisons
av-. (In thousand bushels)
- - - - - - - - - --- -------- - - July 1 -----J~u~l--y~l=-------April 1
--JulY'l
Q.r&!L~~ _po~~llon
---~ 1961-65
1966___
1967____ _ _ _196L_
ALL WHEAT (old crop)
On Farms 1/
108,654
130,771
240,933
147,066
YlJ ___ 4 Commodity Credit Corp. 2/
Mills, Elev. & Whs es.
38,438
9,521
1,539
1,122
2Bg_,~42_ ____ J9~'~7!i _____ 02.,242_ ____ g_7J,~7g_ _
RYE -,.( TarAL
1.129.u. 2
:Jb.l70
702.017
o...,l"'""'d_.c..,.r-op-r--~--------~----------------
42.'J.66o- -
On Farms 1/
2,581
3,955
7,570
3,601
Corr~odity Credit Corp. 2/
145
612
559
535
~ills,_Ei~!L~~n::~ y ~-=--:_:_:J;l~~----- f~7~~~------ ~t~~~i----- f~7~~~--~
CORN
1
On Farms 1/
1,434,415
1,323,576
2,033,694
1,330,004
- z' - =-=--- CMiolmlms odE.itlyJe:vCQ.rle&dliWit _hC_soe~srp.-.--172=/-_3-/ -=-
424,335
184,728
2.43842!~6~9400 -_- -l:-27784i.~585b69-
98,279
97,705
-2:5-77024.5~4[92- - _: -17370}75.~69867-.
OA~~ Fa~!~ ciJP)
237,825
240,746
353,611
198,232
6 Commodity Credit Corp.
Mills El ev . &'\rJhses.
y2j/)
____
3,250
9,353
21.:..41_0_ _ _ _ _6.,1_0~
_____
6,864 n8Q.,f_82
6,685 _ _ _ _ _6},2_3Q.
_
TOTAL
292. 485
31 .20o
u4l.u60
268.447
BARLEY--rold'Cror;r------
---------
--~
----
on Farms 1/
55,290
46,132
113,137
55,956
Commodity Credit Corp. 2/
9,956
5,232
4,523
4,242
-~~il~:~E~Q;AL& Whses. 17_~ _: _ 1~~:~fr_:_:_:_:1~:-~~~:_:_- -_-: :g~:-j~i- __:_:_~~!~-
SORGHUH GRAIN
On Farms 1/
Commodity Credit Corp. 2/
Hills, Elev. & 1;\Jhses. J.r_3/
TOTAL
-
SoYBEA~--------
54,259
71,352
136,565
84,085
4,766
4,784
4,624
4,606
_, -
~ ~6f5l4f.226972 -
-
-
4.56. 7.37 -5)2:-8?''3- -
-
-
-
388.688 -5297877-
~
-
-
247,070 -3157'7bl-.
----------.-...-....----- -------~----
on Farms 1/
36,790
19,155
218,624
85,402
Commodity Credit Corp.JI
17
0
0
0
Hills, Elev. & '\rJhses. 1 _ _ _ ___T_OTAL
_3/
-
-
-
100 100
l_J"b:9o7 -
~-=--1131447..Q86g72- -
:_- -
240. 4 '32
113. 805
-4:5970S6- :_:_:_-199:-2of..
1/ Estimates of the Crop Reporting Board.
2l//
c.c.c.-owned All off-farm
grain at storages
bin not
sites. otherwise
designated,
including
terminals
and
processing
plants.
Includes C.C.C.-owned grain in these storages.
=====-=====-:=-- ====-======--------------------------- -
________
--
r_'_ ------~----
ISSUED BY: The Georgia Crop Reporting Service, USDA, 409A North Lumpkin Street, Athens, Ga.,
in cooperation with the Georgia Department of Agriculture.
After Five Days Return to United States Department of Agriculture
Statistical Reporting Service 409A North Lumpkin Street Athens, Georgia 30601
QEEJ;Qlli 1?!!~~
Postage and Fees Paid
U. s. Department of Agriculture
., . .
SIS
ATHENS, GEORGIA
GEORGIA CROP REPORTING SERVICE
HONEY PRODUCTION
July 28, 1967
GEORGIA
Colonies of bees on July 1 totaled 170,000, according to the Georgia Crop Reporting Service. This is I percent below the 172,000 colonies on hand a year ago. The condition of colonies on July 1 was 81 percent of normal, compared with 85 percent last year. Unfavorable weather damaged the nectar flow in southern areas and low yields are expected this year.
UNITED STATES
Colonies of bees on July I in the 48 States totaled 4,H37,000. This is an increase of percent from the 1966 number and reverses the downward trend in number of colonies which has continued since 1958. The largest increases occurred in the East North Central and South Atlantic regions -- both up 3 percent from a year earlier. The South Central region was up 2 percent and the West North Centra 1 increased 1 percent. The North At 1antic and Western regions were practically unchanged from a year earlier.
Condition of colonies on July 1 for the 48 States was reported at 84 percent of normal -the same as the previous year but below the average condition for recent years. Average
condition of colonies by reg ions ranged from 88 in the West to 80 in the East North Central.
Compared with a year earlier, the West was up 5 percentage points, the South Atlantic was up 2, and the North Atlantic was up I point. The East North Central average condition of colonies declined 5 percentage points, the West North Central was down 3 points, and the South Central was 2 points below a year earlier. A relatively mild winter in many areas of the Nation enabled colonies to winter in good condition without excessive losses. Bee activity during spring months was hampered because of cool, wet weather conditions throughout large areas of the country. Th i s unseasonable weather caused bees to get a late start in replenishing depleted food reserves. Condition improved during late June with advent of warmer temperatures, which was favorable for bee flight and nectar flow.
Condition of nectar plants for the 48 States averaged 79 percent of normal on July 1, , compared with 75 percent a year earlier. The Western region had the most substantial
improvement from a year earlier -- 88 percent this year compared with 72 in 1966. The South Atlantic, at 72, was 5 percentage points above a year earlier and both the North Atlantic and South Central were up 4 points at bl and 76, respectively. Plant conditions were 6 percentage points below a year earlier in the West North Central and 2 points below in the East North Central. Plants throughout much of the 4~ States suffered from a cold, wet spring. Frost in May and June killed fruit blossoms in many areas.
In California, the leading honey producing State in 1966, the cool, rainy spr i ng resulted in a late start, but by early summer nectar produc i ng plants were generally much more abundant than a year earlier. This is reflected in the reported condition of 93 percent compared with 70 on July 1, 1966. Florida, the second ranking honey producer in 1966, experienced a spring drought which reducea the nectar flow but June rains helped to alleviate this condition. Although the July 1 general condition of nectar plants across the Nation was 4 points above a year earlier, it varied widely between the States.
ARCHIE LANGLEY Agricultural Statistician In Charge
L. H. HAR:U S, J 1~ . Statistical Assistant
***********************************************
ISSUED BY: The Georgia Crop Reporting Service, USDA, 409A North Lumpkin Street, Athens, Ga., in cooperation with the Georgia Department of Agriculture.
Colonies of Bees and Condition of Colonies and Nectar Plants on July I
State and Division
Colonies of Bees
1966 Thou.
1967 Thou.
1967 as % of 1966 Percent
Condition 1/
Colonies
Nectar Plants
1966
1967
1966
1967
Maine
N. H.
Vt. Mass.
R. I.
Conn.
N. y N. J.
Pa.
N. At 1
s
s
100
89
86
89
86
s
s
100
91
90
86
88
8
8
100
86
80
86
79
I 0
10
I 00
87
88
89
86
2
2
100
88
82
87
79
I 0
I 0
I 00
8S
86
85
87
164
162
99
81
84
84
82
36
37
103
89
84
79
90
I I7
I I7
I 00
84
83
65
74
- - - 357 - -- - -356-- -- -1oo-- - - 83-- -- 84- --- 7z- -- - 81---
Ohio
149
152
102
84
76
72
69
Ind.
98
102
Jo4
as
73
ao
73
Ill. Mich.
91
93
102
87
83
86
83
116
123
106
80
84
74
82
Wis. E. N. Cent.
---
142 596----
142 -612----
100 -1o3----
a88s----
85 8o----
91 8o----
83 7a---
Minn. Iowa Mo.
195
185
95
86
83
91
79
137
137
100
86
84
89
80
102
107
105
90
88
80
78
N. Dak.
46
50
109
87
83
91
79
S. Dak.
95
101
106
81
78
79
80
Nebr.
99
104
105
80
77
77
78
Kans. W. N. Cent.
- - - -74232 - - - - - 7!3:!1,7_ - - - - 1~016- - - - ~835- - - - 8802---- 8675---- 7799---
Del.
5
5
100
95
95
92
91
Md.
32
32
100
91
88
60
80
Va. W. Va.
106
106
100
82
79
63
69
89
94
106
63
82
48
79
N. C.
s. c.
213
222
104
78
85
57
69
60
63
105
77
80
67
67
GEORGIA Fla.
S. At I
172
310970
99
85
81
71
71
---
92974 T---
-~:oo,----
-,1(05>J----
88
82----
887 4 - - -
80 6z-
--
-
1724- --
Ky.
88
97
110
80
80
63
78
Tenn.
142
151
106
81
86
6S
75
Ala.
99
93
94
88
85
71
75
Miss.
65
65
100
89
89
78
85
Ark.
90
94
104
87
91
76
87
La.
86
86
100
90
86
78
76
Okla . Texas
:
:___
49
13.2
_
__
51
_ _214_
__
__
I.024a___
.
_
78
~3-
___
82 15_
___
z5a8_ ___
77 .B _
_
_
S. Cent.
858
871
102
85
83
72
76
Mont.
80
78
98
83
86
80
86
Idaho
210
220
105
75
93
63
90
Wyo.
31
30
97
85
95
74
82
Colo.
53
51
96
as
79
74
zo
N. Mex.
14
14
100
82
85
79
68
Ariz.
96
85
89
83
80
79
78
Utah
51
53
104
81
81
65
77
Nev.
9
9
100
Bt
88
78
88
Wash.
91
97
107
86
87
79
80
Oreg.
67
70
104
90
90
83
87
Ca I if.
~Jest.
48 States
---I ,-25651-9 ----I-,2S-6S69-----11-0000-----8834-----88-98 ----77-02 ----98-38 --
4, 766
4,837
101
84----~8~4------~75~----~7=9--- ,
~1~/-P_e_r-ce_n_t--of~n-o-rm-a~l---------------------------------
~
After Five Days Return to United States Department of Agriculture
Statistical Reporting Service 409A North Lumpkin Street Athens, Georgia 30601 OFFICIAL BUSINESS
Postage and Fees Paid U. S. Department of Agriculture
Week Ending July 31, 1967
Released 3 p.m. Monday
SHOWERS INTERRUPT FARM ACTIVITIES
Athens, Ga., July 31 -- All farm activities were limited during the week by frequent show-
" ers, according to the Georgia Crop Reporting Service. Most crops, however, benefitted from ample
moisture supplies, but disease and insect controls were hampered by the wet soils and frequent
showers.
Cotton is sett i ng bolls in all areas, according to reports by County Agents. The crop is later than usual, and boll weevil infestation seems somewhat worse than in the past several years. ~reopen weather i s needed for cotton fruiting and insect control.
Corn prospects continue good to excellent. Much of the acreage in central districts is 11made",and ample moisture supplies in northern districts seem to assure a good crop throughout the State.
Peanut prospects were judged better than last year. Disease control is rather difficult, could be overcome with a few days of open weather.
Soybeans continued to make good growth; additional areas are blooming and setting pods.
Tobacco harvest was reported to be almost 60 percent complete. Quality of first marketings was not as good as the previous year. Prices received during the three-day sale averaged about two cents per pound less than last year, according to the Federal-State Market News.
Weather conditions were unfavorable for~ making. Growth is ample, but some hay has become over-mature. Pasture condition is good to excellent in all areas.
Peach harvest is complete except in the northern-most areas. Carlot-equivalent shipments totaled 2,8].3 through July 27, compared to 3,147 for the same period last year. This year's crop was of much better quality than a year ago.
Sweetpotato harvest is well under way in southern areas. Supplies of watermelons and other vegetables have been 1 ight during this period. Southern pea harvest was very active. Planting of fa 11 vegetab 1~s has been de 1ayed by the continued rains.
\4EATHER SUMMARY- Showers continued to occur at frequent intervals over most of Georgia week ending Friday, July 28, 1967. Amounts showed large variations from one observa-
tion point to anothe\. The observer at Tifton recorded only .11 of an inch for the week while Jesup, 100 miles to the east, received 7.41 inches. Nearly five inches of this total fell in one 24-hour period. The Statewide average was well over an inch. This was the sixth straight ~ek of frequent, and sometimes heavy, showers over most areas of Georgia. Showers continued to occur over much of the State during the week with heavier amounts generally in the south.
Georgia temperatures were slightly warmer than during the last four weeks but still averaged below normal in most areas. Averages for the week ranged from about normal at Savannah and Columbus to three degrees below normal at Macon and Rome. Minimum temperatures were about normal but the cloud i ness and frequent showers kept afternoon maximum temperatures below normal during most of the week.
The five-day forecast for the period Tuesday through Saturday (August 1-5) calls for temperatures to average near to slightly below normal with 1 ittle day-to-day change. Rainfall is expected to be moderate to locally heavy and occur as scattered thundershowers throughout the period, mainly in the afternoons and evenings.
ISSUED BY: The Georgia Crop Reporting Service, Athens, Georg ia; in cooperation with the Cooperative Extension Service, University of Georgia; Georgia Department of Agriculture; and the Weather Bureau, ESSA, U. S. Department of Commerce.
UNIV RSITY OF G" , GIA \
AUG 2 \961
LIBRAR IES
U. S. DEPARTMENT OF COMMERCE WEATHER BUREAU Athens, Georgia ESSA
Precipitation For The Week Ending July 28~ 1967
GEORGIA
Temperature extremes for the week ending July 28, 1967 (Provisional)
0
Highest: 96 at Fitzgerald on the 27th and and Fort Stewart on the 28th
580 at Clayton and Helen on the 23rd
.88
~
TJOMa
* For period July 29-31
T, less than .005 inch
After Five Days Retu rn t o United States Department of Ag ricu l tu re
Statistical Reporting Se rvi ce 409A North Lumpk in St ree t Athens , Georgia 3060 1 OFFICIAL BUS INESS
IMMEDIATE- U. S. WEATHER REPOR This repoTt will be trea t ed in a ll
Respects as Letter Mail (See Sec . 34.17, P.L. & R. )
Postage and Fees Paid U. S. Department of Agricultun
Gt
k ot; od '!
~~fw~~rn~~CRO[ifu~@ill~rn~
ATHENS, GEORGIA
August 2, 1967
GOERGIA CHICK HATCHERY REPORT
Placement of broiler chicks in Georgia during the week ended July 29 was 8, 840, 000--3 percent less than the previous week and 6 percent less than the comparable week last year, according to the Georgia Crop Reporting Service.
An estimated 12,031,000 broiler type eggs were set by Georgia hatcheries--
slightly less than the previous week and 8 percent less than the comparable week a
year earlier.
The majority of the prices paid to Georgia producers for broiler hatching eggs
were reported within a range of 55 to 65 cents per dozen. The average price of hatch-
ing eggs was 58 cents per dozen. The price of eggs from flocks with hatchery owned
cockerels generally was 2 cents below the average price. Most prices received for
broiler chicks by Georgia hatcheries were reported within a range of $7.00 to $9.00
with an average of $8. 25 per hundred. The average prices last year were 66 cents
for eggs and $10. 25 for chicks.
Week Ended
GEORGIA EGGS SET, HATCHINGS, AND CHICK PLACEMENTS
I
EGG TYPE
Eggs Set
1966
1967
%of
year ago
Chicks Hatched
1966
1967
Thou.
Thou.
Pet.
Thou.
Thou,
%of year ago
Pet.
July 1 July 8 July 15 July 22 Jul 2.9
Week Ended
729 804 753 804 804
Eggs Set !J
1966 Thou.
1967 Thou.
589
81
754
467
58
609
590
78
556
668
83
583
717
89
643
BROILER TYPE
% of
year ago
Pet.
Chicks Placed for Broilers in Georgia
1966
1967
o/o of
year a o
Thou.
Thou. Pet.
527
70
457
75
510
92
475
81
412
64
Av. Price
Hate
Broiler
Eggs
Chicks
Per
Per
Doz.
Hundred
1967
1967
Cents
Dollars
May 2.7
14,082 12,535
89
9,913 10,001 101
55
June 3
14,026 12,288
88
10,085
9,277
92
55
June 10
13,998 12, 155
87
10,026
9,495 95
55
June 17
13, 820 12, 179
88
9,883
9,457
96
56
June 2.4
13, 859 12, 179
88
9,937
9,226 93
56
July '1
13, 631 12, 3 54
91
9,808
9, 177 94
56
July 8
13,670 12,281
90
9,666
8,980 93
57
July 15
13, 614 .. 12,031
88
95
58
July 22
13,235 12,061
91
95
58
Jul 29
13, 124 12,031
92
94
58
1./ Includes eggs set by hatcheries prod cinght}Gic:&s fet7hatc ery supply flocks.
7.75 7.50 7. 50 7. 7 5
7.75 7. 7 5 8.00 8.25 . 8~ ?-5
8~25
ARCHIE LANGLEY Agricultural Statistician In Charge
U. 5. Department of Agriculture
Georgia Department of Agriculture
Statistical Reporting Service
409A North Lumpkin Street, Athens, Georgia
STATE
Maine Connecticut Pennsylvania Indiana Missouri Delaware Maryland Virginia West Virginia North Carolina South Carolina
GEORGIA
Florida Tennessee Alabama Mississippi Arkansas Louisiana Texas Washington Oregon California
TOTAL 1967 (22 States)
THOUSANDS
THOUSANDS
1,976 2,057
1,875 101
1, 531
1, 484
1, 468
100
331
2-85
309 81
183
188
176
91
1, 545 . 1, 671
1, 538 131
1, 050
930
960
116
543
584
590 79
315
329
334
75
603 .
523
591 99
402
432
407
75
2;670
2, 723
2,692 104
2,777
2,657
2, 909
116
4,367
4, 238 -4,351
97
3,307 3,264
2,975
100
1,672
1, 590
1, 595 98
1, 005
1, 053
1, 162
115
134
137
155 101
368
446
280
76
6,973
6,781
6,741 . 101
5,433 I 5, 442
5, 463
106
545
557
547 151
434
428
441
126
12, 031 12,061 12,031 92
9, 113 9, 110
8,840
94
903
879
843 184
556
556
628
163
738
697
735 63
854
926
828
74
8,274
8,231
8,235 104
6,664 6,789
6,767
104
4,795 4,809
4,938 112
4, 153
4,016
4,032
106
9,846
9,471
9,473 111
7,629
7,424
7, 500
98
1, 107
1,066
1, 161 124
831
834
831
124
4,344 4, 114
4,313 112
3, 329
3,288
3, 257
101
648
642
595 89
452
413
394
77
270
276
303 71
261
276
259
101
1 06
1 1
1 889 98
1 416
1 331
1 370
93
66,221 65,333 65, 500 102 52,063 51, 616 51, 281
101
TOTAL 1966* (22 States)
67,946 65,544 63,996
52,758 52, 193 50, 987
o/o of Last Year
97
100
102
1/ Current week as percent of same week last year.
* Revised.
.
99
99
101
,t_U.
....:...:..l., "..'0.. .u:..:.l.
ell ,_.
P,.tl.O
C/)<r:
Q.) .....
Q.) ~
.0...
Q
"l!l Q)
Q 8
ell_..,
Q) ,...
tl.Oell ..e..l,l Qp.).
OOQ P0..
(/)
::::::>
,Q_).
..:.:.:!,
......
..u:.:.:.!
,_. Q.)
. bO u ....,
0 <r: :; Q.l ..
...., ...... ,_. ,Q_).
~QQ.)..., (/)
:::!_..,(/)(/) (/)
.... ~tl.O~elltil
8 ..... ~Q)
Q.)
Q
....,
~..p.......~..~-z(/~)
0 ec>lln. t~:P~.-:<:8l0t:::JQ.:)j::>Q
0 Q.) ~ ~ ~~
.~.Q>...~.c)Qo;n.) :nCJzit.~0:ca&c.Q:,.e) .u:<..
rz., ,Q....)
.... t/)
Ill .....
c(
c(
.::~~0' 0
.... c(e> ....
t.../. )o~
a
0
f1i
# Cfoo?
;jl{ fJ-3
/C'1
~~1 1 ~@ffi~@L1~ffiillL1
[pffi~@~0
Released 8/7/67 GEORGIA CROP REPORTING SERVICE
GEORGIA PRICES RECEIVED INDEX INCREASES 6 POINTS
The Index of Prices Received by Georgia farmers for all commodities increased 6 points dur-
ing the month ended July 15, 1967 to 256. This was 13 points below the July 15, 1966, index of 269.
Increases in meat animal, broiler, and egg prices more than offset declines in prices of grains and hay. The All Livestock and Livestock products Index at 228 was 9 points above last month, but 11 points below July 15, 1966.
The All Crop Index at 268 was 4 points above a month ago but 15 points below July 15, 1966.
UNITED STATES PRICES RECEIVED INDEX UP 2 POINTS PARITY INDEX UP 2 POINTS, ADJUSTED PARITY RATIO 8o
During the month ended July 15, the Index of Prices Received by Farmers advanced 2 points (3/4 percent) to 257 percent of its 1910-14 average. Higher prices for tomatoes, potatoes, and eggs contributed most to the increase. Price declines for wheat, lettuce, and corn were partially offsetting. The index was 4 percent below July 1966.
The Index of Prices Paid for Commodities and Services, including Interest, Taxes, and Farm Wage Rates rose 2 points during the month to 345, a record high. The index was 11 points (3 pe~ cent) above a year earlier.
With prices paid by farmers increasing and prices of farm products higher, the Preliminary Adjusted Parity Ratio, reflecting Government payments, remained unchanged at eo .
The Parity Ratio, at 74, was also unchanged.
Index Numbers -- Georgia and United States
Index
July 15
June 15
July 15
Record High
1910-14 = 100
GEORGIA
1966
1967
1967
. Index 4.
Date
Prices Received All Commodities All Crops
Livestock and Livestock Products
269 283
y y
250 y
264 IJ
256 268
239 y
219
228
310
March 1951
319
March 1951 g)
295 :.Sept. 1948
UNITED STATES
Prices Received
Parity Index 1}
268
255
334
343
313
Feb. 1951
345
July 1967
Parity Ratio
80
74
123
Oct . 1946
Adjusted Parity Ratio ~
(preliminary)
86
80
80
y 1f Revised . g} Also April 1951.
Prices Paid, Interest, Taxes, and Farm Wage Rates based on
' data for the indicated dates . ~ The Adjusted Parity Ratio, reflecting Government payments,
averaged 86 for the year 1966, compared with 80 fo~ the Parity Ratio~ P~e~~minary Adjusted
Parity Ratios for the current year, supplied by the Economic Research Service, are based on es-
timated cash rec eipts from marketings and estimates . of Government payments . for the current
calendar year.
ARCHIE lANGLEY Agricultural Statistician In Charge
WILLIAM A. WAGNER Agricultural Statistician
ffiSUED BY: The Georgia Crop Reporting Service, USDA, 409A North Lumpkin Street, Athens, Ga . , in cooperation with the Georgia Department of Agriculture .
P~ICES -- RECEIVED AND PAID BY FARMERS JULY 15, 1967 WITH COMPARISONS
GEORGIA
UNITED STATES
Commodity and Unit
July 15 June 15 July 15 July 15 June 15 July 15
1966
1967
1967
1966
1967
1967
PRICES ~ECEIVED:
Wheat, bu. Oats, bu. Corn, bu. Barley, bu. Sorghum Grain, cwt. Cotton, lb. Soybeans, bu. Hay, baled, ton:
All Alfalfa Lespedeza Peanut 11 i 1k Cows, head Hogs, cwt.
Beef Cattle, All, cwt. 11
Cows , cwt. 1/
Steers and Heifers, cwt. Ca 1ves, cwt.
$ 1. 60
$
.80
$ 1.40
$ 1. 02
$ 2. 10
30.5
$ 3. 10
$ 26.50 $ 36.00 $ 29.00 $ 22.50 $ 190.00 $ 23.50 $ 19.40 $ 16.70 $ 21 .80 $ 23.60
1. 55
~80
1.48 .96
2.20 20.5 2.70
27.60 36.50 29.50 24.00 195.00 20.60 19.40 16.40 21.80 25.00
1. 50 .80
1 .45 .99 2.20 22.0 2.70
26.20 35.50 27.50 22.50 210.00
21 .oo
19.80 16.70 22.20 25.50
1. 74 .664
1. 27
1. 06 1.83
29.72 3.37
22.60 23.00 24.20 22.80 245.00 23.20 21 .90 16.90 23.60 25.20
1.49 .717
1. 26
1.06
1.99 19.91 2. 71
23.20 23.90 24.50 23.70 259.00 21.00 22.90 17.40 24.50 26. 80
1. 37 .669
1. 21
1.06
1.99 21.04
2.66
22.40 22.90 24.20 23.50 262.00 21 .40 23 .20 I 7. 50 24.90 27.10
Milk, J holesale, cwt.: Fluid Market Manufactured All }/
$ 5.95 $ 3.80
$ 5.90
6.25
s.os
4.03
6.25
~/6. 35
4.71
5.06
3.95 4 . 68
~/4.fm
Turkeys, lb.
23.0
21.0
21.0
22.0
20.1
20 . 4
Ch ickens, lb., excl. broilers 10.5
7. 5
8.5
9.6
7. 8
7.9
Commerc ial Broilers
15.5
12.5
14.0
16. 1
13.5
14.7
All
15.3
12.3
13.8
15.5
13.0
14. I
Eggs, All, dozen
45.2
33.6
37.6
35.6
27.4
29.9
PRICES PAID, FEED
Mixed Dairy Feed, cwt.:
All under 29% protein
$ 4.10
4.25
4.20
3.78
3. 85
3.84
14% Protein 21
$ 3.95
4.00
3.95
3.56
3.61
3.62
16% Protein
$ 4.10
4.20
4.15
3.82
3.92
3.89
18% Protein
$ 4.20
4.50
4.40
3.97
4.03
4.00
20% Protein
$ 4.40
4.55
4.4~
4.22
4.30
4.2b
Hog feed, 14%-18% protein,cwt$ 4.40
4.55
4.55
4.48
4.58
4.59
Cottonseed Meal, 41%, cwt. $ 4.85
5.20
5.10
5.14
5.36
5.34
Soybean Meal, 44%, cwt.
$ 5.50
5.00
4.90
6.11
5.31
5.3 b
Bran, cwt.
$ 3.65
3.95
3.90
3.34
3.59
3.57
Middlings, cwt.
$ 3.75
4.15
4.10
3.45
3.67
3.68
Corn Meal, cwt.
$ 3.40
3.70
3.65
3.38
3.50
3.49
Broiler Grower Feed, cwt. $ 5.30
5.20
5.20
5.08
5.03
5.03
Laying Feed, cwt.
$ 5.10
5.00
5.10
4.65
4.66
4.65
Scratch Grains, cwt.
$ 4.40
4.40
4.45
4.05
4.11
4.0~
Alfalfa Hay, ton
$ 41~50
40.00
38.00 32.00
32.70
32.60
All Other Hay, ton
$ 31.00
35.50
34.00 30.70
31.10
31.20
l l1/ 11 Cows11 and 11 steers and heifers11 combined with allowance where necessary for slaughter bulls. Includes cull dairy cows sold for slaughter, but not dairy cows for herd replacement.
11 Revised. ~/Preliminary estimate. 21 U. S. price is for under 16 percent.
After Five Days Return to Un i ted States Department of Agriculture
Statistical Reporting Service 409A North Lumpkin Street Athens, Georgia 30601 OFFICIAL BUSINESS
Acguisition s Di vision Un1versity of Georgia University Libraries Athens Georgia 30601
Postage and Fee s Paid U. S. Depa r tment of Agr iculture
3 I .r-
GEORGIA CROP REPORTING SERVICE - ATHENS, GEORGIA
Athens, Georgia
GEORGIA - AUGUST 1 CGTTON REPORT
.. August 8, 1967
Prospects on August l indicated -- a Georgia cotton crop of 220,000 bales (500-p~und gross
~ight), according to information reported by crop correspondents to the Georgia Crop Reporting
Service. Production at this l evel would be -96,000 bales below last year and the smallest crop
of record. Acreage for harvest is estimated at 285,000 and the average yield is indicated to
be 371 pounds per acre.
Adverse weather during the planting season caused poor seed germination and much replanting in some areas. Many farmers failed to get good stands. This, plus heavy plant ~oss f r om cool temperatures and disease, resulted in a considerable acreage of cotton being destroyed and replanted to soybeans or other crops.
Since June 1, frequent and sometimes heavy rains have raade insect control difficult , and boll weevil damage has been heavy.
ARCHIE LANGLEY Agricultural Statistician In Charge
C. L. CRENSHA\rJ Agricultural Statistician
AUGUST 1 CONDI TI ON BY CROP REPORTING DISTRICTS
~k!ct
1965 1966 1967 Percent
1
86 73 54
2
83 68 62
3
85 75 68
4
77 75 74
5
78 73 72
6
81 76 66
7
75 75 70
8
81 85 76
9
88 71 71
State
80 77 70
-4
I
Macon
0
.Columbus
Districts shown are
CrOI~~~o>n~~~o~~tv,~.~~~v:~ ub
ne\)~Slm~ ~l
Districts.
AUG 10 1967
llBlll!.RI[S
I
Albany
1
Valdosta
See r evers e side
for UNITED STATES
i nformati on.
UNITED STATES - COTTON REPORT AS OF AUGUST 1, 1967
The Crop Reporting Board of the Statistical Reporting Service makes the following report
from data furnished by crop correspondents, field statisticians, Bureau of the Census, Agricultural Stabilization and Conservation Service, and cooperating State agencies. The final outturn of cotton compared with this forecast .will depend upon whether the various influences affecting the crop during the .remainder of the season are more or less favorable than usual.
Acreage
____________ 17 ::-~~L~i-nt~-Yl~.-e~ld~p-e_r
Pr~o~d--uction
State -:--~Harv---e-s~tewd~~---~F~or----=~~-h~arv~~e-st~e-d~a-cr~e~~--~5~0~0-~l~b~gr~o~s~s~w~e;l~&.h~t~b~a~l~e~-J
:1961-6~
harvest 1961~ :
: 19b7 : 1961=65' :
: 1967
-----.:=;.;;av;,:..erage : 1966
1967 : average D.-96_6;_.;,:_i-.;n;;;;;d;.;;i;,;;c._._...__.a~:v-er~a:.:::g~e--::~1~9.66 : indio.
1,ooo 1,ooo 1,ooo
1,oco 1,ooo 1,ooo
acres acres
a~re~
Pounds Pounds Pounds bales bales ~~
N. C.
s. c.
Ga.
Tenn. Ala. No.
384
155
90
374 290 267
545
305
200
419 442 432
647
380
285
422 398 3.71
516
365
260
572 475 425
855
564
460 .
445 392 344
358
190
90
561 408 304
300
94
50
474
282
180
566
316
220
614
363
230
788
461
330
419
162
57
Miss. Ark. La.
Okla. Texas
1,499 1,2?8
52? 595
6,030
995 865
357 380
3,968
940 790
340 405 3,700
625 651 600
55? 418 441
521 602 607 270 270 296
362 385 360
1,942 1,483
572
334 4,544
1,353
?56
449 214
3,182
1,175
725 430 250
2, 775
N. Hex.
189
134 ' 128
673 648 581
266
181
155
Ariz.
380
252
247
1,057 979 1,001
839
515
515
Calif.
765
618
590
1,099 952 997
1, 753 1,228 1,225
other
:
. States g/ : 49
26
20.1
402 359 368
41
19
15.4
------~-~-----------~~-----------------------
u. s.
: 14,617 9,554 . 8,545
491 480 468 14,935 9,5?5 8,332
:
A-m-e- r.----: -----------------------------~------------
. Egypt. ]/ : 94.9
78.0
67.5
548 447 503
109.6 72.9
?0.8
YProducti~n ginned-and-to be-ginned:" -A-5oo':pound-bale contains about [80 net pounds-of lint:-
12//
Virginia, Florida, Illinois, Included in State and United
Kentucky, and Nevada. States totals. Grown
in Texas,
. New Mexico, Arizona,
and
California.
CROP REPORTING BOARD
After Five Days Return to United States Department of Agriculture
Statistical Reporting Service
409A North Lumpkin Street Athens, Georgia 30601 OFFICIAL BUSINESS
Postage and Fees Paid
u. S. Department of Agriculture
hi.
{ UN IVER.,SITV 'f'F EORG IA
H 'I(} t) 7
' A- 3
\ AUG 24 1961
~(, 7
G...E. ORGIA CROP REPORTING SE
fw~~rnL1TI miD~.....
ATHENS, GEORGIA
August 9, 1967
GEORGIA CHICK HATCHE RY REPOR T
Placement of broiler chicks in G e orgia during the week e nded August 5 was 8, 822, 000--slightly less than th e pr e vious week and 7 percent less than th e comparable week last year, according to the Ge orgia Crop Reporting Service.
An estimated 11, 854, 000 broile r type eggs were set by Georgia hatcheries-! percent less than the previous w eek and 7 percent less than the comparable week a year earlier.
The majority of the prices paid to G e orgia producers for broiler hatching eggs were reported within a range of 50 to 65 cents per dozen. The average pri ce of hatching eggs was 58 cents per doz en. The price of eggs from flocks with hatche ry owned cockerels generally was 2 cents bel ow the average price. Most prices receive d for broiler chicks by Georgia hatche ries were reported within a range of $6. 00 to $9. 00 with an average of $8. 25 per hundred. The average prices last year were 66 cents for eggs and $10.25 for chicks
Week Ended
July 8 July 15 July 22 July 29 Aug. 5
Week Ended
GEORGIA EGGS SET, HATCHINGS, AND CHICK PLACEMENTS
EGG TYPE
Eggs Set
1966
1967
'1o of
year ago
Chicks Hatched
1966
1967
;
Thou.
Thou.
Pet.
Thou.
Thou.
:
804
467
58
753
590
78
804
668
83
804
717
89
926
585
63
609
457
556
510
583
475
643
412
603
488
'1o of
year ago Pet.
75 92 81 64 81
BROILER TYPE
Eggs Set !J
1966 Thou.
1967 Thou.
o/o of
year ago
Pet.
Chicks Placed for
Broilers in Georgia
o/o of
1966
1967
year
ago
Thou.
Thou. Pet.
Av. Price
Hatch
Broiler
Eggs
Chicks
Per
Per
Doz.
Hundred
1967
1967
Cents
Dollars
June 3
14,026 12,288
88
10,085
9,277
92
55
June 10
13,998 12, 155
87
10, 026
9,495
95
55
June 17
13, 820 12, 179
88
9, 883
9, 457
96
56
June 24
13, 859 12, 179
88
9,937
9,226
93
56
July 1
13,631 12, 3 54
91
9,808
9, 177
94
56
July 8
13, 670 12,281
90
9,666
8,980
93
57
July 15
13, 614 12,031
88
9, 559
9, 113
95
58
July 22
13, 23 5 12,061
91
9,628
9, 110
95
58
July 29
13, 124 12,031
92
9,449
8, 840
94
58
Aug. 5
12,690 11,854
93
9. 524
8, 822
93
58
1/ Includes e gg s set b y hatche ries p roducin g chicks for hatche r y supp1y flocks.
7. 50 7.50 7.75 7.75 7.75 8.00 8.25 8.25 8.25 . 8. 25
ARCHIE LANGLEY Agricultural Statistician In Charge
W. A. WAGNER Agricultural Statistician
U. S. Department of Agriculture
G e orgia Department of A griculture
Statistical Reporting Service
409A North Lumpkin Street, Athens, Georgia
...
EGGS SE T A ND CHICKS PLACED IN COMMERCIAL AREAS BY WEB KS -
STATE
July
22
EGGS SET
Week Ended
July
Aug.
29
5
Ufo of
year
ago 1/
CHICKS PLACED
Week Ended
July
July
Aug.
22
29
5
THOUSANDS
THOUSANDS
-
Maine
Connecticut
'
Pennsylvania
Indiana
Missouri
Delaware
Maryland
Virginia
West Virginia
North Carolina
South Carolina
2,057 285
1, 671 584 523
2, 723 4,238 1, 590
137 6,781
557
1, 875
309 1, 538
590 591 2,692 4,351 1, 595 155 6,741 547
1, 983 109 320 107
1, 391 109 471 62 523 84
2,656 102 4,267 95 1, 635 101
145 97 6,625 99
565 153
1, 484 188
930 329 432 2, 65'7 3,26i 1, 053 446 5, 442 428
1, 468 176
960 334 407
2,909 2,975 1, 162
280 5,463
441
1, 493 179
1, 003 346 425
2, 748 2,798 1, 167
337 5,406
398
GEORGIA
12, 061 12, 031 11, 854 93
9, 110 8,840 8,822
. Florida Tennessee Alabama Mississippi Arkansas Louisiana Texas Was hington Oregon Californi a
TOTAL 1967 (22 States)
879 697 8, 231 4,809 9, 471 1,066 4, 114 642 276 1, 941
843 735 8,235 4,938 9,473 1, 161 4, 313
595 303 1, 889
778 181
692 60 8, 123 102 4,887 110 9,454 109 1, 130 114 4, 158 114
606 96 303 107 1,757 84
65,333 65, 500 64,323 101
556 926 6,789 4,016 7,424 83 4 3,288 41 3 276 1, 331
51,616
628 828 6, 767 4,032 7, 500 831 3,257 394 259 1, 370
51, 281
581 795 6,469 4,084 7,306 823 3,333 44 0 244 1, 381
50, 578
TOTAL 1966* (22 States)
65,544 63,996 63,698
52, 193 50,987 50, 503
% of Last Year
100
102
101
*1/ Current week as p ercent of s arne w eek last year. Revised.
99
101
100
'1o of year
ago 1/
102 81
116 88
107 105 96 99 129 105 132
93
162 77 100 109 95 129 103 87 122 100
100
REP.ORT
GEORGIA CROP REPORTING SERVICE
ATHENS, EORGIA
August I4 , I967
GENERAL CR OP REP ORT AS OF AUGUST 1, 1967
Georqia: Except for cotton and sma ll gra ins, t he Stat e 1 s c rop yields are expected ' to equal or exceed previous records. Rainfall since June I has been mostly adequate to
excess ive and resulted in v i gorous plant g rowth. The heavy foliage and frequen t showers have made i nsect control d iff icult.
Corn: Co rn p rodu cti on i n 1967 i s f o reca st at S2,775,000 bushel s compare d wrt h 58 , 824,000 bushels l a st year. An .i ncrease in both acreage for harvest ' and yield account for
sharp production i ncrease. Acreage for ha rvest is estimated to be 1,505,000 compared with 1,368,000 in 1966. Yield per acre i s placed at 55 bushels -- 6 bushels above the previous high
9 bushels above the indicated leve l the prev ious month.
Tobacco: Georgia 1 s flue-cured tobacco produc t ion is estimated at 150,675,000 pounds-
sharply above the short crop of 96,380,000 pounds last year. This yea r s crop
will be harvested from an estimated 73,500 acres. Yield per acre is indicated to be 2,050
pounds - 470 pounds above last year '1 s average.
".i '
Peanuts: A total of 908 ,200,000 pounds of peanuts is indicated for 1967, compared with S09,760,000 pounds in 1966.
Grain: Production of small gra ins is 9 percent above last year. Larger acreages of wheat an~ rye accoun i for the increase in production as yields for all s~all below year-earlier levels.
Soybeans: Production of soybeans was placed at 13,008,000 bushels -- ~8 percent more than the 6,923,000 bushel crop last year. This year 1 s product ioB wi ll be
harvested from an estimated 542,000 acres compared with 301,000 in 1966. Yields th i s year are expected to average 24 bushels per acre compared with 23 last year.
Peaches: Production of peaches in Georgia th i s year is estimated to be 3,000,000 bushels-- unchanged f rom the fo recast last month. Production at t his level
would be 800,000 bushels below. la s t ye a r.
GEORGIA CROP PRODUCTION AND HARVESTED ACREAGE, 1966 AND 1967
Crop and Unit
Acreage
:Harvested: For
1966
harvest
196
Thousands
Yield Per Acre
Indicated
1966
1967 .
Product ion
Ind i cated
1966
1967
Thousands
Corn, for grain, bu.
Wheat, bu. Oats, bu. ) Rye, bu.
Barley, bu. Tobacco, Type 14, 1b. Sweetpotatoes, cwt. Hay, a11 , ton Cotton, ba 1e Peanuts, (P & T), 1b. Soybeans, for beans, .bu. Sorghums, for grain, bu. Peaches, tot a 1 crop, bu. Pecans, lb.
l/ Pounds of 1i nt.
1'368 65 98 43 11 61 8
460
380 482 301
12
1, 505 124
93 70
9 73. 5
8 462
2S5 478 542
13
43.0 30.0
41 .o
22.5 41.0 1 ,580
85, 1 .88!:
398 J_/ 1 ,6SO
23.0 38.0
55.0 27.0 37.0 18.0
30.0 2 , 050
95 1 l .90::: 371 1I 1,900 24.0 38.0
5S, 824
1 ,950 4,018
96 8
451 96,380
680 867 316 809.,760 . 6,923
456 ' 3,800
37,000
S2, 775
3,348 3,441 1 ,260
270 150,675
760 8bo 220 908,200 13,008 494 3,000 45,000
ARCHIE LANGLEY
c. L. CRENSHAW
Agricultural Stat i stician In Cha rge
Agricultural Stat ist ician
- - - - - - Th; Ge~rg i ~ Cr~p-R;p~rti-;;g-S;r~.i~~-:- USDA-:- 4o9A-N~rth-L~mpkin-St r;et,-Ath;n-;,-G~.-:-
in cooperat ion with the Geo r g ta .Depa .; tment of Agr i culture.
j.
'
. P Lease turn page
~-
.:....' . '.. '
,
I '
GEORGIA CROP REPORTING SERVICE Athens, Georgia
Ending August 14, 1967
YIELD PROSPECTS GOOD MOST CROPS
Athens, Ga., August 14 Georgia's crops remain in generally good condition and yield
prospects for most are very promising, according to the Georgia Crop Reporting Service. Record
yields are indicated for corn, peanuts, soybeans, sweetpotatoes and hays. Record-tying yields
are indicated for tobacco and grain sorghum, but cotton and small grain yields are down.
County Agents repo rte d a slight improvement in the condition of cotton. Pick i ng has started in older plantings in the south. Insect control measures remained active, but weevil infestation continued to increase.
Most of the State's corn is considered made. An average yield of 55 bushels per acre is
expected.
About b5 percent of the respondents judged the soybean crop as good to excellent. Many
plantings are blooming and setting pods. Rains are needed for best development of this crop in a few areas. An average yield of 24 bushels is indicated for the State.
Tobacco harvest moved forward ana was b5 percent complete at the end of the period. Curing
and market i ng remained active.
Peanut digging increased during the week. Insect and disease control continued to receive attention in several areas.
Georgia's pecan prospects vary widely by area and variety. The August 1 forecast placed production at 45,000,000 pounds.
Pastures and hay crops are generally good but army worms were reported to be giving trouble, espec ially in coastal Bermuda.
Sweetpotato harvest moved forward. Market Managers reported supplies of vegetables and melons declining seasonally.
WEATHER SUMMAKY- Rainfall amounts showed large variations over Georgia dur i ng the week ending Friday, August 11. Totals were generally smaller in the northeast where some weather observers reported no measurable rain for the week. In contrast, heavy to excessive amounts were measured at several places in the eastcentral and southeast sections. More than five ~ inches fell at both Brunswick and Newington. Divisional averages for the week ranged from four tenths of an inch in the northeast to two and four tenths inches in the southeast. The statewide average was just over one inch. There was I ittle or no rainfall during the weekend, except in the extreme south and southeast where some excessive amounts were reported.
Temperatures were mild during most of the week, continuing the summer-long trend of un~ seasonably cool weather. Averages for the week ranged from 3 to 6 degrees below early August
normals. The coolest weather occurred during the weekend after a cold front moved across most of the State on Friday. Early morning temperatures dropped to record, or near record, low levels for the date at several places.
The five-day forecast for the period Tuesday through Saturday, (August 15-19), calls for temperatures to average 4 to 8 degrees below normal with a slow warming trend through the period. Normal highs range from ~8 to 92 degrees and normal lows from 66 to 72 degrees. Rainfall i s expected to be 1 ight to moderate and occur as afternoon showers during the latter half of the period.
ISSUED BY: Th e Georg ia Crop Reporting Service, Athens, Georgia; in cooperation with the Cooperat ive Extension Service, University of Georgia; Georgia Department of Agriculture; and the Weather Bureau, ESSA, U. S. Department of Commerce.
U. S. DEPARTMENT OF COMMERCE WEATHER BUREAU Athens, Georgia
ESSA
Precipitation For The Week Ending August ll, 1967
GEORGIA
Temperature extremes for the week ending August 11, 1967 (Provisional)
Highestg 97 at Quitman and Waycross on the 9th
52 at Blue Ridge on the 7th and LaFayette on the 11th
* For period Augo 12-14, 1967
T, less than o005 inch
After Fve Da ys Re t ur o United States Departmen t of Ag r iculture
Statist i ca 1 Repor t i ng' Se v ice 409A No r th Lump n St reet Athens , Geo rgia 306 1 OFF IC AL BUS INESS
IMMED IATE - U. S. WEA ER REPOR This report wi ll be trea ed a
Respe cts a s Le tte r Ma l l (See Sec . 34 .1 7 , P. L. & R.)
Postage and Fees Paid !
U.S. Department of Agriculture
f
)-I !J7oa
.-.1/--A ~
11t 1
A v..~\S
ATHENS, GEORGIA
...
GEORGIA CROP REPORTING SERVICE
I
I
....... mr
- - July 1967 Released 8/15/67
JULY MILK PRODUCTION UP 4 MILLION POUNDS
Milk production on Georgia farms during July totaled e5 mill ion pounds, according to the Georgia Crop Reporting Service. This compares with 81 mill ion pounds produced in juJy last year and 85 mill ion during June 1967. The 1961-65 July average production was 83 mill ion pounds.
Production per cow in herd averaged 595 pounds -- 50 pounds above the previous year, and 5 pounds above the June output. The 5-year average production per cow for the month was 464 pounds.
The estimated average price rece ived by producers for all wholesale milk during July was $6.35 per hundredweight. This would be $.45 above the previous year, and $.10 above the June
Prices paid by dairymen for feed were about 5 cents per hundredweight below June, but averaged about 10 cents above the previous year.
MILK PKODUCTION AND PRICES RECEIVED AND PAID BY DAIRYMEN
Item and Unit
Milk Production, million lbs.
Production Per Cow, I bs. l l
~umber Mi 1k Cows, thousand head
PRICES RECEIVED - DOLLARS 1:/
Ml wholesale milk, cwt. Fluid milk, cwt. Manufactured milk, cwt. ~ilk Cows, head All baled hay, ton
July 1966
~1
545
149
GEORGIA June 1967
85 590
144
July 1967
85 595
143
5.90
5.95 3.80 .190.00 26.50
6.25 6.25
195.00 27.60
~/6.35
210.00 26.20
UN ITED STATES
July
June
July
1966
1967
1967
10,350 1/11,146 736 11 ti21
I0, 311 761
4. 71
5.05 4.03 245.00 22.60
4.68 5.06 .
3.95 259.00
23.20
~/4.80
262.00 22.40
RICE S PAID - DOLLARS ]j Mixed Dairy Feed:
14 Percent Protein, cwt. 2/
16 Percent Protein, cwt. 18 Percent Protein, cwt. 20 Percent Protein, cwt. All Under
29 Percent Protein, cwt.
3.95 4. I0 4.20 4.40
4.10
4.00 4.20 4.50 4.55
4.25
3.95 4.15 4.40 4.45
4.20
3.56 3.82 3.97 4.22
3.78
3. 61 3.92 4.03 4.30
3.85
3.62 3.89 4.00 4.28
3.84.
Y..1. / Monthly average Dollars per unit as of the 15th of the month except wholesale mi 1k which is average for month.
11 Revised.
4/ Pre I imina ry.
I U. S. price is for under 16 percent.
ARCHIE LANGLEY Agricultural Statistician In Charge
W. PAT PARKS Agricultural Statistician
iSSUED-BY:- Th; Georgi~ Crop-R;port i;g-s; r~ i~e-:- USDA-:- 4o9A-North-L~mpkin-St r;et .-Ath;ns .-G~ .-:- in cooperation with the Georgia Department of Agriculture.
UNITED STATES MILK PRODUCTION
July milk output only sl iqhtly below July 1966
July mi lk production in the United States is est imated at 10,311 mill ion pounds, slightly less than a year earlier and 5 percent below the 5-year average for the month. Estimated milk product ion for June 1967 has been revised to 11,146 mill ion pounds. On a daily average basis, product ion decreased 10 percent from June to July this year compared with the average decrease of 11 percent. July output provided 1.67 pounds of milk per person daily compared wi th 1.70 pounds a year earlier. For the first seven months of the year milk production was about the same as the comparable per iod a year earlie r .
July rate per cow up 3 percent from a year earl ier
Milk production per cow during July averaged 761 pounds, up 3 percent from a year earlier and 13 percent above average for the month. Production per cow was at a record level for the month in 46 States. On a daily basis, July output per cow averaged 24.5 pounds, which is 2.9 pounds less than June and compares with 23.7 pounds in July 1966.
Milk Per Cow and Milk Production by Months United States, 1967, with Comparisons
Month
January February March Apr i 1 May June July Jan.-July total August September October November December
Annual 1/ Revised.
Mi Ik per cow
Average
1961-65
1966
Pounds
621
67b
591
635
676
736
690
752
757
812
729
798
671
736
' 629
696
592
663
602
670
581
649
618
687
7,759
8,513
1967 '
715 670 766 785 844 l/821 761
Mi I k product ion
Average:
: Change
1961-65: 1966
1967 :from 1966
Mill ion Pounds
Percent
10,222 9,805 9,855 ro.s
9,696 9' 137 9,217
f0.9
11 ,062 10,537 10,510
-0.3
II ,260 10,725 10,732
fO. I
12,310 II, 525 11 ,508 -0.1
II ,816 11 , 269 l/ 1I , 146 -1 I
10,849 10,350 10.311
-0.4
77,217 73,348 73,279
-0. I
10, 14b 9,763
9,522 9,263
9,643 9,333
9,288 9,012
9,841 9,511
125,660 120,230
After Five Days Return to United States Department of Agriculture
Statistical Report ing Service 409A North Lumpkin Street Athens, Georgia 30601 OFFICIAL BUSINESS
Postage and Fees Paid U. S. De partmen t of Agr iculture
~0
Acgui sitions Division Unlversity of Georgia University Libraries Athens Georgia 30601
GEORGIA CROP REPORTING SERVICE
S/j-
ATHENS, GEORGIA
JULY MILK PRODUCTION UP 4 MILLION POUNDS
July 1967 Released 8/15/67
Milk production on Georgia farms during July totaled 85 mill ion pounds, according to the Georgia Crop Reporting Service. This compares with 81 million pounds produced in July last year and 85 mill ion during June 1967. The 1961-65 July average production was 83 .mill ion pounds.
Production per cow in herd averaged 595 pounds -- 50 pounds above the previous yea r , and 5 pounds above the June output. The 5-year average production per cow for the month was 464 pounds.
The estimated average price rece ived by producers for all wholesale milk dur ing July was . $6.35 pe r hundredweight. This would be $.45 above the previous year, and $.10 above the June average.
Prices paid by dairymen for feed were about 5 cents per hundredweight below June, but averaged about 10 cents above the previous year.
MILK PKODUCTION AND PRICES RECEIVED AND PAID BY DAIRYMEN
Itern and Unit
GEORGIA
July
June
July
1966
1967
1967
UN ITED STATES
July
June
July
1966
1967
1967
Hilk Production, mill ion lbs.
Product ion Per Cow, 1bs. l l
Number Mi 1k Cows , thousand head
HI
85
85
10,350 }/11. 146 10.311
545
590
595
736 }/ S21
761
149
144
143
PRICES RECEIVED - DOLLARS l/
All wholesale milk, cwt. Fluid mi 1k, cwt. Manufactured milk, cwt. Milk Cows, head All ba 1ed hay, ton
: 5.90
5.95 3.80 .190.00 26.50
6.25 6.25
195.00 27.60
~/6.35
210.00 26.20
4.71
5.05 4.03 245.00 22.60
4.68 5.06
3.95 259.00
23.20
~/4.80
262.00 22.40
PRICES PAID - DOLLARS Jj
Mixed Dairy Feed:
14 Percent Protein, cwt. .2/
3.95
4.00
3.95
16 Percent Protein, cwt.
4.10
4.20
4.15
18 Percent Protein, cwt.
4.20
4.50
4.40
20 Percent Protein, cwt.
4.40
4.55
4.45
All Under
29 Percent Protein, cwt.
4.10
4.25
4.20
3.56 3.82 3.97 4.22
3.78
3.61 3.92 4.03 4.30
3.85
3.62 3.89 4.00 4.28
3.84
)ll Month 1y average. 1./ Dollars per unit as of the 15th of the month except wholesale mi 1k which is average for month.
11 Revised ..~1 Pre 1imina ry
'i/ U. S. pr ice i s for under 16 percent.
ARCHIE LANGLEY Agricultural Statistician In Charge
W. PAT PARKS Agricultural Statistician
issuED-BY:- The "Georgia crop-Reporti;g-ser~ice-:- usoA-:- 4o9A-North-L~mpkin-s"treet,-Athens,-Ga.-:- in cooperation wi th the Georgia Department of Agriculture.
UNITED STATES MILK PRODUCTION
July milk output only sl iqhtly below July 1966
July mi lk production Jn the United States is ~stimated at 10,311 mill ion pounds, slightly less than a year earlier and 5 percent below the 5-year average for the month. Estimated milk production for June 1967 has been revised to 11,146 mill ion pounds. On a daily average basis, production decreased 10 percent from June to July this year compared with the average decrease of II percent. July output provided 1.67 pounds of milk per person daily compared with 1.70 pounds a year earlier. For the first seven months of the year milk production was about the same as the comparable period a year earlier.
July rate per cow up 3 percent from a year earlier
Milk production per cow during July averaged 761 pounds, up 3 percent from a year earlier and 13 percent above average for the month. Production per cow was at a record level for the
month in 46 States. On a .daily basis, July output per cow averaged 24.5 pou~ds, which is 2.9
pounds less than June and compares with 23.7 pounds in July 1966.
Milk Per Cow and Milk Production by Months United States, 1967, with Comparisons
Month
January February March Apr i I May June July Jan.-July total August September October November .December
Annual
!/ Revised.
Average 1961-65
Mi Ik per cow
1966 Pounds
621
67'6
591
635
676
736
690
752
757
812
729
798
671
736
629
696
592
663
602
670
581
649
618
6'67
7,759
8,513
1967
715 670 766 785 844 l/821 761
Milk production
Average:
: Change
1961-65: 1966
1967 :from 1966
Mill ion Pounds
Percent
10,222 9,805 9,855
fO.S
9,696 9, 137 9,217
10.9
II ,062 10,537 10,510
-0.3
II, 260 10,725 I0, 732
tO. I
12,310 II, 525 II ,508
-0. I
II ,816 I I , 269 l l I I , 146
-1.1
IO,H49 10,350 I0, 311
-0.4
77,217 73,348 73,279
-0.1
10, 14b 9,763
9,522 9,263
9,643 9,333
: 9,288 9,012
9,841 9,511
125,660 120,230
After Five Days Return to United States Department of Agriculture
Statistical Reporting Service 409A North Lumpkin Street Athens, Georgia 30601 OFFICIAL BUSINESS
Postage and Fees Paid U. S. Derartment of Agriculture
GEORGIA CROP
'
. ATHENS, GEORGIA
August 1.6, 1967
GEORGIA CHICK HATCHE RY REPORT
- . ~ ..
Placement .of broiler chicks in Georgia during the week ended' August 12 was 9, 020, 000--2 percent more than the previous week and 1 percent more than the comparable week last year, according to the Georgia Crop Reporting Service.
An estimated 11, 517, 000 broiler type eggs were set by Georgia hatcheries-3 percent less than tti.e previous week and 10 percent less than the comparable . week a year earlier.
The majority _of the prices paid to Georgia produc-ers for broiler hatching eggs were reported within a range of 50 to 65 cents per doz~n. The average price of hatching eggs was 57 cents per dozen. The price of eggs from flocks with hatchery owned cockerels generally was 2 cents below the average price. Most prices received for broiler chicks by Georgia hatcheries were reported within a range ,of $6.00 to $9.00 with an average of $8. 00. per hundred. The average prices last year were 66 cents for eggs and $10.25 for chicks.
Week Ended
July 15 July 22 July 29 Aug. 5 Aug. 12
Week Ended
GEORGIA 'EGGS SET, HATCHINGS, AND CHICK PLACEMENTS
EGG TYPE
Eggs Set
'fo of
1966
1967
year
ago
Thou.
Thou.
Pet.
-
. ~
753
590 ~ 78
804
668
83
804
717
89
926
585
63
901
619 . ' 69
Chicks Hatched
-
1966
1967
,..
Thou.
Thou.
556
510
583
'475
643
412
603 ..
488
631
473
'fo of year ago Pet.
92 81 64 81 75
<
Eggs Set !}
1966 Thou.
1967 Thou.
BROILER TYPE
Ufo of year ago Pet.
Chicks Placed for
Broilers in Georgia
Ufo of
1966
1967
year
ago
Thou.
Thou. Pet.
Av. Price
Hatch
Broiler
Eggs
Chick's
Per
Per
Doz.
Hundre d
1967
1967
Cents
Dollars
June 10
13,998 12, 155
87
10,026
9,495
95
55
7.50
June 17
13,820 12, 179
88
9,883
9, 457
96
56
7.75
June 24
13,859 12, 179
88
9,937
9,226
93
56
7.75
July 1
13,631 12,354
91
9,808
9, 177
94
56
7.75
July 8
13,670 12,281
90
9,666
8, 980
93
57
8.00
July 15
13, 614 12,031
88
9, 559
9, 113
95
58
8.25
July 22 '
13, 235 12,061
91
9,628
9, 110
95
58
8.25
July 29
13, 124 12,031
92
9,449
8,840
94
58
8.25
I~~ Aug.
Aug.
12,690 12,780
11, 854 11, 517
93 90
9,524 8,938
8,822
93
9,020 -101
58
8.25
57 -: ';' :, . : ' 8. 00
]J Includes eggs set by hatchenes producmg ch1cks for hatchery supply flock&
ARCHIE LANGLEY
W. A. WAGNER .
Agricultural Statistician In Charge
Agricultural Statistician
s. ---------------------------------------------------------~ ~ 7~~ ~ ~- ~ -- ~ ~----------
U. Department of Agriculture
Georgia Dep.a r f ment 'of Agriculture
Statistical Reporting Service
409A North Lumpkin Street, Athens, Georgia
.
STATE
-
Maine
Connecticut
Pennsylvania
Indiana
Missouri
Delaware
Maryland
Virginia
I
West Virginia
North Carolina
South Carolina
:.e;GGS SET
Week Ended
July
Aug.
29
5
THOUSANDS
Aug.
12
Ufo of year j
ago 1/
CHICKS PLACED
Week Ended
July
Aug.
Aug.
29
5
12
THOUSANDS
1, 87 5
309
1, ~38
590
591 2,692 4,351
1, 595 155
6,741 547
1, 983 320
1, 391 471 523
2,656 4,267
1, 635 145
6,625 565
1_, 853 102 31;3 85
1, 580 130 532 71 507 . 83
2, 617 97 4, 274 97 1, 580 104
140 93 6,421 93
554 131
1, 468 176
960 334 407 2,909 2,975 1, 162 280 5,463 441
1, 493 .179
1, 003 346 425
2,748 2,798 1, 167
337 5,406
398
1, 509 195
1, 142 330 356
2, 370 3,084 1, 111
287 5, 181
455
GEORGIA
12, 031 11, 854 11, 517 90
8,840
8, 822
9,020
Florida Tennessee Alabama Mississippi Arkansas Louisiana Texas Washington Oregon California
TOTAL 1967
(22 States)
843 735 8,235 4,938 9,473 1, 161
4, 313
595 303 1, 889
65, 500
778 692 8, 123 4,887 . 9, 454 1, 130 4, 158 606 303 1, 757
64,323
787 639 7,986 4, 803 9,242 1, 125 3,852 55'3 328 1, 877
63,080
185 59
102 108 105 116 .
102 102
89 93
99
628 828 6,767 4,032 7, 500 831 3,257 394 259 1, 370
51,281
581 795 6,469 4,084 7,306 823 3,333 440 244 1, 381
50, 578
557 821 6, 291 4,092 7, 023 796 3, 200 482 205 1, 419
49,926
TOTAL 1966*
(22 States)
63,996 63,698 63,857
50,987 50, 503 47,633
% ofLast :Year
102
101
99 .
*1/ . vurrent week as percent of same week last year Revised.
101
100
105
Page Z
% of
year ago 1/
102
111
109 101 100 105 98
115
66 104 157
101
169 80
104
118
107 121 108 92 75 103 105
WeekEnding August 21,1967
Monday
CROP CONDITIONS OFF SLIGHTLY
Athens, Ga., August 21 --Most Georgia crops showed slightly weaker conditions during the
past week, according to the Georgia Crop Reporting Service. Soil moisture shortages in many
sections and continuing problems from insects were blamed for the decline. Weekend rains
corrected moisture deficiencies, however. Overall prospects for good yields continued except
for cotton.
Infestation levels of cotton insects continued to build despite active control measures, according to County Agents reports. Light harvest continued in more advanced fields in the south and started in a few central counties.
Corn prospects continued very good and earliest harvest for grain began in southernmost oounties. Cuttings for silage continued in other sections.
Soybeans were judged mostly good as fewer excellent" reports were received. Insects recame more of a problem but soil moisture should be up to needs after the weekend rains.
Tobacco harvest neared completion as 93 percent of the crop was judged harvested. Both ~rketing and curing remained very active.
Peanut harvest made very good progress during the week. About one-fifth of the crop has been dug and about 13 percent threshed.
Prospects for pecans remained varied with some sections reporting very good yields expected and others reporting heavy shedding.
An unusually large number of County Agents reported serious outbreaks of army worms. Forage crops and pastures were the primary target but row crops were also being infested. Whole fielqs were reported stripped on some farms and control measures had I imited success. Coastal Bermuda w.as par\icuLarly hard h. i.t.
tl2Y harvest was reported very active during the week and quality was judged good in
most cases. Pastures and I ivestock remained in mostly good condition.
v/EATHER SUMMARY- Heavy to excessive rains fell in the southeast and extreme south at the ~ginning of the period but very I ittle rainfall occurred over the remainder of the State during the week ending F.riday, August 18. A large number of weather observers reported no measurable rain during the week. For many north and central areas it was the driest week since mid-June. General showers moved back over the State during the weekend and several areas received moderate to heavy rains on Saturday or Sunday. The weekend total exceeded three inches at Alma and was more than two inches in the Atlanta and Macon areas.
Temperatures were cool at the beginning of the week but a warming trend brought readings up to near normal during the last half of the period. Mild daytime temperatures returned to the State over the weekend under cloudy, showery conditions. Averages for the week ranged from two degrees below normal at Valdosta to five degrees below normal at Macon.
The five-day forecast for the period Tuesday through Saturday {August 22-26} calls for temperatures to average 4 to 7 degrees below normal. Normal highs for the period range from 87 to 92 degrees and normal lows from 65 to 72. Rainfall is expected to be moderate to locally
heavy and occur as mostly afternoon and evening thundershowers throughout the period.
ISSUED BY:
a .
...
' ,
The 'Georgi Cro'p
Rep6 rt ing
'
Se rv ice,
AtHens,
, r
' , '
,. J.
Georgi a; in . cooperation with
the
Cooperative Extension Service, University of Georgia; Georgia Department of
Agriculture; and the Weather Bureau, ESSA, U. S. Department of Commerce.
U. S. DEPARTlvlENT OF COMMERCE WEATHER BUREAU
Athens, Georgia ESSA
Precipitation ~or The Week Ending August 18, 1967
GEORGIA
Temperature extremes for week ending Aug. 18, 1967 (Provisional)
Highest: 96 at Americus on the 18th
50 at Blairsville on the 14th and 15th and Tallapoosa on the 14th.
* For period Aug. 19-21, 1967
T, less than .005 inch
After Five Days Return to United States Department of Agriculture
Statistical Reporting Service 409A North lumpkin Street Athens, Georgia 30601 OFFICIAL BUSINESS
IMMEDIATE - U. S. WEATHER REPORT
This report will be treate:d in all j (O
Respects as letter Mail
(See Sec. 34.17, P.L. & R.)
The Univ Libr ary Univ Of ~ Ga
Athens Ga 30601
Postage and Fees Paid
u. S. Department of Agriculture
hi
UNIVL SITY OF 3 EORGIA
H- tJ0 7
~~
GEORGIA CROP REPORTING SERVICE
AUG 24 1967
rn w rn w lqb~7~ ~ ~ [b'l? LP [b ~ 'l? ~ ~~t:.L.W.....
ATHENS, GEORGIA
July 1967
August 22, 1967
Item
During July
1966 1/
1967 2/
%of :, last year
Jan. thru July
1966 1/
1967 2/
o/o of
last year
Thou.
Thou.
Pet.
Thou.
Thou.
Pet.
Broiler Type
Pullets Placed{U. S. )3 I
Total Domestic
3,672 3,091
2,916 2,642
79 85
1'!1 .
27, 564 24, 191
24,993 22, 216
91 92
Chickens Tested:
Broiler Type
Georgia United States
500 2, 209
444 89 1, 930 87 .
3,364 14,620
3, 723 111 16, 718 114
Egg Type
Georgia
8
42 525
177
177 100
United States
331
465 140
3,451
4, 014 116
Chicks Hatched:
Broiler Type
Georgia
47,098
42,816 91
314,050 304, 140
97
United States
244,449 241,086 99 1,659,694 1,686,061 102
Egg Type
Georgia
2, 693
2,069 77
23,601
23, 873 101
United States
36,654
33,668 92
390,768 381,739
98
Commercial Slaughter:4/
Young Chickens
Georgia
35,034
34,655 99
225,934 237,374 105
United States
196,672 202,941 103 l, 271, 762 1,346,976 106
Mature Chickens
Light Type
Georgia
438
504 115
4,045
5, 258 130
United States
8,682
9, 135 105
67,877
83, ip3 122
Heavy Type
Georgia
322
299 93
1, 724
2, 341 136
United States
2, 068
1, 795 87
12, 166
14, 786 122
Egg Production:
Mil.
Mil.
Mil.
Mil.
Georgia
381
419 110
2;574
2,873 112
South Atlantic 5/ United States
I 1, 014 5, 477
l, 114 110 5, 886 107 "
7, 006 38, 764
7, 693 110 41, 282- 106
1/ Revised. 2/ Preliminary. 3/ Pullets for broiler hatchery supply flocks, includes
expected pullet replacements from eggs sold during the preceding month at the rate of
125 pullet chicks per 30-doz. case of eggs. 4/ Federal-State Market News Service-
Slaughter reports only include poultry slaughtered under Federal Inspection. 5/ South
AtlanticStates: Del., Md., W.Va., N.C., S.C., Ga., Fla., Va.
YOUNG CHICKENS: SLAUGHTERED UNDER FEDERAL INSPECTION
BY SELECTED STATES, 1966 and 1967
Number Inspected
Indicated Percent Condemned
State
During June
Jan. thru June
During June
Jan. thru June
1966
1967
1966
1967
1966
1967
1966
1967
Thou.
Thou.
Thou.
Thou.
Pet.
~ct.
Pet.
Pet.
Maine 6,626
6,785
34,942 36, 570 3.3
3.4
3.5
3.7
Pa.
8,291
6,808
42, 177 41,020 3.9
4.9
4.3
5.2
Mo.
3, 187
3,500
17,290 19,778 3.6
2.7
5. 8
4.6
Del.
8,492
8,400
45,908 44,497 4.3
4.8
4.6
5. 5
Md.
12, 594 13,332
65,915 72,075 4.0
4.5
4.6
5. 3
Va.
4, 535
4,734
21,697 24,072 3.2
3.6
3.3
4.0
N. C. 23,743 22,876 122,340 125, 771 3.5
3.7
4. 1
4.4
Ga.
35,944 3 7, 593 183, 512 198,395 3.3
4.9
3.7
5.3
Tenn.
6,214
5, 994
30,396 30, 869 3.0
4.3
3. 1
5. 1
Ala.
23, 953 25, 160 121, 542 130, 059 2.8
3.0
3.3
3.8
Miss. 14,835 15,210
76,389 80,614 2.6
2.2
3.2
3.5
Ark.
28,834 33,058 152,603 171,433 3.2
3, 5
3,8
4.5
Texas 11,490 13,940
61,371 72,791 2.8
2.7
3.6
3.4
u. s. 207,644
1,076,948
3.2
3.7
3.8
4.5
218,785
1,159,892
U
~
.:>,
Department of Agnculture
Georg1a Department of Agnculture
Statistical Reporting Service, 409A North Lumpkin Street, Athens, Georgia 30601
End-of- Month Stocks of Poultry, Poultry Products, Meat and Meat Products United States - July 1967
August 1 shell egg holdings w~re 369 thousand cases after a 58-thousand case decline in
July. Holdings were almost 5 times as large as on August 1, 1966 but 15 percent above
average. Frozen egg stocks increased 8 million pounds to 92 million. These stocks
were 50 percent above year earlier holdings but 17 percent below average. Frozen
poultry stocks on August 1 were 371 million pounds, 63 million more than a month earlier.
On August 1, 1966, stocks totaled 209 million pounds and the average is 210 million
pounds. About 60 percent of the poultry in storage was frozen turkeys. Stocks totaled
220 million pounds, up 60 million from a month earlier. August 1, 1966 turkey stocks
were 104 million pounds and the average is 109 million. August 1 holdings of meat were
600 million pounds, down 64 million from a month earlier. With the exception of
canned hams, which increased 6 million to 56 million pounds and a small gain in cured
beef, stocks of all meat items were lower than on July l. Total beef declined 10 million
pounds to 266 million and total pork was down to 235 million pounds after a July decrease
of 58 million. Total stocks of meat were about 100 million more than on August 1, 1966
l and 73 million more than average.
July
Commodit
Unit
961-65 av
July 1966
June 1967
July 1967
Thou.
Thou.
Thou.
Thou.
Eggs:
Shell
Case
320
79
427
369
Frozen eggs, total
Pound
110, 798
61,957
84,633
92,399
Poultry frozen: Broilers or fryers Hens, fowls Turkeys Other & Unclassified
Total Poultry
~ -----------------------------------------------
do.
22, 165
do.
32, 560
do.
108,677
do.
46, 820
do.
210,221
19,211 28,848 103, 563 57,054 208,676
34,877 51,636 159,914 61,779 308,206
35,049 53, 114 220,465 62,223 370,851
Beef: Frozen in Cure and Cured
Pork: Frozen and Cooler
Other meat and meat products
Total all red meats
do.
185, 186
do.
238, 840
do.
102,487
do.
526, 513
220,483
178,530
95, 538 494, 551
27 5, 656
293,074
95, 020 663, 750
266,255
234,952
98,735 599,942
MID-MONTH PRICES RECEIVED AND PRICES PAID
Georgia
United States
Item
July 15 June 15 July 15 July 15 June 15 July 15
1966
1967
1967
1966
1967
1967
Prices Received: Chickens, lb. excluding broilers Com 11 Broilers (lb.) All chickens (lb. ) All Eggs (dozens)
Prices Paid:(per 100 lb.) Broiler Grower Laying Feed Scratch Grains
Cents
10.5 15.5 15. 3 45.2 Dol. 5.30 5. 10 4.40
Cents
7.5 12. 5 12.3 33.6 Dol. 5.20 5.00 4.40
Cents
8. 5 14.0 13.8 37.6 Dol. 5.20 5. 10 4.45
Cents Cents
9.6 16. 1 15.5 35.6 Dol. 5.08 4.65 4.05
7.8 13. 5 13.0 27.4 Dol. 5.03 4.66 I 4. 11
Cents
7.9 14.7 14. 1 29.9 Dol. 5.03 4.65 4.08
*************************************************
This report is made possible through the cooperation of the National Poultry Improvement
Plan, Official State Agencies, the Animal Husbandry Research Division of the Agricultural
Research Service, the Inspection Branch of the Poultry Division, Consumer and Marketing
Service and the Agricultural Estimates Division of the Statistical Reporting Service and
the many breeders, hatcheries, poultry processors and the poultry farmers that report
to these agencies.
ARCHIE LANGLEY
W. A. WAGNER
Agricultural Statistician In Charge
Agricultural Statistician
After Five Days Return to: United States Department of Agriculture
Statistical Reporting 3ervice 409A North Lumpkin Street
Athens, Georgia 30601 -OFFICIAL BUSINESS
Postage and Fees Paid U. S. Department of Agriculture
GEORGIA CROP REPORTING SERVICE
ATHENS, GEORGIA
GEORGIA CHICK HATCHERY RE PORT
1967
)
Placement of broiler chicks in G e or ia during:.tfi~ week ended August 19 wa ~
8, 825,000--2 percent less tlian the p r eviou .week and 3 percent l e ss "than the
comparable week last year, according to the orgia Crop Reporting Service. _
An estimated 11, 277, 000 broiler type eggs were set by Georgia hatcheries--
2 percent less than the previous week and 12 percent less than the comparable
week a year earlier.
The majority of the prices paid to Georgia producers for broiler,hatching eggs
were reported within a range of 50 to 65 cents per dozen. The average price of
hatching eggs was 57 cents per dozen. The price of eggs from flocks with hatchery
owned cockerels generally was 2 cents below the average price. Most prices received
for broiler chicks by Georgia hatcheries were reported within a range of $6. 00 to
$9.00 with an average of $8.00 per hundred. The average prices last year were 67
cents for eggs and $10.50 for chicks.
Week i;nded
GEORGIA EGGS SET, HATCHINGS, AND CHICK PLACE MENTS
EGG TYPE
Eggs Set
1966
1967
Thou.
Thou.
v;o .of year ago
Pet.
Chicks Hatched
1966
1967
Thou.
Thou.
'1o of year .. ago
Pet.
July 22 July 29 Aug. 5 Aug. 12 Aug. 19
Week Ended
804
668
83
583
804 926
614 585
-1/
76 , 63
643 603
901
619
69
631
918
645
70
619
BROILER TYPE
Eggs Set 'ij
1966 Thou.
1967 Thou.
'1o of year ago
Pet.
Chicks Placed for
Broilers in Georgia C!fo of
1966
1967
year
ago
Thou.
Thou. Pet.
475 ' 4i2 488 473 491
81
, 64 ; 81
I
75 79
Av. Price
Hatch
Broiler
Eggs
Chicks
Per
Per
Doz.
Hundred
1967
1967
Cents
Dollars
June 17
13, 820 12, 179
88
9,883
9,457
96
56 .
June 24
13,859 12, 179
88
9,937
9,226
93
56
July 1
13, 631 12, 3 54
91
9,808
9, 177
94
56
July 8
13,670 12,281
90
9,666
8,980
93
57
July 15
13, 614 12,031
88
9, 559
9, 113
95
58
July 22
13,235 12,061
91
9,628
9, 110
95
58
July 29
13, 124 12,031
92
9,449
8,840
94
58
Aug. 5
12,690 11, 854
93
9, 524
8,822
93
58
Aug. 12
12,780 11,517
90
8,938
9,020 101
57
Aug. 19
12, 780 11,277
88
9,079
8, 825 97
57
1/ Revised
~/ Includes eggs set by hatcheries producing chicks for hatchery supply floc ~s ~
7.75 7.75 7.75 8.00 8.25 8.25 8.25 8.25 8.00 8.00
ARCHIE LANGLEY Agricultural Statistician In Charge
W. A. WAGNEW . Agricultural Statistician
----------------------------------------------------------------------j- --r,----------' I
U. S. Department of Agriculture
Georgia Department.of Agricuitur.e
Statistical Reporting Service
--
409A North Lumpkin Street, Athens, Georgia
EGGS S E T A ND CHICKS PLA C D IN C OMMER CIAL A R E L\.S BY WEEKS - 1967
EGGS SET
I
CHI C KS PLA CE D
STATE
Week :8nded
Aug.
Aug. '
5
12
Aug.
19
% of
year
ago 1/
Aug.
5
Week Ende d
Aug.
Aug.
12
19
r '-
THOUSANDS
THOUSANDS
Maip.e
Connecticut
Pennsylvania
Indiana
Missouri
Delaware
Maryland
Virginia
I
West Virginia
North Carolina
South Carolina
1,983 320
l, 391 471 523
2, 656 4,267 1, 635
145 6,625
565
l, 853 313
l, 580
532 507 2, 617 4,274 l, 580 140 6,421 554
l, 745 265
1,363 576 498
2,609 4, 110 1,648
146 6,296
569
I. 96
l, 493
92
179
121
1,003
82
346
79
425
99
2,748
94
2,798
112
1, 167
101
337
90
5,406
146
398
l, 509 195
l, 142
330 356 2,370 3,084 1, 111
287 5, 181
455
l, 417 200
1, 065 300 374
2,709 2, 839 1, 041
374 5, 142
391
GE ORGIA
11, 854 11, 517 11, 277 88
8,822
9,020
8, 825
Florida
Tennessee
Alabama
Mississippi
I
Arkansas
I
Louisiana
I
Texas
Washington
Oregon
California
TOTAL 1967
(22 States)
778 692 8, 123 4,887 9,454 1, 130 4, 158 606 303 1, 7 57
787 639 7,986 4,803 9,242 1, 125 3,852 553 328 l, 877
749 180
680 63
8,062 103 4,614 102
9,299 103 1, 077 117
3,651 98 569 110 341 89
1, 551 81
64,323 63,080 61,695 97
581 795 6,469 4,084 7,306
~23
3,333 440 244
1, 381
50, 578
557 821 6,291 4,092 7, 023 796 3,200 482 205 1, 419
49,926
666 865 6,354 4, 195 7. 211 845 3,278 437 220 1, 407
50, 155
TOTAL 1966*
(22 States)
63,698 63,857 63,681
50, 503 47,633 47,335
o/o of Last Year
101
99
97
l/ Current week as percent of same week last year.
'i .Hevised.
100
105
106
Page 2
%of year
ago 1/
99
-
95 131
73
99
108
92
109
99
102
169
97
178
93 105
119 114 123 115
98 77 103
106
: Nf RS1TY OF GEORGIA
AUG 1967
GEORGIA CROP REPORTING SERVICE
1 THENS, GEORGIA
L-- .......
CONSlnviPTION OF COl1lVJERCIAL FERTILIZERS
August 25, 1967
Consumption of commercial fertilizers in Georgia during the year ended June 30, 1966, totaled 1,655,471 tons - 6 percent more than a year earlier. Fertilizer mixtures accounted for 73,5 percent of th~ . total consumpt~on. The most popular grade of fertilizer used in Georgia
.vas 5-10-15, v1ith this grade accounting for 52.7 percent of all mixtures. The second most im-
portant grade was 4-12-12
Consumption of commercial fertilizer in the United States and Puerto Rico during the year
ended June 30, 1966, totaled 34.5 million tons -- 8 percent more than a year earlier.
Total fertilizer used by both farm and non-farm interests has increased every year since the 1959-6o fertilizer year. During the 1965-66 year, 38 of the 48 contiguous States used more fertillzer than a year earlier with strong increases r egistered in the Cornbelt and Plains States.
The remaining 10 States used less fertilizer than during the previous year.
, Fertilizer mixtures accounted for 56.9 .percent of the total consumption. This compares with
58.3 percent of total a year earlier. Direct application fertilizer materials containing pri-
m~y plant nutrients accounted for about 38.9 percent of the total. Approximately 4.? percent of total consumption consisted of the direct application of secondary and micronutrient materials.
Fertilizer consumption ihcludes all corrumercial fertilizer mat~rials .or products sold or
shipped for farm and non-farm use as fertilizer.
l1aterials used in manufacture of regis-
'tered mixes or for uses other than as fertilizer are e;~cluded from totals. The most popular grade
of mixed fertilizer vras 5-I0-10; the secono most popular grade mis 6-24-24.
. C. L. CRENSHAvl
.
'AgriCbltural Statistician
ARCHIE LAl\lGLEY Agricultural Statistician in charge
Please turn page for information on
nconsumption by I\ind of Fertilizer, by Regions, Year Ended June 30, 196611
______________ ________ ______ ____ __ _T_o_t_a_l__f_er_ti_l_i__~_e_r__1_/_:___C_on__s_u_m....__p.tion by Kind of Fertilj_ze..r.__,__b__ y___R_e_g_io__n_s_, _y__e_a_r..... Ended June ..._ 3.0. _, _1_966___
. .. . :
:
: Natural
. Regi on
i-iixtures : Nit r ogen : Organic Phosphate
. . ____ ~~----l-___ _.Jli~~!!~_!.t~~~rl~l:~:..X~~l~
. !~~
Secondary & Potash : Micronutrie_nt
f!Iat~Eia!~L--~~~!:2:~--
Total
.___.._ _
:
NeH
. Engl and
407,241
15,223
20,434
20,549
2,6$7
317
466,621
. i'1iddle :
Atlantic 1,889,437 149,066
35,618
76,505
27,607
9,029
2,187,262
South
Atlantic 5,435,385 1,086,147
. E. North
. Central
4,464,724 1,817,297
1rl. North Ce ntral
2,77'7,001 2,018,583
39,863 102,500 118,996
43,825 11,021
648,595 728,265
. . -- .... -
. 781,650 246,870
129,045 10,151
5, 729
6, 911,936 7' 712,857
5' 840, 854
E. South Central
2,257,257 724,465
4,817 153,856
57,614
4,006
3' 202,015
vJ. South Central
1,348,906 1,102,462
16,951
338,777
. 43,644
5,583' 2,856,323
Mountain
221,361 459,438 18,904 267,361
10,170
40,993
1,018, 727
Pacific
Other gj
581,420 1,340,792 276,225 65,732
370,757 286
375,349 15,423
37,797 14,804
1,255,117 1,418
3,961, 732 373,888
United
States
19,658,957 8,779,205 562,476 2,781,565 1,288,624 1,461,388 34,532,215
lTExcluctes iiirlrigmaterials and tilequantffiesofriiaterials useCiincommercialmixtures:----
~ Alaska, Hawaii, and Puerto Rico.
ISSUED BY:riie Georgia cropReport:ingservica;-usDA, 4o9A"NOrtili.mapkin street, AthenS,"Ga., ---
in cooperation with the Georgia Department of Agriculture.
After Five Days Return to United States Department of Agriculture
Statistical Reporting Service 409A North Lumpkin Street
- Athens, Georgia 30601 -O- FFICIAL.... B_.U....S..,T...i.m.._S-.S..-
Postage and Fees Paid
U. s. Department of Agriculture
28, 1967
RAINS HINDER FIELD WORK
Released 3 p.m. Monday ,
cording to the Georgia Crop Reporting Service . Heavy rains delayed harvest .operations and
interrupted insect control schedules. In several northern areas, lowland flooding cause'd crop
losses as cree ks and rivers spilled over their banks.
County Agents reported very little progress with cptton harvest. Insect infestations' climbed higher as weather conditions prevented insecticide applications. Defoliation began in southernmost areas during the week.
A good crop of corn is considered 11made 11 Moisture content of the grain remains high in most areas, however, and harvesting activity must await drier t-Jeather .
Soybeans remained in very good condition. Insect numbers were building very rapidly, how~ ever, and open weather was needed for effective control.
Peanut digging continued between rains and by the week 's end one-third of the crop was dug. Wet conditions caused limited sprouting in windrows . Insect and disease controls were applied
weather conditions permitted.
Considerable pecan shedding apparently occurred during the rains. Most County Agents previously judged the crop to be good, but the majority now considered the crop only fair. Tobacco .harvest moved into the final stages, but marketing remained active.
The outbreak of army worms continued serious in many sections. A virus or parasi~e was re ported att.acking the worms in several areas, however , and was slowing the level of infestation. Forage crops, particularly coastal Bermuda, remained the favorite food of the worms . Insecticide treatments had some .success where the weather permitted its use.
WEATHER S~~1ARY - Heavy to excessive rains fell over most of Georgia during the week ending
~iday, August 25. Heaviest amounts were in the northeast mountain area where Helen had a total
for the week of 18.13 inches. More than 8 inches of this total occurred in less than 24 hours
and over 13 inches fell in 2 days. Several other observers measured more thari 10 inches of rain during the week. The average rainfall over the northeast and north-central divisions was
more than 8 1/2 inches and the Statewide average was about 4 1/2 inches, making this one of
~orgials rainest weeks of record. The rainfall decreased from north to south, but amounts were light only in the lower coastal area and in the extreme south. Brunswick was the only station ~ in the State that reported no rain for the week. The excessive rains in the northeast damaged roads, bridges, crops, farmland, and other property. Rainfall was light during the weekend as a coldfront brought clearing skies to the northern section at the beginning of the new week.
Georgia temperatures continued to average cooler than normal. It was warm at the beginning of the week, but the frequent rains and cloudy skies held daytime readings dotrm during most of the period . Cooler air moved into north Georgia at the end of the period. Averages for the week ranged from near normal in the southeast to five degrees below normal in the northwest .
The five-day forecast for the period Tuesday through Saturday (August 29 - September 2) calls for temperatures to average 3 to 6 degrees below normal, except in the southeast I..Jhere near normal averages are indicated. It should be mild most of the week and a little cooler at the week end . Rainfall is expected to range from 1/2 to 1 inch, or more, and occur about l'lednesday or Thursday.
The Georgia Crop-Reporting- Service, -Athens, -Ga.-:;- in-cooperation with-the- - - - Cooperative Extension Service, Univers ity of Georgia; Georgia Department of
Agriculture; and the vreather Bureau, ESSA, u. s. Department of Commerce.
U. S. DEPARTlv!ENT OF COMMERCE WEATHER BUREAU Athens , Georgia
ESSA
Precipitation For The Week Ending August 251 1967
GEORGIA
Temperature extremes for the week ending Aug. 25, 1967 (Provisional)
Highest: 98 at Hawkinsville on the 19th
59 at Clayton and Cornelia on
the 19th
* For the period Aug. 26-28,
T1 less than .005 inch
After Five Days Return to United States Department of Agriculture
Statistical Reporting Service 409A North Lumpkin Street Athens, Georgia 30601 OFFICIAL BUSINESS
IMMEDIATE U. S. WEATHER REPORT This report wi JJ be treated in all
Respects as Letter Mail (See Sec. 34. I7 , P. L. & R. )
. /( 0
The Univ Library Univ Of " Ga Athens Ga 3 0601
Postage and Fees Paid U. S. Department of Agriculture
~G\A
UNIVERSITY OF
~() FARM REPORT 7
GEORGIA CROP REPORTING SERVICE
ATHENS, GEORGIA
August 29, 1967
GEORGIA 1967 TURKEY PRODUCTION UP 22 PERCENT
~gia: The 1967 turkey production in Georgia is expected to be 2,082,000 head compared with 1,709,000 in 1966- or an increase of 22 percent -according to the Georgia
Crop Reporting Service. Heavy breeds are up 344,000 birds while the light breeds have an increase of 29,000 head.
UNITED STATES TURKEY CROP LARGER THAN lAST YEAR
United States: Turkeys raised in 1967 are expected to total a record 125.6 million birds, 8 percent above 1966, according to the Crop Reporting Board. An increase
in production of turkeys is expected in all regions except the North Atlantic and East North Central regions. Percent change from last year by regions is: North Atlantic, down 10 percent;
East North Central, down 5 percent ; 1rJest North Central and South Atlantic, both up 6 percent;
South Central, up 22 percent; and the West up 13 percent.
The number of heavy breed turkeys raised in 1967 is expected to total 110.2 million compared with 101.0 million last year--an increase of 9 percent. Increases in heavy breeds by regions are 6 percent in the 1rJest North Central, 17 percent in the South Atlantic, 22 percent in the South Central and 12 percent in the lJest. The North Atlantic is 10 percent below a year earlier and the East North Central is down 7 percent.
Light breed turkeys raised during 1967 are expected to total 15.4 million birds, 1 percent below the 15.6 million raised during 1966. Decreases are shown in both the North Atlantic and ~ South Atlantic regions which are dot-m 14 and 16 percent,respectively. The East North Central is expected to increase 14 percent, the 1rJest North Central 6 percent, South Central 16 percent, and the West 30 percent.
California, the leading turkey producing State this year, will raise 19.1 million birds; followed by Hinnesota tvith 16.9; Nissouri, 11. 7; Arkansas, 8. 7; Texas, 8.0; Iowa, 7.5; North Carolina, 6.9; Virginia, 5.7; Ohio, 4.3 and Utah, 3.8 million.
Turkey poults hatched during the period September 1966 through July 1967 were 8 percent
above the corresponding period the previous year. Compared tvith a year earlier, increases occurred in all months except April, which was dotm 3 percent and i'1ay which was 4 percent below
1966. The largest percentage increases occurred during the period September 1966 through
February 1967 and ranged from 122 percent of the previous year in September to 151 percent in December. The number of heavy breed eggs in incubators on August 1 was up 41 percent and light breed eggs in incubators were 13 percent above a year earlier. Prices received by producers for live turkeys during January through July have been below the same months of 1966.
C. L. CRENSHA1rJ Agricultural Statistician
ARCHIE lANGlEY Agricultural Statistician In Charge
(Please turn page)
The Georgia Crop Reporting Service, USDA, 4o9A-Nort~umpkin Street, Athens, Ga., in cooperation with the Georgia Department of Agriculture.
- - --------;---
Heavy breedsT-u-rk-e--v-s::---N-u-mrrbegrhRtabirseeeddoSn_Fa_rm_s _:_ Total all-br-ee-ds-----=--
State
:----~-~---~:196 7 as-:-----
: 1967 as: ---;-----;-l9b7as-
and
: 1966 : 1967 : %of : 1966
1967 : %of 1966 1967 : %of
divis2:.Q_~~-~...!.--~...:._1966 . . . : . _ _
: I~.:.. Tho!2:!.. Pcb_.
Thou.
196.;;;..6_.;.__~_ _..;~---=---l:966___
Thou. Pet.
Thou. Th2.!._ Pet .
Maine
37
30 81
2
3 150
39
33 85
N, H.
83
73 88
6
4 67
89
77 87
Vt.
33
20 61
0
0
33
20 61
Mass,
309
234 76
11
15 136
320
249 78
R. I.
19
14 74
0
0
19
14 74
Conn.
153
134 88
4
9 225
157
143 91
N. Y.
352
331 94
26
39 150
378
370 98
N. J.
592
373 63
18
28 156
610
401 66
Pa .
: 1.648 1.692 103
265
186 70
1.913 1.878 98
N. A. :--'1:226 2.901 90 -.332 --284 86
0hio
:-2;991-- 3:b96 -124 -?g------626 84
.3.5g'8 3.185--903, 73b 4,322- 116
Ind.
3,911 3,391 87
289
338 117
4,200 3,729 89
Ill.
1,276
949 74
60
82 137
1,336 1,031 77
Mich.
: 1,108
976 88
89
77 87
1,197 1,053 88
~lis,
: 5.350 4.644 87
177
4.1_2 244
5.527 5.076 92
E. N. C. : -rr;_:63b1'3;$b-9~:r:-3bO-Ws-5 114
l?;:-99b-]37211 ~--
Minn.
: l l , 718- 11,545'-99--4,947 ----s,-392- 109---lb,b$ lD;937-l02- -
Iowa
6,895 7,128 103
32 8
387 118
7,223 7,515 104
Ho.
9,457 11,319 120
533
405 76
9,990 11,724 117
N. Dak. : 1,044 1,023 98
s. Dak.
587
66o 112
77
127 165
1,121 1,1)0 103
444
453 102
1,031 1,113 108
Nebr .
894
874 98
19
10 53
913
884 97
Kans.
562
593 106
48
2 _4
w. N.c. : 31.157-~~-::lo6 ---~~---~b:??b lOb
610 _22.2 98 37~---~9~918 106
Del.
: 102
105 103
216
190 88
318
295 93
Md,
179
157 88
48
1
2
227
1)8 70
va.
2,764 2,771 100
3,470 2,950 85
6,234 5,721 92
w. va.
663
893 135
1,264
771 61
1,927 1,664 86
N. c.
s. c.
: 5,317 5,969 112 1,089 1,885 173
828
886 107
6,145 6,855 112
o
o
1,089 1,6o5 173
Ga. Fla.
s . A.
Ky.
1.629
-22
ll.7b5 569
1.973 121
80
109 1J6
64---~
181
201 111
13:-817___1i?~"b.Q87-~io8
8Ti
217 "J8
19 - 2~11)
1,709 2,082 122
203- 2b5 11r-_....
17,852 18;9'25-106
588
239 -41--
Tenn.
42
32 76
0
0
42
32 76
Ala .
: 1,257 1,115 89
21
9 43
1,278 1,124 88
Miss.
85
94 111
1
1 100
86
95 110
Ark.
: 6,o55 8,216 136
420
504 120
6,475 8,720 135
La.
11
10 91
1
0
12
10 83
Okla .
: 1,298 1,585 122
111
Texas
s. c.
::-~6g3p2-3 19;70.8706~_.J1123L._
104
b??
51 46
17989 ~111961
1,409 6,427
16.,217
1,636
8~005
12_,"Sbl
116
1125~-
Mont. & :
Idaho 1/ : 222
249 112
Wyo .
4
7 175
Colo .
2,287 2,582 113
N. 11ex.
11
9 82
19
6 32
241
255 106
0
0
4
7 175
12
99 825
2,299 2,681 117
1
1 100
12
10 83
Ariz, Utah
93
6~
74
3,346 3,739 112
1
0
94
69 73
36
22 61
3,382 3,761 111
Nev.
:
wash.
457
400 88
49
178 363
506
578 114
Oreg .
1,435 1,740 121
317
339 107
1,752 2,079 119
Calif. west .
: 16.697 18.813 113 :::24 .S52 2...,7..._6_"6.8...__1_1_2
_
27t; _....n._o_::
:29:7_-=-t2.o.;.~..-----~11:.030:o_-~---~_,12.65.'....9.2..7.6.~22:::~281~.9~.~0~2888::_-:::;11=;1!.1.__1__
48 State :
1/'rMootnatlan~ a and10I0d,a9h7o6
110,199 combined
to
109 avoid
15' . 262 disclosing
15.429 individual
99 ll6 ..S.38._..;;1:;;;.;25;;..;:..6;;-.2.;;..8_...;1~0...;;..8_. operations.
After Five Days Return to United StatES Department of Agriculture
Statistical Reporting Service 409A North Lumpkin Street Athens, Georgia 30601
QffiCIAL 2US!~
Postage and Fees Paid
U. s. Department of Agriculture
ATHENS, GEORGIA
August 30, 1967
GEORGIA CHICK HATCHERY REPORT
Placement of broiler chicks in Georgia during the week ended August 26 was 8, 614,000--2 percent less than the previous week and 3 percent less than the comparable week last year, according to the G eorgia Crop Reporting Service.
An estimated 10,754,000 broiler type eggs were set by Georgia hatcheries-5 percent less than the previous week and 11 percent less than the comparable week a year earlier.
The majority of the prices pa id to Georgia producers for broiler hatching eggs were r eported within a range of 50 to 65 cents per dozen. The average price of hatching eggs was 56 cents per dozen. The price of eggs from flocks with hatchery owned cockerels g~nerally was 2 cents below the average price. Most prices received for boiler chicks hy .Georgia hatcheries were reported within a range of $6.00 to $9.00 with an average of $7. 75 pe r hundred. The average prices last year were 67 cents for eggs and $10.50 for chicks.
Week Ended
GEORGIA EGGS SET, HATCHINGS, AND CHICK PLACEMENTS
EGG TYPE
Eggs Set
Chicks Hatched
o/o of
1966
1967
year
1966
1967
ago
'
Thou.
Thou.
Pet.
Thou.
Thou.
o/o of
year ago
Pet.
July 29 Aug. 5 Aug. 12 Aug. 19 Aug. 26
804
926 901 918 1,036
614
76
585
63
619
69
645
70
685 ; 66
643
412
64
603
488
81
631
473
75
. 619
703
491 505
79 72
~ --
Eggs Set -1/
Week
Ended
I
1966
1967
BROILER TYPE
I
o/o of
year ago
Chicks Placed for
Broilers in Geore:ia
o/o of
1966
1967
year
ago
Av. Price
Hatch Broiler
Eggs Chicks
Per
Per
Doz. Hundred
1967 1967
I
June 24 July 1 July 8 July 15 July 22 July 29 Aug. 5 Aug. 12 Aug. 19
Aug. 26
Thou.
13, 859 13, 631 13,670 13,614 13,235 13, 124 12,690 12,780 12, 780 12 111
Thou.
12, 179 12, 3 54 12,281 12, 031 12,061 12, 0 3 1 11, 854 11,517 11, 277 10 754
Pet.
88 91 90 88 91 92 93 90 88
8 9
Thou.
9,937 9,808 9,666 9,559 9,628 9,449 9, 524 8,938 9,079 8 845
Thou.
9,226 9, 177 8,980 9, 113 9, 110 8, 840 8,822 9,020 8,825 8 614
Pet.
93 94 93 95 95 94 93 101 97
9 7
Cents
56 56 57 58 58 58 58 57 57
5 6
Dollars
7.75 7.75 8.00 8. 25 8.25 8.25 8.25 8.00 8.00
7. 75
1/ Include s eggs set by hatcheri e s producing chicks for hatchery supp_l_y_fl_o_c_k_s-.---:.-- . -
ARCHIE LANGLEY Agricultural Statistician In Charge
W. A. WAGNER Agricultural Statistician
U. S. Department of Agriculture
Georgia Department of Agriculture
Statistical Reporting Service
409A North Lumpkin Street, Athens, Georgia
EGGS SET AND CHICKS PLACED IN COMMERCIAL AREAS BY WEEKS - 1967
EGGS SET
I
CHICKS PLACED
STATE
-
Aug. 12
Week Ended Aug. 19
THOUSANDS
Aug. 26 ..
o/o of
I year ago 1/
I.
i
I
Aug. 12
Week Ended
Aug. 19
Aug. 26
THOUSANDS
Maine Copnecticut P~nns y1vania
Ind~ana
Missouri Delaware Maryland Virginia West Virginia North Carolina South Carolina
1, 853 313
1,580 532 507
2, 617 4,274 1, 580
140 6,421
554
1,745 265
1, 363 576 498
2,609 4, 110 1,648
146 6,296
569
1, 8'39 242
1, 468 56:o
399 2, 022 3, 3S9 1, 509
135 5,952
58'7
103 I 1, 509
I
I 69
195
104 i 1, 142
,, 79 I 330
64
356
79
2,370
90
3,084
Il'l 102
1, 111
144
287
86 It 5, 181
165
'I !
455
1, 417 200
1, 065 300 374
2,709 2,839 1, 041
374 5, 142
391
1, 381 160 940 362 429
2, 587 2, 8 79 1, 150
321 4,957
446
GEORGIA
11,517 11, 277 10,754
Florida Tennessee Alabama Mississippi Arkansas Louisiana TeKas Washington Oregon Cqlifornia
I
TQTAL 1967 {22 States}
787 639 7,986 4,803 9,242 1, 125 3,852 553 328 1,877
63, 080
749 680 8,062 4,614 9,299 1,077 3,651 569 341 1, 551
61,695
776 687 7,77'4 4,625 9,209 1,055 3,558 519 361 1, 388
58, 778
TOTAL 1966* (22 States}
63,857
63,681
62,6 8 2 -
o/o ~f Last Year
99
97
94.
}:_/ . Current week as percent of same week last year.
* Revised.
89
9,020
I
197
i
I
557
60 i 821
I
98
I I
6,291
I 102 I 4,092
101
7,023
114 I
796
!
92 I' 3,200
il 81
482
81
205
93
I I
!
1, 419
94 1 49, 926
I
1 47,633
I
I
I 105
8,825
666 865 6,354 4, 195 7' 211 845 3, 278 437 220 1, 407 50, 155
47,335
106
8, 614
656 783 6, 229 4, 116 7, 012 800 3, 181 419 274 1, 318 49,014
47, 162
104
Page 2
I o/o of
I year ago 1/
100 94
101 88
119 106
90
121 90 99
152
97
185 82
105 115 109 117 118
92 136
90
104
~G\A
~() FARM RE
GEORGIA CROP REPORTING SERVICE
ATHENS, GEORGIA
August 30, 1967 GEORGIA CASH FAID~ RECEIPTS UP 82 11ILLION DOLLARS IN 1966
Income from farm marketings and Government payments in Georgia set a new all-time high in 11966 with $1,095,982,000, according .to the Georgia Crop Reporting Service. This is 82 million
dollars above the 1965 income and is the second year receipts have exceeded one billion dollars. Livestock and livestock products accounted for ~632,678,000, or 62.3 percent, of the total marketngs. Receipts from all crops were ~~ 383,131,000 and Government payments amounted to $80,173,000.
Commercial broilers tvere number one t-lith marketings of $224,903,000. Eggs ranked second
with a value of $175,173,000, followed by peanuts with G91,483,000; cattle and calves, $89,232,000; tobacco, $71,522,000; hogs, $66,446,000; and dairy products, ~58,599,000.
Soybeans had the largest percentage increase with 112 percent; peaches were up 47 percent; turkeys, up 33 percent; corn, up 27 percent; and eggs had a gain of 24 percent. Value of cotton was down 52 percent. Decreases in acreage, yield per acre, and price t-7ere responsible for the reduction in receipts from cotton.
GEORGIA QP&!!. E!_Rti, RECEIFTS. 1222
~vestock and Products
_ _$)g_,_21!,QOQ __
Percent of Total 62.3%
Total $1,095,982,000 {Including $80,173",000 ih Govermnent p~yments)"
Crops ___$;i8J,1Jl,Q.OQ. __
Percent of Total 37~7%
C. L. CRENSHAW ~icultural Statistician
ARCHIE LANGLEY Agricultural Statistician in Charge
CASH FARM INCOHE FOR GEORGIA - - ~Thousand Doiiars)----
- - CROPS
Cotton Lint
1964 91,694
1961)
'
78,951
1966 11
~
34,366
Cotton Seed
10,237
9,766.
.' .. .7,9.34
Cotton, Total
101,931
88,717
42,300
Peanuts
.87,444
98,915
91,483
Tobacco
77,130
79,041
71,522
Soybeans
1,055
8,451
17,956
Peaches
6,713
6,540
_9,610
Pecans
4,312
10,593
10,691
Other Fruits and Nuts
1,619
4,356
3,382
Truck Crops
25,616
28,507
32,568
Corn
35,299
34,181
43,515
Forest Products
31,850
34,320
32,424
All Other Cro;ps
22.836
21,211~
27.620
TC!l'AL CROPS
401.805
414_,852
.383 .1.2L._____
LIVESTQ!
Hogs
53,292
61,131
66,446
Cattle and Calves
57,140
76,582
89,232
Dairy Products
52,104
55,558
58,599
Commercial Broilers
174,153
198,566
224,903
Other Chickens
8,295
8,536
9,308
Turkeys
6,199
5,576
7,439
Eggs
125,836
141,596
175,173
Other
~:=--------1.: 6]1)
TC!l'AL LIVESTCCK
AND PRODUCTS
478,654
------=2~.0~l_o_ _ _ _ _ _ _ _ _ _ _ _ _ _~l-.~~7li__ _ _ _
549,555
632,678
GOVERNIVIENT
----~----------------------------------
PAYMENTS
TC!l'AL CASH INCOME
39,416
49,608
--------------------------------
------80-,1-73----
,1r
ALL SOURCES
919,875
Prelimina-ry-.----------------------
1,014,015
1,095,982
-------------------------------------
~ ISSUE~ D B~ Y: ~ The~ Geo~ rgia= Cro= p R~ epor~ ting~ Ser~ vice~ ~USD~ A, ~ 409A~ No~ rth L~ ump~ kin ~ Stre~ e~A- the- ns, Ga., in cooperation with the Georgia Department of Agriculture.
Aft er Five Days Return to United States Department of Agriculture
Statistical Reporting Service
409A North Lumpkin Street Athens, Georgia 30601
OFFICIAL BUSINESS
Postage and Fees Paid
U. s. Department of Agriculture
'7
A
4- t
.~33w~~m~~CRO[ifu~@ifl~~
ATHENS, GEORGIA
GEORGIA CHICK HATCHE RY RE POR T
Placement of broiler chicks in Georgia during the week ended August 26 was 8, 614,000--2 percent less than the previous week and 3 percent less than the comparable week last year, according to the Georgia Crop Reporting Service.
An estimated 10,754,000 broiler type e ggs were set by Georgia hatcheries-5 percent less than the pr e vious week and 11 percent less than the comparable week a year earlier.
The majority of t he prices paid to Georgia producers for broiler hatching eggs were r eported within a range of 50 to 65 cents per dozen. The average price of hatching eggs was 56 cents per dozen. The price of eggs from flocks with hatchery owned cockerels generally was 2 ce nts below the ave rage price. Most prices received for boiler chicks by Georgia hatche ries were reported within a range of $6. 00 to $9.00 with an average of $7.75 p e r hundred. The average prices last year were 67 cents for eggs and $10.50 for chicks.
Week Ended
GEORGIA EGGS SET, HATCHINGS, AND CHICK PLACEMENTS
E GG TYPE
Eggs Set
1966 Thou.
1967 Thou.
o/o of
year ago
Pet.
Chicks Hatched
1966 Thou.
1967 Thou.
o/o of
year ago
Pet.
July 29 Aug. 5 Aug. 12 Aug. 19 Aug. 26
Week
I Ended
804
926 901 918 1, 036
Eggs Set})
1966 Thou.
1967 Thou.
614
76
643
585
63
603
619
69
631
645
70
619
685 ; 66
703
BROILER TYPE
o/o of
ye ar ago
!
Chicks Placed for
Broilers in Georgia
o/o of
1966
1967
year
ago
Pet.
Thou.
Thou. Pet.
412
64
488
81
473
75
491
79
505
72
Av. :Price Hatch Broiler
Eggs Chicks
Per
Per
Doz. Hundred
1967 1967
Cents Dollars
June 24
13, 859 12, 179
88
9,937
9,226
93
56
July 1
13, 631 12,354
91
9,808
9, 177
94
56
July 8
13, 670 12,281
90
9,666
8,980
93
57
July 15
13, 614 12,031
88
9,559
9, 113
95
58
July 22
13,235 12,061
91
9,628
9, 110
95
58
July 29
13, 124 12, 0 31
92
9,449
8, 840
94
58
Aug. 5
12,690 11, 854
93
9, 524
8, 822
93
58
Aug. 12
12,780 11,517
90
8,938
9,020 101
57
Aug. 19
12,780 11,277
88
9,079
8,825
97
57
Aug. 26 I 12 111 10 754
8 9
8 845
8 614
9 7
56
1/ Include s eggs set by hatcherie s producing chicks for hatchery supply flocks.
7.75 7.75 8.00 8. 25 8.25 8.25 8. 25 8.00 8.00 7 75
ARCHIE LANGLEY Agricultural Statistician In Char ge
W. A. WAGNER Agricultural Statistician
U. S. Department of Agricultur e
Georgia Department of Agriculture
Statistical Reporting Se rvice
409A North Lumpkin Street, Athens, Georgia
EGGS SET AND CHICKS PLACED IN COMMERCIAL AREAS BY WEEKS - 1967
EGGS SET
I
CHICKS PLACED
STATE
Week Ended
Aug .
Aug.
12
19
THOUSANDS
Aug. 26
I o/o of year
I ago 1/ I, i I
Aug. 12
Week Ended
Aug.
Aug.
19
26
THOUSANDS
Maine Connecticut Pennsylvania Indiana Missouri Delaware Maryland Virginia West Virginia North Carolina South Carolina
1,853 313
1,580 532 507
2,617 4,274 1, 580
140 6,421
554
1,745 265
1, 363 576 498
2,609 4, 110 1,648
146 6,296
569
1, 839 242
1, 468 560
399 2,022
3,359
11 509 135
5,952 587
103 I 1, 509
I
I 69
195
104 I 1, 142
79
330
II 64
356
79
2,370
90
31084
l 102
11 111
!I 144
287
86 II 5, 181
165 ' I ~
455
1, 417 200
1,065 300 374
2,709 2,839 l, 041
374 5, 142
391
1, 381 160 940 362 429
2, 587 2, 8 79 1, 150
321 41957
446
GEORGIA
11, 517 11,277 101754
89 : 9,020
I
81825
81 614
Florida Tennessee Alabama Mississippi Arkansas Louisiana Texas Washington Oregon California
787
639 7,986 4, 803 9,242 1, 125 3,852
553 328 1,877
749 680 8,062 4,614
9,299 1,077 3,651
569 341 1, 551
776 687 7,774
41625 9,209 1, 055 3,558
519 361
11 388
197 !'
557
60 ! 821
98
I I
6,291
102 101 114
I
I : I
4,092 7,023
796
92 81 81
93
!
I
3,200
i!IIl
482 205
1, 419
666 865 61354 4, 195 7, 211 845 3,278 437 220 1, 407
656 783 61229 41 116 71 012 800 31 181 419 274 1, 318
TOTAL 1967 (22 States)
63,080 61,695 58,778
94 1 49,926
I
50, 155
49,014
TOTAL 1966* (22 States)
63,857 63,681 62,662
o/o of Last Year
99
97
94
}:_/ Current week as percent of same week last year.
* Revised.
1 47, 633
I
I
I 105
47,335 106
47, 162 104
Page 2
I o/o of
I year ago 1/
100 94 101 88 119 106 90 121 90 99 152
97
185 82 105 115 109 117 118 92 136 90
104
J(
Oiooy
AJ Georgia Weekly Crop and Weather Bulle
~ GEORGIA CROP REPORTING SERVI
Athens , Georgia
VTeek Ending September 4, 1967
Tuesday
FARII1 ACTIVITY INCREASES
Athens, Ga., Sept. 5 -- Field work, especially irr southern
I
throughout
most of the week, according to the Georgia Crop Reporting Service. Peanut digging, hay harvest,
cotton defoliation and picking, and insect control were major farm activities. 1rVith the ex-
ception of a f ew counties, soil moistur e was adequate throughout most of the State.
County Agents reported very lit tle change in cotton condition. Open weather in most areas allowed f or mor e effective insect control measures. Harvest continued light in southernmost ~eas, but defoliation in preparation for harvest increased.
Cor harvest progressed slowly as high~oisture grain in most areas will require drier weather conditions. The majority of the crop is considered 11made 11 , and higher than normal yields
expected.
Sovbeans remained in yery good condition. Corn earworm control on this crop was active in
Peanut digging made good progress during the week. Approximately 55 percent of the State
acreageb.ad been dug and 38 percent had been threshed. Yields from the acreage harvested so far have averaged above normal.
Pecan conditions range from poor to good, with most reporters expecting a fair crop. B!l~~~ was active in many areas during the week. Quality was generally low as a result of overmaturity ~nd army worm damage. To~ harvest was virtually completed. weetpotato harvest continued to make good progress from early varieties.
~~ SU}~Y - Rainfall was heavy in the northwest and southeast sections and mostly light to moderate in other areas of Georgia during the week ending Friday, September 1. The observer at Rome measured 4.83 inches while several places in middle and south central Georgia had no measurable rain during the week. Most of the western and southern sections of the State received rain during the week end. Locally excessive ~aounts were reported in the west central area, where Hamilton had 4.08 inches during the 24-hour period ending Honday morning. Saint Simons Island received over 3 inches during the week end.
Georgia temperatures continued unusually cool during the week. Week-end minimum tempera-
tures were in the 5ors in north Georgia after a cold front moved through the area early Friday.
A reading of 55 at Athens Friday morning was the lowest ever recorded so early in the fall
season. Several places had new record lows for the date. Averages for the week ranged from
4 to 8 degrees below normal.
The five-day forecast for the period Tuesday through Saturday, (September 5 - 9) calls for
continued cool weather with averages expected to be 4 to 8 degrees belot-T normal. Heavy rainfall is forecast for the period with amounts mostly between 1 and 2 inches indicat.ed.
August rainfall ranged from excessive over the northern third of the State to slightly deficient in parts of southwest Georgia. Divisional averages were more than double the August .normals in the north central and northeast divisions. Central areas received well above normal ~ounts for the month. Averages were near normal over most of south Georgia but some areas, especially in the southwest, received considerably less than normal. August temperatures were much cooler than normal, continuing the summer-long trend of mild weather. The mild August temperatures, combined with those of June and July, made the the coolest summer in Georgia since Statewide averages were begun in 1892.
isSuED-BY:- The Georgia Crop-Reporting-Service; Athens; Georgia; -in cooperation with-the- - - Cooperative Extension Service, University of Georgia; Georgia Department of Agriculture; and the Weather Bureau, ESSA, U. S. Department of Commerce.
U. S. DEPARTMENT OF COMMERCE WEATHER BUREAU AthenEs;":,SGA eorgia
Precipitation For The Week Ending September 1, .1967
GEORGIA
Temperature extremes for the week ending Sept. 1, 1967 (Provisional)
Highest: 95 at Quitman on the 27th, 28th ml
29th.
0
51 at Clayton on the 29th.
1.27
0
,.~ T..,.._
* For period Septo 2-4 ~ 1967
T~ less than oOO$ inch
Aft er Five Days Retur to United State Department of Ag ri c ltu re
Statisti al Reporting Servi c~ 409A North Lumpki n Stree Athens, Georgia 30601 OFF ICI AL BUS INESS
IMMED IA E - S. WEATH ER REP OR This repo rt wil l be treated i a l
Respects as Letter Mail (See Sec . 34.17, P. L. & R. )
Postage and Fees Paid U. S. Department of Agriculture
August 15, 1967
Released 9/5/67 GEORGIA CROP REPORTING SERVICE
GEORGIA PRICES RECEI VED I NDEX rECLINES 12 POINTS
The Index of Prices Received by Georgia farmers for all commodities declined 12 points during the month ended August 15, 1967 to 244. This was 11 points below the August 15, 1966 index of 255.
There were declines in prices of grains, cotton, tobacco, cottonseed, soybeans, meat animals, broilers, and eggs. The All Livestock and Livestock products index at 217 was 10 points below last month and 24 points below August 15, 1966.
UNITED STATES PRICES RECEIVED I NDEX D~~ 1 POIN PARITY I NDEX DOWN 2 POINTS, ADJUSTED PARITY RATIO 80
The Index of Prices Received by Farmers declined 1 point (1/3 percent) during the month ended August 15 to 256 percent of its 1910-14 average. Contributing most to the decline were lower prices for hogs, tomatoes, and corn. Partially offsetting were price .increases for milk, ~anges, grapefruit, and pears. The index was 6 percent below August 1966.
The Index of Prices Paid for Commodities and Services, including Interest, Taxes, and F~ Wage Rates declined 2 points during the month to 343. The index was 8 points (2 percent) above a year earlier.
With the Prices Received Index down 1 point and the Parity Index down 2 points, the ~eliminary Adjusted Parity Ratio, reflecting Government payments, remained at 80.
The Parity Ratio, at 75, was up 1 point from July.
~-~In-d~e-x----_I_N;D=E:X-A1\TuU:fg'.'IBuE~R-S2--- GEORJuGlIAy:CA5N-D-:UAuNgITlEiDst1S5T-A-T-E~SR-e_c_o_r~d-H-.i,...g~h-
1910-l4 = 100
GE~~-----
~ices Received All Commodities All Crops
avestock and Livestock
1966
255 y
259
1967
256 268
127 ___I....n...d. .-.eL...:_:_ __._---.Q~a-:-t:_e:.-~-
.
244
310 :March 1951
. . 256
. 319 :Harch 1951 gj
Products
241
227 y'
217
295 :Sept. 1948
'UNITED STATES-
----:--------------------------
PriC'Ss Rec~ived Parity Index ;Y
'Parity Ratio
Adjusted Parity Ratro-gr-:
271
257
335
345
81
74
------
256
313 :Feb. 1951
343
345 :July 1967
75
.. 123 :Oct. 1946 -~----
(preliminary)
: 87
80
80
1 Revised:-y Also April 19~1.- }TPricesPaict-;-IntereSt-,-:T::-ax-e-s-,-a-nd~F=-a-r_m_W~age Rates based on
data for the indicated dates. 4/ The Adjusted Parity Ratio, reflecting Government payments, averaged 86 for the year 1966, ~ompared with 80 for the Parity Ratio. Preliminary Adjusted
Parity Ratios for the current year, supplied by the Economic Research Service, are based on es-
tmated cash receipts from marketings and estimates of Government payments for t~e current
calendar year.
ARCHIE LANGLEY A~icultural Statistician In Charge
WILLIAM A. WAGNER Agricultural Statistician
--tiD-BY:- The Georgia crop-R~porting-service; usiS'A: 4o9A- North-Lumpkin-street, -Athens, -Ga.;
in cooperation with the Georgia Department of Agriculture.
After Five Days Return to United States Department of Agriculture
Statistical Reporting Service 409A North Lumpkin Street Athens, Georgia 30601
Q[FICIAL BUSINES~
Postage and Fees Paid
U. s. Department of Agriculture
UNIVERSITY OF GEORGIA
ATHENS, GEORGIA
September 6, 1967
GEORGIA CHICK HATCHE R Y RE PORT
Placement of broiler chicks in G e orgia during the week ended September 2 was 8, 273, 000--4 percent less than th e pr e viou s week and 7 percent less than the comparabl e week last year, according to the Georgia Crop R eporting Service.
An estimated 10, 171, 000 br oile r type e ggs were set by Georgia hatcheries-5 percent less than the previous week and 18 percent less than the comparable \'-'eek a year earlier.
T he majority of the prices pai d to Ge o rgia producers for broiler hatching eggs were r eported within a range of 50 to 65 cents p e r dozen. The average price of hatching eggs was 56 cents p e r dozen. The price of e ggs from flocks with hatchery owned cocke rels generally was 2 c ents be low the ave r age price. Most prices receive d for broiler chicks by Georgia hatche rie s we re reported within a range of $6.00 to $9.00 with an average of $7. 7 5 p e r hundr e d. The ave rage prices last year were 67 cents for eggs and $10.50 for chicks.
Week Ended
GEORGIA EGGS SET, HATCHINGS, AND CHICK PLACEMENTS
EGG TYPE
Eggs Set
1966
1967
Thou.
Thou.
u;o of
year ago ' Pet.
Chicks Hatched
1966
1967
Thou.
Thou.
u;o of year ago
Pet.
Aug. 5 Aug. 12 Aug. 19 Aug. 26 Sept.
Week Ended
926 901 918 1,036 l, 000
U Eggs S e t
1966 Thou.
1967 Thou.
585
63
603
619
69
631
645
70
619
685
66
703
658
66
676
BROILE R TYPE
u;o of
year ago Pet.
Chicks Placed for
Broilers in Georgia
o/o of
1966
1967
year
ago
Thou.
Thou. Pet.
488
81
473
75
491
79
505
72
513
76
Av. Price
Hatch
Broiler
Eggs
Chicks
Per
Per
Doz.
Hundred
1967
1967
Cents
Dollars
July l
13,631 12, 354
91
9,808
9, 177
94
56
July 8
13,670 12,281
90
9,666
8,980
93
57
July 15
13,614 12,031
88
9, 559
9, 113
95
58
July 22
13,235 12,061
91
9,628
9, 110
95
58
July 29
13' 124 12,031
92
9, 449
8, 840
94
58
Aug. 5
12,690 11' 854
93
9, 524
8, 822
93
58
Aug. 12
12,780 11,517
90
8,938
9,020 101
57
Aug. 19
12, 780 11,277
88
9,079
8,825
97
57
Aug. 26
12, 111 10,754
89
8, 845
8,614
97
56
Sept. 2
12,454 10, 171
82
8, 880
8, 273
93
56
1/ Includes eggs set by hatcheries producing chicks for hatcher y supply flocks.
7.75 8.00 8.25 8.25 8.25 8.25 8.00 8.00 7.75 7.75
ARCHIE LANGLEY
W. A. WAGNER
Agricultural Statistician In Charge U. S. Department of Agriculture
Agricultural Statistician
.
Georgia Department of Agriculture
~
St atistical Reporting Service
409A North Lumpkin Street, Athens, Georgia
STATE
Aug. 19
E GGS SET
Week Ended
Aug.
Sept.
26
2
THOUSANDS
% of
year ago 1/
CHICKS PLACED
Week Ended
Aug.
Aug.
Sept.
19
26
2
THOUSANDS
Page Z
% of
year ago 1/
Maine
1,745
1, 839
1, 356 120
1, 417
1, 381
1, 363
99
Connecticut
265
242
244 82
200
160
139
69
Pennsylvania
1,363
1, 468
1, 293
92
1, 065
940
851
90
Indiana
576
560
439
61
300
362
318
72
Missouri
498
399
399
67
374
429
318
89
Delaware
2,609
2,022
2, 188 86
2,709
2, 587
2, 415
99
Maryland
4, 110
3,359
3, 102
73
2,839
2,879
2,940
91
Virginia
1, 648
1, 509
1, 307 94
1, 041
1, 150
1, 084
132
West Virginia
146
135
118
84
374
321
365
87
North Carolina
6,296
5,952
4,257
81
5, 142
4, 957
4,934
96
South Carolina
569
587
591 144
391
446
423
120
.
GEORGIA
11,277 10,754 10,171
82
8,825
8, 614
8,273
93
~
Florida Tennessee Alabama Mississippi Arkansas Louisiana Texas Washington Oregon California TOTAL 1967 (22 States)
749
776
786 177
666
656
631
180
680
687
716
63
865
783
803
79
8,062
7, 774
6,861
92
6,354
6,229
6,278
103
4,614
4,625
4, 514 101
4, 195
4, 116
4,075
113
9, 299
9, 209
8,734
93
7, 211
7,012
7,090
109
1, 077
1, 055
1, 117 118
845
800
759
107
3, 651
3, 558
2, 728
72
3, 278
3, 181
2,785
101
569
519
562 102
437
419
367
91
341
361
291 123
220
274
275
110
1, 551
1,388
1, 168 66
1, 407
1, 318
1, 351
93
61,695 58,778 52,942
87
50, 155 49,014 47, 837
100
TOTAL 1966* (22 States)
63,681 62 , 662 60, 713
47,335 47, 162 47,768
% of Last Year
97
94
87
*1I Current week as p ercent of same w e ek last yea r Revised.
106
104
100
I
[
UNIVE SITY OF GEORG A
1~ 1961
GEORGIA CROP REPORTING SERVICE - ATHENS, GEORGIA
Released September 8, 1967
-GEORGIA carTON REPORT AS OF SEPTEMBER 1, 1967
Georgiats 1967 cotton crop is forecast at 215,000 bales based on information reported by ~op correspondents and ginners as of September 1, the Georgia Crop Reporting Service said to-
day. This is 5,000 bales below the indicated production a month ago. The current forecast is
101,000 bales below the 1966 crop of 316,000 bales and 351,000 less than the 1961-65 average of 5~,000 bales. The current indicated crop is the smallest since estimates were started in
lMO. Indicated yield per acre of 362 pounds is 36 pounds less than last season and 60 pounds
below average.
Frequent showers and cool, damp weather during August made it difficult for growers to con~ol weevils in the northern districts and crop prospects declined in this area. In the southern districts, rainfall was much lighter and the crop showed some improvement.
The development of the crop is later than usual. According to the Bureau of Census, only
5,529 bales had been ginned to September 1 compared to 6, 772 to the same date last year and
36,812 in 1965.
INDICATED COTTON PRODUCTION. 1967~ FINAb_fRODUCTION, 1266. 196,2
District
1967
1966
1965
1
15,000 18,470 41,510
2
9,000 10,900 22,970
3
10,0CO 12,560 24,160
4
20,000 24,280 42,000
5
42,COO 62,110 103,950
6
37,000 63,750 107,480
7
26,000 43,390 73,840
8
52,000 72,340 129,530
9
4,000 8,200 17,560
State
215,000 316,000 563,000
-4
.Columbus
Macon
Districts shown are crop reporting districts and ~ Congressional Districts.
I
0
Please see reverse side for
UNITED STATES information.
Albany
7
Valdosta
UNITED STATES - COTTON REPORT AS OF SEPTEMBER 1, 1967
The Crop Reporting Board of the Statistical Reporting Service makes the following report from data furnished by crop correspondents, field statisticians, Bureau of the Census, Agricultural Stabilization and Conservation Service, and cooperating State agencies. The final outturn of cotton compared with this forecast will depend upon whether the various influences affecting the crop during the remainder of the season are more or less favorable than usual.
State
Acres for
y harvest
1967
1,000 acres
Lint yield per harvested acre 1961-65 average 1966 1967
indic.
Pounds Pounds Pounds
Production g)
500-pound gross weight bales
1961-65
Indicated
average
1966 Aug. 1 Sept. 1
~,ooo
1,ooo
1967
1,ooo
1967
1,ooo
bales
bales bales
bales
N. C.
s. c.
Ga. Te.nn. Ala. Mo.
Miss. Ark. La. Okla. Texas
N. Mex. Ariz. Calif. Other
States 'j)
90 200 285 260 460 90
940 790 340 405 3,700
128 247 590
20
374 419 422 572 445 561
625 557 521 270 362
673 1,057 1,099
402
290
267
442
432
398
362
475
415
392
313
408
293
651
587
418
425
602
579
270
255
385
363
648
562
979
962
952
997
359
353
300 474 566 614 788 419
1,942 1,483
572 334 4,544
266 839 1,753
41
94 282 316 363 461 162
1,353 756 449 214
3,182
181 515 1,228
19
50 180 220 230 330
57
1,175 725 430 250
2,775
155 515 1,225
15
50 180 215 225 . 300 55
1,150 700
410 215 ..
2,800
150 495 1,225 ;
15
u. s .
8,545
491
480
460
14,935
9,575 8,332
8,185 .
.An).er.-
Egypt. li}
548
447
482
109.6
70.8
1 August 1 estimate. 2 Production ginned and to be ginned. A 500-lb. bale contains about
80 net pounds of lint. 3/ Virginia, Florida, Illinois, Kentucky, and Nevada. li/ Included in
State and United States totals. Grown in Texas, New Mexico, Arizona, and California.
C. L. CRENSHAW Agricultural Statistician
ARCHIE LANGLEY Agricultural Statistician In Charge
After Five Days Return to United States Department of Agriculture
Statistical Reporting Service 409A North Lumpkin Street Athens, Georgia 30601 OFFICIAL BUSINESS
1
Postage and Fees Paid U. S. Department of Agriculture
GElABLE
Georgia Crop Reporting Se rv ic e
REPORT / Athens, Georgia
September 1, 1967
~eleased: September 8, 1967
GEORGIA
UNJVERSIT'r OF G::o
Only a 1 ight volume of summer produced vegetables rema ~ o a- f st.
August lowered quality of late vegetables. Production of fall vegetables
expected to be good.
UNITED STATES
--
eavy rains in late southern areas is
LIMA BEANS: Production of summer 1 ima beans, at 242,000 hundredweight is 3 percent less than 1966. In New Jersey, North Carol ina, South Carol ina, Georgia, and
Alabama, peak harvest has past but some supplies, mostly for local outlets, will be available unt i 1 frost.
SNAP BEANS: The summer snap bean crop is estimated at 1,021,000 hundredweight, I percent
above 1966. In the New England States, moderate supplies will be available
until about September 15 and then 1ight supplies until frost. Wet fields in New York have
slowed harvest. Supplies are expected to decline after mid-September. In Pennsylvania, late
plantings are supplying markets with good volume. Supplies should continue through September.
In Illinois, good volume is expected during September with I ighter supplies available until
late October. Cool weather in Michigan has been favorable for crop development. August
weather in Virginia was favorable for late planted beans. Heavy rains in southwest North
Carol ina destroyed a large acreage of beans before harvest was completed. Below normal
volume is expected during September. In the northwest area, acreage is in good condition. In
Georgia, excessive rains and flooding in late August caused considerable damage. Rainfall
~
during should
August in Tennessee was adequate to surplus throughout be available until frost. Light movement continues in
the State. Snap bean supplies Alabama. In Colorado, harvest
is one to two weeks late.
CABBAGE (For fresh market and kraut): Supplies of late summer cabbage are estimated at 3,261,000 hundredweight, 6 perce11t more than
1966 but 5 percent below average. In Pennsylvania, good volume should continue through Septemr ber, In Illinois, supplies are ample. Harvest is nearly completed in Iowa, In North Carol ina,
supplies during August were above normal. Large supplies are expected during September and
most of October. In Georgia, heavy rains caused considerable damage to late plantings. Harvest is nearly completed. Harvest in Colorado is late as a cool growing season has 1 imited normal development. Supplies should be available through September. The crop in Washington remains in good condition in spite of continued hot, dry weather. In California, moderate volume continues from the Salinas Valley and south coastal areas with 1ight supplies also available from the San Francisco Bay district. Movement should continue through the late summer and fall mor.ths.
ARCHIE LANGLEY Agricultural Statistician In Charge
L. H. HARRIS, JR. Vegetable Crop Estimator
lssu"Eo-Bv:- The "Georg(a crop-Report"(;;-g-ser~ice: usoA: 4o9A-North-Lumpkin-Street,-Athens,--Georgia, in cooperation with the Georgia Department of Agriculture.
UNITED STATES - COTTON REPORT AS OF SEPTEMBER 1, 1967
The Crop Reporting Board of the Statistical Reporting Service makes the following report from data furnished by crop correspondents, field statisticians, Bureau of the Census, Agricultural Stabilization and Conservation Service, and cooperating State agencies. The final outturn of cotton compared with this forecast will depend upon whether the various influences affecting the crop during the remainder of the season are more or less favorable than usual.
State
Acres
for
h19a6r7veyst
Lint yield per
harvested acre
1961-65 average 1966 1967
indic.
Production g)
500-pound gross weight bales
1961-65
Indicated
average
1966 Aug. 1 Sept. 1
1967
1967
ACREAGE AND ESTIMATED PRODUCTION REPORTED TO DATE, 1967 WITH COMPARISONS
CROP AND STATE
Acreage
Yield Per Acre
Harvested
For
:Average:
:harvest:Average:
Ind.
:1961-65: 1966
1967 : 1961-65: 1966 1967
-Acres-
-Cwt.-
Production
:Average:
Ind.
:1961-65: 1966 1967
-I , 000 cwt.-
LIMA BEANS
Summer: New Jersey North Ca ro 1 ina South Ca ro 1ina GEORGIA AI abama Group Total
1,480 I ,000 I ,000
33
33
25
49
33
25
1,300 I, I00 I ,000
32
30
35
41
33
35
1,920 I, 700 I ,600
20
22
20
39
37
32
3,940 3' 100 3,000
23
23
28
91
71
84
3.780 3,300 3,300
21
23
20
79
76
66
13' 110 10,200 9.900
25
25
24
319
250
242
SNAP BEANS
Summer: New Hampshire Massachusetts Rhode Island
Connecticut New York Pennsylvania Ohio Illinois Michigan Virginia North Carol ina GEORGIA Tennessee AI abama Colorado
Group Total
200
ISO
130
40
40
40
8
6
5
990
850
800
34
36
40
34
31
32
150
140
140
41
35
40
6
5
6
580
600
650
38
35
40
22
21
26
9,640 7,700 7,000
38
38
45
365
293
315
1 '140
900
850
2,180 I ,600 I ,800
43 54
40
so
45
49
45
118
36 80
38 81
1'220 I ,200 I ,200
30
25
30
37
30
36
2,180 2,300 2,400
32
33
30
71
76
72
450
450
450
40
35
40
18
16
18
5,700 5,600 5,600
44
49
45
249
274
252
1,320 I ,200 1'300
36
37
37
48
44
48
1 ,200
950
900
44
45
43
53
43
39
1 ,020
850
800
31
25
30
32
21
24
670
650
650
51
49
45
34
32
29 I
28,630 25' 140 24,670
40
40
41 1'145 1,008 1,021
CABBAGE !/
Late Summer: Pennsylvania Indiana Illinois Iowa North Ca ro 1ina GEORGIA Colorado Washington California Group Total
2,820 2,400 2,300
202
190
210
572
456
483
1,200 I ,200 I ,200
230
215
220
275
258
264
2,180 2,300 2,400
199
165
200
433
380 480
460
300
230
157
160
150
72
48
34
3,560 3,200 3,000
165
160
175
586
512
525
520
450
45o', Ill
115
105
58
52
47
2,160 I ,900 2,100
258
230
240
560
437
504
1,300 I, 300 I ,400
240
215
230
312
280
322
2, 720 2,900 2,800
214
230
215
582
667
602
16,920 15,950 15,880
204
194
205 3,450 3,090 3,261
!/ Includes processing.
After Five Days Return to United States Department of Agriculture
Statistical Reporting Service 409A North Lumpkin Street Athens, Georgia 30601 OFFICIAL BUSINESS
Postage and Fees Paid U. S. Department of Ag r icuI tu re
Released 3 p.m. Monday
HARVEST SLOWED BY RAINS
Athens, Ga., September 11 --Harvest operations, part icularly for peanuts, were delayed
in some sect ions by rains, according to the Georgia Crop Reporting Service. Other field work
was also hindered by the numerous showers.
County Agents judged the cot t on crop to be about 10 percent gathered by the weekend. The cond ition of the crop changed ve ry 1 ittle from the previous week but defoliating became more widespre a d.
Corn harvest made 1 i ttle progress during the week as ear moisture remained high in most
fields. A bumper crop is expected but only about 7 percent has been harvested.
Insect control was active in soybean fields over the State. Corn ear worms are causing the greatest damage but a good yield is still expected.
Farmers pushed peanut harvest as weather permitted but delays were numerous over much of the peanut belt. About 73 percent of the crop has been dug and about 57 percent threshed. Several areas expressed concern about sprouting in the windrow and in the ground. Reports indicated many of those who have already gathered their crop had excellent yields.
Hay i ng and silage harvests were active in the drier sections of the State. Pecans remained in mostly fair condition.
Several areas reported army worms were being brought under control while others continued to fight the pest. Forage crops remained the principal food but several reports of soybean damage were received.
Considerable land was prepared for fall seedings during the week. About 7 percent of the
small grain planting has been completed.
WEATHER SUMMARY- Rainfall was generally 1ight in the northern and east central sections and moderate to locally heavy in remaining areas of Georgia during the week ending Friday,
September 8. Some excessive amounts were recorded in the lower coastal area where both St. Simons and Sapelo Islands received more than 4 inches. Several weather observers in the
northeast and east central sections reported no measurable rainfall during the week. For ' some places, this was the second week without rain. Most of the northern and western parts
of the State received rain during the weekend with several observers reporting over an inch on Saturday.
Georgia temperatures continued unusually cool for the season. Averages for the week ranged mostly from 3 to 5 degrees below normal. Early morning lows dropped to the 40 1 s in the mounta i ns at midweek and to the sos in middle Georgia. Highs were mostly in the 70 1 s and low sos with the temperature reaching 90 at only a few places.
The five-day forecast for the period Tuesday through Saturday {Sept. 12-16) calls for temperatures to average 3 to 6 degrees below normal, except in the southeast where near normal conditions are indicated. Rainfall is expected to average 1/2 to 1 1/4 inches and occur in showers about Fr i day or Saturday. There is a chance of heavier amounts o~ curring in the coasta I a rea.
ISSUED BY: The Georgia Crop Repor t ing Service, USDA, Athens, Georgia ; in cooperation wi th the Cooperative Extension Service, University of Georgia; Georgia Department of Agr iculture; and the Weathe r Bureau, ESSA, U. S. Department of Commerce.
U. 5. DEPARTMENT OF COMMERCE WEATHER BUREAU Athens; Georgia ESSA
Precipitation For The Week Ending September 8, 1967
GEORGIA
Temperature extrellBs for the week ending
Sept. B, 1967 (Provisional)
Highest: 94 at Quitman on the 2nd. 440 at Blairsville on the 5th
20
~ ~
* For period Sept. 9-11
T, less than .005 inch
Af ter Five Days Retur r. to United States Department of Agriculture
Statist ical Report i ng Service 409A North Lump k in Street Athen s , Georg ia 30601 OFFICIAL BUSINESS
IMMEDIATE - U. S. WEATHER REPORT This report will be treated in all
Respects as Letter Ma i l (See Sec. 34.17, P. L. & R.)
Postage _and Fees Paid U. S. Department of Agriculture
y I S-
.. .
, ,
I o
.,. GEORGIA CROP .RI;.PORTI Athens ,
Week End i ng September ll, 1967
3 p.m. Monday
HARVEST SLOWED BY RAINS
Athens, Ga., September ll --Harvest opera t ions, particularly for peanuts, ~ere delayed
in some sections by rains, accord i ng to the Georgia Crop Reporting Service. Other f.ield work
was also hindered by the numerous showers.
County Agents judged the cotto n crop to be about 10 percent gathered by the weekend. The cond it ion of the crop change d ver y little from the previous week but defoliating became more wi de s pread.
Corn harvest made l i ttle progress during the week as ear moisture remained high in most fields. A bumper crop is expected bu t only about 7 percent has been harvested.
Insect control was active in soybean fields over the State. Corn ear worms are causing the greatest damage but a good yield is still expected.
Farmers pushed peanut harvest a s weather permitted but delays were numerous over much of
the peanut belt. About 73 percent of the crop has been dug and about 57 percent threshed.
Several areas expressed concern about sprouting in the windrow and in the ground. Reports indicated many of those who have already gathered their crop had excellent yields.
Haying and silage harvests we re active in the drier sections of the State. Pecans remained in mostly fair condition.
Several areas reported army worms were being brought under control while others continued to fight the pest. Forage crops remained the principal food but several reports of soybean damage were received.
Considerable land was prepared f or fall seedings during the week. About 7 percent of the
, small grain planting has been completed.
WEATHER SUMMARY- Rainfall was generally light in the northern and east central sections and moderate to locally heavy in rema i ning areas of Georgia during the week ending Friday,
September 8. Some excessive amounts were recorded in the lower coastal area where both St.
Simons and Sapelo Islands received more than 4 inches. Several weather observers in the northeast and east central sections reported no measurable rainfall during the week. For some places, this was the second week without rain. Most of the northern and western parts of the State received rain during the weekend with several observers reporting over an inch on Saturday.
Georgia temperatures continued unusually cool for the season. Averages for the week
ranged mostly from 3 to 5 degrees below normal. Early morning lows dropped to the 40's in the
mountains at midweek and to the SO's in middle Georgia. Highs were mostly in the 70's and low
80's with the temperature reaching 90 at only a few places.
The five-day forecast for the period Tuesday through Saturday (Sept. 12-16) calls for temperatures to average 3 to 6 degrees below normal, except in the southeast where near normal cond i tions are i ndicated. Rainfall i s expected to average 1/2 to l 1/4 inches and occur in showers about Fr i day or Saturday. There is a chance of heavier amounts o~curring in the coastal area.
ISSUED BY: The Georgia Crop Re port i ng Serv ice , USDA, Athens, Georgia ; in cooperation with the Cooperative Extens ion Ser vice, Un i versity of Georgia; Georgia Department of Agriculture; and the Wea t he r Bu rea u , ESSA, U. S. Depa r tment of Commerce.
U. S. DEPARTMENT OF COMMERCE WEATHER BUREAU Athens; Georgia
ESSA
Precip tation For The Week Ending September 8, 1967
GEORGIA
Temperature extreJMs for the week ending
Septo B, 1967 (Provisional)
Highest g 94 at Quitman on the 2nd. 440 at Blairsville on the 5th.
o89 o20
* For period Septo 9-11
T, less than o005 inch
Af te F ive Days Ret r . .o United S a e s~ Departmen o, 3 ri c i '!: re
Stat is "cal Repor t i 3 Se r v =co 409A Nort h Lumpkfn tree: At ens, Georg ia 306 OFF ICIAL BUS IN SS
Postage _and Fees Paid U. S. Department of Agriculture
IMME DIATE This repo t wi ll be t eate . in
Re s pe c s as Letter ta il {See Sec. 34. 17 , P. L. & R. )
The Univ Library Univ Of ' Ga Athens Ga 3o601
REPO ftuf ERSITY OF GEORGIA sf? 1- 1.. rr
GEORGIA CROP REPORTING SERVICE
ATHENS, GEORGIA
[_
GENERAL CROP REPORT AS OF SEPTEMBER 1, 1967
September 12, 1967
Harvest Increasing - Yields ~ Most Crops :
On September 1, harvest of Georgia 's ma jor crops was on the increase, but progress was generally less advanced than normal. Cotton picking was increasing in South Georgia.;peanut picking and threshing were moving forward very rapidly, and early corn harvest was getting under way. Yields for peanuts, corn, and soybeans are estimated at record levels.
~Yield 22_ B'qshels: The estimated 1967 corn yield is placed at 55 bushels--12 bushels ab ove last year . At this l evel, total production would be
82,775,000 bushels compared with 58,824,000 last y ar.
Cotton E9ucti ~Sharply: Production of cotton is forecast at 215,000 bales compared with 316,000 last year -- down 101,000 bales . A
.sharp drop in acreage for harvest and lower yields account for the production decline.
Tobacco Production Up: Production of Type 14 tobacco is forecast at 150,675, 000 pounds,
-------
-- compared with 96,380,000 pounds in 1966.
Peanuts Improve: Peanut conditions improved during August, and production was indicated at 956,000,000 pounds. Last year a crop of 809,760,000 pounds was
realized. Yield per acre is indicated to be 2,000 pounds compared with the 1,680 pounds harvested last year and the previous record of 1,850 pounds.
Soybean Productign ~: The Staters soybean forecast is unchanged from last month at 13,008,000 bushels, compared with 6,923,000 in 1966. Both acre -
age and yield are estimated above last ye ar's l evel.
Pee~ QEE ~:
A pecan crop of 47,000,000 pounds is in prospect for 1967. This com-
pares with last year ts crop of 37,000,000 and the all-time high of
ll4,ooo,ooo pounds in 1963.
Milk production on Georgia farms during August totaled 86 million pounds - 1 percent more than prOduced last month and 5 percent above a year ago. Egg production during August totaled 410 million eggs compared with 382 million during August 1%b.
GEORGIA CROP_fRODUCTION ~ND HARVESTED ACREAGE. 1966 AND 1967 -~-~--
--
Acreage ____l ____!ie1_d_P~e~r~A~c~r~e~~~----~Production
:Harvested For
Indicated :
-------yndicated
Crop and Unit
1966 : harvest : 1966
___ :
1967 :
~---~---
--!_ho usand~------
. 1967
1966
1967
~----~~-T-h~ou-s-an-d-s ------
Corn, for grain, bu. Hheat, bu. Oats, bu. Rye, bu. Barley, bu. Tobacco, Type 14, lb. Sweetpotatoes, cwt. , Hay, all, ton Cotton, bale Peanuts, (P & T) , lb. Soybeans, for beans, bu.
Sorghums, for grain, bu. Peaches, total crop, bu. Pecans. lb. yPO'tlnds of lint:"_ __
1,368
1,505 43.0
55.0
58,824
82, 775
65
124 30.0
27.0
1,950
3,348
98
93 41.0
37.0
4,018
3,441
43
70 22 .5
18.0
968
1 , 2 60
11
9 41.0
30.0
451
270
61
73 . 5 1, 580
2,050
96,380
150, 675
8
8
85+
95+
680
760
460 380
462 285
1. 88 398
-
y
13.6927-y
867 316
912 215
482
478 1,680
2,000
809,760
956,000
301
542 23 .0
24.0
6,923
13,008
12
13 38. 0
38.0
456
494
3,800
3, 000
- - - ------~--~-~--------_)7. OOQ_____ J]~QQ_._
ARCHIE LANGLEY
C. L. CRENSHAH
Agricultural Statistician In Charge
Agricultural Statistician
~ _ _ _ _ _ _ _ _ _ _ _(;E,l~a~e_t~_ :e_a~e fE?_r _U0~e ~t~t~s_ifr~a~inl _ - _ _ _ _ _ _ _ _ _ _
ISSUED BY: The Georgia Crop Repor ting Service, USDA , 409A North Lumpkin Street, Athens, Ga . ,
in cooperation with the Georgia Department of Agriculture.
.
UNITED STATES CROP SUMMARY AS OF SEPTEMBER 1, 1967
Corn prospects increased 1 percent during August. A record 4.7 billion bushels is expected as ---- of September 1, 14 percent more t han last year's record crop and 25 percent above the
1961-65 average.
Soybean production prospects are a record high 1.0 billion bushels, 8 percent more than the record high crop last year and 40 percent above average.
All Wheat production is estimated at a record 1.5 billion bushels, 2 percent more than last month, 18 percent more than last ye ar and 27 percent above average.
Oat production, estimated at 806 million bushels, is 1 percent more than 1966 but 15 perc ent be--- low average.
Sorghwn Grain prospects, a record high 791 million bushels, are 4 percent less than the August 1 forecast, but up 10 percent from 1966 and 44 percent above average.
Hay production is estimated at 123 million tons, 1 percent more than last year and 2 percent above average.
Fall Potato production is forecast at 224 million hundredweight, 2 percent less than last year but 12 percent above average.
Crop and Unit
u. S. ACREAGEJ!AR~~@Q.J:RODUCTION,a 1966 AND 1967
Acre~e
~eld Per Acre
Productiou________
:Harvested: For
: 1966 : harvest
. 1967 .. Thousands
1966
. .: Indicated 1967
Indicated
1966
1967_ _
Thousands
Corn, for grain, bu.
56,888 61,319 72.1
76.5
Wheat, all, bu.
49,843 59,950 26.3
25.7
Oats, bu.
17,848 16,215 44.7
49.7
Barley, bu.
10,227 9,310 38.1
39.9
Rye, bu. Cotton, bale
1,283 9,554
1,102 8,545
21.8
480 !I
21.8
460 !I
Hay, all, ton
65,192 64,151 1.85
1.91
Soybeans, bu.
36,644 40,123 25.4
25.0
Peanuts (P &T), lb.
1,421 1,399 1,696
1,821
Sweetpotatoes, cwt.
157
149
87
95
Tobacco, lb. Peaches, lb.
. 973
989 1,942
2,036
Pecans, lb.
~ounds of lint.
Y
:
Includes
some
quantities
not
harvested.
4,103,323 1,310,642
798,089 ~ 389,557
27,921
9,575 120,863
931,491 2,410,736
13,697
y 1,890,320
3,4o7,4ob 161,600
4,693,917 1,543,073
805,649
373,438 24,002 8,185
122,619
1,002,618
2,556,600
14,130 2,013,487
2, 872 ,;300 208,000
After"Five Days Return to United States Department of Agriculture
Postage and Fees Paid
u. s. Department of Agriculture
Statistical Reporting Service
409A North Lumpkin Street
Athens, Georgia 30601
QEfmlli BUSINESS
~ )\)
Acgui sitions Division Unlversity of Georgia University Libraries Athons Goorgia 30601
REP OR
ATHENS, GEORGIA
'
I
September
l \ ----- I
GEORGIA CHICK HATCHERY REPORT
I;;'
P' lacement of broil e r chicks in G e o rgia d uring t he w e ek ende d S epteI~Q~:ner 9 was
i 8, 217, 000-- t_,peq::ent l e s,s .t.han _th e pr:evi o u s week and 6 p ercent les 's1 than t~ ~ comparable
week last ye '7 r ., a~ :. o f...,din g~ ~o the G e org i a :C r op Re p~ r ting Se rv~c e . ~;
, ~
An esti~ate' l. o', 8'80 , cro o broiler typ e eg g s were s e t by Georgia hat ~h ~ries--
7 percenf -.more than th e p reviou s w ee k but 12 per cent l ess than the comparabf.e w e ek a
year ea:J;"li er.
~
"'
.
I ,,
The m~jo:dfy oJ the p ri~es paid to Georgia pro d uc e rs ' for broi l er h~t1 ti.tng eggs
were r epo rte d withfn a r ange of 50 to 65 cents p e r do z en. The average priqe, of
hatching' eggs was 56 c e nts p er doz e n. The price of egg s f r om flocks with ~a~ he ry owned cockerels generally w as 2 ce nts b e low the ave r a g e pric e , MO.~t pric ~ s-r e c e i ve d
for broiler chicks by G e or gia ha t che ries were r e p ort ed w i t hin .9- range of $6 40,<5 to
$9. 00 with an aver-a:g ~, of $7 ;7 5 p er hun d r ed . The av e rag e pric~s la S.'t yea )ve :r e 67
cents for egg ~"" and $l it 50 - fO.r ~ chi cks . -=-
~
1 '
~.,LACEMENTS \ I
I
GEORGIA E G;GS -S ET , HAT CHINGS, A ND CHICK
rv o. .l,
1
E GG T YPE
I
Week Ended
E ggs S et
---= - - .=-
1966. ' ....... 1967
o/o of
ye ar ;ago
P et.
Chi cks Hatched
I
I
~
--- - ~-- --1
I
1966 ,
I
v..:...l96 7 c; If
Thou t
I Thou. '
o/o of
year ago
Pet.
Aug. 12 Aug. 19 I Aug. 26 Sept. 2 Sept. 9
901
619
918!'-'~'; w. (' 1.,: 03& I 0
-~45
685 .')
-o w --- 1 ooo~
()..
'
J
-' ~
I 6 58
955
614
69 70 66 ~ ~ '66
64
631 -. i 4.-
619 . 703 . I ~o,J 676 673
~ 73 ~ 91
-1 .-:.5, 05 c. .
I 513
75 79 72 76
505
75
~ l ~
l .t7'"""
I
I
Week - I
Ended I '
-
. v
~
'
J Eggs Set 1/ .J
- . ""() L-
._, ..;
-
1,) (
V.J I
~
,
- . BR OILER TYPE
.
""''
I
. . J
-
~ C hicks Placed f~:t B r oile rs in Geor gia
:.--
I ...
I~
H a tAe'vit !
Price Broiler
E ggs
Chicks
..1966 .... 19 6.7
"
' , .~.) '"'
o/o o f
_ye a r ago
. 19 66
I 1 9 6 7 -
o/o of
year
.
) ..J I ago
I
Per Doz. 1967
Per Hundred 1967
Tho ll .
thou.
Pet.
Thou.
Thou. l Pet. Cents j Dollars
I
July 8 l July 15
13,670 12,28 1 90 13, 614 12,03 1 88
9,666
8,980 t 93
57
I
9, 559
9, 113
95
58
8.00 8.25
July 22
13, 23 5 12,061 91
9, 628
9, 110
95
58
8.25
July 29
13, 124 12,031 9 2
9,449
8, 840
94
58
8.25
Aug. 5
12,690 11 , 854 93
9, 524
8, 822
93
58
8 .25
Aug. 12
12, 780 11 , 517 9 0
8,938
9,020 101
57
8.00
Aug. 19
12, 780 11, 277 88
9,079
8,825
97
57
8.00
Aug. 26
12, 111 10, 754 89
8,84 5
8,614
97
56
7.75
Sept. 2
12,454 10, 17 1 82
8, 880
8, 273
93
56
7.75
Sept. 9
12, 342 10, 880 88
8, 76 2
8, 217
94
56
7.75
1/
-
I
n
cl
u
de
s eg
.<-I 2
gs
.,c
_s
,'i
eLt.Jby
.I
h
atc
lJd
h
(
e
r
i
e
s
ARCHIE '~'I.1A NGi1EY'(l .. l
producing
chi c ks
for
hatch e ry ~~ppl.:y.;ifi$.o q:\<:is./r
o 1 JP1 (.Gq~C! Jr.:th;.l2 bs
W . ~ . 1 .W :f\<;;i~_W.R r- :> rj 2i ,:J2
- Agricultural Statistician In Cha rge
Ag ricultul;'a~h~-6atis c;~cw A\20!-
-------------------------- ------ ----- -- ---- ----- ----------!4 --l-J< ~ --.l -----------
U. S. Department of Agri c ult ure
G e o rgi a D ejpf!.,!>tr:q en!L, R,b )f\g lltjx:: ultur e
S tati stical .Re porting Se rvi c e
- ... - - - - - -
409A North Lumpkin Street , Athens, G e orgia
EGGS SET AND CHICKS PLACED IN COMMERCIAL AREAS BY WEEKS - 1967
STATE
Aug.
26
EGGS SET
Week Ended
Sept .
2
Sept.
9
% of
year
ago 1/
CHICKS PLACED
Week Ended
Aug.
26
Sept.
2
Sept.
9
THOUSANDS
THOUSANDS
Page 2
I %of
I year ago 1/
Maine
1,839
1, 356
1, 505 93
1,381
1, 363
1, 313
96
Connecticut
242
244
171 58
160''
139
160
110
Pennsylvania
1, 468
1, 293
1, 405 99 .
940
851
779
98
Indiana
560
439
561 80
362
318
. 343
88
Missouri
399
' 399
393 69
429
318
377
102
Delaware
2,022
2, 188
2,380 93
2,587
2, 415
2,352
96
Maryland
3, 359
3, 102
3,916 87
2,879
2,940
3,076
95
Virginia West Virginia
1, 509 135
1,307 118
1, 600 107 132 93
1, 150
1, 084
1, 040
126
321
365
369
113
.
North Carolina
5,952
4,257
6,205 87
4,957
4,934
4,942
94
::::>
South Carolina
587
591
561 149
446
423
414
126
GEORGIA
10,754 10,171 10,880 88
8,614
8,273
8, 217
94
Florida Tennessee Alabama Mississippi Arkansas Louisiana Texas Washington Oregon California
TOTAL 1967 {22 States)
776 687 7,774 4,625 9,209 1, 055 3, 558
519 361 1, 388
786 716 6,861 4, 514 8, 734 1, 117 2,728
562 291 1, 168
804 205 715 64 7,600 94 4, 167 101
8,358 92 1,070 121 3,637 91
509 83 266 72 1, 553 87
656
631
668
169
783
803
778
76
6,229
6,278
6,289
104
4, 116
lt,075
3, 854
105
7,012
7,090
6,648
99
800
759
771
116
3, 181
2,785
2,705
95
419
367
395
102
274
275
261
107
1, 318
1, 351
1,237
91
58,778 52,942 58,388 92 49,014 47,837 46,988
99
TOTAL 1966* (22 States)
62,662 60, 713 63,595
f47, 162 47,768 47,609
o/o of Last Year
94
87
92
*1/ Current week as percent of same week last year. Revised.
104
100
99
u: .
s p ""
GEORGIA CROP REPORTING SE VICE
ATHENS, GEORGIA
August 1967 Released 9/14/67
AUGUST MILK PRODUCTION UP 4 MILLION PCUNDS
l~lk production on Georgia farms during August totaled 86 million pounds, according to the Georgia Crop Reporting Service. This compares with 82 million pounds produced in August last
year and 85 million during July 1967. The 1961-65 August average production was 83 million
pounds.
Production per cow in herd averaged 600 pounds -- 50 pounds above the previous year, and 5 pounds above the July output. The 5-year average production per cow for the month was 465 pounds.
The estimated average price received by producers for all wholesale milk during August was
$6.25 per hundredweight. This would be $.30 above the previous year, and $.05 above the July
average.
Prices paid by dairymen for feed were about 5 cents per hundredweight below July, but. averaged about 5 cents above the previous year.
MILK rn.@1!Q1L~_RICE~~ AND PAID BY DAIRYMEN
GEORGIA
UNITED STATES
Item and Unit
August
July
- August August
July
August
_1.966
1967
. 1967
1966
1967
1967
0
Milk Production, million lbs.
82
85
86 9,763 10,311
9,757
Production Per Cow, lbs. 1/
550
595
600
696
761
722
Nwnber 1'1ilk Cows,
thousand head
149
143
143
PRICES RECEIVED -DOLLARS All wholesale milk, cwt.
y2/
Fluid milk, cwt.
Hanufactured milk, cwt.
.
5.95 5.95
4~10
6.20 6.20
k/6.25
-- ..0
5.00
5.34 4.24
4.80 5.22 3.94
k/4.98
Milk Cows, he ad
190.00 210~~oo 200.00 249.00 262.00
263.00
All baled hay, ton
25.50 26.20 27.40 23.30 22.40
21.90
y PRICES PAID - DOLLARS
.
Mixed Dairy Feed:
14 Percent Protein, cwt. 21
16 Percent Protein, cwt.
4.05 3.95
3.95
3.56
3.62
3.57
4.10 4.15
4.10
3.87
3.89
3.88
18 Percent Protein, cwt.
4.30 4.40
4.45
4.02
4.00
3.98
20 Percent Protein, cwt. All Under
4.45 4.45
. 4.50
4.25
4.28
4.23
29 Percent Protein, cwt.
4.10 4.20
4.15
3.82
3.84
3.81
1i7MMoonthl-y av-erage.
--
2/ Dollars per unit as of the 15th of the month except wholesale milk which is average for month .
~ Revised.
~ Preliminary
U. s. price is for under 16 percent.
'
ARCHIE LANGLEY Agricultural Statistician In Charge
1-J. PAT PARKS Agricultural Statistician
Yssuin-BY:- The 'Georgia crop- Reporting-service-; usBA-; 4o9A-North-Lumpkin-street, -Athens, -Ga.:- -
in cooperation with the Georgia Department of Agriculture.
UNITED STATES MILK PRODUCTION !~ust milk output~t the same as a year earlier
August milk production in the United States is estimated as 9,757 million pounds, about the
same as a year earlier but 4 percent below the five-year average for the month. Production was
down 5 percent from July compared with the average seasonal decrease of 6 percent. August out-
put provided 1.58 pounds of milk per person daily, compared with 1.60 pounds a year earlier. For the first eight months of the year, production was about the same as in the year earlier period.
~gust rate per cow up 4 percent from a ye~r earlier
Milk production per cow during August averaged 722 pounds, up 4 percent from a year earlier and 15 percent above average for the month. Production per cow was at a record level for the month in 44 States. In August, daily output per cow averaged 23.3 pounds, 1.2 pounds less than July but 0.9 pound below a year earlier.
Milk Per Cmv- and Milk Production by Honths, United States, 1967, with comparisons
Month
January February March April Hay June July August
Jan. -Aug. total
September October November December
Annual
-- --------~
621
678
591
635
676
736
690
752
757
812
729
798
671
736
592
663
602
670
581
649
618
687
7, 759
8,513
-----
.
715
10,222 9,805 9, 855: +0.5
670
9,696 9,137 9,217: +0.9
766
11,062 10,537 10,510: -o.3
785
11,260 10,725 10,732: +0.1
844
12,310 11,525 11,508: -o.1
821
11,816 11,269 11,146: -1.1
761
10,849 10,350 10,311: -o.4
:
9,522
9,643 9,288
92841
9,263
9,333 9,012 9.511
125,660 120,230
--
After Five Days Return to United States Department of Agriculture
Statistical Reporting Service 409A North Lumpkin Street Athens, Georgia 30601
OFFICI~L ~~
Postage and Fees Paid
U. s. Department of Agriculture
Athens, G
Week Ending September 18, 1967 v/EATHER FAVORABLE FOR HARVEST
LIBRARIES
leased 3 p.m. Monday
Athens, Ga., September 18 -- Harvest operations and other fieJd work made good progress
last week, according to the Georg ia Crop Reporting Service. Georgia farmers, particularly in
southern sections, had been keep i ng a worried watch on the tropical storms in the Gulf and
Caribbean area s a nd welcomed the week of open weather.
Cot t on harvest ga i ned momen t um in central and southern counties, according to County Agents reports. Statewide, about 17 percent of the crop was gathered, and defoliation in preparation for harvest became more wi despread. A yield of about 362 pounds of I int, or 215,000 bales, is now expected.
Antic ipated QLn yield for the State is 55 bushels per acre, but the bulk of this is still in the field. About 12 percent of the crop was harvested by week end.
Soybeans continued in good to exc~llent condition with an expected yield of about 24 bushels per acre. Control measures were active for insect pests of this crop.
Peanut harvest made good headway during the fair weather. About 88 percent of the crop
was dug by week ~nd and~ about 77 percent was threshed. A record average yield of 2,000 pounds per acre i s forecast.
Land preparation for fa! I seed ings received much attention during the week. County Agents reported about 13 percent of the small qrains has been planted. Haying and silaqe gathering were also active during the week.
Reports f rom over the State ind icated that the pecan crop is var ied both between sections and from grove to grove within sections. The September I forecast for the nut crop was placed at 47 miII ion pounds ,
Conditions of both cattle and pastures continue to be mostly good. Considerable work was performed during the week to insure continued good grazing.
\-l EATHER SUMMARY- Moderate to heavy rains occurred in north Georgia and other widely scattered sections early in the period but I ittle or none was reported over large areas of the State during the week ending Friday, September 15. Dahlonega had about 5 inches during the previous week end and over 2 inches fell at several other places i n the extreme north. Practically no rain has fallen anywhere in the State since Monday, September II, as skies have been mostly sunny during the past several days.
Days were mild and n.ights unusually cool throughout the week with a slight warming trend
at the week end. Early morning lows dropped to 470 at Augusta and Macon on Friday, setting new records for the date .. Averages for the week ranged from 50 to JQO below normal and were comparable to what Georg i ~ normally experiences a month later in the fall season. Only a very few places recorded a temperature as high as 900 during the week.
The five-day forecast for the per iod Tuesday through Saturday (September 19- 23) calls for temperatures to average near normal wi th only minor day-to-day changes. Rainfall is expected to be I i ght wi th poss i bly a few showers near the last of the period.
ISSUED BY: The Georg ia Cro~ Repo rt i ng Serv i ce, USDA, Athens, Georg ia; in cooperation wi th t~e Cooperative Extens ion Serv i ce, University of Georgia; Georgia Department of Agriculture; and the Weathe r Bureau, ESSA, U. S. Department of Commerce.
U. S. DEPART.MENT OF COMMERCE WEATHER BUREAU Athens, Georgia ESSA
Precipitation For The Week Ending September 1.5, 1967
GEORGIA
Temperature extremes for the week ending Sept. 15, 1967 ' (Provisional)
Highest: 93 at Quitman on the lOth.
410 at Blairsville on the 15th.
* For the period Sept. 16-18, 1967
T, less than .005 inch
After Five Days Return to United States Department of Agriculture
Statistical Reporting Servic~ 409A North Lumpkin Street Athens, Georgia 30601 OFFICIAL BUSINESS
IMMEDIATE - U. S. WEATHER REPORT This report wilf be treated in all
Respects as Letter Mail (See Sec. 34 . 17, P.L. & R.)
Postage- and Fees Paid U.s. Department of Agriculture
:If
Ending September 18, 1967
Released 3 p.m. Monday
v/EATHER FAVORABLE FOR HARVEST
-J
Athens, Ga., September 18 -- Harvest operations and other field work made good progress
last week, according to the Georg ia Crop Reporting Service. Georgia farmers, particularly in
southern sections, had been keep i ng a worried watch on the tropical storms in the Gulf and
Caribbean area s and welcomed the week of open weather.
Cotton harvest gained momentum in central and southern counties, according to County
Agents reports. Statew ide, about 17 percent of the crop was gathered, and defoliation in
preparation for harvest became more widespread. A yield of about 362 pounds of 1 int, or 215,000
bales, is now expected.
.,
. '
Ant i cipated~ yield for the State is 55 bushels per acre, but the bulk of this is still in the f ield. About 12 percent of the crop was harvested by week end.
Soybeans continued in good to excellent condition with an expected yield of about 24 bushels per acre. Control measures were active for insect pests of this crop.
Peanut harvest made good headway dur ing the fair weather. About 88 percent of the crop was dug by week end and about 77 percent was threshed. A record average yield of 2,000 pounds per acre is forecast.
Land preparation for fal I seedings received much attention during the week. County Agents reported about 13 percent of the small qrains has been planted. Haying and silaqe gathering were also active during -the week.
Reports f rom over the State . ind icated that the pecan crop is varied both between sections and from grove to grove within sections. The September 1 forecast for the nut crop was placed at 47 mill ion pounds
,r ,.. Cond i tiqns of. both cattle and pastures continue to be mostly good. Considerable work was performed during the week to insure continued good grazing.
'I
\lEATHER SUMMARY- Moderate to heavy rains occurred in north Georgia and other widely scattered sections early in the period but I ittle or none was reported over large areas of the State dur ing the week ending Friday, September 15. Dahlonega had about 5 inches during the previous week end and over 2 inches fell at several other places in the extreme north. Practically no ra in has fallen anywhere in the State since Monday, September II, as skies have been mostly sunny during the past several days.
Days were mild and nights unus~ally cool throughout the week with a slight warming trend at the week end. Early morning lows dropped to 470 at Augusta and Macon on Friday, setting new records for the date. Averages for the week ranged from 50 to 100 below normal and were comparable to what Georgia normally experiences a month later in the fall season. Only a very few . places recorded a temperature as high as 900 during the week.
The f i ve-day forecast for the per iod Tuesday through Saturday (September 19- 23) calls for temperatures to average near no rmal wi th only minor day-to-day changes. Rainfall is expected ' to be 1ight with possibly a few showers near the las t of the period.
ISSUED BY: The Georgia Crop Report i ng Service, USDA, Athens, Georg ia ; in cooperation wi th t~e Cooperative Extens ion Service, University of Georgia; Geqrgia Department of Agriculture ; and the Weather Bureau, ESSA, U. S. D'epartment of Commerce.
I
.''
U. S. DEPARTMENT OF COMMERCE
WEATHER BUREAU
Athens, Georgia ESSA
Precipitation For The Week Ending September 151 1967
GEORGIA
Temperature extremes for the week ending
Sept. 15, 1967 ' (Provisional)
Highest: 93 at Quitman on the lOth. Lowe3t: ~ 1., 0 at Blairsville. on the l~r:'th.
* For the period Sept. 16-18, 1967
T, less than .005 inch
After Five Days Retur n to
United States Department of Agri culture
Statistical Reporting Servic~
409A North Lumpkin St reet
Athens, Georgia 3060 1
OFF ICIAL BUS INESS
:/(0
IMMEDIATE - U. S. WEATHER REPORT This report wilf be treated i n all
Respects as Letter Mail (See Sec. 34. 17, P.L. & R. )
The Univ Libr ary Univ Of:.'"' Ga Athens Ga 30601
Postage- and Fees Paid U. S. Department of Agriculture
!J[
H Cfo oJ
Lf- A-
GEORGIA CROP REPORTING SERVICE
11:J~ w~~[3[1't? rn~~~~~rnw
ATHENS, GEORGIA
r 20, 1967
GEORGIA CHICK HATCHERY REPORT
Placement of broiler chicks in G eorgia during the week e
ptember 16 was
7, 887,000--4 percent less than the pre vious wee k and 6 percent less-than the comparable
week last year, according to the Georgia Crop Reporting Service.
An estimated 10, 886, 000 broiler type e ggs were set by Georgia hatcheries-slightly more than the previous wee k but 12 percent less than the comparable week a year earlier.
T e ajority o ft e r i "" s i o Ge orgia producers for broiler at L eg gs were reported within a range of 50 to 65 cents per dozen. The average price of hatc hing eg s was 56 cents p er dozen. The price of e ggs from flocks with hatchery owned cockerels gene rally was 2 cents below the average price. Most prices received for broiler chicks by Georgia hatche rie s were reported within a range of $6 . 00 to $9.00 with an average of $7.75 per hundred. The average prices last year were 67 cents for eggs and $10.50 for chicks.
Week Ended
GEORGIA EGGS SET, HATCHINGS, AND CHICK PLACEMENTS
EGG TYPE
Eggs Set
Chicks Hatched
Ufo of
1966
1967
year
1966
1967
ag_o
"' Thou.
Thou.
Pet.
Thou.
Thou.
Ufo of year ago
Pet.
Aug. 19 Aug. 26 Sept. 2 Sept. 9 Sept. 16
Week Ended
918 1,036 1,000
955 l, 015
Eggs Set !}
1966 Thou.
1967 Thou.
64 5
70
619
685
66
703
658
66
676
614
64
673
512
50
763
BROILER TYPE
% of
year ago
Pet.
Chicks Placed for
Broilers in Georgia
%of
1966
1967
year
ago
Thou.
Thou. Pet.
491
79
505
72
513
76
505
75
539
71
Av. Price
Hatch
Broiler
Eggs
Chicks
Per
Per
Doz.
Hundred
1967
1967
Cents
Dollars
July 15
13,614 12,031
88
9, 559
9, 113
95
58
July 22
13,235 12,061
91
9,628
9, 110 95
58
July 29
13, 124 12,031
92
9,449
8,840
94
58
Aug. 5
12,690 11, 854
93
9, 524
8,822 93
58
Aug. 12
12, 780 11,517
90
8,938
9,020 101
57
Aug. 19
12,780 11,277
88
9;079
8,825 97
57
Aug. 26
12, lll 10, 7 54
89
8,845
8,614 97
56
Sept. 2
12,454 10,171
82
8, 880
8, 273
93
56
Sept. 9
12,342 10, 880
88
8,762
8, 217
94
56
Sept. 16
12,437 10,886
88
8,412
7,887
94
56
1/ Includes e gg s set b y hatcheries p roducing chicks for hatcher y supp1y flocks
8.25 8.25 8.25 8.25 8.00 8.00 7.75 7.75 7.75 7.75
ARCHIE LANGLEY Agricultural Statistician In Charge
W. A. WAGNER Agricultural Statistician
U. S. Department of Agriculture
Georgia Department of Agriculture
Statistical Reporting Service
409A North Lumpkin Street, Athens, Georgia
EGGS SET AND CHICKS PLACED IN COMMERCIAL AREAS BY WEEKS - 1967
STATE
EGGS SET
Week Ended
Sept.
Sept.
Sept.
2
9
16
Vfo of year ago 1/
CHICKS PLACED
Week Ended
Sept.
.Sept.
Sept.
2
9
16
THOUSANDS
THOUSANDS
Page 2
'1o of year ago 1/
Maine Connecticut Pennsylvania Indiana Missouri Delaware Maryland Virginia West Virginia North Carolina South Carolina
GEORGIA
Florida Tennessee Alabama Mississippi Arkansas Louisiana Texas Washington Oregon California TOTAL 1967 {22 States)
l, 356 244
1,293 439 399
2, 188 3, 102 1, 307
118 4,257
591
l, 505 171
1, 405 561
393 2,380
3,916 1,600
132 6,205
561
l, 838 102
428 127 1,265 89
534 76 406 62 2,366 92 3,900 88 1, 565 110 118 80 6,385 89 500 130
1, 363
1, 313
1, 341
102
139
160
149
73
851
779
884
90
318
343
330
86
318
377
367
105
2,415
2, 352
1, 950
91
2,940
3,076
2, 241
77
1, 0<34
1, 040
1,020
116
365
369
372
117
4,934 4,942 4,604
89
423
414
467
173
10, 171 10,880 10,886 88
8, 273
8, 217
7, 887
94
776*
804
812 182
631
668
620
157
724*
715
701 65
803
778
849
79
6, 861
7,600
7,897 98
6,278
6,289
6, 134
101
4,514
4, 167
4,417 99
4,075
3,854
3,885
104
8,734
8,358
8, 973 93
7,090
6, 648
6,924
102
1, 117
1,070
1,074 114
759
771
769
119
2,728
3,637
3,727 93
2,785 2,705 2,778
97
562
509
605 102
367
395
371
78
291
266
327 120
275
261
274
91
1, 16 8
1, 553
l, 654 97
1, 3 51
1,237
l, 031
103
52,940* 58,388 60,378 93 47,837 46,988 45,247
97
TOTAL 1966* (22 States)
60, 713 63, 595 64,640
47,768 47,609 46,712
% of Last Year
87
92
93
*1/ Current week as p ercent of same week 1ast year. Revised.
100
99
97
~
~D 1oo7
7 l.f_ 4-3
~y6
GE0 RG I A CR0 P REP0 RT I NG SERV I CE
~21 !illa9~illL1'L? LPWL1~ill'L? &1W~!ill~illTI
ATHENS, GEORGIA Item
August 1967
During August
1966 -1I
1967 -21
o/o of
last year
September 21, 1967
Jan. thru August
1966 -1I
1967 -21
% of
last
year
Broiler T~pe
-
Pullets Placed (U.S. )3 I
Total
Domestic
Chickens Tested:
Broiler Type
Georgia
United States
Egg Type
Georgia
United States
Chicks Hatched:
Broiler Type
Georgia
United States
Egg Type
Georgia
United States
Commercial Slaughter:41
Young Chickens
Georgia
United States
Mature Chickens
Light Type
Georgia
United States
Heavy Type
Georgia
United States
Egg Production:
Georgia
South Atlantic United States
-51
Thou.
3, 552 3,060
617 2,292
35 501
44,412 224,275
2,856 34,389
38, 515 213,084
499 9, 228
253 1, 9 51
382 1, 018 5,403
Thou.
Pet. Thou.
Thou.
Pet.
2,971 84 2,672 87
31, 116 27,251
27,964 90 24,888 91
729 118 2,403 105
35 100 420 84
3,980 16,912
212 3,952
4,452 112 19, 121 113
212 100 4,434 112
41,665 94 231,418 103
2, 183 76 35,307 103
358,462 1,883,969
26,457 425, 157
345, 805 96 1,917,479 102
26,056 98 417,046 98
38,802 101 220,946 104
264,449
276, 176 104
1, 484, 846 1, 567, 922 106
628 126 9,944 108
349 138 2,395 123
410 107 1, 101 108 5,798 107
4, 544 77, 105
1, 977 14, 117
2,956 8,025 44, 167
5,886 130 93,047 121
2,690 136 17, 181 122
3,283 111 8, 795 110 47,081 107
ll Revised. 21 Preliminary. 31 Pullets for broiler hatchery supply flocks, includes
expected pullet replacements from eggs sold during the preceding month at the rate of
125 pullet chicks per 30-doz. case of eggs. 41 Federal-State Market News Service-
Slaughter reports only include poultry slaughtered under Federal Inspection. 51 South
Atlantic States: Del., Md., W. Va., N. C., S. C., Ga., Fla., Va.
-
YOUNG CHICKENS: SLAUGHTERED UNDER FEDERAL INSPECTION BY SELECTED STATES, 1966 and 1967
Number Inspected
Indicated Percent Condemned
State
During July
1966
1967
Thou.
Thou.
Jan. thru July
1966
1967
Thou.
Thou.
During July
1966 1967
Pet.
Pet.
Jan. thru July
1966
1967
Pet.
Pet.
Maine
6,306
5, 878
41,248 42,448 2.8
3.0
3.4
3.6
Pa.
7,531
6,615
49, 708 47,635 3.5
4.5
4. 1
5. 1
Mo.
3,024
3, 244
20,314 23,022 4.0
2.9
5.6
4.4
Del.
7,760
7,758
53,668 52,255 3.8
4.6
4.5
5.4
Md.
12,286 11, 613
78, 201 83,688 3.6
4.3
4.4
5.2
Va.
3,789
4, 519
25,486 28, 591 2.7
2.9
3.2
3.9
N. C.
21,382 20,839 143,722 146,610 3.5
3.2
4.0
4.2
Ga.
32,812 32,098 216,324 230,493 3.0
4.6
3.6
5. 2
Tenn.
5,477
5,054
3 5, 873 35,923 3.2
4. 1
3. 1
4.9
Ala.
21,769 22,468 143, 311 152, 527 2.6
2.7
3.2
3.6
Miss.
13, 653 13, 239
90,042 93,853 2. 5
2.2
3. 1
3.3
Ark.
26,786 28,773 179,389 200, 206 3. 1
2.9
3.7
4.3
I_e:-~~---
u. s.
--1-1-,-1-1-6----1-2-,-5-9-7------7-2-,4-8-7-----8-5-,-3-8-8--
191, 233
1, 268, 181
-3--.0-------2-.8--------3-.-5------3-.-3----
3. 1
3.4
3.7
4.3
193,664
1,353,556
U. S. Department of Agriculture
Georgia Department of Agriculture
Statistical Reporting Service, 409A North Lumpkin Street, Athens, Georgia 30601
End-of-Month Stocks of Poultry, Poultry Products, Meat and Meat Products United States - August 1967
An increase of 116 million pounds during August raised frozen poultry holdings to 484 million pounds. A year e arlie r, frozen poultry holdings totaled 283 million pounds and average is 268 million. The most significant August rise in poultry was in stocks of frozen turkeys. The increase was 104 million pounds compared with the average August increas e of 5l 'million. The 325 million pounds in storage on September 1 were more than double the ave rage stocks of 160 million pounds. Holdings of other classes of poultr y also increased during August. Stocks of frozen eggs increased 6 million pounds to 99 million pounds on Septe mber l. Usually holdings decrease about 2 million pounds during August. Shell egg holdings totaled 327 thousand cases compared with year e arlie r holdings of 57 thousand cases and the average stocks of 256 thousand. Total m e at in storage on Septe mber 1 of 526 million pounds was 74 million less than a month earlier but 93 million more than a year earlier. Average September 1 meat stocks are 466 million. Total beef in storage was 250 million pounds compared with 216 million on Se pt e mber 1, 19~ Total pork stocks were 193 million pounds compared with 140 million a year earlier. Holdings of canned meats, lamb and mutton and veal also declined during August.
Commodity
Eggs: Shell Frozen eggs, total
Unit
Case Pound
Aug. 1961-65 av
Thou.
Aug. 1966
Thou.
July 1967
Thou.
Aug. 1967
Thou.
256
57
391
327
!Q~t ~~! ______ _5J.! J2_8___ -~~.-~3-~ ____ JJ.! 2_1_5___
Poultry, frozen: Broilers or fryers Hens, fowls Turkeys Other & Unclassified
Total Poultry
'
do.
23,009
21,280 35,568
38,061
do.
34,756
30, 530 52,372
54,024
do.
160,021
171,386 221,254 325, 183
do.
49,923
59,744 58,946
67, .009
do.
~! ~ !Q? _____ ]._8_2.! Jjp__-~~~-~~~ ___ j_8j.! _2_7]___
Beef: Frozen in Cure and Cured
Pork: Frozen and Cooler
Other meat and meat products
Total all red meats
I
do.
194,660
do.
180,489
do.
91' 188
do.
466,337
215,821 265, 122
139,957 238,655
77,622 96,867 433,400 600,644
250,428
192,602
83, 184 526,214
MID-MONTH PRICES RECEIVED AND PRICES PAID
Item
Georgia
United States
Aug. 15 July 15 Aug. 15 Aug. 15 July 15 Aug. 15
1966
1967
1967
1966
1967
1967
Prices Received: Chickens, lb. excluding broilers Com 11 Broilers (lb.) All Chickens (lb. ) All eggs (dozens)
Prices Paid:(per 100 lb.) Broiler Grower Laying Feed Scratch Grains
Cents Cents Cents
Cents Cents Cents
10.5
8. 5
8.0
9.5
7.9
7.7
15.0
14.0
12.0
15.7
14.7
12.9
14.8
13.8
11. 9
15.2
14. 1
12.5
46.6 Dol.
37.6 Dol.
35.3 Dol.
39.7 Dol.
29.9 Dol.
29.8 Dol.
-
5. 40 . 5.20
5.20
5. 14
5.03
4.98
r,
5. 10 4. 45
5. 10 4.45
5.00 4.40
4.69 4.08
4.65 4.08
4. 59 4.08
.
This report is made possible through the cooperation of the National Poultry Improvement
Plan, Official State Agencies, the Animal Husbandry Research Division of the Agricultural
Research Service, the Inspection Branch of the Poultry Division, Consumer and Marketing
Service and the Agricultural Estimates Division of the Statistical Reporting Se rvice and
the many breeders, hatcheri es , poultry processors and the poultry farmers that report
to these agencies.
ARCHIE LANGLEY
W. A. WAGNER
Agricultural Statistician In Charge
Agricultural Statistician
After Five Days Return to: Un1ted State s Department of Agrtculture
Statistical Reporting Service 409 A North Lumpkin Street
Athens, Gro rgia OFFICIAL BUSINESS .
Postage and Fees Paid U. S. Department of Agnculture
.
GEORGIA CROP RE Athens,
Week Ending September 25, 1967
Released 3 p.m. Monday
FINE HARVEST WEATHER - GRGWING CROPS NEED RAIN
Athens, Ga., Sept. 25 -- Another week of open weather has been ideal for peanut, corn,
cotton, and hay harvest, but a lack of moisture is hurting soybean and pasture growth, accord-
ing to the Georgia Crop Reporting Service. Except for a few counties, mostly in the northern
part of the State, soil moisture was reported nshort to very short. 11
County Agents reported a slight decline in cotton condition from the previous week, main. ly due to the effects of dry weather on late plantings. Picking continued to increase and is
progressing northward. Statewide, nearly one-fourth of the crop has been picked.
Corn harvest was about one-fifth complete at the end of the period. Excellent yields were repor~from acreages already gathered.
Peanut digging is in the final stages. Ninety-seven percent of the crop has been dug and
92 percent has been threshed.
The condition of sovbea~ declined during the week as soil moisture has become very short aver much of the State. Shedding of pods was noted in several of the drier locations. Rains ~e needed badly for the development of this crop, especially the late-planted acreage.
Hav meking, silage cutting and grain sorghgm harvest moved forward during the week.
Pecans remained in mostly fair condition - about the same as the previous week. SweetEotato condition declined slightly because of dry weather on late plantings. Harvest continued active.
Land preparation for small grains and ~~ Eastures showed good progress, but seeding
was delayed in some areas by dry soils.
,. ~
. .,... . . !
v~THER SUM1ARY -- Practically no rainfall occurred in Georgia during the week ending Friday, September 22. The week end was also free of rain and for most areas of the State this was the second completely rainless week. A few places in middle Georgia have had no measurable rain in four weeks and were very dry by the end of the period. The last rain reported by the observer at Milledgeville was on August 24.
Temperatures were near normal during most of the week but cooler weather moved back into the State late in the period. Early morning temperatures dropped to the forties as far south as Savannah during the week end. Several places reported new record low temperatures for one or more dates. Averages for the week ranged from one to four degrees below normal. This was the 13th consecutive week that Georgia temperatures have averaged cooler than normal. Not since June have temperatures been as warm as normal for a full week.
The five-day forecast for the period Tuesday through Saturday (September 26 - 30) calls for temperatures to average near to slightly below normal with no significant day to day changes.
Rainfall is expected to be light, averaging less than 1/4 inch, and occurring about Saturday.
-ssuED-BY:- The Georgia crop-Reporting-service-; Athens,-Georgia; in-cooperation-with the---
Cooperative Extension Service, University of Georgia; Georgia Department of Agriculture; and the Weather Bureau, ESSA, U. s. Department of Commerce.
U. S. DEPARTMENT OF COMMERCE WEATHER BUREAU Athens, Georgia ESSA
Precipitation For The Week Ending September 22, 1967
GEORGIA
Temperature extremes for the week ending September 22, 1967 (Provisional)
Highest:
93 at Hawkinsville on the 20th and 22nd and Quitman on the 18th and 22nd.
0
43 at Blairsville on the 16th.
* For the period Sept c 23-25
T, less than .005 inch
Af t er Five Days Retu rn t o United States Department of Ag r ic u lture
Statistical Reporting Serv i ce
-
Postage and Fees Paid U. S. Department of Agriculture
409A North Lumpkin Stre e t
Athens , Georgia 3060 1
OFFICIAL BUSINESS
.J(O
IMMEDIATE - U. S. WEATHER RE PORT This report will be trea ted in al l
Respects as Letter Mail
The Univ Libr ary Univ Of '"' Ga Athens Ga 30601
(See Sec . 34 . 17, P. L. & R. )
(j
,.. ... .
Week Ending September 25, 1967
Rereased 3 p.m. Monday
FINE HARVEST WEATHER - GROWI NG CROPS NEED RAI N
Athens, Ga., Sept. 25 -- Another week of open weather has been ideal for peanut, corn,
cotton, and hay harvest, but a lack of moisture is hurting soybean and pasture growth, accord-
ing to the Georgia Crop Reporting Service. Except for a few counties, mostly in the northern
of the State , soil moisture was r eported 11short to very short. 11
County Agents reported a slight decline in cotton condition from the previous week, main ly due to the effects of dry weather on late plantings. Picking continued to increase and is progressing northward. Statewide, nearly one-fourth of the crop has been picked.
Corn harvest was about one-fifth complete at the end of the period. Excellent yields were reported from acreages already gathered.
Peanut digging is in the final stages. Ninety-seven percent of the crop has been dug and percent has been threshed.
The condition of soybeans declined during t he week as soil moisture has become very short wer much of the State: - Shedding of pods was noted in several of the drier locations. Rains are needed badly for the development of this crop, especially the late-planted acreage.
~ mking, silage cutting and ~! sorgh~ harvest moved forward during the week.
Pecans remained in mostly fair condition - about the same as the previous week. Sweet1 potato condition declined slightly because of dry weather on late plantings. Harvest continued
active.
Land preparation for ~mall grains and ~~ Eastures showed good progress, but seeding ~s delayed in some areas by dry soils.
WEATHER ~1ARY -- Practically no rainfall occurred in Georgia during the week ending Friday, September 22. The week end was also free of rain and for most areas of the State this .was the second completely rainless week. A few places in middle Georgia have had no measurable rain in four weeks and were very dry by the end of the period. The last rain reported by the observer at Milledgeville was on August 24.
Temperatures were near normal during most of the week but cooler weather moved back into the State late in the period. Early morning temperatures dropped to the forties as far south 'as Savannah during the week end. Several places reported new record low temperatures for one or more dates. Averages for the week ranged from one to four degrees below normal. This was the 13th consecutive week that Georgia temperatures have averaged cooler than normal. Not since June have temperatures been as warm as normal for a full week.
The five-day forecast for the period Tuesday through Saturday (September 26 - 30) calls for temperatures to average near to slightly below normal with no significant day to day changes. Rainfall is expected to be light, averaging less than 1/4 inch, and occurring about Saturday.
ssuED-BY:- The 'Georgia crop-Reporting-servi~e; Athens,-GeorgiaT in-cooperation-witii the---
Cooperative Extension Servic e, University of Georgia; Georgia Department of Agriculture; and the Weather Bureau, ESSA, U. S. Department of Commerce.
U. S. DEPARTMENT OF COMMERCE WEATHER BUREAU Athens, Georgia ESSA
Precipi tation For The Week Ending September 22, 1967
GEORGIA
Temperature extremes for the week ending September 22, 1967 (Provisional)
Highest:
93 at Hawkinsville on the 20th and 22nd and Quitman on the 18th and 22nd.
0
43 at Blairsville on the 16th.
* For the period Septc 23-25
T, less than .005 inch
After Five Days Retu rn to
Postage and- Fees Paid
United States Department of Ag r icu i t re
U. S. Department of Agriculture
Statistical Reporting Service
409A North Lumpkin Stree t
Athens, Georgia 3060 1 OFFICIAL BUSINESS
j (O
IMMEDIATE - U. S. WEATHER REPOR This report will be treated in a l l
The Univ Library Univ Of "' Ga Athens Ga 30601
Respects as Letter Mail
(See Sec . 34.17, P. L. & R. )
(j
' .,, ...
Athens , Georg1a
Week Ending September 25, 1967
3 p.m. Monday
FINE HARVEST WEATHER - GROWI NG CROPS NEED RAI N
Athens, Ga., Sept. 25 -- Another week of open weather has been ideal for peanut, corn,
cotton, and hay harvest, but a lack of moisture is hurting soybean and pasture growth, accord-
ing to the Georgia Crop Reporting Service. Except for a few counties, mostly in the northern
part of the State , soil moisture was r eported 11short to very short."
County Agents reported a slight decline in cotton condition from the previous week, mainly due to the effects of dry weather on late plantings. Picking continued to increase and is progressing northward. Statewide, nearly one-fourth of the crop has been picked.
Corn harvest was about one-fifth complete at the end of the period. Excellent yields were reporrea-from acreages already gathered.
Peanut digging is in the final stages. Ninety-seven percent of the crop has been dug and 92 percent has been threshed.
The condition of soybeans declined during the week as soil moisture has become very short over much of the State:--shedding of pods was noted in several of the drier locations. Rains
needed badly for the development of this crop, especially the late-planted acreage.
Hay making, silage cutting and grain sorghum harvest moved forward during the week.
Pecans remained in mostly fair condition - about the same as the previous week. Sweetpotato condition declined slightly because of dry weather on late plantings. Harvest continued active.
' Land preparation for ~ grains and ~~ ~stur~ showed good progress, but seeding was delayed in some areas by dry soils.
WEATHER S~1ARY -- Practically no rainfall occurred in Georgia during the week ending
Friday, September 22. The week end was also free of rain and for most areas of the State this
Was the second completely rainless week. A few places in middle Georgia have had no measurable
0
rain in four weeks and were very dry by the end of the period. The last rain reported by the
observer at Milledgeville was on August 24.
Temperatures were near normal during most of the week but cooler weather moved back into the State late in the period. Early morning temperatures dropped to the forties as far south
Savannah during the week end. Several places reported new record low temperatures for one or more dates. Averages for the week ranged from one to four degrees below normal. This was the 13th consecutive week that Georgia temperatures have averaged cooler than normal. Not
e June have temperatures been as warm as normal for a full week.
The five-day forecast for the peri od Tuesday through Saturday (September 26 - 30) calls for temperatures to average near to slightly below normal with no significant day to day changes.
Rainfall is expected to be light, averaging less than 1/4 inch, and occurring about Saturday.
-ssuED-BY:- The 'Georgia crop-Reporting-servi~e; Atherls',-GeorgiaT in-cooperation-witii the---
Cooperative Extension Service, University of Georgia; Georgia Department of Agriculture; and the Weather Bureau, ESSA, U. S. Department of Commerce.
U. S. DEPARTMENT OF COMMERCE WEATHER BUREAU Athens, Georgia ESSA
Precipit ation For The Week Ending September 22, 1967
GEORGIA
Temperature extremes for the week ending September 22, 1967 {Provisional)
Highest:
93 at Hawkinsville on the 20th and 22nd and Quitman on the 18th and 22nd.
0
43 at Blairsville on the 16th.
* For the period Sept. 23-25.
T, less than .005 inch
After Five Days Retu rn t o United States Department of Ag r icu t ure
Statistical Reporting Servi ce 409A North Lumpkin Stree t Athens, Georgia 30601 OFFICIAL BUSINESS
IMMEDIATE - U. S. WEATHER REPORT This report will be treated in a l l
Respects as Letter Mail (See Sec. 34.17, P.L. & R.)
Postage and Fees Paid U. S. Department of Agriculture
&if
t+ 0 7
{fL{ A3
1~,
GEORGIA CROP REPORTING SERVICE
:.Lf-t ~w~~lliL!J'L? rn~tr@rn~mw
ATHENS, GEORGIA
September 27, 1967
GEORGIA CHICK HATCHERY REPORT
Placement of broiler chicks in Georgia during the week ended epte m_9er 23 was
7, 314,000--7 percent less than the previous week and 12 percent les than the corrJ." 1
I
parable week last year, according to the Georgia Crop Reporting Sell ice. l.J R
'4Rtfs
An estimated 11,433,000 broiler type eggs were set by Georgia hatclieri s-5 percent more than the previous week but 8 percent less than the comparable .wee
I
year earlier.
The majority of the prices paid to Georgia producers for broiler hatching eggs were reported within a range of 50 to 65 cents per dozen. The average price of hatc hing eggs was 56 cents per dozen. The price of eggs from flocks with hatchery owned cockerels generally was 2 cents below the average price. Most prices received for broiler chicks by Georgia hatcheries were reported within a range of $6.00 to $9.00 with an average of $7. 7 5 per hundred. The average prices last year were 67 cents for eggs and $10.50 for chicks.
GEORGIA EGGS SET, HATCHINGS, AND CHICK PLACEMENTS
EGG TYPE
E gs Set
Chicks Hatched
Week
o/o of
%of
Ended
1966
1967
year
1966
1967
year
~------------~------------------------------------~---a~g_o___-+-------------------------------------+-a~g~o____ _
Thou.
Thou.
Pet.
Thou.
Thou.
Pet.
Aug. 26 Sept. 2 Sept. 9 Sept. 16 Sept. 23
Week Ended
1,036 l, 000
955 1, 015
893
Eggs Set~/
1966 Thou.
1967 Thou.
685
66
703
658
66
676
614
64
673
512
50
763
532
60
740
BROILER TYPE
% of
year ago
Pet.
Chicks Placed for Broilers in Georgia
1966 Thou.
1967 Thou.
%of year ago
Pet.
505
72
513
76
505
75
539
71
485
66
Av. Price
Hatch Broiler
Eggs Chicks
Per
Per
Doz.
Hundred
1967
1967
Cents Dollars
July 22 July 29 Aug. 5 Aug. 12 Aug. 19 Aug. 26 Sept. 2 Sept. 9 Sept. 16 Sept. 23
13, 235 12, 061
91
9,628
9, 110 95
58
13, 124 12,031
92
9,449
8,840
94
58
12,690 ll, 854
93
9, 524
8,822 93
58
12,780 11,517
90
8,938
9,020 101
57
12,780 11,277
88
9,079
8,825 97
57
12, lll 10, 7 54
89
8, 845
8, 614 97
56
12,454 10, 171
82
8, 880
8,273 93
56
12,342 10, 880
88
8,762
8, 217
94
56
12,437 10,886
88
8,412
7,887
94
56
12,493 11,433
92
8,338
7,314
88
56
1/ Includes eggs set by hatcheries producing chicks for hatchery supply flocks.
8.25 8.25 8.25 8.00 8.00 7.75 7.75 7.75 7. 7 5 7.75
ARCHIE LANGLEY Agricultural Statistician In Charge
W. A. WAGNER Agricultural Statistician
U. S. Department of Agriculture
Georgia Department of Agriculture
Statistical Reporting Service
409A North Lumpkin Street, Athens, Georgia
EGGS S E T AND CHICKS PLACE D IN COMME R CIAL AREA~ BY WEE KS - 1967
EGGS SET
il
CHICKS PLACE D
STATE ..
W eek Ende d
S e pt.
S ept.
9
16
-- o/o of -
Sept.
year
Sept.
23
ago 1/ 9
We ek :6nded
Sept.
Sept.
16
23
T HOUSANDS
~
THOCSANDS
Page 2
o/o of
I
i
year
ago 1/
Maine
1, 505
1, 838
1, 888 104
1, 313
1, 341
948
108
Connecticut
171
428
237 71
160
149
141
81
Pennsylvania
1, 405
1, 265
1, 335 96
779
884
802
83
Indiana Missouri
561 393
534 406
507 403
l 77
343
62
377
330 367
225
58
187
55
Delaware
2,380
2,366
2,328 90
2,352
1, 950
2,046
81
Maryland Virginia
3,916
3,900
3,904 89
3,076
2,241
2, 125
70
1,600
1, 565
I 1, 501 106
1,040
1,020
859
116
West Virginia
132
118
113 75
369
372
249
70
North Carolina
6,205 6,385 6, 169 89
4,942 4,604 2,998
81
.
South Carolina
561
500
474 130
414
467
420
126
~
GEORGIA
10, 880 10, 886 11,433 92
8,217 7,887 7,314
88
Florida Tennessee Alabama Mississippi Arkansas Louisiana Texas Washington Oregon California
TOTAL 1967 {22 States)
804 715
812 701
I 806 198
668
709 61
778
620 849
604
175
779
77
7,600
7, 897
8, 034 100
6,289
6, U4
5,365
92
4, 167 8, 358 1, 070
4 , 4 17 8,973 1,074
4, 558
9,026 1, 076
102
96 124
II 3,854 6,648 771
.),885 6,924
769
3, 801 6,044
795
102 87
117
3,637
3,727
3,443
88 I 2,705
2,778
2,048
74
509 266
605 327
590 263
I 96
395
62
261
371 274
362
90
164
107
1, 553
1, 654
1, 569 88
1, 237
1, 031
877
70
58,388 60,378 60,366 94 46,988 45,247 39, 153
87
TOTAL 1966* {22 States)
63, 595 64,640 64,251
o/o of Last Year
92
93
94
*1/ Current week as percent of same week last year. Revised.
47,609
I
I 99
46,712 97
44,928
I
87
State
1;aoo 1,ooo -T,ooo_.._.._._;_ -1,ooo_____
bushels
EEshe l~
bushels
"Eushels
- 1, oocr~- 1,000
bushels
bushels
~--
New York New Jersey
*
2
2
Pennsylvania Ohio Indiana Illinois
.: .
1,743 1,605
. 8,307
6,892 6,560 16,848
1,963*
2,129 7,883
*
1,993 ' 1,927 8,662
10,79*1
10,950 26,468
2,863 3,373 10,273
11ichigan Wisconsin
5
606
502
87
15
1,200
173
45
\ 946
267
Minnesota
1,430
12,683
6, 721
1,840
29,597
17, 997
Iotva
4,707
24,897
12,381
5,968
59,446
31,909
Missouri
1,'375
6,982
2,943
1, 772
9,972
3, 797
North Dakota
4
811
175
44
1,887
552
South Dakota
23 '
483
186
108
1,521
878
Nebraska Kansas
249 1,123
),666 3,387
1,500 I 1,631
413 1,215
7,144 4,315
3,819 2,147
Delaware Haryland Virginia North Qarolina South Carolina
*
1,663
681
2,060
-ll-
~-
563**
895
* * 1,02*0
~-
-ll-
2,184 3,124
'" '
66*7
1,185
Georgia
1, 739
20
-)!-
2,154
124
Florida Kentucky Tenness!3e
605 2,403
955
2,887
1,26*0
640 2,575
1,110*
3,634
9
1,473*
Alabama
Mississippi Arkansas
.
Louisiana
.:
** ' 3,825*
72*3 *
* *
4,688* 2,628*
1,154
1,762*
Oklahoma
: I
Texas
:
New Mexico
* *
California
847
*
*
924
*
*
Unallocated
. .
*_ l!_n?:_t~d_Sia~e~ .:.. _ .11.:_26.7___1!4.:..1.11____ k_8.z)2.,7____32.,,.32 ___12.9~13- ___ 2_0.:._5.0_ Included in unallocated to avoid disclosing individual operations.
b( Includes stocks at mills, elevators, warehouses, terminals, processors, and CCC-owned grain
at bin sites.
gj Off-farm total plus farm stocks.
.l'\ner ~ 1ve uays .1:1. e 1:urn 1:0: United States Department of Agriculture
Statistical Reporting Service 409A North Lumpkin Street
Athens, Georgia OF~... ICIAL BUSINESS
.t-'ostage and ..l::"ees ..1:-'aid U. S. Department of Agriculture
31 r-
Georgia Weekly Crop and Weather Bulle
~ GEO RGIA' CROP REPORTIN ~fJ::~~--:::~L
A t hen s , Georgi
Week Ending October 2, 1967
HARVEST CONTINUES ACTIVE
Athens, Ga., Oct. 2 -- Georg ia farmers had another week of brisk harvest- particularly
in central and southern -areas - according to the Georgia Crop Reporting Service. Open skies
in these areas dur i ng most of the week .we re near ideal for harvest, but lowered prospects for
late crops, as so il mois t ure in man y areas rema ined short. North Georgia had mostly adequate
moisture.
County Agents' reports showed I i t tle change in the condition of the State's cotton crop. Harvest gained momentum and became more widespread in Central Georgia. About 35 percent of the crop had been gathered by the end of the week compared with 47 percent at th1s time last year.
Corn harvest reached one-th i rd completion, and many fields were reported nearing the proper moisture levels for harvest. Impressive yields continue to be reported as the harvest progresses. Peanut harvest has been completed except for a few scattered fields. Yields and harvesting conditions have been very good this year.
Soybean prospects d~cl ined again last week as low soil moisture in many areas ~aused ' plants to wilt and pods to shed. Worms continued active in many fields, attacking both foliage and pods. A 1 ight frost toward the end of the period burned some fields in central and northern areas, while others escaped damage.
Late season haymaking was very active dur i ng the week. A considerable acreage of pasture was also clipped for weed control. Pasture conditions declined, but cattle remained in good condition.
Fall plowing and land preparation were major activities, but seeding of small grains was .delayed in many areas by dry soils. About 26 percent of the expected small-grain acreage has been planted. Sweetpotato harvest continued, Very light pecan harvest began during the period in southernmost counties.
WEATHER SUMMARY- Heavy rains fell in Northwest Georgia but only I ight to locally moderate amounts were recorded over the remainder of the State during the week ending Friday, September 29. Six inches fell at C~lhoun and several other places i n the northwest had over two inches "on Wednesday and Thursday. In contrast, most reporting stations in the eastern and southern sect ions had less than .one-half inch dur ing the week. No rain was reported in the State during the week end as clear skies prevailed after Thursday. Large areas in the south and east cont inued very dry at the end of the period.
Temperatures were unusually cool at the beginning and near the end of the period. Aver.ages for the week ranged from 7 to 10 degrees below normal. The first freezing temperatures of the fall occurred on Saturday morning when several places in North Georgia recorded lows of 32. or below. Scatte ~ed I ight frost was reported as far south as middle Georgia. New record .lows for September were recorded at numerous places on the 30th. Among these were Athens, Atlanta, and Augusta, each wiih 36.
September rainfall ranged from near normal in the northwest section to much below normal over most central and southern areas. Total rainfall was well below an inch at many places during the month and soils have become very dry. September temperature averages were much below normal over the State, con ti nuing t he cool trend that has persisted since May.
The f ive-day forecast for the per iod Tue sday t hrough Saturday (October 3-7) calls for temperatures to average 3 to 6 degrees above normal. Little or no rainfall is expected during the period.
IssuED-BY:- Th; Ge~rgi~ Cr~p-R;p~rt i ~g-S;r~i~e~ Athe~s~ Ge~rg i ~;-i~ ~o~p;r~tio~ ~ith-the--- Cooperat i ve Extension Serv i ce, Univers i ty of Georgia; Georgia Department of Agriculture; and the Weather Bureau, ESSA, U. S. Department of Commerce.
U. S. DEPART~IENT OF COMMERCE WEATHER BUREAU Athens, Georgia ESSA
Precipitation For the Week Ending September 29, 1967
GEORGIA
Temperature extremes for the week ending Sept. 29, 1967. (Provisional)
.o
Highest: 93 at Quitman on the 23rd and Albany on the 24th
0
33 at Blairsville on the 24th
* For the period Sept.
T, less than .005
After Five Days Return to
United States Department of Agriculture
Statistical Reporting Service
409A North Lumpkin Street
Athens, Georgia 30601
OFFICIAL B.USINESS
..i r' O
IMMEDIATE - U. S. WEATHER REPORT This report will be treated in all
Respects as Letter Mail (See Sec. 34.17, P.L. & R.)
The Univ Library Univ Of -: Ga
At hens Ga 30601
Postage and Fees Paid U. S. Department of Agriculture '
GEORGIA CROP REPORTING
ATHENS, GEORGIA
October 4, 1967
GEORGIA CHICK HATCHE RY REPORT
Placement of broiler chicks in G e orgia during the week ended September 30 was 7, 812, 000--7 percent more than t he p revious week but ll percent less than the comparable week last year, according to the G e o rgia Crop R eporting Service.
An estimated 10,465, 000 broiler type e ggs were set by Georgia hatcheries-8 percent less than the pre vious w eek and 10 p e rc ent l e ss than the comparable w e ek a year earlier.
The majority of the prices paid to G e orgia produce rs for broile r hatching eggs were r eporte d within a rang e of 50 to 65 cents pe r dozen. The average price of hatc hing eggs was 55 c ents p er dozen. The pri ce of e ggs from flocks with hatchery owned cockerels generally was 2 cents below the average price. Most prices r e c e i ve d for broiler chicks by Georgia hatcheries were r e ported within a range of $6.00 to $9. 00 with an average of $7. 50 per hundre d. T he ave rage prices last year were 66 cents for eggs and $10.25 for chicks.
Week Ended
GEORGIA EGGS SET, HATCHINGS, AND CHICK PLACEMENTS
EGG TYPE
E ggs Set
1966
1967
UJo of ye a r a go
Chicks Hatched
1966
1967
Thou.
T hou .
Pet.
Thou.
Thou.
UJo of year a go
Pet.
Sept. 2 Sept. 9 Sept. 16 Sept. 23 Sept. 30
Week Ended
l, 000 955
1, 015 893 774
Eggs Set}_/
1966 Thou.
1967 Thou.
658
66
676
614 512 532 549
JU0 0 1
673 763 740 700
BROILErt TYPE
o/o of
year ago
Pet.
Chicks Placed for
Broilers in Georgia
%of
1966
1967
year
ago
Thou.
Thou. Pet.
513
76
505
75
539
71
485
66
505
72
Av. Price
Hatch
Broiler
Eggs
Chicks
Per
Per
Doz.
Hundre d
1967
1967
Cents
Dollars
July 29
13, 124 12,031
92
9,449
8, 840
94
58
Aug. 5
12, 690 11,854
93
9, 524
8, 822
93
58
Aug. 12
12, 780 11,517
90
8, 938
9,020 101
57
Aug. 19
12, 780 11, 277
88
9,079
8, 825
97
57
Aug. 26
12, lll 10, 754
89
8, 845
8,614
97
56
Sept. 2
12,454 10, 171
82
8, 880
8, 273
93
56
Sept. 9
12,342 10, 880
88
8,762
8,217
94
56
Sept. 16
12,437 10, 886
88
8,412
7, 887
94
56
Sept. 23
12,493 11,433
92
8,338
7,314 88
56
Sept. 30
11,584 10,465
90
8, 771
7,812
89
55
1/ IncludE s e gg s set b y hatcheries p roducing chicks for hatcher y supp1y flocks
8.25 8.25 8.00 8.00 7.75 7.75 7.75 7.75 7.75 7.50
ARCHIE LANGLEY Agricultural Statistician In Charge
W. A. WAGNER Agricultural Statistician
U. S. Department of Agricultur e
Georgia Department of Agricultur e
Statistical R eporting Service
409A North Lumpkin St r eet, Athens, Georgia
EGGS SET AND CHICKS PLACE D IN COMMER CIAL AREAS BY WEE KS - 1967
EGGS SET
CHICKS PLACED
STATE
Week Ended
Sept.
Sept.
16
23
Sept.
30
Ufo of
year
ago 1/
S e pt.
16
Week Ended
Sept.
Sept.
23
30
THO USANDS
THOUSANDS
Page 2
% of
year
ago 1/
Maine Connecticut Pennsylvania Indiana Missouri Delaware Maryland Virginia West Virginia North Carolina South Carolina
1, 838 428
1, 265
534 406 2,366 3,900 1, 565 118 6,385 500
1, 888 237
1, 335 507 403
2,328 3,904 1, 501
113 6, 169
474
1,765 115 332 117
l, 125 95 560 92 396 64
l, 810 71 3, 557 83
1, 312 111
132 123 5, 526 94
478 127
1, 341
948
1, 130
93
149
141
187
126
884
802
878
99
330
225
338
98
367
187
318
97
1, 950
2,046
2, 151
86
2., 241
2, 125
2, 708
86
1, 020
859
1, 005
104
372
2.49
333
83
4,604 2.,998 4,92.9
96
467
42.0
364
104
GEORGIA
10, 886 11,433 10,465 90
7, 887
7,314
7, 812
89
Florida Tennessee Alabama Mississippi Arkansas Louisiana Texas Washington Oregon California
TOTAL 1967 {22 States)
812
806
779 176
620
604
564 178
701
709
703 60
849
779
665
65
7,897
8,034
7. 126 91
6, 134
5, 365
5, 871
95
4,417
4, 558
4, 310 99
3,885
3, 801
3, 540
100
8,973
9,026
8, 223
87
6,924 6,044 6,465
95
1,074
1,076
957 109
769
795
775 115
3,727
3,443
3,022 83
2,778
2,048
2, 812
96
605
590
497 95
371
362
356
86
327
263
385 143
274
164
202
72
1, 654
1, 569
1, 135 83
1, 031
877
1, 166
90
60,378 60,366 54, 59 5 91 45,247 39, 153 44,569
93
TOTAL 1966 (22 States)
64,640 64,251 60,255
46,712 44,928 47,707
o/o of Last Year
93
94
91
*1/ Current week as p ercent of same week last y ear. Revised.
97
87
93
September 15, 1967
Released 10/5 67 8CT 9 1967
GEORGIA CROP REPOR NG SERVICE
GEORGIA PRICES RECEIVED 4 POINTS HIGHER
-.-...... ... ... ....
The Index of Prices Received by Georgia farmers for all commodities increased 4 point s during the month ended September 15, 1967 to 248. This was 3 points below the September 15, 1966 index of 251.
There were declines in the prices of grains, hay, livestock, and broilers. However, a substantial increase in the price of cotton and increases in the prices of milk and eggs wer e sufficient to offset the price declines, and an increase in the All Commodity Index resulted.
UNITED STATES PRICES RECEIVED INDEX DaVN 4 POINTS PARITY INDEX UP 1 POINT, ADJUSTED PARITY RATIO 79
During the month ended September 15, the Index of Prices Received by Farmers declined
4 points (1 1/2 percent) to 252 percent of its 1910-14 average. Contributing most to the decline
were lower prices for hogs, potatoes, and tomatoes. Partially offsetting were seasonally higher prices for milk and eggs. The index was 7 percent below September 1966.
The Index of Prices Paid for Commodities and Services, including Interest, Taxes, and Farm Wage Rates increased 1 point during the month to 344. The index was 7 points (2 percent) above a year earlier.
With prices of farm products lower and prices paid by farmers higher, the Adjusted Parity Ratio, reflecting Government payments, declined 1 point to 79.
The Parity Ratio, at 73, was down 2 points from August.
Index 1910-14 a 100 GEORGIA Prices Received All Commodities All Crops Livestock and Livestock Products
INDEX N1JlvlBERS --GEORGIA AND UNITED STAT;;;.;;E;;,;;S~---..--~--~--
September 15 August 15 :September 15=-~~-R~e.-c..-or.,d;.:...;.H~ig~h~----
1966
1967
1967
Index
Date
251 !I
256 238
244
248
256
. 263
217 y
217
. 310 : 319
295
.
Y :i.vlarch 1951
:March 1951
:Sept. 1948
UNITED STATES
Prices ReCeiVed
Parity Index J/
270
256
337
343
252
313 :Feb. 1951
344
345 :July 1967
Parity Ratio
80
75
k/ Adjusted Parity Ratio
73
123 :Oct. 1946
--:----------~--------
(preliminary)
86
80
79
1/ l7 Revised. g? Also April 19~1.
Prices Paid, Interest, Taxes, and Farm Wage Rates based on
data for the indicated dates. ~ The Adjusted Parity Ratio, reflecting Government payments,
averaged 86 for the year 1966, compared with 80 for the Parity Ratio. Preliminary Adjusted
Parity Ratios for the current year, supplied by the Economic Research Service, are based on es-
timated cash receipts from marketings and estimates of Government payments for the current
calendar year.
ARCHIE LANGlEY Agricultural Statistician In Charge
vHLLIAM A. WAGNER Agricultural Statistician
rssuE"n-BY:- rhe Georgia crop-Reporting-service'.;' usnA-; 4o9A-North-Lumpkin-street, -Athens, -Ga.'.;"' -
in cooperation with the Georgia Department of Agriculture.
P,\IC::S--kHE IVED -AND PAID BY Ft\RMERS StPTEMBER l 1967 WITH . CCMPARISONS
GEORGIA
UNITED STATES
Commodity and Unit
Sept, 15 Aug, 15 :Sept. 15 Spt. 15 Aug. -J5 :Sept. 15
1966
1967
1967
196~
196
I 6
PRICES RECEIVED:
Wheat, bu. Oats, bu. Corn, bu. Barley, bu. Sorghum Grain, cwt. Cotton, lb. Cottonseed, ton Soybeans, bu. Peanuts, lb. Sweetpotatoes, cwt, Hay, baled, ton:
All Alfalfa Lespedeza Peanut Mi I k Cows, head Hogs, cwt.
Beef Cattle, All, cwt. ll
Cows , cwt. ]j Steers and Heifers, cwt. Calves, cwt. Milk, wholesale, cwt.: Fluid Market Manufactured
All ]/ Turkeys, lb. Chickens, lb., excl. broilers
Commercial Broilers All Eggs, All, dozen
$ J.oo
$ .92 $ I .43 $ l. 13 $ 2.20 21.0 $ 62.00 $ 3.00 11.3 $ 6.00
$ 27.00 $ 37.00 $ 29.00 $ 23.00 $ 190.00 $ 22.50
$ 19 .oo
$ 16.20 $ 21.40 $ 23.60
$ 6.25 $ 4.30 $ 6.25 23.0 11.0 14.0 13.9 52.2
I .45 . .80
I. 35 I. 00
20,0 58.00
2.65 11.4 7.00
I. 35
.80
1. l 0
.96 2.05 23.5 50.00 2.55 11.6 6.70
27.40
35.50 28.00 22.50 200.00 19.60 19.70 16,40
22.30 25.50
26.80
35.00 28.00 22.00 200,00
18.90 19.60 16.20 22.20 24.80
6.30
6.30 21.0
8.-o
12.0 11.9
35.3
!I 6.45
21.0
7.5 12.0 11.8
38.5
I. 71
,649 I. 35 1. 06 1.92 21. 17 65.50 2.97
11 2
4.82
23.80 24.30 24.40 23.40 255.00 22.30 22.50 17.20 24.30 26.50
5.65 4,40 5.28 22.2 9.2 14.6 14.0 42.7
1.41
.622 l. 11 1.01 1.92 21 .99 52.00 2.56 11.4 5.50
21.90 22.30 23.30 22.90 263,00 20.40 23.20 17.00 25. l 0 27.00
5.42 3.99 4.9b 20.6 7.7 12.9 12.5 29.8
1.39 .638 I. 12 .982
1.82 21.27 51.70
2.53 11.5 4.44
22. 10 22.60 23.60 22.70 264.00 19.10 23.10 16.50 25.00 26,80
!I 5. 17
20.5 7.9 12.6 12.2 32.0
PRICES PAID, FEED
Mixed Dairy Feed, cwt,: All Under 29% Protein
14% Protein .2/
16% Protein 18% Protein 20% Protein Cottonseed Meal, 41%, cwt. Soybean Meal, 44%, cwt. Bran, cwt. Middlings, cwt. Corn Meal, cwt. Broilir Grower Feed, cwt. Laying Feed, cwt. Scratch Grains, cwt. Alfalfa Hay, ton All Other Hay, ton
$ 4.15 $ 4.00
$ 4.15
$ 4.30
$ 4.50 $ 5.20 $ 5.60
$ 3.80 $ 4.00
$ 3.50 $ 5.40
$ 5. l 0 $ 4.40 $ 43.00
$ 34.00
4.15
3.95 4.10
4.45 4.50 5. l 0
4.80
3.95 4.15
3.55 5.20 5.00 4.40
37.00 32.00
4. I 0 3.80 4.10 4. 35 4.45 5.00
5.30 3.95 4.00 3.40 5.20 4.95 4. 30 38.00
34.00 -
3.89 3.62
3.94 4.09
4.33
5.39 6.23 3.46
3.59 3.52 5. 19 4.75 4.10
33.00 32. l 0
3.bl
3.57
3.8~
3.98 4.23 5.31 5.30 3.52 3. 61 3.42 4.98
4.59 4,08
32.00 30.80
3.79 3.57 3.85 3.98 4. 25
5.34 5.47 3.47 3. 57 3.38 5.01
4. 59 4.03
32.30 30.70
11 11 Cows11 and 11 steers and heifers11 combined with allowance where necessary for slaughter bulls.
21 Includes cull dairy cows sold for slaughter, but not dairy cows for herd replacement.
]I Revised, 41 Preliminary estimate. ,21 U. S. price is for under 16 percent.
After Five Days Return to United States Department of Agriculture
Statistical Reporting Service 409A North Lumpkin Street Athens, Georgia 30601 OFFICIAL BUSINESS
Postage and Fees Paid U. S. Department of Agriculture
;r-
Week Ending October 9, 1967
Released 3 p.m. Monday
HARVEST CONDITION IDEAL
Athens, Ga., Oct. 9 --The third week of open weather enabled farmers in central and
southern districts to progress rapidly with corn and cotton harvest, according to the
Georgia Crop Reporting Serv i ce. Lack of ma t ur i ty i n northern districts has delayed harvest
in this area. Dry soils have delayed land preparat ion and seed germination of fall planted
crops a l l over the State.
County Agents reported that 45 percent of the State's cotton crop has been gathered compared to almost 60 percent by this date last year. The condition of the crop showed very I ittle change from the prev ious week.
Corn harvest proceeded rapidly and was 46 percent complete by the end of the week. Storage and marketing problems are delaying harvest in some areas. Frost damaged some corn in northern counties.
Soybean condition declined and reports indicate prospects are so poor in some late planted fields that they will not be harvested for beans. Dry soils and insects continue to be a problem but most early beans are expected to yield quite well.
Pasture condition declined seasonally but ample graz i ng is available although it is
not of the best quality. Cattle remained in good condition. Seed germination and growth
of winter grazinq _wa!J imited by dry soils.
'4
~
Seeding of small grains was slowed considerably as farmers were reluctant to place the seed in the dry soils, which also was a hindrance to land preparation.
Pecan conditions are extremely varied. Harvest is just beginning. Turnip green harvest was active in south central counties. Sweetpotato harvest continued.
WEATHER SUMMARY- No rain was reported in Georgia during the week ending Friday, October 6. An approaching cold front brought I ight to locally moderate rains to northern and western sections during the weekend. Some totals for the 24-hour period ending Monday morning were: Winder 1.60", Experiment 1.30", Blakely 1.12", Juliette .86, and Plains .41''. Large areas in the southern and eastern sections of the State continued very dry at the end of the period. Several places in these areas have had less than one-half inch of rain in the last 5 to 6 weeks.
Temperatures were cool at the beginning of the period but a warming trend brought readings up to normal, or above, by the end of the week. Highs were in the eighties over most of the S.tate on several days and a few 90 readings were observed in south Georgia. This was the first week in the last 15 that Georgia temperatures averaged as warm as norma I.
The five-day forecast for the period Tuesday through Saturday (Oct. 10-14) calls for temperatures to average 4 to 7 below normal. It should be cool at the beginning of the
period and become a I ittle warmer during the week. Rainfall is expected to average less than 1/4 i nch and occur in showers near the end of the week.
ISSUED BY: The Georgia Crop Report i ng Service, USDA, Athens, Georgia; in cooperation with the Cooperative Extens ion Service, Un i vers i ty of Georgia; Georgia Department of Agriculture; and the Weather Bureau, ESSA, U. S. Department of Commerce.
'
OCT 10 \9 1
UBRP.RIES
U. S. DEPARTMENT OF COMMERCE WEATHER BUREAU
Athens, Georgia ESSA
J Precipitation For The Week Ending October 6, 1967
GEORGIA
Temperature extremes for the week ending Oct. 6, 1967 (Provisional)
Highest:
91 at several places on Oct. 5th or 6th.
26 at Blairsville on Sept. 30.
*For period Oct. 7-9, 1967 T, less than .00.5 inch
After Five Days Return to United States Department of Agr iculture
Statistical Reporting Service 409A North Lumpkin Street Athens, Georgia 30601 OFFICIAL BUSINESS
IMMEDIATE- U. S. WEATHER REPORT This report will be treated in all
Respects as Letter Mail (See Sec. 34.17, P. L. & R.)
Postage and Fees Paid U. S. Department or Agriculture
PD ;.~
t rr ) !l:
( e:
J ill
J~
,
10f
GEORGIA CROP REPORTING SERVICE - ATHENS, GEORGIA
Released October 9, 1967 GEORGIA COTTON REPORT AS OF CCTOBER 1, 1967
Cotton prospects for Georgia as of October 1 were for a production of 215,000 bales, based
on information reported by crop correspondents and ginners, as announced by the Georgia Crop
Reporting Service. The current forecast is the same as a month earlier, but 101,000 bales be-
low the 1966 crop. Indicated yield per acre of 362 pounds is 36 pounds below the 1966 yield
and 60 pounds below average. All areas of the State are expected to harvest a smaller crop than last year.
Weather conditions were favorable during the month, and good progress was mad e i n harvesting operations in the central and southern areas. The crop in the northern districts is later
than usual, and harvest is not as far advanced as normal. A higher percentage of the crop is expected to be harvested by mechanical pickers than usual.
The Bureau of Census reports 80,000 running bales ginned to Cctober 1 compared to 131,000 to the same date last year and 278,000 bales in 1965.
INDICAT.ED COTTON PRODUCTION. 197; FINAL PRODUCTION. 1966. 1965
District
l-967
1966
1965
\ Non-Cotton
\
-.
1 2
3
4 5
6 1 8 9
State
15,000 8,000 9,000
18,000 42,000
39,000
28,000 52,000
4,000
215,000
18,470 10,900 12,560 24,280 62,110
63,750
43,390 72,340 8,200
316,000
41,510 22,970 24,160 42,000 103,950 107,480 73,840 129,530 17,560
563 ,000
-4
.Columbus
Macon
Districts shown are crop reporting districts and not Congressional Districts.
I
0
Please see reverse side for
UNITED STATES information.
Albany
7
Valdosta
LI BRAR IES
UNITED STATES - COTTON REPOKT AS OF OCTOBEK 1, 1967
The Crop Reporting Board of the Statistical Reporting Service makes the following report
from data furnished by crop correspondents, field statisticians, Bureau of the Census, Agricultural Stabilization and Conservation Service, and cooperating State agencies. The final outturn of cotton compared with this forecast will depend upon whether the various influences affecting the crop during the remainder of the season are more or less favorable than usual.
State
N. C.
s. c.
Ga. Tenn. Ala. Mo.
Acres
for
harvest
1967 ll
I ,000
~
90
200
285
260
...
460 90
Lint yield per harvested acre
1961-65: 1966 average:
1967 indic.
Pounds Pounds Pounds
374
290
267
419
442
420
422
398
362
572
475
397
445
392
287
561
408
293
Production '1/
500-pound -qross weight bales
Indicated
1961-65
1966
Sept. 1, Oct. I ,
average
1967
1967
1 ,000
1 ,000
1,000
I ,000
-bal-es
bales
bales
-b--ale-s
300
94
474
282
566
316
614
363
788
461
419
162
50
s.o
180
175
215 .
- 215
225
215
300
275
55
55
Miss. Ark. La. Okla. Texas
N, Mex. Ariz. Ca I if. Other
States 11
940 790 340 405 3,700
128 247 590
20
625
651
600
557
418
425
521
602
607
270
270
213
362
385
363
673
648
562
1 ,057
979
933
1,099
952
956
402
359
339
1,942 1 ,483
572
334 4,544
266 839 1, 753
41
1 ,353 756 449 214
3 J 182
181 515 1,228
19
1 , 150 700 410 2.15
2,800
150 495 I ,225
15
I, 175 700 430 180
2,80.0
150 480 1,175
14
u. s.
8,545
491
480
454
14,935 9,575
b,Hs5
Amer.Egypt. !!,/
67.5
548
447
489
109.6
72.9
67.8
68.7
1/ August 1 estimate. 11 Production ginned and to be ginned. A 500-lb. bale contains about q80 net pounds of 1int. 11 Virginia, Florida, Illinois, Kentucky, and Nevada. !!_/ Included in
State and United States totals. Grown in Texas, New Mexico, Arizona, and California.
C. L. CRENSHAW Agricultural Statistician
ARCHIE LANGLEY Agricultural Statistician In Charge
After Five Days Return to United States Department of Agriculture
Statistical Reporting Service 409A North Lumpkin Street Athens, Georgia 30601 OFFICIAL BUSINESS
Postage and Fees Pa-i~ ~.
U. s. Department of Agriculture
GEORGIA CROP REPORTING SERVICE
ATHENS, GEORGIA
HONEY PRODUCTION
October 10, 1967
GEORGIA HONEY PRODUCTION UP SLIGHTLY FROM 1966
Georgia's 1967 honey production is estimated at 4,250,000 pounds -- 3 percent above last year's production of 4,128,000 pounds. The number of colonies on hand July 1 totaled 170,000, compared with 172,000 one year ago. Yield per colony of 25 pounds was up one pound from a year ago. This slight increase in yield is due mainly to producer's estimate of honey not harvested. Honey for sale in producer's hand on September 15 is 680,000 pounds, compared with 908,000 pounds in 1966.
UNITED STATES HONEY PRODUCTION DOWN 11 PERCENT
The 1967 honey crop for the 48 States is expected to total 219 mill ion pounds. This is II percent below the 1966 production of 247 mill ion pounds and 13 percent below the 1961-65 average. Yield per colony is expected to average 45.4 pounds compared with the 51.9 pound yield last year and the 5-year average of 52.1 pounds. The estimated production is based on 4,837,000 colonies on hand July 1, 1967, an increase of 1 percent from the 1966 number of colonies.
Although the 48 States ave~age yield was the lowest since 1956, sharp fluctuation occurred between States and reg1ons. The largest declines from a year earlier occurred in the North Central States. The East North Central region averaged 42 pounds compared with 70 pounds in 1966. The West North Central decreased to 75 pounds from 93 a year earlier. Yields declined from 42 to 35 pounds in the North Atlantic and from 34 to 32 pounds in the South Central region. Yields were above 1966 in the South Atlantic region-35 pounds in 1967 compared with 32 pounds a year earlier. Yield in the West also increased slightly--from 50 to 51 pounds, due largely to the increase in California from 3~ to 48 pounds per colony.
Honey production declined from last year in all North Central States but .the sharpest declines occurred in Ohio, Indiana, Illinois, and Nebraska. The reduced production can be primarily attributed to the cool, wet spring which continued through June in many areas. Reports indicated that excessive swarming, insecticide losses, and early cutting of alfalfa and clover were also factors contributing to the reduced production. Areas of low production were dispersed throughout the Nation with at least one State in each region reporting production below a year earlier. Bees in northern New England and New Jersey were hampered by frequent ra.in showers throughout the season. South Carolina was the only southeastern State with a production below the relatively poor 1966 crop. Areas within reported extremely low production resulting from dry weather and use of insecticides.
In mid-September, producers reported 79 mill ion pounds of honey on hand for sale compared with 82 mill ion pounds a year earlier. Stocks on hand this September 15 amounted to 36 percent of the 1967 production compared with 33 percent a year earlier.
ARCHIE LANGLEY Agricultural Statistic.ian In Charge
L. H. HARRIS, JR. Statistical Assistant
lssu'Eo-sv:- The Georgi-; crop-Reporti~g-s~r~i~e-:- usoA-:- 4o9A-North-L~mpkin-Str~et,-Ath-en"S,-
Georgia, in cooperation with the Georgia Department of Agriculture.
OCT 11 19of
LIBRARI ES
HONEY PRODUCTION AND STOCKS ON HAND FOR SALE
State and Division
Maine N. H. Vt. Mass. R. I Conn. N y N. J Pa,
N. Atl. Ohio Ind. I1I Mich. Wis.
E. N. Cent. Minn. Iowa Mo. N. Dak. S. Oak. Nebr. Kans.
W. N. Cent. Del. Md. Va. \-1. Va. N. C.
s. c.
Ga. Fla.
s. At I.
Ky. Tenn. Ala. Miss. Ark. La. Okla. Texas
s. Cent.
Colonies
of Bees
1~66
1967
Thousands
5
5
5
5
8
8
10
10
2
2
10
10
164
162
36
37
liZ
117
357
356
149
152
98
102
91
93
116
123
142
142
596
612
195
185
137
137
102 46
10so7
95
101
99
104
49
47
Z23
731
5
5
32
32
106
106
89
94
213
222
60
63
172
170
224
l09
2ZI 11001
88
97
142
lSI
99
93
65
65
90
94
86
86
49
51
23~
234
858
8ZJ
Yield per
Colon~
1966 : 1967
Pounds
31
29
40
29
47
31
22
24
22
21
18
23
sL~
40
34
40
32
29
42
35
41
18
62
20
67 74
40
so
10~
80
70
42
92
90
104 65
7so5
115
lOS
112 95
9so5
65
50
93
75
37
40
40
45
18
22
12
27
10
14
II
10
24
25
68
65
32
35
22
22
20
18
27
23
32
36
26
29
39
44
37
40
~I
42
34
32
Honey for Sale
Hone~ Production
in p ro ducer s
: 1967 as %: Hand on Seet. 15
1966
1~67
of 1966 1966 1967
1.000 Pounds
Percent
1,000 Pounds
155
145
94
53
54
200
145
72
70
59
376
248
66
132
112
220
240
109
88
89
44
42
95
14
15
180
230
128
45
76
8,856 6,480
73
3' 100
2,138
1'224 1,480
121
661
888
3.744 3,393
91
1 .498
1 ,052
14,999 12,403
83
5 661
4,483
6,109 2, 736
45 . 3,238
1 ,067
6,076 2,040
34
2,066
775
6,097 3, 720
61
2,561
2,009
8,584 6,150
72
3,863 .
2,337
14.910 11 .360
76
7.306
6,248
41 !776 26,006
62
191034
12,436
17,940 16,650
93
5,203
4,995
14,248 10,275
72
4,987
4,418
6,630 5,350
81
2,387
2,086
5,290 5,250
99
952
1 '365
10,640 9,595
90
2,660
3,454
9,405 5,200
55
I ,975
I ,872
3.185 21350 67.338 54,670
74
11270
81
1~.534
940 19,130
185
200
108
92
90
1'280 1,440
112
704
648
1,908 2,332
122
611
723
1,068 2,538 238
28b
609
2,130 3,108
146
639
839
660
630
95
145
101
41128 412~0
IOl
~08
680
191992 20,085
100
3.998
4,017
311351 34158l
II 0
7.385
7.707
I ,936 2' 134
110
426
512
2,840 2,718
96
852
761
2,673 2' 139
80
936
. 727
2,080 2,340
112
686
445
2,340 2, 726
116
515
763
3,354 3,784 113
436
378
I ,813 2,040
113
635
775
121189 91828
81
4.997
3.538
29.225 27 1Z09
95
9.483
7.899
West
u. s.
:11261 11266 ~0
51
621605 641029
102
211124
:
:4,766 4,837 51.9 45.4 247,294 219,400
89 82,221
27.001 78,656
After Five Days Return to United States Department of Agriculture
Statistical Reporting Service 409A North Lumpkin Street
Athens, Georgia 30601 OFFICIAL BUSINESS
Postage and Fees Paid U. S. Department of Agr iculture
~G\A
~() FARM REPORT
GEORGIA CROP REPORTING SERVICE
ATHENS, GEORGIA
GENERAL CROP REPORT AS OF CCTOBER 1, 1967
October 11; 1967
Crp Harvest Increasing
By October 1, harvest of Georgia's major crops was increasing, but progress generally was later than usual. Peanut picking was virtually complete, but only one-third of the cotton and corn crops had been gathered. Except for cotton, State average yields are very good.
Corn: The estimated 1967 corn crop is placed at 84,280,000 bushels compared with 58,824,000 bushels tne previous year. Yield per acre was placed at 56 bushels .
Cotton: Production of cotton is forecast at 215,000 bales - u?changed from last ~onth. Production in 1966 totaled 316,000 bales.
Tobacco: Type 14 tobacco production of 150,675,000 pounds is sharply above last yearts crop of 96,380,000 pounds.
Peanuts: The 1967 peanut production of 956,000,000 pounds is the largest ever produced
in Georgia. Yields are estimated to average a ton per acre.
Soybeans: The Staters soybean crop of 13,008,000 bushels is sharply above the 1966 crop of 6,923,000 bushels.
. Pecans: A pecan crop of 48,000,000 pounds was indicated on October 1. The level is 1
million pounds above the previous month's estimate, even though dry weather
has adversely affected the crop in some areas.
Milk production on Georgia farms during September totaled 86 million pounds - 3 million above production a year ago, but the same as produced the previous month.
Eggs produced on Georgia farms during September are estimated at 399 milli.on._- 23 million
above~ previous September total of 376 mil+ion.
.
GEORGIA CROP PRODUCTION AND_J!!RJ[ESTED ACREAGE-1 1966 AND 1967 - -:-:----
:
Acreage
: Yield Per Acre
:
Produ.~ct~l~o~n~----
Harvested: For
Indicated :
Indicated
Crop and Unit
1966 : harvest 1966 1967
. 1967
1966
0
1967
Thousands
Thousands
Corn, for grain, bu. Wheat, bu. Oats, bu. Rye, bu. Barley, bu.
Tobacco, Type 14, lb.
Sweetpotatoes, cwt. Hay, all, ton Cotton, bale Peanuts (P&T), lb. Soybeans, for beans, bu. Sorghums, for grain, bu. Peaches, total crop, bu.
iPfecPanosu.!n.d. lsbo. f lint.
1,368 65 98
43 11 61 8 460 380 482 301 12
1,505 124
93 70
9 ?3.5
8 462 285
478 542 13
43.0 30.0 41.0 22.5 41.0 1,580
85+ 1.88398 1,680 23 .0 38.0
56.0 27.0 37.0 18.0 30.0 2,050
90+ 1.98362 2,000 24.0 36.0
58,824 1,950 4,018
968 461 96,380 680
867
316 809,760
6,923
456 3,800 37.000
84,280
3,348 3,441 1,260
270 150,675
720
915 215 956,000 13,008 468 3,000 L.8,ooo
ARCHIE LANGLEY
Co L. CRENSHA~v
Agricultural Statistician In Charge
Agricultural Statistician
'IssuED-BY:-
The
Geo
r
gi
( a
Please turn page for crop-Reporting-se-r;i
United S ce7 usfiA-;-
tates 4o9A -
Ninoforrtwhn.aLl.t.w~.~i_.r,o._,)~:n.._t,)!~r~olE=rt-.:~--=~-o"=~"w"'8=-~~~-Ga.;
-
-
in cooperation with the Georgia Department of Agricu ture.
'
OCT 13 1967
LIBRARIES
_______ _________ _______ _____________ ... UNITED STATES. CROP SUM.._MARY AS OF CCTO_,B_ER 1. 1967
~-------
Q~rn.12r grain prospects are a record high 4.7 billion bushels, 15 percent more than the 1966 crop ana-26 percent above the 1961-65 average.
eW~~n production is _estimated at 994 million bushels, down 1 percent from the September 1 forecast, but 7 percent more than last year, and 38 percent above average.
Sorghum grain prospects are a record high 789 million bushels, about the same as a month earlier, 10 percent more than last year, and 44 percent above average.
Peanut prospects, dow~ 1 percent from September 1, at 2,542 million pounds, but still a record
high crop -- 5 percent more than last year, and 30 percent above average.
tl5Y production is estimated at 124.6 million tons, up 2 percent from a month earlier, 3 percent
more than last year and 4 percent above average.
Fall potato prospects are 229.5 million hundredweight, up 3 percent from the September 1 fore- --cast, 1 percent more than last year and 15 percent above average.
U.
S.
ACREAGE HARVESTED -Acreage
AND
PRODUCTION, -Yield Per
A1e9re66__a_nd:..1._9.6.7--..--.Pr-o-duct~on
--~
:Harvested: -'FOr-
-
----
Crop and Unit
1966 : harvest
: Indicated :
Indicated
--,----~-----1--
1967 _1966 _..,l 1967_ _..:___122____.!._---1;29]_ _
!hous~~~
Thous~ngs
Corn, for grain, bu. Wheat, all, bu. Oats, bu. Barley, bu. Rye, bu. Cotton, bale Hay, all, ton Soybeans, bu. Peanuts (P&T), lb. Sweetpotatoes, cwt. Tobacco, lb. Peaches, lb. Pecans, lb.
56,888
49,843 17,848 10,227 : 1,283
9,554 65,192 36,644 1,421
: 157
: 973
61,319
59,950
16,215
9,370 1,102
8,545 64,151 40,123
1,399
149
989
72.1
26.3
44.7
38.1
21.8 480
y
1.85
25.4
1,696
87
1,942
76.9
25.9
49.7
39.9
21.8 454
y
1.94
24.8
1,817
94
2,034
yPOunds of lint. -g In~ludes some quantities not har.;eSte"a:---
4,103,323 1,310,642
798,089
389,557 27,921
9,575 120,863
931,491 2,410,736
13,697
y 1,890,320
3,407,400 161,600
4, 717,422
1,553, 741
805,649
373,438 24,002
8,089
124,577
993,715 2,542, 275
14,n8
2' 011,366 2, 724,600
213,400
After Five Days Return to United States Department of Agriculture
Statistical Reporting Service 409A North Lumpkin Street Athens, Georgia 30601
OFFICI~ BUSINE_
Postage and Fees Paid U. S. Department of Agric ulture
Week Ending Qctober 16, 1967
3 p. m. I"londay
OPEN WEATHER AIDS HARVEST -HURTS SOYBEANS
Athens, Ga., October 16 -- Harvest opera
d very active in southern and
central areas, according to the Georgia Crop Reporting Service. Crops have matured slowly in
northern sections, and harvest there was light. The past several weeks of near-ideal harvest
weather have been too dry for late-planted soybeans, and yield prospects have declined.
Georgia farmers have now gathered about half of their cotton crop, according to County Agents. Several southern counties have completed harvest, WhiiB-many northern counties were in the def oliation stage.
Corn harvest made good progress during the week - particularly in southern areas where most of the cotton had been gathered. Grain storage facilities were rapidly filling in several areas, and harvest was halted in a few localities until buyers could arrange for additional storage.
A few early fields of soybeans were combined during the period. Frost has stopped grovrth in many central and northern areas, and harvest is expected to soon gain speed. Overall condition of soybeans declined again due mainly to the dry weather and early up-Btate frost damage of late fields. Early plantings are expected to have good yields.
Pasture conditions declined again. Cattle continued in good condition, but grazing is short in drier sections.
Seeding of small grains reached 39 percent completion, but many farmers were waiting for more favorable soil moisture before risking their seed. The light rains at the beginning of the period helped some areas, while other sections received insufficient rainfall to help the situation.
Pecan harvest was still slow as the main nut fall has not occurred to date. Earliest reporrs-on pecan prices appeared very favorable for the grower. Turnip ~~harvest and irrigation were very active during the period. SweetEota~~ harvest reached its peak in .several areas.
WEATH~ ~1ARX - Rainfall was recorded in all sections of Georgia during the week ending ~iday, October 13, but amounts were highly variable. Totals ranged from over t wo inches at
a few places in the extreme north and southwest to less than 1/4 inch over most of the east-
central section. Huch of central and parts of south Georgia have had less than an inch of rain since September 1, and continue very dry. Some areas that had been extremely dry received good rains during the week. Quitman and ~vaycross, with 1.48 inches, had more rain than they had received in the last 6 or 7 weeks.
Georgia temperatures averaged 1 to 4 degrees below normal during the week. It was cool early in the period but a warming trend brought r eadings to near normal during the last half of the week. Afternoon highs were i n the 80fs over most of the State durin.5 t he week end .
The five-day forecast for the period Tuesday through Sat urday ( October 17-21) calls for temperatures to range from near normal to 3 below nor mal. It should be mild at t he beginning
cooler during the last half of the period. Rainfall is expected to average 1/4 t o 1/2
inch and occur mainly over south Georgia around mi dweek.
rnSUED BY: The Georgia Crop Reporting Servic e , At hens, Ge orgia; in cooperation with t he Cooperative Extension Service, University of Ge orgia; Georgia Department of
Agriculture; and the Weather Bureau, ESSA, u. s. Department of Commerce.
U. S. DEPARTMENT OF COMMERCE WEATHER BUREAU Athens, Georgia
ESSA
Precipitation For The Week Ending Oct~ 13, 1967
GEORGIA
Temperature extremes for the week ending Oct o 13, 1967 (Provisional)
Highest: 940 at Quitman on the 8th.
Lowest: 32 at Blairsville on the 11th and 13th.
* For the period Oct. 14-16, 1967
T, less than .005 inch
After Five Days Return t o United States Department of Agriculture
Statistical Reporting Service 409A North Lumpkin Street Athens, Georgia 30601 OFFICIAL BUSINESS
IMMEDIATE - U. S. WEATHER REPORT This report will be treated in all
Respects as Letter Mail (See Sec. 34.17, P.L. & R.)
Postage and Fees Paid U. S. Department -of Agriculture
GEORGIA CROP REPORTING SERVICE
ATHENS, GEORGIA
SEPTEMBER MILK PKODUCTION UP 3 MILLION POUNDS
September 1967 Release& 10/16/67
Milk production on Georgia farms during September totaled 86 mill ion pounds, according to the Georgia Crop Reporting Service. This compares with 83 mill ion pounds pr~duced in September
last year and 86 mill ion during August 1967. The 1961-65 September average product ion was bl
mill ion pounds.
Production per cow in herd averaged 605 pounds -- 45 pounds above the previous year, and 5 pounds above the August output. The 5-year average production per cow for the month was 456 pounds.
The estimated average price received by producers for all wholesale milk during September was $6.45 per hundredweight. This would be $.20 above the previous year, and $.15 above the August average.
Prices paid by dairymen for feed were about 5 cents per hundredweight below both August and the previous year.
MILK PRODUCTION AND PRICES RECEIVED AND PAID BY. DAIRYMEN
GEORGIA
UNITED STATES
Item and Unit
September August September September August September
1966
1967 1967
1966
1967
1967
Milk Production, mill ion lbs.
Production Per Cow, lbs. l/
Number Mi 1k Cows ,
thousand head
83
86
86
560
600
605
148
143
142
9,263 663
9,757
722
9,173 680
:J/ PRICES RECEIVED - DOLLARS 2/
All wholesale milk, cwt. F1u id mi 1k, cwt. Manufactured milk, cwt. Milk Cows, head All ba 1ed hay, ton
6.25 6.25 4.30 190.00 27.00
6.30 6.30
200.00 27.40
~/6.45
200.00 26.80
5.28 5.62 4.40 255.00 23.80
4.98 5.42
3.99 263.00
21 .90
~/5. 17
264.00 22. 10
PRICES PAID - DOLLARS 11
Mixed Dairy Feed:
14 Percent Protein, cwt. 21
16 Percent Protein, cwt.
18 Percent Protein, cwt. 20 Percent Protein, cwt.
All Under 29 Percent Protein, cwt.
4.00 4.15 4.30 4.50
4.15
3.95 4.10 4.45 4.50
4.15
3.80 4.10 4.35 4.45
4.10
3.62 3.94 4.09 4.33
3.89
3.57 3.88 3.98 4.23
3.81
3.57 3.85 3.98 4.25
3.79
ll Monthly average.
11 Dollars per unit as of the 15th of the month except wholesale milk which is average for month.
'j/ Kevised.
~/ Pre 1imi na ry
21 U. S. price is for under 16 percent.
ARCHIE LANGLEY Agricultural Statistician In Charge
W. PAT PARKS ~gricultural Stat i stician
IssuED-BY:- The Georgi-; crop-Reporti-;:;g-ser~i~e-:- usoA-:- 4o9A-North-L~m'Pkin-s'treet,-Athens,-G-;.-:- in cooperation with the Georgia Department of Agriculture.
..-, '
UNITED STATES MILK PRODUCTION
September milk output one percent less than a year earlier
September milk production in the United States is estimated at 9,173 mill ion pounds, I
percent less than a year earlier and 4 percent below the 5-year average for the month. On a
daily basis, producjion was down 3 percent from August compared with a 2 percent decrease last
year. September output provided 1.53 pounds of milk per person daily, compared with 1.58 pounds
a year earlier. For .the first 9 months of the year, production was about the same as a year
earl ier.
September rate per cow up 3 percent from a year earlier
During Septemb~r milk production per cow averaged 680 pounds, up 3 percent from a year earlier and 15 percent above the 1961-65 average. Production per cow was at a record level for the month in 45 States. Daily output per cow averaged 22.7 pounds, in September, 0.6 pound less than August but 0.6 pound above a year earlier.
Month
January February March Apr i 1 May June July August September
Jan.-Sept. total
October November December
Annual
Milk per cow and Milk Production by.. months, United States, 1967, with comparisons
Average 1961-65
Mi 1k per cow
1966 Pounds
621
678
591
635
676
736
690
752
757
812
729
798
671
736
629
696
592
663
602 581 6i8
7,759
670 649
687
8,513
Aftei Five Days Return to United States Department of Agriculture
Statistical Reporting Service 409A North Lumpkin Street Athens, Georgia 30601 OFFICIAL BUSINESS
0
Acquisitions Division University of Georgia University Librari~s Athons Georgia 30601
Postage and Fees Paid U. S. Department of Agriculture
CATTLE
"""'
ON FEED
GEORGIA CROP REPORTING
CCTOBER 1, 1967
10/18/67
Georgia
Cattle !!Feed Dowg g.OO.Q. Head
On October 1 there were 42,000 head of cattle and calves on grain feed for slaughter in
Georgia. According to the Crop Reporting Service, this was 11,000 head, or 21 percent below
the number on feed last year at this time. The October 1 inventory in Georgia showed a .seasonal
increase of 8 percent from the previous quarter when 39,000 head were on feed.
Fed cattle sold for slaughter during the July-September quarter totaled 35,000 head. This
' compared with 26,000 during the same period of 1966 and 36,000 during the April-June quarter
of this year. There were 38,000 cattle and calves placed on feed during the July-September
quarter -- 27 percent above the number placed a year ago and 41 percent above placements during the previous quarter.
Cattle feeders in Georgia had 37,000 steers and 5,000 heifers on October 1. Of the 42,000 head total, 35,000 had been on feed less than 3 months, 5,000 had been on feed 3-6 months and
the remaining 2,000 had been on feed more than 6 months.
~ Feeding ~~~
~~ 2 ~ Up g_ Percent
Cattle and calves on feed for slaughter market on October 1, 1967 in 32 major feeding
States is estimated at 8,566,000 head, 2 percent more than a year earlier.
Placements ~ ~etings Uo
Cattle and calves placed on feed in the 32 States during July-Deptember totaled 5,120,000,
an increase of 8 percent from the smae period in 1966. Placements were 8 percent larger in the North Central States and 3 percent in the Western States. Shipments of stocker and feeder cattle into 8 Corn Belt States during July and August were down 1 percent from the same period in 1966.
Marketings of fed cattle for slaughter during the third quarter totaled 5,278,000 head-12 percent above the corresponding period in 1966. Fed cattle market~ngs were up 3 percent in
the North Central Stat6s but down 2 percent in the Western States .
Narketing Ig~ntions
Of the October 1 number on feed, cattle feeders intend to market 4,894,000 head during
October, November and December. If these intentions materialize, marketings will be 2 percent above October-December marketings last year from those on feed October 1. Intentions are to
market 35 percent of the three~onth total during October, 31 percent during November, and 34
percent during December. Expected marketings are based on the usual relationship between survey data and actual marketings.
ARCHIE LANGlEY Agricultural Statistician In Charge
\rf . PAT PARKS Agricultural Statistician
ISSUED BY: The Georgia Crop Reporting Service, USDA, 409A North Lumpkin Street, Athens, Ga ., in cooperation with the Georgia Department of Agriculture.
Cattle and Calves on Feed, Placements and 11arketings
---------------------- By Quarters 1/ NLWJBERPlACED
.... -:--~-Nuiiv-r.n=ER- - -
1
CAl~LE ON FEED
ON FEED gj
HA.t~. tKETED gj
STATE
:---..-- ~-:--------:----~---~~---------:-------:--1
:Oct. 1 : July 1 Oct. 1 :July - :April -: July - :July - :April -: Jul y
1966 : 1967 ------~---~-1.1ooo)
1967 : Sept. : June Sept. : Sept. : June : Sept .
_____ : 1966 : 1967 : 1967 : 1966 : 1967 : 1967
- - - :---- - (000)
-----~:-- - - --rooo)
GEORGIA Alabama Florida i_viississippi Tennessee Kentucky Oklahoma
Texas Pennsylvania
53
39
42
30
27
38
26
36
35
22
13
17
17
8
12
13
18
8
53
32
37
48
31
26
23
44
21
21
11
18
18
7
16
7
10
9
26
12
19
15
4
16
14
20
9
39
37
37
20
16
20
20
29
20
123 509
111 584
141 644
94
78
357 386
116
94 117
455 360 455
86 39~
. 56
47
51
40
12
37
39
41
~
12 N. Cent. Sts.
5,064 5,525 5,163 2,719 1,970 2,942 3,203 3,L~30 3,3041
11 lrJestern Sts.
.. 2,458 2,313 2,397 1,396 1,305 1,442 1,389 1,414 1,358
J.?.__ta~e_T_otal_ _ _ _8__..h2g___~.._72_..4_. . 26_-.!_J~.: l?!L---'h844 ____...5......1_2_0_..._5~!88_ _2. 61!__ _2~
Cattle and Calves on Feed by vJeight Groups, Kind of Cattle
and Length of Time on Feed, Geor gia and 32 lvia j or Feeding States,
By Quarters 1/
: ----~--------------------------------------- ------------
:
GEORGIA
:
'32 HAJOR STA TES;;._..-=--~
: -oet.-r-July 1-:-~ oct:--:c-:-oct:l..:~-Julyl-- oct. 1
- --- ----------- Breakdmm of Cattle on Feed
1966
1967 : 1967 : 1966 : 1967 : 1967
rooor----~-- -: -- -----rooo;---------
Total on Feed Height Groups
Under 500 lbs. 500-699 lbs. 700-899 lbs. 900-1,099 lbs. 1,100 lbs. and over
53
39
12
1
24
10
12
17
4
11
1
42
8, 424
8, 724
4
548
400
1)
1,732
1, 9CO
17
3,156
3,697
6
2,565
2,313
423
414
8,566
706 1,870 3,064 2,563
363
Kind of Cattle: Steer s and Steer Calves Heifers and Heifer Calves Cous and Others
43
36
9
3
1
37
5,962
6,159
5
2, 438
2 ,5L~o
24
25
6, on 2, 539
16
Time On Feed:
Under 3 months
28
25
35
4,543
3,631
3-6 months
9
9
5
2,303
3,045
Cver 6 months
: 16 ______2
2
_1.578 _ 2.04_____
~artie-ana-carves-on-reed are animals being fattened for the slaughter market on gr-a~i=n~o~r
y- other concentrates which are expected to produce a carcass that will grade good or better . Includes cattle placed on feed after beginning of quarter and marketed by end of quar t er.
After Five Days Return to United States Department of Agriculture
Statistical Reporting Service
409A North Lumpkin Street Athens:; Georgia_--30601 QIT!.Q.!!L BUSI~
Postage and Fees Paid U. S. Department of Agricul t ure
I~ ~ ((
GE0 RGI A cR0 p RE p 0 RT I NG sERv I cE
0 w~~rnr1w rniD1rrn
!'.
~NIVERSITY OF
rnw::;IA
ATHENS, GEORGIA GEORGIA CHICK HATCHERY REPORT
Placement of broiler chicks in Georgia during the week ended October 14 was 8, 099, 000--1 percent more than the previous week but 8 percent less than the comparable week last year, according to the Georgia Crop Reporting Service.
An estimated 10, 549,000 broiler type eggs were set by Georgia hatcheries-2 percent less than the previous week and 6 percent less than the comparable week a year earlier.
The majority of the prices paid to Georgia producers for broiler hatching eggs were reporte d within a range of 50 to 65 cents per dozen. The average price of hatching eggs was 55 cents per dozen. The price of eggs from flocks with h-atchery owned cockerels generally was 2 cents below the average price. Most prices r e ceived for broiler chicks by Georgia hatcheries were reported within a range of $6; 00 to $9.00 with an average of $7. 50 per hundred. The average prices last year were 65 cents for eggs and $10. 00 for chicks.
Week Ended
GEORGIA EGGS SET, HATCHINGS, AND CHICK PLACEMENTS
EGG TYPE
Eggs Set
Chicks Hatched
o of
1966
1967
year
1966
1967
ago
Thou.
Thou.
Pet.
Thou.
Thou.
o of year ago
Pet.
Sept. 16 Sept. 23 Sept. 30 Oct. 7 Oct. 14
Week Ended
l, 015 893 774 883 932
Eggs Set 7d
1966 Thou.
1967 Thou.
440
43
763
411 1/ 46
740
549
71
700
396
45
742
459
49
644
BROILER TYPE
o of year a o Pet.
Chicks Placed for
Broilers in Georgia
o of
1966
1967
year
a o
Thou.
Thou. Pet.
539
71
485 -
66
505
72
352
47
329
51
Av. Price
Hatch
Broiler
Eggs
Chicks
Per
Per
Doz.
Hundred
1967
1967
Cents
Dollars
Aug. 12
12, 780 11,517
90
8,938
9,020 101
57
Aug. 19
12, 780 11, 277
88
9,079
8,825
97
57
Aug. 26
12, 111 10,754
89
8, 845
8,614
97
56
Sept. 2
12,454 10, 171
82
8, 880
8,273
93
56
Sept. 9
12,342 10,880
88
8,762
8,217
94
56
Sept. 16
12,437 10,886
88
8,412
7,887
94
56
Sept. 23
12,493 11, 433
92
8,338
7,314 88
56
Sept. 30
11,584 10,465
90
8, 771
7,812
89
55
Oct. 7
11,733 10,736
92
8,998
8, 021
89
55
Oct. 14
11,277 10, 549
94
8,775
8,099
92
55
1 Revised.
"!:.I Includes eggs set by hatcheries producing chicks for hatchery supply flocks.
8.00 8.00 7.75 7.75 7.75 7.75 7.75 7. 50 7. 50 7. 50
. -~
ARCHIE LANGLEY Agricultural Statistician In Charge
W. A. WAGNER Agricultural Statistician
....;..,,
U. S. Department of Agriculture
Georgia Department of Agri.Culture
Statistical Reporting Service
409A North Lumpkin Street, Athens, Georgia
r
r
EGGS SET -!\ND CHICKS PLAC E D IN COMMERCIAL AR Z AS BY WEEKS - 1967
Page 2
'
EGGS SET
CHICKS PLACE i>
STATE
Week. Ende d
% of
Week Ended
o/o of
Sept. 30
Oct. 7
i Oct. 14
year
Sept.
ago 1/ 30
Oct. 7
Oct. 14
year ago 1/
!'
t
1 Maine
\ Connecticut .I. Pennsylvania
Indiana
THOUSA NDS
I
THOUSANDS
1,765
1, 809
1, 765 94
1, 130
1, 443
1, 427
104
332
265
321 104 I
187
192
152
79
1, 125 560
1,216 529
I 1,363 115
878
488 75
338
820 276
838
93
322
94
Missouri Delaware Maryland
396 1, 810
3, 557
392 1, 930 3,873
302 2, 234 4, 134
! 51
318
90 95
I
2, 151 2,708
343 2, 187 2, 721
313 2,083 2, 816
85 83 88
Virginia
1, 312
l, 254
l, 475 92
1, 00 5
863
902
110
West Virginia
132
121
111 72
333
391
304
82
North Carolina South Carolina
5, 526 478
4,976 446
6,350 89 496 151
4,929
4,882
4,707
96
372*
364
384
109
GEORGIA
Florida Tennessee Alabama Mississippi Arkansas Louisiana Texas Washington Oregon California TOTAL 1967 (22 States)
10,465 10,736 10, 549
94 i 7. 812
'
8, 021
8,099
92
779
820
833 191
56 4
570
694
197
703
688
692 60
665
781
913
93
7, 126
7, 149
7,792 100
5, 871
6,075
5, 829
95
4,310 8,223
3,942 8,468
4,205 8,467
I 99
3, 54 0
90
6,465
3,805 6,678
3,880 6, 555
101 94
957
1, 052
1,068 120
775
797
790
121
3,022
3,066
3,409 88
2, 812
2,934
2,758
93
497
345
500 87 I 356
403
392
87
385
195
180
64 I 202
255
206
73
1, 135
1, 412
1, 594 84
1, 166
1, 197
1, 142
92
54, 595 54,684 58,328 93 44, 577* 45,998 45,506
95
TOTAL 1966* (22 States)
60,255 60,349 62,499
47,707 48,277 47,946
% of Last Year
91
91
93
*1/ Current week as p ercent of same week last year Revised.
93
95
95
~ week Ending October 23, 1967
0 T 24 \961
Released 3 p.m. Monday
GOOD HARVEST WEATHER CONTINUES
Athens, Ga., Oct. 23 -- Another week of open weather has been ideal for cotton and corn
harvest, according to the Georgia Crop Reporting Service. Harvest activity, however, has been
mostly in southern and central areas as crop maturity in northern counties is much later than
usual.
County Agents reported the cotton crop 58 percent picked. Picking is well along in
southern districts, but barely started in the northern. The State's crop was three-fourths picked at this time last year.
~ Corn harvest advanced rapidly and was nearly two-thirds complete at the end of the period.
Last year at this time, 56 percent of the crop had been gathered.
Soybean harvest was increasing, but remained light. Only 3 percent of the crop was gatherect-ar-the end of the week. Good yields are indicated from the older plantings, but many late beans have been hurt by dry tveather.
liavm~king and sil~ cutting continued in a few areas.
More than half of the small grain acreage has been seeded, but progress was slow in most central and southern areas because-a:r-dry soil. Condition of winter 2astures declined during the week, resulting from the moisture shortage.
Pecan harvest gained momentum in southern areas and had reached the active stage in severa:r-counties. Crop prospects vary widely by area and variety. A total crop of 48 million pounds is expected.
WEA'IHER SUHHARY - l'1ost areas of Georgia received some rain near midweek as a cold front moved-ulroughth~ate. Amounts ranged from more than an inch in parts of the extreme north to less than one-tenth inch over large areas of central, south central and southwest Georgia. A few observers in the southeast measured more than one-half inch during the week. Except 'for the southeast, most of the central and southern sections of the State continued quite dry at the end of the period.
Temperatures were mild early in the period but turned cool again near the end of the week. Most places had their lowest temperatures of the fall season on Friday morning when readings of freezing and below were recorded in the extreme north and frost was observed as far south as Albany. Several places reported new record lows for the date.
The five-day forecast for the period Tuesday through Saturday (October 24 - 28) calls for temperatures to average near normal. It should be mild the first half of the period and
cooler thereafter. Rainfall is expected to range from .3 to .8 of an inch and occur in showers
about Wednesday or Thursday.
ISSUED BY: The Georgia Crop Reporting Service, Athens, Georgia; in cooperation with the Cooperative Extension Service, University of Georgia; Georgia Department of
Agriculture; and the 1rJeather Bureau, ESSA, u. s. Department of Commerce.
p. S. DEPARTMENT OF COMMERCE
WEATHER BUREAU
Athens, Georgia
ESSA
Precipitation For The Week Ending Oct. 20, 1967
GEORGIA
Temperature extremes for the period ending Oct Q 20, 1967 (Provisional)
Highest: 880 at Quitman on the 17th
Lowest: 250 at Blairsville on the 20th
* For the period Oct. 21-23,
T, less than .oo5 inch
After Five Days Return to United States Department of Agriculture
Statistical Reporting Service 409A North Lumpkin Street Athens, Georgia 30601 OFFICIAL BUSINESS
IMMEDIATE- U. S. WEATHER REPORT This report will be treated in all
Respects as Letter Mail (See Sec. 34.17, P.L. & R. )
Postage and Fees Paid U. S. Department of Agricuiture
~
hi- oq o 7
A-3 oca s e v ~ 4
1:- .: .>! DO'l ::..j :iF c<-)J..I. t) :G:E Oc.Rl\G: I Ac. j:.G:R0 p; R' .E.R T. :-tf (l.. :.. :R .?f -:.t J.8 d lf! OJ /I -~'-'- ~:. n: ~:r
~~ JUl E!I.lrKti1~: J~W:t~J:~.tr.Ul~tfc. ~J]]~li~liDm/3~_0
1 s.tj
~.\-~~~.~.....h._~::J~;~r ~F~:1;L!t:-\.)..r.irJ~;,
~t nv ,1.lT
r
o b ~ ..1~l1T ."J:.:s-:1
:..,.-r,~9:,;.;J~JtB_,.~-~ w~~e-~.ra.~o:}.~9,.6!?7r,~j"f-;-2,~r'I;:.C:;
::'r-'e~:~ tqa~i
(.:.;
~-
:~:.~:~ 'cfttJe'l;.=b-5~
{ n
l..a. .,J.
J ' ; ~)r! J
196:7 . cc
J . ,.: .
t-;~ rrr~
.
-
;;; ~~ .)J f !".:0~ !/::z dJ :fJ. l~ }o '3Cs:J. .. ~) .b i ? i :.;~.r;. .,~ :~i J
53 c,t 1 3brrJI.)( ..JJLUiT1 {-o'FlG?-0: Gl~._; 'f-.(.rr~~:~j<).-:'- .:-!1 ,'l :!1/a ofr, [l '!.'J.r!"! f-. t: rl:trro .rn H .'.~ 9 ~'t('o/a
I c-b~!l.<'.J(} ! ''-Ite . . UN!'i;~~.~:JI _; ! )f' .-:: . ' 2~:; .~ urini}. S e ptf. ,..,. '1 I la! s t:1: :.~ OJ aili:; mt-J sept:: r-:-.(1 gtjJ:la~f "1
'
~-196.. Jr/L . ~ :..1967 .2/;J:.; ye-a r ='.-t:~ l~6f6 .qe(.: o _::;C).~6fl' Z/ ' =!:y.J3
3 6 ,' 9 8.5 9 0 :
z. oo,o8.6:a.)(; r 94 ,
I
- - - _.. -
~- .. "f
2,181 71.
33,..:6Z2.J::. 9 5 :
:c. gg ,"l
. ~.G-- ' 399, 513
382., 790 1L g f[
f.~Il.LJZ,' 09b, 65ZL1 <2 i 1 1::8';.-:34q: .., l'O l~
!
l 29,52.3
, -;) 46(>, 585
,... ~.
~
' .I
I
.ob I
.!I$8{ .i3 7'('1 ~ g.(p :r .,., 45ID ~ 6~-B-> : e.g~~
:Jw<,t a.rrsf1.
~\ ~/i.!' ' r
. o.b 299, l'49 .i ' c ;LJ{l:QJ;I.brSr' r :q_tQM)
. (1, 68 3 ,087 l, 7rJ..r 13"Jv.8 11'H;oT
_ , _, .. ,Thoir.( -~s: r:trq~~:./ .-;rhc5~. J .....:--Thou;.-. :;d "1 J?O:t ;!r:..~;E.c:.ta ,:iq ':'l b :l?ict.rr::~;-qErct: ~T;:ir-
1:..~~n:~1.~!:~ :- 9,.J4g :~.:>i<)~,QJ ~ -"1. 32,'.888. , . 4:9.;;4-6).. ,,,,,?._. gr,r .c 8303 0s:f!A ::. J3 ~' 31.~c-; i : !:! H3>. 5 r.lq
) =?a. l '
n ~ , .59~g~.J -~; IIJ 7;.. 8p ~~ l,.. ' 5,8, .2f:>"8J ..- _5 ~. 4.3 6.. ., ' -.;3.!' 3,rt;.i .! .s4t.tt ~) .ci:J ' ~A..iOl 5 c. ..i -&~JO:H! ~ J1
Mp~..~ :.; i 3.!. 5,~,~ ;-x _,c )t 1 .~? i 1,. 2,3 ~ 9.9, 7, c ,12.61 ,7'!!9, ,' 3.r7s:.~:l I..:Z-:o r.fu!:u ::> .ir:.!l5.93i:t .b.P..fi 4..:.l v "f s J
Del.
8, 696 . 8, .'~84 62., 36.4
61,03-9
3. 6 , .r ..4,n3d 6!. , :.~4.~-.3l b~<i ' 5 ~; ~.., "} \!"!
Md.
13, 509 13,373 91,710
97,061 3. 2
4. 2.
. ~.. .!3J L.f'.-~.:. 5. 1 - u .
Va.
4,044
5,040 29,530
33,631 2.9
2"t.8' ..1 ~_;::.- .. 3 .:~Z:E . 3.7
N. c.
2.5, 092 - 2.:4,.96K .. 168,814
171,578
3 .~ c:.; I 3 <o~ O _;.- ' :;..~.,- 3. ~9' : . ~, ; -4,; 1 -- ; \
Ga.
37, 879. 38,'352 ' 2.54, 203 2.68, 845 3. 2.
4. 2
3. 5
5. o
Tenn. Ala. ',,. Miss. Ark.
6, 10'5'1 '~J. ~6;jHHF ~ 41, 978 24, 56'4 :,;) ;-z6,r527-'. '167, 875
15,570 16,107 105,612 30, 591 32., 875 2.09, 980
42, 029 179, 054 -'
109,960 233, 081
.. ,: ... ?. J , ~ .4 :~ .-e_f:_ -~ ~~~- 1: ~ : _: 4~ 8~ .. ,
s-.1 - . \' ' i -~ 21~-s
2.8 l'J:
1
t~-
s
9
L
'!~~
nL. .-,--q
3 '.~ 0u<:
'-:::35. .;
s1."
. .
.z:; 3. 5 ~ - f i Jig ,iW--3.;' 61 'J \t ~ ~" -,i:J r
:!'~?f~_s_____1_2~ J_8_1____ ~~- ~~~ ___ ~~!. ~~ ~ ____1_9_9.! _5?3_ _ _~ :_ ~ _____ ~ ~t~:; ~:~~~J-~~ 25.:~_;:;;._~~<:d. ____ _
u. s. 211, 94o
1, 486, 121
3. 1
3.-z----------3 :-6 ------ 4.2
2.27,392
1, 580,948
U. S. Department of Agriculture
Georgia Department of Agriculture
Statistical Reporting Service, 409A North Lumpkin Street, Athens, Georgia 30601
End-of-Month Stocks of Poultry, Poultry Products, Meat and Meat Products United States - September 1967
Shell egg holdings were 281 thousand cases compared with 100 thousand a year earlier. The October 1 average is 212 thousand cases. Stocks were down 34 thousand cases for the month. Last year the September gain was 43 thousand cases. The average September change is a decrease of 44 thousand cases. Frozen eggs totaled 98 million pounds, about the same as a month earlier. Last year, the September decline was 7 million pounds reducing October 1 stocks to 53 million pounds. The average reduction is 8 million pounds and the average October 1 stocks are 100 million pounds. October ~ wareho.use stocks of frozen poultry were a record 589 million pounds, 44 percent more than a year earlier and 62 percent above the average. Frozen turkey stocks totaled 427 million pounds, a record high. A year earlier, stocks totaled 283 million pounds and the average is 246 million. The September gain of 95 million pounds was 9 million more than the average September increase of 86 million pounds. Total stocks of meat on October 1 were 527 million pounds. This was a September decline of 1 million pounds. A year earlier stocks increased 17 million pounds and holdings were 451 million pounds on October 1. The average change is a reduction of 27 million pounds and average holdings are 439 million pounds. Beef stocks were 237 million pounds, an 8 million pound decrease during September. Frozenpork totaled 203 million pounds, up 4 million from September 1. Stocks of all pork were 34 percent larger than a year earlier and 29 percent larger than average.
Commodity
Unit
Sept. 1961-65 av
Sept. 1966
Aug. 1967
Sept. 1967
Eggs: Shell Frozen eggs, total
Poultry, frozen: Broilers or fryers Hens, fowls Turkeys Other & Unclassified
Total Poultry
Thou.
Thou.
Thou.
Thou.
Case
212
100
315
281
Pound
100,036
53,230
98,938
98,488
~-------------------------------------------------
do.
23, 162
do.
38,004
do.
246,203
do.
56, 588
do.
363,957
26,671 35,206 282, 534 63,957 408,368
36,225 54, 647 332, 059 63,376 486,307
36,351 57,855 426,752 68,060 589,018
Beef: Frozen in Cure
and Cured
do.
197,312
224,699 245, 148 237,414
Pork: Frozen and
Cooler
do.
157, 502
151,037 198, 586 202,890
Other meat and meat
products
do.
84,253
74,861
84,197
86,481
Total all red meats
do.
439, 067
450, 597 527, 931 526, 785
MID-MONTH PRICES RECEIVED AND PRICES PAID
Georgia
United States
Item
Sept. 15 Aug. 15 Sept. 15 Sept. 15 Aug. 15 Sept. 15
1966
1967
1967
1966
1967
1967
Cents
Cents
Cents
Cents Cents
Cents
Prices Received:
Chickens, lb. excluding
broilers
11.0
8.0
7.5
9.2
7.7
7.9
Com 11 Broilers (lb.)
14.0
12.0
12.0
14.6
12.9
12.6
All Chickens (lb. )
13.9
11.9
11. 8
14.0
12. 5
12.2
All eggs (dozens)
52.2
35.3
38.5
42.7
29.8
32.0
Prices Paid:(Eer 100 lb.)
Dol.
Dol.
Dol.
Dol.
Dol.
Dol.
Broiler Grower
5.40
5.20
5.20
5. 19
4~ 98
5.01
Laying Feed
5. 10
5.00
4.95
4.75 4. 59
4.59
Scratch Grains
4.40
4.40
4.30
4. 1.0 - 4.08
4.03
Thts report 1s made posstble through the cooperatlon of the Natlonal Poultry Improvement
Plan, Official State Agencies, the Animal Husbandry Research Division of the Agricultural
Research Service, the Inspection Branch of the Poultry Division, Consumer and Marketing
Service and the Agricultural Estimates Division of the Statistical Reporting Service and
the many breeders, hatcheries, poultry processors and the poultry farmers that report
to these agencies.
ARCHIE LANGLEY
W. A. WAGNER
Agricultural Statistician In Charge
Agricultural Statistician
After Five Days Return to: United States Department of Agriculture
Statistical Reporting Service 409A North Lumpkin Street
Athens, Georgia OFFICIAL BUSINESS
Postage and Fees Paid U. S. Department of Agriculture
&
H- Q'{Oo?
I Lf-A-J
' . ; ., :
~1~ w~~rn~~CROrnPORT NG
ATHENS, GEORGIA
UNIVERSITY Of
1967
GEORGIA CHICK HATCHE RY RE PORT
LIBitAR\ES
~!_
1
Placement of broiler chicks in G e orgia du}mg the week e nded 0 ctobe r 21 was
7, 551, 000--7 percent less than the pre vious w e ek and 9 percent less than the com-
parable week last year, according to the G e orgia Crop R eporting Service.
An estimated 11, 289, 000 broiler type eggs we re set by Georgia hatcheries-? percent more than the previous week but 6 percent l e ss than the comparable we ek a year earlier.
The majority of the prices paid to G e orgia produce rs for broiler hatching e ggs were reported within a range of 50 to 65 cents per dozen. The averag e price of hatching eggs was 56 cents per dozen. The price of eggs from flocks with hatche ry owned cockerels generally was 2 c ents below the average price. Most p r ice s r e c ei ve d for broiler chicks by Georgia hatcheries were r eported within a range of $6. 00 to $9. 00 with an average of $7. 7 5 per hundr e d. The ave rage prices last year were 64 cents for eggs and $9.75 for chicks.
Week Ended
GEORGIA EGGS SET, HATCHINGS, AND CHICK PLACE ME NTS
EGG TYPE
Eggs Set
i
o/o of
1966
1967
year
ago
Chicks Hatched
1966
1967
Thou.
Thou.
Pet.
Thou.
Thou.
o/o of
year ago
Pet.
Sept. 23 Sept. 30 Oct. 7 Oct. 14 Oct. 21
Week Ended
893 774 883 932 888
Eggs Set 1_/
1966 Thou.
1967 Thou,
411
46
549
71
396
45
459
49
568
64
740
485
66
700
505
72
742
352
47
644
329
51
596
412
69
BROILER TYPE
o/o of year ago
Chicks Place d for Broilers in Georgia
Av. P ric e
Ii Hatch E ggs
Broiler Chicks
1966
1967
I o/o of I
year
Per Doz.
ago
1967
Per Hundred 1967
Pet.
Thou.
Thou. Pet. Cents
Dollars
Aug. 19
12, 780 11, 277
88
9,079
8,825 97
57
.(\ug. 26
12, 111 10, 754
89
8, 845
8,614 97
56
Sept. 2
12,454 10, 171
82
8, 880
8,273 93
56
Sept. 9
12,342 10, 880
88
8, 762
8,217 94
56
Sept. 16
12,437 10, 886
88
8,412
7, 887 94
56
Sept. 23
12,493 11,433
92
8,338
7,314 88
56
Sept. 30
11, 584 10,465
90
8,771
7,812 89
55
Oct. 7
11, 733 10,736
92
8,998
8,021 89
55
Oct. 14
11, 277 10, 549
94
8,775
8,099 92
55
Oct. 21
11,981 11, 289
94 I 8,274
7,551 91
56
1/ Includes eggs set by hatcheries producing chicks for hatchery supply flocks.
8.00 7.75 7.75 7. 7 5 7.75 7.75 7.50 7.50 7.50 7.75
ARCHIE LANGLEY Agricultural Statistician In Charge
W. A. WAGNE R Agricultural Statistician
U. S. Department of Agriculture
G e orgia Department of A griculture
Statistical R eporting Se rvice
409A North Lumpkin Stre et, Athens, Georgia
EGGS SET AND CHICKS PLACED IN COMME RCIAL AREAS BY VvEEKS - 1967
Page 2
I
E GGS SET
i
CHIC KS PLA CE D
STATE
Wee k E n g_g__ - -- --- o/o of I
Oct.
7
O ct.
14
Oct.
year
Oct.
21
ago 1/ 1 7
I
Wee k E nde d_~ o/o of
Oct.
Oct.
year
14
21
ago 1/
THO USANDS
THOUSANDS
Maine
'
Connecticut
Pennsylvania
Indiana
Missouri
Delaware
Maryland
1, 809
1,765
1, 794 101
1, 443
1, 427
1,364
113
265
321
293
89 II 192
152
135
79
1, 216
1,363
1,622 106 i 820
838
716
89
529 392
488 302
570 447
88 75
!
I
276 343
322 313
306
91
293
83
1, 930
2, 234
2, 250 87
2, 187
2,083
1, 735
71
3,873
4, 134
4, 158 97
2,721
2, 816
2, 523
83
Virginia West Virginia North Carolina South Carolina
GEORGIA
Florida Tennessee Alabama Mississippi Arkansas Louisiana Texas Washington Oregon California
1, 254 121
1, 475 111
1, 560 121
I 92
863
77
391
902 304
848
119
278
95
4,976
6, 350
6,314 92 I 4,882
4,707
4, 279
102
446
496
448
143
I
;
364
384
380
112
j
!
10, 736 10, 549 11,289
94
I
I
8, 021
8,099
7. 551
91
i
820 688
833 692
914
226
I
I
570
675 60 i 781
694 913
628
168
855
85
7, 149
7,792
8, 133 109 I 6,075
5,829
5,433
90
3,942
4,205
4,305 101
3, 805
3, 880
3, 746
100
8,468
8,467
8,828 94
6,678
6,555
6, 048
85
1, 052 3,066
1,068 3,409
I 1,063 116
3,441 89
797 2,934
790 2,758
745 2,456
113 87
345
195 1, 412
500 180 l , 594
585 . 235
1,666
I 98
403
64
255
84 I 1, 197
392 206 1, 142
349
84
276
169
854
91
TOTAL 1967 {22 States)
TOTAL 1966* (22 States)
54,684 58, 328 60, 711
96 ,45, 998 45, 506 41,798
92
I
I
I
I
60,349 62,499 63, 171
'48, 277 47,946 45, 388
I
o/o of Last Year
91
93
96
I 95
95
92
*1 I Current week as percent of sam e week last year. Revised.
U .S. DEPARTMENT AGRIClJLTURE
STATE DEPARTMENT OF AGRICULTURE
Jtla7. STATISTICAL RE
RTIN~.ii~RV.J.CE
NUV ~
OJQI'1,
THE POULTRY AND EGG SITUATION Approved by the Outlook and Situation Board, Octo
~ f: 't96?"1-J;JS~ '..
S ITUATION AND OUTLOOK (B ROILERS } t..;__...._..;......,...... ~.~.--
Recent Situation
For the 21 st cons ec utive year, broiler production incre ased again in 1967. The number produc e d in 1967 is expected to ris e 3 p ercent from the 2. 57 billion birds in 1966 . The incr ease this year is well below the 8 to 10 p ercent increase in the 2 preceding years and about the same as in 1964. Most of the increase in broiler meat production in 1967 came in the first half when production ran 6 p e rc ent above a year earlier . By September, production was cut back to year-earlier l e v el s . Broiler chick placeme nts for marketing the rest of this year indicate production will likely run below the same period in 1966.
Prices for live broile rs ave r aged 13.8 ce nts per p ound in Janua ry - Septembe r, about 2 cents be low a ye ar earlie r. The larger supply of broilers and increased compe tition of red m eats (principally pork} and turkeys have d pr ess e d broiler prices during most of 1967. With prospe cts of broiler supplies be low a year earlie r and somewhat less competition from red meats, broile r prices are exp ected to improve moderately in coming months. The 9-city average wholesale price for broilers on October 16 was 24. 5 cents per pound. This was slightly above the mid-September price and only about 1/2 cent below a year earlie r. Larger supplies of turke y meat in the last quarter of this year will tend to temper broiler price increases .
USDA began buying young cut-up chickens for the National School Lunch Program in September. Total purchase s for September and October amounted to 25. 5 million pounds at a cost of $7 . 6 million. Last year's prog ram purchases began in August and ended in January 1967. A total of 54 million pounds were purchased at a cost of $16.9 million.
The cost of broiler feed in the first half of 1967 averaged almost 4 percent above a year earlier. During the third quarter, however, the cost declined and averaged almost 4 percent below a year earlier. The broiler-feed price ratio averaged 2. 7 for the January-September period, the least favor a ble since 1961. Prices reported for broiler chicks declined about 12 percent from January to 3eptember. Lower prices for feed and broiler chicks are expected to e xte nd into 1968.
Outlook for 1968 Broiler production is expected to continue increasing in 1968, but not as much
as in 1967. Broiler chick placements and eggs set in r e cent weeks indica.te I railer production by the end of the year will be running below a year earlie... A reduction in the Nation's broiler hatchery supply flock, which was about 1/5 larger this summer than a year ago, has been underway in recent months. Placements of pullet chicks for broiler supply flocks this year have been below a year earlier . These placements indicate the broiler hatchery supply flock will be reduced and by mid-1968 will run well below a year earlier. A reduction in size of the hatchery supply flock would tend to ease the pressure to expand broiler production. Since production of the hatchery supply flock can be diverted to table eggs or proces sing, the prospective smalle r flock would still provide the capacity for a substantial increase in production. Thus an upturn in production is likely in 1968 if red meat prices hold up in the coming year.
Broiler prices next year may average a little higher than in 1967 . Prices in the early months of 1968 are expected to be arou;,1.d levels of a year earlier . But prices later in the year are expected to averag e moderately above the r elatively low levels ofl967.
After Five Days Return to: Unite d States Department of Agriculture
Statistical Reporting Service 4J9A North Lumpkin Street
Athens, Georgia OFFICIAL BUSINESS
Postage and Fees Paid U . S. Department of Agriculture
,J
Acg uisitions Division un1versity Libraries University of Georgia ~~Ans Georgia 3 0 6 01
......
Athens, Georgia
Week Ending October 30; 1967 .
' ************************************
This -is thefd.nal...i.ssue o.f:-the Georgia Weekly Cropand"Weather Btr11.e't:tn fOr I967.
j rublf~
cation of the Bulletin will be resumed in April 1968.
:.
..~ 4.: ...,
'
. .1
Much appreciation .is expressed to County Agents, Market Managers, and Cooperative Weather 1
* * Observers through whose efforts this Bulletin has been possible.
. .,
. ,... ;
* * * * * -r.- * * * * * * * * * * * ~~ ~~ -:t- * -Y.- ~} -r.- ~*' -lf- * ?r * * * * * * * * * * * * *
* *. -l!-
..,'*' :
HARVEST ACTIVE SCUTH, SLOW NORTH
Athens, Ga., Oct. 30 -- Weather was mostly favorable for crop harvest during the week, " according to the Georgia Crop Reporting Service. Good prcgress was made in southern secti~ns,
but lack of maturity prevented much progress in the northern part of the State.
County Agents reported cotton harvest 67 percent complete compared to 81 percent a year ago. Use of mechanical pickers is expecte9 to become widespread in northern counties this
week.
~harvest is more than three-fourths complete in southern districts and well under :
. way in all sections of the .State. It is now 70 percent complete Statewide. All sectiohs hre
reporting excellent yields.
J'
'
Sovbean harvest is gaining momentum and is expected to be in full swing .in about a week.
Haymaking and silage cutting are nearing completion.
Dry soils have limited growth of small grain~ and hampered land preparation in .squthern
areas. Small grain seeding is about 50 percent complete compared to 74 ;~ercent last year.
Pecan harvest is becoming more active. Prospects vary widely by areas
WEATHER S~wMRY: Light to moderate rain was recorded over the north~estern half of . 1 Georgia during the week en~ing Friday, Cctober 27, while very light amounts fell over most of the southeastern half Several observers in northern counties measured more than an inch during the week. A number of places in the dry east central and south central s~ctions received 1no measurable rain. Except for the lm-1er coast, most areas south of the .t'all line continued extremely dry.
Days were sunny and mild and nights were cool during most of the week. The lovTest temperatures occurred near midweek and during the weekend following the passage of fast moving cold fronts. Freezing temperatUres and heavy frost were common over north and central sec,tions on Sunday, Cctober 29. Augusta and l1lacon each had a low of 300 on this date.
Rainfall during the: first :30 ~ays . 0f- October, was near normal in the northern third of Georgia but was well below normal in central and southern sections. Since September was also dry, many places had accumulated large moisture deficits by the end of Cctober. Average rainfall for the two month period was only about 1 1/2 inches in the east-centl'al section. This
was about 25 percent qf normal for the period. Most of south Georgia had less than 50 per cent
of normal rainfall for the two fall months. Cctober temperatures averaged below normal over
Georgia. This was .,the 9th ~onsecutive cooler than normal month and the 8th month of 1967 that
was well belcw normal.
The five-day for~hast for the period Tuesday through Saturday ('Cctober 31-November 4) calls
for temperatures to average 2~ to 5 degrees above normal. Cool weather at the beginning of the
period should be follmved by gradual warming the remainder of the week. Rainfall is expected to be light and occur as showers on Tuesday or Wednesday.
- - - - - - - - - - - - - - - - - - - - - - ~------------------------
ISSUED BY: The Georgia Crop Reporting Service, Athens, Georgia; in cooperation with the Cooperative Extension Service, University of Georgia; Georgia Department ~f
Agriculture; and the Weather Bureau, ESSA, u. s. Department of Commerce.
U. S. DEPARTMENT OF COMMERCE
I , . ~'
. _; ;, ,
WEATHER BUREAU :' ..:.. 1. .:. ..Athe,nsE, SSGAeorgia
., : :. j .
,-~. ...
. . "! ~ (.: ~ 1 ~ ; ;
: .. . ~ '
GEORGIA
~' I
Precipitation For The Week Eliding Oc~obe :t" 27, ~.967 .~J ~ . ~ ~
.) .,
~ )~ .:,~. .;:,. '. ,;v.-t ' . .
week !: ..":
. ''
. 1(~<.f
... .~ '''
:' ,~, -i.~?,. '
Temperature extremes for the
ending -
October 27, 1~67 (Provisional)
0
Hi ghest: 85 at Hawkinsville on the 23rd and 25th and QUitman on the 25th.
250 at Blairsville on the 21st.
: .
,
* For the p~riod Oct. 28-30, 1967
T, less than .oo5 inch
After Five Days Return to United States Department of Agr iculture
Statistical Reporting Service 409A North Lumpkin Street Athens, Georgia 30601 OF.FICIAL BUSINESS
Postage and Fees Paid
U. s. Department of Agriculture
IMMEDIATE - U. S. WEATHER REPORT _ This report wi 11 be treated in a 11
Respects as Letter Mail (See Sec. 34.17, P. L. & R.)
The Univ Library Univ Of " Ga Athens Ga 30601
;:Jc 7ft 1'tJo 7
~ ~.f3
~~0
GEORGIA:
-.
October 1, 1967
~-
UNIVERSI"i ..,,. - '' ORG A
I
MV 2 1961
......
LIB RA".r: s
Released 10/3~/67 GEORGIA CROP REPORTING SERVICE
Corn Stocks 41 Percent Below Last Year
Stocks of corn (old crop) in all posit ions in Georg ia totaled I ,712,000 bushels on October I, 1 1967, 41 percent below the 2,890,000 bushels on hand last year. A decrease of 1,210,000 bushels
of on-farm stocks from last year account for the smaller carryover as off-farm storage increased
over last year. Oats on hand in all positions totaled 1,769,000 bushels, 23 percent below the . 2,301,000 bushels last year. Wheat stocks in all positions amounted to 1,889,000 bushels, 75
percent over the 1,077,000 bushels on hand last year. Ba r ley stocks in all posit ions totaled 126,000 bushels, 15 percent below the 149,000 in sto rage October 1, 1966. Stocks of~ in all , ~::!t~~~~.totaled 650,000 bushels on October 1, 1967, 76 percent above the 369,000 bushels
Georg ia Grain Stocks--October 1, 1967 with compar isons
GRAIN
ON FARMS
1966
1967
1,000 Bushels
OFF FA~MS
1966
1967
1,000 Bushels
ALL POSITIONS
1966
1967
1,000 Bushels
Corn (old crop) Oats Barley Wheat Rye
2,681 1,647
135 488
329
1 ,471 1,445
94
737 554
209
241
2,890
1, 712
654
324
2,301
I, 769
14
32
149
126
589
1,152
1,077
1,889
40
96
369
650
UNITED STATES:
All Stocks Lower Exceet Wheat
Wheat stocks on October 1 were 9 percent more than a year earlier but otherwise the smallest October 1 holdings since 1953. Stocks of the four fP-ed grains totaled 51.5 mill ion tons-- 10 percent less than last year and 40 percent below average. In spite of the increase in all wheat stocks, durum holdings were 16 percent less than last year. Stocks of each of the feed 'grains were below a year earlier and average. Rye stocks were down 13 percent from October I, 1966 while holdings of flaxseed were 19 percent less than last year.
f I
Old corn carryover stocks on October I totaled 817 mi ll ion bushels--3 percent less than a year earlier, and 47 percent less than average. Indicated disappearance of 91b mill ion bushels ,. during the July-September quarter i s 3 percent less than in the same months in 1966 but 23 pe r cent larger than in 1965.
Stocks of old corn on farms, at 563 mill ion bushels, were 6 percent above a year earlier but 5 percent below average. Corn held in off-farm posit ions totaled 254 mill ion bushels compared with 311 mill ion bushels a year earlier.
All wheat in storage October 1 totaled 1,565 mi ll ion bushels, 9 percent more than a year earl ier, but otherwise the smallest October 1 holdings since 19~3. Off-farm stocks, at 956 mill ion bushels, were up 7 percent from last year and farm holdings, at 609 mill ion bushels, I were up 12 perc. ent. Disappearance from all storage positions during the July-September quarter is indicated at 415 mill ion bushels compared with 405 mill ion for the same quarter last year.
Rye stocks in all storage positions on October 1, at 32.9 mill ion bushels, were down 13 percent from a year earlier, Oats stocks in all positions totaled 793 mill ion bushels, 5 percent ,less than a year earlier and 14 percent below average. Barley stored in all positions on
/ ~ October 1 totaled 378 mill ion bushels, 2 percent less than a year earlier and~ percent below average. Sorghum grain old crop carryover stocks on October 1 in all positions were 245 mil l ion 'bushels, 37 percent below last year and 62 percent below average,
ARCHIE LANGLEY Agricultural Statistician In Charge
Please turn page
A. J. BOi{DELON Agricultural Statistician
Grain and position
Stocks of grains, October l, 1967 with compa r isons (In thousand bushels)
Oct. l Av. 1961-65
De t. l 1966
Jul.y l
, i967 '
. ;,
Oct. l 1967
ALL ~/HEAT
On Farms 11 Commodity Credit Corp. 11 Mi lis, Elev. & \.Jhses. 11 l/
TOTAL
~YE
On Farms 11 Commodity Credit Corp. 11 Mills, Elev. & Whses. 11 11
TOTAL CORN (old crop)
On Farms 11
Commodity Credit Corp. 2/
MiII s, E1ev. & ~Jhses. 11- }/
TOTAL
OATS
On Farms 11
Co~modity Credit Corp. 2/
Mills, Elev. & Whses. 11- }/
TOTAL
BARLEY .
On Farms 11
Commodity Credit Corp. 2/
Mills, Elev. & Whses. 11-11
TOTAL
SORGHUM (old crop}
On Farms 1/
Commodity Credit Corp. 11 Mills, Elev. & Whses. !/ 11
TOTAL
469,238
543,737
147,066
609,446
35 '989
7 '661
997
969
____ _ -'~4~3~513______ ~82.251
2ze~216_ _ _ _ _ 25~.131 ~
1,968,799
1,440,950
426,289
1,565,152 '
16,389
15,610
3,601
11,820
236
683
523
474
- - - 13~6Q9_ - - - - - _21,202 - - - - 14~513_ - - - - _2.Q,.l1_
30,234
37.798
18,697 .
32,906
592,560
529,705
l ,330,004
563,182
443,484
134,369
97,690
97,571
- - _5Q7~5Q8_----- 17~.162--- _3Q7~6~6----- 15~.121_
I .543.552
840,243
I .735.340
817,280
808,302
675,361
198,232
659,495
4,317
9,636
6,664
6,674
- ~ _114~527_----- 141.212 ~--- &4~6~1---- _ 121,181_
927.175
832.912
269.537
793.451
253,320
245,252
55,956
228,445
10,649
5,118
4,240
4,030
- - -'~3~028_----- 13~.51---- ~0~5i7_---- !41.~22_
417,068
385,223
120,753
377.904
36,252
50,614
84,090
45,655 .,
4,692
. 4,722
4,606
4,598
- - _6Q5~419_----- 13~.6~--- _2~8~9~7----- 19~.~8~-
646,372
391,201
337.643
245,137 j
Estimates of the Crop Reporting Board. c. c. c.-owned grain at bin sites. All off-farm storages not otherwise designated, including terminals and process ing plants. Includes C. C. C.-owned grain in these storages.
ISSUED BY: The Georgia Crop Reporting Service, USDA, 409A North Lumpkin Street, Athens, Ga.,
in cooperation with the Georgia Department of Agriculture.
i
After Five Days Return to United States Department of Agriculture
Statistical Reporting Service 409A North Lumpkin Street Athens, Georgia 30601 OFFICIAL BUSINESS
Po~tage and Fees Paid U.S. Department of Agriculture
~
r/Dct oo 7
~ ~~-4~
l tt b 7
I
GEORGIA CROP REPORTING SERVICE
ATHENS, GEORGIA
November l, 1967
GEORGIA CHICK HATCHERY REPORT
Placement of broiler chicks in Georgia during the week ended October 28 was .7, 53 7, 000-- slightly less than the previous week and 7 percent less than the comparable week last year, according to the Georgia Crop Reporting Service.
An estimated ll, 271, 000 broiler type eggs were set by Georgia hatcheries-slightly less than in both the previous week and the comparable week a year earlier.
The majority of the prices paid to Georgia producers for broiler hatching eggs were reported within a range of 50 to 65 cents per dozen. The average price of hatching eggs was 56 cents per dozen. The price of eggs from flocks with hatche ry owned cockerels generally was 2 cents below the average price. Most prices receive d for broiler chicks by Georgia hatcheries were reported within a range of $6. 00 to $9. 00 with an average of $7 . 7 5 per hundred. The average prices last year were 62 cents for eggs and $9.25 for chicks.
Week Ended
GEORGIA EGGS SET, HATCHINGS, AND CHICK PLAC~MENTS
EGG TYP:S
Eggs Eet
Chicks Hatched
1966
1967
1966
1967
Thou.
Thou.
Thou.
Thou.
o/o of year ago
Pet.
Sept. 30 Oct. 7 Oct. 14 Oct. 21 Oct. 28
Week Ended
{
774 883 932 888 818
Eggs Set !)
1966 Thou.
1967 Thou.
549
71
700
396
45
742
459
49
644
568
64
596
560
68
682
BROILER TYPE
o of year a o
Pet.
Chicks Placed for
Broilers in Georgia
o/o of
1966
1967
year
a o
Thou.
Thou. Pet.
505
72
352
47
329
51
412
69
334
49
Av. Price
Hatch
Broiler
Eggs
Chicks
Per
Per
Doz.
Hundred
1967
1967
Cents
Dollars
Aug. 26 f, Sept. 2
12, 111 10, 754
89
8,845
8,614 97
56
12,454 10, 171
82
8,880
8,273
93
56
Sept. 9
12,342 10, 880
88
8, 762
8, 217
94
56
Sept. 16
12,437 10, 886
88
8,412
7,887
94
56
Sept. 23
12,493 11,433
92
8,338
7,314
88
56
Sept. 30
11, 584 10, 46 5
90
8,771
7,812
89
55
Oct. 7
11,733 10, 736
92
8,998
8, 021
89
55
Oct. 14
ll, 277 10, 549
94
8, 775
8,099
92
55
Oct. 21
11, 981 ll, 289
94
8,274
7' 551 . 91
56
Oct. 28
11, 27 5 11,271 100
8, 141
7, 537
93
56
' 1/ Includes eggs set by hatcheries producmg chicks for hatchery supply flocks.
7.75 7.75 7.75 7.75 7.75 7.50 7.50 7. 50 7.75 7.75
ARCHIE LANGLEY
Y.I . A. WAGNER
Agricultural Statistician In Charge
Agricultural Statistician
---------------------------------------------------------------------------------
U. S. Department of Agriculture
Georgia Department of Agriculture
Statistical Reporting Service
409A North Lumpkin Street, Athens, Georgia
UNIVERSITY OF GEORGIA
E GGS SE T A ND C HI C KS PLACE D IN :: OMM.t.; RC IAL AREAS BY WEEKS - 1967
Page 2
.1,!
:::: HI C KS PLACZD
STA T E
Week Ended
Oc t.
Oct.
Oct.
Ufiyoe oafr !1 --l =c----1_N...e.:_e,,...k__n_d_e_d_=-_ _1 o/o of
Oct.
Oct.
Oct .
ye ar
--~------~-----~ia~~-----~2~1_ _ _ _ _2_8_._ _1~-a~g~~-l~/11_ _~1~4~------=2~1-------2-8~--1~~a~g~o~l~/-----
THO USA NDS
!
THOUSANDS
Maine Conne cticut Pennsylvania Indiana Missouri Delaware Maryland Virginia We st Virginia North Carolina South Carolina
G E ORGIA
i!
1,765
l, 794
l, 798
95 !i 1, 4 27
1,364
1, 444
106
321 1,363
488
293 1, 622
570
256 1, 468
75 105
ii :l
152 838
492
86 il 322
135 716 306
157
111
780
91
251
78
302
447
456
83 lli! 313
293
345
90
2, 234
2, 250
2,223
91 I 2, 083
1, 735
2,005
84
4, 134 1, 475
111 6,350
4 , 158 1, 560
121 6,314
4 , 199 l, 470
129 6,020
97 89
!
t
2, ~8010462
~01 85
88 I! 4,
2, 523 84 8 278
4,279
2,500 849 227
3,673
78 96 88 83
496
448
426
151
I' !
384
380
323
121
i
10, 549 11,289 11,271 100 : 8, 099
7, 551
7, 537
93
Florida Tenne ssee Alabama Mississippi
i
833 692
914 675
919 679
I:
191 61 :
~i;
628 855
561
161
945
100
7, 792 4,205
8, 133 4 ,305
8,385 4, 4 80
110 107
1
ii
1
5, 829 3, 880
5,433 3,746
5, 569 3, 4 30
92 97
Arkansas
8, 4 67
8,828
9,098
98
6, 555
6,048
5,916
84
Louisiana
1,068
1, 063
1, 062 101 I 790
745
763
118
T exas Washington Oregon California
3,409
3,441
3,567
91 i 2, 758
2,456
2, 4 95
89
500
585
494
82 .i
392
349
235
56
180
235
430 109 li 206
276
131
66
l, 594
1, 666
1, 607
78 r l, 142
854
983
72
TOTAL 1967
58,328 60, 711 60,929
98 f. 45, 506 41,798 41, 119
89
{22 States)
TOTAL 1966* {22 States)
62,499 63, 171 62,439
o/o of Last Year 1
93
96
98
*1/ Current week as percent of same week last year. Revised.
'f: 47,946
R L
95
45,388 92
45,990 89
GEORGIA CROP
ATHENS, GEORGIA
G EO.~_~GIA CHICK HAT CHERY R E PORT
Placement of broiler chicks in Georgia during the week ended October 29' was 8, 141,000 --2 perc e nt less than in the p r e vi.ous week but 7 percent m 'ore than in' t'he"' comparable week last year, according to the Georgia Crop Re porting Service .
An estimated 11, 27 5, 000 broiler type eggs were set by Georgia hatcheries-6 percent less than in the previous week but 4 percent more than in the comparable week a year earlier.
The majority of th e pri ces paid to G ~ orgia producers for broil e r hatching eggs were reported within a range of 60 to 70 cents per do zen. The average price of hatching eggs wa s 62 cants p e r dozen. The price of e ggs from flocks with hatche ry owned cockerels g enerally was 2 cents below t he ave rage price . Most prices receive d for broiler chicks by Georgia hatcheries were reporte d within a range of $8.00 to $ 10.00 with an average of $ 9.25 per hundre d. The average prices last year were 60 cents for eggs and $9 .00 for chicks.
GE ORGIA EGGS SET , HATCHINGS , AND CHICK PLACEMENTS
Week Ended
Oct. 1 Oct. 8 Oct. 15 Oct. 22 Oct . 29
EGG TYPE
.t.;ggs set
I
1965
1966
l I %of
I
l y.:!ar I ago
Thou.
I Thou.
Pet.
I
534
745
14 0
552 550
883 932
I 160
169
428 504
888 708
I 207
j 14 0
Chl'C k S H ate h e d
1965 Thou.
1966 Thou.
o/o of
I year ago
Pet .
476
700
147
501
742
148
361
644
178
427
596
14 0
442
I 682
154
B ROILEH TYPE
___ _ _ A.'!W_ P rice_ _
Week Ended
E ggs Set}:_/
1965
1966
o/o of
year ago
Chicks Placed for Broilers in Georgia
1965
1966
o/o of
year ago
Hatch Eggs Per Doz . 1966
Broiler Chicks Per Hundred 1966
Thou.
Thru.
Pet.
Thou.
Thou. Pet. Cents
Dollars
Aug. 27 10,324 12, 111 117
7,987
8, 845 111 67
10. 50
Sept. 3 10,054 12,454 124
7,667
8,880 116 67
10. 50
Sept. 10 10, 513 12, 342 117
7,329
8, 762 120 67
10. 50
Sept. 17 Sept. 24 Oct. 1
10, 638 10, 752
9, 740
12,437 12,493 11, 584
117
7,098
116
I
I
6, 793
119
7' 187
8,412 119 67 8,338 123 67 8,771 122 66
10. 50 10. 50 10.25
Oct. 8 10, 662 11, 733 11 0
7,404
8,998 122 65
10 .00
Oct, 15 10,667 11,277 106
7,692
8,775 114 65
10.00
Oct . 22 10,712 ll , 981 112
6,870
8,274 120 64
9.75
Oct. 29 10, 822 11, ?.75 104
7' 633
8, 141 107 62
9.25
1/ Includes eggs s et by hatchenes producmg ch1cks for hatchery supply flocks.
ARCHIE LANGLEY Agricultural Statistician In Charge
W. A . WAGNER Agricultural Statistician
U. S. Department of Agricultur e
Agricultural Extension Service
Statistical Reporting Service
State D epartment of Agriculture
315 Hoke Smith Annex, Athens, Georgia
'
'
r
,.
E GGS SET AND CHICKS PLACE D IN C OMMERCIAL A RE AS BY NSE KS-1 966 Pag e 2
STATE
I l
I
I
I
Oct. 15
E GGS SET
We ek E nde d Oct. 22
Oct. 29
i I
CHIC L(S PLA C:ZD
II o/o of ,I year il - Oct.
I Week E nded __ __ __j o/o of
-O ct.
Get.
year
ago 1/ II 15
22
29
ago 1/
Maine Connecticut Pennsylvania Indiana Illinois Missouri Delaware Maryland Virginia West Virginia North Carolina South Carolina
THO USANDS
THOUSANDS
ll
1, 871
1, 796
1, 873 112 It 1, 371
1, 212
1, 376
103
321 1, 188
332 1, 480
337 1, 403
110 102
I
I
181 897
172 797
141
97
849
116
705
635
540
82
I
I
351
329
317
71
14 597
7 598
6
46
9
546
82 II 368
8 353
7
88
385
92
2,454
2,636
2, 515 114
2, 521
.2, 446
2, 378
108
4,374
4 ,228
r 4, 274 107
3,239
3, 104
3, 261
108
1, 577
1, 700
I 1,648 109
769
663
836
86
150 I 6, 810
157 6,492
152 6,669
158 110
I 370 4,966
293 4, 221
266 4,497
118 95
349
3 55
307
83
t
306
318
242
88
GEORGIA
11, 277 11,981 11,275 104
8,775
8,274
8, 141
107
Florida Tennessee Alabama Miss is sippi Arkansas Louisiana Texas Washington Ore gon California
TOTAL 1966 (23 States}
435 1, 153 7,726 4,249 9,390
887 3, 888
575 254 t l, 869
4 05 1, 177 7, 4 27 4 ,279 9, 441
868 3,841
595 362 1, 657
482 138 1, 163 116 7,670 104 4, 170 109 9,354 112 l, 052 111
3,931 102
599 132 385 135
2 , b 11 105
353
373
349
121
1,020
1, 013
948
118
6,097
5, 883
6,059
108
3,827
3,754
3, 538
117
6,857
6,988
6, 966
121
655
660
648
103
2,980
2,837
2,785
99
446
408
41 4
152
284
164
198
106
1, 207
924
1, 322
125
Q2; 113 62,449 62,362 107
47,849 45, 194 4 5, 923
108
TOTAL 1965* (23 States}
57 ~ 377 57,870 58, 145
142,461 I
39,784
42, 590
o/o of Last Year
108
108
107
1/ Current week as percent of same week last year.
* Revised.
!I 113
114
108
.
.>
.,(.j.)
..:.;.j.
.....-4
:;j
.'.Ur.o..
-'"~'
M
P-1c:t:
tll'+-0 (j) 0
v...,
~ ~
'U (j)
r~o..8.,
rbvoOP'vr"o'.
t;O
0
P-1u)
::>
(j)
..'~."..'
.....-4
:;j
.. ..u...
'"' 0 tlO (j)
..... <t: -~
~ ..... >
~t:H";j'vi:0:bV0(Hjl) 2:(<j)
~(/)
zVl Qrt>ilo.p,.r..8.._.o...p,o.....~..._.......<....t.,.d:. ,...bgr._o.O.:.:l>-l
vvv8C)J!l
>Qp:;U)
:::i .3 ~..... ::r: 'v"'
til - ro .r.o.....u,.. ..
~(j) 0
.. ....:!
.tv~.idl lu-l
.... U)tll
<....t. :-cv~r.....t... 'l..C..l.-'4l
<...t.:.
~
~
0
:';::Cil
::~>
Gf
N D<foo?
6-~.t-fl~
::>
I"'"'~
1/~tJoo m~~L11r ~m -L1
[pffi~@l] ~
.-
October 15, 1966. Released 1.1/3/66 GEORG IA CR OP REPORTING SERVICE
GEORGIA PRICES RECEIVED INDE X DECLINES 4 POINTS
Durin g t he month ended Oct ober 15, 1966 the Index of Pr ices Received by Geor gia Farmers declined 4 points to 247. This was 9 points below October 15, 1965,
The price of wholes a le milk was substa ntially abov e a month ago but t hi s was not suff icie nt to offset lower prices for cotto n , hogs, broi le rs and eggs ,
UNITED STATES PR ICES RECEIVED INDEX DOWN 4 POINTS
PM ITY IND EX UNCHANGED, PA.~ IT Y RATIO 79
The Index of Prices Received by Fa rme rs declined 4 points (1 ~ percent) dur i ng the
month e nded October 15 to 266 perce nt of its 1910- 14 avera ge, Lowe r prices for ca t tl e, hogs, and wheat contri buted most to the decline, Pri ce inc reases for wholesale milk ,
oranges, and cotton were partially offse tt ing, The i ndex was 7 percent a bove October
1965.
The Index of Prices Paid by Fa rme rs for Commodities and Services , including Interest, Ta xes, a nd Farm Wage Rat e s remained unc hanged from the previous month, At 337, the index was 5 percent above a year earlier,
With farm product prices off 4 po ints , and th e Pa r i ty Index unchanged, the Parity Ratio dec! i ned l point to 79 in Octobe r , 2 points above a year ear lie r,
Index Numbe r s - - Georgia an d United State s
Index 191 0- 14 = l 00
Octobe r 15 1965
: September 15: October 15
1966
1966
Record High
Index
Dat e
GEORG 1.!\
Prices Received
AI I Commodities
256 ll
251
247
310
March 1951
All Crops
270 ll
. 256
252
319
March 1951 ]/
Livestock and Livestock Products
223 I I
239 1/
231
295
Sep tember 1948
UNITED STATES
Prices Received
249
270
266
313
February 1951
Parity Index 3/
322
337
337
337 21
September 1966
Parity Ratio 4;
77
80
79
12 3
October 1946
ll Revised, 1/ Also April 1951, ]/Prices Paid , Interest, Taxes, and Farm Wage Kates based
on data for the indicated dates, ~/The Parity Ratio is computed as in the past, The Adjusted
Parity Ratio, reflecting Gove rnme nt payments, averaged 82 for the year 1965 compared to 77
for the Parity Ratio, 21 Also October 1966.
ARCHIE LANGLEY Agricultural Stat is tician In Charge
WILLIAM A. WAGNER Agricultural Statisticia n
The Geo rgi a Crop Repo rti ng Se rvice, USD A, 315 Hoke Smith Anne x, At hens, Geo rgia in coope ration with the Cooperative Extension Service, University of Georg ia and t he Georgia Depa rtme nt of Agriculture.
PRICES--RECEIVED AND PAID BY FARMERS, October 15, 1966 WITH COMPARISONS
GEORGIA
UNITED STATES
Oct, 15
Sept. 15 :Oct.l5 Oct. 15 Sept~ 15
Commodi ty an d Unit
1965
1966
1966
1965
1966
PRICE S KECEIVE D
Whea t , bu,
$
I ~45
l. 80 l .so
1. 35
1. 71
Oats, bu .
$
82
.92
.85
.615
.649
Corn, bu .
$
1.18
I .43
1.44
I ,06
1. 35
Barley, bu.
$
1.04
l I3
l. 13
.989
1,06
Sorghum Gra in , cwt.
$
2,00
2,20
2.20
1. 74
l .92
Cotton , l b.
28.5
21.0
20.0
29.39
21. 17
Cottons eed , t on
$ 4 5. 00
62. 00 68,00
46.70
65.50
Soybeans, bu.
$
2,40
3.00
2. 90
2. 31
2.97
Peanuts, lb.
11.3
ll. 3
11. 2
1I. 7
I I 2
Sweetpotatoes, cwt.
$
5.00
6.00
5.50
3.47
4.86
Oct. 15 1966
1.59 .657 l. 29 l. 06 l. 77
22.45 65.90
2.78 11. 2 4.31
Hay, Ba l ed, t on: AI I Al f al fa Lesped ez a Peanut
$ 25 .80
$ 37.50 $ 29. 00 $ 24 . 00
27.00 37. 00 29. 00 23.00
26 . 50 38 , 00
29 .00 24.00
22.80
23. 30 23. 90 22.80
23.ti0 24.30 24. 40 23 .40
24.10 24.70 24.30 23.80
Mi I k Cows, head
$
Hogs, cwt.
$
Beef Ca t tl e , all cwt. 11 $
Cows, cwt. l/
$
Steers and Heifers, cwt . $
Calves, cwt,
$
170.00 22 . 40 15 . 60 12. 70 18 .30 19.3 0
190 .00
22.50 19 . 20 16.50 21.50 24,00
19 5.00 21. 60
19 . l 0 16.10
21.70 23.60
21 4.00 22 . 90 20 . 10
13.30 22. 60 22. l0
255.00 22 . 10
22.50 17 . I 0 24 .40 26 . 50
260 ,00 21 . 20 21 .90 16. 30 23. 80 25 . 70
Milk, wholesale, cwt.:
Fluid Market
$
Manufactured
$
All 1/
$
Turkeys, lb.
Chickens,lb.:Excl. Broilers
Commercial Broilers
All
Eggs, all, dozen
PRICES PAID, FEED:
Mixed Dairy Feed, cwt.:
All under 29% protein $
14% Protein 5/
$
16% Protein-
$
18% Protein
$
20% Protein
$
6,30 3.70 6.25 21.0 11 6 13.4
13.3
45.6
3.95
3.80
3.90
4.10 4.20
6.25 4.30 6.20 23,0
11 .o
14.0
13.9 52.9
!!_I 6,60
23.0 10. 5 12.0
11.9 49.5
4.97
3.53
4.56
21 .3
8.5 14.2
13.5 37.0
4. IS
4.15 11 3.66
4,00
4.05 11 3.43
4.15
4.15 31 3.71
4.30 4.50
4,40 4.50
l31l
3.83 4,00
5. 64 4.38 5. 28
22.2
9. I 14.8 14.2 42.5
!!_I 5.44
22 .7 8. 8
13.3
12.8 41.1
3.89
3.62
3.94 4.09
4.33
3.90 3.63 3.96
4. l 0
4. 34
Cottonseed Meal, 41%, cwt. $ Soybean Meal, 44%, cwt. $
4.10 4.70
5.20
5. I 0
4.41
5.60
5.50
5.01
5.39
5.31
6.23
5. 73
Bran, cwt, Middlings, cwt. Corn Meal, cwt.
$ 3.60
$ 3.65
$ 3.30
3.80 3.80
3. 19
4.00
4.05
3.27
3.50
3.50
3.27
3.46
3.51
3.59
3.66
3.52
3.51
Broiler Grower Feed, cwt. $ 4,80
5.40
5.20
4.83
5.19
5.16
Laying Feed, cwt,
$ 4.75
5.10
5.00
4,40
4.75
4,70
Scratch Grains, cwt,
$ 4.20
4.40
4.35
3.89
4.10
4,10
Alfalfa hay, ton
$ 43.00
43.00 43.00
31.80
33.00
34.00
All other hay, ton
$ 32.00
34.00 34.00
31.10
32.10
-32.20
l l "Cows" and "steers and heifers'' combined with allowance where necessary for slaughter bulls.
11 Includes cull dairy cows sold for slaughter, but not dairy cows for herd replacement.
11 Revised, !!_I Preliminary estimate, 21 U. S. pri ce is for under 16 percent.
After Five Days Return to United States Department of Agriculture
Statistical Reporting Service 315 Hoke Smith Annex Athens, Georgia OFFICIAL BUSINESS
Postage and Fees Paid U. S. Department of Agriculture
~n
UNIVE RSITY OF GEORGIA ~
.--
'
Nnll 8 l987J
October 15, 1967
...
I
Released 11/6/67
-
GEORGIA CROP REPORTING SERVICE
GEO RGIA PRICES RECEIVED 2 POINTS LOWE K
The Index of Prices Received by Georgia farmers for all commodities declined 2 points during
the month ended October 15, 1967 to 247. Th i s was 1 poi nt above the Octobe r 15, 1966 index of 246.
There were declines in the pr i ces of grains, 1 ivestock, broilers and eggs. Increases in
price of cotton and mi lk were not sufficient to offset the pr i ce decl i nes, and a decrease of 2
.I
points in the All Commod it y Index resulted.
UNITED STATES PRICES RECEIVED INDEX DOWN 1 POINT
PARITY INDEX UP 1 POINT, ADJUSTED PARITY RATIO 78
The Index of Prices Received by Farmers declined 1 point (1/3 percent) during the month ended October 15, to 251 percent of it s 1910-14 average. Lower pr i ces for ca tt le, hogs, and
eg gs were mainly respons i ble for the decrease. Partially offsetting were h i gher prices for cot-
' ton and milk. The index was 6 percent below October 1966.
The Index of Prices Paid by Fa rmers for Commod itie s and Services, includ i ng Interes t, Taxes,
and Farm Wage Rates rose 1 point dur i ng the month to 345. The i ndex was &po i nts (2 percent)
above a year ear 1ie r.
With pr i ces paid by farmers higher and prices of farm products lower, the Adjusted Parity Ratio, reflecting Government payments, decl ined 1 point to 7'd .
The Parity Katio remained unchan ged from September at 73.
Index
191 0- 1L~ : 100
INDEX NUMBE RS-- GEORGIA AND UNIH:D STATES
October 15 :september 15 October 15
1966
1967
1967
Record High
Index
Date
GEOKGIA Prices Re ceived
A11 Commod i t ie s All Crops Livestock and Livestock Products
UNITED STATES Prices Rece i ved
Parity Index 1/
Pa r i t y Ra t io
Adjusted Parity Ratio 21
(pre 1 imi na ry)
246 l/
249 l/
247
252
263
266
230 ll
218 ll
20B
266
252
251
337
344
345
79
73
73
85
79
78
310
March 1951
319
March 1951 1:/
295
Sept. 1948
313 Feb. 1951
345
July 1967 !!_/
123
Oct. 1~46
.!/Revised. ]) Also April 1951. 3/ Pr ices Paid, Interest, Taxes, and Farm It/age Rates based on ' data for the indicated dates. !!_!Also October 1967. 21 The Adjusted Parity ~atio, reflect i ng
Government payments, averaged 86 for the year 1966, compared with 80 for the Parity Ratio.
Prelim inary Adjusted Parity Ratios for the current year, supplied by the Economic Research
1 Serv i ce, are based on estimated cash receipts from marketings and est ima tes of Government payments for the current calendar year.
ARCHIE LANGLEY Agricultural Statistician In Charge
WILLI AM A. WAGNER Agricultural Stat istician
ISSUED-BY:- Th; Ge~rgi~ Cr~p-K;p~rti~g-S; r~i~e~ USDA~ 4o9A-N~rth-L~mpkln-Str;et,-Ath;n~,-Geo~gia~ in cooperation wit h the Georgia Departme nt of Agriculture.
I
'
PRICES--RECEIVED AND PAID BY FARMERS, OCTOBE R 15, 1967 WITH COMPARISONS
GEORGIA
UNITED STATES
Oct. 15 Sept. 15 :Oct. 15 Oct. 15 Sept. 15 Oct. 15
Commodi ty and Unit
1966
1967
1967
1966
1967
1967
PRICES RECE IVED:
I:Jhea t, bu. Oats, bu. Co r n, bu. Barley, bu. Sor ghum Grain, cwt. Cotton, lb. Cottonseed, ton Soybea ns, bu. Peanuts, Ib. Swee t Potatoes, cwt. Hay, baled, ton:
AI I Alfalfa Les pedeza Peanut ~1 i I k Cows, head Hogs, cwt. Beef Cattle, all, cwt. 1/ Cows, cwt . ]/ Steers and Heifers, cwt. Ca I ve s , cwt Milk, wholesale, cwt.: Fluid Market Manufactured
AI I }/ Turkeys, lbs. Chickens, lb., excl. broilers
Commerc ial Broilers
AI I Eggs, all, doz.
$ I. 80 $ .85 $ I .44 $ I 13 $ 2.20
c 20.0
$ 68.00 $ 2.90
c I 12
$ 5.50
$ 26.50 $ 38.00 $ 29.00 $ 24.00 $ I 95.00 $ 2 I 40 $ I 8.80 $ 16. I 0 $ 2I. I0 $ 23.60
$ 6.50 $ 4.45 $ 6.50
c 23.0 c I I. 0 c I 2. 0 c 12.0 c 48.7
I. 35 .80
1. I 0
.96 2.05 23.5 50.00 2.55 11.6 6.70
26~80 35.00 2b .OO 22.00 200.00 1o.9o 19.60 16.20 22.20 24.80
1.40 . 80
1.05 1.00 2.00 24.5 52.00 2.45 11.5 6.60
27.10 34.50 28;oo 21 .oo 200.00 17.90 18. 80 15.40 21 .60 24.40
6.65
6.65
2 I .0
7.5 12.0 I I 8 38.5
!16.80 21.0 8.5
1 I. 0
10.9 33.5
I. 59 .657
l. 29 1.06 I. 77 22.45 65.90 2.78 11.3 4.26
24. I 0 24.70 24.30 23.80 260.00 2 I. 20 2 I .90 J6J1-0 23.70 25.70
5.76 4.42 5.39 22.7 8.9 13.2 12.7 41.3
I. 39 .63ti
l. I 2
.9 82 I. 82 2I. 27 51.70 2.53 11.5 4.44
22.10 22.60 23.60 22.70 264.00 I 9.10 23.10 16.50 25.00 26.80
5.67 L:. 05 5.20 20.5 7.9 12.6
I 2. 2
32.0
1.43 .647 1.04 .984
1.68 27.26 54. I 0 2.44 11.5 3.90
22.60 23.20 24.30 22.30 265.00 17.90 22.30 15.80 24.20 26.30
!15. 3 I 19.3 7.6
12.2
I I 7 28.6
PRICES PAID, FEED
Mixed Dairy Feed,cwt.: All Under 29% Protein
14% Prote in 2/ 16% Protein 18% Protein 20% Protein Cottonseed Meal, 41%, cwt. Soybean Meal, 44%, cwt.
Bran, cwt.
Middl i ngs, cwt.
Corn Mea 1 , cwt.
. Broiler Grower Feed, cwt.
Lay i ng Feed, cwt.
Scratch Grains, cwt.
Alfalfa Hay, ton
All Othe r Hay, ton
$ 4.15 $ 4.05
$ 4. I5 $ 4.40
$ 4.50 $ 5. I 0 $ 5.50 $ 3.80 $ 4.05 $ 3.50 $ 5.20 $ 5.00
$ 4.35 $ 43.00 $ 34.00
4.10 3.80 4.10
4.35 4.45 5.00 5.30
3.95 4.00 3.40 5.20 4.95 4.30 38.00 34.00
4.00 3.60 4.00 4.30 4.40
4.95 5. I 0 3.90
4. I 5
3. l 0 5.00 4.75 4.20 36.00 32.00
3.90 3.63 3.96 4. I 0
4.34
5.31
5.73 3.51 3.66
3. 5I 5. I 6 4.70 4.10 34.00
32.20
3.79
3.79
3.57
3.56
3.85
3.86
3.98
3.97
4.25
4.21
5.34
5. 3I
5.47
5.32
3.47
3.50
3.57
3.64
-I
3.38
3.31
5.01
4.91
4.59
4.56
4.03
4.01
32.30 32.60
30.70
3I .60
l l "Cows" and 11 steers and heifers11 combined with allowance where necessary for slaughter bulls. 11 Includes cull dairy cows sold for slaughter, but not da i ry cows for herd replacement.
3/ Rev i sed.
~/ Pre] iminary estimate. 2/ U. S. price is for under 16 percent.
After Five Days Return to United States Department of Agriculture
Statist ical Reporting Serv ice 409A North Lumpk i n Street Athens, Georgia 30601 OFFICIAL BUSINESS
Postage and Fees Paid U. S. Department of Agriculture
3
GEORGIA CROP REPORTING SERVICE - ATHENS, GEORGIA
Athens , Georgia
GEORGIA COTT ON PRODUCTION AS OF NOVEMBER l, 1966
November 8, 1966
)'
A Ge orgia cotton crop of 330,000 bales ()00 pounds gross weight) was indicated on November
l based on information furnish ed by cottoq grower s and ginners . The estimate is 5,000 bales
below last month and 233,000 bal es le ss than the 1965 pr oduction of 563,000. The indicated
yield per acr e of 391 is 76 pounds below last year 's yield and 12 pounds less than the 1960- 64
aver ag e . Production in the northern districts is expe cted to be 42 percent below last year .
The central area will harvest 40 per cent less than in 1965 and the southern ar ea Hill be down 42
percent .
Weather conditi ons during October were favorable in the southern districts for harvesting
operations , and by November l about 95 perc ent of the crop had bee n ginned in t his ar ea. In the
central area, harvest was about 80 percent complete . Frequent showers delayed picking in the
northern distr icts, and harvest was about 50 percent complete by November l.
Bur eau of Ce:l~'..I S ginnings to ~:ovember l Here 259,000 running bales compar ed with 486,000 bales last year and 507 ; 000 bales in l96l.L,
'\ Non-Cotton \
'j
Rome
-.L,
-Di-st-r-ic-t 1966
l
22,000
2
13,000
3
16,000
4
26,000
5
61,000
6
64,000
7
42,000
8
77 ,ooo
9
9,000
1.2
41 , )10 22,970 24 , 160 42,000 103 ,950 107 ,480 73,840 129 ,530 17,560
122~
35,110 24,430 26,390 53,220 114,550 109,490 90 , 7 30 146, )20 16,560
State 330,000 563 ,000 617,000
Districts shown are crop reporting districts and not Congressional Di stricts.
I
Macon
0
. Columbus
Please see reverse side for
UNITED STATES information
Albany
7
Valdosta
UN ITED STATES COTTON REPO f~T AS OF NOVEMBER 1 , 1966
The Crop Reporting Board of the Statistical Reporting Service makes the following report from data furnished by crop correspondents, field statisticians, Bureau of the Census, Ag ri cultural Stabilization and Conservation Service, and cooperating State agencies. The final outturn of cotton compared with this forecast will depend upon whether the various i nfluences affecting the crop during the remainder of the season are more or less favorable than usual.
State
N. C.
s 0 c.
Ga. Tenn. Ala. Mo.
Miss. Ark, La. Okla. Texas
Acres for
harvest
1966 _!/
1 ,000
-acr-es
160 305 405 365 575 190
Lint yield per harvested acre
:1960-64 :ave rage 1965
1966 indic,
Pounds
373 394 403 559 428 559
Pounds
287 484 467 611 504 559
Pounds
285 464 391 513 401 531
995
586
675
646
860
539
572
544
355
507
540
608
430
275
319
273
4,100
347
402
400
Production 1/
500-pound qross weiqht bales
Indicated
)960-64
Oct. 1,
Nov. 1,
ave rage
1965
1966
1966
I ,000
-bal-es
1 ,000 bales
1 ,000
-bal-es
I ,000
-bal-es
302
221
95
95
457
495
300
295
555
563
335
330
603
637
390
390
769
850
505
480
435
390
230
210
I ,845 1,462
560
352 4,480
2,017 1 ,441
562
369 4,665
1 ,390 1,040
440 260
3,525
~
1 '340
975 450
245 3,420
N. Mex. Ariz. Ca 1 if. Other
States 3/
141
682
637
647
254
I ,026 1,108
992
627
I ,072 I, 116
1,014
31
410
362
305
278 851
I ,803
43
233 787 1 ,690
36
200 555 1,400
23
190 525 1, 325
20
u. s.
9.793
475
526
504
14,795
14,956 10,688
Ame r.Egypt. ~I
79.3
542
563
520
105.4
88.2
87.9
11 August 1 estimate. 11 Production ginned and to be ginned. A 500-lb. bale contains about 480 net pounds of 1 int. 11 Virginia, Florida, Illinois, Kentucky, and Nevada. ~/ Included in
State and United States totals. Grown in Texas, New Mexico, Arizona, and California,
C. L, CRENSHAW Agricultural Statistician
....
.. .. ,. "~'-. ~
ARCHIE LANGLEY Agricultural Statistician In Charge
~-
After Five Days Return to ~nited States Department of Agriculture
Statistical Reporting Service 315 Hoke Smith Annex Athens, Georgia OFFICIAL BUSINESS
Postage and Fees Paid U. S. Department of Agriculture
GEORGIA CROP REPORTING S E
ATHENS, GEORGIA
November 8, 1967
GE ORGIA CHICK HATCHERY REPORT
Placement of broiler chicks in Georgia during the week ended November 4 was 7, 637,000--1 percent more than the previous week but 7 percent less than the comparable week last year, according to the Georgia Crop Reporting Service.
An estimated 11, 090, 000 broiler type eggs were set by Georgia hatcheries-2 percent less than the previous week and slightly less than the comparable week a year earlier.
T he majority of the prices paid to Georgia producers for broiler hatching e ggs wer e re ported within a range of 50 to 65 cents per dozen. The average price of hatching eggs was 57 cents per dozen. The price of eggs from flocks with hatchery owned cockerels generally was 2 cents below the average price. Most prices received for broiler chicks by Georgia hatcheries were reported within a range of $6.00 to $9.00 with an average of $8.00 per hundred. The average prices last year were 62 cents for eggs and $9.25 for chicks.
Week Ended
Oct. 7 Oct. 14 Oct. 21 Oct. 28 Nov. 4
Week Ended
GEORGIA EGGS SET, HATCHINGS, AND CHICK PLACEMENTS
EGG TYPE
Eggs Set
Chicks Hatched
1966
1967
o/o of
year ago
1966
1967
Thou.
Thou.
Pet.
;
Thou.
Thou
o/o of
year ago
Pet.
883
396
45
932
459
49
888
568
64
818
560
68
918
404
44
742
352
47
644
329
51
596
412
69
682
334
49
735
326
44
BROILER TYPE
Eggs Set];_/
1966 Thou.
1967 Thou.
o/o of
year ago
Pet.
,.
Chicks Placed for
I Broilers in Georgia
1966
1967
o/o of
year ago
Thou.
Thou. Pet.
Av. Price
Hatch Broiler
Eggs Chicks
Per
Per
Doz.
Hundred
1967
1967
Cents Dollars
Sept. 2
Sept. 9 Sept. 16 Sept. 23 Sept. 30 Oct. 7 Oct. 14 Oct. 21 Oct. 28 Nov. 4
12,454 10, 171
I 82
8, 880
8, 273
93
56
12,342 10, 880
88 I 8,762
8, 217
94
56
12,437 10, 886
88
8,412
7,887
94
56
12,493 11,433
92
8,338
7,314
88
56
11,584 10,465
90
8, 771
7,812
89
55
11,733 10, 736
92
~8,998
8,021
89
55
11,277 10, 549
94
8,775
8,099
92
55
11,981 11, 289
94
8,274
7' 551
91
56
11,275 11,271 100
8, 141
7' 537
93
56
11, 142 11,090 100
8, 171
7,637
93
57
1/ Includes eggs set by hatcheries producing chicks for hatchery supply flocks.
7.75 7.75 7.75 7.75 7.50 7.50 7.50 7.75 7.75 8.00
ARCHIE LANGLEY Agricultural Statistician In Charge
W. A. WAGNER Agricultural Statistician
U. S. Department of Agriculture
Georgia Department of Agriculture
Statistical Reporting Service
409A North Lumpkin Street, Athens, Georgia
1'
E;GGS SET AND CHICKS PLACED IN COMMERCIAL AREAS BY WEEK.:; - 1967
EGGS SET
i;
CHICKS PLAG6D
STATE
Oct. 21
Week Ended Oct. 28
THOUSANDS
Nov. 4
% of
Ji 1[
year I Oct.
ago 1/ ;,,i 21
II
Week Ended
Oct.
Nov.
28
4
THOUSANDS
Maine Connecticut Pennsylvania Indiana Missouri Delaware Maryland Virginia West Virginia North Carolina South Carolina
G E ORGIA
Florida Tennessee Alabama Mississippi Arkansas Louisiana Texas Washington Ore gon California
TOTAL 1967 (22 States)
1, 794 293
1,622 570 447
2, 250 4, 158 1, 560
121 6,314
448
11 J 289
914 675 8, 133 4,305 8, 828 1,063 3,441 585 235 1, 666
60,711
1, 798 256
1, 468 492 456
2,223 4, 199 1,470
129 6,020
426
11,271
919 679 8,385 4,480 9,098 1, 062 3, 567 494 430 1,607
60,929
1, 671 297
1, 3 77 499 460
2,285 4,063 1, 535
114 6,296
348
11,090
867 671 8,434 4, 510 8,987 1,088 3, 704 534 362 1, 519
60, 711
96 ! 1,364
95
135
114
716
95 ,.I' 306
83 I 293
91
II
jl
1, 735
97
o;
1:
2, 523
'I 96
77
I, h
848 278
91 106
I! l,,i
4,
279 380
100 .II. 7, 551
. I
191 1: 628
60 ~i 855
115 I 5,433
110
ol
ji
3, 746
99 103
.I
..l.
6,048 745
96
2,456
98
349
103
276
79
854
100 I:41, 798
1, 444 157 780 251 345
2,005 2, 500
849 227 3,673 323
7J 537
561 945 5, 509 5,430 5, 916 763 2, 495 235 131 983
41,119
1, 396 144 849 306 438
2, 253 2,708
986 262 4,637 379
7,637
682 737 6, 163 3, 606 6,296 779 2,646 308 202 1, 187
44,601
TOTAL 1966* (22 States)
% of Last Year
63, 171 62,439 60,930
96
98
100
li45, 388
I
!l' 92
45, 990 89
47,308 94
1/ Current week as percent of same week last year.
* Revised.
Page 2
f1Jo of year ago 1/
95 101 110
86 118
88 86 95 87 93 123
93
181 82
101 100
89 119
89 74 100 86 94
Cl)
-..:'.":."s,'
u::s
."r.0o.
...... o'"".'o
eli~
en'+'
Cl) 0
v....,
r~ s:: Cl)
"s0::...E.,
vro r'"o"' oro.oOv.. t;t:l
.. D0-iU)
::J
Cl)
-..:H.:.s,
..u:.:.s.
H
(I)
..0..,
~ o.o.u.>......((.II,))
:S'"":':s:.'.0+..',HU(JI)).U.....<.), ..(.I.), s(I::) stl:.:O ..s..:.:
UU)) ro ~
~ E .......,. ..P'tl,. biJHZ
;ernot:'"8".'.E::s'""~':U:J)
. . , .r::z Q(.x,1(>.I-c<)..Q~(~.I)(el,pn).eu:n.r,;._o...:.~.0.:c.-.j,<.el...C~.Jn..l~,)c(.;.H(!~:.:sl)I
..(.., I)U.)...,"0'"~~~
'~+('.I......'..,)"UO)~~o 0
s::
::J
s::
r-1 ttfO
O rt.l -rl<O
-rl <D bOO
rt.l rl ~ t0
rl !=-i 0
? ctl <D
rl !=-i Cl C\l
t=) ,.O rl
rl t'i-i til
srt:.:l H
o ~
0
0 ~~0
rl .P .p 0
.p rl rl
rl rt.l' rt.l
r. rt.l ?-1~-tfll
rl <D (j)
:;j ??cu
') O'rl rl ,i.
r:: C)~ j:.!-1'
' ~i->P
OJ -
ATHENS, GEORGIA
Nove mbe r 9, 1966
G EORGIA C HI C K HATCHER Y REPORT
Place m ent of broiler chicks in Georgia during the we ek ended November 5 was
8, 171, 000 -- slightly more than in the pr evious week and 3 perce n t m or e than in the
comparable week last year, according to t he G e orgia Crop Reporting Se rvice .
An e stimated 11, 142, 000 br oiler type e gg s were set by Georgia hatcheries 1 percent less than in the previo us week and s lightly l ess t han in the comparable
week a year earlier.
The majority of the p r ice s p a id to Georgia produce rs for broiler hatching
eggs were reported within a r ange of 60 to 70 cents per doz e n. The ave rage pri ce of hatching eggs was 62 cents per dozen. The price of e gg s from flocks with hatchery owned cockerels generally was 2 cents below t he average price. Most p rices re-
ceived for broiler chicks by G orgia hatcheries were reported within a rang e of
$8.00 to $10.00 with an average of $9.25 per hundred. The average price s last year were 61 cents for eggs and $9 . 25 for chicks .
Week Ended
GEORGIA EGGS SET, HA CHINGS, AND CHICK PLACEMENTS
EGG TYPE
Eggs Set
1965
196 6
% of
year
Chi cks Hat ched
1965
1966
ago
Thou.
Thou.
Pet.
Thou.
Thou.
% of
year ago
Pet.
Oct. 8 Oct. 15 Oct. 22 Oct. 29 Nov. 5
Week Ended
552
883
160
50 1
550
932
169
361
428
888
207
427
504
708
14 0
442
461
918
199
436
BROILEB. TYPE
1965
Thou.
Eggs Set -1/ 1966
Thou.
Ufo of year ago
Pet.
Chicks Placed fo r
Broil ers in Georgia
196 5
1966
Ufo of year
ago
Thou.
Thou. Pet.
742
148
644
178
596
140
682
154
735
169
Av. Price
Hatch Broiler
E ggs Chicks
Per
P er
Doz . Hundred
1966 1966
Cents Dollars
Sept. 3
10,054 12,454
124
7,667
8,880 116
67
10 . 50
Sept. 10
10, 513 12, 342
117
7,329
8, 762 120
67
10.50
Sept. 17
10,638 12,437
117
7,098
8,412 119
67
10. 50
Sept. 24
10,752 12,493
116
6, 793
8,338 123
67
10.50
Oct. 1
9,740 11,584
119
7, 187
8, 771 122
66
10.25
Oct. 8
10, 662 11, 73 3
110
7, 404
8,998 122
65
10.00
Oct . 15
10,667 11,277
106
7,692
8, 77 5 114
65
10.00
Oct . 22
10,712 11,981
112
6, 870
8,274 120
64
9.75
Oct. 29
10, 822 11,275 104
7,633
8, 141 10 7
62
9.25
Nov. 5
11, 166 11, 142
100 '
7,921
8, 171 103
62
9.25
1/ Includes e gg s set b y hatcherie s p roducing chicks for hatcher y sup p 1y flocks.
ARCHIE LANGLEY Agricultural Statistician In Charge
W. A . WAGNER Agricultur al Statistician
U. S. Department of Agriculture
Agricul tural Extension Service
Statistical Reporting Service
State Department of Ag riculture
315 Hoke Smith Annex, Athens, G e orgia
E GGS S ET P.ND CHI CKS PL- A CE D IN COMME R CIA L AdE AS B Y W_i: ~ KS - 196 6
~ G GS S j~ T
CHICK3 PbAC ,~ D
STATE
W eek ,:;; n de d
I % of
W e ~k E nded
Oct.
22
O ct .
29
I N o v . 5
y e ar
Oct .
ago 1/ 22
Oct.
29
Nov.
5
THOUSA NDS
T HOUSANDS
P age 2
i % of year ago 1/
Maine
1, 796
1, 873
1,74 7 110
1, 212
l, 376
1, 466
113
Conne cti cut Pennsylvania
332 1, 480
33 7 1, 4 03
21 8 1, 204
71 11 4
I '
172 797
141 849
141
75
767
98
Indiana
635
54 0
504 84
329
.317
348
76
Illinois
7
6
5 42
8
7
17
243
Mis s ouri
598
54 6
555 82
353
385
370
92
Delaware
2, 636 2, 51 5 2, 4 29 106
2,446
2,378
2, 588
126
Maryla nd Virginia West Virginia
4, 228 4 , 274
. 1, 700 157
1, 64 8 152
4, 071 101 1, 56 6 105
148 92
3, 104
3, 261
3,205
101
663
836
943
100
293
266
315
91
.
{/)
North Carolina
6, 492
6,669
6,6 33 114
4,221 4,497
5, 070
112
South Ca rolina
355
307
31 1 .8...6,
318
242
277
105
GEOR GIA
Florida T enne ssee A laba ma Missis sippi A rkan sas Loui s iana Texas Washington Oregon California
TOTAL 1966 {23 State s)
11,981 11,275 11 , 142 10~
8,274
8, 141
8, 171
103
405
482
433 134 I 373
349
377
13 4
1, 177
1, 163
1, 172 11 9
1, 013
948
900
92
7, 427
7,6 70
7, 370 C!J9
5, 883
6,059
6, 105
111
4, 279
4 , 170
4, 079 10-8
3,754
3, 538
3, 587
122
9,441
9, 354
9, 119 Hf9
6,988
6,966
7, 061
117
868
1, 0 52
1, 053 11.4
660
648
657
106
3, 841
3, 93 1
3,885 102
2,837
2,785
2,989
102
595
599
538 128
408
414
412
134
362
385
353 152
164
198
205
95
1, 6 57
2, 01 1
1, 874 102
924
1, 322
1, 339
Ill
62,449 62,3 62 60 , 409 105 45, 194 45, 923 47,310
109
TOTAL 1965* {23 States)
57,870 58, 145 57,721
39,784 42, 590 43,349
% of Last Year
108
107
105
*1/ Curr e nt week as p ercent of same w ee k last year. Revised.
114
108
109
3 ~ ~--~G\A
~a FARM
GE ORGI A CROP REPORTING SERVICE
ATH E NS , GEORGIA
GENERAL CROP REPORT AS OF NOVEMBER l, 1967
November 13, 1967
Cr op Harvest Active
By November 1, harvest of Georgia' s corn crop wa s well along . Cotton harvest was behind r the normal 1a ce mostly because of the l atene s s of cr op in northern areas. Harvest of the
large soybean crop was becoming active over much of the State.
Corn: The es timated 1967 corn crop is pla ced a t 84,280, 000 bushels compared with 58,824, 000 bushels the previous year. Yield per acre was placed at 56 bushels.
Cotton : Production of cott on is f orecas t at 235,000 bales compared wi th 316,000 bales in 1966 .
Tobacco : Type 14 t obacco production of 150,675, 000 pounds is sharply above last year's crop of 96,380, 000 pounds .
Peanut s : The 1967 peanut production of 975,120,000 p~unds is the largest ever produced
in Georgia . Yields are estimated t o average over a t on per a cre.
Soybeans: The State' s soybean crop of 13, 008, 000 bushe ls is sharply above the 1966 crop of 6,923 , 000 bushels.
Pecans : A pecan crop of 45,000,000 pounds was i ndicated on Novemcer 1. The l eve l is 3
million pounds below the prev i ous month' s estimate .
Milk product i on on Ge orgia farms during October t otal ed 88 million pounds - 3 million
above producti on a year ago and 2 mill ion above the previous month.
Eggs produced on Georgia farms during October are estimated at 425 million - 39 million above t he previ ous October total of 386 million.
GEORGIA CROP PRODUCTION AND HARVESTED ACREAGE, 1966 AND 1967
Crop a nd Unit
Acreage
Harvested : For
1966 : ha rvest 1967
Yi e ld Per Acre
Indi cat ed
1966
1967
Pr o d u c t i o n
Indicated
1966
1967
Thousands
Thousands
Corn, for grai n, bu. Wheat, bu. Oats, bu . Rye , bu . Barley, bu.
Tobacco, Type 14, l b .
Sweetpot a t oes , cw"t. Hay, all , ton Cotton, bale Peanuts ( P&T), lb. Soybeans , for beans, bu . Sorghums, for grain, bu . Peaches, total crop , bu. Pe cans, lb .
l Pounds of lint.
1,368 65 98 43
ll
61 8 460
380 482
301 12
1,5 05 124
93 70
9 73 5
8 462 285 478 542 13
43 .0 30. 0 41 . 0 22 .5 41. 0
1, 580 1. 8885+-
398 y
1, 680 23 . 0 38 . 0
56 .0 27 . 0
37. 0 18.0 30 . 0 2,050
83
1. 98~
396 y
2, 040 24 . 0
38 . 0
58,824 1,950 4,018
968 461
96,380 680
867 316 809 ,760 6,923 45 6 3, 800
:n ,ooo
NOV 15 1961
84,280
3,348 3,441 1,260
270 150,675
664
915 23 5 975,120 13, 008 494 3, 000 45,000
ARCHIE lANGLEY
LI BRARI ES
C. L. CRENSF..AW
; Agri cul tural Stat istician In Charge ~~~~
Agricultural Statistician
( Please turn page f or United State s information ) :ssu"ED-BY:- The Geor g i a crop-Reporti~g-ser~ice~ usi5A~ 4o9A-North-L~pkin-street, - At hens, -Ga .~
i n cooperation with t he Georgia Department of Agri culture .
UNITED STATES CROP SUMMARY AS OF NOVEMBER 1, 1967
Corn prospects held at a record 4.7 billion bushels, 25 percent more than the 1961-65 - - average, and 14 percent above 1966.
Soybean production is a record 985 milli on bushels, down l percent from a month earlier,
but 6 percent more than the 1966 r ecord crop and 37 percent above average.
Sorghum grain production is forecast at a record high of 775 million bushels, down 2 percent from a month earlier but 8 percent above 1966 and 41 percent more than average.
Fall Potatoes are estimated at 231 million hundredweight, up l percent fr om a month earlier, l percent above last year and 16 percent more than average.
Pecan prospects are for 202 million pounds, 25 percent more than the 1966 crop but ll percent below average.
Milk production during October was 9,209 million pounds, 1 percent less than a year earlier and 5 percent below average.
Eggs laid in October totaled 5,845 million, 4 percent more than both September and a year earlier and 13 percent above average.
Crop and Unit
u. S. ACREAGE HARVESTED AND PRODUCTION, 1966 and 1967
Acreap;e
Yield Per Acre
Production
Harvested For 1966 : harvest
1966
Indicated 1967
1966
Indicated ( 1967
1967
Thousands
Thousands
Corn, for grain, bu. Wheat, all, bu. Oats, bu. Earley, bu. Rye, bu. Cotton, bale Hay, all, ton Soybeans, bu. Peanuts ( P&T), lb. Sweetpotatoes, cwt. Tobacco, lb. Pea ches, lb. Pecans, lb.
y Pounds of lint. ?J
56,888
49,843 17,848 10,227
1,283
9,554 65,192 36,644
1,421
157
973
61,319
59,950 16,215
9,370 1,102
8,545 64,151 40,123
1,399 149 989
72.1 26.3 44.7 38.1
y 21.8 480
1.85 25.4 1,696
87 1,942
76.6 25.9 49.7
399
y 21.8 448
1.94 24.6 1,800
91 2,042
Includes some quantities not harvested.
4,103,323 1,310,642
798,089
389,557 27,921
9,575 120,863
931,491 2,410,736
13,697 1,890,320
3,407,400 gj
161,600
4,696,315
1,553,741 805,649
373,438 24,002
7,969 124,577 985,184 2,518,295
13,668 2,018,569 2,724,600
202,400
After Five Days Return to United States Department of Agriculture
Statistical Reporting Service 409A North Lumpkin Street Athens, Georgia 30601 OFFICIAL BUSINESS
Postage and Fees Paid
U. s. Department of Agriculture
:X
GEORGIA CROP REPORTING SERVICE
ATHENS, GEORGIA
PECAN REPORT AS OF NOVEMBER 1, 1967
November 13, 1967
GEORGIA: Pecan product ion i n Geo rgi a i s fo reca s t at 45,000,000 pounds ~ s of November 1 by the Georgia Crop Reporting Se rv ice. The current est imate is 3,000,000 pounds below the
October 1 report but &,000,000 poun ds a bove t he short 1966 crop of 37,000,000 pounds. Average produc ti on for the 1961-65 period wa s 6 1, 220,000 pounds. This year's p roduct ion f rom improved va r iet ies is estimated at 36,000,000 pounds and seedlings will be 9,000,000 pounds.
Dry wea ther dur i ng S<p tembe r and October reduced crop prospects in many areas. The shortage of moisture resulted in smaller nuts and poorly developed kernels f or some var ieties.
The crop matu red later t han usual and harvest is act ive i n all area s of the State.
PECAN PRODUCTION
STATE
North Ca ro 1 ina
South Ca ro 1 i na
. Geo r o ia
F1or i da
Alabama
Mississ i piJi
~
'
Arkansas
Louis iana
Oklahoma
" Texas
New Mexico
Un i ted States
Improved Var ieties 1/
Wild and Seed] i ng Pe cans
Ave rage 1961-65
Indicated Average
1966
1967
1961-65
1966
Indicated 1967
1,000 pounds
1 ,000 pounds
2' 100
560
1 ,600
540
140
300
4 , 665
tlOO
2,800
895
200
700
50.480
30.000
36,000
10.740
7.000
9 000
2,420
2,000
2,000
1 '580
2,000
1 ,500
26,740
22,500
17,000
5,480 . 4,000
4,000
9,020
7,500
7,000
1o,8E:o
9 , 000
8,000
1,940
1, 200
2 , 300
5,320
3,400
6,200
5,060
7 ,400
5,000
21 '620 23 , 600
11,000
1 '500
200
3,000
21 '540
5,800
47,000
7 , 040
3,500
6,000
31 '160 22 , 500
29,000
__6~2zo_ _ _ _ _ 8~3Qo _ _ _ 3~DQo_ ~ _ _ _ _ _ _ _ _ _ _ _ _ _ _ _ _ _ _
117,235
83,960
85,700
109,755 77 '614-0
116,700
ALL PECANS
STATE
Average 1961-65
1966
Ind i cated 1967
1 ,000 pounds
1 ,000 pounds
1,000 pounds
North Ca ro 1 ina
2,640
700
1,900
South Carol ina
5,560
1, 000
3,500
Georo ia
61 , 220
37.000
45.000
Flor ida
4,000
4,000
3,500
1 Alabama
32,220
26,500
21,000
Miss i ss ippi
19,900
16,500
15,000
Ar k a n s a s
7,260
4,600
8,500
Louisiana
26,680
31,000
16,000
Oklahoma
23,040
6,000
50,000
Tex ::~ s
38,200
26,000
35,000
New Mexico
-----6,-27-0 ----------8-,3-00----------3,-00-0 -----
Un i ted States
226,990
161 ,600
202,400
ll Budded, grafted, or topworked var iet ies.
(See other s ide fo r United States comments)
C. L. CRENSHA\/ Agr icultural Stat i stic ian
ARCHIE LANGLEY Agr icultural Statist i cian In Charge
UNIVERSITY OF GEO RGIA
NOV 15 1967
------ __
LIBR l?IES
~--..-.__
UNITED STATES
PECANS: The U. S. pecan crop is forecast at 202.4 mill ion pounds, 11 percent below average but one-fourth more than last years small crop. Production is expected to be below average
in all States except Arkansas and Oklahoma. In six States--North Carol ina, South Carol ina, Georgia, Arkansas, Oklahoma, and Texas--production is expected to be above last year, but~ smaller crop is expected in five others--Flor ida, Alabama, Mississippi, Louisiana, and New Mexico. Light harvest was underway in most areas by November 1 but production generally was running below earlier forecasts.
The important producing areas of Georgia received I ittle rainfall in September and October. This lack has resulted in smaller sizes and some poorly filled varieties. In Alabama, harvest is advancing as the crop matures, and mechanical harvest is underway in south and central areas. In Mississippi, harvest is well advanced in southern districts with yields varicrle. Very few pecans have been gathered in Louisiana where damage from disease and dry weather has been heavy. In Oklahoma, harvest of a record crop has been underway for 3 weeks but will not be in full swing until the major producing areas receive a hard freeze. In Texas, harvest was active in all areas by November I and was about one-fourth complete. Harvest will pick up momentum in November.
IssuED-BY:- The Georgi~ crop-Reporti~g-S~r~i~e: usoA: 4o9A-North-L~mpkin-Str~et,-Athens,-G~.:-- in cooperation with the Georgia Department of Agriculture.
/
After Five Days Return to United States Department of Agriculture
Statistical Reporting Service 409A North Lumpkin Street Athens, Georgia 30601 OFFICIAL BUSINESS
Postage and Fees Paid U. S. Department of Agriculture
GEORGIA CROP REPORTING
RT
ATHENS, GEORGIA
GENERAL CROP REPORT AS OF NOVEMBER 1, 1966
November 14, 1966
By November 1, harvest of Georgia's major crops was well along. About four-fifths of the cotton had been harvested, and ne arly two-thirds of the corn had been gathered.
Qg: The 1966 estimated corn crop is unchanged f r om last month at 63,3 82 , 000 bushels,
1 compared with 80,835,000 bushels last year .
Cotton: Pr oduction of cotton is forecast at 330,000 bales compared with 563, 000 l ast year.--The-estimate is 5,000 bales below the forecast on October l.
Tobacco: Production of Type 14 tobacco is forecast at 96,720,000 pounds, compared wit h ll2,134:aao-rn 1965.
~~~~: The 1966 peanut production was indicated at 824,550,000 pounds. Last year's crop totaled 897,250,000 pounds. Yield per acre is indicated to be 1,725 pounds compared with
1,850 pounds in 1965.
.
Soybeans: The State's soybean crop is forecast at 5,018,000 bushels compared with
' 3,344:ooo bushels in 1965. Harvest will be active as weather permits.
~
Pecans: A pecan crop of 40,000,000 pounds was indicated on November l. This level is un.
changed from the previous month's estimate, but is much below the 61,000,000 pounds in 1965.
Milk production on Georgia farms during October totaled 85 million pounds - l million ' pounds above the previous month's estimate and 2 million above production during September 1965.
Eggs produced on Georgia farms during October are estimated at 325 million - 23 million 'above-production in 1965 and 7 million above production the previous month
..
GEORGIA CROP PRODUCTION AND HARVESTED ACREAGE. 1965 AND 1966 ---------------~-- Acreag~----:---YieldPer Acre--:-----ProduCti'on_ _ _
Crop and Unit
:HarveSted-:-For----------:rruii;at8d7---:-Indicat~
1965 :harvest: 1965
1966
1965
1966
: : 1966 : : : 2 : _______ ------------------~ho!!~~nds-------------------------! us~~ct8
Corn, for grain, bu.
1,585 1,474
Sl.O
43.0
80,835
63,382
Wheat, bu.
63
57
29.0
31.0
1,827
1,767
'oats, bu.
104
110
41.0
41.0
4,264
4,510
Rye, bu.
36
36
19.0
24.0
684
864
Barley, bu.
16
13
31.0
36.0
496
468
Tobacco, Type 14, lb.
54.7
62.0
2,050
1,560
112,135
96,720
Sweetpotatoes, cwt.
14
13
85
85
1,190
l,lOS
Hay, all, ton
528
542
1.71
1.80
901
975
Cotton, bale
577
405
467 1/
391 1/
563
330
Peanuts (P&T), lb.
485
478 1,850- 1,725- 897,250
824,550
Soybeans, for beans, bu.
168
193
20.5
26.0
3,444
5,018
4Sorghums, for grain, bu.
15
10
34.0
31.0
510
310
Peaches, total crop, bu. :
4 , 800
4, 800
P1eTcaiinosu.
nldbs . : - - or-lint.----------------~---------------
-
-----
-
----
61.000
40.000
----------. -------------
-----------------------------------------------------------------------------------------------
The Georgia Crop Reporting Service , USDA, 315 Hoke Smith Annex, Athens, Georgia, in cooperation with the Cooperative Extension Service, University of Georgia and the Georgia Department of
Agriculture. (Over)
UNITED STATES CROP SUMMARY AS OF NOVEMBER l, 1966
~ prospects held to 4.1 billion bushels, 10 percent more than the 1960-64 average, but l percent below 1965.
Soybean production is 929 million bushels about the same as the forecast on October 1, 10 per-----cent more than the 1965 record crop and 41 percent above average.
Er~__gr~g production is forecast at a record high of 731 million bushels, about the same as last month, but 10 percent above 1965 and 36 percent more than average.
~11_~~~~ are estimated at 219 million hundredweight, 3 perc ent more than the 1965 crop and 15 percent above average.
~~ production, at 130 million bushels, is 4 percent below last year's crop but 4 percent
more than average.
f~~ prospects are for 183 million pounds, 27 percent less than the 1965 crop and 12 percent
below average.
~ilk production during October was 9,426 million pounds, about the same as 1965 but 2 percent
below average.
Eggs laid during October totaled 5,404 million, 5 percent more than September and 8 percent
above average.
U. S. ACREAGE HARVESTED AND PRODUCTION. 196.'5 AND 1966_~
- - - - - - - - - - - - - - : -=-A:~age-:=:--:==Yield-P;;r Acre _-::: ____ _fr.29.~t~2E-=-=
Crop and Unit
: For
:
:
:
:Harvested: harvest :
: Indicated :
Indicated
------- ------ --------------------------:---:--T1h96o5usa:nas1-9-6-6-----:-----1-9-6--5----:-----1-9-6-6------:----T1:9h65ousa:nds1_9_6_6____ 1
Corn, for grain, bu.
57,049 58,754
73.1
70.3
Wheat, all, bu.
49,313 49,087
26.9
26.4
Oats, bu.
19,106 18,966
50.2
44.1
Barley, bu.
9,478 10,604
43.5
37.1
Rye, bu. Cotton, bale Hay, all, ton
1,466 13,617 68,076
1,261 9,793 66,769
22.7 1/ 526 - 1.82
21.6
ll 504
l. 77
Soybeans, bu.
34,551 36,889
24.4
25.2
Peanuts (P&T), lb.
1,443 1,428
l, 735
1,712
Sweetpotatoes, cwt.
206
184
91
88
Tobacco, lb.
977
984
1,898
1,873
Peaches, bu.
Pecans, lb.
ijPounds-of-llnt:-y IncludeS-some quantiiT98-li0tiiarve5t~-
4,171,100 4,129,896
1,326,747 1,295,933 (
959,192
835,593
411,897
393,865
33,277
27,251 v
14,956
10' 290
124,032
118,109
843,708
929,018
2,503,130 2,444,090
18,748
16,178
1y,85743,,684648
1,844,149 2/ 72,757
--2-51-,1-0-0 -----1-83-,3-00-
ARCHIE LANGLEY Agricultural Statistician in Charge
C. L. CRENSHAW Agricultural Statistician
After Five Days Return to
United States Department of Agriculture
Statistical Reporting Service
315 Hoke Smith Annex Athen~, Georgia 30601
--- - - - OFFICIAL BUSINESS
Postage and Fees Paid
U. s. Department of Agriculture
pz
GEORGIA CROP REPORTING SERVICE
UNi ' ..: :, .. , . - J RG IA
NOV 17 1961
LI BRARI ES
ATHENS, GEORGIA
October 1967 Released 11/15/67
OCTOBE R MILK PRODUCTION UP 3 MILLION POUNDS
Mi lk production on Georgia farms dur i ng October totaled 88 mill ion pounds, accord i ng to the Georg ia Crop Reporting Service. Th is compares with b5 mi ll ion pounds produced i n October last year and 86 mill ion du r ing September 1967. The 1961 - 65 October average product ion was 8 1 mi l!' ion pounds.
Production per cow in herd averaged 620 pounds - - 45 pounds above the prev ious year, and 15 pounds above the September output. The 5-year average production per cow for the month was 458 pounds.
The es ti mated ave rage pr i ce received by produce r s for all wholesale mi lk dur i ng October was $6. 80 per hundredwe i ght. Th i s would be $.30 above the previous year, and $.15 above the September average.
Pr ices pa id by dairymen for feed were about 10 cents per hundredweight below September " and about 15 cen t s below the October prices last year.
MILK PRODUCTION AN D PRICES RECEIV ED ANG PAID BY DAI RYMEN
GEO;{G I A
UNITED STATES
1..
Item and Unit
October September October October September October
1966
1967
1967
1966
1967
1967
" Mi 1k Product ion, mi I I ion 1bs.
Production Per Cow, 1bs. _!/
Number Milk Cows,
i thousand head
85
86
8t>
9,333
9' 173 9,209
575
60 5
620
670
680
664
148
142
142
PRICES RECEIVED - DOLLARS 1/ r All wholesale milk, cwt. l l
Flu id milk, cwt.
Manufactured milk, cwt. Mi I k Cows, head
AI I baled hay, ton
6.50 6.50 4.45 195.00 26.50
6.65 !16.80 6.65
200.00 200.00 26. 80 27.10
5.39 5.76 4.42 260.00 24. ]0
5.20 5.67 4.05 264.00 22.10
!15.31
265.00 22.60
, PRICES PAID- DOLLARS];/ Mixed Dairy Feed:
14 Percent Protein, cwt. 2/
16 Percent Prote i n, cwt. 18 Percent Protein, cwt. 20 Percent Protein, cwt. AI I Under 29 Percent Protein, cwt.
4.05 4.15 4.40 4.50
4.15
3.80 4. I0 4.35 4.45
4. I0
3.60 4.00 4.30 4.40
4.00
3.63 3.96 4. I0 4.34
3.90
3.57 3. 85 3. 98 4.25
3.79
3.56 3.86 3.97 4. 2I
3.79
ll Monthly average. 11 Dollars per unit as of the 15th of the month except wholesale milk which is average for month.
3/ Revised. ~/ Pre! imi nary. 1 ~/ U. S. price is for under 16 percent.
ARCHIE LANGLEY Agricultural Statistician In Charge
ltl. PAT PARKS Agricultural Statistic ian
IssuED-BY:- Th-;; Georg i-; Crop- R-;;port i -;;-g-S-;;r~i~e: usoA, 4o9A-North-L~mpkin-Str-;;et,-Ath~ns,-G-;.: in cooperat ion with the Georgia Department of Agriculture.
UNITED STATES MILK P l~ODUCTION
Octobe r milk output l percent less than a year earlier
October milk production in the United States is estimated at 9,209 mill ion pounds, I percent less than a year earlier and 5 percent below the 5-year average. Daily production was down 3 percent from September to October, the same seasonal decline as a year earlier. The average decline in daily production from a month earlier is 2 percent. October output provided 1.49 pounds of milk per person, daily compared with 1.53 pounds a month earlier and 1.52 pounds a year earlier. For the first 10 months of the year, total mi lk production was
about the same as a year earlier.
October rate per cow up 2 percent from a year earlier
During October, milk production per cow averaged 684 pounds, up 2 percent from a year earlier and 14 percent above the 1961-65 average. Production per cow was at a record level for the month in 43 States. Daily output per cow average d 22.1 pounds in October, 0.6 pound less than in September but 0.5 pound above a year earlier.
The October milk- feed price ratio, at l .73, was 4 percent above both a month earlier and a year earlier, and 15 percent above the 1961-65 average. The October 1967 ratio replaced last year 1 s record h i gh for the month. The increase from September to October this year resulted from an increase in milk prices-- from $5.20 per hundredweight in September to $5.31 in October, and a decrease in ration values-- from $3.11 to $3.07. The milkfat-feed price ratio was 25.3 in October compared with 25.0 a month earlier and 25.5 a year earlier.
Milk per cow and Milk Production by months, United States, 1967, with comparisons
Month
Average 1961-65
Mi I k per cow
1966 Pounds
1967
Milk production
:Average: :1961-65: 1966
.. 1967
Change :from 1966
Mill ion Pounds
Percent
January February March Apri I May June July August September October
621
678
715
10,222 9,805 9,855
fO.S
591
635
670
9,696 9' 137 9,217
;10.9
676
736
766
ll ,062 10,537 10,510
-0.3
690
752
785
II ,260 l 0. 725 I0, 732
IO. I
757
812
844
12,310 11 '525 ll. 508
-o. 1 ...
729
798
821
11 ,816 II ,269 II ,146
-I l
671
736
761
IO,o49 10,350 l 0' 311
-0.4
629
696
722
10, l4b 9,763 9,575
-0. I
592
663
6~0
9,522 9,263 9' 173
-1.0
602
670
684
9 643 9,333 9,209
-1.3
Jan.-Oct. total
November December
581
649
618
687
: I06, 531 10 l , 707 101 418
9,288 9,012 9,841 9. 511
-0.3
. ..:
Annual
7.759
8,513
: 125,660 120' 230
After F ive Days Return to United States Department of Agriculture
Statist ical Reporting Service 409A North Lumpkin Street Athens, Georgia 30601 OFFICIAL BUSINESS
Postage and Fees Paid U. S. Department of Agriculture , I
. Of Gf..OI1G\f>. UtUVERS\T'l
2,0 ~~\,)1 VI
ATHENS, GEORGIA
November 15, 1967
GE ORGIA CHICK HATCHERY REPORT
Placement of broiler chicks in Georgia during the week ended November 11 was 8, 270, 000--8 percent more than the previous week but 2 percent less than the comparable week last year, according to the Georgia Crop Reporting Service.
An estimated 10,964, 000 broiler type eggs were set by Georgia hatcheries-! percent less than the previous week and 2 percent less than the comparable week a year earlier.
The majority of the prices paid to Georgia producers for broiler hatching eggs were reported within a range of 50 to 65 cents per dozen. The average price of hatching eggs was 57 cents per dozen. The price of eggs from flocks with hatchery owned cockerels generally was 2 cents below the average price. Most prices r e ceived for broiler chicks by Georgia hatcheries were reported within a range of $6.00 to $9.00 with an average of $8.00 per hundred. The average prices last year were 62 cents for eggs and $9. 25 for chicks.
Week Ended
GEORGIA EGGS SET, HATCHINGS, AND CHICK PLACEMENTS
EGG TYPE
Eggs Set
I u;o of
Chicks Hatched
I
1966
1967
year ago
1966
1967
I
Thou.
Thou.
Pet.
Thou.
Thou.
"/o of year ago
Pet.
Oct. 14 Oct. 21 Oct. 28 Nov. 4 Nov. 11
(
Week Ended
932 888 818 918 744
Eggs Set !)
1966 Thou.
1967 Thou.
459
49
644
568
64
596
560
68
682
404
44
735
232
31
682
BROILER TYPE
Ofo of year ago
Pet.
Chicks Placed for
Broilers in Georgia
Ofo of
1966
1967
year
ago
Thou.
Thou. Pet.
329
51
412
69
334
49
326
44
455
67
Av. Price
Hatch
Broiler
E ggs
Chicks
Per
Per
Doz.
Hundred
1967
1967
Cents
Dollars
Sept. 9
12,342 10, 880
88
8, 762
8, 217
94
56
Sept. 16
12,437 10, 886
88
8,412
7,887
94
56
Sept. 23
12,493 11,433
92
8,338
7,314
88
56
Sept. 30
11, 584 10,465
90
8, 771
7, 812
89
55
Oct. 7
11,733 10, 736
92
8,998
8,021
89
55
Oct. 14
11, 277 10, 549
94
8,775
8,099
92
55
Oct. 21
11,981 11,289
94
8,274
7 J 551
91
56
Oct. 28
11, 275 11,271 100
8, 141
7, 537
93
56
Nov. 4 Nov. 11
11, 142 11,090 100
11, 220 10,964
98
8, 171 8,449
7,637 8,270
I 93
57
98
57
1/ Includes e gg s set b y hate he rie s producing chicks for hatchery supply flocks.
7.75 7.75 7.75 7. 50 7.50 7.50 7.75 7.75 8.00 8.00
ARCHIE LANGLEY Agricultural Statistician In Charge
W. A. WAGNEH. Agricultural Statistician
U. S. Department of Agriculture
Georgia Department of Agriculture
Statistical Reporting Service
409A North Lumpkin Street, Athens, Georgia
BROILER TYPE EGGS SET AND CHICKS PLACED IN COM.ME.RCIAL ARE AS BY WEEKS - 1967
Page 2
STATE
Oct.
28
EGGS SET
Week Ended
Nov.
4
Nov.
11
"/o of I
year
ago 1/
CHICKS PLAC:t:; D
Oct.
28
Week E nded
Nov.
Nov.
4
11
o/o of
year
ago 1/
THOUSANDS
THOUSANDS
Maine Connecticut Pennsylvania Indiana Missouri Delaware
1, 798 256
1, 468
492 456 2,223
1, 671
297 1,377
499 460 2,285
1, 816
219 1, 265
531 420 2, 205
101
5()
l l-3 &1 77 85
j,
l, 444
1~ 57
780
~ 251
345
!I, Z, 005
1, 396 144 849 306 438
2, 253
1, 418 115
'191 314 401 2, 211
100 64 91 85 115 90
Maryland Virginia
4, 199 1, 470
4,063 1, 535
~ 4,31Z 102
1, 515 93
2, 500 849
2, 708 986
2, 788 1, 094
89 110
West Virginia North Carolina
129 6,020
114 6,296
120 6,Z57
81 I 227
')0
!
;
3,673
262 4,637
33 4 4, 896
90 97
South Carolina
426
348
375 107
323
379
309
108
I
.
GEORGIA
11,271 11,090 10,964 98
7,537
7,637
8,270
98
:::::>
:
Florida Tennessee Alabama Mississippi Arkansas Louisiana Texas Washington Oregon California
TOTAL 1967 (22 States)
919
867
963 229
561
682
642
177
679
671
663 62
945
737
826
92
8,385
8, 434
8,300 112
5, 569
6, 163
6, 545
112
4,480
4, 510
4,419 105
3,430
3,606
3, 714
102
9,098
8,987
9. 133
97 i 5,91 6
6, 296
6, 527
91
1,062
1,088
1,064 100
763
779
781
119
3, 567
3,704
3,951 106 I 2,495
2,646
2,746
94
494
534
561 92
235
308
424
107
4 30 1,607
362 l, 519
415 116
i !
131
1,629 82
983
202 1, 187
183 1, 239
65 85
60,929 60,711 61,097 99 '41, 119 44,601 46,768
98
'
-
TOTAL 1966* (22 States)
62,439 60,930 61,917
j45, 990 47,308 47,764
o/o of Last Year
98
100
99
*1/ Current week as p ere ent o f same week last yeat. Revised.
89
94
98
~
'H 0 -;
G 'f-A-3
GEORGIA CROP REPORTING SERVICE
~q~
?1
72/~~trm~w
ATHENS, GEORGIA
OCTOBER 1967
1967
o/o of
Item
During Oct.
last
1966 1/
1967 2/ year
Thou.
Thou.
Pet.
Broiler Type
I
Pullets Placed (U.S. )3/ Total
3,620
I'
3,041 84
38, .90.5
34,405 88
Domestic
3,213
2, 598 81
34, 149
30,494 89
Chickens Tested:
I
Broiler Type
Georgia United States Egg Type
794 2, 673
756 2,456
I 95
92
II
5, 529 22,410
5,776 104 23,972 107
Georgia United States Chicks Hatched:
24 918
I 30 125
569 62 I
270 5,477
284 105 5,469 100
Broiler Type
Georgia
41, 453
37,866 91
440,966
420, 656 95
United States
220,006 204, 548 93 , 2,316,658 2,322,895 100
Egg Type
Georgia United States Commercial Slaughter:4/ Young Chickens Georgia United States Mature Chickens
2,974 37,855
34,618 197,465
l, 567 32,278
I 53 I 32,497
85 : 498,440
29,804 92 482,946 97
i'
!:
I 33,792
98
il
I
333, 767
199,270 101 I I, 880, 552
344,409 1,970,647
103 105
I
I'
Light Type
Georgia
600
831 138
5, 564
7,382 133
United States
13' 3 83
14, 586 109
100,662
118,628 118
Heavy Type
Georgia
381
396 104
2,688
3, 504 130
United States
2, 519
2,434 97
18, 818
22,610 120
Egg Production:
Georgia
386
425 110
3, 718
4, 107 110
South Atlantic 5/
l, 048
l, 130 108
10, 080
11, 000 109
r
United States
5, 595
5, 845 104 l 55, 070
58, 540 106
1 Revised. 2 Preliminary. 3 Pullets for broiler hatchery supply flocks, includes
expected pullet replacements from eggs sold during the preceding month at the rate of
125 pullet chicks per 30-doz. case of eggs. 4/ Federal-State Market News Service-
Slaughter reports only include poultry slaughtered under Federal Inspection. 5/ South
Atlantic States: Del., Md., W. Va., N. C., S. C., Ga., Fla., Va.
~
I
YOUNG CHICKENS: SLAUGHTERED UNDER FEDERAL INSPECTION
BY SELECTED STATES, 1966 and 1967
Number Inspected
Indicated Percent Condemned
State
During Sept.
Jan. thru Sept.
During Sept.
Jan. thru Sept.
1966
1967
1966
1967
1966
1967
1966
1967
Thou.
Thou.
Thou.
Thou.
Pet.
Pet.
Pet.
Pet.
Maine
5, 797
5, 296
53,685 54, 759 2. 6
3. 2
3. 2
3. 5
Pa.
7,504
6,758
65,772 62,194 3.6
4.1
4.0
4.9
Mo.
3,341
3,255
27,248 29,994 3.6
2.2
5.1
3.9
Del.
7, 746
7, 485
70, 110 68,524 3. 8
4. 2
4. 3
5. l
Md.
12, 485 11, 543 104, 195 108, 604 3. 8
3. 8
4. 2
4. 9
Va.
3,617
4,330
33,147 37,961 3.1
2.8
3.1
3.6
N.C.
22,796 21,575 191,610 193,153 3.5
2.9
3.9
3.9
Ga.
34, 070 32, l 09 288, 273 300, 9 54 3. 3
3 9
3 5
4. 9
Tenn.
5, 260
5, 2 6 7
4 7, 238 4 7, 296 3. l
2. 9
3. l
4. 6
Ala.
23,404 22,622 191,279 201,676 2.6
2.9
3.0
3.4
Miss. Ark.
14,608 29, 309
13,970 29, 236
j 120, 220 123, 930 3. 2
239, 289 262, 317 3. 7
2. 3 2. 8
3. l
3. 0
3. 6
3. 9
Texas
12, 5 14 13, 6 18
97, 9 82 114, l 54 3 3
3 l
3 4
3. 2
--------------------------------------------- -----------------------------------
u. s . 200,676
1,686,797
3.3
3.2
3.6
4.0
195,879
1,776,827 i
U. S. Department of Agriculture
Georgia Department of Agriculture
Statistical Reporting Service, 409A North Lumpkin Street, Athens, Georgia 30601
f
End-of- Month Stocks of Poultry, Poultry Products, Meat and Meat Products United States - October 1967
Stocks of shell eggs totaled 263 thousand cases, 20 thousand less than a month earlier but 215 thousand more than a year earlier and 84 thousand cases above average. Frozen eggs declined 2 million pounds during October to 98 million on November 1. Last year the October decline was 7 million pounds and the average decline is 14 million. Stocks of frozen poultry were a record for the second consecutive month. November 1 holdings totaled 720 million pounds, 117 million above a month earlie r and 183 million more than a year earlier . Averag e Nove mber l holdings are 489 million pounds. Holdings of frozen turkeys totaled 551 million pounds, 39 percent higher than on November l, 1966 and 54 percent above average . Total stocks of meat on November 1 w e re 583 million pounds. This was an October gain of 54 million pounds compared with 59 million a year earlier when stocks totaled 509 million pounds. The average October increase is 25 million pounds and average November l stocks are 464 million pounds. Beef totaled 255 million pounds, a 12-million pound gain from October 1. Total pork holdings were 244 million pounds compared with 171 million a year earlier and average. These stocks were the largest for the date since 1951. The 41 million pound October gain in pork was twice the October 1966 increase and almost three times the average.
Commodity
Eggs: She ll Frozen e ggs, total
Poultry, fr:o~en: Broilers or fryers Hens, fowls Turkeys Other & Unclassified
Total Poultry
Unit
Case Pound
do. do. do. do. do.
Oct. 1961-65 av
Oct. 1966 Thou.
Sept. 1967 Thou.
Oct. 1967 Thou.
179
48
283
263
85,8 01
46,096
99,991
97,628
L---------~~-----------------------------------
!1 24,906
. 46,430 1 357,463
60, 278 489,077
29,668
40,377
395,496 71, 102
536,643
35,366
56,587
441,454 69,492
602,919
36,803 63,344 551,253 68, 643 720,043
Beef: Frozen in Cure
and Cured
do.
205, 524
252,853
242,602 254,640
Pork: Frozen and
Cooler
do.
171,344
171, 195
202, 648 243,988
Other meat and meat
products
do.
87,193
85,115
84,458
84, 849
Total all red meats
do.
464,061
509, 163
529,708 583,477
MID-MONTH PRICE S RE CEIVED AND PRICES PAID
G e orgia
United States
Item
Oct. 15 Sept. 15 Oct. 15 Oct. 15 Sept. 15 Oct. 15
1966
1967
1967
1966
1967
1967
Cents
Cents
Cents
Cents Cents
Cents
Prices Received:
Chickens, lb. excluding
broilers Com 1l Broilers (lb.) All Chickens (lb.)
All eggs (dozens} Prices Paid:(per 100 lb.)
11.0 12.0 12.0 48.7 Dol.
7.5 12.0 11.8 38. 5 Dol.
8.5
11,0 10.9
3), 5 Dol.
8.9
13.2
12.7
41. J Dol.
7.9 12.6 12.2
3l, 0 Dol.
7.6
12.2 11.7
Z8,' Ool.
Broiler Grower Laying Feed
5. 20 5. 00
5. 20 4. 95
5. 00 4. 7 5
S. 16 4. 70
5. 01 4. 59
4. 91 4. 56
Scratch Grains
4 . 35
4. 30
4. 20
4. 10 4. 03
4. 01
This report is made possible through the cooperation of the National Poultry Improvement
Plan, Official State Agencies, the Animal Husbandry Research Division of the Agricultural
Research Service, the Inspection Branch of the Poultry Division, Consumer and Marketing
Service and the Agricultural E stimate s Division of the Statistical R eporting Service and
the many breeders, hatche ries, poultr y processors and the poultry farmers that report
to these agencies.
ARCHIE LANGLEY
W. A. WAGNER
Agricultural Statistician In Charge
Agricultural Statistician
After Five Days Return to: Unite d States Department of Agriculture
Statistical Reporting Service 409A North Lumpkin Street
Athens, Georgia 30601 OFFICIAL BUSINESS
Postage and B'eee Paid U. S. Department of Agriculture
'" n)
Ac9 uis itions Division unlversity Libraries University of Georgia ~ 7-he~s Georgi a 30601
G-Pi
~ ~ 9001
G-4A 3
! tf(,7
n iYtJ . .:Zl..-
GEORGIA CROP REPORTING SERVICE
w~~mLL~ rnmtrrn~rn~
ATHENS, GEORGIA
November 22, 1967
GEORGIA CHICK HATCHERY REPORT
Placement of broiler chicks in Georgia during the week ended November 18 was 8, 173, 000--1 percent less than the previous week and 2 percent less than the comparable week last year, according to the Georgia Crop Reporting Service.
An estimated 10,940,000 broiler type eggs were set by Georgia hatcheries-slightly less than the previous week and 2 percent less than the comparable week a year earlier.
The majority of the prices paid to Georgia producers for broiler hatching eggs were r eported within a range of 50 to 65 cents per dozen. The average price of hatching eggs was 57 cents per dozen. The price of eggs from flocks with hatchery owned cockerels generally was 2 cents below the average price. Most prices received for broiler chicks by Georgia hatcheries were reported within a range of $6.00 to $9.00 with an average of $8.00 per hundred. The average prices last year were 63 cents for eggs and $9. 50 for chicks.
I'
Week
Ended
GEORGIA EGGS SET, HATCHINGS, AND CHICK PLACEMENTS
EGG TYPE
Eggs Set
Chicks Hatched
1966
1967
% of
year
ago
1966
1967
Thou.
Thou.
Pet.
Thou.
Thou.
% of
year ago
Pet.
Oct. 21 Oct. 28 Nov. 4 Nov. 11 Nov. 18
Week
f1
Ended
888 818 918 744 693
Eggs Set]:_/
1966 Thou.
1967 Thou.
568
64
596
560
68
682
404
44
735
232
31
682
359
52
638
BROILER TYPE
o/o of
year ago
Pet.
Chicks Placed for Broilers in Georgia
1966
1967
% of
year ago
Thou.
Thou. Pet.
412
69
334
49
326
44
455
67
441
69
Av. Price
Hatch Broiler
Eggs Chicks
Per
Per
Doz.
Hundred
1967
1967
Cents Dollars
Sept. 16
12,437 10, 886
88
8,412
7,887
94
56
7.75
Sept. 23
12,493 11,433
92
8,338
7,314
88 56
7.75
Sept. 30
11,584 10,465
90
8,771
7,812
89
55
7. 50
Oct. 7
11,733 10, 736
92
8,998
8,021
89 55
7. 50
Oct. 14
11, 277 10, 549
94
8, 775
8,099
92
55
7. 50
Oct. 21
11,981 11, 289
94
8,274
7' 551
91
56
7.75
Oct. 28
11,275 11 , 271 100
8, 141
7, 537
93
56
7.75
Nov. 4
11, 142 11,090 100
8, 171
7,637
93
57
8.00
Nov. 11
11,220 10, 964
98
8,449
8,270
98
57
8.00
Nov. 18
11,203 10,940
98
8,376
8, 173
98
?7
8.00
]:_/ Includes eggs set by hatch e nes producmg ch1cks fo:~;,Jhatchery supp1_!i_ flocks.
ARCHIE LANGLEY Agricultural Statistician In Charge
W. A. WAGNER Agricultural Statistician
U. S. Department of Agriculture
Georgia Department of Agriculture
Statistical Reporting Service
409A North Lumpkin St reet, Athens, Georgia
BROILER TYPE EGGS SET AND CHICKS PLACED IN COMMERCIAL AREA- S BY WEEKS - 1967 Page 2
EGGS SET
~
CHICKS PLACED
STATE
Week Ended
Nov.
Nov.
4
ll
Nov. 18
o/o of
year ago 1/
Nov. 4
Week Ended
Nov.
Nov.
11
18
o/o of
year ago 1/
THOUSANDS
THOUSANDS
Maine Connecticut Pennsylvania Indiana Missouri Delaware Maryland Virginia West Virginia North Carolina South Carolina
l, 671
l, 816
1,703
~ 94
1,396
l, 418
1, 366
93
297
219
268 82
144
115
180
102
1,377
l, 265
l, 416 92
849
991
806
75
499
531
525 92
306
314
290
98
460
420
446 88
438
401
383
102
2,285 4,063
2,205 4,312
2, 260 4,223
90 101
I
I
2,253 2,708
2, 211 2,788
2,349 2, 615
90 90
l, 535 114
l, 515 120
1,347 89
I 92
986
62
262
1, 094 334
1, 087 335
118 85
6,296
6,257
6,023
I 88
4,637
4,896
4,875
100
348
375
419 107 I 379
309
360
122
GEORGIA
11, 090 10,964 10,940 98
7,637
8,270
8, 173
98
Florida Tennessee Alabama Mississippi Arkansas Louisiana T exas Washington Oregon California
TOTAL 1967 {22 States)
867
963
909 217
682
642
760
201
671
663
619 55
737
826
848
89
8,434
8,300
8,015 112
6, 163
6,545
6, 545
112
4, 510
4,4 19
4,31 0 102
3,606
j, 714
3,989
114
8,987
9, 133
8,895 97
6,296
6,527
6, 911
99
1,088
1,064
1, 012 97 I 779
781
819
107
3,704
3,951
3, 861 102
2,646
2,746
2, 773
93
534
561
561 91
308
424
341
78
362 l, 519
415 1, 629
276 82 1, 568 77
202
183
338
124
1, 187
1, 239
1, 206
80
60, 711 61,097 59,685 97 '44,6 01 46,768 47,349
100
TOTAL 1966* {22 States)
60,930 61,917 61,490
47,308 47,764 47,330
o/o of Last Year
100
99
97
*1I Current week as percent of same week last year. Revised.
94
98
100
ATHENS, GEORGIA
GEORGIA CHICK HATCHERY RE P ORT
December 6, 1967
Placement of broiler c hicks in G e o r gia during the week ended Dec e mber 2 wa.s 8, 103, 000-- slightly more than in the previous we ek but 1 percent less than the comparable week last year, according to the G e orgia C rop Reporting Service.
An estimated 11, 289, 000 broiler type e ggs were set by Georgia hatcheries- 4 percent more than the pre vious we ek and slightly more than the comparable week a year earlier.
The majo rity of the price s paid to Georgia producers for broiler hatching eggs were report e d within a range of 50 to 6 5 cents p e r dozen. The average price of hatching eggs wa s 57 cents per dozen. The p r ice of e ggs from flocks with hatchery owned cockerels generally was 2 c ents below the a ve r age price. Most price s received for broiler chicks by Georgia hatcheri e s were reporte d within a range of $6.00 to $9 . 00 with an average of $8 . 00 p e r hundr e d. The ave r a ge prices last year were 63 cents for eggs and $9.50 for chicks.
Week Ended
GEORGIA EGGS SE T, HATCHINGS, AND CHICK PLACEMENTS
Eggs Se t
1966
1967
EGG TYPE
I % of
i
year ago
Chicks Hatched
1966
1967
Thou.
T ho u.
Pet.
Thou.
Thou.
% of
year ago
Pet.
Nov. 4 Nov. 11 Nov. 18
l Nov . 25
Dec . 2
Week Ended
918 744 693 885 818
Eggs Set '?.}
1966 Thou.
1967 Thou.
I
4 04
44
735
314 359
-1/
42 52
682 638
556
63
723
326 455 441
/ 44
67 69
314
43
592
72
543
251 I 46
BROILE R TYPE
Chicks Placed for
Av. Price
I Hatch
Broiler
UJo of year
I Broilers in Georgia
Eggs
% of Per
1966
1967
year !' Doz .
Chicks Per Hundred
ago
ago 1967
1967
Pet.
Thou.
Thou. Pet. Cents
Dollars
Sept. 30 Oct. 7 Oct. 14
11, 584 11, 733 11, 277
10,465 10, 736 10, 549
90
8, 771
92 94
I 8,998 8, 77 5
7' 812 8, 0 21
8,099
I 89 ' 55
89
55
92 I 55
Oct. 21
11,981 11, 289
94
8,274
7' 551
91
56
Oct. 28
11,275 11,271 100
8, 141
7' 537
93
56
Nov. 4
11,142 11,090 100
8, 171
7, 63 7
93
57
Nov. 11
11, 220 10,964
98
8,449
8,270
98
57
Nov. 18
11, 203 10, 94 0
98
8,376
8, 173
98
57
Nov. 25
11,433 10,814
95
8, 203
8,068
98
57
Dec. 2
11,276 11,289 100
8, 151
8, 103
99
57
1/ Revtsed
2/ Includes eggs set by hatcheri es producing chicks for hatche ry supply flocks.
7.50 7. 50 7.50 7. 75 7.7 5 8. 00 8. 00 8.00 8.00 8. 00
ARCHIE LANGLEY Agricultural Statistician In C harge
W. A . WAGNER Agricultural Statistician
U. S . Department of Agriculture
Ge orgia Department of Agriculture
Statistical Rep orting Se rvice
409A Nor t h Lum p kin Str ee t , A thens, -G e orgia
UNIVERSITY OF GEORGIA J
. . ., 1967
LIBRARf$
BROILER TYPE EGGS SET AND CHICKS PLACE D IN COMMER :::aAL AREAS BY WEEKS - 1967
Page 2
STATE
Nov. 18
EGGS SET
Week Ended
Nov.
Dec.
25
2
CHICKS Pi..ACED
I u;o of year r.--l'{ov. ago 1/ 18
Week Ended
Nov.
Dec.
25
2
%of year ago 1/
THOUSANDS
THOUSANDS
Maine Connecticut Pennsylvania Indiana Missouri Delaware Maryland Virginia West Virginia North Carolina South Carolina
1, 703 268
1, 416 525 446
2,260 4, 223 1,347
89 6,023
419
1, 711 329
1,324 445
393 2, 198 4,245 1, 423
81 5,978
433
1, 854 101
327
93
l, 281 106
465
82
439
87
2,229
93
4,261 104
l, 410 114
123
81
6, 169
92
401
95
1,366
1,304
1, 359
97
180
151
140
66
806
892
853
119
290
311
327
91
383
375
344
82
2,349
2, 263
2,044
84
2,615
2,943
3, 160
97
1, 087
1, 045
1, 060
105
335
317
274
115
4,875
4,724
4,693
93
360
335
327
93
GEORGIA
10,940 10, 814 11, 289 100 ! 8, 173
8,068
8, 103
99
Florida Tennessee Alabama Mississippi Arkansas Louisiana Texas Was hington Oregon California TOTAL 1967 (22 States)
909
873
900 154
760
694
689
132
619
629
669
60
848
791
766
80
8,015
7,988
8,025 109
6, 545
6,449
6,292
110
4, 310
4, 290
4, 584 107
3,989
4,006
3, 888
112
8, 895
9,046
9,448 104
6, 911
6, 413
6,786
98
1, 012
1,034
991
96 I
819
764
788
106
3, 861 561
3,884 556
4,068
105
I 2,773
'
607 102
341
2,978 383
3,060 388
110 94
276
316
334
85
338
271
272
89
1, 568
1,606
1,734
85
1, 206
1, 165
1, 245
86
59,685 59, 596 61,608 101 . 47' 349 4 6,642 46, 858
100
!
:
TOTAL 1966* (22 States)
61,490 61, 586 61, 146
l o/o of Last Year
97
97
101
*1/ Current week as p ercent of same week last y ear. Revised.
47,330 46,348 46, 73 5
100
101
100
.
::J
'.
No vember 15, 1967
Released 12/7/67
GEORGIA CROP REPORTING SERVICE
GEORG IA PRICES RECEIVED 4 PO INTS HI GHEI{
The Index of Pri ces Rece1ved by Geor gi a farmers for all commodities increased 4 points dut-
' ng the month ended Novembe r 15, 1967 to 251. This was 7 points above the November 15, 1966 ' i ndex of 244.
Substantial i ncreases in the price of cotton and pecans pushed the all crop i ndex 8 points higher than a month ago to 274. Egg prices increased slightly but this was counteracted by
declines in the r; : ce of bro i lers and meat animals so that the 1 ivestock index was 3 points
lower than a month ago at 204.
UNITED STATES PRICES RECEIVED INDEX DOWN 1 POINT
PARITY INDEX DOWN 1 POINT, ADJUSTED PARITY RATIO 78
During the month ended November 15, the Index of Pr i ces Received by Farmers declined 1 po i nt (1/3 percent) to 250 r ercent of i ts 1910-14 average. Contributing most to the decline were lower
pr i ces for cattle and hogs. Part ially offsett : ng were higher prices for cotton. The index was
3 percent below No vember 1966.
The Index of Prices Paid by Farmers for Commodities and Services, including Interest, Taxes, and Farm \1/age Rates decl i ned 1 point (1 1L~ percent) during the month. At 344, the index was 7 po i nts (2 percent) above a year earlier.
Wi th prices of farm products and pr i ces paid by farmers lower, the prel iminary Adjusted
Parity Ratio remained unchanged at 78.
The Par i ty Ratio, at 73, was also unchanged.
Index
1910-14 = 100
INDEX NUMBERS -- GEORGIA AND UNITED STATES
November 15 1966
October 15: November 15
1967
1967
Record High
Index
Date
GEORGIA Prices Rece i ved
All Commod i ties All CrO;JS Livestock and Livestock Products
244 l /
251
225 ll
2. .~7
251
266
274
207 l/
204
310 March 1951
319 March 1951 1/
295
Sept. 1948
UN ITED STi\TES
Prices Rece 1ved
25Sl
Parity Index 11
337
Pa r i t y Rat io
77
Adjusted Par i ty Ratio 21
( p re 1 i mi na ry)
83
251
250
345
344
73
73
78
78
313
Feb. 1951
345 July 1967 !I
123
Oct. 1946
11 Revised. 1/ Also April 1951. 3/ Pr ices Paid, Interest, Tcxes, and Farm Wage Rates based on data for the indicated dates. !:!Also October 1967. ~/The Adjusted Parity Rat io, reflecting ,Government payments, averaged 86 fo, the year 1966, compared with 80 for the Parity Ratio.
Prel imi nary Adjusted Parity Ratios for the current year, suppl ied by the Econom ic Research Serv i ce, a ;e based on est imated cash rece i pts from marketings and estimates of Government pay,ments for the cu rrent calendar year.
ARCHIE LANGLEY Agricultu ral Stat i stic ian In Charge
WILLIAM A. WAGNER Agricultural Statist ician
IssuED-BY:- Th; Georg i ~ crop-~;port i ;9-s;r~ i ~e~ USDA~ 4o9~Nort
in cooperation with t he Georgia De partment of Agric
D.E.C. 8 1967
___ ------... .. . l '.:~1\PI~S ...
.,....
Geo rgi-a,
PR ICES-- RECEIVED AND PAID BY FARME RS, NOVEMBE ~ 15 , 1967 WITH COMPARISONS
GEOKGIA
UNITED STATES
Nov. 15 Oct. 15 Nov. 15 : Nov. 15 Oct. 15 Nov. 15
Commod ity a nd Un it
1966
1967
1967
1966
1967
1967
PRICES RECEIVED:
l;/he 3 t, bu.
$ 1.80
1.40
1. 38
1.60
1 .43
1. 39
Oats , bu. Corn , bu .
$ . 88
. 80
. 1.>5
.663
. 647
.651
$ 1.47
1. 05
1. 05
1. 26
1.04
.970
Ba r le y , bu.
$ 1. 10
1. 00
1. 00
1.06
. 9 84
.974
Sorghum Grai n , cwt .
$ 2. 25
2.00
1 .90
1.81
1.68
1.68
Cotton , 1b.
19 .5
24.5
26 . 5
21. 89
27.26
30.48
Cot t on seed , ton
$ 68.00
52.00
52 .00 65.60
54.10
56.00
Soybeans , bu.
$ 2.80
2.45
2.40
2.80
2.44
2.43
Peanuts , lb.
11.2
11.5
11.4
11.2
11.5
11.5
Sweet Pota t oes, cwt.
$ 5. 25
6.60
6.30
4. 76
3.90
4.51
Hay, baled , ton:
All
$ 26 .50
27.10
27.60 24.50
22.60
22. 80
Al fa l fa
$ 38 .00
34.50
35.50 25.20
23.20
23.40
Les pedeza
$ 29.50
28.00
30.00 24.70
24.30
24.20
Pean ut Mi 1k Cows , head
$ 23.50 $ 200,00
21 .00 200,00
23.00 23.70 200,00 256.00
22.30 265.00
23.10 262.00
Hogs, cw t. Beef Cattle, all, cwt. 1/
$ 19.70 $ 18.30
17. SO 18.80
17.20 18 .30
19.30 20.90
17.90
n.3o
17.00 21.30
Cows , cwt. ],_/
$ 15.50
15.40
15. 10 15.40
15.80
14.90
Steers and Heifers, cwt.
$ 20.80
21.60
21. 10 22.90
24.20
23.60
Ca 1ve s , cwt .
$ 22 .60
24.40
23. 80 25.20
26.30
25.60
Mi ik, wholesale, cwt.:
Flui d Market
$ 6.55
6.60
5.76
5.76
Manuf a ctured
$ 4.35
4.36
4.15
All ]_/ Turkeys, lb.
$ 6.55 24.0
6.60 21.0
!16.60 '20.0
5. 37 23.8
5.32 19.3
!:!/5. 34 19.1
Ch ickens , lb. , excl, bro i lers 11.5
8.5
9.0
9. 1
7.6
7.6
Comme rc ial Broilers
12.5
11.0
10.5
13.5
12.2
11.5
.1\11
12.4
10.9
10.4
12.is
11.7
11.0
Eggs, a ll doz.
50.2
33.5
36 . 1 41.8
28.6
29.6
PRICES PAID, FEED :
Mixed Dairy Feed, cwt.:
All Unde r 29% Prote i n
$ 4.15
4.00
4.10 3.93
3.79
3. 81
14% Protein
$ 4.05
3.60
3.70
3.66
3.56
3.57
16% Protein
$ 4.15
4.00
4.10
3.98
3.86
3.87
18% Protein
$ 4.45
4.30
4.30
4.14
3.97
4.00
20% Pro t e i n
$ 4.50
4.40
4.40
4.34
4.21
4.20
Hog Feed 14%-18% cwt.
$ 4.45
4.30 4.57
4.47
4.41
Cottonseed Meal, 41%, cwt.
$ 5.20
4.95
5.10
5.31
5.31
5.27
Soybea n Meal, 44%, cwt.
$ 5.60
5.10
5.00
5.56
5.32
5.20
Bran, cwt .
$ 3.90
3.90
4.00
3.62
3.50
3.54
Middl . ngs , cwt.
$ 4.15
4.15
4.15
3.75
3.64
3.67
Co rn Mea 1, cwt.
$ 3. 60
3. 10
3. 20
3. 43
3. 31
3. 21
Bro i le r Grower Feed, cwt.
$ 5.20
5.00
4.90
5.05
4.91
4 .83
Lay i ng Feed , cwt,
$ 5.00
4.75
4.70
4.68
4.56
4.49
Sc ratch Grains, cwt.
$ 4. 40
4.20
4.10
4.08
4.01
3.97
Alfal f a Hay , ton
$ 44.00
36 .00
40.00 35.20
32 . 60
33.60
All Other Hay, ton
$ 36.50
32.00
35.00 33.00
31.60
31.90
l l "Cows'' and "steers and Heifers" comb i ned wi th allowance where necessa ry for slaughter bulls.
2/ Inclu des cull dairy cows sold for slaughter, but not dairy cows fo r herd replacement.
3/ Rev ised.
4; Prel iminary est imate.
Aft er F ive Days Return to Un ite d States Department of Agr icultu re
Statist ica l Report . ng Serv ice 409A North Lumpkin St reet At hens , Georgi a 30601 OFFICIAL BUSINESS
Postage a nd Fees Pa id U. S. Department of Agr iculture
GEORGIA CROP REPORTING SERVICE - ATH;;:;s~--. i
Released December 8, 1967 GEORGIA COTTON REPORT AS OF DECE~BER 1, 1967
Cotton production in Georgia in 1967 amounted to 230,000 (500 pounds gross weight) bales, according to the Georgia Crop Reporting Service. This is 86,000 bales below the 1966 crop and is the smallest production since estimates were started in 1866. The indicated 1int yield per acre of 409 pounds is 11 pounds above last year, but 13 pounds below the 1961-65 average yield of 422 pounds.
The short crop is due largely to the decline in acreage. Growers took advantage of the multiple-choice program and most producers elected to divert up to 35 percent of their allotment,
Some intended acreage was not planted due to unfavorable weather during the planting season. Only 340,000 acres were planted and 70,000 acres were abandoned, leaving only 270,000 for harvest. Most of the abandoned acres were planted to other crops, The freeze in November damaged the late .crop in the northern districts and reduced yields much below early expectations. Harvesting operations are later than usual.
Bureau of Census ginnings to December 1 were 213,000 running bales compared to 303,000 to the. same date last year and 548,000 in 1965.
INDICATED COTTON PRODUCTION, 1967, FIN.~L PI~ODUCTJON, 1966, 1965
\ Non-Cotton
\
-.i.,
District
1 2 3 4 5 6 7 8 9
State
1967
6,700 7,100 9,200 17,200 49,700 45,500 31,100 59,800 3,700
230,000
1966
18,470 10,900 12,560 24,280 62. 110 63,750 43,390 72,340 8,200
316,000
1965
41 ,510 22,970 24,160 42,000 103,950 107,480 73,840 129,530 17,560
563,000
-4
.Columbus
Macon
Districts shown are crop
re.pCorotningrgesdsiiosntrail
cts and Distri
c-nt-so-.t
I
0
Please see reverse side for
UNITED STATES information
A1bany
7
Valdosta
UNITED STATES CCTTON REPORT AS OF DECEl'.ffiER l, 1967
The Crop Reporting Board of the Statistical Reporti ng Service makes the following report from data furnished by crop correspondents, field statisticians, Bureau of the Census, Agricultural Stabilization and Conservation Service, and cooperating State agencies. '
y - - - - --~-- --------~-------------~-Lint.-yieidper----:-----production
State
Acreage harvested :
harvested acre
: 500-pound gross weight bales
: l96i-6:s=----:1967: 1961-65 :
: 1967 : 1961-65. : --:-~1967
: average: 1966 : est . : average 1966~~~-1--~~~l- 1966 :~st. J
-----T,ooo--1,000--l,OOO ----
1,000
1,000 1,000
acres ~~~ ~~ Pounds Pounds Pounds
bales
~~
~
N. C.
s. c.
Ga. Tenn. Ala.
llo.
384
155
80 374
290
270
300
94
45
545
305 190 419
442
455
4!4
282
180
647
380 270 422
398
409
566
316
230
516
365 220 572
475
338
614
363
155 1
855
564 . 350 445
392
274
788
461
200 1
358
190
90 561
408
320
419
162
60 '
Hiss. Ark. La . Okla . Texas
1,499
995 900 625
1,278
865
715 557
527
357 327 521
595
380 380 270
6,030 3,968 3,600 362
651
587
1,942
1,353 1,100
418
349
1,483
756
520
602
631
572
449
430
270
253
334
214
200
385
377
4,544
3,182 2,830
N. iiex.
189
134 120 673
648
640
266
181
160
Ariz .
380
252
245 1,057
979
901
839
515
460
Calif.
765
618 588 1,099
952
845
l, 753
1,228 1,035 .
Other
5/ States
49
26 14.9 402
359
425
41
19 13.2
. -----------...--------------------~------ -------- ---------------------~----------~
u. s.
: 14,617 9,554 8,090 Lr9l
480
452 14,935
9,575 7,618
- - - - - - - - - - -- - - - - - - T o t a l -----~-------------------------------~
Amer. - Egypt .: 94.9 78.0 66.4 548
447
459
109.6
. 72.9
63~6 .
]/
ITProduction ginned and tobe ginned.--rsoo-15. balecontain'Saboutl:iSOnet poundsoflint."--
2/ Sums of acreage and production for 11 other States11 rounded for inclusion in Uriited States
totals . J/ Included in State and United States totals.
C L. CRENSHAvJ Agricultural Statistician
ARCHIE LANGlEY Agricultural Statistician In Charge
After Five Days Return to United States Department of Agriculture
Statistical Reporting Service 409A North Lumpkin Street Athens, Georgia 30601
--OFF-IC--I-A--L-- B--U-S.-n.J.E.S.-S-
Postage and Fees Paid
U. s. Department of Agriculture
GElABLE REPORT /
Georgia Crop Reporting Service
VEGETABLES FOR FRESH MARKE . December 1, 1967
QE.C. 13 1967
LIBRARIES
er 11, 1)67
Grcwers intend to harvest 2,200 acres of early spring cabbage in 1968, compared with 2,500
acres harvested in 1967. Little or no rainfall was received during November in the commercial producing areas. Fields are dry and transplanting is being delayed.
The final summary for the 1967 crops will be mailed to you in late December or early January.
U--n--it-e-d- S--t--a-t=e-s-
The 1968 acreage of winter cabbage for harvest is estimated as 35,600 acres, compared
w~th 41,100 acres harvested-last year. In Florida, harvest of the early acreage at Zellwood is underway. Hastings should get into volume movement in December with heaviest supplies expected early in the season. The Sanford-Oviedo area was starting to cut on December 1. Othe~ south central and southern areas should make light starts before mid-December. In the Lower Rio Grande Valley of Texas, planting was underway when Hurricane Beulah hit on September 20 and only a relatively small acreage survived. The heavy rains of Beulah and heavy showers in October and in November kept many fields mud dy and resulted in a sharp reduction in planted
r acreage. Acreage for harvest in the Valley is estimated at 5,300--38 percent of 1967 acreage. Although the acreage that survived Beulah will furnish light supplies in December and January, J it is expected that shipments from the Lower Valley will be very light until February. Ship-
ments fr om the Lower Valley during February, March, and April are expected to be sharply reduced from the previous season. In the Winter Garden, San Antonio, Laredo, and Coastal Bend areas, the acreage for harvest is up slightly from the previous season. Harvest got underway in the San Antonio and ~Jinter Garden areas in early October and shipments should increase in December. Harvest of a small acreage in the Trans-Pecos is also underway. Harvest in Arizona is underway. The crop has made good growth. Harvest in California is now active in desert and south coast areas and should increase, reaching a peak in February.
For the late spring cabbage crop, grot.Jers intend to harvest 11,350 acres, 4 percent below last year. Planting of South Carolina's crop is expected to begin the second week of December. In Georgia, fields were dry and transplanting has been delayed. The supply of plants was adequate as of December 1. Light movement has started from south Alabama and is expected from DeKalb County shortly. The crop in both areas is in good condition. In Ivlississippi, the crop is usually planted about the first of February. Planting in Louisiana was just getting under way on December 1 in the Breaux Bridge area, and is expected to be in full swing by the holidays. In the New Orleans i'1arket garden area, peak harvest is expected during December. In California, planting progressed normally during the first half of November. However, planting was slowed and interrupted by rains during the latter part of the month, particularly in south coastal areas.
ISSUED BY: The Georgia Crop Reporting Service, USDA, 409A North Lumpkin Street, Athens, Ga., in cooperation with the Georgia Department of Agriculture.
ACREAGE AND ESTIPffiTED PRODUCTION REPORTED TO DATE 1968 WITH CONPARISONS
------------- ~---------------~-~---------------
Crop and State
--~~-ACREAQ~------=
Harvested
: For : YIELD PER ACRE
PRODUCTION
:AVerage:
--:harvest:Average:
:Ind.:Average:
: Ind,
:1962-66: _ _127
19~8 :J:22-66:___!27_:1968q22-66: _1267 . _:_.1268_
:
-Acres -
:
- Cwt, -
- 1,000 cwt. -
CABBAGE 1/
Winter: Florida
.
.
.
15,100 15,400 15,800: 183 210
2, 757 3,234
Texas _
18,980 19,000 12,500: 123 125 : : 2,307 2,375
Arizona
1,420
1,600
1,700: 202 170
285
272
California Group Total
----- - - - r b o - 5,260
5,100
5,600: 222
225
: -ho, i1J~ 41,1~0-_3~:t>oo:
171
1,174 1,148 Jan.
~
------ Z,524 7,029
Early Spring gj
:
South carolina 2,720
2,400
2,400: 102
90
276
216
Georgia
2,860
2,500
2,200: 117 125 : 335
312
Alabama
610
650
650: 110 110
67
72
Nississippi
920
700
700: 128 145
118
102 Apr,
=-=__ Louisiana
: 2,060
2,300
2,300:
94 100
California
: 3.060
3.300
3.100: 242 265
__Q~~~~-_:.-l2,230--=-il:-B~o__:=ll.355:--_:l42 :_:1sr-2
: 194
230
: 742
874
l:_7n-~~5b---==:
1/ Includes processing.
g/ 1968 acreage for harvest is prospective acreage.
ARCHIE LAl~GLEY Agricultural Statistician In Charge
L. H. HARRIS, JR Vegetable Crop Estimator
After Five Days Return to United States Department of Agriculture
Statistical Reporting Service 409A North Lumpkin Street Athens, Georgia 30601 QITICIAL BUSHJESS
Postage and Fees Paid U. S. Department of Agriculture
~ UHIY-~-JM-i--0-1' : :_ c.. _;,.
D.E.C 1.9 1961
GEORGIA CROP REPORTING SER ICE
ATHENS, GEORGIA
December 13, 1967
GEORGIA CHICK HATCHERY RE PORT
Placement of broiler chicks in Georgia during the week ended December 9 was 8, 315, 000--3 percent more than the previous week and 2 percent more than the comparable week last year, according to the Georgia Crop Reporting Service.
An estimated 10, 633,000 broiler type eggs were set by Georgia hatcheries-6 percent less than the previous week and 9 percent less than the comparable week a year earlier.
The majority of the prices paid to Georgia producers for broiler hatching eggs were r epo rted within a range of 50 to 65 cents per dozen. The average price of hatching eggs was 57 cents per dozen. The price of eggs from flocks with hatchery owned cockerels generally was 2 cents below the average price. Most prices received for broiler chicks by Georgia hatcheries were reported within a range of $6.00 to $9. 00 with an average of $8.00 per hundred. The average prices last year were 62 cents for eggs and $9.25 for chicks.
Week Ended
Nov. 11 Nov, 18 Nov. 25 Dec. 2 Dec. 9
Week Ended
GZORGIA EGGS SET, HATCHINGS, AND CHICK PLACEMENTS
EGG TYPE
Eggs Set
Chicks Hatched
1966 Thou.
1967 Thou.
I o/o of
year
I ago
Pet. i
1966 Thou.
1967 Thou.
o/o of
year ago
I Pet.
j
744 693 . 885 818 753
314
42
359
52
556
63
592
72
464
62
682
455
67
638
441
69
723
314
43
543
251
46
514
275
54
Eggs Set};_/
1966 Thou.
1967 Thou.
BROILER TYPE
o/o of
year ago
Pet.
Chicks Placed for
Broilers in Georgia
o/o of
1966
1967
year
ago
Thou.
Thou. Pet.
Av. Price
Hatch
Broiler
Eggs
Chicks
Per
Per
Doz.
Hundred
1967
1967
Cents
Dollars
Oct. 7 Oct. 14 Oct. 21 Oct. 28 Nov. 4 Nov. 11 Nov. 18 Nov. 25 Dec. 2 Dec. 9
11, 733 10,736
92
8,998
8, 021
89
55
11, 277 10, 549
94
8,775
8,099
92
55
11,981 11,289
94
8,274
7' 551
91
56
11,275 11,271 100
8, 141
7, 537
93
56
11, 142 11,090 100
8, 171
7,637
93
57
11,220 10,964
98
8,449
8,270
98
57
11, 203 10,940
98
8,376
8, 173
98
57
11,433 10,814
95
8, 203
8,068
98
57
11, 276 11' 289 100
8, 151
8, 103
99
57
11,729 10, 633
91
8, 171
8,315 102
57
};_/ Includes eggs set by hatcheries producing chicks for hatchery supply flocks.
7.50 7.50 7.75 7.75 8.00 8.00 8.00 8.00 8.00 8.00
ARCHIE LANGLEY Agricultural Statistician In Charge
W. A. WAGNER Agricultural Statistician
U. S. Department of Agriculture
Georgia Department of Agriculture
Statistical Reporting Service
409A North Lumpkin Street, Athens, Georgia
BROILER TYPE EGGS SET AND CHICKS PLACED IN COMMERCIAL AR !;AS BY WEEKS - 1967 Page 2
EGGS SET
~~
CHICK.3 PLACED
STATE
Week ~ nded
Nov.
Dec.
25
2
-- o/o of !
Dec.
year ,, Nov.
9
ago 1I ,: 25
W3_ek E nded
Dec.
Dec.
2
9
o/o of
year
ago 1/
THOUSANDS
i
THOUSANDS
II
Maine
1, 711
1, 854
1, 745
100
!,
I
1, 304
1, 359
1, 279
90
Connecticut
329
327
242 69
151
140
128
66
Pennsylvania
1,324
1, 281
1, 3 52 104
892
853
912
99
Indiana
445
465
483 82
311
327
305
89
Missouri
393
439
424 77
375
344
356
95
Delaware
2, 198
2,229
2, 156 91
2,263
2,044
2, 249
92
Maryland
4,245
4, 261
4,079 96
2,943
3, 160
2, 884
100
Virginia
1, 423
1, 410
1,232 86
1, 045
1, 060
1, 020
101
West Virginia
81
123
95 61 I 317
274
322
146
North Carolina South Carolina
5, 978 433
6, 169 401
5,276 396
I 76
4,724
96 I 335
4,693 327
4,609 319
89 79
.
0
GEORGIA
10, 814 11, 289 10,633 91
8,068
8, 103
8, 315
102
Florida Tennessee Alabama Mississippi Arkansas Louisiana Texas Washington Ore gon California
TOTAL 1967 {22 States)
873
629 7,988
4, 290 9,046 1,034 3,884
556 316 1, 606
900 669 8,025
4, 584 9,448
991 4,068
607 334 1, 734
898 171 654 58 7,490 100
4,429 104 8,906 96 1, 107 107 3, 746 100
482 79 258 87 1, 689 83
694
689
744
186
791
766
736
81
6,449
6,292
6,027
108
4,006
3, 888
3, 717
103
6,413
o, 786
6, 728
97
764
788
733
100
2,978
3,060
3,007
105
383
388
416
89
271
272
238
103
1, 165
1, 245
1, 263
86
59, 596 61,608 57,772 93 46,642 46,858 46,307
99
TOTAL 1966* {22 States)
61, 586 61, 146 62, 174
46,348 46,735 46,792
o/o of Last Year
97
101
93
*1/ Current week as percent of same week last year. Revised.
I 101
100
99
-
GEORGIA CROP REPORTING SERVICE
ATHENS, GEORGIA
ovembe r I967 ased 12/15/67
Milk production on Georgia farms during November totaled 87 mill ion pounds, according to the Geor g ia Crop Reporting Service. This compares with 84 mill ion pounds produced in November last year and 88 mill ion during October 1967. The 1961-65 November average production was 78 mi 11 ion pounds.
Production per cow in herd averaged 620 pounds -- 50 pounds above the previous year, and equaled the October output. The 5-year average production per cow for the month was 447 pounds.
The estimated average price received by producers for all wholesale milk during November was $6.60 per hundredweight. This was $.05 above the previous year, and the same as the October average.
'
Prices paid by dairymen for feed were about 5 cents per hundredweight below the previous year but 10 cents above the October 1967 price.
MILK PRODUCTION AND PRICES RECEIVED AND PAID BY DAIRYMEN
GEORGIA
UNITED STATES
Item and Unit
Nov.
Oct.
Nov.
Nov.
Oct.
Nov.
1966
1967
1967
1966
1967
1967
Milk Production, mill ion lbs.
Production Per Cow, lbs. l l
Number Milk Cows,
thousand head
84
88
87
9,012
9,209
8,861
570
620
620
649
684
660
147
142
141
PRICES RECEIVED - DOLLARS 11 All wholesale milk, cwt. 11
Fluid milk, cwt. ~ Manufactured milk, cwt. Milk Cows, head
6.55
6.55 4.35 200.00
6.60 ~/6.60 6.60
200.00 200.00
5.37 5.76 4.36 256.00
5.32 5.76 4.15 265.00
~/5.34
262.00
PRICES PAID - DOLLARS 11
IMixed Dairy Feed: 14 Percent Protein, cwt. 16 Percent Protein, cwt. 18 Percent Protein, cwt. 20 Percent Protein, cwt. AI 1 Under 29 Percent Protein, cwt. Hay, Ton
4.05 4.15 4.45 4.50
4.1> 36.50
3.60 4.00 4.30 4.40
4.00 32.00
3.70 4.10 4. 30 4.40
4.10 35.00
3.66 3.98 4.14 4.34
3.93 33.00
3.56 3.86 3.97 4. 21
3.79 31.60
3.57 3.87 4.00 4.20
3.81 31 .90
ll Monthly average. 11 Dollars per unit as of the 15th of the month except wholesale milk which is average for month.
3/ Revised. ~; Preliminary.
ARCHIE LANGLEY Agricultural Statistician In Charge
'vJ. PAT PARKS Agricultural Statistician
IssuED-BY:- The Ge~rgi~ cr~p-Rep~rting-Servi~e~ usoA: 4o9~N~rth-L~mpkln-Street,-Athens,-G~.~- in cooperation with the Georgia Department of Agriculture.
UNITED STATES MILK PRODUCTION
November milk output 2 percent less than a year earlier
..
November milk production in the United States is estimated at 8,861 mill ion pounds, 2 percent less than a year ea r lier and 5 percent below the 1961-65 average. Daily production was down 1 percent from October to November, compared with no change during this period both last year and for the 5-year average. November output provided 1.48 pounds of milk per person daily, compared with 1.49 pounds a month earlier and 1.52 pounds a year earlier. From January through November this year, milk production totalled about the same as a year earlier.
November rate per cow up 2 percent from a year earlier 1
During November, milk production per cow averaged 660 pounds, up 2 percent from a year earlier and 14 percent above the 1961 - 65 average. Production per cow was at a record level for the month in 42 States. Daily output per cow averaged 22.0 pounds in November, about the same as October and 0.4 pound above a year earlier.
Milk per cow and Milk Production by months, United States, 1967, with comparisons
Month
January February March Apri 1 May June July August September October November
Jan.-Nov. total
Average 1961-65
Milk per cow
1966 Pounds
621
678
591
635
676
736
690
752
757
812
729
798
671
736
629
696
592
663
602
670
581
649
1967
715 670 766 785 844 821 761 722 6bO 684 660
Mi I k product ion
:Average
: Change
:1961-65 1966
1967 :from 1966
Mill ion pounds
Percent
10,222
9,696 11 ,062 11 ,260 12,310 11 ,816 10,849
10' 148 9,522 9,643 9,288
9,805 9, 137 10,537 10,725
11 '525 11 ,269 10,350
9,763 9,263
9,333 9,012
9,855 9,217 10,510 10,732
11 '508 11 '146 10,311
9,757
9' 173 9,209 8, 861
10.5 10.9
-0.3 /0.1
-0.1 -I. 1
-0.4 -0. 1 -1.0
-1.3 -1.7
:115 819 110,719 110,279
-0.4
December Annual
61 8 7 759
687 8 . 513
9.841 9. 511 :125 660 120.230
After Five Days Return to Uni t ed States Department of Agriculture
Stat istical Reporting Service 409A North Lumpkin Street Athens, Georgia 30601 OFFICIAL BUSINESS
900
~cquisitiona D1v1a1on
u.n1ve~a1~ ot Geo~a
OD!ve~s!tJ Lib~ariee
Athons Georgia ~0601
Postage and Fees Paid U. S. Department of Agriculture
~
.]) Cf ()() 7
2:!~w~~rnLht? rniD~rn~mt? Gf 'l3
GEORGIA CROP REPORTING SERVICE
ATHENS, GEORGIA
December 20, 1967
GEORGIA CHICK HATCHERY RE PORT
Placement of broiler chicks in Georgia during the week ended December 16 was 8, 060,000--3 percent less than the previous week and 4 percent less than the comparable week last year, according to the Georgia Crop Reporting Service.
An estimated 11, 427, 000 broiler type eggs were set by Georgia hatcheries-? percent more than the previous week but 4 percent less than the comparable week a year earlier.
The majority of the prices paid to Georgia producers for broiler hatching eggs were r eported within a range of 50 to 65 cents per dozen. The average price of hatching eggs was 57 cents p e r dozen. The price of eggs from flocks with hatchery owned cockerels generally was 2 cents be low the average price. Most prices received for broiler chicks by Georgia hatcheries were reported within a range of $6. 00 to $9. 00 with an average of $8. 00 per hundred. The average prices last year were 62 cents for eggs and $9. 25 for chicks.
Week Ended
GEORGIA EGGS SET, HATCHINGS, AND CHICK PLACEMENTS
EGG TYPE
Eggs Set
' 1966
1967
'7o of
year
ago
Chicks Hatched
1966
1967
Thou.
Thou.
Pet.
Thou.
Thou.
'7o of year ago
Pet.
Nov. 18 Nov. 25 Dec. 2 Dec. 9 Dec. 16
Week Ended
693 885 818 753 711
Eggs Set !./
1966 Thou.
1967 Thou.
359
52
638
556
63
723
592
72
543
464
62
514
513
72
645
BROILER TYPE
% of
year ago
Pet.
Chicks Placed for
Broilers in Georgia
% of
1966
1967
year
ago
Thou.
Thou. Pet.
441
69
314
43
251
46
275
54
463
72
Av. pr1ce
Hatch
Broiler
Eggs
Chicks
Per
Per
Doz.
Hundred
1967
1967
Cents
Dollars
Oct. 14
11, 277 10, 549
94
8,775
8,099
92
55
Oct. 21
11, 981 11,289
94
8, 274
7, 551
91
56
Oct. 28
11,275 11,271 100
8, 141
7, 537
93
56
Nov. 4
11, 142 11,090 100
8, 171
7,637
93
57
Nov. 11
11,220 10,964
98
8,449
8,270
98
57
Nov. 18
11, 203 10,940
98
8,376
8, 173
98
57
Nov. 25
11,433 10,814
95
8,203
8,068
98
57
Dec. 2
11, 276 11, 289 100
8, 151
8, 103
99
57
Dec. 9
11,729 10, 633
91
8, 171
8, 315 102
57
Dec. 16
11,908 11,427
96
8,417
8,060
96
57
1/ Includes e gg s set b y hatcheries p roducing chicks for hatcher y supp1y flocks.
7. 50 7.75 7.75 8.00 8.00 8.00 8.00 8.00 8.00 8.00
ARCHIE LANGLEY Agricultural Statistician In Charge
W. A . WAGNER Agricultural Statistician
U. S. Department of Agriculture
Georgia Department of Agriculture
Statistical Reporting Service
409A North Lumpkin Street, Athens, Georgia
..
..
BROILER TYPE EGGS SET AND CHICKS PLACED IN COMMERCIAL AREAS BY WEEKS - 1967
Page 2
STATE
Dec. 2
EGGS SET
Week Ended
Dec.
Dec.
9
16
o/o of year ago 1/
CHICKS PLACED
Week Ended
Dec.
Dec.
Dec.
2
9
16
o/o of year ago 1/
THOUSANDS
I
THOUSANDS
Maine
1,854
1, 745
1, 738
94
1, 359
1, 279
1, 304
93
Connecticut
327
242
256
66
140
128
146
60
Pennsylvania
1,281
1, 352
1, 317 112
853
912
894
118
Indiana
465
483
462
78
327
305
316
104
Missouri
439
424
319
49
3'~4
356
359
102
Delaware
2,229
2, 156
2, 270 104
2,044
2,249
2, 138
95
Maryland
4,261
4,079
4,296 106
3, 160
2,884
2, 998
93
Virginia
1, 410
1, 232
1, 405 105
1, 060
1, 020
982
107
West Virginia
123
95
128
83
274
322
313
102
North Carolina
6, 169
5, 276
6,372
90
4,693
4,609
4, 535
94
South Carolina
401
396
387
97
327
319
354
85
.
GEORGIA
11,289 10,633 11, 427
96
8, 103
8, 315
8,060
96
~
Florida Tennessee Alabama Mississippi Arkansas Louisiana Texas Washington Oregon California TOTAL 1967 (22 States)
900
898
923 169
689
744
681
176
669 8,025 4,584
654 7,490 4,429
676 8, 173 4,626
62
766
I 105 I 6,292
102
3,888
736 6,027 3, 717
837 5, 970 3, 754
94 104 102
I
9,448
8,906
9, 519 103 I 6,786
6,728
6, 701
99
991 4,068
1, 107 3, 746
1, 102 4,301
104 109
I I
788
3,060
733 3,007
757 3,038
96 105
607
482
472
78
388
416
404
89
334
258
369 119
272
238
238
112
1,734
1,689
1, 737
84
1, 245
1, 263
1,264
83
61,608 57, 772 62,275
99
46,858 46,307 46,043
99
TOTAL 1966* (22 States)
61, 146 62,174 62,987
46,735 46,792 46,742
o/o of Last Year
101
93
99
*1I Current week as p ercent of same week last y ear. Revised.
100
99
99
J;P .1+ 7 ()0/ G:- LfA-
~1 ft 7
~ c. :2 (
ATHENS, GEORGIA
GEORGIA C R0 P R E ~~0 RT I NG S E.R V I C E
ITY OF GEORGIA
22 Qf.C. 1967
D
ember 21 1 1967
GEORGIA: The 1967 production of pecans in Georgia is estimated at 48 1 000,000 pounds compared with 37 1 000, 000 pounds in 1966 according to the Georgia
Crop Reporting Service. The current crop is 22 percent below the 1961-65 average production of 61 1 22 0, 000 pounds. Freezing weather during the early spring months caused damage to the bud crop and the nut set was light, especially on the Stuart variety. Soil moisture was very short during August, September, and October in the southern districts and the size of the nuts was reduced for some varieties. The 1967 production from improved varieties is estimated at 38, 000,000 pounds with 10, 000, 000 pounds coming from seedling trees. The value of the 1967 Georgia pecan crop is placed at $18,160,000 compared with $10 1 980 1 000 in 1966.
UNITED STATES : The 1967 pecan crop is expected to total 2 07,4 00, 000 pounds, up 28 percent from last year but down 9 percent from the 5-year average.
All states except Arkansas and Oklahoma have smaller crops than average. The wild and seedling crop is expected to account for 57 percent of the '67 production compared with the average of 48 percent.
Production in states west of the Mississippi River is expected to total 114,000,000 pounds or 55 percent of the Nation's crop compared with the average of 45 percent. The Oklahoma crop is a record high SO million pounds, exceeding the 1947 record crop by 14 percent.
In Georgia, spring freeze damage and dry weather in the fall months limited production to 78 percent of average. In Texas, 1967 production is 46 percent above last year and almost one percent below average. In Alabama 1 yield and quality are variable with expected production 35 percent less than average.
(Please turn page}
STATE
N.C. S . C. GA. Fla. Ala . Miss. Ark. La. Okla. Texas N.Mex.
u. s.
U. S. PECAN PRODUCTION
Improved Varieties 1/
Average 1961-65
1966
1967
11000 pounds
Wild and seedling pecans
Average 1961-65
1966
1967
11000 pounds
2 11 00 4,665
560
11600
800
2,800
540
140
300
895
2 00
7 00
50,480 30,000 381000
101740
7,000
101000
2142 0
2., 800
2,000
1,580
2,000
11500
26,740
91 02 0 11940 51 060
11500
22,500
7,500 112 00 71400
2 00
17,000
7,000 11900 51000 3,000
5,480
10,880 5132 0
21, 62 0
21,54 0
41000 9,000 31400 231600
518 00
4,000
81000 51600 111 000
471000
71 040 . 31 5 00
7,000
311160
221500
311000
----6-12-7-0 ---8-13-0-0 ---3-,0-0-0-- --------------- --------- -.--
1171235 831960 881300
1091755
771640 1191100
ALL PECANS
STATE
Average 1961-65
1966
1967
1, 000 pounds
1 1000 pounds
1 1000 pounds
N.C.
s. c.
2 1640 51560
700 11000
1 1900 31500
GA.
61 I 2 ~ 0
37 I 000
48 I 000
Fla.
4 1000
4,000
3 1500
Ala. Miss .
32 1220 19,900
26 1500 16,500
21,000 15,000
Ark. La.
71 260 26,680
4, 600 31,000
7 1 50 0 16,000
Okla . Texas
23,040 38,200
6 1000 26,000
SO, 000 38,000
N. Mex. ----------_,~7_9 _________8.!..3_9Q_ _______ ]LO_QQ_ ___. __ _
u o so
2261 990
1 61 1 6 0 0
2 07 1 4 0 0
_!/ Budded, grafted, or topworked varieties.
C. L . CRENSHAW Agricultural Statistician
ARCHIE LANGLEY Agricultural Statistician In Charge
After Five Days Return to United States Department of Agriculture
Statistical Reportin9 Service 4 09A North Lumpkin Street Athens, Georgia OFFICIAL BUSI:f\E SS
Postage and Fees Paid U. S. Department of Agriculture
~
fJ J) 'f {)d 7
GE0 RG I A CR0 P
1r m 01-C4f".t"7'~ ~ ~
Lb '{]
..)I
ATHENS, GEORGIA
N O VEMBE .t{
Item
During Nov.
1966 1/
1967 2/ year
ecember 21, 1967
ru Nov. 1967 2/
o/o of
last year
T ho u.
Thou. Pet.
Thou.
Thou.
Pet.
Broiler Type
Pullets Placed (U.S. )3/
Total
3, 197
3,374 106
42, 102
37,779 90
Domestic
2,794
2,930 105
36, 943
33,424 90
Chickens Tested:
Broiler Type
Georgia
707
548 78
6,236
6,323 101
United States
2,9 9 7
2, 4 93 83
25,406
26,433 104
Egg Type
Georgia
62
16 26
33 1
300 91
United State s Chicks Hatched: Broiler Type
939
I 925 99
6,4 16
6,427 100
I
Georgia United States
38, 263 212, 815
37,870 210, 855
99 1 4 79,229 99 2, 529,473
458, 526 96 2, 533, 7 50 100
Egg Type Georgia United States
Commercial Slaughter:4/ Young Chickens
2, 878 3 5, 530
1, 57 5 26,743
I 55 I
35, 375
75
533,97 0
!,
31,379 89 509,689 95
Georgia United 3tates Mature Chickens Light Type
Georgia
28,654 168,375
644
28, 804 101 1 36 2,421
170, 533 101 2,048, 927
I
!I 828 129
6,208
373,213 103 2, 141, 180 105
8, 210 132
United States
12, 579
13,649 109
113,24 1
132,277 117
Heavy Type
Georgia
417
387
93
II
3, 10 5
3, 891 125
United States
2, 514
2, 108 84
21, 33 2
24,718 116
Egg Production:
l1
Georgia
380
424 112 !'1 4, 098
4, 531 111
South Atlantic 5/
1, 0 27
1, 109 108
11 , 104
12, 109 109
United States
5, 544
5, 700 103 1 60, 611
64, 237 106
1/ Revised. 2 I Preliminary. 3/ P ullets foT broiler hatchery supply flocks, includes
expected pulletreplacements from eggs sold during the preceding m onth at the rate of
125 pullet chicks per 30-doz. cas e of eggs. 4/ Federal-State Market News Service-
Slaughter reports only include poultry slaughtered under Federal Inspection. 5/ South
Atlantic States: Del., Md., W. Va., N . C ., S. C . , Ga., Fla ., Va .
YOUNG CHICKENS: SLAUGHT.i:RZD UNDER ..CZDERAL INSPECTION BY SELECTED S T ATES, 1966 and 1967
Number Inspected
Indicated Pe rcent Condemned
State
During Oct.
J an. thru Oct .
During O ct.
Jan. thru Oct.
1966
1967
1966
19 67
1966
19 67
1966
1967
Thou.
Thou.
Thou.
Thou.
Pet.
Pet.
Pet.
Pet.
Maine
5,900
5,959
59,585 60,718 3.2
3 .2
3.2
3.5
Pa.
7, 362
7, 279
73, 134 69,473 4 . 0
3. 8
4. 0
4. 8
Mo.
3, 032
3, 399
30, 280 33, 393 4 . 2
2. 2
5. 0
3. 7
Del.
7, 853
8, 539
77,963 77,063 3 . 5
4. 8
4. 2
5. l
Md.
12,095 12, 619 11 6 , 290 121, 223 4 . 3
4. 4
4. 2
4. 9
Va.
3,133
4,673
36,280 42,634 3.6
3. 2
3.2
3.6
N.C.
21,871 22,97 2 21 3, 481 216,125 3 . 4
3. 2
3. 8
3.8
Ga.
32, 645 33, 11 8 320, 918 334,072 3 . 5
4. 2
3. 5
4. 9
Tenn.
5,115
4,8 14
52,35 3 5 2,11 0 2. 6
2. 8
3 .0
4.4
Ala.
22, 037 22, 578 213 , 316 z24, 254 3 . l
2. 7
3. 0
3. 3
_1 ___ _ ___1:?: I Miss.
Ark.
j 13, 633
27, 235
~~~i:- t ~~:-:~~-
14, 16 2 13 3 , 853 138,092 3 . 4
2. 2
3. 1
2. 9
29,472 266, 524 291,789 4;3
3. 1
3. 7
3. 8
~3--~~~ ;~ ~~~~ ~~~ _s:_s____ ~ : ~___ _-~:~ ______ ~~ ~- ____ ~~~-- ____ _
202,9 22
1, 979,749
U. S. D ~ partm e nt of Ag ricultur e
Georgia Departm ent of Agriculture
Statistical R e porting Se rvice , 409A North Lumpkin Street, Athens, Georgia 3060 l
End-of-Month 3tocks of Poultry, Poultry Products, Meat and Meat Products -' United 3tate s - November 1967
December 1 stocks of frozen poultry totaled 608 million pounds, 117 million less than a month earlier but 139 million more than a year earlier, Average December 1 holdings are 422 million. Turkey holdings declined 124 million pounds compared with 83 million a year earlier and the average decline of 73 million pounds. Stocks of broilers, roasters, and hens increased during November, Shell egg inventories de clined 85 thousand cases to 154 thousand on December 1. A year earlier there were 23 thousand cases in storage and the average is 117 thousand. Frozen egg stocks decreased 2 million pounds during November compared with 7 million pounds a year earlier and the average November decrease of 16 million pounds. Total December 1 stocks of 95 million pounds were 57 million more a year ea~lier and 26 million more than average. A 7-percent gain in beef holdings during November brought December 1 stocks to 264 million pounds--:---F.l"ozen beef amounted to 250 million after a 15 million pound increase and a million pound gain raised cured beef stocks to 13 million pounds. Total beef holdings were 3 percent under ye ar earlier stocks but 13 percent above average. Total pork in storage on December 1 amounted to 283 million pounds, a 33 million pound gain from November 1. Frozen pork increased 29 million which brought Decembe r 1 stocks to 246 million pounds. The
4 million pound gain in cured pork brought total stocks to 37 million pounds. Supplies of pork were 37 percent above year earlier holdings and 32 percent above average. Veal, lamb and mutton, and canned hams were up slightly from a month earlier. Except for lambs and mutton, stocks for each were above a year earlier and average.
Commodity
Eggs: Shell Frozen eggs, total
Poultry, frozen: Broilers or fryers Hens, fowls Turkeys Other & Unclassified
Total Poultry
Unit
Nov. 1961-65 av
Thou.
Nov. 1966
Thou.
Oct. 1967
Thou.
Nov. 1967
Thou,
Case
11 7
2 3
2 3 9
1 54
Pound - -6_9_,-~l3_ - - - - - - - ~ t. ~ ! - - - 9J.! 393- - - - - 2~ t. '! ! '! - -
do.
26,039
do.
51,244
do.
284,868
do,
59,992
do .
422, 143
34,836 48,567 312,082 72,986 468,471
37,267 64 ,362 554, 169 68,759 724, 557
39,799 70,002 430,055 68,093 607,949
Bee: Frozen in Cure and Cured
Pork: Frozen and Cooler
Other meat and meat products
Total all red meats
233,331
272,643 247,431 263, 544
do.
214,307
. 20 5, 745 250, 452 282,669
do.
90,486
do.
538, 124
86,174 85,835 564, 562 583, 718
90,821 637,034
Item
MID-MONTH PRICES RECEIVED AND PRICES PAID
Georgia
I
United States
Nov. 15 Oct. 15 Nov. 15 Nov. 15 Oct. 15 Nov. 15
1966
1967 1967
1966
1967
1967
Prices Received: Chickens, lb. excluding broilers Com 11 Broilers (lb.} All Chickens {lb.}
All eggs (dozens} Prices Paid:(32er 100 lbJ
Broiler Grower Laying Feed Scratch Grains
Cents Cents Cents
Cents Cents Cents
11. 5 12. 5 12.4
50.2 Dol.
5.20 5.00 4.40
8. 5 11. 0 10.9
33.5 Dol.
5.00 4 .75 4.20
9.0 10. 5 10.4
36. 1 Dol.
4.90 4.70 4. 10
9. 1 13. 5 12.8
41.8 Dol.
5. 05 4.68 4.08
7.6 12.2 11.7
28.6 Dol.
4.91 4. 56 4.01
7.6 11. 5 11. 0
29.6 Dol.
4. 83 4.49 3.97
This report is made poss1ble through the cooperation of the National Poultry Improvement
Plan, Official State Agencies, the Animal Husbandry Research Division of the Agricultural
Research Service, the Inspection Branch of the Poultry Division, Consumer and Marketing
Service and the Agricultural Estimates Division of the Statistical Re porting Service and
the many breeders, hatcheries, poultry processors and the poultry farmers that report
to these agencies.
ARCHIE LANGLEY
W. A. WAGNER
Agricultural Statistician In Charge
Agricultural Statistician
After Five Days Return to: United States Department of Agriculture
Statistical Reporting Service 409A North Lumpkin Street Athens, Georgia 30601 OFFICIAL BUSINESS
Postage and Fees Paid U. S. Department of Agriculture
~
j /j
~G\A
~a FARM REPO
GEORGIA CROP REPORTING SERVICE
LIBRARIES
26, 1967
GEORGIA ANNUAL CROP REPORT 1967
VALUE OF GEO~GIA C~OPS UP 80 MILLION DOLLARS: The value of the principal crops produced in Georgia during 1967 is $460,767,000- 21 percent
above the 1966 value of $380,609,000. The increase is due mostly to increased yields per acre,
resulting from very favorable weather conditions for food and feed crops. Peanuts are Georgia's
most valuable crop with a value of $112,139,000, followed by tobacco with $99,495,000. Corn
ranked third in value with $98,630,000. The value of the cotton crop (lint and seed) is
$33,016,000, the smallest since 1932 when the I int price was 7 per pound. Soybeans made the
largest gain in value with an increase of 64 percent.
RECORD YIELDS: Corn and . eanuts ha d record hi gh yields. The 5&-bushel corn yield is nine bushels above the previous record. The peanut yield of 2,040 pounds exceeded
the previous record by 230 pounds. The tobacco yield of 2,031 pounds equals the 1965 record.
The pecan crop of 4&,000,000 pounds is II ,000,000 pounds above the 1966 production, but is below average. The size of the crop varied widely by areas and varieties. Growers received very good prices this year and the value of the crop is placed at $18,160,000. The 1967 peach . crop of 3,000,000 bushels is bOO,OOO bushels Jess than last year. Value of this year's crop is $11,46h,OOO.
DISTRIBUTION OF 1967 CROP VALUE IN PERCENTAGE OF TOTAL VALUE
\
\
--
ARCHIE LANGLEY Agricultural Statistici a n In Charge
\
\ I \ '
-1\
I
I
I
I
I '
/
/
I
/
C. L. CRENSHAW Agricultural Statistician
J
GEO RG IA ANN UAL C~O P SUMt1ARY 1I 1967 and 1966
J
:
: Ha r v'd
Yield :
: Produc- . Unit
Total "
Cro e
Yea r : Acreage . Per Acre : Unit
tion
Pr ice
Value
1 ,000 acres
1,000 do 1.
1,000 dol.
!
Cotton Lint Z./
Cottonseed Corn, Grain Sorghum Grain Wheat Oats Bar 1ey Rye Potatoes, Sweet Tobacco, All Hay, All Sugar Cane Syrup
196 7 l 96b 196 7 1966 1967 1966 1967 1966
1967 1966
1967 1966
1967 1966 1967 1966 1967 1966 1967 1966
1967 1966 1967 1966
270 3(jO
I, 532 1, 368
11 12 130 65 100 98 9 11 67 43 b b 73.2 62.5
433 460 I .0 1.3
409 398
58 .0 4 3 .Q 37.0 38.0 26.0 30.0 35.0
41 .o
31.0 41.0 18.5 22.5
so.o bs.o
2,031 1'572 1.95 1.88
260 230
Bales Tons Bushels Bushels Bushels Bushels Bushels Bushels Cwt. Pounds Tons Ga lions
230 316
94 130 b8 ,b56
58. ~ 24
407 45 6
3,3~0
1 .950 3,500 4 , 018
279 451 1,240 96b 720 680 148,666
9l:s,255
845 867 260
299
2 L~5 .202
51.50 65.20
l. 11 1.46 l. 11 1.24 1. 54 1. 58
. 82 .82
. 9U
1.01 2.26 2.20 6.30 6.37
.66~
.727
28.00 27.00
I .65 1.50
2~, I 75
31 ,8l:s7 ..
4,b41
8,476
96,630 ~
85,8<S3
452
565 5,205
"
3,081
2,870 .., 3 .295
273
456 2 '()02
..
2,130
4,536 4.332 ~,
99,495
71 ,417
23,660 .
23,409
429
44~ il
Peanuts, for Nuts 2/ Cowpeas, for Peas ll
1967
1966
1967 1966
47 o 4{)2
16
2,040
. 1, 680 7 5
i'ounds
975,120 809 , 760
120
115 114
4. 90
14
~.o Bushels
112 5.20
112,139
92.313 588 ~ 5b2
Soybeans, for Beans ll
1967 1966
542 301
24.0 23.0
Bushels
13,00d 6,923
2.45
2.~0
Lespedeza, for Seed
1967
b .O
1966
9.0
220 200
Pounds
1 '760
.200
1,800
192
Crimson Clover, for Seed
1967
6.0
1966
6.0
85 Pounds 100
510
.250
600
.260
31 ,870
19,384
352 346 128 ~ 156
Fescue, for Seed
Peaches, Total Production 4/
Pecans, Total Product ion
Corr.mercial Vegetables 5/
TOTAL ABOVE CROPS (Excl. acreage of peanut hay, fruits, and pecans.)
1967 1966 1967 1966
1967 1966
1967 1966
10.0 12.0
56 .b 56.0
1967 3753.0 1966 3388.8
200 210
Pounds
2,000
.130
2.520
110
Bushels
3,000 3.82 3,800 2.60
Pounds
48,000 37,000
.378 .297
260 277 ~ II ,468 9,563 ll:s, 160 -i 10,980 14,434 II, 329
460,767 380,609
ll 1967 price and value figures are preliminary. 11 Cotton yield in pounds- pr i ce per pound. ll Covers only acreage alone and harvested for peanuts, peas, and beans. ~/ Includes 218,000
bushels in 1967 and 292,000 bushels in 1966 excess cullage, excluded in computing value.
21 Does not include sweet potatoes.
After Five Days Return to Vnited States Department of Agriculture
Statistical Reporting Service 409A North Lumpkin Street Athens, Georgia 30601 OFFICIAL BUSINESS
~. -
o
!cguisitiona Division University of Georgia UniversitY Librari es Athons Goorgia 30601
Postage and Fees Paid U. S. Department of Agriculture
ETAB LE
Georgia Crop Reporting Service
REP. . . . .:--0. . . . .,.
/ . : ;f >.ORGIA
Athe s, Georgia
ecember 26, 1967
GEORGIA ANNUAL VEGE
- 1967
Production of the eight principal commercial vegetable and three :xocessing crops harvested in Georgia was valued at $18,97 0, 000 in 1967, an increase of 21 percent over the value of $15,661,000 last year. These crops were harvested from an estimated 66,850 acres in 1967 compared to 63,950 in 1966. Watermelons, with a total value of $6,669,000 continue to lead, with sweetpotatoes 1 cantaloups and tomatoes following in order .
weather conditions varied considerably during the spring and summer months 1 howe ver better than average yields were harvested for most crops . The demand for the 1967 production was very good and above average prices were received for all crops .
ACREAGE, PRODU CTION, PRICE AND VALUE OF PRINCIPAL CROPS 1/1967 - 1966
CROP
Year
Acreage Yield Harvested Per Acre Production
Price Per Cwt.
Value
Acres
Cwt .
1 1000 Cv.rt. Dollars 1 1000 dol.
For Fresh 1\1arket:
Beans, Lima
' Beans, Snap S12ring
..
Beans 1 Snap _ii_ummer
Cabbcge 1 Spring
Cabbage 1 Summer
Cantaloups
Corn, Sw eet
Tomatoes
VVatermelons
Sw eet Potatoes
TOTAL FRESH MARKET For Processing : TOTAL
PROCESSING ?:/
1967 1966 1967 1966 1967 1966 1967 1966 1967 1966 1967 196'6 1967 1966 1967 1966 1967 1966 1967 1966 1967 1966
1967 1966
31000 31 1 00 31000 21800 11300 11 2 00 215 00 2,400
450 450 51500 5,500 114 00 1,500 21800 2,500 361000 33,500 8, 000 8,000 63,950 601950
2,900 3,000
26 23 24 27 38 37 125 125 105 115 60 40 32 25 67 60 95 80 90 OS
XXX XXX
XXX
XXX
78 71 72 76 49 44 312 3 00 47 52 330 22 0 45 38 188 150 3142 0 2,680 720 680 512 61 4,311
XXX
XXX
11.00 11.50
9.80 8.90 12.50 13 . 2 0 2 . 85 2.65 3.80 5.00 6.90 5. 70 5 . 10 6.00 7.60 7.10 1195 l. 90 6.30 6 . 37
XXX
: "J'.X
858 816 7 06 676 612 581 889 795 179 260 21277 1,254 230 228 1,429 1, 065 61669 5, 092 4,536 4,332 18,385 15,099
XXX
585
XXX
562
TOTAL I FRESH MARKET
1967
66,850
XXX
XXX
AND PROCESSING
1966
63 , 950
XXX
XXX
XXX XXX
181 97 0 151 661
_V Preliminary. J:/ Includes only Lima Beans , Snap Beans, and Cucumbers for Pickle.
ARCHIE LANGLEY c\gricultural Statistician In Charge
L. H. HARRIS I JR. Statistical Assistant
The Georg ia Crop Reporting Service 1 U . S. Department of Agriculture 1 4 09A North Lum pk in Street in cooperation with the Georg ia Department o f i.\griculture.
GEORGIA - VALUE OF PRODUCTION BY CROPS
UNITED STATES: In 1967, production was 3 percent more than in 1966 for the 27 principal
fresh market vegetables. The 1967 production of 222 million hundredweight compares with 1966 production of 215 million hundredweight and the average annual production of 216 million. Crops making major contributions to this year's increased production from 1966 were onions, cabbage, sweet corn, and celery. Record high production levels were estimated for artichokes, broccoli, lettuce, and onions. The 27 principal vegetable and melon crops had a total value of 1,122 million dollars, 1 percent less than a year earlier. Leading crops in value were lettuce and tomatoes whose combined total accounted for 36 percent of the U. S. total.
The five leading States in the 1967 production of fresh vegetable and melons were California, Florida, Texas, Arizona, and New York. These States accounted for 64 percent of the harvested acreage, 70 percent of the production, and 73 percent of the value ef the vegetables and melons produced in the United States.
This summary provides fresh market estimates for the 27 principal vegetables and melons grown commercially in the more important producing States. These estimates provide basic statistics on over 80 percent of the national output of all vegetables and melons grown for - fresh market sale. It has not been ~ossible to include all vegetables in all States in this program.
These data are based upon informa tion se cured from growers, shippers, processors, public agencies, and other sources.
After Five Days Return to United States Department of Agriculture
Statistical Reporting Service 409A North Lumpkin Street Athens, Georgia 30601 OFFICIAL BUSINESS
Postage and Fees Paid U. S. Department of Agriculture
UN IVE RS ITY CF C!:ORGIA
ATHENS, GEORGIA
Decembe r 27, 1967
GEORGIA CH!CK HATCHE.dY REPORT
Placement of broiler chicks in Georgia during the week ended December 23 was 8, 446, 000--5 percent more than the previous week and slightly more than the comparable week last year, according to the Georgia Crop !.={ e porting Service.
An estimated 11, 445, 000 broiler type eggs were set by Georgia hatcheries-slightly more than the previous week but 3 percent less than the comparable w e ek a year earlier.
The majority of the prices paid to Georgia producers for broiler hatching eggs were reported within a rang e of 50 to 65 cents per dozen. The averag e price of hatching eggs was 57 cents per dozen. The price of eggs from flocks with hatchery owned cockerels generally was 2 cents below the average price. Most prices received for broiler chicks by Georgia hatcheries were reported within a range of $6 . 00 to $9. 00 with an average of $8.00 per hundred. The average prices last year were 62 cents for eggs and $9.25 for chicks.
Week Ended
GEORGIA EGGS SET, HATCHINGS, AND CHICK PLACEME NTS
EGG TYPE
Eggs 3et
1966
1967
I I o/o of I year ago
Chicks Hatched
1966
1967
Thou.
Thou.
Pet.
Thou.
Thou,
I
I o/o of
I year ago Pet.
Nov. 25 Dec. 2 Dec. 9 Dec. 16 Dec. 23
Week Ended
885
818
753
I
711 881
Eggs Set -2/
1966 Thou.
1967 Thou.
556
63
723
460 464
-1/
56 62
543 514
513 556
I
72 63
645 605
BROILER TYPE
o/o of year ago
Pet.
v~hicks Plac'",'d for Broilers in Georgia
1966
1967
o/o of year ago
Thou.
Thou. Pet.
314
43
251
46
275
54
463
72
368
61
Av. Price
Hatch B ro11er
Eggs Chicks
Per
Per
Doz.
Hundred
1967
1967
Cents Dollars
Oct. 21 Oct. 28
11, 981 11, 27 5
11,289 11,271
I 94
8,274
100
8, 141
7, 551 7, 537
91 93
56 56
Nov. 4
11, 142 11,090 100
8, 171
7,637
93
57
Nov. 11
11,220 10,964 98
8,449
8, 270 98
57
Nov. 18
11,203 10,940
98
8,376
8, 173 98
57
Nov. 25
11,433 10, 814
95
8,203
8,068 98
57
Dec. 2
11,276 11,289 100
8, 151
8, 103 99
57
Dec. 9
11,729 10 , 633
91
8, 171
8,315 102
57
Dec. 16
11,908 11,427
96
8,417
8,060 96
57
Dec. 23
11' 83 5 11, 445
97
8,435
8,446 100 I 57
1I Revised.
2/ Includes eggs set by hatcheries producing chicks for hatchery supply flocks.
7.75 7. 7 5 8.00 8.00 8.00 8.00 8.00 8.00 8.00 8.00
ARCHIE LANGLEY Agricultural Statistician In Charge
W . A. WAGNE R Agricultural Statistician
U. S. Department of Agriculture
Georgia Department of Agriculture
Statistical Reporting Service
409A North Lumpkin Stre et, Athens, Georgia
BROILER TYPE E GGS SET AND C HI CKS PLA C ED IN COMMER~IAL ARE A S BY WE EKS - 1967 Page 2
STATE
E GGS SET
Week Ended
Dec.
De c.
9
16
Dec. 23
CHICKS PLACE D
I I o/o of --- ------W'~e=ak=-=E=...:n=d=e=-d=---------:1 o/o of
year . Dec.
iJ e c.
Dec.
year
ago 1/f 9
16
23
ago 1/
THOUSANDS
T ~-IOUSANDS
Maine Connecticut Pennsylvania Indiana
1, 745
1,738
1,907 104 i 1, 279
1, 304
1, 515
108
242 1, 352
483
256 1, 317
462
297 1, 310
482
~85
139 80
m
146 894 316
185
112
802
112
309
93
Missouri D e laware
424 2, 156
319 2,270
330 2,384
55 100
1:. 11
356
1. 2, 249
359 2, 138
370 2, 247
109 97
Maryland Virginia
4,079 1,232
4,296 1, 405
I 4,334 100 I 2, 884
1, 560 110
1, o2o
2,998 982
2,988 1,062
102 142
West Virginia North Carolina
95
128
120 76 I 322
313
261
111
5, 276
6,372
6, 351
92 I 4, 609
4,535
4,640
96
.
South Carolina
396
387
401 98 : 319
354
361
96
::>
GE ORGIA
10,633
11,427 11,445
i 97
8,315
8,060
8,446
100
l
Florida
898
923
848 153 i 744
681
609
142
T enness ee Alabama
654 7,490
676 8, 173
I 738
69 I 736
8,395 108
6,027
837 5,970
777 6, 315
85 109
Mississippi
4,429
4, 626
4, 594 102 : 3, 717
3,754
3,918
109
Arkansas Louisiana T exas
8,906
9, 519
9, 530 100 'i 6, 728
6,701
6,809
99
1, 107 3, 746
1, 102 4,301
1, 061 4, 176
97 112
733
I 3,oo7
757 3,038
703 3, 162
92 107
Washington Oregon California
482 258
472 369
552 364
I 97
416
91
238
404 238
468
103
240
93
1, 689
1, 737
1,673 93 ! 1, 263
1,264
1, 298
90
TOTAL 1967
57,772 62,275 62,852 100
46,043 47,485
102
(22 State s}
' TOTAL 1966*
(22 State s}
62, 174 62,987 62,820
46,792 46,742 46,334
o/o of Last Year
93
99
100
*1I Curr e nt week as percent of same week last year. R e vis e d.
I 99
99
102
...
,.,
PORT
FAtt I G Oii!.t. 29 1967
December l, 1967
Fall Pig Crop Up 6 Percent
GE iRGIA
r
LIBRARIS
Released 12/27/67 GEORGIA
CROP REPORTING SERVICE
Georgia's 1967 fall pig crop is estimated at 1,094,000 head, 6 percent above the JuneNovember 1966 crop of 1,030,000 he ad. Sows farr owed during the period totaled 152,000 head, up 8,000.
1967 ArLual P1g Crop Up ll Percent
Total pigs saved in Georgia for the December 1966 - November 1967 period was placed at 2,344,000 head. This was ll percent above the 2,116,000 during the previous year.
1968 Spring Intentions UE 3 ~g~
Georgia farmers reported intentions to farrow 181,000 sows during the December 1967 May 1968 period. This would be 3 percent above the 176,000 a year ago and 13 percent above the 1961-65 average.
The June-November 1967 pig crop of 42,950,000 head was 2 percent above the 42,141, 000 a year earlier. The combined December 1966-November 1967 crops totaled 91,310,000 head, 4 percent more than the 1966 total of 87,563,000. Farmers intend to farrow 6.5 million sows during the December 1967 - May 1968 period, l percent less than were farrowed during the comparable period a year earlier.
SCWS FARROWING, PIGS PER LITTER, AND PIGS SAVED _ _,_ _ _ _ _ _....Q22r_gi~-~ed States. 1962 -1967----~---
--~S~o:.:.:w..;;.s_ F;;..a;;;;r;.;r~o;.;:w:=i:.:.:n;:;::g_ __..:,_ ___figs PeE._f~ter ___
Pigs ~:::~d~---
Dec.- June-
Dec. -
June-:
Dec.-
June-
-----:.---.:.:M;;;;ay~~---.:.:.N.;;..ov.:..=----~~y__
Hov.
M~---L~-
Year
1,000 head
Number
1,000 head
Georgia
1962 1963
166
157
169 ~
149
7.0
7.0
1,162
1,099 2,261
7.0
7.1
1,183
1,058 ~,241
1964
152
130
7.0
7.0
1,064
910 1,974
1965
144
125
7.0
7.1
1,008
888 1,896
1966
153
145
7.1
7.1 1,086
1,030 2,116
1967
:
176
152
:
7.1
7.2 ;
1,250
1,094 2,344
1968
: 11 181
.
.
--------------------------------~-----~-----------------------~--------------------------------
United
States
1962
6, 996
6,098
7. 08
7.23
49,535 44, 073 93 ,608
1963
7,099
5, 987
7.15
7.23
50,749 43,307 94,056
1964
6,596
5 , 5 25
7.23
7.21
47,682 39,862 87,544
1965
5,890
5,006
7.22
7.27
42,525 36,415 78,940
1966
: 6,201
5,811
7,32
7.25
45,422 42,141 87 ,563
1967
: 6,591
5,820
7.34
7.38
48,360 42,950 91,310
19.____ :-1-L~~~--- ------ -~-- 1.!l2___ _~-- . 21 47,2.92.___________
1 1/ Spring farrowing indicated from breeding i ntentions reports. Average number of pigs per
litter with allowance for trend used to compute innicated pig crop. Number rounded to nearest
100,000 head.
ARCHIE LANGLEY Agricultural Statistician In Charge
W. PAT PARKS Agricultural Statistician
r
I v
~~g~ ~ Farms 1!E :l: f~r9e~~ 1_g Q~~g i~
There were 1,600, 000 hogs and pigs on Georgia farms December 1, 1967, 11 percent above the 1, 443 , 000 head a year earlier. Hogs and pigs kept for breeding purposes totaled 233,000, up 4 percent. Other hogs and pigs were up 12 percent at 1,367,000 head.
1 'Q_. ~ Hog~ !l:nd Pig~ Up f~~nt
Hogs and pigs on farms in the United States December 1, 1967 t otaled 57.9 million head. This was 1 percent above the 57.1 million head a year earlier. Hogs kept for breeding totaled 9.0 million, up 2 percent. The remainder, kept for other purposes, totaled 48.9 million, an increase of 1 percent.
HOGS AND PIGS ON FAffi~S, GEORGIA AND UNITED STATES December 1, 1962 -1967 (Thousand Head)
.
1962: 1,645 1963: 1,612 1964: 1,370 1965: 1,288 1966: 1,443 1967: ~-1..!.600
1/
11
22b
1,386
590
402
199
1,171
444
369
193
1,095
430
329
224
1,219
)00
345
~22--~_1,267_ _ _ 56q____d~3
1!~~ !!!~
284
71
263
62
246
63
256
85
2~_ __2_~
39 33 27 .
33
-41 -
1962: 62,726
11
1/
1963: 62,060
9,117
52,943 18,864 13,949 11,119
1964: 56,106
8,166
47,940 16,483 12,967 10,1)2
1965: )0,)19
8,224
42,295 15,344 11,470 8,689
1966: 57,126
8,858
48,268 17,320 12,827 9,956
1967: 57,943
9,039
48,904 17,770 13,210 9,709
lfData for 11breedingn and II ofuerilnot-aVallable for years priortol%J~
6,678 2,333 6,167 2,171 5,158 1,634 6,095 2,070
- - 6,142 2,073
,.
t, Acknowledgement is-made to-the-Postmasters-and-Rural-and-Star-Route-Carriers for their assistance in collecting the basic information from which these estimates were made. The cooperation shown 1?_,y_s~v~r~l_t!l_o~s~n2._ f_a_m~r~ ~h9_ f.Un!s!.!_e~ :r_ep_or_t~ f_or_ ~h~ir_ .!_nQ_iyi~u~l_f~~s_i~ ~l~o_a:evr.ei~t~d!'
I
ISSUED BY: The Georgia Crop Reporting Service; USDA, 409A North Lumpkin Street, Athens, Ga., in
cooperation with the Georgia Department of Agriculture.
After Five Days Return to
United States Department of Agriculture
Statistical Reporting Service
409A North Lumpkin Street
Athens, Georgia 30601
t .-
OFEJCIAL BUSINESS
t '
~(;0
Acguisitions Division
Un1versity of Georgia
University Libraries
Athens Georgia 30601
Postage and Fees Paid U. S. Department of Agriculture
REPORT
GEORGIA CROP REPORTING SERVICE
ATHENS, GEORGIA
CONSill~TION OF COMMERCIAL FERTILIZERS l}
December 1967
' , Georgia
Consumpti on of commercial fertilizers in Georg ia during the year ending June 30, 1967, was 1,900, 000 tons compared with 1,655,000 t ons for the same period last year, according to the Georgia Crop Report i ng Service. The 15 percent increase f or Ge orgia was the largest percentage increase of any southeastern state. Scme of the cornbelt states had increases of 30 percent.
United States
The United States used 37,127,000 t ons of commercia l fertili zer for the year ending June 30, 1967. This is 8 percent above the 34,532, 000 tons used during the year ending June 30, 1966. Actual plant nutrients (nitrogen, phosphoric oxide and potassium oxide) applied total 14.0 million t ons, an increase of 13 percent from a year earlier.
The two leading states in the consUmption of commercial fertili zers were Illinois and California. Minnesota and I owa had the largest percentage increase with 30 percent gain .
The major consumer of mixed fertilizers was North Carolina with over 1,430,000 tons. In second place was Florida with slight+y over 1, 390 , 000 tons. Ge orgia was third with a total mixed fertilizer consumption of 1,360, 000 tons .
C. L. CRENSHAW.
ARCHIE lANGlEY
Agricultural Statistician
Agricultural Statistician In Charge
1/ This preliminary report is made possible through the cooperation of State fertilizer con~
trol officials and the f ertilizer industry. Tonnages are subject to revision when the annual
report is published in May 1968, but revisions are expected to be minor.
After Five ~ays Return t o United States Department of Agriculture
Statistical Reporting Service 409A North Lumpkin Street Athens, Georgia 30601 OFFICIAL BUSINESS
Postage and Fees Paid U. S. Department of Agriculture
Total
fertilizer l/: Consumption
years ended June
by 30
,
kind o 1966,
f fertiliz and 1967
er1,
by
States,
/)
State
Ma.ine N. H. Vt. Mass. R. I.
Conn. N.Y. N J Pa. Del.
D. of Col. Md. W. Va. Va. N. C.
p: s . c.
l Ga. -Fla. Ohio Ind.
Ill. Mich. Wis. Minn. Iowa
Mo. N.Dak. S. Dak. Nebr. Kans.
Ky . Tenn. Ala. Miss. Ark.
La. Okla. Texas Mont. IQ.aho
Wyo. Colo. N. Mex. Ariz. Utah
Nev. Wash. Creg. Calif.
lviixtures
1966 Tons
1967 Tons
175,917 . 20 ,351
48,212
74,113 16,186
179,435 16,820 36,159 67 , 443 15,539
72,462
579,197 191,045 590,774
110,518
77,662
590,781 196,003
573,051 107,202
3,850 353,:645
60 ,408 660,635 I 1,367,330
4,620 337,029
57,992 698,167 1,428,050
651,602 1,216,918 1,538,900
992,696 I 1,235,264
698,224 1,358,653 1,390,492 l,C89,597 1,342,129
1,195,151 622,554 419,C59 546,245 773,335
1,278,811
654,187 450,849
633,376 1,001,095
792,267 100,801
70,841
186,118 307,394
888,252 132,230
82,168 242,456 371,992
546,895 615,165 702,633 392,564 240,671
542,550 613,594
733,063 414,654 263,596
230,300 212,819 665,116
30,244 45,647
262,542 238,236
766,108 37,117 48,828
12,353 57,530
19,745 33,736 19,273
15,071 70,018
21,474 33,607 21,070
2,833 96,327
55,428 429,665
2,889 99 ,5Cf7
70,761 523,612
Direct-application materials 3/
Secondary & micro-
Primary nutrient
nutrient
1966 Tons
1967 Tons
1966 Tons
1967 Ton s
6 ,955
7,544
13
6
4 ,932
4,028
2
20
12,250
9,678
17
18
17,404
15,490
167
75
1 ,880 .. 1,851
2
2
15,642 76,804 32,575 100,698 14,993
960 43 ,3C8 19,458 138,626 360 ,386
17,C!57 76,376 32,289 110,303 21,571
910
45,7'2.9 17,915 142,643 387,056
116 575 937 6,429 731
8 296
53 20,783 58 ,C84
119 600 553 6,000 780
25 197
64 20,185 60,704
210,661 400,690 237,143 312,597 691,545
221,872 485,401 224,260 334,8C5
671,577
4,173
37,863 8,142 478 640
4,811 55,576
5,510 468
725
1,863,734 160,064
210,042 304,643 977,207
2,003,614
171,718 290,384 476,069
1,277,992
1,275
5,792 1,966
885 1,648
1,350 5,658 1,163 1,346 2,543
451,827 145,520 88,079 564,859 525,989
436,800 165,957 111,C56 633,439 518,204
309 170
6
2,3C8 403
161 180
8 3,073
450
183,681 181,134
295,572 280,365 200,141
197,181 200,589
328,234 299,094 218,810
639 234 2,979 154 169
600 200 3,038
150 141
186,725 277,362 837,606
71,445 228,241
209,578 232 ,Cf73
881,038 103,201 241,428
17 6
5,391
852 12,153
309 36
5,800
736 13,717
30,734 136,658
47,377 173,902
60,153 '
36,667 149,988
51,537 189,680
66,280
173 2,613
74 22,582
382
174 1,093
98 13,950
438
7,863 349,160 286,C85 1,489,950
8,462
2,164
2,412
392,378
17,767 14,874
347,565
21,C55 15,488
1,512,332 1,216,295 l,l48,874
1966
Total 1967
: 1Y6/ as :percent : of 1966
'l'ons
Tons
Percent
182,885 25,285 60,479 91,684
18,068
186,985 102
20,868
83
45,855
76
83 ,ocs 91
17,392
96
88,220 656,576 224,557
697,901 126,242
94,838 1C8
667,757 102
228,845 102
689,354
99
129,553 103
4,818 397,249
79,919 820,044 1,785,800
5,555 382,955
75,971 860,995 1,875,810
115 96 95 ' lC/5
105
866,436
1,655,471 1,784,185 1,305,771
1,927,449
924,907 1,899,630 1,620,262 1,424,870
2,014,431
l107
115 91
109 l05
3,060,160 3,283,775 107
788,410
831,563 1C5
631,067 851,773
1 ,7n4o2,,379961
118 130
1,752,190 2' 281,630 130
1,244,403 1,325,213 106
246,491
298,367 121
158,926
193 '232 122
753,285
878,968 117
833,786
890,646 107
731,215
740,331 101
796,533
814,383 102
1,001,184 1,064,335 106
673,C83
713,898 106
440,981
482,547 109
417,042
472,429 ll3
490,187
470,345
96
1 ,see ,113 1,652,946 110
102,541
141,054 138
286,041
303,973 106
43,260 196,801
67,196 230,220 79,8C8
51,912 120 221,099 ll2 73,109 109 237,237 103
87,788 llO
12,860
13,763 107
463,254
506,759 109
362,568
433,814 120
3,135,910 3,184,818 102
48 States :19,382,732 20,778,761 13,315,625 14,579,703 1,459,970 1,394,498 34,158,327 36,752,962 1C8 & D.C.
Other ~I
276,225
278,575
96,245
93,520
1,418
1,650
373,888
373,745 100
u. s.
:19,658,957 21,057,336 13,4ll,870 14,673,223 1,461,388 1,396,148 34,532,215 37,126,707 1C8
v 1/ Excludes liming materials.
1967 prel:iminary . 'i/ Excludes materials used in commercial mixtures.
!/Alaska, Hawaii, and Puerto Rico.