- Collection:
- Georgia Government Publications
- Title:
- Georgia crop reporting service, 1958
- Creator:
- Georgia. Department of Agriculture. Crop Reporting Service
- Contributor to Resource:
- Georgia. Department of Agriculture. Crop Reporting Service
- Publisher:
- Athens, GA : Georgia. Department of Agriculture. Crop Reporting Service
- Date of Original:
- 1958-12-31
- Subject:
- Georgia
- Location:
- United States, Georgia, 32.75042, -83.50018
- Medium:
- publications (documents)
- Type:
- Text
- Format:
- application/pdf
- Description:
- 1940/1941-1974.
Issued in various sections.
U.S. Dept. of Agriculture Agricultural Marketing Service, University of Georgia College of Agriculture, Georgia Agricultural Extension Service, cooperating.
Split into: Weekly hatchery; Georgia farm report; Farm labor; Monthly poultry summary; and: Livestock report, weekly hatchery. - External Identifiers:
- Call Number GA A400.C7 P1 C7 1958
- Metadata URL:
- https://dlg.galileo.usg.edu/id:dlg_ggpd_i-ga-ba400-pc7-bp1-bc7-b1958-bfolio
- Digital Object URL:
- https://dlg.galileo.usg.edu/do:dlg_ggpd_i-ga-ba400-pc7-bp1-bc7-b1958-bfolio
- Language:
- eng
- Holding Institution:
- University of Georgia. Map and Government Information Library
- Rights:
-

-
~~i GJE(Q)JECGllA C~OlP . ~IIP'(Q)~1rllWCG JE~VllCCIE
AGRICULTURAL EXTENSION SERVICE UNIVERSITY OF GEORGIA AND 1'HE STATE DEPAR'IMENT OF AGRICULTURE
( Athens, Georgia
U.S. DEPARTMENT OF AGRICULTURE AGRICULTURAL. MARKETING SERVICE 319 EXTENSION BLDG., ATHENS, GA.
Ja ~?s ..r 0
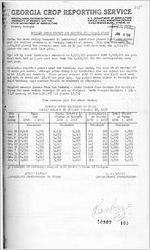
BROILER CHIC K REPORT FOR GEORGIA COi'Il-J1~RCiii.L AP.EA.S
~ring the w: ek ending De ce~ber 28 ~omrne rdal . hatche".ries Rl~ced 5, 72,00~AR,f;i.cks : WJ.th t he broller producers ln Georgla comrnerclal areas -. lhls compc. , the .
5,094,000 placed the pr evious week and is 40 per cent more than t he 3,700 , 000
placed the same week la st year .
Eggs set by local hatci1erie s amountnd to 6,573, 000 compar ed with 6, 718,000 the previous week and is 5 per cent more than the 6,255,000 for the corresponding wee k last year.
Hatcherie s r eportt:.d prices paid for hatching egg s during the vre ek at an !3-VG_rage of 76 cents per .dozen . Average price charg;::;d by hatcherie s for the chicks :was r eported at .13.25 per hundred . The se prices compar e . w:i.t h 75 cent s and 13. 00 l ast week and with 64 cents and ~11. 00 one ye ar ago . Egg prices shown r elate to Georgia pro"':' duced hatching eggs whether b ought on contract or otherwise .
vleighted average pri ces fr om the Fedel!'al - St ate Harke t News Service for broiler s during the week ending De cember 25 are a s f ollm-Js : North neorgia broiler s 2 3/4 -
3 1/2 pounds, at farms 16-321 FOB plant s :1,.7 . jl~
{ .,
(See r everse side f or other state s)
'lJate--
vieek Ending
GH.:ORGIA CEI CK PL.l\ C.CNF:NT BY V\IF:~ KS P.~RIOD OCTOBBR 26 TIJP OUGH :'1ECEl1ffi\ R 28, 1957
t;gg s &et
n s i pments of Chicks
1956 : 1957
1 956
1 95 7
Thousands
Oct . 26 Nov. 2
Nov. 9 Nov. 16
Nov. 23
~ ov. 30 Dec. 7
De c. 14
Dec . 21
Dec. 28
6,109 5,963 6, 060 6 , 16 h 6,179 6,138 5,010
5,909 6,304 6,255
6,27L. 6 ,261 6 ,2 23 6, 512 6,539 6,371 6 ,2 40 6, 70 ''.
6,718 6, 573
Tho u s a n d s
4,134 4,051 4,026 4,146 4,123 4,128
4,157 4,105
4,1L~O
3,387
4,339 4, 340 4,422
4, 378-
4,473 4, h83 4~ 54 3 4,596
4, 596 4,670
'l'hou~iartds . . . , Tqpusand s
.. .~
51+6
507 4,6 80 4, 846
469
542 4, 520 4, 88 2
374
669 4, 400 5, 091
4 0 L~
545 4,550 h, 923
447
482 . 4, 570 L~, 955
43 2
510 4,560 4, 993
' 4 38
493 4,595 5, 036
455
480 L,.,56o 5, 076
4?0
498 L~ , 6 10 5 , 094
313
502 3,700 5 ,172
E:{clusive of hatci1ingsshipi)e d into st, t es -~ut side of Georgia .
---
AP. CFJT, LhNC'rL:t-~Y i.('ricultural Statistician In Charge
~-~ . A HAGrr.GR Agri ~ultural Statisti cian
$8807
__________ ______ EGGS SET AND CHICKS PLACED IN COMMERCIAL AREAS, BY 1NEEK3 - 19 57 --------------- ---- ____ _.
Page 2
....;.__
li
Week Ending
\
: ~ ...
STATE
t~
-D-
~-4-c-
~
~
~
D~
~
~-~~
~
-D_-~_-~_-._ -_-_-..-__
__.I_._o_~_:__
_-!.N~v;-~~-v_.._ _ ;t_N_o_~
.
I"N-~-;:_
r_N~-~
-~
i
D~~---.r.~
-~-:
E.~~
"l-~.~.-~_-._- -_
_;_t__.-.-.--- :.: ___,___cH~~~-~-LA_CE_D_~-~~~~S~Ds ~ .:.7::
... 'l '
. .
, ..
. ...~
- - - 1.--E-G.GS SET THOU_s_M_J_D_s____;__
___-- - ----- - -- - - -
1,236
1, 310 ' 1,22.4
fi
974 . 860:
,..Connecticut
:eeim.sylvania 'Indiana .I l l i n o i s
:IV.d s souri
Delaware Maryland Virginia West Virginia North Carolina S'ou-th .Ce.f61ina
739
1;428
1 ,!
1,754
ll 346 1,508
I 2,405
I
1
2,054
l 1,834
317
2,860
535
831 1, 362 1,665
384 1, 581 2,400 2,085 1,809
326 2,815
519
76'9
1,400 1, 707
329 1,506 2,308 2,061 1,825
310 2,756
500
i I
n
503 614 857 118
H
366
!! 1,630
;; 1,446
11 1,130
il
336
~ 1,~~~
548 6.88 771 122 456 1,489 1,397
1,195 . 437
1,~;~
-
GE ORGIA
-----.-. .-
-
.
.
,
l
j
. _
6, 708
___ ___
6, 718
6,573
uf 4 , 846
Florida
442 __4_2_1_ ____4 4 1 - - - - -t - - 157
4,882 182
Alabama
2,54 7
2,518 2, 4 53
jl 1,920 2,051
.Mi--ssissippi Arkansas Louisia.z1a
1 1, 738 1 2,842
344
1, 783 2,967
403
1, 7ll 2,849
364
1,200
'Il 1,962
j
268
1,273 1,880
241
Texas
2,522
2,54 5 2,592
Wai:hington
257
320
328
Oregon
2ll
215
244
-'""Cl'Oa.,l.i.'flo,'rA"nL-i-a-rl'f'r9~5~7----~~__,..3=1-5,-,2'8"3"'05=-=7=----=316~,,...2..2.. .7.5~74--351,, 1494 44
TOTAL 1956
: 32,087 33,313 33,202
1957 %of 1956 !,I
112
109
107
_.l j
1, 59 9
1
1 70
--lil+l ~8427815
i 20,943
li 111
1,627 169 82 856
2'3 ;:.f'f6
21,403
llO
983 429 746 . 876 131 48 3 1,636 1,399 1,149 361
2,~~;
5;091
92o 417 875 793 133 484 1,847 1,225
1,138 435
2,~0:
987 445 762 794 149 451 1, 705 1,532
1,206 447
2,~~~
4,923 4 ,955
201 2,027 1,338 1,932
243 1,619
153 87
925
24 ,131
21,969
llO
188 2,019 1,307 2,053
267 1,823
189 135 910
184 1,986 1,232 1,992
292 1, 797
169 102 875
24:394 24, 48 5 22,061 21,978
111 111
934 477 886 784 11o 446 1,671 1,353 1,224 354
2,~~
4 , 993
955 492 751 805 124 550 1, 724 1,499 1,190 329
2,~:~
5,0 36
180 1,993 1,240 2,187
283 1,633
223 135 812
199 1,996 1,237 2, ll5
307 1,747
216 135 831
24 ,342 24 ,733 22.340 22,980
109
108
1,oo5 495 101 894 13o 520
1, 745 1,632
1,107 412
2,~~~
961 584 754 913 121 555 1, 13 95 1,425
1,145 359
2, ;:~
5,076 5, 094
214 2,106 1,233 2,235
269 1,731
169 180 869
266 2, . 03
1, .!82 2, 263
,:>07
1, n 3 :: 32 :_4 7
1:: 61
22,953 22, 913
llO 111
9'76 629 694 915
92 529 1,675 1,648 1,018 417 2,024 358 5,172
176 2,282 1,153 2,179
.275 1,769
244 134 767
25,126
18,092
139
..
------~'---------------------------------------~--------------------~------------
1007 ~~3 GE(Q)~CGll.A CCIR{CQYIP ~JEL@{(}~TllNG SJE~VllCIE:
5t AGRICULTURAL EXTENSION SERVICE UNIVERSITY OF' GE:dRGI.A AND THE .
STATE .DEPARTMENT OF AGRICULTURE
Athens, .
Ge.orgia
U.S. DEPARTMENT OF AGRICULTURE AGRICULTURAL MARKETING SERVICE 319 EXTENSION SLOG., ATHENS, GA.
January 6, 1958
FAR11 PRICE
9 /J_.
GEORGIA: The All Conunodity Index of Prices Received by Georgia farmers for the
month ended December 15, 1957 was 245 percent of the 1~10-1914 average,
This was an increase of 9 points (3.8 percent) over the November 15, 1957 index of
2)6.
. .
.
.
.
The All . Crops component of the index was 257 on December 15. This is an increase
of 10 points (h. 0 percent) over the November index of 247 but is 3 points (1. 2
percent) bel.ow the ~ndcix one yeo.r ago. Higher prices for wheat, corn, oats, ,
cotton, cottdnrJ(;Gd, pennuta, tlnd hey cont.ributed heavily to the increase from
the previous month.
The Livestock and Livestock Products Index for the month ended December 15, 195.7 was up 6 points (2;8 percent ) from November 15 and up 22 points (11.3 percent) from the December 15, 1956 index of 195. Higher prices for hogs, beef cattle, eggs, and milk cows more than offset the decline in price for all chickens, butterw
fat and milk (wholesale) from the previous month.
UNITED STATES: The Index of Prices Received by _Farmers showed no changed during
the month ended in mid-D.ecember, the Crop Reporting Board announced
today, Higher prices for meat animals and sweetpotatoes were approximately offset
by declines for cotton, tomatoes, milk, and oranges. The December index, at 242
percent of the 1910-14 average, was 3 percent above a year earlier, and the high-
est for December since _1953.
.
Higher _ pric~~ . of feeder livestock were primarily responsible for raising the Index of Prices Paid for Conunodities and Services, Interest, Taxes, and Farm Wage Rates to a new high as of the 15th of .December. Tractor and truck prices also rose. These increases in the production component of the Parity Index were offset in part, by a slight decline in prices paid for some family living items.
- - - - - - .- - - - - - - - - - - - - - - - - - - - - - - - - - - - - - - - - - Indexes
Summary Table for the United States :December 15,: November 15,:December 15, :____R~c~rg hiEh_
-1-91-0---1-4-... - -100 --: -- 1-9-5o--- :----- 19'57 --:--19-57----: ----Index-:---- -Date
Prices Received
235
242
242
313 Feb. 1951
Parity Index. _!I
290
298
299
299 Dec. 1957
Parity Ratio
81
81
81
123 Oct. 1946
!-/ ~Pr-ic-es-P-a- id- , - In-te-re-st-, -Ta-xe-s,-a-nd-W-ag- e R-a-te- s - ba-se- d -on-d-at-a -fo-r -th-e -in-di-ca-te-d-
dates.
ARCHIE LANGLEY . Agricultura~ Statistician In Charge
RAYMOND R. HANCOCK . Agricultural Statistician
-
/
..~ .
;. .
.. '
; :; .~ :
. ..
-PRICJ!;s '.RECE:rn:nBY FARMERs -nECEMBER 1 s , 19 57 vnTH cicMPAR.I S-rns- -
___ .:.
-
-----
r. : - . .~. . . CCWviODITY
~ .. ' .,, ~ '
..Ave rag~ ..
GE ORGIA Deo.l5,
MD UJ:JIT
}9_1 0-14 I' 19 56
Nnv.l5, 1957
i
. UN J'i 'E D S'.l'ATE S
.1 Dec .15 I 1957 I
Ave rag I ,.~Dec.l5,
1909-14 1956
1
1 I
N1o9y5 ;7l'5,..1
I I
Dec .15, 1957
j
-'
iheat, Bu.
cern, Bu.
$
1-23
2.00
:ji
. ,
.91
''.i
r.2o
1.95 1.13
1.99
. 88
..
' 1.20
. 64
2.07 :
1.93 !
i
.9a I
1.94 .99
(':la ts, Bu. . .
I rish Pot~,. Pwt.
Sweet p,t.' Cwt.
c,ctton, Lb.
..
$ .. ,.
.67
.as
;;; . ;t. .1-3
-
$
.a4 12.1 ,
I 4.75
l:32.1 '
:~90
-.. ...:. .
1
.. :91
;
..
'.
'
I 4.65 4.851
28 .a .II 29.2
.-4 '' .7 .
.a
12.4
.74 . 1.56
4.29 31. 0
I . 61
I 1-.68 . 1 I
3.32 i
:.62 . 1.61 5. (7
31.1
28.2
cott onseed, Ton $
lay ,All, {baled )Ton $ :
Hogs , per C..'wt.
$
Beef Cattle, Cwt. $
lv\ilk Cows , Bea.d. ' $
i
ch ) ckens(All) Lb. ' It
Eggs, Doz .
B. utter fat, Lb.
23.65
....._ ~ .
7.36
3. 9 6 33.$~
'
J.3 ,3
21.4
25.8
48
.co .,
. 24.2q I
15 .50
ll.40
llO.CO
lS . C
49.0
52.0
40.00 41.00 1
I 1. . 24.40 ,.. ~5 -oo
I 16.90 I 1a.oo I
II I 13 .so 14. 50 . II 115 .oc 12C.OO
2 2 . 5 ..
! ' - -'
7.27
5.42
48 .oo
1 5.5 52.2 . 51-.0
i 16.0
I 54.1 I
50.0
11.4 21.5 25 .3
59.90 I 50,CQ 50 .50
I
22-?C
i
I
1 ~" . 90 .I
~9.20
16.20 ll5'.70 117.90
I -14. 00 __1 17.80 I 18-70
'115s. oo 15.8
I 37.1
1174. 0C I' _ na.o~
15.8
15.6
1 45.3 ' 44.4 -
59 .2 .
,
v1ilk ' (wholesale)
per 100% !_/
$
.. 2.43
6.00
5.90 s.so
I 1.601I 5:::, 5:::, 4.53
Soybeans, Bu . peanuts, Lb.
$
'
2.20
5.2
10.3
2.10 9 .a
2 .10 10 .0
-
2.27
4.8 1 ll.o
2.04 10.1
2.06 l O.B
Revi se d
;T
l;_' I P4!
TI'mEX NUMBERS OF PRICES RE C~ IVE:D BY FARME RS TIIJ' GEORGIA
(January 1910 - December 1914 = 100)
Dec.l5, ~ ov.l5, Dec.l5,
- -- - ---- --- - - --
-All Corrmod iti e s . .. All Crops
1956
238 26 0
1957
236 . 247
1957
1 245
257
Gr.ains and Hay Cqt ton Lint
144
142
148 -I
265
237
240
Peanuts
198
188
192
'l'o ba.cco
3a3
407
450
Cott0nseed and Soybeans
?.00
1 67
171
Irish P~tatn e s and 8weetpotatoes
271
245
254
Fruits and Nuts
179
170
179
All Livestock a nd Live stoc k Products
195
211
217
Meat Animals
240
270
269
Poul try a.nd Eggs
140
151
151
Dairy Products
237
234
232
-------- --,..----.-
.. , . --...,-. -~----
-- - -- --- - -- - -
+ ________P_R_I_C_E_S__P_AID....__B__Y_F_A_R.\t_!_E_R_S_F_OR_ SELE CT!BD FE.SDS IECEdBER 15 , 1957 WITH CCMP.ARISONS 1-=/ -----
-------~-------------- GEORGIA
u1HT!i:D STATES
Kirm OF Fll:ED
M~x~~ Dairy Feei All Unde r 29% Prot ein 16~ Prctein 18% Pr otein 20% Protein 24% Protein
De c. 15 1956
4.00 3.95 4. 05 4.15 4 . 35
Nov . 15, Dec.l5,,1 Dec. 15,
1957
195_?._ I _ _ 1956
-------, Dollars Per 10--0---P--o-u-n-ds-
3 .85 3.75 4.00 4.05 4.35
3.90 3 .7 0 4.00
4 .00 4.30
3.82 3.77 3.78 3.99 4.08
J No v-. 15, De c.l5,
1957
1957
3.61 3.56 3.54 3.81 3.92
3.60 3.56 3.51
3 .so
3.90
ni~h Pro t ein Feeds Cottonse ed Me al 3')ybean Meal Meat Scrap
3.45 3 .90 4.70
3.45 3.80 4.55
3.45 3.75 4.55
3.85 3 .86 4. 68
3.65 3.75 4.75
3. 58 3.71 4 . 69
~ai~B r=Pr oducts
Br-an i,.liddl ing s
Corn Mea.;!..
3.45 3.65 3.55
3.20 3.40 3.30
3.20 3.35 3.30
3 . 04 3.12 3.50
2. 65 2.74 3.23
2. 63 2 . 70 3.22
Poultry Fee d Bri;lhr Growing Ma sh Laying Mash Scratch Grains
5.20 4 .80 4 .30
l_l:~ ( Ba.l~i )
Alfalfa
51. 00
... _ AL_Q} h~_r:__ _ _ _ _ _ _ __ 4l.QO
4.95 4.65 4.20
48 .oc 38.00
4.95 4.70 4.15
48.00 38 .00
4.94 4.48 4 .ll
34.80 31.90
4.80 4.32 3.90
30 .70 28. 60
4.81 4.28 3.91
31.10 28 .7 0
~./As reported by Feed Dealers.
~
_ _ _ "_...._..,.._ ""'-'"""~ ~'-'.4...._ I~
6 . V~\.4L.oL..I..&.
v\.VA
~
q 7
~!-' J I
~~I (GJEQ)JR{GllA (C~Q)JP
/~
(, AGRICULTURAL I!:XTENSION SERVICE UNIVERSITY OF GEORGIA AND THE STATE DEPARTMENT OF AGRICULTURE
Athens, Georgia
BROILER CHICK REPORT FOR G~~ CO~CIAL AREAS
During the week ending Janu~ 4 commercial hatcheries placed 5,481,000 chicks ~ th the broiler producers in Georgia commercial areas. This compares with the 5,172,000 placed the previous week and is 24 per cent more than the 4,415,000 placed the same week last year.
Eggs set by local hatche~es amounted to 7,047,000 compared with 6,573,000 the
previous week and is 14 percent more than the 6,162,000 for the corresponding
week last year.
/
1 '
Hatcheries reported prices paid for hatching eggs during the week at an average
of 76 cents per dozen. Average price charged by hatcheries for the chicks was
reported at Ql3.50 per hundred. These prices compare with 76 cents and $13.25
last week and with 64 cents and $11.25 one year ago. Egg prices shown relate to
Georgia produced hatching eggs whether bought on contract or otherwise.
Weighted average prices from the Federal~State Market News Service for broilers during the week ending January 4 are as follows: North Georgia broilers 2 3/4 .. ~ 31/2 pounds, at farms 17.06; FOB plants 18.00.
~
(See reverse side for other states)
GEORGIA CHICK PLACEHENT BY "lEEKS
- - - - PERIOD NOVEMBER 2, 1957 THROUGH JANUARY 4, 1958
Date --~----E-g-g-s -----~-C-hicks Hatched ~/ Inshipments
Total Placed
Week
Set
Placed In Georgia of Chicks
on Farms
Ending 1956--57:1957-58 195~57: 1957-58 1956--57:1957...58 195tt.57:1957..58
Thousands
Thousands
Thousands
Thousands
Nov. 2 ~ Nov. 9
Nov. 16
Nov. 23 Nov. 30
Dec. 7
Dec. 14
Dec. 21
5,963
6,060
6,164
6,179 6,138
5,010
5,909
6,304
6,261
6,223 6,512
6,539 9,311
6,240
6, 708 6,718
4, 051 4, 026 4, 146 4, 123 4, 128 4, 157 4, 105 4, 140
4,340 4,422
4,378 4,473 4,483 4,543 4,596 4,596
469 542 374 669 404 545 447 482 432 510
438 493
455 480 470 498
4,520
4,400 4,550 4,570 4,560
4,595
4,560 4,610
Dec, 28 6,255 6,573
3, 387 4,670
313 502
3,700
Jan. 4 6,162 7,047
3, 986 4,878
429 6o3
4,415
-- - 1/Exclusive of hatchings shipped in-to states outside of Georgia.
4,882
5,091
4,923
4,955 4,993
5,036
5,076 5,094 5,172 5,481
ARCHIE LANGLEY Agricultural Statistician In Charge
W. A. WAGNER
Agricultural Statistician
. . . . . : :-;:;GG :; ~~ 1' NJ Qi.:tl C.K3 F CD I N . C- lvJ- ~.::R c :;:j~.L. :.:~.~.h:.:. :, BY
1958
Page 2
....,
... ,... :-:: '
, . , I .
...
::.
.
.. . .. ,...
; . ,, I
< '
. . ' ...._
;l l I STATE I ___n~-~-----~---- n_~_:__.J_.[__JEm4_._.:.IL-__ II l1o;. o;. I ll~;. -.~~I N~;. De~. D~~. D~~. D~~. J":.
I~
~ .
--~-----~------~~--~----~------~----~------~-----
EGG S SET THOUSJ0IDS
:11
.
CHIC Y..S PL4.C:SD- - : THOU' AlifDS
-~---------------H-----~--------------------++.:-------------~------------------~--~'v~, ,o'~,-' --------------------------------
.Mf.o.ine
1;310 1,224 1,400
II 860
983
920
987
9 34 =~J ~t. ~ 955
1,005
961
976
937
~~CPnD.e cti cut
.:: ..:. -_:
/.~..:.: ,,
~fem1 sy1va$ia
'.:.: ;- ln~?- ana -~ ,; ,. ';. .
Iliinois ::
a:n
1; 3~:2
1,.'si:rs
: 3~ 4:
769
968
1 ~:oo
. 1, 4~_6 .: .
, ,, I J
1'
, 1, 'lb7
..:
!;1
829 . '
-.'
:
.
329 ..: 383 ,.. ',
ill 548
1 68~
429 746
:1 .. 771
876
1 1 : > 12:2
._131
4 17
445 477 ;_492
875
762 686~
;~) sl
79 3
794 784
\~ 8os
133
. 1~9 . 1).()
~.; 124
519 701 894 130
58 4 754 913 121
629 694 915
92
569 701 8W 135
.llf.is so uri Delaware .
1;5iu
2-,-400
i, ~os ..-.1 , 619 .':.
-2-' :ID$' -2,289 .
tl-.- 4 56 . 483
It 1~ ~89 :~ ~ :_+,6 36
..4 8 4 1,84 7
4 51 . 44,6 1, 7os 1,6>ri
550 1, 72 4
Mary land - .
"'
2 ~ 065 ~.061 2,2iB
~- 1,3Q:7 _.. - ~, 3.9 9
)..,22 5 . 1,532 . ~, 35-3
1, 199
Virginia
1~809 1._, e2_P.- 2,007 '
1: 1,19-5
1,14 9
1 , 1 38
1~206 .. i,2~2 4;
1,190
"West Virginia-
No rth Ca rolina
South Carolina
-326
2. -~815
. 5.19
.. 310
2. 7.56
s.oo
344
2 888 ..
. I
.
:
52.3 :.
I 437 . . 361
J. .- ~~ 1, 9~:1 ... . 2 ,C02 I i .. 279 . . _, 320
435 . 2,004
309
44 7 354 2,097 2,042 - ..326 382
329 2,097
398
GECRGIA . '' .;. ... ~-6-'~---.71.8 - - 6, ~7-'-~---__.;._.7-''=--_o~:..)...______..;:___.Jr.-. 4; , s~? ,. :: _: 5, o_91 _ . _4_;,_9_2_3_.___4_....,._9~5_5_ _..4,..._,9_9_'3_. ___s-,'-o_3_6_
ir;=.-::~._:;:;- -",_:-;FAii.lQ~.b'r:; dmaa
:. '
'
;_~,:
~
c
..1
2 ;' ;s" ~2a1
~ Vl l~ '~:. 4i 3 ~:.:
-z.:, i'53 :2, 634:~~
::
.! ,f-: j. =,~ cl8521
.:.
'; ' \ "201 . 2 , 0.21
188 2,o19
184 1, 986
1, 19,~83g
199 1, 996
-- . IJ:i. S:si ssi ppi
-- Arkansas . .Loui Sc ana .
Texas }T~ shington
I 1 ~: 78 3
1 2,967 403
I! 2, 545 320
l',?ll
2,849 36 4
2, 592 328
1 , 921.
3,177 .. 390 2, 706
361
,. I,.
l 273 I .
.
li 1,88:()
i 241
li 1, 627
I! 169
: 1, 338
.
.
, 1,9 32
243
. 1,6 19
1s3
1, 307
2,053 267
1, 823 189
1,2 32
. 1,992 292
1,797 169
1,24 0..
2, 1~ ~
283 1,6'33
22:3
1,2 37
2,:115 :-307
Or~gon
.1 215
244
225
!I
82
87
135
102 135
C.a1_i f o
TOTAL
1rn9i5a7-----~.1+1--3~61~;,22-7~-47~--3~51-~,,14~94~~4~--3~8l~r,2~19~~~64~~--: ---
11 8 56
li23, 4 76
92 s 24 ,131
910 2 ~ ,394
875 s 12 24 , 485 24 ,342
. 8 31 24 ,733
-:..:"'"
~~
::wAi .. :".
.. ~ . ~
,:: . ~, ,
:~
' 19 56
4
,
33,202. - 34 ,717
-
'. ..
109 101 .:. 110 ;
il
..
! 1 21, ~0.~ i ."2 1, ~.69 22,061
I. . . }. ..
I: :uo . no ,.. 111
21,978 22, 340
. ll.l . 109
22, .980
~1o8
- -- - - - - -- ---U------ -------------- ------ ---- - - -~l --~- ~- ---------- --- ~ - --- - ---~ - -- --- --
520 1, 74 5 1,6 32 1,107
412 2,065
360
555
1,895 1, ,125 I, !t:- 5
359 2 , 1 48
357
529 1,675 1,64 8 1,018
417 2,024
3 58
5.,0--76--- -5-,0-94- - -5-,1-72- -
214
266
176
2,106 2,10 3 2, 28 2
1,23 3 1, a3 2 1,1 53
2,2 35 2 ,26 3 2,179
269
307
275
1,7 31 1, 71 3 1,769
169
2 32
244
180
14 7
134
869
861
767
- - - --
25,172 2 5, 485 25,126
616 1, 782 1,649 1,081
450 2,223
339
5, 481
200 2 ,335 1, 429 2, 339
284 1,964
212 137 916
26,609
22,953 22,913 18,092 22,872
110
111
139
116
Ac:;RICU,LTURAL EXTENSION -SERVICE UNIVERSITY OF GEORGIA AND THE
STATE DEPARTMENT OF AGRICULTU
Athens, Georgia
U. 5. DEPARTMENT OF AGRICULTURE
. AGRICUL.TURAL. MARKETING SERVJCE ,
319 EXTENSION BLDG., ATHENS, GA. ,
.. {anu~y 13, 195~ ~ .:; ,
ACREAGE AND INDICATED
~RINCIPAL CGHi11LRCHL PROPE ary 1,. 1958
UNITBb STATE$: On January 1 production of winter . vegetables in 1958 l'TaS expected
, .
to be slightly beiow 1957 production and 3 percent below average:,
the C,rop. Reporting Board announced today . The greatest reductions' from 1957' winJ,:;: ' ..,
ter production are expected for snap beans, carrots, cauliflower, sweet corn,_.... . ;_ : .
green p,eppers and tomatoes. Smaller crops are also reported -for broccoli, Brus-
sels sp-routs, cucumbers and eggplant. The 1958 winter production of cabbage:, ' ' .., ' ' celery, escarole and lettuce promises to be significantly larger than in 1957. In~
creased production is also in prospect for artichokes, beets and shallot-s . l\lb .:'.. ......
significant change from last year's production is indicated for lima , beans, kale :'. , ..
and spin.ach.. Since the January 1 forecasts wer.e 1Jrepared, heavy ;rains have fall.~n in Florida and Te xas and low temperatures invaded florj.da on J_anu.ary 9 and . were
forecast: for Jarniary 10. The effects of these events . cannot be fully api)raise-d at ... ..
this 'time:i' :.btit they will be reflected in the February 1 forecasts.
' .... ' ...
~ABBAQ-E :. The winter crop forecast, at 5,916,000 hundre4weight is 2i-t per.ce.nt . abbv{ ' .. . .
... last . year 1 s .production but 12 percent below average. In Florida, the - mid-December cold -w-ave sharply reduced production prospects for the winter c:ro:P.:; . ;, ' ~:
particularly on the acreage for the early season harvest. Salvaging ;was fairly heavy .immediately following the cold., Complete loss of acreage from the freeze . wa~ comparatively light but in the r:verglades, it now appears that 500 to l,OOO : aCres ~ ;.: .
r;.:rnay be :J.;ost : by drowning. Fields that are now maturing and those expecteg 't,o .rr\a- ... ~
~ c,ure during the next few weeks are generally making small heads. Yolinger plant.-, , ,
ings have generally been retarded and while they appear to be making fairly .good .. . recovery, lower than average yields are expected as a result of the low temJ).erEit~reE . The greater . pqrtion of the acreage lost will probably be replanted. In Te~as, . _' " -;
freezing :temp.eratures in mid-December caused some damage to cabbage in all ;:;mi.th. , -'..
Texas pr.oduc'i'ng' areas. Acreage losses were negligible but yield prospects were ...
reduced: . D-amage to mature cabbage in the Lower Valley was limited largely to outer
leaf burn. Growth of' _young plants and cabbage in the small head stage was retard-_
ed and some young plants in low spots were killed. Prospects on retarded plantings
were improved by the general rains December 31. Flood losses from the heavy :.
panrains of. January 5 .are. e:xpected to be slight. In the Winter Garden, 1agle Pass 'and ' Antonio . areas, where temperatures were lower than in the Valley, mature cab- , ;
'page is puffy and splitti ng, causing lleavy culling at the packing sheds. Late .:-' ~ crops in th~se areas benefited from December rains, Harvest of Arizona cabbage ,.,, ' .
pontinues active with movement runn~ng ahead of last year. In California, harvest : ,
pontinues in most pr_oducing areas. Harve st in the Imperial Valley in.creased steadi.:
ly during the . latter .part of December and will continue .active during most of Janu-: !..
~ry.
.' ' <:..
ONIONS: The , ea~'iy spring acreage in south Texas is tentatively estimated kt 3b,6'o0(
.... aGres, . t.he .same .as the acreage -harvested in 1957 but about a fifth $inal1t
than normal. Heaviest planting occurred in mid-November. The low temperatures 6'r
~ecember 1 and 12, whi~e retarding growth, did not cause serious damage to. .Texas
0nions.; :Hea:zy rains. . cif January 5 caused considerable flooding in the Lower Valley.. . '
~d soilie in th!3 Coastal Bend. Hmvever , most oni ons were large enough to escape
r}omplete water coverage and will survive with slight loss e xcept where t he water
V ~ood for a prolonged period. Onions are in good condition in all areas and are
about at the normal stage of development for this date.
Based on grower's intentions to plant, onion acreage in the late spring states is tentatively placed at 16,900 acres, 31 percent above the 19~rvested acreage and
13 percent above average. ~ubstantial increases are exrected in North Carolina,
Texas and CBlifornia. In North Carolina, growers report that wet weather and a scarcity of plants have hampered planting. Planting in Georgia is continuing as fast as plants become available. Cold weather in 'rexa s has held up shipments of plants to Georgia and planti ng has been delayed. ~light cold damage to plants set
w the fields may result in some resetting. In north Texas, planting has started
but will not become active before mid-January. Cold, wet weather during December delayed preparation of land but planting can continue through February without serious delay in the harvest season, ~lanting of Arizona's crop has been completed.
f
~IONS , continued;
~n California, acreage increases are expected in the btockton, Imperial Valley and J? akersfield areas. Other areas will have little change from last year. The crop ~s in good condition, particularly in the .)tockton area where periodic and well ~paced rains have maintained soil moisture.
WATERNELON~ : Growers in Florida and California intend to have 102,000 acres for late spring harvest in 1958 . This iptended acreage is slightly be-
low the 1957 acreage but 18 percent above average. In south Florida, planting was well along by .January 1 . Heavy rains in early January resulted in serious damage and considerable replanting will be :p.ecessary in this area if growers intentions are to be realized. Planting has started in central Florida and will become . general in this area during January. In CF.J lif'ornia, acreage is expected to be 15 percent less i;.han last ye~r. Planting started .in the Desert Valleys in mid-December and will con tinue througho~t January .
____ Acreage and Indicated Production Reported t~~ate, 1958 with Comparison_s__. ~--
CROP AND STATE
P.CREAGE Average
19h9-56 : 1957 :1958
J YIELD p, .R ACF.E
PRODUCTION
v. :
: n -Average: : Ind.
49-56: 1957 :1958 :1949-56:1957 :i958
- cres -
CABBAGE 1/
Winter, Florida 16,880 13,900 16,600 202 160
Texas
20,620 11,500 16,500 112 120
A;rizona
1,050 1, 300 1,000 236 145
California '. 3,580 3,900 4,100 208 255
190 3,421 2,224 3,040 110 2,322 1,380 1,815 200 249 188 200 210 741 994 a61
Group 'r.o~al 42-;1"20- -3TI,ooo -3"7,'Doo - I6o - ISO - -157- -6-;7"33- Ii, (8'"6 5,"9lo - .:
Early ~pring ~/ . 20,050 17,200 1,7,400 123 144
2,h47 2,485 Apr. 10
LETTUCE' -
Winter, Florida
T~xas
.
ACi'railziofon
a, r..n.
i
Yuma a . .
: Group , Tota~
3, 310 3, 700 3, 7'06' 112 105 100 372 388 . )70 .
11,880 11,400 12;000 96 98 90 ) .. ,116 1,117 1,080 11~ ,120 1D,800 12,000 lL~O 140 . 140 1,970 1,512 1,680
31~,040 L~l,OOO 41,000 . 150 " 14b 155 5,096 5, 740. 6,355 . .
'D3-;35o- -6o,"9oo -6E~?oo- I3o . ~- .I3I - , -138- -8;5'5s- "8, 757 "9,48'5 -
ONIONS Early Spri~g
Texas
Lt:tte .Sprine 2/ North Caroliiia Georgia Louisana .. Texas Arizona California
Group _Total
37,600
.30,000 30,000,
Boo 2:,000
900 1,100.
63 90
75 81 115 24
2,212 , 2,700 Mar. 10
~/; Includes processing.
ARCHI E LANGLEY Agricultural Statistician In Charge
L. H. HARRIS, JR~ Vegetable Crop Estimator
ll'
R;~~GJEO~CGnA t~O!F'
~
AGRICUL.TURAL. EXTENSION SERVICE
, lJNIV E RStTY OF GEORGIA AND THE
' STAYE DEPARTMENT OF AGRICUL.TURE
Athens, Georgia
.-.;
~It~~ ~ >I&:~vnt~ CG .. ". \~ ~
.
.
u.s:DEPARTMENT OF AGRICULTURE:
AGAICUL.TURAL MARKETJNG SERVICE.
3t9 EXTENSION BL.OG., ATHENS, GA . .
January 15, _1958 ,
BROILER CHICK REPOR.T FOR GEOR.GIA cml11ERCIAL AREAS
During the .w~e~ ending January 11 cotnrilerciaJ.: hatcheries placed 5,519,000 chicks :
with the broiler producers ,in Geo.rgia .conun.ercial ~reas. This compares wi~h the ,
lo 5,481,009 p~.aceti the p,r,e,v.ious' w.ee)c and is ,Per cent m?re .than the 4, 763;000
placed tpe s!llfle~ week last year~ - , : .: : .. :
Eggs set ;.:t?Y local hatcheries amounted to 7,229,000 compared with 7,047,0QO the
previous week and is 13 per cent more than the 6, 386,000 for the corre spending
week last year.. :
. _ .: . . : . ~ '
.
,
. .....
.'
f\atcheries reporte.d prices paid for hatching eggs during the week at an average .
of .76 cents per dozen. Average price charged by hatcheries for the chicks was reported ~ at ::,.13~50 per hundreQ.. These prices are the same as tlw previous !!eek ; and comp~re ;wit,h 65 cents and $11.-~$0 one yeaf_: &go.: Egg -pl'ices shown relate- .,to ~
Georgia produce~ hatching egg s whether bought' oh contract or otherwis.e.
.
. .. . .
.
Wl'ighted .average prices from the Federal - State Narket News Service for broiler:s
d~ring t~e week ending January 11 are as follows: 1 North Georgia broilers 2 3/4 L
3 1/2 pounds, at farms 17 .46; FOB plants 18.46.
(
:i "
ate ;: Week , Elding :
(See reverse s.~e f~r o~her states)
'
:
0;
GEORGIA CHICK PLACEi-IENT 'BY v.JEEKS
PERIOD NOV:NBLR 9, 1957 THROUGH JANUARY 11, 1958
Egg s ,
Set
Chicks Hatched l
Inshipme~ts .
Placed Iri GelOr~Ia - . of Chicks
195p..:57 :19.57-58 . 1956-57:1957..: 8 . 19.56-57:1957-58 .
Total flaced' em Farm.s '
1956-57:19.57-58
I
' '
Novi 9
Nov.l6 Nov.23 Nqv.)O Dec , 7
Dec.l4
~c .21
Dec.28 Jan, 4 Jan.ll
Thdusands '
6,060 6,164 6,179 6,138 5,010 5,909 6,304 6,255 6,i62 6,3'86
6,22'3 6,512
6 , 5 39 6,371 6, 24'o 6,708
6, 718
6,573 7,047 7,229
Thousands
4;026. 4;422 '. 4)146 4,378 4,123 4,h73 4,128 4,483 ; 4,:157 4,5h3 1~;1o5 4 ,596 4,140 4,596
3, 387 . ' 4,970 3,,986 4, 878 ..
4;281 4,830
' Thousands
374
hb4 !14 7 . h32 438 1+55 470 . . 313
429. 482
669
545 482 ) 10
493 480 498 . 502 60)< .
689 '
Thousands
..
4,/.t.OO 5;091 :
4,550 4;923 : 4,570 4, 955 : 4,560 4,993 , ' 4,59.5 . 5;o36 : 4,560 5',076 :. 4,910 5,094 :
3,700 5,172
4,415 5;1+81 . 4;763 5,519 ;
atch~ngs
.. . . ~ ;
~
; ~ ;
ARCHIE LANGLEY
. .
Agricultural statistician 'rn c'h~rge
.. . ' '.' ' ,,.
Ge orgia.
.
.. 1 . .
: .. , : . .: W . ~ A~ WAGNER .
Agricultural ~tati~tician
( .
l '
... .
..~ .
:'
r
"
.:-, ..:.;'
. . I j :-:, - -.
~-.
STATE
i Dec.
I
28
I
I Jan. 4
.. . . ~
E.G(T..::i . SE. 'I
A :ND .
GKo l'LA. C.i:!:iJ ' 1 1~ I.A.11v.tlV.tr.;n. ~ .u;..u itit.r.o , D..i.
--.-
I I
I
Jan.
- 11
. '
....
Week Ending
I' ~
Nov. 9
Nov. 16
Nov . 23
Nov. 30
, ... .
I . Dec.
i 7.
~.C:.. -CIJ:\._0 -. ..1.::;1 .00
1) .- -.
I 1-
I , .. Dec. ! :
. 14
l I
~
- '
Dec. Zl ~
.... rta.6 t~
,)
------- , - -- -
Dec. 28
I I I I
Jan.
~ .4
Jan, 11
EGGS SET - T ~Q USAJ.'IDS
Maine
~
Connecticut
Pennsylvania.:
Indiana
Illinois
:il:Iissouri
Delaware
1\.Iaryland
Virginia
West Virginia
North Caro~ina
South Carolina
GEORGIA
I 1,224
I! 769 1 , ,4 0 0
I! 1,707
"I 329 1,506 ! 2, 308
I 2,061 I 1,825
310
I
i 2, 756
I 500 6,573
Florida
A labama
N.d. s sis sippi
Arkansas
Lotusiana
Texas
Washington
Oregon
<California
..
!
I
I
!
441 2,453 1, 711
I
I I
2,849
I
I
364
I 2,592
:' II
328
.I1
244
! 1,194:
.: . I TOTAL 1957-58 -' ..
TOTAL 195_6~.~7 :~<
j 35,444
33,202
1957-58
% .
..o. ..f.,
1Q.5_6 .. . -
-
.
5
7 .
I 1
i
107
._
c
1,400 968
1,496 1,829
' 383 1,619 2,289 2,218 2,007
344 2,888 '
52 3 7,04 7
1,493 931
1,414 1,982
399 1,590 2,432 2,304 1,941
337 2,949
526 7,229
--- --~ --
423
405
2,6 34 2,601
1,921 1,94 5
3,177 3, 307
390
405
2, 706 2, 790
361
294
225
267
1,296 1,222
38,144
34,717 110
38.763
35,5.30 ' 109 .
II I
II 98 3
p 4?9 74:6
I! 876 131
II 483 1,6'36
lr
lq!
l, 399 1,149
,,!I 361
I' 2,002
,I 320
II
li
5,091
!I
!I 201
il 2,027
I. 1, 338
I 1,932
I 243
I 1,619
I
153
I 87
i 925
I I
!
24,131
21,96 9
IjlI 110
!I
CHICKS PLACED - .THOUSANDS..
920 417 875 793 133 484 1,847 1,225 1,138 4:35 2,004 309 4 ,92 3
987 445 762 794 .149 451 1,705 1, 532 1,206 44: 7 2,007 326 4,9 55
934 477 886 784 110 446 1,671 1, 353 1,224 354 2,042 38 2 4 ,993
: 955 1.',005
492
519
751
701
805
894
. 124
1.30
550
520
1, 724 1, 745
1, 499 1,632
:1,190 ... 1, 107
32 9 .
412
2 ~097 . 2,065
398
360
5~036.
5 , 0 76 .
961 584 754 913 121 555 1,895 1, 425 1,145 359 2,148 357 5 , 094
188 2,019 1, 307 2,053
267 1,82 3
189 135 910
24 ,394
22,061 111
184: 1,986 1,232 1,992
292 1, 797
169 102 875
180 1,993 1,240 2,18 7
283 1,633
223 1 35 812
199 1,996 1,2 37 2,115
307 1,74 7
216 135 8 31
24,485
21,978 111
24,34 2
22, 34o' 109
24 ,733 22,980
108
214 2 ,106 1,233. 2,2 35
:'269 1,731
169 180 .
869
266 2,103 1,28 2 2,26 3
30:7 1, 713
232 i 47 861
25,172
22,953 110
25, 48 5 22,913
111
976 629 694 915
92 529 1,675 1,648 1,018 417 2,024 358 5,172
9 37 569 701 830 1 35 616 1, '782 1,649 1,081 4 50 2,223 339 5,481
982 515 680 841 133 581 2,033 1,527 1,079 51 3 2,248 390 5 , 519
176 2,282 1,153 2,179
275 1, 769
244 1 34 76 7
25,126
18 ,092 139
200 2, 335 1, 429 2, 339
284 1, 96 4
212 1 37 916
26,609
23, 437 114
258 2,214 1, 329 2, 376
374 2,030
247 127 926
26 ,922
24 , 442 110
AGRICULTURAL EXTENSION SERVICE . u UNIVERSITY OF GEORG IA AND THE . STATE OEPARTMENT OF AGRICULTURE
U. 5. DEPARTMENT OF AGRICULTURE AGRICU !..l\JRAL MARKETING SERVICF. 319 EXTENSION Bi...DG., A T HENS, GA.
Athens~ Gear gia
January 21, 1958
.
.
GECRGIA ffiC6PECTIVE TURKEY CROP FCR .1958 DCX>IN 20 PERCENT FRCM LAST YE;AR
'NATION' EXPE.CTLD TO I NCREASE 1 ~PERCE.NT
.
GE.O~IA: Turk~y: gr0tN-~rs in Geb~.gia .plan to raise 274,000 tilrkeys in 1958-, a de-
cline. of 20 percent from the number produ~ed last year according to the Georgia Crop Reporting Service 0 This will be the sma~lest number of turkeys pro-
duced qn Georgia farms since 1948 when production totaled 196:000. According to ~tent~ons about 98 p6rcent of the turkeys raised in 1958 will be heavy breeds
with onl y two pe.rcent light breeds.
UNI TE.:O STATES: ~urkey growers intend to produce about t:1e same number of turkeys
.
in 1958 as in 1957 If growers carry ot:t their intentions, about ..
81 million turkeys will be raised, co::npared with 80o6 million in 1957. The North
Central and Western. r e gions plan increases of 3 to 4 perc~nt while the North and
South Atlantic :and 'South Central regions plan decreases of S to 7 percentQ
Heavy 'bi-~ gro-we):-s intend to raise 69,238, OOOturkeys .this year .... 3 percent more '
than last year o ~
,.
Producers plan to, raise about the same number of heavy white breed turkeys ~ last
year. :Heavy whi't'e breeds accounted fer about 22 percent of all heavies in -1957 o '
txpected. increases. from a year ago are 15 percent in the East North Central:,and6
( percent in the West North ..Centr al States Decreases from a year ago are 48 percent
:j.n the West, 18 percent in .the South Atlantic, 12 percent in t.he South Central, ,,
and 5 percent in the North Atlantic States o
.
Growers plan tq _increase bronze and other heavi breeds 4 percent. Reported in~
creases from last year are 10 percent in the West, 4 percent in the West North
Central, and 1 percent in the North Atlantic States., Decreases planned are 6 per-
cent in the . So:Utn'. Centril:l.ll 2 percent in the East North Central, and 1 . percent in .
the South Atlanttq States,
Light breed; gr~~.ers expect to produce il,883,000 turkeys in 1958 -- a decrease of ..
11 percent. Expected ecreases ..ar..e 48 percent in the.. W.est, 26 percent in the
N~th Atlantic, 10 percent in the South Atlant~cJ and 2 percent in the East North
Central ;States. Increases. of 3 percent are planned in the. West North Central and ,
South Central Stateso
~. ..
'Ihe number of turkeys actually raised .in 1958 may vary somewhat from January 1 in- . '
teritions, the difference depending on prices of feed, supply and prices of hatching .
eggs- and growers r
poults aised
1 4
and the percent
sale of turkeys. remaining in growers' hands o In l957 fewer turkeys than intended on January 1. During 1957
.
.
there was an ample supply of poults througpout the hatching season. Feed..supplies
were plentiful and prices worked lower throughout the season. Turkey prices during
1957 averaged abcut 4 cents below 1956o The turkey-feed price ratios were at th~ir
lowest level since 1937 o
ARCHIE LANGLEY Agri~ultural Statistician In Charge
CARL O. DOESCHER
Agricultural Stati stician
',
l
<. .
'
. . . ~-
. '
- ; ..
I
.. ."' . ~ ...
r
1' . . . .
-''
)
:: ; ( ~ ..:..,-..~
, :
. ; '
' '
. . . ..
- 2-
IN'IENTIONS TO RAISE TURKEYS .IN 1958
- - -~- ~-:[ Number-raisecti9~7-17----:- fntended-f~r-;isi~g~~; 19~8- --- ~
----- ------. -----. ----------.--------------- . D~mvainsaditoen
::
-
' .
-bH-reea-e~v'dy-s .-:-. .
-bLJr'.-eghe_-dts-- :-. T-o
--
tal
-;-
-Ib.:1rre-ea"ev-dys-:s-.
-bLri-egeh-dt s-:--T0-t a-i
-::%k'I-'eoyo-tsaf -l1l99T-55u7.8-r-as
Thousands Thousands Thousands Thousands Thousands Thousarrls ~ : Perc.ep.t
Me.
N ~ H.
v~.
M$ss o
R, r.
Conn.,
N ~ Y.
PNa; .J. .
N Atlo
. 126
. 7
133
132
.. : 6 -- 138 _ 1o4
. 1 2 7
112
. ,2
129
12.1
... 2 .123
95
2 . 114
-_111
, 2 .- -113
99
SSS
io
565
578 . . 10 . 588 1C4
39
2
41
39
2
41
100
262
11
273
246
lJ. : 257
. 94
709
. 3.0
739
648
32 ..-. 61JO
92
. 199
23 . 22~
159
~9 .... '. 178 . 80
1 6o2
.,. - l.. - -
-- -
21S
..... - - -
-
1 817
_,_ - -
-
1 588
_,_ - -
-
-
138 :
- -- -
1 726
_,_ -
- . - =
--
95.
--
-
. 3, 731
302 4, 033 3, 622
222 '.. .{,'844 . 95
Ohio
bOO-- - -2~403----
3,oo3-- 2,463--- ~S4o- , - . 3,o03 ~.,. ~1oo--
IndQ '
2,082
So6 . 2j588 2,092
625 2,717 lOS
Ill. Hicho
:wi5 ~
1,209
63 1,272 1,269
67 1,336
105
987 . .
__2l..s~2_ ___
276
g_2!:t
,
__
1073 .246.3
__
942
g_,.JZ
220
___ _1.4_
. ~ 1,162
.:._ ,l,.Q2!
92
...:.~ __11,o__
_EoNoC_ent. . 9, 203
13 669 103 872
9, 603
1,-636 11_, ~39
103
J ' ,..Min~. _, - -8;577--- 1,270 -_- 9,847-- 9,149-- -1;2~9-:- - -16;438-- -i66--
Iowa
5, 810
490 6,300 6,342
588 .: '6, 930 110
Moo N. Dak.
2, 870 612
169 18
3,039 630
2,65/.1
84 23 735 2/ . . 693
90 . , 1.10
S .I).q.k0
546
(:4
610
2/
2/
586
'96
Nebr.
865 ,
61
926
851
75
926 - 100
-Kaps.
817
61
. 878
853
6o
913 1o4
w. N.Cent. --2- 03- 09- 7 ---2- ,1- 33--- 22-,2- 30---21-,0-14---..-2- ,20~1 -. ~ 23~ ~2- 21----10-4--
Del 0 . l'Ido .Vao
Vv~Va<~ . .
N. Co
S,. C0
Ga
FJ;a.,
S. Atl.
Ky .
'Tenn., Ala ., Hiss., Ar k 0 Lao Gkla 0 Texas
80 Cent 0
Nonto Idaho
(
Wyo. Co l o ., Nel1ex. Ariz. Utah
l~ElVo
vfash.
Or e g~
Ca l i f .,
---- 11- 1 ----5-36----'6-47--- - - 73---- .3-8- b ---4- 53-~--- 70--
300
164
464
264
98
.362
78
2,518
4:274 6, 792 2, SSB 3,894 6,;452
9?
. 63 7
1, 027 1, 664
568 . 1, 096 1_, 664
100
1,700
100 1,800 1,539
81 1,620
90
1,124 335
56 1,180 1,069
7
342
269 .
s . 40 1,109 274
94 80
13
-143
281
225
70
2~ .ip5
- "!" 6,863-- -6;3o7-~ -13;i?o-- -r;;s7/;~ -~- "5,664- ...; ~;22f'-.,.. ~93--
- - -
-
- - - - - - - - .-
- - - - ~ - -- -. . . - - -. -
- - - - ...... ~
-. -
;-
- - .- .~
297
18
315 .. 282
17
299
95
181
16
197
'171
20
191
97
154
132
286
161
168
329
115
179
4
183
170
4
174
95
2,090
382 2,472 1,857
368 _2',225
90
. 80
3
83
71
. 8
79
95
741
142
883
776
151
927
105
4,150
574 4,724 3,819
574 4,393
93
- - 7, 872-- -1:2?1- --9:143-- -7:3o7-- - 1,3lo- --8:617----94--
-------------------------------------
46
7
53
40
4
44
83
206
29
235
2C4
31
235
100
6
2
8
5
1
6
75
1,192 71
27 1,219 1,148
3
74
66
10 1,158
95
1
67
91
107
2
109
97
1
98
90
2,496
221 2, 717 2,542
175 2,717
100
6
1
7
6
6
86
669 1,243
22
691
542
214 1,457 1,354
11
SS3
80
176 1,530
loS
13)454
1,085 14,539 15,123
434 15,557
107
West
19,496
1,613 21,109 21,127
844 21,971
104
u.s.
67,262 13,295 8o,SS7 69,238 11, 883 81,121
101
~ Preliminary. gj Not published to avoid disclosing individual operations.
-- - --- - -- - - --~- - .- -
-
---
12.- .
~ qoa 7
UN IVERSITY OF GEORG IA
~~~ <GIE:(Q)JR\CGllA CC~CCJP
315
AGRICULTURAL EXTENSION SERVICE UNIVERSITY OF GEORGIA AND THE STATE DEPARTMENT OF AGRICULTURE
~thens, Georgia
U.S. DEPARTMENT OF AGR1CULTURE AGRICULTURAL MARKETING SERVICE 319 EXTENSION BLDG., ATHENS, GA.
January 22, 1958
.:;.BR-.O;.;I;;;LER';:;:;;.:...;:CH=IC::;,;;K.:;....:.oR~EP:;...;O._R;..;.T...::F:..;;.O:R.;_G_E_ORGIA COMMERCIAL A~
During the week ending Janu~y 18 cc;>rmnerci al hatcheries placed 5,524,000 chicks with the broiler producers in Georgia commercial -areas; This compares with the 5,519,000 piaced the previous week and is 14 percent more than the 4,832,000 placed the same week last year.
Eggs set by local hatcheries amounted to 7,325,000 compared with 7,229,000 the previous week and is .l3 per cent more than the 6;455,000 for the corresponding week last year.
Hatcheries r~ported prices paid for hatching eggs during the week at an average of 77 cents per dozen. Average price charged by hatcheries for the chicks was reported at ~~13. 75 per hundred. These prices compare with 76 cents and $13.50 for the previous week and with 64 cents and ~11.50 . one year ago. Egg . prices
shown relate to Georgia produced hatching eggs whether bought on contract or otherwise.
Weighted average prices from the Federal - State Narket News Service for broilers during the week ending January 18 are as follows: North Georgia broilers 2 3/4 ,..
3 1/2 pounds, at farms 19.91; ..FOB plants 20.86.
(See reverse side for other states)
GEORGIA CHICK PLACI!l1EI-rr BY ~~EKS
--,-
Date
PERIOD NOVEMBER 16; i'957 THROUGH JANUARY 18, 1958
Eggs
Chi~ks Hatched 1/j Inshipments
Total Placed
Week
Set
Placed in Georgi a of Chicks
on F:arms
Ending 1956...57:1957-58 1956..57:1957-58 l956-57: 1957-58 19.56-57:1957-58
Thou~ands
Thousands
Thousands
Thousands
Nov. 16 6,164 6,512
4,146 4,378
404 5L5
4,550
Nov. 23 6,179 6,539
4,123 4,473
447 482
4,570
Nov, 30 6,138 6,371
4,128 4,483
432 510 . . 4,560
Dec. 7 5,010 6:,240
4,157 4,543
438 493
4,595
Dec. 14 5,909 6;708
4,105 4_,596
455 480
4,560
Dec. 21 6,304 6, 718 .
4,140 4,596
470 498
4,610
Dec. 28 6,255 6,573
. 3,387 4, 670 . . 313 '502
3,700
Jan. 4 6,162 7,047
3,986 4,878
429 603
4,415
Jan. 11 6,386 7,229
4,28l 4,830
482 . 689
4, 763
Jan. 18 6,455 7,325 '
4,348 4,802
484 722
4,832
------- - ~ Exclusive of hatchings shipped into states outside of Georgia.
4,923
4,955 4,993 5,036 5,016
5,094 5,172
5,481
5,519
5,524
ARCHIE LANGLEY Agricultural Statistician In Ch~ge
CARL 0. DOESCHER Agricultural Statistician
STATE .
II
I
'
I Jan.
Jan.
I
4
11
EGGS SET AND CHIC:&.~LACED IN CONMERCIAL AREAS, BY WEEKS-1958
Page 2
vJeek Ending
I
I
Nvv Nov.j Nov. Dec.
16
23 1 30
7
I:I .
Dec. Dec.
Dec.
14
21
28
Jan.
4
Jan. 11
Jan. 18
EGGS SET - THOUSANDS
CHICKS PLACED - THOUSANDS
I ________________.,l!llr---------------------------1~--------------------------------------------------------------------
Maine
1,400 1,493 1,427
920 987 934 955 1,005 961
976
937
982
96o
Connecticut Pennsylvania
968
931 990
1,496 1,414 1,578
417 445 477 492
519 584
629
569
515
448
1
875 762. 886 751
701 754
694
701
680
105
Indiana
1,829 1,982 2,058
793 794 784 805
894 913
915
830
841
866
Illinois
383 399 368
133 149 110 124
130 121
92
135
133
126
Missouri
1,619 1,590 1,699
484 451 446 550
520 555
529
616
581
624
Delaware Maryland Virginia
2,289 2,218
I 2,007
2,432 2,428 2, 304 . 2,343 1,941 1,943
l I
1,847 1,705 1,671 1,724 1,225 1,532 1,353 1,499 1,138 1,2o6 1,224 1,190
1,745 1,895 1,632 1,425
1,107 1,145
1,675 1,648 1,018
1,782 1,649 1,081
2,033 1,527 1,079
1,879 1,486 1,128
West Virginia
1 344
337 311
435 447 354 329
412 359
417
450
513 ' 494
North Carolina ~ 2,888 2,949 2,894
2,004 2,097 2,042 2,097 2,065 2,148 2,024 2,223 2,248 2,202
South Carolifla
_..G....,E""'O.B..G. .._.T..,A________
523
526 475
309 326 382 398
J,il-h.?.L---__?._,,....,2_,_29"-----'-'7,,_3,..,2...t-5-:---'---~l l-___,..4.,_.,9~2._.3c..-_,.h1~.L.9'),_5'--ll~93 5,036
360 351
5, 076 5,094
358 5,172
339 5,481
390
5,SJ9
326
5,521,
Florida
423
405 431
188 184 180 199
214 266
176
200
258
236
Alabama
. 2, 634 2,601 2,718
2,019 1,986 1,993 1,996 2,106 2,103 2, 282 2,335 2,214 2,327
Mississippi
1 .1,921 1,945 1,955 ..
1,307 1,232 1,240 1,237 1,233 1,282 1,153 1,429 1,329 1,255
Arkansas Louisiana
I 1
3,177 '390
3,307 3,347 405 422
2,053 1,992 2,187 2, 115 2,235 2;263 2,179 2,339 2,376 2,498
'i
267 292 283 307
269 307
2 ?.)
284
374
347
Texas
2,706 2,790 2,786
1,823 1,797 1,633 1,747 1, 731 1, 713 1, 769 1,964 2,030 2,020
Washington Oregon
361
294 326
..
. 225 267 - 299 . ,
189 169 223 216
169 232
244
212
247
258
135 102 135 135
180 147
134
137
127
156
California
1~ 296 1,222 1,240
910 - 875 812 831
869 861
767
916
926
875
TOTAL 1957-58
38~144 38,763 39;363.
24,394 24,485 24,342 24,733 25,172 25,485 25,126 26, &J9 26,922 26,740
TOTAL 195(r.57
34,717 35,530 35;643
22,061 21,978 . 22,340 22,980 22,953 22,913 1_8,092 23,437 24,442 24,654
1957-5s %.o:r 56-57
110 . . 109 110
111 111 . 109 108
110 lll
139
114
110
lOB
>. d-
UNIVERSITY OF G00~
3 I:;--
~~oo7GJEJ>JRN1HA c~([))JP ~JE)pi(Q)'~Tn ~l:sft ncJE:
A3
.. .
. .
LIBRARIES . . .
.
AGRICULTURAL EXTENSION SERVICE ,:
. .
., ~
U, S.
RIC.ULTURE
0 UNIVERSITY OF GEORGIA At~O "rHE . . .
.
.
AGRI ULTU~AL MARKETING $ERViCE
I STATE DEPARTMENT OF A.CRICUL.TURE
319 EXTENSION Bl..DG., A.'l'HENS, GA.
Athens, Georgia
Jsn~ary 29, 1958
BROILER CHICK REPORT :!'OR GEORGIA CONNLRCIAL ARF~AS
During the week ending January 25 commercial hatcheries placed 6,041,00() chicks
: ~ith the broiler producers in Georgia commercial areas. This compares with the
: 5,524jOOO placed the previous week and is 17 percent more than the 5,160,000
: placed the same week. last year.
' '.
Eggs :set by local hatcheries amounted to 7,796,000 compared with 7,325,000 the : previous week and is 18 percent more than the 6,595,000 for the corresponding week last year.
r Hatcheri~s 'reporte'd prices paid for hat6hing eggs during the week at an average
. of 78 certts 'per do'zen~ Average price charged by hatcheries for the chicks was
: repor:ted at . ~913. 75' per hundred. These prices 'compare with 77 cents and ~13. 75
: fo::- the previous week and with 60 cents .and r:ill,OO one year ago. Egg prices
showd re:j:ate to Geoi'gia produced hatching egg s whether: bought on contract or
: otherWise.
' . ; :. . . . '
. .
vJeighted average p:rices from the Federal - State Market News Service for broilers
during the week ending January 25 are as follows: North Georgia broilers 2 3/4-
3 1/2: pound~, at farms 22.03; FOB plants 23.00.
. .
.
(See reyer_se side for other states)
: .:, "GECJRtHA ..CHIC.K PLACEl'iF;NT BY tn<~EK~ PERI OD NOiLi:TBEi( 23, 1957 THROUGH JANUARY 25, 1958
.-D--at-e-.-. -,~------E-gg-;s~-----~--C-h-i-c-~-s-..-H-a-t-ch-e-d--1-/~----In-s-.-h-i-p-m-e-~-t-s--~~-'-T-q-t-a;-L--P-l-a-c-e-d----
... vleek: : ,:. Set '
Placed in Georgia of Chicks . on F'arms
' ~.Jri~ing 195,6-57 :1957~58 c 1'956-57: 19.57-58 1956-57 :1957-58 . l956-5i:1957-58
... ;Thousands
I
.. Nov. '23 . 6,.179 6,539 ':
Thousands
. 4;123 .~ .4,473
'l'housands h47 . . '482
~ 4,955 1
. . 1'~ousands
1.1 . 4,.570
Nov. 30 6,:138 6 ; 371
4,128 ' 4;48'3
432 . 510 . 4,560 4,993
Dec. 7 5) 01Q. 6, 240
4,157 4,5.43
: Dec. 14 ..: 5.,90~l,'. , 6;708
4;165 . . 4;596 .
Dec. :21 :. 6,.304: 6;7i8 ~-. 4;140 4,;59~ .
438 493 I 4,595 5,036
4?5 . 480 . 4,,560 5,076 470 . 498 .. h,61Q :.:.5,094
. Dec. 28 6;255 6;573 --~
3,387 4,670
313 . $Oi 3, 700 . 5,172
.: Jan. 4 6,162 . 7,047
. Jan. 11 ... 6.,:]86 :7, 2g9 .
3,986 4,878
4,.28i 4, 830
LJ.29
603
4,1-~5. 5,481
4.82 609. . 4, 763- ' ..5, 519
Jan. 18 . 6',:455 7 ,)25 ':.
4/ 348 4, 802
484 . 722. ~ : .. 4;83i . 5,524
Jan. 25 6,,595 7,796
4,61.~0 5,215
52o
826 5,i6o 6,041
1/ Exclusive of hatchings shipped into states outside of Georgia.
.. -
.ARCHIE LANGLEY
-. . : ' '
Agricultural stati;s~.ician In:Charge .- : . .
.
. :
.
.. . : . .. ;. ~
. : CARL O .no~~;.. CHi ~R .Agricultuhi.~ Statistician
..:
: . ,,: .
~:
. .
I '
,. '.
.~
. ~
.~. .
.. . . . . ....: ,1
'
.
'
,
:~
:..'
i
.. .
.
.
'. ; ~
'. '
.. .
-... ~ .
. : : :
I I
. .. .
~ .
:.
.., . ~ ,,
~: .
.. . .... ' .
:,
''
'
. . :.
:.:
.. ,
,:" ' ' r.
?
STl,.TE;
.,
..
1vlaine
' Connecticu t
Pennsylvania
Indiari.a
:Jl1inc1 s - ~lis sotiz.i:_
be.b ware:
:)r.tai- y i a",1.d :
~ virginia
We st Virginia
North Carolina
: ~quth Carolina
-GEQRGL~
Florida
:
'b...J-ao ama
. '
!Vi:kssissippi
;ti-lCansa s
toJis~an~
Texa s
washil)._gton
Or~ gon
C alif~rni.a
EGGS SET A".ill c._- KS PLi~ CED --IN-C-O MME:R Cii.L .rlRE,.s, BY WEEKS-1958
I
II..'Jf. I-.~ - ~- : ! J~- :: :.:I
-
Jan. . : 18
.... _, . .~
- I
l
.. , i ..
. Jan .
'...! .
I
...
:I ., 25 .. .
I j
',,I Nov. 23
Week. End~
- - -
1 Nov, .:
I 30
-J : ~ .:..
, .
D~.c.. . (. ~' n~~:
..
...
'
...
I '
.
.-
n.~.~~ .
:, ..
;
' ~ :
.:.:
. .'.
1 t
I
. Dec.
- I :28
! I
'-:
EGGS SET - TI:TQlTSl".NDS:
!'II
!
I
I
- cHICK:::: PL.:..CED T'HOUSJ:JTDS
~
Pa.c;e z
Jan.
4
Jan.
11
___,_. - .- -- --- -- 1-- -- - -~--
I
I
Jan.
Jan
18
25
-- - - - - - -- -
1,493
I,I, 9.J1 1, 4 1<.1: 1,982
l .
399
1,590
.I 2, 4 32
I 2,2>04
1 I 9Lll
337 .
2,949
526
I. 7, 229 .
4Q5 "
f. ...,
2,601
I 1, 915 .
:-5 ,307
I
105
j 2,790
1: 4;2:7. 1,502
990
890
1,57{3 1, 4 96
2,.058
. -
3o8 1 -699 :..
~- .
2 :;.:~ 28
1, 9<.:04
, 373 l., 7.31 . 2., 390
2 ;3,1 ;3 2;356
1;94'3 2;.095
.31~
: 336
2 .:~9 4 . . 2'; 967
4 7::?
80t],
7, :32J5 ".' . . 7,796
4 3i 2, 118 1,955 3 , 3~ 7
4 22 2, 786.
4 05 . :2-.788
2, 085 3, 449
.i: l8 2, 774
i
987
I,:,II
445 762
79 4
I! 1~9 451
l j 1,705
I'r 1.,:;>32
jl 1,206.
"d .:-.r.4.7
! . 2 ,09'7
l :' ..,...
'-
'326
I 4 ,'9:55
T
I'I I
1.8 4
I
I
1,986
! 1, 232
l I
!
l, 992 292
1, 797
9 34 477 886 78 4
110 446 '
1,671 1;353
...1 22 4
..35-J:
2 . ;_ 04 ~
382 .
, . l:. 9. 93 ..
955 1,005
492
519
-.751 : 701
961 . 58 4 . ' 7 5 L.l:
::976
..
l.
: .629
. :~69 4
805
894
913 i
9'7 15
124
130
121 : . -~- 92
550
1:;724
1,~99
520
555 : _:- --529
+, 745. ' ],, 8.95. ! . 1~675
1,?32 1, .L~z:s
11:648
1,190 329
1,107 412
1,145 . : 1,-018
~ "0 ;)()..,
:. ..
417
2 ,0.97, . 2,0,65. .. 2:,148 2,024
' 398 . . '360.
' 357 . : . 358
5,036 5,076 . 5',09:.1:- ::: 5,172
180 1,993
,l 2i 0 : .
2~ 18'7 283
1;"633
199 1,996
1, 2'37
2,115 307
1, 747
214
266
176
2,~06 .2.,:10 3 . 2,282
1,23-3' -. 1/ , 2:82..' ::.J..: 1,153 2,235 2,263 . - 2,179
269
30 7
275
1,731 1,713 1, 769
937 569 701 8,50 105 616 1, 782 1 , 6 ,19 1,081 450 2,223 339 5 , '81
200 2,305 1, 429 2,339
284 1,964
982 515 680 841 133 581 2,033 1,527 1,079 513 2,2 48 390 5,519
258 2,2H 1, 329 2, 376
374 2,0 .50
960 448 705 866 126 62 4 1,879 1,486 1,128 4 9 11 2,202 326 5,524
236 2, 327 1,255 2 , 198
347 2,020
1,048 561 673 885 145 610
1,775 1,579 1,229
539 2,413
361 6,041
221 2, 344 1, 110 2,699
372 2,188
I
2 9 ::b
326
.372
169
223
216
169
232
244
212
2 ~ 7
258
247
I 267 1,222
299 1, 2:';0
273 .1, 393
102 .
135
135
180
14 7
13~
137
875
8.12
8 31
869
861
767
916
127
156
128
9 26
875
947
TOT1.L '1957-58 TOTi, L ~956-57
II 38.763. .:>5,530
I ~957- b8 %: ~f 56-57 .. ..
109
... ; ~ --.7------- . ~ - - -- -- ~ -- --- ~-
~ ... .
39.363. 4..0,537 35,64:3 35,6 35
u .o lH
.. .
!'"
- . . ....
~
!I 24, '85
1' 'i 21,978
11 ll1
24.. f 34 22,340
;
109
..
2-1 , 733 . 25,172 25, 485 22,980 22', 953 22,91 3
108
110
-..
111
...
25, ~-26 18,092
139
26, 609 23, 437
114
26,922 24 , tJ:42
110
26,740 24,654:
108
28, 415 25,800
110
IJD 7
GJE-0 ~CGllA c~((Jr
AGRICULTURAL EXTF.NSION SERVICE . UNIVERSITY OF GEORGIA AND THE STATE DEP~R T MENT OF AGRICULTURE .
u.'s . DEPARTMENT OF AGRICULTUt~E
. - . AGRICULTURAL MARKETING SfiPVICE . 319 ExTENSION BL.DG., A"fHEI~s. GA.
?ebruary 1, 1958
. GEORGIA.'S COMMERCIAL BROILER INCOME EXCEEDS $1"50, OOO, OOO IN 1957
. .
Commercial broiler product!or1 in Georg,ia for 1957 set a new record high with a
total of 261, 000, qoo birds. Thi.s was . th:e seventh consecutive y.ear that Georgia
has led the nation in broiler production. Georgia's 19 57 total was 151 million birds abo:Ve. Arkansas, the seco1d ranking state. .c'"'ollowing in order of importance were North Caronna, Alabama and Texas. :
Gross income fr o m broilers . pr.oducad in Georgia in 1957 amounted to
$150 , 336, 000. This is an increase of $20, 500, 000 from the 1956 income of
$129, 836, 000 and exceeds the i n come .from any other agr i cultural commodity
in the State. : It ;. s interesting to note that income from broilers in 1957 was
.slightly more than six times the income 10 years ago and was 280 times the
income 20 years ago. Average livewe ight p e r bird wa's 3. 2 pounds compared
with 3.1 pounds in 1956. Average .pr i ce per pound' for the year was' l8.0 cents
compared with 18.8 cents last year and 24.4 cents in 1955. The 1957 price
ranged from a high of 21 c e nts p e r pound in July to a. l9w of 15 cents in Decem-
ber.
..
In recent years, broiler production has spread to new :1re:as in the State; but the
r . fllain commercial counties are Cherok ee, Hall. Forsyth, Whitfield, Lumpkin, White
Jackson, Gwinnett , ~""ranklin, F ickens, ~ ulton, Habersham and Dawson.
'(
~
DIAGRAM SHOWING P R ODUCTIC N AND VALUE C J? GE ORGIA BROILERS
...
p:;eriod 1947- 1957)
Year
1935
1936
1937
.193n
1~n 9
240- 1CJ40
.1941
194 2
1943
1944
i945
200- 1946
1947
1948
I 1949 1950
~r;-
160-
I
!
i
1951 1952 1953
l 1954
1955
1956
1957
120-
Numbers Value
(000)
(000$) '
~00
800 l, ~00 1, :?00 1, ~00 3, 500 ,6, 000 10, 000 17,000
2.4, 6oo
29 .520
2?.,435
28, 117 33,025 45, 574 62, 892 8 8,678 112, 621 121,631 154,471 177,642 222, 780 261,000
230 384 539 61-1 676 l, 495 2, 775 5, 152 12, 19 3 19, 116 24,466
20' 171 24, 191 29, 10 8 32,97'7 45,433 68, 530 8 0 ,610 93, B26 101,951 125,700 129,836 150,336
Number Broilers
lLJ Value , Dollars
1 -240
II , ,
i
I
:. , -:.200
i -- -1
I
I
'
.. .
a..:..:.
I
1.,._.-...'
!
0
::1
(ll I 'I
..
-.
i i -160
I.'"J,:tf! I
!'..... .]
::.::,:{:::_::.:::::! '.;'::.::-:: . '
I'!t;;l:l - IZO
;)/,
f 1
i
80-
40-
40
l___ -~- ---~-- .~~- ~ .LlS___,_,__ L __
L.___ _ _ - - -- - . - .... ..._ -
- - .. .
'47 '48. '49 '50 '51
I 52 '53 '54 '55 '56 '57 .
Years
1957 BROILER PRODUCTION uP '8 PERCENT IN .22 STATES
Commerclal broiler production in 22 important States covered by weekly chick place~ent reports totaled 1,295 million birds during 1957--8 percent more than in 1956 and the largest number of record for these States. These 22 State'S pro-
duced 89 percent of the Nation's broilers in 1956.
Georgia, the leading. State, produced 261 million birds in 1957, followed by
Arkansas with 110 million, North Carolina with lOS million, Alabama with 102
million birds:, and Texas with 101 million birds. Gross income from the sales
of broilers in the 22 States totaled f.?779, 242,000, compared with ~~732,647,000
in 1956. .
.
.
'
COMMERCIAL BROILER PRODUCTION AND GROSS INCOME IN 22 STATES, 1956-1957 "J./
- - - - - - - ------ .
i
m~~~
r._.___---- ,. ..-- . -r--- - .L ..-- - ------
I , I and
I Total , Number
z, .
~reduced
1956
. . 1957
-- - - - - -- -F---- -- - - ; - -..- --- --....-----
.
I .,
Pounds j Price j Gross Number . . Pounds Price . Gross
produced j per lb.l income 2 produced produced per lb ~ncome
! .
1
Thou. \I .
Thou.
Thou. Thou. Cents doll ars . Th'ou. Thou. Cents dOilars
Maine 43-;1ib9 156,488
19.3 30,202 50-;-424 191,611 193 37,364
Conn. 31,700 114,120
20.2 23,052. i1 28,.)70 99,295 20.4 20,256.
Pa. 36,382 123,699 Ind. 1 38,518 127,109 Ill. i 9,126 28,291
20.5 25,358 i 35,291 123,518
20.1 25,549 J 42,370 139,821 20.1 5,686 . 8,337 26,678
20.5 25,321
19.2 26,846 18.7 4,989
'
Mo. 31,700 98,270
i 19.0 18,671 28,200
84,600
18.1 15,313
Del. 85,669 282,708
19.9 56,259 ! 91,680 311,712 19.4 60,472
Md. 67,033 221,209
19.9 Lb,o21 i 72;649 247,007 19.4 47,919
Va. 62,904
I
W.Va. ~ 24,279
'
!
1 1
Ns..cc.
.
94,087 13,359
201,293 80,121
291,670 38,741
19.4 39,051 I 61,646
19.,4 15,543 I 25,233 I
I 18.9 55,126 I; 104,608
19.3 7,477 15,690
191,103 83,269
324,285 so,208
18.5 19.1
17.9 18.5
35,354 15,904
5~,047
9,288
Ga. 12222 ?80__ 690,618 Fla. / 11,830 35,490
18.8 20.6
129,836 7, 311
I
261,000 835,200 18.0 150,336 i~oL,,8"""8,.,.4-.-_...;..;3;.;3~,:.::-71"'4-o; ~--""1~9.=-::,3 ---~6...:..;,5;;.;I"""2-
Ala. 82,473 255,666
18.7 47,Blo j 1o1,961 326,275 18.o 58,739
Miss. 52,855
Ark. j 99,271
La. ! 15,716
~TTaesxha.s
i :
100,116 11,115
preg. ! 8,382
Cali9 52,397
153,280 277,959 48,720 30 0 ,3!~8 37,791
26,8 22 172,910
18.6 28,510 !I 65,012 201,537 18.6 51,70o 1 110,191 319,554
19.6 9,549 ! 17,528 52,584
19.7 59,169 i 100,826 302,478 23.0 8,6921 11,671 39,681
22.5 6,035 j 7,697 24,630 22.0 38,040 j 44,013 140,842
18.3 36,881
18.2 58,159
18.8 9,886 18.9 57,168
22.0 8, 730
21.7 5,345
21.6 30,422
Toto1t195,161 3, 763,323 19.5 732,64711,295,281 4,14!l6;28 18.8 779,242
1./ States having vJeekly chi ck placement reports. 2L . Includes c~sum~')ti~in. households of producers wh i ch is less than 1 ;}ercent of total product i on.
W. A. V.JAGNER
Agricultural Statistician
.. ,
ARS:~:::E IJ.NGLEY Agricultural Statist ician In .Charge
7
VNWEP.- l'i Of GEORGIA
~ft3 GJE(Q)~c;nA . C~OJP ~JEJPJO~lill
AGR IC ULTURA L EXTENSION SERVICE UNIV!;.RSITY OF GEORGIA AND THE STAT.E ~EPARTMENT OF AGRICU!-TURE
Athens, Georgia
U.S.D
CULTURE
AGRu::1J't.TURAL MARKETING SERVICE
319EXTENSION BLDG., ATHENS, GA.
February 4, 1958
HONEY AND BEE0WAX PRODJC'l'I ON - 1957
~QRGIA: Honey productton in Georgia during 1957 totaled 6,727,000 pounds, an in-
.. ... .. crease of 8 pe.rcent over the 1956 production of 6, 210,000 pounds and
179 percent above the short 1955 crop of 2, 412,000 pounds. The number of colonie,s
of'bees in 1957 is est~ted at 217,000 compared with 207,000 one year ago. Hon~y
production per colony in ' 1957 is placed at 31 .f>ounds, a one-pound increase over.
1956 yield and the hi~ hest in recent years. Weather conditions during the early
~pring were generally favorable and good yields were harvested in the southern cpun-
ties .
The value of the 1957 honey crop is estimc.ted a:t ::.1, 769,000 compared with a v aiue of
:1,.726,000 in 1956. The average price received was 26.3 cents per pound f or all
"hOney sold, a decre a se or. l.5 cents from 'last year Is ave'r age of; 27.8 cents. V.:tlue
of beeswax amount to ".63, 000 compared with ':so,oo_o in 1956.
'
UN~TED :. TJ~TES : PROJ)UCTION : The 1957 United States honey prouction was 242,000,000 pounds - slightly below the. 5-year average, but 14 per-
cent more than in 1956, a~cording to the Crop Reporting Board. The crop was ~ro duce:d by 5,412,000 colonf(3.S of bees - 2 percent more t b an in 1956. .tlroductioh per colony of .4h. 8 pound s was 11 percent above the 1956 production of 40.2 pound s' per colony and compares with the 5-year average ..of 44.8 pounds . As of mid-December. (beeke~per.~ had 27 percent of the 1957 cro~ on hand for sale co~pared w~th 23 per~cent 1n m:.Ld-December 1956. Honey product'lon was greater than .ln 1956 ln all . . regions of the country. Bee swax production - 4,h76,000 pounds. - was nearly 9 percent greater than in 1956.
#
. PRJ. CJ,~ : Beekeepers received an average of 18.8 cents per pound on
their 19S7 honey sales - a litt~e less than in 1956. For extracted
honey in wholesale lots, the principal method bf sale, they received 1$.0 cents per
pound; compared with 15~2 .cents in 1956. Beeswax prices averaged 57 cents a poUI)d,
or 2.4 cents higher than in 1956.
.
tToduction of honey was above 1956 in.:. a:l:t- regions of the country-;- lncreases were .
65 .percent in the North Atlantic, 55 percent in the East North Central, 6 percent,; in the \Vest i'Jorth Central, 5 percent in the uouth Central and 2 percent. in the ~outh
Atlantic and W.estern btates.
I, .
The crop in the South Atlantic region w~s above average. In South Carolina and .
Georgia the crop turned o.ut well above average, although the sourwood crop was very
short- In Flori.da the- yield was 2 pounds : aoov~ the previous year and where con-
ditions were generally favorable, especially in South. Florida.
The 10 leading honey States .which produced 59 percent of the crop are California; IIJ.nnesota, Florida, Wisconsin, Idaho, ~ ~owa, Te,xas, New. York, hichigan, and Ohi o
Honey yields per colony averaged 44. 8, . ~ompared with 4o:~ 2 pounds in 1956 and the
average of 44.8 pounds.
~\ .
({3eekeepers received an average price~ of., l8.8 c.ents per pound for all. honey soid: i~
1957' tncluding t he combine d wholesa:ie ahd retail' sales of ' extracted.; chunk and .
comb honey. This was 0.2 cents lower than in"l956. ~he se prices include sales by
large andsrnall apictries .owned by farmers and .gori-farrru~rs:
. .
: . CARL O. DOEbCHER Aericultural 5tatistician
ARCHE LANGLEY Agricul~ural ~ tatistic~an I n Charge
. ' ..
HONEY ~BEEs - NillmEa oFcor.oms;!Nn-' PRrinucrio'N oF Ifo~
'
. ~ ' '
' '
' ..
.:.. I'
'' ~
.
~ :
.' '
I ''
: ,"
.'
.
~
v '
State : Colonies ~ ;Honey PrGduction:
Honey ' : Value df ....
and : Bees ..t . : per Colony
Productlon : Pro'duction
. Div.- .:
:.:
:
:
: 1956 : 1957 : 1956 . : '+957 . 195Q.......: .. 1957 ! 1956
1957
Thousands
Pounds
Thousands Pounds Thous~md Dollars
Maine
6' :_. 6 20
32
'120 . , l92
45 .
. 77 ..
N.H.
' '8
8 . 33
47:
264
376
Vt.
10 11 ' . 4o . 55
400 '
6o5
91
. 135
122 .
l95
Mass.
19 .18 ,,. . i9 18
361:'.. ' 324
126
119
n. I. .. 2 2 25
19
so . 38
17
.. 14
Conn.
14 14 23
18
322
252
112
91
N. Y.
191 189 30
61
5730
11529
1003
2041
N. J.
29 :- 30 . 30
18
870
540
268
169 .,
..;.:I>a=-=._ _ _14_.:...7..:-....,.-_-_13:;.-5:_._ _1~7 -~27,__ _-.;;;2~499
3._64.:.;;.'5_ _..,.---:;.5..;...90.',..__ _.-.-'9....:4.,.:..4__
N. Atl. 426 4i3
24.9 42.h 10,616 _,..__17;sol
2374
318? .
--- - -------- - - - -
Ohio
292 .301 13
26
3796
7826
7.40
1542
Ind.
186 i86 31
35
5766
6510
129:7
-'- 1536 -- ....
Ill.
161 . ..lq3 36
45
5796
7335
123.5'
1577
Mich.,
176 .. 176 . 36
_va_s...;:..._ _ _19~_____i_9-'-4_ _ 41
57
6336
10032
1134
1816 ..
71!_
8036
: . .14_3S~_ _ _l....;:;~_3J8_ _ _2;;_7:. ~28_
E. N. C, lOll 1020 :.
Minn.
241 248
Iowa
155 158
Mo.
111 117
N. Dak. 18 24
S. Dak.- 36 36
Nebr.
52 57
Kans. _ _ _ 2 4..:... - ----~0
29.4 45.2 29,730
!,.6059
- - ---- ---
80
84 19,280
20832
80
76 12 _, 400
. 12008
27
26 2,9')7
)042
84 110 1,512
2640
112 130 4,032
.4680
82
70 4,264
3990
31 _..]2_ __ lJ)Q.L._. _ ._..._l-)20
5804
9199
--- - - - -
3162
3458
2021
1981
620
633 " :
233
433
645
749
652
614
236 _ __,_____,2_...4h
w. N. c. 655 68o 69.9 71.3 45,787
.48512
7569
8112
Del.
Hd.
Va.
w. Va.
N. c.
s. c.
Ga.
Fla.
3. A.
3
3 26
25
78
28
29 '~ .. 26
25
728
143 146 27
24
3861 . .
113 108 . 16
14
1808
176 187 28
20
4928
. 52 57 20
26
1040
' 207 217 30
31 . 6210
248 263. '. 70
72 17,360
970 1010 ..:-~37=-.-=-1---y:) 35' 01~- . .
75 725 3504 1512
3740
.1482 6727 i8936 35701
23 200 1201 559
1661
329 1726 3298 8997 .
23
204
1090 . .
503
1223
468 . : 1769 -~ .
': 3579' '' . 8859.
I , ' n
\. ...
t<Y.
136 135 22
14
2992
T-enn
167 170 20
14
3340
~la.
191 191 19
15
3629 .
l90h .. 2380 2865
931
511
962 : .. '69'3
962 .
:' :811: .7
~1iss.
Ark.
75 77 30 . 98 88 . 22
20
2250
20 ' ! 2156
1540 1760
549
376
49'6 . ' '394'' '
La.
91 92 28
23
2548
2116
451 . .l
398
. Okla.
Texas
2~t ~g ~ ----~-__,___.t~.
~~~5 --.-~.1~~-b___ 15~~ . . .. . 1~~~- :, .j
s. c.. 1075 1063 22.6 23.8 24,2.52
?5,352 -565!~ ' :..:547.3
- - - - . . , ---
Nont.
69 74 86 105 '5934
7770
99'i
1243
Idaho
177 182 . 50
73
8850
13,286
1416,
2126
Wyo. Colo,
35 37 110
85
3850
66 67 62
62
4092
3145 4154
569662 . . ' ' .:,' . 648519 -
N. Mex.
9 10 45
80
405
800
60
121
Ariz.
83 89 67
63
5561
5607
701
656
Utah.
51 54 60
65
3060
3510
465
534
Nev.
7
8 90
95
630
760
101
119
Wash.
82 92 44
49
3608
4508
570
717
Oreg.
51 54 39
42
1989
2268
382
426
Calif. :est-:--
-1
1.75B48"---r2525:6=,9--.5::6:.:95"3~_540>-t:-
29,044 57,023
22360 68158
4211 1015'5
3086 10168
u. s. 5315 5412
I956 Revised3 1957 Preliminary
242,293 40,553
45,596
~thens, Georgia
February 4, 1958
FAR11 PR~CE REPORT AS . OF JANUARY 1.5, 19$8
GEORGIA: The Index of Prices Received by Georgia farmers increased two percent (5 points) during the month ended. in mid-January. Hoderately higher
prices for corn, wtteat, beef cattle and chickens were primarily respons~ble for 'tfue increase. Partially offsett'ing . were declines for oats, eggs, milk, and hogs: The January index, at. 250 was three percent (7 points) above January -a"year ago
and the highest since July 19S7 :when the index was 2.54.
The All Crops component of the index was 262 on January 1S, 19.58. This was an
increase of t-v1o percent (.5 .PQints) when compared with the Deqember index of 2S7
but one percent (three points) below the January 1957 index-of 26S,
.
'
The Livestock and Livestock Products component of the index for the month ended January 1.5, ],9.58 was three percent (6 point?) above the Dec~mber 1.5 index of 217
and up 11 percent (22 points) when compared with the J8.!J.uary _l957 index of .201.
UNITED STATES: The Index of Pribes Received by :Fa:nners 'incr,eased two percent .
(
(S points) duririg the month end~d in mid-January, Sharply higher
prices for commercial vegetables and. moderately higher prices for meat animals
were primarily responsible fo.r the increase, Partially of:!'setting were _. declines
for eggs, dairy products, cotton, and corn.
The Index of Prices Paid, Interest, Taxes, and Farm Wage Rates rose two thirds of one percent (2 points) to 301 on January 15, a new all time high. Primarily responsible were the increase in t~ces on farm real estate and the advance in feeder livestock prices, although increases in mortgage interest and in- farm wage rates a~so contributed.
I
Is;: Summary Table for the United States
.
--Indexes-~ - -:Jaiiuary
ne-ceffib(;r..,.i~,-:January Is-; :--~ Tiecor:d-high---
---- ----- - ----- -- ----------------- --- ---- 191o-141::;1oo : 19.57
Prices Received
238
: 19.57 242
: 1958 ' 247
:- rnctex """ : -Date. - - :. '31~. .. Feb, 19~1
Parity Index ]/
292
299
301
301 Jan, 19.58
r
---------------- - ---------- Parity Ratio
82
81
82
123 .....actA 1946
Y Prices _. Paid, Interest, Taxes, and '\r.Tage Rates based on data for the indicated
dates.
... .
ARCHIE LANGLEY
-.
-
. . ..;
. ~
MYHOND R. H~COCK .
AgricultUral Statistician In Charge
Agricultural Statistician
't ; ..
,__ "
.. .-.
' '
::
...
I' \
.,
'' .
.:- I ,,
. '
. ,
"
' - .. ,. Li ' -,.......
.: . ' .
...,. ...
. ~
. . . .
.
. \
.
..
. . .....
'
' 0"
. ......... .
0 0 M~O
0 ao
0
. . ~-
-. :
! .
' .
\'
r------ -- ------ --- - - - --r - --------- PRICES RECEIV;;;D BY.F.ARM;:RS JANUARY 151. 1958 ~':ITH CCMPARISONS
~ ~ ---- -~- - -.~- -- _
4
- -
- . . . . ...:...:
-
.
1....;......... - - -- .,._ _ _ ,_.
~ 1
COiv.MODITY
--- . -.A-!'.-D -L'-N-IT ----
Wheat, Bu~
$
.'.1.23
l . GEORGIA
Ja_p.l5, Dl')c .l5., Jan.l5,
1 957
1957
- 1958'
I
2 . 04
1.99 .
2 . 00
I UNITED STAlES
Average Jan .15 , j.De9 .15, Jan . 15
19 09-.14 1957
-1957 -- -195-8.-
. 08
2 .09
'.
. '
1.94
1.90
Corn, Bu .
y
.91
1:24.- 1.20
1.27
. '54
:1,23
.99
.93
Oats, Bo.
"' J:ri-sl:t :Pot. ,. Cwt. ,.. " Swe et Po t ., Cwt $
. 67 . h13
.04
.86
...-;
4 .75
~ 9:1
4.85
.90
-
I
I
.40 .7:0
5 ,00
. 88
.75 1.57 4 .47
. 52 ., .61
1.61
1.75
5 . 04
- .16
Cotton, Lb.
Cott on. s.ee d , Ton
./1.11 :fuir.(baled)Ton $
Hogs, per Cwt.
. :,
:tleef C,attle, Cwt . $
1 2 .1 23. 65
' 7 . 36 ,. 3.96
3. 4. ..6' 49 . 0C 25 ~OC 1 :'.20 11 .90
29.2 . 41. 00
2 =, . or
18 . oc 1 4 , .:i 0
29 . 5 4 . co 27 .50 17 . 'lO 1 '. , 2 Q
l ? .ll:
~ ;> .':';5
-
7 ~.27 5 . '1 2
3(' . 2 60.40 22.. 90 . li. 30 14 .90
28 .2
5 0.,50 19 .20 17.9C
, : 18. 7.0 .
27.4
5l. 30 19 . 00 18 . ~~ 0 19.70
l-f!ilk Cows, Head
c'
"'
Ch ickens.(A11) ,Lb.
Eggs, D.o z.
.
Butte rfat ,Lb.
MHk (whole sal:~ )
per 10(},~ .!../ : $
33 .85 . 13 . 3
2i ~-4 25.8
11o.oo .1 6 ~5. 46 .0 51.0
2 . 43
5.90
Soybeans , Bu.
$
2 . 25
Peanut s , Lb
5~2
lC .7
- -. - --------. - ----.I
-- -- ~) Prelim inary f or .tam~a.-ry .19 58 . ,,,._.
120. 00 16 .0 5 4~1 50. 0
585 2.10 io.: o .<
- - - --
130 . 00
I . J,D .4 .
so .o 49 .0
5.55 2 .10 10 .2
48 .00 11.4 '21 . 5 ' 26 . 3
155 . 00 . 17 .1
33 .2 59 .1
1.60
-
4 .8
4.44
2 . 31
11 .1
. '.
I .... .
178 . 00 185.00
15.6
19.0
44 .4
38 .9
59 .2
. !.
4 .51 2 . 06
59.0
4.38
'
~
2 . 05
10.8 . .9.79
JN D;:X NU!viD .:RS OF PRICE S R:I:CE IVED BY FARriERS lN G"GORGIA
I
ie -. , ( January 1910 - .December 1914::100)
..
Jan .l5 , Dec .l5 ; Jan. 15,
1957
1957
1958 "
All Ccmmo d it 's
~~~- ----~~ ---~~~--1
All Crops
Grains and Hay
149
Cotton IJin t
2 :J8
Pe anuts
I
1'cb;,cc o
206 '383
I
Cottonseed . and Soybean s . : Irish Po tatoes & Sweetpotatoe s
203: 271..
Fru its and ' i'l' t s
~79
All Live stock a,,d. Livestock Products .
2 01
Meat Animals
250
Poultry and Eggs ,
144
148
15 3
240
243
192
195
.:450
450
"
171.
192
254
' 258
179
188
215
223
'28 9
298
151
162 .
Dairy Pr o dc:cts
235
226
224 .
- -----------------------~----
------------ ----
...' . 1
.. '
~ .
PRICES PAID BY FARM!!:RS FOR SE LiE.~C~TI;::::.""D~:FE=E~D.:::S_;J::.::M=.:'l:..:lUi~:l:.l:'.:.'I-;;1::.::5:...~:,--=1.9:::.::5.:8::.....W:;:.:::IT:::.R:.:.. .C: ::.:O::1:M.::P::.A::.::.:RI:::.:S:::.O::::.:N:..::S:...:l:::/...:....:..- -
K
nm
OF
:FE~D
' . '
'Jan. 15, .. 19 57
G.~OP.GIA
De c. 15, Jan. 15,
I1'1
UNI'J'ED STATES Jan.'l5, Dec . 15, Jan. 15,
-- - - - - - - - - - - 1-95-7 - - -19-58- - - -.-;.>- -..-:195"7 : 1957
1958
~_i:x:ed_pa_i_ry_l_e~.
All Urider 29% Protein
16;_; Protein 18/~ Pr otein
2016 Prete in 24; Protein
4.00
3 .95 4.05 4.15 4.35
3.8 0
3.70 4 . 00 4.00 4.30
3.85
3.75 4.05 4.00 4 .30
~i~h Protein Fe e ds C"ott"onsE)e-d!lea1 -
Soybean Me al
Meat Scrap
3.45 .3.90 4.70
3.45 3.75 4 . 55
3.45 3.75
Grain_ Hy:- t'ro duct~
Br a n 1ii d dl ings Corn Meal
3 .45 3. 05 3 .55
3.20 3.35 3.30
3.15 3.35 3.40
Po~l_try__F_~ed
Br o iler Growing Mash Laying Mash Scratch Grains
5 .10 4.85 4 .30
4.95 4.70 4.15
4.95 4.70 4. <O
!i_a_y. _(lJ.~1--~d:.LAlfalfa 50.00
48.00
50 . 00
_____ All Other
39.00~----~3~8~.0-0-~38.00
).. ;./ A~_eported by Feed Dealers
3 .86 3.8 0 3.79 4.04 4.13
3.8 5 3 .85 4. 53
3.08 3.14 3.48
4.93 4.49 4.13
35.10 31.90
3 . 60 3.56 3 . 51
3 .so
3 .90
3. 58 3 .71 4. :.g
~ . "3
2 .70 3.22
4.81 4 . 28 3 .91
31.10 28.70
3.61
3.56 3 .52 3,8 0 3 .90
3 .72 3 . 6 '1 4 .75
? . 55
2.71 3.20
J
4.81 4 . 29 3.9 1
31.30 29 .10
-cL
rL1~ ~i(Q)~CGllA C~OJF
[t4 ~,3 AGRICULTURAL EXTENSION SERVICE
~1_? ~;~~~R~~T:A~;EEN~R~~AA~N~CTUHL;URE
Athens, Georgia
LIBRARIES
U S. DEPARTMENT OF AGRICULTURE A RICULTURAL MARKETING SERVICE 3 9 EXTENSION BLDG., ATHEP.IS, GA.
I
February 5, 1958
.,
.l
- - --- BROILER CHICK REPORT FOR GEORGIA COW1ERCIAL AREAS
:;;;....,.._;,_.,_...;........--- '
- --~--
During the week ending February 1 commercial hatcheries placed 6,142,000 chicks with the broiler producers in Georgia commercial areas. This compares with the 6,041,000 placed th previous week and is 19 percent more than the 5,169,000 placed the same week iast year,
Eggs set .byloca1 hatcheries amounted to 7,893,000 compared with 7,796,000 the previous week and is 19 percent more than the. 6,636,000 for the corresponding week last year.
Hatcheries reported prices paid for hatcping eggs:during the week at 'an average of 79 cents per dozen. Av.erage pri~e ch9-:r:ged by hatcheries for. the chicks was reported at -$13.?5 P9r hundred. TI1ese prices compare with 78 cents and ~13,75 for the previous week and with 57 cents and $10';50 one year ago. Egg prices
shown relate to Georgia produced hatching eggs whether bought on contract or otherwise.
Weighted average. price~ from the Federal - State Market News Service for broilers
during the week ending February 1 are as follows: North Georgia broilers 2 3/4 -
31/2 pounds, at farms : 20.49; FOB plants 21.33.
.
(See reverse side f~r otfier states)
GEORGIA CHICK PLA-CEMENT BY WEEKS
.
PERIOD NOVEMBER 30,1957 THROUGH FEBRUARY 1, 1958
.
Date ,_.._ --E~~
We.ek
Set
Ending 1956-57~19574 58
Chicks Ha;ch~d !/ . ,. r;hl;;ents
Total Placed
I Placed in Georgia of Chicks
on Farms
1956-5(:1957-58 . 1956-57:1957-58 1956~57:1~57-58
- - - . - Thousands
Thousands
I Thousands
Thousands
No'V . 30 Dec.. 7 Dec. 14 Dec, 21 Dep, 28
Jan. 4 Jan. 11 Jan. 18 Jan, ; 25
Feb, 11
6,138 '5,010
5,999
6,304 6:,255 6,162
6,386
6,455
6,595
6,636
6,371
6,240 '
6, 708
6, 718.
6,573'
7,047:
7', 229
7,325:
: 7' 796
:
.
7 '
89J
4;128 4,483
432 510 4,560
4,157. 4,543
438 493 4,595
4,~05 . 4,596 .
.45.5.
480
4;560
4,lh0 4,596
470 498 4,610
3,387 4,670
313 502 3, 700
3,986 4,878
429 603 4,415
4, 281 : 4,830
482 689 4,763
4,348 4,802
484 722 4,832
. I 4,640 5,215
520
4,646 5,420
523
826 722
5,160 5,169
1/Exclusive
of
h~tchin~s
'
shipped
into
states
outside
of
Georgia,
4,993
5,036
5',076
5,094 5,;172
5,481
5,519
5,524 6,041
6,142
AI_tCHIE LANGLEY, J. pricmlt.urR1 Stat~stician In Charge
'.
W, A, vlAGNER Agricultural Statistician
Page 2
' i
..
..
. .<. .
. .: :
\rve ek E' nding
;Jah. ' . : J ci.n.. '
.. Feb. :
. ; i
Nov. 'De.c.
Dec.. '' bkc./
bee .[. .Jan. : Jan.
Jan.
Jan.
Feb.
18 :-~ - 25
:. . l
;1_. _ __3o__-'---___,7_.---...i'......._. _ 1_4--:--'--":'-2-1~~-2-8_;:~__._4_.:.:..'...;:.__1_1____:_ _1_8__;.,_ _25_.i-.---1-
!l' :.
. . EGGS SET ~~ TH OUSANDS
! .
j, ~ .~
uI .
.
'
CHICKS PLACEP ':- . 'lliOUSA.l\fDs
:- .. . . ,. -.-.. - ---+;---;-'-----.,.-----,- \~- ~~----=------=-~.,..,---- If ti---::-~- ~-~-:--:-------------..I . , .:.~--'---------------
l;~a:Lr~e .
: : 1, 427 .: :t;5o2 . -1;419
[!.. 9.34 955 l,005 961.- 976 '9.37
982
960 1,,048
955
0:r;r.:.t8ct i cut ; ' ... -:990 . ' :: 890 .:. .: .: 986 .:
.; 477 .. :492
519 584
629 :569 - 515
448
561
5l3
i;~i:..r:sylvania,
!rictiana Illinois
j11ti. ss0uri
-~ :- .-:t;5?8 . 1 _2, 056
. 368
. . !;: 1; 699
. 1)+96 ~1~944
::. 373 . 1, 731
i 51?.
:-2:143.::
4oo 1, 8)_ili
~n :
tl:
:886 . 784
75i.
805
..
>
701 894
754 913
:!j..il l10 .;124 . :.130.. 1 21
1~6 . . : 5$0: : : ;~. 520 555
(>94
915
, n
529
101 . . 68o
:830 ., 841
,i 35 - 133
6i6
581
7o5
866 126
624
673
885 145 610
731
853 148 647
J:ielav1ar e
.. i ... 2, -42 8 _. 2,390 .-:2,.42-4 ~:
~ ~ ! . 1,971~ , ) >724 : . 1:,745 . 1-,..856 _ - ~, ~7-5 ... 1j 182 2,033 1,879 1; 775 1,979
}l~ryland
i: :~'2~343 .. 2,356 . -2, 377
.' I! : 1;353 < - 1~499' 1,632 1.;.425.:, 1,.6.4.8 .. . 1"~ 649 1,527 1,486 1,579 1,642
,Vir:Eir.i a
,... : 1,943 2.,095 . 2j.b91
.i!. 1,;224 . .1',190 -~ :1,107 -i .;1:45 . 1,Ql8 :-~ 1;081 1,079 1,128 1,229 1,216
:W:est Vir ginia .:; t 311
336 : 359 .
':j: :)54 ,. .:; 3~t9~ : 412 359
417 : .450
513
494
539
556
;Nor th Carc1ir:.a. ~: : 2, 894 . 2,967 : ;.2, 9:1.3 .:
:~. tit~ . Qar clir..a : ,. :~ ~_ 475 i:. :. 80h
~OJ ::
ji :' 2;.042 .2, 097 . :2.,065 .2,140 2, 024 2j223 2,248 2,202 2,413 2,265
--!! 382 :. 398
360 35?
358 .JJ9
390
326
361
327
;GECRGIA l'"lb-;i ca .
.. . f ..: 7,325 . 7,796 :.: .7;'89.3
~~ 4,.?93 5, 036 ;5,076 5 ,09lr 5, 1?_4 ~-: 5~_ y81 5, 519 5,524 6,041 6,142
2=7------ . :"':- .-: ~3i--~o5 :~ ; '477
!!---:___;_1;'.;-;sr:r;o,-..~.-.-=1;r9""9'"~ -.-_:_.."~2"14r:_._-~2~-66,_,..---,---'-'f1.,;67,--.:-.,--i.,-~2o""o~---;o2""5'U8----"7""23""6_ ___,2"'2..,..1----nr9..r5
Alabarr:a 'Jifti:ssis ci_ppi
;: z;71B . 2, 788 2 ,89.2
" 1;955 2,o85 2;.048 .
i!ji 1;993 1,9:96 < 4,106 2,103
. 1, 240 1 , 237 1:, 233 .. 1, 282
2,282 2 ~ :335 1,153 1~429
2, 214 1,329
2, 327 1, 255
2, 344 1,410
2,540 1,477
,Ark ru:,_s a s
.. 3, 347
::r;uiJis~. ar~a . .. 1
422
T e~as
: 2:,766
!-;,Ja.:: rur~gt'on.
i .: .326
Cr .8g 0n .
299
_: _.c_8J_~-o~rr~a,_- ~-----lr-_: : --~'-2_4c
3, 449 . 3,549
418 461 2 , ?74 3 ~ 0?. 1
372 , . 324
2?3
~ 312.
.1, 393 1:, 385;
il;:
.
ll
1 jl
_. ;j
2,187 283
1, 633 223 135
812
2,115 J07
1, 747 216
135.
831
2.,23,5 2.,263 269 ) 07
1, 73). . 1,.713 169_ 232 18P '. ~ i 47
869 861
2,179 .. 2t, 339 2,3 ?6
275 1, 769
244
.284 1'/~64 .
~12
374 2,CJ O
24 7
134 . 137 127
767 916
926
2 . 498 347
2, 020 258 156
875
2,699 3 72
2,188 247 128
94 7
2, 560 381
2,256 249 153
931
,)O~Ay : 1957~58
. tcr.At l55c~57
r 5.:~~, 363 '.. 40, 637 , ;~1~ 2.:83 :.J 775 .- .35, 993 : ~J5.~ 4os-
! 24, 31~2 24, 73) ;~ :2~, 172. 25, 48,5 2), 126 26, 609 26,922 26, 740 28 , 415 28 ,746 22, 340 22 ,?Bb . 22, 9~j 22,9lJ. : 18:, ~92 . 23, 437 24,442 24, 654 25, eoo 26, 264
110
113
117
109 108
110 1l1
..
139 11h
110
108
110
109
. .. .
. ....
;
. ~
.
.
:
..
.
.,
~
--.'$/~
~1rll-NCG. ,_SE-~VllCIE:
AGRICULTURAL E)(TENSION SERVIeE
. . . . '
.
'.
I
.
.
. .
u.. 6F s. DEPARTME.NT AGRICULTURE
UNIVERSITY OF GEORGIA ANO THE
AGRICULTURAL MARl<ETING SERVICE
STATE DEPARTMENT .OF AG.RICULTURE
. ..._
Athens, Georgiti< ., ! .
-
319 EXTENSION BLDG.; ATHENS, GA.
. FebrUary 12, 1958
;;
"'- _- . ,
I
B . CHig REPO~TfQif qJORGIA . 'CClMERCIAL ~RE.As ....'. ~
~ring
m.th th
th e
e b
r
w-~e~-
oJ.1er
eridi~g:
produ
cFeerspw~a~G~~?~F.;:~!,~5
?~~j~Y.:J;i~t~~~f.i:~~
;Jl q~~erc_J.:al: ar-e~&;
:
'
Prl~ced
f ..Ttiis. c
?~:1~5,000. c})icks
ompares .w:tth the
6,142,000 placed the previous week and ;is 19' percent'more than the 5,191,000
placed the same w.eek ;l.as:t ,,.y,ear. , . ... . ;
.-:
: . . ..~ . :~:~~ ,:~. ~:.: .:-~:~ :_..:': .; ~-~~- ~: ::;:.~: ~ .~. ;~?:: -;~~; ;:~- .~')> .:-~ ~-~_: :-- ::,' ~ ~:( .~~ : . : : , ~ : .
' nkn Eggs set: by local' h~tcherie~ am9~_t:e:ct ' t~.._8;o2d; 00Q'.-ompared-Wi-th :.7j893,000 the
previous week 'and is 21 per cerit uiore
the 6~ 605;'000 for the corr~sponding
week last year-. - . ;...,. .. . . . .
.:
.
an .. . . . .
. ...:.. : :-~ ~ ~ :~~ ---- ~> ".:! :. .~- ~-~ .-:;~ ~~-:_;: :t _.,. .. ;:~: :.._ .:; '... , . .: -: . . .._..
::
Hatcheries reported prices :pai.d..fo~ hat~hing. eggs,: d~il'l.g the -week at average
of 79 cents per dozen. Average price charged by"hatcheries for th~ chicks was . reported a'jj ~!il3. 7~ Pe.r...hundred.. Thes.e_prices are the same as for -thS.:. jprevious ' week anp compiU-e ;With 56 : cents _.SJ?.d :- :~:)X~.;so--:one: )rear ; ago~ : ~gg-, pr;i.~es ~~own . .
relate
to
Georgia... . produced:
hatq~;i,ng . .
eggs.
wh..e 'the:r..
ho
. ..
u. -.g
h
t
on cbritract ~
or.
otherwise.
Weighte,d a~er~ge price~ from the Fede~al-State Harket News Service for broiler~
during ;the: _week ~ndi_ng Febru~y .8: ar~ <1-s .fo:;llo"t-rSL. .!IJort):l Ge,Qrgi_a l:)roilers 2. 3/4 ...
3
1/2
pounds :
':.:
a
t ~
-.: ra~ rms
19
04
. ..
';"-
-
F~O~. B'_.
. ~p.
la:
n~~t
s
:
2;,6;oo;..,: ~~-.. ..~ -~-
' :
.
' --~' :~
': :
_;.._;;
: :...
: l--
(See reverse side for oth~r states)
... . ; . r ~ .. . . . . .
~
.
.-GZORGIA , 'CHIOK ;PLAC~fENT. -BY lJEEKS . .., , .' .' .
t . ~ l?ElUOD DS.:CE'JII$EE. ~ i957 rp!ROVGM Fri3RUARY 8; :1958
.
-.! :.~
..',
, .
Date
, .D;ggs
Chic-ks--H-a~t-~ch-e-d~1-~/~- -~--I-~n-sh-i-pm--en-t-s -~~~-T-o-ta-i-P-l-ac-e~d~~"
1rJeek
-. - Set:
:.Placed it:l; 9~-?r.gj:a _. of Chicles
on ;Farms .
Ending; 1956--57: 1957...58
1956--57:1957-58 19.5&.-57: 195758 :195~57:. 1957...58
-- -.;..-- ibous~ds- -- -- 'Th(;u8:ands-- - -1'housB.ncts-- - -l'h~usands--
Dec. :7 -., 5,010 : .6.,240 . . . 4,157 : . 4,543
438 493
Dec. l4 1:; 5;909 6noa .: ..Ji~J:95 :, :4;596.. . .\-:;-::4~5 . ...480 ..
Dec. Dec.
2~18
6;,304. 6,255
i
.6, 718
6,573
.. ...... '
.. .
-
~~:3,,1"34807
; :
.
-
.. '
4;596., 4,6'70
.: ;_,
~: ,~
:1,~37i30
<, :
>
:498 5o2
:
_.
4,595 ---- 5,036 ,_.
..4,5.eiQ, ~-. 5~076 , . .
::~43;161o0o
-:"~'
5 094
5:172
:~;':
Jan. ~4
Jan. l1 Jan. 18
Jan. ?5
6,162 7,047
. 6.,386 ;. :7,229
6'; 455 r. 7;J25 :
.6,595 . 7, 796
:.-/-'>43;,9?88~6 ;. .
-..<..~:,_:'44 ~ -3644'08
..,
4,878
4, .8JO
4:.802 :
5:215
;:..)..-;.~:.~,
.;-~:.:44h$~2~al.-92~-L-. .:..'
603 689
':::'B72i26~'--:-;'
;.~.-;44>4r1653".---55:;451091
; 4
.. 5
,,8~362o
:p:.,.
5, 524
6, 041
Feb. 1 6,636 7,893
4,646, 5,420
523 "722 ' ,''.5,169 6,142
Feb. : 8 _. . -~'605 8,020
4,647: 5,460
5l~4
705
. 5,;1.91 9,165
---- .:';
~ ",i;.~:~~ .~ _',;,-._.( ~;'." ~~ : ' "'.' :, :_' '..:;.,..::;...!.:,. ' '
!- I
1/ Explusi.v,~. o!_ hatching-s shipped i-nt6 st'ates:o'uti:tde .:of' :Geor~a.
: ~;; :~~~
-
~-~ .
: ~
.,
. ..
: b ~ ~: - . ;..,'_!
>- .i
' .. ARCHIE .LANGLEY
~ ') -- ~, - - - ~ :- ..~. -:! ~;... \ : ~~ ':'-~-,- ': . :
'.: ot
w. :A. WAGNER .
Agric'ui~wai st:atistician tn: Charge
-Agri.cultural st~t:?..s~ician
.~-"' : '. '
.,
:- .
::
:. ~ ,
.,_'.....
. ' , ~-
~ ..
. ..
,'::
..~- ~ ;
',j
. ~--
:' ,
_.;. ~>. ;... .:. .
. . . ~
...: . :
~'.. --~ -.
.. ! : - ~ , J : j
STATE
EGGS SET AND CHICKS PLACED IN COMMERCIAL AREAS, BY WEEKS - 1957 - 58
_ -_-:-:-..-.:' :r ,/ ; ~~-~-_-----~---: -:---
Heek Ending::.:-: :
.. ... .
. ..._.
~~ _'.. .' _ t;:;.
...
Page 2
. __
.. :: 1!--r-J-...;;.:_;:;;..._-:_~~~-'-~-;-~'_~.;-e_.:_:~'.:.:.._,.,_;._.._:-;_.-F_e-b-.~_:"_ :~,,..._.j;,...'~7ji,~r.--D-e-c-...,--..-~--rf-~~-.-_+. --~-D;-e..,~,;.-~-:~"-r_D_e...,..C:-'.-_~: _ . _J_an.._.._;:.'--;.._:.,..::._.-J-an- . .~.~-:-. ;.~;..4\.;.~;;~::.~:.-.~:~-Jan-.---.--F-eb-.:..,.....,:-~~.....;.ie-b,:-'.:.
1
i5 . l . 1 ';. :. - 8 : .. ~ : ;_:
. .. . : .. , ..
. .~
EGGS SET - THOUSANDS
'
7 .: i4 .. ; : 21 . 28 :
~~ :_ : - ~ - 11
....
, .
: :CHICKS Pr4cEP - mo_trsANns
.. . :
:i _1~- _ ~ 25
. ' . .
1 . . " 8- ..
Maine Connecticut Pennsylvania Indiana Illinois l"Iissouri Delaware Maryland Virginia vJest Virginia North Carolina South Carolina
GEORGIA
Florida Alabama Mississippi Arkansas Louisiana
Texas Washington Oregon
California
-
TOTAL 1957-58
40,6J7 . .: 41;28) :. '_' 41~418 .-. ;
. '
.
. :
TOTAL 1956-57 . . ,3_~,993 _. ,_35;409 . 35~51
f
1957-58% of 1956__._-5__7__'~{-:,-_-_t_tr:. , _.---~ J~1~:~-;~'- :_~?1,5" ;.c-.1 ~
- -- ---- -~---
.- :.., ..-
, . .
. ..,
... .
, .. - ... _.
... :,
24,720 22,980
108
l j005 _., 961 - 976 937 . 982
5l9
' 701
:.- .
'670514
..-
<
629 . 694 --
585 .. 529
701 - . .. 680
: . :a94 _~- -. :88.7 .: 915. .-:. 830 -) :: 84l.
. '130
- 5~0
:-r ;: ~~~5
5~'_::_ ~i~ ~1 ~~- 5~~~
:. 1; 745 : :1,_895 <--: 1,675 s: 1, 782 . . 2,o)3'
r o1'i .1;632 :_: l,1i2$ ,: 1, 648 ~. 1, 649 .. .i.,52J:
' . 1:'107
:_ -~ _ul., 2
:~...1 --~ ,:'
13.45-~9c
_
~-
1 '
o18.
4~1.
=';
'
.::.,
1 '
o81 450
-~
.
, !:,)
..'
;::. 51),
' . '
.;.~.:.
2_.
-
'd65
3.6. 0
--~ .2~;t48 -~- 2,024 , 2,223 ; 2,248
.-; . ' 34:3 -':; 358 . . 339 :.:. . 390.
.>5:'
076 .
. - 214
-~ 5,'094 :.. 5,17.2 -- - 5,481 :. 5,5l9.
.. _:. -2-6$ ... 176 ~-~ 200 ::_.:. 2.58:
..2:~),06 ::_ 2,103 ~-- 2,28a ,~- 2,335 :-::. ?,214:
_Jj2.33 . : l,i8.2 . 1,15) :: 1,429 ~-~- ';J;,329:
':;. a-.;235 . . ?,26.3 . : 2,17:9. .'.' 2,339 .: ~,37b:
. _ .269 :. . . ::307 :: 275 :_.. 281~- .. :-.: 314'
. 1'71'~6l9l
--~ ' 180 -. -. 869 _:25j:i72
,._ _1, 713 .- 1, 769 .: 1,96li . 2'-,030.
.. . 23-2 ; 244 .: 212 --:- 241
.-. : :- 14~1 ~: 134. ::_ 131 ' '_.- 1~:7'
. !885 . 785 V-6 . 9~p-
;
.
. .
. 25. ,48.6
..~25,~-~47-
--.:...2.. 6,6. 2
$ . .
' 29~ 9.:J6i
: .
. .
~2;9~3 : ~"~J:lO
..... ...., .
, . . . : .
:22, -213 ,_.:.17,99i '' 23,4.37 ._24,435
;~ ~-- lll ''. l40 ;: llli"- .. < 110
;i; ... :': h .\ . .. . -_
!: t. ~ ~
. ... . ::
.
.
. .... ~
.. .-:
. ..... .. .
,J ,
-- :
.. . ' ~ _~:
960 :::
462 _;
7.0$ . ~69 ~~ 126 :.J
62& -~
1,879 1,486
1,128
494 2,202
326
5,524
226
2,)27
1,~$5 .:
2
'
498
.T-h7
'.;.'
/ -
, 2
020
2-58.
,.- :,
':
l$6 :.:
875. ::
955 543
731
853
148 647 1,979 1,642 1,216
556
2,265
327 6,142
195 2,540 1,477 2,560
381 2,256
249 153 931
28,746
~
-
. 29,044 .
26,264 : 26;424 : 109 : :. 110 :
AGR.ICULTURAL EXTENSION SERVICE UNIVF.:RSIT Y OF GEORGIA AND THE STATE DE PARTMENT OF AGRICUl.TUR
At hens , Georgia
E~~2~ FE014 ~6
LIBR ARIES
U.S. DEPARTMENT OF AGR IC UL.TURE AGRICULTURAL MARKETING SERViCE 3 19 EXTENSION SLOG., ATHENS, GA.
February 12, 1958
'::~GE Tf. BLES FOR FRF.SH tfl1.RKET
February l, 1958
UNlTi'D S'I'!. TE[. : Winter v egetable production fo r 1958 is n ow expected to be 15 j)er~ cent l es s than 1957 and l n pe rcent below av erage, t he Crop Report-
in~ Board announced today. Los ses from b e lmv fre e zing temperature s i n Florida on
February 4and 5 are re f l ected in t Le 1958 f ore c ast s. The greatest reduction s .
from 1957 lvinter p r oduction are 1ndicated for tomatoes, sweet corn , carrots ," sr'l:ap beans, green .peppers, cauliflower, and cucumbe r s . .Smaller l osses were also re-
Loss - ported for celery , e ggplant, escarole , broccoli, l ettuce, and Brus &el s s prouts . :The
only increases in winter production were f or cabbar e , beets, anu artichokes ; es of production fro m adve rse weat her in Florida account f or most of the re ducti on from eaJ;'lie r f orecasts except f or carrots and caulif l owe r in 'l'e:::as .
In Florida, weather since Je cembe r 12 has been pe rsistently adverse . This ' is the longest period cf such severe weathe r ev er experienced by the ~'lorida vegetable industry . 'l'he peri od started witn a sever e f ree ze on .Jecember 12 and 1 3 . Follovl-
ing this .fr eeze there were several col d wave s whe n t emperatures were. below freezing
and f rosts oeou rred. 'l'l !e late s t was Febru Rry 4 and 5 vJhen below freezin g temperB:-
t ur es damar .ed vegetables as far soutL as Homeste ad end Immokalee . In additi on t he re were frequent heavy rains which f looded and waterlogf'eC: l ar ge are fl s . ~x tremely hi h vlinds were also an adverse factor. This combination caused heavy los~es to the ent ire v egetable industry . :Jardy and tender crops suffered ali ke. Not only have .yield prospects b ee n dr a sticall y lowered but acreage losses hav e been. ex.:. tensiv e . 0hipments of Floridz. v egetables since mid- De cember have be en l ess than half those during the same period a year ar o . Av a ilabl e supplies lvill be still .lighte r during the next six 1-veeks unti l ne-v1l y planted crops come into production .
SNAP BEANS : Flor ida ' s winter crop ls now estimated at l 30,0t.10 cwt. , only 29 per-
.
cent of t h[0f.pr odu ced la &t winter and 21 percent of average. Only
one-half of .the acreage planted ha s or will produce any beans. Yields on a creage
harvested is only sl1ghtly more t han one - hal f of ave ra e . 'l'here nre very few beans
remainine, f or winter harvc ::t . Bean production bas b een very light during January
and will be even smaller in ? ebruary rnd l'iarch . Damage to the crop b egan with a
severe .free.z.e on December 12 and 1 3, follow ed by extreme ly heavy rains in late
Je cember and early January . In Rddition there -vm re s everal freezes and frosts and
ral ns dur.ing January. '1he fre eze of Febr uary 4 and 5 about finis hed the crop.
CABBAGE : froduc tion of the winter crop is n ow forecast at 5,045,000 cwt., 5 percent
above la s t ye ar but ~pe rcent l e ss than aver age . Th(:; cold, wet weather
in Florida resulted in some l o ss of a creage and r educed y i eld prospects . ~le ads
are small in . all are as and heavy cullage is ne ce s sary due to internal drunage . uup-
plies du-ri n g February and e arly 1:arch v.Jill be well below normal l evels . teavy r~in s
and flooding the first week :tn J c-nuary redu ced cabbag E: y i el ds in t he Lower Uc-.lley
area of Texas . ' ... ome fiel d s of . inarket 2.ble cabbaE, e stood under water and mud s e ttle d
in the heads rende-ring them unmarke table. 1)rolonge d cold , wet weather in all sout h
TexPs areas cont ributeci to l osses f rom di sease as the crop 1-1as already ih a weak.:. cned condition from the mid -...J~~ ce rnbe r fre e ze . Later pl antin,_, s are making fairly . ..
good growth . I n California, wea t he r ha s be en .fav or able f or good development. . .
-Iarvest has b Gen ve ry acti v e in the - I mperial Valley which hFtS suppli ed the bulk of .
the . out -of ~S tate shipments . Suppli es fro m t hi s are 2 will be dccre 2.sinc; dtlring
February. Harve s t fo r loe al mcrket is unc~e rway in most other C;.lifo rnia producing
areas and i s expected to start l ate in February in the San Diego area .
. ;. -
-
1
[.'vlEET CORN : \rJinter production i n Florida is now fo r e cast at 175,000 cwt., al;lout
one -fifth of l a s t ye ar 1 s pr oduct~on and 55 perc ent be low average . The
cold, wet weather which starte d i n mid- De ceinber and culminated in the h ar d freeze
of Febr uary 4 and 5 is respon sibl e for t he poor crop prospects . Over half of t he
acreage was a compl ete loss. The early Febru ary f reeze virtually knod<:ed out all
areas except Pompano and lkde County. Crops in the se are as have b e en darr.-ge;d but
will provide mos t of the February and ;arch production. However, movement during ~hese months will continue to be ve ry light.
-Ove r -
CUCUf.ffiERS: Production of Florida's winter crop is currently forecast at 18,000
. cwt., compared with 221,000 cwt. 1ast year and average production of
134,000 cwt. For all practical purp0ses, the -freeze of February 4 and 5 finished
Florid"a' s winter cucumbers. A few protected fields are .in .poor condition and
~houlci"prov1de light supplies the latter half of Harch. Cucumbe!'S moving out of
Florida during February and I'1arch will be mostly Cuban import.
LETTUCE: Production of the winter crop, now forecast at 8,738,000 cwt., is slightly bulm.r last year but 2 percent above average . The de cline from the
January forecast is primarily due to acreage r evision in Arizona which is based qn more complete information than was available earlier. Heavy frosts of February 4-S s ever ely damaged the crop in FloriQa r esultj_hg in loss in acreage and r educed yields. Supplie s from ther e will be light tl: ru February and March . In Texas, the qeavy rains in early January and subsequent unfavorable weather damaged lGttuce in ~11 ar oas . Considor uble production in low spots was too muddy to be utilized. pelay~? d harve st in all fields r e sulted in heaV'J mild,;w infestation. Production from the Lowur Valley in Fcbru.:try ~d March will be lirnit8d to late; plantings -and depo nd~nt on favorable woctth\,; r. Hnrve st of .lnto pl antings in the vJinter Garden is expected to start uarly in .March. .The Yuma arE:.a of j~rizona will furnish supplie s through March. HarvGst continue s at nenr peak volume in thG Imperial Valley of California with about 300 cnrs moving daily by truck and rail from the area . Volume supplie s from this arGa >vill continuo during tho next two weeks and than declL~e seasonally. Harve st of the late acreage at Blythe will bogin l at o in F'E:bruary .
ONIONS: Early spring onions in Texas made only fair progre ss during January. Heavy rains early in thu month soakud i'iulds and dainp, cloudy weather
most of the l!"eMainde-~ of tho month prevented drying. Clear, v-mrm, weather is needed .to f acilitate fi c::ld work and stimulat e plant groHth. A small acreage of early onions in the Lower Valley is . oxpoctcd .to bu harvostud about rrid-Fcbruary but production ther e is expected t o be light until c.:1rly Harch. In the costtll. Bend,. opions aru showing poor color which is most noticeable in later plantings. weeding and cultivation were at n nc ar standstill during J anuary as a r esult of con.;. tinued .wet weather. Flooding early in tho month caused light losses mostly at tho ohd of rows and in low spots. Harvest is expected to begin tho first week in April. P;J_anting of the Laredo crop was complGt cd about the usual time except f or a small late acreage . Thi$ artJ a did not r c;J ccive such heavy r ains as other ar eas and onions ~rc in guncrally good condition. Trnnsplnnting in tho Eagle Pass and Winto~ G~rden areas vlill be complet ed by early February. Early plantings in the se e.r~a s h?-V6 made fair~y good progress but clear, warm we ather would be beneficial.
TOYJATOES: - Florida's winter production is now fore cast at 810,000 cwt., a decline of Sl percent from the January l e stimate . Tho current f ore cast is
70 percent below l ast ycnr and 53 percent bel ow avur::tgo. The period of unfavor--
able wea_ther which started v-:ith the fre eze of Dcccrnbor 12-13 and culminat0d -'With a
more C A~e nsive f r eeze on February 4 and 5 causGd sever e damage to Florida tomatoes .
'fl1e h5nvy rains, cloudy weather and periodic cold 1-mvos vlhich hit t ho s tate during this period gave the crop little opportunity to r e cover. 1cs a r e sult of the latvst free ~c, ~tarly nll of thG Da~e County crop wa s froste d to some degr ee with most of tho acreage hard hit . balvago from crops now in the harve st stage will be ~ight. .Some y ounge;r crops may sucker out but chnnce s of a worthwhile r e covery are poor due to tho gener ally we ak. condition of the crops. A limited acruago of young:
p:t,antings 1-1cr e covered and a f ew see d beds were sc.wod. .Some r eplanting j_s expe cted.
In tho Ft. Myers-Immokalee area remaining fields on February 4 wor e nearly all
young_plants. The se ~o ro singud but acreag(,; losse s aru expe cted to be small. In tho Pompana are a l eaf burn is c xt cnsiv~ but little additional -loss in acreage is
expected. Tho young planting in the Fort Pierce and Manat ee - Ruskin areas wore hit by cold winds and blo1:1ing sand followed by frost. Virtually all crops in thu
Manatee -Ruskin area were killed and will have to bG replantod. DP..mago was extensive in the Fort Pierce ar.qa and substantial r eplanting .-v1ill be ne cossary. In north-c~ntral Florida, most crops -which wore above ground at tl1o time of tho-rrec ze wer e killed. Replanting vrill be vury heavy in this area.
Reissued through Georgi a Crop Reporting Sc~vic e .
ftp q{J7) 7
,Crt
'f-A\).3_,.
;
;
~ .-~
....
~.. .
.. .: '
c,'C.O~c,\f>
.:: . :_ ._.. i . ..
,.
~\'>lf;tl.s. ll'i
or
.'1
. / .
" . . ..,
::~ u?~'O .:: : :. ..
.
c!oJF&cnA c~o'JP> x~ ; nw~ JE~vnciE:
A~~.c~LT~~~(-.E:~TENS,iQ.N S!!R~~<:~>:: ;-. ..
UNIVERSITY I)F GEORGIA AND THE .. . ; ' . . STAT~~:OEP.ARTMENT OF AGRICULTURE -~-
oF . ~ ...' ..... u ~ s. DEPARTMENT AGRicuLTURE
... . : . : AGRICULTURAL MARKETING SERVICE .-'
..
319 EXTENSION BLD,G., ATH~NS. GA .'
Athens, Georgia
February :12, 1958
:/ _:> ; : l3Rbn.ER CHICX ' REJ?ORT. FOR GEORGIA :QCliMERCIM AREAS
;
. . . ..:
~ :
. '.
'( . .
: ... ~4
~ - ~ : ~~ ; , . ,....: .. ..-
:..'
: ~ ~ .
~ ,. p
'
~~ :
': ....
l, .
'
During::the ;week ending February 'B commerbiaJ.; hatcheries pl*ced 6,i65,000 chic~s
with the broiler producers in Qeorgia commercial areas. This compares with the
< , ;: ::_: : . 6,142,000: placed the- previ.ou.s .N~k :.~4 - is . 19. percent. IJ'l.O.r~ than th:e 5, 19:}.., 000
platie~-the_: ~arne wee_k' :t;~~t:~~~~l ;:~ \? !~.: ::~ L:-~.:.J.~;: :t; ;.:; :_< ::~:--~~;
Eggs set by .local hatcheries amounted to 8,020,000 compare~ with :7,893,000 the
f::' ' :: : :. 1pre~i~s week :~ . .is ::?); J)e_r-..c~~t: ;lnGr,(i!. "t.h.~..;t;.be;."6,6,Q?, .O..QO _for the :C,or:responding
week last:"Y~az,... . .- .. -~ . ., _:..;_; :: ~ ;; .: .:-:~ ~~-.' ;:: ;::~ ,._.) ,:;: '..~; ,.:_; ~-~: :~:. :.::,:-~
~ .-.:
i ..
,;
.
..:- . - ~ ; :.
. ,.~ - ;'
' !.:' .
~ t : i_. --:.
~
:
...
Hatcheries reported prices pai~ for hatching eggs during the w~ek .at an average
of :19 cent-,s :~~r ; doz~n! .Aye~-age :-Pr~ce ~e}J.ai,"ged by .AC!-t9.~~r~es for t;h,e ~hicks was ,
repor;ted:at ..;;ilJ.; 75 _per .hundred~ -~ . Th~$e. p:r.ioes .ar~ .the - ~~e ; as :.f?r t~~- previous
1
week
apd
:compare
with
56
cents iand
,~l0.50 .' ort~
year
ago.
Egg prJ.ces shown
relate to Georgia produced hatching eggs \'7hether bought on: contract ..or otherwise,
,:.~. ~ -- . . . .-: .. :._.. :~ ... . . .: . .. <. : . . , .. . . .' . . ~ . .: . -:_ . . . -~ :- ~ ... , :
.
Wei'ght.-ed :aver-age prices frorri the. Fedet~lSta;te _l'1arket. News Ser,\rice--.ror broilers
durin~ .: t~~ weel~ ending .February 8 are as. folloHs: North.. Georgia 'broile;rs 2 3/4 ~
;3 1/2 potinds, at farms 19,04; ; FOB plants 20.00.
. .,: , .. .......
r : ' ,.. .. .. t'J
.: :.:- (.se~ :~~~et-~~.. -~ide :;_.io-.r?_ot~~; :_~~t~t~s) / : ~ :.:; :;
; '
:.
~ '-~
1,.
~
:
.
: : _ _ ; _.... ,
,:~ .
~- l
,-~ - - ~- ..
.-
GE0RG:4\- eHICK -PLACENENT BY l.JEEKS :
~ '
--
' .. '
.. PERIOD...D20Ef113ER _7, 1957 THROUGH FEBRUAR~ 8, 1958
~
'
I
;
~ ~ , . ' ,
~ ,',
" .
~'
, Date.:
: Eggs :.- ..'!'. ,: : . Chi:cks ' tiatcileai.:l;j':: '.:' inshi:PPi~nts
,::~; '.ilPt~ Plaed
1rJeek;._:. . : ; Set ~ . - ; ~ Plac:ed iin Geor.gla
of Chi.cks
~. on F_a,rms ::
; Ending 1956--57:1957-58
1956--57:1957-58 195&-57:1Q5758 . . 1~$6-i51il957;.;58
- ~ - ..~ ~ ~ .rn-euaands.~ , -~. - . ~ ~- .'Thous~ds-:-- - -Tholisan'ds-- -. -l'ho~anct~--
De~. :::.7 .~ 5,010. <6~24d -~. ':':4,{5._7, _': :.~ t,S.L:~f:.:>. ;'.4:3~::. 493 . - ~: ~-4,59$.~ - $i-~36
; Dec, 14 ' .5,909 6, 708
4,105 4,596
455
nee . . ' Dec .21. .. -6,304 ... 6,71~ . ; 4,140 4,596
470
28 !6,255 6,573 ... :: ::..: :3-/3tn:::.-4~=6-?o --:.- 31J :
480
4,56o:. 5~076
;498 5o2
. . :..
. 43,,v9o1o0 .
5;.994
5~i72
~ Jan. 4 6,162 7,047
3,986 4,878
429 6o3
4,415 5;401
. Jan. 11 6,386 7,229
: 4,281 4,830
482 ,689
4,~63 ?-;519
: Jan. 18 6,455 1,325
; 4,348 4, 802
484 t 722
i J~. ,: ~5 :: '6,595 . ,7;.79.6.:. 1 ;., ;.: 4.,-640 .. ,_5.,215 . , ,., .. 5.?Q . . ;826
. Feb, / ..1 ; . .6:;636 ?:; :893:, :> ,:.~.-_. '.~.:4i 946 ~-; "${42~ ::: :; ::Y5.2J:; :-. :722;
Feb. i~~a ;~- ;6,605 : .~ 8,020 - . ~ - ": 4,647 ~ 5;46.0, :. , .., :.-.544 : : 70$:
. 4, 832
. 5,1.60
. ~~5,ll69
5,;L91
5.,524
.6~.041 ~,142
q:)_1, 65
I
j
_ . _",:..-~---;,__ __
~l;E~l~~iv~- of :~a~chi~gs_ :~~~P,Pe9~ j,_n~-~ . ~~<a~es. ~ut_~~e o_f ~eofgia.
; :.~ ,;_.~. ::.: 1.... _.. :: :< :. .' ..._: :. . _.r< \;:: <~. ..'::~: . .<'.r ...' ...~ ~.'. .~ ~::~.; i':~-~ \:.. :~; ~.~ ';~::
t
: ~ ~ .:: .
.~- . : ARCa:IE LANGLEY ,. .
. ' .. ;- ~ ...... ~-.. : ..W. :A. \~!AGNER
r Agrii::'ilu~tirai Statistic{~ :In Ch~ge ; . ... . ; ..., :... :' ,.. ,A~rfc:ultural S:tatistician
:
. i ...;
'
;
(
':..
f :
... : ..
. ,
. '
.. :
' .
! ..
..:: :. .....~ : ...: ::" . .
1
~ . ..
l' : ,' .t: . . ..
' ' ~'
I: '
-~
...~..-i i,:. ,.,, :
: :" :, ':c ' .,- ~
. . , .... .. , "
'4
,. . .
.... ~
-
. -.: \;:
::
.. .
. , : .:
.i',...
: ~
~
, ~
.~::.
.
... , '.;..,
: \
I".. . I -:
1:
,:
(.:
-------~;r::::---~------:E_GGS.. SET. ANDCHI{}KS :PLACED IN COMMERCIAL AREAS;_.BY WE~K~_: - 19St- -:?8
(; ':, .~
Page 2
~ ~~;-.~---~~- ---~-- .- ~ ___ --:~- ,.;_ ~:;:.,:. :r;~~.~--~-~er~k_E_n_d~i~---~,;:~ ~ _ ~:,_- :~;-_:~"--~:~~. ~-~~~., -.~.:~.;.~~.~.~ -~~~--~:~-- ~:~~~~~ .:~::.~:: --~-----~----
STATE
Jan~ I Feb. -1 F~b.
I' 'Dec.
Dec. :. . Dec" :,Dec. J-an. 'Jan~ Jan} \ ~~- J~~:!: Feb.
Feb.
-~--~-: ~- ~~-- ._ .__1_--_- ~-1____. _a~-- ._. _*~ -- --- ~ _. 7~---~--~----2-~l~~ -_,. _28~~: _~~-+--l-1~___1_8:_;~ ~~~>--~-2~5_.~: ~--l--~----8
' . I'
:- :
~r I
--------------~,1~~~~: ___~~~-:~:_~~__;-~--~--~-oo--s_AN_m_. _~_ _~
!
--~--------~-C-HIC~K-S -PlA~CE-D---W-O~US-AN~DS---: ,~,... --~-.,..L' +-!.-~,:~~'-- ----------
Maine Connecticut Pennsylvania Indiana Illinois
Missouri Delaware Maryland Virginia
1,562 ; 1,419 1,482 89.0 _ . 9:86- . 97'7 .. .
1,49.6 1;:5i2 . :. i~463 ..
1,94~ ... 2,143 2,174 373 ---- ... .-400 .... .... -403
1, 731 . 1, 844 . 1,.77Q 2, 390 ~ -: . g., 424. :: .~2, _4~6 ., . 2,3~6 : .. ?~371 ;. .2;'.334 : :
2,095 ' 2~'091" ... 2~'078
955
492
-. :'870551
~
'
......-... 124 -'.
.-- .550'
t,:?24 .
: . . .l1_,_',;,41..99..90."'.
i,005
961.. :.97f>
. 519
601. _:629
701
7$4: ~ -694
189340. .. .'
.. ,, , ~ ~ ,
..
- 52D .c: ..
887: l : 95 l21:; :. '95 555 _, . 5~9
1, 745' .: <1, 89.5 .. 1;675
1,63? c.. - -1,425' .. '1~'648 :t.,l0.7 :1,145 ,1,0:1;8
937
.5~5
.701 :a)o
'135
;;-616
1,_782 1;649 1,081
.982 '.' :':960 _ 529=': ;.462 :680.. :.: 705 . 841:;__ :: 866 :''133 ,c. .126 581 ., ~ :--624
2, 0,33.:. 1,879 1;5?T 1:,486 1,079_: 1:,128
; -i)348~>'~
.. : 545 . ~
,.;; :.
:-673" .
..';:...:
885. <:
14$.~. :;
616 ..:;
1l ,'571795.
.' -:. :. ~- :";
,1 229 .. :.:,1
955
543 731 853 148
647 1,979 1,642 1,216
1,013
573 932
847 150 683 1,926
1,567 1,242
\rfest Virginia North Carolina
South Carolina GEORGIA
33.6 ; . , 3.59
364
2,967 ; ~:9~3: ' _'3 1.02'8 _
. 804 ; : : $'03 : , $03 ,
~: : 7 7% I ~- f 893 . a 020 . .
. -: . .329 .
4,~097.:
-
: J85 $,;0_36::
, . 412 .. . 359 :417
?,06$. :::. _. 2 14. 8 . . ?~0~4
. 366
5,o?'6
:~
.
,-'')s
,34.3-
o.94.-.-.
~
"35'8 - 5:; 172
.-450 2/ 223
.33:9 5~..481
:~51_3 ..-
2, _2_ 4.8 "". .39-0
' .5,_5.i9...':
--494 2_,.202
.
-:....326
$,524
539.... ,:.-..r
- 2,413 361 - -;- ~
;::6,._941.~- .:~
556 2,265
327
6,142
525 2,327
302
6,165
~=;;.,__--------4
Florida
;. 405. ; ........ , ....4.?.1. .... .. .43.4 .
Alabama
2, 788 ; 2,892 3,008
Mississippi
{, ~,085 --.- 2,048 . 2,004 .
. - .. :..199 1,996.. . 1,237
.. 214 .:.: .: 266 ' -~ :17'6
::2.}'.,l2o363'
.
2,103 - -~2 ~~2~2 1,2,82 '- :l ; i53
. 200
2 ~-335
l,h29
: .-2058 .: ;~. 226
2, 2,,327 214 :-~..
. . ~
( ~..
,,;
:-J,J29 : 1:J 2. 55
~
:~.:.-.
J~..,/:'1'.2'iwl201;.'.:.:-:1:''.
195 2,540
1,477
215 2,465 1,461
Arkansas
-.' '3,449. ::0: 3 ~ 549 3j588-:
2,115 2,235 . :2, 263 . :2:,179 2;339 2;376 . ~:;498 '. ~_,~99
2,56o 2,687
Louisiana
.:: . 41:8 :. .:.-~ 461 - ' 479
307
269
307
,'275
za4 . :374
;: 347
..
'
:.
.:372..
'.
381
380
Texas
Washi~tcn
Oregon
2,774 3,021 2,858
372
324 . 389
273 312 .. 329
1 , ;747 . 216
'135
1, 731 169
.. 1,21.1.3.32
.
. 1 :...
':
769 244
1,'964 :'212
180
147
134
. . .
13.7
2;030: 2;_020 Z_,188.:.:..: 2,256
247 12'7
- ~ ~58
-156
..
J 297 . 128
'
249 153
2,229
127su4
California
1-,393 : =: 1,385 . 1,327 ~
'831
86~ .:
8~5
.785
916
92'6 "875 / - ~47'
931
927
TOTAL 1957-58
TOTAL 1956-57
1957-58 %of 1956-57
-~:40,63.7 : ,. . 41~283 " - 41;418 .. .-
.
. '
. '
. : .. .. -:
,:)5,99) _. )~,409~ . : "~5,,9~1 .. .
l
l
J..
-: .
. i~7~ i._:_-: _il$ _:
.. _24, ~720
' ,.
.,...
22 .
980
l< i' 1oa
25,17~;
..
"
~:5, 4S6 ._25,.147
' .22, . . ..
22,95?.:. . .
9i3 '
:1;7;9~1
110.
lll ' '
.,.
' 149
- --
2p,.625
23..._ ,:_437.
.. .114
26, ~3? ..,26, 744.. . ~.tl. i,4. 49
~4J _4J5.';~ 24,654 ::
._.:_::no ~ : . 108 ::~
~51~00
~- .
110
..
28,746 26,264
109
29,044 26,424
110
l.
(_
HNCG SJE~VHCIE:
AGRICULTURAL EXTENSION SERVICE UNIVERSITY OF GEORGIA AND THE . STATE DEPARTMENT OF AGRICULTURE
t_.:,_L_IBRA_R.\.E~.S~"::l S. DEPARTMENT OF AGRICULtURE
AGRICULTURAL MARKETING SERVICE
319 EXTENSION BLDG., ATHENS, GA.
February 17, 1958
LIVESTOCK ON GEORGIA FARHS JANUARY 1: 1958
Estimated inventory numbers of livestock and poultry on Georgia farn~ as of January 1, 1958 showed decreases from a year ago in the numbers of hogs, sheep and l;ambs, horses and mules, and turkeys. The number of cattle and calves was unchanged from last year while chickens on farms showed an increase. Changes in inventory numbers by species were as follows: hogs, down 2 percent; sheep and lambs~ dot~ 11 percent; workstock, do~m 8 percent; turkeys, down 39 percent; and chickens, up 2 percent. The number of cattle and calves was the same as a year ago. (Estimated number of livestock and poultry on farms is shown in the table
on the back of this report.)
The total value .of all .livestock and poultry on Georgia farms January 1, 1958 was ~~178,134,000 compared with ~~147,566,000 a year ago. All species, e;~cept horses and mules, and turkeys sho-v1ed an increase in value. The increases vmre due primarily to a higher value per head as only cattle and chickens failed to show a
decline in numbers.
Valuation in thousands of dollars~ by species in order of rank for 1958 and 1957,
r: )e3s9p,8e3c2ti,0v0e0lya, nd~e~~~3a,s38fo9,ll0o0w0;s:
c
Cattle, hickens,
~)~1l1o9,4084l,2O,0O0O0
and and
)
~95,852,000:
9,415,000; h
hogs, orses
, and
mules, ')7,571,000 and ~~ 7, 626,000; sheep and lambs, :~1,030,000 and G970,000; and
, r- turkeys,. ~~178,000 and ~314,000.
DISTRIBUTION OF GEORGIA LIVESTOCK VALUES BY KINDS ON FAmB (Percent of total value of livestock - January 1, 1958
Hogs ~~39' 832,000
22.4%
Cattle ::)119' 042' 000
66.8%
r
* Sheep and Lambs
~)1,030,000 ... 6%
_______,_
~.
A..'WHIE LANGLEY Agricultur.al Statistician In Charge
. CARL 0. DOESCHiill Agricultural Statistician
. . " . . .. ~...
,. ..
...:.. ...:~
,.
,
. .
. ~ . '
'\. .
/
-' ,
. . ~ ....
,
. ~
...
,. .
' '
Year
.. . ... r. -:
>
\'
.
1:..1.1 Cattle And :-Calves
LIVESTOCK. ON GEORGIA FARMS (IN THOUSANffi) .January 1, 1949 - 1958 . ...
Co;rs & Heifers
~ Other
r-:---
1
Hogs Sheep
Horses
2 Yrs. &
Older Kept
Cows 2 Yrs And
lmd ;
j Pigs .
And, . _.j L21llbS .. ..-. I
Andc Muie~
For Milk
Older
--~
: . . t
-
1,.-~ '
0
.
0
0
Head ...
. .. ..
.(
I Chickens
. (Excluding 1 Comnercial j Broilers)
iTurkeys
. ;:.: :: : :, . ' .' ~ ~
..
.' ":: . . . , , . : . : ~ ~ I
1949
~-~~ .
350
.~~ 192
1950 -1040 .._,;;o 364 . .,. '193
1951 . 1113. ; ' ;~ ."' 364
1952 ,. ~2J.i1
36t~
1953 .. 1422 . ~-: 351
232 . 282
315 .
l954 " ' .1564. :: ' , 1 . 353
452
1955 1627
346
518
1588 1667.
1800 19C8
1698 1!14.3 1472
10
277
9
257
10 .; - 244
11
215
14
192
. 17
166
21
1.$0
-1957 . -.>< 46r:-'>
.... 8116 ,.;: :: .-,J2'.'.::
. 8029 ,,..,,. 54" ;
8298.::.:,_,.. ..--51 .-.!
7795- ,.::c:. $L( :.
7944 8532'
... .: . /
';
::.569l
-~
,:::.
1956 1562
332
517
1663
46
138
19.57 . : ; 15.46 .:' :, 329
512
1730 63
123
1. 9'5'8 . - 1546:...
..326 '
512
1695 ' 56
113
8231
63
85'59 -:' :- :66 .- :.T
8734. . . :' 4<'1' ~ .
. :': :
---'.::-. .-- -..~; ~ ~~-------
.
--~~~----~--------------~----~---:,-.-..-~.~: -~~ ...-.:- ~ ~i: F-:.-
~ ' . .. ~ .
'
ANNUAL LIVESTOCK A1JD POULTRY INVENTORY ~
JANUARY 1, 1958- UNITED STATES
..;::.:: ::; .t:
Th~ combineq ' l;ivestock and poultry ~umbers on farms and ranches as of J~ua.ry :t~ i
1958 showed :a_._decline of 1 perc ent from 1957, and was l.O . percent below the all,.; -_-_,
1:,ime p~ tncreased
on -january 1, dUring 1957.
l944, . Sheep were the Compared with January
only species of 1, 1957, .. pa;ttle
nliuvmebesrtosc Yk~e~rvehidcohtm :;;-~.
_)
+percent; hogs -were down only slightly; sheep were up 2 percent; horses and mules
were dovm 6 percent_; chickens were down 5 percent; and t:urkeys were do1m 6 percent.
' .
CATTLE: The number of cattle and calves on farms and ranches January 1, is ~stimated at 93,967,000 head, a reduction of 535,000 head (nearly 1 percent) from ~ year earlier. Tnis is the secorid year {n a row that numbers have been reduced following 7 consecutive years of increases t~hich brought _cattle numbers to a
t.'ecord high level on January l, 1956. The current estimat"e, although the lov1est
since 1952, is only 3 percent below the record high but is 9 percent above the 1947-56 average.
HOGS: Hog numbers -on farms January 1, 1958 are esti~ated at 51,559,000 head. ~total shows little change from the 51;703,000 head on hand a year earlier, 9ut is 7 percent less than the 1947-56 average.
:!
Uogs and pigs U.."'lder 6 months ol4. 'bn farms January 1 totqled 33,334,000 head, or 1 percent more than on January 1';'-'1957. Host of these 1..-ere . principally from the 1957 fall pig crop lvhich was 2 percent larger than the 1956 fall crop. Sotvs and
gilts on farms numbered 8,684,000 head. This vms 5 percent more than a year
earlier and reflects farmers' intentions to increase spring farro\ol'ings. Narket hogs over 6 months old (excluding sows and gilts for breeding) on January 1, 1958 at 9,541,000 head -v1ere 9 percent less than a year earlier~ --
SHEEP: Stock sheep and l~bs on farms and ranches January 1, 1958 are estimated
at 27,390,000 head. This is 3 percent more than the 26,538,000 head a year
earlier and the largest inventory number since January 1, 1953. All sheep and :._ lambs, including those on feed, totaled Jl,328,COO head, ~p 2 percent from J~~ary
1, 1957. Sheep and lambs on _feed declined 8 percent to .-3, 938,000 head, the lowest
number in 7 years.
'HORSES AND MULES: The downward trend in the number of horses and-mules on farms
and slowed during 1957 . Th~ January 1 inventory is es-t:,imawd,.,at 3;348_,oqo he9-:d~ . 9
percent :less than bri' JanUary 'l, 12.57. The annual 'decline iri horse 'rrnile numbers
ranged from 8 to 13 percent during the preceding 10 years. The January 1 estimate is slightly less than one half of the 194756 ~~erage of 6,730,000.
QHICKENS: Chickens on farms January 1 (excluding commercial broilers) totaled
370,475,ooo -- 5 percent less than a year earlier and 12 percent below the 1947-56
average. The number of chickens decreased in all regions of the country except in
the South Atlantic where an increase of 1 percent occurred and in the 1rJest tvhere
nurobers were the same as a year earlier. The 1957 pullet crop, following several years of lo-v1 egg prices, was the smallest since 1938.. However, imquick respon
to improved egg prices beginning in June, farmers retained as many hens as possible.
As a result, hens mruce up 36 percent of the hens and pullets on hand January 1
compared Ttr.i.t.h 32 percent a year earlier.
..a,
UN IVERSITY 0.1' G'EORGIA )
/0
~'f9 3 7tGIO~~HA C~OJP> ~
fU fJ AGRICULTURAL. EXTENSION SERVICE
.
UNIVERSITY OF GEORGIA AND THE
STATE DEPARTMENT OF AGRICULTURE
FEB 2! 1 -ss
~~~'rlllft!CG SJE~VllCCIE: I
U.S. DEPARTMENT OF AGRICULTURE AGRICULTURAL MARKETING SERVICE 319 EXTENSION BLDG., ATHENS, GA.
February 17, 1958
LIVESTOCK ON_GEORGIA :FARES JANUARY 1, 1958 . .
Estimated inventory numbers of livestock and poultry on Georgia farr~ as of January 1, 1958 showed decreases from a year ago in the numbers of hogs, sheep and lambs, horses and mules, and turkeys. The number of cattle and calves was unchanged from last year while chickens on farms showed an increase. Changes in inventory numbers by species were as follows: hogs, down 2 percent; sheep and lambs, dot-m 11 percent; workstock, down 8 percent; turkeys, down 39 percent; and chickens, up 2 percent. Tlie number of cattle and calves was the same as a year ago. (Estimated number of livestock and poultry on farms is shovrn in the table on the back of this report.)
The total value of all livestock and poultry on Georgia farms January 1, 1958 was ~~178, 134,000 compared vrl.th ~147, 566,000 a year ago. .All species, e~~cept horses and mules, and turkeys shovJ'ed an increase in value. The increases tvere due
primarily to a higher value per head as only cattle and chickens failed to show a
decline in numbers.
Valuation in thousands of dollars, by species in order of rank 'for 1958 and 1957,
r:~e3s9p,8e3c2t,iv00e0lya, n.dare~~3a3,s38fo9,ll0o0w0;s:
Cattle, chickens,
:~:~:1l1o1,9480l4,2O,0O0O0anadnd .~9' 9,451,85,5020,90;00h: ohrosegss, and
mules, ~1 7,571,000 and ~~ 7,626,ooo; sheep and lambs, n,ojo,ooo and ()970,00d; and
turkeys, ~")178, 000 and ~;P314, 000.
DISTRIBUTION OF GEORGIA LIVESTOCK VALUES BY KINDS ON FAIDS (Percent of total value 'of livestock - January 1, 1959
Cattle
::)119' 042 '000 . 66.8%
( * Sheep and Lambs
:)1,030,000 - .6%
ARCHIE LANGLEY Agricultural Statistician In Charge
CARL 0, DOESCHER Agricultural Statistician
)
t
. .. .
, (
', .
.r '
,.
. ,.
.. , : . . ...: .
. .. . .. - ..,;.
.. .... ~ r...
. .. .
:..-<:.'.:liVESTOCK ON GEORGIA FAru1S
(IN THOUSANDS)
:
.. -:-"'; . ~. :- :
J~uary 1, 1949 - 1958
.. :P.. , .
; . ' t' ;
........ .' ~ ~.. '
,; \ "' I I
--- - - -- - 1
Covrs &
Year
' All Cattle
!I Heifers 2 Yrs. &
Other . liogs 1 Sheep
Cows 2 Yrs .hnd . And
i Chickens
Horses Arid : .
I:(CEoxmclnuedricnigal
;Turkeys
I j ........,....,__._...___ ---4------ - ! :.CAaln~des .. .. 1
Older Kept For Milk
.And Older
Pigs Lambs
Mules .''I Broilers_ ) . .
-....J....------'------'------+-:...__,..---r'-'-,....,...;--,--.,..._~""'
- 46';:. .' 1949
ld46' .:. '' .. 1950
;1.951 ;1.952
1953
1954
ro ;1.955
. . : . ':. : .
.,_., .
. '9.82,.._.,.h,.. ,' ... . 50
> 564
1:).13 . ' . :: , . .364
''1241
364
:1442
.:357
' 15'64 .. ',,!
"353
1627
346
1,000 Head ..
192 193
1588 10
1667 . 9
232
1800 . 10
282
1908
ll
375
1698
14
t~52
11!43
17 '
518
1472
21
277
257
244 215
'
: ,:
192 166
".
;)
7957 . :.; . ..
-~ ~-
8li6. .'.: ::.: 8029 .,: . '
?54.{.:.; '~,:~,
.
,.,.:,:
8298 .'... ":-51 =:.. "'
1195 . .'
;:_: 5' / ' ::, ~_.
. .. 4 ,
.. ..
79J.J.i .. ...5.9.. . .' ...~:
8532 ,; . '61 .::-. .
1956 1562
332
1957 1958
1546 ...: 154~.: :;
.329 326
517
1663
46
138
512 , 1730
512
1695
63
56
123 113
88525391
_,.
.,
..,.
'
63 .. 66':..:
"
- :. ' :_
6734 - .' . .40 ;.: :.~ ...._
.
.
. ~
c . .' .. h.:_, ! . ; .
., _ ---------------------~, -:.:"',:"-;.~. _,,.....---.:.~. ;"",!........... ' ..
. , ' ~i
ANNUltL LIVESTOCK .AND POULTRY INYENTORY- ~ : JANUA~Y 1, 1958- . UNITED STATES . .
. \
'I
'
; '
;::
' '
~---:. ~
~: ' : :
: ~ ':
' .' ,:
~I'
The comb~~d .;Li.J:estock and .poultry numbers on .fanns and ranches .'as of J ~mia:ty .i'~:' ~ :"_: .~"
1958 showe'cf a ciecline, of 1 percent from 1957, and was 10 percent beJ.,ow the' .al:J..'... ..: : :
time peB:ic .on Janiiary 1,1944. Sheep were the only species of liv~st'ock lvh~ch ' . ...: .::~.
increased during 1957. Compared tdth January 1, 1957, cattle numbers were :dol'm ,_ . '..:./
i percent; hogs l.Yere down only slightly; sheep were up 2 percent; hprse s ~d mules
~ere dot-m 6 percent; . chickens were d:owi'1 5 perc ~n~; and turkeys l:le~e .d.ot~ 6 percent.
CATTLE: The nwnber of cattle and calves on f(il'ffis and ranches January 1, is
estimated at 93,967,000 head, a reduction of 535,000 head (nearly 1 percent) from
~ year earlier. This is the se~ond year in a row that numbers have been reduced
~ollowing 7 consecutive years of increases tJhich. l;>rougnt,. cattle numbers to a
record high level on January 1, 1956. The current estimate, although the lowest
since 1952, is only 3 percent below the record high but is 9 percent above the
1947-56 average.
liQQl Hog numbers on farms January 1, 1958 are es~L~ated at 51,559,000 head.
This total shows little change from the 51,703,000 :head on hand a year earlier, but is 7 percent les~ than the 1947-56 average. ;
' .. Hogs and pigs ~~der 6 montbs old on farms January 1 totaled 33,334,000 head, or 1
percent more than on January 1, 1957. Most of these were principally from the
1957 fall pig crop tvhich was 2 percent larger than .the 1956 fall crop. :so,.rs and
gilts on farms numbered 8,684,000 head. This uas 5 percent more than a year
earlier and reflects farmers' intentions to increase spring farrowings. Narket
hogs over 6 months old (excluding sows and gilts for breeding) on January 1, 1958 at 9,541,000 head uere 9 percent less t han a year earlier.
li~~~ Stock sheep and lambs on farms and ranches January 1, 1958 are estLmated at 27,390,000 head. This is 3 percent more than the 26,538,000 head a year earlier and the largest inventory numb er since January 1, 1953. All sheep and .
lambs, including those on feed, totaled 31,328 ,000 head, up~ percent from JanuSr.Y
1, 1957. Sheep and lambs on feed declined 8 percent to 3,938,000 head, the lowest number in 7 years.
1I.ORSES AND 1'1ULES: The dowrit-rard trend in the number of horses and :nrules on farm~ slowed during; :l 957.' : The --January 1 inventory is estimated at J*348 ,ooo : .fiead~' :'6 ' percent less than on January 1, 1957. The annual decline in horse and mule numbers ranged from 8 to 13 percent during the preceding 10 years. The January 1 estimate
is slightly less than one half of the 1947-56 average of 6,730,000.
9HICKENS: Chickens on fanns January 1 (excluding commercial broilers) totaled
370,475,ooo -- 5 percent less tha~ a year earlier and 12 percent below the 1947-56
average. The number of chickens decreased in all regions of the country except in the South Atlantic where an increase of 1 percent occurred and in the vfest lvhere numbers were the same as a year earlier. The 1957 pullet crop, follot-r.i.ng several years of lo1:-1 egg prices, l'l'as the smallest since 1938.. However, in. quick response
to improved egg prices beginning in June, farmers retained as many hens as possible. As a resul t, hens make up 36 percent of the hens and pullets on hand January 1 compared t-rit.h 32 percent a year earlier.
AGRICULTURAL EXTENSION SERV ICE UNI\IF:RSITY OF GEORGIA ANO THE STATE DEPAR T :.1ENT OF AGf~iCULTURE
Athens, Gc9orgia
U . S. DEPARTME'NT OF AGRICULTURE
AGRICU L TURAL MARKETING SERVICE
L I B RARIES
319 EXTENSION BLDG., ATHENS, GA.
L----'-_ _,..
F~bruary 20, 1958
B~O ILER CHI CK REPOR T FOR. GEORGIA COJVLiv~:=tC IAL AREPS
~uring the we ek. ending Fehruary 15 commerc i al hatcherie s placed 6,108,000 chi cks with the broiler producers in. Georgia commercial areas . This compa res with the 6,165, 060 placed the previous W8ek and is 18 per cent more than the S, lSS,OOO placed the sarr.e 'li eek la st Jiear .
Eggs set by local hatche'ries amounted to 8, 006,000 compared 'l~ith 8,020 , 000 the previous week and -is 21 per c"-lnt more than the 6,596 , 000 for the corresponding week last year .
Hatcheries rop~rted p~ic es paid fqr hatching .egg s during the week at an average of. 80 cents per do zen. Ave::-age pr ice charged by hatcher'i'es for the chi cks was report ed at $14.00 per hund::-ed , 'l'hese prices compare with 79 cents and $13. 75 last week and with 56 cents and t l O.SO one ye ar ago . r:;gg price s shown relate to Georgia produced hatching eg gs whether bought on contract or otherwise .
\rje i ghted average prices from the Federal-State l"'arket News :Servi ce f or broilers during the 1-1eek ending Fetruary 1) are a& fo llows: North Geo rg ia broilers 2. 3/4 3 l/2 pounds , at farms 19. 32 ; FOB plants 20 . 47 .
r
Date Week I;nding
(bee reverse side for other states)
GEORGIA C'HI G.K PL.A. CE'r-'[_,NT BY \rJEE.I\~
PrniODJJECEMBER- r4- THROUGH FEJ3R.UARY 15, i958- --
Egg s Se t
1956- 57 :1957- 58
Chicks Hatched "J:/
Placed in Georgia 1956- 57:1957- 58
Inshi[Jments nf Chicks
19 56 - 57:1~ 5 7-58
Total Placed on Farms
1956- 57:1957-58
ThOusands
Thou ear..ds
Thousapds ..
Thousands
Dec , 14 5, 909 6,708
4,105 4,596
455
480
Jec . 21 6 , 304 6, 718
4,140 4,596
470
498
~ ~:_) '; . 28
6' 255 6,573
3, 38 7 4,670
313 502
Jan . 4 6, 162 7 ,047.
3, 986 4,878
42 9 603
~1 an , l l 6; 386 7,229
4, 281 4, 830
482 689
Jan . 18 6 ,455 7,325
4, 348 4, 802
484
722
,Tan . 25 6,595 7, 796
4,640 5,215
520
826
F'eb. 1
6;6_'36 7, 89 3
4, 646 5,420
52 3 722,
?eb , 8 Feb. 15
6,605 8,020 6 ,596 8, 006
I 4, 647 5,460
544
4, 668 5 ,46 8
487
705 640
1./ i'.JXClusive of' hat.chir.g :o ship~e d into statc:s outu.de of Georgia.
4,560 5,076 4, 610 5,094 3, 700 5,172 4,415 5,401
4,763 5,519 l.t, 832 5, 524 .. 5 ,160 . 6,041 ' 5, 169 . 6, lh2
5,191 6,165 5,155 6,108
ARCHil!, LANGLi Y Agri cul t~ral Stati stician In Charge
~ . A. vU.GNER
Agricult ural Statistician
(
EGG S SET AND CRICKS PLACED DT COMME..~ CIAL AHEAS , BY WEEKS - 1957 - 58
Page 2
. I
Week Ending
STATE
Maine Cormecticut
rI -
I
! Feb.
1 1-
Feb.
Feb.
--8 -------1-5-
___T ____ III'' II Dec.
Ii !'
14
Dec. 21
-+ - ------n- I EGGS SET - Tt.tOUSAl\1DS
1,419
1,462 1,463
,I
I I
i' i
li 1,005
961
986
977 1:115
i! 519
601
I
Dec. 28
i'I--
J
-
a
-
n
-4
.
Jan. ll
Jan. 18 ..
I Jan,
J. 26
Fet-. 1
Feb. t\
CHICKS PLACED - THOUSANDS
-- - - -- - - - - -
--- -------------
976
937
9'2
96 0
1,048
955 1,013
629
585
529'
462
545
543
573
Feb. 15
1 1 01S 596
Pennsylvania
1,512
1,463 . 1,492
il 701
754
694
701
68 0
70 5
673
731
932
812
Indi ana Illinois Missouri Delaware !l[e.ry1and Virginia 1i\Te s t Virg;inia North Carolina South Ca rolin a GEORGIA
a - F l o r i d .
2,143 400
1, 844 2,424 2,377 2,091
359 2,9 1:5
50 3 7,893 - -427.
2,174 2,C71
1j1, e94
403 1,770 2,406
369 1 , 82 6 2,420
li 130
ii 520 1,745
2,334 2, 078
2,309 2, 039 .
II
pI I
1,6 32 1,10 7
364
" 3,028 503
348 3,096
506
.iI!i
II
412 2, 065
36 0
!I 8,020 4 34_
_
8 _
,006 419___
___i
t __5_, 027164
_
887
915
830
841.
866
121
95
135
133
126
555
~29
16
581
624
1,895 1,675 1, 782 2,033 1,879
1,42 5 1,648 1,649 1,527 1,486
1,145 -1,018 1, 08 1 1, 0 79 1,128
:;59
417
450
513
494
2, 148 2,024 2,2 23 2,248 2,202
343
358
039
39 0
326
5,094 5,172 5,481 5,519 5,524 __2"Ers--- r16----zo-o--258____226
885 145 610 1,775 1,519 1,229
539
2,41 3 361
6,041
221.
853 148 647 1,979 1,642 1,216. 556 2 ,26_5 327 6,142
195
847 150 683 1,926 1, 567 1,242 525 2, 327 302 6,165
215
780
153
592
1,921
1,735
1,271
531
- ~
2, 327 . ....: ~
340
6,108
240-
A. l aliama Mi s d s s i p p i lirkaneas Lc-uisiana Texas
~J\To. s h:i.ngton
Oreg on
~alif orn i a
-----
'TOTAL 1957-58
2,8 92 2, 048 3,549
46 1 3,021
324 312 l, 38 5
41,283
TOTAL 1956-57
35, 409
1957-58 %of 1956-57 1
117
3, 008 2, 004 3, 588
479 2, 858
389 329 1, 327
~ 1, 4 18
35,951
115
-- - -- - -- -
3,005 2,171 3,6 36
447 3,026
405 374 1,249
41,792
35,919
116
li 2,106
I! 1,233
i: 2,2 35
II
Jl
269
I! 1,731 169
l i 180
i~ I
869
I
i!I' 25' 172
,l,i 22,953
!i
it
110
li
I
2,103 1,282 2,2 63
307 1, 713
232
147 885
2,282 1,153 2,179
27 5 l, 769
244 134
785
25, 486 25,147 22,913 17, 99 1
111
140
2,335 1,429 2, 339
284 1, 964
212 1 37 916
26,625
23, 437
114
2,214 1, 329 2, 376
::,74
2, 0 30 24 7 127 .
926
2, 327 1,255 2, 498
34 7 2, 020
258
: 156 . 875
2,344 1,410 2, 69 9
;)72
2,188 297 128 947
26,936 26,744 24,435 24,654
28 , 449 25,800
110
108
110
- - --- --- ---
2,540 1,477 2, 560 .
381 2,2 56
249
' 153 9 31
2,465 2, 366
1,461 1,630
2,68 7 2, 766
380
429
2,229 2,140
274
323
154
158
927 ' 1$071
28' 746 29,044 29,307
26 I 26 4 , . 26 1 424 25,704
I
109
110
' 114
- -- --- -~--- ---- - - -
d".~
H 1UD7
827~
u A
~lb 2-6 (G[(Q)~(GllA <C~(Q)JP> ~EJI(Q)~1rll1NCG E~VllCCJE
AGRICUL.TURAL. EXTENSION SERVICE UNIVERSITY OF GEORGIA AND THE STATE DEPARTMENT OF AGRICULTURE
Athens, Georgia
U . S. DEPA RTMENT OF AGRICU1..TUitE AGRICUL.TURAL. MARKETING SERVICE 319 EXTE iiiSION SL.DG., ATHENS, GA.
February 26, 1958
BROILER CHICK REPORT FOR GEORGIA CO~~RCIAL AREAS
During the week ending February 22 conunercial hatcheries placed 6,132,000 chicks
with the .broiler producers in Georgia conunercial areas. This compares t-lith the
6,108,000 placed the previous week and is 19 per cent more than the 5,137,000
placed the same week last ~ear.
Eggs set. by local hatcheries amounted to 7,887,000 compared with 8,006,000 the previous '1-Teek and is 20 per cent more t han the 6,587,000 for the correspondi~g
week .last year.
~atcheries reported prices paid for hatching eggs during the week at an average
pf 80 cents per dozen. Average price charged by hatcheries for the chicks was reported at )13.75 per hundred. These prices compare with 80 cents and ~14.00 last ueek and t-li th 54 cents and ~:)9. 75 one year ago. Egg prices shown relate to
Georgia produced hatching eggs whether bought on contract or otherwise.
Weighted average prices from the Federal-State llarket News Service for broilers
during the week ending February 22 are as follows: North Georgia broilers 2 3/43 1/2 pounds, at farms 20.02; FOB plants 21.00.
(See reverse side for other states)
GEORGIA CHICK PLACE-IJJT BY WEEKS
1
Date
Eggs
- PERIOD DECillvffiER 21 THROUGH FEBRUARY 22, 1958
~-==a-:;; -=
Chicks Hatched ~/
'
-
Inshipments
Total Placed
Week
Set
Placed in Georgia of Chicks
on Farms
Ending
1956-57:1957-58 1956-57:1957-58 1956-57:.1957-58 1956-57:1957-58
Tho-u-s-an-d=s-=- ==~-~=T~ho~u=sa=nd~s==~===T=h=ou=sa=n=ds==~====T=h=ou=sa=n=ds==
Dec. 21 Dec. 28 Jan. .4
Jan. 11
Jan. 18 Jan. 25
Feb. 1 Feb. 8
Feb. 15
Feb. 22
6,304 6,718 6,255 6,573 6,162 7,047 6,386 7,229 6,455 7,325 6,595 7,796 6,636 7,893 6,605 8,020 6,596 8,006 6,587 7,867
4,140 4,596 3,387 4,670 3,986 4, 878 4,2 81 4, 830 4,348 4,802 4,640 5,215 4,646 5,420 4,647 5,460 4,668 5,468 4,656 5, 479
470 498 313 502 429 603 482 689 484 722 520 826 523 722 544 705 487 640 481 653
4,610
3,700 4,415 4, 763 4, 832 5,160 5,169 5,191 5,155 5,137
5,094 5,172 5,401 5,519 5,524 6,041 6,142 6,165 6,108 6,132
/Exclusive of hatchings shipped into states outside of Georgia.
ARCHIE LANGLEY Agricultural Statistician In Charge
W. A. ~'!AGNER Agricultural Statistician
'
EGGS SET AND .CHICKS PLACED IN COMMERCIAL AREAS, BY \'TEEKS - 1957 - 58
Page 2
-- --------------~--------------------------------~--~------------~--------------------------~~------------
STATE
Feb.
8
,.
.Feb.
15
. Feb-.:.
22:
Week Ending
Dee. '-' 21
.!I
Dec._ Jan.
Jap.
Jan.
28 I
4
11
18
i
Jan. Feb.
25
1
Feb. . Feo.
Feb
8
15. ' . - 22
EGGS :.SET - TH9USANDS
CHICKS PLACED - THOUSANDS
I .
960 .. r, o48
955 1, 013 1;o1$ .
.961
462 . ..545 ' ::. 543
573 . 596: ~ 528
..705 . . 673 ' 731 . 932
:;866 :: .: :) 885 .. :. 853 _.:. 841 "
812 ' . 867 780 ' ~- 957
126 , 145 148 .. :.15d . 1.5j . 125
624 : . .. 61o 6/.a .: . ; ._.683 ' 592 . :. 669
~; 8.79.., ... 1, 775 . ~~979 ,_, -1~:0926 . ' 1,921 \,928
L,486.: ' 1.,579 . J,642 : 1,567 . : 1, 735 1;128 ~ - i,229 ;t,216 : 1,242 . 1,271
.494 . .. 539 ... 556 : 525 : 531
:1,.-133
1/ ?.77 ' 492
2j202< .. 2,413 2,265 >2:,327.. 2,327 :2 420
: 326 . 361 32 7 .~- .302
340 .. ~J43
5,524 ..6, 041 6,142 ' . ..6;165 6,108 . 6/ 132
.. ~~~~~~~---=~~~~---~- --2~25~,~~- -=22=1~'~-' ~.. ~1~95~~ ~=2~15~---24~0~~---~- ~22~9
2:,327 2,34Lr ~,. 2,540 . 2:,46? . 2,306 .-: 2~J97 1, 255 .1,410 :_, :.1,477 1,46.1' 1, 6)0 ~::.I ~ 751
2,498 . .2,699 . :2,560 J.h1 . 372 381
2,020. 2,188 2,256
2',687 : 2, 766 :. : 2';897
3Bo
l29 :~ :;;;os
2';2i 9 2, l 46 .. . 2-~ 3'55
258
29? 249
274
323 .. .. 288
156
128 153
15.4
1S8 _ , . 170
' i
875
94r 931
9~1. 1, on . , 1.022
26' 744 28' 449 28' 746 29' 044. 29' 307: :.)0;, 049
24,654 25,8oo . 26,264 . 26,424 25,704 25,6o5
- 108
110 109
110
114
117
-~-~---J.L.~~---:-----:----ll.__ _ _ _ __ _ _ _~__;___..:_;.--~---- .,. --;-o - - -- -- - - -
~
Gffi:(())J}RGilA C~(Q)JP..~JE~(()) ~~_.1E~VllCJE
.
'
AGRICUL.TURAL. EXTENSION sERVICE
UNIVERSITY OF GEORGiA AND ' TH~
, ' ;
STATE [)EPARTMENT OF AGRICULTURE
.,
U.S. DEPARTMENT OF AGRICUL. TURE
AGRICUL.TURAL. MAPKETING SERVlCE
3'19 EXTENSION BL.OG., ATHENS, GA.
Athens, Georgia
...~ .
.J.
.. ....... ~
: ' ... , : 1957 CA.LF CROP ID:PORT
.. . .
February 26, 1958
GEORGIA: The 1957 calf .crop for Georgia :i,s estimated at 6>18, 000 head - 4. per-cent
above the 1956 crop of 671,000 head and 38 per cent al;>q"l(e~...t he _1 946.;55
average crop of 506,000 head.
The number of calves born in 1957 represents Bj pe rcerit of the cows and :heifers
2 years old and ove r on f;:ums Jgnuary 1, 195? and is 4 percent above the correspond-' ing percentage for 1 956 . CoVJs and heifers 2 years old and over on farrn.s January ,l) 1957, totaled 841,000 hec.d - l percent belmf the S49, QOO head on f ar ms the fire vious year.
UNIT~-i;D !.>TATES: The United 0t at $;:>.: cal:f crop m 1957 tot~ed 41,007, 000 pead:, a de-
cline of 2 percent fr(?m. the 42,010,000 head i n: 1956. 'l'his was the
third consecutive year to show a.o.ecrease in the calf crop and the crop was 4 per-
cent below the record 195~. crop of J.f2,.60l,OOO h ead. However, the 1957 calf crop vias 10 percent l ar ger than the 1946-55 ayerage . All regions showed a decline from 1956 except the South Atlantic.
. .
The decrease in the calf crop during the past year resulte d from a decline in cow-s
and heifers 2 years old and over. The ' n~1mber of all cows and he ife rs . 2 years old :
a and over on January 1, 1 95 7 wa::. 1+7,670,000 head, 2 percent l ess than -year ear- .
lier. Cow herds were further reduced during 195 7.
The number of calves bor n in 1957 e xpres.se d as a percentage of cows and heifers ....r
2 years old and older on ,January 1, 1957 1-ms 86 percent - the s a.Ine as 1956, nnd 1
percentage poj_nt above the aver age of 85 . 'l'his percentage is not s ::.rictly a calving
rate .sirice the J anuary l inventory of cows and he ifers 2 ye a rs old and older does :
not i nclude all t he heif e rs "\ooihich would give birth to calves during the year, and
since the inventor y aoes include some cows that are sold be fore ca lving. 1'he pel"-
centage i s calcula ted t o shew the trend in productivity over a period of time. It
may fluctuate from ye c.1r to ye ar due to v ariations i n cow slaughte r during the year
and trends in breeding herd replacement s . ::.OUTt!2RN C>TATE.S
.... ..
In the South Central States, the calf crop was l J ,520,000 head in 1957, 4 percent below t h.e previous year, whil in the t.outh Atlantic ~tat es the calf crop totaled .:.
3,382,000 he ad, 3 percent above 1 956 . The calf crop expr e ssed as a p~rcen"t of
.
cows and heifers 2 y ear s old ao d over was 82 percent in the t.outh Central s tCJ t es compared with B4 percent i n 1956, and 79 percent in the bouth Atlantic States, :l
point above a year earlier .
,,
ARCHIE LANGLEY Agricul\ural Statistician In Chq.rge .
HILLI !.H E .KIBL..<;R. Agricultural StaUstician
.r .._.
_____ ~ _ ~ ~ __ -~ - -- _ _QA~F_C~O~ ~E~O~T.z. ~9~7_. _ _.. ___ ~ ~....,. ~ _ - ~ ~ - ;;-J
: :
: Cows . and heifers :Calves born as percent o
State
Calves born
2 yrs. & older :cows and heifers 2 yrs.&
-=----- ' and
Division
: :-10-Yr-:---
-:---
: -:-10-
yr
_J:a_nu- -ar-y=1 - - -.
:older January -:-10-yr_:_--
1
1/
:average: 1956 : 1957 :average: 1756 : 1957 :average: 1956 : 195?
:1946-55:
:
:1946-55:
:
:1946-55:
:
-----:-1- ,0- 00-- 1,- 00- 0 --1- ,0- 00--1-,0- 00--1-,0- 00~-1-,0- 00--------------
: head head head head head head Percent Percent Percent
Maine
110 111
105 129 132 126 85 84 83
N.H.
60 60
57
72
74
70 84 81
81
vt. Mass.
241 265 107 100
254 301 327 31U 8o 81
81
96 132 125 118 81 so 81
~.I.
16 15
14
20
19
18 60 81
79
Conn.
98 98
92 121 120 115 82 82
80
N.Y.
1,246 1,346 : 1,293 1,448 1,547 1,521 86 ' 87
85
N.J. I
Ba. : N.A. Ohio
124 13o
130 157 161 159 79 81
82
~ 869 . 953
960 1,028 1,121 1,130 85 85
85
:. 2,E72 -3-;o7s- - . 3,oor- 3,JioE- 3,'b2'5- 3,571- ~ "84-- -as-- -84--:--
: - 98"8 -1;023-- - 98"8 - 1,154- 1,162 - 1,162 - - "86-- -8"8 - - -8"5 - - -
Ind.
: 851 873
838 952 981 942 90 89 89
Ill. : 1.,292 1,349 ,- 1,351 . 1,443 1,482 1,469 90 91
92
Mich. : 866 847
823 1,012 996 991 86 85
83
Wis. : 2,269 2,462 2,456 2,510 2,676 . 2,670 90 92
92
E.N.C. 7 'b,267 -6~5"54-- E,455- 7,571- 7.,297- 7,234 - - EB-- -95- - ~89 - - -
Minn. : 1,592 -1;711-- 1,"599- 1,747- 1,E4o- 1,1347-- 91- - -93-- -9~---
Iowa : 1,781 1,976 1,908 1,944 2,080 2,030 92 95
94
J
Mo.
1,571 1,753 1,754 1,728 1,970 1,928 91 89
91
N. Dak. : 737 893
882 831 1,026 1,014 89 87
87
S. Dak. : 1,142 1,393 1,418 1~284 1,639 1,525 89 85
93
Nebr. : 1,534 1,759 1,697 : 1,716 1,901 1,845 89 93
92
Kans. : 1,483 1;579 1,393 1,669 1,794 1,548 89 88
90
W.N.C. "'i' 9,"841 Ir;o'b4- -15,751 -10,91"8 -12,250 -11,737- - 90-- -90-- -92---
N.C. 7l'b,1oE 17~618- -17,207 -17,989 -19,547 -113,971-- 9o-- -90-- -91--Del. 7 - -33 - - 34- - - -34 - - -41 - - -43 - - -:42 - - 130- - -85 - - -81 - - -
Md.
227 259
266 269 308 302 84. 84
88
Va. W. Va.
564 639
654 680 779 770 83 82
85
271 281
271 319 343 331 85 82
82
N.C.
355 455
469 463 576 579 76 79
81
0.c. : 194 273
2.85 .. 254 346 356 76 79
8o
Ga.
506 671
698 655 849 841 77 79
83
Fla. : 505 585
705 . 789 1,oo8 1,052 54 58
57
S.A. : 7,0'54 -3-;21)7-- 3,382 - 3,469 - 4,252 - 4,273 - - 76-- -7"8 - - -79 - - -
Ky.
: - 76E - -876- - - "872 - - "882 - - 99~ :- - 991 - - "87.,.. - -8"8 - - -8"8 - ':"" -
Tenn.
773 888
885 894 1,032 1,029 86 86
86
Ala. : 621 821
838 810 1,052 1,047 76 78
80
Mj.ss. : . 754 1,074 1,126 1,047 1,432 1,481 72 75
76
ALark. .
:
597
108
710 946
719 735 887 877 81 80 944 926 1,213 1,210 76 78
82 78
Okla. : 1,351 1,545 1,402 1,539 1,717 1,669 88 90
84
T~xas
s.c.
: :
3,868 9,43o
4,113 1o-;973-
3,734 -1o,s2o
4,752
-11,~8'4
4,728 -13,os'b
4,499 -1z,E0--
81 "Bl--
-m87 :i:--
83 -82---
Mc;mt. : - "890 -1;1~1-- I,Io2 - - 98'b- I,2jE- 1,22"5 - - 9o-- -93- - -90 - - -.
I~aho
Wyo.
413 546
548 479 600 616 86 91
89
447 470
480 537 553 558 83 85
86
Colo.
N ~Mex.
756 772
744 876 908 846 86 85
88
542 590
510 683 729 645 79 81
79
Atiz.
366 367
330 469 465 440 78 79
75
Utah
270 309
296 318 364 357 84 85
83
Nev.
220 242
266 289 314 320 76 77
83
1rJash.
413 466
473 486 561 531 85 83
89
Oreg.
499 608
598 608 724 712 82 84
84
Calif. : 1, 278 1.523 1,550 1,537 1, 792 1,802 83 85
86
we st. : '5,59'4 -7-;o44-- 0',1397- 7,26"8- "8,24E- 13,o52-- "84-- -ss-- -eo---
u.s. :37,164 42,010 41,007 43,718 48,729 47,670 85 86
86
j
1/ Not strictly a calving rate. Figure represents calves born expressed as per-
centage of the January 1 inventory of cows and heifers 2 years old and over on January 1 and not the nlli~ber of all cows and heifers giving birth to calves during the year.
~.a-.
Hb fOV7
~r:J G)E<O>!R{GHA CJR{<O>JP> ~IJP>OJR{1I'HNG ~ ua ..
AGRICULTURAL EXTENSION SERVICE
,
UNIVER$1TY OF GEORGIA A~O THE
-'Sl'ATC: C~PARTMENT OF AGRICULTURE
U . 5. DEPARTMENT
~(6JiURE
AGRICULTURAL MARKETING
319 EX"fENSION BLOG., ATHENS, GA. ,.... .
.A,thens, Georgia
.
March 5, i9.5_B . ... ..
. t . ~ : . : .. : ,
FARE PRICE REPORT AS OF FEBRUARY 1.5, 19.58
- . . .-:.
G10B.GIA: The. Index of Prices Received by Georgia farmers increased two percent .._: ._i
(6 points) .during the month .ended in mid-February. The February Ip.d.e,x -. .:-
257 was four percent above January a year ago and the highe st since January 19.5.5
when . the Index was 262.
,. .
. ... . :
The All. Crops component o.f the Index wa s 269 on Febr uary 1.5, 19.58 , This was an
increase of three pe rcent (7 point s ) when compare d Nith the January Index of 262
put slightly below the Februa:::'y 19.57 Index of 27lo
. t :. = . :. .
The Livestock and Livestock Products component of the Inde x f or the month ended : ,
February 1.5, 19.58 was two p ercent (4 n oi nt s) higher than the January l.S Index. of .
226 and up 13 percent (27 points) wh~n compared with the F(:Jbruary 19.57 Index c,r ...
?03. - Moderately higher price s f or hogs, beef cattle and mi lk cows we r e primariJ;y:..-
responsible for the increase. Partially off s et.ting w"ere declines for eggs and
~rholesale milk
'
UNITED ~TA TES: The Index of Prices Received by Farmers increa sed two percent . .C~ ... . ..
points) during the month ended in mid February . PrimariJ.,y resg oiisi~
ble for the increase were substantially hi gher prices f or meat animals, oranges,
snap 'b'e ans, a rid potatoes, Partial ly off setting wer e lower prices f or cotton, egg s,
and milk.
. ..
'rhe Index of Prices Paid for Conmwditie s and ~e rvi ce s, Inter est, Taxe s, and Fqrnc
a Wage B.a~es ro s e a third of l percent durj.ng the month ended February 1.5 to 302 ;
new all-time high. Pric e s pa id f or both living and production goods advanced slightly during the month , primar i l y a~ a result of moderate increases in f ood
prices and further subs t antial increase s in f eeder live stock price s
.
6u~nary Table fo r t he unite d 6tat e s
--Indexes- - : F e'bruary-1~: January IS" "'i'Fe bruary IS: -- -Re cord hig h-- - -
-_ "' !9~P.:l~=~o2 _ _: ___125] __ _: __12.5~ __ _:_ _ ~9_28__ _ :_-_-gi~e!-_-:_-_TI~~~---_-_
Prices Re ceived Parity Index ~/ Parity Ratio
234 ~/ 293
80
247
2.52
31.3
Feb, 19.51
301
302
302
Feb, 19.58
82
83
123 Oct. 1946
I/P;ice~ Paid: Inter e;t: T a~e;,-a;;:d\i~g-;; Rate~ ba~ed ;n--d~t~ f a;: the indicated - -
- datos.
~/ Revised.
,
ARCHIE LANGLEY
Agricultural Statistician In Charge
RAYHOND R. HANCOCK Agricultural t tatistician
. '
.. ..,.
: : -:.-~-~ . .. .~..-
. . .
. .. . .; - .
: . : . ;: . ; . ~: .
.. . .. : :..
(:
. .' . .. . .
~
.. 0
'/' .
' '
__:_ _ _ __.~;RICES BECEIYE.D BY FAFMERS FEBRUARY 15, 1958 WITH -'CoMPARJ"-S"!lo<CNO!.'S!>!______ ~ ~- - --
I
-t Feb ---- c~--0-D-IT.Y-----_-"~ .-<-;~~;ag:-~, Feb:~:::cAl,Jan~;~l Fob 0 15 ~ver~~Ti!~~;rano 1,
15~
0
I - -'--"-AN..,'D LN JT
I 2"513:._ , <-' 1910-.14
19 57_ 19513__ 1958 ' 19 <9-14 1957
19 ~8
I Wheat, Bu.
$
1.23
2.C9l 2. 00 1 2.00 j
. 88
2.07
1.90 ; 1.9
Corn, Bu.
$
I .91
1.30
I I I 1.27 1.38
. 64
1.19
j .93
.95
Oats, Bu.
$
I . 67
.87
.90
.sa j[ .40 I
.73
. 61 !-
. 61
Irish Po t.,Owt. $ Sweet Pot . _,Owt. $
1.13 . 84 1I 5.00
5.00
!I 1.14 1
! 5.25
1.60 I
i.44
4.54
1.76: 5.16 1
2.12 5.42
Cotton, Lb.
Cottonseed , Ton .$
Hay , All (baled )rtn $
Hog s, per Cvrt . $
1 2 .1 23 . 65
7.3 6
I 33.4
II 50.00
I
I I 16 . oo
29.5 31.0 j
I 46.00 49.00
I I
29.20
I
.
11.8o 1 1a.6o
12.4 22 .55
7. 27
I 30.2
I 58 .60
I
22 .50
. 16 .30
27 _.4
24 .9
51.20 1 49.90
19.00 18.70
18.50' 19.70
Beef Cattl e , ~~ . $
I Milk Cows, Head $
I Ch ickens _,All , Lb .
I
Egg s, Doz.
1
Butterfat , Lb .
1
3.96 33 .85 13.3 21.4 25 . 8
.I 12.10
I
i.I 1 05 .00 l 18 .0
1 43 .o
I
1 s1.o
1 6 .20 17.20
5.42
130.00 140.00
48 . 00
19.4 50.0
19 .4 48 . 0
l1.4
n .5
49 . 0 5 C' .O I 26 .3
1_4.90 1 57. 00
18.4 3 ?. . 8 59 . 0
19.70 1 20. 60 I
I 1e5.oo 193.00
19.0 . 19.4
38 .9
_36 . 5
59.6
59.4
Miplke(rw1h0oofltesall/e) . $1i
II 2 . 4 3
5 .90
5 . 00
I 5.90
1.60 .
4 .34
4.42
4 .31
Soybeans, Bu .
$ j
I 2.10
I i 2.1 5 lj
2. ?5
2. ('5
2.05
Peanuts, Lb .
I ! 5 .2
10 .2 10.4
4.8
11.1
9.79
9 . 64
!
I
!
I
Y Pr e liminary f or kbrua'ry ,1958 . Rev ised J a nua ry 1958.
- .- .- - --- ----- ------~---- ---- ---- - - ----- - - --- --- ------------- - -- -- - - - - - - - - -
INDEX NUMBERS OF PRI CES RECEIVED BY FARMERS IN GE ORGU
(January 1910 - Dec ember 1 914 = 1 00)
------- Feb .l5 , Jan .l5 Feb.l5,
- -- ------ -- ----- - - ---- --- - -- -195-7----
1 9 5 8.
1958
-"-----
All Commo ditie s
248
251
257
I '
All Crop s
271
262
269
Grains and Hay
153
153
1 50
Cotton Lint
27 6
243
255
Peanuts Tobacco Cottonseed and Soybeans
208
196
200
383
450
45o
I
209
192
204
Irish Potatoes & Swe etpot a toes Fruits and Nuts
28 1
258
269
179
188
193
I1
All Live stock ahd Live steck P~o duots
203
226
230
L___ ~at Animals
254
~~~:r~~~~~~:_s----------~-~-~-
298
315
162
160
23 6
233
.l,
l
-
KIND OF FEED
Feb . 15 , 1957
Gi'WRGU
J an . 15 , 1958
Feb. 15, 1958
~}xe d Dairy Fee d
All Under 29% Protein 1 6% P-rotein 18% Protein 2<:% Protein 24%Prote in
Hi~h Prot e in Feed s Cottonseed Meal Soybean Meal Meat Scrap
Grain Bv- Products Br ;,.n Middlings Corn Meal
Poul t ry Fe ed
Br o il e r Growing Mash Laying Ma sh Scratch Grains
~ (Baled) JW.f a lfa All other
4 . 05 4 . ('0 4 . 05 4 . 20 4 . 40
3 . 45 3 .80 4 .75
3.45 3 . 65 3 .55
5 . 20 4 .85 4 . 40
52 . 00 39. 00
!/ ~ s _ rep ort e d by yee ~ Dealers.
3 .85 3.75 4 . 05 4 . 00 4 . 30
3.45 3.75
3 .15 3.35 3.40
4 .95 4 .70 4 . 20
50 .00 38.00
3.90 3 .80 4 .10 4 . 00 4 . 30
3.55 3 . 80
3.20 3 . 45 3 . 40
5.00 4 .70 4 . 20
50. 00 40. 00
l!
UNITED STATES
Jj Feb . 15 , ,, 1957
Jan .15 , 1958
Feb . 15, 1958
Ii 3 .88
I
I
i
3 .83
II
I i
3 . 83 4 . 05 4 .14
I 3 .87
i 3.87 4 . 69
'I
" I
!
I
I
3.08 3 .13 3.46
I 4 .96
i 4.51
I 4.11
I . 34 .70
i. 31 . 60
!
3.61 3.56 3.52 3 .80 3.90
3.72 3.68 4 .75
2.66 2.71 3.20
4 .81 4 . 29 3.9 1
31.30 29.10
3.60 3 . 56J 3.51 3 .79 3 . 90
3.76 3.70 4 .95
2.71 2 .'76
3.17
4 .80 4 . 29 3 . 89
31.00 29 . 5 0
Ga.
H D q -~
~~~?-<GIO~<GUA t ~~:lllP((J)IR{lilllN(G JE~VllCCJE.
...
b '58 AGRICUL.TURAL. EXTENSION SER ICE
UNIVERSITY OF GEoRG.IA ANO T C: Ul\0
a.
~
. S
T
A
T
e
;
:o.e
;
P.
'
A
RT
M.
E
N'r
O. F. AGRICU
Ttrlt!!'
Athens, Ge,o;rgi~. ..
..l.:!BRARIES .
u.s. DEPARTMENT oF AGRrcud.uRE; . .AGRICUL.TURAL. MARKETING:SERVICE
319 EXTENSION 1:3L.OG., ATHENS, GA .'
Ivlarch.. 5,~ . i9~8
GEORGIA BROILER cHicK REPORT FOR
cQn1ERcrAL AREAS
During :'bh~ .weelc eQd.ing March l .. .commef.cia:!.';.hatche:r,ies plq.ced 6, 244, ooo dhiks !
l-dth the broiler producers in oe,orgi~ . coninrerc'i,?l areas .. , 'I'~is compares ~ ld.TJ'l the 6;132~:000 placed 'the previous week and is 23 "percent more than the 5,077,:ooo i
.::' . placecl;.the, same week last .,year.
; !I :::..:
: .
. ,
. . ~<
', ; ' ,: '
. .
.
.. -~
Eggs set l~y local hatcheries am.ounted .t9.:. t;:89.6:,ooo .~:ompared with 7,887,,000 the
previous 1week and is 17' percent' more. th~ th.~ ;.9i773;'0oo for ..the correspon'?in~
week last year.
:
.' ~:: :' : ~ . .: -~
. '
/ .
~ ., . .. . . '
:
Hatc!1eri~s reported prices . pa~d .:tbJ:r:hat~hipg :eggs_~ during .the week at Fm .average
of 80 cents per . dozen. Average.. pri'Ge charged:'.'by. natched.,es for the c~icks l-jas
an.d reported at ~~14.00 per hundred. These prices compare with 80 cents and -;:~13, 75
1ast:;"!eek with .5f. c.e?ts and $9~ 75 one year ago. Egg prices sh.otm relat~ to
Georgia produced .ha;t.oh:!J1g. eggs wh:et~e~ . bougpt on ~op.tract or otherwise.
Weighte~ av~rage . pric~s fro~ the F~~eral-State M~ket News Service fo'~, broilers ,:,
during the :week endii).g March 1 are as fo11ol'rs : North Georgia broilers 2 3/4
3 1/2'' p_ounds, at f~!llS 20 ~49; FOB plants 21.52. .
~. . '
:'
;
.
{ ~::
' 'J
..
.'"
.
.
(See reverse side for other st.ates)
GEORGL'l, CHICK PlACEMENT BY \rJEEKS ~ERIOD DECE.tJlBER 28. TIIROUGH I~RCH-: 1; 1958
. ...
Date .. .
.Eggs
Chicks Hatehed "};,/ Inshipments
,Tottl P:tac.ed{.:
Heek :~
.. set. . . . Pl~aqeq in .Georgia
of Chicks
ou -tt'arms
En.qing,.. .:1956-57: 1957-58 195~5 7.:1957-58
1956-57: 1957-58 1950-57:1957-58
' J
'
;
.. .. ,,.
. "
,'.....
"
Thousands
., ..
D~~-. ~8 "
Jan. : t,
6~255 : . 6,573 . 6,162 -7' 047
Th ousan' ds 3,J8'7 4,670 3,986 4,878
Thousands
313 502 429 603
Thousands ....
3,.700 ; 'djl1~"
. 4,415 ; ~,46i'
JJaann:.
11 18'
-
..
6,386 6,455
7,229 7, 325
Jan. 25 ! . 6,595 7, 796
4,281 4,830 4,31+8 4,802
482 484
689 722
:s 4,-763 ; .~$,5i9.'
4,832 ; ,524
. 4,640 5,215
. 520
826
5,160; ~:6,04i
F:Sb. 1 . 6, 636 7,893
. 4,646 5,420
523 722 5;169: 6,142
Reb, 8
6,605 8,020
4,647 5,460
544 705 5,191 6,165
~fjb ;~~5
6,596 8,006
4,668 5,468
487
640
5,155 6,~68
ep ..~2 ; '6.,587 .' 7,887 t, ..
,4,656 5,479
481 65) - 5,J37 6 1)2
> - - - 425 ' - Har~,~2..,,:.
1
:_:
...
~/ E~clusiv~
,. . ( .
:. ,.
6, 773. 7, ,896 '
of hatchings
. '
. . 4,-652 ' 5' 5J.6
---'-
-
shipped into states
.' 708
. 5,077
.
6,44
. .
-~
: . , ..
'
-------~--~__;,__
~ .
. .-. .
outside of Georgia~
! ::
./'".
~;..
..
.. ., ARGI-lT:ITJ!."J ' L. A'N:"l't'LEY
w. A. viAGNER .
~Agn!cu1p~~i- s :,ati.sticia!f In Ch~rg~
.Agricu1t~;:p.:. st~tisti~tan
( '
'
~ : ... !
~ .
: ... .t ....
;f .. ; ..
..; ,'.
.'",
'
.
.;
! ~
' ;I . ,
;....
. / ' .
':
1'::
.. . .:"' :: ...:. .: .. ~
o :r
: ' .;" ......l
.: .. ,. ....
... .... -. ~ .... .. i
._.
:
.' .
':
i..
,, '
'.~
._. . .
i' ..
.: .~. '. \
~ . ! 1. , : , .
.
. . ; l, ~ .~
..
. . ' .
.
. . . f '
.\-
. .!
.: ~: : ~-~
EGGS SET AND CHICKS PLACED IN COMMERCIAL AREAS BY ~VEEKS - 1957...58
- ,.
Week Ending
'
. . ~.
...
'
>
Page 2
. STATE
I I Feb.
Feb. Mar.
15 I 22
1
EGGS SET - THOUSANDS
Dec. Jan. Jan Jan. Jan. Feb. Feb. Feb. Feb. Mar.
28
4
11
18
25
1
8
15
22
1
I
' CHICKS PLACED - THOUSANDS
..
IVlaine Connecticut Pennsylvania Indiana Illinois Missouri Delaware Maryland Virginia West Virginia North Carolina South Carolina GEORGIA
Florida Alabama Mississippi Arkansas Lousiana Texas Washington Oregon California
1,463 1,115 1,492 2,071
369 1,826 2,420
2,309 2,039
348 3,096
506
8~006
419
3,005
2,171 3,636
1.t47 3,026
405
374 1!21:!2
TOTAL 1957-58
41,792
TOTAL 1956-57
35,919
1957-58 ~ 1956-5'.i 116
1,536 1,430
. .
976
931-- . - 98~
1,066 i,035
629 :585' 529
1,463 :,1,572 1,913 1,913
. 694 9i5
: 701 830
..
680 . ;841
364
319
95 135 ' 133
1, 751 . ' ~' 793 . ..
--
529 . ~ ..
. 616 . ' '581
2,323 , ,2,302
..1,675 1, 782 . 2,.033
2,309 2,004
314
'': .-.12,'
. ,
93.3o.81o34.'.'::.-. .......
"
.
. 1,648 . .. .1,018
417
2,985 .506
.. ...;..
2. ' 49.72. 33' ' -' .
1..2,024
- .. 358
7~887
:419
.. 7.896
..
: 441
-
.. - .~!172 176
.1; 649 .. - 1,:527
'1~081 : 1,079
. 45.0 - ': \ '513
:2:223. . ~:: ~,248
..
--2~:!J!J819. ''
; 390
~~212
i 200 - ~:~: ~ 258
2;845 ' . :2,131
2;064 ::.. '1, 885
2,282 - 2j.J35:
1,153 1~429
12,'3221.94
3, 624 '443
2,928
4di
:392
122.13
3,455 .
451 :.
.2,874
.. . .
;
408
}Jj
iJ431
-. ..
. . . - .-
.... . ...
. 2;179
2.15
1,769
244 134
: 18~
. 2~3-39 - ~ ;284
:-.l
j
964 212
t
. :1)7
, 916
..
2,376
' J74
~,030
247 127 926
40,770 _40,322
25,147 26,625 26,936
.. .
36,:_437 36,794
17,991 23;437 24,435
113
110
..
I,
140
114' : 110
960 1,048 _955
462
545
543
705 673 :731
866 885 . 853
126 .
145 -~~.
"
..
148
. 624 610 :: . . 647
1,879 . ' 1, 775 ..1,919
+, J,486 : 1,579 ' : 1;642
1,12e . . 229 :.1 ;-.216
494 -
539
. ..5,6 .~
2,202 ;' .2,413 .- .' 2,265
326 .. 361 . - . 327
2s22k .. 6sohl . ' 6:~ ll,i2
226 ' 22l . . 195 2,32-7 . 2',344 . : 2 ;~4.0
1,255 -~ 1,410 .' .'l t477
2,498 . 2, 699 2;:560
- 347 . 372 . -. . 381 2,020 ~. 2,18.8 . .2:;256
258 29.7 . . ... 249
156 . . . 128 ' 15.3
875 : .. 9~7 .. 93l
26,744 2-8,449. . 28 , _746
..
. .
24,654 25,800 . 26,264
..
loB . 110
109
.
1.,013 1,018
. 573
596
.. 232 .. 812
961 992
528 531 867 784
847
780
957 964
' l-50
153
. . 683 . ..592
125 136 669 716
1,926 1,921 . 1,928 1,941
l,567 '..1,73'5 1, 733 1,751
1,242 :J.,27l
. 525 .~ "531
1,277 1,191 492 5.18
2,327 302
6,16~
2,J27 . 2,420
. ::340 ..6.1Q8
;' .6,133423
2,497 297
6~2uh
.. 215 -- -240
~,4'65 2j 366 1,461 . ' .:;1.,:630 2,687 .:2, 766
' ' :
229
2'41
:' 2,397 2,73t
1,751 . 2,897
-
12'563788.
. : 3-Bo . .
2,~29
429 : 508
2,lli.p ; ' 2,355
.. ' 484 2,340
:.. 274
323 : 288
297
154
158 ' . 170
163
- . 927 .. 1z071 1z022 12007
.,
..
29,044 2?;307 30,049 30,041
..
26,424 ~5,704 25,605 25,589
110 . . 114 ... . ,
117 117 ---
~()1)1 (GfE(Q)~GllA C~(Q)
~
AGRICULTURAL EXTENSION SERVICE UNIVERSITY OF GEORGIA AND THE
STATE DEPARTMENT OF AGRICULTURE
Athens, Georgia
U . S. DEPARTMENT OF 1-.GRICUI..TURE AGR ICUl-TURAL MARKETING SERVICE 319 EXTENSION BLDG., ATH EI~S. G.~.
March 12, 1958
VEGETABLES FOR FRES"!-I H.ARKET
UNI TED STATT-~S : Production of winter vegetable crops for the 1958 season is esti- mated to be 15 percent less than in 1957 and 17 percent below
average, the Crop Reporting Board announced today. Unfavorable weather in Florida
from earlyDecember through the third week of February was responsible for most of
the reduction. The l ar ge st reductions in production compared with last year are indicated for tomatoes, sweet corn, snap beans, c arrots, green peppers, cauliflower
and cucumbers. Small declines are reported for eggplant, lettuce, escarole, kale, broccoli and Brussels sprouts. The only winter crops for which increased production i~ indicated Rre cabbHge , celery, be ets and artichokes . Of the e c.rly spring crops for vJhich forecasts have been made, significant increases over last year sre indi- . c~ted for lettuce, cauliflower, onions and broccoli. barly spring tomato acreage i~ . about a third oyer last year but only sllghtly above ave r age. Reports of growers
intentions point to an increase of 2 percent in late surrm1er onion acreage and ari
incre Dse of ll percent in early summer >mtermelon acre Rge.
In Florida, . the unprecedented unfavorable weather, which started in early December, continued through the third we e k of February. Freezing temperatures, exces sive rains and other f actors took their toll of winter crops, reducing shipments of win-
te-r vegetable:;; through February to about 40 percent of a year earlier. Planting
and growth ~f spring crops have been delayed, and Florida's early April production will be much lighter than normal. Rains have considerably delayed and hindered _)+anting and harvesting of Texa s crops. ~ub-freezing temperatures moved into the Lower Valley in mid-February, but wet fields and cloud cover minimized losses, ~ome r epl anting in the Hest end of the Valley w2.s neces sary. The Far \Jest has enjoyed above normal temperature s which advanced crops beyond a normal stage of development. In Calif ornia , intern1ittent rains during February in areas outside the De~~rt hampered harvest and made planting of spring cr ops linpossible during much of t he month . liost of the country's vegetable producing are a s entered Narch with am-
ple soil moisture for planting of spring crop s .
CABBAGE : The preliminary e sti.:nat e of cabbage acreage in the early spring producing
Sta-tes is pl a ced at 16, BOO c cre s. This acreage is only slightly beiow -
last , year but is .l6 perce nt below average. Acreage decreases in Aiabama, HississippJ and Louisiana more t hem offset . incre a ses in Georgia and California. vJeather was gen!3rally unf<:> vorable for cabbage in all early spring States except Celifornia, In South Cnrolina the crop is in poor condition and behind the normal stage of develop-
mef!.t. H?-rvest i n Georgia will be 2 to J weeks late with below average yields a.nd
qqal;i.ty expected . ln Alabama low tempe ratures caused cons i derable damage. Resetting was necessary in Lississippi where cold, wet weather killed plants. Cold Wflt >veather also de.maged the crop in Louisiana. In California the crop is ma king good proEr e ss. Very little . sp ring cabbage will be available in l'larch this year. Harvest .vdll begin in April in . most States.
OtiiONb : Texas ' early spring onion crop is forec a st at 2, 800,000 cwt., h. percent morE
than_l a st year's producti on and 27 percent above average . Yields this year give promise of appro a ching the record of 110 hundredi-Jei ght harvested in 1951 when drought limited production l ar gely to irrigated acreage . Plants have failed to .nake normal progress to date and ha rvest in 2.11 areas will start later than usual this year. Cool weather c>.nd dusting hnve checked the spread of blight. In spite of adverse grm.ring conditi ons, a good crop is possible in Texas if .Narch weather is favorable . There are a number of fi elds in Lower VBlley that should have been harbestcd in late February but this ope ra tion was prevented by rains. Some loss of
spoiled onions in these fie l ds is e xpected. Hhile a few .i.'ields have been pulled, no onions were expected to be mov~d before the ~)econd week of Harch. Most young onions in Lower Valley are in better condition. Fields flooded during heavy rains
January 4-5 are recoverlnf:' surprisin, l y well. He avy movement from LovJer Valley and
!tnymondville should start in mid- Narch, weather permitting . Active harvest will continue until l a te April. The Coa stal Bend crop is late and e e.rliest fields there w~ll no t be re ady until ar ound A1:ril 1. Movement will be a ctive during April and if the late planted f i el ds make, onions will move from there until early May. Acreage ((loss in Co ~ st al Bend -vms due to flooding in early J anuary . Early acreage at Laredo
(over)
has be en retaided by cold weatner and young fields on low ground show eff~cts of toe
much mcisture. Laredo will have very few onions before April 10. No onions are
expe cted from the Winter Garden in 1-'iarch. Crops there are in good condition but an: two weeks behind normal in development. Harvest will b e active in April.
The prospective 57,170 acte s of late summer onions indicated for herve st inl958 is only 2 percent above l a st year's ha~ve stea-acrea ge and is 6 percent be low average. _
This e stimate is based on r eports from growers con cerning intentions to plant. 0mal
er a cre ag.c: s than l a st y ear are iri prospe ct for Illinois, Michigan , ifhsconsin;
Jv~innes ota and Kansa s . The s e r e ductions may b e more. than offset b~r incre as(; S in New Yo:::-k, I ndiana, Colore.do, Uta h; Nevada, _Hashington, Eastern Oregon, and Cnl:..fornia. In California , the only State HhE. r e any a croage h::> s b e en s ee de d, wet wc <J.thor during February del ayed pl anting.
TONATOES : Tomato acrc ago in the early ,spring States _is e stima t e d at 57,560 qcro s 32 perc ent ab ove t hat har vt stc. d l as L year and about th~> s a me acreage as tho
ave rage for t his group . Large r acr ~ag e s are oxp octc d in both Florida a nd Tex~s, _ but C~lif ornia _' s spring a crc.: <: ge is ' e stimate d to be small&r t han a year ago. Up to Feb-
ruary 25, gr owll rs in Florida had a difficult time in g etting the spring crop startGd,
e sp6 cially in the: l!anat cc ~Ruskin _c,nd Ft. ~i L: rce areas . Tno warme r weathe r r e ce ntly ha s b (,;~:- n goncr al ly bene fic i al, pnrtl.culerly in South Florida . In Tt:: xas; prog:r:o ss of tho spring crop he.s b een sl ow . RE..planting' of some a creage has been ne ce ssary 'b e cause of the unfavorable woathcr in Januar y and February. I n the Impe: ri al Valle y of Ca lifornia , uarl y h arve st cont inuu s ori a_:limited scal e . In the Coachella V-"'lley , thE. crop is more advanced t han normal, and harve sting _, should st2rt the latter p art of lVIarch.
WATERMELONS : Tho . acreage of Garly summe r wat ermelons f.or harve st in 1958 is e xpe ctoc . to: e xcGed t ho a cr . age haryo ste ci l a st y ear by alino st 11 percent . Tho
pr ospe ctive . 335 ,500 a cr' s ccmpc:ros vlith 303,500. D. crc s in 1957 an'd is 16 percent grea t S I' t han tho 1949- 56 avur c.gl; . .h l ar ge r a creage t han l a st year is i ndica t e d -f~r al l
c::1rly summer StatL.s exc ep t Oklr,homa ~ . Rel ativel y high price s r ucoivGd f or watermelon:: l as t y r:;ar ar u primarily r e sponsiblG for curr ent gro-vwr intErest in wate;r rimlons. ~vailability of l and t aken ou~ of othe r crops is an othe r factor . Only Tuxa s and '\rizona hav e see de d a signi f ica nt acrc2.go to date . In Tuxa s, conditions h ave been very unfavorable f or plant development and planting . E~ rly a crc0gu in Lo~er Valley that survive d the mi d- Febru "r y fr ee ze ha s made little progr e ss. R<'-ins del aye d r e Jlanting of l ost a cre age . Oth~ r South Tuxas ~rea s, .which n ormc:1lly plant in Febru ary, :::ould !10t sta rt s eeding unt il Gar l y :tviGrch . Fit;l d work in cuntr nl c.nd c ast Texa s hc:S JL E. n del ayed by r a in . Thos e s uctions still have time to got melons in on sche dule . Jopdi tions in Arizon r., hav.:; be t..n fnvorabl o for oarl y wat er melons and opor~tions thor o' 1n on scbc dulc . In all Southern St ate s t he r e is ampl e moisture for planting. Plant ~ng i s just bcg;i_nning in : thc early summer ~t ate s and, if Nar ch we ather is f avorable , ~his opur a tion . can b e compl e t e d Ot:l schu<;iule .
[n Florida , the spring watermel on crop is l ater t hun usual. E~ rly fi e:lds in South ' lorida a r c not much mar L. adv nnc<.; d t han t hose Jn cont r ['l Fl orida . Tho most advanced .'it::.:lds in South Florida e.ru jus t f orming truc. -l <:;: ['.ve s . 'l'hc ma j ority of tho acre age >hur ' and in central Florida is just emer ging . This s i tuatj_on suggests a late start >f the harvcl st s t-ason an d huavy production occurring almost simultane ously in the s e >wo ar uas .
,.
- 3-
AGREAGE AND INDICATED PRODUCTION REPORTED TO :!JATE, 1958 WITH CO~!PA.RI SON~
:
ACREAGE
YIELD f ER ACRE
PRODUCTION
I I CROP ATID
i i
I
--------~.---~~------+-------~~ -----.~---+-----~!~--~!------
STATE Average!
Ind.
Av .
:::nd. Avor agcl
! Ind.
1 1949-561 1957 1958 49-561195711953 1949- 511957 1! 1958
- Acres -
- Cwt. -
I CABBJ,GE : "};_/
Wintc.: r :
Florida Texas
I
16, 880 20,620
Arizona
I
l
1,050
California Group Total
l
l
I I
3, 5 80 42,120
I
Early Spring : l
South C arolin~ 2,050
Gcorgia ,South I 5,490
J...l abama
I 1,100
13,900 11,500 1,300
3, 900
30, 600
15, 500 16 ,500 1,000
4,100
37 ,100
2,400 2, 400
4,200 4, 300
900
800
202 160 130 112 120 110 236 145 200 208 255 300
160 155 142
134 : so
112 110 108 105
! l-hssissippi
Louisiana
4, 500 4,040
3,200 2, 900 3, 300 3, 000
100 150 91 90
CGarloiufpcrnTioatal
2, 800 3,200 3,400 216 225
~~~--~~--~~------------
20,050 17,200 16, 800 123 144
- 1,000 cHt. -
3,421 2,322
249 741
6,7 33
2,224 1,380
188 994
4,786
2,015 1, 8.15
200 1,230
5 , 260
270 617 119 443 375 624
2,447
43 2 462
94 480 Apr. 10 297 720
2,485
LETTUCE: \:intor:
Florida
Tuxas Arizona , Yuma Calif ornia Group Total
3,310 11,880 14,120
3Lf,o4o
63, 350
3,700 11,400 10, 800 41,000
66 , 900
3,500 10,000
9,700 L.l,OOO
64 , 200
11 ') -'-'-
105 70
372
388
245
96 98 60 1,116 1,117 600
140 140 1.50 1,970 1,512 1, 1~55
150 140 155 5, 096 5, 740 6,355
1 36 131 135 8, 555 8,757 8, 655
~arly Spring:
North Caroli..TJ.a'.l 1,600
I South Carolina. , 1,160
G<: orgia _
600
New Ne xico ~/ 1
250
Arizona ,S . R. V 1 13,550
Cc.lifornia 1 30,080
I Group Toto.l 47 ,020
1, 800 . 850
350 650 19,500 25,000
48 ,150
1,100 600 300
2,100 28, 500 18, 000
50,600
73
75 75 117 135
82
61
56 30
70
48
18
84 85 80 51 30 24
140 140 140 35 91 294
147 155 150 1, 980 3,022 4,275
117 l<_,_~. 125 3,480 3,375 2,250
122 139 137 5,703 6,701 6,943
I
vJATtRf1ELO.f\TS:
Late Spring :
86 , 360 103,200 102,000
85
72
7,450 7,403 May 9
Early Summer: 3f
North Carolina ! 11, 050 12, 000 15,000
49 55
541 660
South C p~olina . 41, 750 43,000 47 , 000
56 43
2,316 1, 849
Georgia
1' 53,250 60 ,000 64 ,000
78 75
4, 151 4,500
H a b nma
17, 260 :1. 9,000 21,000
~hssissippi j 10, 800 13, 000 15,000
91 92 70 72
1,561 1,748 755 936
krk:m sc.s Loui s i ana
1 10,160 12, 000 13,000
I 4, 460 4, 200 4, 500
85 85 77 80
860 1,020 Juno 10 342 3.36
Oklahoma
I' 14, 960 11,000 ll,OOO
63 77
961 847
'l'exas
108 , 880 112 , 000 126,000
47 42
5, 145 4, 704
Arizona
! 5,090 5, 800 6,500 142 175
724 1,015
00 7 7 7 California j 10~,4~8~0~~11~,~5~'0~0~1~2 ,~5~0~0-----135?____16,5____~ nl~~4~l~l~l_,8~9~8~, -------
Group Total 1288,140 303, 500 335,500
65
764
l 8,76R 19,513
I
1/ Include s processing
.~1 Short-time average. . 11 1958 acreage prospe ctive .
ARCHIE U.NGLEY ,griculturnl Statistician I n Charge
r
l
L. F.. HARRI S, Jr. Vcget ablo Crop E stL~ator
tr')M ' (,!2._, AGRICULTURAL EXTENSION SERVICE
U.S. DEPARTMENT OF AGRICULTURE
UNIVERSITY OF GEORGIA AND THE STATE DEPARTMENT OF AGRICULTURE
AGRICULTURAL MARKETIN
319 EXTENSION BLDG., AT E1NS I'GK; OF GEO lA
Athens, ~~oz:gia-
=
.
Harch 12, 1958 :
.
.
MAR . I. '58
BROILER CHICK REPORT FOR GEORGIA COMHERCJJ1L ARF~
. During the week .ending l'1arch 8 coll)Illercial hatcheries placed 6, 307,000 c s
With the br9iler producers in <;}eongia commercial areas. This canpares with ' th~. 6,21.~4,000 placed the previous week and is 17 percent more thart the
5,390,000 placed the same week last year,
_Eggs set by local hatcheries amounted to 8:,003,000 compared with 8,291,000 t.he previous week and is 13 percent more than the 7,081,000 fpr the corresp~d~ng week last year
Hatcheries reported prices paid for hatching eggs during the week at an
average of 80 cents per dozen. .Average Price charged by hatcl;leries for the .
chick~ was reported at (pl4. po per hundred, These prices compare ~rl.th 80
cents .an\] $14, 00 last week and with 53 cents and 1;;9. 75 one year ago. Egg
prices shown relate to Georgia pr..oduced hatching eggs whether bought on
contract or otherwise.
.
.
Y.Jeighted average prices from the Federal-State Harket News .Service for
broilers during the t-Ieek ending March 8 are as follows: North Georgia broilers 2 3/4 ~. 3 1/2 pounds, at ;farms 21~03; FOB plants. 22~00,
(See reverse side for other states)
Please ~ -Beginning this w~ek and continuing throughout the , year, the estimate of egg-s set 't1ill include ~gga set by hatcheries
that are producing chicks for broiler hatchery supply flocks, The 1957 estimates for eggs set have been revised on this basis so that the data for the two years are fully comparable.
GEORGIA CHICK PI.ACEMENT BY lJEEKS
PERIOD JANUARY 4 THROUGH MARCH 8, .1958
Date Week
----~r:
~
-1;5;-
_E~5!E1
~~a-~~--
-5~-
-C~IQ~5~C~~95B--
-c
Ending
.% ,f
19 7
19
% of
19
I
257
Thousands Percent
Thousands
Percent
...
Jan~ :4
Jan.: '11 Jan, 18 Jan. 25 Feb. 1
Feb. 8 Feb, 15 Feb. 22 Mar, 1 Mar. 8
6,340
7,361
116.
4,415 . . 5,481
.124
6,574
7,599
116
4,763 5,519
116
6,643
7,859
118
4,832 5,524
114
. 6, 898
8,199
119
5,160 6,041
117
7,101
8,278
117
5, 169
6,142
119
7,234
8,433
117
5,191 6,165
119
7,174
8,411
117
5,240 6,108
117
. ,'
6,941
8,302
120
5,319
6,132
115
7,217
8,291
115
5,350 6,244
117
7,081
8,003
113
5,390 6,307
117
--------- . '
/ .Includes eggs set by--h-at-c-h-er-ie-s~-p-ro-d-u-c-in~g--c-h-ic-k-s--fo-r--h-a-tc-h-e-r~y-s-u-p-p-l-y-f-l-o-ck~..
. ARCHIE LA}JGLEY Agricultural Statistician In Charge
lrJ. A. 'lrlAGNER Agricultural Sta~istician
EGGS SET AND CHICKS PLACED IN COMMERCIAL AREAS, BY vJEEKS - 1957 - 1958 ~veek Ending
Page 2
STATE
Feb,
iVIar,
r,far.
22
1
8
.. Jan.,
4
Jan. 11
Jan. 18
Jan.
=2_5 .
Feb. . .. ~ Feb.
1
8
Feb. Feb .
15 .
~t2
J1ar,
,: 1
Mar. 8
----------~------~----~----~------~-----~------~' ------~----' ~------~~~~ ~----~------- ~-------~
EGGS SET .. THOUSANDS
II
CHICKS PLACED - THOUSANDS
--------------------~-----------------------------~-----------------------------~---------------~------~~-----~-------.- -----
Maine
1,536 1;430 1,421
937
982
960 1,048
955: 1,013 . . 1,018 961 . 992
999
Connecticut
1,066 1,03.5 1,071
585
529
462
545
54j
573
596 528 . 5Ji
583
Pennsylvania
1,463 1,572 1,453
701 c 680 . 705
673
731 . -_ 932
812 867
784. _.885
Indiana
1, 913 1, 913 1, 905
830
841
866
885
853
8L11
780 957 - 964
993 . ..
Illinois
364
319
352
i35
133
129
145
148
150 . 1.53 125 136 . 179
lviissouri Delaware
1, 751 2,323
1, 793 1,915 2,302 2,294 :
I 616 1,782
581
624
610
647
683 592 669 : 716 .620
2,033 . 1,879 1,775 1,979 1,926 1~921 . 1,9~8 1,941. , 1;986
'
Maryland
2,309 2,360 ':. : 2,356
1,649 1,527 1,486 1,579 1,642 -'J-,567 1:, 735 ~ - 1, 733 - 1, 75i 1,:616
. "'
Virginia
2,004 1,984 - : 1,,993
1,081 1,0-79 .J,,l28 1,229 1,_216 1,242 1,211 : 1,217 ' 1-,191 1,204
...,~ . -
1rJest Virginia North Carolina
314 3,103
313
300
3,044 : 3,030
.. -450 2,339
. 51.3 - . 494 539
556 .. 525
531 492 .. . $18 . 466
2,334 -. :2,276 2,503 2,345. 2,415 2,423 . 2,495 2_,570 2.,651
'.. .....'
South Carolina
506
473
470 .
339
. 390
.326
361
327
302
340 343- ' ~97 _ : 323
=GE=O=-R_GIA__r _ _ _ _ _.._~-~-~8.=3.0.;..2.____Q~91~8.00;.:::;3..:.. --..:..--+'-_..::;..5. 4~~----5_ ,~!.:9.-_ _5.....~,..5.?.__~____~~41;;._. ___;;6~.,1~4..2:;.-........-.:....6:..::1;.:.65::;._..__._:6;...,z.::.10:...:8-;...---::6;..z..:,:l;:j~2-~-..:;..6z.::.-24=4=-- __;Q:o.z.~30~7
Florida
419
441
. Ll47 :
200
258
226 . 221 : 195 ; 215
240
2~9 :. -~. 44l .- ;- 259 ;-
Alabama
2, 845 2j 731 2>864
2,335 :2,214 . .2,327 2,344 2,540 2,465 2,444 2,397 2, 731.. - 2,509
Mississippi Arkansas
2,064 3,624
1,88.5 3,4.5.5
1,973 3,497
1; 429 2,339
1,329 2,376
1,255 1,410 l,h77 1,461 1,630 1, 751' 1,538 - 1,644 2,498 2,699 . 2,560 , 2,687 - .. 2, 766 2.,897 2,qJ8 2,_715 _
. ' ..
Louisiana
443 451
421
.284 374
347
372
381
380 . 429 508
484
471 ,
Texa:s
2,928 2,874 2_,824
1,964 2,030 2,020 2,188 2,256 2,229 2,140 .- 2,355 2,340 2,431 -
1-Jashington
401
408
416.
212
247
258
297
249
274
323 288
297
327
Oregon
392
333 ; 369
137
127
156
128 153
154
158 170.- 163
195
-Cal-ifo-rn-ia- - - --1.!...-----:1.,_233___1_:,_4._31 ,._ +,.,360 . .. .:.
9+6
926 . _ 875
947
931 . 927 -l ; .J7,1 _1,_0_2_2____J,:.,.:o._o_r __9_57_ _
..
TOTAL 1958 t6iAL 1957
I
41,303 40,838 _ 40~ 734
37,432 3?,861 37,896
26,741 24~513
27,022 24,750
26,821 28,539 . 28,826 . 29,132 29,481 30,124 30,114 . 30,320 ' . 24,942 - 26,107 26, 701: 26,799 26,281 26,378 26, 307 26,815-
1958 %of 1957
110 .~... 108 - ::1()7: .. . . ' :. . lb9 : 109
108
109
108
109
ll2 114
114
113 .; '
-----------~~--------~- / ~----~~~--------------------------------~---~--~- - ~- ~-~---~~~ - : ~~~
~
\..-. .
~
- ,' I
--
AGR!CULTURAL EXTENSION SERVICE . UNIVERSITY OF G_EORGIA ANP THE ..: . STATE DEP/\~"n.-IENT OF AGRICULT.fRE
Athens, Georgia
U ..S. DEPARTMENT OF AGRICULTURE , AGRICULTURAL MARKETING SERVICE 319 ID'.TENsiON BLDG., ATHENS, GA.
March 19, 195.8
BROILER CHICK REPORT FOR GEORGJ.A COMMERCIAL AREAS
'D'.lrl.ng the t-Jeek ending lViarch 15 commercial hatcheries placed 6,015,000 chicks
l-lith .the broiler producers in Georgia commercial areas . This compares with
the 6,307,000".placed the previous \'leek and is 12 pe'r cent 'more thnn t.he
5,394,000 placed the same week last year.
Eggs set by local hatcheries amounted to 8,474,000 co' mpared with 8,003,000 the
previous t'leek and is ?1 per cent more . than the 6, 997,000 for the corresponding
week last year.
. . ' ..
' I
'
Hatcheries reported pric es paid for hatching eggs during the week at an average of 61 cents per dozen. Average price charged by hatcheries for the chicks was reported at. ~?14. 25 per hundrGd. These prices compare with 80 cents and :;~14. 00. last Heek and: with 5'3 cer.ts. and :~9. 75 one year ago~ . Egg prices shown relate to Geor~ia produced hatcl:.ing eggs whether bought on contract or othert.v.i.se.
Weighted average prices from the Federal - State Harket News Service far broilers during the week ending March 15 are as follovrs: North Georgia broiler~ 2 3/4 -
3 1/;2. . pound.s , . at farms 21.03 ; FOB plants 22.00.
{See reverse s.ide :.:for other. .s. tates) .
..
GEORGIA .CHICK PLACciJENT BY WEEKS
, :
PERIOD JANUARY 11, 1958 THROUGH 1"1ARCH 15, 1958
"I
-D-at...:;e.-...,...-------EG--GS--SE-T-_-1/-...;..._-.-lf
CHICKS PLACED
~leek
Ending
---------..:.--._.,.--------..,;-----.:..;' -----~..,.....--...;....._;,__
1957
I 1958 II 1958 %of i 1957 '
1957
1958
. 1958 %of
... ' 19. 57 .
Thousands
Percent
Thousands
Percent
Jan. .. ll Jan~ 18 Jan~,; 25
6,574 . 7,599
116
6,643 7, 859 .
.118
. 6,898
8,199
119
Feb. 1
Feb. e
.. 7,101 7,234
.8,278 8,433
117 117
Feb.: 15
' 7,174
8,411
117
feb; ;22
: 6,941
8,302
120
lIar. 1
7-;217 - 8,291
115
Har.. 8
7,081
8,003
113
Har~ '15
. ~ 6,991
8,474 .
121
4,,763 5,519
4,832 . 5,524
5,160 6,041
5,169 6,142
5,191 . 6,165
5,240 6:,108
5,319 "6~i32
5,350 .6, 2.44
' 5,390
.5,394
.
.
:.66 ',
307 b.l5
1i6 114 117 119 119 117 115 . . 117
" 117 112
1 Includes eggs set by hatcheries produc;ing chicks for hatche~y supply flocks.
ARCHIE !.ANGLEY Agricultural; S:tatistician In Charg.e .
- 1rJ. A. vAGl'JER Agricultura1 8tatistici a!'.
' l ' I'
- .
-l ..
' .
..., ',
-1
EGGS SET AND CHICKS PLACED IN COMMERCIAL AREAS, BY 'VEF.KS - 1957-58
Page 2
--
Week Ending
STATE
I I I I I '
)~-1~ ---:rv-la1r-.--!-
Mar.
--~- -8-
I
I --
Har.
--1-5
-
--
-
-
-
~~Jan.
I 1-1--
-
-
Jan.
--18-
-
-
Jan.
-25-I
T- Feb. I 1
Feb. 8
IF~b. 15
I
Feb. 22
_ _. . .;_ -----~-----------
I:1ar.
1
Nar. 8
Mar. 15
,,
EGGS SET - THOUSANDS
. - _ -,--
.. M1a:lne '
1,430 1,421 1,497
Corinecticut
1,035 1,071 1,124
Penr.sy1vania
1,572 1,453 1,512
Indi ana
. . .I11inois
~- ~: r-~ll-SSOUr1
:I
1,913 319
1, 793
1,905 352
1,915
2,013 364
2,029
l:;lelaware
' ; 2,302 2,294 2,336
:_:vJ'-_1iarryg1iannida
I 2,360 1,984
2,356 2,368 1,993 2,198
-: 1~r.est Virginia North Carolina
' 313 J,044
300
335
3,030 3,140
Sou.th Carolina
473
470
511
- - GEORGIA
Florida
8,291 441
8,003 8,4'14
447
462
Alabama
2, 731 2,864 2,923
l'1i ssissippi
Ar~ansas
LoUisiana w'rea_xsnh.isngtp--.n O.regon <.:.
i
I
1,885 3,455
451
2,874
I 408 333
1,973 3,497
421 2,824
416
369
_2:,053 3,663
1~36
2,987 398 360
Califo.r.nia
I .-.1,431 12 360 11g02
TOTAL i-9.57~.58
I 40,838 40,734 42,.585
TOTAL 1956-57
!
I
37,861
37,896 31,815
1957-58 %of l956-5RI 108 II
107
112
II
i 982
529
680
I I
i
841
133
581
2,033
II
!I
1,527 1,079
513
2,334
390
5,519
I 258 2,214
1,329 2,376
374 2,030
247 127 926
27,022
24,750
109
CHICKS PLACED - THOUSA!'\IDS
960 462 705 866 129 624 1,879 1,486 +,128 . 494 2,276 326 5,524
226 2,327 1,255 2,498
347 2,020
258 156 875
26,821
24,942
108
1H)l}8C 955 545 - '543
673 885 145 610
1, 7?S 1,579 1,229
731
853 148 647 1,979 1,642 1,216
539 556 2,503 2,345
361 327 6,041 6,142
221
2,344 1,410 2,699
372 2,188
195 2,540
1,477 2,560 -
381 2,256
297 249 128 1.53 91.~1 931
28,539 28,826
26,107 26,707
109 108
1,013 1,018
- 513 596 932 812 847 780
150 1.53 683 592 1,926 1,921 1,.567 1, 735 1,242 1,271 525 .531 2,415 2,423 302 340 6,165 - 6,108
215 240
2,46.5 1,461 2,687
380 2,229
?,444 1,630 2,766
429 2,140
274 323 154 158 927 1,071
961
528 867
951 125 669 1,928 1, 733 1,277 492 2,495 343 6,122
229 2,397 1,751 2,897
508 2,355
288 170 1 022
29,132 29,481 30,124
26,799 26,281 26,378
109 112 114
- - - -- --
-------- ---- - --
992
531 784 964 136 716 1,941 1,7.51 1,191 518 2,570 297
6!..~~4
241 2, 731 1, 538 2,678
484 2,340
297 163 1 007
999 583 885 993 179 620 1,986 1,616 1,204 466 2,651 323 6, 307
259 2,509 1,644 2,115
471 2,431
327 195
1,003 611 831 905 139 644
1,967 1,540 1,135
460 2,518
393 6,0J.5
203 2,.588 1,537 2,570
392 2,279
324 207
Q_____
30,114
91
26,307
79
114
3
GJEOITRCGllA CCJRiOIP? - ~~1EJP:,(Q!Jl~1U~.~ JEJJ<lV.llCCIE
.o.GRICUL.TURAL Ei(E,;,s~~~ s-~~~;c~ ~ .. ~. .. ;;z:::.: .. ::.~-:~: ~~P~R~MENT oF AGR.JCULTURE
UNIVERSITY OF GEORGiA AND THE
.
.
ST A.TE Ol::PARTME!IbT OF AGRICULTiJRE . :.:' .
, ,
~(7R!CUI.T~.R~L MARKET-ING SERV ICE
.:; 3~9 ~~.iENsi~N Bt..OG., ATHENS, GA.
' ( ~.
. . . :
, :,.
... l1arch= 2o, i958 .
- . .._ ~ ._
PROfPECTFE PLANTINGS FOR 1958 .
The Crop Reporting, Board of the Agricultural M~r~e ting Service :l1J'akes the follow -
inf report fo r the Uni_-~ed 0tates , on the -indic~.ted acrengc s 'of cert ci.in :.crops in
1958 ba sed upon repo:J:~ts fr o!Tl: fa:r.mers in all parts of the country on or c:bout
N~rch. 1 ree;<trdine: ..their P.c:reage plans .forthe 1958 sea son . The acreage s for 1958
are int~rpreta~~ons ot ' r eports from r,rowers and are based on past r el a tionships
between.
such
' .
reports
.
and
acreage s
actuall y
planted.
The purpo se of this r eport is to [I.Ssist grmvers generally in making such f.urther
changes in th~ir a crenge pl<ms a s -mny appe .':lr desirable . 'l'he acrengeD actually planted in 1958 may turn ou t to be .lc r ger or ~maller than i ndicated , by re a son of weather conditions, price changes , l ~bo r supply, financial conditions; _the agri cultural program,. arid the effect of this report itself ' upon fC~rmers 1 ac_t..ions .
., .
' ,.
.
. .
__ -- --~ H-
_.!.... ,.....;,_ ,_ _,
----~-- - - - -
UNITED Jfl'CL ~
- - -----~-.~-~--- -- - - --- - -- -- - - - - -
' i. . j
. . . .
:-- . . . . : . . . - -.-. - - - - - - - --:
CR0 P
. . P LANT t D ACRE AGE 5
1 5 - Av;r~e~--- - ; ~--- - I~dic;t;d- ~l9S8 ;s-p~t
1947 - 56
1958
: of 1957
- - - - - - - - - - - - - - -~ 'fhou~;:.nds - - ,lihousan'ds- - - ~hous ancts - - 'Percent -
I Corn, all ~~
All 5pring 1tJhee.t .... . . . . .. ... Durum ~
Other Spring ..... . ... . .... .
82,874 1 9 , 367
2,546 16 , 821
73,985
12,384
2, 365 10 ,019
75,143 12, 588
1,179 11, 409
101, 6 101.6
49. 9:.
.113. 9
I Oats
B
~
0
rley
-..
,
v
Sor ghu.ms for all purpo s es
h3,976 1 2, )4. t_:-)/o
15, 916
Ld,020 16,"' /C::37
26 ,95'8
39,658 16 , 0_1)4
23, 519
. 92 . 2. . i .70 7. 0
87.2
Potatoes , , , , ,
1,618
l,hl9
Sweetpotatoes , , , 1\
399
Tobacco 1/ .. . .... .,.. ......... 1,634
292 1,123
~oybean s 2/ .... ~ .. . . ..... .. . . . I 15,936 Peanuts 2/..... . ........ . .... I 2, 501
21, 80L1 1, 805
Hny ~;.: o . ~74 ,204
73;776
}TAcreage h-arv~sted-,-fJ 9rm7n . nlone .for all purpo ses .
1,424 294
1, 096 23,985 1 , 7 95 72, 533
.:lOO . J 100 . 7 .. 97 .6 110.0
9 Y . I.~
98 . 3
GEOHGIA
- - --- - - - -- -------------- ---- ----..- - - - - ------- -- - -- - - - -
~ L A ~ T ~ D A t R E A G E S
CR 0 P
. . Average 1947- 56 :
- Xcr~ages- :Y1ct .15e-r:
Planted :Pl ~nted:
195 7
:
. Indicated : l958 as
. 1958
J?e rcent . _
1- --- ;,;c;8- : Thousands : Acre :Thousands
;o~n~ ~u~ ~-.~ .~.~~~ ~ ~ ~~~ J,~46-- ~17.~
-
T -
h-o- u-sa-nd-s-
: -
o-f
1- 9-5f.-
2, 851
10.3
: ..
I Oats, bu. , .... .... .. ... . i
Barley, bu.
771+ . 9
15.0 19 . 4
728 15
604
83
12
80
Irish Pot atoe s, All , cwt . lj ..
7 . 7 ltS, R
5. 2
4 . 6 8:3
L.vreetpot at oe s, Cvlt . 1/ , :; , j
36
L;l. 6
15
14
93
Tobacco, All, lbs 2/. .. . ..
100 . 2 1237
64. 1
64
100
All tor ghums :. . . ....
52
72
68
9 L~
Soybe ans, l~ l one , , , 3/ ,
82
122
1 22
100
Peanuts, (Grown Alone)Jj .,....
828
610
610
l CO
J.ll Hay, Tons .~j .. ..: ..... . .
1,049
. 68
571
564
99
I
--- - - - - - - ---- ---------'--- - - -- - -- ----- - ---- - -- -------
-~./ :!.947 - 56 i.verage .
2/ /;creage Harvested ,
-
'3/ Gr own alone for c.ll
- purpo ses . ~artly dup -
lica t e d in hay ~ creage .
CAR.L 0 . DOESCHER Agr icul"'",ur e: l Statisticiar..
J;RCHII!; LANGLEY A ricultural Statistician Irr Ch~ rge
PROSPECTIVE PLANTING REPORT FOR GEORGIA .AND UNITED STATES
GEORGIA: According to March 1, 1958 reported intentions, Georgia farmers plan to
.
plant about one percent smaller total crop acreage .this year (excluding
cotton) than they planted in 1957. Corn is the only crop to show more acreage
than last year; an increase of 3 percent is illdicated. Tobacco, soybeans, and
peanuts acreages are unchanged.
UNITED STATES: Crop plantings for the Nation's 1958 harvests now seem likely to
edge slightly below last year's low level and dip to the smallest
total acreage in over 40 years. Feed grain acreage will be significantly smaller than in 1957 with less sorghums, oats, and barley but more corn. Food grain
acreage will exceed last year's total with the .winter whe at acreage increase al-
ready in evidence augmented by smaller gains in spring whe at and rice. Soybeans
acreage again will be sharply increased.
The March prospective total for 1958 crops planted or grown now looks like about 333 million acres or less than one million acre s under the 1957 low levelo . This
would be the smallest national crop planting total in compar able available records
feaching back to 1917. To arrive at a total probable acreage for this year other
crops not included in the March Intentions group must be considered. Allowance was
~ade for the planted acreage of winter wheat as estimated last December 1. The ~creage level for cotton was tentatively approximated by the allotted acreage less
the probable reduction for the 1958 Soil Bank program. Allowances also were made
for a number of field, vegetable and seed crops which although important in bal-
qnced production have minor influence on total acreage change.
CORN: The intended planting. of corn in 1958 at 75.1 million acre s is l! percent
above last ye ar but 9 percent below average. The changes from 1957 by geographic area s are only 1 or 2 percent. The national corn allotment of 38.8 million
~cres . is about 4 percent above last year but includes 38 additional countie s in
~he commercial area.
WHEAT: Acreage of all sp ring wheat planted in 1958 will be slightly l a rger than in 1957, if growers carry out their planting intentions as of March l. In-
tentions point to a seeding of 12.6 million acres this year, nearly 2 percent mar~
4han last year but the second smallest acreage of r e cord.
OATS: Seedings made l ast fall and planned for t his spring indicate total plantings
of 39.7 million a cre s of oats for 1958~ This would be 8 peTcent less than
total plantings for 1957, 10 percent under average, and the lowest of any year
since 1940.
.
PEANUTS: Peanut growers will plant 1,795,000 acres of peanuts alone if they ar e
able to carry out their intentions as expre ssed in the survey made about
March 1. This acreage would be only slightly less than the 1,805,000 a cre s planted last year, but 28 percent below the 1947-56 average of 2,501,000 acres. These
acreages include peanuts to be grown alone for hogging off and for other purposes as well as for picking and threshing.
TOBACCO: As of March 1, tob acco producers expressed intentions to plant 1,095, 800
acre s of all t~~e s of toba cco. Should this acreage materialize, it would
be 2.4 percent below the 1,123,000 acres harve sted l a st season and the smalle st
since 1908.
J
Flue-cured typ os are expe cted to total 651,300 acre s-- 2 percent below the 662,700
acre s harvested l ast ye ar and t he lowe st since 1932. Allotments of flue-cur ed at
about 713,000 acre s ar e nearly the same as last seasonJ thus, the decrease in
acreage is attributable almost entirely to Soil Bank ~ ctivity.
J
..
~
.. . ; :.. : .. 1
. ... .
U ~ s ,' o'e:PARTMENT OF AGRICULTURE
'AGNICUI. "'!""URAL MARKETING SERVICE 319 EXTEt."$10N BLDG., AT_HENS, G~.
. ..BRbiLE~ .CHICK :REPORT .FOR .GEO~GIA . COMMERCIAL
March 26, AREAS ' : :
1958
...
During the week ending March 22 commercial hatcheries placed 5,840,000 chicks
with the broiler producers in Georg~a . conunerqiel areas. This compares with the
6,015,000 p1acedthe pre~fous: wee}{,: ~~d: .'l.i{ 2per6ent mo:t:e than the 5,341,000
pl~ced :the same 'I'Teek last year.
: -.: ' '..
Eggs set by local hatcheries ,amounted to 8,816,000 compared with 8,474,000 the
-previous week Md:.-is 23 percent more .than tqe 7,148,:000 for the corresponding
week last year.
.. , .
:-
: , ; ., I
Hatcheries reported prices paid for hatching eggs during ~the week at an average
.of ..82 cents per do.zen. Average .price charged by hatcheries for the chicks was "'reiiorted .at :~14.25 per hu."ldred . :: 'l'beE~ : priqe:S . cor;lp~e with 81 qents ~nd $14.25
last week and t-."ith 5} cents ~d !.P9. 75 on.~ :.year . ago.' . Egg prices shown. relate to
Georgia produced hat ching eggs whether bought on contract or otherwi$e.
I
i
! I
._
'
: ,
I
'
0
'
' ,
i
'
I
;
Weighted average .p_rices from during tl].e week ending Npxch
th 22
e Federp:l,St~te are as follows:
:tv~.~:NarokretthN Geweso
rSgeirat:bi.rcoe~lfoerrs
br 2
o~i/le4
rs -
3 1/2 poUnds, at farms 20.54; FOB pla'rt::.ls 21.49.
.
. . '
Ba.te . Week Ending
...
...
t
..' -~
(
S
e
re\~,erse
. :.
: .
'Sid~
~. . .
.
.f,'.or .. .
~ther
.
.
state~)
.GEORGIA CHICK PIACEHENT BY WEEKS
PERIGD
JA.T'JUARY
01;-
lt9,
1958
THRQUGH
EL\RCH "_22.1_1~~5- '3--------..~--
\
l . ~---19_5_7__
EGils ~..-. -~-58 ,
SliT1;)1~/~~'~:1'~;~.~-I~:-. --19_5_7~.C-H-1IC-K95S_8P,_L~AC-ED-~' .--. .-1958 :% of
.19$7
Thousands .
.
P- .e~r. ..c~~ :~i
'
Thous~mds
Perdemt
Jan. 18' Jan. 25.. :. Feb; . 1
. 6,..643
. .
...67 ,'
f398 lql
. '
7,859
8~199 >.
..
118 ] ;19 -
8; 2ts :: iJ.,1 "
4,832 .. .. 5;160 '
..5.",.16. 9
5,524 .
6,041 6,142 .
114' 117 119
Feb. 8
7,23'4
8,433 ;.'~ ,' '117
5,191 :. 6,165 .
1;19
Feb,. 15 Feb. 22
7,174 . 6,941
. 8,.4l.l . 8,302
. .. . '111267
5,240 5,319 t
6,108 6,132
117 11.5
:rvlar. :i
7,217
8,291
115
5,350 6,244
117
8 Nar.~ Mar. 15
'7;081 6, 997
. .. .
8:,003 . . 8,'474 .
.. 113 : . .. 1-121
J
-!
..
. 5, 390 ,::. 5,394
.. 6,307 6,015
11.7 112
Har~ 22
. "7,lh8
8,816' ,_~: lGJ. ; . . 5,341
5,840
109
-
!/Includes eggs set by hatcheries producing chicks for hatche!'y supply i'l.pcks.
..: -f . ARCHIE LANG~ . . . :. : . . :: ....
:, .'liT. 'A. WAGNEit-'!:
Agr:icultura1 Stati'stician In Charge
'
AgricultUral Statistician
':: ~ . .
) ,_ '
.:-' .~. :.-~:
. ~
. !
...
.. !
' ; ..
1 .
.. ~
. . .
"'
STATE
.
EGGS SET AND CHICKS PLACED IN COMMERCIAL AREAS 1 BY WEEKS, 195-7 - 1958
Week Ending
Mar.
Mar.
Har .
8
15
22
EGGS SET - - THOUSANDS
"
Jan. 18
-
Jan. 25 :
Feb.
Feb.
Feb.
Feb.
1
8
15
. 22
..
'
CHICKS PLACED - THOUSANDS . ..
Mar.
I .1
Page 2
:
..
- - Na:r.
I I 8
-I
Mar. 15
I
I1ar.
22 -
. .
Maine Connecticut Pennsy1va..'1.ia Iruiiiana Illinois :tv.li.ssouri Delaware Maryland Virginia West Virginia North Carolina South Carolina GEORGIA
Florida A1abarra IVri. s s i s s i p p i Arkansas
~llisia.na
Texas Washington Oregon California
1,421 1,071 1,453 1,905
352 1,915 2,294 2,356 1,993
300 3,030
470 8,003
447 2,864 1,973 3,497
421 2,824
416 369
I 1,360
TOTAL 1957-58
40,734
TOTAL 1956-57
37,896
1957-58 %__o_f 1956-5II7' 107
1,497 1,547 ...
. %0 l,Q48
955
1,124 1,149 " .
- 462
545
543 .
1,512 2,013
.
1 2
,'151828
. . 105
673
731
866
885
853
364 . .. 427 " . :. __ ... ],29-:. . . . 145 -~ - . 148
2,029 - 2;i23' -
624
610
647 .
2,336. ?,391
. ___ ),, 819 :.: .1,.175 1,979
2,368' 2,198:
..- 2,63~ ; 2,180
. .
-. . .:i;486 ' 1,128
:, 1,:579
1~229
1 1
;'26142.6
335:
382
494
539 556 .
3,140 .. 3-,235 .. . .. 2;-216 2,"503 2,345
511 . 8,474
..
533 .. 8:,816. -- ~
. . 326 . 5,5~4
i 361 6,041
~ .327 6,142
1,013 .. 1,018
.961
513 . 596
528
932 847 .
812..
867
786 ,_ -951
150 .. :_ ' 153
125
.683 .. . . 592 .. 669
1,926 . ~: 1:,921 ~ 1,-928
1,;$67 ' 1,.242
: 1,135 . 1,271:
. . 1,73~
1,277
525
'531 ' 492.
2 ~-415
302 .
.-2,432430 -
.. 2,495 343
6,-165 6,108 6,l3Z
.. 462 ' . 2,923 -. _2,053 3,663
.: 514 .
3,152 2,222 3_,685
226
2,327 1,255 2,498
221
2,344 1,410 . 2,69-9
195 2,540 .
1,477 2,56o
215 . .240
2,465 '2,444 1,461 .. 1,630 . 2,687 ... 2,766
229
2,391 1,751 2,897
436 . 2,98'.7
. 39I~ '36o . 1;4o2
-..
42,585:- ~
37,875. . '
..
112
. 438 .. 3-,200 '
393 384 1,506 .
44~ 614''
' -
38; 209
117
.. 347 -2,020
258 156 . . . 875
26,8-21
'
.24,942
108
-
372 2,188
297 ' 128 . 947
28",539
26,107
109
381 2,256
249 153 931
. . 28,826
26,707-
108
380 2,229
274 154 927
29,132
. 429
508
2,'140 . .. 2,355
323 . 288
158
170
1,071 . . 1,022
..
. 29,481 30:,124
26,799 - 26,281 26,378
109
112
114
992 -531 :. 784 964 .13'6 716 1,941 1;751 1,191 . 5J.8
2~ _570
.297 6, '244
241 2, 731 1,538 2,678
.484 2, .340
297 163 1,007
30,114
26,307
114
999 583 885993. 179 620 i,-986
1,~16
1.,24. 6064
2_,651
323 6,301
1,003 611
831 905 139
644 ; 1,967 1,540
1,135 460
2,518 393 .
6,015 .
259 . 2,509
'i,644
. 2, 715.
. . 203 . 2,588 1,531 ' 2,570
471
2,431
327 ' 195 : 951
392 2,279
324 207 930
962 656 804 95.8. 175 659 : 1,788 1, 788 ', 1,146 .
470 .
2,211 327 .
5,840 )
. 221 .
2,440 1,452 2,535
413 .2,378 .
312 151 1,052 ..
30,320 26,815
113
29,191 27,319
107
/
28,798 21,558
104
AGRICULTUP.AL i::XTENSION SERVICE UNIVERSITY OF GEORGIA AND THE
n - U '1 El'S),Y iilll__ "''
STATE L>EPARTMENt OF AGRICULTURE ' .. .: .: ::' . .
thens, Georgia
U.S. DEPARTMENT OF AGRICULTURE AGRICULTURAL MARKETING SERVICE 319 EXTENSION Bl..DG., A'rHENS, GA .
Harch 1958
DATA FI?.OII GEORGIA 1957 1rJE LY ll!MTcffi~RY EPORTS ON BROILE!! Clj~~
(Ravised February 1958)
I 1 Ir EWned~~kng
. :
1 Eggs Set
-Ha-tc-hi1n.gJsi
Total
and--cross Statelwvement (ooo)!
Prices
-Hatched-~7
for Local .
-S~~nitpoped-~--To~va-l
-,-P~d ~or
Hatch1.ng
RfoerceBirvoe~~l-e-r
J _1251_ ~ j_0_20l _~t~h~d~ _P~a~e~e_!!t_ _. ~t-~t~ _ _P~a~e~ _g~s_(J.) __C_!!i~kE J.~;l_
Jan. 5 ; 6,340 4,337
3,986
429
Jan. 12 : 6,574
'
Jan. 19 ' 6,643 ''
Jan. 26 ; 6,898
4,725 4,757
5,05h
4,281 4,348 4,640
4,415 4, 763 4, 832 5,160
.64 " 11.25
.65
11.50
.64
11.50
.60
11.00
Feb. 2 7,101 5,076 4,666
503
Feb. 9 7,234 5,166
4,678
513
~eb. 16 : 7,174 5,202
4,805
h35
Feb. 23 : 6,941 5,361
h, 879
440
5,169
.51
' 10.50
5,191 .56
10.50
5,240
.55
10.00
5,319 .54
.!
Mar. 2 7,217 5,461
4, 961
389
5,350
.52
9.75
l-iar. 9 7,001 5,L~82
)J, 984
406
5,390 .53
9.75
Har. 16 ; 6,997 5,285
4,850
544
5,394
.53
9.75
Mar. 23 7,143 5,350
4,843
498
5,341
.53
9.75
l1iar. ~0 ' 7, 014 5, 317
h,825
565
5,390 .53
9.75
Apr .6. : 7,456 5,277 4,890
579
Apr. 13 7,510 5,L:.6S
5,037
529
Apr. 20 7,804 5,454 5,064
501
Ap~. 27 7,741 5,631
5,225
66h
5,469
.54
10.00
5,566
.54
10.00
5;645
.54
.10.00
5,889
.55
10.00
Nay 4 7,806 5,700
5,253
672
' 5',q-?5
.55
10.25
ay 11 7,794 5, U03
_5,348
627
5 ~9 75
.56
10.25
l1c1y . 18 7' 979 5' 912
5,445
594
6, 039
.57
10.25
Hay 25 7, 992 5, 860
5,453
596
6,049
.)8
10.25
June 1 7,818 5,871
5,422
6Lro
June 8 7,970 5,91}
5,460
609
June 15 7,060 5,922
5,h92
677
June 22 7,772 5,9?4
5,554
583
Jun<:! 29 7,5:57 5, 850
5,471
673
6,062
.59
6,069
.59
6,:69
60
6, 137
.61
6,144
.61
10.50 10.50 10.75 11.00 11.00
July 6 culy 13 July 20 July 27
7, 300 1,539 7,856 7,837
5, B72 5,829 5,759 5,591
5,467
627
5,396
679
5,357
667
5,260
684
(over)
6,094
62
6,075
.63
6,024
.63
5,944
.64
11.00 10.75 11.00 11.25
5, }39
618
Aug. 10
5, 680
5, 30.3
4?6
_i\~g. 17
7 JC:: Q
I )
, -"
5,h3 5
.5,196
448
1.
6, 726 .5,367
4, 944
.563
Aug . 31 6,609 .5 ,430
4, 992 .
432
.5, 799 .5,644 5,507 .5,424
.65 6.5 11. .50 :. 67 1l. 75 ~ 67 11.?5 69 12.00
Sept . 7 6,739 .5,317
4,864
40.5
Sept.14 6, 6813 4, 944' 4,.579
478
Sept. 21 6,623 4,831 ' 4,392
440
Sept.28 6-,80) 4,910
4-~433
443
5,269 .5,057 4,832 4,876
69 12. 00
. 69 12. 0n
70 12.00 70 12.00
Oct . .5 6,.522 4,921
4,47.5
0ct . 12 6,.59.5 4,886
4,4.53
373
Oct. 19 6 ~ 708 .5,003
4,.573
354
Oct. 2f> 6,.627 4,814
4,444
402
,.
Nov . 2 6, .5fJ 7 4, 793 . 4,462
420
I\fov . 9 6,.542 4,882
4,.526
.56.5
Nov. 16 6,371 4,884
4,471
4.52
Nov . 23 6,868 4,899
4,.570
385
Nov. 30 6, 6.53 4,913
4,.566
427
4,8.38
4, 826
4,927 4, ,846
4, 882
5,091 4,723 4,9.55 4,993
12 . 00 70 l l. 7.5 70 11. 50 .70 11. 50
70 11. 7.5 71 12. 00 .?l 12. 00 .72 12 .50 73 12 .50
Dec . 7 6,478 .5, 009 . 4,640
396
Dec. 14 7,000 .5,045
4,68.5
391
Dec. 21 7,033 .5,012
4,690
404
Dec. 213 6,090 .5,001
4,743
429
.5,036 .5,076 ~r::: ' 09 4 5,172
7.3 12.75
7.5 12.7.5
. :5
~.., 2c:'
..:...) . :;J
TOTAL :371, 82_3 ':2"76,166. 2.54;680 26,.573
281,2.53
;/'.~c:o '9 :r ev:Ls i.OU3 in~ lud P. eggs set ar:d 12h1~ks l::atched f oT Lat n.her~r sr.:-rpJ.y n.()c. -::r~ . ....
~/ 7otal hatched less outshipments, breeder replacements, destroyed, etc.
H. A. \rTAGNER ~ricu1tural Statistician
ARCHIE LANGLEY Agricultural Statistician In Charge
7
AGR~CULTURAL EXTENSION SERVICE UNiVERSITY OF GEORGIA AND THE - . ; 'STA1'E DEPARTMENT OF AGRICULTURE
LIBRARIES
S. DEPARTMENT OF AGRICULTUR_F.:
- - - - - -- JGRICU L TURAL. MARKETING SERVICE
319 EXTENSION BLDG., ATHENS, GA.
Ath~ris, Georgia
April 2, 1958
..... .
....
FAR11 PRICE REPORT AS OF NARCH 15, 195'3
. . ..
GEORGIA: The _Index of Prices Heceived _by Georgia farmer.s for the month_. ende.d..:.
in mid-JV1arch rose for the sixth consecutive month. Practically all .
commodities contributed to the increase, but most important were continued
higher price.s for meat animals~ The March Index of 262 was two percent (~
points) apove the February Index of 258 and seven percent (16 points) higher
than the March Index a year ago.
- The All Crops component of the' Index was 273 on Ma rch 15, 1958. This Wa.B an
. . . increase of one percent (4 points) when compared with the February Index of
..
269 . and. \
thre~ ~
.
percent
(8
points)
above
the
March 1957
Index
of
265.
;. . ,' The Livestock and Livestock Pr0ducts oomponent of the Index for the month
. ended March 15, 1958 was 237. This compares with 2.31 on February 15 this _ ..
-'year 'and 203 one year e arlier. Higher prices f or hog s, beef cattie and milk
. . .~ cows were primarily responsible for the increase. .Lower prices for eggs atid
wholesale milk were partially offsetting.
.
'
: :.
. UN:!:TFill STATES: The lndex of Prices Received by Farmers increased 4 percent
(11 points) during the month ended in mid-Harch, the . .sharpest _., in.cre~se for any month since February_1951. Nearly all commodities joined in
the rise but most imp orta~t were continued higher prices for meat animals. '- Higher prices f or potatoes, fruit, and' eggs also contributed substantialli 'to
the -increase. The lll!ar.ch index at 263 percent of its 1910-14 average was 11 . percent above a year earlier and at its highest level since Hay 1953.
The Index of Brices Paid for Commodities and Service-s, Interest, Taxes, and Farm Wage Rates (the Parity Index) rose l p ercent to 30~~ on March 15, another all-time high. Higher prices for family living and farm production goods were about equally responsible for the rise over mid-February. The March index was 3 _percent higher than a year earlier.
.
Summary Table for the United States - ~ . -
- - 7noexes-- -; M:arcE 1), -:Feoriia.Ty-15,-:-March-15,-:-- - -Record-higE-
1910-lLalOO
1957
1958
1958 :- -mdex- -- =-Date-
--------~-----------------------------
Prices Received
238
252
263
313 Feb.l951
Parity Index ~/ 3_1 294
302
304
304 Mar.l958
Parity Ratio
81
'83
87
123 Oct.l946
IrPri-;es 'Paid-; Inter est-; Taxes,- and-W~ge Rat es based. on-data for the 'incti:
- cated dates. 3/ Revised
. ARCHIE LANGLEY Agricultural Statistician In Charge
RAYHOND R. HANCOCK Agricultural ~tatistician
. . . ';\
. i.
'.: . .
..... . .- .
. ,.1; ., ...
~
.r
.. :..
. i .: \
::. t
~ .... ': ...... ... :.=....
. .. :. '< -
::i! .,. ....
~ ---- -
~PRICES RECEIVED BY FARMERS MARCH 15, .19S8 WITH COWARISONS .
- - - - - - - - -~ ..,.._._ _,.- --~- ":-:-- ---.-~-- ----:-- .-:-----__.:.__ --- --~- -:- -- '--!"--=.- : - ..
-- -- - , .
i ~~R.~IA- -----T- ---+1--..- -:- -- , --~~D ST.AXE.}-----
l . CoMMODITY. . : j Average !Mar. 15, i Feb. 15, !Mar. 15! l Average ' !Mar. 15,! Feb. 15 jMar.l5,
.Ai.'fD_ tNIT '. I 1910-14 ! 1957 ! 1958 i 1958 l l 1909,..14 ! 1957.
1958 l :-19_58
- --------- - --------~- -- -...,..- ------r -:-------j-----L...----:----J.t_ _-----+----~ -;--- --r::--:-- -
!: Wheat, Bu.
$1 1.23 !1 2.12 !' 2.00 ! 2.m
.as 1 2.CJ7 . l 1.92 1 1.~6
$! I Corn, Bu.
I
1
.91
1.32 l 1.36
1.43 iI !j
.64 I' 1.20 ! .96 ' l.CO
$ Ii
.67 ,.'
.83
I
Irish Potu cwt. '$ !
1.13 j
.ss Il .
I .91 ii
t~~l
"! .40 . .72
i
1.14
1.33
.61
.62
2.12 j" 3.25
$ ~ Sweet Pot .. , cwt. _.
! i I .84
5.25
5.25
~ ~ 5.50
1.60
4.32 ~ - 5.-42 .+ _ 5.~2
Cotton, Lb~
Cottonseed, Ton
i 12.1 1 32.8
I $1 23.65
31.0
1
1
32.0
11 12.4
49.00 1 50.00 \. 1: 22.55
l .: 29.8 1 24.9
-~6.0
~90 I 60.60 49
I 5:;). .;20
~ogs, $l : ~ay,All~.'<baled )Ton $ :I per cwt.
i :j3eef Cattle, Cwt. , $ i
7.36 3.96
23.80 ' 29.20
J 16.40 18.60 I 12.80 17.20
1
1
II 1 28.30 ; 1
1 19 .30
II 17.90 Iil!
7.27 5 .42
$1 Milk Cows, Head
33.85
110.00 1 140.00 jl45.oo li 48.00
! . I
p_ hickens ,pl ,Lb.
I
13.3
18 .5
I 19.4
II
20.9
!i i
11.4
Eggs, Doz.
Iv..-t ; ?1.4
I I 38.3
I.
48.0
I
1i 46 .7
iI '
i
?1.5
rru-tterfat_, Lb ..
1
1 25.8
s1
! i so
I
!so
,,
1 26-.3
1
"d-'1I Milk (wholesale) :
: per 1()()% . 1
2.43
I Y E.l'l'
s .7o i 6.15
6.05 1 1.60
~==ut_:_Lq. _1_~_2 _J_~o"___,_l0.5 II ~ybeans; .Bu
$I
_ ,_ _
I
2.30 I 2.15
il - I
2.15. 4.8
21. 60
1
i 16.80
I! 16 .00
I II 18 ..70 1 18.50
I r . 19.70 20..30
I I,- 20.60 1 21~10
I!159 .oo
I1 18.8
I, 30 .6
i ! 58.7
I . 1193.00 !2ocoo I
19.4 1 .2.6 .8
1
1
I
J,
36 .6
ij '40.8
I
59.4 1 s9'.4
l
i 4.19
.l I
II, 2.26 I
J [ 11.2
U.l Y
4.33 1 4a8
'- .. .
10.~_ 2.05 ,. 2.Io
9 ,64 f
V Revised.
y Preliminary.
.
.
TimEX NuMBERS OF PRICES RECEIVED BY FARJERS m GEORGIA
(January 1910 - December 1914 = 100)
All CQIJillodities All vrops Grains and Hay Cotton Lint Peanuts -- Tobacco Cottonseed and Soybeans .i!riahPotatoe s & Sweetpotatoes Fruits and Nuts
All Livestock and Livestock Products Meat An:imals Foultry and Eggs Dairy Products
' - - - - - -- -- - ---A- - - -
Mar.l5, . Feb~l5, Mar.l5,
1957
1958
1958
--~ -
246
258
262
' I;
265
269
273
151
160
164
27 0
255
263
204
200
202 -- .
383
450
450
209
204
208
292 179 203
269 193 231
280 185
2~7
I 1
1
.,. _
261
' 315
327
144
160
165
.
23o_
24o
239
1
. - ----------------~-- 1
PRICES PAID BY FARMERS FOR SELECTED FEEDS MARCH 15, 1958 WITH COMPARISONS ~_/
.. -- -- - ------------ -GEORGIA
-
-
- - - - ---- ;+!i-
- - - - - - -- - - - -
UNITED STATES
Kllm OF FEED
-Mar--.1-5--, --F-e-~.15, Ma.r.l5, --~11--1\;; 15,
Feb.l5, Ma.r.i5,
____ __ _2?..~2_
~958 _ _1_9_5_8 - - - ---' '__ 19 5?_ _ _~_8_ __~~
Mixed Dairy Feed
All Under 29% Protein
16% Protein la% Protein 2Cffo Protein
24% !Totein
4 .05 4 .00 4.05 4.25 4.40
3.90 3.80 4.10
4.00 4.30
-D--o-lla-r-s-P-e.rj.100 Pounds
3.90 3.80
it I
3.85
3.80
4.20
3.79
4.05 4.30'
44 ..0u2
3.60 3.56 3 ..51
3.79 3.90
3.65 3.60 3.56 3.88 3.97
High Protein Feeds Cottonseed Meal Soybean Meal Meat Scrap
Grain By-Products Bran Middlings Corn Meal
Poultry Feed Broiler GrOwing Mash Laying Mash Scratoh Grains
3.45 3.70 4 .70
3.45 3.65 3.55
5.20 4 .85 4 . 40
3.55 3.8 0
3.80 3.85
3.20 3.45 3.40
5.00 4.70 4. 20
3.25 3.45 3.45
5.10 4.80 4.30
I
IdI 3.84 3.81
fl 4.65
il
:I
I"I
.il,
3.06 3.11 3.45
I, 4.93
4.48
4.11
3.76 3.70 4.95
2.71
2.76 3.17
4.80 4.29 3.89
3.89 3.90 5.54
2.86 2.90 3.20
4.91 4 .38 3.93
Ha} fBaled)
Al a. fa.
51.00
50.00
52.00
1Ul other
38.00
40.00
45.00
--- --------- -- ---- - - - - - - - - -- -----
l/ As reported by Feed Dealers.
--~l't~----33-14-..20-00--------321-9.-..50-00------3209..7700
, {., ,. .. . .
7
. .
AGRICULTURAL EXTENSION SERVICE UNIVERSITY OF GEORGIA AND THE STATE DEPARTMENT OF AGRICIJL.TURE
Athens, Georgia
U.S. OEP~\ RTMENT OF AGRICULT URE AGRI CUL.TURAL MARKETING SERVICE 319 EXTENSION BLDG., ATHENS, GA.
April 2, 1958
'BROILER dHICK REPORT FO'R GEORGIA GOIYlMERCIAL AREAS
During the week ending Marcn 29 commercial hatcheries placed 6,103,000
chicks_with the broiler producers in Georgia commercial areas. This compares
with the 5,840,000 placed the previous week and is 13 per cent more than the 5,390,900 placed the same :week last year.
Eggs set by local hatcheries amounted to 9,101,000 compared with :8,816,;ooo the previous week and is 30 per cent more than the 7,014,000 for the
. porreS:ponding Heek last year.
-
1
..
Hatcheries reported prices paid for hatching eggs during the week at an
aver age of 82 cents pe_r dozen. Average price charged by hatcheries for the
chicks was reported at ;~14. 25 per hundred. These prices compare with 82 cents
;and ~~14. 25 la~t ~reek and with 53 cents and ~)9. 75 one year ago. Egg prices
shown _relate :to Georgia produced hatching eggs lvhether bought on contract or
:otherWise.
-
Weighted average prices from the Federal-State Market News Service for
-broilers during the ueek ending Narch 29 are as f ollows: North Georgia broilers
J( '2 3/4- - _3 1/2
;
-
poun,ds, '
at
farms
20.02.-;
FOB pl.ants 21.00.
(See reverse side for other States)
Date . Week
Ending
GEORGIA CHICK PLACEHENT BY \JEEKS
PERIOD- JANUARY ~5,. i958 THROUGH lviA-RCH 29' 1958
EGGS SET];/
CHICKS PLACED FOR BROI LERS
19.57
1958
1958 %of 1957
1958 I 1958 %of
'
1957
I 1957
Thousands
I'er-cent
Thousands
l I
Percent
J-an. 25
6,898
8,199
119
5,160
6,041 '
117
Feb. 1
e Feb.:
7,101 7,234
8,278
8~433
117
5,169
6,142
119
117 -.. 5,191
6,165
119
Feb. 15
7,174
8,411
. 117
5,240
6,108
117
Feb. 22
6,941
8,302
120
5,319
6,132
115
Mar.- 1 Mar. 8
7,217
8,291
7,081 \ .- 8,003
115 . . .113
5 , 350. 5,390
..
6,244 6, 30.7
117 117
Mar. 15 : 6,997
Har. 22
7,148
8,474 8,816
121 i23
55. ,''334914
6,015 5,840
112 109
Mar. 29
7,014
9,101
130
5,390
6,103
113
,.
!:,/ Includes e:ggs set by hatcher~:es pr.oducing chicks for hatchery _ s~pply flock s.
, ARCHI2 LANGLEY f-4.gricu~tural Statistician In Charge: .,_ ._.
\J. A. '\t.JAGNER A_gricultural Stati.stician
' ." . I,:
.-.
:. .~ .
.
. ~' ' . -
EGQS.:~SET : AND CHICKS-. PLACED IN CClll''iER~IAL AREAS, BY lrJE~KS 1957 - $8-:
.
. . ...
. . ~~ ;
/ ~-
.\ Je'ek:.: Ending ., .,.
-,, -~ - : ...: .::-~
.~- ':
...
~..-
~. . :...
-
.:~
Page 2
STATE-
}tar.
Har.
:r-iar. --
15
22
29
Jan. 25
Feb. Feb.
. 1 - , -: - (3
Feb. Feb.
J.5 . . 22
Mar. Mar.
:1 ,.
8
Nar. 15
l"Iar.
22
Mar. 29
' ! EGGS SET - THOUSANDS
CHICKS PLACED - ~OUSANDS
----- ~- ~----~~~~----------------------~1r-----~----+~~--------~--- - --- -~-~~---------
'Main'e-, - - , 1,421 1,497 1,548 . 11. 1,048
955 : 1,013 1,018
961
992
999 1,003
Connecticut: -
1,071 1,124- 1,140 1 545 .543 573
596
528
531 . : 583
611
962 1,010
656
669
Penns:ilvania i
1,453 1,512 1,522 j 673
731 : 932 . 812
867
704 885
831
804
774
T.nr')w..a
__ 1,905 2,013 2,135
8B5
853
84.7 ~ -780 .
9.57 . 964 :: 993
905
958
870
.. Illinois
.
352
364
420
145
148
150 15~f: 125 , 136 :. 179
139
~ 75
172
l~ssouri
: 'Delaware
..1~,,92195h
2,029 2,336
2,092 2,438
610
647
683
592
669
716
620
644
659
741
1,775 1,979 . 1,926 1,921 1,928 1', 941 1,986 1,967 l, V88 1,741
~: Maryland
2,356 2,368 2,613
1,579 1,642 , 1,561 1, 73'5 i, 733 J, 751 1,616 1,540 1, 788 1,806
Virginia West Virginia
.. 11,993 300
North Carolina :;
3,030
2 ~-1~8 -
335 3,140
2,272 403
3,239
1,229 539
1
2,503
1,216 556
2,345
J.,2h2 525.
2,415
1,271 1,277 1,191 531 .. 492 . 518
2,423 2,495 - ~,570
1,204 466
2,651
1,135 460
2,518
1,146 470
2,271
1,141 527
2,335
South Carolina
470
. 511
548
361
327
302
340 , . 343 ' 297
323
393
327
306
_GE_OP_._G_IA_____- ----~-- 8~,0-0~j----~8,47~--4 9,lq!__~~-6~,0_4~1____6~;]_:1~~2. ____6~,_16~5____6~, 1_0_8____. _6~,_1~3_2____6L244____6~,30_7____6~,0-l_5__~5~,8~4-0____6~,1-0~3
Florida
447
462
h80 : .
221
.195
215
240 . 229
241
259
203
~ 21
237
Alabama Mississippi
2,864
j . 1,973
2, 923 3,356 2,053 2,226
2,344 2,540 2,465 Z,444 2,397 2,731 2,509 2,588 2,~0 2,584
1,1,10 1,477 1,461 1,630 1, 751 i,538 1,61.~4 1,537 l, h52 1,468
AL ~rkuai.1s1isaans a
3,497 421
3;663 3, 703 ...
436
474 ..
2,699 2,560 2,687 2, 766 2,897 2,678 2, 715 2,570 2,535 2,650
372 ' 381
380
429
5o8
484
471
392
413
458
Ts~as
2, 821.~
2,987 -3,196 .
2,188 .2,25q 2,229 2,14o 2,355 2,340 2,431 2,279 2,3.78 2,394
1vashi.ngton
416 398:. - 415 ..
297
249
274
323 : 288
297
327
324
J12
366
0Fegon
369::. ::360 ~ 394 :
128
153 ' 154 158 - ---l70
16j .. 195
207
l 51
175
_c~~-:--r_o~- __i_a~~:-.~~: ~1~,3_6. ~o~:~~1~,4_o~e: ~ 1,45~~ :
947 . . 931
9~~-l~,_0_7_l~_l_,_o_2_2_ 7 _1~,-o_o7~~~-~9-57~~~9-30~~l~,~o-52~~1~,-o_29~-
;~--:::: T~1~~ 1~58 734: ' cc-, ' 40, 42x5B?~ ' -{" ~c$,170 ~ '~-' 28,539 28-~~2:6 _:29,132 29,481 30,124 j]O,ll4 ::: 30,320 29,191 28,198 29,556
Tc~J\t. ~957
- -. J7,896_~ 31~,B't5 ~: -. JB,277 ~- :;: 26,101 *?>70?-.;_: 2o,799 ~~<~6_; 2si>~ i6;37a ; 2~,301 ~~ 26,815 27,379 21,~53 27,491
1958..% of 1957
lor
112.:.
118
109
108
109
112
114 . . 114 -. 113
107
104
108
- - - - - - ----~----~--'-'------------~-~--------------------------------
. I~.)' ..... l . . . ....
I l
. ~ .I .. ( <I j 1 ; )
. cY
tD t:I!JD J
.lJ GJE(Q)~CGllA /C~O:~O'~f THN~ SJE,~VHCJE
AGRICULTURAL EXTENSION SERVICE '.
:r g. .. . ~. S. DEPART~ENT. 0~-A~RIC~LT~~E
UNIVERSITY OF GEORGIA AND THE ,:
.
' AGRICUL..TURAL MARKETI,_.G SERVICE
STATE OEPARTMEN'r OF' AGRICULTURE
319 EXTENSION BL..QG., ~TtfENS, <i_A. .
1 Athens, Georgia
.
Aprii:9, 1958
BROILER CHICK REPORT FOR GEORGIA COHMERCIAL AREAS
. During the week ending April 5 commercial hatcheries placed 6,468;000 .chicks
with the tD:roiler :producers in Georgia commercj_al areas. This compares ;with the 6,103,000 placed the previous week and .is .18 per cent more . th~ the .5,469:,qoo
placed the s~e week last year.
~ ...
. Eggs ;set' by local hatcheries amounted to 9,285,000 compared with 9,101,000
the ;previo,us week ahd is 25 per cent more than the 7, h56, 900 for the corr~l!>o_nd-
ing week l;ast year.
.. . '
.
r..
..' .
_; .. i, . . ..
r .. ... , .. . .
' Hatcheries reported prices paid for hatching ege s du:::-ing the week at an(_.. .
ave:rage of: 82 cents per dozeno A-verage price charged by hatcher:i.es for the
ch;i.cks Has. repor-t?ed at :~14. 25 pe:r hundred. 'I'hese prices c ompe.re vti.th 82 cents
and /~14. 25 last \-Jeek and with 54 cents and :ao.oo one year ago. Egg prices ;,
shot-in relate 'to Georgia produced .hatching eggs whether bought on contract br~
otherwise.'
.
-:i Weighted average prices from the Federal-State Market NetiS Service for
broilers durlng the week ending April 5 are as follmv-s: North Georgia broilers
2 3/4- 3 1/2 polinds, at farms 19.22; FOB plants 20. 20.
.. )
'
(See reverse -side for other States)
...:.
GEORGIA CHICK PLACE11ENT BY \oJEEKS
PERIOD FE'BH.UA~Y 1, 1958 THROUGH APRIL 5, 1958
- -- D~t,e
~ -
.EGGS SET !/
BROILERS - ~: ---~----__,.;.._,_----!'""-':,-.;--_. .
CHICKS PtAC2D FbR.
_Evnid.E:-Li_e'-_nk~g~-=.- ---+1--t _..t...- 1-9- 5-7-----' -- 19-- 58----+ -1I~.191598.5%7 of '~19-57.- . 1958
:1;958 ,%,of
. : 1957 .
. Thousands
Percent
Thousand_s
~ . .Percent
Feb. :t
7,101
8,278
117
Feb.: 8
7, 231~
8, 1~33
117 __.
Feb. l5
7,174
8,4_11 -
117
Feb. 22
6,941
8,302
120
Nar .: 1
7, 217
8., c~91
115
illar. . 8
7, 081
13, 003
113
Har.: 15
6,997
8,!.~74
121
Har. : 22
7,148 8,8;L6
123
M<>.r : 29
7,014
9,101 .
130
;_s_ _ _Apr-.......
--~285 !u..-- _1_,4_5_6
__ _L_125
5,169
6, Ut-2
. 5', 191~ - _., 6,165
119 . ll9 .
1 5,24o --.- . . 5,319
6,108 6,132
.. ,.
ll7 '- 115-' :_:
5, 350
6,244
117
.5, 390
5,394- ~ . ~:<
5>341:. ,
5, .390
6,307 .6,01.5 5,840 6,103
1- ..
. ..
- " .
117 ~:
+12''_
109 ~
113
~~--6,.4...6. 8_
_.... _
'!13 _ ,_:, _
_. __
. !I Ipclude,s <;li;gs ;set by hatcheries pr~duG:Lng ~hicks: f'9r:;-hatchecy supply floc ks.'~:
NtcHIE LANGLEY
V.T . A. HAGNER
Agripultur~l Statistician In Charge
.: .
Agricultural
_S
'
t
a
t
H{
ti
c
i
a
n .
. ' ~
~ ..
..
. ;
. .
,r
.: .~ '
i -
w
.: t : '
.: . . ~ '
. '
...
I . ' . ~ ,! . . ; .
. , '
~ ..
. . (.' . ~- . .
, - ~
.~
.. ( . ' . ( .
, !
. ..J
.. ,
.~ . ~
.. ..
.. ., :
i
..
' STATE .
..
:
.
..
Maine.. . . Connecticut Pennsylvari:La Indiana Ilii.nois llfd.ssouri Del.a w:' -.are Naryland Vir.g1nia West Virginia North Carolina South Carolina
-GEORGIA
Florida : ... Alabama Miss:lssippi Arkansas Louisiana
Texas "Hashington 0reg 0 ~ California
..
TO!'AL _1956. -.:
TOTA_L:-1957 ...
1958 '% o <1957
I
. : EGGS SET AND CHICKS PLACED IN COMMERCIAL AREAS, BY WEEKS - 1958 ..
.
..
Week Ending
.
iiar.l ~ Mar.
22 . i
29
Apr. II
5
I'
l
Feb. 1
I Feb.
Feb.
1 ~ .. 15
Feb. 22
Nar. 1
l'1aar.
Mar. 15
EGGS . .
SET.
-
'fHOUSANDS
. '
~,497
I .. 1,124 I i,512
. .2,013
...
364
2,029
.. ~,336
:.. 2,J68
I ~
. ~
:_, .3~,,-31l394580
. .'' 511
.. 8,474
I
. 462
,. ,1
2,-923
.. 2,053
. ]:.,646336
I,.,
::
~,987
:. ~~~
JI' . . i-' 402 . .
. 1,548
..1:;140
1,522
-2,135
. :-420
..2,.092
~.:2 ' '438
;:-2 ''"."2
;'.'-':267123
... 403
3;.:239
..548
9 '"101 ) .. -
. . .480
. 3,-356 : 2,226
:3 , 703
~ 474
3.,196
415 394 . 1,455
(
.. . . 1,551 .1,193. . 1, 661:_ "2,243 -
- .4!6
-- 2_,124 : .-2,417 .
2,698
.-2;258 .
~- '401
.3,265 '
537
. 9 282 .
-l
.
487
-3,307 . ... 2;310':.
3,641 .
476:.
3,353
432
439 _1,409 .
I 42;~B5
i _31',8.75
l
I
112
I
45,170
38,277 118
45,_932 39 ,_452
116
I
i
...
.-.
..
: CHICK..S PlACED - 'IHO:rJS:Al\JDS
-
..
955 '.. 1;013, 1,018
961 1,013
999 .~ 1,-003
543 . . : 573 731 . . 932
596 . 528
. 812
867
. .
531 784
.
....
_.
583 885
611 .-831
I .... '. 853
. 847:
I t48 -15J I : ~ :~ 647 ..- :683'
I i:,979 . . 1' 9?"6
. '780
153 592 1,921
9:)q. '. . . 964 .993
.. lji
136
119
669
716
620 ..
1,928 1,941 . 1,986 .
:9o5 139 '644 1,967
I 1.,642 1,.56.7;
I
I III
. 1,216
.~ 556
.. 2,345
.. ..
.....
1;242: 525:
2;4l5
'1; 735 1, 733
1,"271 1,277
531 "2,423 ..
2-,44995? '
' 1, 751
1,_19_1 _
1~,2610.64 _..;.
518 . -466
2,5'10 . 2,65:1 .
1,540 1,135
460 2,518
II
I
. 327 6,i42
-
312 ' 6,165: .
354 ;6,108
343 6,132
297 6,244
J.2J: . 393 6,307 6,015
I
d
~-- -. -..-~~
195
215
_240
2"2?
241
.. 259
203
IIIt
2,540 ,. 2,465 -... 2 444 ., 2,397
1,477 1,461 : _. 1,.630 1,751 2,56o 2,687 . 2, 766 2,897
2, 731 1,538
.
12 ',
509
644.
.
.
2,588 1,537
2,678 2, 715 2,5.70
I . 381
380 . 429
508
484
471
392
l 2; 256 2,293 : 2,140 2 ~ 478 2,340 2,/.dl 2;?79
Il . - 249
i
153
' '
931
274
.3.23.
154
158
927' .. 1,071
. 288
297
170
163
1,022 - 1,007
327 .
195 957 .
32h
. 207 . 930
I!
I
28,826
29,2o9> 29 ,495~-' 30,253
30,135
30,320 ... 29,191
I 26,707 26,799 26,281 26,378 26,307 26,815 27,379
I
I
108
109 112
115
115
113
107
..
Page 2
Nar. 22
962 656 804 958 175 659 1,788 1,788 1,146 470 2,271 327 5,840 221 2,41+0 1,452
2, 535
413 2,378
312 151 1,052
28,798
27,558 104
Har.
-29
'
1,010 669 774 870 172 741
1, 741 1,806 1,141
527 2,335
306 6,103
237 2,584 1,468 2,650
458 2,394
366 175 1,029
29,556
27,491 108
Apr.
5 -
1,044
599
997 889 142 739 1,950 1,698 1,397 549 2,432 348 6,468_
253 2,790 1,552 2,812
443 2,528
297 183 1,024
31,134
27,367
114
t '1 ~.J :i,,.r . t\:'i i ;,,: .: , :
t I
, :~'
~o'
...
:
,, ' '
...
' ',,' .'
. h
.OOORGlik! . cool; wet';lfeathericthi:i:yed. farfn.itork frequ~Q1 tly,::, du~ing Nareh:...:4y .: the.
. i .-:r ;~ v ~!. ~, end ; of th~ inorltrf ' irt6 Htja+:,J\ling . oper at~Q~.~r 1~~r ~. t.w9. weeks or more ..behitld
:.usuiU St:h'edule; Gr owth of t:db.~-~-~o .p~q.nt s has :.bee!l >r;et?:p,qed py colq ,r we.ather ' and
:t.r:.anspl:S:ni).ingwa.s ju.'st ' getting_ uqderi{.ay. :,bY the , :A'ir~t, :(?f : AP::ril~ frogtcss of .;.'.
pJiawi>ing.:l~; cotton, a.nd d~he-' -~.cirl,y spr.ifl.g .pla.r,x~e,d ~rops ;i,s m:uch :slow:er .than
:.usu.aJ:~. Throughout Nort!l Ge,.op~J,a:.l:i,a,i:(Jv,eathE)r :haS. J?r~:viented farmers from makirtg- any
or progress wi'th land preparatio'n seeding operations.
~
~
i ' . ~' '_ j I
,' 1
'
.'t ;j !~ ..; .' ;
i ,., '
'
.. ... i : :,
. .1lJ1er:'gt'6\vth 'of smail gr ains' ~rid~ 'pa~.t:ii r.~s has be.eri:,.re.:f!g.~ed _,cnnsiderably by " the..
bae:kw~~a,; s~asori t?: dat~ ~ ' ~1i.~ X,:~P.?'ste{ ay~rag~ :~Q~J1~:iJipn. o.~ bo.tn ~~eat and .~a~ , tu.T.e-S'fJ;.ras the lowest for AprJl I s.J.nc.e , .19Sl. . ~Jhep.t . condJ. t J..on :. ~t 11 percent.:'O.L' !l<!Jrm~+ i-ras 6 points belm( the t.~pbrteCi ' ~opqiii?I1 .~ ye~~ ago while the conditibn of
:pastur:es : c11rrently reported at ()5perc~~t :Qf, nor:'fla~ , was 16 points below la s.t y:ear
.:,.at :.this,s :.time . . .Supplie s of rnoistu:re on :Af>r.:P, 1, ..pa.r:t:i-.culprly sub9oil . -mot.stu:re, '
w~r.1bprpbs:bly the most plenti.f'ul fQr Gebrgi~. ~!) , th~ .~ iast i' e-v1 year.~ . , Wa,rm weather
is.: eeedffid . to bring fast growth' 'of piistii~Gs . and . s~ii11 . g~o.ins . .
, --
~~ i. . ; . .
. . .: - ~ ...: __ , .... . . . i . : = J:.~-~-. -~.. ., . . . . . . .. . . ~ \: .
rx:o~pe:c.ts ;for peache s in Georgia' ;:,(m .Apr i l ' l ;w~r~ 't,h~ )5est '. :J..ri f ive yel'lrs~ ; The .
av,e~<,te :. conditTonofthis J.ea~' s , cr.~~< as ~~Po.:r,~~<;i )(Y~ gr_m~~r s , eg,u~l~d. the, )aighe)st
~:V::l?'r: r .epor:ted .for the date goJ.ng hack td 1 939 . The current. :cond1-t:10.n of 6.5 '.per-:-
cent is the same as the fig ure re ported in 1945 and a gairi in 1 953 . (Prospe cts
;::i:''. . ,. .'. . . .... ... ,.......... for 9 southerh ~ states
. .. :. ' ..; i. i t ;
.
is
shoWn
. , . . :
b.~e.
l
ow
:. ::
.)
:,;..
.:::)
; : .. , ... :
:,\ . ..
Geo:rgia.~s wheat crop i s expected t;~:i be the smp.i1.8$t. since . l950 and one of; :the . .
smalle,s_t .in the la st -25 y ear s . ' ' Wheat dohdition.'s ' o~ Apr i l 1 indicated a crop of .
1,540,.000 bu shels, which v-rould be "i.'y pertent 'J:>eJ,ow' la'$t .year and 29 .percen.t below
..
,a;ve.:r.age vTheat ' th
i
. s
The ..ye
a
de r.
c
l
in
A
e in cons
i
product de raoly
i
on ici
r
p rdsip~.c ge t ' a: d:
t's e~g
e;i':.tlw. dp1.s,1e;'p.1 plar
imarily
ced , in
to th,q
fewer acres in ... o:j.l B.ank in
1958 than in 195 7.
' , ~ . , ..: .
. .
. . . ' : . ~
. ~ . \'. . .. . ~ . ' l
. .
.: ~
. ... :.. . .~. _ . .. . ..
PEP.GH.Es: 'rhe April l. condftion of .~he J?~.G, ch crop .in the S~uthern States was the
.. :.:. best for tha t dnt e s ince ~ :194.:.; and the..s c con<;i hi[h~; st , in . 34 y ears of '-re c-
ord. 'I'his year's condition c:>f . $5 .;r~rcent .compp.r e s. with 7B perce nt on .April: l ..
1ast;year. and the 10-year average of 60 p ercent . Pro 13pe cts arf; substantially a""
bove average in all of the 9 's<)uth,6rn _pea di st at e s . Belmv-normal . t emp eratures
have provided rriorc t han tht ' requ:lt,;4 nu.mbe~. 'q.f c;:hilling hours, and have delayed bud
devoJ:dpmdnt, thus r E:. dti cing the:' 'chnncc.s . of iatc ~ dq.mage ...from spring f rosts. - In-- ,
general', bloom i s r cpor;t cd ' two t '6 fm.l\~ W8cks l ate r than normal.. . . . : .
By the end of March, the maj~rity of. tr~<:;. s .ip ;~0-0; ,F9rt ';rp,lley ar e a of G'e ?.r.f::~:a. --'!:1.?. ~ ~a~sed full bloom; and those : )~n tfi.c "pri ff~ri :Cl.f.ca__:"{8 f~ .noar ,ing .:the; full :..bloom stage . ~h:ts is; two to thre e} WE:. Ck_S' l .e:t t;f i;llah no:r:w~;L. ; .E~~l~.S~ WJ _r.q.in ;thu l a8t. two .weeks of Harch intGrforred with Spraying ~ rn South Car olina , many v E:riLti c.js wo r e ap -
proaching full bloom on. icpr i l l. In. Fortp Cc;:rpli!1a, ;.gc;; nE:r . l y ; b:ud,s w8r e just .:b," gipninr, t o svtel l by thht :dat e , <:~ltho'lirh ' s o~a c n rl,Y.:.:Varic t~~:. s . vJcre blooming . Both
Of thC, S6 ; bt at e s r eport thAt 'coli:J.- wE_ ath,-_} kiilod ~. hich, p.rop~r.tion o:{ buds in_:.a.
bt>lt within the Piedmont 2r t.; a . In Al nb ama, pra cti call,y all varic ti.o s 1..rer c in full bloom in l at o Harch. Ar kai1s ns r oports uxcGllent prospe cts in all ane s, WJ th aoundant moisture supplic~ s ~nd tr e:c.. s in thrifty condition. On AjJril l, tree s were ju.st coming into full bloom in tho t~a shvill E:. ar ea , almoot a month buhind normal. Bloom in the othl.r late r ar (;<.". S of thC~t S tc:~tc is also c xpc ctGd to bG del aye d about a month.
PEACH CONDI TI ON AS OF APRIL l BY bTATE;S (2ERCENT)
~tn.to : Averag8 1947 - 56
1 9~; s
1956
1 95 7
1958
N.C.
66
s.c.
62
2
57
88
9
l
so
83
83
Gn.
62
l
42
71
85
Fla .
57
Ala .
56
15 l
6so5
l/ 78
l/ '83
Miss .
54
4
53
h7
67
(.;:J.. r k .
60
L;: .
58
2
79
86
94
s
48
80
81
Okln.
48
3
6h
77
84
Tuxe.s
47
4
43
64
82
10 Stat us 60
2
Y ;:;stimaks discontinued,
53
ARCHI E lJl.NGlliY
!.gricultur al Stati stician In Charge
78
85
CARL 0. DOT~S CHER Ag ricultural Statistician
' ~
.. :
UNrrnb .STATES - GENERAL CR.Of :REPORTAS OF APRIL i, 1958
!,
:\ ...
.. ~ . ~-~ .. ; t
or A cold, wet Mafch: contii'lued .to halt or slow farming operations ovei," nn.~.'~h 6.f'.~he
Nation. Winter wheat prospElcts werEl maintained :l.mprovEld throU:ghc;)ut ~o.st " of
the :Pla'ins and the Northwest. Vegetable crop planting and harvest were rurther
delayed but fr~its generallY escaped cold damage and Florida citrus made rapid condition rEJcovery.~... Periods of :heavy snow in Mid-Atlantic States and elsewhere,
and heavy and continu~d rainfall in California and .in many Central and ~o~ther~ . areas hindered crops and 'livestock affairs and contributed ~0 increased 'livestock .feeding and less than usual increases in milk .and egg production . Stoqks, of . ~ocd gra'ins remaining on .farms, however, . on April 1 .were almqst an eigh~h ,larger .~han a year earlier. West=Elrn irrigat.ion prospects improved and nrc 'generally ,excel~ lent' . 'Grazing prospe~ts; although still lagging in much of the ,Sou~~., ave'r .rige tho best' iri recemt years and are expecially promising throughout tho We~t. : . . . .
Winter wheat prospects in the Great Plains continue to be outst<:!Pdipgly. fqyoz:aple.
Abundarit sriow:f ~d rairis kept soils wet and almost blanked. out soil .'PloWing ..:ln
Plams are~s . where heaVy losses have occurrGd in drY years. The April l ..forecast
and of 964 million bushels points to tho fourth largq;t winter wheat 'crop yet gr()wn,
not l;)xceeded since. i952
larger than last year's total' wi,nter and spring wheat
outtum: . 'Maey fields in eastern and southeastern Se Gtions show rather. :poor co'rld.i-
tiori, especially those planted late or adversely affected by soil heaving which was not uncommon in March~ Excellent prospects in the Northwest and Plains States
far outweigh areas of lesser acre age with poor prospects. The expected yield .
per seede_d acre rcsulti~g from low winter acreage loss and high Aprill . condition
now laoks ' r cGord h::i,.gh by a wide margin. WintElr oats and barley look l.ess. favor~ abl~ with maPy southeastern. plantings less likely to be harve sted for g:r:ain ~hap.
. usu. :a. lly
.exp. ecte. d
at
t. his
d.
at '
e
. .
,. .
, , ..
WINTER WHEAT: Winter wheat conditions on April 1 indicated a crop.. of 964 .miliion
. .
bushels. This would be 57 million bushels above the December -1 ,
forecast, n~arly 3(perceht larger than the 1957 crop of 707 million bushels_ p.n~
13 percent above . ayerage. Increases from prospects as of Pecember 1 hav;e l;>eon ...
largely confined to the Great Plains, Mountain and Pacific Coast States~ . $1:1c;h. in-
creases more than offset rather sharp reduction in production pro~ects in ~he
South Atlantic and South Central regions, except Oklahoma and Texas.
. .
PASTURES: Prospe cts for the 1958 pasture grazing season arc the . best for the
last 9 years. The condition of' pasture s for the countr;Y as ..a .whole was
83 percent of normal on April i, the highest condition reported since 1949. Th~s
high c6ndition reflects the favorable moisture situation that .erists ovqr much of
the countcy. ?asturo grazing up to April 1 was limited except .for lo'caliz.ed areas
in :the Southeast, South Central, and Pacific Northwest.. In 1110st ar~as qf .tho ...
country, pasture s went into the 1957-58 . wint~r in good condition and, with the
favorable moisture since that time , prospects appear good for :favorable pas.ture :
growth during 1958.
' .
.
MILK ';PRODUCTION: An e.st'imated total of 10,'944 million po~ds of milk wa's produc.cd
in March by milk cows on farms, only slightly more than for the
same
month iast year,
but
10
. pcr~ept
.
a
'
bo .
.vu.
the
...
Na. .r.ch..:)..947.;.5.6
average..
.
Milk Production in Georgia during Mar:ch amounted 'to l02 million pounds. Th~s is 12 pcrcez:it above t he February' prod,uqtion of 88. mill.ion pound.s but 13 mi;llipn:
pounds below Ivfarch 1957.
.,. :.. .... , '
'i
. i
J
- ~~
~
b0 ocry
~~~.~Ir;~)Ri~,~A CC]fRQr ~JE;JP.',OIRf]fllNiG . . lIE\PlRll?b7~'58
> ,.: AG~J.<;:~~T~iV(J;.. .~XTJ:!:NSION SERVICl3:
.i :.: ,; ~ :.:::: ,;;:c u,s, OEPARTMENT OF AGRICUL.TURE
..J.-! .1\!..IV,E;:ij~IT,Y; OF GEORGIA AND THI;! i .
' . ! :' <i : ,AGR.ICVLTURAL MARKETING SERVICE
1 - ~~\~~~~~~~;g~~:': ~~ tG~_I_C.ULruRE ~ '; <:; . ., ~ . . ,, ,L :.: :.;~ ~:119 ~-XTE~ _ION BL.~~~j~T,~5;s::t~t5s
-~.;-. .:; -::,,..'..:; .:. './ :': . ::. ; .. ! ; ;_. .. .:_.:. _., . .. . . :. _ , 1,:~ ,:-~: . . ::.i_ .;_:_ ;, ;.:::-' _,
. .. ,..... .
'" .
.~:-::.;:..\ d ::i:;-- .ih, \~ : , v : . . VT<::GETLBIJ.:.S FOR FRESH M!~RKET
-~ .>:-':": --:.: <,:...i..'.' . .. .
:_.; ;";{ ;,.f./ .):J': ' !.'; ..' .L.: ' . .
ii rii 1 195s . ~::: :: ~ ' -'
,:~ p : . . .. : ' ./ -;.:. .;'. '. , ,f '
--::.":: :. .
...
.
.,, <
...
, :: '
; . ;
..:UNI,'I'E:& .fS:Ti.TEE -: The .. production :of :sp~i:itg vo.g'etab1o ~:~ 'this .ye ar is expc .t~d -~ 9 ...
- >, .L.: ::_; t . :;, :: i : bo: less than ' iri- '195T, the :crop Rcportj_rtg Board announc ed ,-t;,qday.
Forecast.S are '~vai-liable f or vi.:ge:tablE/s ,wh:isfl:c<?mpri.s ~ thrc? -fourths_;Of' _-~p.r.ing_:
I
;.t
vq;-B.t-abhi :f>l!"Cduction, excl11ding)nclons~ ' Indic_e,'te,d J?!'Cduction_ of th~ ~t . ;v~_ge tc;.,~
blGo$.: :is: 4;:-p-r.ceht, 1 oss :t}i:an . last year ;and.' .- J~ p~1~cent bohhi. avC;rage. .09l .d, w_ct
.;we athqp:.dUr.ing:' recent months is ths~' mizi.rt ;f_ra'C:tor c;kifsing t:no d8 clin c~ :"uiif'av;o'r:.:..
o't: able i:we athc r ;'not only'. lowcrt.d yields ':b~t pf'c~t:htcd:' pl~~ting c'onside ~p.P~(f ,. . ~.
acr.e~rg e . -~cu.rnb cr s_ and. tomatoc:~s arc( :t'l;l~e onlY"spJ:;_ii!g-:- crop s _for wl}i _ch ,a ,siz .Q.b),.e .
... incrc asc: :ov.Lr >1e:st. y ear is fndicaied~.-; i..O'ti'the,. o'"thcr. hand ~ignificant' 'q.f clin:Qs :
ar.5t .exp;6:ttJd.in the prodUction of bni?Fs~ ' cab~age ~. l6 t~uc (! , ~arrots, 't: c~ ~ r~,~ --
broccol'i '):'. asp a ragus, gr een peppers; c~mlif'lowu:r- arid gr een 'pea s .
Cold: andw.'.:~.: ~:~ .tke :-'~my 'words: doscr'f~ih.'g: ~j~-~~h_e.r in I"'a~ch -~nd earlier: :mo~th/:.
in th6-st , Ei arly veg.e tablc .produCing are ~ s o.f.' t-hC"_._ tfa.ti on~ Temperat ure s wcr o b~low
normal -f'or.f. most .of Earch and many Sta.t e s had .<;m .uripre coc;iontc.d amou.'nt of rair:l~-
Pltinting a~d hari.rE.:stiilg sche dulf; S. wc~b:i ~ tir<?~ into a turmoil. J.i;ffoct's y/e r f; ,mo.st
p:t?~duncUr on:early' spririg crops. !lt o~~ai;J,.y a 'peavY. v9lwno of irege tab~es~ . r,:ar-.
tibularly - from Florida; would b e movi,ri~Lto '_mq:rkc. t all during the month of ;..pri+.
:rri Florida; cool and extremely vJGt we~thc;rt d6J.:ayqd :_planting .and r ota:t:"deq g ro~th
of . c:t.iops. . Now volume production of mariy: of th~t "St.i:l.t e Is .crops cannot be cxpe.q.": t ad before- u.te Epril or possibly e 8.:ti.v. :.Miiy~ - ~imil ? r weather preva,ilod . ~n .oth,e ~
south~r:n :-.stato s; throwing their 1~ arvest ' A.~te ~ ) ohind .~ ormal schc d~ie s. , In '.Tcpc-:-
as, i -t ha s b C.c.n very dif ficult to olant and hi:U'va st vt:ge t eblus. Hll e arly . c;:rops . in that : ~t a'to have b ucn r etarded a~d .h.arV'e sts ' wili be latE;r t han USUal .thi~ : : .
yeCl r . The south 'i'oxo. s oni on crop ; which ' ncGd~d dry ~e~?-thc r . for curil;lg, ~ : :Ls."_ s~ffer
were ing ~< The Lc st Coast had .r 8cord br ciaking ' r a:tnsduring March. The co'Rs.t,a,l .si> 6-
tion :and c"<:;ntral valleys of California
' fiarcie st hit of th8 we ster.n ar c-a$.' .
Vt.-ry little acreage of ve go tables wa.s a; b)tai ioss from f looding . In,c;t'Qility, to
harve &t at .the prope r timc and lowering of' quality by rain damage. ca1,1sed CO:t:l.- .. .:
siderable loss of product i on. DGs e rt ai'e~. s of th~ ' ~,outhwest also. had .rai n 9w.;..:
ing .the month, but damage to vegctablGS. and melons WaS n ot s erious. ;, s a 'whoJ.'c
.crops in those areas are welf advancod for this time of the yc a:r and t1.r G in
go-od condition.
..... .
,. ,, .
... ,..
- :
. .~
. .
.SNkP BEJ.N.S : Tho' acr t: agt of mid-spring sn_ap be an s, at 15 ,150 acns is 2 pGrccin..t
below last y ear an d one - f ourth 1 8ss 'than averag . Compar.ed with a
ye ar ago, r educti ons in South Carolina, i.lab8ma and Hississippi arc almost off-
set by an increase in Louisian~~ .-_ Tho: a~r6ag.e :in ..th:. qrgia is unchang.ed. ' : :. : ,. : , ..
CABBJ..GE: Early Spring cabbage p:rod].lc~i-pn i&,_o:XPc-~tcd . ~b ..total 2,216,00.0 :~~t .._, 'li
.pe rcent l e ss than wa~ :1)rod.uccci ~ h1st ;/c'ar ,~p:d 9 percent under . avc..rag9.
I.
~-.11 State s in this s e asonal g~o-~p-,.'ei~ cp.f ,Q:~l~i9rr{J~ : a.i:~ 8ip0 c,t~ng l e ss _:P;r-oduc..:: ;
t i on this y e ar than la s t. E s'ti.rha"t-"8'd_' Pr<;>d.u,c~i.()fl :J..l; C.~lifQ.rnia is slig~tly above
last y e ar' s~ In South Ce.r oli:hC)., '. ~he 'cr'Oi?. i~. i'ri 'g o9 d' condition but about. 3,weeks behind its usual schedule . Qti:rwth ~ncl, d~iyc i9pm~n;i.t. wa s r ot afdoc;l by col~, wot ..
we ath er, but a s a whole, st<mc;ls . ~re~ _ go() d:: M.c.i pJ..nt s' a r e healthy. Ha rve st . w;il:l;. ,
start about April . 20. The Goorg:f.a, :fop_) .s . l 5-go _daY, s. lat~ r than normal' bcqau;~e
of cold, wet weather continuing through.. Narch. Lat er plantings ar c :;;xpe c.t ed :"to
yield be t te r than earlier planted f i elds. Harve st prior t o i~pril 1 was very
light. The crop in J,l abama , rhssissippi and Louisiana ha s been affe cted by cold
we t we athe r in about the s ainc manner a s in Ge ~rgi a . If grow~i1g cond:L~~91?-~ . {1-r,~ ,
f avorable during f.pril, Mississippi expe cts harve st to bogin about Nay 5.' Har-
ve st has just begun in Louisiana. The crop, in southern California, wher e most
of the State 's acr uage is located, is in good condition. Some acre age in Ven-
tura County was lost from flooding. Viet fi elds in all areas made harvest diffi-
cu l t .
LETTUCE: Early ~pring l e ttuce production is now for e ca st a t 6,438, 000 cwt., 4 - - - pcrcent l e ss than last year's tonnag e but 13 percent ab ov e avE: rage . Compar ed with las t y<...ar, a sharp de cline in the prospe ctive tonnagE: in California and r 5ductions in tho .Southe rn Status have more than off set a me.rkcd incre ase in i~.rizona and New he xico. In the Carolinas, cold, we t wuather del nyod planting, nducE:d the acre age pl anted, and r etarde d tho crop. Luttuco is quito late and yield prospe cts are p oor. The bulk of the acre age will mature in Nay. Ge orgia acruage is down b e cause sever e we athe r prc..ve ntod planting. I'h u crop is l a t e and harve st is not expected to start until after J.pril 15-thrce woeks h .t or than normal. In Now I"iexico, cool, we t woather during Narch prGvented lettuce from making normal progrGss and many fields have been too wet to thi n. St ands
( o ve r )
. . .. ';.. .. :: ;~~- :~;, ./.
._-2- ' .. . ....= ~ ; . . .:: . . ' .. \. . :: :." ~~.
LETTUCE, Continued: ''genbrally aro good. : This delay may jeopardize quality. and
.
, .. , ::.P::t;Q~u9t~on in late fi elds whi~? -.can. _pe q.am?g od ):>Yr.?~g~ , . __,
temperatures . character-istic of that are:a in the late- spring... .The Jrizona spring
crop is in generally :goad condition although some :mildew has been repor:tcd:'j::n
the Salt River Valley. Harvest is active around Phoenix cmd dallY mov6nient:' :l.s
now heavy. Shipments at a high. level should cont;in-q.e through April with both
the Phoenix and Aguila areas harvesting in this period. In the Wilcox-Bowie
area, planting of late acreage was :delayed by March rains. JUl acreage planned
is reported . to haye gone :p! al1:,hough _some was st~ll . bc:i_ng see~ed in .early Ap;ril.
Early ac:r~ag_e thE)_te wi 1Jl.aturc in May~- . In Californ;i.a, ' th~ sfnall -- acreagc-- piant-
ed thl;_s yeat 'l:l',<iS made unsati~f.ac:tory _ progress ' to date. co(?l; wqt wqa~l;lcq:~~ lms .. retarded ' I)larit (icy_clc)pmon_t 'arid 'y<;}ntrihute~f to . the ~ sprqad' of var:i,ou~. di~Q~ ~s .
and The ctop.: i:ii ia-t;. _jji on].y filir condition. Eariy fields in .Sciuths rri ciJ.~for
#1# ~ia _ in Ke~. - C9un~y ~re _p~w ' ;i l:i,ght .P!'oduction. Thereis _.som~ 'apt,e11ge ~;-~eady
at SaJ?.!-.~ z.1~ia:~ '. Tho. pr~:Xi'cip~l . pr~d~9~g Sclinas area "[ill not ~~vc 'any _:l_e~~uo
until" the' 15th .and tho. Patto:t:s6ri dcial wiil not start before .the 20th. A' r e::.: . duc~d- ~~ly' -~erc age : i,~ ,- pr~_afi~y risp~nsible for tho lfght .Aprii- yol~o qiP,qC.tod
this__yoat," ' ~ut..t.~~ardin( o.ffoct~ rQ:r _-:wcather :have . contributed to _th;ls ' si~~a,tiC?,~
Small 'sizes-- ttre 'b:X:pectcd to, donri:hatd Qarly s oa::ion marketings in Califoritia . '
..
' I
'' ' ' '
~ '' I ;, '-'! ;", _ .:' ,' '
'
' '
: ' ' :. .: ' :: 0 .'
s TOMt.TOES: Tho f~rst forec a st o~ production in the three early spring States pf
: 'Florida~' Texa's and c~JXb'rnia ' . is ' placed at 3,5.98,ooo _cwt~, p~~ce#.t
s above .:l~?T , ~u~- ; -~ersm~ .' b~l?;-1 . a~et_~ge ~ . Nq :signi.fican~ c~ange ~rom ~a';5t -i~:~l!~ ts
total prdduct~on ~:;; : md~cated:at th~s ~J.Ine. Ho-vmver, ~t ~~ worthy . o_f note .:t4at
ill F1o:tid,~-- a 32 p~rccrit ':increase 6vof last y ear 1 s acr8age hns 'bee'n fuliy :nullified l)y -~s!"-j podr. yield ' pf.qsp~c--bs~' 'Thoprogre ss ~f Florid~ 's crop has ~o6n de-
layed 'hy' :excs ssfv6 :raJ::ns, .i oelow ':Gormai 1;-emp'eratures and a lack of sunsh:inri. :': cur-
r t nt harv~ stirig~ havu' b~C:n _:e'1-eme'ly' light, but' the volume is mq)Ei cto'd 'to -j_'n;.. '
crease moderately diii::l,.rif i~p:ril~' _bocotriii{g fairly ~ctivEJ :early iii May artd _rda~_h:i,hg
the piak; dliri:rig :'the scicond''hcil,f of thc;i: month. some' harve sting should continue
J-une, . ' I
through
mo: $~
.
. '
of
'. .
'
''Wcathq'r po-rnii'J:,tihg; Dade County, recent ' . '. . '
I
I
~
'
'
In
'
r.ain~ a~d : ..
: I . '
strong _:1-itnci~ : :ca~~ed ' con~idoi~9~?, 'dqlha~e_ :a_pd '_l_bwt:Jred . the pro:s~~-_cts' for thE:l :sprfug
cjeal. In the Imm9kalec-Fort Myers area., .'Wet land and cool n~ghts rota.r.dcd d o-:-
volopriienk:aridcausod aw{do i~g-c ' 'in 'crdp concU.tiori. crops arc also very ~regu
rh lar iii the ' 'Fort .Pierce. ancf lMtifliitec-iRtis!dri areas~ The wind .and .sfuld st'Orm of ..
March -;2l :'nodesiit~to0: 'uxt~'n~ive 1sctting in .north central Florida. ' 'In TeXa.s,:
grow~:t-5 : 9~~ B,ack '._1-ti.tl} ,?. i,~rgf'; ~crc~~o in _acre-age this year ~o. a l eyel .sl~g,h,t~
ly ,_ aboye avi:lra:ge~ Totna._too $ mad,o" fa;irly _good progress in the Lower Vailoy. in .. . . . Marc_h~ ; : scat'j:,e_r ei4. f:tolds . that .s~r~ived 'the _December frf:w ze.. and _Ja!n~a_ry f'rood )ire
exp~cto-cf tq :fui;i).is_h iJgh~ Sl:lppti,~ s 1 ?-t-e in . AP~i ; .butv o ~e movement is not,..:ox-
pe cted until the' s econd half" of 1'1ay. ' Rarve st shoUld "continue into June, wc~ther
permitting. Crops arc j_n generally good condition but plants have not bcon sub-
,j e c~ed to .the ~s.ual, :wa:r;I!f M?:rc1,1 t,emper~turq_s .. I,f hot weathe:r comes ~n gradually,
cro~s_ wi.~l: ma~e ra:P~4 'g_rowlih.. ;arid ~at~sl~ o~~ory' development.
-
,
'
' ' '
,I,
,
,
" WL TEID1ELONS: -')'he --~~reEi_g~ of' l:at.c' )p~_ihg w;~-t~!-me~otis for ha:rvcst this yea~ iri
- :: 'Frori:da and 'c'Clli1'ori:'lin' i's placed at 102;700 acres, slightly lawor
than last _yeor and. 19 percent above a,voragc. . .Host of this a_c;rcagc i~ in Flori,-
da where the'!crop .i's 'vecy iatd --aiid .itrcguie:r ;;':i..!f :cteveloi;>Iiwnt .ciuo' to 'nUmerous ro-
plaz:i'c:iiigs ' m~tfe' rie'ce ssacy by advc't~ti/wcathcr cCii1ditions. The most' advanced
fields '_in south Florida rioW. l1t:rifi :W~l:t-:-de:Vel6pe~i".-~rt6rs and th"e-I-e is a1p6~sib:i,li
ty of a very 'light 'harve-st ' sfart:Lrit _-abo\it- Mcy 11~ : In central areas, 'the 'earliest
fields ar e just oegiriii.ilig to- r\m\ :c:.Plants are .st:l1l v ery s:mhl.l .on the maJority
of tho -a:dre age:. -Plari'ting 'opqt:at:oris '-~ate ' about c6ffiplct cd . in thJ north and nearing
completion ili wo-~tern 'nt ci<is. :: Q<_;iif6rnia 1 s Inip'erial -v~ uey 6rop is ahout' 10 d,ays
ahead of riorinal 'm _'devq;loprnont art'd -'harvest: ' sh:Ou1d. start MaY 10-15 ~ Grow-~h . is
about '-normal :in . othe r ar eas :.: ' l ' ':_ : ~; .. . : . . . . . .
. .
. ..
. , . .r
:--,- I iNGLEY ... . .. ;.J~i:iltrE
I . , .- . ; , . . ' .
_In Agricu1.tu~al Sta_1A.'s~ician 'ci1nrgc _ : ,_
1~ H . Hi.AAIS, '~R. . :. Vegetable G_rop Estilnator
. . . .... :
.: ..: : : :-..: i : ' '
.: ,.
. '.
. .
. ' .. ..
'.. .
- '.,... .
:r . ( ;.
't. :
, ~,
I :' ~ '.,!" ',' '
. t:
. ' . ~ .
j.
.': _I'.~.... .~ ;:. ': ,.. . : ,.
.:-.:
~
'' .1 ', I
:1 .
' '
I : .. ~ ..! :~. ' ?
.I
J ! ',
1 ' ~
t :.
. ..... ...
.. .! ~ .... , .
, J : ;' .i
.. .~ .~.-
. . . ,
~.
.. .
'I'
:
', ':
. : '
1
Cf007
~~~ (GJE(Q)~(GHA CJffi(())JP>.JffiJEJP>(Q)~1I'HN((; ~I
)
AGRICULTURAl EXTENsiON 'SERViCE ' UNIVERSITY OF GEORGIA AND THE . STATE DEPP,RTME NT OF AGRICULTUR'E
Athens, Georgia
u. s . DEPARTMENT OF A~~ilfiP'e~---
AGRICULTURAL MARKET G SERVICE 319 EXTENSION BL.DG., ATHENS, GA.
April 16, 1958
BROILER CHICK REPORT FOR GEORGIA COl'JlviERCIAL AREAS
During the week ending April 12 commercial hatcheries placed 6; 875,000
chicks with the broiler producers in Georgia commercial area.s. This compares
with the. 6,468,000 placed the previous week and is 24 per cent more than the
5,566;oo'O placed the same week last year.
Eggs set by local hatcheries amoun'lied to 9,032,000 compared ~nth 9,2D5,000 the previous week and 16 20 per cent more than the 7,510,000 for the corresponding week last year.
Hatcheries reported prices paid for hatching eggs during the week at an
average of 82 cents per dozen. Average .pric e charged by hatcheries for the
chicles was reported at U 4. 25 per htindred. These prices compare with 82 cents
. and 'J;l4. 25 last t'leek and t-Iith 54 cents and ~~10. 00 one year ago. Egg prices
shqwn =relate to Georgia produced hatching eggs whether bought on contract or
otherWise.
Weighted average prices from the Federal-State Market News Service for broilers durirg the week end::..ng April 12 are as follows: North Georgia broilers 2 3/4- 3 1/2 pounds, at farms 18.17; FOB pla~ts 19.20.
(See reverse side for other States)
Date 1rJeek
Ending
GEORGIA -CHICK PLACEl~-JEN-T -BY ' iEEKS
- - PERIOD FEBR~ARY 8, 1958 THROUGH APRI L 12, 1958
-
EGGS SET 1/
CHICKS PLACED FOR BROILERS
1957
~-
1958
-
1958 _% of 1957
1957
1958 '1
1958 7; of
1957
Thousands
Percent
Thousands
Percent
Feb. 8 Feb. ~5
7,234 7,174
8,433 8,411
117
5,191
6,165
119
117
5,240
6,108
117
Feb. ~2
6,941
8,302
120
5,319
6,132
115
i"'ar. 1 .
7;217
8,291
115
5,350
6, 244
117
Mar. 8
7,081
8,003
113
5,390
6,307
117
Mar. 15
6,997
8,474
121
5, 394
6,015
112
!Viar. 22
7,lh8
8,816
123
5,341
5,840
109
lllia.r. 29. Apr.,.. 5.
7,014 ' 7,456
9,101 9,285
130 125
. I
5,390 5,469
6,103
113
. 6,468 . ; 118
- - It Apr.:.12
7,510
9,032
120
5,566
6,875
124
1/ Includes eggs set by hatcheries ~reducing chicks for hatchery supply f locks.
ARCHIE LANGLEY Agricultural Statisti ~i art. In Charge
W. A. WAGNER Agricultural Statistician
,. ,
STATE
Maine Connecticut Pennsylvania Indiana Illinois lfdssouri Delaware Maryland Virginia, West Virginia North Carolina South Carolina GEORGIA Florida Alabama Mississippi Arkansas Louisiana Texas 1\Tashington Oregon California
TOTAL 1958 TOTAL 1957
1958 %of 1957
EGGS
SET
AND
CHICKS
PLACED
IN
COMMERCIAL
AREAS .
'
BY \\lEEKS
-
1958
Page 2
I
I
Week Ending
I
I
Mar. 29
I Apr.
Apr. i
. 5 I
12
-
I - Feb.
.
Feb.
I
I
Feb.
Mar.
Har.
Mar.
I I 8
I
15 -
I
~--.: I
8 I 15
Mar. 22
: [ Aps~.l :t-lar.
A~.
29
EGGS SET - THOUSANDS
CHICKS PlACED - THOUSANDS
1,548 1,551
1,140 1,193 l 1,522 1,661
2,135 2,243
420
445
I
I
I
:
2,092 2,438 2,613
2,124 2,417 2,698
I
I
I
2,272
403 3,239
548
2,258 401
3,265
537
I 9,101 9,285
I
I
480 3,356
487 3,307
I 2,226 .2,310
I
I
3,703 474
3,641 476
3,196 3,353
415
432
I
394
439
I
'
1;45:5
1,409
I 45,170 45,932
I 38,277 39,452
I
118
116
i
-
1,611 1,181 1,642 2,275
437 2,204 2,462 2,677 2,202
416 3,276
570 9.032
531 I
3,356 2,353 3,130
513 3.,360
421 389 1,455
46,099
39,500
117
1,013 573 932 847 153 683
1,926 1,567 1,242
525
2,!~15
312 6,165
215 2,465 1,461 2,687
380 2,293
274 154 927
29,209
"26, 799
109
1,018 596 812 780 153 592
1,921 1, 735 1,271
531 2,423
354 6,108
240 2,444 1,630 2,766
.429 2,140
323 158 1,071
29,495
26,281
112
961 528 867 951 131 669 1,928 1, 733 1,277 492 2,495 343 6,132
229 2,397 1,751 2,897
508 2,478
288 "170 1,022
30,253
26,378
115
1,013 531 78h 964 136 716
1,941 1,751 1,191
518 2,570
297 6,244
241
2,731 1,538 2,678
484 2,3h0
297 163 1,007
999 583 885 993 179 620 1,986 1,616 1,204 466 2,651 323 6,307
259 2,509 1,644 2,115
471 2,431
327 195 951
30,135 26,307
115
30,320 26,815
113
1,003 611 831 905 139 644
1,967 1,540 1,135
46o 2,518
393 6,015
203 2,588 1,537 2,570
392 2,279
324 207 930
962 656 804 958 175 659 1,788 1,788 1,146 470 2,271 327 5,840
221
2,440 1,452 2,535
413 2,378
312 151 1,052
29,191 28,798 27,379 27,558
107 104
1,010 . 669 774 870 172 741 1,741 1,806 1,141 527 2,335 306 6,103
237 2,584 1,468 2,650
h58 2,394
366 175 l,G29
29,556
27,491
108
1,044 599 997 889 142 739
1,950 1,698 1,397
549 2,432
348 6,468
2'5"3 2,790 1,552 2,812
443 2,528
297 183 1, 024
31,134
27,367
114
1,070 628 943 944 227 705
2,057 1,741 1,374
570 2,576
335 6 1 815
297 2,876 1,815 2,820
414 2,635
348 189 1,148
32,587
27,736
117
,. :r ;~: . . B--R-O-I-I;-~ER CHICK REPOR
OMMERCIAL ARE,A..S. ....~.:.. .
..,.,
:1 ,Puring chicks with
the' .week ending April the broiler producers
19 -commercial hatcheries placed 6,984,00Q in Georgia commercial 'areas; ....Thi~ :compares
:. wi~h .the: .9,_8.75,000 placed the previous week and is 24 per cent more ~han ~e
~- ::5,~-~4$;- ooo placed the same week last year. .
~. ~
'
'E:ggs
set
by
local
hatcheries
amou~ted
to
9,535,000
i
compar.ed
wit~
;
9,03i,ooo
the previous week and is 22 per cent more than the 7,804,000 for the corres-
> :;ponditlg week last year.
.," . ..: ~ ~ . .
.
.
.
.. .
.. . . . :.
.
~~atc;:heries reported prices paid for hatching eggs during the wee~<: at ~~:
: average of 82 cents per dozen. Average price charged by hatcheries f-or the;
:1;:.
chj,~ks was a.n~: ~?.14. 25
.
repo
l.a~t
rted week
at ~ .and
14. 2~ with
per hundred . These 54 cents and ~~10. 00
prices compare ; withi 82 cetlts
one year ago. Egg prices; >.
',. sh-9~m .relate to : Georgia produced hatching .eggs whether bought on cont~act or :
.: other~r.i.se~
:
~
~ .
. :
; .
'
..
:.
,
.:
~ .
.
. .~
~
.
......
...
: :.~ . ... Wei~hted .average prices from tlie ,Federa:l:..state Narket News Service for
: bro~le:rs during the week ending April 19 are as folloHs: : North Georgia
broilers :2 3/4 - 3 1/2 pounds, at farms 18.04; FOB plants 19.01. :
~ ...
(See teverse side for other states)
GEORGIA CHICK PLACEiENT BY WEEKS
..
PERIOD FEBRUA~Y 15, 1958 THROUGH APRIL 19, 1958
..
, .~ : D.at~ : . .
.
EGGS SET 1/
CHICKS PLACED FOR 'BROILERS
; '' Week . . " ~-.'-',....._...-.------..:...'. _ --..;;;;.......,.--,-~---+-+--:---------r-"-' _.,_- -
_E_nd_!_n_g---..~----1-95-7----1-9+58---' -19_l955_8 7%__of~--1-95-7--;;1-91-:'8-+-!-1'..915985..%7 of
...... : ~ ' - ,; . . ,.
..
Feo 15
Feb; 22
. .. :: Tho~sands
I ..
' { ' '
: 1,174'
6,941
8,411 8,302
Percent
Thousands :. ~
Percent
117
5,240
6,108 ' 1.17-
120
5,319
6,132
l~S:
Mar. 1
.Maf.;; r-6
'IVIar..~ i$ .
. 7,217 .... 7)08" 1:. 6,"997 : ..
8,291 8,003 8,474
115
5,350
6, 244 . 117
113
5,390
6,307 ': ll7~
121
5,394
6,015
112
Nap_. 22
7,148
8,816
123
5,341
5,840
lo9:
5 Mar.
Apr~
.:
..2. 9
7,014. 7,456
9,101 9,285
130
5,390
6,103 :
1~3
125
5,469
6,468 > 14-e.:
Apr. 12
7,510
9,032
120
5,566
6,875 ' 124;
A:-. pr... 19
,t) ..
. 7,.eo4
9,535
.122
.5,645
. 6,9,84
124
: ! / .. ~~~------- - -----------::-l---.:---~__,--:."---------_;_--!. ....!--.--;--
.
':+.ncl;udes ~
eggs
set by
hatcheries
producing
chicks
for
hatch. ery
supply (
flocks.
ARCHIE LANGLEY : !gr~?u.ltur~ Statistician In Charge .
~ ' ...
\
W. A. VJA()NER .
Agricultural Statis~ician
. '
! ...
1 .
..: .
:
I
. .
'
' -
: I ..
'
i
;
.. ' '
:
.. \. .
' . . :
.
. ,.
.,
. :
.. . ~ .~
------rr--------"----~--E: GG.S,SE.T. -,_-A,-~N~~D.:,C.H_:IC,~K.:S;::P.L_A..C:E:D:.:I.N....C:O:M..M.:E:R.:C.I.A.L::.A:R.:E:A::S.,:.:B.Y=:.W::E:E.K.-S:;-::=1::9:5:8..!~~::::::~-~~------:.::aP:a::g.e-=-2._..;__ _._ _ Week Ending
STATE
Apr. Apr. . , Ap~-~
.. Feb. . Feb.. Mar.
Mar.
Mar. Mar.
Mar.
Apr..
Apr.
Apr.
______5__~__1_2__1~_1_9.___~__:_ _I_S~---22---~--l~L---8--~- - ---1_5~__2_2-_~___29__~---5~- ~--l-2__~_1_. 9~;- ..
EGGS SET - THOUSANDS
CHICKS PLACED - THOUSANDS
I MCoainnneecticut
Pennsylvania
1,551 1,193 1, 661
1,611
1,1~1
1, 6:42
1,633 -
1,018
<J,,-19?
596
1;552 812
961 . l,Ol3 -
528 : '531.- ;
867
-784
..
999 ... J.,003
583
611
885
831
:' .
96a: .. :1,010 :_. 1,044
656 669 599
804
774
997
1,070 . 628
943
1 00~ '1;';:'7 -. .. , 922_
Indiana
2,243 2,275 '2; 281 .
780 . 951 : 964. 993 . 905 958
870
889. 944
966
Illinois
Missouri
Delaware
Maryland
Virginia
West Virginia
North Carolina
South Carolina
GEORGIA
.I
445 2,124 2,417
2,698 2,258
401
3,5265 37
9,285
437 2,204 2,462
2,677 2,202
416
3,2J6 5-?o
9 , 0). 2
.. '461
153
131
136
179
.2,'350: :,
592 . 669 . -- 716
620
~-?,i457 ' : ... .. 1,921- .: 1,928 . 1,941 1,986
- ~,-754
1, 735 1, 733 1, 751' 1,616
_?,:436
1,271 1,277 . 1,19t 1,204
-.: ~416' - .. ... .. 5:31
492 : . .. .518. ! 466
'.3,.399
2,423 2,495 ; 2,:570. . 2,651
:5o2 .
. 354
343 ~ -297
323
;9;53>- -. 6,1otr --. ~,132 : .6,244-.: . 6,3o1
139 644 1,967
1,54o 1,135
460
. 2,518 . 393 6,o15
175 659 1,788
1, 788 1,146
470
2,271 327
5,84o
172 741 _'1,741
:1,806 1,141 .. 527
2,335 : 306 6,1o3
142
739 .. 1,950 ~ -- 1,698 :.~ _ 1,397 ~-- 549 :~ 2,432 . 348
6,468
227 705 2,051
1, 741 1,374
570
2,576 . 335 6,875
203 830 2,274 1,640 1,334 622 2,36~41
6,984
Florida Alabama
'
487
5.37 .:._ '488.
3,307 3,356 -3,'542
240 . 229 . 241 2,444 2,397 2,731
259 2,509
203
221 . 237 :'1
253
2,588 2,440 2,584 2,790
297 2,876
271 3,072
Mississippi Arkansas
2,310 2,3,.$3 2,388 3,641 3, 7)0 . .3,855 .
1,630 1, 751 1,538 1,644 1,537 1,452 1,468 . . 1,5.S2 1,81$ 1, 744. 2, 766 2,897 2,678 2, 715 2,570 2,535 2,650 . . 2,812 :~,820 2,844
Louisiana
4 76
513
501
429
508
484
4 71
392 413 _: 45.8 . 443
414
511
Texas
3,353 3,36o 3,426
2,140 2,478 . 2,340 2,431 2,279 2,378 .2,3.94.~ . 2,528 2,63$ 2,-684
vJashington
432
4'21 . 387'
32.3 . 288
297
327 . 324 . 312
366: . . 297
348
.348 . ..
Oregon
439
389
399 . . . . . . ~58 - 170 . . . 163
195
207 151
115 . 183
189
18.3
California
1,409 1,45.5.-:. 1,471
1,071 1,022 : -1,007
957
930 1,052 1,029 : : 1,024 1,148 1,029
-----------------~--~~~--~~~~~-----*-~~-----~--~~~~--~~----~--~~----~~~~~----~~-----~--- :
TOTAL 1958 TOTAL 199"1
45,932 46,099 47,434 39,452 39,500 39,-335
29,495 30,253 30,135 30,320 . 29,191 ~ 28 , ,79~ 29,556 . . 31,134 : 32,587 33,020 ..
26,281 :.- 26,378 . .?6,301 26,815 _27,3-79 .27,558 27,49;1. 27,367 : 21,736 28,050
1958 % o:f 1957
116
11 7
.. 1~1 ..
: J.:l?: ... 115 ; . . '1'15
113 ~ 107
104
ld8
114
117
118
. . " ~ ...
3/_J-
0 : AGRICULTURA.L EXTENSION :SERVI~E
7) UNIVERSITY OF . GEORGIA AND THE . .. ~.~~ STATE DEPARTMt::NT OF . AG l'HCULTURE
1'!98
Athens, Georgia
~--
U.S. DEPARTMENT OF AGRICULTURE AGRICUL. TURAL MARKETING SERVI~E 319XTENSION BLDG., ATHEN3, GA.
Apr:i,l 30, 1958
. . BROIL;m CHICK REPORT FOR GEORGIA CO!-'iNERCIAL AREAS .
During the week ending A.pril.. 26 commercial hatcheri~s placed 7,076, 000
chicks tdth the broiler producers in Georgia commercial areas. This compares
with the 6,984,000 placed the p:r:~evious week and .is 20 per cent more than the .
5,089, 000 placed _the same week last year.
1"!:ggs set by local hatcheries amounted to 9,808,000 compared with 9,535,000
the previous tveek and is 27 per cent more than the 7, .74l,i000 for the corresponding tveek last year.
Hatcheries reported prides paid for hatching eggs dtiring the week ;at an :
average of 82 cents ,per dozen. . Average priQe charged by hatche!ries for the
chicles t.Yas reported at ,:il4. 2$ per hund.red...These ..prices compare with 82 cents
and ~~14~25 last week and with 55 cents anct :ao.oo one year ago, Egg prices .
shown relate to Georgia produced hatching eggs whether bought on contract or
othertnse.
.
1 .
. :
vieighted average prices from the Federal-State l~arke:t News Service for .
broilers during the week ending April 26 are as follows: North Georgia broil~rs
2 3/4- 31/2 pounds, at farms 18.59; FOB plants 19.6~..
(See reverse side for other states)
GEORGIA CHICK PJ..AC:::'J!lENT BY HEEKS
-
-
------,IT"""'-...;;.P..E.R_I_OD__F_'!.BRUARY
22 . 1958
~
THROUGH
APRIL
2~
195-0- - --~
Pat~
EGGS s -a;T 1/
ciiiCKS PLACED FOR BROILEHS
Feek Snding
1957 1958 - -"""T'fiOtisanas
1958 7; of
1957 .l:'ercen
1957 1958 Tnousanas
1958 ~~ of 1957 . '
-percent.
Feb. 22
6,941
8,302
120
5,319 . 6,132
115
liar. 1
7,217
8,291
115
5,350
6,244
117
liar. 8
15 1~ar .
7,081 6,997
8,003 8,474
113
5,390 6,307
ll7
121
5,394
6,015
112
~iar. 22
i1ar.; 29 Apr. 5
7,143 7,014 7,456
8,816
.9;101
"9,285
123
5,341 5,340
109
130
5,390
6,103
113
125
5,469
6,468
118
Apr. 12
Apr. 19 Apr. 26
7,510
. 7, 804
7,741
9,032
9,535
9,808
120
5,566 ; 6,875
124
122
5 ,645 . 6,984
124
127 ' 5,889 : 7,076
120
V - Inpludes eggs s et by hatcheries producinr; chicks for hatche-ry supply flocks;,
Jl.RCHIE LANGLEY .1\grlcultural Statistician In Charge
,. ':
: vJ . : A WAGI\Tlli .
;
Agric~1turAl Statistician :
l .i
. ~ .
. .~
. ','
I .'
..
.. .. I
'
'
. . .~ .
...' ~
. .. . r . '
P'
STATE
Maine Connecticut Pennsylvania Indiana Illinois l"d.ssouri Delaware Maryland Virginia West Virginia North Carolina South Carolina GEORGIA Florida Alabama Mississippi Arkansas Louisiana Texas irJashingt on Oregon California
TarAL 1958 TOTAL 1957 1958 % o:f 1957
EGGS SET AND CHICKS PlACED IN COMMERCIAL AREAS, BY WEEKS - 1958
Fag~ 2
: Week Ending
- ..
..
Apr.
Apr.
Apr.
12
19
26
Feb.
Mar. Mar.
Mar. Mar.
Mar. Apr.
Apr.
Apr.
Apr.
22
1
8
15 22 . 29
5
12
19'
26
-
EGGS SET - THOUSANDS
1,611 1,181 1,642 2,275
437 2,204 2,462 2,677 2,202
416 3,276
570 9,_032 .
537 3,356 2,353 . 3, 730
513 3,360
421 389 1,455
1,633 1,195 1,552 2,281
4~1
2,3.50 2,457 2,75/J 2,4_36
416 3,399
502 9,535
488 3,542 2,388 3,855
507 3,426
387 399'.
1,471
1,651 1,8:39 1,565 . 2,247
448 2,308 2,491 2, 777 2,491
422 3,398
618 9.808
496 3,589 2,431 3,877 .
509 3,556
440 422 1,600
961 528 867
957 131 669 1,928 1,733 1,277 492 2,495 343 . 6,132
229 2,397 1, 751
2'~897
508 2,478
288 170 1,022
46,099 47,434 48,383 . 30,25.3
39,500 39,335 117 . . 121
_39,099 124
-
.
26.,3.78. - 115 .
~
CHICKS PLACED - THOUSANDS
. 1,013 999 531 583 784 885 964 . 993 136 179 716 620
1,941 1,986 1,75.1 1,616 1,191 . 1,204
518 466 2,570 2,651
297 323 6,_244 . 6,307
241 259 2, 731 2,509 1,538 1,644 . 2,678 2, 715
484 471 2,340 2,431
297 327 163 195 1,007 957
1,003 611 831 905 139 644
1,967 1,540 1,135
460 2,518
393 6..!.015
203 2,588
1,537 2,570
392 2,2.79'
324 207 930
962 656 804 958 175 659 . 1,788 1,788 1,146
470 2,271
327 5.1_840
221
2,4no 1,452 2,535
413 2,378
312 151 1,052
1,010 1,044 1;070
669 599
628
774 870
997 889
... 994434
172 142
227
741 739
705
1,741 1,950 2,057
1,.806 1,698 . 1,741
1,141 1,397 ~,3.74
527 549
510
2,335 2,432 2,576
306 '348
335
6,103 6,468 6_.~_875
237 253
297
2; 584 2,790 2,876
1,468 1,552 1,815
2,650 . 2,812 2,820
458 443
414
2,394 . 2,528 2,635
366 297
348
175 183
189
1,029 1,024 1,148
30,135 30,320 29,191 28,798
?6,307 26,815 27,379 27,558
115 113
107 104
G
29,$56 31,134
27,491 27,367 108 114
32,587 27; 7j6
117
-
-
1,oo6 1,111
578
597
922
905
966
929
203
224
830 696
2,274 2,074
1,640 i,826
1,334 1,323
622
578
2,611 2,677
364
390
6.984 7,0']6
271 .293
3,012 , 3,052
1, 744 . i;782
2,844 3,022
511
472
2,684 2,666
348 : . . 387
183
193
1,029 1,007
..
33,020 . .. 33,28.0 28,050 .28 ~.?.76
l18
116
, _ ., -
f
7 1:11(JO
m <GIE(Q)~<GllA C~(Q)JP ~IJPO~'fllNDE<F'GARTMSE~ITI D:vRr~~rt~TlU~tF.% }4a55
AGRICULTURAL EXTENSION SERVICE UNIVERSITY OF GEORGIA AND THE
STATE DEPARTMENT OF AGRICULTURE
~EORGIP.
U.S.
OF
AGRICUL.TURAL MARKE
319 EXTENSION BLDG.,
8
..
TNGHSEE~R'1tl;(~l','~~ s
Athens, Georgia
Hay 5, 1958
- - - GEORGIA CASH FAPJII INCOME FROM :,rvESTOCK SETS ALL TD'IE RECORD Il'J 1957
Cash farm income from livestock on Georgia farms set a new high record of
$354,929,000 in 1957. This is 13 percent or (~39, ?53, 000 above the 1956 income
of $315,179,000. Commercial broilers accounted for ;:pl50,336.,000 or 42 percent of $he total, and t'las followed in rank by hogs with ::~57,833,000; Dairy products, ~;50,479,000; Cattle and Calves, ~P47,610,000; Eggs, ~r41,94l , OOO; Farm chickens, $4,228,000; Turkeys, ~1,823,000; Sheep and lambs, ~~509,000; and 1-Jool, ~170,000.
The 1957 income from livestock .was 36 percent above 1953.
Income from Georgia crops for 1957 "!tri.ll be available in September 1958.
LIVESTOCK CASH FARI-1 INCOI'1E FOR GEORGIA
.19,23
1954
1955
1956
1957
(Thousand Dollars)
Hogs
( '
,1
54,776
59,570
41,879
46,888
57,833
Cattle & Calves Dairy Products Com. Broilers
24,169 43,349 93,826
28,276 42,717 101,951
40,795 45,291 125,700
40,937 1~8' 663 129,836
47,610 50,479 150,336
Other Chickens
4,912
3,998
4,171
4,536
4,228
Tu:rkeys
2,363
2,502
1,912
1,845
1,823
Eggs
37,469
33,152
40,891
42,115
41,941
Sheep & Lambs
44
27
42
245
509
vJool
33
51
54
111
170
============~=======-===================
TOTAL ABOVE
260,941
272,244
300,735
315,176
354,929
=====~ = ============ = ====================
CARL O. DOESCHER Agricultural Statistician
ARCHIE lANGLEY Agricultural Statistician
i
DISTRIBUTION OF 1957 CASH 1NC()}1E _FRCU GEORGIA LIV~TOCK
\~ ~ Q
L
(fl
~ .
.......
tO
~
0
I
I
I
/
J
I
I
~
~/
I
I
&
~
\ / \/
............
~
-----~----------- * Other includes farm chickens, turkeys, sheep and lambs, and \<TOol.
~
UDl
~~A,~ GJE(Q)~CGHA <C~ ~~~~JrllNCG SEIRfVllCE
/1
AGRICULTURAL EXTENSION SERV1CI!. UNIVERSITY DF !00.RGJA
U.S. DEPARTMENT OF AGRICULTURI!
SUTNAIVTEERDSEITPYAROTFMGEENOTROGFIAAAGNRDICTUH~ETURI!
j'N
AGRICULTURAL MARKETING SERVICE 319 EXTENSION BLDG., ATHENS, GA. .
ATHENS, GEORGIA, May 7 -- Acco
gia Crop Reporting Service
1,047,000 broiler chicks were placed with producers
in Georgia during the week ending Hay 3. This compares with the 7,076,000
placed the previous week and is 19 pel" cent more than the .5,925,000 placed the
same week last year,
Eggs set by Georgia hatcheries amounted to 9,712,000 compared t~th 9,808,000 the previous week and is 24 per cent more than the 7, 806,000 for the
corresponding week last year.
Hatcheries repcr ted .prices paid for hatching eggs during the week at an
average of 82 cents per dozen. Ave~age price charged by hatcheries for the chicks \vas reported at $14.25 per hundred. These prices compare with 82 cents and (~14. 25 last week and rri. th 55 cents and ~plO. 25 one year ago. Egg prices
shown relate to Georgia produced hatching eggs whether bought on contract or
otherl-ri.se.
-- -- vJeightecraverage pric~s from the ~deralState Jlfarket N"ews Se-rvice for --
broilers during the week ending Nay 3 are as follows: Georgia broilers 2 3/4 3 1/2 pounds, at farms 19.50; FOB plants 20.46.
(See reverse side for other States)
Date 1rJ'eek Ending,
GEORGIA CHICK PLACENENI' BY vlEEKS
-- PERIOD l-1..1\RCH 1, 1958 THROUGH HAY 3, 1958
EGrGS SET 1/
CHICKS PLACED FOR BROilERS
1957 1958 -
Thousands
1958 % of 1957
Percent
- 1957
195--8
-
1958 }~ of
1957
Thousands
Percent
r1ar. ;1
7,2 17 8,291
115
5,350 6,244 117
l'IIar. 8
7,081 8,003
113
5,390 6,307 117
l1ar. 15
6,9 97 8,474
121
5,394 6,015 112
Mar. 22
7,148 8, 816
123
5,341 5,840 109
Nar. 29
7,014 9,101
130
5,390 6,103 113
Apr. 5
7,456 9,285
125
5,469 6,468 118
Apr. 12
1,510 9,032
120
5,566 6,875 124
Apr. 19
7,804 9,535 : . 122
5,645 6,984 124
Apr. 26
7,741 9,808
127
5,889 7,076 120
-- - Hay 3
7~806 9, 712
124
5,925 7,047 119
1/ Includes eggs set by hatcheries producing chicks- for hatchery supply flocks.
-ARCHIE LANGLEY
- -~
Agricultural Statistician In Charge
- W, A. HAGNER Agricultural Statistician
F
;( )
--------,.,-~...,..-.-----..,...__C"'~GGS SET~ CHICKS PlACED IN COMMERCIAL AREAS.L..~EKS- 1958
- ;_ . ~ '~ .
f:: ~
~>~ -~~ -~
~ f
, ..
l
:.weef( Ending
-~
-~
-
_
. :: ~-
. ,_
: ~ ..
.
-.
STATE
Apr . 19 .)
.. 1- . . ' =.~ . ~-
'I
Apr. j l1ay
_I ,26- _l
3
Page 2
---------
. '
EGGS SET - THOUSANDS
. :
- - -.~ .
l
.- __. ,..1.~
.. .. . . . .
--~------------------
Ha?-ne
1,633 1~651 1,688
1,013
999 1,00) . 962 1;6io. 1,044 . 1,070 1,006 1,111
..COt).llt;!Cticut
1,195 1;239.: 1,2_59
531
583 611
656
669
599 628
578
597
:f'epnsyly~mia
In9iana :.
1,5.52 1,565 1,544
~ j- 2,"281 2-,247 2,350 .
784 964
885 831
804
774
997 943
922
905
993 905
958 -. 8.70
889 91.t4
966
929
. Jllinois~
;;Hissouri
,.
461
448
h84
2, 350 2_, ~08 2, 291
136
179 139
175 -: . 172 142 227
203
224
716
620 644
6.59 ' . 741
739 705
830
696
,.P~;Laware
-}ia.ryland
2;4~7 2;4~1 2,485 ,_ 2, 754 2, 7'17 2,866
1,941 . .. 1,9.:86 ,1,967 1, 788 1, 741 1,950 : .2,051 2,27h 2,074
1,'1.51 ... '1,616 1,546 r, 788 1,806 1,698 1, 741 1,640 1,826
fVii-g1nia ~e-st Virginia .
2,436 2,491 2,653 ... 1,191
~i6
422
412 I 518
:1,204 1,135 1,1L6 1,11.~1 : 1,397 1,374 1,334 1,323
466 460 . 470
527 549 570
622
578
:N9rth Caro1in:a .-' :;sauth carolina
3,399 3,398 .3,h75 . 2,570 2,651 2,518 . 2;27i 2,3.35. 2-,432 2,576 2,611 2,677
5o2 . 618 .. 603
297 323 393
327
306 31~8 335
364
390
YGlEO~RiGdIAa --~-:+---!-9_,_5438~8~~~9148~09~86~-~2~,5.7~1292~-~-~~62,244~4 1~~~6,230~~7.~~~62.,~001=53~~5~,28~.420~.1~~_6~,21~033~7-~ -6,~426~8
6 , 875 297
6, 984 271
7_, 027~6
.A:!.abffiqa ~
3,_$42 3,.589
i'lississippi
2,388 2,431
.Arkansas
3,855 3,877
. I:i'v:uisl.ana
507
5.09
' Texas .Hashington
3,426 3_.,5.56
387
440
:Oregon
399
422
_c_al_i_f.o__rn_i_a_..,._...-:.....-H---=1~,!::.~7:.:1:......__::i,6oo :.
3, 544 .
2, 731 2,5.09 2.588 -- 2,440 2,584
I 2, 508 , 1,538. . 1,644 . . 1:537 1,452 : 1,46~..
4,069 .
2, 678 : 2, 715 2,570 2,535 2i65o :
514 . .
'liBJ~
471 392
413
45'8
-3. ,716 . , 2, 340 .2:,431 2,2'19 2,378 2,394
- 420 1
297
462
1
11
163
327 324 1,95 207
312 - ;66 15l ' . 175 :
:1 2 4Q2i~ ~0_0..;...7_ _ _95;.....7.;..____9-'-3_0__1-',;....0_5_2 . 1;029.-
2~ 790 2,876 3,072 3,052
. 1,552 1,815 1 , 74h 1, 782 ; ~ :812 2,820 2,8!~4 3,022
1 . 443
414
2~528. 2,635
5D. 2,684
472 2,666
; 297 348
348
387
183 189
183
193
; 1,024_. 1,148 __1.;..,0_2_9_ _1..;...,0.,0_7_ _
1,101 629
863
1,035 176
749 2,201
1,646
1,309 632
2,695
363
7,04.7_
263 3,082 1,812
3,051
513 2, 723
362 161
1,034
:,'fOTA~ _J958
..:~~A~ _.1957
i~958~.%-; Qf 1957
47,:434 .3 9 , 3 3 5
12-1
48~383 : .48, 986 : 30,135
39,099 . 39,214 : 26,307
i :..124: . i' 125
115
30,320 29,191 28,798 29,556 Jl,134 32,587 26,81? 27,379 27,558 . ,2_7~~91 ' ~i,367 . 27,736
.113 - 107
104
108 ; 114 ., 117
33,020 28,0.50
118
33,280 28,576
116
33,447 28,547
117
...
I
.. r I
6- ~
h 7 {Jt)
&Lft\3
45~ (GJE(Q)~<GllA CJF&(Q)JP>
~lt.f 7 AGRICULTURAL EXTENS.ION SERV.ICE . . ,
"
UNIVERSITY OF GEORGIA AND THE
STATE DEPARTMENT OF AGRICULTURE
Athens, Georgia . .
-
U.S. DEPARTMENT OF AGRICULTURE
AGRICUL.TURAL MARKETING SERVICE
319 EXTENSION BLDG., ATHENS, GA.
.
May 7, 1958
FARH PRICE REPORT AS OF .APRIL 15, 1958-
l :'
GEOHGIA: During the month ende.d in mid-April, the All Comtnodity Index of P:rices
, Recei\red by Ge_orgia Far:mers decreased- 1 point to . 261 percent of its
Januar.y 1910 to December 1914 average, but remained 16 points or 7 percen~ above
the index on the same date a year earlier.
Farmers received slightly higher prices for grains, peanuts, soybeans, and sweet potatoes during the month. These increases pushed the All Crops Index up 2 points for the month.
Lowe-r prices for chickens and wholesale milk more than off-set slightly higher prices -:t:or meat animals and were influential in pushing .the livestock and livestock products index down 7 points (3 percent) during the month. A summary of these .indexes with comparisons is shown on the reverse side.
UNITED STATES: The Index of Prices Received by Farmers increased l percent (3 points) to 266 percent of the 1910-14 average during the
month ended in mid-April, the Crop Reporting Board announced today. Pr~marily responsible for the increase were record high prices for fruit and vegetables and a . substantial rise in prices received for cotton. Partially offsetting were low. er prices for dairy products, eggs, and poultry. The April Index was 10 percent _above a year earlier and at the highest level since January 1953.
The Index of Prices Paid by Farmers for Commodities ana Services, including I~terest, _ Taxes, and Farm Wage Rates (the Parity Index) rose nearly l percent (2 points) during the month ended April 15 to 306 percent of the 1910-14 average.
This established a new high, 3 percent above a year earli~r: Increases in farm
production costs were entirely responsible for this rise, as prices of family
living items averaged the same as in mid-March.
With both the Index of Prices Received by Farmers and the Index of Prices
raid including Interest, 1'axes, and Farm Wage Rates up approximately l percent during the month the ~arity Ratio remained at 87, about 6 percent higher. than in April 1957. ~
Summary Table for the United States
Indexes
: Apr. 15,
1910 - 14 = 100
1957
Mar. 15, 1958
Apr. 15,
Record high
1958 - Index -- -Da:te - -
Prices Received
242
263
266
313 Feb. 1951
Parity Index !I
296
304
306
306 A1Jr. 1958
Parity Ratio
82
87
87
123 Oct. 1946
l/ Prices Paid, Interest, Taxes, and vJage Rates based on data for the indicated - dates.
ARCHIE LANGLEY Agricultural Statistician In Charge
tJILLIAN E. KIBLER Agricultural Statistician
.... . .
' .. . '
. . ' !.; :>. \
l3Y -' ~ .,.
PRICEs RECEIVED
--- -- . .. - ---- - ---~--- - ~- - -
--- - -- ~-
..
---F-A-RM-E--R-s--A-PR-IL--1 5-,
19sa
--~-
.wiT-H
r- ---
_c o_N_.PA_R_.,r._s_o N_s_ _ _-
-
---
-
-
. . r. : :: .-... ..
GEORGIA
i-.j
mmn STA'l'ES '.
- . tr~W-cl~;~~:-"[A~:~;:-~Mai9s~5~-F~~5fLt~~~~--IAi~s7~]~~~~~
;;~-~t :;~-:- --- --;-r-1:;3 -~-2~C8-- ; .07 -r-;:0311 -----;-";-~,.~ 1 1.9. r 1.95
I I
Gorn , Bu . ... $
..
. 91
Oats , Bu ~ ..
! . -$.
. 67
)$1 Iri'h Pot.; (cwt .
1.13
,. -
, 1 .34
1
j . 81.
I '
l -I
1 . 43 ! 1 . 49 l.
I .91 . ~ - . 90
I
. 64 . 40 1 .14
I
I
i
I 1. 21 1 1.09 -.::J:, : .~ 1_2
I .71
. 62 -~ - ..~62
I r ~:. 1.20 . 3:25
I Sweet Pot ., (cwt . )$
. 84
~::::::.~::Ton :I ~:::5
! Hay (b!i;d) Ton $
Hogs , per .cvrt . $
7~3 6
Beef . Gattle~cwL
$
1
1'
3.96
! 5 . 60
I 33 ,1
I 23 .50
! 16 .60
I' 13 . 40
5 . 5C'
::: : 28 .30 19.30 1 17.9(_)
5.75 1
~.so iI 32.0
!I
I! 19 . 60
j I
18 70
1 1
I
1 . 60
~:::5
7 . 27 5.42
, 5 .15 5 . 52 1 5.85
0:::~ j 3:
'j,:>:.9
f 21.10 1 18 . 50 . I 18.00
1 17.40 1 20 .30
Ii 16 . 90 ' 'J 21.70
20~20
22~2o
Milk Cows , Head $ 33.8 5
Chicken' ,Al1,Lb_. i 13 , 3
I I !I l n 5 . 00 18 .o
1145.00 i 145. 00 JJ
20.9 . j 18,0
48 . 00 11.4
11 151. 00 l2oo . oo
i 18.2 20.8
203 . 00 19 . 0
Egg.s , Doz .
21.4
I I I 36 . 3 \ 46 . 0
44 . 0 j 21 . 5 - ~ 3 0 ~4 40 . 8
37 .4
Butter;fat , Lb . 25 . 8
I 52.0
50 . 0 I 50 . 0 ~~! 26 . 3
Milk {who lesa1e) per l Oaf!
Soybeans , Bu .
Peanuts. , Lb .
$ i 2.43
$
i
I
I
r
5 .2
~II I
1/
Y!
i
I I
5 . 67-
5 .90
5 . 65 i
I ! I, 2 . 45
I
!I . Ij 1 0 . '5
2 .15 1 10.5
2-.20 1 1 l 0 7
1. 50 4 .8
.-- - -- - --- - -- - - ------ - - - - ------- - --- ~- --- ------ -4--- - - - - --
!--/-
--R-:e-v::i
s--e--d--:.-___:::==--2--:/:-:-P=r=e=l=i.m .---in=a=-r-y- .---=-
~-..:..:::=::=:.=:::-.:.:-:::.-;
.
..::-=.:=:-::-.:.._.__
- ..
59 . 5 59.;4
vi' . l)
! 3.98- I 4 . 1 6
i 57.9 .
2/ '3. 91-
! ?.24 2.1 0
i 11.2 1 0 .1
1 2.16
~ l Q.S
- --. - -- --------- --- --- - --
INDEX NlJ1,ffiERS OF PRICE S RECEIVED BY FARME iiS IN GEORGIA
(Ja~uary 1910 - December 1914 = 1 00)
.All Conmoditie s
.All Crops
Grains and Hay
Cotton Lbt
Peanuts
'.i.'obacco
Cottonseed and SoY,bean s .
Iris::t Potatoe s, Sweet Potatoe s
Frui ts a.nd N'\l.ts
All Livestock and Livestock Products
(___I
Meat Animals
~~~~~r~~~~~:~~--- --- -- --
Apr. 15, Mar. 1 5, Apr . 15 ,
1957
1958
--1--9-5-8 --r.
245
26 2
261
:
267
274
275
1
151
164
167
1
272
263
263
I
203. 385
202 450
205. 450
I
208
.208
212
l
300 175
280, 189'
.i. 291
I.
189
201
237
230
266
327
. 336
136
1 65
148
--
228
--
-
-
-__23_5
____ _...:_2_27 __..:_1
! / PRICES PAID BY FA~RS FOR ~IiECTED FEE DS Jl...?RIL 15, 1 958 YTITR em PARI SONS
- - - ~------ -~ --
~ - ----- -- -~ --------~----;-r----- - ----.-
-- -- - - -- . .- -- .________ ___ . __G.O...E_R_G-I.d- - ..- -- - -___... -1;!;_ _ ---.- illHTED.-S.~s__
KTI!D OF FEED
__M
i
x
e._d_
,
D~iry
_'
'
F. .ee~
______ Apr . 15,
Mar . 1 5 , Apr. l 5 !i Apr . 15 , Mar . l5,
------1-9-5--7 - -- -19-5-8 - - -- 19-5-8- !!. 1957
.. 1958
-Do-lla-rs-Pe-r -1 0-0 -Po-und-s
Apr . 15 , 1958
.All Under 29"k Pr otein 1 65~ Protei.!l 18/~ Protein 2 0:~ Pra t e in 24;:~ Protein
~iih Protein Feeds o tcnseed fVte al
Soybean Me<1l Meat Scrap
4.00 3.95 4 . 05 4.15 4 . 40
3 . 45 3.60 4 .70
3 .90 3 . 80 4 . 20 4.05 4 . 30
3.s o 3.85
3 . 95 1\ 3.85 1: ~r . 25 :
Ii 4 . 05 ::
4.40
,.I :
; I
3.90 ,, 3 .901 !
3.83 3 .78 3 .77 3 .98 4. C9
3.82 3 .77 4 .66
3 . f>S 3.50 3 .56 3 .88 3 . 97
3 .89 3 .90 5 . 54
3 . 70 3 .65 3.64 3 .94 4 . 04
3 . 95 4.15 5 .82
Grain By- Products Bran Middlings Co rn Meal
3 . L,O 3 .60 3 .55
PrJU1 try Feed
Broiler Growing Mash Laying Ma sh
5 .20 4 .85
Scratc h Grains
4.40
Hal (Bal~
1\1 alfa
48 . 00
lul other
34&00
--------- - -- ------------
!/ As reported by Fe ed Dealers .
3.25 3.45 3 . 45
5 .10 4 .80 4 . 30
52 . 00 45 .00
3 .30
3 . 50 3 .45
I
I
!I!I
5 .10
44 .. 835o1I1
II' 3287..7s 0o 1
3 . cs
3 .12 3 .43
4 .95 4 . 48 4 . 11
33.40 30 . 60
2 .86 2.9 0 3.20
4 .91 4 . 38 3 .93
30. 70 29 .7 0
2 .93 2 .99 3 . 26
4 . 97 4 . <18 3 .99
30.70 29 . 70
- ----
_ a11a:a.61lii'"S
I)
bq00 7 GCL-
q~~Ai3G!EOJR{<GllA (CJR{OJ~-i-"-I!-~-Q~'~"' 1l"HN<G SJE:!R{VllC!E
I ' AGRICULTURAL EXTENSION SERVICf!
. M~'i
u. s. DEPARTMENT OF AGRICULTURE
~
UNIVERSITY OF GEORGIA AND THE . STATE DEPARTMEHT OF AGRICULTURE
,
IBRIA~I~S
L
. -.
AGRICULTURAL MARKETING SERVICE 319 EXTENSION BLDG ATHENS, GA.
ATHENS, GEORGIA, May 7 -- According to the Georgia Crop Reporting Service 1,047,000 broiler chicks were placed ~dth producers
in Georgia during the week ending l\iay 3. This compares with the 7,076,000
placed the previous week and is 19 per cent more than the .5,92.5,000 placed the same week last year,
Eggs set by Georgia hatcheries _amounted to 9, 712,000 compared t-rith 9,8o8,000 .the previous week and i~ 24 per cent more than the 7, 806,000 for the corresponding week last year.
Hatcheries repcr ted prices paid for hatching eggs during the week at an
; I
average of 82 cents per dozen. Average price charged by hatcheries for the
chicks \vas reported at $14~ 2.5 per hundred. These prices compare w:ith 82 cents
and ~:~14. 2.5 last week and with .5.5 cents and ~iilO. 2.5 one year ago. Egg prices
shown relate to Georgia produced hatching eggs whether bought on contract or
oth erl'rise.
--- - -- -vJeightecr- averagEf prices from the Federal;;.state l\1arRet lfews Service for
broilers during the week ending Nay 3 are as follows: Georgia broilers 2 3/4 3 1/2 pounds, at farms 19.50; FOB plants 20.46.
(See reverse side for other States)
Date Week Ending,
I I
GEORGIA CHICK PLACENENT BY vJEEKS
PERIOD~~RCH 1, 19.58 ~~OUGH lvrAY 3, _1~9.:..5_8_ _ _ _ _ _ _ __
-
EGGS SET 1/
19; - .-~958
-
Thousa nds
19.>8 %of
19.57
Percent
CHICKS PLACED. FOR B' ROILERS
-1957
1958
19.58 %of 1957
-- - Th.ousands
Percent
1ar. ~
Mar. 8
' I
Nar. 1.5
Har. 22
7,217 8,291
115
5, 350 6,244
117
7,081 8,003
113
5,390 6,307
117
6,997 8,474
121
5,394 6,015
112
7,148 8,816
123
5,341 5,840
109
Har. 29 Apr. .5 Apr. l2 Apr. i9 Apr. 26 Hay .3
7,014 9,101
130
5,390 6,103
113
7,456 9,285
125
.5,469 6,468
118
7,.510 9,032
120
5,566 6,875
124
7,804 9,535
122
5,645 6,984
124
7,741 9,808
127
5,889 7,076
120
7,806 9,712
124
5,925 7,047
119
1/ Includes eggs -s-e-t -b-y-h-a-t-c-h-er-i-e-s ~p-r-o-du-c-i-ng--c~h~ic-k-s--fo-r--h-a-t-c-he-~--s~u-p-pl-y--fl-o-c-ks.
-ARCH-IE IJANGLEY Agricultural Statistician In Charge .
- 1-J'. A~ HAGNER
Agricultural Statistician
p ...
. '
...
. .!
- -
EGGS SET A'lJD CHTCKS PlACED IN CO:t-1MERCIAL AREAS BY V.JEEKS - 1 958
Pag e 2 _ _
STATE~
- - - - --"---
' EGGS SET - THOUSANDS
CHICkS PlJlCED ..; m oUSli.NDS
' .--,~--------~------
Maine . :. .Connecticut
.Pennsylvania Indiana
1,633 -
I 1,195
..
1,~52
2,281 .
Illinois f~ ssouri
461 2,350
1~651 1,239
i,565. 2, 247 448 2,308
I
1,688 . !' 1,259
1,544 I
2,350 f
484 '
2,291
- - - __ ---'--- -~--_:._-...;.__
..--,--'""T" ~--------------
1;013 . 531
784 .964 , 136 . 716 .
999 : i,003 583 , . 611
885 831 9-93 905 179 139 620 644
962 <: 656
804 . 958
175 659
1:,010. 669
774 870 . . 172 741
;; Ilela\vare
2,4--57 2,491 2,485
1,941 . .: :1,986 1,967 1,788 1,741
t Ma r y l a n d
2, 754 2, 777 :2,866
1;-751 -: ;1,616 . 1,540 i, 188 1,806
?tr:iTglnia
2,436 2_,491 2,653
1,191 1,20-4 1,135 l,lL.6 l,lhl
::-:'W~.oerstthVCiragrionliinaa.
416
422
412 .
518 - 465 .; 460 - . . 470
527
3,399 3_,398.. 3,475 . r 2,570 2,o5l- 2,51B 2', 271 2:,}35
':- ~outh Carolina
502
618
603
~- GEORGIA ----:-----.~1f1_ _9. ..z,;53~5,.---:..9.l-1..8: 0& .
12 .
Florida
1
488 496. 529
'Alabama
1 3,542 3, 589 3, 544
297
323 393
327
6, 244
~z.:}07. _6., 0lL~84Q
241 :.: 259 2, 731 ; 2,509
2~520838
.
221 ' 2,440
306 ,6,103
23 7
. 2,584
'Ni,ssissippi
2,388 2, 431 2,508
1,538 1;q44 : J-,53 ~ .. :- 1,452. 1:, 468
Ar ka:ncas
Louisiana
3,855 3,877 4, 069
507 509
514
2, 678 ' 2,.715 . ~,570 :,2,535 2; 650
484 1 , . 471 .~ 392
413
458
' Texas . . H?-shington
3;1~26
J87
3,556- 3, 716
2, 340
440
420 'j 297
; 2,431 ~ 2.,279 2,378 327 324 312
2,394 366
.. Oregori .
399 . 422
462
163
.195 207.
151 175
. Ca.lif.ornia
1 l,h7l 1,600 1.:.402 ! ~~07
.957
930 1,052 -~'029-
- ,.
"TOTAL 1958
.
.
,.:$.i3'fAL 1957 c
:~
. ~- .
1+7,4J4 39,335
121
,.
48,383 39,099
- 124
48, 986
30,135
39,214
26, 307
,i .
125 i
115
I
30,320 26,815
113
29,191 28,798 29,556 )1,134 . 32,587 33,020 33,280
27, 379 . 27,558 27,491 '27,367 . :27 ' 736 28,050 28,576
107
104
108 .. 114 117
118
116
. ----------~~ -. ----------------------- ----
/
d--
1ov7
t i lie; A 0 ~(GllA tClR{((J)lP JR{JEJP>((J)lPtlf'llJN\'G \JElR{VlltClE
1 / AGRICULTURAL EXTENSION SERVICE
11 0 1 /C. NIVERSITY OF GEORGIA AND THE
STATE DEPARTMENT OF AGRICULTURE
U.S. DEPARTMENT AGRICUL'iURAL MA 1-
-::: -T~-Q~t.-,,i'C.a,&.~r.IA
,.
319 EXTENSION BLD ~ ATHENS, GA.
May 12, 1958 Mrl3'SS
SPECIAL PEACH REPORT AS OF MAY 1, 1958
WIJR+.RIES
GEORGIA:
Georgia's prospective peach crop for 1958, including both commercial and . . .
farm peaches, is forecast at 3,500,000 bushels, 57 percent above 1957 and 45 per-'
cent above average. If current prospects are realized, this year's crop will be
the largest since 1951 when 3;975,000 bushels were producedQ Picking is expected
to start later than usual this season due to prolonged cold weather during the
winter and early spring
The peach estimates, like those for practically all other crops, necessarily relate to total production Therefore, they include not only inspected rail and truck shipments but also local sales, non-inspected truck shipments to points ~
Georgia and adjoining states, quantities used on farms where produced and any quantities not utilized because of economic conditions. The following table shows the relationship between the DepartlTent!s total production estimates and the i~spected
rail and .truck shipments for the years 1948 through 1957. For most of these years
the percentage of the total production moving in inspected shipments has varied .
from 44 to 59 percent with an average of 53 percent for the period.
If the May 1, 1958 total production forecast of 3,5oo,ooo bushels is realized,
and if the percentage moving in inspected shipments falls within the above range
of 44 to 59 percent, then inspected rail and truck shipments from this year's crop could be anywhere from 4,000 to 5,350 equivalent cars. If the average of 53 per-
cent of the total production moves in inspected shipments, then the inspected rail
and truck shipments would amount to about 4,800 equivalent cars compared with
2}466 equivalent cars in 1957.
.. -
GEORGIA PEACHES
Production Unrecorded
Year :--T--o~t:arl .::.-U:Nrtoi:lt-i-z-e-d.-1~/=: fsanrlmesusaend~;::
0
t
1,000 1,000
1,000
bus.
bus.,
~
1,ooo
~
Number
1948 2,3::t8
1,063
65 3,076 1,190 51
1949 1,674
881
13 2,016
780
47
1950 . 810
336
1,224
474
59
1951 3,975 200
1,039
440 5,934 2,296
58
1952 2,496 100
1,009
277 2,868 1,110
44
1953 3,312
1,216
375 4,41+7 1,721
52
1954 3,000
1955
1,085
285 4,212 1,630
54
.---
1956 1,600
497
32 2,767
67
1957 - 2_,100
:
Av. 48 2,128
30
57 : 19.58 :~/3,500
967
179 2,466 954 4S
809
166 2_,901 1,123
53
!t. Not utilized on account of economic conditions~ g/ Local sales, non-inspected truck shipments to points in Georgia and adjoining
States and quantities used on fanns where produced0 ~/ As reported by the Industry Committee of the Georgia Peach Marketing Agreement.
and Order. Equivalent cars basis 387 bushels per car. ~/ May 1 forecasto
CARL 0 OOESCHER Agricultural Statistician
ARCHIE LANGLEY Agricultural Statistician In Charge
UNITED STA'IES - SPECIAL J'll'..ACH REPCRT AS OF MAX 11 1958
'I
. , ' ' ,::
PEACHES: . First forecast of 1958 production in the 9 Southern States is - --
. 1.5,418,000 bushels, 44 percent above 1956, and the la.zgest crop Sin'ce_ ::
1947. Th~ indicated c~op is 53 percent above the 10-year average which inc.lud8 .:.
the near failure of 195.5.. Each of the 9 States shows an increase over last y.ear
and expects above average production0 All areas have had a good set of fruit, and because of the late bloom this year there has been a minimum of frost damage.
North Carolina had a heavy bloom, and a good set of fruit which is expected
to produce the largest crop since 1951. South Carolina also expects its large_st.=' <
crop since 1951. Heavy thinning will be required to produce good sizes. A number
of grqwers -report leaf curl and . E:pepect a heavy drop of fruit.o Georgia ~ growers re-
port that there is a h~a.vy. s~~ of .fruit and also a good coverage of foliage. Fre~: :.
quent ra:i.r)s haye b:uilt up subsoil moisture to the point where goQCl sizing of ea.zrly
va;rie:tiea i~ .pretty well ~ured where the fruit is properlly thinned.. Thinning of '
i
. .
'
.
.
.
.
ear]y _.variet:ies has become a major problem for the first time. Most of . the ;.:early. :
varieties have been planted since 195~
:. '!
. . Jq.ab~ . has prospects for the largest crop since 1947. Heavy thinning will
be n~cessary. 'All varieties show a .good crop. In Mississippi, some sections .of ::"
the Staii~..have had hail storms but production is expected to be the largest_,sin~e ::.:
1953. . :'
.
', ~.. 'i :.:
Arkansas peach _trees are .loaded with small fruit .and will req't,lire hea~
~. i ! :.;
. .,
thirii.U.ng~ ;F.requent he.avy showers have provided a good moisture .supp]y but have :., ..
inter.:.:~z:ed with the sp;ra~ . pr9gram. Although the bloom was 1ate the fruit .is ex~ . ;__.
peeted to develop rapidly. May 1 conditions indicate the largest crop since - 1945~:
Louisiana also has a heavy set which is being thinned. Frequent rains are inter-
feri~. v4t11 .the _spray programo The. crop is late and harvest of early varieties
is not . e?cpected to begin before June 10. Although Oklahoma expects a good crop , : recent ~eports indicate that many trees have peach leaf curl.. Texas has a heavy.
set Or peaches in all areas. Only a few scattered sections of the State had anY:.
frost ' B.:tter :trees started blo~mi.ng. Soil moisture has been favor~ble and tre~s :. :.
are healthy.
: ' ; '
... In California the set of peaches ranges from light to heavy. There is con-
siderable variation in set between varieties for both Clingstones and Freestones. 'Ihe May 1 condition of Clingstones at 75 percent is sharply below last year and
below average. Growers repqrted the May 1 condition of Freestones to be 72 percent .which is also . sharply below last year and bellow average. Thinning is riow in" ... progres,s,. on both . Clingsi;.ones and Freestones i,n sane districts. In most Sacramentq . and San.. Joaquin Valley locations, peaches bloomed during the prolonged rains. Be-
cause of the difficulty in applying dormant sprays during the rains, considerable .
disea.se a.m insect infestation is reported.
PEACHES
. '
- - - - -:- - - - - .- - - - - - - - - - Pr~.'~cti;n- - - - - - - - - - - - - - - - - -
--:-19 5- -:T- - 956- .-7- state :--Average--:
. 1947-56 :
5
: 1
-i957- -=-- -r~clic;t-;4- - ~
:
:
.1958 ..
~--1~,-00-0-----:1,;-00-0-- . ~--1-,0-00-----1-,0-00------ - 1,o-o-o - ~-
bushels
bushels
bushels
bushels
bushels
N.
s.
Cc4.
Ga.
' ... .
1,157 . 3,031
2,420
. Ala.
Miss. .
.563 37.5 ' .
Ark.
1,534
La,.
7.7.
. Okla.
Texas
270 65.5
1/
950
II
4,3.50
II
1,600
1/
600
ty
v 447 2,2.50
..
80
15
200
.30
575
1,500 4,400 2,100
425 268 1,100
125 30 790
1,62.5 . 4,900 3,500
960 "!468 2,350 ... . 145
.. 350 1,120
. . . .. ' ,. . :.. _. i .....
. :: .::.. , , r-. '
.- ..;' ",: ~- J I; .
' : .: I, : ' ' ' . ' ~
.. .,... . . ::
J
:;;_
\ .
. . \ ,' ;'
I . ~ :,' ' , ', 'I:
w
s--13 -Sy
CROP
:
: .'\CRF~-~.GE FOR F!.RVEST
1958 WITH CGriP!.RISONS
... :YIELD PER J,CRE
PRODUCTION
kl\TD
STATE
SNf, p BF.J~ NS :
Hid - S p r i ng :
:Kverag e : :1949-.56: 1957
- Acre s -
.
Irid . 1958
. : Av.:
:Ind . :Average :
Ind.
. :49- .56 : l957:1958:1949 - S6: 1957 1958
I
._ Cwt .
- 1,000 Cwt. -
I
.South C<erolina: 7,910
6,200 5, cool 20
25 201 157
15.5
116
Ge o rg i a J',laoruna
jJi i s s i s s i p p i
5,040 1, 220
2, 880
3,700 aoo
2,000
3, 700 17
?50 ?~"..'I.. 1, 900, 23
20 16 1 8.5
23
29
22351
26 66
7L~
18
.58
59
17 48
Louisiana
3, 440
2,700 3,0001 24
27 2lj
83
73
63
Group 'l'otal 20,490
. Cl..NTJ.LOUPS :
~arly Summer :
15,400 I5,15ol 20
I
25 20 1 415
37b 303
.South Car olina : 5, 900
6,000 7,400j 36
24
212 144
Georgia i.rizona
8,480
8 :~ 450
9,000 9, 0001 56 4.5 1,)00 9, .500, 108 12.5
475 405 Jun- 10
932 188
Group Total 22, B2o lti,)OO 25, 9001 70 h5
1,til8 737
. SWEET CORN :
Late Spring:
i
I
.South Carolina : 2, 220
1,200 44 42 40
99 so
48
Georgia J,labama Cclifornia
2,060
4,160 : 7,000
2, 300 30 2,600 42 6, 200 68
33 30! .5.5 40 80 80
61 79
69
178 l l-tB 104
47 7 432 496
G Group Total :--r),UW-
, 300
I , CiJCUNJBERS:
0
7
Lat e Spring : :
Nor th Carolina : 5,500
6,200 6, 7001 47
I
42 so I
259 260
33.5
South C ~ rolina : 4,220
3,600 3,200 ! 44
5.5 5.5
185 198 176
Georgie. j;labc.ma
I.rkansas
G4o 1,040
610
Boo 600 270
6001 34
5--5-0 j
55
G5
34 251
55 60 .
44
29 27
50 33
29 12
1.5
33
Louisiana
640
600
6001 48 s o 60
31 30
California
1, 410 1,600 1, 800, 194 200 190
274 320
Group Total I4,25li
.. ONION[) : 1/
1ateSpr:ill.g :
IJ,57u I3,450j ~I
I
I
I
I
North Car olina :
800 2, 3001
75 125
60 288
Georgia
1,010
900
800 81 11.5 95
83 104
76
Louisic:. na
210
47
10
Texa s
7, 980 5, 400 .5 , .500 33 2.5 3.5
267 135 192
J,ri zona
1,180 2,000 2, 700 318 270 270
379 540 729
California
4, 550
3,800 5,100 281 365 300 I 1,243 1, 387 1,.530
Group Tot.al TOl' ~.TOES :
14, 940
12, 900 1 ' 00 135 173 172
1, 9 3 2,22o 2, l~
Lnto Spring : :
.South Carolina: 4,520
Georgia
11,640
H i s s i s s ipp i
1,560
Louisiana
1,190
6,300 12, 600
2,300 1,100
7,000 36 13, 000 39
2,4oo I 28
1, 500 40
34 35
39 36
40 35 41 50
165 214 24.5
452 491 468
hl
92
84
47
45 75
Texa s Group Total W:.TERHELONS:
21,540
4o ~ 4>o
I 16, 000 1s, 6oo 1 30
38, 300 39 , soo 34
22 27 31 33
674 1, 3 (
3.52 421 1, 293
Early SWiuner :
North Ccro1ina : 11,050 12,000 16, 000 1 49
::louth Caro1ina : 41 , 750 43,000 44,000 .56
Georgia
53,250 60 ,000 63,0001 78
"labam?..
17,260 19, 000 21 , 000 91
rhssissippi
10, 800 13,000 16,000 1 70
Arkansa s
10,160 -:<-11, 600 13,0001 85
Louisi2.na
4,L6o 4,200 4,200 1 77
Oklahoma
: 14, 960 11, 000 11, ) 00 63
Texa s J,r i zona
.:108, 080 112,000 124,ooo 1 47 5,090 5' 800 7, 000 !142
California Group 'ota1
: 10,480
: 288 ,I4li
-:<-10,500
-:<-3u2, roo
l0,500jl3.5
330,2l)(j I 55
~7-rnclude s proce ssing .
.55 43 75
92 72
85
80
T1 42 175 -::-180
54
541 660 2, 316 1, 849 4,151 : 4,500
1, 561 1,748
755 936 860 -::- 986
342 336
961 847
5,145 4,704 724 1, 015
1,411 -:<1, 890 l 8,76C: -:~19,1+71
Junl O
~i- Revised .
J,
3/s-
$1r37
UNIV ERSITY OF GEORGIA
qstJ (GJE(O~CGllA CC~O M~~~8 ~1rllNCG ~IE~VllCJE
/..3 lUI
AGRICULTURAL.' ~XTENSION SERVICE
U.S. DEPAR'TMENT OF AGRICULTURE
I
Ut,IIVERSITY OF GEORGIA AND THE
U"'RARl ES
AGRICULTURAL MARKETING SERVICE
STATE 'OEPAiUMENT OF AGRICULTURE.__ _.._ . _ _ _
319EXTENSION BLOG.,'ATHENS, GA .
. Athe~s, qeorgia
Nay 13, 1958
.J
'.:
:- . GENERAL CROP REPORT FOR GEORGIA AS OF HAY 1, 1958 . . : ~ '
.. Alarge "part .C)f. the important spring planted crops is being pla1ited much
later than: usuai -in Georgia this year. As of the first of Hay, most farmers were two weeks to a month or more behind usual schedule with land preparation and plant'ing , operations. In north Georgia only a few fields of cotton or corn have been planted. Southern areas are much further along, but for the State as a
wh"le, only about .half of the corn, cotton, and peanuts have been planted. By
this time la'st year, more t han two-thirds of these crops were planted. Transplanting of tobacco was well along with about 20 percent still to be transplanted,
,. .: ( .
. Most crops were in only fair condition due primarily to the la.teness ' of . planting~ . \rll heat and oats have grown rapidly the last f eH weeks after a l,ate start and :were begihning to head in central and southern Georgia. Due .to ample moisture S'l.ipi_Jlies.; pastures are generally i n very good condition. Peach prospects are the best since 1951.
~ . "
~HALL WHEAT CROP: .V.Jheat production in Georgia is forecast at 1,.560, 000, 16 percent below last year and 28 percent below average. The sharp
decrease . from a year ago and average is due to a much smaller acreage in wheat. The expected yield per acre of 19.5 bushels will be t hree bushels per acre above the .yield 'last year and second only to the record high yield of 21.0 bushels per
.c acre ir'l' 1956. The acreage for harvest this year, current ly estimated at eo'; oO'o, is 29 percent below last year Bnd is .the loHest wheat acreage for Georgia since
1931.
PEACF PRO~Pf': CTf~ GOOD: Georgia's prospective peach crop for 1958, including both commercial and farm production, forecast at 3,500,000
bushels, .will be the largest crop s i nce 1951. Total production last year amount-
ed to 2,100,000 bushels and the 1951 crop v1as 3,975,000 bushels. Based on past relationship between inspected shipments and total production Hhich has varied considerably, inspected rai l and truck movement from this years . Grop could be anywhere : from 3, 980 to 5,340 car equivalents. This co1npares with inspect~d shipments of :2,466 equivalent cars last ye ar. Picking in Georgia is expected .to start 'later than usual this season, due to prolonged cold weather during the win,ter and early spring.
Pl'~.hCHJ.:,8 - Production in Thousands of Bushels !/
- .--- -:- -::-:-..:-AV.erag~--: -1~55--:- -r9.50--:- -r957- -=-- -rncticated--
_ ~T~T~ ~:..:_ _124_1-~6___ .:_ _____ .:_ ______ _: ___ ~ _ ..:.:~ __ ~ _ !928_
N~ C.
1, ;t57
.2/
s. c. . 3,031
2/
:Ga. .
2,420
2/
950 4,350 1, 600
1, 500 4,4oo 2,100
1,625 4, 9oo 3,500
Ala.
:
563
2/
600
425
960
Miss. :
375
2/
447
26 8
46 8
Ark. . : ~a. '
1,53~.
77
2/
3/ 2,250
2/
- 80
1,100 125
2,350 145 .
Okla. '
2 70
IS
200
30
350
us---- Texas :
655
30
9. St ates :--15,581 - - - -
575
790
l,i20
-11,552--- -15,73E----- I5;4I8- ~-
l;-Inclu~es both-commerc1ai and farm-production.- 2;-Less th~n-550-busheis: :- ~
]/ Includes 195,000 bushels unharvested becau se of-economic 'condj.tions.
ARCHIE LPu\TGLJ".''::[
Avricul t ural St atisticien In Charge
CARL 0. DOESCH:,:R Agricultural Statistician
..
', : . :
UNITED STATES - GENERAL CROP REPORT AS OF MAY 1,. ;1.9.58.
. ~... ' .. ' '
A :Larg~ ~heat _crop and excellent hay and forage crop.s are early standouts among 1958 crop prospects. Corn, oats, sorghums and soybeans .are among other crops which advance toward main planting or growth periods in heavlest producinf areas with favorable prospects .. A cool April, wet and stormy _in extensive sections, held back farming operations and plant growth ove r much of the Nation but 1-Jithout .decisive , effects .for most crops. Cotton and corn plantin g was stalled -through ~ch of the South and in some sections may finish extremely late Wheat gro-vrth throughout the Plains continued its excellent show:l.ng under thE? . cool weather and many backward plantings elsewhere shovJed improvement. FrU.its had only limi~ed April cold reverses; Southern peaches ha ve the best Hay :prospects in years. Vegetable crcps and potatoes gained i n leading early areas. Grazing and hay crop prospects n ationally aver age the best in over :30 Y:eB:z:s.
Th.e winter wheat crop throughout much of the Great Plains looks "the best ever" to experienced r eporters a s fields wave with lusty growth. Newhigh per acre yields seem almost a ssu:ted on many f ie lds. However, the heavy stands must finish to harvest without s erious disea se loss or being flattened by storms and need good maturing and harve st <.reather for fullest outcome. Prospects in the North-vmst remain excellent. Spring grain seeding made good April progress in much of the North Central are a, the Northe rn Plains and the Northtv-est. \vorkable soils and . sufficient open 1v-eather in most of Ohio, JY"lichigan, Illinois,. IoWa., 11innesota and rnuc)!r of the Dakota s helped get oats seeded earlier t han usual, and . pushed spring wheat and barley seedjngs where these crops are important.
\JINTER .h'HEA'r: A winter wheat crop of 1,010 million bushels is indicated b~ : . conditions to May 1. This would be the third l a r gest crop of
record, only a little below 1947 and 19.52. A crop of slightly more than a :. :)
billion bushels would be 43 percent J.arger than the 19.57 crop of 707 million bushels, 19 percent more than the aver~ge aDd ne a rly .5 perc ent above th9 forecast a month ago. : Production prospects r emained about the Sart;le a s April 1.fof. most States except the Southern Plains and We stern Corn Belt ar eas. Significant production in_creases occurred in Texas, Okla~oma, Kansas and Nebraska.
PEACHES:. Fi:rst .fore.cast of 19.58 p roduction in the 9 Southern States is . 1~,4;1.8~000 bushels-, 44 percent above 19.56, and the "l argest crop since
1947. .The .indicate d crop is .53 percent above the 10-yea r ave r age -vrhich incJ.udes the near failure of 19.5.5. Ea ch of the 9 States shows an increase over fnst year and exp ects above average production. All area s have had e. good set .of .
fruit, and because of the late bloom this y ear there ha s been a minimum of frost
damage.
North Carolina had a heavy bloom, and a good set of fruit. lmich is expected to produce the" .l e.r .gEi st crop since 19.51, South Caroli na alsp exf)e cts its ~argest crop :since . 19.51. He avy thinning v-Jill be required .to produce good sizes. A number of growers report le af curl ~nd expe ct a heavy drop of fruit. Georgia growers r ep ort that the re i s a heavy set of fruit and also a good coverage of. . foliage~ Frequent r arns ha ve built up. subsoil moisture to the point .where good sizing of early va riet?-es is pretty well insured ~mere the fruit is properly . thinned. Arkansas peach tree s are loaded -vJith small fruit and will requir.e :. heavy thinning. Frequent heavy sho-vre rs he.ve provided a good moisture- supply but have interfer ed with the spray program. In California the set of peaches ranges from light t o heavyo Thc- re is considerable variation in s et between variaties fo~ both Clingstones and Freestones.
in MILK .PB.QpuCTION :. Milk cows on f a rms produced a total of 11,413. million pourids of milk in April. This was practicPlly the s ame amount a s April 1957 but g pe rcent above the 1947-.56 avere.ge for the month. Milk produ~ti1
showed the s ame seasonal increase a s from March to April l a st year, but gained
less thrun usual. Production in April wa s suffici ent to provide 219 pounds of
.
milk '
daily.. to
each person
in
the
United
States.-
POULTRY AND EGG PRODUCTION: Farm flocks laid .5,495 million eggs during April --
3 percent less than in April 19.57 and the lowest April production since 1941. Total egg production, January through April 19.58, was 4 percent below the seme period l a st year. Laying flocks ave r aged
29.5,0.54,000 laye rs during April -- 3 p ercent less the.n April 19.57. The e.verage number of l ayers was down in all r egions except the South Atlantic r e gion end the West.
9007
LfA-3
5 CGJEO~CGllA CCIRiOIP ~ .
j.3 AGRICULT 'JRAL EXTENSION SERVICE \JNI ~.-n,.':'>\i 'l Or GEORGI
UWVE'RSITY O)" GEORGIA 'AND TriE
STA ' r~ tiEP~RTME'NT ;OF AGHICULTUR
Athens, Geo~gia
Ll. S. DE r>A.RTME f'.! T OF AGRICULTURE AGRICULTURP,.L MARKETING SERVICE 319 EXTEI\!SIO 'I BLDG., ATHENS, GA.
. Nay 13~ 1958 ,
GEORGIA: Weather condit~i ons duriJ:!.g mast of A11ril .were very changeable. Tempe~a-:,. . tures averaged se.veral degrees above seasonable normal and heavy rains
oqc1;1rred in .t[le southern part of the State during the fir .s t ..half ..of _. thEl mon~h . an.d in the extreme north near . the end of the month . Vegetable crops,. as a whole, have responded to the i mproved growing conditions during the latter part of April Fair to good stands are reported in most commercial growint: areas .
As of Hay 1, harvest of most crops was expected tc begin later than usual. Growers are hoping f or favorable weather in i1ay and jurie 1.vhich would partly offset earlier unfavorable conditions. Harvesting of cabbagt? and lettuce became fairly acti~e around May l.
UNITED STATES : The producti on of spring vegetable s and melons in 1958 is expect-
ed to be close to last year and averaf,e, the Crop Reporting
Board annonnced today. l nd:!.cated product:i,on is 1 percent ab ove 1957 but l per -
cent below average. The larger production is primarily due to increased acreage. The effects of unfRvorable winter and early spring weather are still evidenced by delayed harvest and lovJ yields for many crops. Sizeable increases over last year's production are indi cated for watermelon s , onlon s , sweet corn, cant aloups and cucumbers. Almost offsetting are declines in prospective production of lettuce, cabbage, celery, carrots and broccoli. bummer watermelon acreaf,e is
expected to be 9 percent larger than the acre age harve sted in 1957.
Hany of the ve getable pr oducing areas of the nation had some unfavorable weather during April. In spite of this, the outlook for supplies of f resh vegetable s on Hay l was brightGr t han it h ad been f or several months . vuppli es of most ve getable s will be light e r than normal duri ng the first half of Y.tay, but after m:i.d-Hay, overall supplies will be more abundant . froduction of winter vege tables was severely curtailed by :lntermit.tent freezes and rains.
SNAP BZANS: l'1id-spring snap bean produ cti on is f oreca st at .303,000 cwt., onef ifth les s than last year and more than a fourth belo>v average. In
bouth Carolina, excessive moisture delayed planting and hampered cultivation. Th(
crop is in only fair condition and is 3 weeks l ate . Harv e st is .expected to start
about June l. Georgia snap be ans are in poor condition and l ate b e cause of ad-
verse spring weather . Harvest is expe cted to start about Hay 15. 0nap beans in
Hississip:oi are in fair condit ion. Har vest is expe cted about Hay 19. Louisi-
ana' s snap bean crop has been r et arded and damaged by nnfavorable weather. Hhile picking will start in mid-May , i t 1~1ill be late in the mont h before appreciable ( supplies are available .
CABBAGE : Early spring production is f orecast at 1,972,000 c1-1t., 21 percent be-.
l ow l as t y ear and 19 pe rcent be low ave rage . The South Carolina crop
was damage~ more seve r e ly by the cold, wet weather than ha d be en expected . There are many seeders and exces sive rain l eached fe rtili zer. Light shipments are just beginning . In Georgia, l i r ht harvest is underway on early planted fields with very poor quality and yields r eported. Late jJlantt-)d fie lds look good, anc). high yields a re expected if weather conditions are f avorable during Nay , Al abama cabbage i s r eport ed to be in good condition. . Volume movement is expected about mid:i'1ay. In Nississippj_ , rainfall has been exces sj_ve . Heads a, r e developing slowly and to small siz.e . Light cutting f or local markEt started about l'iay 1, with active harvest expe cted by h ay 10. The Louisiana crop is in poor condition . iYiost fields have a high proportion of s eeders. Le af spot and worms are also preva_lent. In southern Calif ornia, crop prospe ct s on the rem<nning acreage ar e good. Carlot movement is now declining but volume supplie s a re expe cted to be available .during early Hay .
C.(li\JTALOUPS: This y ear 1 s early summer cantaloup acreage is es.timated a t 25, 900 a cres , ~lhich is an incre ase of 57 percent from las t year 1 s small
acreage. The 1958 a creage is only 13 pe rcent above aver age . A 23 pe rcent increas'
in cantaloup a creage is r eported in South Carolina. Rain ha~:; delayed pl onting and cool weather ha s r et arded growth. The. Grop - is now abou:t 2. to 3 weeks b ehind a normal schedule in i ts development. The .Oeor:gi a crop wns . also de layed. ).ore age there vJa s held at l ast y o[l r 1 s level by: unfav.orabl e c onditions fo r planting . '1h e big acreage increa se is ;i.n, Arizona ,; In that . State , qarly summe r ar-reag e Has
cut to 1, 500 a cre s in 19.57 , the smal -lest in over 30- y ear s . . Exp<msion in new.
growing a rea s brought this y ear's acreage back to a n ormal l evel. 'l'he harve st pattern from this Arizona acreage is not e stablishe d. Howeve r, it appears li.kcl y
t h?.t the bulk .of .the marke ting s will be made from J1,1ne 15 to ,July- 15.
(over)
- 2-
SWEET CORN: The first forecast places production of late spring Slveetcorn at
717,000 cwt., only slightly above l ast yearTsproduction but 12 -.1
percent under average. Southeastern States have about the same acreage as last
year's but are expecting less production. California's acreage and production is
up about 15 percent. April rairis delayed planting in South Carolina, and the
crop is 2 or 3 weeks late. However, it is in good condition. Rains delB;yed plant-
ing in Georgia and some fields v1ere not up on May l. The California crop is in
good condition; egpecially in the desert areas where most of the acreage is lo-
cated. Harvest ha s begtm in both Coachella and Imperial Valle;Y:s. Acreage was in-
c.reased
slightly
in
San
Diego
County
and :the
.Edison-Arvin~~..lheeler. 1\idge
. :. ; .'. ..
. .:
. .
districts.
ONIONS : Production of late spring onions is f o're ca."st at' 2, 8J.~ :,ooo cWt. , which is
one-fourth larger than last year and 42 percent above average . In North
Carolina, many early fields have poor stands but the crop generally is in good
condition. Insects and dise ases have not caused serious damage to date. The
crop is late and harvest is ex-pected to start about May 25. In Georgia, poor :
stands and unfavorable growing conditions have held yield prospects below last
year's level. Recent rains have delayed harvest which is now expected to get un~
derway about May 10. North Texas onions are generally in good condition. Unfavor-
able weather delayed planting of about one-third of the acreage until the l ast
half of March, and some of the se late plantings have irregular stands . Howev~r,
stands arc fairly good on early planted acreage, and yield .pro$pects are genera1ly
good. Heavy rains and hail in the Dallas area in late April caused some damage.
Harve st is expected to start the last week in May . Harvest started in the Yuma
area of Arizona the third week in April. Yields and quality have been good.
Start of harve st in the S21t River Valley is expected the second week in May. In
C2lifornia, movement from Imp erial Valley got underway in mid-April. Harvest has
ptarted in Kern County. In the Stockton aroa, onions have made good r ecovery from
the effects of heavy rains and flooding. Only a small acreage ~as lost. Harvest
;is expected to start the last half of Hay, but supplies will be light until; af.~er.
June l.
TOMATOES-: Late spring tomato production j_s fore cast at l, 293,000 cwt., which il:l
~rcent more thar- was produced . last year out 6 percent less than
average production. In South CRroliria; t omato acre ago "ha s increa sed. Most fields
are in good condition but t he crop is late be cause of cold, wet Heather during tho
planting season. Harvest will l)egin in mid-June , 2 to 3 >veeks later than usual.
In .Georgia, weather was very unfavorable for setting tomatoes. PLnting was de~
layed and there was considerable resetting . Some fields were being reset the .
last week in April. 1'he crop is two weeks behind a normal schedule in its de~elopment and is in only fair condition. Fussissippi tomatoes were transplanted ~boutlO d~ys later than usual b ecause of cold, wet weather. The crop is late
but in good condition. The Louisiana tomato crop is also late this year but is
reported to be in good condition. Early areas in the southern part of the State will come into p-roduction in l ate ~1ay . Setting of late fields in the northern .
l}reas ivas completed in l ate April. In east Texas, grm-vers -planted substantially
~ess acreage than in 1957, but the acreage available for harvest is only slightly
below last year 1 s. Hca-r.r rains and flooding destroyed a considerable acre.age . in
~957. So far this ye ar east Texas tomato8s have not been seriously damaged by
rain. Cool, wet -vmather has r etarded vine grmvth and the crop is late. Harvest
will start at Yoakum about May 20 and at Mathis and a fev-r other areas in east
Texas in late May. Picking in the Jacksonville -Tyler ar ea will not begih uptil
~arly June.
...
~ I
WATERriJELONS : 1ne first forecast of the late spring crop in Florida and Californ:i,~ is 8,601,000 c1.:t., an increase of 16 p(; rcent over last year and 15
p0rcent above average . The a creage in Florida is unchanged from last year and
~lightly lower in Celifornia but yield prospe cts are above last year in both
~tates. Although there was a wide variation in plant ing date of the Florida acre-
age, there is l oss than the usual difference in t he stage of growth between areas.
A very light harvest is expected in the Immokalee area around mid-Hay. In centrRl
Florida, first hnrvest is expected around June l and in the Gainesville-Newberry-
~renton area around June 10. In north and west Florida, harvesting should start
qround June 20. In California, progress of early plantings was r etarded, .but re-
qent .vrarm weather has been conducive to good vine growth . Yield prospe cts are
generally good. Harvest is expe cted to start in l ate Hay
Preliminary a creage in the early s~~er States, estimated at 330,200 a cre s, is slightly under growGrS intentions in March. Acreage at this level is 9 percent over last year and 15 percent above average . Compared with last year, all States
except-Louisiana and California show some increase with North Carolina, Hississip' pi, Arkansas, Arizona and Tex~s accounting for most of it.
..
ARCHIE LANGLEY
Agricultural Statistician In Charge
. 1. H. HARRIS, JR . . Vegetable Crop Estimator '
UNIVERSIJY Of
J~ CREJ,GE I\.ND IN DIC~ TED P~ODUCT
. . T D.icTE , 1958 vJITH corl?t.RISONS
.. . .1\CR.Ki.GE FOR TTf, \TF~S'JliBRAR~~"EL PER J,CRE
PRODuCTI ON
STATE
:f'.veraese :
Irid. : j 'l-V :
:Ind. :Average :
: Ind.
SNf,p BF.J~ NS :
hi d - S p r i ng :
:1949-56: 195 7 - Acr es
.
- 1958 :49- 56: 1957 :1958:1949- 56 : 1957 : 1958
Cwt.
I
- 1, 000 Cwt .
i
I
t:Jouth Cc.r olina : 7,910 6, 200 5, Cool 20 25 20! 157 155 116
Georgia
5,040
Llabama
1, 220
i!Ji s s i s s i p p i
2, 880
Louisiana
3,440
Group t otal 20,490
. CJ,NTJ.LOUPS:
~arly Summer :
t:Jouth Carolina : 5, 900
Geo r g i a
8, 480
L.rizona
8,450
Group Total 22, 820
3,700
soa
2,000 2, 700 1),400
6, 000 9,000 1, 500 lti, )oo
3, 7001 17 750 2l
1:~ 9001 2 3 3, 0001 2h I),l)Oj 20
I
I 7,400i 36
9,0001 56 9J .r/::oo I 108 2), 9001 70
20 16!
85
23 29
22531
26 66
27 21J
b3
I 2) 20
4l)
I
24
45 125
I I
212
475 93 2
[,.)
I 1,o18
74
59
18
17
58
48
73
63
37b 303
144 405 Jun. 10 188
737
. SWEET CORN:
Late Spring:
i
I
South Carolina: 2, 220 1,200 1, 200 44 42 40 I
99 50
48
Georgia lcl abama C2.liforni a
2, 060
. 4,160 7,000
2,400
2,700 5,400
2, 300 30 2, 600 42 6, 2001 68
33
55
30 4o
I '
80 80 i
61 79 178 148 47? 432
69 104 496
Gr oup Total :--r),4W II,7oo I2, 300! 53
6I 5B!
814 709
717
CUCU1'1BERS : Late Spring : :
I
I
.
Nor th Carolina : 5, 500 South Car olina : 4, 220
6, 200 3, 600
63,,
70~1
20v,
47 44
~.2 50 i
55 55 I
259 260 185 198
335 1 76
Georgi<7.
m~o
800
6ool 34 34 25
29 27
15
l
i.l abe.ma J, r k a n s a s
I Louisiana
1, 040 610
640
600
270 600
I :s_5_o_1l
55 )'c:
600 46 " "T/ .
55 60 44 --- I
50 6o 1
58 33
29 12 31 30
33
36
I
California Group Total
1, 410
1, 600 1, 800 ,194 200 190 1
14,2150 I J,67u n,4so l 5I b4 '701
274 320
8o5 880
342 93 ?
. ONIONS : 1/
Late Spr:Gi.g : -
'
North Carolina :
800 2, 3001 --- 75 125
60 288
Georgia Louisiana Texa s l.r izona Cal i f o r n i a Group Total
1,010 210
7, 980 1,180
4, 550 14, 940
900
5,400 2,000 3,800 12, 900
~~~ I
C1 47
5, 5oo 33
2,700 318
5,100 281
16,I;:oo! 135
115 ;~:I
25
270 270 I'
365 300
I I
17 3 172
83 10
267
37 9 1 ' 2/.J.J 1, 983
104
76
135 192 540 729 1, 387 1, 530 2,226 2 , 81~
TOMATOES :
'Late Spring: :
bouth Caroli..11a : 4,520
Georgia
11, 640
Ei ssissippi
1,560
Louisiana
1,190
Te xa s
21,540
Group Total 4o .. 45o
WJ.TERr1ELONS:
6 , 300 12, 600
2,300 1,100 16 , 000 38 ,300
I
7,0001 36
13, 000 39 2,400 I 28 1, 500 1 40
15, 600 ! 30
39,sooi 3L
34 35 39 36
40 35 41 50 22 27
31 33
165 452
LW.
47 67h 1, 379
214
491
92 45 352 1,194
245 468
84
75 421 1, 293
Early Surmncr :
North Carolina : 11,050 12, 000 l? ,O~O I 49
55
{~
::iouth Car olina : 41,750
Georgia
53,250
J l abama
17, 260
43,000 44, 0U0 1 56
60,000 63 , 0001 78 19, 000 21, 0001 91
43 75
92
r1ississippi
10, 800 13, 000 16,0001 70
72
Arkan sas
10,160 -::-11, 600 13, 0001 85 85
Louisiena Oklahoma
. 4,460 4,200 4,200 i 77 14, 960 11,000 11, 5oo 1 63
80 7?
Texa s i.r i zona
.:108 , 080 112,000 124, QOO! 47
42
5,090 5, 800 7, 000 :142 175
. Cali fornia : 10,480 ~<-10 , 500
Gr oup Total :2 88 ,140 -::-Ju2, roo
~,-Include s pr oce ssing .
10,5001135 3303 200 I 65
-::-180 54
541 660 2, .316 l, El49 4,151 : 4_, 500
1,561 1, 748
755 936
860 -:< 986
342 3.36 961 G47
5,145 4, 704 724 1, 015
1,411 -:<1, 890
I S, 7ol: -:<-19,i.J.7I
JunlO
-~~ Revised.
-- ~ 0 1 ~ 0
... 4 - L 0
<o.1 0 00 " " ' . . ~ o I 0 ot
o f 10 1 0 0 ..
00 I
I 0 0 ,....., . ...
AGRICUL TURAI- EXTENSiON SF.RVICE UNIVE:RSITY OF GEORGIA ANO T HE STATE DEPARTMENT OF AGFI;CULTURE .
BROILER CHICK REPORT FOR GEORGIA
U.S. DEPARTMENT OF AGRICULTURE AGRICULTURAL MARKETING SC:RVICE 319 EXTENSION BLDG., ATHENS, GA.
. Hay 14, 1958
ATHENS, GA., May 14 --According to the Georgia Crop Reporting Service
7,134,000 broiler chicks were placed with producers in Georgia during the l-veek
ending j'IIay 10. This cowpares with the 7,047,000 placed the previous week and is
19 per cent more than the 5,975,000 placed the same week last year.
Eggs set by Georgia hatcherj_es amounted to 9,729,000 compared with 9,712,000 the previous Heek and is 25 per cent more than the 7,794,000 for the corresponding week last year.
Hatcheries reported prices paid for hatching eggs during the lreek at an
average of 82 cents per dozen. Average price charged by hatcheries for the
no. chicks vras reported at ~jil4.25 per hundred . These prices compare with 82 cents
and ~:,14. 25 last week and wj_th 56 cents and
25 one year ago. Egg prices
shotm relate to Georgia produced hatching eggs tvhether bought on contract or
otherwise.
1.rJeighted average prices from the Federal-State lviarket News Service for broilers during the week ending Nay 10 are as follows: Georgia broilers 2 3/4 3 1/2 pounds, at farms 20.03; FOB plants 21. 00.
(See r .everse side for other states)
Date V.Teek
Ending
GEORGIA CHICK PLACEHlJ;NT BY \rJEEKS
- PERIOD HARCH 8, 1958 THROUGH lVJ.AY 10, 1958
EGGs SET J/
CHICKS PLACED FOR BROI LERS
1957
1958
---
Thousands
1958 1b of 1957 1957
1958
I Percent
Thousands
1958 % of
- 1957
Percent
Harch 8
7,081
8,003
113
5,390
6,307
117
l'1arch 15
6, 997
8,474
121
5,394
6,015
112
Harch 22
7,148
8,816
123
5,341
5,840
109
l1arch 29
7,014
9,101
130 5,390 6,103
113
April 5
7,456
9,285
125
5, 469
6,468
118
April 12
7,510
9,032
120 5,566 6,875
124
April 19
7,804
9,535
122
5,645
6,984
124
April 26
7,741
9,808
127
5,889
7,076
120
May 3
7;806
9,712
124
5,925
7,047
119
- I 11ay 10
7,794
9,729
125
5,975
7,134
119
1/ Includes eggs set by hatcheries producing chicks for hatchery supply flecks.
ARCHIE LANGLEY Agricultural Statistician In Charge
W. A VAGNER Agricultural Statistician
. EGGS SET AND CHICKS PLACED IN COMMERCIAL AREAS, BY \n!EEKS :- 1958-
\veek Ending
_P.a_,g_,e_.2-
..
. .
STATE
Apr. l'1ay
May
Nar.
26
3'
10 ....
. .. ., .
8
EGGS SET - THOUSANDS
..
Mar. lVIar. Mar. Apr. Apr. j Apr.
15
22
29
5
12 1 19
- __ CHICKS PLACED - THOUSANDS _....;.
Apr. I"lay
26
3
~
May 10
-
lIa:l.ne
1,651 1,688 1,605
999 1,003
962 1,010 1,0~4 1,070 1,006 1,111 1,101 1,117
Connecticut
1,239 1,259 1,213
583 611
656
669
599 646
'578
591
629
682
~ I
I '
l
I
I
:
I
!
' ' I
. '
'
' '
Pennsy1van.ia Indiana Illinois Missouri
Dela~-Tare
Maryland Virgir1ia Hest Virginia North Carolina South Carolina
GEOHGIA
Florida Alabmna l"lississippi
Arka~sas
Louisiana Texas lvashingt on Oregon California
1,565
2'iliiA
II 2,308
I 2,491 2, 777
1,.544
2, t58o4
2,2~1
2,485 2,866
2,L~91 2,653
422
412
3,398 3,475
618
603
9-,80-8 - -9. 7-12
496
529
3,589 3,5~h
2,431 2,508
3,877 4,069
509
5u~
3,556 3, 716
440
420
422
462
1,600 1:402
1,524 2,J57
h28 2,407 2,543 2,892 2, 737
419 3,624
612 9, 729
546 3,793 2,5.04 4,047
518 3,709
514 402 1,592
885. 993 179 620 1,986 1,616 1,204 466 2,651
323
831 905 139
6~4
1,967 1,540 1,135
460 2,518
393
6,307 6,015
259 . 203 2,509 2,588 1,644 1,537 2,715 2,570
l-l71 392 2,517.. 2,405
:?2"7. . 324 195 207 -. 957 930
839 958 175 659 1,788 1,788 1,146 470 2,271 327
5,840
221 2,440 1,452 2,535
413 2,378
312 151 1,052
774
997
870
889
1?2
142
7ll 1,741 1,806 1,141
527 2,335
739 1,950 1,698 1,397
549 2,478
306
348
6J lQ.l__ 6J 1.~68
23.7 2,584 1,468 2,650
458 2,394
366
253 2, 790 1,587 .. 2, 812 .. 443 2,528
297
175
183.
1,029 1,024
943 944 227 705 2,057 1,741 1,374 570
2,6~2
335
.875
297 2,819 1,815 2,820
414 2,635
348 189 1,148
922 966 203 830 2, 274 1,640 1,334 622 2,611
375
6,98h
2?1
2,961 1,744 2,844
511 2,684
3~8
183 1,029
905 929 224 696 2,074 1, 826 1,323 578 2,677 390
7,076
. 293
3,052 1,782 3,022
472 2,666
387 193 lz.00_7
863 1,035
176 . 749 2,201 1,646 1,309 632 2, 625 363
7,047
263 3,082 1,812 3,051
513 2, 723
362 161 1,034
923 1,074
208 830 1,943 1,962
1,395 654
2, 771
372 7-.134
252 3,180 1,826 3,129
506 2,856
324 207 1,088
TOTAL 1958
Lt-8,383 48,986 49,715
TOTAL 1957
39,099 39,214 39,499
~
1958 % of 1957
-~ ~-
II
124
125
.....__.
126
-
30,406 29,317 28,833
26,815 27,379 27,558
-.l13 . . 107 . io5
..
29,556 27,491
108
'---'
31,215 32,614
27,367 27,736 114 118
32,920
28,050 117
33,280
28,"576 116
33,447
28,547 . 117
34,433
28,857 119 '
-
lt .DUl \.U ~-
J..JU.l " J..ll ~ Vll ~ Jlll Jll t ,ll ~lfl l~ I l l 111 1 1 1_ ,. , .... ..
... ..... ... .. . ..
AGRICULTURAL EXTENSI ON SERVICE
l l UNIVE RSITY OF GE<>RGJA AND. nu:: ST~ T E DEPARTME NT -OF AGHICLIL.TURE
BROILER CHICK REPORT FOR t;;EORGIA .
, . .. .
iMl?G~ [ ~VllCCIE lJIIRARlES
I&.JUI&Iilo'-AI!IIMI!!~~F AG R IC U L T UR E AGRICU:..T URAL MARK!.::TING SERVICE 3!9 EX TE NSION SLOG. ; ATH ~ NS, GA.
HAY 21, 1958
ATI{ENS, GA ., Hay 21.-- According to the Georgie3: Crop Reporting Service 7, 437, 00~0 broiler chicks were placed with producers ..In' Georgia during the week ending Hay 17~ This compares t-:ith the 7,134,000 placed the previous tieek and
is 23 per cent more than the 6,039,000 placed the same t-1eek last year.
. , . Eggs set by Georgia hatcheries amounted. to 9, 718,000 compared with
9, 729,000 the previous t-Jeek a"ld is 22 per cent niore than the 7, 979,000 for
the corresponding week last year.
Hatcheries reported prices paid for hatching eggs during the t-Teek at an
average of 82 cents per dozeri. Average price charged by hatcheries for '!1he
chicks was r eported at ;~ll.J.. 25 per .hundred. These prices compare w:i.th 82 cents
and ::~14. 25 last week and with 57 cents and ~)10. 25 one year ago. Egg prices
shot-m relate to Georgia produced hatching eggs whether bought on contr,act or
othert-rise.
Heighted average prices f rom the Federal.:.State Narket News Service for broilers during t~e week ending Hay 17 are as follotl'l'S: Georgia broilers 23/4 - 3 l/2 pounds, at farms 18.54; FOB plants 19.45.
(See reverse side for vther states)
Date liJeek _J!1nding
GEORGIA CHICK PLACE.tVJ.ENT BY HEEKS
PERIOD llfiARCH 15. 1958 THROUGH lVlAY 17. 1958 .
, I-
I 1957
EGGS SET 1/
1958
1958 %of
1957
Cni CI<:S PLACED FOR BROILERS
1957
1958
1958% of 1957
Thousands
Percent
Thousands
Percent
liarch 15
6,997
8,474
121
5,394
6,015
112
Narch 22
7,148
8,816
123
5,341
5,840
109
r-iarch 29
. 7,014
9, 101
130
..5' 390
6,103
113
April 5
7,456
9,285
125
5,469
6,468
118
April 12
7,510
9,032
120
5,566
6,875
.124
April 19 April 26
7, 804 .
'
7,741
9,535
9,808
122 127
5,645 5,889
6,984 7,076
124 120
Hay 3
. 7,806
9, 712
124
5,925
7,047
119
Hay 10
7,794 9,729
125
5,975
7,134
119
Hay 17
7,979
9,718
122
6,039
7,437
123
)/ Ihcludes eggs set by-h-a-t-c-h-eri-e-s-p-r-o-d-u-c-in-g~-c-h-i-ck-s--f-o-r-h-a-t-c-h-ery supply flocks.
ARCRIE LANGLEY Agricultur_al Statistician In Charge
1cJ . A HAGNER Agricultural Statistician
n
I
STATE
Ha:tne Coimecticut Pennsylvania Indiana Illinois ltissouri Delaware Mary1a."ld Virginia West Virginia North Carolina South Carolina _G_,E....O....RGIA . FJ.orida Alabama Mis s i s s i p p i Arkansas Louisi ana Texas Washington Oregou Calif ornia
TOTAL 1958 TOTAL 1957
1958 %of 1957
EGGS SET AND CHICKS PLACED IN COMMERCIAL AREAS, BY 1rJEEKS - 1958
..
Hay j May 3 l 10
l-1eek Ending
I
May
Mar. Mar. Ma.r. Apr. Apr. Apr. Apr.
17
15
22
29
5
12
19
26
;
I
EGGS SET - THOUSANDS
CHICKS PLACED - THOUSANDS
Page 2
..
I M~ I Ha3y .
May
17
1,688
1,259
1,544
2,350
484 2,291
2, 485 2,866
2,653
I 412 3,475
I 603 9, 712
529
3,544 2,508
I 4,069 514
i I
3,716 420
462
1.402
48,986 39,214
125
1,605 1,213 1, 524 2,357
428 2,407
2,5 1.~3
2,892 2,737
419 3,624
612 9 729
546 3, 793 2,504 4,047
518 . 3,709
514 402 1,592 .
49,715
39,499
126
1,719 1,217 1,$75 2,397
438 2,382 2_,503 2, 917 2,925 . 410 3,698
651 9,718
538 3, 756 2J59S I 3, 966
529 3,775
506 401 1,549 .
50,165
4o,io5
125 .
..
1,00} 962
611 656
831 839
905 958 139 175 644 659 1,967 1,788 1,540 1,788 1,135 1,1!~6 460 470 . 2,518 . 2,271 393 .327 6,015 5,840
203 221 . 2, 588 . . 2' 1-140 . 1,537 1,452
2,570 2-,535
392 2,405
324 207 . 930
413 2,378 . 312
151 1,052
-
29,317 28,833
27,379. 2.7-,558
107 105'
1,010 669 774 870 172 741
1,741 1,806 1,141
527 2,335
306 . 6,103
. 237 2,584 _1,468 2,650
!68 2,394
366 175 : 1,029 '
1,0!t4 599 997 889 142 739
1,950 1,698 1,397
' 549 2,478
348 6,468
253 2,790 1,587 2,812
443 2,-528
297 183 1,024
29,556 27,-491
108
3~,215
27,367 114
1,070 646
943
944
227 705 2,057 1,741 1,374 570 . 2,642
1,006 1;l:,t1
578 . 597
922
905
966
929
203
224
830
696
2,274 .2,074
1,640 1,826
1,334 . 1;323
622
578
2,611 2,677
335 375
390
6,875 6,984 7,076
297 271
2~3
2,819 2,961 . . 3-,052 1,815 1,744 1,782 2,820 . 2,844 3,022
414 2,635
348 189
511 2,684
31~8
183
472
2.'...
666 387
193
1,148 1,029 1,007
32;614 ' 32,920
27,736 28,050
118 .117
..
33,280 28,576
116
1,101 . 1,117
629
682
863
923
1,035 1,014
l76
208
74~
. 830
2,201 ._1,94.3
1,646 1;.962
1,309 1,395
632
654
2,695 2,171
363
372
7,047 7,134
263 . 252
3,082' . .3,180
1,812 . 1,826
-
3,051 513
3,129 506
..
2, 723 362
.
2,856 324
i61
207
1,034 1,088
33,447 34~433
82,547 28,857
..
117
119
1,.175 623 : 998 .986 222' 962
2,215 1,769 1,472
631 2, 778
338 7,437
,.259 ... . j,072. 1,897 3,098
530 2,860
355. 221 1,228
35,126
28,428
124
\...J .l.:JV.U.U~. i
.I....IU...L..L.lL l':'. VLL t:i' JllUJ.1lJ1 J t"'!!llH'i lJ I l l 111 1 11-l'l...tV . l ol l - , . . . . , I ' " " ' " ' " " ' ' ' ' '
,,., , _.
b-.;J....
,HJ)q l
~ 4- A
lqo<D
n z{
CGJE(Q)~CGHA C1t:RCO~
AGRICIJLTURAL EXTENSION SERVICE UNIVERSITY OF GEORGIA AND THE STATE DEPARTMENT OF AGRICUL.TURE
BROILER CHICK REPORT Fffi GEORGIA
~~~WG J&JR{VllCI&
DEPARTMENT OF AGRICULTURE ICUL.TURAL MARKETING SERVICE EXTENSION BL.DG., ATHENS, GA: .
.
May 28, 1958
ATHENS, GA., liay 28 -- According to the Georgia Crop Reporting Service .
7,338,000 broiler chicks were placed with producers in Georgia during the week ending Hay 24. This co:npares with the 7,437,000 pl,aced the previous week and,
is 2l _per cent more than the 6;049,000. placed the same week last year.
Eggs set by Georgia hatcheries amounted to 9, 766,000 compared tdth 9, 718,000 the previous week and is 22 per cent more than the 7, 992,000 for the corresponding w~~k last year.
H~tcheries reported pr1.ces paid for hatching eggs .during the week at an average of 81 cents per dozen. Average price charged by hatcheries for the chicks was reported ,at :;~14.00 per htmdred. These prices compare with 82 cents and, ~~14. 25 l~st week and with 58 cents and :;~10. 25 one year ago. Egg prices shown relate. to Georgia produced hatching eggs whether bought on contract or otherrrl.se.
Weighted average prices from the Federal-State. Harket News Service for broilers during the week ending May 24 are as follows: Georgia broilers
2 3/4 - 3 3/4 pounds, at farms 19.15; FOB plants 20.13.
(See reverse side for other states)
Date Week
Ending
GEORGIA CHICK PLACEr1ENT BY 11mEKS PERIOD MARCH 22., 1958 THROUGH HAY 24 z 1958
-
ZGGS SET ];/
I
I
CHICKS PLACED FOR BROILERS
'
1957
1958
1958 %of
1957
1957
1958 ..
1958 %0 f
1957
Thousands
Percen;t
Thousands
Percent
March 22
7,148
8,816
123
5,341
5,840
109 '
l"Iarch 29
7,014
9,101
130
5,390
6,103
113
April 5
7,456
9,285
125
5,469
6,468
118 .
April 12
7,510
9,032
120
5,566 . 6,875
124
April 19
7,804
9,535
122
5,645
6, 98.4
124
April 26
7,7~l
9,808
127
5,889
7,076
120
May 3
7,806
9,712
124
5,925
7,047
119
Hay 10
7,794
9,729
125
5,975
7,13 4
119
l'iay 17
7,979
9,718
122
6,039
7,437
123
Hay 24
7,992
9,766
122
6,049
7,338
121
!/ Includes eggs set by hatcheries producing chicks for hatchery supply flocks.
l\RCHIE LANGLEY Agricultural Statistician In Cha~ge
H. A. WAGNER Agricultural Stc:tt.i.stir:ian
-
STATE
Naine Connecticut Pennsylvania Indiana Illinois l'lissouri Delaware l1aryland Virginia West Virginia North Carolina South Carolina GEORGIA Florida Alabama Iiississi ppi Arkansas Louisiana Texas 1rJashington Oregon C!l1 ..; f' n..,,..,..; !l
Tl'II'AL 1958 TOTAL 1957 1958 % of 1957
.. EGGS SET AND CHICKS PLACJD IN COMl\1ERCIAL AREAS JBY WEEKS 1958
l !
H1a0y
May 1:7
-
May 24 ..
- EGGS SET ,.. THOUSANDS ..
Week End~ng
Mar. N:ar.
22
29
I
Apr. Apr.
5 12
.
~
[-tpr. Apr . lVlay 19 26 . 3
.CHICKS PLACED - 'THOUSANDS
p age 2
..
May 10
May 17
M2at.
. .
1,605 1,213 1,524 2,357
428 2,407 2,543 2,892 2,737
419 3,624
612 9, 729
546 3,193 2,504 4,047
518 3,709
514
1 -~~~
49,715
39,499
126
1~719 1,694
1,217 1,575
'11,'510634
2,397 2,468
h38
465
2,382 2,413
2,503 2,548
2,917 - 2,908
2,925 2, 731
410 3,698
651 92 718
538 3, 756 2,595 3,966
529 . ' 3;775
457 3,676
645 9.766
504 . 3., 813 2,667 . 3,981
524 . 3, 773
506
496
401 . 470
1 .Sl..t9 1 h60
..
50,165 . 50,126 .
40,105 . 40,llJ
125
125
962 1,010 1,044 1,070
656 . 669
599 646
839 774
997 943
-958. 870
889 . 944
175 172 . 142 227
659 741
739 705
1,788 1,741 1,950 2,057
1,.788 - 1,806 1,698 1,741 1,146 . 1,1~.1 1,397 1,374
470 ' 527 ' 549 570
2,271 2,335 2,478 2,642
327 306
348 335
5,840 6,103 6.468 6,875
221 2,41..J.O 1,452 2,535
413 2,378
Jl2 151 1,052
237 253
2,584 2,790
1,468 1,587
2,650 2,812
458
443
2,394 2,528
.366 '. . 297
175
183
1,029 1,024
297 2,819 1,815 2,820
414 2,635
348 189 1,148
28,833 29,556 31,215 32,614
27,558 27,491 27,367 27' 736
105 . 108.. 114 118
..
:
1,006
578 922 966 203 830 2,274 1,640 1,334 622 2,611
375 6,984
271 2,961 1,744 2,844
511 2,684
348 183 ).,029
1,111
597 905 929 224 696 2,074 1,826 1,323 578 2,677 390 7.076
293 3,052 1, 782 3,022
472 2,666
387 193 1,007
1,101 1,117 1,175
629
682
623
863
923
998
1,035 1,074 -986
176
208
222
749
830
962
2,201 1,943 2,215
1,646 1,962 .. 1,769
1,309 1,395 1,472
632
654
631
2,695 2, 771 . 2,778
363
372 . . . 338
7,047 263
7 2134. . 252 .
' 1~437
.. 259
3,082 3,180 ' . 3,07?
1,812 1,826 1,897
3,05.1 3,129 ~ 3,098
513
5o6 530
2,723 . 2,856 2,860
362 ... 321~
355
161
207
221
1,034 . 1,088 1,228
32,920 33,280 33,447 . 34,433
28,050 28,576 28,547 28,857
117 116 117
119
35,126 28,428
124
1,151 - 662
961
1,120 . 207
924 ..
2,136 :
1,919 .
1,515 . -'
686 2,861
410
. :.
',
7z~~8'
276
3,399
1,914
.3,)17 .
486
2,983
364
224 1,068
35,921 28,821
125 '
"-"" .6.J""' ""'...... - .
... --~-- ,_ ~ .l
........ ~ ...... .I.U...... .&..LV.&.I. \,..l.l..i.'-AV\o.A ..&...&..&. J.U...J...U-.i.lc:::LYa
UJI!;""; r l . -L..J... '-"\ J IIIIII li\ ~I II V
llll lr": A \II
f I - -
Cf ()07
qlf1f GJE(Q)~CGllA CC~(Q)JP> L/- AGRICULTURAL EXTENSION SERVICE UNIVERSITY OF GEORGIA AND THE STATE DEPARTMENT OF AGRICULTURE
BROILER CHICK REPORT FOR GEORGIA
JUN
l S. DEPARTMENT OF AGRICULTURE
b '5 8 A RICULTURAL MARKETING SERVICE 19 EXTENSION BLDG., ATHEt~S. GA.
LI B ARIES
June 4, 1958
ATHENS, GA., June 4 ~-According to the Georgia Crop Reporting Service 7,551,000 broiler chicks were placed with producers in Georgia during the Heek ending May 31. This compares with the 7,338,000 placed the previous week and is 25 per cent more than the 6,062,000 placed the same week last year.
Eggs set by Georgia hatcheries amounted to 9,668,000 compared with 9, 766,000 the previous week and is 24 per cent more than the 7,818,000 for
the corresponding t-reek last year.
Hatcheries reported prices paid for hatching eggs during the week at an
average of 80 cents per dozen. Average price charged by hatcheries for the chicks viaS reported at $14.00 per hundred. These prices compare with 81 cents
and ~14.00 last t-Jeek and with 59 cents and ~;ao.5o one year ago. Egg prices
shown relate to Georgia produced hatching eggs whether bought on contract or
otherwise.
Weighted average prices from the Federal-State Narket News Service for
broilers during the ~1Teek ending Nay 31 are as follows: Georgia broilers 2 3/4 - 3 3/4 pounds, at farms 20.03; FOB plants 21.00.
r
Date Week Endint
(See reverse side for other states)
. GEORGIA CHICK PLACE1"ffiNT BY 1/JEEKS
PERIOD HARCH 29 19-_,;~8 THROUGH J1AY 31 1958 -
-
EGGS SET 'J/
CHICKS PLACED FOR BROILERS
1957 19,58
Thousands
1958 7~ of
.. 19.,5.._1
Percent
1957
1958
Thousands
1958 % 0 f 1957
Percent
March 29
April 5
April 12 April 19 April 26
Hay 3 Hay 10 ~1ay 17 1'1ay 24 Hay 31
7,014
9,101
130
7,456
9,285
125
7,510
9,032
120
7,804 9,535 122
7, 7~1
9,808
127
7,806
9,712
124
7, 794
9,729
125
7,979
9,718
122
7,992
9,766
122
7,818
9,668
124
5,390
6,103
113
5,469
6,468
118
5,566 6,875 124
5,645
6,984
124
5,089
7,076
120
5,925
7,047
119
5,975
7,134
119
6,039
7,437
123
6,049
7,338
121
6,062
7,551
125
!./ Includes eggs set by hatcheries producing chicks for hatchery supply flocks.
ARCHIE LANGLEY Agricultural Statistician In Charge
r
vJ . A. \rJAGNER
Agricultural Statistician
r
STATE
Maine Ccmnecticut Pennsylvania Indiana Illinois Missouri Delaware Maryland Virginia \.vest Virginia North Carolina
South Carolina GEORGIA
Florida
Alabama
ll!issis sippi
Arkansas
Louisiana
Texas
Washington
Or~011 _
Cal i f or nia
-
TOTAL 1958
TOI'AL 1957
1958 % o:f 1957
EGGS SET AND CHICKS PLACED IN COMMERCIAL AREAS, BY WEEKS
1958
.Page 2
Hay
1;1ay
J;'lay
17
. 24
31
..
\oveek Ending
'
- ..
Mar. Apr. Apr. Apr. Apr. . May . May Nay Hay May
29
5
12
19
26
::J : . 10
17
24
31
I I
EGGS SET - THOUSANDS
I
-
CHICKS PLACED - r,HOUSANDS
1,719 1,217 1, 575 2,397
438 2,382 2,503 2, 917 2,925
410 3,698
651 9, 718
1,694 1,164 1,503 2,468
465 2,413 2,548 2,908 . 2,731
457 .
3,676 . 645
9,766
l, 725 1,205
1,565 2,506
481 2,321
2,534 2,963 3,020
426 3,705
621 9,668
538
504
3,756 3,813
2, 595 2,667
3,966 3,981
529
524
3, 775 3, 773
I 506
496
- 4Ql . . 470
1,549 1,460
488 3,696 2,676
3, 993 527
3,917 452 . 4~6
1,4 l
50 , 165 40,105
125
50,126 . 50,386
40,113 . .40,109-
r
125
i26
1,010 1,044 669 599
I 774 997
870 889
172 142
741 739 1,741 1, 950
1,806 1,698
l,ll-J.l 1,397
527 549 2,335 2, 478
306 348 6,103 6,468
I 237 253 2,584 2, 790
'
1,1468 2,650
1,587 2, 812
458 443 2,394 2, 528
366 297 175 183
1.029- 1,024
29,556 31,215 27,491 27, 367
108 114
1,070 646
943 94h 227 705 2,057 l, 741 1,374 570 2,642
335 6, 87.5
297 2,819 1,815 2,820
414 2,635
348 +89._ 1,148
l,OOo 578 922 966 203 830
2,274 1,.640
1 ~ 334
62 2 2,611
375 6,984
271 2,961 1,744 2, 844
511 2,684
348 1(13 1,029
32,614 27' 736
118
32,920 28,050
117
l,lll 597
. 905 929 224 696
2,074 1,826 1,323
578 2, 6 77
390 7,076
293 3,052 1,782 3,022
472 2,666
387 193 1,007
33,280
28,576
116
1,101 629 863
1,035 176 749
2,201 1,646 1,309
632 2,695
363 7,047
263 3,082 1,812 3,051
513 2,723
362 . 16:1, 1,034
1,117 1,175 682 623
923 998 1,074 986
208 222
830 962 1,943 2,215 1,962 . 1,769
1,395 1,472
654 2,771
372 7,134
631 2, 778
338 7,437
2.52 3,180 1,826
3,129 506
2,856
259
3' 07.2 1,897 3, 098
530 2, 860
324 355 207 t2J. l,OU8 1,228
1,151 662
961 1,120
207
1,166 783 938
1,071 168
924 843 2,136 2,136 1,919 1,921 1,515 1,530
686 685 2,861 2,984
410 372 7,338 ." 7;551
276 3,399 1,914 3,317
486 2,983
364
1.~
270
3,350 1,972 3,191
538 2,996
428 17..6 _
1.139
33,447 34,433 35,126 35,921 36,207
28,547. 28,8.57 28' 428 28,821 28,793
117
119
12),
12~
J26
3/
AGRICULTURAL EXTENSION ~ERVICE
U.S. D~~ARTMENT OF AGRICULTliRE
. JUN 7 '581 Ul\:lVt:.:RSiiY OF GC:ORGIA AND nn::
STJ:.TE Or.PARTMEI">lT OF AGRI:::IJ!..TtJRE
AGRICUI..!URAL M,!\RKETING SERVICE 319 EXT.Et-lStON 13LDG., i.THENS, GA.
Athens, Georgia
L I B RARIES
Jtmo 5, 1958
FARN PRICE REPORT AS OF MAY 15, 1958
GEORGIA.: During the month ended in mid-}1ay, the All Commodity Index of Prices
Received by Georgia Farmers increased 3 points to 264 percent of _its January 1910 to December 1914 average and remained 17 points or seven per.cerit
above the Index on the same date a year earlier.
The All Crops Index remained unchanged at 275 percent of the 1910-1914
average~ An increase in the price of corn and soybeans \vas offset by a decrease
in price for wheat, oats, and other small grains.
The Livestock and Livestock Products Index increased 8 points over last
.month due primarily to higher prices for beef cattle, hogs, and calves. A summary of these Indexes with comparisons is shown on the reverse side.
UNITED .STATES: The Index of Price s Received by Farmers, at 264 percent of its 1910-14 average, remained unchanged from the r evised April index,
the Crop Reporting Board announced today. The most important increases were- re-
.corded for hogs, cattle , and cotton. Offsetting these increase s were lower prices
for tomato es, potatoes, strawberries, sweet corn, and milk. The May index was
9 percent above J:vlay 1957 and r emained at tho highest l evel since January 1953.
The' Index of Prices Paid for Commodities a.nd Services, Interest, Taxes, and
farm 1rl age Rate s on May 15 r emained at 306, the all"time high first established a
month earlier. Higher prices paid for food and tobacco, f eeder livestock, feed,
and some supply items wer e nearly offse t by decreases f or clothing, building
materials, S6ed, and household furnishings. Tho m:t.d-May index r emained 3 percent
higher than a year earli er.
V.Iith the Index of Prices Received remaining at the r evised April l evel, tho
Parity Ratio stood at 86, about 5 perccnt .highor than Nay 1957.
Sununary Table for tho United Status
Indexe s
Hay 15,
1910. - 14 = 100 1957
April 15, 1958
May 15, 1958
.- IndRxuc-o:r.d...h,Digahte-- _-
Price s Re ce ived
!:_1 242
!:_1 264
264
313 Feb. 1951
Parity Index 3,/
296
306
I
farity Ratio
82
!:_I 86
306
}/ 306 Apr. 1958
86
123 Oct. 1946
1/ Revised. 2/ Prices Paid, Interest, Taxes, and 1rJagc Rate s based on data for
tho indicated-dates . 1/ Also Hay 1958
ARCHIE LANGLEY ~gricultural Statistician In Charge
RAYMOND R. HANCOCK Agricultural Statistician
.. .. .. . . '
.. -
:
1." ' ..~ , ; : .... . : . ...
.. , ~.
..
B": PRICE<;' RECL n TF.5 ' FL .ilf.S ;(S M.:~.Y 15,
19s a ,
. . '
;,:
v:ITH
CQl,~~PL.R, .I:S: O:.lT.S:
...
.:.;' ' .. ...i. : ..~ ;i
~- ~- ;_-
--- ------- ----- - '4- , ..: ._: ~_....._. - ~- .: ~-..:.:.:..:.:._. . ~ , . . . . . J ' ~
--'-----'-------,..:... _'--'----T---~--___.;.GE=:.O:~R.:;G~=L:.:~---
f . . :. : . tn-II.Tl<\'D. ST]j _'il;B:"":'::.C'<._ __
COMMODITY lli'TD' UHT
Corn, Bu.
. $
. '
Oats; Bu ~
Irish Po't. ; cwt':
$
I 1. 23
2 . 06 . - 2 . 03
.91
1.37
'],. . 49
. 67
. 62
.90
1.13
2.50
2o 01 ~. . i .. 88. 1.98
I ... l.SO .
) 4 ,-
1. 23:
1.95
1.93
1.:1? ::_: . . .3_!.,~15
.87 j . . 40
.70 . .. ~~ ? . ....59
.:- ' ' .j .
. . . . ~ :.... ..;
.3 .oo
1..14 . . . -1.3? 3 . l p ... -:2.37
Swe et Pot . , cvrt .
Cotton.:, :Lt:' _:: ,
Cottonsee d , Ton Al l
Hn.y . (b2.l e d) ron ) .
.Hog:s, per. cwt .
$
.84
5 .50
. I :3 . 75
...
1 . 60 . {1 5 . ~ 0
5 . 8~
:5 . 91
12 .1 $ 23 . 65
33 . 2
I I' ' I 32 ~0
32 . 1)
-I
12 .4. :1 31. 5
Z2i3S:.
. 27 . 9 . . 29:.-l .. :
I I 23 .90 2s .so 28 . 20
'! ~--~ = . ?Q.. J.O . .18.20 . 17 . 70
$
I 7 . 36 17 .oo
I
19;.60 20 . 60
I
>n ' 7 . .. It .l7AO
. :
. I
, ..
20 . 20
.:
2:1:
. 70
'
Beef Cattle , c;vt . $ 3 . 96 1 l3 .eo 13 . 7 0 19 . 90
s .42 I n .6o 22 . 20 23 .10
.Mil~ Cows~ .Head
' c_~ :i:ck~n-~ :;: 1~1, Lb.
I .
I 33 . 85 l n s .oo I
11:1.4 . 13 .3 I lF.l . O
l4S . OO J.Sb . OO ~~ 4~ ~oo .'..: 1 ~6? . oo .. 203 .-do 268;00
1e .o 1 19 . 0
1 IB ~5. : 1: .o . ~9,.:6
: .:E~g s , Doz)
21.4
I <1 4 . 0
43;0
21.5' : '! 28 .8
37 ;4 . 35 .5
.BU.tterfa.'t, Lb .
l so.o 12-! .3 25 .8 I :::: 56.o
11
.! 59 . 4 . :pna . ,_, ~F 6
Miik .(whol e sale) Re r l OC)~
r I. I U V . 11 I
1 -'
:; 78
?. /
I
. s . 65 5 . 70
1.5(:
.
.
1, ..l
3 ~ 8 4 ..
1/.
~ 3 ~ 88 .
z/
~ _}. 77
soybcans; Bu .
Pen,rm:t ~ , L:h
!/ Rev ised .
1 2 .40
e ~ . 2 1 l Ci . p
I
I
2/ Pre l im 5.nar y .
?. . 20 l .o . 7 .. ,'.
.. i 2 . 30 II ~~
2 ~ 23 . " ?...;!, ".-. ..[. . 2.13
1.' ! .4 ... 8. . 1, -i
'
.. 'I 1. 1 z_ : '1 0.. 5 '.. ..., . 11.0 '
' ~---..-"77 -.:.i....-...:!_ ___::___
. .1....!- . -
IN DEX N'.iMB.RS OF PRICES :R:CEJ:VED BY' Fi.fl11lJ:R.3 n~ GEORGto\ ,"
.:
(Janua~r 1910 - De c ember 1914 =l OG)
, .
.' inv 15 , ,
Lpr .lJ , Mav 15 ,
- - - - ---- ---- - -- - -.- ,..,..;:,...,._.- -- - -. .._....:_......:..J:.~2L_____ l<:JS8 -~~e.""'-'""- .
.All Comnoditic s
247
261
2154
iul Crop s
26a.,: ;
27 5
215
Gr a ins and H<1y Cotton Li nt
..]z.5n3- . ..
-
1 67,.
263
165 263 ...
Peo.nut s
203
205 .: : 205
Toba cco
385
449
449
Cotton se e d a nd Soybeans
208
' Iri sh Pot nto es , Sweet Pota to e s and Cowpeas 277
Fruits and Nuts
194
21? .. :212 ..
291
295
189 , . !l.M . '
.'ill Live stock an d Li vesto ck Product s Meat .:_"limals
203
230
238
273
. . .. , . ._. ~3 6 :- : :. 354 ~:.,
Foul t r y and Egg::;
135
_
_D_a i_r_y
____ _ Products ..
____________
_
23 1
1 48.
152
227
228
-. . ..
! :"".
- +~ PRICE S PAID BY Fil.RMERS FOR SE:LECT.!:D FEEDS, :MI.Y 15 , 1958 , ViiTH CCM?/. RISONS
G:i: OitGL't ---~
l.JN ITED ST:tTES
ij
K Jl'ID OF FEED
Ma.' 15 , 1957
Apr il 15 , 1958
k~.y 15 , 1 Mi.l.y 15 , April b ,
158
' 1957 1958
~ ---------------
:Mixe d Da iry Feed
~il l Un der 29% Prot e in 16% Pro te in 18~~ ProtEo:in 2a;6 Prot e in 2/f% Prot c in
!!j.f(h Prot e in Feeds Cott onseed Meal Soyb ean Me:.l Me at Scrap
Gr~ in Bz- Products -Bran
Middl i ngs Corn Mcn1
.-, .co
3 .95 4 .10 4 . 2 '" 4 . 35
3 . 45 3 . 65 4 . 60
3.40 3 . 60 3.50
3 .95 3 .85 4 . 25 4 . ('5 4 .40
3 .90 3 .90
3 . 30 3 . 50 3 .45
.12.~.~~!-~-!:~.~-1.QQ_:'.Q.~~d s
4 . 0('
3 .90 4 . ?.5 4 . 1 (' 4 .50
II 3 .8 0 3 .75
II 3 .75 3.97
I,I I
4 . 07
3.95
!
3 .95
I
i
I
i
3 . 35
3 .60
3 .45
3 .80 3 .77 4 . 6..t
3 . 0?..
3 .cs
3.42
3 .70 3 . ~)5
3 . ~4
3 . 94 4 . 04
3 .95 4 .15 5.82
2 .93 2 .99 3 . 20
3 .72 3 . 67 3 . 65 3.98 4 . C8
3.97 4 . 21 5 .88
2.97 3 . 07 3 .31
Pou lt:Y Fee d Bro il cr Growing Ma sh Lay b g Ma sh Scrn.tch Gra ins
Hay (Ba l ed l
ltifalfa .ill Ot he r
5 .10 4 .85 4 . 35
50. 00 36 . 00
1./ l. s r oport c d by Fee d Deal e rs .
5 .10 4.85 4 .30
50 . 00 45 . 00
5 . 20 4 . 90 4 . 40
50 . 00 45 . 00
4 .91 4 . 46 4 .10
4 .97 4 . 48 3 .99
32 . 20 30.70 29 . 80 29 . 7 0
II
5 . 06 4 .52 3 .99
29 .80 ?.8 . , (;
- - --
Cl>
a, ao7
Y A ~ _(G[{i)~(GllA CCJEOJF~~"'ll::'mi:~M1rli~J~ .:f6~VllCIE
5~
.
.
UMI
. . .. . .. . . . . ..
~JM.> /J
AGRICULTURAL EXTENSION SERVICE U ~ lV ERZ IYY OF GEORGIA A ND i HE STATE DEPARTMENT OF AG ;:u~ rtLTURE
Athens, Georgi
, _, - ...;::. J .
~I :.. . j .
GENERAL CROF RE ~ ORT .F'OR GEORGIA AS C:F .iUN_E; i', icj ~~r_ _;
w,e_r:e tf> . ...
. . ... . . ' ) .., .
In spite -of being plant ed very.lat ~- m6st crops i1i G-eorgia
i i~ ~ !~ ~r
good condition -as of the first ' cif June. Weathe r d uring :M a Y.'- was , favoral;ll ~ . fo -,; ,.
growing c.rops a nd farm work i'l'1 most are ci s ofth( 's tite e.xc e pt .south.e~~t :;. :<
Georgia and northe rn counti e s. some tobacco was ' drown ed out a nd row C~()l?~ '
suffered from lack of cultiva t i on due to h e avy rains i n southe a ste rn Georgia.
In n orthern counti e s, w e t soils pre v ented land_pre ;,\. a r a tio11 ,and pl.a1~ti-ng o. f c:ottpn
. and corn U:ntil th e middle of Ma y: Good prog~~s-~. was made th~ last .half df" th ~
be month -' b:ut some cotton an d c-:>rh rema ined to plarited 'o n Jun~ l. . .-(S:~ nCe(}\l;ll\C l
lack :of :moisture -in s ome ar e as, particularly we_ihc 8h tr a l and iu)rth 1 G:eo r:gi ~,:- ,
has ..r.etarded crop growth and se e d g ermina.tioi'i';) . _: _ .. . ~ . -. ; . . ..~:: :
~ . : .,,~
. .
~ ! :.
'
' 1
-:::.Open w e ather the latte r part d:the mo~th was t~~6r abl e for p utting up hay
and combinin g small gr a ins. Excell ent yi eld s _ ar.~ b_t:;.~I'I; g obt.::tined frc;:>.m g-r,a~~ ,:
.hay an'd ;fir -st cuttings of alfal3.. Many fa rm e rs .hi s_.q)ne ~- re a s of the stat e "are
tq clipping -p-a sture s for ha y. Wh eat is gen e r a lly goo~ ~~ ry good throu,g}1,q,ut .t~ ~
state , .but oats va ry fr o m poor t6 v e ry good. Som e Jodging ._of sma,ll g r~~n.s ,_.h.q, ~
oc-c-urred due to rank gr o wth. H ::1. rv ~ st of crimson c;lo ;ve r s e ed w a s un d i!! r ~aY .:.-:
th~: fir s t .of June . Prosp e cts a re good to e xc e llent _:.. l,-'upi n e wa s da_mageq. _.bCl,dly
by the s,;ve r c wint2r.
.. ~:,
. : :The continued w e t w eather earlie r in th o:! y~ a.r wri s fayoli"abl e .for -the .d'ev e-1-
opme:nt 'of insects and dis e as e . In f e sta t i o n s of thrips q.nd .bill bues w e r e ,hea.yy _.
in ,s:ome ar ea s. Some fa rmers wer e - d ust i ng peanyts . . Dtis.ting ' cottpi:l_fol! con l"-, '
t~o~ of.,_boll w ee vil and bollworms was_a lso u:i de rw~ y in s ou,the r ri ar ea s _by ~l) e : , .
ft r. ~.t: o:r J u ne .
I'
. .. ~ :
.
__:r ...
PEA.GH P RODUCTION FORECAST: UNCHANGED FROM MAY 1: . G e orgia' ~ <. : ~ ,-.-
.
i 9 58t.ota l r .. .-
P.ea ch cr.op- (i ncluding fa rm a nd 'comme rci a l' p r o duct'-ion) is e xp -~ ct ;:; d to be _. > .<::
3, 500, 000 bushe ls, th e Georg i.a Crop R e porting S e rvic'e .i:ia:~d t oday . 'rhis is :_
the s a m e a s th e M a y 1 es timate, a n d i s l, 4 00 , 0 00 bu s h e l's m6r .:! than wa s pro-
duc e d l a st y ea r. B a s e d on p as t r e l a t i o ns hi p b e tw e~ n i ns p ,oct ;:; d s hipmeZ1ts a nd
totaJ pr.oducti on which h a s va r ie'd c onsid.; r a bly, insp e ct 8d _r a il 2. n d truc_k mov_e-:- !
to' ment fr_om thi S y ear I 8 CrOp COUld b 0 a nywhe r e fro,m 4 ; QQO'- .5, 34 0 Ca r e qui V -_ ; ,
a1ents. ' ' This compar e s with ii:1~p e cted shipme nts o f, 2,:4 66 e qui_val e nt c a rs l a_st
yea:r , ,
. '
. ~ '
-. Picking sta rte d the l a st 'fe w d a ys of M a y with : th ~ fi ~ .~ f c~_r fr()~ the;F ar.t ~
Valley. a:r ca b d ng shippe d on M a y 29th. Move m e nt incr ca. ~e d r apidly th e fi_rst.
week of June with m o r e than 3 50 e qui va l e nt c a r s s hippe d . .. ,
, , .
;.
WHEAT . P ROs :-=- ECTS Hvn =R O V E : F a 1or a b l e w e a th e r du ring _Ni ay ~mpr.~ved th a
outlook for this year 1 s Wh e a t Crop 1n G e:orgia.~
Tota l produ ction i s now c sti1na t e d a t 1, 760, 000 bush e ls, nearly 13 p e rc l! nt
la rg e r tha n e xpe ct e d a month c a rli a r. Th e yi ..:: ld p e r -'l cr e of Z.2, 0 bush el s _will ' '.; b.e the hi gh e st of r e c ord for th e sta t e , e xc ~e,ding by On d h tHJhel"th e pr evious . . ..
r e-cor'd of 21. .o b ush e ls i ri 19 56 : Combinin g sta rt e d th e l a ?t w.:::;e ~ of May: in the
southern h a lf o f the st2.t e.
In spi t e of th e r e cord high yield per a cre , production this y ear will _b e: 88, 000 . bushe ls l e ss tha n a y ear a go 6.nd inore 'tha n 4 00, 000 b ushels b elow th e 1947-56 ave r a g ;:; . The d e cli n e is due. t'o a ffiuch lowl:! r a cr ~ -":l g e ,in.whe at . . Th e . , \ acr eag e for h a rve st is e stim at ~ d a t 80, 00 :') a cr e s compa r e d with 112, 000 a cr e s ha r ve sted hst ye a r a nd the 10-yea r a v e r a g e of 133., 000 a cres .
RECORD EGG F RODUCTION IN MAY: Egg produ ction in G eo r gi .J. during M a y is e stim a t ed to b e 120 million eggs.
This i s a record high for the month. A year a go, 117 m illion e ggs we r e produc e d. The incr ea se from l a st ye a r w a s due to an incr e a s e i n both th .::! ave r a ge
numbe r of layers on h a nd and the rate of l a y. The a v e r a g e unb 0 r of laye rs rose from 6, 418, 000 in Ma y 1957 to 6, 4 59,000 this ye a r, while the r a t e of lay ( advance from 18. 2 e ggs p e r laye r to 18. 6.
MILK PRODUCTION UNCHANGED FROM 1957: Milk prod12.ct ion i n G e orgia durin g May i s e stimated a t
109 million pounds, the same a s on e y e ar earli e r, but two million poun ds above the 194 7-56 a v e r a g e for the month. The all tim e r 0. cord high for M a y milk production was 114 million pounds in 1946.
ARCHIE LANGLEY Agricultural Statistician In Cha rge
CARL 0. DOESCHER Agricultural Sta tisti c ian
UNITED STATES -GENERAL CROP REPORT AS OF JUNE 1; 1958
Crop prospects are favorable over most of the Nation after a mont~.' ~hich
aided spring planting and crop progress. Winter wheat made gains and :n'ow is
expected to reach an all-time record. Spring small grains made moderate and
uneven sectional improvement. Cotton stands are virtually secured after slow
starts in much of the South. Corn and soybean plantings mainly have been com-
pleted: Forage crops and pastures received some sectional setbacks but gen-
erally .are producing well, keeping farm and range livestock thriving. Fr~~t~ ...
ar~ si~ing. well. Mounting vegetable supplies signal the end of the early' spr'ing
slowdown. . Dry soils slowed crop growth and prospects in some northern ~orh
Belt . ~nd northern Plains sections. Western irrigation water supplies are exc.el-
lent. . .
:. .
'
..
#
.
C.QRN: P .lanting of the 1958 corn crop progressed rapidly the latter hid of May.
. By the first of June, more than nine-tenths of the acreage was 'planted,. a' little ahead .of the usual progress and far ahead of the late situation a year ' ago. Generally, the crop germinated satisfactorily and replanting has not been extensive. There have been a few dry sections wher e planting was delayed a11d also some wet sections where fields could not be prepared as soon as de.stred .' ..
ALL WHEAT: All heat production in 1958 is forecast at l, 27l .million bushel:S . . .. . . . A crop of this size would be more than a third larger than the ' 19S7 production of 947 million bushels and 14 percent more than average~ . .The. . pro~pect~ve winter whe at crop of 1, 069 million bushels is the largest of record and sharply above the 1957 production but the production of a ll spring wheatln 1958 is expected to be 16 percent smaller than the 1957 crop.
PEACHES: Bas e d on conditions as of June 1 the 1958 peach crop is forecast at'
..
74. 5 million bushels, 19 pe1-'cent larger than last year and 18. pe.r- .
cent above average. If prospects mate rialize this will be the largest cr9p. siri~e
1947~ . Howeve r, it should be recognized that unusual weather or action taken by
growers can affect the outcome. In 1957 growers eliminated part of th,e .. Calif- ..
ornia Clingstone crop through a "green drop" program put into effect mder the
Peach Marketing Order afte r June 1. Excluding the California Clingstone crop, ,
which is mostly for canning, the rest of the U. S. crop is estimated at 49. 5 .
million bushels, 24 percent larger than last year and 21 percent above average . ..
All States except Michigan, Missouri, Kansas, Colorado, and Utah expect a
larger crop than in 19 57.
. Production in the 9 Southern States is estimated at 15. 2 million bushels, 42 percent above last year, 51 percent above a ve rage, and the largest crop since 1947. Georgia had generally favorable growing conditions during May. An intensive thinning program has been followed this year. In North Caroli:p.a there was a heavy May drop but trees still have a heavy set. Thinning has been intensive in South Carolina in aneffort to insure good sizing of thefruit.
',J
Harvest of early varieties was mderway but was not expected to be in volume until June 10. Some orchards are being irrigated. Alabama needs a good rain to promote sizing of the peache s, although an excellent crop is still in prospect. Harvest of earliest varieties started about June 1. All areas of Arkansas have a good crop. Although the bloom was late, 'growers expect early peaches not more than a week later than last year.
MILK PRODUCTION: An estimated 12, 889 million pounds of milk was produced
in May by milk cows on farms. This was 1 percent less
than for the corresponding month last year, but 4 percent more than the May
1947-56 average .
EGG PRODUCTION: Farm flocks laid 5, 543 million eggs during May--1 per.;
.
cent less than in May 19 57. Total egg production, January
through May 1958 was 3 percent below the same pe riod last year.
,
.\ : . .... .. . .;:
:5/~
7
cGJEOJFRCGllA Clffi(Q)
..r IPi~il,llN(G E~VllCJE
. il.ORJCIJLTURA L EXTENSION SERVIC . . UNIVERSITY OF GEORGI.\ ANID Tl'iE
STATE D2PARTI:IIENT OF AG r'~~CUL.TURE
~mw (JJf tr.ll!DOOl~
U.S. OE PP,RTMENT 0F' AGRICULTURE
AGRICU LTU R A L MARKETING 'SC: RVICE Sl9 EX 'T EI~I ON BLD'G., ATH~ NS, GA.
'
BROILT'ill CH.IC K REPORT. FOR GEORGI
'.
: -~t.BRARIES
June 11~ 1958
.
I
ATHENS, GA . , June l;L- -Accor 1ng t o the Georgia Qrop Reportine Scrvi'ce
7, 211~ 000 broiler chicks t-rere placed ~Tith producers i'n Georgia durd.ng the vJeek
ending June 7. This compares with the 7,551,000 placed the previous vJeek and
is 19 per c ent more than the 6,069,000 placed the san e week'.last yE,ar .
:c;ggs s et by Georgia hatch eries a.JllOUnted to 9' 616' 000 compared :trith 9,668,000 the previous week and is 21 per cent more than th e 7,970,000 .for the corr esponding tTe ek last year .
t
;
Hatcheries r epor ted prices oaid for hatching eggs during the -vmek at \ an average of 80 cent s per doz en. Average price charged by hatcheries for tl~c
chicks 1vD.S reported at :?13 . 75 per hundred. These pdces compare:_\Jith So cents and ::~14.00 last week and vJith 59 cents and C'l0 . 50 one year ago . Egg pricels
sho-vm relate to Georgia produc ed hatchi 1g eggs whether bought on contract Pr
otherwise .
1:-Jei ghted average pl"ic e s f rom the Federal-State Iiarket News Service for . broilers . during the vleek enc1ing June 7 ;:)J:'.e as follotrs: G8orgia broilers 2 3/43 3/lt P01;1Ilds, at farms 2C . 04; FOB plants 21.00 .
(See r ev erse side for other states)
GEORGIA CHICK PLACEHEN'r BY H8Eh.S
Date Heek Ending
PERIO:J APRIL 5, 19~- 8 THROUGH JUNE 7, 1958
II
I
- -EGGS SET 1/ 11958 % of
CHICKS PLACED FOR 'BROIL'ti?.s
;11958 ~;~f
l957
l95G I 19~7
1957
1958 I 1957
'
April 5
April 12
,April 19
Ap:ril 26
Eay 3 '
: Nay 10 ' Hay 17
rlay 24 : Eay 31
June 7
Thousands
l
1
p
e
r
c
e
n
v.j.
!
7,45.6
I 9,28.5
' I
125 I
7,510
.7, Bo4
I 9, 032
120
9,535 122
7,741
9, 808 I 127
7,eo6
9,712
12/.J.
7. 794'
9' 729
125
7, 9 79
9,718
122
7,9 92 7, 818 7, 970
9,766
122 I
I 9 , 668
l2h
9,616
121
!
l
I I
I
Thousanqs
5,469
5,::~J 66
5,645 5,889 5,925 5,9 75 6,039 6,0)..J,9 6, 062 .
6,069
) . t) ' 468 6,875
6, 90Lr
7,076 7,0h7
7,134
7,4J 7 7,338 7 ,5~Sl 7,211
Percent
118
I' 121;_,
,.
12h . 120:
j. 119.
119
123 .. 121
125
119 .
.1/ Includ es . eggs s ot by hatcheries producine chicks for hatchery supply flocks .
ARCHIE LANGL;:.;y Agricu1tura~ Statistician In Charge
1J. A. 1:-TAGNER Agricultura.l Statist.ician ;
STATE
Maine Connecticut Pennsylvania Indiana Illinois l'ti s s o u r i Delaware Maryland Virginia West Virginia North Carolina South Carolina GEORGIA Florida Alabama Hissis sippi Arkansas \ Louisiana I Texas
~vashington
Oregon California
TOTAL 1958
T0rAL 1957
1958 % of 1957
EGGS SET AND CHICKS PLACED IN COMMERCIAL AREAS. BY WEEKS - 1958
.
1rJeek Ending
Nay 24
I ~ay
June
31
7
EGGS SET - THOUSANDS
Apr. 5
-
Apr. 12
Apr.
Apr.
19
26
;
I I!
I May May
3
10 l
May 17
cHICKS PLACED - THOUSANDS
Page 2
May 24
May
June
31
7
I.
1,694 1,164 1,503 2,468
465 2,413 2,548 2,903 2,731
457 3,676
645 9.766
504 3,813 2,667 3,981
524 3, 773
496 470 1,460
1, 725 1,205 1,565 2,506
481 2,321 2,534 2,963 3,020
426 3,705
621 9,668
488 3,696 2,676 3,993
527 3,917
452 436 1,461
50,126 40,113
125
50,386 40,109
126
1,652 1,254 1,493 2,450
507 2,271 2,554 2,984 2,977
432 3,707
642 9.616
477 3,808 2,797 3,983
532 3,706
449 453 1,592
50,336
40,091
126
1,044 599 997 889 146 739
1,950 1,698 1,397
549 2,478
348 6.468
253 2,790 1,587 2,812
443 ' 2,528
297 183 1,024
1,070 646 943 944 231 705
2,057 1,741 1,374
570 2,642
335 6.875
297 2,819 1,815 2,820
414 2,635
348 189 1,148
31,219 27,367
114
32,618
27' 736 118
1,006 578 ' 922 966 208 830
2,274 1,640 1,334
622 2,611
375 6.984
271 2,961 1,744 2,844
511 2,684
348 183 1,029
1,111
597 905 929 228 696 2,074 1,826 1,323 578 2,677 390
12076
293 3,052 1,782 3,022
472 2,666
387 193 1,007
32,925 28,050
117
33,284 28,576
116
1,101 629 863
1,035 176 749
2,201 1,646 1,309
632 2,695
363 7.047
263 3,082 1,812 3,051
513 2, 723
362 161
1,034
1,117 682
923 1,074
208 830 1,943 1,962
1,395 654
2, 711
372 72134
252 3,180 1,826 3,129
506 2,856
324 207 1,088
1,175 623 963 986 222 962
2,215 1, 769 1,472
631 2, 778
338 72437
259 3,072 1,897 3,098
521 2,860
355 221 1,22_8
1,151 682 961
1,120
207
924 2;136 1,919 1,515
686 2,861
410 72338
276
3,399 1,914 3,317
486 2,983
364 224 1,068
1,166
783 938 1,071 168 . 843
2,136 1,921
. 1,530 685
2,984
372 72551
270
3;350 1;972 3,191
538 2,996
428 176 1,138
1,211 682 916
1,031 . 221
778 2,232 1,945
1,555 651
2:,951
444 72211
241 3,213 ..
2,073 3,433
509 2,924
431 200 1,114
33,447 34,433 28,547 28,857
117 119
35, .082 28,428
123
35,941 28,821
125
36,207 28,793
126
' 35,966 29,274
123
AGRICULTURAL EXTENSION SERVICE UNIVERSITY OF GEORGIA ~NO THE STATE DEPARTMENT OF AGRICULTURE
Athens, Georgia
S. DEPARTMENT OF AGRICULTURE GRICULTURAL MARKETING SERVICE 19 EXTENSION BLDG ATHENS, GA.
une 12, 1958
VEGETABLE CRO
1, 1958
GEORGIA: Weather conditions during May were 'favorable for most growing vege table crops. Har~esting of cabbag e , onions and snap b o3 ans
has passed the peak following a :tela.tively short season. As of June 1 better than average yields are expectedfor tomatoes, cantaloups and wate rmelons. Light movement of these crops is expected to start n ear normal date compared with previous years. Insect damage is reported light to date as growers are taking all precautions in trying to control the many infestations that attack ve_getable crops.
UNITED STATES: Production of spring vegetables ana melons in 1958 is now expected to be slightly above last year and about equal to
average, the Crop R e porting Boa rd announced today. Indicat ;; d production is 2 percent above 1957. Increases in the late spring group of crops more than offset the de cline s in production of othe r spring ve getable s. For individual crops sizeable increases over last year's production are indica ted for watermelons, swee t corn, onions, cantaloup.15, cucumbe rs, tomatoes, and snap beans. Almost offsetting are de cline s in indicate d production of lettuce , cabba ge, cel ery, carrots, broccoli, green peppers and spinach. Estimate s of summe r ve getable crops made to date indicate about the same a creage as in 19 57; whe reas, the melon acreage is 13 percent larg e r than last year.
Summarizing progr e ss to June 1, some crops ar e a little b e hind their normal sche dule b e ca use of wet, cool wenther earlie r in the s eason. Howe ver, should conditions be favorable from here on, most crops should catch up and be on schedule soon.
SNAP BEANS: Production of mid-s~ snap beans, forecast at 3H, 000 cwt., is 10 percent OC!owT93Tand 18 percent l e ss tha n ave rage.
Yie lds in South Ca rolina we re light during May but ar e expe cte d to improve a s la ter plantings come into production. Volume m ovement is expe cte d through the first half of June. In Georgia, ha rve st is a bout complet e . Weather conditi ons in Miss_issippi h a v e b e en favo r a ble for snap ben.ns. Harve st is unde rway a nd will continue through most of June. In Louisia na, early plantings a r e yi e lding poorly. Howe ve r, May w eathe r was fav o r a bh:: and yield pro s p e cts fo r later plantings are good. Volume m ovement got unde rway the last we ek in Ma y and is expected to continue through June 15.
CANTALOUPS: Production of spring cantalo ups is now for e ca st at 3, 301,000 cwt., 7 pe rcent above last year but 18 pe rcent below avera g e .
All States except T exa s expe ct a large r crop than la st year's. Ha rve st of the T exas crop is about thr e e w ee ks b e hind a y ear ago . Shipments began May 23 in the Lower Rio Grande Va lle y and June 1 in Lar e do . Cool weather and rain during the week of Ma. y 18-24 d e lay..; d p roducti on but h a d n u m a terial e ffect on yield and qua lity. Supplie s arc expe cted to be available in good volume through June. In the Da de County and Ft. Myers-Immokalee districts of Florida , the crop was almo st a complet e lo ss due t o exces s ive heavy r ains. In central and north Flo rida , the crop is making good progress, and a light harvest is expected aro und June 10.
The E a rly summer ca nta loup production is forecast a t 2, 059, 000 cwt., ove r two and a ha lf times as la rge as the 1957 crop but only 27 percent a bove ave r a ge . The big increase over last s eason is in Arizona wh2re there were only 1, 500 acres l a st y ea r, th e l ow during th e pa st 30 y ea rs. This y ear heavy expa nsion in new a reas has brought the acrea ge up t o 10, 500, which is near normal. The Arizona crop is in good condition except for the small a cr eage in th e Salt River Va lley. Th~ G e o rgia cr op is in b e tter than a ve r a g e c ondition. Exce ssive r a ins in the extreme s outhe rn part of Georgia cause d heavy shedding of fruit a nd s um e fields we r e drowne d. Earliest shipments a r e expe cted about June 20. i''""avl.> rable w e athe r conditi ons thus far have pr ,) duced a good but later than usual crop in South Ca r olina. P ea k harvest will probably occur in early July.
SWEET CORN: P r o ducti on o f eazl~ sprinff sweet c o rn in F l o rida a nd T e x as is
n ow fo reca st a t , 42, 00 cwt., one third m o r e tha n last
ye a r's pr o ducti on a nd 13 percen t a b ove average. Shipme nts o f .c'""lo rida c o rn r eache d a record high peak during the first half of May. During the last ha lf A the month supplies returned t o a m o re normal level. In the Evergla J e s, v.Jlume is d e clining a n d the shipping seas on is exp e cte d t o e nd betwee n June 20 a.n.J 25. The crop in the important Zellwood area is in exc e llent c onditi on.
- z-
Vegetable Crop Re_eort for June 1, 1958 (Continued)
SWEET CORN, Cont.: Light harvest started there in late May and.will become
general by the week of June 9. In the Starkville-
Brooker section of North Florida, harvest is expected to begin in mid-June. In Texas, harvest started in the Lower Valley in late April and volune has continued steady. Harvest began in the San Antonio area in late May and movement from east Texas is expected to start in early June.
Production of~ spring sweet corn is forecast at 750, 000 cwt., 6 percent above last year's production but 8 percent below average. All the south eastern States in the seasonal group are expecting smaller production than last year's, and California will have a larger crop. The South Carolina crop responded well to the favorable May weather and is in good condition. Harvest is expected to start in late June. In Georgia, harvest will start in early July, which is about two weeks later than usual. The Alabama crop is in good condition with harvest expected about June 15.
CUCUMBERS: The late spring cucumber crop is expected to produce 924,000 cwt. :-;-percent more than last year's production. The North
Carolina crop is in excellent .condition. Most fields have good stands and vine growth is vigoroue. Early fields are in bloom and picking should start about June ZO, three weeks later than usual. Cucumbers in South Carolina are in only fair condition and are late because of adverse spring weather. A light movement started in early June and marketings will be heavy by mid-month. The Georgia crop is in poor condition because of unfavorable spring weather and disease. Marketings from that State are light. Cucumbers in Alabama and Louisiana are late but in good condition. In California, harvest is active but past the season's peak in San Diego and Tulare Counties. Local market areas around Los Angeles will be a source of supplies by late June.
ONlONS: Production of the late spring crop is now forecast at Z, 788, 000 cwt., one-fourth more than last year and 41 percent above average. In .
North Carolina, yield prospects continue good. Harvest started on early fields late in May and should become active the early part of June. Reports indicate very little insect or disease damage. Most of the Georgia acreage was harvested by June 1. Heavy rains during harvest reduced quality. In Texas, yield prospects declined during May. Considerable acreage in the McKinneyPrinceton area was damaged by hail the early part of May. Most of this acreage made a partial recovery. Hot weather in late May stopped top growth and started bulbing in this area and in other areas where additional moisture was needed. Harvest of earliest plantings is expected to start the first week in June. If hot weather continues, most plantings will mature fast and be harvested soon after the middle of June. Arizona's Yuma deal is about finished with good yields and quality. Harvest in the Salt River Valley started the second week in May, but shipments were light until late in the month. In California, movement is continuing from Kern and Fresno Counties but will soon end in the Desert areas. Harvest got underway about June 1 in the Stockton district where more than the usual number of seeders are showing up this year. Volume movement is expected from this district about June 15.
TOMATOES: Production of~ spring tomatoes is estimated at 1, 357,000 cwt., 14 percent more than the 1957 crop but Z percent less than
average. The South Carolina crop is in good condition. The crop will be about two weeks later than usual with light harvest in early June. In Georgia, prospects are for a better than average crop. Harvesting is running late, with first picking in early June. Peak movement is expected about June ZO to 30. Little or no disease has been reported to date. Weather conditions in Mississippi have been favorable for tomatoes. Harvest is expected to begin about June 10. In Louisiana, the tomato crop is in good condition although some two weeks later than usual. Picking started in the Plaquemines area about May ZS, but
is not expected to begin in other areas until the second week in June. In Texas,
some hail damage occurred in scattered areas of east Texas and surface moisture is needed in some areas. Harvest of the light crop in the Yoakum area started the latter part of May. The usually early areas of east Texas--Milano and Franklin--expect to start during the first week in June. Crops in northeastern counties, Avery Section, are not expected to be ready for harvest until after the middle of June.
WATERMELONS: ~spring production is forecast at 8, 601, 000 cwt 16 percent above the 1957 production and 15 percent larger than
average, The Florida crop is irregular and late. Vine growth has been good but unfavorable weather has caused light set of fruit on older plantings. Crop growth has baen delayed, and the harvest season will be concentrated in a shoner period than usual. Supplies are expected to be at peak during the last half of June. Harvest in ~e Immokalee-Ft. Myers area reached its peak in late May but this and other south Florida areas will furnish light supplies until mid..June. In central Florida, harvest is underway on early fields with haryest
.....--"'-- =~...----"~-'~ ~----~- ------ - - ~~- --
- 3Vegetable Cr~ Rej)ort for June 1, 1958 (Continued)
WATERMELONS, Gont.: on the bulk of the acre age expe cte d to start about
June 15. Harvest will start on early fields in the
Newbe rry-Trenton-Gainesville a rea in early June ar..d will b e come active in late June. In other north and w e st Florida sections harvest is expected to start in lat-a June. In Califo r nia., the crop has made satisfactory progress. Harvest is underway in the Imperial Valley. Quality and size are r eported to be good.
Movement has b e en slow to date but is expecte d to pick up in early June. Har-
vest started at Blythe in early June. Volume is expecte d by June 15.
The first producticn forecast of early summer wate rm e lons, at 22, 338, OOC cwt., is 15 percent above last year and nearly a :i'ifth larger than the average
production. In North and South Carolina, the crop is in good cor:dition and plants have made good growth. Yielc. prospe cts are v e ry good. Favorable weather conditions during May e nabled the Georgia and Alabama crops to make excellent progress. If weather cont:inues fa vorable, light harve st is expected in
Georgia about June 20. In Miss i ssippi the crop is in generally good condition.
Light harvest is expected in southe rn areas about the end of June. The crop is late in Arkansas, Louisiara and Okla homa. Considerable r eplanting was
necessary and stands are still spotty in LouisiaEa. In s e cts and disease have been a problem but crop progress the la st half of Ma y was gene rally satisfac-
tory. By J une 1 most area.3 needed additional moistur e . Growing conditions during May were favorable in most areas of Texas. Production from the early areas is about 2 weeks lat~. However, harvest of the mid and late season acreage will start about t!.le usua l time. Ha.rvest in the Falfurrias area started in late May. A small ac:t'eage of "ca ppe d" m e lons in the Pearsall area should
be ready for harvest about Jme 10 with harvest on the open acreage expected
to start in mid-June. ~arve st in the Stockdale, Floresville and P l e asanton areas is expected to start in late June. Harvest is not expecte d to start in the Hempstead, Lockhart e,nd Smithville areas before early July. Crops in central and eastern counties rr~ade good progr es s with warmer weather the last half of May. However, additional tnoisture is n eeded. In Arizona, weather has been generally favorable . Plants a re behird the normal stage of development for this date. In Califorr1i a , harve st i n the Wheeler Ridge district is e xpecte d to start in late June. Earlier a d verse weather delayed the crop in the Kingsburg
area and little movement is expected before early July.
Acreage a nd Indicated Production R eporte d to Da te, 1958 with Comparisons
Crop -Ancf
St M Q
Acreag e~ fo r H a rve st
Av~\'~..~ie.
1949-56
1957
Ind.
1958
- Acres -
Yie ld per Acre P roduction
49A-v5.6195-1zn9d5.8A19v1e9r-aSgQe 1957
Ind.
1958
- - Cwt.
- 1, 000 Cwt. -
WATERMELONS:
E a rly Summer: North Carolina South Carolina Georgia Alabama
Mississippi Arkansas Louisiana
Oklah()-ma Texas Arizona California Group Total
11, 050 12,000 16,000 49 55 55
541 660 880
41, 7 50 43,000 44,000 56 43 60 2, 316 l, 849 2, 640
53,250 60,000 63,000 78 75 80 4, 151 4, 500 5,040
17, 260 19 , 000 21,000 91 92 95 l, 561 1,748 1, 995
10,800 13,000 16,000 70 72 70 755 936 1, 120
10 , 160 11,600 13,000 85 85 83 860 986 1, 079
4,460 4,200 4,200 77 80 85 3~12 336 357
14,960 11,000 111 500 63 77 80 961 847 920
108,880 112,000 124,000 47 42 45 5, 145 4,704 5, 580
5,090 5,800 7, 200 142 175 160 72~ l, 015 l, 152
10,480 10, 500 10, 500 135 180 150 1, -11 1, 890 1, 57 5
288, 140 302, 100 330,400 6 64 68 18, 768 19, 471 22, 338
TOMATOES:
Late Spring:
South Carolina
4, 52.0 6._300 7,000 36 34 35 165 214 245
Georgia
11,640 12,600 13,000 39 39 42 4 52 491 546
Mississippi
1, 560 2, 300 2,400 28 40 45
41
92 108
Louisiana
1, 190 l, 100 1, 500 40 41 45
47
45
68
Texas
21, 540 16,000 15,600 30 22 25 674 352 390
if
Group Tota l
_ _ ___ 4 0, 4 5() . ...... ..-.;.._
..... .
38,300
39,500
34
31
34
1, 379
1, 194 1, 357
CANTALOUPS:
( Early Summer:
South Carolina
5,900 6,000 7,400 36 24 35 212 144 259
Georgia
8,480 9,000 9,000 56 45 60 475 405 540
Arizon2.
8,450 l, 500 10, 500 108 125 120 932 188 l, 260
Group Total
22, 820 16, 500 26,900 70 45 77 1, 618 737 2,059
ARCHIE LANGLEY Agricultural Statistician
L. H. HARRIS, JR.
V e getable Crop Estimator
.._ .1-.l. ' ..l. .l. .&. .&. ~ ...L V ~
' l
/ ..
.
.
J, I,~ .L \J.&.\,.L
. '
UNIVERSITY OF GEQRG IA
AGRICULTURAL EXTENSION SERVICE UI\IIVERSITY OF GEORGIA AND THE STATE DEPARTMENT OF AGR ICJJ L TURE
BROJLER CHICK REPORT FOR GEORGIA
ITCCIE
U.S . DEPARTM
RICULT;URE
AGRICUL TUR t.\ L MARKETING SERVICE
3 19 EXTENSION 13LDG., ATHENS, GA.
June 18, 1958
ATHENS, GA., June 18--A total of 7,063,000 broiler chicks were placed vdth
producers in Georgia during the vreek ending June lh, according to the Georgia Crop Reporting Service. This compares with the 7,211,000 placed the previous week and is 14 per cent more than the 6,169,000 placed the same week: last year.
Eggs .set by Georgia. hatcheries amounted to 9,360,000 compared with
9,619,000 the previous we ek and is 19 per cent more than the 7,860,000 for the
corresponding week last yea~.
Hatcheries reported prices paid for hat ching eggs during the vreel~ at an
average of 79 cents per dozen. Average price charged by hatcheries for the chicks tvas r eported at Jl3. 75 per hundred . These prices compare with 80 cents and .;~13. 75 last week and vri.th 60 cents and ::/10.75 one year ago. Egg prices
shown relate to Georgia produced hatching eggs whether bought on contract or oth er w i s e .
Ueighted average prices from the Federal-State Market News Service for broilers during the week ending June 14 are as follows: Georgia broilers 2 3/43 3/4 pounds, at farms 20.04; FOB plants 21.00.
(See reverse side for other states.)
r
\rleek
Ending
' April 12
April 19 April .26 .
r-iay 3
l1ay 10 l1a:y- 17 iay . 24 i'1ay 31 June 7 June 14
GEORGIA CHICK PLACEl.iZNT BY 1'iEEKS
- - APRIL 12 THROUffi1 JUNE 14
--
EGGS SET lL
CHICKS PLACED FOR BROILERS
1958 %of
1957
1958
1957
1957
19.58 %0 f
1958
1957
Thousands
Perc ent
Thousands
Percent
7,510
9,032
120
7,804
9,535
122
7,741
9,808
127
7,806
9,712
124
7,794
9, 729
125
7,979
9,718
122
7,992
9,766
122
7, 818
9, 668
124
7,970
9,616
121
7,860
9,360
119
5,566 6,875 124
5,645 6,984 124
5,889 7,076 120
5,925 7,047 119
5,975 7,134 119
6,039 7,437 123
6,049 7,338 121
6,062
7,551
125
6,069 7,211 119
6,169
7,063
114
-
1/ Includes eggs s et by hatcheries producing chicks for hatchery supply flocks.
ARCHI E LANGLEY Agricultural Stati stician In Charge
If . A. \>TAGNEB. Agricultural Statistician
r
r
STATE
- EGGS SET AND CHICKS PLACED IN COM!VIERCIAL AREAS l. BY HEEKS - 1958 .. \-Jeek Ending
May June June
31
7
14
EGGS SET - THOUSANDS
Apr. 12
Apr. 19
A~6
I May 3
lVlay 10
Nay 17
M~L
CHICKS PLACED - THOUSANDS
. _Page. 2
Hay
June June
31
7
14
i\iaine
I
Connecticut Pennsylvania
I
Indiana
Illinois
Nissouri
Delaware
lviary1and
Virginia
\vest Virginia
North Carolina
South Carolina
GEORGIA Florida
--
Alabama Missi ssippi Arkansas
I I
Louisiana Texas
I
Washington
Oregon
ca)tfornia
1,725 1,205 1,565 2,506
481 2,321 2,534 2,963 3,020
426 3,705
621 9, 668
488 3,696 2,676
3,993 527
3, 917
h~2
436 1,461
TOTAL 1958 TOTAL 1957 1958 % of 1957
50,386 40,109
126
1,652 1,254
1,493 2,450
507 2,271
2,554 2,984 2,977
432 3,707
642 9,6417673,808 2, 797 3,983
532 3,706
449 453 1,.592
1,561 1,249 1,595 2,400
460 2,195 2,566 2,959 2,823
434 3,687
61_~8
9,360
l-~.96
3, 038 2,694 3,951-!-
I 469 .
3,655 436 402
1,541
1,070 646 943 944
231~~
705 2,057 1,741 1,374
570 2,642
335 6,875
297 2,819 1,815 2,820
414 2,635
348 189 1.1h8
1,006 578 922 966 208* 830
2,271+ 1,640 1,334
622 2,611
375 6, 98L~
271 2,961 1,744 2,844
511 2,684
348 183 1,029
1,111 597 905 929
228{~
696 2,074 1,826 1,323
578 2,677
390 7,076
293 3,052 1,782 3,022
472 2,666
387 193 1,007
1,101 629 863
1,035 176
749 2,201 1,646 1,309
632 2,695
363 7,047
263 3,082 1,812 3,051
513 2, 723
362 161
1~034
1,117 682
923 1,074
208 830 1,943 1,962 1,395 654 2, 771 372 7,134
252 3,180 1,826 3,129
506 2,856
324 207 1a088
50,336 49,422
40,091 39,830
126
124
I 32,61&~ 32,925* 33,284* 33,447 34,433 27' 736 28,050 28,576 28,547 28,857 118 117 116 117 119
1,175 623 963* 986 222 962
2,215 1,769 1,472
631 2, 778
338 7,437
259 3,072 1,897 3,098
521* 2,860
355 221 1 2228
1,151 682* 961
1,120 207 924
2,136 1,9}.9 1,515
686 2,861
410 7,338
276 3,399 1,914 3,317
486 2,983
364 224 1 1 068
1,166 1,211 1,202
783
682
717
938
916 1,010
1,071 1,031 1,106
168
221
215
843
778
852
2,136 2,232 2,196
1,921 1,945 2,014
1,530 1,555 1,524
685
651
688
2,984 2,951 2,889
372
444
395
- - - - - - - 7,551 270
7,211 7,063
241
338
3,350 3,213 3,251
1,972 2,073 1,925
3,191 3,433 3,401
538
509
505
2,996 2,924 2,829
428
431
453
176
200
185
1 2138 11114 1,120
35,082* 35,941* 36,207 28,428 28,.821 28,793
123 125 126
35,966 29' 274
123
35,878 29,328 .
122
ftrMJ 7
.
o n
3 ).!!}'
II';#!TY>Qie\!!lj
m' l.f.A3
~s 'WB
~~~
~ )U (GlEQ)JFRGllA C~(Q)fP ~ElF')u0 ll
AGRJCULTUR.li.L EXTENSION SERVICE UN!\/ER.. ITY OF GEORGiA AND THE STA 'TE OEP~I RTMEN ' T OF AG~ICi.Jl. Ti.JRE
Athens, Georgia
U.S . DEPARTMENT OF AGRICULTURE AGR!CUI-TURAL MAPKETING SERVICE 319 EXTEi~SION BLDG., A THENS, GA.
June 24, 1958
.,;_ ..
LUPI NL SEED PRODUCTION SMALLEST SINCE 19~
(Ov er )
r
-2-
---~---1=.::9:...;:::5.::.8.....:LU~.:PI:.:NE SEF;D FCRECAST BY STA'IES WITH CC!:1PARIS ONS
J
state
. Acreage Harvested
Yield Per Acre
: Production (clean s eed)
;:Aver;ge :1947-56:
~ :-1-9r:'7-
-:
:
..
-rllili..-:.Average:--- :
. .
-rncli--::Average:-- -
-=-
cated :1947~~6: 1957 = cated :1947-56: l957 :
I'ndi:-
cated
~
-
- - - . : . .
~ ,.....
-.: -
-
-
-
-:
-1-95-8 -:-
-
---.: -
--
-: -1-95-8
- :-
-
- -:- -
-
-:.--19-58-
-
. Acres
Pounds - Clean
Thousand p~unds
s. c. 1/ 7,833 7,000 3,500 l/ 973 950
Ga. . : .J 7, 100 . 15,000 6,000
782 800
y 600
7,036 6,650
820 31,312 12,000
2,100 ' 4,920
f la. :' 12,800 3,000 1,800
484 250 .450
6,353
750
810
Ala. : 8,11Q 2,200 1,000
719 550
650
6, ,514 1,210
650
--
u s
-
-:- - - -
. : 65' 060
---27' 200
---12,3 00
-
-
--723
-
--
758
-
-
-
-
-
-
s-o,-5-11-
-20~-6-10-
-~-8,-480-
l/ Short time av erage~
CJ!RL O. DOESCHER Agricultural Statistician
.ARCHIE LANGLEY Agricultural Statistician In C):large .
i ..
..
., - ,.., ....... ,... ..... ,... - ... .co ""-'..: - - - - - -- - - - ...J....
, r'\ I.J ,....,
.., ' , I I ...
AGRICULTURAL EXTENSION SERVICE
-J UNIVERSITY OF GEORGIA AND THE
2 f STATE DEPARTMENT OF' AGRICULTURE
. Athens, Georgia
-CRTI1SON-GLOVER SEED FORECAST
1958 Production. up 74 Percent
GECRGIA: Production of crimson clover seed is forecast at 3,645,000 pounds 74 percent above the short 1957 crop of 2, 090,000 pounds a Despite the
severe cold winter the crop made rapid growth during the favorable springmonths and yfelds were higher than in 1957" Weather conditions were generally favorable during the harvesting season and the seed saved -was in _good condition.; . Reseeding varieties, such ~s, Dixie, Autauga and others amounted to 90 percent or 3 1 281,000 pounds ; of this year's crop. The 271 000 acres harvested is 42 percent above the 19,000 acres harvested in 1957 and 2 percent above the 1947-56 average .
UNITED .STATES: The 1958 crop of crimson clover seed in the Southern State:? is forecast at 13,115,000 pounds by th e -Crop Reporting Board ~ 31
percent more than the r olativ eiy small 1957 crop of 9,983,000 pounds, but 22 perce:nt under. the 1947~56 average production. Reseeding varieties such as Di.xi ~, Autauga, Auburn and others, comprise 8,041JOOO pounds or -61 percent of this . y ear's crop co~pared with 5,646, 000 pounds or 57 percent of th.e .1957 production. A fore-
. cast of the late harvested c:rimson,..clover seed crop in Oregon will be issued
August 151 along with the forecasts for other winter.-cover . crop seeds .
GroWth of crimson clover was r e tarded by unfavorable weather during the winter of 1957-58 but the crop developed well during the late spring months i. Good ( yields were in prospect in advance of harvest, but in some :s ections of .-Tennessee and else .where, he avy rains during the harvest period caused some shattering, ahd r educed the acreage int ended for seed. Production ih South Carolina .is indicated t o be about double last ye ar .Cl.Ild tho Ge orgia an:i Mississippi crops are up 74 and
62 percent, r esp ectively. Le ss notable increases are indicat ed for Alabama, 20-
porccnt; Arkansas, 10 perc ent; and Tenness ee, 4 percent
.. The 94,500 acr es of crimson clover for s eed in the Southern States - is 16 percent larger than a year ago but 14 perc ent under average. Georgia and Mississippi account for most of this year's increase with only Tennessee showing a reduction in acreage harvested.
Prospective yi elds of seed per acre are above last year in all Southern States~ but are below averag.e in Georgia, Tenness ee and Alabama.
Cool weather throughout a larg o part of the spring growing season slowed
maturity of s eed and harvest was 8 to 9 days later than last year in South
Carolina and Tenness ee r espe ctively; 6 dqys later in Alabama and Ge orgia, and about the same as last year in Arkansas and Mississippi. The av erage dates on which harvest began this y ear ares Georgia, May 27; Alabama and Mississippi,
May 28; South Carolina and Arkansas, June 3; and Tenness ee, June 8.
(Ov er)
. '
.
:.
- 2-
Imports of crirrBon clover seed during the 11-month period En~ding May 31,
19.58 totaled 2,.5C4,300 pounds of which 1,036,.500 pounds wer e .from France;
)
804,600 Hungary; 324,800 Italy; 1425800 Germany; 110,600 Great Britnin and
~
8.5,000 from Canada~ This compares with no imports a year earlier and the 1947-56
crop-y~ ar. . av erage of 4,5B5,o6o pounds
. . Carry-over of old crilTlBon clover seed on .farms in the Southern States includ-
ed in this report is estimated at 473,000 pounds, about one -fourth more than last
year's carry-ever of 374,000 pounds. A r eport of stocks held by dealers as ' o.r
June 3.0 'Wi.ll be issued on August 4.
The following table shows the 19.58 forecast. for Southern St-ates, with
ccmparisons~
..
.
:
.... ~ - : - : Acie;. ha;v;sted .- - : - .Yi~id pe; ~c;e- .- - -:- Pr;d~cti;n~ (cl;~ ; e-;d}
~..:-:.: ~ - :~ .:... - .:.... __: ~ - - _: - _:_ - - - ..:. ~ - - - - _ . .1. - - - ..:.: ~ ....: - ...:. - . - - - -
State , :Avere.ge :
:rndi-:Average :
:rndi-:Avcrage :
: Indi-
=1947-56 : 1957 :cated:l947-56 : 1957 :cated:l947-56 : 1957 : cated
- - - - - - - - - - - - - - - - - - - - - - - - : . . : :
- --
t
-
1958
:
-
-
-
:
.,.
- - .1-958- ;
:
1958 ,
-
~-
- -:~ ~
s. c.
... Acres -
- Pounds -
Thousand pounds
.. -
]/5,o6o 3,500 5,000 1/ 134 . 12.5 170 1/ . '684
438
. 850 .
Ga.
26,500 19,000 27' 000 - . 152.
110 135 - 4,044 2,090 3,645
Tenn. .-42,700 27 ,ooo 26,000
148
125 13.5 6,282 . 3,375 3,510
Ala~:~
28,390 20,000 22,; 000
160
Miss .. . ]}7,000 . 6,500 9,000 1/ i4o
Ark. . 2/4,162 s,5oo 5,5oo I/212
11,0 120 200
1~0 4,442
y 140 1/ 996
220
878
2,200 780
1,.100 .
J 2 , .640
1,260 . 1:,210 '
- To-ta-l - So-. ----------------~--------------------
States -110,.520 81,.500 94,500 1.52
122 139 16,814 9,;983 D,ll5
- -- - .:-- - --: - - - - - - - - - - -.. - - - ~ ~ - - - - - ~ - - - - - --.. - - - - - - .- .
1/ Short-time average.
C.ARL O. DOESCHER Agricultural Statistician
.ARCHIE LAN'G L'E.Y Agricultural Statistician In Charge
)
~'J-l11 .rl r n. l \.J,.. , n . F" oi \ 1[1 I '-\ ,.._, lJ,.. dl 11\114, I '""t .. I "1""\()
~d.,
llbqv 7
Glf-A-3
qi~.b (;IE({))1ftCGllA
U.S. DEP!"'.RTMENT OF AGRICULTUR~ AG RIC UI..T li R!\L r.~ARi'~ETii!G St=:RV iCE 31 9 L::XT<::NSiON G LDO. , AT HE tiS, GA.
June 25 , 1 9.58
GEORGIA 1958 SPRING PI'J RF.POR.'I'
'l'he Georgia s pring pi ::; crop fo r 1 9.58 is eE> tiJ7tated t 1, .511 , 000 head . 'I'his is an incre cse of 1i ve perc ent from the 1 957 sprir.g crop o.:: 1 ,4L~2 , 000 l1ead . 'll'1e 19~5 6 spring p i e; crop is th e l :..r gc st pi g crop ewJr r e corded in the ,_:t,ate . p._ total cf 22 9, 000 sm.;s fa rr o\oJed t,;1j s sr.ri~g vJi th an aver;:,ge of 6 . 6 pigs qaveci per l itter . Gr:; vr r:; i a: r u.J,ked lOti1 i n t:ne nati on in the nunbor of p i f; s ._,a vect this spring and r r. rro~Jed t he l art; est n.1mbe r ; or any s t e1te outsia.e of t he cor n bol t .
BasAd 011 r.rmJGrs 1bre edin; intcnti 0 ns un dt'.ne l, 1 )0 , 000 "'mr are exp , cte d to farroV? this fall. I t 1(: SO ;:: lan s ""re r ealiL;ed, the m:u:1ber cf sov1s fn r mving w:U.1 be nine p \. rccnt a'u vve lc<. t> t ;y-ear . Georgia r nnk~> nint'.1 in the m tion :Ln the Illll't'~n r of so-vJs ex,t:>ecte d to f<:UTOH t llis fall .
'l'hi s r eport is be: ~eci. on .::.1. E3UI'Vey o.::.' an r;:;rs fror.1 .J.ll a r e .1s of Georg :i_a . These returns 1-;ere obtiJined l'lrg nly in coopGr&ti..m witi1 tr1e 1)ost Office l)epart mer.t through rur Dl m.:-, _~_1 carrie rs .
r
o::orm.A:
10- Yenr, l 9l.~"i - S-5
l9S6
1:157
1950
SPPH.iG (De c . l to June l)
S ov:s
: t'r rr ovred
: ( Q()(l )
i v. No . P J..gs Pig s Per : S mr~d
Litter
: ( ()00 )
FJ-~.LL (Junr l to Dec . l)
:, ov-rs
l'arro Jed 'or:o )
Av. No .
Pi:;s 1)8r
Litter
: .t:1i3s
s:~ ve d
: (000)
l r..;;r_:) 212
66..a3
1 , 2 32
171
l, Lh2 17 2
6.3
1,081
6.7
1,15 2
212
6.8
l, )j)_,_2
174
6.6
1 ,148
2?. 9
6.6
l,Sll
1 90-::-
10- Ye ar, 1947 - 56
19.56
1957
195 8
G,2 ? l
77,,62un5
7,L \.)
6. 59
6 . 94 7 . 12 7. 0)
.5~, 5' 7 0
)3 ,180 5l, bl 2 52, 71~5
5,27J
5, 19h
5,176
5' 87h-::-
- - - -- - --- - ---
:< !~umber to fa1 -rm-.r, - ndicated .from bre edinc intent ions r eport s
( o v Gr )
6 . 67 7. 00 7. 06
35 jl)O
}5, Ju6
3o , 52h
UN:;:Tr.JD S'l'AT:C~ PIG CROP REPORT - JUNE 1 9.58
The 1 958 spring pig crop totale d 5 2,74.5, 000 head, an i ncr ease of 2 percent from t he 1 9.5 7 spring crop of 51, 812 ,000 head. The number of sows farrowed thi s
spring at 7, 4S6 , 000 he ad wa. s 3 p ercent more th an t he ~7, 277 ,000 sows f arrowed in the spring of 1 957 . The numbe r of pi gs s aved pur litt er averaged 7 .05 , l perc ent
l e ss t han the r e cord high oi' 7 .12 pig s p er litte r in the spring of 1 9.5 7. Re por ts on bree ding i n t enti ons i ndicate a total of 5 , 8?4,000 sows to f arrow this fall. Thi s vwul d be an increa s e of l J percent over the 1 9.5 7 f all f arrowings a s r evi sed . If the i ntende d farr owings are r e alized ami -the numbe r of pi gs saved per li ttcr equo.l s the aver a.ge , plus an allmvan ce for upward trend, the 1 9.58 fall crop would b e ).J.l. .5 mill i on head . Th e combine d spring and fall ;Ji g crops f or 19.58 woul d t he n b e 74.2 !Tillion he ad. This vi ould be 7 perc ent above 1 957 and 5 percent above t he 1 94'(- 56 aver age .
The numbe r of h ogs 6 months ol d and ov~r on f arms 2- nd r anche s J une l was
l p erc ent more t han a year ear l i E. r .
SPRING PIG CROP UP 2 PLR.CEl'TT
The numb er of pi gs s av.ad in the s p ring sE:ason of l 9)8 (D E:.cember 1957 through May 1 958 ) is e st ~_mated a t 5 2, 745 , 000 he ad . Th is i s 2 pe rcent mo r e than t he 1957
spring crop of 51, 812 , 000 ;:nd 3 r:e r cent l e ss than ave r age .
The numbe r of s ows f arr o-~w d in the sp r i ng of 1 958 t otal ed 7, 486, 000 head, 3 p ercent mo r e t h<m la st spr i ng but 10 pa r cen t le ss t h an <:!.verage . The 1 958 spring farroVJings VJer e 3 pGrcentage points l e: ss than i ndicat t:; d by fa r r1c r s 1 re -
J ports on brc.e din g i nte nti ons last De cember . All r e gions (:;Xcopt the 1rJt:st showed
de er ase s from t he Du cemb e r inten tions . The pe :::- centag0 s by rq~ions t ha t the 1 958 spring sov:s f arro lt- d vw n., of 1 95 7 compar <-d 1-Jith tho inte ntion s as r eported l a st D0cembcr arc as fo l l mvs : Nor th Atlantic , 91 pcrcont nmv and 93 pGrcent l ast De cembE.: r ; t:<:.s t North Centr a l, 101 an d 104; \: os t Jorth Central, 106 .and 102; South AC.l ant i c , 102 and l Ot\ ; Soutt Cmtral, 98 an d 102; and \rk s t 1 09 and 107 .
Th .. 7. 05 f i g s s ave d p er littGr t his spring is t he SGcond highu st on r e cord, bd ng exce eded onl y by t h e.: 7 . 1 2 pie s s av ed l as t spring . Thu docline i n aver age; l itte r s ize w'- s gt:: nc: r al i n all r egions c xce1Jt i n the 1:Jc s t . 'I'hc l pe: rccnt doclin~... i n t he t.: pring l Htt. r size fo llm7S 7 con s;.; cuti vo J'car s of increase s t htlt avc r agu d ab out 2 per cent p ur ~rea r . Unf avor able v1onthc r c cnditions a nd a l ar ger porticn of t h u crop fa rroVJing i n tht:. earlier months VJGr o fa ctors contributing to this year 1 s d<.: clino i n littc r s i ze .
1 958 FALL I NTENSIONS UP lJ PERCENT
Repor ts on brc uding j_nt cntions indicat e the.t 5 , 874, 000 sm-Js Hill farrow duri ng the fall sea s on ( ,June through Nr.vcmbor) oi' 1 95 8 . If thus c intentions are r t.;alizt-d , t h3 numbcr cf sovs farrmving this fall VJoul d b .... l J p l; r ccnt mor e than during thl; f al l of 1 95 7 and ll pe; rc l)nt more than avc r::1~ c . Comp ar ~::-d 1-Ji t h l ast y0a r, a ll r cg i.on s cXCGtJt tht. No r t h Atlantic sh owe d incruaso s in the n-umber of soVJs intende d fo r f all l'arroVJing s .
The se changes i'rom la s t year are ba s ed ::m bn.--.;ding inten tions r ep or t ed by f armers about June l.
I f f all fa rrovJing i nt<'mti ons mat~..; rializ t: and the numbe r of pig s s aved per littl.r oqu als th0 avt:. r agL, with an allovmnce f or up1orar d. t r end, the 1 958 fall pig crop will b o about 41 , )00 , 000 he ad . This Hould bEJ t h b l argt.;st f a ll crop since 1)143 , vJhen tho r t.. cor d f c-.11 crop of I..J.7 , 584,000 p i~; s vm s pr odu ce d . 1'hc c ombined pi g crops fo r 1 9) 8 Rould b~ 94, 245 , 000 ho ad, 7 ~~...rcont abG vo l ast year, 5 pur cent above av-.; r ag'-" and onl y slightly b elow t he r c cont hi gh of 95 , 719, 000 hoad f or 1955 .
1-u"tCHIE; LANGLEY Agricultural Stati stici an In Char ge
CARL 0. DOE0 CH:CR
hgricultural Sta t istician
~7
~ttA '3 (Gffi:(Q)~(GllA \C~(Q)W~;u"""'<"'T-.4
q5'1
~ ,... ~ AGRICULTURAL EXTEN310N SERVICE ' <"'.:;) UN IVERSITY OF GEORGIA A ND T HE
JUN2b'58
STATE DEPARTMENT OF AGRICULTURE
BROILER CHICK REPORT FOR GEORGIA
LIBRARIES
u.s. OE?ART MENT OF AGRICU~TURE .
AGRICl.' l..TU RAL MARKETI NG SERVIGE 319 EXTENSION SLOG . , ATHE NS, GA.
June 25, 1958
. ATHENS, GA., June 25--A total of 7,153,000 broiler chicks were placed wit~
produc ers in Georgia during the week ending June 21, according to the Georgia. Crop Reporting Service. This compares ~nth the 7,063,000 placed the previous. ~eek and is 17 per cent more than the 6,137,000 placed the same week last year.
Eggs set by Georgia hatcheries amounted to 9,082,000 compared ~nth
9,360,000 the previous week and is 17 per cent more than the 7,772,000 for the
corresponding week last year~
Hatcheries reported prices paid for hatchi.ng eggs during the t-1eek at an average of 79 cents per dozen. Average price charged by hatcheries for the chicks' was reported at ~13.75 per hundred. These prices compare with 79 cents and .;;13. 75 last t-mek and with 61 cents and ~~11.00 one year ago. Egg prices
shown relate to Georgia produced hatching eggs whether bo~ght on contract or
'otherNise.
\'Jeighted average prices from the Federal-State Harket News Service for broilers during the week ending June 21 are as follows: Georgia broilers 2 3/4-
3 3/4 pounds, at farms 20. 03; FOB plants 21.00.
(See reverse side for other states)
Ueek Ending
___ GEORGIA CHICK PLACENENT BY vJE APR:L 19 TI!ROUGH ~JN~
EK_S_...
,.~ ---
EGGS SET ~: .. ~-
CHICKS PLACED FOR BROI LERS
1957
1958
1958 %of 1957
'1957
1958
11958 %of ' 1957
Thousands
Percent
Thousands
Percen:t
. April .l9 April 26 May J. 1'1ay 10 11ay 17 May 24 May 31 June 1
June 14 June 21
7,804
9,535
122
7,741
9,808
127
7,806
9,712
124
7,794
9,729
125
1,919
9,718
122
7,992
9,766
.122
7,818
9,668
124
1,910
9,616
121
7,860
9,360
119
7,772
9,082
117
5,64$ 6,984
124
5,889 7,076
120
5,925 7,047
119
5,975 7,134
119
6,039 7,-437
123
6,049 1,338
121
6,062 7,551
125
6,069 7,211
119
6,169 1,063
114
6,137 7,153
117
]/Includes eggs set by hatcheries producing chfcks for hatchery supply flocks.
ARCHIE LANGLEY ... Agricultural Statistician In Charge
\v. A. UAGNER
Agricultural Statistician
;,
' .
.
'
STATE
I .. .
- EGGS SET AND CHICKS PlACED IN COIVJMERCIAL AREAS z BY 'tVEEKS 1 o"'_se
1rJeek Ending
-
June June June
'
I
Apr.,
Apr.1
May
May
May l"'ay May
7
14
21 I
19
26
3
10
17
24
31
'
!
-~ -
i
EGGS SET - THOUSANDS
CHICKS PLACED ~ THOUSANDS
Pae;e 2
-
June June June
-7
14
21
Maine Connecticut Pennsylvania Indiana Illinois l'!Jissouri De law-rare 11aryland Virginia 1rJest Virginia North Carolina South Carolina GEORGIA Florida Alabama l'1Iississippi Arkansas Louisiana Texas 1rlashington Oregon California
TOTAL 1958
TOTAL 1957
1958 %of 1957
-- ... ~,..,
1,652 1,254 1,493
1,561 1,6e2 1, 249 :1,328 1,59,5 1,427
1,006 578 922
1,111 597 905
1,101 629 863
1,117 682 923
1,175 1,151 1,166 623 682-r.- 783 963* 961 938
2,450 2,400 2,L.51
966
929 1,035 1,074
986, 1,120 1,071
507
460
427
208-l~
228-:~
176
208
222 207 168
2,271 2,195 2, ll.d
830
696
749
830
962 924 843
2,554 2,984
2,977 432
3,707
2,566 2,959 2,823
434 3,687
2,476 3,012 2,723
420 3,678
2,274
I 1,640
I 1,334 622 2,611
2,074 1,826 1,323
578 2,677
2,201 1,646
1,309 632
2,695
1,943 1,962 1,395
654 2,171
2,215 1,-769'
..
2,136 1,919
1,472 1,515
631 686
2, 778. 2,861
2,136 1,921 1,530
685 2,984
642
648
567
375
390
363
372
338 410 372
9,616
477 3,808 2,797 3,983
532 3,706
9,360 -496
3,838 2,694 3,954 .
469 3,655
~0 8~ J
477 3,771 2,708 3,873
476 3,611
6,984
271 2,961 1,744 2,844
511 2,684
7,076 7., 047 7,134 7,437 . 7,338
293-263~ 252 -~2~ 276
3,052 3,082 3,180 3,072 3,399
1,782 1,812 1,826 1,897 1,914'
3,022 3,051 3, 129 3,098 3,317
472
513
506
521~:- ' 486
2;666 2,723 2,856 2,860 . 2,983 '
7,551 - 270
3,350 1,972 3,191
538 2,996
449
436
453
402
I 1,592 1,$41
-
. '
505 380 1,639
348 183 1,029
387 193
1~_ 007
362 161 1,034
324 207 1,088
355 364 428 221 224 176 1,228 1,068 1,138
. 50,336 49,422 48,856
32 ' 925-::- :'33' 284* 33,447 34,1+33 35,082* ?5,941* 36, 207
l.J.0,091 39,830 40,257
126
124 . 121
28,050 28,576 28,547 28,857 28,428 28,821 28,793
I . 117
116
117
119
123 125 126
1,211 682 9.16
1,031 221 778
2,232 1,945 1,555
651 2,951
444 7,211
241.
3,213 2,073 3,433
509 2,924
431 200 1,114
1,202 717
1,010 1,106
215 852 2,196 2,014 1,524 688 2,889
395 7,063
338 3,251 1,925 3,401
505 2,829
453 185 1,120
l.,?gQ
760 1,005 1,143
188 861 2,084 1,944
1,612 619
2,947 369
7zl53
282 3,310 2,035 3,347
520 3,015
394 216
1,203
35, 966 35,878 36,227
29,274 29,328 29,784
123 122
122
C..,o...
UNIVCHS IT'r OF GEORG IA
r:>cr ~ 'J
C- y .,4
JUN 18 '58
IS ~CGJE(})~CGllA cc ~(())1P ~IE~((J) ~Jrll Ir~ -=-l...--lo=--.1~~-~ JE
AGRICULTU R AL EXTE IIISII)N SERV ~C E UNIVER$!TY OF GEORG IA AND THE STATE OEPf,RT MENT OF AGRIC U LTURE
Athens, Georgia
IJ. S. DEPARTMENT OF AGRICULTURE AG l~ I CUL .I U RAL. M~RKETING SC::R VICE 3 29 E XT E NSION BLDG. , ATHE NS, GA .
June 19 58
GEORGIA COTTON: ACREAGE, YIELD AND P R ODUCTION, 1957
(The s e e stimates are based on the late st available da ta and are pr e liminary)
District a nd
County
A crc ag8
b Cultiva tion
July l
H a rve ste d
DISTRICT I Bartow Catoos a Cha ttooga Da de Floyd Gordon Murray Paulding Polk Walke r Whitfi e ld
-A-cr-e-s
12, 170 630
3,01 0 270
4 , 390 6,680 2,630 1,04 0
~ .ooo
1, 310 l, 100
Acr e s
11 , 930 620
2, 9 70 270
4,330
6, 6JO
2, 580 1, 020 3, 9 10 1,290 1, 080
Total
37, 230
36,630
. Yi e ld Lint Fer Acre
Productio n 500-Pound
In
:Gross We ight
Cultivat io/
Harvest e d: Bal e s
July l .!._
Pounds
P ounds
Bal e s
346
34 7
8,64 0
335
3 35
43 0
251
252
1, 560
27 8
278
160
3 1 0
34 2
3,090
381
382
5, 280
227
228
1' 230
27 5
27 5
590
33 1
332
2, 710
194
195
520
292
29 ll:
660
3 2
3 25
24, 870
DISTRICT II Barrow Che rokee Cla rke Cobb Da wson
D ~Ka lb L"or~:~y.th
.Fulton Gwinnett Hall Ja ckson Lumpkin Oconeu Pickens W::tlton White
Total
2,980 220
1, 000 380
60
260 630 1,030 1' 4t10 75 0 5, 150
20 4 , 4 00
200 10, 7 80
90
29,390
2,9 3 0
321
220
191
990
23 3
380
176
60
167
260
250
620
223
1, 020
27 0
1, 1 20
311
740
207
5,060
3 1 7
2.0
350
4 ,34 0
368
200
170
10, 600
3 Vl
90
37 8
28, 950
32.2
321
1,960
191
90
2 -'P.:>
480
17 6
140
167
20
250
14 0
22 3
290
270
570
3 11
920
2.07
320
3r.1 8
3,670
3 50
15
3 69
3, 3--10
170
75
33~
7, 4- 00
378
70
32 3
19' 500
Page 2.
GEORGIA COTTON; ACREl.GE, YIELD AND PRODUCTION, 1957 _)
District and
County
A creage
In Cult i va.ti on
Jul y 1
Harvest e-:i
.. Yield Lint Pel" Acr ~ Pro d uction
500-Found
In
:G r oss Wei oht
C'..llti vat i. o n
July 1 !J
Har ,..este d: Bales
Acre s
DISTRICT III Banks Elbert Franklin Habersham Hart Lincoln Madison Oglethorpe St.-e-p.!me n s Wilkes
1, 7 4 0 5, 800 3,920
110 7, 230 1, 320 5, 660 4 , 130
330 2, 260
Acres
1,73 0 5, 74 0 3, 890
110 {', 19 () l , 300 5, 610 '~ . 080
3 30
z, 22 0
Pounds
482 39 1 306
LJ: ~ 6
307 226 3 4.4 299
324
300
-P -o u-nd-s
482 391 30 6 4 .:J6 308 226
3 4 L~
299 324 300
Bales
1, 740 4 , 690 2,480
100 4 , 610
610 4,030 2, 540
220 1, 390
Total
32, 550
32,20 C
334
3 3(
22, 410
DISTRICT IV Carroll Chattahoochee Clayton Coweta Douglas Fayette Haralson Harris Heard Henry Lamar Macon Marion Meriwether M:.uscogee Pike Schley Spalding Talbot Taylor Troup Upson
5, 300 80
690 4, 250
4 00 2, 370
830 1,030 1, 300 5, L1l0 l, 290 8, 170 2,370 7, 560
110 4,350 2,700 1, 120
770 5, 130 1, 250
580
Total
57,060
5, 24 0
3 G3
70
100
69 0
25>1
~1, , 210
2.7 4
L} QQ
19 8
2, 3 50
3<17
820
370
l, 010
266
l, 290
374
5, 330
Z68
l, 280
235
8,060
4 13
2,3 40
259
7,
4,
.1
9
0 0
316 391
4 ,290
327
2, 6 80
320
l, l l O
269
770
256
5,090
'~ 54
1,24 0
265
57 0
225
56, 4-10
327
303 10 C 251 27 5 198
3<~ 7
370 266 374 268 235 4 14 259 317 391 3 28 320 269 256
,1: 5 ~
265
225
328
)
3, 320 15
360 2, 4 20
165 l, 700
630
560
1, 000 2,990
630 6,960 l, 270 4,950
90 2,930 l, 790
620 4 10 4, 830 680 270
38, 590
J
Page 3.
.... GEORGIA COTTON: ACREAGE, YIE L D AND PRODUCTION, 1957
' - ,. .
Dainsdtric. t
': c 'ounty .
-'
- ~
Acreage
In Cultivation July l
Harvested
-A c-r e-s
-Ac-re-s
DISTRICT V Baldwin Bibb : Ble: tl~ley Butts ' Cr a~Iord Doege
Greene
Hancock
Houstpn Jasoe r J ohtison Jones L a ur ens M o n r:; e' :
Montgomery Morg.an
Newtpn Peach Pulaski PLtnam Rockda.le TaliafGrro
Treutlt~ n
Twigg s vvashington Wheeler Wilkinson
1, 310 4. 50
3, 520 2, 360
860 8, 870 l, 440 5, 830 3,280 2, 140 10,660
220 18, 370
750 2, 820 9,010 3,970 1,030 6,370
880 1, 590
870 2, 370 2, 280 10 ,470 1,660 l, 270
1, 30 0
'.::40 3, -::: 60 2,330
8 50 8, 730 1, 4 30 5,780 3,2.30 2, 110 10, 510
220 18, 100
740 2, 790 8, 890 3,910 1, 010 6, 27.J},
870 1, 560
860 2, 340 2, 220 . 10, 27 0 . l, 6L.i:0 1,240
. . Yield Lint P e r Acre
Product i on 5 0 0 -, ? o u n d
In
:Gross Weight
Culti va t\0/1. July 1 .:_
Har ves ted: B~ les
-Po-und-s
152 404 401 .
290 4 58 313 218 304 327 362 321 34 5 318 178 255 319 272 4 24 286 225 288 24 3 303 309 353 259 263
Pounds
152 4 14 4: 0 2 290 4 58 3 14 218 304 328 3 62 321 3 tl 5 318 178 2.55 319, 273 4 24 287 225 288 243 305 31 0 354 259 265
Bales : 1:
.. 438160. . _.
2,900 l, 41 0 ...
8 10' 5,710
650, 3, 670 ,: 2, 210 l, 590
"J, 04 0.
160 12, .020
28.0..
s:1, 4 80 92o
z, ito
890 3, 750
.41 0 . 9 4 0. .430 l, 4 90 1, 440 . . 7, 590
880
&90
Tot'al
104 ,650
10 3 , 100
313
313
67, 370'.... i .
DISTR,.i-CT VI BullOch Burke Candler Columbia Effingham Emanuel Glascock Jefferson Jenkins McDuffie Richmond Screven Warren
11' 790 26, 550
5, 000 1, 110
770 12, 480
3,740 13,920
7, 530 4 , 190 1, 320 10, 4 90 7,820
1 1,680
328
2 6,04 0
30 5
4 ,960
306
1, 090
195
760
171
12, 2 80
27'5
3, 700
306
13, 750.
320
7,44 0
299
4, 120
34 5
1, 310
302
10, 34 0
281
7,650
305
328 306 306 195 17 1 275 306 321
299 346 302 282 305
:
8,060 16, 610
3, 170 . 440 270..
7 , 050 2, 360 .. 9, 190 4 ,640 2,970
820 6,070 4 ,880
Total
106,710
10 5, 120
303
303
66,470
Page 4. GEORGIA COTTON: ACRE AGE, YIELD AND PRODUCTION, 1957
District and
County
Acr e age
.. Yield Lint P er Acr e
;
:
Production .J
500-Pound
In
In
:Gross Weight
: Cultivation J uly 1
H arvested Cul tivat i'Jn :Ha rvest e d Bales
July 1 !..
Acres
Acres
Pounds
Fou:<1d s
Bales
DISTRICT VII Baker Calhoun Clay Decatur Dougherty Early Grady Lee Miller Mitchell Quitman Randolph Seminole Stewart Sumter Terrell Thomas Webster
2,260 4,400 2, 380 3,000 1,600
10,320 2,690 2,480 4 ,350 9,460 780 4 ,030 2,760 1, 880 7,410 8,700 4 , 530 1,090
2,240
271
4,370
381
2,360
355
2,960
253
1, 570
215
10,230
404
2,680
335
2,450
291
4,320
396
9,3 4 0
372
770
281
3,990
340
2,730
395
1,860
278
7,310
4 03
8, 610
397
4 , 4 80
323
1,080
271
271
l, 260
381
3,480
355
l, 750
253
l, 560
215
710
40 4
8,630
336
l, 880
291
1, 490
397
3, 580
373
7,260
281
450
341
2, 840
395
2, 250
278
1, 080
4 03
6, 150
398
7, 150
324
3,030
271
610
Total
74, 120
73,350
360
3 60
55, 160
DISTRICT VIII
Atkinson
520
Ben Hill
3,480
B e rrien
2,950
Brooks
6,920
Clinch
50
Coffee
4 ,960
Colquitt
18, 4 70
Cook
3,360
Crisp
8,020
Dooly
15, 110
Echols
40
Irwin
8, 120
Jeff Davis
1, 810
Lanier
360
Lowndes
2, 570
Telfair
2,7 4 0
T i ft
6, 080
Turne r
5,990
Wilcox
6, 890
Worth
16, 120
520
219
3,430
408
2,920
316
6,760
271
50
80
4,890
320
18, 170
433
3, 320
273
7,870
4 81
14,830
399
40
150
8,030
338
1, 800
24 2
360
111
2, 54 0
267
2,690
309
5,990
404
5, 9 10
423
6, 800
4 2/.l:
15,930
392
219
240
4 09
2,930
317
1, 930
271
3, 830
80
J.O
321
3, 280
4 34
16,460
274
1, 900
4 81
7,900
399
12,350
150
10
338
5,670
24 3
910
1 11
80
268
1, 420
310
1, 740
4 0'1:
5, 050
4 24
5, 230
4 2:1:
6,010
39 3
13, 070
Total
114 , 560
112, 850
382
382
90,020
.. '
Page 5. GEORGIA COTTON: ACREAGE, YIELD A:r-;D PRODUCTION, 1957
District and
County
Acreag~
In Cultivation
July 1
Harvest ed
Acres
A cres
Yield Lint Per Acre
Production
500-PoLmd
Ir>
:Grose We-~ght
Cultivat\on Harvested:
July 1 :J
Bales
Po unC:.s
Bales
DISTRICT IX Appling Bacon Brantley Bryan Chatham Evans Liberty Long Pierce Tattnall Toombs Ware Wayne
2, 980 l , 7_?0
20 100
10 2, 290
90 220 1,370 4,200 6,240 470 1,990
2,920
166
1, 730
226
20
100
100
90
10
100
2,260
326
90
lll
220
73
1, 340
166
4, 148
273
6, 120
339
4:50
96
1,960
211
Total
21, 730
21,360
239
167
1,020
228
820
100
5
90
20
lOO
2
327
1, 540
111
20
73
33
167
470
274
2,370
340
4, 350
98
90
213
870
260
11,610
STATE
578,000
570,000
332
333
396,000
1/ Based on acreage in cultivation July 1 less acreage removed to meet allotments.
CARL 0. DOESCHER Agricultural Stati stician
ARCHIE LANGLEY Agricultural Statistician In Charge
J..
L+-~3- CGlEO~\GllA CJFROJP> ~~OFfl~f.OR~G!~JrTINCG SIE~VllCIE:
t;;d
AGRICUI..TURAL EXTEI\'SION SERVICE
D U ~ IV\::RS I"rY OF ~EORGIA AND TH i!:
J.j_
STATE Dl':PARTMl'i: NT OF AGHICULTURE
_$ ~~
U.S. DEPARTt.~EN T OF AGRICULTURE AGR ICULTU RI>.L MAR KE'riNG SERVICF.: 319 EXTE..:S!Oi<l CLOG., A1'! ! ENS, GA.
BROILER CHICK REPORT FOR GE RG~TlI:AfRARtt1l
July 2, 1958
ATHENS, Ga., Ju!y 2 -- A to:-ta~l;-o-;f~6:-.~a~.-,11Mlo broiler chicks were placed
with producers in Georgia during the Yteek ending June 28, according to the
Georgia Crop Reporting Service. This compares with the 7, 153, 000 placed the
previous we ek and is 12 percent more than the 6, 144, 000 placed the same week
last- year.
Eggs set by Geor gia hatcheries amounted to 8, 658, 000 compared with 9, 082,000 the previou s week and is 15 percent mor e than the 7, 557, 000 for the corresponding week last year.
Hatche rie s reported price s paid for hatching egg s during the week at an average of 79 cents per dozen . Average price cha r ged b y hatcheries for the chicks wa s r e porte d a t $13. 50 p~ r l:und r e d. Thes e pric e s compa re with 79 cents
and $13.75 last week and with 61 c ents and $11.00 one year ago. Egg price s shown r elate to Georgia produced ha tching egg s whether b ought on contract or othe rwise.
We ighte d average prices from the Federal-State Marke t N e ws Se rvice for broilers during the week ending J une 28 are as follows: Ge orgia broile rs 2 3/431/2 pounds, at farms 20.4lf , FOB plant s 21. 47f.
(See r eve rs e side for other state s)
(
Wee k
~nding
GE ORGIA CH ICK PLACEMENT E Y WEEKS
- - -A-PR- IL 26 THROUGH JU NE 28
EGG.3 SET ]f
I CHI C KS }. LACED FOR BROILERS
1957
1958
19 58 o/o
of 1957
1957
1958
1958% of 1957
Thou sands
P e rcent
Tho u s ands
Pe rc ent
April 26
7,741
9,808
127
5, 889
7,076
120
M::~.y 3
7,806
9,712
124
5,925
7,04 7
1 19
May 10
7,794
9,729
125
5,975
7' 134
119
Ma y 17 i 7,979
9,718
122
6,0 39
7,437
123
May 24 I 7,992
9,766
122
6,C4: 9
7,338
121
tvfay 31 I 7, 818
9,668
124
6,062
7, 551
125
.J une 7 I 7,970
9,616
121
6,069
7' 211
119
;Tune 14 June 21 June 28
I
I
l
I
7, 860 7,772 7, 557
9, 360 9,082 8,658
119
6, 169
7,063
117
6, 137
7, 153
115
6, 144
6, 878
11 4 117 112
i71nclude s e ggs s et by hatche rie s p roducing chicks for hatchery supply flocks-:--
ARCHIE LANGLEY Agricultura l Sta tistician In Cha rg e
W. A. WAGNER .Ag ricultural Sta tistician
r
(
_...........,_~----,------E_G_C_1S S~T -"~ND CHICY..S FLA CEL: I.N C CJ'-;.fM:SS..C IAL AIG~ LS, BY Wi'~:SKS - 1958
Week Ending
STATE
June 14
June 21
June 28
Apr.
26
May
3
May
10
May
17 .
May 24
May
31
June 7
June 14
June 21
June
28
Maine Connec ticut Pen nsylvania In tiana Illinois Missouri . Delaware Maryland Virginia \"vest Virginia North Carolina South Carulina GEORGIA
.E:'~orida Alabama Mississippi A r kan sas Louisiana Texas Washingt on Or egon California
TOTAL 1958
TOTAL 1957
1958 o/o of 1957
>:'Revised
! Egg s Set - Tho usands
~ :-1 1 56 1
1 i., 249
1, 595 4,400
4 60
11 6 8 2 . 1, 328
1; 427 2,451 . 42.7
1, 65 5 1,250 1,658 2, 44-6
42.1
-1' 1_11 597 905 9?.9 228>:<
1, 101 629 863
1,0 35 176
2, 195
2, 566
2,959
2, 823
2, 143 2,47 '
3,012 2, 7?.3
2, 137 2, 49 1
z, 967
2,6 35
696 2, 074
1, 826 1,323
749 2,201 1, 64:6 1,309
434
4 20
439
578
632
3, 687 3,678 3, 553 2, 677 2,695
1 648 -~ 9, 360
I 496
3, 838
III 2 I 674
i 3, 954
469 3,655
567 9,082
47 7 3, 771 2,708 3, 873
4 76
3, 611
624
390
363
8,658 >--7-,0-7-6- - -7,04 7
16 1 ' 293
263
3,622 3,0 52 3,0 8 2
2, 5-1:6 1, 782
3, 823 I 3,022
4 70 3, 536
t
!
4 72 2, 666
1, 812 3,051
513 2,723
436
505
537
387
362
402 1, 54 1
380 1, 639
I 193
161
I 1, 521 1, 007
1, 03 ~
! 33, 284>:< 33,447
I
I
1 28, 576 28, 54 7
I
116
117
. r-
Chick s Placed - Thousa:ncls
1, 117 1' 17 5 1, 151 1, 166
682
623
682>:< 7,83
923
96Y~
961
938
1, 074
986 1, 120 1, 071
208
222
207 .
168
850
962
924
843
1, 943 2,215 2, 136 2, 136
1, 962 1, 769 1,919 1,921
1,395 1, <1- 72 1, 515 1, 530
654
631
686
685
2,771 2,778 2, 861 2,984
372
338
410
3 72
7' 134 -- -7, -43 7-- -7,-33-8- - -7,-55-1
252
259
276
270
3, 180 3, 0'72 3, 399 3, 350
1, 826 1, 897 l, 91 1 1,972
3, 129 3, 098 3,317 3, 191
506
521>:< 486
538
2,856 2,860 2, 983 2,996
32L1
355
36~
4 28
207
221
224
176
1, 088 ---l,'-2-2-8-- 1, 068 1, 13 8
1, 211 682 916
1, 031 221 778
2,232 1, 945 1, 555
651 2,951
444
7, 211
2H 3, 213 2,073 3,433
509 2.924
200 1, 11 4
34 , 433 35,082* 35,941* 36,207 35, 9 66
28,857 28, 428 28,821 28,79 3 29,274
119
123
125
126
123
1,202. 717
l, 010 1, 106
215 852 2, 196 2,014 l, 524 688 2, 889 395 7,06 3
338 3,251 1, 925 3, 4 01
505 2, 829
4 53 185 1, 120
35,878
29,328
122
1, 220 760
l, 005 l, 143
188 861 2,084 1,944 1, 612 619 2,947 369 7, 153
282 3, 310
2,0 35 3,347
52.0 3,015
394
216
1, 203
36,227
29, 784
122
1, 234 688
1, 008 1, 160
191 8.9 2,0 56 1, 987 l, 630
2,889
.s~ l 7
6, 8 "t' 8
260 3, 251 2, 113 3, 199
450 2, 969
365 20 4 1, 14 2
35, 519
29,256
121
;s-
AG~ICULTURAL EXTENSION SERVIC UNIVERSITY OF GEORGIA AND THE STATE DEPARTMENT OF AGRICULTUI...a..- --
.-ithens, Georgia
----
U.S . DEPARTMENT OF AGRICULTURE\ AGRICUl.TURAL MARKETING SERVICE 319 EXTENSION BLDG., ATHENS, GA.
July 7, 1958 .
FARM PRICE REPORT AS OF JUNE 15, 1958
GEORGIA: The imrlex of prices received by Georgia farmers for all commodities i n-
creased one point to 265percent of the 1910-1914 average during the
month ended June 15. The Index is 17 points (7 percent) above the Index one year ago.
The Al~ Crops Index increased one point to 277 percent of the 1910-1914 average. The Index vlas 10 points (4 percent) above the June 1957 Index.
The Livestock and Livestock Products Index increased one point over last month to 238 percent of the 1910-1914 average. Price increase s Here recorded for hogs, chickens, and milk coHs, with partially offsetting decreaE>es recorded for beef
cattle and eggs . A swmnary of these indexe s with comparison s is shown on the reverse side .
UNITED &Tb.TEL; : The Index of Prices Received by Farmers dropped slightly more than
three percent (9 points) to 255 percent of the 1910-14 average during the month ended Jw1e 15. The most L~portant price declines reported were for vegetables , wheat, cattle, and potatoes. Tho only significant offsetting increases wore for new crop peaches that started moving to market in June and for apples. 'i'he Index was 5 percent above June 1957.
The Index of Prices Paid by Farmers for Commodities and Service s, including Interest, Taxes , and Farm Wage Rates declined 1 point (1/3 of 1 percent) during the month to 305. This vTas the first reduction since July 1957. Prices Paid for both production goods and items bought f or family livj.ng were lower. Hmwvor, the June index was 3 percent higher than a year earlier .
Witp farm product pricus off considerably mor e than prices paid from Hay 15 to June 15, the Parity Ratio dropped to 84. This 1.vas dmm 2 percent from :Hay, but 2 percent higher than Junu 1957.
5ummary Table for the United States
Index 1910-14:: 100
Juno 15, 19.57
May 15, 1958
June 15, 1958
Record high
Index
Dat e
Prices Receivsd
243
264
Parity Index ~/
296
306
255
313 F'cb . 1951
305 y 306 Apr . 1958
Parity Ratio
B2
86
84
123 Oct. 1946
1/ Prices Paid, Interest, Taxes, _and ~fage Rates ba sed on data for tho indicated
- date s. ~/ Also May 1958
ARCHIE LANGLEY Agricultural Statist:i.ctan In Charge
RAYHOND R. HANCOCK Agricultural Statistician
. '
.. . ~ : : . ..
':
PRICES RECEIVED BY F.A.f.MERS Jui-TE 15) 1958 WITH COlvlPARISONS
., ,
----- - - - ---'----
---GE-OR_G_I A _
--~f--~ -- - UNI_TE_D-ST-.ATE~--. - --
COMMODITY .AND UNIT
Wheat, Bu. Corn, Bu . .
Oats,Bu. : .
Irish Po.t., cvrt.
Sweet Pot., cwt.
Cotton, Lb.
Cottonseed, Ton .All
Hay (baled) Ton Hogs, per cwt. Beef Cattle, G~.
--~--'--'..,-:---'-----~ - ----t
.-..,.-.--'----;-- ---r-----
I 'I' Average j.;run.e 15
'
May 15 June 15
I
i
1910....14
1957
1958
1958
.Average _June is
1909-14 1957
I~ 1.23
1.91 2.01
-
I 1.92
.88
1.91
:i; I
$ i $ I
. 91 .6"?,- . 1.13
I
!
1.37 .70
2.50
J 1~50 . ' .e7 I I
3 .oo .
1.55 .79
2.75
I . 64 . 40
1.14
I 1.22 .66
I 1,.31
$ $ $ $
.84 12.1 23. 55
-
7.36
- I-
I 33.7 32.0
I
I -
-
23.70 28.20
18 . 60 20 .60
-
32.0
-
I 27.70
II 21.20
1.60
I
112.4-
1 22.55
II 7.27
5.72
31.9
I -
1e.60
le.40
May 15 1958
1.93
June 15 1958
-
1.70
1,15 . .5!P.
1.19 ; .62
2.37
1.65
5.91
5.52
29.1
-
17.70
29.1
-
17.10
21.70 21.60
$ 3 .96
I 13.70 19.90 18.6 0 1 5 .42
11 .eo 23.10 22.30
Milk Cows, Head
I$ 33.e5
Chick'ens, .All, Lb. I 13.3
I
Eggs , Doz.
I
I
I
21.4
ll5.oo 20.0 37.9
150.00 19.0 43 .o
1155.00 20.0 42 .1
!, 48 .00
I ll.4
I 21.5
163.00 19 .6 2e . 9
200.00 19.6 35.5
210.00 20.3 33.9
Butterfat, Lb.
Milk (whole sale) per 10Cf
$
25.e 2.43
I 51.0
II/
,- 5.66
: 50.0
1/ 5.60
I 50.0
I
-2
/ 5.6
o
I 26.3
I
i 1.60
59.1
ll
I 3 .eo
57.6
!I 3.74
57.3
2/ 3.70
)
Soybeans, Bu. Peanuts , Lb.
$I -
I 5.2 ! l
I 2.35
~.30
I - I I - -
I !
!
2.40
-
I
!
4.e
I 2.1e
I 10.9 I
2.13
I ll.o
I
!
2.13 ll.o
1.L Revised. $;_/ Prel :i.minary.
m:cEX HtJ!:JBERS OF PRICES RECEIVED BY FARMERS m GEORGIA
(Janu.ary 1910 - December 1914 = 100) June 15
May 1 5
1-All-C~rmn~dities .ill Crops
--- - - - - - -- ---------1957_____ __ ]:95e -
248
204
267
275
Grains and Hay
147
165
Cotton Lint
277
263
Peanuts
202
205
Tobacco
385
449
Cottonseed and Soybeans
208
212
Irish Potato e s, Sweet Potatoes and Cowpeas 277
295
Fruits and Nuts
175
189
All Livestock and Livestock Products Meat Animals Foultry and Egg s Dairy Products
209
237
2e8
354
l3e
152
227
226
June 15
_ ___122625~--~I
II 277 I
163
263 205
449 212 .
~
291
206
23e
351
155
226
------- - --~---
PRICES PAID BY F.ARMERS FOR SELECTED FEEDS, JUNE 15, 1958, WITH COMPARISONS ! /
KmD OF . FEED
June 15 , 1957
Q:ORGIA
May 15, 1928
June 15, 1958
II
UNITED STATES
,,I,,, June 15, May 15 , June 15 ,
'I
1957
1958
1958
Mixed Dairy Fe e d
All Unde r 2g;b Prot e in 16% Prot e in 18% Protein 2c% Prote in 24% Protein
!ligh Pr0tein Fe e ds Cottonseed Meal Soybean Meal Meat Scrap
3.90 3 .85 4 .05 ; .10 4 .30
3.45 3.65 4 .70
4.00 3.90 4 .25 4 .10 4 .50
3.95 3.95
-D-o-ll-ar-s-P-er- 10-0-P-oun-ds
3 . 90 3.80 4 .20 4 .00 4 .35
II 3.80 3 . 6e
3 . 67
I 3.':)1 4.02
I
I
3.95 3 . 95
III' !i
3.76 3.74
4 .62
3.72 3.67 3.65 3.98 4 . 08
3.97 4.21 5.es
3.67 3.62 3.61 3.91 4.03
3.97 4.15 5 .79
.Grain By-Products Jm8Ii Middlings Corn Me al
Poultry Feed Tiroiler Growing Mash Laying :Ma s h Scratch Grains
3.35 3.50 3 . 60
5.00 4 .75 4 .35
3.35 3.60 3.45
5 .20 4 .90 4.40
3.25 3.45 3.50
I
li
2.e9 2.97 3.39
2.97 3.07 3.31
2.76
2.se 3.36
5.10
II,, 4 .87
5.06
5.01
4.80 4 .35
II 4 .42 4.06
4.52 3.99
4.47 3.99
Hay (Baled) Al f a l f a All ot he r
50 .00 36 .00
50.00 45 .00
!/ As reported by feed dealers.
45.00 40.00
I' 29.20
I 27.40
!
29 . so 28 .90
?e .70 27.90
- - - ---
PRICES RECEIVED BY FARME RS JUNE 15, 1958 WITH COMPARISONS
-j _:_ -- c;-~---~-. - - . - - - -_--"--_ GE~I\GrA : ""- --;;---:;.
UNITED~_TA~S-
#!J COMvlODITY t '' .!U'-TD UNIT
Wheat, Bu.
I 1i Average J~~e 15
~ I 1910...14 . 1957
1.23
1.91
1
b~Y 15 June 15 ~verage ., June 15 May 15 June 15
1958 2 .OJ.
I ~.-8-8 ~~f---1.-9-1--+-l-.- 1958 1909-14
1.92 ..
_.
1957 ' 1.958
1958
9-3-t--1-.-7-0 ...
Corn, Bu . Oat s, Bu.
. :: ; II ::~ f. 1::: 1::; .1:~:
i 1::: 1:~: ':~:
Irish Pot., cwt. $ 1.13
2~ 50
3.00
2.75
1.14
1.31
2.37
1.65
Sweet Pot. , cwt $
.84
1.50
5.72
5.91
5.52
Cotton, Lb.
12.1
Cottonseed, Ton All
Hay (baled) Ton
$ 23.65
$
Hog s, per cwt.
$ 7.36
Beef Cattle, cwt.
3.96
: I Milk Cows, Head
33.85
I Chickens, All, Lb. 13.3
33.7 1 32.0
32.0 112.4
I 2~ 1122.55 23.70 7~27 1 10 . 60
13.70
1155.00 I ll5.00
I 20 .0
28.20 20.60 19.90 150.00 19.0
.70 1 21.20
I 1s.6o
20.0
I
I
5 .42
:: ::0
31.9
1
18.60
I 18.40
I 17 .so
163.00
19 . 6
29.1
17.70 21.70 23.10 200.00 19.6
29.1
17.10 21. 60 22.30 210.00 20.3
Eggs, Doz.
21.4
37.9 43.0
42.1
21.5
28.9
35.5.
33.9
But.terfat, Lb.
25.8
Milk (wholesale) per 100}
2.43
Soybeans, Bu. Peanuts, Lb.
: I I
I 5-.2 I i
-=-1-/- Revised.---2-/ Prelim--ina-ry.
51.0 . 50.0
11/ y
,- 5.66 5.60
I 2.30 :35 I
!
l
50.0
I -2 /5 . 6 o
I :o
26.3
59.1
1/ 1.60 . I - 3 .so
1 2.18
I 4.8
10.9
57.6
1/
- 3.74 2.13
ll.O
57.3
2/
3.70. 2.13 ' ll.O
TIHJEX 1-m JBERS OF PRICES RECETVED BY FARMERS IN GEORGIA
(January 1910- December 1914 = 100)
June 15 May 15
All Commo dities
-- - - - - -1-9-57-- 1958
248
264
All Crop s
267
275
Grains and Hay
147
165
Cotton Lint
277
263
Peanuts
202
205
Tobacco
385
449
Cottonseed and Soybeans
208
212
Irish ' Potato e s, &-reet Potatoes and Cowpeas 277
295
Fruits and Nuts
175
189
All Livestock and Livestock Products
209
237
Meat Animals
288
354
Poultry and Egg s
138
152
Dairy Products
2Z7
226
June 15
- 2169 585- -l
277 163 263 205 449 212 291 206 238 351 155 226
PRICES PAID BY F.P..RMERS FOR SELECTED FEED~, JUNE 15, 1958, \'I"ITH COMPARISONS
- --------
KIND OF FEED
June 15, 1957
~ORGIA
May 15 , 1958
l: June 15,
June 15, May 15 ,
1958
i! 1957
1958
1._/
June 15, 1958
Mixed Dairy Feed
All Unde r 29'}6 Protein 1&,.0 Prote in 18% Prote in
2Wo Prot e in
24% Protein
Hi~h Protein Fe ed s Cottonseed Meal Soybean Meal Meat Scrap
.Grain By-Products
Bnn
Middlings Corn Me al
3.90 3.85 4 .05
L, .lo
<-.30
3 . ~-i-5 3.65 4 .70
3 .35 3.50 3.60
4.00 3.90 4 .25 4.10 4 .50
3.95 3.95
3.35 3.60 3.45
Dollars Per 100 Pounds
3.90 3.80
II 3.80 3.68
4 .20 4.00 4 .35
II 3.67 3.91 4 . 02
I!
3.95 3.95
I, I;
i I
3.76 3.74
4 .62
I .
3.25 3.45 3.50
2.89
!i 2.97 3.39
3.72 3 . 67 3.65 3.98 4.00
3.97 4.21 5.88
2.97 3.07 3.31
3.67 3.62 3.61 3.91 4.03
3.97 4.15 5.79
2.7 5 2.88 3.36
Poultry Feed 'i3roiler Growing Ma sh Laying :Mash Scratch Grains
gay (Baled)
5.00
4 .75 4 .35
5.20 4.90 4.40
5.10 4.8 0 4 .35
il
II
'II
4 .87 4.42 4 .06
5.06 4.52 3.99
5.01 4.47 3.99
Al f a l f a 11.11 other
50.00 36 .00
50.00 45.00
45.00 40.00
29.20
I 27.40
29.80 28.9-0
?8.70 27.90
i
- - ------------------------------------------------------'~' ------------------------
1/ As reported by feed dealers.
- - - - - - - - - - - - - - - - - - - - - - - - - - - - - - - - - - ---
AGRICULTURAL E.XTENSION SERVICE UNIVERSITY OF GEORGIA AND THE STATE 'D.EPARTMENT OF AGRICULTURE
.i.thens, Georgia
U . S . DEPARTMENT OF AGRICULTURE AGRICULTURAL MARKETING SERVICE 319 EXTEHSION BLDG., ATHENS, GA.
July 7, 1958
FARM PRICE REPORT AS OF JUNE 15, 1958
GEORGIA: The imrlex of prices received by Georgia farmers for all conunodities i n-
creased one point to 265 percent of the 1910-1914 average during the month ended June 15. The Index is 17 points (7 percent) above the Index one year
ago.
The All Crops Index increased one point to 27'7 percent of the 1910-1914 average. The I ndex vms 10 points (4 percent) above the Jun~ 1957 Index,
The Livestock and Livestock Products Index increa sed one point over last
month to 238 percent of the 1910-1914 average . Price i ncrease s Here recorded f or
hogs, chickens, and milk cows, with partially offsetting decreases recorded for beef
cattle and eggs . A smrunary of the se indexe s with comparisons is shown on the r everse side.
U1HTED .STATEG : 1'he Index of Prices Received by Farmers dropped slightly more than
three percent (9 points) to 255 percent of the 1910-14 average during the month ended J'une 15. ThEJ .:ne st important price declines reported were
for vege t ables , wheat, cattle, and potatoes . Tho only significant offsetting in-
cre ases wore for new crop peache s that started moving to market in June and for
apples. 'l'he Index was 5 pe rcent ab ove June 1957.
The Index of Prices Paid by Farmers for Commodities and Service s, including
Inter e st, Taxes, and Farm Wage Rat es declined 1 point (1/3 of l perc ent) during the month to 305. This was the first r eduction since July 1957. Prices Paid
for both production goods an d items bought f or family living wer e l ower, HOl-lGVcr,
the June index wa s 3 percent higher than a yoar earlier.
With farm product. price s off considerably mor e than prices paid from ~1ay 15 t o June 15, the Parity Ratio dropped to 84. This was down 2 percent from May, but 2 pE; rcent higher than Juno 1957
.Sununary Table for the United State s
Index
1910-14 = 100
June 15, Ma;y 15,
1957
1958
June 15, 1958
Re cor d high
InO:ex
Da 'E e
Pricos Re ceived
243
264
y Parity Index
296
306
255
313 F'cb , 1951
305 !;/ 306 Apr. 1958
Parity Ratio
82
86
84
123 Oct, 1946
y Price s Paid, lnterost , Ta xe s, .and Wage Rates based on data for the indicated
date s. ~/ Also May 1958
ARCHIE LANGLEY Agricultural Statistician In Charge
RAYMOND R. HANCOCK Agricultural Statistician
AGRICULTURAL E'XTENSION SERVICE UNIVERSIT Y OF GEORGIA AND THE STA.rE DEPARTMENT OF AGRICULTURE
Athens, G~orgia
UL 1 '58
LIBRAR IES
U.S. DEPARTMENT OF AGRICULTURE AGRICULTURAL MARKETING SERVICE 319 EXTENSION BLDG., ATHE NS, GA.
July 8, 1958
Georgia Cotton Acreage Down 30 Percent
Georgia cotton acreage i n cultivation on July 1, 1958 i s estimat ed at ~06, 000 acres , according to the Georgia Crop Reporting ~ervice. This i s a decrease of 30 perce nt f r om the 578, 000 acres i n cul t ivat ion one year ag o ana lS the smallest acre age si nce estimates were started in 1866 . 'l'he l <! r ges t cotton acreage planted i n Georgia wa s in 1916 with a total of 5, 219, 000 .
United ~ tates current acreage i n cultivation on July l is 1 2,402,000 or a decre ase of 12 percent f rom t he lh, 066 , 000 l ast yee!r and 45 pe.rcent below the 10-year average (1947 - 56 ) of 22, 611,000 .
CARL 0. DO! .EC FER Agricultural StatisticiRn
ARCHIE LArmt:.:Y Agricultural St ati stician In Charge
St ate
rr N, Cerolina S. Car olina Georgi a Tennessee Alabmna Mississippi
1948-$'7
average percent not harvested ~/
1.9 1.0 1.3 2.3 1.0 2.7
Acr eage i n cultivat i on J ul y l
heres (in t housands) ~l'1"'>9'1'r.l.M'7::r;-6 : .
aver age 1957 1958
666 1,003 1, 228
756 1,434 2, 273
351
504
578
495
744
1,333
275 363 406 420
550 1,185
1958 as percent of 1957
78
72 70
85 '74
86
i1i ssouri Arkans as Lou i s i a na Oklahoma Te xas
3. 6
501+
328
308
94
2. 7
1,970 1,170 1,050
90
2. 3
811
461
388
84
6.6
1,108
570
442
78
5.5
9, 171 6,155 5, 650
92
New Hexico
3.3
Ari zong_
1.7
Californi a
1. 3
Other States ~/
3. 8
240
190
184
97
429
366
392
107
935
726
749
103
83
l.~s
1..~0
89
United ~t ates
22, 611
lL~ , 066 12,40~
88
Other States Virginia
Florida Illinois
r Kentucky Nevada
4.1
23 . 3
12. 9 10 .5
81
J,O
44.2
20 . ? 18. 4
89
8. 5
3.5
2. 4
2. 4
100
3. L.
11.0
6. 4
) .7
89
8.1
l.J
2. 3
3. 2
139
Total Amer. Egypt . 1/ 2. 5
50 .4
m1. .1
78. 6
93
y Incl udes acres abaEdoned, r emoved fo r compliance , and pl ace d in boil B.:mk Acr eage Reser ve . 2/ Sums of acre age fo r 11 othor States 11 r ounded fo r i nclu1/ sion in United St<?.t:es t otals . Incl uded in St ":ltFJ and ' United State s t otll.s ,
GEORGIA MAP SHOWING CROP REPORTING DISTRICTS
Georgia Cotton Acreage by Districts
Acres (000) in Cultivation July 1
July 1958 District 1957 1958 in Percent
of 1957
1
37
23
62
2
29
16
55
-\ ..J , \ Rome
)
Non-Co~ton /
" '-r-----( :r- ----
/ -
--"/
(
~)- 3'--- !i
\
.....:...__j
1/( '
--\ \
\ l
3
32
19
59
4 65
57
35
105
67
107
76
61 64
71
74
62
84
87
115
90
78
__9_ _ _ _ 2_2 _ _ _1_8 _ _ _ _82_
r J
> t\ . ~ ... Elber oh, State
57 8
406
70
-------.1'--
....L -
-..
-
Athens (, Atlanta /- I
.-\...- , - - - - - - - - - - - - - -
"
>
'-
/
\ /''-----'
\
r".-
[ --- -.., ~,
' '-..,I
'--- "
\
-~
" -- ">-'r ' " . -\_,'--
r/
-..,
....
\-4
,/"'
//
'\
!
5 \, ~ -~ '1 Augusta\
\
/ Macon
0 ( \.\
\.\ Columbus I
\ ~
!
...-
, ,
(-
\
) JAlbruj 8' '~! 9 I
)
')
-.----.
.
L,
.._.....J--./-~:__
-
-~
.
_;
~----:--"\
/ -\ -,..
!'--------... ' ,-'!
r/
" ----__......\ / , .
I
S~vannah)
,J - ~ ,,;
''
l l~ (
'\
i
Valdosta \.
(
------------~' ~--------------1\' _
)
1 -r n . I \ IM . M Lt I 1 . " 1 / t- MM . ,... I lr"'' J
U;-"'1 I ll" . l ~ llol
I
I ., HI
AGRICULTURAL EXTENSION SERVICE UNIVERSITY OF GEORGIA AND THE STATE DEPARTMENT OF AGRICULTURE
JUL l :"\ ~
U . S. DEPARTMENT OF AGRICULTURE AGRICULTURAL MARKE'TING SERVICE 319 EXTENSION BLDG., ATJiENS, GA.
BROILER CHICK REPORT FOR GEORGI--~-~-'!!.""~'~~~-R~-R-1/0_s -JI
July 9, 19.58
ATHENS, GA., July 9--A total -~f 6,724,000 br~ilsr chicks were placed tdth
producers :tn Georgia during the week ending July 5.; according to the _Georgia Crop
Reporting Service. This compares .with the 6,878,000 placed the previous week and is 10 Fer cent more than t}J.e 6,094,000 placed the same week :last year.
Eggs set by Georgia hatcheries amount ed to 8,.574,000 compared ~nth
8,. 6.58,000 the previous week and is 17 per .cent more than the 7,300,000 for the
corresponding week last year.
Hatcher:i.es reported prices paid for hatching eggs during the week at an average of 78 cents per dozen. Average price charged by hatcheries for the chicks was r eported at $13.25 per hundred. These prices compare with 79 cents and ~/13. 7.5 last week and with 62 cents and Ull. 00 one year ago. Egg prices shot-m relate to Georgia produced hatching eggs whether bought on contract or
othennse.
Heighted average prices from -the Federal-State Market News Service for
broilers during the week ending July .5 are as follows: Georgia broj_lers
2 3/4- 3 3/4 pounds, at farms 19.79; FOB plants 20.6.5.
(See reverse side for other states)
1.-Veek Ending
GEORGIA CHICK PLACE11ENT BY VIJEi;.;KS
APRIL 26 THROUGH JUNE 28
-
-
EGGS SET 1,/
1958 %
-CHICKS PLACED FOR BROILERS 19$8 %-
19.57
19.58 Of 19.57
19.57
19.58 of 19.57
-~hOUsands
Percent
Thousands-- - Percent
Nay 3 Hay 10 Hay 17 Hay 24 Nay 31 June 7 June 14 June 21 June 28
July .5
7,806
7,794 7,979 7,992 7,818 7,970 7,860
7, 772
7 ,.5.57 7,300
9,712 9,729 9, 718 9,766
9,668 9,616 9,360 9,082 8,6.58
8,.574
124 12.5 122 122
124 121 119 ' 117 11.5 117
.5,92.5
5,97.5 6,039 6,049
6,06~
6,069 6,169
6,137 6,144 6,094
7,047 119 7,134 119 7,437 123 7,338 121
7,.5.51 12.5 . 7, 211 119 ' 7' 063 114 7,1.53 117 6,878 112 6,724 110
- iillii:iiiliiiill lii5 1
iii - - ~
-
..
.
- . -L....
!/ Includes eggs set by hatcheries producing chicks for hatchery supply flocks.
ARCHIE LANGLEY Agricultural Statistician In Charge
"h1 . A \"~AGNER Agricultural Statistician
STATE
Haine Connecticut Pennsylvania Indiana Illinois Missouri Delaware 1iary1and Virginia West Virginia North Carolina South Carolina GEORGIA Florida Alabama lli.ssissippi Arkansas Louisiana Texas \rJashington Oregon California
TOTAL 1958
TOTAL 19.57 1958 % of 1957
* Revised
I
I
!
I June
. -~ 21... ..
- EGGS SET AND CHICKS PLACED IN COMHERCIAL AREAS.: BY 1iffiEKS - 19.58 Week Ending
June __.2_._8
July .5
I
I I
May
3
May 10
Hay 17
-
M~~
!Viay 31
i
EGGS SET - THOUSANDS
-
I
I
I
1,682
1,6.55" 1,562
I 1,.328 1,250 1,292
1,427 2,4.51
427 2,143
1,658 2,446
421 2,137
1,406 2,280
415 2,055
2,476 2,491 2,513 3,012 2,967 2,864
2, 723 2,635 2,529
I 420 3,678 567 9,082
439 3,553
624 8,658
436 3,495
591
8,574
477 3, 771 2, 708
461 3,622 2,546
420 3,564. 2,629
3,873
h64-ll-
I
I
3,611
I
I '
505 380
1,639
3,823 470
3,536 537 404
1,521
3, 772
473 3,34.5
471 371 1,521
II 1,101 629
863
1,035
I 176 749
2,201
1,646
1,309
632
II
2,695 363
7, 047
263
3,082
1,812
3,051
513
2' 7?.3 362
161
1,034
1,117 682 923
1,074 208 830
1,943 1,962 1,395
654 2, 771
372 7,134
252 3,180 1,826 3,129
506 2,856
324 207 1,088
--- - CHICKS PLACED - THOUSANDS
1,175 623 963-:!986 222 962
2,215 1,769 1,472
631 2, 778
331* 7,437
1,151 682*
931* 1,120
207 924 2,136 1,919 1,515 686 2,861
410
7,338
1,166 783 938
1,071 163-:!-
843 2,136 1,921 1,530
685 2,984
372 7,551
259 3,072 1,897 3,098
521-ll 2,860
355 221 1,228
276 3, 399 1,914
3,317 486
2,983 364 224
1,068
270 3,350 1,972 3,191
538 2,996
428 176 "
1,202*
June 7
1,211 . 697*
916 1,031
221 778 2,232 1,94.5 1,5.55 651 2,951 444 7,211 241 3,?13 2,073 3,433 509 2,924 431 200 1,114
!.J.8,844~l- 47,854
40,2.57 39,376
121
122
46,578 38,687
120"
33,447 28,547
117
34,433 28,857
119 -
35,015* 28,428
123
35,911-ll28,821
12.5
36,26~
28,793 126
35,981* 29,274
123
Pa~e 2
June 14
..
June 21
1,202
735~~
1,010 1,106
215 8.52 2,196 2,014 1,.524 688 2,889 395 7,063
338 3,251
2,08~~
3,401 505
2,829
453 185 1, 120
1,220 760
1,005 1,143
188 861 2,084 1,944 1,612 619 2,947 369 7,153
282 . .3,310
2,035
3,347 512*
'3,015 394 216
1,203
36,051-lt29,328
122
36,219* 29,784
122
-
-
June 28
1,234 688
1,008 1,160
191 849 2,0.56 1,987 1,630 579 2,889 417 6,878 260 3,251 2,113 3,199 450 2,969 365 204 1,142
35,519
29,256
121
July .5
-1,184 649 932
1,023 191 791
2,275 1,863 1,476
678 2,876
386 6,724
272 3,166 2,14.5 3,096
413 2,811
389 212 1,147
.3h,699
29,277
119
.
U . s ; DEPARTMENT OF lll:ii~UC;:1J AGRICULTURAL MARKET
GENERAL CROP REPORT Ac OF J ULY 1, 1958
: .- :- . .' .i.
The first half of Juno was dry and good progress was made in cultivating
crops <,md harve sting small grains and seed crops. During the l ast hal..f of ttl.o
month," f~equont heavy rains were received over the southern half of thp State . . :.
Corn~ .)iays.? peanuts, and pasture s made rapid improvement, but the fr lquent r~ins . ;;
dama~e d truck crops, especially tomatoe s, cantaloupe s, and wat ermelons. Little_
raipf~l was r e ceived in p arts of tho northern half of the State and corn, P.~ s.,.. ..
turo ~,_ .truck .crops, and gardens suffered soma drunago from lack of moisture . ,.. ...
LEAF..PRODUCTIQN '(!P: Current indications point to a Georgia flue .,..cured tobacco .
. .r . . . ,
crop of 84,100,000 pounds, throe. pe rcent above l a st y ear,. : . :
This will be 43 p ercent b elow tho r e cord crop of lh7,965,000 pounds produce ~ ih .
1?~5. . Tho yield this s eas on is e stimated at 1450 pounds compared with 1290 l a st
year and the r e cord high of 1465 pounds in 1955. Grower s ar c expe cted to harvest .~.
58,000 a cre s, 5,000 l oss t han l a st year. The de cline from 1957 r esulted f rom in-
crcg sed pa rticipation in the ~ oil Bank Progr 0m.
HECO!llJ CORN CROP : Tho 1 958 corn crop is e x1Jc ct ud to b e; a r e cord high for tho :=.t ate.. Tho current f or6ca st of 73,197,000 bu shels will be. ., . '
slightly more than two million bushels above l a st year and 43 p ercent . above the :: : 10-year 1947-56 aver age. Tho yiold per acr e a t 27.0 bushels promise s to be a .: r ecord, surpa ssing the pr evious high of 26 .0 bu shel s produced in 1957. Ampl e. ..
moistur e along .with -incrce.s cd use of hybrid- so c,d and i mprovt.d cultural and fe r t ilization , pr a ctice s in r e cent year s contributed to t he pro sp8 ctivo hi Gher corn yields .
Ftl(;A'l' fD.q~PF;CTS I ITI..>R.Ov.S : Favorc:.blo harve sti ng we ather during tho f irst two weeks
of Jun~ enable d Georgia farmers to finish combining
wheat . ~ndo r ne arly i dGal conditi ons. As a r~sult, tot al producti on is now osti-
mn.t~ d at 1, 840,000 bushels, an incro2.so of 80,000 bushels above thto May 1 f orocast. Tho e stimated yield por a cre of 23.0 bus hels will b e the highc st . of r e cord f or the ~tate , exceeding the pr evious r e cord of 21.0 bushels in 1956 by t wo bush-
Lls.
GOOD PLACH CROP: Georgi a 's 1958 total poach crop ( including f arm and corrunorcial producti on) is e stimat ed a'i:i 3,500,000 bushels. According to ,
FLder al-Stat o Harkct News Sorvico a total of 4,039 equival ent car e had been shipped through July 7. This comp e.r o.s ' with 1;527 car s shipped by this date l ast year. The bulk of thEJ punch crop south of r~ia con has been harvust oci., movement i s in f ul.J,. swing in t ho central ar o2s,. and is underway in nor the rn s e ct ions
QR. .OP
"'
' '
Corn
Bu.
Wheat
Bu.
Oats
Bu.
Rye
Bu.
Barley
Bu.
Tobacco, All
Lb.
Potatoes,Irish er,rt.
?otatoes,Sweet Cwt.
Hay, All
Tons
Peanuts, Alone
Soybeans, Alone
Peaches,total crop
Pears,total crop
Cotton
ACRJ.i:J1.GE (0- 00)
.,
1957 1958
.GEORGIA .CROPS
,
YIELD
'
1~58 1957
Percent oT l95o;
.. .
Indic~
July .i ,.
1958 '.
. '
?RODUCTION (0'06}. . ..1.,
1957
Indic~
July; . l
1958 . \ .
2,738 2,711
112
80
394
315
13
12
13
12
64.1 59.1
5.2
4.6
14
13
571
569
604
592
122
129
578
406
99
26.0 27.0 71,188 73,197
71
16.5 23.0 1,848 1, 840
80
28.0 33.0 11,032 10,395
92
10.5 12.5
136
150
92
26.0 29.0
338
348
92 1,290 1,448
88 49
47
82,711 85,585
254
215
93
46
47
644
611
100
.9c
.96
550
548
98
106
2,100 3,500
86
98
ARCHIE LANGLEY Agricultural Statistician In Charge
CARL O. DOESCHER Agricultural Statistician
UNITED STATES - GENERAL CROP REPORT AS OF JULY 1, 1958
.;!Jotal crop outturn equaUing any previous year now appears likely for : 19~~! Tota,+;:acrE)age harvested for all crops is expected to be s~ightly larger than i.n 1957 from the smallest total planted acreage in 40 years of comparable record ., Crop': d.evetoplfients tbough June and in early July have been mainly favorable . ::-: ' despite -instances of~ local flooding or other storm damage. Yield per acre leyels, all crops considered, now seem likely to pull ahead of last year's record high' unless tripped by late season hazards.
Win~er wheat is setting a new production record with large effect on ~otal crop outturn~ Soybean acreage is re9ord large and growth conditions are promising.
The corn crop now looks slightly smaller than last year but well above averag.e1. . -.
Large to near-average crops of barley, oats, rye and dry beans are in prospect.: A
sharp cut in sorghum acreage assures a sizeable reduction in sorghum gram beiow. '
last yearsrecord crop. Cotton acreage planted may result in tpe. smallest acreage for harvest in over 80 years. Hay tonnage will rank well below but se.9ond :. only to last year's record, ample for demands and well distributed. Forage growth
continued generally favorable during June and most sections have good to excellent grazing. Livestock conditions generally remain excellent with little drought pressure to disturb marketings. Milk production rates per cow were at nee1r record levels for July 1.
The 1958 corn crop is forocast at 3.3 billion bushels, 3 percent below last
year but -5 percent above average . The yield, indicated at 45.2 bushels per har-
vested acre, is somewhat below the record 46.8 last year but far above the 38.8
bushel average. Growing conditions during most of June were not generally favor-
able for corn. Below normal June temperatures over most of tho corn areas with
frequent or -heavy rains through the Ohio-Mississippi Valley and other sections
retarded growth and delayed cultivation. However, warm, dry weather prevailing at the very end of June permltted cultivation and improved the color. The ex-
-YI
cellent soil moisture supplies will help the crop along during summer dry periods
which usually occur in many sections.
Production of peache s for 1958 is for ecast at 74.9 million bushels, 20 percGnt greater than last year and 19 percent above average . As of July 1, it appeared
that the crop will be the largest since 1947. Excluding the California Cling-
stone crop which is mostly for canriing, the remainder of the u. s. Crop is -esti-
mated at 49.9 million bushels, 25 percent l arger than last year and 22 percent above average.
CROP
UNI'lED STATES
:ACREAGE JN THOUS. : 1958 As :
YJELD
PRODUCTICN JN THOUS~
Harv. aFor Harv.: Percent of :
:Ind. July :
:Ind. JUly 1
1957
1958
1957 I 1957 ' : l' 1958 : 1957 : :J.958
Corri, All
Wheat, All
Oats, Cotton,
!/
Hay, All
Soybeans, ~
Peanuts, '[/
Potatoes, Irish
Sweet Potatoes
Tobacco, All
Bu: 72,656 Bu1 43 1664 Bu: '.!4,984
l 14,066
Ton: 73,776 I 21,804
: 1,777 Cwt: 1,383 Cwtt 285
Lb: 1,122
73,185 53,650 31,926 12,402 72,905 24,414
1,762 1,452
282 1,008 . .
100.7 122.9
91.3 28.2
98.8 112.0
99.2
105.1 98.9
97~0
46.8 21.7 37.4
45.2 3,402,832 3,311,.249 25.0 947,102 1,343,490 39.3 1,308,360 1,255,244
1.65
-63.3
1,479
1.57
-. -
.. Q'-.e2 1,551
121,402
18,053 1,660,553
114,246
17,542 1,688,559
!J Acreage in cultivation July 1.
1 Grown Aione : for all purposes.
'
'
I
,
.. , ,
: 0 ~.
. . : ~ ~.. . .. . . ' . .
: :, : .
:: . .
. .. . .
. ~ \ :~
::.) 7
.~ ~ CGJEO~CGllA CJF&OIPJ
' , f AGRICUL TURAL F.XTENSION SERVICE U.NIVERSITY OF GEORGIA AND THE STATE DEPARTMENT OF AGRICULTURE
Athen_s, Georgia ,! ,
VEGETABLE CROP F~PORT
DEPARTMENT OF AGRtCUL;_T'/RE.'> . . UL.TURAL MARKETING SERYIGE _: XTENSION BLDG., ATHENS..~A. .-. .i .
.Ju. ly 14~ 19L~"8 ~. .-.. ....
. : ; . .= . .
GEORGiA: ' ' E:icc essive rainfall during late June did considerable damage to
,: ' :
..'. vegetable crops in southern areas. Harvesting has passed the pe~k ~s ...'.
of c!.~ly, l'on practically all vegetable crops in this area except cantaloups, \ . ..
tomatoes, . ~nd watermelons and these crops are moving in volume ~dth very low
pric'E_:)_S :received. Harvesting of sununer v egetables in the mountain areas is
running .later than usual due to late plantings caused by unfavorable weather
conditi'ons
UNITED STATES: The production of summer vegetables and melons during 1958 .is '' : expected to be 11 pe;cGnt larger than in 1957, the Crop Report-
ing Board announced today. Forecasts prepared July 1 for crops, \>Thich constituted
63 percent of the summer prod'..Action last year, indicate vegetable production,
exclqdfng ~elons, ~Jill be ab out equal to that in 1957. Compared t-1ith last year,
significant,Iy more summer production is indicated for tomatoes, stveet corn, :green
peppers and cabbage. Offsc:!tting these increases are marked declines in celery, ... lettuce~ c?Xr9ts, cucumbers, snap beans and cauliflo~ver.
Current. estimates point to a production of summer melons 25 percent more than
last year and 30 percent aboYe average. This increase resulted from larger
acr.eages ,as well as higher yields. Greater production is expected this summer for all _types of melons-cantaloups, honey detvs and watermelons.
LIHA BEANS: The first forecast of production in the sununer States, at 242,000 cwt., is 11 percent above last year's crop but 25 percent below
average. Georgia and North Carolina ha:d small acreage increases \vhile other States ~-vere unchanged from last year. In Nelv York, cool, t-ret Heather in June resulted in late planting and slow grm~h of the crop. Harvest is expected to
'Qegin in late July- or early August. vJeather conditions in New Jersey caused planting to be spread over a longer period than normal. Because of this, harvest r1il~ be spread out. Some fields are in pod while others are still blooming. Earliest harvest t-lill be after mid-July. Conditions in Naryland have been. much , more favorable this year than last. Limited harvest is expected the second week of July with volume about mid-month. Grotring conditions have been generally favorable in North Carolina.
CABBAGE: The late summer crop is forecast at 3,574,000 ctnJt., 1 percent helo-v7 last year and 11 percent belotv the average. the cool, ~ret Heather
during June in Illinois and Indiana was favorable for growth of the crop. Lack
of rain in the mountain areas of South Carolina anu Georgia has reduced the size
pf heads. In Northern Colorado, insects have caused excessive losses in many
fields; reducing yield prospects. In F ashir.gton, both the processing arid fresh market- crops are experiencing favorable growing conditions. In Ca:Iifornia, moderate supplies are moving to local markets.
CANTALOUPS: The early ~~ crop is forecast at 2,104,000 ctrlt., uhich is almost , three times as large as the 1957 production but only 30 percent .
~.bove average. The big increase \'Jas in .'l.rizona t-7here there were 10,500 acres this season compared with only 1,500 last year. Arizona's acreage is notrl back up to about its usual level. Cantaloups in lviaricopa County, Arizona have made Good progre~s and are expected to yield better than last year. Smae disease is
shotv:i.ng up in the Theba area and yields Hill be affected. Prospects in other
a.reas .of Arizona appear good. Quality and size thus far have been good. : .Daily
$hipments t-rill increase as the season advances. Georgia reports one of. itls hi~est yielding crops but excessive rains reduced quality in some fields .. . . Har-~est had passed its peak in south Georgia and was expected to be at peak in central areas around July 1. The South Carolina crop is reported to be. in good ~oncli-tion and t-Jas not seriously damaged by dry weather. The crop is about two . <1eeks behind its usual schedule with harvest expecte(j to begin -in.- early July. _: ...
~ ATERliELON~:
- :.
Zarl:V summer production is cent above 1957 production
not-r and
fo 27
recast perce
a nt
t
23,80 above
3,000 cwt average.:
0.T3 i-l2e2-p-paesr.:t.,:;
... .:
.
Jr:~~~ : w~-~-~s h~Yf; been favorable for growth of wate:r:melons in North. Cfl:i:'Olin~.. . ,'J;'h~ . , . -:::
.nne.s cl:q mo~t! t;l.reas h_ave covered the ground and the size of matu.re fruit is. .. ... . . -
<'bov:a normal. .. Harvest will start about July 15 in the southeastern counties and
:l'ill reach a peak toward the last of the month. \.Vatermelons in South Carolina
~rc r eported in good condition. Melons are moving from Hampton County and ship-
1ents vlill probably peak in the Barmvell, Hampton, and Allendale areas in rnid-
Jdr . Chesterfield and Darlington Hill peak somet-Jhat later. In Georgia, excess-
ve rcins have caused some damage to the crop in the south ern and central areas
(continued)
-2
Hatermel.ons, continued:
. . . . .. .
of the State. Excessive moisture has hastened maturity, resulting in p6.o:( ,q}l~-
ity. Peak movement is expected the first two weeks in July. Iri Alab8Jlla, . .. .. .
moisture has been adequate for good grot-rth. Some melons are being marketed but
peak movement will not be reached until mid-July. Nississippi Is watermelon crop
has fairly good prospects, although most areas are a little later than usual.
Light movement is occurring in the soutb,Grn cpunties. but volume movement in .the :
State will be between July 15 and August 8. In Arkansas, moisture ;is ample to
abundant. Dise~se has been troublesome in some fields in Hemstead County. In . Louisiana, the crop is in good condition. l'liith recent favorable 1-;eatl:ier, wate~ .
melons in the Washington-St.Tarr.many area- are ripening and some nave already be.en
harvested. Volume movement in the major producing area of North Central Louis.-:- .
iana is e:kpected after mid-July. In Oklahoma, there will be light harvest the
last half of July, but the larger portion of the crop vdll not be ready.lintil the
first of August. Prospects in Texas improved over r:tost of the central and eastern
counties, and crops in some early areas of South Texas 1-rere turning out better
than expected. Supplies are available in all areas of south Texas. tvith the .
e~::ception of Falfurrias-Hebbronville area, where harvest is nearly complete,
melons vdll be available in July. Volume from the central and eastern counties .is
not expected until after July 10. Crops in the extreme northeastern counties--
the usual source of supply for late season harvest--are in good condit~on and
supplies should be available in good volume through August. Host of the production
for September harvest comes from scattered areas in the northwest and prospects
in these areas are favorable at this time. In Arizona, melons are sho1dng some
disease damage and prospects are not as go od as they t.Jere last year. Hovement
started later and slower this year than last. California melon prospects continue
~avorable. First melons from the San Joaquin Valley were harvested late in June
in the \tlheeler Ridge area. Harvest activity will increase there in early July.
The Kingsburg deal is expected to start by ~uly 10.
Acrea__g_e and Indicated Product; on R~orted to Dat e. 1958 " t-1]_ th Com~arJ,sons .
CROP AND STATE
I
ACREAGE FOR HARVEST
YIELD PER ACRE
PRODUCTION
I iI I Average
1949-56
1957
Ind.
1958
Av.
49-56
1957
Ind.
1958
Average
1949-56
11957
Ind.
1958
I
Lll1A BEANS
Acres -
- Cwt. -
- 1' 000 cwt. -
.... Summer: Neu York
1,660
600 600 42 45 40
70 27 24
NevT Jersey
2,020 1,400 1,400 33 28
34
64 39 48
Ohio. ....
650
36
24
:'Maryl a n d
1,150 1,000 1,000 26 20
25
31 20 25
North Carolin 1,460 1,500 1,600 22 26 32
32 39 51
Georgia. 5,760 4,500 4,700 18 21 20 104 94 94
Group Total. 12,710 9,000 9,300 : 26 24 26 324 219 242
SNAP BEANS
Sumrn,er:
New Hampshire 11assachusetts
290
250 280 34 45
1,350 1,200 1,300 35 38
Rhode Island
260
200 200 36 35
Connecticut
1,100 1,000 1,000 35 35
New :York.,L. I.
3,090 1,200 1,200 42 45
New York 10,750 . 10,700 10,500 42 44
Pennsylvania
3,060 : 2,300 2,300 43 45
Ohio ~
Illinois.~
:tv"".Li.chigan~
3,310 3,800 3,;800 40 39 1,280 1,;'200 1;300 27 34 2,520 . 2,600 2,600 31 32
Virginia ti
660 '700 750 30 30
North Car 7,520 6,400 6,800 32 50
G e o r g i a. . . . . . .
2,100 . 1,400 1,300 28 27
Tennessee
1,680 1,200 1,400 36 42
Alabama. . Colo;rado ;,
1,290 1,300 . 1,200 21 24
820
700 650 44 48
Group Total 41,080 36,150 36,580 36 41
35 10 11 10
35
47 46 46
32
9
7 6
32
38 35 32
40 125 54 48
35 448 471 368
45 131 104 104
40 131 148 152 .
33
34 41 43
28 ' 77 83 7J .
30
20 21 22
50 243 320 340
25
59 38 32
40 59 50 56 .
25
28 31 30
45
37 34 .29 :.
38 : 1,494 1,494 1,391,
''
CROP
A~fD
STATE
CABBAGE ]j
- 3-
ACREAGE FOR HARVEST
1958 ~nth Com arisons
!
YIELD PER ACRE 1:
PRODUC TION
I Average
1949-56
1957
Ind. 1958
- Acres -
- J..v. 1957 Ind. IAverage
49-56
II 191,::'8 1.1949-56
1 1957 I
jind. jl958
- Cvrt..
- 1,000 Civt. -
Late Summer: Pennsylvania Indiana Illinois
Iol,J'a
North Car Georgia Colorado Nm-1 l'Iexico Hashington 'Ohlifornia
Group Total ,
CAJ.!TALOUPS
~arly Summer: South Car Georgia Arizona
Group Total.
4,290 2,170
2, 710 980
4,260
750
3,JJ(, ~.
1,800 2,600
900
3,560
600
3, 700 : 181 168 1, 700 : 133 177 2,900 : 179 200
800 : 146 115
3, 800 1 142 162
500 ~ 92 100
--- 3,340 2,600 2,9oo 1 240 258
370
108
1,600 2,380
1,000 2,300
850 1 2,300 ;'
174 231
232 240
l -~
22,830 18,770 19,450 176 192
;
I
~
5,900 8,480
a, t~5o
6,000 9,000 1,500
I 7,400 36 24
9,000 ! 56 45 10,500 j 108 125
22,820 16,500 26,900 l 70 45
170 776
150 282
200 482
150 145
150 607
90
70
225 808
40
215 272
235 548
184 l 4,030
35 212
65 475
120 932 78 : 1,618
559 629
319 255
520 580
104 120
575 570
60 45 690 652
232 183 552 540 3,611 3,574
144 259 1~05 585 188 1,260 737 2,104
1rTATEill1ELONS
Early Summer: North Car
I ~
11,050 12,000 16,ooo 49 55
South Car Georgia
41,750 53,250
43,000 60,000
44,000 63 ,000
l
l
56
78
43 75
Alabama . 17,260 19,000 21,000 l 91 92
Hississippi. 10,800 13,000 16,000 j 70 72
Arkansas 10,160 11,600 13,000 l 85 85
Louisia11a 4,460 4,200 4, 200 j 77 80
Oklahoma 14,960 11, 000 11,500 ; 63 77
Texas .. 108,880 112,000 12)~,000 : 47 42
Arizona 5,090 5, 800 7,200 : 142 175
California 10,480 10,500 11,500...: 135 180
Group Total. 1, 288,140 302,100 331,400 : 65 64
65 541 660 1,040
65 t 2,316 1,849 2,860
85 : 4,151 4,500 5,355
95 : 1,561 1,748 1,995 70 : 755 936 1,120 83 860 986 1,079
85 3h2 336 357
80 961 847 920
50 l 5,145 4,704 6,200
160 724 1,015 1,152
150 .:~.....J., 41-1 1,890 1,725
72 \18,768 19' 471 23,Eb 3
1/ Includes Processing.
ARCHIE LANGLEY Agricultural Statistician, In Charge
L. H. HAR.ltiS, JR. Vegetable Crop Estimator
c:t
,/fi7GIE:O~GllA C~(())JP>111\\j~~~Jrllt'~CG .lEIRiVllCCJE ,
AGRICULTURAL EXTENSION SERVICE
I UNIVE-RSITY OF GEORGIA AND THE . ~ S.TATE DEPART.I-.1ENT OF AGRICULTURE
r
BROILER CHICK REPORT FOR GEORGIA
. ORGIA
JU
L1..
8
'1:8
iJ
: 1
'
.
U.S. DEPARTMENT OF AGRICULTURE '
AGRICUI-TURAL MARKETING SERVICE :
319 EXTENSION SLOG., ATHENS, GA.
LIB RARIES
. _July ~6, 19~8
' ATHENS, GA., July 16--A total of 6,869,000 broiler chicks v1ere placed with producers in Georgia during the v1eek ending July 12, according to the Georgia ~
Crop Reporting Service. This compares with the 6;724,000 placed :the preyious :. vreek and is lJ .per cent more than the 6,075,000 placed the s-ame l~eek last year.:
Eggs set by Georgia hatcheries amounted to 8,531,000 compared tvith
8,574,000 the previous week and is 13 percent more than the 7,539,000 for the
corresponding. week last year.
:
Hatcheries reported prices paid for hatching eggs during the tveek at an
average of 78 cents per dozen. Average price charged by hatcheries for the chicks was reported at ~~13.00 per hundred. These prices compare vrith 78 cents
and .';:;13. 25 last week and tvi th 63 cents and \~10. 75 one year ag o. Egg_ prices
shovm relate to Georgia pr oduced hatching ~ggs vlhether bought on contract or
otherwise.
: .V.Jeighted average pric es from the Federal-State l'iarket Nel'ITS Service for broilers during the week ending J'uly 12 are as .follows: Georgia broi],ers 2 3/4 - 3 . 3/4 pounds, at farms 19.03; FOB plants 20.00.
(See revers e side for other states)
UeeL: Ending
GEORGIA CHICK PLACElvrENT BY lri7EEKS
- H!-~.Y 10 THROUGH JTJLY 12
. - -.-
-r ~-
EGGS SET ]/
I
-
CHICKS PLACED FOR BROILERS
1957
1958
1958 ~& of 1957 1
1957
'1958
1958 % of 1957
Thousands
Percent
Th ousands
Percent
i1ay 10 }fay 17
7,794 7,979
9, 729
I 125
5,975
7 ,13~.
119
9, 718
I
122
6,039
7,437
123
lla.y 24
7,992
9,766
122
6,049
7,338
121
:Hay 31
7,818
9,668
12)-J,
6,062
7,551
125
Jurie 7
7,970
9,616
121
6,069
7,"211
119 .
Jurie 14
7,860
9,360
119
6,169
7,063
114
June 21
7,772
9,082
117
6,137
7, 153
117 :.
June 28
7,557
8,658
115
6,144
6,878
112 !
July 5
7, 300
8,574
117
6,094
6,724
110
July 12
7,539
8,531
. 113
6,075
6,869
113 . .
- - '
1/Includes eggs set by hatcheries produc i ng chicks for hatchery supply f~ocks.
ARCHIE LANGLEY Agricultural Statistician In Charge
\J. A. viAGNER .
Agricultural Statistician ;
STATE
.
Haine Connecticut Pennsylvania Indiana Illinois Missouri Delalflare 11iaryland Virginia 1-;Jest Virginia North Carolina South Carolina GEORGIA
Florida Alabama 1'1ississippi Arkansas Louisiana Texas 1rlashington Oregon California
TOTAL 1958
TOTAL 1957
1958 %of 1957
i.~ Revised
EGGS SET AND CHICKS PLACED IN COMMERCIAL AREAS BY WEEKS - 1958
Page 2
I
June 28
July July
5
12
'
. Week Ending
.
-
Nay
May
Hay
Nay
June June June June July July
.10
17
24
31
7
14 . 21
28
5
12
EGGS SET - THOUSlli~DS
I 1,655 1,250 1,658 2,446 421 2,137 2,491 2,967 2,635 439 3,553 624 8,658
461 3,622 2,546 3,823 I 470 3,536
537 404 1,521
47,854
39,376
122
1,562 1,292 1,406 2,280
415 2,055 2,513 2,864 2,529
436 3,495
591
~,574
420 3,564 2,629 3, 772
473
3,345 471 371
1,521
46,578
38,687
120
1,484 1,244 1,532 2,360
394 1,910 2,395 2,878 2,548
418 3,511
555
8,5~
445 3, 623 2,611 3, 733
472 3,259
401 341
1,559 -
46,204
38,476
120
CHICKS PLACED - THGUSM~DS
1,117 682
923 1,074
208 830 1,943 1,962
1,395 654
2} 771 372
7,134
<~l;l75
623 963-:!986 222 962 2,215 1,769 1,472 631 2, 778
331~!-
----'l.!_437
252 3,180 1,826
3,129 506
2,856
324 207
- 1,088
259 3,072 1,897 3,098
521* 2,860
355
221 1,228
34,433 35,075*
28,857 28,428
119
123
1,151 682* 931-:l-
1,120 207 924
2,136 1,919 1,515
686 2,861
410 7,338
276 3,399 1,914 3,317
486 2,983
364 224 1,068
35,911*
28,821
125
1,166 783 938
1,071
163~-
843 2,136 1,921 1,530
685 2,9 84
372 7,551
270 3,350 1,972 3,191
53 8 2, 996
42 8 176 1, 202-:t-
36,26&:-
28,793
126
1,211 1,202 1,220
697* 735* 760
916 1,010 1,005
1,031 1,106 1,143
221
215
188
778
852
861
2,232 2,196 2,084
1,945 2,014 1,944
1,555 1,524 1,612
651
688
619
2,951 2,889 2, 947
444
395
369
7,21~ 7,<23_7,153
241
3' 2JJ 2,073 3,433
509 2,924
431 200 1,114
338 3,251 2,080* 3,401
505 2,829
453 185 1,120
282 3,310 2,035 3,347
512-:~-
3,015 394 216
1,203
1,234 688
1,.008 1,160
191 849 2,056 1,987 1,630 579 2,889 417 6,878
260 3,251 2,113 3,199
450 2,969
365 204 1,142
35,981* 36~051* 36,219* 35,519
29,274 29,328 29,784 29,256
123
122
122
121
--
. 1,184 1,217
. 694* 721
932
890
.1,023 . 1,075
191 .154
791
719
2,275 2,058
1,863 1,902
1,476 . 1,542
678
.660
2, 876 2,769
386
389
6, 724 6,869
272
221
3,166 .. 2,958
2,145 . 2,124 .
3,096 3,063
413
460
2,811 2,593
389
442
212
173
1,147 1,160
34,744* 34,159
29,277 29,432
119
11-6
__ 3/.r-
GJE(Q)lfR~llA CIFR(Q)JP ~JEIP(()li) JflllNG EIRiVllCCJE
7 AGRICULTURAL EXTENSION SERVICE
,.;~ . ~Q!IGI~l; U.S . DE PARTMENT OF P.GRIC UL TURE
UNIVERSITY OF GEORGIA AND THE
UNI '
AGRICU L TU RA L MAR KETIN G SERVICE
STATE DEPARTMENT OF AGRIC ULTURE
3 19 EXT ENSION BLDG ., ATH E NS, GA .
4
I
Ju 1y 18 , 19-58
\..1 sRP.R_,_E-s,_,_
GEORGIA CORN: 1957 /f.
, YIELD AND PRODUCTION
(These estimates are based on the late st available data and arc preliminary)
District and County: Harvested Acre s:
- - ---- - - - - - - - - - ~ - - - -
DISTRICT I
Bartow
Catoosa
Chattooga
Dade
Floyd
Gordon
Murray
Paulding
Polk
~Ja 1ke r
\-Jh i tf ie 1d
r
Total
DISTRICT II Barrow Che rokee Clarke Cobb Dawson
0~ Kalb Fannin Forsyth Ful t on Gi 1mt; r Gwinne tt Hall Jackson Lumpkin Ocon e e P i ckcns Towns Union \~ a 1ton \~ hi t e
13 ,400 4,040 11 ,200 3 ,460 1I ,850 14,400
~ .5 5 0
8 ,8)0 9 , 550 10,100 9,600
106,000
6,100 6,950 1 ,660
~.350
2,670 2,100 3,930 7;650 7,900 4, 49 0
9 . ~ 50
8,1 50 8, 300 3,110 5, 550 2 ,150 2,400 5,050 12,100 3,640
Yi e 1d Per Acre : Production
--
Sush
-
:;i
-s
-Bu-sh-e ls- --
21. 5 24.0 21. 5 33 .5 28.5 24.0 2) .0 23 .5 21.0 27.5 25 .0
24.3
288,100 97,000 240,800 115,900 337,700 345,600 21 9 ,600 208,000 200,600 277,700 240,000
2,571,000
16.5 24.0
17.0
21 .o
29 .5 20 .5
37.0 24. 5 25 .5 43.5 21.5
19 .5 18.5 37 .0 21. 5 26.0 43.0 L~]. 5 22.0 43.0
100,600 166,800 28,200 122, 800 78,800 43,000 145 ,L~OO 187,h00 201 ,lf-00
1>5,300 213 ,900 158, ;100 153,600 115,100 11 9 ,300 63 ,700 103,200
239, 900 266,200 156 ,500
Total
F
DISTRICT Ill
Banks
Elbe rt
Frankl in
Habe rsham
Hart
Lincoln
Madison
Ogl e thorp e
Rabun
Ste:p hens
~~ i 1ke s
110,000
5,500 5,600 8,500 4,560 7,450 3,520 7,550 6,900 2, 770 3,300 5,350
26.0
18.5 22 . 5 20.0 32 . 0
20.~
18.0 22.0 17. 5 43. 5 20.5 18.0
2,860,000
IOJ ,800 126 , 000 170,000 145 ,900 152,700 63,400 166,100 120,700 120, 500 67,600 96, 300
Total
61,000
21 .8
1'3 31,000
DISTRICT IV Carroll Chattahoochee Clayton t owe ta Vouglas Faye tt e Haralson
27,400 810
3,040 12,400 4,910 6,150 8,300
26.5 19.0 24.0
26. 5 2 ~ .0 22.5
25.5
]26, 100 15 ,400 73 ,000
328,600
l27,l00 138 , +00 211,700
(District 4, Continut:d)
GEORG IA CORN: 1957 ,\CRE/iGE, YIELD 1':\ND PRODUCTION
.Q i~ t_! i t_a!!d_ C.QU_!!t~: __H~ r_ye~ t~d_.l\.f r_s_:_ __Yi.ej_d_P.:.r_ i\ r_:_P.!O.s!U t_i_on
Bus he Is.
. Bushe ls
DISTRICT IV, Cont 1 d
Harris Heard Henry Lamar Macon Marion Meriwether Muscogee Pike Schley Spalding Talbot Taylor Troup Upson
4,690 8,300 10,400 4,520 30 J 100 15,900 15,50C
960 7,400 13,600 2, 770 5,200 ':20,800 .6, 65C 5,200
20.0
20.5 28.0 24.5 28.5 24.0 20.5 18.0 21.5 24.0 30.0 18.5 z4.o 24.0 22.5
93,800 170,200 29 I, 200 l 10,700 857,900 381 ,600 317,800 17,300 159 J 100 326,400 83,100 96,200 499,200 159,600 117,000
Total
215,000
24.7
5,302,000
DISTRICT V Baldwin Bibb Blcck1ey Butts Crawford Dodge Gree ne Hancock
Houston Jasper Johnson Jones Laur e ns Monroe Montgomery Morgan Newton Peach Pulaski
Putnam Rockdale Ta 1i aferro Treutlen Twiggs ~lash i ngton v/hee Ier
~lilkinson
10,000 4,400 22.,600
3' 110 7,050 38,600 4,750 13 ,800 19,400
3,350 32,300
1;760 . 88,800
2,980 20,900 8,500 7,700 9,200 18,700
2,440
3,570
l '790 17' 100 ll ,700 35,400 23,800 14, 300
18.0 3I. 0 29.0 29.0 25.0 23.0 18.0 20.5 33.5. 26.5 2.3.0 19.5 24.0 25.0 23.5 22.0 21;0
35.5 27.0 26.0 25.0 16.5 26.0 23.0 22.5 22.0 19.5
180,000 136,400 655,400 90,200 176,200 887,800 85,500 282,900 649,900 88,800 742,900 34,300
2' 131 '200 74,500
491,100 187,000 161 J 700 326,600 504,900 63,400 89,200 29,500 444,600 269,100 796,500 523,600 278,800
Total
428,000
24.3
10,382,000
DISTRICT VI Bulloch Burke Candler Columbia Effingham Emanuel Glascock Jeffe rson Jenkins McDuffie Richmond Screven Warren
77,000 58,000 26,900 4,000 18,200 49,100 9,800
j5' 100 .33,600
9,450 . 4,750
57,000 '12 J 100
27.5 24.0
25.5 15.0 26.5 25.0 19.5 27.5 24.0 16.5 17.0
29.0 21.0
2' 117,500 1'392 ,000
686,000 .60,000
482,300 1,227,500
19 I , l 00
965,300 806,400 156,000 80,800 1,653,COO 254,100
Total
395,000
25.5
10,072,000
DISTR ICT VI I Bake r Calhoun Clay Decatur Dougherty
26,000
22.5
18,200
23.0
14,300
22.5
55,000
29.5
12,400
23.0
(District I, Continued)
585,000 418,600
321 ,aoo
1,622,500 285,200
f ' .'
J
GEORGIA CORN: 1957 ACRE/\G_h_Y IELD AND PRODUCT! ON
- ------------------------- Qi~tLit_a~d_CUnty: Harvested Acres:
Yield Pe r ~ere: Production
Bushe ls
Bushe ls
DISTRICT VII Cont'd
Early Grady Lee Miller Mi tche 11 QuJtman Randolph Seminole Stewart Sumte r Terrell Thomas lt/cbster
54,500 53,000 21,300 40,700 61,500 5,600 2:2,900 28, 100 17,400 37, 000 26,800 56, 000 12,300
26.5 251.0 23.5 26.0 30.0 21.5
o 2L~.
29.5 1S.5 25. 5 28.0 29.0 19. 0
1 .41~,200 1 ,537,000
500,600 1 ,058,200 l ,845,000
120,400
549,600 829, 000
339,300 943,500 750,400 1 ,624,000
233,700
Total
563,000
26.7
15,008,000
DISTRICT VI I I
Atkinson
Be n Hill
Be rri en
Brooks
Clinch
Coff ee
Colquitt
Cook
Crisp
J
Doo l y
Echols
Irwin
Jeff Davis
Lani e r
Lowndes
Te lfair
Tift
Turne r
~~ i 1cox
Worth
i7,5 00 15, 000 44,3 00
53,500 2,640
62, 000 67,000
29.150 33,300 L~o , 200 4,610
39. ~0 0
23,600 12,400 33,300 32, 000 27,800 19,400 26,400 56,000
23. 0
27.5 27. 0 29.0 26.0
25.5 30.5 28. 0
30. 0 29 .0 25.0 30. 0 23.5 24. 0
25.5 24.0 30.5 29. 0 25.5 30.5
402,500 412,500 1, 196, 100
1 , 551 , 500 68,600
1, 581 ,000 2 , 0 4 3 , 5 00
8 16,200
999, 000 1,165,800
115,200 1,1S7, 000
554,600 297,600 849,200 768,000 847,900 562,600 6]3,200 l ,70.8,.000
J
Total
640,000
27.8
17,81 0 ,000
DISTRICT IX Appling Bacon Brantl ey Bryan Camden Charlton Chatham Evans
Gl~nn
Liberty Long Mcintosh Pi e rce Tattna 11 Toombs Ware
VJ a y n e
28,400 21, 800
5,650 5,400
340 I ,450 I ,600 15,700
320 2,350 4,800
29 0
26,400
38,400 2 9 , 9 00 15,800 21,400
Total
220, 000
STATE TOTALS
2,738,000
ARCHIE LANGLEY Agr icu 1tu ra 1 Statistician, In Cha rge
27.5 28.5 25 . 0 20 . 0 23. 0 23.0
23.5 23.5 25.0 21.5 20.5 21.5 26.5 28.0
28.5 23.0 28.0
781 ,000 621 ,300 141,200 108,000
7,800 : 3,400 37,600 369,000
8,000 5 0 , 5 00 98,400 6,2 00 699,600 1, 075, 200 852,200 363,400 599,200
26.6
5,852,000
26.0
71,188,000
RAYMOND R. HANCOCK /\gricultural Statistician
;s-
AGRICULTURAL EXTENSION SERVICE
r .J UNIVERSITY OF GEORGIA AND TH E
I
STATE DEPARTMENT OF AGRIC ULTUR E
BROILER CHICK REPORT FOR GEORGIA
U.S. DEPARTMENT OF AGRICULTURE AGRICU L.,.. UR.A.L Mi.\R KETING SERV ICE 319 EXTE NS ION B!..DG., AT HEI~S. GA.
July 23, 1958
ATHENS, GA., July 23--A total of 6,340,000 broiler chicks were placed 1vith producers in Georgia during the lveek ending July 19 according to the Georgia Crop Reporting Service. This compares -vrith the 6,869,000 placed the previous
week ru1d is 5 percent more than t he 6,024,000 placed the same week last year.
Eggs set by Georgia hatcheries amounted to 8,348,000 compared vri.th 8,531,000 the previo~3 week and is 6 percent more than the 7,856,000 f or the corresponding week last year.
Hatcheries reported prices paid for hatchj_ng eggs during the week at an average of 76 cents per dozen. Average price charged by hatcheries for the chicks was reported at :~12 . 50 per hundr ed . These prices compare with 78 cents and ::;)13.00 last week and wi t h 63 cents and '311.00 one yea!' ago. Egg prices sho-vm relate to Georgia produced hatching ee; gs vJhether bought on contract or otherwise.
1~Teighted average pr i ces from the Federal-State Narket News Service f or broilers during the week ending July 19 are as follows: Georgia broilers 2 3/43 3/4 pounds, at farms 18.39; FOB plants 19.38.
(See reverse side for other states)
--
\rJeek Ending
GEORGIA CHICK PLAC5VIENT BY \fEEKS
- -- -- 11AY 17 THROUGH JULY 19
1957
i GGS SET J:_/ 7; -~ ------
19.58 19.58 of 1957
CHICKS .PLACED FOR BROILERS.
19.58 %
1957
1958 of 1957
Thousands
Percent
Thousands
Percent
Hay 17 Nay 2t~
Nay 31 June 7 June 14
June 21 June 28
July 5
July 12
July 19
7,979 7,992 7,818 7,970 7,860
7,772 7,557 7,300
7,539 7, 856
9,718
122
9,766
122
9,668
124
9,616
121
9,360
119
9,082
117
8,658
11.5
8,574 . 117
8,531
113
8,348
106
6,039
7,437
123
6,049
7,338
121
6,062
7,551
125
6,069
7,211
119
6,169
7,063
114
6,137
7,153
117
6,144
6,878
112
6,094
6, 724
110
6,075
6,869
113
6,024
6,340
105
1/~In-c~lu-=de=s- =eg=g=s =se=t =by=-~ha=tc=he=r=ie=s =pr=od=uc=in=g=c=hi=ck=s =fo=r=h=at=ch=er=y =su=p=pl=y =fl=oc=ks=.
ARCHIE LANGLEY Agricultural Statistician In Charge
1rJ . A. ~~TAGNER
Agricultural Statistician
--~--------~-------------------E~GG~S~SE=T~A=ND~C=H=IC~K=S_P~U~CE=D~IN=~C-O~W=ff~iR~C=IA~L~A~RE=' ~~S~~B~Yv~il=lE=K~S_-~1~9~58~-----------------P_a~ge~2------ ~
I'
Week Ending
. ~..;.
STATE
July July July
5
12
19
Nay
Hay
Hay
June . June June June July July July
17
24
31
7
14
21
28
5
12
19
'
I
EGGS SET - THOUSANDS
~
- - CHICKS PLACED - THOUSA:IDS
--
I 111aine
Connecti cut Pennsylvania
I ndiana
Illinois 11issouri De l aware Haryland Virginia West Virginia North Carolina South Carolina
- GEORGIA
F l o r i da Alahama rli ssissippi Arkansas
Louisiana Texas Washington Oregon California
1,562 1, 292 1,406 2, 280
415 2,055 2,513 2, 86~. 2,529
436 3,495
591 8,574
420 3, 564 2,62 9 3, 772
473 3,345
471 371 1, 521
1,484 1,244 1,532 2,360
394 1,910 2, 395 2,878 2, 548
418 3,511
555
8,531 _.
445 3,623 2, 611
3, 733 472
3,259 401 341
1,559
1,591
1,175 1,151
1,275
623
682-)(-
1,457
96)-l'.-
931~~
2,309
986 1,120
364
222
207
2,007
962
924
2,320
2,215 2,136
2, 880
1,769 1,919
2,527
1,472 1,515
403
631
686
3,471
2, 778 2,861
8 ,5838~~-~~3341~(~- _7 ,431308
3 , 4L~3313
2, 583 3, 656
475 3,146
468 296 1,476
I
259 3,072
1,897
3,098
521-l:-
I 2, 860
355
221
1,228
276 3,399 1,914 3,317
486 2, 983
364 224 1,068
1,166 783 938
1,071 163* 843
2,136 1,921 1,530
685 2,984
372 7,551
270 3,350 1,972 3,191
538 2,996
428 176 . 1, 202 ~(-
1,211 1,202 1,220 1,234 1,184 1,217 1,181
69 7~~
735-Y--
760
688
694-::- 721
635
:116 1,010 1,005 1,008
932
890 1,038
1,031 1,106 1,143 1,160 1,023 1,075
949
221
215
188
191
191
154
163
778
852
861
849
791
719
739
2,232 2,196 2,084 2, 056 2,275 2,058 2,173
1, 945 2, 014 1, 944 1,987 1,863 1,902 1,829
1,555 1,524 1,612 1,630 1,476 1,542 1,481
651
688
619
579
678
660
653
2,951 2, 889 2, 947 2,889 2,876 2,769 2,711
444
395
369
417
386
389
376
- - - 7' 2~~ ._2_,_~63 7,153 6, 878_ 6, 724 6,869 6,340
241
338
282
260
272
221
240
3,213 3,251 3,310 3,251 3,166 2,958 2,853
2,073 2,08~!- 2,035 2,113 2,145 2,124 2,037
3,433 3,401 3,347 3,199 3,096 3,063 3,137
509
505
512* 450
413
460
474
2,924 2, 829 3, 015 2,969 2, 811 2,593 2,401
431
Lr53
394
365
389
442
381
: 200
185
216
204
212
173
199
1,114 1,120 1,203 1,142 1,147 1,160 1,093 .......
TOTAL 1958 TOTAL 1957
46,578 46,204 45,504 38,687 38,476 38,383
35,075~(- 35' 911-:.~ 36,266* 35' 981~!- 36,051-l!- 36,219~~ 35, 519 34, 744~- 34,159 33,083 28,428 28,821 28' 793 29,274 29,328 29,784 29,256 29,277 29,432 28,740
1958% of 1957
* RevJ..s ed
120
120
L 119
123
125
126
123
122
122
121
119
116
115 ..
,r
'0 9to7
1:/ ~~~~?.J.~o~~c?jp> ~ UNIVERSITY OF GEORGIA AND TliE J STATE DEPARTMENT OF AGRICULTURE
Athens, Georgia
w~,~~~~T~N~o~!~~u~
8 I) f_ s
AGRICULTURAL MARKETING SERVICE
L. U
319 EXTENSION BLDG., ATHENS, GA.
UBP qr~
'I
July 25, 1958
TALL FESCUE SEED FOP~CAST - SOUT!lliP~ AREAS
GEORGIA: The 1958 production of tall fescue seed in Georgia is forecast at .. 1,290,000 pounds compared with 1,100,000 pounds in 1957. Weather con-
ditions were generally favorable during the growing and harvesting season and yields were higher than in recent years. The acreage harvested for seed is esti-
mated at G,ooo acres compared with 5,500 last year.
Production of tall fescue seed in 9 Southern States is forecast by the Crop Heporting Board at 25,083 ,000 pounds of 11 clean11 seed--37 percent above the 1957 crop of 18,280,000 pounds but 6 percent below the 1952-56 average. A report on the late harvested tall fescue seed crops in Idaho, \.Ja shington, and Oregon will be issued August lL~ . 1'he December 1957 estimate for those three states totaled 4, 601,000 pounds, of which 3, 900,000 pounds were produced in Oregon
.Production of t all fescu e seed in each state j_s ex~ ected to be larger than last year, with the leadj_ng state o.f Kentucky indicating a 41 percent increase. Tennessee is up 76 percent; Nissouri, 26; South Carolina, 22; Georgia, 17; .A labama, 11; Hississippi, 18; and .h.rkansas up 9 percent. .t'roduction in Oklahoma 1dll be more than double last ye ar ~ small crop.
A l arger acreage was cut for seed this year in all states except Arkansas.
r
In the latter state, fescue did not drown-out like other s rasses and offered p .q zing early in the season. Commercial growers in Kentucky and T nnessee acr.ount
f or most of the increase in acreage. The total acreage f or seed iri the 9 5outh<:}rr..
s-:~ates is forecast at 106,700 acres--up 17 percent f rom 1957, but 15 percent below
average.
This has been a favorable season for the growth and development of tall fescue seed in the South. F'urther, because of relatively low grass seed prices, m::ny growers saved only the better fi elds f or seed productj.on. As a r esult, l c.r ger yields than l a st year are indicated for all Southern States except ~1issis sippi.
Harvesting of this season's crop began a little l ater than usual in most States. The average dates are as follows: June 14-17 in Alabama, Hississippi, South Carolina and Georgia; June 20-2h in Tennessee and Kentucky; and June 28July l in Missouri, Arkansas, and Oklahoma.
June 30, 1958 carry-over of old crop tall f e scue seed on farms in the 9 states is estimated at 936,000 pounds comp ;~red with 1,204,000 ~) ounds on June 30, 1957. A report giving farn1 carry-over in all t all fescue seed producing state s will be released an August 14 and the r eport on deal er's stocks will be r eleased on August 4.
r
ARCHIE LANGLEY
Agricultural Statistician In Charge
f
(OVER)
vJILLIAi .- A. WAmE:.R Agricultural Statj_stician
Tall Fescue Seed: Acreage Harvested, Yield per acre and Production--
-'
- - - - - - -. - .-A-vera-ge-1-952--5-6-, - - - A-n-nu-al-19-57 -3.11d 1-958- - - --. - - : Acreage har vest ed : Yi eld per acre : Production of clean seed
:Average :-- -:-Indi--:Average :-- -:-Indi--:A:v9 rage:- - - -:-Indi----
:
:1957 : cated :
:1957 : cat ed :
: 1957 : cat ed
- - - - -:-19-52-- 5-6:- - -:- -19.-58- :1-9-.52--5-6 :- - - :- -19-58- :1-r9-5;2o-o.5o6-:-r;ooo-:-r1;9o.5o8o- - -
Acres knres ~ cres Pounds Pounds~Pounds Pounds Pounds Pounds
Mo.
s. c.
Ga. Ky .
Tenn. Ala .
Yti s s . Ark. Ok1a
8,600 10,000 12, 000 203 190
11,300 9, 000 10,000 170 200
12,300 5, 500 6,000 177 200
51,000 43,000 49; 000 250 210
18,200 12,000 17, 000 198 185
8, 600 6,000 6,500 218 220
6, 200 2, 000 2, 500 152 170
5,700 3,000 3, 000 174 170
4, 320 600
700 l3L~ 100
200 '1, 779
220 1, 905
215 2, 334 260 12, 695
230 3, 599 225 1, 879 160 972 18.5 998 180 610
1,900 2,400 1, 800 2, 200
1,100 1,290
9,030 12,740 2,220 3,910 1, 320 1,462
340 400 510 .55.5 60 126
"Totai- I2"b,22o - 9I,Ioo -lo6-:;1oo- -214- - 2oi- - 23.s- 26-:;771- -rB,28o 25;o"Br--
-9 S-ta-te-s ------------------------.------. -----.. --
~
i
UNIVERSITY OF GEORGIA
3;..!:>-
U.S. DEPARTMENT OF AGRICULTURE AGRICULTURAL MARKETING SERVICE 319 E:<TEt..SION BLDG., ATHENS, GA.
July 30, 1958
ATHENS, GA., July 30--A total of 6,204,000 broiler chicks were placed tJith producers in Georgia during the VTeek ending July 26, accordj_ng to the. Georgia Crop Reporting Serviee. This comraares trrl.th the &,340, 000 placed the previous t-mek and is 4 percent more than the 5,944,000 placed the same t-reek last year.
Eggs set by Georgia hatcheries amounted to 8,0hO,OOO compared Vlith
8,348,000 the previous week and is 3 percent more than the 7,837,000 for the corre9ponding ~reek last year.
Hatcheries reported prices _pa.id"for "hatching eggs durj_ng the Heek at an
average of 74 cent.s per dozen. Averag.e price charged by ha.tcheries for the
chicks t-Jas reported at -~12 , 00 per hundred. These prices compare t-rl.th 76 cents
and ::a2. 50 last week and vr~ah 64 cents and ::~lJ. 25 one year ago. Egg prices
shotm relate to Georgia prod"J.ced hatchinc; eggs tvh~ther bought on contract or
otheruise.
.
1'Tei ghted average pr5.ces from the Federal-State r1arket NetTs Service for broilers during the vreelc ending July 26 are as follotrrs: Georgia broilers 3 -4 pounds, at farms 17.20; FOB plants 18.i7.
(See reverse side for other states)
GEORGIA CHICK PLAC:cll.mT BY \lEEKS
- ---
- - NJ\ Y 24 TH-ROUGH tTIJLY 26
Week Ending
-
-
1957
. I'
EGGS S-ET
1958
1/ 1958
%
--
of 1957
..
Thousands
.Percent
I
CHICI~S PLACED FOR BROILERS
1957
1958
1958% of 1957
Thous.ands
P e r c ent
iVlay .24 May . 31
7,992
9,766
122
7,818
9,668
124
6,049 6,062
7,338
121
7,551
125
June 7
7,970
9,616
121
6,069
7,211
119
June 14
7,860
9,360
119
6,169
7,063
114
June 21
7,772
9,082
117 I 6,137
7,153
117
June 28
7,557
8,658
115
6,1Lr4
6,878
112
July 5
7, 300
8,574
117
6,094
6,724
110
July 12
1,539
8,531
113
6,075
6,869
113
July 19
7,856
8,348
106
6,024
6,31+0
105
July 26
7,837
8,040
103
5,944
6,204
104
I . I
- -- l,/ Includes egg~ set by hatcheries .producing chicks for hatchery supply flod:s.
ARCHIE ~NGLEY Agricultural Statistician In Charge
1,'1. A. HAGNZil Agricultural Statistician
."'~
STATE
Maine
Connecticut
Pennsylvania
Indiana
Illinois
.Hissouri
~
Delat.zare
Maryland
Virginia
\-lest Virginia
North Carolina
South Carolina
GEORGIA
Florida Alabama lllississipp:i. Arkansas Louisiana Texas Washington Oregon California
TarAL 1958
TDrAL 1957 1958 % of 1957
* . Rev1sed
EGGS SET AND CHICKS PlACED IN COMMERCIAL AREAS, BY WEEKS - 1958
I Ju1l2y
July
19
July
26
EGGS SET - THOUSANDS
1,484 1,244 1,532 2,360
394 1,910 2,395 2,878 2,548
418 3,511
555 8,531
I 445
3,623 2,611 3,733
472 3,259
401 341 1,559 .
1,591 1,275 1,457 2,309
364 2,CX)7' 2,320 2,880 2,527
403 3,471
588 8,348
431 3,433 2,583 3,656
475 3,146
468 296 1,476
1,624 1,153 1,390 2,237
428 1,928 2,276 2,871 2,487
387 3,331
519 8,040
395 3,350 2,1+73 3,481
462 2,781
475 382 1,420
46,204 45,504 43,890
l'iay
24
1,151 682* 931*
1,120 207 924
2,136 1,919 1,515
686 2,861
410 7,338
276 3,399 1,914 3,317
486 2,983
364
I 224
I 1,068
35, 911*
vTeek Ending
~1U-~~ May
June
31
7
I ~s.l ~~-- J~
1,166 783 938
1,071 163* 843
2,136 1,921 1,530
685 2,984
372 7,551
270 3,350 1,972 3,191
538 2,996
428 176 1,202*
- CHICKS PLACED - THOUSANDS
1,211 697* 916
1,031 221 778
2,232 1,945 1,555
651 2,951
444
7,211
1,202
735* 1,010 1,106
215 852 2,196 2,014
1,52!~
688 2,889
395 7,063
1,220 760
1,005 1,143
188 861 2,084 1,944 1,612 619 2,947
369 7,153
1,234 688
1,008 1,160
191 849 2,056 1,987 1,630
519 2,889
417 6,878
241
338
3,213 3,251
2,073 2,080*
3,433 3,401
509
505
2,924 2,829
431
453
200
185
1,114 1,120
.,.
282 3,310 2,035 3,347
512* 3,015
394 216 1,203
260 3,251 2,113 3,199
450 2,969
365 204 1,142
1,184 694* 932
1,023 191 791
2,275 1,863 1;476
678 2,876
386 6,724
272 3,166 2,145 3,096
413 2,811
389 212 1,147
1,217 721 890
1,075 154 719
2,058 1,902 1,542
66o 2, 769
389 6,869
221 2,958 2,124 3,063
460 2,593
442 173 1,16o
36,2~ 35,981* 36,051* 36,219* 35, _519 34, 744* 34,159
38,476 38,383 31,986 120 119 116
28,821 28,793 29,274 29,328 29,784 29,256 29,277 29,432
125
126
123
122
122
121
119
116
Page 2
July
19
July
26
1,181 635
1,038 949 163 739
2,173 1,829 1,481
653 2, 711
376 6,340
240 2,853 2,037 3,137
474 2,401
381 199 1,093
1,157 592 952 959 147 769
1,928 1,886 1,391
657 2,699
391 6,204
219 2,955 2,037 3,074
456 2,406
420 171 1,081
33,083 28,740
115
32,557 28,388
115
.
....
~qo-n '7
~~g CGJ&(())~~llA CJRi(Q)JP ~lEJP>0IR{1rllNCG JE~V.llCCI&
31AGRICUL.TURAL. EXTENSION SERVICE U~ OF GEORGIA
U.S. DEPARTMENT OF AGRICUL.TURE
UNIVERSITY OF GEORGIA AND THE
AGRI.:UL.TURAL. MARKETING SERVICE
5 '58 STATE DEPART-MENT OF AG_RICUL.TURE J11.r
Athens, Georgia
- MU8
. 3!9 EXTENSION BL.OG., ATHENS, GA.
July
3.. 1,
:
:
195.8;
19_2~ Cal~~ Report
Georgia: Tho 1958 calf crop for Georgia is expected to total 679,000 head three percent less than the 1957 crop of 698,000 head, but 27 percent
above the ten-year (l9h7-56) average crop of 534,000 l:ilead.
United States:
NU11BERS DECLINE SLIGHTLY
1
Tlire 1958 calf crop for t he United States is expected to ,total 4o;872;ooo
head, wllrd.ch compares with 41,007,000 calves born in 1957. This is tho. foU:rth
consecutive decrease in the calf crop and this year 1 s expected number is 4: per-
cent below the 1954 r ecor d crop of 42,601,000 head.
The smaller 1958 calf crop is the r e sult of a smaller number of cows and
heifers on farms. The number of all cows and heifers 2 years old and over.
January 1, 1958 was 46,7 84, 000 head, 2 percent below the number on hand a year
earlier, but 6 percent above the 1947-1956 average. The expected number of calve s , born and to be born in 1958 expr essed as percent of cows and heifers 2 years
old or older January 1, 1958 is 87 percent--1 percent 2ge point above 1957.: Tlus
percentage is not strictly a calving rate since tho January 1 inventory of. cows ' and heifers 2 years old and over does not include all the heifers which. would
give birth to calves during the ye ar, and since t l1e inventory doe s include . some' cows that are sold before calving. The percentage is calculated to show t .ho
trend in productivity over a period of time. It may fluctuate from year to year
due to variations in cow slaughter during the year and trend in breeding herd: .replacements.
Southern .States
In the [:;outh Central States, a calf crop of 10,578,000 head is expec'ted 1 percent more than in 1957, while in the South Atlantic .States the calf crop is
expected to total 3,372,000 he ad--slightly below 1957. The calf crop expressed as a percent of -cows and heifers 2 years old and over was 84 percent in the South Central States as compared with 82 percent in 1957 and 79 percent in the South. Atlantic [:;tatos--unchanged from a year earlier.
ARCHIE LANGLEY Agricultural Statistician In Charge
RAYMOND R. HANCOCK
Agricultural Statistician
. !. : ";' :". ; .. ~: ' " . .: t ~.' -~~ .:
;, ,
; '
'
> '' ' ':
Calf crop r c;_Jort, July 1958
- ~~ \?:~ . 1-:-J~: .:::- - - - .- - - .- - - - : - - - - - - - - - - - - : ._-- - ::-- ~. ,..---
:.. ~-. ' : 't..
State_:' c ' : .
Cows and heifers :Calves born as oercent of:
2 yrs & older :cows and heifer~ 2 :,rrs.& :
Calve s born
a'nci' :
January 1
:older January 1 1/ :
Division
:: -1-0--yr- :-
-
-
- :-
-
-
- :- 1-0--yr- :-
-
-
-
~
:
--_
-
-
-: -10--y-r -: -
-
- :-
-
-
-
. . ..: .:Avf3rage : 1957 : 1958 :Average: 1957 : 1958 : Lveragc: 1957 .: 19$8
-
-
:...
-
::1947-56: .:.. -l~ooo- -
i,ooo:.: ..
'i,ooo:-19-47--5-6:~
--
-:- -- -
- -:1i9,4o76-o56-:1;ooo
2/ ~i:aoo-
heo.d head head Percent Percent Pc,rcent head head head
Maine
N. H.
129 126 118 85
83
84
72
70
65 84
81
84
110 105 99
60
57 55
Vt.
: 302 314 305 81
81
82
244 254 250
Mass.-
i30 118 111 81
81
80
R. I. : 20
18
17 81
79
81
106 . . 96 89
16 . 14 J.4
Conn.
120 115 110 82
80
78
98
92. 86
N. Y.
1,459 1,521 1,473 86
85
87
1,2$9 1,293 1,282
N. J. : 157 159 157 79
82
82
1~5
130 129
Pa. .. : 1~039 . 1,130 1,115 85 . 85
S6
885 . . 960 959
N. A. . """3-;428~ -3-;571- - 3-;E?1-- "84- - - '84-- - - 8"5'- - - 2,"'903 ;:-:- },oo! -2-,903-
0hio
:-1-;1;1- -1;152- -1-,r~s- - '86- - - -ss- - - -8'5 - - - - 990 - :- "98"8 - ~9"5if
Ind.
: 954 942 903 90
89
89
854 8)8 804
Ill.
: 1,~46 1,469 1, 420 90
92
90
1,300 1,351 1,278
Rich~ : 1,002
991
937 86
83
85
858 823 796
Wis.
: 2,517 2,670 2,648 91
92
93
2,289 2,456 2,463
E.N.c. :-7-;0"69- - 7-;234- -7-;033-- "89- - - "89--- -90--- "6,291- o,Esb - 6-,309-
Minn. :-1;74o- -1;847- -r;814-- "92--- '92-- ~ -9~--- 1,5'9'5- 1,'09'9 -r;6o9-
Iowa
: 1,949 2,030 1,971 93
94
93
1,807 1,908 1, 833
Mo . : : 1, 763 1, 928 1, 834 91
91
88
1, 608 1, 754 1,614
N. D;:;.k. : 850 1,014 974 89
87
89
756 882 867
S. Dak. : 1,335 1,525 1,558 89
93
94
1,188 1,418 1,465
Nebr. : 1,749 1, 845 1, 836 90
92
95
1,573 1,697 1, 736
Kans. : 1,690 1,548 1,5l.U 89
90
92
1,510 1,393 1,-418
W.. N.C. :Il-;o-;6- 1l;t37- 11";528-- '91- - - '92--- -92-- -i6,037 -10,751 Io~6o2-
.-':-:-sr---- N. c. :I8-;14s- I 8-;971- 18-;501- - "'90- - - "'91-,... - . -91-- J.'0,)2'8 -i(,2o7 16-,911-
Del. .,.. :,_-Til--- 42--- 41-- Eo--- '81- -
-3J :-- :-3,4:- ~ 33-
H d~
va:i
'1-J . Va.
N. C.
s. c.
: 275
, 699
: 322 47 8
266
302 306 84
770 777 83 331 316 85 579 585 77
356 . 354 77
88 . 88 . 232 . . .266.. . ~69
85
84
82
85
. 578 . 654 .. . 653
2,73 . 271 . ~269
81
82
..370 469. . 480
80
80
206 285 283
Ga .
679 841 838 7a
83
81
. 534. ..698: . .679
Fla. :
S. A.
Ky.
: .824 1,052 1,038 64
67
68
532 70S '7Cb
:=--3--;955843--
-4-,273- -4-;2"55""-
--991-- 96li - -
7876---- -- 7s-9a-------"758-9-- ----2-,77": 5877-- -3-, 388722--3--;"3'87552-
Tenn.
~18 1,029 1,003 86
86
85
794 885 853
Ala.
843 1,047 1,048 77
80
81
Hiss.
1,095 1,481 1,473 72
76
75
650 838 849 796 1,126 1,105
Ark .
754 877 861 82
82
82
614 719 706
La .
958 l, 210 1,198 77
78
76
740 944 910
Okla..
1,556 1, 669 1,593 88
84
87
1,377 1,402 1,386
T5sx.acs .
Hont.
: 4, 729 4,499 4,403 83
83
89
.3,907 3, 73h 3,919
:!1-;7"5'6- I2-;so3-12-;54s-- '82- - - "82--- -84---9,664 -1o,"S'2o Io-;578-
:-1-;o2o- -1-;22) -1-,222-- 91--- 9o--- - 90- - - - 934- I,Io2 -1-;1oo-
Idaho : 496 616 616 87
89
91
vJyo.
541 558 557 84
86
88
433 548 561
452 h8o 490
Colo.
881 846 844 87
88
92
765 744 776
N. lvie x.
681 645 631 80
79
85
548 510 536
Ariz.
466 440 419 78
75
80
366 330 335
Utah
325 357 356 85
83
88
278 296 313
Ne v .
294 320 301 76
83
85
224 266 256
Wash. Greg.
493 531 534 86
89
92
623 712 708 83
84
85
424 473 491 516 598 602
Calif. : 1,566 1, 802 1,764 83
86
90
1, 307 1,550 1,588
WG st :=7~)~6= ~8~0~2= =7~92(: = ~4= = = ~~ = = =82 = = = ~,~L~ = ~,~91 =7~0~8
u.s. :44,298 47,670 46,784 86
86
87
37,901 41,007 40,872
IrNot-strictly a calving r~itc7 -Figure r epresents-calves born- e'iprussod- as per---
- centage of t he number of cows and heifers 2 years o1~ and ovc,r on farms Janu~ 1.
~/ Calves born before Juno 1 plus the number expected to be born after June 1.
BROILER CHICK REPORT FOR GEORGIA
U.S . DEPARTMENT OF AGRICULTURE AGRICULTUR~'L MARKETING SERVICE 319 EXTENSION BLDG., ATHENS, GA.
August 6, 19.58
ATIL.;}!S, GA., August 6--A total of 6,018,000 broiler chicks were placed with
producers in Georgia during the week ending Au~ust 2 according -to the Georgia Crop Reporting Service. This compares tlith th~ 6, 204,000 placed the previous
we ek and is 1 percent more than the 5, 957,000 placed the same tveek last year.
Eggs s .et by Georgia hatcheries an10unted to 7,874,000 compared u~th . 8,040,000 the previous week and is 6 percent more than .the 7,40.5,000 for the corresponding vleek last year.
Hatcheries reported prices paid for hatching eggs during the week _at an averat;e of 72 cents per dozen. Average price charged by hatcheries for the :
chicks t-ras reported at :)11..50 per hundred . These prices compare vrith 74 cents and ) 12.CO last week e.nd with 6.5 cents and '::al.SO one year ago. : :Sgr.; prices shot-m relate to Georgia produced hatching eg~ s whether bought on contract or othervrise.
. Veighted average prj_c e s -fro1a the Federal-State .Narket Net-J'S Service for
broilers during the week encline; August 2 are as follotvs: Georgia br ai.lers 3:t...;_
. 4 pounds; at farms 11. 04; FOB plants 13. 00'.
-
(S ee reverse side for other states)
Feek Ending
GEORGIA CHIC:C PLP.CEfJffiNT BY 'VJE 2KS
l'lAY 31 TH~OUGH AUGUST 2 .
EGGS Sr.::T ~~
: -~--~HICKS --:====~-~======~====~~ PlACED FOR BROILERS-
--~------ 19.58 ~; --++-------~--l i9.58 ;;
1957
19.58
of 1957
19.57
19.58
of 19.5 7
- -Thousands
Percent
Thousands
Percent
N.ay 31
7,818
. 9 ,'668
124
6,062
7,.551
12.5
June 7
7;970
9,616
121
6,069
7,211
119
June 14
7, 860
9,360
119
6,169
7,063
114
June 21
7, 772
9,082
117
6, 137
7,1.53
117
June 23
7, 5.57
8 ,6.5 8
115
6,144
6,878
112
July 5
7,300
8,574
117
6,094
6, 724
110
July 12
7,.539
8,531
113
6,07.5
6, 869
113
July 19
7,856
8,348
106
6,024 6, 340
lOS
July 26
7, C3 7
8,040
103
5' 941.+ 6,204
104
Aug. 2
7,40.5
7,874
'106
.5, 9.5 7
6, 018
101
1/ Includ es e:;gs set by h9-tcheries pr oc.1ucing chi cks for hatcher:( supply flocks.
ARCHI E LANGLr;y Agricultural Statistician In Charge
1;! . A. FAGNL:R Agricultural ~tatistician
'I
EGGS SET AND CHICKS PLACED IN COivJJVIERCIAL AREAS. BY 1rJEEKS - l9S8
Pa!Ze 2
Week Ending
STATE
~------------~
I I July
July ,
-
A-u-g-. -~i ,---H-a-y-~j: ---J-u-ne-~j ---Ju-n-e~-il --J-un-e-~--J-u-n-e ~I---Ju-]-y-~--J-u-ly~-I---Ju-ly--I---J-u-ly,. ~-
A
u
g
.
i I 19
26
2
31
7 I 14
21 j 28
5
12 I 19
26 -
2
l _ _ _ _ _ _ _._ _ _ ____ _ _ _._________ . EGGS SET - 'I'I-IOUSANDS
-~-.....-------++---------------4----___;;...___
CHICI\S PLACED - THOUSANDS
-~-------
Maine Connecticut
1,591 1,275
l 1,624 1,558 ll! 1,166
1,153 1,255 I 783
1,211 1,202 1,220 1,234 1,184 1,217 1,181 1,157
697:;'.- 735~~ 76o
688
694~~
121
635
592
1,155 548
Pen.J.sylvania
1,457 1,390 1,280
938
916 1,010 1,005 1,008
932
890 1,038
952
953
Indiana
2,309 2,237 2,204
1,071
1,031 1,106 1,143 1,160 1,023 1,075
949
959
903
Illinois
364
428 323
163*
221
215
188
191
191
154
163
147
156
I1issouri
2,007 1,928 1,836
843
778
852
861
849
791
719
739
769
701~
Delaware
2,320 2,276 2,152
2,136
?,232 2,196 2,084 .2,056 2,275 2,058 2,173 1,928 1,935
~1aryland
2,880 2,871 2,746
1,921
1,945 2,014 1,94h 1,987 1,863 1,902 1,829 1,886 1,831
Virginia 1rJest Virginia North -Carolina
2,527 403
3,471
2,487 2,400
1,530
I 387 371
3,331 3,333
685
2,984
1,555 651
2,951
1,524 688
2,889
1,612 619
2,947
1,630 579
2,889
1,476 678
2,876
1,542 660
2, 769
1,481
653
2, 711
1,391 657
2,69-9
1,361 624
2,655
South Carolina
588
519 498
372
444
395 . 369
i.D- 7
386
389
376
397
349
GEORGIA Florida
8,31+8
431
8,0lJ._0_7-=-' 874
395 365
7,551__._____T"':...2_1J______7~,_o6-:3;._~--7...::.,_15:..:;.:-.___6...::.,_8_7_8 ___6...::.,_7_2l_~____6...:;_,_8_6_9 ___6...;.,_3_1~.0_ 6 , 2~_!:_~, 018
l 270 : 241
338
282
260
272
221
240
219
233
Alabama
3,433 3,350 3,214 ' 3,350
3,213 3,251 3,310 3,251 3,166 2,958 2,853 2,955 2,800
Hississippi
2,583 2,473 2, 349
1,972
2,073 2,080i~ 2,035 2,113 2, 145 2,124 2,037 2,037 2,041
Arkansas Louisiana
3,656
4 75
3,481 3, 310
3,191
462 443 i 538
3,433 3,401 3,347 3,199 3,096 3,063 3,137 3,074
509
505
512-l~
450
413
l.J.60
4 74
456
2,979 438
Texas Washington
3,146 468
2, 781
~75
2,754 466
I !
2,996 428
2,924 2,829 3,015 2,969 2, 811 2,593 2,401 2,406
431
453
394
365
389
442
381
420
2,353 313
Oregon
296
382 313
176
200
185
216
204
212
173
199
171
156
__;,.____ California
1,476 1,420 1,290
1,202* 1,114
----------------++---"'------ --;;..----------++-~------
1,120
1,203
1,142
1,1-47
1,160
1,093
1,081 - -1,-134-
TOTAL 1958
~.5,504 43,890 42,334 36, 266-l~ . 35' 981~~ 36' 051-ll- 36' 219~~ 35' 519 34' 744-:!- 34' 159 33' 083 32 '557 31,639
TOTAL 1957
38,383 37,9136 36,684 28,793 29,274 29,328 29,784 29,256 29' 277 29,432 28,740 28,388 27,510
1958 % of 1957
119
116 115
126
123
122
122
121
119
116
115
115
115
-------..:.:'-----~---~----~i'! - - - - - - - - - - - - --- - - - - - - - - - - - - - - -----.,.,-- - - - -- - - - -
I
AGRICULTURAL EXTENSION SERVICE UNIVERSITY OF GEORGIA AND THE
STATE DEPARTMENT OF AGRICULTURE
Athens, Georgia
U.S. DEPARTMENT OF AGRICULTURE AGRICULTURAL MARKETING SERVICE 311 EXTENSION BLDG., ATHENS, GA.
August 7, 1958
Farm Price Report As Of July 15, 1958
Georgia: The All Commodity Index of Prices Received by Georgia farmers dropped , two percent ( four points ) to 261 percent of the 1910-1914 Average
during the month ended July 15. Compared to the same period a year earlier, th~
Index is two percent ( five points ) higher.
The All Crops Index dropped to 273 percent of the 1910-1914 average comparee with 277 a month earlier and 275 one year ago. The most important contribu~ors to the decline were lower prices for corn, whea.t, and peaches.
The Livestock and Livestock ?roducts Index declined one percent (two points~ to 235 percent of the 1910-1914 Average, but remained 10 percent (21 points) above the Index one year earlier, Lower prices for beef cattle, dair,y cows and chickens contributed to the decline in the Livestock Index. A summary of these indexes with comparisons is shown on the reverse side.
United 5tates: The Index of Prices Received by Farmers dropped four-tenths of one percent (1 point) to 254 percent of the 1910-14 average dur-
ing the month ended July 15. Most important contributors to the decline were
lower prices for apples, peaches, cantaloup, watermelons, and wheat, reflecting volume movement to market of the new crops. Partially offsetting were seasonal
increases in prices for m~lk and eggs.
The Index of Prices Paid by Farmers for Commodities and Services, including
Interest, Taxes, and Farm Wage Rutes was the same on July 15 as a month earlier. The Index, at 305, was 3 percent higher than in July 1957.
With farm product prices lower than in June and farm cost rates unchanged, the Parity Ra.tio declined 1 point to 83, the same as the revised ratio for July of last year.
Summary Table for the United States
Index 1910-14 .. 100
July 15, June 15,
1957
1958
July 15,
1958
Record h:l..gFi
Index
Dat:e
Prices Received
246
255
254
313 Feb . 1951
Parity Index ~/
I 295
305
305 ~/ 306 Apr. 1958
Parity Ratio
83
84
83
123 Oct. 1946
1/ Prices Paid, Interest, Taxes, and vJage Rates based on data for the indicated - dates. ~/ Also Hay 1958.
ARCHIE LANGLEY
Agricultural Statistician In Charge
RAYI'10ND R. HANCOCK Agricultural Statistician
.... .
... '
-
, . ::
:ca.-:MODITY J\NDUNIT
l~ '.l- .
' .
,.
PRI.CES .RTI;CEI\I"ED. BY li'.IL~.ilS JULY is, 1958, WITH COMPARISONS
,. . . "''\
,..,. ;-"'"
' !
GEORGIA
I
1 Average
I
I
'
July 15 June 15 July 15
1910-14 1957 1958
1958
I.
I.
, Average 1909-14
UNITED STNI'ES :
July 15 1957
I
June 15 July 15
1958 . 1958
Whe::1.t , Bu.
Corti, Bu .
:
. Oa ts, Bu
Irish Pot. , cvrt .
Swe e t Pot. , cvrt .
Cot'ton , lb.
Cottonseed , Ton All
Hay (baled), Ton
:
Hogl? , per cvrt .
Bee f Cattle, cwt .
Milk Cows , Head
Ch ickens , Ali , lb .
$
1 . 23 ! 1 . 86
1 . 92
.1 . 90
$
.91
1.38
1.55
1.54
$
. 67
. 74
.79
. 81
.as
i
I
. 64 1
I. 40
1 . 91 1 . 23
. 62
1 .70
1.19
I . 62
1.64 1.18
. 58
$
1.13
2 . 67
2.75
2 . 95
$
I
.84
5 . 30
-
5 . 45
1 .141 1.60
I
1.59 5 . 29
I 1 . 65
1 .72
5 . 52
5 . 81
; 12 .1
33 .8- 32 . 0
32.0
12.4
32 . 2
29 . 1
30. 8
I
$ 23965
-
-
-
22 . 55 55 . 00
-
45 . 00
- - $
I 24 . 40 27 . 70 27 . 60
$
I 7.35 19 . 60
21 . 20
21 . 1)0
--
7 . 27
$
:I
I 3 . 96 I 14 .00
33.85 ! ns .oo
l3 . 3
20 . 4
18 . 60 155 . 00
20.0
I 18 . 40
I 150. 00 I 1 R. 5
5 . 42 48 . 00 11.4
17 . 50 19 . 30 18 . 40
19 . 6
17 .10 17 .10
21 . 60 21.40
22 . 30 . .22.20
21 0 . 00
20. 3
18 .7
Egg s, doz .
21.4
40 .7
42 . 1
42.0
21 . 5
32 . 0
33 . 9
35 . 9
Butte rfat, lb .
~ 25.8
51.0
50.0
50. 0
20 . 3
58 . 9
57 . 3
57 . 4
Milk (whole sa le) per lOQ<?
.Soybeans , Bu . ..
Peanuts , lb.
$ 1'
2 .43
!I
5 .60
_, I ~ I
-
~,
5.2
2 . 25
-
'
I
1./ 5.55
-2/ 5 . 55
2. 40
I 2.30
-
-
'
I,
1/
1/
2/
1. 60 ,- 3.98 - 3 . G8 - 3 . 84
-
2 . 24
I 4 . 8
10 . 9
I
2 .13
n .o
2 . 11
-
. U R<_}'(iscd . 2/ Pre1=:im=i!::~:!::::~:~: =================================
INDEX NuMBE RS OF FHI CES RR: CE IVED BY FA~lERS IN GC ORGI!l
( J anuary 1910 - December 1914 = 100)
July 15
June 15 Jul y 15
All Commoditie s
l ' 1957
1958
1958
- - - - - -- 261
256
265
l:.ll Cron s
275
277
273 1
Grain-'S and Hay
1 49
1 63
163
Cotton Lbt
278
26 3
253
Peanuts
205
205
205
Tob n.cco
451
449
449
Gottonseed ancl So:tbacns
208
212
212
Irish Potato es , Svreet Pot~toes o.nd Cowpen.s 270
291
281
Fruits :::'.l!d Nut-tl
l <:.o
20C
1 68
All . Livestoc k and Livestock Pro d~ct s
21 4
237
235
Meat J..n:ima ls
300
351
354
Poultry ?.nd Bgg s
1 41
155
148
Dairy Pr oduct s
226
224
224
y PRI~S P.'.lli BY F.flffi,Z':HS FCF. SE:EC'!SD FEEDS, JULY 15 , . 1958 , 'liTH COt,:f'ARISoN S
kiND OF nr.:D
Mixed Da i rv Feed
..._...All Unde r 29% i='r otein 16% Prott.:in lBA' Protein 20f'o Pro te in 2<".% Protein
High Protein Fee ds Cotto. se e d r~c al Soyb cn.n Men.l Me a t Scrap
Gra in By- Produc t s Br o.n Middl i."lg s Corn Me al
Poultry Feed Broiler Growing Ma sh La ying tvb sh Scratc h Gra ins
Hay (B;'ll e d 2 l.J.fn.l f o.
..:.n Other
July 15 _ l 9 ' 37
3 .90 3 .so 4 . C5 4 . 05 4 . 30
3 . 45 3 . 55 4 .70
3 . 25 3 . 50 3 .60
GI;:ORGJ;A
J une 1"-' - 1956
3 .90
3~80
4 . 20 4 . 00 4 . 35
3 .95 3 .95
3.25 3 . 45 3 . 50
li
UI'HTED S'rATES
1u1y 1 5---rr- July 15 Ju."lc 15
] 9")8_ _ _._ _ 1957
1958
Julv 15 19'58
Dolla rs Pe r 10-0-P-ou-n-ds
3 .95 i
3 .90 <i .lO
I
i
I
4 .10 I
3.73
3 . 68 3 .67 3.89
II 4.45
3.99
3 . JS '!
4 . 05 I I I
3 . 25 I
3 .74 3 .73 4 . 69
2 .85
3 . 50
2 .94
3 .50
3.38
3. 67 3 .62 3 . 61 3 .91 4 . 03
3 .97 4 .15 5 .79
2 .76 2 .88 3 .36
3 . 69 3 . 63 3 . 61 3 . 96 4 . 07
4 . C'l 4 . 41 6 . 21
2 . 74 2.94 3 . 38
s . oo 4 .75 4 . 30
5 .10 4 .80 4 . 35
5 . 20 4 .90 4 . 40
4 .87 4 .42 4 . 05
5 . 01 4 . 47 3 .99
5 . a3 4 .56 .- C1
50. 00 34 . 00
45 . 00 40 . 00
45.00 40 . 00
28 . so 27 . so
?8 . 70 27 . 9 0
27 . 80 27 . 30
1/ As r eported by f eed dea1e B.
-------------------------------------~------------
qoo7
q~~ GI~~GITA \C~(Q)!P
1 AGRICULTURAL EXTENSION SERVICE UNIVERSITY OF GEORGIA AND THE
STATE DEPARTMENT OF AGRICULTURE
Athens, Georgia
!RJE!P(Q)~
AR'!'MENT OF AGRICULTURE AGRICUI- TURAL MARKETING SERVICE 319 EXTEtJ:>ION BLDG., ATHENS, GA.
August 8, 1958
GEORGIA - AUGUST 1 COTTON REPORT
Prospective cotton production in Georgia for 1958 of 300,000 bales (500 pounds gross weight) was indicated on August 1 by information reported by crop correspondents to the Georgia Crop Reporting Service. This is 24 percent below the 396,000 bales harvested in 1957 and is the smalle st crop since 1868 when production amolinted to 28'8,000 bales. The record crop .was in 1911 when 2, 769,000 bales were produced in the State
. Indicated lint yield per acre of 359 polmds has been exceeded only by the record 1955 yield of 376 pounds. Preliminary estimated acreage for harvest is ..
401,000 compared with 570,000 last year and is the smallest acreage since estimates were started in 1866. The record acreage was in 1914 when 5,157,000 acres were harvested.
Unfavorable weather dur in~ the early spring months delayed planting opera..
tions and made it difficult to secure good stands. Considerable planting over
was necessary in some areas and the crop was started somewhat later than normal.
Weather conditions were gener::tlly favorable during Hay and June and the crop made .
excellent growth. Frequent rains during the last of June and July made it diffi-
cult. to control boll ~~eevils and bollworms and inf estation became heavy ;in some
areas. .Growers have carried out an intensive inseet control program and on
August l crop prospects were generally good.
'
Final outturn of the crop compared with this forecast will depend upon . whether the various factors affecting the crop during the remainder of theseasrn
are more or less favorable than normal.
.CARL 0. DOESCHER Agricultural btatistician
ARCHIE LANGLLY Agrj_cultural Statistician In Charge
GEORGIA HAP - .SHO\rHNG AUGUbT 1 CONDITION BY CROP REPORTING DI5TRICTS
1958-76% 1957 -76,; 1956-76%
I
0TATE: 1958 - 79'/v 1957 78/; 1956 7$%
Districts shown ate crop
reporting districts and NOT Congressional Districts.-.-
COLUNBUS
--\_____.
VII
VIII
ALDANY
l 958-7 cU J 1957-80% 1956 -75 %
1958-76% 1957-78% 1956-75%
VALDOSTA
IX
1958-82% 1957-68i;
1956-79 ~6
.. . . . : ~.
;'
. . .' ~
r ,
I ::0 ,, . I' j'; '
.. :
UNITED STATES - COTTON REPORT AS -OF AUGUST 1, 195'8
Tb~ crciP R,~porti,ng Board ~f- the Agricultural Marke-ting Service makes_. th~ :- . -'
following report from data furnished by crop correspondents, field statistici~p,
Bureau of the Census, Commodity Stabilization Service, and cooperating State .. _, agencies. The final outturn of cotton compared with this forecast will depend
upon whether the various influences affecting the -crop during the remainder of
the season are more or less favorable than usual.
- - - ,:: -: - A.cres "In- : - - -L"InT: y~eia per - - : - - - -Proauction -37 - - - - .
. . .. > : 97_5 . &tate
cultivation:
harvested
:July 1, 1958:_ _ -_- :--::Lpeerscsenatvernaogte:: 1av94e7rage6 1957
:a:ic-nrdeIi29c/'5a8t"e"d"::-1av54er0a0g-6el:b:: .-g"1r9o75s7s"
-w-e-ig:h-t
bales .. 195'_8- -
: indicated
.
.. .
- . :harvested~/:
'
.
..
--- . -~---------------------------~-------
1,000
1,000 1,000
1,000 .
-acr-es
- -- - Pounds Pounds Pounds bales ': '
bales
bales
. N.
s.
o. c.
.
...
Ga .- . . e :
Tehn~ - ~>:
Ala~- -- .:. -::
l1is-'S. . :
>:
..... Mo.
:
.... Ark.
........ La.
. :
. Okla . '
.. Texas
.. N. Hex.
.... Ariz.
... Calif.
270 359 401 410 544 1,153
297 1,022
379 413 5,340
178 385 739
324
321 373
441
231
306
329 348
628
344
276
333 359
681
396
383
427 474
583
415
307
346 353
884
530
389
388 433 1,759 1,081
400
281 461
399
179
374
416 488 1,458
981
389
380 475
639
348
i75
234 296
374
263
222
295 373 3,937 3,632
573
619 755
269
236
777 1,037 1,097
687
763
714 1,035 1,088 1,348 1,537 '
210 260 300 405 400 l,Q40
285 1,040
375 255 4,150
280 880 1,675
Other
- - - - States ,!/:
38
----- - -- -
-
300
---
-
31.6
-- -
--
348
--
-
-
-49-
-
-
-
28
--
-
- - :,-
28
--
u. s.
ll,928 -
317
388
466 14,136 10,964 . .. 11,583
----------------------------------------
Amer.Egypt.
2/:
76.7
426
485 509
41.6
81.9
81.4
----------- ------------------------------ 1/ 1948-57 average percent not harvested from all causes including r emoved for
- -compliance.
2/ On acres im cultivation July 1 less average percent not harvested.
3/ Production ginned and to be ginned. A 500-pound. bale contains about 480 net
- pounds of lint.
4/ Virginia, Florida, Illinois, Kentucky, and Nevada. ~/ Included in State and United States totals. Grown in Texas, New Mexico, .
- Arizona, and California.
CROP REPORTING BOARD
',. ,, ' .
1;3 CGIE(Q)~CGllA CC~CDJF ~IEJP(())JFi1fllN~ JEIR{VllCCIE
~~
AGRICULT.URALEXTENSIONSE'RVICE
.. ~
'j r UNIVERSITY OF GE.ORGI A AND THE
,. . 'STATE DEPARTMENT OF AGRICULTUR'E
Athens, Geo.rgia
UNIVf.Rsmof'GE .: s , DEPART~ENT OF AGRICULTV~E
-
ORGI G.RICULTURAL MARKETING SERVICE
19 EXTENS.ION eu:.;CG.;ATHENS. GA. '
S2158 !\ugu-~t 11, 1958 ~ . . :.
J -~
. . ~ . . .
GECRGIA P E ANUTS P ICK . -. 1 ~R HED - 1957 CROP
__ C:rb.~ e~ e_~t.im<!:.t~_s_ ~r~ Jl<!.~~cl.PR tll~ J.~t~s_t_ ~Y~i !l__ ~ A.C!:.tSt_ ~g~ -C!:.~~ p_r_e.J. VPi;t~H.::.1. _
District and
: Harvested Acres: Yield Per Acre
Pro d uction ..
County
(pounds)
(000 pounds) .
---------------------------------------------------------------------~---
DISTRICT3 I, II & III
DISTRICT IV
0
0
0
. ,. . .
, I
Chattahoochee
220
4: 64
Macon
5, 57 0
628
Marion
3,600
614
Muscogee : -
15
33 3
Schley
3,090
718
Talbot
19 0
626
Taylor
2, 1?.50
787
Upson
15
533
102 3,499 2,209
5 2, 219
119 1, 770
8
. :- ,, .:; .
Total
14,950
664
9,930
DISTRICT V
Baldwin Eleckley Crawfor d Dodge HouatD'n Johnson Laur e ns Montgomery Newton P each P ulaski Treutlen Twiggs Washington Wheeler Wilkinson
20 2, 140
30 7,270 5,910
390 7, 530 1, 010
10 530 9,360
t1:0 1, 370 1, 660
930 740
4 00 861
4 33 711
773 464 703 769 1, 000 868 816 375 697 492 938 822
8 1, 842
13
5, 171 t:.:, 566
181 5, 296
777 10
4 60 7, 640
15 955 81 ,6 872 608
Tot~.l .
38,940
751
29,230
r''
DISTRICT VI
Bulloch :6 urke Candler 'E: fiingh a m
E manl'.el Glascoclc Jefferson Jenkins McDuffie Richmond Scre ven Warre n
12, 260
993
6, 280
605
1, 220
688
4 50
880
2, 810
64 0
34 0
462
3,0 30
569
2,880
582
15
4 67
280
586
4 , sso.
726
20
400
12, 177 3,797 839 396
1,798 157
1,723 1,677
7
164 3;305
s
Total
34, 13:;
763
26,048
DISTRICT VII
!hker C:a1houn Clay Decatur Do u g h e r t y Early Grady Le e Miller Mitchell
15, 010 17,020 12,050 16,840
6,090
33,310 8, 640
15,900 19,410
l0,9SO
773 982 856 981 750 872 983 822 99 4 1,03Z
(Continued)
11,606 16,717 10,318 16, 517 ~ . 569 29, 046 8,495 13, 069 19, 290
Zl, 660
. , :
GEORGIA PEANUTS PICKED AND THRESHED- 1957 CRO? .
. ~ ~ (1'b~ ~ -~~t}!n<it_e..;~- g.r~ J?.~~~q _OJl_ tll~ J.g.t~~t_ g. Y.i1jip].~ A.<it_?._ g.D;J. -~;r:~. pj_ej!;I:P.}Dg.r;ft._.
District ail.i .
: Harvested A cres: Yield Per Acre :
Production
County
:
: (pounds
(000 pounds)
------------~------------- ~ -~-----------------~--------------------------
.' D!STRiGT VII (Contt)
("uitrnan Randolph
Seminole Stewart Sumter Terrell Thomas Webster
4,360
731
22, 360
838
12,850
732
8, 590
651
15,800
834
22,450
920
4,780
649
9,310
829
Total
265, 750
876
3, 185
18,730
9,4Q5
5, 592
13, 175
20,649
3, 100
7,715
..
232,838
DISTRICT VIII
Atkinson Ben Hill Berrien Brooks Coffee Colquitt Cook Crisp Doo1y Irwin Jeff Davis Lanier Lownd:::s Telfair Tift Turner Wilcox Worth
Total
210 6,7 0 0 1, 89 0
~. 5 ~ 0
3,260 9,060 1,960 13,960 18, 100 15, 180
100 10
550 3,270 12, 150 19, 800 12, 4 20 29,340
152, 490
l, 157 1,027 1, 052
786 92S 912 1, 068 1, 34 2 908 1,262 970 500 773 794 1, 112 1, 179 1, 060 993
1,067
243 6, 880 1, 989 3, 5,62 3, 016 ' 8,260 2,094 18, 739 16,437 19, 163
97 5
4:25 2, 596 13, 514 23,342 13, 162 29, 138
162, 662
. .. . .
'
r ..
..
: . : . ..
' . ..
' I
DISTRICT IX
Appling Bacon Bryan Evans Pierce Tattnall Toombs Wayne
''
'
260 10 ...
170 660
15
9~0
1, 640 40
842 500 735 '
897 800 1, 081 858 400
219
5
125
592
12
.. ' .
1,016
1, 407
16
Total
3,735
908
3,392
STATE
510,000
910
..
464, 100
'
CARL C. DOESCHER Agricu1tural 'Statistician
ARCHIE LANGLEY Agricultu ttal Statistician I~ Charge
. .. ..... . .... ~ .
.. .. .
. ... . .' .
'
'l .
"1 7
L/ ~
c c I6(2- CGIE(Q)~ llA Iffi(())f
AGRICULTURAL EXTENSION SERVICE UNIVERSITY OF GF.:ORGIA AND THE STATE DEPART ME Nr OF AGRICi.!t.TURE
IR\.fE If:)) 1}R1TIT N~~~~
U.S . DEPARTMENT OF AGRICULTURE AGRICuLTURAL MAR KETING SERVICE 319 EXTENSION BLDG., ATHENS, GA.
August 12, 1958
V E GETA B LE CRCt' R.E.1.~ 0R T .c~CR AUGTJ3T 1, 1958
LIMA BEANS: Production of green lima beans in the sum.ner 3tates is estimateJ at 2L.!: 5, 000 cwt., 12 percent more than produced in 1957 but 24
perce nt less than average. Weather cor. di tions ha t e be en g::!nz rally favorable in New Yor k . Light harvest of the Long Island crop is e x pecte d. to start in mi d August. The New Jersey crop is late, and har v est L1 so uthern part of th e .State is just becoming genero..l. The Maryland crop contir1ue s to mo :;e with yi eld and quality r eporte rl to be good. A good yi e lding crop is beh~ 3 harveste d in North Carolina. Only a few beans remain for harvest in south a nd central Georgia. Excessive rains a nd i11sect darnage cut prodt!ction short. 3hou.l J 1-~ugust weather be favorable, a fair crop will b e b.a r ms t ed no rth of Macor...
SNAP BE A NS: Production of s i~ ap bean s in the SLlmmer 3tates is foreca s t at 1, 454, 000 c vt t., about j perc 3nt b e low last yea r and a verage. In
the New Eng land States, ia vo rabb J uly we ath~ r materially impro .-ed yi e ld prospects. P or these .3tates the peal~ har . est has passed Lut suostantial supplies will be available throu:;h August. Growing c onditions in Virginia were favorable and
quality of the crop has b een good. Harvest began about mid-Jdy. Poor stands and considerable disease in some areas of North Caroli aa lower ~d yiel d prospects _ Har v est from early plantings has passed its peak a n d late pla.-1tings lool::: good in Georgia. In T .,mnessee, peak movement has b een passed. C uali. ty o.Z the crop has been good. In Alabama, weather has been favorable for plant growth and a good yield is e --~pe cted . Beans generally ma Je good g rowth throu g h July in Colo rado. Good qllality beans were being s upplied both for local markets and out-of-
state shipments.
CABBAGE: Plroduction of late summer cabbage for fresh market and kraut, forecast a t 3, 96~. 0 00 cwt., is- 10 percent abo ;-e last y <!a r but slightly-
below average. Harvest is un d e rway in all late surnmer States. In ~-=-e nnsylvania recor .:1 yields are in pro s p e ct. July weather was favorable for cabbage in Indiana and Illi n ois. W eather con d itions fav-ore d good growth in North Sarolina. Exce ssive rains in Georgia cause d losses in low are as an d reduce :J. y-iel ::l and quality. In Colorado, yields on mid and lat e season acreage ar~ e:;:pecten to be conside rably bette r than the early plan tings. Volume moveme .:."lt is e ~q:>ecte d by m id August. In i.ii ashin gtO J.1, cabbage ma d e goo d progre ss d u ring J uly, but rain is
ne e ded if c urrent yield prospects ar e to be r e alized. In California, supplies are adequate t o fill local market demand .
WA T ER!vi2 -f._,ONS: _:~arly sum1uer watennelon productivn oase ;l oa con d i.tiOi.1S as of AuguSt! was forecast at a recor d hi g h ::>:i 24, 635, 000 cwt.
Indi cate :i pro -:i L~ ction e x ceeds that o f last y-ea r by 27 perc e n t an :". is ::. 1 percent abo .re a ve rage. This year's lar g e acreage combi11ed with a recor;i yield for the early s urn rner crop were respons ibl e. Gr owi ."lg c onditions in t~1e i raportant producing J ollt hern States have be e ,l \'e ry ia.rorable for both y-i e ld and quality . I-Iowe ';er, s upplies exceed market de mand a.1 d the crop is not bein g f ully utilized. Harve st in North Caroli na is still acti .re. In the Bar n well a rea o f S::>uth Carolina, har ves t acti vity is declining and so n"le 3 row e rs ha -ve cease :::l pic~~i tg becaL~ se of low pric es . Harvest is still acti ve in Ch,:::s t e rfiel d a nd 1-:Ja:di. ngt on Cou:.1ti e s but mo .reme nt h as been restricted ;_:, y mar k et conditioa s. H arvesting has e n d ed in t ["le
main commercial areas in Georgia. i>. few melons a r e s t ill available from sm.ali patches in the northern part of the State. Some melons are b eing harvested in Alabama but the season ~ s dr a wi:.1g to a close. Rains in July dama g ed some fields hut adequate moisture through out the growing season has res ultel in good yields. In Mississippi, e.~ cessi ve rai n in July ca used the wat -e rmelon crop to deteriorate. Supplies in d.eclining vol u me will iJe a vaila~J le throu gh !-:~. ug est . !-Iarve st of watermelons is neari,, g compl e tion in Loui s iana. In Arkansas, rnelons are availa ble in volume. The Cklahoma crop is late and harvest is just s tarti ng . Heavy mo -.rernent is scaeduled to begin in mid-August. In Te ;:as, harvest has ended in s::> uth ern producing areas b ut volume supplies are still available fr om east Te ;cas an:l hom a limited acreage in northwest Texas. Considerab l3 a bandomnent of mature acl'eage is reporte d from south Te :.;:as. Arizona's watermelon crop di d not do as well as e ;cpected earlier. High temperatures and disease combined with unfa vorable market conditions resulte::l in a light harvest. Watermelon harvest is active in California's late districts. The crop there is lighter tha1 last year 1 s becaLl se of adverse spring weather.
ARCHIE LANGLEY Agricultural Statistician In Charge
L. H. HARRIS, JR. Vegetable Crop Estimator
Acreage and Indicated Production RepCJrted to Date, 1958 with Comparisons
Crop and State
LIMA EANS
I_ A c!"eag e for~_r_':_e s t
I Average j
' !Ina
! 1949-56 1 19_5_7 119 58
- Acres -
! ._,'y i eld p~r Acre
! 1 Av.
I Ind
! 1 49-56~957 1958
I - Cwt. -
Summer: New York New Jersey
~.00 I l, 660
6. ll~.
-
42
___ , 2,020 1, 4Q.O" l.~o , 33
45 28
45 34
70
27
27
64
39
48
Ohio Maryland
I 650 1, 150 1,000
36 1, "@"00 ! 26
20
30
24
31
20
30
North Carolina! 1, 460 l, 500 1~ 6i>O j 22 26 32
32
39
51
Georgia
I
I
5,760 4, 500
4, 700 j 18
21
19
104
94
89
I
Group Total r 12,710 9,000 9, 3001 26 24 26
I SNAP BEANS I
Summer:
I
I
I
I
New Hampshire
I Massachusetts ! Rhode Island
I Connecticut
290 1, 350
260
l, 100
250 l, 200
20 0
1,000
28ol 34
l, 300 i JS zoo ! 36
1, 000 i 35
45 38 35 35
15 40 40
40
324 219 245
10
11
13
47
46
52
9
7
8
38
35
40
I I New York, L. I. 3,090 l , 200 1, 200 I 42
New York
10,750 10, 700 10, ?OO 42
45 44
40 41
125
54
48
~48 471 430
Pennsylvania , 3,060 2,300 2,300 j 43 45 48
Ohio
! 3,310 3, 300 3,800 ; 40 39 40
Illinois
i
I
1, 280
1,200
l,300 j 27
34
38
Michigan Virginia
II 2, 520 2,600 2,60 01 31
660 700
750 i 30
32 30
23 35
North Carolina l 7,520 6,400 6,800 1 32 50 45
I
Georgia
2, 100 l, 400 1, ::>oo 1 28 27 25
131 104 110
131 148 152
34
41
49
77
83
73
20
21
26
2LB
320 306 .
59
38
32
Tennessee
l, 680 l, 200 1. 4oo 1 36 4 2 40
59
50
56
Alabama
1, 290 1,300 1, 200 ! 21 24 25
28
31
30
Colorado
820
700
650 ! 44 48 45
51
34
29
Group Total 41; 080 36, 150 36, 580 I 36 41 1:0 l, 4 94 l, 494 1, 454
l
I WATERMELONS !
Early Summer:
I
I
North Carolina 1 11,05012,000 16, ooo II 49 55 70
541 660 l, 120
South Carolina i 41, 750 43, 000 4 4, ooo I 56 43 70 2, 316 1,849 3,080
Georgia Alabama
I! 53, 250 60, 000 63. ooo 1 78 17,26019,000 21,000 j 91
75 92
9u 4, 151 4,500 5, 670 9S 1, 56 1 1, 748 1, 995
Missis .sippi I 10, 800 13, 000 16,000 70 72 6 5
755 936 1,040
Arkansas Louisiana . Oklahoma Texas Arizona
i I 10, 160 11, 600
i
!
I
4,460 14,960
4,200 11,000
12, 700 I
Ll:, 2oo I
11,500 !
j108, 880112,000 124, 000
85 77 63 47
85 80 77 42
85
860 986 1, 080
85
342 336 357
80
961 847 920
55 5, 145 4,704 6, 820
i 5,090 5,800 7, 20 0 l 1t.12 175 115
724 1, 015 828
. California
! 10, 480 10, 500 11,5~0 ! 135 180 150 1, 411 1, 890 l, 725
Group Total ~8. 140 302 , 100 331, 100 !. 65 64 7 ~-1 18,768 19,47124, 635
CABBAGE
I
Late Summer:
I Pennsylvania
4,290
Indiana
I Z, 170
Illinois
I 2,710
I Iowa
I 980
North Carolina 4,260
3,330 1,8JO 2,600
900 3, 560
3,
1oo
I
1
181
168
210
l, 700 i 133 177 200
2,900 179 zoo 220
800 146 115 180
3,800 142 162 165
776 559 777 232 319 340 482 5?.0 638 145 104 144 607 575 627
Georgia
750 600
500 92 100 80
70
60
40
Colorado New Mexico Washington California
I 3, 340 2,680
I I I
370 1,600 2,380
1,000 2, 300
2,700 240 258 250 I 108
850 1 174 232 215 z.~oo 231 24 0 235
808 690 675 40
272 232 183 548 552 540
Group Total l 22, 83 0 18, 770 19,250 176 192 206 i 4, 030 3, 611 3,964
3/S
f) AGRICULTURAL EXTENSION SERVICE ~ UNIVERSITY OF GEORGIA AND THE
STATE DEPARTMENT OF AGRICULTURE
Athens, Georgia
U.S. DEPARTMENT OF AGR..U:w.t!~rrr-E AGRICUl..TURAL MARKET IN 319 EXTENSION BLDG., AT
Augu st 12
GE~ffiR~L CROP REPORT AS OF AUGUST 1, 1958
Heather conditions during July were vary favorable for the vegetative gro1-1th of crops. Rainfall during the month was ample to excoss;.ve in most of south and central Georgia and from the 7th to the end of the month in northern areas . Prospoets for most crops improvc;d during the month as the above average grovJing s eason more than offset losses due to inse cts and diseases . Corn , hays, pec:.nuts, and pasture s made good improvement whj_l e the exce ssive moisture did r educe the quality of truck crops . Record high yields are indicat ed for c orn and all hay withabove average yields indicated for pr actically all other crops .
RECORD CORN CROP: F;worabl e 1-10ather during July improved tho outlook for this year's corn crop in Georgia . Total production is now osti-
mated at 81,330,000 bushels, 11 percent l arger than expected a month earlier.
'.Che expe cted yi eld per a cre of 30 . 0 bushels will be bhe highest on r ecord, sur -
passing the previous high of 26 . 0 bushels produced in 1 95 7. Thc increased yi eld per acre will more than offs et a de cline of one pt rcent in the acreaee for harvest estimated at 2, 711,000 acre s . 'I'he ample moisture supply available in July along 1-Jith the increased usc of hybrid seed, improved cultural and f ertiliz ation
practices, all contributed to the prospc; ctive high corn yields .
TOBACCO PROSPECTS INPRG\TE : The flue-cured toba cc o crop in Georgia, currently e stimated at 84,no, ooo pounds, is nearly f ive porcent
l arger than last year's crop of 81 ,270, 000 pounds . Yield per a cre i s es timated at 1465 pounds, which is a small increase over the July 1 e stimate of 1450 pounds. Flue - cured tobacco gr owers are estimated to have harvested 58, 000 acres this year~ compar ed to 63,000 Acre s in 1957. The quality of the tobacco harve sted this year ' has been b etter than last year ' s crop and has brought a higher price .
GOOD PEANUT CROP : Curr ent conditions point to a Georgia peanut crop of 504, 900,000 pounds, nine percent above last year's crop of
464,100,000 pounds . ~canut f Rrmors drc expected to harvest 510, 000 acre s for nuts, the smne a s harvt:. sted in 1957 . ?rospc ct s on August 1 indicat ed t hat a yield of 990 pounds per a ero could be expe cted frOJ;: this ye<)r ' s cr op compar ed to a yield of 910 pounds per acre for the 1957 crop . Harvesting ope r ations are underway in 5outh G8orgia
.hBOVE AVERAGE PECJ...N CROP: August 1 conditions indic at e that Georgia's pe can gr ovTbr s -vJill harv;.: st a crop of h3 million pounds ,
well above tho r evised e stimat e of 7,500,000 pounds pr oduced in 1957 . This year's estimate is 1 7 million pounds below tho r e cord high production of 60 million pounds produced in 1956 but six million pounds abov8 th~ t on- year (1947-56 ) average production of 37 million pounds . Fr equent r ains during June and July were favorabl e for scab dev~lopment on s usceptible V2riGtios nnd has caused a
heavy drop in many orchards .
GEORG H.
CROP
:ACREA.GS :
YIELD PER ACRE
TOTAL PRODUCTION (IN T::~OU 1 ~
(000) Average :
: indicated l\.Vrage:
:Indicat ed
; 1958 1947-56: 1957 : 1958 : 1947-56 : 1957 : 1958
. Corn . bu.: 2,7ll
Wheat. bu .: GO
. Oat s . bu .: 315 . Hay (All) . ton : 569
17. 3 16 . 4 27 . 8
. 68
26 . 0 16 .5 28. 0
. 96
30 .0 51 , 319 71,188
23 . o 2,174 1, 848
33 . 0 11, 684 11, 032 1. 02 695 550
81,330 1, 840 10,395
578
Tobacco (All) . . l b .:
Pot at oe s,Iri sh,c.,;t .:
. . Potatoos ,Sweet , cwt . :
Cotton .
bal es:
. . Poanuts(P&T) l b . :
Soybeans .
bu :
. . . . . Peaches, t ot al crop:
. bu :
Pears, total crop ,
. .
. bu:
. Pecans . . l b :
l)asture , Condition ~ :
59 . 1 1,237
4 . 6 h6
13
41
401
27 6
510 84.5
110
10. 6
76
1 , 2 90 49
46
333
910 14.0
81
1 , 46 3 47 46
35 9
990 14 . 0
91
123 , 796 82,711
320
254
1,198
6~. 4
6 81
396
571,760 464,100
410 l,hoo
2,420 2,100
169
86
37,346 7,500
86 ,455 215 598
300
5oL., 90o 1,540
4,000
98 43,000
ARCHIE LANGLEY Agricultural btatistician In Charge
RAYMOND R. IUl.NCOCK igricultur al Statistician
. :~ UNITED STATES - GENERAL CROP REPORT AS OF AUGUST 1, 1958
Gains in yield prospects for most crop s during July now seem likely to make 1958 by f ar the Nation's biggest crop year. Losse s f rom too much rain have r educed yield and quality in some sections without matching the wide spread advantage of general freedom from July drought or damage from excessive heat. Crop growth continued slow in July and grain harvest made slower than normal progress in most ar eas.
Major gains during July are now evident for corn, oats, barley, spring wheat flaxseed, and dry beans. Relatively smaller but important increase s arc soen for winter wheat, hay, rice, and tobacco. The cott on crop looks 6 percent larger than last year with yield prospects pushed r ecord high by excellent crops in the Southwest. ~orghmn gr ain has r ocord yield per acre prospects which offse t s ome of the acreage r eduction from last year. .::>oyboans are growing a r ecord crop from near-record yield prospects on the large st acreage ev~ r grown. All wheat and barley outturns arc r ecord large , corn and hay crops are second large st while
oats, potatoe s, and sugar crop s are well above average. Pastures are best for the date in most .memorics.
Production of all corn is foreca st at 3.5 billion bushcls--S percent above the July 1 for ecast, 2 percent above l ast year and 11 percent above average. The improved prospects from la st month r e sult l ar gely from continued ample moisture in practically all ar eas.
The acreage of peanuts to be picked and threshed this year is estimated at l,S3S,OOO acre s, about 3 percent above last year, but 26 percent below the 10-year aver age . Most of the indicat ed increase this year is in the Southwest area where unfavorable harvesting weather last year sharply curtailed the acreage finally picked and threshed. Production of peanuts is estimated at 1,657
nullion pounds, about lS percent above the 1,445 million pounds finally harvested last year. Production e stimated for the Virginia-Carolina area at 510 million
pounds is about 3 percent below 1957 production.
Pecan production is foreca st at 179 million pounds, 27 percent more than in 1957 and 21 percent above average . The prospe cts on August 1 indicate that production of improved varieties will be almost three time s the small 1957 crop. Production of wild or seedling nuts, on the other hand, will be l e ss than in
1957.
Production in the southeastern State s is expe cted to be larger than 1957
while in the States west of the Mississippi prospects are below 1957; In general
all States with the exception of Arkansas and Oklahoma are expe cted to exceed
their 10-year aver ages .
'
UNITED STATES
Acr eage :
Yi eld
CROP
: For Harv.:
I nd. Aug.
1958 1957
1, 1958
1,000 acres .
Corn, All
Bu.: 73,185
Wheat, All
Bu .: 53,650
Oats,
Bu.: 31,926
Cotton, 1/
Bales : 11,928
Hay, All-
Ton . : 72, 90S
Soybeans,for beans Bu .: 23,667
Peanuts, P & T Ton : 1,535
Potatoes,Irish
C\'V"t o : 1,452
Sweet Potatoe s
cwt .: 282
Tobacco, All
lb .: 1,088
46.8 47.6
21.7
26.5
37.4 42.1
388
466
1.65 1.59
23.1 22.9
970 1,080
173.3 176.5
63.) 63.1
1,479 1,588
Production
Ind. Aug.l
1957
1958
l,GOO
1,000
3,402,832 947 ,102
1,308,360
10,964 121,402 479,841 1,445,110
239,539 18,053 1,66o,SS3
3,487,159 1,420,725
1,345,157 11,583
115,936 535, 887 1,657,410
256, 344 17, 807 1, 728,292
!/ Acreage in cul t ivation July 1,1958 l e ss average percent not harve sted.
r
rl~ ?J7
f, b[O~~llA \CJP&(!)JPl
AGRICULTURAL EXTENSION SERVICE UNIVERSITY OF GEORGIA AND THE STATE DEPARTMENT OF AGRICULTURE
BROILER CHICK REPORT FOR GEORGIA
3/s -
'L:JiiRA RIES
U.S. DEPARTMENT OF AGRICULTURE AGRICULTURAL MARKETING SERVICE 319 EY.TENSION BLDG., An-!E i'!S, GA:
August 13,1958
ATHENS, GA., August 13--A total of 5,819,000 broiler chicks were placed with producers in Georgia during the week ending August 9 according to the Georgia Crop Reporting Service. This compares with the 6,018,000 placed the previous week and is one percent less than the 5,799,000 placed the same week last year.
Eggs set by Georgia hatcheries amounted to 7,438,000 compared tJith 7,874,000 the previous vJeek and is one-half per\;ent less than the 7, 4 73,000 for the corresponding week last year.
Hatcheries reported prices paid for hatching eggs during the week at an
average of 70 cents per dozen. Average price charged by hatcheries for the chicks \vas reported at :)11.00 per hundred. These prices compare with 72 cents and ~:~11.50 last vJeek and with 65 cents and ~~11. 50 one year ago. Egg prices shown relate to
Georgia produced hatching egg s Hh ether bought on contract or othervJise.
\veighted average prices from the Federal-State Market News Service for broilers during the \veek e;nding August 9 are as follows: Georgia broilers 2 3/43 1/2 pounds, at farms 17.04; FOB plants 18.00.
Heek Ending
(See reverse side f or other states)
____ - - - GEORGIA CHICK PlACEMENT BY WEEKS JfJNE ...._.._ ~- 7 TF.ROUG!_!._~l!_GUS'L2._ _ I
_. EGGS SET _1/
CHICKS PLACED FOR BROILERS
1957
1958
Thousands
1958 1;
cf 1957 Percent
1957
1958
Thousands
1958% of 1957 Percent
June 7
7,970
9,616
121
6,069
7,211
119
June 14
7,860
9,360
119
6,169
7,063
llh
June 21
7, 772
9,082
117
6,137
7,153
117
June 28
7,557
8,658
115
6,144
6,878
112
July 5
7,300
8,574
117
6,094
6, 724
110
July 12
7,539
8,531
113
6,075
6,869
113
July 19
7,856
8,348
106
6,024
6,340
105
July 26
7,837
8,040
103
5,944
6,204
104
Aug . 2
7,405
7,874
106
5,957
6,018
101
Aug. 9
7' ~.73
7,438
-----
100
5,799
5,819
-- --- --
100
-~-
!/Includes eggs set by hatcheries producing chicks for hatchery supply flocks.
ARCHIE LANGLEY Agricultural Statistician In Charge
H . A. HAGW.d:R Agricultural Statistician
\ -
STATE
Haine Connecticut Pennsylvania Indiana Illinois hissouri Delaware Maryland Virginia West Virginia North Carolina South Carolina
-GEORGIA
Florida Alabama :Missi ssippi Arkansas Louisiana Texas Washington Oregon California
TOTAL 1958
TOTAL 1957 1958 %of 1957
~'~- RevJ..sed
EGGS SET AND CHICKS PLACED IN COMMERCIAL AREAS, BY vJEEKS - 1958
__Page 2
'lfJee1c End1. ng
II July
Aug.
I
26 - 2
'
Aug. I
9
June I
I 1
June
June
7 i 14 ---21
June
28
i I I 1 I July 5
July July July
12 1
--~2
I I
26
Aug.
2 ' ~-
Aug. _9__
EGGS SET - THOUSANDS
CHICKS PLACED - THOUSANDS
I 1,62~.
i 1,153
I 1,390
2,237
h2 8
1,928
2,276
2,871
I
2,487 387
3, 331
519
8 ~ 040
395 3, 350 2,473 3 ,L~81
462
I 2,781
475 382 1,420
~
43,890
37,986
i 116
1,558 1,554
1,211 1,202
1,255 1,257
697-lt-
735J,t-
1,280 1,320
916 1,010
2,204 2,041
1,031 1,106
323
301
221
215
1,836 1,700
778
852
2,152 2,057
2,232 2,196
2' 7L~6 2,683
1,945 2,014
2,400 2,259
1,555 1,524
371
361
651
688
3,333 498
7,874
3,272
. 2,951 2,889
l.t74 7,43 8
1
__
426-l:_L_21~
--
404J,tL_ 063
365 373 --~---
241
338
3,214 3,109
3,213 3,251
2,349 2,368
2,073 2, 08QJ,:-
3,310 l.t43
3,344
4J~.
I
3,433 518-Y.-
3,401 505
2,754 2, 6') 7
2,924 2,829
466 313 1,290
488 269
-1,203
i 431 200
- 1,114
453 185 1,120
42,334 41,002 I 35,972J,:- 36,o6o-::-
36,684 36,069
29,27h 29,328
115
114
123
123
1,220 1,234 1,184 1,217 1,181
760
670J,t- 694J,t- 721
635
1,005 1,008 932
890 1,038
1,143 1,160 1,023 1,075
949
172J,t- 191 191
154
163
861
849 791
719
739
2,084 2,056 2,275 2,058 2,173
1,944 1,987 1,863 1,902 1,829
1,612 1,630 1,476 1,542 1,481
619
579 678
660
653
2,947 2,889 2,876 2,769 2, 711
36H:- 417 386
389
376
7' ~2-L __~J?.78 ~~~72~~86~.z..2~2..
282
260 272
221
240
3,310 3,251 3,166 2,958 2,853
2,035 2,113 2,1L6 2,124 2,037
3,347 3,199 3,096 3,063 3,137
522J,~
46Lr:- 413
h60
474
3,015 2,969 2,811 2,593 2,401
394
365 339
442
381
216
204 212
173
199
1,203 1,1!~2 1, 1!~ 7 1,160 1,093
1,157 592 952 959 147 769
1,928 1,886 1,391
657 2,699
397 6,204
219 2,955 2,037 3,074
456 2,406
420 171
1,08-1 -
1,155 548 953 903 156 704
1,935 1,831 1,361
624 2,655
349 6,018
233 2,800 2,041 2,979
438 2,353
313 156 1,134
36, 205J,~ 35' 5l5J,t- 34' 744-Y.- 34,159 33,083 32,557 31,639
29,784 29,256 29,277 29,432 28,740 28,388 27,510
122
121 119
116
115 115
115
1,142 586 895 993 179 755
1,929 1,705 1,329
669 2,660
366 5,819
224 2,748 1,910 3,014
443 2,283
388 179 1,049
31,265
27,055
116
UNIVERSI TY Of C:EO R lA
UNITED STATES DEPARTMENT OF
AGRlCUL TURE
C3TojJ
UNIVERSITY OF GEORGIA COLLEGE OF AGRICULTURE
Ath zns , G ~o.r gia
AUG 22'58
. '
J'..ug.ust 19, ' 1958
Pullet Chicks for Broiler Hatch~ry 3upply .::-~locks July 1958-- Unite d States
The indicated placement of pullet chicks for broiler hatchery supply flock s by 10 of the lar~est primary b re z der s oi ::;r ailer r e placeme :;:'lt otock totale d 3, 054,000 chicks dt~ring July. Thi s was 82 percent more than in Jl-!ly 1957. ::.=ullet chick p1acenl'ents b y the 10 o ree .le rs during th..:: first seven month s of 1958 totale d 20, 757, 000 -- 29 percen t mor e than during the s ame period. of 1957.
The totals includ.~ p ullet ch tc k s sol d J.uring th3 month, plL1s the :num oer of pullet chicks e z pected from egg s sold during the prec:~ding mo ~'l.th . The con- version from egg s to e x pect e d pullet chicles was made on the basis of 125 pullet. chicks per case of hatchi ng eggs solJ.. The primary oree .:..e rs included in this report acco u!1t for a very large percentag e of total supply of replacement pull ets for ;nailer hatchery supply flocks. Sales of replaceme nt p ullets by these breeders provide an indication of the potential number of pullets available for addition to hatchery egg supply flo ck s ce veral mon ths before the pullets will actually mo ve into the flocks.
Pullet Chicks 1/ P lacements for B ro i ler I~atche r y 3upp1y ..?locks (Reported oy 10 leading breeders)
Month
1956
1,000 chicks
1'957
1, 000 chicks
1958
1, 000 chicks
1958 as percent of 19 57
percent
January............. : .le bruary ............ : March .......... . . . . April .. .. .... ....... : May................. : June ................ : July................ : August ... , .......... : Septemb 3 r ..... ...... : October ............. : November ........... : December ... .. ...... :
Annual Total.., .... :
1, 912 2, 187 .2, 866 .
2.996 2, 854 2,298 1, 778 l, 884 l, 864 1,922 1,900 l, 787 26,24 8
1, 886
. 1, 997 2, 538 3,033 2, 899 2,060 1,676 l, 410 1,935 2,297 1, 926 2,232
25, 895
1, 982 2,270 3, 118 3, 320 3,623 3,390 5,054
! . " 105 114
... " 123
10.9 125 165 182
1/ IncludeD expected pullet replacenicnt... from e g gs sold .:i uring ti'l.e preceding month at the rat e of 125 pullet chicks per case of eggs.
A RCHLS LANGLEY Agric ultural 3tatistician In Charge
V\1 . A . WAGNER l~ gricultural Stati.sticiah
CHICKENS TESTED
In Georgia 253, 865 chickens which supply broiler hatching eggs were tested for pullorum disease during July 1958-'- 25 percent more than in July 1957. Testings of Egg Type chickens for July were 30, 299--75 p e rcent more than in July last year.
In the States for which comparisons are available, l, 634, 200 chickens for supplying broiler hatchery eggs were tested in July for pullorum disease--an increase of 25 percent from July 1957. The number of chickens for other purposes tested in July totaled 499,638, up 37 percent from July 1957.
This report is made possible through the cooperation of the National Pou1trl Improvement Plan, offidal State agencies, the Animal Husbandry Division, Agricult Lcral Research Service and the Agricultural Estimates Division, Agricultural Marketing Service.
Georgia - Chickens Tested ble. Of~icial State Agencies
Month
For Broiler Production
By Months 1957-58 1958-59
Cumulative 1957-58 1958-59
Egg Type Chickens
By Months
1957-58
1958-59
July Aug. Sept. Oct. Nov. Dec. Jan. ..reb. Mar. Apr. May
~une
: 202, 194 : 230, 292 : 334, 522 : 306, 795 : 254, 554 : 252,517 : 41 4: ,416 :275,750
255, 111 211,093 254,024 185;343
253, S65
202, 194 432,486 767,008 1, 073, 803 1, 328, 357 1, 580,874 l, 995, 290 2,271,040 2., 526, 121 2,737,244 2,991,268 3,176,611
253,865
17,274 '-1:7,736 18,286 27,242
8,325 14 , 836 61,618 13,675 12,086 57,426 10, 849 17,445
30,299
United States - Chickens Tested by Official State Agencies
M O!lth
For Broiler Production by Months!}
1957-58
1958-59
For Egg Type Chickens by Months 2/
1957-58
1958-59
July Aug. Sept. Oct. Nov. Dec. Jan. Feb. Mar. April May June
1, 310, 378 1,600,894 2,312,985 2,733,091 2,231,436 2, 211, 202 2,018,172 1,288,985 1, 590,296 1, 701, 433 1, 554, 780 1, 316, 555
1,634,200
363,753 657,950 1, 158, 163 2,197,457 2,221,828
2, 29?' 113 l, 605, 115
397,812 455, 554 239,840 246,376 285,073
499,638
1/ All States e J'cept Mont., N. Mex ., Ariz., Nev. 2/ All States e x cept Ohio, Iowa, Del.., Okla., Mont., N. Me ~:. , Ariz., Nev.
(.'' _ . l
f ..... .
..,. Vi
UNIVERSITY OF GE'ORGIA
I '{'(/) ~lE(Q)~GllA C~(Q) Q ~~~~
l(j
../
AUNGIRVIECRU~LITTUYROAFL
EXTENSION SERVICE GEORG lA A NO THE
STATE DEPARTMENT OF AGRICULTURE
LI,BP lA. R~J-~.~ , . ,
BROILER CHICK REPORT FOR GEORGIA
U.S . OEPAi'?TMEN1' OF AGRICULTURE AGRICULTUHAL MARKETING SERVICE 319 EXTE NSION ElLDG . , J:\THENS, GA.
August 20,1958
ATHENS, Ga., August 20--A total of 5,718,000 broiler chicks Here placed with producers in Georgia during the Heek ending August 16 according to the Georgia Crop Reporting Servic e . This compares tvivh the 5,819,000 t;;lliaced the previous Heek and is on~ percent more than the 5, 644,000 placed the same week last year.
Eggs set by Georgi a hatcheries amounted to 7, 032,000 compared with 7,438,000 the previous t.Jeek and is four percent less than the 1,350)000 for the corresponding week last year.
Hatcheries reported prices paid for hatching eggs during the Heek at an
average of 68 cents per dozen. Average price charged by hatcheries for the chicks m1s reported at ~~10. 75 per hundred. These prices compare W:. th 70 cents and ~~11. 00 last \.Jeek and with 67 cents and ~~11. 75 one year ago. 5:gg prices shown relate to
Georgia produced hatching eggs Hhether bought on cont:cact or other~Tise.
\veighted average prices from the Federal...State 11&.rket Nsvrs Service for brvilers dur~ng the week ending August 16 are as follows: Georgia broilers 2 J/43 1/2 pounds, at farms 17. OLJ.; FOB plants 18 . 00.
(See reverse side for other states)
GEORGIA CHICK PLACill"IEi'.JT BY 1rJEEKS
--
- - -- - ~~ 14 -Tit~OUGH AUGUST 1-6
VJeek Ending
--
EGGS SET];,/
--- -1957
1958
-
Thousands
I 1958 % of 1957
Percent I
CHICKS PLACED FOR BROILERS
1957
1958
Thousands
I 1958 %
-- - of 1957
Percent
June lL~
7 , 8 60
9,360
119
6,169 7,063
114 .
June 21
7,772
9,082
117
6,137 7,153
117
June 28
7,557
8,658
115
6,144 6,878
112
July 5
7,300
8,574
117
6,094 6,724
110
July 12
7,539
8,531
113
6,075 6,869
113
July 19
7,856
8,348
106
6,024 6,340
105
July 26 Aug. 2
7,837
8,040
103
7,405
7,874
106
5,944 6,204
104
5,957 6,018
101
Aug. 9
7,473
7,438
100
5,799 5,819
100
Aug. 16
7,350
7,032
96
5,644 5,718
101
-
-
1/Inc1udes eggs set by hatcheries producing chicks for hatchery supply flocks.
ARCHIE LANGLEY Agricultural Statistician In Charge
U . A. vTAGNER Agricultural Statistician
After Five Days Return to United States Department of Agriculture
Acricultural Marketing Service 319 Extension Building Athens, Georgia OFFICIAL BUSINESS
Penalty For Private Use To Avoid Payment of Postage, ~?300
STATE
Maine Connecticut Pennsylvania Indiana Illinois Missouri Delaware :Naryland Virginia vJest Virginia North Carolina South Carolina GEORGIA
Florida Alabama Mississippi Arkansas Louisiana Texas 1rJashington Oregon California
~
TOTAL 1958
TOTAL 1957
1958 %of 1957
~~Revlsed
---- --- - - - - - - - - --- - - E'-'GGS
s.1w''1' AND CHIC:KS PL.l\.CED ~~-
I E C 0~~~1ETICI.AL AP.E.AS.
DY IJEEK.S
-
1958
Page 2 - ----~
t'ieek Ending
. Aug. Aug.
2
9
Aug.
16
I
-
E_GGS SET - THOUSANDS .
1,558 1,554
1,255 1,257
,1,280 1,320
' 2,204 2,041
323
301
1,836 1, 700
2,152 2,057
2,746 2,683
2,400 2,259
371
361
3,333 3,272
498
1.~74
7,874 365
-
7,438 373
3,214 3,109
2,349 2,368
3,310 3,344
443
434
2,754 2,697
466
488
313
269
1,290 1,203
'
1,423 1,161 1,290 1,952
353 1, 70h 2,038 2,578 2,155
344 3,163
451 7,032
339 3,045 2,303 3,172
39h 2, 600
402 298
-1,274
I
-
J
une
14
-June
21
June I July .
28
5 1
----~------~-----~--~
--~------r-----~-----------------~
July
July
July Aug.
Aug.
Aug.
12
19
26
2
9
16
+:-~~~* I!
1,220
::010 II
i 1,106
760 1,005 1,143
CHICKS PLACED - TIIOUSANDS
1,234
67~~
1,008 1,160
1,184
694~~
932 1,023
1,217
721 890 1,075
1,181
635 1,038
949
1,157 592 952 959
1,155 548
953 903
1,142
586 895 993
1,180
603 924 880
I 215
I
I
852
172~~
191
191
861
8it9
791
154 719
163 739
11~7
156
769 704
179 755
210 728
2,196 2,084 2,056 2,275 2,058 2,173 1,928 1,935 1,929 1,907
2,014 1,944 1,987 1,863 1,902 1,829 1,886 1,831 1,705 1,741
1,524 1,612 1,630 1,476 1,542 1,481 1,391 1,361 1,329 1,374
688
619
579
678
660
653
657
62l~
669
649
2,889 2,947 2,889 2,876 2,769 2,711 2,699 2,655 2,660 2,493
404~~
361~-
417
386
389
376
397 349
366
363
- -- -- 7,063 7,153 6,878 6, 724 6,869 6,340
~- 338 ---~2-82---~~-2-60------2-72------2-2-1
240
6,204 6,018 219 233
5,819 224
5,718 192
3,251 3,310 3,251 3,166 2,958 2,853 2,955 2,800 2,7h8 2, 753
2, 08~~ 2,035 2,113 2,145 2,124 2,037 2,037 2,041 1,910 1,813
3,401 3,347 3,199 3,096 3,063 3,137 3,074 2,979 3,014 2,778
505
522-r~
46Lt3<
413
460
474
456 438
443
392
2,829 3,015 2,969 2,811 2,593 2,401 2,406 2,353 2,283 2,196
453
394
365
389
442
381
420 313
388
374
185
216
204
212
173
199
171 156
179
205
- - 1,120 1,203 1,142 1,147 1,160 1,093 1,081 1,134 1,049
953
42,334 41,002 39,521
36,06~;. 36,205~~ 35,515* 34, 744~~ 34,159 33,083 32,557 31,639 31,265 30,426
36,684 36,069 35,747
29,328 29,784 29,256 29,277 29,432 28,740 28,388 27,510 27,055 26,625
115
- 114
111
123
122
121
119
116
115
115 115
ll6
114
'lvttoD'l
'f:Jflr-3 J,
lGIE QJ lRi cG ITA
ClR{ (Q) JP>
ffiiiEJP> : lFRTIT NlG
SIE:ffiiVITClE
/Cf AGRICULTURAL EXTENSION SEHVICE
UNIVER31TY OF GEORG iA AND i 'HE
STATE DEPARTMENT OF- AGRICULTUR E:
.:
U .S. DEPARTMENT OF AGR!~ULTU~E
AGR IC.'il.'\"UP..4l. MAR KETING SERVI'-E 3~9 E X i'Ei'-LSioN B LDG., ATI'IE :-15, GA.
Athens, Georgia
September 2, 1958
TURKEY PRODUCTION D~J
G~orgia: The 1958 turkey production in Georgia is expected to be 16 percent less than in 1957. Total production is estimated at 287,000 birds com-
pared with 342,000 for last year. Heavy breed turkeys amou.rited to 286,000 birds and light breed to 1,000 birds.
United States: Farmers in the United States are raising about 78 million turkeys
this year:... 4 percent less t han in 1957, according to a preliminary estimate of the Crop Reporting Board. About 3 percent less heavy breeds and 9 percent less light breed turkeys are being raised this year.
Heavy breed turkeys raised total 65,776,000 compared with 67,833,000 raised
in 19sr:--Decreases were 19 percent in the South Atlantic, 18 percent in the . North Atlantic and 10 percent in the South Central States. These decreases wer~
partially offset by an incrG ase of 4 percent in the West North Cffi1tral States.
The nwnber of heavy breed ::,,_1..:-l:eys raised i.s about the same as a year ago in the
East North Central and in the We st.
Light breed turkeys raised total 12,129,000, down 9 percent from last year~ Decreases-occurred in all regions except the West North Central. Light breeds are 16 percent of the total raised this year, the sa:.1e percentage as last year.
Turkeys raised during 1958 are from poults hatched September 1957 through August 1958. The turkey hatch January through May was 10 percent -below last yearo
Hatch during June was 4 percent above June 1957 and July hatch was one third larger than the previous year. Eggs in incubators August 1 were 37 percent above
a year earlier.
Prices received by farmers for turkeys :rvlarch through July averaged 9 percent above the same months in 1957, while feed prices avere.ged 1 percent higher.
In this report, light breed turkeys inciude Beltsville small white, Jersey Buff, Royal Palm . and wild turkeys. Heavy breed turkeys include Heavy White, Bronze and other heavy breeds.
CARL O. DOESCHER Agricultural Statistician
ARCt.riE LANGLEY Agr~cultural Statistician In Charge
...... .
UNI V<.,::> .. 1 Of GEOR'GfA
. SEP 4 !58
LIBRARIES
- - state :: - - - - - -T-urk- e-ys-: - N-um-be-r -Ra-is-ed- o-n. -Fa-rm-s - -. - - - - - -. . - - - -
ans :- -Hea'Vy-br~eds - - 7 - -Light -breeds - -:- - .- Total all breeds- - - 0
Di"iision:- - _- - - :-; - - - - -; - - - - -:- .- - - -:- - - - : - - - - : as 19~8-
: 1957 : 1958 : 1957 : 1958 : 1957 : 1958 :%of 1957
- - - - - - - T'Fiou s: - - Theus .- - 'Theus.-- -T'Fious:- - 'Thous .- - T'Fiou s: - Percent -
Maine
121
l 09 .
7
4
128
113
88
N. H.
130
131
2
2
1 32
133 101
Vt.
108 .
71
2
l
110
72
65
Ha ss.
534
462
8
10
.542
472
87
R. I.
37
27
2
1
39
28
72
Co~D .
251
219
11
6
262
22_5
86
N. Y.
70 9
611
30
10
739
621
8 L~
N. J .
. -191
162
23
9
214
171
80
Pa.
. 1,.578 . 1, 213
197 . 154 1, 77.5 1, 367
77
N.Ati.-.- - -3~639- - ~ 3,oo~ --- 2 82 - - - -197- - - 3~ 941-- 3 ,202-- - 81 - -
Ohio- - - - -:-2-;3'D3- - - 2 ,4o4 - - - o4o- - - - 659- - - 3-;003- - 3 , 063 - - Io2 --
Ind.
2,1.50
2, 315
.5 20
!~.62
2, 670 2, 777
104
Ill.
1,209
968
63
113 1,272 1,081
8.5
Hich.
1,076
. 894
296
149 1,372 1,043
76
viis ..
2, 442
2, 629 . 203
122 2, 645 2, 7.51 104
E. N.'Cent: - - 9-;240--:- - 9 ,215--1,722- - -1~SOs- - Io~ 9o2- -10,71~-- - 9"8 - -
Ihnn: - - - -:8-;652- - - 9 ,123 - - I,29o - - -1-;2I ) - - 9~942- -15 ,345- - I o4 - -
Iowa
5, 810
.5 , 866
490
875 6, 300 6,741 107
I-1o..
3, 0.53
3, 038
110
188 3,163 3,226 102
H. Dak.
1/
1/
1/
1/ .
642
706 110
s. Dak.
I/
I/
I/
I/
681 . 667
98
Nebr.
E46
1,032
ol
20
907 1, 0.52 116
w.IT .cent:-- Kan s.
77.5
712
66
36
841
748
89
2o-;32 2-- -~2I,57'b -- 2,1.54 - - -2-;454- - 22-;476- -23,48'0-- Io4--
Dei.----- -113-:- ~ - - I o"B - - - ~ 43 --- - 39r - - -~6--- 5o5 - -~- - 77 - -
Hd.
294
237
.182
8.2
476
319 . 67
Va .
. 2,682
2,003
4, !~31J
4, L!.O,l
7,116 - 6~4b4
90
W. Va .
576
486
955
968 1,53+ 1, 4.54
9.5
N. C.
1, 734
1, .551
92
184 1, 826 1, 73.5
9.5
s ..c.
1,118
881
74
2.5 ' 1,192 906
76
, Ga .
33.5 . . 286
7
l
342 . 287
84
-su-- Fl a .
182
16.5
137
90
319
2.5.5
00
5.Ati.- ~- -7-;034- - 7 5 , 717 ~- ti, 424 - - -6~148- ~ 13~458- -1I; B65 - -
Ry: -- - - - -304- - - - 31+3- - - - 18 - - - - 24- .- - - 322- - _- ]6( - - 114--
Tenn .
1 81
170
16
17
197 187 . 9.5
Ala.
130
203
84
103
214
306 143
!1is s .
1 79
17 9
4
20
183
199 109
Ar k.
2,057
2, 033
348
348 2,405 2,381
99
La .
76
. . 42
3
0,
79
42
53
Okla .
866
873
2oo
182 1, 066 1,oss
99
Texa s
4, 210
3, 368
.5.5 9
~.00
4, 769 3, 768
79
&.cent:--- - b,oo3- - - 7,211-- 1,232- - -r;o94- - - 9-;235""' - "8 ,3o5"-- -9'0--
Mont: - - - - - 46- - - - -19 - - - - 7 - - - - -1- - - - ~3- - - _ 20 - - -3'8 - -
Idaho
177
124
29
20
206
144
70
Wyo .
.5
6
1
6
6 100
Colo.
1,160
1,242
24
13 1,184 1, 25.5 106
N. Hex.
76
69
3
6
79
75
9.5
Ar i z .
108
100
1
109
100
92
Utah
2, 480
2, 707
185
198 2, 665 2,90.5 109
Nev.
6
2
6
2
33
Wash .
648
.50 8
21
7
669
.51.5
77
Oreg .
1,2 76
1, 391
195
139 1,471 1,530 104
.=t:z,.251: : Calif .
13, 593 13, 389
!:!e~t~ : : : '!9~S1S: :
1,073
397 14, 666 13, 786
94
~,z32: : : :1~1= : 11~:g4: :22,13~ : : :9~::
u. s.
67,833 65,776 13,353 12,129 81,186 77,90.5
96
3
~ Ill.$$ AGRICULTURAL EXTENSION SERVICE
r-t UNIVERSITY OF GEORGIA AND THE STATE DPARTMENT OF AGRICULTURE
BROILER CHICK REPORT FOR GEORGIA
SEP 5 '58
li 8 RMIIS
U.S. DEPARTMENT OF AGRICULTURE AGRICULTURAL MARKETING SERVICE 31~ EXTENSION BLDG., ATHENS, GA.
September 3, 1958
ATHENS, GA., September 3-A total of 5,093,000 broiler chicks were placed
with pro.ducers in Georgia during the week ending August 30, according to .t.he Georgia erop Reporting Service. This compares with the 5,360,000 placed the
previous week and is siX percent less than the 5,424,000 placed the same week last year.
Eggs ~et by Georgia hatcheries amounted to 6,553,000 compared with
6,758,000 .the previous week and is two percent l~ss than the 6,689,000 for the corresponding week last year.
Hatcheries reported prices paid for hatching ~ggs during the week at an average of 66 cents per dozen. Average price charged by hatcheries for the chicks was reported at ;;~10.50 per hundred. These prj.ces compare with 67 cents
and ~~10.50 last week and with 69 cents and [:~12.00 one year ago. Egg prices
shown relate to Georgia produced hatching eggs Whether bought on contract or
otherwise.
Weighted average prices from the Federal-State Market Nel'7S Service for
broilers during the week ending August 30 are as follows: Georgia broilers 2 3/4 3 3/4 pounds, at farms 15.82; FOB plants 16.89.
(See reverse side for other states)
--'ltleek Ending
GEORGIA CHICK PLACEMENT BY vJEEKS
JUNE 28 THROUGH AUGU-ST 30
EGGS SET ];,/
CHICKS PlACED FOR BROILERS
1957
1958 o1f951~9_5~ - 1951
1956
1958 %
of 1957
Thousands
Percent
Thousands
Percent
June 28
July 5
July 12
July 19 July 26
Aug. 2 Aug. 9 Aug. 16
Aug. 23
Aug. 30
1,551
6,658
115
7,300
8,574
117
1,539
6,531
113
7,856
8,348
106
7,837
8,040
103
7,405
7,874
106
7,473
7~438
100
7,350
7,032
96
6,726
6, 758
100
6,689 . 6,553
98
6,144 6,878
112
6,094 6,724
110
6,015 6,869
113
6,024 6,340
105
5,944 6,204
104
5,957 6-r<>lB
101
5,199 5,619
100
5,644 5,718
101
5,507 5,360
91
5,424 5,093
94
17Includes eggs set by hatcheries produc1ng chicks for hatcher.y supply flocks.
. ARCHIE LANGLEY Agricultural Statistician In .Charge
W. A. ~vAGNER
Agricultural Stat.istician
-------------~-
EGGS SET AND CHICKS PlACED IN CO!-'IMERCIAL AREAS, BY lrJEEKS - 19.58
Pap:e 2
--~==~==~-=~----~~~~-----------
Week Ending
STATE
3 I+---A-1-u6g-. -~--A-2-u3g-. -+--A-Ju-Og-.
.'1. J~B 1 Jul~ ,Ju~ J~~ I Ju~~~u~, Au~, A~. A~g.,l Aug.
-~--------------------------~~~~----~--~----~-------L----~~--~3~0-
EGGS SET - 'niOUSAND!J
CHICKS PLACED - THOUSANDS
--- --------------------------------------- -------------~~----~ ~ ------.~. ---------*--~~--------
I Maine
1,423 1,630_ 1,366
1,234 1,184 1,217 1,181 1,157
1,155
1,142
1,180
1,124
1,071
Connecticut
1,161 1,168 1,144
67~:-
694*
721
635
592
5~. 8
586
603
657
623
Pennsyhrania Indiana
1,290 1,350 1,259
1,008
932
890 1,038
952
953
895
924
827
940
1,952 1,805 - 1,806 I 1,160 1,023 1,075
949
959
903
993
880
851
886
I1linoj_s
353 . 286
299 '
l91
191
154
163 147 : 156
179 . : 210
194
180
lvJissouri
l,704 . 1,536- 1,-464
849
791
719
739
769 704
755
728
671
643
Delav1are
2,038 1,960 1,800
2,056 2,275 2,058 2,173 1,928 1,935 1,929 1,907 1,618 1, 759
Maryland
1 2,578 2,510 2,519
1,987 1,863 1,902 1,829 1,886 1,831 1,705 1,741 1,796 1,798
Virginia ~vest Virginia
21 155 2,098 1,986
344
320
337
1,630 1,476 1,542., 1,481 1,391::' .'". 1,361 1,329
579
678
660 : 653 657
624
669
1,374 649
1,301 652
1,163 639
North Carolina
South Carolina GEORGIA
3,163
~-51
7,032
3,076
439 6,758
2,974
409 6,553
2,889 2,876 2, 769 417 386 .~- . 389
6,87~ ... 6,724 6,869
2, 711
376 6,340
2,699 2,655 2,660
' 39'7 - 349
366
6,204 6,018 .:.5,819
2,493
363 5,718
2,478
346 5,360
2,395 337
5,093
-F-lo-r-id-a--------#--~3~89----~3-7-3-----12-3--~~-----2~60-----272
Alab3IIla Jlti.s;:3 i s s i p p i
3,0~5
2.,303
3,019 2,865 2,175 2,111
I 3,2$1 2,113
3,166 2,145
221 2,958 2,124
240
219
2,853 2,955
2,0.37 2,037
. 233 2,800 2,041
~22-4------1-9-2 ------20-0------1-7-1
2,71.~8
2,753
2, 571 2,417
1,910 1,813 1,695 1,649
Arkansas
3,172 3,103 3,049
3,199 3,096 3,063 3,137 3,074 2, 979 3,014 2,778 2,816 2,587
IJouisiana Texas
394 . 407
392 1
2;600 2,465 2,~~87
~64~!-
413
2,969 2,811
460
474
456
2,593 : :.2,401 . 2,406
438 2,353
443 2,283
392 2,196
457 1,948
373 1,869
'\Aiashington
Or~on
402 . 422
363
298 353
330
365
201~
389 442 ' 3,Bl :1, 420
212
173
199. ' 171
313 156
388 179
374 205
359
344
165
125
_ _ _ _ _ _ _ Californ:i..a
1,274 1,323
----------r-~-----.....,._---....,.._
1,192
1,142 1,147 1,160 1,093 1,081 1,134 1,049 .':
953
905
824
-++-_ _~---- ------~-------------4------------
TOTAL 1958
39,521 . 38,656 36,828
35,515* 34, 744* 34:.,15.9 .~: 33,083 32 , 557 31,639 . ;31,265 30,426 28,991 27,886
TOTAL 1957
35~ 747 35,151 34~445
29,256 29,277 29'.~4~ . ~: 28, 740 28,388 27,510 .. 27,055.. 26,625 25,934 25,490
1958 %of 1957
lll 110
107
121
119
ll6 : .: 115
115 - 115
116
114
112
109
*--R-e-v-is-e-d------~------------~ -------------~------------------------------------- ----------------------------------
(GJE(Q)~CGllA C~Or ~~JrllNG !E:~Vll<ClE
~ 1
AGRICULTURAL EXTENSION SERVICE
~
UNIVERSITY OF GEORGIA AND THE
STATE DEPARTMENT OF AGRICULT URE
SEP 1 7 '58
tJ. S. DEPA RTMENT OF .AGRICULTURE
AGRICULT URAL MARKETING SERV ICE 319 EXTENSION BLDG ., ATHE NS, GA.
Athens, Georgia
LI BRAR IES
Beptember ~' 1958
.
,_ r
. . : GEORGIA BROILERS- 1957 PRODUCTIONBY. COUNTIES '\ __...~~ :~ ~ : .. ~ -
'7c ~~..~~}~
~~::: ~~ ~..c-
~~..:~E.-:
,..: ' '" r'~~"->,:..;,..\')
:
1).
_'-'Y-
--<
J
'-.~ ~ These estimates include ail counties . {:""' ~: . .. ' ~
vdth a production of 800,000 or more birds,
. .. ... . .
.' Production for those counties in which l ess ' " ( J..... .... :;; ..,
than 800,000 b~rds were produ~ed are . included as other countl es .- These est:unates are based
' ~'-\1:.~' ..r~~~-< " .:::...._ l~}:.~ r
on information iurnished by Hatcherymen, Feed
Dealers, Processing Plants, Producers, County Agents and
other Agricultural tvorkers.
.. ..
Cherokee County ranked first with a production of 27,000,000 birds, f ollowed in order by Hall, Forsyth," 1r1hitfield, Jackson, Lumpkin, Pickens, Dawson, Franklin, and Hhite.
:, .
j
GEORGIA BROILERS 1957 PRODUCTION BY COUNTIES
GEORGIA
Above 20,000,000
I 1o- 15,ooo,ooo
I.. -:.. .... -.:.
.-: .
5 - 10,000,000
1-';X;.}/.\:.:::):/f. 800,000 - 5,000,000
ARCHIE LANGLEY.
'' . '
Agricultural Statistician In Charge
). 1
...
.\
H. A. \vAGNER Agricultural Statistician
0..
Moo1
1~~~ CGE(())~GllA~ CC~COJJP lP~JE~(Q)~lillWCG IE~VllCCIE
~ AGRICULTURAL EXTENSION SERVICE UNIVERSITY OF ,GEORGiA AND i HE STATE DEPARTMENT dF. AGR-ICUL.TU.RE
Athens;, G:~9l;'~ia . . . , _:. . ..
U.S . DEPARTMENT OF AGRICUL.TURE AGRICUL IU.RA L M~RK ETING SERVICE
3l9 EXTENSION SLbG., ATHENS , GA.
Septen~b.E;lr-; 8, 1958
. . "'' . '
~
. .'. ~'
'; : : . . ' :' : . : ( ' .~ ..; . ': ' : ..
i
:
1~TJi~ E.. N ,S,
GA .. ,
~
~ _ ...
: r. .
_ .
Septen1ber.. 8':"'-Prospect$. qn .S~p:teJ11ber . 1
. . , . . : .':' .., ::.. .. : --~ . :~ : ::-
poi?ted to .a ~ r.e9o.rd .J)i,gh ::
ppr yield of 386 pounds of lint cotto~
acre .this. year. ~ot,a.l. _ pr.oduction .is_,.. e~- '..!J'
pected to be 320,000 bales (500 pounds gross -vreight). Despite the record high
y:i.eld per acre, indicated production this year is 19 perc ent below the 1957 j!)roduet-i~.m of 396,000 bales anc;l is- 53 percent l e ss .than the- 10 ycar~ (l947-56) - .. "--
average of 681,000 bales. The decl~.ne in production is due to a sharp drop in
acreage of cotton for harvest, currently estimated at )9 0, 000. "Tnis is the
I
smalle st qCreage of record fo:c Ge or gi a -going back to 1~66 Hhil~ total production
.of lint is expected to be. .the lot--rest since 1868 vlhen 2~8,000 b?-les 1..rerfi) produ9E(~
:~ . . .
.
--
. '.
-
. ' .' ' . '
r
Weather conditions during August tv-ere generally favorable : for cotton and prospects . improved in most areas of the Stc::tte. Harvesting oper-ations made good
progress :tn southern districts the latter part of imgust and v1as well oodenray
by September 1 in all s ections except the .extreme norther.n counties. The.,qu.a.l:Lty __
"o:t __-c_otton harvested to date has been very good.
'
. . . ' ,~
.. ;.,
Final outturn of the crop, compared vlith this forecast, Hill depend on
whether or not the various factors affecting the cotton crop during the remainde:t- '
of the season are more or less favorable than usual.
.
.
'
..
.
. .
.
;. ' The Bureau of the Census reports 93,000 running bales ginned prior to '
September 1 compared with 11+8, 000 to that date in 1957 and 135,000 in ~956.
.,
'!'
....
ARCHIE LANGLEY
CARL o. DOESCHER : ..,
Agricultural Statistician In Charge
Agricultural Stati, s' t...c..r.a.r..t~
... .. GEO~GIA ~~~HONING INDICAT~PRODUCTION 1958 AND FINAL PRODUC'riON FOR ]:951 & 195.'6' .:
., '
. : . .... .
. , :.
19)8 production indicated on . . ..
7 \.
\
111999555687---412165,,'o00b00o~~\
.--N-~o.I...n...-...c. o.. .t.t.
r ..
I'"'I""(~
.
September l. '
. .:: ~ .-. STl\~E - : ~ ...... ~~ _:
1I99558'T--339260,000000 ..... .. . .. . .._.
\ . I I ROME
Jm~~~,ggg -. c . - . \
...
1956-36:000
ELBE~ON
1956 -579:ooti
:
... ~ .:: t '. ~
Districts" shown a:re "Crop .
Reporting Dist.r'icts ;~md NOT .;_
',
.
or
I
\
I
ATH.CNS 19.58-15, OQ_O
Congr essional Dis.triGts .
.
.., . - ~ r:: . . 1
. :.
l
...,.. . : .. .
C: vr~ -
t'. : : -~r
!.. .
58 6 ~~: -~- ,I0V~0 . .
V.
'
-
. - \ .. AUGUSTA \ .
~ i .. ;_~ .
'':.-
\ 1957-]9',000 \ 1956-6].,000 . _ HACON
jl 1958-65,000 i~~~=~~:ggg
COLUNBUS
--
1958- 52,000 ,.-
1957- 67,000 '' )
~v~")~~ 1956-109' 000
l
VII
)
ALBAN:')
lrl
. 1958-5o,ooo . 195755' 000 \
'\ 56-75,000
VIII
/
1958 - 72,000 \
1957 .. 90,000 ( 1956 -1os,ooo (
VALDOSTA \
~'J I X
;;
1958 - 13,000
1957 - 12,0~~
1956 - 16,oju
r-J9
--
I
\ )
\J
.'' UNITED STATES ... carTON REPORT AS OF SEPTEMBER 1, 1958
,.. ::' ~/ : .
. t ..
The Crop Reporting Board of the Agricultural Marketing Service makes the
following report from data furnished by crop correspondents, field stati'sticians, Bureau of the Census, Commodit,y Stabilization Service, and cooperating State agencies. The final outturn of cotton compared with this forecast will depend up~ whether ~he various . ~nfl.uences affecting the crop during the remainder of the season are mor~ or less favorable than usual.
State
i/ : . 19.58
Acreage
: . . Lj_nt yield per harvested acre
:
Production 2/
SOD-pound gross weight bales
-Ab-an-- -: ---~: ----: ----: ----: --~------------
doned after
: . For :1947~.56: :harvest:average:
1957
19.58 : ~947~.56 indic i average :
19.57
:July 1
:
:
:
:
19.58
. . indio
:
:
N, c...... :
s. c... :
1.8 2.2
9-a : 2.0
Tenn : 2.4
Ala : 1.1
. ~iss : 3.4
Mo : 2.6
Ark : 1.9
La .,. : 3.4 Okl"a:~.: . . :. .: .5~0
Texas :
:
4.8
ANr. ~.Mzex.::
3.3 2.0
Calif
'. Other . States
~ .
y..,!
.
2.1 5.5
. u. s .. ..... : .3.6
Amer.
Egypt, !!,/ : 4.0
acres
270 3.55 398 410 .544 1,14.5
300 1,030
37.5 420 .5,380
178 384 733
38
11,960
75.4
324 321 306 329 276 333 383 427 307 346 389 388
. 400 281 374 416 389 380 17.5 234 222 29.5
.573 619 777 1,037 714 1,035
300 316
317 388
426 48.5
382 379 386 .527 388 .503
.520 .527 .525 309 37.5
769 1,094 1,097
378
486
.534
441 628 681 .583 884 1,759
399 1,458
639 374 3,937
269 687
;1,~348
49
'14)136
231 344 396 . 41.5 .530 1,081
179 981 348 263 3,632
236 763 1,537
28
10,964
21.5 280 320 4.50 440 1,200
32.5 1,130
410 270 4,200
285 87.5 1,67.5
30
12;1o5
41.6
8le9 ' . ,. 87.9
y Preliminary
~/ Production ginned and to be ginned. A SOO-lb. bale contains about 480 net pounds of lint.
Virginia, Florida, Illinois, Kentucky and Nevada,
Included in State and United States totals. Grown in Texas, New l1exico, Arizona, and California.
CROP REPORTING. -BOARD
v
~; 1 GlEO~GllA CC~OlP' UNIVERSI y OF GEORGIA 1rllNCG SIE:~VllCIE
5
AGRICULTURAL EXTENSIQN SERVICE
, ~
UNIVERSITY OF' GEORGIA AND THE _STATE DEPARTMENT OF' AGRICULTURE
SEP 9- '58
U.S. DEPARTMENT OF' AGRICULTURE AGRICULTURAL MARKETING SERVICE 319 EXTENsiON BLDG ., ATHENS, GA
Athens, Georgia
LI BRARIES
.September B, 1958
FARN PRICE REPORT AS OF AUGUST 15, 1958
GEORGIAt The All Commodity Index of Pr:i.ces Received by Georgia farmers
increased one percent (three points) to 265 percent of its 1910-1914 average during the month ended August 15. Compared to the same date a year
ago, the current index is four percent (nine points) higher.
The All Crop Index increased three percent (seven points) to 280 percent of its 19.1D-1914 average. This is the highest level the index has attained since June 1956 when it was 284 percent of its 191D-1914 average
.The ~ivestock and Livestock Products Index declined two percent (four points) to 231 percent of i t s 191D-1914 average, Compared to a year ago, the current index is eight percent (17 points) higher. The principal contributors to the decline fran last month were lower prices for hogs, beef cattle, and chickens. A summary of these indexes with comparisons is shown on the reverse
side~
UNITED STATES: The Index of Prices Received by Fanners dropped one percent
(three points) to 251 percent of its 191D-14 average. Price declines were reported for most farm products. Principal e~~ceptions were higher
prices !or. cotton and seasonal increases for dairy products. At mid-August the index was nearly 2 percent above a year earlier
. The Index of Prices Paid by Farmers for Commodities and Services, including Interest, Taxes, and Farm \'Jage Rates (The Parity Index) declined a third of 1 percent during the month. Food price reductions led the mid-August downturn in prices of both family living and farm production items.
With both farm product prices and prices paid by farmers lower thar,t in midJuly the Parity Ratio far August remained unchanged at 83. This was 1 percent down from August of last year,
Swnrnary Table for the United States
. Index
2 August 15, July .lS,
August 15,
' 191D-14 100
1957
: 1928
1958
I
Prices Received
247
254
251
Parity Index !/
295
305
304
:__R_!C2r~ !!i_Bh_ : Index : Date
313 Feb.l951
3o6 y'Apr.l958
Parity Ratio
84
83
83
123 Oct.1946
y Prices Paid, Interest, Taxes, and 1rlage Rates based on data for the indicated y dates. Also May 1958. ,
ARCliiE LANGLEY gricultural Statistician In Charge
RAYMOND R. HANCOCK Agricultural Statistici an
' .
CO!ili.;ODITY J]ITD UNIT
PRic::; S W. G'E IVr: D BY .F~JiMC RS ".U%"ST 1 5 , 105.8~\'!='f;IT::..:H~CO~i~ vfr':..:.~R=ioS~O:t::N.~SL.----------
GG ORGI!.
l wcrc.ge 1 :> 10...14
J.ug., l 5 , 1 .Tuly 15, l.ug .15 l.voro.ge
1957
1958
1 958 19 C9-l4
""..ug .15, .Tu1y 1 5 L.ug .15
1957
1958
1958
Whe::-.t, Bu.
$
Corn, Bu.
O:'.ts, Bu.
$
Irish Pot. ,Crrt.
:Jwcet Pot. ,Cwt.
Cotton, Lb.
Cot tonseed, Ton
Hay ,1'111, (b a led )Ton ~
Hog s, p e r Cvrt.
$
Bee f Cat tle ,Cwt.
Ailk Cows , He ad
Chick ns ,J'J.1, Lb.
Egg s, Doz.
DuttGrfat, Lb.
-.1ilk (vrholcsa 1c) p or lOO;'f
1.23 .91 . 67
1.13 . 84 12.1 23.65
7.36 .3.96 33.85 13.3 21.4 25.8
2.43
1.91
1.90
1.36
1.54
.so
.81
2.80
2.95
I 5.50 I 5.45
I 33.6 3:~0
50. 00
23.6C 1 27.60
1 9 . 8 0 j- 21. 00
I 13.70 1a .4o
115 . 00 I 150.00
19 .4 41. 5
I 18 .5
.I 42.0
I 51.0
50.0
1/
t:.l
- 5.67
5.60
1.88 1
I
1.52
I
.85 I
I . .2~80
.sa
.64 .40 1.14
5 . oc
1.60
I 34.5
12.4
I 49 . 00 22.55
26. 00 1
l 21.40
7.27
I 18 .10
5.42
I 155.00
17 .o
48.00 11.4
42.0
21.5
50.0
26 .3
2/ - 5.70
1.60
1.90 :
1.64 1.64
1.23 .58
1.74 3.91 32.8 55 .70 18 .00 20.20 18.20 168 . 00 19 .5
58.9
1/
- 4 .18
1.18 1.18
.58
. 54
1.72 1.29
5.81 3.73
30.8 33.2
45.00 47.60
17.10 17.20
21.40 21.10
22.20 21.40
212 .oo 212.00
18 .7 17.4
35 .9 36.9
57.4 57.7
1/ /
3.87 4.07
Soybeans, Bu. 'canut s , Lb.
$
5.2
2.25
2.30
10.5
11.0
4.8
2.27 10 .7
2.11 2.ll
n.o
lL_Rc vi sod
2/ ? rcl "lmi--:.c.ry
JNIJJ:X NU,[BERS OF P RICE S F.!:::G'E IVED BY Fi.Pl.'IERS TIT Q!: ORGI!"
(.Tan~~ ry 1910 - Dc canbor 1914 = 1 00)
Lug .15, July 1 5 , ll.ug~l!3,,
1957
1958
1958
i.J.l Comnod i\tic s 1.11 Crops Grain s and Ho.y Cotton Lint ?canuts Tobacco Co t tonseed and Soyb o ~ns Irish i">ot:'.to e s, 3Yreetpo tato e s Fru its and Nuts
1:..11 Lb rc stock a nd Live stock i:'roducts r.,J.e:-.t lm:lrno.l s f oult r y and Eg(;s Do. ii"J Products
254
262
265
272
273
280
150
1 63
162
Z7 6
263
284
202
205
211
444
449
443
208
212
204
281
28 1
259
139
168
158
21 4
23 5
231
29 <;
354
349
140
148
lLIO
228
226
228
Pl ICES ?LID BY FLRti!::RS FOR SELEC'l.'ED FEE DS 1.UGU3T l5, 1958 WI TH COHi' ...RISON S_!/
:rmm OF FEED
GE ORGIA
Auf1 . 15, July 15,
1957
1958
l.uf!. . l5, l 958
U:HTED ST.LTE S
Lug . 15, July 15,
1957
1958
Lug . 15, 1958
Mixe d D::.iry Feed
l .ll Unde r 2CJ(.. Protein 1 6/~ Protu in 18)~ ? rotein 20io Prote in 24;~ ? :rot e in
3.90
3.8 5 4.05 4 .05 4.40
3.95 3.90 4.10 4 .10 4.45
Dollars Per 100 Pounds
4 . 00 3.90 4 .30 4 .15 4 .50
3.70 3.65 3.64 3.87 4.01
3 .69
3 . 63 3.61 3.96 4 .(]7
3.70 3.64 3.62 3.95 4. 07
Hi (. h Prote in Feeds Co t ton see d il-!cal Soybe~n Me al
Meet Scrap
3 .45 3.70 4 .60
3.95 4.C5
3.95 4 .15
3.78 3.8 '3 4.85
4.01 4.41 6 .21
4.08 4 .57
6.67
Grain By- Products l3ran
Mi d dlines Co rn Me:1l
3.30
3 .so
3.55
3.25 3.50 3.50
3.3 0 3.50 3.40
2.80 2.91 3.39
2 .74 2 . 94
3.38
2.71
2.88 3.39
?ou1try Fe ed
brOile r Grovri11g Ma sh i.ayin: J..1a sh Scratch Gr cins
5.oc
4.85
4.35
5 .20 4.90 4.40
5 .20 4 .95
4 .45
4.91 4.43 4. 03
5 .cs
4 . 56
4 . 01
5.11 4.58 4.00
~.J.:. .(Baled~ 1cl::. :J.1fo. .:-.11 Ot her
47.00 34.00
45.00 40 .00
40 .00 35 . 00
29. 00 Z7 .30
Z7 . 8 0 Z7 . 3 0
28.20
?7 .oo
----------------------------------------------------~------------------------
1/
""
"
'
As repo
-:=::::-
rted
--=
by Feed D
=-=--::.::
e.-:a::l::e::r:::s:=:::===
=
=
=
=
=
=
=
=
=
=
=
:
=
=
=
=
=
=
-
-
=
-
=
--
aI')
H 9~/)"
I -
' :~( (GJE(Q)~(GHA C~(Q)jp)_u:UNIV~ER ,:[~y ~~1rllNCG ~IE:~VllCCIE
:tl
1 AGRICULTURAL EXTENSION SERVICE
'I
UNIVERSITY OF GEORGIA AND THE
STATE DEPARTMENT OF AGRICULTURE
SP l 7'58
U.S. DEPARTMENT OF AGRICULTURE AGRICt.:L.T l.iRA L MARK'::TING SERVICE 319 EXTEN!JION BLCG., ATHENS, GA.
BROILER CHICK REPORT FOR GEORG:LA
LIBRARIES
September 10, 1958
. ATHENS, GA., September 10--A total of 4,879,000 broiler chicks were placed
Nith producers in Georgia during the t-leek e;.1ding September 6, according to the
Georgia Crop Reporting Serv:i.ce. This compares ~tith the 5,093,000 plac ed the
previous Heek and is seven percent less than the 5,269,000 placed the same week
last year,
- -
Eggs set by Georgia hatcheries maounted to 6,618,000 compared with 6, 553,000 the previo~s week and is two percent less than the 6, 739,000 for the corresponding week last year.
Hatcheries reported prices paid for hatching eggs during t..lJ.e tveek at an
average of 66 cents per dozen. Average price charged by hatcheries for the chicks was reported at ~~10.50 per hundred. These prices compare Hith 66 cents
and :;;ao.5o last week and wit.h 69 cents and ::~12.00 one year ago. Egg prices '
shotm relate to Georgia produced hatching eggs tvhether bought on contract or otherwise.
Heighted average prices from the Federal-State .r:Iarket Net-rs S.er..rice for broilers during the week ending September 6 are as follo~ts: Georgia broilers 2 3/4 - 3 3/4 pounds, at farms 15.55; FOB plants 16.49.
(See reverse side for other states)
GEORGIA CHICK PLACENENT BY ~'TEEKS
_.=;;_
,.
\rJeek
<),.FLY 5 THROUGH SEPT:EMBER 6
3GGS
SET
1/-----~--
==============~====
-CHICKS PLACED 'FOR BROILERS
Ending
1957
1958
19~o
of 1957
1957
1958
o1f951985%7
Thousands
Percent
Thousands
Percent
July 5
r July 12 July 19
7,300 8,574
117
6,094 6, 724
110
7,539 7,856
8,531 8,348
I 113
6 ,075
106
6 ,024
6,869 6,340
113 105
July 26
7,837 8,040
103
5,94h 6,204
104
I
Aug. 2 Aug. 9
7,405 7,874
106
7,473 7,438
100
5,957 6,018
101
5'799 5, 819
100
Aug. 16
7,350 7,032
96
5,64h 5, 718
101
Aug . 23
6, 726 6,758
100
5,507 5,360
97
Aug . 30
6,689 6,553
98
5 ,42L~
5,093
94
Sept. 6
6,739 6,618
98
5,269 4,879
93
- - -- ---- -1/
Includes
eggs
---
--- ---- !- -
set by hatcheries producing chicks
for
hatchery
supply
flocks.
ARCHIE LANGLEY .,.----...... Agricultural Statistician In Charge
~!. A. V.TAGNER Agricultural Statisticiar:-.
. .
..
'. ST..:ATE .
\.
..
.. ..
.
:
: '
Haine Connecticut Pennsylvania Indiana Illinois
Missouri Delaware
Maryland V_j,.rginia
\fest Virginia
North Carolina S.outh Carolina GEORGIA
Florida
Alabama Mississippi
Arkansas
l
Louisiana Texas
Washington Oregon
California
TOTAL 1958
TOTAL 1957
19$8 '%'Of 1957
* . Rev~sed
- .: EGGS 'SET AND CHICKS ..PI.ACED I N CJl.ll''lER"IJ'LAL AREAS t BY WE.'w~KS 1958
Week Ending
Aug
Aug. Bept.
23
30
6
-
EGGS SET - THOUSANDS
July . Huly
5
12
July
July
Aug.
19
26
2
CHICKS PlACED - THOUSANDS
Aug.
.. 9
Aug.
16
1,630 1,168 1,350 1,885
286 1,536 1,960 2,653* 2,098
320 3,076
439 6,758
373 3,019 2,175 3,103
407 2,465
422
353 1,323
1,366 1,144 1,259 1,806
299 1,464 1,800 2,519 1,986
331 2,974
409 6,553
323 2,865 2,111
3,049 392
2,287 363 330
1,192
1,353 1,209 1,048 1,785
290 1,367 1,876 2,544 1,942
295 2,957
471 6,618
364 2,955 2,141 2,837
362 1, 775
392 284 1,230
1,184
l 694* 932 1,023 191 791 2,275 1,953* 1,476 678 2,876 386 6, 724
272 3,166 2,145 3,096
413 2,811
380* 212
1,147
1,217 721 890
1,075 154 719
2,058 1,992* 1,542
660 2,769
389 6,869
221 2,958 2,124 3,063
460 2,593
442 173 1,160
1,181 635
1,038 949
174~~-
739 2,173 1,919* 1,481
653 2,711
376 6,340 - 240
2,853 2,037 3,137
474 2,401
381 199 1,093
1,157 592 952 959 173* 769
1,928 1,97trk 1,391
657 2,699
391
~,204
219 2,955 2,037 3,074
456 2,406
420 161* 1,081
1,155 1;142
548
551*
953
895
903
993
156 179
704
755
1,935 1,929
1,921* 1, 7951t-
1,361 1,329
624
669
2,655 349
..
.2,. '63.6606
6,018 5,819
233 . 22li
2,800 . 2,748
2,041 1,910
2,979 2,934*
438
443
2,353 2,283
313
388
156 . 179
1,090* 1,049
1,180 603 924 880 210 728
1,907 1,831* 1,374
649 2,493
363 5, 718
192 2,753 1,813 2, 778
392 2,196
374 205 97B*
pege 2
-- -
Aug.
Aug.
23
30
1,124 1,071
657
623
827
940
851
886
194
180
671
643
1,66B* 1,759
1,853* 1, 798
1,301 1,163
652 . 639
2,478 2,395
346
337
- - 5,360 200
5,093 171
2,571 2,417
1,695 1,649
2,816 2,587
457
373
1,948 1,869
359
344
165
125
905
824
1,022 600
936 870 226 628 1,483 1,930 1,188
537 2,337
275 4,879
202 2,)66 1,658 2,381
395 1,898
359 168 878
38,799* 36,828
35,151 34,445
110
107
36,095 33,989
106
34,825* 34,249* 33,184* 32,663* 31,685* 31,246-:!- 30,541* 29 ,09B*
29,277 29,432 28,740 28,388 27,510 27,055 26,625 25,934
119
116
115
115
115
115
115
112
i
-- -
I
/ ..
27,886 25,490
109
27,218 25,228
108
3/
GE((])~(GllA c~(Q)IP?IIR{l1? f~
i 58 A~~.r.:~~:T,~RAL. E"XTfNSI()N SERVICE . SEP 5 1
UNI'/ERSIT OF GEORG 1A AND THr::
_~-~A~E _DE.PARH1ENT or: AGRI~ULTU R E_
.
UBRA ~\~
AtJ'I'ens ;-' ~e orgi a
U.S. or::r.>ARTMENT OF AGRICUl,T!JR~ :i AGRICU L TURAL MA. P.KC:T!NG .~ 1:-;: RVI.CE,.~ 3l9 E >, 'TEi-lSI(;N BLDG., AT KENS . G~~. _ -..:
Se~tember 1~, '_1958.: ~~
. GENERAL CROP REPORT FOR GEORGIA AS OF SbPTE -'iBER 1, 1958
to ;;_ ~: i'he 1958 crop _year now seems certai.n be on,e 'of the best, if 1iot the .best.,
in Ge?igla history.. Record high ~delds per 'acre for all major fiel d crops anf. -. ;':
many JJUtlor crops have been obtained or were in prospect as of September 1. . AlJl~ng
the crops expected to shcxr record yields per acre f or this year are corn, c ci-tton ~
tobacco, . peanuts, wheat, all hay, soybeans, bar::.ey, and rye. Oats suffere::d .some
darnage _from the cold Hinter but ~vere exceptionally good in some parts of the
sta~(: ~r~d. . .. .. ~ : .
may equal
the
record .
high
jield
of
33.0
bushels
produced
in
1956
,;;The . most . significant aspects of the tveathe r during August were the unusually
faTorable weather the latter part of the month for harvesting cotton and peanuts; and the dry conditions that ~ cieveloped in much of the northern - ti-m-thirds of the .
statG . Late . corn, cotton, and pastures were suffering from lack of moisture in
this :.&... :re.a
by
the
end
of
J~u~ust .
- R.E,C.ORD. COR.N CROP:
Current indications po:!.nt to the largest c~op ever produ:.; ~S: d j_n Ge orgia. Total production is novr. estimated at'
81,33d;'odb bushels, an increase of slightly more than 10 million bushels from the
previous record crop produced last. year of 71,188,000 bushels. The yield per
acre of 30 .0 bushels will also be the highest of record, surpassing the previous
high of 26~ 0 ' bushels produced ' in 1957 by four bushels.
.: GOOD PEANUT CROP: Peanut production in Georgia this year is forecast at
:
573; 750,000 pounds, 24 percent above last year's relative-:-
ly short crop, and approximately two rrillion pounds above average . The yield per
acre promises to be a record high at 1125 pounds
. . .A:BOVE~GE p:gcAN CROP: Indications on September 1 pointed to a pecan ..
- ' '.
crop of 43,000,000 pounds compared with the io-
Y~.a~-- (1947-56) ~:verage production of 37,31.J.6,000 pounds and last year 1s ver.y. short
cr~P~. .f:.7, ).OQ, QOO pounc;is. The current forecast is 17 million pounds belo-vJ the
recot.d crop of 60 million pounds produced in 1956.
: ' LEAF PRODTIQ~BOVE~S-T-ITl\.Ji:_ The flue-cured tobacco- crop in Georgia;-.-- ' :_ currently estimated at 83,160,000 pounds,
is mor,e than eight percent larger than l?st year's. croP. ()f 6.1.,270,000 pounctfl .. _: Yiei& .:Per' acre estimated at 1520 pounds is a record hiGh, Hell above the 1957 . : .
yiEllO qf 1290 pounds and 55 pounds above the previous record yield of lh65 poul'lds
produ~ed in 1955.
:NILK PRODUCTION DOHN: !Iilk production in -Georgia during August is estimated.
. . :. . .
.
at 95 million pou.'1ds. 'l'his is a decrease of five per.:.
~ent . ~:r:om the 100 million pounds pro0ucec;i in July cf this yea,r and August p.f 19.5.7~
. . :: RECORD .EGG PRODUCTION: Georgia's egg- producticm.:curing August is estimate:d .. .
. at .J-09 .m~ll.i~n .eggs. . ';.hts ...i? ~ne rriJ_l;l.on more...than ..
a A. u. g.u. s..t:' .
y. e..ar.
ago
and
repres.erits
a
.h.~ .
i
g
'
h
-.
f. .o
r
.
t. h
e '
m.on.th. ,.
I ' 1
.Gft'OR.'GIA .. .
. . .
, ,
. .... -- ... ... : ..... - .. .
~~~C~Am ~~~R~RE-= I~AL PRODUCTION ~~N_Tl)OU~;)
CROP
l'ooo)
l' 1958
Al~yhe7r-ag56e :i -l951 __~-L: ~I9nd5i8c-~:1-t9:A4v7e-ra5g6e
i
: Indic.
: . l957 ' ]" i'9$8 '
I \ corn.
bu. 2,711 -1
fueat ~ . bu.
80
17.3 . 26.0 : 16.4 16.5
I 30.0 51,319 . 71~;1.88
23.0
2,174 1,848
8:J,.:330 1,840
Oats bu. Hay (all). ton
Tooacco(Type 14)lb.
315
27.8 . 28.0 : 33.0 ll,68h 11,032
569 I
68' 96: l. 04
695
550
58 !1,238 i,290 !1,520
122,566 81,270
10,395
-590
88,160
Potatoes ,Iri'sh,Cwt.
?otaj:,Qes,Swe~et,Cwt.
4.6 .l3
h6 : 49 ' 49 41 : 46 , . 48 .
320 1,198
254
2?5
644
624
Cotton. -.bales f~anuts(for piCl~.;; -: ipg...&..thr3sluing .)lb. Soybeans bu.
3.98_ ; J/2.76 . ,t/333 )/386 .
510
8L~5
910 !1,125
110
10.6 14.0 : 16.0
681
.396
571,760 !464,100
410 ~ 1,400
:_ 32Q '' --
573,750 1,760
?eaches,tot.crop,bu
2,420 2,100
4,200
?e ars, tot. crop, bu. ?ecans. ;11:>.
.
I1 169 37, 346
f a,s~t_~_e~-~~~%~----~~g/~7~3--~\_~~/~7_o_ _ _ _~~~~
86
98
7, 500 43,000
_______
1 Pounds . 2 Condition on September 1.
ARCHIE LANGLEY Agricultural Statistician In Charge
CARL 0 , DOESCHER Agricultural Statistician
tn{IT;ED STATES ~ GENERAL CROP REPORT AS OF SEPI'Er-'IB~ .1,192_8 =
..
Present estimates show a continuing inQrease in crop J,.oduction w~ch ~ total far exceeds anything yet reached by American agriculture~ Late ' inatur.1ng crops generally developed fa~orably during August even though he~t and drought invaded parts of the li'Jest and cool, dry periods retarded maturity of some c;rop~ :
in some North Central sections.
CORN: The production of ail corn is forecast at a near record 3,589 million
.
. bushels, up 3 percent from the August forecast, 5 percent above last
year and 14 percent' abb'Ve average. Corn crop prospects continued to iiJ:lprove .
during Augtist in nearly all areas in response to near normal temperatures and
generally adequate soil moisture.
SO~EANS: Production of soybeans, based on September 1 conditions, is
estimated at 561 million bushels. This is nearly 5 percent above
the forecast a month ago and exceeds the previous record of 480 million bushels
harvested in 1957 by .l7 percent. The 10-year average production is 296 million bushels. The large crop . is the result of both record yields and the highest planted acreage _af ~ecord.
PEANUTS: Production of pea~uts for picking and threshing is estimated at 1, 797 million pounds, up about 8 percent from .August 1 forecast.
At this level, the crop is 24 percent greater than last year, 5 percent above
the 10-year average and tm largest since 1950 when 2, 035 million pounds were produced. The estimated yield at 1,171 pounds per acre is 10 pounds above the
previous record set in 1956.
PECANS: Production of pecans is forecast at 173 million pounds--23 .percent above last year and 17 percent above average. Production in
Louisiana and Oklahoma is expected to be greater than estimated on August 1. How-ever, prospects in Mississippi are not as high as a month ago and in Texas the crop appears to be considerably smaller than estimated on August 1.
PEANUTS PICKED AND THRESHED
5 - - - - - ~------ -Yieid-:Per-Acre- . .- ~ .- - - .... - - -Pro'duetion- ... :---
state
Average - -: - .r!.- ,.. ~:tiiaicated- - Average-- - - . ; - - -Indicated
== . . - - . . = =. 1947--56 . .19;)7. . .. .1958 .
- - - - - - ---..- P ounct s ~
1947-56 :
91
1958
Th ous~ n-a - p oun-a s
va.
1,652 ?,660 2-,ooo
2l5,o35 21e,j~o
212,000
N. C.
1,314 - 1~700
1,700
284,474 306,000
306,000
Tenn.
s. c.
778
825
900
756
975 1,000
2,670 11,468
2,475 11,700
2,700 13,000
GA. .
845
910 1,125
571,760 464;100
513,150
Fla.
7
0 1,100
9,
,7
9, 0
Ala.
836
660 1,050
241,232 135,300
219:,450
Miss.
376
425
400
3,199
2,975
2,400
Ark.
Okla. Texas N. !1e!- _
385 622
450
Boo
L 465
1,200
2,480 103,656
1,800 87,200
1,.860 144,ooo
498
540
775
213,524 159,840
250,3~5
_ _!,.Q7,a _- _!,~O.Q __ _!,]O.Q _ _ __ 7.J.4J7___ ..:.9..:,6.QO___ .)];,_20.Q :.:_
- - - -- -- - - - - - -- - - - - - - - - ... - - - -- - - - - - - - - - - - u.s.
870
970 1,171 l 1,717,078 1,445,110 1,796,785
====. . .===============PEC=A= NS================~=~~
_S_ta_te_ ...
._,.
_- _-_-
!.v...~-r,.!..~-
All Varieties - Produ_,c. tion
,1-9]!1-=:-,52- _- _- _-_-_-_-_- 1-9~-7..-....-
i5 ~ .....
_- _- _-_-_-I!!-d!-c.!-t~-d-1-.2
_~ ~ _
.
T h o u s a n d P o u n d. s
N. C.
s. c.
2,116 3,842
. "' " 950' . 1,100
2,200 4,000
GA.
37 346
Fla.
,8
7 500
2, oo
43,000
,boo
Ala.
17,032
4,000
26,000
l"Iiss.
9,035
7,700
16,200
Ark. .
- 5,014
9,200
4,500
La.
15,330
17,100
17,000
Okla.
19,920
31,000
14,000
Texas N. Mex.
31,640
]J 2, 734
55,000
5,400
38,000
3,500 ..
----------------------------------------- u.-s:-- - --- .... 148,347-------- -1lil:350------ -173:400---:---
1/Shorttiiiie-aVerage-;'------------- ~- .... - - - - - . . , . - - - - - - ... .- .-
)
~:.: L i~ :.L r. ;.
:.
.
.
.; ~g~I.C:UL TURAL ~XTE:NSION SJ::RVICE
' UNI"/ERSITY OF GECJRGIA AND THE
.// .,;STATE .DEPARTMENT OF AGRICULTU.RE
Athens, Georgia
.3; S__,
rr "Int J
~:u
1J. \1
'~-t...n.
~.,.
.t'l:&
.....
1hr~}'
ft:
.!.r.o..
:'s{/v
...~;
~
Ib1.l
S. DEPARTMENT OF AGR~ClJL "f:.l:l~,EJ
septeJ1~ ~~ - .:n~,::~.~~a~: . . OCT 3 l '58 .. f
(.>RICUI .TURAL M,!I.P.I<ET!NG $.i-ZR1,C(,f;:.
319 E;(T ENSit;;N BLDG.; ATRE;NS~' GA :'.:
LIB RARI E.S
._. ;..
GENERAL CROP REPORT FOR GEORGIA AS OF :.SEPT~ illER l, 1958
' I
The.. l958 crop year now seems ce:rtain to .be one of the best} if not the b~..s~, in Geo~gia history. Record high yieJ.ds per acre for all major f ield crops:..~n~;r:.
wany m1nor crops have been obtained or were in p;rosp.ect as of September. l. ...,A.1)'!.9Pg
the crops expected to shav record yields per acre for this year a.re corn, -cotton,
tobacco, .peanuts, wheat, all hay, soybeans:, bar::'.ey, and rye. Oats suffered some
~ druliage' f'rom the cold winter but ~.;ere exceptionally good in some parts of the
st'dte .'and may equal the record high yield of 33.0 bush.els produced in 1956~ . L'
! :-J ~- ~~N.. 0 0
The most
significant. aspec.ts
of
the
toJ'eather
during
A~gust
were
the
unusu~H.;
favorable weather the latter part of the month for harvesting cqtton ang pea~~t$,
and the dry conditions that developed in much of the northern two-thirds of the '
state . Late corn, cotton, and pastures were suffering from ' lack of . moisture in
thts> area by the end of Lu~ust . ; ....
- ~cORD cmN CROP: Current indications point to the largest crop ever ' pro~ .
:' .. ., ....
O.u0 8d j.n Georgia. Total production is non estimate.c;i ~t
81,330,000 bushels, an increase of s2_ightly more than 10 million bushels from ..tJ-le
previous record crop produced last year of 71,188,000 bt1shels. The yield per
ar~.r.e of._ 30~0 bushels will also be the highest of record; surpassing the pr~vious
high of .26.0 bushels produced in 1957 by f.our bushels.
- ,' :~ I
, ,:.GOOD PEANUT CROP: Peanut production in Georgia this year ;i.s forecast at : '
573, 750,000 pounds, 24 percent above last year's relatiye-
ly. short crop, and approximately two million pounds above average. The yield per
. apr~
promises
to.
be
a
r
e
,
c
o.
r
d .
high at '
112. 5
pounds.
.. ' ,.:. -ABOVE AVERAGE PECAN CROP: Indications on September 1 pointed to a pecan
-..
~ - crop of 43,000,000 pounds compared with the 10-
:.:y,ea.j- .(1947-56) average production of 37:,346,0:QO . pounds and last year 1s .very short
o;f-op<9'f" 7,500,000 pounds. The current forecast is 17 million pounds belovJ the .
r~cprd crop of 60 million poUnds produced iri . l956.
........ r.
,
'::-<-LEAF PRODUC-TIO:N- ABOVE --hAST- Y.E..I\.R: The-fluecured tobacco cr-op in Georgia'./ 1
... : .
- - - - - - - --- currently estimated at 88, 160.; 000 pound~.,
n; ~dre than eight percent larger than last year: s crop of BJ,., 270,.000.. pounos: ..
.Yield per acre estimated at 1520 pounds is a record hi~h, v-n~ll above the 1957 : ;
yiel:d of 1290 pounds and 55 pounds above the previous recora :yield of 1h65 pOU:rids
p:n:>duced in 1955.
. .
'.'
!':
;.. , ; :, !'
.. ,...., NILK PRODUCTION D01-JN: liilk production in Georgia during August is estimated
. ,:
at 95 million pcunds . This is i:t d ecrease of five per-
. ~e'ht :erottt the
. . . .
~.. .~
100
million
pounds
.
prodaced .
in
J
u
l-y: .
..of
this
.y:.e.. ar
and
August
of
1257.
~ ... :.~. :'REcoi:m EGG PRODUCTION:.. Georgfafs : egg ~:produc'tion euring- August is estimated
- . .
: ~t .109 million eggs.~ ...This is .. one. million more than
Aug.-\~st a year ago and represents a 11igh .for : the... month.. , ., .. . .. . .
,
"""
.:
-
"
I
. \QROP
.Corn
GEORGIA . ~. .. . ...
~ ~ -
.. =
REAG~ ~E~ ~~~~~$ ~- t ...
J_TOTAL PR. ODUCTION (IN TRDUS.)
ff..
_ 000).
,_y~~ n
.. . A v e r a g e.;
_2~47-56!
.
.1957 . : l:oq:~;p~Ay_er~gE!
_j__2958 1947-56
_ .
TI.ndic
1957
: . 1958
4 bu. ! 2, ,;J.I _. 17.3 i ?~0
30.0 1 51,319 71~~88 , 81,330
~lhe at bu.
80
16.4 : .Lo .5
23.0.
2,174 1,848 ! 1.,8~.0
Oats '., ..
bu. 315
27.8 : 28.0 , 33.0 11,681+ 11,032 .10,395
Hay Call) ~ ton 1 569 i . 68:
961
1. 04
695
550
- 590
Tobacco(Type l4)lb.
. ?otatoes ,Irish,C~vt.
?o'tatoes.,sweet;C\vt.
:t;otton:. .bales F~anuts(for pick.;. ipg...&..threshing .)1lil~Soybeans bu.
Pe aches,tot.crop,bu
?ears,tot.crop, bu.
5B 11;238 i,290 : 1,520 122,566 81,270 8&,160
4. 6 h6 j 49 j 49 .
320
1.3' . . 4r : 46 1 48
..1,198
254
225
644
624
~: 398 : 1/2.76 l/333' Ll/386
681
3,96 : :~ . 320
-
..,...
'-
' .. :
510
845
910 j 1,125
571,760 ~ 464,100 573,750
110
10.6 14.0 ~ 16.0
410 1,400
1, 760
2,420 2,100
4,200
169
86
98
?ecans :lh.
f~sture
%
~/73 i ~/70 g/85
~7 Pounds. ?:.7 Condition on September l.
37,346
7,500 43,000 -----
ARCHIE LANGLEY Agricultural Statistician In Charge
CARL O. DOESCHER Agricultural Statistician
UNITED STATES
-
GENERAL
.
CROP
.
REPORT
AS
' OF
SEPI'EMBER
. '
.'
J..l9i~
. . ..
Present . est~tes show a continUing ilicrease in crop ~:eduction which. il1
totBJ. far exceeds anything yet reached by American agriculture. . Late maturing
crops generally developed favorably during August even though heat and drought
invaded parts of the West and cool, dry periods retarded maturity of some crop$.:'
in some North Central sections.
CORN: The prod~ction of all corn is forecast at a near record 3,589 million
bushels, up 3 percent from the August forecast, 5 percent above last year and 14 per~ent. above. average. Corn crop prospects continueq to improve
during Au'glist in nearly 'all areas in response to near normal temperatu:res and generally ~equate soil moisture.
SOYBEANS: Production of soybeans, based on September 1 conditions, is
.
estimated at 561 million bushels. This is nearly 5 percent above.
the forecast a .month ago and exceeqs the previous record of 480 million bushels
harvested in 1957 by 17 percent. The 10-year average production is 296 million
bushels. The large crop is the result of both record yields and the highest
planted --ac~_eage of record.
'PEANUTS: Production of peanuts for picking and threshing is estimated at 1, 797 million pounds, up about 8 percent from August 1 forecast.
At this level, the crop is 24 percent greater than last year, 5 .percent . above
the 10-year average and tm largest since 1950 when 2,035 million pounds were produced. The estimated yield at 1,171 pounds per acre is 10 pounds above the previous record set in 1956
. . PECANS: Production of pecans is forecast at 173 million pounds--23 percent
above last year and 17 percent above average. !Toduction in Louisiana and Oklahoma is expected to be greater than estimated on August 1. HoW"" ever, prospects in Mississippi are not as high as a month ago and in Texas the crop appears to be considerably smaller than estimated on August 1.
PEANUTS PICKED AND 'IHRESHED
____ _ -------------n~d~rk~- ---------~~~tioo
5 state
Average - -: ~ - - -:rndicated- - Average - - - . ; - - - Indicated
1951 1947-56
1958
1947...56
.9 7
1958 .
= a. .= -- ~-- --..-.-Pounds== ...... ~ - ... Tii ous and~ Po uii-d
Va.
N. c.
1,652 ?,000 1,314 - ~~700
2.,000
1,100
215,035 284,474
21e,~o " 212;000
306,ooo
3o6,ooo
Tenn.
s. c.
778
825
900
756
915 1,000
2,670 ll,468
2,475 ..._ .2;760 ll, 700 ' . 13,000
GA.
845
910 1,125
571,760 464,100
573,750
Fla.
7
0 1,100
9,
,7
9, 0 '
Ala. Miss. Ark.
Okla.
836
660 1,050
~41,232
135,300
219,450
376 385
622
425 450
Boo
t400
465 1,200 ,
3,199 2,480
103,656
2,975 1,800
87,2oo
2;4oo 1,860
144,~o
Texas
498 540
775
213,524 159,840
250,325
!:, ~e~- _ .... ].,Q1~-,. ];'.Q.Q __ ]:,jO.Q ~ ___ 7~4J7____ 9~6.QO__ .... _1]:,_20~-
----------------------------------------- ==== = ==:; :: ==u.s. =
= =
=:: =:: = === = =:: = = = = 870 . 970 1,171
1,717,078 1,445,110 1,796,785
=
=
=
=
PECANS
= = = = :;
= :; ==-
All Varieties - !Toduction
.,
~S-ta-te-~ ~---~-A-v~er-a....~e-~i9'~7~..."-T2-h6~o---u--s-a~-n-~-d--~1~P9~5o~u7-n--d--s------In~d~ic~ate~d~1-95~-8.~-.
N. c.
2,116
-M
;
. 950 2
2,200
s. c.
3,,842
1,100
4,000
GA.
37 346
Fla.
,.-a
7 500
2, oo
43,000
,doo
Ala.
17', 032
4, 000
26,000
Miss.
9,035
7,700
16,200 '
Ark.
5,014
'9,200
4,500
La.
15, ~30.
17, 100
17,000
Okla.
-19,,920
31,000
14,000
Texas
31,640
55,000
38,000
N. Mex.
]/ 2, 734
5,400
3,500 ... . ..
----------------------------------------- u.-s:-- -- -:-- -148,3.47 .... ------- -1t1:3so-- ~-- .- -i''h;4oo-. - .- - ..-
1/Short...t:i.nle-aVerage-:'- - - - -- -- - - - ...... - - - - - --- - - - .~ ~~ - - ~-- . ..
, ,, . .. . .
. .
.; . ~ . . .
ol.
: : ....
a.
Jls-
Mao
fA3
SCi.
;-:~l~~f~e'\i~KL\~TD\1'~~::..-rrr..W~h_i__.~~
Jrrin.i~}
{ ., ;~~~~~~~~~~~~~~ ~~:~~ION'S~~V.ICE .
.,
I
U. $ . . DEPARTME NT OF AGRICUI.TURE
, . , UN lVERSiTY OF Gt!ORGIA AND T HE
AGR!C'-i ;7 URAL.: MAR'KE 'rf N(; SE RV iC E
.:.~....:.. SIA:T'E O.EPART:M~ N 't." oF' A<'i RICULTUR E
3 19 EinENS IUN 8 i..!lG. , A_THE N5 ..GA.
Athens, Georgi a
September 11, . 1~58
----,-~--
VEGETA ~LE CROP REPORT
::. ::
. Sept~mber I, , 1958
.!
I
.~UNITED
.\ .
STATES: Production of
fall. vegetables
i"n
1958
'is
expected
to be
a
ll.t"tle
.
.. larger than In 1957 but slightly .L;nder average pr.oduction, the
of ~~rop Rep?rtlng ::Board af1nounce d today ..Esti. m~.t ~.S: prepared as uf September 1~ . which
~~~t:mr.for abC/U~ . t hre e-fourth's
the prod.l!ct(on In the . fall seas-on, indic<ite
;~tota +- producti'tm wi 11 be 3 percent above 1957. Early Fall cabbage and carrots,
with increased acreage as we ll as better yi e ld prospects are re sponsJble fo~ most
o,f the inprease over last ye ar. Gains in the production of tomatoes and caul7
:i flowe r a_re also expecte d. Partially offsetting th e se incre as e s are Indicate~
.decl ines:. ln product i on of se vc.ral fall crops. Early Fall - l e ttuce shows the ;' large st
~~ crease: !lecause of a 22 purce nt reduction in California's acre age. The product-
ibn of c ~1e ry, cucumbe rs and snap beans is also expected to be under last fall's
~ 7~e Is. . .~
.
li ~A BEAi~; Producti~n of 1 lma be an in the summer States ts placed at 26Q;OQO
~;'
.'.:. cwt~ , 22 perce nt obcve the 1957 crop but 17 perce nt below averag~.
~(ght harvest on Long ls.land has bee n in progress for about 2 weeks. Yield~ . from
e.~: rly pl~ri'tings were average, bLJt with improve d we athe r . conditlons better ._ytel .ds ~'~-~ exp e c;:t~d from later fields . In -New J e rs e y, harve st of I ima beans ' rc.a2h? d :tts
p,~ak around mid-August in the .southern part of the State, and since the n supplies
~~ye bee i decrea~1ng. Harvcst .J n Maryland has pass e d its - ~ e ~k, and continuej .fn
q~~cl ining volume. Growing conditions have bee n fairly good and mildew ontrol has
b~en satis.factor.y. In No.rth Ca -rol ina, harvest of . late pl a ntings Is .unde rway with
hp,~r; yl ~lds : in .p ro.speC:t:;, ...._~0.64: i.'i e 1ds . are rep.orted ..from first ar~d sGcond ' p IJk-
ings Jn the maih produdng are as of Georgia. Dry we ather is causing Jeaves .to
she d from vine s in the c e ntra l are a s of th e State and harvest is about cOinplet~.
SNAP' BEAN.S: The .f .inal f~i-'e cast of s.ummer production, at 1,491,000 cwt., is about
.::..~.
. equal ,.:to 'last year and -9ve rage . In the New England State s, supplies
wi l l be modera tel.y , heavy during the f irst half of Sept embe r and will continue a ~~ i.labl e: t~ dec fg~ sing volume . until frost e nds the se ason. In Upstate New. Yotk,
hcitvest is '.about :three-fourths compl e t e in the import a nt ce ntral are a of the State. D ~ P.Y volum~. will: ..declineduring September . On Long Island, . yield prospe cts on t~ late season a c.reage are good. Movement will continue through October. Har'-
ve:s:t in Ml.chigan .ts. ne ari .ng compl e tion. Yi e lds on the late -a cre age have bee n g_ood.
Mov:ernent o~: :a H_gt):t; scal e will .continue through Se ptember . In Georgia, ve ry .littl e - a~.:r-eag~ renfu.i-ns for.. l'l<! rve sc ' Yields ha ve : be en gooo . in Tenne ss ee. Moveme nt'wi .ll . ~.()nt' i' nue i1+..dl'mtntstiil'lg ' Volurrie ' through September unless a killing frost ends It:.
Harve st in Colorado is past its pe ak and suppli e s wi I 1 decline gradually throu9.h
Septembe r.
~
.
.
!
: ::
- ~:
CAErSAGE: 'i~ t e summer production for fre sh market and saue rkraut is forec a st at
4,038,000 cwt. ' This p~oduct~on is 12 perce nt above last ye ar and aboLt
equ ~ l to a~rage. In northwe stern Pe n.nsylvania, ex~e ssive -: r.a'Jn.s c a us e d some'
.d.amn;~.e . . .. E1~s ewhe re in the st a te,. the 'rep is~ :i.ri. .gc)6d. :~~ri-~ t:tl.pn.~ .. II"! I H i no J.:s,.. :. .
Y.i;e.~ ds . a .re good but low prices are _di.stouragil}g .' rar.ve st . Fa'vor a bte Augus;t wea'fher
in North Carolina improve d yield prosp e cts-. Harve st of the Georgia crop was com-
plete d a bout Se ptember 1. In Colora do, yi e ld prosp e cts fpr the late :s e ason acre age ar~ good." voltJme supplies are now a v a,i. l a,bl ~ . from th e imp_o.rt an t. ; Sa n. LuJs
Va lley. Q-ua'l ity 1s godd and moveme nt should inc.rea se substa nti a lly from the Sa n
Luis Vall e y a nd Northern Colora do during Se pte mbe r. In California, quality con-
ti nue s ve ry good with supplies ampl e for loca l ma rke ts.
CUCUMBERS: Production of e arly fall ~umcumbe rs is for e c a st at 473,000 cwt., 11 pe rce nt unde r 1957 but 23 pe rce nt a bove a ve ra ge . The de c! ine from
l a st ye ar is due to loss acre age with the large st re duction occurring in Virginia. The crop Tn Virginia got off to a good start but rc c~ ive d some damage from th e l~te August rain. A 1 ight ha rve st is in progre ss but volume moveme nt is not e~p e cted until mid-September. The South Carol ina crop is ma king good progre ss.
Stands and growth of the Georgi a crop are re porte d to be poor. Planting in Louisiana is about compl e t e , and the crop is Tn good condition. Suppli e s g1own
in Ca liforni a will proba bly continue in adequate volume to s a tisfy loc a l dema nd.
. LIMA BEANS,
Summer:
New York .
27
New Jersey
48
Ohio
Maryland
20 30
' 30
.. ~ortb..c~r;ol Ina , 'Ge9rgia.. ... ~ ,,
Gr(iu .rotal ..
26- 40 21 21 26 24 2
64 1': . _: ~*~
~NAf> . BEANS' '
I .
I .... ~~:m~~~psh i.re
290 250
34 45 45
i Massacnu~~tts
1,350 1,200 1,300 35 38 45
'. '
10
ll
47 : 46
' 13 sa I
Rhode .., sl and 1 : 260
200 20 36 35 45
I. :! ' . ;'co_p~ecti cut ' .. ' ; 1. l 00 1,000 1,000 35 . 35 .45
. ,_.: N~wYork,_L.
3,090 1,200 1,20 42 45 45
9
38 125 :
7 9
35
45
54 " '54
.. , iNe~ .V.ork -_ - i 10,750 10,700 10,50 42 44 45
Pennsylvania I 3,060 2,300 2,3001 43 45 48
Ohio
I 3,310 3,800 3,800{ 40 39 40
448 471 131 104 131 : 1'48
472 I 10 152
1 MUicl~iin'ogaisn
... _; : .
!. ~.
1,280 2,520
. Vi,rginia
. 660
.. ~ortb ' carolina . .. 7,520
1,200 1,30ol 27
2,6oo 2,6ooj 31 700 75~ 30
6,4oo 6,8oo 32
34 32 30 . 50
35 32 35 4o
3n 4
41
. 46
83 . : 83
20 . 21 . . . 26 243 320 : .' ~12
Geor_g;~ . .. : _ . j. :2,100 1,400 1,300 28 27 28 59 . 38
3:6
.. . Te~ness.ee . . . ; , . .I ,680 1,200 1,400 36 42 .40
59 50 56
'Alabama . 1. 1,290 1,300 1,200i 21 24 25
28 , 3l, -,.. ;: :.jo
c6rorado' : . ..
' Group T~i:~' ( ..
..'I,..4. ~l::-.8~0~280.o;;--~3.,.6....;7,1~05~00-3~6.-.~65.S2~o0~!i-_-3.4,4;.,6;..---4-.8.4~1-__,;4.45~1--r-'1~1-;,4..-13119Z:.fo.4-..~]~. ,"'1"'34~94.4.1.-:...---
: ~ 29 .'!!"'l~...4. ~~1
I . fAB8AGE, 1/ :
!
I
:. !
Late .Summer: : . !
I
Pennsylv~nia ! ' 4,290 3,330 3,700! 181 168 210
776 559 . .777
Indiana
i 2,170
:, . l .llino .~~ - , : .1 2,710
- Iowa
.: ' 980
' ' No~th c_arol ina 4,260
. .G.eorg La . I ; .
750
' . ~C~owloM.reaxdioco..
3,340 370
1,800
2,600 900
3,560 600
2,680
1,700j 133
2,9001 179 8ooi 146
3,8ooi l42 sool 92
,?,7ool 240
. ---! 108
177. 210
200 220 115 1Bo
' 282 I 319 .. . 357 482 520 . ~3.f3.
145 1o4 . :r':*4
162 1_ao _, _6_o7 ,. _ .'_575_ '6_8_41.
---1 100 80
258 250
70 808
60 690
~
40
'675.'
40 ---
.Washi .ngton
.: ta. 11torn_i a
- Grou Total
1,600 2. 3ao
850! 174 2. 300' 231 .
I 2.15 . 272 :_. 232 '
235
548. , 552
.
-2~2~8~30~~~~~~~2~o:~1~6--~~~2~10~~4~o~o~-~,?6~l~l--~~~
f.UCUMBERS, .
. E~ r l Y.. Fa 11 : .
_ yi, rgt.~ia 2/
45
South Carol ina
85
Georgia
22
L,ou i s i ana
.35
:, Cal ifornla
18.0
Grou Total
0
ll .Includes Processing.
ARCHIE LANGLEY
Agricultural Statistician In C~arge
L. H. HARRIS, JR.
Truck Crop Estimator
t;. !I ,\ H ( ITI U t :IJ ,"""' H H ' Ll H'I\11 1 1\ 11' 1 11\'H 1 11 1!.. /1\ 1 ! 1 \..J .... . 1 /.../ I ' P I\1' 1' 1 1\ 1 lo..J h t
I.H 1061
1 tl.?
.
)q :>
g (GJE (()) ~ CGllA
(C
~
COJ
~:.....u...H:~_ 'G-1+-~lfut-
m 0 '<
JrllJN
(G
E~Vll(C[
,/1 AGRICUI.TURAI. EXTENSION SERVICE UNIVERSITY OF GEORGIA AND THE STATE DEPARTMENT OF ACRICUI.TURE
SEP 18 '58
U.S. DEPARTMENT OF AGRICUI.TURE AGR IC!J L.TURAI. MARK~TING SERV:CE ~19 EXTENSION BI.DG., ATI-IENS, GA.
BROILER CHICK REPORT FOR GEORGIA
LI BRARIES
September 17, 1958
ATHENS, GA., September 17--A total of 4,648,000 broiler chicks \'Tere
placed with producers in Georgia during the t-reek ending September 13, accord-
ing to the Georgia Crop Reporting Service. This compares with the 4,879,000
placed the previous t-Teek and is eight percent less than the 5,057,000 placed
the s arne week last year.
Eggs set by Georgia hatcheries amounted t,o 6,988,000 compared with
6,619,000 the previous week and i$ four percent more than the 6,688,000 for the corresponding week last year.
Hatcheries reported prices paid for hatching eggs during the t-Teek at an average of 66 cents per dozen. Average price charged by hatcheries for the
chicks t-ras reported at )10. 75 per hundred. These prices compare t-ri.th 66
cents and ~~10.50 last t-1eek and with 69 cents and ~;~12.00 one year ago. Egg
prices shown relate to Georgia produced hatching eggs whether bought on contract or otherwise.
Ueighted average prices frorri the Federal-State Harket News Service for broilers during the week ending September 13 are as follotvs: Georgia broilers 2 3/4- 3 3/4 pounds, at farms 16.04; FOB plants 17.00.
(See reverse side for other states)
\>leek
Ending
. - GEORGIA CHICK PLACE!IIENT BY \IJEEKS
JULY 1?-THROUGH SEFTEJVIDER 13
-
EGGS SET _1_, /
CHICKS PLACED FOR BROILERS
1957
1958
1958% of 1957
Thousands
Percent
1957
1958
Thousands
; 1958 %
-of 1957
Percent
July 12
1,539 8,531 113
6,075 6,869
113
July .:.19 July 26 Aug. 2
Aug. 9
Aug. 16 Aug. 23 Aug. 30 Sept. 6
7,856 8,348 106
7,837 8,040 103
7,405 7,874 106
7,473 7,438 100
7,350 7,032
96
6, 726 6,758 100
6,689 6,553
98
6,739 6,618
98
6,024 6,340
105
5,944 6,204
104
5,951 6,018
101
5, ?99 5,819
100
5,644 5,718
101
5,501 5,360
97
5,424 5,093
94
5,269 4,879
93
Sept. 13
6,688 6,988 104
5,051 4,648
92
.
);/ Includes eggs set by hatcheries producing chicks for hatchery supply flocks.
ARCHIE lANGLEY Agricultural Statistician In Charge
W. A. 1~TAGNER
Agric~ltural Statistician
.
. .
.
.
- - ---- - ---- -- ----- EGGS SET AND CHICKS PLACED IN C01YJN2RCIAL AREAS BY VJEEKS - 1958
---~ ----- - ---- --- -~- -
------- - - -- - --~- - --
-- ---- --- -----
-----p-ag-e--2-- - -
1'
!
\'leek Ending
STATE
J!Iaine
Cor~ecticut
Pennsylvania Indiana Illinois Missouri Delaware Maryland Virginia
I
l
i
! I I '
Aug,l 30
II Sept. Sept.
6 I
13
~-
! r
EGGS SET - THOUSANDS
July 12
I
I July 19 i
I
I July Aug.
26
2
Aug. 9
)
Aug.
Aug. I
I I
16 - 23 I'
CHICKS PLACED - THOUSANDS
I
I : Aug. 30 I I
I Sept.
6
I
Sept. 13 .
I
11 1,366
1,353
_l l
!I
1,190 1'il 1,217
1,181
1,157
1,155
1,1~.2
1,180
1,124
-
1,071 . 1,022 1,070
1
!I 1,144 1,209 1,175
721
635
592
548
557* 603
657
623
600
536
II 1,259
1,048
1,270
11
Jj
890 1,038
952
953
895
924
827
940
938
758
1 1,806 1, 785 1,698 , 1,075
949
959
903 .993
880
851
886
. 870
864
I'
299
290
303 jl
154
174* 173* 156
179
210
194
180
226
142
1,464 1,367 1,418 .,
719
739
769
704
755
728
671
,643
i
1,800 2,519
1,876 2,544
1,840 2,427
I1
2,058 2,173 1,928 1,935 1,929 1,907 1,668* 1,992* 1,919* 1,97~ 1,921{!- 1, 795* 1,831* 1,853*
1,1759 1,798
628
1,483 1,930
583 1,566 1, 763
j 1,986 1,942 1,917 I 1,542 1,481 1,391 1,361 1,329 1,374 1,301 1,'163 1,188 1,138 .
West Virginia i
337
295
297
North Carolina jl 2,9?4 2,957 3,056 i
Sout h Carolina 1
h09
471
551 i
660 2, 769
389
653 2, 711
376
657 2,699
397
624 2,655
. 349
669 2,660
366
649 2,493
363
652 2,478
346
639 2,395
~37
537 2,337
275
589 2,341
321
GEORGIA
I 6,553 6,618 6,988 6,869 6,340 6,204 6,018 5,819 5,718 5,360 5,093 h,879 4,648
1 =F~1o-~- ~l~da--------~~~ --~~3~23~--~3~----~33~~--4! ----~2~2~1--~~2~4~o--~~2~19~--~23~3~---2~2~4----~1~9~2-----2oo~----17-1~~:--- 20~2~~--~21~5 .
Alab ama 1'1ississippi
~~
2,865 2,111
2,955 3,012 2,141 2,2:39
1 '
2,958 2,124
2,853 2,037
2,955 2,037
2;800 2,748 2,753 2,571 2,041 1,910 1,813 1,695
2,417 1,649
2,366 2,391 1,658 1,553
Arka"lsas Louisi.<Jna 'exas vJashington Oregon California
TOTAL 1958
1 3,049
I!
392
'II 2,287
1
363
11
330
1,192
i
I 36,828
2,837 362
1, 775 392 284
1,230
36,095
3,051 425
2,578 338 252
1,258
37,619
11 3,063 3,137 3,074 2,979 2,934* 2, 778 2,816
1
I
460 2,593
474 2,401
456 2,406
438 2,353
443 2,283
392 2,196
457 1,948
I
41.1.2
381
420
313
388
374
359
j
173
199
161* 156
179
205
165
p 1,160 1,093 1,081 1,090* 1,049
978* 905
2,587 373
1,869 344 125 824
'
34,249* 33,184* 32,663'~~ 31,685~!- 31,24~ 30,541* 29,09~ 27,886
2,381 2,283
395
400
1,898. 1,740
359
342
168 176
878
916
- --
27,218 26,335
TOTAL 1957
I 34,445 33,989 34,691
29,432 28,740 28,388 . 27,510 27,055 26,625 25,934 25,490 25,228 25,028
I 1958 %of 1957
107
106
108
116
115
115
115
115
115
112
109
108
105
:J
-!~Revised
IS
AGRICULTURAL F.XTENSION SERVICE UNIVE R:3 !TY OF GEORG iA AND THE STAT !! D EPAR TMENT OF AGR fC U!.TURE
Athens, Georgia
SEP2 4 '58
UBRARIES
U.S . DE PA RT (.1E:NT OF AGRICULTURE PGRICUL~1'UR.t-.L MA R I<ETI NG SERV ICE 31 9 E"XTENSION 8~.DG ., ATHENS. GA.
September 23, 19.58-
GEORGIA JlAS!f.l'!BJ1 INC O~ill DOh1JIJ h. 9 Pl!;RCENT I N 1957
Cash income (including government paJlnents) for Georgia farmers amounted to :?661, 746,000 in 195 7. This r epresents a decl:i..ne of :~33,808,000 or 4.9 percent fr om t he record f;~ 695,554,000 cash inc ome for 1956. The 1957 cash i ncome, al-
though d otm from 1956, is sti ll th e t hir d highest of record, being exceeded only in 1956 and 1955. Income from co1mnercial br oilers to t aled ::PJ-50~ 336,000 in 1957
and lras more than tt..rice as large as the next highest enterpri s e ~-rhich t-ras cotton and cottonseed at ::~ 70,241-+ ,000 . Inc ome from t ogs at ~~5 ?,833,000 ranke d third in importanc 8, follovred by dairy products ~-r.i:bh an income of ~r~51 , 175,000.
Income from all cropG amounted to ~~272, 737,000 , a decline of ~;;95,854 , 000 or 26 percent from 1956 . Neamvhj_le , income from livestock and l i v estock products increased to .')358,2 82 ,000 , up ~~ 39,707,000 or 12.5percent from 1956. Government payuents uith the Soil Bank IJrograrn in effect increas ed to ) 30, 727,000, about 3~ times l,arger than 1956.
Percentage contribut:.ons to cash farm income by commodj_ ties are as follows:
Commercial broilers,22. 7~~ ; c ott on and cottonseed , 10.6%; hogs, 8.8%; dairy prodD;ct s, 7. 8% ; peanuts, 7.3~.; ; tob acco, 7.3%; cattle &nd calves, 7.2>; .
piSTRIBU!ION OF 1957 CASH I lJCOJ.'L: FHOH G~ORGIA CROPS AND LIVESTOCK
r
ARCHIE LANGLEY Ag,ricul ture.l Statistician In Charge
WILLIAM E. KIBlER Agricultural statistician
CROPS
Cotton Lint Cotton Seed Cotton, Total Peanuts Tobacco Fruits & Pecffils Truck Crops~! Corn Forest Products All Other Crops
1951
CASH FARE I NCOHE FOR GEORGIA ] /
195 19.21 1954
19~2
1956:! 1957 ~/
(Thousand Dollars )
144,498 154.;-321 125,005 112,941 12L~,112 95,516 62,838
22,135 17,996 14,153 12,935 11,319 9,610 7,406
166,633 172,317 139,158 125,876 135,431 105,126 70,244
56,295 42,513 55,39? 29;119 5?,673 60,182 48,555
64,760 62,924 69,407 58,76? 72,326 6)~,573 48,161
19,358 19,865 18,855 17_.341 4,017 17,985 10,314
16,638 16,726 17,128 10,663 11,325 10,7h4 11,031
8,929 6,765 9,160 8,390 14,524 20,759 24,630
39,380 36,382 34,634 31,854 43,163 59,802 34,728
23,641 35,650 40, 72h 30 ,590 22,760 29,420 25,074
TOTAL C'lOPS
395,634 395,142 384,463 312,602 361,219 368,591 272,737
~!- Excluding Irish and Stv-eetpotatoes and minor truck crops, which are included
in all other crop s.
J
LI'7 ESTOCK
Hogs
53,055 50,190 54,776 59,570 1.~1, 879 46, 888 57,833
Ca.ttle & Calves 34,723 29,681 24,169 28,276 40,795 40,937 47,610
Dairy Products 39,390 41,610 43,349 42,717 45,291 49,423 51,175
Com. Broilers
68,530 88,610 93,826 101,951 125,700 129,836 150,336
Other Chickens
4,280 4,537 4,912 3,998 4,171 4,536 4,228
Turkeys
4,172 3,496 2,363 2,502 1,912 1,845 1,823
Eggs
29,280 29,187 37,469 33,152 40,891 42,115 41,941
Other
2,598 2,207 2,224 1, 728 1,362 2, 995 3,336
---
TOT.t>_L LIVESTOC K
- - - - - AND PRODuCTS
G0\T:S:::t"Jl'IENT
236,028 2L.9,518 263 ,088 273,894 302,001 318,575 358,282
PAYliLNTS
- - - - 81634 7,589 4)719 6,640
8,372 8,338 30,727 _)
TOTAL CASH I NCCNE
-AL-L S-OU-RC-ES
640$296 652)249 652 , 270 593,136 671,592 695, 554 661,746
RObE COrmU".JiFTION
Crops
36,606 36,921 52,624 36,844 35,554 37,458 35,241
Livestock
78,761 74,236 75,613 60,085 53,229 56,695 57, 162
TOTAL I NCO:f'.IE I NCLUDThJG HOJ''IE CONSUi:PTTON BUT NO GOVJ:I;P.NHENT PAY!viENTS
Crops
432,240 432,063 437,087 349,446 396,773 406,049 307,978
Livestock
314,789 323,754 338,701 333,979 355,230 375,270 415,441-~
-411 Corn."!lodities 747,029 755,817 775,788 683,425
;
a
TOTAL . I NC011E , ALL CO~:iNODITIES,
AND GOV. Pl\YllENTS. 755,663 763,406 780,507 690,065
_!/ 1956 Revised . '~./ 1957 Preliminary.
752,003 781,319 723,422 760,375 789,707 754,149
I
7
GJE(Q)~(GITA CCJrCO)~~A ~ liTIN~ IE!RiVllCClE
AGRICULTURAL. EXTENSION SERVICE UNIVERSITY. OF GEORG IA AND T iif:: s'TATE DEPARTMENT OF A GRICUL.TU Rf:
BROILER CHICK REPORT FOR GEORGIA
U. !:. DEPARTMENl' OF AG~ICllLTL'RE AG R IC:Ul.TIJ R A L MAR KET IIJG SE.RV ICE 319 iD~T EfoiS t O N 8L.DG . , A 'fi~ENS, GA.
September 24, 1958
. ATHENS , GA., September 24--A to t al of 4,573,000 broiler chicks were placed
trit h producers in Georgia during the weel<: ending September 20, according to the
Georgia Crop Reporting Service. This compares with the 4, 61+8, 000 placed the
pr evious week and is fhre percent l e ss than the 4, 832,000 placed the sar11 e tTeek
last year.
* .i
r~ ~ ..
'
i
Eggs set by Georgla hatcheries amounted to 7,075,000 compared with
6,988,000 the previous week and is seven percent more than the 6,623,000 for
the corresponding week last year.
Hatcheries reported prices paid for hatching eggs during the week at an average of 67 cents per dozen. Average price charged by hatcheries for the
chicks was reported at $11.00 per hundred. These prices compare \-Tith 66 cents and ~:?10. 75 l a st week and v.rit.h 70 cents and ':112.00 one year ago. Egg prices shown relate to Georgia produced hatching eggs tJl ether bought on contract or
othenri.se.
VTeighted average pr ic:es from the Federal- State lviarket NeviS Servic e for broilers during the vmek ending September 20 are as follovJS: Geor gia broilers
2 ' 3/4- 3 3/4 pounds, at farms 15.53.; FOB plants 16.51.
(See reverse side for other states)
GEORGIA CHICK P!.JI.CEI ~NT BY \.vEEKS
==~==~~~======~= J~~-_ 1_9_T_-~_Ro_u_ai_r_s~~~=rn=E=~--~2o~================~
\rJeek 1---- ---~~G~-~E~]/ _l____CH~KS PLAC~~~OR BROILERS
Ending
1957
1958 I 1958 J~ II
1957
1958
1958 %
1 of 19..!?:711
of 1957
- ThousaudS;rercent !
Thousands
Percent
July 19 , July 26 Aug . 2 Aug. 9 Aug. 16 Aug . 23 Aug. 30 Sept. 6 Sept.l3 Sept.20
7,856
8,348
106 1
6,024
6,340
105
7,837
. 8,Q40 ..~ 10~
5,~4 6,2Q4
104
7, 405 7, 8?4
1 ~ 106
5, :t~ 7 .. 6, ~lS
101
7,473
7,438
100
5,799
5,819
100
7,350
7,032
96
5,644
5,718
101
6,726
6,758
100
6,689
6,553
98
5,507
5,360
97
5,424
5,093
94
6,739
6,618
98
5,269
4,879
93
6,688
6,988
104
6,623
7,075
107
5,057
4,648
92
4,832
4,573
95
!/Includes eggs set by hatcheries producing chicks for hatchery supply flocks.
ARCHIE LANGLEY 'Agricultural Statistician In Charge
vJ. A. 1iAGNER
Agricultural Statistician
5
. '
.,.,
-
-------..,.-----..:;E;.;;.:;GGS SET AND CHICKS PLACED IN COMNER~:.::L:...::AR:.::::E;;A:;;S::;.;,:.....:::;B~Y...W:.:.E::=.EK:::~s:...._~-----.::1~95~8=---------=-P..;;:ag~e:.....:.2_.__ -- - - - -
1rJeek Ending
l STATE ~--S-ep-~-~-----S~ei~~~-~~~~~S~e~~~~~~~:~ ~~~~Ju~i~~~l-_--~Ju-~-~--~---~~u-~-~--~~~A~u~~~~~~-~-~~-~!---A-~-~-~---A-~-3_~---S-e-p~-~---S-ei_~___ Se~~-
Naine Connecticut Pennsylvania Indiona Illinois
Mi ssouri Delat-vare
Nary land Vir gi n i a West Virginia North C~.rolina
South Carolina GEORGIA Florj_da
Alabama l'iississippi Arkans as Louisiana Texas Washington Oregon California
,
i
EGGS SET - THOUSANDS
I
CHICKS PLACED - THOUSANDS
---- - ~--~--------------------------------------------------------------------
1,353 1,209 1,048 1,785
290 1,367 1, 876
2,54 1. ~
1,942 295
2,957 471
6,618
364 2,955 2,141 2,837
362 1,775
392 284 1,230
1,190 1,175 1,270 1,698
303 1,418 1,840
2,427 1,917
297 3,056
551 6,988
336
3,012 2,239 3,0_51
425 2,578
338 252 1,258
1,391 1,063 1,048 1,707
298 1,390 1,895
2,395 1,882
287 3,093
568
7.J.075
368
3,157 2,235 2,958
4.15
2,760
367 261 1,099
1,181
635
1,038
949
174-r.-
739
2,173
1,919~:-
I 1,481 653
I'
2,711 376
6,J h0
240
2, 853
2,037
3,137
474
2,401
381
199
1,093
1,157 592 952 959 173-::769
1,928 1, 976~:1,391
657 2,699
397 6,_20h
219
2,955 2,037
3,074 456
2,406 420 161-l:-
1, 081
1,155 548 953 903 156 704
1,935 1,921-l:1,361
624 2,655
349 6,018
233 2,800 2,041 2,979
438 2,353
313 156
1, 090-:~
1, 142
557~:-
895 993 179 755 1,929 1, 795-l~ 1,329 669 2,660
366 5. 819
224 2,748 1, 910
2,934* 443
2,283 388 179
1,049
1,180 603 924 880 210 72 8
1,907
1, 831~:-
1,374 649
2,493 363
5, 718
192 2,753 1,813 2,778
392 2,196
374 205
978:~
1,12h 657 827 851 194 671
1,668-~-
1,853-l:1,301
652 2,478
3h6 5,360
200
2,571 1,695 2,816
457 1,948
359 165 905
1,071 623
91.~0
886 180
61.~3
1,759 1,798 1,163
639 2,395
337 5.093
171 2,417 1,649 2,587
373 1,869
31.+4
125 824
1,022 600 938 870 226 628
1,483 1,930 1,188
537 2,337
275 4.879
202
2,366 1,658 2,381
395 1,898
359 168 878
1,070
536
758
864 142 583 1,566 1,763 1,138
589 2,3hl
321 4.648
215 2,391 1,553 2,283
400 1,740
342 176 916
878 513 692 752 180
552 1,371 1, 714 1,015
497 2,329
292 4,573
151
2,293 1,600 2,165
355 1,618
249 193 821
--------------~------------------------~---------------------------------------------------------------------------- I
TOTAL 1958
I 36,o95 37,619 37' 732
31, 246~:- 30,541* 29,098* 27,886 27,218 26,335 24, 803
TOTAL 1957
33,989 34,691 33,883
28, 71.J.O 28,388 27,510 27,055 26,625 25,934 25,490 25,228 25,028 24,298
1958% of 1957
106
108
111
115
115 115
115
115
112
109
108
105
102
~-r.-R~e~v.1-s-ed~.--------~i ------------------------~--I ---------------------------------------------------------------------~~--
ucvooer o, .L!;/!;>0
~a
'DCJtJ07
1 'f4
~1s:~ CGJE((})~CGITA CC~CCIP u
9AGRICULTURAL EXTENSION SERVICE UNIVERSIT Y OF GEORG IA AND T HE
SEP 3 0 '58
STATE DEPARTMENT OF AGRICULTURE
Athens, Georgia
U BAARbE.S
U.S . DEPARTMENT OF AGRICULTURE
AGRICULTURAL MARKETING SERVICE
S19 EXTENSION BLDG., AT;1ENS, GA .
September 29, 1958
QUARTERLY PIG CROP REPORT
/J
The number of sows farrowed and intended to farrow in the fall of 1958 (June through November) for 9 Corn Belt States is 17 percent larger than in 1957 and 21 percent larger than the 19~7~56 average. The number is nov.r estimated at 3,619,000 for the 9 States (Ohio, India~:n'-, Illi nois, vhsconsin, Ninnesota, Im~a,
South Dakota, Nebraska, and Ka11sas). Farrowings in all of the above-named State s
this fall are up from a year ear1ier, ranging from 7 percent in 1:!isc ons in to 36
percent in South Da1{ota. An increase of 29 per~ent is indicated in Nebraska, 23 percent in Kansas, 21 percent in Io:,.ra, 20 percent in Hin..'1esota, 14 percent in Illinois, 10 percent in Indiana, and 8 percent in Ohio. The September 1 survey _. indicates an increase of less than 1 percent or 22,000 head from the farrowing intentions reported for these States as of June 1, 1958. The 9 States included in this report accounted i or 67 per cent of the United States 1957 pig crop.
:i'iissouri is no longer included in this r eport.
Sows farrowed in the 9 States during June, July, and August totaled 2,059,000 head, 17 percent mer e than for the same period a year earlier. This is 31,000 head less than tvas indicated for this period in June. Thes e farrotvings for the 9 States represent 54 percent of the estimated June-November total--the same percentage as a year earlier--and may be compared with the average of 50
percent. Farmers' reports indicate that the number of soHs farro-v1ed in each of ( r the 3 months was up from a year earlier. The July farrowings sho"t-r the largest
increase over a year earlier, follot-Jed by August and June.
-
.
So"t-rs bred and intended for farrowings in September, October, and November
this year in the 9 States totaled 1,760,000 head, 16 percent more than a year
earlier and 11 percent above average. This is 3 percent or 53,000 head more
than the farrowing intentions reported for these States in June. Nearly one-half
of this increase occurred in IoHa. All of the States shov1 increases for this
period compared with June intentions except Indiana and Illinois, which indicated
no change, and South Dakota Hhich shows a decrease.
Reported breeding intentions indicate 2,010,000 sot-J's to farroH during the 1959 winter quarter (December 1958 through February 1959). This would be an increase of 20 percent or 332,000 head from the 1,678,000 that farrowed during
the same period a year earlier. All of the 9 States shou increases for this
period as corr.pared t-Iith a year earlier. Iowa, Indiana, and Illinois, the major
producing States for this period, show increases of 20 percent , 6 percent, and 31 percent respectively. Increases in other States are: South Dakota, 35 percent; Ninnesota, 34 percent; Kansas, 28 percent; Nebraska, 21 percent, Ohio and Hisconsin each 9 percent.
(Over)
ARCHIE ~GLEY Agricultural Statistician In Charge
'HILLIAN E. KIBlER Agricultural Statistician
.
r
Sows farrolcring by quarters; Selected Corn Belt States
.. .
.
------~- --------------------- - - ~~~~-----~-- - J
June through August
September through November .
State - ______________________ - __ - _ - - - - - - - - -
; Average :
:
: 1958 as :Average:
:
: 1958
: 1947-56 : 1957 : 1958 : %of . :1947-56: 1957 : 1958 1/ : as %of
----
: . --
-~-i;ooo--
: -i";ooo. --
: -i;ooo-
: '195] -P-;rcent-
....:-i;ooo-:-i;ooo--:
I,ooo-
: 1957
-Per~ent
head
.--.
- -head
-head
- - - - head . bead head -------
Ohio !nd;
:t11 lifisc Minn J;owa S, . Dak Nebr Kans
151
155
166
107
192 147
160
109
298
3?.8
359
109
228 176
195
111
275
360
425
118
335 340
373
:110
92
103
109
106
85
86
93
108
156
. 176
209
119
123 122
149 . 122
475
499
600
120
427 4q7
569
122
34
41
56
137
28
33
45
136
68
. 67
90
134
98
95
119
125
--4-0 ----3-6 ----4-5 --. -1-25--t--6~4 ---4-7----57----1-21
Total 9
I
States 1,588 1,765 2,059
I 117
1,580 1,513 1,760
116
~-----------------------------------------
~-~--:---Ju- ne-t- hr- ou- gh~N-oY-en-ibf-lr -T- ota-l --- : -----D- ece-m- be- r t-}l- rou-gh-F-e- br- ua- ry-2J )
. . -=- - -=- State ="Av~r~g~=--- -=----- -:-1958 "is7A;e;a~e7-
7--- 1959-as
:1947-56: 1957 : 1958 ~/ : %of :1947-56:1957:1958: 1959 .1/: %of
---- -=,--- _:--- _:_---- _:_ _1.251..;.--- ~- _:_-..:.--- _:__1_25.-
ill,OOO 1,000 1,000
Per- i1,000 1,000 1~000 1,000
Per-
.
.! head
~
.head
~ ~ . - ~ head head
cent
Oh~o . 342
302
326
108 116 . 141 142 155
109
Ind.,.... 526
504
554
110 210 296 314 333
106
Ill...... 1 610
700
798
114 172 283 336 440
131
liJisc..... 176 189
202
107 51
82 96 105
109
I :tviinn..... 279
~owa 902
298
358
966 1,169
120 "66 121 224
102 142 190 356 460 550
134 120
S.Dak.... 62
74
101
136 . 16
22 40 54 ..
135
Nebr. 166
162
209
129 48
63 95 115
121
Kans..... -1-05----8-3 ---. - -102 -----123 ----_J8 ---38---53---68 ----12-8-
TSottaatle9s ' 3,168 3,278
3,819
. '
117 942 1,383 1,678 2,010
120
l/-N~e; incti~ated by-b;e~din-~ inte-;tio-;;s-r;p~rts:------------ -
4/ Sum of June through August farrowings and September through November intentions to farrow.
J/ December preceding year.
-- -
- - ...,..,.. __ .. - , /.,;IV
BROILER CHICK REPORT FOR GEORGIA
U. $.DEPARTMENT OF AGRICULTURE AGRICULTURAL MARKETING SERVICE 319 EXTENSION BLDG., ATHENS, GA.
October 1~ 1958
ATHENS, GA., October 1--A total of 4,602,000 broiler chicks were placed
t-ri.th producers in Georgia during the week ending September 27, according to the Georgia Crop Reporting Service~ This compares with the 4,573,000 placed :the previous week and is six percent less than the 4,876,000 placed the same week last year.
Eggs set by Georgia hatcheries amounted to 7,030,000 compared t-tith 7,075,000 the previous week and is three percent more than the 6,803,000 for the corresponding week last year.
Hatcheries reported prices paid for hatching eggs during the week at an average of 67 cents per dozen. Average price charged by hatcheries for the chicks was reported at ) 11.00 per hundred. These prices compare with 67 cents
and :Jll.OO last week arid with 70 cents and :)12. 00 one year ago. Egg prices
sho\-m relate to Georgia produced hatching eggs whether bought on confract or otherwise.
Weighted average prices from the Federal-Sta:te Narket. .Nevrs Service for broilers during the week ending September 27 are as follows: Georgia broilers 2 3/4 - 3 3/4 pounds, at farms 15.04; FOB plants 16.00.
(See reverse side for other states)
- --
ltTeek .
-End-in-g--.
GEORGIA CHICK PLACEMENT BY vJEill(S
--
- - JULY 26 THROUGH S-E-PTEMB-ER 27
-- --
. EGGS SET 1,/
- -- 1957
1958
-- - Thousands
1958 %
:-of 1957 .. Percent
- - CHICKS PI~CED FOR BROILERS
1957
1958
-
1958
%
of 1957
. Thousands
Percent
July 26 Aug. 2 Aug. 9 Aug. 16
7,837
8, 040
103
7,405
7, 874
106
7,473
7,438
100
1,350
7,032
96
5,944
6,204
104
5,957
6,018
101
5,799
5,819
100
5,644
5,717
101
Aug. 23
6,726
6,758
100
5,507
5,360
97
Aug. 30
6,689
6,553
98
5,424
5,093
94
Sept. 6 Sept. 13
6, 739
6,618
98
6,688
6,988
104
5,269
4,879
93
5,057
4,648
92
:sept . 20
6,623
7,075
107
4,832
4,573
95
Sept. 27
6,803
7, 030
103
4,876
4,602
94
- . 1/
Includes
- ---
eggs set
-
-
by hatcheries producing
chicks
for
hatchery
supply
~
flocks.
ARCHIE LANGLEY Agricultural Statistician In Charge
W. A. WAGNER Agricultural Statistician
.
STATE
l'1aine Connecticut Pennsylvania Indianc:. Illinois r.'Ii s s o u r i Delaware Maryland Virginia \\fest Virginia North Carolina South Carolina GEORGIA Florida Alabama Mississippi Arkansas .. Louisiana Texas Washington Oregon California
TOTAL 19.58 TOTAL 1957 1958 76 of 1957
~*" Rev1.-sed
!.
- EGGS SET AND CHICKS PLACED IN CONMERCIAL AREAS. BY \>JEEKS
19~8
v/eek Ending
Sept.
13
Sept. Sept.
20
27
EGGS SET - THOUSANDS
:
1,190 1,17.5 1,270 1,698
303 1,418 1,840 2,427 1,917
297 3, 056
5.51 6,988
336 3,012 2,239 3,0.51
425 2,578
338 252 1,258
1,391 1,063 1,048 1,707
298 1,390 1,895 2,395 1,882
287 3,093
568 7,075
368 3,157 2,235 2,9.58
435 2,760
367 261 1,099
1,.58.5 '1,091 1,199 1,602
2.59 1,325 . 1,714 2,1.53 1,836 .
234 3,030
59? 7,030
376 3,177 2,164 3,012
419 2,534
307 261 1,091
37,619 34,691
108
37' 732 36,996
33,883 32,9.51
111
112
July
Aug.
Aug.
Aug.
Aug.
Aug. Sept.
26
2
9
16
23 I 30
6
CHICKS PLACED - THOUSANDS
1,1.57 1,1.5.5 1,142 1,180 1,124 1,071
.592
.548
.5.57* 603
6.57
623
I
9.52 959
9.53 903
895 993
924 880
827 851
940 886
173-l'~
156
179
210
194
180
769
704
7.55
728
671
643
1,928 1,935 1,929 1,907 1,668* 1,7.59
1,97~ 1, 921~~ 1,795* 1,83H- 1,853* 1,798
1,391 1,361 1,329 1,374 1,301 1,163
6.57
624
669
649
6.52
639
2,699 2,65.5 2,660 2,493 2,478 2,395
397
349
366
363
346
337
6,204 6,018 5,819 5,718 5,360 5,093
219
2,95.5 2,037 3,074
456 2,406
J.~20
161-l*" 1,081
233 2,800 2,041 2,979
438 2,353
313 156
1,()90*
224 2,748 1,910 2' 934~*-
443 2,283
388 179
1,049
192 2, 753 1,813 2,778
39Z 2,196
374 205
978~*"
200
171
2,571 2,417
1,695 1,649
2,816 2,587
457
373
1,948 1,869
359
344
165
125
905
824
-
32,663-:t- 31,685-l!- 31' 2 4'6>'~- 30,.541~!- 29,09&~ 27,886
28,388 27,.510 27,05.5 26,625 25,934 25,490
11.5
11.5
115
11.5
112
109
1,022 600 938 870 226 . 628
1,483 t,930 1,188
537 2,337
275 .4, 879
202 2,366 1,6.58 2,381
395 1,898
359 168 . 878
27,218 2.5,228
108
Pa_ge 2
Sept.
13
Sept.
20
Sept.
27
1,070 .536 7.58 864 142 583
1,566 1,763 1,138
589 2,341
321 4,648
215 2,391 1,553 2,283
400 1,740
3)~2
176 916
878 .513 692 7.52 180 552 1,371 1, 714 1,015 497 2,329 292 4,573
151 2,293 1,600 2,165
3.55 1,618
249 193 821
1,009 .5.51 680
732 152 495 1,450 1, 789 1,059 423 2,2h.5 332 4,602
178 2,239 1,649 2,242
309
1,1~69
287 175 829
26,335 2.5,028
105
24,803 24,298
102
24,896
24,134 103
-
3;s
AGRICULTURAL EXTENSION SERVICE
. . UNIVERSITY OF GEORGIA AND THE STAT. E.DEPARTMENT OF AGRICULTURE
Athens, Georgi~
U.S . DEPARTMENT OF AGRICULTURE AGRICULTURAL MARKETING SERVICE 319 EXT.NSION BLDG., ATHENS, GA.
October 6, 1958
FARN PRICE REPORT AS OF SEPTEivJBER 15; 1958
GEORGIA: The All Conunodity lndex of Prices Received by Georgia farmers declined
.
one point during the month ended September 15, !958. The index at 264
percent of its 1910-1914 average is now six points above the level of a -year
earlier~
The All Crops Index remained unchapged from the previous month at 280 percent of its 1910-:1914 average ' during the month ended September 15. Farmers received a hisher price for their cotton due primarily to the above average qual1ty of the cotton marketed. Corn pric es. declined as the marketing of. net-J crop corn began.
The .;L;ivestock and Livestock Products Index declined one point during the month to 230 percent of its 1910-1914 average. Compared to .a year ago. the current index is six percent (13 points) higher. Principal contributors to the decline were lot..rer priqes for hogs and chickens. A sununary of thes e indexes witn comparisons is shown on the reverse side.
UNITED STATES: The Index of Prices Received by F.armers rose tt-Jo percent (7 .points)
tb .'258 percent of its. 1910-14 average during the month ended September 15~ ~rimarily responsible for the increase _were record high pric~s forr grapefruit, near record prices for oranges, and increases for beef cattle, eggs, milk, and' cotton. Partially offsetting were lower prices for hogs, chickens, and
corn. At mid-September the index vms nearly 5 percent above a year earlier.
The September 15 Index of Prices Paid by Farmers for Conunoditi es and Services, Interest, Taxes, and Fann Hage Rates, at 305, was 1 point (1/3 of 1 percent ) above a month earlier and 3 percent higher than a year earlier. Prices of most farm produ~tion goods advanced from August to September but prices of family living items averaged the same.
The more rapid advance in farm product p_riqes during_the month lifted the Parity Ratio 2 percent to 85. It also was 2 percent above a year earlier.
Index 1910 - 14 .. 100
Sununary Table for the United States
September 15, August 15,
1951
1958
September 15
Reco!d high
1958
:Index ~ Date
Prices Received
245
251
Parity Index 1./
_g/295
304
258
313 Feb.l951
305
306 2/At:v.l958
Parity Ratio
83
83
05
123 Oct.l946
_;!/-P-r-ic-e-s--P-a-id--, -I-n-t-e-r-e-s-t-, -T--a-x-e-s,--a-n-d--vT-a-g-e-R--a-t-s--b-a-s-e~d--o-n-d--a-ta--f-o-r--th--e-i-n-d-i-c-a-t-e-d--( dates. . _g/Revised. )./ Also May 1958.
I
ARCHIE LANGLEY Agricultural Statistician In Charge
.RAYNOND .R. HANCOCK Agri'cultural Statistician
-
1UNIVERSITY Of GiORGIA '
OCT 15 '58
UB RARI ~S .
CCl.,1MODITY . l.ND WIT
PRICES Rl!:CEIVED BY FA~AE RS SE P'IEMBER 15, 1958 WITH COMPARISONS
GE!ORG~
. . __.. ._
Uti'IED ST.ll.TE''S ..
I Average 19l0-l4
1
Sept.lS,
Aug ~lS,
sapt.15,
Average 1 sept.l51 Aug .l5
1957
1958
_ 1958. _... 1909-14
1957
1958
" Sept.lS . 1958
'fuea.t, Bu.
$ .. 1.23
1.94
1.88 1.88
.sa
1.96 1.64 1.69
corn, .Bu.
$
.91
1.25
1.52 1.24
.64
1~15
1.18 i.13
Oats, Bu.
$
.67
Irish Pot.,Bu.,cwt.$
1.13
S\'l'eet Pot. ,Bu. ,Cwt .$
Cotton, Lb.
~.1
cottonseed, Ton $1
:I Hay,all(ba1ed)Ton
Hogs, per Cwt.
. 84
12.1
23.65
-
7.36
.87 3.00 5.10 33.3 54.00 25.10 19.30
.85
2.80 5.00 .34.5 49.00
26~00
21.40
.91
-
. 4.75
35.6
50.00
25.80
20.40
.40 1.14
1.60 12.4 22.55
- .
7.27
.60 1.73 2.97 33-.0 53.20 18.20 19.10
.54 1.29 3.73 33.2 47.60 17.20 21.10
..56 1.23 2.74 34.5 45.50 17.60 20~00
Beet Cattle, ewt. $ Milk Cows , Head $
3.96
33 . ~85
13.50 115.00
18.10 18.10 155.00 160.00
5.42 4 8. 0 0
17 .70 21.40 22.20
171.00 212.00 217 .oo
Chickens,Al1,Lb.
Eggs, Doz.
13.3 21.4
17 .o
47.4
17 .o
42.0
16.0 I
44.0
11.4 21.5
17.1 40.3
17.4 36.9
:).5.8 41.0
Butterfat, Lb.
25.8
51.0
50.0 50.0
26 .3
59.3
57.7 58.5
Milk {w~lesale)
per 100 if
$
2.43
Soybeans, Bu..
$ -
Pea.n. uts, Lb.
~
5.2
!/Revised y Preliminary
!./
6.04 2.25
I
! 10.5
1/ .. . 2/ .
- .5. 55 - 6..15 I
-. '
2.10
il.O 10.5
1/
1/
2/
1.60 . 4.46 - 4.06 - 4.29
-
2.13
2.:1:.1 1.98
4.8
10.5 n.o 10.5 J
-
INlEX NUMBERS OF PRICES RECEIVED BY F.ABMERS IN GEORGI.Ii.
(January 1910- December 1914 100)
Sept.l5, Aug .l5, Sept.l5,
r-------------- -----195-7---19-58---19-5-8 --I
1
All Comnodities
258
265
264
lul Crops
277
280
280
Grains and Hay
149
162 149
Co t ton Lint
274
284
293
Pe a n u t s
202
211
202
Tobacco
449
443
443
Cottonseed and Soybeans
224
204
208
. Irish Potatoes & Sweetpotatoes
264
259
248
Fruits and Nuts
192
158
163
..
All Livestock and Livestock Products
217
231
230
Meat .f'..n:imals Poultry and Eggs
294 144
349 140
340 138
I 1
Dairy Products
240
228
242
----~---------------------------------
. 'PRICES PAID BY FARI;ERS FOR SELECTE D EEEDS SE F'lEMBER 15 1 1958 YTITH _CC!VJ?!.,RI.~ONS },I
KIND OF FEED
~O ilGIL'.
Sept.l5, Aug .15,
1957
1958
I Sept. 15, 1958 --
lN I TED STATES
Sept. 15, Aug . 15,
1957
1958
Sept. 15, 1958
Mixe_d Dairy Feed
All Under 29'fo Protein 16% Protein 18% Protein 2~ Protein 24'fo Protein
3.90 3.85 .
4.00 4.00 4.30
4.00 3.90 4.30 4.15 4.50
D-Gl-la-rs Per 100 Pounds
4.00
3.67
3.90
ri 3 .62
4.30
3.60
4.10
3.86
4.40
4.00
3 .70 3.64 3.62 3.95 4.(17
3.65
3.58 3.59 3.90 4.02
H~~h Protein Feeds
Cottonseed Meal Soybean Meal Mea.t Scrap
3.45
3.80 4.55
3.95 4.15
3.85 4.15
3.77 -3.92
4.85
4.00
4.57 6.07
3.96
4.36 6.37
Grain BI-Products
Bran Middlings Corn Meal
3.20 3.40 3.45
3.30 3.50 3.40
3.15 3.40 3.40
2.75 2.86 3.33
2.71
2.88 3.39
2.68
2.82 3.34
Poult!::,l Feed
Broiler Growing Ma. sh Laying Mash
Scratch Grains
s.oo
4.80
4.30
5.20 4.95
4A5
5.20 4.90
4.35
4.89
5.11
5 .. 0 6
4.41
4.58
4.50
,. /
3.98
4.00
3.96
Ha.I (Baled )
Alfalfa All Other
47.00 36.00
!/ As reported by Feed Dealers
40.00 35.00
40.00 31.00
li 29.60 ~ 27.90
28.20 27.00
28.30 26.70
AGRICUL. TURAL EXTENSION SERVIC .~
UNIVERSIT Y OF GEOFtGIA AND -rtiE .
STATE DEPARTMENT OF AGRICULTURE::
I:_<'\
t
h
A \, ~
ns.,
~ ' ,
.G
e
o
r
g
.
i
a
-
,. "' . .
.. ' . .
' ~' I
., .(
.: ... ,.
u.s . OEPARTME:NT OF AGRIC:UL.T URE
AGR lCULT LIRAL MARKETING SERVICE 319 EXTENSION Eli..DG. , . ATH~NS, GA.
: . uctober .8,. 1,958.
1>
I.
. GEORGIA :ccTTGN REPCRT A'u op CCTOBER 1
a ATTJENS, GA., October 8--Pr.ospc ets on Octo oet 1 indicate Geor gia cotton
crop of 3.50 , 000 bal e s (.500 pcunus gro s s 1r1eight ) , a ccording t u inf'o r1:1ati on r e -:-: . port ed by crop corr espondents ~o..t l1e Gc o.r gia . Crop- Eoporti ng &ervice . 'T}Jis i~;
ure i s '30 , 000 'lYa:_les above; the September 1 e s t imatP. , o u t 66 , 000 bale s below t.ivJ
19)7 producti.on 'of 396 , 000 bD l es .. Indicat ed y ield of lirJt ,pe r ac.;re of h2~ .
~-. pouD.q_s .:ls a tecGrd hj_gh fo r t-he~St8~te ~ .Tl1e pr<:-Vi :.. u,s~ hir;h . ~l.as .376. pounds i in 1755 .
Hecord y i e lds , are b ei ng llarve$.ted in all arr.Elo.. ...,,
.... . lritll ather conditions t-re r e v P. r y f~vorahi'e rlur:i.n .; [: eptemh 8r f ()r l_lartestin r: op -
er ati9ns and good pr-ogress \fa s made :i.n all .srer1s . .i!or0 t l1an ')0 pcr'"' e nt of tl1e
crop had been ginn-3d in s outhern distr i~ -:-J s prier +,o Oc tcber 1; 60 ~q p , ~~<; Mt
~n th e centra], ar ea;. and ab r.:ut 50 p er cent i n t he 1.10rthern distr i cts . ,I1e:D<I:t;'~s
indicate th~ qua l ity. (,f t he cru"p he> s h ~H3ri u nu su aJl,y ,rood irf mc st cq nt~ c~~ .
.,
,, ,
~ r.
' 1'l1e unusually fav ora,blr. \JIJ'ctl",<:r has enabl f'd .f arme rs to .'i ,arve s t r:oq_t .p f ... .
d
: '
'
...
:
f>
ttwir cotton this ye?.r v;j_t h a winimum lc' s~ rf lint ar. .:: qual~~ty . . Tlo,A:::e. .;f)..c~,ors.
hc~v:e contribut ed mat'er j_?lly t o t.he j_ncreast~ i n t11e estima t ed producti cn from
320' 000 bales on .S eptemb er 1 to 35 I 000 b ?. l r::s Oil October 1.. .'
'. > ' . ,. ,, I
.
(
.. .' . 1)ur eau ~f Cen su~ ginnings t ~ C. ctober .. l 1rmre 2?FJ , 000 runfi.WG b~1~~ ~: ~91~9~~-~d .
wiyli t~ 'r8 , ooo ;}ile sam~ . dat e la st . s.easnn arid .376 , 000 be l es j_n ,1956 . , , .......... .
1
.. '.
eft..B.L o. Dc~~s ct1ER .
. ,
.
: ft. ~ , . s .. . .. ~
AR CHil~ LMJGJ.J~Y
J.l.gr01Atural "uta't,j_ ~ ticiah
\I= .
l.
-''~~ricultural Statistic ~~r; -~n. ,C.[tar gE;
. . ........ . '.
-
.
.,
'
...
.,.
......
. ~
. .~ .. . ....
\ - .~958-l7 , ~qal Non-cotto~..r
19.5 6 production indi cated on
C'ctober 1.
" p
1 9c.: 7-2 c- 00
-"'" . . . ."T" .....:.... .
_.)
_::;> J
'
I
\ 1956 - !il,oo ... .....-........:. .:
\
19S3 - 3.50 , 000 . I.
:):,~ :
Ir'I
1957 - .-b6 ' 000 :
,
I
. 19.58- 1), $90. \ _ .
19S6 .;: 579 , ooo
. . .,,
19)7 - 20 ' 000
. . i '
. R01E
1956 - 36 , 000
ELJP;F . ON
.
19SH-l , ao
\. '-dJ--l''y \ ~
-:-- A'I'LANTA
AT''ENS 1957 - 2?. , 0
-
/
\ (
v
19 J 6 -~::0~ -
. . Districts . sl~own are Cr.op
Pepofti np, Dist ri. cts and NC~ CcnFrt:'ls sir)I18.l Di stricts .
,
. <
r
\
')
, .
\
VI
1
' 1958-26,:0 ( . . y
. \.'. A :JG.1j'.'l'A . , .r .
r \i~~~=~~:ggg
1
MACOtl
. i~~t~~;6gg
l \ \ ~958- 54,5oo / 1956-?4,mo
CC LU.-IBUS
19.57 - 67 , 000 19S6 -lo9,ooo
~tl___
\__
I \
~) "" I --'\----'",/~
V' """-1
~AVA,'JN~j)
VII ALJAWf
VIII
(
ri
1958 19.57 -
8o
') 0
,ooo
,000
I 1.
IX
l!,./
1 9.58-ls,ooo ?;
19.5 7-12,00() ~I
19.58-56,500
1 9.56 - 108,000\
19)6 -16 , 000 ~,.:/
1957-55,000
_\_\L 19-.5_6_-7_.5_0,_00--l_ _:v=ft_LD=C=;S=TA:_
-
f_ji( c)
UNIVERSITY OF GEORGIA
\ '
OCT 1 j '58
UBRARI~S
UNITED STATES - COTTON REPffiT AS OF OCTOBER 11 1958
The Crop Reporting Board of the Agricultural Marketing Service makes the following report from data furnished b,y crop correspondents, field statisticians, Bureau of the Census, Commodity Stabilization Service, and cooperating State agencies. The final outturn of cotton compared with this forecast will depend upon whether the various influences affecting the crop during the remainde:r of the season are mare or less favorable than usual.
1
: A~:~e
:
:-
~
-~Lei!n'tty!,ied_lda,p2re!r
I
___ !
?:0_2-lP?r_ood~ u!fc"ti.oS!n!
y
!!e!g!:t_b_:~~
State
;
harvest
1958 .1:!:/,
19~7-?ot
1averages
I
:
1957
s
1
1958 :1947-56 1
indic. :average t
1957
1
I
t 1958 a indice
t
I 1,000
I
I
: s
~
- Pounds -
- 11 000 bales -
~.c .. : 270
$.c.. : 355
324 321
409
441 231
306 329
41~
628 344
230 305
Geargia s 398
276 333
422
681 396
350
'fennessee : .410
383 427
515
583 415
440
~1abama : 544
307 346
384
884 530
435
1-Jiss : 1,145
389 388
453 1,759 1,081 1,080
:
~o' 300
Ark' 1,030
Iqtksla==
375 420
400 281 374 4l6 389 380 175 234
496
399 179
466 1,458 981
397
639 348
343
374 263
310 1,000
310 300
Texas . .: 5,380
222 295
366 3,937 3,632
4,100
New ~: 178 Ariz : 384
Calif : 733
other States
J!..
: z
38
:
573 619 777 1,037 714 1,035 300 316
742
1,075 1,080
384
269
687 1,348
49
236 763
1,537
28
275
860
1,650
30
u. s .: ll,96o
. . Amer..
Egypt 1!1 : :
317 388
426 485
469 14,136 10,964 ll,675
81.9
79.4
}/ September l estimate.
'/ Production ginned and to be ginned. A 500-lb. bale contains about 480 net
pounds of lint.
'J/ Virginia, Florida, Illinois, Kentucky, arrl Nevada.
lJJ Included in State and United States totals. Grown in Texas 1 New Mexico,
Arizona, arxl California
CROP RE.P<RTIID BOARD
;
Ga
. _3/5
H/}91)1'/
. :.-
.~ :
i~~ (G!E(Q)JR{CGllA C~(Q)JPl JR{JEJP'(Q)JR{tllN(G ~~Vll~I
~ (7
AGRICULTURAL E~TENSION SERVICE
U.S. DEPARTMENT OF :AGRICULTURE!
. I / :/0
~
UNIVERSITY OF GE:ORGIA AND l'HE STATE DEPARTMENT OF .AGRICULTURE
BROILER CHICK REPORT FOR GEORGIA
AGRICULTURAL MARKETING SERVICE 319 EXTENSION BLDG.; ATH~~. GA. ;
Octob~r 8, :1958 \ :
ATHENS, GA., October 8-A total of 4,927,000 broiler chicks were pla~ed
with producers in Georgia -during the week ending October 4, according to the
Georgia Crop Reporting Service. This compares with the 4,602,000 placed the
previous week and is two percent more than the 4,838,000 placed -the same ~eek
last year.
E~gs set by Georgia hatcheries amounted to 7,110,000 compared lvith . : .
1,030,000 the previous week and is nine percent more than the 6,522,000 for the
corresponding week last year.
.
.
; .
' Hatcheries reported prices paid for hatching eggs duri.ng the week at ;an average of 67 cents per dozen. Average price charged by hatcheries for .th~ chicks was reported at ;n1.00 per hundred. These prices compare ~ri.th 67 cents and ~:~11.00 last week and with 70 cents and ~)12.00 one year ago. Egg prices shown relate to Georgia produced hatching eggs \-1hether bought on contract or otherwise.
1~Teighted average prices from the Federal-State 11arket Ne"t-TS Service for broilers during the week ending October 4 are as follows: Georgia broilers 2 3/4 - 3 3/4 pounds, at farms 15.46; FOB plants 16.41~.
(See reverse side for other states)
.
'Peek Ending
GEORGIA CHICJ~ PLACUW:NT BY HEEKS
AUGUST 2 THROUGH OCTOBER 4
f
; ~--
EGGS SET 1,/
1957
1958
Thousands
19581i. of 1957 Percent
-
-.
CHICKS PlACED FOR BROILERS
1957
1958
Thousands
I
..
1958%
of 1957
Percent
Aug. 2
Aug. 9 Aug. 16
Aug. 23 Aug. 30 Sept. 6
Sept. 13 Sept. 20
Sept. 27 Oct. 4
7,405
7,473
1, 350
6, 726 6,689
6,739 6,688 6,623 6,803 6,522
7,874
106
7,438
100
7,032
96
6,758
100
6,553
98
6,618
98
6,988
104
7,075
107
7,030
103
7,110
109
5,951
5,799 5,644
5,501
5,424 ),269
5,051
4,832
4,876
4,838
6,018
5,819 5,717 !
.. 5,360 ' 5,093
4,879 ~. , 648
4,573 4,602 4,927
101 100 101
97 94 93 92
95 :
94 102
-- - 17Includes
eggs
set
by
hatcher~es
producing
c-hicks
-
for
hatchery
supply
flocks.
' ,
ARCHIE LANGLEY Agricultural Statistician In Charge
\rJ . A. HAGNER Agricultural Statistician.
UNIVERS ITY OF GEO RGIA'
OC1 1.J '58
...
UBR AH I ES
l
STATE
}'iaine Connecticut Pennsylvania Indiana Illinois Missouri Delaware Maryland Virginia \~Jest Virginia North Carolina South Carolina GEORGIA Florida Alabama .lis s i s s i p p i Arkansas Louisiana Texas Hashington Oregon California
TOTAL 1958
TOTAL 1957
1958 %of 1957
* Rev1. .sed
I: : Sept. 20
-- -
EGGS :s ET AND CHICKS PLACED IN COMMERCIAL AREAS, BY 1-JEEKS - 1958
Week Ending
I Sept. I Oct; .
27
4
ll
I'
Aug.2
Aug.
9
Aug. 16
Aug, 23
Aug. Sept.
30
6
Sept. 13
EGGS SET - THOUSANDS
-
CHICKS PLACED - THOUSANDS
1,391 1,063 1,048 1,707
298 1,390 1,895 2,395 1,882
287 3,093
568 7,075
368 3,157 2,235 2,958
435 2,760
367 261
1,099
1,585 1,091 1,199 1,602
259 1,325 1,714 2,153 1,836
234 3,030
597 7,030
376 3,177 2,164 3,012
419 2,534
307 261 1,091
1,404 1,096
897 1,523
230 1,304 1,670 2,071
1, 71.5 229 :
2,951 531
7,110
328 3,104 2,185 2,945
405 2,423
347 213 1,087
1,155
548
953
!
903 188*
I 704
I
I
1,935
1,921-ll-
I 1,361 62)+
2,655
381* 6,018
233 2,800
2,041 2,9"79
I 438 2,353
313 156
1,090-l!-
1,142
551* 895 993 179
755 1,929 1,795* 1,329
669 2,606*
413* 5,819
22~
2,748 .1,910 2,934*
443 2,283
388 179 1,049
1,180 603 924 880 210 728
1,907 1,831* 1,374
649 2,493
384* 5,718
192 2, 753 1,813 2,778
392 2,196
374 205
978-lf-
1,124 657 827 851 194 671
1, 668~!1,853-:f1,301
652 2,478
36&!-
5, 360
200 2,571 1,695 2,816
457 1,948
359 165 905
1,071 623 940 886 187-lf-
643 1,759 1,798 1,163
639 2,395
361* 5,093
171 2,417 1,649 2,587
373 1,869
344 . 125 824
1,022 600. 938 870 226 628
1,483 1,930 1,188
537 2,337
309* 4,879
202 2,366 1,658 2,381
395 1,898
359 168 878
1,070 536 758 864 142
583 1,566 1, 763 1,138
589 2,341
321 4,648
215 2,391
1,553 2,283
400 1,740
342 176 916
'
sept. 20
'878 513 692 752 180 552 1,371 1,714 1,015 497 2,329 292 4,573 151 2,293 1,600 2,165 355 1,618 249 193 821
Page 2
..
sept.
Oct.
27
4
1,009 551 680 682* 152
495 1,450 1,789 1,059
423 2,245
332 4,602
178 2,239 1,649 2,242
309 1,469
287 175 829
1,103 43J 767 760 202
.567 1,601 1,674
956 563 2,351 313 4,927
144
2,382
1, 723. ~ - . 2,405
371 2,"023 . 247 .
123 871
37,732 33, 883
111
36,996 32,951
112
35,768 32,280
111
31, 749-l~ 27,510
115
I
II.
31,239* 27,055
115
. .
30,562-)l26,625
115
29 ,118-lf25,934
112
27,917* 27,252* 25,490 25,228
110 . 108
26,335 25,028
105
24,803 24,298
102
24,84~
24,134 103
26,"506 24,675
107 -
0,..
I
~t;
I
' .,
rGJE(Q)~CGllA C~O~ ulft!f?~
AG-RICULTURAL EXTENSION SERViCE UNIVERSITY OF' . GE~GIA AND THE
-oc1 i 4 '58
STATE DEPARTMENT OF AGRICUL1'URE
Athens; Georgia
U .S. DFPARTMENT OF AGRICULtURE
AvFHCUI..ruRAL MARKETING SERVICE
319 EXTENSION EH.OG., ATHENS, GA . ..
O.ctober 13, 1958.
I. I
icREAcm AND iNDICATED PRODUCTION
October l, 1958
UNITED STATES: Production of vegetables this fall is expected to be larger than in 1957 and above average, the Crop Reporting Board anno~nced
today. Estimates prepared as of _09tober l, which account for over 95 percent of
the production in the fall seas9n, indicate a total production J pE:Jrcent above . last year. Early fall cabbage, ~ith a larger acreage as well -as better yield
:-_prospects, accounts for a large part of the increase over last yea:r_. Substan:-
. tial increases ' i.n production are also indicated for carrots, cauliflower, s-weet
;corn and tomatoes. These increases were partially offset by expectEid declinfJ.s
in the production of celery, lettuce, Brussels sprouts, snap beans and'peppefs.
'
~ '.
"
:
' ' I
'
:, :.:_ . : The main weather factor affecting progress of vegetables during' September
Lwas ~ple rain -vJhich favored rapid growth of crops. Practically all areas of
' the nation received their normal amount or more during the month. The only seq-
- tions short of moisture were some spots in the Carolinas and .Virginia., ana. this -:condition was remedied by rains early in October. On the o~l1er hani:l, narvest _
'Was -.-hampered, cultivation and insect control hindered and quality. 6f ' some veg e-
.tables were lowered. Planting of late fall and winter crops >\ras delil.ye<L
Unseasonably warm weather in the \Vest , particularly in California and soi.l~hwes~. ~ tern_ ~tates, _ speeded t;he maturing .of .cro_ps. Ample sUpplies of most 'vegetables
have been available in California, but shipments of several crop_s :were l:i:gh't _.due
to poor market demand. ~ome lettuce production wa's . iost in New Hexico because
of heavy rains. Over 2,000 acres of fall lettuce were abandoned in the yvilco~:
Arizona area due to damage from heat, rain, and hail. Extremely heavy raiQs -in
so:uth 'l'e:J;t:a.S hindered farming operations c<:>nsiderably._ Cultivatio~ wa~ ,imposqible
- ~ many sections for a long period. . BecaUSE;! of >-reedy fields an apJ?reciable acre. ~ge - of -carrots vJas lo-st. Other crops naturally suffered some damage. . Planting
of winter crops wa.s delayed and some intended acreage of toma-t;,oes will not be . _ .set'. "bther Gulf State's had heav;f rains and eA.'Pected production as w-ell as
quality were lowered. For the remainder of the country v ery little aeia:ge was
actually lost from raj_n damage . Planting and growth of fall and winter v'egeta-:-:
'.b~es in -.Florida are making reasonablY: good progre ss .
SHEET CORN: Fall production in California and Florida is forecast a~r86,ooo cwt .,
.
31 percent above the 1957 crop and almost douhle average. Most of .
the increase is due to heavier plantings in Florida . ~Iowever,- acre age' 'in Ca:li.:.
f'a.rnia is also above last year. Abcl1.!t .. 95 "pe.rcent of Florida's {all crop ac:r.eage i _s _..~n. the. Eyerg~ade$,_ q.I)d_ progress . of .crop.s . is . .generally . ahead of normal. Har-
vest was expected to start October 6-10 and supplies will be available in good
volume the latter part of October. In California, harvest got underway the
iniddle of September in the Kern Cour1ty distri ct , and some .production was available
from the Visalia area the last we ek of Sept ember.
CUCUMBERS: Early fall production is no-v; for e cast at 501,000 cwt ., 5 percent less than last year 's production but nearly a third more than average.
In Virginia, cucumbers a.re moving in volume from the Eastern Shor e . Quality has been good . Dry weather durj_ng September wa s detrimental to unirrigated fields but early October rains will b enefit the crop. 'l'he ~outh Carolina crop is reported to be in good condition. Rains at the beginning of October relieved the moisture shortage and damage is expected to b e slj_ght. Movement is underway and
quality is good. In Louisiana , heavy rains in Snpt ember resulted in considerable rot and extensive blight damage to plants. Light mov ement Hill continue into
November , but no appreciable volume is expe cted . In C~lifornia, supp lies are
declining seasonally. Most production will go to local markets.
LETTUCE: Early fall lettuce production is for e cast at 4,805,000 cwt ., 14 percent below 1957 production and 19 p ercent l oss than average. In
California, a sluggish market has discouraged movement from the Santa Haria and Ventura area. Sizes arc running to tho small side in tho Salina s-\vatsonville area. Hovoment from the Santa Maria and Salinas-vJ.atsonvillo are a is declining. Harvest in tho P'atterson-Tracy area started September 25 , and supplie s are also available from tho Oxnard and Santa Ana areas . Production in the Kern County district is expected to got underway about October 20. In the Texas Panhandle, harvest started the middle of September and supplies were available in fairly good volume the first of October. Supplies will increase the first half of October with movement extending into No vember unless terminated by killing frost.
ARCHIE LANGLEY Agricultural Statistician In Charge
(OVER)
L. H. HARRIS,JR. Truck Crop Estimator
. .... ..
~' '
.' .
:. .,:
. ~ :-,.
! ; . I ." . .
Abreage and Indicated Pr~dtiction Reported to Date, 19.58 with. Compariso.ns ..
..
" ,
" ,
I
.. . !
CROP
ACREAGE FOR HfiliVEST
YIELD PER ACRE
PRODUCTION
l I I AND ' STATE
Avcragfj 1949-.56
19.57
Ind. Av. I 19.57 Ind. Average j19.57 Ind.
19~8 49-.561
19.58 1949-.56
I 19.58
- Acre s - '
;.. Cwt ... -
- 1,000 cwt.
CABBi..GE 1/
Early Fall:
New Htmpahire . 370
300 280 1.54 170 170
57
51 48
lVIas sachusetts . 1,190
900 9.50 163 160 190
Rhode Island 180
100 130 1.53 120 180
Connecticut 760
7.50 7.50 164 130 18.5
New York,. LI 1,180 1,200 1,100 211 ,, 240 240
194 ' 28 .125 . ' 246
144 180 12 . 23 98 . .],39 288 ... 264
New York;Upst.
Domestic ; 7,320 .5,600 . 6,000 287 310 3.50 2,096 1, 737 . 2)100
Danish. 10,320 8,000 7,800 244 232 300 2,.506 1,8.56 2,340
New Jersey 2,040 2,050 1,900 1.5.5 194 190
31.5 398 361
Pennsylvania 1,740 1,300 l ,Soo 18.5 18.5 210 Ohio . .. ... 1, 950 1, 900 2,100 226 288 300 Hichigan 4,1L.O 4, 280 4,500 181 186 190
322 240 . 3iS 447 .548 . 630
7.50 796 . 8.55
Wisconsin . 8, 310 6,300 6,-soo 242 26.5 270 2,014 1,668 1,7.5.5
Minnesota 1,6.50 1,100 1,000 190 170 225
315 187 225
Idaho & Utah 640
590 610 316 341 274
200 201 167
Oregon ~ ... ... 1,790 1,900 lz900 188 19.5 180
334 370 342
Group Total. 43,)80 3o,27o 37,0~0 228 237 253 9,950 8,594 9,744
~WEET CORN : Fall: . Florida 1,910 6,200 . 9,000 so 6.5 60
California 2,860 2,300 2,900 63 8.5 8.5
Group Total 4,780 8,Soo 11,900 58 70 66
106 403 -540 183 196 246 289 .599 . 786
CUCUMBERS :
Early Fill:
Virginia 2/. ~~. 2,100 3,100 2,400 46 4.5 4.5
South Carolina 820
Boo 1,000 68 85 85
Georgia ~ 520
400 300 2.5 22 27
Louisiana ., 880
700 soo 42 35 2.5
Ca1i:J6u~nin~ ...... . ' 1,360 1,600 1,600 178 180 180
Group Total. 4,370 . 6,600 .5,800 89 . 80 86
~/ Includes processing. ~/ Short-time average .
n. .. :1:4o 108
57
68 8.5
13 -
9. 8
38
24' . 12
243 288 288
38.5 529 : SOl
. .. ~ .'. ;
. .
., .
! .. ~
: I
,'f:i9 (' <GJEOJR{CGllA CC!R{(Q)jp) ~~14Q)~1rllNG ~~VllCCIE
3 AGRICULTURAL EXTENSION SERVICE ..
J UNIVERSITY OF GEORGIA AND THE STATE DEPARTMENT OF AGRICULT~RE
Athens, Georgia .
of"''t
lll
l
6
, 58
.UB R!\RJ~s
u.S. DEPART-MENT OF AGRICULTURE AGRICI.JLTIJRA!.. MARKETING SERVICE 319EXTENSIOH E:JLDG . ; ATHENS, GA.
Octob~,r 13, 1958
GENERAL CROP REPORT FOR GEORGIA AS OF OCTOBER 1, 1958 '
Georgia fanmers are breaking all previous record high per acre yields this year for most major crops. Present indications are that corn, cotton, peanuts, tobacco, wheat, barley, ry~ and -all hay per acre yi~lds t~is ye~r will . be the highest of recotg. Practically all areas of the State have had an unusually . favorable growing season for most crops. The months of August and September .were unusually favorable for harvest activities, especailly the harvest of cotton, . peanuts and early corn.
CORN PROSPECTS UP: ._ Georgia 1 s 1958 corn crop, current 1y estimated at 84,040,
000 bushels, _will be. the targest ever produc_e_d_in the
State. This is an increase of approximately three million bushels . over the ::
September 1 estimate and is about 13 million bushels more than the previous high
production of 71,188,000 bushels produced in 1957. The yield per ~ere is current-
ly estimated at 31.0 bushels which is five bushels higher than the previous
record high yh~ld .of 26,0 bushels harvested . in .1957.
RECORD PEANUT YIELDs: Peanut product ion in Georgia is now estimated at
599,250,000 pounds, an increase of four percent over
r
last month's estimate of 573,750,000 pounds. The current production estimate is 29 percent above 'the 464,100,000 pounds produced in 1957. lndicadons are that
Georgia farmers will harvest a record high per acr~ yield of 1175 pounds which
is 85 pounds hig.her than the previous record yield of 1090 pounds. produced in
1956. The acreage for picking and threshing is estimated at 510~000 acres, the
same as .last year.
PECAN PROSPECTS DOWN: The October 1 estimate for all pecans is 41 million
pounds, a decrease of two million pounds from the
September 1 estimate of 43 million pounds. The present estimate is well above
last year's short crop of 7.5 million pounds but is 19 million pounds below the
record crop of 60 mill ion pounds produced in 1956. Damage from insects and
diseases together with the hot, dry weather were the principal factors which re-
duced pecan .pfospects during the month. Production prospects ~ary considerably
between the different areas of ~he State and, also, between orchards in the same
loca 1i ty.
MILK PRODUCTION 001,/N: Milk production in Georgia during Scptember'. is estimated at 92 million pounds. This is a de~l ine of five
mill ion pounds from las~ mon.tli's production -of. 97 -.mill ion.. pou!lds a-nd is four million pounds below last year's Septemberproduction of 9.6 . mill .ion pounds.
EGG PRODUCTION UP: Egg production tn Georgia during ~eptem~er is estimated at 109 million eggs, a record high for the month. This
is an increase_of six million eggs OYer last ye9r's estimate of 103 million eggs and is well above the 10 year (1947-56)' average September production of 64 million
r eggs.
GE.ORGIA
ACREAGE YIELD PER ACRE
TOTAL PRODl.ICTION (IN THOUS. )
CROP
f( 000)
. . . . Corn . . .. .. . . Wheat
Oats
. . Hay (a 11).
bu.
. bu. bu .ton
1958
2, 711 80 315 569
Tobacco (Type 14)1b.
58
Potatoes, Irish, Cwt 4.6
. . . Potatoes, Sweet, Cwt. 13
Cotton
bales 398
Average
1 9 47-5~
I
17 .3 16.4
27.8
.68
1 ,238
46
41
~' /276
1957
1nd ic.I Average 1958 1947-56
:t:b ~u 31.0 16.5 23.0 28.0 33.0
.96 I .03 1,290 1545
49 49 46 1+9 I 1/333 l/.422
51 ,.319
-2 ,'174
11 , 684
695 122,566
320 1 , 198
681
1957
. ~ }1, 188 1,848 11 ,032 .. 550
8.1 ,270 254 644 396
Ind ic .' 1958 .
84,041 1,840 10,39.5 584
89,61 o.
225 637 350
Peanuts(for pick-
. . . ing & threshing) lb. 510
Soybeans.
, bu. 110
Peaches, tot.crop,bu.
845 '10.6
910 1175 571,760 464,100 599,250
14.0 13.0
410
1,400 1,430
2,420 2,100 4,200
Pears,tot.crop, bu
. . . . Pecans
1b.
. . . Pasture
. %
I 2/ 71
2./ 82121 78
169 37,346
86
98
7,500 41 ,000
ll Pounds. 2/ Condition on October
ARCHIE LANGLEY Agricultural Statistician In Charge
RAYMOND R. HANCOCK Agricultural Statistician
,
'J
"
' .
'
UNITED STATES- GENERAL CROP REPORT AS. OF OCTOBER I, 1958
.'. Prospects. remain generally favorable for record-- total crop production given
succe~sful har~est .of late crops. A near frostless September, even in northern
areas, aJ lowed most late fields to gain needed maturity. Heavy rai .nfaJ 1 of damagIng extent caused some los~ in crop qualfty aMd volume ~nd halted 'harvest in some ~reas- mainly in the Mid-South. The volume and quality of o~ttu~n ~rom large acr~ages of late crops also remain under weather influences until harves.t ends.
) CORN: Production of ~11 corn is iore~est at .a record 3,686 million bush~ls
up 3 percent from last month, 8 pe:rc;ent above last year and 17 percent above average. Prosp e ~ts . remained unchanged or improved during September in nearly
' al'l States. weather conditions generally favored maturity as frosts in the
northern corn area held off until the end of Se ptember.
SOYBEANS: A record productioo of 57.3 million bushels of soybeans is esti.-
mated as of Octobe r 1, an increase of 2 percent over the September fo~e~ast. This j~ , aJmost one-fifth above last year, the previous hi~h, an~ ~~arly
do. 'uble
the
., ' .
10-year
avef'age .
' 'PEANUTS: ProduG,ti~n of peanuts is estimated at 1,849 million pounds, UP, about 3 perce nt from the September 1 forecast. Improved production pros-
pects in Virginia, North Carol ina, South Carol ina, Georgia, Mississippi and O~lahoma were noted during the month. The indicated yield of 1,205 pounds per acre
.w'ill, if . it materializes, ex.ceecl by 44 pounds the previous record set in 1956 .. ,' ~.
PECANS; Prospects for the 1958 pecan: crop declined nearly 2 percent during September. The forecast at 170.5 mill ion pounds is 21 percent above
1957 arid 15 percent above average. The reduction occurred east of the Mississippi and in Arkansas, as dry weather plus Hurricane Helene Jn the Carolinas and disease in Mississippi and Arkansas took their toll.
_________________ UNJTD_SIA.IE. ________________ _
I
i
!
Crop .
Acreage \ Yield Per Acrel
.Production
.. .
1 T-- ,
.
1958 I
~o~n~ All:::::: bu:Ii ;3;?~~r .
Jndic. 1958
5o:4--
-1I3l/.\9~v#~eZr~-a36g6~eti'C
;,149g5~7~~3;ri.3~O1gg~5tg8T.12~8
Wheat, All bu . 53,650
27.0
1 1,116,21~ 947,102 ; 1,449.,498
O a t s bu l31,9-26 Cotton bales 11,960
: 44.5 ll
.469
11,293,97~ 14,13~
1,308,360I1,419.r351 10,964\ 11,675
Hayb, All f tobn ]2.,905 i .
..SPoeyan~etasn
s
,2o~
r
beans ...
. .
.
u ..
lb
231,,356~57
1
.
Tobacco . lb ~ 1,088 1
1.65 24 .5
.1205
1628
1i 105,09 1 296,29 .
!2,!1,717,0781 134,4431
121,402 120,374
479,841 1,445,110
1i'11.854792~,538856
1,660,553 ; 1,771 ;679
' 11 Pound~ Z/ Picking and Threshing
-,:~: . - - - - - -=- :- - - - - - - - - -,\11-Pe~~ns - - - - - - - - _ :.;.. - - - - - - -
. : ~tate
: - - - - - - - - - - - P r O d u c t i o n - - - - - - - - - - - - - - - - -
..-N,'-.
-
C
-. . -:. - . -.
- .:-- 1-tv-t!r-ap1go-.e1u.0ni-09C0';fI-fs7=-5"-6 -- :---- .._.. p1,.-.us,_u5 :0]n_0o0--s ----- -- T - --
--rn- c-rr-c1.a.._-t0e0-.0c.r..!l.',-).~o-~---
-
-
puunas
....--
-
:
r,rro
950
1 ,900
)
s. c.
Ga: ..
3 J 842 -37,346
1:I 100 '1,500
3 I 8QO
1
41,000
Fla.,.
4,085
2 400
4 500
iHa.
17,032
-4:ooo
26:coo
Miss.
~rk.
9,035 5, 0 14
7,700 9,200
15,000 3,500
La.
15,330
17,1 00
17,000
.. ,. .
Ok.19.
19 I 920
31I 000
16 I 000
Tex~~ . .
.
31,640
55,000
33,000 1 :
-~~..U:-~SM~_..:.e.-x. _- - ..... -_': -_
l!
_-:: _--_-_-
2 , 7 34
1-~8.-.1.-3~-7-
5 400
3 800
-_-_ _-_-_- 1-~.1..!~..3-.20-_-_ _- -_ _-_-_-_- -_ 1.-10...a.!..5'-QO-_
.;
:
._.. /_- -:_..-..:_ _...:_.-
, l/ Sho~t..:.t ime awr13ge. .
..
- ' ~
.
,. .. .. ..
. .
' '
,-. ... .
1 ... ....
. .
. .: '1 .
. J
. - :r...
.. '\ ~ '
. . ,':. .
. '
: :~ ~ ~ \
., .'
.. ,
..., ,
AGRIC 1JL.TURAL !::XTENSIOIII 5 F.RVICC:
k:, .. UN !Vr:RSITY 0"' Gf.;Ol~Gif, AtW T HF. . ol.:2_.., STATE OEPA RfMENI OF AG f< iCU'-TURE
BROILER CHICK RD:PORT FOR GEORGIA
OC1 2 3 '58
LI BRARIE S
U.S . DEPARTMENT OF AGR 'ICULTURE G.HCliLT URAL MARKE TING SE iWICE 319 EXTE NSIO.N 131.:-:::>G ., ATHENS, GJ\ .
October 22, 1958
ATIIillJ3, GA., October 22--A total of 5,002,000 broiler chicks were placed
tdth producers in Georgia during the week ending October 18, according to the
Georgia Crop Reporting Service. This compares with the 4,942,000 placed the pre.rious trreek and is two percent more than the 4,927,000 placed the same week last year.
i!.:~gs set by Georgia hatcheries amounted to 7, 234,000 compared tdth
7,248,000 the previous week and is eight percent more than the 6,708,000 for the
corresponding week last . year.
Hatcheries reported p!'ices paid for hatching eggs during the t-Teek at an . averag~ of 67 cents per dozen. Average price charged by ha~cheries for. the .
chicks .tvas reported at :;>11.00 per hundred. These prices compare vr.i.th 67 cents and .'ll . OO last week and with 70 c ents and ...>11.50 one ;>ear ago. Egg prices shmm relate to Georgia produced hatching eggs tvhet her bought on contract or othertdse.
Heighted averag-e prices from the Federal-State Narket Netors Service for broilers during the week ending October 10 ar~ as follows: Georgia broilers
2 3/4 - . 3 3/4 pounds, at farms 14. 58; FOB plants 15.50.
(See reverse side for ~ther states)
GEORGIA CHICi\ PLAC.Gl-d:NT BY 1:JEEKS
AUGtiS'l' 16 . THROUGH OCTOBER lB
~{eek . :~nding
Aug. ' 16 Aug ~ 23
Aug . 30
d lf-..--
EGGS SET I
.11. 1957
1958'
i'
I
ThOUSands
I.
l . 7,350 . 6, 726
7,032 6, 758
6,689
6,553
' il CHI~KS PLACED FOR:BH.OI~.RS _.:
1958 <" \'
T of. 195'7 j
Perc ent 96 .
. i957
i 1958 . _1958 7.i
of 1957,
1
Thousands
!Percent.
I .
5, 644
, , 717 . I 101
I 100 I 98
5,507 5,424
5,360 . 97
5,093 . 94
Sept. 6
6,739
6,618
98
5,269
4,879
93
Sept . 13
6,688
6,988
104
5,C57
4,648
92
Sc.pt. 26
I 6,623
7,075
107
4, 832
4,573
95 '
Se!)t. 27
: 6,803
7,030
103
4,876
4,602
94
Oct. 4
6,522
7,110
109
4,838
4,927
102
Oct~ 11 Oct~ 18
6,595
I 6,708 "
7,248 7,234
110
4,826
4,942
108 lI1l__4_,92_ 7 __ $,002 .
102
. 102
.'. '
1/ Includes eggs set by hatcheries producing chicks for hatchery supply flocks.
. ARCHIE LANGLEY Agricultural Statistician Il'l Charge .
1rJ. A. vJAGN::ffi ..
Agricultur4,1 Statistici'an
''
' . t.
.. ...
STATE
:Naine Connecticut Pennsylvania Indiana Illinois l-'.iissouri Delaware Har y land
~rg~n~a
\iest Virginia North Carolina South Carolina GEORGIA F!orida Alabama Mississippi Arkansas Louis:i,.ana Texas 1-fashington Oregon California
TOTAL 1958
T0rAL 1957
1958 %of 1957
*Revised
I
- - EGGS SET AND CHICKS PLACED IN COMMERCIAL AREAS t BY WEEKS 1958
'VIJeek Ending
_,
'
Oct. 4
Oct. 11
Oct. II
18
Aug. 16
Aug. 23
Aug. 30
I I I I
S&pt. j
Sept.~
Sept.
6 I 13 I
20
Sept. 27
!
Set
Oct. 11
Oct 18
I
I
EGGS SET - TIIOUSANDS
-
1,404 ' 1,096
897 1,523
230 1,304 1,670
12',071715
229 2,951
531 7,110 I . 321:$ 3,lol,.
I 2,185 2,945
I 405 2,423
347 . 213
1,087
1,502
1,037
1,2.59
1,640
267
1,235
1,752
12''
210 7. 66 271
3,002
565
7,248
390
3,118
2,068
2,990
435
2,744
339
253
1,209
1,455
1,024
1,257
1, 731
281
1,286
1,565
2,240
1 '
852 255
3,111
551
7,234
396
3, 22t~
2,126
3,005
L.63
2,818
255
291
1,166
I I I
1,180 603 924
880
210
728
II 1,907
' 1,831~~
I
I
1
'
374 649
2,493
II
384* 5,718
192
2,753
1,813
2, 778
392
2,196
374
205
97f*
.I
. 1,12~.
657
827
851
194
. 671
1,66f*
1,853.*
1 '
301 652
2,478
36~
5,36o
200
2,.571
1,695
2,816
457
1;948
359 165
905
CHICKS PLACED - THOUSANDS
1~071
623
940
886
' 187-r.
643
1,759
1, 798
1 '
163 639
2,395
361-l~ .
5,093
171
2,417
1,6L~9
2,5S.7
373
1,869
344 125
824
1,022 600 938 870 226 628
1,483
')
1,070 536 758 864 142
583 1,566
' 5307 ' 589
2,337 2,341 .309* . 321
4,879 4,648
202 215
2,366 2,391 1,658 1,5.53 2,381 2,283
395 hOO 1,898 1, 740
359 342 168 176 878 916
878
513
692
752
180
552
1,371
1,714
1 '
015 497
2,329
292
4,573
151
2,293
1,600
2,165
355
1,618
249
193
821
1,009
551
680
682*
152
495
1,h50
1,789
1 '
059 423
2,245
332
4,602
178
2,239
1,649
2,242
309
1,469
287
175
829
1,103
433 767 760 202
567 1,601 1,674
956 563 2,351 313 4,927
144
2,382 1,723 2,405
371 2,023
247 123 871
1,087 489 584 727 159 570
1,576 1,690 1 ,03 9
478 2,398
344 4,942
"""I$1
2,525 1,639 2,416
404 2,165
272 149 770
1,082
378 633 713 119 495 1,445 1,643 9 3 2 446 2,352 362 5,002
18~
2,355 1,637 2,374
423 2,126
219 141 761
35,768 37,300 31,586
32,280 32,534 33,141
.. [
111
115
113
30,562* 29,11& 27,917-l~
26,625 25,934 25,490
I 115
112 110
27,2.52* 26,335 25,228 25,028
108 105
24,803 24,298
102
24,846* 26,506 26,574
24,134 24,675 24, '2.)7
103
107 110
--
25,820 23,930
108
4-a
3/ s-
.fio?oo1
,
.
. .
r!t'IA3 CGIEO~cG-llA C~COY~- : JPliEJF.>:JIRfJfllNG 1EIRiVllCIE::
tC.,l
S'~
"'O
AGRICULTURAL EXTE' Mii CJNSERVICE UNIVE RSITY OF GF.OR lA AND THE
. UN'IVER ITV'Of GEOR~ I A S.DE. PARTME. NT OF A.G. RI.{J.;.ULT:URE GRICULTURAL MARKETING ~ERVICE
0 ol 7
STATE OEPARiMENT OF AGRICULTURE
OC13. 0 '5 8 19 EXTENSION EJL.OG ATH~NS, ~A.
BROII.ER
CHICK "REPORT~ :FOR
.
.
GEGRGIA . -~""_,..'.
.. . . c.': :.' :
. :.Pq.tobe'r 29, ::t-958..
.. !
ATHENS, GA.,. Octob~r 29--A totai' o , Q3 , 000 broiler chicks were placed l-ri.th producers in Georgia during the week ending Oc-t.ober 25, according to the
Georgia Crop Reporting Serv-i.::e. '!'his cOlJ)pares with t;he .5,002s000 . placed .the . .
preViOUS t-Teelc and __i l-four pe1:cent Jliore :tnan._th$~. 4 ;84g;ooo: plaq;d the Same week .
last year.
.: :. ,:.. ~ . . . .
.-
Eggs set by Georgiq. hatcheries amounted: to 7,239,000 compared tvith ,, .
7,234,000 the previous week and :i,.s ~ine . p~rc~nt , more tt~~ the 6.,627,000 .for
the corresi?ondi ng week last ye9-r~ .:_, ~::, : 1~'; . .~ r:, .. :
' :
:! ..
Hatcheries reported prices paid for .hatbhing ~eggs during the week at an
average of ' 67 cents per dozen~ . _ A-;-er~ge _ p.ric 'e . c:P.arged. by ha~cheries for the . :
chicks Has reported at ~1LOO - per ~und:i:ted .:: Th;.i$e ' p~i ces co;:npare vdth 67 :cepts .
and ~~ 11. oo last week and vJi th 70.. 9 ents ~ anq ::~1L' 5o ,o:ce year ago. Zgg prices
sh otm relate to Georgia produced hatching' eggs Hhether bought on contract or
otherwise.
. ;
.. .
vJej_ghted average prices from. th~ Federfii.:.;Sfate Market News Servic~ for
broilers dUring the week ending October 25 are as' f ollows: Georgia broilel"s
2 3/4 - 3 3/4 pou.~ds, at farms 14.58; FOB plants 15.48.
. . . i: . . .
.
. .
(See reverse side for ,other states)
.-.
GEORGIA CHICK PLACEi'4ENT BY "'lEEKS
-~
Week Ending
Aug. 23
Aug. 30
Sept. 6
JUJGUST 23 THROUGH OCTOBER 25
- - ---- I r
"
EGGS SET 1,/ .
..
..
.-:. 6iiic..KS. . ?LACED .FOR-- .'..B-RO-I- LE~R- S -~ :-~-
: 19.58 %,, u .
' 19$B j{
I 1957 '
1958
of 1951!1 1957_ _ _1958 of 195?.i.._
- Thou:;3ands
. :
.
..
.' -lo'd :_. 6_, 726- ..
6,689 ,
6, 739
{ '
6";758
6,553
6,618
'
P.er:o~l)t jl .. . Thousands ..-
! .
98
98
1..
;'.
. I
: 55','45.26. '47
5,269
... 5;36b
5,093
' 4, 879
Percent : . . .
' 97 94
93
r
$ept. 13 Sept. 20 Sept. 27 Oct. 4
6,..688
6,623
6,803 .
6,522
..
6,988
. 7,075
1,030
7,110
104 .107' ., l03 , .
109 .
5?057 . . .. 4,61.~8
' 44'',8873..26 .
4,573 4,602
4 ,838
4,927
92'
.. 95: . 94~ 102
.
... . ~
Oct. 11 6,595
7,248
110 '
4 ,826
4,942 . 102'
Oct. 18 Oct. 25
6,708 6,627
7,23h
108 '
4 ,927
5,002
102'
7,239 .. 109.
4,846 5,034 104
1,/
Includes
-- --~
:- ~-
eggs set by l}atcheries producing
chicks
for
hatchery
supply
flqcks.
ARCHIE LANGLEY: Agricultural Stat.isticia."l In Ch~ge
li\f. A. HAGNER . :' Agricultura,l St~tisticia~
." ~ -..
EGGS SET AND CHICKS PLACED IN COMI1ERCI;;..A;;-.L.-.Ao;:..;RE-.;A.-S_B;;;o.;Y---.'1E=E=K..:.S__----'l..-.9.-.5_8- - - - - - - - - . - - - - - . . J ' _ a.g..e.-.._..2..__ __
STATE
I I I 1~1 ----~~..,.~~..-: -~------We-~k-En~din~g:~--~--~--~--~--~----~--
o~i l o~t 1 o~~
A~~ A~. Sa~. Sei; I Se~~ I seg. 1
Oct .
Oct.
Oct.
11
18
25
EGGS SET- THOUSANDS
:1
CHICKS PLACED - THOUSANDS
Maine Connecticut Pennsylvania I ru:!j_ana Illinois l-iissouri Delaware Jvlaryland Virgini a West Virginia North Carolina South Carolina GEORGIA. Florida Alabama lflississippi Ark ru!.sas Lo".li si a n a Texas Washington Or eg on California
TOTAL 1958
TOTAL 1957
1958 %of 1957
1,)02 1,455 1,433 . ,, . 1,124 1,071 1,022 1,070
878 1,009 1,103 1,.087 . 1,082 1,056
1,037 1,024 1,063 I 657
623
60o
536
513
551 . 433
489
378
419
1,259 1,257 1,165 1 827
940
938
758
692
680 : 767
584
633 - . -589
1,640 . 1,731 1;563
851
886
870
864
752
682* 760
727
713
646
267
281
309
. fl
194 .. 187*
226
142 . 180
152 202
159
119
96
1,235
I 1, 752 II 2,210
1, 766
II 271
1,286 1,565 2,240 1,852
255
1,420 1,602 2,226 _1, 779
286
.. I "671 . lj 1,668*
I 1,853*
.. 1,301
,652
1~
643 759
1,798
1,163
639
628 1,483 1,930 1,188
537
583 1,566 1,763 1,138
' 589
552 1,371 1,714 1,015
497
495 567 1,450 1,601 1,789 . 1,674 1,059 : 956
423 563
570 1,576 1,690 1,039
478
495 1,445 1,643
932
446
557 1;686 1,566
834
485
'! 3,002 3,111
565
551
J,o89 . 11 .2,478 2,395 2,337 2,341 2,329
580 ,! 36&-r 361* 309*
321
292
2,245 . 2,351 332 313
2,398 344
2,352 362
2,229 315
1, 2~48_ ___;,.;7,;..2.~34~-.7~'.,-;23;;..;..9.__. --+~'--~ 5, 3?_o_.._5,_o_~_4..._,~87.._9_ _4~,6...-4L-.4....z-.5""":'73...____...4,..z6_0-:-2_. _4....,.9..2:-:-7.___4....,..9...4~2----::5~,-00~2--:;5~,...:o3~4
390
396
412
200
171
202 . 215
151
178 144
151
182
180
II 3,118 3,224 2,068 2,126
3,269
2,571 2,417 2,366
2,134. . l 1,695 1,6h9 1,658
2,391 2,293 2,239 2,382 1,553 1,600 1,649 1, 723
2,525 1;"639
2,355 1,637
2,285 1,613
II 2,99o
,I
h35
2, 744
3,oo5 463
2,8i 8
3,179 . 1 2,816 2,587 2,381
469 1 . 457 . 373
395
. -~~92"3 .. ! . 1;948 1,869 1,898
2,283 4oo
1, 740
2,165 355
1,618
2,242 2,4o5 309 371
1,469 2,023
2,416 4o4
2,165
2,374 2,475
423
4n
2,-126 . i,963
I
339 253
25s
319 Ii 359
291 . 264 1 165
1, 209 1, i~6 . 1., 145 1 905
. I.
>. I
344
359
125
168
824 878
342
249
176
193
916 . 821
287 247 175 123 829 8 71
212
219
281
149
141
118
770
761
773
37, 300 32,534
115
37,586 . 33,141
1~3
37,86~ - - if 29, 11~
33,796 li 25,934 . 112 .. ,, . 112
27,917* 25,490
. 110
27",252*
25,22~
108
26,335 25,028
105
24,803
2~,298
102
24,84~ _ 26,5o6
24,134 24,67? . 103 107
26,$74 . 25,820
24,?.37 . "23, 930
110 ~
);08',
. 25,611 23 ; 413 109
':: .
G-el
f/0 ()IJ?
~~~t ((;JE<Ol!R<GITA C~<Dlr iRir<DllFR'lliTJN((; SJEJFRVHCJE
f, /)
I'
AGRICULTU RA L E XTENSir:IN SE RVICE UN IVERSITY -OF GEORG IA A '0 THE . STA T E OEPi'.RTMENT OF AGRICULTWRE
Athens, Georgia
UN IVERSITY OF GEORG IA
N0\1 7 '58
U . S. DEPARTMENT OF AGRICULTURE AGRI CULTURAL MARKETI NG SERVICE 319 E XTEIISION BIADG., ATHENS, GA.
November 6, 1958
U BHARif.:.S
3 j S;-
CGIE(())~(QllA (C~(Q)JP~9., D JrllNCG JEJR{VllCIE:
~
AGRICULTURAL EXTENSION SERVICE UNjVERSITY OF GEORGI A A ND THE . STATE OEPAR1'Mfi.NT OF AGRICULTURE
NOV b ,~8
IJ . S. DEPARTMENT OF AGRICULTLIRE AGRICULTURAL MARKETING SERVICE 319 EXTENSION BLDG., ATHEJI!S, GA
BiiOILER CHICK REPOR.T FOR GEORGIA i
LIBRARi f:..S
No~ember 5, 19~~
ATHENS, GA., November 5--A total of 5,121,000 broiler chicks were placed with producers in Georgia during the week ending November 1, according to the: Georgia Crop Reporting Ser1i ce. This compares with the 5,034,000 placed the prlevious week and is five percent more than the 4,882,000 placed the same week
l~st year.
. Eggs set 'oy Georgia hatcheries amounted to 7,394,000 compared with 7,i239,000 the previous week and is 12 percent more than the 6,587,000 for the cqrresponding .lleek last year.
; Hatcheries reported prices paid for hatching eggs during the week at an
average of 67 cents per dozen. Average pr ice charged by hatcheri~s for the
ch,iclrs was reported at $11.00 per hundred. These prices compare with 67 cents
-~rid ~Jli.oo last week and \-Tith 70 cents and ~:nL 75 one year ago. Egg prices
shown re1ate -to Georgia produced hatching eggs whether bought on contract or
o~herw~se.
: Weighted average prices from the Federal-State Market News Service for broilers during .the week e:1ding November 1 are as follot-vs: Georgia broilers,
2J/4 3 3/4 pounds, at farms 15.49; FOB plants 16.47.
(See reverse side for other states)
GEORGIA CHICK PLACUl!INT BY WEEKS
!I ----------------------- AUGUST 30 THROUGH NOVffiffiER 1
~"---------~--~; ------------
W!eek
1
. EGGS BilT
~/
CHICKS PIACEb FOR BROI LERS '
Eri,ding ,
1957 - 1958 Thousands
o1f9159857% I 1957
1958
Percent
Thousands
I l958 %
I of 1957
I Percent
Aug~ 30
Sept. r 6
. 6,689 6, 739
:6>553 6,618
I 98
5,424
98
$,269
5,093
4,879
l 94
93
sSeepptt.. 123o
6,688 6,623
6,988 7,075
104
5,057 4,648
107
4,832 4,573
92 95
Sept. 27 Oct. 4
6,80~
. 6,522 .
7,030 7,110
103 109
4,876 4,838
4,602 4,927
I 94' 102
Oct. 11
6,595
7,248
110
4, 826 4,942
102
Oct. 18
6,708
7,234
108
4,927 5,002
102
II Oct. .25
6,627
7,239
109
4, 846 5,034
104
Nov. 1
6,587
-1:::/::;I:=n=c=lu=d==es==e=g-:g::s:=. :s:-e.:=t by
7,394 hatcheries
112 producing
-I.
4,882
,..._.__
5,121
_
chicks for hatchery supply
105 flocks.
, .ARCHIE lANGLEY Agricultural Statistician In Charge
1rJ. A_. t'iAGNER Agricultural Statistician
' I t,
. : .
. !
3/
AGRICULTURAL EXTENSION SERVICE UNlVERSITY OF GEORGIA A ND THE . STATE DEPAR1'Mfi.N T OF AGRICULTURE
NOV 6 '!?8
U. 5 . DEPARTMENT OF AGRICULTUAE
AGRICULTURAL MARKETING SERVICE 319 EXTENSION BLDG., ATHE~S. GA
BROILER CHICK REPOHT FOR GEORGIA i
LIBRARI
Nov.ember 5, 195;8
ATHENS, GA., November 5--A total of 5,121,000 broiler chicks were placed
with producers in Georgia ~u.ring "the week ending November 1, according to the:
Georgia Crop Reporting Service. This compares with the 5,034,000 placed the prlevious \'leek an:d is five percent more than the 4, 882,000 placed the same week
l~st year.
. Eggs set 'by Georgia hatcheries amounted to 7,394,000 compared with 7,i239,000 the previous week and is 12 percent more than the 6,587,000 for the
cqrresponding ,:\'leek last year.
: Hatcheries reported prices paid for hatching eggs during the week at an
average of 67 cents per dozen. Average price charged by hatcher~es for the
cl\icks was reported at ~n1. 00 per hundred. These prices compare with 67 cents
~rid ~/li.OO last week and \'Tith 70 cents and ~:~11. 75 one year ago. Egg prices .
shown relate to Georgia produced hatching eggs whether bought on contract or
o~herw~se.
: . Weighted average prices from the Federal-State Market News Service for
broilers during .the week e.:1ding November 1 are as follot'l's: Georgia broilers,
_2: ;3/4 3 3/4 pounds, at farms 15.49; FOB plants 16.47.
(See reverse side for other states)
.~ ;
GEORGIA CHICK PLACEHENT BY WEEKS
1957 ~qs ::;8 l ----------------------- AUGUST 30 THROUGH NOVENBER 1
~----------To--~; -----------
'11-J\eek ' -
ij CHICKS PLACED FOR BROILERS ;
En;ding ,
1
y
1958 %
of 19_57
1957
1958
1958 % of 19_27
Thousands
Percent
Thousands
I Percent
Aug: ' 30
sept. 6
Sept.
sept.
13 ' 20
Sept. 27
Oct. 4
. 6,689
6, 739 6,688 6,623
6,80~
. 6,522 .
~ 6>553
6,618 6,988
7,075 7,030 7,110
II 98
5,424
98 I $,269
104 I 5,057
107
4,832
103
4,876
109
4,838
5,093 4,879 4,648
4,573 4,602
4,927
I
'
94 93
I
92 95
I
94 102
Oct. 11
6,595
7,248
110
4,826 4,942
102
Oct. 18
6,708
7,234
4,927 5,002
102
Oct. .25
6,627
7,239
4,846 5,034
104
l==l III. Nov. 1
6,587
7,394
4,882 5,121
105
===== 1~/~=In=cl=u=de=s=e=g=gs~. s-e=t =b=y =h=at=ch=e=r-i=es=p~rod~cing chick~s-f=o=r=h=a-tc=h=e~ry==su=p=pl=y=f=lo=c~k=s.==
ARCHIE lANGLEY Agricultural Statistician In Charge
1tJ. A_. 'l!'iAGN:SR Agricultural Statistician
'.
t. .>
. . ..~
.... ..
~ ..
'.
..
STATE
Maine Connecticut Pennsylvania Indiana. Illinois l"lissouri Delaware Maryland Virginia West Virginia North Carolina South Carolina GEORGH. Florida Alabama Ydssissippi Arkansas Louisiana Texas 1Jashington Oregon California
TOTAL 1958 TCJIIAL 19.57 1~58 % of 1951
*Revised
-
Oct. 18
EGG-S
SET AND ..
CHICKS
PLACED
IN .COMMERCIAL
AREAS,
BY \iliEKS
-
1958
Week Ending
Oct. 25
Nov. 1
I
Aug. 30
1~ Sept. 6
Sept.
13
20
Sept. 27
Oct. Oct.
4
11
EGGS SET - THOUSANDS
CHICKS PLACED - THOUSANDS
Page 2
I Oct.
Oct.
18
25
Nov. 1
1,455 1,024 1,257 1, 731
281 1,286 1,565 2, 240 1,852
255 3,111
551 7,234
396 3,224 2,126 3,005
463 2,818
255 291 1,166
1,433 1,063 1,165 1,563
309 1,420 1,602 2,226
1, 779 286
3,089 580
7,239
412 3,269 2,134 3,179
469 . 2, 923
319 264 1,145
1,425 1,002 1,176 1,798
302 1,462 1, 724 2,234 1,839
294 3,076
565 7,394
393 3,352 2,146 3,302
461 2,936
3L~3
235 1,085
37,586 37,868
33,141 33,796
I
113 .. 112
I
38,544 33,484
115
1,071
623
940
886
' 187* 643
I
1,759 1,798
I 1,163
639
2,395
361-l~
5,093
171 2,417 1,649 2,587
373 1,869
344 12.5
I 824
1,022 600 938 870 226 628
1,483 1,930 1,188
537 2,337
309{~
4,879
202 2,366 1,653 2,381
395 1,898
359 168 878
27 ,917~!25,490
I 110
I
27' 252~*25,228
108
1,070 536 758 864 142 583
1,566 1, 763 . 1,138
589 2,341
321 4,648
215 2,391 1,553 2,283
400 1,740
342 176 916
26,335
25,028
105
..
. 878 513 692 752 180 552 . 1,371 1,714 1,015 497 2,329 292 4, 573
151 2;293 1,_600 2,'165
355 1;618
249 193 821
1,009 . . 55J,. ' 680
682~~
152 495 1,450 1;789 1,059 423 2,245 . 332 4,602
178 2,239 . 1,649 2; 242 '
309 1,469
287 175 829
.1,103 1,087
433 489
767 584
760 727
202 . 567
159 570
. 1,601 1,576
-1,674 1,690
. 956 . 1,039
' 563 ' 478
2,351 2,398
313 344
. 4,927 4,942
144 ' 151 2;382 2,525 1, 723 1,639 :2;4o5 2,416
371 404
. ?, 023 2,165
. 247 272 123 149 871 770
...
24,803 24,846-~ 26,506 26,574
24,298 . 24,134 . 24,675 24,237
102
103
107 110
1,082 378 633 713 119 495
1,445 1,643
932 446 2,352 362 5,002 182 2,355 1,637 2,374 423 2,126 219 141 761
25,820
23,930
108
1,056 419 589 646 96 557
1,686 1,566
834 485 2,229 315 5,034 180 2,285 1,613 2,475 411 1,963 281 118 773
25,611
23,413
109
1,033 416 768 707 127 535
1,813 1,570
894 571 2,307 297 5,121 213 2,496 1,668 2,465 357 2,143 298 140 792
26,731
23,058
116
6
f/0 ()IJ'}
~i~ (GJE(lFi(GllA t !?2(())!Pl JRI!Pl(())lfRTITlN(G JEJR{Vllt lE
.J,
( .__: 1
AGRICULTURAL EXTENSif')N SERVIC~ UNIVE;RS ITY .OF <;'EORGI A A ND THE . STATE DEP1'\RTMENT OF A GRICULT:JRE
Athens, Georgia
UNI VER ITY OF GEORGI A
'58 NOli 7
U.S. DEPARTMENT OF AGRIC~L. TURE A GR!CULTURAL MARKETING SE~VICE 319 EXTEUSION BI~DG., ATHENS, GA.
November 6, 1958
LI BHARIE.S
GEORGIA: The All Commodity Index of Prices Received by Georgia farmers declined
four points during the month ended October 15, 1958. The index at 260 percent of its 1910-1914 average is 13 points above the level of a year earlier.
The All Crops Index declined thre~ points to 277 percent of its 1910-1914 average but remained 13 points above the October 15, 1957 index of 264. The
principal contributors to the decline in the index from a month earlier were lo~rer pric es for corn, cotton, and peanuts.
The Livestock and Livestock Products Index declined six points during the
month to 224 percent of its 1910-1914 average. ~Vhen compared to a year earlier the index is 13 points above the index of 211 percent on October 15, 1957.
Lower prices for hogs and broilers were the principal contributors for the
decline in the index from September 1958. A summary of these indexes with com-
parisons is sho\-m on the revers e side.
U}JITED STATES: The Index of Prices Received by Farmers dropped slightly more
than 2 percent (6 points) during the month ended October 15 to 252 percent of its 191014 average. l;\Tith the netv crop of grapefruit and oranges
moving to market in volume citrus prices receded sharply from near record levels of last month. Also contributing to the decline were lower prices for hogs, cotton, eggs, and corn. Partially offsetting vJere price increases for milk, stra>-Jberries, wheat, and several vegetable crops.
The Inde;~ of Prices Paid by Farmers for Commodities, Interest, Taxes, and
Farm I:Jage Rates rose to 307 in mid- October, a new high. Host of the nearly l
percent increase in the index resulted from higher farm vage rates. Prices paid for other cornnodities and services averaged only 1 point higher than on September
15.
The Parity Ratio dropped back to 82, the lot-rest since January of this year.
This was three and- one-half percent belotJ mid-September, but 1 percent above
October 1957.
Prices Received
241
258
252
313 Feb. 1951
Parity Index 1/
296
305
307
307 Oct. 1958
Parity Ratio
81
85
82
123 Oct . 1946
------------------------ ------- - - ----- r-' y Prices Paid, Interest, Taxes, and Wage Rates based on data for the indicated
dates.
ARCHIE LANGLEY Agricultural Statistician In Charge
RAYMOND R. HANCOCK Agricultural Statistician
PI\IC2S f-<IT:CEIVE D BY F.LJ-:Z RS OC lOBE ~l. 15 , 1 958 Vlil"'H COMPl1i:ISONS
I
I I GEOH.GII:.._______~----4-----UN=.;..;I=:TE;::'':.:D:......:.S.T::i..:.":.TE=-'S . - - - - , - - -
---C-Cll.-~-v!O_D_ITY----...---1'.-v.-:::-rc._e_e--.,--,-0-c--t-.15, Sept .15 , Oct .15, l.vcraljc Oct .15 , Sept .15 1 Oct .15
1um uN IT
1910-14
1957
195~958 1909-14 1957
1958 i 1958
Vihcat, Bu.
Corn, Bu.
Oats , B~~
$ 1.23
$
. 91
$ . . .67
1.97 1.18
.90
. 1.88 j . 1.94 'I
i.24
1.151
.91 _.95 1!
.88 I
j . 64
.40
1.92
1.69
I 1.06
1.13
.51
.56
1.73 l.C4
.56
Irish Pot. ,Ovrt. $
1.13
_
~::::::e::: :I ~: ~:5 = ~:0 Swee~ Pot.,Qw.t. $ Ton
.84 .. 5.00
Ha.y ,Lll(baled )Toi7$ .j -
24 .20
Hog s,per. Cwt . $$1' 7.36
Bee f Catt.le, Cvrt.
3.96
~ilk Co~s. , Hpd , $1 33 ~85
I Chickens ,All,Lb.
13 .3
:. 17.40 1 3 .3 0
11 115.00 16 .0
~ f1r s, Doz.
21.4
49 .7
Butterfat, Lb.
1-ii:l.k (whol ~ sa;J.o)
per 1 0~
~
25.8
51.0 .
'.
:1 I 2. 43 ' _ , 0 ~15
Soybeans~ Bu.
$
2 .25
Peanuts, Lb .
5 .2
10.2
: 4.751
I 4 . 7 0
1.14. '
1.60 I
1.55 3.29
1 ::~~ 1 ::.~:0. 1 . . 1I
25 .80. ! .27.00 j
.. 1
.
20 . 40, 19 . 40:.
j 18 .10 18 . 30
~:~:5:
7 .27 ' 5.42
32 3 1.. I 49.80
18 .50
17.00
17.40
I 1 60 . 00 160.00 48.00 172. 00
16 .0 1 14 .5 , . 11.4
I 44.0 . .45 : 0 .I ?1.5
~~ 50 . 0
51.0 l 26 ;3
I ... ,
j
.. ,.6 . 15 . 5 ~20 l . 1.60
2 .10 2.co. !
10.5. . 1o~4 I 4.8
I.
I
l:J.9
43.2
I 59 .5 .
.4, . 61
.1.23. : 2.74
1.02 2.97
::::0 17.60 20.00 22.20 217.00 15.8 41.0 .58 .5
::::0 18. 00 18 . 50 22.20 220.00 14.8 38.2 58.7
4 .32 1.98 10.5
4.47 1.93 10.5
JNDEX NUH.BERS OF iPJCE S RE CED.IED BY FJd;HERS JN GEORGrt. .
(Ja nuery 1910 - December 1914 = 100)
.::
.
. Oct.l 5, S~wt .l5 , Oct . 15,
J. .: 1..11. Corill:nod iti~s
1957 . 247
1958 264
1958 ----, 26 0
I
All Crops Grain s and Hay Cotton Lint :
Pe:m ut s
Tob n:cco
:. Cottonse.ed a nd Syyb ea.ns
264
280
277
' 14;5
149
148
246
293 : ..
266
. ,;.
196 .449 . .
424032 . -
200 443
200
2( 8
203
Irish l'otntdc s en d Swe etpota.toe s
261
248
245
Fruit 3 a n d Nuts
1..11 Livestock c.nd Livestock irodu cts i'.lea t .t.nimo.l s Poultry n.l.ld EC~ s Du iry ~ ro ducts
201
163
167
211
230
224
273
340
332
145
138
131
243
242 ..
243
_ __ _ _ _ _ __ _ _ __ ___:GE:.::~~O.I:-;\.::=GL=--------- r~
UNITED ST.LTI:: S
KJND OF FEED
Oct .15 , Sept .15, Oct. 15 ,
1 Oct . 15, Sept ~15;
_ _ _ _ __ _ _ __ 1_95__7_ __1_9_5_8_ _ _ 1_9_58_ _ _ _ , . ) ,957 . 1958 :
1
09t. 15., 1953
Mixed Da~ ;B'eed
JJ. l Under 29;; I'rot c in 16% Protein
18% .i rotcin
20/'o Prot c in
2.;% Protein
3.85 3 .80 4 . 00 4 . 00 4 . 30
4.00 3.90 4 .30 4 .10 4.40
Dolla rs Per 100 ~s
3.90 3.80 4 .10 4 .00
4 . 30
ii ii
II
3.63 3.57 3.58
3.83
3.96
3.55 3 . 58 3 .59 3 .90 4 .02
3.63
3.57 3.56 3.86 3.99
Hi~h Prot e in Feed s Cottonse ed Mear-Soyb can Meal Meat Scr a p
3.40 3.80 4 . 55
3.85 4 .15
3 .70 4 .05
3.72 3.85 4.84
3 .96 4 . 36 6.37
3.83 4 . 26 6.18
Grain By-Pro ducts liran
I,iiddl ing s
Corn Meal
3 .30 3 . <-";5
3 +0
3.15 3.40 3 .40
3.15 3.35 3.25
2.68 2.79 3. 27
2 . 68 2.82 3 .34
2 .66 2 .79 3.28
Pou~_try Feed Broil er Grmrlng :Mash Laying 1112- sh Sera.tch Gra. ins
5.10 4 .70 4.20
5.20 4.90 4 .35
5.00 4 .75 4 . 20
4.83 4 .36 3.92
5.06 4 .50 3.96
4.97 4.45
3.91
Hay {Eal cd ) ,\ J f : :tl f a
1.11 Othe r
47.00 36.00
40. 00 31.00
38 .00 31.00
30.30 27.90
28.30 26 .70
28 . 90 27. 20
l /As r epo rte d by Feed Dealers.
AGRICULTURAL EX 'rENSI'?N SE R VICE UNI VERS ITY OF GF-ORG A Jl, tlO T H:::: STATE D.;'P ARTMENT OF AGR IC U LTURE
_.:, th ans, Geor gia
U.S . DE:PARTMENT OF ti.GR IC UL T ilRF.: A<.- RIC JLTU R AL M .'~R K E T H! G Sr::R V i C E 3 19 E X TE NSI ON B L DG., ATHENS, GA.
November 10 , 1 9S8
GLGR,GIA COJ.'i'C~ RI:PORT AS OF NCVEHBER l
.ATHENS , GA ., No v ember l0 -- ...,ot t.on prospects 'fol~ Gr: orgia as of Nov Gmo cr 1 Ker e .for a pro du~ tion of J6 0 , 0IJO bal e s ( ,SOO pr-und.s g l 'o f'S 1'11eight) as .
announced by tlie Goor gf a Crop .:T8p()d ,:illg Se.rvic e . .. ni.e est{rriate is. .10 , 000 bal es
ao ov e la st month; ivut 3 6 , 000 ba l e s b el ow t he 195 7 crop oi' 376 , 000 t ~l e s . 'l'he
current ..production is t he smal l est si n ce J.&Stl ,_;hen 22b , OOO bal e& ,.,; m' e hm'v est od . I ndicated yi8l d p e r acre , .on the other hun d , o.f l:Jj !t .po t,;.n dc i s by f<::::~ t11 G h i ghe'- t
of .recot!d .: The pr r~vious hi t;h :vras 3 76 :pound & in .1 9:"75 . .i~e c or d or n P.a:!.' r ec.:o d
y i eld s wer.e I?roc.lu ccd ir: __o.l~ ;a~:::JC: S of tte St a~- .;; ..
Producti on in the nortn E' rn dist..riots will be ~'. 7 per"'ent l e::< s than l as t y e ar .
The cent ral di st':r:Lcts t>~lOH a de cl i nP. of 7." ~~ ~~ 1~cent .e nd t he sout.h E:rn di s t rict.s
ha~e a de cr easq of 4 p~ rc Gnt .
. ..
Favorabl e veatLe:t:. for harv n::"!:.:ir. :, c-,.f co tton aJ. loHe d farmer3 t o mak e .excellent .
progre ss vJit h harv est np erations d:.rlng Octob er a!ld 94 :)e l'cent o.l th;e ,cr,op had
been gi nn ed pri or to liO Vf~!"'lbP.r l . The qual i ty )f the crop l1as bt0Gll :_~nu_sudly good i i: all ar;;;ns , .:mrl. fj_r:al ou~. turn 1:ill lv:; hifh ~ r t.hs.c1 e)1Je ..:t.cJ ea1lirr i n t he
season .
ur e<.tu of Cemms 1 ginnings to Novemhcr l Here 33P , 000 rrmnin~ bf;l;Les com par e d wi th JGo , .ooo to .s.amc date la s t year ..an d ~~JO , OOO i n 19)6 . .
CARL 0 DOESC.P.3R Agricul tural Stat i st i ci~n
A;:(GII I .S B NOLEY Agricu1~ural Stat iEtician. I~ Charge
\
\
~
--19:5 8--18 , OOQ.
-
-
r~on cotto/
..
/
-
1957 - 2S, oo(
./ ..... : -.....'(
1?58 pro du ction i ml.i catcd on
!'I9_yom1~ qr _1 .
- STATE ~
1956 - 41 , 00 ...' .. . ... .\ """
. ... . I - . 1958-~~, 000 ( III "--.\
\r;_j ' -' ROME
l 9S7 - 20 , 000 19c'6- i6 '000
'----...~ t'LI3T:R.,O~.r . ,, ' : 1~.
l 9SI:J -- l 6 , oo
.
\
_, , .:r- 1\.TLl\.N'T'A ATHA EES ) 195 7--? 2 , ~ ':10
-,...:J:.r-,-_;~ . . . ~1o;~r:-z- ')3 ono
l 9S8 -:- . 360., OQO
1957 - 3Y6, 000 19~;6 579,boo
Di s tr i ct~ shov'.ri'l are Crop
s. Repor t ing Di s tricts c.nd HOT
Con_s:~e 3s i r:.r..al Cistd.ct
\ \
C....../ ~ . ) .
.". /./
(
\
IV(,
V \
~
I 19)8 - 22 ' 800 \.
VI
\ \
1l 99.5S67-- 6.379', 000000
l~CC N
} AUGUETA
\
l 9SB - ?6 , 300 \
\
I CCLUf-ffiU S ~-
1950 - 55 ' 100
/\_ ---~ 1 l
995.1.~6'7
-
-
~_.0697
,
,
~L,0000
' j 19:;7 _f)6 ' 000 \
~19S6 - :JL , ooo
J -~v~
~
~ {
1
VII
VI II
(-- ? \.._.,.-- \
'-AVANi'll:t<f
IX
~j iJ '
_j
19) 8-15 ' 100
1l~95567-- 1162 ,J 0OO0J0
~ ~
i
1tl
~c
UNI VERSITY OF SF..OR{;IA
~
VALDOSTA
NOV 13 '58
UB R AR I ~S
UNITED STATES - COTTON R~PORT A OF NOVEHBER l, 1958
The Crop Repor ting Boar d of t .l;.e Agr:i.cultural Marketing Service makes the following report from d.ata fur nished by crop c r re spondent s , f ield stati sticians , Bureau of t he Census , Commodity Stabilization :::er vi ce , and cooperating Stat e agencies . The f i nal out-turn of cott on compared with this forecast will depend upon whether the various influences af fe cting t he crop during the reniainder of the season are more or l ess favor able than u.sual .
State
: Acreage : f or
har ves t
. Lint yield per
:
Pr oductic-n 2/
:.1,..9-47-- :;cha:-rv-e .s-te-d -a: c-re-19;~c;g-
-::
-l530'04-7-
p o~
-~ :>c/ -
d:-
g-r
o-s
s -
w-e:
i-gh1-9t
51b3
a-l
e-s
1958 ~/ : average : 1957
. i ncli c . : average 1957 indic ,
1, 000
-acr-es
North Carolina : 270
- Pound s -
324
321
4L~4
- 1,000 bales -
441
231
250
South Carolinp. : 355
Georgia
. . . Tennessee
. . Alabama
:
398
410
544
_?...\.., o~"
329
276
333
383
427
3C 7
3L.6
412
628
344
305
434
681
.396
360
503
56 3
415
430
397
884
530
450
His sis sippi ! : 1,145
38 9
388
432 1, 759 1 , 081 1,030
. . . . Missouri
. . . . Arkansas
. .. Louisiana
300
1, 030 375
. . . . . Oklahoma
Texas
420 5 , 380
400
281
374
416
389
380
1 75
234
222
295
464
399
179
471 1, 458
981
378
639
348
377
37 1~
263
379 3, 937 3, 63 2
- 290
1,010
295 330
4,250
.. Ne1..r Hexico . .
.. /,rizona
:
. ... California
178 384 733
Other ~tat e s }/
38
57 3
619
76 9
26 9
236
285
777 1 , 037 1, 000
687
763
800
714 1 , 03:) 1, 080 1 , 348 1 , 537 1 , 650
300
316
364
49
28
29
Unit ed States 11, 960
317
. . iJller . -
Eg;ypt . 4/ .
75. 4 426
388
472 14,136 10, 964 11, 764
485
499
41.6 81.9
78. 4
~/ Septemb er l e st imat e .
2/ Production ginned and t o be ginned. j , 500- l b . bal e contains about 480 net ..,.. pounds of lint .
1/ Vir ginia, Flor ida, Illinois, Kent ucky' an d ~fE:vada.
4/ I ncluded i n State and Unit ed Stat e s totals. Grown i n Texa s , New Nexico,
- l~ori zona , aYJ. d Cal i f ornj_a .
CRCP REPORTING BO!,RD
.)
l .!'o.'J\ 1U' D II r . '. f'OI 1 P . OVO I"10~ 'l:'n n I)'C'o:'\'[') f'T A A 0 . 1"\P 11Tf11TJ:;'J ,m p n 1 . 1 -n C' 1-1 " .
,
0
AGRICULTURAL EXTENSION SERVICE UNIVEr-lSITY OF GE ORG IA AND 'ftol ~ STATE DEPART MENT OF AGRICU L TLIRE
BROILER CHICK REPORT FOR GEORGIA
..
U . s: DEPARTMENT OF AGRICULTURE :
1 .!..
NOV 1 4 '58
AG R I C U~-T UR A L MAR KETI NG SERVICE . 319 EXTENS ION 13LOG., A 'f HE NS, GA; '
.UB..R: R11'.S
Ncrvember 13, :1958
ATHENS, GA. ,. November 13--A total of 5, 095,000 broiler chicks t-Tere placed
with producers :ln Gect gia during t he "''9ek endi ng November 8, according to the
Georgia C~op Reporting Service. This corilpares Fith the 5,121,01)0 placed the .
previous week;- a."l.d fs a fraction of a percent more than the 5,091,000 placed :; .
the same -vreek = lar::t year .
Eggs set by G~o':'gj_n h=:.tcheries amounted to 7,549,000 compc.r9d with
7,394,000 the previot-:.:3 ~-leek ~nd is 15 percent more than the 6,542,000 for the
corresponding.. t'l'eek .las:t year.
Hatcheries reported p:::-ices ps.id for h~tchi:ng eggs during the week at an
average of 67 c ents per dozen. A~;erage pric e charged by h~t cheries for the
chicks was reported at ~ll. 08 per hundred ~ 'l'h ese p:i.'icas compare wlth G7 cents
and ~~11. 00 last t-reek ar.d wit h 71 cen;:,s a.n-j )l2 o00 O!le ~-e e.?." s.go. Egg prices
'I
shown relate to _Georgia produced hatching eggs v1hertne~ b'o12gl1t on contra~.t or
otherwise.
.
' ;
Weighted average prices from ~he Federal~ State Market News .Service !pr
broilers during the week e:-J.di ng November 8 are as follot-1s: Georgia broilEn:;s
2 3/4- 3 3/4 pounds, at far~s 16. 66; FOB plants 17. 00.
(See reverse side for ot her states)
GEORGIA CHICK PIACElI2HT BY 1rJEEKS
Week Ending
Sept. '6 Sept. 13 Sept. 20
II ~
~f
I
Slt-~ ~JTEHBER
6
TH..li.OUGH NOVEl,iBER ~
S
: . ----#OJ- - EGGS SET -:./
- 1957 '
1958
l - '.!.'housar;.ds
I 1958 % of. 1957 Pe.rcent
CHICKS PLACED FOR BROII~RS
1951 . '1958 ... . ' Thousands
. 1958 %. .
P.oef
1957 rcent
6,739
6_~6:!..8
98
5,269
. .
4, 8'79
93 .
6,688
6,623
6,988 7,075
104 . 107
. 5;057 .
:
4,648
. 4, 832
4,5?3
9925
Sept. 27
6,8C3
7,030
103
4 , 8 76
4,602
94
Oct. 4
6,522 .
7,110
109
4, 838 . 4,92'7
102
Oct. 11 Oct. 18 Oct. 25 Nov. 1
6,595 6,708 6,627
6,587
7,248 7,234 7,239 7,394
110
. 4,826
4,942'
102
108 109
4,927 4;8il6
.. -
5.,002
5,034
.
.
102 -
104 ..
112
4', 862
5,121. .
105
Nov. 8
6,542
7,549
115
5,091 5,095
100
--
I ~
.~/ Includes eggs set by hatcheries producing chicks for hatchery .supply _flocks .
AB.CHIE LANGLEY Agricultural Statistician In Charge
itT. A. vJAGNER. Agricultural Statistician
...
.' t
STATE
--
l1aine Connecticut Pennsylvania Indiana Illinois l'fl.i.ssouri Delaware Marylend Virginia West Virginia North Carolina South Carolina
- GEORGI.A.....
Florida Alabama Mississj.ppi Arkansas Louisia.ua Texas Washj.ngton Oregon Ca1ifo:rnia
T!YI'AL :1958 TOTAL 1957
1958 ~16 of 1957
* Re"Q'i sed
I '
Oct. 25
Nov. 1.
EGGS SET AND CHICKS PLACED IN COJifiJIER-'r.IAL AREAS ' BY vJE"EKS - 1958
..
Week Ending
Nov. 8
1., sept.
I
6
I I sept. Sel)t. Sept..
13
20
27
Oct. 4
Oct. 11 I.
Page 2
..
I Oct.
I I 18 --
. Oct; :~' l-Jo~.
. 25 . .
: ~Nov.
8
EGGS SET - THOUSANDS
CHICKS PLACED THOUSAN'.JS
1,433
I
1,063 1,165
1,563
309
1,420
I 1,602
I I
I
2,226 1, 779
286
3,089
580
7,239
412
3,269
I 2,134 3,179
469
2,923
319 264
1,145
1 ' 425
1,002
., .. .
.
.,
.., .
1,.390 1,'051
1,176 . 1,196
1, 798 1,851
302 1,462 1,724
2,234 1,839
294
.309 1,43.3 1,747 2,238
1,90~
280
3,0?6 565
3,140 646
\ 7,394 7,549
393
437
3,352 .. 3,2-92
2,146 2,188
3,302 h61 .
2,936 343
-
235
1,085
3,417 556
2,903, 320 236
1,115
I 37,868
I 33,796
I
l. 112
38,544 33,484
115 -
39,199 33,219
118
..
. . 1,167 -- . 600
938
8'(0
226 628 1,483 1,930 1,188
537 2,337
30:1* 4,879
202
2,366
1,658
-
. 2 4 ,,,~
:
'
,_ 1\
I
395 1,898
359
168
8'78
'
1,095 .. 536
758 864 142 583 1,566 1,763 1,138 589 2,341 321
1~,648
215 2,391 1,553 2,329*
400 1,740
342 176 916
967 513 692 752 180 552 1,371 1, 714 l,Ol-5 497 2,329
286-~
L.,573
151 2,293 1,600 2;210l!-
355 . 1,618
249 193
. 845~-
1,009 551 680
682-~
152 495 1,450 1,789 1,059 423' 2,245 332 h,602
.178 2,239 1,649 . 2, 242.
309 1,469
287 175 829
1,103 433 767 760 202 567
1,601 1,674
956 563 2,351 313 4,927
1L.4 2,382 1,723 2,405
371 2,023
247 123 892*
27,383* 26,40& .24,955~~- 24,846* 26,527* 25,228 25,028 24,298 24,134 24,675
109 . "106
103
103
-108
I
-
1,087 1,110*
499
378 .
584
633
72'7 . 713
159
119
570
495
1,576 : 1,445
1,690 1,643
1,039
932
478
446
2,398 2,352
344
362
4,942 . 5,002
151
182 .
2,525 2,355
1,639 ; 1,637
2,416 2,-374
40h
423
2,165 2,126
272
209* .
149
141
770
761
1,056 419 589 646 . 96
557 1,686 1,566
834 -485 2,229 315 5,034
180 2,285 1,613 2,475
hll 1,963
281 118 773
..
26,584* 24,237
- 110 ._
25, 838* . 23,930
108 .
25,611 23,41.;3
109
1,033 416 768 707 127 535
1,813 1,570
894 571 2,307 297 5,121
213 2,496 1,668 2,465
357 2,143
298 140 819
1,094 470 814 795 180 655
1,293 1,927
796 611 2,416 327 5,095
185 2,654 1,654 2,308
367 2,158
236 161 836
26,758 23,058
116
27-,032 24;205
. 112
r
Ga
Ht; ?~o~
'1 /13
b"'f
GlEOJRG_ll.&
CCII(Q)JPl..:~JEIF0~1rJ.l.i.~~..r.tG...- ~.- ~.~..V-ITCCIE
/95/: AGR ICULTUF<~~- ~-~TE.NSiON. SERVICE~ . .- .... ' .
. . '.u ..s ~ DEPARTMENT 0~ ~G~~t.uL~YRE
. . UN IVERSITY OF GE ORGIA AND T HE
. - ST Ai.E DE PARTMENT OF AGRICULTU R E
.. A.the~s-, G~:orgfa ' . . . . .
.
AGR ICUL..TURA;L:_MAR.1<ETiNG SERVICE
-~ 319 EXTE:NSION BL.OG. , ~THENS ; '.G A:
'
..: Noy_emp_~:(,V~,. 1?58
- - - - - - ...: .'
'
.:. ~ ;
,
..
.
GENERAL CR.OP REPO~T
-
FOR GEORGIA AS .OF NOVElJiBJiR-1 . l9.58' ... ..
.. : . .
.
t
RECORD PEANUT YIELDS: Peanut production :tn _ G~ orgia _i,q now estimated :at . .-
606, 900,000 pounds, an increase of nearly 31 percent; fr.om- last year 1s '~crop 'p.r.
464;100,000 pound~, the. Georgia Crop Reporting SerY.'ice ~n:t').o~nc.ed .to.day. TlJ~ :Lq_..;.
~f;-~~9e : i .s due ..t o much higher _yields per acre this year: as the;acrcage fo~~- P~ql~inp
.9Pd th~esl}ing i s the sru:ne p.s last years . Current indications point t o. a r-ec;:or,c;i., . l:i:l~_.~y;Le_ld . per.::acre of _1, ~96 ,pounds t<Jhich is 100 .pounds higher thah the :P:re'V'ious :;.
. r.6.o~~-_-;yield ' of ],090 poun.ds produced j_n 1956. 'The lo ye?r. ( 1947-56) avl::!rage
prqduct:icon for Georgia is 571,760.000 pounds vJhile the average yi eld per acre is
845 pooods .
,. . \ ....: -~ -
'
. .
.. PEG~N: , PR0SPEC'rs DECLINE: Dry weather in' rec ent weeks has .retluced prosp~cts '
foi< tqis .year ' s peean crop:--The current f orecast of 38 miilion pound.s'_i s'. thfee .
miliionpounds :o:r s~ven percent belOt-T the October 1 f orec ast .of 41 million :po\inqs;
This. YElalf ' s crop promises to be ~vell above last year ' s short crop of 7. 5 milHql)_. -
p6unqs ,.p:t i;t. viili be 22 million pounds belo~-~ the rec ord c;cop of 60 rni1J.i on . . .-
:fl,Qun?s produced iri "1956. Harvest is under1vay in' c entral and southern parts..~f the.
state . ' .. -~ .. _.--.:
... -;
... .,RECORD - CORN- .PRODUCTION.: Georgia ' s 1958 corn crop, currently estililatect &t :-:c :
t 86~ 1~? , 0QO bushels, '1-Jill be the largest ever produc ed in the State . The J,.atest estiffici.te is nearly 22 percent above last year ' s crop of 71 , 188,000 bushels>~1cl . : . 69 percent above the 10-year ( 1947- 56 ) average of 51, 319,000 bushels~ . Th:'e ;Lndi'c-:< .. ~ ated Y'i:el<;l-. per acre of 32 . 0 bushels is a. neH :rec ord high for the- State exc ~ eding .... 'I the.. P.t~vi9us : rec crd of 26 . 0 bushels by six bushels . The 1958 season ha~ heen : .. :~ . ~
very. favq:r.able f or corn production de cpite the lateness of planting~ ' . , , : . .
~. . .: ~.: i . . .
EGGi:PRODUCTION UP: Hens on Geor gia farms laid 119 . million eggs during , Oct o'\:>.~!'' : This is a rec ord high egg production for O.ctpber. and is lJ percent abcv ~ ..
the pre'{"i;ous October high of 105 million eggs proctuc'i::d. in .+957 . . The ntu11b er of
layers ()n .hand is estimateq at 7,156 , 000 for October compared to the 6,820,000
la~rers on hand during October 1957 . Rate of la~ r:er . ~ay~r .~duri~g _._Oqtober_ is . ~, ::
estimated at 16. 7 eggs c ompared-to 15 . 4- eggs :cturi~~ Oct.bb_t?r J,-g57-, ..
.~.:
.: I
l
.
..HI;LK . P~OD.UC TION DOVJN: l1ilk producti on in aeorgi~; au~ing,_ October is ~stimated ..
at 97 rriil,lion -pounds . This is a . decre ase of three percent from the 100 rnilli,on ,. . .,
pounds produced in October 195 7 but is five pe.rcent . ~bove the. 92 milli"ori p"oun~s ' _
produced .dm:ing September of this year . The all..;time October .rec ord . high ' proQ;,. ,." : ...
uction__ o,_cc-qrred in . 1956 t-Jhen 101 million pouncfs were pr oduced .
. . ' ,.:
..
. CROP
I A~=~E
II 1958
......... .....
- -
- - - I YIELD PEH ACRE . ;rCTAL PRODUCTION( IN 'l'HCUS .~
Average
Indic . Average
1947- 5.6 : 1957 1958 1947..;56
1957 I~~~~-~
Corn _ bu. ~ 2, 711 .
17. 3 ; 26. 0" 32 .0 51,319 71 , 108 86, 752
VJheat bu. I 80
Oats bu. I 315
16 .-4. 27.8
16. 5 1 23 . 0
. 28 . 0 1 33. 0
Zay (all) t on. 1 5.69 . . ' . :: ~: 60 " i . . 96 1.03
I ss . '.:'ooacco (Typel4) lb .
.. .1,238 . 1 , 290 . 1545
.4.6... .?9tato~s , IrishjlXrt ~
. ' 46
?ptatoes ," Sv.rcet, cw,t,;; ., .. ,lj .
.
' : . . :41
:
49 46
49 48
I . : otton... . .. . ~ bal-es . . >98
?eanuts . (.for pick-~ 'I
~ng & threshing ) lb." 51o
. . ' 1)276 " 1/333 1/ 434 ..
845
910 1190
2,174 11,684 .
695 122 , 566
320 1, 198
681
571,760
1,848
11, 032
en,525700
. 1,840 ...
... 10,.395 . ' . 584
.'. .~
89_,610 .. . ~ .
254 .2i5
6~.h .
396 ..
. .
. 624
. 360
h64,100 606,900
.S oybeans bu~ 110
10. 6
- - - - - I ?ecans lb.
-!(Ja?s-otuunreds
. y
cond:..
7co.'
tlo
n
o.n--November_g1j . 68
lh. o 11.5
?/ 80 _g/ 68
410
1,400 1,265
I 37,346
7,500 38,000 I
A:1CHIE LANGLEY Agricultural Statistician In Charge
CARL O. DOF.SCH~R Agricultural Statistician
UN IYrnS!Tf OF &liQRGIA
''
,J ... ; LI BRA ~~
U1TITED STATES - GENERAL CROP REPORT AS OF NOVEHBER 1. 1958
Harvest of late crops progressed swiftly under sunny October weather toward early finish of this record-breaking crop year. Harvest peak is nou past in most States without unusual crop loss. Scarce rainfall in many Central and 1"estern areas during October failed to balance soil moisture losses, which resulted in gro-vJth slowdovm in pastures and fall seeded grains. Livestock continue to thrive on abundant field cleanup, record supplies of stored feed and forage, and much
good fall pasturage in many sections.
The general favorableness of 1958 crop outcome is clearly confirmed as the end of harvest nears. The yield per acre index representing all crops, based on November 1 estimates, nov1 edges one point above the October level to 143- a sharp gain above last year's previous record 126. Production indexes based on November 1 estimates are: All crops, 118 (up 1 point from October); feed grains, 134; food grains, 117; hay and forage, 122; sugar crops, 123; oil crops, 183; cotton, 83;
vegetables, 100; and tobacco, 87. Years 1947-49 equal 100.
CORN: The production of all corn is forecast at 3, 786 million bushels- up 3 percent from last month, 11 percent above last year, and 20 percent above average. Of the all corn production, 3,hl0 million bushels are expected to be . harvested for grain, about the same proportion as last year and thE;! average. The
yield of all corn, 51.7 bushels per acre harvested, is well above the previous record of 46. 8 last year and a third above the 38.8 bushel average. This new high yield reflects the generally excellent moisture conditions during the grordng period, dry harvest 1-Jeather, and the upt-Jard trend in yields due to improved cultural practices. October weather v1as generally favorable for picking the crop. By November 4, harvest was far more advanced than at the same date last year but near the average.
PEANUTS: The production of peanuts from the acreage utilized for picking and threshing is estimated at 1,886 million pou_~ds, up 2 percent from the October 1 forecast as improved yield prospects in Virginia, North Carolina, Georgia, Alabama, and Texas overshadowed a slightly lower yield estimate for Oklahoma. A crop of 1, 886 million pounds would be 30 percent larger than last year and 10 percent above the 10-year average of 1,717 million pounds. Record yields per acre are in prospect for North Carolina, Georgia, Florida, Alabama, Oklahoma, and New Mexico. The estimated yield of 1,228 pounds for the United States is 67 pounds above the previous -record set in 1956.
In the Southeastern area, the crop was dug and threshed under unusually
favorable circumstances. Rainy weather delayed harvest of some late Runner fieldf but damage Has slight and quality of the crop, judged from early samples, t-ras
excellent. In Georgia, it is estimated that 95 percent of the crop had been
threshed by November 1 this year, compared with about 86 percent last year. The
estimated production of 907 million pounds for the area is 37 percent larger than
last year and 2 percent above average. Record yields are estimated for Georgia, . Florida and Alabama, with South Carolina equaling the previou~ record set in 1956.
PECANS: U. s. pecan prospects declined nearly 7 percent during October, with
reductions occurring in all pecan States except the Carolinas, Florida, and New
Mexico. The estimated production of 158 million pounds is 12 percent above 1957
and 7 percent above average~ Of the total production this year, 82,100,000 pounds
or 52 percent tdll be improved varieties. This compares with 24 percent last year
and a lO~year average of 47 percent for improved v~eties.
PASTURES: Pasture condition declined slightly during October, but on Novembel
1 was the best for the date since records v1ere started a quarter of a century ago.
Farmers reported pasture conditions at 84 percent of normal on November 1, 2 per-
centage points above November 1 last year, and 15 points above the 1947-56 average
for the date. Pasture feed declined during October in only the ~Test North Central.
South Central, and South Atlantic regions. fuccellent pastures were reported els~
where over the count~J.
.4/ JV -
3;r
AGRICULTURAL EXTENSION '3ERVICE UNIVERSITY OF GEORGIA I<W1 'fHE STATE OEFART MENT Of' AGR IC ULTURE
Athens, Georgia
U. ~. DEPAP.TMENT OF AGRICULTURE AGR IC UL.TURAI.. MARKETING SERVICE 319 EXTENSION 13L.OO ., ATHENS, GA.
November 173 . 1958 .
LESPEDEZA SS2D FORECAST
GEORGIA: The 1958 lespedeza seed production is expected to be 3,040,000 pounds, according to the Georgia Crop Reporting Service. The
current crop is 20 percent below the 3,800,000 pounds harvested in 1957 and 63 percent l ess .than the 1947-56 averag~ production. Decline in production is due
to the large decrease in acreage. Indicated acres for harvest is 16,000 .or
4.;ooo less than last s eason and about one third of the 10 year (1947-56) .
average. - Heather : conditions have been very favorable during the harvesting
season and average yi eld per acre of 190 pounds is the same as last year but. 1.8 .. p~linds above average. The 1958 production by varieties is as follows: Sericea 1~763,000, Kobe 1,064,000 and Korean 213,00? pounds.
UNITED STAT~ LESPEDEZ.'\ SEEJ CROP LARGEST IN THREE YEARS
The 1~58 . crop of lesp dez a seed in the United States is forecast by .the Crop Reporting Board at ~6??175,000 pounds. This indicated production is 14 percent l .arger than the 1957 crop of 141,685,000 pounds . and 9 percent larger than the . 1947-56 average. The . increase is attributed to a l,arger acreage harvested and . to above-average yields. . Adequate moisture throughout most of the summer .and .fall resulted in an abundant production of hay from fewer acres and a larger acreage , tva~ saved for seed. .Set of seed tvas good and tveather at harvest time favorable for its recovery.
Production is expected to be more than dou,ble last yearrs drought-stricken
crops .in lJ:aryland and Virginia and is also rebounding from previous lOtTS in Oklah6ma. In iussouri, the leading l espedeza seed . producing State , prospective.
production is up 25 percent over last. year apd lesser increases are in prospect
for Kansas, Kentucky, Tennessee and Alabama. An increase of 20 percent is indicated for North Carolina .but because of. a dry growing season southHard, the
increase is more moderat~ in South C?rolina, and a . decline is indicated in Georgia. In contrast, excessive moisture in 'Indiana and Illinois induced rank growth . of both .lespedeza..and. weeds . This together with an early October frost is expected to result in a smaller acreage for seed and .possibly loHer yields. vihile record yields are forecast for Arkansas and Mississippi the acreage ~f
lespedeza cut for seed will qe . le~~ th~n last year .as growers diverted lespedeza. acreage to other ' crops. -
. T~e esti.roated .production by varieties .this year, in thousand pounds, compared t-Tith last year in parenthesis follotvs: Korean 106,045 (90,919); Kobe
45,138 (39,606); Sericea 8,909 (8,826); Tennessee No. 76 and Common 929 (844); and other varieties 1,154 (1,490).
Acreage of lespedeza cut and to be cut for seed is forecast at 738,000
acres--8 percent above the 685,000 acres harvested for seed in 1957 but 2 percent
under average. Sharpest increases in acreage over last yea'r are forecast f or
Oklahoma, Virginia and r1aryl and; the sharpest declines occurred in Indiana,
Illinois, and Arkansas.
The indicated average yield for the Nation of 220 pounds of clean seed per acre is second only to the record high of 227 pounds in 1949. The current yield is 13 pounds per acre above the 1957 yield and 26 pounds above average.
' .
Ccirrj'-o'J'er of le8pedez a s eed by farmers on Jur1e 30, 195 8 is estima.t ed at
7, 482 , 000 pounds. More t han trtoTo-thirds of t l1ese hol dings ~a concentrated in
of .Hissouri, South Carolina, Ge orgi a and Tennessee. These stocks approximate 5
perc'ent the 1957 producti on, and compare w-ith ?,549 ,ooo pounds ' h eld ' on June
30, !1957. : Adding dealers' 1958 m:Ld-year s t ock s to far;ner s! holdings , places total carry-over at 14,257,000 pounds -- down 28 per0ent from the 19,815,000 pounds held on June 30, 195 ? .
Lespedeza Seed: Acreage harvested ~ Yield per acre , and
----- - -,----:-------Pr-o-du-ct,-io-n---Av-er-ag-e..1-94-7-- 5-6,-A-rm-u-al -i957 and 1-95-8- .-., - - ~--
-.A .,::rcs ~ - -~
- _ - - -- Pounds ~-
-P-o-u....n:..d, s
P~1nds
1,000 1,000 J20tz!l0S ,EC1J1ldS
1,000 pounds
Ind~ 24,500 3.5,000 2 4 ~ 000 200
Ill. 23,200 28,000 22,000 180
Mo. 205,700 189,000 236 , 000 188
Kans. 31} 45'0 9' 000 8:~ 000 198
:t-1d. 1/18,938 12,000 20 ,000 1/237
Va. . - 24, 600 14,000 28 , 000 - 175
' JILC. lL~~., 700 116,000 122, 000 1 8:(3
s.c. L.2,9oo 43,ooo 4?,ooo 166
GA.
45 ; 650 20, 000 16,000 172
IfJi . -----6-3,9-0--0---68-,0-0--0--~?l , OOO 214
Tenn. 50,300 84,000 . 88 , 000 1'19
Ala. lh,4o6 . 1o,ooo 9, ooo :.48
Miss. 13,050 9, 000 8,000 130
Ark. 40,400 46,000 34,000 242
Okla. 7,500 2}000 5 ,000 150
230
220 5,009 8,050 5,280
200
200 4,2 78 5, 600 , 4 , 400
225
225 '40,907 . 42,525 53,100
200 .' ,240 7, lOi
225
27.5 1/4,597
140 " 170 . - : L).J..52
1,600 2,700 ' 1~960 .
1,920 5~ 500 4;760
1?~~
170
200 2?;554 20, 300 24,400 170 7, 618 . 7',310 7,990
)
1 90
190 8J3l 9 3, 800 . 3,040
200
220 14 ,.316 13, 600 15, 620
18.5
200 9, _392 15,540 ' 17, 600
1.50
200 2, 180 . 1,500 1, 800
170
160 1,792 1,53.0 . 1,440
330
h25 10,097 15,180 14,450
145
1'75 1,327
290
875
u.s. 749~ 5oo 685,ooo 738,oqo 194 . 207
220 148' 226 . 141' 685 162,,175
1/--f- ?h-or-t-t-im-e -av- er- ag- e .-. -----------------~----------~
- - - - -. - - - - - - - - - - - . ~ ,_;,_
~ .:.:::.
- - -... .:_.- - .- - - ....:. ~ - ~ - - - - - - - -
REISS'UED THROUGH GEORGIA CROP REPORTING SERVICE _ NOVllffiER 17, 1958
- - - ..:. - .._ _ :~ - ~ ~ :.._~ :..:_ - :_.-.. :_- -- - ._ - - - - - - - - - - - - - - - - - - - -
. .
.}
q_, '
;s-'
)-,1 D11.t-J& 7
)q~ :CGIEOiRhttA'c~:~ ~~-(())IF& llN~ ~!E~Vn<ct
:
:.
.
;
: AGRICUL.TURAL EXTENSI ON SERVICE : UNIVE~S.ITY OF GE9R.GIA,AI~6 T HE
STATE OEPARTMENT 'OF AGRICUL.TIJRE
1
" ' - - ,
, 1 , , . , , u~ E lA
:
'
.
. . IJ. S. D.EPARTMENT OF AGRICU(TURE
2 0'58 ., . . :." -~ .
. ' . l(.t\J
'
.
GRICULTURAL 3 t 9 E:XTENSION
SM!A-DPG.K.Gi TAINTHGESHt:$:n,VGICA'~E;
I
I
j
l: ,}
BROILER CHICK REPORr FOR GEORGIA :' . u
~
~
~ .. .
.
, NPvember ~
..1:9
j
~
195r6.:.
1 ' ATHEN~..; GAo, ~ ;Noveinb'er: 19--A t .ottal at; 5;0.16, 000 broiler.: chieks ~rere:~placed w:ith-pr9ducers : in.Georgia du:ring th:e ..vTeek' :~ndirtg Neve.-r.ber 1_5:, according to th~
Georgia Crop Reporting Service. This ccimpares' with the 5,095,000 p~aced the l
ptevious week a'l'ld is ttv-o percent mdre than the 4,923,000 placed : the ;same \feek;
last. year.
~
. .
:
,
.
'
.
. .
\
.
...
.., .. . -
.
.
' .
:
'
~
1 '
~ '.
'
i
) .- ' .
I '
'
'
I
1
\ Eggs set by Georgia hat.cheries: amounted to . 7,311,000 compared With \
n549,000 the previous week a'l'ld is six percent more than the 6,871,000 for: th~
corresponding week last year. . ;
.
.
- .. ,
. ~
.
.
. .... .
; . . '. . : i
; .. .. .: !
~
. : Hatcheries reported prices. paid: for hatching eggs during the . week at ;an i
aterage .of 67 cents per dozen." ' Average price charged by hatcheries :ror ttie ;
chicks was reported at ~:rlL 00 per hundred. These prices compare ~r.i.th 67 C:ents and :;?ll.QO last week and l-J:ith 71 cents and ::a2.00 one year ago. ~gg pr:i..ce~s
sllotttf. reJ,ate to Georgia produced hatching eggs whether bought on c.on:tract :or
otherwise.
. '-;
\
~-Teighted average prices from the Federal-:$ta:te }larket News ;Serrlc e f o~
1
l
b~oilers during the t-1eek ending November . 15 are as follows: . G-eorgia br6il~rs :'
2 '3/4 - J 3/4 pounds, at farms 1.5.59; FOB plants i6~46. '
~ :~
' ....
(See reverse side for other states)
(.
. GEORGIA CHICK PLACU1ENT BY WEEKS
===-==:;:::======:S:=E:~ER 13 THROU'GH NQ.YE@_~R 15
\t.Jeek Eriding
I
y EG~S SET
l957 ..
1958
. 1958 .%
of 1957
CHICKS PLACED :FOR BROILERS' .:
I i9.5B .8 (.:
. 1957
Thousands
Percent
Thousands
Percent .
Se$rt .13 sept;::2o: . Sept. 27.
Oct. 4
Oct. 11 Oct. 18 Oct. 25 Ney. . 1
Nov. 8.
No\r. 15
. 6,688 6,623
6,803 6,522
6,595
6,708 6,627
6,587 6,542 6,871
6;988 . 7,075
7,030 7,110 7,248
7,234 7,239 7,394 7,549 7,Jll
104 . 107 103 109 110 108
109 112 1:15
106
5,051
4,832
4,876 4,838 4,826
4,927 4,846 4,882
5,091 ' 4,923
4,648
4,.573 4,602
4,927 4,942 5,002
5,034 5,121
5,095
5,016
92
95
94
.. ..
..I :.
102
102
102
104
105
lOQ I
102
];./ Inc;t.udes .eggs s.et .by hatcheries producing chicks for hatchery supply flocks~;.: . : , ~~
: c.ARL :a. DoEsCHER
~! l
ARCHIE LANGLEY
t
Agricultural Statistician
Agricultural Statistici~
', .
...
EGGS ~ET AND CHICKS PLACED IN CONMERQIAL AREAS, BY ~-JEEKS - 1958
Page 2
!l
!: :: ; I
~Eiek Endihg
STATE i,_-~~~;~o~~~:- -~-~-~N~ov8-_~~;.=-- __-_.._._.~:-~N1_o.,..-S~ ~~~~~t~:"!'-~- -:~)~s-_ei-~~~~~--:-._-.__-s_e-~;~-_:-"'..~~~s-~e~~-.~~~~~-o-c_-t~.-~~~~--o.-~~i~~~~--: ~.:_o-~~~~-~~~--- --o~~5~~~~~--N-o~~~-~'l-"'--~-~-N-o-8~~~~-- N~~S~~~=
I' \\ EGGS SE.T - TROUSANDS
lj
: -
CHICKS PLACED - ~ THOUSANDS
--------------~~~I ----- ~ ' - -' ---~'-: ---~-~--~-.- ~, ~-~~- ~------ -~---~--------~-~---------..-. --------------------~-------------
J.Vlaine Connecticut Pennsylvania Indiana
i'i.,l_ 1,42.5
1,002
,! 1,176
! 1,798
. 1~390 ' l :, 05l: : 1,196 ;_
1,851:
1,377 . ,-rL 1,.09.5
1; 043 ' .. 1,403
- -~~
..
)j6 758
1,800
,; 864
._, 26f -: 1,009 1,1:0f
' 513':
551
433
692:
680
167 .
' 752
682-lf ' -76_0 _
l,o87 1~11o-)}
499-::.>84
. "~367383
727
713
l,o56 419 589
" 646
1,033 ' _416
768
707
1,094.- 1,099 470 382 814 825
795 797
Illinois
li1 302
309' :
318 . -i! 142
.-. 180 . 152 : -202.- 159
119 . 96 . 127
180 173
I1issour:L
1, 462 1, 433 1,524 -- . -IL . 58-J
- ss2~ : 49.5 ,_567- 57o
-495 : 557
5)5
655 654
Delaware
1111 1, 724 1, 741 ;; : 1,- 782 . _... i<. 1,566 : 1,371. 1, 450 - 1~60J., 1,$76 1,445 1,686 . '11,813 1,293 1,.293
Naryland Virginia
!I i: M~ i:~6~: : --i: ~i 11- -i;i~ .i:6r~ :i;6~~ l;~J~:_._ i;~~~ 1'-~~~ 1' ~~~ - 1,~~~ 1'~~~ 1;~~~
vlest Virginia North Carolina South Carolina
!IIl
294 3, 076
ji 565
280. ' . 255 . -11-.. _. 589- ' ' - ,4~ 7
> 3,140 -: ; ~ j~ 122 -:)c.:, .2,341 -- ~ 2.,3"2 9
6L~6,
614
1 321 . . 2s&*
423 2,24.5
332
563
478 .. .446
485 ' .. 571
2.; }51- 2, 398 - 2~352 2,229 2,307
- 313c.
344 - 362
315
221
611 574 2,416 2,294
327 364
GEORGIA
lt 7,394 7,549. ' ' :-- 7, 311 . 4,-61+8 :4,573 4, 602 4; 927 ' 4,942 . 5,002 5,034 5,121 5,095 5,016
-F-l-or-i-da---------11 -~~39~3~--~-43-1~; ---~-46-6----*1-~~ 21.-5 --~~-1-5-1-----17-8---~-1-4-4----~-15-1--~--1-8-2 ---- -18-0--~1--2-13------18-5----2-0-1
Alabama Nississippi
Arkansas Louisiana Texas
I! 3,352
.li
2,146
3,&~i
,11, 2,936
3,292_ 2,1mr
3,~~J
2,90J ;.
3 , 3 35 .2,3.14
3,~~~
2,765
1 2, 39:]._ 'i 1 ;55 .3
1 2&~6*
1. 1,740
' 2,2~3 -- 2,239 l:,:6oo- 1, 649
2,~~r 2,~~~
-.. 1,618 __ 1,469 ._
2_,_3 82: 1, 723
2 , ~~
2,023'
2,525 1,639
2,~t
2,16.5
2,355 . 1;637
22 ~,1m26
2,28.s ___ 2,496 1,613 1,66:8
2,ti~ , 2~~~
1,963 2,143
,. 2,654 - 1,654
2,~~r
2,158
2,648
r, 727
2,~~~
2,269
vJashingt ~n
Or e g on Californi a
TOTAL 19~ 8 TOTAL 19.57
lj 343
I1I
235 1,085
1!, 38,.544
1
I' 33,484
-- 320 .
306
' 1~123165' , ~,233830
39, 199 , 39,469 ..33,219. 34,377
342 249 I , '
i 1
176 916
! 184153~0
II-f-- 2:6,4a&-)} . 24,955---).}
1 _ 2~~o2a 24,298
' 287 175 829
-24, 846-:!-
24,134
247 - . 189223)~
26,527~~
24,67.5
272 " 209* 281 : 298
;1:49
.141 - 118 1 i4Q
770 '761
773 I -819
26,.584~~ 25~-838*. 25,611 - ~6,7.58
24,231___ 23;930 23,413 _ 23,058
236 273 161 164 r 836 . 812
27,032 27,171 24, 205 ' 24,4.56
1958 % of 1957
I 115 -- 118.:. : . 115 . ' ' . . 1D6
~03
103
108 .. 110 .. -'108 ' 109 ' 116
li2 ' 111
,I .
.. -.
~
. '-
~*' Revised
..' ..'.'.
r~f&:;ucuo, "cv
JJecemoer 4, .1>';> 0 _ 3/ ~
/:/ CGJECC!RiCGllA C!RiCCJP IR1IEJP>b>~lliTNG . SlE~VlLCJE
.,_ ,,, tJ .. . ~~RtCt,JLTUf1AL: EX:r.ENS!oN sERVIce:
wv tJ-'f'
UN iVERSITY .OF GEORGif- AND Tl E .
ASTtAhTeE~Ds,EPA(;R~.T'oMrEgNiT~O F AGRICULTURE ~
1 v ?_ ..
A u.s. oi::~ART.MENT . oF AGR'tcuLiTORE J ,
AGR IC:..tL.'TURM. MARKETING $6RV IC'E , _.
19sa . . . 3N1~9 vEXeT~EbNS~IOrN-: iS4L;.O' ~G., ATH.Efo!.$ ; GA. ~
I
t ~ I
. PULI;.~T,. CHIC~s .F'OR B R O t E qx tcrt RY sUPPLY FLQcks .... : .:!q:.- .:;
.. .. '..' ... < , . October 19 58 .i. United 3taie s,
. '. 'J ..: , - :. ..
'i~~~.i~~i.c~ted ~f ~~ppi~. '.,
placeme.nt' pullet chicks for broiler hp.tche.ry.
fi;o :ks:::.
by leadi'ng~ pr'lmary br~e.ders of broiler replacemeht . stocl< ' total~J , 2. .'568, :.000 ! , . ... :: chick's.' c(uring: Gctober. ' This . Was 12 percent more than in O ctober .1957 . . Pul~; , . l e t c..A.i f~ P.~ac.e.ments b.y .these b reeders d uring the first te n months of 1958
total eo 28, 671, 00 0 --32 percent more than during th z same perio d of. 1957 , :' ...
~ . . i,. ,
T~he . t~t~ls include pullet chicks sold during the month, plus the numbe.r:: of ., ::
pullet c1).icks e x pected from eggs sold during the pr e cedii.g month. The coti.- :. >.::
ve rsion l.{t' om egg s to expected pullet chick s was rr1ade on the basis of 125 pullet
chicks per case of hatching eggs sold. The primary breeders included in this
report account for a very large percentage of total supply of replacement pullet_s__ . . .
for broiler hatchery supply flocks. Sale.s of replaceinent pullets by 'these
breede-rs provide an indicati on of the potential number of pullets available for
addition to hatchery egg supply flocks se v e ral months before the pullets will .. ;: ~ ,.'
actually mo've into the floc ks . .. . _ .
Pulle~ chicks 1I Placemeqts for B roiler Hatchery 3upply ~....locks
(Reported qy. leq.ding. breeder s )
1/ Includ es -expected pull et"re.pla.cem~nts f~~m eggs .s old du_r ~;ng the. preceding
month at the rate .q.f 1.25 pullet -chicks per ca s e of egg's;
.. .
. : '
ARCH.IE L A NGLEY 1\gricultural_.Sta.ti'stici_?.n In Charg e
:\
w. A . WAGNER ..:-:1 :. .
f\ gricultural _Statistician .:' .;
' ..
..... - ....... .. . - ..
. ... . .:. 1 . .
.. ~ . I:
.. ;.'-::. .
:1;,
.: . !'
' -~
't .
I>
'-~. )
' ' " qv lJQ 1 011l " H HlJI I ![J(}ISLJlre lOSSeS y.thjch resu ~'*cd in
.,
., ."...;." ....~.
CHICKENS TESTED
.. ..
i ;
: . ; i ' . ' ' . <; .
. .~ ~
.r~;.ce'orgia 458, 44Z chickens for supplying broiler hatching eggs were. tested
for pullorum ~lisease during october 1958--49 percent more than the 306,795
tested in Ottober 1957. Testings of Egg Type chickens for October were
41, 043--51 .percent more than in September last year.
! .
. .
In the States for which comparisons are available, 3, 119, 231 chickens for
supplying broiler hatching eggs were tested during October--up 15 percent from
Oc'tobet 19.S? .' Te.stirigs July through Oc;:to'ber of this year totaled 8; 987., 892,
up 13, pe'f 'C'erit from the testings during this period in 1957 . The number .of . ' : chicken~. fpr other.. purposes (eggtype) tested in October totaled 2, 314, 846--: down 3 p~rc:ent fr.om October 1957. The number tested July through Octpber.: .:..: totaled 4,' 65'8, 669- .i. about the same number as tested during this per.iod -in .1957 ~ :
rThFs report is made possible through the cooperation of the National .
Poult;~{Imp.rovement Plan offici<H State agencies, the Animal Husbandry Re-;i ,
searcl:i ,'Division, Agricultural Research Service, and the Agricultrual Esti- . :
mate-s 'DiVi sion; Agricultural Marketing Service.
: . .~ .. i. ~ : : . .
. l
: I'
..
:, Georgia - Chickens Tested by Official States A gencies
Month
~"'or Broiler Production
Egg Type Chickeits :
By Months
.
Cumulative
By :Months
.
- ~ .. ~
19.5. ~-7-58
J:. :
Ju_l.Y__ : 20i, 194
Aug.
: 230,-z9z
Sept. 11 . .:, 334, 522
Oct.
: 306,795
Nov. : .: :254 , 554
Dec. ; ,: 252, 517
Jan. ..-: '414, 416
Feb. . ;:275, 750
Mar. .7; 255, 111
Apr.
: -211,093
May
: -254,024
June : ' 185, 343
1958-59
1957~58 .. 1958~59 .. 1957-58 .. 1958-59
253, 865 . :2,40; ,302
...
202, 194 432, 4'86'
.413, 264
767,008
458,442 1, 073, 803
1, 328, 357
1, 580,,874
1,995,Z90
2,271,040
2, 52.6, 121
2,737,244
2,991,268
3, 176,611
253,865 494, -l67.
907 .-4~i
l. 365, 873
r:. ;
: .. .. , . )
.. .. . .
'.. . ' . ...~
... ". ..'
. . -
17,274
. ;,
30,299
47'~ "7:56
42, 581
18,286
35, 652
27,242
41,043
8, 3.25
.. . '
14,836
61,.618
13 ,
.
6
.
7
5 .
.
...
'
.
12,086
57, ~26 '.
10,849
'
. ~ ..
!
17,445
Month . ....
:, .. \
, I
United States - Chickens Tested by Offi'di.l State Agencies
1 . . \
F or Broiler Production
- ,
.
-:~y
.
M
:
o
n.
t
h
s -
1/
~
.: ~" or E gg Type -Chickens
.: -~ ... .'. . -. : by iyfonths 2/
' J I
: . ~
,
, .
,
1957-58
1958-59
1958-59
JulY, Aug.
Sept. Oct. Nov. Dec. Jan. Feb. Mar. Apr. May June
: l, 310, .378 =" 1,' .6oo, 8os '
2, 310, 549 2,723,936 2, 225,580 2,208,307 2,014,868 1,282,382 1, 587,391 1,701,022 1, 554, 643 1, 310, 490
1, 628, 129 1, 596, 792 2,643,740 3, 119,231
363, 753 .
616; i6i
1,251,370
2,379,471 2,483,280 2, 586, 4 56 l, 741, 051
454,617
485, 136 245, 750 276,008 289, 142
500, 558
599,607 1,243,658 2, 314,846
1/ All states except Mont., N.Mex., Ariz., Nev.
- - - - - - - - - 2/ All states except Ohio, Del., Okla., Mont., N. Mex., Ariz., Nev.
11
.
.
--
--- -- i- --
j I ., . , ..... -::-"' ::"' ~. ..
I 6
~/lIj.D-1?93tlP;J' CGJE)~(GllA ~.C~CIP\ Jm:lE.IF?~~nrn-Nca .s~~YK{C~
/fj<J ! AGRICUL~-~RAL txT~~tdN. ~!$:~~~~:~ -~::. .:.::; ~: lJ~i>,~::c:l~ ~:f. Gf.:: R~\l-. DE~ART.ft1EN~ O~~~G~ICULTUA~::'
I j UNIVERSITY OF GEORG~ AND: TJ-1,-; ';. i:.: .::_ , ,; -: '-::. ! :-; ~- ,: . ICUI,.;TURAL MA~I(~TI"'~ SERVICE:
(::) : STATE DEPART~NT 0~ - ~RICULTURE ,; :: ; ~_. ;
,c. 3t .EXT_ENSION B~DG ~; A.!,HEft5.. GA.
~ROIIER CHICK REPOR1t ;FOR GEORGIA :_-~ . '; DEQ l 5.B
Nove=Mb~r 26) 1958
.,
~ -
;
: "" I
~
\
..
Ll : kARIES
.
: ....
ATHENS, GA., November 26-..A total -o'f- , , - roiler chicks were placed
With producers in Georgia during the week eriding November 22, ac~ording to th_e
Qeorg~a - Cro:p Reporting Service. Thi's canp~s With the 5,016-,00~ placed the
nrevious week and is five percent more than 'the 4,955,000 placed :the same week
~ast year. ~
- '
- .-
;"! ft~gs set by Georg~a h~t~he;i~-;~ :~tiunted to 7,524,000 compared with ._: ~
:1,311,000 the previous week and is 10 per cent more than the 6,868,000 for the.
. : :~orresponding., week last year.
.... ;~.
.
..:.: '-
.: ..
; I
H
,
I
..
;
'.:;.:~rwle~eikng
- - ... ~
'
(See reverse side feri other states)
< ~- : .atbJiGU~ti-IIOK PLAcFiiENT BY \'lEEKs :
. . SEPI'EMBER 20 THROUGH NOVEMBER 22
I
- - - - -
EGGS SE~. Y .
" ... ~
..:_': '.:. . 19?7.'
-~?.'-~: ~
. ..
.... ... 195' 6 ~ ' .-o. 1957
CHICKS PLACED FOR -BROILERS
1957
....
~: ~
1958
. :! .
1956 16, o'j: l957
Thousands
Percent
Thousands
Percent
s~pt. ;20 Sept. 27
Oct. 4
6,623
6,803 6,522
7,075 7,030 . . . 7;110
107 .103 . 109
4,832. 4,573 4,876..._-: .., -~.4, 602 : 4, 838 ~ . . .:.4,~27 ..
95 ..
'
94 .: 102
J
oct. 11
6,595
7,248
110 4,826
4,~42
102
'Oct. 18
6,708
7,234. .
108 4,927
5,002 . . 102 '
oct. Nov.
a -:N. .0v.
Nov.
Npv.
=2?. 1
. ~ 15 22
-1/Includes
. 6,627 6,587:.. 6,542 ' 6,871 6,868
..
eggs set by
7,239 7,394 7,549 7,311 7,524
hatcheries
.
109 112 '
4,846 ._.'. :..5,034'.; . 1o4
4,882 .\ :'. >5, 121-. : : 105
' :
!
115 5,091
5,095 :
100
; ;
106 110
4,923 . 4,95_5: . .
.. ......
5,616 . ..5,196
102 105
'
.. . f
'
producing chicks for hatchery supply flocks~
~ . ARCHIE LANGLEY: ..
Agricti.ltural Statietic1an In -Charge.
: i : . .
:
. . !.
. .
.
. .
.
:
!
. .' .:... W.. A. 1rJAGNER .... ~
Agr~~ultural Btati~tic~an
i. :
.
. . :.. . . .:.
... ...
;_ !r ; .. . :: :
~
. . .~ ~ ..
;.'\
r "'.- '-
. ' .. '. . . . ' " , -::: ; I , ,. :
.....
".:: f
1:~ .:':
! .
'-:.:: ;_:
;... ~ ..
,; .
. -:.. ~ -.! . , ..
' . .. -
. .. . .. : ::
..
,.. . ... .. .. . ..t: :~ ~- :r.. .~ ! ' ' o ; / I ' '
~.
o : ' , , ~ ',. ....',
{ ..: ,_::!.
. ,.__..
:
.
. :_.. .
:
:_
.\
.. ..'
. ..
.
: ..
~~ :." .:~.'
. ~ r ~ = ; .'
!
; . -. .' '
., .
EG~ ~ET A~ .C~ICKS PLAC~ IN CONMERCIAL AREAS, B.Y: !JEE~~ .; ~1958
Page 2
;.:.. : ..
, 1 , .
S_TATE-
_, l
. ' . - .: ~ .> .
-h------ - j :Nov{::::-., ;; Ni5\r~ : Nov. ... 1.' .
0
: [
:
,
'
],5 8 !.' . .
.. ~22 - ' -
.. . I. - . EGGS SET - .TH.bVSAJIDS
Wee~ : End#g '
;;~ , .
. .. r
. ..
I I NB. 'I I -S-ep-t.-~,.~- --s-e.:p-t.-' ~~~~;- h-~t-.-~- _-:l _-. . -d-etr. ---~- o-ct-~~-." --O~c'"t]~. ~I ---No-v~. ----~----N-ov-. ~---N-ov-. -
20
. -27 .
4 1 11
18
2s
1
15 I 22
. .
CHICKS PLACED - THOUSANDS'- : . ... . .
Ma i n e ,:
..
1,390 . .. 1,377 .:- . r,.: 353 ~. : l
967
1,009 '
. ..
1,i03
. . ...
1,oa1 . .. 1,11Ql}
1,os-~
Connecticut Pennsylvanfa. Indiana
.. ..
. '
.
11~
015916
1,851
I _;~. , o~J : . .1.. o72 1
-1,4o3 1; 435
513
ssi 433
692 68o
161
1, 800 1, 863
::. 752 .- '682* 760
499-Y.- 378 : 419
584
633 . 589
727
713 . ,, 646
I-llinois :
J.lili,.$SO~i ~
I: 309
318 .-360 .j ,. 180
1,433 1,524 1;623
552
152
202
159
119;! .. 9(>
495 . 567'.' . . 570 .. : :._.. 495 ,; 55:1
:O~aiawcire .
1,, 747
1 ,_3,i~g Maryland
Virginia 1nle$t Virginia North Carolina
I
2,238 ' -1,9os
j
South Carolina -
. 646 '
GEORGIA
'- 7,549
. 1, 782
2,235
. 1,916 2,212
.'~I
1,371 ' 1,450 1, 714 1, 789
1,601 . 1,576_ . 1~-.445 1,61L. . -1;&9o 1,643
11,,6s8~?
3,ig~ -~ 3:~~~ : ;-~~~r ~ ,;~ 2~:~~~ ; 2,~~i 2,~~~ 2,~~ : 2,~~~ 1,951 --~ i~019
614 7,311 ..
- 637 7~524
-'., /f111::
,-;
1,015_ 1,059
956 1,039
932
834'
. 28~ _ :. ' ;33zr:
.. 313 344 362!
315
lf, 57f . 4,602 .i':' 4,927 .' .4,9.42 ., 5.,002:: . 5,034
1,033 416 768 707 127
535
1,813 1,570
894 571 2,.307 297 5,121
1,094 470 814
795 180
655
1,293 1,927
796 611 2,416
327 5,095
1,099 382 825
797 173 654 1,293 1,871
878
574 2,294
364 5,016
1,075 560 818
797 174 676 1,580
1,746 941 468
2,359 369
5,196
Fl orida Alabama l1i.ssissippi Ar kansas . Louisiana
Texas~ :.
~iashington
Oregon ... California
. -~~ 437
-J,292 ~.: 2,188 > '
j ,4li .
556 . . . 2,903 ~ -. ._. ,I_ .. 322306 _'_
- ~ . i,ll5 .
466 . lit1
3,335 . 3;316 2,314 .. 2;365 3, 36.6 .. 3,-;~,;c:;;r;;'>
569 . - . 632 2, 765 :. :. 2,901
3Q6 _: ': c J47
333 <:: :;.299
1,2$6' . ff' l~6
,. . -
. j ~
~
1
1'..
'
1St
a 78 .. t1.44 -. - : :..i5F ._.':; :182 . 18o
2, 293 ' 2,.239 , 2,382 2,525 2,35$_: 2,285
1~ 6oo.- . 1,:'649 : -..1, 72:f i~-639 1,637: ! 1,613
2. ) .
216*
355'
:....:~<;,.
.2..' -2340.29
.
2'..4307.15
2' 4-16-. . 2. ' J71.f' ? .. 2' 475 . .: 404 . 423 .. 411
1,;'618 . ,. ' 1,.469 :-. ~ 2,b2.f . 2~1.65' :: ~ :-2;:126. . 1,96}
. ~,249 ~ 287 . . 247
272
209~
28,i
193 .. '175 . . 123
149
141: ' 118
845*
.829 ,; 89.2~~ . ,770 ...-_, 761,;
?.7~.
213 2,496 1,668
2,465
351 2,143
298 140 819
185 2,654 1,654 2,308
367 2,158
236 161
836
201 2,648
1, 727 2,463
394 2,269
273 164 812
192 2,685 1, 796 2,550
383 2,321
289 168
846
..
.:~ ,;,
TOTAL, I9~8 .
TOTAL:- 1~7
. :-. .. 39,199_:. .. 39,469 4o,'5.o4 :: :
. _'_ 3'3, 219 . 34,37.7 ,. ,}4~ ~~4
1.-958 % or 1957 -
118 .... 115: .117 -~ ..
24,955* 24,298
103
f;
: .. :I :
, . . . >:: . , . .. . ~ . ~ , ~.: ': . J ~ --
: ~
~ : 24;~a4~ 26,'527*. 26, se4~x-J ~- 2s, a3ffi,f 25,611,
. : 24,-134: ~- :..24~ 675
...
-
24 237 - ..
23' 93~ ~
-.. . .
.:,23,
- .
h-13.
- lOJ. o_: ~: .:108 :., . 110 .- . .' 108;, .(. 109.
,. . .. ::- --~ -~.: _.'..
~-
26,758 23,058
116
27,032 24,205
112
27,171 24,456
111
27,989 24,601
114
* Revised
JJecemoer 4, +:t;;~ ~.
_a_.
3
;
c
0
-
-/ Dt; ~0 7
~M3
. .
~3 (QI(Q)$~U~ : C~OIP ~~WllN~,. ~~~YlCClE:
JIIGRICUL.TURAt.. EXTENSION SERVICE. l$.NIVERSiTY OF G~':: ORGIA AND THE
STATE DEPARTMENT OF AGRICULTURE
BRO~LE-~ C~ICK:. RE~OR~ .:~fOR. GEC)RGIA '
:
lJ. S. DEPARTMENT_ OF AGRlC UL.TURE ,
~ .
lEC 5
'58
AG R IC ULTURAL. MARKETING SERVICE. 31g EXTENSION Bt.:DG ., "THt:;NS. iGA. ,
-UBRAHI s : . . ..:: _.,. . , _:De~emb~; :j;.l~58 \-'::
~
. .
.,
':~.;
; ATHENS, GA. :, December 3--A tota]. of 5,320,000 broiler chicks : tverE\ place.ct l
with! p:r,od~ce:r:-~ ih G.~<;>r~ia .during the ."ttJe~ . end.ing November 29.r. acc~rd:i.ng: tq t?e i
Ge o~g~~ C.top f1.eporti.rig Servic~. . This c ompp.res with .the 5, 19.6, 000 placed the ~
prev_ious vmek and is seven percertt mqre than the 4,993,000 placed :the .same week :
lasti year;.:_
'
'
~ :
'
l
i Eggs set .,by. Georgia hatcheries ~oUrited .to 7., 83"2, 000 .compare~ wit~ .
7,52'4;000 the previous week and is 18 percent more thari the 6,653;000 for the
c orr.espond?-ng .week last year.
i
~ Hatcheries reported. prices.:Paid :for.hatc):ring .eggs.-during the 'week. at :,an
averiage of: 67 ,cents ,per dozen. A\rerag.e price charged by'-hatch~ri~s fo:r the ;
chicks was, reported at ;:~n.. OQ per. . hund-r ed. These prices compare 0-th 67 cents
and ~;ill.OO'- la:st week and -vJith 73 cents and ~?12.50 one year ago. ~gg prices . ;
showh relate to Ge orgia produced hatching eggs whether bought on contract or \
other~se..
, ~ .
~
.;~,_ .
~
. \
. .
: vJeighted~average pric-es from .the Federal-State Market News Service for
broi~ers during the week ending November 29 are as follows: Georgia broilers I .
2 3/4 - . 3 3/4 pounds, at farms . 14.05; FOB plants 15.00_.
(See reverse s~de for other states)
..
:
V.Jeek Ending
' ,.
'
: 1---
4
GEORGIA CHICK PLACll1ENT BY "t.JEEKS
'
..SEPTEIVJBER 27 . TIIROUGI-I
EGGS SZT 1,/
NOVEM-BER 2~ -- -- -
CHICKS PLACED.FOR
BROILERS :
- 1957 I 19~7! I
195.8
Thousands
I 1958 % '
of Percent
195.7.
195S
!
Thousands
. .
195-8 %
.of . l957
~
Percent. ..
.!-
,.
<'.
.
.:
:
Sept ~ 27
Oct. ; 4 Oct. , 11
Oct. ; 18 ' ' Oct. : 25
.6, 803
6,522 6,$95 6, 708
'6,627
7,030 7,110 7,248 7,234 7,239
103 109 110 108 . 109
1+,876
4,838 .4,826
..4 '"927
4,846
4,602
4,927 4;942
. 5.' 002
5,034
94 .102 . .. 102
"I
:1,02
104
..
. :-_ ~
H,
Nov. ; 1
,6,587
7,394
11,2
Nov. ;- -8 -
!6,542 .
7,549
115
Nov . \ 15
.6, 871
7,311
106
4,882 .. 5,121 . . .. ' . . .-105 .. ~
5,091 4,923
5,095
5,016
100
10~
. :-
(
Nov. : 22
6, 868
7,524
110
4,955
5,196 '. ,1.0 : ,.
Nov. 2~
.I --
6, 653
. 7' 832
118
4,993
5.,320
.. . .
--~ lot
:
- - ~/ I~cludes.. eggs :set by hatcheries producing chicks for hatchery stlpply fl-oc-ks .
. .
; ...., . (
I
I
~
.. j
~ ;_--~
!; I
'
I
, .. ARCHIE LANGLEY
.
W._ Al \ JAQNJ.(_R .- ~ {
Agricultur.al Statistician .In Charge
~
.
.
.
!
AgricuJ:tur al Statistj__ciarl
. .
.
. .
; .
I
:
,- .
. .: . .: .. :..
:--'
...
! "''
. ;
:
.,
:
~
-...
~ -- -,
. ;,,
J"
..
.,
J ....
. .. '
. . i.: . .
'I --------:T'"-~-----E;;;.G~GS;;;;. SET AND CHICKS PLACED IN COMMERCIAL AREAS, BY WEEKS vJeek End .J.ng
1958
STATE
I
I
Nov.
15 -.
Nov.
22
. I
, :
:
Nov.-
29 ...
'
'
.
..: ~
Sept .
.: 27
. od~. { .~i
Oct.
18 .
Oct.
25
I . Nov.
Nov
1
8
Nti.-e
Connecticut Pennsylvania Indiana Illinois l'Iissouri
Delaware Naryland Virginia West Virginia
North Carolina South Carolina GEORGIA
l
EGGS SET :- THOUSfi;NDS - . . .. ... . '
I
I
I
1,377 1,043 1,403
1';353
. ~,39.4 :
. .. ' .
1,\..0' 0._9 ....
1,0-72 . 1,0&8
551
1,485 .: !(,444
I 680
I 1,800
j
318 1,524
I
1,782 2,235
1;:863 - ~J6o
1,623 1,916 2,212
..
.
'
l
._, 936019-
' . i,640 .
.; 2.,05.1 '
. 2,343 .
682*
152
..
. ...
495
1,450
1,789
I 1,951
I
I
255 3,122
I 614
2,019 283
3,115
::_. 2,123
.... ' 29~ .
. 3:,167
- ..
1,059
I
.
423 2,245
637 . ,. 649
332
I 7,311 7,524 .. 7' 832
4,602
CHICKS PLACED - THOUSANDS
1,103 1,087
433
499->':
767 584
760
727
202
159
56?: . 570 1,601'. ' 1;576
1,674 1,690
956 1,039
563
478
2,351 2,398
313
344
4,927 4,942
..
1,110* 1,056 1,033
378
419
416
633
589
768
713 119
646
-
;
96
707_ 127
. 495: :. - 55?
535
1,445 . 1,686< . 1,813
1,643 1,566 ... . 1,570
932' . 834 . 894
446
485
571
2,352 2,229 2,307
362 . 315
297
5,002 5,034 5,121
1,094 470 814 .118905
655
1,2~3
1,927 796 611
2,416 327
5,095
Florida Alabama Nississippi Arkansas Louisiana Texas
~'Tashington
Oregon. California
TOTAL 1958
466 3,335 2,314 3,366
569 2,765
306 333 1,280
39,469
441 3,316 2,365 3,555
632 2,901
347 299 1;186
..
40,504
446 . 3~341
. ..
178 2,239
144
151
182
180 . 21)'
2,382 2,525 2,355 2,285 2,496
2,536
1,6l.J.9 1,723 1,639 1,637 1,613 . 1,668
3,646 :::- :~ : 2,242 2,40$ . :2,416 . 2,374 2,475 .2,465
69.7 ~ . 2. ,933627
:
.. . . -~ :
,". 309 .. 3-?i _:.
: 1,469 ' 287
-~
-;.
2 '
023 2. '47
' _,464 ~ : :2-;i65 '.
272
423 2,126
209-x-
411
357
1,963 281
.
.
2'
143 298
363
175
123
149
141
118 . 140 '
1,054
829 : . . ' .
-~ .. .
,
..., .. .
. . .. . '
892* .
770
761
773 : 819
41,683
. .
, 24,846-lt-
26,527* 26,584* 25,83B* .25,611
~6
.
-
7.58
:
185 2,654 1,65h 2,308
367 2,i58
236 161 836
2_7' Q3.2
TOTAL 1957
-1958, % of 1957 ~ Revis~d
34,377
I I
115
34,55.4 117
34,816 120
..
24,134 24,675
- . - . ..
I 103 . .
108
-~
24,237 23,930 . 23,413 23;058. 24,2.05
.
110 108
-
109 .. :116 :. .. 1..12
Page 2
Nov. Nov.
Nov
15
22
29
.
'
1,099 ' 1,075 382 560
.825 818 797 797 .173 174 '654 676
],.,293 . . 1,580 1;871; 1,746
:878 941 .574 468 2,294 2,359 . 364 369 5;016 -5,196
.201 192 2,648 2,685 1, 727 1,796 2,463 . 2, 5.50
' 394 383 . 2,269 : 2,321
273 J -~ 289 164 168 812 ,. .. 846
1,015'
584
857
861
..
127 . 736 .
l,6o5
11,'05058i
' . '
461
2,444 :
381 '
5,320
245 . 2,650 1,830
2, 723 . 446 ' 2,302 .
270 . . 138
179 .
27,171 27,989 ..'28,353
24,4?6 24,60). .. 24,462 :.
'"111 114 . '
~- 116 . ..
. ;
Qc:l 1HD91J o 'I
{) J.J A3
DEC"
~f! 1GIE:\OJR{CGllA CJR(Q)lP-l !RiJEJP>(Q) P Ti~ \G. IEIRiVllClE
AGRiCU LTUR Al. EXT-ENSION SE ~VICE .:-IJ NtVF.RS.I'f Y. OF :GE ORG'IA M lD T HE :..~.S..T.. A T E D. ,E.P.A. RT MENT OF' AGRIC IJ I..TIJRE
At~ens , Georgia
U. S. DEPAR TMENT OF A Gr~ICULTURF..: AGRICU L TLlRAl.. I'AARKETING St:: RVICE 319 E X TENsiON 8!.-DG., ATHENS, GA
December 4, 195~ ": : .
FAP~ PRICE REPORT AS OF NOVEMBER 15, 1958
GEORGIA: The All Commodity Index of Prices Received by Georgia farmers rema1ned
. .,
steady at 2.60 percent of its 1910-1914 average during the month ende d
Nov~mb er 15, l958. The index at 260 is seven perc ent (18 point~) apove ~he lev el
of' a year 'ago.
The All Crops Inaex, at 277 percent of its 1910-1914 average, remained .unchanged from th e October. index. Small incr.eases recor ded for all hays, pe anuts, ._S\'il'eetpotatoes and corn were offset by lower prices for cotton, oats, and wheat~ Q.ompared to a year earlier, the index is up eight percent (21 points).
j,
:-.: - The All Livestock ..and Live stock Products index declined tt-ro points t o 223 percent of its 1910-1914 averae e. Lower prices for hogs and milk (wholesa~e) were partially ~ffset by increased prices for beef cat t le , eggs and all chickens. A, s.ummary of these indexes uith comparisons is shown on the rev'er se side.
UNITED STATES: -Th e Ind ex of Prices Received by Farmers dropped- 4 tenths . of 1
percent (1 point) during the month ended November 15, to 251
percent of its ],910-lL~ ?-Verage. l'1ost price chan3es during the month were .
relatively small. Primarily responsible for the index decline were lo\'1er ..prices
f'or oranges, hogs, cotton, corn, and tobacco. Only partially offsetting were
Seasonally high prices for some vegetables for fre sh market, and for potatoes;'
apples , and milk.
The Index of Prices Paid by Farmers, including Interest, Taxes, and Farm.
vJage Rates rose one-thi r d of 1 percent ( 1 point) to 303 percent of its 1910-14
average as of Novemb er 15. This was a new all-time high. Hi gher prices for new
automobiles were primarily responsi_ble. for_ lifting .the index.
.
. "' l
.
.
With the Index of. Pric e s Received off 1 point and the Index of Prices Paid including Interest, Taxes, a nd_, Farm Hage Rates up 1 point,: the. f arity Ratio declined 1 point to 81, the lot-Test recorded for 1958, and the same as for the 3 preceding Novembers.
_ _ :_ _ _ _ _ _ _ _ __S~a-~y?TE;b1e_f_r_tge_UJJi.!:~2 ~t~t~s- -~ _ _. _ _ _ _ _ _ _ _
: Index
: November 1;:>,: October 15,: Novemb er 15,:____R~c~r~ h igh_ _ _
-
'""
19
" i-
1-0--1-4."=.7.1:-00-
-:
-
-
-19-5.7-
--::- -
- 1-958- - ~ : - -
1-9-58- - - :-
I-n-d-e-x - -: - D-at-e -
-
Prices Received
242
252
25.1
313 Feb. 1951
Parity Index 1,/
298
. 301.
308
308 Nov 195.8
Parity Ratio
81
82
81
123 Oct. 1946
-- - ----- - -- ---- -------- -- -- -- - - -- -. -- --- - /
. 1/Prices Paid, Interest, Taxes, .and v[age Rates based on data for the indicated
- 'dates. - ; .
.
... . ~
-w - . .~ J... _, _ - ,- ~ - -- - -- - - - - - - - - '"- - -- - ...- - - - - - - - - ~ - - - - - - -
ARCHIZ LANGLEY Ag~. i~ .c ultural - Statistician In .Charge
RAYllOND R. HANCOCK Agricultural Statistician
. '
" . '
.:;
.; -
..':'. .\ ,.
!' .
.. . '
... ~
-. ...1 " :....
.. . - .
.. . ;'
.t . . ' !..
-:- --.
. ! .
PRICE S RECJ!:IVED BY FARMERS l'!OVEMBER 15, 1958 WITH CCMPARISCNS
c o o.,:oD I T Y ~'\ND UNIT
GEORGIA .
I Average . Nov. 15, 1910...14 1957
I
Oot.15, INov.15, Average
1958
1958
1909-14
UNITED STATES
I I
l
Nov.15, Oct.15, Nov.15,
1957
1958 1958
Wheat, Bu.
$
Corn, Bu.
-$
Oats, Bu.
$
Irish Pot., Cwt. $
Sweet Pot., Cwt. $
1.23 .91 .67
1 .13 .84
1.95
1.;13
.90
-
4.65
1.94
1.15
.95
-
4.70
1.93
1.17
.93
-
4.75
.sa - .64
.40 .
1.14. 1.60
1.93 1 1.73 1.74
.98 .61 1.65
.1.041
.561 1.02 .
.94 .57 1.15
3.36
2.97 3.35
Cotton, Lb.
Cottonseed, Ton $
Hay,al1,(ba1ed)Ton $
Hogs, pe-r--C- wt.
$
12.1
23.6~
-
7.36
28.8
40.00
24.40
--
16.90
34.7
-49 .oo 'Z7 .co
19.40
34.5
50.00
27.20
-
18.90
12.4
22.55
---7.27
31.1 50.00 18.90
--
16.60
333
43.20
18.00 -
18.5.0
32.4 43.50 18.20 17.90
Beef Cattle, Cwt. $ 3.96
13.60
18.30 18.60
5.42 17 .eo . 22.20 22.20
Milk Cows, Head $ 33.85 115.00 160.00 160.00
48.00 174.00 220.00 222.00
Chickens, all ,Lb ~ 13.3
16-.0
14.5
15.0
11 .. 4
16.0
14.8 15.1
Eggs, Doz.
21.4 '
52.2
45.0
46.0
21.5
45.4
38.2 38.3
Butterfat, Lb. Milk(wholesale)
per 100 'if
Soybeans, Bu~ Peanuts, Lb.
25.8
51
1/ $ 2.43 - 5.94
$ -- 2.10
5.2
9.8
51 1/
6.30 2.00 10.4
51
Y. 6.05 2.00 10.5
26.3
1.60
-
4.8
59.6 1/
4. G5 2.04 10.7
58.7
!I
4.46
. 58~5 .
2/ - 4 ..50
1.93 1.89
10.5 10.7
!/ Revised
Y Prelli!1inary
lNDE.X NUJJBERS OF PRICES RECEIVED BY FARMERS lN GEORGIA
(January 1910- December 1914 100)
Nov .15,
Oct .J.5,
NoV:~l5,
1957
1958
1958
All Comnodities All Crops Grains and Hay
Cotton Lint
Peanuts Tobacco Cottonseed and .Soybeans Irish Potatoes, Sweet Potatoes
Fruits and Nuts
All Livestock and Livestock Products Meat Anli!1als Poultry ~d Eggs Dairy Products
242 .
256 142 237 188 .
449
167 245 205
211 'Z'IO 151 235
260
260
277
277
148
148
286
284
200
202
443
. 443
203
. 208
245
248
167
1 67
225
223
332
328
131
135
246
239
PRICES PAID BY FARMERS FOR SEL. EC:rE.D FE. EDS NOVEMBE. R 15, 1958 w:J:TH COMPARISONS
KlHD OF FEED
'I GEORGIA
I I I I N~v~15, Oct .15, 1Nov.15
1957
1958
1958
. UNITED STATES
U1o9v5.715,
Oct.15, 1958
Nov.-15, 1958
Mixed Dairy Feed
All Under 2~ Protein 16% Protein l65b Protein 2~ Protein 2~~ Protein
I
3.85 3.75 4.00 4.05 4.35
Dollars Per 100 Po~a
i
'I
3.90
3.95
3.80
3.85
4.10
4.20
4.00
4.00
4.30
4.30
3.61 3.56 3.54
3.81 3.92
3.63 3.57
3.56 3.86 3.99
I
3.63 3.57 3.55 3.83 3.93
H!gh Protein Feeds
Cottonseed Meal Soybean Meal Meat Scrap
3.45 3.80 4.55
3.70 4.05
3.65 3.95
3.65 3.75 4.75
3,83 4.26
6.18
3.82 4.05
5.72
Grain By-Products Bran Middlings Corn Meal
3.20 3.40 3.30
3.15 3.35 3.25
3.15 3.35 3.20
2.65 2.74 3.23
2.66 2.79 3.28
2.76 2.87 3.16
Poultry Feed Broiler Growing Mash Laying :tvlash Scratch Grains
~ lBaled)
Ala fa All other
4.95 4 ..65 4.20
5.00
4.75 4.20
4.95 4.70 4.15
48.00 38.00
38.00 31.00
40.00 31.00
4.80 4.32 3.90
30.70 28.60
4.97 4.45 3.91
28.90 27.20
4.88 4.38 3.87
29.00 27.20
1/ As reported by Feed Dealera.
AGRICUl-TURAL EXTE~IoN : SERVICE ' .. -.
UNIVE~SITY OF GEORGIA ANLrTHE .. . \
STATE DEPARTMENT OF AGRICULTURE
Athens, Georgia
. ~ . . , :_ . 1;
" '.. .' ' ..
U 1\ RIES
s. U... DE.PARTMENT OF AGRICULTURE
AGR'ICULTURAL MARKET~.NG. SERVICE
319 EXTENSION BLDG., ATHENS, GA.
December 8, 1958
GEORGIA - DECF.'.t1BER 1 COTTON REPORT
..~ Cotto'n production for Georgia in 1958 amounted _t 0 about 355,000 bales (50~ poup.ds gross weight) or 10 percent below the 396;'000 bales harvested' in 1957 and' .48 percent below the 10-year (1947-56) average of 681,000 bales. 'Indicat:e:d
yiefd per acre of 447 pounds of lint is a record high for the State, -. The preious record was' in 1955 with 376 pounds, The harvested acreage of 381,000 is the ~-~~
smallest since estimates were started in 1866. The current acreage is; only 7' per-
cen~ ; of t~e 1914 record harvested acreage of 5,15?,000.
~. _ ::.
\.. \~
. ' j
-
' -
:- ~
Production
in
the
northern
districts
of
the
State
will
1lie
24
1
percent
bel~
las~. season, the central district shows a decline of 10 percent, and the soutnern
dis~icts have 5 percent less production than in 1957.
. .
'
:.~~ Unfavorallnle weather during the early spring months delayed planting opera,_ tions and made it difficult to secure good .stands. Considerahle planting over:
was necessary in some areas and the crop was started somewhat later than normal. Weather conditions were generally favorable during May and June and the crop made excellent growth. Frequent rains during June and July made it difficult to
control boll weevils and bollworms and infestation became heavy. Growers carried
out an intensive control program. Weather conditions during the fall months were ~ very favorable and the final outturn was much better than expected early {n the
season. The crop was harvested under almost ideal conditions and the quality
r as much above normal.
.,
The Bureau of Census reported. )47,,poo running bales ~inned to December l com-
pared
._ wit~ .. ~ '
~8.J,OOO : . .. .
.bales
~o .
the
s.am.-e. ,~-C..1.a-~ te
,
l:~st -- ....
year.
I
,
,_.
'
.
.. . . .. . : " :.
.. ';'M4 :0;;-. PQESCHim . . .. . ... ...... ' .
: ARCHIE .LANGLEY
- : ; : ~ ~ . '
Agr, i.c.ul' -t.;. ,ural
S
t
a
t
i. s
t
i
c
i
an .
.
_
. ,Agriqt+ltural-.Statistician In .Gharge
' ,!
l958 produ-ction indicate<;! Qn
1958-19, ~QO
7 .: : '.NON-COTT. N
Decem~e~ i ..
1 1
99:c5;; 76--
25 41',
o 0
o 0
, .
............
_ .. ........ . !..
.
.. .....
~,
.
;'""":---~.,."... ..
:. . \
...
..... -
~
:i: '
_,
195B:~iI4I,2.:~o.-(.'. r~I- ...._\\ ->~
-- 1958 .,.,, 355,000
,'>~957 :.--1956
...--.- ..
i~97.69J,oooooo........
.
; to ; It~
,!
'
,.
;l I
... .:.-..
. .. ... t"' . .. . . .
19.57-20 ,ODO :
ELB ~-:R'ffitJ _
..
1956.:-J6, 000 ' _ _
195~- 17; 400
. l~oTLANTA ~TJlli'NS
1957 -~20,00
-~-7" :
~- ,ooo
., .
~v ~ ; . . :. : ~- . ~ ~ : ~;;~-~~~~: ~~~;~i~~: -~~~p :.
_,
.
/ 11 :
V
[l 1958 30 200
1957-39.fooo
VI : . \ N~~ CongressionaJ:~is~~ <
AU_G_;-l!ST_A__ __"\_'~_:,ct_~. . , - - _- __-- ,
1956..:6-7,000
r
(, NACON
' 1958-67,800 \ 1957-66,000 . \
--. ... -
l ' .. . . . :
: ' ... 'l . . coLUMBUS .. \ _:,
. . . . . . . .~95.6_:..94,QOQ . - '\ . . .. ... . - ...... _ . 1958-: . 5.7,500... _,._ . . . . ' . ,. :. ' ':. 'i' l. .
-.:. . _.-- ,ooo- : . -~-.- -:L.. _!. ,' -- .- ..;_~ . 19~7- . 67
i -~. . -_; _- .. :_..: .r{ _ .- : . : .. : ;
_ 1.;: . . _-- : _ .; <: J J95q,. ~09,000. . -.- . .-- -- ~v
~----
- _,
' f ;. . __: : :. . ': . _. .., :~ ~ . :-. ~ :.. ; ; -: > ~-.- ... ,_-.:: -: i ' . _ ; . . ~-
VII
\./ VIII
'-\.,.....-
IX
3 SAVANNA,Ii-f'
1958 - 80,600
1958-52,900
1957- 90,000
1957-55,000
1956- 108,000
l 1956-75,000
VALDOSTA
1958-1.5' 200 .t'}
1957-12,000 1956-16 ,000
fl~~
~
.! ,
,
, ,' , : ,.
0
'
' '
' ' ' \
..
' .J ', ' . ..
: , \ I ' t :
' '
~ :1
! ': ', ' :
I I
'~
I'
'
, : '
i .
,_!.._ \
:,
..
:.
..:;
'
,
,'
.: : ._ : .: .:'"'I:
ACREAGE AND PRODUCTION OF COTTON I N GEORGIA . . . .. . _ .. .. . , ... .
>.' ,_. . 1?.46,:.1958 - , J , , ' ' :: ' : ' . ; .' . , ~~: ' , ,' I '
I ' !!
' ::
.. :
._..2 '
0 Y
..
Preliminary
"'- --~ -:;i:.~"'.,., .. - , ~-,..,._ . --~----
' '.
''
Estimate l~~
.. ~
""
-~ . -~-~~~~ 2~ 0 ~: , , : , .,I
: , ' I '. ' '~
' 'J
-~
. I 1 ..
. ;,
:
. ' . tD
; r.Q . L 5 .. : .) \ .A_C~ns HARVESTED
/ .\\ . ..---- ... --- :oz ,: .: :.. : 1 ... :H..;!
/'
'
....
,_ \
. .
\ ' :.
.
/
-\ '\
....:~
H
.. ~.
.. :! ~ ?:-; .
' :
'' ' I ' '
\
.. '
'/
' .
~
'\// . .
..[ UJ l.O --
~ .. : .' .,_,. :':.
j, _
q'
. : <:4
:: ! ' ' . . .
I- -I "'-.~ '
......
I I I
I
'
' -'-, - ~- ~ . '
(~/)'...'.' ::.. . .5. 1I~ '. . . -- ' .. / I BALES .PRODUCED
l::o -~--._.. : .Jf..: : ..
.. .. . t.' .
' t'' ! . . ... -h5 t ~ :
1.,
.. .
... ' .. 'i'; .. ~ .'.
,
'
. ..............~. ..._~
--;1.0 {ll .: ',! ; . :~ ~
. ! .:: . ;
. ...,_'~
;. ,,:. j'
- ' . . H~ ~~ ; i
~ '
....,<..... '.---I't ;..;~,; _- _
,2:
(1;),
:
.
:.,,' ... -.-; - .. "!> . . >'~~ .
. .. .... ...
.. :.~ '
: '" .. ~ . ;_ . .. ~ -
~ ... ' .
...:- .. "~ ,'-: , i '
. .
.
. . . : ~ .. i
. .. . :. L.
~ Je,.,. ...._:.. ~'--- ~ :..- ,: i ,;\,q : ..
,
l
,
j
,
i
- '-...,....,_i-r ...-. - ~... ..-.. ....... -.- - '...- - ......_--.:. ..- - .... ...- -- ~-~,...-- , .- ....- - - -
-
0 1
_l
j :l948 49 5o 51 - S-2: 53- 54 55 56 57 .. 58
Ye a r s
- :
U. S . COTTON REPoRT f,S OF DECEMBER l, 1958
.. ,.
- - - - =- - - - - - - - - - - - : - - Li nt yield per --=--- 15roductfon- Tr - -
State :_ A~rea~e- h~r!e~~~d- .!. _ h~r!e~t~d-a~re ~ _ :~0~-~b . ~r~s~ ~..:. :aJe s _
_:19~7 -.5b: 1957 : 1950 : 1947- : 1957 : 19_.,8 :1?47-Sb : . 1957 : 195'8',..
. . . . . N,
.... .. s.
-,. -
c c. ..
.-.. :-av-e
..
~ : .. :
r-ag-e :-Thousa
655 994
--
nd a
344 500
--: - -es-t .
cres
I"
' . 2q3. 3.52
-::5-6
.
. ...
-av-. -: - - -:--e-st-. :-av-e
Pounds
.. . .
32.4:-
321..
.
...
..
..465.
.
.:. '
': .
306 329 409
r-ag-e :--- - - :-e-st-. -
Thousand bales
.441 231 . . :..... 2~5
628 344
300
-
..... Ga .
1, 214
. .. Tenn. : 743
.:570 .: '381 : < . 276 465 405 . . . 3"83
333
427 ~
.
....
444972 . . ... .
..
681 583
396 '415 .
355 415
... J.la. : 1,421
735 530
307 346 409
. 884 530 .
416
.. . :Hiss . : 2, 217 1, 335' .1, 120 389 388 407 . 1, 759 1, 081
950
.... Ho .
.... J~rk.
... La .
... Okla .
: 487 . . . 305 1, 918 1,130
: 796 440 1, 040 54?.
295 i,020
..
400 374
363 389
410 175
281
416 380 234
447
399 179
433 1, 458 981
390
639 348
375
374 .. 263
275 920
..' 232910/:'
. Texas
8,70h 5, 905 5, 400
222 295
387 3, 937 3, 632
4, 350
. N. Hex.
232
i.riz .
424
. . 183
352
176' 377
.: .
.573 777..
619 . 1,037
818 9'8.p -
. 269 . 687
236 763
300 770
Calif.
925 711 732 714 ' 1,035 1,049 1, 348 1, 537 '1, 600
~I Other States
81
-43 - 34
300 i 316
: '
429
49 .. 28
31
-u.-s-. - -: -21-, 8-53- - 13-, 5-5,8-~ 11-, 8~58-- :-- ..:-: 3- ~7---38- 8 ---46-9 -: -1'- 4,1-36.- . -10-;9-64- ~-11-, 5-81-
3/ . .. ------ - --- - -~ - -- - - - -------- - -- - - -- --- - -- - -
Total i Juner .--
.
,\ ..
.
:' ..
. .
! ; 'I
.
Egypt . :
8'6. 8 . ' 76~2' : . 446 48.5 S29 : 4L6 81.9 : 84.0
'
#
~ -~-
l/-Produ~tio~ gi~-;d-a;d-t~ - be-gi~ed..-~. I: .soo-lb~ - tale-c~ritain~ -;bout 48o ;et - --
- pounds of lint;. 2/ Other ~tCJ,tes ;include Vi rgi.riia, .Florida, Illinois, i<entu cky,
and Nevada . 3/ J.pier . .... Egypt . pr0duced in - Texas , New Nexico , Lrizona., _and
Cal ifornia . I ncluded in State and Unit~d ~tates total . . ;
'' .
-.. ~ - .
Ga
HD 9~7'
'f!l3
I ~!f '(
A.~~
AGRICULTUR A L E XTE!lSION SERVICE UNIVERSITY OF GE ORG IA AND THE ! STATE DE PARTMENt OF AG R ICULTURE
B ROILE R CHICK REPORT l<"'OR GE
----~------~
DEC 11'58
U . S. DEPARTME NT OF AOR ICU!..TURE MJRICUL.TUR A L MARKETiNG SERVICE 319 EXTENSION BLDG., ATHEII!S, GA.
D ecember 10, 1958
A THENS, GA., December 10 -- A total of 5, 388, 000 broiler chicks were
placed with producers in Georgia during the week ending December 6, accor l ing
to the Georgia Crop Reporting .Ser.vic e . This compares with the 5, 320, 00 0
placed the pre vious we e 1~ and is 7 percent more than the 5, 036, 000 placed the
same we e k last ye'ar.
. '
Eggs set by Georgia hatcheries amo unted to 7, 420, 000 compared :with
7, 832, 000 the pr e vious we e k and is 15 'per cent more than the 6, 4 7 8,-"000 .for
the corresponding wee k last ye a r.
Hatcheries report ed prices pai .-1 for hatching eggs d uring t h e week at an
average of 67 c ents per dozen. A verage price charsed by hatcheries for the
chi cks wa s reporte d at $11.00 per .P.ur:1d reJ. These pr i ces compare with 67 .
cents an d $11.. 00 last wee k and with 73 cents and $12. 7 S one year , ago. Eg g
prices shown relate to Ge orgia produced hatching eggs whether bought on con- i
tr:act or otherwise.
Weighted average prices from the F ederal-State Market News Service for
broilers du.ring the week ending De cember 6 are as follows: Geor g ia_broilers
2 3/4 .:. 3 3 I 4 pounds, at farms 14 . 23 , l..'.... OB plants 15 . 07f.
.
(See re."'~rse side for other states)
I.
Week Ending
GEORGIA CHICK PLA CEMENT BY WEEI<:S
OCTOBER 4 T HROUGH DECEMBER 6
II
..
.EGGS SET !_/
I CHICKS PI-;~ACED F CR B ROILERS
1957
1958
~ .1958 o/o
i ofl957
1957
1958
. 1958 o/o
of '1957
Thousands
jP~rc e nt.
Thousands
- Percent .
Oct. 4
oct. 11
6, 522 6, ..59 5
7, 110 7,248
I 109
I 110 .
4, 838 4 , 826
4,927
102
'
4, 9 L~ 2
' 102
Cct. 18 . 6, .708
7,234
108
Cct . 25
6,. 6Z7
7, 239
109
4 ,927 4, 84 6
5, 00 2 ;) ,0 34
102 ' 104
Nov. 1
6, 587
7, 394
112
4 , 882
5, 121 ' 105
Nov. 8
6, 542
7, 549
115
5, 091
5, 095
100
Nov . 15
6, 871
7' 311
106
4,923
5, 01 6
102
Nov. 22 :6,868
7, 524
110 . I 4 , 955 .
5, 196
105
Nov . 29
. 6, 653
7,83Z
118
4 ,99'3
5, 2 20
107
Dec . 6
'6, 4 78
7,420
115 11 S,036
5,388
107
!J ..In clt,1des egg s set by hatche ries producing chick s for hatchery supply floc ~ s.
ARCHIE LANOLE Y Agricultural Statistician In Charge
W. A. WAGNER Agricultural Statistician
3T .AT :!: .
Maine Connecticut Pennsylvania Indiana Illinois Missouri De laware Maryland Virginia West Virginia North Ca rolina South Carolina GEORGIA
.!:~' lorida
Alabama .. :tvi i s s i ssippi .A r Kansas Loui s i a na Texas Washington Oregon Califc rnia
TOTAL 1958
TOTA L 1957
19 58 1o of 19 57
* Revised
I . No.v . .:j
. 22 I
EGGS SET AND CHICKS PLACED IN COMMERCIAL AREAS, BY WEEKS
Nov . ,. Dec.
29
6
I
W e e kEndt' ng
!
l
: i
Oct . Oct .
I 4
11
j Oct.
1 1s
I I I Oct. 25
Nov . 1
Nov. 8
I
- 19 58 Nov.
I 15
I Nov. 22
EGGS SET .- THOUSANDS :
CHICKS PLACED - THOUSANDS
Nov. 29
Page 2
Dec. 6
1, 353 1, 072 1, 485 1, 86 3
- 360
I 1,623 1,916 2,212 2,~19 283 3, 115 637 7, 524
I
I 441
I
!
3,316
2,365
3, 555
632
I
I
I
2,901 347 .299
I 1, 186
1, 394 1,088 1, 444 1, 963
309 1,640 2,051 2,343 2, 123
298 3, 167
649 7, 832
446 3,341 2, 536 3, 646
697 2,932
367 363 1, 054
1, 348 96'-1
1,274 1, 689 .
210 1, 555 2,045 2, 382 2, 063
291. 2,640
6.13 7,420
470 3,079 2,387 3, 6-02
618 2, 806
339 329 1, 159
'40, 504 41,' 683 39, 283
34, 554
l
I . 117
I
-34, 816 . 34, 147
..
120
115
1, 103
43 3
767
760
21 4~
-
567
. , I 1, 601
1, 674
..
956
563
2,3 51
I 313 4,927
144
2,38? 1,72 3 2, 405
381 * 2,023
247 123 892 >'.:
1, 087
499 *
584
.
727 156 :<
570
.1, 576
1,690
1,039
478
2, 398
344
4,942
15l 2, 52~ 1, 6 39 2,416
404 2, 165
272 149 770
1, 110* 378 633 713
116 * 495 1, 44 5 1,643 932 446 2,352 362 5,002
1, 056 419
589 646
96 557 1, 686 1, 566 834 485 2, 229 315 5,034
182
180
2, 35 5 2,285
1,6 37 1, 613
2",374 2, 47 5
423
411
2, 126 1,963
209* ' 281
141
118
761
773
1,033 416 768 707 127 535
1, 813 1, 570
894 571 2,307 297 5, 121'
213 2,496 1,668 2,465
357 2, 143
298 140 819
1, 094 470 81 4 795 180 655
1, 293 1, 927
796 . 611
2,416 327
5, 095
185 2,654 1, 654 2, 308
367 ?., 158 .
236 161 836
1,099 382 825 797 17 3 654
1, 293 1, 871
878 574 2,294 36 4 5, 016
201 2, 648 1, 727 2,46 3
394 2,269
273 164 812
1, 075 560 818 797 174 676
1\ 580 1, 746
941 468 2, 359 369 5, 196
192 2,685 1, 796 2, 550
383 2,321
289 168 861*
1, 015 584 857 861 127 736
1, 605 1, 551 1,008
481 2,444
381 5,320
245 2,650 1, 830 2,723
446 2,302
270 138 779
1,042 522 856 870 143
6~6
1,645 1, 653 1,006
506 2,439
347 5, 388
249 2,628 1,903 2,921
457
2, 165 308 219 955
26, 549 >!<
- 24,675
I 108
26 , 581 * 25 83 5* 25, 611 26,758 27,032
24, 237 . 23,930 23,413 . 23, 644*. 24,205
110
108
109
113
112
27, 171 28, 004* 28,353
24,456 24,601 24,462
111
114
116
-
28, 878 24,828
116
~r.
YD'lotJ1
. . .. .. .....
r'fli3 GlE:CD~GllA C~((J)~IPJJR{TllWCG SIEJ~VllCCIE
q s;-i; AG~.ICL'LTURAL EXTENSi.ON SERVICE
-C. l. 'lj8
,U.S. DEPARTMI::NT OF AGR~U C.T.URE
1 .'/ ' '
UN,IVERSITY OF GE ORGIA A Nu THE
STA1'"E DEPARTMEN1~ OF AGR ICUL-TURE
II.Gf.IIC ULT URAL MARKET ING SERVICE
31 9 EX'rENSio'N BLDG . , AT~.EN~, GA.
UJI,.11 .
BROILER CHICK REPCRT FOR GEORGIA L-_..._......__ _.
. December,l7, 1958
!
ATHENS, ' GA., December 17--A total of 5,255,000 broiler chicks were placed
tdth producers in Georgia during the week endi. ng December 13, according to the
Geqrgia crop: Reporting Service. This compares with the 5,388,000 placed the
previous wee~ and is 4 percent more ,than the 5,076,000 placed ,the same week
last year.
:
to. .Eggs set by Georgia hatcheries amounted a,l46,ooo compared Willi
, 7,420,000 th~ previous week and is 16 percent more than the 7,.000,000 for the
corresponding week last year.
~ :
. J{atcperie s ..repo'rted pl'i~ es paid for' hatching: eggs during :the.w~ek at an
. ave.rage of 61 cehts.. per dozen. Average :price charged by hatcheries for the
.::~; chicks was.reported at ~?11.00 per hundred; These pri ces canpare .l-Tith 67 cents ..: an~ (:ill.OO ;I.~st .w.eek and ~th 75 cents and (~1275 one . year a,go. ~gr( prices
; '~; sho,\m. relate :to Georgia .produced hat.ching eggs whether bought !on :con~ract Qr
. :: ::~
o
t
h
e.
r
W . ,.
is
. .
e
;
::
.
:.
.
.
: ' . '
. .
.
.
. '
. ., : \rTeighte~ average prices from the Federal-State Market News Service for
: broilers dur~ng the week ending December 13 are as follows: Georgia bro-ilers
.. 2 3/4 - 3 3/4 pounds, at farms i4.to; FOB plants 15.00.
.. :
...
.
.....
:
(See
.. : . . :
rev~rse ~ide
.: ... ....::':~.:~;
"f:or
:_ ::...
other : states) ,;:. . .' ~ . .
-
. . .:GEORGIA CHICK PLACW:NT BY \VEEKS
'.. . -:..
OCTOBER 11 THROUCH! DECEI"EER 13
: .: werk . 1~
' -:EGGS sET 1/: :.
..
II ci!:tdKs :P:LAcEn FOR :BROILERS
..~:_',
E..'.\l.dJ...
ng..
..-..,~.-)---19,~5-7
~~ ...
>..
.
.
-.
~.....'
1,_9; :~~'8:
:.:
.
-.....:
;.:;:
:;~c-,.irJl5985~7:'
:l
..
I _: :1...9:~;;7.. .. . .. ::>
19.58
o.lf9c.l985:~ ,.,.
,. ~ ...
.. t
Oct ~ 11
' i Oct. i .8
Oct. 25 Nov~ 1 Nov 8
Nov. i5
Nov~ 22
Nov. 29 Dec.. 6 .Dec. 1.3
: Thousands
Percent
Thousands
. ..
.,
'I
', ,' !
' ~ ' .
... ..
;
;q,595 . - _r~7,248 .:~ -~ . - . -.11_0 . < 4;:8,?.6::. 4:;942 :
6~; 708 . . . '7_;234 ' . 108 '" r .4';927" 5,002
6,627
7,239
109
4, 846
5,034 ~
6, 587 .
7,394 _,
'6.,-542 :; .7,$49,
6,o..11 -.,~ . .-1,31i
q,868
7;524
112
.,4,882 ( 5,121 '
.. ]:],.5 ~: . . 1...06.
.
.:5, .091
4'.70'.)'..3.~
.
.. .
5s,' 0o9l65
; .
110 . 4,955
5,196
6,6$3
6,478 '7, 000 -
7,832
7,h20 8, 146
118
4,993
5,320 .
ll5
5,036 ;. 5,388
l.l6'
.5) b76... . .-. 5, 255
Percelit
I
.
- - .
..
,.
..
102 i
102 104 105
. 100
l 02
105 107
~97
104
!/ Includes .eggs set by hatcheries producing chicks fo~ hatchery ~pply flocks.
,
ARCHIE !ANGLEY
:Agricu~tural Statistician In Chal'ge
.... W. A. WAG1JER Agricultural Statistician
,; .../ . :.
: . ...'! ~
'
'; I, 1 !
. . ' ~
.. . ~ : (
.
.
. t!
. "
. . .
'
,~ ~ .,: .
t.;. , ,_'l
..
-1". t ~
.. :.
! ~ -,
,._ ;
r: . : .1 ' :: , .. :. .. .. ,. ; ~. -:.
: .;.. ~ ~ .-
... -:
-:;' -.~
..: . , :. _..... .:~._,
.
~
:.;.
.
'
.
; ~
,_~..':
'1:
~
--
.' .~.
(..._/ .......
'...- , .
':,,.:;
'
.
. ',/( '.
. ..... ,
EGGS SET AND CHICKS PlACED IN COMMERCIAL AREAS 1 BY \tJEEKS
1958
Page 2
Week End_ing
. -
, STATE
<J --- --No-v:.~~--D~ec~~ -. -- ~P: e-e.--:' -~---O-ct.-'-- -::O~c~t. -- -~ O~ct~~ ~~~N. -ov-. ~...~..-~~No-v-.:~~~--No-vr. ----No~vr. ----No-v.. ---D-ec-.~---D-ec-
_: . ,_ ~_ j..;.; .. 2_9_....:_ :_:__~~- ~-~-- :;.:;..1. _3_.._ ..:t:.;:-4t_ _ _1_1---+;:...,___1_8_.'_....;___._2_5._...;...:___l_~- -:__;.,-:..;8___~--:-.."..l-5____22_ _ _2_9_ _ _6__._ _1_3.
1
EGGS BET::... THOUSANDS ..--
CHICKS PLACED:__- THOUS~NDS :
11aine -- -.
,_ :: 1,394::
,...~
- .I
l;J48 :. 1',453
1,087
.
1,110* 1,056
' ..
1,033
1,094 I~;~ Q~9
1,075
1,015 1,042
1,125
Connecticut _
.. - l,088z :994 . 1-,089 ..
I Pennsylvania ., ' . 1,4461~ -- ' 1;628?4' - i,48566
Indiana
- 1,93 .- 1, 9 ~ 1, 3 -
499*
378: 419
416
470 : .-: 3-u2
560
584 522
567
57'2847
: 63}: .' 564896
768
81~ ,_. :_ . ef9:5
879187
885617 885760
994533
713
707.
19:;) .- ~ . 7,. 7
Illinois . . JJifssou:ri _.:
.. 309 .
210 - . 327
--. 1,6}40 : - 1;555 1; 742
156-ll- ' ll6* - 96
127 - .'180 .. - 1-13
174
127 143
163
51-o 495
557
53-5 . _:655 65.4
676
736 656
696
Dela\-1are
. - 2,0_>1 :- 2_,045 ~-- 2,253 .
1,576 1,445, 1,686
Maty1and
2,343 2;)82 ::. ~-,- 551 ..
1,690 _ 1,643 . 1,566
Virginia .. ~- -
2,123- 2, 063 .: 2-~147 .. 1- 1,039
932
834
1,813 1,570
894
1,293 _.-. 1,2_93 1,927_.. 1,871
796 .. 878
1,580 1,746
941
1,605 1,645 1,551 1,653
1,008 1,006
1,598 1,743
988
lrJest Virginia
298
-291 .' 291
478 .. 446 : . 485 .. 571.- 6i1 .: 5?4
468
481 506
490
Nerth carol-ina - :. 3,167 .. 2,-64o . : ~ - 3;379 :. 1 2,398 :. : 2;.352 2,.2.29. 2,30-7 ~. ; 2,-416 ~ 2,294 2,359 2,444 2,439 2,475
s~u.th. Carolina
649 . ..613 . 610 - 1f. :.:_ 3h4.. > 362 c 315 - :. 297 , - ~ ~.327 : 364
369
381 347
342
_GE_O_R_G_IA______~--~~~7~,~83~2----~7,~4~2_0__~- 8-~~~1~4_6 ___~~-4~~,9~4~2-- ~-5~,~-0~0-2-~~5~,-0~3~~---~5~,-l2_1__~5~,0~9~S:~~~5~,0-l_6__~5,~1~9-6__~5~,~3-20~-5~,~3~8~8--~5~,255
Florida Alabama l-'Iississippi Arkansas
Louisiana Texas .. Washingto!l Oregon
California
.. . .
,: , .. -
_ - ... .
446 3,341 2,5).6 3,646
697 2,932
367 :: 363 ;_.
1,054 :-
-470 . 452
,
3,079 J ;456
2,-387 2, 712
3,662 3;.831
.618
684
2,-80_9 ._ 3; 054
339 ,: 314
-3.29 . __. 371
1,1.5?. . _1~436 ..
- 151 2,525 1,639 2, 416
404 2,165
272 149
770
1_82 2;355 1,637
~ 2,374.:
423 ,:: 2,126 209*
141
76:1.
180_ 213 185
201
2,285 2,496 2,654, - ~: 2,648
1,613 1,668 1,654. .. 1, 727
2,475 . -. 2,465 . -:- ;~ 2~;308:: :_-- 2,463
411 357 367.' 394
1,963 2,143 2,158 : 2,269
281
298
236.. 273'
-118 773
> .140 '161- J. ;t64 819~ :: _-:8)6; ' .~1.~
192 2,685 1, 796 2,550
383 2,321
289 168
861*
245 2,650 1,830 2, 723
446 2,302
270 138
779
249
2,628 1,903 2,921
457
2,165 308 219
955
237 2, 773 1,972 2,999
506 2,211
259 254
878
TOTAL 195~
TOI'AL 1957
I, '
..,
-:41, 68~ --~.. 39' 2'83 43J_:S9o
'31+, 816- . 34, ~:47_ .. 3~,(600 ...
26,58H~
24,237
l
25, 835* 25,611 23,930 ' 23,413
'
., /
I ; , _,
26,758 27,032 ;: .. _27,171 23j644~~ 24,205 '. _:24,456
28,004* 28,353 28,878 24,601 24,462 24,828
29,427 25,320
____ _______ ______ 1~,?8 %of 1957
120 -'
-*--R-e-vi-s--d----------~------~
l ;t5 : .__. :-. 119
110
108
109 - -.:l 'l 3;-- . 112 ,; 111
114
116 116
116
:_. ~"~~- -,.
~'.- - _
~-------------~-~..-~-" ~- -~- ------~- ------------~--------------------
. ; ...
(GJE:(Q)~<GllA C~(Q)JF,~I&:JP?(Q) JrllNCG JE~VllCCJE
,4 , C'
AGRICULTURAL EXTENSION SERVICE
. .
. UNIVERSITY'OF GEORGIJI;, AND -THE ; , ~., . . ',. , .'
-J : iJ: f . . STAT~ DEPARTMENT...OF .AGRlCULTURE '.
'1 ' '.
. U.S. DEPARTMENT OF A()RICULTURE ' ' AGRICIJLTURAL MARKETING SE~VICE
. l19 EXTENSION' BLDG.; 'ATHt::NS; GA.
_ AU~en~_. G~orgi~ ..
, , . r
. . De~errib'e~.. 17 ...19.58
:J__
. ~ , .
~.
-~- .
.
PULLET CHICKS FOR BROILER HATCHERY SUPPLY. ~LOCKS
....: , . : ; ._.: , .
. Nove-mber 1958. ~ United Stat'f~s : . -~ -. . ..
. r. .: : .: . , . . . . .
. ' l
.;
. " ... . : . . .
... . .
, .The i.ndi~ated placement of pullet chicks for broile.r ha~~hery .s.upp.ly flo~ks
.. qy le-~d~ng p:r~mary bre.eders of br'oiler rep1acetne'nt siock .totalecl, .2, i41, 0.09 .
chi'cks ,4uring November ~ This was 11 percent more thi;m 'ih Nove~ber.. 19 ?7
I;>ull.et chic.k placements ly~,.the:se breeders during the ' fil'st elev~n . months .of 1958
.. . totaled. 3.0, SJ~. ooo--:'30 percent =mO're than during the same period of 1957 .
pl.us . , .:: . The. tptal~ ipclud.e .pullet chicks :sold during -the inontl1,
th~ puqtber of
. p~-l~t. chic).<~ . ~pected. f~~om eggs sold during the preceding month . . The conver-
. ~l.~n .fro~- .~ggs t.o .exp~cted pullet chicks was mad~ oh the bash of 125 ,p.ul1et .., :-
chicks per case of hatcniP-g eggs sold. The primary breeders inCluded in.this
report account for a very large percentage of total supply of :r;eplacement pullets
for broiler hatchery supply flocks. S~1es . of r.e.placement pullets by these
-b-reeders provide an indiCation of the potential number of pullets available for a~ditic;m. to. hatchery egg supply flocks several~ months before the pullets will
act'ually move into the flo~ks_. . . . . . .. .. . .. .... . . " - . .
. .Pullet chicks 1/ P1acem.ents {or . :B .roiler Hatchery 3upply Flocks
1 .. .. ..
- (Reported by leading breeders)
Month
.. 1957
1958;
1958 as percent of 1957
1, 000 chicks
" 1, 000
c~ic'l~s
' 1,000
chick~
percent
January ......... ... : 1,912
1, es~
1,982
105
February.... ; ..... : 2, 187
1, ' 9 9 7.
2, 210
114
March ...... : . ...... : 2, 866
... 2;''53'8
3, 118.
-123
April . ........~ ,.-~ ..~ . : 2,996
~.03~
3,320 -
109
May ......... . ...:-. June ......... ,,,: .. -~.: July.. .............
2,854
2,8~~
3,623 ~
.:
125
2, 298
; 2,~60
3, 390
165
1. 7_7fL... .. . _.. .... .1...67.6 .. .. . .......... 3; ~54 .. " ." ... ,.. '1"82 ---
August : .... ; ; : ; :. ... . . ~- ... '"L884
1,410
2,646
188
September........ : October ...... ' . . , .-.. : Novernber ;.. .. ~ ~ ... '
1,864
1,935
1..
9Z
Z..-..-;..
.
.
. . .
. '
"
'",Z ~-9 .1. .
1,900
1,~26
.2~700 .
.. : . -2~ : 5. 68 . .. 2):141
140 :n 2
111
December .... ; .~ -- .;: 1; 787 Annual Total. . ; . : : 26,248
2, 238 25,895
.. : . -,- -- .
t--- I . ',.l
!) II)~l~d.~s ..expected pullet ..r epla:cemerttS' from eggs sold during th~ - p~eceding
- month Cl.~ _ the .~ '
rate
of
125
. ~ ..
pu..l. l~t.
c..h. .ick. 's.
:per
.
~ase
of..eggs... ..
.. ... . ......
AJ;tCHIE; LANGLEY . ; . Agricu1t,..iral Statistician ,~n , Charge
. ' . .
' '
t
.
W. A~ WAGNER . Agricuit.u:r~~ 3tatistician _.
.... ... . ... ..
' .":~
. !, :, . ..
.. .
. .
. \
. . -~
. ..
, .. \
t ~
..... .. ' ..... .. . . ' ~ .. . ....
I
I
'~ I
.. .,.......... .... ....""'- .. .. ...... . . . ' ... ~ . ..~... ... . . . ~ ....
. .. . '. ...
..
('
' .
. ..
. i : : . : ~
. . ~ ~ ...:.
~ :.
.' : ; ..
CHICKENS TESTED
In Georgia 3S.8,J36 chickens for supplying broiler hatching .eggs were. tested ,
j for pullorum disease "during November 1958--52 percent more-than. the -2.54, 554
tested in November . 195~ . . Testings of Egg Type chickens foT: N.ovember w.ere
2.6, 186 over three times the number tested in November last year . . . ..
I :
', 1
I
0 t
,o o I '. I )
',
In the States for which,.comparisons are available, 2., 951, 368 chickens for
supplying broiler hatching eggs were tested during November--up 33 percent
from November 1957. Testings .July_through NovemJ:>e~ of th,i.s ..year..tota1ed
11, 939, 783, up 17 percent hom te.~l;ings ~uring this period in J 951. r _~he;' number
of chickens for other purposes (egg.-type) tested during .November. t.otaled .. :. .
2., 342., 596,;.-down 6 percent from :~~:>vember 1957. Tbe :number. tested -July d-irough November totaled 7, 003, 2.0 1, down 2. percent from this period last year. '7' ~ : :
This report is made pQ~.sible through the cooperation of the Na:tionall P~.ultry
Improvement Plan official Stat.~ agencies, . the Animal Hu.sbandry Resea.-ieh_:l)iv:.:.;
ision, Agricultural Research Service, . and the Agricultural E stimates D'ivis~'on, ;
Agricultural Marketing Service.; .
,..
' : "i :=: .. .; " :
.; . ';,
. : .. ~ . . ;: .: .~.. f' :
Georgia- Chi~kens T-~sted by Official State. Agen:cies .. ' :. :. :.. ': .
. .
, '
: . . ~~- : . . .~
Month
For B.roi.ler Production .
Egg 'TypeCh~~k~~s'
.
; .
'1 :- :: ; . : 'l . ~ .~. . :. ' ~ -~ '
By Months
Cumulative
19 57-58 '1958- 59' . . 1957-58 : 1958-59'
By Months 1957-58' : 1958-59
'
"'
, ..
o'" o o - ow ~ "' ' ,.
-
"' ~ ,. o ,.,.,...., .;.,
July ..: Aug. .
2.02., 194 2.30,2.92.
2.53, 865 2.40,302.
2.02., 194 ' 432.,486
2.53,865 17,2.74 ' 30,,2.99 494, 167 47,736 .. '42} 581
Sept.". :. 334, 522. Oct:.. ~- 306, 795
413,2.64
767,008 997,431 18,286 . . 35, .652.----
458,442. 1,073,803 1, 365, 873 2.7,2.42.
41,043
Nov. : 2.54,554 Dec'.... ...-' : 2.52., 517 Jan. . . ,. 414,416
388, 136
1, 32.8, 357 1, 7:5i,,009
1, 580, 874 1,_995, 2.90
..
8,32.5 14,836 61,618
2.6, 186
.. - ' .:' . ,_.
Feb. =.t ' 2.75,750
2.,2.71,040
13, 67 5
.... . ' ''"' I
Mar . Apr.
May June
. ,. ,.
. . ...
:.::..
(
.
.. ;
. ' I
2.55, 111 2.11, 093 2.54,02.4 185,343
2.) 52.6, 12.1 2.1737~2.44 2.~ ' 99. 1;.-268 3~.- r.i..6.~..- 611
:.. . .. , ..f.
... .. :
. ;' ~-
;_:: \ ' ... ... ) .
12,086 57,42.6 10,849 17. 445
t .l : ,._:
. . ..~ ( :..
. . . . ~ . . . ~
United States ... Chickens,;T~~~ed by Offi~i~l. State:Agencie~. . . :. 'I~:.
For Blroi.ler Product{6ri
- - ,
-.
. ..
~~ : k"'o~ Egg Type : Chi~ke~s . ..
Month
, ,,
- b
y..
M
,.
o
n
t
h
s
1/
"
' ~ ; 1 : t .-: .
1957-58
195.8-59
. .
..
.
.:_ , by ?~ths : 2./ . .~ ... ... . , . . .... -...:..."'-:_"';
. 1957-58
July ;- . : : -~ : .l, 310,378 Aug~ . .. :. , l~ _~OQ.:- 805. . ;-_
$ept.
2., 310, 549
Oct.
2,72.3,936
Nov.
2., 2.2.5, 580
Dec.
2.,2.08,307
Jan.
2,014,868
Feb.
1,2.82.,382.
~ar.
1, 587,391
Apr.
1,701,02.2.
~ay
1, 554,643
June
1,310,490
1, 62.8. 12.9
1, 596,792.
2., 643, 740 I
3, 119, 754 3..:. 2.,951,368
so'o 363, 1s3 . .... .= > ...:.
55:8~ .
676; 162 :. . - ;
:
' 599-I~;60~ -
'.i t. 'J ~
r
. .
l, 2.51, 370 2.,379,471
1, 2.43. 658 I 2.,316,782 ~
2.,483,280
2.,342.,596
2.,586,45(>
1,741,051
454, 617
485, 136
2.45, 750
2.76,008
2.89, 142.
1/ All states except Mont., N. Mex., Ariz., Nev.
2./ All states except Ohio, Del., Okla., Mont., N. Mex., Ariz Nev.
3/ Revised.
.
.
.. ... .
AGRICUL.TURAL EXTENsiON SF.RVICE
UNIVERSITY OF GEORG.iA. ANO ...HE .
STATE OEPAHTMt::Nr OF AGRICUL.TURE
Athens, Georgia
- - . ~
U.s. oe:r-i,.RTMENT OF..AG~ICU L TlJRE
ACRICUL.Tl,I RAI;. .M RI<'E'tll G SERVICE 31~ EX'fENS ON SL.i...G., ATHENS, GA.
December 19, 1958
GEORGIA C0!-1MERCIAL VEGETABLE CROP :.SUMHA.RY l957 - 1958
GEORGIA: Value of Ge orgia's 12 principal fresh mar.ket vegetable and melon crops
included in this report was ~~ 10' sf 7' 000 {n 1958' a decrease of 36 per-
cent from the 1957 value of :~16, 8h6, 000. This sharp decrease .is due mainly to
unfavorable weather conditions around harvest. tirne and le>w prices received for
most major erown v egetable crops in 1958. deprgia rankeq fourth in the United
States in acreage harvested during 19.58.
~ITED~ES: Value of the principal vegetable and melon. crbps totaled
'j 745,555,000 in 1958. This is 12 percent under the record high
value of these crops in 1957, but about equal to the average. Total 1958 prod-
uction of the 28 principa:l frssh market vegetables and melon~. .amou,nt,ed to 212,27l,OOO .cwt., a four percent increase from the year bef.'ore'~ several import-
ant crops came through with substantially larger suppD.es in 1958 thap a year
earlier. '
.
ANNUAL C01JMERCIAL V~GETABLE CROP SUMHARY i9S7'"195:..;:;;8--.:------
Crop
;; Y
Acreage -l -Yield fra duc.tion Pr:Lc.e
ear ' Harvested j Per Acre
Per Cwt. Value
------------~----__.-A--c-re-s---~---~~---l,-OO-O-.-C-w-t. Dollars -~ 1,0-0-0--d-o-l.---
{
Beans, Lima : 1958
4, 700
21
99
7.90
782 ..
for Narket Beans, Snap
: 1957
4,500
21
94
8. 20
. 771 .:
: 1958 ----3~,~90-0------1-9--------'-fi4-- ------1.-3-0-:-~:----5-L-to~~----
for Market S.Ga. : 1957
3,700
20
74
5. 80 ' .. 429 .
Beans, Snap
i 1958
1,300
:28
36
8.20
295
for Ieiarket F.Ga. ; 1957
l, J~oo
. ~ .27
38
1.20
27 l.~
-----------------------------------------------------
Cabbage, S.Ga. : 1958
4, 200
100
. 1/420
1. 45
5013
: 1957
4, 200
110
I/462
l. 35
513
~---------
---------------------------~-------------
Cabbage, N.Ga.
! 1958 r 1957
600
100
6ocr 1oo
60
l. 45
87
6o
2.4;;
-147
------------~--------------------~--------------------~---
Cantaloups
: 1958
i 1957
9,000 9,ooo
60 L~s
540 4o5
2~50
3.so
1,350 1,41s
! -------------- ----- -----------------------------------~--------------
Corn, Svreet
1958
i 1957
2,300 2,400
31 33
71
3.75
266
79
4, 55.
359
Cucumbers for ; 195;~ Harket, Early ; 1957
700
30
ooo
34
21
3.40
71
27
3.65
99
Cucumbers for
r Harket, Late
Lettuce
: 1958 \ 1957
: 1958 : 1957
300
27
400
22
200
90
350
05
8
5.)0
42
9
3.95
36
18
5.?0
103
30
5.70
171
Onions Tomatoes \rJatermelons
: 1958 : 1957
i 1958 .
i 19;) 7 .
1958 1957
800 900
13,000 12,600
63,000 60,000
90
72
115
104
45
1/585
40
- 504
85 1/5,355
75
1+,500
2. 75
245
442
... ' . ..
1,169''
4.75
2,394
.55 . ...2,200
1.30 5,850
Potatoes, Irish,! 1?58
4,800
46
222
2.63
582
All
: 1957
5,200
49
254
2.72
691
Potatoes, St-leet ,! 1958
Al l
i 1957
48
528
4.90
2,587
46
644
5.05 3,252
,. . . .
TOTAL
ABOVE CROPS
: 1958
i 1957
1/8,109 J./7,284
10,827 16,846
1/Include; some quantities ~ot marketed and e~ ~cluded in computing value.
ARCHIE LANGLEY Agricultural Statistician, In Charge
L. H. HARRIS, JR. Statistical Assistant
DEC 2 2 '58
.. ,
- -
".. '
\
\
Watermelons 52..6
:'
]/Includes acreage for
Sweet Corn, Lettuce and
VALUE BY CROPS (Percent of Total)
.]/Includes
value for '~
Sweet Corn:,
Cuci.unbers, Lettuce,
.:
and Onions .
q.5g AGRIC ULTURAL EXTENSION' SERVICE .
UNIVERS IT Y OF "GEOR<::IA ti.ND THE
STA1'E D&::PARTMENT or- AGRICULTU~E
A th~ns, Georgia
U.S. DEPARTMENT OF AGRICUl-TURE AGRICULTURAL "MAR~E ' r!NG SERVICE 319 EXTENSION B L DG. , ATH E NS, GA.
December 19, 1958
VALUE GEORGIA CROPS UP - The value of ~reps produc ed in G eo rgia during
1958 is estimated at $365, 586, 000, or 14 percent
abo.ve the 1957 value o.i $32.0, 186, 000. The increas~. was due' primarily to record
hi g h yid d s per acre for most major crops together with higher prices for cotton
and tobacco. C_orn is Georgia's most. val4able 1958 crQ.p with an estimated value
of $108, 4~,0, 000, followed by cotton lint and seed va!ued at $69 , 367 , 000. The
peanut crop valued at $64, 962., 0 00 ranlced third while tobacco with an estimated valu~ of $5.o.: , 4:6-1,000 is fourth. The vaiue . of these' four crops accounts for 81.3
percent of the total for all crops.
..--..--.- --~--
RECQRD HIGH PER ACRE YIELDS - Unusually favorable weather conditions d uring both growing ai.1.d harvesting seasons to -
ge.ther with improved cultural practices led to the amazing. r esult of recor d hi g h yields per acr e and exc-ellent quality for almost al1major crops. These crops
include corn, cotton, tobacco, peanu.ts, wheat, all hay, grain sorghum , barley
9-nd rye.
GEORGIA CORN PRODUCTION 11TH IN N.~_':qON - Production pf corn estimated
(
: at 86, 7 52., 000 busl1els is the .
largest corn crop eve.r produc ed in the state. With the rec o r d crop Georgia n ow
ranks 11th for the country as a whole in the production of corn. Although corn is
the Only major crop to set a new record high in total production, the production of
several other major crops rose significantly from last' ye~ r. These cr 'ops are
peanuts, tobacco, hay, peaches and pecans.
VALUE C OMPARISONS TEN MOST IMPORTANT CROPS FOR 1958 AND 1957 , IN ORDER OF 19 58 RANK (IN THOUSAND D OLLARS )
Rank Crop l. Corn
.. 1958
19 57 o1/o9o5f8.1 Rank Crop
ua .. $
~ .
.:p
1957
108, 44 0 91, 8 33
~ 6. E.eca.ns
1958
1958 . 1957 1o of
$
$ 1957
10. 94.4 . 2.; lhZ . 506
2. . Cotton & Seed 69,' 3q7 69,17 3 100 7. Peaches
8, 4 94 6, 2.82. . 135
3. Peanuts
64,.962- 48, 2.66 135 8 .. Com. Vegetables?, 658 12., _903 59
4. Tobacco
54,464 4 8, 136 113 9. Oats
7, 651 8,195 90
5. Hay
17' 62.8 14, 52.2. 12.1 10. Wheat
3., 10 3 3, 567 87
DISTRIBUTION O.F l958 CROP VALUE IN P ER CENTAGE CF TOTAL VAL UE
)
CARL C. DOESCHER"'_,/ Agricultural Statistician "
- - -- - -- _......-
1 19.o~o
I
I
I
I
/
. I
------..,.G-EORGIA ANNUAL CROP SUMMARY 1/ 1958 AND 1957
Crop...
.
:
: Yield. :
Unit Total
. v"' ~ar :Acreage :Per Acre: Unit . Producti.on : Price : Value
1; 000 acres
. 1, 000
dol.
l, 000 dol.
Cotton Lint 2/.
1958
381
'47 Bales
355 . 350 62, 125
~--~--~- ~- ~- --~____1_9~5_7_______5~7~0 ---- 333 ~----------~3~9_6____-~3_0_7 ___.6_0,790
1958
Tons
146 4 9.60 7, 242
1957
167 50.20 8, 383
_C______A_i_l_P_________ l95_8_____2_,-7--11____3__2-.0---B-u_s_h_e_l_s____8_6_,_7~.S-2----1-. .~2-5__1_0_8~,. 4--4-0
orn,
urposes _ l957
2,738 26.0
71,188 1.29 ' 91,833
Sorghum Grain
19 58
37 24. 0 Bushels
888 1. 20 1, 066
195~7-------40~~-~2~1-.0-------------8~4~0 ~--1~. ~14------95~8~
Wheat, Harvested 19 58
71 23. 0 Bushels
1, 633 1. 90 3, 103
-------~-----~1957_____1_1_2_ _~16_~~5________~1~,~8_4_8_ _1_.~9~3_ _- ~3~~5_67_
Oats, Ha_r;ested
1958 19 57
276 33.0 Bushels
9, 108
394 28. 0
11, 032
. 84 7, 651 . 77 8, 495
Potatoes, Irish
1958 19 57
4. 8
46 Cwt.
5. 2
4 9
222 2. 63
582
2 54 2. 7 2
69 1
Potatoes, Sweet
1958 1957 .
11
48 Cwt.
14
46
528 4. 90 644 5. OS
2, 587 3. 252
Tobacco, All
1958 1957
-59.1 1,550 Poun ds 64. 1 1, 289
91,598 " 82~ 645
.595 54,464 . 582 48, 136
Hay, All
19-58 1957
630 1.02 Tons
568
. 96
641 27 ..50 17,628 548 26 ,. 50 14, 522
Sorghum Syrup
1958 1957
2
75 Gallons
3
62
150 2. 75 186 2. 65
' 412 493
Sugar Cane Syrup
1958 1957
3
175 Gallons
4
185
525 .740
1.45 1. 45
761 l, 073
Peanuts, Harvested 19 58
for Nuts ~
1957
515 1, 190 Pounds 612, 850
510
910
464., 100
. 106 64, 962 . 104 48, 266
Cowpeas, _I:j7r v e.sted 1958
forPeas~ ..
-1957
50
6. 0 Bushels
47
6 .5
300 4. 35 306 3.70
1, 305 1,132
Soybeans, Harvested 1958
for Beans~l
1957
90 12. 5 Bushels 18 0 14.0
1, 125 2. OS 2, 306 1, 400 2. 14 . 2, 996
Ve1vetBeans,Alone 1958 andiriterplante(j 1957
100
.53 Tons
164
.49
53 37.00 80 32.00
1,961 2,560
Lespedeza, HarvestedforSeed
1958 1957
16
190 . Pounds
3, 0L10 13.00
395
20
190
3,800 11.20
426
Lupine, Harvested 1958
for Seed
1957
7
820 Pounds
5, 74 0 5. 00
287
15
800
12, 000 4. 85
582
Crimson Clover, Har. for Seed
1958 1957
26
135 Pounds
3, 510 24. 50
860
19
ll 0
2, 090 21. 50
449
Fescue, Harvested 1958
for Seed
1957
7.0
Zl5 P ounds
1, 505 15.00
226
5.5
200
l, 100 10.80
119
Peaches, Total
Production 4 I
Pears, Total Producti0n
Pecans, Total Production
1958 1957
1958 1957
1958 1957
Bushels Bushels Pounds
4,000 l, 825
98. 86
38, ooo
7, 500
2.25 3. 50
l. 30 1. 3 5
. . zaa
. 288
8,494 6, 282
127 116
10, 944' 2, 162
Commercial
Vegetables ?J
1958 19 57
104.0 100.8
7,658 12,903
TOTAL ABOVE CROPS (excl.ac.:rea.ge of peanut hay, fruits and pecans)
1958 1957
4, 971. 9 5, 391. 6
365, 586 320, 186
.!./ 1958 price and value fi gures are prehmmary. 2/ Cotton lint yield in pounds.
~ Covers only mature crops (acreage alone and interplanted) harvested for pea-
nuts, peas and b e ans. 4/ Includes some quantities not 1narket ~ d and excluded in
CumputinP, v a lu 0. 5/ J:50es n ot jncJ. cl r;o SWe E> t p o t 'l.to e c "'t'l'ld rr i.sh nof:':}~0 f"."'
! .
1-Cl
... ; .:
3/S
M0 ;
/D9tt:J7
:: ~-
- :: .
~;;3
hiE(Q)~(GllA
'C~OI
~- ~~
i,'. f M I
nJN<Ci
~5\IE~VllCJE
-.)!)
AGRICULTURAL EXTENSION SERVICE UNIVERSITY OF GEORG IA J\NI) THE STATE DEPARTMENT OF AGHICULTURE
BROILER CHICK REPORT FOR GEORGIA
. '. "'
UC 3 .i '5 LIBRAR IE
. S. DEPARTMENT ~F AGRICU~TU~E .GRIC ULTURAL MARKETING SE RVICE
19 EX'fENSION BL.OG., ATHENS;~ GA.
December 24, 1~58
~ ATHENS, _GA., De:.;ember 2h~-A total of 5,734,000 broiler chic.ks were placed
with producers in Geo:r-gia during the week ending December 20, a<::Gording to the
Georgia Crop Reportl::g Serv:i.ce; ' This compares with 'the 5,25.5;000;placed the .
previous week and is ' l3 pefcent ' more thqn the :5,.094,000 -piaced .-the same 'week .
las_t year..
. = - .- ~ - : _. .
;_ , Eggs set by Georgia hatcheries amounted ;to 8,092,000 00mpared wi~h .
:
8,146,000 the previo1.~s week ahd 'is iS percent more ':than the 7,033;000 fo.r the
corresponding week las t ' ye<7t~ - . . . . ' . . . .. . .. . . .
.
. . ..
.
I
:
' ' .,
'
Hatcheries reuorted prices paid for hatching eggs during the week at an ;
ceht; average of 67
per do~~m. Average price cJ.1arged by ha.tch~ries for -the :
chicks :was reported aG-~;~lL ocf -per hillldred, Ti:1ese p:dce~ __.compar.e t-ritli 61 cents
and ~~11. 00 l~st rTeek a:r.~d With . 75 cents and ) 13o 00 erie :year e.g<>"; Egg prices..
shown r.elate to Qecirg:la produ.ced hatching "eggs t-Vheth'er -bought on contract or :
otherwise.
Weighte~ average prices from the Federal-State Market News S~rvice for
broi~ers du..."'i ng the week ending Decemb~r 20 are as f _ollows: Georgia 1Jr()ilers:
2 3/4,:_ 3 3/4 poimds, at farii!s '14.06;. FOB plants 1$.-00.-
.
~
t
... " - . '. #. '. : .
.
. . ..
. ..
.
GEORGIA CHICK -PLACB1ENT BY WEEKS
..
..
==:.E"dds ~. OCTOBER . :-8- Trffioumt:DECElviDER 20 . ! -
w= e: _:.~:...:::k::::;:=:_;_;,;._::= = = = = =
~~T 11
"i'~~ CHICKS ..PlACED FOR :BROILERS
.
Ending '
I % ~ ~~---- - --------~---""'r---------~---r:-~------
\ :1957
1958 . 1958 b.- . 1957
1958
1958
.- : :
'
, _tOf l957
.Thousands
~ -Perc~nt :
.. Thou::oands
~ of'l957 , P~rcent ;
' '
Oct~ 18 Oct.: 25 ,
. 6, 708
:. 6, 6.2-7 .
7,23 4 .?,239
108 . '. 4' 92 7 .. . 5' 002
102 '
.109_ . .4' -846. .. 5J 034 . . 104. '
Nov.. 1 ,
Nov. 8'
Nov.: 15 ~
Nov. 22
: . _Q,5:87-.
, :; 6,5L~2
q,871
6,86~
7,394 '
7,549 7,311 7,524
112.
115 106 llO .. . .
4~88_2 .
5,091 4,923
4, 955
._ -.5,121'.,
5,095
5,016 : 5,196
105
100 102 : .. io5.
Nov.- 29
. : .6,65J
7:~ 8~2 .. .. ll8 . . .4, 9.93: . 5~ 'J20 ' .-107 :._
Dec: 6- . '' : .: 6,478 . . ' 7;420''. . 115 . ...:5,0J6 " .. .. 5,388
107 "
Dec.: 13 ' Dec. 2o :_
..:7,000
:
:.
. .
7
!'
03. 3.
8,146 8,09..f ,.
116 ' 5' 076
5 '255 .
104 '
:u5
.5 ,.o2h ,_ - 5, 734 'il3
~ .'
. l.
...
l/
r~cl~de'.s
eggs
. ----=--:-~
:set 'by hateheries prbduC:in'g
?hibk'i:i" for ' i:iat~hery
s:upply
.flocks
_.
ARCfiiE :LANGLEY -
.
Agri~ultural Stat-istician . ln -Chq.rge --:
~
... .
:
. ... . ~
. . . .: . . -'": .l :.. ::__',
.,
W. A.- vJAGNER
.. . ... '
. ; .. A'g.r.~-: c..ul.t u.. ~a..l $tat:Lst.:ici.an
....
..
' ~
:~ ~-
. . . . . . ~ ' : ~~
,'!,. . .
.. '
. :; -
" I o
, ,
.~
..:.:
t:"
:
... ... :
. . .:-: .. . ... ~ . :, ..._,.
~ 0. ~ :
_,. I
... .. ..
. \
. '
I
. . :... . . ... : ! .~. :: ..
.. .
:.
,, . :_:-' r.
. :-. ~ . . .
. .- . i: . \.' . .... .' '
.. ",
:.. .. .
:
r ,:
.. . . i .
.. . -' '.
. .~ l .
. :.
..
'
:_;
. . ..;
STATE
1-'laine Conn.ecticut _ Pennsylvania Indiana Illinois Nissouri Delaware Maryland Virginia West Virginia North Carolina South Carolina GEORGIA Florida Alabama Mis-si ssippi Arkansas Louisiena Texas Washington Oregon California
TOTAL 1958 TOTAL -1957 1958 % of 1957
* Revised
EGGS SET AND CHICKS .PLACED IN COMMERCIAL AREAS, 'BY WEEI\S . ~ .1958 .. -:- :.
. .Ij
.. ..
v1ek Ending
' '
- : '
Page 2
I . -1 . .
Dec. 6
Dec. Dec.
13
20
Oct. 18
Oct.l 25
Nov, 1
.No8v..,
Nov. 15 "
Nov, 2.2
Nov. 29
Dec, Dec. Dec .
6
13
20
EGGS SET - THOUSANDS
CHICKS PLACED - THOUSANDS
1,348
964
1,274
!i.l
1,689 210
1,555
l 2,045 2,382
2,063
II
I
I
291 2,640
613 . 7,426
470 3,079 .. J: .. 32,,630827 ' . IJ_ . 618 . 2 806 - ..
' 339
329 : 1,1.59
1,453 1,089 1,456 1,836
327 1,?42 2,253 2,551 2,147
291. 3,379
610
1,373 1,101 1,426 1,547
346 1,787 2,068 2,505 2,115
278 3,169 . 624
8,146 8 092
452 . . 458 '
I 3,456 .3.,375
.I 2, 712 . . 2,653
3,831 . 3,703
684
674
3,054 .2,.868
3i4
-396
3:n : .. .:_-430 ..
1,436 . .
....
1~---5. 22
. .. I .
..
39,283 43,590 .. 42;510
34,147 . 36,600'- 36,814 .
115
119 .. ' . ll5
1,110* 1,056- 1,033
378
419 ! hl6
633
5.89
768
713
646
707
11~
96
127
495 557 535
1,445 1,~86 1,813
1,6h3 1,566 1,570
932
834
894
446
485
571
2,352 2,229 2,307
362
31$ .. .. 297
5,002 : 5,034 . . $.:,121
182 2,355 1,637 2,374
423 2,126
._209*
141
761
180 - 213
2,285 : 2,496
.T. ' 613
2,475
. 1,668 2,465.
4il . . 357
1;_963 . 2,143
2e1
298
. '" 118 ; :; 140
. .. 773 . : 819
25,835* 25~611 ??,758
23,930 ~~.t4i3 . . 23,644*
108
109- . : 113-
. 1,094 470 814 795 180
655 1,293 1,927
796 611 2,416 327
5 ;o95
1,099 382 825
797 173 654 1,293 1, 8"(1 878
574 2,294 . .364 5,016
. 1,075
560
- 818 797 .
- 174 676
: 1,5130 1,746 941 468
:, 2:,359 -: . 369 ; 5~196
1,015 584 857 861
127
736 1,605 1,551 1,008
481 2,444
381 5,320
185- -201 _. : :.- 192
2,654 2,648 . 2-; 685
- 1,654 . I, 727.: .:l ; 796
2,3Q8: 2",463 . ~,550
367 . 394 . 383
2,158 2,269 2,)21
236 ..161
273 . .. 164 .
. : 289
> . 168
836 . .812
86l~k
. .
'
'
245 2,650 1,830 2, 723
446 2,302
270 138 779
.
27,032 _27,17;1 28,.004* -28,353
24,~05 . .24,456 24~601 24,462
..
. :112 . . ill
114
116
1,042 1,125 522 567
856 953
870 943 143 163 656 696 1,645 1,598 1,653 1,743 1,006 988 506 490 2,439 2,475 347 342
5,38~_2,255
249 2,628 1,903 2,921
457 2,165
308 219
955
237 2, 773 1,972 2,999
506 2,211
259
254 878
1,142 560 911 819 155 722
1,624 1,998 1,076
511 2,480
361
5, 734
215 2,863 2,000 3,046
449 2,126
298 242 789
2~878 29,427 30,121 24,828 25,320 25,668
116 116 117
AGRICULTURAl.. EXTENSION SERVICE UNIVERSI'fY OF GEOI~GIA AND THE. STATE DEPARTMENT OF AGRICULTURE
Athens, Georgia
JAU3 '59
U. S, .p .EPARTME;NT OF AGRICULTURE AGRIC'ULTURAL MARKETING SERVICE 319 EX'IENSION BLDG., AnIENS, GA.
1. ,
December 29, 1958
GEORGIA-DECEMBER 195~G CROPREPORT
GEORGIA PIGS PRODUC~D lOth .IN NATION: The 1958 pig crop in Georgia is estimated
. ,
.
at :.2, 778,000 head, an increase. ?f seven
percent over the 1957 pig crop of 2,590,000 head. This is the largest pig crop
ever produced in Georgia. With the record 1958 pig crop, Georgia ranks .lOth in
the n.ation .in the number 9f pigs produced. Pigs saved during the spring and fall
season is estimated at 1,511,000 and 1,267,000 head, respectively.
1959 .sPRING saw INTENTIONS UP NINE .PERCENT: Farmers t .reports on breeding intention
.
. .
indicate 250,-000 sows to farrow in the
spring of 1959 (December 1958 through May 1959). This would be an increase of 9
percent from the 229,000 so~'.JS farrowing during the spring of 1958 and is 28 per-
cent above the 10 year average .(1947-56) of 195,000.
PIGS SAVED PER LITTER UP: The number of pigs eaved per litter during .the fall of 1958 is estimated at 7.0 pigs~ This is a record high
for the fall months. Pigs saved per litter during the spring farrowing months of 1958 is estimated at 6.6, d.own slightly from the previous year~
Aok:Iiowledgement is made to the ~Fo stmasters, Rural and St ar
Route Carriers over the State for their assistance in col-
lecting the basic information from which these est~ates
were L1ade. Tne splendid cooperation shown by several
thousand of their patrons who furnished reports for their
individual farms is also appreciated.
. SOWS J;i'ARROWING, PIGS PER LITTER, AND PIGS SAVED; SPRING AND FALL, J/
Year
j Sows Farrowing
. Spring
Fall
- 1,000 head -
GEORGIA 1947 - 1959
Pigs Per Litter Spzj;ng : Fall
- Uumber
Pigs Sav.ed Fall .. Year
1,000 head
1947 1948 1949 1950 1951 19.52
1953 1954 1955 1956 1957 : 1958 : 1959 j!
:,
187 170 182 198 .
208 220
178
194 200 212 212
- 229 .
. 'J:,/ 250
r '
173
5.9
16J
5.9
173
6.1
190
6~3
205
6.1
172
6.3
138
6.5
159 : 6.7
. 165
6.5
172
6.8
174
6.8
181
6.6
6.0
1,103
6.1
1,003
6.1
1,110
6.1
1,247
6.3
1,269
. 6.2 . ' 1,386
6.6
1,157
6.5
1,300
6.7
1,300
6.7
1,442
6.6
1,44~
7.0
1,511
' .
;.
1,038 994 _
1j055
1,159 1,292 1,066
911 1,034 1,106 1,152
1,148 1,267
2,141
1,997 2,165 2,406
2,561 2,452 2,068
2,334 2,406
2,594 2,590 2, 778
J/ Spring, December through May; Fall, June through November .
~/ Spring farrowing indicated from breeding intentions reports.
SEE REVERSE SIDE FOR UNITED STATES REPOET
ARCHIE LANGLEY Agricultural Statistician In Charge
RAYMOND R. HANCOCK Agricultural Statistician
UNITED STATES - DECEMBZR 195 8 PIG CROP :REPGRT
Th~ 1958 pig crop totaled 94 . 8 m..i.ll:l.on head, 8 percent. l arger than th.~ 1957 crop of 88. 0 million head . The spring pig crop at 52 . 3 million head was up 1 per~ cent and the fall crop of 42.5 million head, v~s 17 percent larger than last year ,
and the largest fall crop since 1943 . The. increase in the fall crop resulted from a 16 percent increase in the number of so~.:s farr0win~ and a small increase in pigs
saved per litter . The number saved per litter, .at 7. 17, was the highest. on record
for the fall crop.
For tl:le 1959 spring. pig cr op, repcr ts on breeding intentions indicate a total of 8, 317 , 000 SOt..JS to farr ow., 12 percent iaore than the number .farrowing last spring . If. the intentions materialize, and the number of pigs per litter equals the 10year average with. an allot~ance for upmird trend, the 1959 spring pig crop ~vould be
59 . 0 million head . A crop of this sbe t-rould be 13 percent above last spring ap.d
the largest since 1951.
The number of pigs saved in the 1958 fall season (June through November) is
estimated at 42,470, 000 head . This is 17 percent larger than the 1957 f all, crop
and 21 percent above the 194 7-56 average . The 1958 fall crop tvas the third largest of record, bein g exceeded only in 1942 and 1943 . Fall pig n~bers . were
above last year in all regions of the country, with the heavy producing v1est North Central region shovring the largest increase at 24 percent. . The North Atl~tic
States ~vere up 3 percent, east North Central, 14 percent; South Atlantic, 10 per-
cent; South Central, 15 percent; and the 1rJ'estern States; up 17 per,cent.
The re c ord 7.17 pigs saved per litter compares t-Tith 7. 06 ~ 1957 tThich Has
an the previous high for the fall crop. The increase in average litter size was
general, tdth all regi9ns showing incr.ease except the t-Jest North Central t-Ihich
was U..."lchanged . This is .the seventh straight year of' increase in the average pigs
per litter for the fall pig crop, a:t:J.d the. curr ent litter size is 9. p~r..cent .~bove
the 6 . 60 pigs per .litter for t he 1951 fall crop. Weather conditions were generally
favorabl.e for farrot-li~gs during the fall season.
... --- -
......' . .
1959 SPRING D1TENTIONS UP 12 PERCENT: Farmers t repor~~ on hreeding ' intentions....
.
indicate 8,317,COO sows to farrow in
the spring of 1959 (December 1958 through Hay 1959) . Thi.s v1ould be tan-.increase of. 12 perc~nt from last sp:dng but onl:r slightly above average:. Compar ed with 195'8:, .
l
all r egions of the count ry sho-;..r increases . The Nor.th Atlantic States Show ..an in-:-.: :
crease of 5 percent; eas t :North Central, up 8 percent; t'\Test North Central, 12 per-:
cent; South Atlantic, 11 pe1cent; South Central, 21 percent; and West; :c_ 21 percent~
If the intentions for spring farrowing;? materialize and the .number of..~igs saved ::
per litter equals the average, with an allowance for upward trend, the ~ l959 spring
pig cr op would be 13 percent more than in 1958, 8 percent above averC!-ge, and the . :.
largest since 1951.
..
.. .".'
Year
1947 1948 1949 1950 1951 1952 1953 1954 1955 1956 1957 1958 19) ?
Sot>JS FAR.ttCWING, PIGS PER LITTER , li.tiD PIGS SAVED, SPRING AND ;FALL, ]/ .
Sows Farrowing
Spring
Fall
I .. UNITED STATES 1947 ~ 59
Pigs Per Litter Spring : Fall
Pigs Saved : ,
Spring
Fall
... \ ~. .
Year '
- 1,000 head ::- ..
...
8,548
4,866
7,833
5,010
8,820
5,568
- Number-
6. 11 6.44 6.46
6. 39 6. 58 6 .52
52 , 199 50,468 56,-969
1r..'.-000 h. ea.d . ' ..:.o-
31,090
8.3~ 289'
33,358
83,826
36,275
93,244
9,179
5,927
6. 31
6 . 6.5
57,958
39,423 .. 97,381
9,484 8_,311 7',045
5,955
,5,067
4,479
6.46 6.64 6. 80
6. 60 6. 6.5 6. 69
61,298
' 5C.."...' 1<.... 5
47, 940
39,238 100 586 '33' 694 .~. . 813; 829
29,974
77,914
7,669
5,014
6. 89
6 . 78
52,.582
33,978
86,830
8,359
' 5,586
6. 90
6. 81
57,690
38,029
95,719
7,665
5,194
6. 94
7.00
53,186
36,386
89,572
7,277
y 7,428 8,317
5,124 5 ,926.
?. 12 7. 05
7.06 ! 51,812 7.17 : 52,336
- \21 59,000
36,148 42,470
87,960 94,806
1/Spring, December through Hay; fall, June through November. ~ Spring farrovnng indicated from breeding intentions reports. ]./Average number of pigs per litter 1dth allovmnce for trend used to compute indicated number of spring pigs; number rounded to nearest 500,000 head.
<GJE(Q)JRGHA C~(Q)JP ,~~JllN<G JE~VH~I
AGRICULTURAL EXTENSION SERVICE UNIVERSITY OF GEORGiA . AND THE
1 STATE DEPAAT~ENT OF AGRICULTURE
II
.
I=J S. DEPARTMENT OF AGRICULT:URE
.J "3 '59 AGRICULTURAL MARKETING SI;:RVI~E
I
319 EXTENSION BLDG., ATHENS, OA.
B' ROILER CHICK R.EPORT FOR GEORGIA
December 311 19.58
ATHENS, GA., December 31~-A tota or-5,404;01YO broiler chicks were placed ~ith producers i~ Georgia during the week ending December 27, according to the
GeqrgiJl. Crop R~pbrting Service. This compare,s wi~h the ..5, 734,000 placed the
previous t-reek and is four percent more than the .5, 172, ObO placed the same week
+ast~ year.
: Eggs . set by Georgia hatcherie.s amounted to. 7,844-,000 compared with , . e,o92,090 'the previous week and is 14 perc"ent more "than the 6,890,000 for the qorresponding . week last year.
;
;The majority of' the prices paid for hatching eggs were reported"within :a
range of' 51. to .70 .cents with an aV:erage of' 64 cents per dozen compared :with a
range o! 60i tQ .75 .cents and an average of' 67 cents per dozen le.st week. Most
wices che.r~e9 for chicks were reported within a range of' (~9.00 to ~~11.2.5 with
an average o:: ~~10.50 per hundred compared with a ;range of' ~PlO.OO to . ~)12.00 and
an a~erage of; ~11. 00 :per hundred last week. The .average prices last ye"ard'lere
7p cent~s .for :eggs arid .~~13. 25 for chicks.
.
..
:.' ~
,
I
:
. , vJeighted average prices from the Federal-State Market News Service for ;
oroil~rs d~ing . the week ending December 27 are as follows: Georgia bro~lers
?:, 3/4i - 3 3/4 pounds, at farms 14.04; FOB Plants 15.00.
. ' .
. ;
(See reverse side f'or other states)
, . . ;
GEORGIA CHICK PLACEMENT BY WEEKS
.-~
~- ' -
Week: . Endi'ng . .
. \
~9.57
.....
OCTOBER 2.5 THROUGH
- . EGGS SET 1/ .
IDI ECCEH-MICBKESR
27 PlACED
FOR
BROILERS
- :... 1958 - . f1958 %I
.... -~
of' 1957 .
19.57
1958
. . 19.58:% . .. of 1957
; , Thousands
Percent
Thousands
Percent
i :.
O.t.' ~.5 Nov. 1 "
.
;
..'66.,';568277".
7,239
.. . 7,394
Nov. . 8
6,542
7,549
Nw. :t5
:6;871
7,311
Nw. . 22
Nov. 49
Dec. 6 Dec. 13
.-q,f368
'
. .
. ;
..
6,653 . 6,478 .. :
1,000
7,524 . . c?' 8J?
?,420
8,146
109
4,846
112
4,882
11.5
.5,091
106
4,923
110 h-,955 118 ' 4,993
115
5,036
116
5,076
.5,034 5,121
.5,095 . .5,016
5,196
.5,320 5,388 5,255
-. . ...
.. ;104 .
105."
100
102 '
. :105.
"107. :
107
'
\
104
Dec. 2'0
"1,033 .
8,092
11.5 . 5,094
.5, 734
.. 113 ;
-Dee. 27
.,
. .
:Q,890 .
7,844
.'
114
, ., 172 ..
5,404
.
.
-
104..:.:.
I
!/
. :
:
.
Inc'~ud.es
:
eggs .set
(
by
hatcheries
producing
chicks
for
hatchery
supply
.
flocks
~
ARCHIE lANGLEY
Ag:t:ieultural :statis~tician in. Charge
. . . : . W. A. WAGNER _ . Agriculttir:al Statistician
~-....'
~~ :.
. i
.
..
..
.. . . . ... . : ' . .
.
. .: : -. . . . 4 '
o Jo : : , { o ,- :
. . t ! . . . .
.-.
.... : -~ . . -. ~ ' -.. . ;
. . . ; ~
.o ''
I
. .
' ..
..
. .
- .,
~
. . .... .. ' ..-'.... . : .','.; :.'. ~ .
. ..
. . . . ...
.: : ., ,, , : ..~ . . .
. . . . ~ .
' I '
...
~
. ' .
. -~
. _..
. ..
--
' ~.
EGGS . SET AND CHICKS PlACED IN COMMERCIAL AB.E/iS. BY. WEEKS . - 1958
'. Week Encing~
'
"l: ~. . .
Pae:e 2
-,.
STATE ' ..
Dec:.. =
.. 1;3 -'~
Dec. : , Dec. l
.. :2o
_;:27 - ~
Oct. :11.. : Nov.
25 :
1
...
Nov.
8
Nov.
15
Nov; _. 22 :
; "*
.~ ,\
'
Dec.
Dec. Dec. Dec.
6
13
20
27
Maine
;
. EGGS S:$T - TH OUS.f\.ND$
.. '
.. '' 1,453
1 ) 3.7~"
. .
. .
1;3'33 .:
~
r. l,o56
t
:PtAC.in m cit:r:cKS...
.
~~
ous:AN~.s
:
'
.. .... . . .. . ..... l
..
'
J;,03J .... 1,094 1,099 1,075. .:.
I
i :,o15
1,042
1,125 1,142 1,147
Connecticut
.. '"
1, 089 ::, :)._,101'. .:: : 1,0?5 ..
419 ' 416 .. 470
382
56Q . ::5B4
522
567 560 601
Pe~nsylvania
.::. . :' 1,456
1:,4~6
l,20h .
.; 589 ~ 768'
814
825
818 .. , 857
856
953 911 714
Indiana
Illinois . ..
Missouri
t . ..
Del~ware
1,836. 327 ' ...
12',
742
253.
.
1;547 ....J46 . 1:~ 7~7
2,068 .
1; 5.64
. 646 . 707;
. ; j il ..
'96-' ; 127
.:1;7o6 - .. 5:57 :. 5'35:
1,978 : i 1,686 . 1.,813 :
7.95
J97 . .797 . 861
'l8o'. . . '173 ... 174 :. 127
:': . ~55 .
~5k ~:-! . ~-.676 .:~
7'3;6
1, 29'3'' . 1~ 293 . 1,580 1,605
870 143 656 1,645
943 163 696 1,598
819 155 722 1,624
743 142 665 1,692
Maryland Virginia
2,55F 2,147
2',.505 2' 237 2, 115=. . '1,-969
1' 5.66 . ; ' '1' 510 . 1,927 1,871 1,746 ' 1,551 1,653 1,743 1,998 1,852
834 . .... 89h.
?96
878 ... 941 : 1,008 1,006
988 1,076 1,090
West Virginia Nor:tli Carolina South Carolina GEORGIA
-.:- 291'
~r: . 3' ~i6
: 1 8,146_; ~
..278 .. 263
3:;169' . ..: . 2,92'8 :, - .624 . . .564 . .
a;on -.> -:7, 841-J.
: 4'85 : :.. . 571 :'-
2, 229 . : 2;Jo.r:
. 611 - \ ...$.74 \. '.~ 46~ :~ 481
2,416'.. : 2'~294 : .:2.;-:).59' ..: 2,444
. 315.:.; .'29.7: ''327' ' . - 364 . ' 369: :. 381
5.~ 034 : , . 5; 121; 5-,.095 .5,016. ' 5; 196': .' 5,320
506 2,439
347 5,388
490 2,475
342 5,255
511 2,480
361 5,734
562 2,081
331 5,404
Florida
. 458
~ 368 .
180 - . 213 ; .. 185 ~ :2:Q1.. . .. :192: ... 245
24-9 ---~-23-7----~21-5---~2-1-1
Alabama
3;3.75 ~ 3,322
I 2,2~5 2,496 : 2,65h. . .~; 6.48 : ...: .?'685: ::: 2,650 2,628 2, 773 2,863 2,3'66
Mis~issippi
2,653 2,664
1,613 . 1;6?ft
1 ':6['1. .....1 '72'7; . ' ;,n..j. ' ' ' ' J c.
1 :.796' ..
'
.
1,839
1,903
1,972 2,000 1,946
Arkansas
3, 703 . :3,.590
2,47:5 . ~;h65 : .. 2,308 2,463 2,550 2,7~.3 2,921 2,999 3,046 3,122
Lo~isiana .
674 ... . .6h5 ..
. 4l 1 . . : . :357 ~ : 367
394
383 - . 446
457
5o6 449 398
Texas .. .-
2~'868 .. 2, 689
i -)963 ' 2,.143 , . 2,158 2,_269 ..2,.,_321 . ;.' 2,302 2,165 2,211 2,126 2,105
Wa sh i . n g ton
''396 - -342 ,.
281 : .298 . 236
273 ~ ~ . : 2'89 ; .. ' 27D
308
259 298 258
Oregon . ...
:430
.445
118 : 140
161
1.64 . . . . .!68 . 138
219
254 242 238
__________ ____ California ._
1,522 . 1,643 '
773
.819 . '836 ... 8'12; ' .. ''861* ..119
955
878 789 861
..
.,
.lo,
~.~ ----------------~----~~------------~--------------- --------~~---------------------------
TOTAL 19.58 TarAL 1957 .
1958 % of .1957
. 43,590. 36,600
.;
119 .
42,510
36~8~
l:i:$
40,.684 36,"170
.. 112
'
2.5,611 l26,'75a. 21,032 27,171 28,oo4* 28,J53
23,413 -2'3,644* 24,?05 ' 24~456 '. ' .24,601 : ' 24,46~
.. ot
..
., .-:
~
t
109
1.13 -.' 112
111
114 : 116
28,878 24,828
116
29,427 30,121 28,529 25,320 25,668 25,293
116 117 113
* Revised