- Collection:
- Georgia Government Publications
- Title:
- Dimensions: measuring Georgia's workforce, 2024 October
- Creator:
- Georgia. Department of Labor
- Contributor to Resource:
- Georgia. Department of Labor
- Publisher:
- Atlanta, Ga. : Georgia. Department of Labor
- Date of Original:
- 2024-10
- Subject:
- Labor market--Georgia--Statistics--Periodicals
Wages--Georgia--Statistics--Periodicals
Hours of labor--Georgia--Statistics--Periodicals - Location:
- United States, Georgia, 32.75042, -83.50018
- Medium:
- serials (publications)
- Type:
- Text
- Format:
- application/pdf
- Description:
- Monthly employment statistics for Georgia
- External Identifiers:
- Metadata URL:
- http://dlg.galileo.usg.edu/id:dlg_ggpd_46865732-2024-10
- Digital Object URL:
- http://dlg.galileo.usg.edu/do:dlg_ggpd_46865732-2024-10
- Language:
- eng
- Holding Institution:
- University of Georgia. Map and Government Information Library
- Rights:
-

Jackson Madison Elbert
Polk
Cobb
Gwinnett Barrow Clarke
D I M E N S I O N S Paulding
Haralson Douglas
DeKalb Rock-
Walton
Oconee Oglethorpe
Wilkes
Lincoln
EdgefieSlCd,
Carroll
Fulton Clayton
dale Newton
Morgan Greene Taliaferro
Columbia
Fayette Henry
McDuffie Warren
Heard
Coweta
Spalding Butts Jasper Putnam Hancock
Glascock
Richmond
AikenSC,
Russell, AL
Troup Meriwether Pike Lamar Monroe Jones Baldwin
Jefferson
Burke
Measuring Georgia's Workforce Upson Bibb
Harris
Talbot
Crawford
October 2024 Data
Muscogee
Taylor
Peach
Washington
Wilkinson Twiggs
Johnson
Jenkins Emanuel
Screven
Volume L, Number 10
October 2024 Employment Situation Marion Chattahoo-
Houston Bleckley Macon
Laurens
Treutlen
chee
In millions
CandGleerorgBiaullEomchployEmffiengnhtam
(Seasonally Adjusted)
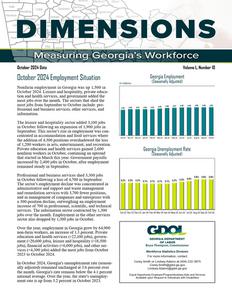
Nonfarm employSmchelenyt in GeorDgoioalywasPuulapski1,50D0odigne OctSotebwearrt202W4e.bsLteerisurSeumatnedr hospitality, private educa-
Montgomery
Wheeler
Toombs
Evans
Bryan
tion and health Qmuitomsatnjobs over
tsheervmicoenst,ha. nTdhgeosveCecrritsnopmrsetnhWtatailcdsohdxeedd
the the
Telfair
mostRjaonbdoslpfhromTeSrreelpl tembLeeer to OctobTeurrnienr clude:BpernoH-ill
fessional and business services, other services, and
Tattnall
Jeff
Liberty
Davis 4.92
4.94 Ap4p.9l3ing 4.94
4.93
4.9L5ong4.96
4.97
Chatham
4.98 4.98 4.98
4.98
4.99
inCfloayrmatiCoanlh.oun Dougherty Worth
Irwin Tift
Coffee
Bacon
Wayne
McIntosh
ThEearlleyisure anBdakheor spitality sector added 3,100 jobs
Pierce
in October following an expansion of 1,900 jBoebrrsieinn Atkinson
SeptemMbilelerr. This secMtoitrc'hselrlise inCoelmqupitltoymCoeonkt was con-
Ware
Brantley
Glynn
centrated in accommodation and food services whLearneier
the Saedmdiniotileon of 4,300 positions overshadowed the loss of 1,200 wDoerckateurrs in Garratdsy, enTtehortmaaisnmeBrnoto,kas nd rLeocwrnedaetsion.
Oct-23
Clinch
Nov-23 Dec-23 Jan-24 Feb-24
Charlton
Mar-24 Apr-24 May-24
Camden
Jun-24
Jul-24
Aug-24 Sep-24
Oct-24
Private education nonfarm workers
and health services gained 2,600 in October, continuing an uptrend
Echols
Georgia Unemployment Rate
(Seasonally Adjusted)
that started in March this year. Government payrolls
increased by 2,400 jobs in October, after employment
remained steady in September.
Professional and business services shed 3,300 jobs in October following a loss of 4,700 in September. The sector's employment decline was concentrated in administrative and support and waste management and remediation services with 3,700 fewer positions, and in management of companies and enterprises with a 300-position decline, outweighing an employment increase of 700 in professional, scientific, and technical services. The information sector contracted by 1,300 jobs over the month. Employment in the other services sector also dropped by 1,300 jobs in October.
3.2% 3.2% 3.2% 3.1% 3.1% 3.1% 3.1% 3.2% 3.3% 3.4% 3.6% 3.6% 3.6% Oct-23 Nov-23 Dec-23 Jan-24 Feb-24 Mar-24 Apr-24 May-24 Jun-24 Jul-24 Aug-24 Sep-24 Oct-24
Over the year, employment in Georgia grew by 64,900 non-farm workers, an increase of 1.3 percent. Private education and health services (+22,100 jobs), government (+20,600 jobs), leisure and hospitality (+18,500 jobs), financial activities (+6,000 jobs), and other services (+4,300 jobs) added the most jobs from October 2023 to October 2024.
In October 2024, Georgia's unemployment rate (seasonally adjusted) remained unchanged at 3.6 percent over the month. Georgia's rate remains below the 4.1 percent national average. Over the year, the state's unemployment rate is up from 3.2 percent in October 2023.
Bruce Thompson, Commissioner
Workforce Statistics Division For more information, contact
Corey Smith or Lindsey Adams at (404) 232-3875 Corey.Smith@gdol.ga.gov
Lindsey.Adams@gdol.ga.gov
Equal Opportunity Employer/ProgramAuxiliary Aids and Services Available upon Request to Individuals with Disabilities
GEORGIA Nonfarm Employment
(In thousands)
(Seasonally Adjusted)
Preliminary
Revised
OCT 2024 SEP 2024
Revised OCT 2023
Change in Jobs from SEP 2024
Net %
Change in Jobs from OCT 2023
Net %
Total Nonfarm
4,985.5
4,984.0
4,920.6
1.5 0.0
64.9 1.3
Total Private
4,265.3
4,266.2
4,221.0
-0.9 0.0
44.3 1.0
Goods Producing
665.4
665.5
662.9
-0.1 0.0
2.5 0.4
Service-Providing
4,320.1
4,318.5
4,257.7
1.6 0.0
62.4 1.5
Private Service-Providing
3,599.9
3,600.7
3,558.1
-0.8 0.0
41.8 1.2
Mining and Logging
9.8
9.8
9.7
0.0 0.0
0.1 1.0
Mining, Logging and Construction
232.9
233.0
231.3
-0.1 0.0
1.6 0.7
Construction
223.1
223.2
221.6
-0.1 0.0
1.5 0.7
Manufacturing
432.5
432.5
431.6
0.0 0.0
0.9 0.2
Durable Goods
224.7
225.4
223.5
-0.7 -0.3
1.2 0.5
Non-Durable Goods
207.8
207.1
208.1
0.7 0.3
-0.3 -0.1
Trade, Transportation, and Utilities
1,035.9
1,036.6
1,038.2
-0.7 -0.1
-2.3 -0.2
Wholesale Trade
225.4
225.7
228.1
-0.3 -0.1
-2.7 -1.2
Retail Trade
520.0
519.0
517.8
1.0 0.2
2.2 0.4
Transportation, Warehousing, and Utilities
290.5
291.9
292.3
-1.4 -0.5
-1.8 -0.6
Information
107.1
108.4
110.8
-1.3 -1.2
-3.7 -3.3
Financial Activities
284.6
284.5
278.6
0.1 0.0
6.0 2.2
Finance and Insurance
203.7
203.5
199.3
0.2 0.1
4.4 2.2
Real Estate and Rental and Leasing
80.9
81.0
79.3
-0.1 -0.1
1.6 2.0
Professional and Business Services
768.6
771.9
771.7
-3.3 -0.4
-3.1 -0.4
Professional, Scientific, and Technical Services
343.3
342.6
335.8
0.7 0.2
7.5 2.2
Management of Companies and Enterprises
95.7
96.0
94.7
-0.3 -0.3
1.0 1.1
Admin and Support, Waste Mngmnt and Remediation
329.6
333.3
341.2
-3.7 -1.1
-11.6 -3.4
Private Education and Health Services
696.5
693.9
674.4
2.6 0.4
22.1 3.3
Private Educational Services
101.4
101.0
99.5
0.4 0.4
1.9 1.9
Health Care and Social Assistance
595.1
592.9
574.9
2.2 0.4
20.2 3.5
Leisure and Hospitality
536.9
533.8
518.4
3.1 0.6
18.5 3.6
Arts, Entertainment, and Recreation
67.3
68.5
65.9
-1.2 -1.8
1.4 2.1
Accommodation and Food Services
469.6
465.3
452.5
4.3 0.9
17.1 3.8
Other Services
170.3
171.6
166.0
-1.3 -0.8
4.3 2.6
Government
720.2
717.8
699.6
2.4 0.3
20.6 2.9
Federal Government
113.6
113.2
109.6
0.4 0.4
4.0 3.6
State Government
166.6
166.0
162.1
0.6 0.4
4.5 2.8
Local Government
440.0
438.6
427.9
1.4 0.3
12.1 2.8
?Note: These seasonally adjusted estimates were prepared in cooperation with the U.S. Department of Labor, Bureau of Labor Statistics, based upon monthly reports submitted by selected
employers throughout Georgia. The estimates include all full- and part-time wage and salary workers who were employed during or received pay for any part of the pay period that includes the twelfth of the month. Proprietors, domestic workers, self-employed persons, unpaid family workers and personnel of the armed forces are excluded. Estimates based on 2023 benchmark.
Source: Georgia Department of Labor, Workforce Statistics Division
Georgia Department of Labor, Bruce Thompson, Commissioner Equal Opportunity Employer/Program Auxiliary Aids and Services Available Upon Request to Individuals With Disabilities
2
GEORGIA Nonfarm Employment
(In thousands)
(Not Seasonally Adjusted)
Preliminary
Revised
Revised
OCT 2024 SEP 2024 OCT 2023
Change in Jobs from SEP 2024
Net %
Change in Jobs from OCT 2023
Net %
Total Nonfarm
5,001.6
4,981.4
4,937.1
20.2 0.4
64.5 1.3
Total Private
4,275.0
4,260.7
4,230.9
14.3 0.3
44.1 1.0
Goods Producing
663.8
666.2
662.0
-2.4 -0.4
1.8 0.3
Service-Providing
4,337.8
4,315.2
4,275.1
22.6 0.5
62.7 1.5
Private Service-Providing
3,611.2
3,594.5
3,568.9
16.7 0.5
42.3 1.2
Mining and Logging
9.8
9.8
9.7
0.0 0.0
0.1 1.0
Mining, Logging and Construction
233.4
234.3
231.9
-0.9 -0.4
1.5 0.7
Construction
223.6
224.5
222.2
-0.9 -0.4
1.4 0.6
Construction of Buildings
52.7
52.6
50.4
0.1 0.2
2.3 4.6
Heavy and Civil Engineering Construction
31.6
32.2
33.9
-0.6 -1.9
-2.3 -6.8
Specialty Trade Contractors
139.3
139.7
137.9
-0.4 -0.3
1.4 1.0
Manufacturing
430.4
431.9
430.1
-1.5 -0.4
0.3 0.1
Durable Goods
223.4
225.2
222.9
-1.8 -0.8
0.5 0.2
Transportation Equipment Manufacturing
60.6
60.9
60.4
-0.3 -0.5
0.2 0.3
Non-Durable Goods
207.0
206.7
207.2
0.3 0.2
-0.2 -0.1
Food Manufacturing
73.6
73.0
70.5
0.6 0.8
3.1 4.4
Textile Mills
14.2
14.2
15.1
0.0 0.0
-0.9 -6.0
Textile Product Mills
24.2
24.3
25.5
-0.1 -0.4
-1.3 -5.1
Trade, Transportation, and Utilities
1,036.4
1,030.0
1,038.0
6.4 0.6
-1.6 -0.2
Wholesale Trade
226.3
225.7
229.1
0.6 0.3
-2.8 -1.2
Merchant Wholesalers, Durable Goods
120.7
121.3
121.1
-0.6 -0.5
-0.4 -0.3
Merchant Wholesalers, Nondurable Goods
66.5
65.0
65.8
1.5 2.3
0.7 1.1
Wholesale Trade Agents and Brokers
39.1
39.4
42.2
-0.3 -0.8
-3.1 -7.4
Retail Trade
518.1
513.0
515.1
5.1 1.0
3.0 0.6
Food and Beverage Retailers
104.0
101.4
100.7
2.6 2.6
3.3 3.3
General Merchandise Retailers
117.1
116.3
119.7
0.8 0.7
-2.6 -2.2
Sporting Goods, Hobby, Musical Instr, Book, & Misc Retailers
40.9
39.7
41.4
1.2 3.0
-0.5 -1.2
Transportation, Warehousing, and Utilities
292.0
291.3
293.8
0.7 0.2
-1.8 -0.6
Utilities
21.2
21.2
21.0
0.0 0.0
0.2 1.0
Transportation and Warehousing
270.8
270.1
272.8
0.7 0.3
-2.0 -0.7
Air Transportation
38.7
38.8
38.6
-0.1 -0.3
0.1 0.3
Truck Transportation
62.2
62.7
62.8
-0.5 -0.8
-0.6 -1.0
Couriers and Messengers
31.2
30.3
30.8
0.9 3.0
0.4 1.3
Warehousing and Storage
87.8
86.8
87.5
1.0 1.2
0.3 0.3
Information
107.1
108.3
111.4
-1.2 -1.1
-4.3 -3.9
Telecommunications
32.9
33.2
34.1
-0.3 -0.9
-1.2 -3.5
Wired and Wireless Telecommunications (expt Satellite)
25.7
25.9
26.6
-0.2 -0.8
-0.9 -3.4
Computing Infra Providers, Data Processing, Web, & Related Svcs
24.6
24.8
24.6
-0.2 -0.8
0.0 0.0
Financial Activities
286.0
284.2
280.2
1.8 0.6
5.8 2.1
Finance and Insurance
205.0
203.8
200.7
1.2 0.6
4.3 2.1
Insurance Carriers and Related Activities
109.4
108.0
103.1
1.4 1.3
6.3 6.1
Real Estate and Rental and Leasing
81.0
80.4
79.5
0.6 0.8
1.5 1.9
Professional and Business Services
772.6
773.8
777.3
-1.2 -0.2
-4.7 -0.6
Professional, Scientific, and Technical Services
342.9
338.9
335.5
4.0 1.2
7.4 2.2
Accounting, Tax Prep, and Bookkeeping Services
40.1
38.7
38.6
1.4 3.6
1.5 3.9
Architectural, Engineering, and Related Services
51.0
50.0
51.6
1.0 2.0
-0.6 -1.2
Computer Systems Design and Related Services
85.0
84.5
82.3
0.5 0.6
2.7 3.3
Management and Technical Consulting Services
62.5
61.2
60.6
1.3 2.1
1.9 3.1
Management of Companies and Enterprises
95.5
95.6
94.8
-0.1 -0.1
0.7 0.7
Admin and Support, Waste Mngmnt and Remediation
334.2
339.3
347.0
-5.1 -1.5
-12.8 -3.7
Employment Services
151.5
156.4
166.0
-4.9 -3.1
-14.5 -8.7
Private Education and Health Services
703.7
696.5
680.2
7.2 1.0
23.5 3.5
Private Educational Services
104.3
102.0
102.3
2.3 2.3
2.0 2.0
Private Colleges, Universities, and Professional Schools
46.4
45.9
47.4
0.5 1.1
-1.0 -2.1
Health Care and Social Assistance
599.4
594.5
577.9
4.9 0.8
21.5 3.7
Ambulatory Health Care Services
269.8
265.6
259.2
4.2 1.6
10.6 4.1
Hospitals
180.1
179.2
173.3
0.9 0.5
6.8 3.9
Nursing and Residential Care Facilities
62.2
62.8
60.8
-0.6 -1.0
1.4 2.3
Social Assistance
87.3
86.9
84.6
0.4 0.5
2.7 3.2
Leisure and Hospitality
535.1
530.3
515.4
4.8 0.9
19.7 3.8
Arts, Entertainment, and Recreation
66.9
66.7
65.7
0.2 0.3
1.2 1.8
Amusement, Gambling, and Recreation Industries
50.0
50.7
46.8
-0.7 -1.4
3.2 6.8
Accommodation and Food Services
468.2
463.6
449.7
4.6 1.0
18.5 4.1
Accommodation
43.8
44.2
45.1
-0.4 -0.9
-1.3 -2.9
Food Services and Drinking Places
424.4
419.4
404.6
5.0 1.2
19.8 4.9
Other Services
170.3
171.4
166.4
-1.1 -0.6
3.9 2.3
Repair and Maintenance
43.2
43.5
45.7
-0.3 -0.7
-2.5 -5.5
Personal and Laundry Services
41.8
43.2
40.9
-1.4 -3.2
0.9 2.2
Religious, Grantmaking, Civic, Professional, and Similar
85.3
84.7
79.8
0.6 0.7
5.5 6.9
Government
726.6
720.7
706.2
5.9 0.8
20.4 2.9
Federal Government
113.8
113.2
109.7
0.6 0.5
4.1 3.7
Department of Defense
47.3
47.3
45.2
0.0 0.0
2.1 4.7
State Government
169.9
168.6
165.3
1.3 0.8
4.6 2.8
State Government Educational Services
101.4
100.3
99.8
1.1 1.1
1.6 1.6
State Government excluding Educational Services
68.5
68.3
65.5
0.2 0.3
3.0 4.6
Local Government
442.9
438.9
431.2
4.0 0.9
11.7 2.7
Local Government Educational Services
256.4
255.4
253.0
1.0 0.4
3.4 1.3
Local Government excluding Educational Services
186.5
183.5
178.2
3.0 1.6
8.3 4.7
?Note: These not seasonally adjusted estimates were prepared in cooperation with the U.S. Department of Labor, Bureau of Labor Statistics, based upon monthly reports submitted by selected
employers throughout Georgia. The estimates include all full- and part-time wage and salary workers who were employed during or received pay for any part of the pay period that includes the
twelfth of the month. Proprietors, domestic workers, self-employed persons, unpaid family workers and personnel of the armed forces are excluded. Estimates based on 2023 benchmark.
Source: Georgia Department of Labor, Workforce Statistics Division
3
ALBANY MSA Nonfarm Employment
(Not Seasonally Adjusted)
(In thousands)
Preliminary
Revised
Revised
OCT 2024 SEP 2024 OCT 2023
Change in Jobs from SEP 2024
Net %
Change in Jobs from OCT 2023
Net %
Total Nonfarm Total Private Goods Producing
63.6
63.1
62.5
0.5 0.8
51.9
51.5
50.7
0.4 0.8
7.0
7.1
7.1
-0.1 -1.4
1.1 1.8 1.2 2.4 -0.1 -1.4
Service-Providing Private Service-Providing Trade, Transportation, and Utilities
56.6
56.0
55.4
44.9
44.4
43.6
13.9
13.6
13.6
0.6 1.1 0.5 1.1 0.3 2.2
1.2 2.2 1.3 3.0 0.3 2.2
Retail Trade Government
Federal Government
7.6
7.5
7.6
11.7
11.6
11.8
2.2
2.2
2.3
0.1 1.3 0.1 0.9 0.0 0.0
0.0 0.0 -0.1 -0.9 -0.1 -4.4
State Government Local Government
2.8
2.8
2.7
0.0 0.0
6.7
6.6
6.8
0.1 1.5
0.1 3.7 -0.1 -1.5
?Note: These not seasonally adjusted estimates were prepared in cooperation with the U.S. Department of Labor, Bureau of Labor Statistics, based upon monthly reports submitted by
selected employers in the Albany Metropolitan Statistical Area, which includes Baker, Dougherty, Lee, Terrell and Worth counties. The estimates include all full- and part-time wage and salary workers who were employed during or received pay for any part of the pay period that includes the twelfth of the month. Proprietors, domestic workers, self-employed persons, unpaid familyworkers and personnel of the armed forces are excluded. Estimates based on 2023 benchmark.
Source: Georgia Department of Labor, Workforce Statistics Division
ATHENS-CLARKE COUNTY MSA Nonfarm Employment
(In thousands)
(Not Seasonally Adjusted)
Preliminary
Revised
Revised
OCT 2024 SEP 2024 OCT 2023
Change in Jobs from SEP 2024
Net %
Change in Jobs from OCT 2023
Net %
Total Nonfarm
106.5
105.7
104.7
0.8 0.8
1.8 1.7
Total Private Goods Producing Service-Providing
75.8
75.5
74.6
11.0
11.0
11.0
95.5
94.7
93.7
0.3 0.4 0.0 0.0 0.8 0.8
1.2 1.6 0.0 0.0 1.8 1.9
Private Service-Providing Trade, Transportation, and Utilities
Retail Trade
64.8
64.5
63.6
17.1
16.9
17.5
11.2
11.0
11.5
0.3 0.5 0.2 1.2 0.2 1.8
1.2 1.9 -0.4 -2.3 -0.3 -2.6
Professional and Business Services Leisure and Hospitality Government
10.0
10.0
10.1
12.5
12.3
12.3
30.7
30.2
30.1
0.0 0.0 0.2 1.6 0.5 1.7
-0.1 -1.0 0.2 1.6 0.6 2.0
Federal Government State Government Local Government
1.2
1.1
1.2
20.6
20.4
20.7
8.9
8.7
8.2
0.1 9.1 0.2 1.0 0.2 2.3
0.0 0.0 -0.1 -0.5 0.7 8.5
?Note: These not seasonally adjusted estimates were prepared in cooperation with the U.S. Department of Labor, Bureau of Labor Statistics, based upon monthly reports submitted by selected
employers in the Athens-Clarke County Metropolitan Statistical Area, which includes Clarke, Madison, Oconee and Oglethorpe counties. The estimates include all full- and part-time wage and salary workers who were employed during or received pay for any part of the pay period that includes the twelfth of the month. Proprietors, domestic workers, self-employed persons, unpaid family workers and personnel of the armed forces are excluded. Estimates based on 2023 benchmark.
Source: Georgia Department of Labor, Workforce Statistics Division
4
ATLANTA MSA Nonfarm Employment
(In thousands)
(Not Seasonally Adjusted)
Preliminary
Revised
OCT 2024 SEP 2024
Change in Jobs Revised from SEP 2024 OCT 2023 Net %Change
in Jobs from OCT 2023
Net %
Total Nonfarm
3,102.1
3,093.0
3,073.4
9.1 0.3
28.7 0.9
Total Private
2,735.8
2,729.6
2,720.1
6.2 0.2
15.7 0.6
Goods Producing
332.4
332.2
329.9
0.2 0.1
2.5 0.8
Service-Providing
2,769.7
2,760.8
2,743.5
8.9 0.3
26.2 1.0
Private Service-Providing
2,403.4
2,397.4
2,390.2
6.0 0.3
13.2 0.6
Mining and Logging
2.1
2.1
2.0
0.0 0.0
0.1 5.0
Mining, Logging and Construction
152.8
151.8
147.7
1.0 0.7
5.1 3.5
Construction
150.7
149.7
145.7
1.0 0.7
5.0 3.4
Construction of Buildings
34.7
34.4
33.5
0.3 0.9
1.2 3.6
Specialty Trade Contractors
93.9
93.9
91.1
0.0 0.0
2.8 3.1
Manufacturing
179.6
180.4
182.2
-0.8 -0.4
-2.6 -1.4
Durable Goods
95.7
96.5
98.0
-0.8 -0.8
-2.3 -2.4
Transportation Equipment Manufacturing
17.6
17.7
17.8
-0.1 -0.6
-0.2 -1.1
Non-Durable Goods
83.9
83.9
84.2
0.0 0.0
-0.3 -0.4
Food Manufacturing
24.5
24.4
24.3
0.1 0.4
0.2 0.8
Trade, Transportation, and Utilities
652.5
650.1
661.3
2.4 0.4
-8.8 -1.3
Wholesale Trade
155.6
155.7
161.3
-0.1 -0.1
-5.7 -3.5
Merchant Wholesalers, Durable Goods
85.3
85.9
88.4
-0.6 -0.7
-3.1 -3.5
Merchant Wholesalers, Nondurable Goods
40.4
39.7
41.3
0.7 1.8
-0.9 -2.2
Wholesale Trade Agents and Brokers
29.9
30.1
31.6
-0.2 -0.7
-1.7 -5.4
Retail Trade
299.4
297.4
300.6
2.0 0.7
-1.2 -0.4
Food and Beverage Retailers
64.9
63.1
62.6
1.8 2.9
2.3 3.7
General Merchandise Retailers
63.2
62.4
64.7
0.8 1.3
-1.5 -2.3
Sporting Goods, Hobby, Musical Instr, Book, & Misc Retailers
25.9
25.6
26.8
0.3 1.2
-0.9 -3.4
Transportation, Warehousing, and Utilities
197.5
197.0
199.4
0.5 0.3
-1.9 -1.0
Utilities
11.1
11.1
10.9
0.0 0.0
0.2 1.8
Transportation and Warehousing
186.4
185.9
188.5
0.5 0.3
-2.1 -1.1
Air Transportation
38.1
38.2
37.9
-0.1 -0.3
0.2 0.5
Truck Transportation
39.0
39.1
38.4
-0.1 -0.3
0.6 1.6
Couriers and Messengers
23.0
22.4
23.2
0.6 2.7
-0.2 -0.9
Information
94.1
95.0
98.0
-0.9 -1.0
-3.9 -4.0
Telecommunications
27.4
27.6
28.4
-0.2 -0.7
-1.0 -3.5
Wired and Wireless Telecommunications (expt Satellite)
20.4
20.5
21.2
-0.1 -0.5
-0.8 -3.8
Computing Infra Providers, Data Processing, Web, & Related Svcs
23.9
24.1
23.7
-0.2 -0.8
0.2 0.8
Financial Activities
208.6
208.3
204.8
0.3 0.1
3.8 1.9
Finance and Insurance
149.5
149.3
147.2
0.2 0.1
2.3 1.6
Insurance Carriers and Related Activities
80.4
79.8
77.1
0.6 0.8
3.3 4.3
Real Estate and Rental and Leasing
59.1
59.0
57.6
0.1 0.2
1.5 2.6
Professional and Business Services
578.6
580.1
590.2
-1.5 -0.3
-11.6 -2.0
Professional, Scientific, and Technical Services
272.6
270.9
273.4
1.7 0.6
-0.8 -0.3
Accounting, Tax Prep, and Bookkeeping Services
28.7
28.1
29.3
0.6 2.1
-0.6 -2.1
Architectural, Engineering, and Related Services
38.9
38.2
39.0
0.7 1.8
-0.1 -0.3
Computer Systems Design and Related Services
74.0
73.6
71.9
0.4 0.5
2.1 2.9
Management and Technical Consulting Services
51.9
51.5
53.5
0.4 0.8
-1.6 -3.0
Management of Companies and Enterprises
81.1
81.4
81.3
-0.3 -0.4
-0.2 -0.3
Admin and Support, Waste Mngmnt and Remediation
224.9
227.8
235.5
-2.9 -1.3
-10.6 -4.5
Employment Services
99.8
102.4
111.5
-2.6 -2.5
-11.7 -10.5
Private Education and Health Services
433.7
430.7
421.6
3.0 0.7
12.1 2.9
Private Educational Services
72.7
71.6
74.2
1.1 1.5
-1.5 -2.0
Health Care and Social Assistance
361.0
359.1
347.4
1.9 0.5
13.6 3.9
Ambulatory Health Care Services
175.3
173.8
167.0
1.5 0.9
8.3 5.0
Hospitals
101.2
100.7
97.7
0.5 0.5
3.5 3.6
Social Assistance
54.6
54.8
52.9
-0.2 -0.4
1.7 3.2
Leisure and Hospitality
327.9
325.1
310.9
2.8 0.9
17.0 5.5
Arts, Entertainment, and Recreation
47.2
46.9
44.8
0.3 0.6
2.4 5.4
Accommodation and Food Services
280.7
278.2
266.1
2.5 0.9
14.6 5.5
Accommodation
22.4
22.3
23.1
0.1 0.5
-0.7 -3.0
Food Services and Drinking Places
258.3
255.9
243.0
2.4 0.9
15.3 6.3
Other Services
108.0
108.1
103.4
-0.1 -0.1
4.6 4.5
Repair and Maintenance
25.6
25.6
26.2
0.0 0.0
-0.6 -2.3
Personal and Laundry Services
30.3
30.7
28.4
-0.4 -1.3
1.9 6.7
Government
366.3
363.4
353.3
2.9 0.8
13.0 3.7
Federal Government
57.0
56.6
54.1
0.4 0.7
2.9 5.4
State Government
79.8
79.3
77.1
0.5 0.6
2.7 3.5
Local Government
229.5
227.5
222.1
2.0 0.9
7.4 3.3
?Note: These not seasonally adjusted estimates were prepared in cooperation with the U.S. Department of Labor, Bureau of Labor Statistics, based upon monthly reports submitted by
selected employers in the Atlanta Metropolitan Statistical Area, which includes Barrow, Bartow, Butts, Carroll, Cherokee, Clayton, Cobb, Coweta, Dawson, DeKalb, Douglas, Fayette, Forsyth,
Fulton, Gwinnett, Haralson, Heard, Henry, Jasper, Lamar, Meriwether, Morgan, Newton, Paulding, Pickens, Pike, Rockdale, Spalding and Walton counties. The estimates include all full- and
part-time wage and salary workers who were employed during or received pay for any part of the pay period that includes the twelfth of the month. Proprietors, domestic workers, self-employed
persons, unpaid family workers and personnel of the armed forces are excluded. Estimates based on 2023 benchmark.
Source: Georgia Department of Labor, Workforce Statistics Division
5
AUGUSTA-RICHMOND COUNTY MSA Nonfarm Employment
(In thousands)
(Not Seasonally Adjusted)
Preliminary Revised OCT 2024 SEP 2024
Revised OCT 2023
Change in Jobs
from SEP 2024
Net
%
Change in Jobs from OCT 2023
Net %
Total Nonfarm Total Private Goods Producing Service-Providing Private Service-Providing Mining, Logging and Construction Manufacturing Trade, Transportation, and Utilities
Wholesale Trade Retail Trade Transportation, Warehousing, and Utilities Information Financial Activities Professional and Business Services Private Education and Health Services Leisure and Hospitality Other Services Government Federal Government State Government Local Government
247.6 202.1
38.9 208.7 163.2
14.3 24.6 41.0
5.2 26.7
9.1 2.0 7.6 35.6 40.8 26.6 9.6 45.5 10.0 13.4 22.1
246.9 201.7
38.8 208.1 162.9
14.2 24.6 40.8
5.2 26.6
9.0 2.0 7.5 35.9 40.4 26.6 9.7 45.2 10.0 13.3 21.9
245.0 200.3
39.1 205.9 161.2
14.7 24.4 41.4
5.3 27.0
9.1 2.0 7.4 35.9 38.6 26.4 9.5 44.7 9.9 12.9 21.9
0.7 0.3 0.4 0.2 0.1 0.3 0.6 0.3 0.3 0.2 0.1 0.7 0.0 0.0 0.2 0.5 0.0 0.0 0.1 0.4 0.1 1.1 0.0 0.0 0.1 1.3 -0.3 -0.8 0.4 1.0 0.0 0.0 -0.1 -1.0 0.3 0.7 0.0 0.0 0.1 0.8 0.2 0.9
2.6 1.1 1.8 0.9 -0.2 -0.5 2.8 1.4 2.0 1.2 -0.4 -2.7 0.2 0.8 -0.4 -1.0 -0.1 -1.9 -0.3 -1.1 0.0 0.0 0.0 0.0 0.2 2.7 -0.3 -0.8 2.2 5.7 0.2 0.8 0.1 1.1 0.8 1.8 0.1 1.0 0.5 3.9 0.2 0.9
?Note: These not seasonally adjusted estimates were prepared in cooperation with the U.S. Department of Labor, Bureau of Labor Statistics, based upon monthly reports submitted by se-
lected employers in the Augusta-Richmond County Metropolitan Statistical Area, which includes Burke, Columbia, Lincoln, McDuffie and Richmond counties in Georgia and Aiken and Edgefield counties in South Carolina. The estimates include all full- and part-time wage and salary workers who were employed during or received pay for any part of the pay period that includes the twelfth of the month. Proprietors, domestic workers, self-employed persons, unpaid family workers and personnel of the armed forces are excluded. Estimates based on 2023 benchmark.
BRUNSWICK MSA Nonfarm Employment
(In thousands)
(Not Seasonally Adjusted)
Preliminary
Revised
Revised
OCT 2024 SEP 2024 OCT 2023
Change in Jobs from SEP 2024
Net %
Change in Jobs from OCT 2023
Net %
Total Nonfarm Total Private Goods Producing Service-Providing Private Service-Providing Trade, Transportation, and Utilities
Retail Trade Government
Federal Government State Government Local Government
48.9
48.9
48.1
0.0 0.0
39.7
39.7
39.2
0.0 0.0
4.4
4.5
4.5
-0.1 -2.2
44.5
44.4
43.6
0.1 0.2
35.3
35.2
34.7
0.1 0.3
9.4
9.2
9.2
0.2 2.2
5.7
5.6
5.6
0.1 1.8
9.2
9.2
8.9
0.0 0.0
2.2
2.2
2.1
0.0 0.0
1.9
1.9
1.8
0.0 0.0
5.1
5.1
5.0
0.0 0.0
0.8 1.7 0.5 1.3 -0.1 -2.2 0.9 2.1 0.6 1.7 0.2 2.2 0.1 1.8 0.3 3.4 0.1 4.8 0.1 5.6 0.1 2.0
?Note: These not seasonally adjusted estimates were prepared in cooperation with the U.S. Department of Labor, Bureau of Labor Statistics, based upon monthly reports submitted by
selected employers in the Brunswick Metropolitan Statistical Area, which includes Brantley, Glynn and McIntosh counties. The estimates include all full- and part-time wage and salary workers who were employed during or received pay for any part of the pay period that includes the twelfth of the month. Proprietors, domestic workers, self-employed persons, unpaid family workers and personnel of the armed forces are excluded. Estimates based on 2023 benchmark.
Source: Georgia Department of Labor, Workforce Statistics Division
6
COLUMBUS MSA Nonfarm Employment
(In thousands)
(Not Seasonally Adjusted)
Preliminary
Revised
Revised
OCT 2024 SEP 2024 OCT 2023
Change in Jobs from SEP 2024
Net %
Change in Jobs from OCT 2023
Net %
Total Nonfarm Total Private Goods Producing Service-Providing Private Service-Providing Mining, Logging and Construction Manufacturing Trade, Transportation, and Utilities
Wholesale Trade Retail Trade Transportation, Warehousing, and Utilities Information Financial Activities Finance and Insurance
Insurance Carriers and Related Activities Professional and Business Services Private Education and Health Services Leisure and Hospitality Other Services Government
Federal Government State Government Local Government
124.9 101.1
16.6 108.3
84.5 5.2 11.4
18.7 2.8
12.9 3.0 1.1
10.7 8.8 4.3
16.0 18.1 15.5
4.4 23.8
6.7 3.9 13.2
124.3 100.8
16.6 107.7
84.2 5.2 11.4
18.6 2.8
12.8 3.0 1.1
10.7 8.8 4.3
16.0 18.0 15.4
4.4 23.5
6.7 3.9 12.9
122.8 99.7 16.4
106.4 83.3 5.1 11.3 18.8 2.8 13.0 3.0 1.2 10.5 8.6 4.2 15.9 17.5 15.0 4.4 23.1 6.6 3.8 12.7
0.6 0.5 0.3 0.3 0.0 0.0 0.6 0.6 0.3 0.4 0.0 0.0 0.0 0.0 0.1 0.5 0.0 0.0 0.1 0.8 0.0 0.0 0.0 0.0 0.0 0.0 0.0 0.0 0.0 0.0 0.0 0.0 0.1 0.6 0.1 0.7 0.0 0.0 0.3 1.3 0.0 0.0 0.0 0.0 0.3 2.3
2.1 1.7 1.4 1.4 0.2 1.2 1.9 1.8 1.2 1.4 0.1 2.0 0.1 0.9 -0.1 -0.5 0.0 0.0 -0.1 -0.8 0.0 0.0 -0.1 -8.3 0.2 1.9 0.2 2.3 0.1 2.4 0.1 0.6 0.6 3.4 0.5 3.3 0.0 0.0 0.7 3.0 0.1 1.5 0.1 2.6 0.5 3.9
?Note: These not seasonally adjusted estimates were prepared in cooperation with the U.S. Department of Labor, Bureau of Labor Statistics, based upon monthly reports submitted by
selected employers in the Columbus Metropolitan Statistical Area, which includes Chattahoochee, Harris, Marion and Muscogee counties in Georgia and Russell County in Alabama. The estimates include all full- and part-time wage and salary workers who were employed during or received pay for any part of the pay period that includes the twelfth of the month. Proprietors, domestic workers, self-employed persons, unpaid family workers and personnel of the armed forces are excluded. Estimates based on 2023 benchmark.
DALTON MSA Nonfarm Employment
(In thousands)
(Not Seasonally Adjusted)
Preliminary
Revised Revised
OCT 2024 SEP 2024 OCT 2023
Change in Jobs from SEP 2024
Net %
Change in Jobs from OCT 2023
Net %
Total Nonfarm Total Private Goods Producing
69.3
69.1
68.9
0.2 0.3
62.1
62.1
61.8
0.0 0.0
22.7
22.8
23.6
-0.1 -0.4
0.4 0.6 0.3 0.5 -0.9 -3.8
Service-Providing Private Service-Providing Manufacturing
46.6
46.3
45.3
0.3 0.7
39.4
39.3
38.2
0.1 0.3
21.4
21.5
22.2
-0.1 -0.5
1.3 2.9 1.2 3.1 -0.8 -3.6
Textile Mills Textile Product Mills Trade, Transportation, and Utilities
3.8
3.8
3.9
0.0 0.0
12.0
12.0
12.6
0.0 0.0
14.0
14.1
14.3
-0.1 -0.7
-0.1 -2.6 -0.6 -4.8 -0.3 -2.1
Retail Trade Transportation, Warehousing, and Utilities Professional and Business Services
6.7
6.7
6.7
0.0 0.0
3.7
3.7
3.8
0.0 0.0
9.3
9.3
8.8
0.0 0.0
0.0 0.0 -0.1 -2.6 0.5 5.7
Government Federal Government State Government
7.2
7.0
7.1
0.2 2.9
0.3
0.3
0.3
0.0 0.0
0.9
0.9
1.0
0.0 0.0
0.1 1.4 0.0 0.0 -0.1 -10.0
Local Government
6.0
5.8
5.8
0.2 3.5
0.2 3.5
?Note: These not seasonally adjusted estimates were prepared in cooperation with the U.S. Department of Labor, Bureau of Labor Statistics, based upon monthly reports submitted by
selected employers in the Dalton Metropolitan Statistical Area, which includes Murray and Whitfield counties. The estimates include all full- and part-time wage and salary workers who were employed during or received pay for any part of the pay period that includes the twelfth of the month. Proprietors, domestic workers, self-employed persons, unpaid family workers and personnel of the armed forces are excluded. Estimates based on 2023 benchmark.
Source: Georgia Department of Labor, Workforce Statistics Division
7
GAINESVILLE MSA Nonfarm Employment
(In thousands)
(Not Seasonally Adjusted)
Preliminary
Revised
Revised
OCT 2024 SEP 2024 OCT 2023
Change in Jobs from SEP 2024
Net %
Change in Jobs from OCT 2023
Net %
Total Nonfarm
111.3
111.1
110.3
0.2 0.2
1.0 0.9
Total Private
99.6
99.4
98.8
0.2 0.2
0.8 0.8
Goods Producing
31.3
31.3
30.6
0.0 0.0
0.7 2.3
Service-Providing
80.0
79.8
79.7
0.2 0.3
0.3 0.4
Private Service-Providing
68.3
68.1
68.2
0.2 0.3
0.1 0.2
Trade, Transportation, and Utilities
21.1
20.9
21.2
0.2 1.0
-0.1 -0.5
Retail Trade
10.1
9.9
9.9
0.2 2.0
0.2 2.0
Government
11.7
11.7
11.5
0.0 0.0
0.2 1.7
Federal Government
0.5
0.5
0.5
0.0 0.0
0.0 0.0
State Government
3.0
3.0
2.9
0.0 0.0
0.1 3.5
Local Government
8.2
8.2
8.1
0.0 0.0
0.1 1.2
?Note: These not seasonally adjusted estimates were prepared in cooperation with the U.S. Department of Labor, Bureau of Labor Statistics, based upon monthly reports submitted by se-
lected employers in the Gainesville Metropolitan Statistical Area, which comprises Hall county. The estimates include all full- and part-time wage and salary workers who were employed during or received pay for any part of the pay period that includes the twelfth of the month. Proprietors, domestic workers, self-employed persons, unpaid family workers and personnel of the armed forces are excluded. Estimates based on 2023 benchmark.
HINESVILLE MSA Nonfarm Employment
(In thousands)
(Not Seasonally Adjusted)
Preliminary Revised Revised OCT 2024 SEP 2024 OCT 2023
Change in Jobs from SEP 2024
Net %
Change in Jobs from OCT 2023
Net %
Total Nonfarm Total Private
22.4
22.4
21.9
14.2
14.2
14.0
0.0 0.0 0.0 0.0
0.5 2.3 0.2 1.4
Goods Producing Service-Providing Private Service-Providing
2.7
2.7
2.7
19.7
19.7
19.2
11.5
11.5
11.3
0.0 0.0 0.0 0.0 0.0 0.0
0.0 0.0 0.5 2.6 0.2 1.8
Government Federal Government State Government
8.2
8.2
7.9
0.0 0.0
3.8
3.9
3.8
-0.1 -2.6
0.4
0.4
0.4
0.0 0.0
0.3 3.8 0.0 0.0 0.0 0.0
Local Government
4.0
3.9
3.7
0.1 2.6
0.3 8.1
?Note: These not seasonally adjusted estimates were prepared in cooperation with the U.S. Department of Labor, Bureau of Labor Statistics, based upon monthly reports submitted by
selected employers in the Hinesville Metropolitan Statistical Area, which includes Liberty and Long counties. The estimates include all full- and part-time wage and salary workers who were employed during or received pay for any part of the pay period that includes the twelfth of the month. Proprietors, domestic workers, self-employed persons, unpaid family workers and personnel of the armed forces are excluded. Estimates based on 2023 benchmark.
Source: Georgia Department of Labor, Workforce Statistics Division
8
MACON-BIBB COUNTY MSA Nonfarm Employment
(In thousands)
(Not Seasonally Adjusted)
Preliminary
Revised
Revised
OCT 2024 SEP 2024 OCT 2023
Change in Jobs from SEP 2024
Net %
Change in Jobs from OCT 2023
Net %
Total Nonfarm
103.1
102.5
100.8
0.6 0.6
2.3 2.3
Total Private
88.3
87.8
86.2
0.5 0.6
2.1 2.4
Goods Producing
11.5
11.5
11.1
0.0 0.0
0.4 3.6
Service-Providing
91.6
91.0
89.7
0.6 0.7
1.9 2.1
Private Service-Providing
76.8
76.3
75.1
0.5 0.7
1.7 2.3
Trade, Transportation, and Utilities
20.5
20.3
19.7
0.2 1.0
0.8 4.1
Retail Trade
12.7
12.5
12.1
0.2 1.6
0.6 5.0
Transportation, Warehousing, and Utilities
4.6
4.6
4.5
0.0 0.0
0.1 2.2
Financial Activities
8.0
8.0
8.0
0.0 0.0
0.0 0.0
Professional and Business Services
11.2
11.2
11.3
0.0 0.0
-0.1 -0.9
Private Education and Health Services
23.2
23.0
22.2
0.2 0.9
1.0 4.5
Leisure and Hospitality
10.5
10.4
10.2
0.1 1.0
0.3 2.9
Government
14.8
14.7
14.6
0.1 0.7
0.2 1.4
Federal Government
1.1
1.1
1.1
0.0 0.0
0.0 0.0
State Government
4.2
4.2
4.1
0.0 0.0
0.1 2.4
Local Government
9.5
9.4
9.4
0.1 1.1
0.1 1.1
?Note: These not seasonally adjusted estimates were prepared in cooperation with the U.S. Department of Labor, Bureau of Labor Statistics, based upon monthly reports submitted by
selected employers in the Macon-Bibb County Metropolitan Statistical Area, which includes Bibb, Crawford, Jones, Monroe and Twiggs counties. The estimates include all full- and part-time wage and salary workers who were employed during or received pay for any part of the pay period that includes the twelfth of the month. Proprietors, domestic workers, self-employed persons, unpaid family workers and personnel of the armed forces are excluded. Estimates based on 2023 benchmark.
ROME MSA Nonfarm Employment
(In thousands)
(Not Seasonally Adjusted)
Preliminary
Revised
Revised
OCT 2024 SEP 2024 OCT 2023
Change in Jobs from SEP 2024
Net %
Change in Jobs from OCT 2023
Net %
Total Nonfarm Total Private
48.3
48.1
47.7
42.7
42.5
42.1
0.2 0.4 0.2 0.5
0.6 1.3 0.6 1.4
Goods Producing Service-Providing Private Service-Providing
7.2
7.2
7.4
41.1
40.9
40.3
35.5
35.3
34.7
0.0 0.0 0.2 0.5 0.2 0.6
-0.2 -2.7 0.8 2.0 0.8 2.3
Manufacturing Trade, Transportation, and Utilities
Retail Trade
6.4
6.4
6.5
0.0 0.0
7.4
7.4
7.5
0.0 0.0
4.5
4.5
4.5
0.0 0.0
-0.1 -1.5 -0.1 -1.3 0.0 0.0
Private Education and Health Services Government
Federal Government
11.2
11.0
10.7
5.6
5.6
5.6
0.2
0.2
0.2
0.2 1.8 0.0 0.0 0.0 0.0
0.5 4.7 0.0 0.0 0.0 0.0
State Government Local Government
1.4
1.4
1.4
0.0 0.0
4.0
4.0
4.0
0.0 0.0
0.0 0.0 0.0 0.0
?Note: These not seasonally adjusted estimates were prepared in cooperation with the U.S. Department of Labor, Bureau of Labor Statistics, based upon monthly reports submitted by
selected employers in the Rome Metropolitan Statistical Area, which comprises Floyd county. The estimates include all full- and part-time wage and salary workers who were employed during or received pay for any part of the pay period that includes the twelfth of the month. Proprietors, domestic workers, self-employed persons, unpaid family workers and personnel of the armed forces are excluded. Estimates based on 2023 benchmark.
Source: Georgia Department of Labor, Workforce Statistics Division
9
SAVANNAH MSA Nonfarm Employment
(In thousands)
(Not Seasonally Adjusted)
Preliminary Revised
Revised
OCT 2024 SEP 2024 OCT 2023
Change in Jobs from SEP 2024
Net %
Change in Jobs from OCT 2023
Net %
Total Nonfarm
208.8
207.8
205.9
1.0 0.5
2.9 1.4
Total Private
182.9
182.3
181.5
0.6 0.3
1.4 0.8
Goods Producing
33.2
33.1
32.6
0.1 0.3
0.6 1.8
Service-Providing
175.6
174.7
173.3
0.9 0.5
2.3 1.3
Private Service-Providing
149.7
149.2
148.9
0.5 0.3
0.8 0.5
Mining, Logging and Construction
10.7
10.6
10.3
0.1 0.9
0.4 3.9
Manufacturing
22.5
22.5
22.3
0.0 0.0
0.2 0.9
Trade, Transportation, and Utilities
50.5
50.1
50.5
0.4 0.8
0.0 0.0
Wholesale Trade
7.9
7.9
7.9
0.0 0.0
0.0 0.0
Retail Trade
23.5
23.3
23.4
0.2 0.9
0.1 0.4
Transportation, Warehousing, and Utilities
19.1
18.9
19.2
0.2 1.1
-0.1 -0.5
Information
1.4
1.4
1.4
0.0 0.0
0.0 0.0
Financial Activities
7.7
7.7
7.6
0.0 0.0
0.1 1.3
Professional and Business Services
23.8
24.5
25.2
-0.7 -2.9
-1.4 -5.6
Private Education and Health Services
30.1
29.7
29.0
0.4 1.4
1.1 3.8
Leisure and Hospitality
28.0
27.5
27.0
0.5 1.8
1.0 3.7
Other Services
8.2
8.3
8.2
-0.1 -1.2
0.0 0.0
Government
25.9
25.5
24.4
0.4 1.6
1.5 6.2
Federal Government
3.0
3.0
2.9
0.0 0.0
0.1 3.5
State Government
5.4
5.3
5.2
0.1 1.9
0.2 3.9
Local Government
17.5
17.2
16.3
0.3 1.7
1.2 7.4
?Note: These not seasonally adjusted estimates were prepared in cooperation with the U.S. Department of Labor, Bureau of Labor Statistics, based upon monthly reports submitted by
selected employers in the Savannah Metropolitan Statistical Area, which includes Bryan, Chatham and Effingham counties. The estimates include all full- and part-time wage and salary workers who were employed during or received pay for any part of the pay period that includes the twelfth of the month. Proprietors, domestic workers, self-employed persons, unpaid family workers and personnel of the armed forces are excluded. Estimates based on 2023 benchmark.
VALDOSTA MSA Nonfarm Employment
(In thousands)
(Not Seasonally Adjusted)
Preliminary Revised
Revised
OCT 2024 SEP 2024 OCT 2023
Change in Jobs from SEP 2024
Net %
Change in Jobs from OCT 2023
Net %
Total Nonfarm Total Private Goods Producing
57.8
57.4
56.8
44.5
44.1
44.3
8.3
8.1
8.1
0.4 0.7 0.4 0.9 0.2 2.5
1.0 1.8 0.2 0.5 0.2 2.5
Service-Providing Private Service-Providing
49.5
49.3
48.7
36.2
36.0
36.2
0.2 0.4 0.2 0.6
0.8 1.6 0.0 0.0
Trade, Transportation, and Utilities
12.8
12.8
12.6
0.0 0.0
0.2 1.6
Retail Trade Government
7.1
7.1
7.1
13.3
13.3
12.5
0.0 0.0 0.0 0.0
0.0 0.0 0.8 6.4
Federal Government
1.1
1.1
1.1
0.0 0.0
0.0 0.0
State Government Local Government
3.6
3.8
3.3
-0.2 -5.3
8.6
8.4
8.1
0.2 2.4
0.3 9.1 0.5 6.2
?Note: These not seasonally adjusted estimates were prepared in cooperation with the U.S. Department of Labor, Bureau of Labor Statistics, based upon monthly reports submitted by
selected employers in the Valdosta Metropolitan Statistical Area, which includes Brooks, Echols, Lanier and Lowndes counties. The estimates include all full- and part-time wage and salary workers who were employed during or received pay for any part of the pay period that includes the twelfth of the month. Proprietors, domestic workers, self-employed persons, unpaid family workers and personnel of the armed forces are excluded. Estimates based on 2023 benchmark.
Source: Georgia Department of Labor, Workforce Statistics Division
10
WARNER ROBINS MSA Nonfarm Employment
(In thousands)
(Not Seasonally Adjusted)
Preliminary Revised
Revised
OCT 2024 SEP 2024 OCT 2023
Change in Jobs from SEP 2024
Net %
Change in Jobs from OCT 2023
Net %
Total Nonfarm Total Private Goods Producing Service-Providing Private Service-Providing Trade, Transportation, and Utilities
Retail Trade Government
Federal Government State Government Local Government
83.8
84.0
81.8
-0.2 -0.2
55.1
55.1
54.2
0.0 0.0
11.5
11.6
11.4
-0.1 -0.9
72.3
72.4
70.4
-0.1 -0.1
43.6
43.5
42.8
0.1 0.2
12.5
12.4
12.4
0.1 0.8
9.9
9.8
9.8
0.1 1.0
28.7
28.9
27.6
-0.2 -0.7
16.0
16.2
15.2
-0.2 -1.2
2.7
2.6
2.5
0.1 3.9
10.0
10.1
9.9
-0.1 -1.0
2.0 2.4 0.9 1.7 0.1 0.9 1.9 2.7 0.8 1.9 0.1 0.8 0.1 1.0 1.1 4.0 0.8 5.3 0.2 8.0 0.1 1.0
?Note: These not seasonally adjusted estimates were prepared in cooperation with the U.S. Department of Labor, Bureau of Labor Statistics, based upon monthly reports submitted by
selected employers in the Warner Robins Metropolitan Statistical Area, which includes Houston, Peach and Pulaski counties. The estimates include all full- and part-time wage and salary workers who were employed during or received pay for any part of the pay period that includes the twelfth of the month. Proprietors, domestic workers, self-employed persons, unpaid family workers and personnel of the armed forces are excluded. Estimates based on 2023 benchmark.
Total Nonfarm Employment by Metro Statistical Area
(In thousands)
(Seasonally Adjusted)
Preliminary
Revised
Revised
OCT 2024 SEP 2024 OCT 2023
Change in Jobs from SEP 2024
Net %
Change in Jobs from OCT 2023
Net %
Albany MSA
63.2
63.1
62.0
0.1 0.2
1.2 1.9
Athens-Clarke County MSA
105.4
105.5
103.6
-0.1 -0.1
1.8 1.7
Atlanta MSA
3,092.5 3,096.6 3,061.8
-4.1 -0.1
30.7 1.0
Octobera-Richmond County MSA
248.0
247.9
245.5
0.1 0.0
2.5 1.0
Brunswick MSA
49.0
49.0
48.3
0.0 0.0
0.7 1.4
Columbus MSA
124.7
124.9
122.6
-0.2 -0.2
2.1 1.7
Dalton MSA
69.2
69.3
68.9
-0.1 -0.1
0.3 0.4
Gainesville MSA
110.7
111.1
109.6
-0.4 -0.4
1.1 1.0
Hinesville MSA
22.3
22.4
21.8
-0.1 -0.4
0.5 2.3
Macon-Bibb County MSA
102.9
102.6
100.7
0.3 0.3
2.2 2.2
Rome MSA
48.2
48.2
47.6
0.0 0.0
0.6 1.3
Savannah MSA
208.8
208.2
206.0
0.6 0.3
2.8 1.4
Valdosta MSA
57.4
57.3
56.3
0.1 0.2
1.1 2.0
Warner Robins MSA
83.4
83.7
81.5
-0.3 -0.4
1.9 2.3
?Note: These seasonally adjusted estimates were prepared in cooperation with the U.S. Department of Labor, Bureau of Labor Statistics, based upon monthly reports submitted by selected
employers throughout Georgia. The estimates include all full- and part-time wage and salary workers who were employed during or received pay for any part of the pay period that includes the twelfth of the month. Proprietors, domestic workers, self-employed persons, unpaid family workers and personnel of the armed forces are excluded. Estimates based on 2023 benchmark.
Source: Georgia Department of Labor, Workforce Statistics Division
11
Georgia Statewide Hours and Earnings
All Employee
Average Weekly Earnings (AWE)
Preliminary OCT 2024
Revised SEP 2024
Revised OCT 2023
Total Private...................................................................................................$1,137.39.......................... $1,133.33.................... $1,093.71 Goods Producing.......................................................................................$1,352.80..........................$1,359.56....................$1,290.50 Private Service Providing...........................................................................$1,099.57.......................... $1,093.11....................$1,058.94 Construction............................................................................................$1,436.54..........................$1,422.80....................$1,343.43 Manufacturing.........................................................................................$1,270.80..........................$1,309.76....................$1,222.30 Trade, Transportation, and Utilities........................................................... $950.46.............................$934.16.......................$923.41 Financial Activities.................................................................................. $1,501.76..........................$1,559.89.................... $1,367.31 Professional and Business Services......................................................$1,456.25..........................$1,489.42....................$1,408.50 Educational and Health Services............................................................ $1,194.25.......................... $1,185.07.................... $1,158.30 Leisure and Hospitality.............................................................................. $496.08............................ $473.09...................... $500.58 Other Services........................................................................................$1,009.20.............................$971.36.......................$890.74
Average Weekly Hours (AWH)
Preliminary OCT 2024
Revised SEP 2024
Revised OCT 2023
Total Private...........................................................................................................34.3.................................. 34.5.............................34.6 Goods Producing................................................................................................40.0.................................. 40.2.............................40.8 Private Service Providing....................................................................................33.3.................................. 33.5.............................33.5 Construction.....................................................................................................40.5...................................40.0............................. 41.4 Manufacturing..................................................................................................39.7...................................40.6.............................40.3 Trade, Transportation, and Utilities..................................................................33.8...................................33.7.............................33.3 Financial Activities........................................................................................... 37.2.................................. 38.9.............................38.8 Professional and Business Services............................................................... 37.6.................................. 38.2............................. 37.6 Educational and Health Services.....................................................................33.1...................................33.6.............................33.0 Leisure and Hospitality.....................................................................................26.0...................................25.6............................. 27.0 Other Services.................................................................................................33.9.................................. 33.3.............................33.6
Average Hourly Earnings (AHE)
Preliminary OCT 2024
Revised SEP 2024
Revised OCT 2023
Total Private.......................................................................................................$33.16.............................. $32.85......................... $31.61 Goods Producing........................................................................................... $33.82.............................. $33.82......................... $31.63 Private Service Providing............................................................................... $33.02.............................. $32.63......................... $31.61 Construction.................................................................................................$35.47.............................. $35.57.........................$32.45 Manufacturing..............................................................................................$32.01.............................. $32.26.........................$30.33 Trade, Transportation, and Utilities.............................................................. $28.12............................... $27.72......................... $27.73 Financial Activities.......................................................................................$40.37...............................$40.10.........................$35.24 Professional and Business Services...........................................................$38.73.............................. $38.99......................... $37.46 Educational and Health Services................................................................ $36.08.............................. $35.27......................... $35.10 Leisure and Hospitality.................................................................................$19.08...............................$18.48.........................$18.54 Other Services.............................................................................................$29.77............................... $29.17.........................$26.51
Read more about the hours and earnings series at http://www.bls.gov/sae/home.htm
?Note: These not seasonally adjusted estimates were prepared in cooperation with the U.S. Department of Labor, Bureau of Labor Statistics, based upon monthly reports submitted by
selected employers throughout Georgia. The estimates include all full- and part-time wage and salary workers who were employed during or received pay for any part of the pay period that includes the twelfth of the month. Proprietors, domestic workers, self-employed persons, unpaid family workers and personnel of the armed forces are excluded. Estimates based on 2023 benchmark.
Source: Georgia Department of Labor, Workforce Statistics Division
12
Georgia MSA Hours and Earnings
All Employee Total Private
Average Weekly Earnings (AWE)
Preliminary OCT 2024
Revised SEP 2024
Revised OCT 2023
Albany MSA ................................................................................................... $828.32............................ $803.67.......................$755.30 Athens-Clarke County MSA ...........................................................................$898.70............................ $892.39....................... $809.17 Atlanta MSA ................................................................................................$1,217.76..........................$1,210.26.................... $1,176.05 Augusta-Richmond County MSA ................................................................$1,059.31..........................$1,060.72....................$1,009.42 Brunswick MSA .............................................................................................$851.23............................ $838.67....................... $730.13 Columbus MSA ...........................................................................................$1,009.47.......................... $1,045.10.......................$936.02 Dalton MSA ................................................................................................$1,032.93.............................$994.18.......................$926.50 Gainesville MSA ..........................................................................................$1,058.76.......................... $1,021.17....................$1,066.52 Hinesville MSA .............................................................................................. $520.34............................ $536.68.......................$513.86 Macon-Bibb County MSA ............................................................................. $936.95............................ $960.23....................... $876.13 Rome MSA .................................................................................................... $832.22............................. $874.15.......................$798.97 Savannah MSA ............................................................................................. $834.07.............................$831.29...................... $833.23 Valdosta MSA ................................................................................................. $932.18............................ $895.54...................... $904.53 Warner Robins MSA ....................................................................................... $927.18............................ $954.80...................... $849.23
Average Weekly Hours (AWH)
Preliminary OCT 2024
Revised SEP 2024
Revised OCT 2023
Albany MSA ..........................................................................................................33.4...................................33.1.............................32.5 Athens-Clarke County MSA .................................................................................31.5...................................30.9.............................30.5 Atlanta MSA ........................................................................................................34.4.................................. 34.5.............................34.6 Augusta-Richmond County MSA .........................................................................34.8...................................35.1.............................34.7 Brunswick MSA ...................................................................................................33.9.................................. 34.4.............................32.8 Columbus MSA ....................................................................................................34.5...................................35.0.............................34.9 Dalton MSA ........................................................................................................ 38.2.................................. 38.4.............................35.8 Gainesville MSA ...................................................................................................34.6.................................. 34.9.............................36.4 Hinesville MSA .....................................................................................................29.2...................................30.1.............................28.5 Macon-Bibb County MSA ....................................................................................35.0.................................. 36.4.............................35.2 Rome MSA ...........................................................................................................32.7...................................32.9............................. 32.1 Savannah MSA .................................................................................................... 30.1...................................30.8............................. 31.9 Valdosta MSA .......................................................................................................32.8...................................32.9.............................33.0 Warner Robins MSA .............................................................................................34.1...................................34.1.............................32.6
Average Hourly Earnings (AHE)
Preliminary OCT 2024
Revised SEP 2024
Revised OCT 2023
Albany MSA ..........................................................................................................24.8.................................24.28...........................23.24 Athens-Clarke County MSA ...............................................................................28.53................................ 28.88...........................26.53 Atlanta MSA ........................................................................................................35.4................................ 35.08...........................33.99 Augusta-Richmond County MSA ...................................................................... 30.44................................ 30.22...........................29.09 Brunswick MSA ................................................................................................. 25.11.................................24.38...........................22.26 Columbus MSA ..................................................................................................29.26................................ 29.86...........................26.82 Dalton MSA .......................................................................................................27.04................................ 25.89...........................25.88 Gainesville MSA ...................................................................................................30.6................................ 29.26.............................29.3 Hinesville MSA ................................................................................................... 17.82................................. 17.83...........................18.03 Macon-Bibb County MSA ..................................................................................26.77................................ 26.38...........................24.89 Rome MSA .........................................................................................................25.45.................................26.57...........................24.89 Savannah MSA .................................................................................................. 27.71................................ 26.99........................... 26.12 Valdosta MSA .....................................................................................................28.42.................................27.22........................... 27.41 Warner Robins MSA ........................................................................................... 27.19......................................28...........................26.05
Read more about the hours and earnings series at http://www.bls.gov/sae/home.htm
?Note: These not seasonally adjusted estimates were prepared in cooperation with the U.S. Department of Labor, Bureau of Labor Statistics, based upon monthly reports submitted by
selected employers throughout Georgia. The estimates include all full- and part-time wage and salary workers who were employed during or received pay for any part of the pay period that includes the twelfth of the month. Proprietors, domestic workers, self-employed persons, unpaid family workers and personnel of the armed forces are excluded. Estimates based on 2023 benchmark.
Source: Georgia Department of Labor, Workforce Statistics Division
13
Dimensions - Measuring Georgia's Labor Force 2023-2024 Unemployment Rates Unemploym(Seenatsornaatellys A--djGuestoerdg)ia and U.S.
5%
4%
3%
2% Oct Nov Dec Jan Feb Mar Apr May Jun Jul Aug Sep Oct
Georgia
U.S.
WA 4.7
OR
4.0
ID
3.7
NV
5.7
UT
CA
3.5
5.4
AZ 3.6
AK 4.6
StSattaeteuUnenmempploloyymmeenntt Rraatteess
October 2024
National Unemployment Rate: 4.1% Rates are seasonally adjusted
MT 3.3
WY 3.2
CO 4.1 NM 4.3
HI 2.9
ND 2.4 SD 1.9
NE 2.7
KS 3.4
MN 3.4
WI 2.9
IA 3.0
IL 5.3 MO 3.8
OK 3.3 TX 4.1
AR 3.3
MS 2.9 LA 4.1
PR 5.4
NH
2.5 ME
VT
2.9
2.3
MI 4.7
OH
IN
4.3
4.4
KY 5.0 TN 3.3
PA 3.4
WV
4.2
VA
2.9
NC 3.7
SC 4.7
AL
GA
2.9
3.6
FL 3.3
MA 3.9
NY 4.4
RI 4.6
CT
NJ 4.7
3.0
DE
4.0
DC 5.7
MD 3.0
Unemployment rate
4.5% or greater 4.0% to 4.4% 3.5% to 3.9% 3.0% to 3.4%
Less than 3.0%
Source: Georgia Department of Labor, Workforce Statistics Division
14
Georgia Labor Force Estimates
Place of Residence - Persons 16 Years and Older
Georgia
(Seasonally adjusted)
Employment Status
Civilian labor force Employed Unemployed Rate
Preliminary OCT 2024
5,416,696 5,220,494
196,202 3.6
Revised SEP 2024
5,415,326 5,219,720
195,606 3.6
Revised OCT 2023
5,330,843 5,159,099
171,744 3.2
Change From
SEP 2024
OCT 2023
1,370 774 596
85,853 61,395 24,458
Georgia
(Not Seasonally adjusted)
Civilian labor force Employed Unemployed Rate
5,406,862 5,215,418
191,444 3.5
5,410,794 5,226,303
184,491 3.4
5,328,162 5,156,667
171,495 3.2
-3,932 -10,885
6,953
78,700 58,751 19,949
Albany MSA
Civilian labor force Employed Unemployed
Rate
65,761 63,072
2,689 4.1
65,201 62,594
2,607 4.0
64,013 61,613 2,400
3.7
560
1,748
478
1,459
82
289
Athens-Clarke County MSA
Civilian labor force Employed Unemployed Rate
106,121 102,295
3,826 3.6
105,293 101,731
3,562 3.4
103,682 100,527
3,155 3.0
828
2,439
564
1,768
264
671
Atlanta MSA
Civilian labor force Employed Unemployed
Rate
3,268,528 3,154,871
113,657 3.5
3,281,981 3,170,768
111,213 3.4
3,243,183 3,139,269
103,914 3.2
-13,453 -15,897
2,444
25,345 15,602
9,743
Octobera-Richmond County MSA
Civilian labor force Employed Unemployed
Rate
268,474 255,215
13,259 4.9
267,738 255,716
12,022 4.5
263,647 254,003
9,644 3.7
736 -501 1,237
4,827 1,212 3,615
Brunswick MSA
Civilian labor force Employed Unemployed
Rate
56,140 54,333
1,807 3.2
56,144 54,432
1,712 3.0
55,098 53,479
1,619 2.9
-4
1,042
-99
854
95
188
Columbus MSA
Civilian labor force Employed Unemployed Rate
123,275 118,270
5,005 4.1
122,996 118,183
4,813 3.9
121,085 116,654
4,431 3.7
279
2,190
87
1,616
192
574
Dalton MSA
Civilian labor force Employed Unemployed Rate
59,831
60,030
59,135
-199
696
57,225
57,295
56,945
-70
280
2,606
2,735
2,190
-129
416
4.4
4.6
3.7
Gainesville MSA
Civilian labor force Employed Unemployed Rate
114,700 111,712
2,988 2.6
114,686 111,860
2,826 2.5
113,512 110,788
2,724 2.4
14
1,188
-148
924
162
264
?Note: MSA data are not seasonally adjusted. Employment includes nonagricultural wage and salary employment, self-employment, unpaid family and private
household workers and agricultural workers. Persons in labor disputes are counted as employed. The use of unrounded data does not imply that the numbers are exact.
Albany MSA: Baker, Dougherty, Lee, Terrell, and Worth counties. Athens-Clarke County MSA: Clarke, Madison, Oconee, and Oglethorpe counties. Atlanta MSA: Barrow, Bartow, Butts, Carroll, Cherokee, Clayton, Cobb, Coweta, Dawson, DeKalb, Douglas, Fayette, Forsyth, Fulton, Gwinnett, Haralson, Heard, Henry, Jasper, Lamar, Meriwether, Morgan, Newton, Paulding, Pickens, Pike, Rockdale, Spalding, and Walton counties.
Octobera-Richmond County MSA: Burke, Columbia, Lincoln, McDuffie, and Richmond counties in Georgia and Aiken and Edgefield counties in South Carolina. Brunswick MSA: Brantley, Glynn, and McIntosh counties. Columbus MSA: Chattahoochee, Harris, Marion, and Muscogee counties in Georgia and Russell County in Alabama. Dalton MSA: Murray and Whitfield counties. Gainesville MSA: Hall County. Hinesville MSA: Liberty and Long counties. Macon-Bibb County MSA: Bibb, Crawford, Jones, Monroe, and Twiggs counties. Rome MSA: Floyd County. Savannah MSA: Bryan, Chatham, and Effingham counties. Valdosta MSA: Brooks, Echols, Lanier, and Lowndes counties. Warner Robins MSA: Houston, Peach and Pulaski counties.
Source: Georgia Department of Labor, Workforce Statistics Division
15
Hinesville MSA
Macon-Bibb County MSA Rome MSA Savannah MSA
Valdosta MSA Warner Robins MSA
Georgia Labor Force Estimates
Place of Residence - Persons 16 Years and Older
Employment Status
Civilian labor force Employed Unemployed Rate
Civilian labor force Employed Unemployed Rate
Preliminary OCT 2024
35,250 34,074
1,176 3.3
100,900 96,756 4,144 4.1
Revised SEP 2024
35,263 34,133
1,130 3.2
100,869 96,820 4,049 4.0
Revised OCT 2023
34,555 33,448
1,107 3.2
98,505 94,905
3,600 3.7
Civilian labor force Employed Unemployed Rate
Civilian labor force Employed Unemployed Rate
48,735 47,037 1,698
3.5
204,008 197,941
6,067 3.0
48,661 47,120 1,541
3.2
204,644 198,737
5,907 2.9
48,017 46,622
1,395 2.9
201,903 196,196
5,707 2.8
Civilian labor force Employed Unemployed Rate
Civilian labor force Employed Unemployed Rate
64,167 61,645
2,522 3.9
89,400 86,573
2,827 3.2
63,724 61,410 2,314
3.6
89,659 86,979
2,680 3.0
62,670 60,480
2,190 3.5
87,342 84,707
2,635 3.0
Change From
SEP 2024
OCT 2023
-13
695
-59
626
46
69
31
2,395
-64
1,851
95
544
74
718
-83
415
157
303
-636 -796 160
2,105 1,745
360
443
1,497
235
1,165
208
332
-259 -406
147
2,058 1,866
192
Area United States
(Seasonally adjusted)
United States
(Not Seasonally adjusted)
United States Labor Force Estimates
Place of Residence - Persons 16 Years and Older
Employment Status
Civilian labor force Employed Unemployed Rate
OCT 2024
168,479,000 161,496,000
6,984,000 4.1
SEP 2024
168,699,000 161,864,000
6,834,000 4.1
OCT 2023
167,723,000 161,280,000
6,443,000 3.8
Change From
SEP 2024
OCT 2023
-220,000 -368,000 150,000
756,000 216,000 541,000
Civilian labor force Employed Unemployed
Rate
168,569,000 161,938,000
6,631,000 3.9
168,569,000 162,046,000
6,524,000 3.9
167,774,000
161,676,000
-108,000
6,098,000
107,000
3.6
795,000 262,000 533,000
?Note: MSA data are not seasonally adjusted. Employment includes nonagricultural wage and salary employment, self-employment, unpaid family and private
household workers and agricultural workers. Persons in labor disputes are counted as employed. The use of unrounded data does not imply that the numbers are exact.
Albany MSA: Baker, Dougherty, Lee, Terrell, and Worth counties. Athens-Clarke County MSA: Clarke, Madison, Oconee, and Oglethorpe counties. Atlanta MSA: Barrow, Bartow, Butts, Carroll, Cherokee, Clayton, Cobb, Coweta, Dawson, DeKalb, Douglas, Fayette, Forsyth, Fulton, Gwinnett, Haralson, Heard, Henry, Jasper, Lamar, Meriwether, Morgan, Newton, Paulding, Pickens, Pike, Rockdale, Spalding, and Walton counties. Octobera-Richmond County MSA: Burke, Columbia, Lincoln, McDuffie, and Richmond counties in Georgia and Aiken and Edgefield counties in South Carolina. Brunswick MSA: Brantley, Glynn, and McIntosh counties. Columbus MSA: Chattahoochee, Harris, Marion, and Muscogee counties in Georgia and Russell County in Alabama. Dalton MSA: Murray and Whitfield counties. Gainesville MSA: Hall County. Hinesville MSA: Liberty and Long counties. Macon-Bibb County MSA: Bibb, Crawford, Jones, Monroe, and Twiggs counties. Rome MSA: Floyd County. Savannah MSA: Bryan, Chatham, and Effingham counties. Valdosta MSA: Brooks, Echols, Lanier, and Lowndes counties. Warner Robins MSA: Houston, Peach and Pulaski counties.
Source: Georgia Department of Labor, Workforce Statistics Division
16
Georgia Labor Force Estimates by County (not seasonally adjusted)
Place of Residence - Persons 16 Years and Older
Georgia
Preliminary October 2024
Labor Force
Employment
Unemployment Number Rate
5,406,862 5,215,418 191,444 3.5
Appling Atkinson Bacon Baker Baldwin
10,436 4,578 5,278 1,177
18,249
10,086 4,385 5,109 1,140 17,429
350 3.4 193 4.2 169 3.2 37 3.1 820 4.5
Banks Barrow Bartow Ben Hill Berrien
12,246 11,976
270 2.2
44,242 42,833 1,409 3.2
53,737 51,868 1,869 3.5
5,811 5,504
307 5.3
8,299
7,856
443 5.3
Bibb Bleckley Brantley Brooks Bryan
66,214 63,237 2,977 4.5
5,136 4,900
236 4.6
7,929
7,636
293 3.7
7,027 6,779
248 3.5
20,843 20,249
594 2.8
Bulloch Burke Butts Calhoun Camden
40,136 38,672 1,464 3.6
9,237 8,623
614 6.6
11,620 11,246
374 3.2
2,470 2,405
65 2.6
23,417 22,664
753 3.2
Candler Carroll Catoosa Charlton Chatham
6,102 5,945
157 2.6
58,976 56,832 2,144 3.6
35,334 34,248 1,086 3.1
5,200 5,045
155 3.0
148,559 143,952 4,607 3.1
Chattahoochee 1,933 1,850
83 4.3
Chattooga
9,790 9,221
569 5.8
Cherokee
146,638 142,475 4,163 2.8
Clarke
62,555 60,041 2,514 4.0
Clay
871
812
59 6.8
Clayton Clinch Cobb Coffee Colquitt
143,913 137,240 6,673 4.6
3,309
3,197
112 3.4
442,738 429,244 13,494 3.0
19,401 18,549
852 4.4
22,802 22,139
663 2.9
Columbia Cook Coweta Crawford Crisp
76,705 74,083 2,622 3.4
8,497
8,196
301 3.5
79,716 77,192 2,524 3.2
5,457 5,266
191 3.5
10,386 10,030
356 3.4
Revised September 2024
Labor Force
Employment
Unemployment Number Rate
5,410,794 5,226,303 184,491 3.4
10,151 4,404 5,136 1,114 18,114
9,808 4,288 4,974 1,077 17,350
343 3.4 116 2.6 162 3.2 37 3.3 764 4.2
11,978 44,380 53,739
5,794 8,017
11,727 43,005 52,028
5,473 7,687
251 2.1 1,375 3.1 1,711 3.2
321 5.5 330 4.1
66,293 5,056 7,878 6,847
20,890
63,375 4,829 7,607 6,613 20,318
2,918 4.4 227 4.5 271 3.4 234 3.4 572 2.7
39,914 9,124
11,652 2,342 23,487
38,561 8,576 11,277 2,281 22,775
1,353 3.4 548 6.0 375 3.2 61 2.6 712 3.0
6,019
5,862
157 2.6
59,122 57,042 2,080 3.5
35,347 34,371
976 2.8
5,178
5,021
157 3.0
149,085 144,571 4,514 3.0
1,911
1,835
76 4.0
9,623
9,243
380 3.9
147,268 143,280 3,988 2.7
62,082 59,744 2,338 3.8
833
783
50 6.0
144,608 137,840 6,768 4.7
3,158
3,062
96 3.0
444,900 431,652 13,248 3.0
19,161 18,456
705 3.7
22,032 21,412
620 2.8
76,893 8,405 79,964 5,424 10,250
74,475 2,418 3.1
8,141
264 3.1
77,524 2,440 3.1
5,236
188 3.5
9,912
338 3.3
Revised October 2023
Labor Force
Employment
Unemployment Number Rate
5,328,162 5,156,667 171,495 3.2
9,193 4,320 5,068 1,098 17,462
8,904 4,199 4,919 1,059 16,686
289 3.1 121 2.8 149 2.9 39 3.6 776 4.4
11,535 43,805 53,151
5,601 7,893
11,269 42,613 51,541 5,381 7,599
266 2.3 1,192 2.7 1,610 3.0
220 3.9 294 3.7
64,666 4,872 7,680 6,699
20,581
62,143 4,658 7,428 6,477 20,040
2,523 3.9 214 4.4 252 3.3 222 3.3 541 2.6
39,391 9,003 11,512 2,365 22,567
37,991 8,492 11,176 2,300 21,878
1,400 3.6 511 5.7 336 2.9 65 2.7 689 3.1
5,989 58,423 34,521 5,053 147,009
5,839 56,417 33,610 4,904 142,709
150 2.5 2,006 3.4
911 2.6 149 2.9 4,300 2.9
1,890 9,513 145,536 61,168
823
1,812 9,209 141,730 59,102
763
78 4.1 304 3.2 3,806 2.6 2,066 3.4
60 7.3
142,553 136,649 5,904 4.1
3,092 2,997
95 3.1
439,905 427,187 12,718 2.9
19,074 18,435
639 3.4
21,724 21,121
603 2.8
75,846 8,335 79,247 5,308 10,062
73,577 8,072 76,799 5,132 9,695
2,269 3.0 263 3.2
2,448 3.1 176 3.3 367 3.6
Source: Georgia Department of Labor, Workforce Statistics Division
17
Georgia Labor Force Estimates by County (not seasonally adjusted)
Place of Residence - Persons 16 Years and Older
Dade Dawson Decatur DeKalb Dodge
Dooly Dougherty Douglas Early Echols
Effingham Elbert Emanuel Evans Fannin
Fayette Floyd Forsyth Franklin Fulton
Gilmer Glascock Glynn Gordon Grady
Greene Gwinnett Habersham Hall Hancock
Haralson Harris Hart Heard Henry
Houston Irwin Jackson Jasper Jeff Davis
Preliminary October 2024
Labor Force
8,632 13,874 11,743 415,264
7,431
Employment
8,355 13,477 11,344 400,271
7,144
Unemployment Number Rate
277 3.2 397 2.9 399 3.4 14,993 3.6 287 3.9
4,590 36,898 77,015
4,174 1,972
4,419
171 3.7
35,165 1,733 4.7
74,162 2,853 3.7
4,009
165 4.0
1,917
55 2.8
34,606 8,493 9,264 4,934 13,023
33,740 8,157 8,768 4,798
12,669
866 2.5 336 4.0 496 5.4 136 2.8 354 2.7
61,056 59,132 1,924 3.2
48,735 47,037 1,698 3.5
133,769 129,925 3,844 2.9
10,476 10,106
370 3.5
591,386 568,760 22,626 3.8
13,512 13,085
427 3.2
1,312 1,245
67 5.1
41,632 40,332 1,300 3.1
29,766 28,786
980 3.3
11,276 10,908
368 3.3
7,965
7,688
277 3.5
515,145 498,502 16,643 3.2
20,688 20,035
653 3.2
114,700 111,712 2,988 2.6
2,687 2,494
193 7.2
13,401 12,931
470 3.5
17,159 16,626
533 3.1
13,454 13,061
393 2.9
5,480 5,299
181 3.3
123,655 118,784 4,871 3.9
72,791 70,631 2,160 3.0
3,772 3,615
157 4.2
52,270 51,074 1,196 2.3
7,443
7,213
230 3.1
6,352 6,053
299 4.7
Revised September 2024
Labor Force
8,662 13,904 11,487 417,332
7,442
Employment
8,398 13,526 11,090 402,523
7,136
Unemployment Number Rate
264 3.0 378 2.7 397 3.5 14,809 3.5 306 4.1
4,484
4,314
170 3.8
36,671 34,990 1,681 4.6
77,437 74,576 2,861 3.7
4,110 3,946
164 4.0
1,889
1,837
52 2.8
34,669 8,467 9,138 4,903 13,001
33,848 8,159 8,699 4,765
12,661
821 2.4 308 3.6 439 4.8 138 2.8 340 2.6
61,252 59,425 1,827 3.0
48,661 47,120 1,541 3.2
134,169 130,522 3,647 2.7
10,411 10,068
343 3.3
593,798 571,632 22,166 3.7
13,464 1,267 41,758 29,813 11,054
13,065 1,226 40,516 28,733 10,724
399 3.0 41 3.2
1,242 3.0 1,080 3.6
330 3.0
7,908
7,635
273 3.5
517,400 501,371 16,029 3.1
20,501 19,888
613 3.0
114,686 111,860 2,826 2.5
2,588
2,422
166 6.4
13,416 13,001
415 3.1
17,110 16,606
504 2.9
13,482 13,091
391 2.9
5,469
5,305
164 3.0
124,146 119,294 4,852 3.9
73,110 71,078 2,032 2.8
3,620
3,482
138 3.8
51,634 50,506 1,128 2.2
7,431
7,215
216 2.9
6,259 5,988
271 4.3
Revised October 2023
Labor Force
8,365 13,683 11,561 412,493
7,323
Employment
8,149 13,340 11,182 398,653
7,067
Unemployment Number Rate
216 2.6 343 2.5 379 3.3 13,840 3.4 256 3.5
4,388 35,981 76,512
4,017 1,864
4,213 34,451 73,840 3,873
1,807
175 4.0 1,530 4.3 2,672 3.5
144 3.6 57 3.1
34,313 8,167 8,770 4,880
12,221
33,447 7,881 8,403 4,746
11,906
866 2.5 286 3.5 367 4.2 134 2.7 315 2.6
60,861 58,885 1,976 3.2
48,017 46,622 1,395 2.9
132,707 129,213 3,494 2.6
10,039 9,714
325 3.2
586,492 566,052 20,440 3.5
12,968 1,252 41,021
28,942 10,853
12,587 1,206 39,847 28,125 10,495
381 2.9 46 3.7 1,174 2.9 817 2.8 358 3.3
7,680 7,437
243 3.2
510,805 495,916 14,889 2.9
19,825 19,247
578 2.9
113,512 110,788 2,724 2.4
2,473 2,336
137 5.5
13,266 16,811 12,770 5,409 122,759
12,850 16,350 12,386
5,249 118,403
416 3.1 461 2.7 384 3.0 160 3.0 4,356 3.5
71,277 3,477 49,309 7,348 6,007
69,250 3,351
48,295 7,129 5,765
2,027 2.8 126 3.6
1,014 2.1 219 3.0 242 4.0
Source: Georgia Department of Labor, Workforce Statistics Division
18
Georgia Labor Force Estimates by County (not seasonally adjusted)
Place of Residence - Persons 16 Years and Older
Jefferson Jenkins Johnson Jones Lamar
Lanier Laurens Lee Liberty Lincoln
Long Lowndes Lumpkin McDuffie McIntosh
Macon Madison Marion Meriwether Miller
Mitchell Monroe Montgomery Morgan Murray
Muscogee Newton Oconee Oglethorpe Paulding
Peach Pickens Pierce Pike Polk
Pulaski Putnam Quitman Rabun Randolph
Preliminary October 2024
Labor Force
6,955 3,459 4,396 13,490 8,655
Employment
6,552 3,294 4,254 13,057 8,313
Unemployment Number Rate
403 5.8 165 4.8 142 3.2 433 3.2 342 4.0
Revised September 2024
Labor Force
6,869 3,448 4,371 13,443 8,707
Employment
6,531 3,286 4,225 13,035 8,362
Unemployment Number Rate
338 4.9 162 4.7 146 3.3 408 3.0 345 4.0
3,895 20,916 15,203 26,531 3,624
3,716 20,086 14,754 25,638
3,453
179 4.6 830 4.0 449 3.0 893 3.4 171 4.7
3,860 20,899 15,099 26,610
3,538
3,705 20,076 14,671 25,744
3,416
155 4.0 823 3.9 428 2.8 866 3.3 122 3.4
8,719 8,436
283 3.2
51,273 49,233 2,040 4.0
18,826 18,267
559 3.0
8,659 8,049
610 7.0
6,579 6,365
214 3.3
8,653
8,389
264 3.1
51,128 49,255 1,873 3.7
18,796 18,281
515 2.7
8,534
8,076
458 5.4
6,508 6,309
199 3.1
4,748 14,453
3,331 9,236 2,876
4,549 13,973 3,201 8,898 2,801
199 4.2 480 3.3 130 3.9 338 3.7
75 2.6
4,631 14,356 3,323 9,243
2,762
4,439 13,906
3,192 8,903 2,692
192 4.1 450 3.1 131 3.9 340 3.7
70 2.5
8,273 13,008 4,069 10,089 15,813
7,939 12,599 3,904
9,786 15,046
334 4.0 409 3.1 165 4.1 303 3.0 767 4.9
8,095 12,978
4,015 10,040 15,840
7,750 12,585 3,862
9,756 15,032
345 4.3 393 3.0 153 3.8 284 2.8 808 5.1
76,559 73,148 3,411 4.5
56,087 53,539 2,548 4.5
21,614 21,026
588 2.7
7,499
7,255
244 3.3
93,642 90,764 2,878 3.1
76,617 73,343 3,274 4.3
56,314 53,736 2,578 4.6
21,468 20,925
543 2.5
7,387
7,156
231 3.1
93,892 91,138 2,754 2.9
12,416 16,291
8,748 9,467 19,375
11,893 15,821 8,429
9,194 18,671
523 4.2 470 2.9 319 3.6 273 2.9 704 3.6
12,374 16,348
8,633 9,487 19,442
11,870 15,901 8,369 9,221 18,772
504 4.1 447 2.7 264 3.1 266 2.8 670 3.4
4,193 9,287
752 8,188 2,375
4,049 8,923
705 7,954 2,265
144 3.4 364 3.9
47 6.3 234 2.9 110 4.6
4,175 9,188
749 8,164 2,336
4,031 8,824
703 7,939 2,229
144 3.4 364 4.0
46 6.1 225 2.8 107 4.6
Source: Georgia Department of Labor, Workforce Statistics Division
Revised October 2023
Labor Force
6,680 3,422 4,121 13,181 8,567
Employment
6,402 3,249 4,005 12,771 8,260
Unemployment Number Rate
278 4.2 173 5.1 116 2.8 410 3.1 307 3.6
3,783 19,791 14,847 26,080 3,510
3,641 19,007 14,439 25,242
3,374
142 3.8 784 4.0 408 2.7 838 3.2 136 3.9
8,475 50,324 18,347 8,403 6,397
8,206 48,555 17,841
7,995 6,204
269 3.2 1,769 3.5
506 2.8 408 4.9 193 3.0
4,631 14,097 3,246
9,159 2,834
4,438 13,715 3,137 8,792 2,761
193 4.2 382 2.7 109 3.4 367 4.0
73 2.6
8,081 12,676 3,861 9,885 15,573
7,785 12,309
3,721 9,612 14,933
296 3.7 367 2.9 140 3.6 273 2.8 640 4.1
75,342 55,531 21,147
7,270 93,040
72,286 53,230 20,639
7,071 90,327
3,056 4.1 2,301 4.1
508 2.4 199 2.7 2,713 2.9
12,014 16,199 8,408 9,395 19,185
11,540 15,747 8,160
9,111 18,543
474 3.9 452 2.8 248 2.9 284 3.0 642 3.3
4,051 9,017
725 7,866 2,325
3,917 8,654
689 7,652 2,232
134 3.3 363 4.0
36 5.0 214 2.7 93 4.0
19
Richmond Rockdale Schley Screven Seminole
Spalding Stephens Stewart Sumter Talbot
Taliaferro Tattnall Taylor Telfair Terrell
Thomas Tift Toombs Towns Treutlen
Troup Turner Twiggs Union Upson
Walker Walton Ware Warren Washington
Wayne Webster Wheeler White Whitfield
Wilcox Wilkes Wilkinson Worth
Georgia Labor Force Estimates by County (not seasonally adjusted)
Place of Residence - Persons 16 Years and Older
Preliminary October 2024
Labor Force
Employment
Unemployment Number Rate
84,145 79,091 5,054 6.0
46,518 44,572 1,946 4.2
2,224
2,145
79 3.6
5,039 4,699
340 6.7
3,191 3,059
132 4.1
30,204 28,980 1,224 4.1
10,628 10,181
447 4.2
2,757 2,692
65 2.4
12,726 12,122
604 4.7
2,982
2,874
108 3.6
589 9,695 2,810 3,398 3,535
563 9,394 2,690 3,180 3,374
26 4.4 301 3.1 120 4.3 218 6.4 161 4.6
18,349 21,674 12,813 4,480 2,770
17,674 21,041 12,303 4,291 2,644
675 3.7 633 2.9 510 4.0 189 4.2 126 4.5
39,600 38,384 1,216 3.1
3,447 3,278
169 4.9
2,731 2,597
134 4.9
12,150 11,841
309 2.5
11,836 11,407
429 3.6
32,979 31,950 1,029 3.1
49,271 47,618 1,653 3.4
15,430 14,897
533 3.5
2,906
2,717
189 6.5
7,244 6,898
346 4.8
12,255 11,840
415 3.4
1,036
993
43 4.2
1,806
1,712
94 5.2
18,056 17,619
437 2.4
44,018 42,179 1,839 4.2
2,797 4,043 3,463 8,948
2,712 3,872 3,319 8,639
85 3.0 171 4.2 144 4.2 309 3.5
Revised September 2024
Labor Force
Employment
Unemployment Number Rate
83,990 79,481 4,509 5.4
46,771 44,809 1,962 4.2
2,211
2,135
76 3.4
4,933
4,669
264 5.4
3,129
2,998
131 4.2
30,379 10,654
2,736 12,617 2,950
29,093 10,226 2,664 12,015 2,863
1,286 4.2 428 4.0 72 2.6 602 4.8 87 2.9
580 9,520 2,822 3,346 3,507
556 9,238 2,704 3,143 3,343
24 4.1 282 3.0 118 4.2 203 6.1 164 4.7
18,123 21,340 12,656 4,530
2,756
17,466 20,716 12,189 4,351 2,634
657 3.6 624 2.9 467 3.7 179 4.0 122 4.4
39,432 38,227 1,205 3.1
3,359
3,208
151 4.5
2,731
2,589
142 5.2
12,050 11,751
299 2.5
11,819 11,398
421 3.6
32,978 49,413 15,303 2,806
7,217
32,002 47,811 14,808 2,699 6,866
976 3.0 1,602 3.2
495 3.2 107 3.8 351 4.9
12,268 989
1,754 18,070 44,190
11,842 956
1,671 17,640 42,263
426 3.5 33 3.3 83 4.7 430 2.4 1,927 4.4
2,735 3,937 3,488 8,810
2,648 3,802 3,346 8,513
87 3.2 135 3.4 142 4.1 297 3.4
Revised October 2023
Labor Force
Employment
Unemployment Number Rate
82,376 46,151 2,199 4,925
3,115
78,737 44,367
2,130 4,693 3,009
3,639 4.4 1,784 3.9
69 3.1 232 4.7 106 3.4
29,935 10,515 2,702 12,574 2,886
28,808 10,144 2,615 12,017 2,790
1,127 3.8 371 3.5 87 3.2 557 4.4 96 3.3
564 9,380 2,802 3,317 3,440
541 9,088 2,697 3,119 3,288
23 4.1 292 3.1 105 3.7 198 6.0 152 4.4
17,717 20,964 12,151
4,237 2,663
17,109 20,384 11,726
4,061 2,558
608 3.4 580 2.8 425 3.5 176 4.2 105 3.9
38,255 3,288 2,674 11,632 11,651
37,200 3,162 2,550
11,343 11,169
1,055 2.8 126 3.8 124 4.6 289 2.5 482 4.1
32,191 48,854 14,960
2,768 7,222
31,294 47,373 14,460 2,655 6,897
897 2.8 1,481 3.0
500 3.3 113 4.1 325 4.5
11,904 1,003 1,663 17,840 43,562
11,505 965
1,580 17,448 42,012
399 3.4 38 3.8 83 5.0
392 2.2 1,550 3.6
2,759 3,846 3,389 8,647
2,664 3,706 3,263 8,376
95 3.4 140 3.6 126 3.7 271 3.1
Source: Georgia Department of Labor, Workforce Statistics Division
20
City Labor Force Estimates
Place of Residence - Persons 16 Years and Older
Preliminary October 2024
Labor Force
Employment
Unemployment Number Rate
Albany 29,900 28,441 1,459 4.9
Alpharetta 38,799 37,722 1,077 2.8
Athens 62,555 60,041 2,514 4.0
Atlanta 279,396 267,617 11,779 4.2
Dekalb Part
25,586 24,778
808 3.2
Fulton Part
253,810 242,839 10,971 4.3
Augusta 84,145 79,091 5,054 6.0
Brookhaven
36,739 35,882
857 2.3
Canton 17,711 17,231
480 2.7
Carrollton 12,257 11,740
517 4.2
Chamblee 21,898 21,365
533 2.4
Columbus 76,559 73,148 3,411 4.5
Dalton 13,859 13,239
620 4.5
Decatur 14,834 14,446
388 2.6
Douglasville
17,740
17,117
623 3.5
Duluth 16,734 16,221
513 3.1
Dunwoody
28,290 27,535
755 2.7
East Point
17,447 16,487
960 5.5
Gainesville
23,122 22,468
654 2.8
Hinesville 15,672 15,163
509 3.2
Johns Creek
46,884 45,587 1,297 2.8
Kennesaw 21,028 20,439
589 2.8
LaGrange 16,374 15,775
599 3.7
Lawrenceville
15,477 14,883
594 3.8
McDonough 13,081 12,465
616 4.7
Macon-Bibb
66,214 63,237 2,977 4.5
Marietta 36,699 35,623 1,076 2.9
Milton 21,309 20,658
651 3.1
Newnan 20,540 19,801
739 3.6
Peachtree City
19,649 19,134
515 2.6
P'tree Corners
26,223 25,520
703 2.7
Pooler 14,788 14,425
363 2.5
Rome 16,976 16,340
636 3.7
Roswell 56,002 54,469 1,533 2.7
Sandy Springs
68,431 66,608 1,823 2.7
Savannah 70,542 68,026 2,516 3.6
Smyrna 36,233 35,120 1,113 3.1
Statesboro
15,181 14,395
786 5.2
Stockbridge
15,178 14,489
689 4.5
Sugar Hill 13,890 13,490
400 2.9
Tucker 20,792 20,203
589 2.8
Union City
10,819 10,113
706 6.5
Valdosta 24,866 23,718 1,148 4.6
Warner Robins
34,682 33,640 1,042 3.0
Woodstock 18,777 18,215
562 3.0
Revised September 2024
Labor Force
Employment
Unemployment Number Rate
29,725 28,299 1,426 4.8
38,993 37,912 1,081 2.8
62,082 59,744 2,338 3.8
280,665 268,982 11,683 4.2
25,771 24,917 854 3.3
254,894 244,065 10,829 4.2
83,990 79,481 4,509 5.4
36,900 36,084
816 2.2
17,775 17,328
447 2.5
12,289 11,784
505 4.1
21,976 21,485
491 2.2
76,617 73,343 3,274 4.3
13,939 13,265
674 4.8
14,929 14,527
402 2.7
17,904 17,213
691 3.9
16,838 16,315
523 3.1
28,392 27,690
702 2.5
17,523 16,570 953 5.4
23,148 22,498 650 2.8
15,721 15,226 495 3.1
47,095 45,817 1,278 2.7
21,140 20,553
587 2.8
16,284 15,710
574 3.5
15,549 14,968
581 3.7
13,136 12,518
618 4.7
66,293 63,375 2,918 4.4
36,938 35,822 1,116 3.0
21,320 20,763
557 2.6
20,634 19,886
748 3.6
19,687 19,229 458 2.3
26,333 25,667 666 2.5
14,865 14,487
378 2.5
16,969 16,369 600 3.5
56,202 54,744 1,458 2.6
68,694 66,944 1,750 2.5
70,774 68,318 2,456 3.5
36,527 35,317 1,210 3.3
15,047 14,353 694 4.6
15,256 14,551
705 4.6
13,971 13,567 404 2.9
20,905 20,316 589 2.8
10,800 10,165 635 5.9
24,803 23,729 1,074 4.3
34,819 33,849
970 2.8
18,884 18,318 566 3.0
Revised October 2023
Labor Force
Employment
Unemployment Number Rate
29,136 27,863 1,273 4.4
38,548 37,542 1,006 2.6
61,168 59,102 2,066 3.4
277,149 266,360 10,789 3.9
25,484 24,677
807 3.2
251,665 241,683 9,982 4.0
82,376 78,737 3,639 4.4
36,509 35,737
772 2.1
17,572 17,141
431 2.5
12,145 11,655
490 4.0
21,755 21,279
476 2.2
75,342 72,286 3,056 4.1
13,680 13,187
493 3.6
14,765 14,388
377 2.6
17,648 17,043
605 3.4
16,638 16,137
501 3.0
28,171 27,424
747 2.7
17,226 16,409
817 4.7
22,883 22,283
600 2.6
15,406 14,929
477 3.1
46,623 45,370 1,253 2.7
20,945 20,341
604 2.9
15,783 15,288
495 3.1
15,297 14,806
491 3.2
12,982 12,425
557 4.3
64,666 62,143 2,523 3.9
36,562 35,452 1,110 3.0
21,114 20,560
554 2.6
20,390 19,700
690 3.4
19,552 19,054
498 2.5
25,994 25,387
607 2.3
14,631 14,300
331 2.3
16,711 16,196
515 3.1
55,609 54,210 1,399 2.5
67,979 66,290 1,689 2.5
69,790 67,438 2,352 3.4
36,028 34,951 1,077 3.0
14,860 14,141
719 4.8
15,026 14,442
584 3.9
13,783 13,420
363 2.6
20,653 20,121
532 2.6
10,633 10,065
568 5.3
24,365 23,391
974 4.0
33,949 32,977
972 2.9
18,611 18,120
491 2.6
Note: City estimates were prepared in cooperation with the U.S. Department of Labor, Bureau of Labor Statistics. All cities listed have total population of 25,000 or more.
Source: Georgia Department of Labor, Workforce Statistics Division
21
UNEMGPeoLrOgiaYUMneEmNploTymReAntTREateBs bYy CCoOunUtyNTIES OCTOBER 2024 October 2024
Dade 3.2
Catoosa 3.1
Walker
Whitfield
Murray 4.9
Fannin 2.7
Union 2.5
Towns 4.2
Rabun 2.9
5.0% or greater 16 counties (10%)
3.1
4.2
Chattooga 5.8
Gordon 3.3
Floyd 3.5
Bartow 3.5
Gilmer 3.2
Pickens 2.9
Cherokee 2.8
Lumpkin 3.0
Dawson 2.9
Forsyth 2.9
White Habersham
2.4
3.2
Stephens
4.2
Banks Franklin
Hall
2.2
3.5
2.6
Jackson 2.3
Madison 3.3
Hart 2.9
Elbert 4.0
4.0% to 4.9% 45 counties (28%)
3.0% to 3.9% 74 counties (47%)
Less than 3.0%
24 counties (15%) Polk
3.6
Haralson 3.5
Carroll 3.6
Heard 3.3
Paulding
Cobb 3.0
Gwinnett 3.2
Barrow 3.2
Clarke 4.0
3.1 Douglas 3.7
Coweta 3.2
Fulton 3.8
DeKalb 3.6 Rockdale
Walton 3.4
Oconee 2.7
Clayton
4.2 Newton
4.6
Fayette 3.2
Henry 3.9
4.5
Morgan 3.0
Spalding 4.1
Butts 3.2
Jasper 3.1
Putnam 3.9
Oglethorpe 3.3
Wilkes 4.2
Lincoln 4.7
Percentages of number of counties may not total 100 due to rounding
Greene 3.5
Taliaferro
4.4
McDuffie
Warren 7.0
Columbia 3.4
6.5
Richmond
Hancock
6.0
7.2
Glascock
5.1
Troup 3.1
Meriwether 3.7
Pike 2.9
Lamar 4.0
Monroe 3.1
Jones 3.2
Baldwin 4.5
Washington
Jefferson 5.8
Burke 6.6
Upson
4.8
Harris 3.1
Talbot 3.6
Muscogee 4.5
Marion Chattahoochee 3.9
3.6
Taylor 4.3
Crawford 3.5
Bibb 4.5
Twiggs 4.9
Wilkinson 4.2
Peach
4.2
Macon 4.2
Houston 3.0
Bleckley 4.6
Laurens 4.0
Johnson 3.2
Emanuel 5.4
Jenkins 4.8
Screven 6.7
Treutlen 4.5
Candler 2.6
Bulloch 3.6
Effingham 2.5
4.3
Schley
Pulaski
Montgomery
Stewart 2.4
3.6
Webster 4.2
Sumter 4.7
Quitm an
6.3 Randolph Terrell
Lee
4.6
4.6
3.0
Clay
Dooly
3.4
Dodge
3.7
3.9
Crisp 3.4
Wilcox 3.0
Turner 4.9
Ben Hill 5.3
4.1 Wheeler
5.2
Telfair 6.4
Jeff Davis 4.7
Toombs 4.0
Evans 2.8
Tattnall
3.1
Bryan 2.8
Appling 3.4
Long 3.2
Liberty 3.4
Chatham 3.1
6.8
Calhoun
Dougherty
2.6
4.7
Early 4.0
Miller 2.6
Baker 3.1
Mitchell 4.0
Worth 3.5
Colquitt 2.9
Irwin 4.2 Tift 2.9
Coffee 4.4
Berrien
Atkinson
5.3
4.2
Cook
3.5 Lanier
Bacon 3.2
Wayne 3.4
Pierce 3.6
Ware 3.5
Brantley 3.7
McIntosh 3.3
Glynn 3.1
Seminole 4.1
Decatur 3.4
Grady 3.3
Thomas 3.7
Brooks 3.5
4.6
Lowndes 4.0
Clinch 3.4
Charlton 3.0
Camden 3.2
Echols
2.8
Georgia's Unemployment Rate: 3.5%
Georgia's U(nNoet SmeasponlaollyyAmdjusetend)t Rate: 3.5% (not seasonally adjusted)
Source: Georgia Department of Labor, Workforce Statistics Division
22
Georgia Unemployment Insurance Claims by County
County
October 2024 Initial
Claims
Average Weekly Benefit
County
October 2024 Initial
Claims
Average Weekly Benefit
County
October 2024 Initial
Claims
Average Weekly Benefit
Georgia
Appling Atkinson Bacon Baker Baldwin Banks Barrow Bartow Ben Hill Berrien Bibb Bleckley Brantley Brooks Bryan Bulloch Burke Butts Calhoun Camden Candler Carroll Catoosa Charlton Chatham Chattahoochee Chattooga Cherokee Clarke Clay Clayton Clinch Cobb Coffee Colquitt Columbia Cook Coweta Crawford Crisp Dade Dawson Decatur DeKalb Dodge Dooly Dougherty Douglas Early Echols Effingham
28,642.............. $340
114.............. $280 129.............. $286
56.............. $233 3.............. $167
60.............. $278 25.............. $316 204.............. $293 318.............. $312 112.............. $278 531.............. $301 305.............. $264 16.............. $293 37.............. $301 62.............. $269 59.............. $316 162.............. $304 292.............. $300 49.............. $304
1.............. $265 52.............. $265 38.............. $306 175.............. $320 70.............. $318 15.............. $235 563.............. $292
9.............. $149 260.............. $294 279.............. $308 379.............. $284
2.............. $303 881.............. $300
32.............. $313 1,290.............. $313
566.............. $282 76.............. $256
832.............. $309 121.............. $292 349.............. $318
12.............. $283 37.............. $234 13.............. $329 18.............. $307 60.............. $297 1,754.............. $305 39.............. $323 13.............. $237 197.............. $268 377.............. $309 21.............. $253
9.............. $278 83.............. $304
Elbert Emanuel Evans Fannin Fayette Floyd Forsyth Franklin Fulton Gilmer Glascock Glynn Gordon Grady Greene Gwinnett Habersham Hall Hancock Haralson Harris Hart Heard Henry Houston Irwin Jackson Jasper Jeff Davis Jefferson Jenkins Johnson Jones Lamar Lanier Laurens Lee Liberty Lincoln Long Lowndes Lumpkin Macon Madison Marion McDuffie McIntosh Meriwether Miller Mitchell Monroe Montgomery Morgan Murray
61.............. $282 172.............. $266
27.............. $322 4.............. $259
163.............. $316 229.............. $305 250.............. $322
95.............. $290 2,552.............. $308
24.............. $326 29.............. $291 139.............. $266 243.............. $300 45.............. $283 39.............. $328 1,496.............. $314 75.............. $283 305.............. $308 41.............. $274 40.............. $292 38.............. $297 68.............. $307 16.............. $302 555.............. $310 230.............. $303 40.............. $316 137.............. $326 36.............. $287 112.............. $255 167.............. $298 30.............. $308 31.............. $289 24.............. $271 31.............. $260 91.............. $284 131.............. $249 31.............. $307 134.............. $281 67.............. $298 26.............. $316 756.............. $294 41.............. $300 23.............. $260 80.............. $325 14.............. $268 373.............. $293 18.............. $249 46.............. $335 14.............. $226 25.............. $224 33.............. $315 29.............. $285 35.............. $336 197.............. $309
Muscogee Newton Oconee Oglethorpe Paulding Peach Pickens Pierce Pike Polk Pulaski Putnam Quitman Rabun Randolph Richmond Rockdale Schley Screven Seminole Spalding Stephens Stewart Sumter Talbot Taliaferro Tattnall Taylor Telfair Terrell Thomas Tift Toombs Towns Treutlen Troup Turner Twiggs Union Upson Walker Walton Ware Warren Washington Wayne Webster Wheeler White Whitfield Wilcox Wilkes Wilkinson Worth
402.............. $287 327.............. $308
50.............. $310 42.............. $316 270.............. $312 44.............. $319 23.............. $310 66.............. $246 21.............. $322 85.............. $314 11.............. $294 28.............. $309
1.............. $189 18.............. $285
8.............. $345 2,521.............. $287
254.............. $313 3.............. $326
131.............. $316 10.............. $219
166.............. $301 69.............. $286 5.............. $365 62.............. $276 9.............. $295 7.............. $361 53.............. $306 21.............. $327 33.............. $230 14.............. $271 44.............. $283 110.............. $275
162.............. $269 5.............. $237
36.............. $290 155.............. $304
20.............. $248 11.............. $325 18.............. $274 74.............. $329 115.............. $298 209.............. $314 121.............. $284 129.............. $310 39.............. $279 62.............. $295 4.............. $365 16.............. $243 32.............. $293 545.............. $298 19.............. $309 45.............. $318 11.............. $315 27.............. $262
?Note: Initial claims include intrastate initial and additional claims, as well as agent state initial and additional claims for regular UI only. Average duration of benefits is represented in weeks.
Data does not include state or federal extended benefits. Source: Georgia Department of Labor, Workforce Statistics Division
23
Bruce Thompson, Commissioner
148 Andrew Young International Boulevard, N.E., Suite 650 Atlanta, Georgia 30303-1751
Return Service Requested