- Collection:
- Georgia Government Publications
- Title:
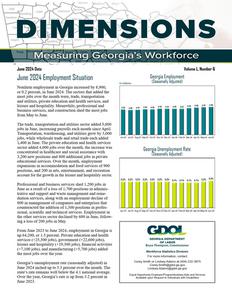
- Dimensions: measuring Georgia's workforce, 2024 June
- Creator:
- Georgia. Department of Labor
- Contributor to Resource:
- Georgia. Department of Labor
- Publisher:
- Atlanta, Ga. : Georgia. Department of Labor
- Date of Original:
- 2024-06
- Subject:
- Labor market--Georgia--Statistics--Periodicals
Wages--Georgia--Statistics--Periodicals
Hours of labor--Georgia--Statistics--Periodicals - Location:
- United States, Georgia, 32.75042, -83.50018
- Medium:
- serials (publications)
- Type:
- Text
- Format:
- application/pdf
- Description:
- Monthly employment statistics for Georgia
- External Identifiers:
- Metadata URL:
- http://dlg.galileo.usg.edu/id:dlg_ggpd_46865732-2024-06
- Digital Object URL:
- http://dlg.galileo.usg.edu/do:dlg_ggpd_46865732-2024-06
- Language:
- eng
- Holding Institution:
- University of Georgia. Map and Government Information Library
- Rights:
-

Jackson Madison Elbert
Polk
Cobb
Gwinnett Barrow Clarke
D I M E N S I O N S Paulding
Haralson Douglas
DeKalb Rock-
Walton
Oconee Oglethorpe
Wilkes
Lincoln
EdgefieSlCd,
Carroll
Fulton Clayton
dale Newton
Morgan Greene Taliaferro
Columbia
Fayette Henry
McDuffie Warren
Heard
Coweta
Spalding Butts Jasper Putnam Hancock
Glascock
Richmond
AikenSC,
Russell, AL
Measuring Georgia's Workforce Troup Meriwether Pike Lamar Monroe Upson
Jones
Baldwin
Jefferson Washington
Burke
Harris
June 2024
DaTatlabot
Bibb
Wilkinson
Crawford
Twiggs
Johnson
Jenkins Emanuel
Screven
Volume L, Number 6
June 2024 Employment Situation Muscogee
Taylor
Peach
Marion Chattahoo-
Houston Bleckley Macon
Laurens
Nonfcahreme employmScehnletyin Georgia increaPsueladskbi y 8D,9od0g0e,
Treutlen In millions
Montgomery
CandGl(eeSroeragsBoiaunlalEollmcyhpAdlojuyEsmftfeiendgn)htam
omro0sS.tt2ejwopabertsrcoevWnete,rbistntheerJumnoeSnu2mt0ht2ewr4.erTeh, eDtrosaoedlcyet,otrrsaWnthsilapctooxartdadtieodnthe Wheeler
Toombs
Evans
Tattnall
Bryan Chatham
Qaunitdmauntilities, private education anCdrishpealth services, andTelfair
lbeuissuinrReeasnasdnosdlephrhvoicsTpeesirtr,aealllintdy.cMoLenesatnruwchtiiolen,
professional and sTuhrenderthe moBsetnjHoiblls
Jeff D4a.9v2is 4.90 Ap4p.9l1ing4.92
4.92
Liberty 4.9L4ong4.93 4.94 4.93
4.95
4.96
4.97
4.98
froClmay
May to June.
Calhoun
Dougherty
Worth
Irwin Tift
Coffee
Bacon
Wayne
McIntosh
ThEeartlryade, transBpakoerrtation and utilities sector added 5,800
Pierce
jobs in June, increasing payrolls each month siBnecrreieAn prilA.tkinson
TranspoMriltlaertion, wareMhoitcuhseilnl g, anCdoluqutiilttitiesCogorkew by 3,000
Ware
Brantley
Glynn
jobs, while wholesale trade and retail trade each adLdaendier
Jun-23 Jul-23 Aug-23 Sep-23 Oct-23 Nov-23 Dec-23 Jan-24 Feb-24 Mar-24 Apr-24 May-24 Jun-24
1,40Se0miinoJleune. The private education and health services Clinch sector addDedeca4t,u0r00 joGbrasdyoveTrhtohmeams onBtrho,oktshe inLcorweandseeswas
concentrated in healthcare and social assistance with Echols 3,200 new positions and 800 additional jobs in private
Camden
ChGareltoorngia Unemployment Rate
(Seasonally Adjusted)
educational services. Over the month, employment
expansions in accommodation and food services of 900
positions, and 200 in arts, entertainment, and recreation
account for the growth in the leisure and hospitality sector.
3.2% 3.2% 3.2% 3.2% 3.2% 3.2% 3.2% 3.1% 3.1% 3.1% 3.1% 3.2% 3.3%
Professional and business services shed 1,200 jobs in
June as a result of a loss of 1,700 positions in adminis-
trative and support and waste management and reme-
diation services, along with an employment decline of
800 in management of companies and enterprises that
counteracted the addition of 1,300 positions in professional, scientific and technical services. Employment in
Jun-23 Jul-23 Aug-23 Sep-23 Oct-23 Nov-23 Dec-23 Jan-24 Feb-24 Mar-24 Apr-24 May-24 Jun-24
the other services sector declined by 600 in June, follow-
ing a loss of 200 jobs in May.
From June 2023 to June 2024, employment in Georgia is up 64,200, or 1.3 percent. Private education and health services (+25,500 jobs), government (+22,600 jobs), leisure and hospitality (+19,300 jobs), financial activities (+7,100 jobs), and manufacturing (+5,700 jobs) added the most jobs over the year.
Georgia's unemployment rate (seasonally adjusted) in June 2024 inched up to 3.3 percent over the month. The state's rate remains well below the 4.1 national average. Over the year, Georgia's rate is up from 3.2 percent in June 2023.
Bruce Thompson, Commissioner
Workforce Statistics Division For more information, contact
Corey Smith or Lindsey Adams at (404) 232-3875 Corey.Smith@gdol.ga.gov
Lindsey.Adams@gdol.ga.gov
Equal Opportunity Employer/ProgramAuxiliary Aids and Services Available upon Request to Individuals with Disabilities
GEORGIA Nonfarm Employment
(In thousands)
(Seasonally Adjusted)
Preliminary
Revised
JUN 2024 MAY 2024
Revised JUN 2023
Change in Jobs from MAY 2024
Net %
Change in Jobs from JUN 2023
Net %
Total Nonfarm
4,979.8
4,970.9
4,915.6
8.9 0.2
64.2 1.3
Total Private
4,264.1
4,256.1
4,222.5
8.0 0.2
41.6 1.0
Goods Producing
667.4
668.1
660.1
-0.7 -0.1
7.3 1.1
Service-Providing
4,312.4
4,302.8
4,255.5
9.6 0.2
56.9 1.3
Private Service-Providing
3,596.7
3,588.0
3,562.4
8.7 0.2
34.3 1.0
Mining and Logging
9.7
9.7
9.7
0.0 0.0
0.0 0.0
Mining, Logging and Construction
232.1
232.8
230.5
-0.7 -0.3
1.6 0.7
Construction
222.4
223.1
220.8
-0.7 -0.3
1.6 0.7
Manufacturing
435.3
435.3
429.6
0.0 0.0
5.7 1.3
Durable Goods
228.4
227.4
222.4
1.0 0.4
6.0 2.7
Non-Durable Goods
206.9
207.9
207.2
-1.0 -0.5
-0.3 -0.1
Trade, Transportation, and Utilities
1,043.2
1,037.4
1,049.8
5.8 0.6
-6.6 -0.6
Wholesale Trade
230.9
229.5
230.1
1.4 0.6
0.8 0.3
Retail Trade
519.7
518.3
519.1
1.4 0.3
0.6 0.1
Transportation, Warehousing, and Utilities
292.6
289.6
300.6
3.0 1.0
-8.0 -2.7
Information
110.2
110.6
119.7
-0.4 -0.4
-9.5 -7.9
Financial Activities
286.3
286.3
279.2
0.0 0.0
7.1 2.5
Finance and Insurance
205.4
206.2
200.0
-0.8 -0.4
5.4 2.7
Real Estate and Rental and Leasing
80.9
80.1
79.2
0.8 1.0
1.7 2.1
Professional and Business Services
775.6
776.8
778.4
-1.2 -0.2
-2.8 -0.4
Professional, Scientific, and Technical Services
344.1
342.8
335.1
1.3 0.4
9.0 2.7
Management of Companies and Enterprises
95.6
96.4
92.7
-0.8 -0.8
2.9 3.1
Admin and Support, Waste Mngmnt and Remediation
335.9
337.6
350.6
-1.7 -0.5
-14.7 -4.2
Private Education and Health Services
685.2
681.2
659.7
4.0 0.6
25.5 3.9
Private Educational Services
100.4
99.6
98.3
0.8 0.8
2.1 2.1
Health Care and Social Assistance
584.8
581.6
561.4
3.2 0.6
23.4 4.2
Leisure and Hospitality
528.1
527.0
508.8
1.1 0.2
19.3 3.8
Arts, Entertainment, and Recreation
65.9
65.7
60.5
0.2 0.3
5.4 8.9
Accommodation and Food Services
462.2
461.3
448.3
0.9 0.2
13.9 3.1
Other Services
168.1
168.7
166.8
-0.6 -0.4
1.3 0.8
Government
715.7
714.8
693.1
0.9 0.1
22.6 3.3
Federal Government
112.6
112.2
109.1
0.4 0.4
3.5 3.2
State Government
165.3
163.5
159.5
1.8 1.1
5.8 3.6
Local Government
437.8
439.1
424.5
-1.3 -0.3
13.3 3.1
?Note: These seasonally adjusted estimates were prepared in cooperation with the U.S. Department of Labor, Bureau of Labor Statistics, based upon monthly reports submitted by selected
employers throughout Georgia. The estimates include all full- and part-time wage and salary workers who were employed during or received pay for any part of the pay period that includes the twelfth of the month. Proprietors, domestic workers, self-employed persons, unpaid family workers and personnel of the armed forces are excluded. Estimates based on 2023 benchmark.
Source: Georgia Department of Labor, Workforce Statistics Division
Georgia Department of Labor, Bruce Thompson, Commissioner Equal Opportunity Employer/Program Auxiliary Aids and Services Available Upon Request to Individuals With Disabilities
2
GEORGIA Nonfarm Employment
(In thousands)
(Not Seasonally Adjusted)
Preliminary
Revised
Revised
JUN 2024 MAY 2024 JUN 2023
Change in Jobs from MAY 2024
Net %
Change in Jobs from JUN 2023
Net %
Total Nonfarm
4,980.4
4,963.5
4,903.7
16.9 0.3
76.7 1.6
Total Private
4,271.8
4,250.0
4,219.5
21.8 0.5
52.3 1.2
Goods Producing
669.8
666.6
663.5
3.2 0.5
6.3 1.0
Service-Providing
4,310.6
4,296.9
4,240.2
13.7 0.3
70.4 1.7
Private Service-Providing
3,602.0
3,583.4
3,556.0
18.6 0.5
46.0 1.3
Mining and Logging
9.8
9.7
9.7
0.1 1.0
0.1 1.0
Mining, Logging and Construction
233.4
233.4
232.8
0.0 0.0
0.6 0.3
Construction
223.6
223.7
223.1
-0.1 0.0
0.5 0.2
Construction of Buildings
52.1
51.9
50.7
0.2 0.4
1.4 2.8
Heavy and Civil Engineering Construction
32.0
31.9
34.5
0.1 0.3
-2.5 -7.3
Specialty Trade Contractors
139.5
139.9
137.9
-0.4 -0.3
1.6 1.2
Manufacturing
436.4
433.2
430.7
3.2 0.7
5.7 1.3
Durable Goods
228.8
226.1
223.3
2.7 1.2
5.5 2.5
Transportation Equipment Manufacturing
62.0
61.4
60.0
0.6 1.0
2.0 3.3
Non-Durable Goods
207.6
207.1
207.4
0.5 0.2
0.2 0.1
Food Manufacturing
71.6
71.3
70.2
0.3 0.4
1.4 2.0
Textile Mills
14.6
14.6
15.3
0.0 0.0
-0.7 -4.6
Textile Product Mills
25.0
25.0
26.0
0.0 0.0
-1.0 -3.9
Trade, Transportation, and Utilities
1,042.0
1,030.9
1,042.6
11.1 1.1
-0.6 -0.1
Wholesale Trade
230.5
227.8
230.1
2.7 1.2
0.4 0.2
Merchant Wholesalers, Durable Goods
123.8
122.3
122.5
1.5 1.2
1.3 1.1
Merchant Wholesalers, Nondurable Goods
66.1
65.2
65.6
0.9 1.4
0.5 0.8
Wholesale Trade Agents and Brokers
40.6
40.3
42.0
0.3 0.7
-1.4 -3.3
Retail Trade
521.4
517.1
515.8
4.3 0.8
5.6 1.1
Food and Beverage Retailers
103.1
101.3
101.2
1.8 1.8
1.9 1.9
General Merchandise Retailers
116.7
116.3
117.2
0.4 0.3
-0.5 -0.4
Sporting Goods, Hobby, Musical Instr, Book, & Misc Retailers
40.5
40.7
41.3
-0.2 -0.5
-0.8 -1.9
Transportation, Warehousing, and Utilities
290.1
286.0
296.7
4.1 1.4
-6.6 -2.2
Utilities
21.1
21.0
20.9
0.1 0.5
0.2 1.0
Transportation and Warehousing
269.0
265.0
275.8
4.0 1.5
-6.8 -2.5
Air Transportation
39.4
38.8
37.9
0.6 1.6
1.5 4.0
Truck Transportation
63.5
61.0
62.4
2.5 4.1
1.1 1.8
Couriers and Messengers
30.4
29.7
29.7
0.7 2.4
0.7 2.4
Warehousing and Storage
86.6
86.0
92.4
0.6 0.7
-5.8 -6.3
Information
110.3
110.3
118.8
0.0 0.0
-8.5 -7.2
Telecommunications
33.5
33.4
34.8
0.1 0.3
-1.3 -3.7
Wired and Wireless Telecommunications (expt Satellite)
26.2
26.1
27.2
0.1 0.4
-1.0 -3.7
Computing Infra Providers, Data Processing, Web, & Related Svcs
24.8
24.6
24.7
0.2 0.8
0.1 0.4
Financial Activities
285.5
284.6
279.4
0.9 0.3
6.1 2.2
Finance and Insurance
204.6
205.0
200.1
-0.4 -0.2
4.5 2.3
Insurance Carriers and Related Activities
106.6
106.3
102.4
0.3 0.3
4.2 4.1
Real Estate and Rental and Leasing
80.9
79.6
79.3
1.3 1.6
1.6 2.0
Professional and Business Services
772.4
776.0
770.0
-3.6 -0.5
2.4 0.3
Professional, Scientific, and Technical Services
343.7
342.0
334.0
1.7 0.5
9.7 2.9
Accounting, Tax Prep, and Bookkeeping Services
38.7
38.6
39.8
0.1 0.3
-1.1 -2.8
Architectural, Engineering, and Related Services
52.0
51.2
51.3
0.8 1.6
0.7 1.4
Computer Systems Design and Related Services
85.9
85.2
82.5
0.7 0.8
3.4 4.1
Management and Technical Consulting Services
62.5
62.8
59.8
-0.3 -0.5
2.7 4.5
Management of Companies and Enterprises
96.1
96.2
93.2
-0.1 -0.1
2.9 3.1
Admin and Support, Waste Mngmnt and Remediation
332.6
337.8
342.8
-5.2 -1.5
-10.2 -3.0
Employment Services
146.9
154.4
158.0
-7.5 -4.9
-11.1 -7.0
Private Education and Health Services
680.9
680.1
654.4
0.8 0.1
26.5 4.1
Private Educational Services
97.6
98.8
95.6
-1.2 -1.2
2.0 2.1
Private Colleges, Universities, and Professional Schools
42.5
43.8
43.4
-1.3 -3.0
-0.9 -2.1
Health Care and Social Assistance
583.3
581.3
558.8
2.0 0.3
24.5 4.4
Ambulatory Health Care Services
262.4
262.1
253.3
0.3 0.1
9.1 3.6
Hospitals
175.9
174.6
167.3
1.3 0.7
8.6 5.1
Nursing and Residential Care Facilities
62.1
61.1
58.4
1.0 1.6
3.7 6.3
Social Assistance
82.9
83.5
79.8
-0.6 -0.7
3.1 3.9
Leisure and Hospitality
539.9
530.7
521.6
9.2 1.7
18.3 3.5
Arts, Entertainment, and Recreation
72.5
67.6
67.4
4.9 7.3
5.1 7.6
Amusement, Gambling, and Recreation Industries
55.2
51.0
50.5
4.2 8.2
4.7 9.3
Accommodation and Food Services
467.4
463.1
454.2
4.3 0.9
13.2 2.9
Accommodation
45.3
44.2
47.3
1.1 2.5
-2.0 -4.2
Food Services and Drinking Places
422.1
418.9
406.9
3.2 0.8
15.2 3.7
Other Services
171.0
170.8
169.2
0.2 0.1
1.8 1.1
Repair and Maintenance
45.6
45.5
46.4
0.1 0.2
-0.8 -1.7
Personal and Laundry Services
43.1
42.6
41.9
0.5 1.2
1.2 2.9
Religious, Grantmaking, Civic, Professional, and Similar
82.3
82.7
80.9
-0.4 -0.5
1.4 1.7
Government
708.6
713.5
684.2
-4.9 -0.7
24.4 3.6
Federal Government
111.7
111.5
108.9
0.2 0.2
2.8 2.6
Department of Defense
46.8
47.0
44.8
-0.2 -0.4
2.0 4.5
State Government
160.5
162.1
152.3
-1.6 -1.0
8.2 5.4
State Government Educational Services
92.2
95.0
87.4
-2.8 -3.0
4.8 5.5
State Government excluding Educational Services
68.3
67.1
64.9
1.2 1.8
3.4 5.2
Local Government
436.4
439.9
423.0
-3.5 -0.8
13.4 3.2
Local Government Educational Services
247.8
255.0
244.5
-7.2 -2.8
3.3 1.4
Local Government excluding Educational Services
188.6
184.9
178.5
3.7 2.0
10.1 5.7
?Note: These not seasonally adjusted estimates were prepared in cooperation with the U.S. Department of Labor, Bureau of Labor Statistics, based upon monthly reports submitted by selected
employers throughout Georgia. The estimates include all full- and part-time wage and salary workers who were employed during or received pay for any part of the pay period that includes the
twelfth of the month. Proprietors, domestic workers, self-employed persons, unpaid family workers and personnel of the armed forces are excluded. Estimates based on 2023 benchmark.
Source: Georgia Department of Labor, Workforce Statistics Division
3
ALBANY MSA Nonfarm Employment
(Not Seasonally Adjusted)
(In thousands)
Preliminary
Revised
Revised
JUN 2024 MAY 2024 JUN 2023
Change in Jobs from MAY 2024
Net %
Change in Jobs from JUN 2023
Net %
Total Nonfarm Total Private Goods Producing
63.4
63.1
61.7
51.5
51.2
50.0
7.1
7.1
7.1
0.3 0.5 0.3 0.6 0.0 0.0
1.7 2.8 1.5 3.0 0.0 0.0
Service-Providing Private Service-Providing Trade, Transportation, and Utilities
56.3
56.0
54.6
44.4
44.1
42.9
13.9
13.6
13.4
0.3 0.5 0.3 0.7 0.3 2.2
1.7 3.1 1.5 3.5 0.5 3.7
Retail Trade Government
Federal Government
7.7
7.5
7.5
0.2 2.7
11.9
11.9
11.7
0.0 0.0
2.2
2.3
2.3
-0.1 -4.4
0.2 2.7 0.2 1.7 -0.1 -4.4
State Government Local Government
2.9
2.9
2.5
0.0 0.0
6.8
6.7
6.9
0.1 1.5
0.4 16.0 -0.1 -1.5
?Note: These not seasonally adjusted estimates were prepared in cooperation with the U.S. Department of Labor, Bureau of Labor Statistics, based upon monthly reports submitted by
selected employers in the Albany Metropolitan Statistical Area, which includes Baker, Dougherty, Lee, Terrell and Worth counties. The estimates include all full- and part-time wage and salary workers who were employed during or received pay for any part of the pay period that includes the twelfth of the month. Proprietors, domestic workers, self-employed persons, unpaid familyworkers and personnel of the armed forces are excluded. Estimates based on 2023 benchmark.
Source: Georgia Department of Labor, Workforce Statistics Division
ATHENS-CLARKE COUNTY MSA Nonfarm Employment
(In thousands)
(Not Seasonally Adjusted)
Preliminary
Revised
Revised
JUN 2024 MAY 2024 JUN 2023
Change in Jobs from MAY 2024
Net %
Change in Jobs from JUN 2023
Net %
Total Nonfarm
104.0
104.3
98.7
-0.3 -0.3
5.3 5.4
Total Private Goods Producing Service-Providing
74.7
74.9
71.7
-0.2 -0.3
11.1
11.1
10.9
0.0 0.0
92.9
93.2
87.8
-0.3 -0.3
3.0 4.2 0.2 1.8 5.1 5.8
Private Service-Providing Trade, Transportation, and Utilities
Retail Trade
63.6
63.8
60.8
-0.2 -0.3
17.1
17.1
16.9
0.0 0.0
11.1
11.1
11.2
0.0 0.0
2.8 4.6 0.2 1.2 -0.1 -0.9
Professional and Business Services Leisure and Hospitality Government
9.9
10.0
8.9
-0.1 -1.0
12.1
12.3
11.3
-0.2 -1.6
29.3
29.4
27.0
-0.1 -0.3
1.0 11.2 0.8 7.1 2.3 8.5
Federal Government State Government Local Government
1.1
1.1
1.1
0.0 0.0
19.7
19.8
18.0
-0.1 -0.5
8.5
8.5
7.9
0.0 0.0
0.0 0.0 1.7 9.4 0.6 7.6
?Note: These not seasonally adjusted estimates were prepared in cooperation with the U.S. Department of Labor, Bureau of Labor Statistics, based upon monthly reports submitted by selected
employers in the Athens-Clarke County Metropolitan Statistical Area, which includes Clarke, Madison, Oconee and Oglethorpe counties. The estimates include all full- and part-time wage and salary workers who were employed during or received pay for any part of the pay period that includes the twelfth of the month. Proprietors, domestic workers, self-employed persons, unpaid family workers and personnel of the armed forces are excluded. Estimates based on 2023 benchmark.
Source: Georgia Department of Labor, Workforce Statistics Division
4
ATLANTA MSA Nonfarm Employment
(In thousands)
(Not Seasonally Adjusted)
Preliminary
Revised
JUN 2024 MAY 2024
Change in Jobs Revised from MAY 2024 JUN 2023 Net %Change
in Jobs from JUN 2023
Net %
Total Nonfarm
3,097.5
3,083.3
3,060.5
14.2 0.5
37.0 1.2
Total Private
2,741.8
2,723.8
2,718.9
18.0 0.7
22.9 0.8
Goods Producing
332.6
331.9
329.1
0.7 0.2
3.5 1.1
Service-Providing
2,764.9
2,751.4
2,731.4
13.5 0.5
33.5 1.2
Private Service-Providing
2,409.2
2,391.9
2,389.8
17.3 0.7
19.4 0.8
Mining and Logging
2.1
2.1
2.0
0.0 0.0
0.1 5.0
Mining, Logging and Construction
149.1
149.5
146.6
-0.4 -0.3
2.5 1.7
Construction
147.0
147.4
144.6
-0.4 -0.3
2.4 1.7
Construction of Buildings
34.4
34.2
33.3
0.2 0.6
1.1 3.3
Specialty Trade Contractors
91.5
92.0
90.3
-0.5 -0.5
1.2 1.3
Manufacturing
183.5
182.4
182.5
1.1 0.6
1.0 0.6
Durable Goods
98.7
97.9
98.7
0.8 0.8
0.0 0.0
Transportation Equipment Manufacturing
18.0
17.9
17.6
0.1 0.6
0.4 2.3
Non-Durable Goods
84.8
84.5
83.8
0.3 0.4
1.0 1.2
Food Manufacturing
24.3
24.3
24.0
0.0 0.0
0.3 1.3
Trade, Transportation, and Utilities
659.7
654.7
665.1
5.0 0.8
-5.4 -0.8
Wholesale Trade
159.9
157.9
163.2
2.0 1.3
-3.3 -2.0
Merchant Wholesalers, Durable Goods
88.6
87.5
89.4
1.1 1.3
-0.8 -0.9
Merchant Wholesalers, Nondurable Goods
40.6
40.0
41.4
0.6 1.5
-0.8 -1.9
Wholesale Trade Agents and Brokers
30.7
30.4
32.4
0.3 1.0
-1.7 -5.3
Retail Trade
302.8
301.9
300.3
0.9 0.3
2.5 0.8
Food and Beverage Retailers
63.7
63.0
62.7
0.7 1.1
1.0 1.6
General Merchandise Retailers
62.8
62.5
63.2
0.3 0.5
-0.4 -0.6
Sporting Goods, Hobby, Musical Instr, Book, & Misc Retailers
26.6
26.4
27.0
0.2 0.8
-0.4 -1.5
Transportation, Warehousing, and Utilities
197.0
194.9
201.6
2.1 1.1
-4.6 -2.3
Utilities
11.1
11.0
10.8
0.1 0.9
0.3 2.8
Transportation and Warehousing
185.9
183.9
190.8
2.0 1.1
-4.9 -2.6
Air Transportation
38.8
38.2
37.2
0.6 1.6
1.6 4.3
Truck Transportation
38.8
37.3
38.5
1.5 4.0
0.3 0.8
Couriers and Messengers
22.2
21.8
22.2
0.4 1.8
0.0 0.0
Information
96.9
97.4
105.9
-0.5 -0.5
-9.0 -8.5
Telecommunications
27.8
27.7
29.0
0.1 0.4
-1.2 -4.1
Wired and Wireless Telecommunications (expt Satellite)
20.7
20.6
21.7
0.1 0.5
-1.0 -4.6
Computing Infra Providers, Data Processing, Web, & Related Svcs
24.0
23.8
23.9
0.2 0.8
0.1 0.4
Financial Activities
209.5
208.1
204.5
1.4 0.7
5.0 2.4
Finance and Insurance
150.6
150.2
146.9
0.4 0.3
3.7 2.5
Insurance Carriers and Related Activities
79.3
79.2
76.0
0.1 0.1
3.3 4.3
Real Estate and Rental and Leasing
58.9
57.9
57.6
1.0 1.7
1.3 2.3
Professional and Business Services
583.5
582.7
587.8
0.8 0.1
-4.3 -0.7
Professional, Scientific, and Technical Services
275.3
273.8
271.9
1.5 0.6
3.4 1.3
Accounting, Tax Prep, and Bookkeeping Services
28.6
28.4
30.5
0.2 0.7
-1.9 -6.2
Architectural, Engineering, and Related Services
39.4
39.0
38.8
0.4 1.0
0.6 1.6
Computer Systems Design and Related Services
74.9
74.2
72.0
0.7 0.9
2.9 4.0
Management and Technical Consulting Services
52.4
52.1
54.8
0.3 0.6
-2.4 -4.4
Management of Companies and Enterprises
81.9
81.9
80.3
0.0 0.0
1.6 2.0
Admin and Support, Waste Mngmnt and Remediation
226.3
227.0
235.6
-0.7 -0.3
-9.3 -4.0
Employment Services
101.8
103.0
110.6
-1.2 -1.2
-8.8 -8.0
Private Education and Health Services
420.7
419.7
405.6
1.0 0.2
15.1 3.7
Private Educational Services
68.1
69.3
70.0
-1.2 -1.7
-1.9 -2.7
Health Care and Social Assistance
352.6
350.4
335.6
2.2 0.6
17.0 5.1
Ambulatory Health Care Services
170.5
169.9
162.4
0.6 0.4
8.1 5.0
Hospitals
98.5
97.7
94.1
0.8 0.8
4.4 4.7
Social Assistance
52.6
53.1
49.8
-0.5 -0.9
2.8 5.6
Leisure and Hospitality
331.8
322.3
315.9
9.5 3.0
15.9 5.0
Arts, Entertainment, and Recreation
50.1
46.5
47.9
3.6 7.7
2.2 4.6
Accommodation and Food Services
281.7
275.8
268.0
5.9 2.1
13.7 5.1
Accommodation
22.6
22.2
23.5
0.4 1.8
-0.9 -3.8
Food Services and Drinking Places
259.1
253.6
244.5
5.5 2.2
14.6 6.0
Other Services
107.1
107.0
105.0
0.1 0.1
2.1 2.0
Repair and Maintenance
26.2
26.1
26.9
0.1 0.4
-0.7 -2.6
Personal and Laundry Services
30.5
30.1
29.1
0.4 1.3
1.4 4.8
Government
355.7
359.5
341.6
-3.8 -1.1
14.1 4.1
Federal Government
55.7
55.5
53.4
0.2 0.4
2.3 4.3
State Government
73.5
74.9
70.9
-1.4 -1.9
2.6 3.7
Local Government
226.5
229.1
217.3
-2.6 -1.1
9.2 4.2
?Note: These not seasonally adjusted estimates were prepared in cooperation with the U.S. Department of Labor, Bureau of Labor Statistics, based upon monthly reports submitted by
selected employers in the Atlanta Metropolitan Statistical Area, which includes Barrow, Bartow, Butts, Carroll, Cherokee, Clayton, Cobb, Coweta, Dawson, DeKalb, Douglas, Fayette, Forsyth,
Fulton, Gwinnett, Haralson, Heard, Henry, Jasper, Lamar, Meriwether, Morgan, Newton, Paulding, Pickens, Pike, Rockdale, Spalding and Walton counties. The estimates include all full- and
part-time wage and salary workers who were employed during or received pay for any part of the pay period that includes the twelfth of the month. Proprietors, domestic workers, self-employed
persons, unpaid family workers and personnel of the armed forces are excluded. Estimates based on 2023 benchmark.
Source: Georgia Department of Labor, Workforce Statistics Division
5
AUGUSTA-RICHMOND COUNTY MSA Nonfarm Employment
(In thousands)
(Not Seasonally Adjusted)
Preliminary Revised JUN 2024 MAY 2024
Revised JUN 2023
Change in Jobs
from MAY 2024
Net
%
Change in Jobs from JUN 2023
Net %
Total Nonfarm Total Private Goods Producing Service-Providing Private Service-Providing Mining, Logging and Construction Manufacturing Trade, Transportation, and Utilities
Wholesale Trade Retail Trade Transportation, Warehousing, and Utilities Information Financial Activities Professional and Business Services Private Education and Health Services Leisure and Hospitality Other Services Government Federal Government State Government Local Government
247.2 202.2
39.2 208.0 163.0
14.3 24.9 41.5
5.4 27.0
9.1 2.0 7.5 35.7 39.6 26.9 9.8 45.0 10.1 13.0 21.9
247.5 202.2
39.0 208.5 163.2
14.2 24.8 41.4
5.3 27.1
9.0 2.0 7.5 36.1 39.4 27.0 9.8 45.3 10.2 13.1 22.0
244.2 200.9
40.4 203.8 160.5
15.9 24.5 41.4
5.3 27.2
8.9 2.0 7.3 35.0 37.7 27.5 9.6 43.3 9.9 12.1 21.3
-0.3 -0.1 0.0 0.0 0.2 0.5 -0.5 -0.2 -0.2 -0.1 0.1 0.7 0.1 0.4 0.1 0.2 0.1 1.9 -0.1 -0.4 0.1 1.1 0.0 0.0 0.0 0.0 -0.4 -1.1 0.2 0.5 -0.1 -0.4 0.0 0.0 -0.3 -0.7 -0.1 -1.0 -0.1 -0.8 -0.1 -0.5
3.0 1.2 1.3 0.7 -1.2 -3.0 4.2 2.1 2.5 1.6 -1.6 -10.1 0.4 1.6 0.1 0.2 0.1 1.9 -0.2 -0.7 0.2 2.3 0.0 0.0 0.2 2.7 0.7 2.0 1.9 5.0 -0.6 -2.2 0.2 2.1 1.7 3.9 0.2 2.0 0.9 7.4 0.6 2.8
?Note: These not seasonally adjusted estimates were prepared in cooperation with the U.S. Department of Labor, Bureau of Labor Statistics, based upon monthly reports submitted by se-
lected employers in the Septembera-Richmond County Metropolitan Statistical Area, which includes Burke, Columbia, Lincoln, McDuffie and Richmond counties in Georgia and Aiken and Edgefield counties in South Carolina. The estimates include all full- and part-time wage and salary workers who were employed during or received pay for any part of the pay period that includes the twelfth of the month. Proprietors, domestic workers, self-employed persons, unpaid family workers and personnel of the armed forces are excluded. Estimates based on 2023 benchmark.
BRUNSWICK MSA Nonfarm Employment
(In thousands)
(Not Seasonally Adjusted)
Preliminary
Revised
Revised
JUN 2024 MAY 2024 JUN 2023
Change in Jobs from MAY 2024
Net %
Change in Jobs from JUN 2023
Net %
Total Nonfarm Total Private Goods Producing Service-Providing Private Service-Providing Trade, Transportation, and Utilities
Retail Trade Government
Federal Government State Government Local Government
49.2
49.1
48.6
0.1 0.2
40.0
39.7
40.0
0.3 0.8
4.5
4.5
4.6
0.0 0.0
44.7
44.6
44.0
0.1 0.2
35.5
35.2
35.4
0.3 0.9
9.3
9.2
9.3
0.1 1.1
5.7
5.7
5.7
0.0 0.0
9.2
9.4
8.6
-0.2 -2.1
2.1
2.2
2.1
-0.1 -4.6
2.1
2.0
1.6
0.1 5.0
5.0
5.2
4.9
-0.2 -3.9
0.6 1.2 0.0 0.0 -0.1 -2.2 0.7 1.6 0.1 0.3 0.0 0.0 0.0 0.0 0.6 7.0 0.0 0.0 0.5 31.3 0.1 2.0
?Note: These not seasonally adjusted estimates were prepared in cooperation with the U.S. Department of Labor, Bureau of Labor Statistics, based upon monthly reports submitted by
selected employers in the Brunswick Metropolitan Statistical Area, which includes Brantley, Glynn and McIntosh counties. The estimates include all full- and part-time wage and salary workers who were employed during or received pay for any part of the pay period that includes the twelfth of the month. Proprietors, domestic workers, self-employed persons, unpaid family workers and personnel of the armed forces are excluded. Estimates based on 2023 benchmark.
Source: Georgia Department of Labor, Workforce Statistics Division
6
COLUMBUS MSA Nonfarm Employment
(In thousands)
(Not Seasonally Adjusted)
Preliminary
Revised
Revised
JUN 2024 MAY 2024 JUN 2023
Change in Jobs from MAY 2024
Net %
Change in Jobs from JUN 2023
Net %
Total Nonfarm Total Private Goods Producing Service-Providing Private Service-Providing Mining, Logging and Construction Manufacturing Trade, Transportation, and Utilities
Wholesale Trade Retail Trade Transportation, Warehousing, and Utilities Information Financial Activities Finance and Insurance
Insurance Carriers and Related Activities Professional and Business Services Private Education and Health Services Leisure and Hospitality Other Services Government
Federal Government State Government Local Government
124.5 101.2
16.5 108.0
84.7 5.1 11.4
18.9 2.9
13.0 3.0 1.2
10.7 8.8 4.3
15.9 17.8 15.7
4.5 23.3
6.7 3.8 12.8
123.7 100.5
16.3 107.4
84.2 5.0 11.3
18.7 2.8
13.0 2.9 1.1
10.7 8.8 4.3
16.0 17.7 15.5
4.5 23.2
6.5 3.8 12.9
121.7 99.1 16.0
105.7 83.1 5.0 11.0 19.0 2.9 13.1 3.0 1.2 10.5 8.4 4.0 16.2 16.6 15.1 4.5 22.6 6.5 3.5 12.6
0.8 0.7 0.7 0.7 0.2 1.2 0.6 0.6 0.5 0.6 0.1 2.0 0.1 0.9 0.2 1.1 0.1 3.6 0.0 0.0 0.1 3.5 0.1 9.1 0.0 0.0 0.0 0.0 0.0 0.0 -0.1 -0.6 0.1 0.6 0.2 1.3 0.0 0.0 0.1 0.4 0.2 3.1 0.0 0.0 -0.1 -0.8
2.8 2.3 2.1 2.1 0.5 3.1 2.3 2.2 1.6 1.9 0.1 2.0 0.4 3.6 -0.1 -0.5 0.0 0.0 -0.1 -0.8 0.0 0.0 0.0 0.0 0.2 1.9 0.4 4.8 0.3 7.5 -0.3 -1.9 1.2 7.2 0.6 4.0 0.0 0.0 0.7 3.1 0.2 3.1 0.3 8.6 0.2 1.6
?Note: These not seasonally adjusted estimates were prepared in cooperation with the U.S. Department of Labor, Bureau of Labor Statistics, based upon monthly reports submitted by
selected employers in the Columbus Metropolitan Statistical Area, which includes Chattahoochee, Harris, Marion and Muscogee counties in Georgia and Russell County in Alabama. The estimates include all full- and part-time wage and salary workers who were employed during or received pay for any part of the pay period that includes the twelfth of the month. Proprietors, domestic workers, self-employed persons, unpaid family workers and personnel of the armed forces are excluded. Estimates based on 2023 benchmark.
DALTON MSA Nonfarm Employment
(In thousands)
(Not Seasonally Adjusted)
Preliminary
Revised Revised
JUN 2024 MAY 2024 JUN 2023
Change in Jobs from MAY 2024
Net %
Change in Jobs from JUN 2023
Net %
Total Nonfarm Total Private Goods Producing
69.0
69.1
68.0
-0.1 -0.1
61.9
62.0
61.1
-0.1 -0.2
22.9
22.9
23.7
0.0 0.0
1.0 1.5 0.8 1.3 -0.8 -3.4
Service-Providing Private Service-Providing Manufacturing
46.1
46.2
44.3
-0.1 -0.2
39.0
39.1
37.4
-0.1 -0.3
21.7
21.7
22.2
0.0 0.0
1.8 4.1 1.6 4.3 -0.5 -2.3
Textile Mills Textile Product Mills Trade, Transportation, and Utilities
3.9
3.9
3.8
12.3
12.3
12.7
14.3
14.2
14.0
0.0 0.0 0.0 0.0 0.1 0.7
0.1 2.6 -0.4 -3.2 0.3 2.1
Retail Trade Transportation, Warehousing, and Utilities Professional and Business Services
6.7
6.8
6.6
-0.1 -1.5
3.7
3.7
3.6
0.0 0.0
9.2
9.3
8.3
-0.1 -1.1
0.1 1.5 0.1 2.8 0.9 10.8
Government Federal Government State Government
7.1
7.1
6.9
0.0 0.0
0.3
0.3
0.3
0.0 0.0
1.0
0.9
0.9
0.1 11.1
0.2 2.9 0.0 0.0 0.1 11.1
Local Government
5.8
5.9
5.7
-0.1 -1.7
0.1 1.8
?Note: These not seasonally adjusted estimates were prepared in cooperation with the U.S. Department of Labor, Bureau of Labor Statistics, based upon monthly reports submitted by
selected employers in the Dalton Metropolitan Statistical Area, which includes Murray and Whitfield counties. The estimates include all full- and part-time wage and salary workers who were employed during or received pay for any part of the pay period that includes the twelfth of the month. Proprietors, domestic workers, self-employed persons, unpaid family workers and personnel of the armed forces are excluded. Estimates based on 2023 benchmark.
Source: Georgia Department of Labor, Workforce Statistics Division
7
GAINESVILLE MSA Nonfarm Employment
(In thousands)
(Not Seasonally Adjusted)
Preliminary
Revised
Revised
JUN 2024 MAY 2024 JUN 2023
Change in Jobs from MAY 2024
Net %
Change in Jobs from JUN 2023
Net %
Total Nonfarm
110.7
111.2
107.0
-0.5 -0.5
3.7 3.5
Total Private
99.1
99.5
95.9
-0.4 -0.4
3.2 3.3
Goods Producing
31.1
31.5
29.8
-0.4 -1.3
1.3 4.4
Service-Providing
79.6
79.7
77.2
-0.1 -0.1
2.4 3.1
Private Service-Providing
68.0
68.0
66.1
0.0 0.0
1.9 2.9
Trade, Transportation, and Utilities
21.2
21.1
20.4
0.1 0.5
0.8 3.9
Retail Trade
10.1
9.9
9.6
0.2 2.0
0.5 5.2
Government
11.6
11.7
11.1
-0.1 -0.9
0.5 4.5
Federal Government
0.5
0.5
0.5
0.0 0.0
0.0 0.0
State Government
2.9
3.0
2.7
-0.1 -3.3
0.2 7.4
Local Government
8.2
8.2
7.9
0.0 0.0
0.3 3.8
?Note: These not seasonally adjusted estimates were prepared in cooperation with the U.S. Department of Labor, Bureau of Labor Statistics, based upon monthly reports submitted by se-
lected employers in the Gainesville Metropolitan Statistical Area, which comprises Hall county. The estimates include all full- and part-time wage and salary workers who were employed during or received pay for any part of the pay period that includes the twelfth of the month. Proprietors, domestic workers, self-employed persons, unpaid family workers and personnel of the armed forces are excluded. Estimates based on 2023 benchmark.
HINESVILLE MSA Nonfarm Employment
(In thousands)
(Not Seasonally Adjusted)
Preliminary Revised Revised JUN 2024 MAY 2024 JUN 2023
Change in Jobs from MAY 2024
Net %
Change in Jobs from JUN 2023
Net %
Total Nonfarm Total Private
22.2
22.3
22.0
-0.1 -0.5
14.3
14.3
14.2
0.0 0.0
0.2 0.9 0.1 0.7
Goods Producing Service-Providing Private Service-Providing
2.8
2.8
2.8
0.0 0.0
19.4
19.5
19.2
-0.1 -0.5
11.5
11.5
11.4
0.0 0.0
0.0 0.0 0.2 1.0 0.1 0.9
Government Federal Government State Government
7.9
8.0
7.8
-0.1 -1.3
3.8
3.8
3.8
0.0 0.0
0.4
0.4
0.4
0.0 0.0
0.1 1.3 0.0 0.0 0.0 0.0
Local Government
3.7
3.8
3.6
-0.1 -2.6
0.1 2.8
?Note: These not seasonally adjusted estimates were prepared in cooperation with the U.S. Department of Labor, Bureau of Labor Statistics, based upon monthly reports submitted by
selected employers in the Hinesville Metropolitan Statistical Area, which includes Liberty and Long counties. The estimates include all full- and part-time wage and salary workers who were employed during or received pay for any part of the pay period that includes the twelfth of the month. Proprietors, domestic workers, self-employed persons, unpaid family workers and personnel of the armed forces are excluded. Estimates based on 2023 benchmark.
Source: Georgia Department of Labor, Workforce Statistics Division
8
MACON-BIBB COUNTY MSA Nonfarm Employment
(In thousands)
(Not Seasonally Adjusted)
Preliminary
Revised
Revised
JUN 2024 MAY 2024 JUN 2023
Change in Jobs from MAY 2024
Net %
Change in Jobs from JUN 2023
Net %
Total Nonfarm
102.0
101.5
100.1
0.5 0.5
1.9 1.9
Total Private
87.5
87.1
86.2
0.4 0.5
1.3 1.5
Goods Producing
11.5
11.4
11.1
0.1 0.9
0.4 3.6
Service-Providing
90.5
90.1
89.0
0.4 0.4
1.5 1.7
Private Service-Providing
76.0
75.7
75.1
0.3 0.4
0.9 1.2
Trade, Transportation, and Utilities
20.3
20.0
20.0
0.3 1.5
0.3 1.5
Retail Trade
12.7
12.6
12.2
0.1 0.8
0.5 4.1
Transportation, Warehousing, and Utilities
4.6
4.5
4.8
0.1 2.2
-0.2 -4.2
Financial Activities
8.0
8.0
8.2
0.0 0.0
-0.2 -2.4
Professional and Business Services
11.2
11.3
11.9
-0.1 -0.9
-0.7 -5.9
Private Education and Health Services
22.5
22.4
20.8
0.1 0.5
1.7 8.2
Leisure and Hospitality
10.5
10.5
10.3
0.0 0.0
0.2 1.9
Government
14.5
14.4
13.9
0.1 0.7
0.6 4.3
Federal Government
1.0
1.0
1.1
0.0 0.0
-0.1 -9.1
State Government
4.1
4.1
3.8
0.0 0.0
0.3 7.9
Local Government
9.4
9.3
9.0
0.1 1.1
0.4 4.4
?Note: These not seasonally adjusted estimates were prepared in cooperation with the U.S. Department of Labor, Bureau of Labor Statistics, based upon monthly reports submitted by
selected employers in the Macon-Bibb County Metropolitan Statistical Area, which includes Bibb, Crawford, Jones, Monroe and Twiggs counties. The estimates include all full- and part-time wage and salary workers who were employed during or received pay for any part of the pay period that includes the twelfth of the month. Proprietors, domestic workers, self-employed persons, unpaid family workers and personnel of the armed forces are excluded. Estimates based on 2023 benchmark.
ROME MSA Nonfarm Employment
(In thousands)
(Not Seasonally Adjusted)
Preliminary
Revised
Revised
JUN 2024 MAY 2024 JUN 2023
Change in Jobs from MAY 2024
Net %
Change in Jobs from JUN 2023
Net %
Total Nonfarm Total Private
47.6
47.6
43.3
42.1
42.1
37.7
0.0 0.0 0.0 0.0
4.3 9.9 4.4 11.7
Goods Producing Service-Providing Private Service-Providing
7.4
7.4
7.5
40.2
40.2
35.8
34.7
34.7
30.2
0.0 0.0 0.0 0.0 0.0 0.0
-0.1 -1.3 4.4 12.3 4.5 14.9
Manufacturing Trade, Transportation, and Utilities
Retail Trade
6.5
6.4
6.5
0.1 1.6
7.5
7.4
7.5
0.1 1.4
4.5
4.5
4.6
0.0 0.0
0.0 0.0 0.0 0.0 -0.1 -2.2
Private Education and Health Services Government
Federal Government
10.8
10.7
10.4
5.5
5.5
5.6
0.2
0.2
0.2
0.1 0.9 0.0 0.0 0.0 0.0
0.4 3.9 -0.1 -1.8 0.0 0.0
State Government Local Government
1.4
1.4
1.4
0.0 0.0
3.9
3.9
4.0
0.0 0.0
0.0 0.0 -0.1 -2.5
?Note: These not seasonally adjusted estimates were prepared in cooperation with the U.S. Department of Labor, Bureau of Labor Statistics, based upon monthly reports submitted by
selected employers in the Rome Metropolitan Statistical Area, which comprises Floyd county. The estimates include all full- and part-time wage and salary workers who were employed during or received pay for any part of the pay period that includes the twelfth of the month. Proprietors, domestic workers, self-employed persons, unpaid family workers and personnel of the armed forces are excluded. Estimates based on 2023 benchmark.
Source: Georgia Department of Labor, Workforce Statistics Division
9
SAVANNAH MSA Nonfarm Employment
(In thousands)
(Not Seasonally Adjusted)
Preliminary Revised
Revised
JUN 2024 MAY 2024 JUN 2023
Change in Jobs from MAY 2024
Net %
Change in Jobs from JUN 2023
Net %
Total Nonfarm
208.2
207.4
204.1
0.8 0.4
4.1 2.0
Total Private
183.3
182.5
180.2
0.8 0.4
3.1 1.7
Goods Producing
33.3
33.1
32.2
0.2 0.6
1.1 3.4
Service-Providing
174.9
174.3
171.9
0.6 0.3
3.0 1.8
Private Service-Providing
150.0
149.4
148.0
0.6 0.4
2.0 1.4
Mining, Logging and Construction
10.7
10.6
10.2
0.1 0.9
0.5 4.9
Manufacturing
22.6
22.5
22.0
0.1 0.4
0.6 2.7
Trade, Transportation, and Utilities
50.3
49.8
49.7
0.5 1.0
0.6 1.2
Wholesale Trade
7.9
7.9
7.9
0.0 0.0
0.0 0.0
Retail Trade
23.4
23.2
23.3
0.2 0.9
0.1 0.4
Transportation, Warehousing, and Utilities
19.0
18.7
18.5
0.3 1.6
0.5 2.7
Information
1.4
1.4
1.3
0.0 0.0
0.1 7.7
Financial Activities
7.7
7.7
7.5
0.0 0.0
0.2 2.7
Professional and Business Services
24.3
24.7
24.4
-0.4 -1.6
-0.1 -0.4
Private Education and Health Services
29.5
29.3
28.4
0.2 0.7
1.1 3.9
Leisure and Hospitality
28.3
28.1
28.2
0.2 0.7
0.1 0.4
Other Services
8.5
8.4
8.5
0.1 1.2
0.0 0.0
Government
24.9
24.9
23.9
0.0 0.0
1.0 4.2
Federal Government
2.9
3.0
2.9
-0.1 -3.3
0.0 0.0
State Government
5.4
5.3
4.9
0.1 1.9
0.5 10.2
Local Government
16.6
16.6
16.1
0.0 0.0
0.5 3.1
?Note: These not seasonally adjusted estimates were prepared in cooperation with the U.S. Department of Labor, Bureau of Labor Statistics, based upon monthly reports submitted by
selected employers in the Savannah Metropolitan Statistical Area, which includes Bryan, Chatham and Effingham counties. The estimates include all full- and part-time wage and salary workers who were employed during or received pay for any part of the pay period that includes the twelfth of the month. Proprietors, domestic workers, self-employed persons, unpaid family workers and personnel of the armed forces are excluded. Estimates based on 2023 benchmark.
VALDOSTA MSA Nonfarm Employment
(In thousands)
(Not Seasonally Adjusted)
Preliminary Revised
Revised
JUN 2024 MAY 2024 JUN 2023
Change in Jobs from MAY 2024
Net %
Change in Jobs from JUN 2023
Net %
Total Nonfarm Total Private Goods Producing
56.7
56.3
56.6
44.3
44.1
44.5
8.1
8.1
8.0
0.4 0.7 0.2 0.5 0.0 0.0
0.1 0.2 -0.2 -0.5 0.1 1.3
Service-Providing Private Service-Providing
48.6
48.2
48.6
36.2
36.0
36.5
0.4 0.8 0.2 0.6
0.0 0.0 -0.3 -0.8
Trade, Transportation, and Utilities
12.9
12.7
12.9
0.2 1.6
0.0 0.0
Retail Trade Government
7.1
7.1
7.1
12.4
12.2
12.1
0.0 0.0 0.2 1.6
0.0 0.0 0.3 2.5
Federal Government
1.1
1.1
1.1
0.0 0.0
0.0 0.0
State Government Local Government
3.1
3.3
2.8
-0.2 -6.1
8.2
7.8
8.2
0.4 5.1
0.3 10.7 0.0 0.0
?Note: These not seasonally adjusted estimates were prepared in cooperation with the U.S. Department of Labor, Bureau of Labor Statistics, based upon monthly reports submitted by
selected employers in the Valdosta Metropolitan Statistical Area, which includes Brooks, Echols, Lanier and Lowndes counties. The estimates include all full- and part-time wage and salary workers who were employed during or received pay for any part of the pay period that includes the twelfth of the month. Proprietors, domestic workers, self-employed persons, unpaid family workers and personnel of the armed forces are excluded. Estimates based on 2023 benchmark.
Source: Georgia Department of Labor, Workforce Statistics Division
10
WARNER ROBINS MSA Nonfarm Employment
(In thousands)
(Not Seasonally Adjusted)
Preliminary Revised
Revised
JUN 2024 MAY 2024 JUN 2023
Change in Jobs from MAY 2024
Net %
Change in Jobs from JUN 2023
Net %
Total Nonfarm Total Private Goods Producing Service-Providing Private Service-Providing Trade, Transportation, and Utilities
Retail Trade Government
Federal Government State Government Local Government
82.0
82.0
81.4
0.0 0.0
54.6
54.4
53.5
0.2 0.4
11.5
11.5
11.2
0.0 0.0
70.5
70.5
70.2
0.0 0.0
43.1
42.9
42.3
0.2 0.5
12.5
12.3
12.7
0.2 1.6
9.8
9.8
9.9
0.0 0.0
27.4
27.6
27.9
-0.2 -0.7
15.3
15.3
15.6
0.0 0.0
2.3
2.3
2.1
0.0 0.0
9.8
10.0
10.2
-0.2 -2.0
0.6 0.7 1.1 2.1 0.3 2.7 0.3 0.4 0.8 1.9 -0.2 -1.6 -0.1 -1.0 -0.5 -1.8 -0.3 -1.9 0.2 9.5 -0.4 -3.9
?Note: These not seasonally adjusted estimates were prepared in cooperation with the U.S. Department of Labor, Bureau of Labor Statistics, based upon monthly reports submitted by
selected employers in the Warner Robins Metropolitan Statistical Area, which includes Houston, Peach and Pulaski counties. The estimates include all full- and part-time wage and salary workers who were employed during or received pay for any part of the pay period that includes the twelfth of the month. Proprietors, domestic workers, self-employed persons, unpaid family workers and personnel of the armed forces are excluded. Estimates based on 2023 benchmark.
Total Nonfarm Employment by Metro Statistical Area
(In thousands)
(Seasonally Adjusted)
Preliminary
Revised
Revised
JUN 2024 MAY 2024 JUN 2023
Change in Jobs from MAY 2024
Net %
Change in Jobs from JUN 2023
Net %
Albany MSA
63.2
63.1
62.2
0.1 0.2
1.0 1.6
Athens-Clarke County MSA
104.9
104.7
100.8
0.2 0.2
4.1 4.1
Atlanta MSA
3,092.9 3,085.8 3,052.6
7.1 0.2
40.3 1.3
Augusta-Richmond County MSA
246.2
246.3
244.8
-0.1 0.0
1.4 0.6
Brunswick MSA
48.6
48.6
47.8
0.0 0.0
0.8 1.7
Columbus MSA
123.9
123.3
122.0
0.6 0.5
1.9 1.6
Dalton MSA
69.2
69.2
68.1
0.0 0.0
1.1 1.6
Gainesville MSA
110.8
110.9
107.0
-0.1 -0.1
3.8 3.6
Hinesville MSA
22.3
22.2
22.1
0.1 0.5
0.2 0.9
Macon-Bibb County MSA
101.8
101.6
100.5
0.2 0.2
1.3 1.3
Rome MSA
47.7
47.7
43.5
0.0 0.0
4.2 9.7
Savannah MSA
207.0
207.3
203.2
-0.3 -0.1
3.8 1.9
Valdosta MSA
56.9
56.4
56.7
0.5 0.9
0.2 0.4
Warner Robins MSA
82.1
82.1
81.0
0.0 0.0
1.1 1.4
?Note: These seasonally adjusted estimates were prepared in cooperation with the U.S. Department of Labor, Bureau of Labor Statistics, based upon monthly reports submitted by selected
employers throughout Georgia. The estimates include all full- and part-time wage and salary workers who were employed during or received pay for any part of the pay period that includes the twelfth of the month. Proprietors, domestic workers, self-employed persons, unpaid family workers and personnel of the armed forces are excluded. Estimates based on 2023 benchmark.
Source: Georgia Department of Labor, Workforce Statistics Division
11
Georgia Statewide Hours and Earnings
All Employee
Average Weekly Earnings (AWE)
Preliminary JUN 2024
Revised MAY 2024
Revised JUN 2023
Total Private...................................................................................................$1,114.71.......................... $1,074.91....................$1,042.32 Goods Producing....................................................................................... $1,351.37..........................$1,294.92....................$1,253.32 Private Service Providing........................................................................... $1,072.47.......................... $1,034.18....................$1,004.66 Construction............................................................................................$1,393.70..........................$1,328.05.................... $1,259.47 Manufacturing......................................................................................... $1,318.71......................... $1,268.64....................$1,206.76 Trade, Transportation, and Utilities............................................................$906.18............................ $892.08...................... $902.43 Financial Activities..................................................................................$1,544.48.......................... $1,417.90....................$1,200.49 Professional and Business Services...................................................... $1,470.32..........................$1,401.64.................... $1,376.77 Educational and Health Services............................................................ $1,176.67.......................... $1,175.23.................... $1,135.54 Leisure and Hospitality.............................................................................. $489.64............................ $492.36.......................$493.42 Other Services.......................................................................................... $946.96.............................$913.48.......................$855.79
Average Weekly Hours (AWH)
Preliminary JUN 2024
Revised MAY 2024
Revised JUN 2023
Total Private...........................................................................................................34.9.................................. 34.2.............................34.4 Goods Producing................................................................................................ 41.1...................................39.6.............................40.6 Private Service Providing....................................................................................33.8.................................. 33.2.............................33.3 Construction..................................................................................................... 41.1.................................. 38.9.............................40.2 Manufacturing.................................................................................................. 41.3...................................40.3.............................40.7 Trade, Transportation, and Utilities..................................................................33.5.................................. 33.2.............................33.3 Financial Activities...........................................................................................33.5................................... 37.7.............................36.5 Professional and Business Services...............................................................33.5................................... 37.1............................. 37.0 Educational and Health Services.....................................................................33.5.................................. 33.8.............................34.4 Leisure and Hospitality.....................................................................................33.5...................................26.4.............................26.7 Other Services.................................................................................................33.5...................................32.8.............................33.6
Average Hourly Earnings (AHE)
Preliminary JUN 2024
Revised MAY 2024
Revised JUN 2023
Total Private.......................................................................................................$31.94...............................$31.43.........................$30.30 Goods Producing........................................................................................... $32.88...............................$32.70.........................$30.87 Private Service Providing................................................................................ $31.73............................... $31.15......................... $30.17 Construction.................................................................................................$33.91............................... $34.14......................... $31.33 Manufacturing..............................................................................................$31.93...............................$31.48.........................$29.65 Trade, Transportation, and Utilities.............................................................. $27.05...............................$26.87..........................$27.10 Financial Activities...................................................................................... $39.40............................... $37.61.........................$32.89 Professional and Business Services.......................................................... $38.49............................... $37.78......................... $37.21 Educational and Health Services.................................................................$34.71.............................. $34.77.........................$33.01 Leisure and Hospitality.................................................................................$18.27...............................$18.65.........................$18.48 Other Services............................................................................................. $27.77...............................$27.85.........................$25.47
Read more about the hours and earnings series at http://www.bls.gov/sae/home.htm
?Note: These not seasonally adjusted estimates were prepared in cooperation with the U.S. Department of Labor, Bureau of Labor Statistics, based upon monthly reports submitted by
selected employers throughout Georgia. The estimates include all full- and part-time wage and salary workers who were employed during or received pay for any part of the pay period that includes the twelfth of the month. Proprietors, domestic workers, self-employed persons, unpaid family workers and personnel of the armed forces are excluded. Estimates based on 2023 benchmark.
Source: Georgia Department of Labor, Workforce Statistics Division
12
Georgia MSA Hours and Earnings
All Employee Total Private
Average Weekly Earnings (AWE)
Preliminary JUN 2024
Revised MAY 2024
Revised JUN 2023
Albany MSA ....................................................................................................$738.37.............................$719.30....................... $737.43 Athens-Clarke County MSA .......................................................................... $889.23............................ $848.26.......................$869.08 Atlanta MSA ...............................................................................................$1,202.60.......................... $1,151.90.....................$1,131.26 Augusta-Richmond County MSA ...................................................................$961.52.............................$953.71.......................$932.58 Brunswick MSA .............................................................................................$801.99.............................$771.23.......................$723.47 Columbus MSA ...........................................................................................$1,022.08..........................$1,005.61.......................$870.40 Dalton MSA ...................................................................................................$974.95............................ $962.68.......................$942.65 Gainesville MSA ..........................................................................................$1,003.93............................ $980.32....................$1,029.25 Hinesville MSA .............................................................................................. $533.87............................ $495.82.......................$493.76 Macon-Bibb County MSA ..............................................................................$877.04............................ $852.38.......................$850.78 Rome MSA .....................................................................................................$829.67............................ $805.64.......................$780.89 Savannah MSA ............................................................................................. $860.50............................ $848.02.......................$831.39 Valdosta MSA ................................................................................................. $928.12............................ $892.65....................... $871.24 Warner Robins MSA ...................................................................................... $890.43............................ $879.04.......................$759.96
Average Weekly Hours (AWH)
Preliminary JUN 2024
Revised MAY 2024
Revised JUN 2023
Albany MSA ..........................................................................................................33.2...................................32.8.............................32.5 Athens-Clarke County MSA .................................................................................31.3...................................29.9.............................32.2 Atlanta MSA ...........................................................................................................35...................................34.1.............................34.5 Augusta-Richmond County MSA ............................................................................34...................................33.7................................33 Brunswick MSA ...................................................................................................34.2...................................32.5.............................32.9 Columbus MSA ....................................................................................................34.8...................................34.7................................34 Dalton MSA ............................................................................................................37................................... 37.4............................. 37.2 Gainesville MSA ...................................................................................................35.3.................................. 34.8.............................35.9 Hinesville MSA .....................................................................................................30.7...................................28.3............................. 27.6 Macon-Bibb County MSA ....................................................................................34.9......................................34.............................35.2 Rome MSA ...........................................................................................................32.6.................................. 32.2............................. 31.5 Savannah MSA ....................................................................................................31.2...................................31.2............................. 32.1 Valdosta MSA .......................................................................................................33.1......................................33.............................32.4 Warner Robins MSA .............................................................................................33.5...................................32.8............................. 31.3
Average Hourly Earnings (AHE)
Preliminary JUN 2024
Revised MAY 2024
Revised JUN 2023
Albany MSA ......................................................................................................$22.24...............................$21.93.........................$22.69 Athens-Clarke County MSA .............................................................................$28.41...............................$28.37.........................$26.99 Atlanta MSA ................................................................................................... $34.36...............................$33.78.........................$32.79 Augusta-Richmond County MSA .....................................................................$28.28.............................. $28.30.........................$28.26 Brunswick MSA ...............................................................................................$23.45...............................$23.73.........................$21.99 Columbus MSA ................................................................................................$29.37.............................. $28.98.........................$25.60 Dalton MSA .....................................................................................................$26.35...............................$25.74.........................$25.34 Gainesville MSA .............................................................................................. $28.44............................... $28.17.........................$28.67 Hinesville MSA ................................................................................................. $17.39............................... $17.52......................... $17.89 Macon-Bibb County MSA ................................................................................ $25.13...............................$25.07......................... $24.17 Rome MSA .......................................................................................................$25.45...............................$25.02......................... $24.79 Savannah MSA ................................................................................................$27.58............................... $27.18.........................$25.90 Valdosta MSA ...................................................................................................$28.04...............................$27.05.........................$26.89 Warner Robins MSA .........................................................................................$26.58.............................. $26.80.........................$24.28
Read more about the hours and earnings series at http://www.bls.gov/sae/home.htm
?Note: These not seasonally adjusted estimates were prepared in cooperation with the U.S. Department of Labor, Bureau of Labor Statistics, based upon monthly reports submitted by
selected employers throughout Georgia. The estimates include all full- and part-time wage and salary workers who were employed during or received pay for any part of the pay period that includes the twelfth of the month. Proprietors, domestic workers, self-employed persons, unpaid family workers and personnel of the armed forces are excluded. Estimates based on 2023 benchmark.
Source: Georgia Department of Labor, Workforce Statistics Division
13
Dimensions - Measuring Georgia's Labor Force 2023-2024 Unemployment Rates Unemploym(Seenatsoranatellsy A--djGuesoterdg)ia and U.S.
5%
4%
3%
2% Jun Jul Aug Sep Oct Nov Dec Jan Feb Mar Apr May Jun
Georgia
U.S.
WA 4.9
OR
4.1
ID
3.4
NV
5.2
UT
CA
3.0
5.2
AZ 3.3
AK 4.5
StSattaeteuUnenmempploloyymmeenntt Rraatteess
June 2024
National Unemployment Rate: 4.1% Rates are seasonally adjusted
MT 3.1
WY 2.9
CO 3.8 NM 3.9
HI 2.9
ND 2.1 SD 2.0
NE 2.6
KS 3.1
MN 2.9
WI 2.9
IA 2.8
IL 5.0 MO 3.7
OK 3.4 TX 4.0
AR 3.3
MS 2.8
LA 4.0
PR 5.8
NH
2.5 ME
VT
2.8
2.1
MI 4.1
OH
IN
4.4
3.8
KY 4.6 TN 3.0
PA 3.4
WV
4.1
VA
2.7
NC 3.6
SC 3.6
AL
GA
2.9
3.3
FL 3.3
MA 3.2
NY 4.2
RI 4.3
CT
NJ 4.6
3.9
DE
4.0
DC 5.4
MD 2.8
Unemployment rate
4.0% or greater 3.5% to 3.9% 3.0% to 3.4% 2.5% to 2.9%
Less than 2.5%
Source: Georgia Department of Labor, Workforce Statistics Division
14
Georgia Labor Force Estimates
Place of Residence - Persons 16 Years and Older
Georgia
(Seasonally adjusted)
Employment Status
Civilian labor force Employed Unemployed Rate
Preliminary JUN 2024
5,391,294 5,214,373
176,921 3.3
Revised MAY 2024
5,375,792 5,205,880
169,912 3.2
Revised JUN 2023
5,310,052 5,140,094
169,958 3.2
Change From
MAY 2024
JUN 2023
15,502 8,493 7,009
81,242 74,279 6,963
Georgia
(Not Seasonally adjusted)
Civilian labor force Employed Unemployed Rate
5,422,227 5,205,129
217,098 4.0
5,414,293 5,228,948
185,345 3.4
5,304,659 5,119,198
185,461 3.5
7,934 -23,819 31,753
117,568 85,931 31,637
Albany MSA
Civilian labor force Employed Unemployed
Rate
65,582 62,431
3,151 4.8
65,297 62,652
2,645 4.1
63,786 61,099
2,687 4.2
285 -221 506
1,796 1,332
464
Athens-Clarke County MSA
Civilian labor force Employed Unemployed Rate
104,146 99,752 4,394
4.2
104,477 101,014
3,463 3.3
98,737 95,194 3,543
3.6
-331 -1,262
931
5,409 4,558
851
Atlanta MSA
Civilian labor force Employed Unemployed
Rate
3,300,120 3,171,567
128,553 3.9
3,291,991 3,181,634
110,357 3.4
3,237,005 3,126,731
110,274 3.4
8,129 -10,067 18,196
63,115 44,836 18,279
Augusta-Richmond County MSA
Civilian labor force Employed Unemployed
Rate
269,561 256,506
13,055 4.8
268,181 257,366
10,815 4.0
264,574 253,907
10,667 4.0
1,380 -860 2,240
4,987 2,599 2,388
Brunswick MSA
Civilian labor force Employed Unemployed
Rate
56,596 54,486
2,110 3.7
56,720 54,907
1,813 3.2
55,430 53,656
1,774 3.2
-124 -421 297
1,166 830 336
Columbus MSA
Civilian labor force Employed Unemployed Rate
123,500 117,955
5,545 4.5
123,176 118,466
4,710 3.8
120,136 115,274
4,862 4.0
324
3,364
-511
2,681
835
683
Dalton MSA
Civilian labor force Employed Unemployed Rate
59,893 57,105 2,788
4.7
60,033 57,646 2,387
4.0
58,443 56,225
2,218 3.8
-140 -541 401
1,450 880 570
Gainesville MSA
Civilian labor force Employed Unemployed Rate
115,054 111,370
3,684 3.2
115,620 112,592
3,028 2.6
111,404 108,453
2,951 2.6
-566 -1,222
656
3,650 2,917
733
?Note: MSA data are not seasonally adjusted. Employment includes nonagricultural wage and salary employment, self-employment, unpaid family and private
household workers and agricultural workers. Persons in labor disputes are counted as employed. The use of unrounded data does not imply that the numbers are exact.
Albany MSA: Baker, Dougherty, Lee, Terrell, and Worth counties. Athens-Clarke County MSA: Clarke, Madison, Oconee, and Oglethorpe counties. Atlanta MSA: Barrow, Bartow, Butts, Carroll, Cherokee, Clayton, Cobb, Coweta, Dawson, DeKalb, Douglas, Fayette, Forsyth, Fulton, Gwinnett, Haralson, Heard, Henry, Jasper, Lamar, Meriwether, Morgan, Newton, Paulding, Pickens, Pike, Rockdale, Spalding, and Walton counties.
Augusta-Richmond County MSA: Burke, Columbia, Lincoln, McDuffie, and Richmond counties in Georgia and Aiken and Edgefield counties in South Carolina. Brunswick MSA: Brantley, Glynn, and McIntosh counties. Columbus MSA: Chattahoochee, Harris, Marion, and Muscogee counties in Georgia and Russell County in Alabama. Dalton MSA: Murray and Whitfield counties. Gainesville MSA: Hall County. Hinesville MSA: Liberty and Long counties. Macon-Bibb County MSA: Bibb, Crawford, Jones, Monroe, and Twiggs counties. Rome MSA: Floyd County. Savannah MSA: Bryan, Chatham, and Effingham counties. Valdosta MSA: Brooks, Echols, Lanier, and Lowndes counties. Warner Robins MSA: Houston, Peach and Pulaski counties.
Source: Georgia Department of Labor, Workforce Statistics Division
15
Hinesville MSA
Macon-Bibb County MSA Rome MSA Savannah MSA
Valdosta MSA Warner Robins MSA
Georgia Labor Force Estimates
Place of Residence - Persons 16 Years and Older
Employment Status
Civilian labor force Employed Unemployed Rate
Civilian labor force Employed Unemployed Rate
Preliminary JUN 2024
35,310 33,922
1,388 3.9
100,863 96,126 4,737 4.7
Revised MAY 2024
35,457 34,227
1,230 3.5
100,455 96,370 4,085 4.1
Revised JUN 2023
34,690 33,457
1,233 3.6
98,241 94,200
4,041 4.1
Civilian labor force Employed Unemployed Rate
Civilian labor force Employed Unemployed Rate
48,477 46,582
1,895 3.9
205,989 198,672
7,317 3.6
48,626 47,004
1,622 3.3
205,570 199,343
6,227 3.0
44,355 42,671 1,684
3.8
200,557 194,252
6,305 3.1
Civilian labor force Employed Unemployed Rate
Civilian labor force Employed Unemployed Rate
63,274 60,365
2,909 4.6
88,603 85,107 3,496
3.9
62,834 60,437
2,397 3.8
88,637 85,677
2,960 3.3
62,758 60,323
2,435 3.9
87,447 84,454
2,993 3.4
Change From
MAY 2024
JUN 2023
-147
620
-305
465
158
155
408 -244 652
2,622 1,926
696
-149 -422 273
4,122 3,911
211
419 -671 1,090
5,432 4,420 1,012
440
516
-72
42
512
474
-34 -570 536
1,156 653 503
Area United States
(Seasonally adjusted)
United States
(Not Seasonally adjusted)
United States Labor Force Estimates
Place of Residence - Persons 16 Years and Older
Employment Status
Civilian labor force Employed Unemployed Rate
Civilian labor force Employed Unemployed Rate
JUN 2024
168,009,000 161,199,000
6,811,000 4.1
169,007,000 161,774,000
7,233,000 4.3
MAY 2024
167,732,000 161,083,000
6,649,000 4.0
167,576,000 161,341,000
6,235,000 3.7
JUN 2023
167,000,000 161,004,000
5,997,000 3.6
167,910,000 161,559,000
6,351,000 3.8
Change From
MAY 2024
JUN 2023
277,000 116,000 162,000
1,009,000 195,000 814,000
1,431,000 433,000 998,000
1,097,000 215,000 882,000
?Note: MSA data are not seasonally adjusted. Employment includes nonagricultural wage and salary employment, self-employment, unpaid family and private
household workers and agricultural workers. Persons in labor disputes are counted as employed. The use of unrounded data does not imply that the numbers are exact.
Albany MSA: Baker, Dougherty, Lee, Terrell, and Worth counties. Athens-Clarke County MSA: Clarke, Madison, Oconee, and Oglethorpe counties. Atlanta MSA: Barrow, Bartow, Butts, Carroll, Cherokee, Clayton, Cobb, Coweta, Dawson, DeKalb, Douglas, Fayette, Forsyth, Fulton, Gwinnett, Haralson, Heard, Henry, Jasper, Lamar, Meriwether, Morgan, Newton, Paulding, Pickens, Pike, Rockdale, Spalding, and Walton counties. Augusta-Richmond County MSA: Burke, Columbia, Lincoln, McDuffie, and Richmond counties in Georgia and Aiken and Edgefield counties in South Carolina. Brunswick MSA: Brantley, Glynn, and McIntosh counties. Columbus MSA: Chattahoochee, Harris, Marion, and Muscogee counties in Georgia and Russell County in Alabama. Dalton MSA: Murray and Whitfield counties. Gainesville MSA: Hall County. Hinesville MSA: Liberty and Long counties. Macon-Bibb County MSA: Bibb, Crawford, Jones, Monroe, and Twiggs counties. Rome MSA: Floyd County. Savannah MSA: Bryan, Chatham, and Effingham counties. Valdosta MSA: Brooks, Echols, Lanier, and Lowndes counties. Warner Robins MSA: Houston, Peach and Pulaski counties.
Source: Georgia Department of Labor, Workforce Statistics Division
16
Georgia Labor Force Estimates by County (not seasonally adjusted)
Place of Residence - Persons 16 Years and Older
Georgia
Preliminary June 2024
Labor Force
Employment
Unemployment Number Rate
5,422,227 5,205,129 217,098 4.0
Appling Atkinson Bacon Baker Baldwin
9,903 4,326 5,062 1,081 17,931
9,487 4,160 4,869 1,027 16,963
416 4.2 166 3.8 193 3.8
54 5.0 968 5.4
Banks Barrow Bartow Ben Hill Berrien
11,817 11,456
361 3.1
44,622 43,051 1,571 3.5
54,097 52,026 2,071 3.8
5,742 5,437
305 5.3
7,790
7,411
379 4.9
Bibb Bleckley Brantley Brooks Bryan
66,358 63,044 3,314 5.0
4,999 4,699 300 6.0
7,829 7,480
349 4.5
6,605 6,330
275 4.2
20,957 20,264
693 3.3
Bulloch Burke Butts Calhoun Camden
39,715 37,862 1,853 4.7
9,111 8,525
586 6.4
11,709 11,281
428 3.7
2,258 2,172
86 3.8
23,430 22,531
899 3.8
Candler Carroll Catoosa Charlton Chatham
5,938 5,745
193 3.3
59,410 56,891 2,519 4.2
35,390 34,182 1,208 3.4
5,144 4,949
195 3.8
150,034 144,531 5,503 3.7
Chattahoochee 1,925 1,826
99 5.1
Chattooga
9,598 9,152 446 4.6
Cherokee 148,095 143,138 4,957 3.3
Clarke
61,617 58,719 2,898 4.7
Clay
804
742
62 7.7
Clayton Clinch Cobb Coffee Colquitt
145,404 138,146 7,258 5.0
3,189 3,075
114 3.6
447,185 431,603 15,582 3.5
18,990 18,156 834 4.4
21,631 20,837
794 3.7
Columbia Cook Coweta Crawford Crisp
77,227 74,307 2,920 3.8
8,364 8,042
322 3.8
80,486 77,586 2,900 3.6
5,402 5,172
230 4.3
10,211 9,808
403 3.9
Revised May 2024
Labor Force
Employment
Unemployment Number Rate
5,414,293 5,228,948 185,345 3.4
9,949 4,380 5,053 1,095 18,011
9,603 4,224 4,890 1,049 17,249
346 3.5 156 3.6 163 3.2
46 4.2 762 4.2
11,825 11,538
287 2.4
44,515 43,182 1,333 3.0
53,977 52,203 1,774 3.3
5,701 5,441
260 4.6
7,809 7,490
319 4.1
66,012 63,164 2,848 4.3
4,948
4,718
230 4.6
7,867 7,573 294 3.7
6,645 6,400
245 3.7
20,922 20,346
576 2.8
39,969 38,568 1,401 3.5
9,091 8,607 484 5.3
11,698 11,319
379 3.2
2,303 2,230
73 3.2
23,423 22,640
783 3.3
5,980 5,824
156 2.6
59,196 57,119 2,077 3.5
35,442 34,391 1,051 3.0
5,175 5,008
167 3.2
149,728 145,013 4,715 3.1
1,935 1,839
96 5.0
9,598 9,233 365 3.8
147,833 143,631 4,202 2.8
61,673 59,427 2,246 3.6
803
751
52 6.5
144,771 138,522 6,249 4.3
3,224
3,121
103 3.2
446,495 432,994 13,501 3.0
19,121 18,360
761 4.0
21,801 21,122
679 3.1
77,401 74,890 2,511 3.2
8,408
8,122
286 3.4
80,283 77,826 2,457 3.1
5,393
5,194
199 3.7
10,210 9,842 368 3.6
Revised June 2023
Labor Force
Employment
Unemployment Number Rate
5,304,659 5,119,198 185,461 3.5
9,697 4,282 5,072 1,086 17,349
9,304 4,146 4,916 1,044 16,511
393 4.1 136 3.2 156 3.1
42 3.9 838 4.8
11,598 11,327
271 2.3
43,815 42,506 1,309 3.0
53,074 51,388 1,686 3.2
5,769 5,509
260 4.5
7,796 7,509
287 3.7
64,596 61,736 2,860 4.4
4,756 4,510
246 5.2
7,655 7,351 304 4.0
6,622 6,380
242 3.7
20,413 19,804 609 3.0
38,766 37,165 1,601 4.1
9,019 8,476 543 6.0
11,514 11,150
364 3.2
2,316 2,243
73 3.2
22,610 21,892
718 3.2
6,102 58,201 34,366
5,074 145,989
5,946 56,085 33,372
4,918 141,275
156 2.6 2,116 3.6
994 2.9 156 3.1 4,714 3.2
1,886 1,801
85 4.5
9,206 8,829
377 4.1
145,074 140,936 4,138 2.9
58,361 56,038 2,323 4.0
807
738
69 8.6
142,704 136,422 6,282 4.4
3,103 3,016
87 2.8
438,589 425,166 13,423 3.1
18,809 18,112
697 3.7
22,462 21,795
667 3.0
75,688 73,153 2,535 3.3
8,305 8,031
274 3.3
79,075 76,570 2,505 3.2
5,266 5,091
175 3.3
9,738 9,359
379 3.9
Source: Georgia Department of Labor, Workforce Statistics Division
17
Georgia Labor Force Estimates by County (not seasonally adjusted)
Place of Residence - Persons 16 Years and Older
Dade Dawson Decatur DeKalb Dodge
Preliminary June 2024
Labor Force
Employment
Unemployment Number Rate
8,526 8,227 299 3.5
13,897 13,419
478 3.4
11,466 10,988
478 4.2
419,417 403,040 16,377 3.9
7,352 6,991
361 4.9
Dooly Dougherty Douglas Early Echols
4,426 4,208
218 4.9
37,030 34,993 2,037 5.5
77,919 74,633 3,286 4.2
4,128 3,920 208 5.0
1,830 1,749
81 4.4
Effingham Elbert Emanuel Evans Fannin
34,998 33,877 1,121 3.2
8,560 8,174 386 4.5
8,972 8,437 535 6.0
4,830 4,647
183 3.8
12,940 12,504 436 3.4
Fayette Floyd Forsyth Franklin Fulton
61,787 59,532 2,255 3.6 48,477 46,582 1,895 3.9 135,133 130,490 4,643 3.4 10,246 9,756 490 4.8 596,925 571,966 24,959 4.2
Gilmer Glascock Glynn Gordon Grady
13,294 12,782
512 3.9
1,247 1,200
47 3.8
42,252 40,733 1,519 3.6
29,487 28,401 1,086 3.7
10,943 10,503 440 4.0
Greene
7,971 7,639
332 4.2
Gwinnett
519,996 500,858 19,138 3.7
Habersham 20,333 19,522
811 4.0
Hall
115,054 111,370 3,684 3.2
Hancock
2,473 2,324
149 6.0
Haralson Harris Hart Heard Henry
13,480 12,965
515 3.8
17,117 16,511 606 3.5
13,242 12,747 495 3.7
5,498 5,285
213 3.9
125,289 119,817 5,472 4.4
Houston Irwin Jackson Jasper Jeff Davis
72,392 69,695 2,697 3.7
3,568 3,392
176 4.9
50,909 49,484 1,425 2.8
7,436 7,167 269 3.6
6,277 5,936
341 5.4
Revised May 2024
Labor Force
Employment
Unemployment Number Rate
8,555 8,306
249 2.9
13,906 13,491
415 3.0
11,471 11,062 409 3.6
418,724 404,194 14,530 3.5
7,359 7,037 322 4.4
4,454 4,268
186 4.2
36,772 35,085 1,687 4.6
77,619 74,857 2,762 3.6
4,133 3,947
186 4.5
1,845 1,774
71 3.8
34,920 8,553 9,003 4,843 12,825
33,984 8,228 8,593 4,677
12,443
936 2.7 325 3.8 410 4.6 166 3.4 382 3.0
61,588 59,698 1,890 3.1 48,626 47,004 1,622 3.3 134,800 130,924 3,876 2.9 10,236 9,856 380 3.7 595,460 573,734 21,726 3.6
13,240 12,806 434 3.3
1,254 1,213
41 3.3
42,289 40,997 1,292 3.1
29,370 28,406 964 3.3
10,988 10,620 368 3.3
7,883 7,591 292 3.7
518,672 502,581 16,091 3.1
20,333 19,670 663 3.3
115,620 112,592 3,028 2.6
2,520 2,378
142 5.6
13,462 13,017 445 3.3
17,123 16,612
511 3.0
13,285 12,859
426 3.2
5,483 5,309
174 3.2
124,739 120,081 4,658 3.7
72,407 70,113 2,294 3.2
3,553 3,398
155 4.4
50,860 49,654 1,206 2.4
7,439 7,205 234 3.1
6,291 6,005 286 4.5
Revised June 2023
Labor Force
Employment
Unemployment Number Rate
8,200 7,961
239 2.9
13,585 13,194
391 2.9
11,593 11,144
449 3.9
411,755 397,297 14,458 3.5
7,073 6,763
310 4.4
4,669 4,485
184 3.9
35,885 34,183 1,702 4.7
76,412 73,553 2,859 3.7
3,996 3,828
168 4.2
1,847 1,796
51 2.8
34,155 8,189 8,885 4,886
12,235
33,173 7,885 8,462 4,723 11,871
982 2.9 304 3.7 423 4.8 163 3.3 364 3.0
60,702 58,738 1,964 3.2
44,355 42,671 1,684 3.8
132,426 128,674 3,752 2.8
9,830 9,480
350 3.6
585,585 563,967 21,618 3.7
12,762 12,355
407 3.2
1,241 1,197
44 3.5
41,337 40,076 1,261 3.1
29,260 28,351 909 3.1
10,766 10,402 364 3.4
7,695 7,437
258 3.4
509,392 493,089 16,303 3.2
19,378 18,720
658 3.4
111,404 108,453 2,951 2.6
2,446 2,310
136 5.6
13,227 12,756
471 3.6
16,657 16,151 506 3.0
12,545 12,136
409 3.3
5,397 5,220
177 3.3
123,142 118,458 4,684 3.8
71,417 69,126 2,291 3.2
3,538 3,393
145 4.1
49,289 48,187 1,102 2.2
7,310 7,078
232 3.2
6,195 5,898
297 4.8
Source: Georgia Department of Labor, Workforce Statistics Division
18
Georgia Labor Force Estimates by County (not seasonally adjusted)
Place of Residence - Persons 16 Years and Older
Jefferson Jenkins Johnson Jones Lamar
Preliminary June 2024
Labor Force
6,900 3,430 4,309 13,453 8,731
Employment
6,511 3,242 4,134 12,903 8,333
Unemployment Number Rate
389 5.6 188 5.5 175 4.1 550 4.1 398 4.6
Revised May 2024
Labor Force
6,860 3,442 4,292 13,418 8,684
Employment
6,541 3,286 4,148 12,948 8,367
Unemployment Number Rate
319 4.7 156 4.5 144 3.4 470 3.5 317 3.7
Lanier Laurens Lee Liberty Lincoln
3,820 3,630
190 5.0
20,660 19,729
931 4.5
15,160 14,650
510 3.4
26,730 25,666 1,064 4.0
3,520 3,367
153 4.3
3,801 20,571 15,115 26,821 3,540
3,637 19,760 14,695 25,873 3,406
164 4.3 811 3.9 420 2.8 948 3.5 134 3.8
Long Lowndes Lumpkin McDuffie McIntosh
8,580 8,256
324 3.8
51,019 48,656 2,363 4.6
18,522 17,826 696 3.8
8,585 8,077 508 5.9
6,515 6,273
242 3.7
8,636 8,354
282 3.3
50,543 48,626 1,917 3.8
18,669 18,121 548 2.9
8,592 8,136 456 5.3
6,564 6,337 227 3.5
Macon Madison Marion Meriwether Miller
4,590 14,130 3,312 9,250 2,726
4,338 13,596
3,158 8,835 2,635
252 5.5 534 3.8 154 4.6 415 4.5
91 3.3
4,591 14,225
3,310 9,242 2,765
4,384 13,775
3,181 8,884 2,680
207 4.5 450 3.2 129 3.9 358 3.9
85 3.1
Mitchell Monroe Montgomery Morgan Murray
7,957 12,902
3,997 9,942 15,710
7,566 12,420
3,797 9,610 14,946
391 4.9 482 3.7 200 5.0 332 3.3 764 4.9
8,001 12,894
3,999 9,970 15,761
7,659 12,474 3,832 9,684 15,100
342 4.3 420 3.3 167 4.2 286 2.9 661 4.2
Muscogee Newton Oconee Oglethorpe Paulding
77,171 73,294 3,877 5.0
56,505 53,749 2,756 4.9
21,155 20,462
693 3.3
7,244 6,975
269 3.7
94,694 91,279 3,415 3.6
76,978 73,622 3,356 4.4
56,262 53,925 2,337 4.2
21,277 20,734
543 2.6
7,302
7,078
224 3.1
94,445 91,546 2,899 3.1
Peach Pickens Pierce Pike Polk
12,123 16,492
8,614 9,504 19,410
11,512 15,916 8,268
9,173 18,599
611 5.0 576 3.5 346 4.0 331 3.5 811 4.2
12,120 16,462
8,601 9,498 19,403
11,623 15,963
8,312 9,216 18,715
497 4.1 499 3.0 289 3.4 282 3.0 688 3.5
Pulaski Putnam Quitman Rabun Randolph
4,088 9,112
719 8,266 2,283
3,900 8,697
679 7,972 2,162
188 4.6 415 4.6 40 5.6 294 3.6 121 5.3
4,110 9,105
723 8,087 2,328
3,941 8,750
685 7,830 2,219
169 4.1 355 3.9
38 5.3 257 3.2 109 4.7
Source: Georgia Department of Labor, Workforce Statistics Division
Revised June 2023
Labor Force
6,733 3,322 4,114 13,109 8,528
Employment
6,413 3,126 3,980 12,658 8,194
Unemployment Number Rate
320 4.8 196 5.9 134 3.3 451 3.4 334 3.9
3,773 19,768 14,810 26,221 3,492
3,614 18,885 14,315 25,287
3,350
159 4.2 883 4.5 495 3.3 934 3.6 142 4.1
8,469 8,170
299 3.5
50,516 48,533 1,983 3.9
17,837 17,259
578 3.2
8,390 7,978
412 4.9
6,438 6,229
209 3.2
4,618 13,379 3,207 9,088 2,888
4,399 12,953
3,087 8,717 2,812
219 4.7 426 3.2 120 3.7 371 4.1
76 2.6
8,055 12,572
3,901 9,795 15,350
7,724 12,162 3,731 9,487 14,736
331 4.1 410 3.3 170 4.4 308 3.1 614 4.0
75,003 71,555 3,448 4.6
55,370 53,065 2,305 4.2
20,076 19,496 580 2.9
6,921 6,707
214 3.1
93,048 90,138 2,910 3.1
11,989 16,172 8,553 9,318 18,804
11,448 15,696
8,259 9,039 18,128
541 4.5 476 2.9 294 3.4 279 3.0 676 3.6
4,041 8,949
724 7,823 2,375
3,880 8,602
683 7,586 2,271
161 4.0 347 3.9
41 5.7 237 3.0 104 4.4
19
Georgia Labor Force Estimates by County (not seasonally adjusted)
Place of Residence - Persons 16 Years and Older
Richmond Rockdale Schley Screven Seminole
Preliminary June 2024
Labor Force
Employment
Unemployment Number Rate
84,420 79,691 4,729 5.6
47,028 44,835 2,193 4.7
2,153 2,062
91 4.2
4,872 4,598
274 5.6
3,083 2,924
159 5.2
Spalding Stephens Stewart Sumter Talbot
30,440 29,082 1,358 4.5
10,535 10,020
515 4.9
2,675 2,581
94 3.5
12,302 11,626
676 5.5
2,924 2,815
109 3.7
Taliaferro Tattnall Taylor Telfair Terrell
584 9,488 2,785 3,322 3,493
554 9,122 2,642 3,062 3,324
30 5.1 366 3.9 143 5.1 260 7.8 169 4.8
Thomas Tift Toombs Towns Treutlen
18,116 21,029 12,526
4,377 2,728
17,307 20,237 11,947
4,124 2,562
809 4.5 792 3.8 579 4.6 253 5.8 166 6.1
Troup Turner Twiggs Union Upson
39,116 37,726 1,390 3.6
3,317 3,169
148 4.5
2,748 2,587
161 5.9
11,940 11,515
425 3.6
11,676 11,206
470 4.0
Walker
33,017 31,779 1,238 3.7
Walton
49,749 47,861 1,888 3.8
Ware
15,327 14,689
638 4.2
Warren
2,778 2,654
124 4.5
Washington 7,248 6,859 389 5.4
Wayne Webster Wheeler White Whitfield
12,308 11,789
519 4.2
978
928
50 5.1
1,692 1,590
102 6.0
18,024 17,484 540 3.0
44,183 42,159 2,024 4.6
Wilcox Wilkes Wilkinson Worth
2,715 3,930 3,457 8,818
2,599 3,766 3,281 8,437
116 4.3 164 4.2 176 5.1 381 4.3
Revised May 2024
Labor Force
Employment
Unemployment Number Rate
84,282 80,230 4,052 4.8
46,850 44,972 1,878 4.0
2,169 2,093
76 3.5
4,861 4,629
232 4.8
3,138 2,996
142 4.5
30,347 29,184 1,163 3.8
10,569 10,122
447 4.2
2,698 2,603
95 3.5
12,361 11,799
562 4.5
2,932 2,833
99 3.4
584 9,532 2,771 3,323 3,497
552 9,212 2,646 3,096 3,338
32 5.5 320 3.4 125 4.5 227 6.8 159 4.5
17,956 21,085 12,581 4,283
2,729
17,251 20,435 12,067
4,090 2,590
705 3.9 650 3.1 514 4.1 193 4.5 139 5.1
38,878 37,720 1,158 3.0
3,309 3,183
126 3.8
2,738 2,590
148 5.4
11,937 11,569 368 3.1
11,729 11,312
417 3.6
33,027 31,989 1,038 3.1
49,571 48,006 1,565 3.2
15,318 14,753 565 3.7
2,811 2,682
129 4.6
7,269 6,925 344 4.7
12,285 11,843
442 3.6
983
944
39 4.0
1,713 1,618
95 5.5
17,823 17,359 464 2.6
44,272 42,546 1,726 3.9
2,724 3,903 3,458 8,818
2,626 3,759 3,314 8,485
98 3.6 144 3.7 144 4.2 333 3.8
Revised June 2023
Labor Force
Employment
Unemployment Number Rate
82,918 78,673 4,245 5.1
46,023 44,197 1,826 4.0
2,129 2,056
73 3.4
4,887 4,608
279 5.7
3,110 2,977
133 4.3
29,848 10,308
2,746 12,268
2,790
28,698 9,894 2,654 11,642 2,702
1,150 3.9 414 4.0 92 3.4 626 5.1 88 3.2
562 9,379 2,763 3,373 3,409
541 9,050 2,643 3,127 3,255
21 3.7 329 3.5 120 4.3 246 7.3 154 4.5
17,398 20,897 12,204
4,077 2,696
16,710 20,221 11,710
3,877 2,562
688 4.0 676 3.2 494 4.0 200 4.9 134 5.0
37,263 3,330 2,698 11,440 11,561
36,101 3,185 2,553 11,107 11,126
1,162 3.1 145 4.4 145 5.4 333 2.9 435 3.8
32,129 31,071 1,058 3.3
48,836 47,253 1,583 3.2
15,227 14,691
536 3.5
2,755 2,622
133 4.8
6,994 6,692
302 4.3
12,056 11,608
448 3.7
982
943
39 4.0
1,629 1,519
110 6.8
17,578 17,125
453 2.6
43,093 41,489 1,604 3.7
2,710 3,841 3,351 8,596
2,599 3,699 3,204 8,302
111 4.1 142 3.7 147 4.4 294 3.4
Source: Georgia Department of Labor, Workforce Statistics Division
20
City Labor Force Estimates
Place of Residence - Persons 16 Years and Older
Preliminary June 2024
Labor Force
Employment
Unemployment Number Rate
Albany 30,009 28,302 1,707 5.7
Alpharetta
39,199 37,935 1,264 3.2
Athens 61,617 58,719 2,898 4.7
Atlanta 281,974 269,157 12,817 4.5
Dekalb Part
25,777 24,949
828 3.2
Fulton Part
256,197 244,208 11,989 4.7
Augusta 84,420 79,691 4,729 5.6
Brookhaven
37,100 36,131
969 2.6
Canton 17,884 17,311
573 3.2
Carrollton 12,419 11,753
666 5.4
Chamblee 22,083 21,513
570 2.6
Columbus
77,171 73,294 3,877 5.0
Dalton 13,896 13,233
663 4.8
Decatur 15,010 14,546
464 3.1
Douglasville
17,995 17,226
769 4.3
Duluth 16,894 16,298
596 3.5
Dunwoody 28,558 27,726
832 2.9
East Point
17,503 16,580
923 5.3
Gainesville
23,218 22,400
818 3.5
Hinesville 15,761 15,180
581 3.7
Johns Creek
47,443 45,844 1,599 3.4
Kennesaw
21,280 20,551
729 3.4
LaGrange
16,153 15,504
649 4.0
Lawrenceville
15,574 14,953
621 4.0
McDonough
13,367 12,573
794 5.9
Macon-Bibb
66,358 63,044 3,314 5.0
Marietta 37,116 35,818 1,298 3.5
Milton 21,486 20,775
711 3.3
Newnan 20,747 19,902
845 4.1
Peachtree City
19,900 19,264
636 3.2
P'tree Corners
26,456 25,640
816 3.1
Pooler 14,916 14,483
433 2.9
Rome 16,883 16,182
701 4.2
Roswell 56,557 54,776 1,781 3.1
Sandy Springs
69,171 66,983 2,188 3.2
Savannah 71,278 68,299 2,979 4.2
Smyrna 36,568 35,313 1,255 3.4
Statesboro
15,087 14,093
994 6.6
Stockbridge
15,318 14,615
703 4.6
Sugar Hill
14,041 13,553
488 3.5
Tucker 20,991 20,342
649 3.1
Union City
10,829 10,170
659 6.1
Valdosta 24,704 23,440 1,264 5.1
Warner Robins
34,488 33,186 1,302 3.8
Woodstock
18,944 18,300
644 3.4
Revised May 2024
Labor Force
Employment
Unemployment Number Rate
29,788 28,376 1,412 4.7
39,157 38,052 1,105 2.8
61,673 59,427 2,246 3.6
281,040 269,983 11,057 3.9
25,737 25,020
717 2.8
255,303 244,963 10,340 4.1
84,282 80,230 4,052 4.8
37,129 36,234 895 2.4
17,859
17,371
488 2.7
12,309 11,800 509 4.1
22,112 21,574 538 2.4
76,978 73,622 3,356 4.4
13,931 13,354
577 4.1
14,985 14,588
397 2.6
17,982 17,278
704 3.9
16,902 16,354
548 3.2
28,635 27,805 830 2.9
17,469 16,631 838 4.8
23,309 22,645
664 2.8
15,841 15,302 539 3.4
47,375 45,986 1,389 2.9
21,219 20,617
602 2.8
16,049 15,502
547 3.4
15,516 15,005
511 3.3
13,241 12,601
640 4.8
66,012 63,164 2,848 4.3
37,025 35,934 1,091 2.9
21,435 20,839
596 2.8
20,716 19,964
752 3.6
19,848 19,318
530 2.7
26,420 25,728
692 2.6
14,922 14,531
391 2.6
16,959 16,329
630 3.7
56,529 54,946 1,583 2.8
69,099 67,190 1,909 2.8
71,045 68,527 2,518 3.5
36,580 35,427 1,153 3.2
15,040 14,356
684 4.5
15,258 14,647
611 4.0
14,012 13,600
412 2.9
21,004 20,401
603 2.9
10,782 10,202
580 5.4
24,444 23,426 1,018 4.2
34,506 33,386 1,120 3.2
18,939 18,363
576 3.0
Revised June 2023
Labor Force
Employment
Unemployment Number Rate
29,030 27,647 1,383 4.8
38,461 37,404 1,057 2.7
58,361 56,038 2,323 4.0
276,708 265,386 11,322 4.1
25,373 24,594
779 3.1
251,335 240,792 10,543 4.2
82,918 78,673 4,245 5.1
36,445 35,616
829 2.3
17,521 17,045
476 2.7
12,167 11,586
581 4.8
21,714 21,206
508 2.3
75,003 71,555 3,448 4.6
13,551 13,022
529 3.9
14,746 14,339
407 2.8
17,688 16,977
711 4.0
16,606 16,045
561 3.4
28,073 27,331
742 2.6
17,184 16,348
836 4.9
22,460 21,813
647 2.9
15,466 14,956
510 3.3
46,559 45,203 1,356 2.9
20,863 20,245
618 3.0
15,422 14,837
585 3.8
15,298 14,721
577 3.8
13,018 12,430
588 4.5
64,596 61,736 2,860 4.4
36,391 35,284 1,107 3.0
21,108 20,484
624 3.0
20,378 19,641
737 3.6
19,537 19,007
530 2.7
25,946 25,243
703 2.7
14,530 14,157
373 2.6
15,510 14,824
686 4.4
55,521 54,010 1,511 2.7
67,896 66,046 1,850 2.7
69,304 66,761 2,543 3.7
35,859 34,786 1,073 3.0
14,676 13,834
842 5.7
15,037 14,449
588 3.9
13,705 13,343
362 2.6
20,651 20,052
599 2.9
10,597 10,028
569 5.4
24,494 23,381 1,113 4.5
34,037 32,916 1,121 3.3
18,588 18,018
570 3.1
Note: City estimates were prepared in cooperation with the U.S. Department of Labor, Bureau of Labor Statistics. All cities listed have total population of 25,000 or more.
Source: Georgia Department of Labor, Workforce Statistics Division
21
UNEMGPeoLrOgiaYUMneEmNploTymReAntTREateBs bYy CCoOunUtyNTIES JUNE 2024 June 2024
Dade 3.5
Catoosa 3.4
Walker
Whitfield
Murray 4.9
Fannin 3.4
Union 3.6
Towns 5.8
Rabun 3.6
6.0% or greater 8 counties (5%)
3.7
4.6
Chattooga 4.6
Gordon 3.7
Floyd 3.9
Bartow 3.8
Gilmer 3.9
Pickens 3.5
Cherokee 3.3
Lumpkin 3.8
Dawson 3.4
Forsyth 3.4
White Habersham
3.0
4.0
Stephens
4.9
Banks Franklin
Hall
3.1
4.8
3.2
Jackson 2.8
Madison 3.8
Hart 3.7
Elbert 4.5
5.0% to 5.9% 30 counties (19%)
4.0% to 4.9% 55 counties (35%)
Less than 4.0%
66 counties (42%) Polk
4.2
Haralson 3.8
Carroll 4.2
Heard 3.9
Paulding
Cobb 3.5
Gwinnett 3.7
Barrow 3.5
Clarke 4.7
3.6 Douglas 4.2
Coweta 3.6
Fulton 4.2
DeKalb 3.9 Rockdale
Walton 3.8
Oconee 3.3
Clayton
4.7 Newton
5.0
Fayette
Henry
4.9
Morgan 3.3
3.6
4.4
Spalding 4.5
Butts 3.7
Jasper 3.6
Putnam 4.6
Oglethorpe 3.7
Wilkes 4.2
Lincoln 4.3
Percentages of number of counties may not total 100 due to rounding
Greene 4.2
Taliaferro
5.1
McDuffie
Warren 5.9
Columbia 3.8
4.5
Richmond
Hancock
5.6
6.0
Glascock
3.8
Troup 3.6
Meriwether 4.5
Pike 3.5
Lamar 4.6
Monroe 3.7
Jones 4.1
Baldwin 5.4
Washington
Jefferson 5.6
Burke 6.4
Upson
5.4
Harris 3.5
Talbot 3.7
Muscogee 5.0
Marion Chattahoochee 4.6
4.0
Taylor 5.1
Crawford 4.3
Bibb 5.0
Twiggs 5.9
Wilkinson 5.1
Peach
5.0
Macon 5.5
Houston 3.7
Bleckley 6.0
Laurens 4.5
Johnson 4.1
Emanuel 6.0
Jenkins 5.5
Screven 5.6
Treutlen 6.1
Candler 3.3
Bulloch 4.7
Effingham 3.2
5.1
Schley
Pulaski
Montgomery
Stewart 3.5
4.2
Webster 5.1
Sumter 5.5
Quitman
5.6 Randolph Terrell
Lee
5.3
4.8
3.4
Clay
Dooly
4.6
Dodge
4.9
4.9
Crisp 3.9
Wilcox 4.3
Turner 4.5
Ben Hill 5.3
5.0 Wheeler
6.0
Telfair 7.8
Jeff Davis 5.4
Toombs 4.6
Evans 3.8
Tattnall
3.9
Bryan 3.3
Appling 4.2
Long 3.8
Liberty 4.0
Chatham 3.7
7.7
Calhoun
Dougherty
3.8
5.5
Early 5.0
Miller 3.3
Baker 5.0
Mitchell 4.9
Worth 4.3
Colquitt 3.7
Irwin 4.9 Tift 3.8
Coffee 4.4
Berrien
Atkinson
4.9
3.8
Cook
3.8 Lanier
Bacon 3.8
Wayne 4.2
Pierce 4.0
Ware 4.2
Brantley 4.5
McIntosh 3.7
Glynn 3.6
Seminole 5.2
Decatur 4.2
Grady 4.0
Thomas 4.5
Brooks 4.2
5.0
Lowndes 4.6
Clinch 3.6
Charlton 3.8
Camden 3.8
Echols
4.4
Georgia's Unemployment Rate: 4.0%
Georgia's U(nNoet SmeasponlaollyyAmdjusetend)t Rate: 4.0% (not seasonally adjusted)
Source: Georgia Department of Labor, Workforce Statistics Division
22
Georgia Unemployment Insurance Claims by County
County
June 2024 Initial
Claims
Average Weekly Benefit
County
June 2024 Initial
Claims
Average Weekly Benefit
County
June 2024 Initial
Claims
Average Weekly Benefit
Georgia
Appling Atkinson Bacon Baker Baldwin Banks Barrow Bartow Ben Hill Berrien Bibb Bleckley Brantley Brooks Bryan Bulloch Burke Butts Calhoun Camden Candler Carroll Catoosa Charlton Chatham Chattahoochee Chattooga Cherokee Clarke Clay Clayton Clinch Cobb Coffee Colquitt Columbia Cook Coweta Crawford Crisp Dade Dawson Decatur DeKalb Dodge Dooly Dougherty Douglas Early Echols Effingham
21,867.............. $338
53.............. $309 22.............. $303
8.............. $300 1.............. $240 65.............. $302 59.............. $315 173.............. $309 184.............. $316 30.............. $300 45.............. $292 379.............. $258 17.............. $278 20.............. $326 21.............. $278 38.............. $308 132.............. $294 90.............. $298 41.............. $286 4.............. $258 36.............. $297 19.............. $294 212.............. $285 48.............. $286 7.............. $270 451.............. $300 7.............. $208 54.............. $307 310.............. $317 270.............. $308 6.............. $365 1,043.............. $297 9.............. $262 1,251.............. $311 101.............. $282 62.............. $297 164.............. $304 25.............. $292 269.............. $282 12.............. $317 36.............. $307 24.............. $227 29.............. $323 57.............. $283 1,899.............. $304 40.............. $298 31.............. $312 211.............. $293 365.............. $310 26.............. $262 2.............. $314 74.............. $316
Elbert Emanuel Evans Fannin Fayette Floyd Forsyth Franklin Fulton Gilmer Glascock Glynn Gordon Grady Greene Gwinnett Habersham Hall Hancock Haralson Harris Hart Heard Henry Houston Irwin Jackson Jasper Jeff Davis Jefferson Jenkins Johnson Jones Lamar Lanier Laurens Lee Liberty Lincoln Long Lowndes Lumpkin Macon Madison Marion McDuffie McIntosh Meriwether Miller Mitchell Monroe Montgomery Morgan Murray
53.............. $320 107.............. $282
14.............. $306 20.............. $279 166.............. $316 235.............. $294 279.............. $319 63.............. $291 2,809.............. $305 36.............. $302
2.............. $336 89.............. $304 155.............. $293 43.............. $288 21.............. $214 1,509.............. $310 103.............. $302 336.............. $310 14.............. $309 30.............. $310 32.............. $298 53.............. $296 20.............. $273 807.............. $304 237.............. $299
8.............. $347 209.............. $326
22.............. $277 27.............. $323 56.............. $301 26.............. $313 13.............. $280 28.............. $291 42.............. $266 15.............. $306 90.............. $272 41.............. $329 82.............. $270 11.............. $302 22.............. $267 205.............. $281 37.............. $284 30.............. $265 55.............. $290
7.............. $317 50.............. $282 12.............. $343 44.............. $312
7.............. $277 30.............. $280 38.............. $317 14.............. $310 28.............. $326 128.............. $263
Muscogee Newton Oconee Oglethorpe Paulding Peach Pickens Pierce Pike Polk Pulaski Putnam Quitman Rabun Randolph Richmond Rockdale Schley Screven Seminole Spalding Stephens Stewart Sumter Talbot Taliaferro Tattnall Taylor Telfair Terrell Thomas Tift Toombs Towns Treutlen Troup Turner Twiggs Union Upson Walker Walton Ware Warren Washington Wayne Webster Wheeler White Whitfield Wilcox Wilkes Wilkinson Worth
359.............. $293 300.............. $312
23.............. $290 25.............. $292 267.............. $318 52.............. $255 26.............. $307 20.............. $255 21.............. $303 87.............. $312 16.............. $309 30.............. $311
0.................. $0 12.............. $290 11.............. $274 642.............. $286 228.............. $314
2.............. $238 27.............. $305 11.............. $227 169.............. $312 60.............. $309
3.............. $302 62.............. $259
9.............. $318 0.................. $0 17.............. $317 13.............. $331 16.............. $299 24.............. $292 95.............. $281 58.............. $259 60.............. $302 9.............. $238 13.............. $302 156.............. $301 20.............. $241 15.............. $275 37.............. $224 43.............. $301 65.............. $263 130.............. $318 47.............. $266 18.............. $309 58.............. $279 47.............. $307 2.............. $355 9.............. $330 33.............. $293 398.............. $259 6.............. $276 12.............. $304 13.............. $326 25.............. $264
?Note: Initial claims include intrastate initial and additional claims, as well as agent state initial and additional claims for regular UI only. Average duration of benefits is represented in weeks.
Data does not include state or federal extended benefits. Source: Georgia Department of Labor, Workforce Statistics Division
23
Bruce Thompson, Commissioner
148 Andrew Young International Boulevard, N.E., Suite 650 Atlanta, Georgia 30303-1751
Return Service Requested