- Collection:
- Georgia Government Publications
- Serial:
- Dimensions (Georgia. Department of Labor)
- Title:
- Dimensions, 2024 March (Georgia. Department of Labor)
- Contributor to Resource:
- Georgia. Department of Labor.
Georgia. Workforce Information and Analysis. - Publisher:
- Atlanta, Ga. : Georgia Dept. of Labor,
- Date of Original:
- 2024-03
- Subject:
- Labor market--Georgia--Statistics--Periodicals.
Wages--Georgia--Statistics--Periodicals.
Hours of labor--Georgia--Statistics--Periodicals.
Hours of labor
Labor market.--fast--(OCoLC)fst00990036
Wages
Georgia
Georgia Government Documents--Serial - Location:
- United States, Georgia, 32.75042, -83.50018
- Medium:
- state government records
- Type:
- Text
- Format:
- application/pdf
- Description:
- Vol. 27, no. 1 (Jan. 2001)-
Title from caption.
Issue no. 12 for each year called annual issue; includes revised estimates for the year.
Compiled by the Dept. of Labor's Workforce Information and Analysis.
Latest issue consulted: Vol. 31, no. 5 (May 2005). - External Identifiers:
- Metadata URL:
- https://dlg.galileo.usg.edu/id:dlg_ggpd_46865732-2024-03
- Digital Object URL:
- https://dlg.galileo.usg.edu/do:dlg_ggpd_46865732-2024-03
- Language:
- eng
- Holding Institution:
- University of Georgia. Map and Government Information Library
- Rights:
-

Jackson Madison Elbert
Polk
Cobb
Gwinnett Barrow Clarke
D I M E N S I O N S Paulding
Haralson Douglas
DeKalb Rock-
Walton
Oconee Oglethorpe Wilkes
Lincoln
EdgefieSlCd,
Carroll
Fulton Clayton
dale Newton
Morgan Greene Taliaferro
Columbia
Fayette Henry
McDuffie Warren
Heard
Coweta
Spalding Butts Jasper Putnam Hancock
Glascock
Richmond
AikenSC,
Russell, AL
Troup Meriwether Pike Lamar Monroe Jones Baldwin
Jefferson
Burke
Measuring Georgia's Workforce Upson Bibb
Harris
Talbot
Crawford
March 2024 Data
Muscogee
Taylor
Peach
Washington
Wilkinson Twiggs
Johnson
Jenkins Emanuel
Screven
Volume L, Number 3
March 2024 Employment Situation Marion Chattahoo-
Houston Bleckley Macon
Laurens
Treutlen
chee
In millions
CandlGereorgBuialloEcmh ploEyfmfinegnhatm
(Seasonally Adjusted)
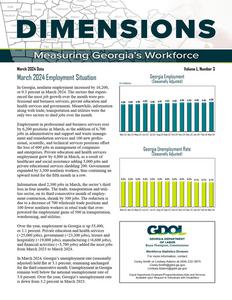
In Georgia, nonfaSrcmhleyemploymeDnotoilyncrePauslaesdki by D1o6d,g2e00, or S0t.e3wapret rceWnetbsitnerMarScuhmt2e0r 24. The sectors that experi-
Montgomery
Wheeler
Toombs
Evans
Bryan
enced the most job growth over Qufietmssainonal and business services,
CthrisepmonWthilcwoxere pro- Telfair private education and
healRthansdeolrpvhicesTearrneldl govLeerenment. MTeuarnnewr hile, inBfeonrHmillation
Tattnall
Jef4f.89 4.90 4.90 4.92 4.90 4.91 4.9L2ibe4rt.9y2
Davis Appling
Long
Chatham
4.94 4.93 4.94
4.93
4.95
along with trade, transportation and utilities were the
oCnlalyy twoCaslehcoutonrs toDsohugehderjtoybsWoovrethr the month.Irwin
Coffee
Tift
Bacon
Wayne
McIntosh
EmEaprlyloyment iBnakperrofessional by 6,200 positions iMn iMtchaerllch,
aansCdothlbqeuuisattidndeistsiosnerovBfiec6rre,i7esn0r0oseAtkinson
jobs inMailldemr inistrative ment and remediation
asenrdvsicuepspaonrtda1n0d0wnCaeoswotkepmroafneasLg-anei-er
Mar-23
Ware
Apr-23
Pierce
Brantley
May-23 Jun-23 Jul-23 Aug-23
Glynn
Sep-23 Oct-23
Nov-23
Dec-23
Jan-24
Feb-24
Mar-24
sthioeSnelamolsi,nssoocleDifee6nc0atit0ufircjo, basnGdirnatdemycahnnaTichgoaemlmasseernvtiBocrfeosockopsmospitaiLnooinwessndoefsfset Clinch and enterprises. Private education and health serviceEschols
Charlton
Camden
Georgia Unemployment Rate
(Seasonally Adjusted)
employment grew by 4,800 in March, as a result of
healthcare and social assistance adding 5,000 jobs and private educational services shedding 200. Government
expanded by 3,300 nonfarm workers, thus continuing an
upward trend for the fifth month in a row.
3.2% 3.2% 3.2% 3.2% 3.2% 3.2% 3.2% 3.2% 3.2% 3.2% 3.1% 3.1% 3.1%
Information shed 2,300 jobs in March, the sector's third loss in four months. The trade, transportation and utili-
ties sector, on its third consecutive month of employ-
ment contraction, shrank by 300 jobs. The reduction is due to a decrease of 700 wholesale trade positions and
100 fewer nonfarm workers in retail trade that overpowered the employment gains of 500 in transportation,
Mar-23 Apr-23 May-23 Jun-23 Jul-23 Aug-23 Sep-23 Oct-23 Nov-23 Dec-23 Jan-24 Feb-24 Mar-24
warehousing, and utilities.
Over the year, employment in Georgia is up 55,400, or 1.1 percent. Private education and health services (+25,000 jobs), government (+23,300 jobs), leisure and hospitality (+19,000 jobs), manufacturing (+6,600 jobs), and financial activities (+5,700 jobs) added the most jobs from March 2023 to March 2024.
In March 2024, Georgia's unemployment rate (seasonally adjusted) held flat at 3.1 percent, remaining unchanged for the third consecutive month. Unemployment in Georgia remains well below the national unemployment rate of 3.8 persent. Over the year, Georgia's unemployment rate is down from 3.2 percent in March 2023.
Bruce Thompson, Commissioner
Workforce Statistics Division For more information, contact
Corey Smith or Lindsey Adams at (404) 232-3875 Corey.Smith@gdol.ga.gov
Lindsey.Adams@gdol.ga.gov
Equal Opportunity Employer/ProgramAuxiliary Aids and Services Available upon Request to Individuals with Disabilities
GEORGIA Nonfarm Employment
(In thousands)
(Seasonally Adjusted)
Preliminary
Revised Revised
MAR 2024 FEB 2024 MAR 2023
Change in Jobs from FEB 2024
Net %
Change in Jobs from MAR 2023
Net %
Total Nonfarm
4,949.5
4,933.3
4,894.1
16.2 0.3
55.4 1.1
Total Private
4,235.9
4,223.0
4,203.8
12.9 0.3
32.1 0.8
Goods Producing
667.2
665.6
655.2
1.6 0.2
12.0 1.8
Service-Providing
4,282.3
4,267.7
4,238.9
14.6 0.3
43.4 1.0
Private Service-Providing
3,568.7
3,557.4
3,548.6
11.3 0.3
20.1 0.6
Mining and Logging
9.6
9.6
9.7
0.0 0.0
-0.1 -1.0
Mining, Logging and Construction
234.8
233.3
229.4
1.5 0.6
5.4 2.4
Construction
225.2
223.7
219.7
1.5 0.7
5.5 2.5
Manufacturing
432.4
432.3
425.8
0.1 0.0
6.6 1.6
Durable Goods
225.6
225.2
219.7
0.4 0.2
5.9 2.7
Non-Durable Goods
206.8
207.1
206.1
-0.3 -0.1
0.7 0.3
Trade, Transportation, and Utilities
1,029.5
1,029.8
1,044.9
-0.3 0.0
-15.4 -1.5
Wholesale Trade
224.9
225.6
228.8
-0.7 -0.3
-3.9 -1.7
Retail Trade
516.2
516.3
519.0
-0.1 0.0
-2.8 -0.5
Transportation, Warehousing, and Utilities
288.4
287.9
297.1
0.5 0.2
-8.7 -2.9
Information
107.5
109.8
124.3
-2.3 -2.1
-16.8 -13.5
Financial Activities
283.6
283.3
277.9
0.3 0.1
5.7 2.1
Finance and Insurance
204.2
203.5
198.6
0.7 0.3
5.6 2.8
Real Estate and Rental and Leasing
79.4
79.8
79.3
-0.4 -0.5
0.1 0.1
Professional and Business Services
777.4
771.2
777.3
6.2 0.8
0.1 0.0
Professional, Scientific, and Technical Services
339.1
339.0
330.7
0.1 0.0
8.4 2.5
Management of Companies and Enterprises
96.4
97.0
92.6
-0.6 -0.6
3.8 4.1
Admin and Support, Waste Mngmnt and Remediation
341.9
335.2
354.0
6.7 2.0
-12.1 -3.4
Private Education and Health Services
674.9
670.1
649.9
4.8 0.7
25.0 3.8
Private Educational Services
98.6
98.8
97.7
-0.2 -0.2
0.9 0.9
Health Care and Social Assistance
576.3
571.3
552.2
5.0 0.9
24.1 4.4
Leisure and Hospitality
527.0
524.7
508.0
2.3 0.4
19.0 3.7
Arts, Entertainment, and Recreation
65.9
67.5
60.5
-1.6 -2.4
5.4 8.9
Accommodation and Food Services
461.1
457.2
447.5
3.9 0.9
13.6 3.0
Other Services
168.8
168.5
166.3
0.3 0.2
2.5 1.5
Government
713.6
710.3
690.3
3.3 0.5
23.3 3.4
Federal Government
111.4
110.9
108.0
0.5 0.5
3.4 3.1
State Government
164.8
164.1
159.1
0.7 0.4
5.7 3.6
Local Government
437.4
435.3
423.2
2.1 0.5
14.2 3.4
?Note: These seasonally adjusted estimates were prepared in cooperation with the U.S. Department of Labor, Bureau of Labor Statistics, based upon monthly reports submitted by selected
employers throughout Georgia. The estimates include all full- and part-time wage and salary workers who were employed during or received pay for any part of the pay period that includes the twelfth of the month. Proprietors, domestic workers, self-employed persons, unpaid family workers and personnel of the armed forces are excluded. Estimates based on 2023 benchmark.
Source: Georgia Department of Labor, Workforce Statistics Division
Georgia Department of Labor, Bruce Thompson, Commissioner Equal Opportunity Employer/Program Auxiliary Aids and Services Available Upon Request to Individuals With Disabilities
2
GEORGIA Nonfarm Employment
(In thousands)
(Not Seasonally Adjusted)
Preliminary
Revised
Revised
MAR 2024 FEB 2024 MAR 2023
Change in Jobs from FEB 2024
Net %
Change in Jobs from MAR 2023
Net %
Total Nonfarm
4,941.3
4,916.6
4,884.4
24.7 0.5
56.9 1.2
Total Private
4,224.7
4,203.8
4,190.8
20.9 0.5
33.9 0.8
Goods Producing
666.5
664.8
655.1
1.7 0.3
11.4 1.7
Service-Providing
4,274.8
4,251.8
4,229.3
23.0 0.5
45.5 1.1
Private Service-Providing
3,558.2
3,539.0
3,535.7
19.2 0.5
22.5 0.6
Mining and Logging
9.6
9.6
9.7
0.0 0.0
-0.1 -1.0
Mining, Logging and Construction
234.1
231.9
228.7
2.2 1.0
5.4 2.4
Construction
224.5
222.3
219.0
2.2 1.0
5.5 2.5
Construction of Buildings
52.4
52.5
48.9
-0.1 -0.2
3.5 7.2
Heavy and Civil Engineering Construction
33.7
33.3
34.7
0.4 1.2
-1.0 -2.9
Specialty Trade Contractors
138.4
136.5
135.4
1.9 1.4
3.0 2.2
Manufacturing
432.4
432.9
426.4
-0.5 -0.1
6.0 1.4
Durable Goods
225.2
225.3
220.0
-0.1 0.0
5.2 2.4
Transportation Equipment Manufacturing
60.9
60.8
58.7
0.1 0.2
2.2 3.8
Non-Durable Goods
207.2
207.6
206.4
-0.4 -0.2
0.8 0.4
Food Manufacturing
71.5
70.9
69.8
0.6 0.9
1.7 2.4
Textile Mills
14.9
15.1
15.5
-0.2 -1.3
-0.6 -3.9
Textile Product Mills
25.1
25.4
25.8
-0.3 -1.2
-0.7 -2.7
Trade, Transportation, and Utilities
1,026.1
1,025.6
1,039.9
0.5 0.1
-13.8 -1.3
Wholesale Trade
224.5
225.4
227.9
-0.9 -0.4
-3.4 -1.5
Merchant Wholesalers, Durable Goods
119.8
120.0
121.7
-0.2 -0.2
-1.9 -1.6
Merchant Wholesalers, Nondurable Goods
64.9
65.8
65.1
-0.9 -1.4
-0.2 -0.3
Wholesale Trade Agents and Brokers
39.8
39.6
41.1
0.2 0.5
-1.3 -3.2
Retail Trade
515.6
513.8
516.6
1.8 0.4
-1.0 -0.2
Food and Beverage Retailers
100.7
101.6
101.7
-0.9 -0.9
-1.0 -1.0
General Merchandise Retailers
116.5
116.7
117.4
-0.2 -0.2
-0.9 -0.8
Sporting Goods, Hobby, Musical Instr, Book, & Misc Retailers
41.4
40.5
40.9
0.9 2.2
0.5 1.2
Transportation, Warehousing, and Utilities
286.0
286.4
295.4
-0.4 -0.1
-9.4 -3.2
Utilities
21.2
21.0
20.8
0.2 1.0
0.4 1.9
Transportation and Warehousing
264.8
265.4
274.6
-0.6 -0.2
-9.8 -3.6
Air Transportation
39.2
38.8
36.7
0.4 1.0
2.5 6.8
Truck Transportation
60.8
60.3
62.3
0.5 0.8
-1.5 -2.4
Couriers and Messengers
29.5
29.4
30.7
0.1 0.3
-1.2 -3.9
Warehousing and Storage
84.7
86.2
92.8
-1.5 -1.7
-8.1 -8.7
Information
107.0
110.4
127.2
-3.4 -3.1
-20.2 -15.9
Telecommunications
33.6
33.7
35.4
-0.1 -0.3
-1.8 -5.1
Wired and Wireless Telecommunications (expt Satellite)
26.3
26.3
27.4
0.0 0.0
-1.1 -4.0
Computing Infra Providers, Data Processing, Web, & Related Svcs
24.5
24.6
24.6
-0.1 -0.4
-0.1 -0.4
Financial Activities
283.4
283.6
276.9
-0.2 -0.1
6.5 2.4
Finance and Insurance
203.7
203.5
198.1
0.2 0.1
5.6 2.8
Insurance Carriers and Related Activities
105.1
105.3
100.8
-0.2 -0.2
4.3 4.3
Real Estate and Rental and Leasing
79.7
80.1
78.8
-0.4 -0.5
0.9 1.1
Professional and Business Services
774.9
768.5
774.8
6.4 0.8
0.1 0.0
Professional, Scientific, and Technical Services
339.2
340.4
330.1
-1.2 -0.4
9.1 2.8
Accounting, Tax Prep, and Bookkeeping Services
38.6
39.0
41.7
-0.4 -1.0
-3.1 -7.4
Architectural, Engineering, and Related Services
51.1
51.2
49.6
-0.1 -0.2
1.5 3.0
Computer Systems Design and Related Services
83.0
83.6
82.3
-0.6 -0.7
0.7 0.9
Management and Technical Consulting Services
62.7
62.7
57.7
0.0 0.0
5.0 8.7
Management of Companies and Enterprises
96.3
97.2
92.4
-0.9 -0.9
3.9 4.2
Admin and Support, Waste Mngmnt and Remediation
339.4
330.9
352.3
8.5 2.6
-12.9 -3.7
Employment Services
157.2
150.0
170.2
7.2 4.8
-13.0 -7.6
Private Education and Health Services
676.9
670.7
648.2
6.2 0.9
28.7 4.4
Private Educational Services
100.5
100.3
98.5
0.2 0.2
2.0 2.0
Private Colleges, Universities, and Professional Schools
46.1
46.0
44.8
0.1 0.2
1.3 2.9
Health Care and Social Assistance
576.4
570.4
549.7
6.0 1.1
26.7 4.9
Ambulatory Health Care Services
258.7
255.5
249.4
3.2 1.3
9.3 3.7
Hospitals
175.1
172.2
164.4
2.9 1.7
10.7 6.5
Nursing and Residential Care Facilities
60.5
60.1
57.3
0.4 0.7
3.2 5.6
Social Assistance
82.1
82.6
78.6
-0.5 -0.6
3.5 4.5
Leisure and Hospitality
522.0
512.8
503.6
9.2 1.8
18.4 3.7
Arts, Entertainment, and Recreation
63.4
63.3
57.7
0.1 0.2
5.7 9.9
Amusement, Gambling, and Recreation Industries
46.4
46.0
41.5
0.4 0.9
4.9 11.8
Accommodation and Food Services
458.6
449.5
445.9
9.1 2.0
12.7 2.9
Accommodation
45.1
43.5
45.5
1.6 3.7
-0.4 -0.9
Food Services and Drinking Places
413.5
406.0
400.4
7.5 1.9
13.1 3.3
Other Services
167.9
167.4
165.1
0.5 0.3
2.8 1.7
Repair and Maintenance
45.8
45.2
45.6
0.6 1.3
0.2 0.4
Personal and Laundry Services
41.1
41.6
40.5
-0.5 -1.2
0.6 1.5
Religious, Grantmaking, Civic, Professional, and Similar
81.0
80.6
79.0
0.4 0.5
2.0 2.5
Government
716.6
712.8
693.6
3.8 0.5
23.0 3.3
Federal Government
111.0
111.0
107.7
0.0 0.0
3.3 3.1
Department of Defense
46.6
46.6
44.3
0.0 0.0
2.3 5.2
State Government
166.9
166.3
161.1
0.6 0.4
5.8 3.6
State Government Educational Services
99.9
99.8
96.5
0.1 0.1
3.4 3.5
State Government excluding Educational Services
67.0
66.5
64.6
0.5 0.8
2.4 3.7
Local Government
438.7
435.5
424.8
3.2 0.7
13.9 3.3
Local Government Educational Services
255.5
255.0
250.8
0.5 0.2
4.7 1.9
Local Government excluding Educational Services
183.2
180.5
174.0
2.7 1.5
9.2 5.3
?Note: These not seasonally adjusted estimates were prepared in cooperation with the U.S. Department of Labor, Bureau of Labor Statistics, based upon monthly reports submitted by selected
employers throughout Georgia. The estimates include all full- and part-time wage and salary workers who were employed during or received pay for any part of the pay period that includes the
twelfth of the month. Proprietors, domestic workers, self-employed persons, unpaid family workers and personnel of the armed forces are excluded. Estimates based on 2023 benchmark.
Source: Georgia Department of Labor, Workforce Statistics Division
3
ALBANY MSA Nonfarm Employment
(Not Seasonally Adjusted)
(In thousands)
Preliminary
Revised
Revised
MAR 2024 FEB 2024 MAR 2023
Change in Jobs from FEB 2024
Net %
Change in Jobs from MAR 2023
Net %
Total Nonfarm Total Private Goods Producing
62.3
61.9
63.0
50.6
50.2
51.2
7.0
7.0
7.0
0.4 0.7 0.4 0.8 0.0 0.0
-0.7 -1.1 -0.6 -1.2 0.0 0.0
Service-Providing Private Service-Providing Trade, Transportation, and Utilities
55.3
54.9
56.0
43.6
43.2
44.2
13.7
13.6
13.6
0.4 0.7 0.4 0.9 0.1 0.7
-0.7 -1.3 -0.6 -1.4 0.1 0.7
Retail Trade Government
Federal Government
7.6
7.5
7.5
11.7
11.7
11.8
2.3
2.3
2.3
0.1 1.3 0.0 0.0 0.0 0.0
0.1 1.3 -0.1 -0.9 0.0 0.0
State Government Local Government
2.8
2.8
2.7
0.0 0.0
6.6
6.6
6.8
0.0 0.0
0.1 3.7 -0.2 -2.9
?Note: These not seasonally adjusted estimates were prepared in cooperation with the U.S. Department of Labor, Bureau of Labor Statistics, based upon monthly reports submitted by
selected employers in the Albany Metropolitan Statistical Area, which includes Baker, Dougherty, Lee, Terrell and Worth counties. The estimates include all full- and part-time wage and salary workers who were employed during or received pay for any part of the pay period that includes the twelfth of the month. Proprietors, domestic workers, self-employed persons, unpaid familyworkers and personnel of the armed forces are excluded. Estimates based on 2023 benchmark.
Source: Georgia Department of Labor, Workforce Statistics Division
ATHENS-CLARKE COUNTY MSA Nonfarm Employment
(In thousands)
(Not Seasonally Adjusted)
Preliminary
Revised
Revised
MAR 2024 FEB 2024 MAR 2023
Change in Jobs from FEB 2024
Net %
Change in Jobs from MAR 2023
Net %
Total Nonfarm
104.6
104.2
100.5
0.4 0.4
4.1 4.1
Total Private Goods Producing Service-Providing
74.2
73.9
72.2
10.9
10.9
10.6
93.7
93.3
89.9
0.3 0.4 0.0 0.0 0.4 0.4
2.0 2.8 0.3 2.8 3.8 4.2
Private Service-Providing Trade, Transportation, and Utilities
Retail Trade
63.3
63.0
61.6
0.3 0.5
17.0
17.1
17.3
-0.1 -0.6
11.0
11.1
11.5
-0.1 -0.9
1.7 2.8 -0.3 -1.7 -0.5 -4.4
Professional and Business Services Leisure and Hospitality Government
9.9
9.9
9.0
12.2
12.0
12.0
30.4
30.3
28.3
0.0 0.0 0.2 1.7 0.1 0.3
0.9 10.0 0.2 1.7 2.1 7.4
Federal Government State Government Local Government
1.1
1.1
1.1
20.7
20.7
19.1
8.6
8.5
8.1
0.0 0.0 0.0 0.0 0.1 1.2
0.0 0.0 1.6 8.4 0.5 6.2
?Note: These not seasonally adjusted estimates were prepared in cooperation with the U.S. Department of Labor, Bureau of Labor Statistics, based upon monthly reports submitted by selected
employers in the Athens-Clarke County Metropolitan Statistical Area, which includes Clarke, Madison, Oconee and Oglethorpe counties. The estimates include all full- and part-time wage and salary workers who were employed during or received pay for any part of the pay period that includes the twelfth of the month. Proprietors, domestic workers, self-employed persons, unpaid family workers and personnel of the armed forces are excluded. Estimates based on 2023 benchmark.
Source: Georgia Department of Labor, Workforce Statistics Division
4
ATLANTA MSA Nonfarm Employment
(In thousands)
(Not Seasonally Adjusted)
Preliminary MAR 2024
Revised FEB 2024
Change in Jobs Revised from FEB 2024 MAR 2023 Net %Change
in Jobs from MAR 2023
Net %
Total Nonfarm
3,068.7
3,057.5
3,038.6
11.2 0.4
30.1 1.0
Total Private
2,708.8
2,699.2
2,693.1
9.6 0.4
15.7 0.6
Goods Producing
330.3
329.3
323.8
1.0 0.3
6.5 2.0
Service-Providing
2,738.4
2,728.2
2,714.8
10.2 0.4
23.6 0.9
Private Service-Providing
2,378.5
2,369.9
2,369.3
8.6 0.4
9.2 0.4
Mining and Logging
2.1
2.1
2.0
0.0 0.0
0.1 5.0
Mining, Logging and Construction
148.3
146.7
143.9
1.6 1.1
4.4 3.1
Construction
146.2
144.6
141.9
1.6 1.1
4.3 3.0
Construction of Buildings
34.1
33.9
32.3
0.2 0.6
1.8 5.6
Specialty Trade Contractors
91.6
90.0
88.9
1.6 1.8
2.7 3.0
Manufacturing
182.0
182.6
179.9
-0.6 -0.3
2.1 1.2
Durable Goods
97.9
98.2
96.9
-0.3 -0.3
1.0 1.0
Transportation Equipment Manufacturing
17.7
17.7
17.2
0.0 0.0
0.5 2.9
Non-Durable Goods
84.1
84.4
83.0
-0.3 -0.4
1.1 1.3
Food Manufacturing
24.3
24.4
23.7
-0.1 -0.4
0.6 2.5
Trade, Transportation, and Utilities
651.7
652.7
662.4
-1.0 -0.2
-10.7 -1.6
Wholesale Trade
156.5
157.4
162.3
-0.9 -0.6
-5.8 -3.6
Merchant Wholesalers, Durable Goods
86.3
86.4
89.3
-0.1 -0.1
-3.0 -3.4
Merchant Wholesalers, Nondurable Goods
40.0
40.6
41.4
-0.6 -1.5
-1.4 -3.4
Wholesale Trade Agents and Brokers
30.2
30.4
31.6
-0.2 -0.7
-1.4 -4.4
Retail Trade
300.3
299.5
300.6
0.8 0.3
-0.3 -0.1
Food and Beverage Retailers
63.1
63.6
62.9
-0.5 -0.8
0.2 0.3
General Merchandise Retailers
62.7
62.8
63.6
-0.1 -0.2
-0.9 -1.4
Sporting Goods, Hobby, Musical Instr, Book, & Misc Retailers
26.8
26.4
26.7
0.4 1.5
0.1 0.4
Transportation, Warehousing, and Utilities
194.9
195.8
199.5
-0.9 -0.5
-4.6 -2.3
Utilities
11.1
11.1
10.7
0.0 0.0
0.4 3.7
Transportation and Warehousing
183.8
184.7
188.8
-0.9 -0.5
-5.0 -2.7
Air Transportation
38.6
38.3
36.0
0.3 0.8
2.6 7.2
Truck Transportation
37.1
37.2
38.1
-0.1 -0.3
-1.0 -2.6
Couriers and Messengers
21.5
21.5
22.9
0.0 0.0
-1.4 -6.1
Information
95.8
98.2
113.9
-2.4 -2.4
-18.1 -15.9
Telecommunications
28.1
28.2
29.4
-0.1 -0.4
-1.3 -4.4
Wired and Wireless Telecommunications (expt Satellite)
21.0
20.9
21.8
0.1 0.5
-0.8 -3.7
Computing Infra Providers, Data Processing, Web, & Related Svcs
23.8
23.8
23.7
0.0 0.0
0.1 0.4
Financial Activities
206.1
207.4
203.3
-1.3 -0.6
2.8 1.4
Finance and Insurance
148.8
149.5
145.4
-0.7 -0.5
3.4 2.3
Insurance Carriers and Related Activities
78.9
79.6
74.7
-0.7 -0.9
4.2 5.6
Real Estate and Rental and Leasing
57.3
57.9
57.9
-0.6 -1.0
-0.6 -1.0
Professional and Business Services
584.6
581.3
586.0
3.3 0.6
-1.4 -0.2
Professional, Scientific, and Technical Services
272.9
273.4
268.1
-0.5 -0.2
4.8 1.8
Accounting, Tax Prep, and Bookkeeping Services
28.3
28.5
31.2
-0.2 -0.7
-2.9 -9.3
Architectural, Engineering, and Related Services
38.8
38.7
37.9
0.1 0.3
0.9 2.4
Computer Systems Design and Related Services
72.5
72.9
71.6
-0.4 -0.6
0.9 1.3
Management and Technical Consulting Services
52.4
52.6
51.1
-0.2 -0.4
1.3 2.5
Management of Companies and Enterprises
82.1
82.9
79.6
-0.8 -1.0
2.5 3.1
Admin and Support, Waste Mngmnt and Remediation
229.6
225.0
238.3
4.6 2.0
-8.7 -3.7
Employment Services
106.3
103.0
116.4
3.3 3.2
-10.1 -8.7
Private Education and Health Services
420.0
416.3
399.6
3.7 0.9
20.4 5.1
Private Educational Services
71.8
71.8
70.8
0.0 0.0
1.0 1.4
Health Care and Social Assistance
348.2
344.5
328.8
3.7 1.1
19.4 5.9
Ambulatory Health Care Services
167.7
165.7
158.8
2.0 1.2
8.9 5.6
Hospitals
98.0
96.6
92.3
1.4 1.5
5.7 6.2
Social Assistance
52.5
52.2
49.0
0.3 0.6
3.5 7.1
Leisure and Hospitality
315.8
310.1
301.6
5.7 1.8
14.2 4.7
Arts, Entertainment, and Recreation
44.5
43.9
39.8
0.6 1.4
4.7 11.8
Accommodation and Food Services
271.3
266.2
261.8
5.1 1.9
9.5 3.6
Accommodation
22.4
22.1
22.7
0.3 1.4
-0.3 -1.3
Food Services and Drinking Places
248.9
244.1
239.1
4.8 2.0
9.8 4.1
Other Services
104.5
103.9
102.5
0.6 0.6
2.0 2.0
Repair and Maintenance
26.2
25.7
26.4
0.5 2.0
-0.2 -0.8
Personal and Laundry Services
28.9
29.3
28.0
-0.4 -1.4
0.9 3.2
Government
359.9
358.3
345.5
1.6 0.5
14.4 4.2
Federal Government
55.2
55.4
52.7
-0.2 -0.4
2.5 4.7
State Government
77.8
77.5
74.8
0.3 0.4
3.0 4.0
Local Government
226.9
225.4
218.0
1.5 0.7
8.9 4.1
?Note: These not seasonally adjusted estimates were prepared in cooperation with the U.S. Department of Labor, Bureau of Labor Statistics, based upon monthly reports submitted by
selected employers in the Atlanta Metropolitan Statistical Area, which includes Barrow, Bartow, Butts, Carroll, Cherokee, Clayton, Cobb, Coweta, Dawson, DeKalb, Douglas, Fayette, Forsyth,
Fulton, Gwinnett, Haralson, Heard, Henry, Jasper, Lamar, Meriwether, Morgan, Newton, Paulding, Pickens, Pike, Rockdale, Spalding and Walton counties. The estimates include all full- and
part-time wage and salary workers who were employed during or received pay for any part of the pay period that includes the twelfth of the month. Proprietors, domestic workers, self-employed
persons, unpaid family workers and personnel of the armed forces are excluded. Estimates based on 2023 benchmark.
Source: Georgia Department of Labor, Workforce Statistics Division
5
AUGUSTA-RICHMOND COUNTY MSA Nonfarm Employment
(In thousands)
(Not Seasonally Adjusted)
Preliminary Revised MAR 2024 FEB 2024
Revised MAR 2023
Change in Jobs
from FEB 2024
Net
%
Change in Jobs from MAR 2023
Net %
Total Nonfarm Total Private Goods Producing Service-Providing Private Service-Providing Mining, Logging and Construction Manufacturing Trade, Transportation, and Utilities
Wholesale Trade Retail Trade Transportation, Warehousing, and Utilities Information Financial Activities Professional and Business Services Private Education and Health Services Leisure and Hospitality Other Services Government Federal Government State Government Local Government
246.8 201.4
38.6 208.2 162.8
14.1 24.5 41.4
5.3 27.1
9.0 2.0 7.5 36.6 38.5 27.3 9.5 45.4 10.2 13.1 22.1
244.2 199.1
38.7 205.5 160.4
14.2 24.5 41.4
5.3 27.1
9.0 2.0 7.5 35.0 38.5 26.5 9.5 45.1 10.1 13.0 22.0
245.3 201.2
41.0 204.3 160.2
16.4 24.6 41.8
5.4 27.3
9.1 2.0 7.2 35.2 37.7 27.0 9.3 44.1 9.7 12.5 21.9
2.6 1.1 2.3 1.2 -0.1 -0.3 2.7 1.3 2.4 1.5 -0.1 -0.7 0.0 0.0 0.0 0.0 0.0 0.0 0.0 0.0 0.0 0.0 0.0 0.0 0.0 0.0 1.6 4.6 0.0 0.0 0.8 3.0 0.0 0.0 0.3 0.7 0.1 1.0 0.1 0.8 0.1 0.5
1.5 0.6 0.2 0.1 -2.4 -5.9 3.9 1.9 2.6 1.6 -2.3 -14.0 -0.1 -0.4 -0.4 -1.0 -0.1 -1.9 -0.2 -0.7 -0.1 -1.1 0.0 0.0 0.3 4.2 1.4 4.0 0.8 2.1 0.3 1.1 0.2 2.2 1.3 3.0 0.5 5.2 0.6 4.8 0.2 0.9
?Note: These not seasonally adjusted estimates were prepared in cooperation with the U.S. Department of Labor, Bureau of Labor Statistics, based upon monthly reports submitted by se-
lected employers in the Septembera-Richmond County Metropolitan Statistical Area, which includes Burke, Columbia, Lincoln, McDuffie and Richmond counties in Georgia and Aiken and Edgefield counties in South Carolina. The estimates include all full- and part-time wage and salary workers who were employed during or received pay for any part of the pay period that includes the twelfth of the month. Proprietors, domestic workers, self-employed persons, unpaid family workers and personnel of the armed forces are excluded. Estimates based on 2023 benchmark.
BRUNSWICK MSA Nonfarm Employment
(In thousands)
(Not Seasonally Adjusted)
Preliminary
Revised
Revised
MAR 2024 FEB 2024 MAR 2023
Change in Jobs from FEB 2024
Net %
Change in Jobs from MAR 2023
Net %
Total Nonfarm Total Private Goods Producing Service-Providing Private Service-Providing Trade, Transportation, and Utilities
Retail Trade Government
Federal Government State Government Local Government
48.2
47.7
46.9
39.1
38.9
38.3
4.4
4.4
4.3
43.8
43.3
42.6
34.7
34.5
34.0
9.3
9.3
9.0
5.7
5.7
5.6
9.1
8.8
8.6
2.2
2.1
2.1
1.8
1.7
1.7
5.1
5.0
4.8
0.5 1.1 0.2 0.5 0.0 0.0 0.5 1.2 0.2 0.6 0.0 0.0 0.0 0.0 0.3 3.4 0.1 4.8 0.1 5.9 0.1 2.0
1.3 2.8 0.8 2.1 0.1 2.3 1.2 2.8 0.7 2.1 0.3 3.3 0.1 1.8 0.5 5.8 0.1 4.8 0.1 5.9 0.3 6.3
?Note: These not seasonally adjusted estimates were prepared in cooperation with the U.S. Department of Labor, Bureau of Labor Statistics, based upon monthly reports submitted by
selected employers in the Brunswick Metropolitan Statistical Area, which includes Brantley, Glynn and McIntosh counties. The estimates include all full- and part-time wage and salary workers who were employed during or received pay for any part of the pay period that includes the twelfth of the month. Proprietors, domestic workers, self-employed persons, unpaid family workers and personnel of the armed forces are excluded. Estimates based on 2023 benchmark.
Source: Georgia Department of Labor, Workforce Statistics Division
6
COLUMBUS MSA Nonfarm Employment
(In thousands)
(Not Seasonally Adjusted)
Preliminary
Revised
Revised
MAR 2024 FEB 2024 MAR 2023
Change in Jobs from FEB 2024
Net %
Change in Jobs from MAR 2023
Net %
Total Nonfarm Total Private Goods Producing Service-Providing Private Service-Providing Mining, Logging and Construction Manufacturing Trade, Transportation, and Utilities
Wholesale Trade Retail Trade Transportation, Warehousing, and Utilities Information Financial Activities Finance and Insurance
Insurance Carriers and Related Activities Professional and Business Services Private Education and Health Services Leisure and Hospitality Other Services Government
Federal Government State Government Local Government
122.9 99.7 16.3
106.6 83.4 5.0 11.3 18.7 2.8 12.9 3.0 1.1 10.6 8.7 4.3 15.9 17.5 15.2 4.4 23.2 6.4 3.9 12.9
122.6 99.5 16.4
106.2 83.1 5.0 11.4 18.6 2.8 12.9 2.9 1.2 10.7 8.8 4.2 15.9 17.4 14.9 4.4 23.1 6.4 3.9 12.8
121.8 98.4 15.6
106.2 82.8 4.9 10.7 18.7 2.8 12.9 3.0 1.2 10.1 8.2 3.7 16.6 16.9 14.9 4.4 23.4 6.5 4.1 12.8
0.3 0.2 0.2 0.2 -0.1 -0.6 0.4 0.4 0.3 0.4 0.0 0.0 -0.1 -0.9 0.1 0.5 0.0 0.0 0.0 0.0 0.1 3.5 -0.1 -8.3 -0.1 -0.9 -0.1 -1.1 0.1 2.4 0.0 0.0 0.1 0.6 0.3 2.0 0.0 0.0 0.1 0.4 0.0 0.0 0.0 0.0 0.1 0.8
1.1 0.9 1.3 1.3 0.7 4.5 0.4 0.4 0.6 0.7 0.1 2.0 0.6 5.6 0.0 0.0 0.0 0.0 0.0 0.0 0.0 0.0 -0.1 -8.3 0.5 5.0 0.5 6.1 0.6 16.2 -0.7 -4.2 0.6 3.6 0.3 2.0 0.0 0.0 -0.2 -0.9 -0.1 -1.5 -0.2 -4.9 0.1 0.8
?Note: These not seasonally adjusted estimates were prepared in cooperation with the U.S. Department of Labor, Bureau of Labor Statistics, based upon monthly reports submitted by
selected employers in the Columbus Metropolitan Statistical Area, which includes Chattahoochee, Harris, Marion and Muscogee counties in Georgia and Russell County in Alabama. The estimates include all full- and part-time wage and salary workers who were employed during or received pay for any part of the pay period that includes the twelfth of the month. Proprietors, domestic workers, self-employed persons, unpaid family workers and personnel of the armed forces are excluded. Estimates based on 2023 benchmark.
DALTON MSA Nonfarm Employment
(In thousands)
(Not Seasonally Adjusted)
Preliminary
Revised Revised
MAR 2024 FEB 2024 MAR 2023
Change in Jobs from FEB 2024
Net %
Change in Jobs from MAR 2023
Net %
Total Nonfarm Total Private Goods Producing
69.2
69.2
68.0
0.0 0.0
62.0
62.1
61.0
-0.1 -0.2
23.2
23.5
23.7
-0.3 -1.3
1.2 1.8 1.0 1.6 -0.5 -2.1
Service-Providing Private Service-Providing Manufacturing
46.0
45.7
44.3
0.3 0.7
38.8
38.6
37.3
0.2 0.5
22.0
22.2
22.3
-0.2 -0.9
1.7 3.8 1.5 4.0 -0.3 -1.4
Textile Mills Textile Product Mills Trade, Transportation, and Utilities
3.9
4.0
3.9
-0.1 -2.5
12.4
12.5
12.7
-0.1 -0.8
14.2
14.2
14.2
0.0 0.0
0.0 0.0 -0.3 -2.4 0.0 0.0
Retail Trade Transportation, Warehousing, and Utilities Professional and Business Services
6.8
6.7
6.6
0.1 1.5
3.7
3.7
3.7
0.0 0.0
9.3
9.4
8.5
-0.1 -1.1
0.2 3.0 0.0 0.0 0.8 9.4
Government Federal Government State Government
7.2
7.1
7.0
0.1 1.4
0.3
0.3
0.3
0.0 0.0
1.0
1.0
1.0
0.0 0.0
0.2 2.9 0.0 0.0 0.0 0.0
Local Government
5.9
5.8
5.7
0.1 1.7
0.2 3.5
?Note: These not seasonally adjusted estimates were prepared in cooperation with the U.S. Department of Labor, Bureau of Labor Statistics, based upon monthly reports submitted by
selected employers in the Dalton Metropolitan Statistical Area, which includes Murray and Whitfield counties. The estimates include all full- and part-time wage and salary workers who were employed during or received pay for any part of the pay period that includes the twelfth of the month. Proprietors, domestic workers, self-employed persons, unpaid family workers and personnel of the armed forces are excluded. Estimates based on 2023 benchmark.
Source: Georgia Department of Labor, Workforce Statistics Division
7
GAINESVILLE MSA Nonfarm Employment
(In thousands)
(Not Seasonally Adjusted)
Preliminary
Revised
Revised
MAR 2024 FEB 2024 MAR 2023
Change in Jobs from FEB 2024
Net %
Change in Jobs from MAR 2023
Net %
Total Nonfarm
109.7
109.2
104.5
0.5 0.5
5.2 5.0
Total Private
98.0
97.6
93.3
0.4 0.4
4.7 5.0
Goods Producing
30.8
30.5
29.1
0.3 1.0
1.7 5.8
Service-Providing
78.9
78.7
75.4
0.2 0.3
3.5 4.6
Private Service-Providing
67.2
67.1
64.2
0.1 0.2
3.0 4.7
Trade, Transportation, and Utilities
20.8
21.0
19.7
-0.2 -1.0
1.1 5.6
Retail Trade
9.8
9.9
9.4
-0.1 -1.0
0.4 4.3
Government
11.7
11.6
11.2
0.1 0.9
0.5 4.5
Federal Government
0.5
0.5
0.5
0.0 0.0
0.0 0.0
State Government
3.0
2.9
2.7
0.1 3.5
0.3 11.1
Local Government
8.2
8.2
8.0
0.0 0.0
0.2 2.5
?Note: These not seasonally adjusted estimates were prepared in cooperation with the U.S. Department of Labor, Bureau of Labor Statistics, based upon monthly reports submitted by se-
lected employers in the Gainesville Metropolitan Statistical Area, which comprises Hall county. The estimates include all full- and part-time wage and salary workers who were employed during or received pay for any part of the pay period that includes the twelfth of the month. Proprietors, domestic workers, self-employed persons, unpaid family workers and personnel of the armed forces are excluded. Estimates based on 2023 benchmark.
HINESVILLE MSA Nonfarm Employment
(In thousands)
(Not Seasonally Adjusted)
Preliminary Revised Revised MAR 2024 FEB 2024 MAR 2023
Change in Jobs from FEB 2024
Net %
Change in Jobs from MAR 2023
Net %
Total Nonfarm Total Private
22.1
21.9
22.0
14.0
14.0
14.2
0.2 0.9 0.0 0.0
0.1 0.5 -0.2 -1.4
Goods Producing Service-Providing Private Service-Providing
2.7
2.8
2.7
-0.1 -3.6
19.4
19.1
19.3
0.3 1.6
11.3
11.2
11.5
0.1 0.9
0.0 0.0 0.1 0.5 -0.2 -1.7
Government Federal Government State Government
8.1
7.9
7.8
0.2 2.5
3.8
3.7
3.7
0.1 2.7
0.4
0.4
0.4
0.0 0.0
0.3 3.9 0.1 2.7 0.0 0.0
Local Government
3.9
3.8
3.7
0.1 2.6
0.2 5.4
?Note: These not seasonally adjusted estimates were prepared in cooperation with the U.S. Department of Labor, Bureau of Labor Statistics, based upon monthly reports submitted by
selected employers in the Hinesville Metropolitan Statistical Area, which includes Liberty and Long counties. The estimates include all full- and part-time wage and salary workers who were employed during or received pay for any part of the pay period that includes the twelfth of the month. Proprietors, domestic workers, self-employed persons, unpaid family workers and personnel of the armed forces are excluded. Estimates based on 2023 benchmark.
Source: Georgia Department of Labor, Workforce Statistics Division
8
MACON-BIBB COUNTY MSA Nonfarm Employment
(In thousands)
(Not Seasonally Adjusted)
Preliminary
Revised
Revised
MAR 2024 FEB 2024 MAR 2023
Change in Jobs from FEB 2024
Net %
Change in Jobs from MAR 2023
Net %
Total Nonfarm
100.6
100.1
100.9
0.5 0.5
-0.3 -0.3
Total Private
86.1
85.6
86.8
0.5 0.6
-0.7 -0.8
Goods Producing
11.2
11.1
11.1
0.1 0.9
0.1 0.9
Service-Providing
89.4
89.0
89.8
0.4 0.5
-0.4 -0.5
Private Service-Providing
74.9
74.5
75.7
0.4 0.5
-0.8 -1.1
Trade, Transportation, and Utilities
19.7
19.5
20.1
0.2 1.0
-0.4 -2.0
Retail Trade
12.2
12.2
12.3
0.0 0.0
-0.1 -0.8
Transportation, Warehousing, and Utilities
4.5
4.5
4.8
0.0 0.0
-0.3 -6.3
Financial Activities
8.0
8.0
8.5
0.0 0.0
-0.5 -5.9
Professional and Business Services
11.2
11.2
11.9
0.0 0.0
-0.7 -5.9
Private Education and Health Services
22.2
22.1
21.2
0.1 0.5
1.0 4.7
Leisure and Hospitality
10.2
10.0
10.1
0.2 2.0
0.1 1.0
Government
14.5
14.5
14.1
0.0 0.0
0.4 2.8
Federal Government
1.0
1.0
1.0
0.0 0.0
0.0 0.0
State Government
4.1
4.1
4.0
0.0 0.0
0.1 2.5
Local Government
9.4
9.4
9.1
0.0 0.0
0.3 3.3
?Note: These not seasonally adjusted estimates were prepared in cooperation with the U.S. Department of Labor, Bureau of Labor Statistics, based upon monthly reports submitted by
selected employers in the Macon-Bibb County Metropolitan Statistical Area, which includes Bibb, Crawford, Jones, Monroe and Twiggs counties. The estimates include all full- and part-time wage and salary workers who were employed during or received pay for any part of the pay period that includes the twelfth of the month. Proprietors, domestic workers, self-employed persons, unpaid family workers and personnel of the armed forces are excluded. Estimates based on 2023 benchmark.
ROME MSA Nonfarm Employment
(In thousands)
(Not Seasonally Adjusted)
Preliminary
Revised
Revised
MAR 2024 FEB 2024 MAR 2023
Change in Jobs from FEB 2024
Net %
Change in Jobs from MAR 2023
Net %
Total Nonfarm Total Private
47.8
47.6
46.7
42.3
42.0
40.9
0.2 0.4 0.3 0.7
1.1 2.4 1.4 3.4
Goods Producing Service-Providing Private Service-Providing
7.4
7.3
7.6
40.4
40.3
39.1
34.9
34.7
33.3
0.1 1.4 0.1 0.3 0.2 0.6
-0.2 -2.6 1.3 3.3 1.6 4.8
Manufacturing Trade, Transportation, and Utilities
Retail Trade
6.4
6.4
6.6
0.0 0.0
7.5
7.4
7.6
0.1 1.4
4.5
4.4
4.6
0.1 2.3
-0.2 -3.0 -0.1 -1.3 -0.1 -2.2
Private Education and Health Services Government
Federal Government
10.7
10.6
10.4
0.1 0.9
5.5
5.6
5.8
-0.1 -1.8
0.2
0.2
0.2
0.0 0.0
0.3 2.9 -0.3 -5.2 0.0 0.0
State Government Local Government
1.4
1.4
1.5
0.0 0.0
3.9
4.0
4.1
-0.1 -2.5
-0.1 -6.7 -0.2 -4.9
?Note: These not seasonally adjusted estimates were prepared in cooperation with the U.S. Department of Labor, Bureau of Labor Statistics, based upon monthly reports submitted by
selected employers in the Rome Metropolitan Statistical Area, which comprises Floyd county. The estimates include all full- and part-time wage and salary workers who were employed during or received pay for any part of the pay period that includes the twelfth of the month. Proprietors, domestic workers, self-employed persons, unpaid family workers and personnel of the armed forces are excluded. Estimates based on 2023 benchmark.
Source: Georgia Department of Labor, Workforce Statistics Division
9
SAVANNAH MSA Nonfarm Employment
(In thousands)
(Not Seasonally Adjusted)
Preliminary Revised
Revised
MAR 2024 FEB 2024 MAR 2023
Change in Jobs from FEB 2024
Net %
Change in Jobs from MAR 2023
Net %
Total Nonfarm
205.8
205.0
202.6
0.8 0.4
3.2 1.6
Total Private
180.8
180.1
178.7
0.7 0.4
2.1 1.2
Goods Producing
32.6
32.8
31.1
-0.2 -0.6
1.5 4.8
Service-Providing
173.2
172.2
171.5
1.0 0.6
1.7 1.0
Private Service-Providing
148.2
147.3
147.6
0.9 0.6
0.6 0.4
Mining, Logging and Construction
10.4
10.4
9.7
0.0 0.0
0.7 7.2
Manufacturing
22.2
22.4
21.4
-0.2 -0.9
0.8 3.7
Trade, Transportation, and Utilities
49.8
49.7
49.5
0.1 0.2
0.3 0.6
Wholesale Trade
7.8
7.9
7.6
-0.1 -1.3
0.2 2.6
Retail Trade
23.2
23.1
23.4
0.1 0.4
-0.2 -0.9
Transportation, Warehousing, and Utilities
18.8
18.7
18.5
0.1 0.5
0.3 1.6
Information
1.4
1.4
1.4
0.0 0.0
0.0 0.0
Financial Activities
7.6
7.6
7.0
0.0 0.0
0.6 8.6
Professional and Business Services
24.5
24.9
25.7
-0.4 -1.6
-1.2 -4.7
Private Education and Health Services
28.9
28.7
28.0
0.2 0.7
0.9 3.2
Leisure and Hospitality
27.7
26.8
27.8
0.9 3.4
-0.1 -0.4
Other Services
8.3
8.2
8.2
0.1 1.2
0.1 1.2
Government
25.0
24.9
23.9
0.1 0.4
1.1 4.6
Federal Government
2.9
3.0
2.9
-0.1 -3.3
0.0 0.0
State Government
5.3
5.3
5.1
0.0 0.0
0.2 3.9
Local Government
16.8
16.6
15.9
0.2 1.2
0.9 5.7
?Note: These not seasonally adjusted estimates were prepared in cooperation with the U.S. Department of Labor, Bureau of Labor Statistics, based upon monthly reports submitted by
selected employers in the Savannah Metropolitan Statistical Area, which includes Bryan, Chatham and Effingham counties. The estimates include all full- and part-time wage and salary workers who were employed during or received pay for any part of the pay period that includes the twelfth of the month. Proprietors, domestic workers, self-employed persons, unpaid family workers and personnel of the armed forces are excluded. Estimates based on 2023 benchmark.
VALDOSTA MSA Nonfarm Employment
(In thousands)
(Not Seasonally Adjusted)
Preliminary Revised
Revised
MAR 2024 FEB 2024 MAR 2023
Change in Jobs from FEB 2024
Net %
Change in Jobs from MAR 2023
Net %
Total Nonfarm Total Private Goods Producing
56.3
56.0
56.4
43.7
43.4
44.1
8.1
8.0
7.9
0.3 0.5 0.3 0.7 0.1 1.3
-0.1 -0.2 -0.4 -0.9 0.2 2.5
Service-Providing Private Service-Providing
48.2
48.0
48.5
35.6
35.4
36.2
0.2 0.4 0.2 0.6
-0.3 -0.6 -0.6 -1.7
Trade, Transportation, and Utilities
12.6
12.6
13.0
0.0 0.0
-0.4 -3.1
Retail Trade Government
7.0
7.1
7.0
-0.1 -1.4
12.6
12.6
12.3
0.0 0.0
0.0 0.0 0.3 2.4
Federal Government
1.1
1.1
1.1
0.0 0.0
0.0 0.0
State Government Local Government
3.3
3.3
2.9
0.0 0.0
8.2
8.2
8.3
0.0 0.0
0.4 13.8 -0.1 -1.2
?Note: These not seasonally adjusted estimates were prepared in cooperation with the U.S. Department of Labor, Bureau of Labor Statistics, based upon monthly reports submitted by
selected employers in the Valdosta Metropolitan Statistical Area, which includes Brooks, Echols, Lanier and Lowndes counties. The estimates include all full- and part-time wage and salary workers who were employed during or received pay for any part of the pay period that includes the twelfth of the month. Proprietors, domestic workers, self-employed persons, unpaid family workers and personnel of the armed forces are excluded. Estimates based on 2023 benchmark.
Source: Georgia Department of Labor, Workforce Statistics Division
10
WARNER ROBINS MSA Nonfarm Employment
(In thousands)
(Not Seasonally Adjusted)
Preliminary Revised
Revised
MAR 2024 FEB 2024 MAR 2023
Change in Jobs from FEB 2024
Net %
Change in Jobs from MAR 2023
Net %
Total Nonfarm Total Private Goods Producing Service-Providing Private Service-Providing Trade, Transportation, and Utilities
Retail Trade Government
Federal Government State Government Local Government
81.4
80.7
80.9
0.7 0.9
54.0
53.8
53.1
0.2 0.4
11.5
11.4
11.0
0.1 0.9
69.9
69.3
69.9
0.6 0.9
42.5
42.4
42.1
0.1 0.2
12.3
12.5
12.7
-0.2 -1.6
9.6
9.8
9.9
-0.2 -2.0
27.4
26.9
27.8
0.5 1.9
15.1
14.7
15.3
0.4 2.7
2.3
2.3
2.3
0.0 0.0
10.0
9.9
10.2
0.1 1.0
0.5 0.6 0.9 1.7 0.5 4.6 0.0 0.0 0.4 1.0 -0.4 -3.2 -0.3 -3.0 -0.4 -1.4 -0.2 -1.3 0.0 0.0 -0.2 -2.0
?Note: These not seasonally adjusted estimates were prepared in cooperation with the U.S. Department of Labor, Bureau of Labor Statistics, based upon monthly reports submitted by
selected employers in the Warner Robins Metropolitan Statistical Area, which includes Houston, Peach and Pulaski counties. The estimates include all full- and part-time wage and salary workers who were employed during or received pay for any part of the pay period that includes the twelfth of the month. Proprietors, domestic workers, self-employed persons, unpaid family workers and personnel of the armed forces are excluded. Estimates based on 2023 benchmark.
Total Nonfarm Employment by Metro Statistical Area
(In thousands)
(Seasonally Adjusted)
Preliminary
Revised
Revised
MAR 2024 FEB 2024 MAR 2023
Change in Jobs from FEB 2024
Net %
Change in Jobs from MAR 2023
Net %
Albany MSA
62.6
62.5
63.0
0.1 0.2
-0.4 -0.6
Athens-Clarke County MSA
104.6
104.4
100.9
0.2 0.2
3.7 3.7
Atlanta MSA
3,078.0 3,070.4 3,044.8
7.6 0.2
33.2 1.1
Augusta-Richmond County MSA
247.6
245.5
245.8
2.1 0.9
1.8 0.7
Brunswick MSA
48.5
48.4
47.4
0.1 0.2
1.1 2.3
Columbus MSA
123.1
123.0
121.7
0.1 0.1
1.4 1.2
Dalton MSA
69.3
69.2
68.1
0.1 0.1
1.2 1.8
Gainesville MSA
109.9
109.6
105.1
0.3 0.3
4.8 4.6
Hinesville MSA
22.0
21.9
22.0
0.1 0.5
0.0 0.0
Macon-Bibb County MSA
100.9
100.6
100.9
0.3 0.3
0.0 0.0
Rome MSA
47.9
47.8
46.5
0.1 0.2
1.4 3.0
Savannah MSA
206.5
206.2
202.8
0.3 0.1
3.7 1.8
Valdosta MSA
56.2
56.1
56.3
0.1 0.2
-0.1 -0.2
Warner Robins MSA
81.6
81.0
80.9
0.6 0.7
0.7 0.9
?Note: These seasonally adjusted estimates were prepared in cooperation with the U.S. Department of Labor, Bureau of Labor Statistics, based upon monthly reports submitted by selected
employers throughout Georgia. The estimates include all full- and part-time wage and salary workers who were employed during or received pay for any part of the pay period that includes the twelfth of the month. Proprietors, domestic workers, self-employed persons, unpaid family workers and personnel of the armed forces are excluded. Estimates based on 2023 benchmark.
Source: Georgia Department of Labor, Workforce Statistics Division
11
Georgia Statewide Hours and Earnings
All Employee
Average Weekly Earnings (AWE)
Preliminary MAR 2024
Revised FEB 2024
Revised MAR 2023
Total Private..................................................................................................$1,044.47..........................$1,066.40....................$1,038.26 Goods Producing....................................................................................... $1,310.15..........................$1,300.08....................$1,235.66 Private Service Providing............................................................................. $995.98..........................$1,022.64....................$1,003.30 Construction............................................................................................$1,325.02.......................... $1,297.92....................$1,270.32 Manufacturing.........................................................................................$1,270.92..........................$1,256.82.................... $1,205.41 Trade, Transportation, and Utilities............................................................$857.67............................ $864.28.......................$883.78 Financial Activities..................................................................................$1,385.70.......................... $1,414.04.................... $1,201.53 Professional and Business Services......................................................$1,384.32.......................... $1,374.55....................$1,383.47 Educational and Health Services.............................................................$1,174.70.......................... $1,142.44.................... $1,135.68 Leisure and Hospitality.............................................................................. $492.64............................ $495.55.......................$491.30 Other Services.......................................................................................... $904.95............................ $900.57.......................$830.32
Average Weekly Hours (AWH)
Preliminary MAR 2024
Revised FEB 2024
Revised MAR 2023
Total Private...........................................................................................................34.2.................................. 34.4.............................34.3 Goods Producing................................................................................................40.3...................................40.3.............................40.5 Private Service Providing.................................................................................... 33.1.................................. 33.3.............................33.2 Construction.....................................................................................................39.4...................................39.0.............................40.2 Manufacturing..................................................................................................40.8...................................40.7.............................40.6 Trade, Transportation, and Utilities..................................................................33.0...................................32.9.............................33.3 Financial Activities...........................................................................................38.1.................................. 38.3.............................36.3 Professional and Business Services...............................................................36.7................................... 37.0............................. 37.2 Educational and Health Services.....................................................................34.0.................................. 33.8.............................33.8 Leisure and Hospitality.....................................................................................26.5...................................26.5.............................26.4 Other Services.................................................................................................33.1...................................33.0.............................33.4
Average Hourly Earnings (AHE)
Preliminary MAR 2024
Revised FEB 2024
Revised MAR 2023
Total Private...................................................................................................... $30.54...............................$31.00.........................$30.27 Goods Producing............................................................................................$32.51.............................. $32.26.........................$30.51 Private Service Providing............................................................................... $30.09...............................$30.71.........................$30.22 Construction................................................................................................ $33.63.............................. $33.28.........................$31.60 Manufacturing.............................................................................................. $31.15.............................. $30.88.........................$29.69 Trade, Transportation, and Utilities..............................................................$25.99.............................. $26.27.........................$26.54 Financial Activities.......................................................................................$36.37.............................. $36.92......................... $33.10 Professional and Business Services........................................................... $37.72............................... $37.15..........................$37.19 Educational and Health Services................................................................ $34.55.............................. $33.80.........................$33.60 Leisure and Hospitality.................................................................................$18.59...............................$18.70......................... $18.61 Other Services.............................................................................................$27.34...............................$27.29.........................$24.86
Read more about the hours and earnings series at http://www.bls.gov/sae/home.htm
?Note: These not seasonally adjusted estimates were prepared in cooperation with the U.S. Department of Labor, Bureau of Labor Statistics, based upon monthly reports submitted by
selected employers throughout Georgia. The estimates include all full- and part-time wage and salary workers who were employed during or received pay for any part of the pay period that includes the twelfth of the month. Proprietors, domestic workers, self-employed persons, unpaid family workers and personnel of the armed forces are excluded. Estimates based on 2023 benchmark.
Source: Georgia Department of Labor, Workforce Statistics Division
12
Georgia MSA Hours and Earnings
All Employee Total Private
Average Weekly Earnings (AWE)
Preliminary MAR 2024
Revised FEB 2024
Revised MAR 2023
Albany MSA ....................................................................................................$743.87.............................$740.80.......................$784.91 Athens-Clarke County MSA .......................................................................... $840.56............................ $835.09.......................$801.31 Atlanta MSA ............................................................................................... $1,138.76.......................... $1,138.86.................... $1,136.23 Augusta-Richmond County MSA ...................................................................$923.72.............................$952.70....................... $937.04 Brunswick MSA .............................................................................................$764.57.............................$749.33....................... $715.48 Columbus MSA ............................................................................................. $954.60.............................$940.15...................... $898.69 Dalton MSA ...................................................................................................$951.90.............................$955.13.......................$855.05 Gainesville MSA ..........................................................................................$1,004.65..........................$1,016.02.....................$1,118.88 Hinesville MSA ...............................................................................................$500.81.............................$474.88.......................$460.70 Macon-Bibb County MSA .............................................................................. $870.74............................ $846.82.......................$875.78 Rome MSA .....................................................................................................$855.14............................ $846.91.......................$819.45 Savannah MSA ............................................................................................. $840.52............................ $843.82...................... $834.23 Valdosta MSA ................................................................................................. $857.72............................ $859.36.......................$826.80 Warner Robins MSA .......................................................................................$846.78.............................$836.74.......................$776.21
Average Weekly Hours (AWH)
Preliminary MAR 2024
Revised FEB 2024
Revised MAR 2023
Albany MSA ..........................................................................................................32.3......................................32.............................33.5 Athens-Clarke County MSA .................................................................................30.4...................................30.4.............................29.7 Atlanta MSA ........................................................................................................34.3.................................. 34.2.............................34.4 Augusta-Richmond County MSA .........................................................................33.7...................................33.7................................34 Brunswick MSA ...................................................................................................32.8...................................31.9.............................32.7 Columbus MSA ....................................................................................................34.4.................................. 34.4.............................33.9 Dalton MSA ......................................................................................................... 37.3................................... 37.5.............................34.9 Gainesville MSA ...................................................................................................35.4...................................35.7................................36 Hinesville MSA ..................................................................................................... 29.1......................................28............................. 27.1 Macon-Bibb County MSA ....................................................................................33.4.................................. 33.3.............................35.2 Rome MSA ........................................................................................................... 32.1...................................32.3............................. 31.7 Savannah MSA ....................................................................................................30.3......................................31.............................32.6 Valdosta MSA .......................................................................................................32.8...................................32.7.............................32.5 Warner Robins MSA ................................................................................................33...................................31.9.............................32.6
Average Hourly Earnings (AHE)
Preliminary MAR 2024
Revised FEB 2024
Revised MAR 2023
Albany MSA ......................................................................................................$23.03............................... $23.15.........................$23.43 Athens-Clarke County MSA ............................................................................. $27.65............................... $27.47.........................$26.98 Atlanta MSA ................................................................................................... $33.20.............................. $33.30.........................$33.03 Augusta-Richmond County MSA ..................................................................... $27.41.............................. $28.27......................... $27.56 Brunswick MSA ...............................................................................................$23.31.............................. $23.49.........................$21.88 Columbus MSA ................................................................................................ $27.75...............................$27.33.........................$26.51 Dalton MSA .....................................................................................................$25.52...............................$25.47.........................$24.50 Gainesville MSA ...............................................................................................$28.38.............................. $28.46.........................$31.08 Hinesville MSA ................................................................................................. $17.21...............................$16.96......................... $17.00 Macon-Bibb County MSA ................................................................................$26.07.............................. $25.43.........................$24.88 Rome MSA ...................................................................................................... $26.64.............................. $26.22.........................$25.85 Savannah MSA ................................................................................................ $27.74...............................$27.22.........................$25.59 Valdosta MSA ................................................................................................... $26.15.............................. $26.28.........................$25.44 Warner Robins MSA .........................................................................................$25.66.............................. $26.23.........................$23.81
Read more about the hours and earnings series at http://www.bls.gov/sae/home.htm
?Note: These not seasonally adjusted estimates were prepared in cooperation with the U.S. Department of Labor, Bureau of Labor Statistics, based upon monthly reports submitted by
selected employers throughout Georgia. The estimates include all full- and part-time wage and salary workers who were employed during or received pay for any part of the pay period that includes the twelfth of the month. Proprietors, domestic workers, self-employed persons, unpaid family workers and personnel of the armed forces are excluded. Estimates based on 2023 benchmark.
Source: Georgia Department of Labor, Workforce Statistics Division
13
Dimensions - Measuring Georgia's Labor Force 2023-2024 Unemployment Rates Unemploy(mSeeanstornaatlelysA--djuGsetoedrg) ia and U.S.
5%
4%
3%
2% Mar Apr May Jun Jul Aug Sep Oct Nov Dec Jan Feb Mar
Georgia
U.S.
WA 4.8
OR
4.2
ID
3.3
NV
5.1
UT
CA
2.8
5.3
AZ 3.8
AK 4.6
StSattaeteuUnenmempploloyymmeenntt Rraatteess
March 2024
National Unemployment Rate: 3.8% Rates are seasonally adjusted
MT 3.3
WY 2.8
CO 3.7 NM 3.8
HI 3.1
ND 2.0 SD 2.1
NE 2.5
KS 2.7
MN 2.7
WI 3.0
IA 2.9
IL 4.8 MO 3.3
OK 3.5 TX 3.9
AR 3.5
MS 3.0 LA 4.4
PR 5.8
NH
2.6 ME
VT
3.3
2.2
MI 3.9
OH
IN
3.8
3.5
KY 4.5 TN 3.2
PA 3.4
WV
4.3
VA
2.9
NC 3.5
SC 3.1
AL
GA
3.0
3.1
FL 3.2
MA 2.9
NY 4.3
RI 4.0
CT
NJ 4.8
4.5
DE
3.9
DC 5.2
MD 2.5
Unemployment rate
4.0% or greater 3.5% to 3.9% 3.0% to 3.4% 2.5% to 2.9%
Less than 2.5%
Source: Georgia Department of Labor, Workforce Statistics Division
14
Georgia Labor Force Estimates
Place of Residence - Persons 16 Years and Older
Georgia
(Seasonally adjusted)
Employment Status
Civilian labor force Employed Unemployed Rate
Preliminary MAR 2024
5,343,463 5,179,980
163,483 3.1
Revised FEB 2024
5,335,097 5,171,557
163,540 3.1
Revised MAR 2023
5,279,998 5,111,716 168,282
3.2
Change From
FEB 2024
MAR 2023
8,366 8,423
-57
63,465 68,264 -4,799
Georgia
(Not Seasonally adjusted)
Civilian labor force Employed Unemployed Rate
5,402,933 5,230,376
172,557 3.2
5,368,054 5,203,816
164,238 3.1
5,312,395 5,139,875
172,520 3.2
34,879 26,560
8,319
90,538 90,501
37
Albany MSA
Civilian labor force Employed Unemployed
Rate
64,388 61,949
2,439 3.8
64,053 61,729 2,324
3.6
64,771 62,290
2,481 3.8
335
-383
220
-341
115
-42
Athens-Clarke County MSA
Civilian labor force Employed Unemployed Rate
104,799 101,542
3,257 3.1
104,331 101,265
3,066 2.9
100,324 97,198 3,126 3.1
468
4,475
277
4,344
191
131
Atlanta MSA
Civilian labor force Employed Unemployed
Rate
3,292,796 3,189,826
102,970 3.1
3,267,501 3,169,302
98,199 3.0
3,241,236 3,139,232
102,004 3.1
25,295 20,524
4,771
51,560 50,594
966
Augusta-Richmond County MSA
Civilian labor force Employed Unemployed
Rate
269,234 259,265
9,969 3.7
265,577 255,588
9,989 3.8
266,087 256,379
9,708 3.6
3,657 3,677
-20
3,147 2,886
261
Brunswick MSA
Civilian labor force Employed Unemployed
Rate
55,668 53,966
1,702 3.1
55,058 53,454
1,604 2.9
53,894 52,209
1,685 3.1
610
1,774
512
1,757
98
17
Columbus MSA
Civilian labor force Employed Unemployed Rate
122,875 118,276
4,599 3.7
121,974 117,464
4,510 3.7
121,249 116,623
4,626 3.8
901
1,626
812
1,653
89
-27
Dalton MSA
Civilian labor force Employed Unemployed Rate
60,310 58,013
2,297 3.8
60,093 57,951
2,142 3.6
59,175 56,746
2,429 4.1
217
1,135
62
1,267
155
-132
Gainesville MSA
Civilian labor force Employed Unemployed Rate
114,608 111,776
2,832 2.5
114,094 111,435
2,659 2.3
109,956 107,214
2,742 2.5
514
4,652
341
4,562
173
90
?Note: MSA data are not seasonally adjusted. Employment includes nonagricultural wage and salary employment, self-employment, unpaid family and private
household workers and agricultural workers. Persons in labor disputes are counted as employed. The use of unrounded data does not imply that the numbers are exact.
Albany MSA: Baker, Dougherty, Lee, Terrell, and Worth counties. Athens-Clarke County MSA: Clarke, Madison, Oconee, and Oglethorpe counties. Atlanta MSA: Barrow, Bartow, Butts, Carroll, Cherokee, Clayton, Cobb, Coweta, Dawson, DeKalb, Douglas, Fayette, Forsyth, Fulton, Gwinnett, Haralson, Heard, Henry, Jasper, Lamar, Meriwether, Morgan, Newton, Paulding, Pickens, Pike, Rockdale, Spalding, and Walton counties.
Augusta-Richmond County MSA: Burke, Columbia, Lincoln, McDuffie, and Richmond counties in Georgia and Aiken and Edgefield counties in South Carolina. Brunswick MSA: Brantley, Glynn, and McIntosh counties. Columbus MSA: Chattahoochee, Harris, Marion, and Muscogee counties in Georgia and Russell County in Alabama. Dalton MSA: Murray and Whitfield counties. Gainesville MSA: Hall County. Hinesville MSA: Liberty and Long counties. Macon-Bibb County MSA: Bibb, Crawford, Jones, Monroe, and Twiggs counties. Rome MSA: Floyd County. Savannah MSA: Bryan, Chatham, and Effingham counties. Valdosta MSA: Brooks, Echols, Lanier, and Lowndes counties. Warner Robins MSA: Houston, Peach and Pulaski counties.
Source: Georgia Department of Labor, Workforce Statistics Division
15
Hinesville MSA
Macon-Bibb County MSA Rome MSA Savannah MSA
Valdosta MSA Warner Robins MSA
Georgia Labor Force Estimates
Place of Residence - Persons 16 Years and Older
Employment Status
Civilian labor force Employed Unemployed Rate
Civilian labor force Employed Unemployed Rate
Preliminary MAR 2024
35,256 34,113
1,143 3.2
99,803 96,080
3,723 3.7
Revised FEB 2024
35,025 33,940
1,085 3.1
98,983 95,449
3,534 3.6
Revised MAR 2023
34,977 33,786
1,191 3.4
99,593 95,802
3,791 3.8
Civilian labor force Employed Unemployed Rate
Civilian labor force Employed Unemployed Rate
49,003 47,521 1,482
3.0
205,045 199,186
5,859 2.9
48,589 47,200 1,389
2.9
203,427 197,902
5,525 2.7
47,546 46,109
1,437 3.0
201,196 195,178
6,018 3.0
Civilian labor force Employed Unemployed Rate
Civilian labor force Employed Unemployed Rate
62,734 60,528
2,206 3.5
88,152 85,414
2,738 3.1
62,585 60,481
2,104 3.4
87,360 84,831
2,529 2.9
62,529 60,322
2,207 3.5
87,368 84,581
2,787 3.2
Change From
FEB 2024
MAR 2023
231
279
173
327
58
-48
820
210
631
278
189
-68
414
1,457
321
1,412
93
45
1,618 1,284
334
3,849 4,008
-159
149
205
47
206
102
-1
792
784
583
833
209
-49
Area United States
(Seasonally adjusted)
United States
(Not Seasonally adjusted)
United States Labor Force Estimates
Place of Residence - Persons 16 Years and Older
Employment Status
Civilian labor force Employed Unemployed Rate
Civilian labor force Employed Unemployed Rate
MAR 2024
167,895,000 161,466,000
6,429,000 3.8
167,960,000 161,356,000
6,604,000 3.9
FEB 2024
167,426,000 160,968,000
6,458,000 3.9
167,285,000 160,315,000
6,970,000 4.2
MAR 2023
166,690,000 160,824,000
5,866,000 3.5
166,783,000 160,741,000
6,043,000 3.6
Change From
FEB 2024
MAR 2023
469,000 498,000 -29,000
1,205,000 642,000 563,000
675,000 1,041,000 -366,000
1,177,000 615,000 561,000
?Note: MSA data are not seasonally adjusted. Employment includes nonagricultural wage and salary employment, self-employment, unpaid family and private
household workers and agricultural workers. Persons in labor disputes are counted as employed. The use of unrounded data does not imply that the numbers are exact.
Albany MSA: Baker, Dougherty, Lee, Terrell, and Worth counties. Athens-Clarke County MSA: Clarke, Madison, Oconee, and Oglethorpe counties. Atlanta MSA: Barrow, Bartow, Butts, Carroll, Cherokee, Clayton, Cobb, Coweta, Dawson, DeKalb, Douglas, Fayette, Forsyth, Fulton, Gwinnett, Haralson, Heard, Henry, Jasper, Lamar, Meriwether, Morgan, Newton, Paulding, Pickens, Pike, Rockdale, Spalding, and Walton counties. Augusta-Richmond County MSA: Burke, Columbia, Lincoln, McDuffie, and Richmond counties in Georgia and Aiken and Edgefield counties in South Carolina. Brunswick MSA: Brantley, Glynn, and McIntosh counties. Columbus MSA: Chattahoochee, Harris, Marion, and Muscogee counties in Georgia and Russell County in Alabama. Dalton MSA: Murray and Whitfield counties. Gainesville MSA: Hall County. Hinesville MSA: Liberty and Long counties. Macon-Bibb County MSA: Bibb, Crawford, Jones, Monroe, and Twiggs counties. Rome MSA: Floyd County. Savannah MSA: Bryan, Chatham, and Effingham counties. Valdosta MSA: Brooks, Echols, Lanier, and Lowndes counties. Warner Robins MSA: Houston, Peach and Pulaski counties.
Source: Georgia Department of Labor, Workforce Statistics Division
16
Georgia Labor Force Estimates by County (not seasonally adjusted)
Place of Residence - Persons 16 Years and Older
Georgia
Preliminary March 2024
Labor Force
Employment
Unemployment Number Rate
5,402,933 5,230,376 172,557 3.2
Appling Atkinson Bacon Baker Baldwin
9,646 4,239 4,871 1,032 18,021
9,376 4,100 4,712
989 17,326
270 2.8 139 3.3 159 3.3
43 4.2 695 3.9
Banks Barrow Bartow Ben Hill Berrien
11,611 11,346
265 2.3
44,542 43,272 1,270 2.9
53,941 52,267 1,674 3.1
5,667
5,411
256 4.5
7,718 7,409
309 4.0
Bibb Bleckley Brantley Brooks Bryan
65,660 63,068 2,592 3.9
4,947 4,735
212 4.3
7,667 7,395
272 3.5
6,490 6,264
226 3.5
20,863 20,310
553 2.7
Bulloch Burke Butts Calhoun Camden
39,964 38,690 1,274 3.2
9,038 8,575
463 5.1
11,670 11,330
340 2.9
2,177 2,107
70 3.2
23,377 22,640
737 3.2
Candler Carroll Catoosa Charlton Chatham
5,913 5,762
151 2.6
59,114 57,175 1,939 3.3
35,174 34,180 994 2.8
5,138 4,976
162 3.2
149,366 144,927 4,439 3.0
Chattahoochee 1,910 1,822
88 4.6
Chattooga
9,606 9,276
330 3.4
Cherokee 147,983 144,014 3,969 2.7
Clarke
61,886 59,808 2,078 3.4
Clay
763
713
50 6.6
Clayton Clinch Cobb Coffee Colquitt
144,571 138,885 5,686 3.9
3,112 3,024
88 2.8
447,000 434,232 12,768 2.9
18,874 18,151
723 3.8
21,025 20,385 640 3.0
Columbia Cook Coweta Crawford Crisp
77,583 75,226 2,357 3.0
8,327 8,069
258 3.1
80,292 77,999 2,293 2.9
5,335 5,150
185 3.5
10,176 9,840
336 3.3
Revised February 2024
Labor Force
Employment
Unemployment Number Rate
5,368,054 5,203,816 164,238 3.1
9,969 4,339 4,947 1,069 18,024
9,703 4,198 4,800 1,028 17,367
266 2.7 141 3.2 147 3.0
41 3.8 657 3.6
11,717 11,451
266 2.3
44,254 43,055 1,199 2.7
53,594 52,030 1,564 2.9
5,601 5,376
225 4.0
7,750 7,454 296 3.8
65,060 62,598 2,462 3.8
4,965
4,761
204 4.1
7,584
7,324
260 3.4
6,554 6,342
212 3.2
20,696 20,175
521 2.5
39,730 38,522 1,208 3.0
8,987 8,553 434 4.8
11,602 11,286
316 2.7
2,267 2,205
62 2.7
23,204 22,520 684 2.9
5,983 5,837
146 2.4
58,662 56,825 1,837 3.1
34,739 33,833 906 2.6
5,153 4,991
162 3.1
148,141 143,953 4,188 2.8
1,912 1,829
83 4.3
9,585 9,263
322 3.4
146,637 142,928 3,709 2.5
61,635 59,662 1,973 3.2
784
737
47 6.0
143,692 138,192 5,500 3.8
3,154 3,070
84 2.7
443,162 431,120 12,042 2.7
18,988 18,286
702 3.7
21,396 20,780
616 2.9
76,471 74,260 2,211 2.9
8,353
8,110
243 2.9
79,739 77,573 2,166 2.7
5,313 5,142
171 3.2
10,192 9,854 338 3.3
Revised March 2023
Labor Force
Employment
Unemployment Number Rate
5,312,395 5,139,875 172,520 3.2
9,634 4,178 4,924 1,046 17,349
9,305 4,026 4,776
999 16,629
329 3.4 152 3.6 148 3.0
47 4.5 720 4.2
11,412 11,159 253 2.2
43,895 42,629 1,266 2.9
53,123 51,486 1,637 3.1
5,713 5,465
248 4.3
7,721 7,460
261 3.4
65,553 62,901 2,652 4.0
4,724 4,522 202 4.3
7,400 7,125
275 3.7
6,452 6,221
231 3.6
20,464 19,886
578 2.8
39,244 37,946 1,298 3.3
8,967 8,503 464 5.2
11,511 11,167 344 3.0
2,206 2,137
69 3.1
22,587 21,862
725 3.2
5,931 5,781
150 2.5
58,089 56,227 1,862 3.2
34,648 33,694 954 2.8
5,082 4,910
172 3.4
146,483 141,991 4,492 3.1
1,892 1,801
91 4.8
9,383 9,024 359 3.8
145,413 141,592 3,821 2.6
59,257 57,281 1,976 3.3
755
694
61 8.1
142,761 136,871 5,890 4.1
2,978 2,894
84 2.8
439,638 427,126 12,512 2.8
18,615 17,885
730 3.9
21,467 20,819
648 3.0
76,594 74,255 2,339 3.1
8,336 8,043
293 3.5
79,063 76,815 2,248 2.8
5,317 5,140
177 3.3
9,730 9,339
391 4.0
Source: Georgia Department of Labor, Workforce Statistics Division
17
Georgia Labor Force Estimates by County (not seasonally adjusted)
Place of Residence - Persons 16 Years and Older
Dade Dawson Decatur DeKalb Dodge
Preliminary March 2024
Labor Force
Employment
Unemployment Number Rate
8,462 8,238
224 2.6
13,868 13,486 382 2.8
11,250 10,857 393 3.5
418,984 405,493 13,491 3.2
7,281 7,006
275 3.8
Dooly Dougherty Douglas Early Echols
4,304 4,127
177 4.1
36,316 34,775 1,541 4.2
77,724 75,087 2,637 3.4
4,067 3,912
155 3.8
1,768 1,711
57 3.2
Effingham Elbert Emanuel Evans Fannin
34,816 8,405 8,837 4,884 12,490
33,949 8,100 8,472 4,739 12,118
867 2.5 305 3.6 365 4.1 145 3.0 372 3.0
Fayette Floyd Forsyth Franklin Fulton
61,645 59,872 1,773 2.9
49,003 47,521 1,482 3.0
134,808 131,207 3,601 2.7
10,214 9,857
357 3.5
595,300 575,261 20,039 3.4
Gilmer Glascock Glynn Gordon Grady
13,145 12,716
429 3.3
1,237 1,197
40 3.2
41,611 40,393 1,218 2.9
29,372 28,462
910 3.1
10,873 10,536
337 3.1
Greene
7,802 7,522 280 3.6
Gwinnett
519,066 503,955 15,111 2.9
Habersham 20,114 19,495
619 3.1
Hall
114,608 111,776 2,832 2.5
Hancock
2,479 2,335
144 5.8
Haralson Harris Hart Heard Henry
13,484 13,044 440 3.3
17,018 16,537
481 2.8
13,157 12,746
411 3.1
5,468 5,304
164 3.0
124,717 120,451 4,266 3.4
Houston Irwin Jackson Jasper Jeff Davis
72,127 70,010 2,117 2.9
3,488 3,356
132 3.8
50,764 49,680 1,084 2.1
7,410 7,188 222 3.0
6,149 5,887
262 4.3
Revised February 2024
Labor Force
Employment
Unemployment Number Rate
8,296 8,093 203 2.4
13,730 13,377 353 2.6
11,377 11,004
373 3.3
415,871 402,796 13,075 3.1
7,229 6,968
261 3.6
4,352
4,185
167 3.8
36,056 34,582 1,474 4.1
77,103 74,574 2,529 3.3
4,092 3,931
161 3.9
1,822 1,765
57 3.1
34,590 8,423 8,832 4,878
12,303
33,774 8,116 8,489 4,740
11,956
816 2.4 307 3.6 343 3.9 138 2.8 347 2.8
61,209 59,524 1,685 2.8
48,589 47,200 1,389 2.9
133,756 130,399 3,357 2.5
10,208 9,879
329 3.2
591,018 571,626 19,392 3.3
12,973 12,585 388 3.0
1,237 1,198
39 3.2
41,094 39,956 1,138 2.8
29,294 28,440 854 2.9
10,944 10,630
314 2.9
7,756 7,484
272 3.5
514,403 500,094 14,309 2.8
20,154 19,490 664 3.3
114,094 111,435 2,659 2.3
2,529 2,386
143 5.7
13,351 12,939
412 3.1
16,926 16,486 440 2.6
13,116 12,730 386 2.9
5,443 5,281
162 3.0
124,000 119,956 4,044 3.3
71,420 69,474 1,946 2.7
3,533 3,402
131 3.7
50,784 49,723 1,061 2.1
7,363 7,160 203 2.8
6,187 5,947
240 3.9
Revised March 2023
Labor Force
Employment
Unemployment Number Rate
8,273 8,047
226 2.7
13,606 13,227
379 2.8
11,324 10,911
413 3.6
412,813 399,138 13,675 3.3
6,897 6,622
275 4.0
4,564 4,372
192 4.2
36,501 34,965 1,536 4.2
76,564 73,891 2,673 3.5
3,922 3,753
169 4.3
1,767 1,713
54 3.1
34,249 8,101 8,776 4,986
12,191
33,301 7,801 8,407 4,836
11,823
948 2.8 300 3.7 369 4.2 150 3.0 368 3.0
60,721 58,969 1,752 2.9
47,546 46,109 1,437 3.0
132,530 129,127 3,403 2.6
9,824 9,499
325 3.3
586,280 566,229 20,051 3.4
12,769 1,219
40,302 29,111 10,839
12,337 1,177
39,088 28,278 10,520
432 3.4 42 3.4
1,214 3.0 833 2.9 319 2.9
7,509 7,234
275 3.7
510,278 495,439 14,839 2.9
19,124 18,507
617 3.2
109,956 107,214 2,742 2.5
2,385 2,257
128 5.4
13,262 16,787 12,516 5,394 123,036
12,815 16,279 12,135
5,220 118,839
447 3.4 508 3.0 381 3.0 174 3.2 4,197 3.4
71,541 69,351 2,190 3.1
3,447 3,307
140 4.1
49,320 48,268 1,052 2.1
7,271 7,069
202 2.8
6,029 5,754
275 4.6
Source: Georgia Department of Labor, Workforce Statistics Division
18
Georgia Labor Force Estimates by County (not seasonally adjusted)
Place of Residence - Persons 16 Years and Older
Jefferson Jenkins Johnson Jones Lamar
Preliminary March 2024
Labor Force
6,793 3,435 4,236 13,310 8,686
Employment
6,502 3,289 4,108 12,882 8,388
Unemployment Number Rate
291 4.3 146 4.3 128 3.0 428 3.2 298 3.4
Revised February 2024
Labor Force
6,819 3,427 4,281 13,219 8,585
Employment
6,550 3,283 4,162 12,813 8,313
Unemployment Number Rate
269 3.9 144 4.2 119 2.8 406 3.1 272 3.2
Lanier Laurens Lee Liberty Lincoln
3,798 20,467 14,967 26,724
3,505
3,641 19,673 14,554 25,847
3,374
157 4.1 794 3.9 413 2.8 877 3.3 131 3.7
3,774 20,578 14,871 26,502
3,494
3,627 19,834 14,477 25,680
3,372
147 3.9 744 3.6 394 2.6 822 3.1 122 3.5
Long Lowndes Lumpkin McDuffie McIntosh
8,532 8,266 266 3.1
50,678 48,912 1,766 3.5
18,847 18,341 506 2.7
8,568 8,169 399 4.7
6,390 6,178
212 3.3
8,523 8,260 263 3.1
50,435 48,747 1,688 3.3
18,599 18,132
467 2.5
8,483 8,085 398 4.7
6,380 6,174 206 3.2
Macon Madison Marion Meriwether Miller
4,497 14,283
3,280 9,192 2,712
4,285 13,840
3,160 8,864 2,631
212 4.7 443 3.1 120 3.7 328 3.6
81 3.0
4,577 14,182 3,255
9,129 2,759
4,373 13,776
3,148 8,822 2,682
204 4.5 406 2.9 107 3.3 307 3.4
77 2.8
Mitchell Monroe Montgomery Morgan Murray
7,891 12,791 3,905 9,900 15,812
7,575 12,401
3,754 9,620 15,164
316 4.0 390 3.0 151 3.9 280 2.8 648 4.1
8,000 12,684
3,916 9,846 15,774
7,696 12,317 3,778 9,586 15,168
304 3.8 367 2.9 138 3.5 260 2.6 606 3.8
Muscogee Newton Oconee Oglethorpe Paulding
76,646 73,570 3,076 4.0
56,178 54,015 2,163 3.9
21,352 20,832
520 2.4
7,278 7,062
216 3.0
94,511 91,757 2,754 2.9
76,136 73,178 2,958 3.9
55,823 53,743 2,080 3.7
21,212 20,737
475 2.2
7,302 7,090
212 2.9
93,879 91,300 2,579 2.7
Peach Pickens Pierce Pike Polk
11,972 16,486
8,525 9,479 19,373
11,508 16,007
8,252 9,214 18,733
464 3.9 479 2.9 273 3.2 265 2.8 640 3.3
11,909 16,343
8,477 9,393 19,241
11,470 15,907 8,222
9,157 18,632
439 3.7 436 2.7 255 3.0 236 2.5 609 3.2
Pulaski Putnam Quitman Rabun Randolph
4,053 9,100
736 7,949 2,308
3,896 8,760
690 7,704 2,205
157 3.9 340 3.7
46 6.3 245 3.1 103 4.5
4,031 9,056
718 7,846 2,304
3,887 8,745
682 7,615 2,208
144 3.6 311 3.4 36 5.0 231 2.9 96 4.2
Source: Georgia Department of Labor, Workforce Statistics Division
Revised March 2023
Labor Force
6,661 3,284 4,037 13,260 8,520
Employment
6,398 3,132 3,914 12,838 8,233
Unemployment Number Rate
263 3.9 152 4.6 123 3.0 422 3.2 287 3.4
3,767 19,605 15,070 26,523
3,470
3,617 18,706 14,627 25,607 3,340
150 4.0 899 4.6 443 2.9 916 3.5 130 3.7
8,454 50,543 18,160
8,480 6,192
8,179 48,771 17,668 8,082 5,996
275 3.3 1,772 3.5
492 2.7 398 4.7 196 3.2
4,387 13,650
3,241 9,088 2,794
4,196 13,228
3,106 8,709 2,713
191 4.4 422 3.1 135 4.2 379 4.2
81 2.9
8,011 12,731 3,809 9,722 15,466
7,706 12,336
3,672 9,439 14,835
305 3.8 395 3.1 137 3.6 283 2.9 631 4.1
75,816 72,452 3,364 4.4
55,207 53,200 2,007 3.6
20,433 19,912
521 2.5
6,984 6,777
207 3.0
93,107 90,409 2,698 2.9
11,834 16,212 8,426
9,317 18,937
11,380 15,758
8,153 9,054 18,291
454 3.8 454 2.8 273 3.2 263 2.8 646 3.4
3,993 8,750
724 7,658 2,373
3,850 8,403
684 7,400 2,267
143 3.6 347 4.0
40 5.5 258 3.4 106 4.5
19
Georgia Labor Force Estimates by County (not seasonally adjusted)
Place of Residence - Persons 16 Years and Older
Richmond Rockdale Schley Screven Seminole
Preliminary March 2024
Labor Force
Employment
Unemployment Number Rate
84,372 80,670 3,702 4.4
46,868 45,099 1,769 3.8
2,140 2,063
77 3.6
4,898 4,681
217 4.4
3,082 2,948
134 4.3
Spalding Stephens Stewart Sumter Talbot
30,294 29,232 1,062 3.5
10,593 10,187 406 3.8
2,670 2,581
89 3.3
12,137 11,603 534 4.4
2,906 2,811
95 3.3
Taliaferro Tattnall Taylor Telfair Terrell
573 9,380 2,767 3,335 3,433
544 9,072 2,656 3,120 3,295
29 5.1 308 3.3 111 4.0 215 6.4 138 4.0
Thomas Tift Toombs Towns Treutlen
17,883 20,782 12,249
4,267 2,664
17,246 20,194 11,828 4,079 2,565
637 3.6 588 2.8 421 3.4 188 4.4
99 3.7
Troup Turner Twiggs Union Upson
38,971 37,919 1,052 2.7
3,248 3,123
125 3.8
2,707 2,579
128 4.7
11,719 11,368
351 3.0
11,813 11,416
397 3.4
Walker
32,732 31,741
991 3.0
Walton
49,615 48,108 1,507 3.0
Ware
15,197 14,676
521 3.4
Warren
2,785 2,692
93 3.3
Washington
7,294 6,987
307 4.2
Wayne Webster Wheeler White Whitfield
12,080 11,687
393 3.3
970
935
35 3.6
1,669 1,580
89 5.3
17,794 17,368
426 2.4
44,498 42,849 1,649 3.7
Wilcox Wilkes Wilkinson Worth
2,689 3,812 3,458 8,640
2,597 3,687 3,323 8,336
92 3.4 125 3.3 135 3.9 304 3.5
Revised February 2024
Labor Force
Employment
Unemployment Number Rate
83,416 79,800 3,616 4.3
46,516 44,804 1,712 3.7
2,135 2,064
71 3.3
4,887 4,665 222 4.5
3,086 2,964
122 4.0
30,105 29,071 1,034 3.4
10,539 10,180
359 3.4
2,692 2,605
87 3.2
12,190 11,664
526 4.3
2,899 2,807
92 3.2
573 9,408 2,751 3,352 3,422
543 9,109 2,644 3,145 3,287
30 5.2 299 3.2 107 3.9 207 6.2 135 3.9
17,864 20,930 12,290
4,138 2,705
17,272 20,378 11,871 3,968
2,597
592 3.3 552 2.6 419 3.4 170 4.1 108 4.0
38,979 3,269 2,707 11,583 11,759
38,004 3,147 2,579
11,258 11,389
975 2.5 122 3.7 128 4.7 325 2.8 370 3.1
32,386 31,468
918 2.8
49,293 47,864 1,429 2.9
15,123 14,623 500 3.3
2,795 2,682
113 4.0
7,204 6,891
313 4.3
12,058 11,664 394 3.3
986
951
35 3.5
1,691 1,605
86 5.1
17,705 17,298
407 2.3
44,319 42,783 1,536 3.5
2,721 3,824 3,421 8,635
2,632 3,701 3,290 8,355
89 3.3 123 3.2 131 3.8 280 3.2
Revised March 2023
Labor Force
Employment
Unemployment Number Rate
83,674 79,851 3,823 4.6
46,076 44,386 1,690 3.7
2,127 2,049
78 3.7
4,955 4,675
280 5.7
3,021 2,903
118 3.9
29,861 28,777 1,084 3.6
10,427 10,029
398 3.8
2,665 2,572
93 3.5
12,095 11,554
541 4.5
2,809 2,715
94 3.3
546 9,168 2,638 3,380 3,472
524 8,870 2,506 3,132 3,312
22 4.0 298 3.3 132 5.0 248 7.3 160 4.6
17,283 20,863 11,990
4,071 2,614
16,651 20,237 11,541
3,889 2,503
632 3.7 626 3.0 449 3.7 182 4.5 111 4.2
37,673 3,240 2,732 11,393 11,696
36,572 3,100 2,587
11,046 11,290
1,101 2.9 140 4.3 145 5.3 347 3.0 406 3.5
32,305 31,302 1,003 3.1
48,878 47,391 1,487 3.0
15,021 14,520
501 3.3
2,756 2,660
96 3.5
7,057 6,764
293 4.2
12,100 984
1,559 17,305 43,709
11,697 947
1,468 16,875 41,911
403 3.3 37 3.8 91 5.8
430 2.5 1,798 4.1
2,662 3,711 3,436 8,682
2,569 3,556 3,308 8,387
93 3.5 155 4.2 128 3.7 295 3.4
Source: Georgia Department of Labor, Workforce Statistics Division
20
City Labor Force Estimates
Place of Residence - Persons 16 Years and Older
Preliminary March 2024
Labor Force
Employment
Unemployment Number Rate
Albany 29,121 27,918 1,203 4.1
Alpharetta 38,909 37,931
978 2.5
Athens 61,630 59,655 1,975 3.2
Atlanta 278,982 269,128 9,854 3.5
Dekalb Part
25,595 24,946
649 2.5
Fulton Part
253,387 244,182 9,205 3.6
Augusta 83,442 79,828 3,614 4.3
Brookhaven 36,950 36,127
823 2.2
Canton 17,706 17,294
412 2.3
Carrollton 12,203 11,744
459 3.8
Chamblee 21,943 21,510
433 2.0
Columbus 76,216 73,258 2,958 3.9
Dalton 13,945 13,428
517 3.7
Decatur 14,908 14,544
364 2.4
Douglasville 17,844 17,221
623 3.5
Duluth 16,785 16,281
504 3.0
Dunwoody 28,425 27,723
702 2.5
East Point 17,346 16,578
768 4.4
Gainesville
22,968 22,400
568 2.5
Hinesville 15,635 15,186
449 2.9
Johns Creek
47,018 45,839 1,179 2.5
Kennesaw 21,067 20,538
529 2.5
LaGrange 16,071 15,610
461 2.9
Lawrenceville
15,395 14,937
458 3.0
McDonough 13,155 12,594
561 4.3
Macon-Bibb 65,098 62,638 2,460 3.8
Marietta 36,759 35,796
963 2.6
Milton 21,320 20,773
547 2.6
Newnan 20,592 19,909
683 3.3
Peachtree City
19,720 19,271
449 2.3
P'tree Corners
26,224 25,613
611 2.3
Pooler 14,772 14,425
347 2.3
Rome 16,914 16,397
517 3.1
Roswell 56,195 54,771 1,424 2.5
Sandy Springs
68,668 66,976 1,692 2.5
Savannah 70,272 68,028 2,244 3.2
Smyrna 36,329 35,290 1,039 2.9
Statesboro
14,923 14,331
592 4.0
Stockbridge
15,208 14,639
569 3.7
Sugar Hill
13,888 13,539
349 2.5
Tucker 20,934 20,340
594 2.8
Union City
10,748 10,169
579 5.4
Valdosta 24,353 23,457
896 3.7
Warner Robins
33,977 33,052
925 2.7
Woodstock 18,771 18,282
489 2.6
Revised February 2024
Labor Force
Employment
Unemployment Number Rate
29,097 27,861 1,236 4.2
38,580 37,652
928 2.4
61,157 59,055 2,102 3.4
277,208 267,153 10,055 3.6
25,462 24,766 696 2.7
251,746 242,387 9,359 3.7
83,132 79,455 3,677 4.4
36,677 35,865
812 2.2
17,595 17,157 438 2.5
12,161 11,649
512 4.2
21,767 21,355
412 1.9
75,868 72,777 3,091 4.1
14,035 13,361
674 4.8
14,769 14,439
330 2.2
17,672 17,094
578 3.3
16,643 16,152
491 3.0
28,228 27,522
706 2.5
17,206 16,456
750 4.4
22,815 22,232
583 2.6
15,522 15,083 439 2.8
46,706 45,502 1,204 2.6
20,913 20,381
532 2.5
15,974 15,453
521 3.3
15,271 14,819
452 3.0
13,075 12,517
558 4.3
64,760 62,311 2,449 3.8
36,465 35,522
943 2.6
21,170 20,620
550 2.6
20,430 19,766
664 3.3
19,607 19,136
471 2.4
26,011 25,410
601 2.3
14,640 14,325
315 2.2
16,997 16,352
645 3.8
55,701 54,368 1,333 2.4
68,069 66,484 1,585 2.3
69,793 67,553 2,240 3.2
36,020 35,020 1,000 2.8
14,829 14,150
679 4.6
15,122 14,550
572 3.8
13,798 13,432
366 2.7
20,754 20,193
561 2.7
10,652 10,095
557 5.2
24,213 23,268
945 3.9
33,945 33,006
939 2.8
18,624 18,137
487 2.6
Revised March 2023
Labor Force
Employment
Unemployment Number Rate
29,637 28,281 1,356 4.6
38,382 37,353 1,029 2.7
59,045 57,016 2,029 3.4
275,587 265,035 10,552 3.8
25,267 24,573
694 2.7
250,320 240,462 9,858 3.9
83,511 79,539 3,972 4.8
36,451 35,586
865 2.4
17,443 17,024
419 2.4
12,035 11,552
483 4.0
21,694 21,188
506 2.3
75,032 71,615 3,417 4.6
13,695 13,112
583 4.3
14,746 14,327
419 2.8
17,659 16,961
698 4.0
16,566 16,027
539 3.3
28,074 27,308
766 2.7
17,168 16,326
842 4.9
22,056 21,415
641 2.9
15,639 15,131
508 3.2
46,369 45,141 1,228 2.6
20,795 20,222
573 2.8
15,550 15,008
542 3.5
15,221 14,704
517 3.4
12,974 12,415
559 4.3
65,263 62,587 2,676 4.1
36,330 35,245 1,085 3.0
20,994 20,456
538 2.6
20,286 19,605
681 3.4
19,490 18,984
506 2.6
25,888 25,213
675 2.6
14,474 14,110
364 2.5
16,338 15,739
599 3.7
55,401 53,936 1,465 2.6
67,828 65,955 1,873 2.8
68,954 66,539 2,415 3.5
35,840 34,748 1,092 3.0
14,718 14,029
689 4.7
14,975 14,431
544 3.6
13,687 13,327
360 2.6
20,655 20,036
619 3.0
10,605 10,014
591 5.6
24,183 23,155 1,028 4.3
33,859 32,778 1,081 3.2
18,508 17,996
512 2.8
Note: City estimates were prepared in cooperation with the U.S. Department of Labor, Bureau of Labor Statistics. All cities listed have total population of 25,000 or more.
Source: Georgia Department of Labor, Workforce Statistics Division
21
UNEMGPeoLrOgiaYUMneEmNploTymReAntTREateBs bYy CCoOunUtyNTIES MARCH 2024 March 2024
Dade 2.6
Catoosa 2.8
Walker
Whitfield
Murray 4.1
Fannin 3.0
Union 3.0
Towns 4.4
Rabun 3.1
5.0% or greater 7 counties (4%)
3.0
3.7
Chattooga 3.4
Gordon 3.1
Floyd 3.0
Bartow 3.1
Gilmer 3.3
Pickens 2.9
Cherokee 2.7
Lumpkin 2.7
Dawson 2.8
Forsyth 2.7
White Habersham
2.4
3.1
Stephens
3.8
Banks Franklin
Hall
2.3
3.5
2.5
Jackson 2.1
Madison 3.1
Hart 3.1
Elbert 3.6
4.0% to 4.9% 27 counties (17%)
3.0% to 3.9% 93 counties (58%)
Less than 3.0%
32 counties (20%) Polk
3.3
Haralson 3.3
Carroll 3.3
Heard 3.0
Paulding
Cobb 2.9
Gwinnett 2.9
Barrow 2.9
Clarke 3.4
2.9 Douglas 3.4
Coweta 2.9
Fulton 3.4
DeKalb 3.2 Rockdale
Walton 3.0
Oconee 2.4
Clayton
3.8 Newton
3.9
Fayette
Henry
3.9
Morgan 2.8
2.9
3.4
Spalding 3.5
Butts 2.9
Jasper 3.0
Putnam 3.7
Oglethorpe 3.0
Wilkes 3.3
Lincoln 3.7
Percentages of number of counties may not total 100 due to rounding
Greene 3.6
Taliaferro
5.1
McDuffie
Warren 4.7
Columbia 3.0
3.3
Richmond
Hancock
4.4
5.8
Glascock
3.2
Troup 2.7
Meriwether 3.6
Pike 2.8
Lamar 3.4
Monroe 3.0
Jones 3.2
Baldwin 3.9
Washington
Jefferson 4.3
Burke 5.1
Upson
4.2
Harris 2.8
Talbot 3.3
Muscogee 4.0
Marion Chattahoochee 3.7
3.4
Taylor 4.0
Crawford 3.5
Bibb 3.9
Twiggs 4.7
Wilkinson 3.9
Peach
3.9
Houston
Macon
2.9
4.7
Bleckley 4.3
Laurens 3.9
Johnson 3.0
Emanuel 4.1
Jenkins 4.3
Screven 4.4
Treutlen 3.7
Candler 2.6
Bulloch 3.2
Effingham 2.5
4.6
Schley
Pulaski
Montgomery
Stewart 3.3
3.6
Webster 3.6
Sumter 4.4
Quitman
6.3 Randolph Terrell
Lee
4.5
4.0
2.8
Clay
Dooly
3.9
Dodge
4.1
3.8
Crisp 3.3
Wilcox 3.4
Turner 3.8
Ben Hill 4.5
3.9 Wheeler
5.3
Telfair 6.4
Jeff Davis 4.3
Toombs 3.4
Evans 3.0
Tattnall
3.3
Bryan 2.7
Appling 2.8
Long 3.1
Liberty 3.3
Chatham 3.0
6.6
Calhoun
Dougherty
3.2
4.2
Early 3.8
Miller 3.0
Baker 4.2
Mitchell 4.0
Worth 3.5
Colquitt 3.0
Irwin 3.8 Tift 2.8
Coffee 3.8
Berrien
Atkinson
4.0
3.3
Cook
3.1 Lanier
Bacon 3.3
Wayne 3.3
Pierce 3.2
Ware 3.4
Brantley 3.5
McIntosh 3.3
Glynn 2.9
Seminole 4.3
Decatur 3.5
Grady 3.1
Thomas 3.6
Brooks 3.5
4.1
Lowndes 3.5
Clinch 2.8
Charlton 3.2
Camden 3.2
Echols
3.2
Georgia's Unemployment Rate: 3.2%
Georgia's U(nNoet SmeasponlaollyyAmdjusetend)t Rate: 3.2% (not seasonally adjusted)
Source: Georgia Department of Labor, Workforce Statistics Division
22
Georgia Unemployment Insurance Claims by County
County
March 2024 Initial
Claims
Average Weekly Benefit
County
March 2024 Initial
Claims
Average Weekly Benefit
County
March 2024 Initial
Claims
Average Weekly Benefit
Georgia
Appling Atkinson Bacon Baker Baldwin Banks Barrow Bartow Ben Hill Berrien Bibb Bleckley Brantley Brooks Bryan Bulloch Burke Butts Calhoun Camden Candler Carroll Catoosa Charlton Chatham Chattahoochee Chattooga Cherokee Clarke Clay Clayton Clinch Cobb Coffee Colquitt Columbia Cook Coweta Crawford Crisp Dade Dawson Decatur DeKalb Dodge Dooly Dougherty Douglas Early Echols Effingham
17,847.............. $337
63.............. $295 19.............. $312 11.............. $300
1.............. $309 54.............. $301 17.............. $309 83.............. $298 210.............. $311 36.............. $259 15.............. $301 282.............. $269 16.............. $257 10.............. $342 17.............. $268 48.............. $309 89.............. $292 80.............. $293 41.............. $307 10.............. $336 31.............. $314 10.............. $295 153.............. $295 44.............. $315
2.............. $235 388.............. $289
7.............. $264 41.............. $318 297.............. $312 115.............. $296
4.................. $0 801.............. $302
4.............. $336 1,176.............. $307
113.............. $294 43.............. $283 132.............. $293 22.............. $278 182.............. $301 12.............. $325 36.............. $296
6.............. $317 38.............. $301 42.............. $276 1,563.............. $297 15.............. $275 15.............. $287 154.............. $292 297.............. $310 11.............. $279
5.............. $302 54.............. $302
Elbert Emanuel Evans Fannin Fayette Floyd Forsyth Franklin Fulton Gilmer Glascock Glynn Gordon Grady Greene Gwinnett Habersham Hall Hancock Haralson Harris Hart Heard Henry Houston Irwin Jackson Jasper Jeff Davis Jefferson Jenkins Johnson Jones Lamar Lanier Laurens Lee Liberty Lincoln Long Lowndes Lumpkin Macon Madison Marion McDuffie McIntosh Meriwether Miller Mitchell Monroe Montgomery Morgan Murray
21.............. $296 32.............. $254 14.............. $282 17.............. $281 146.............. $316 205.............. $293 223.............. $323 27.............. $298 2,307.............. $309 27.............. $305
2.................. $0 81.............. $297 211.............. $305 26.............. $222 24.............. $301 1,330.............. $312 78.............. $293 231.............. $312 18.............. $305 29.............. $310 20.............. $315 29.............. $281 11.............. $315 566.............. $293 174.............. $285 14.............. $342 68.............. $311 22.............. $259 27.............. $283 49.............. $294 13.............. $279 11.............. $303 25.............. $309 23.............. $262
2.............. $226 93.............. $267 22.............. $302 109.............. $258
6.............. $289 20.............. $291 154.............. $292 35.............. $276 28.............. $266 36.............. $276
9.............. $266 56.............. $284 15.............. $267 44.............. $255
8.............. $293 22.............. $301 21.............. $315
9.............. $340 14.............. $282 146.............. $295
Muscogee Newton Oconee Oglethorpe Paulding Peach Pickens Pierce Pike Polk Pulaski Putnam Quitman Rabun Randolph Richmond Rockdale Schley Screven Seminole Spalding Stephens Stewart Sumter Talbot Taliaferro Tattnall Taylor Telfair Terrell Thomas Tift Toombs Towns Treutlen Troup Turner Twiggs Union Upson Walker Walton Ware Warren Washington Wayne Webster Wheeler White Whitfield Wilcox Wilkes Wilkinson Worth
322.............. $265 236.............. $293
23.............. $325 11.............. $314 279.............. $296 22.............. $296 47.............. $314 10.............. $295 21.............. $294 96.............. $306 12.............. $265 25.............. $308 2.................. $0 20.............. $259 3.............. $251 396.............. $291 194.............. $302 4.............. $250 17.............. $284 9.............. $211 149.............. $275 60.............. $294 5.............. $184 63.............. $259 10.............. $230 1.............. $221 16.............. $290 15.............. $260 18.............. $297 18.............. $228 55.............. $297 47.............. $287 48.............. $303 7.............. $254 15.............. $302 127.............. $306 12.............. $265 11.............. $317 30.............. $279 43.............. $268 55.............. $269 110.............. $303 43.............. $291 7.............. $247 29.............. $245 27.............. $309 1.............. $306 7.............. $282 34.............. $284 404.............. $295 6.............. $268 5.............. $295 11.............. $284 21.............. $271
?Note: Initial claims include intrastate initial and additional claims, as well as agent state initial and additional claims for regular UI only. Average duration of benefits is represented in weeks.
Data does not include state or federal extended benefits. Source: Georgia Department of Labor, Workforce Statistics Division
23
Bruce Thompson, Commissioner
148 Andrew Young International Boulevard, N.E. Atlanta, Georgia 30303-1751
Return Service Requested