- Collection:
- Georgia Government Publications
- Title:
- Disparities in tobacco use in Georgia [Feb. 2013]
- Creator:
- Georgia. Department of Public Health. Epidemiology Branch
- Contributor to Resource:
- Georgia. Department of Public Health. Epidemiology Branch
- Publisher:
- Atlanta, Ga. : Georgia. Department of Public Health. Epidemiology Branch
- Date of Original:
- 2013-02
- Subject:
- Georgia
- Location:
- United States, Georgia, 32.75042, -83.50018
- Medium:
- publications (documents)
- Type:
- Text
- Format:
- application/pdf
- External Identifiers:
- IZ MMS ID 9941206623902959
Call Number P780.E6 S1 D5 2013
GU 4120662-ugadb - Metadata URL:
- https://dlg.galileo.usg.edu/id:dlg_ggpd_y-ga-bp780-pe6-bs1-bd5-b2013-belec-p-btext
- Digital Object URL:
- https://dlg.galileo.usg.edu/do:dlg_ggpd_y-ga-bp780-pe6-bs1-bd5-b2013-belec-p-btext
- Language:
- eng
- Holding Institution:
- University of Georgia. Map and Government Information Library
- Rights:
-

The Georgia Department of Public Health
Disparities in Tobacco Use in Georgia
Adult males and females with less than a high school education are significantly more likely to smoke compared to those with a high school degree or above1.
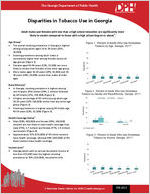
Age Group1 The overall smoking prevalence in Georgia is highest among young adults aged 18 to 24 years (25%; 24,000). Smoking prevalence among adult males is consistently higher than among females across all age groups (Figure 1). Females aged 45-54 years (23%; 15,000) are more likely to smoke than females of any other age group. More males aged 18-24 years (29%; 14,000) and 2534 years (29%; 20,000) smoke than males of older ages.
Race/Ethnicity1 In Georgia, smoking prevalence is highest among non-Hispanic (NH) whites (24%; 1 million) followed by NH blacks (17%; 350,000) (Figure 2). A higher percentage of NH white young adults age 18-24 years (35% 160,000) smoke than any other age group (Figure 3). Smoking prevalence is highest among NH blacks age 45-54 years (22%; 81,000) (Figure 3).
Health Coverage Status1 Male (50%; 400,000) and female (59%; 360,000) smokers are less likely to have health coverage than male (75%; 1.7 million) and female (77%; 1.9 million) nonsmokers (Figure 4). Approximately 57% (535,000) of NH white smokers have health coverage, whereas 44% (140,000) of NH black smokers have health coverage.
Income Level1 Georgia adults with an annual household income of less than $15,000 have the highest smoking prevalence at 35% (310,000); households with
2 Peachtree Street, Atlanta, Ga 30303 | health.state.ga.us
FEB 2013
Disparities in Tobacco Use
income $75K or more have significantly lower smoking prevalence (8%; 120,000) (Figure 5). Males with annual household incomes of less than $15,000 (45%; 167,000) are more likely to smoke than males in higher income groups (Figure 5). As annual household income increases for both males and females, smoking prevalence decreases (Figure 5).
Education Level1 In Georgia, smoking prevalence decreases as education level increases (Figure 6). Adult males (42%; 260,000) and females (30%; 180,000) with less than a high school education are significantly more likely to smoke compared to those with a high school degree or above (Figure 6). A significantly lower percentage of males (9%; 75,000) and females (7%; 67,000) with a college degree smoke than those without a college degree.
Lesbian, Gay, Bisexual, and Transgender (LGBT) Based on the National Adult Tobacco Survey, Georgians who are lesbian, gay, bisexual, and transgender have a higher smoking prevalence (33%; 55,000) compared to heterosexuals (19%; 1.2 million)2.
Cardiovascular Health Based on the Georgia Coverdell Acute Stroke Registry data, 23% of stroke patients who were admitted to participating hospitals during November 2007 to December 2011 were current smokers. Heart attack is the most common form of cardiovascular disease among male (6%; 50,000) and female (6%; 40,000) smokers in Georgia (Figure 7)1.
NH white smokers are more likely to have suffered
from heart attack (7%; 67,000) and angina/coronary heart disease (5%; 52,000) than NH black smokers
(5%; 16,000 for heart attack and 3%; 9,000 for angina/coronary heart disease) (Figure 8)1.
Disparities in Tobacco Use
Lung Cancer Approximately 79% of lung cancer deaths in Georgia are attributable to smoking3. Males (87%) have higher smoking attributable lung cancer deaths than females (67%)3. The lung cancer incidence and mortality rates are significantly lower among Georgia females than among males (Figure 9)4,5,6,7. The incidence rate of lung cancer among NH black males in Georgia is 95 per 100,000 (748 annually), similar to that of NH white males in Georgia (96 per 100,000; 2,618 annually) (Figure 9)4,5,6. The lung cancer incidence rate among NH black females is 43 per 100,000 (506 annually), which is significantly lower than the incidence rate for NH white females in Georgia (61 per 100,000; 2,080 annually) (Figure 9)4,5,6.
*Significantly above the state smoking prevalence, based on 95% confidence intervals Data source: 2011 Georgia Behavioral Risk Factor Surveillance System (BRFSS)
Southeast (Waycross 9-2, 31%; 107,000), Northwest (Rome 1-1, 27%; 120,000), and South (Valdosta 8-1, 26%; 58,000) Public Health Districts have significantly higher smoking prevalence than the overall state average rate (21%; 1.5M) (Table 1 & Figure 10).
Disparities in Tobacco Use
Tobacco Use Among Youth In 2011, 23% (93,000) of Georgia high school students smoked cigarettes or cigars, or used chewing tobacco, snuff, or dip on one or more days within 30 days of the survey8. Male (19%; 39,000) and female (15%; 31,000) high school students are significantly more likely to smoke than male (7%; 12,000) and female (6%; 11,000) middle school students (Figure 11)8. More NH white high school students use cigarettes (25%; 46,000) than other types of tobacco while more NH black high school students (15%; 26,000) use cigars and cigarillos than other types of tobacco8 (Figure 12). NH white (25%; 46,000) high school students are significantly more likely to smoke cigarettes than NH black (8%; 13,000) students; NH white (15%; 29,000) students are also significantly more likely to use smokeless tobacco than NH black (3%; 6,000) students (Figure 12)8. Georgia high school students in 12th grade (25%; 21,000) were significantly more likely to smoke than other grades (Figure 13)8. NH white high school students (63%; 130,000) were significantly more likely to have exposure to secondhand smoke in a room or car within the last 7 days compared to NH blacks (48%; 88,000) and Hispanics (42%; 14,000) (Figure 14)9. The percentage of high school students exposed to secondhand smoke in the past seven days who have been diagnosed with asthma (25%; 62,000) is comparable to those who have not been exposed to secondhand smoke (26%; 53,000)9.
Disparities in Tobacco Use
Data Sources: 1. 2011 Georgia Behavioral Risk Factor Surveillance System
(BRFSS) Data 2. 2009-2010 National Adult Tobacco Survey (ATS) 3. Georgia Vital Statistics, 2004-2008; CDC SAMMEC web
application (http://apps.need.cdc.gov/sammec/) 4. 2006-2010 Georgia Comprehensive Cancer Registry
(GCCR) 5. 2006-2010 National Cancer Institute (NCI) 6. 2006-2010 National Center for Health Statistics (NCHS) 7. Georgia Death File, Georgia Department of Community
Health, Division of Public Health, Vital Records Program, 2004-2008 8. 2011 Georgia Youth Risk Behavior Survey (YRBS) 9. 2011 Georgia Youth Tobacco Survey (YTS)