- Collection:
- Georgia Government Publications
- Title:
- 2012 STD data summary [2012]
- Creator:
- Georgia. Department of Public Health
- Contributor to Resource:
- Georgia. Department of Public Health
- Publisher:
- Atlanta, Ga. : Georgia. Department of Public Health
- Date of Original:
- 2012
- Subject:
- Georgia
- Location:
- United States, Georgia, 32.75042, -83.50018
- Medium:
- publications (documents)
- Type:
- Text
- Format:
- application/pdf
- External Identifiers:
- OCLC 1458472165
Call Number P780 .S1 S8 2012 - Metadata URL:
- https://dlg.galileo.usg.edu/id:dlg_ggpd_y-ga-bp780-b-ps1-bs8-b2012-belec-p-btext
- Digital Object URL:
- https://dlg.galileo.usg.edu/do:dlg_ggpd_y-ga-bp780-b-ps1-bs8-b2012-belec-p-btext
- Language:
- eng
- Holding Institution:
- University of Georgia. Map and Government Information Library
- Rights:
-

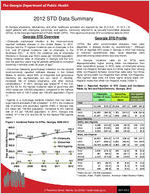
The Georgia DepartmentTohfe PGueobrlgiciaHDeeapaltrhtment of Public Health
2012 STD Data Summary
All Georgia physicians, laboratories, and other healthcare providers are required by law (O.C.G.A. 31-12-2 ) to report patients with chlamydia, gonorrhea, and syphilis, commonly referred to as sexually-transmitted diseases
(STDs), to the Georgia Department of Public Health (DPH). This report summarizes STD surveillance data for 2012.
Georgia STD Overview
Georgia STD Profile
Chlamydia trachomatis infection is the most-commonly reported notifiable disease in the United States. In 2011, Georgia had the 7th-highest incidence rate of chlamydia in the U.S. and 6th-highest incidence rate of chlamydia in the Southeast (SE).1 In 2012, the incidence rate of chlamydia infections in Georgia was 533.2 cases per 100,000 population.
STDs, like other communicable diseases, have clear disparities in disease burden by race/ethnicity.5 Although 37.8% of reported STD cases in Georgia in 2012 had missing or unknown race/ethnicity data, racial disparities were observed among cases where race was known.
Rising incidence rates of chlamydia in Georgia and the U.S. over the past four years may be partially attributed to increased screening in females under 26 years of age.2
Gonorrhea (Nesseria gonorrhoeae) infections are the second most-commonly reported notifiable disease in the United States. In women, about 80% of chlaymdial and gonococcal infections are asymptomatic but can result in infertility, increased risk of ectopic pregnancy, and other serious complications.3 In 2011, Georgia was ranked 6th in the U.S. and the SE for the highest incidence rates of gonorrhea with 159.2 cases per 100,000 population, compared to the national
In Georgia, incidence rates for all STDs were disproportionately higher among black non-Hispanics than other racial/ethnic groups. In 2012, rates of chlamydia among black non-Hispanic females were 6.4 times higher than among white non-Hispanic females. Gonorrhea rates were 16.2 times higher among black non-Hispanics than whites non-Hispanics. P&S syphilis rates were 5.8 times higher among black nonHispanic males than white-non-Hispanic males (Table 1).
Table 1. Reported Number of STD Cases and Incidence Rates, by Sex and Race/Ethnicity, Georgia, 2012
incidence rate of 104.2 cases per 100,000 population (Figure 1).1
Syphilis is a multi-stage bacterial infection that can lead to organ failure and death if left untreated.4 In 2011, the incidence
Total
Chlamydia
Gonorrhea P&S Syphilis
Number of Cases Number of Cases Number of
(Rate1)
(Rate)
Cases (Rate)
rate of primary and secondary syphilis (P&S) in Georgia was 6.9 cases per 100,000 population, compared to the national rate of 4.5 per 100,000 population. In 2011, Georgia was ranked 3rd in the U.S. and the SE for the highest P&S syphilis rates.1
52,336
Sex
Male
14,455
Female
37,447
Race/Ethnicity
(533.2) 15,416
(301.0) 7,351 (747.1) 7,954
(157.1)
(153.1) (158.7)
1,007 (10.3)
939 (19.6) 67 (1.3)
Figure 1. Incidence Rates for STDs, Georgia, 2008-2012
White, Non-Hispanic
Rate per 100,000 Persons
600.0 500.0
442.4 400.0 300.0
413.8
459.3
515.7
533.2
Chlamydia Gonorrhea P&S Syphilis
Total Male Female
6,105 (112.0) 1,440 (53.65) 4,622 (167.1)
Black, non-Hispanic
Total
24,983 (841.9)
Male
8,077 (580.1)
Female
16,796 (1,066.3)
Hispanic/Latino
1,104 419 681
9,775 5,051 4,683
(20.3) (15.6) (24.6)
(329.4) (362.8) (297.3)
134 (2.5) 127 (4.6)
7 (0.3)
799 (14.7) 743 (26.9)
56 (2.0)
200.0 169.6 142.2
161.2
159.2
157.1 Total Male
1,519 (170.3) 195 (21.9) 387 (80.4) 95 (19.7)
35 (0.6) 34 (1.2)
100.0
10.0 0.0
2008
10.1 2009
7.9
2010 Year
6.9 2011
10.3 2012
Female Other2 Total Male Female
1,123 (273.6)
192 (48.5) 47 (24.1)
140 (69.6)
98 (23.9)
35 (8.8) 16 (8.2) 19 (9.5)
<5 (0.0)
<5 (1.0) <5 (2.0) 0 (0.0)
1 Rates are per 100,000 population 2 Includes; Asian, Pacific Islander, American Indian/Alaskan Native.
2 Peachtree Street, Atlanta, Ga 30303 | health.state.ga.us
SEP 2013
2012 STD Data Summary
Chlamydia
In Georgia during 2012, the greatest burden of chlamydia and gonorrhea infections were noted among women and young adults (of both sexes). Women accounted for 72% of reported cases of chlamydia and young people 15-24 years of age accounted for 71% of reported cases of chlamydia (Table 2). In 2012, the rate of chlamydia infection among females 20-24 years was 7.8 times higher than the average incidence rate of chlamydia in Georgia as a whole (Figure 2).
Gonorrhea
During 2012 in Georgia, differences in disease burden by age and sex were less pronounced for gonorrhea than for chlamydia. Females accounted for 52% of reported cases of gonorrhea and young people aged 15-24 years accounted for 62% of reported cases of gonorrhea (Table 2). In 2012, the rate of gonorrhea among females 20-24 years was higher than all other age groups and Georgia as a whole (Figure 2).
Table 2. Number of Reported STD Cases and Incidence
Rates by Age (years) and Sex, Georgia, 2012.
Chlamydia Cases (Rate1)
Gonorrhea Cases (Rate)
P&S Syphilis Cases (Rate)
15-19 yrs
Total
17,207 (2,454.8) 3,985 (568.5) 61 (8.7)
Male
3,523 (977.2) 1,307 (362.5) 54 (15.0)
Female 13,516 (3,970.5) 2,638 (775.0)
6 (1.8)
20-24 yrs
Total
20,168 (2,850.7) 5,624 (795.0) 262 (37.0)
Male
5,538 (1,536.8) 2,551 (707.9) 237 (65.8)
Female 14,489 (4,174.2) 3,041 (876.1) 25 (7.2)
25-30 yrs
Total
7,717 (1,134.8) 2,579 (379.3) 216 (31.8)
Male
2,531 (742.1) 1,408 (412.8) 207 (60.7)
Female
5,131 (1,513.7) 1,154 (340.5)
9 (2.7)
30-34 yrs
Total
3,387 (499.2) 1,279 (188.5) 162 (23.9)
Male
1,286 (385.3) 764 (228.9) 153 (45.8)
Female
2,083 (604.2) 511 (148.2)
9 (2.6)
35-39 yrs
Total
1,482 (219.9) 716 (106.2) 88 (13.1)
Male
607 (184.1) 462 (140.1) 81 (24.6)
Female
867 (251.8) 250 (72.6)
7 (2.0)
40-44 yrs
Total
769 (108.5) 417 (58.8) 91 (12.8)
Male
375 (107.6) 310 (88.9) 86 (24.7)
Female
388 (107.6) 105 (29.1)
5 (1.4)
45-49 yrs
Total
404
(56.5) 303 (42.4)
77 (10.8)
Male
230
(65.8) 248 (70.9)
75 (21.4)
Female
170
(46.6)
54 (14.8)
<5 (0.0)
50+ yrs
Total
382
(13.3) 326 (11.3)
49 (1.7)
Male
220
(16.7) 261 (19.8)
45 (3.4)
Female
159
(10.2)
63 (4.1)
<5 (0.3)
1 Rates are per 100,000 population.
Figure 2. Incidence Rates of Chlamydia and Gonorrhea by Age (years) and Sex, Georgia, 2012.
Incidence Rates per 100,000 Persons
Male 1600 800
0
0
Age 15-19
Female 800 1600 2400 3200 4000
20-24
25-29 30-34 35-39
Chlamydia Gonorrhea
40-44
45-49
>50
Gonorrhea Reinfections
During 2008-2012, approximately 5% (n= 3,799) of Georgians diagnosed with gonorrhea were reinfected within the same year. Furthermore, over the five-year period from 2008-2012, 12.8% (n=8,376) of the total number of persons diagnosed with gonorrhea were reinfected at least once; of those, 21% (n=1,758) were reinfected two or more times during the fiveyear period (Table 3).
Treatment of gonorrhea has been complicated by the increasing resistance to antibiotics used for treatment of gonorrhea. In the last decade, the development of fluoroquinolone resistance has resulted in the availability of only a single class of antibiotics that meet CDC's treatment efficacy standards--the cephalosporins. Recommendations for appropriate screening and treatment of gonorrhea can be found in the CDC's Sexually Transmitted Disease Treatment Guidelines, 20106
Table 3. Number of Repeat Gonorrhea Infections Among Individuals Within 1 Year and 5 Year periods, Georgia, 2008-2012.
Time Period
Single Infection1
Patients2 (%)
Two Infections
More than Two
Infections
Patients (%) Patients (%)
2008
14,566 (95.1) 681 (4.4) 62 (0.4)
2009
12,579 (95.9) 499 (3.8) 33 (0.3)
2010
14,081 (95.0) 681 (4.6) 67 (0.5)
2011
13,784 (94.0) 793 (5.4) 83 (0.6)
2012
13,527 (93.8) 818 (5.7) 82 (0.6)
2008-2012 57,291 (87.2) 6,615 (10.1) 1,758 (2.7)
1 Diagnosed infections 2 Total number of patients
We Protect Lives.
2012 STD Data Summary
Number of Cases
Percentage of Total Cases
Syphilis
In Georgia during 2012, the highest incidence rates of syphilis were observed among males, particularly young adult males. In 2012, the rate of P&S syphilis among men was approximately 15.1 times higher than females, and the rate of P&S syphilis among males aged 20-24 years was 3.4 times higher than the average rate of P&S syphilis among men for all age groups (Figure 3).
Figure 3. Incidence Rates of P&S Syphilis by Age (years) and Sex, Georgia, 2012.
Incidence Rates per 100,000 Persons
Male
Female
80
60
40
20
0
0
10
Age
15-19
20-24
25-29
30-34
35-39
40-44
45-49
>50
Syphilis among MSM
In Georgia, the highest incidence rates of P&S syphilis in 2012 were among men who self-reported as having sex with men (MSM); of all persons with P&S syphilis who identified the sex of their sexual partner, 76% (n= 425/562) occurred among MSM (Figure 4). Nationally, CDC reports that from 2000 to 2011, the percentage of P&S syphilis cases who self-identified as MSM (of all men and women who identified the sex of their sexual partner) increased from 7% to 72%.1
Figure 4. Reported Cases of P&S syphilis, by sexual orientation and sex, Georgia, 2008-2012.
Female Heterosexual Male MSM 750
600
450
300 70%
70%
72%
79%
76%
150
0 2008
2009
2010 Year
2011
2012
Syphilis and HIV Coinfections
Ulcers caused by Treponema pallidum, the bacterium that causes syphilis, increase the risk of acquiring HIV.7 In Georgia, the frequency of coinfection with P&S syphilis and HIV varies by sex and sexual orientation.
In 2012, 57.4% (n=578) of all reported P&S syphilis cases in Georgia were interviewed, of which 74% (n=425) self-identified as MSM. Based on documented and self-reported status of HIV infection, 72% (n=306) of MSMs with P&S syphilis were co-infected with HIV (Figure 5).
Figure 5. Percentage of P&S syphilis cases co-infected with HIV (n=1,758/4,872), by sexual orientation and sex, Georgia, 2008-2012.
100%
MSM Heterosexual Males Females
78%
80% 70%
72%
72%
72%
60%
40%
20%
0% 2008
2009
2010 Year
2011
2012
Data Sources
State STD Data: Numbers are based on cases diagnosed with a STD as of December 31, 2012 and entered as of June 5, 2013. Numbers have not been adjusted for reporting delays. Numbers are taken from Georgia's State Electronic Notifiable Disease Surveillance System (SendSS).
Rates are based on population data obtained from the 2010 U.S Census accessed at : DPH, OASIS http://oasis.state.ga.us/oasis/
References: 1 CDC's Sexually Transmitted Disease Surveillance, 2011: http://www.cdc.gov/std/stats11/
2 2011 Sexually Transmitted Disease Surveillance, Chlamydia Statistics: http://www.cdc.gov/std/chlamydia/stats.htm
3 STDs & Infertility: http://www.cdc.gov/std/infertility/default.htm
4 Syphilis & MSM (Men Who Have Sex With Men), CDC Fact Sheet: http://www.cdc.gov/std/syphilis/STDFact-MSM-Syphilis.htm
5 African Americans Sexually Transmitted Diseases, CDC Fact Sheet: http://www.cdc.gov/nchhstp/newsroom/docs/AAs-and-STD-FactSheet.pdf
6 Update to CDC's Sexually Transmitted Diseases Treatment Guidelines, 2010: Oral Cephalosporins No Longer a Recommended Treatment for Gonococcal Infections: http://www.cdc.gov/mmwr/preview/mmwrhtml/mm6131a3.htm?s_cid=m m6131a3_w
7 Syphilis and HIV: A Dangerous Duo Affecting Gay and Bisexual Men: http://blog.aids.gov/2012/12/syphilis-and-hiv-a-dangerous-duo-affectinggay-and-bisexual-men.html
We Protect Lives.
2012 STD Data Summary
Overview by Health District
Table 4. Reported Number of STDs and Incidence Rates, by Health District, Georgia, 2012.
District
Chlamydia
Gonorrhea
P&S Syphilis
Cases Rate1 Rank2 Cases Rate Rank Cases Rate Rank
1-1 Northwest (Rome)
1,476 230.2 17 390 60.8 16
5 0.8 17
1-2 North Georgia (Dalton)
1,046 236.4 16 148 33.4 18
11 2.5 14
2 North (Gainesville)
1,193 190.2 18 199 31.7 17
6 1.0 16
3-1 Cobb/Douglas
3,509 422.3 14 873 105.1 10
66 7.9 6
3-2 Fulton
7,071 744.6 2 3,235 340.7 1 440 46.3 1
3-3 Clayton County (Jonesboro) 1,715 655.8 9 527 201.5 6
44 16.8 3
3-4 East Metro (Lawrenceville) 4,205 415.7 15 889 87.9 15
49 4.8 11
3-5 DeKalb
5,535 790.8 1 1,969 281.3 2 172 24.6 2
4-4 LaGrange
3,456 428.0 13 809 100.2 13
27 3.3 13
5-1 South Central (Dublin)
815 529.1 11 184 119.5 11
11 7.1 7
5-2 North Central (Macon)
3,542 675.6 7 1,236 235.8 5
32 6.1 9
6 East Central (Augusta)
3,265 702.4 6 842 181.1 7
25 5.4 10
7 West Central (Columbus) 2,735 730.9 4 999 267.0 3
32 8.6 5
8-1 South (Valdosta)
1,890 736.9 3 605 235.9 4
16 6.2 8
8-2 Southwest (Albany)
2,410 675.3 8 721 202.0 8
38 10.6 4
9-1 Coastal (Savannah)
4,157 715.3 5 976 167.9 9
25 4.3 12
9-2 Southeast (Waycross)
2,074 562.8 10 405 109.9 14
5 1.4 15
10 Northeast (Athens)
2,242 484.3 12 409 88.3 12
<5 0.6 18
1 Rates are per 100,000 population 2 Rankings are based on highest rates of disease
Contact: DPH Sexually-Transmitted Disease Program: (404) 463-2579
gdphinfo@dhr.state.ga.us
We Protect Lives.