- Collection:
- Georgia Government Publications
- Serial:
- ... Georgia data summary. Child asthma.
- Title:
- 2020 Georgia data summary: asthma in children
- Creator:
- Georgia. Department of Public Health
- Contributor to Resource:
- Georgia. Department of Public Health, issuing body.
- Publisher:
- Atlanta, Ga. : Georgia. Department of Public Health
- Date of Original:
- 2020
- Subject:
- Asthma in children--Treatment--Georgia--Periodicals
- Location:
- United States, Georgia, 32.75042, -83.50018
- Medium:
- summaries
- Type:
- Text
- Format:
- application/pdf
- Description:
- Data summary of asthma in children in Georgia.
- External Identifiers:
- Call Number GA P780 .S1 A8 2020
- Metadata URL:
- https://dlg.galileo.usg.edu/id:dlg_ggpd_y-ga-bp780-b-ps1-ba8-b2020-belec-p-btext
- Digital Object URL:
- https://dlg.galileo.usg.edu/do:dlg_ggpd_y-ga-bp780-b-ps1-ba8-b2020-belec-p-btext
- Language:
- eng
- Holding Institution:
- University of Georgia. Map and Government Information Library
- Rights:
-

2020 GEORGIA DATA SUMMARY | ASTHMA IN CHILDREN
Asthma is a chronic inflammatory disorder of the airways characterized by episodes of reversible breathing problems due to airways narrowing and obstruction. These episodes can range in severity from mild to life threatening1.
ASTHMA PREVALENCEa:
In 2018, the overall asthma prevalence among children in Georgia aged 0-17 years was 7.6%. Overall, 12.3% of children in Georgia had been told at some point in their lives that they had asthma. Differences in asthma prevalence existed by demographic characteristics.
Boys had a higher prevalence (9.8%) of asthma than girls (5.3%)
Children of non-Hispanic origin had a higher prevalence (8.3%) of asthma compared to those of Hispanic origin (3.3%)
Non-Hispanic Blacks had a higher prevalence (10.4%) of asthma compared to Hispanics (3.3%)
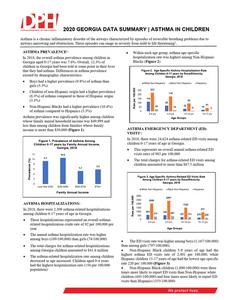
Asthma prevalence was significantly higher among children whose family annual household income was $49,999 and less than among children from families whose family income is more than $50,000 (Figure 1).
Prevalence (%)
Figure 1. Prevalence of Asthma Among Children 0-17 years by Family Annual Income,
Georgia, 2018
12
10
9.3
8
6
4
2
0 Less than $25k
10.6 $25k-$49k
5.3 $50k-$75k
Family Annual Income
5.9 $75k+
ASTHMA HOSPITALIZATIONS:
In 2018, there were 2,309 asthma-related hospitalizations among children 0-17 years of age in Georgia.
These hospitalizations represented an overall asthmarelated hospitalization crude rate of 92 per 100,000 per year
The annual asthma hospitalization rate was higher among boys (109/100,000) than girls (74/100,000)
The total charges for asthma-related hospitalizations among Georgia children amounted to $41.6 million
The asthma-related hospitalization rate among children decreased as age increased. Children aged 0-4 years had the highest hospitalization rate (156 per 100,000 population)
Within each age group, asthma age-specific hospitalization rate was highest among Non-Hispanic Blacks (Figure 2)
Rate per 100,000
Figure 2. Age-Specific Asthma Hospitalization Rate Among Children 0-17 years by Race/Ethnicity, Georgia, 2018
White Non-Hispanics Black Non-Hispanics Hispanics
250
223
200
150 116
100
50
24
0 0-4 yrs
178
68 14
94 30
6
5-9 yrs
10-14 yrs
Age Groups
41
18
2
15-17 yrs
ASTHMA EMERGENCY DEPARTMENT (ED) VISITSc:
In 2018, there were 24,624 asthma-related ED visits among children 0-17 years of age in Georgia.
This represents an overall annual asthma-related ED visits rates of 983 per 100,000
The total charges for asthma-related ED visits among children amounted to more than $67.5 million
Rate per 100,000
Figure 3. Age-Specific Asthma-Related ED Visits Rate Among Children 0-17 years by Race/Ethnicity, Georgia, 2018
White Non-Hispanics Black Non-Hispanics Hispanics
3000 2500 2000 1500 1000
500 0
2046 603
375 0-4 yrs
2401
1522
556 441
321 313
5-9 yrs
10-14 yrs
Age Groups
937 255 220 15-17 yrs
The ED visits rate was higher among boys (1,167/100,000) than among girls (797/100,000). Non-Hispanic Black children 5-9 years of age had the highest asthma ED visits rate of 2,401 per 100,000; while Hispanic children 15-17 years of age had the lowest age-specific rate 220 per 100,000 (Figure 3) Non-Hispanic Black children (1,800/100,000) were three times more likely to report ED visits than Non-Hispanic white children (445/100,000) and four times more likely to report ED visits than Hispanics (353/100,000)
REGIONAL DIFFERENCES IN ASTHMA PREVALENCE, HOSPITALIZATION RATES AND ED VISITS RATES: In Georgia, child asthma prevalence, hospitalization rates and ED visits rates differed by region (Public Health District; PHD).
Prevalence: In 2016-2018, the four PHDs with the highest prevalence of children asthma were West Central (7), Fulton (3-2), East Central (6) and Clayton County (3-3), with rates of 13.9%, 12.3%, 11.8% and 11.2% respectively. (Map 1, Table 1)
Map 1. Asthma Prevalence, Children 0-17 Years of Age, by PHD, Georgia, 2016-2018
Table 1. Asthma Prevalence among children by Public Health Districts from 2016 to 2018
District Name
County
1-1 Northwest (Rome) 1-2 North Georgia (Dalton) 2 North (Gainesville) 3-1 Cobb/Douglas 3-2 Fulton 3-3 Clayton County (Jonesboro) 3-4 East Metro (Lawrenceville) 3-5 DeKalb 4 LaGrange 5-1 South Central (Dublin)
5-2 North Central (Macon)
6 East Central (Augusta)
7 West Central (Columbus)
8-1 South (Valdosta)
8-2 Southwest (Albany)
9-1 Coastal (Savannah)
9-2 Southeast (Waycross)
10 Northeast
Bartow, Catoosa, Chattooga, Dade, Floyd, Gordon, Haralson, Paulding, Polk, Walker Cherokee, Fannin, Gilmer, Murray, Pickens, Whitefield Banks, Dowson, Forsyth, Franklin, Habersham, Hall, Hart, Lumpkin, Rabun, Stephens, Towns, Union, White Cobb, Douglas Fulton
Clayton
Gwinnett, Newton, Rockdale
DeKalb
Butts, Carroll, Coweta, Fayette, Henry, Lamar, Meriwether, Pike, Spalding, Troup, Upson
Bleckley, Dodge, Johnson, Laurens, Montgomery, Pulaski, Telfair, Treutlen, Wheeler, Wilcox Baldwin, Bibb, Crawford, Hancock, Houston, Jasper, Jones, Monroe, Peach, Putnam, Twiggs, Washington, Wilkinson Burke, Columbia, Emanuel, Glascock, Jefferson, Jenkins, Lincoln, McDuffie, Richmond, Screven, Taliaferro, Warren, Wilkes Chattahoochee, Clay, Crisp, Dooly, Harris, Macon, Marion, Muscogee, Quitman, Randolph, Schley, Stewart, Sumter, Talbot, Taylor, Webster Ben Hill, Berrien, Brooks. Cook, Echols, Irwin, Lanier, Lowndes, Tift, Turner Baker, Calhoun, Colquitt, Decatur, Dougherty, Early, Grady, Lee, Miller, Mitchell, Seminole, Terrell, Thomas, Worth Bryan, Camden, Chatham, Effingham, Glynn, Liberty, Long, McIntosh Appling, Atkinson, Bacon, Brantley, Bulloch, Candler, Charlton, Clinch, Coffee, Evans, Jeff Davis, Pierce, Tattnall, Toombs, Ware, Wayne Barrow, Clarke, Elbert, Greene, Jackson, Madison, Morgan, Oconee, Oglethorpe, Walton
Prevalence
7.2% 6.4%
5.7% 6.4% 12.3%
11.2%
7.7% 8.2% 7.8% 10.8%
6.8%
11.8%
13.9% 10.5%
10.4% 7%
10.6% 6%
Hospitalizations: In 2016-2018, four PHDs with the highest age-adjusted asthma hospitalization rates were South Central (5-1), Dekalb (3-5), Fulton (5-2) and Clayton County (3-3) with rates of 283, 182, 165 and 149 per 100,000 respectively. (Map 2, Table 2)
Map 2. Age-Adjusted Asthma Hospitalization Among Children 0-17 Years of Age, by PHD, Georgia, 20162018
Table 2. Age-Adjusted Asthma Hospitalization Rate among children 0-17 years by Public Health Districts, Georgia
District Name
County
Hospitalization Rate (per 100,000) 2016-2018
2018 Annual Numbers
1-1 Northwest (Rome)
Bartow, Catoosa, Chattooga, Dade, Floyd, Gordon, Haralson, Paulding, Polk, Walker
65
87
1-2 North Georgia (Dalton)
Cherokee, Fannin, Gilmer, Murray, Pickens, Whitefield
62
50
2 North (Gainesville)
Banks, Dowson, Forsyth, Franklin, Habersham, Hall, Hart, Lumpkin, Rabun, Stephens, Towns, Union, White
60
80
3-1 Cobb/Douglas
Cobb, Douglas
144
283
3-2 Fulton
Fulton
165
388
3-3 Clayton County (Jonesboro) Clayton
149
112
3-4 East Metro (Lawrenceville) Gwinnett, Newton, Rockdale
93
210
3-5 DeKalb
DeKalb
182
259
4 LaGrange
Butts, Carroll, Coweta, Fayette, Henry, Lamar, Meriwether, Pike,
87
131
Spalding, Troup, Upson
5-1 South Central (Dublin)
Bleckley, Dodge, Johnson, Laurens, Montgomery, Pulaski, Telfair, Treutlen, Wheeler, Wilcox
283
70
5-2 North Central (Macon)
Baldwin, Bibb, Crawford, Hancock, Houston, Jasper, Jones, Monroe, Peach, Putnam, Twiggs, Washington, Wilkinson
129
122
6 East Central (Augusta)
Burke, Columbia, Emanuel, Glascock, Jefferson, Jenkins, Lincoln, McDuffie, Richmond, Screven, Taliaferro, Warren, Wilkes
111
68
7 West Central (Columbus)
Chattahoochee, Clay, Crisp, Dooly, Harris, Macon, Marion, Muscogee, Quitman, Randolph, Schley, Stewart, Sumter, Talbot, Taylor, Webster
108
86
8-1 South (Valdosta)
Ben Hill, Berrien, Brooks. Cook, Echols, Irwin, Lanier, Lowndes, Tift,
112
Turner
53
8-2 Southwest (Albany)
Baker, Calhoun, Colquitt, Decatur, Dougherty, Early, Grady, Lee, Miller, Mitchell, Seminole, Terrell, Thomas, Worth
91
58
9-1 Coastal (Savannah)
Bryan, Camden, Chatham, Effingham, Glynn, Liberty, Long, McIntosh
118
147
Appling, Atkinson, Bacon, Brantley, Bulloch, Candler, Charlton,
9-2 Southeast (Waycross)
Clinch, Coffee, Evans, Jeff Davis, Pierce, Tattnall, Toombs, Ware,
55
42
Wayne
10 Northeast
Barrow, Clarke, Elbert, Greene, Jackson, Madison, Morgan, Oconee, Oglethorpe, Walton
72
63
ED Visits: In 2016-2018, four PHDs with the highest age-adjusted asthma ED visits rates were Dekalb (3-5), East Central (6), Cobb/Douglas (3-1) and Fulton (3-2) with rates of 1433, 1229, 1213, and 1210 per 100,000 respectively. (Map 3, Table 3)
Map 3. Age-Adjusted Asthma ED Visits Among Children 0-17 Years of Age, by PHD, Georgia, 2016-2018
Table 3. Age-Adjusted Asthma ED visits rate among children 0-17 years by Public Health Districts, Georgia
District Name
County
ED Visits Rate (per 100,000)
2016-2018
1-1 Northwest (Rome)
Bartow, Catoosa, Chattooga, Dade, Floyd, Gordon, Haralson, Paulding, Polk, Walker
738
1-2 North Georgia (Dalton) Cherokee, Fannin, Gilmer, Murray, Pickens, Whitefield
367
2 North (Gainesville)
Banks, Dowson, Forsyth, Franklin, Habersham, Hall, Hart, Lumpkin, Rabun, Stephens, Towns, Union, White
409
3-1 Cobb/Douglas
Cobb, Douglas
1,213
3-2 Fulton
Fulton
1,210
3-3 Clayton County (Jonesboro)
Clayton
1,163
3-4 East Metro (Lawrenceville)
Gwinnett, Newton, Rockdale
893
3-5 DeKalb
DeKalb
1,433
4 LaGrange
Butts, Carroll, Coweta, Fayette, Henry, Lamar, Meriwether, Pike, Spalding,
695
Troup, Upson
5-1 South Central (Dublin) 5-2 North Central (Macon)
Bleckley, Dodge, Johnson, Laurens, Montgomery, Pulaski, Telfair, Treutlen, Wheeler, Wilcox Baldwin, Bibb, Crawford, Hancock, Houston, Jasper, Jones, Monroe, Peach, Putnam, Twiggs, Washington, Wilkinson
808 1,028
6 East Central (Augusta) 7 West Central (Columbus) 8-1 South (Valdosta)
Burke, Columbia, Emanuel, Glascock, Jefferson, Jenkins, Lincoln, McDuffie, Richmond, Screven, Taliaferro, Warren, Wilkes Chattahoochee, Clay, Crisp, Dooly, Harris, Macon, Marion, Muscogee, Quitman, Randolph, Schley, Stewart, Sumter, Talbot, Taylor, Webster
Ben Hill, Berrien, Brooks. Cook, Echols, Irwin, Lanier, Lowndes, Tift, Turner
1,229 953 620
8-2 Southwest (Albany)
Baker, Calhoun, Colquitt, Decatur, Dougherty, Early, Grady, Lee, Miller, Mitchell, Seminole, Terrell, Thomas, Worth
867
9-1 Coastal (Savannah)
Bryan, Camden, Chatham, Effingham, Glynn, Liberty, Long, McIntosh
763
9-2 Southeast (Waycross)
Appling, Atkinson, Bacon, Brantley, Bulloch, Candler, Charlton, Clinch, Coffee, Evans, Jeff Davis, Pierce, Tattnall, Toombs, Ware, Wayne
830
10 Northeast
Barrow, Clarke, Elbert, Greene, Jackson, Madison, Morgan, Oconee, Oglethorpe, Walton
781
2018 Annual Numbers
1,245
420 678
2,716 3,582 1,111
2,666
2,656 1,508
288
1,258
1,475
1,002
439 791
1,272 767
750
2020 GEORGIA DATA SUMMARY | ASTHMA IN CHILDREN
Data Sources a. 2016-2018 Georgia Behavioral Risk Factor Surveillance System (BRFSS) The BRFSS is a stratified random-digit dial telephone interview conducted among Georgia non-institutionalized residents 18 years and older to ascertain their health conditions, behaviors, and the use of preventive services. The survey is conducted in collaboration with the Centers for Disease Control and Prevention (CDC).
b. 2016-2018 Georgia Hospital Inpatient Discharge Data Hospitalization data are based on hospital discharge data for Georgia residents who were hospitalized in non-federal acute care hospitals with asthma as the primary diagnosis. The ICD- 10 code: J45 was used to select hospitalizations, based on the Division of Environmental Health Science and Practice, Centers for Disease Control and Prevention (CDC) definition.
c. 2016-2018 Georgia Emergency Department Visits Data Emergency department (ED) visits data are based on Georgia residents who were seen in the emergency department of nonfederal acute care hospitals in Georgia with asthma as the primary diagnosis. The ICD- 10 code: J45 was used to select ED visits, based on the Division of Environmental Health Science and Practice, Centers for Disease Control and Prevention (CDC) definition.
Statistical Significance: Significance was determined when confidence intervals around prevalence were not overlapping
References
1. Health Resources and Services Administration. Women's Health USA 2011. Rockville, Maryland: U.S. Department of Health and Human Services, 2011. Accessed on 8/20/2020. Available at https://mchb.hrsa.gov/whusa11/more/downloads/pdf/w11.pdf