- Collection:
- Georgia Government Publications
- Title:
- Annual report, state fiscal year 1998
- Creator:
- Georgia. Dept. of Medical Assistance
- Publisher:
- Atlanta, Ga. : Dept. of Medical Assistance, 1998
- Date of Original:
- 1997/1998
- Subject:
- Georgia. Department of Medical Assistance
Medical assistance--Georgia
Public welfare--Georgia - Location:
- United States, Georgia, 32.75042, -83.50018
- Medium:
- state government records
- Type:
- Text
- Format:
- application/pdf
- Description:
- Title from cover
- External Identifiers:
- Call Number GA M290 .A1 1998
- Metadata URL:
- https://dlg.galileo.usg.edu/id:dlg_ggpd_y-ga-bm290-b-pa1-b1998
- Digital Object URL:
- https://dlg.galileo.usg.edu/do:dlg_ggpd_y-ga-bm290-b-pa1-b1998
- Language:
- eng
- Holding Institution:
- University of Georgia. Map and Government Information Library
- Rights:
-

THE GEORGIA DEPARTMENT OF MEDICAL ASSISTANCE
ANNUAL REPORT, STATE FISCAL YEAR 1998
Roy E. Barnes, Governor William R. Taylor, Commissioner
2 03
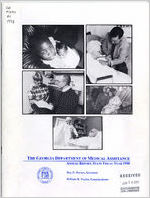
On the cover (clockwise from top left): Brandon Fields with baby sister Brittnee Danielle; Dr. Richard Ackermann with patient Ethel Phillips; Dee Neal with mother Grace Bordley; Carleen and Grant Morse; Dr.
William S. Hutchings, II with patient Faye Robbins.
All photography in SFY98 annual report by Tiffany Leigh Brown.
Roy E. Barnes
GOVERNOR
STATE OF GEORGIA
OFFICE OF THE GOVERNOR
ATLANTA 30334-0900
January 28, 1999
To All Members of the Georgia Legislature and All Georgians:
As a candidate for office last year, I promised you that I would lead the effort to reform our health care system. As Governor, I intend to keep that promise. The principles that will guide reform are:
every patient should have the right to make an informed choice of their health care provider;
access to health care should be affordable for all; and health care decisions should be based on the needs of the patients.
In the first few months of 1999, I will work closely with the Georgia Legislature to lay the organizational foundation that will enable us to jointly achieve positive changes in our health care system.
This Annual Report of the Department of Medical Assistance contains much of the factual nuts and bolts information needed to make informed health care decisions. I urge you to read it and become familiar with the trends and findings it contains. It is a valuable tool for those of us concerned with reshaping our health care system to meet the challenges ahead in the new Millennium.
I look forward to working with you and to our good health.
Kindest regards.
REB/tb
Roy E. Barnes
State of Georgia Department of Medical Assistance
2 Peachtree Street, N.W. Atlanta, Georgia 30303-3159
William R. Taylor, M.D., M.P.H. Commissioner
Dear Reader,
I am pleased to introduce the Department of Medical Assistance's (DMA) Annual Report for State Fiscal Year 1998. DMA manages Georgia's Medicaid program and PeachCare for Kids, which is Georgia's Children's Health Insurance Program. This report describes the health benefits provided by Medicaid, the profile of Medicaid recipients, and the patterns of use of health services.
I can proudly report that Georgia provides substantial coverage to its low-income population and is one of the largest purchasers of health care in the state. Everyone has a stake in this program patients, health care providers, and citizens. Medicaid serves over 1 million (16%) Georgians each year and provides over $3 billion of health care services.
We recognize, however, that many Georgia residents have restricted access to health care because they have no health insurance. While this may seem to be a problem for few, it affects health care for all of us. John F. Kennedy predicted that if a free society cannot help the many who are poor, it cannot save the few who are rich. I believe that Medicaid and PeachCare for Kids are important first steps for moving toward a system where access is no longer a barrier to getting necessary health care.
In this Annual Report we emphasize the impact that long-term care, such as home health care or nursing home care, will have on our state. The combination of rising costs of health care and the rising numbers of seniors will challenge us to redesign the system of care that the elderly receive. Two thousand years ago the Greek philosopher Seneca observed that old age is an incurable disease. Yet today our health care system is designed around acute care, diagnosis and treatment, and cure. This focus must change to meet the needs of the chronically ill population. What is needed now is the integration of acute and chronic care and the integration of physical and mental health care with the goal of maximizing a person's functional status and maintaining his independence as long as possible.
DMA will be working with a complete range of stakeholders that includes Medicaid recipients, advocacy groups, and all provider groups to begin laying a foundation for the future system for caring for an elderly population in a humane and effective manner.
Respectfully yours,
wtd:!f::::M~~'-!~
Commissioner
An Equal Opportunity Employer
The Georgia Department of Medical Assistance
T ABLE OF CONTENTS
The Department of Medical Assistance:
Members of the Board and Departmental Divisions
Introduction
The Children's Health Insurance Program The Medicaid Program
Medicaid Eligibility
Guidelines and Major Coverage Groups
Medicaid Coverage
Mandatory and Optional Benefits
Highlights: State Fiscal Year 1998
Georgia Better Health Care The Medicaid Managed Care Organization Program Disease Management PeachCare for Kids: The Children's Health Insurance Program Rural Health Care The Decision Support System The Medicaid Management Information System The Non-Emergency Transportation Broker System Preventing and Detecting Fraud, Waste and Abuse Home and Community-Based Waiver Programs
Medicaid in Georgia
Recipient Profile
In Brief: State Fiscal Year 1998
1998 Redirection and Enhancements Georgia Statistical Data Expenditures and Recipients by Aid Category Expenditures and Recipients by Age Group Total Medicaid Recipients by Aid Category Total Medicaid Expenditures by Aid Category Expenditures and Recipients by Aid Category
Focusing on Long Term Care
The Aging Population and Long Term Care Costs Georgia Medicaid and Long Term Care Statistics Increased Focus on Long Term Care Alternatives Home and Community-Based Services Ensuring Quality of Care in Long Term Care Settings Long Term Care Recipient Profile
The Indigent Care Trust Fund and Disproportionate Share Hospitals
ICTF SFY98 Disbursements
Provider Participation in Georgia Medicaid
Providers with Paid Claims by Category of Service
Services Provided to Medicaid Recipients, Ranked by Expenditures
Percentage of Expenditures by Category of Service Categories of Service, Providers, Recipients and Expenditures
A History of Medicaid
Benefits and Expenditures: 1970 to 1998
Administrative Expenditures
Divisions and Selected Major Contracts
County Information on Georgia Medicaid Recipients and Expenditures
Analysis of Recipients and Expenditures
Sources and References
State Fiscal Year 1998
2
3 3
4
5
6 6 6 7 7 8 8 8 8 8
9
11
12 12 12 12
13 14
15 17 18 19
21 22
24
27 28 30 31
33
34
35 39
Page 1
r
The Georgia Department of Medical Assistance
State Fiscal Year 1998
Roy E. Barnes, Governor
William R. Taylor, M.D., M.P.H. Commissioner
The Board of Medical Assistance
Mrs. Beauty P. Baldwin Mr. Curtis Brantley
Ms. Carol H. Fullerton Mr. Richard L. Holmes Mr. Kent (Kip) M. Plowman, Jr., C.P.A., C.VA
The Department of Medical Assistance
Margaret Taylor Chief Deputy Commissioner
Mark Trail Deputy Commissioner, Program Operations and Policy
Herbert Weldon Deputy Commissioner, Administration
Stephanie Wright, Director Division of General Administration
Wayne Blank, Director Legal & Regulatory Services
Fran Ellington, Acting Director Division of Quality, Eligibility and Third Party
Carolyn Ferrell, Director Division of Chronic Care Programs
Louise Bryde, Director Division of Managed Care Programs
Dona Cole, Director Division of Indemnity Acute Care
Jim Connolly, Director Division of Reimbursement Services
William Vrooman, Director Division of Systems Management
Page 2
The Georgia Department of Medical Assistance
State Fiscal Year 1998
INTRODUCTION
The Department of Medical Assistance manages the Children's Health Insurance Program (CHIP) and the Medicaid program in Georgia. These programs provide healthcare benefits to approximately 1.2 million people in all of Georgia's 159 counties, using a network of more than 57,000 providers.
THE CIDLDREN'S HEALTH INSURANCE PROGRAM (CIDP)
c!>
1j:~~epeachCare for Kids
The Federal Balanced Budget Act of 1997 established a voluntary new Children's Health Insurance Program (CHIP) to expand healthcare access to uninsured, low-income children. In Georgia, CHIP is called PeachCare for Kids. Uninsured children may be eligible for PeachCare for Kids benefits if their families' incomes are less than or equal to 200% of the Federal poverty limit but above Medicaid income guidelines.
The Balanced Budget Act established the CHIP program for 10 years, and allots nearly $4.3 billion a year up to the year 2001. The Federal/State match for the funds will equal approximately 73% federal to 27% state dollars, a larger federal share than "regular" Medicaid allows. Georgia will contribute $10 million in state funds for the first year of PeachCare for Kids; with federal matching funds, the total budget for the program's first year is more than $36.1 million.
THE MEDICAID PROGRAM
The History and Purpose of Medicaid
In 1965, President Lyndon Johnson and the United States Congress created the Medicaid program with the passage of Title XIX of the Social Security Act. Part of his vision of a "Great Society," Johnson intended Medicaid to help provide healthcare to low-income children and elderly people. The U.S. Congress later expanded the program to cover benefits for the blind and disabled. Medicaid was instituted under the Georgia Department of Public Health in October 1967.
Medicaid is a jointly funded, Federal-State healthcare assistance program serving primarily low-income individuals: children, pregnant women, the elderly, blind and disabled. Patients usually pay no part of costs for covered medical expenses, though a small co-payment may sometimes be required. The Medicaid program varies from state to state. State governments administer the program within broad federal guidelines.
Medicaid and Medicare
Medicaid is often confused with Medicare, a Federal program that provides healthcare reimbursement to everyone in the United States 65 years and older who has worked and paid into the Social Security system. Medicare eligibility, with a few exceptions, is chiefly determined by age. Medicaid eligibility is primarily determined by income and other factors.
Medicaid Eligibility
A person's income and assets generally help determine whether they can receive Medicaid benefits. For each program within Medicaid, certain income limits must be met. Some programs depend more on "medically needy" status to determine eligibility. This means that someone whose income exceeds the maximum limit could still qualify if their medical expenses cause them to "spend down" to Medicaid limits. An eligible is a person who qualifies to receive Medicaid benefits. A recipient is a person who is eligible and has received Medicaid benefits.
Medicaid recipient Gwendolyn Fields, with 3-week old daughter, Brittnee Danielle
Page 3
The Georgia Department of Medical Assistance
State Fiscal Year 1998
MEDICAID ELIGffiILITY GUIDELINES
In order to be eligible for Medicaid an individual must be:
D Aged (over 65); D Blind; D Permanently and totally disabled; D A pregnant woman; D A child or a parenVcaretaker of a Medicaid eligible child.
AND must meet both the income and resource limits set for the appropriate category and any established nonfinancial requirements. Non-financial requirements include criteria such as age, U.S. Citizenship or lawful alien status, and Georgia residency.
Major Coverage Groups within Medicaid:
D SSI Recipients -- Aged, blind or disabled individuals who receive Supplemental Security Income (SSI). D Nursing Home -- Aged, blind or disabled individuals who live in nursing homes and have low income and
limited assets. D Community Care -- Aged, blind or disabled individuals who need nursing home care but can stay at home
with special community care services. D Qualified Medicare Beneficiaries (QMS) -- Aged or disabled individuals who have Medicare Part A
(hospital) insurance, and have income less than 100% of the federal poverty level and limited resources. Medicaid will pay the Medicare premiums (A&B), coinsurance and deductibles only. D Hospice -- Terminally ill individuals who are not expected to live more than six months may be eligible for coverage. Recipients must agree to receive hospice services through a Medicaid participating hospice care provider. D Low Income Medicaid (LIM) -- Adults and children who meet the standards of the old AFDC (Aid to Families with Dependent Children) program. D Right from the Start Medicaid for Pregnant Women (RSM Adults) -- Pregnant women with family income at or below 185% of the federal poverty level. D Right from the Start Medicaid for Children (RSM Children) -- Children under 19 years of age whose family income is at or below the appropriate percentage of the federal poverty level for their age and family size. D Medically Needy -- Pregnant women, children and aged, blind and disabled individuals who have family income which exceeds the established income limit may be eligible under the Medically Needy program. The Medically Needy program allows a client to use incurred/unpaid medical bills to "spend down" the difference between their income and the income limit to become eligible.
The Georgia Medicaid Program, Income and Resource Limits, SFY98
Family Size
Medically
Medically
RSM-
RSM-
RSM-
551
Needy-
Pregnant Women & Children
Needy-Aged, Blind, Disabled
100% FPL
133% FPL
185% FPL Payment Amount
OMB
NH, PeachCare CCSP, for KidsHospice 200% FPL
1 Monthly
$208
$317
$671
$893
$1,242 $494 $671 $1,482
$1,342
Annual
$2,496
$3,804
$8,052 $10,716 $14,904 $5,928 $8,052 $17,784
$16,104
Resource Limits
$2,000
$2,000
$2,000 $4,000 $2,000
2 Monthly Annual
$317 $3,804
$375
$905
~1,203
$1,673 $741 $905
--
$4,500 $10,860 $14,436 $20,076 $8,892 $10,860
--
$1,809 $21,708
Resource Limits 3 Monthly
Annual
$4,000 $375
$4,500
$4,000
---
$1,138 $13,656
$1,513 $18,156
$3,000 $6,000
$2,105 --
--
-- $25,260
--
$3,000
---
$2,276 $27,312
Resource Limits
$4,100
4 Monthly Annual
$442
--
$5,304
--
$1,371
$1,824
$2,537 --
--
--
$16,452 $21,888 $30,444 --
--
--
$2,742 $32,904
Resource Limits
$4,200
Income IS money that IS received on a regular baSIS. In order to be eli.g.ible, an indi.v.idual,s monthly Income must not exceed the Income
limit for the program. Income limits increase incrementally as the number of family members increases.
Resource is another term for asset. An individual's resources may include bank accounts, real property, stocks, bonds, and life
insurance. The resource limit is the limit placed on assets that an individual may have and still be eligible.
Page 4
]
The Georgia Department of Medical Assistance
State Fiscal Year 1998
MEDICAID COVERAGE: MANDATORY AND OPTIONAL BENEFITS
nFnHn__OPTIONAL SERVICESn .....
CoveragePermrrtedby theFederal Governmen(
.. ~iliv~i~~M~RAeqNUDirAedTObRytYhS~FEeRdVeIrCaElSC.o\t~~~~i .
Adult Dental Ambulance Ambulatory Surgical Certified Registered Nurse Anesthetists Childbirth Education Children's Intervention School Services Children's Intervention Services Community Based Alternatives* Community Care*
Community Habilitation and Support Services Waiver Program***
Community Mental Health Centers* Diagnostic, Screening, & Prev:entive Services* Dialysis Drugs Georgia Better Health Care Health Insurance Premiums (Part B - 100% State) Home Health (Therapy Services) Hospice Independent Care and Traumatic Brain Injury Waiver
Programs Intermediate Care Facility (MR) - Privately Owned Intermediate Care Facility (MR) - State Owned* Mental Health Case Management* Mental Retardation Waiver Program* Optometry Orthotics & Prosthetics Perinatal Case Management Physician's Assistant Podiatry
Pregnancy Related Services Psychology Swing Beds (Nursing Home Beds in hospitals)
Targeted Case Management Services: -Child Protective Services* -Adult Protective Services -Children At Risk* -Early Intervention -Adult AIDS Targeted Case Management -DJJ Targeted Case Management - Children at
Risk of Incarceration* Therapeutic Residential Intervention* Waivered Home Care Services
Durable Medical Equipment EPSDT and EPSDT Dental Family Planning Health Insurance Premium Purchase Program (HIPP) Health Insurance Premiums (Part A) Health Insurance Premiums (Part B) Home Health (Non-Therapy Services) Independent Laboratory Inpatient Hospital
Intermediate Care Facility - State Owned* Medicare Crossovers Non-Emergency Transportation Nurse Midwife Nurse Practitioners Oral Surgery Outpatient Hospital Physicians Pre-Admission Screening Annual Resident Review (for nursing home applicants and residents with mental disabilities)
Rural Health Skilled Nursing Facility - Privately Owned Skilled Nursing Facility - State Owned
'Department of Human Resources (DHR), Department of Juvenile Justice (DJJ) or Department of Education (DOE) Administered programs "Currently includes the SOURCE Program, enhanced case management for the elderly. "'This waiver applies specifically to those de-institutionalized by the closing of Brook Run.
Page 5
The Georgia Department of Medical Assistance
State Fiscal Year 1998
HIGHLIGHTS: STATE FISCAL YEAR 1998
Improving Quality ofCare and Controlling Costs
Georgia Better Health Care
o The Georgia Better Health Care Program (GBHC) is a statewide primary care case management program.
In State Fiscal Year 1998, GBHC utilized a network eX more than 4,100 primary care physicians to act as
primary care case managers and deliver healthcare to Georgia's Medicaid recipients. In SFY98, more than 615,000 Medicaid redpients were enrolled in GBHC in all 159 Georgia counties. Through GBHC, Georgia Medicaid assures individuals the righttD choose a primary care physidan, improves each patient's health by
providing continuity eX care, and saves Georgia taxpayers 3.396 out d each dollar spent on Medicaid-funded
health care.
The Medicaid Managed Care Organization (MCO) program
o The Medicaid Mca program offers a standard, comprehensive array of health care services to Medicaid
recipients who choose to enroll. The Mca program increases access to medical care and improves
the health status of enrollees by establishing a medical home and continuum of care. Additionally, the
MCa program improves Health Check, immunization statistics, and birth outcomes, and reduces Medicaid program expenditures by providing more cost-effective utilization of medical resources. During State Fiscal Year 1998, the Department contracted with three MCas, and enrollment included nearly 57,500 Medicaid recipients.
Disease Management
o The Georgia Medicaid program helped to improve the quality of health care for Medicaid recipients by
developing and implementing disease management programs. These programs emphasize preventive
health care - such as regular examinations and effective drug therapy; known best practices in treating
diseases; and consistent education for patients and physicians to reduce the health complications and risks associated with chronic illnesses. The Department's Drug Utilization and Review Board continues to develop guidelines for prescriptions, reviews how consistently patients take the prescribed drug therapies, and evaluates the long-term success of the treatments. This strategy manages chronic problems more effectively and saves the cost of ineffective long-term drug treatment.
Dr. William S. Hutchings, " counsels Georgia Better Health Care enrollee Faye Robbins. Page 6
The Georgia Department of Medical Assistance
State Fiscal Year 1998
Georgia Better Health Care enrollees 7-year old Akyra' Burke and 6-year old Trae'Lyn Burke, with mom Thi'Shilyn Burke
Increasing Access to Realtocarefor All Georgians
~
PeachCare for Kids
PeachCare For Kids:
The Children's Health Insurance Program (CHIP)
o In State Fiscal Year 1998, The Department developed and received approval from the Health Care
Financing Administration to launch PeachCare for Kids - Georgia's Children's Health Insurance Program (CHIP). More than 320,000 of Georgia's children do not have health insurance. PeachCare for Kids offers health insurance to approximately 103,000 of those children, whose families earn too much to qualify for Medicaid, but not enough to afford health insurance.
The plan pays for preventive services and acute medical car~octor's visits and hospital stays-as well as prescribed drugs and vision and dental care. Children enrolled in PeachCare for Kids may choose to use the agency's primary care case-management program -- Georgia Better Health Care (GBHC) -- or enroll in a managed care organization.
In its first year in Georgia, PeachCare for Kids' state and federal funding will combine to create a $36.1 million program.
Rural Health care
o In State Fiscal Year 1998, the Department continued working toward improved access to healthcare for
low-income Georgians living in rural communities. Working with rural and urban hospitals and the Georgia Hospital Association (GHA), the Department equalized the rates paid to rural and urban hospitals and strengthened the primary care set-aside that is an integral part of the Indigent Care Trust Fund (ICTF).
Commissioner Taylor and deputies explored issues of rural health care during visits to Albany, Moultrie, Thomasville, and Waycross and through ongoing discussions with providers. Additionally, the Health Policy Center at Georgia State University, under contract with the Department to provide technical assistance to rural hospitals, continued studying the options available to the Department and the hospitals to determine how best to assist those communities in danger of losing vital healthcare services.
Page?
The Georgia Department of Medical Assistance
State Fiscal Year 1998
Measuring Outcomes and Increasing Accountability
The Decision Support System (DSS)
o The Department contracts with the MedStat Group for a DSS which organizes claims data in a data
warehouse to facilitate analysis. The Department uses the DSS in evaluating cost and utilization, and emphasizing the quality of patient care. By using DSS to determine which recipients receive specific services and then comparing the practice protocols of different providers, the Department can measure treatment outcomes and work to improve the quality of care for all Medicaid recipients. As one of the largest healthcare payers in the state, the Department can improve the quality of healthcare for all Georgians, by improving the quality of care delivered by the large number of providers for Georgia's Medicaid population.
The Medicaid Management Information System (MMIS)
o In State Fiscal Year 1998, the Department issued a Request for Proposal (RFP) to procure a new MMIS
and Operational Services to improve efficiency and effectiveness in administration through additional services and systems. Among many technological and service improvements, the MMIS will facilitate the implementation of plastic Medicaid eligibility cards, enhance Prospective Drug Utilization and Review to ensure that drugs are being prescribed and used appropriately, maximize the effectiveness of electronic claims' submission and reimbursement, and save tax dollars by providing more comprehensive collection and administration of claims for recipients who have other insurance coverage. The MMIS will also be used to process claims and provide required reporting for the PeachCare for Kids Program. The new system design requirements and contract provisions provide flexibility to support current Medicaid administration and future changes in program population, changes and additions to coverage plans and programs, and technology advances over the term of the contract.
The Non-Emergency Transportation Broker System (NET) o The Non-Emergency Transportation System (NET) ensures Georgia's Medicaid recipients access to
medical care in non-emergency situations. NET provides nearly 250,000 trips each month to Georgia Medicaid recipients, at an average cost of less than $16.00 per trip. Three contractors manage transportation services for the Department in 5 regions of the state. The Department holds each broker accountable for the reliability of transportation services and the safety standards of vehicles and drivers. The program has virtually eliminated the rampant fraud that plagued the program in the past, and cut the cost in half.
Preventing and Detecting Fraud, Waste and Abuse
o Nationally, an estimated 10% of the country's $1.1 trillion annual healthcare budget is lost to fraud,
waste and abuse. In 1998, the State successfully investigated and prosecuted 43 criminals in cases
worth more than $21 million, with $11.5 million ordered in restitution. Criminals who are not health care
providers perpetrate one third of the fraud in Medicaid. In the future, it will be even tougher for criminals to steal from the Medicaid program. A budget increase approved during the 1998 legislative session puts 50 additional people on the job proactively working to reduce waste and discourage criminal behavior before money is lost.
Expanding Alternatives to Institutional Long-Term Care
Home and Community-Based Waiver Programs
o Through half a dozen Home and Community Based Waiver Programs, Georgia Medicaid preserves
alternatives for individuals who require long term care. Providing just a little extra help with daily activities enables some of these individuals to live at home or in their own communities, rather than being forced to move into a nursing facility before they're ready. During State Fiscal Year 1998, more
than 16,500 individuals received services under the waiver programs at an average cost of just under $8,500 per person. That's more than $5,500 per person less than Georgia Medicaid spends to provide
care in a nursing facility. The Department is developing a proposal to the federal government to expand these community altematives and to establish a continuum of long-term care services.
Page 8
The Georgia Department of Medical Assistance
State Fiscal Year 1998
MEDICAID IN GEORGIA
SFY98 Recipient Profile
Age
o 62% of recipients are younger than 21 years;
o 26% of recipients fall between the ages of 21 and 64 years; o 12% of recipients are older than 65 years;
Gender o 62% of all recipients are female;
o 38% of recipients are male;
Race
o 53% of recipients are African-American; o 37% of recipients are White;
o 3% of recipients are Hispanic;
o 1% of recipients are American Indian/Alaskan Native or Asian/Pacific Islander;
Rural/Urban o 34% of Georgians who received Medicaid benefits lived in rural areas (126 counties);
o 66% lived in urban areas (33 counties).
lh:B"1yeu 7'%
1to5ya::rs 21%
6to:Dya::rs
3f'/o
AlricmAmerican
5'3"10
Georgia M3dcaid
Recipients by Race
SFY98
Amerian Irdao'A1aska1
Native 0.1%
Asi;nlPacjfic Islcrder 0.9%
Hspnc 3%
Wile
37%
Gea'ga Mrlcad
Recipierts by Gender
SFYOO
M31e 38%
A.JraI 34%
Ferrale 62%
Page 9
The Georgia Department of Medical Assistance
State Fiscal Year 1998
Dr. Elizabeth Patrinas with 2-week old Medicaid recipient Brandon Lee Davis. Page 10
The Georgia Department of Medical Assistance
State Fiscal Year 1998
IN BRIEF: STATE FISCAL YEAR 1998
The Georgia Department of Medical Assistance managed a budget of $3,746,648,550 in SFY98, a 0.22% increase from State Fiscal Year 1997, when Medicaid expenditures totaled $3,738,317,597. The Department's total budget included Unit A-Medicaid Services of $3,369,485,915 and Unit B Indigent Care Trust Fund of $377,162,635.
r;r y..:;::.GEORG1A:DEPARTMENT .OF.MEDICAt::AssISTANCE.;i.Y .
Hi. .....:...:.;:.. .....Sfi98:BiIDG.~ _ h _._.
Unit A - Medicaid Services
$3,369,485,915
Unit B - Indigent Care Trust Fund
$377,162,635
TOTAL
$3,746,648,550
For SFY98, Governor Miller required the Department to propose 5% of its budget for redirection to priority activities for the second consecutive year. The final budget included $101,791,039 in reductions through redirect, and $140,481,125 in increases.
Program Area Administration Benefit Surplus Hospital Managed Care Savings Medicare/Medicaid Crossovers Nursing Homes Pharmacy Physicians Psychology Waivers & Community Programs Women's Programs 1997 Redirection Total Administration DHR Mental Health Increases in Benefit Utilization Nursing Homes Waivers & Community Programs
1997 Enhancement Total 1997 Total
Total ($3,954,766) ($36,439,355) ($65,166,068) ($45,376,373) ($4,997,398) ($60,768,358) ($42,514,863) ($71,670,630) ($3,897,970) ($1,199,375)
($399,792) ($336,384,948)
$2,248,263 $12,980,509 $130,106,687 $22,696,014 $51,247,108
$219,278,581 ($117,106,366)
Program Area Fraud and Abuse Prevention Efforts Hospital Managed Care Savings MedicarelMedicaid Crossovers Nursing Homes Physicians Psychology
;;;;;;i;;. Administration
:,:::::"M ....ijijn. Hospital
1111;1
~i1"I"
ID .. Pharmacy
Waivers & Community Programs
1998 Enhancement Total
1998 Total
Total ($20,000,000) ($19,500,000) ($27,686,436) ($5,000,000)
($6,604,603) ($18,000,000)
($5,000,000)
$21,216,426 $3,876,088
$90,066,907 $10,550,695
$220,302 $14,550,707 $140,481,125 $38,690,086
Grand Total
($78,416,281 )
Page 11
The Georgia Department of Medical Assistance
State Fiscal Year 1998
.. .[National] data for 1996 indicate that Medicaid payments for services for ... children (who constitute over 46 percent of all Medicaid recipients) averaged only a little over $1,000 per child. There are, however, certain other specific groups for whom Medicaid is
at least as essential: those comprising far fewer persons, but ones who have much larger
per-person expenditures. Regardless of their initial financial situation, their medical needs are so great and/or continuous that most of these patients must eventually depend upon Medicaid. When expenditures for these high and lower cost recipients are combined, the 1996 payments to health care vendors for over 36 million Medicaid recipients average $3,400 per person.
Health Care Financing Administration
More than 1.2 million Georgians received Medicaid benefits in 1998, representing a 0.5% decrease from the previous year: the number of Medicaid recipients declined from 1,240,884 in SFY97 to 1,234,741 in SFY98. Benefits expenditures decreased 4 percent from $3,151,030,885 in 1997 to $3,028,628,870 in 1998.
Georgia Statistical Data
From paid claims, on a date-of-payment basis for SFY1998:
7,353,22 1,234,74
16.6% $3,028,628,870
$2,453
Spending per recipient fell by 3.41 % from $2,539 in fiscal year 1997 to $2,453 in 1998. The reduction in per-person spending continues a trend begun in State Fiscal Year 1995. Lowered payment rates for some services, as well as savings from primary-care case management in the Georgia Better Health Care (GBHC) program account for the reduction. Georgia spends apprOXimately 28% less per person than the national average for healthcare services purchased and managed by Medicaid. At the same time, Georgia Medicaid provides broader coverage for its population. Georgia serves 16.6% of its population with Medicaid, compared to 12.5% nationally.
In SFY98, the total number of recipients decreased for the first time in the history of Georgia Medicaid. This decline may be attributed to state and federal welfare reform initiatives, which affect the number of people who qualify for Medicaid.
Expenditure Per Recipient by Aid Category
People who qualify for Medicaid benefits because of age, blindness or disability incurred the highest average annual cost per recipientin SFY98. That yearly cost was $5,801. Children who qualified for Medicaid based on low family income represented the lowest annual cost per person: an average of $908 per child.
Expenditure Per Recipient by Age Group
Generally, the cost to provide benefits to each Medicaid recipient decreases with the age of the recipient. However, infants-children under 1 year old--incur higher medical costs at birth and during their first year of life. Disabled children and young adults who require long term care, and young people who suffer from chronic illnesses also incur higher than average healthcare costs.
Total Medicaid Recipients by Aid Category
Children represent the largest group of people receiving Medicaid benefits in Georgia Fifty-six percent of Medicaid recipients in State Fiscal Year 1998 were younger than 21. Seventeen percent of Medicaid recipients were adults who received Medicaid benefits because they also receive cash assistance or because they were pregnant women. Twenty-seven percent of all Georgia Medicaid recipients qualified because they were aged (older than 65), blind or disabled.
Page 12
The Georgia Department of Medical Assistance
State Fiscal Year 1998
Gaaga r.ledcaid
TOOII Recipients
1!Rl-19E
1,400,(0) ......- - - - - - - - - - - - - - - - - , 1,200,(0) - I - - - - - - - - - - - - = = _ _
1,CXXl,CXXl-l--------==__
lm,CXXl + - - - -
OCO,CXXl 4OO,CXXl 2OO,CXXl
o
SFYOO SFY91 SFY92 SFY93 SFY94 SFY95 SFY96 f!F'(W SFY96
Gaaga r.ledcaid
Expencitlres Per Recipient
1!Rl-19E
$2,700 $2,6Xl
$2,646
$2,&6
$2,616
$2,521
$2,533
$2,4ffi
$2,453
$2,500
$2,3!B
$2,400 $2,D> ~22)
lL $2,2Xl
$2,100 $2,(0)
'-r-
<-,
SFYOO SFY91 SFY92 SFY93 SFY94 SFY95 SFY96 f?('J7 SFY96
<:roya M:rlcad
Exper dtlres per Fe:ipert, by ~ Qup
G;Y1!:9l
$8,677
o
+
,...-OS'
11)00
II)
00
Georgia Medicaid
Expenditures Per Recipient by Aid Category
SFY98
$7,000,---------------------, $6,000 ~~~---------------l $5,000 $4,000 $3,000 $2,000 $1,000
$0
Georgia Medicaid
Total Medicaid Recipients by Aid Category
SFY98
RSM Adults 8.5%
AFDC Adults 8.9%
Aged, Blind or Disabled 26.7%
Georgia Medicaid
Total Medicaid Expenditures by Aid Category
SFY98
RSM Adults 10.1%
AFDC Adults 6.1%
RSM Children 12.2%
AFDC Children
8.5%
Aged, Blind or Disabled 63.1%
Total Medicaid Expenditures by Aid Category
The cost of purchasing healthcare for Georgia Medicaid recipients varies by their aid category. People eligible for benefits because of age or disability tend to require the most in.tensive service.s at a hi.gher cost, while children and healthy adults who qualify because of low income require less expensive services.
The largest total amount of Georgia Medicaid benefit expen~itures in S~Y9~ ~63%) purchased healt~care for people who qualify for Medicaid benefits because of age, blindness or dlsabll~ty. Healthcare expenditures for children accounted for 21% of the Medicaid's SFY98 benefit costs. Benefits purchased for pregnant women receiving Right from the Start Medicaid accounted for 10% of the total benefit expenditures: Adults receiving healthcare through Medicaid because of low income represented the lowest total expenditures: 6% of the total benefits budget.
Page 13
The Georgia Department of Medical Assistance
State Fiscal Year 1998
Expenditures and Recipients by Aid Category
Categorically Needy
Expenditures
Recipients
Expenditures per
Receiving Cash Assistance
Recipient
.. Aged
----- -
--.$T22J9~C757------- -.~~~?~Q===:===========_ ~~]~I~~.=
B'jin(f-----------$11~ 1443iao------- 2,700
$4, 127.76
'Disabled-'"
-.----
- - . - "'$960~774,'678---
"""'f83~~f84--
-----$5,236~29-
aliidrenTi1FamITies with . . -....$145~375~292-----165~1'36-------$88i5:34-
Dependent Children
-Adliifs'ln-Fa-rTiilies with-- - -$113,150,'447'------ ..... 59~874-""--..... ----$1,'889.81-
Dependent Children
TotafforEii~iibnity-c;.-tegory$1;353;245~1'34-- 454~434-----$2:977:8;r
Categorically Needy Not
Expenditures
Recipients
Expenditures per
Receiving Cash Assistance
"Age'd:-Bjjn'(forDisabTed"'-""-"--$7'6:f773~394""-'
Recipient .. 63~346 ---$12:041~38-
aliicfreninFan:ililes-wrth----$g'3: igO;T37---ff3~164-'-'$828:8'0'"
Dependent Children Adultsin-FamiiTes-v:iitti
m
$.'l1',467;1"79.. ---
50~129m
$r424:47
Dependent Children
otherChTidren--- ..- -----$18~19!f,463--_-- 7;1'76 ..-....$2:538:14
TotaTfOrEfi~iihiiitYcategory-$946;1If9:17i-_-23'3~869 .. ----$4;04ff:76
Qualified Medicare
Expenditures
Recipients
Expenditures per
Beneficiary
.....
R~~e~e_,:,!...
~~~~::.==#==:==*.i~i.i}
Medically Needy
Expenditures
Recipients
13
$3,433.54
Page 14
The Georgia Department of Medical Assistance
State Fiscal Year 1998
FOCUSING ON LONG TERM CARE
Long Term Care
Individuals who lose or never develop the capacity to independently care for themselves due to a chronic illness or disability require long term care services -- healthcare or custodial services provided over an extended period of time. Long term care services may be provided in nursing facilities, recipients' homes, and other community based settings such as day care facilities and personal care homes.
Mobility and Self-Care Limitations
Mobility limitations are health conditions lasting 6 months or longer that inhibit an individual's ability to leave the home alone. Self-care limitations are health conditions lasting 6 months or longer that make it difficult for an individual to take care of their personal needs, such as dressing, bathing or getting around inside the home. Experiencing several of these types of limitations increases the likelihood that an individ.ual will eventually require long term care institutionalization.
THE AGING POPULATION AND LONG TERM CARE COSTS
Georgia's Aging PopUlation
National projections estimate the number of people over 65 will increase 112% between 1990 and 2025. In Georgia, the number of people 65 years and older is expected to increase 156% between 1990 and 2025: from 650,542 (1990) to 1,668,000 (2025). Additionally, the overall percentage of Georgians older than 65 will increase from 10% in 1990, to 16.9% in 2025. Georgia's growth rate for the 65+ population will exceed the national growth rate for the same group between 2000 and 2020.
In 1990, Georgia ranked 6th in the nation for the highest percentage (21.3%) of individuals 60 years and older with mobility or self-care limitations. The state ranked 4th in the nation for the highest percentage (57.4%) of residents 85 years and older with one or both of these limitations. Nationally, 17.3% of people 60 years and older and 49.8% of those 85 years and older experienced mobility or self-care limitations in 1990.1
65+ PopUation Percent QoNth
BasOO mLS Ca"5us Blreau PrqEdicrs
25.0%
210'/0 (:o5i: 15.0'/0
C
Q)
10.0'/0
~
~ 5.0%
-' -' ~
"",------
."'" ."'" /
-
~
"
0.0% 2(XX) - 2005 2005 - 2010 2010 - 2015 2015 - 2(Y2()
Peliod - - L S 65t %GroMh R:ite - - - -GA 65t % GroMh R:ite
Percent of 60+, 85+ Populatioo with
Nbbility or Self-eare Urritations
EJasej 00 1990 PdTinistratioo 00 JlQng Rg.Jles
60%
~ 50%
Cl
8Cll
40%
~ 3)0/0
'c0 20%
~ aC..ll
10'/0
0'/0
60+ Years
85+ Years
IOGA II US I
I These figures reflect civilian, non-institutionalized persons. Page 15
r
The Georgia Department of Medical Assistance
State Fiscal Year 1998
Dr. Richard Ackermann with Medicaid recipient Ethel Phillips at the Eastview Nursing Home.
Page 16
The Georgia Department of Medical Assistance
State Fiscal Year 1998
Long Term Care Financing
Long term care consistently represents Medicaid's highest costs per person in Georgia and across the U.S. In 1990, 5% of all elderly lived in nursing facilities. National projections indicate that Medicaid will continue to be the single largest payer of nursing facility care, followed by out-of-pocket payments by individuals. Nationally, expenditures for nursing facility care will increase from $50.9 billion in 1990, to $139.4 billion in 2006, a 174% overall change. The cost of nursing facility care consistently represents 7.0 to 7.6% of total national healthcare expenditures. Families whose elderly and disabled members are not eligible for Medicaid often find the costs of nursing care on a long-term basis difficult to bear.
National Nursing Home Expenditures
Based on 1996 NHE Estimates/HCFA
(/)$140.0 0c $120.0
~$100.0 c .;;; $80.0
..CI)
5 $60.0
:g $40.0
CI)
~ $20.0
W $0.0
1990
1994
1998
2002
2006
III I Medicaid Expenditures 1m Out-of-Pocket Payments 0 Other
Many people who require long term medical care prefer to remain in their own homes, or to stay in their own neighborhoods. Family members often prefer options that allow in-home care as well. Medicaid has traditionally served the majority of individuals in need of long term care services via placement in nursing facilities. The Omnibus Budget Reconciliation Act of 1981 (OBRA 81) established home and community-based waiver programs as options for states to develop cost effective alternatives to nursing facility placements. These programs offer states broad discretion not generally afforded under the State Medicaid Plan to address the needs of individuals who would otherwise receive costly institutional care. Under a waiver program, states may choose to limit the number of individuals who may receive the services or limit the availability of services geographically. Although Georgia has implemented several home and community based waiver programs, most long term care services continue to be provided in nursing facilities.
GEORGIA MEDICAID AND LONG TERM CARE STATISTICS
Payments to nursing facilities - including payments to intermediate care facilities for the mentally retarded (ICF-MR) represent nearly a quarter of Georgia Medicaid's total benefits budget. These payments cover services required by less than 5% of Georgia Medicaid recipients-those people who need long term medical care for chronic conditions or disabilities.
Nursing Facility Benefits Paid
Nursing Facility Recipients
% Medicaid Recipients in Nursing Facilities Expenditures per Nursing Facility Reci ient % Medicaid Expenditures for Nursin Facili Care
$602,689,139 43,083 3.49%
$13,989
19.9%
IPF:M~ Benefits P~id
.
i IqF~MR Recipienp;
.'
% Medicaid Recipients in
ICF-MR Facilities
Expenditures per ICF-MR Recipient i ' , . ' J ' ."
% Medicaid Expendituresfdr
ICF-MR Care
,< .
$113,049,681 1,754 0.14%
$64,453
3.7%
Page 17
The Georgia Department of Medical Assistance
State Fiscal Year 1998
Some recipients eligible for nursing facility services may require placement in a swing bed, or a temporary bed in a hospital while they wait for initial admission or readmission to a nursing facility.
Benefits Paid To Hospitals For Swing Bed Services
Total Expenditures
$650,521
Total Recipients
638
Expenditures per Recipient
$1,019.63
Swing-beds are hospital beds that can be used as needed for either nursing facility or hospital acute care when there are insufficient nursing facility beds to meet the demand. Swing-bed providers must be located in a rural area and have fewer than 100 hospital beds.
Intermediate care services are provided to an individual who has a stable medical condition, but requires intermittent skilled nursing services. The individual must require monitoring and overall management of a medical condition and a mental or functional impairment that would prevent the individual from performing certain tasks.
Skilled level of care is authorized when the patient requires skilled nursing services or skilled rehabilitation services on a daily basis which, as a practical matter, can only be provided on an inpatient basis in a nursing facility. The rehabilitative services must be provided by technical or professional personnel such as a registered nurse, a licensed practical nurse, a physical, occupational, or speech therapist, or an audiologist. Both intermediate and skilled level of care services are provided under the direction of a licensed physician.
During SFY98, approximately 45,000 people received nursing facility care or ICF-MR services paid for by Georgia Medicaid. The majority of the nursing facilities reimbursed by Georgia Medicaid are private facilities. 34,599 Medicaid recipients in Georgia received intermediate care services; 18,925 received skilled care services.2 527 Georgia Medicaid recipients received services in state-owned facilities enrolled to provide intermediate or skilled level care. 1,754 individuals received ICF-MR services. These services represent the most expensive cost per person: the average annual cost of such care is approximately $64,453 per person served. By contrast, the annual average cost to Medicaid of care in all other long term care facilities combined is less than $13,989 per person.
Georgia Medicaid Long-Term Care Recipients
SFY 1998
50,000 -,----43-,0-8-3---------------
45,000
40,000
35,000
30,000
25,000
20,000
15,000
10,000
5,000
o
1,754
All Nursing Facility
All Waivers
ICF/MR
Services
2 One nursing home may provide both services; the difference relates to the level of skilled nursing care required by the resident. Additionally, one patient may receive two different levels of care in a given year. Therefore, the sum of the two totals does not equal the total number of unduplicated recipients.
Page 18
The Georgia Department of Medical Assistance
State Fiscal Year 1998
INCREASED Focus ON LONG TERM CARE ALTERNATIVES
The Health Care Financing Administration (HCFA) has approved six (6) home and community-based waivers and two demonstration projects in Georgia. These programs/projects provide services in the recipient's home and other community settings as an altemative to nursing facility placement. Average per person expenditures under home and community-based waivers may not exceed the average per capita expenditures that would have been made that same year for the level of care provided in a hospital, nursing facility, or an Intermediate Care Facility for the Mentally Retarded.
Services provided to individuals in waiver programs include: personal care assistance, skilled nursing, home modifications, specialized medical equipment and supplies, counseling, emergency response system, home health services, transportation, day care, personal care home, home delivered meals, respite care services, and case management.
During State Fiscal Year 1998, the waiver programs and pilot projects served 16,518 individuals at an average cost of $8,459 per person, compared with an average per-recipient cost of nearly $14,000 for nursing home care and more than $64,000 for ICF-MR services. The Community Care Services Waiver was the largest of the Georgia Medicaid waiver programs, serving 13,497 frail elderly and disabled people at $3,751 per person, for a total for the year for all recipients in the program of $50,622,108. The total cost for all waiver programs and pilot projects in SFY98 totaled $139,732,343.
Medicaid CCSP recipient Grace Bordleywith daughter Dee Neal at the Garden Village Personal Care Home.
THE GEORGIA MEDICAID PROGRAM HOME AND COMMUNITY-BASED SERVICES (HCBS)
Community Care
$50,622,108 13,497
$3,751
Home and Community-based care for the functionally
Services Program
impaired elderly or disabled:
(CCSP)
Independent Care
$13,685,700 323 (including TBI) (including
TBI)
$42,371
Home and Community-based care for the severely physically disabled:
Independent Care for
Home and Community-based care for persons with
Persons with Traumatic
traumatic brain injuries:
Brain In'uries (TBI)
Mental Retardation
$64,804,642 2,222
$29,165 Home and Community-based care for people with
Waiver Program
developmental disabilities:
t
(MRWP) Community Habilitation
$5,040,627 233
$21,634 Home and Community-based care for those persons
I,
and Support Services Waiver (CHSS)
with developmental disabilities in the community and those im acted b the closure of Brook Run:
Waivered Home Care
$3,697,464 150
$24,650 Home or Community-based care for children up to
Services
a e 21 who are 0 en or ventilator-de endent:
SOURCE (Service Options Using Resources in a Communi Environment)
Shepherd Care
$1,078,788 39
$27,661
Page 19
Primary care and Home and Community-based care for the elderly and disabled emphasizing preventive care and case management.
Coordinated case-management and Home and Community-based care for severely physically disabled adults within a s ecific e ra hic area:
The Georgia Department of Medical Assistance
State Fiscal Year 1998
In the state of Georgia, the Department of Medical Assistance is required to reimburse nursing facilities for any Medicaid eligible recipient who meets the criteria for placement However, Medicaid recipients may meet the medical criteria to receive services under the waiver programs, but may not receive services due to budget constraints. The Department may serve only the number of recipients for which funds are allocated through the legislative process.
During the past fIVe (5) years, Georgia Medicaid has been working to expand access through waiver programs to allow Medicaid recipients to stay in their own homes and neighborhoods. These expansions have increased the number of individuals served, the types of disabilities covered, and the number of programs available as an alternative to nursing facility placement. The number of people in Georgia participating in Medicaid waiver programs has grown from 13,171 in 1994 to 16,518 in 1998. The dollars spent on alternative forms of long-term care have grown from less than $55 million in 1994 to $135 million in 1998-an increase of 14896. The dollars spent on
institlrtional care increased 496, from $687,223,168 in SFY94 to $716,389,341 in SFY98.
Carleen Morse with husband Grant Morse, a beneficiary of CCSP respite care services.
Nursing assistant Alice Moore provides assistance to Grant Morse in his home. Page 20
The Georgia Department of Medical Assistance
State Fiscal Year 1998
Medicaid recipient Pete "Zen" Garcia lives and works independently at home.
Georgia Medicaid Total Expenditures for Long-Term Care
SFY94 - SFY98
$900.000.000 $800.000.000 $700.000.000 $600.000.000 $500.000.000 $400.000.000 $300.000.000 $200.000.000 $100.000.000
$0
FY1994
FY1995
FY1996
I IIiiINursing Facilities eWaiver Services
FY1997
FY1998
Referenced waiver programs include home and home community-based waiver programs: Community Care Services Program (CCSP), Independent Care, Mental Retardation Waiver Program (MRWP), Community Habilitation Support Services (CHSS), Waivered Home Care, SOURCE, ShepherdCare.
ENSURING QUALITY OF CARE IN LONG TERM CARE SETTINGS
The Department initiated several quality of life and quality of care projects during SFY98.
D The Department launched a project that will focus on patterns of occurrence and healthcare utilization among Georgia Medicaid recipients with diabetes mellitus. This information will be used to develop and recommend potential diabetes management strategies based on empirical evidence.
D The Department launched a project that will analyze acute and chronic medical conditions associated with a large burden of morbidity (illness) and mortality (death) among nursing facility residents. This analysis will be used to provide feedback reports and educational programs on quality improvement for nursing facility providers and their staff.
D The Department began developing a project that will enable on-site reviews of patient care plans and medical records as well as interviews with residents in the nursing facility. The study will define the patterns of physician supervision in the direct care of patients residing in the nursing facility. Information from this collection will be shared with Medical Directors and attending physicians who have the primary responsibility for the health care needs of nursing facility residents.
Page 21
The Georgia Department of Medical Assistance
State Fiscal Year 1998
GEORGIA MEDICAID:
LONG TERM CARE RECIPIENT PROFILE
Nursing facility care is considered the traditional method of providing long term care. Though some individuals require institutional care from birth, individuals who are 75 years and older account for more than 75% of those receiving nursing facility services and more than 72% of Medicaid's nursing facility expenditures.
The ICF-MR facilities exclusively serve the mentally retarded population. More than 90% of the individuals served in these facilities fall between the ages of 21 and 64. Almost 58% of the total ICF-MR population falls between the ages of 21 to 44.
:'i.'~'ec~ '~.'.,:':i.',:.i:'i: ~T~t~D~W~t~r~~~f:~~0~'~o;J1;(~ EE'HEE.N"9~mgF~~i1ity~rn;s,SE?8/
.'. H. EH.'.'.. .. .. . .....".:,.',:.,'lJ. . ..,P.'pl"e:n.
~~~~~~
n u t ' ...:',':,""
' '.. ,:y
' ' , ' , ,.
4m~~r.ly~r..
38
0.1%
0.1%
$613,885
0.1%
0.1%
$16,155
137
0.3%
0.3%
$2,317,064
0.4%
0.3%
$16,913
58
0.1%
0.1%
$2,257,035
0.4%
0.3%
$38,914
34
0.1%
0.1%
$1,533,297
0.3%
0.2%
$45,097
763
1.8%
1.7%
$16,211,100
2.7%
2.3%
$21,247
3,477
8.0%
7.7%
$55,023,870
9.1%
7.7%
$15,825
6,349
14.6%
14.1%
$88,821,684
14.7% 12.4%
$13,990
14,485
33.4%
~,~~~~s, .. ...
.U.....n...k..r...i..O...W..n..~.../......".."'
1 A
I: 4,'"',,f---:-:..:...::-:-:t---- ;wiiiiiiiiiiii'm:i,:i;;;;:i'i
18,091
41.7%
-:-:-:-:-1:
32.1%
$196,199,309
32.5% 27.4%
$13,545
40.0%
$240,411,154
39.8% 33.6%
$13,289
$(48,738
0.0%
0.0%
:_:_~-:+---:-:-::-:-::-:-::-:-:+---1-:_:-:-:+--:-:-:-:-+0 __:_:_:_:_:_:
F e m a l e > Y ' " ..........................
31,975
73.6%
70.8%
$452,055,582
74.9% 63.1%
$14,138
~~~~)'~~~" !~~~y~~~ ~~~9:~~~~r~ ~~!~Y~r~
~~?~~~~~~ &.So~?~y~r~
~~t~M~~~~' !)i~r~Y unkoowii~"
1 30 68 1,009 573 50 18
0
1,749
0.1% 1.7% 3.9% 57.7% 32.8% 2.9% 1.0% 0.0%
100.0%
0.0% 0.1% 0.2% 2.2% 1.3% 0.1% 0.0% 0.0%
3.9%
$42,119 $1,110,553 $4,013,010 $65,205,200 $38,360,894 $3,315,761 $1,005,147
$0 ($3,003) $113,049,681
0.0% 1.0% 3.5% 57.7% 33.9% 2.9% 0.9% 0.0% 0.0% 100.0%
0.0% 0.2% 0.6% 9.1% 5.4% 0.5% 0.1% 0.0% 0.0% 15.8%
$42,119 $37,018 $59,015 $64,624 $66,947 $66,315 $55,842
$0
$64,637
1,025
58.6%
2.3%
$66,765,562
59.1%
9.3% $65,137.13
Female>
724
41.4%
1.6%
$46,287,122
40.9%
6.5% $63,932.49
* Tables based on FY98 figures from Form HCFA-2082. Some figures were adjusted within the HCFA-2082 report.
Page 22
The Georgia Department of Medical Assistance
State Fiscal Year 1998
GEORGIA MEDICAID:
LONG TERM CARE RECIPIENT PROFILE
In addition to serving the elderly, the Department provides services to physically disabled Medicaid recipients aged 21-64 years under the Independent Care Waiver Program (ICWP) and Traumatic Brain Injury (TBI) programs. The Community Care Service Program (CCSP) allows service to this population as well but does not have the age limitations of the ICWP waiver. To qualify for these waivers, the disabled individuals must meet nursing facility criteria but desire to live in the community. During State Fiscal Year 1998, 362 individuals were served in the ICWPfTBI waivers and Shepherd Care demonstration project at a total cost of $ 14,764,488.
Females are more likely than males to receive nursing facility services. The reverse is true for ICF-MR facilities. When ranking the average cost per institutionalized individual, the ICF-MR male is the most costly.
.,' ... ~RiICIvr'li'Q'1~;swHLJ:CY>
NF-Female
31,975
NF-Male
11,457
ICF/MR-Male
1,025
ICF/MR-Female
724
~~~~~)''J:~~~~'!q~~p~~~i,~.~. .. ',~,Jtv:CQ$ThgRw~~ ..,
NF-Female NF-Male ICF/MR-Male ICF/MR-Female
$452,055,582 $151,332,537
$66,765,562 $46,287,122
ICF/MR-Male ICF/MR-Female NF-Female NF-Male
$65,137 $63,932 $14,13E $13,20S
NF-85+ years NF-75 to 84 years NF-65 to 74 years NF-45 to 64 years ICF/MR-21 to 44 years NF-21 to 44 years ICF/MR-45 to 64 years NF-1 to 5 years ICF/MR-15 to 20 years NF-6 to 14 years ICF/MR-65 to 74 years NF-Under 1 NF-15 to 20 years ICF/MR-6 to 14 years ICF/MR-75 to 84 years ICF/MR-1 to 5 years ICF/MR-Under 1 ICF/MR-85+ years
18,091 14,485
6,349 3,477 1,009
763 573 137
68 58 50 38 34 30 18
o
o
', ~~.~.~~~'&~~,NJ)~~ . n,~m
NF-85+ years
$240,411,15"
NF-75 to 84 years
$196, 199,30~
NF-65 to 74 years
$88,821 ,68~
ICF/MR-21 to 44 years
$65,205,200
NF-45 to 64 years
$55,023,87C
ICF/MR-45 to 64 years
$38,360,894
NF-21 to 44 years
$16,211,10C
ICF/MR-15 to 20 years
$4,013,010
ICF/MR-65 to 74 years
$3,315,761
NF-1 to 5 years
$2,317,064
NF-6 to 14 years
$2,257,035
NF-15 to 20 years
$1,533,297
ICF/MR-6to 14 years
$1,110,553
ICF/MR-75 to 84 years
$1,005,147
NF-Under 1
$613,885
ICF/MR-1 to 5 years
$42,119
ICF/MR-Under 1
$0
ICF/MR-85+ years
$0
...ItANKEDBYCOS'i'PERRECIPlOO> ........................................................................................................
ICF/MR-45 to 64 year~ ICF/MR-65 to 74 year~ ICF/MR-21 to 44 year~ ICF/MR-15 to 20 year~ ICF/MR-75 to 84 year~ NF-15 to 20 years ICF/MR-1 to 5 years NF-6 to 14 years ICF/MR-6 to 14 years NF-21 to 44 years NF-1 to 5 years NF-Under 1 NF-45 to 64 years NF-65 to 74 years NF-75 to 84 years NF-85+ years ICF/MR-Under 1 ICF/MR-85+ years
$66,947 $66,315 $64,624 $59,015 $55,842 $45,097 $42,119 $38,914 $37,018 $21,247 $16,913 $16,155 $15,825 $13,990 $13,545 $13,289
-
Page 23
The Georgia Department of Medical Assistance
State Fiscal Year 1998
INDIGENT CARE TRUST FUND AND DISPROPORTIONATE SHARE HOSPITALS
The Indigent Care Trust Fund (ICTF), established at the beginning of SFY90, funds and supports programs and facilities that serve the medically indigent. Georgia Medicaid distributes ICTF funds to rural and other health care providers, primarily hospitals, that provide a certain share of their care to the indigent and to Medicaid recipients. Through ICTF funding, even uninsured people who do not qualify for Medicaid may receive healthcare from participating providers. Seventy-eight of the 114 counties in Georgia with acute care hospitals have participating ICTF institutions.
ICTF is the largest component of the Disproportionate Share Hospital (DSH) payments made by DMA. ICTF is a state program, while DSH is a Federal Medicaid program. However, ICTF is funded completely through "intergovernmental transfers. Participating hospitals and providers contribute to the fund, and the resulting total (with its federal matching funds) is then disbursed through the Department of Medical Assistance. No money from the state's general fund is used.
The Department requires each hospital to prepare a plan outlining specific spending proposals in primary care programs for 15% of the hospital's ICTF funding. Five percent of that amount may be spent on capital costs. For example, 5% of ICTF disbursements may be used to build a primary care center at the participating hospital.
Eighty-eight Georgia hospitals participated in the Indigent Care Trust Fund in 1998. Among this group, 14 hospitals participated through the Indigent Care Trust Fund II for small rural hospitals. ICTF II was created in SFY 1997 to help address the financial difficulties some small hospitals are facing in Georgia and other states. The requirements to participate in ICTF II are less rigid if the hospital is located in rural area rather than a Metropolitan Statistical Area.
In SFY98, the Department established ICTF advisory committees to assist the agency in determining the best courses of action with regard to hospitals that perform services for indigent and Medicaid recipients. The ICTF Advisory Panel - which includes representatives from hospitals, medical schools, public health, consumer advocacy groups, and government agencies - examined the effectiveness of the ICTF program in addressing the health care needs of Georgians with limited financial resources. The panel unanimously agreed that ICTF funds have been consistently used appropriately, according to federal guidelines and the Department's regulations.
$377,162,635 Indigent Care Trust Fund dollars went to fund primary care programs, indigent care, and other efforts in the hospitals participating in the two ICTF programs in SFY1998.
........
................. 1998 ICTF Hospitals
I.
Hospital
County
ICTF Payment Primary Care
Amount
Appling General
Appling
$402,092
$25,633
J. D. Archbold
Thomas
$1,638,042
$245,706
Athens Regional
Clarke
$12,970,958
$836,975
Bacon County
Bacon
$160,967
$10,262
B-J-C
Jackson
$409,270
$26,091
Baptist- Worth
Worth
$287,418
$43,113
Barrow
Barrow
$118,890
$17,834
Bulloch Memorial
Bulloch
$1,347,392
$202,109
Burke County
Burke
$654,509
$41,725
Camden Medical Center
Camden
$603,768
$38,490
Cobb Memorial
Franklin
$225,516
$33,827
Coffee Regional
Coffee
$3,965,281
$252,787
Colquitt Regional
Colquitt
$1,118,217
$71,286
Page 24
The Georgia Department of Medical Assistance
State Fiscal Year 1998
Hospital
Crawford Long Crisp Regional Dodge County Dooly Medical Center Dorminy Medical Center Early Memorial Egleston Elbert Memorial Emanuel County Emory-Adventist Evans Memorial Fairview Park Floyd Medical Center Georgia Baptist Grady General Grady Memorial Hamilton Medical Center Hancock Memorial Henry Medical Center Hughes Spalding Hutcheson Medical Center Irwin County Jeff Davis Liberty Regional Louis Smith Memorial Meadows Regional Medical Center - Columbus Medical Center Central Ga. Medical College Medical/Surgical Center Memorial-Adel Memorial -Bainbridge Memorial Medical Center M G Boswell Mitchell County Oconee Regional Parkway Regional Peach County Perry Phoebe Putney Polk General Putnam General Roosevelt Warm Spring
1998 ICTF Hospitals
County Fulton
ICTF Payment Primary Care
Amount
$5,837,757
$875,664
Crisp
$1,191,505
$75,958
Dodge
$0
$0
Dooly
$183,189
$11,678
Ben Hill
$984,339
$62,752
Early
$125,812
$8,021
Dekalb
$5,361,744
$804,262
Elbert
$646,971
$41,244
Emanuel
$564,504
$35,987
Cobb
$47,518
$7,128
Evans
$69,408
$4,233
Laurens
$0
$0
Floyd
$6,380,635
$412,114
Fulton
$6,529,312
$979,397
Grady
$410,248
$26,153
Fulton
$100,443,805 $6,574,756
Whitfield
$1,976,635
$296,495
Hancock
$1,054,432
$67,220
Henry
$759,989
$48,449
Fulton
$3,056,915
$194,878
Catoosa
$5,200,105
$331,507
Irwin
$156,335
$9,966
Jeff Davis
$627,729
$40,018
Liberty
$603,112
$38,448
Lanier
$113,331
$17,000
Toombs
$834,633
$53,208
Muscogee
$8,979,089
$581,708
Bibb
$16,540,428 $1,071,820
Richmond
$27,064,485 $1,761,984
Baldwin
$596,516
$38,028
Cook
$313,929
$47,089
Decatur
$1,211,184
$77,213
Chatham
$12,815,367
$898,966
Greene
$342,968
$21,864
Mitchell
$457,720
$29,180
Baldwin
$1,427,059
$90,975
Douglas
$356,897
$53,535
Peach
$301,957
$19,250
Houston
$1,006,395
$64,158
Dougherty
$8,047,757
$520,702
Polk
$228,597
$14,573
Putnam
$244,598
$15,593
Meriwether
$1,284,017
$81,856
Page 25
The Georgia Department of Medical Assistance
State Fiscal Year 1998
1998 ICTF Hospitals
Hospital Satilla Regional
County Ware
ICTF Payment Primary Care
Amount
$3,793,838
$241,857
Scottish Rite
Fulton
$3,070,826
$460,624
Shepherd Center
Fulton
$75,213
$11,282
Smith
Lowndes
$164,705
$24,706
South Fulton
Fulton
$5,070,595
$323,250
South GA Med Center
Lowndes
$3,854,513
$245,725
Southeast GA Med Center Glynn
$10,036,381
$647,616
Southwest Hospital & Med Ctr Fulton
$846,836
$127,025
Stewart-Webster
Stewart
$33,300
$4,995
Sumter Regional
Sumter
$1,784,993
$113,793
TannerNilia Rica
Carroll
$929,709
$59,269
Tattnall Memorial
Tattnall
$422,715
$26,948
Taylor Regional
Pulaski
$448,745
$67,312
Tift General
Tift
$2,904,520
$185,163
University Hospital
Richmond
$7,153,545
$456,038
Upson Regional
Upson
$2,529,225
$161,238
Wayne Memorial
Wayne
$1,689,108
$107,681
West GA Medical Center
Troup
$5,611,604
$357,740
Wheeler County
Wheeler
$90,979
$13,647
TotailCTF
$298,792,596 $21,886,777
"
Berrien County Calhoun Memorial Charlton Memorial Habersham County Higgins General Jefferson Monroe County Murray Medical Center Rabun County Screven County Union General Wills Memorial Brooks County Polk General Subtotal ICTF II
1998 ICTF II Berrien Calhoun Charlton Habersham Haralson Jefferson Monroe Murray Rabun Screven Union Wilkes Brooks Polk
$190,778 $166,416 $109,456 $1,025,293 $657,701 $213,635 $462,644 $1,149,754 $283,390 $141,197
$0 $374,601 $316,561 $116,041 $6,237,777
$12,162 $10,609
$6,978 $65,362 $41,928 $13,619 $29,494 $73,297 $18,066
$9,001 $0
$23,881 $20,181
$7,398 $397,658
ITotal I & II
I~~~_~_
Unable to participate, as DSH limit was $0.
$305,030,3731 $22,284,435[
Page 26
The Georgia Department of Medical Assistance
State Fiscal Year 1998
PROVIDER PARTICIPATION IN GEORGIA MEDICAID
The number of healthcare providers participating in Georgia Medicaid-receiving paid reimbursement for providing services to Medicaid patients-has increased by 46% in the last 6 years, from 18,686 to 27,328. Certain provider categories, however, have declined. The combined number of adult and child dental providers decreased 18% from SFY93 to SFY98. The Department is researching the reasons for the decline in an effort to change that trend.
PROVIDERS WITH PAID CLAIMS BY SELECTED CATEGORY OF SERVICE
Category of Service Community Care Dental, Adult Dental, Child Georgia Better Health Care HEALTH CHECK (EPSDT) Hospital, Inpatient Hospital, Outpatient Nurse Practitioner Nursing Home Intermediate Nursing Facility Services Physician Physician's Assistant Prescribed Drugs
FY93 252 874
1,036
--
353 414 679 108
12 339 12,390
--
1,964
FY94 295 896
1,150 218 523 375 574 176 12 341
13,073 126
1,957
FY95 372 810
1,014 442 688 452 525 180 12 342
14,148 208
1,974
FY96 351 784 970
1,088 877 453 710 179 12 342
14,981 274
2,006
FY97 348 723 918
1,897 1112
408 456 216
12 346 15,135 321 2,122
FY98 365 665 893
2,370 1342
319 337 268
11 345 15,560 370 2,042
TOTAL ALL CATEGORIES
NOTE: The number of providers with paid claims can be considerably less than the number of providers "enrolled'. Providers can remain "enrolled' when they are not submitting paid claims. The total number of providers enrolled at the end of FY98 exceeded 57,000. If a provider has more than one location, the provider is only counted once.
Two of the fastest-growing categories of providers working with Georgia Medicaid in the past 5 years have been physician's assistants (an increase of 194% since 1994) and nurse practitioners (a 52% increase since 1994). DMA is exploring additional options for physician extenders, particularly in underserved areas of the state.
Physician Participation in Georgia Medicaid
SFY93 to SFY98
20,000 -.-----....,.-1.4...-:014=8~t4;9&1 15,13':>--L~AI
= __ 15,000
12390 13,073
~=c::...;::...::..-
'
10,000 5,000
o
1993
1994
1995
1996
1997
1998
Page 27
The Georgia Department of Medical Assistance
State Fiscal Year 1998
I
SERVICES PROVIDED TO MEDICAID RECIPIENTS, RANKED BY EXPENDITURES
1. Hospital services
Medicaid covers inpatient and outpatient hospital services. Many inpatient hospital stays must be precertified or approved before the patient is actually admitted to the hospital. Some outpatient services must be pre-certified as well. In FY98, inpatient reimbursement was initially determined by a flat rate for each hospital admission, specific to the hospital. In October 1997, DMA changed its method of hospital reimbursement to a DRG-based (Diagnosis Related Groups) system. That system is similar to the system used by Medicare. This reimbursement system pays the hospital according to the diagnosis, with payments increasing as the severity of the patient's condition increases.
Hospital costs accounted for 31.3% of Georgia Medicaid's FY98 benefits expenditures; $694,442,760 for inpatient care, and $268,366,413 for outpatient care. 13% of recipients used inpatient hospital services during SFY98, and 45% received outpatient hospital care. The total cost of providing inpatient hospital services decreased in FY98, as well as the percent of recipients using that service. Outpatient total expenditures increased slightly while the percent of recipients using outpatient services decreased.
2. Nursing Facility services
Medicaid covers institutional care, including nursing services, room, board, and personal care for the majority of Georgians requiring nursing home care. The quality of nursing home care in Georgia is regulated by the Office of Regulatory Services (ORS), a division of the Department of Human Resources.
In FY98, 23.3% of Georgia's Medicaid benefits expenditures paid for nursing facility services; $602,689,139 for nursing facility services for the elderly and disabled, $113,049,681 for nursing facility services required for the severely mentally retarded. 3.5% of recipients used nursing facility services.
3. Physician Services
Medical care provided by participating physicians accounted for 12.2% of the Medicaid benefits budget in FY98; $373,968,780 was spent on services and visits reimbursed under the Resource-Based Relative Value Scale used by Medicare. 73% of Georgia Medicaid recipients visited participating physicians last year. 1.9% received care from a physician's assistant, while nurse practitioners cared for 2.2% of Medicaid recipients.
4. Prescribed Drugs
Medicaid recipients in Georgia receive benefits covering prescribed and certain over-the-counter drugs. Less than 1% of drugs require prior approval. In SFY98, the Georgia Pharmacy Foundation acted as the prior approval agent to review and process such requests. 11.8% of the Department's benefits budget was spent on pharmacy services in FY98. Expenditures of $362,183,494 paid for benefits for 70% of recipients under this category of service. Pharmacy benefits costs increased 7% even as the percent of recipients using prescribed drugs decreased 5%. Rebate agreements with pharmaceutical manufacturers saved the state an estimated $58.2 million in FY98.
5. Waiver Services for Home and CommunityBased Care
Growth of these altematives to nursing home care continued for Georgia Medicaid in SFY98. The total cost of such services for FY96 was $87,744,912, less than 3% of the Department's benefits expenditures. In FY97, expenditures for waiver programs totaled $112,894,459- approximately 4.5% of the benefits budget. In FY98, expenditures for waiver programs grew to $134,691,716, 4.4% of the total benefits budget for Georgia Medicaid. 1.3% of recipients used waiver program services in SFY98.
Medicaid recipient Kimberly Clayborne, an expectant mother, with her own mother, Kathy Clayborne.
Page 28
The Georgia Department of Medical Assistance
State Fiscal Year 1998
6. Mental Health Services More than 55,700 Georgians received mental health care in SFY98 paid for by Georgia Medicaid, totaling $103,047,055 for the year. When considered as a group, behavioral health services -- including mental illness, substance abuse and mental retardation diagnoses -- represents the Georgia Medicaid program's highest cost group. This category accounted for 3.4% of the Department's benefits budget. Mental health services include individual, group and family therapy; day treatment; activity therapy; and crisis services. Physician, psychology, inpatient and pharmacy services for mental illness are not included in this amount. Those services are paid for in other Medicaid categories of service.
ill
7. Other Practitioner Services Services in this category include preventive and routine dental services for adults and children, optometric services, podiatry and psychology services, and the care provided by nurse midwives, nurse practitioners, physician's assistants and certified registered nurse anesthetists. Also included in this category are reimbursements to county health departments for diagnostic, screening and preventive services.
The total amount from the FY98 benefits budget reimbursed to providers in this category was $70,199,664, 3.4% of the total benefits budget..
8. Transportation As required by Federal law, Medicaid covers both emergency and non-emergency transportation services to assist recipients who might otherwise have difficulty accessing medical care. During SFY98, the Department revised the process for obtaining non-emergency transportation by moving Medicaid recipients into a brokered system of non-emergency transportation intended to provide better budget predictability and more accountability for quality of services.
Medicaid provider F. Brent Davis, DDS provides dental care to patient Summer Butler.
Transportation costs-including emergency ambulance services-totaled $70,011,678 in SFY98, comprising 2.3% of Medicaid's total benefits budget.
9. Maternal and Child Health Services Maternal and child health services help pregnant women with prenatal and perinatal care, pay for children's preventive healthcare through the HEALTHCHECK program, help children with physical and developmental problems, and assist children at risk through the Family Connection. 1.6% of Georgia's Medicaid expenditures went to these services in FY98-a total of $47,616,936. The majority of those expenditures went to pregnancy services and to HEALTHCHECK.
While this expenditure category represents less than 2% of Georgia DMA's benefits budget for FY98, 34% of all recipients used at least one of its services during the fiscal year.
10. Equipment and Devices Medicaid covers the rental or purchase of medical equipment including hospital beds, wheelchairs, oxygen equipment, and walkers. Medicaid also covers devices such as artificial limbs, braces, glasses and artificial eyes. The total reimbursements under this category of service for FY98 were $37,117,712. That amount represents 1.2% of Medicaid's benefits expenditures for the year. 11 % of all recipients used the services.
Page 29
The Georgia Department of Medical Assistance
State Fiscal Year 1998
11. All Others
Georgia Medicaid pays for a variety of other services, including ambulatory surgical centers and rural health clinics as well as laboratory, x-ray, dialysis and hospice services. Expenditures for care provided in these categories for FY98 totaled $191,653,037, accounting for 6.2% of benefit expenditures.
EXPENDITURES By CATEGORY OF SERVICE, SFY98
Hospital Services Nursing Facilities Physician Services Prescribed Drugs Waiver Services Mental Health Services Transportation Other Practitioner Services
Maternal &Child Health Equipment & Devices All Others
Total Expenditures
$962,809,173 $716,389,341 $373,968,780 $362,183,494 $139,732,343 $103,047,055
$70,011,678 $69,558,968 $47,616,936 $37,117,712 $191,653,037 $3,074,088,517
31.3% 23.3% 12.2% 11.8%
4.5% 3.4% 2.3% 2.3% 1.5% 1.2% 6.2% 100.0%
"Total includes expenditures for NET Brokers and dialysis. Actual SFY98 benefit expenditures total $3,028,628,870.
Hospital Services 31.3"10
Georgia Medicaid
Expenditures by Category of Service
Nursing Facilities 23.3"10
SFY98
Maternal & Child Health
1.5"10 Other Practitioner
Services
2.3"10
t-
Mental Health Services
3.4"10
Prescribed Drugs 11.8"10
Physician Services 12.2"10
All Others 6.2"10
Transportation 2.3"10
Equipment & Devices 1.2"10
Page 30
The Georgia Department of Medical Assistance
Prescribed Drugs
Hospital Services
Hospital, Inpatient Hospital, Outpatient Total Hospital
Includes out-of-state providers.
i
,.
Nursing Facilities
Nursing Home Intermediate Care - MR
Nursing Facility Services
Swing Bed Services
Total Nursing Facilities
Waiver Services Community Care' CCSP SOURCE project Independent Care ShepherdCare Mental Retardation Waiver Model Waiver Community Habilitation and Support Services (Brook Run)
Total Waiver Services
Maternal & Child Health Childbirth Education Program Children at Risk Case Management Children's Intervention Services Early Intervention Case Management Family Planning HEALTH CHECK (EPSDT) Perinatal Case Management Pregnancy-Related Services
Total Maternal and Child Health
Other Practitioner Services Certified Registered Nurse Anesthetists Dental, Adult Dental, Child Dental Oral Surgery Diagnostic, Screening & Preventive Services Nurse Midwife Nurse Practitioner Optometry
State Fiscal Year 1998
.. ...
Providers with
FY98
Paid Claims Recipients
15,560 900,182
2,042 827,008
$437.94 $362,183,494
319 164,614 337 553,471
$4,218.61 484.88
$694,442,760 268,366,413
$962,809,173
'0 <"~v
f" "'<';~:" ."" )1.*& '_.~::,~?:,~. ,
11
1,754 $64,452.50 $113,049,681
345
43,083
13,989.02 602,689,139
16
638
1,019.63
650,521
45,475 $15,753.48 $716,389,341
348
13,497
4
287
107
323
1
39
223
2,222
22
150
11
233
705
16,518
,~., :;<"',.-."".,-,
$3,750.62 $2,797.96 $42,370.59 $27,661.23 29,165.01 24,649.76 21,633.59
8,459.40
$50,622,108 $803,014
13,685,700 1,078,788
64,804,642 3,697,464 5,040,627
$139,732,343
':H4~Z;: A~ F> ;,;:4
7 16 958 59 74 1,342 105 89
159 3,305 10,157 3,360 26,633 301,242 53,625 17,500 415,981
$48.89 394.38 935.23 669.66
61.18 85.74 103.49 88.53 114.47
$7,773 1,303,411 9,499,102 2,250,057 1,629,412 25,828,404 5,549,491 1,549,286 $47,616,936
675
28,914
665
36,257
893 200,397
59
571
35
75,902
139
12,675
268
27,374
589
85,483
$131.46 83.18
137.04 157.75
29.30 489.32
56.07 46.89
$3,801,074 3,015,689
27,461,611 90,073
2,223,688 6,202,152 1,534,981 4,008,560
Page 31
The Georgia Department of Medical Assistance
State Fiscal Year 1998
Categories of Service; Providers, Recipients, Elnd Expenditures
.Providers with .
FY 98 Expenditures
Paid Claims. Ret:lpientS per Recipient
Other Practitioner Services, cont.
Physician's Assistant Podiatry Psychology Other (Medicare Coinsurance & Deductibles)
370 23,325 222 37,712 610 54,367
6,855
85.38 71.32 250.21 428.50
Total Other Practitioner Services
589,832
117.93
1,991,390 2,689,492 13,602,907 2,937,351 $69,558,968
Mental Health Services
Mental Health Clinic Mental Health Case Management Total Mental Health Services
63 51,737 $1,921.62 $99,418,631
27
4,017
903.27
3,628,424
55754
1,848.25 $103,047,055
7' -.
Transportation
Ambulance Non-Emergency Transportation Non-Emergency Transportation Brokers
201
74,824
478 65,682
3
$234.03 225.28
$17,511,171 14,796,792 37,703,715
Total Transportation EqUipment & Devices
,,
~.-. <"
$70,011,678
w
'0.
Durable Medical Equipment Eyeglasses Orthotics/Prosthetics
1,993 1
166
83,000 39,900
9,259
$364.90 17.48
662.44
$30,286,544 697,593
6,133,575
Total Equipment and Devices
~'
All Others
132,159
,j'.
280.86 $37,117,712
. ';":J~ ." .,k._.,_"
~.Y~-'
Adults with AIDS Ambulatory Surgical At Risk of Incarceration Dialysis Federally Qualified Health Centers Georgia Better Health Care HMO Home Health Hospice Laboratory/Radiology PASARR Protective Services, Adult Protective Services, Child Qualified Medicare Beneficiaries Rural Health Clinic Therapeutic Residential Intervention Therapy Services (Physical, Occup., Speech)
20 56
1 223
27 2,370
3 119
48 86
1 1 1
42 18
1,594 4,451 1,840
702 26,122 869,782 73,519
9,776 3,021 169,870 2,815 2,928 22,602
32 21,126
998 1,700
$281.30 298.53 404.12
11,048.34 210.90 24.04 712.41
1,239.73 5,492.09
74.93 1,209.00 1,530.43
938.03 101.88 162.02 28,045.25 376.35
$448,395 1,328,750
743,575 7,755,932 5,509,104 20,910,585 52,375,977 12,119,647 16,591,607 12,728,645 3,403,323 4,481,100 21,201,320
$3,260 3,422,863 27,989,162
639,792
Total All Others
ITOTALS <". . . . . . '.' ....
1,212,878
. ..27~28 1,234,741
$191,653,037
$2,452.85 $3,028,628,8101
Sources. HCFA 2082 report. Provider Participation AnalySIS; HMGR585G; reports generated by Decision Support System at DMA Total does not include expenditures for NET Brokers or dialysis.
'NET reimbursement changed from fee-for-service to a brokered system in October 1997; total costs reflect a partial fiscal year's reimbursements.
'"Brokered services are paid on a capitated basis; accurate count of recipients who used the service is not available.
Page 32
The Georgia Department of Medical Assistance
State Fiscal Year 1998
A HISTORY OF MEDICAID BENEATSEXPENDITURES
Fiscal Year
Number of Unduplicated
Recipients
Cash ** Benefit Payments
Percentage Change
Payments *** by Date
of Service
Percentage Change
1970 1971 1972 1973 1974 1975 1976 1977 1978 1979 1980 1981 1982 1983 1984 1985 1986 1987 1988 1989 1990 1991 1992 1993 1994 1995 1996 1997 1998
472,333 407,127 415,261 445,406 435,866 444,078 444,138 454,823 475,240 500,092 520,983 551,639 624,257 733,702 848,029 944,378 1,058,918 1,135,212 1,181,092 1,240,885 1,234,741
$73,766,763 $128,527,366 $141,138,792 $182,989,393 $187,774,982 $266,136,883 $268,858,408 $318,029,162 $343,319,187 $375,653,922 $435,292,735 $519,934,060 $542,306,612 $613,392,777 $624,861,133 $694,279,055 $785,486,760 $900,119,766 $1,039,092,121 1,202,158,160 1,385,905,937 1,730,756,706 + 2,090,163,405 + 2,380,785,409 + 2,747,463,083 + 3,003,708,266 + 3,089,570,328 + 3,151,030,885 + $3,028,628,870 -
74% 10% 30%
3% 42%
1% 18%
8% 9% 16% 19% 4% 13% 2% 11% 13% 15% 15% 16% 15% 25% 21% 14% 15% 9% 3% 2% 0.40%
$308,142,782 $338,228,610 $377,658,055 $444,155,517 $536,560,178 $545,307,185 $608,309,046 $668,128,193 $739,671,854 $820,893,065 $932,536,868 $1,086,605,506 $1,240,277,978 $1,486,563,690 $1,776,285,458 * $2,108,822,516 * $2,409,645,097 * $2,803,935,767 * $3,023,207,603 * $3,135,777,135 * $3,109,462,293 * $2,972,871,072 *
'Figures include Medicare copayments and deductibles, but exclude Medicare premium payments.
10% 12% 18% 21%
2% 12% 10% 11% 11% 14% 17% 14% 20% 19% 19% 14% 16%
8% 4% -1% -4%
Paid during each fiscal year. In this Annual Report all 'expenditures,' 'benefits' or 'payments' are cash benefits payments, with the exception of payments by date of service.
Expenditures for services prOVided in each fiscal year. Since FY77, based on the Attorney General's ruling, payments have been made from the budget for the same year in which the Medicaid service was rendered. Final expenditure amounts are not known until some time after a fiscal year has ended, since providers have six months from the month of service to file a claim. Date of service figures are expenditures as of June 30, 1994, for FY87-FY93; FY94-FY98 as of 10/30/98. Note that the figures for fiscal years before 1987 were revised to exclude Medicare premium payments.
+Does not include Indigent Care Trust Fund amounts of $88,855,058 in FY91, $246,891,441 in FY92, $246,477,987 in FY 93, $344,976,776 in FY94, $420,296,638 in FY95, $391,707,906 in FY96, $385,000,000 in FY97 and $377,162,635 in FY98.
Page 33
The Georgia Department of Medical Assistance
State Fiscal Year 1998
ICOUNTY INFORMATION ON GEORGIA MEDICAID RECIPIENTS AND EXPENDITURESI
ANALYSIS OF RECIPIENTS AND EXPENDITURES BY RECIPIENT'S COUNTY FY1998
Benefits Paid
Estimated 1998
Population
Unduplicated Recipients
% Population Receiving Medicaid
% Total State
Recipients
Expenditures Per
Recipient
$137,557,962 $16,013,420
193,098 67,050
49,046 7,343
25.4% 11.0%
3.97% 0.59%
$2,804.67 $2,180.77
$1,767,327 $8,769,026
3,835 14,402
889 3,950
23.2% 27.4%
0.07% 0.32%
$1,987.99 $2,220.01
$7,689,326 $27,146,426 $13,096,148
$4,785,410 $22,508,368
$2,752,716
9,824 56,972 25,239
5,421 31,685
6,895
2,882 12,099
4,999 1,679 9,932 1,609
29.3% 21.2% 19.8% 31.0% 31.3% 23.3%
0.23% 0.98% 0.40% 0.14% 0.80% 0.13%
$2,668.05 $2,243.69 $2,619.75 $2,850.15 $2,266.25 $1,710.82
$970,708 $14,061,763
$5,717,854 $10,267,896
$7,125,977 $31,262,133
1,857 19,056
8,215 11,465 11,097 42,560
586 5,489 2,723 3,444 3,786 10,715
31.6% 28.8% 33.1% 30.0% 34.1% 25.2%
0.05% 0.44% 0.22% 0.28% 0.31% 0.87%
$1,656.50 $2,561.81 $2,099.84 $2,981.39 $1,882.19 $2,917.60
$19,296,495 $20,897,989
$4,252,521 $4,274,658
36,892 25,614
8,167 5,959
8,994 7,902 1,156 1,873
24.4% 30.9% 14.2% 31.4%
0.73% 0.64% 0.09% 0.15%
$2,145.49 $2,644.65 $3,678.65 $2,282.25
$27,402,198 $5,283,458 $5,222,936 $7,171,870
$13,949,138
58,547 9,150 9,872
15,675 27,231
11,152 2,853 2,373 2,312 5,315
19.0% 31.2% 24.0% 14.7% 19.5%
0.90% 0.23% 0.19% 0.19% 0.43%
$2,457.16 $1,851.90 $2,200.98 $3,102.02 $2,624.49
$24,526,644 $19,238,704 $26,540,784
$4,678,977 $12,884,675
61,848 51,539 35,817
6,038 19,999
9,768 8,822 9,845 1,946 5,212
15.8% 17.1% 27.5% 32.2% 26.1 %
0.79% 0.71% 0.80% 0.16% 0.42%
$2,510.92 $2,180.76 $2,695.86 $2,404.41 $2,472.12
$13,442,522 $771,391
$4,202,010 $6,281,656
25,068 2,255 4,954 16,828
5,620 460
1,468 2,145
22.4% 20.4% 29.6% 12.7%
0.46% 0.04% 0.12% 0.17%
$2,391.91 $1,676.94 $2,862.40 $2,928.51
$28,371,873
81,317
12,347
15.2%
1.00%
$2,297.88
$7,584,027
7,308
2,454
33.6%
0.20%
$3,090.48
$5,401,074
10,549
2,517
23.9%
0.20%
$2,145.84
$4,810,739
10,859
2,461
22.7%
0.20%
$1,954.79
$10,028,124
22,361
5,677
25.4%
0.46%
$1,766.45
sM~WiM#) .$$;62~;~2@:tiijtAlili;M~M2.MW;hdOi{W% .)$i;#52.~~5
Estimated population for 1998 based on 1990 census figures from the Govemor's Office of Planning and Budget.
Statewide totals reflect unduplicated recipients and expenditures as listed elsewhere in this report. The sum of
'% Total State Recipients' exceeds 100% since a recipient may reside in more than one county during a year. Expenditures do not include Indigent Care Trust Fund dollars or Medicare premiums.
Page 38
The Georgia Department of Medical A:
111111~~llI~ij~lmlm~lm~~~ ~I~m~~1111I
3 2108 03514 5815
I.....-
SELECfED SOURCES AND REFERENCES
State Fiscal Year 1998
I....,j
Form HCFA-2082: Statistical Report on Medical Care, Fiscal Year 1998
HMGR585G: Georgia Medicaid Management Information System, 6/98
HMGR340G: Georgia Medicaid Management Information System, 6/98
Health Care Financing Administration: National Health Care Expenditures Highlights and Projections
Nursing Home Care Expenditures, Table 10a and 10b National Health Expenditures Amounts, 1970-2007, Table 1 and Table 2 Highlights National Health Expenditures, 1997-2007 Highlights National Health Expenditures, 1997 (www.hcfa.qov)
U.S. Bureau of the Census Resident Population of the United States: Middle Series Projections, 2015-2030 Current Population Reports: 65+ in the United States Percent Change of Population 65 Year and over by Region, Division and State: 1980-1990 (Table 5-1 to 5-5) Statistical Abstract of the United States: Georgia Profile, 1997
(www.census.qov)
Administration on Aging Older Persons with Mobility and Self-Care Limitations: 1990
(www.aoa.dhhs.qov)
Georgia State Health Planning Agency
Georgia Hospital Association
Page 39
'The Georgia Department of Medical Assistance
2 Peachtree Street, N.W., 40th Floor Atlanta, Georgia 30303-3159 (404) 656-4479 www.state.ga.us/dma