- Collection:
- Georgia Government Publications
- Serial:
- Short-term employment projections. Workforce investment area #5, DeKalb County.
- Title:
- Georgia jobs 2005-2006 : short-term employment projections. Workforce investment area #5, DeKalb County
- Creator:
- Georgia. Workforce Information and Analysis
- Contributor to Resource:
- Georgia. Workforce Information and Analysis.
- Publisher:
- [Atlanta, GA] : Georgia Dept. of Labor, Workforce Information & Analysis, 2005
- Date of Original:
- 2005/2006
- Subject:
- Employment forecasting--Georgia--DeKalb County--Periodicals
- Location:
- United States, Georgia, DeKalb County, 33.77153, -84.22641
- Medium:
- state government records
- Type:
- Text
- Format:
- application/pdf
- Description:
- Biennial
Title from cover
"See which jobs are expected to be in highest demand over the next two years." - External Identifiers:
- Call Number GA L200.E46 S1 W5 2005-2006
- Metadata URL:
- https://dlg.galileo.usg.edu/id:dlg_ggpd_y-ga-bl200-pe46-bs1-bw5-b2005-h2006-belec-p-btext
- Digital Object URL:
- https://dlg.galileo.usg.edu/do:dlg_ggpd_y-ga-bl200-pe46-bs1-bw5-b2005-h2006-belec-p-btext
- Language:
- eng
- Holding Institution:
- University of Georgia. Map and Government Information Library
- Rights:
-

Moderate-term on-the-job Training
Occupation
New
Job
Positions Replacements
Customer Service Representatives
10
100
Sales Representatives, Wholesale
and Manufacturing, Except Technical
and Scientific Products
0
90
Bookkeeping, Accounting, and Auditing Clerks 0
80
Cooks, Institution and Cafeteria
20
60
Secretaries, Except Legal, Medical,
and Executive
0
80
Team Assemblers
0
70
Executive Secretaries and Administrative
Assistants
0
60
Truck Drivers, Heavy and Tractor-Trailer
0
60
Maintenance and Repair Workers, General 0
50
Medical Assistants
30
20
Annual Openings
110
90 80 80
80 70
60 60 50 50
Average Wage
14.63
22.21 14.11 8.24
14.00 12.49
18.18 20.69 15.93 12.86
Short-term on-the-job Training
Occupation
New
Job
Positions Replacements
Cashiers
0
470
Retail Salespersons
0
380
Combined Food Preparation and Serving
Workers, Including Fast Food
30
240
Laborers and Freight, Stock, and Material
Movers, Hand
0
250
Child Care Workers
140
100
Waiters and Waitresses
0
240
Teacher Assistants
150
70
Stock Clerks and Order Fillers
0
210
Janitors and Cleaners, Except Maids
and Housekeeping Cleaners
60
90
Office Clerks, General
0
130
Annual Openings
470 380
270
250 240 240 220 210
150 130
Average Wage
8.46 11.10
6.59
11.45 7.98 7.60 22,088 10.60
9.67 12.29
For more information, please contact David Yankey at (404) 232-3875 Fax (404) 232-3888
Email: Workforce_Info@dol.state.ga.us
www.dol.state.ga.us/wp/lmi_publications.htm
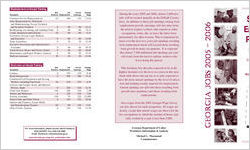
During the years 2005 and 2006, almost 2,800 new jobs will be created annually in the DeKalb County Area. In addition to these job openings arising from employment growth, openings will also arise from the need to replace workers who transfer to other
occupations, retire, die, or leave the labor force permanently for other reasons. This is important because over the next two years job openings resulting from replacement needs will exceed those resulting
from growth in many occupations. It is expected that almost 7,500 additional job openings per year will result from the need to replace workers who
leave doing this period.
This brochure lists the jobs expected to be in the highest demand over the next two years in this area. Each table shows the top ten or so jobs expected to have the most annual openings by the level of education and training usually required for employment. Annual openings are split into those resulting from
growth (new positions) and those resulting from replacements.
Area wages from the 2005 Georgia Wage Survey are also shown for each occupation. All wages are hourly, except that annual wages are shown for the few occupations in which the number of hours typi-
cally worked in a year is less than 2,080.
Georgia Department of Labor Workforce Information & Analysis
Michael L. Thurmond Commissioner
georgia jobs 2005 - 2006
Short-term Employment Projections
See which jobs are expected to be in highest demand over the next two years
Workforce Investment Area #5 DeKalb County
DeKalb County Area's Top Jobs by Most Expected Annual Openings for 2005-2006
More than a Bachelor's Degree
Occupation
New
Job
Positions Replacements
General and Operations Managers
0
100
Management Analysts
50
20
Chief Executives
10
30
Education Administrators, Elementary
and Secondary School
30
10
Instructional Coordinators
30
10
Biological Science Teachers, Postsecondary 20
10
Computer and Information Systems Managers 10
20
Education Administrators, Postsecondary 20
10
Financial Managers
10
20
Lawyers
10
20
Sales Managers
10
20
Annual Openings
100 70 40
Average Wage
41.78 39.74 75.44
40 76,316 40 23.82 30 101,242 30 47.85 30 36.03 30 41.26 30 47.62 30 49.96
Bachelor's Degree
Occupation
New
Job
Positions Replacements
Elementary School Teachers, Except
Special Education
120
70
Secondary School Teachers, Except
Special and Vocational Education
80
60
Middle School Teachers, Except
Special and Vocational Education
50
40
Accountants and Auditors
30
40
Computer Systems Analysts
40
20
Preschool Teachers, Except Special Education 50
10
Insurance Sales Agents
30
20
Network Systems and Data
Communications Analysts
40
10
Computer Software Engineers, Applications 30
10
Computer Software Engineers,
Systems Software
30
10
Kindergarten Teachers, Except
Special Education
30
10
Annual Openings
190
140
90 70 60 60 50
50 40
40
40
Average Wage
49,800
53,645
50,979 26.47 34.10 25,958 67,569
27.24 35.95
39.28
46,513
Associate's Degree
Occupation
New
Job
Positions Replacements
Registered Nurses
0
100
Computer Support Specialists
20
20
Paralegals and Legal Assistants
10
10
Dental Hygienists
10
0
Electrical and Electronic Engineering
Technicians
0
10
Medical and Clinical Laboratory Technicians 0
10
Medical Records and Health Information
Technicians
0
10
Radiologic Technologists and Technicians
0
10
Respiratory Therapists
0
10
Annual Openings
100 40 20 10
10 10
10 10 10
Average Wage
25.47 23.10 21.41 19.75
23.19 14.07
14.91 23.48 23.02
Postsecondary Vocational Training
Occupation
New
Job
Positions Replacements
Automotive Service Technicians and Mechanics10
40
Licensed Practical and Licensed
Vocational Nurses
0
40
Real Estate Sales Agents
20
20
Aircraft Mechanics and Service Technicians 10
10
Appraisers and Assessors of Real Estate
10
10
Avionics Technicians
10
10
Bus and Truck Mechanics and Diesel
Engine Specialists
0
20
Fitness Trainers and Aerobics Instructors
10
10
Hairdressers, Hairstylists, and Cosmetologists 0
20
Electrical and Electronics Repairers,
Commercial and Industrial Equipment
0
10
Emergency Medical Technicians
and Paramedics
0
10
Legal Secretaries
0
10
Medical Secretaries
0
10
Medical Transcriptionists
0
10
Mobile Heavy Equipment Mechanics,
Except Engines
0
10
Annual Openings
50
40 40 20 20 20
20 20 20
10
10 10 10 10
10
Average Wage
21.31
17.50 13.85 24.79 23.39 19.94
17.81 17.68 11.62
18.82
17.71 17.92 14.54 14.03
17.76
Work Experience in a Related Occupation
Occupation
New
Job
Positions Replacements
First-Line Supervisors/Managers of
Office and Administrative Support Workers 0
80
First-Line Supervisors/Managers of
Retail Sales Workers
0
60
First-Line Supervisors/Managers of
Construction Trades and Extraction Workers 20
20
First-Line Supervisors/Managers of
Food Preparation and Serving Workers
0
40
First-Line Supervisors/Managers of
Mechanics, Installers, and Repairers
10
30
Self-Enrichment Education Teachers
30
10
Vocational Education Teachers, Postsecondary 30
10
First-Line Supervisors/Managers of
Production and Operating Workers
0
30
Food Service Managers
20
10
Annual Openings
80
60
40
40
40 40 40
30 30
Average Wage
21.98
18.60
26.76
12.52
25.50 25.25 22.30
24.07 22.06
Long-term on-the-job Training
Occupation
New
Job
Positions Replacements
Cooks, Restaurant
0
60
Police and Sheriff's Patrol Officers
20
40
Carpenters
20
30
Claims Adjusters, Examiners, and Investigators 20
10
Electricians
10
20
Fire Fighters
10
20
Compliance Officers, Except Agriculture,
Construction, Health and Safety,
and Transportation
10
10
Electrical Power-Line Installers and Repairers 10
10
Machinists
10
10
Telecommunications Line Installers
and Repairers
10
10
Water and Liquid Waste Treatment Plant
and System Operators
10
10
Annual Openings
60 60 50 30 30 30
20 20 20
20
20
Average Wage
10.18 17.64 17.01 20.84 21.85 17.19
22.52 21.74 16.74
18.83
15.55
Equal Opportunity Employer/Program Auxiliary Aids and Services Available upon Request to Individuals with Disabilities