- Collection:
- Georgia Government Publications
- Title:
- Georgia nonagricultural employment: 2009 preliminary series [2009]
- Creator:
- Georgia. Department of Labor. Workforce Information and Analysis
- Contributor to Resource:
- Georgia. Department of Labor. Workforce Information and Analysis
- Publisher:
- Atlanta, Ga. : Georgia. Department of Labor. Workforce Information and Analysis
- Date of Original:
- 2009
- Subject:
- Georgia
- Location:
- United States, Georgia, 32.75042, -83.50018
- Medium:
- publications (documents)
- Type:
- Text
- Format:
- application/pdf
- External Identifiers:
- Call Number GA L200.E46 S1 N6 2009
- Metadata URL:
- https://dlg.galileo.usg.edu/id:dlg_ggpd_y-ga-bl200-pe46-bs1-bn6-b2009-belec-p-btext
- Digital Object URL:
- https://dlg.galileo.usg.edu/do:dlg_ggpd_y-ga-bl200-pe46-bs1-bn6-b2009-belec-p-btext
- Language:
- eng
- Holding Institution:
- University of Georgia. Map and Government Information Library
- Rights:
-

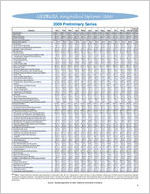
GEORGIA Nonagricultural Employment (000s)
2009 Preliminary Series
Industry
Annual Jan Feb Mar Apr M ay Jun Jul Aug Sep Oct Nov Dec Average
Total Nonfarm Total Private Goods Producing Service-Providing Private Service-Providing Mining and Logging Construction Construction of Buildings Heavy and Civil Engineering Construction Specialty Trade Contractors Manufacturing Durable Goods Computer, Electrical Equip and Appliance Mfg
Transportation Equipment Manufacturing Non-Durable Goods Food Manufacturing Textile Mills Textile Product Mills Trade, Transportation and Utilities Wholesale Trade Merchant Wholesalers, Durable Goods Merchant Wholesalers, Non-durable Goods Wholesale Electronic Markets and Agents and Brokers Retail Trade Food and Beverage Stores General Merchandise Stores Miscellaneous Store Retailers Transportation, Warehousing, and Utilities Utilities Transportation and Warehousing Air Transportation Truck Transportation Couriers and Messengers Warehousing and Storage Information Telecommunications Wired Telecommunications Carriers Wireless Telecommunications Carriers Internet Service Providers, Search Portals, and DP Financial Activities Finance and Insurance Insurance Carriers and Related Activities Real Estate, Rental and Leasing Professional and Business Services Professional, Scientific, and Technical Services Accounting, Tax Preparation and Bookkeeping Architectural, Engineering and Related Services Computer Systems Design and Related Services Management and Technical Consulting Services Management of Companies and Enterprises Admin and Support, Waste Mngmnt and Remediation Employment Services Educational and Health Services Educational Services Colleges, Universities, and Professional Schools Health Care and Social Assistance Ambulatory Health Care Services Hospitals Nursing and Residential Care Facilities Social Assistance Leisure and Hospitality Arts, Entertainment, and Recreation Amusement, Gambling, and Recreation Accommodation and Food Services Accommodation Food Services and Drinking Places Other Services Repair and Maintenance Personal and Laundry Services Religious, Grantmaking, Civic, Professional and Similar Government Federal Government Department of Defense State Government State Government Education Local Government Local Government Education
3,932.7 3,237.0
567.3 3,365.4 2,669.7
9.7 177.8 39.1 25.4 113.3 379.8 173.4 25.0 37.9 206.4 64.6 20.5 33.7 834.9 206.8 104.7 59.8 42.3 443.3 79.8 98.3 20.8 184.8 20.7 164.1 38.1 44.3 20.5 27.8 106.9 51.1 29.4 10.2
6.8 214.0 155.4 66.1 58.6 516.2 225.5 37.7 37.6 48.7 32.8 53.7 237.0 98.1 473.3 86.9 54.1 386.4 145.3 130.5 55.0 55.6 367.4 35.8 26.1 331.6 39.8 291.8 157.0 34.3 33.0 89.7 695.7 99.3 38.2 163.8 80.1 432.6 270.3
3,922.7 3,221.1
558.6 3,364.1 2,662.5
9.5 175.9 38.6 25.1 112.2 373.2 169.6 24.6 36.7 203.6 64.4 20.0 32.5 824.0 204.8 103.3 59.7 41.8 436.3 77.8 96.8 20.5 182.9 20.7 162.2 38.5 43.8 19.4 27.3 106.7 51.2 29.3 10.3
6.8 213.1 155.1 66.2 58.0 514.3 225.5 39.0 37.3 48.4 32.5 53.5 235.3 96.9 475.9 88.5 55.1 387.4 146.0 130.4 55.1 55.9 370.9 36.4 26.5 334.5 39.3 295.2 157.6 34.5 33.1 90.0 701.6 100.4 38.3 166.9 83.3 434.3 272.3
3,907.7 3,205.6
551.9 3,355.8 2,653.7
9.3 172.9 37.8 25.0 110.1 369.7 168.0 24.4 36.5 201.7 64.3 19.8 31.9 819.8 202.1 101.7 59.0 41.4 435.2 78.9 97.8 20.2 182.5 20.7 161.8 38.8 43.5 19.0 27.2 106.1 50.9 29.1 10.3
6.7 211.0 153.5 65.6 57.5 509.6 220.9 37.4 36.6 47.8 31.7 53.4 235.3 96.9 473.6 88.3 55.1 385.3 144.2 130.2 55.3 55.6 376.7 38.1 27.9 338.6 39.6 299.0 156.9 34.1 32.9 89.9 702.1 101.1 38.4 166.6 83.3 434.4 272.6
3,912.7 3,210.9
544.1 3,368.6 2,666.8
9.4 170.4 37.0 25.4 108.0 364.3 165.0 23.5 36.6 199.3 63.7 18.8 31.5 816.9 201.3 100.4 59.5 41.4 435.5 78.8 97.7 20.5 180.1 20.4 159.7 38.7 42.8 18.6 26.6 105.7 51.2 29.3 10.3
7.1 213.1 155.4 66.1 57.7 507.9 220.8 38.0 36.3 47.9 31.0 52.3 234.8 95.2 476.4 87.7 54.5 388.7 146.8 130.4 55.6 55.9 388.7 42.9 31.5 345.8 40.5 305.3 158.1 34.5 33.6 90.0 701.8 105.6 38.8 166.3 83.9 429.9 269.1
3,911.4 3,213.8
541.1 3,370.3 2,672.7
9.4 170.0 36.2 25.7 108.1 361.7 162.4 23.1 36.0 199.3 63.6 19.4 31.9 819.1 200.1
99.3 59.6 41.2 438.3 79.2 98.2 20.7 180.7 20.4 160.3 39.3 42.9 18.7 26.4 105.6 51.1 29.1 10.3 7.2 213.3 155.3 66.4 58.0 505.0 215.3 33.0 36.0 47.7 30.8 52.4 237.3 95.9 478.3 87.3 54.2 391.0 147.6 131.3 55.9 56.2 392.3 44.2 32.6 348.1 40.8 307.3 159.1 34.7 33.9 90.5 697.6 102.5 39.0 163.7 81.4 431.4 270.2
3,878.6 3,196.4
534.4 3,344.2 2,662.0
9.4 167.9 35.7 25.7 106.5 357.1 159.4 22.7 35.3 197.7 63.1 18.8 32.0 815.6 198.3
98.4 59.2 40.7 436.3 79.0 98.5 20.3 181.0 20.5 160.5 39.4 43.4 18.7 25.9 105.4 51.2 29.3 10.3 6.8 212.8 155.1 66.3 57.7 506.9 214.7 33.5 35.6 47.3 30.9 52.2 240.0 98.3 470.2 84.4 53.2 385.8 146.2 130.7 56.1 52.8 391.8 45.9 34.7 345.9 40.7 305.2 159.3 34.2 33.4 91.7 682.2 100.0 39.2 158.2 75.2 424.0 260.4
3,836.0 3,179.6
526.4 3,309.6 2,653.2
9.3 164.6 34.3 25.8 104.5 352.5 157.1 21.5 35.2 195.4 62.8 18.5 31.8 814.4 198.1
97.8 59.1 41.2 435.7 79.3 98.3 20.5 180.6 20.1 160.5 40.2 43.1 18.4 26.8 104.3 51.1 28.9 10.5 6.7 212.4 154.9 66.4 57.5 503.8 211.2 31.4 35.5 46.3 30.7 49.6 243.0 99.8 470.7 84.7 54.3 386.0 147.8 129.7 56.5 52.0 387.8 45.2 34.5 342.6 41.0 301.6 159.8 34.4 33.8 91.6 656.4 99.5 38.3 155.4 72.8 401.5 237.8
3,847.0 3,174.8
523.3 3,323.7 2,651.5
9.3 162.0 34.0 25.6 102.4 352.0 157.4 21.2 35.9 194.6 62.8 18.6 31.4 814.3 197.4
97.3 58.9 41.2 436.7 79.2 97.9 20.5 180.2 20.1 160.1 40.2 43.0 18.4 26.6 103.9 50.9 28.9 10.5 6.6 211.1 154.0 66.1 57.1 501.6 209.5 31.1 35.3 46.3 30.1 49.5 242.6 99.6 476.4 85.8 54.2 390.6 148.8 129.9 56.1 55.8 385.8 43.5 32.5 342.3 40.7 301.6 158.4 34.4 33.8 90.2 672.2 99.0 38.4 159.8 78.1 413.4 251.9
3,836.2 3,150.5
519.4 3,316.8 2,631.1
9.2 159.3 33.1 25.4 100.8 350.9 156.3 21.2 36.1 194.6 63.0 18.8 31.6 809.3 195.7
95.9 59.0 40.8 433.8 79.0 98.8 20.1 179.8 20.1 159.7 40.0 42.6 18.5 26.5 103.5 50.6 28.7 10.5 6.5 209.1 152.7 65.5 56.4 498.4 206.8 31.0 34.8 45.6 29.8 49.2 242.4 99.9 474.8 88.9 56.5 385.9 144.5 129.7 56.1 55.6 379.0 40.9 30.3 338.1 40.0 298.1 157.0 33.8 32.7 90.5 685.7 99.2 38.5 165.2 83.6 421.3 260.5
3,844.9 3,150.6
512.0 3,332.9 2,638.6
9.1 160.6 32.9 25.5 102.2 342.3 151.2 20.4 35.6 191.1 62.9 18.4 31.6 808.9 193.6
94.4 58.8 40.4 435.5 79.6 96.6 20.7 179.8 20.1 159.7 39.8 42.6 18.3 26.6 103.4 50.6 28.7 10.6 6.5 205.2 149.3 65.3 55.9 505.0 209.9 32.1 35.2 46.2 30.1 49.2 245.9 104.0 479.2 93.8 60.4 385.4 143.1 129.8 55.5 57.0 379.4 41.7 28.5 337.7 38.7 299.0 157.5 33.9 33.0 90.6 694.3 100.5 39.0 168.4 89.7 425.4 264.5
3,854.6 3,160.1
511.0 3,343.6 2,649.1
9.1 160.4 33.7 25.4 101.3 341.5 149.5 20.1 35.4 192.0 63.0 18.8 31.6 818.5 193.2 94.1 58.3 40.8 444.8 80.8 101.3 20.3 180.5 20.1 160.4 39.7 42.2 18.8 26.7 103.0 50.6 28.7 10.8
6.5 204.4 148.5
65.0 55.9 506.3 208.1 32.0 34.9 45.6 30.6 48.9 249.3 105.0 480.6 95.3 61.6 385.3 143.5 129.7 55.3 56.8 378.7 39.5 27.2 339.2 38.7 300.5 157.6 34.1 33.2 90.3 694.5 100.3 39.3 167.1 90.0 427.1 265.7
3,835.0 3,145.7
504.6 3,330.4 2,641.1
9.0 156.1
33.2 25.0 97.9 339.5 148.3 20.2 35.1 191.2 62.8 18.5 31.6 823.1 192.0 93.9 57.8 40.3 448.6 80.8 101.9 20.2 182.5 20.1 162.4 39.8 42.1 20.8 26.6 102.6 50.5 28.7 10.9 6.5 204.9 149.1 65.6 55.8 505.1 208.2 32.4 34.3 45.9 30.4 49.1 247.8 103.4 477.5 91.2 59.1 386.3 143.1 130.6 55.1 57.5 372.3 36.9 26.3 335.4 37.8 297.6 155.6 33.4 32.8 89.4 689.3 99.9 39.5 163.3 82.7 426.1 265.4
3,876.6 3,187.2
532.8 3,343.8 2,654.3
9.3 166.5
35.5 25.4 105.6 357.0 159.8 22.3 36.0 197.2 63.4 19.1 31.9 818.2 198.6 98.4 59.1 41.1 438.3 79.4 98.5 20.4 181.3 20.3 161.0 39.4 43.0 19.0 26.8 104.8 50.9 29.0 10.5 6.7 210.4 153.2 65.9 57.2 506.7 214.7 34.1 35.8 47.0 31.0 51.1 240.9 99.4 475.6 88.6 56.0 387.0 145.6 130.2 55.6 55.6 380.9 40.9 29.9 340.0 39.8 300.2 157.8 34.2 33.3 90.4 689.5 100.6 38.7 163.7 82.0 425.1 263.4
Note: These preliminary estimates were prepared in cooperation with the U.S. Department of Labor, Bureau of Labor Statistics, based upon monthly reports submitted by selected
employers throughout Georgia. The estimates include all full- and part-time wage and salary workers who were employed during or received pay for any part of the pay period that includes the twelfth of the month. Proprietors, domestic workers, self-employed persons, unpaid family workers and personnel of the armed forces are excluded. Estimates based on 2009 benchmark.
Source: Georgia Department of Labor, Workforce Information & Analysis
1
GEORGIA Nonagricultural Employment (000s)
2008 Final Series
Industry
Annual Jan Feb Mar Apr M ay Jun Jul Aug Sep Oct Nov Dec Average
Total Nonfarm Total Private Goods Producing Service-Providing Private Service-Providing Mining and Logging Construction Construction of Buildings Heavy and Civil Engineering Construction Specialty Trade Contractors Manufacturing Durable Goods Computer, Electrical Equip and Appliance Mfg
Transportation Equipment Manufacturing Non-Durable Goods Food Manufacturing Textile Mills Textile Product Mills Trade, Transportation and Utilities Wholesale Trade Merchant Wholesalers, Durable Goods Merchant Wholesalers, Non-durable Goods Wholesale Electronic Markets and Agents and Brokers Retail Trade Food and Beverage Stores General Merchandise Stores Miscellaneous Store Retailers Transportation, Warehousing, and Utilities Utilities Transportation and Warehousing Air Transportation Truck Transportation Couriers and Messengers Warehousing and Storage Information Telecommunications Wired Telecommunications Carriers Wireless Telecommunications Carriers Internet Service Providers, Search Portals, and DP Financial Activities Finance and Insurance Insurance Carriers and Related Activities Real Estate, Rental and Leasing Professional and Business Services Professional, Scientific, and Technical Services Accounting, Tax Preparation and Bookkeeping Architectural, Engineering and Related Services Computer Systems Design and Related Services Management and Technical Consulting Services Management of Companies and Enterprises Admin and Support, Waste Mngmnt and Remediation Employment Services Educational and Health Services Educational Services Colleges, Universities, and Professional Schools Health Care and Social Assistance Ambulatory Health Care Services Hospitals Nursing and Residential Care Facilities Social Assistance Leisure and Hospitality Arts, Entertainment, and Recreation Amusement, Gambling, and Recreation Accommodation and Food Services Accommodation Food Services and Drinking Places Other Services Repair and Maintenance Personal and Laundry Services Religious, Grantmaking, Civic, Professional and Similar Government Federal Government Department of Defense State Government State Government Education Local Government Local Government Education
4,110.8 3,426.5
643.8 3,467.0 2,782.7
10.8 211.1 47.6 32.0 131.5 421.9 196.9 27.8 42.3 225.0 67.6 25.2 36.9 883.5 218.0 112.4 62.9 42.7 474.5 81.7 101.2 22.9 191.0 20.7 170.3 39.1 48.7 20.4 28.2 108.7 51.9 29.6 10.8
7.4 226.3 163.9 67.7 62.4 559.0 230.0 37.3 41.4 48.5 33.2 54.9 274.1 129.4 462.4 82.9 50.7 379.5 142.5 126.2 54.4 56.4 383.3 37.2 27.3 346.1 41.8 304.3 159.5 36.6 34.3 88.6 684.3 96.7 36.5 160.5 74.3 427.1 266.6
4,130.7 3,436.4
642.3 3,488.4 2,794.1
10.6 211.4 47.2 31.8 132.4 420.3 196.2 27.5 42.0 224.1 67.1 24.8 36.8 879.3 218.8 112.8 62.9 43.1 469.2 81.5 99.8 22.8 191.3 20.7 170.6 39.6 48.5 20.3 28.3 109.6 52.1 29.8 10.8
7.5 227.1 164.4 68.0 62.7 562.0 233.4 38.6 41.6 49.2 33.6 54.8 273.8 130.0 468.0 85.1 51.9 382.9 143.8 127.1 54.6 57.4 387.2 37.3 27.6 349.9 42.4 307.5 160.9 37.1 34.9 88.9 694.3 98.0 36.6 164.9 78.6 431.4 269.6
4,131.8 3,435.9
638.7 3,493.1 2,797.2
10.5 209.9
46.6 31.5 131.8 418.3 195.6 27.5 42.0 222.7 66.9 24.4 36.5 880.2 218.2 112.4 62.5 43.3 470.3 81.6 101.2 22.3 191.7 20.7 171.0 40.0 48.4 20.3 28.6 109.7 52.3 29.9 10.7 7.6 226.1 163.3 67.6 62.8 559.7 230.3 37.2 41.5 48.7 33.1 54.5 274.9 131.0 467.3 85.0 51.9 382.3 142.4 127.6 54.9 57.4 393.4 39.0 28.9 354.4 43.0 311.4 160.8 36.8 34.8 89.2 695.9 98.1 36.7 165.6 78.8 432.2 270.7
4,137.5 3,443.2
634.4 3,503.1 2,808.8
10.5 208.7
45.7 31.4 131.6 415.2 193.4 27.0 41.7 221.8 67.2 23.6 36.6 876.6 219.0 112.0 62.9 44.1 466.7 80.7 99.6 22.5 190.9 20.5 170.4 39.8 48.4 19.9 28.7 109.5 52.9 29.9 10.6
7.5 226.3 163.3 67.8 63.0 565.8 230.5 37.2 41.3 49.0 32.8 54.4 280.9 134.0 468.9 85.2 52.6 383.7 144.2 127.2 54.5 57.8 400.2 41.6 30.4 358.6 43.6 315.0 161.5 37.0 35.2 89.3 694.3 98.7 36.9 165.4 78.9 430.2 267.9
4,148.4 3,453.6
633.7 3,514.7 2,819.9
10.4 209.5
45.9 31.3 132.3 413.8 192.2 26.9 41.6 221.6 67.6 23.5 36.4 877.7 219.0 111.8 63.0 44.2 467.0 80.0 99.0 22.6 191.7 20.5 171.2 39.6 48.8 20.2 28.8 110.0 52.9 30.0 10.7 7.6 226.6 163.3 68.1 63.3 565.1 226.3 32.0 41.7 49.0 32.8 54.8 284.0 135.4 470.6 85.0 52.5 385.6 145.4 127.9 54.3 58.0 407.2 44.4 33.3 362.8 44.4 318.4 162.7 37.1 35.5 90.1 694.8 98.2 37.1 164.0 77.4 432.6 268.9
4,120.4 3,437.8
631.0 3,489.4 2,806.8
10.3 208.1
46.1 30.8 131.2 412.6 191.6 26.9 41.6 221.0 67.5 23.3 36.5 874.0 218.0 111.4 62.6 44.0 464.0 79.6 99.4 22.1 192.0 20.5 171.5 39.8 48.7 20.2 28.8 110.4 52.8 29.9 10.7
7.6 225.5 162.7 68.0 62.8 565.9 225.6 31.9 41.6 48.7 32.6 54.9 285.4 136.8 462.7 82.4 51.3 380.3 143.0 127.9 54.9 54.5 405.1 46.8 35.6 358.3 43.9 314.4 163.2 36.9 35.0 91.3 682.6 98.4 37.6 158.0 71.1 426.2 259.9
4,079.7 3,418.7
626.0 3,453.7 2,792.7
10.3 206.9
45.3 30.2 131.4 408.8 190.3 26.7 41.6 218.5 67.1 22.7 36.1 873.1 217.7 110.8 62.8 44.1 464.0 80.2 99.8 21.9 191.4 20.5 170.9 39.3 49.2 19.9 29.1 109.3 52.5 29.7 10.7 7.5 225.6 163.3 68.0 62.3 556.2 225.5 30.9 41.5 48.7 33.3 55.6 275.1 127.9 463.6 80.7 50.7 382.9 145.1 128.9 54.8 54.1 402.4 46.4 35.6 356.0 44.8 311.2 162.5 36.6 35.0 90.9 661.0 98.3 37.4 157.0 70.3 405.7 237.4
4,107.4 3,422.2
623.5 3,483.9 2,798.7
10.3 204.5
44.7 29.8 130.0 408.7 189.5 26.5 41.2 219.2 67.7 22.8 36.7 872.3 217.9 110.7 62.4 44.8 463.5 80.3 100.0 22.1 190.9 20.4 170.5 38.7 49.0 20.2 29.3 109.1 52.4 29.4 10.8 7.3 224.5 162.7 67.8 61.8 558.1 225.3 31.1 41.3 48.9 33.2 55.5 277.3 129.3 470.4 82.5 50.5 387.9 146.2 129.2 55.1 57.4 402.3 44.0 33.5 358.3 44.0 314.3 162.0 36.5 35.1 90.4 685.2 97.8 37.3 163.1 76.3 424.3 258.1
4,084.3 3,394.5
617.0 3,467.3 2,777.5
10.3 201.2
43.9 29.4 127.9 405.5 187.1 26.3 40.9 218.4 67.9 22.5 36.6 867.6 217.0 110.1 62.2 44.7 459.9 80.6 100.0 21.6 190.7 20.4 170.3 38.1 48.7 20.1 29.5 108.4 51.9 29.1 10.7
7.4 222.0 160.8 67.3 61.2 553.3 223.4 31.4 40.8 48.6 32.8 55.5 274.4 127.8 470.4 85.2 52.1 385.2 143.8 129.2 54.9 57.3 395.4 42.4 31.7 353.0 42.9 310.1 160.4 36.0 34.3 90.1 689.8 97.9 37.5 165.2 79.3 426.7 262.5
4,074.6 3,374.7
608.9 3,465.7 2,765.8
10.3 197.4
43.6 28.5 125.3 401.2 185.4 26.2 40.3 215.8 67.2 22.1 35.1 864.4 216.2 109.5 62.2 44.5 459.0 80.6 100.3 22.2 189.2 20.5 168.7 37.4 48.5 19.7 29.4 107.3 51.9 29.2 10.7 7.3 222.5 160.7 67.8 61.8 550.1 226.4 32.9 40.3 49.3 32.9 54.8 268.9 122.2 475.3 86.5 52.9 388.8 146.5 128.5 55.8 58.0 386.6 40.5 30.0 346.1 42.7 303.4 159.6 35.7 34.2 89.7 699.9 99.0 37.8 165.8 80.0 435.1 270.1
4,061.7 3,357.0
596.9 3,464.8 2,760.1
10.2 193.0
42.6 27.7 122.7 393.7 180.8 26.0 39.5 212.9 67.5 21.3 33.9 868.6 213.8 107.8 61.7 44.3 466.0 81.7 104.0 21.9 188.8 20.5 168.3 37.3 47.6 20.2 29.1 107.8 52.0 29.3 10.8
7.1 219.8 158.5 67.8 61.3 544.8 227.6 34.7 40.0 49.0 33.1 54.6 262.6 117.3 476.5 85.9 52.5 390.6 147.3 129.3 56.1 57.9 383.3 38.8 28.2 344.5 42.4 302.1 159.3 35.5 34.1 89.7 704.7 98.9 38.0 165.3 80.6 440.5 272.0
4,039.3 3,337.9
586.9 3,452.4 2,751.0
10.1 187.7 41.3 26.8 119.6 389.1 178.1 26.0 38.7 211.0 66.8 21.1 33.4 869.6 211.6 106.7 61.2 43.7 467.5 81.6 105.3 21.7 190.5 20.6 169.9 37.6 46.7 22.8 28.9 107.8 51.7 29.1 10.7
7.1 219.0 158.2
67.7 60.8 540.9 227.7 35.1 39.7 48.9 33.3 54.7 258.5 115.2 475.5 85.7 52.5 389.8 146.4 130.0 56.1 57.3 379.9 37.8 27.4 342.1 41.1 301.0 158.3 34.8 34.1 89.4 701.4 98.7 38.1 164.1 79.8 438.6 271.6
4,102.2 3,411.5
623.6 3,478.6 2,787.9
10.4 204.1 45.0 30.1 129.0 409.1 189.8 26.8 41.1 219.3 67.3 23.1 36.0 873.9 217.1 110.7 62.4 44.0 466.0 80.8 100.8 22.2 190.8 20.5 170.3 38.9 48.4 20.4 28.9 109.0 52.3 29.6 10.7
7.4 224.3 162.1
67.8 62.2 556.7 227.7 34.2 41.1 48.9 33.1 54.9 274.2 128.0 469.3 84.3 51.8 385.0 144.7 128.3 55.0 57.0 393.9 41.4 30.8 352.5 43.1 309.4 160.9 36.4 34.7 89.8 690.7 98.2 37.3 163.2 77.1 429.2 264.6
Note: These preliminary estimates were prepared in cooperation with the U.S. Department of Labor, Bureau of Labor Statistics, based upon monthly reports submitted by selected
employers throughout Georgia. The estimates include all full- and part-time wage and salary workers who were employed during or received pay for any part of the pay period that includes the twelfth of the month. Proprietors, domestic workers, self-employed persons, unpaid family workers and personnel of the armed forces are excluded. Estimates based on 2009 benchmark.
Source: Georgia Department of Labor, Workforce Information & Analysis
2
ATLANTA MSA Nonagricultural Employment (000s)
2009 Preliminary Series
Industry
Annual Jan Feb Mar Apr M ay Jun Jul Aug Sep Oct Nov Dec Average
Total Nonfarm Total Private Goods Producing Service-Providing Private Service-Providing Mining and Logging Construction Construction of Buildings Specialty Trade Contractors Manufacturing Durable Goods
Transportation Equipment Manufacturing Non-Durable Goods Food Manufacturing Trade, Transportation and Utilities Wholesale Trade Merchant Wholesalers, Durable Goods Merchant Wholesalers, Non-durable Goods Wholesale Electronic Markets and Agents and Brokers Retail Trade Food and Beverage Stores General Merchandise Stores Miscellaneous Store Retailers Transportation, Warehousing, and Utilities Utilities Transportation and Warehousing Air Transportation Truck Transportation Couriers and Messengers Information Telecommunications Wired Telecommunications Carriers Wireless Telecommunications Carriers Internet Service Providers, Search Portals, and DP Financial Activities Finance and Insurance Insurance Carriers and Related Activities Real Estate, Rental and Leasing Professional and Business Services Professional, Scientific, and Technical Services Accounting, Tax Preparation and Bookkeeping Architectural, Engineering and Related Services Computer Systems Design and Related Services Management and Technical Consulting Services Management of Companies and Enterprises Admin and Support, Waste Mngmnt and Remediation Employment Services Educational and Health Services Educational Services Health Care and Social Assistance Ambulatory Health Care Services Hospitals Social Assistance Leisure and Hospitality Arts, Entertainment, and Recreation Accommodation and Food Services Accommodation Food Services and Drinking Places Other Services Repair and Maintenance Personal and Laundry Services Government Federal Government State Government Local Government
2,329.9 1,992.3
266.9 2,063.0 1,725.4
1.3 110.5 23.8 71.6 155.1 78.3 13.6 76.8 23.7 529.7 152.3 78.8 39.7 33.8 251.9 47.9 52.3 13.4 125.5 11.4 114.1 36.8 26.4 16.1 82.3 37.0 24.0
8.2 6.4 148.4 106.0 45.0 42.4 381.0 177.7 25.6 28.9 40.8 29.4 40.9 162.4 67.3 268.0 58.0 210.0 81.3 71.1 33.7 217.4 23.7 193.7 22.7 171.0 98.6 19.0 21.9 337.6 47.1 70.0 220.5
2,324.4 1,983.4
263.7 2,060.7 1,719.7
1.4 109.3 23.3 71.0 153.0 76.9 13.3 76.1 23.7 523.8 150.7 77.7 39.6 33.4 248.6 47.7 51.5 13.2 124.5
11.4 113.1 37.1 26.1 15.4 82.2 37.0 23.9
8.3 6.4 147.7 105.8 45.0 41.9 378.4 177.1 26.5 28.5 40.6 29.0 40.8 160.5 66.1 269.7 59.0 210.7 81.7 70.9 34.0 219.0 24.2 194.8 22.1 172.7 98.9 19.3 21.9 341.0 48.2 71.0 221.8
2,314.3 1,972.4
259.5 2,054.8 1,712.9
1.3 106.9 22.7 69.4 151.3 76.0 13.5 75.3 23.6 520.2 148.9 76.6 39.2 33.1 247.1 47.2 51.9 13.1 124.2
11.4 112.8 37.5 25.9 15.1 81.7 36.8 23.7
8.3 6.3 146.4 104.8 44.5 41.6 375.4 174.3 25.8 28.0 40.0 28.4 40.7 160.4 65.7 268.7 59.0 209.7 81.0 70.7 33.7 222.3 25.1 197.2 22.0 175.2 98.2 19.1 21.8 341.9 48.8 71.2 221.9
2,310.9 1,969.8
255.2 2,055.7 1,714.6
1.3 104.9 22.3 67.6 149.0 74.6 13.3 74.4 23.1 516.1 147.7 75.6 39.2 32.9 246.1 47.0 51.5 13.2 122.3
11.3 111.0 37.4 25.3 14.7 81.4 37.0 23.8
8.4 6.6 147.0 105.3 44.9 41.7 374.4 173.0 26.0 27.2 40.4 27.7 39.8 161.6 66.0 269.4 59.0 210.4 81.5 71.0 33.7 226.3 27.3 199.0 22.2 176.8 100.0 19.3 22.4 341.1 50.9 70.7 219.5
2,309.3 1,972.2
253.2 2,056.1 1,719.0
1.3 104.2 21.7 67.3 147.7 73.6 12.9 74.1 23.1 516.7 146.6 74.5 39.1 33.0 247.3 47.1 51.7 13.3 122.8
11.3 111.5 37.9 25.2 14.8 81.2 36.9 23.7
8.4 6.8 147.2 105.3 45.0 41.9 373.0 169.4 23.0 26.9 40.2 27.6 39.8 163.8 66.5 270.7 58.7 212.0 82.0 71.7 33.9 229.5 29.2 200.3 22.1 178.2 100.7 19.4 22.7 337.1 48.7 68.9 219.5
2,291.6 1,964.3
250.1 2,041.5 1,714.2
1.3 102.6 21.2 66.2 146.2 72.4 12.7 73.8 23.3 515.3 145.2 73.9 38.9 32.4 247.1 47.0 52.1 13.2 123.0
11.3 111.7 38.1 25.3 14.8 80.9 37.0 23.9
8.3 6.4 147.0 105.4 44.9 41.6 374.2 169.2 23.6 26.7 39.8 27.5 39.7 165.3 67.8 265.7 57.1 208.6 81.5 71.0 31.6 230.2 30.9 199.3 22.0 177.3 100.9 19.3 22.4 327.3 47.0 66.0 214.3
2,264.5 1,951.2
244.0 2,020.5 1,707.2
1.3 99.7 20.2 64.3 143.0 69.9 12.4 73.1 23.2 513.9 145.1 73.4 39.1 32.6 245.8 47.0 52.0 13.4 123.0 10.9 112.1 38.9 25.3 14.6 80.2 37.0 23.6 8.5 6.3 146.3 104.9 45.0 41.4 372.3 165.8 22.2 26.6 38.5 27.2 37.2 169.3 70.4 264.3 56.6 207.7 81.9 69.9 31.2 228.3 30.5 197.8 22.0 175.8 101.9 19.5 22.7 313.3 47.1 62.9 203.3
2,268.3 1,946.7
242.1 2,026.2 1,704.6
1.3 97.8 20.0 62.7 143.0 70.0 12.8 73.0 23.3 514.2 144.6 72.8 39.0 32.8 246.7 47.0 51.9 13.3 122.9 11.0 111.9 38.9 25.3 14.5 79.9 36.9 23.5 8.5 6.2 145.4 104.4 44.7 41.0 368.5 164.4 22.0 26.4 38.5 26.7 37.0 167.1 69.0 268.0 57.2 210.8 82.6 70.1 33.8 227.2 29.3 197.9 22.0 175.9 101.4 19.4 22.7 321.6 46.7 65.4 209.5
2,262.4 1,932.3
240.3 2,022.1 1,692.0
1.3 96.5 19.6 61.8 142.5 69.6 13.0 72.9 23.4 511.6 143.7 71.9 39.4 32.4 245.0 47.1 52.2 13.1 122.9 11.0 111.9 38.7 25.1 14.6 79.4 36.7 23.4 8.6 6.1 144.1 103.5 44.3 40.6 365.2 162.1 21.9 26.1 37.9 26.3 36.8 166.3 68.4 267.8 58.8 209.0 80.7 70.2 33.7 223.7 27.6 196.1 21.9 174.2 100.2 19.1 22.0 330.1 46.8 68.4 214.9
2,266.8 1,931.3
237.8 2,029.0 1,693.5
1.3 96.5 19.5 61.7 140.0 68.1 12.8 71.9 23.3 510.5 140.4 70.7 38.6 31.1 247.6 47.4 52.0 13.2 122.5 11.0 111.5 38.5 24.9 14.5 79.3 36.7 23.2 8.6 6.1 140.3 100.3 44.0 40.0 370.6 163.9 22.5 26.5 37.8 26.3 36.9 169.8 70.7 269.6 60.0 209.6 81.0 70.2 34.1 221.8 26.6 195.2 21.6 173.6 101.4 18.9 22.1 335.5 47.4 71.3 216.8
2,276.3 1,941.6
237.3 2,039.0 1,704.3
1.3 96.8 19.4 62.1 139.2 66.6 12.9 72.6 23.4 519.7 141.0 70.7 38.6 31.7 255.9 48.2 55.0 13.3 122.8 11.0 111.8 38.5 24.8 14.8 78.7 36.7 23.2 8.8 6.1 139.7 99.9 44.1 39.8 372.3 163.3 22.5 26.1 36.9 26.7 37.2 171.8 71.7 270.5 60.5 210.0 81.7 70.2 34.1 221.7 25.3 196.4 21.6 174.8 101.7 18.9 22.0 334.7 46.8 69.9 218.0
2,264.8 1,934.6
235.2 2,029.6 1,699.4
1.3 94.7 19.4 59.8 139.2 66.2 12.9 73.0 23.3 523.3 140.8 70.9 38.6 31.3 257.3 48.3 55.1 13.5 125.2 10.9 114.3 38.5 24.7 16.3 78.8 36.7 23.1 8.9 6.1 141.1 101.0 44.6 40.1 368.0 161.6 22.7 25.6 36.9 26.7 37.4 169.0 70.4 269.2 58.7 210.5 81.0 70.7 34.0 218.5 24.4 194.1 21.2 172.9 100.5 18.7 22.1 330.2 46.2 66.3 217.7
2,290.3 1,957.7
248.8 2,041.5 1,708.9
1.3 101.7
21.1 65.5 145.8 71.9 13.0 73.9 23.4 517.9 145.6 74.0 39.1 32.5 248.9 47.4 52.4 13.3 123.5 11.2 112.3 38.1 25.4 15.0 80.5 36.9 23.6 8.5 6.3 145.1 103.9 44.7 41.2 372.8 168.5 23.7 27.0 39.0 27.5 38.7 165.6 68.3 268.5 58.6 209.9 81.5 70.6 33.5 223.8 27.0 196.8 22.0 174.9 100.4 19.2 22.2 332.6 47.6 68.5 216.5
Note: These preliminary estimates were prepared in cooperation with the U.S. Department of Labor, Bureau of Labor Statistics, based upon monthly reports submitted by selected
employers in the Atlanta Metropolitan Statistical Area, which includes Barrow, Bartow, Butts, Carroll, Cherokee, Clayton, Cobb, Coweta, Dawson, DeKalb, Douglas, Fayette, Forsyth, Fulton, Gwinnett, Haralson, Heard, Henry, Jasper, Lamer, Meriwether, Newton, Paulding, Pickens, Pike, Rockdale, Spalding and Walton counties. The estimates include all full- and part-time wage and salary workers who were employed during or received pay for any part of the pay period that includes the twelfth of the month. Proprietors, domestic workers, self-employed persons, unpaid family workers and personnel of the armed forces are excluded. Estimates based on 2009 benchmark.
Source: Georgia Department of Labor, Workforce Information & Analysis
3
ATLANTA MSA Nonagricultural Employment (000s)
2008 Final Series
Industry
Annual Jan Feb Mar Apr M ay Jun Jul Aug Sep Oct Nov Dec Average
Total Nonfarm Total Private Goods Producing Service-Providing Private Service-Providing Mining and Logging Construction Construction of Buildings Specialty Trade Contractors Manufacturing Durable Goods
Transportation Equipment Manufacturing Non-Durable Goods Food Manufacturing Trade, Transportation and Utilities Wholesale Trade Merchant Wholesalers, Durable Goods Merchant Wholesalers, Non-durable Goods Wholesale Electronic Markets and Agents and Brokers Retail Trade Food and Beverage Stores General Merchandise Stores Miscellaneous Store Retailers Transportation, Warehousing, and Utilities Utilities Transportation and Warehousing Air Transportation Truck Transportation Couriers and Messengers Information Telecommunications Wired Telecommunications Carriers Wireless Telecommunications Carriers Internet Service Providers, Search Portals, and DP Financial Activities Finance and Insurance Insurance Carriers and Related Activities Real Estate, Rental and Leasing Professional and Business Services Professional, Scientific, and Technical Services Accounting, Tax Preparation and Bookkeeping Architectural, Engineering and Related Services Computer Systems Design and Related Services Management and Technical Consulting Services Management of Companies and Enterprises Admin and Support, Waste Mngmnt and Remediation Employment Services Educational and Health Services Educational Services Health Care and Social Assistance Ambulatory Health Care Services Hospitals Social Assistance Leisure and Hospitality Arts, Entertainment, and Recreation Accommodation and Food Services Accommodation Food Services and Drinking Places Other Services Repair and Maintenance Personal and Laundry Services Government Federal Government State Government Local Government
2,432.5 2,102.1
306.9 2,125.6 1,795.2
1.8 132.7 29.9 83.5 172.4 89.6 15.9 82.8 24.5 560.2 159.7 84.1 41.7 33.9 271.6 49.5 54.0 14.9 128.9
11.6 117.3 37.9 29.2 16.0 83.2 37.1 23.7
8.9 7.0 157.3 112.2 46.0 45.1 409.5 178.1 24.9 31.4 39.3 28.8 42.1 189.3 88.1 259.9 55.7 204.2 78.6 67.9 33.8 227.8 24.6 203.2 23.6 179.6 97.3 21.3 23.1 330.4 46.1 66.7 217.6
2,444.1 2,108.4
307.2 2,136.9 1,801.2
1.8 133.3 29.7 84.5 172.1 89.0 15.9 83.1 24.7 557.9 160.2 84.4 41.7 34.1 268.4 49.4 53.3 14.7 129.3
11.5 117.8 38.4 29.0 15.9 83.7 37.3 23.9
8.9 7.1 157.8 112.5 46.1 45.3 410.2 180.7 25.8 31.5 40.0 29.1 41.9 187.6 87.6 263.5 57.0 206.5 79.5 68.6 34.5 229.8 24.5 205.3 23.9 181.4 98.3 21.6 23.6 335.7 47.3 68.4 220.0
2,445.6 2,108.2
305.7 2,139.9 1,802.5
1.8 132.2 29.2 84.0 171.7 88.7 15.9 83.0 24.8 558.1 159.9 84.2 41.5 34.2 268.7 49.2 53.7 14.5 129.5
11.5 118.0 38.8 29.0 15.9 84.0 37.5 24.0
8.9 7.1 157.3 111.9 46.2 45.4 407.9 178.8 24.9 31.6 39.6 28.6 41.9 187.2 87.6 263.6 57.0 206.6 79.0 69.0 34.5 233.4 25.7 207.7 24.1 183.6 98.2 21.6 23.4 337.4 47.6 68.8 221.0
2,445.8 2,109.1
302.3 2,143.5 1,806.8
1.7 130.4 28.3 83.2 170.2 87.5 15.7 82.7 24.8 554.5 159.6 83.4 41.7 34.5 265.7 48.6 52.8 14.4 129.2
11.3 117.9 38.5 28.9 15.9 84.0 38.1 24.1
8.8 7.0 157.0 111.6 45.9 45.4 412.4 178.8 25.1 30.9 39.9 28.9 41.3 192.3 90.1 264.5 57.1 207.4 79.6 69.0 34.7 236.3 27.7 208.6 24.2 184.4 98.1 21.5 23.4 336.7 48.0 68.9 219.8
2,453.3 2,117.3
302.1 2,151.2 1,815.2
1.6 130.6 28.5 83.4 169.9 87.1 15.6 82.8 25.0 555.7 159.7 83.3 41.7 34.7 266.2 47.8 52.6 14.5 129.8
11.3 118.5 38.3 29.1 16.2 84.5 38.2 24.1
8.9 7.1 157.0 111.5 46.2 45.5 411.5 176.7 22.1 31.2 40.0 28.9 41.6 193.2 89.8 265.9 57.1 208.8 80.0 69.9 34.9 241.4 29.6 211.8 24.4 187.4 99.2 21.7 23.8 336.0 47.4 68.1 220.5
2,437.9 2,414.2 2,109.3 2,097.4
301.1 298.2 2,136.8 2,116.0 1,808.2 1,799.2
1.6 1.5 130.0 128.9 28.7 28.0 82.9 83.1 169.5 167.8 87.3 86.6 15.7 15.3 82.2 81.2 24.8 24.7 553.6 553.2 159.1 159.4 83.0 82.8 41.6 41.9 34.5 34.7 264.8 264.7 47.6 48.0 52.8 53.0 14.3 14.2 129.7 129.1
11.1 11.2 118.6 117.9 38.5 38.0 29.0 29.0 16.1 15.8 84.7 83.9 38.1 37.7 24.0 23.8
8.9 8.8 7.1 7.1 156.3 156.3 111.0 111.5 46.1 46.2 45.3 44.8 412.4 407.3 177.2 177.3 22.2 21.6 31.5 31.4 40.0 40.3 28.8 29.5 41.7 42.6 193.5 187.4 90.3 85.7 260.9 261.4 55.6 54.8 205.3 206.6 78.8 80.4 69.6 69.5 32.7 32.5 241.2 238.6 31.7 31.4 209.5 207.2 24.4 24.7 185.1 182.5 99.1 98.5 21.5 21.0 23.4 23.4 328.6 316.8 47.3 46.6 65.2 64.4 216.1 205.8
2,427.8 2,097.9
296.0 2,131.8 1,801.9
1.5 127.5 27.5 82.4 167.0 86.1 15.6 80.9 25.0 552.0 159.2 82.6 41.4 35.2 263.8 47.8 52.9 14.3 129.0
11.2 117.8 37.5 29.1 16.1 83.7 37.5 23.6
8.8 6.8 155.3 111.0 46.0 44.3 408.3 177.2 21.7 31.2 40.5 29.5 42.5 188.6 86.2 266.0 55.6 210.4 81.1 70.3 34.7 238.1 29.4 208.7 24.2 184.5 98.5 20.9 23.6 329.9 46.1 67.8 216.0
2,413.1 2,082.2
292.8 2,120.3 1,789.4
1.5 125.7 27.0 81.3 165.6 85.2 15.6 80.4 25.0 549.6 158.6 82.3 41.1 35.2 262.4 48.2 53.1 14.0 128.6
11.2 117.4 36.8 29.0 16.0 83.1 37.1 23.4
8.8 7.0 153.5 109.5 45.8 44.0 405.0 175.8 22.2 30.9 40.1 29.1 42.5 186.7 85.1 266.5 57.2 209.3 80.0 70.5 34.6 234.3 28.5 205.8 23.9 181.9 97.4 20.6 23.0 330.9 46.1 69.4 215.4
2,409.1 2,071.5
289.2 2,119.9 1,782.3
1.5 123.3 26.9 79.9 164.4 84.1 14.6 80.3 24.7 546.8 157.6 81.8 40.9 34.9 261.6 48.2 53.4 14.4 127.6
11.3 116.3 36.2 29.1 15.6 82.3 37.2 23.4
8.8 6.8 154.0 109.1 46.0 44.9 405.1 178.6 23.2 30.5 41.2 29.2 41.7 184.8 83.2 268.6 58.0 210.6 80.9 70.1 35.1 228.8 27.1 201.7 23.9 177.8 96.7 20.3 22.9 337.6 47.0 69.5 221.1
2,402.7 2,061.9
284.3 2,118.4 1,777.6
1.5 120.2 26.1 78.1 162.6 82.7 14.5 79.9 24.8 549.8 156.2 80.7 40.6 34.9 266.3 49.1 55.6 14.1 127.3
11.2 116.1 36.2 28.6 15.9 82.5 37.3 23.5
8.8 6.7 152.4 108.0 46.0 44.4 401.0 179.5 24.4 30.2 41.0 29.5 41.6 179.9 79.6 269.6 57.8 211.8 81.3 70.7 35.0 226.1 25.4 200.7 23.6 177.1 96.2 19.9 22.7 340.8 46.6 69.3 224.9
2,390.3 2,052.1
278.6 2,111.7 1,773.5
1.5 116.9 25.2 76.0 160.2 81.1 14.1 79.1 24.5 551.4 155.0 80.0 40.5 34.5 267.7 49.1 56.3 14.1 128.7 11.2 117.5 36.4 28.2 17.6 82.4 37.0 23.4
8.7 6.7 151.7 107.6 45.9 44.1 398.4 179.7 24.5 30.0 41.0 29.7 41.7 177.0 78.4 269.9 57.6 212.3 81.2 71.6 34.7 224.2 24.9 199.3 23.0 176.3 95.5 19.4 22.7 338.2 46.3 69.0 222.9
2,426.4 2,093.1
297.0 2,129.3 1,796.1
1.6 127.6
27.9 81.9 167.8 86.3 15.4 81.5 24.8 553.6 158.7 82.7 41.4 34.6 266.0 48.5 53.6 14.4 128.9 11.3 117.6 37.6 28.9 16.1 83.5 37.5 23.7
8.8 7.0 155.5 110.6 46.0 44.9 407.4 178.2 23.6 31.0 40.2 29.1 41.9 187.3 86.0 265.0 56.7 208.3 80.0 69.7 34.3 233.3 27.5 205.8 24.0 181.8 97.8 20.9 23.3 333.3 46.9 68.0 218.4
Note: These preliminary estimates were prepared in cooperation with the U.S. Department of Labor, Bureau of Labor Statistics, based upon monthly reports submitted by selected
employers in the Atlanta Metropolitan Statistical Area, which includes Barrow, Bartow, Butts, Carroll, Cherokee, Clayton, Cobb, Coweta, Dawson, DeKalb, Douglas, Fayette, Forsyth, Fulton, Gwinnett, Haralson, Heard, Henry, Jasper, Lamer, Meriwether, Newton, Paulding, Pickens, Pike, Rockdale, Spalding and Walton counties. The estimates include all full- and part-time wage and salary workers who were employed during or received pay for any part of the pay period that includes the twelfth of the month. Proprietors, domestic workers, self-employed persons, unpaid family workers and personnel of the armed forces are excluded. Estimates based on 2009 benchmark.
Source: Georgia Department of Labor, Workforce Information & Analysis
4
ALBANY MSA Nonagricultural Employment (000s)
Industry Total Nonfarm Total Private Goods Producing Service-Providing Private Service-Providing Manufacturing Trade, Transportation and Utilities Retail Trade Government Federal Government State Government Local Government
2009 Preliminary Series
Annual Jan Feb Mar Apr M ay Jun Jul Aug Sep Oct Nov Dec Average
63.1 62.8 62.8 62.4 62.3 62.0 61.6 61.3 61.2 61.6 61.8 62.0 62.1
49.1 48.8 48.7 48.5 48.3 48.4 48.3 47.8 47.3 47.7 47.9 47.9 48.2
9.3
9.1
9.0
8.9
8.7
8.6 8.4
8.1
7.7
7.6
7.6
7.5
8.4
53.8 53.7 53.8 53.5 53.6 53.4 53.2 53.2 53.5 54.0 54.2 54.5 53.7
39.8 39.7 39.7 39.6 39.6 39.8 39.9 39.7 39.6 40.1 40.3 40.4 39.9
6.4
6.3
6.2
6.1
5.9
5.7 5.6
5.3
5.0
4.9
4.9
4.9
5.6
12.7 12.3 12.4 12.4 12.5 12.5 12.4 12.3 12.2 12.4 12.5 12.9 12.5
7.7
7.4
7.5
7.5
7.5
7.6 7.5
7.5
7.5
7.5
7.7
7.8
7.6
14.0 14.0 14.1 13.9 14.0 13.6 13.3 13.5 13.9 13.9 13.9 14.1 13.9
3.4
3.4
3.4
3.4
3.4
3.4 3.4
3.4
3.4
3.4
3.4
3.5
3.4
2.6
2.9
3.0
2.8
2.9
2.6 2.6
2.7
3.0
3.0
3.0
3.0
2.8
8.0
7.7
7.7
7.7
7.7
7.6 7.3
7.4
7.5
7.5
7.5
7.6
7.6
2008 Final Series
Industry
Annual Jan Feb Mar Apr M ay Jun Jul Aug Sep Oct Nov Dec Average
Total Nonfarm
64.2 64.8 64.7 64.5 64.4 64.7 63.4 63.9 64.0 64.1 63.9 63.9 64.2
Total Private
50.8 51.1 51.0 50.7 50.7 51.0 50.4 50.4 50.2 50.1 50.0 50.0 50.5
Goods Producing
10.4 10.5 10.5 10.1 10.1 10.2 10.2 10.1 10.1
9.9
9.8
9.7 10.1
Service-Providing
53.8 54.3 54.2 54.4 54.3 54.5 53.2 53.8 53.9 54.2 54.1 54.2 54.1
Private Service-Providing
40.4 40.6 40.5 40.6 40.6 40.8 40.2 40.3 40.1 40.2 40.2 40.3 40.4
Manufacturing
6.6
6.6
6.6
6.5
6.5
6.6 6.6
6.6
6.5
6.4
6.5
6.5
6.5
Trade, Transportation and Utilities
13.3 13.3 13.3 13.0 13.0 12.9 13.0 13.0 13.0 13.2 13.1 13.1 13.1
Retail Trade
8.1
8.0
8.1
7.9
7.9
7.8 7.7
7.7
7.6
7.8
7.9
7.9
7.9
Government
13.4 13.7 13.7 13.8 13.7 13.7 13.0 13.5 13.8 14.0 13.9 13.9 13.7
Federal Government
3.1
3.1
3.1
3.1
3.2
3.2 3.2
3.2
3.2
3.3
3.3
3.4
3.2
State Government
2.6
2.9
2.9
3.0
2.8
2.8 2.6
2.7
3.0
3.0
3.0
2.9
2.9
Local Government
7.7
7.7
7.7
7.7
7.7
7.7 7.2
7.6
7.6
7.7
7.6
7.6
7.6
Note: These preliminary estimates were prepared in cooperation with the U.S. Department of Labor, Bureau of Labor Statistics, based upon monthly reports submitted by selected employers in
the Albany Metropolitan Statistical Area, which includes Baker, Dougherty, Lee, Terrell and Worth counties. The estimates include all full- and part-time wage and salary workers who were employed during or received pay for any part of the pay period that includes the twelfth of the month. Proprietors, domestic workers, self-employed persons, unpaid family workers and personnel of the armed forces are excluded. Estimates based on 2009 benchmark.
Source: Georgia Department of Labor, Workforce Information & Analysis
5
ATHENS - CLARKE MSA Nonagricultural Employment (000s)
Industry Total Nonfarm Total Private Goods Producing Service-Providing Private Service-Providing Trade, Transportation and Utilities Retail Trade Professional and Business Services Leisure and Hospitality Government Federal Government State Government Local Government
2009 Preliminary Series
Annual Jan Feb Mar Apr M ay Jun Jul Aug Sep Oct Nov Dec Average
81.0 80.8 80.2 80.4 80.3 80.1 79.5 79.9 80.5 82.6 81.6 81.3 80.7
57.3 56.9 56.3 56.1 56.4 56.1 56.0 56.3 56.4 57.6 56.9 56.9 56.6
11.0 10.7 10.6 10.3 10.3 10.3 10.2 10.2 10.1 10.0 10.0
9.9 10.3
70.0 70.1 69.6 70.1 70.0 69.8 69.3 69.7 70.4 72.6 71.6 71.4 70.4
46.3 46.2 45.7 45.8 46.1 45.8 45.8 46.1 46.3 47.6 46.9 47.0 46.3
13.2 12.8 12.5 12.5 12.7 12.6 13.0 13.2 13.1 13.1 13.2 13.3 12.9
9.3
9.0
8.7
8.8
8.9
8.8 9.3
9.5
9.4
9.4
9.6
9.7
9.2
6.6
6.6
6.6
6.6
6.4
6.6 6.4
6.2
6.4
6.5
6.5
6.9
6.5
7.8
8.0
7.8
8.1
8.2
8.1 7.9
8.2
8.3
8.3
8.3
8.2
8.1
23.7 23.9 23.9 24.3 23.9 24.0 23.5 23.6 24.1 25.0 24.7 24.4 24.1
1.6
1.5
1.5
1.7
1.6
1.6 1.6
1.6
1.5
1.5
1.6
1.5
1.6
13.9 14.3 14.2 14.4 14.1 14.5 14.3 14.0 14.6 15.4 15.0 15.0 14.5
8.2
8.1
8.2
8.2
8.2
7.9 7.6
8.0
8.0
8.1
8.1
7.9
8.0
2008 Final Series
Industry
Annual Jan Feb Mar Apr M ay Jun Jul Aug Sep Oct Nov Dec Average
Total Nonfarm
84.6 85.0 85.5 85.4 85.3 84.2 83.9 84.6 85.0 85.2 84.9 84.6 84.9
Total Private
61.1 61.3 61.7 61.9 61.8 60.9 60.2 60.9 60.8 60.5 60.1 60.0 60.9
Goods Producing
12.4 12.4 12.2 12.3 12.4 12.3 12.2 12.2 12.0 11.9 11.8 11.5 12.1
Service-Providing
72.2 72.6 73.3 73.1 72.9 71.9 71.7 72.4 73.0 73.3 73.1 73.1 72.7
Private Service-Providing
48.7 48.9 49.5 49.6 49.4 48.6 48.0 48.7 48.8 48.6 48.3 48.5 48.8
Trade, Transportation and Utilities
14.1 13.9 13.7 13.6 13.5 13.3 13.4 13.7 13.6 13.5 13.6 13.8 13.6
Retail Trade
9.8
9.6
9.5
9.5
9.4
9.2 9.4
9.6
9.6
9.6
9.7
9.7
9.6
Professional and Business Services
6.8
6.8
6.9
7.0
7.0
6.9 6.7
6.8
6.9
7.1
6.9
7.0
6.9
Leisure and Hospitality
8.7
9.0
8.9
9.0
9.0
8.6 8.3
8.6
8.7
8.6
8.4
8.3
8.7
Government
23.5 23.7 23.8 23.5 23.5 23.3 23.7 23.7 24.2 24.7 24.8 24.6 23.9
Federal Government
1.6
1.6
1.6
1.6
1.6
1.6 1.7
1.7
1.7
1.7
1.7
1.7
1.7
State Government
14.0 14.1 14.2 14.3 14.3 14.2 14.5 14.0 14.4 14.8 14.8 14.6 14.4
Local Government
7.9
8.0
8.0
7.6
7.6
7.5 7.5
8.0
8.1
8.2
8.3
8.3
7.9
Note: These preliminary estimates were prepared in cooperation with the U.S. Department of Labor, Bureau of Labor Statistics, based upon monthly reports submitted by selected employers in the
Athens - Clarke County Metropolitan Statistical Area, which includes Clarke, Madison, Oconee and Oglethorpe counties. The estimates include all full- and part-time wage and salary workers who were employed during or received pay for any part of the pay period that includes the twelfth of the month. Proprietors, domestic workers, self-employed persons, unpaid family workers and personnel of the armed forces are excluded. Estimates based on 2009 benchmark.
Source: Georgia Department of Labor, Workforce Information & Analysis
6
AUGUSTA - RICHMOND MSA Nonagricultural Employment (000s)
Industry Total Nonfarm Total Private Goods Producing Service-Providing Private Service-Providing Mining, Logging, and Construction Manufacturing Trade, Transportation and Utilities Wholesale Trade Retail Trade Transportation,Warehousing, and Utilities Information Financial Activitities Professional and Business Services Educational and Health Services Leisure and Hospitality Other Services Government Federal Government State Government Local Government
2009 Preliminary Series
Jan 209.9 166.2 33.4 176.5 132.8
11.6 21.8 35.3 4.7 24.2 6.4 2.9 7.5 28.3 28.5 20.6 9.7 43.7 7.9 13.4 22.4
Feb 209.7 165.8 33.0 176.7 132.8
11.4 21.6 35.0 4.7 23.9 6.4 2.8 7.5 28.4 28.6 20.9 9.6 43.9 7.9 13.5 22.5
M ar 209.4 165.8 32.7 176.7 133.1
11.2 21.5 34.8 4.6 23.9 6.3 2.8 7.4 28.5 28.7 21.5 9.4 43.6 7.9 13.5 22.2
Apr 212.7 168.5 32.1 180.6 136.4
11.1 21.0 34.8 4.5 23.9 6.4 2.8 7.6 28.5 28.6 24.4 9.7 44.2 8.5 13.5 22.2
M ay 210.4 166.4 31.6 178.8 134.8
11.0 20.6 34.9 4.5 24.0 6.4 2.8 7.6 28.3 28.8 22.6 9.8 44.0 8.5 13.3 22.2
Jun 209.0 165.4 31.6 177.4 133.8
11.1 20.5 34.9 4.5 24.0 6.4 2.9 7.6 28.5 28.2 22.1 9.6 43.6 8.4 13.3 21.9
Jul 205.9 163.8
31.0 174.9 132.8
10.9 20.1 34.9 4.5 24.1 6.3 2.8 7.6 28.5 28.2 21.3 9.5 42.1 8.4 13.3 20.4
Aug 206.9 164.4
31.1 175.8 133.3
10.9 20.2 34.9 4.5 24.1 6.3 2.8 7.6 28.7 28.6 21.2 9.5 42.5 8.4 13.4 20.7
Sep 207.7 164.3 31.0 176.7 133.3 10.9 20.1 34.8
4.5 24.0 6.3 2.8 7.6 29.1 28.5 20.9 9.6 43.4 8.5 13.6 21.3
Oct 209.0 164.9
30.6 178.4 134.3
10.9 19.7 35.8 4.4 25.2 6.2 2.8 7.4 29.4 28.5 20.8 9.6 44.1 8.6 13.9 21.6
Nov 208.9 164.8 30.6 178.3 134.2 10.9 19.7 36.0
4.4 25.3 6.3 2.8 7.4 29.0 28.6 20.8 9.6 44.1 8.6 13.9 21.6
Annual Dec Average
209.5 209.1
165.4 165.5
30.3 31.6
179.2 177.5
135.1 133.9
10.7 11.1
19.6 20.5
36.5 35.2
4.4
4.5
25.5 24.3
6.6
6.4
2.8
2.8
7.5
7.5
29.6 28.7
28.6 28.5
20.7 21.5
9.4
9.6
44.1 43.6
8.7
8.4
13.8 13.5
21.6 21.7
2008 Final Series
Industry
Annual Jan Feb Mar Apr M ay Jun Jul Aug Sep Oct Nov Dec Average
Total Nonfarm
214.3 215.0 216.0 219.0 219.5 218.2 214.6 215.4 215.9 215.0 214.8 214.7 216.0
Total Private
171.2 171.5 172.8 175.4 175.9 174.9 173.1 173.2 172.9 171.5 171.3 171.1 172.9
Goods Producing
36.3 35.7 35.6 35.8 35.8 35.7 35.4 35.2 35.4 35.0 34.7 34.2 35.4
Service-Providing
178.0 179.3 180.4 183.2 183.7 182.5 179.2 180.2 180.5 180.0 180.1 180.5 180.6
Private Service-Providing
134.9 135.8 137.2 139.6 140.1 139.2 137.7 138.0 137.5 136.5 136.6 136.9 137.5
Mining, Logging, and Construction
12.9 12.5 12.3 12.9 12.9 12.8 12.6 12.5 12.5 12.3 12.1 11.8 12.5
Manufacturing
23.4 23.2 23.3 22.9 22.9 22.9 22.8 22.7 22.9 22.7 22.6 22.4 22.9
Trade, Transportation and Utilities
36.6 36.3 36.3 37.2 37.2 37.5 37.0 36.9 36.7 36.5 36.9 37.1 36.9
Wholesale Trade
4.7
4.8
4.8
5.1
5.1
5.1 4.8
4.9
4.9
4.9
4.9
4.9
4.9
Retail Trade
25.2 24.8 24.9 25.3 25.4 25.5 25.4 25.3 25.1 25.0 25.4 25.5 25.2
Transportation, Warehousing, and Utilities
6.7
6.7
6.6
6.8
6.7
6.9 6.8
6.7
6.7
6.6
6.6
6.7
6.7
Information
3.5
3.5
3.5
3.5
3.5
3.5 3.5
3.4
3.3
3.3
3.3
3.3
3.4
Financial Activities
7.6
7.7
7.7
7.8
7.8
7.8 7.9
7.9
7.8
7.8
7.7
7.7
7.8
Professional and Business Services
30.1 30.6 31.0 31.7 31.6 31.5 30.6 30.4 30.4 29.7 29.4 29.4 30.5
Educational and Health Services
27.9 28.2 28.3 28.2 28.5 27.9 28.2 28.6 28.7 28.6 28.9 28.7 28.4
Leisure and Hospitality
20.4 20.6 21.5 22.0 22.0 21.6 21.2 21.4 21.1 21.0 20.7 20.9 21.2
Other Services
8.8
8.9
8.9
9.2
9.5
9.4 9.3
9.4
9.5
9.6
9.7
9.8
9.3
Government
43.1 43.5 43.2 43.6 43.6 43.3 41.5 42.2 43.0 43.5 43.5 43.6 43.1
Federal Government
7.5
7.5
7.5
7.6
7.6
7.6 7.7
7.7
7.7
7.7
7.8
7.8
7.6
State Government
13.4 13.4 13.4 13.5 13.5 13.4 13.1 13.3 13.4 13.4 13.5 13.3 13.4
Local Government
22.2 22.6 22.3 22.5 22.5 22.3 20.7 21.2 21.9 22.4 22.2 22.5 22.1
Note: These preliminary estimates were prepared in cooperation with the U.S. Department of Labor, Bureau of Labor Statistics, based upon monthly reports submitted by selected employers in the
Augusta - Richmond County Metropolitan Statistical Area, which includes Burke, Columbia, McDuffie and Richmond counties in Georgia and Aiken and Edgefield counties in South Carolina. The estimates include all full- and part-time wage and salary workers who were employed during or received pay for any part of the pay period that includes the twelfth of the month. Proprietors, domestic workers, selfemployed persons, unpaid family workers and personnel of the armed forces are excluded. Estimates based on 2009 benchmark.
Source: Georgia Department of Labor, Workforce Information & Analysis
7
BRUNSWICK MSA Nonagricultural Employment (000s)
Industry
Total Nonfarm Total Private Goods Producing Service-Providing Private Service-Providing Trade, Transportation and Utilities Retail Trade Government Federal Government State Government Local Government
2009 Preliminary Series
Annual Jan Feb Mar Apr M ay Jun Jul Aug Sep Oct Nov Dec Average
42.6 42.6 42.3 42.5 43.1 42.8 42.4 42.5 41.9 42.1 42.2 42.1 42.4
32.3 32.3 32.0 32.1 32.5 32.3 32.2 32.1 31.5 31.7 31.6 31.6 32.0
5.3
5.2
5.1
4.9
4.9
4.8 4.8
4.8
4.7
4.6
4.6
4.6
4.9
37.3 37.4 37.2 37.6 38.2 38.0 37.6 37.7 37.2 37.5 37.6 37.5 37.6
27.0 27.1 26.9 27.2 27.6 27.5 27.4 27.3 26.8 27.1 27.0 27.0 27.2
8.0
7.8
7.8
7.8
7.8
7.8 7.9
7.9
7.7
7.7
7.8
7.8
7.8
5.7
5.5
5.5
5.5
5.5
5.5 5.6
5.6
5.5
5.5
5.6
5.7
5.6
10.3 10.3 10.3 10.4 10.6 10.5 10.2 10.4 10.4 10.4 10.6 10.5 10.4
1.9
1.9
1.9
2.0
2.0
2.0 2.0
2.0
2.0
2.0
2.0
2.0
2.0
1.9
1.9
1.9
1.9
2.0
2.0 1.9
1.9
1.9
1.9
2.0
2.0
1.9
6.5
6.5
6.5
6.5
6.6
6.5 6.3
6.5
6.5
6.5
6.6
6.5
6.5
2008 Final Series
Industry
Annual Jan Feb Mar Apr M ay Jun Jul Aug Sep Oct Nov Dec Average
Total Nonfarm Total Private Goods Producing Service-Providing Private Service-Providing Trade, Transportation and Utilities Retail Trade Government Federal Government State Government Local Government
45.7 45.2 45.6 45.8 46.1 46.1 45.6 45.7 44.8 44.3 44.2 44.0 45.3
35.4 35.0 35.3 35.5 35.7 35.6 35.5 35.6 34.6 33.9 33.8 33.7 35.0
5.9
5.7
5.8
5.7
5.7
5.8 5.6
5.8
5.7
5.6
5.6
5.5
5.7
39.8 39.5 39.8 40.1 40.4 40.3 40.0 39.9 39.1 38.7 38.6 38.5 39.6
29.5 29.3 29.5 29.8 30.0 29.8 29.9 29.8 28.9 28.3 28.2 28.2 29.3
8.7
8.5
8.5
8.3
8.5
8.4 8.4
8.4
8.4
8.4
8.4
8.7
8.5
6.2
6.0
6.0
5.9
5.9
5.9 5.9
6.0
6.1
6.0
6.0
6.3
6.0
10.3 10.2 10.3 10.3 10.4 10.5 10.1 10.1 10.2 10.4 10.4 10.3 10.3
1.9
1.9
1.9
1.9
1.9
2.0 2.0
1.9
1.9
1.9
1.9
1.9
1.9
2.0
2.0
2.1
2.1
2.1
2.1 2.1
2.0
2.0
2.0
2.0
1.9
2.0
6.4
6.3
6.3
6.3
6.4
6.4 6.0
6.2
6.3
6.5
6.5
6.5
6.3
Note: These preliminary estimates were prepared in cooperation with the U.S. Department of Labor, Bureau of Labor Statistics, based upon monthly reports submitted by selected
employers in the Brunswick Metropolitan Statistical Area, which includes Brantley, Glynn and McIntosh counties. The estimates include all full- and part-time wage and salary workers who were employed during or received pay for any part of the pay period that includes the twelfth of the month. Proprietors, domestic workers, self-employed persons, unpaid family workers and personnel of the armed forces are excluded. Estimates based on 2009 benchmark.
Source: Georgia Department of Labor, Workforce Information & Analysis
8
COLUMBUS MSA Nonagricultural Employment (000s)
Industry
Total Nonfarm Total Private Goods Producing Service-Providing Private Service-Providing Trade, Transportation and Utilities Retail Trade Information Financial Activities Finance and Insurance Insurance Carriers and Related Activities Professional and Business Services Leisure and Hospitality Government Federal Government State Government Local Government
2009 Preliminary Series
Jan
117.4 94.2 15.4 102.0 78.8 17.8 12.7 5.8 8.8 7.1 4.8 13.2 12.6 23.2 5.7 4.0 13.5
Feb
117.7 94.0 15.1 102.6 78.9 17.9 12.7 5.8 8.7 7.0 4.8 13.0 12.9 23.7 5.8 4.2 13.7
M ar
117.8 94.0 15.0 102.8 79.0 17.8 12.6 5.8 8.6 7.0 4.8 13.0 13.2 23.8 5.8 4.2 13.8
Apr
118.3 94.7 14.8 103.5 79.9 17.8 12.6 5.7 8.6 7.0 4.8 13.4 13.6 23.6 5.8 4.2 13.6
M ay
118.9 95.2 14.9 104.0 80.3 18.0 12.9 5.7 8.6 7.0 4.7 13.3 13.7 23.7 5.9 4.2 13.6
Jun
118.2 94.8 14.8 103.4 80.0 17.7 12.7 5.8 8.6 6.9 4.7 13.3 13.8 23.4 5.8 3.9 13.7
Jul
116.5 94.3 14.3 102.2 80.0 17.8 12.7 5.6 8.6 6.9 4.7 13.5 13.8 22.2 5.8 3.8 12.6
Aug
117.0 94.1 14.3 102.7 79.8 17.9 12.7 5.6 8.6 6.9 4.7 13.6 13.5 22.9 5.8 4.0 13.1
Sep
116.5 93.1 14.4 102.1 78.7 17.7 12.6 5.6 8.4 6.8 4.6 13.3 13.1 23.4 5.9 4.2 13.3
Oct
116.5 92.6 14.1 102.4 78.5 17.9 12.9 5.6 8.4 6.8 4.6 13.2 13.0 23.9 6.0 4.4 13.5
Nov
116.5 92.5 14.1 102.4 78.4 18.1 13.1 5.6 8.4 6.8 4.5 13.0 13.1 24.0 6.1 4.5 13.4
Annual Dec Average
117.6 93.6 14.0 103.6 79.6 18.3 13.1 5.6 8.4 6.8 4.6 13.1 13.0 24.0 6.0 4.5 13.5
117.4 93.9 14.6 102.8 79.3 17.9 12.8 5.7 8.6 6.9 4.7 13.2 13.3 23.5 5.9 4.2 13.4
2008 Final Series
Industry
Annual Jan Feb Mar Apr M ay Jun Jul Aug Sep Oct Nov Dec Average
Total Nonfarm
120.2 121.7 121.3 122.3 122.9 122.7 120.9 121.3 120.5 120.5 121.0 121.1 121.4
Total Private
97.8 98.7 98.2 99.3 99.7 99.8 98.9 98.6 97.4 97.4 97.6 97.5 98.4
Goods Producing
16.6 16.7 16.5 16.5 16.6 16.7 16.5 16.3 16.1 16.1 15.9 15.7 16.4
Service-Providing
103.6 105.0 104.8 105.8 106.3 106.0 104.4 105.0 104.4 104.4 105.1 105.4 105.0
Private Service-Providing
81.2 82.0 81.7 82.8 83.1 83.1 82.4 82.3 81.3 81.3 81.7 81.8 82.1
Trade, Transportation and Utilities
19.0 19.0 19.0 19.0 19.0 18.9 18.7 18.7 18.5 18.2 18.4 18.6 18.8
Retail Trade
13.9 14.0 14.0 13.8 13.8 13.7 13.6 13.5 13.3 13.0 13.3 13.4 13.6
Information
5.9
6.0
6.0
5.9
5.9
6.0 5.9
5.9
5.9
5.8
5.9
5.9
5.9
Financial Activities
9.2
9.2
9.2
9.2
9.3
9.2 9.2
9.2
9.1
9.0
8.9
8.9
9.1
Finance and Insurance
7.5
7.4
7.4
7.4
7.4
7.4 7.4
7.4
7.3
7.2
7.2
7.2
7.4
Insurance Carriers and Related Activities
5.0
4.9
5.0
4.9
4.9
4.9 4.9
4.9
4.8
4.8
4.8
4.8
4.9
Professional and Business Services
13.6 13.9 13.8 14.7 15.0 14.7 14.2 14.4 14.2 14.3 14.2 14.2 14.3
Leisure and Hospitality
13.2 13.4 13.8 13.8 13.8 13.9 13.9 13.8 13.5 13.5 13.7 13.6 13.7
Government
22.4 23.0 23.1 23.0 23.2 22.9 22.0 22.7 23.1 23.1 23.4 23.6 23.0
Federal Government
5.3
5.4
5.4
5.4
5.5
5.4 5.5
5.6
5.6
5.6
5.7
5.7
5.5
State Government
3.8
4.1
4.1
4.1
4.1
3.7 3.9
3.9
4.1
4.1
4.1
4.1
4.0
Local Government
13.3 13.5 13.6 13.5 13.6 13.8 12.6 13.2 13.4 13.4 13.6 13.8 13.4
Note: These preliminary estimates were prepared in cooperation with the U.S. Department of Labor, Bureau of Labor Statistics, based upon monthly reports submitted by selected
employers in the Columbus Metropolitan Statistical Area, which includes Chattahoochee, Harris, Marion and Muscogee counties in Georgia and Russell County in Alabama. The estimates include all full- and part-time wage and salary workers who were employed during or received pay for any part of the pay period that includes the twelfth of the month. Proprietors, domestic workers, selfemployed persons, unpaid family workers and personnel of the armed forces are excluded. Estimates based on 2009 benchmark.
Source: Georgia Department of Labor, Workforce Information & Analysis
9
DALTON MSA Nonagricultural Employment (000s)
Industry
Total Nonfarm Total Private Goods Producing Service-Providing Private Service-Providing Manufacturing Textile Mills Textile Product Mills Trade, Transportation and Utilities Retail Trade Transportation, Warehouse, and Utilities Professional and Business Services Government Federal Government State Government Local Government
2009 Preliminary Series
Annual Jan Feb Mar Apr M ay Jun Jul Aug Sep Oct Nov Dec Average
68.0 67.3 66.6 66.5 66.5 67.0 65.8 65.6 65.3 65.5 66.3 66.6 66.4
60.6 59.9 59.2 58.9 59.1 59.6 58.8 58.6 58.2 58.3 59.1 59.3 59.1
26.8 26.3 25.8 25.9 26.1 26.3 25.8 25.7 25.7 25.2 25.2 25.0 25.8
41.2 41.0 40.8 40.6 40.4 40.7 40.0 39.9 39.6 40.3 41.1 41.6 40.6
33.8 33.6 33.4 33.0 33.0 33.3 33.0 32.9 32.5 33.1 33.9 34.3 33.3
25.5 25.0 24.4 24.6 24.8 25.0 24.7 24.5 24.6 23.9 23.9 23.8 24.6
2.2
2.2
2.0
2.2
2.2
2.2 2.2
2.3
2.3
2.2
2.3
2.2
2.2
18.3 18.0 17.6 17.8 18.0 18.2 18.1 17.9 18.0 17.7 17.8 17.8 17.9
14.6 14.3 14.3 14.3 14.4 14.4 14.5 14.4 14.4 14.3 14.5 14.7 14.4
7.3
7.2
7.2
7.3
7.3
7.3 7.4
7.4
7.3
7.3
7.5
7.6
7.3
3.4
3.3
3.4
3.3
3.3
3.3 3.4
3.4
3.4
3.4
3.4
3.4
3.4
6.6
6.6
6.6
6.1
6.0
5.9 5.9
5.9
5.6
5.5
5.5
5.5
6.0
7.4
7.4
7.4
7.6
7.4
7.4 7.0
7.0
7.1
7.2
7.2
7.3
7.3
0.3
0.3
0.3
0.4
0.3
0.3 0.3
0.3
0.3
0.3
0.3
0.3
0.3
1.2
1.2
1.2
1.2
1.2
1.1 1.1
1.1
1.2
1.2
1.2
1.2
1.2
5.9
5.9
5.9
6.0
5.9
6.0 5.6
5.6
5.6
5.7
5.7
5.8
5.8
2008 Final Series
Industry
Annual Jan Feb Mar Apr M ay Jun Jul Aug Sep Oct Nov Dec Average
Total Nonfarm Total Private Goods Producing Service-Providing Private Service-Providing Manufacturing Textile Mills Textile Product Mills Trade, Transportation and Utilities Retail Trade Transportation, Warehouse, and Utilities Professional and Business Services Government Federal Government State Government Local Government
76.2 75.8 75.9 75.5 75.2 74.9 73.2 73.6 72.9 71.3 69.9 69.8 73.7
68.3 67.8 67.9 67.8 67.6 67.3 66.1 66.4 65.4 63.8 62.4 62.3 66.1
29.9 29.7 29.3 29.6 29.5 29.4 28.9 29.2 28.9 28.3 27.2 27.0 28.9
46.3 46.1 46.6 45.9 45.7 45.5 44.3 44.4 44.0 43.0 42.7 42.8 44.8
38.4 38.1 38.6 38.2 38.1 37.9 37.2 37.2 36.5 35.5 35.2 35.3 37.2
28.3 28.1 27.7 28.0 27.8 27.8 27.4 27.7 27.4 26.8 25.8 25.6 27.4
2.4
2.3
2.3
2.3
2.3
2.2 2.2
2.2
2.2
2.3
2.3
2.4
2.3
21.2 20.9 20.5 20.7 20.5 20.4 20.0 20.3 20.1 19.4 18.4 18.2 20.1
15.6 15.4 15.6 15.8 15.8 15.6 15.6 15.8 15.4 15.2 15.2 15.2 15.5
7.7
7.6
7.6
7.6
7.6
7.5 7.6
7.6
7.5
7.5
7.5
7.5
7.6
3.5
3.3
3.4
3.6
3.6
3.5 3.6
3.7
3.6
3.4
3.5
3.5
3.5
8.5
8.4
8.7
8.2
8.1
8.3 7.8
7.8
7.7
7.0
7.0
7.2
7.9
7.9
8.0
8.0
7.7
7.6
7.6 7.1
7.2
7.5
7.5
7.5
7.5
7.6
0.3
0.3
0.3
0.3
0.3
0.3 0.3
0.3
0.3
0.3
0.3
0.3
0.3
1.5
1.6
1.6
1.2
1.2
1.1 1.1
1.1
1.2
1.2
1.2
1.2
1.3
6.1
6.1
6.1
6.2
6.1
6.2 5.7
5.8
6.0
6.0
6.0
6.0
6.0
Note: These preliminary estimates were prepared in cooperation with the U.S. Department of Labor, Bureau of Labor Statistics, based upon monthly reports submitted by selected employers in
the Dalton Metropolitan Statistical Area, which includes Murray and Whitfield counties. The estimates include all full- and part-time wage and salary workers who were employed during or received pay for any part of the pay period that includes the twelfth of the month. Proprietors, domestic workers, self-employed persons, unpaid family workers and personnel of the armed forces are excluded. Estimates based on 2009 benchmark.
Source: Georgia Department of Labor, Workforce Information & Analysis
10
GAINESVILLE MSA Nonagricultural Employment (000s)
Industry
Total Nonfarm Total Private Goods Producing Service-Providing Private Service-Providing Trade, Transportation and Utilities Retail Trade Government Federal Government State Government Local Government
2009 Preliminary Series
Annual Jan Feb Mar Apr M ay Jun Jul Aug Sep Oct Nov Dec Average
72.5 72.0 71.3 72.3 72.0 71.7 71.3 71.2 71.8 71.5 71.6 71.9 71.8
62.0 61.4 60.7 61.4 61.4 61.3 61.3 61.1 61.4 60.8 60.8 61.2 61.2 19.9 19.7 19.6 19.5 19.4 19.3 19.2 19.0 18.9 18.6 18.6 18.4 19.2
52.6 52.3 51.7 52.8 52.6 52.4 52.1 52.2 52.9 52.9 53.0 53.5 52.6 42.1 41.7 41.1 41.9 42.0 42.0 42.1 42.1 42.5 42.2 42.2 42.8 42.1 13.9 13.7 13.6 13.6 13.5 13.4 13.5 13.5 13.4 13.3 13.2 13.5 13.5
7.6
7.5
7.5
7.5
7.5
7.5 7.5
7.5
7.5
7.4
7.4
7.5
7.5
10.5 10.6 10.6 10.9 10.6 10.4 10.0 10.1 10.4 10.7 10.8 10.7 10.5
0.5
0.5
0.5
0.6
0.5
0.5 0.5
0.5
0.5
0.5
0.5
0.5
0.5
2.4
2.4
2.4
2.7
2.4
2.4 2.4
2.4
2.6
2.7
2.8
2.8
2.5
7.6
7.7
7.7
7.6
7.7
7.5 7.1
7.2
7.3
7.5
7.5
7.4
7.5
2008 Final Series
Industry
Annual Jan Feb Mar Apr M ay Jun Jul Aug Sep Oct Nov Dec Average
Total Nonfarm Total Private Goods Producing Service-Providing Private Service-Providing Trade, Transportation and Utilities Retail Trade Government Federal Government State Government Local Government
77.6 78.3 78.3 78.9 78.9 77.8 77.9 78.5 78.3 76.9 76.4 75.9 77.8
67.2 67.3 67.6 68.2 68.4 67.5 67.7 67.9 67.5 66.1 65.6 65.1 67.2
21.9 21.7 21.8 21.8 21.8 21.6 21.5 21.5 21.3 20.9 20.7 20.5 21.4
55.7 56.6 56.5 57.1 57.1 56.2 56.4 57.0 57.0 56.0 55.7 55.4 56.4
45.3 45.6 45.8 46.4 46.6 45.9 46.2 46.4 46.2 45.2 44.9 44.6 45.8
14.5 14.6 14.6 14.7 14.7 14.7 14.8 14.9 14.9 14.3 14.5 14.6 14.7
7.8
7.7
7.8
7.8
7.8
7.9 7.9
8.0
8.0
7.8
8.0
7.9
7.9
10.4 11.0 10.7 10.7 10.5 10.3 10.2 10.6 10.8 10.8 10.8 10.8 10.6
0.5
0.5
0.5
0.5
0.5
0.5 0.5
0.5
0.5
0.5
0.5
0.5
0.5
2.5
2.7
2.7
2.7
2.5
2.3 2.4
2.4
2.7
2.6
2.6
2.4
2.5
7.4
7.8
7.5
7.5
7.5
7.5 7.3
7.7
7.6
7.7
7.7
7.9
7.6
Note: These preliminary estimates were prepared in cooperation with the U.S. Department of Labor, Bureau of Labor Statistics, based upon monthly reports submitted by selected employers in
the Gainesville Metropolitan Statistical Area, which comprises Hall county. The estimates include all full- and part-time wage and salary workers who were employed during or received pay for any part of the pay period that includes the twelfth of the month. Proprietors, domestic workers, self-employed persons, unpaid family workers and personnel of the armed forces are excluded. Estimates based on 2009 benchmark.
Source: Georgia Department of Labor, Workforce Information & Analysis
11
HINESVILLE - FT. STEWART MSA Nonagricultural Employment (000s)
Industry
Total Nonfarm Total Private Goods Producing Service-Providing Private Service-Providing Government Federal Government State Government Local Government
2009 Preliminary Series
Annual Jan Feb Mar Apr M ay Jun Jul Aug Sep Oct Nov Dec Average
19.4 19.5 19.4 18.9 19.6 19.3 19.2 19.6 19.3 19.5 19.6 19.5 19.4
11.9 11.9 11.8 12.0 12.0 11.8 11.8 11.9 11.7 11.7 11.7 11.7 11.8
1.8
1.8
1.7
1.8
1.8
1.8 1.8
1.8
1.7
1.7
1.7
1.7
1.8
17.6 17.7 17.7 17.1 17.8 17.5 17.4 17.8 17.6 17.8 17.9 17.8 17.6
10.1 10.1 10.1 10.2 10.2 10.0 10.0 10.1 10.0 10.0 10.0 10.0 10.1
7.5
7.6
7.6
6.9
7.6
7.5 7.4
7.7
7.6
7.8
7.9
7.8
7.6
3.8
3.8
3.8
3.8
3.8
3.8 3.9
3.9
3.9
4.0
4.1
4.1
3.9
0.3
0.3
0.3
0.3
0.3
0.3 0.3
0.3
0.3
0.3
0.3
0.3
0.3
3.4
3.5
3.5
2.8
3.5
3.4 3.2
3.5
3.4
3.5
3.5
3.4
3.4
2008 Final Series
Industry
Annual Jan Feb Mar Apr M ay Jun Jul Aug Sep Oct Nov Dec Average
Total Nonfarm
18.5 18.4 18.7 19.1 19.2 19.5 19.3 19.6 19.6 19.8 19.7 19.8 19.3
Total Private
11.3 11.3 11.5 11.9 12.0 12.0 12.1 12.3 12.3 12.3 12.2 12.3 12.0
Goods Producing
1.8
1.8
1.9
1.9
1.9
1.9 1.9
1.9
1.9
1.9
1.9
1.8
1.9
Service-Providing
16.7 16.6 16.8 17.2 17.3 17.6 17.4 17.7 17.7 17.9 17.8 18.0 17.4
Private Service-Providing
9.5
9.5
9.6 10.0 10.1 10.1 10.2 10.4 10.4 10.4 10.3 10.5 10.1
Government
7.2
7.1
7.2
7.2
7.2
7.5 7.2
7.3
7.3
7.5
7.5
7.5
7.3
Federal Government
3.5
3.5
3.5
3.5
3.5
3.7 3.7
3.6
3.7
3.7
3.7
3.7
3.6
State Government
0.3
0.3
0.3
0.3
0.3
0.3 0.3
0.3
0.3
0.3
0.3
0.3
0.3
Local Government
3.4
3.3
3.4
3.4
3.4
3.5 3.2
3.4
3.3
3.5
3.5
3.5
3.4
Note: These preliminary estimates were prepared in cooperation with the U.S. Department of Labor, Bureau of Labor Statistics, based upon monthly reports submitted by selected employers
in the Hinesville - Ft. Stewart Metropolitan Statistical Area, which includes Liberty and Long counties. The estimates include all full- and part-time wage and salary workers who were employed during or received pay for any part of the pay period that includes the twelfth of the month. Proprietors, domestic workers, self-employed persons, unpaid family workers and personnel of the armed forces are excluded. Estimates based on 2009 benchmark.
Source: Georgia Department of Labor, Workforce Information & Analysis
12
MACON MSA Nonagricultural Employment (000s)
Industry Total Nonfarm Total Private Goods Producing Service-Providing Private Service-Providing Trade Transportation and Utilities Retail Trade Transportation, Warehousing, and Utilities Financial Activities Professional and Business Services Educational and Health Services Leisure and Hospitality Government Federal Government State Government Local Government
2009 Preliminary Series
Annual Jan Feb Mar Apr M ay Jun Jul Aug Sep Oct Nov Dec Average
96.5 97.0 96.8 97.1 97.1 96.2 95.8 96.6 96.2 97.3 97.6 95.9 96.7
81.5 81.8 81.5 81.6 81.8 81.3 81.5 81.9 81.3 82.4 82.6 81.0 81.7
10.5 10.5 10.4 10.5 10.3 10.2 10.2 10.3 10.2 10.1 10.1 10.0 10.3
86.0 86.5 86.4 86.6 86.8 86.0 85.6 86.3 86.0 87.2 87.5 85.9 86.4
71.0 71.3 71.1 71.1 71.5 71.1 71.3 71.6 71.1 72.3 72.5 71.0 71.4
20.1 19.9 19.6 19.5 19.6 19.4 19.5 19.4 19.2 18.8 18.8 18.8 19.4
11.8 11.7 11.5 11.7 11.8 11.7 11.8 11.7 11.6 11.6 11.9 12.0 11.7
4.4
4.3
4.3
4.2
4.2
4.2 4.2
4.1
4.1
4.1
4.1
4.1
4.2
8.1
8.2
8.2
8.4
8.5
8.5 8.7
8.5
8.4
8.4
8.3
8.3
8.4
10.3 10.7 10.9 10.3 10.6 10.9 10.7 11.1 11.3 11.4 11.4 11.5 10.9
18.8 18.9 18.7 19.0 19.0 18.6 18.9 19.0 18.8 19.0 19.0 18.9 18.9
8.5
8.6
8.7
8.8
8.8
8.7 8.6
8.6
8.5
8.5
8.5
8.3
8.6
15.0 15.2 15.3 15.5 15.3 14.9 14.3 14.7 14.9 14.9 15.0 14.9 15.0
1.4
1.4
1.4
1.8
1.6
1.3 1.3
1.3
1.3
1.4
1.4
1.4
1.4
3.3
3.4
3.5
3.4
3.4
3.4 3.3
3.3
3.5
3.4
3.4
3.4
3.4
10.3 10.4 10.4 10.3 10.3 10.2 9.7 10.1 10.1 10.1 10.2 10.1 10.2
2008 Final Series
Industry
Annual Jan Feb Mar Apr M ay Jun Jul Aug Sep Oct Nov Dec Average
Total Nonfarm
100.3 100.9 101.1 102.9 103.4 102.8 101.6 102.4 101.5 100.5 101.3 100.7 101.6
Total Private
85.3 85.6 85.7 87.8 88.2 88.2 87.1 87.5 86.5 85.5 86.1 85.5 86.6
Goods Producing
11.6 11.5 11.5 11.7 11.8 11.7 12.0 11.7 11.5 11.5 11.4 11.1 11.6
Service-Providing
88.7 89.4 89.6 91.2 91.6 91.1 89.6 90.7 90.0 89.0 89.9 89.6 90.0
Private Service-Providing
73.7 74.1 74.2 76.1 76.4 76.5 75.1 75.8 75.0 74.0 74.7 74.4 75.0
Trade Transportation and Utilities
20.6 20.4 20.7 20.9 20.8 20.8 20.8 20.7 20.6 20.7 20.9 20.9 20.7
Retail Trade
12.1 11.9 12.2 12.1 11.9 12.0 12.0 12.0 12.0 12.2 12.5 12.4 12.1
Transportation, Warehousing, and Utilities
4.6
4.6
4.6
4.6
4.7
4.7 4.6
4.6
4.5
4.5
4.5
4.5
4.6
Financial Activities
8.4
8.4
8.4
8.4
8.5
8.5 8.4
8.4
8.3
8.3
8.3
8.3
8.4
Professional and Business Services
11.3 11.7 11.5 12.6 13.1 13.3 12.0 12.5 12.6 11.3 11.6 11.7 12.1
Educational and Health Services
18.8 18.9 18.9 19.0 19.1 18.9 18.9 19.2 19.1 19.5 19.6 19.4 19.1
Leisure and Hospitality
9.0
9.0
9.1
9.3
9.3
9.4 9.2
9.3
8.9
8.7
8.8
8.7
9.1
Government
15.0 15.3 15.4 15.1 15.2 14.6 14.5 14.9 15.0 15.0 15.2 15.2 15.0
Federal Government
1.3
1.4
1.4
1.3
1.3
1.3 1.4
1.3
1.3
1.3
1.4
1.4
1.3
State Government
3.4
3.5
3.6
3.4
3.5
3.2 3.3
3.4
3.4
3.4
3.4
3.4
3.4
Local Government
10.3 10.4 10.4 10.4 10.4 10.1 9.8 10.2 10.3 10.3 10.4 10.4 10.3
Note: These preliminary estimates were prepared in cooperation with the U.S. Department of Labor, Bureau of Labor Statistics, based upon monthly reports submitted by selected employers in
the Macon Metropolitan Statistical Area, which includes Bibb, Crawford, Jones, Monroe and Twiggs counties. The estimates include all full- and part-time wage and salary workers who were employed during or received pay for any part of the pay period that includes the twelfth of the month. Proprietors, domestic workers, self-employed persons, unpaid family workers and personnel of the armed forces are excluded. Estimates based on 2009 benchmark.
Source: Georgia Department of Labor, Workforce Information & Analysis
13
ROME MSA Nonagricultural Employment (000s)
Industry
Total Nonfarm Total Private Goods Producing Service-Providing Private Service-Providing Manufacturing Trade, Transportation and Utilities
Retail Trade Educational and Health Services Government Federal Government State Government Local Government
2009 Preliminary Series
Annual Jan Feb Mar Apr M ay Jun Jul Aug Sep Oct Nov Dec Average
40.1 40.1 39.4 39.3 38.9 38.9 38.6 38.7 38.6 39.8 39.7 40.1 39.4
33.0 32.9 32.3 32.2 31.9 31.9 31.9 31.9 31.6 32.8 32.8 32.9 32.3
7.8
7.7
7.5
7.5
7.6
7.4 7.5
7.5
7.4
7.3
7.3
7.2
7.5
32.3 32.4 31.9 31.8 31.3 31.5 31.1 31.2 31.2 32.5 32.4 32.9 31.9
25.2 25.2 24.8 24.7 24.3 24.5 24.4 24.4 24.2 25.5 25.5 25.7 24.9
6.7
6.6
6.4
6.3
6.3
6.3 6.4
6.3
6.3
6.2
6.1
6.1
6.3
6.6
6.5
6.4
6.3
6.3
6.3 6.3
6.2
6.1
6.1
6.2
6.2
6.3
4.3
4.2
4.1
4.2
4.1
4.1 4.1
4.1
4.0
4.0
4.1
4.1
4.1
8.5
8.6
8.6
8.5
8.3
8.3 8.5
8.6
8.6
8.6
8.7
8.7
8.5
7.1
7.2
7.1
7.1
7.0
7.0 6.7
6.8
7.0
7.0
6.9
7.2
7.0
0.2
0.2
0.2
0.3
0.2
0.2 0.2
0.2
0.2
0.2
0.2
0.3
0.2
2.5
2.6
2.6
2.5
2.5
2.5 2.5
2.5
2.6
2.6
2.6
2.7
2.6
4.4
4.4
4.3
4.3
4.3
4.3 4.0
4.1
4.2
4.2
4.1
4.2
4.2
2008 Final Series
Industry
Annual Jan Feb M ar Apr M ay Jun Jul Aug Sep Oct Nov Dec Average
Total Nonfarm Total Private Goods Producing Service-Providing Private Service-Providing Manufacturing Trade, Transportation and Utilities
Retail Trade Educational and Health Services Government Federal Government State Government Local Government
41.3 41.6 41.5 41.4 41.6 41.6 41.1 41.2 41.7 41.4 41.1 41.1 41.4
34.3 34.4 34.2 34.3 34.4 34.5 34.2 34.2 34.4 34.2 33.9 34.1 34.3
8.5
8.3
8.3
8.1
8.2
8.1 8.1
8.2
8.2
8.4
8.2
8.1
8.2
32.8 33.3 33.2 33.3 33.4 33.5 33.0 33.0 33.5 33.0 32.9 33.0 33.2
25.8 26.1 25.9 26.2 26.2 26.4 26.1 26.0 26.2 25.8 25.7 26.0 26.0
7.4
7.2
7.1
6.9
6.9
6.9 6.9
6.9
6.9
7.2
7.1
7.0
7.0
6.9
6.9
6.9
6.9
6.9
6.9 6.9
6.9
6.8
6.8
6.9
6.9
6.9
4.5
4.4
4.4
4.5
4.4
4.4 4.4
4.4
4.4
4.4
4.5
4.5
4.4
8.2
8.2
8.3
8.3
8.2
8.4 8.4
8.4
8.7
8.7
8.4
8.7
8.4
7.0
7.2
7.3
7.1
7.2
7.1 6.9
7.0
7.3
7.2
7.2
7.0
7.1
0.2
0.2
0.2
0.2
0.2
0.2 0.3
0.2
0.3
0.2
0.2
0.2
0.2
2.5
2.6
2.7
2.6
2.6
2.6 2.5
2.5
2.6
2.6
2.6
2.5
2.6
4.3
4.4
4.4
4.3
4.4
4.3 4.1
4.3
4.4
4.4
4.4
4.3
4.3
Note: These preliminary estimates were prepared in cooperation with the U.S. Department of Labor, Bureau of Labor Statistics, based upon monthly reports submitted by selected employers in
the Rome Metropolitan Statistical Area, which comprises Floyd county. The estimates include all full- and part-time wage and salary workers who were employed during or received pay for any part of the pay period that includes the twelfth of the month. Proprietors, domestic workers, self-employed persons, unpaid family workers and personnel of the armed forces are excluded. Estimates based on 2009 benchmark.
Source: Georgia Department of Labor, Workforce Information & Analysis
14
SAVANNAH MSA Nonagricultural Employment (000s)
Industry Total Nonfarm Total Private Goods Producing Service-Providing Private Service-Providing Mining, Logging, and Construction Manufacturing Trade, Transportation and Utilities Wholesale Trade Retail Trade Transportation, Warehousing, and Utilities Information Financial Activities Professional and Business Services Educational and Health Services Leisure and Hospitality Other Services Government Federal Government State Government Local Government
2009 Preliminary Series
Jan 152.4 129.2 22.6 129.8 106.6
7.9 14.7 33.8
5.9 17.2 10.7
1.9 5.8 16.7 21.9 19.1 7.4 23.2 2.9 5.2 15.1
Feb 152.1 128.6 22.3 129.8 106.3
7.9 14.4 33.4 5.7 17.0 10.7 1.9 5.7 16.6 22.0 19.3 7.4 23.5 2.9 5.5 15.1
M ar 151.5 128.0 22.2 129.3 105.8
7.9 14.3 33.1 5.6 16.9 10.6 1.8 5.7 16.2 21.9 19.8 7.3 23.5 2.9 5.5 15.1
Apr 152.5 128.9 21.6 130.9 107.3
7.5 14.1 33.2 5.7 17.0 10.5 1.8 5.7 16.3 22.4 20.5 7.4 23.6 3.1 5.4 15.1
M ay 152.4 129.0 21.4 131.0 107.6
7.5 13.9 33.2 5.7 17.1 10.4 1.8 5.7 16.1 22.6 20.7 7.5 23.4 3.0 5.3 15.1
Jun 152.1 128.9 21.3 130.8 107.6
7.5 13.8 33.1 5.7 16.9 10.5 1.8 5.7 16.3 22.6 20.6 7.5 23.2 2.9 5.2 15.1
Jul 150.6 127.9 21.2 129.4 106.7
7.5 13.7 32.4 5.7 16.8 9.9 1.8 5.8 15.8 23.2 20.4 7.3 22.7 3.0 5.2 14.5
Aug 150.5 127.6 21.2 129.3 106.4
7.5 13.7 32.3 5.6 16.8 9.9 1.8 5.7 15.9 23.3 20.1 7.3 22.9 3.0 5.4 14.5
Sep 150.3 127.3 21.0 129.3 106.3
7.4 13.6 32.2 5.5 16.8 9.9 1.8 5.7 16.2 23.5 19.7 7.2 23.0 3.0 5.7 14.3
Oct 150.7 127.0 20.8 129.9 106.2
7.4 13.4 32.1 5.5 16.7 9.9 1.8 5.6 16.2 23.7 19.6 7.2 23.7 3.0 5.6 15.1
Nov 151.0 127.1 20.8 130.2 106.3
7.4 13.4 32.3 5.5 16.8 10.0 1.7 5.6 16.1 23.8 19.6 7.2 23.9 3.0 5.6 15.3
Annual Dec Average
150.8 151.4
126.8 128.0
20.6 21.4
130.2 106.2
130.0 106.6
7.3
7.6
13.3 13.9
32.6 32.8
5.5
5.6
17.0 16.9
10.1 10.3
1.7
1.8
5.6
5.7
16.1 16.2
23.7 22.9
19.3 19.9
7.2
7.3
24.0 23.4
3.0
3.0
5.6
5.4
15.4 15.0
2008 Final Series
Industry
Annual Jan Feb Mar Apr M ay Jun Jul Aug Sep Oct Nov Dec Average
Total Nonfarm Total Private
158.9 160.2 160.7 160.5 161.3 160.3 158.0 158.8 158.6 136.3 137.1 137.4 137.5 138.4 137.7 135.7 136.2 135.9
158.1 135.0
159.1 157.0 135.6 133.5
159.3 136.4
Goods Producing Service-Providing Private Service-Providing
24.2 134.7 112.1
24.1 136.1 113.0
24.0 136.7 113.4
23.9 136.6 113.6
24.0 137.3 114.4
24.1 136.2 113.6
23.8 134.2 111.9
24.0 134.8 112.2
23.7 134.9 112.2
23.5 134.6 111.5
23.6 135.5 112.0
23.4 133.6 110.1
23.9 135.4 112.5
Mining, Logging, and Construction
9.4
9.3
9.2
9.1
9.2
9.2 9.0
8.9
8.7
8.4
8.4
8.3
8.9
Manufacturing
14.8 14.8 14.8 14.8 14.8 14.9 14.8 15.1 15.0 15.1 15.2 15.1 14.9
Trade, Transportation and Utilities
36.1 36.0 36.1 36.0 35.8 35.5 35.5 35.6 35.7 35.4 35.8 35.6 35.8
Wholesale Trade
6.7
6.7
6.7
6.8
6.8
6.7 6.5
6.6
6.5
6.5
6.4
6.3
6.6
Retail Trade
18.3 18.2 18.3 18.4 18.3 18.1 18.3 18.2 18.0 18.0 18.3 18.2 18.2
Transportation, Warehousing, and Utilities
11.1 11.1 11.1 10.8 10.7 10.7 10.7 10.8 11.2 10.9 11.1 11.1 10.9
Information
1.9
1.9
1.9
1.9
2.0
2.0 2.0
2.0
2.0
1.9
1.9
1.9
1.9
Financial Activities
6.1
6.1
6.0
6.1
6.1
6.1 6.0
6.0
6.0
6.1
6.0
6.0
6.1
Professional and Business Services
19.1 19.4 19.3 18.7 18.8 18.7 18.0 18.1 18.1 18.0 17.9 17.0 18.4
Educational and Health Services
21.8 22.1 22.1 22.2 22.5 22.3 21.6 21.7 21.8 22.1 22.3 22.0 22.0
Leisure and Hospitality
19.4 19.8 20.2 21.0 21.4 21.1 20.9 21.0 20.8 20.3 20.3 19.9 20.5
Other Services
7.7
7.7
7.8
7.7
7.8
7.9 7.9
7.8
7.8
7.7
7.8
7.7
7.8
Government
22.6 23.1 23.3 23.0 22.9 22.6 22.3 22.6 22.7 23.1 23.5 23.5 22.9
Federal Government
2.9
2.9
2.9
2.9
2.9
2.9 2.9
3.0
2.9
3.0
3.0
3.0
2.9
State Government
5.0
5.5
5.6
5.3
5.2
4.8 5.0
5.2
5.2
5.1
5.3
5.3
5.2
Local Government
14.7 14.7 14.8 14.8 14.8 14.9 14.4 14.4 14.6 15.0 15.2 15.2 14.8
Note: These preliminary estimates were prepared in cooperation with the U.S. Department of Labor, Bureau of Labor Statistics, based upon monthly reports submitted by selected employers in
the Savannah Metropolitan Statistical Area, which includes Bryan, Chatham and Effingham counties. The estimates include all full- and part-time wage and salary workers who were employed during or received pay for any part of the pay period that includes the twelfth of the month. Proprietors, domestic workers, self-employed persons, unpaid family workers and personnel of the armed forces are excluded. Estimates based on 2009 benchmark.
Source: Georgia Department of Labor, Workforce Information & Analysis
15
VALDOSTA MSA Nonagricultural Employment (000s)
Industry Total Nonfarm Total Private Goods Producing Service-Providing Private Service-Providing Trade, Transportation and Utilities Retail Trade Government Federal Government State Government Local Government
2009 Preliminary Series
Annual Jan Feb Mar Apr M ay Jun Jul Aug Sep Oct Nov Dec Average
54.2 54.3 54.1 55.3 55.4 53.7 53.0 53.5 52.9 53.5 53.5 53.0 53.9
41.0 41.0 40.7 41.9 41.9 40.9 40.7 40.7 39.9 40.2 40.1 39.8 40.7
7.7
7.7
7.6
7.6
7.6
7.3 7.2
7.1
7.0
6.9
6.9
6.9
7.3
46.5 46.6 46.5 47.7 47.8 46.4 45.8 46.4 45.9 46.6 46.6 46.1 46.6
33.3 33.3 33.1 34.3 34.3 33.6 33.5 33.6 32.9 33.3 33.2 32.9 33.4
11.5 11.2 11.3 11.4 11.4 11.2 11.1 11.1 10.9 10.9 11.0 11.1 11.2
8.0
7.7
7.8
7.9
7.9
7.8 7.8
7.8
7.7
7.8
7.9
8.0
7.8
13.2 13.3 13.4 13.4 13.5 12.8 12.3 12.8 13.0 13.3 13.4 13.2 13.1
0.8
0.8
0.8
0.9
0.9
0.9 1.0
0.9
0.9
1.0
1.0
1.0
0.9
4.4
4.5
4.6
4.5
4.5
3.8 3.9
4.3
4.3
4.4
4.5
4.3
4.3
8.0
8.0
8.0
8.0
8.1
8.1 7.4
7.6
7.8
7.9
7.9
7.9
7.9
2008 Final Series
Industry
Annual Jan Feb M ar Apr M ay Jun Jul Aug Sep Oct Nov Dec Average
Total Nonfarm
56.3 57.0 56.3 57.2 57.4 55.8 56.0 56.8 56.3 56.4 56.3 55.8 56.5
Total Private
43.4 43.8 43.1 44.0 44.2 43.3 43.8 43.9 43.1 43.1 42.9 42.4 43.4
Goods Producing
8.9
9.0
8.9
8.8
8.9
8.7 8.7
8.7
8.6
8.5
8.3
8.1
8.7
Service-Providing
47.4 48.0 47.4 48.4 48.5 47.1 47.3 48.1 47.7 47.9 48.0 47.7 47.8
Private Service-Providing
34.5 34.8 34.2 35.2 35.3 34.6 35.1 35.2 34.5 34.6 34.6 34.3 34.7
Trade, Transportation and Utilities
12.5 12.5 12.2 12.4 12.4 12.1 12.3 12.2 12.0 12.0 12.1 12.0 12.2
Retail Trade
8.5
8.4
8.2
8.4
8.3
8.1 8.2
8.1
7.9
8.0
8.1
8.1
8.2
Government
12.9 13.2 13.2 13.2 13.2 12.5 12.2 12.9 13.2 13.3 13.4 13.4 13.1
Federal Government
0.8
0.8
0.8
0.8
0.8
0.8 0.8
0.8
0.8
0.8
0.8
0.8
0.8
State Government
4.3
4.5
4.4
4.5
4.5
3.8 3.8
4.3
4.4
4.4
4.4
4.5
4.3
Local Government
7.8
7.9
8.0
7.9
7.9
7.9 7.6
7.8
8.0
8.1
8.2
8.1
7.9
Note: These preliminary estimates were prepared in cooperation with the U.S. Department of Labor, Bureau of Labor Statistics, based upon monthly reports submitted by selected employers in
the Valdosta Metropolitan Statistical Area, which includes Brooks, Echols, Lanier and Lowndes counties. The estimates include all full- and part-time wage and salary workers who were employed during or received pay for any part of the pay period that includes the twelfth of the month. Proprietors, domestic workers, self-employed persons, unpaid family workers and personnel of the armed forces are excluded. Estimates based on 2009 benchmark.
Source: Georgia Department of Labor, Workforce Information & Analysis
16
WARNER ROBINS MSA Nonagricultural Employment (000s)
Industry Total Nonfarm Total Private Goods Producing Service-Providing Private Service-Providing Trade, Transportation and Utilities Retail Trade Government Federal Government State Government Local Government
2009 Preliminary Series
Annual Jan Feb Mar Apr M ay Jun Jul Aug Sep Oct Nov Dec Average
58.0 58.0 58.1 58.7 59.1 59.2 58.8 59.2 59.3 59.3 59.3 59.0 58.8
34.4 34.5 34.5 35.1 35.3 35.2 35.6 35.6 35.3 35.1 34.9 34.6 35.0
6.6
6.6
6.6
6.7
6.8
6.9 6.9
6.9
6.8
6.7
6.6
6.6
6.7
51.4 51.4 51.5 52.0 52.3 52.3 51.9 52.3 52.5 52.6 52.7 52.4 52.1
27.8 27.9 27.9 28.4 28.5 28.3 28.7 28.7 28.5 28.4 28.3 28.0 28.3
7.8
7.7
7.8
7.8
7.8
7.8 7.8
7.8
7.7
7.7
7.8
7.8
7.8
6.1
6.0
6.1
6.1
6.2
6.1 6.0
6.0
6.0
6.0
6.1
6.2
6.1
23.6 23.5 23.6 23.6 23.8 24.0 23.2 23.6 24.0 24.2 24.4 24.4 23.8
14.3 14.3 14.4 14.4 14.5 14.6 14.6 14.7 14.7 14.9 15.0 15.1 14.6
1.2
1.1
1.1
1.1
1.2
1.2 1.1
1.2
1.2
1.2
1.2
1.1
1.2
8.1
8.1
8.1
8.1
8.1
8.2 7.5
7.7
8.1
8.1
8.2
8.2
8.0
2008 Final Series
Industry
Annual Jan Feb Mar Apr M ay Jun Jul Aug Sep Oct Nov Dec Average
Total Nonfarm
58.8 58.6 58.6 58.6 58.9 59.0 58.5 59.1 58.6 59.2 59.1 59.0 58.8
Total Private
35.8 35.5 35.5 35.4 35.8 35.7 35.8 36.0 35.3 35.4 35.5 35.5 35.6
Goods Producing
7.2
7.1
7.1
6.9
7.0
6.9 6.8
6.8
6.7
6.8
6.8
6.8
6.9
Service-Providing
51.6 51.5 51.5 51.7 51.9 52.1 51.7 52.3 51.9 52.4 52.3 52.2 51.9
Private Service-Providing
28.6 28.4 28.4 28.5 28.8 28.8 29.0 29.2 28.6 28.6 28.7 28.7 28.7
Trade, Transportation and Utilities
8.1
8.1
8.0
7.9
7.9
7.9 8.2
8.1
8.0
8.0
8.3
8.2
8.1
Retail Trade
6.4
6.4
6.3
6.3
6.3
6.2 6.3
6.3
6.2
6.2
6.4
6.4
6.3
Government
23.0 23.1 23.1 23.2 23.1 23.3 22.7 23.1 23.3 23.8 23.6 23.5 23.2
Federal Government
14.2 14.2 14.2 14.2 14.2 14.3 14.3 14.3 14.4 14.4 14.4 14.4 14.3
State Government
0.9
1.0
1.0
1.1
1.0
1.0 1.0
1.1
1.0
1.3
1.1
1.0
1.0
Local Government
7.9
7.9
7.9
7.9
7.9
8.0 7.4
7.7
7.9
8.1
8.1
8.1
7.9
Note: These preliminary estimates were prepared in cooperation with the U.S. Department of Labor, Bureau of Labor Statistics, based upon monthly reports submitted by selected employers in
the Warner Robins Metropolitan Statistical Area, which comprises Houston county. The estimates include all full- and part-time wage and salary workers who were employed during or received pay for any part of the pay period that includes the twelfth of the month. Proprietors, domestic workers, self-employed persons, unpaid family workers and personnel of the armed forces are excluded. Estimates based on 2009 benchmark.
Source: Georgia Department of Labor, Workforce Information & Analysis
17