- Collection:
- Georgia Government Publications
- Title:
- Georgia area labor profile: Richmond County area [1994]
- Creator:
- Georgia. Department of Labor
- Contributor to Resource:
- Georgia. Department of Labor
- Publisher:
- Atlanta, Ga. : Georgia. Department of Labor
- Date of Original:
- 1994
- Subject:
- Georgia
- Location:
- United States, Georgia, 32.75042, -83.50018
- Medium:
- publications (documents)
- Type:
- Text
- Format:
- application/pdf
- External Identifiers:
- Call Number GA L200 .S1 P7 R5 1994
- Metadata URL:
- https://dlg.galileo.usg.edu/id:dlg_ggpd_y-ga-bl200-b-ps1-bp7-br5-b1994
- Digital Object URL:
- https://dlg.galileo.usg.edu/do:dlg_ggpd_y-ga-bl200-b-ps1-bp7-br5-b1994
- Language:
- eng
- Holding Institution:
- University of Georgia. Map and Government Information Library
- Rights:
-

GEORGIA
)
)
)
)
)
)
)
)
)
)
)
)
)
)
)
)
)
)
)
AREA LABOR PROFILE
)
)
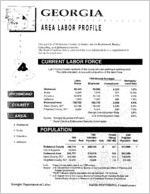
This profile of Richmond County includes data for Richmond, Burke,
)
Columbia, and Jefferson counties.
The South Carolina data is provided for your information as a supplement to
)
the established area.
CURRENT LABOR FORCE
Labor force includes residents of the county who are working or seeking work. This table indicates the size and composition of the labor force.
Labor Force
1993 Annual Averages Employed Unemployed
UnemploymentRate
1. Richmond 2. Burke 3. Columbia 4. Jefferson
Richmond
86,413
80,090
6,323
Burke
8,549
7,618
931
Columbia
35,878
34,108
1,770
Jefferson
7,893
7,327
566
Richmond Area
138,733
129,143
9,590
Aiken County, SC*
63,190
58,160
5,030
Edgefield County, SC*
9,000
8,370
630
Georgia Unemployment Rate
Source: Georgia Department of Labor
U.S. Unemployment Rate
* South Carolina Employment Security Commission
7.3% 10.9%
4.9% 7.2% 6.9% 8.0% 7.0% 5.8% 6.8%
POPULATION
1992
Percent
1990
Estimated
Change
Census Rank Population Rank 1990-1992
2000 Projected Population Rank
Richmond County 189,719
6 202,434
6
City of Augusta
44,639
Richmond Area
293,737
313,913
Aiken County, SC* 120,940
128,566
Edgefield County, SC* 18,375
18,660
6.7
211,688
7
6.9 341,323
6.3 139,000
1.6
21,100
Note: Source:
*
Projected population based on 1990 census U.S. Department of Commerce, Bureau of Census/Georgia Office of Planning and
Budget (projections) "Rank" indicates relative popufation among Georgia's 159 counties. U.S. Department of Commerce, Bureau of Census/South Carolina Budget and
Control Board, Division of Research and Statistical Services (Projections)
Georgia Department of Labor
DAVID POYTHRESS, Commissioner
HIGH SCHOOL GRADUATES 1992-1993
Male
Female
Total
Richmond Burke Columbia Jefferson Total
714
110 421 83
1,328
851
116 403
91
1,461
1,565
226 824 174
2,789
Note: Data on graduates from private high schools are not included. Source: Georgia Department of Education
PER CAPITA ANNUAL INCOME
1992
Percent Relative to Georgia
Percent Relative
to U.S.
Percent Change 1991-1992
Richmond County
17,322
93.4
86.2
1.6
Augusta-Aiken MSA
17,414
93.9
86.6
3.3
Georgia
18,549
92.3
5.0
U.S.A.
20,105
108.4
4.9
Source: U.S. Department of Commerce, Bureau of Economic Analysis
ACTIVE APPLICANTS - State Employment Service
Professional
Agriculture
Miscel
Technical Clerical
Forestry
laneous
and
and
Fishing
Pro Machine Bench- Structural Occu-
Managerial Sales Service
etc.. cessing Trades work Work pations
Total
Richmond Burke Columbia Jefferson
881 1,562 1,055
43 129 72
264 306 121
23
86
93
47 105 276 306 989 753 5,974
6
14
42 157 126
99 688
11
12 82 47 211 110 1,164
9
31
53 105
71
87 558
Total
1,211 2,083 1,341
73 162 453 615 1,397 1,049 8,384
Note: Source:
Detailed figures on the availability of applicants in specific occupations are available from Georgia Department of Labor, Labor Information Systems, or from the nearest office of the state Employment Service. Georgia Department of Labor (Active applicants as of June 1994)
Page 2
245-94
CURRENT INDUSTRY MIX - RICHMOND
INDUSTRY
Agriculture, forestry, and fishing Mining Construction Manufacturing
Food and kindred products Textiles Apparel Lumber and wood products Furniture and fixtures .Paper and allied products Printing and publishing Chemicals and allied products Rubber and miscellaneous plastic products Stone, clay, glass, and concrete Fabricated metal products Industrial machinery, including computers Transportation equipment Instruments and related products Miscellaneous manufacturing industries Transportation and public utitities Wholesale trade Retail trade Finance, insurance, and real estate Services Hotels, other lodging places Personal services Business services Auto repair, services, garages Miscellaneous repair services Motion pictures Amusement and recreation services Health services Legal services Educational services Social services Museums, botanical, zoological gardens Membership organizations Engineering and management services Private households Miscellaneous services Public Administration ALL INDUSTRIES
1993 Average Employment
283 138 3,532 13,436 1,842 1,379 1,430 286
* 1,725
818 1,897
* 1,321
303 515
*
* 31 3,521 3,457 20,377 3,664 43,116 1,199 1,034 3,772 1,035 794 193 1,091 16,745 588 13,087 814
*
481 2,015
249 *
6,716 98,241
Average Weekly Wages
$ 263 632 402 589 484 440 245 529 * 883 509 899 * 531 559 523 * * 330 568 550 232 443 476 199 225 264 364 597 132 244 575 922 472 228 *
211 621 154
* 414 $ 438
Notes: Source:
* Denotes confidential data relating to individual employers which cannot be released.
Average weekly wages is derived by dividing gross payroll dollars paid to all employees - both hourly and salaried - by the average number of employees who had any earnings; average earnings are then divided by the number of weeks in the period to obtain weekly figures. Health Services includes government hospitals. Educational Services includes government educational institutions. Georgia Department of Labor - Data represent jobs in this county covered by unemployment. insurance legislation.
245-94
Page 3
EMPLOYERS
TEN LARGEST EMPLOYERS
Richmond County.Area
County.
Georgia Power Co BILO Inc Doctors Hospital FederalPaper Board Mercantile Stores Mgmt Analysis/Utllzation Saint Joseph Hospital Textron Inc University Hospital Wal-Mart Stores Inc
Burke Richmond Richmond Richmond Richmond Richmond Richmond Richmond Richmond Richmond
THREE LARGEST EMPlciveRs<
Richmond County
Doctors Hospital SaintJoseph Ho Univers1tyH9spi
Note:. Represents empl unemployment insuran government and railroa for Third Quarter 1993.
OCCUPATIONAL PROFILE
Richmond County
Employed persons, 16 years and over
Executive, administrative, and managerial
Professional specialty
Technical and related support
Sales
Administrative, support, including clerical
Service
Farming, forestry, and fishing
Precision production, craft and repair
Machine operators, assemblers, and inspectors
Transportation and material moving
Handlers, equipment cleaners, helpers and laborers
Source: 1990 Census {Summary tape file 3)
Number
79,382 7,617 11,794 3,652
9,143 11,143
14,102 698
9,541
5,627 2,791 3,274
Percent
100.0 9.6
14.9 4.6
11.5 14.0 17.8
0.9 12.0
7.1 3.5 4.1
COMMUTING PATTERNS
Employed Resident$ of Richmond. County
County where Employed
Number
Richmond South Carolina Columbia Other
72,793
8,028
4,014
2,353
Total Residents
100.0
Source: 1990 Census of Population and Housing
Persons Working in Richmond County
Richmond Columbia south Carolina Burke McDuffie Other
Total Residents
Number
72,793. 19,339 10,933
1;666 1;430 4,291
110,452
otal.
5.9 7.5 9.9< 1.5 1.3 3.9
100.0
Page 4
245-94