- Collection:
- Georgia Government Publications
- Title:
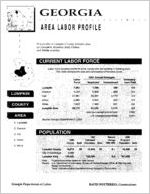
- Georgia area labor profile: Lumpkin County area [1994]
- Creator:
- Georgia. Department of Labor
- Contributor to Resource:
- Georgia. Department of Labor
- Publisher:
- Atlanta, Ga. : Georgia. Department of Labor
- Date of Original:
- 1994
- Subject:
- Georgia
- Location:
- United States, Georgia, 32.75042, -83.50018
- Medium:
- publications (documents)
- Type:
- Text
- Format:
- application/pdf
- External Identifiers:
- Call Number GA L200 .S1 P7 L8 1994
- Metadata URL:
- https://dlg.galileo.usg.edu/id:dlg_ggpd_y-ga-bl200-b-ps1-bp7-bl8-b1994
- Digital Object URL:
- https://dlg.galileo.usg.edu/do:dlg_ggpd_y-ga-bl200-b-ps1-bp7-bl8-b1994
- Language:
- eng
- Holding Institution:
- University of Georgia. Map and Government Information Library
- Rights:
-

GEORGIA
)
)
)
)
)
)
)
)
)
)
)
)
)
)
)
)
)
)
)
AREA LABOR PROFILE
)
)
This profile of Lumpkin County includes data
)
for Lumpkin, Dawson, Hall, Union,
and White counties.
LUMPKIN
COUNTY
AREA
1. Lumpkin 2. Dawson 3. Hall 4. Union 5. White
CURRENT LABOR FORCE
Labor force includes residents of the county who are working or seeking work. This table indicates the size and composition of the labor force.
Labor Force
1993 Annual Averages
Employed Unemployed
UnemploymentRate
Lumpkin Dawson Hall Union White Lumpkin Area
7,863 6,232 57,861 5,994 7,823 85,773
Source: Georgia Department of Labor
7,498
365
5,906
326
55,087
2,774
5,642
352
7,466
357
81,599
4,174
Georgia Unemployment Rate U.S. Unemployment Rate
4.6 5.2 4.8 5.9
4.6
4.9 5.8%
6.8%
POPULATION
1990
Census
1992 Estimated Rank Population Rank
Percent
Change
1990-1992
2000 Projected Population Rank
Lumpkin County City of Dahlonega
14,573 . 89 3,086,
15,458 88
6.1
18,496 82
Lumpkin Area
144,429
152,539
5.6 181,362
Note: Projected population based on 1990 census
Source: U~S. Department of Com,:oerce, Breau of Census/Georgia. Office ofPlanning and
Btidget (projections)
"Rank" indicates relative population among Georgia's 159 counties; .
Georgia Department of Labor
DAVID POYTHRESS, Commissioner
HIGH SCHOOL GRADUATES 1992-1993
Male
Female
Total
Lumpkin
65
66
131
Dawson
38
52
90
Hall
491
365
856
Union
58
56
114
White
74
68
142
Total
726
607
1,333
Note: Data on graduates from private high schools are not included. Source: Georgia Department of Education
PER CAPITA ANNUAL INCOME
1992
Percent Relative to Georgia
Percent Relative
to U.S.
Percent Change 1991-1992
Lumpkin County
15,065
81.2
74.9
6.2
Georgia
18,549
92.3
5.0
U.S.A.
20,105
108.4
4.9
Source: U.S. Department of Commerce, Bureau of Economic Analysis
ACTIVE APPLICANTS - State Employment Service
Professional Technical and
Managerial
Clerical and
Sales
Agriculture
Forestry
Fishing
Service
etc.
Pro-
cessing
Machine Trades
Bench- Structural work Work
MtSCel laneous
Occu~ pations
Totals
Lumpkin Dawson Hall Union White Total
44
75 29
42
45 17
460 1,156 374
31 132 79
54
76
34
631 1,484 533
5
4
30
11
31
35 264
2
6
9
14
21
23 179
49 206 279 230 361 621 3,736
20
7
27
34
62
29 421
9
3
30
15
26
32 279
85 226 375 304 501 740 4,879
Note: Source:
Detailed figures on the availability of applicants in specific occupations are available from Georgia Department of Labor, Labor Information Systems, or from the nearest office of the state Employment Service. Georgia Department of Labor (Active applicants as of June 1994) ..
Page2
187-94
CURRENT INDUSTRY MIX - LUMPKIN
INDUSTRY
1993 Average Employment
Average Weekly Wages
Agriculture, forestry, and fishing Mining
55.
$ 284
*
Construction
102
312
Manufacturing Food and kindred products
982.
402 *
Textiles
*
*
Apparel
124
249
Lumber and wood products
22
241
Printing and publishing
18
359
Rubber and miscellaneous plastic products Industrial machinery, including computers Electronic, other electrical equipment
.*
.*
.
*
Transportation and public utilities
132
543
Wholesale trade
34
416
Retail trade
642
242
Finance, insurance, and real estate
144
451
Services
1,455
405
Hotels, other lodging places
51
233
Personal services
*
*
Business services
39
221
Auto repair, services, garages
7
787
Miscellaneous repair services Motion pictures
.*
* *
Amusement and recreation services
19
1,549
Health services
458
362
Legal services
*
*
Educational services
799
425
Social services
29
160
Membership organizations
11
307
Engineering and management services
13
608
Private households
3
131
Miscellaneous services
*
*
Public Administration
248
350
ALL INDUSTRIES
3,795
$ 375
Notes: * Denotes confidential data relating to individual employerswhichcannot be released.
Average weekly wages is derived by dividing gross payroll doHars paid to all
employees~ both hourly and salaried - by the average number employees who had
any earnings; average earnings are then divided by the number of weeks in the
period to obtain weekty figures.
Health Services includes government hospitals~
Educational Services includes government educational institutions.
Source: Georgia Department of Labor Data represent jobs in this county covered by unemployment insurance legislation.
187-94
Page3
EMPLOYERS
TEN LARGEST EMPLOYERS
Lumpkin County Area
County
C Poultry Co
Hall
Etcon
Hall
Fieldale Farms
Hall
First National Bank
Hall
Liberty Mutual Ins
Hall
Mar Jae Processing
Hall
N E Georgia Health
Hall
NE Georgia Medical
Hall
Warren Featherbone
Hall
Wm Wrigley Jr Co
Hall
THREE LARGEST EMPLOYERS
Lumpkin County
Burlington - Pine Tree Saint Josephs Hospital Torrington Company
Note: Represents employment covered by unemployment insurance, excluding government and railroads. Data shown for Third Quarter 1993.
OCCUPATIONAL PROFILE
Lumpkin County
Employed persons, 16 years and over Executive, administrative, and managerial Professional specialty occupations Technical and related support Sales Administrative, support, including clerical Service Farming, forestry, and fishing Precision production, craft and repair Machine operators, assemblers, and inspectors Transportation and material moving Handlers, equipment cleaners, helpers and laborers
Source: 1990 Census (Summary tape file 3)
Number
6,838 581 546 290 611 869 845 294
1,138 960 430 274
Percent
100.0 8.5 8.0 4.2 8.9
12.7 12.4 4.3 16.6 14,0 6.3 4.0
COMMUTING PATTERNS
Employed Residents of Lumpkin County
County where Employed
Number
Percent of Total
Lumpkin Hall Fulton White Dawson Forsyth Gwinnett Other
3,957
57.4
1,302
18.9
355
5.1
271
3.9
245
3~6
208
3.0
134
1.9
427
6.2
Total Residents
6,899
100.Q
Source: 1990 Census ofPopulation and Housing
Page 4
Pel'$onsWorkingin Lumpkin County
County of Residence
Number
Lumpkil'I Hall .
Dawson White .
.Union Gilmer Other
,95:7
10
Percent of Total
81.5 6.4 2:s 2.2>
1.4
1.1 4:7
187-94