- Collection:
- Georgia Government Publications
- Title:
- Georgia area labor profile: Greene County area [1994]
- Creator:
- Georgia. Department of Labor
- Contributor to Resource:
- Georgia. Department of Labor
- Publisher:
- Atlanta, Ga. : Georgia. Department of Labor
- Date of Original:
- 1994
- Subject:
- Georgia
- Location:
- United States, Georgia, 32.75042, -83.50018
- Medium:
- publications (documents)
- Type:
- Text
- Format:
- application/pdf
- External Identifiers:
- Call Number GA L200 .S1 P7 G72 1994
- Metadata URL:
- https://dlg.galileo.usg.edu/id:dlg_ggpd_y-ga-bl200-b-ps1-bp7-bg72-b1994
- Digital Object URL:
- https://dlg.galileo.usg.edu/do:dlg_ggpd_y-ga-bl200-b-ps1-bp7-bg72-b1994
- Language:
- eng
- Holding Institution:
- University of Georgia. Map and Government Information Library
- Rights:
-

r \z;.,~..} Ji&.
}$' -
.
\ )
)
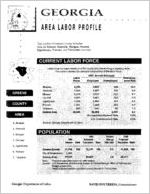
GREENE
COUNTY
AREA
1. Greene 2. Hancock 3. Morgan 4. Oconee 5. Oglethorpe 6. Putnam 7. Taliaferro
)
)
)
)
)
)
)
)
)
)
)
)
)
)
)
)
)
)
)
AREA LABOR PROFILE
This profile of Greene County includes data for Greene, Hancock, Morgan, Oconee, Oglethorpe, Putnam, and Taliaferro counties.
CURRENT LABOR FORCE
Labor force includes residents of the county who are working or seeking work. This table indicates the size and composition of the labor force.
Labor Force
1993 Annual Averages Employed Unemployed
Unemployment Rate
Greene Hancock Morgan Oconee Oglethorpe Putnam Taliaferro Greene Area
5,015 3,926 6,276 9,801 5,028 7,661
699
38,406
Source: Georgia Department of Labor
4,507
508
3,587
339
5,854
422
9,481
320
4,694
334
7,302
359
644
55
36,069
2,337
Georgia Unemployment Rate
U.S. Unemployment Rate
10.1 8.6 6.7 3.3 6.6 4.7 7.9 6.1 5.8% 6,8%
POPULATION
1990 Census
1992
Estimated
Rank PopuJation Rank
Percent Change 199CF1992
2000 Projected Popufation Rank
Greene County 11,793 105 12,147 103
3.0
12,820 106
Cny of Greensboro 2,860
Greene Area
77,017
80,031
3.9
90,317
Note: Projected population based onJ 990 census
Source: u.s; Department of Commerce. Bureau of Census/Georgia Office of Planning and
Budget (projections) . . . "Rank" ;ndicatesrelative poputation among.Georgla's.159 counties.
Georgia Department of Labor
DAVID POYTHRESS, Commissioner
HIGH SCHOOL GRADUATES 1992-1993
Male
Female
Total
Greene Hancock
60
92
152
56
54
110
Margan
59
69
128
Oconee
105
103
208-
Oglethorpe Putnam Taliaferro
41
48
89
53.
75
*
128.
Total
374
441
815
* Included with Greene County.
Nate: Data on graduates from private high schools are not included. Source: Georgia Department of Education
PER CAPITA ANNUAL INCOME
1992
Percent Relative to Georgia
Percent Relative
to U.S.
Percent Change
1991-1992
Greene County
14,162
76.3
70.4
4.9
Georgia
18,549
92.3
5.0
U.S.A.
20,105
108.4
4.9
Source: U.S. Department of Commerce, Bureau of Economic Analysis
ACTIVE APPLICANTS - State Employment Service
Professional
Agriculture
Miscel
Technical aerical
Forestry
laneous
and
and
Fishing
Pr~ Machine Bench Structural Occu-
Managerial Sales Service
etc.. cessing Trades
work Work pations
Total
Greene Hancock Margan Oconee Oglethorpe Putnam Taliaferro Total
18 51
37
7
15
19 29
28 40 244
26 71
83
9
20
32 52
36
53 382
34
69
22
3
13
41
41
35
59
317
52
96
26
7
6
18 16
34
38
293
29
69
23
3
8
14 35
42
34 257
47
67
46
3
16
33
39
45
81 377
1
5
6
1
2
7
3
5
9
39
207 428 243
33
80 164 215 225 314 1,909
Note: Detailed figures on the availability of applicants in specific occupations are available from Georgia Department of Labor, Labor Information Systems, or from the nearest office of the state Employment SeNice.
Source: Georgia Department of Labor (Active applicants as of June 1994)
Page2
13394
CURRENT INDUSTRY MIX - GREENE
INDUSTRY
1993 Average Employment
Average Weekly Wages
Agriculture, forestry, and fishing
124
$ 270
Mining
*
*
Construction
52
396
Manufacturing Tobacco products
1,547.
374.
Textiles
779
340
Apparel
179
209
Lumber and wood products Printing and publishing
134
*
368.
Rubber and miscellaneous plastic products Stone, clay, glass, and concrete Primary metal products
240. .
416
.*
Fabricated metal products Industrial machinery, including computers
* *
.*
Transportation and public utilities
74
529
Wholesale trade
117
322
Retail trade
534
203
Finance, insurance, and real estate
316
342
Services Hotels, other lodging places
. 1,020
315
*
Personal services
34
160
Business services
16
539
Auto repair, services, garages Motion pictures
16.
434.
Amusement and recreation services
89
260
Health services
329
357
Legal services
15
520
Educational services Social services Membership organizations
459.
306.
.
.
Engineering and management services
12
315
Private households Miscellaneous services
10.
.125
Public Administration
238
341
ALL INDUSTRIES
4t038
$ 331
Notes:
Denotes confidential data relating to individual employers whicb cannot be released.
Average weekly wages is derived by dividing gross payrolJ dollars paid to all employees " both hourly and salaried , by the average number of employees who had any earnings; average earnings are then divided by the number of weeks in the periocUo obtain weekly figures.
Health Services includes goyernment hospitals. Educational Services includes government educational institutions.
Source: Georgia Department of Labor:- Data represent jobs in this county covered by unemployment insurance legislation.
133-94
Page3
EMPLOYERS
TEN LARGEST EMPLOYERS
Greene County Area
County
Chipman-Union Inc Reynolds Pfantation Denon Digital Inc Georgia Pacific Co Wellington Puritan Athens Packaging Inc Georgia Power Co Haband Company Horton Homes Sara Lee Knit Products
Greene Greene Morgan Morgan Morgan Oconee Putnam Putnam Putnam Putnam
THREE LARGEST EMPLOYERS
Greene County
Chipman-Union Inc Reynolds Plantation Wellington Puritan
Note: Represents employment covered by unemployment insurance, excluding government and railroads. Data shown for Third Quarter 1993.
OCCUPATIONAL PROFILE
Greene County
Employed persons, 16 years and over Executive, administrative, and managerial Professional specialty occupations Technical and related support Sales Administrative, support, including clerical Service Farming, forestry, and fishing Precision production, craft and repair Machine operators, assemblers, and inspectors Transportation and material moving Handlers, equipment cleaners, helpers and laborers
Source: 1990 Census (Summary tape file 3)
Number
4,863 422 265 73 374 597 623 356 582 962 285
324
Percent
100~0 8.7 5.5 1.5 7.7
12.3 12.8
7.3
12.0
19.8 5.9
6.7
COMMUTING PATTERNS
Employed Residents of Greene. County
County where Employed
Number
Greene Clarke Morgan Putnam Fulton Other
3,772
260
192 102 62 407
Total Residents
4,795
PersonsWorking . in
Greene County
Greene
T,1iaten-p
Hancock
... Oco
. . M1oartga.n.../.
Putnam Ogleth<?flle
other
ercent .Total
.4 .1 ~3 .9. ~9 .9
Source: 1990 Census of Populationraod Housing Page 4
133-94