- Collection:
- Georgia Government Publications
- Serial:
- Obesity in Georgia's 3rd grade children.
- Title:
- Obesity in Georgia's 3rd grade children, 2005
- Creator:
- Georgia. Department of Human Resources. Division of Public Health
- Contributor to Resource:
- Georgia. Department of Human Resources. Division of Public Health
- Publisher:
- Atlanta, Ga. : Georgia. Department of Human Resources. Division of Public Health
- Date of Original:
- 2005
- Subject:
- Obesity in children--Georgia--Periodicals.
Obesity in children--Georgia--Statistics--Periodicals.
Obésité chez l'enfant--Géorgie (État)--Périodiques.
Obésité chez l'enfant--Géorgie (État)--Statistiques--Périodiques.
Georgia Government Documents--Serial - Location:
- United States, Georgia, 32.75042, -83.50018
- Medium:
- state government records
- Type:
- Text
- Format:
- application/pdf
- Description:
- "[A] collaborative effort between the Georgia Department of Human Resources, Division of Public Health, Family Health Branch, Oral Health and Nutrition Sections and the Epidemiology Branch, Chronic Disease, Injury, and Environmental Epidemiology Section as well as the Association of State and Territorial Dental Directors."--2005, page 4.
2005; title from PDF caption (Georgia Government Publications database, viewed March 19, 2024).
2005 (Georgia Government Publications database, viewed March 19, 2024). - External Identifiers:
- Call Number GA H800.P8 S1 G7 2005
- Metadata URL:
- https://dlg.galileo.usg.edu/id:dlg_ggpd_y-ga-bh800-pp8-bs1-bg7-b2005-belec-p-btext
- Digital Object URL:
- https://dlg.galileo.usg.edu/do:dlg_ggpd_y-ga-bh800-pp8-bs1-bg7-b2005-belec-p-btext
- Language:
- eng
- Holding Institution:
- University of Georgia. Map and Government Information Library
- Rights:
-

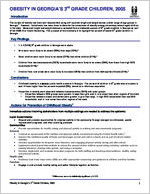
OBESITY IN GEORGIA'S 3rd GRADE CHILDREN, 2005
Introduction
The burden of obesity has been well-documented using self-reported height and weight across a wide range of age groups in Georgia.1 However, limited work has been done to describe the prevalence of obesity among elementary school-aged children in the state. Measured height and weight data were collected from a statewide sample of 3rd grade students in Georgia as part of the 2005 Oral Health Screening. The purpose of this summary is to highlight the percent of obese 3rd grade children in Georgia.
Key Findings
1 in 4 (24%) 3rd grade children in Georgia were obese.
Girls were more likely to be obese (25%) than boys (22%).*
Black children were more likely to be obese (27%) than white children (21%).*
Children from low socioeconomic (SES) households were more likely to be obese (26%) than those from high SES households (21%).*
Children from rural areas were more likely to be obese (26%) than children from Metropolitan Atlanta (21%).*
Conclusions
Childhood obesity is a severe public health problem in Georgia. The percent of children in 3rd grade who are obese is over 4 times higher than the percent expected (5%), based on a reference population.
Disparities in obesity were observed between socioeconomic (SES) and racial groups. Disparities between SES groups were greater in boys than girls and in rural areas than other regions of the state. Disparities between blacks and whites were greater in girls than boys, in high SES households than low SES households, and in rural areas than other regions of the state.
Actions for Prevention of Childhood Obesity2
Immediate actions involving stakeholders from multiple settings are needed to address the epidemic.
Local Governments Expand and promote opportunities for physical activity in the community through changes to ordinances, capital improvement programs, and other planning practices.
Communities Provide opportunities for healthy eating and physical activity in existing and new community programs.
Schools Conduct an assessment of the nutrition and physical activity environment using the School Health Index.3 Improve the nutritional quality of foods and beverages served and sold in schools and as part of school-related activities. Increase opportunities for frequent, more intensive, and engaging physical activity during and after school. Implement school-based interventions to reduce the amount of time children spend doing sedentary activities such as viewing television, playing video games, and using a computer. Develop, implement, and evaluate innovative programs for both staffing and teaching about wellness, healthy eating, and physical activity.
Health care Routinely track body mass index (BMI) and offer appropriate counseling and guidance to children and their families.
Families Engage in and promote healthy eating and active lifestyles together as families.
* Differences were not statistically significant: p 0.05
Obesity in Georgia's 3rd Grade Children, 2005
1
Weight status of 3rd grade children in Georgia
1% of 3rd grade children were underweight. 56% of 3rd grade children were in the normal weight range. 19% of 3rd grade children were overweight. 24% of 3rd grade children were obese.
Percent of 3rd grade children by weight status*, Georgia, 2005
Obese: 24%
Underweight: 1%
Overweight: 19%
Normal: 56%
*Underweight: BMI-for-age < 5th percentile
Normal: BMI-for-age 5th-<85th percentile
Overweight: BMI-for-age 85th-<95th percentile Obese: BMI-for-age 95th percentile
Disparities in Obesity by Socioeconomic Status
Sex and Socioeconomic Status
Girls from low SES households were most likely to be obese (26%). Boys from high SES households were least likely to be obese (19%). Disparity between SES groups was greater in boys than girls.
Percent
Percent of 3rd grade children who were obese* by sex and SES, Georgia, 2005
Low SES
High SES
40
30
25
19 20
26 23
10
0 Boys
Girls
Region and Socioeconomic Status
Children from low SES households in rural areas were most likely to be obese (29%).
Children from low SES households in Suburban Atlanta (18%) and high SES household in rural areas (19%) were least likely to be obese.
Disparity between SES groups was greater in rural areas than other regions of the state.
* Obese: BMI-for-age 95th percentile Based on Free and reduced School Lunch Program eligibility
Percent of 3rd grade children who were obese* by region and SES, Georgia, 2005
Low SES 40
30 22 21
20
18 20
High SES
27 24
29 19
Percent
10
0 Metro Atlanta
Suburban Small Cities Atlanta
Rural
* Obese: BMI-for-age 95th percentile Based on Free and Reduced School Lunch Program eligibility
Obesity in Georgia's 3rd Grade Children, 2005
2
Disparities in Obesity by Race
Sex and Race
Black girls were most likely to be obese (30%). White children were least likely to be obese regardless of sex (21%). Disparity between blacks and whites was greater in girls than boys.
Socioeconomic Status and Race
Black children were most likely to be obese regardless of SES (26%). White children from high SES households were least likely to be obese (19%). Disparity between blacks and whites was greater in children from high SES households than low SES households.
Region and Race
Black children from rural areas were most likely to be obese (33%). White children from Metropolitan Atlanta were least likely to be obese (17%). Disparity between blacks and whites was greater in rural areas than other regions of the state.
Percent
Percent of 3rd grade children who were obese* by sex and race, Georgia, 2005
Blacks
Whites
40
30 23 21
20
30 21
10
0 Boys
Girls
* Obese: BMI-for-age 95th percentile
Percent of 3rd grade children who were obese* by SES and race, Georgia, 2005
Blacks
Whites
40
Percent
30
26
24
20
26 19
10
0 Low SES
High SES
* Obese: BMI-for-age 95th percentile Based on Free and Reduced School Lunch Program eligibility
Percent of 3rd grade children who were obese* by region and race, Georgia, 2005
Blacks 40
30 23
24
20
17
Whites
33 29
21
21
Percent
10
0 Metro Atlanta
Suburban Small Cities Atlanta
Rural
* Obese: BMI-for-age 95th percentile Data are not reported due to fewer than 100 participants
Obesity in Georgia's 3rd Grade Children, 2005
3
Methodology and Sample Size
Sampling The Georgia Department of Human Resources, Division of Public Health conducted a statewide oral health screening in Spring 2005. All public schools with 25 or more students enrolled in 3rd grade were eligible to participate in the screening. During the 2002-2003 school year, there were 1,145 schools with 115,523 children in the 3rd grade. The sampling frame was ordered by the proportion of students eligible for the free and reduced lunch (FRL) program. The 15th school was randomly selected to participate and every 20th school thereafter. If a school refused to participate, a replacement school with a similar proportion of children eligible for the FRL program was randomly selected.
Measurement of obesity Trained staff measured the height and weight of 2,899 children (51% student participation rate with parental consent) from 57 schools across the state. Body mass index (BMI) was calculated by dividing weight in kilograms by height in meters squared for each child. The weight status of children was determined by using growth charts developed by the Centers for Disease Control and Prevention. The growth charts show the distribution of BMI across a range of ages for a reference population. Children were classified as obese if their BMI-for-age was in the 95th percentile or above.
Weighting Results were weighted for non-response and the race and sex distribution of 3rd grade students by geographic regions in Georgia. The sample was weighted by race-only groups due to a substantial proportion of children with unknown or missing ethnicity (26%). Race-only weights were derived by reclassifying Hispanic children in the school enrollment data into raceonly groups based on the racial distribution of Hispanic children ages 5-9 in Georgia reported by the U.S. Census.
Definition of socioeconomic status and geographic regions Eligibility in the FRL program was used as an indicator of SES in this analysis. Eligibility is based on the income and number of persons in the household. For example, households with four individuals were eligible to participate in the FRL program during the 2004-2005 school year if their annual income was less than $34,873. The classification of regions in the state was based on county population density estimates in 2002. Metropolitan Atlanta included counties with 1,500 residents per square mile or more. Counties with 290-900 residents per square mile bordering counties in Metropolitan Atlanta were classified as Suburban Atlanta and those not bordering Metropolitan Atlanta were classified as small cities. Rural areas included counties with fewer than 290 residents per square mile.
SAS was used to calculate weighted prevalence estimates with 95% confidence intervals.
References
1. Georgia Department of Human Resources, Division of Public Health. Overweight and Obesity in Georgia, 2005. April, 2005. Publication number: DPH05.023HW. http://health.state.ga.us/epi/cdiee/obesity.asp
2. Institute of Medicine. Preventing Childhood Obesity: Health in the Balance. Report Brief, September 2004. http://iom.edu/report.asp?id=22596
3. Georgia Department of Human Resources, Division of Public Health. Georgia's Nutrition and Physical Activity Plan to Prevent and Control Obesity and Chronic Diseases, July 2005. Publication number: DPH05/048HW. http://health.state.ga.us/programs/nutrition/publications.asp
The measurement of obesity in Georgia's 3rd grade children was a collaborative effort between the Georgia Department of Human Resources, Division of Public Health, Family Health Branch, Oral Health and Nutrition Sections and the Epidemiology Branch, Chronic Disease, Injury, and Environmental Epidemiology Section as well as the Association of State and Territorial Dental Directors.
For more information and resources about programs to address childhood obesity in Georgia, please contact:
For more information on the prevalence of obesity in Georgia, please contact:
Mara Galic 2 Peachtree Street, NW, 11th Floor
Atlanta, GA 30303-3142
(404)-657-2884
migalic@dhr.state.ga.us
Matt Falb 2 Peachtree Street, NW, 14th Floor Atlanta, GA 30303-3142
(404)-463-4630 mdfalb@dhr.state.ga.us
http://health.state.ga.us/epi/cdiee/obesity.asp
Suggested citation: Falb M and Kanny D. Obesity in Georgia's 3rd Grade Children. Georgia Department of Human Resources, Division of Public Health, January 2006. Publication Number: DPH06.004HW.
Obesity in Georgia's 3rd Grade Children, 2005
4