- Collection:
- Georgia Government Publications
- Title:
- Population projections for Georgia counties, 1990 and 2000
- Creator:
- Wagner, Tom
- Publisher:
- Atlanta, Ga. : Georgia. State Data Center. Division of State Planning. Office of Planning and Budget
- Date of Original:
- 1983-03
- Subject:
- Population forecasting--Georgia--Statistics
Population
Population forecasting
Georgia--Population--Statistics
Georgia
Statistics - Location:
- United States, Georgia, 32.75042, -83.50018
- Medium:
- reports
- Type:
- Text
- Format:
- application/pdf
- Description:
- Report projecting Georgia county populations for 1990 and 2000
- External Identifiers:
- Call Number GA G620.P4 S1 P66 1983
- Metadata URL:
- https://dlg.galileo.usg.edu/id:dlg_ggpd_y-ga-bg620-pp4-bs1-bp66-b1983
- Digital Object URL:
- https://dlg.galileo.usg.edu/do:dlg_ggpd_y-ga-bg620-pp4-bs1-bp66-b1983
- Language:
- eng
- Holding Institution:
- University of Georgia. Map and Government Information Library
- Rights:
-

Ut\
.llG20. 4
'~1 ~1?66
_ _LL~3
Received
APR 11 1983
DOCUMENTS UGA LIBRARIES
Populati n rojections For Ge a ounties
and
State Data Center OFFICE OF PLANNING.& BUDGET 270 Washington St., S.W., Atlanta, Georgia 30334
Telephone (404) 656-2191
Joe Frank Harris Governor
Prepared by Tom Wagner
Clark T. Stevens Director
March 1983
iJNIV. OF~;
T,TTI, ARIES I
TABLE OF CONTENTS
Preface
Summary
3
Methodology
4
Population 1970 and 1980 by County
7
Projected Population 1990 and 2000 by County
7
1980 Population by County by Age, Race, and Sex
11
1990 Projected Population by County by Age, Race, and Sex
15
2000 Projected Population by County by Age, Race, and Sex
19
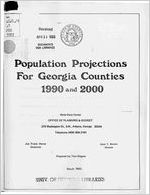
Map - Population Change 1980 - 2000
23
Map - Net Migration 1980 - 2000
24
Preface The population projections presented in this report are demographic projections of future population. They are not a forecast. A demographic projection is a statistical methodology which examines historical trends, fertility and mortality. These projections represent reasonable expectations of what the future population will be assuming no sudden or large changes to present patterns. For example, if an area develops strategies for attracting business and industry at a rate above their current level, it will not be reflected in these projections. Our purpose in distributing these projections is to provide planners a reasonable set of population projections to work from in designing facilities and providing new services.
2
Summary
The State of Georgia is expected to increase its population by almost two million persons by the year 2000. A large part of the increase (over 1 million) will be in the fifteen county metropolitan Atlanta area. Over 1.1 million of the increase will be the result of net migration. From 1970 to 1980 Georgia ranked as the fifth fastest growing state in the country in terms of population gain. This growth pattern is expected to continue 1n the period 1980-2000.
Without question, the Atlanta metropolitan area will be the focal point of the State's population growth from 1980 to the year 2000. In 1970, five of the State's twenty largest counties were in the Atlanta SMSA. By the year 2000 nine of the largest twenty will be in the Atlanta SMSA. The largest four counties will all be located in the Atlanta area, Fulton, Dekalb, Gwinnett, and Cobb.
The county with the largest population increase from 1980 to 2000 will be Gwinnett, increasing over 270,000 persons. Fayette is the county with the largest projected percent increase, over 300 percent for the 1980-2000 period. Other counties experiencing a high percent increase for the same period of time are Camden, Gwinnett, Henry, Lee, Liberty, and Rockdale. Only three counties, Calhoun, Stewart, and Taliaferro are expected to lose population. This continues a trend started in 1960 of many of Georgia's counties sharing in the State's tremendous growth.
The number of persons age 65 and over will continue to increase as a percent of Georgia's total population. In 1970, 8.01 percent of the State's population was 65 and over. By 1980, 9.46 percent was 65+ and this percent will increase to 10.66 by the year 2000.
A dramatic decrease is expected in the percent of population age seventeen and under. In 1970, the percent was 35.83, and by 1980, it had fallen to 30.13. We expect the decline to continue and reach 26.02 percent by the year 2000.
Camden County will experience an increase in population due to the military facility at Kings Bay. Other non-civilian populations are expected to remain the same.
Methodology
A cohort-component procedure was utilized to make the population projections for 1990 and the year 2000. This methodology worked well 1n Georgia when tested against the 1980 Census.
The cohort-component method examines the three elements of population change. They are 1) fertility (births), 2) mortality (deaths), and 3) migration. If we know the number of births and deaths, and we know the net movement of people in and out of a given area, we should be able to project the future population.
Our approach was a "top down" methodology. That is, we projected the state's population and then controlled each county to the projected state total. We feel like this is essential to any methodology before making county level projections. It is much sounder statistically to work with a large geographic area and population base initially rather than adding up all of the parts independently projected. The methodology may be described as follows:
1) Computation of net migration for the previous decade by age, race, and sex by county.
Population x Survival
Year 1
Rate
Expected Population Year 2
Actual Population Year 2
Expected Population Year 2
Net Migration For the Time Period
2) Projection of population for the upcoming decade by age, race, and sex by county.
Population x Projected
Year 2
Survival
Rates
Expected Population Year 3
Expected
Population x Net Migration
Year 3
Rate
Net Migration For the Time Period
Expected Population Year 3
Net Migration + For the Time
Period
Projected Population Year 3
4
3) Computation of births for the decade by race and sex by county.
Average Births For Base Year /
County General Fertility Rate For Base Year /
Female Population
= County General
Age 15-44 For Year 1
Fert ility Rate
For Base Year
U.s. General
Fert ility Rate = Fertility Ratio
For Base Year
For Base Year
U.S. General
County General
Fertility Ratio x Fertility Rate = Fertility Rate
For Base Year
For First Half
For First Half
of Decade
of Decade
U.s. General
Fertility Ratio x Fertility Rate
For Base Year
For second Half
of Decade
County General Fertility Rate For Second Half of Decade
Female Population 15-44
County General x For Midpoint Year
x5
Fert ility Rate
Ex. 83 or 88
Projected Births For Half of Decade
Calculate Proportion Male and Female.
4) Apply assumptions to net migration table.
If the net migration is positive and the population density per square mile is:
a) Less than 250 - No adjustment
b) 250-499
- 90 percent factor applied to net migration
c) 500-749
80 percent factor applied to net migration
d) 750-999
- 70 percent factor applied to net migration
e) 1000-1249
60 percent factor applied to net migration
f) 1250-1499
- 50 percent factor applied to net migration
g) 1500-1749
40 percent factor applied to net migration
h) 1750-1999
- 30 percent factor applied to net migration
i) 2000 or over
25 percent factor applied to net migration
If the net migration ~s negative and the popul~tion density per square mile ~s:
a) Less than 100 - 75 percent factor applied to net migration
b) 100-500
- 50 percent factor applied to net migration
c) over 500
25 percent factor applied to net migration
The result of the above adjustment LS to slow growth due to migration in densely populated areas and reduce the movement out of areas currently losing population.
5
5) Apply IJ.S. Fertility Rates as follows:
White Females Age 15-44 (Per 1,000)
1980-1985 1985-1990 1990-1995 1995-2000
70.7 70.6 68.1 64.8
Non-White Females Age 15-44 (Per 1,000)
1980-1985 1985-1990 1990-1995 1995-2000
82.7 76.8 71.0 67.2
(
POPULATION PROJECTIONS PROJECfED NUMBER OF INHABI fANfS
AREA
1970 RANK
Georgia
4,587,930
AppLing Atkinson Bacon Baker Baldwin Banks Barrow Bartow Ben flill Berrien Bibb Bleckley Brantley Brooks Bryan Bulloch Burke Butts Calhoun Camden Candler Carroll Catoosa Charlton ChAtham Chattahoochee Chattooga Cherokee Clarke Clay Clayton CI inch Cobb Coffee Co Iquit t
12,726
80
5,B79 140
B,233 112
3,875 150
34,240
23
6,833 127
16,859
64
32,911
25
13,171
76
11,556 85
143,366
7
10,291
95
5,940 138
13,743
72
6,539 132
31,5B5
29
18,255
53
10,560 93
6,606 131
11, 33/~
90
6,412 135
45,404
19
28,271
33
5,680 143
187,816
4
25,813
37
20,541
47
31,059
30
6~77 1..2.. 3,636 153
98,126
B
6,405 136
196,793
3
22,828 42
32,298
28
19BO RANK
5,463,105
15,565 78
6,141 142
9,379 116
3,808 152
34,6B6
36
B,702 124
21,354
55
40,760
24
16,000 77
13,525
B7
150,256
9
10,767 105
8,701 125
15,255
BO
10,175 110
35,785
34
19,349 63
13,665 86
5,717 145
13,371
89
7,518 133
56,346
18
36,991
30
7,343 134
202,226
4
21,732
54
21,856
52
51,699
21
7~98
3,553
-14
153
150,357
8
6,66U 138
297,718
3
26,894
45
35,376
35
1990 RANK
6,462,313
17 ,862 6,591 10,461 4,048 41,301 10,031 25,396
116,851
19,036 15,058 161,918 11,225 11,367 16,906 14,621 37,782 21,790 16,330
5,480 27,932 8,2lJ3 66,191 43,495 8,929 221,381 23,562 22,414 75,749
81~
3,885 191,751
6,963 375,316
30,549 38,317
B3 142 120 152
35 123 54 29 78 90
9 113
III
84 92 41 65 86 151 50 133 19 31 130
CD
56 63 17 15 153
7 139
3 46 39
2000 RANK
7,422,594
19,875 83
7,051 142
11,487 120
4,35'} 152
49,552
32
11,020 124
28,991
52
51,611
30
21,9'19
76
16,247
91
173,366
9
11,484 121
14,116 102
18,681
86
19,960 82
39,591
42
24,498
66
19,126
84
5,505 151
34,745
46
8,914 134
74,95.5
24
47,673
34
10,537 128
241,920
5
26,382
58
22,250 75
102,412
14
8~82
4,354
-19
153
219,004
7
7,246 141
1118,304
II
33,519
47
40,546
41
POPULAfl0N CHANGE
1970-1980
B75,175
2,839 262
1,146 -67 446
1,869 4,495 7,849 2,829 1,969 6,890
476 2,761 1,512 3,636 4,200 1,094 3,105 -889 2,037 1,106 10,942 8,720 1,663 14,410 -4,081 1,315 20,640 9,321
-B3 52,231
<'55 100,925
4,066 3,078
PERCENT CHANGE 1970-19BO
19.0B
22.51 4.46 13.92 -1. 73 1.30 27.35 26.66 23.85 21.48 17 .04 4.81 4.63 46.48 11.00 55.60 13.30 5.99 29.40 -13.46 17 .97 17.25 24.10 30.84 29.28 7.67 -15.81 6.40 66.45 14.30
~
-2.28 53.23 3.98 51.28 17 .81 9.53
POPULAfl0N CHANGE
1980-2000
1,959,4B9
4,310 910
2,108 551
14,866 2,318 7,637 10,851 5,919 2,722 23,110 717 5,415 3,426 9,785 3,806 5,149 5,461 -212 21,374 1,396 18,607 10,682 3,194 39,6911 4,650 394 50,713
12~
801 69,447
586 120,586
6,625 5,170
PERCEN f CHANGE 1980-2001
35.B7
27.69
111.82
22.4B 1/1.47 42.86 26.64 35.76 26.62 36.99 20.13 15.38 6.66 62.23 22.46 96.17 10.64 26.61 39.96 -3.71 159.85 18.57 33.02 28.U8 43.50 19.63 21.40
- 1.80 98.09 16..J.6 22.54 46.19 8.80 40.50 24.63 14.61
AREA
Columbia Cook Coweta Crawford Crisp Dade Dawson Decatur DeKalb Dodge Doo1y Dougherty Douglas Early Echols Effingham Elbert Emanuel Evans Fannin fayette rIoyd forayth franklin fulton Gilmer Glascock Glynn Gordon Grady Greene Gwinnett Haberaham Hall Itancock Haralson Harris Hart Heard Henry Houston Irwin
1970 RANK
22,327
43
12,129 84
32,310 27
5,748 142
10,007
55
9,910 98
3,639 152
22,310 44
415,387
2
15,65B
69
10,404 94
B9,639
9
20,659
32
12,6B2
B1
1,924 159
13,632
73
17,262 61
18,357
52
7,290 123
13,357
75
11,364
89
73,742
10
16,928 63
12,7B4
79
605,210
1
8,956 105
2,280 157
50,528
18
23,570
39
17 ,B26
57
10,2..1. 2 96
72,349
11
20,691
46
59,405
14
9,019 104
15,927
67
11,520 B6
15,B14
68
5,354 145
23,724
3B
62,924
13
B,036 1I5
(.
1980 RANK
40,118 25
13,490 88
39,268
26
7,6B4 130
19,489
62
12,318
92
4,774 150
25,495 48
483,024
2
16,955
75
10,B26 104
100,71B
10
54,573
20
13,15B
90
2,297 15B
18,327
71
1B,75B 66
20,795
5B
B,42B 127
14,748
B2
29,Ol'3
43
79,BOO
11
27,95B
44
15,1B5
81
5B9,904
1
11,110 102
2,3B2 155
J4,9B1_19
30,070
41
19,B45 60
11,391 101
166,903
7
25,020
50
75,649
13
9,466 114
18,422
69
15,464 79
1B,5B5 67
6,nO 141
36,309
n
77 ,605
12
8,988 119
1990 RANK
62,116
21
14,638 91
45,725
30
10,341 121
21,502
68
13,949
95
5,744 146
2B,786
47
542,109
2
17,944
81
11,759 109
115,937
10
83,9B8
13
14,301
93
2,621 155
23,103
60
20,207
74
23,321
58
9,356 129
15,524 89
62,774
20
B3,351
14
3B,85B
3B
16,694 85
641,971
1
12,725 102
2,524 156
59,963
22
34,973
42
21,B54 64
12,945 101
296,155
4
2B,172
49
B8,467
12
10,499 118
19,943
75
19,6B5
77
20,319
73
7,712 136
53,685
28
91,294
11
9,901 124
2000 RANK
80,153
17
15,575
94
51,757
29
14,OV 105
23,416
72
15,063
96
6,517 147
31,941
49
571,682
2
18,799
B5
12,B02 112
134,262
10
116,260
12
15,61B
93
2,930 155
27,764
56
21,339
BO
25,667
61
10,199 129
15,66B
92
118,717
11
84,B12
20
50,2B3
3J
17 ,6B1
87
693,322
1
13,887 L06
2,659 158
~,174
25
38,711
43
23,70B
70
14,703 90
441,600
3
30,358
51
97,906
15
11,929 119
20,76B
81
24,571
65
21,37B
79
8,940 133
75,549
23
105,B24
l3
10,737 125
B
POPULATION CHANGE
1970-1980
17,791 1,361 6,958 1,936 1,402 2,40B 1,135 ,J,185 67,637 1,297
ll22 11,079 25,914
476 373 l~ ,695 1,496 2,438 1,130 1,391 17 ,679 6,058 11,030 2,401 -15,306 2,154 102
~,453
6,500 2,019 1,179 94,554 4,329 16,244
447 2,495 3,944 2,771 1,166 12,5B5 14,681
952
PERCENT CHANGE 1970-1980
79.68 11.22 21.54 33.68
7.75 24.30 31. 19 14.2B 16.28 8.2B 4.06 12.36 90.42
3.75 19.39 34.44
8.67 13.20 15.61 10.41 155.57 6.22 65.16 18.7B -2.53 24.05 4.47 ].81 27.58 11.33 11. 5S 130.69 20.92 27.34 4.96 15.67 34.24 17.52 21.7B 53.05 23.33 11.85
POPULA TION CHANGE
- 198- 0-2- 00- 0
PERCENT CHANGE
-19-80--2-00-0
48,035
2,085
12,489
6,339
3,927
2,745
1,743
'" 6,446
f
88,6~
1,844
1,976 ,
33,544 "'
\ 61,6B7 2,460 633
9,437
2,5B1
4,872
1,771
920
B9,674
5,012
22,325
2,496
103,41B
2,777
277
9,193
8,641
3,B63
3,312
274,777
5,3.50
22,257
2,463
2,346
9,107
2,793
-2,1120
39,240
28,219
1,749
119.73 15.46 31.80 02.50 20.15 22.28 36.51 25.2B IB.35 IO.BB 1B.25 33.3U 1I:L04 1B.70 27.56 51.49 13.76 23.43 21.01 6.24
30B.76 6.20 79.85 16.44 J7.53 25.00 11.63 16.72 2B.74 19.47 29.0B
164.63 21. 3"5 -29.42
26.02 12.7J 5B.09 15.03 37.12 108.07 36.36 19.46
AREA
Jackson Jasper Jeff Davis Jefferson Jenkins Johnson Jones Lamar Lanier Laurens Lee Liberty Lincoln Long Lowndes Lumpkin Macon
-edison
Marion McDuffie McIntoah Meriwether Miller Mitchell Monroe Montgomery Morgan Murray Muscogee Newton
- Oconee
glethorpe Paulding Peach Pickens Pierce Pike Polk Pulaski Putnam Quitman Rabun
1970 RANK
1980 RANK
1990 RANK
2000 flANK
POPULATION CHANGE
1970-1980
PERCENT CHANGE 1970-1980
21,093 5,760 9,425 17,174 8,332 7,727 12,270 10,688 5,031 32,738 7,044 17,569 5,895 3,746 55,112 8,728 12,933 13,517 5,099 15,276 7,371 19,461 6,424 18,956 10,991 6,099 9,904 12,986 167,377 26,282
2. 915
7,598 17,520 15,990 9,620 9,281
7,316 29,656 8,066 8,394 2,180 8,327
45
25,343
141
7,553
101
11,473
62
18,403
110
8,841
119
8,660
83
16,579
92
12,215
147
5,654
26
36,990
125
11,684
58
37,583
139
6,716
151
4,524
15
67,972
108
10,762
78
14,003
74
17,747
146
5,297
70
18,546
121
8,046
49
21,229
134
7,038
51
21,114
91
14,610
137
7,011
99
11,572
77
19,685
5
170,108
36
-116
120
-
34,489 12,427 8,929
59
26,110
66
19,151
100
11,652
103
11,897
122
8,937
31
32,386
114
8,950
109
10,295
158
2,357
III
10,466
49
28,716
132
9,626
99
13,206
70
19,888
123
9,687
126
9,446
76
21,291
93
13,566
146
6,178
31
41,671
96
18,604
28
56,024
137
7,617
151
5,705
15
78,577
106
12,224
- - 85
15,585
74
21,583
148
5,603
68
21,511
128
8,815
56
23,259
135
7,727
57
23,815
83
18,078
136
7,456
98
13,402
61
26,179
6
184,156
37
41,794
91 - 17,939
122
10,069
46
34,838
64
22,676
97
13,124
95
14,301
121
11,207
39
34,402
120
9,1326
109
12,309
156
2,523
107
11,795
48
31,278
127
12,020
90
14,662
76
21,432
126
10,586
128
10,140
69
26,144
96
14,773
145
6,611
34
45,893
79
28,821
25
80,691
137
8,426
148
7,044
16
88,910
104
13,533
88
17,313
66
24,931
150-- 5,963
67
24,088
131
9,598
59
25,238
135
8,406
55
26,724
80
21,824
138
7,875
97
15,242
52
32,660
8
198,563
33
48,025
- 82
24,427
122
11,299
43
43,624
61
26,306
100
14,089
93
16,569
114
14,065
44
35,651
125
10,637
103
14,299
157
2,680
108
12,659
9
50 118 99 78 127 130 60 97 145
37 53 21 136 143 16 107 89
- 64
149 69 131 63 137 57 77 138 95 48
8 33
68 -
123 38 59
103 90 104 44 126 101 156 113
4,250 1,793 2,048 1,229
509 933 4,309 1,527 623 4,252 4,640 20,014 821 778 12,860 2,034 1,070 4,230 190 3,270 675 1,768 614 2,158 3,619 912 1,668 6,699 2,731 8,207 4,512 1,331 8,590 3,161 2,032 2,616 1,621 2,730 8B4 1,901 177 2,137
20.15 31.13 21. 73 7.16 6.11 12.07 35.12 14.29 12.38 12.99 65.87 113.92 13.93 20.77 23.33 23.30 8.27
- -31.29 3.88 21.41 9.16 9.08 9.56 11. 38 32.93 14.95 16.84 51.59 1.63 31.23 - - 57.01 17 .52 l19. 03 19.77 21.12 28.19 22.16 9.21 10.96 22.65
8.12 25.69
POPULATION CHANGE
1980-2000
PERCEN r
CHANGE 1980-2000
5,935 4,467 3,189 3,029 1,745 1,480 . 9,565 2,558
957 8,903 17,137 43,108 1,710 2,520 20,938 2,771 3,310 7,184
61i() 5,542 1,552 4,009 1,368 5,610 7,214
864 3,670 12,975 28,455 14,336 12,000 2,370 17,514 7,155 2,4 J7 4,672 5,128 3,265 1,687 4,004
323 2,193
23.42 59.14 27.80 16.46 19.74 17 .09 57.69 20.94 16.93 24.07 146.67 114.70 25.46 55.70 30.80 25.75 23.64
- 40.48 12.57 29.88 19.29 18.88 19.44 26.57 49.38 12.32 31. 71 65.91 16.73 41.57
.- - 96.56 26.54 67.08 37.36 29-.91 39.27 57.38 10.08 18.05 38.89
13.70
~
20.95
AREA
Randolph Richmond . Rockdale Schley Screven Seminole Spalding Stephens Stewart Sumter Talbot Taliaferro fattnall faylor felfair Terrell Thomas lift foombs Towns freutlen froup furner Twiggs Union Upson Walker Walton Ware Warren Washington Wayne Webster Wheeler White Whitfield Wilcox Wilkes Wi lkinson Worth
1970 RANK
8,734 107
162,437
6
18,152
54
3,097 154
12,591
82
7,059 124
39,514
21
20,331
48
6,511 133
26,931
35
6,625 130
2,423 155
16,557 65
7,865 117
11,394
88
11,416 ,87
34,562 22
27,288
34
19,151
50
4,565 149
5,647 144
44,466
20
8,790 106
8,222 113
6,811 128
23,505
40
50,691
17
23,404
41
33,525
24
6,669 129
17 ,480 60
17 ,858
56
2,362 156
4,596 148
7,742 118
55,108
16
6,998 126
10,184 97
9,393 102
14,770
71
1980 RANK
9,599 112
181,629
5
36,747
32
3,433 154
14,043 84
9,057 118
47,899
23
21,763
53
5,896 144
29,360 42
6,536 140
2,032 159
18,134 72
7,902 129
11,445 100
12,017
94
38,098
27
32,862
38
22,592
51
5,638 147
6,087 143
50,003
22
9,510 113
9,354 117
9,390 115
25,998
47
56,470 17
31,211
40
37,180
29
6,583 139
18,842
65
20,750
59
2,341 157
5,155 149
10,120 111
65,789
16
7,682 131
10,951 103
10,368 108
18,064
73
1990 RANK
10,795 116
207,884
6
59,763
24
3,803 154
15,870 87
10,826 115
54,944 27
22,546 62
5,705 149
32,470 45
6,871 141
1,901 159
20,910
71
8,181 134
11,850 106
13,168 99
42,395
32
38,004 40
25,766 53
6,273 144
6,537 143
55,059
26
10,467 119
10,667 117
11,334 112
27,524
51
59,819
23
39,022
37
40,508
36
6,904 140
20,818
72
23,445
57
2,483 158
5,740 147
11,805 107
73,743
18
8,359 132
11,927 105
11,638 110
21,279
70
2000 RANK
12,423 115
237,160
6
87,580
18
4,232 154
17,680 88
12,473 114
60,600
27
22,864
73
5,739 150
35,479
45
7,309 140
1,857 159
23,421
71
8,509 135
12,214 116
111,592 100
46,461
36
42,822
40
28,541
54
6,608 1[16
6,942 144
59,412
28
11 ,425 122
12,026 117
12,946 109
28,362
55
61,129
26
47,448
35
43,240
39
7,339 139
22,857
74
25,597
62
2,678 157
6,269 148
13,041 108
78,810
22
9,034 132
12,873 111
12,899 110
24,472
67
POPULAflON CHANGE
1970-1980
865 19,192 18,595
536 1,452 1,998 8,385 1,432 -615 2,429
-89 -391 1,577
37 51 601 3,536 5,574 3,441 1,073 440 5,537 720 1,132 2,579 2,493 5,779 7,807 3,655 -86 1,362 2,892 -21 559 2,378
. 10,681
684 767 975 3,294
10
PERCENf CHANGE 1970-1980
9.90 11.82 102.44 10.85 '11.53 28.30 21.22 7.04 -9.45 9.02 -1. 34 -16.14 9.52
.47 .45 5.26 10.23 20.43 17.97 23.50 7.79 12.45 8.19 13.77 37.87 10.61 11.'10 33.36 10.90 -1.29 7.79 16.19 -.89 12.16 30.72 19.38 9.77 7.53 10.38 22.30
POPULAflON CHANGE
1980-2000
2,824 55,531 50,833
799 3,637 3,416 12,701 1,101 -157 6,119
773 -175 5,287 607
769 2,575 8,363 9,960 5,949
970 855 9,409 1,915 2,672 3,556 2,364 4,659 16,237 6,060 756 4,015 4,847 337 1,114 2,921 13,021 1,352 1,922 2,531 6,408
PERCHH CHANGE 1980-2000
29.42 30.57 138.33 23.27 25.90 37.72 26.52 5.06 -2.66 20.84 11.83 -1l.6l 29.16 7.68 6.72 21.43 21.95 30.31 26.33 17.20 14.05 18.82 20.14 28.57 37.87 9.09 8.25 52.02 16.30 11.48 21.31 23.36
-14 .t~0 21.61 20.86 19.79 17.60 17 .55 24.41 35.47
AREA
Georgia
Appling Atkinson Bacon Baker Baldwin Banks Barrow Bartow Ben Hill Berrien Bibb Bleckley Brantley Brooks Bryan Bulloch Burke Butts Calhoun Camden Candler Carroll Catoosa Charlton Chatham Chattahoochee Chattooga Cherokee Clarke Clay Clayton Clinch Cobb Coffee Colquitt
TOTAL
5,463,105
15,565 6,141 9,379 3,B08 34,6B6 B,702 21,354 40,760 16,000 13,525 150,256 10,767 8,701 15,255 10,175 35,785 19,349 13,665 5,717 13,371 7,518 56,346 36,991 7,343 202,226 21,732 21,856
~1,699
74 8 3,553
150,357 6,660
297,71B 26,894 35,376
0-4
414,935
1,352 536 B65 346
2,318 650
1,641 3,031 1,376 1,029 11,100
732 726 1,272 986 2,485 1,822 1,026 465 1,133 522 4,083 2,78B 652 16,520 1,589 1,563 4,276 4,560 281 12,384 561 21,009 2,339 2,B96
5-19
1,447,202
4,522 1,815 2,607 1,083 9,204 2,230 5,706 11,238 4,009 3,629 3B,753 3,149 2,601 4,390 2,965 10,303 5,684 3,620 1,631 3,869 1,957 15,709 9,855 2,294 51,410 7,436 5,494 14,172 17 ,B96
42,303 2,000
75,225 7,634 9,618
"'
1980 POPULATION NUMBER OF INHABITANTS
20-34
1,446,125
3,613 1,315 2,075
B32 9,272 2,071 4,996 9,597 3,656 3,077 3B,151 2,344 2,060 3,060 2,512 10,373 4,389 3,621 1,180 3,319 1,561 14,331 9,198 1,562 53,299 10,332 4,798 14,279 29,441
06 44,643
1,529 89,810
6,480 7,698
35-64
1,638,112
4,471 1,B02 2,B14 1,063 10,133 2,735 6,523 12,885 4,730 4,242 46,104 3,300 2,519 4,278 2,960 9,108 5,167 3,928 1,597 3,93B 2,255 16,313 12,073
2,94 59,934
2,19B 7,25B 14,B39 16 711 1,031 44,506 1,915 95,369 7,670 10,795
65+
516,731
1,607 673
1,01B 4B4
3,679 1,016 2,4B8 4,009 2,229 1,54B 16,148 1,242
795 2,255
752 3,516 2,2B7 1,470
B44 1,112 1,223 5,910 3,077
741 21,063
177 2,743 4,133
579 6,521
655 16,305
2,771 4,369
WHI rE FEMALE
2,01B,546
6,297 2,248 4,186
975 10,740 4,161 9,454 18,399
5,867 6,023 48,199 4,216 4,152 4,394 4,021 13,297 4,558 3,991 1,269 4,498 2,654 23,BB3 18,830 2,66B 62,940 3,712 10,342 25,441 28,772
719 70,094 2,359 143,019 10,2B6 13,947
WHITE MALE
1,92B,589
6,084 2,190 3,771
9Z2 10,793 4,093 8,715 17,514
5,266 5,760 43,261 4,081 3,954 4,019 3,917 12,742 4,369 4,276 1,142 4,495 2,434 22,558 17 ,69B 2,491 59,393 9,193 9,572 24,B83 26 912
611 67,856
2,310 13B,606
9,666 13,023
11
BLACK* FEMALE
B04,114
1,64B 871 781
1,038 6,694
232 1,709 2,612 2,704
945 32,155 1,371
324 3,729 1,163 5,158 5,590 2,5B2 1,78B 2,255 1,306
5, no
252 1 ,151 42,903 2,315 1,044
751 10,206 1,20B 6,579
991 8,323 3,763 4,523
BLACK' MALE
711,B56
1,536 B32 641 873
6,459 216
1,476 2,235 2,163
797 26,641 1,099
271 3,113 1,074 4,588 4,832 2,816 1,518 2,123 1,124 4,535
211 1,033 36,990 6,512
B98 624 B,~Ol) 1,015 5,820 1,000 7,770 3,179 3,883
AREA
Columbia Cook Coweta Crawford Crisp Dade Dawson Decatur DeKalb Dodge Dooly Dougherty Douglas Early Echols Effingham Elbert Emanuel (vana fannin fayette floyd forayth franklin fulton Gilmer Glascock Glynn Gordon Grady Greene Gwinnett Haberaham Hall Hancock Haralson Harris Hart Heard Henry Houston Irwin
TOrAL
------
40,118 1 J ,490 39,26B 7,684 19,489 12,318 4,774 25,495 483,024 16,955 1O,B26 100,718 54,573 13,158
2,297 18,327 18,758 20,795
8,428 14,748 29,043 79,800 27,950 15,185 589,904 11,110 2,382 54,981 30,070 19,B45 11,391 166,903 25,020 75,649 9,466 18,422 15,464 18,585 6,520 36,309 77 ,605 8,988
0-4
3,';47 1,090 3,OB3
6O'; 1,702
9';5 363 2,231 31,115 1,258 1,009 9,094 4,732 1,129 217 1,509 1,410 1,884 712 914 2,048 5,242 2,148 987 40,242 781 162 4,021 2,230 1,603 1,034 13,907 1,702 5,569 791 1,231 1,061 1, J37 467 2,859 6,382 695
5-19
11,360 3,B91
10,541 2,266 5,424 3,382 1,242 7,146 121,704 4,676 3,082 29,434 15,806 3,881
654 5,299 4,793 5,604 2,388 3,388 8,511 20,095 7,595 3,893 141,349 2,713
565 14,144
8,252 5,569 3,046 44,745 6,619 19,531 2,933 4,904 3,904 4,909 1,777 9,652 21,877 2,461
20-34
11,06'; 2,075 9,037 1,791 4,403 3,158 1,152 5,803
143,119 3,574 2,235
27,264 14,505
2,655 537
4,319 4,186 4,537 1,833 3,046 6,652 18,933 7,042 3,278 172,258 2,497
476 13,337
7,060 4,252 2,424 49,620 6,228 18,611 2,027 3,948 3,375 4,087 1,403 8,942 20,656 1,794
35-64
12,124 4,014 12,310 2,263 5,';33 3,759 1,513 7,241 153,103 ';,201 3,009 27,626 16,082 3,756
628 5,551 5,835 6,138 2,406 5,168 10,110 26,020 8,820 5,009 174,599 3,669
774 17,351 9,580 5,772
3,226 50,06B 7,733 24,405
2,514 6,040 5,237 5,853 2,047 11,656 24,548 2,773
12
65+
2,022 1,620 4,297
759 2,427 1,064
50(~
3,074 33,983 2,246 1,491 7,300
3,448 1,737
261 1,569 2,534 2,632 1,089 2,232 1,722 9,510 2,353 2,018 61,456 1,450
405 6,128 2,94B 2,649 1,661 B,563 2,738 7,533 1,201 2,299 1,887 2,399
826 3,200 4,142 1,265
WHITE fEMALE
16,809 4,840 14,6B3 2,338 6,254 6,152 2,350 8,000 178,868 6,4B2 2,905 28,885 25,865 3,895
953 7,3B2 6,695 7,330 2,847 7,646 13,882 36,197 13,905 7,046 145,819 5,623 1,065 20,728 14,640 6,962 2,794 81,224 11,780 35,336 1,076 8,810 5,088 7,424 2,668 14,916 30,157 3,234
WHITE MAlE
16,67B 4,';22 13,786 2,275 5,524 5,996 2,383 7,498 165,386 5,938 2,615 27,886 25,579 3,563
922 7,471 6,235 6,847 2,621 7,045 13,709 32,989 13,884 6,572 134,515 5,445
926 19,390 14,022 6,449
2,574 80,039 11,760 33,135
978 8,225 4,998 7,010 2,705 14,730 30,507 2,953
BLACK fEMALE
3,529 2,190 5,761 1,602 4,267
80 21 5,346 73,165 2,450 2,898 23,802 1,676 3,123 221 1,014 3,147 3,522 1,609 30 746 5,707 97 799 167,154 18 200 8,029 732 3,4 J7 3,210 2,B84 442 3,915 3,995 735 2,770 2,157 615 3,468 8,894 1,451
BLACK HALE
3,102 1,93B 5,OJll 1,469 3,444
90 20 4,651 65,605 2,005 2,408 20,145 1,4,)3 2,577 201 1,660 2,681 3,096 1,351 27 706 4,907 72 768 142,416 24 191 6,834 676 2,997 2,813 2,756 1,038 3,263 3,417 652 2,600 1,994 532 3,195 8,047 1,350
AREA
Jackson Jasper Jeff Davis Jefferson Jenkins Johnson Jones Lamar Lanier Laurens Lee Liberty Lincoln Long Lowndes Lumpkin Macon Madison Marion McDuffie Mclntosh Meriwether Miller Mitchell Monroe Montgomery Morgan Murray Muscogee Newton Oconee Oglethorpe Paulding Peach Pickens Pierce Pike Polk Pulaski Putnam Quitman Rabun
fOTAL
25,343 7,553 11,473 18,403 8,841 8,660 16,579 12,215 5,654 36,990 11,684 37,583 6,716 4,524 67,972 10,762 14,003 17,747 5,297 18,546 8,046 21,229 7,038 21,114 14,610 7,011 11,572 19,685 170,108 34,489 12,427 8,929 26,110 19,151 11,652 11,897 8,937 32,386 8,950 10,295 2,357 10,466
r
0-4
1,864 623 925
1,545 716 752
1,319 890 510
3,014 1,011 4,048
507 462 5,680 697 1,240 1,352 378 1,518 602 1,766 572 1,902 996 540 914 1,618 13,471 2,689 943 636 2,108 1,549 812 998 705 2,240 673 730 173 607
~...
5-19
6,662 1,917 3,258 5,271 2,474 2,252 4,564 3,351 1,633 9,737 3,429 10,500 1,795 1,255 18,846 3,094 3,965 4,757 1,604 5,109 2,449 5,670 1,924 6,397 3,899 1,901 3,320 5,698 44,604 9,988 3,282 2,511 7,235 5,565 2,921 3,334 2,380 8,451 2,394 2,735
657
2,l154
r.
20-34
5,985 1,772 2,730 4,041 1,985 1,831 4,139 2,713 1,247 8,246 3,221 15,281 1,478 1,236 19,118 2,017 3,223 4,373 1,122 4,347 1,813 4,771 1,463 4,623 3,496 1,839 2,611 4,986 46,436 7,859 3,499 1,97" 6,670 4,836 2,634 2,723 1,921 6,938 1,875 2,389
470 2,291
.....
35-64
7,925 2,223 3,411 5,028 2,606 2,607 5,156 3,726 1,592 11,376 3,266 6,444 2,129 1,185 18,405 3,085 3,809 5,506 1,541 5,713 2,285 6,218 2,114 5,R49 4,4(17 1,886 3,270 5,865 50,453 10,376 3,646 2,749 7,825 5,511 3,762 3,554 2,871 10,461 2,782 3,265
718 3,557
13
""'\
65+
2,907 1,018 1,149 2,518 1,060 1,218 1,401 1,535
672 4,617
757 1,300
807 386 5,923 1,069 1,766 1,759 652 1,859 898 2,604 965 2,343 1,772 845 1,457 1,518 15,144 3,577 1,057 1,062 2,272 1,690 1,523 1,288 1,060 4,296 1,226 1,176 339 1,557
'\
WHITE FEMALE
11,511 2,313 4,882 4,295 2,629 3,108 5,733 4,156 2,180
12,607 4,418 9,225 2,002 1,619 23,683 5,253 3,101 7,971 1,470 6,083 2,179 6,056 2,584 5,682 4,783 2,397 3,491 9,902
54,934 13,107 5,646
3,098 12,591 4,765
5,873 5,197 3,316 14,337 3,019 3,047
512 5,329
\
WHIfE MALE
11,037 2,176 4,745 4,001 2,563 2,778 5,766 3,800 2,052
12,091 4,427 12,890 1,853 1,722 23,028 5,092 2,983 7,793 1,365 5,696 2,214 5,550 2,446 5,215 4,258 2,411 3,31J9 9,670 53,460 12,488 5,484 2,975 12,242 4,627 5,487 4,984 3,236 13,098 2,839 2,947
507 5,023
"-
BLACK FEMALE
1,454 1,588
960 5,521 1,953 1,531 2,707 2,266
730 6,542 1,445 6,522 1,481
643 11,376
181 4,331 1,029 1,296 3,700 1,947 5,063 1,108 5,371 2,986 1,049 2,529
55 32,350
4,797 699
1,512 652
5,247 159 929
1,225 2,651 1,766 2,201
733 58
BLACK MALE
1,341 1,476
886 4,586 1,696 1,243 2,373 1,993
684 5,750 1,394 8,946 1,300
540 9,885
236 3,588
954 1,166 3,067 1,706 4,560
900 4,846 2,583 1,154 2,243
58 29,364
4, ('fJ7
598 1,344
625 4,512
- 133 787 1,160 2,300 1,326 2,100 605 56
I'
AREA
TOTAL
0-4
Randolph Richmond Rockdale Schley Screven Seminole Spalding Stephens Stewart Sumter Talbot Taliaferro Tattna 11 Taylor fel fair Terrell Thomas rift Toombs Towns Treutlen Troup furner Twigga Union Upson Walker Walton Ware Warren Washington Wayne Webster Wheeler White Whitfield Wilcox Wilkes Wilkinson Worth
9,599 181,629
36,747 3,433 14,043 9,057 47,899 21,763 5,896 29,360 6,536 2,032 18,134 7,902 11,445 12,017 38,098 32,862 22,592 5,638 6,087 50,003 9,510 9,354 9,390 25,998 56,470 31,211 37,180 6,583 18,842 20,750 2,341 5,155 10,120 65,789 7,682 10,951 10,368 18,064
812 13,979
2,862 277
1,211 711
3,761 1,538
433 2,291
499 144 1,365 539 955 1,077 2,970 2,781 1,915 267 486 3,830 892 844 575 1,803 4,338 2,487 3,001 513 1,538 1,696 185 460 678 5,191 585 80S 870 1,414
* "Black" includes all races other than white
5-19
2,659 48,455 10,514
1,049 3,659 2,499 12,904 5,390 1,749 8,327 1,822
485 4,310 2,258 2,931 3,413 10,514 9,496 6,285 1,456 1,695 12,618 2,710 2,721 2,331 6,485 14,234 8,853 9,863 1,850 5,310 5,614
654 1,416 2,569 17 ,650 1,966 2,731 2,987 5,277
20-34
1,961 53,235 8,764
723 3,243 1,886 11,127 5,138 1,167 7,332 1,485
381 4,861 1,655 2,434 2,654 8,501 8,106 5,014 1,OR6 1,313 12,080 2,029 2,100 2,025 5,496 13,031 7,009 8,527 1,357 4,300 4,893
526 1,036 2,268 16,730 1,605 2,354 2,387 4,113
35-64
2,608 50,717 12,023
958 4,079 2,758 14,908 6,894 1,714 7,746 1,867
596 5,463 2,422 3,403 3,305 11,502 9,187 6,856 1,878 1,749 14,910 2,707 2,710 3,030 8,459 18,642 9,486 11,363 1,890 5,279 6,361
691 1,483 3,298 20,566 2,350 3,474 2,998 5,263
14
65+
1,559 15,243
2,584 426
1,851 1,203 5,199 2,803
833 3,664
863 426 2,135 1,028 1,722 1,568 4,611 3,292 2,522 951 844 6,565 1,172 979 1,429 3,755 6,225 3,376 4,426 973 2,415 2,186 285 760 1,307 5,652 1,176 1,587 1,126 1,997
WIHIE.
fEMALE
2,187 54,799 16,823 1,081
3,945 3,073 17,945 9,952 1,070 8,628 1,157
408 6,274 2,356 4,141 2,436 12,056 12,294 8,702 2,874 2,077 17 ,868 3,066 2,340 4,748 9,914 27,751 12,627 14,854 1,372 4,715 8,545
595 1,856 4,969 32,101 2,733 3,077 2,878 6,003
WHITE MALE
2,005 54,310 16,397 1,065
3,690 2,932 16,768 9,093 1,024 7,599 1,150
303 6,527 2,347 3,717 2,263 11,274 11,804 8,061 2,751 1,972 16,317 2,923 2,245 4,615 8,862 26,238 11,878 13,777 1,273 4,433 8,181
554 1,762 4,718 30,621 2,493 2,821 2,830 5,813
BLACK fEMALE
2,965 37,263 1,839
681 3,395 1,674 7,088 1,456 2,035 7,186 2,240
687 2,158 1,771 1,908 3,959 8,043 4,686 3,230
7 1,108 8,555 1,881 2,450
18 3,878 1,293 3,549 4,640 2,125 5,256 2,113
637 810 233 1,534 1,281 2,687 2,423 3,287
BLACK MALE
2,442 35,257 1,688
606 3,013 1,378 6,098 1,262 1,767 5,947 1,989
634 3,175 1,428 1,679 3,359 6,725 4,078 2,599
6 930 7,263 1,640 2,319
9 3,344 1,188 3,157 3,909 1,813 4,'138 1,911
555 727 2ao 1,533 1,175 2,366 2,237 2,961
AREA
Georgia
Appling Atkinson Bacon Baker Baldwin Banks Barrow Bartow Ben Hill Berrien Bibb Bleckley Brantley Brooks Bryan Bulloch Burke Butts Calhoun Camden Candler Carroll Catoosa Charlton Chatham Chattahoochee Chattooga Cherokee Clarke Clay Clayton Clinch Cobb Coffee Colquitt
fOTAL
6,462,313
17 ,862 6,591 10,461 4,048 41,301 10,031 25,396 46,851 19,036 15,058 161,918 11,225 11,367 16,906 14,621 37,782 21,790 16, :530 5,480 27,932 8,283 66,191 43,495 8,929 221,381 23,562 22,414 75,749 _81,108 3,885 191,751 6,963 375,316 30,549 38,317
0-4
516,227
1,499 545 948 368
3,259 769
2,216 3,690 1,727 1,155 12,515
733 988 1,507 1,462 2,781 2,082 1,255 467 1,584 563 5,111 3,183 801 18,499 1,431 1,577 7,476 5,282 356 16,024 598 28,185 2,705 3,232
5-19
1,467,919
4,378 1,604 2,680 1,055 10,966 2,188 6,106 10,472 4,717 3,459 36,311 2,813 2,961 4,244 3,875 9,754 5,855 3,628 1,357 7,550 1,759 15,285 9,521 2,242 52,508 7,681 4,691 18,128 18,403
948 42,394
1,690 72,205
7,844 9,039
1990 POPULATION PROJECTIONS
PROJECfED NUMBER or INHABI fANfS
20-34
1,654,763
4,236 1,451 2,230
066 11 ,223
2,382 5,980 11,253 4,135 3,379 40,586 2,409 2,574 3,523 3,236 10,547 4,829 4,334 1,200 12,344 1,733 16,777 10,655 2,000 54,464 10,883 4,911 19,632 }8,958
732 54,986
1,626 107,741
7,008 8,197
35-64
2,151,726
5,797 2,211 3,316 1,239 12,115 3,511 8,125 16,176 5,821 5,203 52,332 3,747 3,910 5,090 5,037 10,857 6,387 5,281 1,611 4,914 2,712 21,619 15,648 2,874 69,038 3,344 7,669 25,159 20,858 1,201 66,267 2,252 140,222 9,479 12,325
65+
671,678
1,95.2 780
1,287 520
3,738 1,181 2,969 5,260 2,636 1,862 20,174 1,523
934 2,542 1,011 3,843 2,637 1,832
845 1,540 1,516 7,399 4,488 1,012 26,872
223 3,566 5,354 7,607
648 12,080
797 26,963
3,513 5,52/1
WHIfE fEMALE
2,326,152
7,136 2,443 4,550 1,050 12,814 4,750 11,312 21,321 6,858 6,636 47,500 4,366 5,521 4,927 6,059 14,600 5,446 4,875 1,283 5,975 2,845 27,787 22,093 3,275 62,618 3,354 10,660 37,258 29,]57
708 83,841
2,471 175,727 11,667
14,785
WHIfE MALE
2,2 /11,553
6,964 2,404 4,011 1,015 12,431 4,760 10,647 20,147 6,324 6,300 42,834 4,209 5,236 4,490 5,887 13,947 5,474
5,~26
1,146 11,697 2,634 26,458 20,762
3,199 59,174 8,954 9,791 37,038 27,603
609 79,980
2,398 172 ,076 10,907 13,755
BLACKfEMALE
1,005,020
1,969 904
1,083 1,086 8,462
281 1,879 2,951 3,252. 1,129 38,856 1,466
353 4,133 1,399 4,927 5,842 2,903 1,694 2,839 1,545 6,531
324 1,332 53,466 3,515 1,084
799 12,792
1,423 14,874
1,052 14,146 4,315 5,329
15
BLACK" MAlE
889,588
1,793 840 817 897
7,594 240
1,558 2,432 2,602
913 32,728 1,184
257 3,356 1,276 4,308 5,028 3,126 1,357 7,421 1,259 5,415
316 1,123 46,123 7,739
879 654 10,956 1, f45 13,056 1,0 /12 13,367 3,660 4,448
AREA
Columbia Cook Coweta Crawford
Cri~p
Dllde Dawson Decatur DeKalb Dodge Dooly Dougherty Douglas Early Echols Effingham Elbert Emanuel Evans Fann.in Fayette Floyd Forsyth Franklin Fulton Gilmer Glascock Glynn Gordon Grady Greene Gwinnett Haberaham Hall Hancock Haralaon Harris Hart .Ieard Henry HOllston Irwin
TOTAL
62,116 14,638 45,725 10,341 21,502 13,949
5,744 2B,786 542,109 17,944 11,759 115,937 B3,988 14,301
2,621 23,103 20,207 23,321 9,356 15,524 62,714 83,351 to,858 16,694 641,971 12,725 2,524 59,963 34,973 21,B54 12,945 296,155 28,172 BB,467 10,499 19,943 19,685 20,319 7,712 53,6B5 91,294 9,901
0-4
5,732 1,181 3,721
817 1,954 1,016
465 2,542 37,780 1,357 1,094 10,935 7,667 1,299
206 1,961 1,567 2,156
722 962 5,059 5,765
- 3,091 1,OB2 4B,B40 924 179 4,573 2,616 1 ,BOO 1,164 26,B5B 1,876 6,571 B90 1,326 1,337 1,39B 644 4,726 7,434 B19
5-19
20-34
35-64
65+
14,571
15,315
22,701
3,620
3,098
4,718
10,300
10,586
15,779
2,519
2,548
3,563
5,392
4,763
6,395
3,217
3,416
4,807
1,338
1,215
2,049
7,337
6,642
B,686
110,217
147,730
198,807
4,160
3,796
5,967
3,085
2,422
3,498
31,027
28,858
34,732
20,486
22,160
28,633
3,712
3,089
4,293
679
602
843
5,961
5,344
7,753
4,505
4,595
6,621
5,920
4,890
7,151
2,269
2,189
2,B69
3,024
2,925
5,680
15,536
13,676
25,456
17,652
19,486
28,578
B,39U
9,819
14,009
3,502
3,5B1
5,957
137,916
171,221
214,845
2,593
2,783
4,589
48B
591
821
- 12,509 7,B43
13,809 .. 20,078
B,456
12,225
5,527
4,765
6,763
3,302
2,755
3,B65
64,162
B3,129
10B,046
6,227
6,531
9,B21
1B,4B3
21,51l2
31,203
2,736
2,364
2,983
4,327
4,313
7,056
4,029
4,046
7,511
4,350
4,394
6,820
1,B46
1,692
2,5B4
12,036 20,640
12,854 23,715
19,342 31,B3 /1
2,304
2,051
3,247
3,797 2,021 5,339
894 2,998 1,493
677 3,579 47,575 2,664 1,660 10,385 5,042 1,908
291 2,084 2,919 3,204 1,307 2,933 3,047 11,870 3,549 2,572 69,149 1,836
445
- 8,994 3,B33 2,990 1,859 13,960 3,717 10,64B 1,526 2,921 2,762 3,357 946 4,727 7,671 1,480
~<:
WHIrE FEMALE
26,895 5,243
17,529 3,676 6,718 6,944 2,817 9,253
172,220 6,640 3,111 29,056
40,298 4,223 1,153 9,609 7,072 7,966 3,105 8,063 30,669 37,258 18,9J} 7,827 131,761 6,436 1,147 21,950 16,991 7,B11 2,918 145,505 12,849 41,164
953 9,500 7,207 8,191 3,195 23,701 32,054 3,590
WHI fE MALE
27,102 4,716 16,815 3,731 5,884 6,712 2,879 B,827 157,128 6,076 2,769 27,403 40,376 3,846 1,099 9,864 6,655 7,318 2,870 7,401 31,064 33,934 19,513 7,263 121,332 6,244 1,060 19,770 16,406 7,307 2,759 143,613 13,610 3B,780
876 B,B21 7,327 7,689 3,371 24,121 33,109 3,222
BLACK FEMALE
4,346 2,472 6,097 1,558 4,912
142 26
5,759 112,996
2,854 3,197 32,271 1,820 3,497
192 1,915 3,535 4,218 1,863
34 538 6,481 281 816 210,030
19 166 9,B24 B22 3,626 3,856 3,640 554 4,627 4,B33 842 2,6B2 2,322 608 3,08B 13,B37 1,615
BLACK MALE
3,773 2,147 5,284 1,376 3,988
151 22 4,947 99,765 2,374 2,682 27,207 1,494 2,735 177 1,715 2,945 3,819 1,518 26 503 5,678 131 788 17B,848 26 151
- 8,419 75/1 3,110 3,412 3,397 1,159 3,B9'6 3,B37 7BO 2,469 2,117 538 2,775 12,294 1,474
AREA
Jackson Jasper Jeff Davis Jefferson Jenkins Johnson Jones Lamar Lanier Laurens Lee Liberty Lincoln Long Lowndes Lumpkin Macon Madison Marion McDuffie McIntosh Meriwether Miller Mitchell Monroe Montgomery Morgan Murray Muscogee Newton Oconee Oglethorpe Paulding Peach Pickens Pierce Pike Polk Pulaski Putnam Quitman Rabun
TOTAL
28,716 9,626 13,206 19,888 9,687 9,446 21,291 13,566 6,178 41,671 18,604 56,024 7,617 5,705 78,577 12,224 15,585 21,583 5,603 21,511 8,815 2,3259 7,727 23,815 18,078 7,456 13,402 26,179 184,156 41,794 17 ,939 10,069 34,838 22,676 13,124 14,301 11,207 34,402 9,826 12,309 2,523 11,795
0-4
2,211 800
1,106 1,647
857 759 1,744 993 499 3,581 1,632 7,463 559 615 6,605 810 1,410 1,790 403 1,774 702 1,961 617 2,232 1,289 506 1,203 2,230 14,020 3,413 1,615 673 3,143 1,733 942 1,141 933 2,507 787 950 155 680
5-19
6,355 2,175 3,192 4,810 2,327 2,171 4,942 3,060 1,546 9,628 4,520 17,719 1,701 1,586 18,895 3,149 3,819 4,818 1,307 5,017 2,022 5,547 1,866 6,254 3,889 1,787 3,176 6,555 43,054 9,687 4,084 2,223 8,343 5,534 2,658 3,529 2,627 7,205 2,347 2,650
541 2,198
20-34
6,752 2,154 3,026 4,410 2,262 1,978 5,226 2,904 1,439 9,386 4,769 18,034 1,654 1,471 21,432 2,881 3,549 5,278 1,273 4,888 2,173 5,252 1,735 5,475 4,063 2,021 3,072 6,773 50,547 9,817 4,781 2,505 8,637 5,746 2,891 3,245 2,380 7,882 2,136 2,684
521 2,363
35-64
9,906 3,301
4,'~42
5,977 2,993 2,993 7,373 4,716 1,903 13,447 6,634 10,737 2,598 1,599 23,727 3,981 4,676 7,501 1,884 7,143 2,850 7,432 2,420 7,144 6,461 2,244 4,221 8,727 56,237 14,036
6,24~
3,519 11,684 7,380 4,655 4,837 4,014 11,596
3,116 4,257
804 4,356
17
65+
3,492 1,196 1,440 3,044 1,248 1,545 2,006 1,893
791 5,629 1,049 2,071 1,105
434 7,918 1,403 2,131 2,196
736 2,689 1,068 3,067 1,089 2,710 2,376
898 1,730 1,894 20,298 4,841 1,217 1,149 3,0J1., 2,283 1,978 1,549 1,253 5,212 1,440 1,768
502 2,198
WHITE FEMALE
13,099 3,237 5,744 4,408 2,965 3,295 7,845 4,818 2,461
14,143 8,033 13,828 2,334 1,982 26,384 5,869 3,640 9,763 1,653 7,246 2,446 6,690 2,753 6,140 6,351 2,721 4,243 13,147 53,662 16,504 8,467 3,673 17,007 5,935 6,661 6,361 4,736 15,020 3,314 3,945
558 6,032
W\-ll TE MAlE
12,738 3,111 5,551 4,177 2,813 2,927 8,012 4,377 2,276
13,380 8,074 18,127 2,191 2,354 25,490 5,538 3,609 9,785 1,518 6,820 2,538 6,149 2,565 5,756 6,072 2,609 4,024 12,841 51,864 ~, 15,,687 8,'202 3,547 16,635 5,926 6,190 6,204 4,482 13,794 3,147 3,820
569 5,548
BLACK" FEMALE
1,495 1,669
992 6,285 2,062 1,820 2,942 2,302
738 7,529 1,275 10,325 1,638
792 14,299
291 4,644 1,074 1,284 4,122 2,080 5,561 1,389 6,268 3,050 1,026 2,766
102' 40,583
5,227 693
1,534 600
5,841 159 951
1,034 2,973 1,960 2,395
766 109
BLACK*
'~ALE
1,384 1,609
919 5,018 1,847 1,404 2,492 2,069
703 6,619 1,222 13,744 1,454
577 12,404
526 3,692
961 1,148 3,323 1,751 4,859 1,020 5,651 2,605 1,100 2,369
89 38,047 4,376
577 1,315
58B 4,974
- 114 785 955 2,615 1,405 2,149 630 106
AREA
TOTAL
0-4
Randolph Richmond Rockdale Schley Screven Seminole Spalding Stephens Stewart Sumter Talbot Taliaferro Tallnall Taylor Telfair Terrell Thomas THt Toombs Towns Treullen Troup Turner Twiggs Union Upson Walker Walton Ware Warren Washington Wayne Webster Wheeler While Whitfield Wilcox Wilkes Wilkinson Worth
10,795 207,884
59,763 3,803 15,870 10,826 54,944 22,546 5,703 32,470 6,871 1,901 20,910 8,181 11,850 13,168 42,395 38,004 25,766 6,273 6,537 55,059 10,467 10,667 11,334 27,524 59,819 39,022 40,508 6,904 20,818 23,445 2,483 5,740 11,805 73,743 8,359 11,927 11,638 21,279
930 16,892 4,783
n5 1,357
863 4,476 1,646
464 2,699
500 138 1,523 598 988 1,195 3,353 3,330 2,198 338 512 4,512 991 922 750 1,843 4,189 3,233 3,269 551 1,836 1,894 192 514 789 5,832 588 974 1,075 1,777
.. "Black" includes all races other than white
5-19
2,843 51,350 13,599
899 3,963 2,470 12,610 4,936 1,297 7,772 1,621
406 4,395 1,817 2,715 3,165 9,781 9,847 6,158 1,250 1,666 12,628 2,803 2,621 2,293 5,743 12,718 9,245 9,495 1,572 5,080 5,400
569 1,501 2,549 16,027 1,972 2,632 2,881 5,069
20-34
2,26'l 58,935 14,341
897 3,427 2,395 13,201 5,177 1,284 8,051 1,498
347 5,260 1,856 2,452 3,119 9,983 9,101 5,827 1,218 1,348 12,833 2,273 2,409 2,381 5,972 13,873 9,225 9,302 1,449 4,866 5,396
536 1,051 2,340 18,721 1,618 2,539 2,822 4,910
35-64
3,088 60,344 22,619
1,209 4,988 3,396 18,034 7,112 1,704 9,572 2,350
591 6,558 2,729 3,649 3,920 13,745 11,419 8,334 2,098 2,101 17 ,398 3,015 3,348 3,995 9,167 20,693 13,046 12,984 2,184 6,293 7,863
847 1,811 4,262 25,656 2,767 3,893 3,620 7,036
18
65+
1,665 20,363 4,421
463 2,135 1,702 6,623 3,675
954 4,376
902 419 3,174 1 ,181 2,046 1,769 5,533 4,307 3,249 1,369 910 7,688 1,385 1,367 1,915 4,799 8,346 4,273 5,458 1,148 2,743 2,892 339 863 1,865 7,507 1,414 1,889 1,240 2,487
WHITE FEMALE
2,277 55,297 28,587
1,221 4,393 3,757 19,770 10,157
993 9,419 1,272
358 6,913 2,483 4,343 2,457 13,076 13,654 9,844 3,168 2,174 19,119 3,159 2,833 5,658 10,509 29,391 16,468 15,759 1,330 5,223 9,564
676 2,058 5,903 35,684 2,842 3,353 3,241 7,187
Wl-tlTE MALE
2,125 54,710 27,636
1,285 4,115 3,431 18,760 9,266
928 8,386 1,31.3
257 8,141 2,492 3,889 2,350 12,664 13,365 9,193 3,096 2,074 17,766 3,055 2,809 5,649 9,095 27,742 15,697 14,579 1,271 5,024 9,208
668 1,936 5,416 33,768 2,648 2,983 3,226 7,011
BLACK" FEMALE
3,536 50,180 1,849
693 3,876 1,997 8,845 1,696 2,061 8,058 2,285
662 2,620 1,784 1,940 4,573 9,073 5,900 3,747
4 1,273 9,728 2,303 2,610
19 4,271 1,420 3,643 5,491 2,339 5,785 2,407
606 926 267 2,121 1,502 3,024 2,705 3,802
BLACK" MALE
2,857 47,697
1,691
60/~
3,486 1,641 7,569 1,427 1,721 6,607 2,001
624 3,236 1,422 1,678 3,788 7,582 5,085 2,982
5 1,016 8,446 1,950 2,415
8 3,649 1,266 3,214 4,679 1,964 4,786 2,266
533 820 219 1,170 1,367 2,567 2,466 3,279
AREA
Georgia
App ling Atkinson Bacon Baker Baldwin Banks Barrow Bartow Ben HUI Berrien Bibb Bleckley Brantley Brooks Bryan Bulloch Burke Butts Calhoun Camden Candler Carroll Catoosa Charlton Chatham
Chatt~oochee
Chattooga Cherokee Clarke
cray
Clayton CI inch Cobb Coffee Colquitt
TOTAL
7,422,594
19,875 7,051
11,487 4,359 49,552 11,020 28,991 51,611 21,919 16,247 173,366 11,484 14,116 18,681 19,960 39,591 24,498 19,126 5,505 34,745 8,914 74,953 47,673 10,537 241,920 26,382 22,250 102,412 86,982 4,354 219,804 7,246 418,304 33,519 40,546
0-4
499,903
1,414 501 923 349
3,582 694
2,125 3,400 1,716 1,062 11,612
647 980 1,444 1,588 2,529 2,002 .1,222 441 1,474 519 4,993 2,822 783 17,801 1,506 1,343 7,991 4,976 349 15,096 532 25,018 2,529 2,965
5-19
1,656,156
4,380 1,592 2,784 1,105 13,318 2,219 6,947 10,765 5,486 3,502 38,296 2,695 3,469 4,536 5,221 10,071 6,478 4,046 1,390 9,654 1,732 16,370 9,545 2,433 58,176 7,643 4,260 25,311 20,246 1,122 47,975 1,628 80,133 8,335 9,288
2000 POPULATION PROJECTIONS PROJECTED NUMBER OF INHABITANTS
20-34
1,621,366
4,227 1,361 2,3114
810 12,975
2,370 6,276 11,243 4,379 3,165 37 ,381 2,214 2,994 3,611 3,959 9,943 4,828 4,205 1,012 15,219 1,670 16,755 10,060 2,045 51,521 11,731 4,456 23,755
27,7'!J}
696 49,015
1,486 88,781
7,010 7,850
35-64
2,854,121
7,748 2,794 4,007 1,541 15,811 4,490 10,303 20,043 7,697 6,513 64,536 4,238 5,537 6,409 7,888 13,071 8,418 7,508 1,804 6,510 3,460 28,462 19,097 3,992 85,657 5,215 8,280 38,720 25,668 f,545 89,613 2,673 187,081 11,745 14,653
65+
791,048
2,106 803
1,429 554
3,866 1,247 3,340 6,160 2,641 2,005 21,541 1,690 1,136 2,681 1,304 3,977 2,772 2,145
858 1,888 1,533 8,373 6,149 1,284 28,765
287 3,911 6,635 8,352
642 18,105
927 J7,291
3,900 5,790
'\
WIIITE FEMALE
2,600,527
7,707 2,563 4,759 1,092 14,999 5,164 12,817 23,327 7,650 6,995 45,851 4,336 6,903 5,296 8,474 15,492 6,176 5,708 1,278 6,855 2,910 30,816 24,146 3,786 60,960 3,035 10,520 50,187 30,023
674 90,751
2,499 191,873 12,513
14,935
WHITE MALE
2,525,216
7,639 2,574 4,137 1,082 14,150 5,250 12,357 22,125 7,225 6,779 41,509 4,197 6,541 4,860 8,234 14,750 6,512 6,563 1,131 14,939 2,744 29,635 22,656 3,878 57,448 8,625 9,649 50,639 27,804
599 85,297
2,428 187,393 11,675
13,953
BLACK FEMALE
1,218,198
2,371 990
1,516 1,200 11,026
339 2,120 3,406 3,898 1,382 46,322 1,618
411 4,735 1,686 5,010 6,335 3,319 1,744 3,239 1,834 7,969
391 1,589 66,176 5,214 1,174
872 15,675 1,719 23,354 1,173 20,113 5,022 6,379
BLACK MALE
1,078,653
2,158 924
1,075 985
9,377 267
1,697 2,753 3,146 1,091 39,684 1,333
2fil 3,790 1,566 4,U9 5,475 3,536 1,352 9,712 1,426 6,533
480 1,284 57,336 9,500
907 714 13,480
1, 362
20,402 1,146
18,925 4,309 5,279
19
AREA
Columbia Cook Coweta Crawford Crisp Dade Dawson Decatur DeKalb Dodge Oooly Dougherty Douglas Early Echols Effingham Elbert Emanuel Evans fannin fayette floyd forsyth franklin fulton Gilmer Glascock Glynn Gordon Grady Greene Gwinnett Habersham Hall Hancock Haralson Harria Hart Heard Henry Houston Irwin
rOTAl
88,153 15,575 51,757 14,023 23,416 15,063
6,517 31,941 571,682 18,799 12,802 134,262 116,260 15,618 2,930 27,764 21,339 25,667 10,199 15,668 118,717 84,812 50,283 17 ,681 693,322 13,887 2,659 64,174 38,711 23,708 14,703 441,680 30,358 97,906 11,929 20,768 24,571 21,378 8,940 15,549 105,824 10,131
0-4
6,260 1,083 3,534
883 1,894
902 432 2,443 32,970 1,208 1,060 11,072 8,290 1,270 197 1,943 1,439 2,084 693 805 6,955 5,036 3,114 964 44,520 848 158 4,130 2,398 1,726 1,167 31,307 1,643 5,986 887 1,154 1,300 1,220 608 5,219 1,278 162
5-19
20,083 3,534 11,122 3,370 5,844 3,031 1,458 7,741
115,182 4,021 3,307 35,566 26,885 4,016 644 6,990 4,690 6,447 2,280 2,887 28,601 17,463 9,962 3,382
152,640 2,729 502 13,145 7,974 5,773 3,720
94,175 6,108 19,300 2,965 4,118 4,729 4,128 2,140 17,234 22,417 2,426
20-34
18,221 3,152
10,560 2,730 4,573 3,267 1,248 6,650
119,700 3,683 2,422
30,348 28,143
3,055 62(,
5, 5/~ 1 4,204 4,991 2,056 2,590 23,651 17,549 11,155 3,395 153,826 2,525
549 12,090
8,357 4,786 2,829 105,596 6,041 19,881 2,370 4,049 3,974 4,119 1,164 14,635 22,345 2,001
35-64
36,907 5,573 20,304 5,983 7,891 6,020 2,539 11,340 245,286 7,106 4,330 44,330 45,387 5,280 1,136 10,615 7,978 8,911 3,748 6,060 53,971 31,722 21,059 7,049 270,193 5,618
981 23,807 15,339 8,350
5,129 188,886 11,939
39,319 3,948 8,025 11,039 8,023 3,467 31,422 42,341 3,981
20
65+
6,682 2,233 6,237 1,057 3,214 1, B43
840 3,767 58,544 2,781 1,683 12,946 7,555 1,997
327 2,675 3,028 3,234 1,422 3,318 5,539 13,042 4,993 2,891 72,143 2,167
469 11,002 4,643
3,073 1,858 21,716 4,627 13,420 1,759 3,422 3,529 3,888
961 1,039 11,437 1,561
WHITE fEMALE
38,845 5,395 19,794 5,375 6,871 7,425 3,185 10,197 164,986 6,513 3,219 28,672 56,004 4,410 1,306 11,696 7,150 8,264 3,218 8,134 57,937 36,887 23,813 8,287 120,854 7,001 1,193 22,245 18,678 8,375 2,930 217,852 13,322 45,073
814 9,773 9,542 8,554 3,690 34,185 32,610 3,180
WIll' E MALE
39,543 4,861 19,440 5,744 5,993 7,103 3,280 9,927 147,964 5,980 2,825 26,477 56,678 4,039 1,252 12,148 6,813 7,518 3,020 7,481 59,885 33,661 25,314 7,695 111,400 6,833 1,169 19,380 18,206 8,001 2,856 215,464 14,989 42,664
762 9,068 10,007 1,982 4,019 35,655 33,771 3,395
BLACK* fEMALE
5,255 2,856 6,702 1,548 5,804
255 24
6,368 138,340
3,406 3,645 43,038 1,997 4,072
187 2,075
4,Ol13
5,111 2,214
37 469 7,502 868 867 2/J9,460
19 163 12,004 960 3,938 4,678 4,366 712 5,485 5,883 977 2,656 2,532 648 3,030 20,986 1,861
BLACK* MALE
4,510 2,463 5,821 1,356 ,4,748
2BO 28 5,449 120,392 2,900 3,113 36,075 1,581 3,097 105 1,845 3,333 4,774 1,747 16 426 6,762 288 832 211,608 34 134 10,545 867 3,394 4,239 3,998 1,335 4,684 4,4ft) 950 2,366 2,.310 583 2,619 18,391 1,701
ARLA
TOTAL
0-4
~Bndolph ~ichmond
Rockdale Schley Screven Seminole Spalding Stephens Stewart Sumter Talbot Taliaferro Taltnall Taylor Telfair Terrell Thomas Tift Toombs Towns Treutlen Troup Turner Twiggs Union Upson Walker Walton Ware Warren Washington Wayne Webster Wheeler White Whitfield Wilcox Wilkes Wi lkinson Worth
12,423 237,160 B7,5BO
4,232 17 ,6BO 12,473 60,600 22,864
5,739 35,479
7,309 1,857 23,421 8,509 12,214 14,592 46,461 42,H22 28,541 6,608 6,942 59,412 11,425 12,026 12,946 28,362 61,129 47,448 43,240 7,339 22,857 25,597 2,678 6,269 13,041 78,810 9,034 12,873 12,899 24,472
989 16,996
5,409 307
1,306 B55
4,216 1,453
424 2,531
443 125 1,469 543 906 1,163 3,174 3,300 2,086 286 471 4,189 985 881 671 1,642 3,683 3,310 3,067 505 1,726 1,779 171 481 714 5,248 554 923 1,017 1,699
* "Black" includes all races other than white
5-19
3,307 59,498 18,639
920 4,442 2,708 13,296 4,837 1,330 8,284 1,608
408 4,717 1,741 2,767 3,461 10,327 10,903 6,528 1,289 1,628 13,446 3,027 2,816 2,435 5,549 11,723 10,762 9,669 1,638 5,554 5,649
553 1,587 2,646 16,122 2,003 2,900 3,231 5,637
20-34
2, ~05 58,217 1B,357
949 3,287 2,409 13,141 4,886 1,048 7,726 1,333
299 5,075 1,596 2,' 76 2,908 9,062 9,148 5,605
970 1,393 12,701 2,390 2,238 2,285 5,434 12,722 10,104 8,839 1,293 4,418 4,94U
534 1,177 2,2U1 17,146 1,592 2,299 2,616 4,800
35-64
4,194 7B,639 38,013 1,630 6,459 4,414 22,623 7,974 1,969 12,107 2,936
659 8,128 3,464 4,258 5,220 17 ,801 14,545 10,767 2,474 2,497 21,210 3,616 4,460 5,136 10,717 23,369 18,212 15,653 2,681 8,281 9,778 1,061 2,206 5,152 31,170 3,418 4,761 4,668 9,550
'l'l
65+
1,628 23,810
7,162 426
2,186 2,087 7,324 3,714
968 4,831
989 366 4,052 1,165 2,107 1,840 6,097 4,926 3,555 1,589 953 7,866 1,407 1,631 2,419 5,020 9,632 5,060 6,012 1,222 2,878 3,451 359 81B 2,328 9,124 1,467 1,990 1,367 2,786
WHlfE FEMALE
2,279 55,2B6 42,770 1,312 4,684 4,264 20,502 10,065
909 9,873 1,364
305 7,182 2,541 4,388 2,372 13,550 14,480 10,591 3,307 2,188 19,517 3,1[11 3,247 6,399 10,516 29,862 20,295 16,022 1,248 5,515 10,203
750 2,191 6,594 37,614 2,818 3,498 3,478 8,140
WHIlE MALE
2,188 54,322 41,086 1,510 4,405 3,799 19,904 9,166
829 8,832 1,446
228 9,619 2,574 3,944 2,314 13,614 14,421 9,934 3,292 2,118 18,615 3,061 3,302 6,520 8,971 28,2H2 19,694 14,888 1,214 5,420 9,892
749 2,065 5,876 35,409 2,698 3,041 3,515 8,055
BLACK' FEMALE
4,360 65,227
1,943 742
4,483 2,399 10,896 1,994 2,176 9,189 2,412
674 3,188 1,877 2,061 5,417 10,432 7,496 4,452
4 1,480 11 ,195 2,854 2,884
20 4,769 1,584 3,972 6,614 2,646 6,563 2,798
622 1,062
318 2,816 1,811 3,438 3,095 4,478
BLACK' MALE
3,596 62,325 1,781
64B 4,108 2,011 9,298 1,639 1,B25 7,585 2,087
650 3,432 1,517 1,821 4,489 8,865 6,425 3,564
5 1,156 10,085 2,369 2,593
7 4,106 1,401 3,487 5,716 2,231 5,359 2,704
557 951
2~J
2,971 1,707 2,896 2,811 3,799
POPULATION CHANGE 1980 - 2000
~ 40,000 And Over
c=J 20,000 - 39,999
[ill] 5,000 - 19,999
D Under 5,000
t
23
NET MIGRATION 1980 - 2000
[J 50. 000 And Over
[[] 25.000 - 49.999 ~ 10.000 - 24,999
5.000 - 9.999 Under 5.000
t ---- -.
24