- Collection:
- Georgia Government Publications
- Serial:
- Forest inventory & analysis (Georgia Forestry Commission)
- Title:
- Forest inventory & analysis (Georgia Forestry Commission), 2004
- Creator:
- Georgia Forestry Commission
- Contributor to Resource:
- Georgia Forestry Commission.
- Publisher:
- [Macon, GA] : Georgia Forestry Commission, 2006
- Date of Original:
- 2004
- Subject:
- Georgia Forestry Commission
Forest surveys--Georgia
Forests and forestry--Georgia - Location:
- United States, Georgia, 32.75042, -83.50018
- Medium:
- state government records
- Type:
- Text
- Format:
- application/pdf
- Description:
- Title from caption
- External Identifiers:
- Call Number GA F600 .S1 I5 2004
- Metadata URL:
- https://dlg.galileo.usg.edu/id:dlg_ggpd_y-ga-bf600-b-ps1-bi5-b2004
- Digital Object URL:
- https://dlg.galileo.usg.edu/do:dlg_ggpd_y-ga-bf600-b-ps1-bi5-b2004
- Language:
- eng
- Holding Institution:
- University of Georgia. Map and Government Information Library
- Rights:
-

GEORGIA FORES TRY CO MM ISSIO N
FloOO
. $ I I.5
:l._ObLj
~ www.gatrees.org 1-800-GA TREES
An EqualOpporwniry Emptoyr and SNic Provider
..
fOR!S"RI
.
Forest Inventory & Analysis 2004
Forestland Area
Area by Land Class (million acres)
Georgia contains the largest area of forest cover in the South with 24.7 million acres or 67% of the State.T his is an increase of about 3 14,000 acres since the previous forest inventory in 1997. Ninety-eight percent of the forestland is considered available for timber production and known as timberland.The remaining forestland area is reserved forestland where timber removals are prohibited by law or unproductive forestland (produces < 20 cubic feet/acre/year).
l..lnd class
1936 1953 1961 19n 1982 1989 1997 2004
Timberland Other/reserved
2 1.'I 24.0 25.8 21.8 0. 1 0. 1 0.4
23.7 23.6 23.8 21.2 0 .6 0 .5 0 .6 0 .6
Total forestland Nonforestland
T otal land area
21.1 21. 1 25.8 25.3 21. 31 24 . 1 24.4 24. 7 16.2 13.6 11.8 12. 1 12.9 13.0 12.7 12.3 37.6 37.7 37.7 37.4 37.2 37. 1 37. 1 37. 1
Percent forested
57% 64% 69% 68% 65% 65% 66% 67%
Tomls may not sum due to rounding.
Tocal l:lnd .are;a estJmnes c.h:inged slighdy o.,,e,. time due to improvements In
measurement techniques and refinements In cl.usific:adon or small bodies of w.ater
a nd stre.1ms.
Forest Distribution
Ownership of the Timberland
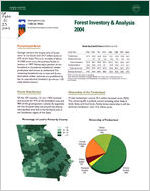
Of the 159 counties, 131 are > 50% forested and account for 91 % of the forestland area and 90% of the growing-stock volume.As expected, the less forested areas are around the Atlanta metropolitan area and in the farmland area in the Southwest region of the State.
Private landowners control 22.3 million forested acres (92%). The remaining 8% is publicly owned including other federal lands, State, and local lands. Family forest ownership is still the dominant landowner with 14.2 million acres.
Percentage of Land in Forest by County
Ownership ofTimberland
< 25 2.5 - 50
so- 1s
-
> 75
Forest
industry 18%
Other corporate
16%
Other public 5%
National forests
3%
Forest-Type Group Composition
Forest Disturbance
Loblolly-shortleaf and longleaf-slash pine groups comprise more than 99% of almost I I million ac res of softwood forest types. Hardwood types and oak-pine forest type account for 54% of the timberland area totaling 13 million acres.The oak-gum-cypress and elm-ash-cottonwood groups make up the bottomland hardwood area.Almost 6.5 million acres are planted pine and represents 60% of softwood forest types or 27% of all timberland.
On the average each year, about 6% of the timberland area experiences some form of disturbance. Harvesting occurs on about 3% of the timberland area and accounts for 56% of the disturbance area.About 44% is caused by all the other disturbances. Fire, weather, insects, and disease account for almost 30% of total disturbance each year.
Average AnnualTimberland Disturbance Types
Area ofTimberland by Forest-Type Group
Loblolly-shortleaf and longleaf-slash pine 45%
~00
359
..e~
u 300
"'O C:
; 200
176
Oakpine 13%
0
:.
: 100
< 0
9763
Nonstocked
1%
Bottom land hardwood
15%
Growing-Stock TreeVolume(~ 5.0 inches d.b.h.) - 1972 to 2004
Growing-stock trees-since 1972. volume has increased by 7.9 billion cubic feet or 31 %. Softwood-has increased 2.6 billion cubic feet or 18%. Hardwood-has increased 5.3 billion cubic feet or 50%.
Softwood
Growing-Stock Tree Volume on Timberland by Diameter Class
1 1972
1!1 1982
0 1989
1997
1 2004
Hardwood
J.5 ., J.O
.S! 2.5
a:ii 2.0 1.s
,Q 1.0
a5 0.5
o.o-- 6
1 1972
Diameter class (inches)
11 1982
0 1989
a 1997
1 2004
8
10
12
14
16
18
20
22+
Diameter class (inches)