- Collection:
- Georgia Government Publications
- Serial:
- Georgia public education report cards (CD-ROM)
- Title:
- 1998-99 Georgia public education report cards : state, systems and schools
- Creator:
- Georgia. Department of Education
- Contributor to Resource:
- Georgia. Department of Education.
- Publisher:
- Atlanta, GA : Dept. of Education
- Date of Original:
- 1998/1999
- Subject:
- Public schools--Georgia--Evaluation--Statistics
Educational indicators--Georgia - Location:
- United States, Georgia, 32.75042, -83.50018
- Medium:
- state government records
- Type:
- Text
- Format:
- application/pdf
- Description:
- Title from menu screen
Text (Statistical tables) - External Identifiers:
- Call Number GA E300 .S1 R45 1998-99
- Metadata URL:
- https://dlg.galileo.usg.edu/id:dlg_ggpd_y-ga-be300-b-ps1-br45-b1998-h99-belec-p-btext
- Digital Object URL:
- https://dlg.galileo.usg.edu/do:dlg_ggpd_y-ga-be300-b-ps1-br45-b1998-h99-belec-p-btext
- Language:
- ang
- Extent:
- computer optical disks ; 4 3/4 in.
- Holding Institution:
- University of Georgia. Map and Government Information Library
- Rights:
-

A Message from the State Superintendent of Schools
Welcome to the 1998-99 Georgia Public Education Report Card!
As part of the continuing statewide effort to improve the quality of education for all students, I am proud to present the fifth annual Georgia Public Education Report Card.
The Georgia Department of Education has developed individual report cards for our state, 180 school systems and 1,844 schools. These reports have two major purposes. First, they promote informed long- and short-term educational planning and decision making based on real data pertinent to schools. Secondly, they serve as a means of accountability at the state, system and school level for the taxpayers of Georgia.
These report cards provide a wealth of information for those persons working to improve school performance, student achievement, and the ability of school systems and schools to better serve their communities. They concisely report data in a wide range of categories to assess student learning and the general condition of education. The evolution of the Georgia Public Education Report Card will continue. It is my hope that these reports allow us to celebrate our successes while providing a basis for planning and implementing processes and programs for continual school improvement.
As Georgia continues its implementation of educational reforms, I encourage educators, parents, community members, and others to continue efforts to improve education for all children and youth in the state.
Thank you for your support and encouragement as we continue the work of improving school performance and public accountability in Georgia.
Linda C. Schrenko January 2000
2000 Georgia Department of Education. All rights reserved. Georgia Department of Education | Atlanta, Georgia Last modified: February 8, 2000
1998-99 GEORGIA PUBLIC EDUCATION REPORT CARD
Introduction
The 1998-99 Georgia Public Education Report Card is provided by the Georgia Department of Education for Georgias 180 school systems and 1,844 schools. Information included in the report cards represents data collected for the school year 1998-99.
TYPES OF REPORT CARDS
Four levels of report cards have been developed to report data on education in Georgia: 1) a state report card, 2) a school system report card, 3) a school report card, and 4) a parent's report card. Data reported are divided into nine areas: student, state-required tests, graduate, college admissions/credit tests, postsecondary, accreditation/recognition, community, fiscal, and certified personnel. The state and school system report cards include data in all nine areas. The school level report cards include data in all of the above categories except fiscal and community.
Four formats consisting of different grade configurations were developed to facilitate reporting at the school level. The formats are: grades K-7, 6-8, 9-12, and K-12. The formats allow for more concisely reporting data pertinent to the individual school. The grades K-12 format includes any school whose grade configuration is inappropriate for the other formats.
DATA
Several organizations and agencies outside the Department of Education provided the data for the 1998-99 report cards: the Board of Regents of the University System of Georgia, the Georgia Department of Technical and Adult Education, the Georgia Department of Labor, the Georgia Department of Human Resources, the Georgia Office of Planning and Budget, The College Board, the Educational Testing Service, the American College Testing Program, the Georgia Student Finance Commission, the Southern Association of Colleges and Schools, the Georgia Migrant Education Agency, the Georgia Accrediting Commission, and the Georgia School Superintendents Association.
Each area of data is reported on a separate page. A description of each area follows:
Student Data report student enrollment in identified programs, students eligible to receive free and reduced-price lunches, dropouts, and retentions.
State-Required Test Data report results on the testing program required of all schools in Georgia. The tests consist of norm-referenced tests (NRTs) in grades 3, 5, and 8, performance assessments in writing in grades 5 and 8, and the grade 11 Georgia High School Graduation Tests.
Graduate Data report graduates by diploma type, graduates eligible for HOPE Scholarships, and four-year high school completion rate.
College Admissions/Credit Test Data report student results on the Scholastic Assessment Test (SAT), the American College Testing (ACT) and the Advanced Placement (AP) Program.
Postsecondary Data report graduates in attendance at Georgia public colleges and universities, those graduates attending Georgia public colleges and universities requiring placement in Learning Support, and graduates in attendance at Georgia postsecondary vocational schools.
Accreditation/Recognition Data consists of two sections. The accreditation section reports accreditation data on schools accredited by either the Southern Association of Colleges and Schools (SACS) or the Georgia Accrediting Commission (GAC). The recognition section reports the schools in the state that received recognition in one or more of the state-sponsored programs of Charter School, Pay for Performance, Georgia School of Excellence, or National Blue Ribbon School.
Community Data report information at the county level pertaining to the socioeconomic status of the community such as students eligible for Migrant Education, at-risk families, food stamp recipients, temporary assistance for needy families (TANF) recipients, per capita income and the unemployment rate. The community data also report the population from the 1990 census and population projections for the county for the years 2000 and 2010.
Fiscal Data report school district revenues and expenditures for the fund categories of general, title programs, lottery K-12 and all other K-12, bonded debt, capital projects and school nutrition. A per-child cost to the system is included in the general fund. Also provided are a total student full-time equivalent (FTE) used for allotment purposes, a system millage rate, and the percent of revenues and of expenditures used for salaries and benefits for teachers and paraprofessionals, for school-level administrators, and for system-level administrators.
Certified Personnel Data report information on administrators, support personnel, and teachers. The system-level reports provide data by personnel type in the following categories: the number of positions, average annual salary, average number of contract days, average daily salary, number of full-time and part-time personnel, sex, certificate level, race/ethnicity, number of years of experience, and average years experience of each personnel type. The school-level reports provide data by personnel type in the following categories: number of positions, average number of contract days, number of full-time and part-time personnel, sex, certificate level, number of years of experience, and average years of experience of each personnel type.
N/A DATA
An N/A is printed as the data element on some report cards. The designation of N/A means that the data are either not applicable or not available.
DEFINITIONS OF DATA ELEMENTS
The Georgia Public Education Report Card is designed to assist systems and schools in educational improvement. The 1998-99 Georgia Public Education Report Cards for the state and school systems include data in the following categories: 1) student, 2) state-required tests, 3) graduate, 4) college admissions/credit tests, 5) postsecondary, 6) accreditation/recognition, 7) community, 8) fiscal, and 9) certified personnel. The school-level report cards include data in all of the above categories except fiscal and community. Brief definitions or further explanation of the data element terms are provided as a companion to the report card. Please refer to the definitions below for the most effective use of the reported data.
STUDENT DATA
Enrollment by Race/Ethnicity and Sex
The number of students in grades K-12 (or school grade range), classified by race/ethnicity and sex, as reported in the October 1998 full-time equivalent (FTE) count. The race/ethnicity classifications are as follows:
Asian, Pacific Islander. A person having origins in any of the original peoples of the Far East, Southeast Asia, the Indian subcontinent, or the Pacific Islands. This area includes, for example, China, India, Japan, Korea, the Philippine Islands, and Samoa.
Black, not of Hispanic origin. A person having origins in any of the black racial groups of Africa.
Hispanic. A person of Mexican, Puerto Rican, Cuban, Central or South American, or other Spanish culture or origin, regardless of race.
American Indian, Alaskan Native. A person having origins in any of the original peoples of North America who maintains cultural identification through tribal affiliation or community recognition.
Multiracial. A person having parents of different races.
White, not of Hispanic origin. A person having origins in any of the original peoples of Europe, North Africa, or the Middle East.
Enrollment in Pre-Kindergarten
The number of students enrolled in a public school pre-kindergarten program, as reported in the October 1998 FTE count. This number may represent students participating in a federally-funded preschool program for special education students and/or students participating in the lottery-funded Georgia pre-kindergarten program. The lottery-funded pre-kindergarten program is the first statewide program of its kind in Georgia. It is one of only three education programs funded by the Georgia Lottery for Education. This count does not include PK students enrolled in a non-public school program.
Enrollment in Selected Programs
Gifted
The number of students enrolled in the Gifted Program, as reported by an unduplicated count of the October 1998 and March 1999 FTE. Gifted students meet state eligibility criteria for gifted education and receive special instruction and/or special ancillary services to achieve at levels commensurate with their identified abilities.
Non-vocational Labs
The number of students in grades 9-12 enrolled in non-vocational lab courses, as reported in the October 1998 FTE count. These classes are state-approved academic instructional programs, other than performing arts, that provide a laboratory component. The laboratory setting allows a significant portion of the instructional time to be spent in hands-on activities. Examples of non-vocational lab classes may include science, art, and computer applications.
Vocational Labs
The number of students in grades 9-12 enrolled in vocational lab courses, as reported in the October 1998 FTE count. Vocational lab courses are state-approved and provide a laboratory component. The laboratory setting allows a significant portion of the instructional time to be spent in hands-on activities.
Alternative Programs
The number of students enrolled in an Alternative Program, as reported in the October 1998 FTE count. Alternative Programs are designed for a variety of students who may require an altered or modified educational environment. For example, Alternative Programs serve students who exhibit disruptive behaviors in the traditional school; students with regular status who choose to complete high school in a night school placement; or those whose academic progress may be furthered in a modified instructional program delivered in classes with smaller teacher-pupil ratios.
Enrollment in Compensatory Programs
Special Education
The number of students enrolled in special education classes, as reported in the December 1998 FTE count. Special Education Programs are provided for identified eligible students with one or more disabilities, including intellectual disabilities, emotional/behavior disorders, specific learning disabilities, orthopedic impairments, speech/language impairments, visual impairments, significant developmental delay, and deaf/blind disabilities. The reporting of Special Education students is broken out by students in grades K-12 and students in prekindergarten.
English to Speakers of Other Languages (ESOL)
The number of students enrolled in the state-funded ESOL program at least one 50-60 minute segment of the day as reported in the October 1998 FTE count. ESOL students are
those students who, because their native language/home language/first language is other than English, have difficulty speaking, reading, writing, or understanding the English language. ESOL students do not possess sufficient English language skills to benefit fully from the regular classroom instruction.
Remedial Education
The number of students enrolled in the Remedial Program at least one 50-60 minute segment of the day, as reported in the October 1998 FTE count. The purpose of the Remedial Program is to assist students in grades 2-5 and 9-12 as they attempt to meet academic expectations of the Quality Core Curriculum (QCC) in reading, mathematics, and writing.
Special Instructional Assistance (SIA)
The number of students enrolled in the Special Instructional Assistance (SIA) Program, at least one 50-60 minute segment of the day, as reported in the October 1998 FTE count. The SIA Program is designed to serve students in the primary grades (K-3) who have been identified as having developmental delays that may prevent them from maintaining a level of performance consistent with normal expectations for their respective ages.
Title I
The number of schools providing Title I Program services for students as reported on local school systems Title I Applications submitted to the Title I Unit at the Georgia Department of Education in June 1998. Title I (previously entitled Chapter I) is a federal program that funds supplemental educational programs in reading and mathematics for children who are academically behind their peers. On the report card, each school is denoted as being served by a School-wide Title I program or a Targeted Assistance Title I program, or as not being served by a Title I program.
A school electing to operate a school-wide Title I program must plan for one year and must exceed defined poverty level criteria as having 50% or more of the student population eligible for a free or reduced-price lunch. School-wide programs use federal funds in combination with state and local funds to instructionally benefit all children in the school. A Targeted Assistance Title I school has less than 50% of the student population eligible to receive a free or reduced-price lunch. Title I services are only provided for the targeted population, those students at risk of failing the States content standards.
Percent of Student Population
The number of students enrolled in a selected or compensatory program divided by the total number of students reported in the October 1998 FTE count as enrolled in the grades served by this program. For example, the SIA Program serves only students in grades K-3. The percent of student population reports the percentage of students enrolled in SIA in grades K-3 compared to the total number of students in grades K-3 in the school.
Students Eligible to Receive Free or Reduced-price Lunches
Free /Reduced-price Lunches
The number of students eligible under federal guidelines to receive free or reduced-price lunches (as reported to the Department of Education in October 1998) and the percentage of eligible students, calculated by dividing the number of eligible students by the total school enrollment (as reported by the October 1998 FTE count).
Dropout Rate
The number of dropouts reported by the school system on the October 1999 FTE count and the percentage of dropouts, calculated by dividing the number of dropouts by the total enrollment for the 1998-99 school year. Dropouts are counted from the October FTE count of the prior year until the October FTE count of the current year. Students are reported as dropouts if they leave school for one of the following reasons: Marriage, Expelled, Financial Hardship/Job, Incarcerated/Under Jurisdiction of Juvenile or Criminal Justice Authority, Low Grades/School Failure, Military, Adult Education/Postsecondary, Pregnant/Parent, Removed for Lack of Attendance, Serious Illness/Accident, and Unknown.
The total enrollment for the 1998-99 school year used for the calculation of the dropout rate is an unduplicated count of students from the October 1998 and March 1999 FTE counts, plus any withdrawn students that were not counted in either of these FTE counts. This calculation for total enrollment is different from the one used for the 1995-96 and 1994-95 report cards. In previous years, a weighted average enrollment was calculated using the fall and spring FTE counts. The total enrollment calculation used for the 1996-97 and the 1998-99 report cards is a more precise accounting of student enrollment at the school. Due to the change in the calculation of total enrollment, the dropout rates reported for 199697, 1997-98, and 1998-99 are not comparable with dropout rates reported on the 1995-96 Report Card or earlier Report Cards.
Retained Students, by Race/Ethnicity and Sex
The number of students reported in the October 1998 FTE as being in the same grade for the 1998-99 school year as they had been in the 1997-98 school year.
STATE-REQUIRED TEST DATA
Norm-referenced Tests (NRT)
The Iowa Tests of Basic Skills (ITBS) are administered in grades 3, 5 and 8 as an every student testing program. Prior to the 1996-97 school year, only the Reading Comprehension and Mathematics sub-tests were required for all students. Data for the last three years of testing are provided for these two sub-tests. In 1996, the required
statewide program was changed to include all tests from the total battery of the ITBS. Beginning with the 1996-97 school year, all students in grades 3, 5, and 8 were required to take the Reading Vocabulary, Language Arts, Social Studies, Science, and Sources of Information sub-tests in addition to the Reading Comprehension and Mathematics sub-tests. Scores for these five additional tests, as well as a Composite Score, are reported for the last two years.
Norm-referenced test (NRT) scores show the level at which a school or system is performing compared to the national average for the year in which the test was normed. The ITBS were renormed in the 1991-92 school year. Percentile scores rank students in comparison to all the students in the norming group who scored lower than the average student in that school or system.
Performance Assessments
Writing Assessment: Grade 5. The writing assessment for grade five consists of an evaluation of student response to an assigned prompt. Each paper is scored by trained raters using a standardized scoring system. The papers are evaluated to determine which of six developmental stages the writing represents. A students work is rated holistically: the reader balances all the features of the written piece to arrive at a single judgment of overall effectiveness based on the Developmental Stage/Scoring Guidelines. The report card shows the percentage of students taking the Grade 5 Writing Assessment scoring in each of the six developmental stages.
Writing Assessment: Grade 8. The writing assessment for grade eight consists of an evaluation of student response to an assigned prompt. Each student paper is scored by two raters, who independently rate the composition on five aspects or domains of effective writing. A score of 1 to 4 is assigned to each domain by each reader. These scores represent a continuum of writing that ranges from inadequate to very good. Scores assigned to each domain by each rater are summed and domain scores are combined to obtain a total score for each student. The total score is then converted to a three-digit scaled score ranging from 100 to 300.
Georgia High School Graduation Tests (GHSGT)
Students who entered ninth grade since July 1, 1991, must pass the English language arts, mathematics and writing tests as part of the requirements to obtain a high school diploma. Passing the social studies test is also a graduation requirement for students who entered ninth grade since July 1, 1993 (i.e., the graduating class of 1997). Students in the graduating class of 1998 were also required to pass the science test.
Eleventh-grade students have their first opportunity to pass the graduation tests with the fall administration of the writing test. The first administration of the English language arts, mathematics, social studies and science tests occurs in the spring of the junior year. The data reported for the high school graduation tests are based on scores of 11th-grade regular program students.
Comparison Groups
State law mandates the use of a comprehensive evaluation process that groups local school systems. The methodology used to compare systems on the state testing program is based on socioeconomic status as measured by the proportion of students eligible to
participate in the free or reduced-price lunch program. Systems are grouped according to enrollment categories: large systems have 10,000 or more students; mid-sized systems have between 2,000 and 9,999 students; and small systems have fewer than 2,000 students. Within size groups, systems are rank-ordered by the proportion of students eligible for free or reduced-price lunch and then divided into 22 groups -- three groups of large systems, 12 groups of mid-sized systems and seven groups of small systems. Groups are defined so as to ensure that the systems within them are as similar as possible.
For the 1998-99 report cards, the groupings are based on 1996-97 statistical information. These data were the most recent at the time the results of the state testing program were available. Groups in later reports may change because more recent demographic information may be available.
GRADUATE DATA
Graduates by Credentials, Race/Ethnicity and Sex
Diplomas with Both College Prep and Vocational Endorsements
The number of students graduating in 1999 who completed a program of study of 21 Carnegie units meeting the criteria of both the college preparatory program and vocational education. Formal seals of endorsements for both programs are affixed to these students high school diplomas.
Diplomas with College Prep Endorsements
The number of students graduating in 1999 who completed a program of study of 21 Carnegie units in a college-preparatory program. A formal seal of endorsement is affixed to these students high school diplomas.
Diplomas with Vocational Endorsements
The number of students graduating in 1999 who completed a program of study of 21 Carnegie units of which 4 must be in vocational education. A formal seal of endorsement is affixed to these students high school diplomas.
High School Diplomas
The number of students graduating in 1999 who completed a program of study consisting of 21 Carnegie units of general curriculum.
Special Education Diplomas
The number of students with disabilities assigned to a special education program who have not met the state assessment requirements or who have not completed all of the requirements for a high school diploma, but who have nevertheless completed their Individualized Education Program (IEP) and graduated in 1999. The diplomas identify graduates as Special Education students.
Certificates of Performance
The number of students completing high school in 1999 who met all requirements for attendance and Carnegie units but do not meet the standardized assessment criteria for a diploma. These students are awarded the performance certificate in place of the high school diploma. After leaving high school, students receiving the certificates of performance are provided opportunities to retake the required assessments and, if they pass, are awarded the appropriate diploma.
HOPE Scholarships
The number of graduates eligible to receive HOPE--Helping Outstanding Pupils Educationally--Scholarships as reported by local school systems to the Georgia Student Finance Commission. Eligible students include those who graduated any time during the 1998-99 school year as well as in the summer of 1999 while maintaining a B average during their high school program of study. Eligible students may use the HOPE scholarship to attend a postsecondary school in Georgia. The HOPE scholarship program is funded by the Georgia Lottery for Education.
The percentage of graduates was computed using the number of reported eligible-forHOPE graduates, divided by the number of 1998-99 graduates as reported in the Fall 1999 FTE reporting cycle.
High School Completion Rate
The percentage of students who entered ninth grade in a given year and were in the graduating class four years later. The 1998-99 report card provides the percent of student enrollment in grade 9 in 1995-96 who were in the graduating class of 1999. The completion rate is calculated by the following:
1) sum the 9th-grade dropouts in 1995-96, the 10th-grade dropouts in 1996-97, the 11thgrade dropouts in 1997-98 and the 12th-grade dropouts in 1998-99 for a four-year total of dropouts
2) divide the sum of dropouts (in step 1) by the sum of dropouts plus the number of graduates in the class of 1999
3) subtract the result in step 2 (a decimal figure) from the number 1.00 4) change the result in step 3 from a decimal to a percentage (example: .83 equals 83%)
COLLEGE ADMISSIONS/CREDIT TEST DATA
Scholastic Assessment Test (SAT)
The SAT is a college admissions test developed by The College Entrance Examination Board and Educational Testing Service (ETS). It consists of verbal and mathematics components; scores on each section range from 200 to 800 and sum to the total score, which ranges from 400 to 1600.
The College Board releases SAT scores annually in order to compare individual student, school, system, and state scores with the national average. The averages released by The College Board are based on the most recent, or last, test administration of students. For example, if a student took the SAT three times, the last of his three scores is used for calculating school, system, state, and national averages. Many colleges, on the other hand, use students highest verbal and highest math scores in determining admissions. For example, if a student took the SAT three times but his highest verbal score was on his first administration and his highest math score was on the second administration, the college would select these two scores to compute the students highest total score.
For these reasons, the 1998-99 report card provides the SAT data using both methods. SAT scores, provided by The College Board, are reported for the school, system, and state by the highest verbal, math, and total score and by the most recent administration verbal, math, and total score. The national scores are reported by most recent administration only. Therefore, please note that only the most recent, or last, test scores for the school, system and state can be compared to the national scores. Note also that averages released by The College Board are based on scores of private as well as public school students. Thus, the national scores based on the most recent test administration shown on the report card contain scores of private school students. All scores reported are for students enrolled in the twelfth grade during the 1998-99 school year regardless of the year of the test administration.
The report card data also include the highest verbal, math, and total scores for students enrolled in the college preparatory diploma program and for those in other diploma programs. Since the diploma programs are unique to Georgia schools, The College Board could not provide these data. Local school systems were given the opportunity to calculate and provide the data on those test-takers who were in the college preparatory diploma program and on those in the vocational and general diploma programs. All local systems did not furnish this additional information. For those systems, an N/A appears on the rows entitled SAT data for college prep and other diploma programs.
In 1994, Educational Testing Service revised the SAT and renormed, or recentered, the scoring system. This new scoring system was used for the first time in the April 1995 administration. All SAT scores on the report cards are based on the recentered scale.
American College Testing (ACT)
The ACT is a college admissions test developed by The American College Testing Program. It consists of four curriculum-based tests that measure academic achievement in the areas of English, mathematics, reading, and science reasoning. Scores on each subtest range from 1 to 36. Scores are reported for all four subtests and are combined to report a composite score.
ACT scores are released annually in order to compare individual student, school, system, and state scores with the national average. The averages released by The American College Testing Program are based on the most recent, or last, test administration of students. All scores reported on the 1998-99 report card are based on students last test administration. Scores for each of the four subtests as well as the composite score are reported at both the system and school levels.
Advanced Placement Exams (AP)
The Advanced Placement Program (AP) is a cooperative educational endeavor between secondary schools and colleges and universities. It exposes high school students to college-level material through involvement in an AP course and gives them the opportunity to demonstrate course mastery through an AP exam. Each AP exam grade is a weighted combination of the students score on each of two sections of the test. The final grade is reported on a scale of 1 to 5. A student who earns a grade of 3, 4 or 5 on an AP exam is generally considered qualified to receive credit for the equivalent course at one of the colleges and universities that gives credit for AP exams.
AP exams were taken in the content areas of art, biology, calculus, chemistry, computer science, economics, English, environmental science, French, German, government, history, Latin, music theory, physics, psychology, Spanish, and statistics. The AP exams taken by the largest number of students in Georgia public schools were in the content areas of United States history, English literature and composition, and calculus.
The AP data for high schools and school systems in the report card are based on 1998-99 high school students who took at least one AP exam in 1998-99. Not all high schools in Georgia provide AP classes or AP exams. For these schools and systems, an N/A appears for the AP data.
POSTSECONDARY DATA
Graduates Entering Georgia Public Colleges
The 1998-99 report card provides two years of data on attendance at a Georgia public college or university. The data report the number of 1998 graduates of Georgia public high schools who attended one of the 34 University System of Georgia institutions during the 1998-99 school year and the number of 1997 graduates of Georgia public high schools who attended a University System of Georgia institution during the 1997-98 school year. These data were provided by the Board of Regents of the University System of Georgia. Data are not reported if fewer than five students attended a Georgia public college to protect the confidentiality of those students. Data are not available for those students who attended a private college in Georgia or any out-of-state college.
Learning Support (LS) Required
College freshmen attending a Georgia public college who do not meet minimal academic criteria set by the University System of Georgia or those set by an individual institution in the University System are required to take Learning Support (previously called Developmental Studies). The 1998-99 report card provides two years of data on Learning Support. The data report the number of 1997 and 1998 graduates of Georgia public high schools who attended one of the 34 University System of Georgia institutions during the academic year following their high school graduation and were required to take Learning Support because they did not meet minimum requirements set by the University System of Georgia.
All data on graduates entering Georgia public colleges and universities were provided by the Board of Regents of the University System of Georgia. Data were not reported if fewer than five students from a public high school or system attended a Georgia public college. No information is available on students who attended a private college in Georgia or any out-of-state college.
Postsecondary Vocational Attendance
The 1998-99 report card provides two years of data on attendance at a Georgia public adult and technical school. The data report: 1) the number of 1998 graduates of Georgia public school systems who entered a diploma or degree program at a Georgia public vocational or technical institute during the 1998-99 year, and 2) the number of 1997 graduates of Georgia public school systems who entered a diploma or degree program at a Georgia public vocational or technical institute during the 1997-98 year and the number who entered during the 1998-99 year. These data were provided by the Georgia Department of Adult and Technical Education Schools. Data were unavailable for those students who attended a private technical school in Georgia or any out-of-state technical school.
ACCREDITATION/RECOGNITION DATA
Accreditation
Accreditation by Southern Association of Colleges and Schools (SACS)
The Southern Association of Colleges and Schools (SACS) offers a process of accreditation to educational institutions in eleven southern states. SACS accreditation is a voluntary process of evaluation and application of educational standards or criteria.
SACS consists of two commissions, the Elementary/Middle Commission and the Secondary/Middle Commission. Elementary schools are accredited by the Elementary Commission and secondary schools are accredited by the Secondary Commission. Middle schools may choose to be evaluated and accredited by either the Elementary Commission or the Secondary Commission. Schools housing grade ranges spanning both elementary and secondary are evaluated jointly by both commissions. In some schools housing grades 6-12, the accreditation evaluation for the middle grades is conducted by the Elementary/Middle Commission and the grades 9-12 evaluation is completed by the Secondary/Middle Commission. Schools which have been formally accepted into the accreditation process for evaluation for the first time are noted as being candidates for accreditation.
Accreditation by Georgia Accrediting Commission (GAC)
The Georgia Accrediting Commission (GAC) has accredited Georgia schools that meet its standards since 1904. Schools must complete an application and submit to an on-site visit by a GAC consultant to obtain GAC accreditation, and must have a GAC consultant on-site visit every five years to maintain accreditation.
The GAC recognizes four levels of accreditation: Preparation Status, Provisional Status, Accredited Status, and Accredited with Quality Status. Preparation Status is given to schools which have begun the process of applying the GAC standards and procedures. Provisional Status is given to schools which have begun applying GAC standards and procedures and have met standards in the areas of finances and administrator qualifications. Accreditation Status is given to schools which have met financial and administrator qualifications and have met at least 85% of the standards in each of the sections set by the GAC Board of Directors. A school is Accredited with Quality when it meets all of the standards which apply to Accreditation Status. The accreditation status of each school must be approved by the GAC Board of Directors.
Awards/Recognitions
The awards/recognitions included in the 1998-99 report card are those approved by the State Department of Education and are available to all schools in the state. Each program is described below.
Charter School
A school that becomes a charter school has a unique opportunity to rethink how it structures and delivers education programs for improving the learning of students while being freed from the state laws, State Board of Education rules and regulations, and local board of education rules and regulations that govern other schools. A charter is a binding contract with the charter school, its local board of education and the State Board of Education. This charter, when approved by the faculty and parents of the school, the local board of education and the State Board of Education, substitutes for state education statutes as well as state and local rules, policies, regulations, and standards as the structure for the charter school.
Pay for Performance
Through the Pay for Performance Program, exemplary public schools and schools making outstanding progress toward becoming exemplary may be rewarded. Not a merit pay program, the pay for performance program motivates and rewards entire school faculties for working together to make their schools exemplary. A school selected for participation in the program has one school year to attain at least 80% of its previously-approved performance objectives in order to receive an award based on $2,000 per certified faculty member. A school listed on the Report Card as having received recognition in the Pay for Performance program has participated in the program for a year, met at least 80% of its goals, and been awarded the $2,000 per certified faculty member.
Georgia School of Excellence
The Georgia Schools of Excellence Program recognizes exemplary schools that have excellent, successful programs in many areas of school life. Each year, in a statewide competition, one elementary, one middle, and one high school from each of Georgias eleven congressional districts may be selected for this honor. A school recognized as a Georgia School of Excellence cannot reapply for this award for five years.
National Blue Ribbon School
The National Blue Ribbon Schools Program recognizes outstanding schools from each state. Georgia nominates ten schools per year. Selected schools undergo a rigorous review of effective practices including a site visit of promising schools. A review panel considers the site visit report for recommendation of schools selected for recognition. Not a competition, schools are judged on their own merit.
COMMUNITY DATA
With the exception of the migrant education eligibility information, all community data are collected and reported at the county level only. Data reported for city school systems are the figures for the county in which the city system resides.
Children Eligible for Migrant Education
The number of children and youth in the Migrant Student Transfer System between September 1, 1998, and August 31, 1999, identified as eligible to receive services through the Migrant Education Program. A child/youth is eligible to receive Migrant Education Program services if: 1) she/he is between 3 and 21 years of age; 2) parent, guardian, or other immediate family member is a migratory agricultural worker or fisher; and 3) moved within the past 36 months from one school district to another to enable the migrant worker to obtain temporary or seasonal employment in an agricultural or fishing activity. The reported data also include 3- and 4-year olds, drop-outs, and students served by Georgia public schools only in the summer. The data were provided by the Georgia Migrant Education Program and reflect the number of individuals eligible to receive services through the Migrant Education Program, not the number migrant students actually receiving educational services by a specific school system.
Number of Families-at-Risk
An at-risk family is one whose first child was born to a resident parent who had one or more of the following at-risk indicators:
1) under the age of 20, 2) does not qualify for a high school diploma, 3) unmarried.
The data on the report card are for the 1997 calendar year; the data are not cumulative and do not total to the number of at-risk families in the county. Instead, the data only report the number of families with the first child born in 1997 to a parent having one or more of the identified risk factors. The data were provided by the Georgia Department of Human Resources, Division of Public Health, Health Assessment Services, Natality Data Base.
Number of Food Stamp Participants
The purpose of the food stamp program is to assure that low income families have adequate and nutritious food. An eligible food stamp household must have a gross income less than approximately 130% of the federal poverty level and net income of less than approximately 100% of the federal poverty level. Countable resources of household members cannot exceed $2,000 (or $3,000 if the household includes an elderly or disabled member). Food stamp participants must meet citizenship and work requirements. The data are a yearly average of the number of participants receiving benefits each month from July 1998 through June 1999. The data were collected and provided by the Georgia Department of Human Resources, Department of Family and Children Services.
Number of Families Receiving Temporary Assistance for Needy Families (TANF)
The Temporary Assistance for Needy Families (TANF) program provides cash assistance for needy families with dependent children who are deprived of the support of one parent by reason of death, incapacity, absence, unemployment, or underemployment. When deprivation is based on unemployment or underemployment, one parent must have an established work history. The data are a yearly average of the number of families receiving aid each month from July 1998 through June 1999. TANF recipients are the most economically deprived with income substantially below the federal poverty level. The data were collected and provided by the Georgia Department of Human Resources, Department of Family and Children Services.
Per Capita Income
Per capita personal income is the annual total personal income of residents from all sources (e.g. wages/salaries, proprietors income, rental, dividends, interest) divided by the Census Bureau midyear estimates of resident population. The data are collected by the US Department of Commerce, Bureau of Economic Analysis. The data are available in May of each year but are two years behind. The data on the report card were released by the Commerce Department in May 1999 for the calendar year 1997.
Unemployment Rate
The unemployment rate is defined as the number of unemployed persons divided by the total work force. The data on the report card are for the 1998 calendar year.
Unemployed persons are those: 1) on a temporary layoff, 2) whose job ended involuntarily and began looking for work, 3) who terminated their job voluntarily and began looking for work, 4) who completed temporary assignments and began looking for work, 5) reentrants into the job market search, and 6) new entrants (those who never worked) entering the job market.
The labor force comprises all persons 16 years old or older classified as employed or unemployed as previously described. The data were provided by the Georgia Department of Labor and represent a summation of monthly averages.
1990 Population
The total population as reported by the 1990 US census data collection. These data were provided by the Georgia Office of Planning and Budget.
Projected 2000 Population
A calculation using the 1990 population and other variables to project the number of residents for the year 2000. The calculations were completed and the data provided by the Georgia Office of Planning and Budget.
Projected 2010 Population
A calculation using the 1990 population and other variables to project the number of residents for the year 2010. The calculations were completed and the data provided by the Georgia Office of Planning and Budget.
FISCAL DATA
FTE Count
The FTE or full-time equivalent student count is a method of accounting for students for funding purposes. The FTE count for all students is taken two times every school year, in October and in March. An additional count for students enrolled in special education is taken in December. Two FTEs are reported on the fiscal page of the report card. One is the actual student count taken in October 1998. The other is a calculation of averaging FTE counts to determine the student count for use in allocating state QBE mid-term allotment funds to the system.
Millage Rate
The Boards of Education of most local school systems are authorized by Georgia law to levy taxes on the value of taxable property for the support and maintenance of education. (Some city school systems and one county system must have their millage rates approved by their municipal or county governing bodies, such as the City Council or County Commission.) The property tax levy cannot be greater than 20 mills unless a higher rate is authorized by a local referendum or granted by charter. This Report Card provides the 1998 school millage rate (used for tax collections in the fall of 1998 to fund the 1998-99 school year). Millage data are collected by the Georgia Department of Revenue, Property Tax Division.
Value of One Mill
Each mill levied raises 1/1000 of a dollar for each dollar of assessed taxable property valued in the area served by a local school system. The value of one mill is 1/1000 of the net taxable assessed value of property in the school system. State law requires that most property be assessed at 40 percent of fair market value. (For qualifying property owners, the total assessed value is reduced by homestead or inventory exemptions.) To ensure comparability among school systems, the Millage Rate and Value of One Mill data have been adjusted in four cities that assess property at a different fraction of market value. The value of one mill has not been adjusted to reflect the fee charged by county governments for collection of school property taxes (usually 2.5%) or for property taxes due but not collected.
Value of One Mill per FTE
This value depicts the amount that one property tax mill could raise for each FTE student in the school system in 1998-99. The actual amount collected is usually reduced slightly due to delinquent or uncollected taxes and/or to collection fees charged by most County Commissions.
Revenues
The number of dollars received by a system from local, state, and federal sources to teach and support the children of the school system. The amount is determined by taking the total dollars received at the system level from local, state, and federal sources (collected from the 1998-99 financial report, Department of Education form DE0046). To determine the amount spent per full-time equivalent (FTE), the revenues are divided by the systems FY99 full-time equivalent (FTE) student counts used to allocate state QBE mid-term allotment funds to the system.
Explanation of Calculations of Revenues
Funds Included:
100 200 300, 370 402 404 406 414 408-412, 424-499 570 516-559, 580-598 600
General Funds Debt Service Fund Capital Projects Funds Title I Education of Individuals with Disabilities Vocational Education - Federally Funded Title II All Other Special Revenues K-12 Lottery All Other K-12 School Food Service
Source:
1000-1995 3120-3200 3300
Total Local Revenues Total State QBE Revenues Total State Lottery (K-12) Revenues
3510, 3600, 3800, 3995 4300-4900 5100, 5300, 5995
Total State Other Program Revenues Total Federal Revenues Total Other Revenues
Expenditures
The number of dollars spent to teach and support the children in the school system. The amount is determined by taking the total dollars expended at the system level (collected from the 1998-99 financial report, Department of Education form DE0046). To determine the amount spent per full-time equivalent (FTE), the expenditures are divided by the systems FY98 full-time equivalent (FTE) student counts used to allocate state QBE mid-term allotment funds to the system. The total dollars expended are split into the following fund accounts: general fund, title programs, lottery K-12 and all other K-12, bonded debt, capital projects, and school nutrition. Each fund is subdivided into the following expenditure areas: instruction, media, instructional support, pupil services, general administration, school administration, transportation, maintenance and operations, renovations and capital projects, school food services, and debt service.
Explanations of Calculations of Expenditures
Funds Included:
General Fund Fund 100 General
Title Programs Fund 402 Title I Fund 404 Education of Individuals with Disabilities Fund 406 Vocational Education - Federally Funded Fund 414 Title II Funds 408-412, 424-499 All Other Federal Funds
Lottery K-12 and All Other K-12 Fund 570 K-12 Lottery Funds 516-559, 580-598 All Other K-12
Bonded Debt Fund 200 Debt Service
Capital Projects Fund 300 Capital Projects Funds Fund 370 Capital Outlay - Exceptional Growth
School Nutrition Fund 600 School Food Service
Expenditure Area
Instruction Media Instructional Support
Pupil Services General Administration
School Administration Transportation Maintenance & Operations
Renovations & Capital Projects
School Food Services Debt Service
Function(s) Included
1000 Instruction 2220 Educational Media Services 2210 Improvement of Instructional Services 2800 Central Services 2900 Other Support Services 2100 Pupil Services 2300 General Administration 2500 Business Services 2400 School Administration 2700 Student Transportation Services 2600 Maintenance and Operation of Plant
Services 4000 Facilities Acquisition and Construction
Services 3100 School Food Services 5100 Debt Service
Salaries and Benefits as Percentages of Revenues and of Expenditures
The dollar amount spent on salaries and benefits for teachers and paraprofessionals providing direct instruction, for administrative staff in the schools and for system-level administrative staff. The amount is determined by taking the total dollars expended at the system level (collected from the 1998-99 financial report, Department of Education form DE0046).
Explanations of Calculations of Salaries and Benefits
Funds Included:
100 200 300, 370 402 404 406 414 408-412, 424-499 570 516-559, 580-598 600
General Funds Debt Service Fund Capital Projects Funds Title I Education of Individuals with Disabilities Vocational Education - Federally Funded Title II All Other Special Revenues K-12 Lottery All Other K-12 School Food Service
Teacher and Paraprofessional Salaries and Benefits
Function
Objects
1000 Instruction
110 Teachers 115 Extended day teachers 117 Extended year 140 Aides and paraprofessionals 142 Clerical 191 Other administrative personnel 200 Employee benefits
School Administration Salaries and Benefits
Functions
Objects
2400 School Administration
190 Other management personnel 191 Other administrative personnel 200 Employee benefits
General Administration Salaries and Benefits
Functions
Objects
2300 General Administration
120 Superintendent 121 Deputy, associate, assistant, area
superintendent 190 Other management personnel 191 Other administrative personnel 200 Employee benefits
2500 Business Services
190 Other management personnel 191 Other administrative personnel 200 Employee benefits
Total Salaries and Benefits as Percent of Revenues
The total salaries and benefits for teachers and paraprofessionals, school administrators, or system-level administrators divided by the grand total of all revenues.
Total Salaries and Benefits as Percent of Expenditures
The total salaries and benefits for teachers and paraprofessionals, school administrators, or system-level administrators divided by the grand total of all expenditures.
CERTIFIED PERSONNEL DATA
Certified Personnel
These data are compiled from information reported by local school systems on the Certified/Classified Personnel Information (CPI) Report. The CPI is used to gather information regarding school system employees. The Report Card includes only those employees who hold a valid Georgia certificate.
For each category of personnel, the number of positions and the number of certified personnel are reported. The number of positions is a decimal number of the certified positions at that location, with partial numbers representing part-time positions, while the number of personnel is an actual head count of full-time and part-time certified employees. For example, two full-time teachers and one teacher who works for half of the day is reported as 2.5 teacher positions and 3 certified personnel. See below:
Positions Personnel
K-12 Teachers
2.5
Full-time
2
Part-time
1
A full-time certified employee serving more than one school is counted as a part-time employee at the respective schools but as a full-time employee in the system-wide totals.
Years experience refers to the total number of approved years of service as an educator.
Administrators Include:
CPI Code Number(s) 600 601-648 650 660
665 670, 671 672 673 674 680
Title
System Superintendent Administrative Supervisory Personnel Director of Psychoeducational Program Director of Georgia Learning Resources
System (GLRS) Director of Child Serve Vocational Director Vocational Supervisor Youth Apprenticeship Director Adult Education Director/Coordinator Athletics Director
Support Personnel Include:
CPI Code Number(s) 400-407, 412 415, 417-419, 421-424, 426-427 434-437, 439 440, 442, 445 441 455, 460, 465-466, 470-471, 473, 495
469, 475 476 479 480 481 482-483 484 485
Title
Student Service Personnel Information Service Personnel Paraprofessionals/Teacher Aides Librarians/Media Specialists Teacher Support Specialist Other professional staff with valid
certification Special Education Specialists Kindergarten Specialists Diagnosticians Speech-Language Pathologists Audiologists Physical/Occupational Therapists Orientation/Mobility Specialists Recreational Therapists
Teachers include:
CPI Code Number(s)
085-120 130 140-141 142 145 146-148 149 150 151 153 155
Title
Regular Instructional Personnel Instructional Specialists Special Education Teachers Related Vocational Instruction Personnel Hospital/Homebound Instruction Personnel Gifted Instruction Personnel Adapted Physical Education Teachers Vocational Instruction Teachers Young Farmer Teachers Psycho-Educational Teachers Adult Education Teachers
Itinerant Teachers A full-time certified employee serving more than one school is counted as a part-time employee at the respective schools but as a full-time employee in the system-wide totals.
Years Experience Years experience refers to the total number of approved years of service as an educator.
Certified Staff Ratios
These ratios are based on numbers of positions as defined above.
Teacher/Administrator Ratio. The number of teacher positions in a system for every one administrator position.
Teacher/Support Person Ratio. The number of teacher positions in a system for every one support personnel position.
Teacher/Staff Ratio. The number of teacher positions in a system for every one certified staff position (administrators and support personnel).
Student Enrollment/All Teachers Ratio. The number of students enrolled in a school system for every one teacher position, including instructional specialists, special education teachers and vocational instructional teachers, as well as regular classroom teachers.
Certified Personnel by Category
These percentages are based on numbers of persons in each category.
1998-99 GEORGIA PUBLIC EDUCATION REPORT CARD STATE SUMMARY
The Georgia Public Education Report Card is designed to assist systems and schools in educational improvement. This report card contains a variety of data elements. An explanation of the terms is provided as a companion to the report card data. Please refer to the definitions for the most effective use of the reported data.
STUDENT DATA
Total K-12 1,370,555
PK
30,783
Enrollment, by Race/Ethnicity and Sex
Black
American Multi-
White Hispanic Asian Indian
racial
Male Female
517,740 763,991 45,782 27,335
37.8%
55.7%
3.3%
2.0%
1,865 13,842 701,027 669,528 0.1% 1.0% 51.1% 48.9%
13,583 44.1%
15,071 49.0%
1,265 4.1%
344 1.1%
33 0.1%
487 16,502 14,281 1.6% 53.6% 46.4%
Enrollment in Selected Programs
Program
Program % of Student Enrollment Population
Gifted (Grades K-12)
88,651
6.5%
Non-Vocational Labs (Grades 9-12)
299,378
80.5%
Vocational Labs (Grades 9-12)
206,244
55.5%
Alternative Programs (Grades 6-12)
7,124
1.0%
Students Eligible to Receive Free/Reduced Lunches
Number
Percent
607,532
43.4%
Dropout Rate
Number
Percent
6-12 9-12
30,157 27,352
3.9% 6.5%
Enrollment in Compensatory Programs
Program
Program % of Student Enrollment Population
Special Education (Grades K-12)
146,762
(PK)
8,073
English to Speakers of Other Languages (ESOL) (Grades K-12)
19,992
10.7% N/A
1.5%
Remedial Education (Grades 2-5, 9-12)
110,515 13.4%
Special Instructional Assistance (SIA) (Grades K-3)
79,899 17.5%
Title I (Grades K-12)
Number of schools with:
Schoolwide program
554
Targeted Assistance program
442
No Title I program
848
Total 57,075
Retained Students, by Race/Ethnicity and Sex
Black
White Hispanic
American MultiAsian Indian racial
30,329 53.1%
23,474 41.1%
2,213 3.9%
615 1.1%
63 0.1%
381 0.7%
Male Female
35,588 21,487 62.4% 37.6%
Prepared by Georgia Department of Education
Page 1
STATE-REQUIRED TEST DATA
NORM-REFERENCED TESTS
Grade 3 Iowa Tests of Basic Skills (ITBS) Each chart reflects data for three years of testing.
Reading Comprehension
Mathematics
50
54
53
52
0 98-99 97-98 96-97
State
50
61
61
59
0 98-99 97-98 96-97
State
Reading Vocabulary
50
50
50
49
0 98-99 97-98 96-97
State
Social Studies
50
56
55
55
0 98-99 97-98 96-97
State
Language Arts
50
64
62
59
0 98-99 97-98 96-97
State
Science
50
59
59
58
0 98-99 97-98 96-97
State
Sources of Information
Composite Score
50
57 0
98-99
56
55
State
50
58
57
97-98 96-97
0 98-99 97-98
1998-99 GEORGIA PUBLIC EDUCATION REPORT CARD STATE SUMMARY
Prepared by Georgia Department of Education
State 56 Scores Reported
in Percentiles 96-97
Page 2
STATE-REQUIRED TEST DATA
NORM-REFERENCED TESTS
Grade 5 Iowa Tests of Basic Skills (ITBS) Each chart reflects data for three years of testing.
Reading Comprehension
Mathematics
50
53
53
52
0 98-99 97-98 96-97
State
50
59
58
57
0 98-99 97-98 96-97
State
Reading Vocabulary
50
48
48
46
0 98-99 97-98 96-97
State
Social Studies
50
57
56
55
0 98-99 97-98 96-97
State
Language Arts
50
63
61
58
0 98-99 97-98 96-97
State
Science
50
60
59
59
0 98-99 97-98 96-97
State
Sources of Information
Composite Score
50
58 0
98-99
58
57
State
50
57
56
97-98 96-97
0 98-99 97-98
1998-99 GEORGIA PUBLIC EDUCATION REPORT CARD STATE SUMMARY
Prepared by Georgia Department of Education
State 55 Scores Reported
in Percentiles 96-97
Page 3
STATE-REQUIRED TEST DATA
NORM-REFERENCED TESTS
Grade 8 Iowa Tests of Basic Skills (ITBS) Each chart reflects data for three years of testing.
Reading Comprehension
Mathematics
50
49
48
48
0 98-99 97-98 96-97
State
50
56
55
54
0 98-99 97-98 96-97
State
Reading Vocabulary
50
46
45
44
0 98-99 97-98 96-97
State
Social Studies
50
54
53
53
0 98-99 97-98 96-97
State
Language Arts
50
60
58
56
0 98-99 97-98 96-97
State
Science
50
56
55
53
0 98-99 97-98 96-97
State
Sources of Information
Composite Score
50
57 0
98-99
56
55
State
50
56
54
97-98 96-97
0 98-99 97-98
1998-99 GEORGIA PUBLIC EDUCATION REPORT CARD STATE SUMMARY
Prepared by Georgia Department of Education
State 54 Scores Reported
in Percentiles 96-97
Page 4
STATE-REQUIRED TEST DATA
PERFORMANCE ASSESSMENTS
Grade 5 Writing Assessment
Percent at Developmental Stages: Stage 1: The Emerging Writer Stage 2: The Developing Writer Stage 3: The Focusing Writer Stage 4: The Experimenting Writer Stage 5: The Engaging Writer Stage 6: The Extending Writer
1998-99 1997-98
0%
0%
1%
3%
16%
19%
41%
41%
29%
27%
12%
10%
1996-97
0% 3% 21% 37% 26% 12%
Grade 8 Writing Assessment
Categories of Scaled Scores
Inadequate Minimal Good Very Good
less than 162 162-209 210-247 greater than 247
1998-99 Percent Scoring
State
8% 40% 41% 11%
1997-98 Percent Scoring
State
11% 46% 34%
8%
Average Scaled Score: (Range 100-300)
208
202
1996-97 Percent Scoring
State
15% 46% 30%
8%
198
GEORGIA HIGH SCHOOL GRADUATION TESTS (GHSGT)
Percent of Regular Program 11th Graders Passing the Georgia High School Graduation Tests on First Administration
English Language Arts Mathematics Social Studies Science
All Components listed above
Writing
1998-99 96% 88% 80% 72% 68% 93%
1997-98 94% 88% 78% 74% 68% 92%
1996-97 94% 87% 78% 74% 67% 93%
1998-99 GEORGIA PUBLIC EDUCATION REPORT CARD
STATE SUMMARY
Prepared by Georgia Department of Education
Page 5
GRADUATE DATA
1999 Graduates by Credentials, Race/Ethnicity and Sex
Diplomas with Both College Prep. & Voc. Endorsements
Diplomas with College Prep. Endorsements Diplomas with Vocational Endorsements General High School Diplomas Special Education Diplomas
Total All Diplomas
Certificates of Performance
Total Graduates
Total 10,799 32,191 14,962
1,349 2,055 61,356 4,192 65,548
Black
American MultiWhite Hispanic Asian Indian racial
Male Female
3,227 29.9% 9,266 28.8% 5,487 36.7%
715 53.0% 1,116 54.3%
19,811 32.3%
7,184 66.5% 20,918 65.0% 9,074 60.6%
575 42.6%
886 43.1%
38,637 63.0%
143 1.3%
546 1.7%
261 1.7%
33 2.4%
33 1.6%
1,016 1.7%
200 1.9% 1,211 3.8%
87 0.6%
16 1.2%
12 0.6%
1,526 2.5%
11 0.1%
44 0.1%
13 0.1%
2 0.1%
4 0.2%
74 0.1%
34 0.3%
206 0.6%
40 0.3%
8 0.6%
4 0.2%
292 0.5%
4,131 6,668 38.3% 61.7% 14,179 18,012 44.0% 56.0% 8,636 6,326
57.7% 42.3% 829 520
61.5% 38.5% 1,298 757
63.2% 36.8%
29,073 32,283 47.4% 52.6%
2,939
981 169
81
8
14 1,559 2,633
70.1% 23.4% 4.0% 1.9% 0.2% 0.3% 37.2% 62.8%
22,750 39,618 1,185 1,607
82 306 30,632 34,916
34.7% 60.4% 1.8% 2.5% 0.1% 0.5% 46.7% 53.3%
HOPE Scholarships
Number of 1999 Graduates Number Eligible Percent Eligible
65,548 40,292 61.5%
High School Completion Rate Percent of 1995Grade 9 Enrollment
in Graduating Class of1999
Completion Rate '95-'99
68.9%
COLLEGE ADMISSIONS / CREDIT TEST DATA
Scholastic Assessment Test (SAT)
No. Taking
Average Score
Tests Verbal Math Total
Based on students' highest verbal and highest math scores
Georgia
492 488 980
Based on students' last test administration
Georgia Nation
41,958 952,913
483 479 962 502 508 1,010
American College Testing (ACT)
Georgia
Nation
English Mathematics Reading Science Reasoning
19.1 19.9 20.2 19.9
20.4 20.7 21.3 21.0
CompositeScore
19.9
21.9
Advanced Placement Exams (AP)
Number of Students Taking Tests
Number of Tests Taken Number of Test Scores 3 or Higher
(Score Range 1-5 Possible) Percent of Test Scores 3 or Higher
15,225 23,969 13,024
54.3%
1998-99 GEORGIA PUBLIC EDUCATION REPORT CARD STATE SUMMARY
Prepared by Georgia Department of Education
Page 6
POSTSECONDARY DATA
Graduates Entering Georgia Public Colleges and Universities
Percent of Graduating Number Class
1998 Graduates Entering 1998-99
1997 Graduates Entering 1997-98
24,117 23,696
37.5% 38.8%
Graduates Entering Georgia Public Colleges and Universities and
Requiring Learning Support (LS)
Number Requiring
LS
5,318
5,475
Percent of those attending Georgia
Public Colleges
22.1%
23.1%
In previous years, the Report Card presented College Prep Curriculum information provided by the Board of Regents on students requiring Learning Support. Due to inconsistencies in the data provided by the Board of Regents in defining College Prep Completers versus Local Board of Education data defining College Prep Endorsements, the Department of Education Report Card will not provide this information until discrepancies can be reconciled.
Graduates Entering Georgia Public Technical and Adult Schools
Entered 1998-99 Entered 1997-98
Number Percent
Number Percent
1998 Graduates 1997 Graduates
4,153 394
6.5% 0.6%
N/A 3,978
N/A 6.5%
ACCREDITATION / RECOGNITION DATA
Southern Association of Colleges and Schools (SACS) Accrediting Commission
Secondary/Middle Commission Elementary/Middle Commission Both Elementary/Secondary Commissions Joint Commission Candidate for Accreditation
Accreditation by Georgia Accrediting Commission (GAC)
Accredited by GAC Accredited with Quality by GAC
Number of Schools
357 1105
4 7 40
Number of Schools
179 638
Awards / Recognition
State Recognized Program
Number of Schools
Charter School
27
Pay for Performance Recipient
69
Georgia School of Excellence
30
National Blue Ribbon School
5
COMMUNITY DATA
Number of Children Eligible for Migrant Education Number of Families-At-Risk Number of Food Stamp Participants Number of Families Receiving TANF * Per Capita Income Unemployment Rate 1990 Population Projected 2000 Population Projected 2010 Population
17,897 28,628 587,476 65,198 $23,882
4.2% 6,478,216 7,703,202 8,663,057
* Known as AFDC before January 1997
1998-99 GEORGIA PUBLIC EDUCATION REPORT CARD
STATE SUMMARY
Prepared by Georgia Department of Education
Page 7
FISCAL DATA
FTE Count
FTE Count used for Allotment Fall '98 FTE Count
1,357,391 1,370,555
K-12 Revenues
Lottery K-12 and
Grand Total
Per-
Title
All Other
Bonded
Capital
School
Total
Per-
Sources: General Fund cent Per FTE Programs
K-12
Debt
Projects
Nutrition
Amount cent
Local
$3,100,471,607 40.1% $2,284 $445,017 $29,472,532 $387,964,057 $851,073,413 $168,199,712 $4,537,626,341 43.4%
State-QBE $4,503,322,800 58.2% $3,318
$40,113 $2,043,663
$0
$0
$0 $4,505,406,577 43.0%
StateLottery
$64,984 0.0%
$0
$11,314 $30,935,755
$0 $23,749,638
$0 $54,761,692 0.5%
StateOther
$86,488,864 1.1% $64 $10,358,169 $43,421,769 $147,411 $148,376,408 $32,506,994 $321,299,617 3.1%
Federal
$26,010,102 0.3% $19 $349,494,907 $27,887,381
$235
$0 $264,280,980 $667,673,607 6.4%
Other
$18,865,436 0.2% $14
$1,756 $1,663,048 $121,590,623 $236,395,113 $276,659 $378,792,636 3.6%
Total
$7,735,223,794 100% $5,699 $360,351,278 $135,424,152 $509,702,327 1,259,594,573 $465,264,346$10,465,560,472 100%
K-12 Expenditures
Instruction $4,974,486,655 66.2% $3,665 $265,539,009 $79,947,525
$2,699 $38,154,625
$-17,336 $5,358,113,179 53.0%
Media
Instruction Support
Pupil Services General Admin. School Admin. Trans-
portation Maint. & Ops. Capital Projects School Food Debt Service
$181,706,485 2.4% $320,500,388 4.3% $329,876,580 4.4% $172,086,410 2.3% $483,858,113 6.4% $351,944,270 4.7% $657,576,103 8.7%
$30,962,405 0.4% $6,209,379 0.1%
$10,655,357 0.1%
$134 $2,106,989 $878,570 $236 $45,824,789 $16,628,840
$0 $3,409
$4,168,285 $2,537,859
$171 $188,860,501 1.9% $351,280 $385,846,568 3.8%
$243 $30,760,792 $15,766,884
$0
$6,701
$387 $376,411,345 3.7%
$127 $14,803,769 $3,078,738 $770,453 $6,189,733 $150,149 $197,079,254 1.9%
$356 $774,440 $2,370,895
$0 $336,296
$0 $487,339,745 4.8%
$259 $4,023,138 $317,400
$0 $450,812
$2,503 $356,738,124 3.5%
$484 $905,557 $5,150,011
$0 $8,378,656 $187,466 $672,197,796 6.6%
$23 $199,348 $1,242,419 $105,402 1,050,205,759 $224,264 $1,082,939,599 10.7%
$5 $1,121,542 $13,224,826
$0 $1,330,173 $456,569,040 $478,454,962 4.7%
$8
$0 $811,457 $486,267,024 $32,758,363
$3,318 $530,495,520 5.2%
Total
$7,519,862,150 100% $5,540 $366,059,377 $139,417,569 $487,148,987 1,144,517,267 $457,471,245$10,114,476,597 100%
Salaries and Benefits as Percentages of Revenues and of Expenditures
Percentage of Revenues Percentage of Expenditures
Total of
Total of
General Fund
General Fund
Title Programs
Title Programs
Lottery K-12
Lottery K-12
Total Salaries
and
Total
and
Total
Salaries
Benefits
and Benefits All Other K-12 K - 12 All Other K-12 K - 12
Teachers and Paraprofessionals $3,814,322,629 $1,053,828,621 $4,868,151,250
59.1%
46.5%
60.7%
48.1%
School Administration
$273,450,488 $94,629,796 $368,080,284
4.5%
3.5%
4.6%
3.6%
General Administration
$66,123,681 $27,233,779 $93,357,460
1.1%
0.9%
1.2%
0.9%
1998-99 GEORGIA PUBLIC EDUCATION REPORT CARD
STATE SUMMARY
Prepared by Georgia Department of Education
Page 8
CERTIFIED PERSONNEL DATA
Administrators Support Personnel PK-12 Teachers
Number
Average Annual Salary Positions Average Contract Days
Average Daily Salary
Full-time Personnel Part-time
Male Sex Female
Certificate Level
4 Yr Bachelor's 5 Yr Master's 6 Yr Specialist's 7 Yr Doctoral Other*
Race/ Ethnicity
Black White Hispanic Asian American Indian Multiracial
Years Experience
<1 1-10 11-20 21-30 >30
Average
6,484.45
$65,401.32 218.65
$299.11
6,280 1,205
3,014 4,471
430 2,041 4,033
978 3
1,816 5,627
15 6
21 0
33 790 2,199 3,727 736
21.47
7,835.21
$47,316.70 195.64
$241.86
7,460 1,924
1,984 7,400
1,475 5,017 2,578
298 16
1,850 7,459
36 12 21
6
408 2,819 2,924 2,761
472
15.59
87,779.22
$39,670.53 190.40
$208.36
85,899 2,629
15,535 72,993
43,732 36,213
7,522 646 415
17,539 69,957
506 218 256
52
5,248 36,979 26,029 18,070
2,202
12.69
*Includes One- and Two-Year Vocational Certificates.
Certified Staff Position Ratios
Teacher/Administrator Ratio
14:1
Teacher/Support Person Ratio
11:1
Teacher/Staff Ratio
6:1
Student Enrollment/All Teachers Ratio
16:1
Certified Personnel Category
84.0% 100%
7.1%
by 8.9%
80% 60%
40%
20%
0%
Teachers
Administrators
Support Personnel
1998-99 GEORGIA PUBLIC EDUCATION REPORT CARD
STATE SUMMARY
Prepared by Georgia Department of Education
Page 9
System and School Report Cards
Use the menu below to select a school system's report cards. Each system's report cards are in one file, with the system-level report first and each of the schools in the system following in alphabetical order. Click on the system name below to view that system's reports.
Appling County Atkinson County Atlanta City Bacon County Baker County Baldwin County Banks County Barrow County Bartow County Ben Hill County Berrien County Bibb County Bleckley County Brantley County Bremen City Brooks County Bryan County Buford City Bulloch County Burke County Butts County Calhoun City Calhoun County Camden County Candler County Carroll County Carrollton City Cartersville City Catoosa County Charlton County Chatham County Chattahoochee County Chattooga County Cherokee County Chickamauga City Clarke County Clay County Clayton County Clinch County Cobb County Coffee County Colquitt County Columbia County Commerce City Cook County
Coweta County Crawford County Crisp County Dade County Dalton City Dawson County Decatur City Decatur County DeKalb County Dodge County Dooly County Dougherty County Douglas County Dublin City Early County Echols County Effingham County Elbert County Emanuel County Evans County Fannin County Fayette County Floyd County Forsyth County Franklin County Fulton County Gainesville City Gilmer County Glascock County Glynn County Gordon County Grady County Greene County Gwinnett County Habersham County Hall County Hancock County Haralson County Harris County Hart County Heard County Henry County Houston County Irwin County Jackson County
Jasper County Jeff Davis County Jefferson City Jefferson County Jenkins County Johnson County Jones County Lamar County Lanier County Laurens County Lee County Liberty County Lincoln County Long County Lowndes County Lumpkin County Macon County Madison County Marietta City Marion County McDuffie County McIntosh County Meriwether County Miller County Mitchell County Monroe County Montgomery County Morgan County Murray County Muscogee County Newton County Oconee County Oglethorpe County Paulding County Peach County Pelham City Pickens County Pierce County Pike County Polk County Pulaski County Putnam County Quitman County Rabun County Randolph County
Richmond County Rockdale County Rome City Schley County Screven County Seminole County Social Circle City Spalding County Stephens County Stewart County Sumter County Talbot County Taliaferro County Tattnall County Taylor County Telfair County Terrell County Thomas County Thomaston-Upson County Thomasville City Tift County Toombs County Towns County Treutlen County Trion City Troup County Turner County Twiggs County Union County Valdosta City Vidalia City Walker County Walton County Ware County Warren County Washington County Wayne County Webster County Wheeler County White County Whitfield County Wilcox County Wilkes County Wilkinson County Worth County
2000 Georgia Department of Education. All rights reserved. Georgia Department of Education | Atlanta, Georgia Last modified: February 8, 2000
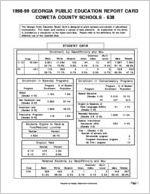
1998-99 GEORGIA PUBLIC EDUCATION REPORT CARD APPLING COUNTY SCHOOLS - 601
The Georgia Public Education Report Card is designed to assist systems and schools in educational improvement. This report card contains a variety of data elements. An explanation of the terms is provided as a companion to the report card data. Please refer to the definitions for the most effective use of the reported data.
Total
K-12
3,323
PK
151
STUDENT DATA
Enrollment, by Race/Ethnicity and Sex
Black
White Hispanic
American Multi-
Asian Indian
racial
958 28.8%
2,245 67.6%
100 3.0%
4 0.1%
0 0.0%
16 0.5%
36 23.8%
109 72.2%
3 2.0%
0 0.0%
0 0.0%
3 2.0%
Male
1,703 51.2%
95 62.9%
Female
1,620 48.8%
56 37.1%
Enrollment in Selected Programs
Program
Program % of Student Enrollment Population
Gifted (Grades K-12)
27
< 1%
Non-Vocational Labs (Grades 9-12)
943
88.0%
Vocational Labs (Grades 9-12)
681
63.5%
Alternative Programs (Grades 6-12)
7
< 1%
Students Eligible to Receive Free/Reduced Lunches
Number
Percent
2,019
58.1%
Dropout Rate
Number
Percent
6-12
116
6.0%
9-12
111
9.8%
Enrollment in Compensatory Programs
Program
Program % of Student Enrollment Population
Special Education
(Grades K-12)
453
PK
26
English to Speakers of
Other Languages (ESOL)
0
(Grades K-12)
Remedial Education (Grades 2-5, 9-12)
357
Special Instructional
Assistance (SIA)
0
(Grades K-3)
Title I (Grades K-12) Number of schools with: Schoolwide program Targeted Assistance program No Title I program
13.6% N/A
0.0%
17.4%
0.0%
0 3 3
Total 145
Retained Students, by Race/Ethnicity and Sex
Black
White Hispanic
American MultiAsian Indian racial
60 41.4%
77 53.1%
6 4.1%
0 0.0%
0 0.0%
2 1.4%
Male Female
95
50
65.5% 34.5%
Prepared by Georgia Department of Education
Page 1
STATE-REQUIRED TEST DATA
NORM-REFERENCED TESTS
Grade 3 Iowa Tests of Basic Skills (ITBS) Each chart reflects data for three years of testing.
Reading Comprehension
Mathematics
50
47 54 51 53 55 52 0
98-99 97-98 96-97
System State
50
48 61 58 61 62 59 0
98-99 97-98 96-97
System State
Reading Vocabulary
50
43 50 51 50 52 49 0
98-99 97-98 96-97
System State
Social Studies
50
48 56 59 55 57 55 0
98-99 97-98 96-97
System State
Language Arts
50
59 64 65 62 67 59 0
98-99 97-98 96-97
System State
Science
50
58 59 75 59 73 58 0
98-99 97-98 96-97
System State
Sources of Information
Composite Score
50
50 57 0
98-99
System
50
60 56 59 55 97-98 96-97
State
50 58 62 57 0
98-99 97-98
1998-99 GEORGIA PUBLIC EDUCATION REPORT CARD Appling County Schools
Prepared by Georgia Department of Education
System State Scores Reported 62 56 in Percentiles 96-97
Page 2
STATE-REQUIRED TEST DATA
NORM-REFERENCED TESTS
Grade 5 Iowa Tests of Basic Skills (ITBS) Each chart reflects data for three years of testing.
Reading Comprehension
Mathematics
50
53 53 53 53 55 52 0
98-99 97-98 96-97
System State
50
53 59 57 58 56 57 0
98-99 97-98 96-97
System State
Reading Vocabulary
50
51 48 48 48 46 46 0
98-99 97-98 96-97
System State
Social Studies
50
55 57 58 56 54 55 0
98-99 97-98 96-97
System State
Language Arts
50
64 63 63 61 63 58 0
98-99 97-98 96-97
System State
Science
50
63 60 65 59 64 59 0
98-99 97-98 96-97
System State
Sources of Information
Composite Score
50
57 58 0
98-99
System
50
58 58 58 57 97-98 96-97
State
57 57 58 56 0
98-99 97-98
1998-99 GEORGIA PUBLIC EDUCATION REPORT CARD Appling County Schools
Prepared by Georgia Department of Education
System State Scores Reported 58 55 in Percentiles 96-97
Page 3
STATE-REQUIRED TEST DATA
NORM-REFERENCED TESTS Grade 8
Iowa Tests of Basic Skills (ITBS) Each chart reflects data for three years of testing.
Reading Comprehension
Mathematics
50
48 49 51 48 46 48 0
98-99 97-98 96-97
System State
50
65 56 60 55 57 54 0
98-99 97-98 96-97
System State
Reading Vocabulary
50
42 46 46 45 41 44 0
98-99 97-98 96-97
System State
Language Arts
50
60 60 58 58 54 56 0
98-99 97-98 96-97
System State
Social Studies
50
54 54 47 53 48 53 0
98-99 97-98 96-97
System State
Science
50
60 56 56 55 51 53 0
98-99 97-98 96-97
System State
Sources of Information
Composite Score
50
57 57 0
98-99
System
50
53 56 50 55 97-98 96-97
State
58 56 54 54 0
98-99 97-98
1998-99 GEORGIA PUBLIC EDUCATION REPORT CARD Appling County Schools
Prepared by Georgia Department of Education
System State Scores Reported 51 54 in Percentiles 96-97
Page 4
STATE-REQUIRED TEST DATA
PERFORMANCE ASSESSMENTS
Grade 5 Writing Assessment
1998-99
1997-98
1996-97
Percent at Developmental Stages:
Comparison
Comparison
Comparison
System Group State System Group State System Group State
Stage Stage Stage Stage Stage Stage
1: The Emerging Writer 2: The Developing Writer 3: The Focusing Writer 4: The Experimenting Writer 5: The Engaging Writer 6: The Extending Writer
0% 2% 20% 48% 19% 11%
0% 2% 21% 46% 23% 7%
0% 1% 16% 41% 29% 12%
0% 9% 32% 33% 21% 4%
0% 3% 22% 43% 23% 7%
0% 3% 19% 41% 27% 10%
0% 5% 25% 41% 20% 9%
0% 3% 23% 37% 26% 10%
0% 3% 21% 37% 26% 12%
Grade 8 Writing Assessment
1998-99 Percent Scoring 1997-98 Percent Scoring 1996-97 Percent Scoring
Categories of Scaled Scores
Comparison
Comparison
Comparison
System Group State System Group State System Group State
Inadequate (less than 162)
Minimal (162-209)
Good
(210-247)
Very Good (greater than 247)
6% 48% 38%
8%
9% 46% 36%
9%
8% 40% 41% 11%
18% 50% 25%
7%
13% 50% 31%
6%
11% 46% 34%
8%
28% 45% 21%
6%
18% 52% 24%
5%
15% 46% 30%
8%
Average Scaled Score: (Range 100-300)
207
203 208
193
197 202
188
192 198
GEORGIA HIGH SCHOOL GRADUATION TESTS (GHSGT)
Percent of Regular Program 11th Graders Passing the Georgia High School Graduation Tests on First Administration
1998-99
1997-98
1996-97
Comparison
Comparison
Comparison
System Group State System Group State System Group State
English Language Arts Mathematics Social Studies Science
94% 89% 76% 70%
94% 86% 76% 69%
96% 88% 80% 72%
95% 89% 76% 72%
93% 86% 73% 71%
94% 88% 78% 74%
93% 80% 65% 66%
94% 87% 76% 72%
94% 87% 78% 74%
All Components listed above 6 4 %
63% 68% 67%
63% 68% 60%
65% 67%
Writing
91%
93% 93% 92%
91% 92% 81%
92% 93%
1998-99 GEORGIA PUBLIC EDUCATION REPORT CARD
Appling County Schools
Prepared by Georgia Department of Education
Page 5
GRADUATE DATA
1999 Graduates by Credentials, Race/Ethnicity and Sex
Diplomas with Both College Prep. & Voc. Endorsements
Diplomas with College Prep. Endorsements Diplomas with Vocational Endorsements General High School Diplomas Special Education Diplomas
Total All Diplomas
Certificates of Performance
Total Graduates
Total 34 47 75 0 10
166 18
184
Black
8 23.5%
6 12.8%
22 29.3%
0
American MultiWhite Hispanic Asian Indian racial
26 76.5%
41 87.2%
53 70.7%
0
0 0.0%
0 0.0%
0 0.0%
0
0 0.0%
0 0.0%
0 0.0%
0
0 0.0%
0 0.0%
0 0.0%
0
0 0.0%
0 0.0%
0 0.0%
0
Male Female
8 23.5%
28 59.6%
51 68.0%
0
26 76.5%
19 40.4%
24 32.0%
0
5 50.0%
41 24.7%
13 72.2%
54 29.3%
5 50.0%
125 75.3%
5 27.8%
130 70.7%
0 0.0%
0 0.0%
0 0.0%
0 0.0%
0 0.0%
0 0.0%
0 0.0%
0 0.0%
0 0.0%
0 0.0%
0 0.0%
0 0.0%
0 0.0%
0 0.0%
0 0.0%
0 0.0%
9 90.0%
96 57.8%
7 38.9%
103 56.0%
1 10.0%
70 42.2%
11 61.1%
81 44.0%
HOPE Scholarships
System State
Number of 1999 Graduates 1 8 4
Number Eligible
89
Percent Eligible
48.4%
65,548 40,292 61.5%
High School Completion Rate Percent of 1995Grade 9 Enrollment
in Graduating Class of1999
System
State
Completion Rate '95-'99 68.7% 68.9%
COLLEGE ADMISSIONS / CREDIT TEST DATA
Scholastic Assessment Test (SAT)
No. Taking
Average Score
Tests
Verbal Math Total
Based on students' highest verbal and highest math scores
System College Prep. Endorsement Other Diplomas
466 460 926 474 469 943 381 361 742
Georgia
492 488 980
Based on students' last test administration
System Georgia
97
461 453
914
41,958 483 479 962
Nation
952,913 502 508 1010
American College Testing (ACT)
System State Nation
English
18.5
19.1 20.4
Mathematics
18.4
19.9 20.7
Reading
19.1
20.2 21.3
Science Reasoning 18.4
19.9 21.0
CompositeScore 18.7
19.9 21.9
Advanced Placement Exams (AP)
No. of Students Taking Tests
No. of Tests Taken No. of Test Scores
3 or Higher Percent of Test
Scores 3 or Higher
System State 0 15,225
N/A 23,969 N/A 13,024
N/A 54.3%
1998-99 GEORGIA PUBLIC EDUCATION REPORT CARD Appling County Schools
Prepared by Georgia Department of Education
Page 6
POSTSECONDARY DATA
Graduates Entering Georgia Public Colleges and Universities
Graduates Entering Georgia Public Colleges and Universities and
Requiring Learning Support (LS)
1998 Graduates Entering 1998-99
1997 Graduates Entering 1997-98
Percent of Graduating Number Class
44
25.0%
66
36.3%
Number Requiring
LS
10
27
Percent of those attending Georgia
Public Colleges
22.7%
40.9%
In previous years, the Report Card presented College Prep Curriculum information provided by the Board of Regents on students requiring Learning Support. Due to inconsistencies in the data provided by the Board of Regents in defining College Prep Completers versus Local Board of Education data defining College Prep Endorsements, the Department of Education Report Card will not provide this information until discrepancies can be reconciled.
Graduates Entering Georgia Public Technical and Adult Schools
Entering 1998-99 Entering 1997-98
Number Percent
Number Percent
1998 Graduates 1997 Graduates
21
11.9%
4
2.2%
N/A 21
N/A 11.5%
ACCREDITATION / RECOGNITION DATA
Southern Association of Colleges and Schools (SACS) Accrediting Commission
Secondary/Middle Commission Elementary/Middle Commission Both Elementary/Secondary Commissions Joint Commission Candidate for Accreditation
Accreditation by Georgia Accrediting Commission (GAC)
Accredited by GAC Accredited with Quality by GAC
Number of Schools
1 0 0 0 5
Number of Schools
0 6
Awards / Recognition
State Recognized Program
Number of Schools
Charter School
0
Pay for Performance Recipient
0
Georgia School of Excellence
0
National Blue Ribbon School
0
COMMUNITY DATA
Number of Children Eligible for Migrant Education Number of Families-At-Risk * Number of Food Stamp Participants * Number of Families Receiving TANF * ** Per Capita Income * Unemployment Rate * 1990 Population * Projected 2000 Population * Projected 2010 Population *
* Data Available at County Level Only ** Known as AFDC before January 1997
417 69
1,493 92
$16,998 9.9%
15,744 17,076 18,318
1998-99 GEORGIA PUBLIC EDUCATION REPORT CARD Appling County Schools
Prepared by Georgia Department of Education
Page 7
FISCAL DATA
Millage Rate
14.00
* Fall 1998 Property Tax Digest is used to calculate the 98-99 Value of One Mill
FTE Count
FTE Count used for Allotment Calculation 3,294.0 Fall '98 FTE Count 3,323
Value of One Mill
$603,323 $183.15 per Allotment FTE
Sources: Local State-QBE State-
Lottery State-
Other Federal Other
Total
PerGeneral Fund cent Per FTE
$8,671,878 44.4% $2,633 $10,577,104 54.2% $3,211
K-12 Revenues
Lottery K-12
and
Title
All Other
Programs
K-12
$100
$0
Bonded Debt $1,739
$0
$0
$0
$0 0.0%
$0
$0
$74,123
$0
$179,427 0.9% $54
$81,984 0.4% $25
$5,641 0.0%
$2
$19,516,036 100% $5,925
$92,489 $1,472,356
$0 $1,564,946
$0 $12,500
$0 $86,623
$0 $0 $0 $1,739
Capital Projects
$37,659 $0
$0
$25,000 $0 $0
$62,659
School Nutrition
$340,450 $0
$0
$95,490 $808,163
$0 $1,244,104
Grand Total
Total
Per-
Amount cent
$9,051,829 40.3%
$10,577,104 47.1%
$74,123 0.3%
$392,406 1.7% $2,375,004 10.6%
$5,641 0.0% $22,476,110 100%
Instruction
Media Instruction
Support Pupil Services General Admin. School Admin. Trans-
portation Maint. & Ops. Capital Projects School Food Debt Service
Total
$12,522,413 65.8% $3,802 $588,806 3.1% $179
$614,955 3.2% $187
K-12 Expenditures
$1,209,664
$74,123
$0
$7,402
$0
$0
$286,506
$25,302
$0
$851,224 4.5% $258
$42,868
$0
$0
$448,603 2.4% $136
$61,709
$0
$0
$1,135,983 6.0% $345
$0
$0
$0
$1,055,687 5.5% $320
$18,827
$0
$0
$1,664,693 8.7% $505
$900
$0
$0
$142,943 0.8% $43
$0
$0
$0
$0 0.0%
$0
$2,750
$0
$0
$0 0.0%
$0
$0
$0
$0
$19,025,311 100% $5,775 $1,630,629
$99,425
$0
$0
$0 $13,806,201 62.0%
$0
$0
$596,208 2.7%
$0
$0
$926,764 4.2%
$0
$0
$894,092 4.0%
$0
$0
$510,313 2.3%
$0
$0 $1,135,983 5.1%
$0
$0 $1,074,514 4.8%
$0
$0 $1,665,593 7.5%
$258,424
$0
$401,367 1.8%
$0 $1,239,142 $1,241,892 5.6%
$0
$0
$0 0.0%
$258,424 $1,239,142 $22,252,933 100%
Salaries and Benefits as Percentages of Revenues and of Expenditures
Teachers and Paraprofessionals
Salaries $10,317,924
Benefits $2,221,278
Percentage of Revenues Percentage of Expenditures
Total of
Total of
General Fund
General Fund
Title Programs
Title Programs
Lottery K-12
Lottery K-12
Total Salaries
and
Total
and
Total
and Benefits All Other K-12 K - 12 All Other K-12 K - 12
$12,539,202
59.2%
55.8%
60.4%
56.3%
School Administration
$686,348
$168,432
$854,780
4.0%
3.8%
4.1%
3.8%
General Administration
$217,412
$63,103
$280,515
1.3%
1.2%
1.4%
1.3%
1998-99 GEORGIA PUBLIC EDUCATION REPORT CARD
Appling County Schools - 601
Prepared by Georgia Department of Education
Page 8
CERTIFIED PERSONNEL DATA
Number
Average Annual Salary Positions Average Contract Days
Average Daily Salary
Full-time Personnel Part-time
Sex Male Female
4 Yr Bachelor's Certificate 5 Yr Master's
Level 6 Yr Specialist's 7 Yr Doctoral Other*
Black
White Race/ Hispanic Ethnicity Asian
American Indian
Multiracial
Years Experience
<1 1-10 11-20 21-30 >30
Average
Administrators
18.88
$64,736.98 216.76
$298.66
17 3
11 9
0 5 14 1 0
1 19
0 0 0 0
0 1 2 15 2
24.65
Support Personnel PK-12 Teachers
21.78
231.89
$44,616.44 194.81
$229.02
$41,589.13 191.30
$217.41
20
230
4
3
1
43
23
190
4
114
8
84
11
31
0
0
1
4
0
33
24
199
0
0
0
0
0
1
0
0
1
6
8
72
6
76
9
72
0
7
14.58
16.14
*Includes One- and Two-Year Vocational Certificates.
Certified Staff Position Ratios
Teacher/Administrator Ratio 12:1
Teacher/Support Person Ratio 11:1
Teacher/Staff Ratio 6:1
Student Enrollment/All Teachers 14:1
Certified Personnel by Category
84.1% 100%
7.2%
8.7%
80% 60%
40%
20%
0%
Teachers
Administrators
Support Personnel
1998-99 GEORGIA PUBLIC EDUCATION REPORT CARD
Appling County Schools - 601
Prepared by Georgia Department of Education
Page 9
1998-99 GEORGIA PUBLIC EDUCATION REPORT CARD
APPLING COUNTY SCHOOLS
Altamaha Elementary School - 6011050
Grade Range PK-5
The Georgia Public Education Report Card is designed to assist systems and schools in educational improvement. This report card contains a variety of data elements. An explanation of the terms is provided as a companion to the report card data. Please refer to the definitions for the most effective use of the reported data.
STUDENT DATA
Total
K-5
254
PK
25
Enrollment, by Race/Ethnicity and Sex
Black
White Hispanic
American Asian Indian
Multiracial
11 4.3%
238 93.7%
3 1.2%
0 0.0%
0 0.0%
2 0.8%
1 4.0%
24 96.0%
0 0.0%
0 0.0%
0 0.0%
0 0.0%
Male Female
136 53.5%
118 46.5%
17 68.0%
8 32.0%
Enrollment in Selected Programs
Program
Program % of Student Enrollment Population
Gifted (Grades K-12)
0
0.0%
Alternative Programs (Grades 6-12)
N/A
N/A
Students Eligible to Receive Free/Reduced Lunches
Number
Percent
School System
121 2,019
43.4% 58.1%
Dropout Rate *
Number
Rate
School System
N/A N/A
N/A N/A
* Dropout rates are not applicable for grades PK-5.
Enrollment in Compensatory Programs
Program
Program % of Student Enrollment Population
Special Education (Grades K-12)
23
9.1%
(PK)
1
N/A
English to Speakers of Other Languages (ESOL) (Grades K-12)
0
0.0%
Remedial Education (Grades 2-5, 9-12)
32 19.8%
Special Instructional Assistance (SIA) (Grades K-3)
0
0.0%
Title I (Grades K-12)
This school has no Title I program.
Total 2
Retained Students, by Race/Ethnicity and Sex
Black
White Hispanic
American MultiAsian Indian racial
Male Female
0
2
0.0% 100.0%
0 0.0%
0 0.0%
0 0.0%
0
2
0.0% 100.0%
0 0.0%
Prepared by Georgia Department of Education
Page 1
STATE-REQUIRED TEST DATA
NORM-REFERENCED TESTS Grade 3
Iowa Tests of Basic Skills (ITBS) Each chart reflects data for three years of testing.
Reading Comprehension 50
49 47 54 0
98-99
67 51 53 97-98
52 55 52 96-97
Mathematics
School 50
System
State
0
50 48 61 98-99
79 58 61 97-98
60 62 59 96-97
School System State
Reading Vocabulary 50
62 43 50 0
98-99
82 51 50 97-98
56 52 49 96-97
Language Arts
School 50
System
State
0
57 59 64 98-99
77 65 62 97-98
55 67 59 96-97
School System State
Social Studies 50
53 48 56 0
98-99
72 59 55 97-98
56 57 55 96-97
Science
School 50
System
State
0
70 58 59 98-99
83 75 59 97-98
65 73 58 96-97
School System State
Sources of Information
Composite Score
50
53 50 57 0
98-99
School 50
System
76 60 56 97-98
55 59 55 96-97
State 0
56 50 58 98-99
78 62 57 97-98
1998-99 GEORGIA PUBLIC EDUCATION REPORT CARD Altamaha Elementary School - 6011050
Prepared by Georgia Department of Education
56 62 56 96-97
Scores Reported in Percentiles
School System State
Page 2
STATE-REQUIRED TEST DATA
NORM-REFERENCED TESTS Grade 5
Iowa Tests of Basic Skills (ITBS) Each chart reflects data for three years of testing.
Reading Comprehension
Mathematics
50
49 53 53 0
98-99
53 53 53 97-98
58 55 52 96-97
School 50
System
State
0
45 53 59 98-99
52 57 58 97-98
58 56 57 96-97
School System State
Reading Vocabulary 50
47 51 48 0
98-99
55 48 48 97-98
49 46 46 96-97
Language Arts
School 50
System
State
0
50 64 63 98-99
55 63 61 97-98
52 63 58 96-97
School System State
Social Studies 50
52 55 57 0
98-99
63 58 56 97-98
61 54 55 96-97
Science
School 50
System
State
0
60 63 60 98-99
72 65 59 97-98
65 64 59 96-97
School System State
Sources of Information
Composite Score
50
49 57 58 0
98-99
School 50
System
62 58 58 97-98
61 58 57 96-97
State 0
51 57 57 98-99
60 58 56 97-98
59 58 55 96-97
1998-99 GEORGIA PUBLIC EDUCATION REPORT CARD Altamaha Elementary School - 6011050
Prepared by Georgia Department of Education
Scores Reported in Percentiles
School System State
Page 3
STATE-REQUIRED TEST DATA
PERFORMANCE ASSESSMENTS
Grade 5 Writing Assessment
Percent at Developmental Stages:
1998-99 School System State
1997-98 School System State
1996-97 School System State
Stage Stage Stage Stage Stage Stage
1:The Emerging Writer 2:The Developing Writer 3:The Focusing Writer 4:The Experimenting 5:The Engaging Writer 6:The Extending Writer
0% 3% 18% 47% 18% 13%
0% 2% 20% 48% 19% 11%
0% 1% 16% 41% 29% 12%
0% 19% 25% 19% 25%
9%
0% 9% 32% 33% 21% 4%
0% 3% 19% 41% 27% 10%
0% 3% 21% 47% 24% 6%
0% 5% 25% 41% 20% 9%
0% 3% 21% 37% 26% 12%
AWARDS / RECOGNITION DATA
Schools in Georgia may receive recognition in the following programs: Charter School Pay for Performance Program Georgia School of Excellence National Blue Ribbon School Altamaha Elementary School did not receive recognition in any of these programs during the 1998-99 school year.
1998-99 GEORGIA PUBLIC EDUCATION REPORT CARD Altamaha Elementary School - 6011050
Prepared by Georgia Department of Education
Page 4
CERTIFIED PERSONNEL DATA
Positions Number Average Contract Days
Personnel Sex
Certificate
Years Experience
Full-time Part-time
Male Female
4 Yr Bachelor's 5 Yr Master's 6 Yr Specialist's 7 Yr Doctoral Other*
<1 1-10 11-20 21-30 >30
Average
Administrators
1.00 210.00
1 0
0 1
0 0 1 0 0 0 0 1 0 0 17.00
Support Personnel
1.15 192.61
0 3
0 3
1 2 0 0 0 1 0 2 0 0 8.00
PK-12 Teachers
16.37 190.20
16 2
1 17
11 6 1 0 0 1 6 6 5 0
14.72
*Includes One- and Two-Year Vocational Certificates.
ACCREDITATION DATA
Candidate for accreditation by Southern Association of Colleges and Schools (SACS):
Elementary/Middle Commission. Accredited with Quality by Georgia
Accrediting Commission (GAC).
1998-99 GEORGIA PUBLIC EDUCATION REPORT CARD Altamaha Elementary School - 6011050
Prepared by Georgia Department of Education
Page 5
1998-99 GEORGIA PUBLIC EDUCATION REPORT CARD
APPLING COUNTY SCHOOLS
Appling County Elementary School - 6010177
Grade Range 3-5
The Georgia Public Education Report Card is designed to assist systems and schools in educational improvement. This report card contains a variety of data elements. An explanation of the terms is provided as a companion to the report card data. Please refer to the definitions for the most effective use of the reported data.
STUDENT DATA
Total 505
3-5 Enrollment, by Race/Ethnicity and Sex
Black
White Hispanic
American Multi-
Asian Indian
racial
178 35.2%
303 60.0%
23 4.6%
0 0.0%
0 0.0%
1 0.2%
Male Female
261 51.7%
244 48.3%
Enrollment in Selected Programs
Program
Program % of Student Enrollment Population
Gifted (Grades K-12)
12
2.4%
Alternative Programs (Grades 6-12)
N/A
N/A
Students Eligible to Receive Free/Reduced Lunches
Number
Percent
School System
343 2,019
67.9% 58.1%
Dropout Rate *
Number
Rate
School System
N/A N/A
N/A N/A
* Dropout rates are not applicable for grades PK-5.
Enrollment in Compensatory Programs
Program
Program % of Student Enrollment Population
Special Education (Grades K-12)
87 17.2%
(PK)
0
N/A
English to Speakers of Other Languages (ESOL) (Grades K-12)
0
0.0%
Remedial Education (Grades 2-5, 9-12)
144 28.5%
Special Instructional Assistance (SIA) (Grades K-3)
0
0.0%
Title I (Grades K-12)
This school has a Targeted Assistance program.
Total 8
Retained Students, by Race/Ethnicity and Sex
Black
White Hispanic
American Multi-
Asian Indian
racial
6 75.0%
1 12.5%
1 12.5%
0 0.0%
0 0.0%
0 0.0%
Male Female
6
2
75.0% 25.0%
Prepared by Georgia Department of Education
Page 1
STATE-REQUIRED TEST DATA
NORM-REFERENCED TESTS Grade 3
Iowa Tests of Basic Skills (ITBS) Each chart reflects data for three years of testing.
Reading Comprehension 50
45 47 54 0
98-99
46 51 53 97-98
55 55 52 96-97
Mathematics
School 50
System
State
0
48 48 61 98-99
52 58 61 97-98
63 62 59 96-97
School System State
Reading Vocabulary 50
37 43 50 0
98-99
44 51 50 97-98
53 52 49 96-97
Language Arts
School 50
System
State
0
59 59 64 98-99
63 65 62 97-98
72 67 59 96-97
School System State
Social Studies 50
46 48 56 0
98-99
57 59 55 97-98
58 57 55 96-97
Science
School 50
System
State
0
55 58 59 98-99
74 75 59 97-98
77 73 58 96-97
School System State
Sources of Information
Composite Score
50
49 50 57 0
98-99
School 50
System
55 60 56 97-98
60 59 55 96-97
State 0
48 50 58 98-99
58 62 57 97-98
1998-99 GEORGIA PUBLIC EDUCATION REPORT CARD Appling County Elementary School - 6010177
Prepared by Georgia Department of Education
65 62 56 96-97
Scores Reported in Percentiles
School System State
Page 2
STATE-REQUIRED TEST DATA
NORM-REFERENCED TESTS Grade 5
Iowa Tests of Basic Skills (ITBS) Each chart reflects data for three years of testing.
Reading Comprehension
Mathematics
50
54 53 53 0
98-99
52 53 53 97-98
54 55 52 96-97
School 50
System
State
0
53 53 59 98-99
56 57 58 97-98
55 56 57 96-97
School System State
Reading Vocabulary 50
49 51 48 0
98-99
45 48 48 97-98
45 46 46 96-97
Language Arts
School 50
System
State
0
66 64 63 98-99
63 63 61 97-98
63 63 58 96-97
School System State
Social Studies 50
54 55 57 0
98-99
55 58 56 97-98
50 54 55 96-97
Science
School 50
System
State
0
62 63 60 98-99
62 65 59 97-98
64 64 59 96-97
School System State
Sources of Information
Composite Score
50
58 57 58 0
98-99
School 50
System
56 58 58 97-98
57 58 57 96-97
State 0
57 57 57 98-99
57 58 56 97-98
57 58 55 96-97
1998-99 GEORGIA PUBLIC EDUCATION REPORT CARD Appling County Elementary School - 6010177
Prepared by Georgia Department of Education
Scores Reported in Percentiles
School System State
Page 3
STATE-REQUIRED TEST DATA
PERFORMANCE ASSESSMENTS
Grade 5 Writing Assessment
Percent at Developmental Stages:
1998-99 School System State
1997-98 School System State
1996-97 School System State
Stage Stage Stage Stage Stage Stage
1:The Emerging Writer 2:The Developing Writer 3:The Focusing Writer 4:The Experimenting 5:The Engaging Writer 6:The Extending Writer
0% 2% 23% 49% 17% 9%
0% 2% 20% 48% 19% 11%
0% 1% 16% 41% 29% 12%
0% 7% 34% 36% 20% 3%
0% 9% 32% 33% 21% 4%
0% 3% 19% 41% 27% 10%
0% 6% 26% 41% 18% 9%
0% 5% 25% 41% 20% 9%
0% 3% 21% 37% 26% 12%
AWARDS / RECOGNITION DATA
Schools in Georgia may receive recognition in the following programs: Charter School Pay for Performance Program Georgia School of Excellence National Blue Ribbon School Appling County Elementary School did not receive recognition in any of these programs during the 1998-99 school year.
1998-99 GEORGIA PUBLIC EDUCATION REPORT CARD Appling County Elementary School - 6010177
Prepared by Georgia Department of Education
Page 4
CERTIFIED PERSONNEL DATA
Positions Number Average Contract Days
Personnel Sex
Certificate
Years Experience
Full-time Part-time
Male Female
4 Yr Bachelor's 5 Yr Master's 6 Yr Specialist's 7 Yr Doctoral Other*
<1 1-10 11-20 21-30 >30
Average
Administrators
2.00 210.00
2 0
2 0
0 1 1 0 0 0 0 0 1 1 34.00
Support Personnel
3.30 190.00
2 2
0 4
1 3 0 0 0 0 3 0 1 0 10.75
PK-12 Teachers
36.38 190.18
34 4
4 34
16 18
4 0 0 0 4 17 15 2 19.26
*Includes One- and Two-Year Vocational Certificates.
ACCREDITATION DATA
Candidate for accreditation by Southern Association of Colleges and Schools (SACS):
Elementary/Middle Commission. Accredited with Quality by Georgia
Accrediting Commission (GAC).
1998-99 GEORGIA PUBLIC EDUCATION REPORT CARD Appling County Elementary School - 6010177
Prepared by Georgia Department of Education
Page 5
1998-99 GEORGIA PUBLIC EDUCATION REPORT CARD
APPLING COUNTY SCHOOLS
Appling County High School - 6012050
Grade Range 9-12
The Georgia Public Education Report Card is designed to assist systems and schools in educational improvement. This report card contains a variety of data elements. An explanation of the terms is provided as a companion to the report card data. Please refer to the definitions for the most effective use of the reported data.
Total 1,072
STUDENT DATA
9-12 Enrollment, by Race/Ethnicity and Sex
Black
White Hispanic
American Multi-
Asian Indian
racial
328 30.6%
726 67.7%
14 1.3%
2 0.2%
0 0.0%
2 0.2%
Male Female
546 50.9%
526 49.1%
Enrollment in Selected Programs
Program
Gifted (Grades K-12)
Program % of Student Enrollment Population
0
0.0%
Non-Vocational Labs (Grades 9-12)
943
Vocational Labs
(Grades 9-12)
681
Alternative Programs (Grades 6-12)
5
88.0% 63.5%
< 1%
Students Eligible to Receive Free/Reduced Lunches
Number
Percent
School System
583 2,019
54.4% 58.1%
Enrollment in Compensatory Programs
Program
Program % of Student Enrollment Population
Special Education (Grades K-12) PK
129 12.0%
0
N/A
English to Speakers of Other Languages (ESOL) (Grades K-12)
0
0.0%
Remedial Education (Grades 2-5, 9-12)
98
9.1%
Title I (Grades K-12)
This school has no Title I program.
Dropout Rate for Grades 9-12
Number
Rate
School System
111
9.8%
111
9.8%
Total 94
Retained Students, by Race/Ethnicity and Sex
Black
White Hispanic
American MultiAsian Indian racial
43 45.7%
49 52.1%
2 2.1%
0 0.0%
0 0.0%
0 0.0%
Male Female
63
31
67.0% 33.0%
Prepared by Georgia Department of Education
Page 1
STATE-REQUIRED TEST DATA
GEORGIA HIGH SCHOOL GRADUATION TESTS (GHSGT)
Percent of Regular Program 11th Graders Passing the Georgia High School Graduation Tests on First Administration
English Language Arts Mathematics Social Studies Science
All Components listed above
Writing
1998-99
School System State
94% 89% 76% 70%
94% 89% 76% 70%
96% 88% 80% 72%
64% 64% 68%
91% 91% 93%
1997-98
School System State
95% 89% 76% 72%
95% 89% 76% 72%
94% 88% 78% 74%
67% 67% 68%
92% 92% 92%
1996-97
School System State
93% 80% 65% 66%
93% 80% 65% 66%
94% 87% 78% 74%
60% 60% 67%
81% 81% 93%
GRADUATE DATA
1999 Graduates by Credentials, Race/Ethnicity and Sex
Diplomas with Both College Prep. & Voc. Endorsements
Diplomas with College Prep. Endorsements Diplomas with Vocational Endorsements General High School Diplomas Special Education Diplomas
Total All Diplomas
Certificates of Performance
Total Graduates
Total 34 47 75 0
Black
8 23.5%
6 12.8%
22 29.3%
0
White Hispanic
26 76.5%
0 0.0%
41 87.2%
0 0.0%
53 70.7%
0 0.0%
0
0
American MultiAsian Indian racial
0 0.0%
0 0.0%
0 0.0%
0 0.0%
0 0.0%
0 0.0%
0 0.0%
0 0.0%
0 0.0%
0
0
0
10
5
5
0
0
0
0
50.0% 50.0% 0.0% 0.0% 0.0% 0.0%
166
41
125
0
0
0
0
24.7% 75.3% 0.0% 0.0% 0.0% 0.0%
18
13
5
0
0
0
0
72.2% 27.8% 0.0% 0.0% 0.0% 0.0%
184
54
130
0
0
0
0
29.3% 70.7% 0.0% 0.0% 0.0% 0.0%
Male Female
8
26
23.5% 76.5%
28
19
59.6% 40.4%
51
24
68.0% 32.0%
0
0
9 90.0%
96 57.8%
7 38.9%
103 56.0%
1 10.0%
70 42.2%
11 61.1%
81 44.0%
HOPE Scholarships
School System
Number of 1999 Graduates 1 8 4
Number Eligible
89
Percent Eligible
48.4%
184 89
48.4%
State
65,548 40,292 61.5%
High School Completion Rate
Percent of 1995Grade 9 Enrollment in Graduating Class of1999 School System State
Completion Rate '95-'99 68.7% 68.7% 68.9%
1998-99 GEORGIA PUBLIC EDUCATION REPORT CARD
Appling County High School - 6012050
Prepared by Georgia Department of Education
Page 2
COLLEGE ADMISSIONS / CREDIT TEST DATA
Scholastic Assessment Test (SAT)
Based on students' highest verbal and highest math scores
No. Taking
Average Score
Tests Verbal Math Total
Based on students' last test administration
Average Score Verbal Math Total
School College Prep. Endorsement Other Diplomas
97 466 460
926
474 469
943
381 361
742
System College Prep. Endorsement Other Diplomas
97 466 460
926
474 469
943
381 361
742
Georgia
41,958 492 488
980
461 N/A N/A
461 N/A N/A
483
453 N/A N/A
453 N/A N/A
479
914 N/A N/A
914 N/A N/A
962
Nation
952,913 N/A N/A N/A
502 508 1010
American College Testing (ACT)
Advanced Placement Exams (AP)
Number taking tests: English Mathematics Reading Science Reasoning CompositeScore
1 5 School System State
18.5 18.5 19.1
18.4 18.4 19.9
19.1 18.4
19.1 18.4
20.2 19.9
18.7 18.7 19.9
No. of Students Taking Tests
No. of Tests Taken No. of Test Scores
3 or Higher Percent of Test
Scores 3 or Higher
School 0
N/A N/A
N/A
System State 0 15,225
N/A 23,969 N/A 13,024
N/A 54.3%
POST-SECONDARY DATA
Graduates Entering Georgia Public Colleges
Graduates Entering Georgia Public Colleges and Requiring Learning Support (LS)
1998 Graduates Entering in 1998-99
1997 Graduates Entering in 1997-98
Percent of Graduating Number Class
School
44
25.0%
System 4 4
25.0%
School
66
36.3%
System 6 6
36.3%
Number Requiring
LS 10 10
27 27
Percent of those attending Georgia
Public Colleges
22.7%
22.7%
40.9%
40.9%
In previous years, the Report Card presented College Prep Curriculum information provided by the Board of Regents on students requiring Learning Support. Due to inconsistencies in the data provided by the Board of Regents in defining College Prep Completers versus Local Board of Education data defining College Prep Endorsements, the Department of Education Report Card will not provide this information until discrepancies can be reconciled.
Graduates Entering Georgia Public Technical and Adult Schools
1998 Graduates School System
Entering Number 21 21
1998-99 Percent 11.9% 11.9%
Entering Number N/A N/A
1997-98 Percent
N/A N/A
1997 Graduates School
4
2.2%
System
4
2.2%
21
11.5%
21
11.5%
1998-99 GEORGIA PUBLIC EDUCATION REPORT CARD Appling County High School - 6012050
Prepared by Georgia Department of Education
Page 3
CERTIFIED PERSONNEL DATA
Positions Number Average Contract Days
Administrators
4.50 223.33
Support Personnel
4.43 199.26
PK-12 Teachers
64.40 193.16
Personnel Sex
Certificate
Years Experience
Full-time Part-time
Male Female
4 Yr Bachelor's 5 Yr Master's 6 Yr Specialist's 7 Yr Doctoral Other*
<1 1-10 11-20 21-30 >30
Average
4 1
3 2
0 1 3 1 0
0 1 0 4 0
21.80
3 3
0 6
1 0 4 0 1
0 1 2 3 0
17.50
62 4
24 42
33 19 10
0 4
4 26 17 17
2
14.00
*Includes One- and Two-Year Vocational Certificates.
ACCREDITATION DATA
Accredited by Southern Association of Colleges and Schools (SACS): Secondary/Middle Commission. Accredited with Quality by Georgia Accrediting Commission (GAC).
AWARDS / RECOGNITION DATA
Schools in Georgia may receive recognition in the following programs: Charter School Pay for Performance Program Georgia School of Excellence National Blue Ribbon School Appling County High School did not receive recognition in any of these programs during the 1998-99 school year.
1998-99 GEORGIA PUBLIC EDUCATION REPORT CARD Appling County High School - 6012050
Prepared by Georgia Department of Education
Page 4
1998-99 GEORGIA PUBLIC EDUCATION REPORT CARD
APPLING COUNTY SCHOOLS
Appling County Middle School - 6010195
Grade Range 6-8
The Georgia Public Education Report Card is designed to assist systems and schools in educational improvement. This report card contains a variety of data elements. An explanation of the terms is provided as a companion to the report card data. Please refer to the definitions for the most effective use of the reported data.
STUDENT DATA
Total 760
6-8 Enrollment, by Race/Ethnicity and Sex
Black
White Hispanic
American Multi-
Asian Indian
racial
217 28.6%
515 67.8%
24 3.2%
2 0.3%
0 0.0%
2 0.3%
Male 386
50.8%
Female 374
49.2%
Enrollment in Selected Programs
Program
Gifted (Grades K-12)
Program % of Student Enrollment Population
15
2.0%
Alternative Programs (Grades 6-12)
2
< 1%
Students Eligible to Receive Free/Reduced Lunches
Number
Percent
School System
413 2,019
54.3% 58.1%
Enrollment in Compensatory Programs
Program
Program % of Student Enrollment Population
Special Education (Grades K-12) (PK)
120 15.8%
0
N/A
English to Speakers of Other Languages (ESOL) (Grades K-12)
0
0.0%
Title I (Grades K-12)
This school has no Title I program.
Dropout Rate for Grades 6-8
Number
Rate
School System
5
0.6%
5
0.6%
Total 6
Retained Students, by Race/Ethnicity and Sex
Black
White Hispanic
American MultiAsian Indian racial
3 50.0%
3 50.0%
0 0.0%
0 0.0%
0 0.0%
0 0.0%
Male Female
3
3
50.0% 50.0%
Prepared by Georgia Department of Education
Page 1
STATE-REQUIRED TEST DATA
NORM-REFERENCED TESTS Grade 8
Iowa Tests of Basic Skills (ITBS) Each chart reflects data for three years of testing.
Reading Comprehension 50
48 48 49 0
98-99
51 51 48 97-98
46 46 48 96-97
Mathematics
School 50
System
State
0
65 65 56 98-99
60 60 55 97-98
57 57 54 96-97
School System State
Reading Vocabulary 50
42 42 46 0
98-99
46 46 45 97-98
41 41 44 96-97
Language Arts
School 50
System
State
0
60 60 60 98-99
58 58 58 97-98
54 54 56 96-97
School System State
Social Studies 50
54 54 54 0
98-99
47 47 53 97-98
48 48 53 96-97
Science
School 50
System
State
0
60 60 56 98-99
56 56 55 97-98
51 51 53 96-97
School System State
Sources of Information
Composite Score
50
57 57 57 0
98-99
School 50
System
53 53 56 97-98
50 50 55 96-97
State 0
58 58 56 98-99
54 54 54 97-98
1998-99 GEORGIA PUBLIC EDUCATION REPORT CARD Appling County Middle School - 6010195
Prepared by Georgia Department of Education
51 51 54 96-97
Scores Reported in Percentiles
School System State
Page 2
STATE-REQUIRED TEST DATA
Categories of Scaled Scores
Inadequate (less than 162)
Minimal (162-209)
Good
(210-247)
Very Good (greater than 247)
Average Scaled Score: (Range 100-300)
PERFORMANCE ASSESSMENTS
Grade 8 Writing Assessment
1998-99 Percent Scoring
1997-98 Percent Scoring
1996-97 Percent Scoring
School System State School System State School System State
6% 48% 38%
8%
6% 48% 38%
8%
8% 40% 41% 11%
18% 50% 25%
7%
18% 50% 25%
7%
11% 46% 34%
8%
28% 45% 21%
6%
28% 45% 21%
6%
15% 46% 30%
8%
207
207
208 193
193 202 188
188 198
AWARDS / RECOGNITION DATA
Schools in Georgia may receive recognition in the following programs: Charter School Pay for Performance Program Georgia School of Excellence National Blue Ribbon School Appling County Middle School did not receive recognition in any of these programs during the 1998-99 school year.
1998-99 GEORGIA PUBLIC EDUCATION REPORT CARD Appling County Middle School - 6010195
Prepared by Georgia Department of Education
Page 3
CERTIFIED PERSONNEL DATA
Positions Number Average Contract Days
Personnel Sex
Certificate
Years Experience
Full-time Part-time
Male Female
4 Yr Bachelor's 5 Yr Master's 6 Yr Specialist's 7 Yr Doctoral Other*
<1 1-10 11-20 21-30 >30
Average
Administrators
2.00 220.00
2 0
2 0
0 1 1 0 0 0 0 1 0 1 25.50
Support Personnel
2.83 198.48
2 3
0 5
1 2 2 0 0 1 0 2 2 0 16.20
PK-12 Teachers
54.05 191.61
53 3
12 44
28 17 11
0 0 0 23 17 15 1 15.23
*Includes One- and Two-Year Vocational Certificates.
ACCREDITATION DATA
Candidate for accreditation by Southern Association of Colleges and Schools (SACS):
Elementary/Middle Commission. Accredited with Quality by Georgia
Accrediting Commission (GAC).
1998-99 GEORGIA PUBLIC EDUCATION REPORT CARD Appling County Middle School - 6010195
Prepared by Georgia Department of Education
Page 4
1998-99 GEORGIA PUBLIC EDUCATION REPORT CARD
APPLING COUNTY SCHOOLS
Appling County Primary School - 6010277
Grade Range PK-2
The Georgia Public Education Report Card is designed to assist systems and schools in educational improvement. This report card contains a variety of data elements. An explanation of the terms is provided as a companion to the report card data. Please refer to the definitions for the most effective use of the reported data.
STUDENT DATA
Total
K-2
572
PK
111
Enrollment, by Race/Ethnicity and Sex
Black
White Hispanic
American Asian Indian
Multiracial
204 35.7%
331 57.9%
28 4.9%
0 0.0%
0 0.0%
9 1.6%
35 31.5%
70 63.1%
3 2.7%
0 0.0%
0 0.0%
3 2.7%
Male Female
288 50.3%
284 49.7%
68 61.3%
43 38.7%
Enrollment in Selected Programs
Program
Program % of Student Enrollment Population
Gifted (Grades K-12)
0
0.0%
Alternative Programs (Grades 6-12)
N/A
N/A
Students Eligible to Receive Free/Reduced Lunches
Number
Percent
School System
456 2,019
66.8% 58.1%
Dropout Rate *
Number
Rate
School System
N/A N/A
N/A N/A
* Dropout rates are not applicable for grades PK-5.
Enrollment in Compensatory Programs
Program
Program % of Student Enrollment Population
Special Education (Grades K-12)
77 13.5%
(PK)
24
N/A
English to Speakers of Other Languages (ESOL) (Grades K-12)
0
0.0%
Remedial Education (Grades 2-5, 9-12)
64 32.3%
Special Instructional Assistance (SIA) (Grades K-3)
0
0.0%
Title I (Grades K-12)
This school has a Targeted Assistance program.
Total 35
Retained Students, by Race/Ethnicity and Sex
Black
White Hispanic
American MultiAsian Indian racial
8 22.9%
22 62.9%
3 8.6%
0 0.0%
0 0.0%
2 5.7%
Male Female
21
14
60.0% 40.0%
Prepared by Georgia Department of Education
Page 1
STATE-REQUIRED TEST DATA
NORM-REFERENCED TESTS Grade 3
Iowa Tests of Basic Skills (ITBS) Each chart reflects data for three years of testing.
Reading Comprehension 50
N/A 47 54 0
98-99
N/A 51 53 97-98
N/A 55 52 96-97
Mathematics
School 50
System
State
N/A 48 61 0
98-99
N/A 58 61 97-98
N/A 62 59 96-97
School System State
Reading Vocabulary 50
N/A 43 50 0
98-99
N/A 51 50 97-98
N/A 52 49 96-97
Language Arts
School 50
System
State
N/A 59 64 0
98-99
N/A 65 62 97-98
N/A 67 59 96-97
School System State
Social Studies 50
N/A 48 56 0
98-99
N/A 59 55 97-98
N/A 57 55 96-97
Science
School 50
System
State
N/A 58 59 0
98-99
N/A 75 59 97-98
N/A 73 58 96-97
School System State
Sources of Information
Composite Score
School
50
50
System
N/A 50 57 0
98-99
N/A 60 56 N/A 59 55
97-98
96-97
State
N/A 50 58 0
98-99
N/A 62 57 97-98
N/A 62 56 96-97
1998-99 GEORGIA PUBLIC EDUCATION REPORT CARD Appling County Primary School - 6010277
Prepared by Georgia Department of Education
Scores Reported in Percentiles
School System State
Page 2
STATE-REQUIRED TEST DATA
NORM-REFERENCED TESTS
Grade 5 Iowa Tests of Basic Skills (ITBS) Each chart reflects data for three years of testing. No fifth-grade students are enrolled at Appling County Primary School.
Reading Comprehension
Mathematics
50
N/A 53 53 0
98-99
N/A 53 53 97-98
N/A 55 52 96-97
School 50
System
State
N/A 53 59 0
98-99
N/A 57 58 97-98
N/A 56 57 96-97
School System State
Reading Vocabulary 50
N/A 51 48 0
98-99
N/A 48 48 97-98
N/A 46 46 96-97
Language Arts
School 50
System
State
N/A 64 63 0
98-99
N/A 63 61 97-98
N/A 63 58 96-97
School System State
Social Studies 50
N/A 55 57 0
98-99
N/A 58 56 97-98
N/A 54 55 96-97
Science
School 50
System
State
N/A 63 60 0
98-99
N/A 65 59 97-98
N/A 64 59 96-97
School System State
Sources of Information
Composite Score
School
50
50
System
N/A 57 58 0
98-99
N/A 58 58 N/A 58 57
97-98
96-97
State
N/A 57 57 0
98-99
N/A 58 56 97-98
N/A 58 55 96-97
1998-99 GEORGIA PUBLIC EDUCATION REPORT CARD Appling County Primary School - 6010277
Prepared by Georgia Department of Education
Scores Reported in Percentiles
School System State
Page 3
STATE-REQUIRED TEST DATA
PERFORMANCE ASSESSMENTS
Grade 5 Writing Assessment
Percent at Developmental Stages:
1998-99 School System State
1997-98 School System State
1996-97 School System State
Stage Stage Stage Stage Stage Stage
1:The Emerging Writer 2:The Developing Writer 3:The Focusing Writer 4:The Experimenting 5:The Engaging Writer 6:The Extending Writer
N/A N/A N/A N/A N/A N/A
0% 2% 20% 48% 19% 11%
0% 1% 16% 41% 29% 12%
N/A N/A N/A N/A N/A N/A
0% 9% 32% 33% 21% 4%
0% 3% 19% 41% 27% 10%
N/A N/A N/A N/A N/A N/A
No fifth-grade students are enrolled at Appling County Primary School.
0% 5% 25% 41% 20% 9%
0% 3% 21% 37% 26% 12%
AWARDS / RECOGNITION DATA
Schools in Georgia may receive recognition in the following programs: Charter School Pay for Performance Program Georgia School of Excellence National Blue Ribbon School Appling County Primary School did not receive recognition in any of these programs during the 1998-99 school year.
1998-99 GEORGIA PUBLIC EDUCATION REPORT CARD Appling County Primary School - 6010277
Prepared by Georgia Department of Education
Page 4
CERTIFIED PERSONNEL DATA
Positions Number Average Contract Days
Personnel Sex
Certificate
Years Experience
Full-time Part-time
Male Female
4 Yr Bachelor's 5 Yr Master's 6 Yr Specialist's 7 Yr Doctoral Other*
<1 1-10 11-20 21-30 >30
Average
Administrators
2.00 205.00
2 0
1 1
0 0 2 0 0 0 0 0 2 0 25.00
Support Personnel
3.30 193.64
2 2
0 4
0 3 1 0 0 0 2 1 1 0 11.75
PK-12 Teachers
44.19 190.00
43 3
2 44
24 18
4 0 0 0 10 15 19 2 18.72
*Includes One- and Two-Year Vocational Certificates.
ACCREDITATION DATA
Candidate for accreditation by Southern Association of Colleges and Schools (SACS):
Elementary/Middle Commission. Accredited with Quality by Georgia
Accrediting Commission (GAC).
1998-99 GEORGIA PUBLIC EDUCATION REPORT CARD Appling County Primary School - 6010277
Prepared by Georgia Department of Education
Page 5
1998-99 GEORGIA PUBLIC EDUCATION REPORT CARD
APPLING COUNTY SCHOOLS
Fourth District Elementary School - 6015050
Grade Range PK-5
The Georgia Public Education Report Card is designed to assist systems and schools in educational improvement. This report card contains a variety of data elements. An explanation of the terms is provided as a companion to the report card data. Please refer to the definitions for the most effective use of the reported data.
STUDENT DATA
Total
K-5
160
PK
15
Enrollment, by Race/Ethnicity and Sex
Black
White Hispanic
American Asian Indian
Multiracial
20 12.5%
132 82.5%
8 5.0%
0 0.0%
0 0.0%
0 0.0%
0
15
0.0% 100.0%
0 0.0%
0 0.0%
0 0.0%
0 0.0%
Male Female
86 53.8%
74 46.3%
10 66.7%
5 33.3%
Enrollment in Selected Programs
Program
Program % of Student Enrollment Population
Gifted (Grades K-12)
0
0.0%
Alternative Programs (Grades 6-12)
N/A
N/A
Students Eligible to Receive Free/Reduced Lunches
Number
Percent
School System
103 2,019
58.9% 58.1%
Dropout Rate *
Number
Rate
School System
N/A N/A
N/A N/A
* Dropout rates are not applicable for grades PK-5.
Enrollment in Compensatory Programs
Program
Program % of Student Enrollment Population
Special Education (Grades K-12)
17 10.6%
(PK)
1
N/A
English to Speakers of Other Languages (ESOL) (Grades K-12)
0
0.0%
Remedial Education (Grades 2-5, 9-12)
19 17.4%
Special Instructional Assistance (SIA) (Grades K-3)
0
0.0%
Title I (Grades K-12)
This school has a Targeted Assistance program.
Total 0
Retained Students, by Race/Ethnicity and Sex
Black
White Hispanic
American MultiAsian Indian racial
0
0
0
0
0
0
Male Female
0
0
Prepared by Georgia Department of Education
Page 1
STATE-REQUIRED TEST DATA
NORM-REFERENCED TESTS Grade 3
Iowa Tests of Basic Skills (ITBS) Each chart reflects data for three years of testing.
Reading Comprehension 50
57 47 54 0
98-99
54 51 53 97-98
60 55 52 96-97
Mathematics
School 50
System
State
0
42 48 61 98-99
56 58 61 97-98
60 62 59 96-97
School System State
Reading Vocabulary 50
45 43 50 0
98-99
42 51 50 97-98
41 52 49 96-97
Language Arts
School 50
System
State
0
60 59 64 98-99
58 65 62 97-98
53 67 59 96-97
School System State
Social Studies 50
49 48 56 0
98-99
54 59 55 97-98
50 57 55 96-97
Science
School 50
System
State
0
57 58 59 98-99
69 75 59 97-98
60 73 58 96-97
School System State
Sources of Information
Composite Score
50
55 50 57 0
98-99
School 50
System
59 60 56 97-98
57 59 55 96-97
State 0
52 50 58 98-99
57 62 57 97-98
1998-99 GEORGIA PUBLIC EDUCATION REPORT CARD Fourth District Elementary School - 6015050
Prepared by Georgia Department of Education
54 62 56 96-97
Scores Reported in Percentiles
School System State
Page 2
STATE-REQUIRED TEST DATA
NORM-REFERENCED TESTS Grade 5
Iowa Tests of Basic Skills (ITBS) Each chart reflects data for three years of testing.
Reading Comprehension
Mathematics
50
53 53 53 0
98-99
60 53 53 97-98
58 55 52 96-97
School 50
System
State
0
71 53 59 98-99
63 57 58 97-98
59 56 57 96-97
School System State
Reading Vocabulary 50
69 51 48 0
98-99
53 48 48 97-98
50 46 46 96-97
Language Arts
School 50
System
State
0
76 64 63 98-99
69 63 61 97-98
74 63 58 96-97
School System State
Social Studies 50
71 55 57 0
98-99
65 58 56 97-98
65 54 55 96-97
Science
School 50
System
State
0
74 63 60 98-99
75 65 59 97-98
70 64 59 96-97
School System State
Sources of Information
Composite Score
50
68 57 58 0
98-99
School 50
System
60 58 58 97-98
60 58 57 96-97
State 0
71 57 57 98-99
66 58 56 97-98
64 58 55 96-97
1998-99 GEORGIA PUBLIC EDUCATION REPORT CARD Fourth District Elementary School - 6015050
Prepared by Georgia Department of Education
Scores Reported in Percentiles
School System State
Page 3
STATE-REQUIRED TEST DATA
PERFORMANCE ASSESSMENTS
Grade 5 Writing Assessment
Percent at Developmental Stages:
1998-99 School System State
1997-98 School System State
1996-97 School System State
Stage Stage Stage Stage Stage Stage
1:The Emerging Writer 2:The Developing Writer 3:The Focusing Writer 4:The Experimenting 5:The Engaging Writer 6:The Extending Writer
0% 0% 0% 44% 33% 22%
0% 2% 20% 48% 19% 11%
0% 1% 16% 41% 29% 12%
0% 7% 31% 34% 21% 7%
0% 9% 32% 33% 21% 4%
0% 3% 19% 41% 27% 10%
0% 0% 25% 38% 25% 13%
0% 5% 25% 41% 20% 9%
0% 3% 21% 37% 26% 12%
AWARDS / RECOGNITION DATA
Schools in Georgia may receive recognition in the following programs: Charter School Pay for Performance Program Georgia School of Excellence National Blue Ribbon School Fourth District Elementary School did not receive recognition in any of these programs during the 1998-99 school year.
1998-99 GEORGIA PUBLIC EDUCATION REPORT CARD Fourth District Elementary School - 6015050
Prepared by Georgia Department of Education
Page 4
CERTIFIED PERSONNEL DATA
Positions Number Average Contract Days
Personnel Sex
Certificate
Years Experience
Full-time Part-time
Male Female
4 Yr Bachelor's 5 Yr Master's 6 Yr Specialist's 7 Yr Doctoral Other*
<1 1-10 11-20 21-30 >30
Average
Administrators
1.00 210.00
1 0
1 0
0 0 1 0 0 0 0 0 1 0 24.00
Support Personnel
2.15 190.00
1 3
0 4
1 2 1 0 0 1 1 1 1 0 12.00
PK-12 Teachers
13.50 190.00
13 2
1 14
5 8 2 0 0 1 6 3 5 0 14.87
*Includes One- and Two-Year Vocational Certificates.
ACCREDITATION DATA
Candidate for accreditation by Southern Association of Colleges and Schools (SACS):
Elementary/Middle Commission. Accredited with Quality by Georgia
Accrediting Commission (GAC).
1998-99 GEORGIA PUBLIC EDUCATION REPORT CARD Fourth District Elementary School - 6015050
Prepared by Georgia Department of Education
Page 5
1998-99 GEORGIA PUBLIC EDUCATION REPORT CARD ATKINSON COUNTY SCHOOLS - 602
The Georgia Public Education Report Card is designed to assist systems and schools in educational improvement. This report card contains a variety of data elements. An explanation of the terms is provided as a companion to the report card data. Please refer to the definitions for the most effective use of the reported data.
Total
K-12
1,502
PK
72
STUDENT DATA
Enrollment, by Race/Ethnicity and Sex
Black
White Hispanic
American Multi-
Asian Indian
racial
390 26.0%
858 57.1%
241 16.0%
0 0.0%
2 0.1%
11 0.7%
13 18.1%
43 59.7%
15 20.8%
0 0.0%
0 0.0%
1 1.4%
Male
767 51.1%
36 50.0%
Female
735 48.9%
36 50.0%
Enrollment in Selected Programs
Program
Program % of Student Enrollment Population
Gifted (Grades K-12)
76
5.1%
Non-Vocational Labs (Grades 9-12)
300
75.2%
Vocational Labs (Grades 9-12)
329
82.5%
Alternative Programs (Grades 6-12)
0
0.0%
Students Eligible to Receive Free/Reduced Lunches
Number
Percent
1,309
83.2%
Dropout Rate
Number
Percent
6-12 9-12
57
7.0%
46
11.0%
Enrollment in Compensatory Programs
Program
Program % of Student Enrollment Population
Special Education
(Grades K-12)
200
PK
28
English to Speakers of
Other Languages (ESOL)
37
(Grades K-12)
Remedial Education (Grades 2-5, 9-12)
119
Special Instructional
Assistance (SIA)
38
(Grades K-3)
Title I (Grades K-12) Number of schools with: Schoolwide program Targeted Assistance program No Title I program
13.3% N/A
2.5%
13.4%
7.1%
2 0 1
Total 115
Retained Students, by Race/Ethnicity and Sex
Black
White Hispanic
American MultiAsian Indian racial
41 35.7%
49
23
42.6% 20.0%
0 0.0%
1 0.9%
1 0.9%
Male Female
79
36
68.7% 31.3%
Prepared by Georgia Department of Education
Page 1
STATE-REQUIRED TEST DATA
NORM-REFERENCED TESTS
Grade 3 Iowa Tests of Basic Skills (ITBS) Each chart reflects data for three years of testing.
Reading Comprehension
Mathematics
50
51 54 58 53 60 52 0
98-99 97-98 96-97
System State
50
61 61 64 61 74 59 0
98-99 97-98 96-97
System State
Reading Vocabulary
50
49 50 43 50 86 49 0
98-99 97-98 96-97
System State
Social Studies
50
45 56 59 55 68 55 0
98-99 97-98 96-97
System State
Language Arts
50
70 64 73 62 81 59 0
98-99 97-98 96-97
System State
Science
50
54 59 68 59 79 58 0
98-99 97-98 96-97
System State
Sources of Information
Composite Score
50
55 57 0
98-99
System
50
50 56 61 55 97-98 96-97
State
56 58 61 57 0
98-99 97-98
1998-99 GEORGIA PUBLIC EDUCATION REPORT CARD Atkinson County Schools
Prepared by Georgia Department of Education
System State Scores Reported 74 56 in Percentiles 96-97
Page 2
STATE-REQUIRED TEST DATA
NORM-REFERENCED TESTS
Grade 5 Iowa Tests of Basic Skills (ITBS) Each chart reflects data for three years of testing.
Reading Comprehension
Mathematics
50
45 53 45 53 49 52 0
98-99 97-98 96-97
System State
50
44 59 50 58 46 57 0
98-99 97-98 96-97
System State
Reading Vocabulary
50
36 48 97 48 70 46 0
98-99 97-98 96-97
System State
Social Studies
50
38 57 38 56 37 55 0
98-99 97-98 96-97
System State
Language Arts
50
54 63 68 61 58 58 0
98-99 97-98 96-97
System State
Science
50
44 60 47 59 38 59 0
98-99 97-98 96-97
System State
Sources of Information
Composite Score
50
45 58 0
98-99
System
50
43 58 48 57 97-98 96-97
State
43 57 53 56 0
98-99 97-98
1998-99 GEORGIA PUBLIC EDUCATION REPORT CARD Atkinson County Schools
Prepared by Georgia Department of Education
System State Scores Reported 46 55 in Percentiles 96-97
Page 3
STATE-REQUIRED TEST DATA
NORM-REFERENCED TESTS Grade 8
Iowa Tests of Basic Skills (ITBS) Each chart reflects data for three years of testing.
Reading Comprehension
Mathematics
50
37 49 43 48 38 48 0
98-99 97-98 96-97
System State
50
36 56 46 55 41 54 0
98-99 97-98 96-97
System State
Reading Vocabulary
50
25 46 36 45 29 44 0
98-99 97-98 96-97
System State
Language Arts
50
51 60 61 58 53 56 0
98-99 97-98 96-97
System State
Social Studies
50
30 54 44 53 34 53 0
98-99 97-98 96-97
System State
Science
50
39 56 48 55 41 53 0
98-99 97-98 96-97
System State
Sources of Information
Composite Score
50
43 57 0
98-99
System
50
50 56 44 55 97-98 96-97
State
37 56 48 54 0
98-99 97-98
1998-99 GEORGIA PUBLIC EDUCATION REPORT CARD Atkinson County Schools
Prepared by Georgia Department of Education
System State Scores Reported 39 54 in Percentiles 96-97
Page 4
STATE-REQUIRED TEST DATA
PERFORMANCE ASSESSMENTS
Grade 5 Writing Assessment
1998-99
1997-98
1996-97
Percent at Developmental Stages:
Comparison
Comparison
Comparison
System Group State System Group State System Group State
Stage Stage Stage Stage Stage Stage
1: The Emerging Writer 2: The Developing Writer 3: The Focusing Writer 4: The Experimenting Writer 5: The Engaging Writer 6: The Extending Writer
2% 2% 22% 54% 18% 3%
1% 3% 31% 46% 16% 3%
0% 1% 16% 41% 29% 12%
0% 1% 21% 56% 15% 5%
1% 6% 30% 43% 17% 3%
0% 3% 19% 41% 27% 10%
0% 2% 43% 35% 14% 5%
1% 8% 33% 35% 17% 6%
0% 3% 21% 37% 26% 12%
Grade 8 Writing Assessment
1998-99 Percent Scoring 1997-98 Percent Scoring 1996-97 Percent Scoring
Categories of Scaled Scores
Comparison
Comparison
Comparison
System Group State System Group State System Group State
Inadequate (less than 162)
Minimal (162-209)
Good
(210-247)
Very Good (greater than 247)
9% 51% 39%
1%
19% 56% 23%
2%
8% 40% 41% 11%
27% 55% 16%
2%
26% 55% 17%
2%
11% 46% 34%
8%
47% 40% 13%
0%
36% 49% 14%
2%
15% 46% 30%
8%
Average Scaled Score: (Range 100-300)
200
188 208
178
182 202
169
176 198
GEORGIA HIGH SCHOOL GRADUATION TESTS (GHSGT)
Percent of Regular Program 11th Graders Passing the Georgia High School Graduation Tests on First Administration
1998-99
1997-98
1996-97
Comparison
Comparison
Comparison
System Group State System Group State System Group State
English Language Arts Mathematics Social Studies Science
83% 65% 52% 49%
88% 69% 50% 41%
96% 88% 80% 72%
90% 79% 54% 52%
89% 75% 61% 53%
94% 88% 78% 74%
89% 81% 65% 55%
88% 74% 59% 46%
94% 87% 78% 74%
All Components listed above 4 1 %
32% 68% 41%
42% 68% 47%
39% 67%
Writing
85%
82% 93% 85%
85% 92% 83%
84% 93%
1998-99 GEORGIA PUBLIC EDUCATION REPORT CARD
Atkinson County Schools
Prepared by Georgia Department of Education
Page 5
GRADUATE DATA
1999 Graduates by Credentials, Race/Ethnicity and Sex
Diplomas with Both College Prep. & Voc. Endorsements
Diplomas with College Prep. Endorsements Diplomas with Vocational Endorsements General High School Diplomas Special Education Diplomas
Total All Diplomas
Certificates of Performance
Total Graduates
Total 12 18 27 0 3 60 18 78
Black
American MultiWhite Hispanic Asian Indian racial
0 0.0%
6 33.3%
12 44.4%
0
12 100.0%
12 66.7%
14 51.9%
0
0 0.0%
0 0.0%
1 3.7%
0
0 0.0%
0 0.0%
0 0.0%
0
0 0.0%
0 0.0%
0 0.0%
0
0 0.0%
0 0.0%
0 0.0%
0
Male Female
3 25.0%
9 50.0%
14 51.9%
0
9 75.0%
9 50.0%
13 48.1%
0
1 33.3%
19 31.7%
8 44.4%
27 34.6%
2
0
66.7% 0.0%
40
1
66.7% 1.7%
8
2
44.4% 11.1%
48
3
61.5% 3.8%
0 0.0%
0 0.0%
0 0.0%
0 0.0%
0 0.0%
0 0.0%
0 0.0%
0 0.0%
0 0.0%
0 0.0%
0 0.0%
0 0.0%
2 66.7%
28 46.7%
4 22.2%
32 41.0%
1 33.3%
32 53.3%
14 77.8%
46 59.0%
HOPE Scholarships
System State
Number of 1999 Graduates 7 8
Number Eligible
32
Percent Eligible
41.0%
65,548 40,292 61.5%
High School Completion Rate Percent of 1995Grade 9 Enrollment
in Graduating Class of1999
System
State
Completion Rate '95-'99 61.4% 68.9%
COLLEGE ADMISSIONS / CREDIT TEST DATA
Scholastic Assessment Test (SAT)
No. Taking
Average Score
Tests
Verbal Math Total
Based on students' highest verbal and highest math scores
System College Prep. Endorsement Other Diplomas
469 436 905 475 433 908 445 395 840
Georgia
492 488 980
Based on students' last test administration
System Georgia
19
467 433
900
41,958 483 479 962
Nation
952,913 502 508 1010
American College Testing (ACT)
System State Nation
English Mathematics Reading Science Reasoning
N/A N/A N/A N/A
19.1 19.9 20.2 19.9
20.4 20.7 21.3 21.0
CompositeScore N/A * 19.9 21.9
* Scores not reported when fewer than 5 tests taken.
Advanced Placement Exams (AP)
No. of Students Taking Tests
No. of Tests Taken No. of Test Scores
3 or Higher Percent of Test
Scores 3 or Higher
System State 0 15,225
N/A 23,969 N/A 13,024
N/A 54.3%
1998-99 GEORGIA PUBLIC EDUCATION REPORT CARD Atkinson County Schools
Prepared by Georgia Department of Education
Page 6
POSTSECONDARY DATA
Graduates Entering Georgia Public Colleges and Universities
Graduates Entering Georgia Public Colleges and Universities and
Requiring Learning Support (LS)
1998 Graduates Entering 1998-99
1997 Graduates Entering 1997-98
Percent of Graduating Number Class
12
19.7%
16
25.0%
Number Requiring
LS
4
5
Percent of those attending Georgia
Public Colleges
33.3%
31.3%
In previous years, the Report Card presented College Prep Curriculum information provided by the Board of Regents on students requiring Learning Support. Due to inconsistencies in the data provided by the Board of Regents in defining College Prep Completers versus Local Board of Education data defining College Prep Endorsements, the Department of Education Report Card will not provide this information until discrepancies can be reconciled.
Graduates Entering Georgia Public Technical and Adult Schools
Entering 1998-99 Entering 1997-98
Number Percent
Number Percent
1998 Graduates 1997 Graduates
6
9.8%
0
0.0%
N/A 9
N/A 14.1%
ACCREDITATION / RECOGNITION DATA
Southern Association of Colleges and Schools (SACS) Accrediting Commission
Secondary/Middle Commission Elementary/Middle Commission Both Elementary/Secondary Commissions Joint Commission Candidate for Accreditation
Accreditation by Georgia Accrediting Commission (GAC)
Accredited by GAC Accredited with Quality by GAC
Number of Schools
1 0 0 0 0
Number of Schools
0 3
Awards / Recognition
State Recognized Program
Number of Schools
Charter School
0
Pay for Performance Recipient
0
Georgia School of Excellence
0
National Blue Ribbon School
0
COMMUNITY DATA
Number of Children Eligible for Migrant Education Number of Families-At-Risk * Number of Food Stamp Participants * Number of Families Receiving TANF * ** Per Capita Income * Unemployment Rate * 1990 Population * Projected 2000 Population * Projected 2010 Population *
* Data Available at County Level Only ** Known as AFDC before January 1997
287 51
811 77
$18,578 7.7%
6,213 5,751 5,867
1998-99 GEORGIA PUBLIC EDUCATION REPORT CARD Atkinson County Schools
Prepared by Georgia Department of Education
Page 7
FISCAL DATA
Millage Rate
13.25
* Fall 1998 Property Tax Digest is used to calculate the 98-99 Value of One Mill
FTE Count
FTE Count used for Allotment Calculation 1,490.0 Fall '98 FTE Count 1,502
Value of One Mill
$100,445 $67.41 per Allotment FTE
Sources: Local State-QBE State-
Lottery State-
Other Federal Other
Total
PerGeneral Fund cent Per FTE
$1,416,271 19.3% $951 $5,708,910 77.7% $3,831
K-12 Revenues
Lottery K-12
and
Title
All Other
Programs
K-12
$0
$0
Bonded Debt $0
$0
$0
$0
$0 0.0%
$0
$0
$33,856
$0
$214,484 2.9% $144
$7,855
$12,270
$0
$0 0.0%
$0 $901,662
$16,550
$0
$12,281 0.2%
$8
$0
$0
$0
$7,351,946 100% $4,934 $909,517
$62,676
$0
Capital Projects
$130,205 $0
$0
$0 $0 $0 $130,205
School Nutrition
$35,320 $0
$0
$50,520 $578,397
$0 $664,238
Grand Total
Total
Per-
Amount cent
$1,581,797 17.3%
$5,708,910 62.6%
$33,856 0.4%
$285,130 3.1% $1,496,609 16.4%
$12,281 0.1% $9,118,585 100%
Instruction
Media Instruction
Support Pupil Services General Admin. School Admin. Trans-
portation Maint. & Ops. Capital Projects School Food Debt Service
Total
$4,521,237 66.6% $3,034 $225,803 3.3% $152
$358,278 5.3% $240
$185,388 2.7% $124
$315,554 4.7% $212
$365,086 5.4% $245
$382,291 5.6% $257
$402,498 5.9% $270
$26,205 0.4% $18
$1,978 0.0%
$1
$0 0.0%
$0
$6,784,323 100% $4,553
K-12 Expenditures
$596,297
$63,601
$0
$52,433
$0
$0
$81,839
$0
$0
$13,765
$0
$0
$85,230
$125
$0
$0
$0
$0
$11,136
$219
$0
$0
$192
$0
$0
$0
$0
$0
$0
$0
$0
$0
$0
$840,703
$64,137
$0
$0 $0 $0 $0 $0 $0 $0 $0 $3,270 $0 $0
$3,270
$0 $0 $0 $0 $0 $0 $0 $0 $0 $655,348 $0
$655,348
$5,181,136 62.1% $278,237 3.3% $440,118 5.3% $199,153 2.4% $400,910 4.8% $365,086 4.4% $393,647 4.7% $402,691 4.8% $29,475 0.4% $657,326 7.9% $0 0.0%
$8,347,783 100%
Salaries and Benefits as Percentages of Revenues and of Expenditures
Teachers and Paraprofessionals
Salaries $3,648,635
Benefits $1,000,178
Percentage of Revenues Percentage of Expenditures
Total of
Total of
General Fund
General Fund
Title Programs
Title Programs
Lottery K-12
Lottery K-12
Total Salaries
and
Total
and
Total
and Benefits All Other K-12 K - 12 All Other K-12 K - 12
$4,648,813
55.8%
51.0%
60.5%
55.7%
School Administration
$215,592
$68,887
$284,479
3.4%
3.1%
3.7%
3.4%
General Administration
$119,682
$54,994
$174,676
2.1%
1.9%
2.3%
2.1%
1998-99 GEORGIA PUBLIC EDUCATION REPORT CARD
Atkinson County Schools - 602
Prepared by Georgia Department of Education
Page 8
CERTIFIED PERSONNEL DATA
Number
Average Annual Salary Positions Average Contract Days
Average Daily Salary
Full-time Personnel Part-time
Sex Male Female
4 Yr Bachelor's Certificate 5 Yr Master's
Level 6 Yr Specialist's 7 Yr Doctoral Other*
Black
White Race/ Hispanic Ethnicity Asian
American Indian
Multiracial
Years Experience
<1 1-10 11-20 21-30 >30
Average
Administrators
8.00
$56,781.40 222.50
$255.20
8 0
3 5
0 1 5 2 0
1 7 0 0 0 0
0 0 4 3 1
21.25
Support Personnel PK-12 Teachers
9.00
94.00
$40,949.29 190.00
$215.52
$36,402.30 190.93
$190.66
9
94
0
0
2
23
7
71
0
52
7
36
2
6
0
0
0
0
1
17
8
76
0
1
0
0
0
0
0
0
2
7
1
39
3
25
3
17
0
6
14.22
12.47
*Includes One- and Two-Year Vocational Certificates.
Certified Staff Position Ratios
Teacher/Administrator Ratio 12:1
Teacher/Support Person Ratio 10:1
Teacher/Staff Ratio 6:1
Student Enrollment/All Teachers 16:1
Certified Personnel by Category
84.7% 100%
7.2%
8.1%
80% 60%
40%
20%
0%
Teachers
Administrators
Support Personnel
1998-99 GEORGIA PUBLIC EDUCATION REPORT CARD
Atkinson County Schools - 602
Prepared by Georgia Department of Education
Page 9
1998-99 GEORGIA PUBLIC EDUCATION REPORT CARD
ATKINSON COUNTY SCHOOLS
Atkinson County High School - 6021050
Grade Range 8-12
The Georgia Public Education Report Card is designed to assist systems and schools in educational improvement. This report card contains a variety of data elements. An explanation of the terms is provided as a companion to the report card data. Please refer to the definitions for the most effective use of the reported data.
STUDENT DATA
Total 512
8-12 Enrollment, by Race/Ethnicity and Sex
Black
White Hispanic
American Multi-
Asian Indian
racial
152 29.7%
318 62.1%
40 7.8%
0 0.0%
1 0.2%
1 0.2%
Male 265
51.8%
Female 247
48.2%
Enrollment in Selected Programs
Program
Program % of Student Enrollment Population
Gifted (Grades K-12)
40
7.8%
Non-Vocational Labs (Grades 9-12)
300
75.2%
Vocational Labs (Grades 9-12)
329
82.5%
Alternative Programs (Grades 6-12)
0
0.0%
Students Eligible to Receive Free/Reduced Lunches
Number
Percent
School System
392 1,309
76.6% 83.2%
Enrollment in Compensatory Programs
Program
Program % of Student Enrollment Population
Special Education (Grades K-12) PK
44
8.6%
0
N/A
English to Speakers of Other Languages (ESOL) (Grades K-12)
8
1.6%
Remedial Education (Grades 2-5, 9-12)
53 13.3%
Special Instructional Assistance (SIA) (Grades K-3)
N/A
N/A
Title I (Grades K-12) This school has no Title I program.
Dropout Rate for Grades 8-12
Number
Rate
School System
57
10.2%
57
10.2%
Total 51
Retained Students, by Race/Ethnicity and Sex
Black
White Hispanic
American MultiAsian Indian racial
22 43.1%
25 49.0%
3 5.9%
0 0.0%
1 2.0%
0 0.0%
Male Female
39
12
76.5% 23.5%
Prepared by Georgia Department of Education
Page 1
STATE-REQUIRED TEST DATA
NORM-REFERENCED TESTS
Grade 3 Iowa Tests of Basic Skills (ITBS) Each chart reflects data for three years of testing.
No third-grade students are enrolled at Atkinson County High School.
Reading Comprehension
Mathematics
50
N/A 51 54 0
98-99
N/A 58 53 97-98
N/A 60 52 96-97
School 50
System
State
N/A 61 61 0
98-99
N/A 64 61 97-98
N/A 74 59 96-97
School System State
Reading Vocabulary 50
N/A 49 50 0
98-99
N/A 43 50 97-98
N/A 86 49 96-97
Language Arts
School 50
System
State
N/A 70 64 0
98-99
N/A 73 62 97-98
N/A 81 59 96-97
School System State
Social Studies 50
N/A 45 56 0
98-99
N/A 59 55 97-98
N/A 68 55 96-97
Science
School 50
System
State
N/A 54 59 0
98-99
N/A 68 59 97-98
N/A 79 58 96-97
School System State
Sources of Information
Composite Score
School
50
50
System
N/A 55 57 0
98-99
N/A 50 56 N/A 61 55
97-98
96-97
State
N/A 56 58 0
98-99
N/A 61 57 97-98
N/A 74 56 96-97
1998-99 GEORGIA PUBLIC EDUCATION REPORT CARD Atkinson County High School - 6021050
Prepared by Georgia Department of Education
Scores Reported in Percentiles
School System State
Page 2
STATE-REQUIRED TEST DATA
NORM-REFERENCED TESTS
Grade 5 Iowa Tests of Basic Skills (ITBS) Each chart reflects data for three years of testing. No fifth-grade students are enrolled at Atkinson County High School.
Reading Comprehension
Mathematics
50
N/A 45 53 0
98-99
N/A 45 53 97-98
N/A 49 52 96-97
School 50
System
State
N/A 44 59 0
98-99
N/A 50 58 97-98
N/A 46 57 96-97
School System State
Reading Vocabulary 50
N/A 36 48 0
98-99
N/A 97 48 97-98
N/A 70 46 96-97
Language Arts
School 50
System
State
N/A 54 63 0
98-99
N/A 68 61 97-98
N/A 58 58 96-97
School System State
Social Studies 50
N/A 38 57 0
98-99
N/A 38 56 97-98
N/A 37 55 96-97
Science
School 50
System
State
N/A 44 60 0
98-99
N/A 47 59 97-98
N/A 38 59 96-97
School System State
Sources of Information
Composite Score
School
50
50
System
N/A 45 58 0
98-99
N/A 43 58 N/A 48 57
97-98
96-97
State
N/A 43 57 0
98-99
N/A 53 56 97-98
N/A 46 55 96-97
1998-99 GEORGIA PUBLIC EDUCATION REPORT CARD Atkinson County High School - 6021050
Prepared by Georgia Department of Education
Scores Reported in Percentiles
School System State
Page 3
STATE-REQUIRED TEST DATA
NORM-REFERENCED TESTS Grade 8
Iowa Tests of Basic Skills (ITBS) Each chart reflects data for three years of testing.
Reading Comprehension 50
37 37 49 0
98-99
43 43 48 97-98
38 38 48 96-97
Mathematics
School 50
System
State
0
36 36 56 98-99
46 46 55 97-98
41 41 54 96-97
School System State
Reading Vocabulary 50
25 25 46 0
98-99
36 36 45 97-98
29 29 44 96-97
Language Arts
School 50
System
State
0
51 51 60 98-99
61 61 58 97-98
53 53 56 96-97
School System State
Social Studies 50
30 30 54 0
98-99
44 44 53 97-98
34 34 53 96-97
Science
School 50
System
State
0
39 39 56 98-99
48 48 55 97-98
41 41 53 96-97
School System State
Sources of Information
Composite Score
50
43 43 57 0
98-99
School 50
System
50 50 56 97-98
44 44 55 96-97
State 0
37 37 56 98-99
48 48 54 97-98
1998-99 GEORGIA PUBLIC EDUCATION REPORT CARD Atkinson County High School - 6021050
Prepared by Georgia Department of Education
39 39 54 96-97
Scores Reported in Percentiles
School System State
Page 4
STATE-REQUIRED TEST DATA
PERFORMANCE ASSESSMENTS
Grade 5 Writing Assessment
Percent at Developmental Stages:
1998-99 School System State
1997-98 School System State
1996-97 School System State
Stage Stage Stage Stage Stage Stage
1:The Emerging Writer 2:The Developing Writer 3:The Focusing Writer 4:The Experimenting 5:The Engaging Writer 6:The Extending Writer
N/A N/A N/A N/A N/A N/A
2% 2% 22% 54% 18% 3%
0% 1% 16% 41% 29% 12%
N/A N/A N/A N/A N/A N/A
0% 1% 21% 56% 15% 5%
0% 3% 19% 41% 27% 10%
N/A N/A N/A N/A N/A N/A
0% 2% 43% 35% 14% 5%
0% 3% 21% 37% 26% 12%
No fifth-grade students are enrolled at Atkinson County High School.
Categories of Scaled Scores
Inadequate (less than 162)
Minimal (162-209)
Good
(210-247)
Very Good (greater than 247)
Average Scaled Score: (Range 100-300)
Grade 8 Writing Assessment
1998-99 Percent Scoring
1997-98 Percent Scoring
1996-97 Percent Scoring
School System State School System State School System State
9% 51% 39%
1%
9% 51% 39%
1%
8% 40% 41% 11%
27% 55% 16%
2%
27% 55% 16%
2%
11% 46% 34%
8%
47% 40% 13%
0%
47% 40% 13%
0%
15% 46% 30%
8%
200
200
208 178
178 202 169
169 198
GEORGIA HIGH SCHOOL GRADUATION TESTS (GHSGT)
Percent of Regular Program 11th Graders Passing the Georgia High School Graduation Tests on First Administration
English Language Arts Mathematics Social Studies Science
All Components listed above
Writing
1998-99
School System State
83% 65% 52% 49%
41%
83% 65% 52% 49%
41%
96% 88% 80% 72%
68%
85% 85% 93%
1997-98
School System State
90% 79% 54% 52%
41%
90% 79% 54% 52%
41%
94% 88% 78% 74%
68%
85% 85% 92%
1996-97
School System State
89% 81% 65% 55%
47%
89% 81% 65% 55%
47%
94% 87% 78% 74%
67%
83% 83% 93%
1998-99 GEORGIA PUBLIC EDUCATION REPORT CARD Atkinson County High School - 6021050
Prepared by Georgia Department of Education
Page 5
GRADUATE DATA
1999 Graduates by Credentials, Race/Ethnicity and Sex
Diplomas with Both College Prep. & Voc. Endorsements
Diplomas with College Prep. Endorsements Diplomas with Vocational Endorsements General High School Diplomas Special Education Diplomas
Total All Diplomas
Certificates of Performance
Total Graduates
Total 12 18 27 0
Black
0 0.0%
6 33.3%
12 44.4%
0
White Hispanic
12 100.0%
0 0.0%
12 66.7%
0 0.0%
14 51.9%
1 3.7%
0
0
American MultiAsian Indian racial
0 0.0%
0 0.0%
0 0.0%
0 0.0%
0 0.0%
0 0.0%
0 0.0%
0 0.0%
0 0.0%
0
0
0
3
1
2
0
0
0
0
33.3% 66.7% 0.0% 0.0% 0.0% 0.0%
60
19
40
1
0
0
0
31.7% 66.7% 1.7% 0.0% 0.0% 0.0%
18
8
8
2
0
0
0
44.4% 44.4% 11.1% 0.0% 0.0% 0.0%
78
27
48
3
0
0
0
34.6% 61.5% 3.8% 0.0% 0.0% 0.0%
Male Female
3
9
25.0% 75.0%
9
9
50.0% 50.0%
14
13
51.9% 48.1%
0
0
2 66.7%
28 46.7%
4 22.2%
32 41.0%
1 33.3%
32 53.3%
14 77.8%
46 59.0%
HOPE Scholarships
School System
Number of 1999 Graduates 7 8
Number Eligible
32
Percent Eligible
41.0%
78 32 41.0%
State
65,548 40,292 61.5%
High School Completion Rate
Percent of 1995Grade 9 Enrollment in Graduating Class of1999 School System State
Completion Rate '95-'99 61.4% 61.4% 68.9%
1998-99 GEORGIA PUBLIC EDUCATION REPORT CARD
Atkinson County High School - 6021050
Prepared by Georgia Department of Education
Page 6
COLLEGE ADMISSIONS / CREDIT TEST DATA
Scholastic Assessment Test (SAT)
Based on students' highest verbal and highest math scores
No. Taking
Average Score
Tests Verbal Math Total
Based on students' last test administration
Average Score Verbal Math Total
School College Prep. Endorsement Other Diplomas
19 469 436
905
475 433
908
445 395
840
System College Prep. Endorsement Other Diplomas
19 469 436
905
475 433
908
445 395
840
Georgia
41,958 492 488
980
467 N/A N/A
467 N/A N/A
483
433 N/A N/A
433 N/A N/A
479
900 N/A N/A
900 N/A N/A
962
Nation
952,913 N/A N/A N/A
502 508 1010
American College Testing (ACT)
Advanced Placement Exams (AP)
Number taking tests: English Mathematics Reading Science Reasoning CompositeScore
N/A
School System
N/A
N/A
N/A
N/A
N/A N/A
N/A N/A
N/A
N/A
State 19.1 19.9 20.2 19.9 19.9
No. of Students Taking Tests
No. of Tests Taken No. of Test Scores
3 or Higher Percent of Test
Scores 3 or Higher
School 0
N/A N/A
N/A
System State 0 15,225
N/A 23,969 N/A 13,024
N/A 54.3%
POST-SECONDARY DATA
Graduates Entering Georgia Public Colleges
Graduates Entering Georgia Public Colleges and Requiring Learning Support (LS)
1998 Graduates Entering in 1998-99
1997 Graduates Entering in 1997-98
Percent of Graduating Number Class
School
12
19.7%
System 1 2
19.7%
School
16
25.0%
System 1 6
25.0%
Number Requiring
LS 4 4
5 5
Percent of those attending Georgia
Public Colleges
33.3%
33.3%
31.3%
31.3%
In previous years, the Report Card presented College Prep Curriculum information provided by the Board of Regents on students requiring Learning Support. Due to inconsistencies in the data provided by the Board of Regents in defining College Prep Completers versus Local Board of Education data defining College Prep Endorsements, the Department of Education Report Card will not provide this information until discrepancies can be reconciled.
Graduates Entering Georgia Public Technical and Adult Schools
1998 Graduates School System
Entering Number 6 6
1998-99 Percent
9.8% 9.8%
Entering Number N/A N/A
1997-98 Percent
N/A N/A
1997 Graduates School
0
0.0%
System
0
0.0%
9
14.1%
9
14.1%
1998-99 GEORGIA PUBLIC EDUCATION REPORT CARD Atkinson County High School - 6021050
Prepared by Georgia Department of Education
Page 7
CERTIFIED PERSONNEL DATA
Positions Number Average Contract Days
Administrators
1.00 190.00
Support Personnel
2.00 190.00
PK-12 Teachers
30.50 193.84
Personnel Sex
Certificate
Years Experience
Full-time Part-time
Male Female
4 Yr Bachelor's 5 Yr Master's 6 Yr Specialist's 7 Yr Doctoral Other*
<1 1-10 11-20 21-30 >30
Average
1 0
1 0
0 1 0 0 0
0 0 0 1 0
28.00
2 0
1 1
0 1 1 0 0
0 0 2 0 0
18.50
30 1
13 18
14 14
3 0 0
5 8 10 7 1
12.68
*Includes One- and Two-Year Vocational Certificates.
ACCREDITATION DATA
Accredited by Southern Association of Colleges and Schools (SACS): Secondary/Middle Commission. Accredited with Quality by Georgia Accrediting Commission (GAC).
AWARDS / RECOGNITION DATA
Schools in Georgia may receive recognition in the following programs: Charter School Pay for Performance Program Georgia School of Excellence National Blue Ribbon School Atkinson County High School did not receive recognition in any of these programs during the 1998-99 school year.
1998-99 GEORGIA PUBLIC EDUCATION REPORT CARD Atkinson County High School - 6021050
Prepared by Georgia Department of Education
Page 8
1998-99 GEORGIA PUBLIC EDUCATION REPORT CARD
ATKINSON COUNTY SCHOOLS
Pearson Elementary School - 6020190
Grade Range PK-7
The Georgia Public Education Report Card is designed to assist systems and schools in educational improvement. This report card contains a variety of data elements. An explanation of the terms is provided as a companion to the report card data. Please refer to the definitions for the most effective use of the reported data.
STUDENT DATA
Total
K-7
723
PK
51
Enrollment, by Race/Ethnicity and Sex
Black
White Hispanic
American Asian Indian
Multiracial
173 23.9%
398 55.0%
144 19.9%
0 0.0%
1 0.1%
7 1.0%
9 17.6%
30 58.8%
11 21.6%
0 0.0%
0 0.0%
1 2.0%
Male Female
365 50.5%
358 49.5%
26 51.0%
25 49.0%
Enrollment in Selected Programs
Program
Program % of Student Enrollment Population
Gifted (Grades K-12)
24
3.3%
Alternative Programs (Grades 6-12)
0
0.0%
Students Eligible to Receive Free/Reduced Lunches
Number
Percent
School System
693 1,309
89.5% 83.2%
Dropout Rate for Grades 6-7
Number
Rate
School System
0
0.0%
0
0.0%
Enrollment in Compensatory Programs
Program
Program % of Student Enrollment Population
Special Education (Grades K-12)
108 14.9%
(PK)
22
N/A
English to Speakers of Other Languages (ESOL) (Grades K-12)
20
2.8%
Remedial Education (Grades 2-5, 9-12)
32
9.1%
Special Instructional Assistance (SIA) (Grades K-3)
27
6.9%
Title I (Grades K-12)
This school has a schoolwide program.
Total 27
Retained Students, by Race/Ethnicity and Sex
Black
White Hispanic
American MultiAsian Indian racial
7 25.9%
9
10
33.3% 37.0%
0 0.0%
0 0.0%
1 3.7%
Male Female
13
14
48.1% 51.9%
Prepared by Georgia Department of Education
Page 1
STATE-REQUIRED TEST DATA
NORM-REFERENCED TESTS Grade 3
Iowa Tests of Basic Skills (ITBS) Each chart reflects data for three years of testing.
Reading Comprehension 50
54 51 54 0
98-99
58 58 53 97-98
59 60 52 96-97
Mathematics
School 50
System
State
0
61 61 61 98-99
65 64 61 97-98
72 74 59 96-97
School System State
Reading Vocabulary 50
51 49 50 0
98-99
42 43 50 97-98
90 86 49 96-97
Language Arts
School 50
System
State
0
70 70 64 98-99
72 73 62 97-98
78 81 59 96-97
School System State
Social Studies 50
47 45 56 0
98-99
64 59 55 97-98
69 68 55 96-97
Science
School 50
System
State
0
56 54 59 98-99
74 68 59 97-98
80 79 58 96-97
School System State
Sources of Information
Composite Score
50
55 55 57 0
98-99
School 50
System
48 50 56 97-98
57 61 55 96-97
State 0
57 56 58 98-99
63 61 57 97-98
1998-99 GEORGIA PUBLIC EDUCATION REPORT CARD Pearson Elementary School - 6020190
Prepared by Georgia Department of Education
74 74 56 96-97
Scores Reported in Percentiles
School System State
Page 2
STATE-REQUIRED TEST DATA
NORM-REFERENCED TESTS Grade 5
Iowa Tests of Basic Skills (ITBS) Each chart reflects data for three years of testing.
Reading Comprehension
Mathematics
50
43 45 53 0
98-99
41 45 53 97-98
47 49 52 96-97
School 50
System
State
0
41 44 59 98-99
49 50 58 97-98
47 46 57 96-97
School System State
Reading Vocabulary 50
33 36 48 0
98-99
99 97 48 97-98
80 70 46 96-97
Language Arts
School 50
System
State
0
50 54 63 98-99
70 68 61 97-98
58 58 58 96-97
School System State
Social Studies 50
34 38 57 0
98-99
36 38 56 97-98
35 37 55 96-97
Science
School 50
System
State
0
40 44 60 98-99
44 47 59 97-98
38 38 59 96-97
School System State
Sources of Information
Composite Score
50
42 45 58 0
98-99
School 50
System
38 43 58 97-98
48 48 57 96-97
State 0
39 43 57 98-99
54 53 56 97-98
47 46 55 96-97
1998-99 GEORGIA PUBLIC EDUCATION REPORT CARD Pearson Elementary School - 6020190
Prepared by Georgia Department of Education
Scores Reported in Percentiles
School System State
Page 3
STATE-REQUIRED TEST DATA
PERFORMANCE ASSESSMENTS
Grade 5 Writing Assessment
Percent at Developmental Stages:
1998-99 School System State
1997-98 School System State
1996-97 School System State
Stage Stage Stage Stage Stage Stage
1:The Emerging Writer 2:The Developing Writer 3:The Focusing Writer 4:The Experimenting 5:The Engaging Writer 6:The Extending Writer
2% 1% 23% 56% 14% 3%
2% 2% 22% 54% 18% 3%
0% 1% 16% 41% 29% 12%
0% 1% 25% 58% 8% 4%
0% 1% 21% 56% 15% 5%
0% 3% 19% 41% 27% 10%
0% 0% 44% 34% 14% 7%
0% 2% 43% 35% 14% 5%
0% 3% 21% 37% 26% 12%
AWARDS / RECOGNITION DATA
Schools in Georgia may receive recognition in the following programs: Charter School Pay for Performance Program Georgia School of Excellence National Blue Ribbon School Pearson Elementary School did not receive recognition in any of these programs during the 1998-99 school year.
1998-99 GEORGIA PUBLIC EDUCATION REPORT CARD Pearson Elementary School - 6020190
Prepared by Georgia Department of Education
Page 4
CERTIFIED PERSONNEL DATA
Positions Number Average Contract Days
Personnel Sex
Certificate
Years Experience
Full-time Part-time
Male Female
4 Yr Bachelor's 5 Yr Master's 6 Yr Specialist's 7 Yr Doctoral Other*
<1 1-10 11-20 21-30 >30
Average
Administrators
2.00 225.00
2 0
1 1
0 0 2 0 0 0 0 1 1 0 20.00
Support Personnel
3.00 190.00
3 0
0 3
0 3 0 0 0 0 1 1 1 0 13.33
PK-12 Teachers
42.00 189.29
42 0
9 33
29 11
2 0 0 1 20 10 7 4 12.36
*Includes One- and Two-Year Vocational Certificates.
ACCREDITATION DATA
Accredited with Quality by Georgia Accrediting Commission (GAC).
1998-99 GEORGIA PUBLIC EDUCATION REPORT CARD Pearson Elementary School - 6020190
Prepared by Georgia Department of Education
Page 5
1998-99 GEORGIA PUBLIC EDUCATION REPORT CARD
ATKINSON COUNTY SCHOOLS
Willacoochee Elementary School - 6020187
Grade Range PK-7
The Georgia Public Education Report Card is designed to assist systems and schools in educational improvement. This report card contains a variety of data elements. An explanation of the terms is provided as a companion to the report card data. Please refer to the definitions for the most effective use of the reported data.
STUDENT DATA
Total
K-7
267
PK
21
Enrollment, by Race/Ethnicity and Sex
Black
White Hispanic
American Asian Indian
Multiracial
65 24.3%
142 53.2%
57 21.3%
0 0.0%
0 0.0%
3 1.1%
4 19.0%
13 61.9%
4 19.0%
0 0.0%
0 0.0%
0 0.0%
Male Female
137 51.3%
130 48.7%
10 47.6%
11 52.4%
Enrollment in Selected Programs
Program
Program % of Student Enrollment Population
Gifted (Grades K-12)
12
4.5%
Alternative Programs (Grades 6-12)
0
0.0%
Students Eligible to Receive Free/Reduced Lunches
Number
Percent
School System
224 1,309
77.8% 83.2%
Dropout Rate for Grades 6-7
Number
Rate
School System
0
0.0%
0
0.0%
Enrollment in Compensatory Programs
Program
Program % of Student Enrollment Population
Special Education (Grades K-12)
48 18.0%
(PK)
6
N/A
English to Speakers of Other Languages (ESOL) (Grades K-12)
9
3.4%
Remedial Education (Grades 2-5, 9-12)
34 25.4%
Special Instructional Assistance (SIA) (Grades K-3)
11
7.4%
Title I (Grades K-12)
This school has a schoolwide program.
Total 37
Retained Students, by Race/Ethnicity and Sex
Black
White Hispanic
American MultiAsian Indian racial
12 32.4%
15
10
40.5% 27.0%
0 0.0%
0 0.0%
0 0.0%
Male Female
27
10
73.0% 27.0%
Prepared by Georgia Department of Education
Page 1
STATE-REQUIRED TEST DATA
NORM-REFERENCED TESTS Grade 3
Iowa Tests of Basic Skills (ITBS) Each chart reflects data for three years of testing.
Reading Comprehension 50
42 51 54 0
98-99
56 58 53 97-98
64 60 52 96-97
Mathematics
School 50
System
State
0
62 61 61 98-99
63 64 61 97-98
83 74 59 96-97
School System State
Reading Vocabulary 50
43 49 50 0
98-99
46 43 50 97-98
61 86 49 96-97
Language Arts
School 50
System
State
0
74 70 64 98-99
77 73 62 97-98
91 81 59 96-97
School System State
Social Studies 50
38 45 56 0
98-99
43 59 55 97-98
58 68 55 96-97
Science
School 50
System
State
0
50 54 59 98-99
46 68 59 97-98
68 79 58 96-97
School System State
Sources of Information
Composite Score
50
54 55 57 0
98-99
School 50
System
55 50 56 97-98
77 61 55 96-97
State 0
53 56 58 98-99
56 61 57 97-98
1998-99 GEORGIA PUBLIC EDUCATION REPORT CARD Willacoochee Elementary School - 6020187
Prepared by Georgia Department of Education
75 74 56 96-97
Scores Reported in Percentiles
School System State
Page 2
STATE-REQUIRED TEST DATA
NORM-REFERENCED TESTS Grade 5
Iowa Tests of Basic Skills (ITBS) Each chart reflects data for three years of testing.
Reading Comprehension
Mathematics
50
54 45 53 0
98-99
53 45 53 97-98
52 49 52 96-97
School 50
System
State
0
54 44 59 98-99
52 50 58 97-98
41 46 57 96-97
School System State
Reading Vocabulary 50
48 36 48 0
98-99
51 97 48 97-98
31 70 46 96-97
Language Arts
School 50
System
State
0
72 54 63 98-99
65 68 61 97-98
56 58 58 96-97
School System State
Social Studies 50
55 38 57 0
98-99
43 38 56 97-98
44 37 55 96-97
Science
School 50
System
State
0
60 44 60 98-99
55 47 59 97-98
42 38 59 96-97
School System State
Sources of Information
Composite Score
50
57 45 58 0
98-99
School 50
System
53 43 58 97-98
48 48 57 96-97
State 0
58 43 57 98-99
52 53 56 97-98
44 46 55 96-97
1998-99 GEORGIA PUBLIC EDUCATION REPORT CARD Willacoochee Elementary School - 6020187
Prepared by Georgia Department of Education
Scores Reported in Percentiles
School System State
Page 3
STATE-REQUIRED TEST DATA
PERFORMANCE ASSESSMENTS
Grade 5 Writing Assessment
Percent at Developmental Stages:
1998-99 School System State
1997-98 School System State
1996-97 School System State
Stage Stage Stage Stage Stage Stage
1:The Emerging Writer 2:The Developing Writer 3:The Focusing Writer 4:The Experimenting 5:The Engaging Writer 6:The Extending Writer
0% 6% 13% 44% 38% 0%
2% 2% 22% 54% 18% 3%
0% 1% 16% 41% 29% 12%
0% 0% 10% 53% 30% 7%
0% 1% 21% 56% 15% 5%
0% 3% 19% 41% 27% 10%
0% 9% 39% 39% 13% 0%
0% 2% 43% 35% 14% 5%
0% 3% 21% 37% 26% 12%
AWARDS / RECOGNITION DATA
Schools in Georgia may receive recognition in the following programs: Charter School Pay for Performance Program Georgia School of Excellence National Blue Ribbon School Willacoochee Elementary School did not receive recognition in any of these programs during the 1998-99 school year.
1998-99 GEORGIA PUBLIC EDUCATION REPORT CARD Willacoochee Elementary School - 6020187
Prepared by Georgia Department of Education
Page 4
CERTIFIED PERSONNEL DATA
Positions Number Average Contract Days
Personnel Sex
Certificate
Years Experience
Full-time Part-time
Male Female
4 Yr Bachelor's 5 Yr Master's 6 Yr Specialist's 7 Yr Doctoral Other*
<1 1-10 11-20 21-30 >30
Average
Administrators
1.00 230.00
1 0
1 0
0 0 1 0 0 0 0 1 0 0 12.00
Support Personnel
2.00 190.00
2 0
0 2
0 1 1 0 0 1 0 0 1 0 13.50
PK-12 Teachers
21.50 190.00
21 1
1 21
10 11
1 0 0 2 11 5 3 1 11.82
*Includes One- and Two-Year Vocational Certificates.
ACCREDITATION DATA
Accredited with Quality by Georgia Accrediting Commission (GAC).
1998-99 GEORGIA PUBLIC EDUCATION REPORT CARD Willacoochee Elementary School - 6020187
Prepared by Georgia Department of Education
Page 5
1998-99 GEORGIA PUBLIC EDUCATION REPORT CARD ATLANTA CITY SCHOOLS - 761
The Georgia Public Education Report Card is designed to assist systems and schools in educational improvement. This report card contains a variety of data elements. An explanation of the terms is provided as a companion to the report card data. Please refer to the definitions for the most effective use of the reported data.
Total
K-12
59,493
PK
1,048
STUDENT DATA
Enrollment, by Race/Ethnicity and Sex
Black
White Hispanic
American Multi-
Asian Indian
racial
53,447 89.8%
3,822 6.4%
1,325 2.2%
700 1.2%
25 0.0%
174 0.3%
931 88.8%
52 5.0%
47 4.5%
10 1.0%
0 0.0%
8 0.8%
Male
29,911 50.3%
544 51.9%
Female
29,582 49.7%
504 48.1%
Enrollment in Selected Programs
Program
Program % of Student Enrollment Population
Gifted (Grades K-12)
3,033
5.1%
Non-Vocational Labs (Grades 9-12)
11,467
81.4%
Vocational Labs (Grades 9-12)
7,623
54.1%
Alternative Programs (Grades 6-12)
388
1.5%
Students Eligible to Receive Free/Reduced Lunches
Number
Percent
45,695
75.5%
Dropout Rate
Number
Percent
6-12 9-12
1,953 1,248
4.7% 5.4%
Enrollment in Compensatory Programs
Program
Program % of Student Enrollment Population
Special Education (Grades K-12)
PK
4,682 221
English to Speakers of
Other Languages (ESOL)
957
(Grades K-12)
Remedial Education (Grades 2-5, 9-12)
6,259
Special Instructional Assistance (SIA) (Grades K-3)
10,603
Title I (Grades K-12) Number of schools with: Schoolwide program Targeted Assistance program No Title I program
7.9% N/A
1.6%
17.6%
46.3%
89 2 7
Total 3,570
Retained Students, by Race/Ethnicity and Sex
Black
White Hispanic
American MultiAsian Indian racial
3,363 94.2%
103 2.9%
82 2.3%
19 0.5%
0 0.0%
3 0.1%
Male Female 2,187 1,383 61.3% 38.7%
Prepared by Georgia Department of Education
Page 1
STATE-REQUIRED TEST DATA
NORM-REFERENCED TESTS
Grade 3 Iowa Tests of Basic Skills (ITBS) Each chart reflects data for three years of testing.
Reading Comprehension
Mathematics
50
50 54 55 53 48 52 0
98-99 97-98 96-97
System State
50
53 61 58 61 51 59 0
98-99 97-98 96-97
System State
Reading Vocabulary
50
50 50 51 50 44 49 0
98-99 97-98 96-97
System State
Social Studies
50
50 56 52 55 50 55 0
98-99 97-98 96-97
System State
Language Arts
50
61 64 63 62 54 59 0
98-99 97-98 96-97
System State
Science
50
49 59 52 59 48 58 0
98-99 97-98 96-97
System State
Sources of Information
Composite Score
50
48 57 0
98-99
System
50
51 56 47 55 97-98 96-97
State
51 58 55 57 0
98-99 97-98
1998-99 GEORGIA PUBLIC EDUCATION REPORT CARD Atlanta City Schools
Prepared by Georgia Department of Education
System State Scores Reported 48 56 in Percentiles 96-97
Page 2
STATE-REQUIRED TEST DATA
NORM-REFERENCED TESTS
Grade 5 Iowa Tests of Basic Skills (ITBS) Each chart reflects data for three years of testing.
Reading Comprehension
Mathematics
50
47 53 52 53 49 52 0
98-99 97-98 96-97
System State
50
48 59 53 58 50 57 0
98-99 97-98 96-97
System State
Reading Vocabulary
50
48 48 52 48 44 46 0
98-99 97-98 96-97
System State
Social Studies
50
54 57 54 56 52 55 0
98-99 97-98 96-97
System State
Language Arts
50
56 63 60 61 51 58 0
98-99 97-98 96-97
System State
Science
50
48 60 50 59 48 59 0
98-99 97-98 96-97
System State
Sources of Information
Composite Score
50
47 58 0
98-99
System
50
51 58 49 57 97-98 96-97
State
49 57 52 56 0
98-99 97-98
1998-99 GEORGIA PUBLIC EDUCATION REPORT CARD Atlanta City Schools
Prepared by Georgia Department of Education
System State Scores Reported 48 55 in Percentiles 96-97
Page 3
STATE-REQUIRED TEST DATA
NORM-REFERENCED TESTS Grade 8
Iowa Tests of Basic Skills (ITBS) Each chart reflects data for three years of testing.
Reading Comprehension
Mathematics
50
36 49 35 48 34 48 0
98-99 97-98 96-97
System State
50
45 56 43 55 43 54 0
98-99 97-98 96-97
System State
Reading Vocabulary
50
32 46 36 45 27 44 0
98-99 97-98 96-97
System State
Language Arts
50
42 60 43 58 40 56 0
98-99 97-98 96-97
System State
Social Studies
50
42 54 45 53 41 53 0
98-99 97-98 96-97
System State
Science
50
36 56 39 55 35 53 0
98-99 97-98 96-97
System State
Sources of Information
Composite Score
50
42 57 0
98-99
System
50
42 56 42 55 97-98 96-97
State
39 56 40 54 0
98-99 97-98
1998-99 GEORGIA PUBLIC EDUCATION REPORT CARD Atlanta City Schools
Prepared by Georgia Department of Education
System State Scores Reported 37 54 in Percentiles 96-97
Page 4
STATE-REQUIRED TEST DATA
PERFORMANCE ASSESSMENTS
Grade 5 Writing Assessment
1998-99
1997-98
1996-97
Percent at Developmental Stages:
Comparison
Comparison
Comparison
System Group State System Group State System Group State
Stage Stage Stage Stage Stage Stage
1: The Emerging Writer 2: The Developing Writer 3: The Focusing Writer 4: The Experimenting Writer 5: The Engaging Writer 6: The Extending Writer
1% 2% 22% 47% 22% 6%
0% 1% 19% 44% 25% 9%
0% 1% 16% 41% 29% 12%
1% 4% 24% 47% 19% 5%
1% 3% 22% 43% 23% 8%
0% 3% 19% 41% 27% 10%
1% 6% 32% 39% 17% 5%
1% 5% 28% 39% 20% 7%
0% 3% 21% 37% 26% 12%
Grade 8 Writing Assessment
1998-99 Percent Scoring 1997-98 Percent Scoring 1996-97 Percent Scoring
Categories of Scaled Scores
Comparison
Comparison
Comparison
System Group State System Group State System Group State
Inadequate (less than 162)
Minimal (162-209)
Good
(210-247)
Very Good (greater than 247)
16% 51% 28%
5%
12% 48% 34%
7%
8% 40% 41% 11%
25% 53% 19%
3%
16% 53% 27%
4%
11% 46% 34%
8%
34% 48% 15%
3%
24% 51% 21%
5%
15% 46% 30%
8%
Average Scaled Score: (Range 100-300)
193
200 208
184
194 202
177
187 198
GEORGIA HIGH SCHOOL GRADUATION TESTS (GHSGT)
Percent of Regular Program 11th Graders Passing the Georgia High School Graduation Tests on First Administration
1998-99
1997-98
1996-97
Comparison
Comparison
Comparison
System Group State System Group State System Group State
English Language Arts Mathematics Social Studies Science
91% 79% 73% 61%
94% 83% 76% 63%
96% 88% 80% 72%
89% 78% 68% 61%
93% 84% 72% 66%
94% 88% 78% 74%
89% 72% 65% 52%
90% 77% 68% 58%
94% 87% 78% 74%
All Components listed above 5 5 %
59% 68% 54%
60% 68% 46%
52% 67%
Writing
85%
90% 93% 83%
89% 92% 82%
88% 93%
1998-99 GEORGIA PUBLIC EDUCATION REPORT CARD
Atlanta City Schools
Prepared by Georgia Department of Education
Page 5
GRADUATE DATA
1999 Graduates by Credentials, Race/Ethnicity and Sex
Diplomas with Both College Prep. & Voc. Endorsements
Diplomas with College Prep. Endorsements Diplomas with Vocational Endorsements General High School Diplomas Special Education Diplomas
Total All Diplomas
Certificates of Performance
Total Graduates
Total 440
1,106 273 39 97
1,955 86
2,041
Black
430 97.7%
981 88.7%
269 98.5%
39 100.0%
95 97.9%
1,814 92.8%
86 100.0%
1,900 93.1%
American MultiWhite Hispanic Asian Indian racial
1 0.2%
95 8.6%
1 0.4%
0 0.0%
2 2.1%
99 5.1%
6 1.4%
12 1.1%
1 0.4%
0 0.0%
0 0.0%
19 1.0%
3 0.7%
14 1.3%
2 0.7%
0 0.0%
0 0.0%
19 1.0%
0 0.0%
0 0.0%
0 0.0%
0 0.0%
0 0.0%
0 0.0%
0 0.0%
4 0.4%
0 0.0%
0 0.0%
0 0.0%
4 0.2%
0
0
0
0
0
0.0% 0.0% 0.0% 0.0% 0.0%
99
19
19
0
4
4.9% 0.9% 0.9% 0.0% 0.2%
Male Female
156 35.5%
455 41.1%
151 55.3%
24 61.5%
62 63.9%
848 43.4%
284 64.5%
651 58.9%
122 44.7%
15 38.5%
35 36.1%
1,107 56.6%
36
50
41.9% 58.1%
884 1,157 43.3% 56.7%
HOPE Scholarships
System State
Number of 1999 Graduates 2 , 0 4 1
Number Eligible
1099
Percent Eligible
53.8%
65,548 40,292 61.5%
High School Completion Rate Percent of 1995Grade 9 Enrollment
in Graduating Class of1999
System
State
Completion Rate '95-'99 57.1% 68.9%
COLLEGE ADMISSIONS / CREDIT TEST DATA
Scholastic Assessment Test (SAT)
No. Taking
Average Score
Tests
Verbal Math Total
Based on students' highest verbal and highest math scores
System College Prep. Endorsement Other Diplomas
445 441 N/A
436 430 N/A
881 871 N/A
Georgia
492 488 980
Based on students' last test administration
System Georgia
1,265
435 426
861
41,958 483 479 962
Nation
952,913 502 508 1010
American College Testing (ACT)
System State Nation
English
17.4
19.1 20.4
Mathematics
18.4
19.9 20.7
Reading
18.6
20.2 21.3
Science Reasoning 18.3
19.9 21.0
CompositeScore 18.3
19.9 21.9
Advanced Placement Exams (AP)
No. of Students Taking Tests
No. of Tests Taken No. of Test Scores
3 or Higher Percent of Test
Scores 3 or Higher
System State 537 15,225 877 23,969 184 13,024
21.0% 54.3%
1998-99 GEORGIA PUBLIC EDUCATION REPORT CARD Atlanta City Schools
Prepared by Georgia Department of Education
Page 6
POSTSECONDARY DATA
Graduates Entering Georgia Public Colleges and Universities
Graduates Entering Georgia Public Colleges and Universities and
Requiring Learning Support (LS)
1998 Graduates Entering 1998-99
1997 Graduates Entering 1997-98
Percent of Graduating Number Class
452
21.7%
437
21.1%
Number Requiring
LS
200
202
Percent of those attending Georgia
Public Colleges
44.2%
46.2%
In previous years, the Report Card presented College Prep Curriculum information provided by the Board of Regents on students requiring Learning Support. Due to inconsistencies in the data provided by the Board of Regents in defining College Prep Completers versus Local Board of Education data defining College Prep Endorsements, the Department of Education Report Card will not provide this information until discrepancies can be reconciled.
Graduates Entering Georgia Public Technical and Adult Schools
Entering 1998-99 Entering 1997-98
Number Percent
Number Percent
1998 Graduates 1997 Graduates
53
2.5%
3
0.1%
N/A 109
N/A 5.3%
ACCREDITATION / RECOGNITION DATA
Southern Association of Colleges and Schools (SACS) Accrediting Commission
Secondary/Middle Commission Elementary/Middle Commission Both Elementary/Secondary Commissions Joint Commission Candidate for Accreditation
Accreditation by Georgia Accrediting Commission (GAC)
Accredited by GAC Accredited with Quality by GAC
Number of Schools
11 0 0 0 0
Number of Schools
68 16
Awards / Recognition
State Recognized Program
Number of Schools
Charter School
0
Pay for Performance Recipient
4
Georgia School of Excellence
3
National Blue Ribbon School
1
COMMUNITY DATA
Number of Children Eligible for Migrant Education Number of Families-At-Risk * Number of Food Stamp Participants * Number of Families Receiving TANF * ** Per Capita Income * Unemployment Rate * 1990 Population * Projected 2000 Population * Projected 2010 Population *
* Data Available at County Level Only ** Known as AFDC before January 1997
2 3,556 78,669 10,804 $37,800
4.1% 648,951 716,710 756,926
1998-99 GEORGIA PUBLIC EDUCATION REPORT CARD Atlanta City Schools
Prepared by Georgia Department of Education
Page 7
FISCAL DATA
Millage Rate
25.43
* Fall 1998 Property Tax Digest is used to calculate the 98-99 Value of One Mill
FTE Count
FTE Count used for Allotment Calculation 58,745.0 Fall '98 FTE Count 59,493
Value of One Mill
$11,677,419 $198.78 per Allotment FTE
Sources: Local State-QBE State-
Lottery State-
Other Federal Other
Total
PerGeneral Fund cent Per FTE $299,126,165 63.7% $5,092 $166,824,484 35.5% $2,840
K-12 Revenues
Lottery K-12
and
Title
All Other
Programs
K-12
$0 $348,296
Bonded Debt $0
$0
$0
$0
Capital Projects $94,588,354
$0
School Nutrition $2,631,902
$0
$0 0.0%
$0
$0 $522,992
$0
$0
$0
$1,551,583 0.3% $26 $147,736
$1,375,867 0.3% $412,075 0.1%
$23 $28,144,827
$7
$0
$469,290,176 100% $7,988 $28,292,564
$2,960,089 $2,979,220 $1,505,671 $8,316,271
$0 $17,542,580 $1,481,388
$0
$0 $17,810,935
$0 $1,868,989
$0
$0 $113,999,924 $21,924,225
Grand Total
Total
Per-
Amount cent
$396,694,719 61.8%
$166,824,484 26.0%
$522,992 0.1%
$23,683,378 3.7% $50,310,850 7.8%
$3,786,736 0.6% $641,823,162 100%
Instruction
Media
Instruction Support
Pupil Services General Admin. School Admin. Trans-
portation Maint. & Ops. Capital Projects School Food Debt Service
K-12 Expenditures
$267,357,663 63.8% $4,551 $21,099,599 $6,086,458
$0 $2,971,602
$0
$8,622,270 2.1% $147
$0
$34,037
$0
$0
$0
$25,053,787 6.0% $426 $2,894,252 $5,214,942
$0 $101,529
$0
$19,633,095 4.7% $334 $2,319,695 $1,312,348
$0
$0
$0
$15,721,778 3.7% $268 $1,172,872
$46,722
$0
$32,915
$0
$5,905,024 1.4% $101
$89,601 $268,594
$0
$0
$0
$12,198,814 2.9% $208 $644,630
$92,443
$0 $174,602
$0
$64,881,080 15.5% $1,104
$37,114
$1,914
$0 $5,171,940
$0
$0 0.0%
$0
$15,000 $642,242
$0 $55,909,030
$0
$0 0.0%
$0
$89,113
$18,970
$0
$0 $22,504,966
$0 0.0%
$0
$0
$0
$0
$0
$0
$297,515,324 54.3% $8,656,308 1.6%
$33,264,511 6.1% $23,265,139 4.2% $16,974,288 3.1%
$6,263,219 1.1% $13,110,491 2.4% $70,092,050 12.8% $56,566,273 10.3% $22,613,050 4.1%
$0 0.0%
Total
$419,373,515 100% $7,139 $28,361,879 $13,718,675
$0 $64,361,621 $22,504,966 $548,320,658 100%
Salaries and Benefits as Percentages of Revenues and of Expenditures
Teachers and Paraprofessionals
Salaries $187,708,705
Benefits $62,280,892
Percentage of Revenues Percentage of Expenditures
Total of
Total of
General Fund
General Fund
Title Programs
Title Programs
Lottery K-12
Lottery K-12
Total Salaries
and
Total
and
Total
and Benefits All Other K-12 K - 12 All Other K-12 K - 12
$249,989,597
49.4%
38.9%
54.2%
45.6%
School Administration
$4,158,949 $1,346,810
$5,505,759
1.1%
0.9%
1.2%
1.0%
General Administration
$3,183,980 $3,124,742
$6,308,722
1.2%
1.0%
1.4%
1.2%
1998-99 GEORGIA PUBLIC EDUCATION REPORT CARD
Atlanta City Schools - 761
Prepared by Georgia Department of Education
Page 8
CERTIFIED PERSONNEL DATA
Number
Average Annual Salary Positions Average Contract Days
Average Daily Salary
Full-time Personnel Part-time
Sex Male Female
4 Yr Bachelor's Certificate 5 Yr Master's
Level 6 Yr Specialist's 7 Yr Doctoral Other*
Black
White Race/ Hispanic Ethnicity Asian
American Indian
Multiracial
Years Experience
<1 1-10 11-20 21-30 >30
Average
Administrators
331.00
$67,182.94 228.47
$294.06
331 0
95 236
0 105 138
88 0
283 47 0 1 0 0
0 18 62 179 72
24.87
Support Personnel PK-12 Teachers
318.00
3,639.00
$52,263.03 199.64
$261.78
$43,822.71 190.56
$229.96
318
3,639
0
0
52
638
266
3,001
12
1,799
189
1,564
89
219
28
49
0
8
267
2,953
50
625
1
53
0
8
0
0
0
0
4
159
64
1,431
103
795
97
914
50
340
19.69
14.93
*Includes One- and Two-Year Vocational Certificates.
Certified Staff Position Ratios
Teacher/Administrator Ratio 11:1
Teacher/Support Person Ratio 11:1
Teacher/Staff Ratio 6:1
Student Enrollment/All Teachers 16:1
Certified Personnel by Category
84.9% 100%
7.7%
7.4%
80% 60%
40%
20%
0%
Teachers
Administrators
Support Personnel
1998-99 GEORGIA PUBLIC EDUCATION REPORT CARD
Atlanta City Schools - 761
Prepared by Georgia Department of Education
Page 9
1998-99 GEORGIA PUBLIC EDUCATION REPORT CARD
ATLANTA CITY SCHOOLS
Adamsville Elementary School - 7612050
Grade Range K-5
The Georgia Public Education Report Card is designed to assist systems and schools in educational improvement. This report card contains a variety of data elements. An explanation of the terms is provided as a companion to the report card data. Please refer to the definitions for the most effective use of the reported data.
STUDENT DATA
Total 522
K-5 Enrollment, by Race/Ethnicity and Sex
Black
White Hispanic
American Multi-
Asian Indian
racial
514 98.5%
6 1.1%
2 0.4%
0 0.0%
0 0.0%
0 0.0%
Male Female
271 51.9%
251 48.1%
Enrollment in Selected Programs
Program
Program % of Student Enrollment Population
Gifted (Grades K-12)
0
0.0%
Alternative Programs (Grades 6-12)
N/A
N/A
Students Eligible to Receive Free/Reduced Lunches
Number
Percent
School System
495 45,695
94.8% 75.5%
Dropout Rate *
Number
Rate
School System
N/A N/A
N/A N/A
* Dropout rates are not applicable for grades PK-5.
Enrollment in Compensatory Programs
Program
Program % of Student Enrollment Population
Special Education (Grades K-12)
31
5.9%
(PK)
0
N/A
English to Speakers of Other Languages (ESOL) (Grades K-12)
0
0.0%
Remedial Education (Grades 2-5, 9-12)
50 14.2%
Special Instructional Assistance (SIA) (Grades K-3)
193 53.3%
Title I (Grades K-12)
This school has a schoolwide program.
Total 10
Retained Students, by Race/Ethnicity and Sex
Black
White Hispanic
American Multi-
Asian Indian
racial
10 100.0%
0 0.0%
0 0.0%
0 0.0%
0 0.0%
0 0.0%
Male Female
6
4
60.0% 40.0%
Prepared by Georgia Department of Education
Page 1
STATE-REQUIRED TEST DATA
NORM-REFERENCED TESTS Grade 3
Iowa Tests of Basic Skills (ITBS) Each chart reflects data for three years of testing.
Reading Comprehension 50
41 50 54 0
98-99
56 55 53 97-98
68 48 52 96-97
Mathematics
School 50
System
State
0
45 53 61 98-99
49 58 61 97-98
65 51 59 96-97
School System State
Reading Vocabulary 50
36 50 50 0
98-99
53 51 50 97-98
70 44 49 96-97
Language Arts
School 50
System
State
0
58 61 64 98-99
49 63 62 97-98
70 54 59 96-97
School System State
Social Studies 50
44 50 56 0
98-99
50 52 55 97-98
53 50 55 96-97
Science
School 50
System
State
0
48 49 59 98-99
45 52 59 97-98
64 48 58 96-97
School System State
Sources of Information
Composite Score
50
35 48 57 0
98-99
School 50
System
42 51 56 97-98
52 47 55 96-97
State 0
43 51 58 98-99
48 55 57 97-98
1998-99 GEORGIA PUBLIC EDUCATION REPORT CARD Adamsville Elementary School - 7612050
Prepared by Georgia Department of Education
62 48 56 96-97
Scores Reported in Percentiles
School System State
Page 2
STATE-REQUIRED TEST DATA
NORM-REFERENCED TESTS Grade 5
Iowa Tests of Basic Skills (ITBS) Each chart reflects data for three years of testing.
Reading Comprehension
Mathematics
50
40 47 53 0
98-99
63 52 53 97-98
74 49 52 96-97
School 50
System
State
0
41 48 59 98-99
64 53 58 97-98
73 50 57 96-97
School System State
Reading Vocabulary 50
30 48 48 0
98-99
81 52 48 97-98
75 44 46 96-97
Language Arts
School 50
System
State
0
43 56 63 98-99
64 60 61 97-98
75 51 58 96-97
School System State
Social Studies 50
47 54 57 0
98-99
59 54 56 97-98
62 52 55 96-97
Science
School 50
System
State
0
39 48 60 98-99
50 50 59 97-98
57 48 59 96-97
School System State
Sources of Information
Composite Score
50
31 47 58 0
98-99
School 50
System
46 51 58 97-98
59 49 57 96-97
State 0
38 49 57 98-99
59 52 56 97-98
68 48 55 96-97
1998-99 GEORGIA PUBLIC EDUCATION REPORT CARD Adamsville Elementary School - 7612050
Prepared by Georgia Department of Education
Scores Reported in Percentiles
School System State
Page 3
STATE-REQUIRED TEST DATA
PERFORMANCE ASSESSMENTS
Grade 5 Writing Assessment
Percent at Developmental Stages:
1998-99 School System State
1997-98 School System State
1996-97 School System State
Stage Stage Stage Stage Stage Stage
1:The Emerging Writer 2:The Developing Writer 3:The Focusing Writer 4:The Experimenting 5:The Engaging Writer 6:The Extending Writer
3% 3% 31% 47% 16% 0%
1% 2% 22% 47% 22% 6%
0% 1% 16% 41% 29% 12%
1% 6% 29% 47% 14% 3%
1% 4% 24% 47% 19% 5%
0% 3% 19% 41% 27% 10%
3% 6% 35% 34% 21% 1%
1% 6% 32% 39% 17% 5%
0% 3% 21% 37% 26% 12%
AWARDS / RECOGNITION DATA
Schools in Georgia may receive recognition in the following programs: Charter School Pay for Performance Program Georgia School of Excellence National Blue Ribbon School Adamsville Elementary School did not receive recognition in any of these programs during the 1998-99 school year.
1998-99 GEORGIA PUBLIC EDUCATION REPORT CARD Adamsville Elementary School - 7612050
Prepared by Georgia Department of Education
Page 4
CERTIFIED PERSONNEL DATA
Positions Number Average Contract Days
Personnel Sex
Certificate
Years Experience
Full-time Part-time
Male Female
4 Yr Bachelor's 5 Yr Master's 6 Yr Specialist's 7 Yr Doctoral Other*
<1 1-10 11-20 21-30 >30
Average
Administrators
3.00 227.33
3 0
0 3
0 1 2 0 0 0 1 0 2 0 20.00
Support Personnel
2.00 195.00
2 0
0 2
0 2 0 0 0 0 0 2 0 0 16.50
PK-12 Teachers
35.60 190.00
34 4
5 33
19 17
2 0 0 1 10 8 14 5 18.97
*Includes One- and Two-Year Vocational Certificates.
ACCREDITATION DATA
Accredited by Georgia Accrediting Commission (GAC).
1998-99 GEORGIA PUBLIC EDUCATION REPORT CARD Adamsville Elementary School - 7612050
Prepared by Georgia Department of Education
Page 5
1998-99 GEORGIA PUBLIC EDUCATION REPORT CARD
ATLANTA CITY SCHOOLS
Anderson Park Elementary School - 7613050
Grade Range PK-5
The Georgia Public Education Report Card is designed to assist systems and schools in educational improvement. This report card contains a variety of data elements. An explanation of the terms is provided as a companion to the report card data. Please refer to the definitions for the most effective use of the reported data.
STUDENT DATA
Total
K-5
390
PK
39
Enrollment, by Race/Ethnicity and Sex
Black
White Hispanic
American Asian Indian
Multiracial
387 99.2%
1 0.3%
2 0.5%
0 0.0%
0 0.0%
0 0.0%
38 97.4%
0 0.0%
0 0.0%
0 0.0%
0 0.0%
1 2.6%
Male Female
182 46.7%
208 53.3%
24 61.5%
15 38.5%
Enrollment in Selected Programs
Program
Program % of Student Enrollment Population
Gifted (Grades K-12)
4
1.0%
Alternative Programs (Grades 6-12)
N/A
N/A
Students Eligible to Receive Free/Reduced Lunches
Number
Percent
School System
328 45,695
76.5% 75.5%
Dropout Rate *
Number
Rate
School System
N/A N/A
N/A N/A
* Dropout rates are not applicable for grades PK-5.
Enrollment in Compensatory Programs
Program
Program % of Student Enrollment Population
Special Education (Grades K-12)
42 10.8%
(PK)
0
N/A
English to Speakers of Other Languages (ESOL) (Grades K-12)
0
0.0%
Remedial Education (Grades 2-5, 9-12)
56 22.3%
Special Instructional Assistance (SIA) (Grades K-3)
148 51.6%
Title I (Grades K-12)
This school has a schoolwide program.
Total 10
Retained Students, by Race/Ethnicity and Sex
Black
White Hispanic
American MultiAsian Indian racial
10 100.0%
0 0.0%
0 0.0%
0 0.0%
0 0.0%
0 0.0%
Male Female
5
5
50.0% 50.0%
Prepared by Georgia Department of Education
Page 1
STATE-REQUIRED TEST DATA
NORM-REFERENCED TESTS Grade 3
Iowa Tests of Basic Skills (ITBS) Each chart reflects data for three years of testing.
Reading Comprehension 50
20 50 54 0
98-99
29 55 53 97-98
36 48 52 96-97
Mathematics
School 50
System
State
0
22 53 61 98-99
27 58 61 97-98
27 51 59 96-97
School System State
Reading Vocabulary 50
19 50 50 0
98-99
22 51 50 97-98
26 44 49 96-97
Language Arts
School 50
System
State
0
25 61 64 98-99
34 63 62 97-98
37 54 59 96-97
School System State
Social Studies 50
28 50 56 0
98-99
25 52 55 97-98
33 50 55 96-97
Science
School 50
System
State
0
27 49 59 98-99
25 52 59 97-98
33 48 58 96-97
School System State
Sources of Information
Composite Score
50
26 48 57 0
98-99
School 50
System
29 51 56 97-98
37 47 55 96-97
State 0
22 51 58 98-99
25 55 57 97-98
1998-99 GEORGIA PUBLIC EDUCATION REPORT CARD Anderson Park Elementary School - 7613050
Prepared by Georgia Department of Education
30 48 56 96-97
Scores Reported in Percentiles
School System State
Page 2
STATE-REQUIRED TEST DATA
NORM-REFERENCED TESTS Grade 5
Iowa Tests of Basic Skills (ITBS) Each chart reflects data for three years of testing.
Reading Comprehension
Mathematics
50
32 47 53 0
98-99
32 52 53 97-98
27 49 52 96-97
School 50
System
State
0
35 48 59 98-99
26 53 58 97-98
26 50 57 96-97
School System State
Reading Vocabulary 50
17 48 48 0
98-99
13 52 48 97-98
13 44 46 96-97
Language Arts
School 50
System
State
0
35 56 63 98-99
34 60 61 97-98
31 51 58 96-97
School System State
Social Studies 50
58 54 57 0
98-99
29 54 56 97-98
24 52 55 96-97
Science
School 50
System
State
0
38 48 60 98-99
22 50 59 97-98
39 48 59 96-97
School System State
Sources of Information
Composite Score
50
43 47 58 0
98-99
School 50
System
36 51 58 97-98
35 49 57 96-97
State 0
37 49 57 98-99
26 52 56 97-98
27 48 55 96-97
1998-99 GEORGIA PUBLIC EDUCATION REPORT CARD Anderson Park Elementary School - 7613050
Prepared by Georgia Department of Education
Scores Reported in Percentiles
School System State
Page 3
STATE-REQUIRED TEST DATA
PERFORMANCE ASSESSMENTS
Grade 5 Writing Assessment
Percent at Developmental Stages:
1998-99 School System State
1997-98 School System State
1996-97 School System State
Stage Stage Stage Stage Stage Stage
1:The Emerging Writer 2:The Developing Writer 3:The Focusing Writer 4:The Experimenting 5:The Engaging Writer 6:The Extending Writer
0% 12% 38% 33% 17%
0%
1% 2% 22% 47% 22% 6%
0% 1% 16% 41% 29% 12%
0% 6% 26% 51% 15% 0%
1% 4% 24% 47% 19% 5%
0% 3% 19% 41% 27% 10%
8% 5% 45% 24% 13% 5%
1% 6% 32% 39% 17% 5%
0% 3% 21% 37% 26% 12%
AWARDS / RECOGNITION DATA
Schools in Georgia may receive recognition in the following programs: Charter School Pay for Performance Program Georgia School of Excellence National Blue Ribbon School Anderson Park Elementary School did not receive recognition in any of these programs during the 1998-99 school year.
1998-99 GEORGIA PUBLIC EDUCATION REPORT CARD Anderson Park Elementary School - 7613050
Prepared by Georgia Department of Education
Page 4
CERTIFIED PERSONNEL DATA
Positions Number Average Contract Days
Personnel Sex
Certificate
Years Experience
Full-time Part-time
Male Female
4 Yr Bachelor's 5 Yr Master's 6 Yr Specialist's 7 Yr Doctoral Other*
<1 1-10 11-20 21-30 >30
Average
Administrators
2.00 231.00
2 0
1 1
0 1 1 0 0 0 0 0 1 1 28.50
Support Personnel
1.90 194.21
1 3
2 2
0 2 2 0 0 0 1 0 2 1 24.25
PK-12 Teachers
24.70 190.40
22 6
4 24
15 11
1 1 0 1 13 6 6 2 13.21
*Includes One- and Two-Year Vocational Certificates.
ACCREDITATION DATA
Accredited by Georgia Accrediting Commission (GAC).
1998-99 GEORGIA PUBLIC EDUCATION REPORT CARD Anderson Park Elementary School - 7613050
Prepared by Georgia Department of Education
Page 5
1998-99 GEORGIA PUBLIC EDUCATION REPORT CARD
ATLANTA CITY SCHOOLS
Arkwright Elementary School - 7615050
Grade Range K-5
The Georgia Public Education Report Card is designed to assist systems and schools in educational improvement. This report card contains a variety of data elements. An explanation of the terms is provided as a companion to the report card data. Please refer to the definitions for the most effective use of the reported data.
STUDENT DATA
Total 258
K-5 Enrollment, by Race/Ethnicity and Sex
Black
White Hispanic
American Multi-
Asian Indian
racial
233 90.3%
22 8.5%
2 0.8%
0 0.0%
1 0.4%
0 0.0%
Male Female
113 43.8%
145 56.2%
Enrollment in Selected Programs
Program
Program % of Student Enrollment Population
Gifted (Grades K-12)
0
0.0%
Alternative Programs (Grades 6-12)
N/A
N/A
Students Eligible to Receive Free/Reduced Lunches
Number
Percent
School System
246 45,695
95.3% 75.5%
Dropout Rate *
Number
Rate
School System
N/A N/A
N/A N/A
* Dropout rates are not applicable for grades PK-5.
Enrollment in Compensatory Programs
Program
Program % of Student Enrollment Population
Special Education (Grades K-12)
10
3.9%
(PK)
0
N/A
English to Speakers of Other Languages (ESOL) (Grades K-12)
0
0.0%
Remedial Education (Grades 2-5, 9-12)
37 22.3%
Special Instructional Assistance (SIA) (Grades K-3)
52 29.4%
Title I (Grades K-12)
This school has a schoolwide program.
Total 3
Retained Students, by Race/Ethnicity and Sex
Black
White Hispanic
American Multi-
Asian Indian
racial
3 100.0%
0 0.0%
0 0.0%
0 0.0%
0 0.0%
0 0.0%
Male Female
2
1
66.7% 33.3%
Prepared by Georgia Department of Education
Page 1
STATE-REQUIRED TEST DATA
NORM-REFERENCED TESTS Grade 3
Iowa Tests of Basic Skills (ITBS) Each chart reflects data for three years of testing.
Reading Comprehension 50
50 50 54 0
98-99
51 55 53 97-98
30 48 52 96-97
Mathematics
School 50
System
State
0
53 53 61 98-99
57 58 61 97-98
47 51 59 96-97
School System State
Reading Vocabulary 50
57 50 50 0
98-99
55 51 50 97-98
29 44 49 96-97
Language Arts
School 50
System
State
0
52 61 64 98-99
56 63 62 97-98
38 54 59 96-97
School System State
Social Studies 50
47 50 56 0
98-99
63 52 55 97-98
36 50 55 96-97
Science
School 50
System
State
0
36 49 59 98-99
53 52 59 97-98
35 48 58 96-97
School System State
Sources of Information
Composite Score
50
41 48 57 0
98-99
School 50
System
46 51 56 97-98
32 47 55 96-97
State 0
47 51 58 98-99
54 55 57 97-98
1998-99 GEORGIA PUBLIC EDUCATION REPORT CARD Arkwright Elementary School - 7615050
Prepared by Georgia Department of Education
33 48 56 96-97
Scores Reported in Percentiles
School System State
Page 2
STATE-REQUIRED TEST DATA
NORM-REFERENCED TESTS Grade 5
Iowa Tests of Basic Skills (ITBS) Each chart reflects data for three years of testing.
Reading Comprehension
Mathematics
50
36 47 53 0
98-99
53 52 53 97-98
48 49 52 96-97
School 50
System
State
0
47 48 59 98-99
59 53 58 97-98
50 50 57 96-97
School System State
Reading Vocabulary 50
24 48 48 0
98-99
36 52 48 97-98
36 44 46 96-97
Language Arts
School 50
System
State
0
47 56 63 98-99
66 60 61 97-98
57 51 58 96-97
School System State
Social Studies 50
34 54 57 0
98-99
43 54 56 97-98
43 52 55 96-97
Science
School 50
System
State
0
27 48 60 98-99
30 50 59 97-98
37 48 59 96-97
School System State
Sources of Information
Composite Score
50
37 47 58 0
98-99
School 50
System
54 51 58 97-98
53 49 57 96-97
State 0
35 49 57 98-99
49 52 56 97-98
45 48 55 96-97
1998-99 GEORGIA PUBLIC EDUCATION REPORT CARD Arkwright Elementary School - 7615050
Prepared by Georgia Department of Education
Scores Reported in Percentiles
School System State
Page 3
STATE-REQUIRED TEST DATA
PERFORMANCE ASSESSMENTS
Grade 5 Writing Assessment
Percent at Developmental Stages:
1998-99 School System State
1997-98 School System State
1996-97 School System State
Stage Stage Stage Stage Stage Stage
1:The Emerging Writer 2:The Developing Writer 3:The Focusing Writer 4:The Experimenting 5:The Engaging Writer 6:The Extending Writer
0% 0% 15% 48% 33% 5%
1% 2% 22% 47% 22% 6%
0% 1% 16% 41% 29% 12%
0% 3% 32% 50% 13% 3%
1% 4% 24% 47% 19% 5%
0% 3% 19% 41% 27% 10%
0% 7% 39% 24% 22% 7%
1% 6% 32% 39% 17% 5%
0% 3% 21% 37% 26% 12%
AWARDS / RECOGNITION DATA
Schools in Georgia may receive recognition in the following programs: Charter School Pay for Performance Program Georgia School of Excellence National Blue Ribbon School Arkwright Elementary School did not receive recognition in any of these programs during the 1998-99 school year.
1998-99 GEORGIA PUBLIC EDUCATION REPORT CARD Arkwright Elementary School - 7615050
Prepared by Georgia Department of Education
Page 4
CERTIFIED PERSONNEL DATA
Positions Number Average Contract Days
Personnel Sex
Certificate
Years Experience
Full-time Part-time
Male Female
4 Yr Bachelor's 5 Yr Master's 6 Yr Specialist's 7 Yr Doctoral Other*
<1 1-10 11-20 21-30 >30
Average
Administrators
2.00 231.00
2 0
0 2
0 1 0 1 0 0 0 0 2 0 24.50
Support Personnel
2.20 193.64
1 4
0 5
1 3 0 1 0 0 0 1 3 1 26.40
PK-12 Teachers
17.00 193.06
16 4
3 17
8 11
0 1 0 1 4 5 6 4 19.25
*Includes One- and Two-Year Vocational Certificates.
ACCREDITATION DATA
Accredited by Georgia Accrediting Commission (GAC).
1998-99 GEORGIA PUBLIC EDUCATION REPORT CARD Arkwright Elementary School - 7615050
Prepared by Georgia Department of Education
Page 5
1998-99 GEORGIA PUBLIC EDUCATION REPORT CARD
ATLANTA CITY SCHOOLS
Beecher Hills Elementary School - 7613051
Grade Range K-5
The Georgia Public Education Report Card is designed to assist systems and schools in educational improvement. This report card contains a variety of data elements. An explanation of the terms is provided as a companion to the report card data. Please refer to the definitions for the most effective use of the reported data.
STUDENT DATA
Total 301
K-5 Enrollment, by Race/Ethnicity and Sex
Black
White Hispanic
American Multi-
Asian Indian
racial
298 99.0%
3 1.0%
0 0.0%
0 0.0%
0 0.0%
0 0.0%
Male Female
159 52.8%
142 47.2%
Enrollment in Selected Programs
Program
Program % of Student Enrollment Population
Gifted (Grades K-12)
13
4.3%
Alternative Programs (Grades 6-12)
N/A
N/A
Students Eligible to Receive Free/Reduced Lunches
Number
Percent
School System
227 45,695
75.4% 75.5%
Dropout Rate *
Number
Rate
School System
N/A N/A
N/A N/A
* Dropout rates are not applicable for grades PK-5.
Enrollment in Compensatory Programs
Program
Program % of Student Enrollment Population
Special Education (Grades K-12)
13
4.3%
(PK)
0
N/A
English to Speakers of Other Languages (ESOL) (Grades K-12)
0
0.0%
Remedial Education (Grades 2-5, 9-12)
59 26.7%
Special Instructional Assistance (SIA) (Grades K-3)
20 11.0%
Title I (Grades K-12)
This school has a schoolwide program.
Total 13
Retained Students, by Race/Ethnicity and Sex
Black
White Hispanic
American Multi-
Asian Indian
racial
13 100.0%
0 0.0%
0 0.0%
0 0.0%
0 0.0%
0 0.0%
Male Female
8
5
61.5% 38.5%
Prepared by Georgia Department of Education
Page 1
STATE-REQUIRED TEST DATA
NORM-REFERENCED TESTS Grade 3
Iowa Tests of Basic Skills (ITBS) Each chart reflects data for three years of testing.
Reading Comprehension 50
61 50 54 0
98-99
51 55 53 97-98
65 48 52 96-97
Mathematics
School 50
System
State
0
60 53 61 98-99
60 58 61 97-98
62 51 59 96-97
School System State
Reading Vocabulary 50
58 50 50 0
98-99
51 51 50 97-98
47 44 49 96-97
Language Arts
School 50
System
State
0
70 61 64 98-99
70 63 62 97-98
71 54 59 96-97
School System State
Social Studies 50
63 50 56 0
98-99
52 52 55 97-98
65 50 55 96-97
Science
School 50
System
State
0
51 49 59 98-99
46 52 59 97-98
64 48 58 96-97
School System State
Sources of Information
Composite Score
50
64 48 57 0
98-99
School 50
System
50 51 56 97-98
59 47 55 96-97
State 0
62 51 58 98-99
55 55 57 97-98
1998-99 GEORGIA PUBLIC EDUCATION REPORT CARD Beecher Hills Elementary School - 7613051
Prepared by Georgia Department of Education
64 48 56 96-97
Scores Reported in Percentiles
School System State
Page 2
STATE-REQUIRED TEST DATA
NORM-REFERENCED TESTS Grade 5
Iowa Tests of Basic Skills (ITBS) Each chart reflects data for three years of testing.
Reading Comprehension
Mathematics
50
59 47 53 0
98-99
44 52 53 97-98
46 49 52 96-97
School 50
System
State
0
57 48 59 98-99
50 53 58 97-98
53 50 57 96-97
School System State
Reading Vocabulary 50
84 48 48 0
98-99
37 52 48 97-98
37 44 46 96-97
Language Arts
School 50
System
State
0
63 56 63 98-99
62 60 61 97-98
58 51 58 96-97
School System State
Social Studies 50
63 54 57 0
98-99
46 54 56 97-98
50 52 55 96-97
Science
School 50
System
State
0
69 48 60 98-99
43 50 59 97-98
51 48 59 96-97
School System State
Sources of Information
Composite Score
50
55 47 58 0
98-99
School 50
System
61 51 58 97-98
58 49 57 96-97
State 0
64 49 57 98-99
51 52 56 97-98
52 48 55 96-97
1998-99 GEORGIA PUBLIC EDUCATION REPORT CARD Beecher Hills Elementary School - 7613051
Prepared by Georgia Department of Education
Scores Reported in Percentiles
School System State
Page 3
STATE-REQUIRED TEST DATA
PERFORMANCE ASSESSMENTS
Grade 5 Writing Assessment
Percent at Developmental Stages:
1998-99 School System State
1997-98 School System State
1996-97 School System State
Stage Stage Stage Stage Stage Stage
1:The Emerging Writer 2:The Developing Writer 3:The Focusing Writer 4:The Experimenting 5:The Engaging Writer 6:The Extending Writer
0% 0% 18% 58% 18% 6%
1% 2% 22% 47% 22% 6%
0% 1% 16% 41% 29% 12%
0% 0% 17% 51% 21% 11%
1% 4% 24% 47% 19% 5%
0% 3% 19% 41% 27% 10%
0% 4% 34% 50% 10% 2%
1% 6% 32% 39% 17% 5%
0% 3% 21% 37% 26% 12%
AWARDS / RECOGNITION DATA
Schools in Georgia may receive recognition in the following programs: Charter School Pay for Performance Program Georgia School of Excellence National Blue Ribbon School Beecher Hills Elementary School did not receive recognition in any of these programs during the 1998-99 school year.
1998-99 GEORGIA PUBLIC EDUCATION REPORT CARD Beecher Hills Elementary School - 7613051
Prepared by Georgia Department of Education
Page 4
CERTIFIED PERSONNEL DATA
Positions Number Average Contract Days
Personnel Sex
Certificate
Years Experience
Full-time Part-time
Male Female
4 Yr Bachelor's 5 Yr Master's 6 Yr Specialist's 7 Yr Doctoral Other*
<1 1-10 11-20 21-30 >30
Average
Administrators
2.00 231.00
2 0
1 1
0 2 0 0 0 0 0 1 1 0 23.50
Support Personnel
1.70 195.29
1 3
0 4
0 2 1 1 0 0 1 1 1 1 20.25
PK-12 Teachers
19.40 190.00
17 7
4 20
11 13
0 0 0 1 11 5 4 3 13.13
*Includes One- and Two-Year Vocational Certificates.
ACCREDITATION DATA
Accredited by Georgia Accrediting Commission (GAC).
1998-99 GEORGIA PUBLIC EDUCATION REPORT CARD Beecher Hills Elementary School - 7613051
Prepared by Georgia Department of Education
Page 5
1998-99 GEORGIA PUBLIC EDUCATION REPORT CARD
ATLANTA CITY SCHOOLS
Benteen Elementary School - 7615051
Grade Range K-5
The Georgia Public Education Report Card is designed to assist systems and schools in educational improvement. This report card contains a variety of data elements. An explanation of the terms is provided as a companion to the report card data. Please refer to the definitions for the most effective use of the reported data.
STUDENT DATA
Total 451
K-5 Enrollment, by Race/Ethnicity and Sex
Black
White Hispanic
American Multi-
Asian Indian
racial
223 49.4%
15 3.3%
199 44.1%
13 2.9%
1 0.2%
0 0.0%
Male Female
240 53.2%
211 46.8%
Enrollment in Selected Programs
Program
Program % of Student Enrollment Population
Gifted (Grades K-12)
0
0.0%
Alternative Programs (Grades 6-12)
N/A
N/A
Students Eligible to Receive Free/Reduced Lunches
Number
Percent
School System
405 45,695
89.8% 75.5%
Dropout Rate *
Number
Rate
School System
N/A N/A
N/A N/A
* Dropout rates are not applicable for grades PK-5.
Enrollment in Compensatory Programs
Program
Program % of Student Enrollment Population
Special Education (Grades K-12)
14
3.1%
(PK)
0
N/A
English to Speakers of Other Languages (ESOL) (Grades K-12)
78 17.3%
Remedial Education (Grades 2-5, 9-12)
66 23.2%
Special Instructional Assistance (SIA) (Grades K-3)
227 73.7%
Title I (Grades K-12)
This school has a schoolwide program.
Total 24
Retained Students, by Race/Ethnicity and Sex
Black
White Hispanic
American Multi-
Asian Indian
racial
7 29.2%
3 12.5%
14 58.3%
0 0.0%
0 0.0%
0 0.0%
Male Female
16
8
66.7% 33.3%
Prepared by Georgia Department of Education
Page 1
STATE-REQUIRED TEST DATA
NORM-REFERENCED TESTS Grade 3
Iowa Tests of Basic Skills (ITBS) Each chart reflects data for three years of testing.
Reading Comprehension 50
72 50 54 0
98-99
66 55 53 97-98
77 48 52 96-97
Mathematics
School 50
System
State
0
64 53 61 98-99
75 58 61 97-98
75 51 59 96-97
School System State
Reading Vocabulary 50
63 50 50 0
98-99
67 51 50 97-98
75 44 49 96-97
Language Arts
School 50
System
State
0
85 61 64 98-99
86 63 62 97-98
88 54 59 96-97
School System State
Social Studies 50
51 50 56 0
98-99
47 52 55 97-98
50 50 55 96-97
Science
School 50
System
State
0
74 49 59 98-99
50 52 59 97-98
65 48 58 96-97
School System State
Sources of Information
Composite Score
50
54 48 57 0
98-99
School 50
System
51 51 56 97-98
43 47 55 96-97
State 0
68 51 58 98-99
64 55 57 97-98
1998-99 GEORGIA PUBLIC EDUCATION REPORT CARD Benteen Elementary School - 7615051
Prepared by Georgia Department of Education
69 48 56 96-97
Scores Reported in Percentiles
School System State
Page 2
STATE-REQUIRED TEST DATA
NORM-REFERENCED TESTS Grade 5
Iowa Tests of Basic Skills (ITBS) Each chart reflects data for three years of testing.
Reading Comprehension
Mathematics
50
45 47 53 0
98-99
39 52 53 97-98
56 49 52 96-97
School 50
System
State
0
55 48 59 98-99
54 53 58 97-98
75 50 57 96-97
School System State
Reading Vocabulary 50
86 48 48 0
98-99
49 52 48 97-98
99 44 46 96-97
Language Arts
School 50
System
State
0
65 56 63 98-99
67 60 61 97-98
73 51 58 96-97
School System State
Social Studies 50
60 54 57 0
98-99
48 54 56 97-98
80 52 55 96-97
Science
School 50
System
State
0
45 48 60 98-99
46 50 59 97-98
78 48 59 96-97
School System State
Sources of Information
Composite Score
50
50 47 58 0
98-99
School 50
System
45 51 58 97-98
58 49 57 96-97
State 0
56 49 57 98-99
50 52 56 97-98
76 48 55 96-97
1998-99 GEORGIA PUBLIC EDUCATION REPORT CARD Benteen Elementary School - 7615051
Prepared by Georgia Department of Education
Scores Reported in Percentiles
School System State
Page 3
STATE-REQUIRED TEST DATA
PERFORMANCE ASSESSMENTS
Grade 5 Writing Assessment
Percent at Developmental Stages:
1998-99 School System State
1997-98 School System State
1996-97 School System State
Stage Stage Stage Stage Stage Stage
1:The Emerging Writer 2:The Developing Writer 3:The Focusing Writer 4:The Experimenting 5:The Engaging Writer 6:The Extending Writer
0% 0% 19% 57% 21% 3%
1% 2% 22% 47% 22% 6%
0% 1% 16% 41% 29% 12%
0% 4% 33% 50% 8% 4%
1% 4% 24% 47% 19% 5%
0% 3% 19% 41% 27% 10%
0% 4% 34% 36% 23% 4%
1% 6% 32% 39% 17% 5%
0% 3% 21% 37% 26% 12%
AWARDS / RECOGNITION DATA
Schools in Georgia may receive recognition in the following programs: Charter School Pay for Performance Program Georgia School of Excellence National Blue Ribbon School Benteen Elementary School did not receive recognition in any of these programs during the 1998-99 school year.
1998-99 GEORGIA PUBLIC EDUCATION REPORT CARD Benteen Elementary School - 7615051
Prepared by Georgia Department of Education
Page 4
CERTIFIED PERSONNEL DATA
Positions Number Average Contract Days
Personnel Sex
Certificate
Years Experience
Full-time Part-time
Male Female
4 Yr Bachelor's 5 Yr Master's 6 Yr Specialist's 7 Yr Doctoral Other*
<1 1-10 11-20 21-30 >30
Average
Administrators
2.00 231.00
2 0
0 2
0 1 0 1 0 0 0 0 2 0 28.00
Support Personnel
1.70 196.47
1 3
1 3
0 2 1 1 0 0 3 1 0 0 9.00
PK-12 Teachers
33.90 190.00
32 4
6 30
17 17
2 0 0 1 20 9 3 3 11.92
*Includes One- and Two-Year Vocational Certificates.
ACCREDITATION DATA
Accredited by Georgia Accrediting Commission (GAC).
1998-99 GEORGIA PUBLIC EDUCATION REPORT CARD Benteen Elementary School - 7615051
Prepared by Georgia Department of Education
Page 5
1998-99 GEORGIA PUBLIC EDUCATION REPORT CARD
ATLANTA CITY SCHOOLS
Bethune Elementary School - 7611052
Grade Range K-5
The Georgia Public Education Report Card is designed to assist systems and schools in educational improvement. This report card contains a variety of data elements. An explanation of the terms is provided as a companion to the report card data. Please refer to the definitions for the most effective use of the reported data.
STUDENT DATA
Total 384
K-5 Enrollment, by Race/Ethnicity and Sex
Black
White Hispanic
American Multi-
Asian Indian
racial
382 99.5%
1 0.3%
1 0.3%
0 0.0%
0 0.0%
0 0.0%
Male Female
162 42.2%
222 57.8%
Enrollment in Selected Programs
Program
Program % of Student Enrollment Population
Gifted (Grades K-12)
0
0.0%
Alternative Programs (Grades 6-12)
N/A
N/A
Students Eligible to Receive Free/Reduced Lunches
Number
Percent
School System
384 45,695
100.0% 75.5%
Dropout Rate *
Number
Rate
School System
N/A N/A
N/A N/A
* Dropout rates are not applicable for grades PK-5.
Enrollment in Compensatory Programs
Program
Program % of Student Enrollment Population
Special Education (Grades K-12)
23
6.0%
(PK)
0
N/A
English to Speakers of Other Languages (ESOL) (Grades K-12)
0
0.0%
Remedial Education (Grades 2-5, 9-12)
68 28.1%
Special Instructional Assistance (SIA) (Grades K-3)
137 52.9%
Title I (Grades K-12)
This school has a schoolwide program.
Total 8
Retained Students, by Race/Ethnicity and Sex
Black
White Hispanic
American Multi-
Asian Indian
racial
7 87.5%
1 12.5%
0 0.0%
0 0.0%
0 0.0%
0 0.0%
Male Female
5
3
62.5% 37.5%
Prepared by Georgia Department of Education
Page 1
STATE-REQUIRED TEST DATA
NORM-REFERENCED TESTS Grade 3
Iowa Tests of Basic Skills (ITBS) Each chart reflects data for three years of testing.
Reading Comprehension 50
26 50 54 0
98-99
62 55 53 97-98
51 48 52 96-97
Mathematics
School 50
System
State
0
35 53 61 98-99
51 58 61 97-98
38 51 59 96-97
School System State
Reading Vocabulary 50
30 50 50 0
98-99
60 51 50 97-98
31 44 49 96-97
Language Arts
School 50
System
State
0
39 61 64 98-99
63 63 62 97-98
42 54 59 96-97
School System State
Social Studies 50
33 50 56 0
98-99
53 52 55 97-98
39 50 55 96-97
Science
School 50
System
State
0
25 49 59 98-99
64 52 59 97-98
39 48 58 96-97
School System State
Sources of Information
Composite Score
50
25 48 57 0
98-99
School 50
System
38 51 56 97-98
33 47 55 96-97
State 0
28 51 58 98-99
57 55 57 97-98
1998-99 GEORGIA PUBLIC EDUCATION REPORT CARD Bethune Elementary School - 7611052
Prepared by Georgia Department of Education
37 48 56 96-97
Scores Reported in Percentiles
School System State
Page 2
STATE-REQUIRED TEST DATA
NORM-REFERENCED TESTS Grade 5
Iowa Tests of Basic Skills (ITBS) Each chart reflects data for three years of testing.
Reading Comprehension
Mathematics
50
31 47 53 0
98-99
41 52 53 97-98
24 49 52 96-97
School 50
System
State
0
20 48 59 98-99
45 53 58 97-98
27 50 57 96-97
School System State
Reading Vocabulary 50
21 48 48 0
98-99
51 52 48 97-98
11 44 46 96-97
Language Arts
School 50
System
State
0
26 56 63 98-99
51 60 61 97-98
26 51 58 96-97
School System State
Social Studies 50
24 54 57 0
98-99
49 54 56 97-98
25 52 55 96-97
Science
School 50
System
State
0
17 48 60 98-99
39 50 59 97-98
27 48 59 96-97
School System State
Sources of Information
Composite Score
50
24 47 58 0
98-99
School 50
System
41 51 58 97-98
28 49 57 96-97
State 0
21 49 57 98-99
43 52 56 97-98
23 48 55 96-97
1998-99 GEORGIA PUBLIC EDUCATION REPORT CARD Bethune Elementary School - 7611052
Prepared by Georgia Department of Education
Scores Reported in Percentiles
School System State
Page 3
STATE-REQUIRED TEST DATA
PERFORMANCE ASSESSMENTS
Grade 5 Writing Assessment
Percent at Developmental Stages:
1998-99 School System State
1997-98 School System State
1996-97 School System State
Stage Stage Stage Stage Stage Stage
1:The Emerging Writer 2:The Developing Writer 3:The Focusing Writer 4:The Experimenting 5:The Engaging Writer 6:The Extending Writer
3% 7% 28% 41% 21% 0%
1% 2% 22% 47% 22% 6%
0% 1% 16% 41% 29% 12%
3% 3% 20% 48% 23% 5%
1% 4% 24% 47% 19% 5%
0% 3% 19% 41% 27% 10%
3% 6% 42% 40% 8% 0%
1% 6% 32% 39% 17% 5%
0% 3% 21% 37% 26% 12%
AWARDS / RECOGNITION DATA
Schools in Georgia may receive recognition in the following programs: Charter School Pay for Performance Program Georgia School of Excellence National Blue Ribbon School Bethune Elementary School did not receive recognition in any of these programs during the 1998-99 school year.
1998-99 GEORGIA PUBLIC EDUCATION REPORT CARD Bethune Elementary School - 7611052
Prepared by Georgia Department of Education
Page 4
CERTIFIED PERSONNEL DATA
Positions Number Average Contract Days
Personnel Sex
Certificate
Years Experience
Full-time Part-time
Male Female
4 Yr Bachelor's 5 Yr Master's 6 Yr Specialist's 7 Yr Doctoral Other*
<1 1-10 11-20 21-30 >30
Average
Administrators
2.20 230.00
2 1
0 3
0 1 1 1 0 0 0 2 1 0 23.00
Support Personnel
1.70 194.71
1 3
0 4
0 2 1 1 0 0 1 1 1 1 19.00
PK-12 Teachers
33.20 190.00
31 6
1 36
22 12
3 0 0 0 14 10 8 5 16.11
*Includes One- and Two-Year Vocational Certificates.
ACCREDITATION DATA
Accredited by Georgia Accrediting Commission (GAC).
1998-99 GEORGIA PUBLIC EDUCATION REPORT CARD Bethune Elementary School - 7611052
Prepared by Georgia Department of Education
Page 5
1998-99 GEORGIA PUBLIC EDUCATION REPORT CARD
ATLANTA CITY SCHOOLS
Blalock Elementary School - 7614052
Grade Range K-5
The Georgia Public Education Report Card is designed to assist systems and schools in educational improvement. This report card contains a variety of data elements. An explanation of the terms is provided as a companion to the report card data. Please refer to the definitions for the most effective use of the reported data.
STUDENT DATA
Total 533
K-5 Enrollment, by Race/Ethnicity and Sex
Black
White Hispanic
American Multi-
Asian Indian
racial
532 99.8%
0 0.0%
1 0.2%
0 0.0%
0 0.0%
0 0.0%
Male Female
293 55.0%
240 45.0%
Enrollment in Selected Programs
Program
Program % of Student Enrollment Population
Gifted (Grades K-12)
0
0.0%
Alternative Programs (Grades 6-12)
N/A
N/A
Students Eligible to Receive Free/Reduced Lunches
Number
Percent
School System
516 45,695
96.8% 75.5%
Dropout Rate *
Number
Rate
School System
N/A N/A
N/A N/A
* Dropout rates are not applicable for grades PK-5.
Enrollment in Compensatory Programs
Program
Program % of Student Enrollment Population
Special Education (Grades K-12)
42
7.9%
(PK)
9
N/A
English to Speakers of Other Languages (ESOL) (Grades K-12)
0
0.0%
Remedial Education (Grades 2-5, 9-12)
91 27.8%
Special Instructional Assistance (SIA) (Grades K-3)
274 68.0%
Title I (Grades K-12)
This school has a schoolwide program.
Total 33
Retained Students, by Race/Ethnicity and Sex
Black
White Hispanic
American Multi-
Asian Indian
racial
33 100.0%
0 0.0%
0 0.0%
0 0.0%
0 0.0%
0 0.0%
Male Female
24
9
72.7% 27.3%
Prepared by Georgia Department of Education
Page 1
STATE-REQUIRED TEST DATA
NORM-REFERENCED TESTS Grade 3
Iowa Tests of Basic Skills (ITBS) Each chart reflects data for three years of testing.
Reading Comprehension 50
27 50 54 0
98-99
36 55 53 97-98
41 48 52 96-97
Mathematics
School 50
System
State
0
30 53 61 98-99
47 58 61 97-98
36 51 59 96-97
School System State
Reading Vocabulary 50
38 50 50 0
98-99
46 51 50 97-98
37 44 49 96-97
Language Arts
School 50
System
State
0
29 61 64 98-99
40 63 62 97-98
35 54 59 96-97
School System State
Social Studies 50
26 50 56 0
98-99
37 52 55 97-98
38 50 55 96-97
Science
School 50
System
State
0
26 49 59 98-99
56 52 59 97-98
39 48 58 96-97
School System State
Sources of Information
Composite Score
50
20 48 57 0
98-99
School 50
System
36 51 56 97-98
27 47 55 96-97
State 0
25 51 58 98-99
41 55 57 97-98
1998-99 GEORGIA PUBLIC EDUCATION REPORT CARD Blalock Elementary School - 7614052
Prepared by Georgia Department of Education
33 48 56 96-97
Scores Reported in Percentiles
School System State
Page 2
STATE-REQUIRED TEST DATA
NORM-REFERENCED TESTS Grade 5
Iowa Tests of Basic Skills (ITBS) Each chart reflects data for three years of testing.
Reading Comprehension
Mathematics
50
19 47 53 0
98-99
25 52 53 97-98
23 49 52 96-97
School 50
System
State
0
21 48 59 98-99
28 53 58 97-98
27 50 57 96-97
School System State
Reading Vocabulary 50
15 48 48 0
98-99
20 52 48 97-98
16 44 46 96-97
Language Arts
School 50
System
State
0
33 56 63 98-99
24 60 61 97-98
27 51 58 96-97
School System State
Social Studies 50
23 54 57 0
98-99
24 54 56 97-98
25 52 55 96-97
Science
School 50
System
State
0
17 48 60 98-99
17 50 59 97-98
18 48 59 96-97
School System State
Sources of Information
Composite Score
50
26 47 58 0
98-99
School 50
System
24 51 58 97-98
21 49 57 96-97
State 0
20 49 57 98-99
20 52 56 97-98
21 48 55 96-97
1998-99 GEORGIA PUBLIC EDUCATION REPORT CARD Blalock Elementary School - 7614052
Prepared by Georgia Department of Education
Scores Reported in Percentiles
School System State
Page 3
STATE-REQUIRED TEST DATA
PERFORMANCE ASSESSMENTS
Grade 5 Writing Assessment
Percent at Developmental Stages:
1998-99 School System State
1997-98 School System State
1996-97 School System State
Stage Stage Stage Stage Stage Stage
1:The Emerging Writer 2:The Developing Writer 3:The Focusing Writer 4:The Experimenting 5:The Engaging Writer 6:The Extending Writer
0% 6% 30% 45% 19% 0%
1% 2% 22% 47% 22% 6%
0% 1% 16% 41% 29% 12%
0% 2% 52% 36% 10% 0%
1% 4% 24% 47% 19% 5%
0% 3% 19% 41% 27% 10%
0% 3% 26% 50% 18% 3%
1% 6% 32% 39% 17% 5%
0% 3% 21% 37% 26% 12%
AWARDS / RECOGNITION DATA
Schools in Georgia may receive recognition in the following programs: Charter School Pay for Performance Program Georgia School of Excellence National Blue Ribbon School Blalock Elementary School did not receive recognition in any of these programs during the 1998-99 school year.
1998-99 GEORGIA PUBLIC EDUCATION REPORT CARD Blalock Elementary School - 7614052
Prepared by Georgia Department of Education
Page 4
CERTIFIED PERSONNEL DATA
Positions Number Average Contract Days
Personnel Sex
Certificate
Years Experience
Full-time Part-time
Male Female
4 Yr Bachelor's 5 Yr Master's 6 Yr Specialist's 7 Yr Doctoral Other*
<1 1-10 11-20 21-30 >30
Average
Administrators
2.00 231.00
2 0
0 2
0 0 1 1 0 0 0 0 1 1 32.00
Support Personnel
1.90 192.63
1 2
0 3
1 1 1 0 0 0 1 0 1 1 22.33
PK-12 Teachers
30.60 190.00
29 5
4 30
17 14
2 1 0 3 17 2 6 6 13.65
*Includes One- and Two-Year Vocational Certificates.
ACCREDITATION DATA
Accredited by Georgia Accrediting Commission (GAC).
1998-99 GEORGIA PUBLIC EDUCATION REPORT CARD Blalock Elementary School - 7614052
Prepared by Georgia Department of Education
Page 5
1998-99 GEORGIA PUBLIC EDUCATION REPORT CARD
ATLANTA CITY SCHOOLS
Boyd Elementary School - 7611053
Grade Range K-5
The Georgia Public Education Report Card is designed to assist systems and schools in educational improvement. This report card contains a variety of data elements. An explanation of the terms is provided as a companion to the report card data. Please refer to the definitions for the most effective use of the reported data.
STUDENT DATA
Total 372
K-5 Enrollment, by Race/Ethnicity and Sex
Black
White Hispanic
American Multi-
Asian Indian
racial
370 99.5%
1 0.3%
1 0.3%
0 0.0%
0 0.0%
0 0.0%
Male Female
188 50.5%
184 49.5%
Enrollment in Selected Programs
Program
Program % of Student Enrollment Population
Gifted (Grades K-12)
2
< 1%
Alternative Programs (Grades 6-12)
N/A
N/A
Students Eligible to Receive Free/Reduced Lunches
Number
Percent
School System
347 45,695
93.3% 75.5%
Dropout Rate *
Number
Rate
School System
N/A N/A
N/A N/A
* Dropout rates are not applicable for grades PK-5.
Enrollment in Compensatory Programs
Program
Program % of Student Enrollment Population
Special Education (Grades K-12)
38 10.2%
(PK)
0
N/A
English to Speakers of Other Languages (ESOL) (Grades K-12)
0
0.0%
Remedial Education (Grades 2-5, 9-12)
55 23.4%
Special Instructional Assistance (SIA) (Grades K-3)
177 66.5%
Title I (Grades K-12)
This school has a schoolwide program.
Total 5
Retained Students, by Race/Ethnicity and Sex
Black
White Hispanic
American Multi-
Asian Indian
racial
5 100.0%
0 0.0%
0 0.0%
0 0.0%
0 0.0%
0 0.0%
Male Female
4
1
80.0% 20.0%
Prepared by Georgia Department of Education
Page 1
STATE-REQUIRED TEST DATA
NORM-REFERENCED TESTS Grade 3
Iowa Tests of Basic Skills (ITBS) Each chart reflects data for three years of testing.
Reading Comprehension 50
49 50 54 0
98-99
53 55 53 97-98
24 48 52 96-97
Mathematics
School 50
System
State
0
53 53 61 98-99
45 58 61 97-98
19 51 59 96-97
School System State
Reading Vocabulary 50
61 50 50 0
98-99
50 51 50 97-98
26 44 49 96-97
Language Arts
School 50
System
State
0
61 61 64 98-99
44 63 62 97-98
20 54 59 96-97
School System State
Social Studies 50
59 50 56 0
98-99
42 52 55 97-98
21 50 55 96-97
Science
School 50
System
State
0
60 49 59 98-99
35 52 59 97-98
25 48 58 96-97
School System State
Sources of Information
Composite Score
50
48 48 57 0
98-99
School 50
System
31 51 56 97-98
20 47 55 96-97
State 0
56 51 58 98-99
40 55 57 97-98
1998-99 GEORGIA PUBLIC EDUCATION REPORT CARD Boyd Elementary School - 7611053
Prepared by Georgia Department of Education
19 48 56 96-97
Scores Reported in Percentiles
School System State
Page 2
STATE-REQUIRED TEST DATA
NORM-REFERENCED TESTS Grade 5
Iowa Tests of Basic Skills (ITBS) Each chart reflects data for three years of testing.
Reading Comprehension
Mathematics
50
43 47 53 0
98-99
40 52 53 97-98
31 49 52 96-97
School 50
System
State
0
28 48 59 98-99
31 53 58 97-98
22 50 57 96-97
School System State
Reading Vocabulary 50
33 48 48 0
98-99
50 52 48 97-98
13 44 46 96-97
Language Arts
School 50
System
State
0
44 56 63 98-99
48 60 61 97-98
33 51 58 96-97
School System State
Social Studies 50
28 54 57 0
98-99
27 54 56 97-98
24 52 55 96-97
Science
School 50
System
State
0
19 48 60 98-99
25 50 59 97-98
21 48 59 96-97
School System State
Sources of Information
Composite Score
50
39 47 58 0
98-99
School 50
System
30 51 58 97-98
32 49 57 96-97
State 0
30 49 57 98-99
32 52 56 97-98
23 48 55 96-97
1998-99 GEORGIA PUBLIC EDUCATION REPORT CARD Boyd Elementary School - 7611053
Prepared by Georgia Department of Education
Scores Reported in Percentiles
School System State
Page 3
STATE-REQUIRED TEST DATA
PERFORMANCE ASSESSMENTS
Grade 5 Writing Assessment
Percent at Developmental Stages:
1998-99 School System State
1997-98 School System State
1996-97 School System State
Stage Stage Stage Stage Stage Stage
1:The Emerging Writer 2:The Developing Writer 3:The Focusing Writer 4:The Experimenting 5:The Engaging Writer 6:The Extending Writer
2% 0% 24% 42% 29% 2%
1% 2% 22% 47% 22% 6%
0% 1% 16% 41% 29% 12%
4% 9% 20% 50% 17% 0%
1% 4% 24% 47% 19% 5%
0% 3% 19% 41% 27% 10%
2% 11% 50% 26%
9% 2%
1% 6% 32% 39% 17% 5%
0% 3% 21% 37% 26% 12%
AWARDS / RECOGNITION DATA
Schools in Georgia may receive recognition in the following programs: Charter School Pay for Performance Program Georgia School of Excellence National Blue Ribbon School Boyd Elementary School did not receive recognition in any of these programs during the 1998-99 school year.
1998-99 GEORGIA PUBLIC EDUCATION REPORT CARD Boyd Elementary School - 7611053
Prepared by Georgia Department of Education
Page 4
CERTIFIED PERSONNEL DATA
Positions Number Average Contract Days
Personnel Sex
Certificate
Years Experience
Full-time Part-time
Male Female
4 Yr Bachelor's 5 Yr Master's 6 Yr Specialist's 7 Yr Doctoral Other*
<1 1-10 11-20 21-30 >30
Average
Administrators
2.00 231.00
2 0
0 2
0 0 1 1 0 0 0 1 0 1 25.00
Support Personnel
1.40 192.86
1 1
1 1
0 2 0 0 0 0 1 1 0 0 7.50
PK-12 Teachers
32.50 190.00
30 6
6 30
14 17
5 0 0 1 11 8 7 9 19.08
*Includes One- and Two-Year Vocational Certificates.
ACCREDITATION DATA
Accredited by Georgia Accrediting Commission (GAC).
1998-99 GEORGIA PUBLIC EDUCATION REPORT CARD Boyd Elementary School - 7611053
Prepared by Georgia Department of Education
Page 5
1998-99 GEORGIA PUBLIC EDUCATION REPORT CARD
ATLANTA CITY SCHOOLS
Brandon Elementary School - 7612053
Grade Range K-5
The Georgia Public Education Report Card is designed to assist systems and schools in educational improvement. This report card contains a variety of data elements. An explanation of the terms is provided as a companion to the report card data. Please refer to the definitions for the most effective use of the reported data.
STUDENT DATA
Total 513
K-5 Enrollment, by Race/Ethnicity and Sex
Black
White Hispanic
American Multi-
Asian Indian
racial
61 11.9%
446 86.9%
1 0.2%
3 0.6%
0 0.0%
2 0.4%
Male Female
254 49.5%
259 50.5%
Enrollment in Selected Programs
Program
Program % of Student Enrollment Population
Gifted (Grades K-12)
180
35.1%
Alternative Programs (Grades 6-12)
N/A
N/A
Students Eligible to Receive Free/Reduced Lunches
Number
Percent
School System
26 45,695
5.1% 75.5%
Dropout Rate *
Number
Rate
School System
N/A N/A
N/A N/A
* Dropout rates are not applicable for grades PK-5.
Enrollment in Compensatory Programs
Program
Program % of Student Enrollment Population
Special Education (Grades K-12)
34
6.6%
(PK)
0
N/A
English to Speakers of Other Languages (ESOL) (Grades K-12)
0
0.0%
Remedial Education (Grades 2-5, 9-12)
31
9.7%
Special Instructional Assistance (SIA) (Grades K-3)
0
0.0%
Title I (Grades K-12)
This school has no Title I program.
Total 14
Retained Students, by Race/Ethnicity and Sex
Black
White Hispanic
American Multi-
Asian Indian
racial
4 28.6%
10 71.4%
0 0.0%
0 0.0%
0 0.0%
0 0.0%
Male Female
6
8
42.9% 57.1%
Prepared by Georgia Department of Education
Page 1
STATE-REQUIRED TEST DATA
NORM-REFERENCED TESTS Grade 3
Iowa Tests of Basic Skills (ITBS) Each chart reflects data for three years of testing.
Reading Comprehension 50
83 50 54 0
98-99
83 55 53 97-98
80 48 52 96-97
Mathematics
School 50
System
State
0
91 53 61 98-99
91 58 61 97-98
89 51 59 96-97
School System State
Reading Vocabulary 50
82 50 50 0
98-99
82 51 50 97-98
83 44 49 96-97
Language Arts
School 50
System
State
0
94 61 64 98-99
93 63 62 97-98
85 54 59 96-97
School System State
Social Studies 50
87 50 56 0
98-99
84 52 55 97-98
83 50 55 96-97
Science
School 50
System
State
0
93 49 59 98-99
82 52 59 97-98
83 48 58 96-97
School System State
Sources of Information
Composite Score
50
88 48 57 0
98-99
School 50
System
87 51 56 97-98
86 47 55 96-97
State 0
93 51 58 98-99
89 55 57 97-98
1998-99 GEORGIA PUBLIC EDUCATION REPORT CARD Brandon Elementary School - 7612053
Prepared by Georgia Department of Education
87 48 56 96-97
Scores Reported in Percentiles
School System State
Page 2
STATE-REQUIRED TEST DATA
NORM-REFERENCED TESTS Grade 5
Iowa Tests of Basic Skills (ITBS) Each chart reflects data for three years of testing.
Reading Comprehension
Mathematics
50
79 47 53 0
98-99
76 52 53 97-98
76 49 52 96-97
School 50
System
State
0
89 48 59 98-99
86 53 58 97-98
85 50 57 96-97
School System State
Reading Vocabulary 50
79 48 48 0
98-99
78 52 48 97-98
74 44 46 96-97
Language Arts
School 50
System
State
0
83 56 63 98-99
81 60 61 97-98
76 51 58 96-97
School System State
Social Studies 50
88 54 57 0
98-99
89 54 56 97-98
83 52 55 96-97
Science
School 50
System
State
0
85 48 60 98-99
83 50 59 97-98
78 48 59 96-97
School System State
Sources of Information
Composite Score
50
87 47 58 0
98-99
School 50
System
85 51 58 97-98
82 49 57 96-97
State 0
89 49 57 98-99
87 52 56 97-98
83 48 55 96-97
1998-99 GEORGIA PUBLIC EDUCATION REPORT CARD Brandon Elementary School - 7612053
Prepared by Georgia Department of Education
Scores Reported in Percentiles
School System State
Page 3
STATE-REQUIRED TEST DATA
PERFORMANCE ASSESSMENTS
Grade 5 Writing Assessment
Percent at Developmental Stages:
1998-99 School System State
1997-98 School System State
1996-97 School System State
Stage Stage Stage Stage Stage Stage
1:The Emerging Writer 2:The Developing Writer 3:The Focusing Writer 4:The Experimenting 5:The Engaging Writer 6:The Extending Writer
0% 0% 6% 21% 48% 25%
1% 2% 22% 47% 22% 6%
0% 1% 16% 41% 29% 12%
0% 0% 10% 33% 33% 25%
1% 4% 24% 47% 19% 5%
0% 3% 19% 41% 27% 10%
0% 1% 15% 24% 32% 28%
1% 6% 32% 39% 17% 5%
0% 3% 21% 37% 26% 12%
AWARDS / RECOGNITION DATA
Schools in Georgia may receive recognition in the following programs: Charter School Pay for Performance Program Georgia School of Excellence National Blue Ribbon School Brandon Elementary School did not receive recognition in any of these programs during the 1998-99 school year.
1998-99 GEORGIA PUBLIC EDUCATION REPORT CARD Brandon Elementary School - 7612053
Prepared by Georgia Department of Education
Page 4
CERTIFIED PERSONNEL DATA
Positions Number Average Contract Days
Personnel Sex
Certificate
Years Experience
Full-time Part-time
Male Female
4 Yr Bachelor's 5 Yr Master's 6 Yr Specialist's 7 Yr Doctoral Other*
<1 1-10 11-20 21-30 >30
Average
Administrators
3.00 227.33
3 0
0 3
0 1 1 1 0 0 0 0 2 1 28.67
Support Personnel
2.30 194.35
1 3
1 3
0 3 1 0 0 0 1 3 0 0 13.25
PK-12 Teachers
32.60 190.00
31 4
2 33
16 17
2 0 0 0 15 11 6 3 14.94
*Includes One- and Two-Year Vocational Certificates.
ACCREDITATION DATA
Accredited by Georgia Accrediting Commission (GAC).
1998-99 GEORGIA PUBLIC EDUCATION REPORT CARD Brandon Elementary School - 7612053
Prepared by Georgia Department of Education
Page 5
1998-99 GEORGIA PUBLIC EDUCATION REPORT CARD
ATLANTA CITY SCHOOLS
Bunche Middle School - 7610180
Grade Range 6-8
The Georgia Public Education Report Card is designed to assist systems and schools in educational improvement. This report card contains a variety of data elements. An explanation of the terms is provided as a companion to the report card data. Please refer to the definitions for the most effective use of the reported data.
STUDENT DATA
Total 984
6-8 Enrollment, by Race/Ethnicity and Sex
Black
White Hispanic
American Multi-
Asian Indian
racial
977 99.3%
2 0.2%
2 0.2%
0 0.0%
0 0.0%
3 0.3%
Male 490
49.8%
Female 494
50.2%
Enrollment in Selected Programs
Program
Gifted (Grades K-12)
Program % of Student Enrollment Population
57
5.8%
Alternative Programs (Grades 6-12)
0
0.0%
Students Eligible to Receive Free/Reduced Lunches
Number
Percent
School System
604 45,695
61.4% 75.5%
Enrollment in Compensatory Programs
Program
Program % of Student Enrollment Population
Special Education (Grades K-12) (PK)
74
7.5%
0
N/A
English to Speakers of Other Languages (ESOL) (Grades K-12)
0
0.0%
Title I (Grades K-12)
This school has a schoolwide program.
Dropout Rate for Grades 6-8
Number
Rate
School System
41
3.0%
705
3.8%
Total 16
Retained Students, by Race/Ethnicity and Sex
Black
White Hispanic
American MultiAsian Indian racial
16 100.0%
0 0.0%
0 0.0%
0 0.0%
0 0.0%
0 0.0%
Male Female
12
4
75.0% 25.0%
Prepared by Georgia Department of Education
Page 1
STATE-REQUIRED TEST DATA
NORM-REFERENCED TESTS Grade 8
Iowa Tests of Basic Skills (ITBS) Each chart reflects data for three years of testing.
Reading Comprehension 50
44 36 49 0
98-99
47 35 48 97-98
43 34 48 96-97
Mathematics
School 50
System
State
0
50 45 56 98-99
54 43 55 97-98
54 43 54 96-97
School System State
Reading Vocabulary 50
54 32 46 0
98-99
85 36 45 97-98
38 27 44 96-97
Language Arts
School 50
System
State
0
55 42 60 98-99
62 43 58 97-98
55 40 56 96-97
School System State
Social Studies 50
56 42 54 0
98-99
70 45 53 97-98
58 41 53 96-97
Science
School 50
System
State
0
58 36 56 98-99
82 39 55 97-98
62 35 53 96-97
School System State
Sources of Information
Composite Score
50
48 42 57 0
98-99
School 50
System
52 42 56 97-98
52 42 55 96-97
State 0
53 39 56 98-99
66 40 54 97-98
1998-99 GEORGIA PUBLIC EDUCATION REPORT CARD Bunche Middle School - 7610180
Prepared by Georgia Department of Education
54 37 54 96-97
Scores Reported in Percentiles
School System State
Page 2
STATE-REQUIRED TEST DATA
Categories of Scaled Scores
Inadequate (less than 162)
Minimal (162-209)
Good
(210-247)
Very Good (greater than 247)
Average Scaled Score: (Range 100-300)
PERFORMANCE ASSESSMENTS
Grade 8 Writing Assessment
1998-99 Percent Scoring
1997-98 Percent Scoring
1996-97 Percent Scoring
School System State School System State School System State
8% 39% 41% 11%
16% 51% 28%
5%
8% 40% 41% 11%
6% 47% 40%
7%
25% 53% 19%
3%
11% 46% 34%
8%
22% 47% 24%
7%
34% 48% 15%
3%
15% 46% 30%
8%
209
193
208 207
184 202 191
177 198
AWARDS / RECOGNITION DATA
Schools in Georgia may receive recognition in the following programs: Charter School Pay for Performance Program Georgia School of Excellence National Blue Ribbon School Bunche Middle School did not receive recognition in any of these programs during the 1998-99 school year.
1998-99 GEORGIA PUBLIC EDUCATION REPORT CARD Bunche Middle School - 7610180
Prepared by Georgia Department of Education
Page 3
CERTIFIED PERSONNEL DATA
Positions Number Average Contract Days
Personnel Sex
Certificate
Years Experience
Full-time Part-time
Male Female
4 Yr Bachelor's 5 Yr Master's 6 Yr Specialist's 7 Yr Doctoral Other*
<1 1-10 11-20 21-30 >30
Average
Administrators
4.00 225.50
4 0
2 2
0 1 3 0 0 0 1 0 2 1 25.75
Support Personnel
3.60 195.56
3 1
0 4
0 1 3 0 0 0 0 1 3 0 22.75
PK-12 Teachers
46.80 190.21
46 2
9 39
24 21
3 0 0 2 22 10 11 3 13.02
*Includes One- and Two-Year Vocational Certificates.
ACCREDITATION DATA
Accredited with Quality by Georgia Accrediting Commission (GAC).
1998-99 GEORGIA PUBLIC EDUCATION REPORT CARD Bunche Middle School - 7610180
Prepared by Georgia Department of Education
Page 4
1998-99 GEORGIA PUBLIC EDUCATION REPORT CARD
ATLANTA CITY SCHOOLS
Burgess Elementary School - 7611054
Grade Range PK-5
The Georgia Public Education Report Card is designed to assist systems and schools in educational improvement. This report card contains a variety of data elements. An explanation of the terms is provided as a companion to the report card data. Please refer to the definitions for the most effective use of the reported data.
STUDENT DATA
Total
K-5
403
PK
48
Enrollment, by Race/Ethnicity and Sex
Black
White Hispanic
American Asian Indian
Multiracial
401 99.5%
1 0.2%
1 0.2%
0 0.0%
0 0.0%
0 0.0%
48 100.0%
0 0.0%
0 0.0%
0 0.0%
0 0.0%
0 0.0%
Male Female
199 49.4%
204 50.6%
18 37.5%
30 62.5%
Enrollment in Selected Programs
Program
Program % of Student Enrollment Population
Gifted (Grades K-12)
0
0.0%
Alternative Programs (Grades 6-12)
N/A
N/A
Students Eligible to Receive Free/Reduced Lunches
Number
Percent
School System
330 45,695
73.2% 75.5%
Dropout Rate *
Number
Rate
School System
N/A N/A
N/A N/A
* Dropout rates are not applicable for grades PK-5.
Enrollment in Compensatory Programs
Program
Program % of Student Enrollment Population
Special Education (Grades K-12)
32
7.9%
(PK)
16
N/A
English to Speakers of Other Languages (ESOL) (Grades K-12)
0
0.0%
Remedial Education (Grades 2-5, 9-12)
64 26.3%
Special Instructional Assistance (SIA) (Grades K-3)
182 61.5%
Title I (Grades K-12)
This school has a schoolwide program.
Total 11
Retained Students, by Race/Ethnicity and Sex
Black
White Hispanic
American MultiAsian Indian racial
11 100.0%
0 0.0%
0 0.0%
0 0.0%
0 0.0%
0 0.0%
Male Female
5
6
45.5% 54.5%
Prepared by Georgia Department of Education
Page 1
STATE-REQUIRED TEST DATA
NORM-REFERENCED TESTS Grade 3
Iowa Tests of Basic Skills (ITBS) Each chart reflects data for three years of testing.
Reading Comprehension 50
62 50 54 0
98-99
65 55 53 97-98
74 48 52 96-97
Mathematics
School 50
System
State
0
53 53 61 98-99
50 58 61 97-98
61 51 59 96-97
School System State
Reading Vocabulary 50
54 50 50 0
98-99
53 51 50 97-98
59 44 49 96-97
Language Arts
School 50
System
State
0
68 61 64 98-99
59 63 62 97-98
61 54 59 96-97
School System State
Social Studies 50
50 50 56 0
98-99
44 52 55 97-98
68 50 55 96-97
Science
School 50
System
State
0
55 49 59 98-99
39 52 59 97-98
57 48 58 96-97
School System State
Sources of Information
Composite Score
50
45 48 57 0
98-99
School 50
System
48 51 56 97-98
62 47 55 96-97
State 0
54 51 58 98-99
51 55 57 97-98
1998-99 GEORGIA PUBLIC EDUCATION REPORT CARD Burgess Elementary School - 7611054
Prepared by Georgia Department of Education
63 48 56 96-97
Scores Reported in Percentiles
School System State
Page 2
STATE-REQUIRED TEST DATA
NORM-REFERENCED TESTS Grade 5
Iowa Tests of Basic Skills (ITBS) Each chart reflects data for three years of testing.
Reading Comprehension
Mathematics
50
34 47 53 0
98-99
54 52 53 97-98
51 49 52 96-97
School 50
System
State
0
30 48 59 98-99
58 53 58 97-98
53 50 57 96-97
School System State
Reading Vocabulary 50
71 48 48 0
98-99
46 52 48 97-98
57 44 46 96-97
Language Arts
School 50
System
State
0
48 56 63 98-99
58 60 61 97-98
67 51 58 96-97
School System State
Social Studies 50
35 54 57 0
98-99
53 54 56 97-98
58 52 55 96-97
Science
School 50
System
State
0
31 48 60 98-99
52 50 59 97-98
54 48 59 96-97
School System State
Sources of Information
Composite Score
50
40 47 58 0
98-99
School 50
System
41 51 58 97-98
62 49 57 96-97
State 0
37 49 57 98-99
51 52 56 97-98
58 48 55 96-97
1998-99 GEORGIA PUBLIC EDUCATION REPORT CARD Burgess Elementary School - 7611054
Prepared by Georgia Department of Education
Scores Reported in Percentiles
School System State
Page 3
STATE-REQUIRED TEST DATA
PERFORMANCE ASSESSMENTS
Grade 5 Writing Assessment
Percent at Developmental Stages:
1998-99 School System State
1997-98 School System State
1996-97 School System State
Stage Stage Stage Stage Stage Stage
1:The Emerging Writer 2:The Developing Writer 3:The Focusing Writer 4:The Experimenting 5:The Engaging Writer 6:The Extending Writer
0% 2% 11% 54% 22% 11%
1% 2% 22% 47% 22% 6%
0% 1% 16% 41% 29% 12%
0% 0% 18% 55% 27% 0%
1% 4% 24% 47% 19% 5%
0% 3% 19% 41% 27% 10%
0% 0% 25% 40% 33% 3%
1% 6% 32% 39% 17% 5%
0% 3% 21% 37% 26% 12%
AWARDS / RECOGNITION DATA
Schools in Georgia may receive recognition in the following programs: Charter School Pay for Performance Program Georgia School of Excellence National Blue Ribbon School Burgess Elementary School did not receive recognition in any of these programs during the 1998-99 school year.
1998-99 GEORGIA PUBLIC EDUCATION REPORT CARD Burgess Elementary School - 7611054
Prepared by Georgia Department of Education
Page 4
CERTIFIED PERSONNEL DATA
Positions Number Average Contract Days
Personnel Sex
Certificate
Years Experience
Full-time Part-time
Male Female
4 Yr Bachelor's 5 Yr Master's 6 Yr Specialist's 7 Yr Doctoral Other*
<1 1-10 11-20 21-30 >30
Average
Administrators
2.00 231.00
2 0
1 1
0 0 0 2 0 0 0 0 2 0 26.00
Support Personnel
1.80 196.67
1 2
0 3
0 1 2 0 0 0 1 1 0 1 19.67
PK-12 Teachers
28.00 190.00
26 5
3 28
16 15
0 0 0 2 10 11 7 1 13.71
*Includes One- and Two-Year Vocational Certificates.
ACCREDITATION DATA
Accredited by Georgia Accrediting Commission (GAC).
1998-99 GEORGIA PUBLIC EDUCATION REPORT CARD Burgess Elementary School - 7611054
Prepared by Georgia Department of Education
Page 5
1998-99 GEORGIA PUBLIC EDUCATION REPORT CARD
ATLANTA CITY SCHOOLS
C W Hill Elementary School - 7615561
Grade Range PK-5
The Georgia Public Education Report Card is designed to assist systems and schools in educational improvement. This report card contains a variety of data elements. An explanation of the terms is provided as a companion to the report card data. Please refer to the definitions for the most effective use of the reported data.
STUDENT DATA
Total
K-5
566
PK
14
Enrollment, by Race/Ethnicity and Sex
Black
White Hispanic
American Asian Indian
Multiracial
562 99.3%
3 0.5%
1 0.2%
0 0.0%
0 0.0%
0 0.0%
13 92.9%
0 0.0%
0 0.0%
1 7.1%
0 0.0%
0 0.0%
Male Female
290 51.2%
276 48.8%
13 92.9%
1 7.1%
Enrollment in Selected Programs
Program
Program % of Student Enrollment Population
Gifted (Grades K-12)
4
< 1%
Alternative Programs (Grades 6-12)
N/A
N/A
Students Eligible to Receive Free/Reduced Lunches
Number
Percent
School System
576 45,695
99.3% 75.5%
Dropout Rate *
Number
Rate
School System
N/A N/A
N/A N/A
* Dropout rates are not applicable for grades PK-5.
Enrollment in Compensatory Programs
Program
Program % of Student Enrollment Population
Special Education (Grades K-12)
75 13.3%
(PK)
14
N/A
English to Speakers of Other Languages (ESOL) (Grades K-12)
0
0.0%
Remedial Education (Grades 2-5, 9-12)
71 19.8%
Special Instructional Assistance (SIA) (Grades K-3)
179 44.0%
Title I (Grades K-12)
This school has a schoolwide program.
Total 23
Retained Students, by Race/Ethnicity and Sex
Black
White Hispanic
American MultiAsian Indian racial
23 100.0%
0 0.0%
0 0.0%
0 0.0%
0 0.0%
0 0.0%
Male Female
13
10
56.5% 43.5%
Prepared by Georgia Department of Education
Page 1
STATE-REQUIRED TEST DATA
NORM-REFERENCED TESTS Grade 3
Iowa Tests of Basic Skills (ITBS) Each chart reflects data for three years of testing.
Reading Comprehension 50
31 50 54 0
98-99
31 55 53 97-98
26 48 52 96-97
Mathematics
School 50
System
State
0
33 53 61 98-99
35 58 61 97-98
35 51 59 96-97
School System State
Reading Vocabulary 50
29 50 50 0
98-99
30 51 50 97-98
26 44 49 96-97
Language Arts
School 50
System
State
0
45 61 64 98-99
39 63 62 97-98
43 54 59 96-97
School System State
Social Studies 50
32 50 56 0
98-99
35 52 55 97-98
35 50 55 96-97
Science
School 50
System
State
0
32 49 59 98-99
33 52 59 97-98
26 48 58 96-97
School System State
Sources of Information
Composite Score
50
38 48 57 0
98-99
School 50
System
34 51 56 97-98
34 47 55 96-97
State 0
33 51 58 98-99
33 55 57 97-98
1998-99 GEORGIA PUBLIC EDUCATION REPORT CARD C W Hill Elementary School - 7615561
Prepared by Georgia Department of Education
31 48 56 96-97
Scores Reported in Percentiles
School System State
Page 2
STATE-REQUIRED TEST DATA
NORM-REFERENCED TESTS Grade 5
Iowa Tests of Basic Skills (ITBS) Each chart reflects data for three years of testing.
Reading Comprehension
Mathematics
50
42 47 53 0
98-99
56 52 53 97-98
42 49 52 96-97
School 50
System
State
0
56 48 59 98-99
60 53 58 97-98
26 50 57 96-97
School System State
Reading Vocabulary 50
48 48 48 0
98-99
40 52 48 97-98
30 44 46 96-97
Language Arts
School 50
System
State
0
47 56 63 98-99
41 60 61 97-98
34 51 58 96-97
School System State
Social Studies 50
49 54 57 0
98-99
46 54 56 97-98
32 52 55 96-97
Science
School 50
System
State
0
49 48 60 98-99
34 50 59 97-98
33 48 59 96-97
School System State
Sources of Information
Composite Score
50
39 47 58 0
98-99
School 50
System
36 51 58 97-98
36 49 57 96-97
State 0
45 49 57 98-99
42 52 56 97-98
31 48 55 96-97
1998-99 GEORGIA PUBLIC EDUCATION REPORT CARD C W Hill Elementary School - 7615561
Prepared by Georgia Department of Education
Scores Reported in Percentiles
School System State
Page 3
STATE-REQUIRED TEST DATA
PERFORMANCE ASSESSMENTS
Grade 5 Writing Assessment
Percent at Developmental Stages:
1998-99 School System State
1997-98 School System State
1996-97 School System State
Stage Stage Stage Stage Stage Stage
1:The Emerging Writer 2:The Developing Writer 3:The Focusing Writer 4:The Experimenting 5:The Engaging Writer 6:The Extending Writer
0% 4% 29% 40% 23% 4%
1% 2% 22% 47% 22% 6%
0% 1% 16% 41% 29% 12%
0% 13% 29% 47% 10%
1%
1% 4% 24% 47% 19% 5%
0% 3% 19% 41% 27% 10%
0% 4% 40% 47% 9% 0%
1% 6% 32% 39% 17% 5%
0% 3% 21% 37% 26% 12%
AWARDS / RECOGNITION DATA
Schools in Georgia may receive recognition in the following programs: Charter School Pay for Performance Program Georgia School of Excellence National Blue Ribbon School C W Hill Elementary School did not receive recognition in any of these programs during the 1998-99 school year.
1998-99 GEORGIA PUBLIC EDUCATION REPORT CARD C W Hill Elementary School - 7615561
Prepared by Georgia Department of Education
Page 4
CERTIFIED PERSONNEL DATA
Positions Number Average Contract Days
Personnel Sex
Certificate
Years Experience
Full-time Part-time
Male Female
4 Yr Bachelor's 5 Yr Master's 6 Yr Specialist's 7 Yr Doctoral Other*
<1 1-10 11-20 21-30 >30
Average
Administrators
3.00 220.67
3 0
0 3
0 1 2 0 0 0 0 1 2 0 22.67
Support Personnel
2.60 193.85
2 2
2 2
0 3 0 1 0 0 1 0 2 1 21.25
PK-12 Teachers
37.10 190.00
34 7
6 35
20 18
2 1 0 4 18 12 4 3 11.83
*Includes One- and Two-Year Vocational Certificates.
ACCREDITATION DATA
Accredited by Georgia Accrediting Commission (GAC).
1998-99 GEORGIA PUBLIC EDUCATION REPORT CARD C W Hill Elementary School - 7615561
Prepared by Georgia Department of Education
Page 5
1998-99 GEORGIA PUBLIC EDUCATION REPORT CARD
ATLANTA CITY SCHOOLS
Campbell Elementary School - 7613054
Grade Range PK-5
The Georgia Public Education Report Card is designed to assist systems and schools in educational improvement. This report card contains a variety of data elements. An explanation of the terms is provided as a companion to the report card data. Please refer to the definitions for the most effective use of the reported data.
STUDENT DATA
Total
K-5
357
PK
40
Enrollment, by Race/Ethnicity and Sex
Black
White Hispanic
American Asian Indian
Multiracial
357 100.0%
0 0.0%
0 0.0%
0 0.0%
0 0.0%
0 0.0%
39 97.5%
0 0.0%
1 2.5%
0 0.0%
0 0.0%
0 0.0%
Male Female
174 48.7%
183 51.3%
22 55.0%
18 45.0%
Enrollment in Selected Programs
Program
Program % of Student Enrollment Population
Gifted (Grades K-12)
0
0.0%
Alternative Programs (Grades 6-12)
N/A
N/A
Students Eligible to Receive Free/Reduced Lunches
Number
Percent
School System
392 45,695
98.7% 75.5%
Dropout Rate *
Number
Rate
School System
N/A N/A
N/A N/A
* Dropout rates are not applicable for grades PK-5.
Enrollment in Compensatory Programs
Program
Program % of Student Enrollment Population
Special Education (Grades K-12)
19
5.3%
(PK)
0
N/A
English to Speakers of Other Languages (ESOL) (Grades K-12)
0
0.0%
Remedial Education (Grades 2-5, 9-12)
46 20.8%
Special Instructional Assistance (SIA) (Grades K-3)
175 68.4%
Title I (Grades K-12)
This school has a schoolwide program.
Total 20
Retained Students, by Race/Ethnicity and Sex
Black
White Hispanic
American MultiAsian Indian racial
20 100.0%
0 0.0%
0 0.0%
0 0.0%
0 0.0%
0 0.0%
Male Female
16
4
80.0% 20.0%
Prepared by Georgia Department of Education
Page 1
STATE-REQUIRED TEST DATA
NORM-REFERENCED TESTS Grade 3
Iowa Tests of Basic Skills (ITBS) Each chart reflects data for three years of testing.
Reading Comprehension 50
53 50 54 0
98-99
51 55 53 97-98
31 48 52 96-97
Mathematics
School 50
System
State
0
45 53 61 98-99
54 58 61 97-98
44 51 59 96-97
School System State
Reading Vocabulary 50
32 50 50 0
98-99
36 51 50 97-98
52 44 49 96-97
Language Arts
School 50
System
State
0
43 61 64 98-99
42 63 62 97-98
41 54 59 96-97
School System State
Social Studies 50
39 50 56 0
98-99
46 52 55 97-98
44 50 55 96-97
Science
School 50
System
State
0
47 49 59 98-99
65 52 59 97-98
41 48 58 96-97
School System State
Sources of Information
Composite Score
50
38 48 57 0
98-99
School 50
System
32 51 56 97-98
46 47 55 96-97
State 0
40 51 58 98-99
46 55 57 97-98
1998-99 GEORGIA PUBLIC EDUCATION REPORT CARD Campbell Elementary School - 7613054
Prepared by Georgia Department of Education
41 48 56 96-97
Scores Reported in Percentiles
School System State
Page 2
STATE-REQUIRED TEST DATA
NORM-REFERENCED TESTS Grade 5
Iowa Tests of Basic Skills (ITBS) Each chart reflects data for three years of testing.
Reading Comprehension
Mathematics
50
40 47 53 0
98-99
49 52 53 97-98
34 49 52 96-97
School 50
System
State
0
42 48 59 98-99
51 53 58 97-98
44 50 57 96-97
School System State
Reading Vocabulary 50
26 48 48 0
98-99
19 52 48 97-98
14 44 46 96-97
Language Arts
School 50
System
State
0
42 56 63 98-99
39 60 61 97-98
24 51 58 96-97
School System State
Social Studies 50
47 54 57 0
98-99
22 54 56 97-98
23 52 55 96-97
Science
School 50
System
State
0
42 48 60 98-99
17 50 59 97-98
20 48 59 96-97
School System State
Sources of Information
Composite Score
50
35 47 58 0
98-99
School 50
System
27 51 58 97-98
26 49 57 96-97
State 0
38 49 57 98-99
28 52 56 97-98
25 48 55 96-97
1998-99 GEORGIA PUBLIC EDUCATION REPORT CARD Campbell Elementary School - 7613054
Prepared by Georgia Department of Education
Scores Reported in Percentiles
School System State
Page 3
STATE-REQUIRED TEST DATA
PERFORMANCE ASSESSMENTS
Grade 5 Writing Assessment
Percent at Developmental Stages:
1998-99 School System State
1997-98 School System State
1996-97 School System State
Stage Stage Stage Stage Stage Stage
1:The Emerging Writer 2:The Developing Writer 3:The Focusing Writer 4:The Experimenting 5:The Engaging Writer 6:The Extending Writer
0% 0% 22% 56% 22% 0%
1% 2% 22% 47% 22% 6%
0% 1% 16% 41% 29% 12%
0% 8% 23% 54% 13% 3%
1% 4% 24% 47% 19% 5%
0% 3% 19% 41% 27% 10%
3% 3% 42% 31% 19% 3%
1% 6% 32% 39% 17% 5%
0% 3% 21% 37% 26% 12%
AWARDS / RECOGNITION DATA
Schools in Georgia may receive recognition in the following programs: Charter School Pay for Performance Program Georgia School of Excellence National Blue Ribbon School Campbell Elementary School did not receive recognition in any of these programs during the 1998-99 school year.
1998-99 GEORGIA PUBLIC EDUCATION REPORT CARD Campbell Elementary School - 7613054
Prepared by Georgia Department of Education
Page 4
CERTIFIED PERSONNEL DATA
Positions Number Average Contract Days
Personnel Sex
Certificate
Years Experience
Full-time Part-time
Male Female
4 Yr Bachelor's 5 Yr Master's 6 Yr Specialist's 7 Yr Doctoral Other*
<1 1-10 11-20 21-30 >30
Average
Administrators
2.00 231.00
2 0
1 1
0 0 2 0 0 0 0 0 1 1 30.50
Support Personnel
1.40 192.14
1 3
1 3
0 2 1 1 0 0 3 0 1 0 12.75
PK-12 Teachers
26.30 190.00
24 6
3 27
17 9 3 1 0 1
13 5
10 1
15.47
*Includes One- and Two-Year Vocational Certificates.
ACCREDITATION DATA
Accredited by Georgia Accrediting Commission (GAC).
1998-99 GEORGIA PUBLIC EDUCATION REPORT CARD Campbell Elementary School - 7613054
Prepared by Georgia Department of Education
Page 5
1998-99 GEORGIA PUBLIC EDUCATION REPORT CARD
ATLANTA CITY SCHOOLS
Capitol View Elementary School - 7615054
Grade Range K-5
The Georgia Public Education Report Card is designed to assist systems and schools in educational improvement. This report card contains a variety of data elements. An explanation of the terms is provided as a companion to the report card data. Please refer to the definitions for the most effective use of the reported data.
STUDENT DATA
Total 432
K-5 Enrollment, by Race/Ethnicity and Sex
Black
White Hispanic
American Multi-
Asian Indian
racial
390 90.3%
4 0.9%
36 8.3%
0 0.0%
0 0.0%
2 0.5%
Male Female
241 55.8%
191 44.2%
Enrollment in Selected Programs
Program
Program % of Student Enrollment Population
Gifted (Grades K-12)
0
0.0%
Alternative Programs (Grades 6-12)
N/A
N/A
Students Eligible to Receive Free/Reduced Lunches
Number
Percent
School System
389 45,695
90.0% 75.5%
Dropout Rate *
Number
Rate
School System
N/A N/A
N/A N/A
* Dropout rates are not applicable for grades PK-5.
Enrollment in Compensatory Programs
Program
Program % of Student Enrollment Population
Special Education (Grades K-12)
22
5.1%
(PK)
0
N/A
English to Speakers of Other Languages (ESOL) (Grades K-12)
22
5.1%
Remedial Education (Grades 2-5, 9-12)
51 19.1%
Special Instructional Assistance (SIA) (Grades K-3)
198 66.2%
Title I (Grades K-12)
This school has a schoolwide program.
Total 34
Retained Students, by Race/Ethnicity and Sex
Black
White Hispanic
American Multi-
Asian Indian
racial
28 82.4%
0 0.0%
6 17.6%
0 0.0%
0 0.0%
0 0.0%
Male Female
20
14
58.8% 41.2%
Prepared by Georgia Department of Education
Page 1
STATE-REQUIRED TEST DATA
NORM-REFERENCED TESTS Grade 3
Iowa Tests of Basic Skills (ITBS) Each chart reflects data for three years of testing.
Reading Comprehension 50
45 50 54 0
98-99
60 55 53 97-98
51 48 52 96-97
Mathematics
School 50
System
State
0
57 53 61 98-99
72 58 61 97-98
67 51 59 96-97
School System State
Reading Vocabulary 50
37 50 50 0
98-99
66 51 50 97-98
41 44 49 96-97
Language Arts
School 50
System
State
0
67 61 64 98-99
74 63 62 97-98
58 54 59 96-97
School System State
Social Studies 50
54 50 56 0
98-99
59 52 55 97-98
54 50 55 96-97
Science
School 50
System
State
0
43 49 59 98-99
73 52 59 97-98
71 48 58 96-97
School System State
Sources of Information
Composite Score
50
51 48 57 0
98-99
School 50
System
59 51 56 97-98
53 47 55 96-97
State 0
51 51 58 98-99
67 55 57 97-98
1998-99 GEORGIA PUBLIC EDUCATION REPORT CARD Capitol View Elementary School - 7615054
Prepared by Georgia Department of Education
58 48 56 96-97
Scores Reported in Percentiles
School System State
Page 2
STATE-REQUIRED TEST DATA
NORM-REFERENCED TESTS Grade 5
Iowa Tests of Basic Skills (ITBS) Each chart reflects data for three years of testing.
Reading Comprehension
Mathematics
50
59 47 53 0
98-99
48 52 53 97-98
39 49 52 96-97
School 50
System
State
0
59 48 59 98-99
52 53 58 97-98
63 50 57 96-97
School System State
Reading Vocabulary 50
21 48 48 0
98-99
48 52 48 97-98
29 44 46 96-97
Language Arts
School 50
System
State
0
57 56 63 98-99
65 60 61 97-98
43 51 58 96-97
School System State
Social Studies 50
80 54 57 0
98-99
47 54 56 97-98
43 52 55 96-97
Science
School 50
System
State
0
81 48 60 98-99
42 50 59 97-98
31 48 59 96-97
School System State
Sources of Information
Composite Score
50
47 47 58 0
98-99
School 50
System
38 51 58 97-98
45 49 57 96-97
State 0
66 49 57 98-99
47 52 56 97-98
41 48 55 96-97
1998-99 GEORGIA PUBLIC EDUCATION REPORT CARD Capitol View Elementary School - 7615054
Prepared by Georgia Department of Education
Scores Reported in Percentiles
School System State
Page 3
STATE-REQUIRED TEST DATA
PERFORMANCE ASSESSMENTS
Grade 5 Writing Assessment
Percent at Developmental Stages:
1998-99 School System State
1997-98 School System State
1996-97 School System State
Stage Stage Stage Stage Stage Stage
1:The Emerging Writer 2:The Developing Writer 3:The Focusing Writer 4:The Experimenting 5:The Engaging Writer 6:The Extending Writer
0% 0% 16% 53% 25% 5%
1% 2% 22% 47% 22% 6%
0% 1% 16% 41% 29% 12%
0% 0% 17% 47% 24% 12%
1% 4% 24% 47% 19% 5%
0% 3% 19% 41% 27% 10%
0% 6% 31% 50% 13% 0%
1% 6% 32% 39% 17% 5%
0% 3% 21% 37% 26% 12%
AWARDS / RECOGNITION DATA
Schools in Georgia may receive recognition in the following programs: Charter School Pay for Performance Program Georgia School of Excellence National Blue Ribbon School Capitol View Elementary School did not receive recognition in any of these programs during the 1998-99 school year.
1998-99 GEORGIA PUBLIC EDUCATION REPORT CARD Capitol View Elementary School - 7615054
Prepared by Georgia Department of Education
Page 4
CERTIFIED PERSONNEL DATA
Positions Number Average Contract Days
Personnel Sex
Certificate
Years Experience
Full-time Part-time
Male Female
4 Yr Bachelor's 5 Yr Master's 6 Yr Specialist's 7 Yr Doctoral Other*
<1 1-10 11-20 21-30 >30
Average
Administrators
2.00 231.00
2 0
1 1
0 1 1 0 0 0 0 0 2 0 27.00
Support Personnel
2.10 193.81
1 3
1 3
1 1 2 0 0 0 2 1 1 0 14.75
PK-12 Teachers
22.90 190.00
21 5
8 18
12 12
1 1 0 1 12 6 5 2 12.65
*Includes One- and Two-Year Vocational Certificates.
ACCREDITATION DATA
Accredited by Georgia Accrediting Commission (GAC).
1998-99 GEORGIA PUBLIC EDUCATION REPORT CARD Capitol View Elementary School - 7615054
Prepared by Georgia Department of Education
Page 5
1998-99 GEORGIA PUBLIC EDUCATION REPORT CARD
ATLANTA CITY SCHOOLS
Carver High School - 7613055
Grade Range PK, 9-12
The Georgia Public Education Report Card is designed to assist systems and schools in educational improvement. This report card contains a variety of data elements. An explanation of the terms is provided as a companion to the report card data. Please refer to the definitions for the most effective use of the reported data.
STUDENT DATA
Total
9-12
586
PK
38
Enrollment, by Race/Ethnicity and Sex
Black
American Multi-
White Hispanic Asian Indian
racial
582 99.3%
1 0.2%
2 0.3%
1 0.2%
0 0.0%
0 0.0%
37 97.4%
1 2.6%
0 0.0%
0 0.0%
0 0.0%
0 0.0%
Male 305
52.0% 18
47.4%
Female 281
48.0% 20
52.6%
Enrollment in Selected Programs
Program
Gifted (Grades K-12)
Non-Vocational Labs (Grades 9-12)
Program % of Student Enrollment Population
19
3.2%
497
84.8%
Vocational Labs (Grades 9-12)
369
63.0%
Alternative Programs (Grades 6-12)
86
14.7%
Students Eligible to Receive Free/Reduced Lunches
Number
Percent
School System
333 45,695
53.4% 75.5%
Enrollment in Compensatory Programs
Program
Program % of Student Enrollment Population
Special Education (Grades K-12) PK
75 12.8%
0
N/A
English to Speakers of Other Languages (ESOL) (Grades K-12)
0
0.0%
Remedial Education (Grades 2-5, 9-12)
104 17.7%
Title I (Grades K-12)
This school has a schoolwide program.
Dropout Rate for Grades 9-12
Number
Rate
School System
112 1,248
9.9% 5.4%
Total 116
Retained Students, by Race/Ethnicity and Sex
Black
White Hispanic
American Multi-
Asian Indian
racial
116 100.0%
0 0.0%
0 0.0%
0 0.0%
0 0.0%
0 0.0%
Male Female
68
48
58.6% 41.4%
Prepared by Georgia Department of Education
Page 1
STATE-REQUIRED TEST DATA
GEORGIA HIGH SCHOOL GRADUATION TESTS (GHSGT)
Percent of Regular Program 11th Graders Passing the Georgia High School Graduation Tests on First Administration
English Language Arts Mathematics Social Studies Science
All Components listed above
Writing
1998-99
School System State
77% 62% 39% 26%
91% 79% 73% 61%
96% 88% 80% 72%
18% 55% 68%
66% 85% 93%
1997-98
School System State
69% 46% 21% 22%
89% 78% 68% 61%
94% 88% 78% 74%
14% 54% 68%
70% 83% 92%
1996-97
School System State
67% 58% 23% 27%
89% 72% 65% 52%
94% 87% 78% 74%
16% 46% 67%
68% 82% 93%
GRADUATE DATA
1999 Graduates by Credentials, Race/Ethnicity and Sex
Diplomas with Both College Prep. & Voc. Endorsements
Diplomas with College Prep. Endorsements Diplomas with Vocational Endorsements General High School Diplomas Special Education Diplomas
Total All Diplomas
Certificates of Performance
Total Graduates
Total 27 6 39 0
Black
27 100.0%
6 100.0%
39 100.0%
0
White
0 0.0%
0 0.0%
0 0.0%
0
Hispanic
0 0.0%
0 0.0%
0 0.0%
0
American MultiAsian Indian racial
0 0.0%
0 0.0%
0 0.0%
0 0.0%
0 0.0%
0 0.0%
0 0.0%
0 0.0%
0 0.0%
0
0
0
Male Female
12
15
44.4% 55.6%
6 100.0%
0 0.0%
17
22
43.6% 56.4%
0
0
4
4
100.0%
76
76
100.0%
0
0
0 0.0%
0 0.0%
0
0 0.0%
0 0.0%
0
0 0.0%
0 0.0%
0
0 0.0%
0 0.0%
0
0 0.0%
0 0.0%
0
2 50.0%
37 48.7%
0
2 50.0%
39 51.3%
0
76
76
100.0%
0 0.0%
0 0.0%
0 0.0%
0 0.0%
0 0.0%
37
39
48.7% 51.3%
HOPE Scholarships
School System
Number of 1999 Graduates 7 6
Number Eligible
22
Percent Eligible
28.9%
2,041 1,099 53.8%
State
65,548 40,292 61.5%
High School Completion Rate
Percent of 1995Grade 9 Enrollment in Graduating Class of1999 School System State
Completion Rate '95-'99 31.8% 57.1% 68.9%
1998-99 GEORGIA PUBLIC EDUCATION REPORT CARD
Carver High School - 7613055
Prepared by Georgia Department of Education
Page 2
COLLEGE ADMISSIONS / CREDIT TEST DATA
Scholastic Assessment Test (SAT)
Based on students' highest verbal and highest math scores
No. Taking
Average Score
Tests Verbal Math Total
Based on students' last test administration
Average Score Verbal Math Total
School
21
College Prep. Endorsement
Other Diplomas
System
1,265
College Prep. Endorsement
Other Diplomas
Georgia
41,958
381 373 N/A
445 441 N/A
492
397 381 N/A
436 430 N/A
488
778 754 N/A
881 871 N/A
980
378 N/A N/A
435 N/A N/A
483
390 N/A N/A
426 N/A N/A
479
768 N/A N/A
861 N/A N/A
962
Nation
952,913 N/A N/A N/A
502 508 1010
American College Testing (ACT)
Advanced Placement Exams (AP)
Number taking tests: English Mathematics Reading Science Reasoning CompositeScore
9 School System State
12.2 17.4 19.1
15.9 18.4 19.9
14.3 16.3
18.6 18.3
20.2 19.9
14.7 18.3 19.9
No. of Students Taking Tests
No. of Tests Taken No. of Test Scores
3 or Higher Percent of Test
Scores 3 or Higher
School 11 13 0
0.0%
System State 537 15,225 877 23,969 184 13,024
21.0% 54.3%
POST-SECONDARY DATA
Graduates Entering Georgia Public Colleges
Graduates Entering Georgia Public Colleges and Requiring Learning Support (LS)
1998 Graduates Entering in 1998-99
1997 Graduates Entering in 1997-98
Percent of Graduating Number Class
School
3
3.6%
System 452
21.7%
School
6
8.3%
System 437
21.1%
Number Requiring
LS 1 200
5 202
Percent of those attending Georgia
Public Colleges
33.3%
44.2%
83.3%
46.2%
In previous years, the Report Card presented College Prep Curriculum information provided by the Board of Regents on students requiring Learning Support. Due to inconsistencies in the data provided by the Board of Regents in defining College Prep Completers versus Local Board of Education data defining College Prep Endorsements, the Department of Education Report Card will not provide this information until discrepancies can be reconciled.
Graduates Entering Georgia Public Technical and Adult Schools
1998 Graduates School System
Entering Number 2 53
1998-99 Percent
2.4% 2.5%
Entering Number N/A N/A
1997-98 Percent
N/A N/A
1997 Graduates School
0
0.0%
System
3
0.1%
6
8.3%
109
5.3%
1998-99 GEORGIA PUBLIC EDUCATION REPORT CARD Carver High School - 7613055
Prepared by Georgia Department of Education
Page 3
CERTIFIED PERSONNEL DATA
Positions Number Average Contract Days
Administrators
5.00 216.40
Support Personnel
4.10 195.85
PK-12 Teachers
34.70 190.86
Personnel Sex
Certificate
Years Experience
Full-time Part-time
Male Female
4 Yr Bachelor's 5 Yr Master's 6 Yr Specialist's 7 Yr Doctoral Other*
<1 1-10 11-20 21-30 >30
Average
5 0
3 2
0 1 4 0 0
0 1 0 4 0
24.40
3 2
2 3
0 2 3 0 0
0 1 0 1 3
28.60
34 2
9 27
14 18
2 0 2
1 7 7 15 6
20.19
*Includes One- and Two-Year Vocational Certificates.
ACCREDITATION DATA
Accredited by Southern Association of Colleges and Schools (SACS): Secondary/Middle Commission.
AWARDS / RECOGNITION DATA
Schools in Georgia may receive recognition in the following programs: Charter School Pay for Performance Program Georgia School of Excellence National Blue Ribbon School Carver High School did not receive recognition in any of these programs during the 1998-99 school year.
1998-99 GEORGIA PUBLIC EDUCATION REPORT CARD Carver High School - 7613055
Prepared by Georgia Department of Education
Page 4
1998-99 GEORGIA PUBLIC EDUCATION REPORT CARD
ATLANTA CITY SCHOOLS
Cascade Elementary School - 7610196
Grade Range K-5
The Georgia Public Education Report Card is designed to assist systems and schools in educational improvement. This report card contains a variety of data elements. An explanation of the terms is provided as a companion to the report card data. Please refer to the definitions for the most effective use of the reported data.
STUDENT DATA
Total 497
K-5 Enrollment, by Race/Ethnicity and Sex
Black
White Hispanic
American Multi-
Asian Indian
racial
496 99.8%
1 0.2%
0 0.0%
0 0.0%
0 0.0%
0 0.0%
Male Female
254 51.1%
243 48.9%
Enrollment in Selected Programs
Program
Program % of Student Enrollment Population
Gifted (Grades K-12)
0
0.0%
Alternative Programs (Grades 6-12)
N/A
N/A
Students Eligible to Receive Free/Reduced Lunches
Number
Percent
School System
453 45,695
91.1% 75.5%
Dropout Rate *
Number
Rate
School System
N/A N/A
N/A N/A
* Dropout rates are not applicable for grades PK-5.
Enrollment in Compensatory Programs
Program
Program % of Student Enrollment Population
Special Education (Grades K-12)
23
4.6%
(PK)
0
N/A
English to Speakers of Other Languages (ESOL) (Grades K-12)
0
0.0%
Remedial Education (Grades 2-5, 9-12)
67 21.5%
Special Instructional Assistance (SIA) (Grades K-3)
168 47.2%
Title I (Grades K-12)
This school has a schoolwide program.
Total 9
Retained Students, by Race/Ethnicity and Sex
Black
White Hispanic
American Multi-
Asian Indian
racial
9 100.0%
0 0.0%
0 0.0%
0 0.0%
0 0.0%
0 0.0%
Male Female
6
3
66.7% 33.3%
Prepared by Georgia Department of Education
Page 1
STATE-REQUIRED TEST DATA
NORM-REFERENCED TESTS Grade 3
Iowa Tests of Basic Skills (ITBS) Each chart reflects data for three years of testing.
Reading Comprehension 50
57 50 54 0
98-99
90 55 53 97-98
80 48 52 96-97
Mathematics
School 50
System
State
0
62 53 61 98-99
91 58 61 97-98
76 51 59 96-97
School System State
Reading Vocabulary 50
52 50 50 0
98-99
83 51 50 97-98
70 44 49 96-97
Language Arts
School 50
System
State
0
66 61 64 98-99
94 63 62 97-98
76 54 59 96-97
School System State
Social Studies 50
51 50 56 0
98-99
83 52 55 97-98
75 50 55 96-97
Science
School 50
System
State
0
45 49 59 98-99
85 52 59 97-98
79 48 58 96-97
School System State
Sources of Information
Composite Score
50
52 48 57 0
98-99
School 50
System
78 51 56 97-98
77 47 55 96-97
State 0
54 51 58 98-99
90 55 57 97-98
1998-99 GEORGIA PUBLIC EDUCATION REPORT CARD Cascade Elementary School - 7610196
Prepared by Georgia Department of Education
79 48 56 96-97
Scores Reported in Percentiles
School System State
Page 2
STATE-REQUIRED TEST DATA
NORM-REFERENCED TESTS Grade 5
Iowa Tests of Basic Skills (ITBS) Each chart reflects data for three years of testing.
Reading Comprehension
Mathematics
50
66 47 53 0
98-99
75 52 53 97-98
54 49 52 96-97
School 50
System
State
0
67 48 59 98-99
79 53 58 97-98
62 50 57 96-97
School System State
Reading Vocabulary 50
73 48 48 0
98-99
66 52 48 97-98
46 44 46 96-97
Language Arts
School 50
System
State
0
74 56 63 98-99
76 60 61 97-98
62 51 58 96-97
School System State
Social Studies 50
66 54 57 0
98-99
73 54 56 97-98
71 52 55 96-97
Science
School 50
System
State
0
68 48 60 98-99
68 50 59 97-98
58 48 59 96-97
School System State
Sources of Information
Composite Score
50
63 47 58 0
98-99
School 50
System
70 51 58 97-98
48 49 57 96-97
State 0
68 49 57 98-99
75 52 56 97-98
59 48 55 96-97
1998-99 GEORGIA PUBLIC EDUCATION REPORT CARD Cascade Elementary School - 7610196
Prepared by Georgia Department of Education
Scores Reported in Percentiles
School System State
Page 3
STATE-REQUIRED TEST DATA
PERFORMANCE ASSESSMENTS
Grade 5 Writing Assessment
Percent at Developmental Stages:
1998-99 School System State
1997-98 School System State
1996-97 School System State
Stage Stage Stage Stage Stage Stage
1:The Emerging Writer 2:The Developing Writer 3:The Focusing Writer 4:The Experimenting 5:The Engaging Writer 6:The Extending Writer
0% 0% 5% 39% 44% 7%
1% 2% 22% 47% 22% 6%
0% 1% 16% 41% 29% 12%
0% 2% 6% 68% 24% 0%
1% 4% 24% 47% 19% 5%
0% 3% 19% 41% 27% 10%
0% 7% 24% 53% 15% 2%
1% 6% 32% 39% 17% 5%
0% 3% 21% 37% 26% 12%
AWARDS / RECOGNITION DATA
Schools in Georgia may receive recognition in the following programs: Charter School Pay for Performance Program Georgia School of Excellence National Blue Ribbon School Cascade Elementary School did not receive recognition in any of these programs during the 1998-99 school year.
1998-99 GEORGIA PUBLIC EDUCATION REPORT CARD Cascade Elementary School - 7610196
Prepared by Georgia Department of Education
Page 4
CERTIFIED PERSONNEL DATA
Positions Number Average Contract Days
Personnel Sex
Certificate
Years Experience
Full-time Part-time
Male Female
4 Yr Bachelor's 5 Yr Master's 6 Yr Specialist's 7 Yr Doctoral Other*
<1 1-10 11-20 21-30 >30
Average
Administrators
3.00 227.33
3 0
1 2
0 1 1 1 0 0 0 0 3 0 28.00
Support Personnel
2.50 197.20
1 3
1 3
0 3 1 0 0 0 0 2 2 0 20.50
PK-12 Teachers
28.80 190.00
27 4
5 26
15 14
2 0 0 1 11 8 7 4 14.77
*Includes One- and Two-Year Vocational Certificates.
ACCREDITATION DATA
Accredited by Georgia Accrediting Commission (GAC).
1998-99 GEORGIA PUBLIC EDUCATION REPORT CARD Cascade Elementary School - 7610196
Prepared by Georgia Department of Education
Page 5
1998-99 GEORGIA PUBLIC EDUCATION REPORT CARD
ATLANTA CITY SCHOOLS
Centennial Place Elementary School - 7610199
Grade Range PK-5
The Georgia Public Education Report Card is designed to assist systems and schools in educational improvement. This report card contains a variety of data elements. An explanation of the terms is provided as a companion to the report card data. Please refer to the definitions for the most effective use of the reported data.
STUDENT DATA
Total
K-5
492
PK
4
Enrollment, by Race/Ethnicity and Sex
Black
White Hispanic
American Asian Indian
Multiracial
476 96.7%
10 2.0%
3 0.6%
3 0.6%
0 0.0%
0 0.0%
4 100.0%
0 0.0%
0 0.0%
0 0.0%
0 0.0%
0 0.0%
Male Female
257 52.2%
235 47.8%
3 75.0%
1 25.0%
Enrollment in Selected Programs
Program
Program % of Student Enrollment Population
Gifted (Grades K-12)
11
2.2%
Alternative Programs (Grades 6-12)
N/A
N/A
Students Eligible to Receive Free/Reduced Lunches
Number
Percent
School System
319 45,695
64.3% 75.5%
Dropout Rate *
Number
Rate
School System
N/A N/A
N/A N/A
* Dropout rates are not applicable for grades PK-5.
Enrollment in Compensatory Programs
Program
Program % of Student Enrollment Population
Special Education (Grades K-12)
37
7.5%
(PK)
11
N/A
English to Speakers of Other Languages (ESOL) (Grades K-12)
0
0.0%
Remedial Education (Grades 2-5, 9-12)
61 20.5%
Special Instructional Assistance (SIA) (Grades K-3)
116 32.0%
Title I (Grades K-12)
This school has a schoolwide program.
Total 13
Retained Students, by Race/Ethnicity and Sex
Black
White Hispanic
American MultiAsian Indian racial
13 100.0%
0 0.0%
0 0.0%
0 0.0%
0 0.0%
0 0.0%
Male Female
7
6
53.8% 46.2%
Prepared by Georgia Department of Education
Page 1
STATE-REQUIRED TEST DATA
NORM-REFERENCED TESTS Grade 3
Iowa Tests of Basic Skills (ITBS) Each chart reflects data for three years of testing.
Reading Comprehension 50
51 50 54 0
98-99
46 55 53 97-98
39 48 52 96-97
Mathematics
School 50
System
State
0
57 53 61 98-99
34 58 61 97-98
44 51 59 96-97
School System State
Reading Vocabulary 50
50 50 50 0
98-99
47 51 50 97-98
54 44 49 96-97
Language Arts
School 50
System
State
0
74 61 64 98-99
42 63 62 97-98
45 54 59 96-97
School System State
Social Studies 50
64 50 56 0
98-99
45 52 55 97-98
48 50 55 96-97
Science
School 50
System
State
0
61 49 59 98-99
72 52 59 97-98
59 48 58 96-97
School System State
Sources of Information
Composite Score
50
63 48 57 0
98-99
School 50
System
63 51 56 97-98
39 47 55 96-97
State 0
61 51 58 98-99
50 55 57 97-98
1998-99 GEORGIA PUBLIC EDUCATION REPORT CARD Centennial Place Elementary School - 7610199
Prepared by Georgia Department of Education
48 48 56 96-97
Scores Reported in Percentiles
School System State
Page 2
STATE-REQUIRED TEST DATA
NORM-REFERENCED TESTS Grade 5
Iowa Tests of Basic Skills (ITBS) Each chart reflects data for three years of testing.
Reading Comprehension
Mathematics
50
40 47 53 0
98-99
39 52 53 97-98
68 49 52 96-97
School 50
System
State
0
31 48 59 98-99
32 53 58 97-98
61 50 57 96-97
School System State
Reading Vocabulary 50
33 48 48 0
98-99
19 52 48 97-98
85 44 46 96-97
Language Arts
School 50
System
State
0
56 56 63 98-99
45 60 61 97-98
67 51 58 96-97
School System State
Social Studies 50
35 54 57 0
98-99
43 54 56 97-98
81 52 55 96-97
Science
School 50
System
State
0
35 48 60 98-99
23 50 59 97-98
71 48 59 96-97
School System State
Sources of Information
Composite Score
50
44 47 58 0
98-99
School 50
System
42 51 58 97-98
59 49 57 96-97
State 0
38 49 57 98-99
32 52 56 97-98
70 48 55 96-97
1998-99 GEORGIA PUBLIC EDUCATION REPORT CARD Centennial Place Elementary School - 7610199
Prepared by Georgia Department of Education
Scores Reported in Percentiles
School System State
Page 3
STATE-REQUIRED TEST DATA
PERFORMANCE ASSESSMENTS
Grade 5 Writing Assessment
Percent at Developmental Stages:
1998-99 School System State
1997-98 School System State
1996-97 School System State
Stage Stage Stage Stage Stage Stage
1:The Emerging Writer 2:The Developing Writer 3:The Focusing Writer 4:The Experimenting 5:The Engaging Writer 6:The Extending Writer
0% 2% 27% 48% 17% 4%
1% 2% 22% 47% 22% 6%
0% 1% 16% 41% 29% 12%
0% 11% 61% 21%
7% 0%
1% 4% 24% 47% 19% 5%
0% 3% 19% 41% 27% 10%
0% 16% 40% 44%
0% 0%
1% 6% 32% 39% 17% 5%
0% 3% 21% 37% 26% 12%
AWARDS / RECOGNITION DATA
Schools in Georgia may receive recognition in the following programs: Charter School Pay for Performance Program Georgia School of Excellence National Blue Ribbon School Centennial Place Elementary School did not receive recognition in any of these programs during the 1998-99 school year.
1998-99 GEORGIA PUBLIC EDUCATION REPORT CARD Centennial Place Elementary School - 7610199
Prepared by Georgia Department of Education
Page 4
CERTIFIED PERSONNEL DATA
Positions Number Average Contract Days
Personnel Sex
Certificate
Years Experience
Full-time Part-time
Male Female
4 Yr Bachelor's 5 Yr Master's 6 Yr Specialist's 7 Yr Doctoral Other*
<1 1-10 11-20 21-30 >30
Average
Administrators
0.00 0.00
0 0
0 0
0 0 0 0 0 0 0 0 0 0 0.00
Support Personnel
0.00 0.00
0 0
0 0
0 0 0 0 0 0 0 0 0 0 0.00
PK-12 Teachers
29.10 190.34
28 2
4 26
13 15
1 1 0 7 17 4 2 0 7.03
*Includes One- and Two-Year Vocational Certificates.
ACCREDITATION DATA
Not accredited by Southern Association of Colleges and Schools (SACS) or Georgia Accrediting Commission (GAC).
1998-99 GEORGIA PUBLIC EDUCATION REPORT CARD Centennial Place Elementary School - 7610199
Prepared by Georgia Department of Education
Page 5
1998-99 GEORGIA PUBLIC EDUCATION REPORT CARD
ATLANTA CITY SCHOOLS
Cleveland Elementary School - 7614056
Grade Range K-5
The Georgia Public Education Report Card is designed to assist systems and schools in educational improvement. This report card contains a variety of data elements. An explanation of the terms is provided as a companion to the report card data. Please refer to the definitions for the most effective use of the reported data.
STUDENT DATA
Total 761
K-5 Enrollment, by Race/Ethnicity and Sex
Black
White Hispanic
American Multi-
Asian Indian
racial
729 95.8%
0 0.0%
26 3.4%
6 0.8%
0 0.0%
0 0.0%
Male Female
383 50.3%
378 49.7%
Enrollment in Selected Programs
Program
Program % of Student Enrollment Population
Gifted (Grades K-12)
29
3.8%
Alternative Programs (Grades 6-12)
N/A
N/A
Students Eligible to Receive Free/Reduced Lunches
Number
Percent
School System
703 45,695
92.4% 75.5%
Dropout Rate *
Number
Rate
School System
N/A N/A
N/A N/A
* Dropout rates are not applicable for grades PK-5.
Enrollment in Compensatory Programs
Program
Program % of Student Enrollment Population
Special Education (Grades K-12)
53
7.0%
(PK)
0
N/A
English to Speakers of Other Languages (ESOL) (Grades K-12)
19
2.5%
Remedial Education (Grades 2-5, 9-12)
125 25.3%
Special Instructional Assistance (SIA) (Grades K-3)
166 31.9%
Title I (Grades K-12)
This school has a schoolwide program.
Total 37
Retained Students, by Race/Ethnicity and Sex
Black
White Hispanic
American Multi-
Asian Indian
racial
37 100.0%
0 0.0%
0 0.0%
0 0.0%
0 0.0%
0 0.0%
Male Female
29
8
78.4% 21.6%
Prepared by Georgia Department of Education
Page 1
STATE-REQUIRED TEST DATA
NORM-REFERENCED TESTS Grade 3
Iowa Tests of Basic Skills (ITBS) Each chart reflects data for three years of testing.
Reading Comprehension 50
38 50 54 0
98-99
39 55 53 97-98
32 48 52 96-97
Mathematics
School 50
System
State
0
60 53 61 98-99
63 58 61 97-98
49 51 59 96-97
School System State
Reading Vocabulary 50
81 50 50 0
98-99
29 51 50 97-98
28 44 49 96-97
Language Arts
School 50
System
State
0
75 61 64 98-99
70 63 62 97-98
61 54 59 96-97
School System State
Social Studies 50
52 50 56 0
98-99
46 52 55 97-98
40 50 55 96-97
Science
School 50
System
State
0
51 49 59 98-99
39 52 59 97-98
32 48 58 96-97
School System State
Sources of Information
Composite Score
50
52 48 57 0
98-99
School 50
System
50 51 56 97-98
37 47 55 96-97
State 0
59 51 58 98-99
50 55 57 97-98
1998-99 GEORGIA PUBLIC EDUCATION REPORT CARD Cleveland Elementary School - 7614056
Prepared by Georgia Department of Education
39 48 56 96-97
Scores Reported in Percentiles
School System State
Page 2
STATE-REQUIRED TEST DATA
NORM-REFERENCED TESTS Grade 5
Iowa Tests of Basic Skills (ITBS) Each chart reflects data for three years of testing.
Reading Comprehension
Mathematics
50
57 47 53 0
98-99
80 52 53 97-98
69 49 52 96-97
School 50
System
State
0
55 48 59 98-99
67 53 58 97-98
55 50 57 96-97
School System State
Reading Vocabulary 50
40 48 48 0
98-99
92 52 48 97-98
55 44 46 96-97
Language Arts
School 50
System
State
0
60 56 63 98-99
74 60 61 97-98
53 51 58 96-97
School System State
Social Studies 50
58 54 57 0
98-99
58 54 56 97-98
68 52 55 96-97
Science
School 50
System
State
0
68 48 60 98-99
82 50 59 97-98
74 48 59 96-97
School System State
Sources of Information
Composite Score
50
46 47 58 0
98-99
School 50
System
66 51 58 97-98
55 49 57 96-97
State 0
56 49 57 98-99
74 52 56 97-98
62 48 55 96-97
1998-99 GEORGIA PUBLIC EDUCATION REPORT CARD Cleveland Elementary School - 7614056
Prepared by Georgia Department of Education
Scores Reported in Percentiles
School System State
Page 3
STATE-REQUIRED TEST DATA
PERFORMANCE ASSESSMENTS
Grade 5 Writing Assessment
Percent at Developmental Stages:
1998-99 School System State
1997-98 School System State
1996-97 School System State
Stage Stage Stage Stage Stage Stage
1:The Emerging Writer 2:The Developing Writer 3:The Focusing Writer 4:The Experimenting 5:The Engaging Writer 6:The Extending Writer
0% 0% 26% 44% 19% 11%
1% 2% 22% 47% 22% 6%
0% 1% 16% 41% 29% 12%
0% 0% 31% 42% 18% 8%
1% 4% 24% 47% 19% 5%
0% 3% 19% 41% 27% 10%
1% 3% 22% 47% 22% 5%
1% 6% 32% 39% 17% 5%
0% 3% 21% 37% 26% 12%
AWARDS / RECOGNITION DATA
Schools in Georgia may receive recognition in the following programs: Charter School Pay for Performance Program Georgia School of Excellence National Blue Ribbon School Cleveland Elementary School did not receive recognition in any of these programs during the 1998-99 school year.
1998-99 GEORGIA PUBLIC EDUCATION REPORT CARD Cleveland Elementary School - 7614056
Prepared by Georgia Department of Education
Page 4
CERTIFIED PERSONNEL DATA
Positions Number Average Contract Days
Personnel Sex
Certificate
Years Experience
Full-time Part-time
Male Female
4 Yr Bachelor's 5 Yr Master's 6 Yr Specialist's 7 Yr Doctoral Other*
<1 1-10 11-20 21-30 >30
Average
Administrators
2.00 231.00
2 0
0 2
0 1 1 0 0 0 0 1 1 0 19.00
Support Personnel
2.00 197.00
1 2
0 3
0 0 3 0 0 0 0 1 2 0 23.67
PK-12 Teachers
44.10 190.00
42 5
8 39
27 19
1 0 0 2 15 10 18 2 16.45
*Includes One- and Two-Year Vocational Certificates.
ACCREDITATION DATA
Accredited by Georgia Accrediting Commission (GAC).
1998-99 GEORGIA PUBLIC EDUCATION REPORT CARD Cleveland Elementary School - 7614056
Prepared by Georgia Department of Education
Page 5
1998-99 GEORGIA PUBLIC EDUCATION REPORT CARD
ATLANTA CITY SCHOOLS
Coan Middle School - 7615056
Grade Range 6-8
The Georgia Public Education Report Card is designed to assist systems and schools in educational improvement. This report card contains a variety of data elements. An explanation of the terms is provided as a companion to the report card data. Please refer to the definitions for the most effective use of the reported data.
STUDENT DATA
Total 656
6-8 Enrollment, by Race/Ethnicity and Sex
Black
White Hispanic
American Multi-
Asian Indian
racial
642 97.9%
6 0.9%
7 1.1%
1 0.2%
0 0.0%
0 0.0%
Male 349
53.2%
Female 307
46.8%
Enrollment in Selected Programs
Program
Gifted (Grades K-12)
Program % of Student Enrollment Population
9
1.4%
Alternative Programs (Grades 6-12)
0
0.0%
Students Eligible to Receive Free/Reduced Lunches
Number
Percent
School System
616 45,695
93.9% 75.5%
Enrollment in Compensatory Programs
Program
Program % of Student Enrollment Population
Special Education (Grades K-12) (PK)
89 13.6%
0
N/A
English to Speakers of Other Languages (ESOL) (Grades K-12)
0
0.0%
Title I (Grades K-12)
This school has a schoolwide program.
Dropout Rate for Grades 6-8
Number
Rate
School System
36
3.7%
705
3.8%
Total 14
Retained Students, by Race/Ethnicity and Sex
Black
White Hispanic
American MultiAsian Indian racial
14 100.0%
0 0.0%
0 0.0%
0 0.0%
0 0.0%
0 0.0%
Male Female
8
6
57.1% 42.9%
Prepared by Georgia Department of Education
Page 1
STATE-REQUIRED TEST DATA
NORM-REFERENCED TESTS Grade 8
Iowa Tests of Basic Skills (ITBS) Each chart reflects data for three years of testing.
Reading Comprehension 50
22 36 49 0
98-99
26 35 48 97-98
22 34 48 96-97
Mathematics
School 50
System
State
0
31 45 56 98-99
43 43 55 97-98
29 43 54 96-97
School System State
Reading Vocabulary 50
14 32 46 0
98-99
19 36 45 97-98
13 27 44 96-97
Language Arts
School 50
System
State
0
29 42 60 98-99
33 43 58 97-98
25 40 56 96-97
School System State
Social Studies 50
31 42 54 0
98-99
34 45 53 97-98
27 41 53 96-97
Science
School 50
System
State
0
22 36 56 98-99
30 39 55 97-98
25 35 53 96-97
School System State
Sources of Information
Composite Score
50
30 42 57 0
98-99
School 50
System
38 42 56 97-98
30 42 55 96-97
State 0
25 39 56 98-99
32 40 54 97-98
1998-99 GEORGIA PUBLIC EDUCATION REPORT CARD Coan Middle School - 7615056
Prepared by Georgia Department of Education
23 37 54 96-97
Scores Reported in Percentiles
School System State
Page 2
STATE-REQUIRED TEST DATA
Categories of Scaled Scores
Inadequate (less than 162)
Minimal (162-209)
Good
(210-247)
Very Good (greater than 247)
Average Scaled Score: (Range 100-300)
PERFORMANCE ASSESSMENTS
Grade 8 Writing Assessment
1998-99 Percent Scoring
1997-98 Percent Scoring
1996-97 Percent Scoring
School System State School System State School System State
19% 49% 30%
3%
16% 51% 28%
5%
8% 40% 41% 11%
33% 49% 17%
1%
25% 53% 19%
3%
11% 46% 34%
8%
58% 34%
8% 0%
34% 48% 15%
3%
15% 46% 30%
8%
191
193
208 177
184 202 156
177 198
AWARDS / RECOGNITION DATA
Schools in Georgia may receive recognition in the following programs: Charter School Pay for Performance Program Georgia School of Excellence National Blue Ribbon School Coan Middle School did not receive recognition in any of these programs during the 1998-99 school year.
1998-99 GEORGIA PUBLIC EDUCATION REPORT CARD Coan Middle School - 7615056
Prepared by Georgia Department of Education
Page 3
CERTIFIED PERSONNEL DATA
Positions Number Average Contract Days
Personnel Sex
Certificate
Years Experience
Full-time Part-time
Male Female
4 Yr Bachelor's 5 Yr Master's 6 Yr Specialist's 7 Yr Doctoral Other*
<1 1-10 11-20 21-30 >30
Average
Administrators
3.00 227.33
3 0
1 2
0 1 2 0 0 0 0 0 3 0 28.00
Support Personnel
4.10 198.54
3 2
1 4
0 5 0 0 0 0 1 2 2 0 14.80
PK-12 Teachers
39.90 190.25
39 3
13 29
22 14
6 0 0 5 12 11 10 4 15.05
*Includes One- and Two-Year Vocational Certificates.
ACCREDITATION DATA
Accredited with Quality by Georgia Accrediting Commission (GAC).
1998-99 GEORGIA PUBLIC EDUCATION REPORT CARD Coan Middle School - 7615056
Prepared by Georgia Department of Education
Page 4
1998-99 GEORGIA PUBLIC EDUCATION REPORT CARD
ATLANTA CITY SCHOOLS
Collier Heights Elementary School - 7611057
Grade Range K-5
The Georgia Public Education Report Card is designed to assist systems and schools in educational improvement. This report card contains a variety of data elements. An explanation of the terms is provided as a companion to the report card data. Please refer to the definitions for the most effective use of the reported data.
STUDENT DATA
Total 583
K-5 Enrollment, by Race/Ethnicity and Sex
Black
White Hispanic
American Multi-
Asian Indian
racial
581 99.7%
1 0.2%
0 0.0%
0 0.0%
1 0.2%
0 0.0%
Male Female
288 49.4%
295 50.6%
Enrollment in Selected Programs
Program
Program % of Student Enrollment Population
Gifted (Grades K-12)
18
3.1%
Alternative Programs (Grades 6-12)
N/A
N/A
Students Eligible to Receive Free/Reduced Lunches
Number
Percent
School System
488 45,695
83.7% 75.5%
Dropout Rate *
Number
Rate
School System
N/A N/A
N/A N/A
* Dropout rates are not applicable for grades PK-5.
Enrollment in Compensatory Programs
Program
Program % of Student Enrollment Population
Special Education (Grades K-12)
18
3.1%
(PK)
0
N/A
English to Speakers of Other Languages (ESOL) (Grades K-12)
0
0.0%
Remedial Education (Grades 2-5, 9-12)
140 35.0%
Special Instructional Assistance (SIA) (Grades K-3)
166 44.9%
Title I (Grades K-12)
This school has a schoolwide program.
Total 12
Retained Students, by Race/Ethnicity and Sex
Black
White Hispanic
American Multi-
Asian Indian
racial
12 100.0%
0 0.0%
0 0.0%
0 0.0%
0 0.0%
0 0.0%
Male Female
4
8
33.3% 66.7%
Prepared by Georgia Department of Education
Page 1
STATE-REQUIRED TEST DATA
NORM-REFERENCED TESTS Grade 3
Iowa Tests of Basic Skills (ITBS) Each chart reflects data for three years of testing.
Reading Comprehension 50
35 50 54 0
98-99
47 55 53 97-98
48 48 52 96-97
Mathematics
School 50
System
State
0
40 53 61 98-99
51 58 61 97-98
52 51 59 96-97
School System State
Reading Vocabulary 50
32 50 50 0
98-99
39 51 50 97-98
33 44 49 96-97
Language Arts
School 50
System
State
0
49 61 64 98-99
58 63 62 97-98
54 54 59 96-97
School System State
Social Studies 50
36 50 56 0
98-99
50 52 55 97-98
49 50 55 96-97
Science
School 50
System
State
0
34 49 59 98-99
43 52 59 97-98
51 48 58 96-97
School System State
Sources of Information
Composite Score
50
37 48 57 0
98-99
School 50
System
48 51 56 97-98
48 47 55 96-97
State 0
36 51 58 98-99
48 55 57 97-98
1998-99 GEORGIA PUBLIC EDUCATION REPORT CARD Collier Heights Elementary School - 7611057
Prepared by Georgia Department of Education
48 48 56 96-97
Scores Reported in Percentiles
School System State
Page 2
STATE-REQUIRED TEST DATA
NORM-REFERENCED TESTS Grade 5
Iowa Tests of Basic Skills (ITBS) Each chart reflects data for three years of testing.
Reading Comprehension
Mathematics
50
44 47 53 0
98-99
40 52 53 97-98
39 49 52 96-97
School 50
System
State
0
50 48 59 98-99
56 53 58 97-98
46 50 57 96-97
School System State
Reading Vocabulary 50
45 48 48 0
98-99
48 52 48 97-98
26 44 46 96-97
Language Arts
School 50
System
State
0
56 56 63 98-99
60 60 61 97-98
42 51 58 96-97
School System State
Social Studies 50
44 54 57 0
98-99
49 54 56 97-98
44 52 55 96-97
Science
School 50
System
State
0
36 48 60 98-99
46 50 59 97-98
42 48 59 96-97
School System State
Sources of Information
Composite Score
50
51 47 58 0
98-99
School 50
System
60 51 58 97-98
43 49 57 96-97
State 0
46 49 57 98-99
51 52 56 97-98
40 48 55 96-97
1998-99 GEORGIA PUBLIC EDUCATION REPORT CARD Collier Heights Elementary School - 7611057
Prepared by Georgia Department of Education
Scores Reported in Percentiles
School System State
Page 3
STATE-REQUIRED TEST DATA
PERFORMANCE ASSESSMENTS
Grade 5 Writing Assessment
Percent at Developmental Stages:
1998-99 School System State
1997-98 School System State
1996-97 School System State
Stage Stage Stage Stage Stage Stage
1:The Emerging Writer 2:The Developing Writer 3:The Focusing Writer 4:The Experimenting 5:The Engaging Writer 6:The Extending Writer
0% 2% 26% 54% 15% 2%
1% 2% 22% 47% 22% 6%
0% 1% 16% 41% 29% 12%
0% 5% 19% 54% 19% 3%
1% 4% 24% 47% 19% 5%
0% 3% 19% 41% 27% 10%
2% 7% 28% 40% 19% 3%
1% 6% 32% 39% 17% 5%
0% 3% 21% 37% 26% 12%
AWARDS / RECOGNITION DATA
Schools in Georgia may receive recognition in the following programs: Charter School Pay for Performance Program Georgia School of Excellence National Blue Ribbon School Collier Heights Elementary School did not receive recognition in any of these programs during the 1998-99 school year.
1998-99 GEORGIA PUBLIC EDUCATION REPORT CARD Collier Heights Elementary School - 7611057
Prepared by Georgia Department of Education
Page 4
CERTIFIED PERSONNEL DATA
Positions Number Average Contract Days
Personnel Sex
Certificate
Years Experience
Full-time Part-time
Male Female
4 Yr Bachelor's 5 Yr Master's 6 Yr Specialist's 7 Yr Doctoral Other*
<1 1-10 11-20 21-30 >30
Average
Administrators
3.00 227.33
3 0
0 3
0 0 2 1 0 0 0 1 1 1 22.67
Support Personnel
1.60 196.25
1 2
1 2
0 1 1 1 0 0 2 0 1 0 12.67
PK-12 Teachers
36.10 190.00
35 3
4 34
19 16
3 0 0 1 15 6 13 3 15.34
*Includes One- and Two-Year Vocational Certificates.
ACCREDITATION DATA
Accredited by Georgia Accrediting Commission (GAC).
1998-99 GEORGIA PUBLIC EDUCATION REPORT CARD Collier Heights Elementary School - 7611057
Prepared by Georgia Department of Education
Page 5
1998-99 GEORGIA PUBLIC EDUCATION REPORT CARD
ATLANTA CITY SCHOOLS
Connally Elementary School - 7612057
Grade Range K-5
The Georgia Public Education Report Card is designed to assist systems and schools in educational improvement. This report card contains a variety of data elements. An explanation of the terms is provided as a companion to the report card data. Please refer to the definitions for the most effective use of the reported data.
STUDENT DATA
Total 722
K-5 Enrollment, by Race/Ethnicity and Sex
Black
White Hispanic
American Multi-
Asian Indian
racial
720 99.7%
0 0.0%
2 0.3%
0 0.0%
0 0.0%
0 0.0%
Male Female
383 53.0%
339 47.0%
Enrollment in Selected Programs
Program
Program % of Student Enrollment Population
Gifted (Grades K-12)
0
0.0%
Alternative Programs (Grades 6-12)
N/A
N/A
Students Eligible to Receive Free/Reduced Lunches
Number
Percent
School System
644 45,695
89.2% 75.5%
Dropout Rate *
Number
Rate
School System
N/A N/A
N/A N/A
* Dropout rates are not applicable for grades PK-5.
Enrollment in Compensatory Programs
Program
Program % of Student Enrollment Population
Special Education (Grades K-12)
79 10.9%
(PK)
0
N/A
English to Speakers of Other Languages (ESOL) (Grades K-12)
0
0.0%
Remedial Education (Grades 2-5, 9-12)
108 22.5%
Special Instructional Assistance (SIA) (Grades K-3)
91 18.3%
Title I (Grades K-12)
This school has a schoolwide program.
Total 15
Retained Students, by Race/Ethnicity and Sex
Black
White Hispanic
American Multi-
Asian Indian
racial
15 100.0%
0 0.0%
0 0.0%
0 0.0%
0 0.0%
0 0.0%
Male Female
11
4
73.3% 26.7%
Prepared by Georgia Department of Education
Page 1
STATE-REQUIRED TEST DATA
NORM-REFERENCED TESTS Grade 3
Iowa Tests of Basic Skills (ITBS) Each chart reflects data for three years of testing.
Reading Comprehension 50
46 50 54 0
98-99
74 55 53 97-98
57 48 52 96-97
Mathematics
School 50
System
State
0
52 53 61 98-99
64 58 61 97-98
61 51 59 96-97
School System State
Reading Vocabulary 50
43 50 50 0
98-99
63 51 50 97-98
64 44 49 96-97
Language Arts
School 50
System
State
0
57 61 64 98-99
67 63 62 97-98
62 54 59 96-97
School System State
Social Studies 50
44 50 56 0
98-99
62 52 55 97-98
61 50 55 96-97
Science
School 50
System
State
0
45 49 59 98-99
62 52 59 97-98
58 48 58 96-97
School System State
Sources of Information
Composite Score
50
37 48 57 0
98-99
School 50
System
61 51 56 97-98
57 47 55 96-97
State 0
46 51 58 98-99
64 55 57 97-98
1998-99 GEORGIA PUBLIC EDUCATION REPORT CARD Connally Elementary School - 7612057
Prepared by Georgia Department of Education
59 48 56 96-97
Scores Reported in Percentiles
School System State
Page 2
STATE-REQUIRED TEST DATA
NORM-REFERENCED TESTS Grade 5
Iowa Tests of Basic Skills (ITBS) Each chart reflects data for three years of testing.
Reading Comprehension
Mathematics
50
31 47 53 0
98-99
39 52 53 97-98
31 49 52 96-97
School 50
System
State
0
29 48 59 98-99
51 53 58 97-98
29 50 57 96-97
School System State
Reading Vocabulary 50
21 48 48 0
98-99
32 52 48 97-98
29 44 46 96-97
Language Arts
School 50
System
State
0
34 56 63 98-99
51 60 61 97-98
29 51 58 96-97
School System State
Social Studies 50
24 54 57 0
98-99
40 54 56 97-98
24 52 55 96-97
Science
School 50
System
State
0
22 48 60 98-99
34 50 59 97-98
21 48 59 96-97
School System State
Sources of Information
Composite Score
50
25 47 58 0
98-99
School 50
System
42 51 58 97-98
28 49 57 96-97
State 0
25 49 57 98-99
40 52 56 97-98
24 48 55 96-97
1998-99 GEORGIA PUBLIC EDUCATION REPORT CARD Connally Elementary School - 7612057
Prepared by Georgia Department of Education
Scores Reported in Percentiles
School System State
Page 3
STATE-REQUIRED TEST DATA
PERFORMANCE ASSESSMENTS
Grade 5 Writing Assessment
Percent at Developmental Stages:
1998-99 School System State
1997-98 School System State
1996-97 School System State
Stage Stage Stage Stage Stage Stage
1:The Emerging Writer 2:The Developing Writer 3:The Focusing Writer 4:The Experimenting 5:The Engaging Writer 6:The Extending Writer
1% 5% 30% 49% 13% 3%
1% 2% 22% 47% 22% 6%
0% 1% 16% 41% 29% 12%
2% 4% 34% 42% 12% 4%
1% 4% 24% 47% 19% 5%
0% 3% 19% 41% 27% 10%
3% 15% 36% 37%
9% 0%
1% 6% 32% 39% 17% 5%
0% 3% 21% 37% 26% 12%
AWARDS / RECOGNITION DATA
Schools in Georgia may receive recognition in the following programs: Charter School Pay for Performance Program Georgia School of Excellence National Blue Ribbon School Connally Elementary School did not receive recognition in any of these programs during the 1998-99 school year.
1998-99 GEORGIA PUBLIC EDUCATION REPORT CARD Connally Elementary School - 7612057
Prepared by Georgia Department of Education
Page 4
CERTIFIED PERSONNEL DATA
Positions Number Average Contract Days
Personnel Sex
Certificate
Years Experience
Full-time Part-time
Male Female
4 Yr Bachelor's 5 Yr Master's 6 Yr Specialist's 7 Yr Doctoral Other*
<1 1-10 11-20 21-30 >30
Average
Administrators
3.00 227.33
3 0
1 2
0 1 1 1 0 0 0 0 1 2 30.00
Support Personnel
2.80 195.71
2 2
1 3
0 3 1 0 0 0 0 4 0 0 15.25
PK-12 Teachers
42.50 190.00
41 4
7 38
18 25
1 1 0 2 10 14 12 7 18.42
*Includes One- and Two-Year Vocational Certificates.
ACCREDITATION DATA
Accredited by Georgia Accrediting Commission (GAC).
1998-99 GEORGIA PUBLIC EDUCATION REPORT CARD Connally Elementary School - 7612057
Prepared by Georgia Department of Education
Page 5
1998-99 GEORGIA PUBLIC EDUCATION REPORT CARD
ATLANTA CITY SCHOOLS
Continental Colony Elementary School - 7613057
Grade Range K-5
The Georgia Public Education Report Card is designed to assist systems and schools in educational improvement. This report card contains a variety of data elements. An explanation of the terms is provided as a companion to the report card data. Please refer to the definitions for the most effective use of the reported data.
STUDENT DATA
Total 700
K-5 Enrollment, by Race/Ethnicity and Sex
Black
White Hispanic
American Multi-
Asian Indian
racial
692 98.9%
4 0.6%
3 0.4%
0 0.0%
0 0.0%
1 0.1%
Male Female
367 52.4%
333 47.6%
Enrollment in Selected Programs
Program
Program % of Student Enrollment Population
Gifted (Grades K-12)
33
4.7%
Alternative Programs (Grades 6-12)
N/A
N/A
Students Eligible to Receive Free/Reduced Lunches
Number
Percent
School System
522 45,695
74.6% 75.5%
Dropout Rate *
Number
Rate
School System
N/A N/A
N/A N/A
* Dropout rates are not applicable for grades PK-5.
Enrollment in Compensatory Programs
Program
Program % of Student Enrollment Population
Special Education (Grades K-12)
45
6.4%
(PK)
0
N/A
English to Speakers of Other Languages (ESOL) (Grades K-12)
0
0.0%
Remedial Education (Grades 2-5, 9-12)
81 16.9%
Special Instructional Assistance (SIA) (Grades K-3)
70 15.0%
Title I (Grades K-12)
This school has a schoolwide program.
Total 15
Retained Students, by Race/Ethnicity and Sex
Black
White Hispanic
American Multi-
Asian Indian
racial
15 100.0%
0 0.0%
0 0.0%
0 0.0%
0 0.0%
0 0.0%
Male Female
6
9
40.0% 60.0%
Prepared by Georgia Department of Education
Page 1
STATE-REQUIRED TEST DATA
NORM-REFERENCED TESTS Grade 3
Iowa Tests of Basic Skills (ITBS) Each chart reflects data for three years of testing.
Reading Comprehension 50
40 50 54 0
98-99
37 55 53 97-98
50 48 52 96-97
Mathematics
School 50
System
State
0
39 53 61 98-99
37 58 61 97-98
56 51 59 96-97
School System State
Reading Vocabulary 50
44 50 50 0
98-99
44 51 50 97-98
44 44 49 96-97
Language Arts
School 50
System
State
0
53 61 64 98-99
51 63 62 97-98
60 54 59 96-97
School System State
Social Studies 50
44 50 56 0
98-99
47 52 55 97-98
53 50 55 96-97
Science
School 50
System
State
0
38 49 59 98-99
39 52 59 97-98
57 48 58 96-97
School System State
Sources of Information
Composite Score
50
38 48 57 0
98-99
School 50
System
38 51 56 97-98
46 47 55 96-97
State 0
41 51 58 98-99
43 55 57 97-98
1998-99 GEORGIA PUBLIC EDUCATION REPORT CARD Continental Colony Elementary School - 7613057
Prepared by Georgia Department of Education
53 48 56 96-97
Scores Reported in Percentiles
School System State
Page 2
STATE-REQUIRED TEST DATA
NORM-REFERENCED TESTS Grade 5
Iowa Tests of Basic Skills (ITBS) Each chart reflects data for three years of testing.
Reading Comprehension
Mathematics
50
41 47 53 0
98-99
46 52 53 97-98
47 49 52 96-97
School 50
System
State
0
47 48 59 98-99
50 53 58 97-98
50 50 57 96-97
School System State
Reading Vocabulary 50
33 48 48 0
98-99
33 52 48 97-98
36 44 46 96-97
Language Arts
School 50
System
State
0
54 56 63 98-99
59 60 61 97-98
56 51 58 96-97
School System State
Social Studies 50
40 54 57 0
98-99
46 54 56 97-98
49 52 55 96-97
Science
School 50
System
State
0
36 48 60 98-99
36 50 59 97-98
46 48 59 96-97
School System State
Sources of Information
Composite Score
50
45 47 58 0
98-99
School 50
System
49 51 58 97-98
53 49 57 96-97
State 0
41 49 57 98-99
45 52 56 97-98
48 48 55 96-97
1998-99 GEORGIA PUBLIC EDUCATION REPORT CARD Continental Colony Elementary School - 7613057
Prepared by Georgia Department of Education
Scores Reported in Percentiles
School System State
Page 3
STATE-REQUIRED TEST DATA
PERFORMANCE ASSESSMENTS
Grade 5 Writing Assessment
Percent at Developmental Stages:
1998-99 School System State
1997-98 School System State
1996-97 School System State
Stage Stage Stage Stage Stage Stage
1:The Emerging Writer 2:The Developing Writer 3:The Focusing Writer 4:The Experimenting 5:The Engaging Writer 6:The Extending Writer
3% 2% 17% 37% 36% 6%
1% 2% 22% 47% 22% 6%
0% 1% 16% 41% 29% 12%
1% 1% 16% 48% 27% 7%
1% 4% 24% 47% 19% 5%
0% 3% 19% 41% 27% 10%
1% 3% 34% 41% 15% 7%
1% 6% 32% 39% 17% 5%
0% 3% 21% 37% 26% 12%
AWARDS / RECOGNITION DATA
Schools in Georgia may receive recognition in the following programs: Charter School Pay for Performance Program Georgia School of Excellence National Blue Ribbon School Continental Colony Elementary School did not receive recognition in any of these programs during the 1998-99 school year.
1998-99 GEORGIA PUBLIC EDUCATION REPORT CARD Continental Colony Elementary School - 7613057
Prepared by Georgia Department of Education
Page 4
CERTIFIED PERSONNEL DATA
Positions Number Average Contract Days
Personnel Sex
Certificate
Years Experience
Full-time Part-time
Male Female
4 Yr Bachelor's 5 Yr Master's 6 Yr Specialist's 7 Yr Doctoral Other*
<1 1-10 11-20 21-30 >30
Average
Administrators
2.00 231.00
2 0
0 2
0 1 0 1 0 0 0 0 1 1 26.50
Support Personnel
3.00 196.00
2 2
0 4
0 3 1 0 0 0 1 0 3 0 21.25
PK-12 Teachers
41.70 190.00
40 4
5 39
20 18
4 2 0 1 12 10 18 3 17.48
*Includes One- and Two-Year Vocational Certificates.
ACCREDITATION DATA
Accredited by Georgia Accrediting Commission (GAC).
1998-99 GEORGIA PUBLIC EDUCATION REPORT CARD Continental Colony Elementary School - 7613057
Prepared by Georgia Department of Education
Page 5
1998-99 GEORGIA PUBLIC EDUCATION REPORT CARD
ATLANTA CITY SCHOOLS
Cook Elementary School - 7614057
Grade Range K-5
The Georgia Public Education Report Card is designed to assist systems and schools in educational improvement. This report card contains a variety of data elements. An explanation of the terms is provided as a companion to the report card data. Please refer to the definitions for the most effective use of the reported data.
STUDENT DATA
Total 486
K-5 Enrollment, by Race/Ethnicity and Sex
Black
White Hispanic
American Multi-
Asian Indian
racial
484 99.6%
0 0.0%
0 0.0%
0 0.0%
0 0.0%
2 0.4%
Male Female
231 47.5%
255 52.5%
Enrollment in Selected Programs
Program
Program % of Student Enrollment Population
Gifted (Grades K-12)
0
0.0%
Alternative Programs (Grades 6-12)
N/A
N/A
Students Eligible to Receive Free/Reduced Lunches
Number
Percent
School System
481 45,695
99.0% 75.5%
Dropout Rate *
Number
Rate
School System
N/A N/A
N/A N/A
* Dropout rates are not applicable for grades PK-5.
Enrollment in Compensatory Programs
Program
Program % of Student Enrollment Population
Special Education (Grades K-12)
36
7.4%
(PK)
0
N/A
English to Speakers of Other Languages (ESOL) (Grades K-12)
0
0.0%
Remedial Education (Grades 2-5, 9-12)
58 20.6%
Special Instructional Assistance (SIA) (Grades K-3)
277 75.3%
Title I (Grades K-12)
This school has a schoolwide program.
Total 31
Retained Students, by Race/Ethnicity and Sex
Black
White Hispanic
American Multi-
Asian Indian
racial
30 96.8%
0 0.0%
0 0.0%
0 0.0%
0 0.0%
1 3.2%
Male Female
16
15
51.6% 48.4%
Prepared by Georgia Department of Education
Page 1
STATE-REQUIRED TEST DATA
NORM-REFERENCED TESTS Grade 3
Iowa Tests of Basic Skills (ITBS) Each chart reflects data for three years of testing.
Reading Comprehension 50
24 50 54 0
98-99
39 55 53 97-98
29 48 52 96-97
Mathematics
School 50
System
State
0
33 53 61 98-99
43 58 61 97-98
35 51 59 96-97
School System State
Reading Vocabulary 50
36 50 50 0
98-99
27 51 50 97-98
20 44 49 96-97
Language Arts
School 50
System
State
0
30 61 64 98-99
38 63 62 97-98
41 54 59 96-97
School System State
Social Studies 50
34 50 56 0
98-99
30 52 55 97-98
55 50 55 96-97
Science
School 50
System
State
0
34 49 59 98-99
32 52 59 97-98
44 48 58 96-97
School System State
Sources of Information
Composite Score
50
28 48 57 0
98-99
School 50
System
29 51 56 97-98
32 47 55 96-97
State 0
31 51 58 98-99
32 55 57 97-98
1998-99 GEORGIA PUBLIC EDUCATION REPORT CARD Cook Elementary School - 7614057
Prepared by Georgia Department of Education
36 48 56 96-97
Scores Reported in Percentiles
School System State
Page 2
STATE-REQUIRED TEST DATA
NORM-REFERENCED TESTS Grade 5
Iowa Tests of Basic Skills (ITBS) Each chart reflects data for three years of testing.
Reading Comprehension
Mathematics
50
30 47 53 0
98-99
24 52 53 97-98
25 49 52 96-97
School 50
System
State
0
31 48 59 98-99
22 53 58 97-98
20 50 57 96-97
School System State
Reading Vocabulary 50
14 48 48 0
98-99
11 52 48 97-98
7 44 46 96-97
Language Arts
School 50
System
State
0
45 56 63 98-99
27 60 61 97-98
26 51 58 96-97
School System State
Social Studies 50
33 54 57 0
98-99
47 54 56 97-98
25 52 55 96-97
Science
School 50
System
State
0
25 48 60 98-99
19 50 59 97-98
25 48 59 96-97
School System State
Sources of Information
Composite Score
50
36 47 58 0
98-99
School 50
System
30 51 58 97-98
30 49 57 96-97
State 0
30 49 57 98-99
24 52 56 97-98
21 48 55 96-97
1998-99 GEORGIA PUBLIC EDUCATION REPORT CARD Cook Elementary School - 7614057
Prepared by Georgia Department of Education
Scores Reported in Percentiles
School System State
Page 3
STATE-REQUIRED TEST DATA
PERFORMANCE ASSESSMENTS
Grade 5 Writing Assessment
Percent at Developmental Stages:
1998-99 School System State
1997-98 School System State
1996-97 School System State
Stage Stage Stage Stage Stage Stage
1:The Emerging Writer 2:The Developing Writer 3:The Focusing Writer 4:The Experimenting 5:The Engaging Writer 6:The Extending Writer
0% 3% 30% 43% 16% 8%
1% 2% 22% 47% 22% 6%
0% 1% 16% 41% 29% 12%
0% 5% 40% 50% 5% 0%
1% 4% 24% 47% 19% 5%
0% 3% 19% 41% 27% 10%
0% 22% 44% 29%
4% 0%
1% 6% 32% 39% 17% 5%
0% 3% 21% 37% 26% 12%
AWARDS / RECOGNITION DATA
Schools in Georgia may receive recognition in the following programs: Charter School Pay for Performance Program Georgia School of Excellence National Blue Ribbon School Cook Elementary School did not receive recognition in any of these programs during the 1998-99 school year.
1998-99 GEORGIA PUBLIC EDUCATION REPORT CARD Cook Elementary School - 7614057
Prepared by Georgia Department of Education
Page 4
CERTIFIED PERSONNEL DATA
Positions Number Average Contract Days
Personnel Sex
Certificate
Years Experience
Full-time Part-time
Male Female
4 Yr Bachelor's 5 Yr Master's 6 Yr Specialist's 7 Yr Doctoral Other*
<1 1-10 11-20 21-30 >30
Average
Administrators
2.00 231.00
2 0
0 2
0 0 2 0 0 0 0 0 1 1 29.00
Support Personnel
1.60 193.75
1 1
0 2
1 0 1 0 0 0 0 0 1 1 29.00
PK-12 Teachers
33.30 190.00
32 3
3 32
19 12
2 2 0 4 13 7 10 1 13.11
*Includes One- and Two-Year Vocational Certificates.
ACCREDITATION DATA
Accredited by Georgia Accrediting Commission (GAC).
1998-99 GEORGIA PUBLIC EDUCATION REPORT CARD Cook Elementary School - 7614057
Prepared by Georgia Department of Education
Page 5
1998-99 GEORGIA PUBLIC EDUCATION REPORT CARD
ATLANTA CITY SCHOOLS
Crim Evening Classes - 7610289
Grade Range 9-12
The Georgia Public Education Report Card is designed to assist systems and schools in educational improvement. This report card contains a variety of data elements. An explanation of the terms is provided as a companion to the report card data. Please refer to the definitions for the most effective use of the reported data.
Total 173
STUDENT DATA
9-12 Enrollment, by Race/Ethnicity and Sex
Black
White Hispanic
American Multi-
Asian Indian
racial
170 98.3%
1 0.6%
2 1.2%
0 0.0%
0 0.0%
0 0.0%
Male Female
68 39.3%
105 60.7%
Enrollment in Selected Programs
Program
Gifted (Grades K-12)
Program % of Student Enrollment Population
0
0.0%
Non-Vocational Labs (Grades 9-12)
Vocational Labs (Grades 9-12)
Alternative Programs (Grades 6-12)
66
38.2%
44
25.4%
0
0.0%
Students Eligible to Receive Free/Reduced Lunches
Number
Percent
School System
0 45,695
0.0% 75.5%
Enrollment in Compensatory Programs
Program
Program % of Student Enrollment Population
Special Education (Grades K-12) PK
0
0.0%
0
N/A
English to Speakers of Other Languages (ESOL) (Grades K-12)
0
0.0%
Remedial Education (Grades 2-5, 9-12)
0
0.0%
Title I (Grades K-12)
This school has no Title I program.
Dropout Rate for Grades 9-12
Number
Rate
School System
1 1,248
0.3% 5.4%
Total 4
Retained Students, by Race/Ethnicity and Sex
Black
White Hispanic
American MultiAsian Indian racial
4 100.0%
0 0.0%
0 0.0%
0 0.0%
0 0.0%
0 0.0%
Male Female
3
1
75.0% 25.0%
Prepared by Georgia Department of Education
Page 1
STATE-REQUIRED TEST DATA
GEORGIA HIGH SCHOOL GRADUATION TESTS (GHSGT)
Percent of Regular Program 11th Graders Passing the Georgia High School Graduation Tests on First Administration
English Language Arts Mathematics Social Studies Science
All Components listed above
Writing
1998-99
School System State
83% 75% 77% 85%
91% 79% 73% 61%
96% 88% 80% 72%
64% 55% 68%
92% 85% 93%
1997-98
School System State
94% 56% 87% 73%
89% 78% 68% 61%
94% 88% 78% 74%
62% 54% 68%
44% 83% 92%
1996-97
School System State
85% 50% 50% 22%
89% 72% 65% 52%
94% 87% 78% 74%
11% 46% 67%
75% 82% 93%
GRADUATE DATA
1999 Graduates by Credentials, Race/Ethnicity and Sex
Diplomas with Both College Prep. & Voc. Endorsements
Diplomas with College Prep. Endorsements
Diplomas with Vocational Endorsements
General High School Diplomas
Special Education Diplomas
Total All Diplomas
Total N/A
Black N/A
White Hispanic
N/A
N/A
American MultiAsian Indian racial
N/A
N/A
N/A
N/A
N/A
N/A
N/A
N/A
N/A
N/A
N/A
N/A
N/A
N/A
N/A
N/A
N/A
N/A
N/A
N/A
N/A
N/A
N/A
N/A
N/A
N/A
N/A
N/A
N/A
N/A
N/A
N/A
Male Female
N/A
N/A
N/A
N/A
N/A
N/A
N/A
N/A
N/A
N/A
Certificates of Performance
Total Graduates
N/A
N/A
N/A
N/A
N/A
N/A
N/A
N/A
N/A
N/A
HOPE Scholarships
School System
Number of 1999 Graduates Number Eligible Percent Eligible
N/A N/A N/A
2,041 1,099 53.8%
State
65,548 40,292 61.5%
High School Completion Rate
Percent of 1995Grade 9 Enrollment in Graduating Class of1999 School System State
Completion Rate '95-'99 N / A 57.1% 68.9%
1998-99 GEORGIA PUBLIC EDUCATION REPORT CARD
Crim Evening Classes - 7610289
Prepared by Georgia Department of Education
Page 2
COLLEGE ADMISSIONS / CREDIT TEST DATA
Scholastic Assessment Test (SAT)
Based on students' highest verbal and highest math scores
No. Taking
Average Score
Tests Verbal Math Total
Based on students' last test administration
Average Score Verbal Math Total
School
N/A
College Prep. Endorsement
Other Diplomas
System
1,265
College Prep. Endorsement
Other Diplomas
Georgia
41,958
N/A N/A N/A
445 441 N/A
492
N/A N/A N/A
436 430 N/A
488
N/A N/A N/A
881 871 N/A
980
N/A N/A N/A
435 N/A N/A
483
N/A N/A N/A
426 N/A N/A
479
N/A N/A N/A
861 N/A N/A
962
Nation
952,913 N/A N/A N/A
502 508 1010
American College Testing (ACT)
Advanced Placement Exams (AP)
Number taking tests: English Mathematics Reading Science Reasoning CompositeScore
N/A
School System
N/A 17.4
N/A 18.4
N/A N/A
18.6 18.3
N/A 18.3
State 19.1 19.9 20.2 19.9 19.9
No. of Students Taking Tests
No. of Tests Taken No. of Test Scores
3 or Higher Percent of Test
Scores 3 or Higher
School 0
N/A N/A
N/A
System State 537 15,225 877 23,969 184 13,024
21.0% 54.3%
POST-SECONDARY DATA
Graduates Entering Georgia Public Colleges
Graduates Entering Georgia Public Colleges and Requiring Learning Support (LS)
1998 Graduates Entering in 1998-99
1997 Graduates Entering in 1997-98
Percent of Graduating Number Class
School N / A
N/A
System 452
21.7%
School N / A
N/A
System 437
21.1%
Number Requiring
LS N/A 200
N/A 202
Percent of those attending Georgia
Public Colleges
N/A
44.2%
N/A
46.2%
In previous years, the Report Card presented College Prep Curriculum information provided by the Board of Regents on students requiring Learning Support. Due to inconsistencies in the data provided by the Board of Regents in defining College Prep Completers versus Local Board of Education data defining College Prep Endorsements, the Department of Education Report Card will not provide this information until discrepancies can be reconciled.
Graduates Entering Georgia Public Technical and Adult Schools
1998 Graduates School System
Entering Number N/A 53
1998-99 Percent
N/A 2.5%
Entering Number N/A N/A
1997-98 Percent
N/A N/A
1997 Graduates School System
N/A 3
N/A 0.1%
N/A 109
N/A 5.3%
1998-99 GEORGIA PUBLIC EDUCATION REPORT CARD Crim Evening Classes - 7610289
Prepared by Georgia Department of Education
Page 3
CERTIFIED PERSONNEL DATA
Positions Number Average Contract Days
Administrators
0.00 0.00
Support Personnel
0.00 0.00
PK-12 Teachers
9.00 190.00
Personnel Sex
Certificate
Years Experience
Full-time Part-time
Male Female
4 Yr Bachelor's 5 Yr Master's 6 Yr Specialist's 7 Yr Doctoral Other*
<1 1-10 11-20 21-30 >30
Average
0 0
0 0
0 0 0 0 0
0 0 0 0 0
0.00
0 0
0 0
0 0 0 0 0
0 0 0 0 0
0.00
9 0
4 5
5 3 1 0 0
2 5 2 0 0
5.11
*Includes One- and Two-Year Vocational Certificates.
ACCREDITATION DATA
Not accredited by Southern Association of Colleges and Schools (SACS) or Georgia Accrediting Commission (GAC).
AWARDS / RECOGNITION DATA
Schools in Georgia may receive recognition in the following programs: Charter School Pay for Performance Program Georgia School of Excellence National Blue Ribbon School Crim Evening Classes did not receive recognition in any of these programs during the 1998-99 school year.
1998-99 GEORGIA PUBLIC EDUCATION REPORT CARD Crim Evening Classes - 7610289
Prepared by Georgia Department of Education
Page 4
1998-99 GEORGIA PUBLIC EDUCATION REPORT CARD
ATLANTA CITY SCHOOLS
Crim High School - 7612664
Grade Range 9-12
The Georgia Public Education Report Card is designed to assist systems and schools in educational improvement. This report card contains a variety of data elements. An explanation of the terms is provided as a companion to the report card data. Please refer to the definitions for the most effective use of the reported data.
Total 839
STUDENT DATA
9-12 Enrollment, by Race/Ethnicity and Sex
Black
White Hispanic
American Multi-
Asian Indian
racial
832 99.2%
2 0.2%
5 0.6%
0 0.0%
0 0.0%
0 0.0%
Male Female
418 49.8%
421 50.2%
Enrollment in Selected Programs
Program
Gifted (Grades K-12)
Program % of Student Enrollment Population
26
3.1%
Non-Vocational Labs (Grades 9-12)
647
Vocational Labs
(Grades 9-12)
534
Alternative Programs (Grades 6-12)
0
77.1% 63.6%
0.0%
Students Eligible to Receive Free/Reduced Lunches
Number
Percent
School System
464 45,695
55.3% 75.5%
Enrollment in Compensatory Programs
Program
Program % of Student Enrollment Population
Special Education (Grades K-12) PK
48
5.7%
0
N/A
English to Speakers of Other Languages (ESOL) (Grades K-12)
0
0.0%
Remedial Education (Grades 2-5, 9-12)
153 18.2%
Title I (Grades K-12)
This school has a schoolwide program.
Dropout Rate for Grades 9-12
Number
Rate
School System
81 1,248
5.5% 5.4%
Total 68
Retained Students, by Race/Ethnicity and Sex
Black
White Hispanic
American MultiAsian Indian racial
68 100.0%
0 0.0%
0 0.0%
0 0.0%
0 0.0%
0 0.0%
Male Female
44
24
64.7% 35.3%
Prepared by Georgia Department of Education
Page 1
STATE-REQUIRED TEST DATA
GEORGIA HIGH SCHOOL GRADUATION TESTS (GHSGT)
Percent of Regular Program 11th Graders Passing the Georgia High School Graduation Tests on First Administration
English Language Arts Mathematics Social Studies Science
All Components listed above
Writing
1998-99
School System State
82% 68% 58% 58%
91% 79% 73% 61%
96% 88% 80% 72%
44% 55% 68%
78% 85% 93%
1997-98
School System State
88% 71% 55% 69%
89% 78% 68% 61%
94% 88% 78% 74%
43% 54% 68%
69% 83% 92%
1996-97
School System State
85% 61% 43% 31%
89% 72% 65% 52%
94% 87% 78% 74%
25% 46% 67%
79% 82% 93%
GRADUATE DATA
1999 Graduates by Credentials, Race/Ethnicity and Sex
Diplomas with Both College Prep. & Voc. Endorsements
Diplomas with College Prep. Endorsements Diplomas with Vocational Endorsements General High School Diplomas Special Education Diplomas
Total All Diplomas
Certificates of Performance
Total Graduates
Total 67 44 8 0
Black
67 100.0%
44 100.0%
8 100.0%
0
White Hispanic
0 0.0%
0 0.0%
0 0.0%
0 0.0%
0 0.0%
0 0.0%
0
0
American MultiAsian Indian racial
0 0.0%
0 0.0%
0 0.0%
0 0.0%
0 0.0%
0 0.0%
0 0.0%
0 0.0%
0 0.0%
0
0
0
4
4
100.0%
123
123
100.0%
7
7
100.0%
130
130
100.0%
0 0.0%
0 0.0%
0 0.0%
0 0.0%
0 0.0%
0 0.0%
0 0.0%
0 0.0%
0 0.0%
0 0.0%
0 0.0%
0 0.0%
0 0.0%
0 0.0%
0 0.0%
0 0.0%
0 0.0%
0 0.0%
0 0.0%
0 0.0%
Male Female
20
47
29.9% 70.1%
22
22
50.0% 50.0%
7
1
87.5% 12.5%
0
0
2 50.0%
51 41.5%
4 57.1%
55 42.3%
2 50.0%
72 58.5%
3 42.9%
75 57.7%
HOPE Scholarships
School System
Number of 1999 Graduates 1 3 0
Number Eligible
69
Percent Eligible
53.1%
2,041 1,099 53.8%
State
65,548 40,292 61.5%
High School Completion Rate
Percent of 1995Grade 9 Enrollment in Graduating Class of1999 School System State
Completion Rate '95-'99 53.7% 57.1% 68.9%
1998-99 GEORGIA PUBLIC EDUCATION REPORT CARD
Crim High School - 7612664
Prepared by Georgia Department of Education
Page 2
COLLEGE ADMISSIONS / CREDIT TEST DATA
Scholastic Assessment Test (SAT)
Based on students' highest verbal and highest math scores
No. Taking
Average Score
Tests Verbal Math Total
Based on students' last test administration
Average Score Verbal Math Total
School
74
College Prep. Endorsement
Other Diplomas
System
1,265
College Prep. Endorsement
Other Diplomas
Georgia
41,958
379 374 N/A
445 441 N/A
492
375 368 N/A
436 430 N/A
488
754 742 N/A
881 871 N/A
980
370 N/A N/A
435 N/A N/A
483
367 N/A N/A
426 N/A N/A
479
737 N/A N/A
861 N/A N/A
962
Nation
952,913 N/A N/A N/A
502 508 1010
American College Testing (ACT)
Advanced Placement Exams (AP)
Number taking tests: English Mathematics Reading Science Reasoning CompositeScore
1 9 School System State
14.5 17.4 19.1
16.6 18.4 19.9
15.5 16.6
18.6 18.3
20.2 19.9
15.9 18.3 19.9
No. of Students Taking Tests
No. of Tests Taken No. of Test Scores
3 or Higher Percent of Test
Scores 3 or Higher
School 46 60 2
3.3%
System State 537 15,225 877 23,969 184 13,024
21.0% 54.3%
POST-SECONDARY DATA
Graduates Entering Georgia Public Colleges
Graduates Entering Georgia Public Colleges and Requiring Learning Support (LS)
1998 Graduates Entering in 1998-99
1997 Graduates Entering in 1997-98
Percent of Graduating Number Class
School
11
7.6%
System 452
21.7%
School
26
16.4%
System 437
21.1%
Number Requiring
LS 7 200
12 202
Percent of those attending Georgia
Public Colleges
63.6%
44.2%
46.2%
46.2%
In previous years, the Report Card presented College Prep Curriculum information provided by the Board of Regents on students requiring Learning Support. Due to inconsistencies in the data provided by the Board of Regents in defining College Prep Completers versus Local Board of Education data defining College Prep Endorsements, the Department of Education Report Card will not provide this information until discrepancies can be reconciled.
Graduates Entering Georgia Public Technical and Adult Schools
1998 Graduates School System
Entering Number 6 53
1998-99 Percent
4.2% 2.5%
Entering Number N/A N/A
1997-98 Percent
N/A N/A
1997 Graduates School
0
0.0%
System
3
0.1%
7
4.4%
109
5.3%
1998-99 GEORGIA PUBLIC EDUCATION REPORT CARD Crim High School - 7612664
Prepared by Georgia Department of Education
Page 3
CERTIFIED PERSONNEL DATA
Positions Number Average Contract Days
Administrators
4.00 225.50
Support Personnel
4.20 199.05
PK-12 Teachers
44.40 195.81
Personnel Sex
Certificate
Years Experience
Full-time Part-time
Male Female
4 Yr Bachelor's 5 Yr Master's 6 Yr Specialist's 7 Yr Doctoral Other*
<1 1-10 11-20 21-30 >30
Average
4 0
2 2
0 0 2 2 0
0 0 1 2 1
27.00
3 2
0 5
0 2 2 1 0
0 1 1 1 2
24.40
44 1
16 29
22 20
3 0 0
3 13
9 17
3
15.49
*Includes One- and Two-Year Vocational Certificates.
ACCREDITATION DATA
Accredited by Southern Association of Colleges and Schools (SACS): Secondary/Middle Commission.
AWARDS / RECOGNITION DATA
Schools in Georgia may receive recognition in the following programs: Charter School Pay for Performance Program Georgia School of Excellence National Blue Ribbon School Crim High School did not receive recognition in any of these programs during the 1998-99 school year.
1998-99 GEORGIA PUBLIC EDUCATION REPORT CARD Crim High School - 7612664
Prepared by Georgia Department of Education
Page 4
1998-99 GEORGIA PUBLIC EDUCATION REPORT CARD
ATLANTA CITY SCHOOLS
D H Stanton Elementary School - 7615066
Grade Range K-5
The Georgia Public Education Report Card is designed to assist systems and schools in educational improvement. This report card contains a variety of data elements. An explanation of the terms is provided as a companion to the report card data. Please refer to the definitions for the most effective use of the reported data.
STUDENT DATA
Total 584
K-5 Enrollment, by Race/Ethnicity and Sex
Black
White Hispanic
American Multi-
Asian Indian
racial
577 98.8%
3 0.5%
4 0.7%
0 0.0%
0 0.0%
0 0.0%
Male Female
309 52.9%
275 47.1%
Enrollment in Selected Programs
Program
Program % of Student Enrollment Population
Gifted (Grades K-12)
0
0.0%
Alternative Programs (Grades 6-12)
N/A
N/A
Students Eligible to Receive Free/Reduced Lunches
Number
Percent
School System
581 45,695
99.5% 75.5%
Dropout Rate *
Number
Rate
School System
N/A N/A
N/A N/A
* Dropout rates are not applicable for grades PK-5.
Enrollment in Compensatory Programs
Program
Program % of Student Enrollment Population
Special Education (Grades K-12)
29
5.0%
(PK)
0
N/A
English to Speakers of Other Languages (ESOL) (Grades K-12)
0
0.0%
Remedial Education (Grades 2-5, 9-12)
86 22.8%
Special Instructional Assistance (SIA) (Grades K-3)
286 67.3%
Title I (Grades K-12)
This school has a schoolwide program.
Total 9
Retained Students, by Race/Ethnicity and Sex
Black
White Hispanic
American Multi-
Asian Indian
racial
9 100.0%
0 0.0%
0 0.0%
0 0.0%
0 0.0%
0 0.0%
Male Female
9
0
100.0% 0.0%
Prepared by Georgia Department of Education
Page 1
STATE-REQUIRED TEST DATA
NORM-REFERENCED TESTS Grade 3
Iowa Tests of Basic Skills (ITBS) Each chart reflects data for three years of testing.
Reading Comprehension 50
76 50 54 0
98-99
19 55 53 97-98
22 48 52 96-97
Mathematics
School 50
System
State
0
72 53 61 98-99
19 58 61 97-98
21 51 59 96-97
School System State
Reading Vocabulary 50
95 50 50 0
98-99
16 51 50 97-98
18 44 49 96-97
Language Arts
School 50
System
State
0
90 61 64 98-99
28 63 62 97-98
30 54 59 96-97
School System State
Social Studies 50
62 50 56 0
98-99
23 52 55 97-98
26 50 55 96-97
Science
School 50
System
State
0
82 49 59 98-99
24 52 59 97-98
28 48 58 96-97
School System State
Sources of Information
Composite Score
50
46 48 57 0
98-99
School 50
System
26 51 56 97-98
31 47 55 96-97
State 0
77 51 58 98-99
21 55 57 97-98
1998-99 GEORGIA PUBLIC EDUCATION REPORT CARD D H Stanton Elementary School - 7615066
Prepared by Georgia Department of Education
24 48 56 96-97
Scores Reported in Percentiles
School System State
Page 2
STATE-REQUIRED TEST DATA
NORM-REFERENCED TESTS Grade 5
Iowa Tests of Basic Skills (ITBS) Each chart reflects data for three years of testing.
Reading Comprehension
Mathematics
50
59 47 53 0
98-99
24 52 53 97-98
29 49 52 96-97
School 50
System
State
0
44 48 59 98-99
34 53 58 97-98
18 50 57 96-97
School System State
Reading Vocabulary 50
81 48 48 0
98-99
20 52 48 97-98
11 44 46 96-97
Language Arts
School 50
System
State
0
67 56 63 98-99
31 60 61 97-98
28 51 58 96-97
School System State
Social Studies 50
47 54 57 0
98-99
30 54 56 97-98
21 52 55 96-97
Science
School 50
System
State
0
46 48 60 98-99
28 50 59 97-98
29 48 59 96-97
School System State
Sources of Information
Composite Score
50
34 47 58 0
98-99
School 50
System
32 51 58 97-98
30 49 57 96-97
State 0
52 49 57 98-99
27 52 56 97-98
22 48 55 96-97
1998-99 GEORGIA PUBLIC EDUCATION REPORT CARD D H Stanton Elementary School - 7615066
Prepared by Georgia Department of Education
Scores Reported in Percentiles
School System State
Page 3
STATE-REQUIRED TEST DATA
PERFORMANCE ASSESSMENTS
Grade 5 Writing Assessment
Percent at Developmental Stages:
1998-99 School System State
1997-98 School System State
1996-97 School System State
Stage Stage Stage Stage Stage Stage
1:The Emerging Writer 2:The Developing Writer 3:The Focusing Writer 4:The Experimenting 5:The Engaging Writer 6:The Extending Writer
0% 5% 32% 48% 12% 3%
1% 2% 22% 47% 22% 6%
0% 1% 16% 41% 29% 12%
0% 3% 24% 57% 10% 6%
1% 4% 24% 47% 19% 5%
0% 3% 19% 41% 27% 10%
6% 6% 38% 31% 19% 0%
1% 6% 32% 39% 17% 5%
0% 3% 21% 37% 26% 12%
AWARDS / RECOGNITION DATA
Schools in Georgia may receive recognition in the following programs: Charter School Pay for Performance Program Georgia School of Excellence National Blue Ribbon School D H Stanton Elementary School did not receive recognition in any of these programs during the 1998-99 school year.
1998-99 GEORGIA PUBLIC EDUCATION REPORT CARD D H Stanton Elementary School - 7615066
Prepared by Georgia Department of Education
Page 4
CERTIFIED PERSONNEL DATA
Positions Number Average Contract Days
Personnel Sex
Certificate
Years Experience
Full-time Part-time
Male Female
4 Yr Bachelor's 5 Yr Master's 6 Yr Specialist's 7 Yr Doctoral Other*
<1 1-10 11-20 21-30 >30
Average
Administrators
3.00 234.67
3 0
0 3
0 0 1 2 0 0 0 0 3 0 23.67
Support Personnel
0.60 200.00
0 1
1 0
0 1 0 0 0 0 0 1 0 0 11.00
PK-12 Teachers
40.80 190.00
40 2
6 36
26 11
3 2 0 5 14 13 6 4 12.81
*Includes One- and Two-Year Vocational Certificates.
ACCREDITATION DATA
Accredited by Georgia Accrediting Commission (GAC).
1998-99 GEORGIA PUBLIC EDUCATION REPORT CARD D H Stanton Elementary School - 7615066
Prepared by Georgia Department of Education
Page 5
1998-99 GEORGIA PUBLIC EDUCATION REPORT CARD
ATLANTA CITY SCHOOLS
Dobbs Elementary School - 7613058
Grade Range K-5
The Georgia Public Education Report Card is designed to assist systems and schools in educational improvement. This report card contains a variety of data elements. An explanation of the terms is provided as a companion to the report card data. Please refer to the definitions for the most effective use of the reported data.
STUDENT DATA
Total 338
K-5 Enrollment, by Race/Ethnicity and Sex
Black
White Hispanic
American Multi-
Asian Indian
racial
338 100.0%
0 0.0%
0 0.0%
0 0.0%
0 0.0%
0 0.0%
Male Female
162 47.9%
176 52.1%
Enrollment in Selected Programs
Program
Program % of Student Enrollment Population
Gifted (Grades K-12)
0
0.0%
Alternative Programs (Grades 6-12)
N/A
N/A
Students Eligible to Receive Free/Reduced Lunches
Number
Percent
School System
335 45,695
99.1% 75.5%
Dropout Rate *
Number
Rate
School System
N/A N/A
N/A N/A
* Dropout rates are not applicable for grades PK-5.
Enrollment in Compensatory Programs
Program
Program % of Student Enrollment Population
Special Education (Grades K-12)
13
3.8%
(PK)
0
N/A
English to Speakers of Other Languages (ESOL) (Grades K-12)
0
0.0%
Remedial Education (Grades 2-5, 9-12)
52 24.2%
Special Instructional Assistance (SIA) (Grades K-3)
159 66.5%
Title I (Grades K-12)
This school has a schoolwide program.
Total 13
Retained Students, by Race/Ethnicity and Sex
Black
White Hispanic
American Multi-
Asian Indian
racial
13 100.0%
0 0.0%
0 0.0%
0 0.0%
0 0.0%
0 0.0%
Male Female
7
6
53.8% 46.2%
Prepared by Georgia Department of Education
Page 1
STATE-REQUIRED TEST DATA
NORM-REFERENCED TESTS Grade 3
Iowa Tests of Basic Skills (ITBS) Each chart reflects data for three years of testing.
Reading Comprehension 50
41 50 54 0
98-99
49 55 53 97-98
25 48 52 96-97
Mathematics
School 50
System
State
0
45 53 61 98-99
59 58 61 97-98
30 51 59 96-97
School System State
Reading Vocabulary 50
23 50 50 0
98-99
48 51 50 97-98
17 44 49 96-97
Language Arts
School 50
System
State
0
52 61 64 98-99
65 63 62 97-98
36 54 59 96-97
School System State
Social Studies 50
35 50 56 0
98-99
58 52 55 97-98
45 50 55 96-97
Science
School 50
System
State
0
31 49 59 98-99
54 52 59 97-98
28 48 58 96-97
School System State
Sources of Information
Composite Score
50
35 48 57 0
98-99
School 50
System
48 51 56 97-98
31 47 55 96-97
State 0
36 51 58 98-99
55 55 57 97-98
1998-99 GEORGIA PUBLIC EDUCATION REPORT CARD Dobbs Elementary School - 7613058
Prepared by Georgia Department of Education
30 48 56 96-97
Scores Reported in Percentiles
School System State
Page 2
STATE-REQUIRED TEST DATA
NORM-REFERENCED TESTS Grade 5
Iowa Tests of Basic Skills (ITBS) Each chart reflects data for three years of testing.
Reading Comprehension
Mathematics
50
32 47 53 0
98-99
50 52 53 97-98
26 49 52 96-97
School 50
System
State
0
60 48 59 98-99
63 53 58 97-98
26 50 57 96-97
School System State
Reading Vocabulary 50
33 48 48 0
98-99
30 52 48 97-98
15 44 46 96-97
Language Arts
School 50
System
State
0
42 56 63 98-99
68 60 61 97-98
50 51 58 96-97
School System State
Social Studies 50
48 54 57 0
98-99
69 54 56 97-98
49 52 55 96-97
Science
School 50
System
State
0
59 48 60 98-99
55 50 59 97-98
36 48 59 96-97
School System State
Sources of Information
Composite Score
50
50 47 58 0
98-99
School 50
System
52 51 58 97-98
53 49 57 96-97
State 0
48 49 57 98-99
58 52 56 97-98
38 48 55 96-97
1998-99 GEORGIA PUBLIC EDUCATION REPORT CARD Dobbs Elementary School - 7613058
Prepared by Georgia Department of Education
Scores Reported in Percentiles
School System State
Page 3
STATE-REQUIRED TEST DATA
PERFORMANCE ASSESSMENTS
Grade 5 Writing Assessment
Percent at Developmental Stages:
1998-99 School System State
1997-98 School System State
1996-97 School System State
Stage Stage Stage Stage Stage Stage
1:The Emerging Writer 2:The Developing Writer 3:The Focusing Writer 4:The Experimenting 5:The Engaging Writer 6:The Extending Writer
2% 0% 31% 39% 20% 8%
1% 2% 22% 47% 22% 6%
0% 1% 16% 41% 29% 12%
2% 0% 22% 34% 24% 18%
1% 4% 24% 47% 19% 5%
0% 3% 19% 41% 27% 10%
0% 6% 6% 55% 29% 3%
1% 6% 32% 39% 17% 5%
0% 3% 21% 37% 26% 12%
AWARDS / RECOGNITION DATA
Schools in Georgia may receive recognition in the following programs: Charter School Pay for Performance Program Georgia School of Excellence National Blue Ribbon School Dobbs Elementary School did not receive recognition in any of these programs during the 1998-99 school year.
1998-99 GEORGIA PUBLIC EDUCATION REPORT CARD Dobbs Elementary School - 7613058
Prepared by Georgia Department of Education
Page 4
CERTIFIED PERSONNEL DATA
Positions Number Average Contract Days
Personnel Sex
Certificate
Years Experience
Full-time Part-time
Male Female
4 Yr Bachelor's 5 Yr Master's 6 Yr Specialist's 7 Yr Doctoral Other*
<1 1-10 11-20 21-30 >30
Average
Administrators
2.00 231.00
2 0
1 1
0 2 0 0 0 0 0 1 0 1 23.00
Support Personnel
1.40 194.29
1 2
0 3
0 2 0 1 0 0 0 2 1 0 19.67
PK-12 Teachers
24.20 190.00
22 6
5 23
20 6 1 1 0 2
15 6 4 1
10.39
*Includes One- and Two-Year Vocational Certificates.
ACCREDITATION DATA
Accredited by Georgia Accrediting Commission (GAC).
1998-99 GEORGIA PUBLIC EDUCATION REPORT CARD Dobbs Elementary School - 7613058
Prepared by Georgia Department of Education
Page 5
1998-99 GEORGIA PUBLIC EDUCATION REPORT CARD
ATLANTA CITY SCHOOLS
Douglass High School - 7614058
Grade Range 9-12
The Georgia Public Education Report Card is designed to assist systems and schools in educational improvement. This report card contains a variety of data elements. An explanation of the terms is provided as a companion to the report card data. Please refer to the definitions for the most effective use of the reported data.
Total 2,055
STUDENT DATA
9-12 Enrollment, by Race/Ethnicity and Sex
Black
White Hispanic
American Multi-
Asian Indian
racial
2,034 99.0%
6 0.3%
1 0.0%
12 0.6%
0 0.0%
2 0.1%
Male Female
968 47.1%
1,087 52.9%
Enrollment in Selected Programs
Program
Gifted (Grades K-12)
Program % of Student Enrollment Population
185
9.0%
Non-Vocational Labs (Grades 9-12)
Vocational Labs (Grades 9-12)
Alternative Programs (Grades 6-12)
1,762 1,146
0
85.7% 55.8%
0.0%
Students Eligible to Receive Free/Reduced Lunches
Number
Percent
School System
978 45,695
47.6% 75.5%
Enrollment in Compensatory Programs
Program
Program % of Student Enrollment Population
Special Education (Grades K-12) PK
87
4.2%
0
N/A
English to Speakers of Other Languages (ESOL) (Grades K-12)
0
0.0%
Remedial Education (Grades 2-5, 9-12)
255 12.4%
Title I (Grades K-12)
This school has a schoolwide program.
Dropout Rate for Grades 9-12
Number
Rate
School System
136 1,248
4.1% 5.4%
Total 197
Retained Students, by Race/Ethnicity and Sex
Black
White Hispanic
American MultiAsian Indian racial
196 99.5%
1 0.5%
0 0.0%
0 0.0%
0 0.0%
0 0.0%
Male Female
125
72
63.5% 36.5%
Prepared by Georgia Department of Education
Page 1
STATE-REQUIRED TEST DATA
GEORGIA HIGH SCHOOL GRADUATION TESTS (GHSGT)
Percent of Regular Program 11th Graders Passing the Georgia High School Graduation Tests on First Administration
English Language Arts Mathematics Social Studies Science
All Components listed above
Writing
1998-99
School System State
92% 80% 74% 59%
91% 79% 73% 61%
96% 88% 80% 72%
55% 55% 68%
93% 85% 93%
1997-98
School System State
89% 83% 71% 56%
89% 78% 68% 61%
94% 88% 78% 74%
52% 54% 68%
89% 83% 92%
1996-97
School System State
91% 78% 63% 57%
89% 72% 65% 52%
94% 87% 78% 74%
50% 46% 67%
91% 82% 93%
GRADUATE DATA
1999 Graduates by Credentials, Race/Ethnicity and Sex
Diplomas with Both College Prep. & Voc. Endorsements
Diplomas with College Prep. Endorsements Diplomas with Vocational Endorsements General High School Diplomas Special Education Diplomas
Total All Diplomas
Certificates of Performance
Total Graduates
Total 69
233 3 0
Black
69 100.0%
230 98.7%
3 100.0%
0
White Hispanic
0 0.0%
0 0.0%
0 0.0%
1 0.4%
0 0.0%
0 0.0%
0
0
American MultiAsian Indian racial
0 0.0%
0 0.0%
0 0.0%
1 0.4%
0 0.0%
1 0.4%
0 0.0%
0 0.0%
0 0.0%
0
0
0
7
7
100.0%
312
309
99.0%
0
0
0 0.0%
0 0.0%
0
0 0.0%
1 0.3%
0
0 0.0%
1 0.3%
0
0 0.0%
0 0.0%
0
0 0.0%
1 0.3%
0
312
309
0
1
1
0
1
99.0%
0.0% 0.3% 0.3% 0.0% 0.3%
Male Female
22
47
31.9% 68.1%
95
138
40.8% 59.2%
0
3
0.0% 100.0%
0
0
4 57.1%
121 38.8%
0
3 42.9%
191 61.2%
0
121
191
38.8% 61.2%
HOPE Scholarships
School System
Number of 1999 Graduates 3 1 2
Number Eligible
199
Percent Eligible
63.8%
2,041 1,099 53.8%
State
65,548 40,292 61.5%
High School Completion Rate
Percent of 1995Grade 9 Enrollment in Graduating Class of1999 School System State
Completion Rate '95-'99 69.6% 57.1% 68.9%
1998-99 GEORGIA PUBLIC EDUCATION REPORT CARD
Douglass High School - 7614058
Prepared by Georgia Department of Education
Page 2
COLLEGE ADMISSIONS / CREDIT TEST DATA
Scholastic Assessment Test (SAT)
Based on students' highest verbal and highest math scores
No. Taking
Average Score
Tests Verbal Math Total
Based on students' last test administration
Average Score Verbal Math Total
School
219
College Prep. Endorsement
Other Diplomas
System
1,265
College Prep. Endorsement
Other Diplomas
Georgia
41,958
443 432 N/A
445 441 N/A
492
430 418 N/A
436 430 N/A
488
873 850 N/A
881 871 N/A
980
433 N/A N/A
435 N/A N/A
483
418 N/A N/A
426 N/A N/A
479
851 N/A N/A
861 N/A N/A
962
Nation
952,913 N/A N/A N/A
502 508 1010
American College Testing (ACT)
Advanced Placement Exams (AP)
Number taking tests: English Mathematics Reading Science Reasoning CompositeScore
4 7 School System State
17.9 17.4 19.1
18.1 18.4 19.9
18.9 18.4
18.6 18.3
20.2 19.9
18.4 18.3 19.9
No. of Students Taking Tests
No. of Tests Taken No. of Test Scores
3 or Higher Percent of Test
Scores 3 or Higher
School 118 214 13
6.1%
System State 537 15,225 877 23,969 184 13,024
21.0% 54.3%
POST-SECONDARY DATA
Graduates Entering Georgia Public Colleges
Graduates Entering Georgia Public Colleges and Requiring Learning Support (LS)
1998 Graduates Entering in 1998-99
1997 Graduates Entering in 1997-98
Percent of Graduating Number Class
School
91
31.0%
System 452
21.7%
School
104
29.1%
System 437
21.1%
Number Requiring
LS 55 200
51 202
Percent of those attending Georgia
Public Colleges
60.4%
44.2%
49.0%
46.2%
In previous years, the Report Card presented College Prep Curriculum information provided by the Board of Regents on students requiring Learning Support. Due to inconsistencies in the data provided by the Board of Regents in defining College Prep Completers versus Local Board of Education data defining College Prep Endorsements, the Department of Education Report Card will not provide this information until discrepancies can be reconciled.
Graduates Entering Georgia Public Technical and Adult Schools
1998 Graduates School System
Entering Number 6 53
1998-99 Percent
2.0% 2.5%
Entering Number N/A N/A
1997-98 Percent
N/A N/A
1997 Graduates School
1
0.3%
System
3
0.1%
20
5.6%
109
5.3%
1998-99 GEORGIA PUBLIC EDUCATION REPORT CARD Douglass High School - 7614058
Prepared by Georgia Department of Education
Page 3
CERTIFIED PERSONNEL DATA
Positions Number Average Contract Days
Administrators
5.00 224.40
Support Personnel
8.50 201.18
PK-12 Teachers
101.10 190.89
Personnel Sex
Certificate
Years Experience
Full-time Part-time
Male Female
4 Yr Bachelor's 5 Yr Master's 6 Yr Specialist's 7 Yr Doctoral Other*
<1 1-10 11-20 21-30 >30
Average
5 0
3 2
0 1 3 1 0
0 0 1 1 3
29.20
8 1
2 7
0 6 3 0 0
0 1 1 5 2
24.00
100 4
29 75
32 64
5 3 0
2 32 15 40 15
18.38
*Includes One- and Two-Year Vocational Certificates.
ACCREDITATION DATA
Accredited by Southern Association of Colleges and Schools (SACS): Secondary/Middle Commission.
AWARDS / RECOGNITION DATA
Schools in Georgia may receive recognition in the following programs: Charter School Pay for Performance Program Georgia School of Excellence National Blue Ribbon School Douglass High School did not receive recognition in any of these programs during the 1998-99 school year.
1998-99 GEORGIA PUBLIC EDUCATION REPORT CARD Douglass High School - 7614058
Prepared by Georgia Department of Education
Page 4
1998-99 GEORGIA PUBLIC EDUCATION REPORT CARD
ATLANTA CITY SCHOOLS
Dunbar Elementary School - 7615558
Grade Range K-5
The Georgia Public Education Report Card is designed to assist systems and schools in educational improvement. This report card contains a variety of data elements. An explanation of the terms is provided as a companion to the report card data. Please refer to the definitions for the most effective use of the reported data.
STUDENT DATA
Total 500
K-5 Enrollment, by Race/Ethnicity and Sex
Black
White Hispanic
American Multi-
Asian Indian
racial
498 99.6%
0 0.0%
0 0.0%
0 0.0%
0 0.0%
2 0.4%
Male Female
264 52.8%
236 47.2%
Enrollment in Selected Programs
Program
Program % of Student Enrollment Population
Gifted (Grades K-12)
0
0.0%
Alternative Programs (Grades 6-12)
N/A
N/A
Students Eligible to Receive Free/Reduced Lunches
Number
Percent
School System
483 45,695
96.6% 75.5%
Dropout Rate *
Number
Rate
School System
N/A N/A
N/A N/A
* Dropout rates are not applicable for grades PK-5.
Enrollment in Compensatory Programs
Program
Program % of Student Enrollment Population
Special Education (Grades K-12)
21
4.2%
(PK)
0
N/A
English to Speakers of Other Languages (ESOL) (Grades K-12)
0
0.0%
Remedial Education (Grades 2-5, 9-12)
75 23.1%
Special Instructional Assistance (SIA) (Grades K-3)
257 73.0%
Title I (Grades K-12)
This school has a schoolwide program.
Total 12
Retained Students, by Race/Ethnicity and Sex
Black
White Hispanic
American Multi-
Asian Indian
racial
12 100.0%
0 0.0%
0 0.0%
0 0.0%
0 0.0%
0 0.0%
Male Female
11
1
91.7% 8.3%
Prepared by Georgia Department of Education
Page 1
STATE-REQUIRED TEST DATA
NORM-REFERENCED TESTS Grade 3
Iowa Tests of Basic Skills (ITBS) Each chart reflects data for three years of testing.
Reading Comprehension 50
44 50 54 0
98-99
45 55 53 97-98
57 48 52 96-97
Mathematics
School 50
System
State
0
56 53 61 98-99
44 58 61 97-98
63 51 59 96-97
School System State
Reading Vocabulary 50
52 50 50 0
98-99
48 51 50 97-98
53 44 49 96-97
Language Arts
School 50
System
State
0
53 61 64 98-99
43 63 62 97-98
70 54 59 96-97
School System State
Social Studies 50
42 50 56 0
98-99
33 52 55 97-98
53 50 55 96-97
Science
School 50
System
State
0
57 49 59 98-99
32 52 59 97-98
59 48 58 96-97
School System State
Sources of Information
Composite Score
50
46 48 57 0
98-99
School 50
System
48 51 56 97-98
48 47 55 96-97
State 0
50 51 58 98-99
40 55 57 97-98
1998-99 GEORGIA PUBLIC EDUCATION REPORT CARD Dunbar Elementary School - 7615558
Prepared by Georgia Department of Education
59 48 56 96-97
Scores Reported in Percentiles
School System State
Page 2
STATE-REQUIRED TEST DATA
NORM-REFERENCED TESTS Grade 5
Iowa Tests of Basic Skills (ITBS) Each chart reflects data for three years of testing.
Reading Comprehension
Mathematics
50
27 47 53 0
98-99
37 52 53 97-98
46 49 52 96-97
School 50
System
State
0
29 48 59 98-99
38 53 58 97-98
35 50 57 96-97
School System State
Reading Vocabulary 50
31 48 48 0
98-99
30 52 48 97-98
42 44 46 96-97
Language Arts
School 50
System
State
0
38 56 63 98-99
37 60 61 97-98
40 51 58 96-97
School System State
Social Studies 50
34 54 57 0
98-99
34 54 56 97-98
34 52 55 96-97
Science
School 50
System
State
0
27 48 60 98-99
27 50 59 97-98
34 48 59 96-97
School System State
Sources of Information
Composite Score
50
30 47 58 0
98-99
School 50
System
30 51 58 97-98
21 49 57 96-97
State 0
29 49 57 98-99
32 52 56 97-98
33 48 55 96-97
1998-99 GEORGIA PUBLIC EDUCATION REPORT CARD Dunbar Elementary School - 7615558
Prepared by Georgia Department of Education
Scores Reported in Percentiles
School System State
Page 3
STATE-REQUIRED TEST DATA
PERFORMANCE ASSESSMENTS
Grade 5 Writing Assessment
Percent at Developmental Stages:
1998-99 School System State
1997-98 School System State
1996-97 School System State
Stage Stage Stage Stage Stage Stage
1:The Emerging Writer 2:The Developing Writer 3:The Focusing Writer 4:The Experimenting 5:The Engaging Writer 6:The Extending Writer
0% 0% 8% 57% 30% 5%
1% 2% 22% 47% 22% 6%
0% 1% 16% 41% 29% 12%
3% 7% 36% 42% 8% 3%
1% 4% 24% 47% 19% 5%
0% 3% 19% 41% 27% 10%
0% 10% 32% 37% 16%
5%
1% 6% 32% 39% 17% 5%
0% 3% 21% 37% 26% 12%
AWARDS / RECOGNITION DATA
Schools in Georgia may receive recognition in the following programs: Charter School Pay for Performance Program Georgia School of Excellence National Blue Ribbon School Dunbar Elementary School did not receive recognition in any of these programs during the 1998-99 school year.
1998-99 GEORGIA PUBLIC EDUCATION REPORT CARD Dunbar Elementary School - 7615558
Prepared by Georgia Department of Education
Page 4
CERTIFIED PERSONNEL DATA
Positions Number Average Contract Days
Personnel Sex
Certificate
Years Experience
Full-time Part-time
Male Female
4 Yr Bachelor's 5 Yr Master's 6 Yr Specialist's 7 Yr Doctoral Other*
<1 1-10 11-20 21-30 >30
Average
Administrators
3.00 227.33
3 0
1 2
0 1 0 2 0 0 0 0 2 1 29.00
Support Personnel
2.00 196.00
1 3
0 4
0 3 1 0 0 0 0 0 1 3 32.50
PK-12 Teachers
32.40 190.00
30 5
1 34
21 13
1 0 0 1 10 9 12 3 16.94
*Includes One- and Two-Year Vocational Certificates.
ACCREDITATION DATA
Accredited by Georgia Accrediting Commission (GAC).
1998-99 GEORGIA PUBLIC EDUCATION REPORT CARD Dunbar Elementary School - 7615558
Prepared by Georgia Department of Education
Page 5
1998-99 GEORGIA PUBLIC EDUCATION REPORT CARD
ATLANTA CITY SCHOOLS
East Lake Elementary School - 7612059
Grade Range PK-5
The Georgia Public Education Report Card is designed to assist systems and schools in educational improvement. This report card contains a variety of data elements. An explanation of the terms is provided as a companion to the report card data. Please refer to the definitions for the most effective use of the reported data.
STUDENT DATA
Total
K-5
422
PK
40
Enrollment, by Race/Ethnicity and Sex
Black
White Hispanic
American Asian Indian
Multiracial
420 99.5%
1 0.2%
1 0.2%
0 0.0%
0 0.0%
0 0.0%
40 100.0%
0 0.0%
0 0.0%
0 0.0%
0 0.0%
0 0.0%
Male Female
217 51.4%
205 48.6%
13 32.5%
27 67.5%
Enrollment in Selected Programs
Program
Program % of Student Enrollment Population
Gifted (Grades K-12)
0
0.0%
Alternative Programs (Grades 6-12)
N/A
N/A
Students Eligible to Receive Free/Reduced Lunches
Number
Percent
School System
459 45,695
99.4% 75.5%
Dropout Rate *
Number
Rate
School System
N/A N/A
N/A N/A
* Dropout rates are not applicable for grades PK-5.
Enrollment in Compensatory Programs
Program
Program % of Student Enrollment Population
Special Education (Grades K-12)
31
7.3%
(PK)
0
N/A
English to Speakers of Other Languages (ESOL) (Grades K-12)
0
0.0%
Remedial Education (Grades 2-5, 9-12)
110 40.4%
Special Instructional Assistance (SIA) (Grades K-3)
105 37.2%
Title I (Grades K-12)
This school has a schoolwide program.
Total 19
Retained Students, by Race/Ethnicity and Sex
Black
White Hispanic
American MultiAsian Indian racial
19 100.0%
0 0.0%
0 0.0%
0 0.0%
0 0.0%
0 0.0%
Male Female
11
8
57.9% 42.1%
Prepared by Georgia Department of Education
Page 1
STATE-REQUIRED TEST DATA
NORM-REFERENCED TESTS Grade 3
Iowa Tests of Basic Skills (ITBS) Each chart reflects data for three years of testing.
Reading Comprehension 50
30 50 54 0
98-99
34 55 53 97-98
31 48 52 96-97
Mathematics
School 50
System
State
0
35 53 61 98-99
36 58 61 97-98
34 51 59 96-97
School System State
Reading Vocabulary 50
23 50 50 0
98-99
30 51 50 97-98
23 44 49 96-97
Language Arts
School 50
System
State
0
44 61 64 98-99
57 63 62 97-98
46 54 59 96-97
School System State
Social Studies 50
33 50 56 0
98-99
35 52 55 97-98
35 50 55 96-97
Science
School 50
System
State
0
28 49 59 98-99
34 52 59 97-98
39 48 58 96-97
School System State
Sources of Information
Composite Score
50
34 48 57 0
98-99
School 50
System
33 51 56 97-98
35 47 55 96-97
State 0
32 51 58 98-99
36 55 57 97-98
1998-99 GEORGIA PUBLIC EDUCATION REPORT CARD East Lake Elementary School - 7612059
Prepared by Georgia Department of Education
33 48 56 96-97
Scores Reported in Percentiles
School System State
Page 2
STATE-REQUIRED TEST DATA
NORM-REFERENCED TESTS Grade 5
Iowa Tests of Basic Skills (ITBS) Each chart reflects data for three years of testing.
Reading Comprehension
Mathematics
50
25 47 53 0
98-99
37 52 53 97-98
55 49 52 96-97
School 50
System
State
0
31 48 59 98-99
35 53 58 97-98
48 50 57 96-97
School System State
Reading Vocabulary 50
15 48 48 0
98-99
81 52 48 97-98
93 44 46 96-97
Language Arts
School 50
System
State
0
41 56 63 98-99
47 60 61 97-98
44 51 58 96-97
School System State
Social Studies 50
32 54 57 0
98-99
29 54 56 97-98
32 52 55 96-97
Science
School 50
System
State
0
25 48 60 98-99
62 50 59 97-98
27 48 59 96-97
School System State
Sources of Information
Composite Score
50
37 47 58 0
98-99
School 50
System
45 51 58 97-98
39 49 57 96-97
State 0
28 49 57 98-99
45 52 56 97-98
42 48 55 96-97
1998-99 GEORGIA PUBLIC EDUCATION REPORT CARD East Lake Elementary School - 7612059
Prepared by Georgia Department of Education
Scores Reported in Percentiles
School System State
Page 3
STATE-REQUIRED TEST DATA
PERFORMANCE ASSESSMENTS
Grade 5 Writing Assessment
Percent at Developmental Stages:
1998-99 School System State
1997-98 School System State
1996-97 School System State
Stage Stage Stage Stage Stage Stage
1:The Emerging Writer 2:The Developing Writer 3:The Focusing Writer 4:The Experimenting 5:The Engaging Writer 6:The Extending Writer
2% 2% 34% 43% 13% 4%
1% 2% 22% 47% 22% 6%
0% 1% 16% 41% 29% 12%
0% 4% 19% 63% 13% 2%
1% 4% 24% 47% 19% 5%
0% 3% 19% 41% 27% 10%
0% 0% 38% 45% 15% 3%
1% 6% 32% 39% 17% 5%
0% 3% 21% 37% 26% 12%
AWARDS / RECOGNITION DATA
Schools in Georgia may receive recognition in the following programs: Charter School Pay for Performance Program Georgia School of Excellence National Blue Ribbon School East Lake Elementary School did not receive recognition in any of these programs during the 1998-99 school year.
1998-99 GEORGIA PUBLIC EDUCATION REPORT CARD East Lake Elementary School - 7612059
Prepared by Georgia Department of Education
Page 4
CERTIFIED PERSONNEL DATA
Positions Number Average Contract Days
Personnel Sex
Certificate
Years Experience
Full-time Part-time
Male Female
4 Yr Bachelor's 5 Yr Master's 6 Yr Specialist's 7 Yr Doctoral Other*
<1 1-10 11-20 21-30 >30
Average
Administrators
2.00 231.00
2 0
2 0
0 1 0 1 0 0 0 1 1 0 21.00
Support Personnel
2.00 195.00
1 3
0 4
1 2 1 0 0 0 1 1 1 1 21.25
PK-12 Teachers
30.70 190.00
29 5
3 31
16 17
1 0 0 1 8 11 10 4 17.97
*Includes One- and Two-Year Vocational Certificates.
ACCREDITATION DATA
Accredited by Georgia Accrediting Commission (GAC).
1998-99 GEORGIA PUBLIC EDUCATION REPORT CARD East Lake Elementary School - 7612059
Prepared by Georgia Department of Education
Page 5
1998-99 GEORGIA PUBLIC EDUCATION REPORT CARD
ATLANTA CITY SCHOOLS
F L Stanton Elementary School - 7615566
Grade Range K-5
The Georgia Public Education Report Card is designed to assist systems and schools in educational improvement. This report card contains a variety of data elements. An explanation of the terms is provided as a companion to the report card data. Please refer to the definitions for the most effective use of the reported data.
STUDENT DATA
Total 316
K-5 Enrollment, by Race/Ethnicity and Sex
Black
White Hispanic
American Multi-
Asian Indian
racial
315 99.7%
0 0.0%
1 0.3%
0 0.0%
0 0.0%
0 0.0%
Male Female
172 54.4%
144 45.6%
Enrollment in Selected Programs
Program
Program % of Student Enrollment Population
Gifted (Grades K-12)
0
0.0%
Alternative Programs (Grades 6-12)
N/A
N/A
Students Eligible to Receive Free/Reduced Lunches
Number
Percent
School System
304 45,695
96.2% 75.5%
Dropout Rate *
Number
Rate
School System
N/A N/A
N/A N/A
* Dropout rates are not applicable for grades PK-5.
Enrollment in Compensatory Programs
Program
Program % of Student Enrollment Population
Special Education (Grades K-12)
22
7.0%
(PK)
0
N/A
English to Speakers of Other Languages (ESOL) (Grades K-12)
0
0.0%
Remedial Education (Grades 2-5, 9-12)
55 23.8%
Special Instructional Assistance (SIA) (Grades K-3)
117 59.1%
Title I (Grades K-12)
This school has a schoolwide program.
Total 7
Retained Students, by Race/Ethnicity and Sex
Black
White Hispanic
American Multi-
Asian Indian
racial
7 100.0%
0 0.0%
0 0.0%
0 0.0%
0 0.0%
0 0.0%
Male Female
7
0
100.0% 0.0%
Prepared by Georgia Department of Education
Page 1
STATE-REQUIRED TEST DATA
NORM-REFERENCED TESTS Grade 3
Iowa Tests of Basic Skills (ITBS) Each chart reflects data for three years of testing.
Reading Comprehension 50
43 50 54 0
98-99
41 55 53 97-98
40 48 52 96-97
Mathematics
School 50
System
State
0
53 53 61 98-99
43 58 61 97-98
55 51 59 96-97
School System State
Reading Vocabulary 50
49 50 50 0
98-99
42 51 50 97-98
44 44 49 96-97
Language Arts
School 50
System
State
0
61 61 64 98-99
55 63 62 97-98
61 54 59 96-97
School System State
Social Studies 50
45 50 56 0
98-99
40 52 55 97-98
51 50 55 96-97
Science
School 50
System
State
0
43 49 59 98-99
41 52 59 97-98
53 48 58 96-97
School System State
Sources of Information
Composite Score
50
60 48 57 0
98-99
School 50
System
48 51 56 97-98
50 47 55 96-97
State 0
51 51 58 98-99
43 55 57 97-98
1998-99 GEORGIA PUBLIC EDUCATION REPORT CARD F L Stanton Elementary School - 7615566
Prepared by Georgia Department of Education
50 48 56 96-97
Scores Reported in Percentiles
School System State
Page 2
STATE-REQUIRED TEST DATA
NORM-REFERENCED TESTS Grade 5
Iowa Tests of Basic Skills (ITBS) Each chart reflects data for three years of testing.
Reading Comprehension
Mathematics
50
60 47 53 0
98-99
46 52 53 97-98
57 49 52 96-97
School 50
System
State
0
57 48 59 98-99
53 53 58 97-98
82 50 57 96-97
School System State
Reading Vocabulary 50
72 48 48 0
98-99
58 52 48 97-98
54 44 46 96-97
Language Arts
School 50
System
State
0
54 56 63 98-99
58 60 61 97-98
67 51 58 96-97
School System State
Social Studies 50
58 54 57 0
98-99
55 54 56 97-98
69 52 55 96-97
Science
School 50
System
State
0
45 48 60 98-99
43 50 59 97-98
72 48 59 96-97
School System State
Sources of Information
Composite Score
50
58 47 58 0
98-99
School 50
System
57 51 58 97-98
69 49 57 96-97
State 0
56 49 57 98-99
52 52 56 97-98
70 48 55 96-97
1998-99 GEORGIA PUBLIC EDUCATION REPORT CARD F L Stanton Elementary School - 7615566
Prepared by Georgia Department of Education
Scores Reported in Percentiles
School System State
Page 3
STATE-REQUIRED TEST DATA
PERFORMANCE ASSESSMENTS
Grade 5 Writing Assessment
Percent at Developmental Stages:
1998-99 School System State
1997-98 School System State
1996-97 School System State
Stage Stage Stage Stage Stage Stage
1:The Emerging Writer 2:The Developing Writer 3:The Focusing Writer 4:The Experimenting 5:The Engaging Writer 6:The Extending Writer
0% 2% 9% 48% 30% 9%
1% 2% 22% 47% 22% 6%
0% 1% 16% 41% 29% 12%
2% 4% 31% 51% 11% 2%
1% 4% 24% 47% 19% 5%
0% 3% 19% 41% 27% 10%
1% 3% 30% 42% 19% 4%
1% 6% 32% 39% 17% 5%
0% 3% 21% 37% 26% 12%
AWARDS / RECOGNITION DATA
Schools in Georgia may receive recognition in the following programs: Charter School Pay for Performance Program Georgia School of Excellence National Blue Ribbon School F L Stanton Elementary School did not receive recognition in any of these programs during the 1998-99 school year.
1998-99 GEORGIA PUBLIC EDUCATION REPORT CARD F L Stanton Elementary School - 7615566
Prepared by Georgia Department of Education
Page 4
CERTIFIED PERSONNEL DATA
Positions Number Average Contract Days
Personnel Sex
Certificate
Years Experience
Full-time Part-time
Male Female
4 Yr Bachelor's 5 Yr Master's 6 Yr Specialist's 7 Yr Doctoral Other*
<1 1-10 11-20 21-30 >30
Average
Administrators
2.00 231.00
2 0
0 2
0 0 1 1 0 0 0 1 1 0 21.00
Support Personnel
2.10 195.24
1 3
0 4
0 2 2 0 0 0 1 0 3 0 21.75
PK-12 Teachers
21.40 190.00
19 7
2 24
14 10
2 0 0 2 10 9 4 1 12.23
*Includes One- and Two-Year Vocational Certificates.
ACCREDITATION DATA
Accredited by Georgia Accrediting Commission (GAC).
1998-99 GEORGIA PUBLIC EDUCATION REPORT CARD F L Stanton Elementary School - 7615566
Prepared by Georgia Department of Education
Page 5
1998-99 GEORGIA PUBLIC EDUCATION REPORT CARD
ATLANTA CITY SCHOOLS
Fain Elementary School - 7613059
Grade Range K-5
The Georgia Public Education Report Card is designed to assist systems and schools in educational improvement. This report card contains a variety of data elements. An explanation of the terms is provided as a companion to the report card data. Please refer to the definitions for the most effective use of the reported data.
STUDENT DATA
Total 581
K-5 Enrollment, by Race/Ethnicity and Sex
Black
White Hispanic
American Multi-
Asian Indian
racial
572 98.5%
1 0.2%
8 1.4%
0 0.0%
0 0.0%
0 0.0%
Male Female
274 47.2%
307 52.8%
Enrollment in Selected Programs
Program
Program % of Student Enrollment Population
Gifted (Grades K-12)
0
0.0%
Alternative Programs (Grades 6-12)
N/A
N/A
Students Eligible to Receive Free/Reduced Lunches
Number
Percent
School System
571 45,695
98.3% 75.5%
Dropout Rate *
Number
Rate
School System
N/A N/A
N/A N/A
* Dropout rates are not applicable for grades PK-5.
Enrollment in Compensatory Programs
Program
Program % of Student Enrollment Population
Special Education (Grades K-12)
37
6.4%
(PK)
0
N/A
English to Speakers of Other Languages (ESOL) (Grades K-12)
0
0.0%
Remedial Education (Grades 2-5, 9-12)
79 21.4%
Special Instructional Assistance (SIA) (Grades K-3)
270 62.2%
Title I (Grades K-12)
This school has a schoolwide program.
Total 58
Retained Students, by Race/Ethnicity and Sex
Black
White Hispanic
American Multi-
Asian Indian
racial
58 100.0%
0 0.0%
0 0.0%
0 0.0%
0 0.0%
0 0.0%
Male Female
31
27
53.4% 46.6%
Prepared by Georgia Department of Education
Page 1
STATE-REQUIRED TEST DATA
NORM-REFERENCED TESTS Grade 3
Iowa Tests of Basic Skills (ITBS) Each chart reflects data for three years of testing.
Reading Comprehension 50
64 50 54 0
98-99
40 55 53 97-98
38 48 52 96-97
Mathematics
School 50
System
State
0
49 53 61 98-99
48 58 61 97-98
35 51 59 96-97
School System State
Reading Vocabulary 50
88 50 50 0
98-99
28 51 50 97-98
21 44 49 96-97
Language Arts
School 50
System
State
0
62 61 64 98-99
64 63 62 97-98
42 54 59 96-97
School System State
Social Studies 50
53 50 56 0
98-99
44 52 55 97-98
39 50 55 96-97
Science
School 50
System
State
0
65 49 59 98-99
43 52 59 97-98
34 48 58 96-97
School System State
Sources of Information
Composite Score
50
53 48 57 0
98-99
School 50
System
53 51 56 97-98
44 47 55 96-97
State 0
61 51 58 98-99
46 55 57 97-98
1998-99 GEORGIA PUBLIC EDUCATION REPORT CARD Fain Elementary School - 7613059
Prepared by Georgia Department of Education
35 48 56 96-97
Scores Reported in Percentiles
School System State
Page 2
STATE-REQUIRED TEST DATA
NORM-REFERENCED TESTS Grade 5
Iowa Tests of Basic Skills (ITBS) Each chart reflects data for three years of testing.
Reading Comprehension
Mathematics
50
70 47 53 0
98-99
63 52 53 97-98
54 49 52 96-97
School 50
System
State
0
75 48 59 98-99
53 53 58 97-98
51 50 57 96-97
School System State
Reading Vocabulary 50
91 48 48 0
98-99
73 52 48 97-98
63 44 46 96-97
Language Arts
School 50
System
State
0
78 56 63 98-99
68 60 61 97-98
37 51 58 96-97
School System State
Social Studies 50
85 54 57 0
98-99
56 54 56 97-98
65 52 55 96-97
Science
School 50
System
State
0
79 48 60 98-99
40 50 59 97-98
54 48 59 96-97
School System State
Sources of Information
Composite Score
50
73 47 58 0
98-99
School 50
System
57 51 58 97-98
40 49 57 96-97
State 0
81 49 57 98-99
56 52 56 97-98
49 48 55 96-97
1998-99 GEORGIA PUBLIC EDUCATION REPORT CARD Fain Elementary School - 7613059
Prepared by Georgia Department of Education
Scores Reported in Percentiles
School System State
Page 3
STATE-REQUIRED TEST DATA
PERFORMANCE ASSESSMENTS
Grade 5 Writing Assessment
Percent at Developmental Stages:
1998-99 School System State
1997-98 School System State
1996-97 School System State
Stage Stage Stage Stage Stage Stage
1:The Emerging Writer 2:The Developing Writer 3:The Focusing Writer 4:The Experimenting 5:The Engaging Writer 6:The Extending Writer
0% 2% 17% 52% 21% 9%
1% 2% 22% 47% 22% 6%
0% 1% 16% 41% 29% 12%
1% 3% 36% 49% 10% 1%
1% 4% 24% 47% 19% 5%
0% 3% 19% 41% 27% 10%
3% 4% 45% 38% 9% 1%
1% 6% 32% 39% 17% 5%
0% 3% 21% 37% 26% 12%
AWARDS / RECOGNITION DATA
Schools in Georgia may receive recognition in the following programs: Charter School Pay for Performance Program Georgia School of Excellence National Blue Ribbon School Fain Elementary School did not receive recognition in any of these programs during the 1998-99 school year.
1998-99 GEORGIA PUBLIC EDUCATION REPORT CARD Fain Elementary School - 7613059
Prepared by Georgia Department of Education
Page 4
CERTIFIED PERSONNEL DATA
Positions Number Average Contract Days
Personnel Sex
Certificate
Years Experience
Full-time Part-time
Male Female
4 Yr Bachelor's 5 Yr Master's 6 Yr Specialist's 7 Yr Doctoral Other*
<1 1-10 11-20 21-30 >30
Average
Administrators
3.00 227.33
3 0
0 3
0 0 2 1 0 0 0 2 0 1 23.00
Support Personnel
2.20 192.73
1 2
1 2
0 3 0 0 0 0 1 0 0 2 25.33
PK-12 Teachers
35.60 190.00
34 5
6 33
23 11
5 0 0 3 14 6 11 5 15.49
*Includes One- and Two-Year Vocational Certificates.
ACCREDITATION DATA
Accredited by Georgia Accrediting Commission (GAC).
1998-99 GEORGIA PUBLIC EDUCATION REPORT CARD Fain Elementary School - 7613059
Prepared by Georgia Department of Education
Page 5
1998-99 GEORGIA PUBLIC EDUCATION REPORT CARD
ATLANTA CITY SCHOOLS
Fickett Elementary School - 7613559
Grade Range PK-5
The Georgia Public Education Report Card is designed to assist systems and schools in educational improvement. This report card contains a variety of data elements. An explanation of the terms is provided as a companion to the report card data. Please refer to the definitions for the most effective use of the reported data.
STUDENT DATA
Total
K-5
825
PK
19
Enrollment, by Race/Ethnicity and Sex
Black
White Hispanic
American Asian Indian
Multiracial
815 98.8%
5 0.6%
4 0.5%
0 0.0%
0 0.0%
1 0.1%
19 100.0%
0 0.0%
0 0.0%
0 0.0%
0 0.0%
0 0.0%
Male Female
415 50.3%
410 49.7%
7 36.8%
12 63.2%
Enrollment in Selected Programs
Program
Program % of Student Enrollment Population
Gifted (Grades K-12)
42
5.1%
Alternative Programs (Grades 6-12)
N/A
N/A
Students Eligible to Receive Free/Reduced Lunches
Number
Percent
School System
663 45,695
78.6% 75.5%
Dropout Rate *
Number
Rate
School System
N/A N/A
N/A N/A
* Dropout rates are not applicable for grades PK-5.
Enrollment in Compensatory Programs
Program
Program % of Student Enrollment Population
Special Education (Grades K-12)
39
4.7%
(PK)
0
N/A
English to Speakers of Other Languages (ESOL) (Grades K-12)
0
0.0%
Remedial Education (Grades 2-5, 9-12)
110 18.8%
Special Instructional Assistance (SIA) (Grades K-3)
110 20.1%
Title I (Grades K-12)
This school has a schoolwide program.
Total 4
Retained Students, by Race/Ethnicity and Sex
Black
White Hispanic
American MultiAsian Indian racial
4 100.0%
0 0.0%
0 0.0%
0 0.0%
0 0.0%
0 0.0%
Male Female
3
1
75.0% 25.0%
Prepared by Georgia Department of Education
Page 1
STATE-REQUIRED TEST DATA
NORM-REFERENCED TESTS Grade 3
Iowa Tests of Basic Skills (ITBS) Each chart reflects data for three years of testing.
Reading Comprehension 50
48 50 54 0
98-99
59 55 53 97-98
49 48 52 96-97
Mathematics
School 50
System
State
0
58 53 61 98-99
67 58 61 97-98
59 51 59 96-97
School System State
Reading Vocabulary 50
51 50 50 0
98-99
65 51 50 97-98
51 44 49 96-97
Language Arts
School 50
System
State
0
67 61 64 98-99
70 63 62 97-98
68 54 59 96-97
School System State
Social Studies 50
55 50 56 0
98-99
65 52 55 97-98
56 50 55 96-97
Science
School 50
System
State
0
52 49 59 98-99
61 52 59 97-98
59 48 58 96-97
School System State
Sources of Information
Composite Score
50
47 48 57 0
98-99
School 50
System
57 51 56 97-98
54 47 55 96-97
State 0
54 51 58 98-99
64 55 57 97-98
1998-99 GEORGIA PUBLIC EDUCATION REPORT CARD Fickett Elementary School - 7613559
Prepared by Georgia Department of Education
58 48 56 96-97
Scores Reported in Percentiles
School System State
Page 2
STATE-REQUIRED TEST DATA
NORM-REFERENCED TESTS Grade 5
Iowa Tests of Basic Skills (ITBS) Each chart reflects data for three years of testing.
Reading Comprehension
Mathematics
50
41 47 53 0
98-99
41 52 53 97-98
38 49 52 96-97
School 50
System
State
0
49 48 59 98-99
47 53 58 97-98
38 50 57 96-97
School System State
Reading Vocabulary 50
31 48 48 0
98-99
33 52 48 97-98
26 44 46 96-97
Language Arts
School 50
System
State
0
56 56 63 98-99
57 60 61 97-98
38 51 58 96-97
School System State
Social Studies 50
38 54 57 0
98-99
43 54 56 97-98
34 52 55 96-97
Science
School 50
System
State
0
33 48 60 98-99
42 50 59 97-98
31 48 59 96-97
School System State
Sources of Information
Composite Score
50
40 47 58 0
98-99
School 50
System
50 51 58 97-98
36 49 57 96-97
State 0
40 49 57 98-99
44 52 56 97-98
33 48 55 96-97
1998-99 GEORGIA PUBLIC EDUCATION REPORT CARD Fickett Elementary School - 7613559
Prepared by Georgia Department of Education
Scores Reported in Percentiles
School System State
Page 3
STATE-REQUIRED TEST DATA
PERFORMANCE ASSESSMENTS
Grade 5 Writing Assessment
Percent at Developmental Stages:
1998-99 School System State
1997-98 School System State
1996-97 School System State
Stage Stage Stage Stage Stage Stage
1:The Emerging Writer 2:The Developing Writer 3:The Focusing Writer 4:The Experimenting 5:The Engaging Writer 6:The Extending Writer
1% 3% 30% 47% 18% 2%
1% 2% 22% 47% 22% 6%
0% 1% 16% 41% 29% 12%
1% 5% 26% 54% 9% 3%
1% 4% 24% 47% 19% 5%
0% 3% 19% 41% 27% 10%
4% 9% 39% 32% 12% 5%
1% 6% 32% 39% 17% 5%
0% 3% 21% 37% 26% 12%
AWARDS / RECOGNITION DATA
Schools in Georgia may receive recognition in the following programs: Charter School Pay for Performance Program Georgia School of Excellence National Blue Ribbon School Fickett Elementary School did not receive recognition in any of these programs during the 1998-99 school year.
1998-99 GEORGIA PUBLIC EDUCATION REPORT CARD Fickett Elementary School - 7613559
Prepared by Georgia Department of Education
Page 4
CERTIFIED PERSONNEL DATA
Positions Number Average Contract Days
Personnel Sex
Certificate
Years Experience
Full-time Part-time
Male Female
4 Yr Bachelor's 5 Yr Master's 6 Yr Specialist's 7 Yr Doctoral Other*
<1 1-10 11-20 21-30 >30
Average
Administrators
3.00 227.33
3 0
0 3
0 1 1 1 0 0 0 0 3 0 24.67
Support Personnel
2.00 201.00
1 2
0 3
0 2 1 0 0 0 0 1 2 0 22.33
PK-12 Teachers
48.20 190.00
46 6
3 49
30 19
3 0 0 3 23 9 14 3 13.13
*Includes One- and Two-Year Vocational Certificates.
ACCREDITATION DATA
Accredited by Georgia Accrediting Commission (GAC).
1998-99 GEORGIA PUBLIC EDUCATION REPORT CARD Fickett Elementary School - 7613559
Prepared by Georgia Department of Education
Page 5
1998-99 GEORGIA PUBLIC EDUCATION REPORT CARD
ATLANTA CITY SCHOOLS
Garden Hills Elementary School - 7611560
Grade Range PK-5
The Georgia Public Education Report Card is designed to assist systems and schools in educational improvement. This report card contains a variety of data elements. An explanation of the terms is provided as a companion to the report card data. Please refer to the definitions for the most effective use of the reported data.
STUDENT DATA
Total
K-5
385
PK
25
Enrollment, by Race/Ethnicity and Sex
Black
White Hispanic
American Asian Indian
Multiracial
79 20.5%
90 23.4%
184 47.8%
25 6.5%
1 0.3%
6 1.6%
7 28.0%
8 32.0%
7 28.0%
2 8.0%
0 0.0%
1 4.0%
Male Female
207 53.8%
178 46.2%
11 44.0%
14 56.0%
Enrollment in Selected Programs
Program
Program % of Student Enrollment Population
Gifted (Grades K-12)
62
16.1%
Alternative Programs (Grades 6-12)
N/A
N/A
Students Eligible to Receive Free/Reduced Lunches
Number
Percent
School System
287 45,695
70.0% 75.5%
Dropout Rate *
Number
Rate
School System
N/A N/A
N/A N/A
* Dropout rates are not applicable for grades PK-5.
Enrollment in Compensatory Programs
Program
Program % of Student Enrollment Population
Special Education (Grades K-12)
28
7.3%
(PK)
5
N/A
English to Speakers of Other Languages (ESOL) (Grades K-12)
145 37.7%
Remedial Education (Grades 2-5, 9-12)
33 13.6%
Special Instructional Assistance (SIA) (Grades K-3)
150 55.1%
Title I (Grades K-12)
This school has a schoolwide program.
Total 14
Retained Students, by Race/Ethnicity and Sex
Black
White Hispanic
American MultiAsian Indian racial
2 14.3%
3
9
21.4% 64.3%
0 0.0%
0 0.0%
0 0.0%
Male Female
11
3
78.6% 21.4%
Prepared by Georgia Department of Education
Page 1
STATE-REQUIRED TEST DATA
NORM-REFERENCED TESTS Grade 3
Iowa Tests of Basic Skills (ITBS) Each chart reflects data for three years of testing.
Reading Comprehension 50
47 50 54 0
98-99
60 55 53 97-98
60 48 52 96-97
Mathematics
School 50
System
State
0
55 53 61 98-99
70 58 61 97-98
62 51 59 96-97
School System State
Reading Vocabulary 50
43 50 50 0
98-99
49 51 50 97-98
55 44 49 96-97
Language Arts
School 50
System
State
0
67 61 64 98-99
71 63 62 97-98
64 54 59 96-97
School System State
Social Studies 50
49 50 56 0
98-99
60 52 55 97-98
61 50 55 96-97
Science
School 50
System
State
0
43 49 59 98-99
62 52 59 97-98
55 48 58 96-97
School System State
Sources of Information
Composite Score
50
52 48 57 0
98-99
School 50
System
65 51 56 97-98
65 47 55 96-97
State 0
50 51 58 98-99
66 55 57 97-98
1998-99 GEORGIA PUBLIC EDUCATION REPORT CARD Garden Hills Elementary School - 7611560
Prepared by Georgia Department of Education
62 48 56 96-97
Scores Reported in Percentiles
School System State
Page 2
STATE-REQUIRED TEST DATA
NORM-REFERENCED TESTS Grade 5
Iowa Tests of Basic Skills (ITBS) Each chart reflects data for three years of testing.
Reading Comprehension
Mathematics
50
56 47 53 0
98-99
56 52 53 97-98
69 49 52 96-97
School 50
System
State
0
58 48 59 98-99
53 53 58 97-98
67 50 57 96-97
School System State
Reading Vocabulary 50
39 48 48 0
98-99
50 52 48 97-98
58 44 46 96-97
Language Arts
School 50
System
State
0
64 56 63 98-99
61 60 61 97-98
68 51 58 96-97
School System State
Social Studies 50
56 54 57 0
98-99
61 54 56 97-98
70 52 55 96-97
Science
School 50
System
State
0
55 48 60 98-99
59 50 59 97-98
67 48 59 96-97
School System State
Sources of Information
Composite Score
50
63 47 58 0
98-99
School 50
System
59 51 58 97-98
72 49 57 96-97
State 0
57 49 57 98-99
57 52 56 97-98
70 48 55 96-97
1998-99 GEORGIA PUBLIC EDUCATION REPORT CARD Garden Hills Elementary School - 7611560
Prepared by Georgia Department of Education
Scores Reported in Percentiles
School System State
Page 3
STATE-REQUIRED TEST DATA
PERFORMANCE ASSESSMENTS
Grade 5 Writing Assessment
Percent at Developmental Stages:
1998-99 School System State
1997-98 School System State
1996-97 School System State
Stage Stage Stage Stage Stage Stage
1:The Emerging Writer 2:The Developing Writer 3:The Focusing Writer 4:The Experimenting 5:The Engaging Writer 6:The Extending Writer
0% 3% 22% 53% 19% 3%
1% 2% 22% 47% 22% 6%
0% 1% 16% 41% 29% 12%
0% 3% 17% 26% 37% 14%
1% 4% 24% 47% 19% 5%
0% 3% 19% 41% 27% 10%
0% 6% 23% 27% 33% 10%
1% 6% 32% 39% 17% 5%
0% 3% 21% 37% 26% 12%
AWARDS / RECOGNITION DATA
Schools in Georgia may receive recognition in the following programs: Charter School Pay for Performance Program Georgia School of Excellence National Blue Ribbon School Garden Hills Elementary School did not receive recognition in any of these programs during the 1998-99 school year.
1998-99 GEORGIA PUBLIC EDUCATION REPORT CARD Garden Hills Elementary School - 7611560
Prepared by Georgia Department of Education
Page 4
CERTIFIED PERSONNEL DATA
Positions Number Average Contract Days
Personnel Sex
Certificate
Years Experience
Full-time Part-time
Male Female
4 Yr Bachelor's 5 Yr Master's 6 Yr Specialist's 7 Yr Doctoral Other*
<1 1-10 11-20 21-30 >30
Average
Administrators
2.00 231.00
2 0
0 2
0 0 2 0 0 0 0 0 2 0 26.50
Support Personnel
2.00 195.50
1 3
1 3
0 3 1 0 0 0 2 1 1 0 13.25
PK-12 Teachers
33.30 190.00
31 4
2 33
13 20
0 2 0 2 13 11 8 1 13.43
*Includes One- and Two-Year Vocational Certificates.
ACCREDITATION DATA
Accredited by Georgia Accrediting Commission (GAC).
1998-99 GEORGIA PUBLIC EDUCATION REPORT CARD Garden Hills Elementary School - 7611560
Prepared by Georgia Department of Education
Page 5
1998-99 GEORGIA PUBLIC EDUCATION REPORT CARD
ATLANTA CITY SCHOOLS
Gideons Elementary School - 7612560
Grade Range PK-5
The Georgia Public Education Report Card is designed to assist systems and schools in educational improvement. This report card contains a variety of data elements. An explanation of the terms is provided as a companion to the report card data. Please refer to the definitions for the most effective use of the reported data.
STUDENT DATA
Total
K-5
615
PK
80
Enrollment, by Race/Ethnicity and Sex
Black
White Hispanic
American Asian Indian
Multiracial
581 94.5%
9 1.5%
3 0.5%
20 3.3%
2 0.3%
0 0.0%
76 95.0%
0 0.0%
0 0.0%
4 5.0%
0 0.0%
0 0.0%
Male Female
333 54.1%
282 45.9%
44 55.0%
36 45.0%
Enrollment in Selected Programs
Program
Program % of Student Enrollment Population
Gifted (Grades K-12)
0
0.0%
Alternative Programs (Grades 6-12)
N/A
N/A
Students Eligible to Receive Free/Reduced Lunches
Number
Percent
School System
655 45,695
94.2% 75.5%
Dropout Rate *
Number
Rate
School System
N/A N/A
N/A N/A
* Dropout rates are not applicable for grades PK-5.
Enrollment in Compensatory Programs
Program
Program % of Student Enrollment Population
Special Education (Grades K-12)
22
3.6%
(PK)
0
N/A
English to Speakers of Other Languages (ESOL) (Grades K-12)
16
2.6%
Remedial Education (Grades 2-5, 9-12)
67 16.2%
Special Instructional Assistance (SIA) (Grades K-3)
274 61.4%
Title I (Grades K-12)
This school has a schoolwide program.
Total 27
Retained Students, by Race/Ethnicity and Sex
Black
White Hispanic
American MultiAsian Indian racial
27 100.0%
0 0.0%
0 0.0%
0 0.0%
0 0.0%
0 0.0%
Male Female
18
9
66.7% 33.3%
Prepared by Georgia Department of Education
Page 1
STATE-REQUIRED TEST DATA
NORM-REFERENCED TESTS Grade 3
Iowa Tests of Basic Skills (ITBS) Each chart reflects data for three years of testing.
Reading Comprehension 50
56 50 54 0
98-99
53 55 53 97-98
49 48 52 96-97
Mathematics
School 50
System
State
0
64 53 61 98-99
54 58 61 97-98
61 51 59 96-97
School System State
Reading Vocabulary 50
47 50 50 0
98-99
58 51 50 97-98
48 44 49 96-97
Language Arts
School 50
System
State
0
58 61 64 98-99
55 63 62 97-98
56 54 59 96-97
School System State
Social Studies 50
43 50 56 0
98-99
37 52 55 97-98
46 50 55 96-97
Science
School 50
System
State
0
43 49 59 98-99
42 52 59 97-98
45 48 58 96-97
School System State
Sources of Information
Composite Score
50
41 48 57 0
98-99
School 50
System
37 51 56 97-98
48 47 55 96-97
State 0
49 51 58 98-99
46 55 57 97-98
1998-99 GEORGIA PUBLIC EDUCATION REPORT CARD Gideons Elementary School - 7612560
Prepared by Georgia Department of Education
49 48 56 96-97
Scores Reported in Percentiles
School System State
Page 2
STATE-REQUIRED TEST DATA
NORM-REFERENCED TESTS Grade 5
Iowa Tests of Basic Skills (ITBS) Each chart reflects data for three years of testing.
Reading Comprehension
Mathematics
50
88 47 53 0
98-99
76 52 53 97-98
63 49 52 96-97
School 50
System
State
0
64 48 59 98-99
54 53 58 97-98
60 50 57 96-97
School System State
Reading Vocabulary 50
92 48 48 0
98-99
60 52 48 97-98
72 44 46 96-97
Language Arts
School 50
System
State
0
90 56 63 98-99
81 60 61 97-98
64 51 58 96-97
School System State
Social Studies 50
87 54 57 0
98-99
73 54 56 97-98
59 52 55 96-97
Science
School 50
System
State
0
91 48 60 98-99
68 50 59 97-98
57 48 59 96-97
School System State
Sources of Information
Composite Score
50
91 47 58 0
98-99
School 50
System
78 51 58 97-98
54 49 57 96-97
State 0
91 49 57 98-99
73 52 56 97-98
60 48 55 96-97
1998-99 GEORGIA PUBLIC EDUCATION REPORT CARD Gideons Elementary School - 7612560
Prepared by Georgia Department of Education
Scores Reported in Percentiles
School System State
Page 3
STATE-REQUIRED TEST DATA
PERFORMANCE ASSESSMENTS
Grade 5 Writing Assessment
Percent at Developmental Stages:
1998-99 School System State
1997-98 School System State
1996-97 School System State
Stage Stage Stage Stage Stage Stage
1:The Emerging Writer 2:The Developing Writer 3:The Focusing Writer 4:The Experimenting 5:The Engaging Writer 6:The Extending Writer
1% 1% 30% 38% 22% 7%
1% 2% 22% 47% 22% 6%
0% 1% 16% 41% 29% 12%
3% 2% 36% 38% 16% 2%
1% 4% 24% 47% 19% 5%
0% 3% 19% 41% 27% 10%
0% 6% 41% 30% 15% 7%
1% 6% 32% 39% 17% 5%
0% 3% 21% 37% 26% 12%
AWARDS / RECOGNITION DATA
Schools in Georgia may receive recognition in the following programs: Charter School Pay for Performance Program Georgia School of Excellence National Blue Ribbon School Gideons Elementary School did not receive recognition in any of these programs during the 1998-99 school year.
1998-99 GEORGIA PUBLIC EDUCATION REPORT CARD Gideons Elementary School - 7612560
Prepared by Georgia Department of Education
Page 4
CERTIFIED PERSONNEL DATA
Positions Number Average Contract Days
Personnel Sex
Certificate
Years Experience
Full-time Part-time
Male Female
4 Yr Bachelor's 5 Yr Master's 6 Yr Specialist's 7 Yr Doctoral Other*
<1 1-10 11-20 21-30 >30
Average
Administrators
3.00 227.33
3 0
1 2
0 2 1 0 0 0 0 1 0 2 26.67
Support Personnel
1.70 192.35
1 2
0 3
0 2 1 0 0 0 0 1 1 1 25.00
PK-12 Teachers
39.40 190.00
38 4
4 38
21 13
8 0 0 0 18 15 5 4 13.74
*Includes One- and Two-Year Vocational Certificates.
ACCREDITATION DATA
Accredited by Georgia Accrediting Commission (GAC).
1998-99 GEORGIA PUBLIC EDUCATION REPORT CARD Gideons Elementary School - 7612560
Prepared by Georgia Department of Education
Page 5
1998-99 GEORGIA PUBLIC EDUCATION REPORT CARD
ATLANTA CITY SCHOOLS
Grady High School - 7614560
Grade Range 9-12
The Georgia Public Education Report Card is designed to assist systems and schools in educational improvement. This report card contains a variety of data elements. An explanation of the terms is provided as a companion to the report card data. Please refer to the definitions for the most effective use of the reported data.
Total 877
STUDENT DATA
9-12 Enrollment, by Race/Ethnicity and Sex
Black
White Hispanic
American Multi-
Asian Indian
racial
630 71.8%
229 26.1%
8 0.9%
7 0.8%
1 0.1%
2 0.2%
Male Female
404 46.1%
473 53.9%
Enrollment in Selected Programs
Program
Gifted (Grades K-12)
Program % of Student Enrollment Population
138
15.7%
Non-Vocational Labs (Grades 9-12)
715
Vocational Labs
(Grades 9-12)
354
Alternative Programs (Grades 6-12)
85
81.5% 40.4%
9.7%
Students Eligible to Receive Free/Reduced Lunches
Number
Percent
School System
363 45,695
41.4% 75.5%
Enrollment in Compensatory Programs
Program
Program % of Student Enrollment Population
Special Education (Grades K-12) PK
85
9.7%
0
N/A
English to Speakers of Other Languages (ESOL) (Grades K-12)
0
0.0%
Remedial Education (Grades 2-5, 9-12)
71
8.1%
Title I (Grades K-12)
This school has a schoolwide program.
Dropout Rate for Grades 9-12
Number
Rate
School System
89 1,248
6.0% 5.4%
Total 115
Retained Students, by Race/Ethnicity and Sex
Black
White Hispanic
American MultiAsian Indian racial
102 88.7%
11 9.6%
1 0.9%
1 0.9%
0 0.0%
0 0.0%
Male Female
53
62
46.1% 53.9%
Prepared by Georgia Department of Education
Page 1
STATE-REQUIRED TEST DATA
GEORGIA HIGH SCHOOL GRADUATION TESTS (GHSGT)
Percent of Regular Program 11th Graders Passing the Georgia High School Graduation Tests on First Administration
English Language Arts Mathematics Social Studies Science
All Components listed above
Writing
1998-99
School System State
98% 85% 83% 77%
91% 79% 73% 61%
96% 88% 80% 72%
73% 55% 68%
88% 85% 93%
1997-98
School System State
93% 84% 73% 62%
89% 78% 68% 61%
94% 88% 78% 74%
58% 54% 68%
85% 83% 92%
1996-97
School System State
88% 75% 68% 64%
89% 72% 65% 52%
94% 87% 78% 74%
58% 46% 67%
80% 82% 93%
GRADUATE DATA
1999 Graduates by Credentials, Race/Ethnicity and Sex
Diplomas with Both College Prep. & Voc. Endorsements
Diplomas with College Prep. Endorsements Diplomas with Vocational Endorsements General High School Diplomas Special Education Diplomas
Total All Diplomas
Certificates of Performance
Total Graduates
Total 19 71 22 0
Black
18 94.7%
37 52.1%
22 100.0%
0
White Hispanic
0 0.0%
1 5.3%
32 45.1%
2 2.8%
0 0.0%
0 0.0%
0
0
American MultiAsian Indian racial
0 0.0%
0 0.0%
0 0.0%
0 0.0%
0 0.0%
0 0.0%
0 0.0%
0 0.0%
0 0.0%
0
0
0
9
8
1
0
0
0
0
88.9% 11.1% 0.0% 0.0% 0.0% 0.0%
121
85
33
3
0
0
0
70.2% 27.3% 2.5% 0.0% 0.0% 0.0%
2
2
100.0%
0 0.0%
0 0.0%
0 0.0%
0 0.0%
0 0.0%
123
87
33
3
0
0
0
70.7% 26.8% 2.4% 0.0% 0.0% 0.0%
Male Female
4
15
21.1% 78.9%
36
35
50.7% 49.3%
13
9
59.1% 40.9%
0
0
5
4
55.6% 44.4%
58
63
47.9% 52.1%
0
2
0.0% 100.0%
58
65
47.2% 52.8%
HOPE Scholarships
School System
Number of 1999 Graduates 1 2 3
Number Eligible
83
Percent Eligible
67.5%
2,041 1,099 53.8%
State
65,548 40,292 61.5%
High School Completion Rate
Percent of 1995Grade 9 Enrollment in Graduating Class of1999 School System State
Completion Rate '95-'99 60.6% 57.1% 68.9%
1998-99 GEORGIA PUBLIC EDUCATION REPORT CARD
Grady High School - 7614560
Prepared by Georgia Department of Education
Page 2
COLLEGE ADMISSIONS / CREDIT TEST DATA
Scholastic Assessment Test (SAT)
Based on students' highest verbal and highest math scores
No. Taking
Average Score
Tests Verbal Math Total
Based on students' last test administration
Average Score Verbal Math Total
School
82
College Prep. Endorsement
Other Diplomas
System
1,265
College Prep. Endorsement
Other Diplomas
Georgia
41,958
523 511 N/A
445 441 N/A
492
492 489 N/A
436 430 N/A
488
1015 1000
N/A
881 871 N/A
980
508 N/A N/A
435 N/A N/A
483
481 N/A N/A
426 N/A N/A
479
989 N/A N/A
861 N/A N/A
962
Nation
952,913 N/A N/A N/A
502 508 1010
American College Testing (ACT)
Advanced Placement Exams (AP)
Number taking tests: English Mathematics Reading Science Reasoning CompositeScore
1 4 School System State
17.9 17.4 19.1
18.7 18.4 19.9
19.9 20.4
18.6 18.3
20.2 19.9
19.4 18.3 19.9
No. of Students Taking Tests
No. of Tests Taken No. of Test Scores
3 or Higher Percent of Test
Scores 3 or Higher
School 70
141 74
52.5%
System State 537 15,225 877 23,969 184 13,024
21.0% 54.3%
POST-SECONDARY DATA
Graduates Entering Georgia Public Colleges
Graduates Entering Georgia Public Colleges and Requiring Learning Support (LS)
1998 Graduates Entering in 1998-99
1997 Graduates Entering in 1997-98
Percent of Graduating Number Class
School
20
18.2%
System 452
21.7%
School
28
21.9%
System 437
21.1%
Number Requiring
LS 4 200
7 202
Percent of those attending Georgia
Public Colleges
20.0%
44.2%
25.0%
46.2%
In previous years, the Report Card presented College Prep Curriculum information provided by the Board of Regents on students requiring Learning Support. Due to inconsistencies in the data provided by the Board of Regents in defining College Prep Completers versus Local Board of Education data defining College Prep Endorsements, the Department of Education Report Card will not provide this information until discrepancies can be reconciled.
Graduates Entering Georgia Public Technical and Adult Schools
1998 Graduates School System
Entering Number 1 53
1998-99 Percent
0.9% 2.5%
Entering Number N/A N/A
1997-98 Percent
N/A N/A
1997 Graduates School
0
0.0%
System
3
0.1%
2
1.6%
109
5.3%
1998-99 GEORGIA PUBLIC EDUCATION REPORT CARD Grady High School - 7614560
Prepared by Georgia Department of Education
Page 3
CERTIFIED PERSONNEL DATA
Positions Number Average Contract Days
Administrators
3.00 227.33
Support Personnel
3.90 198.21
PK-12 Teachers
46.70 190.86
Personnel Sex
Certificate
Years Experience
Full-time Part-time
Male Female
4 Yr Bachelor's 5 Yr Master's 6 Yr Specialist's 7 Yr Doctoral Other*
<1 1-10 11-20 21-30 >30
Average
3 0
2 1
0 1 1 1 0
0 0 0 3 0
25.67
3 2
2 3
0 4 1 0 0
0 2 3 0 0
12.00
46 2
21 27
18 28
1 1 0
0 17 19 10
2
14.29
*Includes One- and Two-Year Vocational Certificates.
ACCREDITATION DATA
Accredited by Southern Association of Colleges and Schools (SACS): Secondary/Middle Commission.
AWARDS / RECOGNITION DATA
Schools in Georgia may receive recognition in the following programs: Charter School Pay for Performance Program Georgia School of Excellence National Blue Ribbon School Grady High School did not receive recognition in any of these programs during the 1998-99 school year.
1998-99 GEORGIA PUBLIC EDUCATION REPORT CARD Grady High School - 7614560
Prepared by Georgia Department of Education
Page 4
1998-99 GEORGIA PUBLIC EDUCATION REPORT CARD
ATLANTA CITY SCHOOLS
Grove Park Elementary School - 7615560
Grade Range PK-5
The Georgia Public Education Report Card is designed to assist systems and schools in educational improvement. This report card contains a variety of data elements. An explanation of the terms is provided as a companion to the report card data. Please refer to the definitions for the most effective use of the reported data.
STUDENT DATA
Total
K-5
585
PK
20
Enrollment, by Race/Ethnicity and Sex
Black
White Hispanic
American Asian Indian
Multiracial
582 99.5%
0 0.0%
0 0.0%
0 0.0%
0 0.0%
3 0.5%
20 100.0%
0 0.0%
0 0.0%
0 0.0%
0 0.0%
0 0.0%
Male Female
296 50.6%
289 49.4%
9 45.0%
11 55.0%
Enrollment in Selected Programs
Program
Program % of Student Enrollment Population
Gifted (Grades K-12)
0
0.0%
Alternative Programs (Grades 6-12)
N/A
N/A
Students Eligible to Receive Free/Reduced Lunches
Number
Percent
School System
588 45,695
97.2% 75.5%
Dropout Rate *
Number
Rate
School System
N/A N/A
N/A N/A
* Dropout rates are not applicable for grades PK-5.
Enrollment in Compensatory Programs
Program
Program % of Student Enrollment Population
Special Education (Grades K-12)
54
9.2%
(PK)
0
N/A
English to Speakers of Other Languages (ESOL) (Grades K-12)
0
0.0%
Remedial Education (Grades 2-5, 9-12)
88 22.5%
Special Instructional Assistance (SIA) (Grades K-3)
219 56.2%
Title I (Grades K-12)
This school has a schoolwide program.
Total 20
Retained Students, by Race/Ethnicity and Sex
Black
White Hispanic
American MultiAsian Indian racial
20 100.0%
0 0.0%
0 0.0%
0 0.0%
0 0.0%
0 0.0%
Male Female
13
7
65.0% 35.0%
Prepared by Georgia Department of Education
Page 1
STATE-REQUIRED TEST DATA
NORM-REFERENCED TESTS Grade 3
Iowa Tests of Basic Skills (ITBS) Each chart reflects data for three years of testing.
Reading Comprehension 50
63 50 54 0
98-99
80 55 53 97-98
59 48 52 96-97
Mathematics
School 50
System
State
0
61 53 61 98-99
76 58 61 97-98
59 51 59 96-97
School System State
Reading Vocabulary 50
63 50 50 0
98-99
72 51 50 97-98
54 44 49 96-97
Language Arts
School 50
System
State
0
61 61 64 98-99
78 63 62 97-98
62 54 59 96-97
School System State
Social Studies 50
56 50 56 0
98-99
67 52 55 97-98
60 50 55 96-97
Science
School 50
System
State
0
69 49 59 98-99
85 52 59 97-98
76 48 58 96-97
School System State
Sources of Information
Composite Score
50
72 48 57 0
98-99
School 50
System
67 51 56 97-98
64 47 55 96-97
State 0
64 51 58 98-99
77 55 57 97-98
1998-99 GEORGIA PUBLIC EDUCATION REPORT CARD Grove Park Elementary School - 7615560
Prepared by Georgia Department of Education
64 48 56 96-97
Scores Reported in Percentiles
School System State
Page 2
STATE-REQUIRED TEST DATA
NORM-REFERENCED TESTS Grade 5
Iowa Tests of Basic Skills (ITBS) Each chart reflects data for three years of testing.
Reading Comprehension
Mathematics
50
34 47 53 0
98-99
46 52 53 97-98
39 49 52 96-97
School 50
System
State
0
43 48 59 98-99
60 53 58 97-98
29 50 57 96-97
School System State
Reading Vocabulary 50
40 48 48 0
98-99
45 52 48 97-98
41 44 46 96-97
Language Arts
School 50
System
State
0
53 56 63 98-99
65 60 61 97-98
47 51 58 96-97
School System State
Social Studies 50
62 54 57 0
98-99
58 54 56 97-98
77 52 55 96-97
Science
School 50
System
State
0
53 48 60 98-99
36 50 59 97-98
63 48 59 96-97
School System State
Sources of Information
Composite Score
50
32 47 58 0
98-99
School 50
System
48 51 58 97-98
46 49 57 96-97
State 0
46 49 57 98-99
51 52 56 97-98
51 48 55 96-97
1998-99 GEORGIA PUBLIC EDUCATION REPORT CARD Grove Park Elementary School - 7615560
Prepared by Georgia Department of Education
Scores Reported in Percentiles
School System State
Page 3
STATE-REQUIRED TEST DATA
PERFORMANCE ASSESSMENTS
Grade 5 Writing Assessment
Percent at Developmental Stages:
1998-99 School System State
1997-98 School System State
1996-97 School System State
Stage Stage Stage Stage Stage Stage
1:The Emerging Writer 2:The Developing Writer 3:The Focusing Writer 4:The Experimenting 5:The Engaging Writer 6:The Extending Writer
0% 2% 27% 56% 10% 5%
1% 2% 22% 47% 22% 6%
0% 1% 16% 41% 29% 12%
0% 3% 25% 55% 16% 1%
1% 4% 24% 47% 19% 5%
0% 3% 19% 41% 27% 10%
0% 8% 46% 30% 14% 0%
1% 6% 32% 39% 17% 5%
0% 3% 21% 37% 26% 12%
AWARDS / RECOGNITION DATA
Schools in Georgia may receive recognition in the following programs: Charter School Pay for Performance Program Georgia School of Excellence National Blue Ribbon School Grove Park Elementary School did not receive recognition in any of these programs during the 1998-99 school year.
1998-99 GEORGIA PUBLIC EDUCATION REPORT CARD Grove Park Elementary School - 7615560
Prepared by Georgia Department of Education
Page 4
CERTIFIED PERSONNEL DATA
Positions Number Average Contract Days
Personnel Sex
Certificate
Years Experience
Full-time Part-time
Male Female
4 Yr Bachelor's 5 Yr Master's 6 Yr Specialist's 7 Yr Doctoral Other*
<1 1-10 11-20 21-30 >30
Average
Administrators
3.00 227.33
3 0
0 3
0 2 0 1 0 0 1 0 1 1 20.00
Support Personnel
3.10 195.81
2 3
1 4
0 4 1 0 0 0 2 1 1 1 16.20
PK-12 Teachers
29.60 190.00
27 6
5 28
22 11
0 0 0 4 17 4 6 2 10.82
*Includes One- and Two-Year Vocational Certificates.
ACCREDITATION DATA
Accredited by Georgia Accrediting Commission (GAC).
1998-99 GEORGIA PUBLIC EDUCATION REPORT CARD Grove Park Elementary School - 7615560
Prepared by Georgia Department of Education
Page 5
1998-99 GEORGIA PUBLIC EDUCATION REPORT CARD
ATLANTA CITY SCHOOLS
Guice Elementary School - 7611061
Grade Range PK-5
The Georgia Public Education Report Card is designed to assist systems and schools in educational improvement. This report card contains a variety of data elements. An explanation of the terms is provided as a companion to the report card data. Please refer to the definitions for the most effective use of the reported data.
STUDENT DATA
Total
K-5
251
PK
20
Enrollment, by Race/Ethnicity and Sex
Black
White Hispanic
American Asian Indian
Multiracial
226 90.0%
11 4.4%
12 4.8%
0 0.0%
0 0.0%
2 0.8%
18 90.0%
1 5.0%
1 5.0%
0 0.0%
0 0.0%
0 0.0%
Male Female
128 51.0%
123 49.0%
9 45.0%
11 55.0%
Enrollment in Selected Programs
Program
Program % of Student Enrollment Population
Gifted (Grades K-12)
0
0.0%
Alternative Programs (Grades 6-12)
N/A
N/A
Students Eligible to Receive Free/Reduced Lunches
Number
Percent
School System
267 45,695
98.5% 75.5%
Dropout Rate *
Number
Rate
School System
N/A N/A
N/A N/A
* Dropout rates are not applicable for grades PK-5.
Enrollment in Compensatory Programs
Program
Program % of Student Enrollment Population
Special Education (Grades K-12)
28 11.2%
(PK)
0
N/A
English to Speakers of Other Languages (ESOL) (Grades K-12)
0
0.0%
Remedial Education (Grades 2-5, 9-12)
38 24.5%
Special Instructional Assistance (SIA) (Grades K-3)
82 46.9%
Title I (Grades K-12)
This school has a schoolwide program.
Total 0
Retained Students, by Race/Ethnicity and Sex
Black
White Hispanic
American MultiAsian Indian racial
0
0
0
0
0
0
Male Female
0
0
Prepared by Georgia Department of Education
Page 1
STATE-REQUIRED TEST DATA
NORM-REFERENCED TESTS Grade 3
Iowa Tests of Basic Skills (ITBS) Each chart reflects data for three years of testing.
Reading Comprehension 50
31 50 54 0
98-99
36 55 53 97-98
30 48 52 96-97
Mathematics
School 50
System
State
0
26 53 61 98-99
49 58 61 97-98
51 51 59 96-97
School System State
Reading Vocabulary 50
23 50 50 0
98-99
30 51 50 97-98
30 44 49 96-97
Language Arts
School 50
System
State
0
29 61 64 98-99
32 63 62 97-98
40 54 59 96-97
School System State
Social Studies 50
24 50 56 0
98-99
37 52 55 97-98
36 50 55 96-97
Science
School 50
System
State
0
22 49 59 98-99
34 52 59 97-98
41 48 58 96-97
School System State
Sources of Information
Composite Score
50
31 48 57 0
98-99
School 50
System
32 51 56 97-98
34 47 55 96-97
State 0
23 51 58 98-99
33 55 57 97-98
1998-99 GEORGIA PUBLIC EDUCATION REPORT CARD Guice Elementary School - 7611061
Prepared by Georgia Department of Education
36 48 56 96-97
Scores Reported in Percentiles
School System State
Page 2
STATE-REQUIRED TEST DATA
NORM-REFERENCED TESTS Grade 5
Iowa Tests of Basic Skills (ITBS) Each chart reflects data for three years of testing.
Reading Comprehension
Mathematics
50
35 47 53 0
98-99
67 52 53 97-98
33 49 52 96-97
School 50
System
State
0
30 48 59 98-99
66 53 58 97-98
23 50 57 96-97
School System State
Reading Vocabulary 50
19 48 48 0
98-99
65 52 48 97-98
18 44 46 96-97
Language Arts
School 50
System
State
0
33 56 63 98-99
65 60 61 97-98
26 51 58 96-97
School System State
Social Studies 50
27 54 57 0
98-99
60 54 56 97-98
21 52 55 96-97
Science
School 50
System
State
0
22 48 60 98-99
74 50 59 97-98
20 48 59 96-97
School System State
Sources of Information
Composite Score
50
28 47 58 0
98-99
School 50
System
51 51 58 97-98
23 49 57 96-97
State 0
26 49 57 98-99
64 52 56 97-98
20 48 55 96-97
1998-99 GEORGIA PUBLIC EDUCATION REPORT CARD Guice Elementary School - 7611061
Prepared by Georgia Department of Education
Scores Reported in Percentiles
School System State
Page 3
STATE-REQUIRED TEST DATA
PERFORMANCE ASSESSMENTS
Grade 5 Writing Assessment
Percent at Developmental Stages:
1998-99 School System State
1997-98 School System State
1996-97 School System State
Stage Stage Stage Stage Stage Stage
1:The Emerging Writer 2:The Developing Writer 3:The Focusing Writer 4:The Experimenting 5:The Engaging Writer 6:The Extending Writer
0% 4% 26% 44% 26% 0%
1% 2% 22% 47% 22% 6%
0% 1% 16% 41% 29% 12%
0% 10% 16% 35% 35%
0%
1% 4% 24% 47% 19% 5%
0% 3% 19% 41% 27% 10%
0% 10% 29% 48% 14%
0%
1% 6% 32% 39% 17% 5%
0% 3% 21% 37% 26% 12%
AWARDS / RECOGNITION DATA
Schools in Georgia may receive recognition in the following programs: Charter School Pay for Performance Program Georgia School of Excellence National Blue Ribbon School Guice Elementary School did not receive recognition in any of these programs during the 1998-99 school year.
1998-99 GEORGIA PUBLIC EDUCATION REPORT CARD Guice Elementary School - 7611061
Prepared by Georgia Department of Education
Page 4
CERTIFIED PERSONNEL DATA
Positions Number Average Contract Days
Personnel Sex
Certificate
Years Experience
Full-time Part-time
Male Female
4 Yr Bachelor's 5 Yr Master's 6 Yr Specialist's 7 Yr Doctoral Other*
<1 1-10 11-20 21-30 >30
Average
Administrators
2.00 242.00
2 0
0 2
0 1 0 1 0 0 0 0 2 0 25.50
Support Personnel
1.90 195.79
1 3
1 3
0 2 1 1 0 0 3 1 0 0 6.50
PK-12 Teachers
18.50 190.00
17 6
5 18
10 12
1 0 0 0 11 9 3 0 12.26
*Includes One- and Two-Year Vocational Certificates.
ACCREDITATION DATA
Accredited by Georgia Accrediting Commission (GAC).
1998-99 GEORGIA PUBLIC EDUCATION REPORT CARD Guice Elementary School - 7611061
Prepared by Georgia Department of Education
Page 5
1998-99 GEORGIA PUBLIC EDUCATION REPORT CARD
ATLANTA CITY SCHOOLS
Harper/Archer High School - 7612561
Grade Range 9-12
The Georgia Public Education Report Card is designed to assist systems and schools in educational improvement. This report card contains a variety of data elements. An explanation of the terms is provided as a companion to the report card data. Please refer to the definitions for the most effective use of the reported data.
Total 1,037
STUDENT DATA
9-12 Enrollment, by Race/Ethnicity and Sex
Black
White Hispanic
American Multi-
Asian Indian
racial
1,033 99.6%
3 0.3%
1 0.1%
0 0.0%
0 0.0%
0 0.0%
Male Female
537 51.8%
500 48.2%
Enrollment in Selected Programs
Program
Gifted (Grades K-12)
Program % of Student Enrollment Population
11
1.1%
Non-Vocational Labs (Grades 9-12)
844
Vocational Labs
(Grades 9-12)
699
Alternative Programs (Grades 6-12)
53
81.4% 67.4%
5.1%
Students Eligible to Receive Free/Reduced Lunches
Number
Percent
School System
952 45,695
91.8% 75.5%
Enrollment in Compensatory Programs
Program
Program % of Student Enrollment Population
Special Education (Grades K-12) PK
163 15.7%
0
N/A
English to Speakers of Other Languages (ESOL) (Grades K-12)
0
0.0%
Remedial Education (Grades 2-5, 9-12)
124 12.0%
Title I (Grades K-12)
This school has a schoolwide program.
Dropout Rate for Grades 9-12
Number
Rate
School System
160 1,248
9.3% 5.4%
Total 176
Retained Students, by Race/Ethnicity and Sex
Black
White Hispanic
American MultiAsian Indian racial
176 100.0%
0 0.0%
0 0.0%
0 0.0%
0 0.0%
0 0.0%
Male Female
99
77
56.3% 43.8%
Prepared by Georgia Department of Education
Page 1
STATE-REQUIRED TEST DATA
GEORGIA HIGH SCHOOL GRADUATION TESTS (GHSGT)
Percent of Regular Program 11th Graders Passing the Georgia High School Graduation Tests on First Administration
English Language Arts Mathematics Social Studies Science
All Components listed above
Writing
1998-99
School System State
86% 62% 58% 32%
91% 79% 73% 61%
96% 88% 80% 72%
29% 55% 68%
80% 85% 93%
1997-98
School System State
84% 56% 45% 39%
89% 78% 68% 61%
94% 88% 78% 74%
31% 54% 68%
72% 83% 92%
1996-97
School System State
81% 48% 50% 32%
89% 72% 65% 52%
94% 87% 78% 74%
22% 46% 67%
83% 82% 93%
GRADUATE DATA
1999 Graduates by Credentials, Race/Ethnicity and Sex
Diplomas with Both College Prep. & Voc. Endorsements
Diplomas with College Prep. Endorsements Diplomas with Vocational Endorsements General High School Diplomas Special Education Diplomas
Total All Diplomas
Certificates of Performance
Total Graduates
Total 39 21 22 8 12
102 27
129
Black
39 100.0%
21 100.0%
22 100.0%
8 100.0%
12 100.0%
102 100.0%
27 100.0%
129 100.0%
White Hispanic
0 0.0%
0 0.0%
0 0.0%
0 0.0%
0 0.0%
0 0.0%
0 0.0%
0 0.0%
0 0.0%
0 0.0%
0 0.0%
0 0.0%
0 0.0%
0 0.0%
0 0.0%
0 0.0%
American MultiAsian Indian racial
0 0.0%
0 0.0%
0 0.0%
0 0.0%
0 0.0%
0 0.0%
0 0.0%
0 0.0%
0 0.0%
0 0.0%
0 0.0%
0 0.0%
0 0.0%
0 0.0%
0 0.0%
0 0.0%
0 0.0%
0 0.0%
0 0.0%
0 0.0%
0 0.0%
0 0.0%
0 0.0%
0 0.0%
Male Female
23 59.0%
10 47.6%
16 41.0%
11 52.4%
11 50.0%
6 75.0%
7 58.3%
11 50.0%
2 25.0%
5 41.7%
57
45
55.9% 44.1%
12
15
44.4% 55.6%
69
60
53.5% 46.5%
HOPE Scholarships
School System
Number of 1999 Graduates 1 2 9
Number Eligible
45
Percent Eligible
34.9%
2,041 1,099 53.8%
State
65,548 40,292 61.5%
High School Completion Rate
Percent of 1995Grade 9 Enrollment in Graduating Class of1999 School System State
Completion Rate '95-'99 41.7% 57.1% 68.9%
1998-99 GEORGIA PUBLIC EDUCATION REPORT CARD
Harper/Archer High School - 7612561
Prepared by Georgia Department of Education
Page 2
COLLEGE ADMISSIONS / CREDIT TEST DATA
Scholastic Assessment Test (SAT)
Based on students' highest verbal and highest math scores
No. Taking
Average Score
Tests Verbal Math Total
Based on students' last test administration
Average Score Verbal Math Total
School
50
College Prep. Endorsement
Other Diplomas
System
1,265
College Prep. Endorsement
Other Diplomas
Georgia
41,958
372 362 N/A
445 441 N/A
492
367 362 N/A
436 430 N/A
488
739 724 N/A
881 871 N/A
980
352 N/A N/A
435 N/A N/A
483
358 N/A N/A
426 N/A N/A
479
710 N/A N/A
861 N/A N/A
962
Nation
952,913 N/A N/A N/A
502 508 1010
American College Testing (ACT)
Advanced Placement Exams (AP)
Number taking tests: English Mathematics Reading Science Reasoning CompositeScore
6 School System State
13.3 17.4 19.1
15.5 18.4 19.9
15.7 16.0
18.6 18.3
20.2 19.9
15.3 18.3 19.9
No. of Students Taking Tests
No. of Tests Taken No. of Test Scores
3 or Higher Percent of Test
Scores 3 or Higher
School 20 21 0
0.0%
System State 537 15,225 877 23,969 184 13,024
21.0% 54.3%
POST-SECONDARY DATA
Graduates Entering Georgia Public Colleges
Graduates Entering Georgia Public Colleges and Requiring Learning Support (LS)
1998 Graduates Entering in 1998-99
1997 Graduates Entering in 1997-98
Percent of Graduating Number Class
School
13
9.1%
System 452
21.7%
School
9
5.6%
System 437
21.1%
Number Requiring
LS 11 200
7 202
Percent of those attending Georgia
Public Colleges
84.6%
44.2%
77.8%
46.2%
In previous years, the Report Card presented College Prep Curriculum information provided by the Board of Regents on students requiring Learning Support. Due to inconsistencies in the data provided by the Board of Regents in defining College Prep Completers versus Local Board of Education data defining College Prep Endorsements, the Department of Education Report Card will not provide this information until discrepancies can be reconciled.
Graduates Entering Georgia Public Technical and Adult Schools
1998 Graduates School System
Entering Number 2 53
1998-99 Percent
1.4% 2.5%
Entering Number N/A N/A
1997-98 Percent
N/A N/A
1997 Graduates School
1
0.6%
System
3
0.1%
15
9.3%
109
5.3%
1998-99 GEORGIA PUBLIC EDUCATION REPORT CARD Harper/Archer High School - 7612561
Prepared by Georgia Department of Education
Page 3
CERTIFIED PERSONNEL DATA
Positions Number Average Contract Days
Administrators
4.00 225.50
Support Personnel
6.60 200.00
PK-12 Teachers
51.60 191.16
Personnel Sex
Certificate
Years Experience
Full-time Part-time
Male Female
4 Yr Bachelor's 5 Yr Master's 6 Yr Specialist's 7 Yr Doctoral Other*
<1 1-10 11-20 21-30 >30
Average
4 0
3 1
0 1 0 3 0
0 0 1 2 1
26.25
6 2
1 7
1 1 4 2 0
0 0 1 5 2
27.75
51 2
17 36
23 25
4 0 1
3 15 10 16
9
17.64
*Includes One- and Two-Year Vocational Certificates.
ACCREDITATION DATA
Accredited by Southern Association of Colleges and Schools (SACS): Secondary/Middle Commission.
AWARDS / RECOGNITION DATA
Schools in Georgia may receive recognition in the following programs: Charter School Pay for Performance Program Georgia School of Excellence National Blue Ribbon School Harper/Archer High School did not receive recognition in any of these programs during the 1998-99 school year.
1998-99 GEORGIA PUBLIC EDUCATION REPORT CARD Harper/Archer High School - 7612561
Prepared by Georgia Department of Education
Page 4
1998-99 GEORGIA PUBLIC EDUCATION REPORT CARD
ATLANTA CITY SCHOOLS
Herndon Elementary School - 7614561
Grade Range K-5
The Georgia Public Education Report Card is designed to assist systems and schools in educational improvement. This report card contains a variety of data elements. An explanation of the terms is provided as a companion to the report card data. Please refer to the definitions for the most effective use of the reported data.
STUDENT DATA
Total 584
K-5 Enrollment, by Race/Ethnicity and Sex
Black
White Hispanic
American Multi-
Asian Indian
racial
572 97.9%
12 2.1%
0 0.0%
0 0.0%
0 0.0%
0 0.0%
Male Female
291 49.8%
293 50.2%
Enrollment in Selected Programs
Program
Program % of Student Enrollment Population
Gifted (Grades K-12)
0
0.0%
Alternative Programs (Grades 6-12)
N/A
N/A
Students Eligible to Receive Free/Reduced Lunches
Number
Percent
School System
583 45,695
99.8% 75.5%
Dropout Rate *
Number
Rate
School System
N/A N/A
N/A N/A
* Dropout rates are not applicable for grades PK-5.
Enrollment in Compensatory Programs
Program
Program % of Student Enrollment Population
Special Education (Grades K-12)
59 10.1%
(PK)
0
N/A
English to Speakers of Other Languages (ESOL) (Grades K-12)
0
0.0%
Remedial Education (Grades 2-5, 9-12)
60 15.7%
Special Instructional Assistance (SIA) (Grades K-3)
124 30.3%
Title I (Grades K-12)
This school has a schoolwide program.
Total 39
Retained Students, by Race/Ethnicity and Sex
Black
White Hispanic
American Multi-
Asian Indian
racial
39 100.0%
0 0.0%
0 0.0%
0 0.0%
0 0.0%
0 0.0%
Male Female
31
8
79.5% 20.5%
Prepared by Georgia Department of Education
Page 1
STATE-REQUIRED TEST DATA
NORM-REFERENCED TESTS Grade 3
Iowa Tests of Basic Skills (ITBS) Each chart reflects data for three years of testing.
Reading Comprehension 50
16 50 54 0
98-99
22 55 53 97-98
20 48 52 96-97
Mathematics
School 50
System
State
0
20 53 61 98-99
34 58 61 97-98
25 51 59 96-97
School System State
Reading Vocabulary 50
15 50 50 0
98-99
29 51 50 97-98
27 44 49 96-97
Language Arts
School 50
System
State
0
25 61 64 98-99
31 63 62 97-98
24 54 59 96-97
School System State
Social Studies 50
21 50 56 0
98-99
28 52 55 97-98
28 50 55 96-97
Science
School 50
System
State
0
24 49 59 98-99
27 52 59 97-98
25 48 58 96-97
School System State
Sources of Information
Composite Score
50
19 48 57 0
98-99
School 50
System
31 51 56 97-98
26 47 55 96-97
State 0
18 51 58 98-99
30 55 57 97-98
1998-99 GEORGIA PUBLIC EDUCATION REPORT CARD Herndon Elementary School - 7614561
Prepared by Georgia Department of Education
23 48 56 96-97
Scores Reported in Percentiles
School System State
Page 2
STATE-REQUIRED TEST DATA
NORM-REFERENCED TESTS Grade 5
Iowa Tests of Basic Skills (ITBS) Each chart reflects data for three years of testing.
Reading Comprehension
Mathematics
50
33 47 53 0
98-99
45 52 53 97-98
38 49 52 96-97
School 50
System
State
0
21 48 59 98-99
48 53 58 97-98
28 50 57 96-97
School System State
Reading Vocabulary 50
29 48 48 0
98-99
66 52 48 97-98
20 44 46 96-97
Language Arts
School 50
System
State
0
33 56 63 98-99
54 60 61 97-98
34 51 58 96-97
School System State
Social Studies 50
18 54 57 0
98-99
39 54 56 97-98
23 52 55 96-97
Science
School 50
System
State
0
14 48 60 98-99
21 50 59 97-98
18 48 59 96-97
School System State
Sources of Information
Composite Score
50
22 47 58 0
98-99
School 50
System
44 51 58 97-98
30 49 57 96-97
State 0
20 49 57 98-99
40 52 56 97-98
24 48 55 96-97
1998-99 GEORGIA PUBLIC EDUCATION REPORT CARD Herndon Elementary School - 7614561
Prepared by Georgia Department of Education
Scores Reported in Percentiles
School System State
Page 3
STATE-REQUIRED TEST DATA
PERFORMANCE ASSESSMENTS
Grade 5 Writing Assessment
Percent at Developmental Stages:
1998-99 School System State
1997-98 School System State
1996-97 School System State
Stage Stage Stage Stage Stage Stage
1:The Emerging Writer 2:The Developing Writer 3:The Focusing Writer 4:The Experimenting 5:The Engaging Writer 6:The Extending Writer
1% 1% 45% 37% 13% 1%
1% 2% 22% 47% 22% 6%
0% 1% 16% 41% 29% 12%
1% 6% 39% 44% 10% 0%
1% 4% 24% 47% 19% 5%
0% 3% 19% 41% 27% 10%
2% 13% 38% 33% 10%
3%
1% 6% 32% 39% 17% 5%
0% 3% 21% 37% 26% 12%
AWARDS / RECOGNITION DATA
Schools in Georgia may receive recognition in the following programs: Charter School Pay for Performance Program Georgia School of Excellence National Blue Ribbon School Herndon Elementary School did not receive recognition in any of these programs during the 1998-99 school year.
1998-99 GEORGIA PUBLIC EDUCATION REPORT CARD Herndon Elementary School - 7614561
Prepared by Georgia Department of Education
Page 4
CERTIFIED PERSONNEL DATA
Positions Number Average Contract Days
Personnel Sex
Certificate
Years Experience
Full-time Part-time
Male Female
4 Yr Bachelor's 5 Yr Master's 6 Yr Specialist's 7 Yr Doctoral Other*
<1 1-10 11-20 21-30 >30
Average
Administrators
3.00 227.33
3 0
1 2
0 1 2 0 0 0 0 2 0 1 20.67
Support Personnel
1.60 196.25
1 2
0 3
0 1 1 1 0 0 0 1 1 1 25.33
PK-12 Teachers
30.10 190.00
28 5
5 28
20 12
1 0 0 1 17 8 6 1 11.42
*Includes One- and Two-Year Vocational Certificates.
ACCREDITATION DATA
Accredited by Georgia Accrediting Commission (GAC).
1998-99 GEORGIA PUBLIC EDUCATION REPORT CARD Herndon Elementary School - 7614561
Prepared by Georgia Department of Education
Page 5
1998-99 GEORGIA PUBLIC EDUCATION REPORT CARD
ATLANTA CITY SCHOOLS
Hope Elementary School - 7612062
Grade Range K-5
The Georgia Public Education Report Card is designed to assist systems and schools in educational improvement. This report card contains a variety of data elements. An explanation of the terms is provided as a companion to the report card data. Please refer to the definitions for the most effective use of the reported data.
STUDENT DATA
Total 354
K-5 Enrollment, by Race/Ethnicity and Sex
Black
White Hispanic
American Multi-
Asian Indian
racial
350 98.9%
1 0.3%
3 0.8%
0 0.0%
0 0.0%
0 0.0%
Male Female
196 55.4%
158 44.6%
Enrollment in Selected Programs
Program
Program % of Student Enrollment Population
Gifted (Grades K-12)
5
1.4%
Alternative Programs (Grades 6-12)
N/A
N/A
Students Eligible to Receive Free/Reduced Lunches
Number
Percent
School System
354 45,695
100.0% 75.5%
Dropout Rate *
Number
Rate
School System
N/A N/A
N/A N/A
* Dropout rates are not applicable for grades PK-5.
Enrollment in Compensatory Programs
Program
Program % of Student Enrollment Population
Special Education (Grades K-12)
20
5.6%
(PK)
0
N/A
English to Speakers of Other Languages (ESOL) (Grades K-12)
0
0.0%
Remedial Education (Grades 2-5, 9-12)
53 22.6%
Special Instructional Assistance (SIA) (Grades K-3)
146 57.7%
Title I (Grades K-12)
This school has a schoolwide program.
Total 15
Retained Students, by Race/Ethnicity and Sex
Black
White Hispanic
American Multi-
Asian Indian
racial
15 100.0%
0 0.0%
0 0.0%
0 0.0%
0 0.0%
0 0.0%
Male Female
11
4
73.3% 26.7%
Prepared by Georgia Department of Education
Page 1
STATE-REQUIRED TEST DATA
NORM-REFERENCED TESTS Grade 3
Iowa Tests of Basic Skills (ITBS) Each chart reflects data for three years of testing.
Reading Comprehension 50
20 50 54 0
98-99
38 55 53 97-98
26 48 52 96-97
Mathematics
School 50
System
State
0
27 53 61 98-99
34 58 61 97-98
27 51 59 96-97
School System State
Reading Vocabulary 50
28 50 50 0
98-99
30 51 50 97-98
35 44 49 96-97
Language Arts
School 50
System
State
0
32 61 64 98-99
44 63 62 97-98
31 54 59 96-97
School System State
Social Studies 50
27 50 56 0
98-99
37 52 55 97-98
34 50 55 96-97
Science
School 50
System
State
0
32 49 59 98-99
32 52 59 97-98
26 48 58 96-97
School System State
Sources of Information
Composite Score
50
29 48 57 0
98-99
School 50
System
29 51 56 97-98
27 47 55 96-97
State 0
27 51 58 98-99
33 55 57 97-98
1998-99 GEORGIA PUBLIC EDUCATION REPORT CARD Hope Elementary School - 7612062
Prepared by Georgia Department of Education
28 48 56 96-97
Scores Reported in Percentiles
School System State
Page 2
STATE-REQUIRED TEST DATA
NORM-REFERENCED TESTS Grade 5
Iowa Tests of Basic Skills (ITBS) Each chart reflects data for three years of testing.
Reading Comprehension
Mathematics
50
52 47 53 0
98-99
44 52 53 97-98
43 49 52 96-97
School 50
System
State
0
51 48 59 98-99
33 53 58 97-98
40 50 57 96-97
School System State
Reading Vocabulary 50
42 48 48 0
98-99
32 52 48 97-98
20 44 46 96-97
Language Arts
School 50
System
State
0
35 56 63 98-99
25 60 61 97-98
25 51 58 96-97
School System State
Social Studies 50
44 54 57 0
98-99
26 54 56 97-98
38 52 55 96-97
Science
School 50
System
State
0
69 48 60 98-99
55 50 59 97-98
39 48 59 96-97
School System State
Sources of Information
Composite Score
50
30 47 58 0
98-99
School 50
System
34 51 58 97-98
35 49 57 96-97
State 0
45 49 57 98-99
35 52 56 97-98
32 48 55 96-97
1998-99 GEORGIA PUBLIC EDUCATION REPORT CARD Hope Elementary School - 7612062
Prepared by Georgia Department of Education
Scores Reported in Percentiles
School System State
Page 3
STATE-REQUIRED TEST DATA
PERFORMANCE ASSESSMENTS
Grade 5 Writing Assessment
Percent at Developmental Stages:
1998-99 School System State
1997-98 School System State
1996-97 School System State
Stage Stage Stage Stage Stage Stage
1:The Emerging Writer 2:The Developing Writer 3:The Focusing Writer 4:The Experimenting 5:The Engaging Writer 6:The Extending Writer
0% 0% 26% 59% 11% 4%
1% 2% 22% 47% 22% 6%
0% 1% 16% 41% 29% 12%
0% 9% 28% 40% 21% 0%
1% 4% 24% 47% 19% 5%
0% 3% 19% 41% 27% 10%
0% 14% 32% 42% 12%
0%
1% 6% 32% 39% 17% 5%
0% 3% 21% 37% 26% 12%
AWARDS / RECOGNITION DATA
Schools in Georgia may receive recognition in the following programs: Charter School Pay for Performance Program Georgia School of Excellence National Blue Ribbon School Hope Elementary School did not receive recognition in any of these programs during the 1998-99 school year.
1998-99 GEORGIA PUBLIC EDUCATION REPORT CARD Hope Elementary School - 7612062
Prepared by Georgia Department of Education
Page 4
CERTIFIED PERSONNEL DATA
Positions Number Average Contract Days
Personnel Sex
Certificate
Years Experience
Full-time Part-time
Male Female
4 Yr Bachelor's 5 Yr Master's 6 Yr Specialist's 7 Yr Doctoral Other*
<1 1-10 11-20 21-30 >30
Average
Administrators
2.20 230.00
2 1
0 3
0 1 2 0 0 0 0 2 0 1 23.67
Support Personnel
1.60 196.25
1 2
2 1
0 1 1 1 0 0 0 1 2 0 22.00
PK-12 Teachers
29.30 190.00
28 4
3 29
15 13
4 0 0 0 16 11 2 3 12.78
*Includes One- and Two-Year Vocational Certificates.
ACCREDITATION DATA
Accredited by Georgia Accrediting Commission (GAC).
1998-99 GEORGIA PUBLIC EDUCATION REPORT CARD Hope Elementary School - 7612062
Prepared by Georgia Department of Education
Page 5
1998-99 GEORGIA PUBLIC EDUCATION REPORT CARD
ATLANTA CITY SCHOOLS
Howell Elementary School - 7614562
Grade Range K-5
The Georgia Public Education Report Card is designed to assist systems and schools in educational improvement. This report card contains a variety of data elements. An explanation of the terms is provided as a companion to the report card data. Please refer to the definitions for the most effective use of the reported data.
STUDENT DATA
Total 388
K-5 Enrollment, by Race/Ethnicity and Sex
Black
White Hispanic
American Multi-
Asian Indian
racial
383 98.7%
1 0.3%
4 1.0%
0 0.0%
0 0.0%
0 0.0%
Male Female
209 53.9%
179 46.1%
Enrollment in Selected Programs
Program
Program % of Student Enrollment Population
Gifted (Grades K-12)
0
0.0%
Alternative Programs (Grades 6-12)
N/A
N/A
Students Eligible to Receive Free/Reduced Lunches
Number
Percent
School System
365 45,695
94.1% 75.5%
Dropout Rate *
Number
Rate
School System
N/A N/A
N/A N/A
* Dropout rates are not applicable for grades PK-5.
Enrollment in Compensatory Programs
Program
Program % of Student Enrollment Population
Special Education (Grades K-12)
38
9.8%
(PK)
0
N/A
English to Speakers of Other Languages (ESOL) (Grades K-12)
0
0.0%
Remedial Education (Grades 2-5, 9-12)
48 17.3%
Special Instructional Assistance (SIA) (Grades K-3)
143 58.1%
Title I (Grades K-12)
This school has a schoolwide program.
Total 13
Retained Students, by Race/Ethnicity and Sex
Black
White Hispanic
American Multi-
Asian Indian
racial
13 100.0%
0 0.0%
0 0.0%
0 0.0%
0 0.0%
0 0.0%
Male Female
6
7
46.2% 53.8%
Prepared by Georgia Department of Education
Page 1
STATE-REQUIRED TEST DATA
NORM-REFERENCED TESTS Grade 3
Iowa Tests of Basic Skills (ITBS) Each chart reflects data for three years of testing.
Reading Comprehension 50
33 50 54 0
98-99
39 55 53 97-98
23 48 52 96-97
Mathematics
School 50
System
State
0
39 53 61 98-99
59 58 61 97-98
34 51 59 96-97
School System State
Reading Vocabulary 50
31 50 50 0
98-99
31 51 50 97-98
23 44 49 96-97
Language Arts
School 50
System
State
0
43 61 64 98-99
63 63 62 97-98
37 54 59 96-97
School System State
Social Studies 50
47 50 56 0
98-99
41 52 55 97-98
28 50 55 96-97
Science
School 50
System
State
0
41 49 59 98-99
33 52 59 97-98
22 48 58 96-97
School System State
Sources of Information
Composite Score
50
46 48 57 0
98-99
School 50
System
45 51 56 97-98
31 47 55 96-97
State 0
40 51 58 98-99
46 55 57 97-98
1998-99 GEORGIA PUBLIC EDUCATION REPORT CARD Howell Elementary School - 7614562
Prepared by Georgia Department of Education
26 48 56 96-97
Scores Reported in Percentiles
School System State
Page 2
STATE-REQUIRED TEST DATA
NORM-REFERENCED TESTS Grade 5
Iowa Tests of Basic Skills (ITBS) Each chart reflects data for three years of testing.
Reading Comprehension
Mathematics
50
41 47 53 0
98-99
37 52 53 97-98
28 49 52 96-97
School 50
System
State
0
43 48 59 98-99
48 53 58 97-98
28 50 57 96-97
School System State
Reading Vocabulary 50
67 48 48 0
98-99
30 52 48 97-98
16 44 46 96-97
Language Arts
School 50
System
State
0
54 56 63 98-99
60 60 61 97-98
29 51 58 96-97
School System State
Social Studies 50
48 54 57 0
98-99
61 54 56 97-98
28 52 55 96-97
Science
School 50
System
State
0
22 48 60 98-99
56 50 59 97-98
25 48 59 96-97
School System State
Sources of Information
Composite Score
50
39 47 58 0
98-99
School 50
System
42 51 58 97-98
27 49 57 96-97
State 0
41 49 57 98-99
49 52 56 97-98
24 48 55 96-97
1998-99 GEORGIA PUBLIC EDUCATION REPORT CARD Howell Elementary School - 7614562
Prepared by Georgia Department of Education
Scores Reported in Percentiles
School System State
Page 3
STATE-REQUIRED TEST DATA
PERFORMANCE ASSESSMENTS
Grade 5 Writing Assessment
Percent at Developmental Stages:
1998-99 School System State
1997-98 School System State
1996-97 School System State
Stage Stage Stage Stage Stage Stage
1:The Emerging Writer 2:The Developing Writer 3:The Focusing Writer 4:The Experimenting 5:The Engaging Writer 6:The Extending Writer
0% 2% 26% 55% 17% 0%
1% 2% 22% 47% 22% 6%
0% 1% 16% 41% 29% 12%
0% 9% 19% 53% 19% 0%
1% 4% 24% 47% 19% 5%
0% 3% 19% 41% 27% 10%
4% 8% 37% 35% 17% 0%
1% 6% 32% 39% 17% 5%
0% 3% 21% 37% 26% 12%
AWARDS / RECOGNITION DATA
Schools in Georgia may receive recognition in the following programs: Charter School Pay for Performance Program Georgia School of Excellence National Blue Ribbon School Howell Elementary School did not receive recognition in any of these programs during the 1998-99 school year.
1998-99 GEORGIA PUBLIC EDUCATION REPORT CARD Howell Elementary School - 7614562
Prepared by Georgia Department of Education
Page 4
CERTIFIED PERSONNEL DATA
Positions Number Average Contract Days
Personnel Sex
Certificate
Years Experience
Full-time Part-time
Male Female
4 Yr Bachelor's 5 Yr Master's 6 Yr Specialist's 7 Yr Doctoral Other*
<1 1-10 11-20 21-30 >30
Average
Administrators
2.00 231.00
2 0
1 1
0 0 2 0 0 0 0 0 2 0 27.00
Support Personnel
2.00 195.00
1 3
0 4
0 2 2 0 0 0 0 3 0 1 23.75
PK-12 Teachers
31.70 190.00
30 4
4 30
15 18
1 0 0 0 13 3 16 2 17.00
*Includes One- and Two-Year Vocational Certificates.
ACCREDITATION DATA
Accredited by Georgia Accrediting Commission (GAC).
1998-99 GEORGIA PUBLIC EDUCATION REPORT CARD Howell Elementary School - 7614562
Prepared by Georgia Department of Education
Page 5
1998-99 GEORGIA PUBLIC EDUCATION REPORT CARD
ATLANTA CITY SCHOOLS
Hubert Elementary School - 7615062
Grade Range PK-5
The Georgia Public Education Report Card is designed to assist systems and schools in educational improvement. This report card contains a variety of data elements. An explanation of the terms is provided as a companion to the report card data. Please refer to the definitions for the most effective use of the reported data.
STUDENT DATA
Total
K-5
245
PK
40
Enrollment, by Race/Ethnicity and Sex
Black
White Hispanic
American Asian Indian
Multiracial
177 72.2%
52 21.2%
14 5.7%
1 0.4%
0 0.0%
1 0.4%
30 75.0%
4 10.0%
3 7.5%
0 0.0%
0 0.0%
3 7.5%
Male Female
117 47.8%
128 52.2%
19 47.5%
21 52.5%
Enrollment in Selected Programs
Program
Program % of Student Enrollment Population
Gifted (Grades K-12)
0
0.0%
Alternative Programs (Grades 6-12)
N/A
N/A
Students Eligible to Receive Free/Reduced Lunches
Number
Percent
School System
269 45,695
94.4% 75.5%
Dropout Rate *
Number
Rate
School System
N/A N/A
N/A N/A
* Dropout rates are not applicable for grades PK-5.
Enrollment in Compensatory Programs
Program
Program % of Student Enrollment Population
Special Education (Grades K-12)
20
8.2%
(PK)
0
N/A
English to Speakers of Other Languages (ESOL) (Grades K-12)
6
2.4%
Remedial Education (Grades 2-5, 9-12)
32 21.1%
Special Instructional Assistance (SIA) (Grades K-3)
110 62.5%
Title I (Grades K-12)
This school has a schoolwide program.
Total 16
Retained Students, by Race/Ethnicity and Sex
Black
White Hispanic
American MultiAsian Indian racial
11 68.8%
5 31.3%
0 0.0%
0 0.0%
0 0.0%
0 0.0%
Male Female
7
9
43.8% 56.3%
Prepared by Georgia Department of Education
Page 1
STATE-REQUIRED TEST DATA
NORM-REFERENCED TESTS Grade 3
Iowa Tests of Basic Skills (ITBS) Each chart reflects data for three years of testing.
Reading Comprehension 50
36 50 54 0
98-99
40 55 53 97-98
32 48 52 96-97
Mathematics
School 50
System
State
0
46 53 61 98-99
53 58 61 97-98
43 51 59 96-97
School System State
Reading Vocabulary 50
29 50 50 0
98-99
29 51 50 97-98
23 44 49 96-97
Language Arts
School 50
System
State
0
63 61 64 98-99
55 63 62 97-98
58 54 59 96-97
School System State
Social Studies 50
48 50 56 0
98-99
41 52 55 97-98
35 50 55 96-97
Science
School 50
System
State
0
43 49 59 98-99
47 52 59 97-98
35 48 58 96-97
School System State
Sources of Information
Composite Score
50
41 48 57 0
98-99
School 50
System
49 51 56 97-98
56 47 55 96-97
State 0
44 51 58 98-99
45 55 57 97-98
1998-99 GEORGIA PUBLIC EDUCATION REPORT CARD Hubert Elementary School - 7615062
Prepared by Georgia Department of Education
40 48 56 96-97
Scores Reported in Percentiles
School System State
Page 2
STATE-REQUIRED TEST DATA
NORM-REFERENCED TESTS Grade 5
Iowa Tests of Basic Skills (ITBS) Each chart reflects data for three years of testing.
Reading Comprehension
Mathematics
50
51 47 53 0
98-99
47 52 53 97-98
48 49 52 96-97
School 50
System
State
0
31 48 59 98-99
50 53 58 97-98
67 50 57 96-97
School System State
Reading Vocabulary 50
27 48 48 0
98-99
60 52 48 97-98
75 44 46 96-97
Language Arts
School 50
System
State
0
55 56 63 98-99
50 60 61 97-98
55 51 58 96-97
School System State
Social Studies 50
49 54 57 0
98-99
67 54 56 97-98
56 52 55 96-97
Science
School 50
System
State
0
28 48 60 98-99
52 50 59 97-98
62 48 59 96-97
School System State
Sources of Information
Composite Score
50
43 47 58 0
98-99
School 50
System
45 51 58 97-98
50 49 57 96-97
State 0
40 49 57 98-99
53 52 56 97-98
57 48 55 96-97
1998-99 GEORGIA PUBLIC EDUCATION REPORT CARD Hubert Elementary School - 7615062
Prepared by Georgia Department of Education
Scores Reported in Percentiles
School System State
Page 3
STATE-REQUIRED TEST DATA
PERFORMANCE ASSESSMENTS
Grade 5 Writing Assessment
Percent at Developmental Stages:
1998-99 School System State
1997-98 School System State
1996-97 School System State
Stage Stage Stage Stage Stage Stage
1:The Emerging Writer 2:The Developing Writer 3:The Focusing Writer 4:The Experimenting 5:The Engaging Writer 6:The Extending Writer
4% 4% 22% 48% 22% 0%
1% 2% 22% 47% 22% 6%
0% 1% 16% 41% 29% 12%
3% 5% 21% 53% 16% 3%
1% 4% 24% 47% 19% 5%
0% 3% 19% 41% 27% 10%
0% 5% 38% 41% 14% 3%
1% 6% 32% 39% 17% 5%
0% 3% 21% 37% 26% 12%
AWARDS / RECOGNITION DATA
Schools in Georgia may receive recognition in the following programs: Charter School Pay for Performance Program Georgia School of Excellence National Blue Ribbon School Hubert Elementary School did not receive recognition in any of these programs during the 1998-99 school year.
1998-99 GEORGIA PUBLIC EDUCATION REPORT CARD Hubert Elementary School - 7615062
Prepared by Georgia Department of Education
Page 4
CERTIFIED PERSONNEL DATA
Positions Number Average Contract Days
Personnel Sex
Certificate
Years Experience
Full-time Part-time
Male Female
4 Yr Bachelor's 5 Yr Master's 6 Yr Specialist's 7 Yr Doctoral Other*
<1 1-10 11-20 21-30 >30
Average
Administrators
2.00 231.00
2 0
0 2
0 1 1 0 0 0 0 0 1 1 31.00
Support Personnel
1.90 195.26
1 3
0 4
1 1 2 0 0 0 1 1 1 1 19.75
PK-12 Teachers
17.20 190.00
15 7
8 14
13 7 1 1 0 1 6 6 8 1
16.91
*Includes One- and Two-Year Vocational Certificates.
ACCREDITATION DATA
Accredited by Georgia Accrediting Commission (GAC).
1998-99 GEORGIA PUBLIC EDUCATION REPORT CARD Hubert Elementary School - 7615062
Prepared by Georgia Department of Education
Page 5
1998-99 GEORGIA PUBLIC EDUCATION REPORT CARD
ATLANTA CITY SCHOOLS
Humphries Elementary School - 7615562
Grade Range PK-5
The Georgia Public Education Report Card is designed to assist systems and schools in educational improvement. This report card contains a variety of data elements. An explanation of the terms is provided as a companion to the report card data. Please refer to the definitions for the most effective use of the reported data.
STUDENT DATA
Total
K-5
517
PK
40
Enrollment, by Race/Ethnicity and Sex
Black
White Hispanic
American Asian Indian
Multiracial
507 98.1%
3 0.6%
5 1.0%
1 0.2%
0 0.0%
1 0.2%
36 90.0%
0 0.0%
2 5.0%
1 2.5%
0 0.0%
1 2.5%
Male Female
273 52.8%
244 47.2%
25 62.5%
15 37.5%
Enrollment in Selected Programs
Program
Program % of Student Enrollment Population
Gifted (Grades K-12)
0
0.0%
Alternative Programs (Grades 6-12)
N/A
N/A
Students Eligible to Receive Free/Reduced Lunches
Number
Percent
School System
406 45,695
72.9% 75.5%
Dropout Rate *
Number
Rate
School System
N/A N/A
N/A N/A
* Dropout rates are not applicable for grades PK-5.
Enrollment in Compensatory Programs
Program
Program % of Student Enrollment Population
Special Education (Grades K-12)
41
7.9%
(PK)
5
N/A
English to Speakers of Other Languages (ESOL) (Grades K-12)
0
0.0%
Remedial Education (Grades 2-5, 9-12)
39 11.0%
Special Instructional Assistance (SIA) (Grades K-3)
235 65.8%
Title I (Grades K-12)
This school has a schoolwide program.
Total 29
Retained Students, by Race/Ethnicity and Sex
Black
White Hispanic
American MultiAsian Indian racial
29 100.0%
0 0.0%
0 0.0%
0 0.0%
0 0.0%
0 0.0%
Male Female
17
12
58.6% 41.4%
Prepared by Georgia Department of Education
Page 1
STATE-REQUIRED TEST DATA
NORM-REFERENCED TESTS Grade 3
Iowa Tests of Basic Skills (ITBS) Each chart reflects data for three years of testing.
Reading Comprehension 50
64 50 54 0
98-99
68 55 53 97-98
29 48 52 96-97
Mathematics
School 50
System
State
0
72 53 61 98-99
84 58 61 97-98
31 51 59 96-97
School System State
Reading Vocabulary 50
60 50 50 0
98-99
79 51 50 97-98
34 44 49 96-97
Language Arts
School 50
System
State
0
70 61 64 98-99
83 63 62 97-98
53 54 59 96-97
School System State
Social Studies 50
67 50 56 0
98-99
70 52 55 97-98
36 50 55 96-97
Science
School 50
System
State
0
76 49 59 98-99
76 52 59 97-98
34 48 58 96-97
School System State
Sources of Information
Composite Score
50
62 48 57 0
98-99
School 50
System
67 51 56 97-98
35 47 55 96-97
State 0
69 51 58 98-99
77 55 57 97-98
1998-99 GEORGIA PUBLIC EDUCATION REPORT CARD Humphries Elementary School - 7615562
Prepared by Georgia Department of Education
33 48 56 96-97
Scores Reported in Percentiles
School System State
Page 2
STATE-REQUIRED TEST DATA
NORM-REFERENCED TESTS Grade 5
Iowa Tests of Basic Skills (ITBS) Each chart reflects data for three years of testing.
Reading Comprehension
Mathematics
50
34 47 53 0
98-99
36 52 53 97-98
31 49 52 96-97
School 50
System
State
0
33 48 59 98-99
50 53 58 97-98
44 50 57 96-97
School System State
Reading Vocabulary 50
46 48 48 0
98-99
38 52 48 97-98
22 44 46 96-97
Language Arts
School 50
System
State
0
49 56 63 98-99
46 60 61 97-98
31 51 58 96-97
School System State
Social Studies 50
65 54 57 0
98-99
36 54 56 97-98
31 52 55 96-97
Science
School 50
System
State
0
28 48 60 98-99
33 50 59 97-98
31 48 59 96-97
School System State
Sources of Information
Composite Score
50
40 47 58 0
98-99
School 50
System
43 51 58 97-98
36 49 57 96-97
State 0
41 49 57 98-99
39 52 56 97-98
31 48 55 96-97
1998-99 GEORGIA PUBLIC EDUCATION REPORT CARD Humphries Elementary School - 7615562
Prepared by Georgia Department of Education
Scores Reported in Percentiles
School System State
Page 3
STATE-REQUIRED TEST DATA
PERFORMANCE ASSESSMENTS
Grade 5 Writing Assessment
Percent at Developmental Stages:
1998-99 School System State
1997-98 School System State
1996-97 School System State
Stage Stage Stage Stage Stage Stage
1:The Emerging Writer 2:The Developing Writer 3:The Focusing Writer 4:The Experimenting 5:The Engaging Writer 6:The Extending Writer
1% 0% 1% 58% 32% 7%
1% 2% 22% 47% 22% 6%
0% 1% 16% 41% 29% 12%
2% 7% 13% 38% 28% 13%
1% 4% 24% 47% 19% 5%
0% 3% 19% 41% 27% 10%
8% 9% 30% 45% 8% 0%
1% 6% 32% 39% 17% 5%
0% 3% 21% 37% 26% 12%
AWARDS / RECOGNITION DATA
Schools in Georgia may receive recognition in the following programs: Charter School Pay for Performance Program Georgia School of Excellence National Blue Ribbon School Humphries Elementary School did not receive recognition in any of these programs during the 1998-99 school year.
1998-99 GEORGIA PUBLIC EDUCATION REPORT CARD Humphries Elementary School - 7615562
Prepared by Georgia Department of Education
Page 4
CERTIFIED PERSONNEL DATA
Positions Number Average Contract Days
Personnel Sex
Certificate
Years Experience
Full-time Part-time
Male Female
4 Yr Bachelor's 5 Yr Master's 6 Yr Specialist's 7 Yr Doctoral Other*
<1 1-10 11-20 21-30 >30
Average
Administrators
3.00 227.33
3 0
1 2
0 1 2 0 0 0 1 1 1 0 19.67
Support Personnel
2.00 195.00
1 3
1 3
1 2 1 0 0 0 0 2 0 2 25.50
PK-12 Teachers
33.70 190.00
32 4
7 29
25 9 2 0 0 3
20 6 6 1
10.56
*Includes One- and Two-Year Vocational Certificates.
ACCREDITATION DATA
Accredited by Georgia Accrediting Commission (GAC).
1998-99 GEORGIA PUBLIC EDUCATION REPORT CARD Humphries Elementary School - 7615562
Prepared by Georgia Department of Education
Page 5
1998-99 GEORGIA PUBLIC EDUCATION REPORT CARD
ATLANTA CITY SCHOOLS
Hutchinson Elementary School - 7611063
Grade Range PK-5
The Georgia Public Education Report Card is designed to assist systems and schools in educational improvement. This report card contains a variety of data elements. An explanation of the terms is provided as a companion to the report card data. Please refer to the definitions for the most effective use of the reported data.
STUDENT DATA
Total
K-5
574
PK
39
Enrollment, by Race/Ethnicity and Sex
Black
White Hispanic
American Asian Indian
Multiracial
361 62.9%
29 5.1%
67 11.7%
87 15.2%
0 0.0%
30 5.2%
26 66.7%
1 2.6%
12 30.8%
0 0.0%
0 0.0%
0 0.0%
Male Female
292 50.9%
282 49.1%
25 64.1%
14 35.9%
Enrollment in Selected Programs
Program
Program % of Student Enrollment Population
Gifted (Grades K-12)
0
0.0%
Alternative Programs (Grades 6-12)
N/A
N/A
Students Eligible to Receive Free/Reduced Lunches
Number
Percent
School System
527 45,695
86.0% 75.5%
Dropout Rate *
Number
Rate
School System
N/A N/A
N/A N/A
* Dropout rates are not applicable for grades PK-5.
Enrollment in Compensatory Programs
Program
Program % of Student Enrollment Population
Special Education (Grades K-12)
32
5.6%
(PK)
0
N/A
English to Speakers of Other Languages (ESOL) (Grades K-12)
115 20.0%
Remedial Education (Grades 2-5, 9-12)
51 13.7%
Special Instructional Assistance (SIA) (Grades K-3)
154 39.2%
Title I (Grades K-12)
This school has a schoolwide program.
Total 16
Retained Students, by Race/Ethnicity and Sex
Black
White Hispanic
American MultiAsian Indian racial
14 87.5%
1 6.3%
0 0.0%
1 6.3%
0 0.0%
0 0.0%
Male Female
10
6
62.5% 37.5%
Prepared by Georgia Department of Education
Page 1
STATE-REQUIRED TEST DATA
NORM-REFERENCED TESTS Grade 3
Iowa Tests of Basic Skills (ITBS) Each chart reflects data for three years of testing.
Reading Comprehension 50
36 50 54 0
98-99
38 55 53 97-98
36 48 52 96-97
Mathematics
School 50
System
State
0
37 53 61 98-99
41 58 61 97-98
44 51 59 96-97
School System State
Reading Vocabulary 50
24 50 50 0
98-99
40 51 50 97-98
36 44 49 96-97
Language Arts
School 50
System
State
0
41 61 64 98-99
38 63 62 97-98
47 54 59 96-97
School System State
Social Studies 50
34 50 56 0
98-99
44 52 55 97-98
40 50 55 96-97
Science
School 50
System
State
0
37 49 59 98-99
33 52 59 97-98
37 48 58 96-97
School System State
Sources of Information
Composite Score
50
33 48 57 0
98-99
School 50
System
32 51 56 97-98
45 47 55 96-97
State 0
33 51 58 98-99
35 55 57 97-98
1998-99 GEORGIA PUBLIC EDUCATION REPORT CARD Hutchinson Elementary School - 7611063
Prepared by Georgia Department of Education
40 48 56 96-97
Scores Reported in Percentiles
School System State
Page 2
STATE-REQUIRED TEST DATA
NORM-REFERENCED TESTS Grade 5
Iowa Tests of Basic Skills (ITBS) Each chart reflects data for three years of testing.
Reading Comprehension
Mathematics
50
41 47 53 0
98-99
39 52 53 97-98
35 49 52 96-97
School 50
System
State
0
57 48 59 98-99
50 53 58 97-98
43 50 57 96-97
School System State
Reading Vocabulary 50
44 48 48 0
98-99
37 52 48 97-98
17 44 46 96-97
Language Arts
School 50
System
State
0
57 56 63 98-99
61 60 61 97-98
47 51 58 96-97
School System State
Social Studies 50
49 54 57 0
98-99
47 54 56 97-98
36 52 55 96-97
Science
School 50
System
State
0
69 48 60 98-99
40 50 59 97-98
29 48 59 96-97
School System State
Sources of Information
Composite Score
50
49 47 58 0
98-99
School 50
System
44 51 58 97-98
45 49 57 96-97
State 0
53 49 57 98-99
45 52 56 97-98
35 48 55 96-97
1998-99 GEORGIA PUBLIC EDUCATION REPORT CARD Hutchinson Elementary School - 7611063
Prepared by Georgia Department of Education
Scores Reported in Percentiles
School System State
Page 3
STATE-REQUIRED TEST DATA
PERFORMANCE ASSESSMENTS
Grade 5 Writing Assessment
Percent at Developmental Stages:
1998-99 School System State
1997-98 School System State
1996-97 School System State
Stage Stage Stage Stage Stage Stage
1:The Emerging Writer 2:The Developing Writer 3:The Focusing Writer 4:The Experimenting 5:The Engaging Writer 6:The Extending Writer
0% 0% 6% 56% 31% 8%
1% 2% 22% 47% 22% 6%
0% 1% 16% 41% 29% 12%
2% 3% 26% 47% 21% 2%
1% 4% 24% 47% 19% 5%
0% 3% 19% 41% 27% 10%
2% 2% 35% 46% 16% 0%
1% 6% 32% 39% 17% 5%
0% 3% 21% 37% 26% 12%
AWARDS / RECOGNITION DATA
Schools in Georgia may receive recognition in the following programs: Charter School Pay for Performance Program Georgia School of Excellence National Blue Ribbon School Hutchinson Elementary School did not receive recognition in any of these programs during the 1998-99 school year.
1998-99 GEORGIA PUBLIC EDUCATION REPORT CARD Hutchinson Elementary School - 7611063
Prepared by Georgia Department of Education
Page 4
CERTIFIED PERSONNEL DATA
Positions Number Average Contract Days
Personnel Sex
Certificate
Years Experience
Full-time Part-time
Male Female
4 Yr Bachelor's 5 Yr Master's 6 Yr Specialist's 7 Yr Doctoral Other*
<1 1-10 11-20 21-30 >30
Average
Administrators
3.00 227.33
3 0
1 2
0 1 2 0 0 0 0 0 3 0 22.67
Support Personnel
2.40 195.00
1 3
0 4
0 3 1 0 0 1 1 2 0 0 10.75
PK-12 Teachers
35.40 190.00
35 2
6 31
14 20
2 1 0 0 19 9 7 2 12.89
*Includes One- and Two-Year Vocational Certificates.
ACCREDITATION DATA
Accredited by Georgia Accrediting Commission (GAC).
1998-99 GEORGIA PUBLIC EDUCATION REPORT CARD Hutchinson Elementary School - 7611063
Prepared by Georgia Department of Education
Page 5
1998-99 GEORGIA PUBLIC EDUCATION REPORT CARD
ATLANTA CITY SCHOOLS
Inman Middle School - 7611563
Grade Range 6-8
The Georgia Public Education Report Card is designed to assist systems and schools in educational improvement. This report card contains a variety of data elements. An explanation of the terms is provided as a companion to the report card data. Please refer to the definitions for the most effective use of the reported data.
STUDENT DATA
Total 754
6-8 Enrollment, by Race/Ethnicity and Sex
Black
White Hispanic
American Multi-
Asian Indian
racial
449 59.5%
279 37.0%
8 1.1%
9 1.2%
1 0.1%
8 1.1%
Male 369
48.9%
Female 385
51.1%
Enrollment in Selected Programs
Program
Gifted (Grades K-12)
Program % of Student Enrollment Population
353
46.8%
Alternative Programs (Grades 6-12)
0
0.0%
Students Eligible to Receive Free/Reduced Lunches
Number
Percent
School System
516 45,695
68.4% 75.5%
Enrollment in Compensatory Programs
Program
Program % of Student Enrollment Population
Special Education (Grades K-12) (PK)
86 11.4%
0
N/A
English to Speakers of Other Languages (ESOL) (Grades K-12)
0
0.0%
Title I (Grades K-12)
This school has a Targeted Assistance program.
Dropout Rate for Grades 6-8
Number
Rate
School System
43
3.9%
705
3.8%
Total 22
Retained Students, by Race/Ethnicity and Sex
Black
White Hispanic
American MultiAsian Indian racial
21 95.5%
0 0.0%
1 4.5%
0 0.0%
0 0.0%
0 0.0%
Male Female
12
10
54.5% 45.5%
Prepared by Georgia Department of Education
Page 1
STATE-REQUIRED TEST DATA
NORM-REFERENCED TESTS Grade 8
Iowa Tests of Basic Skills (ITBS) Each chart reflects data for three years of testing.
Reading Comprehension 50
66 36 49 0
98-99
63 35 48 97-98
56 34 48 96-97
Mathematics
School 50
System
State
0
70 45 56 98-99
64 43 55 97-98
61 43 54 96-97
School System State
Reading Vocabulary 50
59 32 46 0
98-99
58 36 45 97-98
52 27 44 96-97
Language Arts
School 50
System
State
0
73 42 60 98-99
67 43 58 97-98
64 40 56 96-97
School System State
Social Studies 50
73 42 54 0
98-99
69 45 53 97-98
62 41 53 96-97
Science
School 50
System
State
0
71 36 56 98-99
64 39 55 97-98
57 35 53 96-97
School System State
Sources of Information
Composite Score
50
75 42 57 0
98-99
School 50
System
71 42 56 97-98
64 42 55 96-97
State 0
73 39 56 98-99
67 40 54 97-98
1998-99 GEORGIA PUBLIC EDUCATION REPORT CARD Inman Middle School - 7611563
Prepared by Georgia Department of Education
62 37 54 96-97
Scores Reported in Percentiles
School System State
Page 2
STATE-REQUIRED TEST DATA
Categories of Scaled Scores
Inadequate (less than 162)
Minimal (162-209)
Good
(210-247)
Very Good (greater than 247)
Average Scaled Score: (Range 100-300)
PERFORMANCE ASSESSMENTS
Grade 8 Writing Assessment
1998-99 Percent Scoring
1997-98 Percent Scoring
1996-97 Percent Scoring
School System State School System State School System State
3% 29% 48% 20%
16% 51% 28%
5%
8% 40% 41% 11%
9% 47% 35% 10%
25% 53% 19%
3%
11% 46% 34%
8%
15% 42% 29% 15%
34% 48% 15%
3%
15% 46% 30%
8%
220
193
208 204
184 202 203
177 198
AWARDS / RECOGNITION DATA
Through the Pay for Performance Program, exemplary public schools and schools making outstanding progress toward becoming exemplary may be rewarded. Not a merit pay program, the Pay for Performance Program motivates and rewards entire school faculties for working together to make their schools exemplary. A school selected for participation in the program has one school year to attain at least 80% of its previously-approved performance objectives in order to receive an award based on $2,000 per certified faculty member.
Inman Middle School was a Pay for Performance recipient in 1998-99.
1998-99 GEORGIA PUBLIC EDUCATION REPORT CARD Inman Middle School - 7611563
Prepared by Georgia Department of Education
Page 3
CERTIFIED PERSONNEL DATA
Positions Number Average Contract Days
Personnel Sex
Certificate
Years Experience
Full-time Part-time
Male Female
4 Yr Bachelor's 5 Yr Master's 6 Yr Specialist's 7 Yr Doctoral Other*
<1 1-10 11-20 21-30 >30
Average
Administrators
3.00 227.33
3 0
1 2
0 1 1 1 0 0 0 0 2 1 29.33
Support Personnel
4.00 198.75
3 2
0 5
0 4 1 0 0 0 1 4 0 0 15.40
PK-12 Teachers
42.30 190.00
42 1
10 33
15 23
5 0 0 2 17 10 11 3 14.42
*Includes One- and Two-Year Vocational Certificates.
ACCREDITATION DATA
Accredited with Quality by Georgia Accrediting Commission (GAC).
1998-99 GEORGIA PUBLIC EDUCATION REPORT CARD Inman Middle School - 7611563
Prepared by Georgia Department of Education
Page 4
1998-99 GEORGIA PUBLIC EDUCATION REPORT CARD
ATLANTA CITY SCHOOLS
Jackson Elementary School - 7612563
Grade Range K-5
The Georgia Public Education Report Card is designed to assist systems and schools in educational improvement. This report card contains a variety of data elements. An explanation of the terms is provided as a companion to the report card data. Please refer to the definitions for the most effective use of the reported data.
STUDENT DATA
Total 557
K-5 Enrollment, by Race/Ethnicity and Sex
Black
White Hispanic
American Multi-
Asian Indian
racial
97 17.4%
422 75.8%
19 3.4%
12 2.2%
0 0.0%
7 1.3%
Male Female
282 50.6%
275 49.4%
Enrollment in Selected Programs
Program
Program % of Student Enrollment Population
Gifted (Grades K-12)
147
26.4%
Alternative Programs (Grades 6-12)
N/A
N/A
Students Eligible to Receive Free/Reduced Lunches
Number
Percent
School System
114 45,695
20.5% 75.5%
Dropout Rate *
Number
Rate
School System
N/A N/A
N/A N/A
* Dropout rates are not applicable for grades PK-5.
Enrollment in Compensatory Programs
Program
Program % of Student Enrollment Population
Special Education (Grades K-12)
40
7.2%
(PK)
0
N/A
English to Speakers of Other Languages (ESOL) (Grades K-12)
16
2.9%
Remedial Education (Grades 2-5, 9-12)
36 10.5%
Special Instructional Assistance (SIA) (Grades K-3)
0
0.0%
Title I (Grades K-12)
This school has no Title I program.
Total 7
Retained Students, by Race/Ethnicity and Sex
Black
White Hispanic
American Multi-
Asian Indian
racial
2 28.6%
4 57.1%
1 14.3%
0 0.0%
0 0.0%
0 0.0%
Male Female
4
3
57.1% 42.9%
Prepared by Georgia Department of Education
Page 1
STATE-REQUIRED TEST DATA
NORM-REFERENCED TESTS Grade 3
Iowa Tests of Basic Skills (ITBS) Each chart reflects data for three years of testing.
Reading Comprehension 50
81 50 54 0
98-99
84 55 53 97-98
78 48 52 96-97
Mathematics
School 50
System
State
0
88 53 61 98-99
94 58 61 97-98
87 51 59 96-97
School System State
Reading Vocabulary 50
78 50 50 0
98-99
86 51 50 97-98
82 44 49 96-97
Language Arts
School 50
System
State
0
93 61 64 98-99
96 63 62 97-98
88 54 59 96-97
School System State
Social Studies 50
83 50 56 0
98-99
86 52 55 97-98
79 50 55 96-97
Science
School 50
System
State
0
81 49 59 98-99
83 52 59 97-98
80 48 58 96-97
School System State
Sources of Information
Composite Score
50
87 48 57 0
98-99
School 50
System
91 51 56 97-98
82 47 55 96-97
State 0
88 51 58 98-99
92 55 57 97-98
1998-99 GEORGIA PUBLIC EDUCATION REPORT CARD Jackson Elementary School - 7612563
Prepared by Georgia Department of Education
85 48 56 96-97
Scores Reported in Percentiles
School System State
Page 2
STATE-REQUIRED TEST DATA
NORM-REFERENCED TESTS Grade 5
Iowa Tests of Basic Skills (ITBS) Each chart reflects data for three years of testing.
Reading Comprehension
Mathematics
50
80 47 53 0
98-99
69 52 53 97-98
80 49 52 96-97
School 50
System
State
0
87 48 59 98-99
78 53 58 97-98
89 50 57 96-97
School System State
Reading Vocabulary 50
77 48 48 0
98-99
69 52 48 97-98
77 44 46 96-97
Language Arts
School 50
System
State
0
86 56 63 98-99
78 60 61 97-98
84 51 58 96-97
School System State
Social Studies 50
83 54 57 0
98-99
76 54 56 97-98
81 52 55 96-97
Science
School 50
System
State
0
84 48 60 98-99
73 50 59 97-98
80 48 59 96-97
School System State
Sources of Information
Composite Score
50
84 47 58 0
98-99
School 50
System
77 51 58 97-98
86 49 57 96-97
State 0
88 49 57 98-99
77 52 56 97-98
86 48 55 96-97
1998-99 GEORGIA PUBLIC EDUCATION REPORT CARD Jackson Elementary School - 7612563
Prepared by Georgia Department of Education
Scores Reported in Percentiles
School System State
Page 3
STATE-REQUIRED TEST DATA
PERFORMANCE ASSESSMENTS
Grade 5 Writing Assessment
Percent at Developmental Stages:
1998-99 School System State
1997-98 School System State
1996-97 School System State
Stage Stage Stage Stage Stage Stage
1:The Emerging Writer 2:The Developing Writer 3:The Focusing Writer 4:The Experimenting 5:The Engaging Writer 6:The Extending Writer
0% 0% 6% 38% 38% 17%
1% 2% 22% 47% 22% 6%
0% 1% 16% 41% 29% 12%
0% 1% 13% 32% 39% 14%
1% 4% 24% 47% 19% 5%
0% 3% 19% 41% 27% 10%
1% 0% 7% 33% 34% 25%
1% 6% 32% 39% 17% 5%
0% 3% 21% 37% 26% 12%
AWARDS / RECOGNITION DATA
Schools in Georgia may receive recognition in the following programs: Charter School Pay for Performance Program Georgia School of Excellence National Blue Ribbon School Jackson Elementary School did not receive recognition in any of these programs during the 1998-99 school year.
1998-99 GEORGIA PUBLIC EDUCATION REPORT CARD Jackson Elementary School - 7612563
Prepared by Georgia Department of Education
Page 4
CERTIFIED PERSONNEL DATA
Positions Number Average Contract Days
Personnel Sex
Certificate
Years Experience
Full-time Part-time
Male Female
4 Yr Bachelor's 5 Yr Master's 6 Yr Specialist's 7 Yr Doctoral Other*
<1 1-10 11-20 21-30 >30
Average
Administrators
3.00 227.33
3 0
0 3
0 1 0 2 0 0 0 1 1 1 24.33
Support Personnel
2.40 194.58
1 3
0 4
0 2 2 0 0 0 1 2 1 0 16.75
PK-12 Teachers
34.10 190.00
32 6
3 35
24 12
2 0 0 0 19 12 7 0 12.50
*Includes One- and Two-Year Vocational Certificates.
ACCREDITATION DATA
Accredited by Georgia Accrediting Commission (GAC).
1998-99 GEORGIA PUBLIC EDUCATION REPORT CARD Jackson Elementary School - 7612563
Prepared by Georgia Department of Education
Page 5
1998-99 GEORGIA PUBLIC EDUCATION REPORT CARD
ATLANTA CITY SCHOOLS
Kennedy Middle School - 7615563
Grade Range PK, 6-8
The Georgia Public Education Report Card is designed to assist systems and schools in educational improvement. This report card contains a variety of data elements. An explanation of the terms is provided as a companion to the report card data. Please refer to the definitions for the most effective use of the reported data.
STUDENT DATA
Total
6-8
748
PK
92
Enrollment, by Race/Ethnicity and Sex
Black
American Multi-
White Hispanic Asian Indian
racial
747 99.9%
0 0.0%
1 0.1%
0 0.0%
0 0.0%
0 0.0%
91 98.9%
1 1.1%
0 0.0%
0 0.0%
0 0.0%
0 0.0%
Male 397
53.1% 48
52.2%
Female 351
46.9% 44
47.8%
Enrollment in Selected Programs
Program
Program Enrollment
Gifted
7
(Grades K-12)
Alternative Programs
0
(Grades 6-12)
% of Student Population < 1%
0.0%
Students Eligible to Receive Free/Reduced Lunches
Number
Percent
School System
577 45,695
68.7% 75.5%
Enrollment in Compensatory Programs
Program
Program % of Student Enrollment Population
Special Education (Grades K-12) (PK)
91 12.2%
0
N/A
English to Speakers of Other Languages (ESOL) (Grades K-12)
0
0.0%
Title I (Grades K-12)
This school has a schoolwide program.
Dropout Rate for Grades 6-8
Number
Rate
School System
89
7.4%
705
3.8%
Total 110
Retained Students, by Race/Ethnicity and Sex
Black
White Hispanic
American MultiAsian Indian racial
110 100.0%
0 0.0%
0 0.0%
0 0.0%
0 0.0%
0 0.0%
Male Female
70
40
63.6% 36.4%
Prepared by Georgia Department of Education
Page 1
STATE-REQUIRED TEST DATA
NORM-REFERENCED TESTS Grade 8
Iowa Tests of Basic Skills (ITBS) Each chart reflects data for three years of testing.
Reading Comprehension 50
20 36 49 0
98-99
23 35 48 97-98
24 34 48 96-97
Mathematics
School 50
System
State
0
21 45 56 98-99
22 43 55 97-98
25 43 54 96-97
School System State
Reading Vocabulary 50
12 32 46 0
98-99
17 36 45 97-98
16 27 44 96-97
Language Arts
School 50
System
State
0
31 42 60 98-99
33 43 58 97-98
29 40 56 96-97
School System State
Social Studies 50
24 42 54 0
98-99
25 45 53 97-98
28 41 53 96-97
Science
School 50
System
State
0
20 36 56 98-99
18 39 55 97-98
18 35 53 96-97
School System State
Sources of Information
Composite Score
50
25 42 57 0
98-99
School 50
System
27 42 56 97-98
27 42 55 96-97
State 0
19 39 56 98-99
22 40 54 97-98
1998-99 GEORGIA PUBLIC EDUCATION REPORT CARD Kennedy Middle School - 7615563
Prepared by Georgia Department of Education
22 37 54 96-97
Scores Reported in Percentiles
School System State
Page 2
STATE-REQUIRED TEST DATA
Categories of Scaled Scores
Inadequate (less than 162)
Minimal (162-209)
Good
(210-247)
Very Good (greater than 247)
Average Scaled Score: (Range 100-300)
PERFORMANCE ASSESSMENTS
Grade 8 Writing Assessment
1998-99 Percent Scoring
1997-98 Percent Scoring
1996-97 Percent Scoring
School System State School System State School System State
21% 64% 14%
1%
16% 51% 28%
5%
8% 40% 41% 11%
34% 55% 10%
0%
25% 53% 19%
3%
11% 46% 34%
8%
44% 42% 12%
2%
34% 48% 15%
3%
15% 46% 30%
8%
183
193
208 169
184 202 167
177 198
AWARDS / RECOGNITION DATA
Schools in Georgia may receive recognition in the following programs: Charter School Pay for Performance Program Georgia School of Excellence National Blue Ribbon School Kennedy Middle School did not receive recognition in any of these programs during the 1998-99 school year.
1998-99 GEORGIA PUBLIC EDUCATION REPORT CARD Kennedy Middle School - 7615563
Prepared by Georgia Department of Education
Page 3
CERTIFIED PERSONNEL DATA
Positions Number Average Contract Days
Personnel Sex
Certificate
Years Experience
Full-time Part-time
Male Female
4 Yr Bachelor's 5 Yr Master's 6 Yr Specialist's 7 Yr Doctoral Other*
<1 1-10 11-20 21-30 >30
Average
Administrators
3.00 227.33
3 0
2 1
0 1 2 0 0 0 0 0 1 2 29.67
Support Personnel
3.60 197.78
3 1
0 4
0 2 2 0 0 0 0 1 2 1 24.50
PK-12 Teachers
33.50 190.00
32 4
7 29
17 15
4 0 0 3 11 6 10 6 17.67
*Includes One- and Two-Year Vocational Certificates.
ACCREDITATION DATA
Accredited with Quality by Georgia Accrediting Commission (GAC).
1998-99 GEORGIA PUBLIC EDUCATION REPORT CARD Kennedy Middle School - 7615563
Prepared by Georgia Department of Education
Page 4
1998-99 GEORGIA PUBLIC EDUCATION REPORT CARD
ATLANTA CITY SCHOOLS
Kimberly Elementary School - 7611064
Grade Range PK-5
The Georgia Public Education Report Card is designed to assist systems and schools in educational improvement. This report card contains a variety of data elements. An explanation of the terms is provided as a companion to the report card data. Please refer to the definitions for the most effective use of the reported data.
STUDENT DATA
Total
K-5
617
PK
78
Enrollment, by Race/Ethnicity and Sex
Black
White Hispanic
American Asian Indian
Multiracial
614 99.5%
1 0.2%
0 0.0%
0 0.0%
0 0.0%
2 0.3%
78 100.0%
0 0.0%
0 0.0%
0 0.0%
0 0.0%
0 0.0%
Male Female
318 51.5%
299 48.5%
35 44.9%
43 55.1%
Enrollment in Selected Programs
Program
Program % of Student Enrollment Population
Gifted (Grades K-12)
0
0.0%
Alternative Programs (Grades 6-12)
N/A
N/A
Students Eligible to Receive Free/Reduced Lunches
Number
Percent
School System
577 45,695
83.0% 75.5%
Dropout Rate *
Number
Rate
School System
N/A N/A
N/A N/A
* Dropout rates are not applicable for grades PK-5.
Enrollment in Compensatory Programs
Program
Program % of Student Enrollment Population
Special Education (Grades K-12)
45
7.3%
(PK)
0
N/A
English to Speakers of Other Languages (ESOL) (Grades K-12)
0
0.0%
Remedial Education (Grades 2-5, 9-12)
61 15.7%
Special Instructional Assistance (SIA) (Grades K-3)
222 50.3%
Title I (Grades K-12)
This school has a schoolwide program.
Total 9
Retained Students, by Race/Ethnicity and Sex
Black
White Hispanic
American MultiAsian Indian racial
8 88.9%
1 11.1%
0 0.0%
0 0.0%
0 0.0%
0 0.0%
Male Female
8
1
88.9% 11.1%
Prepared by Georgia Department of Education
Page 1
STATE-REQUIRED TEST DATA
NORM-REFERENCED TESTS Grade 3
Iowa Tests of Basic Skills (ITBS) Each chart reflects data for three years of testing.
Reading Comprehension 50
69 50 54 0
98-99
77 55 53 97-98
77 48 52 96-97
Mathematics
School 50
System
State
0
60 53 61 98-99
74 58 61 97-98
69 51 59 96-97
School System State
Reading Vocabulary 50
75 50 50 0
98-99
72 51 50 97-98
70 44 49 96-97
Language Arts
School 50
System
State
0
72 61 64 98-99
83 63 62 97-98
72 54 59 96-97
School System State
Social Studies 50
64 50 56 0
98-99
67 52 55 97-98
65 50 55 96-97
Science
School 50
System
State
0
73 49 59 98-99
78 52 59 97-98
79 48 58 96-97
School System State
Sources of Information
Composite Score
50
61 48 57 0
98-99
School 50
System
62 51 56 97-98
69 47 55 96-97
State 0
68 51 58 98-99
75 55 57 97-98
1998-99 GEORGIA PUBLIC EDUCATION REPORT CARD Kimberly Elementary School - 7611064
Prepared by Georgia Department of Education
72 48 56 96-97
Scores Reported in Percentiles
School System State
Page 2
STATE-REQUIRED TEST DATA
NORM-REFERENCED TESTS Grade 5
Iowa Tests of Basic Skills (ITBS) Each chart reflects data for three years of testing.
Reading Comprehension
Mathematics
50
46 47 53 0
98-99
54 52 53 97-98
59 49 52 96-97
School 50
System
State
0
59 48 59 98-99
51 53 58 97-98
47 50 57 96-97
School System State
Reading Vocabulary 50
69 48 48 0
98-99
91 52 48 97-98
88 44 46 96-97
Language Arts
School 50
System
State
0
73 56 63 98-99
69 60 61 97-98
64 51 58 96-97
School System State
Social Studies 50
66 54 57 0
98-99
63 54 56 97-98
69 52 55 96-97
Science
School 50
System
State
0
61 48 60 98-99
67 50 59 97-98
65 48 59 96-97
School System State
Sources of Information
Composite Score
50
59 47 58 0
98-99
School 50
System
54 51 58 97-98
61 49 57 96-97
State 0
63 49 57 98-99
64 52 56 97-98
64 48 55 96-97
1998-99 GEORGIA PUBLIC EDUCATION REPORT CARD Kimberly Elementary School - 7611064
Prepared by Georgia Department of Education
Scores Reported in Percentiles
School System State
Page 3
STATE-REQUIRED TEST DATA
PERFORMANCE ASSESSMENTS
Grade 5 Writing Assessment
Percent at Developmental Stages:
1998-99 School System State
1997-98 School System State
1996-97 School System State
Stage Stage Stage Stage Stage Stage
1:The Emerging Writer 2:The Developing Writer 3:The Focusing Writer 4:The Experimenting 5:The Engaging Writer 6:The Extending Writer
0% 0% 9% 43% 42% 6%
1% 2% 22% 47% 22% 6%
0% 1% 16% 41% 29% 12%
0% 4% 18% 61% 14% 3%
1% 4% 24% 47% 19% 5%
0% 3% 19% 41% 27% 10%
0% 7% 38% 32% 17% 5%
1% 6% 32% 39% 17% 5%
0% 3% 21% 37% 26% 12%
AWARDS / RECOGNITION DATA
Schools in Georgia may receive recognition in the following programs: Charter School Pay for Performance Program Georgia School of Excellence National Blue Ribbon School Kimberly Elementary School did not receive recognition in any of these programs during the 1998-99 school year.
1998-99 GEORGIA PUBLIC EDUCATION REPORT CARD Kimberly Elementary School - 7611064
Prepared by Georgia Department of Education
Page 4
CERTIFIED PERSONNEL DATA
Positions Number Average Contract Days
Personnel Sex
Certificate
Years Experience
Full-time Part-time
Male Female
4 Yr Bachelor's 5 Yr Master's 6 Yr Specialist's 7 Yr Doctoral Other*
<1 1-10 11-20 21-30 >30
Average
Administrators
3.00 227.33
3 0
0 3
0 1 1 1 0 0 0 0 0 3 33.67
Support Personnel
2.10 195.24
1 3
1 3
0 2 2 0 0 0 0 2 2 0 22.25
PK-12 Teachers
38.80 190.00
38 5
8 35
25 15
1 2 0 1 16 9 11 6 16.28
*Includes One- and Two-Year Vocational Certificates.
ACCREDITATION DATA
Accredited by Georgia Accrediting Commission (GAC).
1998-99 GEORGIA PUBLIC EDUCATION REPORT CARD Kimberly Elementary School - 7611064
Prepared by Georgia Department of Education
Page 5
1998-99 GEORGIA PUBLIC EDUCATION REPORT CARD
ATLANTA CITY SCHOOLS
King Middle School - 7610373
Grade Range 6-8
The Georgia Public Education Report Card is designed to assist systems and schools in educational improvement. This report card contains a variety of data elements. An explanation of the terms is provided as a companion to the report card data. Please refer to the definitions for the most effective use of the reported data.
STUDENT DATA
Total 768
6-8 Enrollment, by Race/Ethnicity and Sex
Black
White Hispanic
American Multi-
Asian Indian
racial
631 82.2%
36 4.7%
76 9.9%
23 3.0%
0 0.0%
2 0.3%
Male 380
49.5%
Female 388
50.5%
Enrollment in Selected Programs
Program
Gifted (Grades K-12)
Program % of Student Enrollment Population
19
2.5%
Alternative Programs (Grades 6-12)
0
0.0%
Students Eligible to Receive Free/Reduced Lunches
Number
Percent
School System
675 45,695
87.9% 75.5%
Enrollment in Compensatory Programs
Program
Program % of Student Enrollment Population
Special Education (Grades K-12) (PK)
88 11.5%
0
N/A
English to Speakers of Other Languages (ESOL) (Grades K-12)
27
3.5%
Title I (Grades K-12)
This school has a schoolwide program.
Dropout Rate for Grades 6-8
Number
Rate
School System
45
4.0%
705
3.8%
Total 20
Retained Students, by Race/Ethnicity and Sex
Black
White Hispanic
American MultiAsian Indian racial
18 90.0%
2 10.0%
0 0.0%
0 0.0%
0 0.0%
0 0.0%
Male Female
8
12
40.0% 60.0%
Prepared by Georgia Department of Education
Page 1
STATE-REQUIRED TEST DATA
NORM-REFERENCED TESTS Grade 8
Iowa Tests of Basic Skills (ITBS) Each chart reflects data for three years of testing.
Reading Comprehension 50
31 36 49 0
98-99
27 35 48 97-98
29 34 48 96-97
Mathematics
School 50
System
State
0
38 45 56 98-99
40 43 55 97-98
47 43 54 96-97
School System State
Reading Vocabulary 50
15 32 46 0
98-99
15 36 45 97-98
18 27 44 96-97
Language Arts
School 50
System
State
0
32 42 60 98-99
34 43 58 97-98
37 40 56 96-97
School System State
Social Studies 50
37 42 54 0
98-99
37 45 53 97-98
38 41 53 96-97
Science
School 50
System
State
0
29 36 56 98-99
34 39 55 97-98
28 35 53 96-97
School System State
Sources of Information
Composite Score
50
33 42 57 0
98-99
School 50
System
36 42 56 97-98
38 42 55 96-97
State 0
29 39 56 98-99
33 40 54 97-98
1998-99 GEORGIA PUBLIC EDUCATION REPORT CARD King Middle School - 7610373
Prepared by Georgia Department of Education
33 37 54 96-97
Scores Reported in Percentiles
School System State
Page 2
STATE-REQUIRED TEST DATA
Categories of Scaled Scores
Inadequate (less than 162)
Minimal (162-209)
Good
(210-247)
Very Good (greater than 247)
Average Scaled Score: (Range 100-300)
PERFORMANCE ASSESSMENTS
Grade 8 Writing Assessment
1998-99 Percent Scoring
1997-98 Percent Scoring
1996-97 Percent Scoring
School System State School System State School System State
27% 58% 16%
0%
16% 51% 28%
5%
8% 40% 41% 11%
37% 55%
8% 0%
25% 53% 19%
3%
11% 46% 34%
8%
47% 47%
6% 0%
34% 48% 15%
3%
15% 46% 30%
8%
182
193
208 171
184 202 163
177 198
AWARDS / RECOGNITION DATA
Schools in Georgia may receive recognition in the following programs: Charter School Pay for Performance Program Georgia School of Excellence National Blue Ribbon School King Middle School did not receive recognition in any of these programs during the 1998-99 school year.
1998-99 GEORGIA PUBLIC EDUCATION REPORT CARD King Middle School - 7610373
Prepared by Georgia Department of Education
Page 3
CERTIFIED PERSONNEL DATA
Positions Number Average Contract Days
Personnel Sex
Certificate
Years Experience
Full-time Part-time
Male Female
4 Yr Bachelor's 5 Yr Master's 6 Yr Specialist's 7 Yr Doctoral Other*
<1 1-10 11-20 21-30 >30
Average
Administrators
3.00 227.33
3 0
1 2
0 1 2 0 0 0 0 1 2 0 22.00
Support Personnel
4.00 197.50
4 0
1 3
0 3 0 1 0 1 1 2 0 0 10.75
PK-12 Teachers
46.40 190.00
45 4
12 37
19 24
6 0 0 0 13 12 17 7 18.84
*Includes One- and Two-Year Vocational Certificates.
ACCREDITATION DATA
Accredited with Quality by Georgia Accrediting Commission (GAC).
1998-99 GEORGIA PUBLIC EDUCATION REPORT CARD King Middle School - 7610373
Prepared by Georgia Department of Education
Page 4
1998-99 GEORGIA PUBLIC EDUCATION REPORT CARD
ATLANTA CITY SCHOOLS
Lakewood Elementary School - 7612064
Grade Range K-5
The Georgia Public Education Report Card is designed to assist systems and schools in educational improvement. This report card contains a variety of data elements. An explanation of the terms is provided as a companion to the report card data. Please refer to the definitions for the most effective use of the reported data.
STUDENT DATA
Total 330
K-5 Enrollment, by Race/Ethnicity and Sex
Black
White Hispanic
American Multi-
Asian Indian
racial
286 86.7%
33 10.0%
7 2.1%
0 0.0%
1 0.3%
3 0.9%
Male Female
171 51.8%
159 48.2%
Enrollment in Selected Programs
Program
Program % of Student Enrollment Population
Gifted (Grades K-12)
0
0.0%
Alternative Programs (Grades 6-12)
N/A
N/A
Students Eligible to Receive Free/Reduced Lunches
Number
Percent
School System
322 45,695
97.6% 75.5%
Dropout Rate *
Number
Rate
School System
N/A N/A
N/A N/A
* Dropout rates are not applicable for grades PK-5.
Enrollment in Compensatory Programs
Program
Program % of Student Enrollment Population
Special Education (Grades K-12)
51 15.5%
(PK)
0
N/A
English to Speakers of Other Languages (ESOL) (Grades K-12)
0
0.0%
Remedial Education (Grades 2-5, 9-12)
68 30.5%
Special Instructional Assistance (SIA) (Grades K-3)
111 52.6%
Title I (Grades K-12)
This school has a schoolwide program.
Total 27
Retained Students, by Race/Ethnicity and Sex
Black
White Hispanic
American Multi-
Asian Indian
racial
25 92.6%
2 7.4%
0 0.0%
0 0.0%
0 0.0%
0 0.0%
Male Female
15
12
55.6% 44.4%
Prepared by Georgia Department of Education
Page 1
STATE-REQUIRED TEST DATA
NORM-REFERENCED TESTS Grade 3
Iowa Tests of Basic Skills (ITBS) Each chart reflects data for three years of testing.
Reading Comprehension 50
30 50 54 0
98-99
36 55 53 97-98
27 48 52 96-97
Mathematics
School 50
System
State
0
32 53 61 98-99
44 58 61 97-98
28 51 59 96-97
School System State
Reading Vocabulary 50
22 50 50 0
98-99
30 51 50 97-98
22 44 49 96-97
Language Arts
School 50
System
State
0
39 61 64 98-99
41 63 62 97-98
27 54 59 96-97
School System State
Social Studies 50
28 50 56 0
98-99
38 52 55 97-98
30 50 55 96-97
Science
School 50
System
State
0
32 49 59 98-99
39 52 59 97-98
26 48 58 96-97
School System State
Sources of Information
Composite Score
50
32 48 57 0
98-99
School 50
System
37 51 56 97-98
28 47 55 96-97
State 0
29 51 58 98-99
38 55 57 97-98
1998-99 GEORGIA PUBLIC EDUCATION REPORT CARD Lakewood Elementary School - 7612064
Prepared by Georgia Department of Education
26 48 56 96-97
Scores Reported in Percentiles
School System State
Page 2
STATE-REQUIRED TEST DATA
NORM-REFERENCED TESTS Grade 5
Iowa Tests of Basic Skills (ITBS) Each chart reflects data for three years of testing.
Reading Comprehension
Mathematics
50
41 47 53 0
98-99
75 52 53 97-98
42 49 52 96-97
School 50
System
State
0
32 48 59 98-99
62 53 58 97-98
51 50 57 96-97
School System State
Reading Vocabulary 50
26 48 48 0
98-99
44 52 48 97-98
73 44 46 96-97
Language Arts
School 50
System
State
0
33 56 63 98-99
74 60 61 97-98
54 51 58 96-97
School System State
Social Studies 50
25 54 57 0
98-99
51 54 56 97-98
46 52 55 96-97
Science
School 50
System
State
0
23 48 60 98-99
35 50 59 97-98
36 48 59 96-97
School System State
Sources of Information
Composite Score
50
28 47 58 0
98-99
School 50
System
50 51 58 97-98
49 49 57 96-97
State 0
25 49 57 98-99
55 52 56 97-98
48 48 55 96-97
1998-99 GEORGIA PUBLIC EDUCATION REPORT CARD Lakewood Elementary School - 7612064
Prepared by Georgia Department of Education
Scores Reported in Percentiles
School System State
Page 3
STATE-REQUIRED TEST DATA
PERFORMANCE ASSESSMENTS
Grade 5 Writing Assessment
Percent at Developmental Stages:
1998-99 School System State
1997-98 School System State
1996-97 School System State
Stage Stage Stage Stage Stage Stage
1:The Emerging Writer 2:The Developing Writer 3:The Focusing Writer 4:The Experimenting 5:The Engaging Writer 6:The Extending Writer
0% 0% 27% 51% 19% 3%
1% 2% 22% 47% 22% 6%
0% 1% 16% 41% 29% 12%
0% 0% 33% 43% 17% 5%
1% 4% 24% 47% 19% 5%
0% 3% 19% 41% 27% 10%
0% 7% 40% 38% 12% 2%
1% 6% 32% 39% 17% 5%
0% 3% 21% 37% 26% 12%
AWARDS / RECOGNITION DATA
Schools in Georgia may receive recognition in the following programs: Charter School Pay for Performance Program Georgia School of Excellence National Blue Ribbon School Lakewood Elementary School did not receive recognition in any of these programs during the 1998-99 school year.
1998-99 GEORGIA PUBLIC EDUCATION REPORT CARD Lakewood Elementary School - 7612064
Prepared by Georgia Department of Education
Page 4
CERTIFIED PERSONNEL DATA
Positions Number Average Contract Days
Personnel Sex
Certificate
Years Experience
Full-time Part-time
Male Female
4 Yr Bachelor's 5 Yr Master's 6 Yr Specialist's 7 Yr Doctoral Other*
<1 1-10 11-20 21-30 >30
Average
Administrators
2.00 231.00
2 0
1 1
0 0 2 0 0 0 0 1 0 1 22.50
Support Personnel
2.10 193.81
1 3
0 4
0 3 1 0 0 0 1 0 3 0 19.25
PK-12 Teachers
26.50 190.38
25 5
2 28
13 14
2 1 0 0 9 3 14 4 20.83
*Includes One- and Two-Year Vocational Certificates.
ACCREDITATION DATA
Accredited by Georgia Accrediting Commission (GAC).
1998-99 GEORGIA PUBLIC EDUCATION REPORT CARD Lakewood Elementary School - 7612064
Prepared by Georgia Department of Education
Page 5
1998-99 GEORGIA PUBLIC EDUCATION REPORT CARD
ATLANTA CITY SCHOOLS
Lin Elementary School - 7612564
Grade Range K-5
The Georgia Public Education Report Card is designed to assist systems and schools in educational improvement. This report card contains a variety of data elements. An explanation of the terms is provided as a companion to the report card data. Please refer to the definitions for the most effective use of the reported data.
STUDENT DATA
Total 449
K-5 Enrollment, by Race/Ethnicity and Sex
Black
White Hispanic
American Multi-
Asian Indian
racial
259 57.7%
167 37.2%
6 1.3%
3 0.7%
0 0.0%
14 3.1%
Male Female
224 49.9%
225 50.1%
Enrollment in Selected Programs
Program
Program % of Student Enrollment Population
Gifted (Grades K-12)
47
10.5%
Alternative Programs (Grades 6-12)
N/A
N/A
Students Eligible to Receive Free/Reduced Lunches
Number
Percent
School System
222 45,695
49.4% 75.5%
Dropout Rate *
Number
Rate
School System
N/A N/A
N/A N/A
* Dropout rates are not applicable for grades PK-5.
Enrollment in Compensatory Programs
Program
Program % of Student Enrollment Population
Special Education (Grades K-12)
12
2.7%
(PK)
0
N/A
English to Speakers of Other Languages (ESOL) (Grades K-12)
15
3.3%
Remedial Education (Grades 2-5, 9-12)
93 31.1%
Special Instructional Assistance (SIA) (Grades K-3)
62 20.5%
Title I (Grades K-12)
This school has a schoolwide program.
Total 5
Retained Students, by Race/Ethnicity and Sex
Black
White Hispanic
American Multi-
Asian Indian
racial
3 60.0%
2 40.0%
0 0.0%
0 0.0%
0 0.0%
0 0.0%
Male Female
3
2
60.0% 40.0%
Prepared by Georgia Department of Education
Page 1
STATE-REQUIRED TEST DATA
NORM-REFERENCED TESTS Grade 3
Iowa Tests of Basic Skills (ITBS) Each chart reflects data for three years of testing.
Reading Comprehension 50
60 50 54 0
98-99
54 55 53 97-98
60 48 52 96-97
Mathematics
School 50
System
State
0
60 53 61 98-99
53 58 61 97-98
61 51 59 96-97
School System State
Reading Vocabulary 50
49 50 50 0
98-99
44 51 50 97-98
50 44 49 96-97
Language Arts
School 50
System
State
0
64 61 64 98-99
54 63 62 97-98
58 54 59 96-97
School System State
Social Studies 50
59 50 56 0
98-99
59 52 55 97-98
63 50 55 96-97
Science
School 50
System
State
0
56 49 59 98-99
58 52 59 97-98
61 48 58 96-97
School System State
Sources of Information
Composite Score
50
62 48 57 0
98-99
School 50
System
56 51 56 97-98
58 47 55 96-97
State 0
59 51 58 98-99
54 55 57 97-98
1998-99 GEORGIA PUBLIC EDUCATION REPORT CARD Lin Elementary School - 7612564
Prepared by Georgia Department of Education
60 48 56 96-97
Scores Reported in Percentiles
School System State
Page 2
STATE-REQUIRED TEST DATA
NORM-REFERENCED TESTS Grade 5
Iowa Tests of Basic Skills (ITBS) Each chart reflects data for three years of testing.
Reading Comprehension
Mathematics
50
53 47 53 0
98-99
53 52 53 97-98
65 49 52 96-97
School 50
System
State
0
54 48 59 98-99
60 53 58 97-98
63 50 57 96-97
School System State
Reading Vocabulary 50
58 48 48 0
98-99
51 52 48 97-98
58 44 46 96-97
Language Arts
School 50
System
State
0
67 56 63 98-99
62 60 61 97-98
62 51 58 96-97
School System State
Social Studies 50
58 54 57 0
98-99
60 54 56 97-98
63 52 55 96-97
Science
School 50
System
State
0
53 48 60 98-99
59 50 59 97-98
64 48 59 96-97
School System State
Sources of Information
Composite Score
50
61 47 58 0
98-99
School 50
System
61 51 58 97-98
65 49 57 96-97
State 0
58 49 57 98-99
58 52 56 97-98
63 48 55 96-97
1998-99 GEORGIA PUBLIC EDUCATION REPORT CARD Lin Elementary School - 7612564
Prepared by Georgia Department of Education
Scores Reported in Percentiles
School System State
Page 3
STATE-REQUIRED TEST DATA
PERFORMANCE ASSESSMENTS
Grade 5 Writing Assessment
Percent at Developmental Stages:
1998-99 School System State
1997-98 School System State
1996-97 School System State
Stage Stage Stage Stage Stage Stage
1:The Emerging Writer 2:The Developing Writer 3:The Focusing Writer 4:The Experimenting 5:The Engaging Writer 6:The Extending Writer
0% 0% 6% 30% 39% 26%
1% 2% 22% 47% 22% 6%
0% 1% 16% 41% 29% 12%
1% 1% 15% 35% 35% 13%
1% 4% 24% 47% 19% 5%
0% 3% 19% 41% 27% 10%
0% 2% 18% 37% 25% 18%
1% 6% 32% 39% 17% 5%
0% 3% 21% 37% 26% 12%
AWARDS / RECOGNITION DATA
Schools in Georgia may receive recognition in the following programs: Charter School Pay for Performance Program Georgia School of Excellence National Blue Ribbon School Lin Elementary School did not receive recognition in any of these programs during the 1998-99 school year.
1998-99 GEORGIA PUBLIC EDUCATION REPORT CARD Lin Elementary School - 7612564
Prepared by Georgia Department of Education
Page 4
CERTIFIED PERSONNEL DATA
Positions Number Average Contract Days
Personnel Sex
Certificate
Years Experience
Full-time Part-time
Male Female
4 Yr Bachelor's 5 Yr Master's 6 Yr Specialist's 7 Yr Doctoral Other*
<1 1-10 11-20 21-30 >30
Average
Administrators
2.00 231.00
2 0
0 2
0 2 0 0 0 0 0 0 2 0 27.00
Support Personnel
2.00 195.00
1 3
0 4
0 2 2 0 0 0 0 2 2 0 21.75
PK-12 Teachers
30.40 190.00
29 4
6 27
14 17
1 1 0 3 17 3 6 4 12.27
*Includes One- and Two-Year Vocational Certificates.
ACCREDITATION DATA
Accredited by Georgia Accrediting Commission (GAC).
1998-99 GEORGIA PUBLIC EDUCATION REPORT CARD Lin Elementary School - 7612564
Prepared by Georgia Department of Education
Page 5
1998-99 GEORGIA PUBLIC EDUCATION REPORT CARD
ATLANTA CITY SCHOOLS
Long Middle School - 7610173
Grade Range 6-8
The Georgia Public Education Report Card is designed to assist systems and schools in educational improvement. This report card contains a variety of data elements. An explanation of the terms is provided as a companion to the report card data. Please refer to the definitions for the most effective use of the reported data.
STUDENT DATA
Total 814
6-8 Enrollment, by Race/Ethnicity and Sex
Black
White Hispanic
American Multi-
Asian Indian
racial
719 88.3%
4 0.5%
20 2.5%
66 8.1%
0 0.0%
5 0.6%
Male 445
54.7%
Female 369
45.3%
Enrollment in Selected Programs
Program
Gifted (Grades K-12)
Program % of Student Enrollment Population
28
3.4%
Alternative Programs (Grades 6-12)
0
0.0%
Students Eligible to Receive Free/Reduced Lunches
Number
Percent
School System
751 45,695
92.3% 75.5%
Enrollment in Compensatory Programs
Program
Program % of Student Enrollment Population
Special Education (Grades K-12) (PK)
104 12.8%
0
N/A
English to Speakers of Other Languages (ESOL) (Grades K-12)
58
7.1%
Title I (Grades K-12)
This school has a schoolwide program.
Dropout Rate for Grades 6-8
Number
Rate
School System
47
4.0%
705
3.8%
Total 74
Retained Students, by Race/Ethnicity and Sex
Black
White Hispanic
American MultiAsian Indian racial
73 98.6%
0 0.0%
0 0.0%
1 1.4%
0 0.0%
0 0.0%
Male Female
48
26
64.9% 35.1%
Prepared by Georgia Department of Education
Page 1
STATE-REQUIRED TEST DATA
NORM-REFERENCED TESTS Grade 8
Iowa Tests of Basic Skills (ITBS) Each chart reflects data for three years of testing.
Reading Comprehension 50
30 36 49 0
98-99
29 35 48 97-98
28 34 48 96-97
Mathematics
School 50
System
State
0
46 45 56 98-99
37 43 55 97-98
43 43 54 96-97
School System State
Reading Vocabulary 50
50 32 46 0
98-99
35 36 45 97-98
25 27 44 96-97
Language Arts
School 50
System
State
0
38 42 60 98-99
36 43 58 97-98
36 40 56 96-97
School System State
Social Studies 50
32 42 54 0
98-99
38 45 53 97-98
35 41 53 96-97
Science
School 50
System
State
0
28 36 56 98-99
30 39 55 97-98
29 35 53 96-97
School System State
Sources of Information
Composite Score
50
34 42 57 0
98-99
School 50
System
35 42 56 97-98
38 42 55 96-97
State 0
35 39 56 98-99
32 40 54 97-98
1998-99 GEORGIA PUBLIC EDUCATION REPORT CARD Long Middle School - 7610173
Prepared by Georgia Department of Education
33 37 54 96-97
Scores Reported in Percentiles
School System State
Page 2
STATE-REQUIRED TEST DATA
Categories of Scaled Scores
Inadequate (less than 162)
Minimal (162-209)
Good
(210-247)
Very Good (greater than 247)
Average Scaled Score: (Range 100-300)
PERFORMANCE ASSESSMENTS
Grade 8 Writing Assessment
1998-99 Percent Scoring
1997-98 Percent Scoring
1996-97 Percent Scoring
School System State School System State School System State
16% 62% 21%
1%
16% 51% 28%
5%
8% 40% 41% 11%
33% 53% 13%
1%
25% 53% 19%
3%
11% 46% 34%
8%
31% 53% 14%
2%
34% 48% 15%
3%
15% 46% 30%
8%
187
193
208 176
184 202 177
177 198
AWARDS / RECOGNITION DATA
Schools in Georgia may receive recognition in the following programs: Charter School Pay for Performance Program Georgia School of Excellence National Blue Ribbon School Long Middle School did not receive recognition in any of these programs during the 1998-99 school year.
1998-99 GEORGIA PUBLIC EDUCATION REPORT CARD Long Middle School - 7610173
Prepared by Georgia Department of Education
Page 3
CERTIFIED PERSONNEL DATA
Positions Number Average Contract Days
Personnel Sex
Certificate
Years Experience
Full-time Part-time
Male Female
4 Yr Bachelor's 5 Yr Master's 6 Yr Specialist's 7 Yr Doctoral Other*
<1 1-10 11-20 21-30 >30
Average
Administrators
3.00 227.33
3 0
1 2
0 1 1 1 0 0 1 1 1 0 18.67
Support Personnel
4.10 199.02
3 2
1 4
0 3 2 0 0 0 1 2 2 0 18.20
PK-12 Teachers
50.50 190.00
49 2
7 44
24 24
3 0 0 1 23 13 12 2 13.08
*Includes One- and Two-Year Vocational Certificates.
ACCREDITATION DATA
Accredited with Quality by Georgia Accrediting Commission (GAC).
1998-99 GEORGIA PUBLIC EDUCATION REPORT CARD Long Middle School - 7610173
Prepared by Georgia Department of Education
Page 4
1998-99 GEORGIA PUBLIC EDUCATION REPORT CARD
ATLANTA CITY SCHOOLS
M A Jones Elementary School - 7614063
Grade Range K-5
The Georgia Public Education Report Card is designed to assist systems and schools in educational improvement. This report card contains a variety of data elements. An explanation of the terms is provided as a companion to the report card data. Please refer to the definitions for the most effective use of the reported data.
STUDENT DATA
Total 457
K-5 Enrollment, by Race/Ethnicity and Sex
Black
White Hispanic
American Multi-
Asian Indian
racial
453 99.1%
0 0.0%
1 0.2%
2 0.4%
0 0.0%
1 0.2%
Male Female
237 51.9%
220 48.1%
Enrollment in Selected Programs
Program
Program % of Student Enrollment Population
Gifted (Grades K-12)
0
0.0%
Alternative Programs (Grades 6-12)
N/A
N/A
Students Eligible to Receive Free/Reduced Lunches
Number
Percent
School System
431 45,695
94.3% 75.5%
Dropout Rate *
Number
Rate
School System
N/A N/A
N/A N/A
* Dropout rates are not applicable for grades PK-5.
Enrollment in Compensatory Programs
Program
Program % of Student Enrollment Population
Special Education (Grades K-12)
49 10.7%
(PK)
0
N/A
English to Speakers of Other Languages (ESOL) (Grades K-12)
0
0.0%
Remedial Education (Grades 2-5, 9-12)
64 22.9%
Special Instructional Assistance (SIA) (Grades K-3)
182 56.9%
Title I (Grades K-12)
This school has a schoolwide program.
Total 8
Retained Students, by Race/Ethnicity and Sex
Black
White Hispanic
American Multi-
Asian Indian
racial
8 100.0%
0 0.0%
0 0.0%
0 0.0%
0 0.0%
0 0.0%
Male Female
4
4
50.0% 50.0%
Prepared by Georgia Department of Education
Page 1
STATE-REQUIRED TEST DATA
NORM-REFERENCED TESTS Grade 3
Iowa Tests of Basic Skills (ITBS) Each chart reflects data for three years of testing.
Reading Comprehension 50
56 50 54 0
98-99
31 55 53 97-98
26 48 52 96-97
Mathematics
School 50
System
State
0
48 53 61 98-99
44 58 61 97-98
30 51 59 96-97
School System State
Reading Vocabulary 50
46 50 50 0
98-99
25 51 50 97-98
21 44 49 96-97
Language Arts
School 50
System
State
0
64 61 64 98-99
50 63 62 97-98
38 54 59 96-97
School System State
Social Studies 50
57 50 56 0
98-99
40 52 55 97-98
32 50 55 96-97
Science
School 50
System
State
0
43 49 59 98-99
40 52 59 97-98
29 48 58 96-97
School System State
Sources of Information
Composite Score
50
43 48 57 0
98-99
School 50
System
37 51 56 97-98
33 47 55 96-97
State 0
49 51 58 98-99
37 55 57 97-98
1998-99 GEORGIA PUBLIC EDUCATION REPORT CARD M A Jones Elementary School - 7614063
Prepared by Georgia Department of Education
28 48 56 96-97
Scores Reported in Percentiles
School System State
Page 2
STATE-REQUIRED TEST DATA
NORM-REFERENCED TESTS Grade 5
Iowa Tests of Basic Skills (ITBS) Each chart reflects data for three years of testing.
Reading Comprehension
Mathematics
50
31 47 53 0
98-99
31 52 53 97-98
33 49 52 96-97
School 50
System
State
0
30 48 59 98-99
40 53 58 97-98
27 50 57 96-97
School System State
Reading Vocabulary 50
15 48 48 0
98-99
15 52 48 97-98
19 44 46 96-97
Language Arts
School 50
System
State
0
42 56 63 98-99
41 60 61 97-98
29 51 58 96-97
School System State
Social Studies 50
48 54 57 0
98-99
30 54 56 97-98
36 52 55 96-97
Science
School 50
System
State
0
36 48 60 98-99
26 50 59 97-98
35 48 59 96-97
School System State
Sources of Information
Composite Score
50
42 47 58 0
98-99
School 50
System
37 51 58 97-98
35 49 57 96-97
State 0
34 49 57 98-99
30 52 56 97-98
29 48 55 96-97
1998-99 GEORGIA PUBLIC EDUCATION REPORT CARD M A Jones Elementary School - 7614063
Prepared by Georgia Department of Education
Scores Reported in Percentiles
School System State
Page 3
STATE-REQUIRED TEST DATA
PERFORMANCE ASSESSMENTS
Grade 5 Writing Assessment
Percent at Developmental Stages:
1998-99 School System State
1997-98 School System State
1996-97 School System State
Stage Stage Stage Stage Stage Stage
1:The Emerging Writer 2:The Developing Writer 3:The Focusing Writer 4:The Experimenting 5:The Engaging Writer 6:The Extending Writer
0% 2% 21% 56% 21% 0%
1% 2% 22% 47% 22% 6%
0% 1% 16% 41% 29% 12%
4% 2% 28% 54% 11% 2%
1% 4% 24% 47% 19% 5%
0% 3% 19% 41% 27% 10%
0% 10% 54% 23% 13%
0%
1% 6% 32% 39% 17% 5%
0% 3% 21% 37% 26% 12%
AWARDS / RECOGNITION DATA
Schools in Georgia may receive recognition in the following programs: Charter School Pay for Performance Program Georgia School of Excellence National Blue Ribbon School M A Jones Elementary School did not receive recognition in any of these programs during the 1998-99 school year.
1998-99 GEORGIA PUBLIC EDUCATION REPORT CARD M A Jones Elementary School - 7614063
Prepared by Georgia Department of Education
Page 4
CERTIFIED PERSONNEL DATA
Positions Number Average Contract Days
Personnel Sex
Certificate
Years Experience
Full-time Part-time
Male Female
4 Yr Bachelor's 5 Yr Master's 6 Yr Specialist's 7 Yr Doctoral Other*
<1 1-10 11-20 21-30 >30
Average
Administrators
2.00 231.00
2 0
1 1
0 0 1 1 0 0 0 0 1 1 31.00
Support Personnel
2.40 194.17
1 3
0 4
0 3 1 0 0 0 1 1 2 0 17.50
PK-12 Teachers
31.70 190.00
30 5
4 31
20 13
2 0 0 1 16 11 5 2 13.11
*Includes One- and Two-Year Vocational Certificates.
ACCREDITATION DATA
Accredited by Georgia Accrediting Commission (GAC).
1998-99 GEORGIA PUBLIC EDUCATION REPORT CARD M A Jones Elementary School - 7614063
Prepared by Georgia Department of Education
Page 5
1998-99 GEORGIA PUBLIC EDUCATION REPORT CARD
ATLANTA CITY SCHOOLS
Marshall Middle School - 7610189
Grade Range 6-8
The Georgia Public Education Report Card is designed to assist systems and schools in educational improvement. This report card contains a variety of data elements. An explanation of the terms is provided as a companion to the report card data. Please refer to the definitions for the most effective use of the reported data.
STUDENT DATA
Total 666
6-8 Enrollment, by Race/Ethnicity and Sex
Black
White Hispanic
American Multi-
Asian Indian
racial
654 98.2%
8 1.2%
3 0.5%
0 0.0%
0 0.0%
1 0.2%
Male 329
49.4%
Female 337
50.6%
Enrollment in Selected Programs
Program
Gifted (Grades K-12)
Program % of Student Enrollment Population
0
0.0%
Alternative Programs (Grades 6-12)
0
0.0%
Students Eligible to Receive Free/Reduced Lunches
Number
Percent
School System
580 45,695
87.1% 75.5%
Enrollment in Compensatory Programs
Program
Program % of Student Enrollment Population
Special Education (Grades K-12) (PK)
70 10.5%
0
N/A
English to Speakers of Other Languages (ESOL) (Grades K-12)
0
0.0%
Title I (Grades K-12)
This school has a schoolwide program.
Dropout Rate for Grades 6-8
Number
Rate
School System
41
4.3%
705
3.8%
Total 14
Retained Students, by Race/Ethnicity and Sex
Black
White Hispanic
American MultiAsian Indian racial
14 100.0%
0 0.0%
0 0.0%
0 0.0%
0 0.0%
0 0.0%
Male Female
11
3
78.6% 21.4%
Prepared by Georgia Department of Education
Page 1
STATE-REQUIRED TEST DATA
NORM-REFERENCED TESTS Grade 8
Iowa Tests of Basic Skills (ITBS) Each chart reflects data for three years of testing.
Reading Comprehension 50
28 36 49 0
98-99
24 35 48 97-98
31 34 48 96-97
Mathematics
School 50
System
State
0
39 45 56 98-99
29 43 55 97-98
40 43 54 96-97
School System State
Reading Vocabulary 50
26 32 46 0
98-99
22 36 45 97-98
20 27 44 96-97
Language Arts
School 50
System
State
0
36 42 60 98-99
27 43 58 97-98
25 40 56 96-97
School System State
Social Studies 50
35 42 54 0
98-99
30 45 53 97-98
32 41 53 96-97
Science
School 50
System
State
0
25 36 56 98-99
25 39 55 97-98
30 35 53 96-97
School System State
Sources of Information
Composite Score
50
34 42 57 0
98-99
School 50
System
27 42 56 97-98
38 42 55 96-97
State 0
32 39 56 98-99
23 40 54 97-98
1998-99 GEORGIA PUBLIC EDUCATION REPORT CARD Marshall Middle School - 7610189
Prepared by Georgia Department of Education
29 37 54 96-97
Scores Reported in Percentiles
School System State
Page 2
STATE-REQUIRED TEST DATA
Categories of Scaled Scores
Inadequate (less than 162)
Minimal (162-209)
Good
(210-247)
Very Good (greater than 247)
Average Scaled Score: (Range 100-300)
PERFORMANCE ASSESSMENTS
Grade 8 Writing Assessment
1998-99 Percent Scoring
1997-98 Percent Scoring
1996-97 Percent Scoring
School System State School System State School System State
27% 55% 16%
2%
16% 51% 28%
5%
8% 40% 41% 11%
35% 56%
8% 1%
25% 53% 19%
3%
11% 46% 34%
8%
44% 49%
7% 0%
34% 48% 15%
3%
15% 46% 30%
8%
180
193
208 173
184 202 166
177 198
AWARDS / RECOGNITION DATA
Schools in Georgia may receive recognition in the following programs: Charter School Pay for Performance Program Georgia School of Excellence National Blue Ribbon School Marshall Middle School did not receive recognition in any of these programs during the 1998-99 school year.
1998-99 GEORGIA PUBLIC EDUCATION REPORT CARD Marshall Middle School - 7610189
Prepared by Georgia Department of Education
Page 3
CERTIFIED PERSONNEL DATA
Positions Number Average Contract Days
Personnel Sex
Certificate
Years Experience
Full-time Part-time
Male Female
4 Yr Bachelor's 5 Yr Master's 6 Yr Specialist's 7 Yr Doctoral Other*
<1 1-10 11-20 21-30 >30
Average
Administrators
3.00 227.33
3 0
2 1
0 1 1 1 0 0 0 0 3 0 25.00
Support Personnel
3.10 197.10
2 2
1 3
0 3 1 0 0 0 1 1 0 2 22.25
PK-12 Teachers
37.00 190.27
36 3
5 34
13 23
3 0 0 1 20 5 11 2 13.82
*Includes One- and Two-Year Vocational Certificates.
ACCREDITATION DATA
Accredited with Quality by Georgia Accrediting Commission (GAC).
1998-99 GEORGIA PUBLIC EDUCATION REPORT CARD Marshall Middle School - 7610189
Prepared by Georgia Department of Education
Page 4
1998-99 GEORGIA PUBLIC EDUCATION REPORT CARD
ATLANTA CITY SCHOOLS
Mays High School - 7610182
Grade Range 9-12
The Georgia Public Education Report Card is designed to assist systems and schools in educational improvement. This report card contains a variety of data elements. An explanation of the terms is provided as a companion to the report card data. Please refer to the definitions for the most effective use of the reported data.
Total 1,401
STUDENT DATA
9-12 Enrollment, by Race/Ethnicity and Sex
Black
White Hispanic
American Multi-
Asian Indian
racial
1,395 99.6%
1 0.1%
0 0.0%
3 0.2%
1 0.1%
1 0.1%
Male Female
655 46.8%
746 53.2%
Enrollment in Selected Programs
Program
Gifted (Grades K-12)
Program % of Student Enrollment Population
19
1.4%
Non-Vocational Labs (Grades 9-12)
Vocational Labs (Grades 9-12)
Alternative Programs (Grades 6-12)
1,121 830 0
80.0% 59.2%
0.0%
Students Eligible to Receive Free/Reduced Lunches
Number
Percent
School System
635 45,695
45.3% 75.5%
Enrollment in Compensatory Programs
Program
Program % of Student Enrollment Population
Special Education (Grades K-12) PK
56
4.0%
0
N/A
English to Speakers of Other Languages (ESOL) (Grades K-12)
0
0.0%
Remedial Education (Grades 2-5, 9-12)
119
8.5%
Title I (Grades K-12)
This school has a schoolwide program.
Dropout Rate for Grades 9-12
Number
Rate
School System
54 1,248
2.3% 5.4%
Total 108
Retained Students, by Race/Ethnicity and Sex
Black
White Hispanic
American MultiAsian Indian racial
108 100.0%
0 0.0%
0 0.0%
0 0.0%
0 0.0%
0 0.0%
Male Female
62
46
57.4% 42.6%
Prepared by Georgia Department of Education
Page 1
STATE-REQUIRED TEST DATA
GEORGIA HIGH SCHOOL GRADUATION TESTS (GHSGT)
Percent of Regular Program 11th Graders Passing the Georgia High School Graduation Tests on First Administration
English Language Arts Mathematics Social Studies Science
All Components listed above
Writing
1998-99
School System State
97% 91% 84% 79%
91% 79% 73% 61%
96% 88% 80% 72%
70% 55% 68%
88% 85% 93%
1997-98
School System State
96% 91% 88% 82%
89% 78% 68% 61%
94% 88% 78% 74%
78% 54% 68%
91% 83% 92%
1996-97
School System State
96% 86% 80% 74%
89% 72% 65% 52%
94% 87% 78% 74%
67% 46% 67%
88% 82% 93%
GRADUATE DATA
1999 Graduates by Credentials, Race/Ethnicity and Sex
Diplomas with Both College Prep. & Voc. Endorsements
Diplomas with College Prep. Endorsements Diplomas with Vocational Endorsements General High School Diplomas Special Education Diplomas
Total All Diplomas
Certificates of Performance
Total Graduates
Total 37
205 14 1 8
265 4
269
Black
37 100.0%
205 100.0%
14 100.0%
1 100.0%
8 100.0%
265 100.0%
4 100.0%
269 100.0%
American MultiWhite Hispanic Asian Indian racial
0 0.0%
0 0.0%
0 0.0%
0 0.0%
0 0.0%
0 0.0%
0 0.0%
0 0.0%
0 0.0%
0 0.0%
0 0.0%
0 0.0%
0 0.0%
0 0.0%
0 0.0%
0 0.0%
0 0.0%
0 0.0%
0 0.0%
0 0.0%
0 0.0%
0 0.0%
0 0.0%
0 0.0%
0 0.0%
0 0.0%
0 0.0%
0 0.0%
0 0.0%
0 0.0%
0 0.0%
0 0.0%
0 0.0%
0 0.0%
0 0.0%
0 0.0%
0 0.0%
0 0.0%
0 0.0%
0 0.0%
Male Female
16 43.2%
74 36.1%
21 56.8%
131 63.9%
10 71.4%
1 100.0%
4 50.0%
4 28.6%
0 0.0%
4 50.0%
105
160
39.6% 60.4%
2
2
50.0% 50.0%
107
162
39.8% 60.2%
HOPE Scholarships
School System
Number of 1999 Graduates 2 6 9
Number Eligible
180
Percent Eligible
66.9%
2,041 1,099 53.8%
State
65,548 40,292 61.5%
High School Completion Rate
Percent of 1995Grade 9 Enrollment in Graduating Class of1999 School System State
Completion Rate '95-'99 75.4% 57.1% 68.9%
1998-99 GEORGIA PUBLIC EDUCATION REPORT CARD
Mays High School - 7610182
Prepared by Georgia Department of Education
Page 2
COLLEGE ADMISSIONS / CREDIT TEST DATA
Scholastic Assessment Test (SAT)
Based on students' highest verbal and highest math scores
No. Taking
Average Score
Tests Verbal Math Total
Based on students' last test administration
Average Score Verbal Math Total
School
243
College Prep. Endorsement
Other Diplomas
System
1,265
College Prep. Endorsement
Other Diplomas
Georgia
41,958
467 463 N/A
445 441 N/A
492
455 450 N/A
436 430 N/A
488
922 913 N/A
881 871 N/A
980
455 N/A N/A
435 N/A N/A
483
444 N/A N/A
426 N/A N/A
479
899 N/A N/A
861 N/A N/A
962
Nation
952,913 N/A N/A N/A
502 508 1010
American College Testing (ACT)
Advanced Placement Exams (AP)
Number taking tests: English Mathematics Reading Science Reasoning CompositeScore
9 1 School System State
18.9 17.4 19.1
20.1 18.4 19.9
19.5 19.5
18.6 18.3
20.2 19.9
19.6 18.3 19.9
No. of Students Taking Tests
No. of Tests Taken No. of Test Scores
3 or Higher Percent of Test
Scores 3 or Higher
School 87
159 21
13.2%
System State 537 15,225 877 23,969 184 13,024
21.0% 54.3%
POST-SECONDARY DATA
Graduates Entering Georgia Public Colleges
Graduates Entering Georgia Public Colleges and Requiring Learning Support (LS)
1998 Graduates Entering in 1998-99
1997 Graduates Entering in 1997-98
Percent of Graduating Number Class
School
109
37.2%
System 452
21.7%
School
75
27.2%
System 437
21.1%
Number Requiring
LS 30 200
34 202
Percent of those attending Georgia
Public Colleges
27.5%
44.2%
45.3%
46.2%
In previous years, the Report Card presented College Prep Curriculum information provided by the Board of Regents on students requiring Learning Support. Due to inconsistencies in the data provided by the Board of Regents in defining College Prep Completers versus Local Board of Education data defining College Prep Endorsements, the Department of Education Report Card will not provide this information until discrepancies can be reconciled.
Graduates Entering Georgia Public Technical and Adult Schools
1998 Graduates School System
Entering Number 9 53
1998-99 Percent
3.1% 2.5%
Entering Number N/A N/A
1997-98 Percent
N/A N/A
1997 Graduates School
1
0.4%
System
3
0.1%
10
3.6%
109
5.3%
1998-99 GEORGIA PUBLIC EDUCATION REPORT CARD Mays High School - 7610182
Prepared by Georgia Department of Education
Page 3
CERTIFIED PERSONNEL DATA
Positions Number Average Contract Days
Administrators
5.00 224.40
Support Personnel
7.10 197.32
PK-12 Teachers
70.00 190.43
Personnel Sex
Certificate
Years Experience
Full-time Part-time
Male Female
4 Yr Bachelor's 5 Yr Master's 6 Yr Specialist's 7 Yr Doctoral Other*
<1 1-10 11-20 21-30 >30
Average
5 0
2 3
0 5 0 0 0
0 0 0 5 0
28.00
6 2
2 6
0 5 3 0 0
0 2 2 2 2
21.88
69 2
24 47
25 38
5 3 0
1 16 10 29 15
21.90
*Includes One- and Two-Year Vocational Certificates.
ACCREDITATION DATA
Accredited by Southern Association of Colleges and Schools (SACS): Secondary/Middle Commission.
AWARDS / RECOGNITION DATA
Schools in Georgia may receive recognition in the following programs: Charter School Pay for Performance Program Georgia School of Excellence National Blue Ribbon School Mays High School did not receive recognition in any of these programs during the 1998-99 school year.
1998-99 GEORGIA PUBLIC EDUCATION REPORT CARD Mays High School - 7610182
Prepared by Georgia Department of Education
Page 4
1998-99 GEORGIA PUBLIC EDUCATION REPORT CARD
ATLANTA CITY SCHOOLS
McGill Elementary School - 7610473
Grade Range PK-5
The Georgia Public Education Report Card is designed to assist systems and schools in educational improvement. This report card contains a variety of data elements. An explanation of the terms is provided as a companion to the report card data. Please refer to the definitions for the most effective use of the reported data.
STUDENT DATA
Total
K-5
364
PK
80
Enrollment, by Race/Ethnicity and Sex
Black
White Hispanic
American Asian Indian
Multiracial
327 89.8%
4 1.1%
32 8.8%
0 0.0%
0 0.0%
1 0.3%
57 71.3%
0 0.0%
21 26.3%
0 0.0%
0 0.0%
2 2.5%
Male Female
181 49.7%
183 50.3%
44 55.0%
36 45.0%
Enrollment in Selected Programs
Program
Program % of Student Enrollment Population
Gifted (Grades K-12)
5
1.4%
Alternative Programs (Grades 6-12)
N/A
N/A
Students Eligible to Receive Free/Reduced Lunches
Number
Percent
School System
409 45,695
92.1% 75.5%
Dropout Rate *
Number
Rate
School System
N/A N/A
N/A N/A
* Dropout rates are not applicable for grades PK-5.
Enrollment in Compensatory Programs
Program
Program % of Student Enrollment Population
Special Education (Grades K-12)
16
4.4%
(PK)
0
N/A
English to Speakers of Other Languages (ESOL) (Grades K-12)
0
0.0%
Remedial Education (Grades 2-5, 9-12)
47 20.9%
Special Instructional Assistance (SIA) (Grades K-3)
145 58.0%
Title I (Grades K-12)
This school has a schoolwide program.
Total 5
Retained Students, by Race/Ethnicity and Sex
Black
White Hispanic
American MultiAsian Indian racial
5 100.0%
0 0.0%
0 0.0%
0 0.0%
0 0.0%
0 0.0%
Male Female
3
2
60.0% 40.0%
Prepared by Georgia Department of Education
Page 1
STATE-REQUIRED TEST DATA
NORM-REFERENCED TESTS Grade 3
Iowa Tests of Basic Skills (ITBS) Each chart reflects data for three years of testing.
Reading Comprehension 50
85 50 54 0
98-99
85 55 53 97-98
50 48 52 96-97
Mathematics
School 50
System
State
0
85 53 61 98-99
79 58 61 97-98
59 51 59 96-97
School System State
Reading Vocabulary 50
56 50 50 0
98-99
39 51 50 97-98
44 44 49 96-97
Language Arts
School 50
System
State
0
84 61 64 98-99
80 63 62 97-98
49 54 59 96-97
School System State
Social Studies 50
88 50 56 0
98-99
69 52 55 97-98
59 50 55 96-97
Science
School 50
System
State
0
73 49 59 98-99
79 52 59 97-98
40 48 58 96-97
School System State
Sources of Information
Composite Score
50
87 48 57 0
98-99
School 50
System
85 51 56 97-98
57 47 55 96-97
State 0
84 51 58 98-99
78 55 57 97-98
1998-99 GEORGIA PUBLIC EDUCATION REPORT CARD McGill Elementary School - 7610473
Prepared by Georgia Department of Education
50 48 56 96-97
Scores Reported in Percentiles
School System State
Page 2
STATE-REQUIRED TEST DATA
NORM-REFERENCED TESTS Grade 5
Iowa Tests of Basic Skills (ITBS) Each chart reflects data for three years of testing.
Reading Comprehension
Mathematics
50
56 47 53 0
98-99
74 52 53 97-98
66 49 52 96-97
School 50
System
State
0
53 48 59 98-99
77 53 58 97-98
75 50 57 96-97
School System State
Reading Vocabulary 50
58 48 48 0
98-99
85 52 48 97-98
67 44 46 96-97
Language Arts
School 50
System
State
0
49 56 63 98-99
80 60 61 97-98
70 51 58 96-97
School System State
Social Studies 50
54 54 57 0
98-99
82 54 56 97-98
74 52 55 96-97
Science
School 50
System
State
0
31 48 60 98-99
65 50 59 97-98
59 48 59 96-97
School System State
Sources of Information
Composite Score
50
45 47 58 0
98-99
School 50
System
68 51 58 97-98
78 49 57 96-97
State 0
46 49 57 98-99
77 52 56 97-98
74 48 55 96-97
1998-99 GEORGIA PUBLIC EDUCATION REPORT CARD McGill Elementary School - 7610473
Prepared by Georgia Department of Education
Scores Reported in Percentiles
School System State
Page 3
STATE-REQUIRED TEST DATA
PERFORMANCE ASSESSMENTS
Grade 5 Writing Assessment
Percent at Developmental Stages:
1998-99 School System State
1997-98 School System State
1996-97 School System State
Stage Stage Stage Stage Stage Stage
1:The Emerging Writer 2:The Developing Writer 3:The Focusing Writer 4:The Experimenting 5:The Engaging Writer 6:The Extending Writer
0% 0% 23% 61% 14% 2%
1% 2% 22% 47% 22% 6%
0% 1% 16% 41% 29% 12%
0% 3% 9% 50% 32% 6%
1% 4% 24% 47% 19% 5%
0% 3% 19% 41% 27% 10%
0% 3% 22% 56% 19% 0%
1% 6% 32% 39% 17% 5%
0% 3% 21% 37% 26% 12%
AWARDS / RECOGNITION DATA
Schools in Georgia may receive recognition in the following programs: Charter School Pay for Performance Program Georgia School of Excellence National Blue Ribbon School McGill Elementary School did not receive recognition in any of these programs during the 1998-99 school year.
1998-99 GEORGIA PUBLIC EDUCATION REPORT CARD McGill Elementary School - 7610473
Prepared by Georgia Department of Education
Page 4
CERTIFIED PERSONNEL DATA
Positions Number Average Contract Days
Personnel Sex
Certificate
Years Experience
Full-time Part-time
Male Female
4 Yr Bachelor's 5 Yr Master's 6 Yr Specialist's 7 Yr Doctoral Other*
<1 1-10 11-20 21-30 >30
Average
Administrators
2.00 231.00
2 0
0 2
0 0 2 0 0 0 0 0 1 1 31.50
Support Personnel
1.70 195.88
1 3
0 4
0 2 1 1 0 0 1 1 2 0 18.75
PK-12 Teachers
19.30 190.00
18 3
4 17
13 5 0 3 0 0
13 2 5 1
12.14
*Includes One- and Two-Year Vocational Certificates.
ACCREDITATION DATA
Accredited by Georgia Accrediting Commission (GAC).
1998-99 GEORGIA PUBLIC EDUCATION REPORT CARD McGill Elementary School - 7610473
Prepared by Georgia Department of Education
Page 5
1998-99 GEORGIA PUBLIC EDUCATION REPORT CARD
ATLANTA CITY SCHOOLS
Miles Elementary School - 7614564
Grade Range PK-5
The Georgia Public Education Report Card is designed to assist systems and schools in educational improvement. This report card contains a variety of data elements. An explanation of the terms is provided as a companion to the report card data. Please refer to the definitions for the most effective use of the reported data.
STUDENT DATA
Total
K-5
462
PK
16
Enrollment, by Race/Ethnicity and Sex
Black
White Hispanic
American Asian Indian
Multiracial
460 99.6%
0 0.0%
2 0.4%
0 0.0%
0 0.0%
0 0.0%
16 100.0%
0 0.0%
0 0.0%
0 0.0%
0 0.0%
0 0.0%
Male Female
236 51.1%
226 48.9%
12 75.0%
4 25.0%
Enrollment in Selected Programs
Program
Program % of Student Enrollment Population
Gifted (Grades K-12)
24
5.2%
Alternative Programs (Grades 6-12)
N/A
N/A
Students Eligible to Receive Free/Reduced Lunches
Number
Percent
School System
392 45,695
82.0% 75.5%
Dropout Rate *
Number
Rate
School System
N/A N/A
N/A N/A
* Dropout rates are not applicable for grades PK-5.
Enrollment in Compensatory Programs
Program
Program % of Student Enrollment Population
Special Education (Grades K-12)
33
7.1%
(PK)
16
N/A
English to Speakers of Other Languages (ESOL) (Grades K-12)
0
0.0%
Remedial Education (Grades 2-5, 9-12)
61 20.1%
Special Instructional Assistance (SIA) (Grades K-3)
49 15.3%
Title I (Grades K-12)
This school has a schoolwide program.
Total 6
Retained Students, by Race/Ethnicity and Sex
Black
White Hispanic
American MultiAsian Indian racial
Male Female
6 100.0%
0 0.0%
0 0.0%
0 0.0%
0 0.0%
0
6
0.0% 100.0%
0 0.0%
Prepared by Georgia Department of Education
Page 1
STATE-REQUIRED TEST DATA
NORM-REFERENCED TESTS Grade 3
Iowa Tests of Basic Skills (ITBS) Each chart reflects data for three years of testing.
Reading Comprehension 50
63 50 54 0
98-99
62 55 53 97-98
83 48 52 96-97
Mathematics
School 50
System
State
0
58 53 61 98-99
57 58 61 97-98
55 51 59 96-97
School System State
Reading Vocabulary 50
51 50 50 0
98-99
51 51 50 97-98
56 44 49 96-97
Language Arts
School 50
System
State
0
68 61 64 98-99
74 63 62 97-98
73 54 59 96-97
School System State
Social Studies 50
57 50 56 0
98-99
54 52 55 97-98
58 50 55 96-97
Science
School 50
System
State
0
43 49 59 98-99
69 52 59 97-98
62 48 58 96-97
School System State
Sources of Information
Composite Score
50
48 48 57 0
98-99
School 50
System
57 51 56 97-98
47 47 55 96-97
State 0
55 51 58 98-99
64 55 57 97-98
1998-99 GEORGIA PUBLIC EDUCATION REPORT CARD Miles Elementary School - 7614564
Prepared by Georgia Department of Education
63 48 56 96-97
Scores Reported in Percentiles
School System State
Page 2
STATE-REQUIRED TEST DATA
NORM-REFERENCED TESTS Grade 5
Iowa Tests of Basic Skills (ITBS) Each chart reflects data for three years of testing.
Reading Comprehension
Mathematics
50
32 47 53 0
98-99
37 52 53 97-98
41 49 52 96-97
School 50
System
State
0
32 48 59 98-99
40 53 58 97-98
44 50 57 96-97
School System State
Reading Vocabulary 50
23 48 48 0
98-99
25 52 48 97-98
29 44 46 96-97
Language Arts
School 50
System
State
0
48 56 63 98-99
49 60 61 97-98
41 51 58 96-97
School System State
Social Studies 50
29 54 57 0
98-99
33 54 56 97-98
43 52 55 96-97
Science
School 50
System
State
0
23 48 60 98-99
39 50 59 97-98
38 48 59 96-97
School System State
Sources of Information
Composite Score
50
37 47 58 0
98-99
School 50
System
43 51 58 97-98
43 49 57 96-97
State 0
30 49 57 98-99
37 52 56 97-98
39 48 55 96-97
1998-99 GEORGIA PUBLIC EDUCATION REPORT CARD Miles Elementary School - 7614564
Prepared by Georgia Department of Education
Scores Reported in Percentiles
School System State
Page 3
STATE-REQUIRED TEST DATA
PERFORMANCE ASSESSMENTS
Grade 5 Writing Assessment
Percent at Developmental Stages:
1998-99 School System State
1997-98 School System State
1996-97 School System State
Stage Stage Stage Stage Stage Stage
1:The Emerging Writer 2:The Developing Writer 3:The Focusing Writer 4:The Experimenting 5:The Engaging Writer 6:The Extending Writer
1% 6% 25% 43% 21% 4%
1% 2% 22% 47% 22% 6%
0% 1% 16% 41% 29% 12%
4% 4% 16% 46% 26% 3%
1% 4% 24% 47% 19% 5%
0% 3% 19% 41% 27% 10%
0% 3% 34% 54% 9% 0%
1% 6% 32% 39% 17% 5%
0% 3% 21% 37% 26% 12%
AWARDS / RECOGNITION DATA
Schools in Georgia may receive recognition in the following programs: Charter School Pay for Performance Program Georgia School of Excellence National Blue Ribbon School Miles Elementary School did not receive recognition in any of these programs during the 1998-99 school year.
1998-99 GEORGIA PUBLIC EDUCATION REPORT CARD Miles Elementary School - 7614564
Prepared by Georgia Department of Education
Page 4
CERTIFIED PERSONNEL DATA
Positions Number Average Contract Days
Personnel Sex
Certificate
Years Experience
Full-time Part-time
Male Female
4 Yr Bachelor's 5 Yr Master's 6 Yr Specialist's 7 Yr Doctoral Other*
<1 1-10 11-20 21-30 >30
Average
Administrators
2.00 231.00
2 0
0 2
0 1 1 0 0 0 0 0 1 1 28.50
Support Personnel
3.00 193.33
2 3
1 4
1 3 1 0 0 0 2 0 2 1 19.20
PK-12 Teachers
28.20 190.00
26 7
4 29
18 14
0 1 0 5 13 4 9 2 13.15
*Includes One- and Two-Year Vocational Certificates.
ACCREDITATION DATA
Accredited by Georgia Accrediting Commission (GAC).
1998-99 GEORGIA PUBLIC EDUCATION REPORT CARD Miles Elementary School - 7614564
Prepared by Georgia Department of Education
Page 5
1998-99 GEORGIA PUBLIC EDUCATION REPORT CARD
ATLANTA CITY SCHOOLS
Mitchell Elementary School - 7615564
Grade Range PK-5
The Georgia Public Education Report Card is designed to assist systems and schools in educational improvement. This report card contains a variety of data elements. An explanation of the terms is provided as a companion to the report card data. Please refer to the definitions for the most effective use of the reported data.
STUDENT DATA
Total
K-5
539
PK
19
Enrollment, by Race/Ethnicity and Sex
Black
White Hispanic
American Asian Indian
Multiracial
413 76.6%
55 10.2%
69 12.8%
2 0.4%
0 0.0%
0 0.0%
3 15.8%
16 84.2%
0 0.0%
0 0.0%
0 0.0%
0 0.0%
Male Female
275 51.0%
264 49.0%
15 78.9%
4 21.1%
Enrollment in Selected Programs
Program
Program % of Student Enrollment Population
Gifted (Grades K-12)
13
2.4%
Alternative Programs (Grades 6-12)
N/A
N/A
Students Eligible to Receive Free/Reduced Lunches
Number
Percent
School System
465 45,695
83.3% 75.5%
Dropout Rate *
Number
Rate
School System
N/A N/A
N/A N/A
* Dropout rates are not applicable for grades PK-5.
Enrollment in Compensatory Programs
Program
Program % of Student Enrollment Population
Special Education (Grades K-12)
31
5.8%
(PK)
86
N/A
English to Speakers of Other Languages (ESOL) (Grades K-12)
39
7.2%
Remedial Education (Grades 2-5, 9-12)
60 17.2%
Special Instructional Assistance (SIA) (Grades K-3)
203 52.3%
Title I (Grades K-12)
This school has a schoolwide program.
Total 29
Retained Students, by Race/Ethnicity and Sex
Black
White Hispanic
American MultiAsian Indian racial
21 72.4%
2
6
6.9% 20.7%
0 0.0%
0 0.0%
0 0.0%
Male Female
17
12
58.6% 41.4%
Prepared by Georgia Department of Education
Page 1
STATE-REQUIRED TEST DATA
NORM-REFERENCED TESTS Grade 3
Iowa Tests of Basic Skills (ITBS) Each chart reflects data for three years of testing.
Reading Comprehension 50
28 50 54 0
98-99
31 55 53 97-98
33 48 52 96-97
Mathematics
School 50
System
State
0
41 53 61 98-99
44 58 61 97-98
36 51 59 96-97
School System State
Reading Vocabulary 50
42 50 50 0
98-99
34 51 50 97-98
24 44 49 96-97
Language Arts
School 50
System
State
0
47 61 64 98-99
47 63 62 97-98
34 54 59 96-97
School System State
Social Studies 50
35 50 56 0
98-99
44 52 55 97-98
41 50 55 96-97
Science
School 50
System
State
0
35 49 59 98-99
35 52 59 97-98
36 48 58 96-97
School System State
Sources of Information
Composite Score
50
34 48 57 0
98-99
School 50
System
36 51 56 97-98
32 47 55 96-97
State 0
35 51 58 98-99
37 55 57 97-98
1998-99 GEORGIA PUBLIC EDUCATION REPORT CARD Mitchell Elementary School - 7615564
Prepared by Georgia Department of Education
34 48 56 96-97
Scores Reported in Percentiles
School System State
Page 2
STATE-REQUIRED TEST DATA
NORM-REFERENCED TESTS Grade 5
Iowa Tests of Basic Skills (ITBS) Each chart reflects data for three years of testing.
Reading Comprehension
Mathematics
50
40 47 53 0
98-99
32 52 53 97-98
33 49 52 96-97
School 50
System
State
0
42 48 59 98-99
30 53 58 97-98
54 50 57 96-97
School System State
Reading Vocabulary 50
69 48 48 0
98-99
45 52 48 97-98
28 44 46 96-97
Language Arts
School 50
System
State
0
39 56 63 98-99
35 60 61 97-98
45 51 58 96-97
School System State
Social Studies 50
33 54 57 0
98-99
33 54 56 97-98
48 52 55 96-97
Science
School 50
System
State
0
27 48 60 98-99
38 50 59 97-98
44 48 59 96-97
School System State
Sources of Information
Composite Score
50
37 47 58 0
98-99
School 50
System
29 51 58 97-98
43 49 57 96-97
State 0
36 49 57 98-99
32 52 56 97-98
42 48 55 96-97
1998-99 GEORGIA PUBLIC EDUCATION REPORT CARD Mitchell Elementary School - 7615564
Prepared by Georgia Department of Education
Scores Reported in Percentiles
School System State
Page 3
STATE-REQUIRED TEST DATA
PERFORMANCE ASSESSMENTS
Grade 5 Writing Assessment
Percent at Developmental Stages:
1998-99 School System State
1997-98 School System State
1996-97 School System State
Stage Stage Stage Stage Stage Stage
1:The Emerging Writer 2:The Developing Writer 3:The Focusing Writer 4:The Experimenting 5:The Engaging Writer 6:The Extending Writer
0% 5% 29% 51% 11% 5%
1% 2% 22% 47% 22% 6%
0% 1% 16% 41% 29% 12%
2% 4% 18% 52% 20% 4%
1% 4% 24% 47% 19% 5%
0% 3% 19% 41% 27% 10%
0% 7% 27% 56% 8% 2%
1% 6% 32% 39% 17% 5%
0% 3% 21% 37% 26% 12%
AWARDS / RECOGNITION DATA
Schools in Georgia may receive recognition in the following programs: Charter School Pay for Performance Program Georgia School of Excellence National Blue Ribbon School Mitchell Elementary School did not receive recognition in any of these programs during the 1998-99 school year.
1998-99 GEORGIA PUBLIC EDUCATION REPORT CARD Mitchell Elementary School - 7615564
Prepared by Georgia Department of Education
Page 4
CERTIFIED PERSONNEL DATA
Positions Number Average Contract Days
Personnel Sex
Certificate
Years Experience
Full-time Part-time
Male Female
4 Yr Bachelor's 5 Yr Master's 6 Yr Specialist's 7 Yr Doctoral Other*
<1 1-10 11-20 21-30 >30
Average
Administrators
3.00 234.67
3 0
0 3
0 0 0 3 0 0 0 0 3 0 27.67
Support Personnel
2.20 195.00
1 3
3 1
0 2 2 0 0 0 3 1 0 0 10.50
PK-12 Teachers
35.10 190.00
32 6
8 30
23 15
0 0 0 1 26 4 3 4 10.92
*Includes One- and Two-Year Vocational Certificates.
ACCREDITATION DATA
Accredited by Georgia Accrediting Commission (GAC).
1998-99 GEORGIA PUBLIC EDUCATION REPORT CARD Mitchell Elementary School - 7615564
Prepared by Georgia Department of Education
Page 5
1998-99 GEORGIA PUBLIC EDUCATION REPORT CARD
ATLANTA CITY SCHOOLS
Morningside Elementary School - 7611664
Grade Range PK-5
The Georgia Public Education Report Card is designed to assist systems and schools in educational improvement. This report card contains a variety of data elements. An explanation of the terms is provided as a companion to the report card data. Please refer to the definitions for the most effective use of the reported data.
STUDENT DATA
Total
K-5
733
PK
19
Enrollment, by Race/Ethnicity and Sex
Black
White Hispanic
American Asian Indian
Multiracial
198 27.0%
509 69.4%
10 1.4%
9 1.2%
1 0.1%
6 0.8%
5 26.3%
13 68.4%
0 0.0%
1 5.3%
0 0.0%
0 0.0%
Male Female
387 52.8%
346 47.2%
10 52.6%
9 47.4%
Enrollment in Selected Programs
Program
Program % of Student Enrollment Population
Gifted (Grades K-12)
242
33.0%
Alternative Programs (Grades 6-12)
N/A
N/A
Students Eligible to Receive Free/Reduced Lunches
Number
Percent
School System
137 45,695
18.2% 75.5%
Dropout Rate *
Number
Rate
School System
N/A N/A
N/A N/A
* Dropout rates are not applicable for grades PK-5.
Enrollment in Compensatory Programs
Program
Program % of Student Enrollment Population
Special Education (Grades K-12)
59
8.0%
(PK)
0
N/A
English to Speakers of Other Languages (ESOL) (Grades K-12)
0
0.0%
Remedial Education (Grades 2-5, 9-12)
52 10.8%
Special Instructional Assistance (SIA) (Grades K-3)
0
0.0%
Title I (Grades K-12)
This school has no Title I program.
Total 7
Retained Students, by Race/Ethnicity and Sex
Black
White Hispanic
American MultiAsian Indian racial
5 71.4%
1
1
14.3% 14.3%
0 0.0%
0 0.0%
0 0.0%
Male Female
5
2
71.4% 28.6%
Prepared by Georgia Department of Education
Page 1
STATE-REQUIRED TEST DATA
NORM-REFERENCED TESTS Grade 3
Iowa Tests of Basic Skills (ITBS) Each chart reflects data for three years of testing.
Reading Comprehension 50
83 50 54 0
98-99
80 55 53 97-98
80 48 52 96-97
Mathematics
School 50
System
State
0
87 53 61 98-99
83 58 61 97-98
79 51 59 96-97
School System State
Reading Vocabulary 50
81 50 50 0
98-99
78 51 50 97-98
85 44 49 96-97
Language Arts
School 50
System
State
0
88 61 64 98-99
83 63 62 97-98
74 54 59 96-97
School System State
Social Studies 50
86 50 56 0
98-99
80 52 55 97-98
76 50 55 96-97
Science
School 50
System
State
0
85 49 59 98-99
79 52 59 97-98
79 48 58 96-97
School System State
Sources of Information
Composite Score
50
85 48 57 0
98-99
School 50
System
81 51 56 97-98
80 47 55 96-97
State 0
88 51 58 98-99
84 55 57 97-98
1998-99 GEORGIA PUBLIC EDUCATION REPORT CARD Morningside Elementary School - 7611664
Prepared by Georgia Department of Education
79 48 56 96-97
Scores Reported in Percentiles
School System State
Page 2
STATE-REQUIRED TEST DATA
NORM-REFERENCED TESTS Grade 5
Iowa Tests of Basic Skills (ITBS) Each chart reflects data for three years of testing.
Reading Comprehension
Mathematics
50
71 47 53 0
98-99
72 52 53 97-98
73 49 52 96-97
School 50
System
State
0
75 48 59 98-99
74 53 58 97-98
74 50 57 96-97
School System State
Reading Vocabulary 50
72 48 48 0
98-99
67 52 48 97-98
74 44 46 96-97
Language Arts
School 50
System
State
0
74 56 63 98-99
75 60 61 97-98
67 51 58 96-97
School System State
Social Studies 50
80 54 57 0
98-99
79 54 56 97-98
81 52 55 96-97
Science
School 50
System
State
0
76 48 60 98-99
78 50 59 97-98
78 48 59 96-97
School System State
Sources of Information
Composite Score
50
75 47 58 0
98-99
School 50
System
76 51 58 97-98
80 49 57 96-97
State 0
77 49 57 98-99
77 52 56 97-98
77 48 55 96-97
1998-99 GEORGIA PUBLIC EDUCATION REPORT CARD Morningside Elementary School - 7611664
Prepared by Georgia Department of Education
Scores Reported in Percentiles
School System State
Page 3
STATE-REQUIRED TEST DATA
PERFORMANCE ASSESSMENTS
Grade 5 Writing Assessment
Percent at Developmental Stages:
1998-99 School System State
1997-98 School System State
1996-97 School System State
Stage Stage Stage Stage Stage Stage
1:The Emerging Writer 2:The Developing Writer 3:The Focusing Writer 4:The Experimenting 5:The Engaging Writer 6:The Extending Writer
0% 0% 15% 40% 29% 16%
1% 2% 22% 47% 22% 6%
0% 1% 16% 41% 29% 12%
0% 3% 6% 42% 33% 14%
1% 4% 24% 47% 19% 5%
0% 3% 19% 41% 27% 10%
0% 1% 14% 43% 27% 15%
1% 6% 32% 39% 17% 5%
0% 3% 21% 37% 26% 12%
AWARDS / RECOGNITION DATA
The Georgia School of Excellence Program recognizes exemplary schools that have excellent, successful programs in many areas of school life. Each year, in a statewide competition, one elementary, one middle and one high school from each of Georgia's 11 congressional districts may be selected for this honor.
Morningside Elementary School was designated a 1998-99 Georgia School of Excellence.
1998-99 GEORGIA PUBLIC EDUCATION REPORT CARD Morningside Elementary School - 7611664
Prepared by Georgia Department of Education
Page 4
CERTIFIED PERSONNEL DATA
Positions Number Average Contract Days
Personnel Sex
Certificate
Years Experience
Full-time Part-time
Male Female
4 Yr Bachelor's 5 Yr Master's 6 Yr Specialist's 7 Yr Doctoral Other*
<1 1-10 11-20 21-30 >30
Average
Administrators
3.00 227.33
3 0
0 3
0 0 2 1 0 0 1 0 1 1 21.67
Support Personnel
2.40 195.83
1 3
0 4
1 2 1 0 0 0 1 1 2 0 18.25
PK-12 Teachers
46.40 190.00
45 4
7 42
23 22
3 1 0 1 17 17 10 4 15.29
*Includes One- and Two-Year Vocational Certificates.
ACCREDITATION DATA
Accredited by Georgia Accrediting Commission (GAC).
1998-99 GEORGIA PUBLIC EDUCATION REPORT CARD Morningside Elementary School - 7611664
Prepared by Georgia Department of Education
Page 5
1998-99 GEORGIA PUBLIC EDUCATION REPORT CARD
ATLANTA CITY SCHOOLS
North Atlanta High School - 7610192
Grade Range 9-12
The Georgia Public Education Report Card is designed to assist systems and schools in educational improvement. This report card contains a variety of data elements. An explanation of the terms is provided as a companion to the report card data. Please refer to the definitions for the most effective use of the reported data.
Total 1,529
STUDENT DATA
9-12 Enrollment, by Race/Ethnicity and Sex
Black
White Hispanic
American Multi-
Asian Indian
racial
1,075 70.3%
299 19.6%
71 4.6%
66 4.3%
3 0.2%
15 1.0%
Male Female
679 44.4%
850 55.6%
Enrollment in Selected Programs
Program
Gifted (Grades K-12)
Program % of Student Enrollment Population
326
21.3%
Non-Vocational Labs (Grades 9-12)
Vocational Labs (Grades 9-12)
Alternative Programs (Grades 6-12)
1,353 475 0
88.5% 31.1%
0.0%
Students Eligible to Receive Free/Reduced Lunches
Number
Percent
School System
617 45,695
40.4% 75.5%
Enrollment in Compensatory Programs
Program
Program % of Student Enrollment Population
Special Education (Grades K-12) PK
46
3.0%
0
N/A
English to Speakers of Other Languages (ESOL) (Grades K-12)
48
3.1%
Remedial Education (Grades 2-5, 9-12)
87
5.7%
Title I (Grades K-12)
This school has no Title I program.
Dropout Rate for Grades 9-12
Number
Rate
School System
129 1,248
5.5% 5.4%
Total 233
Retained Students, by Race/Ethnicity and Sex
Black
White Hispanic
American MultiAsian Indian racial
184 79.0%
27 11.6%
18 7.7%
4 1.7%
0 0.0%
0 0.0%
Male Female
155
78
66.5% 33.5%
Prepared by Georgia Department of Education
Page 1
STATE-REQUIRED TEST DATA
GEORGIA HIGH SCHOOL GRADUATION TESTS (GHSGT)
Percent of Regular Program 11th Graders Passing the Georgia High School Graduation Tests on First Administration
English Language Arts Mathematics Social Studies Science
All Components listed above
Writing
1998-99
School System State
97% 91% 82% 82%
91% 79% 73% 61%
96% 88% 80% 72%
77% 55% 68%
91% 85% 93%
1997-98
School System State
95% 91% 87% 83%
89% 78% 68% 61%
94% 88% 78% 74%
77% 54% 68%
91% 83% 92%
1996-97
School System State
95% 89% 81% 74%
89% 72% 65% 52%
94% 87% 78% 74%
70% 46% 67%
92% 82% 93%
GRADUATE DATA
1999 Graduates by Credentials, Race/Ethnicity and Sex
Diplomas with Both College Prep. & Voc. Endorsements
Diplomas with College Prep. Endorsements Diplomas with Vocational Endorsements General High School Diplomas Special Education Diplomas
Total All Diplomas
Certificates of Performance
Total Graduates
Total 4
233 14 0
Black
4 100.0%
157 67.4%
13 92.9%
0
White Hispanic
0 0.0%
0 0.0%
60 25.8%
7 3.0%
1 7.1%
0 0.0%
0
0
American MultiAsian Indian racial
0 0.0%
0 0.0%
0 0.0%
6 2.6%
0 0.0%
3 1.3%
0 0.0%
0 0.0%
0 0.0%
0
0
0
7
7
100.0%
0 0.0%
0 0.0%
0 0.0%
0 0.0%
0 0.0%
258
181
61
7
6
0
3
70.2% 23.6% 2.7% 2.3% 0.0% 1.2%
0
0
0
0
0
0
0
258
181
61
7
6
0
3
70.2% 23.6% 2.7% 2.3% 0.0% 1.2%
Male Female
0
4
0.0% 100.0%
98
135
42.1% 57.9%
7
7
50.0% 50.0%
0
0
5 71.4%
110 42.6%
0
2 28.6%
148 57.4%
0
110
148
42.6% 57.4%
HOPE Scholarships
School System
Number of 1999 Graduates 2 5 8
Number Eligible
177
Percent Eligible
68.6%
2,041 1,099 53.8%
State
65,548 40,292 61.5%
High School Completion Rate
Percent of 1995Grade 9 Enrollment in Graduating Class of1999 School System State
Completion Rate '95-'99 75.2% 57.1% 68.9%
1998-99 GEORGIA PUBLIC EDUCATION REPORT CARD
North Atlanta High School - 7610192
Prepared by Georgia Department of Education
Page 2
COLLEGE ADMISSIONS / CREDIT TEST DATA
Scholastic Assessment Test (SAT)
Based on students' highest verbal and highest math scores
No. Taking
Average Score
Tests Verbal Math Total
Based on students' last test administration
Average Score Verbal Math Total
School
216
College Prep. Endorsement
Other Diplomas
System
1,265
College Prep. Endorsement
Other Diplomas
Georgia
41,958
507 502 N/A
445 441 N/A
492
481 477 N/A
436 430 N/A
488
988 979 N/A
881 871 N/A
980
499 N/A N/A
435 N/A N/A
483
472 N/A N/A
426 N/A N/A
479
971 N/A N/A
861 N/A N/A
962
Nation
952,913 N/A N/A N/A
502 508 1010
American College Testing (ACT)
Advanced Placement Exams (AP)
Number taking tests: English Mathematics Reading Science Reasoning CompositeScore
4 6 School System State
19.6 17.4 19.1
19.5 18.4 19.9
21.5 19.5
18.6 18.3
20.2 19.9
20.1 18.3 19.9
No. of Students Taking Tests
No. of Tests Taken No. of Test Scores
3 or Higher Percent of Test
Scores 3 or Higher
School 61 98 69
70.4%
System State 537 15,225 877 23,969 184 13,024
21.0% 54.3%
POST-SECONDARY DATA
Graduates Entering Georgia Public Colleges
Graduates Entering Georgia Public Colleges and Requiring Learning Support (LS)
1998 Graduates Entering in 1998-99
1997 Graduates Entering in 1997-98
Percent of Graduating Number Class
School
82
28.5%
System 452
21.7%
School
72
28.7%
System 437
21.1%
Number Requiring
LS 22 200
18 202
Percent of those attending Georgia
Public Colleges
26.8%
44.2%
25.0%
46.2%
In previous years, the Report Card presented College Prep Curriculum information provided by the Board of Regents on students requiring Learning Support. Due to inconsistencies in the data provided by the Board of Regents in defining College Prep Completers versus Local Board of Education data defining College Prep Endorsements, the Department of Education Report Card will not provide this information until discrepancies can be reconciled.
Graduates Entering Georgia Public Technical and Adult Schools
1998 Graduates School System
Entering Number 4 53
1998-99 Percent
1.4% 2.5%
Entering Number N/A N/A
1997-98 Percent
N/A N/A
1997 Graduates School
0
0.0%
System
3
0.1%
8
3.2%
109
5.3%
1998-99 GEORGIA PUBLIC EDUCATION REPORT CARD North Atlanta High School - 7610192
Prepared by Georgia Department of Education
Page 3
CERTIFIED PERSONNEL DATA
Positions Number Average Contract Days
Administrators
6.00 223.67
Support Personnel
6.40 196.25
PK-12 Teachers
79.50 191.26
Personnel Sex
Certificate
Years Experience
Full-time Part-time
Male Female
4 Yr Bachelor's 5 Yr Master's 6 Yr Specialist's 7 Yr Doctoral Other*
<1 1-10 11-20 21-30 >30
Average
6 0
5 1
0 1 3 2 0
0 1 2 3 0
16.50
6 1
1 6
0 5 1 1 0
0 3 3 1 0
12.71
79 1
29 51
25 45
5 5 0
4 21 22 26
7
17.03
*Includes One- and Two-Year Vocational Certificates.
ACCREDITATION DATA
Accredited by Southern Association of Colleges and Schools (SACS): Secondary/Middle Commission.
AWARDS / RECOGNITION DATA
Schools in Georgia may receive recognition in the following programs: Charter School Pay for Performance Program Georgia School of Excellence National Blue Ribbon School North Atlanta High School did not receive recognition in any of these programs during the 1998-99 school year.
1998-99 GEORGIA PUBLIC EDUCATION REPORT CARD North Atlanta High School - 7610192
Prepared by Georgia Department of Education
Page 4
1998-99 GEORGIA PUBLIC EDUCATION REPORT CARD
ATLANTA CITY SCHOOLS
Oglethorpe Elementary School - 7614664
Grade Range K-5
The Georgia Public Education Report Card is designed to assist systems and schools in educational improvement. This report card contains a variety of data elements. An explanation of the terms is provided as a companion to the report card data. Please refer to the definitions for the most effective use of the reported data.
STUDENT DATA
Total 190
K-5 Enrollment, by Race/Ethnicity and Sex
Black
White Hispanic
American Multi-
Asian Indian
racial
188 98.9%
2 1.1%
0 0.0%
0 0.0%
0 0.0%
0 0.0%
Male Female
91 47.9%
99 52.1%
Enrollment in Selected Programs
Program
Program % of Student Enrollment Population
Gifted (Grades K-12)
14
7.4%
Alternative Programs (Grades 6-12)
N/A
N/A
Students Eligible to Receive Free/Reduced Lunches
Number
Percent
School System
160 45,695
84.2% 75.5%
Dropout Rate *
Number
Rate
School System
N/A N/A
N/A N/A
* Dropout rates are not applicable for grades PK-5.
Enrollment in Compensatory Programs
Program
Program % of Student Enrollment Population
Special Education (Grades K-12)
11
5.8%
(PK)
0
N/A
English to Speakers of Other Languages (ESOL) (Grades K-12)
0
0.0%
Remedial Education (Grades 2-5, 9-12)
27 20.6%
Special Instructional Assistance (SIA) (Grades K-3)
64 50.8%
Title I (Grades K-12)
This school has a schoolwide program.
Total 11
Retained Students, by Race/Ethnicity and Sex
Black
White Hispanic
American Multi-
Asian Indian
racial
11 100.0%
0 0.0%
0 0.0%
0 0.0%
0 0.0%
0 0.0%
Male Female
10
1
90.9% 9.1%
Prepared by Georgia Department of Education
Page 1
STATE-REQUIRED TEST DATA
NORM-REFERENCED TESTS Grade 3
Iowa Tests of Basic Skills (ITBS) Each chart reflects data for three years of testing.
Reading Comprehension 50
46 50 54 0
98-99
47 55 53 97-98
52 48 52 96-97
Mathematics
School 50
System
State
0
50 53 61 98-99
55 58 61 97-98
55 51 59 96-97
School System State
Reading Vocabulary 50
41 50 50 0
98-99
48 51 50 97-98
46 44 49 96-97
Language Arts
School 50
System
State
0
73 61 64 98-99
65 63 62 97-98
52 54 59 96-97
School System State
Social Studies 50
46 50 56 0
98-99
52 52 55 97-98
55 50 55 96-97
Science
School 50
System
State
0
45 49 59 98-99
41 52 59 97-98
42 48 58 96-97
School System State
Sources of Information
Composite Score
50
56 48 57 0
98-99
School 50
System
46 51 56 97-98
41 47 55 96-97
State 0
53 51 58 98-99
48 55 57 97-98
1998-99 GEORGIA PUBLIC EDUCATION REPORT CARD Oglethorpe Elementary School - 7614664
Prepared by Georgia Department of Education
48 48 56 96-97
Scores Reported in Percentiles
School System State
Page 2
STATE-REQUIRED TEST DATA
NORM-REFERENCED TESTS Grade 5
Iowa Tests of Basic Skills (ITBS) Each chart reflects data for three years of testing.
Reading Comprehension
Mathematics
50
50 47 53 0
98-99
46 52 53 97-98
47 49 52 96-97
School 50
System
State
0
63 48 59 98-99
65 53 58 97-98
61 50 57 96-97
School System State
Reading Vocabulary 50
40 48 48 0
98-99
69 52 48 97-98
28 44 46 96-97
Language Arts
School 50
System
State
0
69 56 63 98-99
64 60 61 97-98
60 51 58 96-97
School System State
Social Studies 50
56 54 57 0
98-99
66 54 56 97-98
51 52 55 96-97
Science
School 50
System
State
0
45 48 60 98-99
70 50 59 97-98
51 48 59 96-97
School System State
Sources of Information
Composite Score
50
65 47 58 0
98-99
School 50
System
45 51 58 97-98
54 49 57 96-97
State 0
59 49 57 98-99
62 52 56 97-98
51 48 55 96-97
1998-99 GEORGIA PUBLIC EDUCATION REPORT CARD Oglethorpe Elementary School - 7614664
Prepared by Georgia Department of Education
Scores Reported in Percentiles
School System State
Page 3
STATE-REQUIRED TEST DATA
PERFORMANCE ASSESSMENTS
Grade 5 Writing Assessment
Percent at Developmental Stages:
1998-99 School System State
1997-98 School System State
1996-97 School System State
Stage Stage Stage Stage Stage Stage
1:The Emerging Writer 2:The Developing Writer 3:The Focusing Writer 4:The Experimenting 5:The Engaging Writer 6:The Extending Writer
4% 0% 0% 14% 57% 25%
1% 2% 22% 47% 22% 6%
0% 1% 16% 41% 29% 12%
0% 3% 3% 36% 42% 17%
1% 4% 24% 47% 19% 5%
0% 3% 19% 41% 27% 10%
0% 0% 11% 58% 14% 14%
1% 6% 32% 39% 17% 5%
0% 3% 21% 37% 26% 12%
AWARDS / RECOGNITION DATA
Schools in Georgia may receive recognition in the following programs: Charter School Pay for Performance Program Georgia School of Excellence National Blue Ribbon School Oglethorpe Elementary School did not receive recognition in any of these programs during the 1998-99 school year.
1998-99 GEORGIA PUBLIC EDUCATION REPORT CARD Oglethorpe Elementary School - 7614664
Prepared by Georgia Department of Education
Page 4
CERTIFIED PERSONNEL DATA
Positions Number Average Contract Days
Personnel Sex
Certificate
Years Experience
Full-time Part-time
Male Female
4 Yr Bachelor's 5 Yr Master's 6 Yr Specialist's 7 Yr Doctoral Other*
<1 1-10 11-20 21-30 >30
Average
Administrators
2.00 231.00
2 0
1 1
0 0 1 1 0 0 0 0 1 1 29.50
Support Personnel
1.80 195.56
1 3
0 4
0 3 1 0 0 0 0 2 2 0 20.25
PK-12 Teachers
20.20 190.00
18 6
1 23
16 8 0 0 0 1
11 4 3 5
15.63
*Includes One- and Two-Year Vocational Certificates.
ACCREDITATION DATA
Accredited by Georgia Accrediting Commission (GAC).
1998-99 GEORGIA PUBLIC EDUCATION REPORT CARD Oglethorpe Elementary School - 7614664
Prepared by Georgia Department of Education
Page 5
1998-99 GEORGIA PUBLIC EDUCATION REPORT CARD
ATLANTA CITY SCHOOLS
Parks Middle School - 7615664
Grade Range 6-8
The Georgia Public Education Report Card is designed to assist systems and schools in educational improvement. This report card contains a variety of data elements. An explanation of the terms is provided as a companion to the report card data. Please refer to the definitions for the most effective use of the reported data.
STUDENT DATA
Total 597
6-8 Enrollment, by Race/Ethnicity and Sex
Black
White Hispanic
American Multi-
Asian Indian
racial
557 93.3%
3 0.5%
8 1.3%
28 4.7%
0 0.0%
1 0.2%
Male 287
48.1%
Female 310
51.9%
Enrollment in Selected Programs
Program
Gifted (Grades K-12)
Program % of Student Enrollment Population
0
0.0%
Alternative Programs (Grades 6-12)
0
0.0%
Students Eligible to Receive Free/Reduced Lunches
Number
Percent
School System
558 45,695
93.5% 75.5%
Enrollment in Compensatory Programs
Program
Program % of Student Enrollment Population
Special Education (Grades K-12) (PK)
45
7.5%
0
N/A
English to Speakers of Other Languages (ESOL) (Grades K-12)
19
3.2%
Title I (Grades K-12)
This school has a schoolwide program.
Dropout Rate for Grades 6-8
Number
Rate
School System
29
3.2%
705
3.8%
Total 3
Retained Students, by Race/Ethnicity and Sex
Black
White Hispanic
American MultiAsian Indian racial
3 100.0%
0 0.0%
0 0.0%
0 0.0%
0 0.0%
0 0.0%
Male Female
2
1
66.7% 33.3%
Prepared by Georgia Department of Education
Page 1
STATE-REQUIRED TEST DATA
NORM-REFERENCED TESTS Grade 8
Iowa Tests of Basic Skills (ITBS) Each chart reflects data for three years of testing.
Reading Comprehension 50
29 36 49 0
98-99
40 35 48 97-98
28 34 48 96-97
Mathematics
School 50
System
State
0
27 45 56 98-99
34 43 55 97-98
54 43 54 96-97
School System State
Reading Vocabulary 50
26 32 46 0
98-99
68 36 45 97-98
39 27 44 96-97
Language Arts
School 50
System
State
0
25 42 60 98-99
30 43 58 97-98
40 40 56 96-97
School System State
Social Studies 50
34 42 54 0
98-99
34 45 53 97-98
33 41 53 96-97
Science
School 50
System
State
0
22 36 56 98-99
26 39 55 97-98
21 35 53 96-97
School System State
Sources of Information
Composite Score
50
26 42 57 0
98-99
School 50
System
29 42 56 97-98
29 42 55 96-97
State 0
25 39 56 98-99
32 40 54 97-98
1998-99 GEORGIA PUBLIC EDUCATION REPORT CARD Parks Middle School - 7615664
Prepared by Georgia Department of Education
32 37 54 96-97
Scores Reported in Percentiles
School System State
Page 2
STATE-REQUIRED TEST DATA
Categories of Scaled Scores
Inadequate (less than 162)
Minimal (162-209)
Good
(210-247)
Very Good (greater than 247)
Average Scaled Score: (Range 100-300)
PERFORMANCE ASSESSMENTS
Grade 8 Writing Assessment
1998-99 Percent Scoring
1997-98 Percent Scoring
1996-97 Percent Scoring
School System State School System State School System State
18% 54% 25%
3%
16% 51% 28%
5%
8% 40% 41% 11%
25% 57% 15%
3%
25% 53% 19%
3%
11% 46% 34%
8%
30% 61%
9% 1%
34% 48% 15%
3%
15% 46% 30%
8%
188
193
208 182
184 202 176
177 198
AWARDS / RECOGNITION DATA
Schools in Georgia may receive recognition in the following programs: Charter School Pay for Performance Program Georgia School of Excellence National Blue Ribbon School Parks Middle School did not receive recognition in any of these programs during the 1998-99 school year.
1998-99 GEORGIA PUBLIC EDUCATION REPORT CARD Parks Middle School - 7615664
Prepared by Georgia Department of Education
Page 3
CERTIFIED PERSONNEL DATA
Positions Number Average Contract Days
Personnel Sex
Certificate
Years Experience
Full-time Part-time
Male Female
4 Yr Bachelor's 5 Yr Master's 6 Yr Specialist's 7 Yr Doctoral Other*
<1 1-10 11-20 21-30 >30
Average
Administrators
4.00 225.50
4 0
2 2
0 2 1 1 0 0 1 1 2 0 17.25
Support Personnel
1.70 202.94
1 2
0 3
1 1 1 0 0 0 2 1 0 0 10.00
PK-12 Teachers
33.90 190.29
33 2
11 24
18 13
4 0 0 2 15 9 7 2 13.54
*Includes One- and Two-Year Vocational Certificates.
ACCREDITATION DATA
Accredited with Quality by Georgia Accrediting Commission (GAC).
1998-99 GEORGIA PUBLIC EDUCATION REPORT CARD Parks Middle School - 7615664
Prepared by Georgia Department of Education
Page 4
1998-99 GEORGIA PUBLIC EDUCATION REPORT CARD
ATLANTA CITY SCHOOLS
Perkerson Elementary School - 7610296
Grade Range K-5
The Georgia Public Education Report Card is designed to assist systems and schools in educational improvement. This report card contains a variety of data elements. An explanation of the terms is provided as a companion to the report card data. Please refer to the definitions for the most effective use of the reported data.
STUDENT DATA
Total 536
K-5 Enrollment, by Race/Ethnicity and Sex
Black
White Hispanic
American Multi-
Asian Indian
racial
512 95.5%
12 2.2%
10 1.9%
0 0.0%
0 0.0%
2 0.4%
Male Female
261 48.7%
275 51.3%
Enrollment in Selected Programs
Program
Program % of Student Enrollment Population
Gifted (Grades K-12)
0
0.0%
Alternative Programs (Grades 6-12)
N/A
N/A
Students Eligible to Receive Free/Reduced Lunches
Number
Percent
School System
443 45,695
82.6% 75.5%
Dropout Rate *
Number
Rate
School System
N/A N/A
N/A N/A
* Dropout rates are not applicable for grades PK-5.
Enrollment in Compensatory Programs
Program
Program % of Student Enrollment Population
Special Education (Grades K-12)
26
4.9%
(PK)
0
N/A
English to Speakers of Other Languages (ESOL) (Grades K-12)
0
0.0%
Remedial Education (Grades 2-5, 9-12)
83 22.9%
Special Instructional Assistance (SIA) (Grades K-3)
152 40.6%
Title I (Grades K-12)
This school has a schoolwide program.
Total 37
Retained Students, by Race/Ethnicity and Sex
Black
White Hispanic
American Multi-
Asian Indian
racial
35 94.6%
1 2.7%
1 2.7%
0 0.0%
0 0.0%
0 0.0%
Male Female
22
15
59.5% 40.5%
Prepared by Georgia Department of Education
Page 1
STATE-REQUIRED TEST DATA
NORM-REFERENCED TESTS Grade 3
Iowa Tests of Basic Skills (ITBS) Each chart reflects data for three years of testing.
Reading Comprehension 50
45 50 54 0
98-99
48 55 53 97-98
35 48 52 96-97
Mathematics
School 50
System
State
0
43 53 61 98-99
44 58 61 97-98
42 51 59 96-97
School System State
Reading Vocabulary 50
50 50 50 0
98-99
41 51 50 97-98
28 44 49 96-97
Language Arts
School 50
System
State
0
57 61 64 98-99
52 63 62 97-98
43 54 59 96-97
School System State
Social Studies 50
46 50 56 0
98-99
56 52 55 97-98
44 50 55 96-97
Science
School 50
System
State
0
35 49 59 98-99
33 52 59 97-98
48 48 58 96-97
School System State
Sources of Information
Composite Score
50
36 48 57 0
98-99
School 50
System
34 51 56 97-98
39 47 55 96-97
State 0
42 51 58 98-99
41 55 57 97-98
1998-99 GEORGIA PUBLIC EDUCATION REPORT CARD Perkerson Elementary School - 7610296
Prepared by Georgia Department of Education
40 48 56 96-97
Scores Reported in Percentiles
School System State
Page 2
STATE-REQUIRED TEST DATA
NORM-REFERENCED TESTS Grade 5
Iowa Tests of Basic Skills (ITBS) Each chart reflects data for three years of testing.
Reading Comprehension
Mathematics
50
57 47 53 0
98-99
63 52 53 97-98
42 49 52 96-97
School 50
System
State
0
60 48 59 98-99
39 53 58 97-98
40 50 57 96-97
School System State
Reading Vocabulary 50
50 48 48 0
98-99
52 52 48 97-98
33 44 46 96-97
Language Arts
School 50
System
State
0
61 56 63 98-99
48 60 61 97-98
44 51 58 96-97
School System State
Social Studies 50
74 54 57 0
98-99
47 54 56 97-98
48 52 55 96-97
Science
School 50
System
State
0
39 48 60 98-99
47 50 59 97-98
33 48 59 96-97
School System State
Sources of Information
Composite Score
50
45 47 58 0
98-99
School 50
System
42 51 58 97-98
44 49 57 96-97
State 0
55 49 57 98-99
46 52 56 97-98
39 48 55 96-97
1998-99 GEORGIA PUBLIC EDUCATION REPORT CARD Perkerson Elementary School - 7610296
Prepared by Georgia Department of Education
Scores Reported in Percentiles
School System State
Page 3
STATE-REQUIRED TEST DATA
PERFORMANCE ASSESSMENTS
Grade 5 Writing Assessment
Percent at Developmental Stages:
1998-99 School System State
1997-98 School System State
1996-97 School System State
Stage Stage Stage Stage Stage Stage
1:The Emerging Writer 2:The Developing Writer 3:The Focusing Writer 4:The Experimenting 5:The Engaging Writer 6:The Extending Writer
0% 0% 22% 48% 19% 10%
1% 2% 22% 47% 22% 6%
0% 1% 16% 41% 29% 12%
0% 3% 34% 41% 20% 3%
1% 4% 24% 47% 19% 5%
0% 3% 19% 41% 27% 10%
1% 4% 26% 57% 12% 2%
1% 6% 32% 39% 17% 5%
0% 3% 21% 37% 26% 12%
AWARDS / RECOGNITION DATA
Schools in Georgia may receive recognition in the following programs: Charter School Pay for Performance Program Georgia School of Excellence National Blue Ribbon School Perkerson Elementary School did not receive recognition in any of these programs during the 1998-99 school year.
1998-99 GEORGIA PUBLIC EDUCATION REPORT CARD Perkerson Elementary School - 7610296
Prepared by Georgia Department of Education
Page 4
CERTIFIED PERSONNEL DATA
Positions Number Average Contract Days
Personnel Sex
Certificate
Years Experience
Full-time Part-time
Male Female
4 Yr Bachelor's 5 Yr Master's 6 Yr Specialist's 7 Yr Doctoral Other*
<1 1-10 11-20 21-30 >30
Average
Administrators
3.00 227.33
3 0
1 2
0 0 1 2 0 0 0 1 1 1 30.33
Support Personnel
2.30 196.96
1 3
0 4
0 2 1 1 0 0 1 2 0 1 19.50
PK-12 Teachers
34.70 190.00
33 5
5 33
19 18
0 1 0 1 13 13 7 4 14.47
*Includes One- and Two-Year Vocational Certificates.
ACCREDITATION DATA
Accredited by Georgia Accrediting Commission (GAC).
1998-99 GEORGIA PUBLIC EDUCATION REPORT CARD Perkerson Elementary School - 7610296
Prepared by Georgia Department of Education
Page 5
1998-99 GEORGIA PUBLIC EDUCATION REPORT CARD
ATLANTA CITY SCHOOLS
Peterson Elementary School - 7612565
Grade Range K-5
The Georgia Public Education Report Card is designed to assist systems and schools in educational improvement. This report card contains a variety of data elements. An explanation of the terms is provided as a companion to the report card data. Please refer to the definitions for the most effective use of the reported data.
STUDENT DATA
Total 316
K-5 Enrollment, by Race/Ethnicity and Sex
Black
White Hispanic
American Multi-
Asian Indian
racial
309 97.8%
1 0.3%
4 1.3%
0 0.0%
0 0.0%
2 0.6%
Male Female
174 55.1%
142 44.9%
Enrollment in Selected Programs
Program
Program % of Student Enrollment Population
Gifted (Grades K-12)
5
1.6%
Alternative Programs (Grades 6-12)
N/A
N/A
Students Eligible to Receive Free/Reduced Lunches
Number
Percent
School System
305 45,695
96.5% 75.5%
Dropout Rate *
Number
Rate
School System
N/A N/A
N/A N/A
* Dropout rates are not applicable for grades PK-5.
Enrollment in Compensatory Programs
Program
Program % of Student Enrollment Population
Special Education (Grades K-12)
14
4.4%
(PK)
0
N/A
English to Speakers of Other Languages (ESOL) (Grades K-12)
0
0.0%
Remedial Education (Grades 2-5, 9-12)
48 22.3%
Special Instructional Assistance (SIA) (Grades K-3)
141 62.9%
Title I (Grades K-12)
This school has a schoolwide program.
Total 7
Retained Students, by Race/Ethnicity and Sex
Black
White Hispanic
American Multi-
Asian Indian
racial
7 100.0%
0 0.0%
0 0.0%
0 0.0%
0 0.0%
0 0.0%
Male Female
7
0
100.0% 0.0%
Prepared by Georgia Department of Education
Page 1
STATE-REQUIRED TEST DATA
NORM-REFERENCED TESTS Grade 3
Iowa Tests of Basic Skills (ITBS) Each chart reflects data for three years of testing.
Reading Comprehension 50
44 50 54 0
98-99
19 55 53 97-98
27 48 52 96-97
Mathematics
School 50
System
State
0
35 53 61 98-99
39 58 61 97-98
37 51 59 96-97
School System State
Reading Vocabulary 50
61 50 50 0
98-99
43 51 50 97-98
50 44 49 96-97
Language Arts
School 50
System
State
0
36 61 64 98-99
33 63 62 97-98
58 54 59 96-97
School System State
Social Studies 50
39 50 56 0
98-99
35 52 55 97-98
35 50 55 96-97
Science
School 50
System
State
0
34 49 59 98-99
40 52 59 97-98
32 48 58 96-97
School System State
Sources of Information
Composite Score
50
35 48 57 0
98-99
School 50
System
26 51 56 97-98
33 47 55 96-97
State 0
36 51 58 98-99
32 55 57 97-98
1998-99 GEORGIA PUBLIC EDUCATION REPORT CARD Peterson Elementary School - 7612565
Prepared by Georgia Department of Education
37 48 56 96-97
Scores Reported in Percentiles
School System State
Page 2
STATE-REQUIRED TEST DATA
NORM-REFERENCED TESTS Grade 5
Iowa Tests of Basic Skills (ITBS) Each chart reflects data for three years of testing.
Reading Comprehension
Mathematics
50
42 47 53 0
98-99
54 52 53 97-98
55 49 52 96-97
School 50
System
State
0
42 48 59 98-99
45 53 58 97-98
50 50 57 96-97
School System State
Reading Vocabulary 50
39 48 48 0
98-99
59 52 48 97-98
30 44 46 96-97
Language Arts
School 50
System
State
0
56 56 63 98-99
57 60 61 97-98
54 51 58 96-97
School System State
Social Studies 50
64 54 57 0
98-99
45 54 56 97-98
54 52 55 96-97
Science
School 50
System
State
0
51 48 60 98-99
43 50 59 97-98
41 48 59 96-97
School System State
Sources of Information
Composite Score
50
49 47 58 0
98-99
School 50
System
43 51 58 97-98
42 49 57 96-97
State 0
50 49 57 98-99
50 52 56 97-98
46 48 55 96-97
1998-99 GEORGIA PUBLIC EDUCATION REPORT CARD Peterson Elementary School - 7612565
Prepared by Georgia Department of Education
Scores Reported in Percentiles
School System State
Page 3
STATE-REQUIRED TEST DATA
PERFORMANCE ASSESSMENTS
Grade 5 Writing Assessment
Percent at Developmental Stages:
1998-99 School System State
1997-98 School System State
1996-97 School System State
Stage Stage Stage Stage Stage Stage
1:The Emerging Writer 2:The Developing Writer 3:The Focusing Writer 4:The Experimenting 5:The Engaging Writer 6:The Extending Writer
0% 5% 25% 43% 25% 2%
1% 2% 22% 47% 22% 6%
0% 1% 16% 41% 29% 12%
0% 2% 7% 55% 31% 2%
1% 4% 24% 47% 19% 5%
0% 3% 19% 41% 27% 10%
0% 2% 37% 54% 5% 2%
1% 6% 32% 39% 17% 5%
0% 3% 21% 37% 26% 12%
AWARDS / RECOGNITION DATA
Schools in Georgia may receive recognition in the following programs: Charter School Pay for Performance Program Georgia School of Excellence National Blue Ribbon School Peterson Elementary School did not receive recognition in any of these programs during the 1998-99 school year.
1998-99 GEORGIA PUBLIC EDUCATION REPORT CARD Peterson Elementary School - 7612565
Prepared by Georgia Department of Education
Page 4
CERTIFIED PERSONNEL DATA
Positions Number Average Contract Days
Personnel Sex
Certificate
Years Experience
Full-time Part-time
Male Female
4 Yr Bachelor's 5 Yr Master's 6 Yr Specialist's 7 Yr Doctoral Other*
<1 1-10 11-20 21-30 >30
Average
Administrators
2.00 231.00
2 0
0 2
0 0 2 0 0 0 1 0 1 0 16.50
Support Personnel
1.50 198.00
1 3
0 4
0 3 1 0 0 0 2 0 1 1 19.75
PK-12 Teachers
21.90 190.00
20 7
4 23
16 11
0 0 0 1 8 10 7 1 15.19
*Includes One- and Two-Year Vocational Certificates.
ACCREDITATION DATA
Accredited by Georgia Accrediting Commission (GAC).
1998-99 GEORGIA PUBLIC EDUCATION REPORT CARD Peterson Elementary School - 7612565
Prepared by Georgia Department of Education
Page 5
1998-99 GEORGIA PUBLIC EDUCATION REPORT CARD
ATLANTA CITY SCHOOLS
Peyton Forest Elementary School - 7613065
Grade Range K-5
The Georgia Public Education Report Card is designed to assist systems and schools in educational improvement. This report card contains a variety of data elements. An explanation of the terms is provided as a companion to the report card data. Please refer to the definitions for the most effective use of the reported data.
STUDENT DATA
Total 615
K-5 Enrollment, by Race/Ethnicity and Sex
Black
White Hispanic
American Multi-
Asian Indian
racial
602 97.9%
1 0.2%
12 2.0%
0 0.0%
0 0.0%
0 0.0%
Male Female
306 49.8%
309 50.2%
Enrollment in Selected Programs
Program
Program % of Student Enrollment Population
Gifted (Grades K-12)
67
10.9%
Alternative Programs (Grades 6-12)
N/A
N/A
Students Eligible to Receive Free/Reduced Lunches
Number
Percent
School System
404 45,695
65.7% 75.5%
Dropout Rate *
Number
Rate
School System
N/A N/A
N/A N/A
* Dropout rates are not applicable for grades PK-5.
Enrollment in Compensatory Programs
Program
Program % of Student Enrollment Population
Special Education (Grades K-12)
47
7.6%
(PK)
0
N/A
English to Speakers of Other Languages (ESOL) (Grades K-12)
0
0.0%
Remedial Education (Grades 2-5, 9-12)
75 17.6%
Special Instructional Assistance (SIA) (Grades K-3)
46 11.3%
Title I (Grades K-12)
This school has a schoolwide program.
Total 21
Retained Students, by Race/Ethnicity and Sex
Black
White Hispanic
American Multi-
Asian Indian
racial
18 85.7%
0 0.0%
3 14.3%
0 0.0%
0 0.0%
0 0.0%
Male Female
15
6
71.4% 28.6%
Prepared by Georgia Department of Education
Page 1
STATE-REQUIRED TEST DATA
NORM-REFERENCED TESTS Grade 3
Iowa Tests of Basic Skills (ITBS) Each chart reflects data for three years of testing.
Reading Comprehension 50
46 50 54 0
98-99
51 55 53 97-98
50 48 52 96-97
Mathematics
School 50
System
State
0
57 53 61 98-99
48 58 61 97-98
64 51 59 96-97
School System State
Reading Vocabulary 50
44 50 50 0
98-99
41 51 50 97-98
52 44 49 96-97
Language Arts
School 50
System
State
0
71 61 64 98-99
62 63 62 97-98
67 54 59 96-97
School System State
Social Studies 50
57 50 56 0
98-99
46 52 55 97-98
63 50 55 96-97
Science
School 50
System
State
0
48 49 59 98-99
42 52 59 97-98
51 48 58 96-97
School System State
Sources of Information
Composite Score
50
54 48 57 0
98-99
School 50
System
48 51 56 97-98
54 47 55 96-97
State 0
55 51 58 98-99
47 55 57 97-98
1998-99 GEORGIA PUBLIC EDUCATION REPORT CARD Peyton Forest Elementary School - 7613065
Prepared by Georgia Department of Education
59 48 56 96-97
Scores Reported in Percentiles
School System State
Page 2
STATE-REQUIRED TEST DATA
NORM-REFERENCED TESTS Grade 5
Iowa Tests of Basic Skills (ITBS) Each chart reflects data for three years of testing.
Reading Comprehension
Mathematics
50
62 47 53 0
98-99
51 52 53 97-98
54 49 52 96-97
School 50
System
State
0
73 48 59 98-99
56 53 58 97-98
59 50 57 96-97
School System State
Reading Vocabulary 50
72 48 48 0
98-99
43 52 48 97-98
39 44 46 96-97
Language Arts
School 50
System
State
0
84 56 63 98-99
67 60 61 97-98
60 51 58 96-97
School System State
Social Studies 50
73 54 57 0
98-99
53 54 56 97-98
56 52 55 96-97
Science
School 50
System
State
0
68 48 60 98-99
47 50 59 97-98
50 48 59 96-97
School System State
Sources of Information
Composite Score
50
69 47 58 0
98-99
School 50
System
55 51 58 97-98
58 49 57 96-97
State 0
74 49 57 98-99
54 52 56 97-98
54 48 55 96-97
1998-99 GEORGIA PUBLIC EDUCATION REPORT CARD Peyton Forest Elementary School - 7613065
Prepared by Georgia Department of Education
Scores Reported in Percentiles
School System State
Page 3
STATE-REQUIRED TEST DATA
PERFORMANCE ASSESSMENTS
Grade 5 Writing Assessment
Percent at Developmental Stages:
1998-99 School System State
1997-98 School System State
1996-97 School System State
Stage Stage Stage Stage Stage Stage
1:The Emerging Writer 2:The Developing Writer 3:The Focusing Writer 4:The Experimenting 5:The Engaging Writer 6:The Extending Writer
0% 1% 12% 48% 35% 4%
1% 2% 22% 47% 22% 6%
0% 1% 16% 41% 29% 12%
2% 1% 10% 52% 30% 5%
1% 4% 24% 47% 19% 5%
0% 3% 19% 41% 27% 10%
0% 4% 33% 31% 25% 7%
1% 6% 32% 39% 17% 5%
0% 3% 21% 37% 26% 12%
AWARDS / RECOGNITION DATA
Schools in Georgia may receive recognition in the following programs: Charter School Pay for Performance Program Georgia School of Excellence National Blue Ribbon School Peyton Forest Elementary School did not receive recognition in any of these programs during the 1998-99 school year.
1998-99 GEORGIA PUBLIC EDUCATION REPORT CARD Peyton Forest Elementary School - 7613065
Prepared by Georgia Department of Education
Page 4
CERTIFIED PERSONNEL DATA
Positions Number Average Contract Days
Personnel Sex
Certificate
Years Experience
Full-time Part-time
Male Female
4 Yr Bachelor's 5 Yr Master's 6 Yr Specialist's 7 Yr Doctoral Other*
<1 1-10 11-20 21-30 >30
Average
Administrators
3.00 227.33
3 0
1 2
0 2 1 0 0 0 0 1 1 1 24.00
Support Personnel
1.60 196.25
1 2
0 3
0 2 1 0 0 0 1 1 1 0 17.33
PK-12 Teachers
38.80 190.00
36 7
2 41
23 17
3 0 0 2 14 11 9 7 16.88
*Includes One- and Two-Year Vocational Certificates.
ACCREDITATION DATA
Accredited by Georgia Accrediting Commission (GAC).
1998-99 GEORGIA PUBLIC EDUCATION REPORT CARD Peyton Forest Elementary School - 7613065
Prepared by Georgia Department of Education
Page 5
1998-99 GEORGIA PUBLIC EDUCATION REPORT CARD
ATLANTA CITY SCHOOLS
Pitts Elementary School - 7613565
Grade Range PK-5
The Georgia Public Education Report Card is designed to assist systems and schools in educational improvement. This report card contains a variety of data elements. An explanation of the terms is provided as a companion to the report card data. Please refer to the definitions for the most effective use of the reported data.
STUDENT DATA
Total
K-5
305
PK
33
Enrollment, by Race/Ethnicity and Sex
Black
White Hispanic
American Asian Indian
Multiracial
299 98.0%
3 1.0%
3 1.0%
0 0.0%
0 0.0%
0 0.0%
33 100.0%
0 0.0%
0 0.0%
0 0.0%
0 0.0%
0 0.0%
Male Female
168 55.1%
137 44.9%
13 39.4%
20 60.6%
Enrollment in Selected Programs
Program
Program % of Student Enrollment Population
Gifted (Grades K-12)
1
< 1%
Alternative Programs (Grades 6-12)
N/A
N/A
Students Eligible to Receive Free/Reduced Lunches
Number
Percent
School System
290 45,695
85.8% 75.5%
Dropout Rate *
Number
Rate
School System
N/A N/A
N/A N/A
* Dropout rates are not applicable for grades PK-5.
Enrollment in Compensatory Programs
Program
Program % of Student Enrollment Population
Special Education (Grades K-12)
24
7.9%
(PK)
15
N/A
English to Speakers of Other Languages (ESOL) (Grades K-12)
0
0.0%
Remedial Education (Grades 2-5, 9-12)
26 13.2%
Special Instructional Assistance (SIA) (Grades K-3)
135 59.5%
Title I (Grades K-12)
This school has a schoolwide program.
Total 26
Retained Students, by Race/Ethnicity and Sex
Black
White Hispanic
American MultiAsian Indian racial
26 100.0%
0 0.0%
0 0.0%
0 0.0%
0 0.0%
0 0.0%
Male Female
12
14
46.2% 53.8%
Prepared by Georgia Department of Education
Page 1
STATE-REQUIRED TEST DATA
NORM-REFERENCED TESTS Grade 3
Iowa Tests of Basic Skills (ITBS) Each chart reflects data for three years of testing.
Reading Comprehension 50
47 50 54 0
98-99
30 55 53 97-98
20 48 52 96-97
Mathematics
School 50
System
State
0
76 53 61 98-99
64 58 61 97-98
27 51 59 96-97
School System State
Reading Vocabulary 50
68 50 50 0
98-99
44 51 50 97-98
14 44 49 96-97
Language Arts
School 50
System
State
0
64 61 64 98-99
52 63 62 97-98
30 54 59 96-97
School System State
Social Studies 50
44 50 56 0
98-99
29 52 55 97-98
24 50 55 96-97
Science
School 50
System
State
0
49 49 59 98-99
25 52 59 97-98
21 48 58 96-97
School System State
Sources of Information
Composite Score
50
48 48 57 0
98-99
School 50
System
29 51 56 97-98
27 47 55 96-97
State 0
56 51 58 98-99
35 55 57 97-98
1998-99 GEORGIA PUBLIC EDUCATION REPORT CARD Pitts Elementary School - 7613565
Prepared by Georgia Department of Education
21 48 56 96-97
Scores Reported in Percentiles
School System State
Page 2
STATE-REQUIRED TEST DATA
NORM-REFERENCED TESTS Grade 5
Iowa Tests of Basic Skills (ITBS) Each chart reflects data for three years of testing.
Reading Comprehension
Mathematics
50
26 47 53 0
98-99
29 52 53 97-98
26 49 52 96-97
School 50
System
State
0
20 48 59 98-99
32 53 58 97-98
22 50 57 96-97
School System State
Reading Vocabulary 50
7 48 48 10 52 48 10 44 46 0
98-99
97-98
96-97
Language Arts
School 50
System
State
0
37 56 63 98-99
35 60 61 97-98
23 51 58 96-97
School System State
Social Studies 50
19 54 57 0
98-99
20 54 56 97-98
19 52 55 96-97
Science
School 50
System
State
0
18 48 60 98-99
15 50 59 97-98
19 48 59 96-97
School System State
Sources of Information
Composite Score
50
28 47 58 0
98-99
School 50
System
23 51 58 97-98
26 49 57 96-97
State 0
21 49 57 98-99
20 52 56 97-98
19 48 55 96-97
1998-99 GEORGIA PUBLIC EDUCATION REPORT CARD Pitts Elementary School - 7613565
Prepared by Georgia Department of Education
Scores Reported in Percentiles
School System State
Page 3
STATE-REQUIRED TEST DATA
PERFORMANCE ASSESSMENTS
Grade 5 Writing Assessment
Percent at Developmental Stages:
1998-99 School System State
1997-98 School System State
1996-97 School System State
Stage Stage Stage Stage Stage Stage
1:The Emerging Writer 2:The Developing Writer 3:The Focusing Writer 4:The Experimenting 5:The Engaging Writer 6:The Extending Writer
0% 4% 21% 54% 17% 4%
1% 2% 22% 47% 22% 6%
0% 1% 16% 41% 29% 12%
3% 3% 18% 64% 12% 0%
1% 4% 24% 47% 19% 5%
0% 3% 19% 41% 27% 10%
2% 2% 21% 48% 25% 0%
1% 6% 32% 39% 17% 5%
0% 3% 21% 37% 26% 12%
AWARDS / RECOGNITION DATA
Schools in Georgia may receive recognition in the following programs: Charter School Pay for Performance Program Georgia School of Excellence National Blue Ribbon School Pitts Elementary School did not receive recognition in any of these programs during the 1998-99 school year.
1998-99 GEORGIA PUBLIC EDUCATION REPORT CARD Pitts Elementary School - 7613565
Prepared by Georgia Department of Education
Page 4
CERTIFIED PERSONNEL DATA
Positions Number Average Contract Days
Personnel Sex
Certificate
Years Experience
Full-time Part-time
Male Female
4 Yr Bachelor's 5 Yr Master's 6 Yr Specialist's 7 Yr Doctoral Other*
<1 1-10 11-20 21-30 >30
Average
Administrators
2.00 231.00
2 0
0 2
0 1 1 0 0 0 0 2 0 0 16.00
Support Personnel
2.30 192.17
1 2
1 2
0 2 1 0 0 0 2 0 0 1 15.33
PK-12 Teachers
18.30 190.00
16 6
6 16
11 11
0 0 0 0 16 3 1 2 9.86
*Includes One- and Two-Year Vocational Certificates.
ACCREDITATION DATA
Accredited by Georgia Accrediting Commission (GAC).
1998-99 GEORGIA PUBLIC EDUCATION REPORT CARD Pitts Elementary School - 7613565
Prepared by Georgia Department of Education
Page 5
1998-99 GEORGIA PUBLIC EDUCATION REPORT CARD
ATLANTA CITY SCHOOLS
Price Middle School - 7610288
Grade Range 6-8
The Georgia Public Education Report Card is designed to assist systems and schools in educational improvement. This report card contains a variety of data elements. An explanation of the terms is provided as a companion to the report card data. Please refer to the definitions for the most effective use of the reported data.
STUDENT DATA
Total 597
6-8 Enrollment, by Race/Ethnicity and Sex
Black
White Hispanic
American Multi-
Asian Indian
racial
549 92.0%
8 1.3%
7 1.2%
29 4.9%
2 0.3%
2 0.3%
Male 296
49.6%
Female 301
50.4%
Enrollment in Selected Programs
Program
Gifted (Grades K-12)
Program % of Student Enrollment Population
2
< 1%
Alternative Programs (Grades 6-12)
0
0.0%
Students Eligible to Receive Free/Reduced Lunches
Number
Percent
School System
560 45,695
93.8% 75.5%
Enrollment in Compensatory Programs
Program
Program % of Student Enrollment Population
Special Education (Grades K-12) (PK)
89 14.9%
0
N/A
English to Speakers of Other Languages (ESOL) (Grades K-12)
34
5.7%
Title I (Grades K-12)
This school has a schoolwide program.
Dropout Rate for Grades 6-8
Number
Rate
School System
35
3.7%
705
3.8%
Total 13
Retained Students, by Race/Ethnicity and Sex
Black
White Hispanic
American MultiAsian Indian racial
12 92.3%
1 7.7%
0 0.0%
0 0.0%
0 0.0%
0 0.0%
Male Female
6
7
46.2% 53.8%
Prepared by Georgia Department of Education
Page 1
STATE-REQUIRED TEST DATA
NORM-REFERENCED TESTS Grade 8
Iowa Tests of Basic Skills (ITBS) Each chart reflects data for three years of testing.
Reading Comprehension 50
28 36 49 0
98-99
29 35 48 97-98
22 34 48 96-97
Mathematics
School 50
System
State
0
44 45 56 98-99
40 43 55 97-98
28 43 54 96-97
School System State
Reading Vocabulary 50
25 32 46 0
98-99
27 36 45 97-98
15 27 44 96-97
Language Arts
School 50
System
State
0
34 42 60 98-99
38 43 58 97-98
31 40 56 96-97
School System State
Social Studies 50
35 42 54 0
98-99
37 45 53 97-98
32 41 53 96-97
Science
School 50
System
State
0
27 36 56 98-99
29 39 55 97-98
26 35 53 96-97
School System State
Sources of Information
Composite Score
50
34 42 57 0
98-99
School 50
System
37 42 56 97-98
33 42 55 96-97
State 0
31 39 56 98-99
32 40 54 97-98
1998-99 GEORGIA PUBLIC EDUCATION REPORT CARD Price Middle School - 7610288
Prepared by Georgia Department of Education
25 37 54 96-97
Scores Reported in Percentiles
School System State
Page 2
STATE-REQUIRED TEST DATA
Categories of Scaled Scores
Inadequate (less than 162)
Minimal (162-209)
Good
(210-247)
Very Good (greater than 247)
Average Scaled Score: (Range 100-300)
PERFORMANCE ASSESSMENTS
Grade 8 Writing Assessment
1998-99 Percent Scoring
1997-98 Percent Scoring
1996-97 Percent Scoring
School System State School System State School System State
21% 61% 17%
1%
16% 51% 28%
5%
8% 40% 41% 11%
17% 58% 19%
6%
25% 53% 19%
3%
11% 46% 34%
8%
39% 52%
9% 1%
34% 48% 15%
3%
15% 46% 30%
8%
180
193
208 188
184 202 173
177 198
AWARDS / RECOGNITION DATA
Schools in Georgia may receive recognition in the following programs: Charter School Pay for Performance Program Georgia School of Excellence National Blue Ribbon School Price Middle School did not receive recognition in any of these programs during the 1998-99 school year.
1998-99 GEORGIA PUBLIC EDUCATION REPORT CARD Price Middle School - 7610288
Prepared by Georgia Department of Education
Page 3
CERTIFIED PERSONNEL DATA
Positions Number Average Contract Days
Personnel Sex
Certificate
Years Experience
Full-time Part-time
Male Female
4 Yr Bachelor's 5 Yr Master's 6 Yr Specialist's 7 Yr Doctoral Other*
<1 1-10 11-20 21-30 >30
Average
Administrators
3.00 227.33
3 0
1 2
0 1 1 1 0 0 0 1 2 0 23.33
Support Personnel
4.00 195.00
4 0
1 3
0 3 1 0 0 0 1 2 1 0 15.25
PK-12 Teachers
34.10 190.29
33 3
5 31
20 14
2 0 0 3 13 7 12 1 13.97
*Includes One- and Two-Year Vocational Certificates.
ACCREDITATION DATA
Accredited with Quality by Georgia Accrediting Commission (GAC).
1998-99 GEORGIA PUBLIC EDUCATION REPORT CARD Price Middle School - 7610288
Prepared by Georgia Department of Education
Page 4
1998-99 GEORGIA PUBLIC EDUCATION REPORT CARD
ATLANTA CITY SCHOOLS
Ragsdale Elementary School - 7615065
Grade Range K-5
The Georgia Public Education Report Card is designed to assist systems and schools in educational improvement. This report card contains a variety of data elements. An explanation of the terms is provided as a companion to the report card data. Please refer to the definitions for the most effective use of the reported data.
STUDENT DATA
Total 378
K-5 Enrollment, by Race/Ethnicity and Sex
Black
White Hispanic
American Multi-
Asian Indian
racial
376 99.5%
0 0.0%
2 0.5%
0 0.0%
0 0.0%
0 0.0%
Male Female
191 50.5%
187 49.5%
Enrollment in Selected Programs
Program
Program % of Student Enrollment Population
Gifted (Grades K-12)
0
0.0%
Alternative Programs (Grades 6-12)
N/A
N/A
Students Eligible to Receive Free/Reduced Lunches
Number
Percent
School System
289 45,695
76.5% 75.5%
Dropout Rate *
Number
Rate
School System
N/A N/A
N/A N/A
* Dropout rates are not applicable for grades PK-5.
Enrollment in Compensatory Programs
Program
Program % of Student Enrollment Population
Special Education (Grades K-12)
26
6.9%
(PK)
0
N/A
English to Speakers of Other Languages (ESOL) (Grades K-12)
0
0.0%
Remedial Education (Grades 2-5, 9-12)
51 20.2%
Special Instructional Assistance (SIA) (Grades K-3)
164 62.6%
Title I (Grades K-12)
This school has a schoolwide program.
Total 13
Retained Students, by Race/Ethnicity and Sex
Black
White Hispanic
American Multi-
Asian Indian
racial
13 100.0%
0 0.0%
0 0.0%
0 0.0%
0 0.0%
0 0.0%
Male Female
8
5
61.5% 38.5%
Prepared by Georgia Department of Education
Page 1
STATE-REQUIRED TEST DATA
NORM-REFERENCED TESTS Grade 3
Iowa Tests of Basic Skills (ITBS) Each chart reflects data for three years of testing.
Reading Comprehension 50
29 50 54 0
98-99
71 55 53 97-98
50 48 52 96-97
Mathematics
School 50
System
State
0
48 53 61 98-99
77 58 61 97-98
61 51 59 96-97
School System State
Reading Vocabulary 50
27 50 50 0
98-99
73 51 50 97-98
50 44 49 96-97
Language Arts
School 50
System
State
0
67 61 64 98-99
89 63 62 97-98
58 54 59 96-97
School System State
Social Studies 50
40 50 56 0
98-99
60 52 55 97-98
44 50 55 96-97
Science
School 50
System
State
0
26 49 59 98-99
49 52 59 97-98
37 48 58 96-97
School System State
Sources of Information
Composite Score
50
38 48 57 0
98-99
School 50
System
63 51 56 97-98
37 47 55 96-97
State 0
39 51 58 98-99
71 55 57 97-98
1998-99 GEORGIA PUBLIC EDUCATION REPORT CARD Ragsdale Elementary School - 7615065
Prepared by Georgia Department of Education
47 48 56 96-97
Scores Reported in Percentiles
School System State
Page 2
STATE-REQUIRED TEST DATA
NORM-REFERENCED TESTS Grade 5
Iowa Tests of Basic Skills (ITBS) Each chart reflects data for three years of testing.
Reading Comprehension
Mathematics
50
33 47 53 0
98-99
41 52 53 97-98
33 49 52 96-97
School 50
System
State
0
37 48 59 98-99
50 53 58 97-98
40 50 57 96-97
School System State
Reading Vocabulary 50
23 48 48 0
98-99
37 52 48 97-98
28 44 46 96-97
Language Arts
School 50
System
State
0
45 56 63 98-99
38 60 61 97-98
40 51 58 96-97
School System State
Social Studies 50
34 54 57 0
98-99
25 54 56 97-98
34 52 55 96-97
Science
School 50
System
State
0
25 48 60 98-99
26 50 59 97-98
34 48 59 96-97
School System State
Sources of Information
Composite Score
50
38 47 58 0
98-99
School 50
System
28 51 58 97-98
39 49 57 96-97
State 0
32 49 57 98-99
32 52 56 97-98
34 48 55 96-97
1998-99 GEORGIA PUBLIC EDUCATION REPORT CARD Ragsdale Elementary School - 7615065
Prepared by Georgia Department of Education
Scores Reported in Percentiles
School System State
Page 3
STATE-REQUIRED TEST DATA
PERFORMANCE ASSESSMENTS
Grade 5 Writing Assessment
Percent at Developmental Stages:
1998-99 School System State
1997-98 School System State
1996-97 School System State
Stage Stage Stage Stage Stage Stage
1:The Emerging Writer 2:The Developing Writer 3:The Focusing Writer 4:The Experimenting 5:The Engaging Writer 6:The Extending Writer
0% 5% 18% 55% 14% 2%
1% 2% 22% 47% 22% 6%
0% 1% 16% 41% 29% 12%
2% 4% 17% 48% 26% 2%
1% 4% 24% 47% 19% 5%
0% 3% 19% 41% 27% 10%
4% 8% 25% 37% 22% 4%
1% 6% 32% 39% 17% 5%
0% 3% 21% 37% 26% 12%
AWARDS / RECOGNITION DATA
Schools in Georgia may receive recognition in the following programs: Charter School Pay for Performance Program Georgia School of Excellence National Blue Ribbon School Ragsdale Elementary School did not receive recognition in any of these programs during the 1998-99 school year.
1998-99 GEORGIA PUBLIC EDUCATION REPORT CARD Ragsdale Elementary School - 7615065
Prepared by Georgia Department of Education
Page 4
CERTIFIED PERSONNEL DATA
Positions Number Average Contract Days
Personnel Sex
Certificate
Years Experience
Full-time Part-time
Male Female
4 Yr Bachelor's 5 Yr Master's 6 Yr Specialist's 7 Yr Doctoral Other*
<1 1-10 11-20 21-30 >30
Average
Administrators
2.00 231.00
2 0
0 2
0 1 0 1 0 0 0 0 1 1 32.50
Support Personnel
1.60 195.00
1 3
0 4
0 3 1 0 0 0 2 2 0 0 12.75
PK-12 Teachers
24.30 190.00
22 6
3 25
19 9 0 0 0 1
15 5 4 3
12.89
*Includes One- and Two-Year Vocational Certificates.
ACCREDITATION DATA
Accredited by Georgia Accrediting Commission (GAC).
1998-99 GEORGIA PUBLIC EDUCATION REPORT CARD Ragsdale Elementary School - 7615065
Prepared by Georgia Department of Education
Page 5
1998-99 GEORGIA PUBLIC EDUCATION REPORT CARD
ATLANTA CITY SCHOOLS
Rivers Elementary School - 7611066
Grade Range PK-5
The Georgia Public Education Report Card is designed to assist systems and schools in educational improvement. This report card contains a variety of data elements. An explanation of the terms is provided as a companion to the report card data. Please refer to the definitions for the most effective use of the reported data.
STUDENT DATA
Total
K-5
369
PK
20
Enrollment, by Race/Ethnicity and Sex
Black
White Hispanic
American Asian Indian
Multiracial
157 42.5%
103 27.9%
70 19.0%
36 9.8%
1 0.3%
2 0.5%
12 60.0%
7 35.0%
0 0.0%
1 5.0%
0 0.0%
0 0.0%
Male Female
201 54.5%
168 45.5%
10 50.0%
10 50.0%
Enrollment in Selected Programs
Program
Program % of Student Enrollment Population
Gifted (Grades K-12)
65
17.6%
Alternative Programs (Grades 6-12)
N/A
N/A
Students Eligible to Receive Free/Reduced Lunches
Number
Percent
School System
221 45,695
56.8% 75.5%
Dropout Rate *
Number
Rate
School System
N/A N/A
N/A N/A
* Dropout rates are not applicable for grades PK-5.
Enrollment in Compensatory Programs
Program
Program % of Student Enrollment Population
Special Education (Grades K-12)
39 10.6%
(PK)
0
N/A
English to Speakers of Other Languages (ESOL) (Grades K-12)
68 18.4%
Remedial Education (Grades 2-5, 9-12)
56 23.0%
Special Instructional Assistance (SIA) (Grades K-3)
48 18.3%
Title I (Grades K-12)
This school has a schoolwide program.
Total 11
Retained Students, by Race/Ethnicity and Sex
Black
White Hispanic
American MultiAsian Indian racial
3 27.3%
1
6
9.1% 54.5%
1 9.1%
0 0.0%
0 0.0%
Male Female
8
3
72.7% 27.3%
Prepared by Georgia Department of Education
Page 1
STATE-REQUIRED TEST DATA
NORM-REFERENCED TESTS Grade 3
Iowa Tests of Basic Skills (ITBS) Each chart reflects data for three years of testing.
Reading Comprehension 50
64 50 54 0
98-99
66 55 53 97-98
65 48 52 96-97
Mathematics
School 50
System
State
0
69 53 61 98-99
67 58 61 97-98
66 51 59 96-97
School System State
Reading Vocabulary 50
60 50 50 0
98-99
58 51 50 97-98
63 44 49 96-97
Language Arts
School 50
System
State
0
77 61 64 98-99
77 63 62 97-98
85 54 59 96-97
School System State
Social Studies 50
68 50 56 0
98-99
70 52 55 97-98
75 50 55 96-97
Science
School 50
System
State
0
65 49 59 98-99
66 52 59 97-98
65 48 58 96-97
School System State
Sources of Information
Composite Score
50
70 48 57 0
98-99
School 50
System
67 51 56 97-98
80 47 55 96-97
State 0
69 51 58 98-99
69 55 57 97-98
1998-99 GEORGIA PUBLIC EDUCATION REPORT CARD Rivers Elementary School - 7611066
Prepared by Georgia Department of Education
74 48 56 96-97
Scores Reported in Percentiles
School System State
Page 2
STATE-REQUIRED TEST DATA
NORM-REFERENCED TESTS Grade 5
Iowa Tests of Basic Skills (ITBS) Each chart reflects data for three years of testing.
Reading Comprehension
Mathematics
50
59 47 53 0
98-99
68 52 53 97-98
63 49 52 96-97
School 50
System
State
0
71 48 59 98-99
75 53 58 97-98
60 50 57 96-97
School System State
Reading Vocabulary 50
48 48 48 0
98-99
67 52 48 97-98
60 44 46 96-97
Language Arts
School 50
System
State
0
80 56 63 98-99
81 60 61 97-98
65 51 58 96-97
School System State
Social Studies 50
70 54 57 0
98-99
78 54 56 97-98
63 52 55 96-97
Science
School 50
System
State
0
68 48 60 98-99
74 50 59 97-98
66 48 59 96-97
School System State
Sources of Information
Composite Score
50
75 47 58 0
98-99
School 50
System
75 51 58 97-98
64 49 57 96-97
State 0
73 49 57 98-99
77 52 56 97-98
64 48 55 96-97
1998-99 GEORGIA PUBLIC EDUCATION REPORT CARD Rivers Elementary School - 7611066
Prepared by Georgia Department of Education
Scores Reported in Percentiles
School System State
Page 3
STATE-REQUIRED TEST DATA
PERFORMANCE ASSESSMENTS
Grade 5 Writing Assessment
Percent at Developmental Stages:
1998-99 School System State
1997-98 School System State
1996-97 School System State
Stage Stage Stage Stage Stage Stage
1:The Emerging Writer 2:The Developing Writer 3:The Focusing Writer 4:The Experimenting 5:The Engaging Writer 6:The Extending Writer
0% 0% 15% 48% 27% 9%
1% 2% 22% 47% 22% 6%
0% 1% 16% 41% 29% 12%
0% 2% 16% 40% 23% 19%
1% 4% 24% 47% 19% 5%
0% 3% 19% 41% 27% 10%
0% 0% 39% 35% 16% 10%
1% 6% 32% 39% 17% 5%
0% 3% 21% 37% 26% 12%
AWARDS / RECOGNITION DATA
Schools in Georgia may receive recognition in the following programs: Charter School Pay for Performance Program Georgia School of Excellence National Blue Ribbon School Rivers Elementary School did not receive recognition in any of these programs during the 1998-99 school year.
1998-99 GEORGIA PUBLIC EDUCATION REPORT CARD Rivers Elementary School - 7611066
Prepared by Georgia Department of Education
Page 4
CERTIFIED PERSONNEL DATA
Positions Number Average Contract Days
Personnel Sex
Certificate
Years Experience
Full-time Part-time
Male Female
4 Yr Bachelor's 5 Yr Master's 6 Yr Specialist's 7 Yr Doctoral Other*
<1 1-10 11-20 21-30 >30
Average
Administrators
2.00 231.00
2 0
0 2
0 1 1 0 0 0 0 0 0 2 32.50
Support Personnel
2.40 194.17
1 3
1 3
0 2 1 1 0 0 3 0 1 0 12.50
PK-12 Teachers
30.70 190.00
29 5
3 31
18 15
1 0 0 0 14 7 12 1 15.91
*Includes One- and Two-Year Vocational Certificates.
ACCREDITATION DATA
Accredited by Georgia Accrediting Commission (GAC).
1998-99 GEORGIA PUBLIC EDUCATION REPORT CARD Rivers Elementary School - 7611066
Prepared by Georgia Department of Education
Page 5
1998-99 GEORGIA PUBLIC EDUCATION REPORT CARD
ATLANTA CITY SCHOOLS
Rusk Elementary School - 7613066
Grade Range K-5
The Georgia Public Education Report Card is designed to assist systems and schools in educational improvement. This report card contains a variety of data elements. An explanation of the terms is provided as a companion to the report card data. Please refer to the definitions for the most effective use of the reported data.
STUDENT DATA
Total 590
K-5 Enrollment, by Race/Ethnicity and Sex
Black
White Hispanic
American Multi-
Asian Indian
racial
582 98.6%
2 0.3%
2 0.3%
4 0.7%
0 0.0%
0 0.0%
Male Female
310 52.5%
280 47.5%
Enrollment in Selected Programs
Program
Program % of Student Enrollment Population
Gifted (Grades K-12)
0
0.0%
Alternative Programs (Grades 6-12)
N/A
N/A
Students Eligible to Receive Free/Reduced Lunches
Number
Percent
School System
548 45,695
92.9% 75.5%
Dropout Rate *
Number
Rate
School System
N/A N/A
N/A N/A
* Dropout rates are not applicable for grades PK-5.
Enrollment in Compensatory Programs
Program
Program % of Student Enrollment Population
Special Education (Grades K-12)
44
7.5%
(PK)
0
N/A
English to Speakers of Other Languages (ESOL) (Grades K-12)
0
0.0%
Remedial Education (Grades 2-5, 9-12)
122 32.6%
Special Instructional Assistance (SIA) (Grades K-3)
203 48.6%
Title I (Grades K-12)
This school has a schoolwide program.
Total 36
Retained Students, by Race/Ethnicity and Sex
Black
White Hispanic
American Multi-
Asian Indian
racial
36 100.0%
0 0.0%
0 0.0%
0 0.0%
0 0.0%
0 0.0%
Male Female
22
14
61.1% 38.9%
Prepared by Georgia Department of Education
Page 1
STATE-REQUIRED TEST DATA
NORM-REFERENCED TESTS Grade 3
Iowa Tests of Basic Skills (ITBS) Each chart reflects data for three years of testing.
Reading Comprehension 50
18 50 54 0
98-99
74 55 53 97-98
62 48 52 96-97
Mathematics
School 50
System
State
0
23 53 61 98-99
71 58 61 97-98
62 51 59 96-97
School System State
Reading Vocabulary 50
15 50 50 0
98-99
66 51 50 97-98
51 44 49 96-97
Language Arts
School 50
System
State
0
26 61 64 98-99
74 63 62 97-98
51 54 59 96-97
School System State
Social Studies 50
28 50 56 0
98-99
53 52 55 97-98
58 50 55 96-97
Science
School 50
System
State
0
27 49 59 98-99
74 52 59 97-98
65 48 58 96-97
School System State
Sources of Information
Composite Score
50
22 48 57 0
98-99
School 50
System
71 51 56 97-98
55 47 55 96-97
State 0
20 51 58 98-99
70 55 57 97-98
1998-99 GEORGIA PUBLIC EDUCATION REPORT CARD Rusk Elementary School - 7613066
Prepared by Georgia Department of Education
57 48 56 96-97
Scores Reported in Percentiles
School System State
Page 2
STATE-REQUIRED TEST DATA
NORM-REFERENCED TESTS Grade 5
Iowa Tests of Basic Skills (ITBS) Each chart reflects data for three years of testing.
Reading Comprehension
Mathematics
50
25 47 53 0
98-99
52 52 53 97-98
66 49 52 96-97
School 50
System
State
0
20 48 59 98-99
49 53 58 97-98
53 50 57 96-97
School System State
Reading Vocabulary 50
8 48 48 56 52 48 70 44 46 0
98-99
97-98
96-97
Language Arts
School 50
System
State
0
31 56 63 98-99
67 60 61 97-98
63 51 58 96-97
School System State
Social Studies 50
24 54 57 0
98-99
50 54 56 97-98
53 52 55 96-97
Science
School 50
System
State
0
21 48 60 98-99
49 50 59 97-98
54 48 59 96-97
School System State
Sources of Information
Composite Score
50
32 47 58 0
98-99
School 50
System
51 51 58 97-98
55 49 57 96-97
State 0
21 49 57 98-99
53 52 56 97-98
58 48 55 96-97
1998-99 GEORGIA PUBLIC EDUCATION REPORT CARD Rusk Elementary School - 7613066
Prepared by Georgia Department of Education
Scores Reported in Percentiles
School System State
Page 3
STATE-REQUIRED TEST DATA
PERFORMANCE ASSESSMENTS
Grade 5 Writing Assessment
Percent at Developmental Stages:
1998-99 School System State
1997-98 School System State
1996-97 School System State
Stage Stage Stage Stage Stage Stage
1:The Emerging Writer 2:The Developing Writer 3:The Focusing Writer 4:The Experimenting 5:The Engaging Writer 6:The Extending Writer
2% 2% 36% 39% 17% 5%
1% 2% 22% 47% 22% 6%
0% 1% 16% 41% 29% 12%
0% 6% 62% 31% 2% 0%
1% 4% 24% 47% 19% 5%
0% 3% 19% 41% 27% 10%
1% 16% 50% 21%
9% 3%
1% 6% 32% 39% 17% 5%
0% 3% 21% 37% 26% 12%
AWARDS / RECOGNITION DATA
Schools in Georgia may receive recognition in the following programs: Charter School Pay for Performance Program Georgia School of Excellence National Blue Ribbon School Rusk Elementary School did not receive recognition in any of these programs during the 1998-99 school year.
1998-99 GEORGIA PUBLIC EDUCATION REPORT CARD Rusk Elementary School - 7613066
Prepared by Georgia Department of Education
Page 4
CERTIFIED PERSONNEL DATA
Positions Number Average Contract Days
Personnel Sex
Certificate
Years Experience
Full-time Part-time
Male Female
4 Yr Bachelor's 5 Yr Master's 6 Yr Specialist's 7 Yr Doctoral Other*
<1 1-10 11-20 21-30 >30
Average
Administrators
3.60 226.11
3 1
0 4
0 2 1 1 0 0 0 1 3 0 25.00
Support Personnel
2.00 195.00
1 3
1 3
1 1 2 0 0 0 0 2 2 0 21.75
PK-12 Teachers
38.40 190.00
37 5
5 37
27 14
0 1 0 1 17 7 11 6 15.14
*Includes One- and Two-Year Vocational Certificates.
ACCREDITATION DATA
Accredited by Georgia Accrediting Commission (GAC).
1998-99 GEORGIA PUBLIC EDUCATION REPORT CARD Rusk Elementary School - 7613066
Prepared by Georgia Department of Education
Page 5
1998-99 GEORGIA PUBLIC EDUCATION REPORT CARD
ATLANTA CITY SCHOOLS
Scott Elementary School - 7613566
Grade Range PK-5
The Georgia Public Education Report Card is designed to assist systems and schools in educational improvement. This report card contains a variety of data elements. An explanation of the terms is provided as a companion to the report card data. Please refer to the definitions for the most effective use of the reported data.
STUDENT DATA
Total
K-5
554
PK
19
Enrollment, by Race/Ethnicity and Sex
Black
White Hispanic
American Asian Indian
Multiracial
548 98.9%
0 0.0%
6 1.1%
0 0.0%
0 0.0%
0 0.0%
19 100.0%
0 0.0%
0 0.0%
0 0.0%
0 0.0%
0 0.0%
Male Female
286 51.6%
268 48.4%
11 57.9%
8 42.1%
Enrollment in Selected Programs
Program
Program % of Student Enrollment Population
Gifted (Grades K-12)
4
< 1%
Alternative Programs (Grades 6-12)
N/A
N/A
Students Eligible to Receive Free/Reduced Lunches
Number
Percent
School System
542 45,695
94.6% 75.5%
Dropout Rate *
Number
Rate
School System
N/A N/A
N/A N/A
* Dropout rates are not applicable for grades PK-5.
Enrollment in Compensatory Programs
Program
Program % of Student Enrollment Population
Special Education (Grades K-12)
39
7.0%
(PK)
0
N/A
English to Speakers of Other Languages (ESOL) (Grades K-12)
0
0.0%
Remedial Education (Grades 2-5, 9-12)
65 19.2%
Special Instructional Assistance (SIA) (Grades K-3)
225 58.1%
Title I (Grades K-12)
This school has a schoolwide program.
Total 31
Retained Students, by Race/Ethnicity and Sex
Black
White Hispanic
American MultiAsian Indian racial
31 100.0%
0 0.0%
0 0.0%
0 0.0%
0 0.0%
0 0.0%
Male Female
18
13
58.1% 41.9%
Prepared by Georgia Department of Education
Page 1
STATE-REQUIRED TEST DATA
NORM-REFERENCED TESTS Grade 3
Iowa Tests of Basic Skills (ITBS) Each chart reflects data for three years of testing.
Reading Comprehension 50
54 50 54 0
98-99
31 55 53 97-98
32 48 52 96-97
Mathematics
School 50
System
State
0
56 53 61 98-99
60 58 61 97-98
43 51 59 96-97
School System State
Reading Vocabulary 50
46 50 50 0
98-99
61 51 50 97-98
24 44 49 96-97
Language Arts
School 50
System
State
0
61 61 64 98-99
64 63 62 97-98
40 54 59 96-97
School System State
Social Studies 50
47 50 56 0
98-99
55 52 55 97-98
51 50 55 96-97
Science
School 50
System
State
0
41 49 59 98-99
44 52 59 97-98
37 48 58 96-97
School System State
Sources of Information
Composite Score
50
47 48 57 0
98-99
School 50
System
43 51 56 97-98
39 47 55 96-97
State 0
50 51 58 98-99
55 55 57 97-98
1998-99 GEORGIA PUBLIC EDUCATION REPORT CARD Scott Elementary School - 7613566
Prepared by Georgia Department of Education
40 48 56 96-97
Scores Reported in Percentiles
School System State
Page 2
STATE-REQUIRED TEST DATA
NORM-REFERENCED TESTS Grade 5
Iowa Tests of Basic Skills (ITBS) Each chart reflects data for three years of testing.
Reading Comprehension
Mathematics
50
54 47 53 0
98-99
66 52 53 97-98
69 49 52 96-97
School 50
System
State
0
59 48 59 98-99
67 53 58 97-98
66 50 57 96-97
School System State
Reading Vocabulary 50
73 48 48 0
98-99
89 52 48 97-98
93 44 46 96-97
Language Arts
School 50
System
State
0
67 56 63 98-99
76 60 61 97-98
75 51 58 96-97
School System State
Social Studies 50
74 54 57 0
98-99
75 54 56 97-98
83 52 55 96-97
Science
School 50
System
State
0
77 48 60 98-99
70 50 59 97-98
67 48 59 96-97
School System State
Sources of Information
Composite Score
50
64 47 58 0
98-99
School 50
System
74 51 58 97-98
72 49 57 96-97
State 0
70 49 57 98-99
75 52 56 97-98
75 48 55 96-97
1998-99 GEORGIA PUBLIC EDUCATION REPORT CARD Scott Elementary School - 7613566
Prepared by Georgia Department of Education
Scores Reported in Percentiles
School System State
Page 3
STATE-REQUIRED TEST DATA
PERFORMANCE ASSESSMENTS
Grade 5 Writing Assessment
Percent at Developmental Stages:
1998-99 School System State
1997-98 School System State
1996-97 School System State
Stage Stage Stage Stage Stage Stage
1:The Emerging Writer 2:The Developing Writer 3:The Focusing Writer 4:The Experimenting 5:The Engaging Writer 6:The Extending Writer
1% 3% 43% 49% 3% 1%
1% 2% 22% 47% 22% 6%
0% 1% 16% 41% 29% 12%
0% 18% 54% 22%
4% 0%
1% 4% 24% 47% 19% 5%
0% 3% 19% 41% 27% 10%
0% 13% 41% 38%
9% 0%
1% 6% 32% 39% 17% 5%
0% 3% 21% 37% 26% 12%
AWARDS / RECOGNITION DATA
Schools in Georgia may receive recognition in the following programs: Charter School Pay for Performance Program Georgia School of Excellence National Blue Ribbon School Scott Elementary School did not receive recognition in any of these programs during the 1998-99 school year.
1998-99 GEORGIA PUBLIC EDUCATION REPORT CARD Scott Elementary School - 7613566
Prepared by Georgia Department of Education
Page 4
CERTIFIED PERSONNEL DATA
Positions Number Average Contract Days
Personnel Sex
Certificate
Years Experience
Full-time Part-time
Male Female
4 Yr Bachelor's 5 Yr Master's 6 Yr Specialist's 7 Yr Doctoral Other*
<1 1-10 11-20 21-30 >30
Average
Administrators
3.00 227.33
3 0
1 2
0 0 3 0 0 0 0 1 2 0 20.33
Support Personnel
2.40 193.33
1 2
0 3
1 2 0 0 0 0 0 2 1 0 21.00
PK-12 Teachers
34.50 190.00
32 7
4 35
21 15
2 1 0 0 17 10 5 7 15.03
*Includes One- and Two-Year Vocational Certificates.
ACCREDITATION DATA
Accredited by Georgia Accrediting Commission (GAC).
1998-99 GEORGIA PUBLIC EDUCATION REPORT CARD Scott Elementary School - 7613566
Prepared by Georgia Department of Education
Page 5
1998-99 GEORGIA PUBLIC EDUCATION REPORT CARD
ATLANTA CITY SCHOOLS
Slater Elementary School - 7614066
Grade Range PK-5
The Georgia Public Education Report Card is designed to assist systems and schools in educational improvement. This report card contains a variety of data elements. An explanation of the terms is provided as a companion to the report card data. Please refer to the definitions for the most effective use of the reported data.
STUDENT DATA
Total
K-5
474
PK
33
Enrollment, by Race/Ethnicity and Sex
Black
White Hispanic
American Asian Indian
Multiracial
470 99.2%
0 0.0%
3 0.6%
0 0.0%
0 0.0%
1 0.2%
33 100.0%
0 0.0%
0 0.0%
0 0.0%
0 0.0%
0 0.0%
Male Female
249 52.5%
225 47.5%
17 51.5%
16 48.5%
Enrollment in Selected Programs
Program
Program % of Student Enrollment Population
Gifted (Grades K-12)
1
< 1%
Alternative Programs (Grades 6-12)
N/A
N/A
Students Eligible to Receive Free/Reduced Lunches
Number
Percent
School System
434 45,695
85.6% 75.5%
Dropout Rate *
Number
Rate
School System
N/A N/A
N/A N/A
* Dropout rates are not applicable for grades PK-5.
Enrollment in Compensatory Programs
Program
Program % of Student Enrollment Population
Special Education (Grades K-12)
78 16.5%
(PK)
32
N/A
English to Speakers of Other Languages (ESOL) (Grades K-12)
0
0.0%
Remedial Education (Grades 2-5, 9-12)
76 25.2%
Special Instructional Assistance (SIA) (Grades K-3)
213 65.5%
Title I (Grades K-12)
This school has a schoolwide program.
Total 15
Retained Students, by Race/Ethnicity and Sex
Black
White Hispanic
American MultiAsian Indian racial
15 100.0%
0 0.0%
0 0.0%
0 0.0%
0 0.0%
0 0.0%
Male Female
13
2
86.7% 13.3%
Prepared by Georgia Department of Education
Page 1
STATE-REQUIRED TEST DATA
NORM-REFERENCED TESTS Grade 3
Iowa Tests of Basic Skills (ITBS) Each chart reflects data for three years of testing.
Reading Comprehension 50
49 50 54 0
98-99
34 55 53 97-98
49 48 52 96-97
Mathematics
School 50
System
State
0
37 53 61 98-99
43 58 61 97-98
64 51 59 96-97
School System State
Reading Vocabulary 50
43 50 50 0
98-99
37 51 50 97-98
51 44 49 96-97
Language Arts
School 50
System
State
0
30 61 64 98-99
32 63 62 97-98
51 54 59 96-97
School System State
Social Studies 50
27 50 56 0
98-99
33 52 55 97-98
50 50 55 96-97
Science
School 50
System
State
0
35 49 59 98-99
38 52 59 97-98
43 48 58 96-97
School System State
Sources of Information
Composite Score
50
29 48 57 0
98-99
School 50
System
24 51 56 97-98
39 47 55 96-97
State 0
32 51 58 98-99
33 55 57 97-98
1998-99 GEORGIA PUBLIC EDUCATION REPORT CARD Slater Elementary School - 7614066
Prepared by Georgia Department of Education
49 48 56 96-97
Scores Reported in Percentiles
School System State
Page 2
STATE-REQUIRED TEST DATA
NORM-REFERENCED TESTS Grade 5
Iowa Tests of Basic Skills (ITBS) Each chart reflects data for three years of testing.
Reading Comprehension
Mathematics
50
42 47 53 0
98-99
42 52 53 97-98
56 49 52 96-97
School 50
System
State
0
44 48 59 98-99
40 53 58 97-98
67 50 57 96-97
School System State
Reading Vocabulary 50
75 48 48 0
98-99
61 52 48 97-98
58 44 46 96-97
Language Arts
School 50
System
State
0
43 56 63 98-99
44 60 61 97-98
48 51 58 96-97
School System State
Social Studies 50
62 54 57 0
98-99
41 54 56 97-98
58 52 55 96-97
Science
School 50
System
State
0
34 48 60 98-99
65 50 59 97-98
38 48 59 96-97
School System State
Sources of Information
Composite Score
50
28 47 58 0
98-99
School 50
System
32 51 58 97-98
43 49 57 96-97
State 0
43 49 57 98-99
47 52 56 97-98
50 48 55 96-97
1998-99 GEORGIA PUBLIC EDUCATION REPORT CARD Slater Elementary School - 7614066
Prepared by Georgia Department of Education
Scores Reported in Percentiles
School System State
Page 3
STATE-REQUIRED TEST DATA
PERFORMANCE ASSESSMENTS
Grade 5 Writing Assessment
Percent at Developmental Stages:
1998-99 School System State
1997-98 School System State
1996-97 School System State
Stage Stage Stage Stage Stage Stage
1:The Emerging Writer 2:The Developing Writer 3:The Focusing Writer 4:The Experimenting 5:The Engaging Writer 6:The Extending Writer
0% 0% 18% 64% 11% 5%
1% 2% 22% 47% 22% 6%
0% 1% 16% 41% 29% 12%
2% 6% 25% 49% 15% 4%
1% 4% 24% 47% 19% 5%
0% 3% 19% 41% 27% 10%
0% 4% 27% 50% 13% 6%
1% 6% 32% 39% 17% 5%
0% 3% 21% 37% 26% 12%
AWARDS / RECOGNITION DATA
Through the Pay for Performance Program, exemplary public schools and schools making outstanding progress toward becoming exemplary may be rewarded. Not a merit pay program, the Pay for Performance Program motivates and rewards entire school faculties for working together to make their schools exemplary. A school selected for participation in the program has one school year to attain at least 80% of its previously-approved performance objectives in order to receive an award based on $2,000 per certified faculty member.
Slater Elementary School was a Pay for Performance recipient in 1998-99.
1998-99 GEORGIA PUBLIC EDUCATION REPORT CARD Slater Elementary School - 7614066
Prepared by Georgia Department of Education
Page 4
CERTIFIED PERSONNEL DATA
Positions Number Average Contract Days
Personnel Sex
Certificate
Years Experience
Full-time Part-time
Male Female
4 Yr Bachelor's 5 Yr Master's 6 Yr Specialist's 7 Yr Doctoral Other*
<1 1-10 11-20 21-30 >30
Average
Administrators
3.00 227.33
3 0
1 2
0 1 2 0 0 0 0 2 1 0 18.67
Support Personnel
2.60 193.85
2 3
1 4
0 3 2 0 0 0 2 1 2 0 14.40
PK-12 Teachers
37.40 190.00
36 4
9 31
15 22
3 0 0 0 13 12 12 3 16.60
*Includes One- and Two-Year Vocational Certificates.
ACCREDITATION DATA
Accredited by Georgia Accrediting Commission (GAC).
1998-99 GEORGIA PUBLIC EDUCATION REPORT CARD Slater Elementary School - 7614066
Prepared by Georgia Department of Education
Page 5
1998-99 GEORGIA PUBLIC EDUCATION REPORT CARD
ATLANTA CITY SCHOOLS
Slaton Elementary School - 7614566
Grade Range K-5
The Georgia Public Education Report Card is designed to assist systems and schools in educational improvement. This report card contains a variety of data elements. An explanation of the terms is provided as a companion to the report card data. Please refer to the definitions for the most effective use of the reported data.
STUDENT DATA
Total 272
K-5 Enrollment, by Race/Ethnicity and Sex
Black
White Hispanic
American Multi-
Asian Indian
racial
164 60.3%
19 7.0%
29 10.7%
58 21.3%
2 0.7%
0 0.0%
Male Female
155 57.0%
117 43.0%
Enrollment in Selected Programs
Program
Program % of Student Enrollment Population
Gifted (Grades K-12)
0
0.0%
Alternative Programs (Grades 6-12)
N/A
N/A
Students Eligible to Receive Free/Reduced Lunches
Number
Percent
School System
238 45,695
87.5% 75.5%
Dropout Rate *
Number
Rate
School System
N/A N/A
N/A N/A
* Dropout rates are not applicable for grades PK-5.
Enrollment in Compensatory Programs
Program
Program % of Student Enrollment Population
Special Education (Grades K-12)
12
4.4%
(PK)
0
N/A
English to Speakers of Other Languages (ESOL) (Grades K-12)
61 22.4%
Remedial Education (Grades 2-5, 9-12)
55 28.2%
Special Instructional Assistance (SIA) (Grades K-3)
87 50.3%
Title I (Grades K-12)
This school has a schoolwide program.
Total 20
Retained Students, by Race/Ethnicity and Sex
Black
White Hispanic
American Multi-
Asian Indian
racial
9 45.0%
2 10.0%
5 25.0%
4 20.0%
0 0.0%
0 0.0%
Male Female
17
3
85.0% 15.0%
Prepared by Georgia Department of Education
Page 1
STATE-REQUIRED TEST DATA
NORM-REFERENCED TESTS Grade 3
Iowa Tests of Basic Skills (ITBS) Each chart reflects data for three years of testing.
Reading Comprehension 50
38 50 54 0
98-99
29 55 53 97-98
34 48 52 96-97
Mathematics
School 50
System
State
0
64 53 61 98-99
53 58 61 97-98
64 51 59 96-97
School System State
Reading Vocabulary 50
36 50 50 0
98-99
20 51 50 97-98
31 44 49 96-97
Language Arts
School 50
System
State
0
54 61 64 98-99
39 63 62 97-98
48 54 59 96-97
School System State
Social Studies 50
57 50 56 0
98-99
54 52 55 97-98
56 50 55 96-97
Science
School 50
System
State
0
54 49 59 98-99
41 52 59 97-98
60 48 58 96-97
School System State
Sources of Information
Composite Score
50
54 48 57 0
98-99
School 50
System
43 51 56 97-98
46 47 55 96-97
State 0
52 51 58 98-99
41 55 57 97-98
1998-99 GEORGIA PUBLIC EDUCATION REPORT CARD Slaton Elementary School - 7614566
Prepared by Georgia Department of Education
51 48 56 96-97
Scores Reported in Percentiles
School System State
Page 2
STATE-REQUIRED TEST DATA
NORM-REFERENCED TESTS Grade 5
Iowa Tests of Basic Skills (ITBS) Each chart reflects data for three years of testing.
Reading Comprehension
Mathematics
50
30 47 53 0
98-99
46 52 53 97-98
31 49 52 96-97
School 50
System
State
0
41 48 59 98-99
58 53 58 97-98
46 50 57 96-97
School System State
Reading Vocabulary 50
16 48 48 0
98-99
36 52 48 97-98
49 44 46 96-97
Language Arts
School 50
System
State
0
38 56 63 98-99
51 60 61 97-98
27 51 58 96-97
School System State
Social Studies 50
35 54 57 0
98-99
54 54 56 97-98
35 52 55 96-97
Science
School 50
System
State
0
32 48 60 98-99
48 50 59 97-98
36 48 59 96-97
School System State
Sources of Information
Composite Score
50
38 47 58 0
98-99
School 50
System
58 51 58 97-98
43 49 57 96-97
State 0
33 49 57 98-99
51 52 56 97-98
35 48 55 96-97
1998-99 GEORGIA PUBLIC EDUCATION REPORT CARD Slaton Elementary School - 7614566
Prepared by Georgia Department of Education
Scores Reported in Percentiles
School System State
Page 3
STATE-REQUIRED TEST DATA
PERFORMANCE ASSESSMENTS
Grade 5 Writing Assessment
Percent at Developmental Stages:
1998-99 School System State
1997-98 School System State
1996-97 School System State
Stage Stage Stage Stage Stage Stage
1:The Emerging Writer 2:The Developing Writer 3:The Focusing Writer 4:The Experimenting 5:The Engaging Writer 6:The Extending Writer
0% 0% 24% 41% 32% 3%
1% 2% 22% 47% 22% 6%
0% 1% 16% 41% 29% 12%
0% 0% 18% 56% 21% 6%
1% 4% 24% 47% 19% 5%
0% 3% 19% 41% 27% 10%
0% 5% 30% 43% 18% 5%
1% 6% 32% 39% 17% 5%
0% 3% 21% 37% 26% 12%
AWARDS / RECOGNITION DATA
Schools in Georgia may receive recognition in the following programs: Charter School Pay for Performance Program Georgia School of Excellence National Blue Ribbon School Slaton Elementary School did not receive recognition in any of these programs during the 1998-99 school year.
1998-99 GEORGIA PUBLIC EDUCATION REPORT CARD Slaton Elementary School - 7614566
Prepared by Georgia Department of Education
Page 4
CERTIFIED PERSONNEL DATA
Positions Number Average Contract Days
Personnel Sex
Certificate
Years Experience
Full-time Part-time
Male Female
4 Yr Bachelor's 5 Yr Master's 6 Yr Specialist's 7 Yr Doctoral Other*
<1 1-10 11-20 21-30 >30
Average
Administrators
2.00 231.00
2 0
0 2
0 1 1 0 0 0 0 1 1 0 19.00
Support Personnel
2.00 221.50
1 3
1 3
0 3 1 0 0 0 1 1 1 1 20.50
PK-12 Teachers
20.90 190.00
19 5
2 22
12 10
1 1 0 2 10 6 3 3 13.00
*Includes One- and Two-Year Vocational Certificates.
ACCREDITATION DATA
Accredited by Georgia Accrediting Commission (GAC).
1998-99 GEORGIA PUBLIC EDUCATION REPORT CARD Slaton Elementary School - 7614566
Prepared by Georgia Department of Education
Page 5
1998-99 GEORGIA PUBLIC EDUCATION REPORT CARD
ATLANTA CITY SCHOOLS
Smith Elementary School - 7611567
Grade Range K-5
The Georgia Public Education Report Card is designed to assist systems and schools in educational improvement. This report card contains a variety of data elements. An explanation of the terms is provided as a companion to the report card data. Please refer to the definitions for the most effective use of the reported data.
STUDENT DATA
Total 530
K-5 Enrollment, by Race/Ethnicity and Sex
Black
White Hispanic
American Multi-
Asian Indian
racial
52 9.8%
449 84.7%
15 2.8%
9 1.7%
0 0.0%
5 0.9%
Male Female
258 48.7%
272 51.3%
Enrollment in Selected Programs
Program
Program % of Student Enrollment Population
Gifted (Grades K-12)
155
29.2%
Alternative Programs (Grades 6-12)
N/A
N/A
Students Eligible to Receive Free/Reduced Lunches
Number
Percent
School System
41 45,695
7.7% 75.5%
Dropout Rate *
Number
Rate
School System
N/A N/A
N/A N/A
* Dropout rates are not applicable for grades PK-5.
Enrollment in Compensatory Programs
Program
Program % of Student Enrollment Population
Special Education (Grades K-12)
50
9.4%
(PK)
0
N/A
English to Speakers of Other Languages (ESOL) (Grades K-12)
0
0.0%
Remedial Education (Grades 2-5, 9-12)
22
6.8%
Special Instructional Assistance (SIA) (Grades K-3)
0
0.0%
Title I (Grades K-12)
This school has no Title I program.
Total 4
Retained Students, by Race/Ethnicity and Sex
Black
White Hispanic
American Multi-
Asian Indian
racial
0
4
0.0% 100.0%
0 0.0%
0 0.0%
0 0.0%
0 0.0%
Male Female
2
2
50.0% 50.0%
Prepared by Georgia Department of Education
Page 1
STATE-REQUIRED TEST DATA
NORM-REFERENCED TESTS Grade 3
Iowa Tests of Basic Skills (ITBS) Each chart reflects data for three years of testing.
Reading Comprehension 50
83 50 54 0
98-99
83 55 53 97-98
86 48 52 96-97
Mathematics
School 50
System
State
0
97 53 61 98-99
93 58 61 97-98
90 51 59 96-97
School System State
Reading Vocabulary 50
86 50 50 0
98-99
86 51 50 97-98
86 44 49 96-97
Language Arts
School 50
System
State
0
97 61 64 98-99
94 63 62 97-98
91 54 59 96-97
School System State
Social Studies 50
86 50 56 0
98-99
89 52 55 97-98
90 50 55 96-97
Science
School 50
System
State
0
88 49 59 98-99
86 52 59 97-98
88 48 58 96-97
School System State
Sources of Information
Composite Score
50
90 48 57 0
98-99
School 50
System
90 51 56 97-98
88 47 55 96-97
State 0
94 51 58 98-99
92 55 57 97-98
1998-99 GEORGIA PUBLIC EDUCATION REPORT CARD Smith Elementary School - 7611567
Prepared by Georgia Department of Education
92 48 56 96-97
Scores Reported in Percentiles
School System State
Page 2
STATE-REQUIRED TEST DATA
NORM-REFERENCED TESTS Grade 5
Iowa Tests of Basic Skills (ITBS) Each chart reflects data for three years of testing.
Reading Comprehension
Mathematics
50
77 47 53 0
98-99
83 52 53 97-98
80 49 52 96-97
School 50
System
State
0
82 48 59 98-99
88 53 58 97-98
88 50 57 96-97
School System State
Reading Vocabulary 50
82 48 48 0
98-99
89 52 48 97-98
83 44 46 96-97
Language Arts
School 50
System
State
0
89 56 63 98-99
93 60 61 97-98
88 51 58 96-97
School System State
Social Studies 50
85 54 57 0
98-99
89 54 56 97-98
90 52 55 96-97
Science
School 50
System
State
0
84 48 60 98-99
86 50 59 97-98
87 48 59 96-97
School System State
Sources of Information
Composite Score
50
84 47 58 0
98-99
School 50
System
89 51 58 97-98
87 49 57 96-97
State 0
87 49 57 98-99
92 52 56 97-98
91 48 55 96-97
1998-99 GEORGIA PUBLIC EDUCATION REPORT CARD Smith Elementary School - 7611567
Prepared by Georgia Department of Education
Scores Reported in Percentiles
School System State
Page 3
STATE-REQUIRED TEST DATA
PERFORMANCE ASSESSMENTS
Grade 5 Writing Assessment
Percent at Developmental Stages:
1998-99 School System State
1997-98 School System State
1996-97 School System State
Stage Stage Stage Stage Stage Stage
1:The Emerging Writer 2:The Developing Writer 3:The Focusing Writer 4:The Experimenting 5:The Engaging Writer 6:The Extending Writer
0% 0% 0% 25% 38% 37%
1% 2% 22% 47% 22% 6%
0% 1% 16% 41% 29% 12%
0% 0% 1% 11% 41% 46%
1% 4% 24% 47% 19% 5%
0% 3% 19% 41% 27% 10%
0% 0% 10% 18% 43% 30%
1% 6% 32% 39% 17% 5%
0% 3% 21% 37% 26% 12%
AWARDS / RECOGNITION DATA
The National Blue Ribbon School Program recognizes outstanding schools from each state. Georgia nominates 10 schools per year. Selected schools undergo a rigorous review of effective practices including a site review. Smith Elementary School was designated a 1998-99 National Blue Ribbon School.
1998-99 GEORGIA PUBLIC EDUCATION REPORT CARD Smith Elementary School - 7611567
Prepared by Georgia Department of Education
Page 4
CERTIFIED PERSONNEL DATA
Positions Number Average Contract Days
Personnel Sex
Certificate
Years Experience
Full-time Part-time
Male Female
4 Yr Bachelor's 5 Yr Master's 6 Yr Specialist's 7 Yr Doctoral Other*
<1 1-10 11-20 21-30 >30
Average
Administrators
3.00 227.33
3 0
2 1
0 2 0 1 0 0 1 0 2 0 18.67
Support Personnel
1.40 195.71
1 2
0 3
0 2 1 0 0 0 0 2 1 0 19.33
PK-12 Teachers
33.80 190.00
32 4
1 35
21 14
1 0 0 2 16 13 3 2 11.06
*Includes One- and Two-Year Vocational Certificates.
ACCREDITATION DATA
Accredited by Georgia Accrediting Commission (GAC).
1998-99 GEORGIA PUBLIC EDUCATION REPORT CARD Smith Elementary School - 7611567
Prepared by Georgia Department of Education
Page 5
1998-99 GEORGIA PUBLIC EDUCATION REPORT CARD
ATLANTA CITY SCHOOLS
South Atlanta High School - 7610195
Grade Range 9-12
The Georgia Public Education Report Card is designed to assist systems and schools in educational improvement. This report card contains a variety of data elements. An explanation of the terms is provided as a companion to the report card data. Please refer to the definitions for the most effective use of the reported data.
Total 1,419
STUDENT DATA
9-12 Enrollment, by Race/Ethnicity and Sex
Black
White Hispanic
American Multi-
Asian Indian
racial
1,296 91.3%
17 1.2%
17 1.2%
82 5.8%
1 0.1%
6 0.4%
Male Female
740 52.1%
679 47.9%
Enrollment in Selected Programs
Program
Gifted (Grades K-12)
Program % of Student Enrollment Population
0
0.0%
Non-Vocational Labs (Grades 9-12)
Vocational Labs (Grades 9-12)
Alternative Programs (Grades 6-12)
1,192 1,009
0
84.0% 71.1%
0.0%
Students Eligible to Receive Free/Reduced Lunches
Number
Percent
School System
1,108 45,695
78.1% 75.5%
Enrollment in Compensatory Programs
Program
Program % of Student Enrollment Population
Special Education (Grades K-12) PK
187 13.2%
0
N/A
English to Speakers of Other Languages (ESOL) (Grades K-12)
73
5.1%
Remedial Education (Grades 2-5, 9-12)
111
7.8%
Title I (Grades K-12)
This school has a schoolwide program.
Dropout Rate for Grades 9-12
Number
Rate
School System
139 1,248
6.2% 5.4%
Total 190
Retained Students, by Race/Ethnicity and Sex
Black
White Hispanic
American MultiAsian Indian racial
180 94.7%
2 1.1%
0 0.0%
6 3.2%
0 0.0%
2 1.1%
Male Female
121
69
63.7% 36.3%
Prepared by Georgia Department of Education
Page 1
STATE-REQUIRED TEST DATA
GEORGIA HIGH SCHOOL GRADUATION TESTS (GHSGT)
Percent of Regular Program 11th Graders Passing the Georgia High School Graduation Tests on First Administration
English Language Arts Mathematics Social Studies Science
All Components listed above
Writing
1998-99
School System State
90% 80% 81% 56%
91% 79% 73% 61%
96% 88% 80% 72%
53% 55% 68%
85% 85% 93%
1997-98
School System State
87% 76% 63% 48%
89% 78% 68% 61%
94% 88% 78% 74%
45% 54% 68%
74% 83% 92%
1996-97
School System State
95% 83% 83% 57%
89% 72% 65% 52%
94% 87% 78% 74%
53% 46% 67%
76% 82% 93%
GRADUATE DATA
1999 Graduates by Credentials, Race/Ethnicity and Sex
Diplomas with Both College Prep. & Voc. Endorsements
Diplomas with College Prep. Endorsements Diplomas with Vocational Endorsements General High School Diplomas Special Education Diplomas
Total All Diplomas
Certificates of Performance
Total Graduates
Total 37 59 60 2 12
170 9
179
Black
35 94.6%
58 98.3%
60 100.0%
2 100.0%
12 100.0%
167 98.2%
9 100.0%
176 98.3%
American MultiWhite Hispanic Asian Indian racial
0 0.0%
0 0.0%
1 2.7%
1 1.7%
1 2.7%
0 0.0%
0 0.0%
0 0.0%
0 0.0%
0 0.0%
0 0.0%
0 0.0%
0 0.0%
0 0.0%
0 0.0%
0 0.0%
0 0.0%
0 0.0%
0 0.0%
0 0.0%
0 0.0%
0 0.0%
0 0.0%
0 0.0%
0 0.0%
0 0.0%
2 1.2%
1 0.6%
0 0.0%
0 0.0%
0 0.0%
0 0.0%
0 0.0%
0 0.0%
0 0.0%
0 0.0%
2 1.1%
1 0.6%
0 0.0%
0 0.0%
Male Female
14 37.8%
23 39.0%
23 62.2%
36 61.0%
33 55.0%
1 50.0%
12 100.0%
27 45.0%
1 50.0%
0 0.0%
83
87
48.8% 51.2%
6
3
66.7% 33.3%
89
90
49.7% 50.3%
HOPE Scholarships
School System
Number of 1999 Graduates 1 7 9
Number Eligible
65
Percent Eligible
36.3%
2,041 1,099 53.8%
State
65,548 40,292 61.5%
High School Completion Rate
Percent of 1995Grade 9 Enrollment in Graduating Class of1999 School System State
Completion Rate '95-'99 46.7% 57.1% 68.9%
1998-99 GEORGIA PUBLIC EDUCATION REPORT CARD
South Atlanta High School - 7610195
Prepared by Georgia Department of Education
Page 2
COLLEGE ADMISSIONS / CREDIT TEST DATA
Scholastic Assessment Test (SAT)
Based on students' highest verbal and highest math scores
No. Taking
Average Score
Tests Verbal Math Total
Based on students' last test administration
Average Score Verbal Math Total
School
75
College Prep. Endorsement
Other Diplomas
System
1,265
College Prep. Endorsement
Other Diplomas
Georgia
41,958
410 407 N/A
445 441 N/A
492
424 419 N/A
436 430 N/A
488
834 826 N/A
881 871 N/A
980
404 N/A N/A
435 N/A N/A
483
417 N/A N/A
426 N/A N/A
479
821 N/A N/A
861 N/A N/A
962
Nation
952,913 N/A N/A N/A
502 508 1010
American College Testing (ACT)
Advanced Placement Exams (AP)
Number taking tests: English Mathematics Reading Science Reasoning CompositeScore
7 School System State
17.0 17.4 19.1
17.9 18.4 19.9
15.3 16.6
18.6 18.3
20.2 19.9
16.9 18.3 19.9
No. of Students Taking Tests
No. of Tests Taken No. of Test Scores
3 or Higher Percent of Test
Scores 3 or Higher
School 25 32 2
6.3%
System State 537 15,225 877 23,969 184 13,024
21.0% 54.3%
POST-SECONDARY DATA
Graduates Entering Georgia Public Colleges
Graduates Entering Georgia Public Colleges and Requiring Learning Support (LS)
1998 Graduates Entering in 1998-99
1997 Graduates Entering in 1997-98
Percent of Graduating Number Class
School
25
13.5%
System 452
21.7%
School
24
13.9%
System 437
21.1%
Number Requiring
LS 10 200
13 202
Percent of those attending Georgia
Public Colleges
40.0%
44.2%
54.2%
46.2%
In previous years, the Report Card presented College Prep Curriculum information provided by the Board of Regents on students requiring Learning Support. Due to inconsistencies in the data provided by the Board of Regents in defining College Prep Completers versus Local Board of Education data defining College Prep Endorsements, the Department of Education Report Card will not provide this information until discrepancies can be reconciled.
Graduates Entering Georgia Public Technical and Adult Schools
1998 Graduates School System
Entering Number 6 53
1998-99 Percent
3.2% 2.5%
Entering Number N/A N/A
1997-98 Percent
N/A N/A
1997 Graduates School
0
0.0%
System
3
0.1%
5
2.9%
109
5.3%
1998-99 GEORGIA PUBLIC EDUCATION REPORT CARD South Atlanta High School - 7610195
Prepared by Georgia Department of Education
Page 3
CERTIFIED PERSONNEL DATA
Positions Number Average Contract Days
Administrators
4.00 225.50
Support Personnel
7.30 198.08
PK-12 Teachers
71.30 193.03
Personnel Sex
Certificate
Years Experience
Full-time Part-time
Male Female
4 Yr Bachelor's 5 Yr Master's 6 Yr Specialist's 7 Yr Doctoral Other*
<1 1-10 11-20 21-30 >30
Average
4 0
3 1
0 2 1 1 0
0 0 1 2 1
31.00
7 1
4 4
0 3 4 1 0
0 1 2 2 3
25.75
71 1
25 47
35 31
5 1 0
2 14 11 23 22
22.19
*Includes One- and Two-Year Vocational Certificates.
ACCREDITATION DATA
Accredited by Southern Association of Colleges and Schools (SACS): Secondary/Middle Commission.
AWARDS / RECOGNITION DATA
Schools in Georgia may receive recognition in the following programs: Charter School Pay for Performance Program Georgia School of Excellence National Blue Ribbon School South Atlanta High School did not receive recognition in any of these programs during the 1998-99 school year.
1998-99 GEORGIA PUBLIC EDUCATION REPORT CARD South Atlanta High School - 7610195
Prepared by Georgia Department of Education
Page 4
1998-99 GEORGIA PUBLIC EDUCATION REPORT CARD
ATLANTA CITY SCHOOLS
Southside High School - 7610186
Grade Range 9-12
The Georgia Public Education Report Card is designed to assist systems and schools in educational improvement. This report card contains a variety of data elements. An explanation of the terms is provided as a companion to the report card data. Please refer to the definitions for the most effective use of the reported data.
Total 1,137
STUDENT DATA
9-12 Enrollment, by Race/Ethnicity and Sex
Black
White Hispanic
American Multi-
Asian Indian
racial
1,019 89.6%
33 2.9%
52 4.6%
31 2.7%
1 0.1%
1 0.1%
Male Female
566 49.8%
571 50.2%
Enrollment in Selected Programs
Program
Gifted (Grades K-12)
Program % of Student Enrollment Population
49
4.3%
Non-Vocational Labs (Grades 9-12)
951
Vocational Labs
(Grades 9-12)
766
Alternative Programs (Grades 6-12)
0
83.6% 67.4%
0.0%
Students Eligible to Receive Free/Reduced Lunches
Number
Percent
School System
623 45,695
54.8% 75.5%
Enrollment in Compensatory Programs
Program
Program % of Student Enrollment Population
Special Education (Grades K-12) PK
89
7.8%
0
N/A
English to Speakers of Other Languages (ESOL) (Grades K-12)
31
2.7%
Remedial Education (Grades 2-5, 9-12)
48
4.2%
Title I (Grades K-12)
This school has a schoolwide program.
Dropout Rate for Grades 9-12
Number
Rate
School System
133 1,248
7.2% 5.4%
Total 145
Retained Students, by Race/Ethnicity and Sex
Black
White Hispanic
American MultiAsian Indian racial
134 92.4%
6 4.1%
4 2.8%
1 0.7%
0 0.0%
0 0.0%
Male Female
83
62
57.2% 42.8%
Prepared by Georgia Department of Education
Page 1
STATE-REQUIRED TEST DATA
GEORGIA HIGH SCHOOL GRADUATION TESTS (GHSGT)
Percent of Regular Program 11th Graders Passing the Georgia High School Graduation Tests on First Administration
English Language Arts Mathematics Social Studies Science
All Components listed above
Writing
1998-99
School System State
90% 90% 80% 66%
91% 79% 73% 61%
96% 88% 80% 72%
60% 55% 68%
87% 85% 93%
1997-98
School System State
97% 87% 82% 65%
89% 78% 68% 61%
94% 88% 78% 74%
60% 54% 68%
78% 83% 92%
1996-97
School System State
92% 74% 82% 60%
89% 72% 65% 52%
94% 87% 78% 74%
50% 46% 67%
85% 82% 93%
GRADUATE DATA
1999 Graduates by Credentials, Race/Ethnicity and Sex
Diplomas with Both College Prep. & Voc. Endorsements
Diplomas with College Prep. Endorsements Diplomas with Vocational Endorsements General High School Diplomas Special Education Diplomas
Total All Diplomas
Certificates of Performance
Total Graduates
Total 77 56 25 18 9
185 0
Black
70 90.9%
50 89.3%
22 88.0%
18 100.0%
9 100.0%
169 91.4%
0
White Hispanic
1 1.3%
4 5.2%
3 5.4%
1 1.8%
0 0.0%
1 4.0%
0 0.0%
0 0.0%
0 0.0%
0 0.0%
4 2.2%
6 3.2%
0
0
American MultiAsian Indian racial
2 2.6%
0 0.0%
0 0.0%
2 3.6%
0 0.0%
0 0.0%
2 8.0%
0 0.0%
0 0.0%
0 0.0%
0 0.0%
0 0.0%
0 0.0%
0 0.0%
0 0.0%
6 3.2%
0 0.0%
0 0.0%
0
0
0
185
169
4
6
6
0
0
91.4%
2.2% 3.2% 3.2% 0.0% 0.0%
Male Female
21
56
27.3% 72.7%
21
35
37.5% 62.5%
19
6
76.0% 24.0%
10
8
55.6% 44.4%
5
4
55.6% 44.4%
76
109
41.1% 58.9%
0
0
76
109
41.1% 58.9%
HOPE Scholarships
School System
Number of 1999 Graduates 1 8 5
Number Eligible
97
Percent Eligible
52.4%
2,041 1,099 53.8%
State
65,548 40,292 61.5%
High School Completion Rate
Percent of 1995Grade 9 Enrollment in Graduating Class of1999 School System State
Completion Rate '95-'99 52.9% 57.1% 68.9%
1998-99 GEORGIA PUBLIC EDUCATION REPORT CARD
Southside High School - 7610186
Prepared by Georgia Department of Education
Page 2
COLLEGE ADMISSIONS / CREDIT TEST DATA
Scholastic Assessment Test (SAT)
Based on students' highest verbal and highest math scores
No. Taking
Average Score
Tests Verbal Math Total
Based on students' last test administration
Average Score Verbal Math Total
School
104
College Prep. Endorsement
Other Diplomas
System
1,265
College Prep. Endorsement
Other Diplomas
Georgia
41,958
392 392 N/A
445 441 N/A
492
404 393 N/A
436 430 N/A
488
796 785 N/A
881 871 N/A
980
385 N/A N/A
435 N/A N/A
483
395 N/A N/A
426 N/A N/A
479
780 N/A N/A
861 N/A N/A
962
Nation
952,913 N/A N/A N/A
502 508 1010
American College Testing (ACT)
Advanced Placement Exams (AP)
Number taking tests: English Mathematics Reading Science Reasoning CompositeScore
2 5 School System State
16.0 17.4 19.1
17.0 18.4 19.9
16.7 15.8
18.6 18.3
20.2 19.9
16.4 18.3 19.9
No. of Students Taking Tests
No. of Tests Taken No. of Test Scores
3 or Higher Percent of Test
Scores 3 or Higher
School 30 38 0
0.0%
System State 537 15,225 877 23,969 184 13,024
21.0% 54.3%
POST-SECONDARY DATA
Graduates Entering Georgia Public Colleges
Graduates Entering Georgia Public Colleges and Requiring Learning Support (LS)
1998 Graduates Entering in 1998-99
1997 Graduates Entering in 1997-98
Percent of Graduating Number Class
School
45
24.7%
System 452
21.7%
School
32
17.8%
System 437
21.1%
Number Requiring
LS 24 200
21 202
Percent of those attending Georgia
Public Colleges
53.3%
44.2%
65.6%
46.2%
In previous years, the Report Card presented College Prep Curriculum information provided by the Board of Regents on students requiring Learning Support. Due to inconsistencies in the data provided by the Board of Regents in defining College Prep Completers versus Local Board of Education data defining College Prep Endorsements, the Department of Education Report Card will not provide this information until discrepancies can be reconciled.
Graduates Entering Georgia Public Technical and Adult Schools
1998 Graduates School System
Entering Number 5 53
1998-99 Percent
2.7% 2.5%
Entering Number N/A N/A
1997-98 Percent
N/A N/A
1997 Graduates School
0
0.0%
System
3
0.1%
9
5.0%
109
5.3%
1998-99 GEORGIA PUBLIC EDUCATION REPORT CARD Southside High School - 7610186
Prepared by Georgia Department of Education
Page 3
CERTIFIED PERSONNEL DATA
Positions Number Average Contract Days
Administrators
6.00 220.33
Support Personnel
8.00 200.00
PK-12 Teachers
63.70 190.78
Personnel Sex
Certificate
Years Experience
Full-time Part-time
Male Female
4 Yr Bachelor's 5 Yr Master's 6 Yr Specialist's 7 Yr Doctoral Other*
<1 1-10 11-20 21-30 >30
Average
6 0
4 2
0 1 2 3 0
0 1 1 4 0
22.00
8 0
1 7
0 6 2 0 0
0 1 1 6 0
19.88
62 4
24 42
26 32
4 2 2
0 19 17 26
4
18.32
*Includes One- and Two-Year Vocational Certificates.
ACCREDITATION DATA
Accredited by Southern Association of Colleges and Schools (SACS): Secondary/Middle Commission.
AWARDS / RECOGNITION DATA
The Georgia School of Excellence Program recognizes exemplary schools that have excellent, successful programs in many areas of school life. Each year, in a statewide competition, one elementary, one middle and one high school from each of Georgia's 11 congressional districts may be selected for this honor.
Southside High School was designated a 1998-99 Georgia School of Excellence.
1998-99 GEORGIA PUBLIC EDUCATION REPORT CARD Southside High School - 7610186
Prepared by Georgia Department of Education
Page 4
1998-99 GEORGIA PUBLIC EDUCATION REPORT CARD
ATLANTA CITY SCHOOLS
Sutton Middle School - 7613067
Grade Range 6-8
The Georgia Public Education Report Card is designed to assist systems and schools in educational improvement. This report card contains a variety of data elements. An explanation of the terms is provided as a companion to the report card data. Please refer to the definitions for the most effective use of the reported data.
STUDENT DATA
Total 843
6-8 Enrollment, by Race/Ethnicity and Sex
Black
White Hispanic
American Multi-
Asian Indian
racial
458 54.3%
271 32.1%
90 10.7%
17 2.0%
2 0.2%
5 0.6%
Male 404
47.9%
Female 439
52.1%
Enrollment in Selected Programs
Program
Gifted (Grades K-12)
Program % of Student Enrollment Population
263
31.2%
Alternative Programs (Grades 6-12)
0
0.0%
Students Eligible to Receive Free/Reduced Lunches
Number
Percent
School System
384 45,695
45.6% 75.5%
Enrollment in Compensatory Programs
Program
Program % of Student Enrollment Population
Special Education (Grades K-12) (PK)
77
9.1%
0
N/A
English to Speakers of Other Languages (ESOL) (Grades K-12)
54
6.4%
Title I (Grades K-12)
This school has a Targeted Assistance program.
Dropout Rate for Grades 6-8
Number
Rate
School System
84
6.8%
705
3.8%
Total 42
Retained Students, by Race/Ethnicity and Sex
Black
White Hispanic
American MultiAsian Indian racial
31 73.8%
6
5
14.3% 11.9%
0 0.0%
0 0.0%
0 0.0%
Male Female
32
10
76.2% 23.8%
Prepared by Georgia Department of Education
Page 1
STATE-REQUIRED TEST DATA
NORM-REFERENCED TESTS Grade 8
Iowa Tests of Basic Skills (ITBS) Each chart reflects data for three years of testing.
Reading Comprehension 50
58 36 49 0
98-99
57 35 48 97-98
55 34 48 96-97
Mathematics
School 50
System
State
0
60 45 56 98-99
68 43 55 97-98
58 43 54 96-97
School System State
Reading Vocabulary 50
47 32 46 0
98-99
54 36 45 97-98
51 27 44 96-97
Language Arts
School 50
System
State
0
65 42 60 98-99
65 43 58 97-98
62 40 56 96-97
School System State
Social Studies 50
61 42 54 0
98-99
64 45 53 97-98
59 41 53 96-97
Science
School 50
System
State
0
58 36 56 98-99
60 39 55 97-98
55 35 53 96-97
School System State
Sources of Information
Composite Score
50
58 42 57 0
98-99
School 50
System
65 42 56 97-98
62 42 55 96-97
State 0
61 39 56 98-99
64 40 54 97-98
1998-99 GEORGIA PUBLIC EDUCATION REPORT CARD Sutton Middle School - 7613067
Prepared by Georgia Department of Education
61 37 54 96-97
Scores Reported in Percentiles
School System State
Page 2
STATE-REQUIRED TEST DATA
Categories of Scaled Scores
Inadequate (less than 162)
Minimal (162-209)
Good
(210-247)
Very Good (greater than 247)
Average Scaled Score: (Range 100-300)
PERFORMANCE ASSESSMENTS
Grade 8 Writing Assessment
1998-99 Percent Scoring
1997-98 Percent Scoring
1996-97 Percent Scoring
School System State School System State School System State
6% 35% 43% 16%
16% 51% 28%
5%
8% 40% 41% 11%
12% 42% 31% 15%
25% 53% 19%
3%
11% 46% 34%
8%
16% 38% 35% 11%
34% 48% 15%
3%
15% 46% 30%
8%
215
193
208 205
184 202 201
177 198
AWARDS / RECOGNITION DATA
Through the Pay for Performance Program, exemplary public schools and schools making outstanding progress toward becoming exemplary may be rewarded. Not a merit pay program, the Pay for Performance Program motivates and rewards entire school faculties for working together to make their schools exemplary. A school selected for participation in the program has one school year to attain at least 80% of its previously-approved performance objectives in order to receive an award based on $2,000 per certified faculty member.
Sutton Middle School was a Pay for Performance recipient in 1998-99.
1998-99 GEORGIA PUBLIC EDUCATION REPORT CARD Sutton Middle School - 7613067
Prepared by Georgia Department of Education
Page 3
CERTIFIED PERSONNEL DATA
Positions Number Average Contract Days
Personnel Sex
Certificate
Years Experience
Full-time Part-time
Male Female
4 Yr Bachelor's 5 Yr Master's 6 Yr Specialist's 7 Yr Doctoral Other*
<1 1-10 11-20 21-30 >30
Average
Administrators
3.00 227.33
3 0
2 1
0 1 2 0 0 0 0 1 2 0 21.33
Support Personnel
4.00 198.00
3 2
1 4
0 2 3 0 0 0 0 5 0 0 15.60
PK-12 Teachers
55.00 190.36
55 0
8 47
28 22
3 2 0 1 21 20 10 3 14.75
*Includes One- and Two-Year Vocational Certificates.
ACCREDITATION DATA
Accredited with Quality by Georgia Accrediting Commission (GAC).
1998-99 GEORGIA PUBLIC EDUCATION REPORT CARD Sutton Middle School - 7613067
Prepared by Georgia Department of Education
Page 4
1998-99 GEORGIA PUBLIC EDUCATION REPORT CARD
ATLANTA CITY SCHOOLS
Sylvan Hills Middle School - 7610188
Grade Range 6-8
The Georgia Public Education Report Card is designed to assist systems and schools in educational improvement. This report card contains a variety of data elements. An explanation of the terms is provided as a companion to the report card data. Please refer to the definitions for the most effective use of the reported data.
STUDENT DATA
Total 922
6-8 Enrollment, by Race/Ethnicity and Sex
Black
White Hispanic
American Multi-
Asian Indian
racial
912 98.9%
0 0.0%
9 1.0%
1 0.1%
0 0.0%
0 0.0%
Male 470
51.0%
Female 452
49.0%
Enrollment in Selected Programs
Program
Gifted (Grades K-12)
Program % of Student Enrollment Population
20
2.2%
Alternative Programs (Grades 6-12)
0
0.0%
Students Eligible to Receive Free/Reduced Lunches
Number
Percent
School System
812 45,695
88.1% 75.5%
Enrollment in Compensatory Programs
Program
Program % of Student Enrollment Population
Special Education (Grades K-12) (PK)
96 10.4%
0
N/A
English to Speakers of Other Languages (ESOL) (Grades K-12)
0
0.0%
Title I (Grades K-12)
This school has a schoolwide program.
Dropout Rate for Grades 6-8
Number
Rate
School System
48
3.6%
705
3.8%
Total 27
Retained Students, by Race/Ethnicity and Sex
Black
White Hispanic
American MultiAsian Indian racial
27 100.0%
0 0.0%
0 0.0%
0 0.0%
0 0.0%
0 0.0%
Male Female
13
14
48.1% 51.9%
Prepared by Georgia Department of Education
Page 1
STATE-REQUIRED TEST DATA
NORM-REFERENCED TESTS Grade 8
Iowa Tests of Basic Skills (ITBS) Each chart reflects data for three years of testing.
Reading Comprehension 50
46 36 49 0
98-99
34 35 48 97-98
37 34 48 96-97
Mathematics
School 50
System
State
0
52 45 56 98-99
41 43 55 97-98
44 43 54 96-97
School System State
Reading Vocabulary 50
39 32 46 0
98-99
25 36 45 97-98
28 27 44 96-97
Language Arts
School 50
System
State
0
32 42 60 98-99
39 43 58 97-98
40 40 56 96-97
School System State
Social Studies 50
36 42 54 0
98-99
41 45 53 97-98
36 41 53 96-97
Science
School 50
System
State
0
26 36 56 98-99
32 39 55 97-98
28 35 53 96-97
School System State
Sources of Information
Composite Score
50
35 42 57 0
98-99
School 50
System
38 42 56 97-98
36 42 55 96-97
State 0
35 39 56 98-99
36 40 54 97-98
1998-99 GEORGIA PUBLIC EDUCATION REPORT CARD Sylvan Hills Middle School - 7610188
Prepared by Georgia Department of Education
35 37 54 96-97
Scores Reported in Percentiles
School System State
Page 2
STATE-REQUIRED TEST DATA
Categories of Scaled Scores
Inadequate (less than 162)
Minimal (162-209)
Good
(210-247)
Very Good (greater than 247)
Average Scaled Score: (Range 100-300)
PERFORMANCE ASSESSMENTS
Grade 8 Writing Assessment
1998-99 Percent Scoring
1997-98 Percent Scoring
1996-97 Percent Scoring
School System State School System State School System State
22% 62% 16%
0%
16% 51% 28%
5%
8% 40% 41% 11%
27% 59% 12%
2%
25% 53% 19%
3%
11% 46% 34%
8%
45% 42% 12%
1%
34% 48% 15%
3%
15% 46% 30%
8%
182
193
208 180
184 202 168
177 198
AWARDS / RECOGNITION DATA
Schools in Georgia may receive recognition in the following programs: Charter School Pay for Performance Program Georgia School of Excellence National Blue Ribbon School Sylvan Hills Middle School did not receive recognition in any of these programs during the 1998-99 school year.
1998-99 GEORGIA PUBLIC EDUCATION REPORT CARD Sylvan Hills Middle School - 7610188
Prepared by Georgia Department of Education
Page 3
CERTIFIED PERSONNEL DATA
Positions Number Average Contract Days
Personnel Sex
Certificate
Years Experience
Full-time Part-time
Male Female
4 Yr Bachelor's 5 Yr Master's 6 Yr Specialist's 7 Yr Doctoral Other*
<1 1-10 11-20 21-30 >30
Average
Administrators
3.00 227.33
3 0
1 2
0 0 2 1 0 0 0 1 2 0 24.00
Support Personnel
6.40 196.56
6 1
0 7
0 2 4 1 0 0 1 2 3 1 22.86
PK-12 Teachers
51.30 190.00
50 4
14 40
31 17
6 0 0 3 24 5 17 5 15.44
*Includes One- and Two-Year Vocational Certificates.
ACCREDITATION DATA
Accredited with Quality by Georgia Accrediting Commission (GAC).
1998-99 GEORGIA PUBLIC EDUCATION REPORT CARD Sylvan Hills Middle School - 7610188
Prepared by Georgia Department of Education
Page 4
1998-99 GEORGIA PUBLIC EDUCATION REPORT CARD
ATLANTA CITY SCHOOLS
Therrell High School - 7614567
Grade Range 9-12
The Georgia Public Education Report Card is designed to assist systems and schools in educational improvement. This report card contains a variety of data elements. An explanation of the terms is provided as a companion to the report card data. Please refer to the definitions for the most effective use of the reported data.
Total 1,198
STUDENT DATA
9-12 Enrollment, by Race/Ethnicity and Sex
Black
White Hispanic
American Multi-
Asian Indian
racial
1,192 99.5%
5 0.4%
0 0.0%
1 0.1%
0 0.0%
0 0.0%
Male Female
619 51.7%
579 48.3%
Enrollment in Selected Programs
Program
Gifted (Grades K-12)
Program % of Student Enrollment Population
27
2.3%
Non-Vocational Labs (Grades 9-12)
969
Vocational Labs
(Grades 9-12)
615
Alternative Programs (Grades 6-12)
164
80.9% 51.3% 13.7%
Students Eligible to Receive Free/Reduced Lunches
Number
Percent
School System
677 45,695
56.5% 75.5%
Enrollment in Compensatory Programs
Program
Program % of Student Enrollment Population
Special Education (Grades K-12) PK
78
6.5%
0
N/A
English to Speakers of Other Languages (ESOL) (Grades K-12)
0
0.0%
Remedial Education (Grades 2-5, 9-12)
142 11.9%
Title I (Grades K-12)
This school has a schoolwide program.
Dropout Rate for Grades 9-12
Number
Rate
School System
141 1,248
7.0% 5.4%
Total 212
Retained Students, by Race/Ethnicity and Sex
Black
White Hispanic
American MultiAsian Indian racial
212 100.0%
0 0.0%
0 0.0%
0 0.0%
0 0.0%
0 0.0%
Male Female
125
87
59.0% 41.0%
Prepared by Georgia Department of Education
Page 1
STATE-REQUIRED TEST DATA
GEORGIA HIGH SCHOOL GRADUATION TESTS (GHSGT)
Percent of Regular Program 11th Graders Passing the Georgia High School Graduation Tests on First Administration
English Language Arts Mathematics Social Studies Science
All Components listed above
Writing
1998-99
School System State
93% 74% 68% 53%
91% 79% 73% 61%
96% 88% 80% 72%
45% 55% 68%
78% 85% 93%
1997-98
School System State
88% 76% 61% 56%
89% 78% 68% 61%
94% 88% 78% 74%
50% 54% 68%
85% 83% 92%
1996-97
School System State
86% 66% 63% 39%
89% 72% 65% 52%
94% 87% 78% 74%
36% 46% 67%
82% 82% 93%
GRADUATE DATA
1999 Graduates by Credentials, Race/Ethnicity and Sex
Diplomas with Both College Prep. & Voc. Endorsements
Diplomas with College Prep. Endorsements Diplomas with Vocational Endorsements General High School Diplomas Special Education Diplomas
Total All Diplomas
Certificates of Performance
Total Graduates
Total 38 89 29 9 11
176 22
198
Black
38 100.0%
89 100.0%
29 100.0%
9 100.0%
10 90.9%
175 99.4%
22 100.0%
197 99.5%
White Hispanic
0 0.0%
0 0.0%
0 0.0%
0 0.0%
0 0.0%
0 0.0%
1 9.1%
0 0.0%
0 0.0%
0 0.0%
1 0.6%
0 0.0%
0 0.0%
0 0.0%
1 0.5%
0 0.0%
American MultiAsian Indian racial
0 0.0%
0 0.0%
0 0.0%
0 0.0%
0 0.0%
0 0.0%
0 0.0%
0 0.0%
0 0.0%
0 0.0%
0 0.0%
0 0.0%
0 0.0%
0 0.0%
0 0.0%
0 0.0%
0 0.0%
0 0.0%
0 0.0%
0 0.0%
0 0.0%
0 0.0%
0 0.0%
0 0.0%
Male Female
14 36.8%
29 32.6%
24 63.2%
60 67.4%
17 58.6%
5 55.6%
7 63.6%
12 41.4%
4 44.4%
4 36.4%
72
104
40.9% 59.1%
8
14
36.4% 63.6%
80
118
40.4% 59.6%
HOPE Scholarships
School System
Number of 1999 Graduates 1 9 8
Number Eligible
82
Percent Eligible
41.4%
2,041 1,099 53.8%
State
65,548 40,292 61.5%
High School Completion Rate
Percent of 1995Grade 9 Enrollment in Graduating Class of1999 School System State
Completion Rate '95-'99 53.1% 57.1% 68.9%
1998-99 GEORGIA PUBLIC EDUCATION REPORT CARD
Therrell High School - 7614567
Prepared by Georgia Department of Education
Page 2
COLLEGE ADMISSIONS / CREDIT TEST DATA
Scholastic Assessment Test (SAT)
Based on students' highest verbal and highest math scores
No. Taking
Average Score
Tests Verbal Math Total
Based on students' last test administration
Average Score Verbal Math Total
School
89
College Prep. Endorsement
Other Diplomas
System
1,265
College Prep. Endorsement
Other Diplomas
Georgia
41,958
424 419 N/A
445 441 N/A
492
403 393 N/A
436 430 N/A
488
827 812 N/A
881 871 N/A
980
414 N/A N/A
435 N/A N/A
483
394 N/A N/A
426 N/A N/A
479
808 N/A N/A
861 N/A N/A
962
Nation
952,913 N/A N/A N/A
502 508 1010
American College Testing (ACT)
Advanced Placement Exams (AP)
Number taking tests: English Mathematics Reading Science Reasoning CompositeScore
2 7 School System State
15.7 17.4 19.1
15.9 18.4 19.9
17.4 17.1
18.6 18.3
20.2 19.9
16.7 18.3 19.9
No. of Students Taking Tests
No. of Tests Taken No. of Test Scores
3 or Higher Percent of Test
Scores 3 or Higher
School 32 52 3
5.8%
System State 537 15,225 877 23,969 184 13,024
21.0% 54.3%
POST-SECONDARY DATA
Graduates Entering Georgia Public Colleges
Graduates Entering Georgia Public Colleges and Requiring Learning Support (LS)
1998 Graduates Entering in 1998-99
1997 Graduates Entering in 1997-98
Percent of Graduating Number Class
School
30
15.3%
System 452
21.7%
School
39
21.1%
System 437
21.1%
Number Requiring
LS 20 200
23 202
Percent of those attending Georgia
Public Colleges
66.7%
44.2%
59.0%
46.2%
In previous years, the Report Card presented College Prep Curriculum information provided by the Board of Regents on students requiring Learning Support. Due to inconsistencies in the data provided by the Board of Regents in defining College Prep Completers versus Local Board of Education data defining College Prep Endorsements, the Department of Education Report Card will not provide this information until discrepancies can be reconciled.
Graduates Entering Georgia Public Technical and Adult Schools
1998 Graduates School System
Entering Number 7 53
1998-99 Percent
3.6% 2.5%
Entering Number N/A N/A
1997-98 Percent
N/A N/A
1997 Graduates School
0
0.0%
System
3
0.1%
10
5.4%
109
5.3%
1998-99 GEORGIA PUBLIC EDUCATION REPORT CARD Therrell High School - 7614567
Prepared by Georgia Department of Education
Page 3
CERTIFIED PERSONNEL DATA
Positions Number Average Contract Days
Administrators
4.00 225.50
Support Personnel
6.90 197.54
PK-12 Teachers
59.60 190.84
Personnel Sex
Certificate
Years Experience
Full-time Part-time
Male Female
4 Yr Bachelor's 5 Yr Master's 6 Yr Specialist's 7 Yr Doctoral Other*
<1 1-10 11-20 21-30 >30
Average
4 0
2 2
0 2 2 0 0
0 0 2 2 0
21.25
6 2
2 6
0 5 1 2 0
1 1 4 1 1
17.50
59 2
14 47
25 28
7 1 0
4 14 13 23
7
17.82
*Includes One- and Two-Year Vocational Certificates.
ACCREDITATION DATA
Accredited by Southern Association of Colleges and Schools (SACS): Secondary/Middle Commission.
AWARDS / RECOGNITION DATA
Schools in Georgia may receive recognition in the following programs: Charter School Pay for Performance Program Georgia School of Excellence National Blue Ribbon School Therrell High School did not receive recognition in any of these programs during the 1998-99 school year.
1998-99 GEORGIA PUBLIC EDUCATION REPORT CARD Therrell High School - 7614567
Prepared by Georgia Department of Education
Page 4
1998-99 GEORGIA PUBLIC EDUCATION REPORT CARD
ATLANTA CITY SCHOOLS
Thomasville Heights Elementary School - 7615067
Grade Range PK-5
The Georgia Public Education Report Card is designed to assist systems and schools in educational improvement. This report card contains a variety of data elements. An explanation of the terms is provided as a companion to the report card data. Please refer to the definitions for the most effective use of the reported data.
STUDENT DATA
Total
K-5
701
PK
20
Enrollment, by Race/Ethnicity and Sex
Black
White Hispanic
American Asian Indian
Multiracial
698 99.6%
3 0.4%
0 0.0%
0 0.0%
0 0.0%
0 0.0%
20 100.0%
0 0.0%
0 0.0%
0 0.0%
0 0.0%
0 0.0%
Male Female
334 47.6%
367 52.4%
9 45.0%
11 55.0%
Enrollment in Selected Programs
Program
Program % of Student Enrollment Population
Gifted (Grades K-12)
0
0.0%
Alternative Programs (Grades 6-12)
N/A
N/A
Students Eligible to Receive Free/Reduced Lunches
Number
Percent
School System
711 45,695
98.6% 75.5%
Dropout Rate *
Number
Rate
School System
N/A N/A
N/A N/A
* Dropout rates are not applicable for grades PK-5.
Enrollment in Compensatory Programs
Program
Program % of Student Enrollment Population
Special Education (Grades K-12)
18
2.6%
(PK)
0
N/A
English to Speakers of Other Languages (ESOL) (Grades K-12)
0
0.0%
Remedial Education (Grades 2-5, 9-12)
80 17.5%
Special Instructional Assistance (SIA) (Grades K-3)
327 63.2%
Title I (Grades K-12)
This school has a schoolwide program.
Total 42
Retained Students, by Race/Ethnicity and Sex
Black
White Hispanic
American MultiAsian Indian racial
42 100.0%
0 0.0%
0 0.0%
0 0.0%
0 0.0%
0 0.0%
Male Female
23
19
54.8% 45.2%
Prepared by Georgia Department of Education
Page 1
STATE-REQUIRED TEST DATA
NORM-REFERENCED TESTS Grade 3
Iowa Tests of Basic Skills (ITBS) Each chart reflects data for three years of testing.
Reading Comprehension 50
46 50 54 0
98-99
35 55 53 97-98
38 48 52 96-97
Mathematics
School 50
System
State
0
47 53 61 98-99
33 58 61 97-98
47 51 59 96-97
School System State
Reading Vocabulary 50
39 50 50 0
98-99
45 51 50 97-98
44 44 49 96-97
Language Arts
School 50
System
State
0
35 61 64 98-99
29 63 62 97-98
40 54 59 96-97
School System State
Social Studies 50
25 50 56 0
98-99
29 52 55 97-98
35 50 55 96-97
Science
School 50
System
State
0
26 49 59 98-99
34 52 59 97-98
38 48 58 96-97
School System State
Sources of Information
Composite Score
50
31 48 57 0
98-99
School 50
System
32 51 56 97-98
31 47 55 96-97
State 0
32 51 58 98-99
28 55 57 97-98
1998-99 GEORGIA PUBLIC EDUCATION REPORT CARD Thomasville Heights Elementary School - 7615067
Prepared by Georgia Department of Education
37 48 56 96-97
Scores Reported in Percentiles
School System State
Page 2
STATE-REQUIRED TEST DATA
NORM-REFERENCED TESTS Grade 5
Iowa Tests of Basic Skills (ITBS) Each chart reflects data for three years of testing.
Reading Comprehension
Mathematics
50
51 47 53 0
98-99
39 52 53 97-98
47 49 52 96-97
School 50
System
State
0
42 48 59 98-99
26 53 58 97-98
46 50 57 96-97
School System State
Reading Vocabulary 50
46 48 48 0
98-99
43 52 48 97-98
43 44 46 96-97
Language Arts
School 50
System
State
0
37 56 63 98-99
39 60 61 97-98
52 51 58 96-97
School System State
Social Studies 50
25 54 57 0
98-99
32 54 56 97-98
45 52 55 96-97
Science
School 50
System
State
0
19 48 60 98-99
33 50 59 97-98
53 48 59 96-97
School System State
Sources of Information
Composite Score
50
24 47 58 0
98-99
School 50
System
41 51 58 97-98
42 49 57 96-97
State 0
29 49 57 98-99
33 52 56 97-98
46 48 55 96-97
1998-99 GEORGIA PUBLIC EDUCATION REPORT CARD Thomasville Heights Elementary School - 7615067
Prepared by Georgia Department of Education
Scores Reported in Percentiles
School System State
Page 3
STATE-REQUIRED TEST DATA
PERFORMANCE ASSESSMENTS
Grade 5 Writing Assessment
Percent at Developmental Stages:
1998-99 School System State
1997-98 School System State
1996-97 School System State
Stage Stage Stage Stage Stage Stage
1:The Emerging Writer 2:The Developing Writer 3:The Focusing Writer 4:The Experimenting 5:The Engaging Writer 6:The Extending Writer
0% 4% 16% 61% 16% 4%
1% 2% 22% 47% 22% 6%
0% 1% 16% 41% 29% 12%
0% 0% 29% 56% 15% 0%
1% 4% 24% 47% 19% 5%
0% 3% 19% 41% 27% 10%
0% 4% 37% 26% 30% 4%
1% 6% 32% 39% 17% 5%
0% 3% 21% 37% 26% 12%
AWARDS / RECOGNITION DATA
Schools in Georgia may receive recognition in the following programs: Charter School Pay for Performance Program Georgia School of Excellence National Blue Ribbon School Thomasville Heights Elementary School did not receive recognition in any of these programs during the 1998-99 school year.
1998-99 GEORGIA PUBLIC EDUCATION REPORT CARD Thomasville Heights Elementary School - 7615067
Prepared by Georgia Department of Education
Page 4
CERTIFIED PERSONNEL DATA
Positions Number Average Contract Days
Personnel Sex
Certificate
Years Experience
Full-time Part-time
Male Female
4 Yr Bachelor's 5 Yr Master's 6 Yr Specialist's 7 Yr Doctoral Other*
<1 1-10 11-20 21-30 >30
Average
Administrators
3.00 227.33
3 0
1 2
0 0 2 1 0 0 0 0 1 2 29.00
Support Personnel
2.00 196.50
1 3
1 3
0 3 1 0 0 0 2 1 1 0 11.50
PK-12 Teachers
43.40 190.00
42 4
6 40
29 11
5 1 0 1 18 13 13 1 14.83
*Includes One- and Two-Year Vocational Certificates.
ACCREDITATION DATA
Accredited by Georgia Accrediting Commission (GAC).
1998-99 GEORGIA PUBLIC EDUCATION REPORT CARD Thomasville Heights Elementary School - 7615067
Prepared by Georgia Department of Education
Page 5
1998-99 GEORGIA PUBLIC EDUCATION REPORT CARD
ATLANTA CITY SCHOOLS
Toomer Elementary School - 7615567
Grade Range PK-5
The Georgia Public Education Report Card is designed to assist systems and schools in educational improvement. This report card contains a variety of data elements. An explanation of the terms is provided as a companion to the report card data. Please refer to the definitions for the most effective use of the reported data.
STUDENT DATA
Total
K-5
498
PK
40
Enrollment, by Race/Ethnicity and Sex
Black
White Hispanic
American Asian Indian
Multiracial
491 98.6%
2 0.4%
5 1.0%
0 0.0%
0 0.0%
0 0.0%
40 100.0%
0 0.0%
0 0.0%
0 0.0%
0 0.0%
0 0.0%
Male Female
262 52.6%
236 47.4%
19 47.5%
21 52.5%
Enrollment in Selected Programs
Program
Program % of Student Enrollment Population
Gifted (Grades K-12)
7
1.4%
Alternative Programs (Grades 6-12)
N/A
N/A
Students Eligible to Receive Free/Reduced Lunches
Number
Percent
School System
524 45,695
97.4% 75.5%
Dropout Rate *
Number
Rate
School System
N/A N/A
N/A N/A
* Dropout rates are not applicable for grades PK-5.
Enrollment in Compensatory Programs
Program
Program % of Student Enrollment Population
Special Education (Grades K-12)
49
9.8%
(PK)
0
N/A
English to Speakers of Other Languages (ESOL) (Grades K-12)
0
0.0%
Remedial Education (Grades 2-5, 9-12)
66 19.6%
Special Instructional Assistance (SIA) (Grades K-3)
198 57.6%
Title I (Grades K-12)
This school has a schoolwide program.
Total 17
Retained Students, by Race/Ethnicity and Sex
Black
White Hispanic
American MultiAsian Indian racial
17 100.0%
0 0.0%
0 0.0%
0 0.0%
0 0.0%
0 0.0%
Male Female
9
8
52.9% 47.1%
Prepared by Georgia Department of Education
Page 1
STATE-REQUIRED TEST DATA
NORM-REFERENCED TESTS Grade 3
Iowa Tests of Basic Skills (ITBS) Each chart reflects data for three years of testing.
Reading Comprehension 50
30 50 54 0
98-99
42 55 53 97-98
26 48 52 96-97
Mathematics
School 50
System
State
0
33 53 61 98-99
40 58 61 97-98
28 51 59 96-97
School System State
Reading Vocabulary 50
28 50 50 0
98-99
33 51 50 97-98
25 44 49 96-97
Language Arts
School 50
System
State
0
47 61 64 98-99
46 63 62 97-98
20 54 59 96-97
School System State
Social Studies 50
39 50 56 0
98-99
45 52 55 97-98
32 50 55 96-97
Science
School 50
System
State
0
32 49 59 98-99
46 52 59 97-98
31 48 58 96-97
School System State
Sources of Information
Composite Score
50
36 48 57 0
98-99
School 50
System
46 51 56 97-98
27 47 55 96-97
State 0
33 51 58 98-99
41 55 57 97-98
1998-99 GEORGIA PUBLIC EDUCATION REPORT CARD Toomer Elementary School - 7615567
Prepared by Georgia Department of Education
25 48 56 96-97
Scores Reported in Percentiles
School System State
Page 2
STATE-REQUIRED TEST DATA
NORM-REFERENCED TESTS Grade 5
Iowa Tests of Basic Skills (ITBS) Each chart reflects data for three years of testing.
Reading Comprehension
Mathematics
50
29 47 53 0
98-99
32 52 53 97-98
30 49 52 96-97
School 50
System
State
0
28 48 59 98-99
34 53 58 97-98
23 50 57 96-97
School System State
Reading Vocabulary 50
16 48 48 0
98-99
22 52 48 97-98
15 44 46 96-97
Language Arts
School 50
System
State
0
44 56 63 98-99
47 60 61 97-98
36 51 58 96-97
School System State
Social Studies 50
42 54 57 0
98-99
39 54 56 97-98
30 52 55 96-97
Science
School 50
System
State
0
20 48 60 98-99
29 50 59 97-98
28 48 59 96-97
School System State
Sources of Information
Composite Score
50
34 47 58 0
98-99
School 50
System
43 51 58 97-98
32 49 57 96-97
State 0
29 49 57 98-99
34 52 56 97-98
26 48 55 96-97
1998-99 GEORGIA PUBLIC EDUCATION REPORT CARD Toomer Elementary School - 7615567
Prepared by Georgia Department of Education
Scores Reported in Percentiles
School System State
Page 3
STATE-REQUIRED TEST DATA
PERFORMANCE ASSESSMENTS
Grade 5 Writing Assessment
Percent at Developmental Stages:
1998-99 School System State
1997-98 School System State
1996-97 School System State
Stage Stage Stage Stage Stage Stage
1:The Emerging Writer 2:The Developing Writer 3:The Focusing Writer 4:The Experimenting 5:The Engaging Writer 6:The Extending Writer
0% 4% 18% 46% 25% 7%
1% 2% 22% 47% 22% 6%
0% 1% 16% 41% 29% 12%
0% 0% 13% 61% 26% 0%
1% 4% 24% 47% 19% 5%
0% 3% 19% 41% 27% 10%
0% 5% 27% 54% 11% 4%
1% 6% 32% 39% 17% 5%
0% 3% 21% 37% 26% 12%
AWARDS / RECOGNITION DATA
Schools in Georgia may receive recognition in the following programs: Charter School Pay for Performance Program Georgia School of Excellence National Blue Ribbon School Toomer Elementary School did not receive recognition in any of these programs during the 1998-99 school year.
1998-99 GEORGIA PUBLIC EDUCATION REPORT CARD Toomer Elementary School - 7615567
Prepared by Georgia Department of Education
Page 4
CERTIFIED PERSONNEL DATA
Positions Number Average Contract Days
Personnel Sex
Certificate
Years Experience
Full-time Part-time
Male Female
4 Yr Bachelor's 5 Yr Master's 6 Yr Specialist's 7 Yr Doctoral Other*
<1 1-10 11-20 21-30 >30
Average
Administrators
2.00 231.00
2 0
2 0
0 0 1 1 0 0 0 0 0 2 34.00
Support Personnel
1.90 195.26
1 3
0 4
1 2 1 0 0 0 1 1 1 1 20.00
PK-12 Teachers
33.90 190.00
32 4
4 32
14 21
0 1 0 1 15 14 5 1 12.44
*Includes One- and Two-Year Vocational Certificates.
ACCREDITATION DATA
Accredited by Georgia Accrediting Commission (GAC).
1998-99 GEORGIA PUBLIC EDUCATION REPORT CARD Toomer Elementary School - 7615567
Prepared by Georgia Department of Education
Page 5
1998-99 GEORGIA PUBLIC EDUCATION REPORT CARD
ATLANTA CITY SCHOOLS
Towns Elementary School - 7611068
Grade Range PK-5
The Georgia Public Education Report Card is designed to assist systems and schools in educational improvement. This report card contains a variety of data elements. An explanation of the terms is provided as a companion to the report card data. Please refer to the definitions for the most effective use of the reported data.
STUDENT DATA
Total
K-5
474
PK
18
Enrollment, by Race/Ethnicity and Sex
Black
White Hispanic
American Asian Indian
Multiracial
472 99.6%
1 0.2%
1 0.2%
0 0.0%
0 0.0%
0 0.0%
18 100.0%
0 0.0%
0 0.0%
0 0.0%
0 0.0%
0 0.0%
Male Female
212 44.7%
262 55.3%
8 44.4%
10 55.6%
Enrollment in Selected Programs
Program
Program % of Student Enrollment Population
Gifted (Grades K-12)
0
0.0%
Alternative Programs (Grades 6-12)
N/A
N/A
Students Eligible to Receive Free/Reduced Lunches
Number
Percent
School System
483 45,695
98.2% 75.5%
Dropout Rate *
Number
Rate
School System
N/A N/A
N/A N/A
* Dropout rates are not applicable for grades PK-5.
Enrollment in Compensatory Programs
Program
Program % of Student Enrollment Population
Special Education (Grades K-12)
31
6.5%
(PK)
0
N/A
English to Speakers of Other Languages (ESOL) (Grades K-12)
0
0.0%
Remedial Education (Grades 2-5, 9-12)
77 23.6%
Special Instructional Assistance (SIA) (Grades K-3)
163 52.2%
Title I (Grades K-12)
This school has a schoolwide program.
Total 31
Retained Students, by Race/Ethnicity and Sex
Black
White Hispanic
American MultiAsian Indian racial
31 100.0%
0 0.0%
0 0.0%
0 0.0%
0 0.0%
0 0.0%
Male Female
19
12
61.3% 38.7%
Prepared by Georgia Department of Education
Page 1
STATE-REQUIRED TEST DATA
NORM-REFERENCED TESTS Grade 3
Iowa Tests of Basic Skills (ITBS) Each chart reflects data for three years of testing.
Reading Comprehension 50
66 50 54 0
98-99
46 55 53 97-98
42 48 52 96-97
Mathematics
School 50
System
State
0
50 53 61 98-99
43 58 61 97-98
42 51 59 96-97
School System State
Reading Vocabulary 50
53 50 50 0
98-99
53 51 50 97-98
29 44 49 96-97
Language Arts
School 50
System
State
0
57 61 64 98-99
53 63 62 97-98
36 54 59 96-97
School System State
Social Studies 50
52 50 56 0
98-99
37 52 55 97-98
38 50 55 96-97
Science
School 50
System
State
0
51 49 59 98-99
42 52 59 97-98
36 48 58 96-97
School System State
Sources of Information
Composite Score
50
54 48 57 0
98-99
School 50
System
35 51 56 97-98
49 47 55 96-97
State 0
53 51 58 98-99
42 55 57 97-98
1998-99 GEORGIA PUBLIC EDUCATION REPORT CARD Towns Elementary School - 7611068
Prepared by Georgia Department of Education
38 48 56 96-97
Scores Reported in Percentiles
School System State
Page 2
STATE-REQUIRED TEST DATA
NORM-REFERENCED TESTS Grade 5
Iowa Tests of Basic Skills (ITBS) Each chart reflects data for three years of testing.
Reading Comprehension
Mathematics
50
53 47 53 0
98-99
40 52 53 97-98
43 49 52 96-97
School 50
System
State
0
58 48 59 98-99
47 53 58 97-98
54 50 57 96-97
School System State
Reading Vocabulary 50
49 48 48 0
98-99
33 52 48 97-98
30 44 46 96-97
Language Arts
School 50
System
State
0
63 56 63 98-99
45 60 61 97-98
53 51 58 96-97
School System State
Social Studies 50
74 54 57 0
98-99
48 54 56 97-98
47 52 55 96-97
Science
School 50
System
State
0
67 48 60 98-99
38 50 59 97-98
33 48 59 96-97
School System State
Sources of Information
Composite Score
50
60 47 58 0
98-99
School 50
System
35 51 58 97-98
38 49 57 96-97
State 0
63 49 57 98-99
39 52 56 97-98
42 48 55 96-97
1998-99 GEORGIA PUBLIC EDUCATION REPORT CARD Towns Elementary School - 7611068
Prepared by Georgia Department of Education
Scores Reported in Percentiles
School System State
Page 3
STATE-REQUIRED TEST DATA
PERFORMANCE ASSESSMENTS
Grade 5 Writing Assessment
Percent at Developmental Stages:
1998-99 School System State
1997-98 School System State
1996-97 School System State
Stage Stage Stage Stage Stage Stage
1:The Emerging Writer 2:The Developing Writer 3:The Focusing Writer 4:The Experimenting 5:The Engaging Writer 6:The Extending Writer
1% 0% 12% 62% 20% 4%
1% 2% 22% 47% 22% 6%
0% 1% 16% 41% 29% 12%
1% 3% 32% 55% 8% 1%
1% 4% 24% 47% 19% 5%
0% 3% 19% 41% 27% 10%
0% 3% 33% 33% 26% 3%
1% 6% 32% 39% 17% 5%
0% 3% 21% 37% 26% 12%
AWARDS / RECOGNITION DATA
Schools in Georgia may receive recognition in the following programs: Charter School Pay for Performance Program Georgia School of Excellence National Blue Ribbon School Towns Elementary School did not receive recognition in any of these programs during the 1998-99 school year.
1998-99 GEORGIA PUBLIC EDUCATION REPORT CARD Towns Elementary School - 7611068
Prepared by Georgia Department of Education
Page 4
CERTIFIED PERSONNEL DATA
Positions Number Average Contract Days
Personnel Sex
Certificate
Years Experience
Full-time Part-time
Male Female
4 Yr Bachelor's 5 Yr Master's 6 Yr Specialist's 7 Yr Doctoral Other*
<1 1-10 11-20 21-30 >30
Average
Administrators
2.00 231.00
2 0
0 2
0 1 0 1 0 0 0 0 2 0 25.50
Support Personnel
1.60 200.00
0 4
2 2
0 4 0 0 0 0 0 3 0 1 20.25
PK-12 Teachers
32.90 190.00
31 6
4 33
22 11
3 1 0 2 19 5 9 2 12.27
*Includes One- and Two-Year Vocational Certificates.
ACCREDITATION DATA
Accredited by Georgia Accrediting Commission (GAC).
1998-99 GEORGIA PUBLIC EDUCATION REPORT CARD Towns Elementary School - 7611068
Prepared by Georgia Department of Education
Page 5
1998-99 GEORGIA PUBLIC EDUCATION REPORT CARD
ATLANTA CITY SCHOOLS
Turner Middle School - 7610191
Grade Range 6-8
The Georgia Public Education Report Card is designed to assist systems and schools in educational improvement. This report card contains a variety of data elements. An explanation of the terms is provided as a companion to the report card data. Please refer to the definitions for the most effective use of the reported data.
STUDENT DATA
Total 568
6-8 Enrollment, by Race/Ethnicity and Sex
Black
White Hispanic
American Multi-
Asian Indian
racial
565 99.5%
1 0.2%
1 0.2%
1 0.2%
0 0.0%
0 0.0%
Male 287
50.5%
Female 281
49.5%
Enrollment in Selected Programs
Program
Gifted (Grades K-12)
Program % of Student Enrollment Population
0
0.0%
Alternative Programs (Grades 6-12)
0
0.0%
Students Eligible to Receive Free/Reduced Lunches
Number
Percent
School System
503 45,695
88.6% 75.5%
Enrollment in Compensatory Programs
Program
Program % of Student Enrollment Population
Special Education (Grades K-12) (PK)
82 14.4%
0
N/A
English to Speakers of Other Languages (ESOL) (Grades K-12)
0
0.0%
Title I (Grades K-12)
This school has a schoolwide program.
Dropout Rate for Grades 6-8
Number
Rate
School System
25
3.1%
705
3.8%
Total 23
Retained Students, by Race/Ethnicity and Sex
Black
White Hispanic
American MultiAsian Indian racial
22 95.7%
0 0.0%
1 4.3%
0 0.0%
0 0.0%
0 0.0%
Male Female
16
7
69.6% 30.4%
Prepared by Georgia Department of Education
Page 1
STATE-REQUIRED TEST DATA
NORM-REFERENCED TESTS Grade 8
Iowa Tests of Basic Skills (ITBS) Each chart reflects data for three years of testing.
Reading Comprehension 50
32 36 49 0
98-99
30 35 48 97-98
34 34 48 96-97
Mathematics
School 50
System
State
0
36 45 56 98-99
35 43 55 97-98
43 43 54 96-97
School System State
Reading Vocabulary 50
20 32 46 0
98-99
24 36 45 97-98
38 27 44 96-97
Language Arts
School 50
System
State
0
35 42 60 98-99
32 43 58 97-98
34 40 56 96-97
School System State
Social Studies 50
35 42 54 0
98-99
33 45 53 97-98
39 41 53 96-97
Science
School 50
System
State
0
30 36 56 98-99
26 39 55 97-98
30 35 53 96-97
School System State
Sources of Information
Composite Score
50
38 42 57 0
98-99
School 50
System
38 42 56 97-98
40 42 55 96-97
State 0
32 39 56 98-99
29 40 54 97-98
1998-99 GEORGIA PUBLIC EDUCATION REPORT CARD Turner Middle School - 7610191
Prepared by Georgia Department of Education
35 37 54 96-97
Scores Reported in Percentiles
School System State
Page 2
STATE-REQUIRED TEST DATA
Categories of Scaled Scores
Inadequate (less than 162)
Minimal (162-209)
Good
(210-247)
Very Good (greater than 247)
Average Scaled Score: (Range 100-300)
PERFORMANCE ASSESSMENTS
Grade 8 Writing Assessment
1998-99 Percent Scoring
1997-98 Percent Scoring
1996-97 Percent Scoring
School System State School System State School System State
18% 57% 22%
2%
16% 51% 28%
5%
8% 40% 41% 11%
38% 53%
8% 1%
25% 53% 19%
3%
11% 46% 34%
8%
38% 47% 13%
2%
34% 48% 15%
3%
15% 46% 30%
8%
188
193
208 171
184 202 174
177 198
AWARDS / RECOGNITION DATA
Schools in Georgia may receive recognition in the following programs: Charter School Pay for Performance Program Georgia School of Excellence National Blue Ribbon School Turner Middle School did not receive recognition in any of these programs during the 1998-99 school year.
1998-99 GEORGIA PUBLIC EDUCATION REPORT CARD Turner Middle School - 7610191
Prepared by Georgia Department of Education
Page 3
CERTIFIED PERSONNEL DATA
Positions Number Average Contract Days
Personnel Sex
Certificate
Years Experience
Full-time Part-time
Male Female
4 Yr Bachelor's 5 Yr Master's 6 Yr Specialist's 7 Yr Doctoral Other*
<1 1-10 11-20 21-30 >30
Average
Administrators
3.00 227.33
3 0
0 3
0 1 0 2 0 0 0 0 2 1 28.33
Support Personnel
4.20 196.90
3 2
2 3
0 3 1 1 0 0 3 2 0 0 9.40
PK-12 Teachers
39.10 190.26
38 3
10 31
21 16
3 1 0 1 14 13 9 4 15.20
*Includes One- and Two-Year Vocational Certificates.
ACCREDITATION DATA
Accredited with Quality by Georgia Accrediting Commission (GAC).
1998-99 GEORGIA PUBLIC EDUCATION REPORT CARD Turner Middle School - 7610191
Prepared by Georgia Department of Education
Page 4
1998-99 GEORGIA PUBLIC EDUCATION REPORT CARD
ATLANTA CITY SCHOOLS
Usher Middle School - 7610193
Grade Range 6-8
The Georgia Public Education Report Card is designed to assist systems and schools in educational improvement. This report card contains a variety of data elements. An explanation of the terms is provided as a companion to the report card data. Please refer to the definitions for the most effective use of the reported data.
STUDENT DATA
Total 1,043
6-8 Enrollment, by Race/Ethnicity and Sex
Black
White Hispanic
American Multi-
Asian Indian
racial
1,037 99.4%
1 0.1%
5 0.5%
0 0.0%
0 0.0%
0 0.0%
Male 505
48.4%
Female 538
51.6%
Enrollment in Selected Programs
Program
Gifted (Grades K-12)
Program % of Student Enrollment Population
36
3.5%
Alternative Programs (Grades 6-12)
0
0.0%
Students Eligible to Receive Free/Reduced Lunches
Number
Percent
School System
857 45,695
82.2% 75.5%
Enrollment in Compensatory Programs
Program
Program % of Student Enrollment Population
Special Education (Grades K-12) (PK)
107 10.3%
0
N/A
English to Speakers of Other Languages (ESOL) (Grades K-12)
0
0.0%
Title I (Grades K-12)
This school has a schoolwide program.
Dropout Rate for Grades 6-8
Number
Rate
School System
53
3.5%
705
3.8%
Total 6
Retained Students, by Race/Ethnicity and Sex
Black
White Hispanic
American MultiAsian Indian racial
6 100.0%
0 0.0%
0 0.0%
0 0.0%
0 0.0%
0 0.0%
Male Female
5
1
83.3% 16.7%
Prepared by Georgia Department of Education
Page 1
STATE-REQUIRED TEST DATA
NORM-REFERENCED TESTS Grade 8
Iowa Tests of Basic Skills (ITBS) Each chart reflects data for three years of testing.
Reading Comprehension 50
33 36 49 0
98-99
33 35 48 97-98
29 34 48 96-97
Mathematics
School 50
System
State
0
44 45 56 98-99
34 43 55 97-98
34 43 54 96-97
School System State
Reading Vocabulary 50
27 32 46 0
98-99
34 36 45 97-98
18 27 44 96-97
Language Arts
School 50
System
State
0
40 42 60 98-99
34 43 58 97-98
32 40 56 96-97
School System State
Social Studies 50
40 42 54 0
98-99
40 45 53 97-98
39 41 53 96-97
Science
School 50
System
State
0
35 36 56 98-99
33 39 55 97-98
37 35 53 96-97
School System State
Sources of Information
Composite Score
50
43 42 57 0
98-99
School 50
System
38 42 56 97-98
40 42 55 96-97
State 0
37 39 56 98-99
33 40 54 97-98
1998-99 GEORGIA PUBLIC EDUCATION REPORT CARD Usher Middle School - 7610193
Prepared by Georgia Department of Education
33 37 54 96-97
Scores Reported in Percentiles
School System State
Page 2
STATE-REQUIRED TEST DATA
Categories of Scaled Scores
Inadequate (less than 162)
Minimal (162-209)
Good
(210-247)
Very Good (greater than 247)
Average Scaled Score: (Range 100-300)
PERFORMANCE ASSESSMENTS
Grade 8 Writing Assessment
1998-99 Percent Scoring
1997-98 Percent Scoring
1996-97 Percent Scoring
School System State School System State School System State
14% 54% 31%
1%
16% 51% 28%
5%
8% 40% 41% 11%
27% 60% 12%
0%
25% 53% 19%
3%
11% 46% 34%
8%
31% 58% 11%
0%
34% 48% 15%
3%
15% 46% 30%
8%
192
193
208 177
184 202 175
177 198
AWARDS / RECOGNITION DATA
Schools in Georgia may receive recognition in the following programs: Charter School Pay for Performance Program Georgia School of Excellence National Blue Ribbon School Usher Middle School did not receive recognition in any of these programs during the 1998-99 school year.
1998-99 GEORGIA PUBLIC EDUCATION REPORT CARD Usher Middle School - 7610193
Prepared by Georgia Department of Education
Page 3
CERTIFIED PERSONNEL DATA
Positions Number Average Contract Days
Personnel Sex
Certificate
Years Experience
Full-time Part-time
Male Female
4 Yr Bachelor's 5 Yr Master's 6 Yr Specialist's 7 Yr Doctoral Other*
<1 1-10 11-20 21-30 >30
Average
Administrators
4.00 225.50
4 0
1 3
0 0 3 1 0 0 0 0 2 2 30.25
Support Personnel
6.00 197.00
5 2
2 5
0 6 1 0 0 0 1 4 2 0 18.86
PK-12 Teachers
53.50 190.19
52 3
15 40
28 20
7 0 0 3 19 11 13 9 16.11
*Includes One- and Two-Year Vocational Certificates.
ACCREDITATION DATA
Accredited with Quality by Georgia Accrediting Commission (GAC).
1998-99 GEORGIA PUBLIC EDUCATION REPORT CARD Usher Middle School - 7610193
Prepared by Georgia Department of Education
Page 4
1998-99 GEORGIA PUBLIC EDUCATION REPORT CARD
ATLANTA CITY SCHOOLS
Venetian Hills Elementary School - 7612568
Grade Range K-5
The Georgia Public Education Report Card is designed to assist systems and schools in educational improvement. This report card contains a variety of data elements. An explanation of the terms is provided as a companion to the report card data. Please refer to the definitions for the most effective use of the reported data.
STUDENT DATA
Total 516
K-5 Enrollment, by Race/Ethnicity and Sex
Black
White Hispanic
American Multi-
Asian Indian
racial
511 99.0%
2 0.4%
3 0.6%
0 0.0%
0 0.0%
0 0.0%
Male Female
266 51.6%
250 48.4%
Enrollment in Selected Programs
Program
Program % of Student Enrollment Population
Gifted (Grades K-12)
0
0.0%
Alternative Programs (Grades 6-12)
N/A
N/A
Students Eligible to Receive Free/Reduced Lunches
Number
Percent
School System
485 45,695
94.0% 75.5%
Dropout Rate *
Number
Rate
School System
N/A N/A
N/A N/A
* Dropout rates are not applicable for grades PK-5.
Enrollment in Compensatory Programs
Program
Program % of Student Enrollment Population
Special Education (Grades K-12)
29
5.6%
(PK)
0
N/A
English to Speakers of Other Languages (ESOL) (Grades K-12)
0
0.0%
Remedial Education (Grades 2-5, 9-12)
50 14.9%
Special Instructional Assistance (SIA) (Grades K-3)
241 67.7%
Title I (Grades K-12)
This school has a schoolwide program.
Total 6
Retained Students, by Race/Ethnicity and Sex
Black
White Hispanic
American Multi-
Asian Indian
racial
6 100.0%
0 0.0%
0 0.0%
0 0.0%
0 0.0%
0 0.0%
Male Female
5
1
83.3% 16.7%
Prepared by Georgia Department of Education
Page 1
STATE-REQUIRED TEST DATA
NORM-REFERENCED TESTS Grade 3
Iowa Tests of Basic Skills (ITBS) Each chart reflects data for three years of testing.
Reading Comprehension 50
69 50 54 0
98-99
79 55 53 97-98
39 48 52 96-97
Mathematics
School 50
System
State
0
57 53 61 98-99
78 58 61 97-98
40 51 59 96-97
School System State
Reading Vocabulary 50
89 50 50 0
98-99
96 51 50 97-98
37 44 49 96-97
Language Arts
School 50
System
State
0
76 61 64 98-99
92 63 62 97-98
42 54 59 96-97
School System State
Social Studies 50
65 50 56 0
98-99
68 52 55 97-98
52 50 55 96-97
Science
School 50
System
State
0
60 49 59 98-99
74 52 59 97-98
31 48 58 96-97
School System State
Sources of Information
Composite Score
50
51 48 57 0
98-99
School 50
System
72 51 56 97-98
45 47 55 96-97
State 0
67 51 58 98-99
82 55 57 97-98
1998-99 GEORGIA PUBLIC EDUCATION REPORT CARD Venetian Hills Elementary School - 7612568
Prepared by Georgia Department of Education
39 48 56 96-97
Scores Reported in Percentiles
School System State
Page 2
STATE-REQUIRED TEST DATA
NORM-REFERENCED TESTS Grade 5
Iowa Tests of Basic Skills (ITBS) Each chart reflects data for three years of testing.
Reading Comprehension
Mathematics
50
53 47 53 0
98-99
50 52 53 97-98
54 49 52 96-97
School 50
System
State
0
53 48 59 98-99
50 53 58 97-98
57 50 57 96-97
School System State
Reading Vocabulary 50
82 48 48 0
98-99
75 52 48 97-98
57 44 46 96-97
Language Arts
School 50
System
State
0
62 56 63 98-99
63 60 61 97-98
63 51 58 96-97
School System State
Social Studies 50
72 54 57 0
98-99
51 54 56 97-98
64 52 55 96-97
Science
School 50
System
State
0
56 48 60 98-99
53 50 59 97-98
57 48 59 96-97
School System State
Sources of Information
Composite Score
50
38 47 58 0
98-99
School 50
System
42 51 58 97-98
51 49 57 96-97
State 0
58 49 57 98-99
54 52 56 97-98
56 48 55 96-97
1998-99 GEORGIA PUBLIC EDUCATION REPORT CARD Venetian Hills Elementary School - 7612568
Prepared by Georgia Department of Education
Scores Reported in Percentiles
School System State
Page 3
STATE-REQUIRED TEST DATA
PERFORMANCE ASSESSMENTS
Grade 5 Writing Assessment
Percent at Developmental Stages:
1998-99 School System State
1997-98 School System State
1996-97 School System State
Stage Stage Stage Stage Stage Stage
1:The Emerging Writer 2:The Developing Writer 3:The Focusing Writer 4:The Experimenting 5:The Engaging Writer 6:The Extending Writer
3% 2% 21% 56% 18% 0%
1% 2% 22% 47% 22% 6%
0% 1% 16% 41% 29% 12%
3% 3% 22% 53% 14% 5%
1% 4% 24% 47% 19% 5%
0% 3% 19% 41% 27% 10%
1% 5% 36% 35% 16% 5%
1% 6% 32% 39% 17% 5%
0% 3% 21% 37% 26% 12%
AWARDS / RECOGNITION DATA
Schools in Georgia may receive recognition in the following programs: Charter School Pay for Performance Program Georgia School of Excellence National Blue Ribbon School Venetian Hills Elementary School did not receive recognition in any of these programs during the 1998-99 school year.
1998-99 GEORGIA PUBLIC EDUCATION REPORT CARD Venetian Hills Elementary School - 7612568
Prepared by Georgia Department of Education
Page 4
CERTIFIED PERSONNEL DATA
Positions Number Average Contract Days
Personnel Sex
Certificate
Years Experience
Full-time Part-time
Male Female
4 Yr Bachelor's 5 Yr Master's 6 Yr Specialist's 7 Yr Doctoral Other*
<1 1-10 11-20 21-30 >30
Average
Administrators
3.00 234.67
3 0
1 2
0 1 2 0 0 0 0 1 2 0 21.33
Support Personnel
1.90 194.74
1 3
0 4
1 2 1 0 0 0 0 2 1 1 22.75
PK-12 Teachers
30.60 190.00
29 6
7 28
16 16
3 0 0 2 17 7 6 3 12.80
*Includes One- and Two-Year Vocational Certificates.
ACCREDITATION DATA
Accredited by Georgia Accrediting Commission (GAC).
1998-99 GEORGIA PUBLIC EDUCATION REPORT CARD Venetian Hills Elementary School - 7612568
Prepared by Georgia Department of Education
Page 5
1998-99 GEORGIA PUBLIC EDUCATION REPORT CARD
ATLANTA CITY SCHOOLS
Walden Middle School - 7613068
Grade Range 6-8
The Georgia Public Education Report Card is designed to assist systems and schools in educational improvement. This report card contains a variety of data elements. An explanation of the terms is provided as a companion to the report card data. Please refer to the definitions for the most effective use of the reported data.
STUDENT DATA
Total 416
6-8 Enrollment, by Race/Ethnicity and Sex
Black
White Hispanic
American Multi-
Asian Indian
racial
414 99.5%
0 0.0%
1 0.2%
1 0.2%
0 0.0%
0 0.0%
Male 200
48.1%
Female 216
51.9%
Enrollment in Selected Programs
Program
Gifted (Grades K-12)
Program % of Student Enrollment Population
42
10.1%
Alternative Programs (Grades 6-12)
0
0.0%
Students Eligible to Receive Free/Reduced Lunches
Number
Percent
School System
384 45,695
92.3% 75.5%
Enrollment in Compensatory Programs
Program
Program % of Student Enrollment Population
Special Education (Grades K-12) (PK)
39
9.4%
0
N/A
English to Speakers of Other Languages (ESOL) (Grades K-12)
0
0.0%
Title I (Grades K-12)
This school has a schoolwide program.
Dropout Rate for Grades 6-8
Number
Rate
School System
19
3.4%
705
3.8%
Total 12
Retained Students, by Race/Ethnicity and Sex
Black
White Hispanic
American MultiAsian Indian racial
12 100.0%
0 0.0%
0 0.0%
0 0.0%
0 0.0%
0 0.0%
Male Female
8
4
66.7% 33.3%
Prepared by Georgia Department of Education
Page 1
STATE-REQUIRED TEST DATA
NORM-REFERENCED TESTS Grade 8
Iowa Tests of Basic Skills (ITBS) Each chart reflects data for three years of testing.
Reading Comprehension 50
28 36 49 0
98-99
24 35 48 97-98
22 34 48 96-97
Mathematics
School 50
System
State
0
31 45 56 98-99
34 43 55 97-98
29 43 54 96-97
School System State
Reading Vocabulary 50
24 32 46 0
98-99
16 36 45 97-98
19 27 44 96-97
Language Arts
School 50
System
State
0
40 42 60 98-99
33 43 58 97-98
31 40 56 96-97
School System State
Social Studies 50
57 42 54 0
98-99
44 45 53 97-98
35 41 53 96-97
Science
School 50
System
State
0
32 36 56 98-99
34 39 55 97-98
25 35 53 96-97
School System State
Sources of Information
Composite Score
50
43 42 57 0
98-99
School 50
System
35 42 56 97-98
33 42 55 96-97
State 0
37 39 56 98-99
31 40 54 97-98
1998-99 GEORGIA PUBLIC EDUCATION REPORT CARD Walden Middle School - 7613068
Prepared by Georgia Department of Education
26 37 54 96-97
Scores Reported in Percentiles
School System State
Page 2
STATE-REQUIRED TEST DATA
Categories of Scaled Scores
Inadequate (less than 162)
Minimal (162-209)
Good
(210-247)
Very Good (greater than 247)
Average Scaled Score: (Range 100-300)
PERFORMANCE ASSESSMENTS
Grade 8 Writing Assessment
1998-99 Percent Scoring
1997-98 Percent Scoring
1996-97 Percent Scoring
School System State School System State School System State
8% 47% 40%
4%
16% 51% 28%
5%
8% 40% 41% 11%
31% 54% 14%
1%
25% 53% 19%
3%
11% 46% 34%
8%
48% 47%
4% 1%
34% 48% 15%
3%
15% 46% 30%
8%
200
193
208 178
184 202 163
177 198
AWARDS / RECOGNITION DATA
Schools in Georgia may receive recognition in the following programs: Charter School Pay for Performance Program Georgia School of Excellence National Blue Ribbon School Walden Middle School did not receive recognition in any of these programs during the 1998-99 school year.
1998-99 GEORGIA PUBLIC EDUCATION REPORT CARD Walden Middle School - 7613068
Prepared by Georgia Department of Education
Page 3
CERTIFIED PERSONNEL DATA
Positions Number Average Contract Days
Personnel Sex
Certificate
Years Experience
Full-time Part-time
Male Female
4 Yr Bachelor's 5 Yr Master's 6 Yr Specialist's 7 Yr Doctoral Other*
<1 1-10 11-20 21-30 >30
Average
Administrators
3.00 227.33
3 0
1 2
0 2 1 0 0 0 0 1 2 0 22.00
Support Personnel
2.70 198.15
2 2
2 2
1 2 0 1 0 0 0 2 1 1 24.75
PK-12 Teachers
25.90 190.39
24 4
11 17
18 8 1 1 0 3
17 4 3 1
9.07
*Includes One- and Two-Year Vocational Certificates.
ACCREDITATION DATA
Accredited with Quality by Georgia Accrediting Commission (GAC).
1998-99 GEORGIA PUBLIC EDUCATION REPORT CARD Walden Middle School - 7613068
Prepared by Georgia Department of Education
Page 4
1998-99 GEORGIA PUBLIC EDUCATION REPORT CARD
ATLANTA CITY SCHOOLS
Washington Evening High School - 7614768
Grade Range 9-12
The Georgia Public Education Report Card is designed to assist systems and schools in educational improvement. This report card contains a variety of data elements. An explanation of the terms is provided as a companion to the report card data. Please refer to the definitions for the most effective use of the reported data.
Total 382
STUDENT DATA
9-12 Enrollment, by Race/Ethnicity and Sex
Black
White Hispanic
American Multi-
Asian Indian
racial
377 98.7%
1 0.3%
4 1.0%
0 0.0%
0 0.0%
0 0.0%
Male Female
219 57.3%
163 42.7%
Enrollment in Selected Programs
Program
Gifted (Grades K-12)
Program % of Student Enrollment Population
0
0.0%
Non-Vocational Labs (Grades 9-12)
77
Vocational Labs
(Grades 9-12)
107
Alternative Programs (Grades 6-12)
0
20.2% 28.0%
0.0%
Students Eligible to Receive Free/Reduced Lunches
Number
Percent
School System
0 45,695
0.0% 75.5%
Enrollment in Compensatory Programs
Program
Program % of Student Enrollment Population
Special Education (Grades K-12) PK
4
1.0%
0
N/A
English to Speakers of Other Languages (ESOL) (Grades K-12)
0
0.0%
Remedial Education (Grades 2-5, 9-12)
0
0.0%
Title I (Grades K-12)
This school has no Title I program.
Dropout Rate for Grades 9-12
Number
Rate
School System
0 1,248
0.0% 5.4%
Total 54
Retained Students, by Race/Ethnicity and Sex
Black
White Hispanic
American MultiAsian Indian racial
54 100.0%
0 0.0%
0 0.0%
0 0.0%
0 0.0%
0 0.0%
Male Female
30
24
55.6% 44.4%
Prepared by Georgia Department of Education
Page 1
STATE-REQUIRED TEST DATA
GEORGIA HIGH SCHOOL GRADUATION TESTS (GHSGT)
Percent of Regular Program 11th Graders Passing the Georgia High School Graduation Tests on First Administration
English Language Arts Mathematics Social Studies Science
All Components listed above
Writing
1998-99
School System State
52% 23% 19% 38%
91% 79% 73% 61%
96% 88% 80% 72%
5% 55% 68%
52% 85% 93%
1997-98
School System State
79% 67% 28% 40%
89% 78% 68% 61%
94% 88% 78% 74%
18% 54% 68%
77% 83% 92%
1996-97
School System State
83% 43% 31% 11%
89% 72% 65% 52%
94% 87% 78% 74%
11% 46% 67%
30% 82% 93%
GRADUATE DATA
1999 Graduates by Credentials, Race/Ethnicity and Sex
Diplomas with Both College Prep. & Voc. Endorsements
Diplomas with College Prep. Endorsements
Diplomas with Vocational Endorsements
General High School Diplomas
Special Education Diplomas
Total All Diplomas
Total N/A
Black N/A
White Hispanic
N/A
N/A
American MultiAsian Indian racial
N/A
N/A
N/A
N/A
N/A
N/A
N/A
N/A
N/A
N/A
N/A
N/A
N/A
N/A
N/A
N/A
N/A
N/A
N/A
N/A
N/A
N/A
N/A
N/A
N/A
N/A
N/A
N/A
N/A
N/A
N/A
N/A
Male Female
N/A
N/A
N/A
N/A
N/A
N/A
N/A
N/A
N/A
N/A
Certificates of Performance
Total Graduates
N/A
N/A
N/A
N/A
N/A
N/A
N/A
N/A
N/A
N/A
HOPE Scholarships
School System
Number of 1999 Graduates Number Eligible Percent Eligible
N/A N/A N/A
2,041 1,099 53.8%
State
65,548 40,292 61.5%
High School Completion Rate
Percent of 1995Grade 9 Enrollment in Graduating Class of1999 School System State
Completion Rate '95-'99 N / A 57.1% 68.9%
1998-99 GEORGIA PUBLIC EDUCATION REPORT CARD
Washington Evening High School - 7614768
Prepared by Georgia Department of Education
Page 2
COLLEGE ADMISSIONS / CREDIT TEST DATA
Scholastic Assessment Test (SAT)
Based on students' highest verbal and highest math scores
No. Taking
Average Score
Tests Verbal Math Total
Based on students' last test administration
Average Score Verbal Math Total
School
1
College Prep. Endorsement
Other Diplomas
System
1,265
College Prep. Endorsement
Other Diplomas
Georgia
41,958
270 N/A N/A
445 441 N/A
492
290 N/A N/A
436 430 N/A
488
560 N/A N/A
881 871 N/A
980
270 N/A N/A
435 N/A N/A
483
290 N/A N/A
426 N/A N/A
479
560 N/A N/A
861 N/A N/A
962
Nation
952,913 N/A N/A N/A
502 508 1010
American College Testing (ACT)
Advanced Placement Exams (AP)
Number taking tests: English Mathematics Reading Science Reasoning CompositeScore
N/A
School System
N/A 17.4
N/A 18.4
N/A N/A
18.6 18.3
N/A 18.3
State 19.1 19.9 20.2 19.9 19.9
No. of Students Taking Tests
No. of Tests Taken No. of Test Scores
3 or Higher Percent of Test
Scores 3 or Higher
School 0
N/A N/A
N/A
System State 537 15,225 877 23,969 184 13,024
21.0% 54.3%
POST-SECONDARY DATA
Graduates Entering Georgia Public Colleges
Graduates Entering Georgia Public Colleges and Requiring Learning Support (LS)
1998 Graduates Entering in 1998-99
1997 Graduates Entering in 1997-98
Percent of Graduating Number Class
School N / A
N/A
System 452
21.7%
School N / A
N/A
System 437
21.1%
Number Requiring
LS 2 200
1 202
Percent of those attending Georgia
Public Colleges
100.0%
44.2%
100.0%
46.2%
In previous years, the Report Card presented College Prep Curriculum information provided by the Board of Regents on students requiring Learning Support. Due to inconsistencies in the data provided by the Board of Regents in defining College Prep Completers versus Local Board of Education data defining College Prep Endorsements, the Department of Education Report Card will not provide this information until discrepancies can be reconciled.
Graduates Entering Georgia Public Technical and Adult Schools
1998 Graduates School System
Entering Number N/A 53
1998-99 Percent
N/A 2.5%
Entering Number N/A N/A
1997-98 Percent
N/A N/A
1997 Graduates School System
N/A 3
N/A 0.1%
N/A 109
N/A 5.3%
1998-99 GEORGIA PUBLIC EDUCATION REPORT CARD Washington Evening High School - 7614768
Prepared by Georgia Department of Education
Page 3
CERTIFIED PERSONNEL DATA
Positions Number Average Contract Days
Administrators
0.00 0.00
Support Personnel
0.00 0.00
PK-12 Teachers
13.50 197.70
Personnel Sex
Certificate
Years Experience
Full-time Part-time
Male Female
4 Yr Bachelor's 5 Yr Master's 6 Yr Specialist's 7 Yr Doctoral Other*
<1 1-10 11-20 21-30 >30
Average
0 0
0 0
0 0 0 0 0
0 0 0 0 0
0.00
0 0
0 0
0 0 0 0 0
0 0 0 0 0
0.00
13 1
5 9
7 5 1 1 0
0 7 3 4 0
12.71
*Includes One- and Two-Year Vocational Certificates.
ACCREDITATION DATA
Not accredited by Southern Association of Colleges and Schools (SACS) or Georgia Accrediting Commission (GAC).
AWARDS / RECOGNITION DATA
Schools in Georgia may receive recognition in the following programs: Charter School Pay for Performance Program Georgia School of Excellence National Blue Ribbon School Washington Evening High School did not receive recognition in any of these programs during the 1998-99 school year.
1998-99 GEORGIA PUBLIC EDUCATION REPORT CARD Washington Evening High School - 7614768
Prepared by Georgia Department of Education
Page 4
1998-99 GEORGIA PUBLIC EDUCATION REPORT CARD
ATLANTA CITY SCHOOLS
Washington High School - 7614568
Grade Range 9-12
The Georgia Public Education Report Card is designed to assist systems and schools in educational improvement. This report card contains a variety of data elements. An explanation of the terms is provided as a companion to the report card data. Please refer to the definitions for the most effective use of the reported data.
Total 1,461
STUDENT DATA
9-12 Enrollment, by Race/Ethnicity and Sex
Black
White Hispanic
American Multi-
Asian Indian
racial
1,435 98.2%
2 0.1%
4 0.3%
15 1.0%
0 0.0%
5 0.3%
Male Female
730 50.0%
731 50.0%
Enrollment in Selected Programs
Program
Gifted (Grades K-12)
Program % of Student Enrollment Population
25
1.7%
Non-Vocational Labs (Grades 9-12)
Vocational Labs (Grades 9-12)
Alternative Programs (Grades 6-12)
1,273 675 0
87.1% 46.2%
0.0%
Students Eligible to Receive Free/Reduced Lunches
Number
Percent
School System
1,027 45,695
70.3% 75.5%
Enrollment in Compensatory Programs
Program
Program % of Student Enrollment Population
Special Education (Grades K-12) PK
136
9.3%
0
N/A
English to Speakers of Other Languages (ESOL) (Grades K-12)
0
0.0%
Remedial Education (Grades 2-5, 9-12)
600 41.1%
Title I (Grades K-12)
This school has a schoolwide program.
Dropout Rate for Grades 9-12
Number
Rate
School System
73 1,248
3.2% 5.4%
Total 252
Retained Students, by Race/Ethnicity and Sex
Black
White Hispanic
American MultiAsian Indian racial
252 100.0%
0 0.0%
0 0.0%
0 0.0%
0 0.0%
0 0.0%
Male Female 152 100
60.3% 39.7%
Prepared by Georgia Department of Education
Page 1
STATE-REQUIRED TEST DATA
GEORGIA HIGH SCHOOL GRADUATION TESTS (GHSGT)
Percent of Regular Program 11th Graders Passing the Georgia High School Graduation Tests on First Administration
English Language Arts Mathematics Social Studies Science
All Components listed above
Writing
1998-99
School System State
88% 71% 65% 47%
91% 79% 73% 61%
96% 88% 80% 72%
41% 55% 68%
78% 85% 93%
1997-98
School System State
80% 66% 51% 55%
89% 78% 68% 61%
94% 88% 78% 74%
40% 54% 68%
79% 83% 92%
1996-97
School System State
82% 47% 42% 32%
89% 72% 65% 52%
94% 87% 78% 74%
24% 46% 67%
71% 82% 93%
GRADUATE DATA
1999 Graduates by Credentials, Race/Ethnicity and Sex
Diplomas with Both College Prep. & Voc. Endorsements
Diplomas with College Prep. Endorsements Diplomas with Vocational Endorsements General High School Diplomas Special Education Diplomas
Total All Diplomas
Certificates of Performance
Total Graduates
Total 26 89 37 1 14
167 15
182
Black
26 100.0%
84 94.4%
37 100.0%
1 100.0%
14 100.0%
162 97.0%
15 100.0%
177 97.3%
American MultiWhite Hispanic Asian Indian racial
0 0.0%
0 0.0%
0 0.0%
0 0.0%
0 0.0%
5 5.6%
0 0.0%
0 0.0%
0 0.0%
0 0.0%
0 0.0%
0 0.0%
0 0.0%
0 0.0%
0 0.0%
0 0.0%
0 0.0%
0 0.0%
0 0.0%
0 0.0%
0 0.0%
0 0.0%
0 0.0%
0 0.0%
0 0.0%
0 0.0%
0 0.0%
5 3.0%
0 0.0%
0 0.0%
0 0.0%
0 0.0%
0 0.0%
0 0.0%
0 0.0%
0 0.0%
0 0.0%
5 2.7%
0 0.0%
0 0.0%
Male Female
10 38.5%
41 46.1%
16 61.5%
48 53.9%
17 45.9%
1 100.0%
9 64.3%
20 54.1%
0 0.0%
5 35.7%
78
89
46.7% 53.3%
4
11
26.7% 73.3%
82
100
45.1% 54.9%
HOPE Scholarships
School System
Number of 1999 Graduates 1 8 2
Number Eligible
80
Percent Eligible
44.0%
2,041 1,099 53.8%
State
65,548 40,292 61.5%
High School Completion Rate
Percent of 1995Grade 9 Enrollment in Graduating Class of1999 School System State
Completion Rate '95-'99 58.1% 57.1% 68.9%
1998-99 GEORGIA PUBLIC EDUCATION REPORT CARD
Washington High School - 7614568
Prepared by Georgia Department of Education
Page 2
COLLEGE ADMISSIONS / CREDIT TEST DATA
Scholastic Assessment Test (SAT)
Based on students' highest verbal and highest math scores
No. Taking
Average Score
Tests Verbal Math Total
Based on students' last test administration
Average Score Verbal Math Total
School
90
College Prep. Endorsement
Other Diplomas
System
1,265
College Prep. Endorsement
Other Diplomas
Georgia
41,958
399 407 N/A
445 441 N/A
492
417 420 N/A
436 430 N/A
488
816 827 N/A
881 871 N/A
980
389 N/A N/A
435 N/A N/A
483
409 N/A N/A
426 N/A N/A
479
798 N/A N/A
861 N/A N/A
962
Nation
952,913 N/A N/A N/A
502 508 1010
American College Testing (ACT)
Advanced Placement Exams (AP)
Number taking tests: English Mathematics Reading Science Reasoning CompositeScore
1 5 School System State
13.5 17.4 19.1
17.9 18.4 19.9
16.1 16.2
18.6 18.3
20.2 19.9
15.9 18.3 19.9
No. of Students Taking Tests
No. of Tests Taken No. of Test Scores
3 or Higher Percent of Test
Scores 3 or Higher
School 37 49 0
0.0%
System State 537 15,225 877 23,969 184 13,024
21.0% 54.3%
POST-SECONDARY DATA
Graduates Entering Georgia Public Colleges
Graduates Entering Georgia Public Colleges and Requiring Learning Support (LS)
1998 Graduates Entering in 1998-99
1997 Graduates Entering in 1997-98
Percent of Graduating Number Class
School
18
10.7%
System 452
21.7%
School
21
16.3%
System 437
21.1%
Number Requiring
LS 13 200
10 202
Percent of those attending Georgia
Public Colleges
72.2%
44.2%
47.6%
46.2%
In previous years, the Report Card presented College Prep Curriculum information provided by the Board of Regents on students requiring Learning Support. Due to inconsistencies in the data provided by the Board of Regents in defining College Prep Completers versus Local Board of Education data defining College Prep Endorsements, the Department of Education Report Card will not provide this information until discrepancies can be reconciled.
Graduates Entering Georgia Public Technical and Adult Schools
1998 Graduates School System
Entering Number 4 53
1998-99 Percent
2.4% 2.5%
Entering Number N/A N/A
1997-98 Percent
N/A N/A
1997 Graduates School
0
0.0%
System
3
0.1%
16
12.4%
109
5.3%
1998-99 GEORGIA PUBLIC EDUCATION REPORT CARD Washington High School - 7614568
Prepared by Georgia Department of Education
Page 3
CERTIFIED PERSONNEL DATA
Positions Number Average Contract Days
Administrators
4.00 225.50
Support Personnel
7.60 197.63
PK-12 Teachers
80.60 190.99
Personnel Sex
Certificate
Years Experience
Full-time Part-time
Male Female
4 Yr Bachelor's 5 Yr Master's 6 Yr Specialist's 7 Yr Doctoral Other*
<1 1-10 11-20 21-30 >30
Average
4 0
2 2
0 0 3 1 0
0 0 0 2 2
28.25
7 1
2 6
0 5 3 0 0
0 2 2 2 2
22.50
80 2
29 53
33 40
4 2 3
5 27 11 27 12
17.57
*Includes One- and Two-Year Vocational Certificates.
ACCREDITATION DATA
Accredited by Southern Association of Colleges and Schools (SACS): Secondary/Middle Commission.
AWARDS / RECOGNITION DATA
Schools in Georgia may receive recognition in the following programs: Charter School Pay for Performance Program Georgia School of Excellence National Blue Ribbon School Washington High School did not receive recognition in any of these programs during the 1998-99 school year.
1998-99 GEORGIA PUBLIC EDUCATION REPORT CARD Washington High School - 7614568
Prepared by Georgia Department of Education
Page 4
1998-99 GEORGIA PUBLIC EDUCATION REPORT CARD
ATLANTA CITY SCHOOLS
Waters Elementary School - 7615068
Grade Range K-5
The Georgia Public Education Report Card is designed to assist systems and schools in educational improvement. This report card contains a variety of data elements. An explanation of the terms is provided as a companion to the report card data. Please refer to the definitions for the most effective use of the reported data.
STUDENT DATA
Total 559
K-5 Enrollment, by Race/Ethnicity and Sex
Black
White Hispanic
American Multi-
Asian Indian
racial
533 95.3%
1 0.2%
5 0.9%
10 1.8%
0 0.0%
10 1.8%
Male Female
270 48.3%
289 51.7%
Enrollment in Selected Programs
Program
Program % of Student Enrollment Population
Gifted (Grades K-12)
7
1.3%
Alternative Programs (Grades 6-12)
N/A
N/A
Students Eligible to Receive Free/Reduced Lunches
Number
Percent
School System
536 45,695
95.9% 75.5%
Dropout Rate *
Number
Rate
School System
N/A N/A
N/A N/A
* Dropout rates are not applicable for grades PK-5.
Enrollment in Compensatory Programs
Program
Program % of Student Enrollment Population
Special Education (Grades K-12)
71 12.7%
(PK)
0
N/A
English to Speakers of Other Languages (ESOL) (Grades K-12)
13
2.3%
Remedial Education (Grades 2-5, 9-12)
116 32.0%
Special Instructional Assistance (SIA) (Grades K-3)
223 59.2%
Title I (Grades K-12)
This school has a schoolwide program.
Total 47
Retained Students, by Race/Ethnicity and Sex
Black
White Hispanic
American Multi-
Asian Indian
racial
47 100.0%
0 0.0%
0 0.0%
0 0.0%
0 0.0%
0 0.0%
Male Female
25
22
53.2% 46.8%
Prepared by Georgia Department of Education
Page 1
STATE-REQUIRED TEST DATA
NORM-REFERENCED TESTS Grade 3
Iowa Tests of Basic Skills (ITBS) Each chart reflects data for three years of testing.
Reading Comprehension 50
72 50 54 0
98-99
65 55 53 97-98
26 48 52 96-97
Mathematics
School 50
System
State
0
70 53 61 98-99
76 58 61 97-98
36 51 59 96-97
School System State
Reading Vocabulary 50
60 50 50 0
98-99
57 51 50 97-98
19 44 49 96-97
Language Arts
School 50
System
State
0
77 61 64 98-99
82 63 62 97-98
36 54 59 96-97
School System State
Social Studies 50
65 50 56 0
98-99
65 52 55 97-98
32 50 55 96-97
Science
School 50
System
State
0
70 49 59 98-99
70 52 59 97-98
27 48 58 96-97
School System State
Sources of Information
Composite Score
50
68 48 57 0
98-99
School 50
System
67 51 56 97-98
35 47 55 96-97
State 0
70 51 58 98-99
71 55 57 97-98
1998-99 GEORGIA PUBLIC EDUCATION REPORT CARD Waters Elementary School - 7615068
Prepared by Georgia Department of Education
29 48 56 96-97
Scores Reported in Percentiles
School System State
Page 2
STATE-REQUIRED TEST DATA
NORM-REFERENCED TESTS Grade 5
Iowa Tests of Basic Skills (ITBS) Each chart reflects data for three years of testing.
Reading Comprehension
Mathematics
50
33 47 53 0
98-99
45 52 53 97-98
26 49 52 96-97
School 50
System
State
0
28 48 59 98-99
39 53 58 97-98
21 50 57 96-97
School System State
Reading Vocabulary 50
12 48 48 0
98-99
19 52 48 97-98
11 44 46 96-97
Language Arts
School 50
System
State
0
36 56 63 98-99
51 60 61 97-98
30 51 58 96-97
School System State
Social Studies 50
28 54 57 0
98-99
53 54 56 97-98
26 52 55 96-97
Science
School 50
System
State
0
25 48 60 98-99
32 50 59 97-98
21 48 59 96-97
School System State
Sources of Information
Composite Score
50
31 47 58 0
98-99
School 50
System
45 51 58 97-98
28 49 57 96-97
State 0
26 49 57 98-99
40 52 56 97-98
21 48 55 96-97
1998-99 GEORGIA PUBLIC EDUCATION REPORT CARD Waters Elementary School - 7615068
Prepared by Georgia Department of Education
Scores Reported in Percentiles
School System State
Page 3
STATE-REQUIRED TEST DATA
PERFORMANCE ASSESSMENTS
Grade 5 Writing Assessment
Percent at Developmental Stages:
1998-99 School System State
1997-98 School System State
1996-97 School System State
Stage Stage Stage Stage Stage Stage
1:The Emerging Writer 2:The Developing Writer 3:The Focusing Writer 4:The Experimenting 5:The Engaging Writer 6:The Extending Writer
0% 4% 34% 51% 9% 1%
1% 2% 22% 47% 22% 6%
0% 1% 16% 41% 29% 12%
4% 4% 40% 46% 4% 0%
1% 4% 24% 47% 19% 5%
0% 3% 19% 41% 27% 10%
4% 10% 41% 42%
3% 0%
1% 6% 32% 39% 17% 5%
0% 3% 21% 37% 26% 12%
AWARDS / RECOGNITION DATA
Schools in Georgia may receive recognition in the following programs: Charter School Pay for Performance Program Georgia School of Excellence National Blue Ribbon School Waters Elementary School did not receive recognition in any of these programs during the 1998-99 school year.
1998-99 GEORGIA PUBLIC EDUCATION REPORT CARD Waters Elementary School - 7615068
Prepared by Georgia Department of Education
Page 4
CERTIFIED PERSONNEL DATA
Positions Number Average Contract Days
Personnel Sex
Certificate
Years Experience
Full-time Part-time
Male Female
4 Yr Bachelor's 5 Yr Master's 6 Yr Specialist's 7 Yr Doctoral Other*
<1 1-10 11-20 21-30 >30
Average
Administrators
3.00 227.33
3 0
1 2
0 0 2 1 0 0 0 0 3 0 25.67
Support Personnel
2.80 198.57
2 2
1 3
1 2 1 0 0 0 1 0 1 2 27.75
PK-12 Teachers
37.50 190.00
36 4
8 32
23 15
1 1 0 4 13 8 12 3 14.90
*Includes One- and Two-Year Vocational Certificates.
ACCREDITATION DATA
Accredited by Georgia Accrediting Commission (GAC).
1998-99 GEORGIA PUBLIC EDUCATION REPORT CARD Waters Elementary School - 7615068
Prepared by Georgia Department of Education
Page 5
1998-99 GEORGIA PUBLIC EDUCATION REPORT CARD
ATLANTA CITY SCHOOLS
West Elementary School - 7611069
Grade Range K-5
The Georgia Public Education Report Card is designed to assist systems and schools in educational improvement. This report card contains a variety of data elements. An explanation of the terms is provided as a companion to the report card data. Please refer to the definitions for the most effective use of the reported data.
STUDENT DATA
Total 277
K-5 Enrollment, by Race/Ethnicity and Sex
Black
White Hispanic
American Multi-
Asian Indian
racial
199 71.8%
65 23.5%
5 1.8%
2 0.7%
1 0.4%
5 1.8%
Male Female
146 52.7%
131 47.3%
Enrollment in Selected Programs
Program
Program % of Student Enrollment Population
Gifted (Grades K-12)
12
4.3%
Alternative Programs (Grades 6-12)
N/A
N/A
Students Eligible to Receive Free/Reduced Lunches
Number
Percent
School System
200 45,695
72.2% 75.5%
Dropout Rate *
Number
Rate
School System
N/A N/A
N/A N/A
* Dropout rates are not applicable for grades PK-5.
Enrollment in Compensatory Programs
Program
Program % of Student Enrollment Population
Special Education (Grades K-12)
21
7.6%
(PK)
0
N/A
English to Speakers of Other Languages (ESOL) (Grades K-12)
0
0.0%
Remedial Education (Grades 2-5, 9-12)
39 22.0%
Special Instructional Assistance (SIA) (Grades K-3)
99 51.3%
Title I (Grades K-12)
This school has a schoolwide program.
Total 18
Retained Students, by Race/Ethnicity and Sex
Black
White Hispanic
American Multi-
Asian Indian
racial
15 83.3%
3 16.7%
0 0.0%
0 0.0%
0 0.0%
0 0.0%
Male Female
11
7
61.1% 38.9%
Prepared by Georgia Department of Education
Page 1
STATE-REQUIRED TEST DATA
NORM-REFERENCED TESTS Grade 3
Iowa Tests of Basic Skills (ITBS) Each chart reflects data for three years of testing.
Reading Comprehension 50
53 50 54 0
98-99
46 55 53 97-98
58 48 52 96-97
Mathematics
School 50
System
State
0
54 53 61 98-99
59 58 61 97-98
64 51 59 96-97
School System State
Reading Vocabulary 50
29 50 50 0
98-99
40 51 50 97-98
49 44 49 96-97
Language Arts
School 50
System
State
0
53 61 64 98-99
60 63 62 97-98
46 54 59 96-97
School System State
Social Studies 50
44 50 56 0
98-99
45 52 55 97-98
55 50 55 96-97
Science
School 50
System
State
0
38 49 59 98-99
45 52 59 97-98
48 48 58 96-97
School System State
Sources of Information
Composite Score
50
47 48 57 0
98-99
School 50
System
46 51 56 97-98
61 47 55 96-97
State 0
44 51 58 98-99
48 55 57 97-98
1998-99 GEORGIA PUBLIC EDUCATION REPORT CARD West Elementary School - 7611069
Prepared by Georgia Department of Education
55 48 56 96-97
Scores Reported in Percentiles
School System State
Page 2
STATE-REQUIRED TEST DATA
NORM-REFERENCED TESTS Grade 5
Iowa Tests of Basic Skills (ITBS) Each chart reflects data for three years of testing.
Reading Comprehension
Mathematics
50
45 47 53 0
98-99
46 52 53 97-98
56 49 52 96-97
School 50
System
State
0
55 48 59 98-99
45 53 58 97-98
60 50 57 96-97
School System State
Reading Vocabulary 50
42 48 48 0
98-99
33 52 48 97-98
40 44 46 96-97
Language Arts
School 50
System
State
0
50 56 63 98-99
54 60 61 97-98
47 51 58 96-97
School System State
Social Studies 50
55 54 57 0
98-99
52 54 56 97-98
52 52 55 96-97
Science
School 50
System
State
0
43 48 60 98-99
50 50 59 97-98
44 48 59 96-97
School System State
Sources of Information
Composite Score
50
50 47 58 0
98-99
School 50
System
53 51 58 97-98
54 49 57 96-97
State 0
47 49 57 98-99
47 52 56 97-98
50 48 55 96-97
1998-99 GEORGIA PUBLIC EDUCATION REPORT CARD West Elementary School - 7611069
Prepared by Georgia Department of Education
Scores Reported in Percentiles
School System State
Page 3
STATE-REQUIRED TEST DATA
PERFORMANCE ASSESSMENTS
Grade 5 Writing Assessment
Percent at Developmental Stages:
1998-99 School System State
1997-98 School System State
1996-97 School System State
Stage Stage Stage Stage Stage Stage
1:The Emerging Writer 2:The Developing Writer 3:The Focusing Writer 4:The Experimenting 5:The Engaging Writer 6:The Extending Writer
0% 3% 25% 53% 13% 6%
1% 2% 22% 47% 22% 6%
0% 1% 16% 41% 29% 12%
0% 5% 30% 40% 18% 8%
1% 4% 24% 47% 19% 5%
0% 3% 19% 41% 27% 10%
3% 0% 24% 29% 37% 8%
1% 6% 32% 39% 17% 5%
0% 3% 21% 37% 26% 12%
AWARDS / RECOGNITION DATA
Schools in Georgia may receive recognition in the following programs: Charter School Pay for Performance Program Georgia School of Excellence National Blue Ribbon School West Elementary School did not receive recognition in any of these programs during the 1998-99 school year.
1998-99 GEORGIA PUBLIC EDUCATION REPORT CARD West Elementary School - 7611069
Prepared by Georgia Department of Education
Page 4
CERTIFIED PERSONNEL DATA
Positions Number Average Contract Days
Personnel Sex
Certificate
Years Experience
Full-time Part-time
Male Female
4 Yr Bachelor's 5 Yr Master's 6 Yr Specialist's 7 Yr Doctoral Other*
<1 1-10 11-20 21-30 >30
Average
Administrators
2.00 231.00
2 0
0 2
0 1 1 0 0 0 0 0 2 0 24.00
Support Personnel
1.90 194.21
1 4
0 5
0 4 1 0 0 0 1 3 0 1 18.20
PK-12 Teachers
21.60 190.00
19 7
5 21
15 10
0 1 0 1 19 1 4 1 9.81
*Includes One- and Two-Year Vocational Certificates.
ACCREDITATION DATA
Accredited by Georgia Accrediting Commission (GAC).
1998-99 GEORGIA PUBLIC EDUCATION REPORT CARD West Elementary School - 7611069
Prepared by Georgia Department of Education
Page 5
1998-99 GEORGIA PUBLIC EDUCATION REPORT CARD
ATLANTA CITY SCHOOLS
West Fulton Middle School - 7610293
Grade Range 6-8
The Georgia Public Education Report Card is designed to assist systems and schools in educational improvement. This report card contains a variety of data elements. An explanation of the terms is provided as a companion to the report card data. Please refer to the definitions for the most effective use of the reported data.
STUDENT DATA
Total 1,033
6-8 Enrollment, by Race/Ethnicity and Sex
Black
White Hispanic
American Multi-
Asian Indian
racial
1,028 99.5%
4 0.4%
0 0.0%
0 0.0%
1 0.1%
0 0.0%
Male 526
50.9%
Female 507
49.1%
Enrollment in Selected Programs
Program
Gifted (Grades K-12)
Program % of Student Enrollment Population
0
0.0%
Alternative Programs (Grades 6-12)
0
0.0%
Students Eligible to Receive Free/Reduced Lunches
Number
Percent
School System
700 45,695
67.8% 75.5%
Enrollment in Compensatory Programs
Program
Program % of Student Enrollment Population
Special Education (Grades K-12) (PK)
102
9.9%
0
N/A
English to Speakers of Other Languages (ESOL) (Grades K-12)
0
0.0%
Title I (Grades K-12)
This school has a schoolwide program.
Dropout Rate for Grades 6-8
Number
Rate
School System
40
2.7%
705
3.8%
Total 14
Retained Students, by Race/Ethnicity and Sex
Black
White Hispanic
American MultiAsian Indian racial
13 92.9%
1 7.1%
0 0.0%
0 0.0%
0 0.0%
0 0.0%
Male Female
12
2
85.7% 14.3%
Prepared by Georgia Department of Education
Page 1
STATE-REQUIRED TEST DATA
NORM-REFERENCED TESTS Grade 8
Iowa Tests of Basic Skills (ITBS) Each chart reflects data for three years of testing.
Reading Comprehension 50
31 36 49 0
98-99
31 35 48 97-98
25 34 48 96-97
Mathematics
School 50
System
State
0
40 45 56 98-99
36 43 55 97-98
26 43 54 96-97
School System State
Reading Vocabulary 50
23 32 46 0
98-99
39 36 45 97-98
16 27 44 96-97
Language Arts
School 50
System
State
0
42 42 60 98-99
45 43 58 97-98
28 40 56 96-97
School System State
Social Studies 50
37 42 54 0
98-99
46 45 53 97-98
35 41 53 96-97
Science
School 50
System
State
0
33 36 56 98-99
32 39 55 97-98
21 35 53 96-97
School System State
Sources of Information
Composite Score
50
41 42 57 0
98-99
School 50
System
34 42 56 97-98
31 42 55 96-97
State 0
35 39 56 98-99
37 40 54 97-98
1998-99 GEORGIA PUBLIC EDUCATION REPORT CARD West Fulton Middle School - 7610293
Prepared by Georgia Department of Education
26 37 54 96-97
Scores Reported in Percentiles
School System State
Page 2
STATE-REQUIRED TEST DATA
Categories of Scaled Scores
Inadequate (less than 162)
Minimal (162-209)
Good
(210-247)
Very Good (greater than 247)
Average Scaled Score: (Range 100-300)
PERFORMANCE ASSESSMENTS
Grade 8 Writing Assessment
1998-99 Percent Scoring
1997-98 Percent Scoring
1996-97 Percent Scoring
School System State School System State School System State
19% 58% 22%
1%
16% 51% 28%
5%
8% 40% 41% 11%
29% 57% 14%
0%
25% 53% 19%
3%
11% 46% 34%
8%
46% 45%
8% 1%
34% 48% 15%
3%
15% 46% 30%
8%
185
193
208 178
184 202 167
177 198
AWARDS / RECOGNITION DATA
Schools in Georgia may receive recognition in the following programs: Charter School Pay for Performance Program Georgia School of Excellence National Blue Ribbon School West Fulton Middle School did not receive recognition in any of these programs during the 1998-99 school year.
1998-99 GEORGIA PUBLIC EDUCATION REPORT CARD West Fulton Middle School - 7610293
Prepared by Georgia Department of Education
Page 3
CERTIFIED PERSONNEL DATA
Positions Number Average Contract Days
Personnel Sex
Certificate
Years Experience
Full-time Part-time
Male Female
4 Yr Bachelor's 5 Yr Master's 6 Yr Specialist's 7 Yr Doctoral Other*
<1 1-10 11-20 21-30 >30
Average
Administrators
4.00 225.50
4 0
2 2
0 1 2 1 0 0 0 0 3 1 29.50
Support Personnel
6.10 199.51
5 2
1 6
0 4 1 2 0 0 0 2 5 0 21.14
PK-12 Teachers
53.00 190.00
52 2
16 38
24 29
1 0 0 4 23 9 14 4 13.69
*Includes One- and Two-Year Vocational Certificates.
ACCREDITATION DATA
Accredited with Quality by Georgia Accrediting Commission (GAC).
1998-99 GEORGIA PUBLIC EDUCATION REPORT CARD West Fulton Middle School - 7610293
Prepared by Georgia Department of Education
Page 4
1998-99 GEORGIA PUBLIC EDUCATION REPORT CARD
ATLANTA CITY SCHOOLS
West Manor Elementary School - 7612569
Grade Range K-5
The Georgia Public Education Report Card is designed to assist systems and schools in educational improvement. This report card contains a variety of data elements. An explanation of the terms is provided as a companion to the report card data. Please refer to the definitions for the most effective use of the reported data.
STUDENT DATA
Total 271
K-5 Enrollment, by Race/Ethnicity and Sex
Black
White Hispanic
American Multi-
Asian Indian
racial
271 100.0%
0 0.0%
0 0.0%
0 0.0%
0 0.0%
0 0.0%
Male Female
133 49.1%
138 50.9%
Enrollment in Selected Programs
Program
Program % of Student Enrollment Population
Gifted (Grades K-12)
35
12.9%
Alternative Programs (Grades 6-12)
N/A
N/A
Students Eligible to Receive Free/Reduced Lunches
Number
Percent
School System
188 45,695
69.4% 75.5%
Dropout Rate *
Number
Rate
School System
N/A N/A
N/A N/A
* Dropout rates are not applicable for grades PK-5.
Enrollment in Compensatory Programs
Program
Program % of Student Enrollment Population
Special Education (Grades K-12)
18
6.6%
(PK)
0
N/A
English to Speakers of Other Languages (ESOL) (Grades K-12)
0
0.0%
Remedial Education (Grades 2-5, 9-12)
40 22.3%
Special Instructional Assistance (SIA) (Grades K-3)
21 11.2%
Title I (Grades K-12)
This school has a schoolwide program.
Total 6
Retained Students, by Race/Ethnicity and Sex
Black
White Hispanic
American Multi-
Asian Indian
racial
6 100.0%
0 0.0%
0 0.0%
0 0.0%
0 0.0%
0 0.0%
Male Female
6
0
100.0% 0.0%
Prepared by Georgia Department of Education
Page 1
STATE-REQUIRED TEST DATA
NORM-REFERENCED TESTS Grade 3
Iowa Tests of Basic Skills (ITBS) Each chart reflects data for three years of testing.
Reading Comprehension 50
51 50 54 0
98-99
60 55 53 97-98
51 48 52 96-97
Mathematics
School 50
System
State
0
54 53 61 98-99
63 58 61 97-98
48 51 59 96-97
School System State
Reading Vocabulary 50
53 50 50 0
98-99
55 51 50 97-98
40 44 49 96-97
Language Arts
School 50
System
State
0
73 61 64 98-99
77 63 62 97-98
58 54 59 96-97
School System State
Social Studies 50
63 50 56 0
98-99
67 52 55 97-98
54 50 55 96-97
Science
School 50
System
State
0
65 49 59 98-99
62 52 59 97-98
58 48 58 96-97
School System State
Sources of Information
Composite Score
50
54 48 57 0
98-99
School 50
System
58 51 56 97-98
48 47 55 96-97
State 0
60 51 58 98-99
64 55 57 97-98
1998-99 GEORGIA PUBLIC EDUCATION REPORT CARD West Manor Elementary School - 7612569
Prepared by Georgia Department of Education
51 48 56 96-97
Scores Reported in Percentiles
School System State
Page 2
STATE-REQUIRED TEST DATA
NORM-REFERENCED TESTS Grade 5
Iowa Tests of Basic Skills (ITBS) Each chart reflects data for three years of testing.
Reading Comprehension
Mathematics
50
51 47 53 0
98-99
58 52 53 97-98
50 49 52 96-97
School 50
System
State
0
53 48 59 98-99
63 53 58 97-98
53 50 57 96-97
School System State
Reading Vocabulary 50
41 48 48 0
98-99
54 52 48 97-98
39 44 46 96-97
Language Arts
School 50
System
State
0
66 56 63 98-99
62 60 61 97-98
44 51 58 96-97
School System State
Social Studies 50
48 54 57 0
98-99
71 54 56 97-98
54 52 55 96-97
Science
School 50
System
State
0
38 48 60 98-99
54 50 59 97-98
46 48 59 96-97
School System State
Sources of Information
Composite Score
50
47 47 58 0
98-99
School 50
System
64 51 58 97-98
52 49 57 96-97
State 0
49 49 57 98-99
61 52 56 97-98
47 48 55 96-97
1998-99 GEORGIA PUBLIC EDUCATION REPORT CARD West Manor Elementary School - 7612569
Prepared by Georgia Department of Education
Scores Reported in Percentiles
School System State
Page 3
STATE-REQUIRED TEST DATA
PERFORMANCE ASSESSMENTS
Grade 5 Writing Assessment
Percent at Developmental Stages:
1998-99 School System State
1997-98 School System State
1996-97 School System State
Stage Stage Stage Stage Stage Stage
1:The Emerging Writer 2:The Developing Writer 3:The Focusing Writer 4:The Experimenting 5:The Engaging Writer 6:The Extending Writer
0% 0% 10% 52% 31% 7%
1% 2% 22% 47% 22% 6%
0% 1% 16% 41% 29% 12%
0% 0% 9% 39% 48% 5%
1% 4% 24% 47% 19% 5%
0% 3% 19% 41% 27% 10%
0% 0% 13% 44% 37% 6%
1% 6% 32% 39% 17% 5%
0% 3% 21% 37% 26% 12%
AWARDS / RECOGNITION DATA
Through the Pay for Performance Program, exemplary public schools and schools making outstanding progress toward becoming exemplary may be rewarded. Not a merit pay program, the Pay for Performance Program motivates and rewards entire school faculties for working together to make their schools exemplary. A school selected for participation in the program has one school year to attain at least 80% of its previously-approved performance objectives in order to receive an award based on $2,000 per certified faculty member.
West Manor Elementary School was a Pay for Performance recipient in 1998-99.
1998-99 GEORGIA PUBLIC EDUCATION REPORT CARD West Manor Elementary School - 7612569
Prepared by Georgia Department of Education
Page 4
CERTIFIED PERSONNEL DATA
Positions Number Average Contract Days
Personnel Sex
Certificate
Years Experience
Full-time Part-time
Male Female
4 Yr Bachelor's 5 Yr Master's 6 Yr Specialist's 7 Yr Doctoral Other*
<1 1-10 11-20 21-30 >30
Average
Administrators
2.00 231.00
2 0
0 2
0 1 1 0 0 0 0 0 2 0 25.50
Support Personnel
1.50 195.33
1 3
0 4
0 3 1 0 0 0 0 1 3 0 23.75
PK-12 Teachers
17.80 190.00
16 5
4 17
10 9 2 0 0 0 9 3 7 2
17.05
*Includes One- and Two-Year Vocational Certificates.
ACCREDITATION DATA
Accredited by Georgia Accrediting Commission (GAC).
1998-99 GEORGIA PUBLIC EDUCATION REPORT CARD West Manor Elementary School - 7612569
Prepared by Georgia Department of Education
Page 5
1998-99 GEORGIA PUBLIC EDUCATION REPORT CARD
ATLANTA CITY SCHOOLS
White Elementary School - 7613069
Grade Range K-5
The Georgia Public Education Report Card is designed to assist systems and schools in educational improvement. This report card contains a variety of data elements. An explanation of the terms is provided as a companion to the report card data. Please refer to the definitions for the most effective use of the reported data.
STUDENT DATA
Total 417
K-5 Enrollment, by Race/Ethnicity and Sex
Black
White Hispanic
American Multi-
Asian Indian
racial
416 99.8%
1 0.2%
0 0.0%
0 0.0%
0 0.0%
0 0.0%
Male Female
227 54.4%
190 45.6%
Enrollment in Selected Programs
Program
Program % of Student Enrollment Population
Gifted (Grades K-12)
6
1.4%
Alternative Programs (Grades 6-12)
N/A
N/A
Students Eligible to Receive Free/Reduced Lunches
Number
Percent
School System
378 45,695
90.6% 75.5%
Dropout Rate *
Number
Rate
School System
N/A N/A
N/A N/A
* Dropout rates are not applicable for grades PK-5.
Enrollment in Compensatory Programs
Program
Program % of Student Enrollment Population
Special Education (Grades K-12)
39
9.4%
(PK)
0
N/A
English to Speakers of Other Languages (ESOL) (Grades K-12)
0
0.0%
Remedial Education (Grades 2-5, 9-12)
69 26.1%
Special Instructional Assistance (SIA) (Grades K-3)
169 58.9%
Title I (Grades K-12)
This school has a schoolwide program.
Total 22
Retained Students, by Race/Ethnicity and Sex
Black
White Hispanic
American Multi-
Asian Indian
racial
22 100.0%
0 0.0%
0 0.0%
0 0.0%
0 0.0%
0 0.0%
Male Female
16
6
72.7% 27.3%
Prepared by Georgia Department of Education
Page 1
STATE-REQUIRED TEST DATA
NORM-REFERENCED TESTS Grade 3
Iowa Tests of Basic Skills (ITBS) Each chart reflects data for three years of testing.
Reading Comprehension 50
60 50 54 0
98-99
77 55 53 97-98
58 48 52 96-97
Mathematics
School 50
System
State
0
50 53 61 98-99
79 58 61 97-98
53 51 59 96-97
School System State
Reading Vocabulary 50
42 50 50 0
98-99
61 51 50 97-98
65 44 49 96-97
Language Arts
School 50
System
State
0
61 61 64 98-99
75 63 62 97-98
61 54 59 96-97
School System State
Social Studies 50
46 50 56 0
98-99
64 52 55 97-98
66 50 55 96-97
Science
School 50
System
State
0
56 49 59 98-99
85 52 59 97-98
62 48 58 96-97
School System State
Sources of Information
Composite Score
50
54 48 57 0
98-99
School 50
System
79 51 56 97-98
62 47 55 96-97
State 0
54 51 58 98-99
77 55 57 97-98
1998-99 GEORGIA PUBLIC EDUCATION REPORT CARD White Elementary School - 7613069
Prepared by Georgia Department of Education
60 48 56 96-97
Scores Reported in Percentiles
School System State
Page 2
STATE-REQUIRED TEST DATA
NORM-REFERENCED TESTS Grade 5
Iowa Tests of Basic Skills (ITBS) Each chart reflects data for three years of testing.
Reading Comprehension
Mathematics
50
41 47 53 0
98-99
61 52 53 97-98
60 49 52 96-97
School 50
System
State
0
41 48 59 98-99
54 53 58 97-98
44 50 57 96-97
School System State
Reading Vocabulary 50
38 48 48 0
98-99
71 52 48 97-98
67 44 46 96-97
Language Arts
School 50
System
State
0
45 56 63 98-99
67 60 61 97-98
56 51 58 96-97
School System State
Social Studies 50
35 54 57 0
98-99
51 54 56 97-98
41 52 55 96-97
Science
School 50
System
State
0
31 48 60 98-99
49 50 59 97-98
42 48 59 96-97
School System State
Sources of Information
Composite Score
50
38 47 58 0
98-99
School 50
System
51 51 58 97-98
58 49 57 96-97
State 0
36 49 57 98-99
55 52 56 97-98
49 48 55 96-97
1998-99 GEORGIA PUBLIC EDUCATION REPORT CARD White Elementary School - 7613069
Prepared by Georgia Department of Education
Scores Reported in Percentiles
School System State
Page 3
STATE-REQUIRED TEST DATA
PERFORMANCE ASSESSMENTS
Grade 5 Writing Assessment
Percent at Developmental Stages:
1998-99 School System State
1997-98 School System State
1996-97 School System State
Stage Stage Stage Stage Stage Stage
1:The Emerging Writer 2:The Developing Writer 3:The Focusing Writer 4:The Experimenting 5:The Engaging Writer 6:The Extending Writer
0% 2% 20% 46% 30% 2%
1% 2% 22% 47% 22% 6%
0% 1% 16% 41% 29% 12%
2% 4% 13% 50% 25% 6%
1% 4% 24% 47% 19% 5%
0% 3% 19% 41% 27% 10%
0% 14% 36% 41%
7% 2%
1% 6% 32% 39% 17% 5%
0% 3% 21% 37% 26% 12%
AWARDS / RECOGNITION DATA
Schools in Georgia may receive recognition in the following programs: Charter School Pay for Performance Program Georgia School of Excellence National Blue Ribbon School White Elementary School did not receive recognition in any of these programs during the 1998-99 school year.
1998-99 GEORGIA PUBLIC EDUCATION REPORT CARD White Elementary School - 7613069
Prepared by Georgia Department of Education
Page 4
CERTIFIED PERSONNEL DATA
Positions Number Average Contract Days
Personnel Sex
Certificate
Years Experience
Full-time Part-time
Male Female
4 Yr Bachelor's 5 Yr Master's 6 Yr Specialist's 7 Yr Doctoral Other*
<1 1-10 11-20 21-30 >30
Average
Administrators
2.00 231.00
2 0
0 2
0 2 0 0 0 0 0 1 1 0 20.00
Support Personnel
2.20 194.55
1 3
2 2
0 4 0 0 0 0 1 3 0 0 12.50
PK-12 Teachers
24.40 190.00
22 6
3 25
18 8 2 0 0 0
11 8 7 2
14.43
*Includes One- and Two-Year Vocational Certificates.
ACCREDITATION DATA
Accredited by Georgia Accrediting Commission (GAC).
1998-99 GEORGIA PUBLIC EDUCATION REPORT CARD White Elementary School - 7613069
Prepared by Georgia Department of Education
Page 5
1998-99 GEORGIA PUBLIC EDUCATION REPORT CARD
ATLANTA CITY SCHOOLS
Whitefoord Elementary School - 7613569
Grade Range K-5
The Georgia Public Education Report Card is designed to assist systems and schools in educational improvement. This report card contains a variety of data elements. An explanation of the terms is provided as a companion to the report card data. Please refer to the definitions for the most effective use of the reported data.
STUDENT DATA
Total 666
K-5 Enrollment, by Race/Ethnicity and Sex
Black
White Hispanic
American Multi-
Asian Indian
racial
660 99.1%
1 0.2%
4 0.6%
0 0.0%
0 0.0%
1 0.2%
Male Female
305 45.8%
361 54.2%
Enrollment in Selected Programs
Program
Program % of Student Enrollment Population
Gifted (Grades K-12)
1
< 1%
Alternative Programs (Grades 6-12)
N/A
N/A
Students Eligible to Receive Free/Reduced Lunches
Number
Percent
School System
503 45,695
75.5% 75.5%
Dropout Rate *
Number
Rate
School System
N/A N/A
N/A N/A
* Dropout rates are not applicable for grades PK-5.
Enrollment in Compensatory Programs
Program
Program % of Student Enrollment Population
Special Education (Grades K-12)
27
4.1%
(PK)
0
N/A
English to Speakers of Other Languages (ESOL) (Grades K-12)
0
0.0%
Remedial Education (Grades 2-5, 9-12)
70 16.3%
Special Instructional Assistance (SIA) (Grades K-3)
286 60.3%
Title I (Grades K-12)
This school has a schoolwide program.
Total 37
Retained Students, by Race/Ethnicity and Sex
Black
White Hispanic
American Multi-
Asian Indian
racial
37 100.0%
0 0.0%
0 0.0%
0 0.0%
0 0.0%
0 0.0%
Male Female
20
17
54.1% 45.9%
Prepared by Georgia Department of Education
Page 1
STATE-REQUIRED TEST DATA
NORM-REFERENCED TESTS Grade 3
Iowa Tests of Basic Skills (ITBS) Each chart reflects data for three years of testing.
Reading Comprehension 50
29 50 54 0
98-99
65 55 53 97-98
61 48 52 96-97
Mathematics
School 50
System
State
0
38 53 61 98-99
59 58 61 97-98
61 51 59 96-97
School System State
Reading Vocabulary 50
26 50 50 0
98-99
50 51 50 97-98
47 44 49 96-97
Language Arts
School 50
System
State
0
46 61 64 98-99
49 63 62 97-98
50 54 59 96-97
School System State
Social Studies 50
36 50 56 0
98-99
36 52 55 97-98
36 50 55 96-97
Science
School 50
System
State
0
30 49 59 98-99
35 52 59 97-98
33 48 58 96-97
School System State
Sources of Information
Composite Score
50
33 48 57 0
98-99
School 50
System
35 51 56 97-98
35 47 55 96-97
State 0
33 51 58 98-99
44 55 57 97-98
1998-99 GEORGIA PUBLIC EDUCATION REPORT CARD Whitefoord Elementary School - 7613569
Prepared by Georgia Department of Education
43 48 56 96-97
Scores Reported in Percentiles
School System State
Page 2
STATE-REQUIRED TEST DATA
NORM-REFERENCED TESTS Grade 5
Iowa Tests of Basic Skills (ITBS) Each chart reflects data for three years of testing.
Reading Comprehension
Mathematics
50
60 47 53 0
98-99
76 52 53 97-98
63 49 52 96-97
School 50
System
State
0
49 48 59 98-99
80 53 58 97-98
63 50 57 96-97
School System State
Reading Vocabulary 50
76 48 48 0
98-99
96 52 48 97-98
71 44 46 96-97
Language Arts
School 50
System
State
0
68 56 63 98-99
68 60 61 97-98
56 51 58 96-97
School System State
Social Studies 50
69 54 57 0
98-99
80 54 56 97-98
81 52 55 96-97
Science
School 50
System
State
0
56 48 60 98-99
69 50 59 97-98
68 48 59 96-97
School System State
Sources of Information
Composite Score
50
41 47 58 0
98-99
School 50
System
47 51 58 97-98
52 49 57 96-97
State 0
59 49 57 98-99
73 52 56 97-98
64 48 55 96-97
1998-99 GEORGIA PUBLIC EDUCATION REPORT CARD Whitefoord Elementary School - 7613569
Prepared by Georgia Department of Education
Scores Reported in Percentiles
School System State
Page 3
STATE-REQUIRED TEST DATA
PERFORMANCE ASSESSMENTS
Grade 5 Writing Assessment
Percent at Developmental Stages:
1998-99 School System State
1997-98 School System State
1996-97 School System State
Stage Stage Stage Stage Stage Stage
1:The Emerging Writer 2:The Developing Writer 3:The Focusing Writer 4:The Experimenting 5:The Engaging Writer 6:The Extending Writer
0% 1% 11% 58% 26% 4%
1% 2% 22% 47% 22% 6%
0% 1% 16% 41% 29% 12%
0% 1% 30% 55% 11% 3%
1% 4% 24% 47% 19% 5%
0% 3% 19% 41% 27% 10%
0% 3% 16% 54% 26% 1%
1% 6% 32% 39% 17% 5%
0% 3% 21% 37% 26% 12%
AWARDS / RECOGNITION DATA
Schools in Georgia may receive recognition in the following programs: Charter School Pay for Performance Program Georgia School of Excellence National Blue Ribbon School Whitefoord Elementary School did not receive recognition in any of these programs during the 1998-99 school year.
1998-99 GEORGIA PUBLIC EDUCATION REPORT CARD Whitefoord Elementary School - 7613569
Prepared by Georgia Department of Education
Page 4
CERTIFIED PERSONNEL DATA
Positions Number Average Contract Days
Personnel Sex
Certificate
Years Experience
Full-time Part-time
Male Female
4 Yr Bachelor's 5 Yr Master's 6 Yr Specialist's 7 Yr Doctoral Other*
<1 1-10 11-20 21-30 >30
Average
Administrators
3.00 234.67
3 0
0 3
0 1 1 1 0 0 0 2 0 1 24.67
Support Personnel
1.50 199.33
0 3
0 3
0 2 1 0 0 0 1 0 2 0 16.33
PK-12 Teachers
36.00 190.00
35 4
6 33
28 8 2 1 0 2
15 10 11
1 13.92
*Includes One- and Two-Year Vocational Certificates.
ACCREDITATION DATA
Accredited by Georgia Accrediting Commission (GAC).
1998-99 GEORGIA PUBLIC EDUCATION REPORT CARD Whitefoord Elementary School - 7613569
Prepared by Georgia Department of Education
Page 5
1998-99 GEORGIA PUBLIC EDUCATION REPORT CARD
ATLANTA CITY SCHOOLS
Williams Elementary School - 7614569
Grade Range PK-5
The Georgia Public Education Report Card is designed to assist systems and schools in educational improvement. This report card contains a variety of data elements. An explanation of the terms is provided as a companion to the report card data. Please refer to the definitions for the most effective use of the reported data.
STUDENT DATA
Total
K-5
541
PK
40
Enrollment, by Race/Ethnicity and Sex
Black
White Hispanic
American Asian Indian
Multiracial
538 99.4%
2 0.4%
1 0.2%
0 0.0%
0 0.0%
0 0.0%
40 100.0%
0 0.0%
0 0.0%
0 0.0%
0 0.0%
0 0.0%
Male Female
257 47.5%
284 52.5%
21 52.5%
19 47.5%
Enrollment in Selected Programs
Program
Program % of Student Enrollment Population
Gifted (Grades K-12)
0
0.0%
Alternative Programs (Grades 6-12)
N/A
N/A
Students Eligible to Receive Free/Reduced Lunches
Number
Percent
School System
581 45,695
100.0% 75.5%
Dropout Rate *
Number
Rate
School System
N/A N/A
N/A N/A
* Dropout rates are not applicable for grades PK-5.
Enrollment in Compensatory Programs
Program
Program % of Student Enrollment Population
Special Education (Grades K-12)
38
7.0%
(PK)
0
N/A
English to Speakers of Other Languages (ESOL) (Grades K-12)
0
0.0%
Remedial Education (Grades 2-5, 9-12)
81 24.0%
Special Instructional Assistance (SIA) (Grades K-3)
279 67.6%
Title I (Grades K-12)
This school has a schoolwide program.
Total 13
Retained Students, by Race/Ethnicity and Sex
Black
White Hispanic
American MultiAsian Indian racial
13 100.0%
0 0.0%
0 0.0%
0 0.0%
0 0.0%
0 0.0%
Male Female
6
7
46.2% 53.8%
Prepared by Georgia Department of Education
Page 1
STATE-REQUIRED TEST DATA
NORM-REFERENCED TESTS Grade 3
Iowa Tests of Basic Skills (ITBS) Each chart reflects data for three years of testing.
Reading Comprehension 50
36 50 54 0
98-99
25 55 53 97-98
24 48 52 96-97
Mathematics
School 50
System
State
0
34 53 61 98-99
23 58 61 97-98
23 51 59 96-97
School System State
Reading Vocabulary 50
70 50 50 0
98-99
69 51 50 97-98
68 44 49 96-97
Language Arts
School 50
System
State
0
54 61 64 98-99
29 63 62 97-98
42 54 59 96-97
School System State
Social Studies 50
30 50 56 0
98-99
22 52 55 97-98
29 50 55 96-97
Science
School 50
System
State
0
36 49 59 98-99
20 52 59 97-98
24 48 58 96-97
School System State
Sources of Information
Composite Score
50
32 48 57 0
98-99
School 50
System
24 51 56 97-98
22 47 55 96-97
State 0
38 51 58 98-99
25 55 57 97-98
1998-99 GEORGIA PUBLIC EDUCATION REPORT CARD Williams Elementary School - 7614569
Prepared by Georgia Department of Education
29 48 56 96-97
Scores Reported in Percentiles
School System State
Page 2
STATE-REQUIRED TEST DATA
NORM-REFERENCED TESTS Grade 5
Iowa Tests of Basic Skills (ITBS) Each chart reflects data for three years of testing.
Reading Comprehension
Mathematics
50
40 47 53 0
98-99
33 52 53 97-98
24 49 52 96-97
School 50
System
State
0
33 48 59 98-99
31 53 58 97-98
26 50 57 96-97
School System State
Reading Vocabulary 50
99 48 48 0
98-99
73 52 48 97-98
23 44 46 96-97
Language Arts
School 50
System
State
0
50 56 63 98-99
47 60 61 97-98
25 51 58 96-97
School System State
Social Studies 50
55 54 57 0
98-99
44 54 56 97-98
28 52 55 96-97
Science
School 50
System
State
0
54 48 60 98-99
61 50 59 97-98
31 48 59 96-97
School System State
Sources of Information
Composite Score
50
24 47 58 0
98-99
School 50
System
34 51 58 97-98
24 49 57 96-97
State 0
51 49 57 98-99
46 52 56 97-98
25 48 55 96-97
1998-99 GEORGIA PUBLIC EDUCATION REPORT CARD Williams Elementary School - 7614569
Prepared by Georgia Department of Education
Scores Reported in Percentiles
School System State
Page 3
STATE-REQUIRED TEST DATA
PERFORMANCE ASSESSMENTS
Grade 5 Writing Assessment
Percent at Developmental Stages:
1998-99 School System State
1997-98 School System State
1996-97 School System State
Stage Stage Stage Stage Stage Stage
1:The Emerging Writer 2:The Developing Writer 3:The Focusing Writer 4:The Experimenting 5:The Engaging Writer 6:The Extending Writer
2% 0% 33% 48% 15% 2%
1% 2% 22% 47% 22% 6%
0% 1% 16% 41% 29% 12%
0% 4% 38% 55% 4% 0%
1% 4% 24% 47% 19% 5%
0% 3% 19% 41% 27% 10%
0% 6% 49% 36% 8% 2%
1% 6% 32% 39% 17% 5%
0% 3% 21% 37% 26% 12%
AWARDS / RECOGNITION DATA
Schools in Georgia may receive recognition in the following programs: Charter School Pay for Performance Program Georgia School of Excellence National Blue Ribbon School Williams Elementary School did not receive recognition in any of these programs during the 1998-99 school year.
1998-99 GEORGIA PUBLIC EDUCATION REPORT CARD Williams Elementary School - 7614569
Prepared by Georgia Department of Education
Page 4
CERTIFIED PERSONNEL DATA
Positions Number Average Contract Days
Personnel Sex
Certificate
Years Experience
Full-time Part-time
Male Female
4 Yr Bachelor's 5 Yr Master's 6 Yr Specialist's 7 Yr Doctoral Other*
<1 1-10 11-20 21-30 >30
Average
Administrators
3.00 227.33
3 0
1 2
0 0 0 3 0 0 0 0 3 0 23.67
Support Personnel
2.20 194.55
1 3
2 2
0 3 0 1 0 0 2 2 0 0 12.00
PK-12 Teachers
37.10 190.00
36 4
5 35
23 13
2 2 0 1 19 6 10 4 13.88
*Includes One- and Two-Year Vocational Certificates.
ACCREDITATION DATA
Accredited by Georgia Accrediting Commission (GAC).
1998-99 GEORGIA PUBLIC EDUCATION REPORT CARD Williams Elementary School - 7614569
Prepared by Georgia Department of Education
Page 5
1998-99 GEORGIA PUBLIC EDUCATION REPORT CARD
ATLANTA CITY SCHOOLS
Woodson Elementary School - 7615569
Grade Range PK-5
The Georgia Public Education Report Card is designed to assist systems and schools in educational improvement. This report card contains a variety of data elements. An explanation of the terms is provided as a companion to the report card data. Please refer to the definitions for the most effective use of the reported data.
STUDENT DATA
Total
K-5
526
PK
15
Enrollment, by Race/Ethnicity and Sex
Black
White Hispanic
American Asian Indian
Multiracial
526 100.0%
0 0.0%
0 0.0%
0 0.0%
0 0.0%
0 0.0%
15 100.0%
0 0.0%
0 0.0%
0 0.0%
0 0.0%
0 0.0%
Male Female
266 50.6%
260 49.4%
12 80.0%
3 20.0%
Enrollment in Selected Programs
Program
Program % of Student Enrollment Population
Gifted (Grades K-12)
0
0.0%
Alternative Programs (Grades 6-12)
N/A
N/A
Students Eligible to Receive Free/Reduced Lunches
Number
Percent
School System
470 45,695
86.9% 75.5%
Dropout Rate *
Number
Rate
School System
N/A N/A
N/A N/A
* Dropout rates are not applicable for grades PK-5.
Enrollment in Compensatory Programs
Program
Program % of Student Enrollment Population
Special Education (Grades K-12)
23
4.4%
(PK)
12
N/A
English to Speakers of Other Languages (ESOL) (Grades K-12)
0
0.0%
Remedial Education (Grades 2-5, 9-12)
48 14.4%
Special Instructional Assistance (SIA) (Grades K-3)
188 50.8%
Title I (Grades K-12)
This school has a schoolwide program.
Total 28
Retained Students, by Race/Ethnicity and Sex
Black
White Hispanic
American MultiAsian Indian racial
28 100.0%
0 0.0%
0 0.0%
0 0.0%
0 0.0%
0 0.0%
Male Female
12
16
42.9% 57.1%
Prepared by Georgia Department of Education
Page 1
STATE-REQUIRED TEST DATA
NORM-REFERENCED TESTS Grade 3
Iowa Tests of Basic Skills (ITBS) Each chart reflects data for three years of testing.
Reading Comprehension 50
49 50 54 0
98-99
51 55 53 97-98
55 48 52 96-97
Mathematics
School 50
System
State
0
50 53 61 98-99
52 58 61 97-98
46 51 59 96-97
School System State
Reading Vocabulary 50
45 50 50 0
98-99
49 51 50 97-98
71 44 49 96-97
Language Arts
School 50
System
State
0
68 61 64 98-99
62 63 62 97-98
47 54 59 96-97
School System State
Social Studies 50
56 50 56 0
98-99
46 52 55 97-98
35 50 55 96-97
Science
School 50
System
State
0
51 49 59 98-99
33 52 59 97-98
29 48 58 96-97
School System State
Sources of Information
Composite Score
50
35 48 57 0
98-99
School 50
System
30 51 56 97-98
28 47 55 96-97
State 0
51 51 58 98-99
44 55 57 97-98
1998-99 GEORGIA PUBLIC EDUCATION REPORT CARD Woodson Elementary School - 7615569
Prepared by Georgia Department of Education
40 48 56 96-97
Scores Reported in Percentiles
School System State
Page 2
STATE-REQUIRED TEST DATA
NORM-REFERENCED TESTS Grade 5
Iowa Tests of Basic Skills (ITBS) Each chart reflects data for three years of testing.
Reading Comprehension
Mathematics
50
66 47 53 0
98-99
65 52 53 97-98
76 49 52 96-97
School 50
System
State
0
60 48 59 98-99
68 53 58 97-98
66 50 57 96-97
School System State
Reading Vocabulary 50
85 48 48 0
98-99
81 52 48 97-98
94 44 46 96-97
Language Arts
School 50
System
State
0
70 56 63 98-99
76 60 61 97-98
69 51 58 96-97
School System State
Social Studies 50
69 54 57 0
98-99
80 54 56 97-98
72 52 55 96-97
Science
School 50
System
State
0
71 48 60 98-99
73 50 59 97-98
70 48 59 96-97
School System State
Sources of Information
Composite Score
50
47 47 58 0
98-99
School 50
System
53 51 58 97-98
67 49 57 96-97
State 0
66 49 57 98-99
71 52 56 97-98
73 48 55 96-97
1998-99 GEORGIA PUBLIC EDUCATION REPORT CARD Woodson Elementary School - 7615569
Prepared by Georgia Department of Education
Scores Reported in Percentiles
School System State
Page 3
STATE-REQUIRED TEST DATA
PERFORMANCE ASSESSMENTS
Grade 5 Writing Assessment
Percent at Developmental Stages:
1998-99 School System State
1997-98 School System State
1996-97 School System State
Stage Stage Stage Stage Stage Stage
1:The Emerging Writer 2:The Developing Writer 3:The Focusing Writer 4:The Experimenting 5:The Engaging Writer 6:The Extending Writer
0% 0% 30% 52% 12% 5%
1% 2% 22% 47% 22% 6%
0% 1% 16% 41% 29% 12%
0% 2% 25% 49% 22% 2%
1% 4% 24% 47% 19% 5%
0% 3% 19% 41% 27% 10%
0% 13% 35% 33% 17%
2%
1% 6% 32% 39% 17% 5%
0% 3% 21% 37% 26% 12%
AWARDS / RECOGNITION DATA
Schools in Georgia may receive recognition in the following programs: Charter School Pay for Performance Program Georgia School of Excellence National Blue Ribbon School Woodson Elementary School did not receive recognition in any of these programs during the 1998-99 school year.
1998-99 GEORGIA PUBLIC EDUCATION REPORT CARD Woodson Elementary School - 7615569
Prepared by Georgia Department of Education
Page 4
CERTIFIED PERSONNEL DATA
Positions Number Average Contract Days
Personnel Sex
Certificate
Years Experience
Full-time Part-time
Male Female
4 Yr Bachelor's 5 Yr Master's 6 Yr Specialist's 7 Yr Doctoral Other*
<1 1-10 11-20 21-30 >30
Average
Administrators
3.00 227.33
3 0
0 3
0 0 3 0 0 0 0 2 1 0 20.00
Support Personnel
1.90 195.26
1 3
1 3
0 3 1 0 0 0 1 2 1 0 14.50
PK-12 Teachers
31.20 190.00
29 5
5 29
26 7 1 0 0 3
15 4 4 8
14.91
*Includes One- and Two-Year Vocational Certificates.
ACCREDITATION DATA
Accredited by Georgia Accrediting Commission (GAC).
1998-99 GEORGIA PUBLIC EDUCATION REPORT CARD Woodson Elementary School - 7615569
Prepared by Georgia Department of Education
Page 5
1998-99 GEORGIA PUBLIC EDUCATION REPORT CARD
ATLANTA CITY SCHOOLS
Young Middle School - 7610282
Grade Range 6-8
The Georgia Public Education Report Card is designed to assist systems and schools in educational improvement. This report card contains a variety of data elements. An explanation of the terms is provided as a companion to the report card data. Please refer to the definitions for the most effective use of the reported data.
STUDENT DATA
Total 1,120
6-8 Enrollment, by Race/Ethnicity and Sex
Black
White Hispanic
American Multi-
Asian Indian
racial
1,116 99.6%
1 0.1%
3 0.3%
0 0.0%
0 0.0%
0 0.0%
Male 546
48.8%
Female 574
51.3%
Enrollment in Selected Programs
Program
Gifted (Grades K-12)
Program % of Student Enrollment Population
111
9.9%
Alternative Programs (Grades 6-12)
0
0.0%
Students Eligible to Receive Free/Reduced Lunches
Number
Percent
School System
830 45,695
74.1% 75.5%
Enrollment in Compensatory Programs
Program
Program % of Student Enrollment Population
Special Education (Grades K-12) (PK)
59
5.3%
0
N/A
English to Speakers of Other Languages (ESOL) (Grades K-12)
0
0.0%
Title I (Grades K-12)
This school has a schoolwide program.
Dropout Rate for Grades 6-8
Number
Rate
School System
30
1.8%
705
3.8%
Total 37
Retained Students, by Race/Ethnicity and Sex
Black
White Hispanic
American MultiAsian Indian racial
37 100.0%
0 0.0%
0 0.0%
0 0.0%
0 0.0%
0 0.0%
Male Female
21
16
56.8% 43.2%
Prepared by Georgia Department of Education
Page 1
STATE-REQUIRED TEST DATA
NORM-REFERENCED TESTS Grade 8
Iowa Tests of Basic Skills (ITBS) Each chart reflects data for three years of testing.
Reading Comprehension 50
41 36 49 0
98-99
44 35 48 97-98
38 34 48 96-97
Mathematics
School 50
System
State
0
55 45 56 98-99
55 43 55 97-98
52 43 54 96-97
School System State
Reading Vocabulary 50
45 32 46 0
98-99
50 36 45 97-98
33 27 44 96-97
Language Arts
School 50
System
State
0
52 42 60 98-99
55 43 58 97-98
47 40 56 96-97
School System State
Social Studies 50
50 42 54 0
98-99
52 45 53 97-98
48 41 53 96-97
Science
School 50
System
State
0
46 36 56 98-99
52 39 55 97-98
37 35 53 96-97
School System State
Sources of Information
Composite Score
50
50 42 57 0
98-99
School 50
System
48 42 56 97-98
47 42 55 96-97
State 0
49 39 56 98-99
52 40 54 97-98
1998-99 GEORGIA PUBLIC EDUCATION REPORT CARD Young Middle School - 7610282
Prepared by Georgia Department of Education
43 37 54 96-97
Scores Reported in Percentiles
School System State
Page 2
STATE-REQUIRED TEST DATA
Categories of Scaled Scores
Inadequate (less than 162)
Minimal (162-209)
Good
(210-247)
Very Good (greater than 247)
Average Scaled Score: (Range 100-300)
PERFORMANCE ASSESSMENTS
Grade 8 Writing Assessment
1998-99 Percent Scoring
1997-98 Percent Scoring
1996-97 Percent Scoring
School System State School System State School System State
8% 51% 36%
5%
16% 51% 28%
5%
8% 40% 41% 11%
17% 51% 29%
3%
25% 53% 19%
3%
11% 46% 34%
8%
22% 56% 19%
3%
34% 48% 15%
3%
15% 46% 30%
8%
200
193
208 192
184 202 185
177 198
AWARDS / RECOGNITION DATA
The Georgia School of Excellence Program recognizes exemplary schools that have excellent, successful programs in many areas of school life. Each year, in a statewide competition, one elementary, one middle and one high school from each of Georgia's 11 congressional districts may be selected for this honor.
Young Middle School was designated a 1998-99 Georgia School of Excellence.
1998-99 GEORGIA PUBLIC EDUCATION REPORT CARD Young Middle School - 7610282
Prepared by Georgia Department of Education
Page 3
CERTIFIED PERSONNEL DATA
Positions Number Average Contract Days
Personnel Sex
Certificate
Years Experience
Full-time Part-time
Male Female
4 Yr Bachelor's 5 Yr Master's 6 Yr Specialist's 7 Yr Doctoral Other*
<1 1-10 11-20 21-30 >30
Average
Administrators
4.00 231.00
4 0
2 2
0 2 2 0 0 0 1 0 1 2 24.75
Support Personnel
5.90 197.12
5 2
0 7
0 4 3 0 0 0 2 3 2 0 15.43
PK-12 Teachers
60.50 190.17
60 1
15 46
28 29
4 0 0 3 38 7 11 2 10.84
*Includes One- and Two-Year Vocational Certificates.
ACCREDITATION DATA
Accredited with Quality by Georgia Accrediting Commission (GAC).
1998-99 GEORGIA PUBLIC EDUCATION REPORT CARD Young Middle School - 7610282
Prepared by Georgia Department of Education
Page 4
1998-99 GEORGIA PUBLIC EDUCATION REPORT CARD BACON COUNTY SCHOOLS - 603
The Georgia Public Education Report Card is designed to assist systems and schools in educational improvement. This report card contains a variety of data elements. An explanation of the terms is provided as a companion to the report card data. Please refer to the definitions for the most effective use of the reported data.
Total
K-12
1,893
PK
104
STUDENT DATA
Enrollment, by Race/Ethnicity and Sex
Black
White Hispanic
American Multi-
Asian Indian
racial
437 23.1%
1,416 74.8%
18 1.0%
3 0.2%
0 0.0%
19 1.0%
35 33.7%
66 63.5%
3 2.9%
0 0.0%
0 0.0%
0 0.0%
Male
996 52.6%
59 56.7%
Female
897 47.4%
45 43.3%
Enrollment in Selected Programs
Program
Program % of Student Enrollment Population
Gifted (Grades K-12)
66
3.5%
Non-Vocational Labs (Grades 9-12)
315
56.1%
Vocational Labs (Grades 9-12)
432
77.0%
Alternative Programs (Grades 6-12)
0
0.0%
Students Eligible to Receive Free/Reduced Lunches
Number
Percent
947
47.4%
Dropout Rate
Number
Percent
6-12 9-12
65
6.0%
64
10.6%
Enrollment in Compensatory Programs
Program
Program % of Student Enrollment Population
Special Education
(Grades K-12)
250
PK
14
English to Speakers of
Other Languages (ESOL)
0
(Grades K-12)
Remedial Education (Grades 2-5, 9-12)
238
Special Instructional
Assistance (SIA)
168
(Grades K-3)
Title I (Grades K-12) Number of schools with: Schoolwide program Targeted Assistance program No Title I program
13.2% N/A
0.0%
20.8%
28.6%
3 0 0
Total 46
Retained Students, by Race/Ethnicity and Sex
Black
White Hispanic
American MultiAsian Indian racial
11 23.9%
34 73.9%
0 0.0%
0 0.0%
0 0.0%
1 2.2%
Male Female
30
16
65.2% 34.8%
Prepared by Georgia Department of Education
Page 1
STATE-REQUIRED TEST DATA
NORM-REFERENCED TESTS
Grade 3 Iowa Tests of Basic Skills (ITBS) Each chart reflects data for three years of testing.
Reading Comprehension
Mathematics
50
57 54 46 53 43 52 0
98-99 97-98 96-97
System State
50
64 61 46 61 55 59 0
98-99 97-98 96-97
System State
Reading Vocabulary
50
67 50 43 50 43 49 0
98-99 97-98 96-97
System State
Social Studies
50
54 56 45 55 42 55 0
98-99 97-98 96-97
System State
Language Arts
50
68 64 51 62 49 59 0
98-99 97-98 96-97
System State
Science
50
63 59 48 59 54 58 0
98-99 97-98 96-97
System State
Sources of Information
Composite Score
50
60 57 0
98-99
System
50
43 56 45 55 97-98 96-97
State
61 58 46 57 0
98-99 97-98
1998-99 GEORGIA PUBLIC EDUCATION REPORT CARD Bacon County Schools
Prepared by Georgia Department of Education
System State Scores Reported 47 56 in Percentiles 96-97
Page 2
STATE-REQUIRED TEST DATA
NORM-REFERENCED TESTS
Grade 5 Iowa Tests of Basic Skills (ITBS) Each chart reflects data for three years of testing.
Reading Comprehension
Mathematics
50
49 53 44 53 43 52 0
98-99 97-98 96-97
System State
50
52 59 46 58 49 57 0
98-99 97-98 96-97
System State
Reading Vocabulary
50
54 48 54 48 38 46 0
98-99 97-98 96-97
System State
Social Studies
50
48 57 47 56 36 55 0
98-99 97-98 96-97
System State
Language Arts
50
53 63 43 61 37 58 0
98-99 97-98 96-97
System State
Science
50
53 60 47 59 46 59 0
98-99 97-98 96-97
System State
Sources of Information
Composite Score
50
54 58 0
98-99
System
50
46 58 44 57 97-98 96-97
State
50 57 44 56 0
98-99 97-98
1998-99 GEORGIA PUBLIC EDUCATION REPORT CARD Bacon County Schools
Prepared by Georgia Department of Education
System State Scores Reported 40 55 in Percentiles 96-97
Page 3
STATE-REQUIRED TEST DATA
NORM-REFERENCED TESTS Grade 8
Iowa Tests of Basic Skills (ITBS) Each chart reflects data for three years of testing.
Reading Comprehension
Mathematics
50
43 49 42 48 42 48 0
98-99 97-98 96-97
System State
50
49 56 49 55 42 54 0
98-99 97-98 96-97
System State
Reading Vocabulary
50
38 46 35 45 36 44 0
98-99 97-98 96-97
System State
Language Arts
50
54 60 58 58 55 56 0
98-99 97-98 96-97
System State
Social Studies
50
71 54 43 53 47 53 0
98-99 97-98 96-97
System State
Science
50
43 56 52 55 49 53 0
98-99 97-98 96-97
System State
Sources of Information
Composite Score
50
51 57 0
98-99
System
50
47 56 51 55 97-98 96-97
State
52 56 48 54 0
98-99 97-98
1998-99 GEORGIA PUBLIC EDUCATION REPORT CARD Bacon County Schools
Prepared by Georgia Department of Education
System State Scores Reported 46 54 in Percentiles 96-97
Page 4
STATE-REQUIRED TEST DATA
PERFORMANCE ASSESSMENTS
Grade 5 Writing Assessment
1998-99
1997-98
1996-97
Percent at Developmental Stages:
Comparison
Comparison
Comparison
System Group State System Group State System Group State
Stage Stage Stage Stage Stage Stage
1: The Emerging Writer 2: The Developing Writer 3: The Focusing Writer 4: The Experimenting Writer 5: The Engaging Writer 6: The Extending Writer
0% 2% 31% 47% 17% 3%
0% 1% 19% 43% 27% 10%
0% 1% 16% 41% 29% 12%
0% 3% 23% 47% 22% 6%
0% 3% 22% 45% 24% 6%
0% 3% 19% 41% 27% 10%
0% 3% 21% 38% 29% 10%
0% 4% 24% 41% 23% 8%
0% 3% 21% 37% 26% 12%
Grade 8 Writing Assessment
1998-99 Percent Scoring 1997-98 Percent Scoring 1996-97 Percent Scoring
Categories of Scaled Scores
Comparison
Comparison
Comparison
System Group State System Group State System Group State
Inadequate (less than 162)
Minimal (162-209)
Good
(210-247)
Very Good (greater than 247)
14% 56% 28%
2%
8% 45% 39%
9%
8% 40% 41% 11%
13% 56% 29%
2%
10% 51% 32%
6%
11% 46% 34%
8%
15% 53% 31%
1%
18% 49% 28%
6%
15% 46% 30%
8%
Average Scaled Score: (Range 100-300)
192
205 208
196
200 202
194
194 198
GEORGIA HIGH SCHOOL GRADUATION TESTS (GHSGT)
Percent of Regular Program 11th Graders Passing the Georgia High School Graduation Tests on First Administration
1998-99
1997-98
1996-97
Comparison
Comparison
Comparison
System Group State System Group State System Group State
English Language Arts Mathematics Social Studies Science
91% 80% 65% 53%
95% 86% 76% 68%
96% 88% 80% 72%
91% 83% 66% 59%
93% 85% 72% 69%
94% 88% 78% 74%
91% 78% 71% 58%
93% 87% 76% 73%
94% 87% 78% 74%
All Components listed above 4 5 %
63% 68% 46%
59% 68% 51%
67% 67%
Writing
92%
92% 93% 92%
90% 92% 91%
94% 93%
1998-99 GEORGIA PUBLIC EDUCATION REPORT CARD
Bacon County Schools
Prepared by Georgia Department of Education
Page 5
GRADUATE DATA
1999 Graduates by Credentials, Race/Ethnicity and Sex
Diplomas with Both College Prep. & Voc. Endorsements
Diplomas with College Prep. Endorsements Diplomas with Vocational Endorsements General High School Diplomas Special Education Diplomas
Total All Diplomas
Certificates of Performance
Total Graduates
Total 38 5 53 0 5
101 11
112
Black
American MultiWhite Hispanic Asian Indian racial
Male Female
7 18.4%
0 0.0%
10 18.9%
0
31 81.6%
5 100.0%
43 81.1%
0
0 0.0%
0 0.0%
0 0.0%
0
0 0.0%
0 0.0%
0 0.0%
0
0 0.0%
0 0.0%
0 0.0%
0
0
10
0.0% 26.3%
0
5
0.0% 100.0%
0
27
0.0% 50.9%
0
0
28 73.7%
0 0.0%
26 49.1%
0
3 60.0%
20 19.8%
6 54.5%
26 23.2%
2 40.0%
81 80.2%
5 45.5%
86 76.8%
0 0.0%
0 0.0%
0 0.0%
0 0.0%
0 0.0%
0 0.0%
0 0.0%
0 0.0%
0 0.0%
0 0.0%
0 0.0%
0 0.0%
0 0.0%
0 0.0%
0 0.0%
0 0.0%
3 60.0%
45 44.6%
3 27.3%
48 42.9%
2 40.0%
56 55.4%
8 72.7%
64 57.1%
HOPE Scholarships
System State
Number of 1999 Graduates 1 1 2
Number Eligible
60
Percent Eligible
53.6%
65,548 40,292 61.5%
High School Completion Rate Percent of 1995Grade 9 Enrollment
in Graduating Class of1999
System
State
Completion Rate '95-'99 60.5% 68.9%
COLLEGE ADMISSIONS / CREDIT TEST DATA
Scholastic Assessment Test (SAT)
No. Taking
Average Score
Tests
Verbal Math Total
Based on students' highest verbal and highest math scores
System College Prep. Endorsement Other Diplomas
467 450 917 492 468 960 362 339 701
Georgia
492 488 980
Based on students' last test administration
System Georgia
53
454 441
895
41,958 483 479 962
Nation
952,913 502 508 1010
American College Testing (ACT)
System State Nation
English
18.8
19.1 20.4
Mathematics
17.7
19.9 20.7
Reading
20.8
20.2 21.3
Science Reasoning 18.5
19.9 21.0
CompositeScore 19.0
19.9 21.9
Advanced Placement Exams (AP)
No. of Students Taking Tests
No. of Tests Taken No. of Test Scores
3 or Higher Percent of Test
Scores 3 or Higher
System State 0 15,225
N/A 23,969 N/A 13,024
N/A 54.3%
1998-99 GEORGIA PUBLIC EDUCATION REPORT CARD Bacon County Schools
Prepared by Georgia Department of Education
Page 6
POSTSECONDARY DATA
Graduates Entering Georgia Public Colleges and Universities
Graduates Entering Georgia Public Colleges and Universities and
Requiring Learning Support (LS)
1998 Graduates Entering 1998-99
1997 Graduates Entering 1997-98
Percent of Graduating Number Class
40
36.0%
36
29.5%
Number Requiring
LS
22
16
Percent of those attending Georgia
Public Colleges
55.0%
44.4%
In previous years, the Report Card presented College Prep Curriculum information provided by the Board of Regents on students requiring Learning Support. Due to inconsistencies in the data provided by the Board of Regents in defining College Prep Completers versus Local Board of Education data defining College Prep Endorsements, the Department of Education Report Card will not provide this information until discrepancies can be reconciled.
Graduates Entering Georgia Public Technical and Adult Schools
Entering 1998-99 Entering 1997-98
Number Percent
Number Percent
1998 Graduates 1997 Graduates
10
9.0%
0
0.0%
N/A 17
N/A 13.9%
ACCREDITATION / RECOGNITION DATA
Southern Association of Colleges and Schools (SACS) Accrediting Commission
Secondary/Middle Commission Elementary/Middle Commission Both Elementary/Secondary Commissions Joint Commission Candidate for Accreditation
Accreditation by Georgia Accrediting Commission (GAC)
Accredited by GAC Accredited with Quality by GAC
Number of Schools
1 0 0 0 0
Number of Schools
0 3
Awards / Recognition
State Recognized Program
Number of Schools
Charter School
0
Pay for Performance Recipient
0
Georgia School of Excellence
0
National Blue Ribbon School
0
COMMUNITY DATA
Number of Children Eligible for Migrant Education Number of Families-At-Risk * Number of Food Stamp Participants * Number of Families Receiving TANF * ** Per Capita Income * Unemployment Rate * 1990 Population * Projected 2000 Population * Projected 2010 Population *
* Data Available at County Level Only ** Known as AFDC before January 1997
152 37
1,065 138
$17,292 8.8%
9,566 9,872 10,131
1998-99 GEORGIA PUBLIC EDUCATION REPORT CARD Bacon County Schools
Prepared by Georgia Department of Education
Page 7
FISCAL DATA
Millage Rate
12.50
* Fall 1998 Property Tax Digest is used to calculate the 98-99 Value of One Mill
FTE Count
FTE Count used for Allotment Calculation 1,859.0 Fall '98 FTE Count 1,893
Value of One Mill
$141,983 $76.37 per Allotment FTE
Sources: Local State-QBE State-
Lottery State-
Other Federal Other
Total
PerGeneral Fund cent Per FTE
$1,799,808 18.5% $968 $7,774,374 80.0% $4,182
K-12 Revenues
Lottery K-12
and
Title
All Other
Programs
K-12
$0
$55,523
Bonded Debt $0
$0
$0
$0
$0 0.0%
$0
$0
$44,977
$0
$131,782 1.4% $71
$0
$0
$0
$0 0.0%
$0 $789,505 $125,540
$0
$10,959 0.1%
$6
$0
$0
$0
$9,716,924 100% $5,227 $789,505 $226,040
$0
Capital Projects
$726,486 $0
$0
$0 $0 $0 $726,486
School Nutrition
$224,901 $0
$0
$57,926 $452,992
$1,632 $737,452
Grand Total
Total
Per-
Amount cent
$2,806,719 23.0%
$7,774,374 63.7%
$44,977 0.4%
$189,708 1.6% $1,368,038 11.2%
$12,591 0.1% $12,196,409 100%
Instruction
Media Instruction
Support Pupil Services General Admin. School Admin. Trans-
portation Maint. & Ops. Capital Projects School Food Debt Service
Total
$6,153,129 64.6% $3,310 $271,809 2.9% $146
$260,950 2.7% $140
$407,661 4.3% $219
$282,206 3.0% $152
$675,850 7.1% $364
$597,101 6.3% $321
$869,329 9.1% $468
$0 0.0%
$0
$5,714 0.1%
$3
$0 0.0%
$0
$9,523,753 100% $5,123
K-12 Expenditures
$652,814 $161,442
$0
$0
$0
$0
$71,033
$3,821
$0
$12,535
$26,818
$0
$34,228
$3,315
$0
$6,786
$0
$0
$10,753
$0
$0
$1,170
$467
$0
$0
$0
$0
$0
$0
$0
$0
$0
$0
$789,322 $195,864
$0
$0 $0 $0 $0 $11,762 $0 $0 $16,347 $42,347 $0 $0
$0 $0 $0 $0 $0 $0 $0 $0 $0 $778,196 $0
$6,967,386 61.3% $271,809 2.4% $335,806 3.0% $447,015 3.9% $331,512 2.9% $682,637 6.0% $607,854 5.4% $887,313 7.8% $42,347 0.4% $783,910 6.9% $0 0.0%
$70,456 $778,196 $11,357,593 100%
Salaries and Benefits as Percentages of Revenues and of Expenditures
Teachers and Paraprofessionals
Salaries $5,237,859
Benefits $1,196,802
Percentage of Revenues Percentage of Expenditures
Total of
Total of
General Fund
General Fund
Title Programs
Title Programs
Lottery K-12
Lottery K-12
Total Salaries
and
Total
and
Total
and Benefits All Other K-12 K - 12 All Other K-12 K - 12
$6,434,661
60.0%
52.8%
61.2%
56.7%
School Administration
$456,062
$109,920
$565,982
5.3%
4.6%
5.4%
5.0%
General Administration
$185,307
$42,545
$227,852
2.1%
1.9%
2.2%
2.0%
1998-99 GEORGIA PUBLIC EDUCATION REPORT CARD
Bacon County Schools - 603
Prepared by Georgia Department of Education
Page 8
CERTIFIED PERSONNEL DATA
Number
Average Annual Salary Positions Average Contract Days
Average Daily Salary
Full-time Personnel Part-time
Sex Male Female
4 Yr Bachelor's Certificate 5 Yr Master's
Level 6 Yr Specialist's 7 Yr Doctoral Other*
Black
White Race/ Hispanic Ethnicity Asian
American Indian
Multiracial
Years Experience
<1 1-10 11-20 21-30 >30
Average
Administrators
12.80
$57,798.78 204.22
$283.02
11 4
8 7
0 2 12 1 0
0 15
0 0 0 0
0 0 4 7 4
25.13
Support Personnel PK-12 Teachers
9.19
138.03
$44,569.87 192.18
$231.92
$36,707.30 190.29
$192.90
8
135
2
5
2
28
8
112
1
75
6
46
3
16
0
2
0
1
0
10
10
129
0
1
0
0
0
0
0
0
0
8
1
65
4
43
5
21
0
3
19.10
12.31
*Includes One- and Two-Year Vocational Certificates.
Certified Staff Position Ratios
Teacher/Administrator Ratio 11:1
Teacher/Support Person Ratio 15:1
Teacher/Staff Ratio 6:1
Student Enrollment/All Teachers 14:1
Certified Personnel by Category
84.8% 100%
9.1%
6.1%
80% 60%
40%
20%
0%
Teachers
Administrators
Support Personnel
1998-99 GEORGIA PUBLIC EDUCATION REPORT CARD
Bacon County Schools - 603
Prepared by Georgia Department of Education
Page 9
1998-99 GEORGIA PUBLIC EDUCATION REPORT CARD
BACON COUNTY SCHOOLS
Bacon County Elementary School - 6033050
Grade Range 3-5
The Georgia Public Education Report Card is designed to assist systems and schools in educational improvement. This report card contains a variety of data elements. An explanation of the terms is provided as a companion to the report card data. Please refer to the definitions for the most effective use of the reported data.
STUDENT DATA
Total 458
3-5 Enrollment, by Race/Ethnicity and Sex
Black
White Hispanic
American Multi-
Asian Indian
racial
117 25.5%
323 70.5%
6 1.3%
1 0.2%
0 0.0%
11 2.4%
Male Female
259 56.6%
199 43.4%
Enrollment in Selected Programs
Program
Program % of Student Enrollment Population
Gifted (Grades K-12)
17
3.7%
Alternative Programs (Grades 6-12)
N/A
N/A
Students Eligible to Receive Free/Reduced Lunches
Number
Percent
School System
257
56.1%
947
47.4%
Dropout Rate *
Number
Rate
School System
N/A N/A
N/A N/A
* Dropout rates are not applicable for grades PK-5.
Enrollment in Compensatory Programs
Program
Program % of Student Enrollment Population
Special Education (Grades K-12)
89 19.4%
(PK)
0
N/A
English to Speakers of Other Languages (ESOL) (Grades K-12)
0
0.0%
Remedial Education (Grades 2-5, 9-12)
210 45.9%
Special Instructional Assistance (SIA) (Grades K-3)
0
0.0%
Title I (Grades K-12)
This school has a schoolwide program.
Total 2
Retained Students, by Race/Ethnicity and Sex
Black
White Hispanic
American Multi-
Asian Indian
racial
1 50.0%
1 50.0%
0 0.0%
0 0.0%
0 0.0%
0 0.0%
Male Female
1
1
50.0% 50.0%
Prepared by Georgia Department of Education
Page 1
STATE-REQUIRED TEST DATA
NORM-REFERENCED TESTS Grade 3
Iowa Tests of Basic Skills (ITBS) Each chart reflects data for three years of testing.
Reading Comprehension 50
57 57 54 0
98-99
46 46 53 97-98
43 43 52 96-97
Mathematics
School 50
System
State
0
64 64 61 98-99
46 46 61 97-98
55 55 59 96-97
School System State
Reading Vocabulary 50
67 67 50 0
98-99
43 43 50 97-98
43 43 49 96-97
Language Arts
School 50
System
State
0
68 68 64 98-99
51 51 62 97-98
49 49 59 96-97
School System State
Social Studies 50
54 54 56 0
98-99
45 45 55 97-98
42 42 55 96-97
Science
School 50
System
State
0
63 63 59 98-99
48 48 59 97-98
54 54 58 96-97
School System State
Sources of Information
Composite Score
50
60 60 57 0
98-99
School 50
System
43 43 56 97-98
45 45 55 96-97
State 0
61 61 58 98-99
46 46 57 97-98
1998-99 GEORGIA PUBLIC EDUCATION REPORT CARD Bacon County Elementary School - 6033050
Prepared by Georgia Department of Education
47 47 56 96-97
Scores Reported in Percentiles
School System State
Page 2
STATE-REQUIRED TEST DATA
NORM-REFERENCED TESTS Grade 5
Iowa Tests of Basic Skills (ITBS) Each chart reflects data for three years of testing.
Reading Comprehension
Mathematics
50
49 49 53 0
98-99
44 44 53 97-98
43 43 52 96-97
School 50
System
State
0
52 52 59 98-99
46 46 58 97-98
49 49 57 96-97
School System State
Reading Vocabulary 50
54 54 48 0
98-99
54 54 48 97-98
38 38 46 96-97
Language Arts
School 50
System
State
0
53 53 63 98-99
43 43 61 97-98
37 37 58 96-97
School System State
Social Studies 50
48 48 57 0
98-99
47 47 56 97-98
36 36 55 96-97
Science
School 50
System
State
0
53 53 60 98-99
47 47 59 97-98
46 46 59 96-97
School System State
Sources of Information
Composite Score
50
54 54 58 0
98-99
School 50
System
46 46 58 97-98
44 44 57 96-97
State 0
50 50 57 98-99
44 44 56 97-98
40 40 55 96-97
1998-99 GEORGIA PUBLIC EDUCATION REPORT CARD Bacon County Elementary School - 6033050
Prepared by Georgia Department of Education
Scores Reported in Percentiles
School System State
Page 3
STATE-REQUIRED TEST DATA
PERFORMANCE ASSESSMENTS
Grade 5 Writing Assessment
Percent at Developmental Stages:
1998-99 School System State
1997-98 School System State
1996-97 School System State
Stage Stage Stage Stage Stage Stage
1:The Emerging Writer 2:The Developing Writer 3:The Focusing Writer 4:The Experimenting 5:The Engaging Writer 6:The Extending Writer
0% 2% 31% 47% 17% 3%
0% 2% 31% 47% 17% 3%
0% 1% 16% 41% 29% 12%
0% 3% 23% 47% 22% 6%
0% 3% 23% 47% 22% 6%
0% 3% 19% 41% 27% 10%
0% 3% 21% 38% 29% 10%
0% 3% 21% 38% 29% 10%
0% 3% 21% 37% 26% 12%
AWARDS / RECOGNITION DATA
Schools in Georgia may receive recognition in the following programs: Charter School Pay for Performance Program Georgia School of Excellence National Blue Ribbon School Bacon County Elementary School did not receive recognition in any of these programs during the 1998-99 school year.
1998-99 GEORGIA PUBLIC EDUCATION REPORT CARD Bacon County Elementary School - 6033050
Prepared by Georgia Department of Education
Page 4
CERTIFIED PERSONNEL DATA
Positions Number Average Contract Days
Personnel Sex
Certificate
Years Experience
Full-time Part-time
Male Female
4 Yr Bachelor's 5 Yr Master's 6 Yr Specialist's 7 Yr Doctoral Other*
<1 1-10 11-20 21-30 >30
Average
Administrators
1.50 203.33
1 1
1 1
0 0 2 0 0 0 0 1 1 0 21.00
Support Personnel
1.60 190.00
1 1
0 2
0 1 1 0 0 0 0 2 0 0 16.50
PK-12 Teachers
29.01 190.00
28 2
2 28
17 6 7 0 0 1
16 8 5 0
12.17
*Includes One- and Two-Year Vocational Certificates.
ACCREDITATION DATA
Accredited with Quality by Georgia Accrediting Commission (GAC).
1998-99 GEORGIA PUBLIC EDUCATION REPORT CARD Bacon County Elementary School - 6033050
Prepared by Georgia Department of Education
Page 5
1998-99 GEORGIA PUBLIC EDUCATION REPORT CARD
BACON COUNTY SCHOOLS
Bacon County Middle/High School - 6032050
Grade Range 6-12
The Georgia Public Education Report Card is designed to assist systems and schools in educational improvement. This report card contains a variety of data elements. An explanation of the terms is provided as a companion to the report card data. Please refer to the definitions for the most effective use of the reported data.
STUDENT DATA
Total 1,012
6-12 Enrollment, by Race/Ethnicity and Sex
Black
White Hispanic
American Multi-
Asian Indian
racial
222 21.9%
779 77.0%
6 0.6%
2 0.2%
0 0.0%
3 0.3%
Male 517
51.1%
Female 495
48.9%
Enrollment in Selected Programs
Program
Program % of Student Enrollment Population
Gifted (Grades K-12)
49
4.8%
Non-Vocational Labs (Grades 9-12)
315
56.1%
Vocational Labs (Grades 9-12)
432
77.0%
Alternative Programs (Grades 6-12)
0
0.0%
Students Eligible to Receive Free/Reduced Lunches
Number
Percent
School System
414
40.9%
947
47.4%
Enrollment in Compensatory Programs
Program
Program % of Student Enrollment Population
Special Education (Grades K-12) PK
109 10.8%
0
N/A
English to Speakers of Other Languages (ESOL) (Grades K-12)
0
0.0%
Remedial Education (Grades 2-5, 9-12)
28
5.0%
Special Instructional Assistance (SIA) (Grades K-3)
N/A
N/A
Title I (Grades K-12) This school has a schoolwide program.
Dropout Rate for Grades 6-12
Number
Rate
School System
65
6.0%
65
6.0%
Total 21
Retained Students, by Race/Ethnicity and Sex
Black
White Hispanic
American MultiAsian Indian racial
6 28.6%
15 71.4%
0 0.0%
0 0.0%
0 0.0%
0 0.0%
Male Female
15
6
71.4% 28.6%
Prepared by Georgia Department of Education
Page 1
STATE-REQUIRED TEST DATA
NORM-REFERENCED TESTS
Grade 3 Iowa Tests of Basic Skills (ITBS) Each chart reflects data for three years of testing.
No third-grade students are enrolled at Bacon County Middle/High School.
Reading Comprehension
Mathematics
50
N/A 57 54 0
98-99
N/A 46 53 97-98
N/A 43 52 96-97
School 50
System
State
N/A 64 61 0
98-99
N/A 46 61 97-98
N/A 55 59 96-97
School System State
Reading Vocabulary 50
N/A 67 50 0
98-99
N/A 43 50 97-98
N/A 43 49 96-97
Language Arts
School 50
System
State
N/A 68 64 0
98-99
N/A 51 62 97-98
N/A 49 59 96-97
School System State
Social Studies 50
N/A 54 56 0
98-99
N/A 45 55 97-98
N/A 42 55 96-97
Science
School 50
System
State
N/A 63 59 0
98-99
N/A 48 59 97-98
N/A 54 58 96-97
School System State
Sources of Information
Composite Score
School
50
50
System
N/A 60 57 0
98-99
N/A 43 56 N/A 45 55
97-98
96-97
State
N/A 61 58 0
98-99
N/A 46 57 97-98
N/A 47 56 96-97
1998-99 GEORGIA PUBLIC EDUCATION REPORT CARD Bacon County Middle/High School - 6032050
Prepared by Georgia Department of Education
Scores Reported in Percentiles
School System State
Page 2
STATE-REQUIRED TEST DATA
NORM-REFERENCED TESTS
Grade 5 Iowa Tests of Basic Skills (ITBS) Each chart reflects data for three years of testing. No fifth-grade students are enrolled at Bacon County Middle/High School.
Reading Comprehension
Mathematics
50
N/A 49 53 0
98-99
N/A 44 53 97-98
N/A 43 52 96-97
School 50
System
State
N/A 52 59 0
98-99
N/A 46 58 97-98
N/A 49 57 96-97
School System State
Reading Vocabulary 50
N/A 54 48 0
98-99
N/A 54 48 97-98
N/A 38 46 96-97
Language Arts
School 50
System
State
N/A 53 63 0
98-99
N/A 43 61 97-98
N/A 37 58 96-97
School System State
Social Studies 50
N/A 48 57 0
98-99
N/A 47 56 97-98
N/A 36 55 96-97
Science
School 50
System
State
N/A 53 60 0
98-99
N/A 47 59 97-98
N/A 46 59 96-97
School System State
Sources of Information
Composite Score
School
50
50
System
N/A 54 58 0
98-99
N/A 46 58 N/A 44 57
97-98
96-97
State
N/A 50 57 0
98-99
N/A 44 56 97-98
N/A 40 55 96-97
1998-99 GEORGIA PUBLIC EDUCATION REPORT CARD Bacon County Middle/High School - 6032050
Prepared by Georgia Department of Education
Scores Reported in Percentiles
School System State
Page 3
STATE-REQUIRED TEST DATA
NORM-REFERENCED TESTS Grade 8
Iowa Tests of Basic Skills (ITBS) Each chart reflects data for three years of testing.
Reading Comprehension 50
43 43 49 0
98-99
42 42 48 97-98
42 42 48 96-97
Mathematics
School 50
System
State
0
49 49 56 98-99
49 49 55 97-98
42 42 54 96-97
School System State
Reading Vocabulary 50
38 38 46 0
98-99
35 35 45 97-98
36 36 44 96-97
Language Arts
School 50
System
State
0
54 54 60 98-99
58 58 58 97-98
55 55 56 96-97
School System State
Social Studies 50
71 71 54 0
98-99
43 43 53 97-98
47 47 53 96-97
Science
School 50
System
State
0
43 43 56 98-99
52 52 55 97-98
49 49 53 96-97
School System State
Sources of Information
Composite Score
50
51 51 57 0
98-99
School 50
System
47 47 56 97-98
51 51 55 96-97
State 0
52 52 56 98-99
48 48 54 97-98
1998-99 GEORGIA PUBLIC EDUCATION REPORT CARD Bacon County Middle/High School - 6032050
Prepared by Georgia Department of Education
46 46 54 96-97
Scores Reported in Percentiles
School System State
Page 4
STATE-REQUIRED TEST DATA
PERFORMANCE ASSESSMENTS
Grade 5 Writing Assessment
Percent at Developmental Stages:
1998-99 School System State
1997-98 School System State
1996-97 School System State
Stage Stage Stage Stage Stage Stage
1:The Emerging Writer 2:The Developing Writer 3:The Focusing Writer 4:The Experimenting 5:The Engaging Writer 6:The Extending Writer
N/A N/A N/A N/A N/A N/A
0% 2% 31% 47% 17% 3%
0% 1% 16% 41% 29% 12%
N/A N/A N/A N/A N/A N/A
0% 3% 23% 47% 22% 6%
0% 3% 19% 41% 27% 10%
N/A N/A N/A N/A N/A N/A
0% 3% 21% 38% 29% 10%
0% 3% 21% 37% 26% 12%
No fifth-grade students are enrolled at Bacon County Middle/High School.
Categories of Scaled Scores
Inadequate (less than 162)
Minimal (162-209)
Good
(210-247)
Very Good (greater than 247)
Average Scaled Score: (Range 100-300)
Grade 8 Writing Assessment
1998-99 Percent Scoring
1997-98 Percent Scoring
1996-97 Percent Scoring
School System State School System State School System State
14% 56% 28%
2%
14% 56% 28%
2%
8% 40% 41% 11%
13% 56% 29%
2%
13% 56% 29%
2%
11% 46% 34%
8%
15% 53% 31%
1%
15% 53% 31%
1%
15% 46% 30%
8%
192
192
208 196
196 202 194
194 198
GEORGIA HIGH SCHOOL GRADUATION TESTS (GHSGT)
Percent of Regular Program 11th Graders Passing the Georgia High School Graduation Tests on First Administration
English Language Arts Mathematics Social Studies Science
All Components listed above
Writing
1998-99
School System State
91% 80% 65% 53%
45%
91% 80% 65% 53%
45%
96% 88% 80% 72%
68%
92% 92% 93%
1997-98
School System State
91% 83% 66% 59%
46%
91% 83% 66% 59%
46%
94% 88% 78% 74%
68%
92% 92% 92%
1996-97
School System State
91% 78% 71% 58%
51%
91% 78% 71% 58%
51%
94% 87% 78% 74%
67%
91% 91% 93%
1998-99 GEORGIA PUBLIC EDUCATION REPORT CARD Bacon County Middle/High School - 6032050
Prepared by Georgia Department of Education
Page 5
GRADUATE DATA
1999 Graduates by Credentials, Race/Ethnicity and Sex
Diplomas with Both College Prep. & Voc. Endorsements
Diplomas with College Prep. Endorsements Diplomas with Vocational Endorsements General High School Diplomas Special Education Diplomas
Total All Diplomas
Certificates of Performance
Total Graduates
Total 38 5 53 0
Black
7 18.4%
0 0.0%
10 18.9%
0
American MultiWhite Hispanic Asian Indian racial
31 81.6%
0 0.0%
0 0.0%
0 0.0%
0 0.0%
5 100.0%
0 0.0%
0 0.0%
0 0.0%
0 0.0%
43 81.1%
0 0.0%
0 0.0%
0 0.0%
0 0.0%
0
0
0
0
0
Male Female
10
28
26.3% 73.7%
5 100.0%
0 0.0%
27
26
50.9% 49.1%
0
0
5
3
2
0
0
0
0
3
2
60.0% 40.0% 0.0% 0.0% 0.0% 0.0% 60.0% 40.0%
101
20
81
0
0
0
0
45
56
19.8% 80.2% 0.0% 0.0% 0.0% 0.0% 44.6% 55.4%
11
6
5
0
0
0
0
3
8
54.5% 45.5% 0.0% 0.0% 0.0% 0.0% 27.3% 72.7%
112
26
86
0
0
0
0
48
64
23.2% 76.8% 0.0% 0.0% 0.0% 0.0% 42.9% 57.1%
HOPE Scholarships
School System
Number of 1999 Graduates 1 1 2
Number Eligible
60
Percent Eligible
53.6%
112 60
53.6%
State
65,548 40,292 61.5%
High School Completion Rate
Percent of 1995Grade 9 Enrollment in Graduating Class of1999 School System State
Completion Rate '95-'99 60.5% 60.5% 68.9%
1998-99 GEORGIA PUBLIC EDUCATION REPORT CARD
Bacon County Middle/High School - 6032050
Prepared by Georgia Department of Education
Page 6
COLLEGE ADMISSIONS / CREDIT TEST DATA
Scholastic Assessment Test (SAT)
Based on students' highest verbal and highest math scores
No. Taking
Average Score
Tests Verbal Math Total
Based on students' last test administration
Average Score Verbal Math Total
School College Prep. Endorsement Other Diplomas
53 467 450
917
492 468
960
362 339
701
System College Prep. Endorsement Other Diplomas
53 467 450
917
492 468
960
362 339
701
Georgia
41,958 492 488
980
454 N/A N/A
454 N/A N/A
483
441 N/A N/A
441 N/A N/A
479
895 N/A N/A
895 N/A N/A
962
Nation
952,913 N/A N/A N/A
502 508 1010
American College Testing (ACT)
Advanced Placement Exams (AP)
Number taking tests: English Mathematics Reading Science Reasoning CompositeScore
6 School System State
18.8 18.8 19.1
17.7 17.7 19.9
20.8 18.5
20.8 18.5
20.2 19.9
19.0 19.0 19.9
No. of Students Taking Tests
No. of Tests Taken No. of Test Scores
3 or Higher Percent of Test
Scores 3 or Higher
School 0
N/A N/A
N/A
System State 0 15,225
N/A 23,969 N/A 13,024
N/A 54.3%
POST-SECONDARY DATA
Graduates Entering Georgia Public Colleges
Graduates Entering Georgia Public Colleges and Requiring Learning Support (LS)
1998 Graduates Entering in 1998-99
1997 Graduates Entering in 1997-98
Percent of Graduating Number Class
School
40
36.0%
System 4 0
36.0%
School
36
29.5%
System 3 6
29.5%
Number Requiring
LS 22 22
16 16
Percent of those attending Georgia
Public Colleges
55.0%
55.0%
44.4%
44.4%
In previous years, the Report Card presented College Prep Curriculum information provided by the Board of Regents on students requiring Learning Support. Due to inconsistencies in the data provided by the Board of Regents in defining College Prep Completers versus Local Board of Education data defining College Prep Endorsements, the Department of Education Report Card will not provide this information until discrepancies can be reconciled.
Graduates Entering Georgia Public Technical and Adult Schools
1998 Graduates School System
Entering Number 10 10
1998-99 Percent
9.0% 9.0%
Entering Number N/A N/A
1997-98 Percent
N/A N/A
1997 Graduates School
0
0.0%
System
0
0.0%
17
13.9%
17
13.9%
1998-99 GEORGIA PUBLIC EDUCATION REPORT CARD Bacon County Middle/High School - 6032050
Prepared by Georgia Department of Education
Page 7
CERTIFIED PERSONNEL DATA
Positions Number Average Contract Days
Administrators
5.00 200.40
Support Personnel
3.00 196.67
PK-12 Teachers
67.02 191.31
Personnel Sex
Certificate
Years Experience
Full-time Part-time
Male Female
4 Yr Bachelor's 5 Yr Master's 6 Yr Specialist's 7 Yr Doctoral Other*
<1 1-10 11-20 21-30 >30
Average
4 2
6 0
0 1 5 0 0
0 0 1 4 1
25.17
3 0
0 3
0 2 1 0 0
0 0 1 2 0
22.00
65 3
25 43
35 24
6 2 1
5 28 21 11
3
12.93
*Includes One- and Two-Year Vocational Certificates.
ACCREDITATION DATA
Accredited by Southern Association of Colleges and Schools (SACS): Secondary/Middle Commission. Accredited with Quality by Georgia Accrediting Commission (GAC).
AWARDS / RECOGNITION DATA
Schools in Georgia may receive recognition in the following programs: Charter School Pay for Performance Program Georgia School of Excellence National Blue Ribbon School Bacon County Middle/High School did not receive recognition in any of these programs during the 1998-99 school year.
1998-99 GEORGIA PUBLIC EDUCATION REPORT CARD Bacon County Middle/High School - 6032050
Prepared by Georgia Department of Education
Page 8
1998-99 GEORGIA PUBLIC EDUCATION REPORT CARD
BACON COUNTY SCHOOLS
Bacon County Primary School - 6031050
Grade Range PK-2
The Georgia Public Education Report Card is designed to assist systems and schools in educational improvement. This report card contains a variety of data elements. An explanation of the terms is provided as a companion to the report card data. Please refer to the definitions for the most effective use of the reported data.
STUDENT DATA
Total
K-2
423
PK
104
Enrollment, by Race/Ethnicity and Sex
Black
White Hispanic
American Asian Indian
Multiracial
98 23.2%
314 74.2%
6 1.4%
0 0.0%
0 0.0%
5 1.2%
35 33.7%
66 63.5%
3 2.9%
0 0.0%
0 0.0%
0 0.0%
Male Female
220 52.0%
203 48.0%
59 56.7%
45 43.3%
Enrollment in Selected Programs
Program
Program % of Student Enrollment Population
Gifted (Grades K-12)
0
0.0%
Alternative Programs (Grades 6-12)
N/A
N/A
Students Eligible to Receive Free/Reduced Lunches
Number
Percent
School System
276
52.4%
947
47.4%
Dropout Rate *
Number
Rate
School System
N/A N/A
N/A N/A
* Dropout rates are not applicable for grades PK-5.
Enrollment in Compensatory Programs
Program
Program % of Student Enrollment Population
Special Education (Grades K-12)
52 12.3%
(PK)
14
N/A
English to Speakers of Other Languages (ESOL) (Grades K-12)
0
0.0%
Remedial Education (Grades 2-5, 9-12)
0
0.0%
Special Instructional Assistance (SIA) (Grades K-3)
168 39.7%
Title I (Grades K-12)
This school has a schoolwide program.
Total 23
Retained Students, by Race/Ethnicity and Sex
Black
White Hispanic
American MultiAsian Indian racial
4 17.4%
18 78.3%
0 0.0%
0 0.0%
0 0.0%
1 4.3%
Male Female
14
9
60.9% 39.1%
Prepared by Georgia Department of Education
Page 1
STATE-REQUIRED TEST DATA
NORM-REFERENCED TESTS
Grade 3 Iowa Tests of Basic Skills (ITBS) Each chart reflects data for three years of testing.
No third-grade students are enrolled at Bacon County Primary School.
Reading Comprehension
Mathematics
50
N/A 57 54 0
98-99
N/A 46 53 97-98
N/A 43 52 96-97
School 50
System
State
N/A 64 61 0
98-99
N/A 46 61 97-98
N/A 55 59 96-97
School System State
Reading Vocabulary 50
N/A 67 50 0
98-99
N/A 43 50 97-98
N/A 43 49 96-97
Language Arts
School 50
System
State
N/A 68 64 0
98-99
N/A 51 62 97-98
N/A 49 59 96-97
School System State
Social Studies 50
N/A 54 56 0
98-99
N/A 45 55 97-98
N/A 42 55 96-97
Science
School 50
System
State
N/A 63 59 0
98-99
N/A 48 59 97-98
N/A 54 58 96-97
School System State
Sources of Information
Composite Score
School
50
50
System
N/A 60 57 0
98-99
N/A 43 56 N/A 45 55
97-98
96-97
State
N/A 61 58 0
98-99
N/A 46 57 97-98
N/A 47 56 96-97
1998-99 GEORGIA PUBLIC EDUCATION REPORT CARD Bacon County Primary School - 6031050
Prepared by Georgia Department of Education
Scores Reported in Percentiles
School System State
Page 2
STATE-REQUIRED TEST DATA
NORM-REFERENCED TESTS
Grade 5 Iowa Tests of Basic Skills (ITBS) Each chart reflects data for three years of testing. No fifth-grade students are enrolled at Bacon County Primary School.
Reading Comprehension
Mathematics
50
N/A 49 53 0
98-99
N/A 44 53 97-98
N/A 43 52 96-97
School 50
System
State
N/A 52 59 0
98-99
N/A 46 58 97-98
N/A 49 57 96-97
School System State
Reading Vocabulary 50
N/A 54 48 0
98-99
N/A 54 48 97-98
N/A 38 46 96-97
Language Arts
School 50
System
State
N/A 53 63 0
98-99
N/A 43 61 97-98
N/A 37 58 96-97
School System State
Social Studies 50
N/A 48 57 0
98-99
N/A 47 56 97-98
N/A 36 55 96-97
Science
School 50
System
State
N/A 53 60 0
98-99
N/A 47 59 97-98
N/A 46 59 96-97
School System State
Sources of Information
Composite Score
School
50
50
System
N/A 54 58 0
98-99
N/A 46 58 N/A 44 57
97-98
96-97
State
N/A 50 57 0
98-99
N/A 44 56 97-98
N/A 40 55 96-97
1998-99 GEORGIA PUBLIC EDUCATION REPORT CARD Bacon County Primary School - 6031050
Prepared by Georgia Department of Education
Scores Reported in Percentiles
School System State
Page 3
STATE-REQUIRED TEST DATA
PERFORMANCE ASSESSMENTS
Grade 5 Writing Assessment
Percent at Developmental Stages:
1998-99 School System State
1997-98 School System State
1996-97 School System State
Stage Stage Stage Stage Stage Stage
1:The Emerging Writer 2:The Developing Writer 3:The Focusing Writer 4:The Experimenting 5:The Engaging Writer 6:The Extending Writer
N/A N/A N/A N/A N/A N/A
0% 2% 31% 47% 17% 3%
0% 1% 16% 41% 29% 12%
N/A N/A N/A N/A N/A N/A
0% 3% 23% 47% 22% 6%
0% 3% 19% 41% 27% 10%
N/A N/A N/A N/A N/A N/A
No fifth-grade students are enrolled at Bacon County Primary School.
0% 3% 21% 38% 29% 10%
0% 3% 21% 37% 26% 12%
AWARDS / RECOGNITION DATA
Schools in Georgia may receive recognition in the following programs: Charter School Pay for Performance Program Georgia School of Excellence National Blue Ribbon School Bacon County Primary School did not receive recognition in any of these programs during the 1998-99 school year.
1998-99 GEORGIA PUBLIC EDUCATION REPORT CARD Bacon County Primary School - 6031050
Prepared by Georgia Department of Education
Page 4
CERTIFIED PERSONNEL DATA
Positions Number Average Contract Days
Personnel Sex
Certificate
Years Experience
Full-time Part-time
Male Female
4 Yr Bachelor's 5 Yr Master's 6 Yr Specialist's 7 Yr Doctoral Other*
<1 1-10 11-20 21-30 >30
Average
Administrators
2.00 200.00
2 0
0 2
0 0 1 1 0 0 0 1 1 0 22.50
Support Personnel
2.40 190.00
2 1
0 3
0 3 0 0 0 0 0 2 1 0 19.00
PK-12 Teachers
39.50 188.78
39 1
0 40
21 16
3 0 0 2 20 13 5 0 11.35
*Includes One- and Two-Year Vocational Certificates.
ACCREDITATION DATA
Accredited with Quality by Georgia Accrediting Commission (GAC).
1998-99 GEORGIA PUBLIC EDUCATION REPORT CARD Bacon County Primary School - 6031050
Prepared by Georgia Department of Education
Page 5
1998-99 GEORGIA PUBLIC EDUCATION REPORT CARD BAKER COUNTY SCHOOLS - 604
The Georgia Public Education Report Card is designed to assist systems and schools in educational improvement. This report card contains a variety of data elements. An explanation of the terms is provided as a companion to the report card data. Please refer to the definitions for the most effective use of the reported data.
Total
K-7
369
PK
71
STUDENT DATA
Enrollment, by Race/Ethnicity and Sex
Black
White Hispanic
American Multi-
Asian Indian
racial
254 68.8%
102 27.6%
9 2.4%
0 0.0%
2 0.5%
2 0.5%
55 77.5%
13 18.3%
2 2.8%
0 0.0%
0 0.0%
1 1.4%
Male
189 51.2%
38 53.5%
Female
180 48.8%
33 46.5%
Enrollment in Selected Programs
Program
Program % of Student Enrollment Population
Gifted (Grades K-12)
0
0.0%
Non-Vocational Labs (Grades 9-12)
N/A
N/A
Vocational Labs (Grades 9-12)
N/A
N/A
Alternative Programs (Grades 6-12)
0
0.0%
Students Eligible to Receive Free/Reduced Lunches
Number
Percent
383
87.0%
Dropout Rate
Number
Percent
6-12 9-12
0 N/A
0.0% N/A
Enrollment in Compensatory Programs
Program
Program % of Student Enrollment Population
Special Education
(Grades K-12)
87
PK
7
English to Speakers of
Other Languages (ESOL)
5
(Grades K-12)
Remedial Education (Grades 2-5, 9-12)
42
Special Instructional
Assistance (SIA)
68
(Grades K-3)
Title I (Grades K-12) Number of schools with: Schoolwide program Targeted Assistance program No Title I program
23.6% N/A
1.4%
21.6%
38.6%
1 0 0
Total 23
Retained Students, by Race/Ethnicity and Sex
Black
White Hispanic
American MultiAsian Indian racial
19 82.6%
4 17.4%
0 0.0%
0 0.0%
0 0.0%
0 0.0%
Male Female
17
6
73.9% 26.1%
Prepared by Georgia Department of Education
Page 1
STATE-REQUIRED TEST DATA
NORM-REFERENCED TESTS
Grade 3 Iowa Tests of Basic Skills (ITBS) Each chart reflects data for three years of testing.
Reading Comprehension
Mathematics
50
33 54 30 53 31 52 0
98-99 97-98 96-97
System State
50
40 61 35 61 41 59 0
98-99 97-98 96-97
System State
Reading Vocabulary
50
29 50 26 50 27 49 0
98-99 97-98 96-97
System State
Social Studies
50
37 56 30 55 31 55 0
98-99 97-98 96-97
System State
Language Arts
50
52 64 40 62 43 59 0
98-99 97-98 96-97
System State
Science
50
39 59 32 59 37 58 0
98-99 97-98 96-97
System State
Sources of Information
Composite Score
50
47 57 0
98-99
System
50
32 56 40 55 97-98 96-97
State
39 58 30 57 0
98-99 97-98
1998-99 GEORGIA PUBLIC EDUCATION REPORT CARD Baker County Schools
Prepared by Georgia Department of Education
System State Scores Reported 34 56 in Percentiles 96-97
Page 2
STATE-REQUIRED TEST DATA
NORM-REFERENCED TESTS
Grade 5 Iowa Tests of Basic Skills (ITBS) Each chart reflects data for three years of testing.
Reading Comprehension
Mathematics
50
35 53 24 53 27 52 0
98-99 97-98 96-97
System State
50
37 59 45 58 38 57 0
98-99 97-98 96-97
System State
Reading Vocabulary
50
25 48 10 48 18 46 0
98-99 97-98 96-97
System State
Social Studies
50
26 57 17 56 26 55 0
98-99 97-98 96-97
System State
Language Arts
50
58 63 37 61 37 58 0
98-99 97-98 96-97
System State
Science
50
29 60 21 59 31 59 0
98-99 97-98 96-97
System State
Sources of Information
Composite Score
50
46 58 0
98-99
System
50
36 58 30 57 97-98 96-97
State
36 57 25 56 0
98-99 97-98
1998-99 GEORGIA PUBLIC EDUCATION REPORT CARD Baker County Schools
Prepared by Georgia Department of Education
System State Scores Reported 28 55 in Percentiles 96-97
Page 3
STATE-REQUIRED TEST DATA
NORM-REFERENCED TESTS
Grade 8 Iowa Tests of Basic Skills (ITBS) Each chart reflects data for three years of testing.
No eighth-grade students are enrolled at Baker County schools.
Reading Comprehension
Mathematics
50
N/A 49 N/A 48 N/A 48 0
98-99 97-98 96-97
System State
50
N/A 56 N/A 55 N/A 54 0
98-99 97-98 96-97
System State
Reading Vocabulary
50
N/A 46 N/A 45 N/A 44 0
98-99 97-98 96-97
System State
Language Arts
50
N/A 60 N/A 58 N/A 56 0
98-99 97-98 96-97
System State
Social Studies
50
N/A 54 N/A 53 N/A 53 0
98-99 97-98 96-97
System State
Science
50
N/A 56 N/A 55 N/A 53 0
98-99 97-98 96-97
System State
Sources of Information
Composite Score
50
System
50
System
N/A 57 N/A 56 N/A 55 0
98-99 97-98 96-97
State
State
N/A 56 0
N/A 54
Scores Reported N/A 54 in Percentiles
98-99 97-98 96-97
1998-99 GEORGIA PUBLIC EDUCATION REPORT CARD Baker County Schools
Prepared by Georgia Department of Education
Page 4
STATE-REQUIRED TEST DATA
PERFORMANCE ASSESSMENTS
Grade 5 Writing Assessment
1998-99
1997-98
1996-97
Percent at Developmental Stages:
Comparison
Comparison
Comparison
System Group State System Group State System Group State
Stage Stage Stage Stage Stage Stage
1: The Emerging Writer 2: The Developing Writer 3: The Focusing Writer 4: The Experimenting Writer 5: The Engaging Writer 6: The Extending Writer
0% 0% 34% 50% 16% 0%
1% 3% 31% 46% 16% 3%
0% 1% 16% 41% 29% 12%
0% 36% 54%
7% 4% 0%
1% 15% 38% 35% 10%
2%
0% 3% 19% 41% 27% 10%
2% 16% 49% 16% 16%
0%
2% 11% 36% 36% 14%
2%
0% 3% 21% 37% 26% 12%
Grade 8 Writing Assessment
1998-99 Percent Scoring 1997-98 Percent Scoring 1996-97 Percent Scoring
Categories of Scaled Scores
Comparison
Comparison
Comparison
System Group State System Group State System Group State
Inadequate (less than 162)
Minimal (162-209)
Good
(210-247)
Very Good (greater than 247)
N/A N/A N/A N/A
N/A N/A N/A N/A
8% 40% 41% 11%
N/A N/A N/A N/A
36% 52% 11%
1%
11% 46% 34%
8%
N/A N/A N/A N/A
40% 45% 13%
2%
15% 46% 30%
8%
Average Scaled Score: (Range 100-300)
N/A
N/A
208 N/A
172 202 N/A
173 198
No eighth-grade students are enrolled at Baker County schools.
GEORGIA HIGH SCHOOL GRADUATION TESTS (GHSGT)
Percent of Regular Program 11th Graders Passing the Georgia High School Graduation Tests on First Administration
1998-99
1997-98
1996-97
Comparison
Comparison
Comparison
System Group State System Group State System Group State
English Language Arts Mathematics Social Studies Science
All Components listed above Writing
N/A N/A N/A N/A N/A N/A
N/A N/A N/A N/A N/A N/A
96% 88% 80% 72% 68% 93%
N/A N/A N/A N/A N/A N/A
N/A N/A N/A N/A N/A N/A
94% 88% 78% 74% 68% 92%
N/A N/A N/A N/A N/A N/A
82% 64% 40% 37% 26% 84%
94% 87% 78% 74% 67% 93%
No eleventh-grade students are enrolled at Baker County schools.
1998-99 GEORGIA PUBLIC EDUCATION REPORT CARD
Baker County Schools
Prepared by Georgia Department of Education
Page 5
GRADUATE DATA
1999 Graduates by Credentials, Race/Ethnicity and Sex
Diplomas with Both College Prep. & Voc. Endorsements
Diplomas with College Prep. Endorsements
Diplomas with Vocational Endorsements
General High School Diplomas
Special Education Diplomas
Total All Diplomas
Total N/A
Black N/A
American MultiWhite Hispanic Asian Indian racial
N/A N/A N/A N/A N/A
Male Female N/A N/A
N/A
N/A
N/A N/A N/A N/A N/A
N/A N/A
N/A
N/A
N/A N/A N/A N/A N/A
N/A N/A
N/A
N/A
N/A N/A N/A N/A N/A
N/A N/A
N/A
N/A
N/A N/A N/A N/A N/A
N/A N/A
N/A
Certificates of Performance
Total Graduates
N/A N/A
N/A
N/A N/A N/A N/A N/A
N/A N/A
HOPE Scholarships
System State
Number of 1999 Graduates Number Eligible Percent Eligible
N/A N/A N/A
65,548 40,292 61.5%
High School Completion Rate Percent of 1995Grade 9 Enrollment
in Graduating Class of1999
System
State
Completion Rate '95-'99 N / A
68.9%
COLLEGE ADMISSIONS / CREDIT TEST DATA
Scholastic Assessment Test (SAT)
No. Taking
Average Score
Tests
Verbal Math Total
Based on students' highest verbal and highest math scores
System College Prep. Endorsement Other Diplomas
N/A N/A N/A
N/A N/A N/A
N/A N/A N/A
Georgia
492 488 980
Based on students' last test administration
System Georgia
N/A 41,958
N/A N/A 483 479
N/A 962
Nation
952,913 502 508 1010
American College Testing (ACT)
System State Nation
English Mathematics Reading Science Reasoning
N/A N/A N/A N/A
19.1 19.9 20.2 19.9
20.4 20.7 21.3 21.0
CompositeScore N/A * 19.9 21.9
* Scores not reported when fewer than 5 tests taken.
Advanced Placement Exams (AP)
No. of Students Taking Tests
No. of Tests Taken No. of Test Scores
3 or Higher Percent of Test
Scores 3 or Higher
System State N/A 15,225 N/A 23,969 N/A 13,024
N/A 54.3%
1998-99 GEORGIA PUBLIC EDUCATION REPORT CARD Baker County Schools
Prepared by Georgia Department of Education
Page 6
POSTSECONDARY DATA
Graduates Entering Georgia Public Colleges and Universities
Graduates Entering Georgia Public Colleges and Universities and
Requiring Learning Support (LS)
1998 Graduates Entering 1998-99
1997 Graduates Entering 1997-98
Percent of Graduating Number Class
N/A
N/A
N/A
N/A
Number Requiring
LS
N/A
N/A
Percent of those attending Georgia
Public Colleges
N/A
N/A
In previous years, the Report Card presented College Prep Curriculum information provided by the Board of Regents on students requiring Learning Support. Due to inconsistencies in the data provided by the Board of Regents in defining College Prep Completers versus Local Board of Education data defining College Prep Endorsements, the Department of Education Report Card will not provide this information until discrepancies can be reconciled.
Graduates Entering Georgia Public Technical and Adult Schools
Entering 1998-99 Entering 1997-98
Number Percent
Number Percent
1998 Graduates 1997 Graduates
N/A N/A
N/A N/A
N/A N/A
N/A N/A
ACCREDITATION / RECOGNITION DATA
Southern Association of Colleges and Schools (SACS) Accrediting Commission
Secondary/Middle Commission Elementary/Middle Commission Both Elementary/Secondary Commissions Joint Commission Candidate for Accreditation
Accreditation by Georgia Accrediting Commission (GAC)
Accredited by GAC Accredited with Quality by GAC
Number of Schools
0 0 0 0 0
Number of Schools
0 1
Awards / Recognition
State Recognized Program
Number of Schools
Charter School
0
Pay for Performance Recipient
0
Georgia School of Excellence
0
National Blue Ribbon School
0
COMMUNITY DATA
Number of Children Eligible for Migrant Education Number of Families-At-Risk * Number of Food Stamp Participants * Number of Families Receiving TANF * ** Per Capita Income * Unemployment Rate * 1990 Population * Projected 2000 Population * Projected 2010 Population *
* Data Available at County Level Only ** Known as AFDC before January 1997
11 15 860 76 $17,049 9.4% 3,615 3,599 3,636
1998-99 GEORGIA PUBLIC EDUCATION REPORT CARD Baker County Schools
Prepared by Georgia Department of Education
Page 7
FISCAL DATA
Millage Rate
16.80
* Fall 1998 Property Tax Digest is used to calculate the 98-99 Value of One Mill
FTE Count
FTE Count used for Allotment Calculation 364.0 Fall '98 FTE Count 369
Value of One Mill
$95,283 $261.76 per Allotment FTE
Sources: Local State-QBE State-
Lottery State-
Other Federal Other
Total
PerGeneral Fund cent Per FTE
$1,652,531 51.0% $4,540 $1,529,237 47.2% $4,201
K-12 Revenues
Lottery K-12
and
Title
All Other
Programs
K-12
$482
$51,845
Bonded Debt $72
$0
$0
$0
$0 0.0%
$0
$0
$11,022
$0
$7,742 0.2% $21
$0
$0
$0
$50,570 1.6% $139 $601,323
$9,874
$0
$0 0.0%
$0
$0
$0
$0
$3,240,081 100% $8,901 $601,805
$72,742
$72
Capital Projects
$221,498 $0
$0
$0 $0 $0 $221,498
School Nutrition
$9,719 $0
$0
$16,365 $155,137
$0 $181,221
Grand Total
Total
Per-
Amount cent
$1,936,150 44.8%
$1,529,237 35.4%
$11,022 0.3%
$24,107 0.6% $816,905 18.9%
$0 0.0% $4,317,421 100%
Instruction
Media
Instruction Support
Pupil Services General Admin. School Admin. Trans-
portation Maint. & Ops. Capital Projects School Food Debt Service
$2,001,215 65.6% $5,498 $77,299 2.5% $212
$62,406 2.0% $171
$4,850 0.2% $13
$274,041 9.0% $753
$101,376 3.3% $279
$329,239 10.8% $905
$199,176 6.5% $547
$0 0.0%
$0
$821 0.0%
$2
$0 0.0%
$0
K-12 Expenditures
$274,674 $105,443
$0
$0
$0
$0
$22,133
$0
$0
$0
$0
$0
$16,611
$0
$0
$1,133
$0
$0
$0
$0
$0
$2,790
$0
$0
$25,780
$0
$0
$223,207 $114,297
$0
$0
$0
$40,094
$0 $0 $0 $0 $0 $0 $0 $0 $84,582 $0 $0
$0 $0 $0 $0 $0 $0 $0 $0 $0 $194,230 $0
$2,381,334 57.3% $77,299 1.9% $84,539 2.0% $4,850 0.1%
$290,652 7.0% $102,510 2.5% $329,239 7.9% $201,967 4.9% $110,362 2.7% $532,556 12.8%
$40,094 1.0%
Total
$3,050,427 100% $8,380 $566,331 $219,740
$40,094
* This system received funds that followed students to other systems.
$84,582 $194,230 $4,155,407 100%
Salaries and Benefits as Percentages of Revenues and of Expenditures
Teachers and Paraprofessionals
Salaries $1,545,682
Benefits $343,787
Percentage of Revenues Percentage of Expenditures
Total of
Total of
General Fund
General Fund
Title Programs
Title Programs
Lottery K-12
Lottery K-12
Total Salaries
and
Total
and
Total
and Benefits All Other K-12 K - 12 All Other K-12 K - 12
$1,889,469
48.3%
43.8%
49.2%
45.5%
School Administration
$65,419
$18,256
$83,675
2.1%
1.9%
2.2%
2.0%
General Administration
$141,716
$39,656
$181,372
4.6%
4.2%
4.7%
4.4%
1998-99 GEORGIA PUBLIC EDUCATION REPORT CARD
Baker County Schools - 604
Prepared by Georgia Department of Education
Page 8
CERTIFIED PERSONNEL DATA
Number
Average Annual Salary Positions Average Contract Days
Average Daily Salary
Full-time Personnel Part-time
Sex Male Female
4 Yr Bachelor's Certificate 5 Yr Master's
Level 6 Yr Specialist's 7 Yr Doctoral Other*
Black
White Race/ Hispanic Ethnicity Asian
American Indian
Multiracial
Years Experience
<1 1-10 11-20 21-30 >30
Average
Administrators
3.00
$67,596.25 220.33
$306.79
3 0
2 1
0 1 2 0 0
1 2 0 0 0 0
0 0 0 2 1
26.67
Support Personnel PK-12 Teachers
2.00
34.00
$41,207.50 190.00
$216.88
$36,362.21 190.00
$191.38
2
34
0
0
0
4
2
30
1
19
1
9
0
6
0
0
0
0
1
18
1
16
0
0
0
0
0
0
0
0
0
1
0
13
1
10
0
10
1
0
29.00
14.24
*Includes One- and Two-Year Vocational Certificates.
Certified Staff Position Ratios
Teacher/Administrator Ratio 11:1
Teacher/Support Person Ratio 17:1
Teacher/Staff Ratio 7:1
Student Enrollment/All Teachers 11:1
Certified Personnel by Category
87.2% 100%
7.7%
5.1%
80% 60%
40%
20%
0%
Teachers
Administrators
Support Personnel
1998-99 GEORGIA PUBLIC EDUCATION REPORT CARD
Baker County Schools - 604
Prepared by Georgia Department of Education
Page 9
1998-99 GEORGIA PUBLIC EDUCATION REPORT CARD
BAKER COUNTY SCHOOLS
Baker County Elementary School - 6040182
Grade Range PK-7
The Georgia Public Education Report Card is designed to assist systems and schools in educational improvement. This report card contains a variety of data elements. An explanation of the terms is provided as a companion to the report card data. Please refer to the definitions for the most effective use of the reported data.
STUDENT DATA
Total
K-7
369
PK
71
Enrollment, by Race/Ethnicity and Sex
Black
White Hispanic
American Asian Indian
Multiracial
254 68.8%
102 27.6%
9 2.4%
0 0.0%
2 0.5%
2 0.5%
55 77.5%
13 18.3%
2 2.8%
0 0.0%
0 0.0%
1 1.4%
Male Female
189 51.2%
180 48.8%
38 53.5%
33 46.5%
Enrollment in Selected Programs
Program
Program % of Student Enrollment Population
Gifted (Grades K-12)
0
0.0%
Alternative Programs (Grades 6-12)
0
0.0%
Students Eligible to Receive Free/Reduced Lunches
Number
Percent
School System
383
87.0%
383
87.0%
Dropout Rate for Grades 6-7
Number
Rate
School System
0
0.0%
0
0.0%
Enrollment in Compensatory Programs
Program
Program % of Student Enrollment Population
Special Education (Grades K-12)
87 23.6%
(PK)
7
N/A
English to Speakers of Other Languages (ESOL) (Grades K-12)
5
1.4%
Remedial Education (Grades 2-5, 9-12)
42 21.6%
Special Instructional Assistance (SIA) (Grades K-3)
68 38.6%
Title I (Grades K-12)
This school has a schoolwide program.
Total 23
Retained Students, by Race/Ethnicity and Sex
Black
White Hispanic
American MultiAsian Indian racial
19 82.6%
4 17.4%
0 0.0%
0 0.0%
0 0.0%
0 0.0%
Male Female
17
6
73.9% 26.1%
Prepared by Georgia Department of Education
Page 1
STATE-REQUIRED TEST DATA
NORM-REFERENCED TESTS Grade 3
Iowa Tests of Basic Skills (ITBS) Each chart reflects data for three years of testing.
Reading Comprehension 50
33 33 54 0
98-99
30 30 53 97-98
31 31 52 96-97
Mathematics
School 50
System
State
0
40 40 61 98-99
35 35 61 97-98
41 41 59 96-97
School System State
Reading Vocabulary 50
29 29 50 0
98-99
26 26 50 97-98
27 27 49 96-97
Language Arts
School 50
System
State
0
52 52 64 98-99
40 40 62 97-98
43 43 59 96-97
School System State
Social Studies 50
37 37 56 0
98-99
30 30 55 97-98
31 31 55 96-97
Science
School 50
System
State
0
39 39 59 98-99
32 32 59 97-98
37 37 58 96-97
School System State
Sources of Information
Composite Score
50
47 47 57 0
98-99
School 50
System
32 32 56 97-98
40 40 55 96-97
State 0
39 39 58 98-99
30 30 57 97-98
1998-99 GEORGIA PUBLIC EDUCATION REPORT CARD Baker County Elementary School - 6040182
Prepared by Georgia Department of Education
34 34 56 96-97
Scores Reported in Percentiles
School System State
Page 2
STATE-REQUIRED TEST DATA
NORM-REFERENCED TESTS Grade 5
Iowa Tests of Basic Skills (ITBS) Each chart reflects data for three years of testing.
Reading Comprehension
Mathematics
50
35 35 53 0
98-99
24 24 53 97-98
27 27 52 96-97
School 50
System
State
0
37 37 59 98-99
45 45 58 97-98
38 38 57 96-97
School System State
Reading Vocabulary 50
25 25 48 0
98-99
10 10 48 97-98
18 18 46 96-97
Language Arts
School 50
System
State
0
58 58 63 98-99
37 37 61 97-98
37 37 58 96-97
School System State
Social Studies 50
26 26 57 0
98-99
17 17 56 97-98
26 26 55 96-97
Science
School 50
System
State
0
29 29 60 98-99
21 21 59 97-98
31 31 59 96-97
School System State
Sources of Information
Composite Score
50
46 46 58 0
98-99
School 50
System
36 36 58 97-98
30 30 57 96-97
State 0
36 36 57 98-99
25 25 56 97-98
28 28 55 96-97
1998-99 GEORGIA PUBLIC EDUCATION REPORT CARD Baker County Elementary School - 6040182
Prepared by Georgia Department of Education
Scores Reported in Percentiles
School System State
Page 3
STATE-REQUIRED TEST DATA
PERFORMANCE ASSESSMENTS
Grade 5 Writing Assessment
Percent at Developmental Stages:
1998-99 School System State
1997-98 School System State
1996-97 School System State
Stage Stage Stage Stage Stage Stage
1:The Emerging Writer 2:The Developing Writer 3:The Focusing Writer 4:The Experimenting 5:The Engaging Writer 6:The Extending Writer
0% 0% 34% 50% 16% 0%
0% 0% 34% 50% 16% 0%
0% 1% 16% 41% 29% 12%
0% 36% 54%
7% 4% 0%
0% 36% 54%
7% 4% 0%
0% 3% 19% 41% 27% 10%
2% 16% 49% 16% 16%
0%
2% 16% 49% 16% 16%
0%
0% 3% 21% 37% 26% 12%
AWARDS / RECOGNITION DATA
Schools in Georgia may receive recognition in the following programs: Charter School Pay for Performance Program Georgia School of Excellence National Blue Ribbon School Baker County Elementary School did not receive recognition in any of these programs during the 1998-99 school year.
1998-99 GEORGIA PUBLIC EDUCATION REPORT CARD Baker County Elementary School - 6040182
Prepared by Georgia Department of Education
Page 4
CERTIFIED PERSONNEL DATA
Positions Number Average Contract Days
Personnel Sex
Certificate
Years Experience
Full-time Part-time
Male Female
4 Yr Bachelor's 5 Yr Master's 6 Yr Specialist's 7 Yr Doctoral Other*
<1 1-10 11-20 21-30 >30
Average
Administrators
1.00 231.00
1 0
1 0
0 0 1 0 0 0 0 0 1 0 23.00
Support Personnel
2.00 190.00
2 0
0 2
1 1 0 0 0 0 0 1 0 1 29.00
PK-12 Teachers
34.00 190.00
34 0
4 30
19 9 6 0 0 1
13 10 10
0 14.24
*Includes One- and Two-Year Vocational Certificates.
ACCREDITATION DATA
Accredited with Quality by Georgia Accrediting Commission (GAC).
1998-99 GEORGIA PUBLIC EDUCATION REPORT CARD Baker County Elementary School - 6040182
Prepared by Georgia Department of Education
Page 5
1998-99 GEORGIA PUBLIC EDUCATION REPORT CARD BALDWIN COUNTY SCHOOLS - 605
The Georgia Public Education Report Card is designed to assist systems and schools in educational improvement. This report card contains a variety of data elements. An explanation of the terms is provided as a companion to the report card data. Please refer to the definitions for the most effective use of the reported data.
Total
K-12
6,233
PK
153
STUDENT DATA
Enrollment, by Race/Ethnicity and Sex
Black
White Hispanic
American Multi-
Asian Indian
racial
3,768 60.5%
2,318 37.2%
28 0.4%
70 1.1%
5 0.1%
44 0.7%
93 60.8%
54 35.3%
1 0.7%
2 1.3%
0 0.0%
3 2.0%
Male
3,135 50.3%
78 51.0%
Female
3,098 49.7%
75 49.0%
Enrollment in Selected Programs
Program
Program % of Student Enrollment Population
Gifted (Grades K-12)
492
7.9%
Non-Vocational Labs (Grades 9-12)
965
55.2%
Vocational Labs (Grades 9-12)
998
57.1%
Alternative Programs (Grades 6-12)
26
< 1%
Students Eligible to Receive Free/Reduced Lunches
Number
Percent
3,400
53.2%
Dropout Rate
Number
Percent
6-12
163
4.8%
9-12
162
8.4%
Enrollment in Compensatory Programs
Program
Program % of Student Enrollment Population
Special Education (Grades K-12)
PK
1,016 37
English to Speakers of
Other Languages (ESOL)
0
(Grades K-12)
Remedial Education (Grades 2-5, 9-12)
558
Special Instructional
Assistance (SIA)
364
(Grades K-3)
Title I (Grades K-12) Number of schools with: Schoolwide program Targeted Assistance program No Title I program
16.3% N/A
0.0%
14.8%
16.9%
2 6 1
Total 509
Retained Students, by Race/Ethnicity and Sex
Black
White Hispanic
American MultiAsian Indian racial
339 66.6%
165 32.4%
2 0.4%
1 0.2%
0 0.0%
2 0.4%
Male Female 319 190
62.7% 37.3%
Prepared by Georgia Department of Education
Page 1
STATE-REQUIRED TEST DATA
NORM-REFERENCED TESTS
Grade 3 Iowa Tests of Basic Skills (ITBS) Each chart reflects data for three years of testing.
Reading Comprehension
Mathematics
50
60 54 57 53 52 52 0
98-99 97-98 96-97
System State
50
72 61 68 61 71 59 0
98-99 97-98 96-97
System State
Reading Vocabulary
50
69 50 60 50 51 49 0
98-99 97-98 96-97
System State
Social Studies
50
67 56 67 55 60 55 0
98-99 97-98 96-97
System State
Language Arts
50
76 64 70 62 69 59 0
98-99 97-98 96-97
System State
Science
50
69 59 64 59 65 58 0
98-99 97-98 96-97
System State
Sources of Information
Composite Score
50
61 57 0
98-99
System
50
58 56 57 55 97-98 96-97
State
68 58 64 57 0
98-99 97-98
1998-99 GEORGIA PUBLIC EDUCATION REPORT CARD Baldwin County Schools
Prepared by Georgia Department of Education
System State Scores Reported 62 56 in Percentiles 96-97
Page 2
STATE-REQUIRED TEST DATA
NORM-REFERENCED TESTS
Grade 5 Iowa Tests of Basic Skills (ITBS) Each chart reflects data for three years of testing.
Reading Comprehension
Mathematics
50
54 53 54 53 50 52 0
98-99 97-98 96-97
System State
50
66 59 63 58 62 57 0
98-99 97-98 96-97
System State
Reading Vocabulary
50
54 48 45 48 46 46 0
98-99 97-98 96-97
System State
Social Studies
50
57 57 59 56 51 55 0
98-99 97-98 96-97
System State
Language Arts
50
64 63 64 61 63 58 0
98-99 97-98 96-97
System State
Science
50
61 60 59 59 55 59 0
98-99 97-98 96-97
System State
Sources of Information
Composite Score
50
57 58 0
98-99
System
50
56 58 54 57 97-98 96-97
State
59 57 58 56 0
98-99 97-98
1998-99 GEORGIA PUBLIC EDUCATION REPORT CARD Baldwin County Schools
Prepared by Georgia Department of Education
System State Scores Reported 54 55 in Percentiles 96-97
Page 3
STATE-REQUIRED TEST DATA
NORM-REFERENCED TESTS Grade 8
Iowa Tests of Basic Skills (ITBS) Each chart reflects data for three years of testing.
Reading Comprehension
Mathematics
50
48 49 43 48 42 48 0
98-99 97-98 96-97
System State
50
62 56 56 55 55 54 0
98-99 97-98 96-97
System State
Reading Vocabulary
50
43 46 37 45 38 44 0
98-99 97-98 96-97
System State
Language Arts
50
61 60 57 58 60 56 0
98-99 97-98 96-97
System State
Social Studies
50
51 54 48 53 49 53 0
98-99 97-98 96-97
System State
Science
50
52 56 42 55 45 53 0
98-99 97-98 96-97
System State
Sources of Information
Composite Score
50
51 57 0
98-99
System
50
49 56 48 55 97-98 96-97
State
56 56 48 54 0
98-99 97-98
1998-99 GEORGIA PUBLIC EDUCATION REPORT CARD Baldwin County Schools
Prepared by Georgia Department of Education
System State Scores Reported 50 54 in Percentiles 96-97
Page 4
STATE-REQUIRED TEST DATA
PERFORMANCE ASSESSMENTS
Grade 5 Writing Assessment
1998-99
1997-98
1996-97
Percent at Developmental Stages:
Comparison
Comparison
Comparison
System Group State System Group State System Group State
Stage Stage Stage Stage Stage Stage
1: The Emerging Writer 2: The Developing Writer 3: The Focusing Writer 4: The Experimenting Writer 5: The Engaging Writer 6: The Extending Writer
0% 1% 25% 42% 23% 8%
0% 1% 19% 43% 27% 10%
0% 1% 16% 41% 29% 12%
0% 1% 21% 47% 27% 4%
0% 3% 22% 43% 23% 7%
0% 3% 19% 41% 27% 10%
0% 4% 24% 41% 23% 8%
0% 5% 26% 39% 22% 8%
0% 3% 21% 37% 26% 12%
Grade 8 Writing Assessment
1998-99 Percent Scoring 1997-98 Percent Scoring 1996-97 Percent Scoring
Categories of Scaled Scores
Comparison
Comparison
Comparison
System Group State System Group State System Group State
Inadequate (less than 162)
Minimal (162-209)
Good
(210-247)
Very Good (greater than 247)
10% 50% 34%
5%
8% 45% 39%
9%
8% 40% 41% 11%
14% 55% 25%
6%
13% 50% 31%
6%
11% 46% 34%
8%
16% 51% 29%
5%
18% 48% 28%
6%
15% 46% 30%
8%
Average Scaled Score: (Range 100-300)
199
205 208
193
197 202
194
194 198
GEORGIA HIGH SCHOOL GRADUATION TESTS (GHSGT)
Percent of Regular Program 11th Graders Passing the Georgia High School Graduation Tests on First Administration
1998-99
1997-98
1996-97
Comparison
Comparison
Comparison
System Group State System Group State System Group State
English Language Arts Mathematics Social Studies Science
92% 76% 67% 60%
95% 86% 76% 68%
96% 88% 80% 72%
94% 75% 71% 64%
93% 86% 73% 71%
94% 88% 78% 74%
87% 70% 58% 53%
91% 81% 69% 65%
94% 87% 78% 74%
All Components listed above 5 3 %
63% 68% 55%
63% 68% 43%
57% 67%
Writing
85%
92% 93% 91%
91% 92% 84%
91% 93%
1998-99 GEORGIA PUBLIC EDUCATION REPORT CARD
Baldwin County Schools
Prepared by Georgia Department of Education
Page 5
GRADUATE DATA
1999 Graduates by Credentials, Race/Ethnicity and Sex
Diplomas with Both College Prep. & Voc. Endorsements
Diplomas with College Prep. Endorsements Diplomas with Vocational Endorsements General High School Diplomas Special Education Diplomas
Total All Diplomas
Certificates of Performance
Total Graduates
Total 58 68 96 28 6
256 66
322
Black
41 70.7%
17 25.0%
60 62.5%
19 67.9%
3 50.0%
140 54.7%
59 89.4%
199 61.8%
American MultiWhite Hispanic Asian Indian racial
17 29.3%
45 66.2%
34 35.4%
9 32.1%
3 50.0%
108 42.2%
0 0.0%
0 0.0%
0 0.0%
0 0.0%
0 0.0%
0 0.0%
0 0.0%
5 7.4%
1 1.0%
0 0.0%
0 0.0%
6 2.3%
0 0.0%
0 0.0%
0 0.0%
0 0.0%
0 0.0%
0 0.0%
0 0.0%
1 1.5%
1 1.0%
0 0.0%
0 0.0%
2 0.8%
7
0
0
0
0
10.6% 0.0% 0.0% 0.0% 0.0%
115
0
6
0
2
35.7% 0.0% 1.9% 0.0% 0.6%
Male Female
19 32.8%
27 39.7%
52 54.2%
14 50.0%
3 50.0%
115 44.9%
39 67.2%
41 60.3%
44 45.8%
14 50.0%
3 50.0%
141 55.1%
27
39
40.9% 59.1%
142 180 44.1% 55.9%
HOPE Scholarships
System State
Number of 1999 Graduates 3 2 2
Number Eligible
107
Percent Eligible
33.2%
65,548 40,292 61.5%
High School Completion Rate Percent of 1995Grade 9 Enrollment
in Graduating Class of1999
System
State
Completion Rate '95-'99 62.2% 68.9%
COLLEGE ADMISSIONS / CREDIT TEST DATA
Scholastic Assessment Test (SAT)
No. Taking
Average Score
Tests
Verbal Math Total
Based on students' highest verbal and highest math scores
System College Prep. Endorsement Other Diplomas
474 443 917 495 469 964 358 330 688
Georgia
492 488 980
Based on students' last test administration
System Georgia
143
464 435
899
41,958 483 479 962
Nation
952,913 502 508 1010
American College Testing (ACT)
System State Nation
English
17.3
19.1 20.4
Mathematics
17.6
19.9 20.7
Reading
18.8
20.2 21.3
Science Reasoning 17.6
19.9 21.0
CompositeScore 18.0
19.9 21.9
Advanced Placement Exams (AP)
No. of Students Taking Tests
No. of Tests Taken No. of Test Scores
3 or Higher Percent of Test
Scores 3 or Higher
System State 18 15,225 23 23,969 10 13,024
43.5% 54.3%
1998-99 GEORGIA PUBLIC EDUCATION REPORT CARD Baldwin County Schools
Prepared by Georgia Department of Education
Page 6
POSTSECONDARY DATA
Graduates Entering Georgia Public Colleges and Universities
Graduates Entering Georgia Public Colleges and Universities and
Requiring Learning Support (LS)
1998 Graduates Entering 1998-99
1997 Graduates Entering 1997-98
Percent of Graduating Number Class
76
22.9%
63
24.7%
Number Requiring
LS
16
10
Percent of those attending Georgia
Public Colleges
21.1%
15.9%
In previous years, the Report Card presented College Prep Curriculum information provided by the Board of Regents on students requiring Learning Support. Due to inconsistencies in the data provided by the Board of Regents in defining College Prep Completers versus Local Board of Education data defining College Prep Endorsements, the Department of Education Report Card will not provide this information until discrepancies can be reconciled.
Graduates Entering Georgia Public Technical and Adult Schools
Entering 1998-99 Entering 1997-98
Number Percent
Number Percent
1998 Graduates 1997 Graduates
47
14.2%
3
1.2%
N/A 32
N/A 12.5%
ACCREDITATION / RECOGNITION DATA
Southern Association of Colleges and Schools (SACS) Accrediting Commission
Secondary/Middle Commission Elementary/Middle Commission Both Elementary/Secondary Commissions Joint Commission Candidate for Accreditation
Accreditation by Georgia Accrediting Commission (GAC)
Accredited by GAC Accredited with Quality by GAC
Number of Schools
1 2 0 0 0
Number of Schools
0 0
Awards / Recognition
State Recognized Program
Number of Schools
Charter School
0
Pay for Performance Recipient
1
Georgia School of Excellence
0
National Blue Ribbon School
0
COMMUNITY DATA
Number of Children Eligible for Migrant Education Number of Families-At-Risk * Number of Food Stamp Participants * Number of Families Receiving TANF * ** Per Capita Income * Unemployment Rate * 1990 Population * Projected 2000 Population * Projected 2010 Population *
* Data Available at County Level Only ** Known as AFDC before January 1997
11 138 3,217 402 $19,843 5.4% 39,530 42,691 46,721
1998-99 GEORGIA PUBLIC EDUCATION REPORT CARD Baldwin County Schools
Prepared by Georgia Department of Education
Page 7
FISCAL DATA
Millage Rate
16.65
* Fall 1998 Property Tax Digest is used to calculate the 98-99 Value of One Mill
FTE Count
FTE Count used for Allotment Calculation 6,163.0 Fall '98 FTE Count 6,233
Value of One Mill
$460,508 $74.72 per Allotment FTE
Sources: Local State-QBE State-
Lottery State-
Other Federal Other
Total
PerGeneral Fund cent Per FTE
$8,409,657 25.6% $1,365 $23,862,059 72.6% $3,872
K-12 Revenues
Lottery K-12
and
Title
All Other
Programs
K-12
$0
$0
Bonded Debt $233,934
$0
$0
$0
$0 0.0%
$0
$0 $136,361
$0
$589,743 1.8% $96
$0 0.0%
$0
$0 0.0%
$0
$32,861,460 100% $5,333
$127,911 $2,102,603
$0 $2,230,514
$74,896 $33,810
$0 $245,068
$0 $0 $4,714,506 $4,948,440
Capital Projects
$356,608 $0
$0
$1,002,174 $0
$1,500,000 $2,858,783
School Nutrition
$632,879 $0
$0
$153,458 $1,554,905
$0 $2,341,243
Grand Total
Total
Per-
Amount cent
$9,633,081 21.2%
$23,862,059 52.5%
$136,361 0.3%
$1,948,183 4.3% $3,691,319 8.1% $6,214,506 13.7% $45,485,511 100%
Instruction
Media Instruction
Support Pupil Services General Admin. School Admin. Trans-
portation Maint. & Ops. Capital Projects School Food Debt Service
Total
K-12 Expenditures
$22,185,553 67.4% $3,600 $1,610,452 $139,971
$0
$0
$0
$703,846 2.1% $114
$0
$0
$0
$0
$0
$966,384 2.9% $157 $226,838
$51,498
$0
$0
$0
$1,351,512 4.1% $219 $148,149
$7,975
$0
$0
$0
$941,124 2.9% $153 $143,156
$0
$0
$0
$0
$2,153,006 6.5% $349
$12,760
$45,000
$0
$0
$0
$1,613,670 4.9% $262
$86,446
-$19
$0
$0
$0
$3,000,366 9.1% $487
$0
$6,045
$0
$0
$0
$0 0.0%
$0
$0
$0
$0 $8,195,317
$0
$12,123 0.0%
$2
$516
$0
$0
$0 $2,299,403
$0 0.0%
$0
$0
$0 $597,101
$0
$0
$32,927,588 100% $5,343 $2,228,320 $250,471 $597,101 $8,195,317 $2,299,403
$23,935,977 51.5% $703,846 1.5%
$1,244,721 2.7% $1,507,637 3.2% $1,084,280 2.3% $2,210,766 4.8% $1,700,097 3.7% $3,006,412 6.5% $8,195,317 17.6% $2,312,043 5.0%
$597,101 1.3%
$46,498,203 100%
Salaries and Benefits as Percentages of Revenues and of Expenditures
Teachers and Paraprofessionals
Salaries $17,112,685
Benefits $4,687,640
Percentage of Revenues Percentage of Expenditures
Total of
Total of
General Fund
General Fund
Title Programs
Title Programs
Lottery K-12
Lottery K-12
Total Salaries
and
Total
and
Total
and Benefits All Other K-12 K - 12 All Other K-12 K - 12
$21,800,325
61.7%
47.9%
61.6%
46.9%
School Administration
$1,259,212
$419,793
$1,679,005
4.8%
3.7%
4.7%
3.6%
General Administration
$406,735
$243,030
$649,765
1.8%
1.4%
1.8%
1.4%
1998-99 GEORGIA PUBLIC EDUCATION REPORT CARD
Baldwin County Schools - 605
Prepared by Georgia Department of Education
Page 8
CERTIFIED PERSONNEL DATA
Number
Average Annual Salary Positions Average Contract Days
Average Daily Salary
Full-time Personnel Part-time
Sex Male Female
4 Yr Bachelor's Certificate 5 Yr Master's
Level 6 Yr Specialist's 7 Yr Doctoral Other*
Black
White Race/ Hispanic Ethnicity Asian
American Indian
Multiracial
Years Experience
<1 1-10 11-20 21-30 >30
Average
Administrators
27.00
$61,878.79 225.93
$273.89
27 0
10 17
1 4 19 3 0
8 19
0 0 0 0
0 3 9 14 1
21.11
Support Personnel PK-12 Teachers
32.64
418.60
$46,191.90 192.00
$240.59
$37,991.35 190.00
$199.95
32
418
1
1
6
63
27
356
1
195
24
180
7
37
1
3
0
4
9
107
24
311
0
0
0
0
0
1
0
0
0
16
4
171
12
116
14
109
3
7
20.79
13.85
*Includes One- and Two-Year Vocational Certificates.
Certified Staff Position Ratios
Teacher/Administrator Ratio 16:1
Teacher/Support Person Ratio 13:1
Teacher/Staff Ratio 7:1
Student Enrollment/All Teachers 15:1
Certified Personnel by Category
87.5% 100%
5.6%
6.9%
80% 60%
40%
20%
0%
Teachers
Administrators
Support Personnel
1998-99 GEORGIA PUBLIC EDUCATION REPORT CARD
Baldwin County Schools - 605
Prepared by Georgia Department of Education
Page 9
1998-99 GEORGIA PUBLIC EDUCATION REPORT CARD
BALDWIN COUNTY SCHOOLS
Baldwin High School - 6050189
Grade Range 9-12
The Georgia Public Education Report Card is designed to assist systems and schools in educational improvement. This report card contains a variety of data elements. An explanation of the terms is provided as a companion to the report card data. Please refer to the definitions for the most effective use of the reported data.
Total 1,747
STUDENT DATA
9-12 Enrollment, by Race/Ethnicity and Sex
Black
White Hispanic
American Multi-
Asian Indian
racial
1,051 60.2%
655 37.5%
3 0.2%
29 1.7%
3 0.2%
6 0.3%
Male Female
848 48.5%
899 51.5%
Enrollment in Selected Programs
Program
Gifted (Grades K-12)
Program % of Student Enrollment Population
72
4.1%
Non-Vocational Labs (Grades 9-12)
965
Vocational Labs
(Grades 9-12)
998
Alternative Programs (Grades 6-12)
0
55.2% 57.1%
0.0%
Students Eligible to Receive Free/Reduced Lunches
Number
Percent
School System
674 3,400
38.6% 53.2%
Enrollment in Compensatory Programs
Program
Program % of Student Enrollment Population
Special Education (Grades K-12) PK
192 11.0%
0
N/A
English to Speakers of Other Languages (ESOL) (Grades K-12)
0
0.0%
Remedial Education (Grades 2-5, 9-12)
137
7.8%
Title I (Grades K-12)
This school has no Title I program.
Dropout Rate for Grades 9-12
Number
Rate
School System
99
5.4%
162
8.4%
Total 258
Retained Students, by Race/Ethnicity and Sex
Black
White Hispanic
American MultiAsian Indian racial
169 65.5%
88 34.1%
0 0.0%
1 0.4%
0 0.0%
0 0.0%
Male Female 141 117
54.7% 45.3%
Prepared by Georgia Department of Education
Page 1
STATE-REQUIRED TEST DATA
GEORGIA HIGH SCHOOL GRADUATION TESTS (GHSGT)
Percent of Regular Program 11th Graders Passing the Georgia High School Graduation Tests on First Administration
English Language Arts Mathematics Social Studies Science
All Components listed above
Writing
1998-99
School System State
92% 76% 67% 60%
92% 76% 67% 60%
96% 88% 80% 72%
53% 53% 68%
85% 85% 93%
1997-98
School System State
94% 75% 71% 64%
94% 75% 71% 64%
94% 88% 78% 74%
55% 55% 68%
91% 91% 92%
1996-97
School System State
87% 70% 58% 53%
87% 70% 58% 53%
94% 87% 78% 74%
43% 43% 67%
84% 84% 93%
GRADUATE DATA
1999 Graduates by Credentials, Race/Ethnicity and Sex
Diplomas with Both College Prep. & Voc. Endorsements
Diplomas with College Prep. Endorsements Diplomas with Vocational Endorsements General High School Diplomas Special Education Diplomas
Total All Diplomas
Certificates of Performance
Total Graduates
Total 58 68 96 28 6
256 66
322
Black
41 70.7%
17 25.0%
60 62.5%
19 67.9%
3 50.0%
140 54.7%
59 89.4%
199 61.8%
White Hispanic
17 29.3%
45 66.2%
0 0.0%
0 0.0%
34 35.4%
9 32.1%
3 50.0%
0 0.0%
0 0.0%
0 0.0%
108 42.2%
0 0.0%
7 10.6%
0 0.0%
115 35.7%
0 0.0%
American MultiAsian Indian racial
0 0.0%
5 7.4%
0 0.0%
0 0.0%
0 0.0%
1 1.5%
1 1.0%
0 0.0%
0 0.0%
0 0.0%
0 0.0%
0 0.0%
1 1.0%
0 0.0%
0 0.0%
6 2.3%
0 0.0%
2 0.8%
0 0.0%
0 0.0%
0 0.0%
6 1.9%
0 0.0%
2 0.6%
Male Female
19 32.8%
27 39.7%
39 67.2%
41 60.3%
52 54.2%
14 50.0%
3 50.0%
44 45.8%
14 50.0%
3 50.0%
115
141
44.9% 55.1%
27
39
40.9% 59.1%
142
180
44.1% 55.9%
HOPE Scholarships
School System
Number of 1999 Graduates 3 2 2
Number Eligible
107
Percent Eligible
33.2%
322 107 33.2%
State
65,548 40,292 61.5%
High School Completion Rate
Percent of 1995Grade 9 Enrollment in Graduating Class of1999 School System State
Completion Rate '95-'99 62.3% 62.2% 68.9%
1998-99 GEORGIA PUBLIC EDUCATION REPORT CARD
Baldwin High School - 6050189
Prepared by Georgia Department of Education
Page 2
COLLEGE ADMISSIONS / CREDIT TEST DATA
Scholastic Assessment Test (SAT)
Based on students' highest verbal and highest math scores
No. Taking
Average Score
Tests Verbal Math Total
Based on students' last test administration
Average Score Verbal Math Total
School
143 474 443
917
College Prep. Endorsement
495 469
964
Other Diplomas
358 330
688
System
143 474 443
917
College Prep. Endorsement
495 469
964
Other Diplomas
358 330
688
Georgia
41,958 492 488
980
464 N/A N/A
464 N/A N/A
483
435 N/A N/A
435 N/A N/A
479
899 N/A N/A
899 N/A N/A
962
Nation
952,913 N/A N/A N/A
502 508 1010
American College Testing (ACT)
Advanced Placement Exams (AP)
Number taking tests: English Mathematics Reading Science Reasoning CompositeScore
8 School System State
17.3 17.3 19.1
17.6 17.6 19.9
18.8 17.6
18.8 17.6
20.2 19.9
18.0 18.0 19.9
No. of Students Taking Tests
No. of Tests Taken No. of Test Scores
3 or Higher Percent of Test
Scores 3 or Higher
School 18 23 10
43.5%
System State 18 15,225 23 23,969 10 13,024
43.5% 54.3%
POST-SECONDARY DATA
Graduates Entering Georgia Public Colleges
Graduates Entering Georgia Public Colleges and Requiring Learning Support (LS)
1998 Graduates Entering in 1998-99
1997 Graduates Entering in 1997-98
Percent of Graduating Number Class
School
76
22.9%
System 7 6
22.9%
School
63
24.7%
System 6 3
24.7%
Number Requiring
LS 16 16
10 10
Percent of those attending Georgia
Public Colleges
21.1%
21.1%
15.9%
15.9%
In previous years, the Report Card presented College Prep Curriculum information provided by the Board of Regents on students requiring Learning Support. Due to inconsistencies in the data provided by the Board of Regents in defining College Prep Completers versus Local Board of Education data defining College Prep Endorsements, the Department of Education Report Card will not provide this information until discrepancies can be reconciled.
Graduates Entering Georgia Public Technical and Adult Schools
1998 Graduates School System
Entering Number 47 47
1998-99 Percent 14.2% 14.2%
Entering Number N/A N/A
1997-98 Percent
N/A N/A
1997 Graduates School
3
1.2%
System
3
1.2%
32
12.5%
32
12.5%
1998-99 GEORGIA PUBLIC EDUCATION REPORT CARD Baldwin High School - 6050189
Prepared by Georgia Department of Education
Page 3
CERTIFIED PERSONNEL DATA
Positions Number Average Contract Days
Administrators
6.00 223.33
Support Personnel
8.00 190.00
PK-12 Teachers
93.00 190.00
Personnel Sex
Certificate
Years Experience
Full-time Part-time
Male Female
4 Yr Bachelor's 5 Yr Master's 6 Yr Specialist's 7 Yr Doctoral Other*
<1 1-10 11-20 21-30 >30
Average
6 0
3 3
1 1 3 1 0
0 1 3 2 0
19.50
8 0
1 7
0 7 1 0 0
0 1 2 4 1
22.50
93 0
32 61
46 37
5 1 4
10 35 24 23
1
12.88
*Includes One- and Two-Year Vocational Certificates.
ACCREDITATION DATA
Accredited by Southern Association of Colleges and Schools (SACS): Secondary/Middle Commission.
AWARDS / RECOGNITION DATA
Schools in Georgia may receive recognition in the following programs: Charter School Pay for Performance Program Georgia School of Excellence National Blue Ribbon School Baldwin High School did not receive recognition in any of these programs during the 1998-99 school year.
1998-99 GEORGIA PUBLIC EDUCATION REPORT CARD Baldwin High School - 6050189
Prepared by Georgia Department of Education
Page 4
1998-99 GEORGIA PUBLIC EDUCATION REPORT CARD
BALDWIN COUNTY SCHOOLS
Baldwin Middle School - 6050190
Grade Range 6-8
The Georgia Public Education Report Card is designed to assist systems and schools in educational improvement. This report card contains a variety of data elements. An explanation of the terms is provided as a companion to the report card data. Please refer to the definitions for the most effective use of the reported data.
STUDENT DATA
Total 780
6-8 Enrollment, by Race/Ethnicity and Sex
Black
White Hispanic
American Multi-
Asian Indian
racial
494 63.3%
269 34.5%
2 0.3%
9 1.2%
0 0.0%
6 0.8%
Male 394
50.5%
Female 386
49.5%
Enrollment in Selected Programs
Program
Gifted (Grades K-12)
Program % of Student Enrollment Population
64
8.2%
Alternative Programs
18
(Grades 6-12)
2.3%
Students Eligible to Receive Free/Reduced Lunches
Number
Percent
School System
491 3,400
62.9% 53.2%
Enrollment in Compensatory Programs
Program
Program % of Student Enrollment Population
Special Education (Grades K-12) (PK)
169 21.7%
0
N/A
English to Speakers of Other Languages (ESOL) (Grades K-12)
0
0.0%
Title I (Grades K-12)
This school has a schoolwide program.
Dropout Rate for Grades 6-8
Number
Rate
School System
1
0.1%
1
0.1%
Total 38
Retained Students, by Race/Ethnicity and Sex
Black
White Hispanic
American MultiAsian Indian racial
25 65.8%
13 34.2%
0 0.0%
0 0.0%
0 0.0%
0 0.0%
Male Female
32
6
84.2% 15.8%
Prepared by Georgia Department of Education
Page 1
STATE-REQUIRED TEST DATA
NORM-REFERENCED TESTS Grade 8
Iowa Tests of Basic Skills (ITBS) Each chart reflects data for three years of testing.
Reading Comprehension 50
44 48 49 0
98-99
36 43 48 97-98
39 42 48 96-97
Mathematics
School 50
System
State
0
60 62 56 98-99
51 56 55 97-98
49 55 54 96-97
School System State
Reading Vocabulary 50
33 43 46 0
98-99
29 37 45 97-98
34 38 44 96-97
Language Arts
School 50
System
State
0
57 61 60 98-99
49 57 58 97-98
53 60 56 96-97
School System State
Social Studies 50
43 51 54 0
98-99
38 48 53 97-98
41 49 53 96-97
Science
School 50
System
State
0
37 52 56 98-99
31 42 55 97-98
37 45 53 96-97
School System State
Sources of Information
Composite Score
50
44 51 57 0
98-99
School 50
System
41 49 56 97-98
40 48 55 96-97
State 0
47 56 56 98-99
38 48 54 97-98
1998-99 GEORGIA PUBLIC EDUCATION REPORT CARD Baldwin Middle School - 6050190
Prepared by Georgia Department of Education
42 50 54 96-97
Scores Reported in Percentiles
School System State
Page 2
STATE-REQUIRED TEST DATA
Categories of Scaled Scores
Inadequate (less than 162)
Minimal (162-209)
Good
(210-247)
Very Good (greater than 247)
Average Scaled Score: (Range 100-300)
PERFORMANCE ASSESSMENTS
Grade 8 Writing Assessment
1998-99 Percent Scoring
1997-98 Percent Scoring
1996-97 Percent Scoring
School System State School System State School System State
16% 56% 26%
3%
10% 50% 34%
5%
8% 40% 41% 11%
16% 63% 18%
3%
14% 55% 25%
6%
11% 46% 34%
8%
23% 52% 20%
4%
16% 51% 29%
5%
15% 46% 30%
8%
190
199
208 187
193 202 186
194 198
AWARDS / RECOGNITION DATA
Schools in Georgia may receive recognition in the following programs: Charter School Pay for Performance Program Georgia School of Excellence National Blue Ribbon School Baldwin Middle School did not receive recognition in any of these programs during the 1998-99 school year.
1998-99 GEORGIA PUBLIC EDUCATION REPORT CARD Baldwin Middle School - 6050190
Prepared by Georgia Department of Education
Page 3
CERTIFIED PERSONNEL DATA
Positions Number Average Contract Days
Personnel Sex
Certificate
Years Experience
Full-time Part-time
Male Female
4 Yr Bachelor's 5 Yr Master's 6 Yr Specialist's 7 Yr Doctoral Other*
<1 1-10 11-20 21-30 >30
Average
Administrators
3.00 226.67
3 0
2 1
0 0 3 0 0 0 1 0 2 0 22.00
Support Personnel
4.00 195.00
4 0
1 3
1 3 0 0 0 0 1 1 1 1 21.75
PK-12 Teachers
52.00 190.00
52 0
8 44
20 23
8 1 0 1 24 14 12 1 13.60
*Includes One- and Two-Year Vocational Certificates.
ACCREDITATION DATA
Accredited by Southern Association of Colleges and Schools (SACS):
Elementary/Middle Commission.
1998-99 GEORGIA PUBLIC EDUCATION REPORT CARD Baldwin Middle School - 6050190
Prepared by Georgia Department of Education
Page 4
1998-99 GEORGIA PUBLIC EDUCATION REPORT CARD
BALDWIN COUNTY SCHOOLS
Blandy Hills Elementary School - 6050195
Grade Range PK-5
The Georgia Public Education Report Card is designed to assist systems and schools in educational improvement. This report card contains a variety of data elements. An explanation of the terms is provided as a companion to the report card data. Please refer to the definitions for the most effective use of the reported data.
STUDENT DATA
Total
K-5
714
PK
53
Enrollment, by Race/Ethnicity and Sex
Black
White Hispanic
American Asian Indian
Multiracial
423 59.2%
282 39.5%
3 0.4%
2 0.3%
1 0.1%
3 0.4%
32 60.4%
20 37.7%
0 0.0%
1 1.9%
0 0.0%
0 0.0%
Male Female
384 53.8%
330 46.2%
36 67.9%
17 32.1%
Enrollment in Selected Programs
Program
Program % of Student Enrollment Population
Gifted (Grades K-12)
62
8.7%
Alternative Programs (Grades 6-12)
N/A
N/A
Students Eligible to Receive Free/Reduced Lunches
Number
Percent
School System
395 3,400
51.5% 53.2%
Dropout Rate *
Number
Rate
School System
N/A N/A
N/A N/A
* Dropout rates are not applicable for grades PK-5.
Enrollment in Compensatory Programs
Program
Program % of Student Enrollment Population
Special Education (Grades K-12)
132 18.5%
(PK)
36
N/A
English to Speakers of Other Languages (ESOL) (Grades K-12)
0
0.0%
Remedial Education (Grades 2-5, 9-12)
123 25.7%
Special Instructional Assistance (SIA) (Grades K-3)
86 18.1%
Title I (Grades K-12)
This school has a Targeted Assistance program.
Total 61
Retained Students, by Race/Ethnicity and Sex
Black
White Hispanic
American MultiAsian Indian racial
40 65.6%
19 31.1%
1 1.6%
0 0.0%
0 0.0%
1 1.6%
Male Female
42
19
68.9% 31.1%
Prepared by Georgia Department of Education
Page 1
STATE-REQUIRED TEST DATA
NORM-REFERENCED TESTS Grade 3
Iowa Tests of Basic Skills (ITBS) Each chart reflects data for three years of testing.
Reading Comprehension 50
52 60 54 0
98-99
56 57 53 97-98
55 52 52 96-97
Mathematics
School 50
System
State
0
77 72 61 98-99
62 68 61 97-98
74 71 59 96-97
School System State
Reading Vocabulary 50
81 69 50 0
98-99
67 60 50 97-98
65 51 49 96-97
Language Arts
School 50
System
State
0
83 76 64 98-99
68 70 62 97-98
73 69 59 96-97
School System State
Social Studies 50
71 67 56 0
98-99
71 67 55 97-98
59 60 55 96-97
Science
School 50
System
State
0
64 69 59 98-99
56 64 59 97-98
62 65 58 96-97
School System State
Sources of Information
Composite Score
50
67 61 57 0
98-99
School 50
System
56 58 56 97-98
61 57 55 96-97
State 0
72 68 58 98-99
63 64 57 97-98
1998-99 GEORGIA PUBLIC EDUCATION REPORT CARD Blandy Hills Elementary School - 6050195
Prepared by Georgia Department of Education
64 62 56 96-97
Scores Reported in Percentiles
School System State
Page 2
STATE-REQUIRED TEST DATA
NORM-REFERENCED TESTS Grade 5
Iowa Tests of Basic Skills (ITBS) Each chart reflects data for three years of testing.
Reading Comprehension
Mathematics
50
53 54 53 0
98-99
54 54 53 97-98
46 50 52 96-97
School 50
System
State
0
69 66 59 98-99
67 63 58 97-98
63 62 57 96-97
School System State
Reading Vocabulary 50
54 54 48 0
98-99
43 45 48 97-98
43 46 46 96-97
Language Arts
School 50
System
State
0
63 64 63 98-99
64 64 61 97-98
55 63 58 96-97
School System State
Social Studies 50
56 57 57 0
98-99
58 59 56 97-98
46 51 55 96-97
Science
School 50
System
State
0
60 61 60 98-99
54 59 59 97-98
52 55 59 96-97
School System State
Sources of Information
Composite Score
50
58 57 58 0
98-99
School 50
System
56 56 58 97-98
50 54 57 96-97
State 0
59 59 57 98-99
57 58 56 97-98
50 54 55 96-97
1998-99 GEORGIA PUBLIC EDUCATION REPORT CARD Blandy Hills Elementary School - 6050195
Prepared by Georgia Department of Education
Scores Reported in Percentiles
School System State
Page 3
STATE-REQUIRED TEST DATA
PERFORMANCE ASSESSMENTS
Grade 5 Writing Assessment
Percent at Developmental Stages:
1998-99 School System State
1997-98 School System State
1996-97 School System State
Stage Stage Stage Stage Stage Stage
1:The Emerging Writer 2:The Developing Writer 3:The Focusing Writer 4:The Experimenting 5:The Engaging Writer 6:The Extending Writer
0% 0% 22% 46% 22% 9%
0% 1% 25% 42% 23% 8%
0% 1% 16% 41% 29% 12%
0% 0% 24% 54% 18% 3%
0% 1% 21% 47% 27% 4%
0% 3% 19% 41% 27% 10%
0% 4% 20% 45% 23% 9%
0% 4% 24% 41% 23% 8%
0% 3% 21% 37% 26% 12%
AWARDS / RECOGNITION DATA
Schools in Georgia may receive recognition in the following programs: Charter School Pay for Performance Program Georgia School of Excellence National Blue Ribbon School Blandy Hills Elementary School did not receive recognition in any of these programs during the 1998-99 school year.
1998-99 GEORGIA PUBLIC EDUCATION REPORT CARD Blandy Hills Elementary School - 6050195
Prepared by Georgia Department of Education
Page 4
CERTIFIED PERSONNEL DATA
Positions Number Average Contract Days
Personnel Sex
Certificate
Years Experience
Full-time Part-time
Male Female
4 Yr Bachelor's 5 Yr Master's 6 Yr Specialist's 7 Yr Doctoral Other*
<1 1-10 11-20 21-30 >30
Average
Administrators
2.00 205.00
2 0
0 2
0 1 1 0 0 0 1 0 1 0 16.50
Support Personnel
2.00 190.00
2 0
0 2
0 1 1 0 0 0 0 2 0 0 15.50
PK-12 Teachers
48.00 190.00
48 0
4 44
21 22
5 0 0 2 21 14 11 0 12.81
*Includes One- and Two-Year Vocational Certificates.
ACCREDITATION DATA
Not accredited by Southern Association of Colleges and Schools (SACS) or Georgia Accrediting Commission (GAC).
1998-99 GEORGIA PUBLIC EDUCATION REPORT CARD Blandy Hills Elementary School - 6050195
Prepared by Georgia Department of Education
Page 5
1998-99 GEORGIA PUBLIC EDUCATION REPORT CARD
BALDWIN COUNTY SCHOOLS
Boddie Middle School - 6053050
Grade Range 6-8
The Georgia Public Education Report Card is designed to assist systems and schools in educational improvement. This report card contains a variety of data elements. An explanation of the terms is provided as a companion to the report card data. Please refer to the definitions for the most effective use of the reported data.
STUDENT DATA
Total 564
6-8 Enrollment, by Race/Ethnicity and Sex
Black
White Hispanic
American Multi-
Asian Indian
racial
312 55.3%
242 42.9%
2 0.4%
8 1.4%
0 0.0%
0 0.0%
Male 276
48.9%
Female 288
51.1%
Enrollment in Selected Programs
Program
Gifted (Grades K-12)
Program % of Student Enrollment Population
73
12.9%
Alternative Programs (Grades 6-12)
8
1.4%
Students Eligible to Receive Free/Reduced Lunches
Number
Percent
School System
324 3,400
57.4% 53.2%
Enrollment in Compensatory Programs
Program
Program % of Student Enrollment Population
Special Education (Grades K-12) (PK)
117 20.7%
0
N/A
English to Speakers of Other Languages (ESOL) (Grades K-12)
0
0.0%
Title I (Grades K-12)
This school has a schoolwide program.
Dropout Rate for Grades 6-8
Number
Rate
School System
0
0.0%
1
0.1%
Total 31
Retained Students, by Race/Ethnicity and Sex
Black
White Hispanic
American MultiAsian Indian racial
18 58.1%
12 38.7%
1 3.2%
0 0.0%
0 0.0%
0 0.0%
Male Female
25
6
80.6% 19.4%
Prepared by Georgia Department of Education
Page 1
STATE-REQUIRED TEST DATA
NORM-REFERENCED TESTS Grade 8
Iowa Tests of Basic Skills (ITBS) Each chart reflects data for three years of testing.
Reading Comprehension 50
56 48 49 0
98-99
52 43 48 97-98
46 42 48 96-97
Mathematics
School 50
System
State
0
67 62 56 98-99
61 56 55 97-98
61 55 54 96-97
School System State
Reading Vocabulary 50
59 43 46 0
98-99
49 37 45 97-98
43 38 44 96-97
Language Arts
School 50
System
State
0
68 61 60 98-99
65 57 58 97-98
69 60 56 96-97
School System State
Social Studies 50
64 51 54 0
98-99
59 48 53 97-98
59 49 53 96-97
Science
School 50
System
State
0
72 52 56 98-99
57 42 55 97-98
57 45 53 96-97
School System State
Sources of Information
Composite Score
50
62 51 57 0
98-99
School 50
System
56 49 56 97-98
57 48 55 96-97
State 0
68 56 56 98-99
59 48 54 97-98
1998-99 GEORGIA PUBLIC EDUCATION REPORT CARD Boddie Middle School - 6053050
Prepared by Georgia Department of Education
60 50 54 96-97
Scores Reported in Percentiles
School System State
Page 2
STATE-REQUIRED TEST DATA
Categories of Scaled Scores
Inadequate (less than 162)
Minimal (162-209)
Good
(210-247)
Very Good (greater than 247)
Average Scaled Score: (Range 100-300)
PERFORMANCE ASSESSMENTS
Grade 8 Writing Assessment
1998-99 Percent Scoring
1997-98 Percent Scoring
1996-97 Percent Scoring
School System State School System State School System State
2% 42% 47%
9%
10% 50% 34%
5%
8% 40% 41% 11%
11% 46% 35%
8%
14% 55% 25%
6%
11% 46% 34%
8%
6% 49% 40%
5%
16% 51% 29%
5%
15% 46% 30%
8%
212
199
208 201
193 202 205
194 198
AWARDS / RECOGNITION DATA
Schools in Georgia may receive recognition in the following programs: Charter School Pay for Performance Program Georgia School of Excellence National Blue Ribbon School Boddie Middle School did not receive recognition in any of these programs during the 1998-99 school year.
1998-99 GEORGIA PUBLIC EDUCATION REPORT CARD Boddie Middle School - 6053050
Prepared by Georgia Department of Education
Page 3
CERTIFIED PERSONNEL DATA
Positions Number Average Contract Days
Personnel Sex
Certificate
Years Experience
Full-time Part-time
Male Female
4 Yr Bachelor's 5 Yr Master's 6 Yr Specialist's 7 Yr Doctoral Other*
<1 1-10 11-20 21-30 >30
Average
Administrators
2.00 225.00
2 0
1 1
0 0 1 1 0 0 0 1 0 1 22.00
Support Personnel
3.00 190.00
3 0
1 2
0 2 1 0 0 0 0 1 2 0 21.67
PK-12 Teachers
41.60 190.00
41 1
9 33
17 18
6 1 0 1 14 16 11 0 14.24
*Includes One- and Two-Year Vocational Certificates.
ACCREDITATION DATA
Accredited by Southern Association of Colleges and Schools (SACS):
Elementary/Middle Commission.
1998-99 GEORGIA PUBLIC EDUCATION REPORT CARD Boddie Middle School - 6053050
Prepared by Georgia Department of Education
Page 4
1998-99 GEORGIA PUBLIC EDUCATION REPORT CARD
BALDWIN COUNTY SCHOOLS
Davis Elementary School - 6051052
Grade Range PK-5
The Georgia Public Education Report Card is designed to assist systems and schools in educational improvement. This report card contains a variety of data elements. An explanation of the terms is provided as a companion to the report card data. Please refer to the definitions for the most effective use of the reported data.
STUDENT DATA
Total
K-5
472
PK
20
Enrollment, by Race/Ethnicity and Sex
Black
White Hispanic
American Asian Indian
Multiracial
265 56.1%
194 41.1%
2 0.4%
6 1.3%
0 0.0%
5 1.1%
13 65.0%
7 35.0%
0 0.0%
0 0.0%
0 0.0%
0 0.0%
Male Female
252 53.4%
220 46.6%
9 45.0%
11 55.0%
Enrollment in Selected Programs
Program
Program % of Student Enrollment Population
Gifted (Grades K-12)
72
15.3%
Alternative Programs (Grades 6-12)
N/A
N/A
Students Eligible to Receive Free/Reduced Lunches
Number
Percent
School System
262 3,400
53.3% 53.2%
Dropout Rate *
Number
Rate
School System
N/A N/A
N/A N/A
* Dropout rates are not applicable for grades PK-5.
Enrollment in Compensatory Programs
Program
Program % of Student Enrollment Population
Special Education (Grades K-12)
64 13.6%
(PK)
0
N/A
English to Speakers of Other Languages (ESOL) (Grades K-12)
0
0.0%
Remedial Education (Grades 2-5, 9-12)
65 21.2%
Special Instructional Assistance (SIA) (Grades K-3)
59 18.2%
Title I (Grades K-12)
This school has a Targeted Assistance program.
Total 25
Retained Students, by Race/Ethnicity and Sex
Black
White Hispanic
American MultiAsian Indian racial
20 80.0%
5 20.0%
0 0.0%
0 0.0%
0 0.0%
0 0.0%
Male Female
17
8
68.0% 32.0%
Prepared by Georgia Department of Education
Page 1
STATE-REQUIRED TEST DATA
NORM-REFERENCED TESTS Grade 3
Iowa Tests of Basic Skills (ITBS) Each chart reflects data for three years of testing.
Reading Comprehension 50
65 60 54 0
98-99
64 57 53 97-98
59 52 52 96-97
Mathematics
School 50
System
State
0
66 72 61 98-99
71 68 61 97-98
69 71 59 96-97
School System State
Reading Vocabulary 50
58 69 50 0
98-99
51 60 50 97-98
48 51 49 96-97
Language Arts
School 50
System
State
0
70 76 64 98-99
75 70 62 97-98
71 69 59 96-97
School System State
Social Studies 50
67 67 56 0
98-99
72 67 55 97-98
64 60 55 96-97
Science
School 50
System
State
0
67 69 59 98-99
65 64 59 97-98
65 65 58 96-97
School System State
Sources of Information
Composite Score
50
61 61 57 0
98-99
School 50
System
69 58 56 97-98
62 57 55 96-97
State 0
65 68 58 98-99
68 64 57 97-98
1998-99 GEORGIA PUBLIC EDUCATION REPORT CARD Davis Elementary School - 6051052
Prepared by Georgia Department of Education
64 62 56 96-97
Scores Reported in Percentiles
School System State
Page 2
STATE-REQUIRED TEST DATA
NORM-REFERENCED TESTS Grade 5
Iowa Tests of Basic Skills (ITBS) Each chart reflects data for three years of testing.
Reading Comprehension
Mathematics
50
65 54 53 0
98-99
57 54 53 97-98
57 50 52 96-97
School 50
System
State
0
79 66 59 98-99
67 63 58 97-98
67 62 57 96-97
School System State
Reading Vocabulary 50
62 54 48 0
98-99
50 45 48 97-98
45 46 46 96-97
Language Arts
School 50
System
State
0
73 64 63 98-99
69 64 61 97-98
69 63 58 96-97
School System State
Social Studies 50
74 57 57 0
98-99
60 59 56 97-98
61 51 55 96-97
Science
School 50
System
State
0
73 61 60 98-99
63 59 59 97-98
63 55 59 96-97
School System State
Sources of Information
Composite Score
50
70 57 58 0
98-99
School 50
System
62 56 58 97-98
56 54 57 96-97
State 0
74 59 57 98-99
62 58 56 97-98
61 54 55 96-97
1998-99 GEORGIA PUBLIC EDUCATION REPORT CARD Davis Elementary School - 6051052
Prepared by Georgia Department of Education
Scores Reported in Percentiles
School System State
Page 3
STATE-REQUIRED TEST DATA
PERFORMANCE ASSESSMENTS
Grade 5 Writing Assessment
Percent at Developmental Stages:
1998-99 School System State
1997-98 School System State
1996-97 School System State
Stage Stage Stage Stage Stage Stage
1:The Emerging Writer 2:The Developing Writer 3:The Focusing Writer 4:The Experimenting 5:The Engaging Writer 6:The Extending Writer
0% 0% 9% 39% 28% 24%
0% 1% 25% 42% 23% 8%
0% 1% 16% 41% 29% 12%
0% 0% 17% 54% 28% 1%
0% 1% 21% 47% 27% 4%
0% 3% 19% 41% 27% 10%
0% 0% 16% 53% 25% 6%
0% 4% 24% 41% 23% 8%
0% 3% 21% 37% 26% 12%
AWARDS / RECOGNITION DATA
Through the Pay for Performance Program, exemplary public schools and schools making outstanding progress toward becoming exemplary may be rewarded. Not a merit pay program, the Pay for Performance Program motivates and rewards entire school faculties for working together to make their schools exemplary. A school selected for participation in the program has one school year to attain at least 80% of its previously-approved performance objectives in order to receive an award based on $2,000 per certified faculty member.
Davis Elementary School was a Pay for Performance recipient in 1998-99.
1998-99 GEORGIA PUBLIC EDUCATION REPORT CARD Davis Elementary School - 6051052
Prepared by Georgia Department of Education
Page 4
CERTIFIED PERSONNEL DATA
Positions Number Average Contract Days
Personnel Sex
Certificate
Years Experience
Full-time Part-time
Male Female
4 Yr Bachelor's 5 Yr Master's 6 Yr Specialist's 7 Yr Doctoral Other*
<1 1-10 11-20 21-30 >30
Average
Administrators
1.50 206.67
1 1
0 2
0 0 2 0 0 0 0 0 2 0 25.50
Support Personnel
1.34 190.00
1 1
1 1
0 1 1 0 0 0 1 1 0 0 9.00
PK-12 Teachers
33.50 190.00
33 1
1 33
12 17
5 0 0 0 10 11 13 0 16.56
*Includes One- and Two-Year Vocational Certificates.
ACCREDITATION DATA
Not accredited by Southern Association of Colleges and Schools (SACS) or Georgia Accrediting Commission (GAC).
1998-99 GEORGIA PUBLIC EDUCATION REPORT CARD Davis Elementary School - 6051052
Prepared by Georgia Department of Education
Page 5
1998-99 GEORGIA PUBLIC EDUCATION REPORT CARD
BALDWIN COUNTY SCHOOLS
Midway Elementary School - 6050194
Grade Range PK-5
The Georgia Public Education Report Card is designed to assist systems and schools in educational improvement. This report card contains a variety of data elements. An explanation of the terms is provided as a companion to the report card data. Please refer to the definitions for the most effective use of the reported data.
STUDENT DATA
Total
K-5
756
PK
20
Enrollment, by Race/Ethnicity and Sex
Black
White Hispanic
American Asian Indian
Multiracial
508 67.2%
233 30.8%
5 0.7%
3 0.4%
0 0.0%
7 0.9%
12 60.0%
7 35.0%
0 0.0%
0 0.0%
0 0.0%
1 5.0%
Male Female
361 47.8%
395 52.2%
7 35.0%
13 65.0%
Enrollment in Selected Programs
Program
Program % of Student Enrollment Population
Gifted (Grades K-12)
31
4.1%
Alternative Programs (Grades 6-12)
N/A
N/A
Students Eligible to Receive Free/Reduced Lunches
Number
Percent
School System
561 3,400
72.3% 53.2%
Dropout Rate *
Number
Rate
School System
N/A N/A
N/A N/A
* Dropout rates are not applicable for grades PK-5.
Enrollment in Compensatory Programs
Program
Program % of Student Enrollment Population
Special Education (Grades K-12)
139 18.4%
(PK)
0
N/A
English to Speakers of Other Languages (ESOL) (Grades K-12)
0
0.0%
Remedial Education (Grades 2-5, 9-12)
93 19.9%
Special Instructional Assistance (SIA) (Grades K-3)
104 19.4%
Title I (Grades K-12)
This school has a Targeted Assistance program.
Total 57
Retained Students, by Race/Ethnicity and Sex
Black
White Hispanic
American MultiAsian Indian racial
43 75.4%
13 22.8%
0 0.0%
0 0.0%
0 0.0%
1 1.8%
Male Female
36
21
63.2% 36.8%
Prepared by Georgia Department of Education
Page 1
STATE-REQUIRED TEST DATA
NORM-REFERENCED TESTS Grade 3
Iowa Tests of Basic Skills (ITBS) Each chart reflects data for three years of testing.
Reading Comprehension 50
54 60 54 0
98-99
45 57 53 97-98
42 52 52 96-97
Mathematics
School 50
System
State
0
61 72 61 98-99
67 68 61 97-98
64 71 59 96-97
School System State
Reading Vocabulary 50
53 69 50 0
98-99
47 60 50 97-98
36 51 49 96-97
Language Arts
School 50
System
State
0
59 76 64 98-99
60 70 62 97-98
56 69 59 96-97
School System State
Social Studies 50
61 67 56 0
98-99
54 67 55 97-98
43 60 55 96-97
Science
School 50
System
State
0
58 69 59 98-99
50 64 59 97-98
52 65 58 96-97
School System State
Sources of Information
Composite Score
50
54 61 57 0
98-99
School 50
System
52 58 56 97-98
48 57 55 96-97
State 0
57 68 58 98-99
53 64 57 97-98
1998-99 GEORGIA PUBLIC EDUCATION REPORT CARD Midway Elementary School - 6050194
Prepared by Georgia Department of Education
49 62 56 96-97
Scores Reported in Percentiles
School System State
Page 2
STATE-REQUIRED TEST DATA
NORM-REFERENCED TESTS Grade 5
Iowa Tests of Basic Skills (ITBS) Each chart reflects data for three years of testing.
Reading Comprehension
Mathematics
50
49 54 53 0
98-99
53 54 53 97-98
44 50 52 96-97
School 50
System
State
0
63 66 59 98-99
64 63 58 97-98
59 62 57 96-97
School System State
Reading Vocabulary 50
41 54 48 0
98-99
43 45 48 97-98
37 46 46 96-97
Language Arts
School 50
System
State
0
59 64 63 98-99
62 64 61 97-98
56 63 58 96-97
School System State
Social Studies 50
51 57 57 0
98-99
61 59 56 97-98
48 51 55 96-97
Science
School 50
System
State
0
55 61 60 98-99
58 59 59 97-98
45 55 59 96-97
School System State
Sources of Information
Composite Score
50
51 57 58 0
98-99
School 50
System
60 56 58 97-98
49 54 57 96-97
State 0
53 59 57 98-99
58 58 56 97-98
48 54 55 96-97
1998-99 GEORGIA PUBLIC EDUCATION REPORT CARD Midway Elementary School - 6050194
Prepared by Georgia Department of Education
Scores Reported in Percentiles
School System State
Page 3
STATE-REQUIRED TEST DATA
PERFORMANCE ASSESSMENTS
Grade 5 Writing Assessment
Percent at Developmental Stages:
1998-99 School System State
1997-98 School System State
1996-97 School System State
Stage Stage Stage Stage Stage Stage
1:The Emerging Writer 2:The Developing Writer 3:The Focusing Writer 4:The Experimenting 5:The Engaging Writer 6:The Extending Writer
0% 2% 28% 39% 25% 5%
0% 1% 25% 42% 23% 8%
0% 1% 16% 41% 29% 12%
0% 1% 25% 35% 32% 7%
0% 1% 21% 47% 27% 4%
0% 3% 19% 41% 27% 10%
0% 4% 23% 49% 18% 6%
0% 4% 24% 41% 23% 8%
0% 3% 21% 37% 26% 12%
AWARDS / RECOGNITION DATA
Schools in Georgia may receive recognition in the following programs: Charter School Pay for Performance Program Georgia School of Excellence National Blue Ribbon School Midway Elementary School did not receive recognition in any of these programs during the 1998-99 school year.
1998-99 GEORGIA PUBLIC EDUCATION REPORT CARD Midway Elementary School - 6050194
Prepared by Georgia Department of Education
Page 4
CERTIFIED PERSONNEL DATA
Positions Number Average Contract Days
Personnel Sex
Certificate
Years Experience
Full-time Part-time
Male Female
4 Yr Bachelor's 5 Yr Master's 6 Yr Specialist's 7 Yr Doctoral Other*
<1 1-10 11-20 21-30 >30
Average
Administrators
2.00 205.00
2 0
0 2
0 0 2 0 0 0 0 0 2 0 22.50
Support Personnel
1.33 190.00
1 1
1 1
0 0 2 0 0 0 0 2 0 0 12.00
PK-12 Teachers
50.00 190.00
50 0
2 48
22 24
4 0 0 0 21 10 16 3 16.00
*Includes One- and Two-Year Vocational Certificates.
ACCREDITATION DATA
Not accredited by Southern Association of Colleges and Schools (SACS) or Georgia Accrediting Commission (GAC).
1998-99 GEORGIA PUBLIC EDUCATION REPORT CARD Midway Elementary School - 6050194
Prepared by Georgia Department of Education
Page 5
1998-99 GEORGIA PUBLIC EDUCATION REPORT CARD
BALDWIN COUNTY SCHOOLS
Northside Elementary School - 6055052
Grade Range PK-5
The Georgia Public Education Report Card is designed to assist systems and schools in educational improvement. This report card contains a variety of data elements. An explanation of the terms is provided as a companion to the report card data. Please refer to the definitions for the most effective use of the reported data.
STUDENT DATA
Total
K-5
389
PK
20
Enrollment, by Race/Ethnicity and Sex
Black
White Hispanic
American Asian Indian
Multiracial
240 61.7%
127 32.6%
2 0.5%
12 3.1%
1 0.3%
7 1.8%
13 65.0%
7 35.0%
0 0.0%
0 0.0%
0 0.0%
0 0.0%
Male Female
202 51.9%
187 48.1%
9 45.0%
11 55.0%
Enrollment in Selected Programs
Program
Program % of Student Enrollment Population
Gifted (Grades K-12)
44
11.3%
Alternative Programs (Grades 6-12)
N/A
N/A
Students Eligible to Receive Free/Reduced Lunches
Number
Percent
School System
180 3,400
44.0% 53.2%
Dropout Rate *
Number
Rate
School System
N/A N/A
N/A N/A
* Dropout rates are not applicable for grades PK-5.
Enrollment in Compensatory Programs
Program
Program % of Student Enrollment Population
Special Education (Grades K-12)
51 13.1%
(PK)
0
N/A
English to Speakers of Other Languages (ESOL) (Grades K-12)
0
0.0%
Remedial Education (Grades 2-5, 9-12)
38 15.6%
Special Instructional Assistance (SIA) (Grades K-3)
24
8.7%
Title I (Grades K-12)
This school has a Targeted Assistance program.
Total 5
Retained Students, by Race/Ethnicity and Sex
Black
White Hispanic
American MultiAsian Indian racial
2 40.0%
3 60.0%
0 0.0%
0 0.0%
0 0.0%
0 0.0%
Male Female
3
2
60.0% 40.0%
Prepared by Georgia Department of Education
Page 1
STATE-REQUIRED TEST DATA
NORM-REFERENCED TESTS Grade 3
Iowa Tests of Basic Skills (ITBS) Each chart reflects data for three years of testing.
Reading Comprehension 50
N/A 60 54 0
98-99
46 57 53 97-98
40 52 52 96-97
Mathematics
School 50
System
State
N/A 72 61
0
98-99
63 68 61 97-98
54 71 59 96-97
School System State
Reading Vocabulary 50
N/A 69 50 0
98-99
48 60 50 97-98
37 51 49 96-97
Language Arts
School 50
System
State
N/A 76 64
0
98-99
59 70 62 97-98
57 69 59 96-97
School System State
Social Studies 50
N/A 67 56 0
98-99
55 67 55 97-98
51 60 55 96-97
Science
School 50
System
State
N/A 69 59
0
98-99
64 64 59 97-98
53 65 58 96-97
School System State
Sources of Information
Composite Score
50
N/A 61 57 0
98-99
School 50
System
54 58 56 97-98
45 57 55 96-97
State
N/A 68 58
0
98-99
56 64 57 97-98
1998-99 GEORGIA PUBLIC EDUCATION REPORT CARD Northside Elementary School - 6055052
Prepared by Georgia Department of Education
48 62 56 96-97
Scores Reported in Percentiles
School System State
Page 2
STATE-REQUIRED TEST DATA
NORM-REFERENCED TESTS Grade 5
Iowa Tests of Basic Skills (ITBS) Each chart reflects data for three years of testing.
Reading Comprehension
Mathematics
50
N/A 54 53 0
98-99
53 54 53 97-98
56 50 52 96-97
School 50
System
State
N/A 66 59
0
98-99
56 63 58 97-98
67 62 57 96-97
School System State
Reading Vocabulary 50
N/A 54 48 0
98-99
43 45 48 97-98
49 46 46 96-97
Language Arts
School 50
System
State
N/A 64 63
0
98-99
54 64 61 97-98
72 63 58 96-97
School System State
Social Studies 50
N/A 57 57 0
98-99
56 59 56 97-98
60 51 55 96-97
Science
School 50
System
State
N/A 61 60
0
98-99
61 59 59 97-98
61 55 59 96-97
School System State
Sources of Information
Composite Score
50
N/A 57 58 0
98-99
School 50
System
51 56 58 97-98
63 54 57 96-97
State
N/A 59 57
0
98-99
53 58 56 97-98
62 54 55 96-97
1998-99 GEORGIA PUBLIC EDUCATION REPORT CARD Northside Elementary School - 6055052
Prepared by Georgia Department of Education
Scores Reported in Percentiles
School System State
Page 3
STATE-REQUIRED TEST DATA
PERFORMANCE ASSESSMENTS
Grade 5 Writing Assessment
Percent at Developmental Stages:
1998-99 School System State
1997-98 School System State
1996-97 School System State
Stage Stage Stage Stage Stage Stage
1:The Emerging Writer 2:The Developing Writer 3:The Focusing Writer 4:The Experimenting 5:The Engaging Writer 6:The Extending Writer
N/A N/A N/A N/A N/A N/A
0% 1% 25% 42% 23% 8%
0% 1% 16% 41% 29% 12%
0% 0% 11% 37% 41% 9%
0% 1% 21% 47% 27% 4%
0% 3% 19% 41% 27% 10%
0% 8% 28% 29% 17% 17%
0% 4% 24% 41% 23% 8%
No Grade-5 Writing Assessment scores were reported for Northside Elementary School.
0% 3% 21% 37% 26% 12%
AWARDS / RECOGNITION DATA
Schools in Georgia may receive recognition in the following programs: Charter School Pay for Performance Program Georgia School of Excellence National Blue Ribbon School Northside Elementary School did not receive recognition in any of these programs during the 1998-99 school year.
1998-99 GEORGIA PUBLIC EDUCATION REPORT CARD Northside Elementary School - 6055052
Prepared by Georgia Department of Education
Page 4
CERTIFIED PERSONNEL DATA
Positions Number Average Contract Days
Personnel Sex
Certificate
Years Experience
Full-time Part-time
Male Female
4 Yr Bachelor's 5 Yr Master's 6 Yr Specialist's 7 Yr Doctoral Other*
<1 1-10 11-20 21-30 >30
Average
Administrators
1.50 210.00
1 1
0 2
0 0 2 0 0 0 0 2 0 0 19.50
Support Personnel
1.33 190.00
1 1
1 1
0 1 1 0 0 0 0 1 1 0 20.00
PK-12 Teachers
30.50 190.00
30 1
2 29
14 16
1 0 0 0 18 5 8 0 13.00
*Includes One- and Two-Year Vocational Certificates.
ACCREDITATION DATA
Not accredited by Southern Association of Colleges and Schools (SACS) or Georgia Accrediting Commission (GAC).
1998-99 GEORGIA PUBLIC EDUCATION REPORT CARD Northside Elementary School - 6055052
Prepared by Georgia Department of Education
Page 5
1998-99 GEORGIA PUBLIC EDUCATION REPORT CARD
BALDWIN COUNTY SCHOOLS
Southside Elementary School - 6052054
Grade Range PK-5
The Georgia Public Education Report Card is designed to assist systems and schools in educational improvement. This report card contains a variety of data elements. An explanation of the terms is provided as a companion to the report card data. Please refer to the definitions for the most effective use of the reported data.
STUDENT DATA
Total
K-5
442
PK
20
Enrollment, by Race/Ethnicity and Sex
Black
White Hispanic
American Asian Indian
Multiracial
284 64.3%
152 34.4%
2 0.5%
0 0.0%
0 0.0%
4 0.9%
11 55.0%
8 40.0%
0 0.0%
0 0.0%
0 0.0%
1 5.0%
Male Female
230 52.0%
212 48.0%
11 55.0%
9 45.0%
Enrollment in Selected Programs
Program
Program % of Student Enrollment Population
Gifted (Grades K-12)
31
7.0%
Alternative Programs (Grades 6-12)
N/A
N/A
Students Eligible to Receive Free/Reduced Lunches
Number
Percent
School System
304 3,400
65.8% 53.2%
Dropout Rate *
Number
Rate
School System
N/A N/A
N/A N/A
* Dropout rates are not applicable for grades PK-5.
Enrollment in Compensatory Programs
Program
Program % of Student Enrollment Population
Special Education (Grades K-12)
81 18.3%
(PK)
1
N/A
English to Speakers of Other Languages (ESOL) (Grades K-12)
0
0.0%
Remedial Education (Grades 2-5, 9-12)
71 22.8%
Special Instructional Assistance (SIA) (Grades K-3)
42 14.9%
Title I (Grades K-12)
This school has a Targeted Assistance program.
Total 16
Retained Students, by Race/Ethnicity and Sex
Black
White Hispanic
American MultiAsian Indian racial
8 50.0%
8 50.0%
0 0.0%
0 0.0%
0 0.0%
0 0.0%
Male Female
13
3
81.3% 18.8%
Prepared by Georgia Department of Education
Page 1
STATE-REQUIRED TEST DATA
NORM-REFERENCED TESTS Grade 3
Iowa Tests of Basic Skills (ITBS) Each chart reflects data for three years of testing.
Reading Comprehension 50
77 60 54 0
98-99
61 57 53 97-98
47 52 52 96-97
Mathematics
School 50
System
State
0
87 72 61 98-99
77 68 61 97-98
80 71 59 96-97
School System State
Reading Vocabulary 50
96 69 50 0
98-99
79 60 50 97-98
39 51 49 96-97
Language Arts
School 50
System
State
0
93 76 64 98-99
81 70 62 97-98
71 69 59 96-97
School System State
Social Studies 50
87 67 56 0
98-99
78 67 55 97-98
75 60 55 96-97
Science
School 50
System
State
0
91 69 59 98-99
77 64 59 97-98
85 65 58 96-97
School System State
Sources of Information
Composite Score
50
73 61 57 0
98-99
School 50
System
59 58 56 97-98
57 57 55 96-97
State 0
92 68 58 98-99
75 64 57 97-98
1998-99 GEORGIA PUBLIC EDUCATION REPORT CARD Southside Elementary School - 6052054
Prepared by Georgia Department of Education
71 62 56 96-97
Scores Reported in Percentiles
School System State
Page 2
STATE-REQUIRED TEST DATA
NORM-REFERENCED TESTS Grade 5
Iowa Tests of Basic Skills (ITBS) Each chart reflects data for three years of testing.
Reading Comprehension
Mathematics
50
49 54 53 0
98-99
47 54 53 97-98
49 50 52 96-97
School 50
System
State
0
58 66 59 98-99
51 63 58 97-98
63 62 57 96-97
School System State
Reading Vocabulary 50
63 54 48 0
98-99
29 45 48 97-98
49 46 46 96-97
Language Arts
School 50
System
State
0
57 64 63 98-99
64 64 61 97-98
67 63 58 96-97
School System State
Social Studies 50
54 57 57 0
98-99
60 59 56 97-98
53 51 55 96-97
Science
School 50
System
State
0
53 61 60 98-99
58 59 59 97-98
62 55 59 96-97
School System State
Sources of Information
Composite Score
50
56 57 58 0
98-99
School 50
System
48 56 58 97-98
58 54 57 96-97
State 0
54 59 57 98-99
53 58 56 97-98
58 54 55 96-97
1998-99 GEORGIA PUBLIC EDUCATION REPORT CARD Southside Elementary School - 6052054
Prepared by Georgia Department of Education
Scores Reported in Percentiles
School System State
Page 3
STATE-REQUIRED TEST DATA
PERFORMANCE ASSESSMENTS
Grade 5 Writing Assessment
Percent at Developmental Stages:
1998-99 School System State
1997-98 School System State
1996-97 School System State
Stage Stage Stage Stage Stage Stage
1:The Emerging Writer 2:The Developing Writer 3:The Focusing Writer 4:The Experimenting 5:The Engaging Writer 6:The Extending Writer
0% 0% 29% 37% 35% 0%
0% 1% 25% 42% 23% 8%
0% 1% 16% 41% 29% 12%
0% 2% 25% 57% 14% 2%
0% 1% 21% 47% 27% 4%
0% 3% 19% 41% 27% 10%
0% 0% 16% 33% 48% 3%
0% 4% 24% 41% 23% 8%
0% 3% 21% 37% 26% 12%
AWARDS / RECOGNITION DATA
Schools in Georgia may receive recognition in the following programs: Charter School Pay for Performance Program Georgia School of Excellence National Blue Ribbon School Southside Elementary School did not receive recognition in any of these programs during the 1998-99 school year.
1998-99 GEORGIA PUBLIC EDUCATION REPORT CARD Southside Elementary School - 6052054
Prepared by Georgia Department of Education
Page 4
CERTIFIED PERSONNEL DATA
Positions Number Average Contract Days
Personnel Sex
Certificate
Years Experience
Full-time Part-time
Male Female
4 Yr Bachelor's 5 Yr Master's 6 Yr Specialist's 7 Yr Doctoral Other*
<1 1-10 11-20 21-30 >30
Average
Administrators
1.50 206.67
1 1
0 2
0 0 2 0 0 0 0 0 2 0 23.00
Support Personnel
1.00 190.00
1 0
0 1
0 1 0 0 0 0 0 0 1 0 22.00
PK-12 Teachers
32.00 190.00
32 0
2 30
17 13
2 0 0 0 12 12 8 0 13.91
*Includes One- and Two-Year Vocational Certificates.
ACCREDITATION DATA
Not accredited by Southern Association of Colleges and Schools (SACS) or Georgia Accrediting Commission (GAC).
1998-99 GEORGIA PUBLIC EDUCATION REPORT CARD Southside Elementary School - 6052054
Prepared by Georgia Department of Education
Page 5
1998-99 GEORGIA PUBLIC EDUCATION REPORT CARD
BALDWIN COUNTY SCHOOLS
West End Elementary School - 6053054
Grade Range PK-5
The Georgia Public Education Report Card is designed to assist systems and schools in educational improvement. This report card contains a variety of data elements. An explanation of the terms is provided as a companion to the report card data. Please refer to the definitions for the most effective use of the reported data.
STUDENT DATA
Total
K-5
369
PK
20
Enrollment, by Race/Ethnicity and Sex
Black
White Hispanic
American Asian Indian
Multiracial
191 51.8%
164 44.4%
7 1.9%
1 0.3%
0 0.0%
6 1.6%
12 60.0%
5 25.0%
1 5.0%
1 5.0%
0 0.0%
1 5.0%
Male Female
188 50.9%
181 49.1%
6 30.0%
14 70.0%
Enrollment in Selected Programs
Program
Program % of Student Enrollment Population
Gifted (Grades K-12)
43
11.7%
Alternative Programs (Grades 6-12)
N/A
N/A
Students Eligible to Receive Free/Reduced Lunches
Number
Percent
School System
209 3,400
53.7% 53.2%
Dropout Rate *
Number
Rate
School System
N/A N/A
N/A N/A
* Dropout rates are not applicable for grades PK-5.
Enrollment in Compensatory Programs
Program
Program % of Student Enrollment Population
Special Education (Grades K-12)
71 19.2%
(PK)
0
N/A
English to Speakers of Other Languages (ESOL) (Grades K-12)
0
0.0%
Remedial Education (Grades 2-5, 9-12)
31 13.8%
Special Instructional Assistance (SIA) (Grades K-3)
49 19.0%
Title I (Grades K-12)
This school has a Targeted Assistance program.
Total 18
Retained Students, by Race/Ethnicity and Sex
Black
White Hispanic
American MultiAsian Indian racial
14 77.8%
4 22.2%
0 0.0%
0 0.0%
0 0.0%
0 0.0%
Male Female
10
8
55.6% 44.4%
Prepared by Georgia Department of Education
Page 1
STATE-REQUIRED TEST DATA
NORM-REFERENCED TESTS Grade 3
Iowa Tests of Basic Skills (ITBS) Each chart reflects data for three years of testing.
Reading Comprehension 50
N/A 60 54 0
98-99
71 57 53 97-98
68 52 52 96-97
Mathematics
School 50
System
State
N/A 72 61
0
98-99
72 68 61 97-98
80 71 59 96-97
School System State
Reading Vocabulary 50
N/A 69 50 0
98-99
60 60 50 97-98
74 51 49 96-97
Language Arts
School 50
System
State
N/A 76 64
0
98-99
77 70 62 97-98
83 69 59 96-97
School System State
Social Studies 50
N/A 67 56 0
98-99
68 67 55 97-98
68 60 55 96-97
Science
School 50
System
State
N/A 69 59
0
98-99
76 64 59 97-98
69 65 58 96-97
School System State
Sources of Information
Composite Score
50
N/A 61 57 0
98-99
School 50
System
62 58 56 97-98
66 57 55 96-97
State
N/A 68 58
0
98-99
71 64 57 97-98
1998-99 GEORGIA PUBLIC EDUCATION REPORT CARD West End Elementary School - 6053054
Prepared by Georgia Department of Education
73 62 56 96-97
Scores Reported in Percentiles
School System State
Page 2
STATE-REQUIRED TEST DATA
NORM-REFERENCED TESTS Grade 5
Iowa Tests of Basic Skills (ITBS) Each chart reflects data for three years of testing.
Reading Comprehension
Mathematics
50
N/A 54 53 0
98-99
57 54 53 97-98
49 50 52 96-97
School 50
System
State
N/A 66 59
0
98-99
67 63 58 97-98
53 62 57 96-97
School System State
Reading Vocabulary 50
N/A 54 48 0
98-99
72 45 48 97-98
62 46 46 96-97
Language Arts
School 50
System
State
N/A 64 63
0
98-99
72 64 61 97-98
64 63 58 96-97
School System State
Social Studies 50
N/A 57 57 0
98-99
55 59 56 97-98
45 51 55 96-97
Science
School 50
System
State
N/A 61 60
0
98-99
59 59 59 97-98
45 55 59 96-97
School System State
Sources of Information
Composite Score
50
N/A 57 58 0
98-99
School 50
System
58 56 58 97-98
49 54 57 96-97
State
N/A 59 57
0
98-99
62 58 56 97-98
51 54 55 96-97
1998-99 GEORGIA PUBLIC EDUCATION REPORT CARD West End Elementary School - 6053054
Prepared by Georgia Department of Education
Scores Reported in Percentiles
School System State
Page 3
STATE-REQUIRED TEST DATA
PERFORMANCE ASSESSMENTS
Grade 5 Writing Assessment
Percent at Developmental Stages:
1998-99 School System State
1997-98 School System State
1996-97 School System State
Stage Stage Stage Stage Stage Stage
1:The Emerging Writer 2:The Developing Writer 3:The Focusing Writer 4:The Experimenting 5:The Engaging Writer 6:The Extending Writer
N/A N/A N/A N/A N/A N/A
0% 1% 25% 42% 23% 8%
0% 1% 16% 41% 29% 12%
0% 3% 15% 49% 31% 3%
0% 1% 21% 47% 27% 4%
0% 3% 19% 41% 27% 10%
0% 3% 45% 38% 8% 2%
0% 4% 24% 41% 23% 8%
No Grade-5 Writing Assessment scores were reported for West End Elementary School.
0% 3% 21% 37% 26% 12%
AWARDS / RECOGNITION DATA
Schools in Georgia may receive recognition in the following programs: Charter School Pay for Performance Program Georgia School of Excellence National Blue Ribbon School West End Elementary School did not receive recognition in any of these programs during the 1998-99 school year.
1998-99 GEORGIA PUBLIC EDUCATION REPORT CARD West End Elementary School - 6053054
Prepared by Georgia Department of Education
Page 4
CERTIFIED PERSONNEL DATA
Positions Number Average Contract Days
Personnel Sex
Certificate
Years Experience
Full-time Part-time
Male Female
4 Yr Bachelor's 5 Yr Master's 6 Yr Specialist's 7 Yr Doctoral Other*
<1 1-10 11-20 21-30 >30
Average
Administrators
0.50 210.00
0 1
0 1
0 0 1 0 0 0 0 1 0 0 20.00
Support Personnel
2.00 190.00
2 0
0 2
0 2 0 0 0 0 0 1 1 0 19.50
PK-12 Teachers
29.00 190.00
29 0
2 27
20 9 0 0 0 0
11 10
7 1 14.28
*Includes One- and Two-Year Vocational Certificates.
ACCREDITATION DATA
Not accredited by Southern Association of Colleges and Schools (SACS) or Georgia Accrediting Commission (GAC).
1998-99 GEORGIA PUBLIC EDUCATION REPORT CARD West End Elementary School - 6053054
Prepared by Georgia Department of Education
Page 5
1998-99 GEORGIA PUBLIC EDUCATION REPORT CARD BANKS COUNTY SCHOOLS - 606
The Georgia Public Education Report Card is designed to assist systems and schools in educational improvement. This report card contains a variety of data elements. An explanation of the terms is provided as a companion to the report card data. Please refer to the definitions for the most effective use of the reported data.
Total
K-12
2,115
PK
147
STUDENT DATA
Enrollment, by Race/Ethnicity and Sex
Black
White Hispanic
American Multi-
Asian Indian
racial
84 4.0%
1,986 93.9%
25 1.2%
19 0.9%
0 0.0%
1 0.0%
5 3.4%
137 93.2%
3 2.0%
2 1.4%
0 0.0%
0 0.0%
Male
1,124 53.1%
79 53.7%
Female
991 46.9%
68 46.3%
Enrollment in Selected Programs
Program
Program % of Student Enrollment Population
Gifted (Grades K-12)
111
5.2%
Non-Vocational Labs (Grades 9-12)
499
89.4%
Vocational Labs (Grades 9-12)
466
83.5%
Alternative Programs (Grades 6-12)
0
0.0%
Students Eligible to Receive Free/Reduced Lunches
Number
Percent
1,177
52.0%
Dropout Rate
Number
Percent
6-12 9-12
40
3.5%
39
6.6%
Enrollment in Compensatory Programs
Program
Program % of Student Enrollment Population
Special Education
(Grades K-12)
234
PK
8
English to Speakers of
Other Languages (ESOL)
0
(Grades K-12)
Remedial Education (Grades 2-5, 9-12)
169
Special Instructional
Assistance (SIA)
41
(Grades K-3)
Title I (Grades K-12) Number of schools with: Schoolwide program Targeted Assistance program No Title I program
11.1% N/A
0.0%
13.6%
5.7%
0 3 1
Total 79
Retained Students, by Race/Ethnicity and Sex
Black
White Hispanic
American MultiAsian Indian racial
3 3.8%
75 94.9%
1 1.3%
0 0.0%
0 0.0%
0 0.0%
Male Female
58
21
73.4% 26.6%
Prepared by Georgia Department of Education
Page 1
STATE-REQUIRED TEST DATA
NORM-REFERENCED TESTS
Grade 3 Iowa Tests of Basic Skills (ITBS) Each chart reflects data for three years of testing.
Reading Comprehension
Mathematics
50
55 54 56 53 55 52 0
98-99 97-98 96-97
System State
50
59 61 62 61 58 59 0
98-99 97-98 96-97
System State
Reading Vocabulary
50
49 50 49 50 49 49 0
98-99 97-98 96-97
System State
Social Studies
50
59 56 61 55 63 55 0
98-99 97-98 96-97
System State
Language Arts
50
59 64 61 62 62 59 0
98-99 97-98 96-97
System State
Science
50
61 59 67 59 63 58 0
98-99 97-98 96-97
System State
Sources of Information
Composite Score
50
54 57 0
98-99
System
50
56 56 60 55 97-98 96-97
State
58 58 60 57 0
98-99 97-98
1998-99 GEORGIA PUBLIC EDUCATION REPORT CARD Banks County Schools
Prepared by Georgia Department of Education
System State Scores Reported 59 56 in Percentiles 96-97
Page 2
STATE-REQUIRED TEST DATA
NORM-REFERENCED TESTS
Grade 5 Iowa Tests of Basic Skills (ITBS) Each chart reflects data for three years of testing.
Reading Comprehension
Mathematics
50
55 53 55 53 55 52 0
98-99 97-98 96-97
System State
50
58 59 58 58 63 57 0
98-99 97-98 96-97
System State
Reading Vocabulary
50
46 48 46 48 47 46 0
98-99 97-98 96-97
System State
Social Studies
50
59 57 59 56 58 55 0
98-99 97-98 96-97
System State
Language Arts
50
57 63 53 61 51 58 0
98-99 97-98 96-97
System State
Science
50
61 60 62 59 66 59 0
98-99 97-98 96-97
System State
Sources of Information
Composite Score
50
57 58 0
98-99
System
50
57 58 61 57 97-98 96-97
State
57 57 56 56 0
98-99 97-98
1998-99 GEORGIA PUBLIC EDUCATION REPORT CARD Banks County Schools
Prepared by Georgia Department of Education
System State Scores Reported 58 55 in Percentiles 96-97
Page 3
STATE-REQUIRED TEST DATA
NORM-REFERENCED TESTS Grade 8
Iowa Tests of Basic Skills (ITBS) Each chart reflects data for three years of testing.
Reading Comprehension
Mathematics
50
53 49 53 48 51 48 0
98-99 97-98 96-97
System State
50
60 56 55 55 52 54 0
98-99 97-98 96-97
System State
Reading Vocabulary
50
49 46 57 45 50 44 0
98-99 97-98 96-97
System State
Language Arts
50
66 60 59 58 59 56 0
98-99 97-98 96-97
System State
Social Studies
50
62 54 55 53 58 53 0
98-99 97-98 96-97
System State
Science
50
60 56 58 55 57 53 0
98-99 97-98 96-97
System State
Sources of Information
Composite Score
50
62 57 0
98-99
System
50
55 56 56 55 97-98 96-97
State
61 56 57 54 0
98-99 97-98
1998-99 GEORGIA PUBLIC EDUCATION REPORT CARD Banks County Schools
Prepared by Georgia Department of Education
System State Scores Reported 56 54 in Percentiles 96-97
Page 4
STATE-REQUIRED TEST DATA
PERFORMANCE ASSESSMENTS
Grade 5 Writing Assessment
1998-99
1997-98
1996-97
Percent at Developmental Stages:
Comparison
Comparison
Comparison
System Group State System Group State System Group State
Stage Stage Stage Stage Stage Stage
1: The Emerging Writer 2: The Developing Writer 3: The Focusing Writer 4: The Experimenting Writer 5: The Engaging Writer 6: The Extending Writer
0% 0% 6% 40% 42% 12%
0% 1% 19% 43% 27% 10%
0% 1% 16% 41% 29% 12%
2% 2% 17% 44% 29% 5%
0% 3% 22% 45% 24% 6%
0% 3% 19% 41% 27% 10%
1% 5% 20% 43% 22% 9%
1% 5% 23% 39% 24% 8%
0% 3% 21% 37% 26% 12%
Grade 8 Writing Assessment
1998-99 Percent Scoring 1997-98 Percent Scoring 1996-97 Percent Scoring
Categories of Scaled Scores
Comparison
Comparison
Comparison
System Group State System Group State System Group State
Inadequate (less than 162)
Minimal (162-209)
Good
(210-247)
Very Good (greater than 247)
4% 26% 45% 25%
8% 45% 39%
9%
8% 40% 41% 11%
9% 43% 35% 13%
10% 51% 32%
6%
11% 46% 34%
8%
15% 53% 24%
7%
16% 49% 28%
7%
15% 46% 30%
8%
Average Scaled Score: (Range 100-300)
223
205 208
207
200 202
195
195 198
GEORGIA HIGH SCHOOL GRADUATION TESTS (GHSGT)
Percent of Regular Program 11th Graders Passing the Georgia High School Graduation Tests on First Administration
1998-99
1997-98
1996-97
Comparison
Comparison
Comparison
System Group State System Group State System Group State
English Language Arts Mathematics Social Studies Science
98% 95% 82% 62%
95% 86% 76% 68%
96% 88% 80% 72%
96% 90% 77% 76%
93% 85% 72% 69%
94% 88% 78% 74%
97% 93% 82% 76%
91% 84% 70% 68%
94% 87% 78% 74%
All Components listed above 5 9 %
63% 68% 65%
59% 68% 69%
59% 67%
Writing
95%
92% 93% 92%
90% 92% 95%
91% 93%
1998-99 GEORGIA PUBLIC EDUCATION REPORT CARD
Banks County Schools
Prepared by Georgia Department of Education
Page 5
GRADUATE DATA
1999 Graduates by Credentials, Race/Ethnicity and Sex
Diplomas with Both College Prep. & Voc. Endorsements
Diplomas with College Prep. Endorsements Diplomas with Vocational Endorsements General High School Diplomas Special Education Diplomas
Total All Diplomas
Certificates of Performance
Total Graduates
Total 29 12 50 0
Black
1 3.4%
2 16.7%
2 4.0%
0
American MultiWhite Hispanic Asian Indian racial
27 93.1%
10 83.3%
47 94.0%
0
0 0.0%
0 0.0%
1 2.0%
0
1 3.4%
0 0.0%
0 0.0%
0
0 0.0%
0 0.0%
0 0.0%
0
0 0.0%
0 0.0%
0 0.0%
0
Male Female
12 41.4%
6 50.0%
26 52.0%
0
17 58.6%
6 50.0%
24 48.0%
0
3
0
3
0.0% 100.0%
94
5
87
5.3% 92.6%
1
1
100.0%
0 0.0%
95
6
87
6.3% 91.6%
0 0.0%
1 1.1%
0 0.0%
1 1.1%
0 0.0%
1 1.1%
0 0.0%
1 1.1%
0 0.0%
0 0.0%
0 0.0%
0 0.0%
0
2
0.0% 66.7%
0
46
0.0% 48.9%
0
1
0.0% 100.0%
0
47
0.0% 49.5%
1 33.3%
48 51.1%
0 0.0%
48 50.5%
HOPE Scholarships
System State
Number of 1999 Graduates 9 5
Number Eligible
54
Percent Eligible
56.8%
65,548 40,292 61.5%
High School Completion Rate Percent of 1995Grade 9 Enrollment
in Graduating Class of1999
System
State
Completion Rate '95-'99 65.5% 68.9%
COLLEGE ADMISSIONS / CREDIT TEST DATA
Scholastic Assessment Test (SAT)
No. Taking
Average Score
Tests
Verbal Math Total
Based on students' highest verbal and highest math scores
System College Prep. Endorsement Other Diplomas
449 458 907 490 530 1020 330 330 660
Georgia
492 488 980
Based on students' last test administration
System Georgia
50
442 447
889
41,958 483 479 962
Nation
952,913 502 508 1010
American College Testing (ACT)
System State Nation
English
17.5
19.1 20.4
Mathematics
16.8
19.9 20.7
Reading
17.3
20.2 21.3
Science Reasoning 18.8
19.9 21.0
CompositeScore 17.8
19.9 21.9
Advanced Placement Exams (AP)
No. of Students Taking Tests
No. of Tests Taken No. of Test Scores
3 or Higher Percent of Test
Scores 3 or Higher
System State 0 15,225
N/A 23,969 N/A 13,024
N/A 54.3%
1998-99 GEORGIA PUBLIC EDUCATION REPORT CARD Banks County Schools
Prepared by Georgia Department of Education
Page 6
POSTSECONDARY DATA
Graduates Entering Georgia Public Colleges and Universities
Graduates Entering Georgia Public Colleges and Universities and
Requiring Learning Support (LS)
1998 Graduates Entering 1998-99
1997 Graduates Entering 1997-98
Percent of Graduating Number Class
27
24.5%
26
31.0%
Number Requiring
LS
7
4
Percent of those attending Georgia
Public Colleges
25.9%
15.4%
In previous years, the Report Card presented College Prep Curriculum information provided by the Board of Regents on students requiring Learning Support. Due to inconsistencies in the data provided by the Board of Regents in defining College Prep Completers versus Local Board of Education data defining College Prep Endorsements, the Department of Education Report Card will not provide this information until discrepancies can be reconciled.
Graduates Entering Georgia Public Technical and Adult Schools
Entering 1998-99 Entering 1997-98
Number Percent
Number Percent
1998 Graduates 1997 Graduates
8
7.3%
1
1.2%
N/A 12
N/A 14.3%
ACCREDITATION / RECOGNITION DATA
Southern Association of Colleges and Schools (SACS) Accrediting Commission
Secondary/Middle Commission Elementary/Middle Commission Both Elementary/Secondary Commissions Joint Commission Candidate for Accreditation
Accreditation by Georgia Accrediting Commission (GAC)
Accredited by GAC Accredited with Quality by GAC
Number of Schools
1 3 0 0 0
Number of Schools
0 4
Awards / Recognition
State Recognized Program
Number of Schools
Charter School
0
Pay for Performance Recipient
1
Georgia School of Excellence
0
National Blue Ribbon School
0
COMMUNITY DATA
Number of Children Eligible for Migrant Education Number of Families-At-Risk * Number of Food Stamp Participants * Number of Families Receiving TANF * ** Per Capita Income * Unemployment Rate * 1990 Population * Projected 2000 Population * Projected 2010 Population *
* Data Available at County Level Only ** Known as AFDC before January 1997
8 44 681 48 $18,745 4.0% 10,308 12,479 13,605
1998-99 GEORGIA PUBLIC EDUCATION REPORT CARD Banks County Schools
Prepared by Georgia Department of Education
Page 7
FISCAL DATA
Millage Rate
10.40
* Fall 1998 Property Tax Digest is used to calculate the 98-99 Value of One Mill
FTE Count
FTE Count used for Allotment Calculation 2,097.0 Fall '98 FTE Count 2,115
Value of One Mill
$316,822 $151.08 per Allotment FTE
Sources: Local State-QBE State-
Lottery State-
Other Federal Other
Total
PerGeneral Fund cent Per FTE
$3,535,357 33.2% $1,686 $6,457,364 60.7% $3,079
K-12 Revenues
Lottery K-12
and
Title
All Other
Programs
K-12
$0
$0
Bonded Debt
$1,851,486
$0
$0
$0
$0 0.0%
$0
$0
$45,422
$0
$642,944 6.0% $307
$0 0.0%
$0
$0 0.0%
$0
$10,635,665 100% $5,072
$23,096 $509,353
$0 $532,449
$0 $0 $0 $45,422
$0 $0 $0 $1,851,486
Capital Projects
$164,016 $0
$0
$2,454,249 $0
$2,899,988 $5,518,254
School Nutrition
$261,875 $0
$0
$49,928 $520,570
$0 $832,374
Grand Total
Total
Per-
Amount cent
$5,812,735 29.9%
$6,457,364 33.3%
$45,422 0.2%
$3,170,218 16.3% $1,029,923 5.3% $2,899,988 14.9% $19,415,652 100%
Instruction
Media Instruction
Support Pupil Services General Admin. School Admin. Trans-
portation Maint. & Ops. Capital Projects School Food Debt Service
Total
$6,914,544 67.0% $3,297 $304,570 3.0% $145
$349,384 3.4% $167
$425,572 4.1% $203
$298,464 2.9% $142
$559,333 5.4% $267
$679,578 6.6% $324
$743,576 7.2% $355
$45,923 0.4% $22
$0 0.0%
$0
$0 0.0%
$0
$10,320,947 100% $4,922
K-12 Expenditures
$467,900
$45,177
$0
$0
$0
$6,382
$0
$0
$0
$0
$70,565
$315
$0
$0
$0
$14,885
$0
$0
$0
$0
$10,140
$0
$0
$0
$0
$0
$0
$0
$0
$0
$0
$0
$0
$0
$0
$0
$0
$0
$0
$0
$0
$0
$0 $5,902,635
$0
$0
$0
$0
$0 $1,027,240
$0
$0 $615,320
$0
$0
$7,427,623 40.2% $310,952 1.7% $420,264 2.3% $440,458 2.4% $308,604 1.7% $559,333 3.0% $679,578 3.7% $743,576 4.0%
$5,948,558 32.2% $1,027,240 5.6%
$615,320 3.3%
$569,874
$45,492 $615,320 $5,902,635 $1,027,240 $18,481,510 100%
Salaries and Benefits as Percentages of Revenues and of Expenditures
Teachers and Paraprofessionals
Salaries $4,757,920
Benefits $1,349,594
Percentage of Revenues Percentage of Expenditures
Total of
Total of
General Fund
General Fund
Title Programs
Title Programs
Lottery K-12
Lottery K-12
Total Salaries
and
Total
and
Total
and Benefits All Other K-12 K - 12 All Other K-12 K - 12
$6,107,514
54.5%
31.5%
55.8%
33.0%
School Administration
$334,348
$111,709
$446,057
4.0%
2.3%
4.1%
2.4%
General Administration
$143,851
$57,985
$201,836
1.8%
1.0%
1.8%
1.1%
1998-99 GEORGIA PUBLIC EDUCATION REPORT CARD
Banks County Schools - 606
Prepared by Georgia Department of Education
Page 8
CERTIFIED PERSONNEL DATA
Number
Average Annual Salary Positions Average Contract Days
Average Daily Salary
Full-time Personnel Part-time
Sex Male Female
4 Yr Bachelor's Certificate 5 Yr Master's
Level 6 Yr Specialist's 7 Yr Doctoral Other*
Black
White Race/ Hispanic Ethnicity Asian
American Indian
Multiracial
Years Experience
<1 1-10 11-20 21-30 >30
Average
Administrators
10.00
$61,886.73 211.00
$293.30
9 2
6 5
0 3 7 1 0
0 11
0 0 0 0
0 0 5 6 0
21.64
Support Personnel PK-12 Teachers
10.50
123.90
$45,116.41 192.86
$233.94
$36,991.02 191.00
$193.67
10
123
1
1
3
24
8
100
1
59
6
51
3
12
1
1
0
1
0
1
11
123
0
0
0
0
0
0
0
0
0
11
2
51
5
46
4
16
0
0
18.55
11.35
*Includes One- and Two-Year Vocational Certificates.
Certified Staff Position Ratios
Teacher/Administrator Ratio 12:1
Teacher/Support Person Ratio 12:1
Teacher/Staff Ratio 6:1
Student Enrollment/All Teachers 17:1
Certified Personnel by Category
84.9% 100%
7.5%
7.5%
80% 60%
40%
20%
0%
Teachers
Administrators
Support Personnel
1998-99 GEORGIA PUBLIC EDUCATION REPORT CARD
Banks County Schools - 606
Prepared by Georgia Department of Education
Page 9
1998-99 GEORGIA PUBLIC EDUCATION REPORT CARD
BANKS COUNTY SCHOOLS
Banks County Elementary School - 6062050
Grade Range 3-5
The Georgia Public Education Report Card is designed to assist systems and schools in educational improvement. This report card contains a variety of data elements. An explanation of the terms is provided as a companion to the report card data. Please refer to the definitions for the most effective use of the reported data.
STUDENT DATA
Total 506
3-5 Enrollment, by Race/Ethnicity and Sex
Black
White Hispanic
American Multi-
Asian Indian
racial
19 3.8%
479 94.7%
5 1.0%
2 0.4%
0 0.0%
1 0.2%
Male Female
261 51.6%
245 48.4%
Enrollment in Selected Programs
Program
Program % of Student Enrollment Population
Gifted (Grades K-12)
26
5.1%
Alternative Programs (Grades 6-12)
N/A
N/A
Students Eligible to Receive Free/Reduced Lunches
Number
Percent
School System
308 1,177
60.9% 52.0%
Dropout Rate *
Number
Rate
School System
N/A N/A
N/A N/A
* Dropout rates are not applicable for grades PK-5.
Enrollment in Compensatory Programs
Program
Program % of Student Enrollment Population
Special Education (Grades K-12)
77 15.2%
(PK)
0
N/A
English to Speakers of Other Languages (ESOL) (Grades K-12)
0
0.0%
Remedial Education (Grades 2-5, 9-12)
83 16.4%
Special Instructional Assistance (SIA) (Grades K-3)
0
0.0%
Title I (Grades K-12)
This school has no Title I program.
Total 4
Retained Students, by Race/Ethnicity and Sex
Black
White Hispanic
American Multi-
Asian Indian
racial
1 25.0%
3 75.0%
0 0.0%
0 0.0%
0 0.0%
0 0.0%
Male Female
4
0
100.0% 0.0%
Prepared by Georgia Department of Education
Page 1
STATE-REQUIRED TEST DATA
NORM-REFERENCED TESTS Grade 3
Iowa Tests of Basic Skills (ITBS) Each chart reflects data for three years of testing.
Reading Comprehension 50
55 55 54 0
98-99
56 56 53 97-98
55 55 52 96-97
Mathematics
School 50
System
State
0
59 59 61 98-99
62 62 61 97-98
58 58 59 96-97
School System State
Reading Vocabulary 50
49 49 50 0
98-99
49 49 50 97-98
49 49 49 96-97
Language Arts
School 50
System
State
0
59 59 64 98-99
61 61 62 97-98
62 62 59 96-97
School System State
Social Studies 50
59 59 56 0
98-99
61 61 55 97-98
63 63 55 96-97
Science
School 50
System
State
0
61 61 59 98-99
67 67 59 97-98
63 63 58 96-97
School System State
Sources of Information
Composite Score
50
54 54 57 0
98-99
School 50
System
56 56 56 97-98
60 60 55 96-97
State 0
58 58 58 98-99
60 60 57 97-98
1998-99 GEORGIA PUBLIC EDUCATION REPORT CARD Banks County Elementary School - 6062050
Prepared by Georgia Department of Education
59 59 56 96-97
Scores Reported in Percentiles
School System State
Page 2
STATE-REQUIRED TEST DATA
NORM-REFERENCED TESTS Grade 5
Iowa Tests of Basic Skills (ITBS) Each chart reflects data for three years of testing.
Reading Comprehension
Mathematics
50
55 55 53 0
98-99
55 55 53 97-98
55 55 52 96-97
School 50
System
State
0
58 58 59 98-99
58 58 58 97-98
63 63 57 96-97
School System State
Reading Vocabulary 50
46 46 48 0
98-99
46 46 48 97-98
47 47 46 96-97
Language Arts
School 50
System
State
0
57 57 63 98-99
53 53 61 97-98
51 51 58 96-97
School System State
Social Studies 50
59 59 57 0
98-99
59 59 56 97-98
58 58 55 96-97
Science
School 50
System
State
0
61 61 60 98-99
62 62 59 97-98
66 66 59 96-97
School System State
Sources of Information
Composite Score
50
57 57 58 0
98-99
School 50
System
57 57 58 97-98
61 61 57 96-97
State 0
57 57 57 98-99
56 56 56 97-98
58 58 55 96-97
1998-99 GEORGIA PUBLIC EDUCATION REPORT CARD Banks County Elementary School - 6062050
Prepared by Georgia Department of Education
Scores Reported in Percentiles
School System State
Page 3
STATE-REQUIRED TEST DATA
PERFORMANCE ASSESSMENTS
Grade 5 Writing Assessment
Percent at Developmental Stages:
1998-99 School System State
1997-98 School System State
1996-97 School System State
Stage Stage Stage Stage Stage Stage
1:The Emerging Writer 2:The Developing Writer 3:The Focusing Writer 4:The Experimenting 5:The Engaging Writer 6:The Extending Writer
0% 0% 6% 40% 42% 12%
0% 0% 6% 40% 42% 12%
0% 1% 16% 41% 29% 12%
2% 2% 17% 44% 29% 5%
2% 2% 17% 44% 29% 5%
0% 3% 19% 41% 27% 10%
1% 5% 20% 43% 22% 9%
1% 5% 20% 43% 22% 9%
0% 3% 21% 37% 26% 12%
AWARDS / RECOGNITION DATA
Schools in Georgia may receive recognition in the following programs: Charter School Pay for Performance Program Georgia School of Excellence National Blue Ribbon School Banks County Elementary School did not receive recognition in any of these programs during the 1998-99 school year.
1998-99 GEORGIA PUBLIC EDUCATION REPORT CARD Banks County Elementary School - 6062050
Prepared by Georgia Department of Education
Page 4
CERTIFIED PERSONNEL DATA
Positions Number Average Contract Days
Personnel Sex
Certificate
Years Experience
Full-time Part-time
Male Female
4 Yr Bachelor's 5 Yr Master's 6 Yr Specialist's 7 Yr Doctoral Other*
<1 1-10 11-20 21-30 >30
Average
Administrators
1.00 210.00
1 0
1 0
0 0 1 0 0 0 0 0 1 0 26.00
Support Personnel
2.00 190.00
2 0
1 1
0 2 0 0 0 0 0 2 0 0 18.50
PK-12 Teachers
29.64 190.00
29 2
3 28
12 16
3 0 0 3 11 15 2 0 10.81
*Includes One- and Two-Year Vocational Certificates.
ACCREDITATION DATA
Accredited by Southern Association of Colleges and Schools (SACS):
Elementary/Middle Commission. Accredited with Quality by Georgia
Accrediting Commission (GAC).
1998-99 GEORGIA PUBLIC EDUCATION REPORT CARD Banks County Elementary School - 6062050
Prepared by Georgia Department of Education
Page 5
1998-99 GEORGIA PUBLIC EDUCATION REPORT CARD
BANKS COUNTY SCHOOLS
Banks County High School - 6061050
Grade Range 9-12
The Georgia Public Education Report Card is designed to assist systems and schools in educational improvement. This report card contains a variety of data elements. An explanation of the terms is provided as a companion to the report card data. Please refer to the definitions for the most effective use of the reported data.
Total 558
STUDENT DATA
9-12 Enrollment, by Race/Ethnicity and Sex
Black
White Hispanic
American Multi-
Asian Indian
racial
27 4.8%
520 93.2%
6 1.1%
5 0.9%
0 0.0%
0 0.0%
Male Female
315 56.5%
243 43.5%
Enrollment in Selected Programs
Program
Gifted (Grades K-12)
Program % of Student Enrollment Population
29
5.2%
Non-Vocational Labs (Grades 9-12)
499
Vocational Labs
(Grades 9-12)
466
Alternative Programs (Grades 6-12)
0
89.4% 83.5%
0.0%
Students Eligible to Receive Free/Reduced Lunches
Number
Percent
School System
169 1,177
30.3% 52.0%
Enrollment in Compensatory Programs
Program
Program % of Student Enrollment Population
Special Education (Grades K-12) PK
57 10.2%
0
N/A
English to Speakers of Other Languages (ESOL) (Grades K-12)
0
0.0%
Remedial Education (Grades 2-5, 9-12)
67 12.0%
Title I (Grades K-12)
This school has a Targeted Assistance program.
Dropout Rate for Grades 9-12
Number
Rate
School System
39
6.6%
39
6.6%
Total 33
Retained Students, by Race/Ethnicity and Sex
Black
White Hispanic
American MultiAsian Indian racial
1 3.0%
32 97.0%
0 0.0%
0 0.0%
0 0.0%
0 0.0%
Male Female
23
10
69.7% 30.3%
Prepared by Georgia Department of Education
Page 1
STATE-REQUIRED TEST DATA
GEORGIA HIGH SCHOOL GRADUATION TESTS (GHSGT)
Percent of Regular Program 11th Graders Passing the Georgia High School Graduation Tests on First Administration
English Language Arts Mathematics Social Studies Science
All Components listed above
Writing
1998-99
School System State
98% 95% 82% 62%
98% 95% 82% 62%
96% 88% 80% 72%
59% 59% 68%
95% 95% 93%
1997-98
School System State
96% 90% 77% 76%
96% 90% 77% 76%
94% 88% 78% 74%
65% 65% 68%
92% 92% 92%
1996-97
School System State
97% 93% 82% 76%
97% 93% 82% 76%
94% 87% 78% 74%
69% 69% 67%
95% 95% 93%
GRADUATE DATA
1999 Graduates by Credentials, Race/Ethnicity and Sex
Diplomas with Both College Prep. & Voc. Endorsements
Diplomas with College Prep. Endorsements Diplomas with Vocational Endorsements General High School Diplomas Special Education Diplomas
Total All Diplomas
Certificates of Performance
Total Graduates
Total 29 12 50 0
Black
1 3.4%
2 16.7%
2 4.0%
0
White Hispanic
27 93.1%
0 0.0%
10 83.3%
0 0.0%
47 94.0%
1 2.0%
0
0
American MultiAsian Indian racial
1 3.4%
0 0.0%
0 0.0%
0 0.0%
0 0.0%
0 0.0%
0 0.0%
0 0.0%
0 0.0%
0
0
0
Male Female
12
17
41.4% 58.6%
6
6
50.0% 50.0%
26
24
52.0% 48.0%
0
0
3
0
3
0
0
0
0
2
1
0.0% 100.0% 0.0% 0.0% 0.0% 0.0% 66.7% 33.3%
94
5
87
1
1
0
0
46
48
5.3% 92.6% 1.1% 1.1% 0.0% 0.0% 48.9% 51.1%
1
1
100.0%
0 0.0%
0 0.0%
0 0.0%
0 0.0%
0
1
0.0% 100.0%
0 0.0%
95
6
87
1
1
0
0
47
48
6.3% 91.6% 1.1% 1.1% 0.0% 0.0% 49.5% 50.5%
HOPE Scholarships
School System
Number of 1999 Graduates 9 5
Number Eligible
54
Percent Eligible
56.8%
95 54 56.8%
State
65,548 40,292 61.5%
High School Completion Rate
Percent of 1995Grade 9 Enrollment in Graduating Class of1999 School System State
Completion Rate '95-'99 65.5% 65.5% 68.9%
1998-99 GEORGIA PUBLIC EDUCATION REPORT CARD
Banks County High School - 6061050
Prepared by Georgia Department of Education
Page 2
COLLEGE ADMISSIONS / CREDIT TEST DATA
Scholastic Assessment Test (SAT)
Based on students' highest verbal and highest math scores
No. Taking
Average Score
Tests Verbal Math Total
Based on students' last test administration
Average Score Verbal Math Total
School
50
College Prep. Endorsement
Other Diplomas
System
50
College Prep. Endorsement
Other Diplomas
Georgia
41,958
449 458
907
490 530 1020
330 330
660
449 458
907
490 530 1020
330 330
660
492 488
980
442 N/A N/A
442 N/A N/A
483
447 N/A N/A
447 N/A N/A
479
889 N/A N/A
889 N/A N/A
962
Nation
952,913 N/A N/A N/A
502 508 1010
American College Testing (ACT)
Advanced Placement Exams (AP)
Number taking tests: English Mathematics Reading Science Reasoning CompositeScore
6 School System State
17.5 17.5 19.1
16.8 16.8 19.9
17.3 18.8
17.3 18.8
20.2 19.9
17.8 17.8 19.9
No. of Students Taking Tests
No. of Tests Taken No. of Test Scores
3 or Higher Percent of Test
Scores 3 or Higher
School 0
N/A N/A
N/A
System State 0 15,225
N/A 23,969 N/A 13,024
N/A 54.3%
POST-SECONDARY DATA
Graduates Entering Georgia Public Colleges
Graduates Entering Georgia Public Colleges and Requiring Learning Support (LS)
1998 Graduates Entering in 1998-99
1997 Graduates Entering in 1997-98
Percent of Graduating Number Class
School
27
24.5%
System 2 7
24.5%
School
26
31.0%
System 2 6
31.0%
Number Requiring
LS 7 7
4 4
Percent of those attending Georgia
Public Colleges
25.9%
25.9%
15.4%
15.4%
In previous years, the Report Card presented College Prep Curriculum information provided by the Board of Regents on students requiring Learning Support. Due to inconsistencies in the data provided by the Board of Regents in defining College Prep Completers versus Local Board of Education data defining College Prep Endorsements, the Department of Education Report Card will not provide this information until discrepancies can be reconciled.
Graduates Entering Georgia Public Technical and Adult Schools
1998 Graduates School System
Entering Number 8 8
1998-99 Percent
7.3% 7.3%
Entering Number N/A N/A
1997-98 Percent
N/A N/A
1997 Graduates School
1
1.2%
System
1
1.2%
12
14.3%
12
14.3%
1998-99 GEORGIA PUBLIC EDUCATION REPORT CARD Banks County High School - 6061050
Prepared by Georgia Department of Education
Page 3
CERTIFIED PERSONNEL DATA
Positions Number Average Contract Days
Administrators
2.00 210.00
Support Personnel
2.00 200.00
PK-12 Teachers
32.60 191.04
Personnel Sex
Certificate
Years Experience
Full-time Part-time
Male Female
4 Yr Bachelor's 5 Yr Master's 6 Yr Specialist's 7 Yr Doctoral Other*
<1 1-10 11-20 21-30 >30
Average
2 0
1 1
0 1 1 0 0
0 0 1 1 0
18.50
2 0
0 2
0 1 1 0 0
0 1 1 0 0
14.50
30 7
14 23
21 11
3 1 1
5 12 15
5 0
12.14
*Includes One- and Two-Year Vocational Certificates.
ACCREDITATION DATA
Accredited by Southern Association of Colleges and Schools (SACS): Secondary/Middle Commission. Accredited with Quality by Georgia Accrediting Commission (GAC).
AWARDS / RECOGNITION DATA
Schools in Georgia may receive recognition in the following programs: Charter School Pay for Performance Program Georgia School of Excellence National Blue Ribbon School Banks County High School did not receive recognition in any of these programs during the 1998-99 school year.
1998-99 GEORGIA PUBLIC EDUCATION REPORT CARD Banks County High School - 6061050
Prepared by Georgia Department of Education
Page 4
1998-99 GEORGIA PUBLIC EDUCATION REPORT CARD
BANKS COUNTY SCHOOLS
Banks County Middle School - 6060289
Grade Range 6-8
The Georgia Public Education Report Card is designed to assist systems and schools in educational improvement. This report card contains a variety of data elements. An explanation of the terms is provided as a companion to the report card data. Please refer to the definitions for the most effective use of the reported data.
STUDENT DATA
Total 497
6-8 Enrollment, by Race/Ethnicity and Sex
Black
White Hispanic
American Multi-
Asian Indian
racial
15 3.0%
473 95.2%
4 0.8%
5 1.0%
0 0.0%
0 0.0%
Male 257
51.7%
Female 240
48.3%
Enrollment in Selected Programs
Program
Gifted (Grades K-12)
Program % of Student Enrollment Population
39
7.8%
Alternative Programs (Grades 6-12)
0
0.0%
Students Eligible to Receive Free/Reduced Lunches
Number
Percent
School System
256 1,177
51.5% 52.0%
Enrollment in Compensatory Programs
Program
Program % of Student Enrollment Population
Special Education (Grades K-12) (PK)
55 11.1%
0
N/A
English to Speakers of Other Languages (ESOL) (Grades K-12)
0
0.0%
Title I (Grades K-12)
This school has a Targeted Assistance program.
Dropout Rate for Grades 6-8
Number
Rate
School System
1
0.2%
1
0.2%
Total 8
Retained Students, by Race/Ethnicity and Sex
Black
White Hispanic
American MultiAsian Indian racial
0
8
0.0% 100.0%
0 0.0%
0 0.0%
0 0.0%
0 0.0%
Male Female
6
2
75.0% 25.0%
Prepared by Georgia Department of Education
Page 1
STATE-REQUIRED TEST DATA
NORM-REFERENCED TESTS Grade 8
Iowa Tests of Basic Skills (ITBS) Each chart reflects data for three years of testing.
Reading Comprehension 50
53 53 49 0
98-99
53 53 48 97-98
51 51 48 96-97
Mathematics
School 50
System
State
0
60 60 56 98-99
55 55 55 97-98
52 52 54 96-97
School System State
Reading Vocabulary 50
49 49 46 0
98-99
57 57 45 97-98
50 50 44 96-97
Language Arts
School 50
System
State
0
66 66 60 98-99
59 59 58 97-98
59 59 56 96-97
School System State
Social Studies 50
62 62 54 0
98-99
55 55 53 97-98
58 58 53 96-97
Science
School 50
System
State
0
60 60 56 98-99
58 58 55 97-98
57 57 53 96-97
School System State
Sources of Information
Composite Score
50
62 62 57 0
98-99
School 50
System
55 55 56 97-98
56 56 55 96-97
State 0
61 61 56 98-99
57 57 54 97-98
1998-99 GEORGIA PUBLIC EDUCATION REPORT CARD Banks County Middle School - 6060289
Prepared by Georgia Department of Education
56 56 54 96-97
Scores Reported in Percentiles
School System State
Page 2
STATE-REQUIRED TEST DATA
Categories of Scaled Scores
Inadequate (less than 162)
Minimal (162-209)
Good
(210-247)
Very Good (greater than 247)
Average Scaled Score: (Range 100-300)
PERFORMANCE ASSESSMENTS
Grade 8 Writing Assessment
1998-99 Percent Scoring
1997-98 Percent Scoring
1996-97 Percent Scoring
School System State School System State School System State
4% 26% 45% 25%
4% 26% 45% 25%
8% 40% 41% 11%
9% 43% 35% 13%
9% 43% 35% 13%
11% 46% 34%
8%
15% 53% 24%
7%
15% 53% 24%
7%
15% 46% 30%
8%
223
223
208 207
207 202 195
195 198
AWARDS / RECOGNITION DATA
Through the Pay for Performance Program, exemplary public schools and schools making outstanding progress toward becoming exemplary may be rewarded. Not a merit pay program, the Pay for Performance Program motivates and rewards entire school faculties for working together to make their schools exemplary. A school selected for participation in the program has one school year to attain at least 80% of its previously-approved performance objectives in order to receive an award based on $2,000 per certified faculty member.
Banks County Middle School was a Pay for Performance recipient in 1998-99.
1998-99 GEORGIA PUBLIC EDUCATION REPORT CARD Banks County Middle School - 6060289
Prepared by Georgia Department of Education
Page 3
CERTIFIED PERSONNEL DATA
Positions Number Average Contract Days
Personnel Sex
Certificate
Years Experience
Full-time Part-time
Male Female
4 Yr Bachelor's 5 Yr Master's 6 Yr Specialist's 7 Yr Doctoral Other*
<1 1-10 11-20 21-30 >30
Average
Administrators
2.00 210.00
2 0
1 1
0 0 2 0 0 0 0 2 0 0 20.00
Support Personnel
2.00 190.00
2 0
1 1
0 2 0 0 0 0 0 0 2 0 26.00
PK-12 Teachers
28.16 190.00
24 6
7 23
17 12
1 0 0 4 14 8 4 0 9.90
*Includes One- and Two-Year Vocational Certificates.
ACCREDITATION DATA
Accredited by Southern Association of Colleges and Schools (SACS):
Elementary/Middle Commission. Accredited with Quality by Georgia
Accrediting Commission (GAC).
1998-99 GEORGIA PUBLIC EDUCATION REPORT CARD Banks County Middle School - 6060289
Prepared by Georgia Department of Education
Page 4
1998-99 GEORGIA PUBLIC EDUCATION REPORT CARD
BANKS COUNTY SCHOOLS
Banks County Primary School - 6060189
Grade Range PK-2
The Georgia Public Education Report Card is designed to assist systems and schools in educational improvement. This report card contains a variety of data elements. An explanation of the terms is provided as a companion to the report card data. Please refer to the definitions for the most effective use of the reported data.
STUDENT DATA
Total
K-2
554
PK
147
Enrollment, by Race/Ethnicity and Sex
Black
White Hispanic
American Asian Indian
Multiracial
23 4.2%
514 92.8%
10 1.8%
7 1.3%
0 0.0%
0 0.0%
5 3.4%
137 93.2%
3 2.0%
2 1.4%
0 0.0%
0 0.0%
Male Female
291 52.5%
263 47.5%
79 53.7%
68 46.3%
Enrollment in Selected Programs
Program
Program % of Student Enrollment Population
Gifted (Grades K-12)
17
3.1%
Alternative Programs (Grades 6-12)
N/A
N/A
Students Eligible to Receive Free/Reduced Lunches
Number
Percent
School System
444 1,177
63.3% 52.0%
Dropout Rate *
Number
Rate
School System
N/A N/A
N/A N/A
* Dropout rates are not applicable for grades PK-5.
Enrollment in Compensatory Programs
Program
Program % of Student Enrollment Population
Special Education (Grades K-12)
45
8.1%
(PK)
8
N/A
English to Speakers of Other Languages (ESOL) (Grades K-12)
0
0.0%
Remedial Education (Grades 2-5, 9-12)
19 10.6%
Special Instructional Assistance (SIA) (Grades K-3)
41
7.4%
Title I (Grades K-12)
This school has a Targeted Assistance program.
Total 34
Retained Students, by Race/Ethnicity and Sex
Black
White Hispanic
American MultiAsian Indian racial
1 2.9%
32 94.1%
1 2.9%
0 0.0%
0 0.0%
0 0.0%
Male Female
25
9
73.5% 26.5%
Prepared by Georgia Department of Education
Page 1
STATE-REQUIRED TEST DATA
NORM-REFERENCED TESTS
Grade 3 Iowa Tests of Basic Skills (ITBS) Each chart reflects data for three years of testing.
No third-grade students are enrolled at Banks County Primary School.
Reading Comprehension
Mathematics
50
N/A 55 54 0
98-99
N/A 56 53 97-98
N/A 55 52 96-97
School 50
System
State
N/A 59 61 0
98-99
N/A 62 61 97-98
N/A 58 59 96-97
School System State
Reading Vocabulary 50
N/A 49 50 0
98-99
N/A 49 50 97-98
N/A 49 49 96-97
Language Arts
School 50
System
State
N/A 59 64 0
98-99
N/A 61 62 97-98
N/A 62 59 96-97
School System State
Social Studies 50
N/A 59 56 0
98-99
N/A 61 55 97-98
N/A 63 55 96-97
Science
School 50
System
State
N/A 61 59 0
98-99
N/A 67 59 97-98
N/A 63 58 96-97
School System State
Sources of Information
Composite Score
School
50
50
System
N/A 54 57 0
98-99
N/A 56 56 N/A 60 55
97-98
96-97
State
N/A 58 58 0
98-99
N/A 60 57 97-98
N/A 59 56 96-97
1998-99 GEORGIA PUBLIC EDUCATION REPORT CARD Banks County Primary School - 6060189
Prepared by Georgia Department of Education
Scores Reported in Percentiles
School System State
Page 2
STATE-REQUIRED TEST DATA
NORM-REFERENCED TESTS
Grade 5 Iowa Tests of Basic Skills (ITBS) Each chart reflects data for three years of testing. No fifth-grade students are enrolled at Banks County Primary School.
Reading Comprehension
Mathematics
50
N/A 55 53 0
98-99
N/A 55 53 97-98
N/A 55 52 96-97
School 50
System
State
N/A 58 59 0
98-99
N/A 58 58 97-98
N/A 63 57 96-97
School System State
Reading Vocabulary 50
N/A 46 48 0
98-99
N/A 46 48 97-98
N/A 47 46 96-97
Language Arts
School 50
System
State
N/A 57 63 0
98-99
N/A 53 61 97-98
N/A 51 58 96-97
School System State
Social Studies 50
N/A 59 57 0
98-99
N/A 59 56 97-98
N/A 58 55 96-97
Science
School 50
System
State
N/A 61 60 0
98-99
N/A 62 59 97-98
N/A 66 59 96-97
School System State
Sources of Information
Composite Score
School
50
50
System
N/A 57 58 0
98-99
N/A 57 58 N/A 61 57
97-98
96-97
State
N/A 57 57 0
98-99
N/A 56 56 97-98
N/A 58 55 96-97
1998-99 GEORGIA PUBLIC EDUCATION REPORT CARD Banks County Primary School - 6060189
Prepared by Georgia Department of Education
Scores Reported in Percentiles
School System State
Page 3
STATE-REQUIRED TEST DATA
PERFORMANCE ASSESSMENTS
Grade 5 Writing Assessment
Percent at Developmental Stages:
1998-99 School System State
1997-98 School System State
1996-97 School System State
Stage Stage Stage Stage Stage Stage
1:The Emerging Writer 2:The Developing Writer 3:The Focusing Writer 4:The Experimenting 5:The Engaging Writer 6:The Extending Writer
N/A N/A N/A N/A N/A N/A
0% 0% 6% 40% 42% 12%
0% 1% 16% 41% 29% 12%
N/A N/A N/A N/A N/A N/A
2% 2% 17% 44% 29% 5%
0% 3% 19% 41% 27% 10%
N/A N/A N/A N/A N/A N/A
No fifth-grade students are enrolled at Banks County Primary School.
1% 5% 20% 43% 22% 9%
0% 3% 21% 37% 26% 12%
AWARDS / RECOGNITION DATA
Schools in Georgia may receive recognition in the following programs: Charter School Pay for Performance Program Georgia School of Excellence National Blue Ribbon School Banks County Primary School did not receive recognition in any of these programs during the 1998-99 school year.
1998-99 GEORGIA PUBLIC EDUCATION REPORT CARD Banks County Primary School - 6060189
Prepared by Georgia Department of Education
Page 4
CERTIFIED PERSONNEL DATA
Positions Number Average Contract Days
Personnel Sex
Certificate
Years Experience
Full-time Part-time
Male Female
4 Yr Bachelor's 5 Yr Master's 6 Yr Specialist's 7 Yr Doctoral Other*
<1 1-10 11-20 21-30 >30
Average
Administrators
1.50 203.33
1 1
2 0
0 1 1 0 0 0 0 1 1 0 22.00
Support Personnel
2.00 190.00
2 0
0 2
0 1 1 0 0 0 0 1 1 0 21.50
PK-12 Teachers
31.50 190.00
31 1
0 32
14 14
4 0 0 0 18 10 4 0 10.88
*Includes One- and Two-Year Vocational Certificates.
ACCREDITATION DATA
Accredited by Southern Association of Colleges and Schools (SACS):
Elementary/Middle Commission. Accredited with Quality by Georgia
Accrediting Commission (GAC).
1998-99 GEORGIA PUBLIC EDUCATION REPORT CARD Banks County Primary School - 6060189
Prepared by Georgia Department of Education
Page 5
1998-99 GEORGIA PUBLIC EDUCATION REPORT CARD BARROW COUNTY SCHOOLS - 607
The Georgia Public Education Report Card is designed to assist systems and schools in educational improvement. This report card contains a variety of data elements. An explanation of the terms is provided as a companion to the report card data. Please refer to the definitions for the most effective use of the reported data.
Total
K-12
7,695
PK
149
STUDENT DATA
Enrollment, by Race/Ethnicity and Sex
Black
White Hispanic
American Multi-
Asian Indian
racial
948 12.3%
6,231 81.0%
145 1.9%
285 3.7%
6 0.1%
80 1.0%
15 10.1%
120 80.5%
4 2.7%
6 4.0%
0 0.0%
4 2.7%
Male
3,992 51.9%
85 57.0%
Female
3,703 48.1%
64 43.0%
Enrollment in Selected Programs
Program
Program % of Student Enrollment Population
Gifted (Grades K-12)
335
4.4%
Non-Vocational Labs (Grades 9-12)
1,206
70.9%
Vocational Labs (Grades 9-12)
1,121
65.9%
Alternative Programs (Grades 6-12)
17
< 1%
Students Eligible to Receive Free/Reduced Lunches
Number
Percent
2,479
31.6%
Dropout Rate
Number
Percent
6-12
194
4.8%
9-12
186
9.7%
Enrollment in Compensatory Programs
Program
Program % of Student Enrollment Population
Special Education (Grades K-12)
PK
1,158 53
English to Speakers of
Other Languages (ESOL)
11
(Grades K-12)
Remedial Education (Grades 2-5, 9-12)
550
Special Instructional
Assistance (SIA)
735
(Grades K-3)
Title I (Grades K-12) Number of schools with: Schoolwide program Targeted Assistance program No Title I program
15.0% N/A < 1%
12.6%
25.5%
1 3 7
Total 414
Retained Students, by Race/Ethnicity and Sex
Black
White Hispanic
American MultiAsian Indian racial
69 16.7%
303 73.2%
12 2.9%
19 4.6%
1 0.2%
10 2.4%
Male Female 261 153
63.0% 37.0%
Prepared by Georgia Department of Education
Page 1
STATE-REQUIRED TEST DATA
NORM-REFERENCED TESTS
Grade 3 Iowa Tests of Basic Skills (ITBS) Each chart reflects data for three years of testing.
Reading Comprehension
Mathematics
50
54 54 54 53 57 52 0
98-99 97-98 96-97
System State
50
62 61 65 61 65 59 0
98-99 97-98 96-97
System State
Reading Vocabulary
50
52 50 51 50 53 49 0
98-99 97-98 96-97
System State
Social Studies
50
61 56 60 55 64 55 0
98-99 97-98 96-97
System State
Language Arts
50
57 64 55 62 50 59 0
98-99 97-98 96-97
System State
Science
50
62 59 63 59 67 58 0
98-99 97-98 96-97
System State
Sources of Information
Composite Score
50
59 57 0
98-99
System
50
55 56 60 55 97-98 96-97
State
59 58 58 57 0
98-99 97-98
1998-99 GEORGIA PUBLIC EDUCATION REPORT CARD Barrow County Schools
Prepared by Georgia Department of Education
System State Scores Reported 60 56 in Percentiles 96-97
Page 2
STATE-REQUIRED TEST DATA
NORM-REFERENCED TESTS
Grade 5 Iowa Tests of Basic Skills (ITBS) Each chart reflects data for three years of testing.
Reading Comprehension
Mathematics
50
57 53 53 53 53 52 0
98-99 97-98 96-97
System State
50
65 59 60 58 56 57 0
98-99 97-98 96-97
System State
Reading Vocabulary
50
60 48 48 48 48 46 0
98-99 97-98 96-97
System State
Social Studies
50
63 57 58 56 55 55 0
98-99 97-98 96-97
System State
Language Arts
50
62 63 56 61 47 58 0
98-99 97-98 96-97
System State
Science
50
68 60 65 59 61 59 0
98-99 97-98 96-97
System State
Sources of Information
Composite Score
50
63 58 0
98-99
System
50
59 58 56 57 97-98 96-97
State
63 57 58 56 0
98-99 97-98
1998-99 GEORGIA PUBLIC EDUCATION REPORT CARD Barrow County Schools
Prepared by Georgia Department of Education
System State Scores Reported 54 55 in Percentiles 96-97
Page 3
STATE-REQUIRED TEST DATA
NORM-REFERENCED TESTS Grade 8
Iowa Tests of Basic Skills (ITBS) Each chart reflects data for three years of testing.
Reading Comprehension
Mathematics
50
51 49 54 48 52 48 0
98-99 97-98 96-97
System State
50
56 56 58 55 52 54 0
98-99 97-98 96-97
System State
Reading Vocabulary
50
48 46 51 45 49 44 0
98-99 97-98 96-97
System State
Language Arts
50
58 60 58 58 52 56 0
98-99 97-98 96-97
System State
Social Studies
50
53 54 56 53 53 53 0
98-99 97-98 96-97
System State
Science
50
57 56 60 55 58 53 0
98-99 97-98 96-97
System State
Sources of Information
Composite Score
50
61 57 0
98-99
System
50
59 56 57 55 97-98 96-97
State
57 56 59 54 0
98-99 97-98
1998-99 GEORGIA PUBLIC EDUCATION REPORT CARD Barrow County Schools
Prepared by Georgia Department of Education
System State Scores Reported 54 54 in Percentiles 96-97
Page 4
STATE-REQUIRED TEST DATA
PERFORMANCE ASSESSMENTS
Grade 5 Writing Assessment
1998-99
1997-98
1996-97
Percent at Developmental Stages:
Comparison
Comparison
Comparison
System Group State System Group State System Group State
Stage Stage Stage Stage Stage Stage
1: The Emerging Writer 2: The Developing Writer 3: The Focusing Writer 4: The Experimenting Writer 5: The Engaging Writer 6: The Extending Writer
0% 0% 10% 37% 38% 15%
0% 1% 17% 40% 30% 11%
0% 1% 16% 41% 29% 12%
0% 1% 16% 46% 25% 10%
0% 1% 18% 44% 27% 9%
0% 3% 19% 41% 27% 10%
0% 2% 22% 37% 28% 10%
0% 3% 19% 37% 29% 12%
0% 3% 21% 37% 26% 12%
Grade 8 Writing Assessment
1998-99 Percent Scoring 1997-98 Percent Scoring 1996-97 Percent Scoring
Categories of Scaled Scores
Comparison
Comparison
Comparison
System Group State System Group State System Group State
Inadequate (less than 162)
Minimal (162-209)
Good
(210-247)
Very Good (greater than 247)
2% 42% 46%
9%
5% 39% 47% 10%
8% 40% 41% 11%
10% 51% 33%
5%
9% 49% 35%
7%
11% 46% 34%
8%
14% 49% 31%
7%
10% 45% 35%
9%
15% 46% 30%
8%
Average Scaled Score: (Range 100-300)
212
211 208
199
202 202
198
204 198
GEORGIA HIGH SCHOOL GRADUATION TESTS (GHSGT)
Percent of Regular Program 11th Graders Passing the Georgia High School Graduation Tests on First Administration
1998-99
1997-98
1996-97
Comparison
Comparison
Comparison
System Group State System Group State System Group State
English Language Arts Mathematics Social Studies Science
98% 90% 85% 76%
97% 92% 82% 76%
96% 88% 80% 72%
96% 95% 76% 77%
96% 92% 80% 78%
94% 88% 78% 74%
95% 94% 83% 79%
95% 92% 83% 79%
94% 87% 78% 74%
All Components listed above 7 2 %
71% 68% 69%
72% 68% 73%
74% 67%
Writing
95%
95% 93% 96%
94% 92% 96%
95% 93%
1998-99 GEORGIA PUBLIC EDUCATION REPORT CARD
Barrow County Schools
Prepared by Georgia Department of Education
Page 5
GRADUATE DATA
1999 Graduates by Credentials, Race/Ethnicity and Sex
Diplomas with Both College Prep. & Voc. Endorsements
Diplomas with College Prep. Endorsements Diplomas with Vocational Endorsements General High School Diplomas Special Education Diplomas
Total All Diplomas
Certificates of Performance
Total Graduates
Total 70 95 98 7 10
280 0
Black
American MultiWhite Hispanic Asian Indian racial
8 11.4%
9 9.5%
18 18.4%
0 0.0%
3 30.0%
38 13.6%
57 81.4%
79 83.2%
77 78.6%
7 100.0%
7 70.0%
227 81.1%
0 0.0%
0 0.0%
2 2.0%
0 0.0%
0 0.0%
2 0.7%
5 7.1%
7 7.4%
1 1.0%
0 0.0%
0 0.0%
13 4.6%
0 0.0%
0 0.0%
0 0.0%
0 0.0%
0 0.0%
0 0.0%
0 0.0%
0 0.0%
0 0.0%
0 0.0%
0 0.0%
0 0.0%
0
0
0
0
0
0
Male Female
34 48.6%
40 42.1%
51 52.0%
5 71.4%
5 50.0%
36 51.4%
55 57.9%
47 48.0%
2 28.6%
5 50.0%
135 145 48.2% 51.8%
0
0
280
38
227
2
13
0
0
135 145
13.6% 81.1% 0.7% 4.6% 0.0% 0.0% 48.2% 51.8%
HOPE Scholarships
System State
Number of 1999 Graduates 2 8 0
Number Eligible
168
Percent Eligible
60.0%
65,548 40,292 61.5%
High School Completion Rate Percent of 1995Grade 9 Enrollment
in Graduating Class of1999
System
State
Completion Rate '95-'99 64.1% 68.9%
COLLEGE ADMISSIONS / CREDIT TEST DATA
Scholastic Assessment Test (SAT)
No. Taking
Average Score
Tests
Verbal Math Total
Based on students' highest verbal and highest math scores
System College Prep. Endorsement Other Diplomas
493 486 979 507 494 1001 412 359 771
Georgia
492 488 980
Based on students' last test administration
System Georgia
151
485 479
964
41,958 483 479 962
Nation
952,913 502 508 1010
American College Testing (ACT)
System State Nation
English
20.9
19.1 20.4
Mathematics
20.0
19.9 20.7
Reading
23.2
20.2 21.3
Science Reasoning 21.9
19.9 21.0
CompositeScore 21.6
19.9 21.9
Advanced Placement Exams (AP)
No. of Students Taking Tests
No. of Tests Taken No. of Test Scores
3 or Higher Percent of Test
Scores 3 or Higher
System State 72 15,225
109 23,969 74 13,024
67.9% 54.3%
1998-99 GEORGIA PUBLIC EDUCATION REPORT CARD Barrow County Schools
Prepared by Georgia Department of Education
Page 6
POSTSECONDARY DATA
Graduates Entering Georgia Public Colleges and Universities
Graduates Entering Georgia Public Colleges and Universities and
Requiring Learning Support (LS)
1998 Graduates Entering 1998-99
1997 Graduates Entering 1997-98
Percent of Graduating Number Class
109
39.5%
87
37.7%
Number Requiring
LS
29
20
Percent of those attending Georgia
Public Colleges
26.6%
23.0%
In previous years, the Report Card presented College Prep Curriculum information provided by the Board of Regents on students requiring Learning Support. Due to inconsistencies in the data provided by the Board of Regents in defining College Prep Completers versus Local Board of Education data defining College Prep Endorsements, the Department of Education Report Card will not provide this information until discrepancies can be reconciled.
Graduates Entering Georgia Public Technical and Adult Schools
Entering 1998-99 Entering 1997-98
Number Percent
Number Percent
1998 Graduates 1997 Graduates
13
4.7%
1
0.4%
N/A 9
N/A 3.9%
ACCREDITATION / RECOGNITION DATA
Southern Association of Colleges and Schools (SACS) Accrediting Commission
Secondary/Middle Commission Elementary/Middle Commission Both Elementary/Secondary Commissions Joint Commission Candidate for Accreditation
Accreditation by Georgia Accrediting Commission (GAC)
Accredited by GAC Accredited with Quality by GAC
Number of Schools
4 0 0 0 7
Number of Schools
0 11
Awards / Recognition
State Recognized Program
Number of Schools
Charter School
0
Pay for Performance Recipient
1
Georgia School of Excellence
0
National Blue Ribbon School
0
COMMUNITY DATA
Number of Children Eligible for Migrant Education Number of Families-At-Risk * Number of Food Stamp Participants * Number of Families Receiving TANF * ** Per Capita Income * Unemployment Rate * 1990 Population * Projected 2000 Population * Projected 2010 Population *
* Data Available at County Level Only ** Known as AFDC before January 1997
0 141 2,402 149 $19,283 4.1% 29,721 38,416 42,446
1998-99 GEORGIA PUBLIC EDUCATION REPORT CARD Barrow County Schools
Prepared by Georgia Department of Education
Page 7
FISCAL DATA
Millage Rate
18.42
* Fall 1998 Property Tax Digest is used to calculate the 98-99 Value of One Mill
FTE Count
FTE Count used for Allotment Calculation 7,653.0 Fall '98 FTE Count 7,695
Value of One Mill
$752,384 $98.31 per Allotment FTE
Sources: Local State-QBE State-
Lottery State-
Other Federal Other
Total
PerGeneral Fund cent Per FTE
$14,947,639 34.9% $1,953 $27,509,683 64.3% $3,595
K-12 Revenues
Lottery K-12
and
Title
All Other
Programs
K-12
$0
$0
Bonded Debt
$5,801,445
$0
$0
$0
$0 0.0%
$0
$0 $163,582
$0
$354,002 0.8% $46
$0 0.0%
$0
$0 0.0%
$0
$42,811,325 100% $5,594
$0 $1,939,702
$0 $1,939,702
$0 $0 $0 $163,582
$0 $0 $0 $5,801,445
Capital Projects
$285,315 $0
$0
$0 $0 $0 $285,315
School Nutrition $1,136,502
$0
$0
$190,602 $1,207,371
$0 $2,534,475
Grand Total
Total
Per-
Amount cent
$22,170,902 41.4%
$27,509,683 51.4%
$163,582 0.3%
$544,604 1.0% $3,147,073 5.9%
$0 0.0% $53,535,846 100%
Instruction
Media Instruction
Support Pupil Services General Admin. School Admin. Trans-
portation Maint. & Ops. Capital Projects School Food Debt Service
Total
K-12 Expenditures
$28,299,706 67.1% $3,698 $1,564,467 $170,700
$0
$0
$0
$936,190 2.2% $122
$17,690
$0
$0
$0
$0
$1,614,472 3.8% $211 $343,221
$0
$0
$0
$0
$1,026,908 2.4% $134 $142,257
$0
$0
$0
$0
$1,607,120 3.8% $210
$94,742
$0
$0
$52
$0
$3,009,643 7.1% $393
$13,442
$0
$0
$0
$0
$1,970,377 4.7% $257
$4,758
$0
$0
$0
$0
$2,767,786 6.6% $362
$6,192
$15,581
$0
$0
$0
$929,200 2.2% $121
$0
$0
$0 $7,464,874
$0
$1,047 0.0%
$0
$935
$0
$0
$0 $2,491,674
$0 0.0%
$0
$0
$0 $4,847,099
$0
$0
$42,162,453 100% $5,508 $2,187,709 $186,282 $4,847,099 $7,464,926 $2,491,674
$30,034,875 50.6% $953,881 1.6%
$1,957,694 3.3% $1,169,166 2.0% $1,701,915 2.9% $3,023,085 5.1% $1,975,136 3.3% $2,789,560 4.7% $8,394,074 14.1% $2,493,657 4.2% $4,847,099 8.2%
$59,340,147 100%
Salaries and Benefits as Percentages of Revenues and of Expenditures
Teachers and Paraprofessionals
Salaries $21,753,702
Benefits $5,952,355
Percentage of Revenues Percentage of Expenditures
Total of
Total of
General Fund
General Fund
Title Programs
Title Programs
Lottery K-12
Lottery K-12
Total Salaries
and
Total
and
Total
and Benefits All Other K-12 K - 12 All Other K-12 K - 12
$27,706,057
61.7%
51.8%
62.2%
46.7%
School Administration
$1,499,295
$601,650
$2,100,945
4.7%
3.9%
4.7%
3.5%
General Administration
$397,266
$174,007
$571,273
1.3%
1.1%
1.3%
1.0%
1998-99 GEORGIA PUBLIC EDUCATION REPORT CARD
Barrow County Schools - 607
Prepared by Georgia Department of Education
Page 8
CERTIFIED PERSONNEL DATA
Number
Average Annual Salary Positions Average Contract Days
Average Daily Salary
Full-time Personnel Part-time
Sex Male Female
4 Yr Bachelor's Certificate 5 Yr Master's
Level 6 Yr Specialist's 7 Yr Doctoral Other*
Black
White Race/ Hispanic Ethnicity Asian
American Indian
Multiracial
Years Experience
<1 1-10 11-20 21-30 >30
Average
Administrators
43.48
$64,865.37 224.67
$288.71
42 2
19 25
0 9 24 10 1
4 40
0 0 0 0
1 4 14 25 0
19.59
Support Personnel PK-12 Teachers
44.00
525.89
$40,349.35 197.70
$204.09
$37,083.06 191.29
$193.86
44
517
0
13
7
83
37
447
4
276
27
202
10
42
3
8
0
2
0
17
43
513
1
0
0
0
0
0
0
0
8
97
18
211
10
135
7
82
1
5
10.86
10.16
*Includes One- and Two-Year Vocational Certificates.
Certified Staff Position Ratios
Teacher/Administrator Ratio 12:1
Teacher/Support Person Ratio 12:1
Teacher/Staff Ratio 6:1
Student Enrollment/All Teachers 15:1
Certified Personnel by Category
85.8% 100%
7.1%
7.1%
80% 60%
40%
20%
0%
Teachers
Administrators
Support Personnel
1998-99 GEORGIA PUBLIC EDUCATION REPORT CARD
Barrow County Schools - 607
Prepared by Georgia Department of Education
Page 9
1998-99 GEORGIA PUBLIC EDUCATION REPORT CARD
BARROW COUNTY SCHOOLS
Auburn Elementary School - 6071050
Grade Range PK-5
The Georgia Public Education Report Card is designed to assist systems and schools in educational improvement. This report card contains a variety of data elements. An explanation of the terms is provided as a companion to the report card data. Please refer to the definitions for the most effective use of the reported data.
STUDENT DATA
Total
K-5
724
PK
25
Enrollment, by Race/Ethnicity and Sex
Black
White Hispanic
American Asian Indian
Multiracial
31 4.3%
652 90.1%
12 1.7%
14 1.9%
0 0.0%
15 2.1%
2 8.0%
22 88.0%
1 4.0%
0 0.0%
0 0.0%
0 0.0%
Male Female
361 49.9%
363 50.1%
18 72.0%
7 28.0%
Enrollment in Selected Programs
Program
Program % of Student Enrollment Population
Gifted (Grades K-12)
19
2.6%
Alternative Programs (Grades 6-12)
N/A
N/A
Students Eligible to Receive Free/Reduced Lunches
Number
Percent
School System
179 2,479
23.9% 31.6%
Dropout Rate *
Number
Rate
School System
N/A N/A
N/A N/A
* Dropout rates are not applicable for grades PK-5.
Enrollment in Compensatory Programs
Program
Program % of Student Enrollment Population
Special Education (Grades K-12)
87 12.0%
(PK)
12
N/A
English to Speakers of Other Languages (ESOL) (Grades K-12)
0
0.0%
Remedial Education (Grades 2-5, 9-12)
62 13.3%
Special Instructional Assistance (SIA) (Grades K-3)
114 23.4%
Title I (Grades K-12)
This school has no Title I program.
Total 50
Retained Students, by Race/Ethnicity and Sex
Black
White Hispanic
American MultiAsian Indian racial
0 0.0%
45 90.0%
2 4.0%
1 2.0%
0 0.0%
2 4.0%
Male Female
29
21
58.0% 42.0%
Prepared by Georgia Department of Education
Page 1
STATE-REQUIRED TEST DATA
NORM-REFERENCED TESTS Grade 3
Iowa Tests of Basic Skills (ITBS) Each chart reflects data for three years of testing.
Reading Comprehension 50
60 54 54 0
98-99
59 54 53 97-98
63 57 52 96-97
Mathematics
School 50
System
State
0
70 62 61 98-99
75 65 61 97-98
73 65 59 96-97
School System State
Reading Vocabulary 50
62 52 50 0
98-99
61 51 50 97-98
59 53 49 96-97
Language Arts
School 50
System
State
0
60 57 64 98-99
62 55 62 97-98
66 50 59 96-97
School System State
Social Studies 50
67 61 56 0
98-99
67 60 55 97-98
72 64 55 96-97
Science
School 50
System
State
0
74 62 59 98-99
75 63 59 97-98
76 67 58 96-97
School System State
Sources of Information
Composite Score
50
63 59 57 0
98-99
School 50
System
65 55 56 97-98
67 60 55 96-97
State 0
67 59 58 98-99
67 58 57 97-98
1998-99 GEORGIA PUBLIC EDUCATION REPORT CARD Auburn Elementary School - 6071050
Prepared by Georgia Department of Education
69 60 56 96-97
Scores Reported in Percentiles
School System State
Page 2
STATE-REQUIRED TEST DATA
NORM-REFERENCED TESTS Grade 5
Iowa Tests of Basic Skills (ITBS) Each chart reflects data for three years of testing.
Reading Comprehension
Mathematics
50
61 57 53 0
98-99
57 53 53 97-98
52 53 52 96-97
School 50
System
State
0
66 65 59 98-99
60 60 58 97-98
58 56 57 96-97
School System State
Reading Vocabulary 50
75 60 48 0
98-99
51 48 48 97-98
49 48 46 96-97
Language Arts
School 50
System
State
0
66 62 63 98-99
52 56 61 97-98
44 47 58 96-97
School System State
Social Studies 50
65 63 57 0
98-99
61 58 56 97-98
50 55 55 96-97
Science
School 50
System
State
0
73 68 60 98-99
64 65 59 97-98
52 61 59 96-97
School System State
Sources of Information
Composite Score
50
67 63 58 0
98-99
School 50
System
62 59 58 97-98
56 56 57 96-97
State 0
68 63 57 98-99
58 58 56 97-98
50 54 55 96-97
1998-99 GEORGIA PUBLIC EDUCATION REPORT CARD Auburn Elementary School - 6071050
Prepared by Georgia Department of Education
Scores Reported in Percentiles
School System State
Page 3
STATE-REQUIRED TEST DATA
PERFORMANCE ASSESSMENTS
Grade 5 Writing Assessment
Percent at Developmental Stages:
1998-99 School System State
1997-98 School System State
1996-97 School System State
Stage Stage Stage Stage Stage Stage
1:The Emerging Writer 2:The Developing Writer 3:The Focusing Writer 4:The Experimenting 5:The Engaging Writer 6:The Extending Writer
0% 0% 11% 40% 37% 13%
0% 0% 10% 37% 38% 15%
0% 1% 16% 41% 29% 12%
0% 1% 17% 54% 21% 7%
0% 1% 16% 46% 25% 10%
0% 3% 19% 41% 27% 10%
0% 0% 24% 43% 30% 3%
0% 2% 22% 37% 28% 10%
0% 3% 21% 37% 26% 12%
AWARDS / RECOGNITION DATA
Schools in Georgia may receive recognition in the following programs: Charter School Pay for Performance Program Georgia School of Excellence National Blue Ribbon School Auburn Elementary School did not receive recognition in any of these programs during the 1998-99 school year.
1998-99 GEORGIA PUBLIC EDUCATION REPORT CARD Auburn Elementary School - 6071050
Prepared by Georgia Department of Education
Page 4
CERTIFIED PERSONNEL DATA
Positions Number Average Contract Days
Personnel Sex
Certificate
Years Experience
Full-time Part-time
Male Female
4 Yr Bachelor's 5 Yr Master's 6 Yr Specialist's 7 Yr Doctoral Other*
<1 1-10 11-20 21-30 >30
Average
Administrators
2.00 223.00
2 0
1 1
0 0 1 1 0 0 0 1 1 0 20.00
Support Personnel
4.33 193.08
4 1
2 3
1 2 2 0 0 0 4 1 0 0 6.20
PK-12 Teachers
43.65 190.14
40 8
4 44
27 15
5 1 0 10 13 14 11 0 11.13
*Includes One- and Two-Year Vocational Certificates.
ACCREDITATION DATA
Candidate for accreditation by Southern Association of Colleges and Schools (SACS):
Elementary/Middle Commission. Accredited with Quality by Georgia
Accrediting Commission (GAC).
1998-99 GEORGIA PUBLIC EDUCATION REPORT CARD Auburn Elementary School - 6071050
Prepared by Georgia Department of Education
Page 5
1998-99 GEORGIA PUBLIC EDUCATION REPORT CARD
BARROW COUNTY SCHOOLS
Bethlehem Elementary School - 6072050
Grade Range PK-5
The Georgia Public Education Report Card is designed to assist systems and schools in educational improvement. This report card contains a variety of data elements. An explanation of the terms is provided as a companion to the report card data. Please refer to the definitions for the most effective use of the reported data.
STUDENT DATA
Total
K-5
511
PK
1
Enrollment, by Race/Ethnicity and Sex
Black
White Hispanic
American Asian Indian
Multiracial
59 11.5%
389 76.1%
19 3.7%
41 8.0%
1 0.2%
2 0.4%
0
1
0.0% 100.0%
0 0.0%
0 0.0%
0 0.0%
0 0.0%
Male 270
52.8% 1
100.0%
Female 241
47.2% 0
0.0%
Enrollment in Selected Programs
Program
Program % of Student Enrollment Population
Gifted (Grades K-12)
6
1.2%
Alternative Programs (Grades 6-12)
N/A
N/A
Students Eligible to Receive Free/Reduced Lunches
Number
Percent
School System
228 2,479
44.5% 31.6%
Dropout Rate *
Number
Rate
School System
N/A N/A
N/A N/A
* Dropout rates are not applicable for grades PK-5.
Enrollment in Compensatory Programs
Program
Program % of Student Enrollment Population
Special Education (Grades K-12)
74 14.5%
(PK)
1
N/A
English to Speakers of Other Languages (ESOL) (Grades K-12)
0
0.0%
Remedial Education (Grades 2-5, 9-12)
59 17.3%
Special Instructional Assistance (SIA) (Grades K-3)
104 29.7%
Title I (Grades K-12)
This school has a Targeted Assistance program.
Total 24
Retained Students, by Race/Ethnicity and Sex
Black
White Hispanic
American MultiAsian Indian racial
2 8.3%
20 83.3%
0 0.0%
1 4.2%
0 0.0%
1 4.2%
Male Female
19
5
79.2% 20.8%
Prepared by Georgia Department of Education
Page 1
STATE-REQUIRED TEST DATA
NORM-REFERENCED TESTS Grade 3
Iowa Tests of Basic Skills (ITBS) Each chart reflects data for three years of testing.
Reading Comprehension 50
50 54 54 0
98-99
46 54 53 97-98
44 57 52 96-97
Mathematics
School 50
System
State
0
62 62 61 98-99
58 65 61 97-98
53 65 59 96-97
School System State
Reading Vocabulary 50
44 52 50 0
98-99
38 51 50 97-98
44 53 49 96-97
Language Arts
School 50
System
State
0
61 57 64 98-99
47 55 62 97-98
34 50 59 96-97
School System State
Social Studies 50
56 61 56 0
98-99
54 60 55 97-98
53 64 55 96-97
Science
School 50
System
State
0
61 62 59 98-99
55 63 59 97-98
57 67 58 96-97
School System State
Sources of Information
Composite Score
50
55 59 57 0
98-99
School 50
System
49 55 56 97-98
52 60 55 96-97
State 0
56 59 58 98-99
51 58 57 97-98
1998-99 GEORGIA PUBLIC EDUCATION REPORT CARD Bethlehem Elementary School - 6072050
Prepared by Georgia Department of Education
47 60 56 96-97
Scores Reported in Percentiles
School System State
Page 2
STATE-REQUIRED TEST DATA
NORM-REFERENCED TESTS Grade 5
Iowa Tests of Basic Skills (ITBS) Each chart reflects data for three years of testing.
Reading Comprehension
Mathematics
50
50 57 53 0
98-99
46 53 53 97-98
50 53 52 96-97
School 50
System
State
0
62 65 59 98-99
56 60 58 97-98
53 56 57 96-97
School System State
Reading Vocabulary 50
49 60 48 0
98-99
37 48 48 97-98
42 48 46 96-97
Language Arts
School 50
System
State
0
54 62 63 98-99
53 56 61 97-98
40 47 58 96-97
School System State
Social Studies 50
59 63 57 0
98-99
51 58 56 97-98
56 55 55 96-97
Science
School 50
System
State
0
61 68 60 98-99
57 65 59 97-98
56 61 59 96-97
School System State
Sources of Information
Composite Score
50
59 63 58 0
98-99
School 50
System
56 59 58 97-98
53 56 57 96-97
State 0
57 63 57 98-99
52 58 56 97-98
51 54 55 96-97
1998-99 GEORGIA PUBLIC EDUCATION REPORT CARD Bethlehem Elementary School - 6072050
Prepared by Georgia Department of Education
Scores Reported in Percentiles
School System State
Page 3
STATE-REQUIRED TEST DATA
PERFORMANCE ASSESSMENTS
Grade 5 Writing Assessment
Percent at Developmental Stages:
1998-99 School System State
1997-98 School System State
1996-97 School System State
Stage Stage Stage Stage Stage Stage
1:The Emerging Writer 2:The Developing Writer 3:The Focusing Writer 4:The Experimenting 5:The Engaging Writer 6:The Extending Writer
0% 0% 7% 29% 51% 12%
0% 0% 10% 37% 38% 15%
0% 1% 16% 41% 29% 12%
1% 0% 11% 44% 35% 8%
0% 1% 16% 46% 25% 10%
0% 3% 19% 41% 27% 10%
0% 2% 28% 28% 31% 11%
0% 2% 22% 37% 28% 10%
0% 3% 21% 37% 26% 12%
AWARDS / RECOGNITION DATA
Schools in Georgia may receive recognition in the following programs: Charter School Pay for Performance Program Georgia School of Excellence National Blue Ribbon School Bethlehem Elementary School did not receive recognition in any of these programs during the 1998-99 school year.
1998-99 GEORGIA PUBLIC EDUCATION REPORT CARD Bethlehem Elementary School - 6072050
Prepared by Georgia Department of Education
Page 4
CERTIFIED PERSONNEL DATA
Positions Number Average Contract Days
Personnel Sex
Certificate
Years Experience
Full-time Part-time
Male Female
4 Yr Bachelor's 5 Yr Master's 6 Yr Specialist's 7 Yr Doctoral Other*
<1 1-10 11-20 21-30 >30
Average
Administrators
2.00 225.50
2 0
1 1
0 1 0 1 0 0 1 0 1 0 17.50
Support Personnel
3.30 190.91
3 1
0 4
0 4 0 0 0 2 1 1 0 0 5.00
PK-12 Teachers
35.86 190.01
34 6
6 34
22 16
2 0 0 8 18 9 5 0 8.20
*Includes One- and Two-Year Vocational Certificates.
ACCREDITATION DATA
Candidate for accreditation by Southern Association of Colleges and Schools (SACS):
Elementary/Middle Commission. Accredited with Quality by Georgia
Accrediting Commission (GAC).
1998-99 GEORGIA PUBLIC EDUCATION REPORT CARD Bethlehem Elementary School - 6072050
Prepared by Georgia Department of Education
Page 5
1998-99 GEORGIA PUBLIC EDUCATION REPORT CARD
BARROW COUNTY SCHOOLS
Bramlett Elementary School - 6070193
Grade Range PK-5
The Georgia Public Education Report Card is designed to assist systems and schools in educational improvement. This report card contains a variety of data elements. An explanation of the terms is provided as a companion to the report card data. Please refer to the definitions for the most effective use of the reported data.
STUDENT DATA
Total
K-5
744
PK
21
Enrollment, by Race/Ethnicity and Sex
Black
White Hispanic
American Asian Indian
Multiracial
41 5.5%
626 84.1%
12 1.6%
57 7.7%
0 0.0%
8 1.1%
2 9.5%
17 81.0%
0 0.0%
1 4.8%
0 0.0%
1 4.8%
Male Female
397 53.4%
347 46.6%
13 61.9%
8 38.1%
Enrollment in Selected Programs
Program
Program % of Student Enrollment Population
Gifted (Grades K-12)
22
3.0%
Alternative Programs (Grades 6-12)
N/A
N/A
Students Eligible to Receive Free/Reduced Lunches
Number
Percent
School System
242 2,479
31.6% 31.6%
Dropout Rate *
Number
Rate
School System
N/A N/A
N/A N/A
* Dropout rates are not applicable for grades PK-5.
Enrollment in Compensatory Programs
Program
Program % of Student Enrollment Population
Special Education (Grades K-12)
93 12.5%
(PK)
10
N/A
English to Speakers of Other Languages (ESOL) (Grades K-12)
0
0.0%
Remedial Education (Grades 2-5, 9-12)
83 18.2%
Special Instructional Assistance (SIA) (Grades K-3)
107 20.8%
Title I (Grades K-12)
This school has no Title I program.
Total 60
Retained Students, by Race/Ethnicity and Sex
Black
White Hispanic
American MultiAsian Indian racial
6 10.0%
44 73.3%
1 1.7%
9 15.0%
0 0.0%
0 0.0%
Male Female
38
22
63.3% 36.7%
Prepared by Georgia Department of Education
Page 1
STATE-REQUIRED TEST DATA
NORM-REFERENCED TESTS Grade 3
Iowa Tests of Basic Skills (ITBS) Each chart reflects data for three years of testing.
Reading Comprehension 50
58 54 54 0
98-99
53 54 53 97-98
56 57 52 96-97
Mathematics
School 50
System
State
0
62 62 61 98-99
68 65 61 97-98
66 65 59 96-97
School System State
Reading Vocabulary 50
52 52 50 0
98-99
52 51 50 97-98
51 53 49 96-97
Language Arts
School 50
System
State
0
54 57 64 98-99
49 55 62 97-98
43 50 59 96-97
School System State
Social Studies 50
58 61 56 0
98-99
63 60 55 97-98
62 64 55 96-97
Science
School 50
System
State
0
61 62 59 98-99
63 63 59 97-98
63 67 58 96-97
School System State
Sources of Information
Composite Score
50
60 59 57 0
98-99
School 50
System
55 55 56 97-98
58 60 55 96-97
State 0
58 59 58 98-99
58 58 57 97-98
1998-99 GEORGIA PUBLIC EDUCATION REPORT CARD Bramlett Elementary School - 6070193
Prepared by Georgia Department of Education
58 60 56 96-97
Scores Reported in Percentiles
School System State
Page 2
STATE-REQUIRED TEST DATA
NORM-REFERENCED TESTS Grade 5
Iowa Tests of Basic Skills (ITBS) Each chart reflects data for three years of testing.
Reading Comprehension
Mathematics
50
56 57 53 0
98-99
55 53 53 97-98
47 53 52 96-97
School 50
System
State
0
60 65 59 98-99
59 60 58 97-98
42 56 57 96-97
School System State
Reading Vocabulary 50
53 60 48 0
98-99
52 48 48 97-98
37 48 46 96-97
Language Arts
School 50
System
State
0
54 62 63 98-99
55 56 61 97-98
37 47 58 96-97
School System State
Social Studies 50
61 63 57 0
98-99
61 58 56 97-98
52 55 55 96-97
Science
School 50
System
State
0
64 68 60 98-99
61 65 59 97-98
57 61 59 96-97
School System State
Sources of Information
Composite Score
50
60 63 58 0
98-99
School 50
System
64 59 58 97-98
51 56 57 96-97
State 0
59 63 57 98-99
58 58 56 97-98
45 54 55 96-97
1998-99 GEORGIA PUBLIC EDUCATION REPORT CARD Bramlett Elementary School - 6070193
Prepared by Georgia Department of Education
Scores Reported in Percentiles
School System State
Page 3
STATE-REQUIRED TEST DATA
PERFORMANCE ASSESSMENTS
Grade 5 Writing Assessment
Percent at Developmental Stages:
1998-99 School System State
1997-98 School System State
1996-97 School System State
Stage Stage Stage Stage Stage Stage
1:The Emerging Writer 2:The Developing Writer 3:The Focusing Writer 4:The Experimenting 5:The Engaging Writer 6:The Extending Writer
0% 1% 14% 44% 30% 11%
0% 0% 10% 37% 38% 15%
0% 1% 16% 41% 29% 12%
0% 3% 21% 44% 26% 7%
0% 1% 16% 46% 25% 10%
0% 3% 19% 41% 27% 10%
1% 5% 33% 36% 23% 2%
0% 2% 22% 37% 28% 10%
0% 3% 21% 37% 26% 12%
AWARDS / RECOGNITION DATA
Schools in Georgia may receive recognition in the following programs: Charter School Pay for Performance Program Georgia School of Excellence National Blue Ribbon School Bramlett Elementary School did not receive recognition in any of these programs during the 1998-99 school year.
1998-99 GEORGIA PUBLIC EDUCATION REPORT CARD Bramlett Elementary School - 6070193
Prepared by Georgia Department of Education
Page 4
CERTIFIED PERSONNEL DATA
Positions Number Average Contract Days
Personnel Sex
Certificate
Years Experience
Full-time Part-time
Male Female
4 Yr Bachelor's 5 Yr Master's 6 Yr Specialist's 7 Yr Doctoral Other*
<1 1-10 11-20 21-30 >30
Average
Administrators
2.00 223.00
2 0
1 1
0 1 1 0 0 0 0 1 1 0 20.50
Support Personnel
2.33 191.43
2 1
2 1
0 2 1 0 0 0 1 1 1 0 13.67
PK-12 Teachers
48.02 190.12
44 10
7 47
29 21
4 0 0 14 27 8 5 0 6.98
*Includes One- and Two-Year Vocational Certificates.
ACCREDITATION DATA
Candidate for accreditation by Southern Association of Colleges and Schools (SACS):
Elementary/Middle Commission. Accredited with Quality by Georgia
Accrediting Commission (GAC).
1998-99 GEORGIA PUBLIC EDUCATION REPORT CARD Bramlett Elementary School - 6070193
Prepared by Georgia Department of Education
Page 5
1998-99 GEORGIA PUBLIC EDUCATION REPORT CARD
BARROW COUNTY SCHOOLS
County Line Elementary School - 6073050
Grade Range K-5
The Georgia Public Education Report Card is designed to assist systems and schools in educational improvement. This report card contains a variety of data elements. An explanation of the terms is provided as a companion to the report card data. Please refer to the definitions for the most effective use of the reported data.
STUDENT DATA
Total 518
K-5 Enrollment, by Race/Ethnicity and Sex
Black
White Hispanic
American Multi-
Asian Indian
racial
33 6.4%
461 89.0%
1 0.2%
17 3.3%
2 0.4%
4 0.8%
Male Female
272 52.5%
246 47.5%
Enrollment in Selected Programs
Program
Program % of Student Enrollment Population
Gifted (Grades K-12)
13
2.5%
Alternative Programs (Grades 6-12)
N/A
N/A
Students Eligible to Receive Free/Reduced Lunches
Number
Percent
School System
145 2,479
28.0% 31.6%
Dropout Rate *
Number
Rate
School System
N/A N/A
N/A N/A
* Dropout rates are not applicable for grades PK-5.
Enrollment in Compensatory Programs
Program
Program % of Student Enrollment Population
Special Education (Grades K-12)
107 20.7%
(PK)
0
N/A
English to Speakers of Other Languages (ESOL) (Grades K-12)
0
0.0%
Remedial Education (Grades 2-5, 9-12)
49 14.9%
Special Instructional Assistance (SIA) (Grades K-3)
99 27.6%
Title I (Grades K-12)
This school has no Title I program.
Total 8
Retained Students, by Race/Ethnicity and Sex
Black
White Hispanic
American Multi-
Asian Indian
racial
1 12.5%
6 75.0%
0 0.0%
0 0.0%
1 12.5%
0 0.0%
Male Female
4
4
50.0% 50.0%
Prepared by Georgia Department of Education
Page 1
STATE-REQUIRED TEST DATA
NORM-REFERENCED TESTS Grade 3
Iowa Tests of Basic Skills (ITBS) Each chart reflects data for three years of testing.
Reading Comprehension 50
48 54 54 0
98-99
52 54 53 97-98
64 57 52 96-97
Mathematics
School 50
System
State
0
55 62 61 98-99
60 65 61 97-98
66 65 59 96-97
School System State
Reading Vocabulary 50
51 52 50 0
98-99
49 51 50 97-98
58 53 49 96-97
Language Arts
School 50
System
State
0
45 57 64 98-99
60 55 62 97-98
53 50 59 96-97
School System State
Social Studies 50
63 61 56 0
98-99
62 60 55 97-98
75 64 55 96-97
Science
School 50
System
State
0
62 62 59 98-99
65 63 59 97-98
76 67 58 96-97
School System State
Sources of Information
Composite Score
50
54 59 57 0
98-99
School 50
System
53 55 56 97-98
66 60 55 96-97
State 0
54 59 58 98-99
58 58 57 97-98
1998-99 GEORGIA PUBLIC EDUCATION REPORT CARD County Line Elementary School - 6073050
Prepared by Georgia Department of Education
67 60 56 96-97
Scores Reported in Percentiles
School System State
Page 2
STATE-REQUIRED TEST DATA
NORM-REFERENCED TESTS Grade 5
Iowa Tests of Basic Skills (ITBS) Each chart reflects data for three years of testing.
Reading Comprehension
Mathematics
50
59 57 53 0
98-99
54 53 53 97-98
53 53 52 96-97
School 50
System
State
0
70 65 59 98-99
65 60 58 97-98
57 56 57 96-97
School System State
Reading Vocabulary 50
60 60 48 0
98-99
52 48 48 97-98
52 48 46 96-97
Language Arts
School 50
System
State
0
66 62 63 98-99
63 56 61 97-98
53 47 58 96-97
School System State
Social Studies 50
64 63 57 0
98-99
66 58 56 97-98
56 55 55 96-97
Science
School 50
System
State
0
72 68 60 98-99
76 65 59 97-98
66 61 59 96-97
School System State
Sources of Information
Composite Score
50
66 63 58 0
98-99
School 50
System
63 59 58 97-98
61 56 57 96-97
State 0
66 63 57 98-99
65 58 56 97-98
58 54 55 96-97
1998-99 GEORGIA PUBLIC EDUCATION REPORT CARD County Line Elementary School - 6073050
Prepared by Georgia Department of Education
Scores Reported in Percentiles
School System State
Page 3
STATE-REQUIRED TEST DATA
PERFORMANCE ASSESSMENTS
Grade 5 Writing Assessment
Percent at Developmental Stages:
1998-99 School System State
1997-98 School System State
1996-97 School System State
Stage Stage Stage Stage Stage Stage
1:The Emerging Writer 2:The Developing Writer 3:The Focusing Writer 4:The Experimenting 5:The Engaging Writer 6:The Extending Writer
0% 2% 10% 30% 40% 18%
0% 0% 10% 37% 38% 15%
0% 1% 16% 41% 29% 12%
0% 2% 9% 36% 32% 21%
0% 1% 16% 46% 25% 10%
0% 3% 19% 41% 27% 10%
0% 0% 17% 39% 26% 19%
0% 2% 22% 37% 28% 10%
0% 3% 21% 37% 26% 12%
AWARDS / RECOGNITION DATA
Through the Pay for Performance Program, exemplary public schools and schools making outstanding progress toward becoming exemplary may be rewarded. Not a merit pay program, the Pay for Performance Program motivates and rewards entire school faculties for working together to make their schools exemplary. A school selected for participation in the program has one school year to attain at least 80% of its previously-approved performance objectives in order to receive an award based on $2,000 per certified faculty member.
County Line Elementary School was a Pay for Performance recipient in 1998-99.
1998-99 GEORGIA PUBLIC EDUCATION REPORT CARD County Line Elementary School - 6073050
Prepared by Georgia Department of Education
Page 4
CERTIFIED PERSONNEL DATA
Positions Number Average Contract Days
Personnel Sex
Certificate
Years Experience
Full-time Part-time
Male Female
4 Yr Bachelor's 5 Yr Master's 6 Yr Specialist's 7 Yr Doctoral Other*
<1 1-10 11-20 21-30 >30
Average
Administrators
2.00 225.50
2 0
0 2
0 0 1 1 0 0 0 0 2 0 21.00
Support Personnel
2.20 190.91
2 1
0 3
0 3 0 0 0 1 2 0 0 0 5.33
PK-12 Teachers
32.60 190.08
31 6
3 34
20 16
1 0 0 11 20 5 1 0 5.54
*Includes One- and Two-Year Vocational Certificates.
ACCREDITATION DATA
Candidate for accreditation by Southern Association of Colleges and Schools (SACS):
Elementary/Middle Commission. Accredited with Quality by Georgia
Accrediting Commission (GAC).
1998-99 GEORGIA PUBLIC EDUCATION REPORT CARD County Line Elementary School - 6073050
Prepared by Georgia Department of Education
Page 5
1998-99 GEORGIA PUBLIC EDUCATION REPORT CARD
BARROW COUNTY SCHOOLS
Holsenbeck Elementary School - 6074050
Grade Range PK-5
The Georgia Public Education Report Card is designed to assist systems and schools in educational improvement. This report card contains a variety of data elements. An explanation of the terms is provided as a companion to the report card data. Please refer to the definitions for the most effective use of the reported data.
STUDENT DATA
Total
K-5
589
PK
39
Enrollment, by Race/Ethnicity and Sex
Black
White Hispanic
American Asian Indian
Multiracial
97 16.5%
447 75.9%
22 3.7%
15 2.5%
1 0.2%
7 1.2%
2 5.1%
31 79.5%
0 0.0%
3 7.7%
0 0.0%
3 7.7%
Male Female
330 56.0%
259 44.0%
21 53.8%
18 46.2%
Enrollment in Selected Programs
Program
Program % of Student Enrollment Population
Gifted (Grades K-12)
20
3.4%
Alternative Programs (Grades 6-12)
N/A
N/A
Students Eligible to Receive Free/Reduced Lunches
Number
Percent
School System
288 2,479
45.9% 31.6%
Dropout Rate *
Number
Rate
School System
N/A N/A
N/A N/A
* Dropout rates are not applicable for grades PK-5.
Enrollment in Compensatory Programs
Program
Program % of Student Enrollment Population
Special Education (Grades K-12)
99 16.8%
(PK)
22
N/A
English to Speakers of Other Languages (ESOL) (Grades K-12)
0
0.0%
Remedial Education (Grades 2-5, 9-12)
65 17.1%
Special Instructional Assistance (SIA) (Grades K-3)
99 24.2%
Title I (Grades K-12)
This school has a Targeted Assistance program.
Total 38
Retained Students, by Race/Ethnicity and Sex
Black
White Hispanic
American MultiAsian Indian racial
9 23.7%
24
4
63.2% 10.5%
0 0.0%
0 0.0%
1 2.6%
Male Female
21
17
55.3% 44.7%
Prepared by Georgia Department of Education
Page 1
STATE-REQUIRED TEST DATA
NORM-REFERENCED TESTS Grade 3
Iowa Tests of Basic Skills (ITBS) Each chart reflects data for three years of testing.
Reading Comprehension 50
55 54 54 0
98-99
57 54 53 97-98
59 57 52 96-97
Mathematics
School 50
System
State
0
61 62 61 98-99
64 65 61 97-98
63 65 59 96-97
School System State
Reading Vocabulary 50
54 52 50 0
98-99
54 51 50 97-98
54 53 49 96-97
Language Arts
School 50
System
State
0
61 57 64 98-99
54 55 62 97-98
40 50 59 96-97
School System State
Social Studies 50
62 61 56 0
98-99
57 60 55 97-98
60 64 55 96-97
Science
School 50
System
State
0
59 62 59 98-99
66 63 59 97-98
68 67 58 96-97
School System State
Sources of Information
Composite Score
50
60 59 57 0
98-99
School 50
System
52 55 56 97-98
58 60 55 96-97
State 0
59 59 58 98-99
58 58 57 97-98
1998-99 GEORGIA PUBLIC EDUCATION REPORT CARD Holsenbeck Elementary School - 6074050
Prepared by Georgia Department of Education
59 60 56 96-97
Scores Reported in Percentiles
School System State
Page 2
STATE-REQUIRED TEST DATA
NORM-REFERENCED TESTS Grade 5
Iowa Tests of Basic Skills (ITBS) Each chart reflects data for three years of testing.
Reading Comprehension
Mathematics
50
61 57 53 0
98-99
52 53 53 97-98
59 53 52 96-97
School 50
System
State
0
73 65 59 98-99
65 60 58 97-98
66 56 57 96-97
School System State
Reading Vocabulary 50
60 60 48 0
98-99
48 48 48 97-98
59 48 46 96-97
Language Arts
School 50
System
State
0
69 62 63 98-99
52 56 61 97-98
45 47 58 96-97
School System State
Social Studies 50
71 63 57 0
98-99
56 58 56 97-98
62 55 55 96-97
Science
School 50
System
State
0
73 68 60 98-99
71 65 59 97-98
67 61 59 96-97
School System State
Sources of Information
Composite Score
50
64 63 58 0
98-99
School 50
System
54 59 58 97-98
58 56 57 96-97
State 0
69 63 57 98-99
58 58 56 97-98
60 54 55 96-97
1998-99 GEORGIA PUBLIC EDUCATION REPORT CARD Holsenbeck Elementary School - 6074050
Prepared by Georgia Department of Education
Scores Reported in Percentiles
School System State
Page 3
STATE-REQUIRED TEST DATA
PERFORMANCE ASSESSMENTS
Grade 5 Writing Assessment
Percent at Developmental Stages:
1998-99 School System State
1997-98 School System State
1996-97 School System State
Stage Stage Stage Stage Stage Stage
1:The Emerging Writer 2:The Developing Writer 3:The Focusing Writer 4:The Experimenting 5:The Engaging Writer 6:The Extending Writer
0% 0% 3% 28% 38% 31%
0% 0% 10% 37% 38% 15%
0% 1% 16% 41% 29% 12%
0% 0% 8% 42% 34% 15%
0% 1% 16% 46% 25% 10%
0% 3% 19% 41% 27% 10%
0% 1% 12% 39% 34% 14%
0% 2% 22% 37% 28% 10%
0% 3% 21% 37% 26% 12%
AWARDS / RECOGNITION DATA
Schools in Georgia may receive recognition in the following programs: Charter School Pay for Performance Program Georgia School of Excellence National Blue Ribbon School Holsenbeck Elementary School did not receive recognition in any of these programs during the 1998-99 school year.
1998-99 GEORGIA PUBLIC EDUCATION REPORT CARD Holsenbeck Elementary School - 6074050
Prepared by Georgia Department of Education
Page 4
CERTIFIED PERSONNEL DATA
Positions Number Average Contract Days
Personnel Sex
Certificate
Years Experience
Full-time Part-time
Male Female
4 Yr Bachelor's 5 Yr Master's 6 Yr Specialist's 7 Yr Doctoral Other*
<1 1-10 11-20 21-30 >30
Average
Administrators
2.00 223.00
2 0
0 2
0 0 2 0 0 0 0 0 2 0 23.00
Support Personnel
3.33 191.00
3 1
2 2
0 3 1 0 0 1 0 2 0 1 13.25
PK-12 Teachers
47.50 190.37
44 8
6 46
26 22
2 2 0 4 22 18 8 0 11.44
*Includes One- and Two-Year Vocational Certificates.
ACCREDITATION DATA
Candidate for accreditation by Southern Association of Colleges and Schools (SACS):
Elementary/Middle Commission. Accredited with Quality by Georgia
Accrediting Commission (GAC).
1998-99 GEORGIA PUBLIC EDUCATION REPORT CARD Holsenbeck Elementary School - 6074050
Prepared by Georgia Department of Education
Page 5
1998-99 GEORGIA PUBLIC EDUCATION REPORT CARD
BARROW COUNTY SCHOOLS
Kennedy Elementary School - 6070189
Grade Range PK-5
The Georgia Public Education Report Card is designed to assist systems and schools in educational improvement. This report card contains a variety of data elements. An explanation of the terms is provided as a companion to the report card data. Please refer to the definitions for the most effective use of the reported data.
STUDENT DATA
Total
K-5
586
PK
23
Enrollment, by Race/Ethnicity and Sex
Black
White Hispanic
American Asian Indian
Multiracial
139 23.7%
409 69.8%
13 2.2%
12 2.0%
0 0.0%
13 2.2%
2 8.7%
20 87.0%
0 0.0%
1 4.3%
0 0.0%
0 0.0%
Male Female
307 52.4%
279 47.6%
11 47.8%
12 52.2%
Enrollment in Selected Programs
Program
Program % of Student Enrollment Population
Gifted (Grades K-12)
9
1.5%
Alternative Programs (Grades 6-12)
N/A
N/A
Students Eligible to Receive Free/Reduced Lunches
Number
Percent
School System
302 2,479
49.6% 31.6%
Dropout Rate *
Number
Rate
School System
N/A N/A
N/A N/A
* Dropout rates are not applicable for grades PK-5.
Enrollment in Compensatory Programs
Program
Program % of Student Enrollment Population
Special Education (Grades K-12)
119 20.3%
(PK)
7
N/A
English to Speakers of Other Languages (ESOL) (Grades K-12)
0
0.0%
Remedial Education (Grades 2-5, 9-12)
77 20.4%
Special Instructional Assistance (SIA) (Grades K-3)
128 30.3%
Title I (Grades K-12)
This school has a schoolwide program.
Total 30
Retained Students, by Race/Ethnicity and Sex
Black
White Hispanic
American MultiAsian Indian racial
14 46.7%
13 43.3%
2 6.7%
0 0.0%
0 0.0%
1 3.3%
Male Female
17
13
56.7% 43.3%
Prepared by Georgia Department of Education
Page 1
STATE-REQUIRED TEST DATA
NORM-REFERENCED TESTS Grade 3
Iowa Tests of Basic Skills (ITBS) Each chart reflects data for three years of testing.
Reading Comprehension 50
45 54 54 0
98-99
52 54 53 97-98
52 57 52 96-97
Mathematics
School 50
System
State
0
52 62 61 98-99
61 65 61 97-98
62 65 59 96-97
School System State
Reading Vocabulary 50
46 52 50 0
98-99
50 51 50 97-98
52 53 49 96-97
Language Arts
School 50
System
State
0
50 57 64 98-99
60 55 62 97-98
53 50 59 96-97
School System State
Social Studies 50
53 61 56 0
98-99
55 60 55 97-98
61 64 55 96-97
Science
School 50
System
State
0
46 62 59 98-99
56 63 59 97-98
60 67 58 96-97
School System State
Sources of Information
Composite Score
50
50 59 57 0
98-99
School 50
System
60 55 56 97-98
55 60 55 96-97
State 0
48 59 58 98-99
56 58 57 97-98
1998-99 GEORGIA PUBLIC EDUCATION REPORT CARD Kennedy Elementary School - 6070189
Prepared by Georgia Department of Education
57 60 56 96-97
Scores Reported in Percentiles
School System State
Page 2
STATE-REQUIRED TEST DATA
NORM-REFERENCED TESTS Grade 5
Iowa Tests of Basic Skills (ITBS) Each chart reflects data for three years of testing.
Reading Comprehension
Mathematics
50
55 57 53 0
98-99
49 53 53 97-98
59 53 52 96-97
School 50
System
State
0
64 65 59 98-99
52 60 58 97-98
64 56 57 96-97
School System State
Reading Vocabulary 50
57 60 48 0
98-99
46 48 48 97-98
52 48 46 96-97
Language Arts
School 50
System
State
0
64 62 63 98-99
53 56 61 97-98
61 47 58 96-97
School System State
Social Studies 50
58 63 57 0
98-99
54 58 56 97-98
54 55 55 96-97
Science
School 50
System
State
0
64 68 60 98-99
59 65 59 97-98
65 61 59 96-97
School System State
Sources of Information
Composite Score
50
66 63 58 0
98-99
School 50
System
54 59 58 97-98
61 56 57 96-97
State 0
62 63 57 98-99
52 58 56 97-98
61 54 55 96-97
1998-99 GEORGIA PUBLIC EDUCATION REPORT CARD Kennedy Elementary School - 6070189
Prepared by Georgia Department of Education
Scores Reported in Percentiles
School System State
Page 3
STATE-REQUIRED TEST DATA
PERFORMANCE ASSESSMENTS
Grade 5 Writing Assessment
Percent at Developmental Stages:
1998-99 School System State
1997-98 School System State
1996-97 School System State
Stage Stage Stage Stage Stage Stage
1:The Emerging Writer 2:The Developing Writer 3:The Focusing Writer 4:The Experimenting 5:The Engaging Writer 6:The Extending Writer
0% 0% 7% 39% 41% 13%
0% 0% 10% 37% 38% 15%
0% 1% 16% 41% 29% 12%
0% 3% 25% 52% 16% 3%
0% 1% 16% 46% 25% 10%
0% 3% 19% 41% 27% 10%
0% 3% 20% 36% 29% 12%
0% 2% 22% 37% 28% 10%
0% 3% 21% 37% 26% 12%
AWARDS / RECOGNITION DATA
Schools in Georgia may receive recognition in the following programs: Charter School Pay for Performance Program Georgia School of Excellence National Blue Ribbon School Kennedy Elementary School did not receive recognition in any of these programs during the 1998-99 school year.
1998-99 GEORGIA PUBLIC EDUCATION REPORT CARD Kennedy Elementary School - 6070189
Prepared by Georgia Department of Education
Page 4
CERTIFIED PERSONNEL DATA
Positions Number Average Contract Days
Personnel Sex
Certificate
Years Experience
Full-time Part-time
Male Female
4 Yr Bachelor's 5 Yr Master's 6 Yr Specialist's 7 Yr Doctoral Other*
<1 1-10 11-20 21-30 >30
Average
Administrators
2.00 223.00
2 0
1 1
0 0 2 0 0 0 0 2 0 0 17.00
Support Personnel
2.30 191.30
2 1
0 3
1 2 0 0 0 0 2 1 0 0 11.00
PK-12 Teachers
42.60 190.05
41 6
6 41
26 17
4 0 0 2 22 11 12 0 12.62
*Includes One- and Two-Year Vocational Certificates.
ACCREDITATION DATA
Candidate for accreditation by Southern Association of Colleges and Schools (SACS):
Elementary/Middle Commission. Accredited with Quality by Georgia
Accrediting Commission (GAC).
1998-99 GEORGIA PUBLIC EDUCATION REPORT CARD Kennedy Elementary School - 6070189
Prepared by Georgia Department of Education
Page 5
1998-99 GEORGIA PUBLIC EDUCATION REPORT CARD
BARROW COUNTY SCHOOLS
Russell Middle School - 6070289
Grade Range 6-8
The Georgia Public Education Report Card is designed to assist systems and schools in educational improvement. This report card contains a variety of data elements. An explanation of the terms is provided as a companion to the report card data. Please refer to the definitions for the most effective use of the reported data.
STUDENT DATA
Total 561
6-8 Enrollment, by Race/Ethnicity and Sex
Black
White Hispanic
American Multi-
Asian Indian
racial
43 7.7%
471 84.0%
15 2.7%
24 4.3%
0 0.0%
8 1.4%
Male 273
48.7%
Female 288
51.3%
Enrollment in Selected Programs
Program
Gifted (Grades K-12)
Program % of Student Enrollment Population
29
5.2%
Alternative Programs (Grades 6-12)
3
< 1%
Students Eligible to Receive Free/Reduced Lunches
Number
Percent
School System
166 2,479
29.6% 31.6%
Enrollment in Compensatory Programs
Program
Program % of Student Enrollment Population
Special Education (Grades K-12) (PK)
94 16.8%
0
N/A
English to Speakers of Other Languages (ESOL) (Grades K-12)
0
0.0%
Title I (Grades K-12)
This school has no Title I program.
Dropout Rate for Grades 6-8
Number
Rate
School System
0
0.0%
8
0.4%
Total 14
Retained Students, by Race/Ethnicity and Sex
Black
White Hispanic
American MultiAsian Indian racial
1 7.1%
10 71.4%
0 0.0%
1 7.1%
0
2
0.0% 14.3%
Male Female
9
5
64.3% 35.7%
Prepared by Georgia Department of Education
Page 1
STATE-REQUIRED TEST DATA
NORM-REFERENCED TESTS Grade 8
Iowa Tests of Basic Skills (ITBS) Each chart reflects data for three years of testing.
Reading Comprehension 50
53 51 49 0
98-99
54 54 48 97-98
53 52 48 96-97
Mathematics
School 50
System
State
0
52 56 56 98-99
58 58 55 97-98
52 52 54 96-97
School System State
Reading Vocabulary 50
57 48 46 0
98-99
62 51 45 97-98
51 49 44 96-97
Language Arts
School 50
System
State
0
58 58 60 98-99
58 58 58 97-98
53 52 56 96-97
School System State
Social Studies 50
54 53 54 0
98-99
58 56 53 97-98
53 53 53 96-97
Science
School 50
System
State
0
58 57 56 98-99
62 60 55 97-98
55 58 53 96-97
School System State
Sources of Information
Composite Score
50
65 61 57 0
98-99
School 50
System
57 59 56 97-98
56 57 55 96-97
State 0
57 57 56 98-99
60 59 54 97-98
1998-99 GEORGIA PUBLIC EDUCATION REPORT CARD Russell Middle School - 6070289
Prepared by Georgia Department of Education
54 54 54 96-97
Scores Reported in Percentiles
School System State
Page 2
STATE-REQUIRED TEST DATA
Categories of Scaled Scores
Inadequate (less than 162)
Minimal (162-209)
Good
(210-247)
Very Good (greater than 247)
Average Scaled Score: (Range 100-300)
PERFORMANCE ASSESSMENTS
Grade 8 Writing Assessment
1998-99 Percent Scoring
1997-98 Percent Scoring
1996-97 Percent Scoring
School System State School System State School System State
1% 40% 50%
9%
2% 42% 46%
9%
8% 40% 41% 11%
8% 47% 38%
7%
10% 51% 33%
5%
11% 46% 34%
8%
13% 46% 33%
9%
14% 49% 31%
7%
15% 46% 30%
8%
213
212
208 203
199 202 201
198 198
AWARDS / RECOGNITION DATA
Schools in Georgia may receive recognition in the following programs: Charter School Pay for Performance Program Georgia School of Excellence National Blue Ribbon School Russell Middle School did not receive recognition in any of these programs during the 1998-99 school year.
1998-99 GEORGIA PUBLIC EDUCATION REPORT CARD Russell Middle School - 6070289
Prepared by Georgia Department of Education
Page 3
CERTIFIED PERSONNEL DATA
Positions Number Average Contract Days
Personnel Sex
Certificate
Years Experience
Full-time Part-time
Male Female
4 Yr Bachelor's 5 Yr Master's 6 Yr Specialist's 7 Yr Doctoral Other*
<1 1-10 11-20 21-30 >30
Average
Administrators
3.00 222.00
3 0
1 2
0 0 3 0 0 0 0 0 3 0 22.67
Support Personnel
1.00 190.00
1 0
0 1
0 1 0 0 0 0 1 0 0 0 7.00
PK-12 Teachers
43.23 191.41
41 4
11 34
22 18
4 1 0 8 16 10 10 1 12.07
*Includes One- and Two-Year Vocational Certificates.
ACCREDITATION DATA
Accredited by Southern Association of Colleges and Schools (SACS): Secondary/Middle Commission.
Accredited with Quality by Georgia Accrediting Commission (GAC).
1998-99 GEORGIA PUBLIC EDUCATION REPORT CARD Russell Middle School - 6070289
Prepared by Georgia Department of Education
Page 4
1998-99 GEORGIA PUBLIC EDUCATION REPORT CARD
BARROW COUNTY SCHOOLS
Statham Elementary School - 6075050
Grade Range PK-5
The Georgia Public Education Report Card is designed to assist systems and schools in educational improvement. This report card contains a variety of data elements. An explanation of the terms is provided as a companion to the report card data. Please refer to the definitions for the most effective use of the reported data.
STUDENT DATA
Total
K-5
484
PK
40
Enrollment, by Race/Ethnicity and Sex
Black
White Hispanic
American Asian Indian
Multiracial
93 19.2%
369 76.2%
1 0.2%
11 2.3%
0 0.0%
10 2.1%
7 17.5%
29 72.5%
3 7.5%
1 2.5%
0 0.0%
0 0.0%
Male Female
256 52.9%
228 47.1%
21 52.5%
19 47.5%
Enrollment in Selected Programs
Program
Program % of Student Enrollment Population
Gifted (Grades K-12)
19
3.9%
Alternative Programs (Grades 6-12)
N/A
N/A
Students Eligible to Receive Free/Reduced Lunches
Number
Percent
School System
204 2,479
38.9% 31.6%
Dropout Rate *
Number
Rate
School System
N/A N/A
N/A N/A
* Dropout rates are not applicable for grades PK-5.
Enrollment in Compensatory Programs
Program
Program % of Student Enrollment Population
Special Education (Grades K-12)
76 15.7%
(PK)
1
N/A
English to Speakers of Other Languages (ESOL) (Grades K-12)
0
0.0%
Remedial Education (Grades 2-5, 9-12)
60 18.7%
Special Instructional Assistance (SIA) (Grades K-3)
84 25.2%
Title I (Grades K-12)
This school has a Targeted Assistance program.
Total 30
Retained Students, by Race/Ethnicity and Sex
Black
White Hispanic
American MultiAsian Indian racial
4 13.3%
23 76.7%
0 0.0%
0 0.0%
0
3
0.0% 10.0%
Male Female
16
14
53.3% 46.7%
Prepared by Georgia Department of Education
Page 1
STATE-REQUIRED TEST DATA
NORM-REFERENCED TESTS Grade 3
Iowa Tests of Basic Skills (ITBS) Each chart reflects data for three years of testing.
Reading Comprehension 50
60 54 54 0
98-99
58 54 53 97-98
59 57 52 96-97
Mathematics
School 50
System
State
0
68 62 61 98-99
68 65 61 97-98
70 65 59 96-97
School System State
Reading Vocabulary 50
53 52 50 0
98-99
50 51 50 97-98
58 53 49 96-97
Language Arts
School 50
System
State
0
64 57 64 98-99
49 55 62 97-98
60 50 59 96-97
School System State
Social Studies 50
70 61 56 0
98-99
64 60 55 97-98
69 64 55 96-97
Science
School 50
System
State
0
67 62 59 98-99
54 63 59 97-98
66 67 58 96-97
School System State
Sources of Information
Composite Score
50
66 59 57 0
98-99
School 50
System
53 55 56 97-98
60 60 55 96-97
State 0
65 59 58 98-99
56 58 57 97-98
1998-99 GEORGIA PUBLIC EDUCATION REPORT CARD Statham Elementary School - 6075050
Prepared by Georgia Department of Education
64 60 56 96-97
Scores Reported in Percentiles
School System State
Page 2
STATE-REQUIRED TEST DATA
NORM-REFERENCED TESTS Grade 5
Iowa Tests of Basic Skills (ITBS) Each chart reflects data for three years of testing.
Reading Comprehension
Mathematics
50
53 57 53 0
98-99
57 53 53 97-98
54 53 52 96-97
School 50
System
State
0
59 65 59 98-99
65 60 58 97-98
57 56 57 96-97
School System State
Reading Vocabulary 50
59 60 48 0
98-99
55 48 48 97-98
50 48 46 96-97
Language Arts
School 50
System
State
0
58 62 63 98-99
66 56 61 97-98
51 47 58 96-97
School System State
Social Studies 50
58 63 57 0
98-99
60 58 56 97-98
54 55 55 96-97
Science
School 50
System
State
0
61 68 60 98-99
68 65 59 97-98
63 61 59 96-97
School System State
Sources of Information
Composite Score
50
58 63 58 0
98-99
School 50
System
61 59 58 97-98
55 56 57 96-97
State 0
58 63 57 98-99
62 58 56 97-98
54 54 55 96-97
1998-99 GEORGIA PUBLIC EDUCATION REPORT CARD Statham Elementary School - 6075050
Prepared by Georgia Department of Education
Scores Reported in Percentiles
School System State
Page 3
STATE-REQUIRED TEST DATA
PERFORMANCE ASSESSMENTS
Grade 5 Writing Assessment
Percent at Developmental Stages:
1998-99 School System State
1997-98 School System State
1996-97 School System State
Stage Stage Stage Stage Stage Stage
1:The Emerging Writer 2:The Developing Writer 3:The Focusing Writer 4:The Experimenting 5:The Engaging Writer 6:The Extending Writer
0% 0% 14% 43% 33% 9%
0% 0% 10% 37% 38% 15%
0% 1% 16% 41% 29% 12%
0% 0% 21% 49% 13% 13%
0% 1% 16% 46% 25% 10%
0% 3% 19% 41% 27% 10%
0% 1% 18% 40% 29% 12%
0% 2% 22% 37% 28% 10%
0% 3% 21% 37% 26% 12%
AWARDS / RECOGNITION DATA
Schools in Georgia may receive recognition in the following programs: Charter School Pay for Performance Program Georgia School of Excellence National Blue Ribbon School Statham Elementary School did not receive recognition in any of these programs during the 1998-99 school year.
1998-99 GEORGIA PUBLIC EDUCATION REPORT CARD Statham Elementary School - 6075050
Prepared by Georgia Department of Education
Page 4
CERTIFIED PERSONNEL DATA
Positions Number Average Contract Days
Personnel Sex
Certificate
Years Experience
Full-time Part-time
Male Female
4 Yr Bachelor's 5 Yr Master's 6 Yr Specialist's 7 Yr Doctoral Other*
<1 1-10 11-20 21-30 >30
Average
Administrators
2.00 223.00
2 0
0 2
0 1 1 0 0 0 0 1 1 0 17.50
Support Personnel
3.10 190.65
2 2
0 4
0 2 1 1 0 1 2 0 1 0 11.25
PK-12 Teachers
35.42 190.50
33 7
3 37
23 14
3 0 0 5 16 13 5 1 11.28
*Includes One- and Two-Year Vocational Certificates.
ACCREDITATION DATA
Candidate for accreditation by Southern Association of Colleges and Schools (SACS):
Elementary/Middle Commission. Accredited with Quality by Georgia
Accrediting Commission (GAC).
1998-99 GEORGIA PUBLIC EDUCATION REPORT CARD Statham Elementary School - 6075050
Prepared by Georgia Department of Education
Page 5
1998-99 GEORGIA PUBLIC EDUCATION REPORT CARD
BARROW COUNTY SCHOOLS
Westside Middle School - 6070198
Grade Range 6-8
The Georgia Public Education Report Card is designed to assist systems and schools in educational improvement. This report card contains a variety of data elements. An explanation of the terms is provided as a companion to the report card data. Please refer to the definitions for the most effective use of the reported data.
STUDENT DATA
Total 629
6-8 Enrollment, by Race/Ethnicity and Sex
Black
White Hispanic
American Multi-
Asian Indian
racial
92 14.6%
491 78.1%
17 2.7%
23 3.7%
0 0.0%
6 1.0%
Male 348
55.3%
Female 281
44.7%
Enrollment in Selected Programs
Program
Gifted (Grades K-12)
Program % of Student Enrollment Population
40
6.4%
Alternative Programs (Grades 6-12)
2
< 1%
Students Eligible to Receive Free/Reduced Lunches
Number
Percent
School System
212 2,479
33.7% 31.6%
Enrollment in Compensatory Programs
Program
Program % of Student Enrollment Population
Special Education (Grades K-12) (PK)
107 17.0%
0
N/A
English to Speakers of Other Languages (ESOL) (Grades K-12)
0
0.0%
Title I (Grades K-12)
This school has no Title I program.
Dropout Rate for Grades 6-8
Number
Rate
School System
3
0.4%
8
0.4%
Total 24
Retained Students, by Race/Ethnicity and Sex
Black
White Hispanic
American MultiAsian Indian racial
2 8.3%
20 83.3%
1 4.2%
1 4.2%
0 0.0%
0 0.0%
Male Female
20
4
83.3% 16.7%
Prepared by Georgia Department of Education
Page 1
STATE-REQUIRED TEST DATA
NORM-REFERENCED TESTS Grade 8
Iowa Tests of Basic Skills (ITBS) Each chart reflects data for three years of testing.
Reading Comprehension 50
51 51 49 0
98-99
56 54 48 N/A 52 48
97-98
96-97
Mathematics
School 50
System
State
0
56 56 56 98-99
59 58 55 N/A 52 54
97-98
96-97
School System State
Reading Vocabulary 50
47 48 46 0
98-99
48 51 45 N/A 49 44
97-98
96-97
Language Arts
School 50
System
State
0
57 58 60 98-99
58 58 58 N/A 52 56
97-98
96-97
School System State
Social Studies 50
54 53 54 0
98-99
57 56 53 N/A 53 53
97-98
96-97
Science
School 50
System
State
0
57 57 56 98-99
60 60 55 N/A 58 53
97-98
96-97
School System State
Sources of Information
Composite Score
50
61 61 57 0
98-99
School 50
System
64 59 56 N/A 57 55
97-98
96-97
State 0
57 57 56 98-99
60 59 54 N/A 54 54
97-98
96-97
1998-99 GEORGIA PUBLIC EDUCATION REPORT CARD Westside Middle School - 6070198
Prepared by Georgia Department of Education
Scores Reported in Percentiles
School System State
Page 2
STATE-REQUIRED TEST DATA
Categories of Scaled Scores
Inadequate (less than 162)
Minimal (162-209)
Good
(210-247)
Very Good (greater than 247)
Average Scaled Score: (Range 100-300)
PERFORMANCE ASSESSMENTS
Grade 8 Writing Assessment
1998-99 Percent Scoring
1997-98 Percent Scoring
1996-97 Percent Scoring
School System State School System State School System State
2% 46% 43%
9%
2% 42% 46%
9%
8% 40% 41% 11%
7% 54% 33%
5%
10% 51% 33%
5%
11% 46% 34%
8%
N/A N/A N/A N/A
14% 49% 31%
7%
15% 46% 30%
8%
211
212
208 200
199 202 N/A
198 198
AWARDS / RECOGNITION DATA
Schools in Georgia may receive recognition in the following programs: Charter School Pay for Performance Program Georgia School of Excellence National Blue Ribbon School Westside Middle School did not receive recognition in any of these programs during the 1998-99 school year.
1998-99 GEORGIA PUBLIC EDUCATION REPORT CARD Westside Middle School - 6070198
Prepared by Georgia Department of Education
Page 3
CERTIFIED PERSONNEL DATA
Positions Number Average Contract Days
Personnel Sex
Certificate
Years Experience
Full-time Part-time
Male Female
4 Yr Bachelor's 5 Yr Master's 6 Yr Specialist's 7 Yr Doctoral Other*
<1 1-10 11-20 21-30 >30
Average
Administrators
3.50 217.43
3 1
2 2
0 1 2 1 0 0 1 0 3 0 22.75
Support Personnel
2.00 195.00
2 0
0 2
0 2 0 0 0 0 1 0 1 0 16.50
PK-12 Teachers
43.23 190.34
41 4
8 37
21 20
4 0 0 9 18 12 6 0 9.13
*Includes One- and Two-Year Vocational Certificates.
ACCREDITATION DATA
Accredited by Southern Association of Colleges and Schools (SACS): Secondary/Middle Commission.
Accredited with Quality by Georgia Accrediting Commission (GAC).
1998-99 GEORGIA PUBLIC EDUCATION REPORT CARD Westside Middle School - 6070198
Prepared by Georgia Department of Education
Page 4
1998-99 GEORGIA PUBLIC EDUCATION REPORT CARD
BARROW COUNTY SCHOOLS
Winder-Barrow High School - 6073052
Grade Range 9-12
The Georgia Public Education Report Card is designed to assist systems and schools in educational improvement. This report card contains a variety of data elements. An explanation of the terms is provided as a companion to the report card data. Please refer to the definitions for the most effective use of the reported data.
Total 1,701
STUDENT DATA
9-12 Enrollment, by Race/Ethnicity and Sex
Black
White Hispanic
American Multi-
Asian Indian
racial
225 13.2%
1,385 81.4%
26 1.5%
60 3.5%
2 0.1%
3 0.2%
Male Female
836 49.1%
865 50.9%
Enrollment in Selected Programs
Program
Gifted (Grades K-12)
Program % of Student Enrollment Population
121
7.1%
Non-Vocational Labs (Grades 9-12)
Vocational Labs (Grades 9-12)
Alternative Programs (Grades 6-12)
1,206 1,121
8
70.9% 65.9%
< 1%
Students Eligible to Receive Free/Reduced Lunches
Number
Percent
School System
260 2,479
15.3% 31.6%
Enrollment in Compensatory Programs
Program
Program % of Student Enrollment Population
Special Education (Grades K-12) PK
186 10.9%
0
N/A
English to Speakers of Other Languages (ESOL) (Grades K-12)
11
< 1%
Remedial Education (Grades 2-5, 9-12)
95
5.6%
Title I (Grades K-12)
This school has no Title I program.
Dropout Rate for Grades 9-12
Number
Rate
School System
186
9.7%
186
9.7%
Total 123
Retained Students, by Race/Ethnicity and Sex
Black
White Hispanic
American MultiAsian Indian racial
26 21.1%
90 73.2%
1 0.8%
6 4.9%
0 0.0%
0 0.0%
Male Female
82
41
66.7% 33.3%
Prepared by Georgia Department of Education
Page 1
STATE-REQUIRED TEST DATA
GEORGIA HIGH SCHOOL GRADUATION TESTS (GHSGT)
Percent of Regular Program 11th Graders Passing the Georgia High School Graduation Tests on First Administration
English Language Arts Mathematics Social Studies Science
All Components listed above
Writing
1998-99
School System State
98% 90% 85% 76%
98% 90% 85% 76%
96% 88% 80% 72%
72% 72% 68%
95% 95% 93%
1997-98
School System State
96% 95% 76% 77%
96% 95% 76% 77%
94% 88% 78% 74%
69% 69% 68%
96% 96% 92%
1996-97
School System State
95% 94% 83% 79%
95% 94% 83% 79%
94% 87% 78% 74%
73% 73% 67%
96% 96% 93%
GRADUATE DATA
1999 Graduates by Credentials, Race/Ethnicity and Sex
Diplomas with Both College Prep. & Voc. Endorsements
Diplomas with College Prep. Endorsements Diplomas with Vocational Endorsements General High School Diplomas Special Education Diplomas
Total All Diplomas
Certificates of Performance
Total Graduates
Total 70 95 98 7 10
280 0
Black
8 11.4%
9 9.5%
18 18.4%
0 0.0%
3 30.0%
38 13.6%
0
White Hispanic
57 81.4%
0 0.0%
79 83.2%
0 0.0%
77 78.6%
2 2.0%
7 100.0%
0 0.0%
7 70.0%
0 0.0%
227 81.1%
2 0.7%
0
0
American MultiAsian Indian racial
5 7.1%
0 0.0%
0 0.0%
7 7.4%
0 0.0%
0 0.0%
1 1.0%
0 0.0%
0 0.0%
0 0.0%
0 0.0%
0 0.0%
0 0.0%
0 0.0%
0 0.0%
13 4.6%
0 0.0%
0 0.0%
0
0
0
280
38
227
2
13
0
0
13.6% 81.1% 0.7% 4.6% 0.0% 0.0%
Male Female
34
36
48.6% 51.4%
40
55
42.1% 57.9%
51
47
52.0% 48.0%
5
2
71.4% 28.6%
5
5
50.0% 50.0%
135
145
48.2% 51.8%
0
0
135
145
48.2% 51.8%
HOPE Scholarships
School System
Number of 1999 Graduates 2 8 0
Number Eligible
168
Percent Eligible
60.0%
280 168 60.0%
State
65,548 40,292 61.5%
High School Completion Rate
Percent of 1995Grade 9 Enrollment in Graduating Class of1999 School System State
Completion Rate '95-'99 64.1% 64.1% 68.9%
1998-99 GEORGIA PUBLIC EDUCATION REPORT CARD
Winder-Barrow High School - 6073052
Prepared by Georgia Department of Education
Page 2
COLLEGE ADMISSIONS / CREDIT TEST DATA
Scholastic Assessment Test (SAT)
Based on students' highest verbal and highest math scores
No. Taking
Average Score
Tests Verbal Math Total
Based on students' last test administration
Average Score Verbal Math Total
School
151
College Prep. Endorsement
Other Diplomas
System
151
College Prep. Endorsement
Other Diplomas
Georgia
41,958
493 486
979
507 494 1001
412 359
771
493 486
979
507 494 1001
412 359
771
492 488
980
485 N/A N/A
485 N/A N/A
483
479 N/A N/A
479 N/A N/A
479
964 N/A N/A
964 N/A N/A
962
Nation
952,913 N/A N/A N/A
502 508 1010
American College Testing (ACT)
Advanced Placement Exams (AP)
Number taking tests: English Mathematics Reading Science Reasoning CompositeScore
3 6 School System State
20.9 20.9 19.1
20.0 20.0 19.9
23.2 21.9
23.2 21.9
20.2 19.9
21.6 21.6 19.9
No. of Students Taking Tests
No. of Tests Taken No. of Test Scores
3 or Higher Percent of Test
Scores 3 or Higher
School 72
109 74
67.9%
System State 72 15,225
109 23,969 74 13,024
67.9% 54.3%
POST-SECONDARY DATA
Graduates Entering Georgia Public Colleges
Graduates Entering Georgia Public Colleges and Requiring Learning Support (LS)
1998 Graduates Entering in 1998-99
1997 Graduates Entering in 1997-98
Percent of Graduating Number Class
School
109
39.5%
System 109
39.5%
School
87
37.7%
System 8 7
37.7%
Number Requiring
LS 29 29
20 20
Percent of those attending Georgia
Public Colleges
26.6%
26.6%
23.0%
23.0%
In previous years, the Report Card presented College Prep Curriculum information provided by the Board of Regents on students requiring Learning Support. Due to inconsistencies in the data provided by the Board of Regents in defining College Prep Completers versus Local Board of Education data defining College Prep Endorsements, the Department of Education Report Card will not provide this information until discrepancies can be reconciled.
Graduates Entering Georgia Public Technical and Adult Schools
1998 Graduates School System
Entering Number 13 13
1998-99 Percent
4.7% 4.7%
Entering Number N/A N/A
1997-98 Percent
N/A N/A
1997 Graduates School
1
0.4%
System
1
0.4%
9
3.9%
9
3.9%
1998-99 GEORGIA PUBLIC EDUCATION REPORT CARD Winder-Barrow High School - 6073052
Prepared by Georgia Department of Education
Page 3
CERTIFIED PERSONNEL DATA
Positions Number Average Contract Days
Administrators
6.98 225.60
Support Personnel
6.05 211.65
PK-12 Teachers
102.34 195.34
Personnel Sex
Certificate
Years Experience
Full-time Part-time
Male Female
4 Yr Bachelor's 5 Yr Master's 6 Yr Specialist's 7 Yr Doctoral Other*
<1 1-10 11-20 21-30 >30
Average
6 1
5 2
0 2 3 2 0
0 1 3 3 0
18.71
6 1
0 7
1 3 2 1 0
0 2 2 3 0
16.86
97 7
35 69
45 42 11
4 2
22 36 25 19
2
10.87
*Includes One- and Two-Year Vocational Certificates.
ACCREDITATION DATA
Accredited by Southern Association of Colleges and Schools (SACS): Secondary/Middle Commission. Accredited with Quality by Georgia Accrediting Commission (GAC).
AWARDS / RECOGNITION DATA
Schools in Georgia may receive recognition in the following programs: Charter School Pay for Performance Program Georgia School of Excellence National Blue Ribbon School Winder-Barrow High School did not receive recognition in any of these programs during the 1998-99 school year.
1998-99 GEORGIA PUBLIC EDUCATION REPORT CARD Winder-Barrow High School - 6073052
Prepared by Georgia Department of Education
Page 4
1998-99 GEORGIA PUBLIC EDUCATION REPORT CARD
BARROW COUNTY SCHOOLS
Winder-Barrow Middle School - 6072052
Grade Range 6-8
The Georgia Public Education Report Card is designed to assist systems and schools in educational improvement. This report card contains a variety of data elements. An explanation of the terms is provided as a companion to the report card data. Please refer to the definitions for the most effective use of the reported data.
STUDENT DATA
Total 648
6-8 Enrollment, by Race/Ethnicity and Sex
Black
White Hispanic
American Multi-
Asian Indian
racial
95 14.7%
531 81.9%
7 1.1%
11 1.7%
0 0.0%
4 0.6%
Male 342
52.8%
Female 306
47.2%
Enrollment in Selected Programs
Program
Gifted (Grades K-12)
Program % of Student Enrollment Population
37
5.7%
Alternative Programs (Grades 6-12)
4
< 1%
Students Eligible to Receive Free/Reduced Lunches
Number
Percent
School System
253 2,479
39.0% 31.6%
Enrollment in Compensatory Programs
Program
Program % of Student Enrollment Population
Special Education (Grades K-12) (PK)
116 17.9%
0
N/A
English to Speakers of Other Languages (ESOL) (Grades K-12)
0
0.0%
Title I (Grades K-12)
This school has no Title I program.
Dropout Rate for Grades 6-8
Number
Rate
School System
5
0.7%
8
0.4%
Total 13
Retained Students, by Race/Ethnicity and Sex
Black
White Hispanic
American MultiAsian Indian racial
4 30.8%
8 61.5%
1 7.7%
0 0.0%
0 0.0%
0 0.0%
Male Female
6
7
46.2% 53.8%
Prepared by Georgia Department of Education
Page 1
STATE-REQUIRED TEST DATA
NORM-REFERENCED TESTS Grade 8
Iowa Tests of Basic Skills (ITBS) Each chart reflects data for three years of testing.
Reading Comprehension 50
49 51 49 0
98-99
51 54 48 97-98
51 52 48 96-97
Mathematics
School 50
System
State
0
61 56 56 98-99
56 58 55 97-98
52 52 54 96-97
School System State
Reading Vocabulary 50
40 48 46 0
98-99
45 51 45 97-98
46 49 44 96-97
Language Arts
School 50
System
State
0
58 58 60 98-99
59 58 58 97-98
52 52 56 96-97
School System State
Social Studies 50
51 53 54 0
98-99
54 56 53 97-98
53 53 53 96-97
Science
School 50
System
State
0
57 57 56 98-99
60 60 55 97-98
61 58 53 96-97
School System State
Sources of Information
Composite Score
50
56 61 57 0
98-99
School 50
System
57 59 56 97-98
59 57 55 96-97
State 0
56 57 56 98-99
57 59 54 97-98
1998-99 GEORGIA PUBLIC EDUCATION REPORT CARD Winder-Barrow Middle School - 6072052
Prepared by Georgia Department of Education
55 54 54 96-97
Scores Reported in Percentiles
School System State
Page 2
STATE-REQUIRED TEST DATA
Categories of Scaled Scores
Inadequate (less than 162)
Minimal (162-209)
Good
(210-247)
Very Good (greater than 247)
Average Scaled Score: (Range 100-300)
PERFORMANCE ASSESSMENTS
Grade 8 Writing Assessment
1998-99 Percent Scoring
1997-98 Percent Scoring
1996-97 Percent Scoring
School System State School System State School System State
3% 39% 47% 11%
2% 42% 46%
9%
8% 40% 41% 11%
14% 52% 30%
4%
10% 51% 33%
5%
11% 46% 34%
8%
15% 51% 28%
6%
14% 49% 31%
7%
15% 46% 30%
8%
212
212
208 195
199 202 195
198 198
AWARDS / RECOGNITION DATA
Schools in Georgia may receive recognition in the following programs: Charter School Pay for Performance Program Georgia School of Excellence National Blue Ribbon School Winder-Barrow Middle School did not receive recognition in any of these programs during the 1998-99 school year.
1998-99 GEORGIA PUBLIC EDUCATION REPORT CARD Winder-Barrow Middle School - 6072052
Prepared by Georgia Department of Education
Page 3
CERTIFIED PERSONNEL DATA
Positions Number Average Contract Days
Personnel Sex
Certificate
Years Experience
Full-time Part-time
Male Female
4 Yr Bachelor's 5 Yr Master's 6 Yr Specialist's 7 Yr Doctoral Other*
<1 1-10 11-20 21-30 >30
Average
Administrators
4.00 226.75
4 0
2 2
0 0 4 0 0 0 1 0 3 0 19.25
Support Personnel
2.05 194.88
2 1
0 3
0 1 0 2 0 0 1 2 0 0 14.00
PK-12 Teachers
45.45 190.07
43 4
12 35
26 17
4 0 0 11 16 12 7 1 9.66
*Includes One- and Two-Year Vocational Certificates.
ACCREDITATION DATA
Accredited by Southern Association of Colleges and Schools (SACS): Secondary/Middle Commission.
Accredited with Quality by Georgia Accrediting Commission (GAC).
1998-99 GEORGIA PUBLIC EDUCATION REPORT CARD Winder-Barrow Middle School - 6072052
Prepared by Georgia Department of Education
Page 4
1998-99 GEORGIA PUBLIC EDUCATION REPORT CARD BARTOW COUNTY SCHOOLS - 608
The Georgia Public Education Report Card is designed to assist systems and schools in educational improvement. This report card contains a variety of data elements. An explanation of the terms is provided as a companion to the report card data. Please refer to the definitions for the most effective use of the reported data.
Total
K-12
11,074
PK
247
STUDENT DATA
Enrollment, by Race/Ethnicity and Sex
Black
White Hispanic
American Multi-
Asian Indian
racial
855 7.7%
9,912 89.5%
169 1.5%
60 0.5%
32 0.3%
46 0.4%
10 4.0%
232 93.9%
3 1.2%
0 0.0%
1 0.4%
1 0.4%
Male
5,793 52.3%
135 54.7%
Female
5,281 47.7%
112 45.3%
Enrollment in Selected Programs
Program
Program % of Student Enrollment Population
Gifted (Grades K-12)
833
7.5%
Non-Vocational Labs (Grades 9-12)
1,773
66.9%
Vocational Labs (Grades 9-12)
1,299
49.0%
Alternative Programs (Grades 6-12)
32
< 1%
Students Eligible to Receive Free/Reduced Lunches
Number
Percent
4,315
38.1%
Dropout Rate
Number
Percent
6-12 9-12
356
5.6%
354
10.9%
Enrollment in Compensatory Programs
Program
Program % of Student Enrollment Population
Special Education (Grades K-12)
PK
1,657 70
English to Speakers of
Other Languages (ESOL)
4
(Grades K-12)
Remedial Education (Grades 2-5, 9-12)
594
Special Instructional Assistance (SIA) (Grades K-3)
1,218
Title I (Grades K-12) Number of schools with: Schoolwide program Targeted Assistance program No Title I program
15.0% N/A < 1%
9.2%
30.9%
0 6 9
Total 80
Retained Students, by Race/Ethnicity and Sex
Black
White Hispanic
American MultiAsian Indian racial
2 2.5%
76 95.0%
0 0.0%
0 0.0%
2 2.5%
0 0.0%
Male Female
51
29
63.8% 36.3%
Prepared by Georgia Department of Education
Page 1
STATE-REQUIRED TEST DATA
NORM-REFERENCED TESTS
Grade 3 Iowa Tests of Basic Skills (ITBS) Each chart reflects data for three years of testing.
Reading Comprehension
Mathematics
50
52 54 60 53 55 52 0
98-99 97-98 96-97
System State
50
66 61 71 61 67 59 0
98-99 97-98 96-97
System State
Reading Vocabulary
50
51 50 56 50 53 49 0
98-99 97-98 96-97
System State
Social Studies
50
53 56 63 55 53 55 0
98-99 97-98 96-97
System State
Language Arts
50
64 64 75 62 66 59 0
98-99 97-98 96-97
System State
Science
50
53 59 64 59 60 58 0
98-99 97-98 96-97
System State
Sources of Information
Composite Score
50
61 57 0
98-99
System
50
68 56 60 55 97-98 96-97
State
57 58 67 57 0
98-99 97-98
1998-99 GEORGIA PUBLIC EDUCATION REPORT CARD Bartow County Schools
Prepared by Georgia Department of Education
System State Scores Reported 60 56 in Percentiles 96-97
Page 2
STATE-REQUIRED TEST DATA
NORM-REFERENCED TESTS
Grade 5 Iowa Tests of Basic Skills (ITBS) Each chart reflects data for three years of testing.
Reading Comprehension
Mathematics
50
52 53 50 53 50 52 0
98-99 97-98 96-97
System State
50
59 59 58 58 57 57 0
98-99 97-98 96-97
System State
Reading Vocabulary
50
46 48 45 48 45 46 0
98-99 97-98 96-97
System State
Social Studies
50
53 57 47 56 47 55 0
98-99 97-98 96-97
System State
Language Arts
50
61 63 61 61 59 58 0
98-99 97-98 96-97
System State
Science
50
60 60 56 59 56 59 0
98-99 97-98 96-97
System State
Sources of Information
Composite Score
50
56 58 0
98-99
System
50
55 58 53 57 97-98 96-97
State
55 57 54 56 0
98-99 97-98
1998-99 GEORGIA PUBLIC EDUCATION REPORT CARD Bartow County Schools
Prepared by Georgia Department of Education
System State Scores Reported 53 55 in Percentiles 96-97
Page 3
STATE-REQUIRED TEST DATA
NORM-REFERENCED TESTS Grade 8
Iowa Tests of Basic Skills (ITBS) Each chart reflects data for three years of testing.
Reading Comprehension
Mathematics
50
46 49 46 48 43 48 0
98-99 97-98 96-97
System State
50
59 56 57 55 52 54 0
98-99 97-98 96-97
System State
Reading Vocabulary
50
44 46 42 45 43 44 0
98-99 97-98 96-97
System State
Language Arts
50
63 60 61 58 55 56 0
98-99 97-98 96-97
System State
Social Studies
50
54 54 49 53 51 53 0
98-99 97-98 96-97
System State
Science
50
56 56 52 55 51 53 0
98-99 97-98 96-97
System State
Sources of Information
Composite Score
50
55 57 0
98-99
System
50
52 56 51 55 97-98 96-97
State
57 56 54 54 0
98-99 97-98
1998-99 GEORGIA PUBLIC EDUCATION REPORT CARD Bartow County Schools
Prepared by Georgia Department of Education
System State Scores Reported 52 54 in Percentiles 96-97
Page 4
STATE-REQUIRED TEST DATA
PERFORMANCE ASSESSMENTS
Grade 5 Writing Assessment
1998-99
1997-98
1996-97
Percent at Developmental Stages:
Comparison
Comparison
Comparison
System Group State System Group State System Group State
Stage Stage Stage Stage Stage Stage
1: The Emerging Writer 2: The Developing Writer 3: The Focusing Writer 4: The Experimenting Writer 5: The Engaging Writer 6: The Extending Writer
0% 2% 16% 47% 25% 9%
0% 1% 15% 40% 30% 14%
0% 1% 16% 41% 29% 12%
0% 2% 15% 41% 30% 8%
0% 2% 17% 38% 29% 13%
0% 3% 19% 41% 27% 10%
0% 2% 17% 39% 30% 11%
0% 2% 18% 39% 29% 12%
0% 3% 21% 37% 26% 12%
Grade 8 Writing Assessment
1998-99 Percent Scoring 1997-98 Percent Scoring 1996-97 Percent Scoring
Categories of Scaled Scores
Comparison
Comparison
Comparison
System Group State System Group State System Group State
Inadequate (less than 162)
Minimal (162-209)
Good
(210-247)
Very Good (greater than 247)
5% 50% 42%
4%
6% 37% 45% 13%
8% 40% 41% 11%
5% 58% 35%
3%
9% 43% 38% 10%
11% 46% 34%
8%
10% 55% 30%
4%
14% 49% 30%
7%
15% 46% 30%
8%
Average Scaled Score: (Range 100-300)
204
212 208
201
206 202
198
198 198
GEORGIA HIGH SCHOOL GRADUATION TESTS (GHSGT)
Percent of Regular Program 11th Graders Passing the Georgia High School Graduation Tests on First Administration
1998-99
1997-98
1996-97
Comparison
Comparison
Comparison
System Group State System Group State System Group State
English Language Arts Mathematics Social Studies Science
95% 88% 75% 65%
96% 89% 82% 75%
96% 88% 80% 72%
87% 85% 70% 67%
94% 90% 81% 78%
94% 88% 78% 74%
92% 87% 76% 66%
94% 89% 80% 74%
94% 87% 78% 74%
All Components listed above 6 1 %
71% 68% 60%
72% 68% 61%
68% 67%
Writing
94%
94% 93% 87%
93% 92% 93%
93% 93%
1998-99 GEORGIA PUBLIC EDUCATION REPORT CARD
Bartow County Schools
Prepared by Georgia Department of Education
Page 5
GRADUATE DATA
1999 Graduates by Credentials, Race/Ethnicity and Sex
Diplomas with Both College Prep. & Voc. Endorsements
Diplomas with College Prep. Endorsements Diplomas with Vocational Endorsements General High School Diplomas Special Education Diplomas
Total All Diplomas
Certificates of Performance
Total Graduates
Total 68
143 100
13 18 342 46 388
Black
4 5.9%
11 7.7%
8 8.0%
1 7.7%
5 27.8%
29 8.5%
14 30.4%
43 11.1%
American MultiWhite Hispanic Asian Indian racial
63 92.6%
130 90.9%
92 92.0%
12 92.3%
13 72.2%
310 90.6%
0 0.0%
0 0.0%
0 0.0%
0 0.0%
0 0.0%
0 0.0%
1 1.5%
2 1.4%
0 0.0%
0 0.0%
0 0.0%
3 0.9%
0 0.0%
0 0.0%
0 0.0%
0 0.0%
0 0.0%
0 0.0%
0 0.0%
0 0.0%
0 0.0%
0 0.0%
0 0.0%
0 0.0%
25
2
4
1
0
54.3% 4.3% 8.7% 2.2% 0.0%
335
2
7
1
0
86.3% 0.5% 1.8% 0.3% 0.0%
Male Female
28 41.2%
67 46.9%
63 63.0%
5 38.5%
11 61.1%
174 50.9%
40 58.8%
76 53.1%
37 37.0%
8 61.5%
7 38.9%
168 49.1%
17
29
37.0% 63.0%
191 197 49.2% 50.8%
HOPE Scholarships
System State
Number of 1999 Graduates 3 8 8
Number Eligible
203
Percent Eligible
52.3%
65,548 40,292 61.5%
High School Completion Rate Percent of 1995Grade 9 Enrollment
in Graduating Class of1999
System
State
Completion Rate '95-'99 54.5% 68.9%
COLLEGE ADMISSIONS / CREDIT TEST DATA
Scholastic Assessment Test (SAT)
No. Taking
Average Score
Tests
Verbal Math Total
Based on students' highest verbal and highest math scores
System College Prep. Endorsement Other Diplomas
460 458 918 481 474 955 370 363 733
Georgia
492 488 980
Based on students' last test administration
System Georgia
219
454 449
903
41,958 483 479 962
Nation
952,913 502 508 1010
American College Testing (ACT)
System State Nation
English
19.7
19.1 20.4
Mathematics
20.7
19.9 20.7
Reading
19.9
20.2 21.3
Science Reasoning 20.3
19.9 21.0
CompositeScore 20.4
19.9 21.9
Advanced Placement Exams (AP)
No. of Students Taking Tests
No. of Tests Taken No. of Test Scores
3 or Higher Percent of Test
Scores 3 or Higher
System State 170 15,225 246 23,969 28 13,024
11.4% 54.3%
1998-99 GEORGIA PUBLIC EDUCATION REPORT CARD Bartow County Schools
Prepared by Georgia Department of Education
Page 6
POSTSECONDARY DATA
Graduates Entering Georgia Public Colleges and Universities
Graduates Entering Georgia Public Colleges and Universities and
Requiring Learning Support (LS)
1998 Graduates Entering 1998-99
1997 Graduates Entering 1997-98
Percent of Graduating Number Class
99
26.1%
103
22.8%
Number Requiring
LS
25
29
Percent of those attending Georgia
Public Colleges
25.3%
28.2%
In previous years, the Report Card presented College Prep Curriculum information provided by the Board of Regents on students requiring Learning Support. Due to inconsistencies in the data provided by the Board of Regents in defining College Prep Completers versus Local Board of Education data defining College Prep Endorsements, the Department of Education Report Card will not provide this information until discrepancies can be reconciled.
Graduates Entering Georgia Public Technical and Adult Schools
Entering 1998-99 Entering 1997-98
Number Percent
Number Percent
1998 Graduates 1997 Graduates
24
6.3%
1
0.2%
N/A 12
N/A 2.7%
ACCREDITATION / RECOGNITION DATA
Southern Association of Colleges and Schools (SACS) Accrediting Commission
Secondary/Middle Commission Elementary/Middle Commission Both Elementary/Secondary Commissions Joint Commission Candidate for Accreditation
Accreditation by Georgia Accrediting Commission (GAC)
Accredited by GAC Accredited with Quality by GAC
Number of Schools
5 10
0 0 0
Number of Schools
0 0
Awards / Recognition
State Recognized Program
Number of Schools
Charter School
8
Pay for Performance Recipient
1
Georgia School of Excellence
0
National Blue Ribbon School
0
COMMUNITY DATA
Number of Children Eligible for Migrant Education Number of Families-At-Risk * Number of Food Stamp Participants * Number of Families Receiving TANF * ** Per Capita Income * Unemployment Rate * 1990 Population * Projected 2000 Population * Projected 2010 Population *
* Data Available at County Level Only ** Known as AFDC before January 1997
3 264 2,542 207 $19,729 4.4% 55,911 71,220 79,747
1998-99 GEORGIA PUBLIC EDUCATION REPORT CARD Bartow County Schools
Prepared by Georgia Department of Education
Page 7
FISCAL DATA
Millage Rate
18.78
* Fall 1998 Property Tax Digest is used to calculate the 98-99 Value of One Mill
FTE Count
FTE Count used for Allotment Calculation 11,024.0 Fall '98 FTE Count 11,074
Value of One Mill
$1,045,854 $94.87 per Allotment FTE
Sources: Local State-QBE State-
Lottery State-
Other Federal Other
Total
PerGeneral Fund cent Per FTE
$21,019,673 34.5% $1,907 $39,003,381 64.1% $3,538
K-12 Revenues
Lottery K-12
and
Title
All Other
Programs
K-12
$0
$0
Bonded Debt $142,460
$0
$0
$0
Capital Projects $9,657,480
$0
$0 0.0%
$0
$0 $333,593
$0
$0
$817,401 1.3% $74
$9,887 0.0%
$1
$0 0.0%
$0
$60,850,342 100% $5,520
$48,814 $2,447,290
$0 $2,496,104
$0 $97,706
$0 $431,300
$0 $603,772
$0
$0
$0
$0
$142,460 $10,261,252
School Nutrition $1,705,992
$0
$0
$265,886 $1,902,565
$0 $3,874,443
Grand Total
Total
Per-
Amount cent
$32,525,606 41.7%
$39,003,381 50.0%
$333,593 0.4%
$1,735,873 2.2% $4,457,449 5.7%
$0 0.0% $78,055,904 100%
Instruction
Media Instruction
Support Pupil Services General Admin. School Admin. Trans-
portation Maint. & Ops. Capital Projects School Food Debt Service
Total
K-12 Expenditures
$39,716,519 65.9% $3,603 $1,572,185 $308,291
$0
$0
$0
$1,376,819 2.3% $125
$19,020
$0
$0
$0
$0
$1,392,915 2.3% $126
$86,526
$20,559
$0
$0
$0
$2,235,831 3.7% $203 $305,403
$494
$0
$0
$0
$1,380,462 2.3% $125 $163,575
$0
$0
$57,767
$0
$4,862,784 8.1% $441
$4,054
$0
$0
$0
$0
$3,093,081 5.1% $281
$6,239
$0
$0
$0
$0
$4,822,164 8.0% $437
$0
$0
$0
$0
$0
$254,325 0.4% $23
$0
$0
$0 $10,506,024
$0
$1,023 0.0%
$0
$0
$0
$0
$0 $3,323,433
$1,118,261 1.9% $101
$0
$0 $7,099,446
$10
$0
$60,254,189 100% $5,465 $2,157,005 $329,344 $7,099,446 $10,563,801 $3,323,433
$41,596,995 49.7% $1,395,840 1.7% $1,500,001 1.8% $2,541,729 3.0% $1,601,805 1.9% $4,866,839 5.8% $3,099,320 3.7% $4,822,164 5.8%
$10,760,349 12.9% $3,324,457 4.0% $8,217,717 9.8%
$83,727,221 100%
Salaries and Benefits as Percentages of Revenues and of Expenditures
Teachers and Paraprofessionals
Salaries $29,873,892
Benefits $8,113,322
Percentage of Revenues Percentage of Expenditures
Total of
Total of
General Fund
General Fund
Title Programs
Title Programs
Lottery K-12
Lottery K-12
Total Salaries
and
Total
and
Total
and Benefits All Other K-12 K - 12 All Other K-12 K - 12
$37,987,214
59.6%
48.7%
60.5%
45.4%
School Administration
$2,654,080
$931,400
$3,585,480
5.6%
4.6%
5.7%
4.3%
General Administration
$553,765
$160,469
$714,234
1.1%
0.9%
1.1%
0.9%
1998-99 GEORGIA PUBLIC EDUCATION REPORT CARD
Bartow County Schools - 608
Prepared by Georgia Department of Education
Page 8
CERTIFIED PERSONNEL DATA
Number
Average Annual Salary Positions Average Contract Days
Average Daily Salary
Full-time Personnel Part-time
Sex Male Female
4 Yr Bachelor's Certificate 5 Yr Master's
Level 6 Yr Specialist's 7 Yr Doctoral Other*
Black
White Race/ Hispanic Ethnicity Asian
American Indian
Multiracial
Years Experience
<1 1-10 11-20 21-30 >30
Average
Administrators
47.00
$63,915.04 214.04
$298.61
46 2
22 26
1 9 34 4 0
4 44
0 0 0 0
0 4 14 27 3
21.63
Support Personnel PK-12 Teachers
56.98
760.63
$45,192.44 196.05
$230.52
$36,987.58 190.42
$194.24
55
748
4
9
10
159
49
598
0
424
39
285
20
38
0
5
0
5
2
40
57
712
0
4
0
0
0
1
0
0
1
69
18
349
24
198
14
132
2
9
15.29
11.36
*Includes One- and Two-Year Vocational Certificates.
Certified Staff Position Ratios
Teacher/Administrator Ratio 16:1
Teacher/Support Person Ratio 13:1
Teacher/Staff Ratio 7:1
Student Enrollment/All Teachers 15:1
Certified Personnel by Category
87.6% 100%
5.6%
6.8%
80% 60%
40%
20%
0%
Teachers
Administrators
Support Personnel
1998-99 GEORGIA PUBLIC EDUCATION REPORT CARD
Bartow County Schools - 608
Prepared by Georgia Department of Education
Page 9
1998-99 GEORGIA PUBLIC EDUCATION REPORT CARD
BARTOW COUNTY SCHOOLS
Adairsville Elementary School - 6080177
Grade Range PK-5
The Georgia Public Education Report Card is designed to assist systems and schools in educational improvement. This report card contains a variety of data elements. An explanation of the terms is provided as a companion to the report card data. Please refer to the definitions for the most effective use of the reported data.
STUDENT DATA
Total
K-5
658
PK
21
Enrollment, by Race/Ethnicity and Sex
Black
White Hispanic
American Asian Indian
Multiracial
88 13.4%
552 83.9%
10 1.5%
4 0.6%
3 0.5%
1 0.2%
0
21
0.0% 100.0%
0 0.0%
0 0.0%
0 0.0%
0 0.0%
Male Female
322 48.9%
336 51.1%
6 28.6%
15 71.4%
Enrollment in Selected Programs
Program
Program % of Student Enrollment Population
Gifted (Grades K-12)
27
4.1%
Alternative Programs (Grades 6-12)
N/A
N/A
Students Eligible to Receive Free/Reduced Lunches
Number
Percent
School System
325 4,315
47.9% 38.1%
Dropout Rate *
Number
Rate
School System
N/A N/A
N/A N/A
* Dropout rates are not applicable for grades PK-5.
Enrollment in Compensatory Programs
Program
Program % of Student Enrollment Population
Special Education (Grades K-12)
90 13.7%
(PK)
4
N/A
English to Speakers of Other Languages (ESOL) (Grades K-12)
0
0.0%
Remedial Education (Grades 2-5, 9-12)
54 12.1%
Special Instructional Assistance (SIA) (Grades K-3)
163 36.2%
Title I (Grades K-12)
This school has a Targeted Assistance program.
Total 0
Retained Students, by Race/Ethnicity and Sex
Black
White Hispanic
American MultiAsian Indian racial
0
0
0
0
0
0
Male Female
0
0
Prepared by Georgia Department of Education
Page 1
STATE-REQUIRED TEST DATA
NORM-REFERENCED TESTS Grade 3
Iowa Tests of Basic Skills (ITBS) Each chart reflects data for three years of testing.
Reading Comprehension 50
N/A 52 54 0
98-99
N/A 60 53 97-98
42 55 52 96-97
Mathematics
School 50
System
State
N/A 66 61 0
98-99
N/A 71 61 97-98
53 67 59 96-97
School System State
Reading Vocabulary 50
N/A 51 50 0
98-99
N/A 56 50 97-98
37 53 49 96-97
Language Arts
School 50
System
State
N/A 64 64 0
98-99
N/A 75 62 97-98
55 66 59 96-97
School System State
Social Studies 50
N/A 53 56 0
98-99
N/A 63 55 97-98
41 53 55 96-97
Science
School 50
System
State
N/A 53 59 0
98-99
N/A 64 59 97-98
43 60 58 96-97
School System State
Sources of Information
Composite Score
School
50
50
System
N/A 61 57 0
98-99
N/A 68 56 97-98
52 60 55 96-97
State
N/A 57 58 0
98-99
N/A 67 57 97-98
1998-99 GEORGIA PUBLIC EDUCATION REPORT CARD Adairsville Elementary School - 6080177
Prepared by Georgia Department of Education
46 60 56 96-97
Scores Reported in Percentiles
School System State
Page 2
STATE-REQUIRED TEST DATA
NORM-REFERENCED TESTS Grade 5
Iowa Tests of Basic Skills (ITBS) Each chart reflects data for three years of testing.
Reading Comprehension
Mathematics
50
N/A 52 53 0
98-99
N/A 50 53 97-98
44 50 52 96-97
School 50
System
State
N/A 59 59 0
98-99
N/A 58 58 97-98
40 57 57 96-97
School System State
Reading Vocabulary 50
N/A 46 48 0
98-99
N/A 45 48 97-98
37 45 46 96-97
Language Arts
School 50
System
State
N/A 61 63 0
98-99
N/A 61 61 97-98
49 59 58 96-97
School System State
Social Studies 50
N/A 53 57 0
98-99
N/A 47 56 97-98
29 47 55 96-97
Science
School 50
System
State
N/A 60 60 0
98-99
N/A 56 59 97-98
44 56 59 96-97
School System State
Sources of Information
Composite Score
School
50
50
System
N/A 56 58 0
98-99
N/A 55 58 97-98
40 53 57 96-97
State
N/A 55 57 0
98-99
N/A 54 56 97-98
1998-99 GEORGIA PUBLIC EDUCATION REPORT CARD Adairsville Elementary School - 6080177
Prepared by Georgia Department of Education
40 53 55 96-97
Scores Reported in Percentiles
School System State
Page 3
STATE-REQUIRED TEST DATA
PERFORMANCE ASSESSMENTS
Grade 5 Writing Assessment
Percent at Developmental Stages:
1998-99 School System State
1997-98 School System State
1996-97 School System State
Stage Stage Stage Stage Stage Stage
1:The Emerging Writer 2:The Developing Writer 3:The Focusing Writer 4:The Experimenting 5:The Engaging Writer 6:The Extending Writer
N/A N/A N/A N/A N/A N/A
0% 2% 16% 47% 25% 9%
0% 1% 16% 41% 29% 12%
N/A N/A N/A N/A N/A N/A
0% 2% 15% 41% 30% 8%
0% 3% 19% 41% 27% 10%
0% 1% 36% 34% 18% 10%
0% 2% 17% 39% 30% 11%
No Grade-5 Writing Assessment scores were reported for Adairsville Elementary School.
0% 3% 21% 37% 26% 12%
AWARDS / RECOGNITION DATA
Schools that become a Charter School have a unique opportunity to rethink how they structure and deliver education programs for improving the learning of their students while being freed from the state laws, State Board of Education rules and regulations, and local board of education rules and regulations that govern other schools. A 'charter' is a binding contract that, when approved by the faculty and parents of the school, the local board of education and the State Board of Education, substitutes for state education statutes, state and local rules, policies, regulations and standards.
Adairsville Elementary School is a Charter School for 1998-99.
1998-99 GEORGIA PUBLIC EDUCATION REPORT CARD Adairsville Elementary School - 6080177
Prepared by Georgia Department of Education
Page 4
CERTIFIED PERSONNEL DATA
Positions Number Average Contract Days
Personnel Sex
Certificate
Years Experience
Full-time Part-time
Male Female
4 Yr Bachelor's 5 Yr Master's 6 Yr Specialist's 7 Yr Doctoral Other*
<1 1-10 11-20 21-30 >30
Average
Administrators
1.00 200.00
1 0
0 1
0 0 1 0 0 0 0 0 1 0 25.00
Support Personnel
2.00 190.00
2 0
0 2
0 2 0 0 0 0 1 1 0 0 13.50
PK-12 Teachers
41.50 190.00
41 1
3 39
28 13
1 0 0 4 19 13 6 0 10.76
*Includes One- and Two-Year Vocational Certificates.
ACCREDITATION DATA
Accredited by Southern Association of Colleges and Schools (SACS):
Elementary/Middle Commission.
1998-99 GEORGIA PUBLIC EDUCATION REPORT CARD Adairsville Elementary School - 6080177
Prepared by Georgia Department of Education
Page 5
1998-99 GEORGIA PUBLIC EDUCATION REPORT CARD
BARTOW COUNTY SCHOOLS
Adairsville Middle/High School - 6080277
Grade Range 6-12
The Georgia Public Education Report Card is designed to assist systems and schools in educational improvement. This report card contains a variety of data elements. An explanation of the terms is provided as a companion to the report card data. Please refer to the definitions for the most effective use of the reported data.
STUDENT DATA
Total 973
6-12 Enrollment, by Race/Ethnicity and Sex
Black
White Hispanic
American Multi-
Asian Indian
racial
83 8.5%
866 89.0%
7 0.7%
13 1.3%
3 0.3%
1 0.1%
Male 515
52.9%
Female 458
47.1%
Enrollment in Selected Programs
Program
Program % of Student Enrollment Population
Gifted (Grades K-12)
69
7.1%
Non-Vocational Labs (Grades 9-12)
282
58.6%
Vocational Labs (Grades 9-12)
293
60.9%
Alternative Programs (Grades 6-12)
11
1.1%
Students Eligible to Receive Free/Reduced Lunches
Number
Percent
School System
296 4,315
30.4% 38.1%
Enrollment in Compensatory Programs
Program
Program % of Student Enrollment Population
Special Education (Grades K-12) PK
115 11.8%
0
N/A
English to Speakers of Other Languages (ESOL) (Grades K-12)
0
0.0%
Remedial Education (Grades 2-5, 9-12)
28
5.8%
Special Instructional Assistance (SIA) (Grades K-3)
N/A
N/A
Title I (Grades K-12) This school has no Title I program.
Dropout Rate for Grades 6-12
Number
Rate
School System
53
4.7%
356
5.6%
Total 0
Retained Students, by Race/Ethnicity and Sex
Black
White Hispanic
American MultiAsian Indian racial
0
0
0
0
0
0
Male Female
0
0
Prepared by Georgia Department of Education
Page 1
STATE-REQUIRED TEST DATA
NORM-REFERENCED TESTS
Grade 3 Iowa Tests of Basic Skills (ITBS) Each chart reflects data for three years of testing.
No third-grade students are enrolled at Adairsville Middle/High School.
Reading Comprehension
Mathematics
50
N/A 52 54 0
98-99
N/A 60 53 97-98
N/A 55 52 96-97
School 50
System
State
N/A 66 61 0
98-99
N/A 71 61 97-98
N/A 67 59 96-97
School System State
Reading Vocabulary 50
N/A 51 50 0
98-99
N/A 56 50 97-98
N/A 53 49 96-97
Language Arts
School 50
System
State
N/A 64 64 0
98-99
N/A 75 62 97-98
N/A 66 59 96-97
School System State
Social Studies 50
N/A 53 56 0
98-99
N/A 63 55 97-98
N/A 53 55 96-97
Science
School 50
System
State
N/A 53 59 0
98-99
N/A 64 59 97-98
N/A 60 58 96-97
School System State
Sources of Information
Composite Score
School
50
50
System
N/A 61 57 0
98-99
N/A 68 56 N/A 60 55
97-98
96-97
State
N/A 57 58 0
98-99
N/A 67 57 97-98
N/A 60 56 96-97
1998-99 GEORGIA PUBLIC EDUCATION REPORT CARD Adairsville Middle/High School - 6080277
Prepared by Georgia Department of Education
Scores Reported in Percentiles
School System State
Page 2
STATE-REQUIRED TEST DATA
NORM-REFERENCED TESTS
Grade 5 Iowa Tests of Basic Skills (ITBS) Each chart reflects data for three years of testing. No fifth-grade students are enrolled at Adairsville Middle/High School.
Reading Comprehension
Mathematics
50
N/A 52 53 0
98-99
N/A 50 53 97-98
N/A 50 52 96-97
School 50
System
State
N/A 59 59 0
98-99
N/A 58 58 97-98
N/A 57 57 96-97
School System State
Reading Vocabulary 50
N/A 46 48 0
98-99
N/A 45 48 97-98
N/A 45 46 96-97
Language Arts
School 50
System
State
N/A 61 63 0
98-99
N/A 61 61 97-98
N/A 59 58 96-97
School System State
Social Studies 50
N/A 53 57 0
98-99
N/A 47 56 97-98
N/A 47 55 96-97
Science
School 50
System
State
N/A 60 60 0
98-99
N/A 56 59 97-98
N/A 56 59 96-97
School System State
Sources of Information
Composite Score
School
50
50
System
N/A 56 58 0
98-99
N/A 55 58 N/A 53 57
97-98
96-97
State
N/A 55 57 0
98-99
N/A 54 56 97-98
N/A 53 55 96-97
1998-99 GEORGIA PUBLIC EDUCATION REPORT CARD Adairsville Middle/High School - 6080277
Prepared by Georgia Department of Education
Scores Reported in Percentiles
School System State
Page 3
STATE-REQUIRED TEST DATA
NORM-REFERENCED TESTS Grade 8
Iowa Tests of Basic Skills (ITBS) Each chart reflects data for three years of testing.
Reading Comprehension 50
49 46 49 0
98-99
44 46 48 97-98
43 43 48 96-97
Mathematics
School 50
System
State
0
60 59 56 98-99
56 57 55 97-98
47 52 54 96-97
School System State
Reading Vocabulary 50
47 44 46 0
98-99
38 42 45 97-98
46 43 44 96-97
Language Arts
School 50
System
State
0
65 63 60 98-99
61 61 58 97-98
54 55 56 96-97
School System State
Social Studies 50
55 54 54 0
98-99
47 49 53 97-98
41 51 53 96-97
Science
School 50
System
State
0
55 56 56 98-99
54 52 55 97-98
42 51 53 96-97
School System State
Sources of Information
Composite Score
50
60 55 57 0
98-99
School 50
System
54 52 56 97-98
46 51 55 96-97
State 0
58 57 56 98-99
53 54 54 97-98
1998-99 GEORGIA PUBLIC EDUCATION REPORT CARD Adairsville Middle/High School - 6080277
Prepared by Georgia Department of Education
44 52 54 96-97
Scores Reported in Percentiles
School System State
Page 4
STATE-REQUIRED TEST DATA
PERFORMANCE ASSESSMENTS
Grade 5 Writing Assessment
Percent at Developmental Stages:
1998-99 School System State
1997-98 School System State
1996-97 School System State
Stage Stage Stage Stage Stage Stage
1:The Emerging Writer 2:The Developing Writer 3:The Focusing Writer 4:The Experimenting 5:The Engaging Writer 6:The Extending Writer
N/A N/A N/A N/A N/A N/A
0% 2% 16% 47% 25% 9%
0% 1% 16% 41% 29% 12%
N/A N/A N/A N/A N/A N/A
0% 2% 15% 41% 30% 8%
0% 3% 19% 41% 27% 10%
N/A N/A N/A N/A N/A N/A
0% 2% 17% 39% 30% 11%
0% 3% 21% 37% 26% 12%
No fifth-grade students are enrolled at Adairsville Middle/High School.
Categories of Scaled Scores
Inadequate (less than 162)
Minimal (162-209)
Good
(210-247)
Very Good (greater than 247)
Average Scaled Score: (Range 100-300)
Grade 8 Writing Assessment
1998-99 Percent Scoring
1997-98 Percent Scoring
1996-97 Percent Scoring
School System State School System State School System State
4% 46% 44%
5%
5% 50% 42%
4%
8% 40% 41% 11%
3% 54% 41%
1%
5% 58% 35%
3%
11% 46% 34%
8%
7% 56% 32%
5%
10% 55% 30%
4%
15% 46% 30%
8%
209
204
208 204
201 202 199
198 198
GEORGIA HIGH SCHOOL GRADUATION TESTS (GHSGT)
Percent of Regular Program 11th Graders Passing the Georgia High School Graduation Tests on First Administration
English Language Arts Mathematics Social Studies Science
All Components listed above
Writing
1998-99
School System State
97% 84% 70% 63%
56%
95% 88% 75% 65%
61%
96% 88% 80% 72%
68%
95% 94% 93%
1997-98
School System State
83% 84% 75% 69%
66%
87% 85% 70% 67%
60%
94% 88% 78% 74%
68%
83% 87% 92%
1996-97
School System State
93% 87% 83% 71%
65%
92% 87% 76% 66%
61%
94% 87% 78% 74%
67%
93% 93% 93%
1998-99 GEORGIA PUBLIC EDUCATION REPORT CARD Adairsville Middle/High School - 6080277
Prepared by Georgia Department of Education
Page 5
GRADUATE DATA
1999 Graduates by Credentials, Race/Ethnicity and Sex
Diplomas with Both College Prep. & Voc. Endorsements
Diplomas with College Prep. Endorsements Diplomas with Vocational Endorsements General High School Diplomas Special Education Diplomas
Total All Diplomas
Certificates of Performance
Total Graduates
Total 29 21 23 0
Black
3 10.3%
0 0.0%
1 4.3%
0
White Hispanic
26 89.7%
0 0.0%
20 95.2%
0 0.0%
22 95.7%
0 0.0%
0
0
American MultiAsian Indian racial
0 0.0%
0 0.0%
0 0.0%
1 4.8%
0 0.0%
0 0.0%
0 0.0%
0 0.0%
0 0.0%
0
0
0
2
0
2
0
0
0
0
0.0% 100.0% 0.0% 0.0% 0.0% 0.0%
75
4
70
0
1
0
0
5.3% 93.3% 0.0% 1.3% 0.0% 0.0%
14
5
5
0
4
0
0
35.7% 35.7% 0.0% 28.6% 0.0% 0.0%
89
9
75
0
5
0
0
10.1% 84.3% 0.0% 5.6% 0.0% 0.0%
Male Female
13
16
44.8% 55.2%
11
10
52.4% 47.6%
16
7
69.6% 30.4%
0
0
1 50.0%
41 54.7%
8 57.1%
49 55.1%
1 50.0%
34 45.3%
6 42.9%
40 44.9%
HOPE Scholarships
School System
Number of 1999 Graduates 8 9
Number Eligible
50
Percent Eligible
56.2%
388 203 52.3%
State
65,548 40,292 61.5%
High School Completion Rate
Percent of 1995Grade 9 Enrollment in Graduating Class of1999 School System State
Completion Rate '95-'99 60.5% 54.5% 68.9%
1998-99 GEORGIA PUBLIC EDUCATION REPORT CARD
Adairsville Middle/High School - 6080277
Prepared by Georgia Department of Education
Page 6
COLLEGE ADMISSIONS / CREDIT TEST DATA
Scholastic Assessment Test (SAT)
Based on students' highest verbal and highest math scores
No. Taking
Average Score
Tests Verbal Math Total
Based on students' last test administration
Average Score Verbal Math Total
School College Prep. Endorsement Other Diplomas
45 456 444
900
498 476
974
330 340
670
System
219 460 458
918
College Prep. Endorsement
481 474
955
Other Diplomas
370 363
733
Georgia
41,958 492 488
980
449 N/A N/A
454 N/A N/A
483
438 N/A N/A
449 N/A N/A
479
887 N/A N/A
903 N/A N/A
962
Nation
952,913 N/A N/A N/A
502 508 1010
American College Testing (ACT)
Advanced Placement Exams (AP)
Number taking tests: English Mathematics Reading Science Reasoning CompositeScore
2 2 School System State
19.9 19.7 19.1
20.6 20.7 19.9
20.5 20.4
19.9 20.3
20.2 19.9
20.5 20.4 19.9
No. of Students Taking Tests
No. of Tests Taken No. of Test Scores
3 or Higher Percent of Test
Scores 3 or Higher
School 16 18 8
44.4%
System State 170 15,225 246 23,969 28 13,024
11.4% 54.3%
POST-SECONDARY DATA
Graduates Entering Georgia Public Colleges
Graduates Entering Georgia Public Colleges and Requiring Learning Support (LS)
1998 Graduates Entering in 1998-99
1997 Graduates Entering in 1997-98
Percent of Graduating Number Class
School
29
31.2%
System 9 9
26.1%
School
35
41.2%
System 103
22.8%
Number Requiring
LS 12 25
10 29
Percent of those attending Georgia
Public Colleges
41.4%
25.3%
28.6%
28.2%
In previous years, the Report Card presented College Prep Curriculum information provided by the Board of Regents on students requiring Learning Support. Due to inconsistencies in the data provided by the Board of Regents in defining College Prep Completers versus Local Board of Education data defining College Prep Endorsements, the Department of Education Report Card will not provide this information until discrepancies can be reconciled.
Graduates Entering Georgia Public Technical and Adult Schools
1998 Graduates School System
Entering Number 6 24
1998-99 Percent
6.5% 6.3%
Entering Number N/A N/A
1997-98 Percent
N/A N/A
1997 Graduates School
0
0.0%
System
1
0.2%
1
1.2%
12
2.7%
1998-99 GEORGIA PUBLIC EDUCATION REPORT CARD Adairsville Middle/High School - 6080277
Prepared by Georgia Department of Education
Page 7
CERTIFIED PERSONNEL DATA
Positions Number Average Contract Days
Administrators
4.00 217.50
Support Personnel
3.49 190.00
PK-12 Teachers
70.00 190.60
Personnel Sex
Certificate
Years Experience
Full-time Part-time
Male Female
4 Yr Bachelor's 5 Yr Master's 6 Yr Specialist's 7 Yr Doctoral Other*
<1 1-10 11-20 21-30 >30
Average
4 0
2 2
0 1 3 0 0
0 0 1 3 0
22.50
3 1
0 4
0 3 1 0 0
0 2 1 1 0
11.50
68 1
22 47
37 25
5 1 1
6 28 23 10
2
12.32
*Includes One- and Two-Year Vocational Certificates.
ACCREDITATION DATA
Accredited by Southern Association of Colleges and Schools (SACS): Secondary/Middle Commission.
AWARDS / RECOGNITION DATA
Schools in Georgia may receive recognition in the following programs: Charter School Pay for Performance Program Georgia School of Excellence National Blue Ribbon School Adairsville Middle/High School did not receive recognition in any of these programs during the 1998-99 school year.
1998-99 GEORGIA PUBLIC EDUCATION REPORT CARD Adairsville Middle/High School - 6080277
Prepared by Georgia Department of Education
Page 8
1998-99 GEORGIA PUBLIC EDUCATION REPORT CARD
BARTOW COUNTY SCHOOLS
Allatoona Elementary School - 6080196
Grade Range PK-5
The Georgia Public Education Report Card is designed to assist systems and schools in educational improvement. This report card contains a variety of data elements. An explanation of the terms is provided as a companion to the report card data. Please refer to the definitions for the most effective use of the reported data.
STUDENT DATA
Total
K-5
653
PK
22
Enrollment, by Race/Ethnicity and Sex
Black
White Hispanic
American Asian Indian
Multiracial
21 3.2%
615 94.2%
10 1.5%
1 0.2%
2 0.3%
4 0.6%
1 4.5%
21 95.5%
0 0.0%
0 0.0%
0 0.0%
0 0.0%
Male Female
348 53.3%
305 46.7%
10 45.5%
12 54.5%
Enrollment in Selected Programs
Program
Program % of Student Enrollment Population
Gifted (Grades K-12)
33
5.1%
Alternative Programs (Grades 6-12)
N/A
N/A
Students Eligible to Receive Free/Reduced Lunches
Number
Percent
School System
374 4,315
55.4% 38.1%
Dropout Rate *
Number
Rate
School System
N/A N/A
N/A N/A
* Dropout rates are not applicable for grades PK-5.
Enrollment in Compensatory Programs
Program
Program % of Student Enrollment Population
Special Education (Grades K-12)
103 15.8%
(PK)
4
N/A
English to Speakers of Other Languages (ESOL) (Grades K-12)
0
0.0%
Remedial Education (Grades 2-5, 9-12)
43 10.5%
Special Instructional Assistance (SIA) (Grades K-3)
145 30.9%
Title I (Grades K-12)
This school has a Targeted Assistance program.
Total 0
Retained Students, by Race/Ethnicity and Sex
Black
White Hispanic
American MultiAsian Indian racial
0
0
0
0
0
0
Male Female
0
0
Prepared by Georgia Department of Education
Page 1
STATE-REQUIRED TEST DATA
NORM-REFERENCED TESTS Grade 3
Iowa Tests of Basic Skills (ITBS) Each chart reflects data for three years of testing.
Reading Comprehension 50
50 52 54 0
98-99
55 60 53 97-98
50 55 52 96-97
Mathematics
School 50
System
State
0
63 66 61 98-99
69 71 61 97-98
68 67 59 96-97
School System State
Reading Vocabulary 50
51 51 50 0
98-99
49 56 50 97-98
51 53 49 96-97
Language Arts
School 50
System
State
0
56 64 64 98-99
66 75 62 97-98
59 66 59 96-97
School System State
Social Studies 50
50 53 56 0
98-99
56 63 55 97-98
52 53 55 96-97
Science
School 50
System
State
0
50 53 59 98-99
59 64 59 97-98
59 60 58 96-97
School System State
Sources of Information
Composite Score
50
56 61 57 0
98-99
School 50
System
59 68 56 97-98
57 60 55 96-97
State 0
53 57 58 98-99
60 67 57 97-98
1998-99 GEORGIA PUBLIC EDUCATION REPORT CARD Allatoona Elementary School - 6080196
Prepared by Georgia Department of Education
57 60 56 96-97
Scores Reported in Percentiles
School System State
Page 2
STATE-REQUIRED TEST DATA
NORM-REFERENCED TESTS Grade 5
Iowa Tests of Basic Skills (ITBS) Each chart reflects data for three years of testing.
Reading Comprehension
Mathematics
50
45 52 53 0
98-99
53 50 53 97-98
48 50 52 96-97
School 50
System
State
0
51 59 59 98-99
57 58 58 97-98
47 57 57 96-97
School System State
Reading Vocabulary 50
42 46 48 0
98-99
45 45 48 97-98
43 45 46 96-97
Language Arts
School 50
System
State
0
54 61 63 98-99
60 61 61 97-98
49 59 58 96-97
School System State
Social Studies 50
47 53 57 0
98-99
47 47 56 97-98
44 47 55 96-97
Science
School 50
System
State
0
55 60 60 98-99
69 56 59 97-98
59 56 59 96-97
School System State
Sources of Information
Composite Score
50
50 56 58 0
98-99
School 50
System
56 55 58 97-98
47 53 57 96-97
State 0
48 55 57 98-99
56 54 56 97-98
48 53 55 96-97
1998-99 GEORGIA PUBLIC EDUCATION REPORT CARD Allatoona Elementary School - 6080196
Prepared by Georgia Department of Education
Scores Reported in Percentiles
School System State
Page 3
STATE-REQUIRED TEST DATA
PERFORMANCE ASSESSMENTS
Grade 5 Writing Assessment
Percent at Developmental Stages:
1998-99 School System State
1997-98 School System State
1996-97 School System State
Stage Stage Stage Stage Stage Stage
1:The Emerging Writer 2:The Developing Writer 3:The Focusing Writer 4:The Experimenting 5:The Engaging Writer 6:The Extending Writer
1% 4% 29% 48% 13% 4%
0% 2% 16% 47% 25% 9%
0% 1% 16% 41% 29% 12%
0% 3% 15% 35% 37% 8%
0% 2% 15% 41% 30% 8%
0% 3% 19% 41% 27% 10%
0% 4% 18% 47% 21% 10%
0% 2% 17% 39% 30% 11%
0% 3% 21% 37% 26% 12%
AWARDS / RECOGNITION DATA
Schools in Georgia may receive recognition in the following programs: Charter School Pay for Performance Program Georgia School of Excellence National Blue Ribbon School Allatoona Elementary School did not receive recognition in any of these programs during the 1998-99 school year.
1998-99 GEORGIA PUBLIC EDUCATION REPORT CARD Allatoona Elementary School - 6080196
Prepared by Georgia Department of Education
Page 4
CERTIFIED PERSONNEL DATA
Positions Number Average Contract Days
Personnel Sex
Certificate
Years Experience
Full-time Part-time
Male Female
4 Yr Bachelor's 5 Yr Master's 6 Yr Specialist's 7 Yr Doctoral Other*
<1 1-10 11-20 21-30 >30
Average
Administrators
2.00 205.00
2 0
1 1
0 1 1 0 0 0 0 0 1 1 29.00
Support Personnel
3.00 190.00
3 0
0 3
0 3 0 0 0 0 1 1 1 0 16.33
PK-12 Teachers
42.00 190.00
42 0
1 41
25 15
2 0 0 2 28 6 6 0 9.52
*Includes One- and Two-Year Vocational Certificates.
ACCREDITATION DATA
Accredited by Southern Association of Colleges and Schools (SACS):
Elementary/Middle Commission.
1998-99 GEORGIA PUBLIC EDUCATION REPORT CARD Allatoona Elementary School - 6080196
Prepared by Georgia Department of Education
Page 5
1998-99 GEORGIA PUBLIC EDUCATION REPORT CARD
BARTOW COUNTY SCHOOLS
Cass High School - 6080577
Grade Range 9-12
The Georgia Public Education Report Card is designed to assist systems and schools in educational improvement. This report card contains a variety of data elements. An explanation of the terms is provided as a companion to the report card data. Please refer to the definitions for the most effective use of the reported data.
Total 1,240
STUDENT DATA
9-12 Enrollment, by Race/Ethnicity and Sex
Black
White Hispanic
American Multi-
Asian Indian
racial
148 11.9%
1,067 86.0%
14 1.1%
8 0.6%
2 0.2%
1 0.1%
Male Female
624 50.3%
616 49.7%
Enrollment in Selected Programs
Program
Gifted (Grades K-12)
Program % of Student Enrollment Population
251
20.2%
Non-Vocational Labs (Grades 9-12)
Vocational Labs (Grades 9-12)
Alternative Programs (Grades 6-12)
1,026 752 4
82.7% 60.6%
< 1%
Students Eligible to Receive Free/Reduced Lunches
Number
Percent
School System
217 4,315
17.5% 38.1%
Enrollment in Compensatory Programs
Program
Program % of Student Enrollment Population
Special Education (Grades K-12) PK
180 14.5%
0
N/A
English to Speakers of Other Languages (ESOL) (Grades K-12)
0
0.0%
Remedial Education (Grades 2-5, 9-12)
69
5.6%
Title I (Grades K-12)
This school has no Title I program.
Dropout Rate for Grades 9-12
Number
Rate
School System
160
10.4%
354
10.9%
Total 0
Retained Students, by Race/Ethnicity and Sex
Black
White Hispanic
American MultiAsian Indian racial
0
0
0
0
0
0
Male Female
0
0
Prepared by Georgia Department of Education
Page 1
STATE-REQUIRED TEST DATA
GEORGIA HIGH SCHOOL GRADUATION TESTS (GHSGT)
Percent of Regular Program 11th Graders Passing the Georgia High School Graduation Tests on First Administration
English Language Arts Mathematics Social Studies Science
All Components listed above
Writing
1998-99
School System State
95% 86% 68% 60%
95% 88% 75% 65%
96% 88% 80% 72%
56% 61% 68%
94% 94% 93%
1997-98
School System State
89% 85% 69% 67%
87% 85% 70% 67%
94% 88% 78% 74%
58% 60% 68%
89% 87% 92%
1996-97
School System State
91% 87% 73% 64%
92% 87% 76% 66%
94% 87% 78% 74%
59% 61% 67%
93% 93% 93%
GRADUATE DATA
1999 Graduates by Credentials, Race/Ethnicity and Sex
Diplomas with Both College Prep. & Voc. Endorsements
Diplomas with College Prep. Endorsements Diplomas with Vocational Endorsements General High School Diplomas Special Education Diplomas
Total All Diplomas
Certificates of Performance
Total Graduates
Total 39
122 77 13 16
267 32
299
Black
1 2.6%
11 9.0%
7 9.1%
1 7.7%
5 31.3%
25 9.4%
9 28.1%
34 11.4%
White Hispanic
37 94.9%
110 90.2%
0 0.0%
0 0.0%
70 90.9%
12 92.3%
11 68.8%
0 0.0%
0 0.0%
0 0.0%
240 89.9%
0 0.0%
20 62.5%
2 6.3%
260 87.0%
2 0.7%
American MultiAsian Indian racial
1 2.6%
1 0.8%
0 0.0%
0 0.0%
0 0.0%
0 0.0%
0 0.0%
0 0.0%
0 0.0%
0 0.0%
0 0.0%
0 0.0%
0 0.0%
0 0.0%
0 0.0%
2 0.7%
0 0.0%
0 0.0%
0 0.0%
1 3.1%
0 0.0%
2 0.7%
1 0.3%
0 0.0%
Male Female
15 38.5%
56 45.9%
24 61.5%
66 54.1%
47 61.0%
5 38.5%
10 62.5%
30 39.0%
8 61.5%
6 37.5%
133
134
49.8% 50.2%
9
23
28.1% 71.9%
142
157
47.5% 52.5%
HOPE Scholarships
School System
Number of 1999 Graduates 2 9 9
Number Eligible
153
Percent Eligible
51.2%
388 203 52.3%
State
65,548 40,292 61.5%
High School Completion Rate
Percent of 1995Grade 9 Enrollment in Graduating Class of1999 School System State
Completion Rate '95-'99 58.1% 54.5% 68.9%
1998-99 GEORGIA PUBLIC EDUCATION REPORT CARD
Cass High School - 6080577
Prepared by Georgia Department of Education
Page 2
COLLEGE ADMISSIONS / CREDIT TEST DATA
Scholastic Assessment Test (SAT)
Based on students' highest verbal and highest math scores
No. Taking
Average Score
Tests Verbal Math Total
Based on students' last test administration
Average Score Verbal Math Total
School
174 461 462
923
College Prep. Endorsement
477 473
950
Other Diplomas
372 364
736
System
219 460 458
918
College Prep. Endorsement
481 474
955
Other Diplomas
370 363
733
Georgia
41,958 492 488
980
456 N/A N/A
454 N/A N/A
483
452 N/A N/A
449 N/A N/A
479
908 N/A N/A
903 N/A N/A
962
Nation
952,913 N/A N/A N/A
502 508 1010
American College Testing (ACT)
Advanced Placement Exams (AP)
Number taking tests: English Mathematics Reading Science Reasoning CompositeScore
1 8 School System State
19.4 19.7 19.1
20.8 20.7 19.9
19.1 20.3
19.9 20.3
20.2 19.9
20.2 20.4 19.9
No. of Students Taking Tests
No. of Tests Taken No. of Test Scores
3 or Higher Percent of Test
Scores 3 or Higher
School 89
138 16
11.6%
System State 170 15,225 246 23,969 28 13,024
11.4% 54.3%
POST-SECONDARY DATA
Graduates Entering Georgia Public Colleges
Graduates Entering Georgia Public Colleges and Requiring Learning Support (LS)
1998 Graduates Entering in 1998-99
1997 Graduates Entering in 1997-98
Percent of Graduating Number Class
School
70
24.4%
System 9 9
26.1%
School
68
18.6%
System 103
22.8%
Number Requiring
LS 13 25
19 29
Percent of those attending Georgia
Public Colleges
18.6%
25.3%
27.9%
28.2%
In previous years, the Report Card presented College Prep Curriculum information provided by the Board of Regents on students requiring Learning Support. Due to inconsistencies in the data provided by the Board of Regents in defining College Prep Completers versus Local Board of Education data defining College Prep Endorsements, the Department of Education Report Card will not provide this information until discrepancies can be reconciled.
Graduates Entering Georgia Public Technical and Adult Schools
1998 Graduates School System
Entering Number 18 24
1998-99 Percent
6.3% 6.3%
Entering Number N/A N/A
1997-98 Percent
N/A N/A
1997 Graduates School
1
0.3%
System
1
0.2%
11
3.0%
12
2.7%
1998-99 GEORGIA PUBLIC EDUCATION REPORT CARD Cass High School - 6080577
Prepared by Georgia Department of Education
Page 3
CERTIFIED PERSONNEL DATA
Positions Number Average Contract Days
Administrators
4.00 210.00
Support Personnel
5.00 190.00
PK-12 Teachers
84.48 190.59
Personnel Sex
Certificate
Years Experience
Full-time Part-time
Male Female
4 Yr Bachelor's 5 Yr Master's 6 Yr Specialist's 7 Yr Doctoral Other*
<1 1-10 11-20 21-30 >30
Average
4 0
3 1
0 1 3 0 0
0 1 1 2 0
18.75
5 0
1 4
0 4 1 0 0
0 1 2 2 0
15.40
78 5
42 41
47 25
6 2 3
5 28 25 23
2
14.16
*Includes One- and Two-Year Vocational Certificates.
ACCREDITATION DATA
Accredited by Southern Association of Colleges and Schools (SACS): Secondary/Middle Commission.
AWARDS / RECOGNITION DATA
Schools in Georgia may receive recognition in the following programs: Charter School Pay for Performance Program Georgia School of Excellence National Blue Ribbon School Cass High School did not receive recognition in any of these programs during the 1998-99 school year.
1998-99 GEORGIA PUBLIC EDUCATION REPORT CARD Cass High School - 6080577
Prepared by Georgia Department of Education
Page 4
1998-99 GEORGIA PUBLIC EDUCATION REPORT CARD
BARTOW COUNTY SCHOOLS
Cass Middle School - 6080195
Grade Range 6-8
The Georgia Public Education Report Card is designed to assist systems and schools in educational improvement. This report card contains a variety of data elements. An explanation of the terms is provided as a companion to the report card data. Please refer to the definitions for the most effective use of the reported data.
STUDENT DATA
Total 870
6-8 Enrollment, by Race/Ethnicity and Sex
Black
White Hispanic
American Multi-
Asian Indian
racial
83 9.5%
775 89.1%
9 1.0%
1 0.1%
0 0.0%
2 0.2%
Male 461
53.0%
Female 409
47.0%
Enrollment in Selected Programs
Program
Gifted (Grades K-12)
Program % of Student Enrollment Population
86
9.9%
Alternative Programs (Grades 6-12)
6
< 1%
Students Eligible to Receive Free/Reduced Lunches
Number
Percent
School System
397 4,315
45.6% 38.1%
Enrollment in Compensatory Programs
Program
Program % of Student Enrollment Population
Special Education (Grades K-12) (PK)
117 13.4%
0
N/A
English to Speakers of Other Languages (ESOL) (Grades K-12)
0
0.0%
Title I (Grades K-12)
This school has no Title I program.
Dropout Rate for Grades 6-8
Number
Rate
School System
0
0.0%
2
0.1%
Total 0
Retained Students, by Race/Ethnicity and Sex
Black
White Hispanic
American MultiAsian Indian racial
0
0
0
0
0
0
Male Female
0
0
Prepared by Georgia Department of Education
Page 1
STATE-REQUIRED TEST DATA
NORM-REFERENCED TESTS Grade 8
Iowa Tests of Basic Skills (ITBS) Each chart reflects data for three years of testing.
Reading Comprehension 50
44 46 49 0
98-99
46 46 48 97-98
44 43 48 96-97
Mathematics
School 50
System
State
0
58 59 56 98-99
59 57 55 97-98
59 52 54 96-97
School System State
Reading Vocabulary 50
43 44 46 0
98-99
39 42 45 97-98
45 43 44 96-97
Language Arts
School 50
System
State
0
61 63 60 98-99
63 61 58 97-98
60 55 56 96-97
School System State
Social Studies 50
54 54 54 0
98-99
50 49 53 97-98
59 51 53 96-97
Science
School 50
System
State
0
56 56 56 98-99
50 52 55 97-98
60 51 53 96-97
School System State
Sources of Information
Composite Score
50
55 55 57 0
98-99
School 50
System
50 52 56 97-98
53 51 55 96-97
State 0
56 57 56 98-99
54 54 54 97-98
1998-99 GEORGIA PUBLIC EDUCATION REPORT CARD Cass Middle School - 6080195
Prepared by Georgia Department of Education
59 52 54 96-97
Scores Reported in Percentiles
School System State
Page 2
STATE-REQUIRED TEST DATA
Categories of Scaled Scores
Inadequate (less than 162)
Minimal (162-209)
Good
(210-247)
Very Good (greater than 247)
Average Scaled Score: (Range 100-300)
PERFORMANCE ASSESSMENTS
Grade 8 Writing Assessment
1998-99 Percent Scoring
1997-98 Percent Scoring
1996-97 Percent Scoring
School System State School System State School System State
6% 60% 33%
1%
5% 50% 42%
4%
8% 40% 41% 11%
5% 59% 34%
2%
5% 58% 35%
3%
11% 46% 34%
8%
9% 52% 34%
5%
10% 55% 30%
4%
15% 46% 30%
8%
198
204
208 201
201 202 202
198 198
AWARDS / RECOGNITION DATA
Schools in Georgia may receive recognition in the following programs: Charter School Pay for Performance Program Georgia School of Excellence National Blue Ribbon School Cass Middle School did not receive recognition in any of these programs during the 1998-99 school year.
1998-99 GEORGIA PUBLIC EDUCATION REPORT CARD Cass Middle School - 6080195
Prepared by Georgia Department of Education
Page 3
CERTIFIED PERSONNEL DATA
Positions Number Average Contract Days
Personnel Sex
Certificate
Years Experience
Full-time Part-time
Male Female
4 Yr Bachelor's 5 Yr Master's 6 Yr Specialist's 7 Yr Doctoral Other*
<1 1-10 11-20 21-30 >30
Average
Administrators
5.00 218.00
5 0
4 1
0 3 2 0 0 0 1 1 3 0 19.60
Support Personnel
2.00 190.00
2 0
0 2
0 2 0 0 0 0 0 1 0 1 26.00
PK-12 Teachers
58.46 190.86
56 5
18 43
46 13
2 0 0 8 31 12 9 1 9.77
*Includes One- and Two-Year Vocational Certificates.
ACCREDITATION DATA
Accredited by Southern Association of Colleges and Schools (SACS): Secondary/Middle Commission.
1998-99 GEORGIA PUBLIC EDUCATION REPORT CARD Cass Middle School - 6080195
Prepared by Georgia Department of Education
Page 4
1998-99 GEORGIA PUBLIC EDUCATION REPORT CARD
BARTOW COUNTY SCHOOLS
Cloverleaf Elementary School - 6081052
Grade Range K-5
The Georgia Public Education Report Card is designed to assist systems and schools in educational improvement. This report card contains a variety of data elements. An explanation of the terms is provided as a companion to the report card data. Please refer to the definitions for the most effective use of the reported data.
STUDENT DATA
Total 597
K-5 Enrollment, by Race/Ethnicity and Sex
Black
White Hispanic
American Multi-
Asian Indian
racial
35 5.9%
529 88.6%
24 4.0%
4 0.7%
4 0.7%
1 0.2%
Male Female
301 50.4%
296 49.6%
Enrollment in Selected Programs
Program
Program % of Student Enrollment Population
Gifted (Grades K-12)
27
4.5%
Alternative Programs (Grades 6-12)
N/A
N/A
Students Eligible to Receive Free/Reduced Lunches
Number
Percent
School System
195 4,315
32.7% 38.1%
Dropout Rate *
Number
Rate
School System
N/A N/A
N/A N/A
* Dropout rates are not applicable for grades PK-5.
Enrollment in Compensatory Programs
Program
Program % of Student Enrollment Population
Special Education (Grades K-12)
72 12.1%
(PK)
0
N/A
English to Speakers of Other Languages (ESOL) (Grades K-12)
0
0.0%
Remedial Education (Grades 2-5, 9-12)
18
4.7%
Special Instructional Assistance (SIA) (Grades K-3)
122 28.9%
Title I (Grades K-12)
This school has no Title I program.
Total 0
Retained Students, by Race/Ethnicity and Sex
Black
White Hispanic
American Multi-
Asian Indian
racial
0
0
0
0
0
0
Male Female
0
0
Prepared by Georgia Department of Education
Page 1
STATE-REQUIRED TEST DATA
NORM-REFERENCED TESTS Grade 3
Iowa Tests of Basic Skills (ITBS) Each chart reflects data for three years of testing.
Reading Comprehension 50
N/A 52 54 0
98-99
N/A 60 53 97-98
N/A 55 52 96-97
Mathematics
School 50
System
State
N/A 66 61 0
98-99
N/A 71 61 97-98
N/A 67 59 96-97
School System State
Reading Vocabulary 50
N/A 51 50 0
98-99
N/A 56 50 97-98
N/A 53 49 96-97
Language Arts
School 50
System
State
N/A 64 64 0
98-99
N/A 75 62 97-98
N/A 66 59 96-97
School System State
Social Studies 50
N/A 53 56 0
98-99
N/A 63 55 97-98
N/A 53 55 96-97
Science
School 50
System
State
N/A 53 59 0
98-99
N/A 64 59 97-98
N/A 60 58 96-97
School System State
Sources of Information
Composite Score
School
50
50
System
N/A 61 57 0
98-99
N/A 68 56 N/A 60 55
97-98
96-97
State
N/A 57 58 0
98-99
N/A 67 57 97-98
N/A 60 56 96-97
1998-99 GEORGIA PUBLIC EDUCATION REPORT CARD Cloverleaf Elementary School - 6081052
Prepared by Georgia Department of Education
Scores Reported in Percentiles
School System State
Page 2
STATE-REQUIRED TEST DATA
NORM-REFERENCED TESTS Grade 5
Iowa Tests of Basic Skills (ITBS) Each chart reflects data for three years of testing.
Reading Comprehension
Mathematics
50
N/A 52 53 0
98-99
N/A 50 53 97-98
N/A 50 52 96-97
School 50
System
State
N/A 59 59 0
98-99
N/A 58 58 97-98
N/A 57 57 96-97
School System State
Reading Vocabulary 50
N/A 46 48 0
98-99
N/A 45 48 97-98
N/A 45 46 96-97
Language Arts
School 50
System
State
N/A 61 63 0
98-99
N/A 61 61 97-98
N/A 59 58 96-97
School System State
Social Studies 50
N/A 53 57 0
98-99
N/A 47 56 97-98
N/A 47 55 96-97
Science
School 50
System
State
N/A 60 60 0
98-99
N/A 56 59 97-98
N/A 56 59 96-97
School System State
Sources of Information
Composite Score
School
50
50
System
N/A 56 58 0
98-99
N/A 55 58 N/A 53 57
97-98
96-97
State
N/A 55 57 0
98-99
N/A 54 56 97-98
N/A 53 55 96-97
1998-99 GEORGIA PUBLIC EDUCATION REPORT CARD Cloverleaf Elementary School - 6081052
Prepared by Georgia Department of Education
Scores Reported in Percentiles
School System State
Page 3
STATE-REQUIRED TEST DATA
PERFORMANCE ASSESSMENTS
Grade 5 Writing Assessment
Percent at Developmental Stages:
1998-99 School System State
1997-98 School System State
1996-97 School System State
Stage Stage Stage Stage Stage Stage
1:The Emerging Writer 2:The Developing Writer 3:The Focusing Writer 4:The Experimenting 5:The Engaging Writer 6:The Extending Writer
0% 1% 8% 44% 24% 21%
0% 2% 16% 47% 25% 9%
0% 1% 16% 41% 29% 12%
0% 4% 20% 44% 23% 10%
0% 2% 15% 41% 30% 8%
0% 3% 19% 41% 27% 10%
0% 2% 22% 33% 27% 15%
0% 2% 17% 39% 30% 11%
0% 3% 21% 37% 26% 12%
AWARDS / RECOGNITION DATA
Schools that become a Charter School have a unique opportunity to rethink how they structure and deliver education programs for improving the learning of their students while being freed from the state laws, State Board of Education rules and regulations, and local board of education rules and regulations that govern other schools. A 'charter' is a binding contract that, when approved by the faculty and parents of the school, the local board of education and the State Board of Education, substitutes for state education statutes, state and local rules, policies, regulations and standards.
Cloverleaf Elementary School is a Charter School for 1998-99.
1998-99 GEORGIA PUBLIC EDUCATION REPORT CARD Cloverleaf Elementary School - 6081052
Prepared by Georgia Department of Education
Page 4
CERTIFIED PERSONNEL DATA
Positions Number Average Contract Days
Personnel Sex
Certificate
Years Experience
Full-time Part-time
Male Female
4 Yr Bachelor's 5 Yr Master's 6 Yr Specialist's 7 Yr Doctoral Other*
<1 1-10 11-20 21-30 >30
Average
Administrators
2.00 205.00
2 0
1 1
0 0 2 0 0 0 0 0 2 0 30.00
Support Personnel
3.00 190.00
3 0
0 3
0 2 1 0 0 0 0 1 2 0 23.00
PK-12 Teachers
45.00 190.00
44 2
3 43
19 25
2 0 0 3 16 17 9 1 13.61
*Includes One- and Two-Year Vocational Certificates.
ACCREDITATION DATA
Accredited by Southern Association of Colleges and Schools (SACS):
Elementary/Middle Commission.
1998-99 GEORGIA PUBLIC EDUCATION REPORT CARD Cloverleaf Elementary School - 6081052
Prepared by Georgia Department of Education
Page 5
1998-99 GEORGIA PUBLIC EDUCATION REPORT CARD
BARTOW COUNTY SCHOOLS
Emerson Elementary School - 6082052
Grade Range PK-5
The Georgia Public Education Report Card is designed to assist systems and schools in educational improvement. This report card contains a variety of data elements. An explanation of the terms is provided as a companion to the report card data. Please refer to the definitions for the most effective use of the reported data.
STUDENT DATA
Total
K-5
525
PK
29
Enrollment, by Race/Ethnicity and Sex
Black
White Hispanic
American Asian Indian
Multiracial
15 2.9%
493 93.9%
10 1.9%
3 0.6%
2 0.4%
2 0.4%
1 3.4%
27 93.1%
0 0.0%
0 0.0%
1 3.4%
0 0.0%
Male Female
276 52.6%
249 47.4%
18 62.1%
11 37.9%
Enrollment in Selected Programs
Program
Program % of Student Enrollment Population
Gifted (Grades K-12)
25
4.8%
Alternative Programs (Grades 6-12)
N/A
N/A
Students Eligible to Receive Free/Reduced Lunches
Number
Percent
School System
325 4,315
58.7% 38.1%
Dropout Rate *
Number
Rate
School System
N/A N/A
N/A N/A
* Dropout rates are not applicable for grades PK-5.
Enrollment in Compensatory Programs
Program
Program % of Student Enrollment Population
Special Education (Grades K-12)
96 18.3%
(PK)
4
N/A
English to Speakers of Other Languages (ESOL) (Grades K-12)
0
0.0%
Remedial Education (Grades 2-5, 9-12)
22
6.1%
Special Instructional Assistance (SIA) (Grades K-3)
85 24.9%
Title I (Grades K-12)
This school has a Targeted Assistance program.
Total 8
Retained Students, by Race/Ethnicity and Sex
Black
White Hispanic
American MultiAsian Indian racial
0
8
0.0% 100.0%
0 0.0%
0 0.0%
0 0.0%
0 0.0%
Male Female
4
4
50.0% 50.0%
Prepared by Georgia Department of Education
Page 1
STATE-REQUIRED TEST DATA
NORM-REFERENCED TESTS Grade 3
Iowa Tests of Basic Skills (ITBS) Each chart reflects data for three years of testing.
Reading Comprehension 50
N/A 52 54 0
98-99
66 60 53 97-98
54 55 52 96-97
Mathematics
School 50
System
State
N/A 66 61
0
98-99
79 71 61 97-98
65 67 59 96-97
School System State
Reading Vocabulary 50
N/A 51 50 0
98-99
67 56 50 97-98
53 53 49 96-97
Language Arts
School 50
System
State
N/A 64 64
0
98-99
86 75 62 97-98
69 66 59 96-97
School System State
Social Studies 50
N/A 53 56 0
98-99
79 63 55 97-98
59 53 55 96-97
Science
School 50
System
State
N/A 53 59
0
98-99
74 64 59 97-98
66 60 58 96-97
School System State
Sources of Information
Composite Score
50
N/A 61 57 0
98-99
School 50
System
79 68 56 97-98
57 60 55 96-97
State
N/A 57 58
0
98-99
79 67 57 97-98
1998-99 GEORGIA PUBLIC EDUCATION REPORT CARD Emerson Elementary School - 6082052
Prepared by Georgia Department of Education
62 60 56 96-97
Scores Reported in Percentiles
School System State
Page 2
STATE-REQUIRED TEST DATA
NORM-REFERENCED TESTS Grade 5
Iowa Tests of Basic Skills (ITBS) Each chart reflects data for three years of testing.
Reading Comprehension
Mathematics
50
N/A 52 53 0
98-99
53 50 53 97-98
49 50 52 96-97
School 50
System
State
N/A 59 59
0
98-99
58 58 58 97-98
56 57 57 96-97
School System State
Reading Vocabulary 50
N/A 46 48 0
98-99
50 45 48 97-98
48 45 46 96-97
Language Arts
School 50
System
State
N/A 61 63
0
98-99
62 61 61 97-98
57 59 58 96-97
School System State
Social Studies 50
N/A 53 57 0
98-99
49 47 56 97-98
48 47 55 96-97
Science
School 50
System
State
N/A 60 60
0
98-99
55 56 59 97-98
53 56 59 96-97
School System State
Sources of Information
Composite Score
50
N/A 56 58 0
98-99
School 50
System
54 55 58 97-98
47 53 57 96-97
State
N/A 55 57
0
98-99
53 54 56 97-98
51 53 55 96-97
1998-99 GEORGIA PUBLIC EDUCATION REPORT CARD Emerson Elementary School - 6082052
Prepared by Georgia Department of Education
Scores Reported in Percentiles
School System State
Page 3
STATE-REQUIRED TEST DATA
PERFORMANCE ASSESSMENTS
Grade 5 Writing Assessment
Percent at Developmental Stages:
1998-99 School System State
1997-98 School System State
1996-97 School System State
Stage Stage Stage Stage Stage Stage
1:The Emerging Writer 2:The Developing Writer 3:The Focusing Writer 4:The Experimenting 5:The Engaging Writer 6:The Extending Writer
0% 1% 29% 55% 12% 3%
0% 2% 16% 47% 25% 9%
0% 1% 16% 41% 29% 12%
0% 2% 20% 45% 26% 6%
0% 2% 15% 41% 30% 8%
0% 3% 19% 41% 27% 10%
0% 0% 13% 35% 38% 13%
0% 2% 17% 39% 30% 11%
0% 3% 21% 37% 26% 12%
AWARDS / RECOGNITION DATA
Schools that become a Charter School have a unique opportunity to rethink how they structure and deliver education programs for improving the learning of their students while being freed from the state laws, State Board of Education rules and regulations, and local board of education rules and regulations that govern other schools. A 'charter' is a binding contract that, when approved by the faculty and parents of the school, the local board of education and the State Board of Education, substitutes for state education statutes, state and local rules, policies, regulations and standards.
Emerson Elementary School is a Charter School for 1998-99.
1998-99 GEORGIA PUBLIC EDUCATION REPORT CARD Emerson Elementary School - 6082052
Prepared by Georgia Department of Education
Page 4
CERTIFIED PERSONNEL DATA
Positions Number Average Contract Days
Personnel Sex
Certificate
Years Experience
Full-time Part-time
Male Female
4 Yr Bachelor's 5 Yr Master's 6 Yr Specialist's 7 Yr Doctoral Other*
<1 1-10 11-20 21-30 >30
Average
Administrators
2.00 210.00
2 0
1 1
0 0 2 0 0 0 0 0 2 0 25.00
Support Personnel
3.00 190.00
3 0
1 2
0 3 0 0 0 0 1 2 0 0 12.00
PK-12 Teachers
38.99 189.59
38 2
3 37
18 20
2 0 0 1 18 13 8 0 12.05
*Includes One- and Two-Year Vocational Certificates.
ACCREDITATION DATA
Accredited by Southern Association of Colleges and Schools (SACS):
Elementary/Middle Commission.
1998-99 GEORGIA PUBLIC EDUCATION REPORT CARD Emerson Elementary School - 6082052
Prepared by Georgia Department of Education
Page 5
1998-99 GEORGIA PUBLIC EDUCATION REPORT CARD
BARTOW COUNTY SCHOOLS
Hamilton Crossing Elementary School - 6080377
Grade Range PK-5
The Georgia Public Education Report Card is designed to assist systems and schools in educational improvement. This report card contains a variety of data elements. An explanation of the terms is provided as a companion to the report card data. Please refer to the definitions for the most effective use of the reported data.
STUDENT DATA
Total
K-5
575
PK
22
Enrollment, by Race/Ethnicity and Sex
Black
White Hispanic
American Asian Indian
Multiracial
54 9.4%
497 86.4%
9 1.6%
1 0.2%
3 0.5%
11 1.9%
1 4.5%
20 90.9%
1 4.5%
0 0.0%
0 0.0%
0 0.0%
Male Female
304 52.9%
271 47.1%
14 63.6%
8 36.4%
Enrollment in Selected Programs
Program
Program % of Student Enrollment Population
Gifted (Grades K-12)
31
5.4%
Alternative Programs (Grades 6-12)
N/A
N/A
Students Eligible to Receive Free/Reduced Lunches
Number
Percent
School System
286 4,315
47.9% 38.1%
Dropout Rate *
Number
Rate
School System
N/A N/A
N/A N/A
* Dropout rates are not applicable for grades PK-5.
Enrollment in Compensatory Programs
Program
Program % of Student Enrollment Population
Special Education (Grades K-12)
99 17.2%
(PK)
5
N/A
English to Speakers of Other Languages (ESOL) (Grades K-12)
0
0.0%
Remedial Education (Grades 2-5, 9-12)
40 10.1%
Special Instructional Assistance (SIA) (Grades K-3)
148 39.1%
Title I (Grades K-12)
This school has a Targeted Assistance program.
Total 0
Retained Students, by Race/Ethnicity and Sex
Black
White Hispanic
American MultiAsian Indian racial
0
0
0
0
0
0
Male Female
0
0
Prepared by Georgia Department of Education
Page 1
STATE-REQUIRED TEST DATA
NORM-REFERENCED TESTS Grade 3
Iowa Tests of Basic Skills (ITBS) Each chart reflects data for three years of testing.
Reading Comprehension 50
54 52 54 0
98-99
60 60 53 97-98
55 55 52 96-97
Mathematics
School 50
System
State
0
68 66 61 98-99
66 71 61 97-98
61 67 59 96-97
School System State
Reading Vocabulary 50
50 51 50 0
98-99
53 56 50 97-98
49 53 49 96-97
Language Arts
School 50
System
State
0
72 64 64 98-99
73 75 62 97-98
71 66 59 96-97
School System State
Social Studies 50
57 53 56 0
98-99
55 63 55 97-98
55 53 55 96-97
Science
School 50
System
State
0
56 53 59 98-99
59 64 59 97-98
65 60 58 96-97
School System State
Sources of Information
Composite Score
50
66 61 57 0
98-99
School 50
System
67 68 56 97-98
63 60 55 96-97
State 0
61 57 58 98-99
64 67 57 97-98
1998-99 GEORGIA PUBLIC EDUCATION REPORT CARD Hamilton Crossing Elementary School - 6080377
Prepared by Georgia Department of Education
64 60 56 96-97
Scores Reported in Percentiles
School System State
Page 2
STATE-REQUIRED TEST DATA
NORM-REFERENCED TESTS Grade 5
Iowa Tests of Basic Skills (ITBS) Each chart reflects data for three years of testing.
Reading Comprehension
Mathematics
50
59 52 53 0
98-99
47 50 53 97-98
47 50 52 96-97
School 50
System
State
0
67 59 59 98-99
58 58 58 97-98
44 57 57 96-97
School System State
Reading Vocabulary 50
51 46 48 0
98-99
41 45 48 97-98
41 45 46 96-97
Language Arts
School 50
System
State
0
68 61 63 98-99
61 61 61 97-98
56 59 58 96-97
School System State
Social Studies 50
59 53 57 0
98-99
45 47 56 97-98
43 47 55 96-97
Science
School 50
System
State
0
66 60 60 98-99
49 56 59 97-98
55 56 59 96-97
School System State
Sources of Information
Composite Score
50
65 56 58 0
98-99
School 50
System
55 55 58 97-98
49 53 57 96-97
State 0
64 55 57 98-99
53 54 56 97-98
47 53 55 96-97
1998-99 GEORGIA PUBLIC EDUCATION REPORT CARD Hamilton Crossing Elementary School - 6080377
Prepared by Georgia Department of Education
Scores Reported in Percentiles
School System State
Page 3
STATE-REQUIRED TEST DATA
PERFORMANCE ASSESSMENTS
Grade 5 Writing Assessment
Percent at Developmental Stages:
1998-99 School System State
1997-98 School System State
1996-97 School System State
Stage Stage Stage Stage Stage Stage
1:The Emerging Writer 2:The Developing Writer 3:The Focusing Writer 4:The Experimenting 5:The Engaging Writer 6:The Extending Writer
0% 1% 5% 48% 35% 11%
0% 2% 16% 47% 25% 9%
0% 1% 16% 41% 29% 12%
0% 0% 18% 37% 35% 9%
0% 2% 15% 41% 30% 8%
0% 3% 19% 41% 27% 10%
0% 3% 10% 42% 37% 9%
0% 2% 17% 39% 30% 11%
0% 3% 21% 37% 26% 12%
AWARDS / RECOGNITION DATA
Schools in Georgia may receive recognition in the following programs: Charter School Pay for Performance Program Georgia School of Excellence National Blue Ribbon School Hamilton Crossing Elementary School did not receive recognition in any of these programs during the 1998-99 school year.
1998-99 GEORGIA PUBLIC EDUCATION REPORT CARD Hamilton Crossing Elementary School - 6080377
Prepared by Georgia Department of Education
Page 4
CERTIFIED PERSONNEL DATA
Positions Number Average Contract Days
Personnel Sex
Certificate
Years Experience
Full-time Part-time
Male Female
4 Yr Bachelor's 5 Yr Master's 6 Yr Specialist's 7 Yr Doctoral Other*
<1 1-10 11-20 21-30 >30
Average
Administrators
2.00 200.00
2 0
0 2
0 1 1 0 0 0 0 1 0 1 26.00
Support Personnel
2.00 190.00
2 0
0 2
0 1 1 0 0 0 0 2 0 0 15.00
PK-12 Teachers
45.50 190.00
45 1
2 44
23 20
3 0 0 3 18 13 12 0 13.33
*Includes One- and Two-Year Vocational Certificates.
ACCREDITATION DATA
Accredited by Southern Association of Colleges and Schools (SACS):
Elementary/Middle Commission.
1998-99 GEORGIA PUBLIC EDUCATION REPORT CARD Hamilton Crossing Elementary School - 6080377
Prepared by Georgia Department of Education
Page 5
1998-99 GEORGIA PUBLIC EDUCATION REPORT CARD
BARTOW COUNTY SCHOOLS
Kingston Elementary School - 6080296
Grade Range PK-5
The Georgia Public Education Report Card is designed to assist systems and schools in educational improvement. This report card contains a variety of data elements. An explanation of the terms is provided as a companion to the report card data. Please refer to the definitions for the most effective use of the reported data.
STUDENT DATA
Total
K-5
516
PK
30
Enrollment, by Race/Ethnicity and Sex
Black
White Hispanic
American Asian Indian
Multiracial
38 7.4%
465 90.1%
6 1.2%
0 0.0%
0 0.0%
7 1.4%
1 3.3%
29 96.7%
0 0.0%
0 0.0%
0 0.0%
0 0.0%
Male Female
294 57.0%
222 43.0%
16 53.3%
14 46.7%
Enrollment in Selected Programs
Program
Program % of Student Enrollment Population
Gifted (Grades K-12)
25
4.8%
Alternative Programs (Grades 6-12)
N/A
N/A
Students Eligible to Receive Free/Reduced Lunches
Number
Percent
School System
306 4,315
56.0% 38.1%
Dropout Rate *
Number
Rate
School System
N/A N/A
N/A N/A
* Dropout rates are not applicable for grades PK-5.
Enrollment in Compensatory Programs
Program
Program % of Student Enrollment Population
Special Education (Grades K-12)
90 17.4%
(PK)
16
N/A
English to Speakers of Other Languages (ESOL) (Grades K-12)
2
< 1%
Remedial Education (Grades 2-5, 9-12)
70 19.6%
Special Instructional Assistance (SIA) (Grades K-3)
114 33.0%
Title I (Grades K-12)
This school has a Targeted Assistance program.
Total 8
Retained Students, by Race/Ethnicity and Sex
Black
White Hispanic
American MultiAsian Indian racial
1 12.5%
7 87.5%
0 0.0%
0 0.0%
0 0.0%
0 0.0%
Male Female
6
2
75.0% 25.0%
Prepared by Georgia Department of Education
Page 1
STATE-REQUIRED TEST DATA
NORM-REFERENCED TESTS Grade 3
Iowa Tests of Basic Skills (ITBS) Each chart reflects data for three years of testing.
Reading Comprehension 50
N/A 52 54 0
98-99
N/A 60 53 97-98
47 55 52 96-97
Mathematics
School 50
System
State
N/A 66 61 0
98-99
N/A 71 61 97-98
61 67 59 96-97
School System State
Reading Vocabulary 50
N/A 51 50 0
98-99
N/A 56 50 97-98
50 53 49 96-97
Language Arts
School 50
System
State
N/A 64 64 0
98-99
N/A 75 62 97-98
54 66 59 96-97
School System State
Social Studies 50
N/A 53 56 0
98-99
N/A 63 55 97-98
46 53 55 96-97
Science
School 50
System
State
N/A 53 59 0
98-99
N/A 64 59 97-98
48 60 58 96-97
School System State
Sources of Information
Composite Score
School
50
50
System
N/A 61 57 0
98-99
N/A 68 56 97-98
47 60 55 96-97
State
N/A 57 58 0
98-99
N/A 67 57 97-98
1998-99 GEORGIA PUBLIC EDUCATION REPORT CARD Kingston Elementary School - 6080296
Prepared by Georgia Department of Education
49 60 56 96-97
Scores Reported in Percentiles
School System State
Page 2
STATE-REQUIRED TEST DATA
NORM-REFERENCED TESTS Grade 5
Iowa Tests of Basic Skills (ITBS) Each chart reflects data for three years of testing.
Reading Comprehension
Mathematics
50
N/A 52 53 0
98-99
N/A 50 53 97-98
56 50 52 96-97
School 50
System
State
N/A 59 59 0
98-99
N/A 58 58 97-98
70 57 57 96-97
School System State
Reading Vocabulary 50
N/A 46 48 0
98-99
N/A 45 48 97-98
53 45 46 96-97
Language Arts
School 50
System
State
N/A 61 63 0
98-99
N/A 61 61 97-98
72 59 58 96-97
School System State
Social Studies 50
N/A 53 57 0
98-99
N/A 47 56 97-98
63 47 55 96-97
Science
School 50
System
State
N/A 60 60 0
98-99
N/A 56 59 97-98
64 56 59 96-97
School System State
Sources of Information
Composite Score
School
50
50
System
N/A 56 58 0
98-99
N/A 55 58 97-98
65 53 57 96-97
State
N/A 55 57 0
98-99
N/A 54 56 97-98
1998-99 GEORGIA PUBLIC EDUCATION REPORT CARD Kingston Elementary School - 6080296
Prepared by Georgia Department of Education
66 53 55 96-97
Scores Reported in Percentiles
School System State
Page 3
STATE-REQUIRED TEST DATA
PERFORMANCE ASSESSMENTS
Grade 5 Writing Assessment
Percent at Developmental Stages:
1998-99 School System State
1997-98 School System State
1996-97 School System State
Stage Stage Stage Stage Stage Stage
1:The Emerging Writer 2:The Developing Writer 3:The Focusing Writer 4:The Experimenting 5:The Engaging Writer 6:The Extending Writer
0% 6% 31% 46% 9% 9%
0% 2% 16% 47% 25% 9%
0% 1% 16% 41% 29% 12%
0% 3% 17% 30% 17% 2%
0% 2% 15% 41% 30% 8%
0% 3% 19% 41% 27% 10%
2% 8% 17% 50% 15% 8%
0% 2% 17% 39% 30% 11%
0% 3% 21% 37% 26% 12%
AWARDS / RECOGNITION DATA
Schools that become a Charter School have a unique opportunity to rethink how they structure and deliver education programs for improving the learning of their students while being freed from the state laws, State Board of Education rules and regulations, and local board of education rules and regulations that govern other schools. A 'charter' is a binding contract that, when approved by the faculty and parents of the school, the local board of education and the State Board of Education, substitutes for state education statutes, state and local rules, policies, regulations and standards.
Kingston Elementary School is a Charter School for 1998-99.
1998-99 GEORGIA PUBLIC EDUCATION REPORT CARD Kingston Elementary School - 6080296
Prepared by Georgia Department of Education
Page 4
CERTIFIED PERSONNEL DATA
Positions Number Average Contract Days
Personnel Sex
Certificate
Years Experience
Full-time Part-time
Male Female
4 Yr Bachelor's 5 Yr Master's 6 Yr Specialist's 7 Yr Doctoral Other*
<1 1-10 11-20 21-30 >30
Average
Administrators
2.00 200.00
2 0
1 1
0 1 1 0 0 0 1 0 1 0 16.50
Support Personnel
3.00 190.00
3 0
0 3
0 2 1 0 0 0 2 0 1 0 11.33
PK-12 Teachers
36.50 190.00
36 1
4 33
20 15
2 0 0 0 20 11 6 0 11.65
*Includes One- and Two-Year Vocational Certificates.
ACCREDITATION DATA
Accredited by Southern Association of Colleges and Schools (SACS):
Elementary/Middle Commission.
1998-99 GEORGIA PUBLIC EDUCATION REPORT CARD Kingston Elementary School - 6080296
Prepared by Georgia Department of Education
Page 5
1998-99 GEORGIA PUBLIC EDUCATION REPORT CARD
BARTOW COUNTY SCHOOLS
Mission Road Elementary School - 6080186
Grade Range PK-5
The Georgia Public Education Report Card is designed to assist systems and schools in educational improvement. This report card contains a variety of data elements. An explanation of the terms is provided as a companion to the report card data. Please refer to the definitions for the most effective use of the reported data.
STUDENT DATA
Total
K-5
620
PK
28
Enrollment, by Race/Ethnicity and Sex
Black
White Hispanic
American Asian Indian
Multiracial
75 12.1%
526 84.8%
16 2.6%
2 0.3%
0 0.0%
1 0.2%
4 14.3%
24 85.7%
0 0.0%
0 0.0%
0 0.0%
0 0.0%
Male Female
332 53.5%
288 46.5%
15 53.6%
13 46.4%
Enrollment in Selected Programs
Program
Program % of Student Enrollment Population
Gifted (Grades K-12)
38
6.1%
Alternative Programs (Grades 6-12)
N/A
N/A
Students Eligible to Receive Free/Reduced Lunches
Number
Percent
School System
194 4,315
29.9% 38.1%
Dropout Rate *
Number
Rate
School System
N/A N/A
N/A N/A
* Dropout rates are not applicable for grades PK-5.
Enrollment in Compensatory Programs
Program
Program % of Student Enrollment Population
Special Education (Grades K-12)
97 15.6%
(PK)
15
N/A
English to Speakers of Other Languages (ESOL) (Grades K-12)
1
< 1%
Remedial Education (Grades 2-5, 9-12)
88 21.2%
Special Instructional Assistance (SIA) (Grades K-3)
121 27.9%
Title I (Grades K-12)
This school has no Title I program.
Total 13
Retained Students, by Race/Ethnicity and Sex
Black
White Hispanic
American MultiAsian Indian racial
0
13
0.0% 100.0%
0 0.0%
0 0.0%
0 0.0%
0 0.0%
Male Female
8
5
61.5% 38.5%
Prepared by Georgia Department of Education
Page 1
STATE-REQUIRED TEST DATA
NORM-REFERENCED TESTS Grade 3
Iowa Tests of Basic Skills (ITBS) Each chart reflects data for three years of testing.
Reading Comprehension 50
N/A 52 54 0
98-99
N/A 60 53 97-98
61 55 52 96-97
Mathematics
School 50
System
State
N/A 66 61 0
98-99
N/A 71 61 97-98
71 67 59 96-97
School System State
Reading Vocabulary 50
N/A 51 50 0
98-99
N/A 56 50 97-98
62 53 49 96-97
Language Arts
School 50
System
State
N/A 64 64 0
98-99
N/A 75 62 97-98
75 66 59 96-97
School System State
Social Studies 50
N/A 53 56 0
98-99
N/A 63 55 97-98
52 53 55 96-97
Science
School 50
System
State
N/A 53 59 0
98-99
N/A 64 59 97-98
67 60 58 96-97
School System State
Sources of Information
Composite Score
School
50
50
System
N/A 61 57 0
98-99
N/A 68 56 97-98
67 60 55 96-97
State
N/A 57 58 0
98-99
N/A 67 57 97-98
1998-99 GEORGIA PUBLIC EDUCATION REPORT CARD Mission Road Elementary School - 6080186
Prepared by Georgia Department of Education
66 60 56 96-97
Scores Reported in Percentiles
School System State
Page 2
STATE-REQUIRED TEST DATA
NORM-REFERENCED TESTS Grade 5
Iowa Tests of Basic Skills (ITBS) Each chart reflects data for three years of testing.
Reading Comprehension
Mathematics
50
N/A 52 53 0
98-99
N/A 50 53 97-98
56 50 52 96-97
School 50
System
State
N/A 59 59 0
98-99
N/A 58 58 97-98
76 57 57 96-97
School System State
Reading Vocabulary 50
N/A 46 48 0
98-99
N/A 45 48 97-98
49 45 46 96-97
Language Arts
School 50
System
State
N/A 61 63 0
98-99
N/A 61 61 97-98
69 59 58 96-97
School System State
Social Studies 50
N/A 53 57 0
98-99
N/A 47 56 97-98
55 47 55 96-97
Science
School 50
System
State
N/A 60 60 0
98-99
N/A 56 59 97-98
61 56 59 96-97
School System State
Sources of Information
Composite Score
School
50
50
System
N/A 56 58 0
98-99
N/A 55 58 97-98
62 53 57 96-97
State
N/A 55 57 0
98-99
N/A 54 56 97-98
1998-99 GEORGIA PUBLIC EDUCATION REPORT CARD Mission Road Elementary School - 6080186
Prepared by Georgia Department of Education
63 53 55 96-97
Scores Reported in Percentiles
School System State
Page 3
STATE-REQUIRED TEST DATA
PERFORMANCE ASSESSMENTS
Grade 5 Writing Assessment
Percent at Developmental Stages:
1998-99 School System State
1997-98 School System State
1996-97 School System State
Stage Stage Stage Stage Stage Stage
1:The Emerging Writer 2:The Developing Writer 3:The Focusing Writer 4:The Experimenting 5:The Engaging Writer 6:The Extending Writer
N/A N/A N/A N/A N/A N/A
0% 2% 16% 47% 25% 9%
0% 1% 16% 41% 29% 12%
N/A N/A N/A N/A N/A N/A
0% 2% 15% 41% 30% 8%
0% 3% 19% 41% 27% 10%
0% 0% 13% 16% 52% 19%
0% 2% 17% 39% 30% 11%
No Grade-5 Writing Assessment scores were reported for Mission Road Elementary School.
0% 3% 21% 37% 26% 12%
AWARDS / RECOGNITION DATA
Schools that become a Charter School have a unique opportunity to rethink how they structure and deliver education programs for improving the learning of their students while being freed from the state laws, State Board of Education rules and regulations, and local board of education rules and regulations that govern other schools. A 'charter' is a binding contract that, when approved by the faculty and parents of the school, the local board of education and the State Board of Education, substitutes for state education statutes, state and local rules, policies, regulations and standards.
Mission Road Elementary School is a Charter School for 1998-99.
1998-99 GEORGIA PUBLIC EDUCATION REPORT CARD Mission Road Elementary School - 6080186
Prepared by Georgia Department of Education
Page 4
CERTIFIED PERSONNEL DATA
Positions Number Average Contract Days
Personnel Sex
Certificate
Years Experience
Full-time Part-time
Male Female
4 Yr Bachelor's 5 Yr Master's 6 Yr Specialist's 7 Yr Doctoral Other*
<1 1-10 11-20 21-30 >30
Average
Administrators
3.00 203.33
3 0
0 3
0 0 3 0 0 0 0 3 0 0 16.00
Support Personnel
3.00 190.00
3 0
0 3
0 3 0 0 0 0 1 2 0 0 13.00
PK-12 Teachers
42.94 190.17
42 2
3 41
26 15
3 0 0 2 17 13 11 1 13.80
*Includes One- and Two-Year Vocational Certificates.
ACCREDITATION DATA
Accredited by Southern Association of Colleges and Schools (SACS):
Elementary/Middle Commission.
1998-99 GEORGIA PUBLIC EDUCATION REPORT CARD Mission Road Elementary School - 6080186
Prepared by Georgia Department of Education
Page 5
1998-99 GEORGIA PUBLIC EDUCATION REPORT CARD
BARTOW COUNTY SCHOOLS
Pine Log Elementary School - 6084052
Grade Range PK-5
The Georgia Public Education Report Card is designed to assist systems and schools in educational improvement. This report card contains a variety of data elements. An explanation of the terms is provided as a companion to the report card data. Please refer to the definitions for the most effective use of the reported data.
STUDENT DATA
Total
K-5
360
PK
21
Enrollment, by Race/Ethnicity and Sex
Black
White Hispanic
American Asian Indian
Multiracial
1 0.3%
350 97.2%
4 1.1%
0 0.0%
2 0.6%
3 0.8%
1 4.8%
19 90.5%
0 0.0%
0 0.0%
0 0.0%
1 4.8%
Male Female
193 53.6%
167 46.4%
14 66.7%
7 33.3%
Enrollment in Selected Programs
Program
Program % of Student Enrollment Population
Gifted (Grades K-12)
19
5.3%
Alternative Programs (Grades 6-12)
N/A
N/A
Students Eligible to Receive Free/Reduced Lunches
Number
Percent
School System
146 4,315
38.3% 38.1%
Dropout Rate *
Number
Rate
School System
N/A N/A
N/A N/A
* Dropout rates are not applicable for grades PK-5.
Enrollment in Compensatory Programs
Program
Program % of Student Enrollment Population
Special Education (Grades K-12)
64 17.8%
(PK)
3
N/A
English to Speakers of Other Languages (ESOL) (Grades K-12)
0
0.0%
Remedial Education (Grades 2-5, 9-12)
26 11.0%
Special Instructional Assistance (SIA) (Grades K-3)
44 18.6%
Title I (Grades K-12)
This school has no Title I program.
Total 8
Retained Students, by Race/Ethnicity and Sex
Black
White Hispanic
American MultiAsian Indian racial
0 0.0%
6 75.0%
0 0.0%
0 0.0%
2 25.0%
0 0.0%
Male Female
6
2
75.0% 25.0%
Prepared by Georgia Department of Education
Page 1
STATE-REQUIRED TEST DATA
NORM-REFERENCED TESTS Grade 3
Iowa Tests of Basic Skills (ITBS) Each chart reflects data for three years of testing.
Reading Comprehension 50
N/A 52 54 0
98-99
N/A 60 53 97-98
45 55 52 96-97
Mathematics
School 50
System
State
N/A 66 61 0
98-99
N/A 71 61 97-98
55 67 59 96-97
School System State
Reading Vocabulary 50
N/A 51 50 0
98-99
N/A 56 50 97-98
48 53 49 96-97
Language Arts
School 50
System
State
N/A 64 64 0
98-99
N/A 75 62 97-98
36 66 59 96-97
School System State
Social Studies 50
N/A 53 56 0
98-99
N/A 63 55 97-98
44 53 55 96-97
Science
School 50
System
State
N/A 53 59 0
98-99
N/A 64 59 97-98
51 60 58 96-97
School System State
Sources of Information
Composite Score
School
50
50
System
N/A 61 57 0
98-99
N/A 68 56 97-98
49 60 55 96-97
State
N/A 57 58 0
98-99
N/A 67 57 97-98
1998-99 GEORGIA PUBLIC EDUCATION REPORT CARD Pine Log Elementary School - 6084052
Prepared by Georgia Department of Education
46 60 56 96-97
Scores Reported in Percentiles
School System State
Page 2
STATE-REQUIRED TEST DATA
NORM-REFERENCED TESTS Grade 5
Iowa Tests of Basic Skills (ITBS) Each chart reflects data for three years of testing.
Reading Comprehension
Mathematics
50
N/A 52 53 0
98-99
N/A 50 53 97-98
54 50 52 96-97
School 50
System
State
N/A 59 59 0
98-99
N/A 58 58 97-98
61 57 57 96-97
School System State
Reading Vocabulary 50
N/A 46 48 0
98-99
N/A 45 48 97-98
53 45 46 96-97
Language Arts
School 50
System
State
N/A 61 63 0
98-99
N/A 61 61 97-98
64 59 58 96-97
School System State
Social Studies 50
N/A 53 57 0
98-99
N/A 47 56 97-98
53 47 55 96-97
Science
School 50
System
State
N/A 60 60 0
98-99
N/A 56 59 97-98
59 56 59 96-97
School System State
Sources of Information
Composite Score
School
50
50
System
N/A 56 58 0
98-99
N/A 55 58 97-98
56 53 57 96-97
State
N/A 55 57 0
98-99
N/A 54 56 97-98
1998-99 GEORGIA PUBLIC EDUCATION REPORT CARD Pine Log Elementary School - 6084052
Prepared by Georgia Department of Education
57 53 55 96-97
Scores Reported in Percentiles
School System State
Page 3
STATE-REQUIRED TEST DATA
PERFORMANCE ASSESSMENTS
Grade 5 Writing Assessment
Percent at Developmental Stages:
1998-99 School System State
1997-98 School System State
1996-97 School System State
Stage Stage Stage Stage Stage Stage
1:The Emerging Writer 2:The Developing Writer 3:The Focusing Writer 4:The Experimenting 5:The Engaging Writer 6:The Extending Writer
N/A N/A N/A N/A N/A N/A
0% 2% 16% 47% 25% 9%
0% 1% 16% 41% 29% 12%
N/A N/A N/A N/A N/A N/A
0% 2% 15% 41% 30% 8%
0% 3% 19% 41% 27% 10%
0% 0% 13% 53% 28% 6%
0% 2% 17% 39% 30% 11%
No Grade-5 Writing Assessment scores were reported for Pine Log Elementary School.
0% 3% 21% 37% 26% 12%
AWARDS / RECOGNITION DATA
Schools that become a Charter School have a unique opportunity to rethink how they structure and deliver education programs for improving the learning of their students while being freed from the state laws, State Board of Education rules and regulations, and local board of education rules and regulations that govern other schools. A 'charter' is a binding contract that, when approved by the faculty and parents of the school, the local board of education and the State Board of Education, substitutes for state education statutes, state and local rules, policies, regulations and standards.
Pine Log Elementary School is a Charter School for 1998-99.
1998-99 GEORGIA PUBLIC EDUCATION REPORT CARD Pine Log Elementary School - 6084052
Prepared by Georgia Department of Education
Page 4
CERTIFIED PERSONNEL DATA
Positions Number Average Contract Days
Personnel Sex
Certificate
Years Experience
Full-time Part-time
Male Female
4 Yr Bachelor's 5 Yr Master's 6 Yr Specialist's 7 Yr Doctoral Other*
<1 1-10 11-20 21-30 >30
Average
Administrators
2.00 205.00
2 0
0 2
0 0 2 0 0 0 0 1 1 0 23.00
Support Personnel
2.00 190.00
2 0
0 2
0 2 0 0 0 0 0 1 1 0 22.00
PK-12 Teachers
26.50 190.00
26 1
1 26
14 10
3 0 0 3 14 4 6 0 10.48
*Includes One- and Two-Year Vocational Certificates.
ACCREDITATION DATA
Accredited by Southern Association of Colleges and Schools (SACS):
Elementary/Middle Commission.
1998-99 GEORGIA PUBLIC EDUCATION REPORT CARD Pine Log Elementary School - 6084052
Prepared by Georgia Department of Education
Page 5
1998-99 GEORGIA PUBLIC EDUCATION REPORT CARD
BARTOW COUNTY SCHOOLS
South Central Middle School - 6080190
Grade Range 6-8
The Georgia Public Education Report Card is designed to assist systems and schools in educational improvement. This report card contains a variety of data elements. An explanation of the terms is provided as a companion to the report card data. Please refer to the definitions for the most effective use of the reported data.
STUDENT DATA
Total 919
6-8 Enrollment, by Race/Ethnicity and Sex
Black
White Hispanic
American Multi-
Asian Indian
racial
31 3.4%
853 92.8%
17 1.8%
9 1.0%
3 0.3%
6 0.7%
Male 483
52.6%
Female 436
47.4%
Enrollment in Selected Programs
Program
Gifted (Grades K-12)
Program % of Student Enrollment Population
51
5.5%
Alternative Programs (Grades 6-12)
2
< 1%
Students Eligible to Receive Free/Reduced Lunches
Number
Percent
School System
404 4,315
44.0% 38.1%
Enrollment in Compensatory Programs
Program
Program % of Student Enrollment Population
Special Education (Grades K-12) (PK)
164 17.8%
0
N/A
English to Speakers of Other Languages (ESOL) (Grades K-12)
0
0.0%
Title I (Grades K-12)
This school has no Title I program.
Dropout Rate for Grades 6-8
Number
Rate
School System
1
0.1%
2
0.1%
Total 0
Retained Students, by Race/Ethnicity and Sex
Black
White Hispanic
American MultiAsian Indian racial
0
0
0
0
0
0
Male Female
0
0
Prepared by Georgia Department of Education
Page 1
STATE-REQUIRED TEST DATA
NORM-REFERENCED TESTS Grade 8
Iowa Tests of Basic Skills (ITBS) Each chart reflects data for three years of testing.
Reading Comprehension 50
43 46 49 0
98-99
47 46 48 97-98
42 43 48 96-97
Mathematics
School 50
System
State
0
55 59 56 98-99
55 57 55 97-98
46 52 54 96-97
School System State
Reading Vocabulary 50
44 44 46 0
98-99
44 42 45 97-98
40 43 44 96-97
Language Arts
School 50
System
State
0
57 63 60 98-99
55 61 58 97-98
50 55 56 96-97
School System State
Social Studies 50
53 54 54 0
98-99
49 49 53 97-98
46 51 53 96-97
Science
School 50
System
State
0
54 56 56 98-99
51 52 55 97-98
45 51 53 96-97
School System State
Sources of Information
Composite Score
50
51 55 57 0
98-99
School 50
System
53 52 56 97-98
53 51 55 96-97
State 0
53 57 56 98-99
52 54 54 97-98
1998-99 GEORGIA PUBLIC EDUCATION REPORT CARD South Central Middle School - 6080190
Prepared by Georgia Department of Education
47 52 54 96-97
Scores Reported in Percentiles
School System State
Page 2
STATE-REQUIRED TEST DATA
Categories of Scaled Scores
Inadequate (less than 162)
Minimal (162-209)
Good
(210-247)
Very Good (greater than 247)
Average Scaled Score: (Range 100-300)
PERFORMANCE ASSESSMENTS
Grade 8 Writing Assessment
1998-99 Percent Scoring
1997-98 Percent Scoring
1996-97 Percent Scoring
School System State School System State School System State
5% 47% 45%
2%
5% 50% 42%
4%
8% 40% 41% 11%
6% 56% 34%
4%
5% 58% 35%
3%
11% 46% 34%
8%
14% 59% 25%
2%
10% 55% 30%
4%
15% 46% 30%
8%
203
204
208 201
201 202 193
198 198
AWARDS / RECOGNITION DATA
Through the Pay for Performance Program, exemplary public schools and schools making outstanding progress toward becoming exemplary may be rewarded. Not a merit pay program, the Pay for Performance Program motivates and rewards entire school faculties for working together to make their schools exemplary. A school selected for participation in the program has one school year to attain at least 80% of its previously-approved performance objectives in order to receive an award based on $2,000 per certified faculty member.
South Central Middle School was a Pay for Performance recipient in 1998-99.
1998-99 GEORGIA PUBLIC EDUCATION REPORT CARD South Central Middle School - 6080190
Prepared by Georgia Department of Education
Page 3
CERTIFIED PERSONNEL DATA
Positions Number Average Contract Days
Personnel Sex
Certificate
Years Experience
Full-time Part-time
Male Female
4 Yr Bachelor's 5 Yr Master's 6 Yr Specialist's 7 Yr Doctoral Other*
<1 1-10 11-20 21-30 >30
Average
Administrators
3.00 220.00
3 0
2 1
0 0 3 0 0 0 0 3 0 0 13.00
Support Personnel
4.00 190.00
4 0
0 4
0 2 2 0 0 1 0 2 1 0 13.25
PK-12 Teachers
64.30 190.00
64 1
24 41
38 23
3 1 0 10 31 19 5 0 9.12
*Includes One- and Two-Year Vocational Certificates.
ACCREDITATION DATA
Accredited by Southern Association of Colleges and Schools (SACS): Secondary/Middle Commission.
1998-99 GEORGIA PUBLIC EDUCATION REPORT CARD South Central Middle School - 6080190
Prepared by Georgia Department of Education
Page 4
1998-99 GEORGIA PUBLIC EDUCATION REPORT CARD
BARTOW COUNTY SCHOOLS
Taylorsville Elementary School - 6080396
Grade Range PK-5
The Georgia Public Education Report Card is designed to assist systems and schools in educational improvement. This report card contains a variety of data elements. An explanation of the terms is provided as a companion to the report card data. Please refer to the definitions for the most effective use of the reported data.
STUDENT DATA
Total
K-5
723
PK
24
Enrollment, by Race/Ethnicity and Sex
Black
White Hispanic
American Asian Indian
Multiracial
26 3.6%
679 93.9%
12 1.7%
2 0.3%
3 0.4%
1 0.1%
0
24
0.0% 100.0%
0 0.0%
0 0.0%
0 0.0%
0 0.0%
Male Female
381 52.7%
342 47.3%
13 54.2%
11 45.8%
Enrollment in Selected Programs
Program
Program % of Student Enrollment Population
Gifted (Grades K-12)
28
3.9%
Alternative Programs (Grades 6-12)
N/A
N/A
Students Eligible to Receive Free/Reduced Lunches
Number
Percent
School System
315 4,315
42.2% 38.1%
Dropout Rate *
Number
Rate
School System
N/A N/A
N/A N/A
* Dropout rates are not applicable for grades PK-5.
Enrollment in Compensatory Programs
Program
Program % of Student Enrollment Population
Special Education (Grades K-12)
117 16.2%
(PK)
7
N/A
English to Speakers of Other Languages (ESOL) (Grades K-12)
0
0.0%
Remedial Education (Grades 2-5, 9-12)
88 18.9%
Special Instructional Assistance (SIA) (Grades K-3)
164 33.1%
Title I (Grades K-12)
This school has a Targeted Assistance program.
Total 41
Retained Students, by Race/Ethnicity and Sex
Black
White Hispanic
American MultiAsian Indian racial
1 2.4%
40 97.6%
0 0.0%
0 0.0%
0 0.0%
0 0.0%
Male Female
25
16
61.0% 39.0%
Prepared by Georgia Department of Education
Page 1
STATE-REQUIRED TEST DATA
NORM-REFERENCED TESTS Grade 3
Iowa Tests of Basic Skills (ITBS) Each chart reflects data for three years of testing.
Reading Comprehension 50
N/A 52 54 0
98-99
N/A 60 53 97-98
67 55 52 96-97
Mathematics
School 50
System
State
N/A 66 61 0
98-99
N/A 71 61 97-98
83 67 59 96-97
School System State
Reading Vocabulary 50
N/A 51 50 0
98-99
N/A 56 50 97-98
69 53 49 96-97
Language Arts
School 50
System
State
N/A 64 64 0
98-99
N/A 75 62 97-98
85 66 59 96-97
School System State
Social Studies 50
N/A 53 56 0
98-99
N/A 63 55 97-98
63 53 55 96-97
Science
School 50
System
State
N/A 53 59 0
98-99
N/A 64 59 97-98
68 60 58 96-97
School System State
Sources of Information
Composite Score
School
50
50
System
N/A 61 57 0
98-99
N/A 68 56 97-98
68 60 55 96-97
State
N/A 57 58 0
98-99
N/A 67 57 97-98
1998-99 GEORGIA PUBLIC EDUCATION REPORT CARD Taylorsville Elementary School - 6080396
Prepared by Georgia Department of Education
73 60 56 96-97
Scores Reported in Percentiles
School System State
Page 2
STATE-REQUIRED TEST DATA
NORM-REFERENCED TESTS Grade 5
Iowa Tests of Basic Skills (ITBS) Each chart reflects data for three years of testing.
Reading Comprehension
Mathematics
50
N/A 52 53 0
98-99
N/A 50 53 97-98
48 50 52 96-97
School 50
System
State
N/A 59 59 0
98-99
N/A 58 58 97-98
58 57 57 96-97
School System State
Reading Vocabulary 50
N/A 46 48 0
98-99
N/A 45 48 97-98
41 45 46 96-97
Language Arts
School 50
System
State
N/A 61 63 0
98-99
N/A 61 61 97-98
58 59 58 96-97
School System State
Social Studies 50
N/A 53 57 0
98-99
N/A 47 56 97-98
47 47 55 96-97
Science
School 50
System
State
N/A 60 60 0
98-99
N/A 56 59 97-98
55 56 59 96-97
School System State
Sources of Information
Composite Score
School
50
50
System
N/A 56 58 0
98-99
N/A 55 58 97-98
49 53 57 96-97
State
N/A 55 57 0
98-99
N/A 54 56 97-98
1998-99 GEORGIA PUBLIC EDUCATION REPORT CARD Taylorsville Elementary School - 6080396
Prepared by Georgia Department of Education
51 53 55 96-97
Scores Reported in Percentiles
School System State
Page 3
STATE-REQUIRED TEST DATA
PERFORMANCE ASSESSMENTS
Grade 5 Writing Assessment
Percent at Developmental Stages:
1998-99 School System State
1997-98 School System State
1996-97 School System State
Stage Stage Stage Stage Stage Stage
1:The Emerging Writer 2:The Developing Writer 3:The Focusing Writer 4:The Experimenting 5:The Engaging Writer 6:The Extending Writer
0% 0% 5% 51% 37% 6%
0% 2% 16% 47% 25% 9%
0% 1% 16% 41% 29% 12%
1% 4% 10% 51% 27% 7%
0% 2% 15% 41% 30% 8%
0% 3% 19% 41% 27% 10%
0% 2% 14% 47% 33% 5%
0% 2% 17% 39% 30% 11%
0% 3% 21% 37% 26% 12%
AWARDS / RECOGNITION DATA
Schools that become a Charter School have a unique opportunity to rethink how they structure and deliver education programs for improving the learning of their students while being freed from the state laws, State Board of Education rules and regulations, and local board of education rules and regulations that govern other schools. A 'charter' is a binding contract that, when approved by the faculty and parents of the school, the local board of education and the State Board of Education, substitutes for state education statutes, state and local rules, policies, regulations and standards.
Taylorsville Elementary School is a Charter School for 1998-99.
1998-99 GEORGIA PUBLIC EDUCATION REPORT CARD Taylorsville Elementary School - 6080396
Prepared by Georgia Department of Education
Page 4
CERTIFIED PERSONNEL DATA
Positions Number Average Contract Days
Personnel Sex
Certificate
Years Experience
Full-time Part-time
Male Female
4 Yr Bachelor's 5 Yr Master's 6 Yr Specialist's 7 Yr Doctoral Other*
<1 1-10 11-20 21-30 >30
Average
Administrators
2.00 205.00
2 0
0 2
0 0 1 1 0 0 0 0 2 0 24.00
Support Personnel
3.00 190.00
3 0
0 3
0 3 0 0 0 0 0 2 1 0 19.67
PK-12 Teachers
42.97 190.00
41 4
1 44
23 22
0 0 0 4 23 10 8 0 10.38
*Includes One- and Two-Year Vocational Certificates.
ACCREDITATION DATA
Accredited by Southern Association of Colleges and Schools (SACS):
Elementary/Middle Commission.
1998-99 GEORGIA PUBLIC EDUCATION REPORT CARD Taylorsville Elementary School - 6080396
Prepared by Georgia Department of Education
Page 5
1998-99 GEORGIA PUBLIC EDUCATION REPORT CARD
BARTOW COUNTY SCHOOLS
White Elementary School - 6080175
Grade Range PK-5
The Georgia Public Education Report Card is designed to assist systems and schools in educational improvement. This report card contains a variety of data elements. An explanation of the terms is provided as a companion to the report card data. Please refer to the definitions for the most effective use of the reported data.
STUDENT DATA
Total
K-5
549
PK
50
Enrollment, by Race/Ethnicity and Sex
Black
White Hispanic
American Asian Indian
Multiracial
41 7.5%
491 89.4%
14 2.6%
2 0.4%
0 0.0%
1 0.2%
1 2.0%
47 94.0%
2 4.0%
0 0.0%
0 0.0%
0 0.0%
Male Female
286 52.1%
263 47.9%
29 58.0%
21 42.0%
Enrollment in Selected Programs
Program
Program % of Student Enrollment Population
Gifted (Grades K-12)
40
7.3%
Alternative Programs (Grades 6-12)
N/A
N/A
Students Eligible to Receive Free/Reduced Lunches
Number
Percent
School System
223 4,315
37.2% 38.1%
Dropout Rate *
Number
Rate
School System
N/A N/A
N/A N/A
* Dropout rates are not applicable for grades PK-5.
Enrollment in Compensatory Programs
Program
Program % of Student Enrollment Population
Special Education (Grades K-12)
83 15.1%
(PK)
12
N/A
English to Speakers of Other Languages (ESOL) (Grades K-12)
1
< 1%
Remedial Education (Grades 2-5, 9-12)
20
5.4%
Special Instructional Assistance (SIA) (Grades K-3)
112 30.5%
Title I (Grades K-12)
This school has no Title I program.
Total 2
Retained Students, by Race/Ethnicity and Sex
Black
White Hispanic
American MultiAsian Indian racial
Male Female
0
2
0.0% 100.0%
0 0.0%
0 0.0%
0 0.0%
0
2
0.0% 100.0%
0 0.0%
Prepared by Georgia Department of Education
Page 1
STATE-REQUIRED TEST DATA
NORM-REFERENCED TESTS Grade 3
Iowa Tests of Basic Skills (ITBS) Each chart reflects data for three years of testing.
Reading Comprehension 50
N/A 52 54 0
98-99
N/A 60 53 97-98
64 55 52 96-97
Mathematics
School 50
System
State
N/A 66 61 0
98-99
N/A 71 61 97-98
70 67 59 96-97
School System State
Reading Vocabulary 50
N/A 51 50 0
98-99
N/A 56 50 97-98
54 53 49 96-97
Language Arts
School 50
System
State
N/A 64 64 0
98-99
N/A 75 62 97-98
65 66 59 96-97
School System State
Social Studies 50
N/A 53 56 0
98-99
N/A 63 55 97-98
59 53 55 96-97
Science
School 50
System
State
N/A 53 59 0
98-99
N/A 64 59 97-98
63 60 58 96-97
School System State
Sources of Information
Composite Score
School
50
50
System
N/A 61 57 0
98-99
N/A 68 56 97-98
69 60 55 96-97
State
N/A 57 58 0
98-99
N/A 67 57 97-98
1998-99 GEORGIA PUBLIC EDUCATION REPORT CARD White Elementary School - 6080175
Prepared by Georgia Department of Education
67 60 56 96-97
Scores Reported in Percentiles
School System State
Page 2
STATE-REQUIRED TEST DATA
NORM-REFERENCED TESTS Grade 5
Iowa Tests of Basic Skills (ITBS) Each chart reflects data for three years of testing.
Reading Comprehension
Mathematics
50
N/A 52 53 0
98-99
N/A 50 53 97-98
57 50 52 96-97
School 50
System
State
N/A 59 59 0
98-99
N/A 58 58 97-98
68 57 57 96-97
School System State
Reading Vocabulary 50
N/A 46 48 0
98-99
N/A 45 48 97-98
54 45 46 96-97
Language Arts
School 50
System
State
N/A 61 63 0
98-99
N/A 61 61 97-98
69 59 58 96-97
School System State
Social Studies 50
N/A 53 57 0
98-99
N/A 47 56 97-98
56 47 55 96-97
Science
School 50
System
State
N/A 60 60 0
98-99
N/A 56 59 97-98
64 56 59 96-97
School System State
Sources of Information
Composite Score
School
50
50
System
N/A 56 58 0
98-99
N/A 55 58 97-98
68 53 57 96-97
State
N/A 55 57 0
98-99
N/A 54 56 97-98
1998-99 GEORGIA PUBLIC EDUCATION REPORT CARD White Elementary School - 6080175
Prepared by Georgia Department of Education
64 53 55 96-97
Scores Reported in Percentiles
School System State
Page 3
STATE-REQUIRED TEST DATA
PERFORMANCE ASSESSMENTS
Grade 5 Writing Assessment
Percent at Developmental Stages:
1998-99 School System State
1997-98 School System State
1996-97 School System State
Stage Stage Stage Stage Stage Stage
1:The Emerging Writer 2:The Developing Writer 3:The Focusing Writer 4:The Experimenting 5:The Engaging Writer 6:The Extending Writer
0% 1% 8% 38% 39% 13%
0% 2% 16% 47% 25% 9%
0% 1% 16% 41% 29% 12%
0% 0% 2% 40% 43% 14%
0% 2% 15% 41% 30% 8%
0% 3% 19% 41% 27% 10%
0% 1% 8% 39% 38% 14%
0% 2% 17% 39% 30% 11%
0% 3% 21% 37% 26% 12%
AWARDS / RECOGNITION DATA
Schools that become a Charter School have a unique opportunity to rethink how they structure and deliver education programs for improving the learning of their students while being freed from the state laws, State Board of Education rules and regulations, and local board of education rules and regulations that govern other schools. A 'charter' is a binding contract that, when approved by the faculty and parents of the school, the local board of education and the State Board of Education, substitutes for state education statutes, state and local rules, policies, regulations and standards.
White Elementary School is a Charter School for 1998-99.
1998-99 GEORGIA PUBLIC EDUCATION REPORT CARD White Elementary School - 6080175
Prepared by Georgia Department of Education
Page 4
CERTIFIED PERSONNEL DATA
Positions Number Average Contract Days
Personnel Sex
Certificate
Years Experience
Full-time Part-time
Male Female
4 Yr Bachelor's 5 Yr Master's 6 Yr Specialist's 7 Yr Doctoral Other*
<1 1-10 11-20 21-30 >30
Average
Administrators
2.00 205.00
2 0
1 1
0 0 2 0 0 0 0 0 2 0 26.00
Support Personnel
3.00 190.00
3 0
0 3
0 3 0 0 0 0 2 0 0 1 14.00
PK-12 Teachers
35.99 190.00
35 2
6 31
19 15
3 0 0 3 15 7 11 1 13.78
*Includes One- and Two-Year Vocational Certificates.
ACCREDITATION DATA
Accredited by Southern Association of Colleges and Schools (SACS):
Elementary/Middle Commission.
1998-99 GEORGIA PUBLIC EDUCATION REPORT CARD White Elementary School - 6080175
Prepared by Georgia Department of Education
Page 5
1998-99 GEORGIA PUBLIC EDUCATION REPORT CARD
BARTOW COUNTY SCHOOLS
Woodland Middle/High School - 6080198
Grade Range 6-11
The Georgia Public Education Report Card is designed to assist systems and schools in educational improvement. This report card contains a variety of data elements. An explanation of the terms is provided as a companion to the report card data. Please refer to the definitions for the most effective use of the reported data.
STUDENT DATA
Total 1,296
6-11 Enrollment, by Race/Ethnicity and Sex
Black
White Hispanic
American Multi-
Asian Indian
racial
116 9.0%
1,154 89.0%
7 0.5%
10 0.8%
5 0.4%
4 0.3%
Male 673
51.9%
Female 623
48.1%
Enrollment in Selected Programs
Program
Program % of Student Enrollment Population
Gifted (Grades K-12)
83
6.4%
Non-Vocational Labs (Grades 9-12)
465
50.1%
Vocational Labs (Grades 9-12)
254
27.3%
Alternative Programs (Grades 6-12)
9
< 1%
Students Eligible to Receive Free/Reduced Lunches
Number
Percent
School System
312 4,315
24.1% 38.1%
Enrollment in Compensatory Programs
Program
Program % of Student Enrollment Population
Special Education (Grades K-12) PK
170 13.1%
0
N/A
English to Speakers of Other Languages (ESOL) (Grades K-12)
0
0.0%
Remedial Education (Grades 2-5, 9-12)
28
3.0%
Special Instructional Assistance (SIA) (Grades K-3)
N/A
N/A
Title I (Grades K-12) This school has no Title I program.
Dropout Rate for Grades 6-11
Number
Rate
School System
142
8.9%
302
5.1%
Total 0
Retained Students, by Race/Ethnicity and Sex
Black
White Hispanic
American MultiAsian Indian racial
0
0
0
0
0
0
Male Female
0
0
Prepared by Georgia Department of Education
Page 1
STATE-REQUIRED TEST DATA
NORM-REFERENCED TESTS
Grade 3 Iowa Tests of Basic Skills (ITBS) Each chart reflects data for three years of testing.
No third-grade students are enrolled at Woodland Middle/High School.
Reading Comprehension
Mathematics
50
N/A 52 54 0
98-99
N/A 60 53 97-98
N/A 55 52 96-97
School 50
System
State
N/A 66 61 0
98-99
N/A 71 61 97-98
N/A 67 59 96-97
School System State
Reading Vocabulary 50
N/A 51 50 0
98-99
N/A 56 50 97-98
N/A 53 49 96-97
Language Arts
School 50
System
State
N/A 64 64 0
98-99
N/A 75 62 97-98
N/A 66 59 96-97
School System State
Social Studies 50
N/A 53 56 0
98-99
N/A 63 55 97-98
N/A 53 55 96-97
Science
School 50
System
State
N/A 53 59 0
98-99
N/A 64 59 97-98
N/A 60 58 96-97
School System State
Sources of Information
Composite Score
School
50
50
System
N/A 61 57 0
98-99
N/A 68 56 N/A 60 55
97-98
96-97
State
N/A 57 58 0
98-99
N/A 67 57 97-98
N/A 60 56 96-97
1998-99 GEORGIA PUBLIC EDUCATION REPORT CARD Woodland Middle/High School - 6080198
Prepared by Georgia Department of Education
Scores Reported in Percentiles
School System State
Page 2
STATE-REQUIRED TEST DATA
NORM-REFERENCED TESTS
Grade 5 Iowa Tests of Basic Skills (ITBS) Each chart reflects data for three years of testing. No fifth-grade students are enrolled at Woodland Middle/High School.
Reading Comprehension
Mathematics
50
N/A 52 53 0
98-99
N/A 50 53 97-98
N/A 50 52 96-97
School 50
System
State
N/A 59 59 0
98-99
N/A 58 58 97-98
N/A 57 57 96-97
School System State
Reading Vocabulary 50
N/A 46 48 0
98-99
N/A 45 48 97-98
N/A 45 46 96-97
Language Arts
School 50
System
State
N/A 61 63 0
98-99
N/A 61 61 97-98
N/A 59 58 96-97
School System State
Social Studies 50
N/A 53 57 0
98-99
N/A 47 56 97-98
N/A 47 55 96-97
Science
School 50
System
State
N/A 60 60 0
98-99
N/A 56 59 97-98
N/A 56 59 96-97
School System State
Sources of Information
Composite Score
School
50
50
System
N/A 56 58 0
98-99
N/A 55 58 N/A 53 57
97-98
96-97
State
N/A 55 57 0
98-99
N/A 54 56 97-98
N/A 53 55 96-97
1998-99 GEORGIA PUBLIC EDUCATION REPORT CARD Woodland Middle/High School - 6080198
Prepared by Georgia Department of Education
Scores Reported in Percentiles
School System State
Page 3
STATE-REQUIRED TEST DATA
NORM-REFERENCED TESTS Grade 8
Iowa Tests of Basic Skills (ITBS) Each chart reflects data for three years of testing.
Reading Comprehension 50
56 46 49 0
98-99
49 46 48 N/A 43 48
97-98
96-97
Mathematics
School 50
System
State
0
69 59 56 98-99
58 57 55 N/A 52 54
97-98
96-97
School System State
Reading Vocabulary 50
48 44 46 0
98-99
48 42 45 N/A 43 44
97-98
96-97
Language Arts
School 50
System
State
0
77 63 60 98-99
70 61 58 N/A 55 56
97-98
96-97
School System State
Social Studies 50
56 54 54 0
98-99
48 49 53 N/A 51 53
97-98
96-97
Science
School 50
System
State
0
64 56 56 98-99
58 52 55 N/A 51 53
97-98
96-97
School System State
Sources of Information
Composite Score
50
61 55 57 0
98-99
School 50
System
53 52 56 N/A 51 55
97-98
96-97
State 0
65 57 56 98-99
57 54 54 N/A 52 54
97-98
96-97
1998-99 GEORGIA PUBLIC EDUCATION REPORT CARD Woodland Middle/High School - 6080198
Prepared by Georgia Department of Education
Scores Reported in Percentiles
School System State
Page 4
STATE-REQUIRED TEST DATA
PERFORMANCE ASSESSMENTS
Grade 5 Writing Assessment
Percent at Developmental Stages:
1998-99 School System State
1997-98 School System State
1996-97 School System State
Stage Stage Stage Stage Stage Stage
1:The Emerging Writer 2:The Developing Writer 3:The Focusing Writer 4:The Experimenting 5:The Engaging Writer 6:The Extending Writer
N/A N/A N/A N/A N/A N/A
0% 2% 16% 47% 25% 9%
0% 1% 16% 41% 29% 12%
N/A N/A N/A N/A N/A N/A
0% 2% 15% 41% 30% 8%
0% 3% 19% 41% 27% 10%
N/A N/A N/A N/A N/A N/A
0% 2% 17% 39% 30% 11%
0% 3% 21% 37% 26% 12%
No fifth-grade students are enrolled at Woodland Middle/High School.
Categories of Scaled Scores
Inadequate (less than 162)
Minimal (162-209)
Good
(210-247)
Very Good (greater than 247)
Average Scaled Score: (Range 100-300)
Grade 8 Writing Assessment
1998-99 Percent Scoring
1997-98 Percent Scoring
1996-97 Percent Scoring
School System State School System State School System State
2% 35% 51% 12%
5% 50% 42%
4%
8% 40% 41% 11%
2% 61% 32%
5%
5% 58% 35%
3%
11% 46% 34%
8%
N/A N/A N/A N/A
10% 55% 30%
4%
15% 46% 30%
8%
215
204
208 202
201 202 N/A
198 198
GEORGIA HIGH SCHOOL GRADUATION TESTS (GHSGT)
Percent of Regular Program 11th Graders Passing the Georgia High School Graduation Tests on First Administration
English Language Arts Mathematics Social Studies Science
All Components listed above
Writing
1998-99
School System State
96% 92% 84% 72%
68%
95% 88% 75% 65%
61%
96% 88% 80% 72%
68%
94% 94% 93%
1997-98
School System State
N/A N/A N/A N/A
N/A
87% 85% 70% 67%
60%
94% 88% 78% 74%
68%
N/A 87% 92%
1996-97
School System State
N/A N/A N/A N/A
N/A
92% 87% 76% 66%
61%
94% 87% 78% 74%
67%
N/A 93% 93%
1998-99 GEORGIA PUBLIC EDUCATION REPORT CARD Woodland Middle/High School - 6080198
Prepared by Georgia Department of Education
Page 5
GRADUATE DATA
1999 Graduates by Credentials, Race/Ethnicity and Sex
Diplomas with Both College Prep. & Voc. Endorsements
Diplomas with College Prep. Endorsements
Diplomas with Vocational Endorsements
General High School Diplomas
Special Education Diplomas
Total All Diplomas
Total N/A
Black N/A
White Hispanic N/A N/A
American MultiAsian Indian racial
N/A N/A N/A
N/A
N/A
N/A N/A N/A N/A N/A
N/A
N/A
N/A N/A N/A N/A N/A
N/A
N/A
N/A N/A N/A N/A N/A
N/A
N/A
N/A N/A N/A N/A N/A
N/A
Male Female N/A N/A N/A N/A N/A N/A N/A N/A N/A N/A
Certificates of Performance
Total Graduates
N/A
N/A
N/A N/A N/A N/A N/A
N/A N/A
N/A
HOPE Scholarships
School System
Number of 1999 Graduates Number Eligible Percent Eligible
N/A N/A N/A
388 203 52.3%
State
65,548 40,292 61.5%
High School Completion Rate
Percent of 1995Grade 9 Enrollment in Graduating Class of1999 School System State
Completion Rate '95-'99 N / A 54.5% 68.9%
1998-99 GEORGIA PUBLIC EDUCATION REPORT CARD
Woodland Middle/High School - 6080198
Prepared by Georgia Department of Education
Page 6
COLLEGE ADMISSIONS / CREDIT TEST DATA
Scholastic Assessment Test (SAT)
Based on students' highest verbal and highest math scores
No. Taking
Average Score
Tests Verbal Math Total
Based on students' last test administration
Average Score Verbal Math Total
School
N/A
College Prep. Endorsement
Other Diplomas
System
219
College Prep. Endorsement
Other Diplomas
Georgia
41,958
N/A N/A N/A
460 481 370
492
N/A N/A N/A
458 474 363
488
N/A N/A N/A
918 955 733
980
N/A N/A N/A
454 N/A N/A
483
N/A N/A N/A
449 N/A N/A
479
N/A N/A N/A
903 N/A N/A
962
Nation
952,913 N/A N/A N/A
502 508 1010
American College Testing (ACT)
Advanced Placement Exams (AP)
Number taking tests: English Mathematics Reading Science Reasoning CompositeScore
N/A
School System
N/A 19.7
N/A 20.7
N/A N/A
19.9 20.3
N/A 20.4
State 19.1 19.9 20.2 19.9 19.9
No. of Students Taking Tests
No. of Tests Taken No. of Test Scores
3 or Higher Percent of Test
Scores 3 or Higher
School 65 90 4
4.4%
System State 170 15,225 246 23,969 28 13,024
11.4% 54.3%
POST-SECONDARY DATA
Graduates Entering Georgia Public Colleges
Graduates Entering Georgia Public Colleges and Requiring Learning Support (LS)
1998 Graduates Entering in 1998-99
1997 Graduates Entering in 1997-98
Percent of Graduating Number Class
School N / A
N/A
System 9 9
26.1%
School N / A
N/A
System 103
22.8%
Number Requiring
LS N/A 25
N/A 29
Percent of those attending Georgia
Public Colleges
N/A
25.3%
N/A
28.2%
In previous years, the Report Card presented College Prep Curriculum information provided by the Board of Regents on students requiring Learning Support. Due to inconsistencies in the data provided by the Board of Regents in defining College Prep Completers versus Local Board of Education data defining College Prep Endorsements, the Department of Education Report Card will not provide this information until discrepancies can be reconciled.
Graduates Entering Georgia Public Technical and Adult Schools
1998 Graduates School System
Entering Number N/A 24
1998-99 Percent
N/A 6.3%
Entering Number N/A N/A
1997-98 Percent
N/A N/A
1997 Graduates School System
N/A 1
N/A 0.2%
N/A 12
N/A 2.7%
1998-99 GEORGIA PUBLIC EDUCATION REPORT CARD Woodland Middle/High School - 6080198
Prepared by Georgia Department of Education
Page 7
CERTIFIED PERSONNEL DATA
Positions Number Average Contract Days
Administrators
4.00 217.50
Support Personnel
4.00 190.00
PK-12 Teachers
73.50 191.89
Personnel Sex
Certificate
Years Experience
Full-time Part-time
Male Female
4 Yr Bachelor's 5 Yr Master's 6 Yr Specialist's 7 Yr Doctoral Other*
<1 1-10 11-20 21-30 >30
Average
4 0
2 2
1 0 2 1 0
0 1 1 2 0
18.00
4 0
1 3
0 2 2 0 0
0 2 2 0 0
13.00
68 6
25 49
45 25
2 1 1
13 40 16
4 1
8.15
*Includes One- and Two-Year Vocational Certificates.
ACCREDITATION DATA
Accredited by Southern Association of Colleges and Schools (SACS): Secondary/Middle Commission.
AWARDS / RECOGNITION DATA
Schools in Georgia may receive recognition in the following programs: Charter School Pay for Performance Program Georgia School of Excellence National Blue Ribbon School Woodland Middle/High School did not receive recognition in any of these programs during the 1998-99 school year.
1998-99 GEORGIA PUBLIC EDUCATION REPORT CARD Woodland Middle/High School - 6080198
Prepared by Georgia Department of Education
Page 8
1998-99 GEORGIA PUBLIC EDUCATION REPORT CARD BEN HILL COUNTY SCHOOLS - 609
The Georgia Public Education Report Card is designed to assist systems and schools in educational improvement. This report card contains a variety of data elements. An explanation of the terms is provided as a companion to the report card data. Please refer to the definitions for the most effective use of the reported data.
Total
K-12
3,454
PK
134
STUDENT DATA
Enrollment, by Race/Ethnicity and Sex
Black
White Hispanic
American Multi-
Asian Indian
racial
1,574 45.6%
1,804 52.2%
48 1.4%
11 0.3%
6 0.2%
11 0.3%
67 50.0%
64 47.8%
1 0.7%
0 0.0%
0 0.0%
2 1.5%
Male
1,768 51.2%
72 53.7%
Female
1,686 48.8%
62 46.3%
Enrollment in Selected Programs
Program
Program % of Student Enrollment Population
Gifted (Grades K-12)
90
2.6%
Non-Vocational Labs (Grades 9-12)
806
82.1%
Vocational Labs (Grades 9-12)
707
72.0%
Alternative Programs (Grades 6-12)
16
< 1%
Students Eligible to Receive Free/Reduced Lunches
Number
Percent
2,137
59.6%
Dropout Rate
Number
Percent
6-12 9-12
91
4.7%
85
8.2%
Enrollment in Compensatory Programs
Program
Program % of Student Enrollment Population
Special Education
(Grades K-12)
324
PK
42
English to Speakers of
Other Languages (ESOL)
9
(Grades K-12)
Remedial Education (Grades 2-5, 9-12)
361
Special Instructional
Assistance (SIA)
285
(Grades K-3)
Title I (Grades K-12) Number of schools with: Schoolwide program Targeted Assistance program No Title I program
9.4% N/A < 1%
17.2%
26.7%
3 0 1
Total 161
Retained Students, by Race/Ethnicity and Sex
Black
White Hispanic
American MultiAsian Indian racial
76 47.2%
81 50.3%
3 1.9%
0 0.0%
1 0.6%
0 0.0%
Male Female
102
59
63.4% 36.6%
Prepared by Georgia Department of Education
Page 1
STATE-REQUIRED TEST DATA
NORM-REFERENCED TESTS
Grade 3 Iowa Tests of Basic Skills (ITBS) Each chart reflects data for three years of testing.
Reading Comprehension
Mathematics
50
37 54 34 53 38 52 0
98-99 97-98 96-97
System State
50
47 61 45 61 46 59 0
98-99 97-98 96-97
System State
Reading Vocabulary
50
35 50 31 50 34 49 0
98-99 97-98 96-97
System State
Social Studies
50
42 56 39 55 45 55 0
98-99 97-98 96-97
System State
Language Arts
50
49 64 46 62 53 59 0
98-99 97-98 96-97
System State
Science
50
45 59 41 59 48 58 0
98-99 97-98 96-97
System State
Sources of Information
Composite Score
50
37 57 0
98-99
System
50
34 56 42 55 97-98 96-97
State
41 58 39 57 0
98-99 97-98
1998-99 GEORGIA PUBLIC EDUCATION REPORT CARD Ben Hill County Schools
Prepared by Georgia Department of Education
System State Scores Reported 43 56 in Percentiles 96-97
Page 2
STATE-REQUIRED TEST DATA
NORM-REFERENCED TESTS
Grade 5 Iowa Tests of Basic Skills (ITBS) Each chart reflects data for three years of testing.
Reading Comprehension
Mathematics
50
44 53 42 53 39 52 0
98-99 97-98 96-97
System State
50
48 59 46 58 46 57 0
98-99 97-98 96-97
System State
Reading Vocabulary
50
35 48 36 48 44 46 0
98-99 97-98 96-97
System State
Social Studies
50
47 57 47 56 43 55 0
98-99 97-98 96-97
System State
Language Arts
50
60 63 56 61 53 58 0
98-99 97-98 96-97
System State
Science
50
53 60 52 59 49 59 0
98-99 97-98 96-97
System State
Sources of Information
Composite Score
50
49 58 0
98-99
System
50
48 58 46 57 97-98 96-97
State
49 57 48 56 0
98-99 97-98
1998-99 GEORGIA PUBLIC EDUCATION REPORT CARD Ben Hill County Schools
Prepared by Georgia Department of Education
System State Scores Reported 45 55 in Percentiles 96-97
Page 3
STATE-REQUIRED TEST DATA
NORM-REFERENCED TESTS Grade 8
Iowa Tests of Basic Skills (ITBS) Each chart reflects data for three years of testing.
Reading Comprehension
Mathematics
50
37 49 35 48 36 48 0
98-99 97-98 96-97
System State
50
52 56 46 55 45 54 0
98-99 97-98 96-97
System State
Reading Vocabulary
50
29 46 28 45 27 44 0
98-99 97-98 96-97
System State
Language Arts
50
52 60 42 58 46 56 0
98-99 97-98 96-97
System State
Social Studies
50
49 54 44 53 46 53 0
98-99 97-98 96-97
System State
Science
50
57 56 45 55 44 53 0
98-99 97-98 96-97
System State
Sources of Information
Composite Score
50
50 57 0
98-99
System
50
42 56 43 55 97-98 96-97
State
48 56 41 54 0
98-99 97-98
1998-99 GEORGIA PUBLIC EDUCATION REPORT CARD Ben Hill County Schools
Prepared by Georgia Department of Education
System State Scores Reported 41 54 in Percentiles 96-97
Page 4
STATE-REQUIRED TEST DATA
PERFORMANCE ASSESSMENTS
Grade 5 Writing Assessment
1998-99
1997-98
1996-97
Percent at Developmental Stages:
Comparison
Comparison
Comparison
System Group State System Group State System Group State
Stage Stage Stage Stage Stage Stage
1: The Emerging Writer 2: The Developing Writer 3: The Focusing Writer 4: The Experimenting Writer 5: The Engaging Writer 6: The Extending Writer
0% 2% 29% 46% 15% 6%
0% 2% 21% 46% 23% 7%
0% 1% 16% 41% 29% 12%
0% 8% 32% 27% 24% 9%
0% 3% 22% 43% 23% 7%
0% 3% 19% 41% 27% 10%
1% 8% 27% 38% 20% 5%
0% 5% 26% 37% 22% 8%
0% 3% 21% 37% 26% 12%
Grade 8 Writing Assessment
1998-99 Percent Scoring 1997-98 Percent Scoring 1996-97 Percent Scoring
Categories of Scaled Scores
Comparison
Comparison
Comparison
System Group State System Group State System Group State
Inadequate (less than 162)
Minimal (162-209)
Good
(210-247)
Very Good (greater than 247)
14% 45% 34%
8%
9% 46% 36%
9%
8% 40% 41% 11%
20% 45% 30%
5%
13% 50% 31%
6%
11% 46% 34%
8%
26% 43% 22%
9%
21% 47% 25%
7%
15% 46% 30%
8%
Average Scaled Score: (Range 100-300)
197
203 208
194
197 202
189
192 198
GEORGIA HIGH SCHOOL GRADUATION TESTS (GHSGT)
Percent of Regular Program 11th Graders Passing the Georgia High School Graduation Tests on First Administration
1998-99
1997-98
1996-97
Comparison
Comparison
Comparison
System Group State System Group State System Group State
English Language Arts Mathematics Social Studies Science
94% 86% 76% 65%
94% 86% 76% 69%
96% 88% 80% 72%
89% 87% 74% 68%
93% 86% 73% 71%
94% 88% 78% 74%
91% 85% 69% 74%
94% 83% 70% 71%
94% 87% 78% 74%
All Components listed above 6 0 %
63% 68% 61%
63% 68% 63%
61% 67%
Writing
85%
93% 93% 90%
91% 92% 93%
93% 93%
1998-99 GEORGIA PUBLIC EDUCATION REPORT CARD
Ben Hill County Schools
Prepared by Georgia Department of Education
Page 5
GRADUATE DATA
1999 Graduates by Credentials, Race/Ethnicity and Sex
Diplomas with Both College Prep. & Voc. Endorsements
Diplomas with College Prep. Endorsements Diplomas with Vocational Endorsements General High School Diplomas Special Education Diplomas
Total All Diplomas
Certificates of Performance
Total Graduates
Total 60 33
102 4 4
203 1
204
Black
American MultiWhite Hispanic Asian Indian racial
Male Female
18 30.0%
3 9.1%
57 55.9%
1 25.0%
1 25.0%
42 70.0%
28 84.8%
44 43.1%
3 75.0%
3 75.0%
0 0.0%
0 0.0%
0 0.0%
0 0.0%
0 0.0%
0 0.0%
1 3.0%
1 1.0%
0 0.0%
0 0.0%
0 0.0%
1 3.0%
0 0.0%
0 0.0%
0 0.0%
0 0.0%
0 0.0%
0 0.0%
0 0.0%
0 0.0%
22 36.7%
16 48.5%
61 59.8%
1 25.0%
2 50.0%
38 63.3%
17 51.5%
41 40.2%
3 75.0%
2 50.0%
80
120
0
2
1
0
102 101
39.4% 59.1% 0.0% 1.0% 0.5% 0.0% 50.2% 49.8%
0
1
0
0
0
0
1
0
0.0% 100.0% 0.0% 0.0% 0.0% 0.0% 100.0% 0.0%
80
121
0
2
1
0
103 101
39.2% 59.3% 0.0% 1.0% 0.5% 0.0% 50.5% 49.5%
HOPE Scholarships
System State
Number of 1999 Graduates 2 0 4
Number Eligible
115
Percent Eligible
56.4%
65,548 40,292 61.5%
High School Completion Rate Percent of 1995Grade 9 Enrollment
in Graduating Class of1999
System
State
Completion Rate '95-'99 66.4% 68.9%
COLLEGE ADMISSIONS / CREDIT TEST DATA
Scholastic Assessment Test (SAT)
No. Taking
Average Score
Tests
Verbal Math Total
Based on students' highest verbal and highest math scores
System College Prep. Endorsement Other Diplomas
454 467 921 475 491 966 404 401 805
Georgia
492 488 980
Based on students' last test administration
System Georgia
102
449 461
910
41,958 483 479 962
Nation
952,913 502 508 1010
American College Testing (ACT)
System State Nation
English Mathematics Reading Science Reasoning
N/A N/A N/A N/A
19.1 19.9 20.2 19.9
20.4 20.7 21.3 21.0
CompositeScore N/A * 19.9 21.9
* Scores not reported when fewer than 5 tests taken.
Advanced Placement Exams (AP)
No. of Students Taking Tests
No. of Tests Taken No. of Test Scores
3 or Higher Percent of Test
Scores 3 or Higher
System State 18 15,225 18 23,969 13 13,024
72.2% 54.3%
1998-99 GEORGIA PUBLIC EDUCATION REPORT CARD Ben Hill County Schools
Prepared by Georgia Department of Education
Page 6
POSTSECONDARY DATA
Graduates Entering Georgia Public Colleges and Universities
Graduates Entering Georgia Public Colleges and Universities and
Requiring Learning Support (LS)
1998 Graduates Entering 1998-99
1997 Graduates Entering 1997-98
Percent of Graduating Number Class
82
42.7%
69
42.9%
Number Requiring
LS
30
12
Percent of those attending Georgia
Public Colleges
36.6%
17.4%
In previous years, the Report Card presented College Prep Curriculum information provided by the Board of Regents on students requiring Learning Support. Due to inconsistencies in the data provided by the Board of Regents in defining College Prep Completers versus Local Board of Education data defining College Prep Endorsements, the Department of Education Report Card will not provide this information until discrepancies can be reconciled.
Graduates Entering Georgia Public Technical and Adult Schools
Entering 1998-99 Entering 1997-98
Number Percent
Number Percent
1998 Graduates 1997 Graduates
36
18.8%
2
1.2%
N/A 20
N/A 12.4%
ACCREDITATION / RECOGNITION DATA
Southern Association of Colleges and Schools (SACS) Accrediting Commission
Secondary/Middle Commission Elementary/Middle Commission Both Elementary/Secondary Commissions Joint Commission Candidate for Accreditation
Accreditation by Georgia Accrediting Commission (GAC)
Accredited by GAC Accredited with Quality by GAC
Number of Schools
1 0 0 0 0
Number of Schools
0 4
Awards / Recognition
State Recognized Program
Number of Schools
Charter School
0
Pay for Performance Recipient
0
Georgia School of Excellence
0
National Blue Ribbon School
0
COMMUNITY DATA
Number of Children Eligible for Migrant Education Number of Families-At-Risk * Number of Food Stamp Participants * Number of Families Receiving TANF * ** Per Capita Income * Unemployment Rate * 1990 Population * Projected 2000 Population * Projected 2010 Population *
* Data Available at County Level Only ** Known as AFDC before January 1997
53 70 2,040 245 $18,038 5.9% 16,245 17,790 19,651
1998-99 GEORGIA PUBLIC EDUCATION REPORT CARD Ben Hill County Schools
Prepared by Georgia Department of Education
Page 7
FISCAL DATA
Millage Rate
18.00
* Fall 1998 Property Tax Digest is used to calculate the 98-99 Value of One Mill
FTE Count
FTE Count used for Allotment Calculation 3,394.0 Fall '98 FTE Count 3,454
Value of One Mill
$216,846 $63.89 per Allotment FTE
Sources: Local State-QBE State-
Lottery State-
Other Federal Other
Total
PerGeneral Fund cent Per FTE
$4,106,444 22.7% $1,210 $13,572,519 74.9% $3,999
K-12 Revenues
Lottery K-12
and
Title
All Other
Programs
K-12
$0
$0
Bonded Debt $555,877
$0
$0
$0
$0 0.0%
$0
$0
$76,783
$0
$426,660 2.4% $126
$0 0.0%
$0
$6,289 0.0%
$2
$18,111,913 100% $5,337
$0 $1,537,638
$0 $1,537,638
$18,748 $14,929
$0 $110,460
$999 $0 $0
$556,877
Capital Projects
$0 $0
$0
$0 $0 $0 $0
School Nutrition
$322,585 $0
$0
$98,644 $903,713
$0 $1,324,943
Grand Total
Total
Per-
Amount cent
$4,984,908 23.0%
$13,572,519 62.7%
$76,783 0.4%
$545,051 2.5% $2,456,280 11.3%
$6,289 0.0% $21,641,833 100%
Instruction
Media Instruction
Support Pupil Services General Admin. School Admin. Trans-
portation Maint. & Ops. Capital Projects School Food Debt Service
Total
$11,807,139 68.1% $3,479 $344,422 2.0% $101
$666,569 3.8% $196
K-12 Expenditures
$1,331,394 $104,917
$0
$0
$0
$0
$120,601
$4,810
$0
$725,159 4.2% $214
$17,707
$0
$0
$484,173 2.8% $143
$55,187
$0
$0
$1,435,389 8.3% $423
$2,336
$0
$0
$742,911 4.3% $219
$14,376
$243
$0
$1,122,344 6.5% $331
$20,890
$0
$0
$0 0.0%
$0
$0
$0
$0
$1,866 0.0%
$1
$1,757
$489
$0
$0 0.0%
$0
$0
$0 $379,518
$17,329,977 100% $5,107 $1,564,250 $110,460 $379,518
$0
$0 $13,243,451 63.8%
$0
$0
$344,422 1.7%
$0
$0
$791,981 3.8%
$0
$0
$742,866 3.6%
$0
$0
$539,361 2.6%
$0
$0 $1,437,725 6.9%
$0
$0
$757,531 3.6%
$0
$0 $1,143,234 5.5%
$87,774
$0
$87,774 0.4%
$0 $1,299,870 $1,303,984 6.3%
$0
$0
$379,518 1.8%
$87,774 $1,299,870 $20,771,852 100%
Salaries and Benefits as Percentages of Revenues and of Expenditures
Teachers and Paraprofessionals
Salaries $9,339,328
Benefits $2,571,864
Percentage of Revenues Percentage of Expenditures
Total of
Total of
General Fund
General Fund
Title Programs
Title Programs
Lottery K-12
Lottery K-12
Total Salaries
and
Total
and
Total
and Benefits All Other K-12 K - 12 All Other K-12 K - 12
$11,911,192
60.3%
55.0%
62.7%
57.3%
School Administration
$853,487
$295,005
$1,148,492
5.8%
5.3%
6.0%
5.5%
General Administration
$170,571
$108,661
$279,232
1.4%
1.3%
1.5%
1.3%
1998-99 GEORGIA PUBLIC EDUCATION REPORT CARD
Ben Hill County Schools - 609
Prepared by Georgia Department of Education
Page 8
CERTIFIED PERSONNEL DATA
Number
Average Annual Salary Positions Average Contract Days
Average Daily Salary
Full-time Personnel Part-time
Sex Male Female
4 Yr Bachelor's Certificate 5 Yr Master's
Level 6 Yr Specialist's 7 Yr Doctoral Other*
Black
White Race/ Hispanic Ethnicity Asian
American Indian
Multiracial
Years Experience
<1 1-10 11-20 21-30 >30
Average
Administrators
21.50
$58,247.77 216.05
$269.61
21 1
10 12
1 3 18 0 0
3 19
0 0 0 0
1 5 10 5 1
16.45
Support Personnel PK-12 Teachers
23.00
224.12
$44,313.56 197.39
$224.50
$39,364.41 189.96
$207.22
21
222
5
3
9
36
17
189
4
90
14
92
6
39
1
3
1
1
5
21
21
204
0
0
0
0
0
0
0
0
2
9
5
77
14
82
3
51
2
6
14.58
14.44
*Includes One- and Two-Year Vocational Certificates.
Certified Staff Position Ratios
Teacher/Administrator Ratio 10:1
Teacher/Support Person Ratio 10:1
Teacher/Staff Ratio 5:1
Student Enrollment/All Teachers 15:1
Certified Personnel by Category
82.4% 100%
8.1%
9.5%
80% 60%
40%
20%
0%
Teachers
Administrators
Support Personnel
1998-99 GEORGIA PUBLIC EDUCATION REPORT CARD
Ben Hill County Schools - 609
Prepared by Georgia Department of Education
Page 9
1998-99 GEORGIA PUBLIC EDUCATION REPORT CARD
BEN HILL COUNTY SCHOOLS
Ben Hill County Elementary School - 6091050
Grade Range 3-5
The Georgia Public Education Report Card is designed to assist systems and schools in educational improvement. This report card contains a variety of data elements. An explanation of the terms is provided as a companion to the report card data. Please refer to the definitions for the most effective use of the reported data.
STUDENT DATA
Total 854
3-5 Enrollment, by Race/Ethnicity and Sex
Black
White Hispanic
American Multi-
Asian Indian
racial
395 46.3%
443 51.9%
7 0.8%
2 0.2%
0 0.0%
7 0.8%
Male Female
449 52.6%
405 47.4%
Enrollment in Selected Programs
Program
Program % of Student Enrollment Population
Gifted (Grades K-12)
25
2.9%
Alternative Programs (Grades 6-12)
N/A
N/A
Students Eligible to Receive Free/Reduced Lunches
Number
Percent
School System
561 2,137
65.7% 59.6%
Dropout Rate *
Number
Rate
School System
N/A N/A
N/A N/A
* Dropout rates are not applicable for grades PK-5.
Enrollment in Compensatory Programs
Program
Program % of Student Enrollment Population
Special Education (Grades K-12)
80
9.4%
(PK)
0
N/A
English to Speakers of Other Languages (ESOL) (Grades K-12)
0
0.0%
Remedial Education (Grades 2-5, 9-12)
292 34.2%
Special Instructional Assistance (SIA) (Grades K-3)
0
0.0%
Title I (Grades K-12)
This school has a schoolwide program.
Total 29
Retained Students, by Race/Ethnicity and Sex
Black
White Hispanic
American Multi-
Asian Indian
racial
15 51.7%
14 48.3%
0 0.0%
0 0.0%
0 0.0%
0 0.0%
Male Female
14
15
48.3% 51.7%
Prepared by Georgia Department of Education
Page 1
STATE-REQUIRED TEST DATA
NORM-REFERENCED TESTS Grade 3
Iowa Tests of Basic Skills (ITBS) Each chart reflects data for three years of testing.
Reading Comprehension 50
37 37 54 0
98-99
34 34 53 97-98
38 38 52 96-97
Mathematics
School 50
System
State
0
47 47 61 98-99
45 45 61 97-98
46 46 59 96-97
School System State
Reading Vocabulary 50
35 35 50 0
98-99
31 31 50 97-98
34 34 49 96-97
Language Arts
School 50
System
State
0
49 49 64 98-99
46 46 62 97-98
53 53 59 96-97
School System State
Social Studies 50
42 42 56 0
98-99
39 39 55 97-98
45 45 55 96-97
Science
School 50
System
State
0
45 45 59 98-99
41 41 59 97-98
48 48 58 96-97
School System State
Sources of Information
Composite Score
50
37 37 57 0
98-99
School 50
System
34 34 56 97-98
42 42 55 96-97
State 0
41 41 58 98-99
39 39 57 97-98
1998-99 GEORGIA PUBLIC EDUCATION REPORT CARD Ben Hill County Elementary School - 6091050
Prepared by Georgia Department of Education
43 43 56 96-97
Scores Reported in Percentiles
School System State
Page 2
STATE-REQUIRED TEST DATA
NORM-REFERENCED TESTS Grade 5
Iowa Tests of Basic Skills (ITBS) Each chart reflects data for three years of testing.
Reading Comprehension
Mathematics
50
44 44 53 0
98-99
42 42 53 97-98
39 39 52 96-97
School 50
System
State
0
48 48 59 98-99
46 46 58 97-98
46 46 57 96-97
School System State
Reading Vocabulary 50
35 35 48 0
98-99
36 36 48 97-98
44 44 46 96-97
Language Arts
School 50
System
State
0
60 60 63 98-99
56 56 61 97-98
53 53 58 96-97
School System State
Social Studies 50
47 47 57 0
98-99
47 47 56 97-98
43 43 55 96-97
Science
School 50
System
State
0
53 53 60 98-99
52 52 59 97-98
49 49 59 96-97
School System State
Sources of Information
Composite Score
50
49 49 58 0
98-99
School 50
System
48 48 58 97-98
46 46 57 96-97
State 0
49 49 57 98-99
48 48 56 97-98
45 45 55 96-97
1998-99 GEORGIA PUBLIC EDUCATION REPORT CARD Ben Hill County Elementary School - 6091050
Prepared by Georgia Department of Education
Scores Reported in Percentiles
School System State
Page 3
STATE-REQUIRED TEST DATA
PERFORMANCE ASSESSMENTS
Grade 5 Writing Assessment
Percent at Developmental Stages:
1998-99 School System State
1997-98 School System State
1996-97 School System State
Stage Stage Stage Stage Stage Stage
1:The Emerging Writer 2:The Developing Writer 3:The Focusing Writer 4:The Experimenting 5:The Engaging Writer 6:The Extending Writer
0% 2% 29% 46% 15% 6%
0% 2% 29% 46% 15% 6%
0% 1% 16% 41% 29% 12%
0% 8% 32% 27% 24% 9%
0% 8% 32% 27% 24% 9%
0% 3% 19% 41% 27% 10%
1% 8% 27% 38% 20% 5%
1% 8% 27% 38% 20% 5%
0% 3% 21% 37% 26% 12%
AWARDS / RECOGNITION DATA
Schools in Georgia may receive recognition in the following programs: Charter School Pay for Performance Program Georgia School of Excellence National Blue Ribbon School Ben Hill County Elementary School did not receive recognition in any of these programs during the 1998-99 school year.
1998-99 GEORGIA PUBLIC EDUCATION REPORT CARD Ben Hill County Elementary School - 6091050
Prepared by Georgia Department of Education
Page 4
CERTIFIED PERSONNEL DATA
Positions Number Average Contract Days
Personnel Sex
Certificate
Years Experience
Full-time Part-time
Male Female
4 Yr Bachelor's 5 Yr Master's 6 Yr Specialist's 7 Yr Doctoral Other*
<1 1-10 11-20 21-30 >30
Average
Administrators
2.00 200.00
2 0
1 1
0 1 1 0 0 0 1 1 0 0 14.50
Support Personnel
4.00 190.00
4 0
1 3
0 2 1 1 0 0 2 2 0 0 9.00
PK-12 Teachers
55.00 190.00
55 0
3 52
24 20 10
1 0 5 21 22 6 1 11.95
*Includes One- and Two-Year Vocational Certificates.
ACCREDITATION DATA
Accredited with Quality by Georgia Accrediting Commission (GAC).
1998-99 GEORGIA PUBLIC EDUCATION REPORT CARD Ben Hill County Elementary School - 6091050
Prepared by Georgia Department of Education
Page 5
1998-99 GEORGIA PUBLIC EDUCATION REPORT CARD
BEN HILL COUNTY SCHOOLS
Ben Hill County Middle School - 6090296
Grade Range 6-8
The Georgia Public Education Report Card is designed to assist systems and schools in educational improvement. This report card contains a variety of data elements. An explanation of the terms is provided as a companion to the report card data. Please refer to the definitions for the most effective use of the reported data.
STUDENT DATA
Total 830
6-8 Enrollment, by Race/Ethnicity and Sex
Black
White Hispanic
American Multi-
Asian Indian
racial
374 45.1%
436 52.5%
14 1.7%
3 0.4%
1 0.1%
2 0.2%
Male 397
47.8%
Female 433
52.2%
Enrollment in Selected Programs
Program
Gifted (Grades K-12)
Program % of Student Enrollment Population
27
3.3%
Alternative Programs
13
(Grades 6-12)
1.6%
Students Eligible to Receive Free/Reduced Lunches
Number
Percent
School System
498 2,137
60.0% 59.6%
Enrollment in Compensatory Programs
Program
Program % of Student Enrollment Population
Special Education (Grades K-12) (PK)
107 12.9%
0
N/A
English to Speakers of Other Languages (ESOL) (Grades K-12)
4
< 1%
Title I (Grades K-12)
This school has a schoolwide program.
Dropout Rate for Grades 6-8
Number
Rate
School System
6
0.7%
6
0.7%
Total 43
Retained Students, by Race/Ethnicity and Sex
Black
White Hispanic
American MultiAsian Indian racial
19 44.2%
22 51.2%
2 4.7%
0 0.0%
0 0.0%
0 0.0%
Male Female
28
15
65.1% 34.9%
Prepared by Georgia Department of Education
Page 1
STATE-REQUIRED TEST DATA
NORM-REFERENCED TESTS Grade 8
Iowa Tests of Basic Skills (ITBS) Each chart reflects data for three years of testing.
Reading Comprehension 50
37 37 49 0
98-99
35 35 48 97-98
36 36 48 96-97
Mathematics
School 50
System
State
0
52 52 56 98-99
46 46 55 97-98
45 45 54 96-97
School System State
Reading Vocabulary 50
29 29 46 0
98-99
28 28 45 97-98
27 27 44 96-97
Language Arts
School 50
System
State
0
52 52 60 98-99
42 42 58 97-98
46 46 56 96-97
School System State
Social Studies 50
49 49 54 0
98-99
44 44 53 97-98
46 46 53 96-97
Science
School 50
System
State
0
57 57 56 98-99
45 45 55 97-98
44 44 53 96-97
School System State
Sources of Information
Composite Score
50
50 50 57 0
98-99
School 50
System
42 42 56 97-98
43 43 55 96-97
State 0
48 48 56 98-99
41 41 54 97-98
1998-99 GEORGIA PUBLIC EDUCATION REPORT CARD Ben Hill County Middle School - 6090296
Prepared by Georgia Department of Education
41 41 54 96-97
Scores Reported in Percentiles
School System State
Page 2
STATE-REQUIRED TEST DATA
Categories of Scaled Scores
Inadequate (less than 162)
Minimal (162-209)
Good
(210-247)
Very Good (greater than 247)
Average Scaled Score: (Range 100-300)
PERFORMANCE ASSESSMENTS
Grade 8 Writing Assessment
1998-99 Percent Scoring
1997-98 Percent Scoring
1996-97 Percent Scoring
School System State School System State School System State
14% 45% 34%
8%
14% 45% 34%
8%
8% 40% 41% 11%
20% 45% 30%
5%
20% 45% 30%
5%
11% 46% 34%
8%
26% 43% 22%
9%
26% 43% 22%
9%
15% 46% 30%
8%
197
197
208 194
194 202 189
189 198
AWARDS / RECOGNITION DATA
Schools in Georgia may receive recognition in the following programs: Charter School Pay for Performance Program Georgia School of Excellence National Blue Ribbon School Ben Hill County Middle School did not receive recognition in any of these programs during the 1998-99 school year.
1998-99 GEORGIA PUBLIC EDUCATION REPORT CARD Ben Hill County Middle School - 6090296
Prepared by Georgia Department of Education
Page 3
CERTIFIED PERSONNEL DATA
Positions Number Average Contract Days
Personnel Sex
Certificate
Years Experience
Full-time Part-time
Male Female
4 Yr Bachelor's 5 Yr Master's 6 Yr Specialist's 7 Yr Doctoral Other*
<1 1-10 11-20 21-30 >30
Average
Administrators
3.00 216.67
3 0
2 1
0 0 3 0 0 0 1 2 0 0 13.33
Support Personnel
2.00 195.00
2 0
0 2
0 2 0 0 0 0 1 1 0 0 10.50
PK-12 Teachers
52.40 189.96
52 1
5 48
23 14 16
0 0 0 21 18 13 1 14.53
*Includes One- and Two-Year Vocational Certificates.
ACCREDITATION DATA
Accredited with Quality by Georgia Accrediting Commission (GAC).
1998-99 GEORGIA PUBLIC EDUCATION REPORT CARD Ben Hill County Middle School - 6090296
Prepared by Georgia Department of Education
Page 4
1998-99 GEORGIA PUBLIC EDUCATION REPORT CARD
BEN HILL COUNTY SCHOOLS
Ben Hill County Primary School - 6090196
Grade Range PK-2
The Georgia Public Education Report Card is designed to assist systems and schools in educational improvement. This report card contains a variety of data elements. An explanation of the terms is provided as a companion to the report card data. Please refer to the definitions for the most effective use of the reported data.
STUDENT DATA
Total
K-2
788
PK
134
Enrollment, by Race/Ethnicity and Sex
Black
White Hispanic
American Asian Indian
Multiracial
394 50.0%
372 47.2%
18 2.3%
3 0.4%
0 0.0%
1 0.1%
67 50.0%
64 47.8%
1 0.7%
0 0.0%
0 0.0%
2 1.5%
Male Female
416 52.8%
372 47.2%
72 53.7%
62 46.3%
Enrollment in Selected Programs
Program
Program % of Student Enrollment Population
Gifted (Grades K-12)
0
0.0%
Alternative Programs (Grades 6-12)
N/A
N/A
Students Eligible to Receive Free/Reduced Lunches
Number
Percent
School System
690 2,137
74.8% 59.6%
Dropout Rate *
Number
Rate
School System
N/A N/A
N/A N/A
* Dropout rates are not applicable for grades PK-5.
Enrollment in Compensatory Programs
Program
Program % of Student Enrollment Population
Special Education (Grades K-12)
72
9.1%
(PK)
42
N/A
English to Speakers of Other Languages (ESOL) (Grades K-12)
5
< 1%
Remedial Education (Grades 2-5, 9-12)
0
0.0%
Special Instructional Assistance (SIA) (Grades K-3)
285 36.2%
Title I (Grades K-12)
This school has a schoolwide program.
Total 23
Retained Students, by Race/Ethnicity and Sex
Black
White Hispanic
American MultiAsian Indian racial
6 26.1%
16 69.6%
1 4.3%
0 0.0%
0 0.0%
0 0.0%
Male Female
17
6
73.9% 26.1%
Prepared by Georgia Department of Education
Page 1
STATE-REQUIRED TEST DATA
NORM-REFERENCED TESTS
Grade 3 Iowa Tests of Basic Skills (ITBS) Each chart reflects data for three years of testing.
No third-grade students are enrolled at Ben Hill County Primary School.
Reading Comprehension
Mathematics
50
N/A 37 54 0
98-99
N/A 34 53 97-98
N/A 38 52 96-97
School 50
System
State
N/A 47 61 0
98-99
N/A 45 61 97-98
N/A 46 59 96-97
School System State
Reading Vocabulary 50
N/A 35 50 0
98-99
N/A 31 50 97-98
N/A 34 49 96-97
Language Arts
School 50
System
State
N/A 49 64 0
98-99
N/A 46 62 97-98
N/A 53 59 96-97
School System State
Social Studies 50
N/A 42 56 0
98-99
N/A 39 55 97-98
N/A 45 55 96-97
Science
School 50
System
State
N/A 45 59 0
98-99
N/A 41 59 97-98
N/A 48 58 96-97
School System State
Sources of Information
Composite Score
School
50
50
System
N/A 37 57 0
98-99
N/A 34 56 N/A 42 55
97-98
96-97
State
N/A 41 58 0
98-99
N/A 39 57 97-98
N/A 43 56 96-97
1998-99 GEORGIA PUBLIC EDUCATION REPORT CARD Ben Hill County Primary School - 6090196
Prepared by Georgia Department of Education
Scores Reported in Percentiles
School System State
Page 2
STATE-REQUIRED TEST DATA
NORM-REFERENCED TESTS
Grade 5 Iowa Tests of Basic Skills (ITBS) Each chart reflects data for three years of testing. No fifth-grade students are enrolled at Ben Hill County Primary School.
Reading Comprehension
Mathematics
50
N/A 44 53 0
98-99
N/A 42 53 97-98
N/A 39 52 96-97
School 50
System
State
N/A 48 59 0
98-99
N/A 46 58 97-98
N/A 46 57 96-97
School System State
Reading Vocabulary 50
N/A 35 48 0
98-99
N/A 36 48 97-98
N/A 44 46 96-97
Language Arts
School 50
System
State
N/A 60 63 0
98-99
N/A 56 61 97-98
N/A 53 58 96-97
School System State
Social Studies 50
N/A 47 57 0
98-99
N/A 47 56 97-98
N/A 43 55 96-97
Science
School 50
System
State
N/A 53 60 0
98-99
N/A 52 59 97-98
N/A 49 59 96-97
School System State
Sources of Information
Composite Score
School
50
50
System
N/A 49 58 0
98-99
N/A 48 58 N/A 46 57
97-98
96-97
State
N/A 49 57 0
98-99
N/A 48 56 97-98
N/A 45 55 96-97
1998-99 GEORGIA PUBLIC EDUCATION REPORT CARD Ben Hill County Primary School - 6090196
Prepared by Georgia Department of Education
Scores Reported in Percentiles
School System State
Page 3
STATE-REQUIRED TEST DATA
PERFORMANCE ASSESSMENTS
Grade 5 Writing Assessment
Percent at Developmental Stages:
1998-99 School System State
1997-98 School System State
1996-97 School System State
Stage Stage Stage Stage Stage Stage
1:The Emerging Writer 2:The Developing Writer 3:The Focusing Writer 4:The Experimenting 5:The Engaging Writer 6:The Extending Writer
N/A N/A N/A N/A N/A N/A
0% 2% 29% 46% 15% 6%
0% 1% 16% 41% 29% 12%
N/A N/A N/A N/A N/A N/A
0% 8% 32% 27% 24% 9%
0% 3% 19% 41% 27% 10%
N/A N/A N/A N/A N/A N/A
No fifth-grade students are enrolled at Ben Hill County Primary School.
1% 8% 27% 38% 20% 5%
0% 3% 21% 37% 26% 12%
AWARDS / RECOGNITION DATA
Schools in Georgia may receive recognition in the following programs: Charter School Pay for Performance Program Georgia School of Excellence National Blue Ribbon School Ben Hill County Primary School did not receive recognition in any of these programs during the 1998-99 school year.
1998-99 GEORGIA PUBLIC EDUCATION REPORT CARD Ben Hill County Primary School - 6090196
Prepared by Georgia Department of Education
Page 4
CERTIFIED PERSONNEL DATA
Positions Number Average Contract Days
Personnel Sex
Certificate
Years Experience
Full-time Part-time
Male Female
4 Yr Bachelor's 5 Yr Master's 6 Yr Specialist's 7 Yr Doctoral Other*
<1 1-10 11-20 21-30 >30
Average
Administrators
3.00 210.00
3 0
2 1
0 1 2 0 0 0 0 1 1 1 22.67
Support Personnel
2.00 190.00
2 0
0 2
0 2 0 0 0 0 1 0 1 0 18.00
PK-12 Teachers
49.00 188.80
49 0
1 48
19 26
4 0 0 0 16 21 11 1 14.96
*Includes One- and Two-Year Vocational Certificates.
ACCREDITATION DATA
Accredited with Quality by Georgia Accrediting Commission (GAC).
1998-99 GEORGIA PUBLIC EDUCATION REPORT CARD Ben Hill County Primary School - 6090196
Prepared by Georgia Department of Education
Page 5
1998-99 GEORGIA PUBLIC EDUCATION REPORT CARD
BEN HILL COUNTY SCHOOLS
Fitzgerald High School - 6090291
Grade Range 9-12
The Georgia Public Education Report Card is designed to assist systems and schools in educational improvement. This report card contains a variety of data elements. An explanation of the terms is provided as a companion to the report card data. Please refer to the definitions for the most effective use of the reported data.
Total 982
STUDENT DATA
9-12 Enrollment, by Race/Ethnicity and Sex
Black
White Hispanic
American Multi-
Asian Indian
racial
411 41.9%
553 56.3%
9 0.9%
3 0.3%
5 0.5%
1 0.1%
Male Female
506 51.5%
476 48.5%
Enrollment in Selected Programs
Program
Gifted (Grades K-12)
Program % of Student Enrollment Population
38
3.9%
Non-Vocational Labs (Grades 9-12)
806
Vocational Labs
(Grades 9-12)
707
Alternative Programs (Grades 6-12)
3
82.1% 72.0%
< 1%
Students Eligible to Receive Free/Reduced Lunches
Number
Percent
School System
388 2,137
39.5% 59.6%
Enrollment in Compensatory Programs
Program
Program % of Student Enrollment Population
Special Education (Grades K-12) PK
65
6.6%
0
N/A
English to Speakers of Other Languages (ESOL) (Grades K-12)
0
0.0%
Remedial Education (Grades 2-5, 9-12)
69
7.0%
Title I (Grades K-12)
This school has no Title I program.
Dropout Rate for Grades 9-12
Number
Rate
School System
85
8.2%
85
8.2%
Total 66
Retained Students, by Race/Ethnicity and Sex
Black
White Hispanic
American MultiAsian Indian racial
36 54.5%
29 43.9%
0 0.0%
0 0.0%
1 1.5%
0 0.0%
Male Female
43
23
65.2% 34.8%
Prepared by Georgia Department of Education
Page 1
STATE-REQUIRED TEST DATA
GEORGIA HIGH SCHOOL GRADUATION TESTS (GHSGT)
Percent of Regular Program 11th Graders Passing the Georgia High School Graduation Tests on First Administration
English Language Arts Mathematics Social Studies Science
All Components listed above
Writing
1998-99
School System State
94% 86% 76% 65%
94% 86% 76% 65%
96% 88% 80% 72%
60% 60% 68%
85% 85% 93%
1997-98
School System State
89% 87% 74% 68%
89% 87% 74% 68%
94% 88% 78% 74%
61% 61% 68%
90% 90% 92%
1996-97
School System State
91% 85% 69% 74%
91% 85% 69% 74%
94% 87% 78% 74%
63% 63% 67%
93% 93% 93%
GRADUATE DATA
1999 Graduates by Credentials, Race/Ethnicity and Sex
Diplomas with Both College Prep. & Voc. Endorsements
Diplomas with College Prep. Endorsements Diplomas with Vocational Endorsements General High School Diplomas Special Education Diplomas
Total All Diplomas
Certificates of Performance
Total Graduates
Total 60 33
102 4 4
203 1
204
Black
18 30.0%
3 9.1%
57 55.9%
1 25.0%
1 25.0%
80 39.4%
0 0.0%
80 39.2%
American MultiWhite Hispanic Asian Indian racial
42 70.0%
28 84.8%
0 0.0%
0 0.0%
0 0.0%
1 3.0%
0 0.0%
1 3.0%
0 0.0%
0 0.0%
44 43.1%
3 75.0%
3 75.0%
0 0.0%
0 0.0%
0 0.0%
1 1.0%
0 0.0%
0 0.0%
0 0.0%
0 0.0%
0 0.0%
0 0.0%
0 0.0%
0 0.0%
120 59.1%
0 0.0%
2 1.0%
1 0.5%
0 0.0%
1 100.0%
0 0.0%
0 0.0%
0 0.0%
0 0.0%
121 59.3%
0 0.0%
2 1.0%
1 0.5%
0 0.0%
Male Female
22 36.7%
16 48.5%
38 63.3%
17 51.5%
61 59.8%
1 25.0%
2 50.0%
41 40.2%
3 75.0%
2 50.0%
102
101
50.2% 49.8%
1 100.0%
0 0.0%
103
101
50.5% 49.5%
HOPE Scholarships
School System
Number of 1999 Graduates 2 0 4
Number Eligible
115
Percent Eligible
56.4%
204 115 56.4%
State
65,548 40,292 61.5%
High School Completion Rate
Percent of 1995Grade 9 Enrollment in Graduating Class of1999 School System State
Completion Rate '95-'99 66.4% 66.4% 68.9%
1998-99 GEORGIA PUBLIC EDUCATION REPORT CARD
Fitzgerald High School - 6090291
Prepared by Georgia Department of Education
Page 2
COLLEGE ADMISSIONS / CREDIT TEST DATA
Scholastic Assessment Test (SAT)
Based on students' highest verbal and highest math scores
No. Taking
Average Score
Tests Verbal Math Total
Based on students' last test administration
Average Score Verbal Math Total
School
102 454 467
921
College Prep. Endorsement
475 491
966
Other Diplomas
404 401
805
System
102 454 467
921
College Prep. Endorsement
475 491
966
Other Diplomas
404 401
805
Georgia
41,958 492 488
980
449 N/A N/A
449 N/A N/A
483
461 N/A N/A
461 N/A N/A
479
910 N/A N/A
910 N/A N/A
962
Nation
952,913 N/A N/A N/A
502 508 1010
American College Testing (ACT)
Advanced Placement Exams (AP)
Number taking tests: English Mathematics Reading Science Reasoning
1 * School N/A N/A N/A N/A
System N/A N/A N/A N/A
State 19.1 19.9 20.2 19.9
CompositeScore
N/A
N/A 19.9
* Scores are not reported when fewer than 5 take the ACT
No. of Students Taking Tests
No. of Tests Taken No. of Test Scores
3 or Higher Percent of Test
Scores 3 or Higher
School 18 18 13
72.2%
System State 18 15,225 18 23,969 13 13,024
72.2% 54.3%
POST-SECONDARY DATA
Graduates Entering Georgia Public Colleges
Graduates Entering Georgia Public Colleges and Requiring Learning Support (LS)
1998 Graduates Entering in 1998-99
1997 Graduates Entering in 1997-98
Percent of Graduating Number Class
School
82
42.7%
System 8 2
42.7%
School
69
42.9%
System 6 9
42.9%
Number Requiring
LS 30 30
12 12
Percent of those attending Georgia
Public Colleges
36.6%
36.6%
17.4%
17.4%
In previous years, the Report Card presented College Prep Curriculum information provided by the Board of Regents on students requiring Learning Support. Due to inconsistencies in the data provided by the Board of Regents in defining College Prep Completers versus Local Board of Education data defining College Prep Endorsements, the Department of Education Report Card will not provide this information until discrepancies can be reconciled.
Graduates Entering Georgia Public Technical and Adult Schools
1998 Graduates School System
Entering Number 36 36
1998-99 Percent 18.8% 18.8%
Entering Number N/A N/A
1997-98 Percent
N/A N/A
1997 Graduates School
2
1.2%
System
2
1.2%
20
12.4%
20
12.4%
1998-99 GEORGIA PUBLIC EDUCATION REPORT CARD Fitzgerald High School - 6090291
Prepared by Georgia Department of Education
Page 3
CERTIFIED PERSONNEL DATA
Positions Number Average Contract Days
Administrators
6.00 216.67
Support Personnel
5.00 190.80
PK-12 Teachers
56.32 190.92
Personnel Sex
Certificate
Years Experience
Full-time Part-time
Male Female
4 Yr Bachelor's 5 Yr Master's 6 Yr Specialist's 7 Yr Doctoral Other*
<1 1-10 11-20 21-30 >30
Average
6 0
3 3
0 1 5 0 0
1 1 2 2 0
16.17
4 3
3 4
2 5 0 0 0
1 0 6 0 0
13.29
53 5
26 32
18 27 10
2 1
4 11 21 19
3
16.91
*Includes One- and Two-Year Vocational Certificates.
ACCREDITATION DATA
Accredited by Southern Association of Colleges and Schools (SACS): Secondary/Middle Commission. Accredited with Quality by Georgia Accrediting Commission (GAC).
AWARDS / RECOGNITION DATA
Schools in Georgia may receive recognition in the following programs: Charter School Pay for Performance Program Georgia School of Excellence National Blue Ribbon School Fitzgerald High School did not receive recognition in any of these programs during the 1998-99 school year.
1998-99 GEORGIA PUBLIC EDUCATION REPORT CARD Fitzgerald High School - 6090291
Prepared by Georgia Department of Education
Page 4
1998-99 GEORGIA PUBLIC EDUCATION REPORT CARD BERRIEN COUNTY SCHOOLS - 610
The Georgia Public Education Report Card is designed to assist systems and schools in educational improvement. This report card contains a variety of data elements. An explanation of the terms is provided as a companion to the report card data. Please refer to the definitions for the most effective use of the reported data.
Total
K-12
3,073
PK
99
STUDENT DATA
Enrollment, by Race/Ethnicity and Sex
Black
White Hispanic
American Multi-
Asian Indian
racial
502 16.3%
2,475 80.5%
62 2.0%
5 0.2%
9 0.3%
20 0.7%
9 9.1%
88 88.9%
1 1.0%
0 0.0%
0 0.0%
1 1.0%
Male
1,623 52.8%
52 52.5%
Female
1,450 47.2%
47 47.5%
Enrollment in Selected Programs
Program
Program % of Student Enrollment Population
Gifted (Grades K-12)
155
5.0%
Non-Vocational Labs (Grades 9-12)
479
58.4%
Vocational Labs (Grades 9-12)
624
76.1%
Alternative Programs (Grades 6-12)
28
1.8%
Students Eligible to Receive Free/Reduced Lunches
Number
Percent
1,541
48.6%
Dropout Rate
Number
Percent
6-12 9-12
93
5.3%
88
9.9%
Enrollment in Compensatory Programs
Program
Program % of Student Enrollment Population
Special Education
(Grades K-12)
328
PK
33
English to Speakers of
Other Languages (ESOL)
0
(Grades K-12)
Remedial Education (Grades 2-5, 9-12)
445
Special Instructional
Assistance (SIA)
199
(Grades K-3)
Title I (Grades K-12) Number of schools with: Schoolwide program Targeted Assistance program No Title I program
10.7% N/A
0.0%
25.0%
19.7%
2 0 2
Total 149
Retained Students, by Race/Ethnicity and Sex
Black
White Hispanic
American MultiAsian Indian racial
30 20.1%
114 76.5%
4 2.7%
0 0.0%
0 0.0%
1 0.7%
Male Female
98
51
65.8% 34.2%
Prepared by Georgia Department of Education
Page 1
STATE-REQUIRED TEST DATA
NORM-REFERENCED TESTS
Grade 3 Iowa Tests of Basic Skills (ITBS) Each chart reflects data for three years of testing.
Reading Comprehension
Mathematics
50
49 54 50 53 41 52 0
98-99 97-98 96-97
System State
50
53 61 56 61 46 59 0
98-99 97-98 96-97
System State
Reading Vocabulary
50
42 50 45 50 37 49 0
98-99 97-98 96-97
System State
Social Studies
50
48 56 44 55 44 55 0
98-99 97-98 96-97
System State
Language Arts
50
62 64 67 62 44 59 0
98-99 97-98 96-97
System State
Science
50
52 59 57 59 54 58 0
98-99 97-98 96-97
System State
Sources of Information
Composite Score
50
48 57 0
98-99
System
50
51 56 41 55 97-98 96-97
State
50 58 53 57 0
98-99 97-98
1998-99 GEORGIA PUBLIC EDUCATION REPORT CARD Berrien County Schools
Prepared by Georgia Department of Education
System State Scores Reported 43 56 in Percentiles 96-97
Page 2
STATE-REQUIRED TEST DATA
NORM-REFERENCED TESTS
Grade 5 Iowa Tests of Basic Skills (ITBS) Each chart reflects data for three years of testing.
Reading Comprehension
Mathematics
50
44 53 44 53 40 52 0
98-99 97-98 96-97
System State
50
45 59 42 58 34 57 0
98-99 97-98 96-97
System State
Reading Vocabulary
50
37 48 38 48 32 46 0
98-99 97-98 96-97
System State
Social Studies
50
41 57 37 56 34 55 0
98-99 97-98 96-97
System State
Language Arts
50
53 63 46 61 43 58 0
98-99 97-98 96-97
System State
Science
50
49 60 52 59 49 59 0
98-99 97-98 96-97
System State
Sources of Information
Composite Score
50
42 58 0
98-99
System
50
41 58 33 57 97-98 96-97
State
43 57 41 56 0
98-99 97-98
1998-99 GEORGIA PUBLIC EDUCATION REPORT CARD Berrien County Schools
Prepared by Georgia Department of Education
System State Scores Reported 37 55 in Percentiles 96-97
Page 3
STATE-REQUIRED TEST DATA
NORM-REFERENCED TESTS Grade 8
Iowa Tests of Basic Skills (ITBS) Each chart reflects data for three years of testing.
Reading Comprehension
Mathematics
50
45 49 46 48 40 48 0
98-99 97-98 96-97
System State
50
43 56 45 55 46 54 0
98-99 97-98 96-97
System State
Reading Vocabulary
50
40 46 47 45 41 44 0
98-99 97-98 96-97
System State
Language Arts
50
54 60 59 58 55 56 0
98-99 97-98 96-97
System State
Social Studies
50
48 54 48 53 44 53 0
98-99 97-98 96-97
System State
Science
50
46 56 52 55 48 53 0
98-99 97-98 96-97
System State
Sources of Information
Composite Score
50
48 57 0
98-99
System
50
48 56 43 55 97-98 96-97
State
46 56 49 54 0
98-99 97-98
1998-99 GEORGIA PUBLIC EDUCATION REPORT CARD Berrien County Schools
Prepared by Georgia Department of Education
System State Scores Reported 46 54 in Percentiles 96-97
Page 4
STATE-REQUIRED TEST DATA
PERFORMANCE ASSESSMENTS
Grade 5 Writing Assessment
1998-99
1997-98
1996-97
Percent at Developmental Stages:
Comparison
Comparison
Comparison
System Group State System Group State System Group State
Stage Stage Stage Stage Stage Stage
1: The Emerging Writer 2: The Developing Writer 3: The Focusing Writer 4: The Experimenting Writer 5: The Engaging Writer 6: The Extending Writer
0% 2% 25% 46% 23% 2%
0% 2% 19% 43% 26% 9%
0% 1% 16% 41% 29% 12%
1% 9% 34% 36% 16% 3%
0% 3% 22% 43% 23% 7%
0% 3% 19% 41% 27% 10%
0% 10% 35% 39% 14%
1%
0% 3% 23% 37% 26% 10%
0% 3% 21% 37% 26% 12%
Grade 8 Writing Assessment
1998-99 Percent Scoring 1997-98 Percent Scoring 1996-97 Percent Scoring
Categories of Scaled Scores
Comparison
Comparison
Comparison
System Group State System Group State System Group State
Inadequate (less than 162)
Minimal (162-209)
Good
(210-247)
Very Good (greater than 247)
13% 57% 27%
3%
8% 45% 39%
8%
8% 40% 41% 11%
12% 59% 24%
5%
13% 50% 31%
6%
11% 46% 34%
8%
17% 57% 23%
3%
18% 52% 24%
5%
15% 46% 30%
8%
Average Scaled Score: (Range 100-300)
193
205 208
194
197 202
190
192 198
GEORGIA HIGH SCHOOL GRADUATION TESTS (GHSGT)
Percent of Regular Program 11th Graders Passing the Georgia High School Graduation Tests on First Administration
1998-99
1997-98
1996-97
Comparison
Comparison
Comparison
System Group State System Group State System Group State
English Language Arts Mathematics Social Studies Science
96% 94% 70% 68%
96% 89% 81% 73%
96% 88% 80% 72%
93% 89% 70% 73%
93% 86% 73% 71%
94% 88% 78% 74%
96% 89% 71% 72%
94% 87% 76% 72%
94% 87% 78% 74%
All Components listed above 6 0 %
69% 68% 61%
63% 68% 63%
65% 67%
Writing
92%
94% 93% 86%
91% 92% 91%
92% 93%
1998-99 GEORGIA PUBLIC EDUCATION REPORT CARD
Berrien County Schools
Prepared by Georgia Department of Education
Page 5
GRADUATE DATA
1999 Graduates by Credentials, Race/Ethnicity and Sex
Diplomas with Both College Prep. & Voc. Endorsements
Diplomas with College Prep. Endorsements Diplomas with Vocational Endorsements General High School Diplomas Special Education Diplomas
Total All Diplomas
Certificates of Performance
Total Graduates
Total 49 13 69 0 5
136 10
146
Black
American MultiWhite Hispanic Asian Indian racial
5 10.2%
0 0.0%
11 15.9%
0
44 89.8%
13 100.0%
57 82.6%
0
0 0.0%
0 0.0%
1 1.4%
0
0 0.0%
0 0.0%
0 0.0%
0
0 0.0%
0 0.0%
0 0.0%
0
0 0.0%
0 0.0%
0 0.0%
0
Male Female
16 32.7%
7 53.8%
43 62.3%
0
33 67.3%
6 46.2%
26 37.7%
0
3 60.0%
19 14.0%
2 20.0%
21 14.4%
2 40.0%
116 85.3%
8 80.0%
124 84.9%
0 0.0%
1 0.7%
0 0.0%
1 0.7%
0 0.0%
0 0.0%
0 0.0%
0 0.0%
0 0.0%
0 0.0%
0 0.0%
0 0.0%
0
5
0.0% 100.0%
0
71
0.0% 52.2%
0
2
0.0% 20.0%
0
73
0.0% 50.0%
0 0.0%
65 47.8%
8 80.0%
73 50.0%
HOPE Scholarships
System State
Number of 1999 Graduates 1 4 6
Number Eligible
79
Percent Eligible
54.1%
65,548 40,292 61.5%
High School Completion Rate Percent of 1995Grade 9 Enrollment
in Graduating Class of1999
System
State
Completion Rate '95-'99 70.5% 68.9%
COLLEGE ADMISSIONS / CREDIT TEST DATA
Scholastic Assessment Test (SAT)
No. Taking
Average Score
Tests
Verbal Math Total
Based on students' highest verbal and highest math scores
System College Prep. Endorsement Other Diplomas
474 473 947 482 491 973 443 383 826
Georgia
492 488 980
Based on students' last test administration
System Georgia
69
467 469
936
41,958 483 479 962
Nation
952,913 502 508 1010
American College Testing (ACT)
System State Nation
English Mathematics Reading Science Reasoning
N/A N/A N/A N/A
19.1 19.9 20.2 19.9
20.4 20.7 21.3 21.0
CompositeScore N/A * 19.9 21.9
* Scores not reported when fewer than 5 tests taken.
Advanced Placement Exams (AP)
No. of Students Taking Tests
No. of Tests Taken No. of Test Scores
3 or Higher Percent of Test
Scores 3 or Higher
System State 16 15,225 18 23,969 9 13,024
50.0% 54.3%
1998-99 GEORGIA PUBLIC EDUCATION REPORT CARD Berrien County Schools
Prepared by Georgia Department of Education
Page 6
POSTSECONDARY DATA
Graduates Entering Georgia Public Colleges and Universities
Graduates Entering Georgia Public Colleges and Universities and
Requiring Learning Support (LS)
1998 Graduates Entering 1998-99
1997 Graduates Entering 1997-98
Percent of Graduating Number Class
36
26.9%
59
40.1%
Number Requiring
LS
10
7
Percent of those attending Georgia
Public Colleges
27.8%
11.9%
In previous years, the Report Card presented College Prep Curriculum information provided by the Board of Regents on students requiring Learning Support. Due to inconsistencies in the data provided by the Board of Regents in defining College Prep Completers versus Local Board of Education data defining College Prep Endorsements, the Department of Education Report Card will not provide this information until discrepancies can be reconciled.
Graduates Entering Georgia Public Technical and Adult Schools
Entering 1998-99 Entering 1997-98
Number Percent
Number Percent
1998 Graduates 1997 Graduates
23
17.2%
0
0.0%
N/A 14
N/A 9.5%
ACCREDITATION / RECOGNITION DATA
Southern Association of Colleges and Schools (SACS) Accrediting Commission
Secondary/Middle Commission Elementary/Middle Commission Both Elementary/Secondary Commissions Joint Commission Candidate for Accreditation
Accreditation by Georgia Accrediting Commission (GAC)
Accredited by GAC Accredited with Quality by GAC
Number of Schools
1 0 0 0 0
Number of Schools
0 4
Awards / Recognition
State Recognized Program
Number of Schools
Charter School
0
Pay for Performance Recipient
0
Georgia School of Excellence
0
National Blue Ribbon School
0
COMMUNITY DATA
Number of Children Eligible for Migrant Education Number of Families-At-Risk * Number of Food Stamp Participants * Number of Families Receiving TANF * ** Per Capita Income * Unemployment Rate * 1990 Population * Projected 2000 Population * Projected 2010 Population *
* Data Available at County Level Only ** Known as AFDC before January 1997
70 57 1,905 176 $17,353 4.5% 14,153 14,769 15,367
1998-99 GEORGIA PUBLIC EDUCATION REPORT CARD Berrien County Schools
Prepared by Georgia Department of Education
Page 7
FISCAL DATA
Millage Rate
11.25
* Fall 1998 Property Tax Digest is used to calculate the 98-99 Value of One Mill
FTE Count
FTE Count used for Allotment Calculation 3,039.0 Fall '98 FTE Count 3,073
Value of One Mill
$232,352 $76.45 per Allotment FTE
Sources: Local State-QBE State-
Lottery State-
Other Federal Other
Total
PerGeneral Fund cent Per FTE
$2,770,382 19.0% $912 $11,109,932 76.3% $3,656
K-12 Revenues
Lottery K-12
and
Title
All Other
Programs
K-12
$0
$1,524
Bonded Debt
$1,260,815
$0
$0
$0
$0 0.0%
$0
$0
$66,872
$0
$290,748 2.0% $96
$392,060 2.7% $129
$0 0.0%
$0
$14,563,124 100% $4,793
$0 $653,035
$0 $653,035
$17,477 $989,809
$0 $1,075,683
$0 $0 $0 $1,260,815
Capital Projects
$645,948 $0
$0
$0 $0 $0 $645,948
School Nutrition
$319,683 $0
$0
$72,840 $746,293
$0 $1,138,817
Grand Total
Total
Per-
Amount cent
$4,998,355 25.8%
$11,109,932 57.5%
$66,872 0.3%
$381,066 2.0% $2,781,198 14.4%
$0 0.0% $19,337,424 100%
Instruction
Media Instruction
Support Pupil Services General Admin. School Admin. Trans-
portation Maint. & Ops. Capital Projects School Food Debt Service
Total
$9,213,448 65.2% $3,032 $311,514 2.2% $103
$764,170 5.4% $251
$459,489 3.3% $151
$405,668 2.9% $133
$911,245 6.4% $300
$744,430 5.3% $245
$1,063,514 7.5% $350
$261,373 1.8% $86
$0 0.0%
$0
$0 0.0%
$0
$14,134,855 100% $4,651
K-12 Expenditures
$562,680 $156,215
$0
$0
$0
$0
$13,892 $1,101,178
$0
$82,439 $213,419
$0
$4,934 $157,064
$0
$639
$0
$0
$640
$0
$0
$539
$20,998
$0
$0
$0
$0
$921
$114
$0
$0
$0 $1,250,730
$666,688 $1,648,991 $1,250,730
$0
$0
$0
$0
$0
$0
$0
$0
$0
$0
$0
$0
$0
$0
$0
$0
$800,111
$0
$0 $1,092,886
$0
$0
$9,932,343 50.7% $311,514 1.6%
$1,879,241 9.6% $755,348 3.9% $567,667 2.9% $911,884 4.7% $745,071 3.8%
$1,085,052 5.5% $1,061,485 5.4% $1,093,923 5.6% $1,250,730 6.4%
$800,111 $1,092,886 $19,594,264 100%
Salaries and Benefits as Percentages of Revenues and of Expenditures
Teachers and Paraprofessionals
Salaries $7,559,069
Benefits $1,637,149
Percentage of Revenues Percentage of Expenditures
Total of
Total of
General Fund
General Fund
Title Programs
Title Programs
Lottery K-12
Lottery K-12
Total Salaries
and
Total
and
Total
and Benefits All Other K-12 K - 12 All Other K-12 K - 12
$9,196,218
56.4%
47.6%
55.9%
46.9%
School Administration
$537,104
$140,796
$677,900
4.2%
3.5%
4.1%
3.5%
General Administration
$228,941
$70,855
$299,796
1.8%
1.6%
1.8%
1.5%
1998-99 GEORGIA PUBLIC EDUCATION REPORT CARD
Berrien County Schools - 610
Prepared by Georgia Department of Education
Page 8
CERTIFIED PERSONNEL DATA
Number
Average Annual Salary Positions Average Contract Days
Average Daily Salary
Full-time Personnel Part-time
Sex Male Female
4 Yr Bachelor's Certificate 5 Yr Master's
Level 6 Yr Specialist's 7 Yr Doctoral Other*
Black
White Race/ Hispanic Ethnicity Asian
American Indian
Multiracial
Years Experience
<1 1-10 11-20 21-30 >30
Average
Administrators
18.61
$65,553.48 223.32
$293.55
18 2
11 9
0 2 18 0 0
1 19
0 0 0 0
0 0 5 12 3
25.25
Support Personnel PK-12 Teachers
15.10
192.94
$40,377.04 192.65
$209.59
$37,579.67 190.06
$197.73
12
191
6
3
2
33
16
161
2
110
15
59
1
25
0
0
0
0
1
6
17
181
0
1
0
0
0
6
0
0
1
7
6
79
5
57
3
49
3
2
16.50
13.80
*Includes One- and Two-Year Vocational Certificates.
Certified Staff Position Ratios
Teacher/Administrator Ratio 10:1
Teacher/Support Person Ratio 13:1
Teacher/Staff Ratio 6:1
Student Enrollment/All Teachers 16:1
Certified Personnel by Category
83.6% 100%
8.6%
7.8%
80% 60%
40%
20%
0%
Teachers
Administrators
Support Personnel
1998-99 GEORGIA PUBLIC EDUCATION REPORT CARD
Berrien County Schools - 610
Prepared by Georgia Department of Education
Page 9
1998-99 GEORGIA PUBLIC EDUCATION REPORT CARD
BERRIEN COUNTY SCHOOLS
Berrien Elementary School - 6100195
Grade Range 3-5
The Georgia Public Education Report Card is designed to assist systems and schools in educational improvement. This report card contains a variety of data elements. An explanation of the terms is provided as a companion to the report card data. Please refer to the definitions for the most effective use of the reported data.
STUDENT DATA
Total 748
3-5 Enrollment, by Race/Ethnicity and Sex
Black
White Hispanic
American Multi-
Asian Indian
racial
119 15.9%
609 81.4%
13 1.7%
0 0.0%
4 0.5%
3 0.4%
Male Female
373 49.9%
375 50.1%
Enrollment in Selected Programs
Program
Program % of Student Enrollment Population
Gifted (Grades K-12)
56
7.5%
Alternative Programs (Grades 6-12)
N/A
N/A
Students Eligible to Receive Free/Reduced Lunches
Number
Percent
School System
408 1,541
54.5% 48.6%
Dropout Rate *
Number
Rate
School System
N/A N/A
N/A N/A
* Dropout rates are not applicable for grades PK-5.
Enrollment in Compensatory Programs
Program
Program % of Student Enrollment Population
Special Education (Grades K-12)
64
8.6%
(PK)
0
N/A
English to Speakers of Other Languages (ESOL) (Grades K-12)
0
0.0%
Remedial Education (Grades 2-5, 9-12)
261 34.9%
Special Instructional Assistance (SIA) (Grades K-3)
0
0.0%
Title I (Grades K-12)
This school has a schoolwide program.
Total 1
Retained Students, by Race/Ethnicity and Sex
Black
White Hispanic
American Multi-
Asian Indian
racial
0
1
0.0% 100.0%
0 0.0%
0 0.0%
0 0.0%
0 0.0%
Male Female
1
0
100.0% 0.0%
Prepared by Georgia Department of Education
Page 1
STATE-REQUIRED TEST DATA
NORM-REFERENCED TESTS Grade 3
Iowa Tests of Basic Skills (ITBS) Each chart reflects data for three years of testing.
Reading Comprehension 50
49 49 54 0
98-99
50 50 53 97-98
41 41 52 96-97
Mathematics
School 50
System
State
0
53 53 61 98-99
56 56 61 97-98
46 46 59 96-97
School System State
Reading Vocabulary 50
42 42 50 0
98-99
45 45 50 97-98
37 37 49 96-97
Language Arts
School 50
System
State
0
62 62 64 98-99
67 67 62 97-98
44 44 59 96-97
School System State
Social Studies 50
48 48 56 0
98-99
44 44 55 97-98
44 44 55 96-97
Science
School 50
System
State
0
52 52 59 98-99
57 57 59 97-98
54 54 58 96-97
School System State
Sources of Information
Composite Score
50
48 48 57 0
98-99
School 50
System
51 51 56 97-98
41 41 55 96-97
State 0
50 50 58 98-99
53 53 57 97-98
1998-99 GEORGIA PUBLIC EDUCATION REPORT CARD Berrien Elementary School - 6100195
Prepared by Georgia Department of Education
43 43 56 96-97
Scores Reported in Percentiles
School System State
Page 2
STATE-REQUIRED TEST DATA
NORM-REFERENCED TESTS Grade 5
Iowa Tests of Basic Skills (ITBS) Each chart reflects data for three years of testing.
Reading Comprehension
Mathematics
50
44 44 53 0
98-99
44 44 53 97-98
40 40 52 96-97
School 50
System
State
0
45 45 59 98-99
42 42 58 97-98
34 34 57 96-97
School System State
Reading Vocabulary 50
37 37 48 0
98-99
38 38 48 97-98
32 32 46 96-97
Language Arts
School 50
System
State
0
53 53 63 98-99
46 46 61 97-98
43 43 58 96-97
School System State
Social Studies 50
41 41 57 0
98-99
37 37 56 97-98
34 34 55 96-97
Science
School 50
System
State
0
49 49 60 98-99
52 52 59 97-98
49 49 59 96-97
School System State
Sources of Information
Composite Score
50
42 42 58 0
98-99
School 50
System
41 41 58 97-98
33 33 57 96-97
State 0
43 43 57 98-99
41 41 56 97-98
37 37 55 96-97
1998-99 GEORGIA PUBLIC EDUCATION REPORT CARD Berrien Elementary School - 6100195
Prepared by Georgia Department of Education
Scores Reported in Percentiles
School System State
Page 3
STATE-REQUIRED TEST DATA
PERFORMANCE ASSESSMENTS
Grade 5 Writing Assessment
Percent at Developmental Stages:
1998-99 School System State
1997-98 School System State
1996-97 School System State
Stage Stage Stage Stage Stage Stage
1:The Emerging Writer 2:The Developing Writer 3:The Focusing Writer 4:The Experimenting 5:The Engaging Writer 6:The Extending Writer
0% 2% 25% 46% 23% 2%
0% 2% 25% 46% 23% 2%
0% 1% 16% 41% 29% 12%
1% 9% 34% 36% 16% 3%
1% 9% 34% 36% 16% 3%
0% 3% 19% 41% 27% 10%
0% 10% 35% 39% 14%
1%
0% 10% 35% 39% 14%
1%
0% 3% 21% 37% 26% 12%
AWARDS / RECOGNITION DATA
Schools in Georgia may receive recognition in the following programs: Charter School Pay for Performance Program Georgia School of Excellence National Blue Ribbon School Berrien Elementary School did not receive recognition in any of these programs during the 1998-99 school year.
1998-99 GEORGIA PUBLIC EDUCATION REPORT CARD Berrien Elementary School - 6100195
Prepared by Georgia Department of Education
Page 4
CERTIFIED PERSONNEL DATA
Positions Number Average Contract Days
Personnel Sex
Certificate
Years Experience
Full-time Part-time
Male Female
4 Yr Bachelor's 5 Yr Master's 6 Yr Specialist's 7 Yr Doctoral Other*
<1 1-10 11-20 21-30 >30
Average
Administrators
2.00 220.00
2 0
2 0
0 0 2 0 0 0 0 0 2 0 26.00
Support Personnel
2.00 190.00
1 2
0 3
0 2 1 0 0 0 0 2 1 0 20.00
PK-12 Teachers
44.00 190.00
44 0
2 42
26 11
7 0 0 2 16 15 10 1 13.70
*Includes One- and Two-Year Vocational Certificates.
ACCREDITATION DATA
Accredited with Quality by Georgia Accrediting Commission (GAC).
1998-99 GEORGIA PUBLIC EDUCATION REPORT CARD Berrien Elementary School - 6100195
Prepared by Georgia Department of Education
Page 5
1998-99 GEORGIA PUBLIC EDUCATION REPORT CARD
BERRIEN COUNTY SCHOOLS
Berrien High School - 6102050
Grade Range 9-12
The Georgia Public Education Report Card is designed to assist systems and schools in educational improvement. This report card contains a variety of data elements. An explanation of the terms is provided as a companion to the report card data. Please refer to the definitions for the most effective use of the reported data.
Total 820
STUDENT DATA
9-12 Enrollment, by Race/Ethnicity and Sex
Black
White Hispanic
American Multi-
Asian Indian
racial
136 16.6%
663 80.9%
14 1.7%
2 0.2%
2 0.2%
3 0.4%
Male Female
444 54.1%
376 45.9%
Enrollment in Selected Programs
Program
Gifted (Grades K-12)
Program % of Student Enrollment Population
49
6.0%
Non-Vocational Labs (Grades 9-12)
479
Vocational Labs
(Grades 9-12)
624
Alternative Programs (Grades 6-12)
16
58.4% 76.1%
2.0%
Students Eligible to Receive Free/Reduced Lunches
Number
Percent
School System
249 1,541
30.4% 48.6%
Enrollment in Compensatory Programs
Program
Program % of Student Enrollment Population
Special Education (Grades K-12) PK
58
7.1%
0
N/A
English to Speakers of Other Languages (ESOL) (Grades K-12)
0
0.0%
Remedial Education (Grades 2-5, 9-12)
149 18.2%
Title I (Grades K-12)
This school has no Title I program.
Dropout Rate for Grades 9-12
Number
Rate
School System
88
9.9%
88
9.9%
Total 70
Retained Students, by Race/Ethnicity and Sex
Black
White Hispanic
American MultiAsian Indian racial
15 21.4%
54 77.1%
0 0.0%
0 0.0%
0 0.0%
1 1.4%
Male Female
48
22
68.6% 31.4%
Prepared by Georgia Department of Education
Page 1
STATE-REQUIRED TEST DATA
GEORGIA HIGH SCHOOL GRADUATION TESTS (GHSGT)
Percent of Regular Program 11th Graders Passing the Georgia High School Graduation Tests on First Administration
English Language Arts Mathematics Social Studies Science
All Components listed above
Writing
1998-99
School System State
96% 94% 70% 68%
96% 94% 70% 68%
96% 88% 80% 72%
60% 60% 68%
92% 92% 93%
1997-98
School System State
93% 89% 70% 73%
93% 89% 70% 73%
94% 88% 78% 74%
61% 61% 68%
86% 86% 92%
1996-97
School System State
96% 89% 71% 72%
96% 89% 71% 72%
94% 87% 78% 74%
63% 63% 67%
91% 91% 93%
GRADUATE DATA
1999 Graduates by Credentials, Race/Ethnicity and Sex
Diplomas with Both College Prep. & Voc. Endorsements
Diplomas with College Prep. Endorsements Diplomas with Vocational Endorsements General High School Diplomas Special Education Diplomas
Total All Diplomas
Certificates of Performance
Total Graduates
Total 49 13 69 0
Black
5 10.2%
0 0.0%
11 15.9%
0
White Hispanic
44 89.8%
0 0.0%
13 100.0%
0 0.0%
57 82.6%
1 1.4%
0
0
American MultiAsian Indian racial
0 0.0%
0 0.0%
0 0.0%
0 0.0%
0 0.0%
0 0.0%
0 0.0%
0 0.0%
0 0.0%
0
0
0
Male Female
16
33
32.7% 67.3%
7
6
53.8% 46.2%
43
26
62.3% 37.7%
0
0
5
3
2
0
0
0
0
5
0
60.0% 40.0% 0.0% 0.0% 0.0% 0.0% 100.0% 0.0%
136
19
116
1
0
0
0
71
65
14.0% 85.3% 0.7% 0.0% 0.0% 0.0% 52.2% 47.8%
10
2
8
0
0
0
0
2
8
20.0% 80.0% 0.0% 0.0% 0.0% 0.0% 20.0% 80.0%
146
21
124
1
0
0
0
73
73
14.4% 84.9% 0.7% 0.0% 0.0% 0.0% 50.0% 50.0%
HOPE Scholarships
School System
Number of 1999 Graduates 1 4 6
Number Eligible
79
Percent Eligible
54.1%
146 79
54.1%
State
65,548 40,292 61.5%
High School Completion Rate
Percent of 1995Grade 9 Enrollment in Graduating Class of1999 School System State
Completion Rate '95-'99 70.5% 70.5% 68.9%
1998-99 GEORGIA PUBLIC EDUCATION REPORT CARD
Berrien High School - 6102050
Prepared by Georgia Department of Education
Page 2
COLLEGE ADMISSIONS / CREDIT TEST DATA
Scholastic Assessment Test (SAT)
Based on students' highest verbal and highest math scores
No. Taking
Average Score
Tests Verbal Math Total
Based on students' last test administration
Average Score Verbal Math Total
School College Prep. Endorsement Other Diplomas
69 474 473
947
482 491
973
443 383
826
System College Prep. Endorsement Other Diplomas
69 474 473
947
482 491
973
443 383
826
Georgia
41,958 492 488
980
467 N/A N/A
467 N/A N/A
483
469 N/A N/A
469 N/A N/A
479
936 N/A N/A
936 N/A N/A
962
Nation
952,913 N/A N/A N/A
502 508 1010
American College Testing (ACT)
Advanced Placement Exams (AP)
Number taking tests: English Mathematics Reading Science Reasoning
1 * School N/A N/A N/A N/A
System N/A N/A N/A N/A
State 19.1 19.9 20.2 19.9
CompositeScore
N/A
N/A 19.9
* Scores are not reported when fewer than 5 take the ACT
No. of Students Taking Tests
No. of Tests Taken No. of Test Scores
3 or Higher Percent of Test
Scores 3 or Higher
School 16 18 9
50.0%
System State 16 15,225 18 23,969 9 13,024
50.0% 54.3%
POST-SECONDARY DATA
Graduates Entering Georgia Public Colleges
Graduates Entering Georgia Public Colleges and Requiring Learning Support (LS)
1998 Graduates Entering in 1998-99
1997 Graduates Entering in 1997-98
Percent of Graduating Number Class
School
36
26.9%
System 3 6
26.9%
School
59
40.1%
System 5 9
40.1%
Number Requiring
LS 10 10
7 7
Percent of those attending Georgia
Public Colleges
27.8%
27.8%
11.9%
11.9%
In previous years, the Report Card presented College Prep Curriculum information provided by the Board of Regents on students requiring Learning Support. Due to inconsistencies in the data provided by the Board of Regents in defining College Prep Completers versus Local Board of Education data defining College Prep Endorsements, the Department of Education Report Card will not provide this information until discrepancies can be reconciled.
Graduates Entering Georgia Public Technical and Adult Schools
1998 Graduates School System
Entering Number 23 23
1998-99 Percent 17.2% 17.2%
Entering Number N/A N/A
1997-98 Percent
N/A N/A
1997 Graduates School
0
0.0%
System
0
0.0%
14
9.5%
14
9.5%
1998-99 GEORGIA PUBLIC EDUCATION REPORT CARD Berrien High School - 6102050
Prepared by Georgia Department of Education
Page 3
CERTIFIED PERSONNEL DATA
Positions Number Average Contract Days
Administrators
3.00 223.33
Support Personnel
3.00 196.67
PK-12 Teachers
44.94 189.80
Personnel Sex
Certificate
Years Experience
Full-time Part-time
Male Female
4 Yr Bachelor's 5 Yr Master's 6 Yr Specialist's 7 Yr Doctoral Other*
<1 1-10 11-20 21-30 >30
Average
3 0
3 0
0 0 3 0 0
0 0 0 3 0
25.67
3 0
1 2
0 3 0 0 0
0 1 0 0 2
23.00
44 1
19 26
19 19
7 0 0
1 14 10 19
1
16.93
*Includes One- and Two-Year Vocational Certificates.
ACCREDITATION DATA
Accredited by Southern Association of Colleges and Schools (SACS): Secondary/Middle Commission. Accredited with Quality by Georgia Accrediting Commission (GAC).
AWARDS / RECOGNITION DATA
Schools in Georgia may receive recognition in the following programs: Charter School Pay for Performance Program Georgia School of Excellence National Blue Ribbon School Berrien High School did not receive recognition in any of these programs during the 1998-99 school year.
1998-99 GEORGIA PUBLIC EDUCATION REPORT CARD Berrien High School - 6102050
Prepared by Georgia Department of Education
Page 4
1998-99 GEORGIA PUBLIC EDUCATION REPORT CARD
BERRIEN COUNTY SCHOOLS
Berrien Middle School - 6100194
Grade Range 6-8
The Georgia Public Education Report Card is designed to assist systems and schools in educational improvement. This report card contains a variety of data elements. An explanation of the terms is provided as a companion to the report card data. Please refer to the definitions for the most effective use of the reported data.
STUDENT DATA
Total 751
6-8 Enrollment, by Race/Ethnicity and Sex
Black
White Hispanic
American Multi-
Asian Indian
racial
120 16.0%
614 81.8%
12 1.6%
1 0.1%
1 0.1%
3 0.4%
Male 399
53.1%
Female 352
46.9%
Enrollment in Selected Programs
Program
Gifted (Grades K-12)
Program % of Student Enrollment Population
36
4.8%
Alternative Programs
12
(Grades 6-12)
1.6%
Students Eligible to Receive Free/Reduced Lunches
Number
Percent
School System
397 1,541
52.9% 48.6%
Enrollment in Compensatory Programs
Program
Program % of Student Enrollment Population
Special Education (Grades K-12) (PK)
82 10.9%
0
N/A
English to Speakers of Other Languages (ESOL) (Grades K-12)
0
0.0%
Title I (Grades K-12)
This school has no Title I program.
Dropout Rate for Grades 6-8
Number
Rate
School System
5
0.6%
5
0.6%
Total 36
Retained Students, by Race/Ethnicity and Sex
Black
White Hispanic
American MultiAsian Indian racial
7 19.4%
28 77.8%
1 2.8%
0 0.0%
0 0.0%
0 0.0%
Male Female
24
12
66.7% 33.3%
Prepared by Georgia Department of Education
Page 1
STATE-REQUIRED TEST DATA
NORM-REFERENCED TESTS Grade 8
Iowa Tests of Basic Skills (ITBS) Each chart reflects data for three years of testing.
Reading Comprehension 50
45 45 49 0
98-99
46 46 48 97-98
40 40 48 96-97
Mathematics
School 50
System
State
0
43 43 56 98-99
45 45 55 97-98
46 46 54 96-97
School System State
Reading Vocabulary 50
40 40 46 0
98-99
47 47 45 97-98
41 41 44 96-97
Language Arts
School 50
System
State
0
54 54 60 98-99
59 59 58 97-98
55 55 56 96-97
School System State
Social Studies 50
48 48 54 0
98-99
48 48 53 97-98
44 44 53 96-97
Science
School 50
System
State
0
46 46 56 98-99
52 52 55 97-98
48 48 53 96-97
School System State
Sources of Information
Composite Score
50
48 48 57 0
98-99
School 50
System
48 48 56 97-98
43 43 55 96-97
State 0
46 46 56 98-99
49 49 54 97-98
1998-99 GEORGIA PUBLIC EDUCATION REPORT CARD Berrien Middle School - 6100194
Prepared by Georgia Department of Education
46 46 54 96-97
Scores Reported in Percentiles
School System State
Page 2
STATE-REQUIRED TEST DATA
Categories of Scaled Scores
Inadequate (less than 162)
Minimal (162-209)
Good
(210-247)
Very Good (greater than 247)
Average Scaled Score: (Range 100-300)
PERFORMANCE ASSESSMENTS
Grade 8 Writing Assessment
1998-99 Percent Scoring
1997-98 Percent Scoring
1996-97 Percent Scoring
School System State School System State School System State
13% 57% 27%
3%
13% 57% 27%
3%
8% 40% 41% 11%
12% 59% 24%
5%
12% 59% 24%
5%
11% 46% 34%
8%
17% 57% 23%
3%
17% 57% 23%
3%
15% 46% 30%
8%
193
193
208 194
194 202 190
190 198
AWARDS / RECOGNITION DATA
Schools in Georgia may receive recognition in the following programs: Charter School Pay for Performance Program Georgia School of Excellence National Blue Ribbon School Berrien Middle School did not receive recognition in any of these programs during the 1998-99 school year.
1998-99 GEORGIA PUBLIC EDUCATION REPORT CARD Berrien Middle School - 6100194
Prepared by Georgia Department of Education
Page 3
CERTIFIED PERSONNEL DATA
Positions Number Average Contract Days
Personnel Sex
Certificate
Years Experience
Full-time Part-time
Male Female
4 Yr Bachelor's 5 Yr Master's 6 Yr Specialist's 7 Yr Doctoral Other*
<1 1-10 11-20 21-30 >30
Average
Administrators
3.00 210.00
3 0
1 2
0 0 3 0 0 0 0 2 1 0 21.00
Support Personnel
2.00 190.00
2 0
1 1
0 2 0 0 0 0 1 1 0 0 14.00
PK-12 Teachers
46.00 190.00
46 0
9 37
23 17
6 0 0 2 18 18 8 0 13.39
*Includes One- and Two-Year Vocational Certificates.
ACCREDITATION DATA
Accredited with Quality by Georgia Accrediting Commission (GAC).
1998-99 GEORGIA PUBLIC EDUCATION REPORT CARD Berrien Middle School - 6100194
Prepared by Georgia Department of Education
Page 4
1998-99 GEORGIA PUBLIC EDUCATION REPORT CARD
BERRIEN COUNTY SCHOOLS
Berrien Primary School - 6105050
Grade Range PK-2
The Georgia Public Education Report Card is designed to assist systems and schools in educational improvement. This report card contains a variety of data elements. An explanation of the terms is provided as a companion to the report card data. Please refer to the definitions for the most effective use of the reported data.
STUDENT DATA
Total
K-2
754
PK
99
Enrollment, by Race/Ethnicity and Sex
Black
White Hispanic
American Asian Indian
Multiracial
127 16.8%
589 78.1%
23 3.1%
2 0.3%
2 0.3%
11 1.5%
9 9.1%
88 88.9%
1 1.0%
0 0.0%
0 0.0%
1 1.0%
Male Female
407 54.0%
347 46.0%
52 52.5%
47 47.5%
Enrollment in Selected Programs
Program
Program % of Student Enrollment Population
Gifted (Grades K-12)
14
1.9%
Alternative Programs (Grades 6-12)
N/A
N/A
Students Eligible to Receive Free/Reduced Lunches
Number
Percent
School System
487 1,541
57.1% 48.6%
Dropout Rate *
Number
Rate
School System
N/A N/A
N/A N/A
* Dropout rates are not applicable for grades PK-5.
Enrollment in Compensatory Programs
Program
Program % of Student Enrollment Population
Special Education (Grades K-12)
124 16.4%
(PK)
33
N/A
English to Speakers of Other Languages (ESOL) (Grades K-12)
0
0.0%
Remedial Education (Grades 2-5, 9-12)
35 16.3%
Special Instructional Assistance (SIA) (Grades K-3)
199 26.4%
Title I (Grades K-12)
This school has a schoolwide program.
Total 42
Retained Students, by Race/Ethnicity and Sex
Black
White Hispanic
American MultiAsian Indian racial
8 19.0%
31 73.8%
3 7.1%
0 0.0%
0 0.0%
0 0.0%
Male Female
25
17
59.5% 40.5%
Prepared by Georgia Department of Education
Page 1
STATE-REQUIRED TEST DATA
NORM-REFERENCED TESTS
Grade 3 Iowa Tests of Basic Skills (ITBS) Each chart reflects data for three years of testing.
No third-grade students are enrolled at Berrien Primary School.
Reading Comprehension
Mathematics
50
N/A 49 54 0
98-99
N/A 50 53 97-98
N/A 41 52 96-97
School 50
System
State
N/A 53 61 0
98-99
N/A 56 61 97-98
N/A 46 59 96-97
School System State
Reading Vocabulary 50
N/A 42 50 0
98-99
N/A 45 50 97-98
N/A 37 49 96-97
Language Arts
School 50
System
State
N/A 62 64 0
98-99
N/A 67 62 97-98
N/A 44 59 96-97
School System State
Social Studies 50
N/A 48 56 0
98-99
N/A 44 55 97-98
N/A 44 55 96-97
Science
School 50
System
State
N/A 52 59 0
98-99
N/A 57 59 97-98
N/A 54 58 96-97
School System State
Sources of Information
Composite Score
School
50
50
System
N/A 48 57 0
98-99
N/A 51 56 N/A 41 55
97-98
96-97
State
N/A 50 58 0
98-99
N/A 53 57 97-98
N/A 43 56 96-97
1998-99 GEORGIA PUBLIC EDUCATION REPORT CARD Berrien Primary School - 6105050
Prepared by Georgia Department of Education
Scores Reported in Percentiles
School System State
Page 2
STATE-REQUIRED TEST DATA
NORM-REFERENCED TESTS
Grade 5 Iowa Tests of Basic Skills (ITBS) Each chart reflects data for three years of testing. No fifth-grade students are enrolled at Berrien Primary School.
Reading Comprehension
Mathematics
50
N/A 44 53 0
98-99
N/A 44 53 97-98
N/A 40 52 96-97
School 50
System
State
N/A 45 59 0
98-99
N/A 42 58 97-98
N/A 34 57 96-97
School System State
Reading Vocabulary 50
N/A 37 48 0
98-99
N/A 38 48 97-98
N/A 32 46 96-97
Language Arts
School 50
System
State
N/A 53 63 0
98-99
N/A 46 61 97-98
N/A 43 58 96-97
School System State
Social Studies 50
N/A 41 57 0
98-99
N/A 37 56 97-98
N/A 34 55 96-97
Science
School 50
System
State
N/A 49 60 0
98-99
N/A 52 59 97-98
N/A 49 59 96-97
School System State
Sources of Information
Composite Score
School
50
50
System
N/A 42 58 0
98-99
N/A 41 58 N/A 33 57
97-98
96-97
State
N/A 43 57 0
98-99
N/A 41 56 97-98
N/A 37 55 96-97
1998-99 GEORGIA PUBLIC EDUCATION REPORT CARD Berrien Primary School - 6105050
Prepared by Georgia Department of Education
Scores Reported in Percentiles
School System State
Page 3
STATE-REQUIRED TEST DATA
PERFORMANCE ASSESSMENTS
Grade 5 Writing Assessment
Percent at Developmental Stages:
1998-99 School System State
1997-98 School System State
1996-97 School System State
Stage Stage Stage Stage Stage Stage
1:The Emerging Writer 2:The Developing Writer 3:The Focusing Writer 4:The Experimenting 5:The Engaging Writer 6:The Extending Writer
N/A N/A N/A N/A N/A N/A
0% 2% 25% 46% 23% 2%
0% 1% 16% 41% 29% 12%
N/A N/A N/A N/A N/A N/A
1% 9% 34% 36% 16% 3%
0% 3% 19% 41% 27% 10%
N/A N/A N/A N/A N/A N/A
No fifth-grade students are enrolled at Berrien Primary School.
0% 10% 35% 39% 14%
1%
0% 3% 21% 37% 26% 12%
AWARDS / RECOGNITION DATA
Schools in Georgia may receive recognition in the following programs: Charter School Pay for Performance Program Georgia School of Excellence National Blue Ribbon School Berrien Primary School did not receive recognition in any of these programs during the 1998-99 school year.
1998-99 GEORGIA PUBLIC EDUCATION REPORT CARD Berrien Primary School - 6105050
Prepared by Georgia Department of Education
Page 4
CERTIFIED PERSONNEL DATA
Positions Number Average Contract Days
Personnel Sex
Certificate
Years Experience
Full-time Part-time
Male Female
4 Yr Bachelor's 5 Yr Master's 6 Yr Specialist's 7 Yr Doctoral Other*
<1 1-10 11-20 21-30 >30
Average
Administrators
2.00 220.00
2 0
1 1
0 0 2 0 0 0 0 0 1 1 31.50
Support Personnel
3.60 190.00
2 3
0 5
0 5 0 0 0 0 2 1 1 1 17.00
PK-12 Teachers
55.00 190.36
54 2
1 55
40 11
5 0 0 2 30 13 11 0 11.70
*Includes One- and Two-Year Vocational Certificates.
ACCREDITATION DATA
Accredited with Quality by Georgia Accrediting Commission (GAC).
1998-99 GEORGIA PUBLIC EDUCATION REPORT CARD Berrien Primary School - 6105050
Prepared by Georgia Department of Education
Page 5
1998-99 GEORGIA PUBLIC EDUCATION REPORT CARD BIBB COUNTY SCHOOLS - 611
The Georgia Public Education Report Card is designed to assist systems and schools in educational improvement. This report card contains a variety of data elements. An explanation of the terms is provided as a companion to the report card data. Please refer to the definitions for the most effective use of the reported data.
Total
K-12
24,229
PK
391
STUDENT DATA
Enrollment, by Race/Ethnicity and Sex
Black
White Hispanic
American Multi-
Asian Indian
racial
16,469 68.0%
7,349 30.3%
148 0.6%
144 0.6%
49 0.2%
70 0.3%
311 79.5%
74 18.9%
4 1.0%
2 0.5%
0 0.0%
0 0.0%
Male
12,124 50.0%
232 59.3%
Female
12,105 50.0%
159 40.7%
Enrollment in Selected Programs
Program
Program % of Student Enrollment Population
Gifted (Grades K-12)
971
4.0%
Non-Vocational Labs (Grades 9-12)
4,819
82.8%
Vocational Labs (Grades 9-12)
3,427
58.9%
Alternative Programs (Grades 6-12)
89
< 1%
Students Eligible to Receive Free/Reduced Lunches
Number
Percent
15,047
61.1%
Dropout Rate
Number
Percent
6-12
548
4.3%
9-12
535
8.1%
Enrollment in Compensatory Programs
Program
Program % of Student Enrollment Population
Special Education (Grades K-12)
PK
2,351 110
English to Speakers of
Other Languages (ESOL)
77
(Grades K-12)
Remedial Education (Grades 2-5, 9-12)
1,792
Special Instructional
Assistance (SIA)
323
(Grades K-3)
Title I (Grades K-12) Number of schools with: Schoolwide program Targeted Assistance program No Title I program
9.7% N/A < 1%
12.4%
3.6%
18 0
24
Total 1,974
Retained Students, by Race/Ethnicity and Sex
Black
White Hispanic
American MultiAsian Indian racial
1,606 81.4%
351 17.8%
9 0.5%
4 0.2%
3 0.2%
1 0.1%
Male Female 1,159 815 58.7% 41.3%
Prepared by Georgia Department of Education
Page 1
STATE-REQUIRED TEST DATA
NORM-REFERENCED TESTS
Grade 3 Iowa Tests of Basic Skills (ITBS) Each chart reflects data for three years of testing.
Reading Comprehension
Mathematics
50
54 54 48 53 47 52 0
98-99 97-98 96-97
System State
50
67 61 59 61 55 59 0
98-99 97-98 96-97
System State
Reading Vocabulary
50
55 50 47 50 46 49 0
98-99 97-98 96-97
System State
Social Studies
50
59 56 53 55 54 55 0
98-99 97-98 96-97
System State
Language Arts
50
71 64 62 62 62 59 0
98-99 97-98 96-97
System State
Science
50
57 59 50 59 49 58 0
98-99 97-98 96-97
System State
Sources of Information
Composite Score
50
61 57 0
98-99
System
50
53 56 53 55 97-98 96-97
State
62 58 53 57 0
98-99 97-98
1998-99 GEORGIA PUBLIC EDUCATION REPORT CARD Bibb County Schools
Prepared by Georgia Department of Education
System State Scores Reported 53 56 in Percentiles 96-97
Page 2
STATE-REQUIRED TEST DATA
NORM-REFERENCED TESTS
Grade 5 Iowa Tests of Basic Skills (ITBS) Each chart reflects data for three years of testing.
Reading Comprehension
Mathematics
50
54 53 49 53 50 52 0
98-99 97-98 96-97
System State
50
62 59 56 58 53 57 0
98-99 97-98 96-97
System State
Reading Vocabulary
50
58 48 48 48 44 46 0
98-99 97-98 96-97
System State
Social Studies
50
58 57 52 56 48 55 0
98-99 97-98 96-97
System State
Language Arts
50
67 63 60 61 60 58 0
98-99 97-98 96-97
System State
Science
50
57 60 54 59 52 59 0
98-99 97-98 96-97
System State
Sources of Information
Composite Score
50
57 58 0
98-99
System
50
54 58 55 57 97-98 96-97
State
59 57 53 56 0
98-99 97-98
1998-99 GEORGIA PUBLIC EDUCATION REPORT CARD Bibb County Schools
Prepared by Georgia Department of Education
System State Scores Reported 52 55 in Percentiles 96-97
Page 3
STATE-REQUIRED TEST DATA
NORM-REFERENCED TESTS Grade 8
Iowa Tests of Basic Skills (ITBS) Each chart reflects data for three years of testing.
Reading Comprehension
Mathematics
50
38 49 39 48 38 48 0
98-99 97-98 96-97
System State
50
47 56 45 55 45 54 0
98-99 97-98 96-97
System State
Reading Vocabulary
50
35 46 34 45 36 44 0
98-99 97-98 96-97
System State
Language Arts
50
52 60 51 58 51 56 0
98-99 97-98 96-97
System State
Social Studies
50
43 54 44 53 44 53 0
98-99 97-98 96-97
System State
Science
50
39 56 42 55 40 53 0
98-99 97-98 96-97
System State
Sources of Information
Composite Score
50
49 57 0
98-99
System
50
49 56 47 55 97-98 96-97
State
44 56 44 54 0
98-99 97-98
1998-99 GEORGIA PUBLIC EDUCATION REPORT CARD Bibb County Schools
Prepared by Georgia Department of Education
System State Scores Reported 43 54 in Percentiles 96-97
Page 4
STATE-REQUIRED TEST DATA
PERFORMANCE ASSESSMENTS
Grade 5 Writing Assessment
1998-99
1997-98
1996-97
Percent at Developmental Stages:
Comparison
Comparison
Comparison
System Group State System Group State System Group State
Stage Stage Stage Stage Stage Stage
1: The Emerging Writer 2: The Developing Writer 3: The Focusing Writer 4: The Experimenting Writer 5: The Engaging Writer 6: The Extending Writer
0% 1% 19% 48% 23% 7%
0% 1% 19% 44% 25% 9%
0% 1% 16% 41% 29% 12%
0% 2% 24% 44% 23% 6%
1% 3% 22% 43% 23% 8%
0% 3% 19% 41% 27% 10%
0% 3% 28% 41% 22% 6%
1% 5% 28% 39% 20% 7%
0% 3% 21% 37% 26% 12%
Grade 8 Writing Assessment
1998-99 Percent Scoring 1997-98 Percent Scoring 1996-97 Percent Scoring
Categories of Scaled Scores
Comparison
Comparison
Comparison
System Group State System Group State System Group State
Inadequate (less than 162)
Minimal (162-209)
Good
(210-247)
Very Good (greater than 247)
10% 51% 34%
5%
12% 48% 34%
7%
8% 40% 41% 11%
9% 57% 31%
2%
16% 53% 27%
4%
11% 46% 34%
8%
18% 57% 20%
6%
24% 51% 21%
5%
15% 46% 30%
8%
Average Scaled Score: (Range 100-300)
200
200 208
198
194 202
190
187 198
GEORGIA HIGH SCHOOL GRADUATION TESTS (GHSGT)
Percent of Regular Program 11th Graders Passing the Georgia High School Graduation Tests on First Administration
1998-99
1997-98
1996-97
Comparison
Comparison
Comparison
System Group State System Group State System Group State
English Language Arts Mathematics Social Studies Science
94% 79% 74% 60%
94% 83% 76% 63%
96% 88% 80% 72%
93% 78% 71% 61%
93% 84% 72% 66%
94% 88% 78% 74%
92% 71% 64% 55%
90% 77% 68% 58%
94% 87% 78% 74%
All Components listed above 5 5 %
59% 68% 55%
60% 68% 49%
52% 67%
Writing
93%
90% 93% 90%
89% 92% 91%
88% 93%
1998-99 GEORGIA PUBLIC EDUCATION REPORT CARD
Bibb County Schools
Prepared by Georgia Department of Education
Page 5
GRADUATE DATA
1999 Graduates by Credentials, Race/Ethnicity and Sex
Diplomas with Both College Prep. & Voc. Endorsements
Diplomas with College Prep. Endorsements Diplomas with Vocational Endorsements General High School Diplomas Special Education Diplomas
Total All Diplomas
Certificates of Performance
Total Graduates
Total 73
554 120
22 45 814 65 879
Black
49 67.1%
355 64.1%
95 79.2%
21 95.5%
38 84.4%
558 68.6%
59 90.8%
617 70.2%
American MultiWhite Hispanic Asian Indian racial
24 32.9%
185 33.4%
25 20.8%
1 4.5%
7 15.6%
242 29.7%
0 0.0%
4 0.7%
0 0.0%
0 0.0%
0 0.0%
4 0.5%
0 0.0%
7 1.3%
0 0.0%
0 0.0%
0 0.0%
7 0.9%
0 0.0%
3 0.5%
0 0.0%
0 0.0%
0 0.0%
3 0.4%
0 0.0%
0 0.0%
0 0.0%
0 0.0%
0 0.0%
0 0.0%
6
0
0
0
0
9.2% 0.0% 0.0% 0.0% 0.0%
248
4
7
3
0
28.2% 0.5% 0.8% 0.3% 0.0%
Male Female
26 35.6%
219 39.5%
67 55.8%
14 63.6%
15 33.3%
341 41.9%
47 64.4%
335 60.5%
53 44.2%
8 36.4%
30 66.7%
473 58.1%
20
45
30.8% 69.2%
361 518 41.1% 58.9%
HOPE Scholarships
System State
Number of 1999 Graduates 8 7 9
Number Eligible
472
Percent Eligible
53.7%
65,548 40,292 61.5%
High School Completion Rate Percent of 1995Grade 9 Enrollment
in Graduating Class of1999
System
State
Completion Rate '95-'99 56.5% 68.9%
COLLEGE ADMISSIONS / CREDIT TEST DATA
Scholastic Assessment Test (SAT)
No. Taking
Average Score
Tests
Verbal Math Total
Based on students' highest verbal and highest math scores
System College Prep. Endorsement Other Diplomas
466 443 909 502 481 983 440 408 848
Georgia
492 488 980
Based on students' last test administration
System Georgia
541
456 434
890
41,958 483 479 962
Nation
952,913 502 508 1010
American College Testing (ACT)
System State Nation
English
19.5
19.1 20.4
Mathematics
19.1
19.9 20.7
Reading
20.7
20.2 21.3
Science Reasoning 19.9
19.9 21.0
CompositeScore 19.9
19.9 21.9
Advanced Placement Exams (AP)
No. of Students Taking Tests
No. of Tests Taken No. of Test Scores
3 or Higher Percent of Test
Scores 3 or Higher
System State 163 15,225 211 23,969 68 13,024
32.2% 54.3%
1998-99 GEORGIA PUBLIC EDUCATION REPORT CARD Bibb County Schools
Prepared by Georgia Department of Education
Page 6
POSTSECONDARY DATA
Graduates Entering Georgia Public Colleges and Universities
Graduates Entering Georgia Public Colleges and Universities and
Requiring Learning Support (LS)
1998 Graduates Entering 1998-99
1997 Graduates Entering 1997-98
Percent of Graduating Number Class
289
35.8%
330
39.5%
Number Requiring
LS
123
140
Percent of those attending Georgia
Public Colleges
42.6%
42.4%
In previous years, the Report Card presented College Prep Curriculum information provided by the Board of Regents on students requiring Learning Support. Due to inconsistencies in the data provided by the Board of Regents in defining College Prep Completers versus Local Board of Education data defining College Prep Endorsements, the Department of Education Report Card will not provide this information until discrepancies can be reconciled.
Graduates Entering Georgia Public Technical and Adult Schools
Entering 1998-99 Entering 1997-98
Number Percent
Number Percent
1998 Graduates 1997 Graduates
100
12.4%
8
1.0%
N/A 84
N/A 10.0%
ACCREDITATION / RECOGNITION DATA
Southern Association of Colleges and Schools (SACS) Accrediting Commission
Secondary/Middle Commission Elementary/Middle Commission Both Elementary/Secondary Commissions Joint Commission Candidate for Accreditation
Accreditation by Georgia Accrediting Commission (GAC)
Accredited by GAC Accredited with Quality by GAC
Number of Schools
10 31
0 0 0
Number of Schools
0 0
Awards / Recognition
State Recognized Program
Number of Schools
Charter School
0
Pay for Performance Recipient
0
Georgia School of Excellence
0
National Blue Ribbon School
0
COMMUNITY DATA
Number of Children Eligible for Migrant Education Number of Families-At-Risk * Number of Food Stamp Participants * Number of Families Receiving TANF * ** Per Capita Income * Unemployment Rate * 1990 Population * Projected 2000 Population * Projected 2010 Population *
* Data Available at County Level Only ** Known as AFDC before January 1997
1 699 21,070 2,558 $23,975 5.9% 149,967 147,032 152,048
1998-99 GEORGIA PUBLIC EDUCATION REPORT CARD Bibb County Schools
Prepared by Georgia Department of Education
Page 7
FISCAL DATA
Millage Rate
16.85
* Fall 1998 Property Tax Digest is used to calculate the 98-99 Value of One Mill
FTE Count
FTE Count used for Allotment Calculation 23,878.0 Fall '98 FTE Count 24,229
Value of One Mill
$2,739,336 $114.72 per Allotment FTE
Sources: Local State-QBE State-
Lottery State-
Other Federal Other
Total
PerGeneral Fund cent Per FTE
$48,540,473 37.9% $2,033 $77,708,131 60.7% $3,254
K-12 Revenues
Lottery K-12
and
Title
All Other
Programs
K-12
$0
$29,011
Bonded Debt $107
$0
$0
$0
$0 0.0%
$0
$0 $494,451
$0
$1,207,105 0.9% $51 $254,932 0.2% $11 $384,177 0.3% $16
$128,094,819 100% $5,365
$0 $9,577,366
$0 $9,577,366
$2,678,550 $539,779 $0
$3,741,793
$0 $0 $0 $107
Capital Projects
$335,138 $0
School Nutrition $2,780,003
$0
$0
$0
Grand Total
Total
Per-
Amount cent
$51,684,733 31.9%
$77,708,131 48.0%
$494,451 0.3%
$0 $716,634 $4,602,290 2.8%
$0 $7,110,104
$9,548,422
$1,202
$17,482,182 10.8% $9,933,802 6.1%
$9,883,560 $10,607,944 $161,905,592 100%
Instruction
Media
Instruction Support
Pupil Services General Admin. School Admin. Trans-
portation Maint. & Ops. Capital Projects School Food Debt Service
K-12 Expenditures
$84,919,024 67.0% $3,556 $6,916,479 $1,847,981
$0
$59,406
$0
$3,436,738 2.7% $144
$46,834
$7,401
$0
$0
$0
$3,835,170 3.0% $161 $1,571,291 $429,429
$0
$0
$0
$6,133,471 4.8% $257 $318,401 $769,171
$0
$0
$0
$3,158,041 2.5% $132 $494,861
$53,919
$0
$8,796
$0
$8,508,845 6.7% $356
$58,831 $105,575
$0
$0
$0
$4,131,456 3.3% $173
$54,256
$0
$0
$0
$0
$11,991,848 9.5% $502 $119,753
$49,655
$0
$0
$0
$239,558 0.2% $10
$0 $481,957
$0 $11,859,701
$0
$3,656 0.0%
$0
$0
$0
$0
$0 $9,888,778
$400,329 0.3% $17
$0
$0 $1,410,883
$0
$0
$93,742,892 57.4% $3,490,974 2.1% $5,835,892 3.6% $7,221,044 4.4% $3,715,618 2.3% $8,673,253 5.3% $4,185,713 2.6%
$12,161,256 7.4% $12,581,216 7.7%
$9,892,435 6.1% $1,811,213 1.1%
Total
$126,758,142 100% $5,308 $9,580,709 $3,745,092 $1,410,883 $11,927,904 $9,888,778 $163,311,511 100%
Salaries and Benefits as Percentages of Revenues and of Expenditures
Teachers and Paraprofessionals
Salaries $67,729,662
Benefits $18,481,938
Percentage of Revenues Percentage of Expenditures
Total of
Total of
General Fund
General Fund
Title Programs
Title Programs
Lottery K-12
Lottery K-12
Total Salaries
and
Total
and
Total
and Benefits All Other K-12 K - 12 All Other K-12 K - 12
$86,211,600
61.0%
53.2%
61.5%
52.8%
School Administration
$4,927,244 $1,794,650
$6,721,894
4.8%
4.2%
4.8%
4.1%
General Administration
$760,634
$460,487
$1,221,121
0.9%
0.8%
0.9%
0.7%
1998-99 GEORGIA PUBLIC EDUCATION REPORT CARD
Bibb County Schools - 611
Prepared by Georgia Department of Education
Page 8
CERTIFIED PERSONNEL DATA
Number
Average Annual Salary Positions Average Contract Days
Average Daily Salary
Full-time Personnel Part-time
Sex Male Female
4 Yr Bachelor's Certificate 5 Yr Master's
Level 6 Yr Specialist's 7 Yr Doctoral Other*
Black
White Race/ Hispanic Ethnicity Asian
American Indian
Multiracial
Years Experience
<1 1-10 11-20 21-30 >30
Average
Administrators
116.89
$59,049.98 209.09
$282.42
103 49
44 108
8 52 74 18
0
58 94
0 0 0 0
0 13 42 67 30
22.89
Support Personnel PK-12 Teachers
144.50
1,624.65
$47,594.75 195.05
$244.01
$38,687.82 190.50
$203.08
143
1,575
3
69
12
252
134
1,392
1
786
88
713
50
129
7
14
0
2
64
624
81
1,008
0
4
1
7
0
1
0
0
1
70
27
643
43
461
61
394
14
76
19.21
14.08
*Includes One- and Two-Year Vocational Certificates.
Certified Staff Position Ratios
Teacher/Administrator Ratio 14:1
Teacher/Support Person Ratio 11:1
Teacher/Staff Ratio 6:1
Student Enrollment/All Teachers 15:1
Certified Personnel by Category
84.7% 100%
7.8%
7.5%
80% 60%
40%
20%
0%
Teachers
Administrators
Support Personnel
1998-99 GEORGIA PUBLIC EDUCATION REPORT CARD
Bibb County Schools - 611
Prepared by Georgia Department of Education
Page 9
1998-99 GEORGIA PUBLIC EDUCATION REPORT CARD
BIBB COUNTY SCHOOLS
Alexander II Magnet School - 6111050
Grade Range K-6
The Georgia Public Education Report Card is designed to assist systems and schools in educational improvement. This report card contains a variety of data elements. An explanation of the terms is provided as a companion to the report card data. Please refer to the definitions for the most effective use of the reported data.
STUDENT DATA
Total 319
K-6 Enrollment, by Race/Ethnicity and Sex
Black
White Hispanic
American Multi-
Asian Indian
racial
149 46.7%
163 51.1%
2 0.6%
4 1.3%
0 0.0%
1 0.3%
Male Female
143 44.8%
176 55.2%
Enrollment in Selected Programs
Program
Program % of Student Enrollment Population
Gifted (Grades K-12)
24
7.5%
Alternative Programs (Grades 6-12)
0
0.0%
Students Eligible to Receive Free/Reduced Lunches
Number
Percent
School System
116 15,047
36.4% 61.1%
Dropout Rate for Grade 6
Number
Rate
School System
0
0.0%
0
0.0%
Enrollment in Compensatory Programs
Program
Program % of Student Enrollment Population
Special Education (Grades K-12)
9
2.8%
(PK)
0
N/A
English to Speakers of Other Languages (ESOL) (Grades K-12)
0
0.0%
Remedial Education (Grades 2-5, 9-12)
35 18.6%
Special Instructional Assistance (SIA) (Grades K-3)
0
0.0%
Title I (Grades K-12)
This school has no Title I program.
Total 14
Retained Students, by Race/Ethnicity and Sex
Black
White Hispanic
American Multi-
Asian Indian
racial
10 71.4%
4 28.6%
0 0.0%
0 0.0%
0 0.0%
0 0.0%
Male Female
5
9
35.7% 64.3%
Prepared by Georgia Department of Education
Page 1
STATE-REQUIRED TEST DATA
NORM-REFERENCED TESTS Grade 3
Iowa Tests of Basic Skills (ITBS) Each chart reflects data for three years of testing.
Reading Comprehension 50
69 54 54 0
98-99
52 48 53 97-98
66 47 52 96-97
Mathematics
School 50
System
State
0
76 67 61 98-99
63 59 61 97-98
71 55 59 96-97
School System State
Reading Vocabulary 50
58 55 50 0
98-99
52 47 50 97-98
62 46 49 96-97
Language Arts
School 50
System
State
0
72 71 64 98-99
50 62 62 97-98
66 62 59 96-97
School System State
Social Studies 50
71 59 56 0
98-99
63 53 55 97-98
72 54 55 96-97
Science
School 50
System
State
0
75 57 59 98-99
71 50 59 97-98
71 49 58 96-97
School System State
Sources of Information
Composite Score
50
71 61 57 0
98-99
School 50
System
64 53 56 97-98
71 53 55 96-97
State 0
72 62 58 98-99
60 53 57 97-98
1998-99 GEORGIA PUBLIC EDUCATION REPORT CARD Alexander II Magnet School - 6111050
Prepared by Georgia Department of Education
70 53 56 96-97
Scores Reported in Percentiles
School System State
Page 2
STATE-REQUIRED TEST DATA
NORM-REFERENCED TESTS Grade 5
Iowa Tests of Basic Skills (ITBS) Each chart reflects data for three years of testing.
Reading Comprehension
Mathematics
50
64 54 53 0
98-99
61 49 53 97-98
65 50 52 96-97
School 50
System
State
0
72 62 59 98-99
66 56 58 97-98
65 53 57 96-97
School System State
Reading Vocabulary 50
56 58 48 0
98-99
55 48 48 97-98
62 44 46 96-97
Language Arts
School 50
System
State
0
64 67 63 98-99
75 60 61 97-98
64 60 58 96-97
School System State
Social Studies 50
68 58 57 0
98-99
60 52 56 97-98
65 48 55 96-97
Science
School 50
System
State
0
72 57 60 98-99
72 54 59 97-98
71 52 59 96-97
School System State
Sources of Information
Composite Score
50
72 57 58 0
98-99
School 50
System
62 54 58 97-98
66 55 57 96-97
State 0
69 59 57 98-99
66 53 56 97-98
66 52 55 96-97
1998-99 GEORGIA PUBLIC EDUCATION REPORT CARD Alexander II Magnet School - 6111050
Prepared by Georgia Department of Education
Scores Reported in Percentiles
School System State
Page 3
STATE-REQUIRED TEST DATA
PERFORMANCE ASSESSMENTS
Grade 5 Writing Assessment
Percent at Developmental Stages:
1998-99 School System State
1997-98 School System State
1996-97 School System State
Stage Stage Stage Stage Stage Stage
1:The Emerging Writer 2:The Developing Writer 3:The Focusing Writer 4:The Experimenting 5:The Engaging Writer 6:The Extending Writer
0% 0% 5% 58% 29% 8%
0% 1% 19% 48% 23% 7%
0% 1% 16% 41% 29% 12%
0% 0% 6% 42% 38% 15%
0% 2% 24% 44% 23% 6%
0% 3% 19% 41% 27% 10%
0% 2% 16% 35% 28% 19%
0% 3% 28% 41% 22% 6%
0% 3% 21% 37% 26% 12%
AWARDS / RECOGNITION DATA
Schools in Georgia may receive recognition in the following programs: Charter School Pay for Performance Program Georgia School of Excellence National Blue Ribbon School Alexander II Magnet School did not receive recognition in any of these programs during the 1998-99 school year.
1998-99 GEORGIA PUBLIC EDUCATION REPORT CARD Alexander II Magnet School - 6111050
Prepared by Georgia Department of Education
Page 4
CERTIFIED PERSONNEL DATA
Positions Number Average Contract Days
Personnel Sex
Certificate
Years Experience
Full-time Part-time
Male Female
4 Yr Bachelor's 5 Yr Master's 6 Yr Specialist's 7 Yr Doctoral Other*
<1 1-10 11-20 21-30 >30
Average
Administrators
1.00 210.00
1 0
0 1
0 0 1 0 0 0 0 1 0 0 18.00
Support Personnel
2.00 190.00
2 0
0 2
0 2 0 0 0 0 0 1 1 0 22.50
PK-12 Teachers
19.00 190.00
18 2
0 20
8 9 3 0 0 0 7 6 7 0 15.80
*Includes One- and Two-Year Vocational Certificates.
ACCREDITATION DATA
Accredited by Southern Association of Colleges and Schools (SACS):
Elementary/Middle Commission.
1998-99 GEORGIA PUBLIC EDUCATION REPORT CARD Alexander II Magnet School - 6111050
Prepared by Georgia Department of Education
Page 5
1998-99 GEORGIA PUBLIC EDUCATION REPORT CARD
BIBB COUNTY SCHOOLS
Appling Middle School - 6115050
Grade Range 7-8
The Georgia Public Education Report Card is designed to assist systems and schools in educational improvement. This report card contains a variety of data elements. An explanation of the terms is provided as a companion to the report card data. Please refer to the definitions for the most effective use of the reported data.
STUDENT DATA
Total 585
7-8 Enrollment, by Race/Ethnicity and Sex
Black
White Hispanic
American Multi-
Asian Indian
racial
554 94.7%
26 4.4%
3 0.5%
2 0.3%
0 0.0%
0 0.0%
Male 298
50.9%
Female 287
49.1%
Enrollment in Selected Programs
Program
Gifted (Grades K-12)
Program % of Student Enrollment Population
20
3.4%
Alternative Programs (Grades 6-12)
4
< 1%
Students Eligible to Receive Free/Reduced Lunches
Number
Percent
School System
460 15,047
78.6% 61.1%
Enrollment in Compensatory Programs
Program
Program % of Student Enrollment Population
Special Education (Grades K-12) (PK)
67 11.5%
0
N/A
English to Speakers of Other Languages (ESOL) (Grades K-12)
0
0.0%
Title I (Grades K-12)
This school has no Title I program.
Dropout Rate for Grades 7-8
Number
Rate
School System
4
0.6%
13
0.3%
Total 44
Retained Students, by Race/Ethnicity and Sex
Black
White Hispanic
American MultiAsian Indian racial
41 93.2%
3 6.8%
0 0.0%
0 0.0%
0 0.0%
0 0.0%
Male Female
31
13
70.5% 29.5%
Prepared by Georgia Department of Education
Page 1
STATE-REQUIRED TEST DATA
NORM-REFERENCED TESTS Grade 8
Iowa Tests of Basic Skills (ITBS) Each chart reflects data for three years of testing.
Reading Comprehension 50
33 38 49 0
98-99
33 39 48 97-98
41 38 48 96-97
Mathematics
School 50
System
State
0
43 47 56 98-99
44 45 55 97-98
45 45 54 96-97
School System State
Reading Vocabulary 50
32 35 46 0
98-99
27 34 45 97-98
34 36 44 96-97
Language Arts
School 50
System
State
0
49 52 60 98-99
49 51 58 97-98
56 51 56 96-97
School System State
Social Studies 50
37 43 54 0
98-99
36 44 53 97-98
45 44 53 96-97
Science
School 50
System
State
0
34 39 56 98-99
39 42 55 97-98
38 40 53 96-97
School System State
Sources of Information
Composite Score
50
45 49 57 0
98-99
School 50
System
42 49 56 97-98
50 47 55 96-97
State 0
39 44 56 98-99
38 44 54 97-98
1998-99 GEORGIA PUBLIC EDUCATION REPORT CARD Appling Middle School - 6115050
Prepared by Georgia Department of Education
45 43 54 96-97
Scores Reported in Percentiles
School System State
Page 2
STATE-REQUIRED TEST DATA
Categories of Scaled Scores
Inadequate (less than 162)
Minimal (162-209)
Good
(210-247)
Very Good (greater than 247)
Average Scaled Score: (Range 100-300)
PERFORMANCE ASSESSMENTS
Grade 8 Writing Assessment
1998-99 Percent Scoring
1997-98 Percent Scoring
1996-97 Percent Scoring
School System State School System State School System State
11% 59% 29%
1%
10% 51% 34%
5%
8% 40% 41% 11%
11% 66% 22%
0%
9% 57% 31%
2%
11% 46% 34%
8%
15% 62% 18%
5%
18% 57% 20%
6%
15% 46% 30%
8%
193
200
208 192
198 202 190
190 198
AWARDS / RECOGNITION DATA
Schools in Georgia may receive recognition in the following programs: Charter School Pay for Performance Program Georgia School of Excellence National Blue Ribbon School Appling Middle School did not receive recognition in any of these programs during the 1998-99 school year.
1998-99 GEORGIA PUBLIC EDUCATION REPORT CARD Appling Middle School - 6115050
Prepared by Georgia Department of Education
Page 3
CERTIFIED PERSONNEL DATA
Positions Number Average Contract Days
Personnel Sex
Certificate
Years Experience
Full-time Part-time
Male Female
4 Yr Bachelor's 5 Yr Master's 6 Yr Specialist's 7 Yr Doctoral Other*
<1 1-10 11-20 21-30 >30
Average
Administrators
2.00 210.00
2 0
1 1
0 1 1 0 0 0 1 1 0 0 9.50
Support Personnel
2.00 192.50
2 0
0 2
0 2 0 0 0 0 1 0 1 0 14.00
PK-12 Teachers
36.50 190.41
36 1
7 30
20 17
0 0 0 2 14 12 6 3 14.19
*Includes One- and Two-Year Vocational Certificates.
ACCREDITATION DATA
Accredited by Southern Association of Colleges and Schools (SACS): Secondary/Middle Commission.
1998-99 GEORGIA PUBLIC EDUCATION REPORT CARD Appling Middle School - 6115050
Prepared by Georgia Department of Education
Page 4
1998-99 GEORGIA PUBLIC EDUCATION REPORT CARD
BIBB COUNTY SCHOOLS
Ballard Hudson Middle School - 6111052
Grade Range 7-8
The Georgia Public Education Report Card is designed to assist systems and schools in educational improvement. This report card contains a variety of data elements. An explanation of the terms is provided as a companion to the report card data. Please refer to the definitions for the most effective use of the reported data.
STUDENT DATA
Total 509
7-8 Enrollment, by Race/Ethnicity and Sex
Black
White Hispanic
American Multi-
Asian Indian
racial
368 72.3%
133 26.1%
1 0.2%
4 0.8%
2 0.4%
1 0.2%
Male 250
49.1%
Female 259
50.9%
Enrollment in Selected Programs
Program
Gifted (Grades K-12)
Program % of Student Enrollment Population
14
2.8%
Alternative Programs
11
(Grades 6-12)
2.2%
Students Eligible to Receive Free/Reduced Lunches
Number
Percent
School System
396 15,047
77.8% 61.1%
Enrollment in Compensatory Programs
Program
Program % of Student Enrollment Population
Special Education (Grades K-12) (PK)
61 12.0%
0
N/A
English to Speakers of Other Languages (ESOL) (Grades K-12)
0
0.0%
Title I (Grades K-12)
This school has no Title I program.
Dropout Rate for Grades 7-8
Number
Rate
School System
2
0.3%
13
0.3%
Total 32
Retained Students, by Race/Ethnicity and Sex
Black
White Hispanic
American MultiAsian Indian racial
21 65.6%
11 34.4%
0 0.0%
0 0.0%
0 0.0%
0 0.0%
Male Female
18
14
56.3% 43.8%
Prepared by Georgia Department of Education
Page 1
STATE-REQUIRED TEST DATA
NORM-REFERENCED TESTS Grade 8
Iowa Tests of Basic Skills (ITBS) Each chart reflects data for three years of testing.
Reading Comprehension 50
26 38 49 0
98-99
28 39 48 97-98
28 38 48 96-97
Mathematics
School 50
System
State
0
32 47 56 98-99
34 45 55 97-98
33 45 54 96-97
School System State
Reading Vocabulary 50
21 35 46 0
98-99
25 34 45 97-98
24 36 44 96-97
Language Arts
School 50
System
State
0
39 52 60 98-99
42 51 58 97-98
40 51 56 96-97
School System State
Social Studies 50
32 43 54 0
98-99
33 44 53 97-98
36 44 53 96-97
Science
School 50
System
State
0
28 39 56 98-99
29 42 55 97-98
32 40 53 96-97
School System State
Sources of Information
Composite Score
50
35 49 57 0
98-99
School 50
System
38 49 56 97-98
39 47 55 96-97
State 0
30 44 56 98-99
32 44 54 97-98
1998-99 GEORGIA PUBLIC EDUCATION REPORT CARD Ballard Hudson Middle School - 6111052
Prepared by Georgia Department of Education
33 43 54 96-97
Scores Reported in Percentiles
School System State
Page 2
STATE-REQUIRED TEST DATA
Categories of Scaled Scores
Inadequate (less than 162)
Minimal (162-209)
Good
(210-247)
Very Good (greater than 247)
Average Scaled Score: (Range 100-300)
PERFORMANCE ASSESSMENTS
Grade 8 Writing Assessment
1998-99 Percent Scoring
1997-98 Percent Scoring
1996-97 Percent Scoring
School System State School System State School System State
14% 59% 25%
2%
10% 51% 34%
5%
8% 40% 41% 11%
10% 63% 26%
1%
9% 57% 31%
2%
11% 46% 34%
8%
19% 66% 12%
3%
18% 57% 20%
6%
15% 46% 30%
8%
190
200
208 195
198 202 184
190 198
AWARDS / RECOGNITION DATA
Schools in Georgia may receive recognition in the following programs: Charter School Pay for Performance Program Georgia School of Excellence National Blue Ribbon School Ballard Hudson Middle School did not receive recognition in any of these programs during the 1998-99 school year.
1998-99 GEORGIA PUBLIC EDUCATION REPORT CARD Ballard Hudson Middle School - 6111052
Prepared by Georgia Department of Education
Page 3
CERTIFIED PERSONNEL DATA
Positions Number Average Contract Days
Personnel Sex
Certificate
Years Experience
Full-time Part-time
Male Female
4 Yr Bachelor's 5 Yr Master's 6 Yr Specialist's 7 Yr Doctoral Other*
<1 1-10 11-20 21-30 >30
Average
Administrators
2.00 210.00
2 0
1 1
0 1 0 1 0 0 0 1 1 0 21.00
Support Personnel
3.00 193.33
3 0
1 2
0 3 0 0 0 0 0 0 1 2 32.00
PK-12 Teachers
34.50 190.43
34 1
11 24
17 16
2 0 0 2 15 8 6 4 14.37
*Includes One- and Two-Year Vocational Certificates.
ACCREDITATION DATA
Accredited by Southern Association of Colleges and Schools (SACS): Secondary/Middle Commission.
1998-99 GEORGIA PUBLIC EDUCATION REPORT CARD Ballard Hudson Middle School - 6111052
Prepared by Georgia Department of Education
Page 4
1998-99 GEORGIA PUBLIC EDUCATION REPORT CARD
BIBB COUNTY SCHOOLS
Barden Elementary School - 6114052
Grade Range K-6
The Georgia Public Education Report Card is designed to assist systems and schools in educational improvement. This report card contains a variety of data elements. An explanation of the terms is provided as a companion to the report card data. Please refer to the definitions for the most effective use of the reported data.
STUDENT DATA
Total 508
K-6 Enrollment, by Race/Ethnicity and Sex
Black
White Hispanic
American Multi-
Asian Indian
racial
396 78.0%
110 21.7%
2 0.4%
0 0.0%
0 0.0%
0 0.0%
Male Female
265 52.2%
243 47.8%
Enrollment in Selected Programs
Program
Program % of Student Enrollment Population
Gifted (Grades K-12)
0
0.0%
Alternative Programs (Grades 6-12)
0
0.0%
Students Eligible to Receive Free/Reduced Lunches
Number
Percent
School System
404 15,047
79.5% 61.1%
Dropout Rate for Grade 6
Number
Rate
School System
0
0.0%
0
0.0%
Enrollment in Compensatory Programs
Program
Program % of Student Enrollment Population
Special Education (Grades K-12)
90 17.7%
(PK)
0
N/A
English to Speakers of Other Languages (ESOL) (Grades K-12)
0
0.0%
Remedial Education (Grades 2-5, 9-12)
50 16.9%
Special Instructional Assistance (SIA) (Grades K-3)
0
0.0%
Title I (Grades K-12)
This school has a schoolwide program.
Total 25
Retained Students, by Race/Ethnicity and Sex
Black
White Hispanic
American Multi-
Asian Indian
racial
20 80.0%
5 20.0%
0 0.0%
0 0.0%
0 0.0%
0 0.0%
Male Female
12
13
48.0% 52.0%
Prepared by Georgia Department of Education
Page 1
STATE-REQUIRED TEST DATA
NORM-REFERENCED TESTS Grade 3
Iowa Tests of Basic Skills (ITBS) Each chart reflects data for three years of testing.
Reading Comprehension 50
47 54 54 0
98-99
49 48 53 97-98
52 47 52 96-97
Mathematics
School 50
System
State
0
62 67 61 98-99
45 59 61 97-98
48 55 59 96-97
School System State
Reading Vocabulary 50
43 55 50 0
98-99
46 47 50 97-98
41 46 49 96-97
Language Arts
School 50
System
State
0
70 71 64 98-99
62 62 62 97-98
61 62 59 96-97
School System State
Social Studies 50
48 59 56 0
98-99
48 53 55 97-98
48 54 55 96-97
Science
School 50
System
State
0
45 57 59 98-99
37 50 59 97-98
46 49 58 96-97
School System State
Sources of Information
Composite Score
50
46 61 57 0
98-99
School 50
System
47 53 56 97-98
52 53 55 96-97
State 0
52 62 58 98-99
47 53 57 97-98
1998-99 GEORGIA PUBLIC EDUCATION REPORT CARD Barden Elementary School - 6114052
Prepared by Georgia Department of Education
49 53 56 96-97
Scores Reported in Percentiles
School System State
Page 2
STATE-REQUIRED TEST DATA
NORM-REFERENCED TESTS Grade 5
Iowa Tests of Basic Skills (ITBS) Each chart reflects data for three years of testing.
Reading Comprehension
Mathematics
50
57 54 53 0
98-99
46 49 53 97-98
45 50 52 96-97
School 50
System
State
0
53 62 59 98-99
58 56 58 97-98
54 53 57 96-97
School System State
Reading Vocabulary 50
42 58 48 0
98-99
69 48 48 97-98
82 44 46 96-97
Language Arts
School 50
System
State
0
62 67 63 98-99
64 60 61 97-98
64 60 58 96-97
School System State
Social Studies 50
41 58 57 0
98-99
46 52 56 97-98
37 48 55 96-97
Science
School 50
System
State
0
43 57 60 98-99
42 54 59 97-98
46 52 59 96-97
School System State
Sources of Information
Composite Score
50
48 57 58 0
98-99
School 50
System
48 54 58 97-98
49 55 57 96-97
State 0
48 59 57 98-99
51 53 56 97-98
51 52 55 96-97
1998-99 GEORGIA PUBLIC EDUCATION REPORT CARD Barden Elementary School - 6114052
Prepared by Georgia Department of Education
Scores Reported in Percentiles
School System State
Page 3
STATE-REQUIRED TEST DATA
PERFORMANCE ASSESSMENTS
Grade 5 Writing Assessment
Percent at Developmental Stages:
1998-99 School System State
1997-98 School System State
1996-97 School System State
Stage Stage Stage Stage Stage Stage
1:The Emerging Writer 2:The Developing Writer 3:The Focusing Writer 4:The Experimenting 5:The Engaging Writer 6:The Extending Writer
0% 0% 19% 44% 31% 7%
0% 1% 19% 48% 23% 7%
0% 1% 16% 41% 29% 12%
0% 1% 18% 58% 19% 3%
0% 2% 24% 44% 23% 6%
0% 3% 19% 41% 27% 10%
0% 0% 29% 42% 27% 2%
0% 3% 28% 41% 22% 6%
0% 3% 21% 37% 26% 12%
AWARDS / RECOGNITION DATA
Schools in Georgia may receive recognition in the following programs: Charter School Pay for Performance Program Georgia School of Excellence National Blue Ribbon School Barden Elementary School did not receive recognition in any of these programs during the 1998-99 school year.
1998-99 GEORGIA PUBLIC EDUCATION REPORT CARD Barden Elementary School - 6114052
Prepared by Georgia Department of Education
Page 4
CERTIFIED PERSONNEL DATA
Positions Number Average Contract Days
Personnel Sex
Certificate
Years Experience
Full-time Part-time
Male Female
4 Yr Bachelor's 5 Yr Master's 6 Yr Specialist's 7 Yr Doctoral Other*
<1 1-10 11-20 21-30 >30
Average
Administrators
1.50 206.67
1 1
0 2
0 0 1 1 0 0 0 0 2 0 25.50
Support Personnel
2.00 190.00
2 0
0 2
0 2 0 0 0 0 1 1 0 0 8.50
PK-12 Teachers
31.50 190.16
31 1
1 31
19 10
2 1 0 6 11 10 5 0 10.72
*Includes One- and Two-Year Vocational Certificates.
ACCREDITATION DATA
Accredited by Southern Association of Colleges and Schools (SACS):
Elementary/Middle Commission.
1998-99 GEORGIA PUBLIC EDUCATION REPORT CARD Barden Elementary School - 6114052
Prepared by Georgia Department of Education
Page 5
1998-99 GEORGIA PUBLIC EDUCATION REPORT CARD
BIBB COUNTY SCHOOLS
Bernd Elementary School - 6111054
Grade Range K-6
The Georgia Public Education Report Card is designed to assist systems and schools in educational improvement. This report card contains a variety of data elements. An explanation of the terms is provided as a companion to the report card data. Please refer to the definitions for the most effective use of the reported data.
STUDENT DATA
Total 355
K-6 Enrollment, by Race/Ethnicity and Sex
Black
White Hispanic
American Multi-
Asian Indian
racial
218 61.4%
136 38.3%
1 0.3%
0 0.0%
0 0.0%
0 0.0%
Male Female
195 54.9%
160 45.1%
Enrollment in Selected Programs
Program
Program % of Student Enrollment Population
Gifted (Grades K-12)
7
2.0%
Alternative Programs (Grades 6-12)
0
0.0%
Students Eligible to Receive Free/Reduced Lunches
Number
Percent
School System
259 15,047
73.0% 61.1%
Dropout Rate for Grade 6
Number
Rate
School System
0
0.0%
0
0.0%
Enrollment in Compensatory Programs
Program
Program % of Student Enrollment Population
Special Education (Grades K-12)
26
7.3%
(PK)
2
N/A
English to Speakers of Other Languages (ESOL) (Grades K-12)
0
0.0%
Remedial Education (Grades 2-5, 9-12)
45 22.5%
Special Instructional Assistance (SIA) (Grades K-3)
0
0.0%
Title I (Grades K-12)
This school has a schoolwide program.
Total 17
Retained Students, by Race/Ethnicity and Sex
Black
White Hispanic
American Multi-
Asian Indian
racial
9 52.9%
8 47.1%
0 0.0%
0 0.0%
0 0.0%
0 0.0%
Male Female
10
7
58.8% 41.2%
Prepared by Georgia Department of Education
Page 1
STATE-REQUIRED TEST DATA
NORM-REFERENCED TESTS Grade 3
Iowa Tests of Basic Skills (ITBS) Each chart reflects data for three years of testing.
Reading Comprehension 50
40 54 54 0
98-99
40 48 53 97-98
42 47 52 96-97
Mathematics
School 50
System
State
0
58 67 61 98-99
60 59 61 97-98
64 55 59 96-97
School System State
Reading Vocabulary 50
39 55 50 0
98-99
37 47 50 97-98
43 46 49 96-97
Language Arts
School 50
System
State
0
68 71 64 98-99
62 62 62 97-98
69 62 59 96-97
School System State
Social Studies 50
57 59 56 0
98-99
43 53 55 97-98
52 54 55 96-97
Science
School 50
System
State
0
61 57 59 98-99
46 50 59 97-98
53 49 58 96-97
School System State
Sources of Information
Composite Score
50
55 61 57 0
98-99
School 50
System
48 53 56 97-98
58 53 55 96-97
State 0
56 62 58 98-99
48 53 57 97-98
1998-99 GEORGIA PUBLIC EDUCATION REPORT CARD Bernd Elementary School - 6111054
Prepared by Georgia Department of Education
57 53 56 96-97
Scores Reported in Percentiles
School System State
Page 2
STATE-REQUIRED TEST DATA
NORM-REFERENCED TESTS Grade 5
Iowa Tests of Basic Skills (ITBS) Each chart reflects data for three years of testing.
Reading Comprehension
Mathematics
50
51 54 53 0
98-99
47 49 53 97-98
42 50 52 96-97
School 50
System
State
0
62 62 59 98-99
66 56 58 97-98
50 53 57 96-97
School System State
Reading Vocabulary 50
92 58 48 0
98-99
89 48 48 97-98
92 44 46 96-97
Language Arts
School 50
System
State
0
72 67 63 98-99
73 60 61 97-98
62 60 58 96-97
School System State
Social Studies 50
80 58 57 0
98-99
83 52 56 97-98
69 48 55 96-97
Science
School 50
System
State
0
76 57 60 98-99
86 54 59 97-98
79 52 59 96-97
School System State
Sources of Information
Composite Score
50
61 57 58 0
98-99
School 50
System
51 54 58 97-98
52 55 57 96-97
State 0
72 59 57 98-99
74 53 56 97-98
64 52 55 96-97
1998-99 GEORGIA PUBLIC EDUCATION REPORT CARD Bernd Elementary School - 6111054
Prepared by Georgia Department of Education
Scores Reported in Percentiles
School System State
Page 3
STATE-REQUIRED TEST DATA
PERFORMANCE ASSESSMENTS
Grade 5 Writing Assessment
Percent at Developmental Stages:
1998-99 School System State
1997-98 School System State
1996-97 School System State
Stage Stage Stage Stage Stage Stage
1:The Emerging Writer 2:The Developing Writer 3:The Focusing Writer 4:The Experimenting 5:The Engaging Writer 6:The Extending Writer
0% 0% 27% 47% 27% 0%
0% 1% 19% 48% 23% 7%
0% 1% 16% 41% 29% 12%
0% 0% 42% 44% 8% 0%
0% 2% 24% 44% 23% 6%
0% 3% 19% 41% 27% 10%
0% 0% 45% 52% 0% 3%
0% 3% 28% 41% 22% 6%
0% 3% 21% 37% 26% 12%
AWARDS / RECOGNITION DATA
Schools in Georgia may receive recognition in the following programs: Charter School Pay for Performance Program Georgia School of Excellence National Blue Ribbon School Bernd Elementary School did not receive recognition in any of these programs during the 1998-99 school year.
1998-99 GEORGIA PUBLIC EDUCATION REPORT CARD Bernd Elementary School - 6111054
Prepared by Georgia Department of Education
Page 4
CERTIFIED PERSONNEL DATA
Positions Number Average Contract Days
Personnel Sex
Certificate
Years Experience
Full-time Part-time
Male Female
4 Yr Bachelor's 5 Yr Master's 6 Yr Specialist's 7 Yr Doctoral Other*
<1 1-10 11-20 21-30 >30
Average
Administrators
1.00 210.00
1 0
0 1
0 0 1 0 0 0 0 0 0 1 34.00
Support Personnel
2.00 190.00
2 0
0 2
0 2 0 0 0 0 0 1 0 1 25.50
PK-12 Teachers
21.00 190.00
21 0
1 20
11 9 1 0 0 1
11 5 4 0
12.52
*Includes One- and Two-Year Vocational Certificates.
ACCREDITATION DATA
Accredited by Southern Association of Colleges and Schools (SACS):
Elementary/Middle Commission.
1998-99 GEORGIA PUBLIC EDUCATION REPORT CARD Bernd Elementary School - 6111054
Prepared by Georgia Department of Education
Page 5
1998-99 GEORGIA PUBLIC EDUCATION REPORT CARD
BIBB COUNTY SCHOOLS
Brookdale Elementary School - 6110191
Grade Range K-6
The Georgia Public Education Report Card is designed to assist systems and schools in educational improvement. This report card contains a variety of data elements. An explanation of the terms is provided as a companion to the report card data. Please refer to the definitions for the most effective use of the reported data.
STUDENT DATA
Total 523
K-6 Enrollment, by Race/Ethnicity and Sex
Black
White Hispanic
American Multi-
Asian Indian
racial
479 91.6%
41 7.8%
2 0.4%
0 0.0%
0 0.0%
1 0.2%
Male Female
268 51.2%
255 48.8%
Enrollment in Selected Programs
Program
Program % of Student Enrollment Population
Gifted (Grades K-12)
3
< 1%
Alternative Programs (Grades 6-12)
0
0.0%
Students Eligible to Receive Free/Reduced Lunches
Number
Percent
School System
487 15,047
93.1% 61.1%
Dropout Rate for Grade 6
Number
Rate
School System
0
0.0%
0
0.0%
Enrollment in Compensatory Programs
Program
Program % of Student Enrollment Population
Special Education (Grades K-12)
75 14.3%
(PK)
0
N/A
English to Speakers of Other Languages (ESOL) (Grades K-12)
0
0.0%
Remedial Education (Grades 2-5, 9-12)
57 19.4%
Special Instructional Assistance (SIA) (Grades K-3)
44 14.3%
Title I (Grades K-12)
This school has a schoolwide program.
Total 28
Retained Students, by Race/Ethnicity and Sex
Black
White Hispanic
American Multi-
Asian Indian
racial
24 85.7%
4 14.3%
0 0.0%
0 0.0%
0 0.0%
0 0.0%
Male Female
17
11
60.7% 39.3%
Prepared by Georgia Department of Education
Page 1
STATE-REQUIRED TEST DATA
NORM-REFERENCED TESTS Grade 3
Iowa Tests of Basic Skills (ITBS) Each chart reflects data for three years of testing.
Reading Comprehension 50
27 54 54 0
98-99
24 48 53 97-98
38 47 52 96-97
Mathematics
School 50
System
State
0
45 67 61 98-99
42 59 61 97-98
49 55 59 96-97
School System State
Reading Vocabulary 50
26 55 50 0
98-99
26 47 50 97-98
34 46 49 96-97
Language Arts
School 50
System
State
0
52 71 64 98-99
38 62 62 97-98
61 62 59 96-97
School System State
Social Studies 50
29 59 56 0
98-99
31 53 55 97-98
39 54 55 96-97
Science
School 50
System
State
0
31 57 59 98-99
27 50 59 97-98
35 49 58 96-97
School System State
Sources of Information
Composite Score
50
34 61 57 0
98-99
School 50
System
31 53 56 97-98
43 53 55 96-97
State 0
34 62 58 98-99
30 53 57 97-98
1998-99 GEORGIA PUBLIC EDUCATION REPORT CARD Brookdale Elementary School - 6110191
Prepared by Georgia Department of Education
41 53 56 96-97
Scores Reported in Percentiles
School System State
Page 2
STATE-REQUIRED TEST DATA
NORM-REFERENCED TESTS Grade 5
Iowa Tests of Basic Skills (ITBS) Each chart reflects data for three years of testing.
Reading Comprehension
Mathematics
50
30 54 53 0
98-99
37 49 53 97-98
39 50 52 96-97
School 50
System
State
0
41 62 59 98-99
40 56 58 97-98
38 53 57 96-97
School System State
Reading Vocabulary 50
58 58 48 0
98-99
21 48 48 97-98
25 44 46 96-97
Language Arts
School 50
System
State
0
52 67 63 98-99
42 60 61 97-98
43 60 58 96-97
School System State
Social Studies 50
35 58 57 0
98-99
33 52 56 97-98
39 48 55 96-97
Science
School 50
System
State
0
31 57 60 98-99
33 54 59 97-98
35 52 59 96-97
School System State
Sources of Information
Composite Score
50
35 57 58 0
98-99
School 50
System
36 54 58 97-98
40 55 57 96-97
State 0
37 59 57 98-99
34 53 56 97-98
36 52 55 96-97
1998-99 GEORGIA PUBLIC EDUCATION REPORT CARD Brookdale Elementary School - 6110191
Prepared by Georgia Department of Education
Scores Reported in Percentiles
School System State
Page 3
STATE-REQUIRED TEST DATA
PERFORMANCE ASSESSMENTS
Grade 5 Writing Assessment
Percent at Developmental Stages:
1998-99 School System State
1997-98 School System State
1996-97 School System State
Stage Stage Stage Stage Stage Stage
1:The Emerging Writer 2:The Developing Writer 3:The Focusing Writer 4:The Experimenting 5:The Engaging Writer 6:The Extending Writer
0% 4% 29% 60% 5% 0%
0% 1% 19% 48% 23% 7%
0% 1% 16% 41% 29% 12%
0% 3% 43% 37% 16% 2%
0% 2% 24% 44% 23% 6%
0% 3% 19% 41% 27% 10%
0% 6% 52% 33% 6% 2%
0% 3% 28% 41% 22% 6%
0% 3% 21% 37% 26% 12%
AWARDS / RECOGNITION DATA
Schools in Georgia may receive recognition in the following programs: Charter School Pay for Performance Program Georgia School of Excellence National Blue Ribbon School Brookdale Elementary School did not receive recognition in any of these programs during the 1998-99 school year.
1998-99 GEORGIA PUBLIC EDUCATION REPORT CARD Brookdale Elementary School - 6110191
Prepared by Georgia Department of Education
Page 4
CERTIFIED PERSONNEL DATA
Positions Number Average Contract Days
Personnel Sex
Certificate
Years Experience
Full-time Part-time
Male Female
4 Yr Bachelor's 5 Yr Master's 6 Yr Specialist's 7 Yr Doctoral Other*
<1 1-10 11-20 21-30 >30
Average
Administrators
2.00 205.00
2 0
1 1
0 0 2 0 0 0 0 2 0 0 18.50
Support Personnel
3.00 190.00
3 0
0 3
0 2 1 0 0 0 1 0 2 0 18.67
PK-12 Teachers
37.50 190.00
37 1
1 37
14 23
1 0 0 0 11 15 11 1 15.50
*Includes One- and Two-Year Vocational Certificates.
ACCREDITATION DATA
Accredited by Southern Association of Colleges and Schools (SACS):
Elementary/Middle Commission.
1998-99 GEORGIA PUBLIC EDUCATION REPORT CARD Brookdale Elementary School - 6110191
Prepared by Georgia Department of Education
Page 5
1998-99 GEORGIA PUBLIC EDUCATION REPORT CARD
BIBB COUNTY SCHOOLS
Bruce Elementary School - 6113054
Grade Range PK-6
The Georgia Public Education Report Card is designed to assist systems and schools in educational improvement. This report card contains a variety of data elements. An explanation of the terms is provided as a companion to the report card data. Please refer to the definitions for the most effective use of the reported data.
STUDENT DATA
Total
K-6
530
PK
20
Enrollment, by Race/Ethnicity and Sex
Black
White Hispanic
American Asian Indian
Multiracial
482 90.9%
47 8.9%
0 0.0%
0 0.0%
0 0.0%
1 0.2%
16 80.0%
4 20.0%
0 0.0%
0 0.0%
0 0.0%
0 0.0%
Male Female
263 49.6%
267 50.4%
14 70.0%
6 30.0%
Enrollment in Selected Programs
Program
Program % of Student Enrollment Population
Gifted (Grades K-12)
3
< 1%
Alternative Programs (Grades 6-12)
0
0.0%
Students Eligible to Receive Free/Reduced Lunches
Number
Percent
School System
517 15,047
94.0% 61.1%
Dropout Rate for Grade 6
Number
Rate
School System
0
0.0%
0
0.0%
Enrollment in Compensatory Programs
Program
Program % of Student Enrollment Population
Special Education (Grades K-12)
43
8.1%
(PK)
1
N/A
English to Speakers of Other Languages (ESOL) (Grades K-12)
0
0.0%
Remedial Education (Grades 2-5, 9-12)
62 20.4%
Special Instructional Assistance (SIA) (Grades K-3)
42 13.6%
Title I (Grades K-12)
This school has a schoolwide program.
Total 31
Retained Students, by Race/Ethnicity and Sex
Black
White Hispanic
American MultiAsian Indian racial
28 90.3%
3 9.7%
0 0.0%
0 0.0%
0 0.0%
0 0.0%
Male Female
21
10
67.7% 32.3%
Prepared by Georgia Department of Education
Page 1
STATE-REQUIRED TEST DATA
NORM-REFERENCED TESTS Grade 3
Iowa Tests of Basic Skills (ITBS) Each chart reflects data for three years of testing.
Reading Comprehension 50
71 54 54 0
98-99
31 48 53 97-98
32 47 52 96-97
Mathematics
School 50
System
State
0
85 67 61 98-99
41 59 61 97-98
36 55 59 96-97
School System State
Reading Vocabulary 50
84 55 50 0
98-99
29 47 50 97-98
26 46 49 96-97
Language Arts
School 50
System
State
0
82 71 64 98-99
50 62 62 97-98
48 62 59 96-97
School System State
Social Studies 50
68 59 56 0
98-99
30 53 55 97-98
36 54 55 96-97
Science
School 50
System
State
0
79 57 59 98-99
35 50 59 97-98
32 49 58 96-97
School System State
Sources of Information
Composite Score
50
78 61 57 0
98-99
School 50
System
39 53 56 97-98
37 53 55 96-97
State 0
79 62 58 98-99
35 53 57 97-98
1998-99 GEORGIA PUBLIC EDUCATION REPORT CARD Bruce Elementary School - 6113054
Prepared by Georgia Department of Education
34 53 56 96-97
Scores Reported in Percentiles
School System State
Page 2
STATE-REQUIRED TEST DATA
NORM-REFERENCED TESTS Grade 5
Iowa Tests of Basic Skills (ITBS) Each chart reflects data for three years of testing.
Reading Comprehension
Mathematics
50
55 54 53 0
98-99
36 49 53 97-98
35 50 52 96-97
School 50
System
State
0
64 62 59 98-99
49 56 58 97-98
33 53 57 96-97
School System State
Reading Vocabulary 50
81 58 48 0
98-99
25 48 48 97-98
19 44 46 96-97
Language Arts
School 50
System
State
0
67 67 63 98-99
58 60 61 97-98
47 60 58 96-97
School System State
Social Studies 50
44 58 57 0
98-99
45 52 56 97-98
25 48 55 96-97
Science
School 50
System
State
0
38 57 60 98-99
65 54 59 97-98
23 52 59 96-97
School System State
Sources of Information
Composite Score
50
51 57 58 0
98-99
School 50
System
45 54 58 97-98
40 55 57 96-97
State 0
54 59 57 98-99
48 53 56 97-98
30 52 55 96-97
1998-99 GEORGIA PUBLIC EDUCATION REPORT CARD Bruce Elementary School - 6113054
Prepared by Georgia Department of Education
Scores Reported in Percentiles
School System State
Page 3
STATE-REQUIRED TEST DATA
PERFORMANCE ASSESSMENTS
Grade 5 Writing Assessment
Percent at Developmental Stages:
1998-99 School System State
1997-98 School System State
1996-97 School System State
Stage Stage Stage Stage Stage Stage
1:The Emerging Writer 2:The Developing Writer 3:The Focusing Writer 4:The Experimenting 5:The Engaging Writer 6:The Extending Writer
0% 0% 19% 66% 14% 2%
0% 1% 19% 48% 23% 7%
0% 1% 16% 41% 29% 12%
0% 6% 28% 52% 11% 1%
0% 2% 24% 44% 23% 6%
0% 3% 19% 41% 27% 10%
1% 2% 39% 46% 10% 2%
0% 3% 28% 41% 22% 6%
0% 3% 21% 37% 26% 12%
AWARDS / RECOGNITION DATA
Schools in Georgia may receive recognition in the following programs: Charter School Pay for Performance Program Georgia School of Excellence National Blue Ribbon School Bruce Elementary School did not receive recognition in any of these programs during the 1998-99 school year.
1998-99 GEORGIA PUBLIC EDUCATION REPORT CARD Bruce Elementary School - 6113054
Prepared by Georgia Department of Education
Page 4
CERTIFIED PERSONNEL DATA
Positions Number Average Contract Days
Personnel Sex
Certificate
Years Experience
Full-time Part-time
Male Female
4 Yr Bachelor's 5 Yr Master's 6 Yr Specialist's 7 Yr Doctoral Other*
<1 1-10 11-20 21-30 >30
Average
Administrators
1.50 206.67
1 1
0 2
0 1 1 0 0 0 0 1 1 0 20.50
Support Personnel
2.00 190.00
2 0
0 2
0 1 1 0 0 0 1 0 0 1 21.50
PK-12 Teachers
36.50 190.14
36 1
1 36
21 12
4 0 0 1 20 10 5 1 11.35
*Includes One- and Two-Year Vocational Certificates.
ACCREDITATION DATA
Accredited by Southern Association of Colleges and Schools (SACS):
Elementary/Middle Commission.
1998-99 GEORGIA PUBLIC EDUCATION REPORT CARD Bruce Elementary School - 6113054
Prepared by Georgia Department of Education
Page 5
1998-99 GEORGIA PUBLIC EDUCATION REPORT CARD
BIBB COUNTY SCHOOLS
Burdell Elementary School - 6114054
Grade Range PK-6
The Georgia Public Education Report Card is designed to assist systems and schools in educational improvement. This report card contains a variety of data elements. An explanation of the terms is provided as a companion to the report card data. Please refer to the definitions for the most effective use of the reported data.
STUDENT DATA
Total
K-6
398
PK
19
Enrollment, by Race/Ethnicity and Sex
Black
White Hispanic
American Asian Indian
Multiracial
389 97.7%
7 1.8%
0 0.0%
2 0.5%
0 0.0%
0 0.0%
19 100.0%
0 0.0%
0 0.0%
0 0.0%
0 0.0%
0 0.0%
Male Female
201 50.5%
197 49.5%
11 57.9%
8 42.1%
Enrollment in Selected Programs
Program
Program % of Student Enrollment Population
Gifted (Grades K-12)
7
1.8%
Alternative Programs (Grades 6-12)
0
0.0%
Students Eligible to Receive Free/Reduced Lunches
Number
Percent
School System
398 15,047
95.4% 61.1%
Dropout Rate for Grade 6
Number
Rate
School System
0
0.0%
0
0.0%
Enrollment in Compensatory Programs
Program
Program % of Student Enrollment Population
Special Education (Grades K-12)
19
4.8%
(PK)
0
N/A
English to Speakers of Other Languages (ESOL) (Grades K-12)
0
0.0%
Remedial Education (Grades 2-5, 9-12)
89 37.7%
Special Instructional Assistance (SIA) (Grades K-3)
0
0.0%
Title I (Grades K-12)
This school has a schoolwide program.
Total 32
Retained Students, by Race/Ethnicity and Sex
Black
White Hispanic
American MultiAsian Indian racial
32 100.0%
0 0.0%
0 0.0%
0 0.0%
0 0.0%
0 0.0%
Male Female
20
12
62.5% 37.5%
Prepared by Georgia Department of Education
Page 1
STATE-REQUIRED TEST DATA
NORM-REFERENCED TESTS Grade 3
Iowa Tests of Basic Skills (ITBS) Each chart reflects data for three years of testing.
Reading Comprehension 50
63 54 54 0
98-99
52 48 53 97-98
33 47 52 96-97
Mathematics
School 50
System
State
0
74 67 61 98-99
61 59 61 97-98
48 55 59 96-97
School System State
Reading Vocabulary 50
62 55 50 0
98-99
66 47 50 97-98
51 46 49 96-97
Language Arts
School 50
System
State
0
83 71 64 98-99
75 62 62 97-98
50 62 59 96-97
School System State
Social Studies 50
62 59 56 0
98-99
40 53 55 97-98
46 54 55 96-97
Science
School 50
System
State
0
49 57 59 98-99
38 50 59 97-98
37 49 58 96-97
School System State
Sources of Information
Composite Score
50
72 61 57 0
98-99
School 50
System
38 53 56 97-98
39 53 55 96-97
State 0
68 62 58 98-99
51 53 57 97-98
1998-99 GEORGIA PUBLIC EDUCATION REPORT CARD Burdell Elementary School - 6114054
Prepared by Georgia Department of Education
41 53 56 96-97
Scores Reported in Percentiles
School System State
Page 2
STATE-REQUIRED TEST DATA
NORM-REFERENCED TESTS Grade 5
Iowa Tests of Basic Skills (ITBS) Each chart reflects data for three years of testing.
Reading Comprehension
Mathematics
50
39 54 53 0
98-99
41 49 53 97-98
38 50 52 96-97
School 50
System
State
0
47 62 59 98-99
45 56 58 97-98
45 53 57 96-97
School System State
Reading Vocabulary 50
34 58 48 0
98-99
21 48 48 97-98
19 44 46 96-97
Language Arts
School 50
System
State
0
61 67 63 98-99
51 60 61 97-98
54 60 58 96-97
School System State
Social Studies 50
40 58 57 0
98-99
27 52 56 97-98
29 48 55 96-97
Science
School 50
System
State
0
33 57 60 98-99
34 54 59 97-98
33 52 59 96-97
School System State
Sources of Information
Composite Score
50
39 57 58 0
98-99
School 50
System
42 54 58 97-98
40 55 57 96-97
State 0
41 59 57 98-99
36 53 56 97-98
37 52 55 96-97
1998-99 GEORGIA PUBLIC EDUCATION REPORT CARD Burdell Elementary School - 6114054
Prepared by Georgia Department of Education
Scores Reported in Percentiles
School System State
Page 3
STATE-REQUIRED TEST DATA
PERFORMANCE ASSESSMENTS
Grade 5 Writing Assessment
Percent at Developmental Stages:
1998-99 School System State
1997-98 School System State
1996-97 School System State
Stage Stage Stage Stage Stage Stage
1:The Emerging Writer 2:The Developing Writer 3:The Focusing Writer 4:The Experimenting 5:The Engaging Writer 6:The Extending Writer
0% 2% 20% 52% 26% 0%
0% 1% 19% 48% 23% 7%
0% 1% 16% 41% 29% 12%
0% 3% 44% 41% 9% 3%
0% 2% 24% 44% 23% 6%
0% 3% 19% 41% 27% 10%
0% 0% 17% 47% 33% 3%
0% 3% 28% 41% 22% 6%
0% 3% 21% 37% 26% 12%
AWARDS / RECOGNITION DATA
Schools in Georgia may receive recognition in the following programs: Charter School Pay for Performance Program Georgia School of Excellence National Blue Ribbon School Burdell Elementary School did not receive recognition in any of these programs during the 1998-99 school year.
1998-99 GEORGIA PUBLIC EDUCATION REPORT CARD Burdell Elementary School - 6114054
Prepared by Georgia Department of Education
Page 4
CERTIFIED PERSONNEL DATA
Positions Number Average Contract Days
Personnel Sex
Certificate
Years Experience
Full-time Part-time
Male Female
4 Yr Bachelor's 5 Yr Master's 6 Yr Specialist's 7 Yr Doctoral Other*
<1 1-10 11-20 21-30 >30
Average
Administrators
1.00 210.00
1 0
1 0
0 1 0 0 0 0 0 0 0 1 44.00
Support Personnel
2.00 190.00
2 0
0 2
0 1 1 0 0 0 1 0 0 1 19.00
PK-12 Teachers
27.00 190.00
27 0
2 25
16 10
1 0 0 2 11 10 3 1 11.74
*Includes One- and Two-Year Vocational Certificates.
ACCREDITATION DATA
Accredited by Southern Association of Colleges and Schools (SACS):
Elementary/Middle Commission.
1998-99 GEORGIA PUBLIC EDUCATION REPORT CARD Burdell Elementary School - 6114054
Prepared by Georgia Department of Education
Page 5
1998-99 GEORGIA PUBLIC EDUCATION REPORT CARD
BIBB COUNTY SCHOOLS
Burghard Elementary School - 6115054
Grade Range K-6
The Georgia Public Education Report Card is designed to assist systems and schools in educational improvement. This report card contains a variety of data elements. An explanation of the terms is provided as a companion to the report card data. Please refer to the definitions for the most effective use of the reported data.
STUDENT DATA
Total 502
K-6 Enrollment, by Race/Ethnicity and Sex
Black
White Hispanic
American Multi-
Asian Indian
racial
410 81.7%
86 17.1%
3 0.6%
0 0.0%
1 0.2%
2 0.4%
Male Female
267 53.2%
235 46.8%
Enrollment in Selected Programs
Program
Program % of Student Enrollment Population
Gifted (Grades K-12)
12
2.4%
Alternative Programs (Grades 6-12)
0
0.0%
Students Eligible to Receive Free/Reduced Lunches
Number
Percent
School System
449 15,047
89.4% 61.1%
Dropout Rate for Grade 6
Number
Rate
School System
0
0.0%
0
0.0%
Enrollment in Compensatory Programs
Program
Program % of Student Enrollment Population
Special Education (Grades K-12)
72 14.3%
(PK)
0
N/A
English to Speakers of Other Languages (ESOL) (Grades K-12)
0
0.0%
Remedial Education (Grades 2-5, 9-12)
72 26.2%
Special Instructional Assistance (SIA) (Grades K-3)
0
0.0%
Title I (Grades K-12)
This school has a schoolwide program.
Total 52
Retained Students, by Race/Ethnicity and Sex
Black
White Hispanic
American Multi-
Asian Indian
racial
40 76.9%
12 23.1%
0 0.0%
0 0.0%
0 0.0%
0 0.0%
Male Female
36
16
69.2% 30.8%
Prepared by Georgia Department of Education
Page 1
STATE-REQUIRED TEST DATA
NORM-REFERENCED TESTS Grade 3
Iowa Tests of Basic Skills (ITBS) Each chart reflects data for three years of testing.
Reading Comprehension 50
76 54 54 0
98-99
37 48 53 97-98
40 47 52 96-97
Mathematics
School 50
System
State
0
85 67 61 98-99
44 59 61 97-98
56 55 59 96-97
School System State
Reading Vocabulary 50
91 55 50 0
98-99
39 47 50 97-98
43 46 49 96-97
Language Arts
School 50
System
State
0
82 71 64 98-99
32 62 62 97-98
55 62 59 96-97
School System State
Social Studies 50
68 59 56 0
98-99
30 53 55 97-98
55 54 55 96-97
Science
School 50
System
State
0
69 57 59 98-99
27 50 59 97-98
39 49 58 96-97
School System State
Sources of Information
Composite Score
50
64 61 57 0
98-99
School 50
System
27 53 56 97-98
53 53 55 96-97
State 0
77 62 58 98-99
30 53 57 97-98
1998-99 GEORGIA PUBLIC EDUCATION REPORT CARD Burghard Elementary School - 6115054
Prepared by Georgia Department of Education
48 53 56 96-97
Scores Reported in Percentiles
School System State
Page 2
STATE-REQUIRED TEST DATA
NORM-REFERENCED TESTS Grade 5
Iowa Tests of Basic Skills (ITBS) Each chart reflects data for three years of testing.
Reading Comprehension
Mathematics
50
35 54 53 0
98-99
43 49 53 97-98
42 50 52 96-97
School 50
System
State
0
42 62 59 98-99
56 56 58 97-98
45 53 57 96-97
School System State
Reading Vocabulary 50
82 58 48 0
98-99
30 48 48 97-98
32 44 46 96-97
Language Arts
School 50
System
State
0
51 67 63 98-99
56 60 61 97-98
55 60 58 96-97
School System State
Social Studies 50
30 58 57 0
98-99
41 52 56 97-98
42 48 55 96-97
Science
School 50
System
State
0
36 57 60 98-99
42 54 59 97-98
41 52 59 96-97
School System State
Sources of Information
Composite Score
50
39 57 58 0
98-99
School 50
System
53 54 58 97-98
50 55 57 96-97
State 0
41 59 57 98-99
46 53 56 97-98
43 52 55 96-97
1998-99 GEORGIA PUBLIC EDUCATION REPORT CARD Burghard Elementary School - 6115054
Prepared by Georgia Department of Education
Scores Reported in Percentiles
School System State
Page 3
STATE-REQUIRED TEST DATA
PERFORMANCE ASSESSMENTS
Grade 5 Writing Assessment
Percent at Developmental Stages:
1998-99 School System State
1997-98 School System State
1996-97 School System State
Stage Stage Stage Stage Stage Stage
1:The Emerging Writer 2:The Developing Writer 3:The Focusing Writer 4:The Experimenting 5:The Engaging Writer 6:The Extending Writer
0% 3% 29% 38% 21% 9%
0% 1% 19% 48% 23% 7%
0% 1% 16% 41% 29% 12%
0% 0% 26% 52% 7% 15%
0% 2% 24% 44% 23% 6%
0% 3% 19% 41% 27% 10%
0% 4% 27% 37% 24% 8%
0% 3% 28% 41% 22% 6%
0% 3% 21% 37% 26% 12%
AWARDS / RECOGNITION DATA
Schools in Georgia may receive recognition in the following programs: Charter School Pay for Performance Program Georgia School of Excellence National Blue Ribbon School Burghard Elementary School did not receive recognition in any of these programs during the 1998-99 school year.
1998-99 GEORGIA PUBLIC EDUCATION REPORT CARD Burghard Elementary School - 6115054
Prepared by Georgia Department of Education
Page 4
CERTIFIED PERSONNEL DATA
Positions Number Average Contract Days
Personnel Sex
Certificate
Years Experience
Full-time Part-time
Male Female
4 Yr Bachelor's 5 Yr Master's 6 Yr Specialist's 7 Yr Doctoral Other*
<1 1-10 11-20 21-30 >30
Average
Administrators
1.50 206.67
1 1
0 2
0 1 1 0 0 0 1 0 1 0 15.00
Support Personnel
2.00 190.00
2 0
0 2
0 2 0 0 0 0 0 1 1 0 19.50
PK-12 Teachers
33.00 190.15
32 2
1 33
24 8 2 0 0 3
20 7 4 0
8.85
*Includes One- and Two-Year Vocational Certificates.
ACCREDITATION DATA
Accredited by Southern Association of Colleges and Schools (SACS):
Elementary/Middle Commission.
1998-99 GEORGIA PUBLIC EDUCATION REPORT CARD Burghard Elementary School - 6115054
Prepared by Georgia Department of Education
Page 5
1998-99 GEORGIA PUBLIC EDUCATION REPORT CARD
BIBB COUNTY SCHOOLS
Burke Elementary School - 6110183
Grade Range PK-6
The Georgia Public Education Report Card is designed to assist systems and schools in educational improvement. This report card contains a variety of data elements. An explanation of the terms is provided as a companion to the report card data. Please refer to the definitions for the most effective use of the reported data.
STUDENT DATA
Total
K-6
371
PK
40
Enrollment, by Race/Ethnicity and Sex
Black
White Hispanic
American Asian Indian
Multiracial
370 99.7%
1 0.3%
0 0.0%
0 0.0%
0 0.0%
0 0.0%
39 97.5%
1 2.5%
0 0.0%
0 0.0%
0 0.0%
0 0.0%
Male Female
186 50.1%
185 49.9%
23 57.5%
17 42.5%
Enrollment in Selected Programs
Program
Program % of Student Enrollment Population
Gifted (Grades K-12)
0
0.0%
Alternative Programs (Grades 6-12)
0
0.0%
Students Eligible to Receive Free/Reduced Lunches
Number
Percent
School System
400 15,047
97.3% 61.1%
Dropout Rate for Grade 6
Number
Rate
School System
0
0.0%
0
0.0%
Enrollment in Compensatory Programs
Program
Program % of Student Enrollment Population
Special Education (Grades K-12)
46 12.4%
(PK)
1
N/A
English to Speakers of Other Languages (ESOL) (Grades K-12)
0
0.0%
Remedial Education (Grades 2-5, 9-12)
22 11.1%
Special Instructional Assistance (SIA) (Grades K-3)
0
0.0%
Title I (Grades K-12)
This school has a schoolwide program.
Total 22
Retained Students, by Race/Ethnicity and Sex
Black
White Hispanic
American MultiAsian Indian racial
22 100.0%
0 0.0%
0 0.0%
0 0.0%
0 0.0%
0 0.0%
Male Female
12
10
54.5% 45.5%
Prepared by Georgia Department of Education
Page 1
STATE-REQUIRED TEST DATA
NORM-REFERENCED TESTS Grade 3
Iowa Tests of Basic Skills (ITBS) Each chart reflects data for three years of testing.
Reading Comprehension 50
65 54 54 0
98-99
50 48 53 97-98
52 47 52 96-97
Mathematics
School 50
System
State
0
80 67 61 98-99
86 59 61 97-98
77 55 59 96-97
School System State
Reading Vocabulary 50
77 55 50 0
98-99
85 47 50 97-98
79 46 49 96-97
Language Arts
School 50
System
State
0
82 71 64 98-99
82 62 62 97-98
74 62 59 96-97
School System State
Social Studies 50
53 59 56 0
98-99
63 53 55 97-98
55 54 55 96-97
Science
School 50
System
State
0
63 57 59 98-99
54 50 59 97-98
48 49 58 96-97
School System State
Sources of Information
Composite Score
50
64 61 57 0
98-99
School 50
System
59 53 56 97-98
56 53 55 96-97
State 0
70 62 58 98-99
69 53 57 97-98
1998-99 GEORGIA PUBLIC EDUCATION REPORT CARD Burke Elementary School - 6110183
Prepared by Georgia Department of Education
63 53 56 96-97
Scores Reported in Percentiles
School System State
Page 2
STATE-REQUIRED TEST DATA
NORM-REFERENCED TESTS Grade 5
Iowa Tests of Basic Skills (ITBS) Each chart reflects data for three years of testing.
Reading Comprehension
Mathematics
50
72 54 53 0
98-99
44 49 53 97-98
39 50 52 96-97
School 50
System
State
0
78 62 59 98-99
59 56 58 97-98
50 53 57 96-97
School System State
Reading Vocabulary 50
80 58 48 0
98-99
51 48 48 97-98
15 44 46 96-97
Language Arts
School 50
System
State
0
79 67 63 98-99
60 60 61 97-98
57 60 58 96-97
School System State
Social Studies 50
64 58 57 0
98-99
33 52 56 97-98
27 48 55 96-97
Science
School 50
System
State
0
57 57 60 98-99
35 54 59 97-98
34 52 59 96-97
School System State
Sources of Information
Composite Score
50
50 57 58 0
98-99
School 50
System
45 54 58 97-98
40 55 57 96-97
State 0
66 59 57 98-99
46 53 56 97-98
37 52 55 96-97
1998-99 GEORGIA PUBLIC EDUCATION REPORT CARD Burke Elementary School - 6110183
Prepared by Georgia Department of Education
Scores Reported in Percentiles
School System State
Page 3
STATE-REQUIRED TEST DATA
PERFORMANCE ASSESSMENTS
Grade 5 Writing Assessment
Percent at Developmental Stages:
1998-99 School System State
1997-98 School System State
1996-97 School System State
Stage Stage Stage Stage Stage Stage
1:The Emerging Writer 2:The Developing Writer 3:The Focusing Writer 4:The Experimenting 5:The Engaging Writer 6:The Extending Writer
0% 0% 39% 42% 18% 0%
0% 1% 19% 48% 23% 7%
0% 1% 16% 41% 29% 12%
0% 11% 46% 30% 11%
3%
0% 2% 24% 44% 23% 6%
0% 3% 19% 41% 27% 10%
0% 15% 35% 35% 13%
3%
0% 3% 28% 41% 22% 6%
0% 3% 21% 37% 26% 12%
AWARDS / RECOGNITION DATA
Schools in Georgia may receive recognition in the following programs: Charter School Pay for Performance Program Georgia School of Excellence National Blue Ribbon School Burke Elementary School did not receive recognition in any of these programs during the 1998-99 school year.
1998-99 GEORGIA PUBLIC EDUCATION REPORT CARD Burke Elementary School - 6110183
Prepared by Georgia Department of Education
Page 4
CERTIFIED PERSONNEL DATA
Positions Number Average Contract Days
Personnel Sex
Certificate
Years Experience
Full-time Part-time
Male Female
4 Yr Bachelor's 5 Yr Master's 6 Yr Specialist's 7 Yr Doctoral Other*
<1 1-10 11-20 21-30 >30
Average
Administrators
1.00 210.00
1 0
0 1
0 0 0 1 0 0 0 0 0 1 39.00
Support Personnel
2.00 190.00
2 0
0 2
0 2 0 0 0 0 1 1 0 0 14.00
PK-12 Teachers
29.00 190.00
29 0
3 26
13 14
2 0 0 1 10 5 12 1 16.00
*Includes One- and Two-Year Vocational Certificates.
ACCREDITATION DATA
Accredited by Southern Association of Colleges and Schools (SACS):
Elementary/Middle Commission.
1998-99 GEORGIA PUBLIC EDUCATION REPORT CARD Burke Elementary School - 6110183
Prepared by Georgia Department of Education
Page 5
1998-99 GEORGIA PUBLIC EDUCATION REPORT CARD
BIBB COUNTY SCHOOLS
Butler Early Childhood Center - 6110179
Grade Range PK-12
The Georgia Public Education Report Card is designed to assist systems and schools in educational improvement. This report card contains a variety of data elements. An explanation of the terms is provided as a companion to the report card data. Please refer to the definitions for the most effective use of the reported data.
STUDENT DATA
Total
K-12
84
PK
113
Enrollment, by Race/Ethnicity and Sex
Black
American Multi-
White Hispanic Asian Indian
racial
59 70.2%
25 29.8%
0 0.0%
0 0.0%
0 0.0%
0 0.0%
78 69.0%
32 28.3%
1 0.9%
2 1.8%
0 0.0%
0 0.0%
Male 62
73.8% 76
67.3%
Female 22
26.2% 37
32.7%
Enrollment in Selected Programs
Program
Gifted (Grades K-12)
Non-Vocational Labs (Grades 9-12)
Vocational Labs (Grades 9-12)
Program % of Student Enrollment Population
0
0.0%
0
0.0%
3
8.3%
Alternative Programs (Grades 6-12)
0
0.0%
Students Eligible to Receive Free/Reduced Lunches
Number
Percent
School System
147 15,047
74.6% 61.1%
Enrollment in Compensatory Programs
Program
Program % of Student Enrollment Population
Special Education (Grades K-12) PK
44 52.4%
86
N/A
English to Speakers of Other Languages (ESOL) (Grades K-12)
0
0.0%
Remedial Education (Grades 2-5, 9-12)
0
0.0%
Special Instructional Assistance (SIA) (Grades K-3)
0
0.0%
Title I (Grades K-12)
This school has no Title I program.
Dropout Rate for Grades 6-12
Number
Rate
School System
0
0.0%
548
4.3%
Total 0
Retained Students, by Race/Ethnicity and Sex
Black
White Hispanic
American Multi-
Asian Indian
racial
0
0
0
0
0
0
Male Female
0
0
Prepared by Georgia Department of Education
Page 1
STATE-REQUIRED TEST DATA
NORM-REFERENCED TESTS Grade 3
Iowa Tests of Basic Skills (ITBS) Each chart reflects data for three years of testing.
Reading Comprehension 50
N/A 54 54 0
98-99
N/A 48 53 97-98
N/A 47 52 96-97
Mathematics
School 50
System
State
N/A 67 61 0
98-99
N/A 59 61 97-98
N/A 55 59 96-97
School System State
Reading Vocabulary 50
N/A 55 50 0
98-99
N/A 47 50 97-98
N/A 46 49 96-97
Language Arts
School 50
System
State
N/A 71 64 0
98-99
N/A 62 62 97-98
N/A 62 59 96-97
School System State
Social Studies 50
N/A 59 56 0
98-99
N/A 53 55 97-98
N/A 54 55 96-97
Science
School 50
System
State
N/A 57 59 0
98-99
N/A 50 59 97-98
N/A 49 58 96-97
School System State
Sources of Information
Composite Score
School
50
50
System
N/A 61 57 0
98-99
N/A 53 56 N/A 53 55
97-98
96-97
State
N/A 62 58 0
98-99
N/A 53 57 97-98
N/A 53 56 96-97
1998-99 GEORGIA PUBLIC EDUCATION REPORT CARD Butler Early Childhood Center - 6110179
Prepared by Georgia Department of Education
Scores Reported in Percentiles
School System State
Page 2
STATE-REQUIRED TEST DATA
NORM-REFERENCED TESTS Grade 5
Iowa Tests of Basic Skills (ITBS) Each chart reflects data for three years of testing.
Reading Comprehension
Mathematics
50
N/A 54 53 0
98-99
N/A 49 53 97-98
N/A 50 52 96-97
School 50
System
State
N/A 62 59 0
98-99
N/A 56 58 97-98
N/A 53 57 96-97
School System State
Reading Vocabulary 50
N/A 58 48 0
98-99
N/A 48 48 97-98
N/A 44 46 96-97
Language Arts
School 50
System
State
N/A 67 63 0
98-99
N/A 60 61 97-98
N/A 60 58 96-97
School System State
Social Studies 50
N/A 58 57 0
98-99
N/A 52 56 97-98
N/A 48 55 96-97
Science
School 50
System
State
N/A 57 60 0
98-99
N/A 54 59 97-98
N/A 52 59 96-97
School System State
Sources of Information
Composite Score
School
50
50
System
N/A 57 58 0
98-99
N/A 54 58 N/A 55 57
97-98
96-97
State
N/A 59 57 0
98-99
N/A 53 56 97-98
N/A 52 55 96-97
1998-99 GEORGIA PUBLIC EDUCATION REPORT CARD Butler Early Childhood Center - 6110179
Prepared by Georgia Department of Education
Scores Reported in Percentiles
School System State
Page 3
STATE-REQUIRED TEST DATA
NORM-REFERENCED TESTS Grade 8
Iowa Tests of Basic Skills (ITBS) Each chart reflects data for three years of testing.
Reading Comprehension 50
N/A 38 49 0
98-99
N/A 39 48 97-98
N/A 38 48 96-97
Mathematics
School 50
System
State
N/A 47 56 0
98-99
N/A 45 55 97-98
N/A 45 54 96-97
School System State
Reading Vocabulary 50
N/A 35 46 0
98-99
N/A 34 45 97-98
N/A 36 44 96-97
Language Arts
School 50
System
State
N/A 52 60 0
98-99
N/A 51 58 97-98
N/A 51 56 96-97
School System State
Social Studies 50
N/A 43 54 0
98-99
N/A 44 53 97-98
N/A 44 53 96-97
Science
School 50
System
State
N/A 39 56 0
98-99
N/A 42 55 97-98
N/A 40 53 96-97
School System State
Sources of Information
Composite Score
School
50
50
System
N/A 49 57 0
98-99
N/A 49 56 N/A 47 55
97-98
96-97
State
N/A 44 56 0
98-99
N/A 44 54 97-98
N/A 43 54 96-97
1998-99 GEORGIA PUBLIC EDUCATION REPORT CARD Butler Early Childhood Center - 6110179
Prepared by Georgia Department of Education
Scores Reported in Percentiles
School System State
Page 4
STATE-REQUIRED TEST DATA
PERFORMANCE ASSESSMENTS
Grade 5 Writing Assessment
Percent at Developmental Stages:
1998-99 School System State
1997-98 School System State
1996-97 School System State
Stage Stage Stage Stage Stage Stage
1:The Emerging Writer 2:The Developing Writer 3:The Focusing Writer 4:The Experimenting 5:The Engaging Writer 6:The Extending Writer
N/A N/A N/A N/A N/A N/A
0% 1% 19% 48% 23% 7%
0% 1% 16% 41% 29% 12%
N/A N/A N/A N/A N/A N/A
0% 2% 24% 44% 23% 6%
0% 3% 19% 41% 27% 10%
N/A N/A N/A N/A N/A N/A
0% 3% 28% 41% 22% 6%
0% 3% 21% 37% 26% 12%
No Grade-5 Writing Assessment scores were reported for Butler Early Childhood Center.
Grade 8 Writing Assessment
1998-99 Percent Scoring
1997-98 Percent Scoring
1996-97 Percent Scoring
Categories of Scaled Scores
School System State School System State School System State
Inadequate (less than 162)
Minimal (162-209)
Good
(210-247)
Very Good (greater than 247)
N/A N/A N/A N/A
10% 51% 34%
5%
8% 40% 41% 11%
N/A N/A N/A N/A
9% 57% 31%
2%
11% 46% 34%
8%
N/A N/A N/A N/A
18% 57% 20%
6%
15% 46% 30%
8%
Average Scaled Score: (Range 100-300)
N/A
200
208 N/A
198 202 N/A
190 198
No Grade Eight Writing Assessment Scores were reported for Butler Early Childhood Center.
GEORGIA HIGH SCHOOL GRADUATION TESTS (GHSGT)
Percent of Regular Program 11th Graders Passing the Georgia High School Graduation Tests on First Administration
1998-99
1997-98
1996-97
School System State School System State School System State
English Language Arts Mathematics Social Studies Science
All Components listed above
N/A N/A N/A N/A
N/A
94% 79% 74% 60%
55%
96% 88% 80% 72%
68%
N/A N/A N/A N/A
N/A
93% 78% 71% 61%
55%
94% 88% 78% 74%
68%
N/A N/A N/A N/A
N/A
92% 71% 64% 55%
49%
94% 87% 78% 74%
67%
Writing
N/A 93% 93% N/A 90% 92% N/A 91% 93%
No Georgia High School Graduation Test scores were reported for Butler Early Childhood Center.
1998-99 GEORGIA PUBLIC EDUCATION REPORT CARD Butler Early Childhood Center - 6110179
Prepared by Georgia Department of Education
Page 5
GRADUATE DATA
1999 Graduates by Credentials, Race/Ethnicity and Sex
Diplomas with Both College Prep. & Voc. Endorsements
Diplomas with College Prep. Endorsements Diplomas with Vocational Endorsements General High School Diplomas Special Education Diplomas
Total All Diplomas
Certificates of Performance
Total Graduates
Total 0
Black 0
American MultiWhite Hispanic Asian Indian racial
0
0
0
0
0
0
0
0
0
0
0
0
1
1
100.0%
0
0
0 0.0%
0
0 0.0%
0
0 0.0%
0
0 0.0%
0
0 0.0%
0
1
0
1
0
0
0
0
0.0% 100.0% 0.0% 0.0% 0.0% 0.0%
2
1
1
0
0
0
0
50.0% 50.0% 0.0% 0.0% 0.0% 0.0%
0
0
0
0
0
0
0
2
1
1
0
0
0
0
50.0% 50.0% 0.0% 0.0% 0.0% 0.0%
Male Female
0
0
0
0
0
1
0.0% 100.0%
0
0
0 0.0%
0 0.0%
1 100.0%
2 100.0%
0
0
0
2
0.0% 100.0%
HOPE Scholarships
School System
Number of 1999 Graduates Number Eligible Percent Eligible
2 0 0.0%
879 472 53.7%
State
65,548 40,292 61.5%
High School Completion Rate
Percent of 1995Grade 9 Enrollment in Graduating Class of1999 School System State
Completion Rate '95-'99 100.0% 56.5% 68.9%
1998-99 GEORGIA PUBLIC EDUCATION REPORT CARD
Butler Early Childhood Center - 6110179
Prepared by Georgia Department of Education
Page 6
COLLEGE ADMISSIONS / CREDIT TEST DATA
Scholastic Assessment Test (SAT)
Based on students' highest verbal and highest math scores
No. Taking
Average Score
Tests Verbal Math Total
Based on students' last test administration
Average Score Verbal Math Total
School
N/A
College Prep. Endorsement
Other Diplomas
System
541
College Prep. Endorsement
Other Diplomas
Georgia
41,958
N/A N/A N/A
466 502 440
492
N/A N/A N/A
443 481 408
488
N/A N/A N/A
909 983 848
980
N/A N/A N/A
456 N/A N/A
483
N/A N/A N/A
434 N/A N/A
479
N/A N/A N/A
890 N/A N/A
962
Nation
952,913 N/A N/A N/A
502 508 1010
American College Testing (ACT)
Advanced Placement Exams (AP)
Number taking tests: English Mathematics Reading Science Reasoning CompositeScore
N/A
School System
N/A 19.5
N/A 19.1
N/A N/A
20.7 19.9
N/A 19.9
State 19.1 19.9 20.2 19.9 19.9
No. of Students Taking Tests
No. of Tests Taken No. of Test Scores
3 or Higher Percent of Test
Scores 3 or Higher
School 0
N/A N/A
N/A
System State 163 15,225 211 23,969 68 13,024
32.2% 54.3%
POST-SECONDARY DATA
Graduates Entering Georgia Public Colleges
Graduates Entering Georgia Public Colleges and Requiring Learning Support (LS)
1998 Graduates Entering in 1998-99
1997 Graduates Entering in 1997-98
Percent of Graduating Number Class
School
0
0.0%
System 289
35.8%
School
0
0.0%
System 330
39.5%
Number Requiring
LS N/A 123
N/A 140
Percent of those attending Georgia
Public Colleges
N/A
42.6%
N/A
42.4%
In previous years, the Report Card presented College Prep Curriculum information provided by the Board of Regents on students requiring Learning Support. Due to inconsistencies in the data provided by the Board of Regents in defining College Prep Completers versus Local Board of Education data defining College Prep Endorsements, the Department of Education Report Card will not provide this information until discrepancies can be reconciled.
Graduates Entering Georgia Public Technical and Adult Schools
1998 Graduates School System
Entering Number 0 100
1998-99 Percent
0.0% 12.4%
Entering Number N/A N/A
1997-98 Percent
N/A N/A
1997 Graduates School
0
0.0%
System
8
1.0%
0
0.0%
84
10.0%
1998-99 GEORGIA PUBLIC EDUCATION REPORT CARD Butler Early Childhood Center - 6110179
Prepared by Georgia Department of Education
Page 7
CERTIFIED PERSONNEL DATA
Positions Number Average Contract Days
Administrators
1.00 210.00
Support Personnel
0.00 0.00
PK-12 Teachers
15.00 190.00
Personnel Sex
Certificate
Years Experience
Full-time Part-time
Male Female
4 Yr Bachelor's 5 Yr Master's 6 Yr Specialist's 7 Yr Doctoral Other*
<1 1-10 11-20 21-30 >30
Average
1 0
0 1
0 0 1 0 0
0 0 1 0 0
20.00
0 0
0 0
0 0 0 0 0
0 0 0 0 0
0.00
15 0
1 14
9 6 0 0 0
0 7 5 3 0
13.13
*Includes One- and Two-Year Vocational Certificates.
ACCREDITATION DATA
Not accredited by Southern Association of Colleges and Schools (SACS) or Georgia Accrediting Commission (GAC).
AWARDS / RECOGNITION DATA
Schools in Georgia may receive recognition in the following programs: Charter School Pay for Performance Program Georgia School of Excellence National Blue Ribbon School Butler Early Childhood Center did not receive recognition in any of these programs during the 1998-99 school year.
1998-99 GEORGIA PUBLIC EDUCATION REPORT CARD Butler Early Childhood Center - 6110179
Prepared by Georgia Department of Education
Page 8
1998-99 GEORGIA PUBLIC EDUCATION REPORT CARD
BIBB COUNTY SCHOOLS
Carter Elementary School - 6110194
Grade Range K-6
The Georgia Public Education Report Card is designed to assist systems and schools in educational improvement. This report card contains a variety of data elements. An explanation of the terms is provided as a companion to the report card data. Please refer to the definitions for the most effective use of the reported data.
STUDENT DATA
Total 917
K-6 Enrollment, by Race/Ethnicity and Sex
Black
White Hispanic
American Multi-
Asian Indian
racial
226 24.6%
662 72.2%
4 0.4%
10 1.1%
13 1.4%
2 0.2%
Male Female
448 48.9%
469 51.1%
Enrollment in Selected Programs
Program
Program % of Student Enrollment Population
Gifted (Grades K-12)
39
4.3%
Alternative Programs (Grades 6-12)
0
0.0%
Students Eligible to Receive Free/Reduced Lunches
Number
Percent
School System
183 15,047
20.0% 61.1%
Dropout Rate for Grade 6
Number
Rate
School System
0
0.0%
0
0.0%
Enrollment in Compensatory Programs
Program
Program % of Student Enrollment Population
Special Education (Grades K-12)
52
5.7%
(PK)
3
N/A
English to Speakers of Other Languages (ESOL) (Grades K-12)
10
1.1%
Remedial Education (Grades 2-5, 9-12)
73 13.4%
Special Instructional Assistance (SIA) (Grades K-3)
0
0.0%
Title I (Grades K-12)
This school has no Title I program.
Total 28
Retained Students, by Race/Ethnicity and Sex
Black
White Hispanic
American Multi-
Asian Indian
racial
12 42.9%
16 57.1%
0 0.0%
0 0.0%
0 0.0%
0 0.0%
Male Female
19
9
67.9% 32.1%
Prepared by Georgia Department of Education
Page 1
STATE-REQUIRED TEST DATA
NORM-REFERENCED TESTS Grade 3
Iowa Tests of Basic Skills (ITBS) Each chart reflects data for three years of testing.
Reading Comprehension 50
67 54 54 0
98-99
62 48 53 97-98
63 47 52 96-97
Mathematics
School 50
System
State
0
72 67 61 98-99
70 59 61 97-98
70 55 59 96-97
School System State
Reading Vocabulary 50
63 55 50 0
98-99
58 47 50 97-98
68 46 49 96-97
Language Arts
School 50
System
State
0
74 71 64 98-99
74 62 62 97-98
79 62 59 96-97
School System State
Social Studies 50
64 59 56 0
98-99
67 53 55 97-98
66 54 55 96-97
Science
School 50
System
State
0
66 57 59 98-99
68 50 59 97-98
63 49 58 96-97
School System State
Sources of Information
Composite Score
50
67 61 57 0
98-99
School 50
System
67 53 56 97-98
67 53 55 96-97
State 0
69 62 58 98-99
68 53 57 97-98
1998-99 GEORGIA PUBLIC EDUCATION REPORT CARD Carter Elementary School - 6110194
Prepared by Georgia Department of Education
68 53 56 96-97
Scores Reported in Percentiles
School System State
Page 2
STATE-REQUIRED TEST DATA
NORM-REFERENCED TESTS Grade 5
Iowa Tests of Basic Skills (ITBS) Each chart reflects data for three years of testing.
Reading Comprehension
Mathematics
50
64 54 53 0
98-99
59 49 53 97-98
57 50 52 96-97
School 50
System
State
0
70 62 59 98-99
67 56 58 97-98
65 53 57 96-97
School System State
Reading Vocabulary 50
57 58 48 0
98-99
54 48 48 97-98
58 44 46 96-97
Language Arts
School 50
System
State
0
73 67 63 98-99
67 60 61 97-98
68 60 58 96-97
School System State
Social Studies 50
67 58 57 0
98-99
63 52 56 97-98
60 48 55 96-97
Science
School 50
System
State
0
71 57 60 98-99
65 54 59 97-98
68 52 59 96-97
School System State
Sources of Information
Composite Score
50
70 57 58 0
98-99
School 50
System
66 54 58 97-98
65 55 57 96-97
State 0
70 59 57 98-99
64 53 56 97-98
64 52 55 96-97
1998-99 GEORGIA PUBLIC EDUCATION REPORT CARD Carter Elementary School - 6110194
Prepared by Georgia Department of Education
Scores Reported in Percentiles
School System State
Page 3
STATE-REQUIRED TEST DATA
PERFORMANCE ASSESSMENTS
Grade 5 Writing Assessment
Percent at Developmental Stages:
1998-99 School System State
1997-98 School System State
1996-97 School System State
Stage Stage Stage Stage Stage Stage
1:The Emerging Writer 2:The Developing Writer 3:The Focusing Writer 4:The Experimenting 5:The Engaging Writer 6:The Extending Writer
0% 0% 14% 49% 22% 14%
0% 1% 19% 48% 23% 7%
0% 1% 16% 41% 29% 12%
0% 1% 12% 42% 35% 10%
0% 2% 24% 44% 23% 6%
0% 3% 19% 41% 27% 10%
0% 1% 19% 41% 30% 9%
0% 3% 28% 41% 22% 6%
0% 3% 21% 37% 26% 12%
AWARDS / RECOGNITION DATA
Schools in Georgia may receive recognition in the following programs: Charter School Pay for Performance Program Georgia School of Excellence National Blue Ribbon School Carter Elementary School did not receive recognition in any of these programs during the 1998-99 school year.
1998-99 GEORGIA PUBLIC EDUCATION REPORT CARD Carter Elementary School - 6110194
Prepared by Georgia Department of Education
Page 4
CERTIFIED PERSONNEL DATA
Positions Number Average Contract Days
Personnel Sex
Certificate
Years Experience
Full-time Part-time
Male Female
4 Yr Bachelor's 5 Yr Master's 6 Yr Specialist's 7 Yr Doctoral Other*
<1 1-10 11-20 21-30 >30
Average
Administrators
2.00 205.00
2 0
0 2
0 0 2 0 0 0 0 2 0 0 19.50
Support Personnel
3.00 190.00
3 0
0 3
0 2 1 0 0 0 1 1 1 0 14.67
PK-12 Teachers
45.25 190.00
43 4
3 44
22 18
7 0 0 2 19 16 10 0 12.96
*Includes One- and Two-Year Vocational Certificates.
ACCREDITATION DATA
Accredited by Southern Association of Colleges and Schools (SACS):
Elementary/Middle Commission.
1998-99 GEORGIA PUBLIC EDUCATION REPORT CARD Carter Elementary School - 6110194
Prepared by Georgia Department of Education
Page 5
1998-99 GEORGIA PUBLIC EDUCATION REPORT CARD
BIBB COUNTY SCHOOLS
Central High School - 6110186
Grade Range 9-12
The Georgia Public Education Report Card is designed to assist systems and schools in educational improvement. This report card contains a variety of data elements. An explanation of the terms is provided as a companion to the report card data. Please refer to the definitions for the most effective use of the reported data.
Total 1,057
STUDENT DATA
9-12 Enrollment, by Race/Ethnicity and Sex
Black
White Hispanic
American Multi-
Asian Indian
racial
612 57.9%
425 40.2%
6 0.6%
10 0.9%
2 0.2%
2 0.2%
Male Female
485 45.9%
572 54.1%
Enrollment in Selected Programs
Program
Gifted (Grades K-12)
Program % of Student Enrollment Population
164
15.5%
Non-Vocational Labs (Grades 9-12)
923
Vocational Labs
(Grades 9-12)
529
Alternative Programs (Grades 6-12)
2
87.3% 50.0%
< 1%
Students Eligible to Receive Free/Reduced Lunches
Number
Percent
School System
389 15,047
36.8% 61.1%
Enrollment in Compensatory Programs
Program
Program % of Student Enrollment Population
Special Education (Grades K-12) PK
74
7.0%
0
N/A
English to Speakers of Other Languages (ESOL) (Grades K-12)
1
< 1%
Remedial Education (Grades 2-5, 9-12)
8
< 1%
Title I (Grades K-12)
This school has no Title I program.
Dropout Rate for Grades 9-12
Number
Rate
School System
61
5.1%
535
8.1%
Total 137
Retained Students, by Race/Ethnicity and Sex
Black
White Hispanic
American MultiAsian Indian racial
100 73.0%
36 26.3%
1 0.7%
0 0.0%
0 0.0%
0 0.0%
Male Female
72
65
52.6% 47.4%
Prepared by Georgia Department of Education
Page 1
STATE-REQUIRED TEST DATA
GEORGIA HIGH SCHOOL GRADUATION TESTS (GHSGT)
Percent of Regular Program 11th Graders Passing the Georgia High School Graduation Tests on First Administration
English Language Arts Mathematics Social Studies Science
All Components listed above
Writing
1998-99
School System State
97% 84% 83% 68%
94% 79% 74% 60%
96% 88% 80% 72%
63% 55% 68%
96% 93% 93%
1997-98
School System State
98% 91% 85% 78%
93% 78% 71% 61%
94% 88% 78% 74%
75% 55% 68%
98% 90% 92%
1996-97
School System State
96% 82% 79% 72%
92% 71% 64% 55%
94% 87% 78% 74%
68% 49% 67%
95% 91% 93%
GRADUATE DATA
1999 Graduates by Credentials, Race/Ethnicity and Sex
Diplomas with Both College Prep. & Voc. Endorsements
Diplomas with College Prep. Endorsements Diplomas with Vocational Endorsements General High School Diplomas Special Education Diplomas
Total All Diplomas
Certificates of Performance
Total Graduates
Total 6
109 18 4 6
143 1
144
Black
5 83.3%
51 46.8%
17 94.4%
4 100.0%
5 83.3%
82 57.3%
1 100.0%
83 57.6%
American MultiWhite Hispanic Asian Indian racial
1 16.7%
56 51.4%
0 0.0%
1 0.9%
0 0.0%
0 0.0%
0 0.0%
1 0.9%
0 0.0%
0 0.0%
1 5.6%
0 0.0%
1 16.7%
0 0.0%
0 0.0%
0 0.0%
0 0.0%
0 0.0%
0 0.0%
0 0.0%
0 0.0%
0 0.0%
0 0.0%
0 0.0%
0 0.0%
59 41.3%
1 0.7%
0 0.0%
1 0.7%
0 0.0%
0 0.0%
0 0.0%
0 0.0%
0 0.0%
0 0.0%
59 41.0%
1 0.7%
0 0.0%
1 0.7%
0 0.0%
Male Female
0 0.0%
41 37.6%
6 100.0%
68 62.4%
11 61.1%
3 75.0%
3 50.0%
7 38.9%
1 25.0%
3 50.0%
58
85
40.6% 59.4%
1 100.0%
0 0.0%
59
85
41.0% 59.0%
HOPE Scholarships
School System
Number of 1999 Graduates 1 4 4
Number Eligible
102
Percent Eligible
70.8%
879 472 53.7%
State
65,548 40,292 61.5%
High School Completion Rate
Percent of 1995Grade 9 Enrollment in Graduating Class of1999 School System State
Completion Rate '95-'99 52.7% 56.5% 68.9%
1998-99 GEORGIA PUBLIC EDUCATION REPORT CARD
Central High School - 6110186
Prepared by Georgia Department of Education
Page 2
COLLEGE ADMISSIONS / CREDIT TEST DATA
Scholastic Assessment Test (SAT)
Based on students' highest verbal and highest math scores
No. Taking
Average Score
Tests Verbal Math Total
Based on students' last test administration
Average Score Verbal Math Total
School
127
College Prep. Endorsement
Other Diplomas
System
541
College Prep. Endorsement
Other Diplomas
Georgia
41,958
516 486 1002
525 510 1035
290 335
625
466 443
909
502 481
983
440 408
848
492 488
980
505 N/A N/A
456 N/A N/A
483
477 N/A N/A
434 N/A N/A
479
982 N/A N/A
890 N/A N/A
962
Nation
952,913 N/A N/A N/A
502 508 1010
American College Testing (ACT)
Advanced Placement Exams (AP)
Number taking tests: English Mathematics Reading Science Reasoning CompositeScore
4 4 School System State
21.4 19.5 19.1
20.3 19.1 19.9
22.8 21.7
20.7 19.9
20.2 19.9
21.7 19.9 19.9
No. of Students Taking Tests
No. of Tests Taken No. of Test Scores
3 or Higher Percent of Test
Scores 3 or Higher
School 47 70 34
48.6%
System State 163 15,225 211 23,969 68 13,024
32.2% 54.3%
POST-SECONDARY DATA
Graduates Entering Georgia Public Colleges
Graduates Entering Georgia Public Colleges and Requiring Learning Support (LS)
1998 Graduates Entering in 1998-99
1997 Graduates Entering in 1997-98
Percent of Graduating Number Class
School
148
46.8%
System 289
35.8%
School
142
47.0%
System 330
39.5%
Number Requiring
LS 52 123
35 140
Percent of those attending Georgia
Public Colleges
35.1%
42.6%
24.6%
42.4%
In previous years, the Report Card presented College Prep Curriculum information provided by the Board of Regents on students requiring Learning Support. Due to inconsistencies in the data provided by the Board of Regents in defining College Prep Completers versus Local Board of Education data defining College Prep Endorsements, the Department of Education Report Card will not provide this information until discrepancies can be reconciled.
Graduates Entering Georgia Public Technical and Adult Schools
1998 Graduates School System
Entering Number 33 100
1998-99 Percent 10.4% 12.4%
Entering Number N/A N/A
1997-98 Percent
N/A N/A
1997 Graduates School
2
0.7%
System
8
1.0%
22
7.3%
84
10.0%
1998-99 GEORGIA PUBLIC EDUCATION REPORT CARD Central High School - 6110186
Prepared by Georgia Department of Education
Page 3
CERTIFIED PERSONNEL DATA
Positions Number Average Contract Days
Administrators
5.14 205.18
Support Personnel
5.00 196.00
PK-12 Teachers
74.67 191.54
Personnel Sex
Certificate
Years Experience
Full-time Part-time
Male Female
4 Yr Bachelor's 5 Yr Master's 6 Yr Specialist's 7 Yr Doctoral Other*
<1 1-10 11-20 21-30 >30
Average
3 9
5 7
1 7 4 0 0
0 0 2 6 4
24.50
5 0
0 5
0 1 3 1 0
0 1 1 3 0
20.80
65 14
31 48
33 40
4 1 1
2 22 18 26 11
18.32
*Includes One- and Two-Year Vocational Certificates.
ACCREDITATION DATA
Accredited by Southern Association of Colleges and Schools (SACS): Secondary/Middle Commission.
AWARDS / RECOGNITION DATA
Schools in Georgia may receive recognition in the following programs: Charter School Pay for Performance Program Georgia School of Excellence National Blue Ribbon School Central High School did not receive recognition in any of these programs during the 1998-99 school year.
1998-99 GEORGIA PUBLIC EDUCATION REPORT CARD Central High School - 6110186
Prepared by Georgia Department of Education
Page 4
1998-99 GEORGIA PUBLIC EDUCATION REPORT CARD
BIBB COUNTY SCHOOLS
Clisby Magnet School - 6115056
Grade Range K-6
The Georgia Public Education Report Card is designed to assist systems and schools in educational improvement. This report card contains a variety of data elements. An explanation of the terms is provided as a companion to the report card data. Please refer to the definitions for the most effective use of the reported data.
STUDENT DATA
Total 295
K-6 Enrollment, by Race/Ethnicity and Sex
Black
White Hispanic
American Multi-
Asian Indian
racial
181 61.4%
102 34.6%
6 2.0%
1 0.3%
2 0.7%
3 1.0%
Male Female
144 48.8%
151 51.2%
Enrollment in Selected Programs
Program
Program % of Student Enrollment Population
Gifted (Grades K-12)
11
3.7%
Alternative Programs (Grades 6-12)
0
0.0%
Students Eligible to Receive Free/Reduced Lunches
Number
Percent
School System
164 15,047
55.6% 61.1%
Dropout Rate for Grade 6
Number
Rate
School System
0
0.0%
0
0.0%
Enrollment in Compensatory Programs
Program
Program % of Student Enrollment Population
Special Education (Grades K-12)
27
9.2%
(PK)
0
N/A
English to Speakers of Other Languages (ESOL) (Grades K-12)
6
2.0%
Remedial Education (Grades 2-5, 9-12)
31 16.9%
Special Instructional Assistance (SIA) (Grades K-3)
0
0.0%
Title I (Grades K-12)
This school has no Title I program.
Total 13
Retained Students, by Race/Ethnicity and Sex
Black
White Hispanic
American Multi-
Asian Indian
racial
8 61.5%
3 23.1%
1 7.7%
0 0.0%
1 7.7%
0 0.0%
Male Female
6
7
46.2% 53.8%
Prepared by Georgia Department of Education
Page 1
STATE-REQUIRED TEST DATA
NORM-REFERENCED TESTS Grade 3
Iowa Tests of Basic Skills (ITBS) Each chart reflects data for three years of testing.
Reading Comprehension 50
56 54 54 0
98-99
60 48 53 97-98
49 47 52 96-97
Mathematics
School 50
System
State
0
64 67 61 98-99
60 59 61 97-98
49 55 59 96-97
School System State
Reading Vocabulary 50
50 55 50 0
98-99
54 47 50 97-98
43 46 49 96-97
Language Arts
School 50
System
State
0
59 71 64 98-99
72 62 62 97-98
60 62 59 96-97
School System State
Social Studies 50
58 59 56 0
98-99
65 53 55 97-98
50 54 55 96-97
Science
School 50
System
State
0
50 57 59 98-99
53 50 59 97-98
47 49 58 96-97
School System State
Sources of Information
Composite Score
50
64 61 57 0
98-99
School 50
System
69 53 56 97-98
55 53 55 96-97
State 0
58 62 58 98-99
63 53 57 97-98
1998-99 GEORGIA PUBLIC EDUCATION REPORT CARD Clisby Magnet School - 6115056
Prepared by Georgia Department of Education
51 53 56 96-97
Scores Reported in Percentiles
School System State
Page 2
STATE-REQUIRED TEST DATA
NORM-REFERENCED TESTS Grade 5
Iowa Tests of Basic Skills (ITBS) Each chart reflects data for three years of testing.
Reading Comprehension
Mathematics
50
48 54 53 0
98-99
55 49 53 97-98
50 50 52 96-97
School 50
System
State
0
50 62 59 98-99
51 56 58 97-98
45 53 57 96-97
School System State
Reading Vocabulary 50
47 58 48 0
98-99
48 48 48 97-98
48 44 46 96-97
Language Arts
School 50
System
State
0
58 67 63 98-99
61 60 61 97-98
58 60 58 96-97
School System State
Social Studies 50
47 58 57 0
98-99
53 52 56 97-98
50 48 55 96-97
Science
School 50
System
State
0
46 57 60 98-99
60 54 59 97-98
53 52 59 96-97
School System State
Sources of Information
Composite Score
50
58 57 58 0
98-99
School 50
System
62 54 58 97-98
55 55 57 96-97
State 0
49 59 57 98-99
56 53 56 97-98
51 52 55 96-97
1998-99 GEORGIA PUBLIC EDUCATION REPORT CARD Clisby Magnet School - 6115056
Prepared by Georgia Department of Education
Scores Reported in Percentiles
School System State
Page 3
STATE-REQUIRED TEST DATA
PERFORMANCE ASSESSMENTS
Grade 5 Writing Assessment
Percent at Developmental Stages:
1998-99 School System State
1997-98 School System State
1996-97 School System State
Stage Stage Stage Stage Stage Stage
1:The Emerging Writer 2:The Developing Writer 3:The Focusing Writer 4:The Experimenting 5:The Engaging Writer 6:The Extending Writer
0% 0% 18% 50% 18% 13%
0% 1% 19% 48% 23% 7%
0% 1% 16% 41% 29% 12%
0% 0% 13% 41% 39% 7%
0% 2% 24% 44% 23% 6%
0% 3% 19% 41% 27% 10%
0% 5% 30% 33% 23% 9%
0% 3% 28% 41% 22% 6%
0% 3% 21% 37% 26% 12%
AWARDS / RECOGNITION DATA
Schools in Georgia may receive recognition in the following programs: Charter School Pay for Performance Program Georgia School of Excellence National Blue Ribbon School Clisby Magnet School did not receive recognition in any of these programs during the 1998-99 school year.
1998-99 GEORGIA PUBLIC EDUCATION REPORT CARD Clisby Magnet School - 6115056
Prepared by Georgia Department of Education
Page 4
CERTIFIED PERSONNEL DATA
Positions Number Average Contract Days
Personnel Sex
Certificate
Years Experience
Full-time Part-time
Male Female
4 Yr Bachelor's 5 Yr Master's 6 Yr Specialist's 7 Yr Doctoral Other*
<1 1-10 11-20 21-30 >30
Average
Administrators
1.00 210.00
1 0
0 1
0 0 0 1 0 0 0 0 1 0 24.00
Support Personnel
2.00 190.00
2 0
0 2
0 2 0 0 0 0 0 1 1 0 18.50
PK-12 Teachers
19.00 190.00
19 0
1 18
12 5 1 1 0 2 6 7 4 0
14.32
*Includes One- and Two-Year Vocational Certificates.
ACCREDITATION DATA
Accredited by Southern Association of Colleges and Schools (SACS):
Elementary/Middle Commission.
1998-99 GEORGIA PUBLIC EDUCATION REPORT CARD Clisby Magnet School - 6115056
Prepared by Georgia Department of Education
Page 5
1998-99 GEORGIA PUBLIC EDUCATION REPORT CARD
BIBB COUNTY SCHOOLS
Danforth Primary School - 6111058
Grade Range PK-2
The Georgia Public Education Report Card is designed to assist systems and schools in educational improvement. This report card contains a variety of data elements. An explanation of the terms is provided as a companion to the report card data. Please refer to the definitions for the most effective use of the reported data.
STUDENT DATA
Total
K-2
328
PK
41
Enrollment, by Race/Ethnicity and Sex
Black
White Hispanic
American Asian Indian
Multiracial
319 97.3%
9 2.7%
0 0.0%
0 0.0%
0 0.0%
0 0.0%
39 95.1%
2 4.9%
0 0.0%
0 0.0%
0 0.0%
0 0.0%
Male Female
156 47.6%
172 52.4%
23 56.1%
18 43.9%
Enrollment in Selected Programs
Program
Program % of Student Enrollment Population
Gifted (Grades K-12)
0
0.0%
Alternative Programs (Grades 6-12)
N/A
N/A
Students Eligible to Receive Free/Reduced Lunches
Number
Percent
School System
332 15,047
90.0% 61.1%
Dropout Rate *
Number
Rate
School System
N/A N/A
N/A N/A
* Dropout rates are not applicable for grades PK-5.
Enrollment in Compensatory Programs
Program
Program % of Student Enrollment Population
Special Education (Grades K-12)
20
6.1%
(PK)
0
N/A
English to Speakers of Other Languages (ESOL) (Grades K-12)
0
0.0%
Remedial Education (Grades 2-5, 9-12)
0
0.0%
Special Instructional Assistance (SIA) (Grades K-3)
147 44.8%
Title I (Grades K-12)
This school has a schoolwide program.
Total 36
Retained Students, by Race/Ethnicity and Sex
Black
White Hispanic
American MultiAsian Indian racial
34 94.4%
2 5.6%
0 0.0%
0 0.0%
0 0.0%
0 0.0%
Male Female
22
14
61.1% 38.9%
Prepared by Georgia Department of Education
Page 1
STATE-REQUIRED TEST DATA
NORM-REFERENCED TESTS
Grade 3 Iowa Tests of Basic Skills (ITBS) Each chart reflects data for three years of testing.
No third-grade students are enrolled at Danforth Primary School.
Reading Comprehension
Mathematics
50
N/A 54 54 0
98-99
N/A 48 53 97-98
N/A 47 52 96-97
School 50
System
State
N/A 67 61 0
98-99
N/A 59 61 97-98
N/A 55 59 96-97
School System State
Reading Vocabulary 50
N/A 55 50 0
98-99
N/A 47 50 97-98
N/A 46 49 96-97
Language Arts
School 50
System
State
N/A 71 64 0
98-99
N/A 62 62 97-98
N/A 62 59 96-97
School System State
Social Studies 50
N/A 59 56 0
98-99
N/A 53 55 97-98
N/A 54 55 96-97
Science
School 50
System
State
N/A 57 59 0
98-99
N/A 50 59 97-98
N/A 49 58 96-97
School System State
Sources of Information
Composite Score
School
50
50
System
N/A 61 57 0
98-99
N/A 53 56 N/A 53 55
97-98
96-97
State
N/A 62 58 0
98-99
N/A 53 57 97-98
N/A 53 56 96-97
1998-99 GEORGIA PUBLIC EDUCATION REPORT CARD Danforth Primary School - 6111058
Prepared by Georgia Department of Education
Scores Reported in Percentiles
School System State
Page 2
STATE-REQUIRED TEST DATA
NORM-REFERENCED TESTS
Grade 5 Iowa Tests of Basic Skills (ITBS) Each chart reflects data for three years of testing. No fifth-grade students are enrolled at Danforth Primary School.
Reading Comprehension
Mathematics
50
N/A 54 53 0
98-99
N/A 49 53 97-98
N/A 50 52 96-97
School 50
System
State
N/A 62 59 0
98-99
N/A 56 58 97-98
N/A 53 57 96-97
School System State
Reading Vocabulary 50
N/A 58 48 0
98-99
N/A 48 48 97-98
N/A 44 46 96-97
Language Arts
School 50
System
State
N/A 67 63 0
98-99
N/A 60 61 97-98
N/A 60 58 96-97
School System State
Social Studies 50
N/A 58 57 0
98-99
N/A 52 56 97-98
N/A 48 55 96-97
Science
School 50
System
State
N/A 57 60 0
98-99
N/A 54 59 97-98
N/A 52 59 96-97
School System State
Sources of Information
Composite Score
School
50
50
System
N/A 57 58 0
98-99
N/A 54 58 N/A 55 57
97-98
96-97
State
N/A 59 57 0
98-99
N/A 53 56 97-98
N/A 52 55 96-97
1998-99 GEORGIA PUBLIC EDUCATION REPORT CARD Danforth Primary School - 6111058
Prepared by Georgia Department of Education
Scores Reported in Percentiles
School System State
Page 3
STATE-REQUIRED TEST DATA
PERFORMANCE ASSESSMENTS
Grade 5 Writing Assessment
Percent at Developmental Stages:
1998-99 School System State
1997-98 School System State
1996-97 School System State
Stage Stage Stage Stage Stage Stage
1:The Emerging Writer 2:The Developing Writer 3:The Focusing Writer 4:The Experimenting 5:The Engaging Writer 6:The Extending Writer
N/A N/A N/A N/A N/A N/A
0% 1% 19% 48% 23% 7%
0% 1% 16% 41% 29% 12%
N/A N/A N/A N/A N/A N/A
0% 2% 24% 44% 23% 6%
0% 3% 19% 41% 27% 10%
N/A N/A N/A N/A N/A N/A
No fifth-grade students are enrolled at Danforth Primary School.
0% 3% 28% 41% 22% 6%
0% 3% 21% 37% 26% 12%
AWARDS / RECOGNITION DATA
Schools in Georgia may receive recognition in the following programs: Charter School Pay for Performance Program Georgia School of Excellence National Blue Ribbon School Danforth Primary School did not receive recognition in any of these programs during the 1998-99 school year.
1998-99 GEORGIA PUBLIC EDUCATION REPORT CARD Danforth Primary School - 6111058
Prepared by Georgia Department of Education
Page 4
CERTIFIED PERSONNEL DATA
Positions Number Average Contract Days
Personnel Sex
Certificate
Years Experience
Full-time Part-time
Male Female
4 Yr Bachelor's 5 Yr Master's 6 Yr Specialist's 7 Yr Doctoral Other*
<1 1-10 11-20 21-30 >30
Average
Administrators
1.00 210.00
1 0
1 0
0 1 0 0 0 0 0 0 0 1 34.00
Support Personnel
2.00 190.00
2 0
0 2
0 0 2 0 0 0 0 0 2 0 23.00
PK-12 Teachers
28.00 190.00
28 0
0 28
15 10
3 0 0 0 9 10 7 2 17.32
*Includes One- and Two-Year Vocational Certificates.
ACCREDITATION DATA
Accredited by Southern Association of Colleges and Schools (SACS):
Elementary/Middle Commission.
1998-99 GEORGIA PUBLIC EDUCATION REPORT CARD Danforth Primary School - 6111058
Prepared by Georgia Department of Education
Page 5
1998-99 GEORGIA PUBLIC EDUCATION REPORT CARD
BIBB COUNTY SCHOOLS
Hamilton Elementary School - 6111060
Grade Range PK-6
The Georgia Public Education Report Card is designed to assist systems and schools in educational improvement. This report card contains a variety of data elements. An explanation of the terms is provided as a companion to the report card data. Please refer to the definitions for the most effective use of the reported data.
STUDENT DATA
Total
K-6
378
PK
19
Enrollment, by Race/Ethnicity and Sex
Black
White Hispanic
American Asian Indian
Multiracial
372 98.4%
6 1.6%
0 0.0%
0 0.0%
0 0.0%
0 0.0%
19 100.0%
0 0.0%
0 0.0%
0 0.0%
0 0.0%
0 0.0%
Male Female
198 52.4%
180 47.6%
11 57.9%
8 42.1%
Enrollment in Selected Programs
Program
Program % of Student Enrollment Population
Gifted (Grades K-12)
2
< 1%
Alternative Programs (Grades 6-12)
1
1.7%
Students Eligible to Receive Free/Reduced Lunches
Number
Percent
School System
381 15,047
96.0% 61.1%
Dropout Rate for Grade 6
Number
Rate
School System
0
0.0%
0
0.0%
Enrollment in Compensatory Programs
Program
Program % of Student Enrollment Population
Special Education (Grades K-12)
73 19.3%
(PK)
0
N/A
English to Speakers of Other Languages (ESOL) (Grades K-12)
0
0.0%
Remedial Education (Grades 2-5, 9-12)
34 16.7%
Special Instructional Assistance (SIA) (Grades K-3)
0
0.0%
Title I (Grades K-12)
This school has a schoolwide program.
Total 25
Retained Students, by Race/Ethnicity and Sex
Black
White Hispanic
American MultiAsian Indian racial
24 96.0%
1 4.0%
0 0.0%
0 0.0%
0 0.0%
0 0.0%
Male Female
14
11
56.0% 44.0%
Prepared by Georgia Department of Education
Page 1
STATE-REQUIRED TEST DATA
NORM-REFERENCED TESTS Grade 3
Iowa Tests of Basic Skills (ITBS) Each chart reflects data for three years of testing.
Reading Comprehension 50
60 54 54 0
98-99
37 48 53 97-98
30 47 52 96-97
Mathematics
School 50
System
State
0
77 67 61 98-99
67 59 61 97-98
50 55 59 96-97
School System State
Reading Vocabulary 50
66 55 50 0
98-99
24 47 50 97-98
21 46 49 96-97
Language Arts
School 50
System
State
0
84 71 64 98-99
64 62 62 97-98
48 62 59 96-97
School System State
Social Studies 50
53 59 56 0
98-99
48 53 55 97-98
39 54 55 96-97
Science
School 50
System
State
0
32 57 59 98-99
33 50 59 97-98
35 49 58 96-97
School System State
Sources of Information
Composite Score
50
72 61 57 0
98-99
School 50
System
55 53 56 97-98
44 53 55 96-97
State 0
64 62 58 98-99
48 53 57 97-98
1998-99 GEORGIA PUBLIC EDUCATION REPORT CARD Hamilton Elementary School - 6111060
Prepared by Georgia Department of Education
37 53 56 96-97
Scores Reported in Percentiles
School System State
Page 2
STATE-REQUIRED TEST DATA
NORM-REFERENCED TESTS Grade 5
Iowa Tests of Basic Skills (ITBS) Each chart reflects data for three years of testing.
Reading Comprehension
Mathematics
50
62 54 53 0
98-99
49 49 53 97-98
56 50 52 96-97
School 50
System
State
0
60 62 59 98-99
53 56 58 97-98
64 53 57 96-97
School System State
Reading Vocabulary 50
68 58 48 0
98-99
45 48 48 97-98
45 44 46 96-97
Language Arts
School 50
System
State
0
77 67 63 98-99
64 60 61 97-98
68 60 58 96-97
School System State
Social Studies 50
44 58 57 0
98-99
46 52 56 97-98
38 48 55 96-97
Science
School 50
System
State
0
38 57 60 98-99
43 54 59 97-98
43 52 59 96-97
School System State
Sources of Information
Composite Score
50
56 57 58 0
98-99
School 50
System
47 54 58 97-98
61 55 57 96-97
State 0
57 59 57 98-99
48 53 56 97-98
54 52 55 96-97
1998-99 GEORGIA PUBLIC EDUCATION REPORT CARD Hamilton Elementary School - 6111060
Prepared by Georgia Department of Education
Scores Reported in Percentiles
School System State
Page 3
STATE-REQUIRED TEST DATA
PERFORMANCE ASSESSMENTS
Grade 5 Writing Assessment
Percent at Developmental Stages:
1998-99 School System State
1997-98 School System State
1996-97 School System State
Stage Stage Stage Stage Stage Stage
1:The Emerging Writer 2:The Developing Writer 3:The Focusing Writer 4:The Experimenting 5:The Engaging Writer 6:The Extending Writer
0% 3% 22% 47% 25% 3%
0% 1% 19% 48% 23% 7%
0% 1% 16% 41% 29% 12%
0% 0% 28% 52% 18% 2%
0% 2% 24% 44% 23% 6%
0% 3% 19% 41% 27% 10%
0% 2% 55% 39% 5% 0%
0% 3% 28% 41% 22% 6%
0% 3% 21% 37% 26% 12%
AWARDS / RECOGNITION DATA
Schools in Georgia may receive recognition in the following programs: Charter School Pay for Performance Program Georgia School of Excellence National Blue Ribbon School Hamilton Elementary School did not receive recognition in any of these programs during the 1998-99 school year.
1998-99 GEORGIA PUBLIC EDUCATION REPORT CARD Hamilton Elementary School - 6111060
Prepared by Georgia Department of Education
Page 4
CERTIFIED PERSONNEL DATA
Positions Number Average Contract Days
Personnel Sex
Certificate
Years Experience
Full-time Part-time
Male Female
4 Yr Bachelor's 5 Yr Master's 6 Yr Specialist's 7 Yr Doctoral Other*
<1 1-10 11-20 21-30 >30
Average
Administrators
2.00 205.00
2 0
0 2
0 1 1 0 0 0 0 1 1 0 23.00
Support Personnel
2.00 190.00
2 0
1 1
0 2 0 0 0 0 1 0 1 0 17.50
PK-12 Teachers
31.00 190.00
31 0
3 28
17 11
3 0 0 0 13 10 7 1 14.26
*Includes One- and Two-Year Vocational Certificates.
ACCREDITATION DATA
Accredited by Southern Association of Colleges and Schools (SACS):
Elementary/Middle Commission.
1998-99 GEORGIA PUBLIC EDUCATION REPORT CARD Hamilton Elementary School - 6111060
Prepared by Georgia Department of Education
Page 5
1998-99 GEORGIA PUBLIC EDUCATION REPORT CARD
BIBB COUNTY SCHOOLS
Hartley Elementary School - 6112060
Grade Range PK-6
The Georgia Public Education Report Card is designed to assist systems and schools in educational improvement. This report card contains a variety of data elements. An explanation of the terms is provided as a companion to the report card data. Please refer to the definitions for the most effective use of the reported data.
STUDENT DATA
Total
K-6
416
PK
20
Enrollment, by Race/Ethnicity and Sex
Black
White Hispanic
American Asian Indian
Multiracial
415 99.8%
1 0.2%
0 0.0%
0 0.0%
0 0.0%
0 0.0%
20 100.0%
0 0.0%
0 0.0%
0 0.0%
0 0.0%
0 0.0%
Male Female
201 48.3%
215 51.7%
14 70.0%
6 30.0%
Enrollment in Selected Programs
Program
Program % of Student Enrollment Population
Gifted (Grades K-12)
15
3.6%
Alternative Programs (Grades 6-12)
0
0.0%
Students Eligible to Receive Free/Reduced Lunches
Number
Percent
School System
422 15,047
96.8% 61.1%
Dropout Rate for Grade 6
Number
Rate
School System
0
0.0%
0
0.0%
Enrollment in Compensatory Programs
Program
Program % of Student Enrollment Population
Special Education (Grades K-12)
41
9.9%
(PK)
0
N/A
English to Speakers of Other Languages (ESOL) (Grades K-12)
0
0.0%
Remedial Education (Grades 2-5, 9-12)
48 21.3%
Special Instructional Assistance (SIA) (Grades K-3)
0
0.0%
Title I (Grades K-12)
This school has a schoolwide program.
Total 31
Retained Students, by Race/Ethnicity and Sex
Black
White Hispanic
American MultiAsian Indian racial
31 100.0%
0 0.0%
0 0.0%
0 0.0%
0 0.0%
0 0.0%
Male Female
16
15
51.6% 48.4%
Prepared by Georgia Department of Education
Page 1
STATE-REQUIRED TEST DATA
NORM-REFERENCED TESTS Grade 3
Iowa Tests of Basic Skills (ITBS) Each chart reflects data for three years of testing.
Reading Comprehension 50
32 54 54 0
98-99
31 48 53 97-98
26 47 52 96-97
Mathematics
School 50
System
State
0
55 67 61 98-99
49 59 61 97-98
43 55 59 96-97
School System State
Reading Vocabulary 50
34 55 50 0
98-99
26 47 50 97-98
35 46 49 96-97
Language Arts
School 50
System
State
0
69 71 64 98-99
50 62 62 97-98
49 62 59 96-97
School System State
Social Studies 50
40 59 56 0
98-99
37 53 55 97-98
39 54 55 96-97
Science
School 50
System
State
0
31 57 59 98-99
33 50 59 97-98
33 49 58 96-97
School System State
Sources of Information
Composite Score
50
41 61 57 0
98-99
School 50
System
38 53 56 97-98
40 53 55 96-97
State 0
43 62 58 98-99
37 53 57 97-98
1998-99 GEORGIA PUBLIC EDUCATION REPORT CARD Hartley Elementary School - 6112060
Prepared by Georgia Department of Education
39 53 56 96-97
Scores Reported in Percentiles
School System State
Page 2
STATE-REQUIRED TEST DATA
NORM-REFERENCED TESTS Grade 5
Iowa Tests of Basic Skills (ITBS) Each chart reflects data for three years of testing.
Reading Comprehension
Mathematics
50
43 54 53 0
98-99
35 49 53 97-98
35 50 52 96-97
School 50
System
State
0
61 62 59 98-99
48 56 58 97-98
48 53 57 96-97
School System State
Reading Vocabulary 50
29 58 48 0
98-99
22 48 48 97-98
20 44 46 96-97
Language Arts
School 50
System
State
0
68 67 63 98-99
43 60 61 97-98
52 60 58 96-97
School System State
Social Studies 50
48 58 57 0
98-99
34 52 56 97-98
31 48 55 96-97
Science
School 50
System
State
0
47 57 60 98-99
25 54 59 97-98
34 52 59 96-97
School System State
Sources of Information
Composite Score
50
49 57 58 0
98-99
School 50
System
38 54 58 97-98
36 55 57 96-97
State 0
51 59 57 98-99
34 53 56 97-98
36 52 55 96-97
1998-99 GEORGIA PUBLIC EDUCATION REPORT CARD Hartley Elementary School - 6112060
Prepared by Georgia Department of Education
Scores Reported in Percentiles
School System State
Page 3
STATE-REQUIRED TEST DATA
PERFORMANCE ASSESSMENTS
Grade 5 Writing Assessment
Percent at Developmental Stages:
1998-99 School System State
1997-98 School System State
1996-97 School System State
Stage Stage Stage Stage Stage Stage
1:The Emerging Writer 2:The Developing Writer 3:The Focusing Writer 4:The Experimenting 5:The Engaging Writer 6:The Extending Writer
0% 2% 17% 52% 24% 4%
0% 1% 19% 48% 23% 7%
0% 1% 16% 41% 29% 12%
0% 2% 39% 37% 22% 0%
0% 2% 24% 44% 23% 6%
0% 3% 19% 41% 27% 10%
0% 0% 28% 49% 21% 0%
0% 3% 28% 41% 22% 6%
0% 3% 21% 37% 26% 12%
AWARDS / RECOGNITION DATA
Schools in Georgia may receive recognition in the following programs: Charter School Pay for Performance Program Georgia School of Excellence National Blue Ribbon School Hartley Elementary School did not receive recognition in any of these programs during the 1998-99 school year.
1998-99 GEORGIA PUBLIC EDUCATION REPORT CARD Hartley Elementary School - 6112060
Prepared by Georgia Department of Education
Page 4
CERTIFIED PERSONNEL DATA
Positions Number Average Contract Days
Personnel Sex
Certificate
Years Experience
Full-time Part-time
Male Female
4 Yr Bachelor's 5 Yr Master's 6 Yr Specialist's 7 Yr Doctoral Other*
<1 1-10 11-20 21-30 >30
Average
Administrators
2.00 205.00
2 0
0 2
0 0 1 1 0 0 0 0 1 1 30.00
Support Personnel
2.00 190.00
2 0
0 2
0 1 1 0 0 0 1 0 1 0 15.00
PK-12 Teachers
26.50 190.00
26 1
1 26
13 10
4 0 0 1 11 6 9 0 14.19
*Includes One- and Two-Year Vocational Certificates.
ACCREDITATION DATA
Accredited by Southern Association of Colleges and Schools (SACS):
Elementary/Middle Commission.
1998-99 GEORGIA PUBLIC EDUCATION REPORT CARD Hartley Elementary School - 6112060
Prepared by Georgia Department of Education
Page 5
1998-99 GEORGIA PUBLIC EDUCATION REPORT CARD
BIBB COUNTY SCHOOLS
Heard Elementary School - 6113060
Grade Range K-6
The Georgia Public Education Report Card is designed to assist systems and schools in educational improvement. This report card contains a variety of data elements. An explanation of the terms is provided as a companion to the report card data. Please refer to the definitions for the most effective use of the reported data.
STUDENT DATA
Total 559
K-6 Enrollment, by Race/Ethnicity and Sex
Black
White Hispanic
American Multi-
Asian Indian
racial
32 5.7%
518 92.7%
4 0.7%
3 0.5%
1 0.2%
1 0.2%
Male Female
316 56.5%
243 43.5%
Enrollment in Selected Programs
Program
Program % of Student Enrollment Population
Gifted (Grades K-12)
5
< 1%
Alternative Programs (Grades 6-12)
0
0.0%
Students Eligible to Receive Free/Reduced Lunches
Number
Percent
School System
168 15,047
30.1% 61.1%
Dropout Rate for Grade 6
Number
Rate
School System
0
0.0%
0
0.0%
Enrollment in Compensatory Programs
Program
Program % of Student Enrollment Population
Special Education (Grades K-12)
60 10.7%
(PK)
0
N/A
English to Speakers of Other Languages (ESOL) (Grades K-12)
0
0.0%
Remedial Education (Grades 2-5, 9-12)
38 11.3%
Special Instructional Assistance (SIA) (Grades K-3)
0
0.0%
Title I (Grades K-12)
This school has no Title I program.
Total 25
Retained Students, by Race/Ethnicity and Sex
Black
White Hispanic
American Multi-
Asian Indian
racial
2 8.0%
23 92.0%
0 0.0%
0 0.0%
0 0.0%
0 0.0%
Male Female
17
8
68.0% 32.0%
Prepared by Georgia Department of Education
Page 1
STATE-REQUIRED TEST DATA
NORM-REFERENCED TESTS Grade 3
Iowa Tests of Basic Skills (ITBS) Each chart reflects data for three years of testing.
Reading Comprehension 50
68 54 54 0
98-99
52 48 53 97-98
61 47 52 96-97
Mathematics
School 50
System
State
0
71 67 61 98-99
63 59 61 97-98
75 55 59 96-97
School System State
Reading Vocabulary 50
63 55 50 0
98-99
51 47 50 97-98
62 46 49 96-97
Language Arts
School 50
System
State
0
71 71 64 98-99
62 62 62 97-98
74 62 59 96-97
School System State
Social Studies 50
71 59 56 0
98-99
53 53 55 97-98
67 54 55 96-97
Science
School 50
System
State
0
72 57 59 98-99
44 50 59 97-98
58 49 58 96-97
School System State
Sources of Information
Composite Score
50
69 61 57 0
98-99
School 50
System
57 53 56 97-98
64 53 55 96-97
State 0
70 62 58 98-99
54 53 57 97-98
1998-99 GEORGIA PUBLIC EDUCATION REPORT CARD Heard Elementary School - 6113060
Prepared by Georgia Department of Education
67 53 56 96-97
Scores Reported in Percentiles
School System State
Page 2
STATE-REQUIRED TEST DATA
NORM-REFERENCED TESTS Grade 5
Iowa Tests of Basic Skills (ITBS) Each chart reflects data for three years of testing.
Reading Comprehension
Mathematics
50
54 54 53 0
98-99
55 49 53 97-98
57 50 52 96-97
School 50
System
State
0
55 62 59 98-99
59 56 58 97-98
60 53 57 96-97
School System State
Reading Vocabulary 50
55 58 48 0
98-99
56 48 48 97-98
57 44 46 96-97
Language Arts
School 50
System
State
0
57 67 63 98-99
52 60 61 97-98
68 60 58 96-97
School System State
Social Studies 50
55 58 57 0
98-99
53 52 56 97-98
62 48 55 96-97
Science
School 50
System
State
0
62 57 60 98-99
64 54 59 97-98
63 52 59 96-97
School System State
Sources of Information
Composite Score
50
62 57 58 0
98-99
School 50
System
59 54 58 97-98
70 55 57 96-97
State 0
57 59 57 98-99
56 53 56 97-98
64 52 55 96-97
1998-99 GEORGIA PUBLIC EDUCATION REPORT CARD Heard Elementary School - 6113060
Prepared by Georgia Department of Education
Scores Reported in Percentiles
School System State
Page 3
STATE-REQUIRED TEST DATA
PERFORMANCE ASSESSMENTS
Grade 5 Writing Assessment
Percent at Developmental Stages:
1998-99 School System State
1997-98 School System State
1996-97 School System State
Stage Stage Stage Stage Stage Stage
1:The Emerging Writer 2:The Developing Writer 3:The Focusing Writer 4:The Experimenting 5:The Engaging Writer 6:The Extending Writer
1% 1% 21% 51% 19% 6%
0% 1% 19% 48% 23% 7%
0% 1% 16% 41% 29% 12%
0% 3% 19% 35% 34% 9%
0% 2% 24% 44% 23% 6%
0% 3% 19% 41% 27% 10%
0% 5% 29% 46% 15% 5%
0% 3% 28% 41% 22% 6%
0% 3% 21% 37% 26% 12%
AWARDS / RECOGNITION DATA
Schools in Georgia may receive recognition in the following programs: Charter School Pay for Performance Program Georgia School of Excellence National Blue Ribbon School Heard Elementary School did not receive recognition in any of these programs during the 1998-99 school year.
1998-99 GEORGIA PUBLIC EDUCATION REPORT CARD Heard Elementary School - 6113060
Prepared by Georgia Department of Education
Page 4
CERTIFIED PERSONNEL DATA
Positions Number Average Contract Days
Personnel Sex
Certificate
Years Experience
Full-time Part-time
Male Female
4 Yr Bachelor's 5 Yr Master's 6 Yr Specialist's 7 Yr Doctoral Other*
<1 1-10 11-20 21-30 >30
Average
Administrators
2.00 205.00
2 0
1 1
0 1 1 0 0 0 1 0 1 0 13.50
Support Personnel
2.00 190.00
2 0
0 2
0 2 0 0 0 0 1 1 0 0 8.00
PK-12 Teachers
30.70 190.00
30 2
1 31
12 18
2 0 0 1 7 15 6 3 16.38
*Includes One- and Two-Year Vocational Certificates.
ACCREDITATION DATA
Accredited by Southern Association of Colleges and Schools (SACS):
Elementary/Middle Commission.
1998-99 GEORGIA PUBLIC EDUCATION REPORT CARD Heard Elementary School - 6113060
Prepared by Georgia Department of Education
Page 5
1998-99 GEORGIA PUBLIC EDUCATION REPORT CARD
BIBB COUNTY SCHOOLS
Hunt Magnet School - 6115060
Grade Range K-6
The Georgia Public Education Report Card is designed to assist systems and schools in educational improvement. This report card contains a variety of data elements. An explanation of the terms is provided as a companion to the report card data. Please refer to the definitions for the most effective use of the reported data.
STUDENT DATA
Total 316
K-6 Enrollment, by Race/Ethnicity and Sex
Black
White Hispanic
American Multi-
Asian Indian
racial
262 82.9%
40 12.7%
12 3.8%
0 0.0%
0 0.0%
2 0.6%
Male Female
155 49.1%
161 50.9%
Enrollment in Selected Programs
Program
Program % of Student Enrollment Population
Gifted (Grades K-12)
0
0.0%
Alternative Programs (Grades 6-12)
0
0.0%
Students Eligible to Receive Free/Reduced Lunches
Number
Percent
School System
203 15,047
64.2% 61.1%
Dropout Rate for Grade 6
Number
Rate
School System
0
0.0%
0
0.0%
Enrollment in Compensatory Programs
Program
Program % of Student Enrollment Population
Special Education (Grades K-12)
5
1.6%
(PK)
0
N/A
English to Speakers of Other Languages (ESOL) (Grades K-12)
0
0.0%
Remedial Education (Grades 2-5, 9-12)
38 20.2%
Special Instructional Assistance (SIA) (Grades K-3)
0
0.0%
Title I (Grades K-12)
This school has no Title I program.
Total 12
Retained Students, by Race/Ethnicity and Sex
Black
White Hispanic
American Multi-
Asian Indian
racial
11 91.7%
1 8.3%
0 0.0%
0 0.0%
0 0.0%
0 0.0%
Male Female
9
3
75.0% 25.0%
Prepared by Georgia Department of Education
Page 1
STATE-REQUIRED TEST DATA
NORM-REFERENCED TESTS Grade 3
Iowa Tests of Basic Skills (ITBS) Each chart reflects data for three years of testing.
Reading Comprehension 50
39 54 54 0
98-99
54 48 53 97-98
46 47 52 96-97
Mathematics
School 50
System
State
0
53 67 61 98-99
60 59 61 97-98
52 55 59 96-97
School System State
Reading Vocabulary 50
45 55 50 0
98-99
52 47 50 97-98
46 46 49 96-97
Language Arts
School 50
System
State
0
65 71 64 98-99
65 62 62 97-98
59 62 59 96-97
School System State
Social Studies 50
51 59 56 0
98-99
60 53 55 97-98
54 54 55 96-97
Science
School 50
System
State
0
45 57 59 98-99
49 50 59 97-98
44 49 58 96-97
School System State
Sources of Information
Composite Score
50
51 61 57 0
98-99
School 50
System
58 53 56 97-98
53 53 55 96-97
State 0
50 62 58 98-99
57 53 57 97-98
1998-99 GEORGIA PUBLIC EDUCATION REPORT CARD Hunt Magnet School - 6115060
Prepared by Georgia Department of Education
50 53 56 96-97
Scores Reported in Percentiles
School System State
Page 2
STATE-REQUIRED TEST DATA
NORM-REFERENCED TESTS Grade 5
Iowa Tests of Basic Skills (ITBS) Each chart reflects data for three years of testing.
Reading Comprehension
Mathematics
50
45 54 53 0
98-99
53 49 53 97-98
60 50 52 96-97
School 50
System
State
0
50 62 59 98-99
52 56 58 97-98
63 53 57 96-97
School System State
Reading Vocabulary 50
30 58 48 0
98-99
46 48 48 97-98
52 44 46 96-97
Language Arts
School 50
System
State
0
48 67 63 98-99
54 60 61 97-98
64 60 58 96-97
School System State
Social Studies 50
48 58 57 0
98-99
54 52 56 97-98
59 48 55 96-97
Science
School 50
System
State
0
40 57 60 98-99
50 54 59 97-98
58 52 59 96-97
School System State
Sources of Information
Composite Score
50
58 57 58 0
98-99
School 50
System
62 54 58 97-98
68 55 57 96-97
State 0
46 59 57 98-99
52 53 56 97-98
61 52 55 96-97
1998-99 GEORGIA PUBLIC EDUCATION REPORT CARD Hunt Magnet School - 6115060
Prepared by Georgia Department of Education
Scores Reported in Percentiles
School System State
Page 3
STATE-REQUIRED TEST DATA
PERFORMANCE ASSESSMENTS
Grade 5 Writing Assessment
Percent at Developmental Stages:
1998-99 School System State
1997-98 School System State
1996-97 School System State
Stage Stage Stage Stage Stage Stage
1:The Emerging Writer 2:The Developing Writer 3:The Focusing Writer 4:The Experimenting 5:The Engaging Writer 6:The Extending Writer
0% 2% 27% 51% 18% 2%
0% 1% 19% 48% 23% 7%
0% 1% 16% 41% 29% 12%
2% 5% 17% 38% 29% 10%
0% 2% 24% 44% 23% 6%
0% 3% 19% 41% 27% 10%
0% 2% 13% 42% 31% 11%
0% 3% 28% 41% 22% 6%
0% 3% 21% 37% 26% 12%
AWARDS / RECOGNITION DATA
Schools in Georgia may receive recognition in the following programs: Charter School Pay for Performance Program Georgia School of Excellence National Blue Ribbon School Hunt Magnet School did not receive recognition in any of these programs during the 1998-99 school year.
1998-99 GEORGIA PUBLIC EDUCATION REPORT CARD Hunt Magnet School - 6115060
Prepared by Georgia Department of Education
Page 4
CERTIFIED PERSONNEL DATA
Positions Number Average Contract Days
Personnel Sex
Certificate
Years Experience
Full-time Part-time
Male Female
4 Yr Bachelor's 5 Yr Master's 6 Yr Specialist's 7 Yr Doctoral Other*
<1 1-10 11-20 21-30 >30
Average
Administrators
1.00 210.00
1 0
1 0
0 0 1 0 0 0 0 0 1 0 29.00
Support Personnel
2.00 190.00
2 0
0 2
0 0 2 0 0 0 0 0 1 1 28.50
PK-12 Teachers
17.50 190.00
17 1
1 17
2 12
4 0 0 0 3 7 8 0 18.22
*Includes One- and Two-Year Vocational Certificates.
ACCREDITATION DATA
Accredited by Southern Association of Colleges and Schools (SACS):
Elementary/Middle Commission.
1998-99 GEORGIA PUBLIC EDUCATION REPORT CARD Hunt Magnet School - 6115060
Prepared by Georgia Department of Education
Page 5
1998-99 GEORGIA PUBLIC EDUCATION REPORT CARD
BIBB COUNTY SCHOOLS
Ingram/Pye Elementary School - 6113067
Grade Range K-6
The Georgia Public Education Report Card is designed to assist systems and schools in educational improvement. This report card contains a variety of data elements. An explanation of the terms is provided as a companion to the report card data. Please refer to the definitions for the most effective use of the reported data.
STUDENT DATA
Total 490
K-6 Enrollment, by Race/Ethnicity and Sex
Black
White Hispanic
American Multi-
Asian Indian
racial
487 99.4%
2 0.4%
0 0.0%
0 0.0%
0 0.0%
1 0.2%
Male Female
244 49.8%
246 50.2%
Enrollment in Selected Programs
Program
Program % of Student Enrollment Population
Gifted (Grades K-12)
7
1.4%
Alternative Programs (Grades 6-12)
0
0.0%
Students Eligible to Receive Free/Reduced Lunches
Number
Percent
School System
489 15,047
99.8% 61.1%
Dropout Rate for Grade 6
Number
Rate
School System
0
0.0%
0
0.0%
Enrollment in Compensatory Programs
Program
Program % of Student Enrollment Population
Special Education (Grades K-12)
43
8.8%
(PK)
0
N/A
English to Speakers of Other Languages (ESOL) (Grades K-12)
0
0.0%
Remedial Education (Grades 2-5, 9-12)
68 24.6%
Special Instructional Assistance (SIA) (Grades K-3)
50 14.4%
Title I (Grades K-12)
This school has a schoolwide program.
Total 50
Retained Students, by Race/Ethnicity and Sex
Black
White Hispanic
American Multi-
Asian Indian
racial
50 100.0%
0 0.0%
0 0.0%
0 0.0%
0 0.0%
0 0.0%
Male Female
31
19
62.0% 38.0%
Prepared by Georgia Department of Education
Page 1
STATE-REQUIRED TEST DATA
NORM-REFERENCED TESTS Grade 3
Iowa Tests of Basic Skills (ITBS) Each chart reflects data for three years of testing.
Reading Comprehension 50
25 54 54 0
98-99
31 48 53 97-98
30 47 52 96-97
Mathematics
School 50
System
State
0
42 67 61 98-99
45 59 61 97-98
29 55 59 96-97
School System State
Reading Vocabulary 50
24 55 50 0
98-99
27 47 50 97-98
24 46 49 96-97
Language Arts
School 50
System
State
0
54 71 64 98-99
48 62 62 97-98
45 62 59 96-97
School System State
Social Studies 50
38 59 56 0
98-99
35 53 55 97-98
29 54 55 96-97
Science
School 50
System
State
0
30 57 59 98-99
35 50 59 97-98
31 49 58 96-97
School System State
Sources of Information
Composite Score
50
41 61 57 0
98-99
School 50
System
39 53 56 97-98
33 53 55 96-97
State 0
36 62 58 98-99
36 53 57 97-98
1998-99 GEORGIA PUBLIC EDUCATION REPORT CARD Ingram/Pye Elementary School - 6113067
Prepared by Georgia Department of Education
29 53 56 96-97
Scores Reported in Percentiles
School System State
Page 2
STATE-REQUIRED TEST DATA
NORM-REFERENCED TESTS Grade 5
Iowa Tests of Basic Skills (ITBS) Each chart reflects data for three years of testing.
Reading Comprehension
Mathematics
50
50 54 53 0
98-99
43 49 53 97-98
33 50 52 96-97
School 50
System
State
0
63 62 59 98-99
60 56 58 97-98
36 53 57 96-97
School System State
Reading Vocabulary 50
94 58 48 0
98-99
74 48 48 97-98
18 44 46 96-97
Language Arts
School 50
System
State
0
65 67 63 98-99
73 60 61 97-98
32 60 58 96-97
School System State
Social Studies 50
41 58 57 0
98-99
57 52 56 97-98
27 48 55 96-97
Science
School 50
System
State
0
47 57 60 98-99
57 54 59 97-98
28 52 59 96-97
School System State
Sources of Information
Composite Score
50
52 57 58 0
98-99
School 50
System
60 54 58 97-98
39 55 57 96-97
State 0
56 59 57 98-99
62 53 56 97-98
29 52 96-97
1998-99 GEORGIA PUBLIC EDUCATION REPORT CARD Ingram/Pye Elementary School - 6113067
Prepared by Georgia Department of Education
Scores Reported in Percentiles
School System State
Page 3
STATE-REQUIRED TEST DATA
PERFORMANCE ASSESSMENTS
Grade 5 Writing Assessment
Percent at Developmental Stages:
1998-99 School System State
1997-98 School System State
1996-97 School System State
Stage Stage Stage Stage Stage Stage
1:The Emerging Writer 2:The Developing Writer 3:The Focusing Writer 4:The Experimenting 5:The Engaging Writer 6:The Extending Writer
0% 0% 33% 50% 17% 0%
0% 1% 19% 48% 23% 7%
0% 1% 16% 41% 29% 12%
0% 14% 40% 43%
2% 0%
0% 2% 24% 44% 23% 6%
0% 3% 19% 41% 27% 10%
0% 8% 50% 38% 4% 0%
0% 3% 28% 41% 22% 6%
0% 3% 21% 37% 26% 12%
AWARDS / RECOGNITION DATA
Schools in Georgia may receive recognition in the following programs: Charter School Pay for Performance Program Georgia School of Excellence National Blue Ribbon School Ingram/Pye Elementary School did not receive recognition in any of these programs during the 1998-99 school year.
1998-99 GEORGIA PUBLIC EDUCATION REPORT CARD Ingram/Pye Elementary School - 6113067
Prepared by Georgia Department of Education
Page 4
CERTIFIED PERSONNEL DATA
Positions Number Average Contract Days
Personnel Sex
Certificate
Years Experience
Full-time Part-time
Male Female
4 Yr Bachelor's 5 Yr Master's 6 Yr Specialist's 7 Yr Doctoral Other*
<1 1-10 11-20 21-30 >30
Average
Administrators
1.50 206.67
1 1
2 0
0 0 1 1 0 0 0 0 0 2 34.50
Support Personnel
2.00 190.00
2 0
0 2
0 1 1 0 0 0 0 2 0 0 11.00
PK-12 Teachers
37.00 190.14
36 2
3 35
20 15
2 1 0 3 11 8 15 1 15.87
*Includes One- and Two-Year Vocational Certificates.
ACCREDITATION DATA
Accredited by Southern Association of Colleges and Schools (SACS):
Elementary/Middle Commission.
1998-99 GEORGIA PUBLIC EDUCATION REPORT CARD Ingram/Pye Elementary School - 6113067
Prepared by Georgia Department of Education
Page 5
1998-99 GEORGIA PUBLIC EDUCATION REPORT CARD
BIBB COUNTY SCHOOLS
Jones Elementary School - 6113062
Grade Range K-6
The Georgia Public Education Report Card is designed to assist systems and schools in educational improvement. This report card contains a variety of data elements. An explanation of the terms is provided as a companion to the report card data. Please refer to the definitions for the most effective use of the reported data.
STUDENT DATA
Total 521
K-6 Enrollment, by Race/Ethnicity and Sex
Black
White Hispanic
American Multi-
Asian Indian
racial
511 98.1%
5 1.0%
5 1.0%
0 0.0%
0 0.0%
0 0.0%
Male Female
284 54.5%
237 45.5%
Enrollment in Selected Programs
Program
Program % of Student Enrollment Population
Gifted (Grades K-12)
1
< 1%
Alternative Programs (Grades 6-12)
0
0.0%
Students Eligible to Receive Free/Reduced Lunches
Number
Percent
School System
372 15,047
71.4% 61.1%
Dropout Rate for Grade 6
Number
Rate
School System
0
0.0%
0
0.0%
Enrollment in Compensatory Programs
Program
Program % of Student Enrollment Population
Special Education (Grades K-12)
37
7.1%
(PK)
0
N/A
English to Speakers of Other Languages (ESOL) (Grades K-12)
0
0.0%
Remedial Education (Grades 2-5, 9-12)
102 33.7%
Special Instructional Assistance (SIA) (Grades K-3)
0
0.0%
Title I (Grades K-12)
This school has no Title I program.
Total 42
Retained Students, by Race/Ethnicity and Sex
Black
White Hispanic
American Multi-
Asian Indian
racial
42 100.0%
0 0.0%
0 0.0%
0 0.0%
0 0.0%
0 0.0%
Male Female
31
11
73.8% 26.2%
Prepared by Georgia Department of Education
Page 1
STATE-REQUIRED TEST DATA
NORM-REFERENCED TESTS Grade 3
Iowa Tests of Basic Skills (ITBS) Each chart reflects data for three years of testing.
Reading Comprehension 50
43 54 54 0
98-99
32 48 53 97-98
38 47 52 96-97
Mathematics
School 50
System
State
0
57 67 61 98-99
44 59 61 97-98
42 55 59 96-97
School System State
Reading Vocabulary 50
45 55 50 0
98-99
32 47 50 97-98
33 46 49 96-97
Language Arts
School 50
System
State
0
72 71 64 98-99
54 62 62 97-98
54 62 59 96-97
School System State
Social Studies 50
56 59 56 0
98-99
49 53 55 97-98
46 54 55 96-97
Science
School 50
System
State
0
59 57 59 98-99
41 50 59 97-98
42 49 58 96-97
School System State
Sources of Information
Composite Score
50
56 61 57 0
98-99
School 50
System
51 53 56 97-98
48 53 55 96-97
State 0
57 62 58 98-99
44 53 57 97-98
1998-99 GEORGIA PUBLIC EDUCATION REPORT CARD Jones Elementary School - 6113062
Prepared by Georgia Department of Education
43 53 56 96-97
Scores Reported in Percentiles
School System State
Page 2
STATE-REQUIRED TEST DATA
NORM-REFERENCED TESTS Grade 5
Iowa Tests of Basic Skills (ITBS) Each chart reflects data for three years of testing.
Reading Comprehension
Mathematics
50
49 54 53 0
98-99
40 49 53 97-98
48 50 52 96-97
School 50
System
State
0
55 62 59 98-99
45 56 58 97-98
60 53 57 96-97
School System State
Reading Vocabulary 50
53 58 48 0
98-99
33 48 48 97-98
37 44 46 96-97
Language Arts
School 50
System
State
0
81 67 63 98-99
56 60 61 97-98
63 60 58 96-97
School System State
Social Studies 50
70 58 57 0
98-99
48 52 56 97-98
54 48 55 96-97
Science
School 50
System
State
0
57 57 60 98-99
47 54 59 97-98
58 52 59 96-97
School System State
Sources of Information
Composite Score
50
58 57 58 0
98-99
School 50
System
56 54 58 97-98
55 55 57 96-97
State 0
62 59 57 98-99
47 53 56 97-98
54 52 55 96-97
1998-99 GEORGIA PUBLIC EDUCATION REPORT CARD Jones Elementary School - 6113062
Prepared by Georgia Department of Education
Scores Reported in Percentiles
School System State
Page 3
STATE-REQUIRED TEST DATA
PERFORMANCE ASSESSMENTS
Grade 5 Writing Assessment
Percent at Developmental Stages:
1998-99 School System State
1997-98 School System State
1996-97 School System State
Stage Stage Stage Stage Stage Stage
1:The Emerging Writer 2:The Developing Writer 3:The Focusing Writer 4:The Experimenting 5:The Engaging Writer 6:The Extending Writer
0% 3% 17% 51% 23% 6%
0% 1% 19% 48% 23% 7%
0% 1% 16% 41% 29% 12%
0% 6% 45% 34% 14% 2%
0% 2% 24% 44% 23% 6%
0% 3% 19% 41% 27% 10%
0% 5% 21% 49% 21% 5%
0% 3% 28% 41% 22% 6%
0% 3% 21% 37% 26% 12%
AWARDS / RECOGNITION DATA
Schools in Georgia may receive recognition in the following programs: Charter School Pay for Performance Program Georgia School of Excellence National Blue Ribbon School Jones Elementary School did not receive recognition in any of these programs during the 1998-99 school year.
1998-99 GEORGIA PUBLIC EDUCATION REPORT CARD Jones Elementary School - 6113062
Prepared by Georgia Department of Education
Page 4
CERTIFIED PERSONNEL DATA
Positions Number Average Contract Days
Personnel Sex
Certificate
Years Experience
Full-time Part-time
Male Female
4 Yr Bachelor's 5 Yr Master's 6 Yr Specialist's 7 Yr Doctoral Other*
<1 1-10 11-20 21-30 >30
Average
Administrators
1.50 206.67
1 1
1 1
0 1 1 0 0 0 1 0 0 1 24.00
Support Personnel
2.00 190.00
2 0
0 2
0 2 0 0 0 0 1 0 1 0 18.00
PK-12 Teachers
28.50 190.18
28 1
3 26
13 12
4 0 0 3 11 10 5 0 11.07
*Includes One- and Two-Year Vocational Certificates.
ACCREDITATION DATA
Accredited by Southern Association of Colleges and Schools (SACS):
Elementary/Middle Commission.
1998-99 GEORGIA PUBLIC EDUCATION REPORT CARD Jones Elementary School - 6113062
Prepared by Georgia Department of Education
Page 5
1998-99 GEORGIA PUBLIC EDUCATION REPORT CARD
BIBB COUNTY SCHOOLS
King Elementary School - 6110185
Grade Range 3-6
The Georgia Public Education Report Card is designed to assist systems and schools in educational improvement. This report card contains a variety of data elements. An explanation of the terms is provided as a companion to the report card data. Please refer to the definitions for the most effective use of the reported data.
STUDENT DATA
Total 402
3-6 Enrollment, by Race/Ethnicity and Sex
Black
White Hispanic
American Multi-
Asian Indian
racial
389 96.8%
13 3.2%
0 0.0%
0 0.0%
0 0.0%
0 0.0%
Male Female
212 52.7%
190 47.3%
Enrollment in Selected Programs
Program
Program % of Student Enrollment Population
Gifted (Grades K-12)
0
0.0%
Alternative Programs (Grades 6-12)
0
0.0%
Students Eligible to Receive Free/Reduced Lunches
Number
Percent
School System
379 15,047
94.3% 61.1%
Dropout Rate for Grade 6
Number
Rate
School System
0
0.0%
0
0.0%
Enrollment in Compensatory Programs
Program
Program % of Student Enrollment Population
Special Education (Grades K-12)
60 14.9%
(PK)
0
N/A
English to Speakers of Other Languages (ESOL) (Grades K-12)
0
0.0%
Remedial Education (Grades 2-5, 9-12)
92 30.7%
Special Instructional Assistance (SIA) (Grades K-3)
0
0.0%
Title I (Grades K-12)
This school has a schoolwide program.
Total 14
Retained Students, by Race/Ethnicity and Sex
Black
White Hispanic
American Multi-
Asian Indian
racial
14 100.0%
0 0.0%
0 0.0%
0 0.0%
0 0.0%
0 0.0%
Male Female
10
4
71.4% 28.6%
Prepared by Georgia Department of Education
Page 1
STATE-REQUIRED TEST DATA
NORM-REFERENCED TESTS Grade 3
Iowa Tests of Basic Skills (ITBS) Each chart reflects data for three years of testing.
Reading Comprehension 50
64 54 54 0
98-99
31 48 53 97-98
35 47 52 96-97
Mathematics
School 50
System
State
0
73 67 61 98-99
43 59 61 97-98
41 55 59 96-97
School System State
Reading Vocabulary 50
80 55 50 0
98-99
31 47 50 97-98
30 46 49 96-97
Language Arts
School 50
System
State
0
76 71 64 98-99
51 62 62 97-98
42 62 59 96-97
School System State
Social Studies 50
52 59 56 0
98-99
30 53 55 97-98
33 54 55 96-97
Science
School 50
System
State
0
53 57 59 98-99
32 50 59 97-98
32 49 58 96-97
School System State
Sources of Information
Composite Score
50
63 61 57 0
98-99
School 50
System
36 53 56 97-98
39 53 55 96-97
State 0
67 62 58 98-99
34 53 57 97-98
1998-99 GEORGIA PUBLIC EDUCATION REPORT CARD King Elementary School - 6110185
Prepared by Georgia Department of Education
35 53 56 96-97
Scores Reported in Percentiles
School System State
Page 2
STATE-REQUIRED TEST DATA
NORM-REFERENCED TESTS Grade 5
Iowa Tests of Basic Skills (ITBS) Each chart reflects data for three years of testing.
Reading Comprehension
Mathematics
50
69 54 53 0
98-99
32 49 53 97-98
37 50 52 96-97
School 50
System
State
0
78 62 59 98-99
36 56 58 97-98
33 53 57 96-97
School System State
Reading Vocabulary 50
72 58 48 0
98-99
21 48 48 97-98
30 44 46 96-97
Language Arts
School 50
System
State
0
73 67 63 98-99
40 60 61 97-98
42 60 58 96-97
School System State
Social Studies 50
84 58 57 0
98-99
24 52 56 97-98
30 48 55 96-97
Science
School 50
System
State
0
66 57 60 98-99
29 54 59 97-98
26 52 59 96-97
School System State
Sources of Information
Composite Score
50
58 57 58 0
98-99
School 50
System
35 54 58 97-98
37 55 57 96-97
State 0
73 59 57 98-99
29 53 56 97-98
32 52 55 96-97
1998-99 GEORGIA PUBLIC EDUCATION REPORT CARD King Elementary School - 6110185
Prepared by Georgia Department of Education
Scores Reported in Percentiles
School System State
Page 3
STATE-REQUIRED TEST DATA
PERFORMANCE ASSESSMENTS
Grade 5 Writing Assessment
Percent at Developmental Stages:
1998-99 School System State
1997-98 School System State
1996-97 School System State
Stage Stage Stage Stage Stage Stage
1:The Emerging Writer 2:The Developing Writer 3:The Focusing Writer 4:The Experimenting 5:The Engaging Writer 6:The Extending Writer
0% 0% 18% 52% 25% 5%
0% 1% 19% 48% 23% 7%
0% 1% 16% 41% 29% 12%
0% 4% 36% 49% 11% 0%
0% 2% 24% 44% 23% 6%
0% 3% 19% 41% 27% 10%
0% 4% 41% 44% 12% 0%
0% 3% 28% 41% 22% 6%
0% 3% 21% 37% 26% 12%
AWARDS / RECOGNITION DATA
Schools in Georgia may receive recognition in the following programs: Charter School Pay for Performance Program Georgia School of Excellence National Blue Ribbon School King Elementary School did not receive recognition in any of these programs during the 1998-99 school year.
1998-99 GEORGIA PUBLIC EDUCATION REPORT CARD King Elementary School - 6110185
Prepared by Georgia Department of Education
Page 4
CERTIFIED PERSONNEL DATA
Positions Number Average Contract Days
Personnel Sex
Certificate
Years Experience
Full-time Part-time
Male Female
4 Yr Bachelor's 5 Yr Master's 6 Yr Specialist's 7 Yr Doctoral Other*
<1 1-10 11-20 21-30 >30
Average
Administrators
1.50 206.67
1 1
0 2
0 0 1 1 0 0 0 1 1 0 21.50
Support Personnel
2.00 190.00
2 0
0 2
0 1 1 0 0 0 0 0 2 0 23.00
PK-12 Teachers
29.00 190.17
28 2
3 27
12 14
4 0 0 1 13 6 6 4 15.23
*Includes One- and Two-Year Vocational Certificates.
ACCREDITATION DATA
Accredited by Southern Association of Colleges and Schools (SACS):
Elementary/Middle Commission.
1998-99 GEORGIA PUBLIC EDUCATION REPORT CARD King Elementary School - 6110185
Prepared by Georgia Department of Education
Page 5
1998-99 GEORGIA PUBLIC EDUCATION REPORT CARD
BIBB COUNTY SCHOOLS
Lane Elementary School - 6114062
Grade Range PK-6
The Georgia Public Education Report Card is designed to assist systems and schools in educational improvement. This report card contains a variety of data elements. An explanation of the terms is provided as a companion to the report card data. Please refer to the definitions for the most effective use of the reported data.
STUDENT DATA
Total
K-6
344
PK
39
Enrollment, by Race/Ethnicity and Sex
Black
White Hispanic
American Asian Indian
Multiracial
168 48.8%
155 45.1%
5 1.5%
6 1.7%
7 2.0%
3 0.9%
14 35.9%
24 61.5%
1 2.6%
0 0.0%
0 0.0%
0 0.0%
Male Female
161 46.8%
183 53.2%
21 53.8%
18 46.2%
Enrollment in Selected Programs
Program
Program % of Student Enrollment Population
Gifted (Grades K-12)
15
4.4%
Alternative Programs (Grades 6-12)
0
0.0%
Students Eligible to Receive Free/Reduced Lunches
Number
Percent
School System
179 15,047
46.7% 61.1%
Dropout Rate for Grade 6
Number
Rate
School System
0
0.0%
0
0.0%
Enrollment in Compensatory Programs
Program
Program % of Student Enrollment Population
Special Education (Grades K-12)
16
4.7%
(PK)
2
N/A
English to Speakers of Other Languages (ESOL) (Grades K-12)
9
2.6%
Remedial Education (Grades 2-5, 9-12)
31 16.7%
Special Instructional Assistance (SIA) (Grades K-3)
0
0.0%
Title I (Grades K-12)
This school has no Title I program.
Total 30
Retained Students, by Race/Ethnicity and Sex
Black
White Hispanic
American MultiAsian Indian racial
26 86.7%
4 13.3%
0 0.0%
0 0.0%
0 0.0%
0 0.0%
Male Female
13
17
43.3% 56.7%
Prepared by Georgia Department of Education
Page 1
STATE-REQUIRED TEST DATA
NORM-REFERENCED TESTS Grade 3
Iowa Tests of Basic Skills (ITBS) Each chart reflects data for three years of testing.
Reading Comprehension 50
64 54 54 0
98-99
70 48 53 97-98
56 47 52 96-97
Mathematics
School 50
System
State
0
82 67 61 98-99
58 59 61 97-98
63 55 59 96-97
School System State
Reading Vocabulary 50
66 55 50 0
98-99
77 47 50 97-98
48 46 49 96-97
Language Arts
School 50
System
State
0
83 71 64 98-99
76 62 62 97-98
74 62 59 96-97
School System State
Social Studies 50
80 59 56 0
98-99
71 53 55 97-98
70 54 55 96-97
Science
School 50
System
State
0
75 57 59 98-99
70 50 59 97-98
66 49 58 96-97
School System State
Sources of Information
Composite Score
50
76 61 57 0
98-99
School 50
System
60 53 56 97-98
65 53 55 96-97
State 0
78 62 58 98-99
69 53 57 97-98
1998-99 GEORGIA PUBLIC EDUCATION REPORT CARD Lane Elementary School - 6114062
Prepared by Georgia Department of Education
65 53 56 96-97
Scores Reported in Percentiles
School System State
Page 2
STATE-REQUIRED TEST DATA
NORM-REFERENCED TESTS Grade 5
Iowa Tests of Basic Skills (ITBS) Each chart reflects data for three years of testing.
Reading Comprehension
Mathematics
50
56 54 53 0
98-99
52 49 53 97-98
59 50 52 96-97
School 50
System
State
0
59 62 59 98-99
48 56 58 97-98
66 53 57 96-97
School System State
Reading Vocabulary 50
51 58 48 0
98-99
44 48 48 97-98
48 44 46 96-97
Language Arts
School 50
System
State
0
78 67 63 98-99
67 60 61 97-98
76 60 58 96-97
School System State
Social Studies 50
61 58 57 0
98-99
54 52 56 97-98
60 48 55 96-97
Science
School 50
System
State
0
64 57 60 98-99
55 54 59 97-98
69 52 59 96-97
School System State
Sources of Information
Composite Score
50
72 57 58 0
98-99
School 50
System
59 54 58 97-98
70 55 57 96-97
State 0
65 59 57 98-99
55 53 56 97-98
66 52 55 96-97
1998-99 GEORGIA PUBLIC EDUCATION REPORT CARD Lane Elementary School - 6114062
Prepared by Georgia Department of Education
Scores Reported in Percentiles
School System State
Page 3
STATE-REQUIRED TEST DATA
PERFORMANCE ASSESSMENTS
Grade 5 Writing Assessment
Percent at Developmental Stages:
1998-99 School System State
1997-98 School System State
1996-97 School System State
Stage Stage Stage Stage Stage Stage
1:The Emerging Writer 2:The Developing Writer 3:The Focusing Writer 4:The Experimenting 5:The Engaging Writer 6:The Extending Writer
0% 0% 10% 43% 35% 13%
0% 1% 19% 48% 23% 7%
0% 1% 16% 41% 29% 12%
0% 0% 6% 56% 27% 10%
0% 2% 24% 44% 23% 6%
0% 3% 19% 41% 27% 10%
0% 0% 20% 35% 35% 11%
0% 3% 28% 41% 22% 6%
0% 3% 21% 37% 26% 12%
AWARDS / RECOGNITION DATA
Schools in Georgia may receive recognition in the following programs: Charter School Pay for Performance Program Georgia School of Excellence National Blue Ribbon School Lane Elementary School did not receive recognition in any of these programs during the 1998-99 school year.
1998-99 GEORGIA PUBLIC EDUCATION REPORT CARD Lane Elementary School - 6114062
Prepared by Georgia Department of Education
Page 4
CERTIFIED PERSONNEL DATA
Positions Number Average Contract Days
Personnel Sex
Certificate
Years Experience
Full-time Part-time
Male Female
4 Yr Bachelor's 5 Yr Master's 6 Yr Specialist's 7 Yr Doctoral Other*
<1 1-10 11-20 21-30 >30
Average
Administrators
1.00 210.00
1 0
0 1
0 0 1 0 0 0 0 0 1 0 22.00
Support Personnel
2.00 190.00
2 0
0 2
0 2 0 0 0 0 0 1 1 0 18.00
PK-12 Teachers
19.00 190.00
18 2
0 20
7 12
1 0 0 0 4 7 8 1 18.85
*Includes One- and Two-Year Vocational Certificates.
ACCREDITATION DATA
Accredited by Southern Association of Colleges and Schools (SACS):
Elementary/Middle Commission.
1998-99 GEORGIA PUBLIC EDUCATION REPORT CARD Lane Elementary School - 6114062
Prepared by Georgia Department of Education
Page 5
1998-99 GEORGIA PUBLIC EDUCATION REPORT CARD
BIBB COUNTY SCHOOLS
McEvoy Middle School - 6112052
Grade Range 7-8
The Georgia Public Education Report Card is designed to assist systems and schools in educational improvement. This report card contains a variety of data elements. An explanation of the terms is provided as a companion to the report card data. Please refer to the definitions for the most effective use of the reported data.
STUDENT DATA
Total 749
7-8 Enrollment, by Race/Ethnicity and Sex
Black
White Hispanic
American Multi-
Asian Indian
racial
612 81.7%
133 17.8%
4 0.5%
0 0.0%
0 0.0%
0 0.0%
Male 374
49.9%
Female 375
50.1%
Enrollment in Selected Programs
Program
Gifted (Grades K-12)
Program % of Student Enrollment Population
37
4.9%
Alternative Programs
11
(Grades 6-12)
1.5%
Students Eligible to Receive Free/Reduced Lunches
Number
Percent
School System
584 15,047
78.0% 61.1%
Enrollment in Compensatory Programs
Program
Program % of Student Enrollment Population
Special Education (Grades K-12) (PK)
106 14.2%
0
N/A
English to Speakers of Other Languages (ESOL) (Grades K-12)
0
0.0%
Title I (Grades K-12)
This school has no Title I program.
Dropout Rate for Grades 7-8
Number
Rate
School System
6
0.7%
13
0.3%
Total 62
Retained Students, by Race/Ethnicity and Sex
Black
White Hispanic
American MultiAsian Indian racial
54 87.1%
8 12.9%
0 0.0%
0 0.0%
0 0.0%
0 0.0%
Male Female
42
20
67.7% 32.3%
Prepared by Georgia Department of Education
Page 1
STATE-REQUIRED TEST DATA
NORM-REFERENCED TESTS Grade 8
Iowa Tests of Basic Skills (ITBS) Each chart reflects data for three years of testing.
Reading Comprehension 50
33 38 49 0
98-99
36 39 48 97-98
32 38 48 96-97
Mathematics
School 50
System
State
0
39 47 56 98-99
42 45 55 97-98
43 45 54 96-97
School System State
Reading Vocabulary 50
27 35 46 0
98-99
31 34 45 97-98
34 36 44 96-97
Language Arts
School 50
System
State
0
47 52 60 98-99
46 51 58 97-98
44 51 56 96-97
School System State
Social Studies 50
38 43 54 0
98-99
41 44 53 97-98
36 44 53 96-97
Science
School 50
System
State
0
35 39 56 98-99
38 42 55 97-98
33 40 53 96-97
School System State
Sources of Information
Composite Score
50
43 49 57 0
98-99
School 50
System
45 49 56 97-98
39 47 55 96-97
State 0
37 44 56 98-99
39 44 54 97-98
1998-99 GEORGIA PUBLIC EDUCATION REPORT CARD McEvoy Middle School - 6112052
Prepared by Georgia Department of Education
36 43 54 96-97
Scores Reported in Percentiles
School System State
Page 2
STATE-REQUIRED TEST DATA
Categories of Scaled Scores
Inadequate (less than 162)
Minimal (162-209)
Good
(210-247)
Very Good (greater than 247)
Average Scaled Score: (Range 100-300)
PERFORMANCE ASSESSMENTS
Grade 8 Writing Assessment
1998-99 Percent Scoring
1997-98 Percent Scoring
1996-97 Percent Scoring
School System State School System State School System State
16% 58% 25%
1%
10% 51% 34%
5%
8% 40% 41% 11%
9% 60% 30%
1%
9% 57% 31%
2%
11% 46% 34%
8%
20% 56% 21%
3%
18% 57% 20%
6%
15% 46% 30%
8%
191
200
208 195
198 202 189
190 198
AWARDS / RECOGNITION DATA
Schools in Georgia may receive recognition in the following programs: Charter School Pay for Performance Program Georgia School of Excellence National Blue Ribbon School McEvoy Middle School did not receive recognition in any of these programs during the 1998-99 school year.
1998-99 GEORGIA PUBLIC EDUCATION REPORT CARD McEvoy Middle School - 6112052
Prepared by Georgia Department of Education
Page 3
CERTIFIED PERSONNEL DATA
Positions Number Average Contract Days
Personnel Sex
Certificate
Years Experience
Full-time Part-time
Male Female
4 Yr Bachelor's 5 Yr Master's 6 Yr Specialist's 7 Yr Doctoral Other*
<1 1-10 11-20 21-30 >30
Average
Administrators
2.00 210.00
2 0
1 1
0 1 0 1 0 0 0 0 2 0 27.00
Support Personnel
3.00 193.33
3 0
0 3
0 2 1 0 0 0 0 2 1 0 17.67
PK-12 Teachers
51.50 190.29
51 1
17 35
26 18
6 2 0 1 22 14 13 2 13.81
*Includes One- and Two-Year Vocational Certificates.
ACCREDITATION DATA
Accredited by Southern Association of Colleges and Schools (SACS): Secondary/Middle Commission.
1998-99 GEORGIA PUBLIC EDUCATION REPORT CARD McEvoy Middle School - 6112052
Prepared by Georgia Department of Education
Page 4
1998-99 GEORGIA PUBLIC EDUCATION REPORT CARD
BIBB COUNTY SCHOOLS
Miller Core Knowledge Magnet Middle School - 6110298
Grade Range 6-8
The Georgia Public Education Report Card is designed to assist systems and schools in educational improvement. This report card contains a variety of data elements. An explanation of the terms is provided as a companion to the report card data. Please refer to the definitions for the most effective use of the reported data.
STUDENT DATA
Total 693
6-8 Enrollment, by Race/Ethnicity and Sex
Black
White Hispanic
American Multi-
Asian Indian
racial
342 49.4%
340 49.1%
3 0.4%
5 0.7%
2 0.3%
1 0.1%
Male 340
49.1%
Female 353
50.9%
Enrollment in Selected Programs
Program
Gifted (Grades K-12)
Program % of Student Enrollment Population
142
20.5%
Alternative Programs (Grades 6-12)
4
< 1%
Students Eligible to Receive Free/Reduced Lunches
Number
Percent
School System
277 15,047
40.0% 61.1%
Enrollment in Compensatory Programs
Program
Program % of Student Enrollment Population
Special Education (Grades K-12) (PK)
56
8.1%
0
N/A
English to Speakers of Other Languages (ESOL) (Grades K-12)
0
0.0%
Title I (Grades K-12)
This school has no Title I program.
Dropout Rate for Grades 6-8
Number
Rate
School System
0
0.0%
13
0.2%
Total 23
Retained Students, by Race/Ethnicity and Sex
Black
White Hispanic
American MultiAsian Indian racial
20 87.0%
3 13.0%
0 0.0%
0 0.0%
0 0.0%
0 0.0%
Male Female
17
6
73.9% 26.1%
Prepared by Georgia Department of Education
Page 1
STATE-REQUIRED TEST DATA
NORM-REFERENCED TESTS Grade 8
Iowa Tests of Basic Skills (ITBS) Each chart reflects data for three years of testing.
Reading Comprehension 50
53 38 49 0
98-99
54 39 48 97-98
51 38 48 96-97
Mathematics
School 50
System
State
0
60 47 56 98-99
62 45 55 97-98
57 45 54 96-97
School System State
Reading Vocabulary 50
51 35 46 0
98-99
49 34 45 97-98
47 36 44 96-97
Language Arts
School 50
System
State
0
63 52 60 98-99
61 51 58 97-98
57 51 56 96-97
School System State
Social Studies 50
53 43 54 0
98-99
57 44 53 97-98
52 44 53 96-97
Science
School 50
System
State
0
52 39 56 98-99
56 42 55 97-98
54 40 53 96-97
School System State
Sources of Information
Composite Score
50
59 49 57 0
98-99
School 50
System
60 49 56 97-98
56 47 55 96-97
State 0
57 44 56 98-99
60 44 54 97-98
1998-99 GEORGIA PUBLIC EDUCATION REPORT CARD Miller Core Knowledge Magnet Middle School - 6110298
Prepared by Georgia Department of Education
54 43 54 96-97
Scores Reported in Percentiles
School System State
Page 2
STATE-REQUIRED TEST DATA
Categories of Scaled Scores
Inadequate (less than 162)
Minimal (162-209)
Good
(210-247)
Very Good (greater than 247)
Average Scaled Score: (Range 100-300)
PERFORMANCE ASSESSMENTS
Grade 8 Writing Assessment
1998-99 Percent Scoring
1997-98 Percent Scoring
1996-97 Percent Scoring
School System State School System State School System State
5% 33% 46% 16%
10% 51% 34%
5%
8% 40% 41% 11%
3% 44% 47%
6%
9% 57% 31%
2%
11% 46% 34%
8%
16% 54% 21%
9%
18% 57% 20%
6%
15% 46% 30%
8%
216
200
208 211
198 202 194
190 198
AWARDS / RECOGNITION DATA
Schools in Georgia may receive recognition in the following programs: Charter School Pay for Performance Program Georgia School of Excellence National Blue Ribbon School Miller Core Knowledge Magnet Middle School did not receive recognition in any of these programs during the 1998-99 school year.
1998-99 GEORGIA PUBLIC EDUCATION REPORT CARD Miller Core Knowledge Magnet Middle School - 6110298
Prepared by Georgia Department of Education
Page 3
CERTIFIED PERSONNEL DATA
Positions Number Average Contract Days
Personnel Sex
Certificate
Years Experience
Full-time Part-time
Male Female
4 Yr Bachelor's 5 Yr Master's 6 Yr Specialist's 7 Yr Doctoral Other*
<1 1-10 11-20 21-30 >30
Average
Administrators
2.00 210.00
2 0
1 1
0 1 0 1 0 0 0 0 1 1 29.50
Support Personnel
3.00 193.33
3 0
0 3
0 1 2 0 0 0 0 1 2 0 22.00
PK-12 Teachers
48.00 190.63
47 2
7 42
19 26
4 0 0 0 16 17 15 1 15.65
*Includes One- and Two-Year Vocational Certificates.
ACCREDITATION DATA
Accredited by Southern Association of Colleges and Schools (SACS): Secondary/Middle Commission.
1998-99 GEORGIA PUBLIC EDUCATION REPORT CARD Miller Core Knowledge Magnet Middle School - 6110298
Prepared by Georgia Department of Education
Page 4
1998-99 GEORGIA PUBLIC EDUCATION REPORT CARD
BIBB COUNTY SCHOOLS
Morgan Magnet School - 6113066
Grade Range PK-6
The Georgia Public Education Report Card is designed to assist systems and schools in educational improvement. This report card contains a variety of data elements. An explanation of the terms is provided as a companion to the report card data. Please refer to the definitions for the most effective use of the reported data.
STUDENT DATA
Total
K-6
589
PK
41
Enrollment, by Race/Ethnicity and Sex
Black
White Hispanic
American Asian Indian
Multiracial
426 72.3%
142 24.1%
17 2.9%
1 0.2%
0 0.0%
3 0.5%
29 70.7%
10 24.4%
2 4.9%
0 0.0%
0 0.0%
0 0.0%
Male Female
308 52.3%
281 47.7%
25 61.0%
16 39.0%
Enrollment in Selected Programs
Program
Program % of Student Enrollment Population
Gifted (Grades K-12)
6
1.0%
Alternative Programs (Grades 6-12)
0
0.0%
Students Eligible to Receive Free/Reduced Lunches
Number
Percent
School System
521 15,047
82.7% 61.1%
Dropout Rate for Grade 6
Number
Rate
School System
0
0.0%
0
0.0%
Enrollment in Compensatory Programs
Program
Program % of Student Enrollment Population
Special Education (Grades K-12)
47
8.0%
(PK)
2
N/A
English to Speakers of Other Languages (ESOL) (Grades K-12)
11
1.9%
Remedial Education (Grades 2-5, 9-12)
79 25.1%
Special Instructional Assistance (SIA) (Grades K-3)
0
0.0%
Title I (Grades K-12)
This school has a schoolwide program.
Total 25
Retained Students, by Race/Ethnicity and Sex
Black
White Hispanic
American MultiAsian Indian racial
18 72.0%
6 24.0%
1 4.0%
0 0.0%
0 0.0%
0 0.0%
Male Female
13
12
52.0% 48.0%
Prepared by Georgia Department of Education
Page 1
STATE-REQUIRED TEST DATA
NORM-REFERENCED TESTS Grade 3
Iowa Tests of Basic Skills (ITBS) Each chart reflects data for three years of testing.
Reading Comprehension 50
38 54 54 0
98-99
33 48 53 97-98
37 47 52 96-97
Mathematics
School 50
System
State
0
56 67 61 98-99
32 59 61 97-98
45 55 59 96-97
School System State
Reading Vocabulary 50
38 55 50 0
98-99
27 47 50 97-98
33 46 49 96-97
Language Arts
School 50
System
State
0
69 71 64 98-99
36 62 62 97-98
50 62 59 96-97
School System State
Social Studies 50
40 59 56 0
98-99
35 53 55 97-98
43 54 55 96-97
Science
School 50
System
State
0
39 57 59 98-99
32 50 59 97-98
38 49 58 96-97
School System State
Sources of Information
Composite Score
50
46 61 57 0
98-99
School 50
System
36 53 56 97-98
44 53 55 96-97
State 0
46 62 58 98-99
32 53 57 97-98
1998-99 GEORGIA PUBLIC EDUCATION REPORT CARD Morgan Magnet School - 6113066
Prepared by Georgia Department of Education
40 53 56 96-97
Scores Reported in Percentiles
School System State
Page 2
STATE-REQUIRED TEST DATA
NORM-REFERENCED TESTS Grade 5
Iowa Tests of Basic Skills (ITBS) Each chart reflects data for three years of testing.
Reading Comprehension
Mathematics
50
44 54 53 0
98-99
39 49 53 97-98
50 50 52 96-97
School 50
System
State
0
52 62 59 98-99
43 56 58 97-98
51 53 57 96-97
School System State
Reading Vocabulary 50
31 58 48 0
98-99
28 48 48 97-98
40 44 46 96-97
Language Arts
School 50
System
State
0
58 67 63 98-99
38 60 61 97-98
49 60 58 96-97
School System State
Social Studies 50
33 58 57 0
98-99
36 52 56 97-98
42 48 55 96-97
Science
School 50
System
State
0
44 57 60 98-99
35 54 59 97-98
47 52 59 96-97
School System State
Sources of Information
Composite Score
50
48 57 58 0
98-99
School 50
System
43 54 58 97-98
59 55 57 96-97
State 0
44 59 57 98-99
36 53 56 97-98
48 52 55 96-97
1998-99 GEORGIA PUBLIC EDUCATION REPORT CARD Morgan Magnet School - 6113066
Prepared by Georgia Department of Education
Scores Reported in Percentiles
School System State
Page 3
STATE-REQUIRED TEST DATA
PERFORMANCE ASSESSMENTS
Grade 5 Writing Assessment
Percent at Developmental Stages:
1998-99 School System State
1997-98 School System State
1996-97 School System State
Stage Stage Stage Stage Stage Stage
1:The Emerging Writer 2:The Developing Writer 3:The Focusing Writer 4:The Experimenting 5:The Engaging Writer 6:The Extending Writer
0% 0% 26% 48% 16% 6%
0% 1% 19% 48% 23% 7%
0% 1% 16% 41% 29% 12%
0% 3% 36% 42% 16% 3%
0% 2% 24% 44% 23% 6%
0% 3% 19% 41% 27% 10%
0% 7% 17% 37% 37% 2%
0% 3% 28% 41% 22% 6%
0% 3% 21% 37% 26% 12%
AWARDS / RECOGNITION DATA
Schools in Georgia may receive recognition in the following programs: Charter School Pay for Performance Program Georgia School of Excellence National Blue Ribbon School Morgan Magnet School did not receive recognition in any of these programs during the 1998-99 school year.
1998-99 GEORGIA PUBLIC EDUCATION REPORT CARD Morgan Magnet School - 6113066
Prepared by Georgia Department of Education
Page 4
CERTIFIED PERSONNEL DATA
Positions Number Average Contract Days
Personnel Sex
Certificate
Years Experience
Full-time Part-time
Male Female
4 Yr Bachelor's 5 Yr Master's 6 Yr Specialist's 7 Yr Doctoral Other*
<1 1-10 11-20 21-30 >30
Average
Administrators
1.50 206.67
1 1
1 1
0 1 0 1 0 0 0 0 2 0 24.50
Support Personnel
2.00 190.00
2 0
0 2
0 1 1 0 0 0 0 1 0 1 23.50
PK-12 Teachers
35.00 190.14
34 2
2 34
20 15
1 0 0 3 19 8 6 0 9.64
*Includes One- and Two-Year Vocational Certificates.
ACCREDITATION DATA
Accredited by Southern Association of Colleges and Schools (SACS):
Elementary/Middle Commission.
1998-99 GEORGIA PUBLIC EDUCATION REPORT CARD Morgan Magnet School - 6113066
Prepared by Georgia Department of Education
Page 5
1998-99 GEORGIA PUBLIC EDUCATION REPORT CARD
BIBB COUNTY SCHOOLS
Northeast High School - 6110286
Grade Range 9-12
The Georgia Public Education Report Card is designed to assist systems and schools in educational improvement. This report card contains a variety of data elements. An explanation of the terms is provided as a companion to the report card data. Please refer to the definitions for the most effective use of the reported data.
Total 1,096
STUDENT DATA
9-12 Enrollment, by Race/Ethnicity and Sex
Black
White Hispanic
American Multi-
Asian Indian
racial
1,047 95.5%
38 3.5%
5 0.5%
2 0.2%
2 0.2%
2 0.2%
Male Female
513 46.8%
583 53.2%
Enrollment in Selected Programs
Program
Gifted (Grades K-12)
Program % of Student Enrollment Population
38
3.5%
Non-Vocational Labs (Grades 9-12)
998
Vocational Labs
(Grades 9-12)
735
Alternative Programs (Grades 6-12)
15
91.1% 67.1%
1.4%
Students Eligible to Receive Free/Reduced Lunches
Number
Percent
School System
609 15,047
55.6% 61.1%
Enrollment in Compensatory Programs
Program
Program % of Student Enrollment Population
Special Education (Grades K-12) PK
55
5.0%
0
N/A
English to Speakers of Other Languages (ESOL) (Grades K-12)
0
0.0%
Remedial Education (Grades 2-5, 9-12)
39
3.6%
Title I (Grades K-12)
This school has no Title I program.
Dropout Rate for Grades 9-12
Number
Rate
School System
112
9.5%
535
8.1%
Total 192
Retained Students, by Race/Ethnicity and Sex
Black
White Hispanic
American MultiAsian Indian racial
183 95.3%
6 3.1%
1 0.5%
1 0.5%
1 0.5%
0 0.0%
Male Female
107
85
55.7% 44.3%
Prepared by Georgia Department of Education
Page 1
STATE-REQUIRED TEST DATA
GEORGIA HIGH SCHOOL GRADUATION TESTS (GHSGT)
Percent of Regular Program 11th Graders Passing the Georgia High School Graduation Tests on First Administration
English Language Arts Mathematics Social Studies Science
All Components listed above
Writing
1998-99
School System State
88% 69% 59% 44%
94% 79% 74% 60%
96% 88% 80% 72%
38% 55% 68%
87% 93% 93%
1997-98
School System State
86% 65% 56% 42%
93% 78% 71% 61%
94% 88% 78% 74%
36% 55% 68%
83% 90% 92%
1996-97
School System State
88% 56% 50% 41%
92% 71% 64% 55%
94% 87% 78% 74%
34% 49% 67%
85% 91% 93%
GRADUATE DATA
1999 Graduates by Credentials, Race/Ethnicity and Sex
Diplomas with Both College Prep. & Voc. Endorsements
Diplomas with College Prep. Endorsements Diplomas with Vocational Endorsements General High School Diplomas Special Education Diplomas
Total All Diplomas
Certificates of Performance
Total Graduates
Total 3
126 10 0
Black
3 100.0%
118 93.7%
9 90.0%
0
White
0 0.0%
6 4.8%
1 10.0%
0
Hispanic
0 0.0%
1 0.8%
0 0.0%
0
American MultiAsian Indian racial
0 0.0%
0 0.0%
0 0.0%
1 0.8%
0 0.0%
0 0.0%
0 0.0%
0 0.0%
0 0.0%
0
0
0
Male Female
3 100.0%
0 0.0%
47
79
37.3% 62.7%
9
1
90.0% 10.0%
0
0
5
5
100.0%
144
135
93.8%
24
24
100.0%
168
159
94.6%
0 0.0%
7 4.9%
0 0.0%
7 4.2%
0 0.0%
1 0.7%
0 0.0%
1 0.6%
0 0.0%
1 0.7%
0 0.0%
1 0.6%
0 0.0%
0 0.0%
0 0.0%
0 0.0%
0 0.0%
0 0.0%
0 0.0%
0 0.0%
1 20.0%
60 41.7%
8 33.3%
68 40.5%
4 80.0%
84 58.3%
16 66.7%
100 59.5%
HOPE Scholarships
School System
Number of 1999 Graduates 1 6 8
Number Eligible
98
Percent Eligible
58.3%
879 472 53.7%
State
65,548 40,292 61.5%
High School Completion Rate
Percent of 1995Grade 9 Enrollment in Graduating Class of1999 School System State
Completion Rate '95-'99 56.8% 56.5% 68.9%
1998-99 GEORGIA PUBLIC EDUCATION REPORT CARD
Northeast High School - 6110286
Prepared by Georgia Department of Education
Page 2
COLLEGE ADMISSIONS / CREDIT TEST DATA
Scholastic Assessment Test (SAT)
Based on students' highest verbal and highest math scores
No. Taking
Average Score
Tests Verbal Math Total
Based on students' last test administration
Average Score Verbal Math Total
School College Prep. Endorsement Other Diplomas
87 420 391
811
418 392
810
370 337
707
System
541 466 443
909
College Prep. Endorsement
502 481
983
Other Diplomas
440 408
848
Georgia
41,958 492 488
980
412 N/A N/A
456 N/A N/A
483
383 N/A N/A
434 N/A N/A
479
795 N/A N/A
890 N/A N/A
962
Nation
952,913 N/A N/A N/A
502 508 1010
American College Testing (ACT)
Advanced Placement Exams (AP)
Number taking tests: English Mathematics Reading Science Reasoning CompositeScore
9 School System State
15.4 19.5 19.1
15.6 19.1 19.9
16.1 15.1
20.7 19.9
20.2 19.9
15.6 19.9 19.9
No. of Students Taking Tests
No. of Tests Taken No. of Test Scores
3 or Higher Percent of Test
Scores 3 or Higher
School 26 27 0
0.0%
System State 163 15,225 211 23,969 68 13,024
32.2% 54.3%
POST-SECONDARY DATA
Graduates Entering Georgia Public Colleges
Graduates Entering Georgia Public Colleges and Requiring Learning Support (LS)
1998 Graduates Entering in 1998-99
1997 Graduates Entering in 1997-98
Percent of Graduating Number Class
School
57
31.8%
System 289
35.8%
School
59
34.1%
System 330
39.5%
Number Requiring
LS 37 123
40 140
Percent of those attending Georgia
Public Colleges
64.9%
42.6%
67.8%
42.4%
In previous years, the Report Card presented College Prep Curriculum information provided by the Board of Regents on students requiring Learning Support. Due to inconsistencies in the data provided by the Board of Regents in defining College Prep Completers versus Local Board of Education data defining College Prep Endorsements, the Department of Education Report Card will not provide this information until discrepancies can be reconciled.
Graduates Entering Georgia Public Technical and Adult Schools
1998 Graduates School System
Entering Number 18 100
1998-99 Percent 10.1% 12.4%
Entering Number N/A N/A
1997-98 Percent
N/A N/A
1997 Graduates School
3
1.7%
System
8
1.0%
14
8.1%
84
10.0%
1998-99 GEORGIA PUBLIC EDUCATION REPORT CARD Northeast High School - 6110286
Prepared by Georgia Department of Education
Page 3
CERTIFIED PERSONNEL DATA
Positions Number Average Contract Days
Administrators
6.45 206.74
Support Personnel
5.00 196.00
PK-12 Teachers
65.10 192.18
Personnel Sex
Certificate
Years Experience
Full-time Part-time
Male Female
4 Yr Bachelor's 5 Yr Master's 6 Yr Specialist's 7 Yr Doctoral Other*
<1 1-10 11-20 21-30 >30
Average
5 7
3 9
2 6 3 1 0
0 1 4 5 2
22.67
5 0
1 4
0 5 0 0 0
0 2 0 3 0
15.80
58 8
17 49
24 38
2 1 1
3 25 13 17
8
15.94
*Includes One- and Two-Year Vocational Certificates.
ACCREDITATION DATA
Accredited by Southern Association of Colleges and Schools (SACS): Secondary/Middle Commission.
AWARDS / RECOGNITION DATA
Schools in Georgia may receive recognition in the following programs: Charter School Pay for Performance Program Georgia School of Excellence National Blue Ribbon School Northeast High School did not receive recognition in any of these programs during the 1998-99 school year.
1998-99 GEORGIA PUBLIC EDUCATION REPORT CARD Northeast High School - 6110286
Prepared by Georgia Department of Education
Page 4
1998-99 GEORGIA PUBLIC EDUCATION REPORT CARD
BIBB COUNTY SCHOOLS
Porter Elementary School - 6111067
Grade Range K-6
The Georgia Public Education Report Card is designed to assist systems and schools in educational improvement. This report card contains a variety of data elements. An explanation of the terms is provided as a companion to the report card data. Please refer to the definitions for the most effective use of the reported data.
STUDENT DATA
Total 502
K-6 Enrollment, by Race/Ethnicity and Sex
Black
White Hispanic
American Multi-
Asian Indian
racial
43 8.6%
453 90.2%
3 0.6%
1 0.2%
0 0.0%
2 0.4%
Male Female
254 50.6%
248 49.4%
Enrollment in Selected Programs
Program
Program % of Student Enrollment Population
Gifted (Grades K-12)
7
1.4%
Alternative Programs (Grades 6-12)
0
0.0%
Students Eligible to Receive Free/Reduced Lunches
Number
Percent
School System
152 15,047
30.3% 61.1%
Dropout Rate for Grade 6
Number
Rate
School System
0
0.0%
0
0.0%
Enrollment in Compensatory Programs
Program
Program % of Student Enrollment Population
Special Education (Grades K-12)
17
3.4%
(PK)
0
N/A
English to Speakers of Other Languages (ESOL) (Grades K-12)
3
< 1%
Remedial Education (Grades 2-5, 9-12)
43 14.1%
Special Instructional Assistance (SIA) (Grades K-3)
0
0.0%
Title I (Grades K-12)
This school has no Title I program.
Total 21
Retained Students, by Race/Ethnicity and Sex
Black
White Hispanic
American Multi-
Asian Indian
racial
2 9.5%
16 76.2%
3 14.3%
0 0.0%
0 0.0%
0 0.0%
Male Female
15
6
71.4% 28.6%
Prepared by Georgia Department of Education
Page 1
STATE-REQUIRED TEST DATA
NORM-REFERENCED TESTS Grade 3
Iowa Tests of Basic Skills (ITBS) Each chart reflects data for three years of testing.
Reading Comprehension 50
59 54 54 0
98-99
62 48 53 97-98
58 47 52 96-97
Mathematics
School 50
System
State
0
65 67 61 98-99
66 59 61 97-98
62 55 59 96-97
School System State
Reading Vocabulary 50
55 55 50 0
98-99
62 47 50 97-98
62 46 49 96-97
Language Arts
School 50
System
State
0
67 71 64 98-99
75 62 62 97-98
73 62 59 96-97
School System State
Social Studies 50
71 59 56 0
98-99
74 53 55 97-98
70 54 55 96-97
Science
School 50
System
State
0
67 57 59 98-99
74 50 59 97-98
62 49 58 96-97
School System State
Sources of Information
Composite Score
50
67 61 57 0
98-99
School 50
System
69 53 56 97-98
62 53 55 96-97
State 0
66 62 58 98-99
71 53 57 97-98
1998-99 GEORGIA PUBLIC EDUCATION REPORT CARD Porter Elementary School - 6111067
Prepared by Georgia Department of Education
65 53 56 96-97
Scores Reported in Percentiles
School System State
Page 2
STATE-REQUIRED TEST DATA
NORM-REFERENCED TESTS Grade 5
Iowa Tests of Basic Skills (ITBS) Each chart reflects data for three years of testing.
Reading Comprehension
Mathematics
50
53 54 53 0
98-99
61 49 53 97-98
55 50 52 96-97
School 50
System
State
0
68 62 59 98-99
63 56 58 97-98
59 53 57 96-97
School System State
Reading Vocabulary 50
54 58 48 0
98-99
52 48 48 97-98
53 44 46 96-97
Language Arts
School 50
System
State
0
67 67 63 98-99
66 60 61 97-98
63 60 58 96-97
School System State
Social Studies 50
57 58 57 0
98-99
58 52 56 97-98
50 48 55 96-97
Science
School 50
System
State
0
62 57 60 98-99
61 54 59 97-98
53 52 59 96-97
School System State
Sources of Information
Composite Score
50
63 57 58 0
98-99
School 50
System
65 54 58 97-98
64 55 57 96-97
State 0
61 59 57 98-99
61 53 56 97-98
56 52 55 96-97
1998-99 GEORGIA PUBLIC EDUCATION REPORT CARD Porter Elementary School - 6111067
Prepared by Georgia Department of Education
Scores Reported in Percentiles
School System State
Page 3
STATE-REQUIRED TEST DATA
PERFORMANCE ASSESSMENTS
Grade 5 Writing Assessment
Percent at Developmental Stages:
1998-99 School System State
1997-98 School System State
1996-97 School System State
Stage Stage Stage Stage Stage Stage
1:The Emerging Writer 2:The Developing Writer 3:The Focusing Writer 4:The Experimenting 5:The Engaging Writer 6:The Extending Writer
0% 0% 25% 55% 18% 1%
0% 1% 19% 48% 23% 7%
0% 1% 16% 41% 29% 12%
0% 2% 16% 51% 26% 5%
0% 2% 24% 44% 23% 6%
0% 3% 19% 41% 27% 10%
0% 1% 23% 32% 35% 8%
0% 3% 28% 41% 22% 6%
0% 3% 21% 37% 26% 12%
AWARDS / RECOGNITION DATA
Schools in Georgia may receive recognition in the following programs: Charter School Pay for Performance Program Georgia School of Excellence National Blue Ribbon School Porter Elementary School did not receive recognition in any of these programs during the 1998-99 school year.
1998-99 GEORGIA PUBLIC EDUCATION REPORT CARD Porter Elementary School - 6111067
Prepared by Georgia Department of Education
Page 4
CERTIFIED PERSONNEL DATA
Positions Number Average Contract Days
Personnel Sex
Certificate
Years Experience
Full-time Part-time
Male Female
4 Yr Bachelor's 5 Yr Master's 6 Yr Specialist's 7 Yr Doctoral Other*
<1 1-10 11-20 21-30 >30
Average
Administrators
1.50 206.67
1 1
0 2
0 0 2 0 0 0 0 0 2 0 25.00
Support Personnel
2.00 190.00
2 0
0 2
0 2 0 0 0 0 0 0 2 0 26.00
PK-12 Teachers
26.00 190.19
24 4
2 26
14 10
4 0 0 0 8 12 7 1 16.43
*Includes One- and Two-Year Vocational Certificates.
ACCREDITATION DATA
Accredited by Southern Association of Colleges and Schools (SACS):
Elementary/Middle Commission.
1998-99 GEORGIA PUBLIC EDUCATION REPORT CARD Porter Elementary School - 6111067
Prepared by Georgia Department of Education
Page 5
1998-99 GEORGIA PUBLIC EDUCATION REPORT CARD
BIBB COUNTY SCHOOLS
Redding Elementary School - 6114067
Grade Range K-6
The Georgia Public Education Report Card is designed to assist systems and schools in educational improvement. This report card contains a variety of data elements. An explanation of the terms is provided as a companion to the report card data. Please refer to the definitions for the most effective use of the reported data.
STUDENT DATA
Total 437
K-6 Enrollment, by Race/Ethnicity and Sex
Black
White Hispanic
American Multi-
Asian Indian
racial
108 24.7%
326 74.6%
1 0.2%
0 0.0%
0 0.0%
2 0.5%
Male Female
239 54.7%
198 45.3%
Enrollment in Selected Programs
Program
Program % of Student Enrollment Population
Gifted (Grades K-12)
20
4.6%
Alternative Programs (Grades 6-12)
0
0.0%
Students Eligible to Receive Free/Reduced Lunches
Number
Percent
School System
124 15,047
28.4% 61.1%
Dropout Rate for Grade 6
Number
Rate
School System
0
0.0%
0
0.0%
Enrollment in Compensatory Programs
Program
Program % of Student Enrollment Population
Special Education (Grades K-12)
45 10.3%
(PK)
0
N/A
English to Speakers of Other Languages (ESOL) (Grades K-12)
0
0.0%
Remedial Education (Grades 2-5, 9-12)
47 17.7%
Special Instructional Assistance (SIA) (Grades K-3)
0
0.0%
Title I (Grades K-12)
This school has no Title I program.
Total 11
Retained Students, by Race/Ethnicity and Sex
Black
White Hispanic
American Multi-
Asian Indian
racial
1 9.1%
10 90.9%
0 0.0%
0 0.0%
0 0.0%
0 0.0%
Male Female
5
6
45.5% 54.5%
Prepared by Georgia Department of Education
Page 1
STATE-REQUIRED TEST DATA
NORM-REFERENCED TESTS Grade 3
Iowa Tests of Basic Skills (ITBS) Each chart reflects data for three years of testing.
Reading Comprehension 50
54 54 54 0
98-99
61 48 53 97-98
57 47 52 96-97
Mathematics
School 50
System
State
0
66 67 61 98-99
70 59 61 97-98
59 55 59 96-97
School System State
Reading Vocabulary 50
53 55 50 0
98-99
52 47 50 97-98
56 46 49 96-97
Language Arts
School 50
System
State
0
63 71 64 98-99
65 62 62 97-98
65 62 59 96-97
School System State
Social Studies 50
65 59 56 0
98-99
71 53 55 97-98
64 54 55 96-97
Science
School 50
System
State
0
60 57 59 98-99
66 50 59 97-98
61 49 58 96-97
School System State
Sources of Information
Composite Score
50
65 61 57 0
98-99
School 50
System
69 53 56 97-98
59 53 55 96-97
State 0
61 62 58 98-99
67 53 57 97-98
1998-99 GEORGIA PUBLIC EDUCATION REPORT CARD Redding Elementary School - 6114067
Prepared by Georgia Department of Education
60 53 56 96-97
Scores Reported in Percentiles
School System State
Page 2
STATE-REQUIRED TEST DATA
NORM-REFERENCED TESTS Grade 5
Iowa Tests of Basic Skills (ITBS) Each chart reflects data for three years of testing.
Reading Comprehension
Mathematics
50
53 54 53 0
98-99
51 49 53 97-98
54 50 52 96-97
School 50
System
State
0
60 62 59 98-99
52 56 58 97-98
50 53 57 96-97
School System State
Reading Vocabulary 50
51 58 48 0
98-99
49 48 48 97-98
45 44 46 96-97
Language Arts
School 50
System
State
0
59 67 63 98-99
54 60 61 97-98
62 60 58 96-97
School System State
Social Studies 50
61 58 57 0
98-99
49 52 56 97-98
52 48 55 96-97
Science
School 50
System
State
0
63 57 60 98-99
54 54 59 97-98
64 52 59 96-97
School System State
Sources of Information
Composite Score
50
58 57 58 0
98-99
School 50
System
52 54 58 97-98
55 55 57 96-97
State 0
58 59 57 98-99
51 53 56 97-98
56 52 55 96-97
1998-99 GEORGIA PUBLIC EDUCATION REPORT CARD Redding Elementary School - 6114067
Prepared by Georgia Department of Education
Scores Reported in Percentiles
School System State
Page 3
STATE-REQUIRED TEST DATA
PERFORMANCE ASSESSMENTS
Grade 5 Writing Assessment
Percent at Developmental Stages:
1998-99 School System State
1997-98 School System State
1996-97 School System State
Stage Stage Stage Stage Stage Stage
1:The Emerging Writer 2:The Developing Writer 3:The Focusing Writer 4:The Experimenting 5:The Engaging Writer 6:The Extending Writer
0% 0% 16% 42% 31% 11%
0% 1% 19% 48% 23% 7%
0% 1% 16% 41% 29% 12%
0% 2% 19% 39% 30% 8%
0% 2% 24% 44% 23% 6%
0% 3% 19% 41% 27% 10%
0% 1% 24% 37% 28% 7%
0% 3% 28% 41% 22% 6%
0% 3% 21% 37% 26% 12%
AWARDS / RECOGNITION DATA
Schools in Georgia may receive recognition in the following programs: Charter School Pay for Performance Program Georgia School of Excellence National Blue Ribbon School Redding Elementary School did not receive recognition in any of these programs during the 1998-99 school year.
1998-99 GEORGIA PUBLIC EDUCATION REPORT CARD Redding Elementary School - 6114067
Prepared by Georgia Department of Education
Page 4
CERTIFIED PERSONNEL DATA
Positions Number Average Contract Days
Personnel Sex
Certificate
Years Experience
Full-time Part-time
Male Female
4 Yr Bachelor's 5 Yr Master's 6 Yr Specialist's 7 Yr Doctoral Other*
<1 1-10 11-20 21-30 >30
Average
Administrators
1.50 206.67
1 1
1 1
0 0 2 0 0 0 0 0 0 2 33.50
Support Personnel
2.00 190.00
2 0
0 2
0 1 1 0 0 0 0 1 0 1 23.50
PK-12 Teachers
24.00 190.21
22 4
1 25
12 11
3 0 0 2 9 8 5 2 14.19
*Includes One- and Two-Year Vocational Certificates.
ACCREDITATION DATA
Accredited by Southern Association of Colleges and Schools (SACS):
Elementary/Middle Commission.
1998-99 GEORGIA PUBLIC EDUCATION REPORT CARD Redding Elementary School - 6114067
Prepared by Georgia Department of Education
Page 5
1998-99 GEORGIA PUBLIC EDUCATION REPORT CARD
BIBB COUNTY SCHOOLS
Rice Elementary School - 6115067
Grade Range K-6
The Georgia Public Education Report Card is designed to assist systems and schools in educational improvement. This report card contains a variety of data elements. An explanation of the terms is provided as a companion to the report card data. Please refer to the definitions for the most effective use of the reported data.
STUDENT DATA
Total 572
K-6 Enrollment, by Race/Ethnicity and Sex
Black
White Hispanic
American Multi-
Asian Indian
racial
434 75.9%
122 21.3%
8 1.4%
0 0.0%
4 0.7%
4 0.7%
Male Female
266 46.5%
306 53.5%
Enrollment in Selected Programs
Program
Program % of Student Enrollment Population
Gifted (Grades K-12)
0
0.0%
Alternative Programs (Grades 6-12)
1
1.3%
Students Eligible to Receive Free/Reduced Lunches
Number
Percent
School System
470 15,047
82.2% 61.1%
Dropout Rate for Grade 6
Number
Rate
School System
0
0.0%
0
0.0%
Enrollment in Compensatory Programs
Program
Program % of Student Enrollment Population
Special Education (Grades K-12)
55
9.6%
(PK)
0
N/A
English to Speakers of Other Languages (ESOL) (Grades K-12)
5
< 1%
Remedial Education (Grades 2-5, 9-12)
83 24.5%
Special Instructional Assistance (SIA) (Grades K-3)
0
0.0%
Title I (Grades K-12)
This school has a schoolwide program.
Total 35
Retained Students, by Race/Ethnicity and Sex
Black
White Hispanic
American Multi-
Asian Indian
racial
30 85.7%
5 14.3%
0 0.0%
0 0.0%
0 0.0%
0 0.0%
Male Female
18
17
51.4% 48.6%
Prepared by Georgia Department of Education
Page 1
STATE-REQUIRED TEST DATA
NORM-REFERENCED TESTS Grade 3
Iowa Tests of Basic Skills (ITBS) Each chart reflects data for three years of testing.
Reading Comprehension 50
43 54 54 0
98-99
37 48 53 97-98
34 47 52 96-97
Mathematics
School 50
System
State
0
68 67 61 98-99
55 59 61 97-98
32 55 59 96-97
School System State
Reading Vocabulary 50
45 55 50 0
98-99
38 47 50 97-98
38 46 49 96-97
Language Arts
School 50
System
State
0
71 71 64 98-99
62 62 62 97-98
46 62 59 96-97
School System State
Social Studies 50
48 59 56 0
98-99
47 53 55 97-98
44 54 55 96-97
Science
School 50
System
State
0
55 57 59 98-99
50 50 59 97-98
35 49 58 96-97
School System State
Sources of Information
Composite Score
50
57 61 57 0
98-99
School 50
System
52 53 56 97-98
34 53 55 96-97
State 0
57 62 58 98-99
49 53 57 97-98
1998-99 GEORGIA PUBLIC EDUCATION REPORT CARD Rice Elementary School - 6115067
Prepared by Georgia Department of Education
36 53 56 96-97
Scores Reported in Percentiles
School System State
Page 2
STATE-REQUIRED TEST DATA
NORM-REFERENCED TESTS Grade 5
Iowa Tests of Basic Skills (ITBS) Each chart reflects data for three years of testing.
Reading Comprehension
Mathematics
50
50 54 53 0
98-99
45 49 53 97-98
49 50 52 96-97
School 50
System
State
0
60 62 59 98-99
61 56 58 97-98
57 53 57 96-97
School System State
Reading Vocabulary 50
65 58 48 0
98-99
66 48 48 97-98
49 44 46 96-97
Language Arts
School 50
System
State
0
66 67 63 98-99
66 60 61 97-98
65 60 58 96-97
School System State
Social Studies 50
65 58 57 0
98-99
48 52 56 97-98
44 48 55 96-97
Science
School 50
System
State
0
57 57 60 98-99
44 54 59 97-98
49 52 59 96-97
School System State
Sources of Information
Composite Score
50
60 57 58 0
98-99
School 50
System
58 54 58 97-98
59 55 57 96-97
State 0
61 59 57 98-99
54 53 56 97-98
53 52 55 96-97
1998-99 GEORGIA PUBLIC EDUCATION REPORT CARD Rice Elementary School - 6115067
Prepared by Georgia Department of Education
Scores Reported in Percentiles
School System State
Page 3
STATE-REQUIRED TEST DATA
PERFORMANCE ASSESSMENTS
Grade 5 Writing Assessment
Percent at Developmental Stages:
1998-99 School System State
1997-98 School System State
1996-97 School System State
Stage Stage Stage Stage Stage Stage
1:The Emerging Writer 2:The Developing Writer 3:The Focusing Writer 4:The Experimenting 5:The Engaging Writer 6:The Extending Writer
0% 1% 15% 58% 20% 4%
0% 1% 19% 48% 23% 7%
0% 1% 16% 41% 29% 12%
0% 3% 10% 53% 27% 5%
0% 2% 24% 44% 23% 6%
0% 3% 19% 41% 27% 10%
0% 0% 18% 56% 22% 4%
0% 3% 28% 41% 22% 6%
0% 3% 21% 37% 26% 12%
AWARDS / RECOGNITION DATA
Schools in Georgia may receive recognition in the following programs: Charter School Pay for Performance Program Georgia School of Excellence National Blue Ribbon School Rice Elementary School did not receive recognition in any of these programs during the 1998-99 school year.
1998-99 GEORGIA PUBLIC EDUCATION REPORT CARD Rice Elementary School - 6115067
Prepared by Georgia Department of Education
Page 4
CERTIFIED PERSONNEL DATA
Positions Number Average Contract Days
Personnel Sex
Certificate
Years Experience
Full-time Part-time
Male Female
4 Yr Bachelor's 5 Yr Master's 6 Yr Specialist's 7 Yr Doctoral Other*
<1 1-10 11-20 21-30 >30
Average
Administrators
2.00 205.00
2 0
1 1
0 0 2 0 0 0 1 0 1 0 16.50
Support Personnel
2.00 190.00
2 0
0 2
0 2 0 0 0 0 0 0 2 0 22.00
PK-12 Teachers
30.50 190.00
30 1
0 31
19 10
2 0 0 0 16 9 4 2 12.32
*Includes One- and Two-Year Vocational Certificates.
ACCREDITATION DATA
Accredited by Southern Association of Colleges and Schools (SACS):
Elementary/Middle Commission.
1998-99 GEORGIA PUBLIC EDUCATION REPORT CARD Rice Elementary School - 6115067
Prepared by Georgia Department of Education
Page 5
1998-99 GEORGIA PUBLIC EDUCATION REPORT CARD
BIBB COUNTY SCHOOLS
Riley Elementary School - 6111068
Grade Range PK-6
The Georgia Public Education Report Card is designed to assist systems and schools in educational improvement. This report card contains a variety of data elements. An explanation of the terms is provided as a companion to the report card data. Please refer to the definitions for the most effective use of the reported data.
STUDENT DATA
Total
K-6
463
PK
20
Enrollment, by Race/Ethnicity and Sex
Black
White Hispanic
American Asian Indian
Multiracial
453 97.8%
6 1.3%
0 0.0%
0 0.0%
0 0.0%
4 0.9%
20 100.0%
0 0.0%
0 0.0%
0 0.0%
0 0.0%
0 0.0%
Male Female
226 48.8%
237 51.2%
6 30.0%
14 70.0%
Enrollment in Selected Programs
Program
Program % of Student Enrollment Population
Gifted (Grades K-12)
11
2.4%
Alternative Programs (Grades 6-12)
1
2.0%
Students Eligible to Receive Free/Reduced Lunches
Number
Percent
School System
438 15,047
90.7% 61.1%
Dropout Rate for Grade 6
Number
Rate
School System
0
0.0%
0
0.0%
Enrollment in Compensatory Programs
Program
Program % of Student Enrollment Population
Special Education (Grades K-12)
23
5.0%
(PK)
0
N/A
English to Speakers of Other Languages (ESOL) (Grades K-12)
0
0.0%
Remedial Education (Grades 2-5, 9-12)
65 25.3%
Special Instructional Assistance (SIA) (Grades K-3)
0
0.0%
Title I (Grades K-12)
This school has a schoolwide program.
Total 35
Retained Students, by Race/Ethnicity and Sex
Black
White Hispanic
American MultiAsian Indian racial
34 97.1%
1 2.9%
0 0.0%
0 0.0%
0 0.0%
0 0.0%
Male Female
21
14
60.0% 40.0%
Prepared by Georgia Department of Education
Page 1
STATE-REQUIRED TEST DATA
NORM-REFERENCED TESTS Grade 3
Iowa Tests of Basic Skills (ITBS) Each chart reflects data for three years of testing.
Reading Comprehension 50
35 54 54 0
98-99
39 48 53 97-98
40 47 52 96-97
Mathematics
School 50
System
State
0
50 67 61 98-99
59 59 61 97-98
57 55 59 96-97
School System State
Reading Vocabulary 50
41 55 50 0
98-99
40 47 50 97-98
38 46 49 96-97
Language Arts
School 50
System
State
0
57 71 64 98-99
64 62 62 97-98
63 62 59 96-97
School System State
Social Studies 50
36 59 56 0
98-99
46 53 55 97-98
49 54 55 96-97
Science
School 50
System
State
0
36 57 59 98-99
44 50 59 97-98
58 49 58 96-97
School System State
Sources of Information
Composite Score
50
46 61 57 0
98-99
School 50
System
47 53 56 97-98
52 53 55 96-97
State 0
41 62 58 98-99
49 53 57 97-98
1998-99 GEORGIA PUBLIC EDUCATION REPORT CARD Riley Elementary School - 6111068
Prepared by Georgia Department of Education
54 53 56 96-97
Scores Reported in Percentiles
School System State
Page 2
STATE-REQUIRED TEST DATA
NORM-REFERENCED TESTS Grade 5
Iowa Tests of Basic Skills (ITBS) Each chart reflects data for three years of testing.
Reading Comprehension
Mathematics
50
51 54 53 0
98-99
42 49 53 97-98
33 50 52 96-97
School 50
System
State
0
62 62 59 98-99
41 56 58 97-98
35 53 57 96-97
School System State
Reading Vocabulary 50
35 58 48 0
98-99
29 48 48 97-98
23 44 46 96-97
Language Arts
School 50
System
State
0
79 67 63 98-99
51 60 61 97-98
57 60 58 96-97
School System State
Social Studies 50
47 58 57 0
98-99
39 52 56 97-98
24 48 55 96-97
Science
School 50
System
State
0
46 57 60 98-99
42 54 59 97-98
30 52 59 96-97
School System State
Sources of Information
Composite Score
50
58 57 58 0
98-99
School 50
System
44 54 58 97-98
46 55 57 96-97
State 0
57 59 57 98-99
40 53 56 97-98
36 52 55 96-97
1998-99 GEORGIA PUBLIC EDUCATION REPORT CARD Riley Elementary School - 6111068
Prepared by Georgia Department of Education
Scores Reported in Percentiles
School System State
Page 3
STATE-REQUIRED TEST DATA
PERFORMANCE ASSESSMENTS
Grade 5 Writing Assessment
Percent at Developmental Stages:
1998-99 School System State
1997-98 School System State
1996-97 School System State
Stage Stage Stage Stage Stage Stage
1:The Emerging Writer 2:The Developing Writer 3:The Focusing Writer 4:The Experimenting 5:The Engaging Writer 6:The Extending Writer
0% 2% 34% 38% 18% 2%
0% 1% 19% 48% 23% 7%
0% 1% 16% 41% 29% 12%
0% 2% 31% 47% 16% 2%
0% 2% 24% 44% 23% 6%
0% 3% 19% 41% 27% 10%
0% 6% 31% 52% 9% 0%
0% 3% 28% 41% 22% 6%
0% 3% 21% 37% 26% 12%
AWARDS / RECOGNITION DATA
Schools in Georgia may receive recognition in the following programs: Charter School Pay for Performance Program Georgia School of Excellence National Blue Ribbon School Riley Elementary School did not receive recognition in any of these programs during the 1998-99 school year.
1998-99 GEORGIA PUBLIC EDUCATION REPORT CARD Riley Elementary School - 6111068
Prepared by Georgia Department of Education
Page 4
CERTIFIED PERSONNEL DATA
Positions Number Average Contract Days
Personnel Sex
Certificate
Years Experience
Full-time Part-time
Male Female
4 Yr Bachelor's 5 Yr Master's 6 Yr Specialist's 7 Yr Doctoral Other*
<1 1-10 11-20 21-30 >30
Average
Administrators
1.50 206.67
1 1
0 2
0 0 2 0 0 0 0 1 1 0 24.00
Support Personnel
2.00 190.00
2 0
0 2
0 1 0 1 0 0 0 0 2 0 24.50
PK-12 Teachers
31.30 190.16
30 2
2 30
11 16
4 1 0 2 14 11 4 1 12.09
*Includes One- and Two-Year Vocational Certificates.
ACCREDITATION DATA
Accredited by Southern Association of Colleges and Schools (SACS):
Elementary/Middle Commission.
1998-99 GEORGIA PUBLIC EDUCATION REPORT CARD Riley Elementary School - 6111068
Prepared by Georgia Department of Education
Page 5
1998-99 GEORGIA PUBLIC EDUCATION REPORT CARD
BIBB COUNTY SCHOOLS
Southeast High School - 6110189
Grade Range 9-12
The Georgia Public Education Report Card is designed to assist systems and schools in educational improvement. This report card contains a variety of data elements. An explanation of the terms is provided as a companion to the report card data. Please refer to the definitions for the most effective use of the reported data.
Total 908
STUDENT DATA
9-12 Enrollment, by Race/Ethnicity and Sex
Black
White Hispanic
American Multi-
Asian Indian
racial
662 72.9%
239 26.3%
3 0.3%
3 0.3%
0 0.0%
1 0.1%
Male Female
435 47.9%
473 52.1%
Enrollment in Selected Programs
Program
Gifted (Grades K-12)
Program % of Student Enrollment Population
10
1.1%
Non-Vocational Labs (Grades 9-12)
706
Vocational Labs
(Grades 9-12)
580
Alternative Programs (Grades 6-12)
12
77.8% 63.9%
1.3%
Students Eligible to Receive Free/Reduced Lunches
Number
Percent
School System
463 15,047
51.0% 61.1%
Enrollment in Compensatory Programs
Program
Program % of Student Enrollment Population
Special Education (Grades K-12) PK
106 11.7%
0
N/A
English to Speakers of Other Languages (ESOL) (Grades K-12)
0
0.0%
Remedial Education (Grades 2-5, 9-12)
4
< 1%
Title I (Grades K-12)
This school has no Title I program.
Dropout Rate for Grades 9-12
Number
Rate
School System
205
17.7%
535
8.1%
Total 192
Retained Students, by Race/Ethnicity and Sex
Black
White Hispanic
American MultiAsian Indian racial
156 81.3%
34 17.7%
1 0.5%
1 0.5%
0 0.0%
0 0.0%
Male Female
104
88
54.2% 45.8%
Prepared by Georgia Department of Education
Page 1
STATE-REQUIRED TEST DATA
GEORGIA HIGH SCHOOL GRADUATION TESTS (GHSGT)
Percent of Regular Program 11th Graders Passing the Georgia High School Graduation Tests on First Administration
English Language Arts Mathematics Social Studies Science
All Components listed above
Writing
1998-99
School System State
95% 71% 73% 43%
94% 79% 74% 60%
96% 88% 80% 72%
38% 55% 68%
94% 93% 93%
1997-98
School System State
89% 66% 56% 50%
93% 78% 71% 61%
94% 88% 78% 74%
42% 55% 68%
90% 90% 92%
1996-97
School System State
87% 63% 53% 41%
92% 71% 64% 55%
94% 87% 78% 74%
35% 49% 67%
89% 91% 93%
GRADUATE DATA
1999 Graduates by Credentials, Race/Ethnicity and Sex
Diplomas with Both College Prep. & Voc. Endorsements
Diplomas with College Prep. Endorsements Diplomas with Vocational Endorsements General High School Diplomas Special Education Diplomas
Total All Diplomas
Certificates of Performance
Total Graduates
Total 35 39 35 4 15
128 19
147
Black
22 62.9%
26 66.7%
23 65.7%
4 100.0%
12 80.0%
87 68.0%
18 94.7%
105 71.4%
White Hispanic
13 37.1%
12 30.8%
0 0.0%
0 0.0%
12 34.3%
0 0.0%
3 20.0%
0 0.0%
0 0.0%
0 0.0%
40 31.3%
0 0.0%
1 5.3%
0 0.0%
41 27.9%
0 0.0%
American MultiAsian Indian racial
0 0.0%
1 2.6%
0 0.0%
0 0.0%
0 0.0%
0 0.0%
0 0.0%
0 0.0%
0 0.0%
0 0.0%
0 0.0%
0 0.0%
0 0.0%
0 0.0%
0 0.0%
1 0.8%
0 0.0%
0 0.0%
0 0.0%
0 0.0%
0 0.0%
1 0.7%
0 0.0%
0 0.0%
Male Female
8 22.9%
13 33.3%
27 77.1%
26 66.7%
16 45.7%
2 50.0%
5 33.3%
19 54.3%
2 50.0%
10 66.7%
44
84
34.4% 65.6%
5
14
26.3% 73.7%
49
98
33.3% 66.7%
HOPE Scholarships
School System
Number of 1999 Graduates 1 4 7
Number Eligible
37
Percent Eligible
25.2%
879 472 53.7%
State
65,548 40,292 61.5%
High School Completion Rate
Percent of 1995Grade 9 Enrollment in Graduating Class of1999 School System State
Completion Rate '95-'99 46.8% 56.5% 68.9%
1998-99 GEORGIA PUBLIC EDUCATION REPORT CARD
Southeast High School - 6110189
Prepared by Georgia Department of Education
Page 2
COLLEGE ADMISSIONS / CREDIT TEST DATA
Scholastic Assessment Test (SAT)
Based on students' highest verbal and highest math scores
No. Taking
Average Score
Tests Verbal Math Total
Based on students' last test administration
Average Score Verbal Math Total
School College Prep. Endorsement Other Diplomas
44 415 388
803
448 422
870
395 338
733
System
541 466 443
909
College Prep. Endorsement
502 481
983
Other Diplomas
440 408
848
Georgia
41,958 492 488
980
405 N/A N/A
456 N/A N/A
483
381 N/A N/A
434 N/A N/A
479
786 N/A N/A
890 N/A N/A
962
Nation
952,913 N/A N/A N/A
502 508 1010
American College Testing (ACT)
Advanced Placement Exams (AP)
Number taking tests: English Mathematics Reading Science Reasoning
3 * School N/A N/A N/A N/A
System 19.5 19.1 20.7 19.9
State 19.1 19.9 20.2 19.9
CompositeScore
N/A 19.9 19.9
* Scores are not reported when fewer than 5 take the ACT
No. of Students Taking Tests
No. of Tests Taken No. of Test Scores
3 or Higher Percent of Test
Scores 3 or Higher
School 14 14 3
21.4%
System State 163 15,225 211 23,969 68 13,024
32.2% 54.3%
POST-SECONDARY DATA
Graduates Entering Georgia Public Colleges
Graduates Entering Georgia Public Colleges and Requiring Learning Support (LS)
1998 Graduates Entering in 1998-99
1997 Graduates Entering in 1997-98
Percent of Graduating Number Class
School
18
18.0%
System 289
35.8%
School
46
39.7%
System 330
39.5%
Number Requiring
LS 6 123
18 140
Percent of those attending Georgia
Public Colleges
33.3%
42.6%
39.1%
42.4%
In previous years, the Report Card presented College Prep Curriculum information provided by the Board of Regents on students requiring Learning Support. Due to inconsistencies in the data provided by the Board of Regents in defining College Prep Completers versus Local Board of Education data defining College Prep Endorsements, the Department of Education Report Card will not provide this information until discrepancies can be reconciled.
Graduates Entering Georgia Public Technical and Adult Schools
1998 Graduates School System
Entering Number 17 100
1998-99 Percent 17.0% 12.4%
Entering Number N/A N/A
1997-98 Percent
N/A N/A
1997 Graduates School
1
0.9%
System
8
1.0%
17
14.7%
84
10.0%
1998-99 GEORGIA PUBLIC EDUCATION REPORT CARD Southeast High School - 6110189
Prepared by Georgia Department of Education
Page 3
CERTIFIED PERSONNEL DATA
Positions Number Average Contract Days
Administrators
6.40 210.31
Support Personnel
5.00 200.00
PK-12 Teachers
63.67 190.66
Personnel Sex
Certificate
Years Experience
Full-time Part-time
Male Female
4 Yr Bachelor's 5 Yr Master's 6 Yr Specialist's 7 Yr Doctoral Other*
<1 1-10 11-20 21-30 >30
Average
5 7
5 7
1 6 5 0 0
0 1 5 4 2
21.42
5 0
0 5
0 3 2 0 0
0 2 1 2 0
16.00
57 8
25 40
29 33
3 0 0
2 25 17 17
4
14.63
*Includes One- and Two-Year Vocational Certificates.
ACCREDITATION DATA
Accredited by Southern Association of Colleges and Schools (SACS): Secondary/Middle Commission.
AWARDS / RECOGNITION DATA
Schools in Georgia may receive recognition in the following programs: Charter School Pay for Performance Program Georgia School of Excellence National Blue Ribbon School Southeast High School did not receive recognition in any of these programs during the 1998-99 school year.
1998-99 GEORGIA PUBLIC EDUCATION REPORT CARD Southeast High School - 6110189
Prepared by Georgia Department of Education
Page 4
1998-99 GEORGIA PUBLIC EDUCATION REPORT CARD
BIBB COUNTY SCHOOLS
Southwest High School - 6110386
Grade Range 9-12
The Georgia Public Education Report Card is designed to assist systems and schools in educational improvement. This report card contains a variety of data elements. An explanation of the terms is provided as a companion to the report card data. Please refer to the definitions for the most effective use of the reported data.
Total 1,145
STUDENT DATA
9-12 Enrollment, by Race/Ethnicity and Sex
Black
White Hispanic
American Multi-
Asian Indian
racial
985 86.0%
156 13.6%
1 0.1%
2 0.2%
0 0.0%
1 0.1%
Male Female
534 46.6%
611 53.4%
Enrollment in Selected Programs
Program
Gifted (Grades K-12)
Program % of Student Enrollment Population
48
4.2%
Non-Vocational Labs (Grades 9-12)
Vocational Labs (Grades 9-12)
Alternative Programs (Grades 6-12)
1,027 697 9
89.7% 60.9%
< 1%
Students Eligible to Receive Free/Reduced Lunches
Number
Percent
School System
634 15,047
55.4% 61.1%
Enrollment in Compensatory Programs
Program
Program % of Student Enrollment Population
Special Education (Grades K-12) PK
75
6.6%
0
N/A
English to Speakers of Other Languages (ESOL) (Grades K-12)
0
0.0%
Remedial Education (Grades 2-5, 9-12)
38
3.3%
Title I (Grades K-12)
This school has no Title I program.
Dropout Rate for Grades 9-12
Number
Rate
School System
97
7.7%
535
8.1%
Total 217
Retained Students, by Race/Ethnicity and Sex
Black
White Hispanic
American MultiAsian Indian racial
196 90.3%
20 9.2%
0 0.0%
1 0.5%
0 0.0%
0 0.0%
Male Female
122
95
56.2% 43.8%
Prepared by Georgia Department of Education
Page 1
STATE-REQUIRED TEST DATA
GEORGIA HIGH SCHOOL GRADUATION TESTS (GHSGT)
Percent of Regular Program 11th Graders Passing the Georgia High School Graduation Tests on First Administration
English Language Arts Mathematics Social Studies Science
All Components listed above
Writing
1998-99
School System State
94% 76% 73% 58%
94% 79% 74% 60%
96% 88% 80% 72%
55% 55% 68%
90% 93% 93%
1997-98
School System State
96% 82% 68% 57%
93% 78% 71% 61%
94% 88% 78% 74%
52% 55% 68%
90% 90% 92%
1996-97
School System State
91% 73% 61% 50%
92% 71% 64% 55%
94% 87% 78% 74%
43% 49% 67%
90% 91% 93%
GRADUATE DATA
1999 Graduates by Credentials, Race/Ethnicity and Sex
Diplomas with Both College Prep. & Voc. Endorsements
Diplomas with College Prep. Endorsements Diplomas with Vocational Endorsements General High School Diplomas Special Education Diplomas
Total All Diplomas
Certificates of Performance
Total Graduates
Total 23 93 27 14 12
169 13
182
Black
17 73.9%
80 86.0%
25 92.6%
13 92.9%
12 100.0%
147 87.0%
12 92.3%
159 87.4%
White Hispanic
6 26.1%
12 12.9%
0 0.0%
0 0.0%
2 7.4%
1 7.1%
0 0.0%
0 0.0%
0 0.0%
0 0.0%
21 12.4%
0 0.0%
1 7.7%
0 0.0%
22 12.1%
0 0.0%
American MultiAsian Indian racial
0 0.0%
1 1.1%
0 0.0%
0 0.0%
0 0.0%
0 0.0%
0 0.0%
0 0.0%
0 0.0%
0 0.0%
0 0.0%
0 0.0%
0 0.0%
0 0.0%
0 0.0%
1 0.6%
0 0.0%
0 0.0%
0 0.0%
0 0.0%
0 0.0%
1 0.5%
0 0.0%
0 0.0%
Male Female
12 52.2%
40 43.0%
11 47.8%
53 57.0%
12 44.4%
9 64.3%
3 25.0%
15 55.6%
5 35.7%
9 75.0%
76
93
45.0% 55.0%
4
9
30.8% 69.2%
80
102
44.0% 56.0%
HOPE Scholarships
School System
Number of 1999 Graduates 1 8 2
Number Eligible
83
Percent Eligible
45.6%
879 472 53.7%
State
65,548 40,292 61.5%
High School Completion Rate
Percent of 1995Grade 9 Enrollment in Graduating Class of1999 School System State
Completion Rate '95-'99 50.8% 56.5% 68.9%
1998-99 GEORGIA PUBLIC EDUCATION REPORT CARD
Southwest High School - 6110386
Prepared by Georgia Department of Education
Page 2
COLLEGE ADMISSIONS / CREDIT TEST DATA
Scholastic Assessment Test (SAT)
Based on students' highest verbal and highest math scores
No. Taking
Average Score
Tests Verbal Math Total
Based on students' last test administration
Average Score Verbal Math Total
School
97
College Prep. Endorsement
Other Diplomas
System
541
College Prep. Endorsement
Other Diplomas
Georgia
41,958
441 415
856
535 517 1052
485 470
955
466 443
909
502 481
983
440 408
848
492 488
980
432 N/A N/A
456 N/A N/A
483
405 N/A N/A
434 N/A N/A
479
837 N/A N/A
890 N/A N/A
962
Nation
952,913 N/A N/A N/A
502 508 1010
American College Testing (ACT)
Advanced Placement Exams (AP)
Number taking tests: English Mathematics Reading Science Reasoning CompositeScore
1 1 School System State
16.9 19.5 19.1
18.0 19.1 19.9
18.6 18.5
20.7 19.9
20.2 19.9
18.0 19.9 19.9
No. of Students Taking Tests
No. of Tests Taken No. of Test Scores
3 or Higher Percent of Test
Scores 3 or Higher
School 31 47 10
21.3%
System State 163 15,225 211 23,969 68 13,024
32.2% 54.3%
POST-SECONDARY DATA
Graduates Entering Georgia Public Colleges
Graduates Entering Georgia Public Colleges and Requiring Learning Support (LS)
1998 Graduates Entering in 1998-99
1997 Graduates Entering in 1997-98
Percent of Graduating Number Class
School
56
27.1%
System 289
35.8%
School
83
34.0%
System 330
39.5%
Number Requiring
LS 28 123
47 140
Percent of those attending Georgia
Public Colleges
50.0%
42.6%
56.6%
42.4%
In previous years, the Report Card presented College Prep Curriculum information provided by the Board of Regents on students requiring Learning Support. Due to inconsistencies in the data provided by the Board of Regents in defining College Prep Completers versus Local Board of Education data defining College Prep Endorsements, the Department of Education Report Card will not provide this information until discrepancies can be reconciled.
Graduates Entering Georgia Public Technical and Adult Schools
1998 Graduates School System
Entering Number 30 100
1998-99 Percent 14.5% 12.4%
Entering Number N/A N/A
1997-98 Percent
N/A N/A
1997 Graduates School
2
0.8%
System
8
1.0%
31
12.7%
84
10.0%
1998-99 GEORGIA PUBLIC EDUCATION REPORT CARD Southwest High School - 6110386
Prepared by Georgia Department of Education
Page 3
CERTIFIED PERSONNEL DATA
Positions Number Average Contract Days
Administrators
5.40 202.96
Support Personnel
5.00 196.00
PK-12 Teachers
72.55 191.54
Personnel Sex
Certificate
Years Experience
Full-time Part-time
Male Female
4 Yr Bachelor's 5 Yr Master's 6 Yr Specialist's 7 Yr Doctoral Other*
<1 1-10 11-20 21-30 >30
Average
4 7
4 7
3 5 3 0 0
0 1 2 7 1
21.36
5 0
0 5
0 5 0 0 0
0 0 0 4 1
27.20
65 9
27 47
38 32
4 0 0
2 28 15 22
7
16.31
*Includes One- and Two-Year Vocational Certificates.
ACCREDITATION DATA
Accredited by Southern Association of Colleges and Schools (SACS): Secondary/Middle Commission.
AWARDS / RECOGNITION DATA
Schools in Georgia may receive recognition in the following programs: Charter School Pay for Performance Program Georgia School of Excellence National Blue Ribbon School Southwest High School did not receive recognition in any of these programs during the 1998-99 school year.
1998-99 GEORGIA PUBLIC EDUCATION REPORT CARD Southwest High School - 6110386
Prepared by Georgia Department of Education
Page 4
1998-99 GEORGIA PUBLIC EDUCATION REPORT CARD
BIBB COUNTY SCHOOLS
Springdale Elementary School - 6113068
Grade Range K-6
The Georgia Public Education Report Card is designed to assist systems and schools in educational improvement. This report card contains a variety of data elements. An explanation of the terms is provided as a companion to the report card data. Please refer to the definitions for the most effective use of the reported data.
STUDENT DATA
Total 852
K-6 Enrollment, by Race/Ethnicity and Sex
Black
White Hispanic
American Multi-
Asian Indian
racial
235 27.6%
563 66.1%
9 1.1%
45 5.3%
0 0.0%
0 0.0%
Male Female
379 44.5%
473 55.5%
Enrollment in Selected Programs
Program
Program % of Student Enrollment Population
Gifted (Grades K-12)
34
4.0%
Alternative Programs (Grades 6-12)
0
0.0%
Students Eligible to Receive Free/Reduced Lunches
Number
Percent
School System
148 15,047
17.4% 61.1%
Dropout Rate for Grade 6
Number
Rate
School System
0
0.0%
0
0.0%
Enrollment in Compensatory Programs
Program
Program % of Student Enrollment Population
Special Education (Grades K-12)
49
5.8%
(PK)
13
N/A
English to Speakers of Other Languages (ESOL) (Grades K-12)
19
2.2%
Remedial Education (Grades 2-5, 9-12)
38
7.2%
Special Instructional Assistance (SIA) (Grades K-3)
0
0.0%
Title I (Grades K-12)
This school has no Title I program.
Total 22
Retained Students, by Race/Ethnicity and Sex
Black
White Hispanic
American Multi-
Asian Indian
racial
14 63.6%
8 36.4%
0 0.0%
0 0.0%
0 0.0%
0 0.0%
Male Female
9
13
40.9% 59.1%
Prepared by Georgia Department of Education
Page 1
STATE-REQUIRED TEST DATA
NORM-REFERENCED TESTS Grade 3
Iowa Tests of Basic Skills (ITBS) Each chart reflects data for three years of testing.
Reading Comprehension 50
66 54 54 0
98-99
69 48 53 97-98
64 47 52 96-97
Mathematics
School 50
System
State
0
72 67 61 98-99
73 59 61 97-98
72 55 59 96-97
School System State
Reading Vocabulary 50
63 55 50 0
98-99
64 47 50 97-98
65 46 49 96-97
Language Arts
School 50
System
State
0
83 71 64 98-99
77 62 62 97-98
80 62 59 96-97
School System State
Social Studies 50
71 59 56 0
98-99
68 53 55 97-98
67 54 55 96-97
Science
School 50
System
State
0
69 57 59 98-99
73 50 59 97-98
72 49 58 96-97
School System State
Sources of Information
Composite Score
50
71 61 57 0
98-99
School 50
System
70 53 56 97-98
68 53 55 96-97
State 0
72 62 58 98-99
72 53 57 97-98
1998-99 GEORGIA PUBLIC EDUCATION REPORT CARD Springdale Elementary School - 6113068
Prepared by Georgia Department of Education
71 53 56 96-97
Scores Reported in Percentiles
School System State
Page 2
STATE-REQUIRED TEST DATA
NORM-REFERENCED TESTS Grade 5
Iowa Tests of Basic Skills (ITBS) Each chart reflects data for three years of testing.
Reading Comprehension
Mathematics
50
64 54 53 0
98-99
66 49 53 97-98
64 50 52 96-97
School 50
System
State
0
70 62 59 98-99
71 56 58 97-98
71 53 57 96-97
School System State
Reading Vocabulary 50
56 58 48 0
98-99
56 48 48 97-98
60 44 46 96-97
Language Arts
School 50
System
State
0
72 67 63 98-99
76 60 61 97-98
81 60 58 96-97
School System State
Social Studies 50
66 58 57 0
98-99
68 52 56 97-98
63 48 55 96-97
Science
School 50
System
State
0
71 57 60 98-99
72 54 59 97-98
73 52 59 96-97
School System State
Sources of Information
Composite Score
50
66 57 58 0
98-99
School 50
System
70 54 58 97-98
72 55 57 96-97
State 0
69 59 57 98-99
71 53 56 97-98
71 52 55 96-97
1998-99 GEORGIA PUBLIC EDUCATION REPORT CARD Springdale Elementary School - 6113068
Prepared by Georgia Department of Education
Scores Reported in Percentiles
School System State
Page 3
STATE-REQUIRED TEST DATA
PERFORMANCE ASSESSMENTS
Grade 5 Writing Assessment
Percent at Developmental Stages:
1998-99 School System State
1997-98 School System State
1996-97 School System State
Stage Stage Stage Stage Stage Stage
1:The Emerging Writer 2:The Developing Writer 3:The Focusing Writer 4:The Experimenting 5:The Engaging Writer 6:The Extending Writer
0% 0% 6% 37% 42% 15%
0% 1% 19% 48% 23% 7%
0% 1% 16% 41% 29% 12%
0% 0% 3% 25% 49% 23%
0% 2% 24% 44% 23% 6%
0% 3% 19% 41% 27% 10%
0% 0% 10% 26% 41% 22%
0% 3% 28% 41% 22% 6%
0% 3% 21% 37% 26% 12%
AWARDS / RECOGNITION DATA
Schools in Georgia may receive recognition in the following programs: Charter School Pay for Performance Program Georgia School of Excellence National Blue Ribbon School Springdale Elementary School did not receive recognition in any of these programs during the 1998-99 school year.
1998-99 GEORGIA PUBLIC EDUCATION REPORT CARD Springdale Elementary School - 6113068
Prepared by Georgia Department of Education
Page 4
CERTIFIED PERSONNEL DATA
Positions Number Average Contract Days
Personnel Sex
Certificate
Years Experience
Full-time Part-time
Male Female
4 Yr Bachelor's 5 Yr Master's 6 Yr Specialist's 7 Yr Doctoral Other*
<1 1-10 11-20 21-30 >30
Average
Administrators
2.00 205.00
2 0
1 1
0 1 1 0 0 0 0 1 1 0 16.50
Support Personnel
2.00 190.00
2 0
0 2
0 2 0 0 0 0 1 1 0 0 12.00
PK-12 Teachers
44.00 190.00
43 2
1 44
22 18
5 0 0 0 15 16 14 0 15.42
*Includes One- and Two-Year Vocational Certificates.
ACCREDITATION DATA
Accredited by Southern Association of Colleges and Schools (SACS):
Elementary/Middle Commission.
1998-99 GEORGIA PUBLIC EDUCATION REPORT CARD Springdale Elementary School - 6113068
Prepared by Georgia Department of Education
Page 5
1998-99 GEORGIA PUBLIC EDUCATION REPORT CARD
BIBB COUNTY SCHOOLS
Taylor Elementary School - 6115068
Grade Range K-6
The Georgia Public Education Report Card is designed to assist systems and schools in educational improvement. This report card contains a variety of data elements. An explanation of the terms is provided as a companion to the report card data. Please refer to the definitions for the most effective use of the reported data.
STUDENT DATA
Total 525
K-6 Enrollment, by Race/Ethnicity and Sex
Black
White Hispanic
American Multi-
Asian Indian
racial
209 39.8%
304 57.9%
1 0.2%
5 1.0%
1 0.2%
5 1.0%
Male Female
257 49.0%
268 51.0%
Enrollment in Selected Programs
Program
Program % of Student Enrollment Population
Gifted (Grades K-12)
18
3.4%
Alternative Programs (Grades 6-12)
0
0.0%
Students Eligible to Receive Free/Reduced Lunches
Number
Percent
School System
174 15,047
33.1% 61.1%
Dropout Rate for Grade 6
Number
Rate
School System
0
0.0%
0
0.0%
Enrollment in Compensatory Programs
Program
Program % of Student Enrollment Population
Special Education (Grades K-12)
31
5.9%
(PK)
0
N/A
English to Speakers of Other Languages (ESOL) (Grades K-12)
7
1.3%
Remedial Education (Grades 2-5, 9-12)
49 14.2%
Special Instructional Assistance (SIA) (Grades K-3)
0
0.0%
Title I (Grades K-12)
This school has no Title I program.
Total 12
Retained Students, by Race/Ethnicity and Sex
Black
White Hispanic
American Multi-
Asian Indian
racial
9 75.0%
3 25.0%
0 0.0%
0 0.0%
0 0.0%
0 0.0%
Male Female
7
5
58.3% 41.7%
Prepared by Georgia Department of Education
Page 1
STATE-REQUIRED TEST DATA
NORM-REFERENCED TESTS Grade 3
Iowa Tests of Basic Skills (ITBS) Each chart reflects data for three years of testing.
Reading Comprehension 50
59 54 54 0
98-99
63 48 53 97-98
69 47 52 96-97
Mathematics
School 50
System
State
0
72 67 61 98-99
66 59 61 97-98
78 55 59 96-97
School System State
Reading Vocabulary 50
64 55 50 0
98-99
59 47 50 97-98
69 46 49 96-97
Language Arts
School 50
System
State
0
69 71 64 98-99
61 62 62 97-98
74 62 59 96-97
School System State
Social Studies 50
74 59 56 0
98-99
68 53 55 97-98
77 54 55 96-97
Science
School 50
System
State
0
73 57 59 98-99
66 50 59 97-98
75 49 58 96-97
School System State
Sources of Information
Composite Score
50
71 61 57 0
98-99
School 50
System
63 53 56 97-98
79 53 55 96-97
State 0
71 62 58 98-99
65 53 57 97-98
1998-99 GEORGIA PUBLIC EDUCATION REPORT CARD Taylor Elementary School - 6115068
Prepared by Georgia Department of Education
77 53 56 96-97
Scores Reported in Percentiles
School System State
Page 2
STATE-REQUIRED TEST DATA
NORM-REFERENCED TESTS Grade 5
Iowa Tests of Basic Skills (ITBS) Each chart reflects data for three years of testing.
Reading Comprehension
Mathematics
50
67 54 53 0
98-99
68 49 53 97-98
60 50 52 96-97
School 50
System
State
0
74 62 59 98-99
75 56 58 97-98
62 53 57 96-97
School System State
Reading Vocabulary 50
63 58 48 0
98-99
67 48 48 97-98
75 44 46 96-97
Language Arts
School 50
System
State
0
74 67 63 98-99
63 60 61 97-98
70 60 58 96-97
School System State
Social Studies 50
67 58 57 0
98-99
72 52 56 97-98
67 48 55 96-97
Science
School 50
System
State
0
73 57 60 98-99
66 54 59 97-98
68 52 59 96-97
School System State
Sources of Information
Composite Score
50
67 57 58 0
98-99
School 50
System
68 54 58 97-98
71 55 57 96-97
State 0
71 59 57 98-99
68 53 56 97-98
71 52 55 96-97
1998-99 GEORGIA PUBLIC EDUCATION REPORT CARD Taylor Elementary School - 6115068
Prepared by Georgia Department of Education
Scores Reported in Percentiles
School System State
Page 3
STATE-REQUIRED TEST DATA
PERFORMANCE ASSESSMENTS
Grade 5 Writing Assessment
Percent at Developmental Stages:
1998-99 School System State
1997-98 School System State
1996-97 School System State
Stage Stage Stage Stage Stage Stage
1:The Emerging Writer 2:The Developing Writer 3:The Focusing Writer 4:The Experimenting 5:The Engaging Writer 6:The Extending Writer
0% 5% 9% 33% 40% 12%
0% 1% 19% 48% 23% 7%
0% 1% 16% 41% 29% 12%
0% 0% 11% 46% 25% 18%
0% 2% 24% 44% 23% 6%
0% 3% 19% 41% 27% 10%
0% 3% 16% 42% 28% 9%
0% 3% 28% 41% 22% 6%
0% 3% 21% 37% 26% 12%
AWARDS / RECOGNITION DATA
Schools in Georgia may receive recognition in the following programs: Charter School Pay for Performance Program Georgia School of Excellence National Blue Ribbon School Taylor Elementary School did not receive recognition in any of these programs during the 1998-99 school year.
1998-99 GEORGIA PUBLIC EDUCATION REPORT CARD Taylor Elementary School - 6115068
Prepared by Georgia Department of Education
Page 4
CERTIFIED PERSONNEL DATA
Positions Number Average Contract Days
Personnel Sex
Certificate
Years Experience
Full-time Part-time
Male Female
4 Yr Bachelor's 5 Yr Master's 6 Yr Specialist's 7 Yr Doctoral Other*
<1 1-10 11-20 21-30 >30
Average
Administrators
1.50 206.67
1 1
0 2
0 0 2 0 0 0 0 0 1 1 28.50
Support Personnel
2.00 190.00
2 0
0 2
0 2 0 0 0 0 1 0 1 0 17.50
PK-12 Teachers
28.00 190.18
27 2
0 29
10 14
5 0 0 2 9 6 11 1 15.72
*Includes One- and Two-Year Vocational Certificates.
ACCREDITATION DATA
Accredited by Southern Association of Colleges and Schools (SACS):
Elementary/Middle Commission.
1998-99 GEORGIA PUBLIC EDUCATION REPORT CARD Taylor Elementary School - 6115068
Prepared by Georgia Department of Education
Page 5
1998-99 GEORGIA PUBLIC EDUCATION REPORT CARD
BIBB COUNTY SCHOOLS
Tinsley Elementary School - 6111069
Grade Range K-6
The Georgia Public Education Report Card is designed to assist systems and schools in educational improvement. This report card contains a variety of data elements. An explanation of the terms is provided as a companion to the report card data. Please refer to the definitions for the most effective use of the reported data.
STUDENT DATA
Total 401
K-6 Enrollment, by Race/Ethnicity and Sex
Black
White Hispanic
American Multi-
Asian Indian
racial
191 47.6%
199 49.6%
7 1.7%
3 0.7%
0 0.0%
1 0.2%
Male Female
214 53.4%
187 46.6%
Enrollment in Selected Programs
Program
Program % of Student Enrollment Population
Gifted (Grades K-12)
8
2.0%
Alternative Programs (Grades 6-12)
0
0.0%
Students Eligible to Receive Free/Reduced Lunches
Number
Percent
School System
206 15,047
51.4% 61.1%
Dropout Rate for Grade 6
Number
Rate
School System
0
0.0%
0
0.0%
Enrollment in Compensatory Programs
Program
Program % of Student Enrollment Population
Special Education (Grades K-12)
131 32.7%
(PK)
0
N/A
English to Speakers of Other Languages (ESOL) (Grades K-12)
0
0.0%
Remedial Education (Grades 2-5, 9-12)
30 12.9%
Special Instructional Assistance (SIA) (Grades K-3)
0
0.0%
Title I (Grades K-12)
This school has no Title I program.
Total 29
Retained Students, by Race/Ethnicity and Sex
Black
White Hispanic
American Multi-
Asian Indian
racial
22 75.9%
6 20.7%
0 0.0%
0 0.0%
0 0.0%
1 3.4%
Male Female
20
9
69.0% 31.0%
Prepared by Georgia Department of Education
Page 1
STATE-REQUIRED TEST DATA
NORM-REFERENCED TESTS Grade 3
Iowa Tests of Basic Skills (ITBS) Each chart reflects data for three years of testing.
Reading Comprehension 50
61 54 54 0
98-99
49 48 53 97-98
54 47 52 96-97
Mathematics
School 50
System
State
0
72 67 61 98-99
58 59 61 97-98
65 55 59 96-97
School System State
Reading Vocabulary 50
57 55 50 0
98-99
52 47 50 97-98
52 46 49 96-97
Language Arts
School 50
System
State
0
76 71 64 98-99
55 62 62 97-98
62 62 59 96-97
School System State
Social Studies 50
69 59 56 0
98-99
52 53 55 97-98
55 54 55 96-97
Science
School 50
System
State
0
64 57 59 98-99
54 50 59 97-98
53 49 58 96-97
School System State
Sources of Information
Composite Score
50
64 61 57 0
98-99
School 50
System
52 53 56 97-98
57 53 55 96-97
State 0
67 62 58 98-99
52 53 57 97-98
1998-99 GEORGIA PUBLIC EDUCATION REPORT CARD Tinsley Elementary School - 6111069
Prepared by Georgia Department of Education
60 53 56 96-97
Scores Reported in Percentiles
School System State
Page 2
STATE-REQUIRED TEST DATA
NORM-REFERENCED TESTS Grade 5
Iowa Tests of Basic Skills (ITBS) Each chart reflects data for three years of testing.
Reading Comprehension
Mathematics
50
64 54 53 0
98-99
52 49 53 97-98
63 50 52 96-97
School 50
System
State
0
71 62 59 98-99
62 56 58 97-98
66 53 57 96-97
School System State
Reading Vocabulary 50
62 58 48 0
98-99
46 48 48 97-98
54 44 46 96-97
Language Arts
School 50
System
State
0
76 67 63 98-99
64 60 61 97-98
64 60 58 96-97
School System State
Social Studies 50
67 58 57 0
98-99
63 52 56 97-98
61 48 55 96-97
Science
School 50
System
State
0
69 57 60 98-99
67 54 59 97-98
63 52 59 96-97
School System State
Sources of Information
Composite Score
50
72 57 58 0
98-99
School 50
System
64 54 58 97-98
59 55 57 96-97
State 0
71 59 57 98-99
62 53 56 97-98
61 52 55 96-97
1998-99 GEORGIA PUBLIC EDUCATION REPORT CARD Tinsley Elementary School - 6111069
Prepared by Georgia Department of Education
Scores Reported in Percentiles
School System State
Page 3
STATE-REQUIRED TEST DATA
PERFORMANCE ASSESSMENTS
Grade 5 Writing Assessment
Percent at Developmental Stages:
1998-99 School System State
1997-98 School System State
1996-97 School System State
Stage Stage Stage Stage Stage Stage
1:The Emerging Writer 2:The Developing Writer 3:The Focusing Writer 4:The Experimenting 5:The Engaging Writer 6:The Extending Writer
2% 0% 22% 45% 18% 14%
0% 1% 19% 48% 23% 7%
0% 1% 16% 41% 29% 12%
0% 0% 26% 48% 22% 4%
0% 2% 24% 44% 23% 6%
0% 3% 19% 41% 27% 10%
3% 3% 24% 42% 16% 13%
0% 3% 28% 41% 22% 6%
0% 3% 21% 37% 26% 12%
AWARDS / RECOGNITION DATA
Schools in Georgia may receive recognition in the following programs: Charter School Pay for Performance Program Georgia School of Excellence National Blue Ribbon School Tinsley Elementary School did not receive recognition in any of these programs during the 1998-99 school year.
1998-99 GEORGIA PUBLIC EDUCATION REPORT CARD Tinsley Elementary School - 6111069
Prepared by Georgia Department of Education
Page 4
CERTIFIED PERSONNEL DATA
Positions Number Average Contract Days
Personnel Sex
Certificate
Years Experience
Full-time Part-time
Male Female
4 Yr Bachelor's 5 Yr Master's 6 Yr Specialist's 7 Yr Doctoral Other*
<1 1-10 11-20 21-30 >30
Average
Administrators
1.50 206.67
1 1
0 2
0 0 2 0 0 0 0 1 1 0 20.50
Support Personnel
4.00 197.50
4 0
1 3
1 2 1 0 0 0 0 3 1 0 17.25
PK-12 Teachers
34.50 190.14
32 5
3 34
17 15
5 0 0 1 10 12 12 2 16.62
*Includes One- and Two-Year Vocational Certificates.
ACCREDITATION DATA
Accredited by Southern Association of Colleges and Schools (SACS):
Elementary/Middle Commission.
1998-99 GEORGIA PUBLIC EDUCATION REPORT CARD Tinsley Elementary School - 6111069
Prepared by Georgia Department of Education
Page 5
1998-99 GEORGIA PUBLIC EDUCATION REPORT CARD
BIBB COUNTY SCHOOLS
Union Elementary School - 6110283
Grade Range K-6
The Georgia Public Education Report Card is designed to assist systems and schools in educational improvement. This report card contains a variety of data elements. An explanation of the terms is provided as a companion to the report card data. Please refer to the definitions for the most effective use of the reported data.
STUDENT DATA
Total 709
K-6 Enrollment, by Race/Ethnicity and Sex
Black
White Hispanic
American Multi-
Asian Indian
racial
413 58.3%
275 38.8%
7 1.0%
7 1.0%
1 0.1%
6 0.8%
Male Female
382 53.9%
327 46.1%
Enrollment in Selected Programs
Program
Program % of Student Enrollment Population
Gifted (Grades K-12)
27
3.8%
Alternative Programs (Grades 6-12)
0
0.0%
Students Eligible to Receive Free/Reduced Lunches
Number
Percent
School System
371 15,047
52.3% 61.1%
Dropout Rate for Grade 6
Number
Rate
School System
0
0.0%
0
0.0%
Enrollment in Compensatory Programs
Program
Program % of Student Enrollment Population
Special Education (Grades K-12)
124 17.5%
(PK)
0
N/A
English to Speakers of Other Languages (ESOL) (Grades K-12)
0
0.0%
Remedial Education (Grades 2-5, 9-12)
60 14.0%
Special Instructional Assistance (SIA) (Grades K-3)
0
0.0%
Title I (Grades K-12)
This school has no Title I program.
Total 35
Retained Students, by Race/Ethnicity and Sex
Black
White Hispanic
American Multi-
Asian Indian
racial
29 82.9%
6 17.1%
0 0.0%
0 0.0%
0 0.0%
0 0.0%
Male Female
24
11
68.6% 31.4%
Prepared by Georgia Department of Education
Page 1
STATE-REQUIRED TEST DATA
NORM-REFERENCED TESTS Grade 3
Iowa Tests of Basic Skills (ITBS) Each chart reflects data for three years of testing.
Reading Comprehension 50
52 54 54 0
98-99
54 48 53 97-98
50 47 52 96-97
Mathematics
School 50
System
State
0
66 67 61 98-99
72 59 61 97-98
59 55 59 96-97
School System State
Reading Vocabulary 50
50 55 50 0
98-99
50 47 50 97-98
50 46 49 96-97
Language Arts
School 50
System
State
0
65 71 64 98-99
63 62 62 97-98
70 62 59 96-97
School System State
Social Studies 50
61 59 56 0
98-99
64 53 55 97-98
55 54 55 96-97
Science
School 50
System
State
0
56 57 59 98-99
60 50 59 97-98
55 49 58 96-97
School System State
Sources of Information
Composite Score
50
60 61 57 0
98-99
School 50
System
59 53 56 97-98
55 53 55 96-97
State 0
59 62 58 98-99
61 53 57 97-98
1998-99 GEORGIA PUBLIC EDUCATION REPORT CARD Union Elementary School - 6110283
Prepared by Georgia Department of Education
58 53 56 96-97
Scores Reported in Percentiles
School System State
Page 2
STATE-REQUIRED TEST DATA
NORM-REFERENCED TESTS Grade 5
Iowa Tests of Basic Skills (ITBS) Each chart reflects data for three years of testing.
Reading Comprehension
Mathematics
50
44 54 53 0
98-99
49 49 53 97-98
57 50 52 96-97
School 50
System
State
0
48 62 59 98-99
52 56 58 97-98
66 53 57 96-97
School System State
Reading Vocabulary 50
34 58 48 0
98-99
45 48 48 97-98
55 44 46 96-97
Language Arts
School 50
System
State
0
59 67 63 98-99
60 60 61 97-98
64 60 58 96-97
School System State
Social Studies 50
49 58 57 0
98-99
56 52 56 97-98
62 48 55 96-97
Science
School 50
System
State
0
48 57 60 98-99
64 54 59 97-98
71 52 59 96-97
School System State
Sources of Information
Composite Score
50
48 57 58 0
98-99
School 50
System
54 54 58 97-98
61 55 57 96-97
State 0
48 59 57 98-99
55 53 56 97-98
64 52 55 96-97
1998-99 GEORGIA PUBLIC EDUCATION REPORT CARD Union Elementary School - 6110283
Prepared by Georgia Department of Education
Scores Reported in Percentiles
School System State
Page 3
STATE-REQUIRED TEST DATA
PERFORMANCE ASSESSMENTS
Grade 5 Writing Assessment
Percent at Developmental Stages:
1998-99 School System State
1997-98 School System State
1996-97 School System State
Stage Stage Stage Stage Stage Stage
1:The Emerging Writer 2:The Developing Writer 3:The Focusing Writer 4:The Experimenting 5:The Engaging Writer 6:The Extending Writer
0% 2% 18% 49% 20% 9%
0% 1% 19% 48% 23% 7%
0% 1% 16% 41% 29% 12%
1% 4% 18% 49% 18% 10%
0% 2% 24% 44% 23% 6%
0% 3% 19% 41% 27% 10%
1% 2% 24% 48% 21% 3%
0% 3% 28% 41% 22% 6%
0% 3% 21% 37% 26% 12%
AWARDS / RECOGNITION DATA
Schools in Georgia may receive recognition in the following programs: Charter School Pay for Performance Program Georgia School of Excellence National Blue Ribbon School Union Elementary School did not receive recognition in any of these programs during the 1998-99 school year.
1998-99 GEORGIA PUBLIC EDUCATION REPORT CARD Union Elementary School - 6110283
Prepared by Georgia Department of Education
Page 4
CERTIFIED PERSONNEL DATA
Positions Number Average Contract Days
Personnel Sex
Certificate
Years Experience
Full-time Part-time
Male Female
4 Yr Bachelor's 5 Yr Master's 6 Yr Specialist's 7 Yr Doctoral Other*
<1 1-10 11-20 21-30 >30
Average
Administrators
2.00 205.00
2 0
1 1
0 0 2 0 0 0 0 0 2 0 23.50
Support Personnel
2.00 190.00
2 0
0 2
0 1 1 0 0 0 0 1 1 0 24.50
PK-12 Teachers
44.00 190.00
43 2
2 43
25 18
2 0 0 4 16 13 11 1 12.31
*Includes One- and Two-Year Vocational Certificates.
ACCREDITATION DATA
Accredited by Southern Association of Colleges and Schools (SACS):
Elementary/Middle Commission.
1998-99 GEORGIA PUBLIC EDUCATION REPORT CARD Union Elementary School - 6110283
Prepared by Georgia Department of Education
Page 5
1998-99 GEORGIA PUBLIC EDUCATION REPORT CARD
BIBB COUNTY SCHOOLS
Weaver Middle School - 6110197
Grade Range 7-8
The Georgia Public Education Report Card is designed to assist systems and schools in educational improvement. This report card contains a variety of data elements. An explanation of the terms is provided as a companion to the report card data. Please refer to the definitions for the most effective use of the reported data.
STUDENT DATA
Total 967
7-8 Enrollment, by Race/Ethnicity and Sex
Black
White Hispanic
American Multi-
Asian Indian
racial
547 56.6%
394 40.7%
9 0.9%
13 1.3%
0 0.0%
4 0.4%
Male 522
54.0%
Female 445
46.0%
Enrollment in Selected Programs
Program
Gifted (Grades K-12)
Program % of Student Enrollment Population
71
7.3%
Alternative Programs (Grades 6-12)
6
< 1%
Students Eligible to Receive Free/Reduced Lunches
Number
Percent
School System
496 15,047
51.3% 61.1%
Enrollment in Compensatory Programs
Program
Program % of Student Enrollment Population
Special Education (Grades K-12) (PK)
97 10.0%
0
N/A
English to Speakers of Other Languages (ESOL) (Grades K-12)
6
< 1%
Title I (Grades K-12)
This school has no Title I program.
Dropout Rate for Grades 7-8
Number
Rate
School System
1
0.1%
13
0.3%
Total 41
Retained Students, by Race/Ethnicity and Sex
Black
White Hispanic
American MultiAsian Indian racial
24 58.5%
17 41.5%
0 0.0%
0 0.0%
0 0.0%
0 0.0%
Male Female
29
12
70.7% 29.3%
Prepared by Georgia Department of Education
Page 1
STATE-REQUIRED TEST DATA
NORM-REFERENCED TESTS Grade 8
Iowa Tests of Basic Skills (ITBS) Each chart reflects data for three years of testing.
Reading Comprehension 50
43 38 49 0
98-99
45 39 48 97-98
45 38 48 96-97
Mathematics
School 50
System
State
0
50 47 56 98-99
44 45 55 97-98
47 45 54 96-97
School System State
Reading Vocabulary 50
43 35 46 0
98-99
41 34 45 97-98
43 36 44 96-97
Language Arts
School 50
System
State
0
56 52 60 98-99
57 51 58 97-98
57 51 56 96-97
School System State
Social Studies 50
52 43 54 0
98-99
49 44 53 97-98
52 44 53 96-97
Science
School 50
System
State
0
45 39 56 98-99
48 42 55 97-98
49 40 53 96-97
School System State
Sources of Information
Composite Score
50
57 49 57 0
98-99
School 50
System
54 49 56 97-98
54 47 55 96-97
State 0
51 44 56 98-99
50 44 54 97-98
1998-99 GEORGIA PUBLIC EDUCATION REPORT CARD Weaver Middle School - 6110197
Prepared by Georgia Department of Education
51 43 54 96-97
Scores Reported in Percentiles
School System State
Page 2
STATE-REQUIRED TEST DATA
Categories of Scaled Scores
Inadequate (less than 162)
Minimal (162-209)
Good
(210-247)
Very Good (greater than 247)
Average Scaled Score: (Range 100-300)
PERFORMANCE ASSESSMENTS
Grade 8 Writing Assessment
1998-99 Percent Scoring
1997-98 Percent Scoring
1996-97 Percent Scoring
School System State School System State School System State
4% 51% 40%
5%
10% 51% 34%
5%
8% 40% 41% 11%
9% 56% 33%
3%
9% 57% 31%
2%
11% 46% 34%
8%
15% 53% 25%
8%
18% 57% 20%
6%
15% 46% 30%
8%
205
200
208 199
198 202 196
190 198
AWARDS / RECOGNITION DATA
Schools in Georgia may receive recognition in the following programs: Charter School Pay for Performance Program Georgia School of Excellence National Blue Ribbon School Weaver Middle School did not receive recognition in any of these programs during the 1998-99 school year.
1998-99 GEORGIA PUBLIC EDUCATION REPORT CARD Weaver Middle School - 6110197
Prepared by Georgia Department of Education
Page 3
CERTIFIED PERSONNEL DATA
Positions Number Average Contract Days
Personnel Sex
Certificate
Years Experience
Full-time Part-time
Male Female
4 Yr Bachelor's 5 Yr Master's 6 Yr Specialist's 7 Yr Doctoral Other*
<1 1-10 11-20 21-30 >30
Average
Administrators
3.00 206.67
3 0
0 3
0 0 3 0 0 0 0 2 1 0 18.67
Support Personnel
4.00 193.75
3 2
0 5
0 3 2 0 0 0 2 3 0 0 10.80
PK-12 Teachers
61.00 190.25
60 2
14 48
27 29
4 2 0 3 33 14 10 2 11.21
*Includes One- and Two-Year Vocational Certificates.
ACCREDITATION DATA
Accredited by Southern Association of Colleges and Schools (SACS): Secondary/Middle Commission.
1998-99 GEORGIA PUBLIC EDUCATION REPORT CARD Weaver Middle School - 6110197
Prepared by Georgia Department of Education
Page 4
1998-99 GEORGIA PUBLIC EDUCATION REPORT CARD
BIBB COUNTY SCHOOLS
Weir Elementary School - 6114069
Grade Range K-6
The Georgia Public Education Report Card is designed to assist systems and schools in educational improvement. This report card contains a variety of data elements. An explanation of the terms is provided as a companion to the report card data. Please refer to the definitions for the most effective use of the reported data.
STUDENT DATA
Total 559
K-6 Enrollment, by Race/Ethnicity and Sex
Black
White Hispanic
American Multi-
Asian Indian
racial
368 65.8%
182 32.6%
1 0.2%
0 0.0%
3 0.5%
5 0.9%
Male Female
292 52.2%
267 47.8%
Enrollment in Selected Programs
Program
Program % of Student Enrollment Population
Gifted (Grades K-12)
9
1.6%
Alternative Programs (Grades 6-12)
0
0.0%
Students Eligible to Receive Free/Reduced Lunches
Number
Percent
School System
513 15,047
91.8% 61.1%
Dropout Rate for Grade 6
Number
Rate
School System
0
0.0%
0
0.0%
Enrollment in Compensatory Programs
Program
Program % of Student Enrollment Population
Special Education (Grades K-12)
102 18.2%
(PK)
0
N/A
English to Speakers of Other Languages (ESOL) (Grades K-12)
0
0.0%
Remedial Education (Grades 2-5, 9-12)
83 25.9%
Special Instructional Assistance (SIA) (Grades K-3)
40 11.8%
Title I (Grades K-12)
This school has a schoolwide program.
Total 39
Retained Students, by Race/Ethnicity and Sex
Black
White Hispanic
American Multi-
Asian Indian
racial
30 76.9%
9 23.1%
0 0.0%
0 0.0%
0 0.0%
0 0.0%
Male Female
24
15
61.5% 38.5%
Prepared by Georgia Department of Education
Page 1
STATE-REQUIRED TEST DATA
NORM-REFERENCED TESTS Grade 3
Iowa Tests of Basic Skills (ITBS) Each chart reflects data for three years of testing.
Reading Comprehension 50
40 54 54 0
98-99
41 48 53 97-98
32 47 52 96-97
Mathematics
School 50
System
State
0
53 67 61 98-99
55 59 61 97-98
47 55 59 96-97
School System State
Reading Vocabulary 50
38 55 50 0
98-99
37 47 50 97-98
23 46 49 96-97
Language Arts
School 50
System
State
0
65 71 64 98-99
60 62 62 97-98
47 62 59 96-97
School System State
Social Studies 50
42 59 56 0
98-99
43 53 55 97-98
40 54 55 96-97
Science
School 50
System
State
0
39 57 59 98-99
45 50 59 97-98
37 49 58 96-97
School System State
Sources of Information
Composite Score
50
49 61 57 0
98-99
School 50
System
47 53 56 97-98
43 53 55 96-97
State 0
47 62 58 98-99
46 53 57 97-98
1998-99 GEORGIA PUBLIC EDUCATION REPORT CARD Weir Elementary School - 6114069
Prepared by Georgia Department of Education
38 53 56 96-97
Scores Reported in Percentiles
School System State
Page 2
STATE-REQUIRED TEST DATA
NORM-REFERENCED TESTS Grade 5
Iowa Tests of Basic Skills (ITBS) Each chart reflects data for three years of testing.
Reading Comprehension
Mathematics
50
54 54 53 0
98-99
49 49 53 97-98
41 50 52 96-97
School 50
System
State
0
75 62 59 98-99
65 56 58 97-98
42 53 57 96-97
School System State
Reading Vocabulary 50
64 58 48 0
98-99
42 48 48 97-98
25 44 46 96-97
Language Arts
School 50
System
State
0
69 67 63 98-99
59 60 61 97-98
50 60 58 96-97
School System State
Social Studies 50
59 58 57 0
98-99
44 52 56 97-98
45 48 55 96-97
Science
School 50
System
State
0
58 57 60 98-99
44 54 59 97-98
36 52 59 96-97
School System State
Sources of Information
Composite Score
50
61 57 58 0
98-99
School 50
System
52 54 58 97-98
41 55 57 96-97
State 0
63 59 57 98-99
50 53 56 97-98
39 52 55 96-97
1998-99 GEORGIA PUBLIC EDUCATION REPORT CARD Weir Elementary School - 6114069
Prepared by Georgia Department of Education
Scores Reported in Percentiles
School System State
Page 3
STATE-REQUIRED TEST DATA
PERFORMANCE ASSESSMENTS
Grade 5 Writing Assessment
Percent at Developmental Stages:
1998-99 School System State
1997-98 School System State
1996-97 School System State
Stage Stage Stage Stage Stage Stage
1:The Emerging Writer 2:The Developing Writer 3:The Focusing Writer 4:The Experimenting 5:The Engaging Writer 6:The Extending Writer
0% 0% 26% 48% 17% 9%
0% 1% 19% 48% 23% 7%
0% 1% 16% 41% 29% 12%
0% 0% 24% 58% 18% 0%
0% 2% 24% 44% 23% 6%
0% 3% 19% 41% 27% 10%
0% 3% 41% 41% 13% 2%
0% 3% 28% 41% 22% 6%
0% 3% 21% 37% 26% 12%
AWARDS / RECOGNITION DATA
Schools in Georgia may receive recognition in the following programs: Charter School Pay for Performance Program Georgia School of Excellence National Blue Ribbon School Weir Elementary School did not receive recognition in any of these programs during the 1998-99 school year.
1998-99 GEORGIA PUBLIC EDUCATION REPORT CARD Weir Elementary School - 6114069
Prepared by Georgia Department of Education
Page 4
CERTIFIED PERSONNEL DATA
Positions Number Average Contract Days
Personnel Sex
Certificate
Years Experience
Full-time Part-time
Male Female
4 Yr Bachelor's 5 Yr Master's 6 Yr Specialist's 7 Yr Doctoral Other*
<1 1-10 11-20 21-30 >30
Average
Administrators
2.00 205.00
2 0
0 2
0 0 2 0 0 0 0 1 1 0 21.00
Support Personnel
2.00 190.00
2 0
0 2
0 2 0 0 0 0 1 0 1 0 14.50
PK-12 Teachers
39.00 190.00
39 0
3 36
15 19
5 0 0 4 12 12 10 1 14.10
*Includes One- and Two-Year Vocational Certificates.
ACCREDITATION DATA
Accredited by Southern Association of Colleges and Schools (SACS):
Elementary/Middle Commission.
1998-99 GEORGIA PUBLIC EDUCATION REPORT CARD Weir Elementary School - 6114069
Prepared by Georgia Department of Education
Page 5
1998-99 GEORGIA PUBLIC EDUCATION REPORT CARD
BIBB COUNTY SCHOOLS
Westside High School - 6110198
Grade Range 9-12
The Georgia Public Education Report Card is designed to assist systems and schools in educational improvement. This report card contains a variety of data elements. An explanation of the terms is provided as a companion to the report card data. Please refer to the definitions for the most effective use of the reported data.
Total 1,579
STUDENT DATA
9-12 Enrollment, by Race/Ethnicity and Sex
Black
White Hispanic
American Multi-
Asian Indian
racial
817 51.7%
728 46.1%
11 0.7%
14 0.9%
5 0.3%
4 0.3%
Male Female
789 50.0%
790 50.0%
Enrollment in Selected Programs
Program
Gifted (Grades K-12)
Program % of Student Enrollment Population
119
7.5%
Non-Vocational Labs (Grades 9-12)
Vocational Labs (Grades 9-12)
Alternative Programs (Grades 6-12)
1,165 883 12
73.8% 55.9%
< 1%
Students Eligible to Receive Free/Reduced Lunches
Number
Percent
School System
472 15,047
29.9% 61.1%
Enrollment in Compensatory Programs
Program
Program % of Student Enrollment Population
Special Education (Grades K-12) PK
83
5.3%
0
N/A
English to Speakers of Other Languages (ESOL) (Grades K-12)
0
0.0%
Remedial Education (Grades 2-5, 9-12)
22
1.4%
Title I (Grades K-12)
This school has no Title I program.
Dropout Rate for Grades 9-12
Number
Rate
School System
60
3.4%
535
8.1%
Total 199
Retained Students, by Race/Ethnicity and Sex
Black
White Hispanic
American MultiAsian Indian racial
139 69.8%
57 28.6%
1 0.5%
1 0.5%
1 0.5%
0 0.0%
Male Female
113
86
56.8% 43.2%
Prepared by Georgia Department of Education
Page 1
STATE-REQUIRED TEST DATA
GEORGIA HIGH SCHOOL GRADUATION TESTS (GHSGT)
Percent of Regular Program 11th Graders Passing the Georgia High School Graduation Tests on First Administration
English Language Arts Mathematics Social Studies Science
All Components listed above
Writing
1998-99
School System State
97% 91% 84% 77%
94% 79% 74% 60%
96% 88% 80% 72%
74% 55% 68%
95% 93% 93%
1997-98
School System State
95% 84% 81% 70%
93% 78% 71% 61%
94% 88% 78% 74%
64% 55% 68%
92% 90% 92%
1996-97
School System State
N/A N/A N/A N/A
92% 71% 64% 55%
94% 87% 78% 74%
N/A 49% 67%
N/A 91% 93%
GRADUATE DATA
1999 Graduates by Credentials, Race/Ethnicity and Sex
Diplomas with Both College Prep. & Voc. Endorsements
Diplomas with College Prep. Endorsements Diplomas with Vocational Endorsements General High School Diplomas Special Education Diplomas
Total All Diplomas
Certificates of Performance
Total Graduates
Total 6
187 29 0
Black
2 33.3%
80 42.8%
20 69.0%
0
White Hispanic
4 66.7%
0 0.0%
99 52.9%
2 1.1%
9 31.0%
0 0.0%
0
0
American MultiAsian Indian racial
0 0.0%
0 0.0%
0 0.0%
4 2.1%
2 1.1%
0 0.0%
0 0.0%
0 0.0%
0 0.0%
0
0
0
6
4
2
0
0
0
0
66.7% 33.3% 0.0% 0.0% 0.0% 0.0%
228
106
114
2
4
2
0
46.5% 50.0% 0.9% 1.8% 0.9% 0.0%
8
4
4
0
0
0
0
50.0% 50.0% 0.0% 0.0% 0.0% 0.0%
236
110
118
2
4
2
0
46.6% 50.0% 0.8% 1.7% 0.8% 0.0%
Male Female
3
3
50.0% 50.0%
78
109
41.7% 58.3%
19
10
65.5% 34.5%
0
0
3 50.0%
103 45.2%
2 25.0%
105 44.5%
3 50.0%
125 54.8%
6 75.0%
131 55.5%
HOPE Scholarships
School System
Number of 1999 Graduates 2 3 6
Number Eligible
152
Percent Eligible
64.4%
879 472 53.7%
State
65,548 40,292 61.5%
High School Completion Rate
Percent of 1995Grade 9 Enrollment in Graduating Class of1999 School System State
Completion Rate '95-'99 N / A 56.5% 68.9%
1998-99 GEORGIA PUBLIC EDUCATION REPORT CARD
Westside High School - 6110198
Prepared by Georgia Department of Education
Page 2
COLLEGE ADMISSIONS / CREDIT TEST DATA
Scholastic Assessment Test (SAT)
Based on students' highest verbal and highest math scores
No. Taking
Average Score
Tests Verbal Math Total
Based on students' last test administration
Average Score Verbal Math Total
School
186 478 465
943
College Prep. Endorsement
500 470
970
Other Diplomas
480 370
850
System
541 466 443
909
College Prep. Endorsement
502 481
983
Other Diplomas
440 408
848
Georgia
41,958 492 488
980
466 N/A N/A
456 N/A N/A
483
456 N/A N/A
434 N/A N/A
479
922 N/A N/A
890 N/A N/A
962
Nation
952,913 N/A N/A N/A
502 508 1010
American College Testing (ACT)
Advanced Placement Exams (AP)
Number taking tests: English Mathematics Reading Science Reasoning CompositeScore
3 3 School System State
19.5 19.5 19.1
19.3 19.1 19.9
20.4 20.0
20.7 19.9
20.2 19.9
19.9 19.9 19.9
No. of Students Taking Tests
No. of Tests Taken No. of Test Scores
3 or Higher Percent of Test
Scores 3 or Higher
School 45 53 21
39.6%
System State 163 15,225 211 23,969 68 13,024
32.2% 54.3%
POST-SECONDARY DATA
Graduates Entering Georgia Public Colleges
Graduates Entering Georgia Public Colleges and Requiring Learning Support (LS)
1998 Graduates Entering in 1998-99
1997 Graduates Entering in 1997-98
Percent of Graduating Number Class
School N / A
N/A
System 289
35.8%
School N / A
N/A
System 330
39.5%
Number Requiring
LS N/A 123
N/A 140
Percent of those attending Georgia
Public Colleges
N/A
42.6%
N/A
42.4%
In previous years, the Report Card presented College Prep Curriculum information provided by the Board of Regents on students requiring Learning Support. Due to inconsistencies in the data provided by the Board of Regents in defining College Prep Completers versus Local Board of Education data defining College Prep Endorsements, the Department of Education Report Card will not provide this information until discrepancies can be reconciled.
Graduates Entering Georgia Public Technical and Adult Schools
1998 Graduates School System
Entering Number N/A 100
1998-99 Percent
N/A 12.4%
Entering Number N/A N/A
1997-98 Percent
N/A N/A
1997 Graduates School System
N/A 8
N/A 1.0%
N/A 84
N/A 10.0%
1998-99 GEORGIA PUBLIC EDUCATION REPORT CARD Westside High School - 6110198
Prepared by Georgia Department of Education
Page 3
CERTIFIED PERSONNEL DATA
Positions Number Average Contract Days
Administrators
8.00 206.25
Support Personnel
6.00 196.67
PK-12 Teachers
85.64 191.30
Personnel Sex
Certificate
Years Experience
Full-time Part-time
Male Female
4 Yr Bachelor's 5 Yr Master's 6 Yr Specialist's 7 Yr Doctoral Other*
<1 1-10 11-20 21-30 >30
Average
6 8
3 11
0 6 6 2 0
0 2 5 4 3
20.71
6 0
1 5
0 6 0 0 0
1 1 0 4 0
17.67
78 9
30 57
45 35
5 2 0
7 44 18 15
3
11.46
*Includes One- and Two-Year Vocational Certificates.
ACCREDITATION DATA
Accredited by Southern Association of Colleges and Schools (SACS): Secondary/Middle Commission.
AWARDS / RECOGNITION DATA
Schools in Georgia may receive recognition in the following programs: Charter School Pay for Performance Program Georgia School of Excellence National Blue Ribbon School Westside High School did not receive recognition in any of these programs during the 1998-99 school year.
1998-99 GEORGIA PUBLIC EDUCATION REPORT CARD Westside High School - 6110198
Prepared by Georgia Department of Education
Page 4
1998-99 GEORGIA PUBLIC EDUCATION REPORT CARD
BIBB COUNTY SCHOOLS
Williams Elementary School - 6110383
Grade Range PK-6
The Georgia Public Education Report Card is designed to assist systems and schools in educational improvement. This report card contains a variety of data elements. An explanation of the terms is provided as a companion to the report card data. Please refer to the definitions for the most effective use of the reported data.
STUDENT DATA
Total
K-6
454
PK
19
Enrollment, by Race/Ethnicity and Sex
Black
White Hispanic
American Asian Indian
Multiracial
446 98.2%
4 0.9%
2 0.4%
1 0.2%
0 0.0%
1 0.2%
18 94.7%
1 5.3%
0 0.0%
0 0.0%
0 0.0%
0 0.0%
Male Female
237 52.2%
217 47.8%
8 42.1%
11 57.9%
Enrollment in Selected Programs
Program
Program % of Student Enrollment Population
Gifted (Grades K-12)
5
1.1%
Alternative Programs (Grades 6-12)
0
0.0%
Students Eligible to Receive Free/Reduced Lunches
Number
Percent
School System
455 15,047
96.2% 61.1%
Dropout Rate for Grade 6
Number
Rate
School System
0
0.0%
0
0.0%
Enrollment in Compensatory Programs
Program
Program % of Student Enrollment Population
Special Education (Grades K-12)
72 15.9%
(PK)
0
N/A
English to Speakers of Other Languages (ESOL) (Grades K-12)
0
0.0%
Remedial Education (Grades 2-5, 9-12)
67 27.2%
Special Instructional Assistance (SIA) (Grades K-3)
0
0.0%
Title I (Grades K-12)
This school has a schoolwide program.
Total 38
Retained Students, by Race/Ethnicity and Sex
Black
White Hispanic
American MultiAsian Indian racial
38 100.0%
0 0.0%
0 0.0%
0 0.0%
0 0.0%
0 0.0%
Male Female
24
14
63.2% 36.8%
Prepared by Georgia Department of Education
Page 1
STATE-REQUIRED TEST DATA
NORM-REFERENCED TESTS Grade 3
Iowa Tests of Basic Skills (ITBS) Each chart reflects data for three years of testing.
Reading Comprehension 50
27 54 54 0
98-99
28 48 53 97-98
34 47 52 96-97
Mathematics
School 50
System
State
0
60 67 61 98-99
54 59 61 97-98
36 55 59 96-97
School System State
Reading Vocabulary 50
47 55 50 0
98-99
24 47 50 97-98
18 46 49 96-97
Language Arts
School 50
System
State
0
54 71 64 98-99
45 62 62 97-98
46 62 59 96-97
School System State
Social Studies 50
39 59 56 0
98-99
42 53 55 97-98
40 54 55 96-97
Science
School 50
System
State
0
53 57 59 98-99
35 50 59 97-98
33 49 58 96-97
School System State
Sources of Information
Composite Score
50
39 61 57 0
98-99
School 50
System
40 53 56 97-98
33 53 55 96-97
State 0
45 62 58 98-99
38 53 57 97-98
1998-99 GEORGIA PUBLIC EDUCATION REPORT CARD Williams Elementary School - 6110383
Prepared by Georgia Department of Education
33 53 56 96-97
Scores Reported in Percentiles
School System State
Page 2
STATE-REQUIRED TEST DATA
NORM-REFERENCED TESTS Grade 5
Iowa Tests of Basic Skills (ITBS) Each chart reflects data for three years of testing.
Reading Comprehension
Mathematics
50
61 54 53 0
98-99
36 49 53 97-98
38 50 52 96-97
School 50
System
State
0
60 62 59 98-99
47 56 58 97-98
32 53 57 96-97
School System State
Reading Vocabulary 50
92 58 48 0
98-99
96 48 48 97-98
23 44 46 96-97
Language Arts
School 50
System
State
0
74 67 63 98-99
48 60 61 97-98
37 60 58 96-97
School System State
Social Studies 50
58 58 57 0
98-99
53 52 56 97-98
27 48 55 96-97
Science
School 50
System
State
0
70 57 60 98-99
36 54 59 97-98
28 52 59 96-97
School System State
Sources of Information
Composite Score
50
40 57 58 0
98-99
School 50
System
32 54 58 97-98
32 55 57 96-97
State 0
64 59 57 98-99
46 53 56 97-98
29 52 55 96-97
1998-99 GEORGIA PUBLIC EDUCATION REPORT CARD Williams Elementary School - 6110383
Prepared by Georgia Department of Education
Scores Reported in Percentiles
School System State
Page 3
STATE-REQUIRED TEST DATA
PERFORMANCE ASSESSMENTS
Grade 5 Writing Assessment
Percent at Developmental Stages:
1998-99 School System State
1997-98 School System State
1996-97 School System State
Stage Stage Stage Stage Stage Stage
1:The Emerging Writer 2:The Developing Writer 3:The Focusing Writer 4:The Experimenting 5:The Engaging Writer 6:The Extending Writer
0% 2% 16% 56% 27% 0%
0% 1% 19% 48% 23% 7%
0% 1% 16% 41% 29% 12%
0% 4% 32% 48% 16% 0%
0% 2% 24% 44% 23% 6%
0% 3% 19% 41% 27% 10%
0% 0% 36% 55% 10% 0%
0% 3% 28% 41% 22% 6%
0% 3% 21% 37% 26% 12%
AWARDS / RECOGNITION DATA
Schools in Georgia may receive recognition in the following programs: Charter School Pay for Performance Program Georgia School of Excellence National Blue Ribbon School Williams Elementary School did not receive recognition in any of these programs during the 1998-99 school year.
1998-99 GEORGIA PUBLIC EDUCATION REPORT CARD Williams Elementary School - 6110383
Prepared by Georgia Department of Education
Page 4
CERTIFIED PERSONNEL DATA
Positions Number Average Contract Days
Personnel Sex
Certificate
Years Experience
Full-time Part-time
Male Female
4 Yr Bachelor's 5 Yr Master's 6 Yr Specialist's 7 Yr Doctoral Other*
<1 1-10 11-20 21-30 >30
Average
Administrators
1.50 206.67
1 1
0 2
0 0 2 0 0 0 0 1 0 1 26.50
Support Personnel
2.00 190.00
2 0
0 2
0 1 1 0 0 0 0 2 0 0 15.50
PK-12 Teachers
31.50 190.16
31 1
2 30
19 9 3 1 0 0
18 8 3 3
11.78
*Includes One- and Two-Year Vocational Certificates.
ACCREDITATION DATA
Accredited by Southern Association of Colleges and Schools (SACS):
Elementary/Middle Commission.
1998-99 GEORGIA PUBLIC EDUCATION REPORT CARD Williams Elementary School - 6110383
Prepared by Georgia Department of Education
Page 5
1998-99 GEORGIA PUBLIC EDUCATION REPORT CARD
BIBB COUNTY SCHOOLS
Winship Magnet School - 6113070
Grade Range K-6
The Georgia Public Education Report Card is designed to assist systems and schools in educational improvement. This report card contains a variety of data elements. An explanation of the terms is provided as a companion to the report card data. Please refer to the definitions for the most effective use of the reported data.
STUDENT DATA
Total 322
K-6 Enrollment, by Race/Ethnicity and Sex
Black
White Hispanic
American Multi-
Asian Indian
racial
283 87.9%
32 9.9%
0 0.0%
0 0.0%
3 0.9%
4 1.2%
Male Female
161 50.0%
161 50.0%
Enrollment in Selected Programs
Program
Program % of Student Enrollment Population
Gifted (Grades K-12)
12
3.7%
Alternative Programs (Grades 6-12)
0
0.0%
Students Eligible to Receive Free/Reduced Lunches
Number
Percent
School System
246 15,047
76.4% 61.1%
Dropout Rate for Grade 6
Number
Rate
School System
0
0.0%
0
0.0%
Enrollment in Compensatory Programs
Program
Program % of Student Enrollment Population
Special Education (Grades K-12)
17
5.3%
(PK)
0
N/A
English to Speakers of Other Languages (ESOL) (Grades K-12)
0
0.0%
Remedial Education (Grades 2-5, 9-12)
50 26.2%
Special Instructional Assistance (SIA) (Grades K-3)
0
0.0%
Title I (Grades K-12)
This school has a schoolwide program.
Total 6
Retained Students, by Race/Ethnicity and Sex
Black
White Hispanic
American Multi-
Asian Indian
racial
6 100.0%
0 0.0%
0 0.0%
0 0.0%
0 0.0%
0 0.0%
Male Female
3
3
50.0% 50.0%
Prepared by Georgia Department of Education
Page 1
STATE-REQUIRED TEST DATA
NORM-REFERENCED TESTS Grade 3
Iowa Tests of Basic Skills (ITBS) Each chart reflects data for three years of testing.
Reading Comprehension 50
56 54 54 0
98-99
53 48 53 97-98
48 47 52 96-97
Mathematics
School 50
System
State
0
75 67 61 98-99
64 59 61 97-98
53 55 59 96-97
School System State
Reading Vocabulary 50
75 55 50 0
98-99
45 47 50 97-98
39 46 49 96-97
Language Arts
School 50
System
State
0
81 71 64 98-99
64 62 62 97-98
56 62 59 96-97
School System State
Social Studies 50
83 59 56 0
98-99
59 53 55 97-98
55 54 55 96-97
Science
School 50
System
State
0
68 57 59 98-99
60 50 59 97-98
44 49 58 96-97
School System State
Sources of Information
Composite Score
50
74 61 57 0
98-99
School 50
System
61 53 56 97-98
52 53 55 96-97
State 0
76 62 58 98-99
59 53 57 97-98
1998-99 GEORGIA PUBLIC EDUCATION REPORT CARD Winship Magnet School - 6113070
Prepared by Georgia Department of Education
51 53 56 96-97
Scores Reported in Percentiles
School System State
Page 2
STATE-REQUIRED TEST DATA
NORM-REFERENCED TESTS Grade 5
Iowa Tests of Basic Skills (ITBS) Each chart reflects data for three years of testing.
Reading Comprehension
Mathematics
50
51 54 53 0
98-99
46 49 53 97-98
56 50 52 96-97
School 50
System
State
0
54 62 59 98-99
55 56 58 97-98
42 53 57 96-97
School System State
Reading Vocabulary 50
44 58 48 0
98-99
38 48 48 97-98
33 44 46 96-97
Language Arts
School 50
System
State
0
65 67 63 98-99
61 60 61 97-98
59 60 58 96-97
School System State
Social Studies 50
66 58 57 0
98-99
56 52 56 97-98
41 48 55 96-97
Science
School 50
System
State
0
53 57 60 98-99
48 54 59 97-98
37 52 59 96-97
School System State
Sources of Information
Composite Score
50
62 57 58 0
98-99
School 50
System
55 54 58 97-98
48 55 57 96-97
State 0
59 59 57 98-99
52 53 56 97-98
46 52 55 96-97
1998-99 GEORGIA PUBLIC EDUCATION REPORT CARD Winship Magnet School - 6113070
Prepared by Georgia Department of Education
Scores Reported in Percentiles
School System State
Page 3
STATE-REQUIRED TEST DATA
PERFORMANCE ASSESSMENTS
Grade 5 Writing Assessment
Percent at Developmental Stages:
1998-99 School System State
1997-98 School System State
1996-97 School System State
Stage Stage Stage Stage Stage Stage
1:The Emerging Writer 2:The Developing Writer 3:The Focusing Writer 4:The Experimenting 5:The Engaging Writer 6:The Extending Writer
0% 2% 16% 45% 25% 11%
0% 1% 19% 48% 23% 7%
0% 1% 16% 41% 29% 12%
0% 0% 30% 51% 19% 0%
0% 2% 24% 44% 23% 6%
0% 3% 19% 41% 27% 10%
0% 0% 32% 32% 30% 7%
0% 3% 28% 41% 22% 6%
0% 3% 21% 37% 26% 12%
AWARDS / RECOGNITION DATA
Schools in Georgia may receive recognition in the following programs: Charter School Pay for Performance Program Georgia School of Excellence National Blue Ribbon School Winship Magnet School did not receive recognition in any of these programs during the 1998-99 school year.
1998-99 GEORGIA PUBLIC EDUCATION REPORT CARD Winship Magnet School - 6113070
Prepared by Georgia Department of Education
Page 4
CERTIFIED PERSONNEL DATA
Positions Number Average Contract Days
Personnel Sex
Certificate
Years Experience
Full-time Part-time
Male Female
4 Yr Bachelor's 5 Yr Master's 6 Yr Specialist's 7 Yr Doctoral Other*
<1 1-10 11-20 21-30 >30
Average
Administrators
1.00 210.00
1 0
0 1
0 1 0 0 0 0 0 0 1 0 29.00
Support Personnel
2.00 190.00
2 0
0 2
0 1 1 0 0 0 0 2 0 0 15.00
PK-12 Teachers
19.00 190.00
19 0
1 18
7 8 4 0 0 1 4 4 9 1 16.47
*Includes One- and Two-Year Vocational Certificates.
ACCREDITATION DATA
Accredited by Southern Association of Colleges and Schools (SACS):
Elementary/Middle Commission.
1998-99 GEORGIA PUBLIC EDUCATION REPORT CARD Winship Magnet School - 6113070
Prepared by Georgia Department of Education
Page 5
1998-99 GEORGIA PUBLIC EDUCATION REPORT CARD BLECKLEY COUNTY SCHOOLS - 612
The Georgia Public Education Report Card is designed to assist systems and schools in educational improvement. This report card contains a variety of data elements. An explanation of the terms is provided as a companion to the report card data. Please refer to the definitions for the most effective use of the reported data.
Total
K-12
2,244
PK
130
STUDENT DATA
Enrollment, by Race/Ethnicity and Sex
Black
White Hispanic
American Multi-
Asian Indian
racial
687 30.6%
1,518 67.6%
8 0.4%
19 0.8%
1 0.0%
11 0.5%
56 43.1%
73 56.2%
1 0.8%
0 0.0%
0 0.0%
0 0.0%
Male
1,110 49.5%
66 50.8%
Female
1,134 50.5%
64 49.2%
Enrollment in Selected Programs
Program
Program % of Student Enrollment Population
Gifted (Grades K-12)
151
6.7%
Non-Vocational Labs (Grades 9-12)
349
54.6%
Vocational Labs (Grades 9-12)
420
65.7%
Alternative Programs (Grades 6-12)
10
< 1%
Students Eligible to Receive Free/Reduced Lunches
Number
Percent
1,159
48.8%
Dropout Rate
Number
Percent
6-12 9-12
57
4.7%
54
7.9%
Enrollment in Compensatory Programs
Program
Program % of Student Enrollment Population
Special Education
(Grades K-12)
316
PK
9
English to Speakers of
Other Languages (ESOL)
0
(Grades K-12)
Remedial Education (Grades 2-5, 9-12)
207
Special Instructional
Assistance (SIA)
90
(Grades K-3)
Title I (Grades K-12) Number of schools with: Schoolwide program Targeted Assistance program No Title I program
14.1% N/A
0.0%
15.0%
11.7%
2 0 2
Total 79
Retained Students, by Race/Ethnicity and Sex
Black
White Hispanic
American MultiAsian Indian racial
44 55.7%
34 43.0%
0 0.0%
0 0.0%
0 0.0%
1 1.3%
Male Female
48
31
60.8% 39.2%
Prepared by Georgia Department of Education
Page 1
STATE-REQUIRED TEST DATA
NORM-REFERENCED TESTS
Grade 3 Iowa Tests of Basic Skills (ITBS) Each chart reflects data for three years of testing.
Reading Comprehension
Mathematics
50
67 54 62 53 67 52 0
98-99 97-98 96-97
System State
50
70 61 73 61 72 59 0
98-99 97-98 96-97
System State
Reading Vocabulary
50
59 50 61 50 55 49 0
98-99 97-98 96-97
System State
Social Studies
50
63 56 62 55 57 55 0
98-99 97-98 96-97
System State
Language Arts
50
71 64 71 62 62 59 0
98-99 97-98 96-97
System State
Science
50
69 59 67 59 70 58 0
98-99 97-98 96-97
System State
Sources of Information
Composite Score
50
63 57 0
98-99
System
50
59 56 61 55 97-98 96-97
State
67 58 66 57 0
98-99 97-98
1998-99 GEORGIA PUBLIC EDUCATION REPORT CARD Bleckley County Schools
Prepared by Georgia Department of Education
System State Scores Reported 64 56 in Percentiles 96-97
Page 2
STATE-REQUIRED TEST DATA
NORM-REFERENCED TESTS
Grade 5 Iowa Tests of Basic Skills (ITBS) Each chart reflects data for three years of testing.
Reading Comprehension
Mathematics
50
57 53 55 53 50 52 0
98-99 97-98 96-97
System State
50
67 59 68 58 63 57 0
98-99 97-98 96-97
System State
Reading Vocabulary
50
53 48 53 48 45 46 0
98-99 97-98 96-97
System State
Social Studies
50
68 57 65 56 54 55 0
98-99 97-98 96-97
System State
Language Arts
50
71 63 60 61 50 58 0
98-99 97-98 96-97
System State
Science
50
71 60 63 59 58 59 0
98-99 97-98 96-97
System State
Sources of Information
Composite Score
50
63 58 0
98-99
System
50
59 58 55 57 97-98 96-97
State
66 57 61 56 0
98-99 97-98
1998-99 GEORGIA PUBLIC EDUCATION REPORT CARD Bleckley County Schools
Prepared by Georgia Department of Education
System State Scores Reported 53 55 in Percentiles 96-97
Page 3
STATE-REQUIRED TEST DATA
NORM-REFERENCED TESTS Grade 8
Iowa Tests of Basic Skills (ITBS) Each chart reflects data for three years of testing.
Reading Comprehension
Mathematics
50
62 49 51 48 51 48 0
98-99 97-98 96-97
System State
50
72 56 62 55 59 54 0
98-99 97-98 96-97
System State
Reading Vocabulary
50
54 46 47 45 45 44 0
98-99 97-98 96-97
System State
Language Arts
50
72 60 52 58 45 56 0
98-99 97-98 96-97
System State
Social Studies
50
61 54 52 53 51 53 0
98-99 97-98 96-97
System State
Science
50
63 56 56 55 54 53 0
98-99 97-98 96-97
System State
Sources of Information
Composite Score
50
66 57 0
98-99
System
50
59 56 54 55 97-98 96-97
State
67 56 56 54 0
98-99 97-98
1998-99 GEORGIA PUBLIC EDUCATION REPORT CARD Bleckley County Schools
Prepared by Georgia Department of Education
System State Scores Reported 53 54 in Percentiles 96-97
Page 4
STATE-REQUIRED TEST DATA
PERFORMANCE ASSESSMENTS
Grade 5 Writing Assessment
1998-99
1997-98
1996-97
Percent at Developmental Stages:
Comparison
Comparison
Comparison
System Group State System Group State System Group State
Stage Stage Stage Stage Stage Stage
1: The Emerging Writer 2: The Developing Writer 3: The Focusing Writer 4: The Experimenting Writer 5: The Engaging Writer 6: The Extending Writer
0% 1% 19% 44% 23% 14%
0% 2% 19% 43% 26% 9%
0% 1% 16% 41% 29% 12%
0% 1% 24% 36% 24% 15%
0% 3% 21% 42% 26% 8%
0% 3% 19% 41% 27% 10%
1% 5% 23% 29% 27% 15%
0% 5% 22% 34% 26% 12%
0% 3% 21% 37% 26% 12%
Grade 8 Writing Assessment
1998-99 Percent Scoring 1997-98 Percent Scoring 1996-97 Percent Scoring
Categories of Scaled Scores
Comparison
Comparison
Comparison
System Group State System Group State System Group State
Inadequate (less than 162)
Minimal (162-209)
Good
(210-247)
Very Good (greater than 247)
4% 37% 44% 15%
8% 45% 39%
8%
8% 40% 41% 11%
19% 41% 34%
7%
12% 48% 34%
6%
11% 46% 34%
8%
18% 51% 25%
6%
16% 49% 28%
7%
15% 46% 30%
8%
Average Scaled Score: (Range 100-300)
215
205 208
199
200 202
195
196 198
GEORGIA HIGH SCHOOL GRADUATION TESTS (GHSGT)
Percent of Regular Program 11th Graders Passing the Georgia High School Graduation Tests on First Administration
1998-99
1997-98
1996-97
Comparison
Comparison
Comparison
System Group State System Group State System Group State
English Language Arts Mathematics Social Studies Science
97% 94% 77% 77%
96% 89% 81% 73%
96% 88% 80% 72%
94% 89% 67% 66%
94% 90% 77% 76%
94% 88% 78% 74%
92% 86% 78% 84%
93% 86% 76% 74%
94% 87% 78% 74%
All Components listed above 7 2 %
69% 68% 56%
68% 68% 73%
66% 67%
Writing
98%
94% 93% 88%
92% 92% 91%
92% 93%
1998-99 GEORGIA PUBLIC EDUCATION REPORT CARD
Bleckley County Schools
Prepared by Georgia Department of Education
Page 5
GRADUATE DATA
1999 Graduates by Credentials, Race/Ethnicity and Sex
Diplomas with Both College Prep. & Voc. Endorsements
Diplomas with College Prep. Endorsements Diplomas with Vocational Endorsements General High School Diplomas Special Education Diplomas
Total All Diplomas
Certificates of Performance
Total Graduates
Total 0
Black 0
American MultiWhite Hispanic Asian Indian racial
0
0
0
0
0
Male Female
0
0
46
2
43
0
1
0
0
21
25
4.3% 93.5% 0.0% 2.2% 0.0% 0.0% 45.7% 54.3%
68
21
46
0
0
0
1
33
35
30.9% 67.6% 0.0% 0.0% 0.0% 1.5% 48.5% 51.5%
0
0
0
0
0
0
0
0
0
8
6
2
0
0
0
0
5
3
75.0% 25.0% 0.0% 0.0% 0.0% 0.0% 62.5% 37.5%
122
29
91
0
1
0
1
59
63
23.8% 74.6% 0.0% 0.8% 0.0% 0.8% 48.4% 51.6%
0
0
0
0
0
0
0
0
0
122
29
91
0
1
0
1
59
63
23.8% 74.6% 0.0% 0.8% 0.0% 0.8% 48.4% 51.6%
HOPE Scholarships
System State
Number of 1999 Graduates 1 2 2
Number Eligible
65
Percent Eligible
53.3%
65,548 40,292 61.5%
High School Completion Rate Percent of 1995Grade 9 Enrollment
in Graduating Class of1999
System
State
Completion Rate '95-'99 65.6% 68.9%
COLLEGE ADMISSIONS / CREDIT TEST DATA
Scholastic Assessment Test (SAT)
No. Taking
Average Score
Tests
Verbal Math Total
Based on students' highest verbal and highest math scores
System College Prep. Endorsement Other Diplomas
489 475 964 507 506 1013 437 393 830
Georgia
492 488 980
Based on students' last test administration
System Georgia
51
486 473
959
41,958 483 479 962
Nation
952,913 502 508 1010
American College Testing (ACT)
System State Nation
English Mathematics Reading Science Reasoning
N/A N/A N/A N/A
19.1 19.9 20.2 19.9
20.4 20.7 21.3 21.0
CompositeScore N/A * 19.9 21.9
* Scores not reported when fewer than 5 tests taken.
Advanced Placement Exams (AP)
No. of Students Taking Tests
No. of Tests Taken No. of Test Scores
3 or Higher Percent of Test
Scores 3 or Higher
System State 0 15,225
N/A 23,969 N/A 13,024
N/A 54.3%
1998-99 GEORGIA PUBLIC EDUCATION REPORT CARD Bleckley County Schools
Prepared by Georgia Department of Education
Page 6
POSTSECONDARY DATA
Graduates Entering Georgia Public Colleges and Universities
Graduates Entering Georgia Public Colleges and Universities and
Requiring Learning Support (LS)
1998 Graduates Entering 1998-99
1997 Graduates Entering 1997-98
Percent of Graduating Number Class
54
41.9%
50
38.2%
Number Requiring
LS
14
8
Percent of those attending Georgia
Public Colleges
25.9%
16.0%
In previous years, the Report Card presented College Prep Curriculum information provided by the Board of Regents on students requiring Learning Support. Due to inconsistencies in the data provided by the Board of Regents in defining College Prep Completers versus Local Board of Education data defining College Prep Endorsements, the Department of Education Report Card will not provide this information until discrepancies can be reconciled.
Graduates Entering Georgia Public Technical and Adult Schools
Entering 1998-99 Entering 1997-98
Number Percent
Number Percent
1998 Graduates 1997 Graduates
16
12.4%
1
0.8%
N/A 22
N/A 16.8%
ACCREDITATION / RECOGNITION DATA
Southern Association of Colleges and Schools (SACS) Accrediting Commission
Secondary/Middle Commission Elementary/Middle Commission Both Elementary/Secondary Commissions Joint Commission Candidate for Accreditation
Accreditation by Georgia Accrediting Commission (GAC)
Accredited by GAC Accredited with Quality by GAC
Number of Schools
1 0 0 0 0
Number of Schools
1 3
Awards / Recognition
State Recognized Program
Number of Schools
Charter School
0
Pay for Performance Recipient
1
Georgia School of Excellence
0
National Blue Ribbon School
0
COMMUNITY DATA
Number of Children Eligible for Migrant Education Number of Families-At-Risk * Number of Food Stamp Participants * Number of Families Receiving TANF * ** Per Capita Income * Unemployment Rate * 1990 Population * Projected 2000 Population * Projected 2010 Population *
* Data Available at County Level Only ** Known as AFDC before January 1997
0 39 1,376 176 $18,583 4.9% 10,430 11,427 11,894
1998-99 GEORGIA PUBLIC EDUCATION REPORT CARD Bleckley County Schools
Prepared by Georgia Department of Education
Page 7
FISCAL DATA
Millage Rate
13.40
* Fall 1998 Property Tax Digest is used to calculate the 98-99 Value of One Mill
FTE Count
FTE Count used for Allotment Calculation 2,234.0 Fall '98 FTE Count 2,244
Value of One Mill
$140,939 $63.08 per Allotment FTE
Sources: Local State-QBE State-
Lottery State-
Other Federal Other
Total
PerGeneral Fund cent Per FTE
$1,903,679 16.9% $852 $9,219,017 82.0% $4,127
K-12 Revenues
Lottery K-12
and
Title
All Other
Programs
K-12
$0
$17,564
Bonded Debt $0
$0
$0
$0
$0 0.0%
$0
$0
$50,374
$0
$117,836 1.0% $53
$0
$0
$0
$4,749 0.0%
$2 $769,018
$77,473
$0
$2,434 0.0%
$1
$0
$0
$0
$11,247,716 100% $5,035 $769,018 $145,412
$0
Capital Projects
$915,658 $0
$0
$0 $0 $0 $915,658
School Nutrition
$327,932 $0
$0
$66,586 $583,270
$0 $977,788
Grand Total
Total
Per-
Amount cent
$3,164,834 22.5%
$9,219,017 65.6%
$50,374 0.4%
$184,422 1.3% $1,434,511 10.2%
$2,434 0.0% $14,055,593 100%
Instruction
Media Instruction
Support Pupil Services General Admin. School Admin. Trans-
portation Maint. & Ops. Capital Projects School Food Debt Service
Total
$7,463,522 67.9% $3,341 $264,254 2.4% $118
$341,567 3.1% $153
$426,017 3.9% $191
$220,683 2.0% $99
$699,257 6.4% $313
$527,166 4.8% $236
$761,648 6.9% $341
$256,974 2.3% $115
$24,892 0.2% $11
$0 0.0%
$0
$10,985,983 100% $4,918
K-12 Expenditures
$529,509
$50,374
$0
$0
$3,994
$0
$0
$0
$61,039
$0
$0
$0
$89,291
$88,361
$0
$0
$81,951
$0
$0
$0
$0
$0
$0
$0
$3,389
$0
$0 $127,182
$0
$0
$0
$0
$0
$0
$0 $1,018,795
$0
$0
$0
$0
$0
$0 $101,010
$0
$769,176 $138,735 $101,010 $1,145,977
$0 $0 $0 $0 $0 $0 $0 $0 $0 $979,868 $0
$8,043,406 57.0% $268,249 1.9% $402,606 2.9% $603,670 4.3% $302,634 2.1% $699,257 5.0% $657,738 4.7% $761,648 5.4%
$1,275,769 9.0% $1,004,761 7.1%
$101,010 0.7%
$979,868 $14,120,752 100%
Salaries and Benefits as Percentages of Revenues and of Expenditures
Teachers and Paraprofessionals
Salaries $6,081,173
Benefits $1,361,175
Percentage of Revenues Percentage of Expenditures
Total of
Total of
General Fund
General Fund
Title Programs
Title Programs
Lottery K-12
Lottery K-12
Total Salaries
and
Total
and
Total
and Benefits All Other K-12 K - 12 All Other K-12 K - 12
$7,442,348
61.2%
52.9%
62.6%
52.7%
School Administration
$461,571
$116,134
$577,705
4.8%
4.1%
4.9%
4.1%
General Administration
$140,015
$40,476
$180,491
1.5%
1.3%
1.5%
1.3%
1998-99 GEORGIA PUBLIC EDUCATION REPORT CARD
Bleckley County Schools - 612
Prepared by Georgia Department of Education
Page 8
CERTIFIED PERSONNEL DATA
Number
Average Annual Salary Positions Average Contract Days
Average Daily Salary
Full-time Personnel Part-time
Sex Male Female
4 Yr Bachelor's Certificate 5 Yr Master's
Level 6 Yr Specialist's 7 Yr Doctoral Other*
Black
White Race/ Hispanic Ethnicity Asian
American Indian
Multiracial
Years Experience
<1 1-10 11-20 21-30 >30
Average
Administrators
13.80
$57,735.80 211.45
$273.05
13 2
6 9
1 5 7 2 0
0 15
0 0 0 0
0 2 4 7 2
23.47
Support Personnel PK-12 Teachers
15.50
157.60
$42,229.77 187.29
$225.48
$38,046.75 190.85
$199.35
15
156
1
3
3
26
13
133
2
74
12
66
2
16
0
2
0
1
0
12
16
146
0
0
0
0
0
0
0
1
1
13
4
42
6
54
4
45
1
5
15.38
14.70
*Includes One- and Two-Year Vocational Certificates.
Certified Staff Position Ratios
Teacher/Administrator Ratio 11:1
Teacher/Support Person Ratio 10:1
Teacher/Staff Ratio 5:1
Student Enrollment/All Teachers 14:1
Certified Personnel by Category
83.7% 100%
7.9%
8.4%
80% 60%
40%
20%
0%
Teachers
Administrators
Support Personnel
1998-99 GEORGIA PUBLIC EDUCATION REPORT CARD
Bleckley County Schools - 612
Prepared by Georgia Department of Education
Page 9
1998-99 GEORGIA PUBLIC EDUCATION REPORT CARD
BLECKLEY COUNTY SCHOOLS
Bleckley County Elementary School - 6120197
Grade Range 3-5
The Georgia Public Education Report Card is designed to assist systems and schools in educational improvement. This report card contains a variety of data elements. An explanation of the terms is provided as a companion to the report card data. Please refer to the definitions for the most effective use of the reported data.
STUDENT DATA
Total 543
3-5 Enrollment, by Race/Ethnicity and Sex
Black
White Hispanic
American Multi-
Asian Indian
racial
158 29.1%
378 69.6%
2 0.4%
1 0.2%
0 0.0%
4 0.7%
Male Female
272 50.1%
271 49.9%
Enrollment in Selected Programs
Program
Program % of Student Enrollment Population
Gifted (Grades K-12)
44
8.1%
Alternative Programs (Grades 6-12)
N/A
N/A
Students Eligible to Receive Free/Reduced Lunches
Number
Percent
School System
285 1,159
52.5% 48.8%
Dropout Rate *
Number
Rate
School System
N/A N/A
N/A N/A
* Dropout rates are not applicable for grades PK-5.
Enrollment in Compensatory Programs
Program
Program % of Student Enrollment Population
Special Education (Grades K-12)
74 13.6%
(PK)
0
N/A
English to Speakers of Other Languages (ESOL) (Grades K-12)
0
0.0%
Remedial Education (Grades 2-5, 9-12)
79 14.5%
Special Instructional Assistance (SIA) (Grades K-3)
0
0.0%
Title I (Grades K-12)
This school has no Title I program.
Total 6
Retained Students, by Race/Ethnicity and Sex
Black
White Hispanic
American Multi-
Asian Indian
racial
2 33.3%
4 66.7%
0 0.0%
0 0.0%
0 0.0%
0 0.0%
Male Female
5
1
83.3% 16.7%
Prepared by Georgia Department of Education
Page 1
STATE-REQUIRED TEST DATA
NORM-REFERENCED TESTS Grade 3
Iowa Tests of Basic Skills (ITBS) Each chart reflects data for three years of testing.
Reading Comprehension 50
67 67 54 0
98-99
62 62 53 97-98
67 67 52 96-97
Mathematics
School 50
System
State
0
70 70 61 98-99
73 73 61 97-98
72 72 59 96-97
School System State
Reading Vocabulary 50
59 59 50 0
98-99
61 61 50 97-98
55 55 49 96-97
Language Arts
School 50
System
State
0
71 71 64 98-99
71 71 62 97-98
62 62 59 96-97
School System State
Social Studies 50
63 63 56 0
98-99
62 62 55 97-98
57 57 55 96-97
Science
School 50
System
State
0
69 69 59 98-99
67 67 59 97-98
70 70 58 96-97
School System State
Sources of Information
Composite Score
50
63 63 57 0
98-99
School 50
System
59 59 56 97-98
61 61 55 96-97
State 0
67 67 58 98-99
66 66 57 97-98
1998-99 GEORGIA PUBLIC EDUCATION REPORT CARD Bleckley County Elementary School - 6120197
Prepared by Georgia Department of Education
64 64 56 96-97
Scores Reported in Percentiles
School System State
Page 2
STATE-REQUIRED TEST DATA
NORM-REFERENCED TESTS Grade 5
Iowa Tests of Basic Skills (ITBS) Each chart reflects data for three years of testing.
Reading Comprehension
Mathematics
50
57 57 53 0
98-99
55 55 53 97-98
50 50 52 96-97
School 50
System
State
0
67 67 59 98-99
68 68 58 97-98
63 63 57 96-97
School System State
Reading Vocabulary 50
53 53 48 0
98-99
53 53 48 97-98
45 45 46 96-97
Language Arts
School 50
System
State
0
71 71 63 98-99
60 60 61 97-98
50 50 58 96-97
School System State
Social Studies 50
68 68 57 0
98-99
65 65 56 97-98
54 54 55 96-97
Science
School 50
System
State
0
71 71 60 98-99
63 63 59 97-98
58 58 59 96-97
School System State
Sources of Information
Composite Score
50
63 63 58 0
98-99
School 50
System
59 59 58 97-98
55 55 57 96-97
State 0
66 66 57 98-99
61 61 56 97-98
53 53 55 96-97
1998-99 GEORGIA PUBLIC EDUCATION REPORT CARD Bleckley County Elementary School - 6120197
Prepared by Georgia Department of Education
Scores Reported in Percentiles
School System State
Page 3
STATE-REQUIRED TEST DATA
PERFORMANCE ASSESSMENTS
Grade 5 Writing Assessment
Percent at Developmental Stages:
1998-99 School System State
1997-98 School System State
1996-97 School System State
Stage Stage Stage Stage Stage Stage
1:The Emerging Writer 2:The Developing Writer 3:The Focusing Writer 4:The Experimenting 5:The Engaging Writer 6:The Extending Writer
0% 1% 19% 44% 23% 14%
0% 1% 19% 44% 23% 14%
0% 1% 16% 41% 29% 12%
0% 1% 24% 36% 24% 15%
0% 1% 24% 36% 24% 15%
0% 3% 19% 41% 27% 10%
1% 5% 23% 29% 27% 15%
1% 5% 23% 29% 27% 15%
0% 3% 21% 37% 26% 12%
AWARDS / RECOGNITION DATA
Through the Pay for Performance Program, exemplary public schools and schools making outstanding progress toward becoming exemplary may be rewarded. Not a merit pay program, the Pay for Performance Program motivates and rewards entire school faculties for working together to make their schools exemplary. A school selected for participation in the program has one school year to attain at least 80% of its previously-approved performance objectives in order to receive an award based on $2,000 per certified faculty member.
Bleckley County Elementary School was a Pay for Performance recipient in 1998-99.
1998-99 GEORGIA PUBLIC EDUCATION REPORT CARD Bleckley County Elementary School - 6120197
Prepared by Georgia Department of Education
Page 4
CERTIFIED PERSONNEL DATA
Positions Number Average Contract Days
Personnel Sex
Certificate
Years Experience
Full-time Part-time
Male Female
4 Yr Bachelor's 5 Yr Master's 6 Yr Specialist's 7 Yr Doctoral Other*
<1 1-10 11-20 21-30 >30
Average
Administrators
2.00 220.00
2 0
0 2
0 1 1 0 0 0 0 0 2 0 25.00
Support Personnel
1.30 171.08
1 1
0 2
0 2 0 0 0 0 0 1 1 0 21.00
PK-12 Teachers
33.40 190.00
32 2
1 33
16 11
6 1 0 5 12 9 7 1 11.76
*Includes One- and Two-Year Vocational Certificates.
ACCREDITATION DATA
Accredited with Quality by Georgia Accrediting Commission (GAC).
1998-99 GEORGIA PUBLIC EDUCATION REPORT CARD Bleckley County Elementary School - 6120197
Prepared by Georgia Department of Education
Page 5
1998-99 GEORGIA PUBLIC EDUCATION REPORT CARD
BLECKLEY COUNTY SCHOOLS
Bleckley County High School - 6120377
Grade Range 9-12
The Georgia Public Education Report Card is designed to assist systems and schools in educational improvement. This report card contains a variety of data elements. An explanation of the terms is provided as a companion to the report card data. Please refer to the definitions for the most effective use of the reported data.
Total 639
STUDENT DATA
9-12 Enrollment, by Race/Ethnicity and Sex
Black
White Hispanic
American Multi-
Asian Indian
racial
195 30.5%
436 68.2%
0 0.0%
5 0.8%
1 0.2%
2 0.3%
Male Female
304 47.6%
335 52.4%
Enrollment in Selected Programs
Program
Gifted (Grades K-12)
Program % of Student Enrollment Population
53
8.3%
Non-Vocational Labs (Grades 9-12)
349
Vocational Labs
(Grades 9-12)
420
Alternative Programs (Grades 6-12)
10
54.6% 65.7%
1.6%
Students Eligible to Receive Free/Reduced Lunches
Number
Percent
School System
244 1,159
38.2% 48.8%
Enrollment in Compensatory Programs
Program
Program % of Student Enrollment Population
Special Education (Grades K-12) PK
66 10.3%
0
N/A
English to Speakers of Other Languages (ESOL) (Grades K-12)
0
0.0%
Remedial Education (Grades 2-5, 9-12)
78 12.2%
Title I (Grades K-12)
This school has no Title I program.
Dropout Rate for Grades 9-12
Number
Rate
School System
54
7.9%
54
7.9%
Total 40
Retained Students, by Race/Ethnicity and Sex
Black
White Hispanic
American MultiAsian Indian racial
23 57.5%
16 40.0%
0 0.0%
0 0.0%
0 0.0%
1 2.5%
Male Female
25
15
62.5% 37.5%
Prepared by Georgia Department of Education
Page 1
STATE-REQUIRED TEST DATA
GEORGIA HIGH SCHOOL GRADUATION TESTS (GHSGT)
Percent of Regular Program 11th Graders Passing the Georgia High School Graduation Tests on First Administration
English Language Arts Mathematics Social Studies Science
All Components listed above
Writing
1998-99
School System State
97% 94% 77% 77%
97% 94% 77% 77%
96% 88% 80% 72%
72% 72% 68%
98% 98% 93%
1997-98
School System State
94% 89% 67% 66%
94% 89% 67% 66%
94% 88% 78% 74%
56% 56% 68%
88% 88% 92%
1996-97
School System State
92% 86% 78% 84%
92% 86% 78% 84%
94% 87% 78% 74%
73% 73% 67%
91% 91% 93%
GRADUATE DATA
1999 Graduates by Credentials, Race/Ethnicity and Sex
Diplomas with Both College Prep. & Voc. Endorsements
Diplomas with College Prep. Endorsements Diplomas with Vocational Endorsements General High School Diplomas Special Education Diplomas
Total All Diplomas
Certificates of Performance
Total Graduates
Total 0
Black 0
White Hispanic
0
0
American MultiAsian Indian racial
0
0
0
46
2
43
0
1
0
0
4.3% 93.5% 0.0% 2.2% 0.0% 0.0%
68
21
46
0
0
0
1
30.9% 67.6% 0.0% 0.0% 0.0% 1.5%
0
0
0
0
0
0
0
8
6
2
0
0
0
0
75.0% 25.0% 0.0% 0.0% 0.0% 0.0%
122
29
91
0
1
0
1
23.8% 74.6% 0.0% 0.8% 0.0% 0.8%
0
0
0
0
0
0
0
122
29
91
0
1
0
1
23.8% 74.6% 0.0% 0.8% 0.0% 0.8%
Male Female
0
0
21 45.7%
33 48.5%
0
25 54.3%
35 51.5%
0
5 62.5%
59 48.4%
0
3 37.5%
63 51.6%
0
59
63
48.4% 51.6%
HOPE Scholarships
School System
Number of 1999 Graduates 1 2 2
Number Eligible
65
Percent Eligible
53.3%
122 65
53.3%
State
65,548 40,292 61.5%
High School Completion Rate
Percent of 1995Grade 9 Enrollment in Graduating Class of1999 School System State
Completion Rate '95-'99 65.6% 65.6% 68.9%
1998-99 GEORGIA PUBLIC EDUCATION REPORT CARD
Bleckley County High School - 6120377
Prepared by Georgia Department of Education
Page 2
COLLEGE ADMISSIONS / CREDIT TEST DATA
Scholastic Assessment Test (SAT)
Based on students' highest verbal and highest math scores
No. Taking
Average Score
Tests Verbal Math Total
Based on students' last test administration
Average Score Verbal Math Total
School
51
College Prep. Endorsement
Other Diplomas
System
51
College Prep. Endorsement
Other Diplomas
Georgia
41,958
489 475
964
507 506 1013
437 393
830
489 475
964
507 506 1013
437 393
830
492 488
980
486 N/A N/A
486 N/A N/A
483
473 N/A N/A
473 N/A N/A
479
959 N/A N/A
959 N/A N/A
962
Nation
952,913 N/A N/A N/A
502 508 1010
American College Testing (ACT)
Advanced Placement Exams (AP)
Number taking tests: English Mathematics Reading Science Reasoning
4 * School N/A N/A N/A N/A
System N/A N/A N/A N/A
State 19.1 19.9 20.2 19.9
CompositeScore
N/A
N/A 19.9
* Scores are not reported when fewer than 5 take the ACT
No. of Students Taking Tests
No. of Tests Taken No. of Test Scores
3 or Higher Percent of Test
Scores 3 or Higher
School 0
N/A N/A
N/A
System State 0 15,225
N/A 23,969 N/A 13,024
N/A 54.3%
POST-SECONDARY DATA
Graduates Entering Georgia Public Colleges
Graduates Entering Georgia Public Colleges and Requiring Learning Support (LS)
1998 Graduates Entering in 1998-99
1997 Graduates Entering in 1997-98
Percent of Graduating Number Class
School
54
41.9%
System 5 4
41.9%
School
50
38.2%
System 5 0
38.2%
Number Requiring
LS 14 14
8 8
Percent of those attending Georgia
Public Colleges
25.9%
25.9%
16.0%
16.0%
In previous years, the Report Card presented College Prep Curriculum information provided by the Board of Regents on students requiring Learning Support. Due to inconsistencies in the data provided by the Board of Regents in defining College Prep Completers versus Local Board of Education data defining College Prep Endorsements, the Department of Education Report Card will not provide this information until discrepancies can be reconciled.
Graduates Entering Georgia Public Technical and Adult Schools
1998 Graduates School System
Entering Number 16 16
1998-99 Percent 12.4% 12.4%
Entering Number N/A N/A
1997-98 Percent
N/A N/A
1997 Graduates School
1
0.8%
System
1
0.8%
22
16.8%
22
16.8%
1998-99 GEORGIA PUBLIC EDUCATION REPORT CARD Bleckley County High School - 6120377
Prepared by Georgia Department of Education
Page 3
CERTIFIED PERSONNEL DATA
Positions Number Average Contract Days
Administrators
3.40 215.29
Support Personnel
2.50 198.00
PK-12 Teachers
43.00 192.37
Personnel Sex
Certificate
Years Experience
Full-time Part-time
Male Female
4 Yr Bachelor's 5 Yr Master's 6 Yr Specialist's 7 Yr Doctoral Other*
<1 1-10 11-20 21-30 >30
Average
3 1
3 1
1 1 1 1 0
0 1 0 3 0
21.50
2 1
2 1
1 2 0 0 0
0 0 1 1 1
25.33
41 4
18 27
23 18
3 0 1
6 12 13 14
0
13.76
*Includes One- and Two-Year Vocational Certificates.
ACCREDITATION DATA
Accredited by Southern Association of Colleges and Schools (SACS): Secondary/Middle Commission.
Accredited by Georgia Accrediting Commission (GAC).
AWARDS / RECOGNITION DATA
Schools in Georgia may receive recognition in the following programs: Charter School Pay for Performance Program Georgia School of Excellence National Blue Ribbon School Bleckley County High School did not receive recognition in any of these programs during the 1998-99 school year.
1998-99 GEORGIA PUBLIC EDUCATION REPORT CARD Bleckley County High School - 6120377
Prepared by Georgia Department of Education
Page 4
1998-99 GEORGIA PUBLIC EDUCATION REPORT CARD
BLECKLEY COUNTY SCHOOLS
Bleckley County Middle School - 6120277
Grade Range 6-8
The Georgia Public Education Report Card is designed to assist systems and schools in educational improvement. This report card contains a variety of data elements. An explanation of the terms is provided as a companion to the report card data. Please refer to the definitions for the most effective use of the reported data.
STUDENT DATA
Total 490
6-8 Enrollment, by Race/Ethnicity and Sex
Black
White Hispanic
American Multi-
Asian Indian
racial
146 29.8%
333 68.0%
1 0.2%
6 1.2%
0 0.0%
4 0.8%
Male 254
51.8%
Female 236
48.2%
Enrollment in Selected Programs
Program
Gifted (Grades K-12)
Program % of Student Enrollment Population
45
9.2%
Alternative Programs (Grades 6-12)
0
0.0%
Students Eligible to Receive Free/Reduced Lunches
Number
Percent
School System
226 1,159
46.1% 48.8%
Enrollment in Compensatory Programs
Program
Program % of Student Enrollment Population
Special Education (Grades K-12) (PK)
74 15.1%
0
N/A
English to Speakers of Other Languages (ESOL) (Grades K-12)
0
0.0%
Title I (Grades K-12)
This school has a schoolwide program.
Dropout Rate for Grades 6-8
Number
Rate
School System
3
0.6%
3
0.6%
Total 11
Retained Students, by Race/Ethnicity and Sex
Black
White Hispanic
American MultiAsian Indian racial
5 45.5%
6 54.5%
0 0.0%
0 0.0%
0 0.0%
0 0.0%
Male Female
7
4
63.6% 36.4%
Prepared by Georgia Department of Education
Page 1
STATE-REQUIRED TEST DATA
NORM-REFERENCED TESTS Grade 8
Iowa Tests of Basic Skills (ITBS) Each chart reflects data for three years of testing.
Reading Comprehension 50
62 62 49 0
98-99
51 51 48 97-98
51 51 48 96-97
Mathematics
School 50
System
State
0
72 72 56 98-99
62 62 55 97-98
59 59 54 96-97
School System State
Reading Vocabulary 50
54 54 46 0
98-99
47 47 45 97-98
45 45 44 96-97
Language Arts
School 50
System
State
0
72 72 60 98-99
52 52 58 97-98
45 45 56 96-97
School System State
Social Studies 50
61 61 54 0
98-99
52 52 53 97-98
51 51 53 96-97
Science
School 50
System
State
0
63 63 56 98-99
56 56 55 97-98
54 54 53 96-97
School System State
Sources of Information
Composite Score
50
66 66 57 0
98-99
School 50
System
59 59 56 97-98
54 54 55 96-97
State 0
67 67 56 98-99
56 56 54 97-98
1998-99 GEORGIA PUBLIC EDUCATION REPORT CARD Bleckley County Middle School - 6120277
Prepared by Georgia Department of Education
53 53 54 96-97
Scores Reported in Percentiles
School System State
Page 2
STATE-REQUIRED TEST DATA
Categories of Scaled Scores
Inadequate (less than 162)
Minimal (162-209)
Good
(210-247)
Very Good (greater than 247)
Average Scaled Score: (Range 100-300)
PERFORMANCE ASSESSMENTS
Grade 8 Writing Assessment
1998-99 Percent Scoring
1997-98 Percent Scoring
1996-97 Percent Scoring
School System State School System State School System State
4% 37% 44% 15%
4% 37% 44% 15%
8% 40% 41% 11%
19% 41% 34%
7%
19% 41% 34%
7%
11% 46% 34%
8%
18% 51% 25%
6%
18% 51% 25%
6%
15% 46% 30%
8%
215
215
208 199
199 202 195
195 198
AWARDS / RECOGNITION DATA
Schools in Georgia may receive recognition in the following programs: Charter School Pay for Performance Program Georgia School of Excellence National Blue Ribbon School Bleckley County Middle School did not receive recognition in any of these programs during the 1998-99 school year.
1998-99 GEORGIA PUBLIC EDUCATION REPORT CARD Bleckley County Middle School - 6120277
Prepared by Georgia Department of Education
Page 3
CERTIFIED PERSONNEL DATA
Positions Number Average Contract Days
Personnel Sex
Certificate
Years Experience
Full-time Part-time
Male Female
4 Yr Bachelor's 5 Yr Master's 6 Yr Specialist's 7 Yr Doctoral Other*
<1 1-10 11-20 21-30 >30
Average
Administrators
2.00 205.00
2 0
1 1
0 1 1 0 0 0 0 1 1 0 21.00
Support Personnel
3.20 184.88
3 1
0 4
0 3 1 0 0 0 1 2 1 0 13.75
PK-12 Teachers
36.60 190.87
36 1
6 31
18 14
4 1 0 1 8 16 10 2 16.86
*Includes One- and Two-Year Vocational Certificates.
ACCREDITATION DATA
Accredited with Quality by Georgia Accrediting Commission (GAC).
1998-99 GEORGIA PUBLIC EDUCATION REPORT CARD Bleckley County Middle School - 6120277
Prepared by Georgia Department of Education
Page 4
1998-99 GEORGIA PUBLIC EDUCATION REPORT CARD
BLECKLEY COUNTY SCHOOLS
Bleckley County Primary School - 6121050
Grade Range PK-2
The Georgia Public Education Report Card is designed to assist systems and schools in educational improvement. This report card contains a variety of data elements. An explanation of the terms is provided as a companion to the report card data. Please refer to the definitions for the most effective use of the reported data.
STUDENT DATA
Total
K-2
572
PK
130
Enrollment, by Race/Ethnicity and Sex
Black
White Hispanic
American Asian Indian
Multiracial
188 32.9%
371 64.9%
5 0.9%
7 1.2%
0 0.0%
1 0.2%
56 43.1%
73 56.2%
1 0.8%
0 0.0%
0 0.0%
0 0.0%
Male Female
280 49.0%
292 51.0%
66 50.8%
64 49.2%
Enrollment in Selected Programs
Program
Program % of Student Enrollment Population
Gifted (Grades K-12)
9
1.6%
Alternative Programs (Grades 6-12)
N/A
N/A
Students Eligible to Receive Free/Reduced Lunches
Number
Percent
School System
404 1,159
57.5% 48.8%
Dropout Rate *
Number
Rate
School System
N/A N/A
N/A N/A
* Dropout rates are not applicable for grades PK-5.
Enrollment in Compensatory Programs
Program
Program % of Student Enrollment Population
Special Education (Grades K-12)
102 17.8%
(PK)
9
N/A
English to Speakers of Other Languages (ESOL) (Grades K-12)
0
0.0%
Remedial Education (Grades 2-5, 9-12)
50 25.4%
Special Instructional Assistance (SIA) (Grades K-3)
90 15.7%
Title I (Grades K-12)
This school has a schoolwide program.
Total 22
Retained Students, by Race/Ethnicity and Sex
Black
White Hispanic
American MultiAsian Indian racial
14 63.6%
8 36.4%
0 0.0%
0 0.0%
0 0.0%
0 0.0%
Male Female
11
11
50.0% 50.0%
Prepared by Georgia Department of Education
Page 1
STATE-REQUIRED TEST DATA
NORM-REFERENCED TESTS
Grade 3 Iowa Tests of Basic Skills (ITBS) Each chart reflects data for three years of testing.
No third-grade students are enrolled at Bleckley County Primary School.
Reading Comprehension
Mathematics
50
N/A 67 54 0
98-99
N/A 62 53 97-98
N/A 67 52 96-97
School 50
System
State
N/A 70 61 0
98-99
N/A 73 61 97-98
N/A 72 59 96-97
School System State
Reading Vocabulary 50
N/A 59 50 0
98-99
N/A 61 50 97-98
N/A 55 49 96-97
Language Arts
School 50
System
State
N/A 71 64 0
98-99
N/A 71 62 97-98
N/A 62 59 96-97
School System State
Social Studies 50
N/A 63 56 0
98-99
N/A 62 55 97-98
N/A 57 55 96-97
Science
School 50
System
State
N/A 69 59 0
98-99
N/A 67 59 97-98
N/A 70 58 96-97
School System State
Sources of Information
Composite Score
School
50
50
System
N/A 63 57 0
98-99
N/A 59 56 N/A 61 55
97-98
96-97
State
N/A 67 58 0
98-99
N/A 66 57 97-98
N/A 64 56 96-97
1998-99 GEORGIA PUBLIC EDUCATION REPORT CARD Bleckley County Primary School - 6121050
Prepared by Georgia Department of Education
Scores Reported in Percentiles
School System State
Page 2
STATE-REQUIRED TEST DATA
NORM-REFERENCED TESTS
Grade 5 Iowa Tests of Basic Skills (ITBS) Each chart reflects data for three years of testing. No fifth-grade students are enrolled at Bleckley County Primary School.
Reading Comprehension
Mathematics
50
N/A 57 53 0
98-99
N/A 55 53 97-98
N/A 50 52 96-97
School 50
System
State
N/A 67 59 0
98-99
N/A 68 58 97-98
N/A 63 57 96-97
School System State
Reading Vocabulary 50
N/A 53 48 0
98-99
N/A 53 48 97-98
N/A 45 46 96-97
Language Arts
School 50
System
State
N/A 71 63 0
98-99
N/A 60 61 97-98
N/A 50 58 96-97
School System State
Social Studies 50
N/A 68 57 0
98-99
N/A 65 56 97-98
N/A 54 55 96-97
Science
School 50
System
State
N/A 71 60 0
98-99
N/A 63 59 97-98
N/A 58 59 96-97
School System State
Sources of Information
Composite Score
School
50
50
System
N/A 63 58 0
98-99
N/A 59 58 N/A 55 57
97-98
96-97
State
N/A 66 57 0
98-99
N/A 61 56 97-98
N/A 53 55 96-97
1998-99 GEORGIA PUBLIC EDUCATION REPORT CARD Bleckley County Primary School - 6121050
Prepared by Georgia Department of Education
Scores Reported in Percentiles
School System State
Page 3
STATE-REQUIRED TEST DATA
PERFORMANCE ASSESSMENTS
Grade 5 Writing Assessment
Percent at Developmental Stages:
1998-99 School System State
1997-98 School System State
1996-97 School System State
Stage Stage Stage Stage Stage Stage
1:The Emerging Writer 2:The Developing Writer 3:The Focusing Writer 4:The Experimenting 5:The Engaging Writer 6:The Extending Writer
N/A N/A N/A N/A N/A N/A
0% 1% 19% 44% 23% 14%
0% 1% 16% 41% 29% 12%
N/A N/A N/A N/A N/A N/A
0% 1% 24% 36% 24% 15%
0% 3% 19% 41% 27% 10%
N/A N/A N/A N/A N/A N/A
No fifth-grade students are enrolled at Bleckley County Primary School.
1% 5% 23% 29% 27% 15%
0% 3% 21% 37% 26% 12%
AWARDS / RECOGNITION DATA
Schools in Georgia may receive recognition in the following programs: Charter School Pay for Performance Program Georgia School of Excellence National Blue Ribbon School Bleckley County Primary School did not receive recognition in any of these programs during the 1998-99 school year.
1998-99 GEORGIA PUBLIC EDUCATION REPORT CARD Bleckley County Primary School - 6121050
Prepared by Georgia Department of Education
Page 4
CERTIFIED PERSONNEL DATA
Positions Number Average Contract Days
Personnel Sex
Certificate
Years Experience
Full-time Part-time
Male Female
4 Yr Bachelor's 5 Yr Master's 6 Yr Specialist's 7 Yr Doctoral Other*
<1 1-10 11-20 21-30 >30
Average
Administrators
2.00 205.00
2 0
1 1
0 0 2 0 0 0 1 0 1 0 18.50
Support Personnel
5.50 182.55
5 1
0 6
0 6 0 0 0 0 3 2 1 0 12.83
PK-12 Teachers
43.60 190.00
43 2
1 44
18 24
3 0 0 1 9 17 16 2 16.56
*Includes One- and Two-Year Vocational Certificates.
ACCREDITATION DATA
Accredited with Quality by Georgia Accrediting Commission (GAC).
1998-99 GEORGIA PUBLIC EDUCATION REPORT CARD Bleckley County Primary School - 6121050
Prepared by Georgia Department of Education
Page 5
1998-99 GEORGIA PUBLIC EDUCATION REPORT CARD BRANTLEY COUNTY SCHOOLS - 613
The Georgia Public Education Report Card is designed to assist systems and schools in educational improvement. This report card contains a variety of data elements. An explanation of the terms is provided as a companion to the report card data. Please refer to the definitions for the most effective use of the reported data.
Total
K-12
3,007
PK
127
STUDENT DATA
Enrollment, by Race/Ethnicity and Sex
Black
White Hispanic
American Multi-
Asian Indian
racial
136 4.5%
2,847 94.7%
8 0.3%
4 0.1%
1 0.0%
11 0.4%
6 4.7%
119 93.7%
1 0.8%
0 0.0%
0 0.0%
1 0.8%
Male
1,566 52.1%
59 46.5%
Female
1,441 47.9%
68 53.5%
Enrollment in Selected Programs
Program
Program % of Student Enrollment Population
Gifted (Grades K-12)
148
4.9%
Non-Vocational Labs (Grades 9-12)
647
78.0%
Vocational Labs (Grades 9-12)
632
76.2%
Alternative Programs (Grades 6-12)
0
0.0%
Students Eligible to Receive Free/Reduced Lunches
Number
Percent
1,574
50.2%
Dropout Rate
Number
Percent
6-12 9-12
103
6.0%
101
11.3%
Enrollment in Compensatory Programs
Program
Program % of Student Enrollment Population
Special Education
(Grades K-12)
343
PK
19
English to Speakers of
Other Languages (ESOL)
0
(Grades K-12)
Remedial Education (Grades 2-5, 9-12)
180
Special Instructional
Assistance (SIA)
212
(Grades K-3)
Title I (Grades K-12) Number of schools with: Schoolwide program Targeted Assistance program No Title I program
11.4% N/A
0.0%
10.2%
21.9%
3 0 2
Total 120
Retained Students, by Race/Ethnicity and Sex
Black
White Hispanic
American MultiAsian Indian racial
3 2.5%
116 96.7%
0 0.0%
1 0.8%
0 0.0%
0 0.0%
Male Female
81
39
67.5% 32.5%
Prepared by Georgia Department of Education
Page 1
STATE-REQUIRED TEST DATA
NORM-REFERENCED TESTS
Grade 3 Iowa Tests of Basic Skills (ITBS) Each chart reflects data for three years of testing.
Reading Comprehension
Mathematics
50
53 54 49 53 48 52 0
98-99 97-98 96-97
System State
50
55 61 53 61 50 59 0
98-99 97-98 96-97
System State
Reading Vocabulary
50
50 50 45 50 45 49 0
98-99 97-98 96-97
System State
Social Studies
50
50 56 42 55 51 55 0
98-99 97-98 96-97
System State
Language Arts
50
59 64 57 62 42 59 0
98-99 97-98 96-97
System State
Science
50
49 59 48 59 46 58 0
98-99 97-98 96-97
System State
Sources of Information
Composite Score
50
54 57 0
98-99
System
50
49 56 47 55 97-98 96-97
State
53 58 48 57 0
98-99 97-98
1998-99 GEORGIA PUBLIC EDUCATION REPORT CARD Brantley County Schools
Prepared by Georgia Department of Education
System State Scores Reported 46 56 in Percentiles 96-97
Page 2
STATE-REQUIRED TEST DATA
NORM-REFERENCED TESTS
Grade 5 Iowa Tests of Basic Skills (ITBS) Each chart reflects data for three years of testing.
Reading Comprehension
Mathematics
50
54 53 46 53 49 52 0
98-99 97-98 96-97
System State
50
49 59 45 58 48 57 0
98-99 97-98 96-97
System State
Reading Vocabulary
50
46 48 41 48 46 46 0
98-99 97-98 96-97
System State
Social Studies
50
53 57 47 56 46 55 0
98-99 97-98 96-97
System State
Language Arts
50
54 63 57 61 44 58 0
98-99 97-98 96-97
System State
Science
50
59 60 49 59 51 59 0
98-99 97-98 96-97
System State
Sources of Information
Composite Score
50
49 58 0
98-99
System
50
46 58 47 57 97-98 96-97
State
51 57 46 56 0
98-99 97-98
1998-99 GEORGIA PUBLIC EDUCATION REPORT CARD Brantley County Schools
Prepared by Georgia Department of Education
System State Scores Reported 46 55 in Percentiles 96-97
Page 3
STATE-REQUIRED TEST DATA
NORM-REFERENCED TESTS Grade 8
Iowa Tests of Basic Skills (ITBS) Each chart reflects data for three years of testing.
Reading Comprehension
Mathematics
50
50 49 43 48 43 48 0
98-99 97-98 96-97
System State
50
56 56 51 55 48 54 0
98-99 97-98 96-97
System State
Reading Vocabulary
50
46 46 41 45 38 44 0
98-99 97-98 96-97
System State
Language Arts
50
56 60 44 58 38 56 0
98-99 97-98 96-97
System State
Social Studies
50
55 54 50 53 45 53 0
98-99 97-98 96-97
System State
Science
50
59 56 51 55 42 53 0
98-99 97-98 96-97
System State
Sources of Information
Composite Score
50
54 57 0
98-99
System
50
49 56 42 55 97-98 96-97
State
55 56 47 54 0
98-99 97-98
1998-99 GEORGIA PUBLIC EDUCATION REPORT CARD Brantley County Schools
Prepared by Georgia Department of Education
System State Scores Reported 41 54 in Percentiles 96-97
Page 4
STATE-REQUIRED TEST DATA
PERFORMANCE ASSESSMENTS
Grade 5 Writing Assessment
1998-99
1997-98
1996-97
Percent at Developmental Stages:
Comparison
Comparison
Comparison
System Group State System Group State System Group State
Stage Stage Stage Stage Stage Stage
1: The Emerging Writer 2: The Developing Writer 3: The Focusing Writer 4: The Experimenting Writer 5: The Engaging Writer 6: The Extending Writer
0% 1% 20% 44% 30% 5%
0% 2% 21% 44% 25% 7%
0% 1% 16% 41% 29% 12%
0% 2% 22% 45% 22% 7%
0% 3% 22% 43% 23% 7%
0% 3% 19% 41% 27% 10%
0% 5% 25% 40% 25% 6%
0% 3% 23% 37% 26% 10%
0% 3% 21% 37% 26% 12%
Grade 8 Writing Assessment
1998-99 Percent Scoring 1997-98 Percent Scoring 1996-97 Percent Scoring
Categories of Scaled Scores
Comparison
Comparison
Comparison
System Group State System Group State System Group State
Inadequate (less than 162)
Minimal (162-209)
Good
(210-247)
Very Good (greater than 247)
8% 42% 44%
7%
8% 48% 38%
6%
8% 40% 41% 11%
8% 64% 26%
2%
13% 50% 31%
6%
11% 46% 34%
8%
23% 55% 20%
1%
18% 52% 24%
5%
15% 46% 30%
8%
Average Scaled Score: (Range 100-300)
206
203 208
194
197 202
186
192 198
GEORGIA HIGH SCHOOL GRADUATION TESTS (GHSGT)
Percent of Regular Program 11th Graders Passing the Georgia High School Graduation Tests on First Administration
1998-99
1997-98
1996-97
Comparison
Comparison
Comparison
System Group State System Group State System Group State
English Language Arts Mathematics Social Studies Science
96% 88% 81% 73%
94% 85% 74% 66%
96% 88% 80% 72%
94% 94% 70% 65%
93% 86% 73% 71%
94% 88% 78% 74%
92% 91% 69% 64%
94% 87% 76% 72%
94% 87% 78% 74%
All Components listed above 6 9 %
60% 68% 56%
63% 68% 58%
65% 67%
Writing
97%
90% 93% 94%
91% 92% 92%
92% 93%
1998-99 GEORGIA PUBLIC EDUCATION REPORT CARD
Brantley County Schools
Prepared by Georgia Department of Education
Page 5
GRADUATE DATA
1999 Graduates by Credentials, Race/Ethnicity and Sex
Diplomas with Both College Prep. & Voc. Endorsements
Diplomas with College Prep. Endorsements Diplomas with Vocational Endorsements General High School Diplomas Special Education Diplomas
Total All Diplomas
Certificates of Performance
Total Graduates
Total 25 35 71 0 10
141 19
160
Black
2 8.0%
2 5.7%
1 1.4%
0
American MultiWhite Hispanic Asian Indian racial
23 92.0%
32 91.4%
70 98.6%
0
0 0.0%
1 2.9%
0 0.0%
0
0 0.0%
0 0.0%
0 0.0%
0
0 0.0%
0 0.0%
0 0.0%
0
0 0.0%
0 0.0%
0 0.0%
0
Male Female
8 32.0%
18 51.4%
49 69.0%
0
17 68.0%
17 48.6%
22 31.0%
0
0 0.0%
5 3.5%
2 10.5%
7 4.4%
10 100.0%
135 95.7%
17 89.5%
152 95.0%
0 0.0%
1 0.7%
0 0.0%
1 0.6%
0 0.0%
0 0.0%
0 0.0%
0 0.0%
0 0.0%
0 0.0%
0 0.0%
0 0.0%
0 0.0%
0 0.0%
0 0.0%
0 0.0%
9 90.0%
84 59.6%
3 15.8%
87 54.4%
1 10.0%
57 40.4%
16 84.2%
73 45.6%
HOPE Scholarships
System State
Number of 1999 Graduates 1 6 0
Number Eligible
63
Percent Eligible
39.4%
65,548 40,292 61.5%
High School Completion Rate Percent of 1995Grade 9 Enrollment
in Graduating Class of1999
System
State
Completion Rate '95-'99 62.5% 68.9%
COLLEGE ADMISSIONS / CREDIT TEST DATA
Scholastic Assessment Test (SAT)
No. Taking
Average Score
Tests
Verbal Math Total
Based on students' highest verbal and highest math scores
System College Prep. Endorsement Other Diplomas
447 443 890 469 460 929 363 375 738
Georgia
492 488 980
Based on students' last test administration
System Georgia
70
442 436
878
41,958 483 479 962
Nation
952,913 502 508 1010
American College Testing (ACT)
System State Nation
English Mathematics Reading Science Reasoning
N/A N/A N/A N/A
19.1 19.9 20.2 19.9
20.4 20.7 21.3 21.0
CompositeScore N/A * 19.9 21.9
* Scores not reported when fewer than 5 tests taken.
Advanced Placement Exams (AP)
No. of Students Taking Tests
No. of Tests Taken No. of Test Scores
3 or Higher Percent of Test
Scores 3 or Higher
System State 0 15,225
N/A 23,969 N/A 13,024
N/A 54.3%
1998-99 GEORGIA PUBLIC EDUCATION REPORT CARD Brantley County Schools
Prepared by Georgia Department of Education
Page 6
POSTSECONDARY DATA
Graduates Entering Georgia Public Colleges and Universities
Graduates Entering Georgia Public Colleges and Universities and
Requiring Learning Support (LS)
1998 Graduates Entering 1998-99
1997 Graduates Entering 1997-98
Percent of Graduating Number Class
51
43.2%
43
36.4%
Number Requiring
LS
15
19
Percent of those attending Georgia
Public Colleges
29.4%
44.2%
In previous years, the Report Card presented College Prep Curriculum information provided by the Board of Regents on students requiring Learning Support. Due to inconsistencies in the data provided by the Board of Regents in defining College Prep Completers versus Local Board of Education data defining College Prep Endorsements, the Department of Education Report Card will not provide this information until discrepancies can be reconciled.
Graduates Entering Georgia Public Technical and Adult Schools
Entering 1998-99 Entering 1997-98
Number Percent
Number Percent
1998 Graduates 1997 Graduates
5
4.2%
1
0.8%
N/A 4
N/A 3.4%
ACCREDITATION / RECOGNITION DATA
Southern Association of Colleges and Schools (SACS) Accrediting Commission
Secondary/Middle Commission Elementary/Middle Commission Both Elementary/Secondary Commissions Joint Commission Candidate for Accreditation
Accreditation by Georgia Accrediting Commission (GAC)
Accredited by GAC Accredited with Quality by GAC
Number of Schools
1 0 0 0 0
Number of Schools
0 4
Awards / Recognition
State Recognized Program
Number of Schools
Charter School
0
Pay for Performance Recipient
0
Georgia School of Excellence
0
National Blue Ribbon School
0
COMMUNITY DATA
Number of Children Eligible for Migrant Education Number of Families-At-Risk * Number of Food Stamp Participants * Number of Families Receiving TANF * ** Per Capita Income * Unemployment Rate * 1990 Population * Projected 2000 Population * Projected 2010 Population *
* Data Available at County Level Only ** Known as AFDC before January 1997
4 29 1,611 75 $15,887 6.5% 11,077 14,863 16,017
1998-99 GEORGIA PUBLIC EDUCATION REPORT CARD Brantley County Schools
Prepared by Georgia Department of Education
Page 7
FISCAL DATA
Millage Rate
14.45
* Fall 1998 Property Tax Digest is used to calculate the 98-99 Value of One Mill
FTE Count
FTE Count used for Allotment Calculation 2,993.0 Fall '98 FTE Count 3,007
Value of One Mill
$163,466 $54.61 per Allotment FTE
Sources: Local State-QBE State-
Lottery State-
Other Federal Other
Total
PerGeneral Fund cent Per FTE
$2,422,498 17.4% $809 $11,359,766 81.8% $3,795
K-12 Revenues
Lottery K-12
and
Title
All Other
Programs
K-12
$0
$0
Bonded Debt $924,346
$0
$0
$0
$0 0.0%
$0
$0
$64,090
$0
$112,226 0.8% $37
$0 0.0%
$0
$229 0.0%
$0
$13,894,719 100% $4,641
$0 $1,117,389
-$229 $1,117,160
$0 $0 $0 $64,090
$0 $0 $0 $924,346
Capital Projects
$54,546 $0
$0
$608,202 $0 $0
$662,749
School Nutrition
$283,720 $0
$0
$75,130 $658,926
$6,192 $1,023,969
Grand Total
Total
Per-
Amount cent
$3,685,112 20.8%
$11,359,766 64.2%
$64,090 0.4%
$795,559 4.5% $1,776,315 10.0%
$6,192 0.0% $17,687,035 100%
Instruction
Media Instruction
Support Pupil Services General Admin. School Admin. Trans-
portation Maint. & Ops. Capital Projects School Food Debt Service
Total
K-12 Expenditures
$8,753,009 64.9% $2,924 $1,004,107
$64,090
$0
$0
$0
$392,045 2.9% $131
$15,959
$0
$0
$0
$0
$485,017 3.6% $162
$84,500
$0
$0
$0
$0
$383,698 2.8% $128
$17,316
$0
$0
$0
$0
$317,900 2.4% $106
$22,587
$0
$0
$0
$0
$880,175 6.5% $294
$140
$0
$0
$0
$0
$961,208 7.1% $321
$6,705
$0
$0
$0
$0
$1,155,684 8.6% $386
$0
$0
$0
$0
$0
$164,902 1.2% $55
$0
$0
$0 $1,764,745
$0
$0 0.0%
$0
$0
$0
$0
$0 $1,096,833
$0 0.0%
$0
$0
$0 $844,911
$0
$0
$13,493,642 100% $4,507 $1,151,316
$64,090 $844,911 $1,764,745 $1,096,833
$9,821,206 53.3% $408,005 2.2% $569,518 3.1% $401,015 2.2% $340,487 1.8% $880,315 4.8% $967,913 5.3%
$1,155,684 6.3% $1,929,648 10.5% $1,096,833 6.0%
$844,911 4.6%
$18,415,539 100%
Salaries and Benefits as Percentages of Revenues and of Expenditures
Teachers and Paraprofessionals
Salaries $7,256,168
Benefits $1,603,766
Percentage of Revenues Percentage of Expenditures
Total of
Total of
General Fund
General Fund
Title Programs
Title Programs
Lottery K-12
Lottery K-12
Total Salaries
and
Total
and
Total
and Benefits All Other K-12 K - 12 All Other K-12 K - 12
$8,859,934
58.8%
50.1%
60.2%
48.1%
School Administration
$553,272
$138,724
$691,996
4.6%
3.9%
4.7%
3.8%
General Administration
$142,207
$42,714
$184,921
1.2%
1.0%
1.3%
1.0%
1998-99 GEORGIA PUBLIC EDUCATION REPORT CARD
Brantley County Schools - 613
Prepared by Georgia Department of Education
Page 8
CERTIFIED PERSONNEL DATA
Number
Average Annual Salary Positions Average Contract Days
Average Daily Salary
Full-time Personnel Part-time
Sex Male Female
4 Yr Bachelor's Certificate 5 Yr Master's
Level 6 Yr Specialist's 7 Yr Doctoral Other*
Black
White Race/ Hispanic Ethnicity Asian
American Indian
Multiracial
Years Experience
<1 1-10 11-20 21-30 >30
Average
Administrators
14.98
$66,140.09 228.68
$289.23
14 1
9 6
0 3 9 3 0
0 15
0 0 0 0
0 0 5 8 2
22.60
Support Personnel PK-12 Teachers
13.61
200.85
$44,259.13 200.30
$220.96
$35,858.18 188.63
$190.10
13
166
43
36
22
38
34
164
28
116
19
65
9
19
0
0
0
2
1
1
55
201
0
0
0
0
0
0
0
0
7
30
18
87
18
45
12
36
1
4
12.91
11.09
*Includes One- and Two-Year Vocational Certificates.
Certified Staff Position Ratios
Teacher/Administrator Ratio 13:1
Teacher/Support Person Ratio 15:1
Teacher/Staff Ratio 7:1
Student Enrollment/All Teachers 15:1
Certified Personnel by Category
74.0% 100%
5.5% 20.5%
80% 60%
40%
20%
0%
Teachers
Administrators
Support Personnel
1998-99 GEORGIA PUBLIC EDUCATION REPORT CARD
Brantley County Schools - 613
Prepared by Georgia Department of Education
Page 9
1998-99 GEORGIA PUBLIC EDUCATION REPORT CARD
BRANTLEY COUNTY SCHOOLS
Brantley County High School - 6131050
Grade Range 9-12
The Georgia Public Education Report Card is designed to assist systems and schools in educational improvement. This report card contains a variety of data elements. An explanation of the terms is provided as a companion to the report card data. Please refer to the definitions for the most effective use of the reported data.
Total 829
STUDENT DATA
9-12 Enrollment, by Race/Ethnicity and Sex
Black
White Hispanic
American Multi-
Asian Indian
racial
41 4.9%
779 94.0%
5 0.6%
1 0.1%
1 0.1%
2 0.2%
Male Female
444 53.6%
385 46.4%
Enrollment in Selected Programs
Program
Gifted (Grades K-12)
Program % of Student Enrollment Population
42
5.1%
Non-Vocational Labs (Grades 9-12)
647
Vocational Labs
(Grades 9-12)
632
Alternative Programs (Grades 6-12)
0
78.0% 76.2%
0.0%
Students Eligible to Receive Free/Reduced Lunches
Number
Percent
School System
270 1,574
32.6% 50.2%
Enrollment in Compensatory Programs
Program
Program % of Student Enrollment Population
Special Education (Grades K-12) PK
73
8.8%
0
N/A
English to Speakers of Other Languages (ESOL) (Grades K-12)
0
0.0%
Remedial Education (Grades 2-5, 9-12)
47
5.7%
Title I (Grades K-12)
This school has no Title I program.
Dropout Rate for Grades 9-12
Number
Rate
School System
101
11.3%
101
11.3%
Total 43
Retained Students, by Race/Ethnicity and Sex
Black
White Hispanic
American MultiAsian Indian racial
1 2.3%
42 97.7%
0 0.0%
0 0.0%
0 0.0%
0 0.0%
Male Female
30
13
69.8% 30.2%
Prepared by Georgia Department of Education
Page 1
STATE-REQUIRED TEST DATA
GEORGIA HIGH SCHOOL GRADUATION TESTS (GHSGT)
Percent of Regular Program 11th Graders Passing the Georgia High School Graduation Tests on First Administration
English Language Arts Mathematics Social Studies Science
All Components listed above
Writing
1998-99
School System State
96% 88% 81% 73%
96% 88% 81% 73%
96% 88% 80% 72%
69% 69% 68%
97% 97% 93%
1997-98
School System State
94% 94% 70% 65%
94% 94% 70% 65%
94% 88% 78% 74%
56% 56% 68%
94% 94% 92%
1996-97
School System State
92% 91% 69% 64%
92% 91% 69% 64%
94% 87% 78% 74%
58% 58% 67%
92% 92% 93%
GRADUATE DATA
1999 Graduates by Credentials, Race/Ethnicity and Sex
Diplomas with Both College Prep. & Voc. Endorsements
Diplomas with College Prep. Endorsements Diplomas with Vocational Endorsements General High School Diplomas Special Education Diplomas
Total All Diplomas
Certificates of Performance
Total Graduates
Total 25 35 71 0
Black
2 8.0%
2 5.7%
1 1.4%
0
White Hispanic
23 92.0%
0 0.0%
32 91.4%
1 2.9%
70 98.6%
0 0.0%
0
0
American MultiAsian Indian racial
0 0.0%
0 0.0%
0 0.0%
0 0.0%
0 0.0%
0 0.0%
0 0.0%
0 0.0%
0 0.0%
0
0
0
10
0
10
0
0
0
0
0.0% 100.0% 0.0% 0.0% 0.0% 0.0%
141
5
135
1
0
0
0
3.5% 95.7% 0.7% 0.0% 0.0% 0.0%
19
2
17
0
0
0
0
10.5% 89.5% 0.0% 0.0% 0.0% 0.0%
160
7
152
1
0
0
0
4.4% 95.0% 0.6% 0.0% 0.0% 0.0%
Male Female
8
17
32.0% 68.0%
18
17
51.4% 48.6%
49
22
69.0% 31.0%
0
0
9 90.0%
84 59.6%
3 15.8%
87 54.4%
1 10.0%
57 40.4%
16 84.2%
73 45.6%
HOPE Scholarships
School System
Number of 1999 Graduates 1 6 0
Number Eligible
63
Percent Eligible
39.4%
160 63
39.4%
State
65,548 40,292 61.5%
High School Completion Rate
Percent of 1995Grade 9 Enrollment in Graduating Class of1999 School System State
Completion Rate '95-'99 62.5% 62.5% 68.9%
1998-99 GEORGIA PUBLIC EDUCATION REPORT CARD
Brantley County High School - 6131050
Prepared by Georgia Department of Education
Page 2
COLLEGE ADMISSIONS / CREDIT TEST DATA
Scholastic Assessment Test (SAT)
Based on students' highest verbal and highest math scores
No. Taking
Average Score
Tests Verbal Math Total
Based on students' last test administration
Average Score Verbal Math Total
School College Prep. Endorsement Other Diplomas
70 447 443
890
469 460
929
363 375
738
System College Prep. Endorsement Other Diplomas
70 447 443
890
469 460
929
363 375
738
Georgia
41,958 492 488
980
442 N/A N/A
442 N/A N/A
483
436 N/A N/A
436 N/A N/A
479
878 N/A N/A
878 N/A N/A
962
Nation
952,913 N/A N/A N/A
502 508 1010
American College Testing (ACT)
Advanced Placement Exams (AP)
Number taking tests: English Mathematics Reading Science Reasoning
3 * School N/A N/A N/A N/A
System N/A N/A N/A N/A
State 19.1 19.9 20.2 19.9
CompositeScore
N/A
N/A 19.9
* Scores are not reported when fewer than 5 take the ACT
No. of Students Taking Tests
No. of Tests Taken No. of Test Scores
3 or Higher Percent of Test
Scores 3 or Higher
School 0
N/A N/A
N/A
System State 0 15,225
N/A 23,969 N/A 13,024
N/A 54.3%
POST-SECONDARY DATA
Graduates Entering Georgia Public Colleges
Graduates Entering Georgia Public Colleges and Requiring Learning Support (LS)
1998 Graduates Entering in 1998-99
1997 Graduates Entering in 1997-98
Percent of Graduating Number Class
School
51
43.2%
System 5 1
43.2%
School
43
36.4%
System 4 3
36.4%
Number Requiring
LS 15 15
19 19
Percent of those attending Georgia
Public Colleges
29.4%
29.4%
44.2%
44.2%
In previous years, the Report Card presented College Prep Curriculum information provided by the Board of Regents on students requiring Learning Support. Due to inconsistencies in the data provided by the Board of Regents in defining College Prep Completers versus Local Board of Education data defining College Prep Endorsements, the Department of Education Report Card will not provide this information until discrepancies can be reconciled.
Graduates Entering Georgia Public Technical and Adult Schools
1998 Graduates School System
Entering Number 5 5
1998-99 Percent
4.2% 4.2%
Entering Number N/A N/A
1997-98 Percent
N/A N/A
1997 Graduates School
1
0.8%
System
1
0.8%
4
3.4%
4
3.4%
1998-99 GEORGIA PUBLIC EDUCATION REPORT CARD Brantley County High School - 6131050
Prepared by Georgia Department of Education
Page 3
CERTIFIED PERSONNEL DATA
Positions Number Average Contract Days
Administrators
3.48 228.62
Support Personnel
2.69 205.08
PK-12 Teachers
52.17 189.71
Personnel Sex
Certificate
Years Experience
Full-time Part-time
Male Female
4 Yr Bachelor's 5 Yr Master's 6 Yr Specialist's 7 Yr Doctoral Other*
<1 1-10 11-20 21-30 >30
Average
2 2
3 1
0 2 1 1 0
0 0 3 1 0
17.50
2 21
10 13
12 8 3 0 0
3 6 7 7 0
13.87
35 18
17 36
31 15
5 0 2
10 18 12 10
3
12.49
*Includes One- and Two-Year Vocational Certificates.
ACCREDITATION DATA
Accredited by Southern Association of Colleges and Schools (SACS): Secondary/Middle Commission. Accredited with Quality by Georgia Accrediting Commission (GAC).
AWARDS / RECOGNITION DATA
Schools in Georgia may receive recognition in the following programs: Charter School Pay for Performance Program Georgia School of Excellence National Blue Ribbon School Brantley County High School did not receive recognition in any of these programs during the 1998-99 school year.
1998-99 GEORGIA PUBLIC EDUCATION REPORT CARD Brantley County High School - 6131050
Prepared by Georgia Department of Education
Page 4
1998-99 GEORGIA PUBLIC EDUCATION REPORT CARD
BRANTLEY COUNTY SCHOOLS
Brantley County Middle School - 6130194
Grade Range 6-8
The Georgia Public Education Report Card is designed to assist systems and schools in educational improvement. This report card contains a variety of data elements. An explanation of the terms is provided as a companion to the report card data. Please refer to the definitions for the most effective use of the reported data.
STUDENT DATA
Total 741
6-8 Enrollment, by Race/Ethnicity and Sex
Black
White Hispanic
American Multi-
Asian Indian
racial
41 5.5%
693 93.5%
2 0.3%
1 0.1%
0 0.0%
4 0.5%
Male 365
49.3%
Female 376
50.7%
Enrollment in Selected Programs
Program
Gifted (Grades K-12)
Program % of Student Enrollment Population
38
5.1%
Alternative Programs (Grades 6-12)
0
0.0%
Students Eligible to Receive Free/Reduced Lunches
Number
Percent
School System
371 1,574
50.1% 50.2%
Enrollment in Compensatory Programs
Program
Program % of Student Enrollment Population
Special Education (Grades K-12) (PK)
90 12.1%
0
N/A
English to Speakers of Other Languages (ESOL) (Grades K-12)
0
0.0%
Title I (Grades K-12)
This school has a schoolwide program.
Dropout Rate for Grades 6-8
Number
Rate
School System
2
0.2%
2
0.2%
Total 33
Retained Students, by Race/Ethnicity and Sex
Black
White Hispanic
American MultiAsian Indian racial
1 3.0%
31 93.9%
0 0.0%
1 3.0%
0 0.0%
0 0.0%
Male Female
20
13
60.6% 39.4%
Prepared by Georgia Department of Education
Page 1
STATE-REQUIRED TEST DATA
NORM-REFERENCED TESTS Grade 8
Iowa Tests of Basic Skills (ITBS) Each chart reflects data for three years of testing.
Reading Comprehension 50
50 50 49 0
98-99
43 43 48 97-98
43 43 48 96-97
Mathematics
School 50
System
State
0
56 56 56 98-99
51 51 55 97-98
48 48 54 96-97
School System State
Reading Vocabulary 50
46 46 46 0
98-99
41 41 45 97-98
38 38 44 96-97
Language Arts
School 50
System
State
0
56 56 60 98-99
44 44 58 97-98
38 38 56 96-97
School System State
Social Studies 50
55 55 54 0
98-99
50 50 53 97-98
45 45 53 96-97
Science
School 50
System
State
0
59 59 56 98-99
51 51 55 97-98
42 42 53 96-97
School System State
Sources of Information
Composite Score
50
54 54 57 0
98-99
School 50
System
49 49 56 97-98
42 42 55 96-97
State 0
55 55 56 98-99
47 47 54 97-98
1998-99 GEORGIA PUBLIC EDUCATION REPORT CARD Brantley County Middle School - 6130194
Prepared by Georgia Department of Education
41 41 54 96-97
Scores Reported in Percentiles
School System State
Page 2
STATE-REQUIRED TEST DATA
Categories of Scaled Scores
Inadequate (less than 162)
Minimal (162-209)
Good
(210-247)
Very Good (greater than 247)
Average Scaled Score: (Range 100-300)
PERFORMANCE ASSESSMENTS
Grade 8 Writing Assessment
1998-99 Percent Scoring
1997-98 Percent Scoring
1996-97 Percent Scoring
School System State School System State School System State
8% 42% 44%
7%
8% 42% 44%
7%
8% 40% 41% 11%
8% 64% 26%
2%
8% 64% 26%
2%
11% 46% 34%
8%
23% 55% 20%
1%
23% 55% 20%
1%
15% 46% 30%
8%
206
206
208 194
194 202 186
186 198
AWARDS / RECOGNITION DATA
Schools in Georgia may receive recognition in the following programs: Charter School Pay for Performance Program Georgia School of Excellence National Blue Ribbon School Brantley County Middle School did not receive recognition in any of these programs during the 1998-99 school year.
1998-99 GEORGIA PUBLIC EDUCATION REPORT CARD Brantley County Middle School - 6130194
Prepared by Georgia Department of Education
Page 3
CERTIFIED PERSONNEL DATA
Positions Number Average Contract Days
Personnel Sex
Certificate
Years Experience
Full-time Part-time
Male Female
4 Yr Bachelor's 5 Yr Master's 6 Yr Specialist's 7 Yr Doctoral Other*
<1 1-10 11-20 21-30 >30
Average
Administrators
3.00 226.67
3 0
2 1
0 0 3 0 0 0 0 1 2 0 22.00
Support Personnel
2.31 198.64
2 22
11 13
14 6 4 0 0 3
10 6 4 1
11.88
PK-12 Teachers
45.69 190.00
28 18
16 30
22 17
7 0 0 5 20 11 9 1 11.63
*Includes One- and Two-Year Vocational Certificates.
ACCREDITATION DATA
Accredited with Quality by Georgia Accrediting Commission (GAC).
1998-99 GEORGIA PUBLIC EDUCATION REPORT CARD Brantley County Middle School - 6130194
Prepared by Georgia Department of Education
Page 4
1998-99 GEORGIA PUBLIC EDUCATION REPORT CARD
BRANTLEY COUNTY SCHOOLS
Hoboken Elementary School - 6132050
Grade Range PK-5
The Georgia Public Education Report Card is designed to assist systems and schools in educational improvement. This report card contains a variety of data elements. An explanation of the terms is provided as a companion to the report card data. Please refer to the definitions for the most effective use of the reported data.
STUDENT DATA
Total
K-5
462
PK
41
Enrollment, by Race/Ethnicity and Sex
Black
White Hispanic
American Asian Indian
Multiracial
8 1.7%
454 98.3%
0 0.0%
0 0.0%
0 0.0%
0 0.0%
2 4.9%
39 95.1%
0 0.0%
0 0.0%
0 0.0%
0 0.0%
Male Female
236 51.1%
226 48.9%
20 48.8%
21 51.2%
Enrollment in Selected Programs
Program
Program % of Student Enrollment Population
Gifted (Grades K-12)
30
6.5%
Alternative Programs (Grades 6-12)
N/A
N/A
Students Eligible to Receive Free/Reduced Lunches
Number
Percent
School System
261 1,574
51.9% 50.2%
Dropout Rate *
Number
Rate
School System
N/A N/A
N/A N/A
* Dropout rates are not applicable for grades PK-5.
Enrollment in Compensatory Programs
Program
Program % of Student Enrollment Population
Special Education (Grades K-12)
86 18.6%
(PK)
3
N/A
English to Speakers of Other Languages (ESOL) (Grades K-12)
0
0.0%
Remedial Education (Grades 2-5, 9-12)
40 13.2%
Special Instructional Assistance (SIA) (Grades K-3)
46 14.6%
Title I (Grades K-12)
This school has a schoolwide program.
Total 12
Retained Students, by Race/Ethnicity and Sex
Black
White Hispanic
American MultiAsian Indian racial
0
12
0.0% 100.0%
0 0.0%
0 0.0%
0 0.0%
0 0.0%
Male Female
10
2
83.3% 16.7%
Prepared by Georgia Department of Education
Page 1
STATE-REQUIRED TEST DATA
NORM-REFERENCED TESTS Grade 3
Iowa Tests of Basic Skills (ITBS) Each chart reflects data for three years of testing.
Reading Comprehension 50
61 53 54 0
98-99
62 49 53 97-98
58 48 52 96-97
Mathematics
School 50
System
State
0
67 55 61 98-99
73 53 61 97-98
63 50 59 96-97
School System State
Reading Vocabulary 50
60 50 50 0
98-99
57 45 50 97-98
56 45 49 96-97
Language Arts
School 50
System
State
0
68 59 64 98-99
73 57 62 97-98
60 42 59 96-97
School System State
Social Studies 50
67 50 56 0
98-99
62 42 55 97-98
64 51 55 96-97
Science
School 50
System
State
0
62 49 59 98-99
63 48 59 97-98
59 46 58 96-97
School System State
Sources of Information
Composite Score
50
63 54 57 0
98-99
School 50
System
64 49 56 97-98
59 47 55 96-97
State 0
64 53 58 98-99
65 48 57 97-98
1998-99 GEORGIA PUBLIC EDUCATION REPORT CARD Hoboken Elementary School - 6132050
Prepared by Georgia Department of Education
60 46 56 96-97
Scores Reported in Percentiles
School System State
Page 2
STATE-REQUIRED TEST DATA
NORM-REFERENCED TESTS Grade 5
Iowa Tests of Basic Skills (ITBS) Each chart reflects data for three years of testing.
Reading Comprehension
Mathematics
50
63 54 53 0
98-99
56 46 53 97-98
58 49 52 96-97
School 50
System
State
0
65 49 59 98-99
60 45 58 97-98
58 48 57 96-97
School System State
Reading Vocabulary 50
58 46 48 0
98-99
59 41 48 97-98
61 46 46 96-97
Language Arts
School 50
System
State
0
71 54 63 98-99
73 57 61 97-98
64 44 58 96-97
School System State
Social Studies 50
68 53 57 0
98-99
64 47 56 97-98
57 46 55 96-97
Science
School 50
System
State
0
72 59 60 98-99
64 49 59 97-98
66 51 59 96-97
School System State
Sources of Information
Composite Score
50
66 49 58 0
98-99
School 50
System
61 46 58 97-98
58 47 57 96-97
State 0
68 51 57 98-99
64 46 56 97-98
60 46 55 96-97
1998-99 GEORGIA PUBLIC EDUCATION REPORT CARD Hoboken Elementary School - 6132050
Prepared by Georgia Department of Education
Scores Reported in Percentiles
School System State
Page 3
STATE-REQUIRED TEST DATA
PERFORMANCE ASSESSMENTS
Grade 5 Writing Assessment
Percent at Developmental Stages:
1998-99 School System State
1997-98 School System State
1996-97 School System State
Stage Stage Stage Stage Stage Stage
1:The Emerging Writer 2:The Developing Writer 3:The Focusing Writer 4:The Experimenting 5:The Engaging Writer 6:The Extending Writer
0% 0% 12% 37% 40% 12%
0% 1% 20% 44% 30% 5%
0% 1% 16% 41% 29% 12%
0% 2% 17% 37% 34% 9%
0% 2% 22% 45% 22% 7%
0% 3% 19% 41% 27% 10%
0% 2% 19% 31% 38% 10%
0% 5% 25% 40% 25% 6%
0% 3% 21% 37% 26% 12%
AWARDS / RECOGNITION DATA
Schools in Georgia may receive recognition in the following programs: Charter School Pay for Performance Program Georgia School of Excellence National Blue Ribbon School Hoboken Elementary School did not receive recognition in any of these programs during the 1998-99 school year.
1998-99 GEORGIA PUBLIC EDUCATION REPORT CARD Hoboken Elementary School - 6132050
Prepared by Georgia Department of Education
Page 4
CERTIFIED PERSONNEL DATA
Positions Number Average Contract Days
Personnel Sex
Certificate
Years Experience
Full-time Part-time
Male Female
4 Yr Bachelor's 5 Yr Master's 6 Yr Specialist's 7 Yr Doctoral Other*
<1 1-10 11-20 21-30 >30
Average
Administrators
1.00 220.00
1 0
0 1
0 0 1 0 0 0 0 0 0 1 32.00
Support Personnel
2.01 194.98
2 1
0 3
1 1 1 0 0 0 1 1 1 0 18.33
PK-12 Teachers
30.99 190.00
31 0
2 29
15 14
2 0 0 2 13 8 8 0 13.39
*Includes One- and Two-Year Vocational Certificates.
ACCREDITATION DATA
Accredited with Quality by Georgia Accrediting Commission (GAC).
1998-99 GEORGIA PUBLIC EDUCATION REPORT CARD Hoboken Elementary School - 6132050
Prepared by Georgia Department of Education
Page 5
1998-99 GEORGIA PUBLIC EDUCATION REPORT CARD
BRANTLEY COUNTY SCHOOLS
Nahunta Elementary School - 6130294
Grade Range 3-5
The Georgia Public Education Report Card is designed to assist systems and schools in educational improvement. This report card contains a variety of data elements. An explanation of the terms is provided as a companion to the report card data. Please refer to the definitions for the most effective use of the reported data.
STUDENT DATA
Total 457
3-5 Enrollment, by Race/Ethnicity and Sex
Black
White Hispanic
American Multi-
Asian Indian
racial
21 4.6%
434 95.0%
0 0.0%
2 0.4%
0 0.0%
0 0.0%
Male Female
240 52.5%
217 47.5%
Enrollment in Selected Programs
Program
Program % of Student Enrollment Population
Gifted (Grades K-12)
27
5.9%
Alternative Programs (Grades 6-12)
N/A
N/A
Students Eligible to Receive Free/Reduced Lunches
Number
Percent
School System
302 1,574
66.1% 50.2%
Dropout Rate *
Number
Rate
School System
N/A N/A
N/A N/A
* Dropout rates are not applicable for grades PK-5.
Enrollment in Compensatory Programs
Program
Program % of Student Enrollment Population
Special Education (Grades K-12)
63 13.8%
(PK)
0
N/A
English to Speakers of Other Languages (ESOL) (Grades K-12)
0
0.0%
Remedial Education (Grades 2-5, 9-12)
93 20.4%
Special Instructional Assistance (SIA) (Grades K-3)
47 34.3%
Title I (Grades K-12)
This school has no Title I program.
Total 4
Retained Students, by Race/Ethnicity and Sex
Black
White Hispanic
American Multi-
Asian Indian
racial
0
4
0.0% 100.0%
0 0.0%
0 0.0%
0 0.0%
0 0.0%
Male Female
2
2
50.0% 50.0%
Prepared by Georgia Department of Education
Page 1
STATE-REQUIRED TEST DATA
NORM-REFERENCED TESTS Grade 3
Iowa Tests of Basic Skills (ITBS) Each chart reflects data for three years of testing.
Reading Comprehension 50
48 53 54 0
98-99
43 49 53 97-98
43 48 52 96-97
Mathematics
School 50
System
State
0
48 55 61 98-99
44 53 61 97-98
44 50 59 96-97
School System State
Reading Vocabulary 50
45 50 50 0
98-99
39 45 50 97-98
39 45 49 96-97
Language Arts
School 50
System
State
0
55 59 64 98-99
49 57 62 97-98
33 42 59 96-97
School System State
Social Studies 50
40 50 56 0
98-99
33 42 55 97-98
44 51 55 96-97
Science
School 50
System
State
0
42 49 59 98-99
40 48 59 97-98
40 46 58 96-97
School System State
Sources of Information
Composite Score
50
49 54 57 0
98-99
School 50
System
42 49 56 97-98
41 47 55 96-97
State 0
46 53 58 98-99
40 48 57 97-98
1998-99 GEORGIA PUBLIC EDUCATION REPORT CARD Nahunta Elementary School - 6130294
Prepared by Georgia Department of Education
39 46 56 96-97
Scores Reported in Percentiles
School System State
Page 2
STATE-REQUIRED TEST DATA
NORM-REFERENCED TESTS Grade 5
Iowa Tests of Basic Skills (ITBS) Each chart reflects data for three years of testing.
Reading Comprehension
Mathematics
50
49 54 53 0
98-99
42 46 53 97-98
45 49 52 96-97
School 50
System
State
0
40 49 59 98-99
38 45 58 97-98
44 48 57 96-97
School System State
Reading Vocabulary 50
41 46 48 0
98-99
33 41 48 97-98
41 46 46 96-97
Language Arts
School 50
System
State
0
44 54 63 98-99
48 57 61 97-98
35 44 58 96-97
School System State
Social Studies 50
43 53 57 0
98-99
37 47 56 97-98
41 46 55 96-97
Science
School 50
System
State
0
51 59 60 98-99
39 49 59 97-98
45 51 59 96-97
School System State
Sources of Information
Composite Score
50
39 49 58 0
98-99
School 50
System
38 46 58 97-98
44 47 57 96-97
State 0
42 51 57 98-99
38 46 56 97-98
40 46 55 96-97
1998-99 GEORGIA PUBLIC EDUCATION REPORT CARD Nahunta Elementary School - 6130294
Prepared by Georgia Department of Education
Scores Reported in Percentiles
School System State
Page 3
STATE-REQUIRED TEST DATA
PERFORMANCE ASSESSMENTS
Grade 5 Writing Assessment
Percent at Developmental Stages:
1998-99 School System State
1997-98 School System State
1996-97 School System State
Stage Stage Stage Stage Stage Stage
1:The Emerging Writer 2:The Developing Writer 3:The Focusing Writer 4:The Experimenting 5:The Engaging Writer 6:The Extending Writer
0% 2% 23% 47% 25% 2%
0% 1% 20% 44% 30% 5%
0% 1% 16% 41% 29% 12%
0% 2% 25% 49% 16% 6%
0% 2% 22% 45% 22% 7%
0% 3% 19% 41% 27% 10%
0% 6% 28% 43% 19% 4%
0% 5% 25% 40% 25% 6%
0% 3% 21% 37% 26% 12%
AWARDS / RECOGNITION DATA
Schools in Georgia may receive recognition in the following programs: Charter School Pay for Performance Program Georgia School of Excellence National Blue Ribbon School Nahunta Elementary School did not receive recognition in any of these programs during the 1998-99 school year.
1998-99 GEORGIA PUBLIC EDUCATION REPORT CARD Nahunta Elementary School - 6130294
Prepared by Georgia Department of Education
Page 4
CERTIFIED PERSONNEL DATA
Positions Number Average Contract Days
Personnel Sex
Certificate
Years Experience
Full-time Part-time
Male Female
4 Yr Bachelor's 5 Yr Master's 6 Yr Specialist's 7 Yr Doctoral Other*
<1 1-10 11-20 21-30 >30
Average
Administrators
2.00 215.00
2 0
1 1
0 1 0 1 0 0 0 1 1 0 19.00
Support Personnel
1.00 200.00
1 0
0 1
0 1 0 0 0 0 0 1 0 0 11.00
PK-12 Teachers
37.00 185.54
37 0
3 34
24 11
2 0 0 5 20 6 6 0 9.49
*Includes One- and Two-Year Vocational Certificates.
ACCREDITATION DATA
Accredited with Quality by Georgia Accrediting Commission (GAC).
1998-99 GEORGIA PUBLIC EDUCATION REPORT CARD Nahunta Elementary School - 6130294
Prepared by Georgia Department of Education
Page 5
1998-99 GEORGIA PUBLIC EDUCATION REPORT CARD
BRANTLEY COUNTY SCHOOLS
Nahunta Primary School - 6133050
Grade Range PK-2
The Georgia Public Education Report Card is designed to assist systems and schools in educational improvement. This report card contains a variety of data elements. An explanation of the terms is provided as a companion to the report card data. Please refer to the definitions for the most effective use of the reported data.
STUDENT DATA
Total
K-2
518
PK
86
Enrollment, by Race/Ethnicity and Sex
Black
White Hispanic
American Asian Indian
Multiracial
25 4.8%
487 94.0%
1 0.2%
0 0.0%
0 0.0%
5 1.0%
4 4.7%
80 93.0%
1 1.2%
0 0.0%
0 0.0%
1 1.2%
Male Female
281 54.2%
237 45.8%
39 45.3%
47 54.7%
Enrollment in Selected Programs
Program
Program % of Student Enrollment Population
Gifted (Grades K-12)
11
2.1%
Alternative Programs (Grades 6-12)
N/A
N/A
Students Eligible to Receive Free/Reduced Lunches
Number
Percent
School System
370 1,574
61.3% 50.2%
Dropout Rate *
Number
Rate
School System
N/A N/A
N/A N/A
* Dropout rates are not applicable for grades PK-5.
Enrollment in Compensatory Programs
Program
Program % of Student Enrollment Population
Special Education (Grades K-12)
31
6.0%
(PK)
16
N/A
English to Speakers of Other Languages (ESOL) (Grades K-12)
0
0.0%
Remedial Education (Grades 2-5, 9-12)
0
0.0%
Special Instructional Assistance (SIA) (Grades K-3)
119 23.0%
Title I (Grades K-12)
This school has a schoolwide program.
Total 28
Retained Students, by Race/Ethnicity and Sex
Black
White Hispanic
American MultiAsian Indian racial
1 3.6%
27 96.4%
0 0.0%
0 0.0%
0 0.0%
0 0.0%
Male Female
19
9
67.9% 32.1%
Prepared by Georgia Department of Education
Page 1
STATE-REQUIRED TEST DATA
NORM-REFERENCED TESTS
Grade 3 Iowa Tests of Basic Skills (ITBS) Each chart reflects data for three years of testing.
No third-grade students are enrolled at Nahunta Primary School.
Reading Comprehension
Mathematics
50
N/A 53 54 0
98-99
N/A 49 53 97-98
N/A 48 52 96-97
School 50
System
State
N/A 55 61 0
98-99
N/A 53 61 97-98
N/A 50 59 96-97
School System State
Reading Vocabulary 50
N/A 50 50 0
98-99
N/A 45 50 97-98
N/A 45 49 96-97
Language Arts
School 50
System
State
N/A 59 64 0
98-99
N/A 57 62 97-98
N/A 42 59 96-97
School System State
Social Studies 50
N/A 50 56 0
98-99
N/A 42 55 97-98
N/A 51 55 96-97
Science
School 50
System
State
N/A 49 59 0
98-99
N/A 48 59 97-98
N/A 46 58 96-97
School System State
Sources of Information
Composite Score
School
50
50
System
N/A 54 57 0
98-99
N/A 49 56 N/A 47 55
97-98
96-97
State
N/A 53 58 0
98-99
N/A 48 57 97-98
N/A 46 56 96-97
1998-99 GEORGIA PUBLIC EDUCATION REPORT CARD Nahunta Primary School - 6133050
Prepared by Georgia Department of Education
Scores Reported in Percentiles
School System State
Page 2
STATE-REQUIRED TEST DATA
NORM-REFERENCED TESTS
Grade 5 Iowa Tests of Basic Skills (ITBS) Each chart reflects data for three years of testing. No fifth-grade students are enrolled at Nahunta Primary School.
Reading Comprehension
Mathematics
50
N/A 54 53 0
98-99
N/A 46 53 97-98
N/A 49 52 96-97
School 50
System
State
N/A 49 59 0
98-99
N/A 45 58 97-98
N/A 48 57 96-97
School System State
Reading Vocabulary 50
N/A 46 48 0
98-99
N/A 41 48 97-98
N/A 46 46 96-97
Language Arts
School 50
System
State
N/A 54 63 0
98-99
N/A 57 61 97-98
N/A 44 58 96-97
School System State
Social Studies 50
N/A 53 57 0
98-99
N/A 47 56 97-98
N/A 46 55 96-97
Science
School 50
System
State
N/A 59 60 0
98-99
N/A 49 59 97-98
N/A 51 59 96-97
School System State
Sources of Information
Composite Score
School
50
50
System
N/A 49 58 0
98-99
N/A 46 58 N/A 47 57
97-98
96-97
State
N/A 51 57 0
98-99
N/A 46 56 97-98
N/A 46 55 96-97
1998-99 GEORGIA PUBLIC EDUCATION REPORT CARD Nahunta Primary School - 6133050
Prepared by Georgia Department of Education
Scores Reported in Percentiles
School System State
Page 3
STATE-REQUIRED TEST DATA
PERFORMANCE ASSESSMENTS
Grade 5 Writing Assessment
Percent at Developmental Stages:
1998-99 School System State
1997-98 School System State
1996-97 School System State
Stage Stage Stage Stage Stage Stage
1:The Emerging Writer 2:The Developing Writer 3:The Focusing Writer 4:The Experimenting 5:The Engaging Writer 6:The Extending Writer
N/A N/A N/A N/A N/A N/A
0% 1% 20% 44% 30% 5%
0% 1% 16% 41% 29% 12%
N/A N/A N/A N/A N/A N/A
0% 2% 22% 45% 22% 7%
0% 3% 19% 41% 27% 10%
N/A N/A N/A N/A N/A N/A
No fifth-grade students are enrolled at Nahunta Primary School.
0% 5% 25% 40% 25% 6%
0% 3% 21% 37% 26% 12%
AWARDS / RECOGNITION DATA
Schools in Georgia may receive recognition in the following programs: Charter School Pay for Performance Program Georgia School of Excellence National Blue Ribbon School Nahunta Primary School did not receive recognition in any of these programs during the 1998-99 school year.
1998-99 GEORGIA PUBLIC EDUCATION REPORT CARD Nahunta Primary School - 6133050
Prepared by Georgia Department of Education
Page 4
CERTIFIED PERSONNEL DATA
Positions Number Average Contract Days
Personnel Sex
Certificate
Years Experience
Full-time Part-time
Male Female
4 Yr Bachelor's 5 Yr Master's 6 Yr Specialist's 7 Yr Doctoral Other*
<1 1-10 11-20 21-30 >30
Average
Administrators
1.00 240.00
1 0
1 0
0 0 1 0 0 0 0 0 0 1 34.00
Support Personnel
3.60 192.78
3 1
0 4
0 4 0 0 0 1 1 2 0 0 9.75
PK-12 Teachers
35.00 187.29
35 0
0 35
24 8 3 0 0 8
16 8 3 0
7.94
*Includes One- and Two-Year Vocational Certificates.
ACCREDITATION DATA
Not accredited by Southern Association of Colleges and Schools (SACS) or Georgia Accrediting Commission (GAC).
1998-99 GEORGIA PUBLIC EDUCATION REPORT CARD Nahunta Primary School - 6133050
Prepared by Georgia Department of Education
Page 5
1998-99 GEORGIA PUBLIC EDUCATION REPORT CARD BREMEN CITY SCHOOLS - 763
The Georgia Public Education Report Card is designed to assist systems and schools in educational improvement. This report card contains a variety of data elements. An explanation of the terms is provided as a companion to the report card data. Please refer to the definitions for the most effective use of the reported data.
Total
K-12
1,370
PK
65
STUDENT DATA
Enrollment, by Race/Ethnicity and Sex
Black
White Hispanic
American Multi-
Asian Indian
racial
132 9.6%
1,223 89.3%
6 0.4%
3 0.2%
0 0.0%
6 0.4%
7 10.8%
58 89.2%
0 0.0%
0 0.0%
0 0.0%
0 0.0%
Male
707 51.6%
32 49.2%
Female
663 48.4%
33 50.8%
Enrollment in Selected Programs
Program
Program % of Student Enrollment Population
Gifted (Grades K-12)
131
9.6%
Non-Vocational Labs (Grades 9-12)
368
95.3%
Vocational Labs (Grades 9-12)
221
57.3%
Alternative Programs (Grades 6-12)
11
1.6%
Students Eligible to Receive Free/Reduced Lunches
Number
Percent
303
21.1%
Dropout Rate
Number
Percent
6-12 9-12
7
1.0%
6
1.5%
Enrollment in Compensatory Programs
Program
Program % of Student Enrollment Population
Special Education
(Grades K-12)
249
PK
42
English to Speakers of
Other Languages (ESOL)
0
(Grades K-12)
Remedial Education (Grades 2-5, 9-12)
52
Special Instructional
Assistance (SIA)
67
(Grades K-3)
Title I (Grades K-12) Number of schools with: Schoolwide program Targeted Assistance program No Title I program
18.2% N/A
0.0%
6.3%
14.4%
0 2 0
Total 13
Retained Students, by Race/Ethnicity and Sex
Black
White Hispanic
American MultiAsian Indian racial
1 7.7%
12 92.3%
0 0.0%
0 0.0%
0 0.0%
0 0.0%
Male Female
8
5
61.5% 38.5%
Prepared by Georgia Department of Education
Page 1
STATE-REQUIRED TEST DATA
NORM-REFERENCED TESTS
Grade 3 Iowa Tests of Basic Skills (ITBS) Each chart reflects data for three years of testing.
Reading Comprehension
Mathematics
50
71 54 68 53 69 52 0
98-99 97-98 96-97
System State
50
75 61 77 61 79 59 0
98-99 97-98 96-97
System State
Reading Vocabulary
50
71 50 64 50 63 49 0
98-99 97-98 96-97
System State
Social Studies
50
70 56 70 55 67 55 0
98-99 97-98 96-97
System State
Language Arts
50
80 64 63 62 69 59 0
98-99 97-98 96-97
System State
Science
50
74 59 75 59 74 58 0
98-99 97-98 96-97
System State
Sources of Information
Composite Score
50
72 57 0
98-99
System
50
69 56 67 55 97-98 96-97
State
74 58 71 57 0
98-99 97-98
1998-99 GEORGIA PUBLIC EDUCATION REPORT CARD Bremen City Schools
Prepared by Georgia Department of Education
System State Scores Reported 71 56 in Percentiles 96-97
Page 2
STATE-REQUIRED TEST DATA
NORM-REFERENCED TESTS
Grade 5 Iowa Tests of Basic Skills (ITBS) Each chart reflects data for three years of testing.
Reading Comprehension
Mathematics
50
57 53 61 53 59 52 0
98-99 97-98 96-97
System State
50
63 59 64 58 64 57 0
98-99 97-98 96-97
System State
Reading Vocabulary
50
60 48 62 48 57 46 0
98-99 97-98 96-97
System State
Social Studies
50
63 57 66 56 63 55 0
98-99 97-98 96-97
System State
Language Arts
50
62 63 63 61 61 58 0
98-99 97-98 96-97
System State
Science
50
64 60 69 59 67 59 0
98-99 97-98 96-97
System State
Sources of Information
Composite Score
50
57 58 0
98-99
System
50
63 58 64 57 97-98 96-97
State
61 57 64 56 0
98-99 97-98
1998-99 GEORGIA PUBLIC EDUCATION REPORT CARD Bremen City Schools
Prepared by Georgia Department of Education
System State Scores Reported 63 55 in Percentiles 96-97
Page 3
STATE-REQUIRED TEST DATA
NORM-REFERENCED TESTS Grade 8
Iowa Tests of Basic Skills (ITBS) Each chart reflects data for three years of testing.
Reading Comprehension
Mathematics
50
60 49 62 48 60 48 0
98-99 97-98 96-97
System State
50
70 56 66 55 63 54 0
98-99 97-98 96-97
System State
Reading Vocabulary
50
60 46 63 45 62 44 0
98-99 97-98 96-97
System State
Language Arts
50
70 60 65 58 63 56 0
98-99 97-98 96-97
System State
Social Studies
50
62 54 63 53 63 53 0
98-99 97-98 96-97
System State
Science
50
64 56 67 55 59 53 0
98-99 97-98 96-97
System State
Sources of Information
Composite Score
50
64 57 0
98-99
System
50
64 56 62 55 97-98 96-97
State
66 56 65 54 0
98-99 97-98
1998-99 GEORGIA PUBLIC EDUCATION REPORT CARD Bremen City Schools
Prepared by Georgia Department of Education
System State Scores Reported 62 54 in Percentiles 96-97
Page 4
STATE-REQUIRED TEST DATA
PERFORMANCE ASSESSMENTS
Grade 5 Writing Assessment
1998-99
1997-98
1996-97
Percent at Developmental Stages:
Comparison
Comparison
Comparison
System Group State System Group State System Group State
Stage Stage Stage Stage Stage Stage
1: The Emerging Writer 2: The Developing Writer 3: The Focusing Writer 4: The Experimenting Writer 5: The Engaging Writer 6: The Extending Writer
0% 0% 2% 44% 42% 12%
0% 0% 3% 34% 42% 19%
0% 1% 16% 41% 29% 12%
0% 0% 13% 35% 40% 11%
0% 0% 11% 34% 43% 12%
0% 3% 19% 41% 27% 10%
0% 1% 9% 46% 28% 16%
0% 0% 7% 36% 41% 17%
0% 3% 21% 37% 26% 12%
Grade 8 Writing Assessment
1998-99 Percent Scoring 1997-98 Percent Scoring 1996-97 Percent Scoring
Categories of Scaled Scores
Comparison
Comparison
Comparison
System Group State System Group State System Group State
Inadequate (less than 162)
Minimal (162-209)
Good
(210-247)
Very Good (greater than 247)
1% 18% 53% 29%
1% 24% 57% 18%
8% 40% 41% 11%
1% 37% 50% 12%
4% 45% 41% 10%
11% 46% 34%
8%
4% 55% 34%
7%
5% 47% 39% 10%
15% 46% 30%
8%
Average Scaled Score: (Range 100-300)
229
224 208
216
211 202
204
209 198
GEORGIA HIGH SCHOOL GRADUATION TESTS (GHSGT)
Percent of Regular Program 11th Graders Passing the Georgia High School Graduation Tests on First Administration
1998-99
1997-98
1996-97
Comparison
Comparison
Comparison
System Group State System Group State System Group State
English Language Arts Mathematics Social Studies Science
99% 94% 90% 89%
99% 98% 87% 85%
96% 88% 80% 72%
99% 93% 84% 86%
99% 92% 86% 84%
94% 88% 78% 74%
95% 94% 83% 86%
97% 92% 82% 82%
94% 87% 78% 74%
All Components listed above 8 8 %
81% 68% 78%
78% 68% 81%
73% 67%
Writing
95%
95% 93% 95%
94% 92% 97%
96% 93%
1998-99 GEORGIA PUBLIC EDUCATION REPORT CARD
Bremen City Schools
Prepared by Georgia Department of Education
Page 5
GRADUATE DATA
1999 Graduates by Credentials, Race/Ethnicity and Sex
Diplomas with Both College Prep. & Voc. Endorsements
Diplomas with College Prep. Endorsements Diplomas with Vocational Endorsements General High School Diplomas Special Education Diplomas
Total All Diplomas
Certificates of Performance
Total Graduates
Total 5
56 15
2 4 82 2 84
Black
American MultiWhite Hispanic Asian Indian racial
Male Female
1 20.0%
7 12.5%
0 0.0%
0 0.0%
1 25.0%
4 80.0%
49 87.5%
15 100.0%
2 100.0%
3 75.0%
0 0.0%
0 0.0%
0 0.0%
0 0.0%
0 0.0%
0 0.0%
0 0.0%
0 0.0%
0 0.0%
0 0.0%
0 0.0%
0 0.0%
0 0.0%
0 0.0%
0 0.0%
0
2
3
0.0% 40.0% 60.0%
0
26
30
0.0% 46.4% 53.6%
0
11
4
0.0% 73.3% 26.7%
0 0.0%
0
2
0.0% 100.0%
0
4
0
0.0% 100.0% 0.0%
9
73
0
0
0
0
43
39
11.0% 89.0% 0.0% 0.0% 0.0% 0.0% 52.4% 47.6%
1
1
0
0
0
0
1
1
50.0% 50.0% 0.0% 0.0% 0.0% 0.0% 50.0% 50.0%
10
74
0
0
0
0
44
40
11.9% 88.1% 0.0% 0.0% 0.0% 0.0% 52.4% 47.6%
HOPE Scholarships
System State
Number of 1999 Graduates 8 4
Number Eligible
60
Percent Eligible
71.4%
65,548 40,292 61.5%
High School Completion Rate Percent of 1995Grade 9 Enrollment
in Graduating Class of1999
System
State
Completion Rate '95-'99 90.3% 68.9%
COLLEGE ADMISSIONS / CREDIT TEST DATA
Scholastic Assessment Test (SAT)
No. Taking
Average Score
Tests
Verbal Math Total
Based on students' highest verbal and highest math scores
System College Prep. Endorsement Other Diplomas
483 461 944 493 467 960 355 355 710
Georgia
492 488 980
Based on students' last test administration
System Georgia
52
472 453
925
41,958 483 479 962
Nation
952,913 502 508 1010
American College Testing (ACT)
System State Nation
English
17.9
19.1 20.4
Mathematics
18.4
19.9 20.7
Reading
17.7
20.2 21.3
Science Reasoning 18.2
19.9 21.0
CompositeScore 18.2
19.9 21.9
Advanced Placement Exams (AP)
No. of Students Taking Tests
No. of Tests Taken No. of Test Scores
3 or Higher Percent of Test
Scores 3 or Higher
System State 0 15,225
N/A 23,969 N/A 13,024
N/A 54.3%
1998-99 GEORGIA PUBLIC EDUCATION REPORT CARD Bremen City Schools
Prepared by Georgia Department of Education
Page 6
POSTSECONDARY DATA
Graduates Entering Georgia Public Colleges and Universities
Graduates Entering Georgia Public Colleges and Universities and
Requiring Learning Support (LS)
1998 Graduates Entering 1998-99
1997 Graduates Entering 1997-98
Percent of Graduating Number Class
45
52.9%
31
45.6%
Number Requiring
LS
8
11
Percent of those attending Georgia
Public Colleges
17.8%
35.5%
In previous years, the Report Card presented College Prep Curriculum information provided by the Board of Regents on students requiring Learning Support. Due to inconsistencies in the data provided by the Board of Regents in defining College Prep Completers versus Local Board of Education data defining College Prep Endorsements, the Department of Education Report Card will not provide this information until discrepancies can be reconciled.
Graduates Entering Georgia Public Technical and Adult Schools
Entering 1998-99 Entering 1997-98
Number Percent
Number Percent
1998 Graduates 1997 Graduates
3
3.5%
0
0.0%
N/A 1
N/A 1.5%
ACCREDITATION / RECOGNITION DATA
Southern Association of Colleges and Schools (SACS) Accrediting Commission
Secondary/Middle Commission Elementary/Middle Commission Both Elementary/Secondary Commissions Joint Commission Candidate for Accreditation
Accreditation by Georgia Accrediting Commission (GAC)
Accredited by GAC Accredited with Quality by GAC
Number of Schools
1 1 0 0 0
Number of Schools
0 2
Awards / Recognition
State Recognized Program
Number of Schools
Charter School
0
Pay for Performance Recipient
0
Georgia School of Excellence
0
National Blue Ribbon School
0
COMMUNITY DATA
Number of Children Eligible for Migrant Education Number of Families-At-Risk * Number of Food Stamp Participants * Number of Families Receiving TANF * ** Per Capita Income * Unemployment Rate * 1990 Population * Projected 2000 Population * Projected 2010 Population *
* Data Available at County Level Only ** Known as AFDC before January 1997
0 62 1,707 138 $18,274 5.8% 21,966 25,495 28,598
1998-99 GEORGIA PUBLIC EDUCATION REPORT CARD Bremen City Schools
Prepared by Georgia Department of Education
Page 7
FISCAL DATA
Millage Rate
13.88
* Fall 1998 Property Tax Digest is used to calculate the 98-99 Value of One Mill
FTE Count
FTE Count used for Allotment Calculation 1,348.0 Fall '98 FTE Count 1,370
Value of One Mill
$73,273 $54.35 per Allotment FTE
Sources: Local State-QBE State-
Lottery State-
Other Federal Other
Total
PerGeneral Fund cent Per FTE
$1,346,523 19.8% $999 $5,379,305 79.2% $3,991
K-12 Revenues
Lottery K-12
and
Title
All Other
Programs
K-12
$0
$0
Bonded Debt $506,916
$0
$0
$0
$0 0.0%
$0
$0
$33,114
$0
$65,169 1.0% $48
$0 0.0%
$0
$0 0.0%
$0
$6,790,998 100% $5,038
$0 $519,929
$0 $519,929
$35,329 $0 $0
$68,444
$0 $0 $0 $506,916
Capital Projects
$724,201 $0
$0
$410,389 $0 $0
$1,134,590
School Nutrition
$246,253 $0
$0
$39,205 $162,214
$399 $448,071
Grand Total
Total
Per-
Amount cent
$2,823,895 29.8%
$5,379,305 56.8%
$33,114 0.3%
$550,093 5.8% $682,143 7.2%
$399 0.0% $9,468,951 100%
Instruction
Media Instruction
Support Pupil Services General Admin. School Admin. Trans-
portation Maint. & Ops. Capital Projects School Food Debt Service
Total
$4,770,310 71.5% $3,539 $175,897 2.6% $130
$231,907 3.5% $172
$212,012 3.2% $157
$216,078 3.2% $160
$579,678 8.7% $430
$41,546 0.6% $31
$435,981 6.5% $323
$0 0.0%
$0
$3,768 0.1%
$3
$0 0.0%
$0
$6,667,182 100% $4,945
K-12 Expenditures
$454,776
$35,099
$0
$0
$1,619
$0
$0
$0
$170,078
$12,970
$0
$0
$407
$17,212
$0
$0
$10,330
$0
$0
$0
$0
$0
$0
$0
$0
$0
$0
$26,555
$0
$0
$0 $1,444,571
$0
$0
$0 $127,914
$0
$0
$0
$0
$0
$0 $524,992
$0
$0 $0 $0 $0 $0 $0 $0 $0 $0 $434,662 $0
$637,212
$65,282 $524,992 $1,599,041 $434,662
$5,260,186 53.0% $177,517 1.8% $414,956 4.2% $229,632 2.3% $226,409 2.3% $579,678 5.8% $68,101 0.7%
$1,880,553 18.9% $127,914 1.3% $438,431 4.4% $524,992 5.3%
$9,928,374 100%
Salaries and Benefits as Percentages of Revenues and of Expenditures
Teachers and Paraprofessionals
Salaries $3,704,043
Benefits $1,069,039
Percentage of Revenues Percentage of Expenditures
Total of
Total of
General Fund
General Fund
Title Programs
Title Programs
Lottery K-12
Lottery K-12
Total Salaries
and
Total
and
Total
and Benefits All Other K-12 K - 12 All Other K-12 K - 12
$4,773,082
64.7%
50.4%
64.8%
48.1%
School Administration
$324,752
$118,816
$443,568
6.0%
4.7%
6.0%
4.5%
General Administration
$100,329
$46,748
$147,077
2.0%
1.6%
2.0%
1.5%
1998-99 GEORGIA PUBLIC EDUCATION REPORT CARD
Bremen City Schools - 763
Prepared by Georgia Department of Education
Page 8
CERTIFIED PERSONNEL DATA
Number
Average Annual Salary Positions Average Contract Days
Average Daily Salary
Full-time Personnel Part-time
Sex Male Female
4 Yr Bachelor's Certificate 5 Yr Master's
Level 6 Yr Specialist's 7 Yr Doctoral Other*
Black
White Race/ Hispanic Ethnicity Asian
American Indian
Multiracial
Years Experience
<1 1-10 11-20 21-30 >30
Average
Administrators
7.58
$64,817.13 221.32
$292.87
7 1
5 3
0 2 4 2 0
0 8 0 0 0 0
0 0 6 1 1
19.00
Support Personnel PK-12 Teachers
6.80
81.37
$45,294.29 179.15
$252.83
$43,676.58 190.15
$229.69
5
79
3
5
0
13
8
71
0
12
7
47
1
25
0
0
0
0
0
1
8
83
0
0
0
0
0
0
0
0
0
0
2
30
3
33
3
20
0
1
17.63
15.04
*Includes One- and Two-Year Vocational Certificates.
Certified Staff Position Ratios
Teacher/Administrator Ratio 11:1
Teacher/Support Person Ratio 12:1
Teacher/Staff Ratio 6:1
Student Enrollment/All Teachers 17:1
Certified Personnel by Category
84.0% 100%
8.0%
8.0%
80% 60%
40%
20%
0%
Teachers
Administrators
Support Personnel
1998-99 GEORGIA PUBLIC EDUCATION REPORT CARD
Bremen City Schools - 763
Prepared by Georgia Department of Education
Page 9
1998-99 GEORGIA PUBLIC EDUCATION REPORT CARD
BREMEN CITY SCHOOLS
Bremen Middle/High School - 7631050
Grade Range 6-12
The Georgia Public Education Report Card is designed to assist systems and schools in educational improvement. This report card contains a variety of data elements. An explanation of the terms is provided as a companion to the report card data. Please refer to the definitions for the most effective use of the reported data.
STUDENT DATA
Total 682
6-12 Enrollment, by Race/Ethnicity and Sex
Black
White Hispanic
American Multi-
Asian Indian
racial
61 8.9%
615 90.2%
3 0.4%
2 0.3%
0 0.0%
1 0.1%
Male 355
52.1%
Female 327
47.9%
Enrollment in Selected Programs
Program
Program % of Student Enrollment Population
Gifted (Grades K-12)
60
8.8%
Non-Vocational Labs (Grades 9-12)
368
95.3%
Vocational Labs (Grades 9-12)
221
57.3%
Alternative Programs (Grades 6-12)
11
1.6%
Students Eligible to Receive Free/Reduced Lunches
Number
Percent
School System
115
16.9%
303
21.1%
Enrollment in Compensatory Programs
Program
Program % of Student Enrollment Population
Special Education (Grades K-12) PK
114 16.7%
0
N/A
English to Speakers of Other Languages (ESOL) (Grades K-12)
0
0.0%
Remedial Education (Grades 2-5, 9-12)
0
0.0%
Special Instructional Assistance (SIA) (Grades K-3)
N/A
N/A
Title I (Grades K-12) This school has a Targeted Assistance program.
Dropout Rate for Grades 6-12
Number
Rate
School System
7
1.0%
7
1.0%
Total 5
Retained Students, by Race/Ethnicity and Sex
Black
White Hispanic
American MultiAsian Indian racial
1 20.0%
4 80.0%
0 0.0%
0 0.0%
0 0.0%
0 0.0%
Male Female
3
2
60.0% 40.0%
Prepared by Georgia Department of Education
Page 1
STATE-REQUIRED TEST DATA
NORM-REFERENCED TESTS
Grade 3 Iowa Tests of Basic Skills (ITBS) Each chart reflects data for three years of testing.
No third-grade students are enrolled at Bremen Middle/High School.
Reading Comprehension
Mathematics
50
N/A 71 54 0
98-99
N/A 68 53 97-98
N/A 69 52 96-97
School 50
System
State
N/A 75 61 0
98-99
N/A 77 61 97-98
N/A 79 59 96-97
School System State
Reading Vocabulary 50
N/A 71 50 0
98-99
N/A 64 50 97-98
N/A 63 49 96-97
Language Arts
School 50
System
State
N/A 80 64 0
98-99
N/A 63 62 97-98
N/A 69 59 96-97
School System State
Social Studies 50
N/A 70 56 0
98-99
N/A 70 55 97-98
N/A 67 55 96-97
Science
School 50
System
State
N/A 74 59 0
98-99
N/A 75 59 97-98
N/A 74 58 96-97
School System State
Sources of Information
Composite Score
School
50
50
System
N/A 72 57 0
98-99
N/A 69 56 N/A 67 55
97-98
96-97
State
N/A 74 58 0
98-99
N/A 71 57 97-98
N/A 71 56 96-97
1998-99 GEORGIA PUBLIC EDUCATION REPORT CARD Bremen Middle/High School - 7631050
Prepared by Georgia Department of Education
Scores Reported in Percentiles
School System State
Page 2
STATE-REQUIRED TEST DATA
NORM-REFERENCED TESTS
Grade 5 Iowa Tests of Basic Skills (ITBS) Each chart reflects data for three years of testing. No fifth-grade students are enrolled at Bremen Middle/High School.
Reading Comprehension
Mathematics
50
N/A 57 53 0
98-99
N/A 61 53 97-98
N/A 59 52 96-97
School 50
System
State
N/A 63 59 0
98-99
N/A 64 58 97-98
N/A 64 57 96-97
School System State
Reading Vocabulary 50
N/A 60 48 0
98-99
N/A 62 48 97-98
N/A 57 46 96-97
Language Arts
School 50
System
State
N/A 62 63 0
98-99
N/A 63 61 97-98
N/A 61 58 96-97
School System State
Social Studies 50
N/A 63 57 0
98-99
N/A 66 56 97-98
N/A 63 55 96-97
Science
School 50
System
State
N/A 64 60 0
98-99
N/A 69 59 97-98
N/A 67 59 96-97
School System State
Sources of Information
Composite Score
School
50
50
System
N/A 57 58 0
98-99
N/A 63 58 N/A 64 57
97-98
96-97
State
N/A 61 57 0
98-99
N/A 64 56 97-98
N/A 63 55 96-97
1998-99 GEORGIA PUBLIC EDUCATION REPORT CARD Bremen Middle/High School - 7631050
Prepared by Georgia Department of Education
Scores Reported in Percentiles
School System State
Page 3
STATE-REQUIRED TEST DATA
NORM-REFERENCED TESTS Grade 8
Iowa Tests of Basic Skills (ITBS) Each chart reflects data for three years of testing.
Reading Comprehension 50
60 60 49 0
98-99
62 62 48 97-98
60 60 48 96-97
Mathematics
School 50
System
State
0
70 70 56 98-99
66 66 55 97-98
63 63 54 96-97
School System State
Reading Vocabulary 50
60 60 46 0
98-99
63 63 45 97-98
62 62 44 96-97
Language Arts
School 50
System
State
0
70 70 60 98-99
65 65 58 97-98
63 63 56 96-97
School System State
Social Studies 50
62 62 54 0
98-99
63 63 53 97-98
63 63 53 96-97
Science
School 50
System
State
0
64 64 56 98-99
67 67 55 97-98
59 59 53 96-97
School System State
Sources of Information
Composite Score
50
64 64 57 0
98-99
School 50
System
64 64 56 97-98
62 62 55 96-97
State 0
66 66 56 98-99
65 65 54 97-98
1998-99 GEORGIA PUBLIC EDUCATION REPORT CARD Bremen Middle/High School - 7631050
Prepared by Georgia Department of Education
62 62 54 96-97
Scores Reported in Percentiles
School System State
Page 4
STATE-REQUIRED TEST DATA
PERFORMANCE ASSESSMENTS
Grade 5 Writing Assessment
Percent at Developmental Stages:
1998-99 School System State
1997-98 School System State
1996-97 School System State
Stage Stage Stage Stage Stage Stage
1:The Emerging Writer 2:The Developing Writer 3:The Focusing Writer 4:The Experimenting 5:The Engaging Writer 6:The Extending Writer
N/A N/A N/A N/A N/A N/A
0% 0% 2% 44% 42% 12%
0% 1% 16% 41% 29% 12%
N/A N/A N/A N/A N/A N/A
0% 0% 13% 35% 40% 11%
0% 3% 19% 41% 27% 10%
N/A N/A N/A N/A N/A N/A
0% 1% 9% 46% 28% 16%
0% 3% 21% 37% 26% 12%
No fifth-grade students are enrolled at Bremen Middle/High School.
Categories of Scaled Scores
Inadequate (less than 162)
Minimal (162-209)
Good
(210-247)
Very Good (greater than 247)
Average Scaled Score: (Range 100-300)
Grade 8 Writing Assessment
1998-99 Percent Scoring
1997-98 Percent Scoring
1996-97 Percent Scoring
School System State School System State School System State
1% 18% 53% 29%
1% 18% 53% 29%
8% 40% 41% 11%
1% 37% 50% 12%
1% 37% 50% 12%
11% 46% 34%
8%
4% 55% 34%
7%
4% 55% 34%
7%
15% 46% 30%
8%
229
229
208 216
216 202 204
204 198
GEORGIA HIGH SCHOOL GRADUATION TESTS (GHSGT)
Percent of Regular Program 11th Graders Passing the Georgia High School Graduation Tests on First Administration
English Language Arts Mathematics Social Studies Science
All Components listed above
Writing
1998-99
School System State
99% 94% 90% 89%
88%
99% 94% 90% 89%
88%
96% 88% 80% 72%
68%
95% 95% 93%
1997-98
School System State
99% 93% 84% 86%
78%
99% 93% 84% 86%
78%
94% 88% 78% 74%
68%
95% 95% 92%
1996-97
School System State
95% 94% 83% 86%
81%
95% 94% 83% 86%
81%
94% 87% 78% 74%
67%
97% 97% 93%
1998-99 GEORGIA PUBLIC EDUCATION REPORT CARD Bremen Middle/High School - 7631050
Prepared by Georgia Department of Education
Page 5
GRADUATE DATA
1999 Graduates by Credentials, Race/Ethnicity and Sex
Diplomas with Both College Prep. & Voc. Endorsements
Diplomas with College Prep. Endorsements Diplomas with Vocational Endorsements General High School Diplomas Special Education Diplomas
Total All Diplomas
Certificates of Performance
Total Graduates
Total 5
56 15
2 4 82 2 84
Black
1 20.0%
7 12.5%
0 0.0%
0 0.0%
1 25.0%
9 11.0%
1 50.0%
10 11.9%
American MultiWhite Hispanic Asian Indian racial
4 80.0%
0 0.0%
0 0.0%
0 0.0%
0 0.0%
49 87.5%
0 0.0%
0 0.0%
0 0.0%
0 0.0%
15 100.0%
0 0.0%
0 0.0%
0 0.0%
0 0.0%
2 100.0%
0 0.0%
0 0.0%
0 0.0%
0 0.0%
3 75.0%
73 89.0%
0 0.0%
0 0.0%
0 0.0%
0 0.0%
0 0.0%
0 0.0%
0 0.0%
0 0.0%
1 50.0%
0 0.0%
0 0.0%
0 0.0%
0 0.0%
74 88.1%
0 0.0%
0 0.0%
0 0.0%
0 0.0%
Male Female
2
3
40.0% 60.0%
26
30
46.4% 53.6%
11
4
73.3% 26.7%
0
2
0.0% 100.0%
4 100.0%
43 52.4%
0 0.0%
39 47.6%
1
1
50.0% 50.0%
44
40
52.4% 47.6%
HOPE Scholarships
School System
Number of 1999 Graduates 8 4
Number Eligible
60
Percent Eligible
71.4%
84 60 71.4%
State
65,548 40,292 61.5%
High School Completion Rate
Percent of 1995Grade 9 Enrollment in Graduating Class of1999 School System State
Completion Rate '95-'99 90.3% 90.3% 68.9%
1998-99 GEORGIA PUBLIC EDUCATION REPORT CARD
Bremen Middle/High School - 7631050
Prepared by Georgia Department of Education
Page 6
COLLEGE ADMISSIONS / CREDIT TEST DATA
Scholastic Assessment Test (SAT)
Based on students' highest verbal and highest math scores
No. Taking
Average Score
Tests Verbal Math Total
Based on students' last test administration
Average Score Verbal Math Total
School College Prep. Endorsement Other Diplomas
52 483 461
944
493 467
960
355 355
710
System College Prep. Endorsement Other Diplomas
52 483 461
944
493 467
960
355 355
710
Georgia
41,958 492 488
980
472 N/A N/A
472 N/A N/A
483
453 N/A N/A
453 N/A N/A
479
925 N/A N/A
925 N/A N/A
962
Nation
952,913 N/A N/A N/A
502 508 1010
American College Testing (ACT)
Advanced Placement Exams (AP)
Number taking tests: English Mathematics Reading Science Reasoning CompositeScore
1 5 School System State
17.9 17.9 19.1
18.4 18.4 19.9
17.7 18.2
17.7 18.2
20.2 19.9
18.2 18.2 19.9
No. of Students Taking Tests
No. of Tests Taken No. of Test Scores
3 or Higher Percent of Test
Scores 3 or Higher
School 0
N/A N/A
N/A
System State 0 15,225
N/A 23,969 N/A 13,024
N/A 54.3%
POST-SECONDARY DATA
Graduates Entering Georgia Public Colleges
Graduates Entering Georgia Public Colleges and Requiring Learning Support (LS)
1998 Graduates Entering in 1998-99
1997 Graduates Entering in 1997-98
Percent of Graduating Number Class
School
45
52.9%
System 4 5
52.9%
School
31
45.6%
System 3 1
45.6%
Number Requiring
LS 8 8
11 11
Percent of those attending Georgia
Public Colleges
17.8%
17.8%
35.5%
35.5%
In previous years, the Report Card presented College Prep Curriculum information provided by the Board of Regents on students requiring Learning Support. Due to inconsistencies in the data provided by the Board of Regents in defining College Prep Completers versus Local Board of Education data defining College Prep Endorsements, the Department of Education Report Card will not provide this information until discrepancies can be reconciled.
Graduates Entering Georgia Public Technical and Adult Schools
1998 Graduates School System
Entering Number 3 3
1998-99 Percent
3.5% 3.5%
Entering Number N/A N/A
1997-98 Percent
N/A N/A
1997 Graduates School
0
0.0%
System
0
0.0%
1
1.5%
1
1.5%
1998-99 GEORGIA PUBLIC EDUCATION REPORT CARD Bremen Middle/High School - 7631050
Prepared by Georgia Department of Education
Page 7
CERTIFIED PERSONNEL DATA
Positions Number Average Contract Days
Administrators
3.00 216.67
Support Personnel
2.50 179.00
PK-12 Teachers
38.90 190.00
Personnel Sex
Certificate
Years Experience
Full-time Part-time
Male Female
4 Yr Bachelor's 5 Yr Master's 6 Yr Specialist's 7 Yr Doctoral Other*
<1 1-10 11-20 21-30 >30
Average
3 0
2 1
0 1 2 0 0
0 0 3 0 0
14.67
2 1
0 3
0 2 1 0 0
0 1 1 1 0
17.00
38 2
10 30
8 22 10
0 0
0 17 13
9 1
14.03
*Includes One- and Two-Year Vocational Certificates.
ACCREDITATION DATA
Accredited by Southern Association of Colleges and Schools (SACS): Secondary/Middle Commission. Accredited with Quality by Georgia Accrediting Commission (GAC).
AWARDS / RECOGNITION DATA
Schools in Georgia may receive recognition in the following programs: Charter School Pay for Performance Program Georgia School of Excellence National Blue Ribbon School Bremen Middle/High School did not receive recognition in any of these programs during the 1998-99 school year.
1998-99 GEORGIA PUBLIC EDUCATION REPORT CARD Bremen Middle/High School - 7631050
Prepared by Georgia Department of Education
Page 8
1998-99 GEORGIA PUBLIC EDUCATION REPORT CARD
BREMEN CITY SCHOOLS
Jones Elementary School - 7632050
Grade Range PK-5
The Georgia Public Education Report Card is designed to assist systems and schools in educational improvement. This report card contains a variety of data elements. An explanation of the terms is provided as a companion to the report card data. Please refer to the definitions for the most effective use of the reported data.
STUDENT DATA
Total
K-5
688
PK
65
Enrollment, by Race/Ethnicity and Sex
Black
White Hispanic
American Asian Indian
Multiracial
71 10.3%
608 88.4%
3 0.4%
1 0.1%
0 0.0%
5 0.7%
7 10.8%
58 89.2%
0 0.0%
0 0.0%
0 0.0%
0 0.0%
Male Female
352 51.2%
336 48.8%
32 49.2%
33 50.8%
Enrollment in Selected Programs
Program
Program % of Student Enrollment Population
Gifted (Grades K-12)
71
10.3%
Alternative Programs (Grades 6-12)
N/A
N/A
Students Eligible to Receive Free/Reduced Lunches
Number
Percent
School System
188
25.0%
303
21.1%
Dropout Rate *
Number
Rate
School System
N/A N/A
N/A N/A
* Dropout rates are not applicable for grades PK-5.
Enrollment in Compensatory Programs
Program
Program % of Student Enrollment Population
Special Education (Grades K-12)
135 19.6%
(PK)
42
N/A
English to Speakers of Other Languages (ESOL) (Grades K-12)
0
0.0%
Remedial Education (Grades 2-5, 9-12)
52 11.7%
Special Instructional Assistance (SIA) (Grades K-3)
67 14.4%
Title I (Grades K-12)
This school has a Targeted Assistance program.
Total 8
Retained Students, by Race/Ethnicity and Sex
Black
White Hispanic
American MultiAsian Indian racial
0
8
0.0% 100.0%
0 0.0%
0 0.0%
0 0.0%
0 0.0%
Male Female
5
3
62.5% 37.5%
Prepared by Georgia Department of Education
Page 1
STATE-REQUIRED TEST DATA
NORM-REFERENCED TESTS Grade 3
Iowa Tests of Basic Skills (ITBS) Each chart reflects data for three years of testing.
Reading Comprehension 50
71 71 54 0
98-99
68 68 53 97-98
69 69 52 96-97
Mathematics
School 50
System
State
0
75 75 61 98-99
77 77 61 97-98
79 79 59 96-97
School System State
Reading Vocabulary 50
71 71 50 0
98-99
64 64 50 97-98
63 63 49 96-97
Language Arts
School 50
System
State
0
80 80 64 98-99
63 63 62 97-98
69 69 59 96-97
School System State
Social Studies 50
70 70 56 0
98-99
70 70 55 97-98
67 67 55 96-97
Science
School 50
System
State
0
74 74 59 98-99
75 75 59 97-98
74 74 58 96-97
School System State
Sources of Information
Composite Score
50
72 72 57 0
98-99
School 50
System
69 69 56 97-98
67 67 55 96-97
State 0
74 74 58 98-99
71 71 57 97-98
1998-99 GEORGIA PUBLIC EDUCATION REPORT CARD Jones Elementary School - 7632050
Prepared by Georgia Department of Education
71 71 56 96-97
Scores Reported in Percentiles
School System State
Page 2
STATE-REQUIRED TEST DATA
NORM-REFERENCED TESTS Grade 5
Iowa Tests of Basic Skills (ITBS) Each chart reflects data for three years of testing.
Reading Comprehension
Mathematics
50
57 57 53 0
98-99
61 61 53 97-98
59 59 52 96-97
School 50
System
State
0
63 63 59 98-99
64 64 58 97-98
64 64 57 96-97
School System State
Reading Vocabulary 50
60 60 48 0
98-99
62 62 48 97-98
57 57 46 96-97
Language Arts
School 50
System
State
0
62 62 63 98-99
63 63 61 97-98
61 61 58 96-97
School System State
Social Studies 50
63 63 57 0
98-99
66 66 56 97-98
63 63 55 96-97
Science
School 50
System
State
0
64 64 60 98-99
69 69 59 97-98
67 67 59 96-97
School System State
Sources of Information
Composite Score
50
57 57 58 0
98-99
School 50
System
63 63 58 97-98
64 64 57 96-97
State 0
61 61 57 98-99
64 64 56 97-98
63 63 55 96-97
1998-99 GEORGIA PUBLIC EDUCATION REPORT CARD Jones Elementary School - 7632050
Prepared by Georgia Department of Education
Scores Reported in Percentiles
School System State
Page 3
STATE-REQUIRED TEST DATA
PERFORMANCE ASSESSMENTS
Grade 5 Writing Assessment
Percent at Developmental Stages:
1998-99 School System State
1997-98 School System State
1996-97 School System State
Stage Stage Stage Stage Stage Stage
1:The Emerging Writer 2:The Developing Writer 3:The Focusing Writer 4:The Experimenting 5:The Engaging Writer 6:The Extending Writer
0% 0% 2% 44% 42% 12%
0% 0% 2% 44% 42% 12%
0% 1% 16% 41% 29% 12%
0% 0% 13% 35% 40% 11%
0% 0% 13% 35% 40% 11%
0% 3% 19% 41% 27% 10%
0% 1% 9% 46% 28% 16%
0% 1% 9% 46% 28% 16%
0% 3% 21% 37% 26% 12%
AWARDS / RECOGNITION DATA
Schools in Georgia may receive recognition in the following programs: Charter School Pay for Performance Program Georgia School of Excellence National Blue Ribbon School Jones Elementary School did not receive recognition in any of these programs during the 1998-99 school year.
1998-99 GEORGIA PUBLIC EDUCATION REPORT CARD Jones Elementary School - 7632050
Prepared by Georgia Department of Education
Page 4
CERTIFIED PERSONNEL DATA
Positions Number Average Contract Days
Personnel Sex
Certificate
Years Experience
Full-time Part-time
Male Female
4 Yr Bachelor's 5 Yr Master's 6 Yr Specialist's 7 Yr Doctoral Other*
<1 1-10 11-20 21-30 >30
Average
Administrators
2.00 210.00
2 0
1 1
0 0 2 0 0 0 0 1 1 0 21.50
Support Personnel
3.30 169.91
2 2
0 4
0 4 0 0 0 0 1 1 2 0 17.75
PK-12 Teachers
42.30 190.18
40 5
4 41
5 25 15
0 0 0 14 20 11 0 15.78
*Includes One- and Two-Year Vocational Certificates.
ACCREDITATION DATA
Accredited by Southern Association of Colleges and Schools (SACS):
Elementary/Middle Commission. Accredited with Quality by Georgia
Accrediting Commission (GAC).
1998-99 GEORGIA PUBLIC EDUCATION REPORT CARD Jones Elementary School - 7632050
Prepared by Georgia Department of Education
Page 5
1998-99 GEORGIA PUBLIC EDUCATION REPORT CARD BROOKS COUNTY SCHOOLS - 614
The Georgia Public Education Report Card is designed to assist systems and schools in educational improvement. This report card contains a variety of data elements. An explanation of the terms is provided as a companion to the report card data. Please refer to the definitions for the most effective use of the reported data.
Total
K-12
2,684
PK
69
STUDENT DATA
Enrollment, by Race/Ethnicity and Sex
Black
White Hispanic
American Multi-
Asian Indian
racial
1,751 65.2%
854 31.8%
54 2.0%
7 0.3%
0 0.0%
18 0.7%
49 71.0%
17 24.6%
2 2.9%
0 0.0%
0 0.0%
1 1.4%
Male
1,448 53.9%
35 50.7%
Female
1,236 46.1%
34 49.3%
Enrollment in Selected Programs
Program
Program % of Student Enrollment Population
Gifted (Grades K-12)
35
1.3%
Non-Vocational Labs (Grades 9-12)
329
51.2%
Vocational Labs (Grades 9-12)
595
92.7%
Alternative Programs (Grades 6-12)
22
1.6%
Students Eligible to Receive Free/Reduced Lunches
Number
Percent
2,079
75.5%
Dropout Rate
Number
Percent
6-12 9-12
94
6.4%
82
11.5%
Enrollment in Compensatory Programs
Program
Program % of Student Enrollment Population
Special Education
(Grades K-12)
258
PK
14
English to Speakers of
Other Languages (ESOL)
0
(Grades K-12)
Remedial Education (Grades 2-5, 9-12)
463
Special Instructional
Assistance (SIA)
212
(Grades K-3)
Title I (Grades K-12) Number of schools with: Schoolwide program Targeted Assistance program No Title I program
9.6% N/A
0.0%
30.5%
22.3%
3 0 1
Total 273
Retained Students, by Race/Ethnicity and Sex
Black
White Hispanic
American MultiAsian Indian racial
205 75.1%
62 22.7%
4 1.5%
0 0.0%
0 0.0%
2 0.7%
Male Female
182
91
66.7% 33.3%
Prepared by Georgia Department of Education
Page 1
STATE-REQUIRED TEST DATA
NORM-REFERENCED TESTS
Grade 3 Iowa Tests of Basic Skills (ITBS) Each chart reflects data for three years of testing.
Reading Comprehension
Mathematics
50
33 54 33 53 22 52 0
98-99 97-98 96-97
System State
50
40 61 41 61 27 59 0
98-99 97-98 96-97
System State
Reading Vocabulary
50
38 50 33 50 18 49 0
98-99 97-98 96-97
System State
Social Studies
50
35 56 34 55 22 55 0
98-99 97-98 96-97
System State
Language Arts
50
45 64 44 62 26 59 0
98-99 97-98 96-97
System State
Science
50
39 59 41 59 31 58 0
98-99 97-98 96-97
System State
Sources of Information
Composite Score
50
38 57 0
98-99
System
50
34 56 24 55 97-98 96-97
State
37 58 35 57 0
98-99 97-98
1998-99 GEORGIA PUBLIC EDUCATION REPORT CARD Brooks County Schools
Prepared by Georgia Department of Education
System State Scores Reported 22 56 in Percentiles 96-97
Page 2
STATE-REQUIRED TEST DATA
NORM-REFERENCED TESTS
Grade 5 Iowa Tests of Basic Skills (ITBS) Each chart reflects data for three years of testing.
Reading Comprehension
Mathematics
50
39 53 36 53 33 52 0
98-99 97-98 96-97
System State
50
57 59 44 58 41 57 0
98-99 97-98 96-97
System State
Reading Vocabulary
50
60 48 21 48 19 46 0
98-99 97-98 96-97
System State
Social Studies
50
46 57 32 56 32 55 0
98-99 97-98 96-97
System State
Language Arts
50
59 63 42 61 36 58 0
98-99 97-98 96-97
System State
Science
50
53 60 38 59 37 59 0
98-99 97-98 96-97
System State
Sources of Information
Composite Score
50
45 58 0
98-99
System
50
38 58 36 57 97-98 96-97
State
50 57 35 56 0
98-99 97-98
1998-99 GEORGIA PUBLIC EDUCATION REPORT CARD Brooks County Schools
Prepared by Georgia Department of Education
System State Scores Reported 33 55 in Percentiles 96-97
Page 3
STATE-REQUIRED TEST DATA
NORM-REFERENCED TESTS Grade 8
Iowa Tests of Basic Skills (ITBS) Each chart reflects data for three years of testing.
Reading Comprehension
Mathematics
50
34 49 34 48 33 48 0
98-99 97-98 96-97
System State
50
55 56 42 55 37 54 0
98-99 97-98 96-97
System State
Reading Vocabulary
50
36 46 26 45 24 44 0
98-99 97-98 96-97
System State
Language Arts
50
50 60 45 58 42 56 0
98-99 97-98 96-97
System State
Social Studies
50
40 54 37 53 39 53 0
98-99 97-98 96-97
System State
Science
50
39 56 35 55 37 53 0
98-99 97-98 96-97
System State
Sources of Information
Composite Score
50
47 57 0
98-99
System
50
40 56 38 55 97-98 96-97
State
42 56 36 54 0
98-99 97-98
1998-99 GEORGIA PUBLIC EDUCATION REPORT CARD Brooks County Schools
Prepared by Georgia Department of Education
System State Scores Reported 36 54 in Percentiles 96-97
Page 4
STATE-REQUIRED TEST DATA
PERFORMANCE ASSESSMENTS
Grade 5 Writing Assessment
1998-99
1997-98
1996-97
Percent at Developmental Stages:
Comparison
Comparison
Comparison
System Group State System Group State System Group State
Stage Stage Stage Stage Stage Stage
1: The Emerging Writer 2: The Developing Writer 3: The Focusing Writer 4: The Experimenting Writer 5: The Engaging Writer 6: The Extending Writer
1% 0% 20% 49% 23% 7%
0% 3% 27% 45% 19% 5%
0% 1% 16% 41% 29% 12%
1% 5% 25% 37% 24% 6%
1% 7% 34% 40% 14% 3%
0% 3% 19% 41% 27% 10%
3% 10% 30% 30% 18%
8%
1% 8% 35% 35% 15% 6%
0% 3% 21% 37% 26% 12%
Grade 8 Writing Assessment
1998-99 Percent Scoring 1997-98 Percent Scoring 1996-97 Percent Scoring
Categories of Scaled Scores
Comparison
Comparison
Comparison
System Group State System Group State System Group State
Inadequate (less than 162)
Minimal (162-209)
Good
(210-247)
Very Good (greater than 247)
19% 54% 25%
3%
19% 52% 26%
3%
8% 40% 41% 11%
15% 60% 22%
3%
29% 54% 16%
1%
11% 46% 34%
8%
29% 50% 18%
2%
37% 46% 14%
3%
15% 46% 30%
8%
Average Scaled Score: (Range 100-300)
187
190 208
190
179 202
181
175 198
GEORGIA HIGH SCHOOL GRADUATION TESTS (GHSGT)
Percent of Regular Program 11th Graders Passing the Georgia High School Graduation Tests on First Administration
1998-99
1997-98
1996-97
Comparison
Comparison
Comparison
System Group State System Group State System Group State
English Language Arts Mathematics Social Studies Science
86% 66% 54% 40%
89% 75% 62% 50%
96% 88% 80% 72%
90% 71% 55% 53%
86% 75% 57% 50%
94% 88% 78% 74%
86% 66% 53% 46%
88% 74% 60% 55%
94% 87% 78% 74%
All Components listed above 3 6 %
45% 68% 42%
41% 68% 38%
46% 67%
Writing
93%
84% 93% 89%
82% 92% 89%
84% 93%
1998-99 GEORGIA PUBLIC EDUCATION REPORT CARD
Brooks County Schools
Prepared by Georgia Department of Education
Page 5
GRADUATE DATA
1999 Graduates by Credentials, Race/Ethnicity and Sex
Diplomas with Both College Prep. & Voc. Endorsements
Diplomas with College Prep. Endorsements Diplomas with Vocational Endorsements General High School Diplomas Special Education Diplomas
Total All Diplomas
Certificates of Performance
Total Graduates
Total 27 19 34 1 5 86 21
107
Black
American MultiWhite Hispanic Asian Indian racial
Male Female
18 66.7%
12 63.2%
21 61.8%
0 0.0%
5 100.0%
9 33.3%
5 26.3%
11 32.4%
1 100.0%
0 0.0%
0 0.0%
1 5.3%
1 2.9%
0 0.0%
0 0.0%
0 0.0%
1 5.3%
0 0.0%
0 0.0%
0 0.0%
0 0.0%
0 0.0%
0 0.0%
0 0.0%
0 0.0%
0
10
0.0% 37.0%
0
12
0.0% 63.2%
1
17
2.9% 50.0%
0
1
0.0% 100.0%
0
4
0.0% 80.0%
17 63.0%
7 36.8%
17 50.0%
0 0.0%
1 20.0%
56
26
2
1
0
1
44
42
65.1% 30.2% 2.3% 1.2% 0.0% 1.2% 51.2% 48.8%
19 90.5%
2
0
0
0
0
6
15
9.5% 0.0% 0.0% 0.0% 0.0% 28.6% 71.4%
75
28
2
1
0
1
50
57
70.1% 26.2% 1.9% 0.9% 0.0% 0.9% 46.7% 53.3%
HOPE Scholarships
System State
Number of 1999 Graduates 1 0 7
Number Eligible
46
Percent Eligible
43.0%
65,548 40,292 61.5%
High School Completion Rate Percent of 1995Grade 9 Enrollment
in Graduating Class of1999
System
State
Completion Rate '95-'99 50.5% 68.9%
COLLEGE ADMISSIONS / CREDIT TEST DATA
Scholastic Assessment Test (SAT)
No. Taking
Average Score
Tests
Verbal Math Total
Based on students' highest verbal and highest math scores
System College Prep. Endorsement Other Diplomas
444 415 859 495 455 950 350 323 673
Georgia
492 488 980
Based on students' last test administration
System Georgia
55
435 401
836
41,958 483 479 962
Nation
952,913 502 508 1010
American College Testing (ACT)
System State Nation
English
17.5
19.1 20.4
Mathematics
16.9
19.9 20.7
Reading
18.7
20.2 21.3
Science Reasoning 18.4
19.9 21.0
CompositeScore 17.9
19.9 21.9
Advanced Placement Exams (AP)
No. of Students Taking Tests
No. of Tests Taken No. of Test Scores
3 or Higher Percent of Test
Scores 3 or Higher
System State 4 15,225 4 23,969 2 13,024
50.0% 54.3%
1998-99 GEORGIA PUBLIC EDUCATION REPORT CARD Brooks County Schools
Prepared by Georgia Department of Education
Page 6
POSTSECONDARY DATA
Graduates Entering Georgia Public Colleges and Universities
Graduates Entering Georgia Public Colleges and Universities and
Requiring Learning Support (LS)
1998 Graduates Entering 1998-99
1997 Graduates Entering 1997-98
Percent of Graduating Number Class
21
16.7%
25
18.1%
Number Requiring
LS
9
5
Percent of those attending Georgia
Public Colleges
42.9%
20.0%
In previous years, the Report Card presented College Prep Curriculum information provided by the Board of Regents on students requiring Learning Support. Due to inconsistencies in the data provided by the Board of Regents in defining College Prep Completers versus Local Board of Education data defining College Prep Endorsements, the Department of Education Report Card will not provide this information until discrepancies can be reconciled.
Graduates Entering Georgia Public Technical and Adult Schools
Entering 1998-99 Entering 1997-98
Number Percent
Number Percent
1998 Graduates 1997 Graduates
12
9.5%
2
1.4%
N/A 19
N/A 13.8%
ACCREDITATION / RECOGNITION DATA
Southern Association of Colleges and Schools (SACS) Accrediting Commission
Secondary/Middle Commission Elementary/Middle Commission Both Elementary/Secondary Commissions Joint Commission Candidate for Accreditation
Accreditation by Georgia Accrediting Commission (GAC)
Accredited by GAC Accredited with Quality by GAC
Number of Schools
1 0 0 0 0
Number of Schools
0 4
Awards / Recognition
State Recognized Program
Number of Schools
Charter School
0
Pay for Performance Recipient
0
Georgia School of Excellence
0
National Blue Ribbon School
0
COMMUNITY DATA
Number of Children Eligible for Migrant Education Number of Families-At-Risk * Number of Food Stamp Participants * Number of Families Receiving TANF * ** Per Capita Income * Unemployment Rate * 1990 Population * Projected 2000 Population * Projected 2010 Population *
* Data Available at County Level Only ** Known as AFDC before January 1997
253 56
2,575 227
$15,757 5.6%
15,398 16,507 17,245
1998-99 GEORGIA PUBLIC EDUCATION REPORT CARD Brooks County Schools
Prepared by Georgia Department of Education
Page 7
FISCAL DATA
Millage Rate
14.32
* Fall 1998 Property Tax Digest is used to calculate the 98-99 Value of One Mill
FTE Count
FTE Count used for Allotment Calculation 2,650.0 Fall '98 FTE Count 2,684
Value of One Mill
$219,357 $82.77 per Allotment FTE
Sources: Local State-QBE State-
Lottery State-
Other Federal Other
Total
PerGeneral Fund cent Per FTE
$3,449,112 26.1% $1,302 $9,653,081 73.1% $3,643
K-12 Revenues
Lottery K-12
and
Title
All Other
Programs
K-12
$0
$0
Bonded Debt $0
$0
$0
$0
$0 0.0%
$0
$0
$59,785
$0
$107,556 0.8% $41
$24,000
$0
$0
$0 0.0%
$0 $1,288,820 $195,199
$0
$599 0.0%
$0
$0
$0
$0
$13,210,349 100% $4,986 $1,312,820 $254,984
$0
Capital Projects
$0 $0
$0
$0 $0 $0 $0
School Nutrition
$205,032 $0
$0
$71,825 $1,115,099
$0 $1,391,957
Grand Total
Total
Per-
Amount cent
$3,654,144 22.6%
$9,653,081 59.7%
$59,785 0.4%
$203,381 1.3% $2,599,119 16.1%
$599 0.0% $16,170,112 100%
Instruction
Media Instruction
Support Pupil Services General Admin. School Admin. Trans-
portation Maint. & Ops. Capital Projects School Food Debt Service
Total
$8,163,171 61.7% $3,080 $335,916 2.5% $127
$534,877 4.0% $202
$445,746 3.4% $168
$403,305 3.0% $152
$1,089,270 8.2% $411
$746,349 5.6% $282
$1,063,281 8.0% $401
$451,694 3.4% $170
$0 0.0%
$0
$0 0.0%
$0
K-12 Expenditures
$866,085
$62,791
$0
$0
$0
$0
$227,223 $157,877
$0
$40,856
$0
$0
$124,731
$34,675
$0
$0
$0
$0
$2,153
$0
$0
$1,557
$0
$0
$0
$0
$0
$0
$0
$0
$0
$0
$0
$13,233,613 100% $4,993 $1,262,608 $255,344
$0
$0
$0
$0
$0
$0
$0
$0
$0
$0
$0
$0
$0
$0
$0
$0
$0
$0
$0
$0 $1,374,078
$0
$0
$9,092,048 56.4% $335,916 2.1% $919,978 5.7% $486,602 3.0% $562,713 3.5%
$1,089,270 6.8% $748,502 4.6%
$1,064,839 6.6% $451,694 2.8%
$1,374,078 8.5% $0 0.0%
$0 $1,374,078 $16,125,645 100%
Salaries and Benefits as Percentages of Revenues and of Expenditures
Teachers and Paraprofessionals
Salaries $6,467,755
Benefits $1,777,683
Percentage of Revenues Percentage of Expenditures
Total of
Total of
General Fund
General Fund
Title Programs
Title Programs
Lottery K-12
Lottery K-12
Total Salaries
and
Total
and
Total
and Benefits All Other K-12 K - 12 All Other K-12 K - 12
$8,245,438
55.8%
51.0%
55.9%
51.1%
School Administration
$645,668
$204,887
$850,555
5.8%
5.3%
5.8%
5.3%
General Administration
$241,119
$88,333
$329,452
2.2%
2.0%
2.2%
2.0%
1998-99 GEORGIA PUBLIC EDUCATION REPORT CARD
Brooks County Schools - 614
Prepared by Georgia Department of Education
Page 8
CERTIFIED PERSONNEL DATA
Number
Average Annual Salary Positions Average Contract Days
Average Daily Salary
Full-time Personnel Part-time
Sex Male Female
4 Yr Bachelor's Certificate 5 Yr Master's
Level 6 Yr Specialist's 7 Yr Doctoral Other*
Black
White Race/ Hispanic Ethnicity Asian
American Indian
Multiracial
Years Experience
<1 1-10 11-20 21-30 >30
Average
Administrators
15.50
$61,668.33 214.52
$287.48
15 1
7 9
0 2 14 0 0
6 10
0 0 0 0
0 1 5 5 5
23.38
Support Personnel PK-12 Teachers
17.00
169.65
$42,612.10 192.35
$221.53
$36,703.98 190.26
$192.91
17
167
0
5
4
29
13
143
3
102
12
64
2
6
0
0
0
0
4
55
12
117
0
0
1
0
0
0
0
0
1
3
7
73
4
63
1
25
4
8
15.59
12.66
*Includes One- and Two-Year Vocational Certificates.
Certified Staff Position Ratios
Teacher/Administrator Ratio 11:1
Teacher/Support Person Ratio 10:1
Teacher/Staff Ratio 5:1
Student Enrollment/All Teachers 16:1
Certified Personnel by Category
83.9% 100%
7.8%
8.3%
80% 60%
40%
20%
0%
Teachers
Administrators
Support Personnel
1998-99 GEORGIA PUBLIC EDUCATION REPORT CARD
Brooks County Schools - 614
Prepared by Georgia Department of Education
Page 9
1998-99 GEORGIA PUBLIC EDUCATION REPORT CARD
BROOKS COUNTY SCHOOLS
Brooks County High School - 6142050
Grade Range 9-12
The Georgia Public Education Report Card is designed to assist systems and schools in educational improvement. This report card contains a variety of data elements. An explanation of the terms is provided as a companion to the report card data. Please refer to the definitions for the most effective use of the reported data.
Total 649
STUDENT DATA
9-12 Enrollment, by Race/Ethnicity and Sex
Black
White Hispanic
American Multi-
Asian Indian
racial
444 68.4%
192 29.6%
8 1.2%
3 0.5%
0 0.0%
2 0.3%
Male Female
323 49.8%
326 50.2%
Enrollment in Selected Programs
Program
Gifted (Grades K-12)
Program % of Student Enrollment Population
17
2.6%
Non-Vocational Labs (Grades 9-12)
329
Vocational Labs
(Grades 9-12)
595
Alternative Programs (Grades 6-12)
18
51.2% 92.7%
2.8%
Students Eligible to Receive Free/Reduced Lunches
Number
Percent
School System
427 2,079
65.8% 75.5%
Enrollment in Compensatory Programs
Program
Program % of Student Enrollment Population
Special Education (Grades K-12) PK
65 10.0%
0
N/A
English to Speakers of Other Languages (ESOL) (Grades K-12)
0
0.0%
Remedial Education (Grades 2-5, 9-12)
177 27.6%
Title I (Grades K-12)
This school has no Title I program.
Dropout Rate for Grades 9-12
Number
Rate
School System
82
11.5%
82
11.5%
Total 58
Retained Students, by Race/Ethnicity and Sex
Black
White Hispanic
American MultiAsian Indian racial
44 75.9%
13 22.4%
1 1.7%
0 0.0%
0 0.0%
0 0.0%
Male Female
31
27
53.4% 46.6%
Prepared by Georgia Department of Education
Page 1
STATE-REQUIRED TEST DATA
GEORGIA HIGH SCHOOL GRADUATION TESTS (GHSGT)
Percent of Regular Program 11th Graders Passing the Georgia High School Graduation Tests on First Administration
English Language Arts Mathematics Social Studies Science
All Components listed above
Writing
1998-99
School System State
86% 66% 54% 40%
86% 66% 54% 40%
96% 88% 80% 72%
36% 36% 68%
93% 93% 93%
1997-98
School System State
90% 71% 55% 53%
90% 71% 55% 53%
94% 88% 78% 74%
42% 42% 68%
89% 89% 92%
1996-97
School System State
86% 66% 53% 46%
86% 66% 53% 46%
94% 87% 78% 74%
38% 38% 67%
89% 89% 93%
GRADUATE DATA
1999 Graduates by Credentials, Race/Ethnicity and Sex
Diplomas with Both College Prep. & Voc. Endorsements
Diplomas with College Prep. Endorsements Diplomas with Vocational Endorsements General High School Diplomas Special Education Diplomas
Total All Diplomas
Certificates of Performance
Total Graduates
Total 27 19 34 1 5 86 21
107
Black
18 66.7%
12 63.2%
21 61.8%
0 0.0%
5 100.0%
56 65.1%
19 90.5%
75 70.1%
American MultiWhite Hispanic Asian Indian racial
9 33.3%
5 26.3%
0 0.0%
1 5.3%
0 0.0%
1 5.3%
0 0.0%
0 0.0%
0 0.0%
0 0.0%
11 32.4%
1 100.0%
0 0.0%
1 2.9%
0 0.0%
0 0.0%
0 0.0%
0 0.0%
0 0.0%
0 0.0%
0 0.0%
0 0.0%
1 2.9%
0 0.0%
0 0.0%
26 30.2%
2 2.3%
1 1.2%
0 0.0%
1 1.2%
2 9.5%
0 0.0%
0 0.0%
0 0.0%
0 0.0%
28 26.2%
2 1.9%
1 0.9%
0 0.0%
1 0.9%
Male Female
10 37.0%
12 63.2%
17 63.0%
7 36.8%
17 50.0%
1 100.0%
4 80.0%
17 50.0%
0 0.0%
1 20.0%
44
42
51.2% 48.8%
6
15
28.6% 71.4%
50
57
46.7% 53.3%
HOPE Scholarships
School System
Number of 1999 Graduates 1 0 7
Number Eligible
46
Percent Eligible
43.0%
107 46
43.0%
State
65,548 40,292 61.5%
High School Completion Rate
Percent of 1995Grade 9 Enrollment in Graduating Class of1999 School System State
Completion Rate '95-'99 50.5% 50.5% 68.9%
1998-99 GEORGIA PUBLIC EDUCATION REPORT CARD
Brooks County High School - 6142050
Prepared by Georgia Department of Education
Page 2
COLLEGE ADMISSIONS / CREDIT TEST DATA
Scholastic Assessment Test (SAT)
Based on students' highest verbal and highest math scores
No. Taking
Average Score
Tests Verbal Math Total
Based on students' last test administration
Average Score Verbal Math Total
School College Prep. Endorsement Other Diplomas
55 444 415
859
495 455
950
350 323
673
System College Prep. Endorsement Other Diplomas
55 444 415
859
495 455
950
350 323
673
Georgia
41,958 492 488
980
435 N/A N/A
435 N/A N/A
483
401 N/A N/A
401 N/A N/A
479
836 N/A N/A
836 N/A N/A
962
Nation
952,913 N/A N/A N/A
502 508 1010
American College Testing (ACT)
Advanced Placement Exams (AP)
Number taking tests: English Mathematics Reading Science Reasoning CompositeScore
1 1 School System State
17.5 17.5 19.1
16.9 16.9 19.9
18.7 18.4
18.7 18.4
20.2 19.9
17.9 17.9 19.9
No. of Students Taking Tests
No. of Tests Taken No. of Test Scores
3 or Higher Percent of Test
Scores 3 or Higher
School 4 4 2
50.0%
System State 4 15,225 4 23,969 2 13,024
50.0% 54.3%
POST-SECONDARY DATA
Graduates Entering Georgia Public Colleges
Graduates Entering Georgia Public Colleges and Requiring Learning Support (LS)
1998 Graduates Entering in 1998-99
1997 Graduates Entering in 1997-98
Percent of Graduating Number Class
School
21
16.7%
System 2 1
16.7%
School
25
18.1%
System 2 5
18.1%
Number Requiring
LS 9 9
5 5
Percent of those attending Georgia
Public Colleges
42.9%
42.9%
20.0%
20.0%
In previous years, the Report Card presented College Prep Curriculum information provided by the Board of Regents on students requiring Learning Support. Due to inconsistencies in the data provided by the Board of Regents in defining College Prep Completers versus Local Board of Education data defining College Prep Endorsements, the Department of Education Report Card will not provide this information until discrepancies can be reconciled.
Graduates Entering Georgia Public Technical and Adult Schools
1998 Graduates School System
Entering Number 12 12
1998-99 Percent
9.5% 9.5%
Entering Number N/A N/A
1997-98 Percent
N/A N/A
1997 Graduates School
2
1.4%
System
2
1.4%
19
13.8%
19
13.8%
1998-99 GEORGIA PUBLIC EDUCATION REPORT CARD Brooks County High School - 6142050
Prepared by Georgia Department of Education
Page 3
CERTIFIED PERSONNEL DATA
Positions Number Average Contract Days
Administrators
3.50 212.86
Support Personnel
4.00 195.00
PK-12 Teachers
42.40 191.89
Personnel Sex
Certificate
Years Experience
Full-time Part-time
Male Female
4 Yr Bachelor's 5 Yr Master's 6 Yr Specialist's 7 Yr Doctoral Other*
<1 1-10 11-20 21-30 >30
Average
3 1
3 1
0 1 3 0 0
0 0 2 1 1
22.75
4 0
1 3
2 2 0 0 0
0 2 0 1 1
15.75
41 3
19 25
20 23
1 0 0
2 13 16
8 5
15.57
*Includes One- and Two-Year Vocational Certificates.
ACCREDITATION DATA
Accredited by Southern Association of Colleges and Schools (SACS): Secondary/Middle Commission. Accredited with Quality by Georgia Accrediting Commission (GAC).
AWARDS / RECOGNITION DATA
Schools in Georgia may receive recognition in the following programs: Charter School Pay for Performance Program Georgia School of Excellence National Blue Ribbon School Brooks County High School did not receive recognition in any of these programs during the 1998-99 school year.
1998-99 GEORGIA PUBLIC EDUCATION REPORT CARD Brooks County High School - 6142050
Prepared by Georgia Department of Education
Page 4
1998-99 GEORGIA PUBLIC EDUCATION REPORT CARD
BROOKS COUNTY SCHOOLS
Brooks County Middle School - 6140197
Grade Range 6-8
The Georgia Public Education Report Card is designed to assist systems and schools in educational improvement. This report card contains a variety of data elements. An explanation of the terms is provided as a companion to the report card data. Please refer to the definitions for the most effective use of the reported data.
STUDENT DATA
Total 690
6-8 Enrollment, by Race/Ethnicity and Sex
Black
White Hispanic
American Multi-
Asian Indian
racial
433 62.8%
242 35.1%
13 1.9%
1 0.1%
0 0.0%
1 0.1%
Male 382
55.4%
Female 308
44.6%
Enrollment in Selected Programs
Program
Gifted (Grades K-12)
Program % of Student Enrollment Population
11
1.6%
Alternative Programs (Grades 6-12)
4
< 1%
Students Eligible to Receive Free/Reduced Lunches
Number
Percent
School System
517 2,079
74.9% 75.5%
Enrollment in Compensatory Programs
Program
Program % of Student Enrollment Population
Special Education (Grades K-12) (PK)
49
7.1%
0
N/A
English to Speakers of Other Languages (ESOL) (Grades K-12)
0
0.0%
Title I (Grades K-12)
This school has a schoolwide program.
Dropout Rate for Grades 6-8
Number
Rate
School System
12
1.6%
12
1.6%
Total 108
Retained Students, by Race/Ethnicity and Sex
Black
White Hispanic
American MultiAsian Indian racial
75 69.4%
32 29.6%
1 0.9%
0 0.0%
0 0.0%
0 0.0%
Male Female
85
23
78.7% 21.3%
Prepared by Georgia Department of Education
Page 1
STATE-REQUIRED TEST DATA
NORM-REFERENCED TESTS Grade 8
Iowa Tests of Basic Skills (ITBS) Each chart reflects data for three years of testing.
Reading Comprehension 50
34 34 49 0
98-99
34 34 48 97-98
33 33 48 96-97
Mathematics
School 50
System
State
0
55 55 56 98-99
42 42 55 97-98
37 37 54 96-97
School System State
Reading Vocabulary 50
36 36 46 0
98-99
26 26 45 97-98
24 24 44 96-97
Language Arts
School 50
System
State
0
50 50 60 98-99
45 45 58 97-98
42 42 56 96-97
School System State
Social Studies 50
40 40 54 0
98-99
37 37 53 97-98
39 39 53 96-97
Science
School 50
System
State
0
39 39 56 98-99
35 35 55 97-98
37 37 53 96-97
School System State
Sources of Information
Composite Score
50
47 47 57 0
98-99
School 50
System
40 40 56 97-98
38 38 55 96-97
State 0
42 42 56 98-99
36 36 54 97-98
1998-99 GEORGIA PUBLIC EDUCATION REPORT CARD Brooks County Middle School - 6140197
Prepared by Georgia Department of Education
36 36 54 96-97
Scores Reported in Percentiles
School System State
Page 2
STATE-REQUIRED TEST DATA
Categories of Scaled Scores
Inadequate (less than 162)
Minimal (162-209)
Good
(210-247)
Very Good (greater than 247)
Average Scaled Score: (Range 100-300)
PERFORMANCE ASSESSMENTS
Grade 8 Writing Assessment
1998-99 Percent Scoring
1997-98 Percent Scoring
1996-97 Percent Scoring
School System State School System State School System State
19% 54% 25%
3%
19% 54% 25%
3%
8% 40% 41% 11%
15% 60% 22%
3%
15% 60% 22%
3%
11% 46% 34%
8%
29% 50% 18%
2%
29% 50% 18%
2%
15% 46% 30%
8%
187
187
208 190
190 202 181
181 198
AWARDS / RECOGNITION DATA
Schools in Georgia may receive recognition in the following programs: Charter School Pay for Performance Program Georgia School of Excellence National Blue Ribbon School Brooks County Middle School did not receive recognition in any of these programs during the 1998-99 school year.
1998-99 GEORGIA PUBLIC EDUCATION REPORT CARD Brooks County Middle School - 6140197
Prepared by Georgia Department of Education
Page 3
CERTIFIED PERSONNEL DATA
Positions Number Average Contract Days
Personnel Sex
Certificate
Years Experience
Full-time Part-time
Male Female
4 Yr Bachelor's 5 Yr Master's 6 Yr Specialist's 7 Yr Doctoral Other*
<1 1-10 11-20 21-30 >30
Average
Administrators
2.00 220.00
2 0
1 1
0 1 1 0 0 0 0 1 1 0 18.00
Support Personnel
3.00 190.00
3 0
0 3
1 2 0 0 0 0 1 1 0 1 18.67
PK-12 Teachers
39.00 190.00
39 0
6 33
24 14
1 0 0 1 19 14 5 0 10.95
*Includes One- and Two-Year Vocational Certificates.
ACCREDITATION DATA
Accredited with Quality by Georgia Accrediting Commission (GAC).
1998-99 GEORGIA PUBLIC EDUCATION REPORT CARD Brooks County Middle School - 6140197
Prepared by Georgia Department of Education
Page 4
1998-99 GEORGIA PUBLIC EDUCATION REPORT CARD
BROOKS COUNTY SCHOOLS
North Brooks Elementary School - 6140393
Grade Range PK-5
The Georgia Public Education Report Card is designed to assist systems and schools in educational improvement. This report card contains a variety of data elements. An explanation of the terms is provided as a companion to the report card data. Please refer to the definitions for the most effective use of the reported data.
STUDENT DATA
Total
K-5
380
PK
20
Enrollment, by Race/Ethnicity and Sex
Black
White Hispanic
American Asian Indian
Multiracial
149 39.2%
200 52.6%
24 6.3%
1 0.3%
0 0.0%
6 1.6%
10 50.0%
10 50.0%
0 0.0%
0 0.0%
0 0.0%
0 0.0%
Male Female
218 57.4%
162 42.6%
14 70.0%
6 30.0%
Enrollment in Selected Programs
Program
Program % of Student Enrollment Population
Gifted (Grades K-12)
3
< 1%
Alternative Programs (Grades 6-12)
N/A
N/A
Students Eligible to Receive Free/Reduced Lunches
Number
Percent
School System
303 2,079
75.8% 75.5%
Dropout Rate *
Number
Rate
School System
N/A N/A
N/A N/A
* Dropout rates are not applicable for grades PK-5.
Enrollment in Compensatory Programs
Program
Program % of Student Enrollment Population
Special Education (Grades K-12)
55 14.5%
(PK)
1
N/A
English to Speakers of Other Languages (ESOL) (Grades K-12)
0
0.0%
Remedial Education (Grades 2-5, 9-12)
63 25.3%
Special Instructional Assistance (SIA) (Grades K-3)
70 25.9%
Title I (Grades K-12)
This school has a schoolwide program.
Total 18
Retained Students, by Race/Ethnicity and Sex
Black
White Hispanic
American MultiAsian Indian racial
10 55.6%
7 38.9%
0 0.0%
0 0.0%
0 0.0%
1 5.6%
Male Female
14
4
77.8% 22.2%
Prepared by Georgia Department of Education
Page 1
STATE-REQUIRED TEST DATA
NORM-REFERENCED TESTS Grade 3
Iowa Tests of Basic Skills (ITBS) Each chart reflects data for three years of testing.
Reading Comprehension 50
38 33 54 0
98-99
39 33 53 97-98
29 22 52 96-97
Mathematics
School 50
System
State
0
49 40 61 98-99
43 41 61 97-98
35 27 59 96-97
School System State
Reading Vocabulary 50
48 38 50 0
98-99
33 33 50 97-98
24 18 49 96-97
Language Arts
School 50
System
State
0
44 45 64 98-99
39 44 62 97-98
23 26 59 96-97
School System State
Social Studies 50
43 35 56 0
98-99
39 34 55 97-98
31 22 55 96-97
Science
School 50
System
State
0
51 39 59 98-99
42 41 59 97-98
34 31 58 96-97
School System State
Sources of Information
Composite Score
50
46 38 57 0
98-99
School 50
System
41 34 56 97-98
24 24 55 96-97
State 0
44 37 58 98-99
38 35 57 97-98
1998-99 GEORGIA PUBLIC EDUCATION REPORT CARD North Brooks Elementary School - 6140393
Prepared by Georgia Department of Education
26 22 56 96-97
Scores Reported in Percentiles
School System State
Page 2
STATE-REQUIRED TEST DATA
NORM-REFERENCED TESTS Grade 5
Iowa Tests of Basic Skills (ITBS) Each chart reflects data for three years of testing.
Reading Comprehension
Mathematics
50
41 39 53 0
98-99
42 36 53 97-98
49 33 52 96-97
School 50
System
State
0
68 57 59 98-99
55 44 58 97-98
66 41 57 96-97
School System State
Reading Vocabulary 50
83 60 48 0
98-99
33 21 48 97-98
39 19 46 96-97
Language Arts
School 50
System
State
0
57 59 63 98-99
42 42 61 97-98
48 36 58 96-97
School System State
Social Studies 50
64 46 57 0
98-99
44 32 56 97-98
54 32 55 96-97
Science
School 50
System
State
0
73 53 60 98-99
50 38 59 97-98
60 37 59 96-97
School System State
Sources of Information
Composite Score
50
56 45 58 0
98-99
School 50
System
44 38 58 97-98
56 36 57 96-97
State 0
63 50 57 98-99
43 35 56 97-98
53 33 55 96-97
1998-99 GEORGIA PUBLIC EDUCATION REPORT CARD North Brooks Elementary School - 6140393
Prepared by Georgia Department of Education
Scores Reported in Percentiles
School System State
Page 3
STATE-REQUIRED TEST DATA
PERFORMANCE ASSESSMENTS
Grade 5 Writing Assessment
Percent at Developmental Stages:
1998-99 School System State
1997-98 School System State
1996-97 School System State
Stage Stage Stage Stage Stage Stage
1:The Emerging Writer 2:The Developing Writer 3:The Focusing Writer 4:The Experimenting 5:The Engaging Writer 6:The Extending Writer
0% 0% 16% 53% 20% 12%
1% 0% 20% 49% 23% 7%
0% 1% 16% 41% 29% 12%
2% 8% 15% 32% 32% 11%
1% 5% 25% 37% 24% 6%
0% 3% 19% 41% 27% 10%
0% 4% 23% 36% 20% 18%
3% 10% 30% 30% 18%
8%
0% 3% 21% 37% 26% 12%
AWARDS / RECOGNITION DATA
Schools in Georgia may receive recognition in the following programs: Charter School Pay for Performance Program Georgia School of Excellence National Blue Ribbon School North Brooks Elementary School did not receive recognition in any of these programs during the 1998-99 school year.
1998-99 GEORGIA PUBLIC EDUCATION REPORT CARD North Brooks Elementary School - 6140393
Prepared by Georgia Department of Education
Page 4
CERTIFIED PERSONNEL DATA
Positions Number Average Contract Days
Personnel Sex
Certificate
Years Experience
Full-time Part-time
Male Female
4 Yr Bachelor's 5 Yr Master's 6 Yr Specialist's 7 Yr Doctoral Other*
<1 1-10 11-20 21-30 >30
Average
Administrators
2.00 210.00
2 0
2 0
0 0 2 0 0 0 0 1 1 0 20.50
Support Personnel
2.00 190.00
2 0
0 2
0 2 0 0 0 1 0 1 0 0 8.50
PK-12 Teachers
24.50 190.00
24 1
2 23
15 8 2 0 0 0
10 11
4 0 12.00
*Includes One- and Two-Year Vocational Certificates.
ACCREDITATION DATA
Accredited with Quality by Georgia Accrediting Commission (GAC).
1998-99 GEORGIA PUBLIC EDUCATION REPORT CARD North Brooks Elementary School - 6140393
Prepared by Georgia Department of Education
Page 5
1998-99 GEORGIA PUBLIC EDUCATION REPORT CARD
BROOKS COUNTY SCHOOLS
Quitman Elementary School - 6140193
Grade Range PK-5
The Georgia Public Education Report Card is designed to assist systems and schools in educational improvement. This report card contains a variety of data elements. An explanation of the terms is provided as a companion to the report card data. Please refer to the definitions for the most effective use of the reported data.
STUDENT DATA
Total
K-5
965
PK
49
Enrollment, by Race/Ethnicity and Sex
Black
White Hispanic
American Asian Indian
Multiracial
725 75.1%
220 22.8%
9 0.9%
2 0.2%
0 0.0%
9 0.9%
39 79.6%
7 14.3%
2 4.1%
0 0.0%
0 0.0%
1 2.0%
Male Female
525 54.4%
440 45.6%
21 42.9%
28 57.1%
Enrollment in Selected Programs
Program
Program % of Student Enrollment Population
Gifted (Grades K-12)
4
< 1%
Alternative Programs (Grades 6-12)
N/A
N/A
Students Eligible to Receive Free/Reduced Lunches
Number
Percent
School System
832 2,079
82.1% 75.5%
Dropout Rate *
Number
Rate
School System
N/A N/A
N/A N/A
* Dropout rates are not applicable for grades PK-5.
Enrollment in Compensatory Programs
Program
Program % of Student Enrollment Population
Special Education (Grades K-12)
89
9.2%
(PK)
13
N/A
English to Speakers of Other Languages (ESOL) (Grades K-12)
0
0.0%
Remedial Education (Grades 2-5, 9-12)
223 35.5%
Special Instructional Assistance (SIA) (Grades K-3)
142 20.9%
Title I (Grades K-12)
This school has a schoolwide program.
Total 89
Retained Students, by Race/Ethnicity and Sex
Black
White Hispanic
American MultiAsian Indian racial
76 85.4%
10 11.2%
2 2.2%
0 0.0%
0 0.0%
1 1.1%
Male Female
52
37
58.4% 41.6%
Prepared by Georgia Department of Education
Page 1
STATE-REQUIRED TEST DATA
NORM-REFERENCED TESTS Grade 3
Iowa Tests of Basic Skills (ITBS) Each chart reflects data for three years of testing.
Reading Comprehension 50
32 33 54 0
98-99
31 33 53 97-98
20 22 52 96-97
Mathematics
School 50
System
State
0
36 40 61 98-99
40 41 61 97-98
24 27 59 96-97
School System State
Reading Vocabulary 50
34 38 50 0
98-99
33 33 50 97-98
16 18 49 96-97
Language Arts
School 50
System
State
0
46 45 64 98-99
46 44 62 97-98
27 26 59 96-97
School System State
Social Studies 50
32 35 56 0
98-99
33 34 55 97-98
19 22 55 96-97
Science
School 50
System
State
0
35 39 59 98-99
40 41 59 97-98
29 31 58 96-97
School System State
Sources of Information
Composite Score
50
35 38 57 0
98-99
School 50
System
32 34 56 97-98
24 24 55 96-97
State 0
34 37 58 98-99
35 35 57 97-98
1998-99 GEORGIA PUBLIC EDUCATION REPORT CARD Quitman Elementary School - 6140193
Prepared by Georgia Department of Education
21 22 56 96-97
Scores Reported in Percentiles
School System State
Page 2
STATE-REQUIRED TEST DATA
NORM-REFERENCED TESTS Grade 5
Iowa Tests of Basic Skills (ITBS) Each chart reflects data for three years of testing.
Reading Comprehension
Mathematics
50
38 39 53 0
98-99
33 36 53 97-98
29 33 52 96-97
School 50
System
State
0
52 57 59 98-99
40 44 58 97-98
32 41 57 96-97
School System State
Reading Vocabulary 50
49 60 48 0
98-99
17 21 48 97-98
14 19 46 96-97
Language Arts
School 50
System
State
0
60 59 63 98-99
42 42 61 97-98
32 36 58 96-97
School System State
Social Studies 50
36 46 57 0
98-99
29 32 56 97-98
26 32 55 96-97
Science
School 50
System
State
0
43 53 60 98-99
33 38 59 97-98
29 37 59 96-97
School System State
Sources of Information
Composite Score
50
40 45 58 0
98-99
School 50
System
36 38 58 97-98
30 36 57 96-97
State 0
44 50 57 98-99
32 35 56 97-98
26 33 55 96-97
1998-99 GEORGIA PUBLIC EDUCATION REPORT CARD Quitman Elementary School - 6140193
Prepared by Georgia Department of Education
Scores Reported in Percentiles
School System State
Page 3
STATE-REQUIRED TEST DATA
PERFORMANCE ASSESSMENTS
Grade 5 Writing Assessment
Percent at Developmental Stages:
1998-99 School System State
1997-98 School System State
1996-97 School System State
Stage Stage Stage Stage Stage Stage
1:The Emerging Writer 2:The Developing Writer 3:The Focusing Writer 4:The Experimenting 5:The Engaging Writer 6:The Extending Writer
1% 0% 21% 48% 24% 5%
1% 0% 20% 49% 23% 7%
0% 1% 16% 41% 29% 12%
1% 4% 29% 39% 21% 4%
1% 5% 25% 37% 24% 6%
0% 3% 19% 41% 27% 10%
4% 12% 33% 28% 18%
5%
3% 10% 30% 30% 18%
8%
0% 3% 21% 37% 26% 12%
AWARDS / RECOGNITION DATA
Schools in Georgia may receive recognition in the following programs: Charter School Pay for Performance Program Georgia School of Excellence National Blue Ribbon School Quitman Elementary School did not receive recognition in any of these programs during the 1998-99 school year.
1998-99 GEORGIA PUBLIC EDUCATION REPORT CARD Quitman Elementary School - 6140193
Prepared by Georgia Department of Education
Page 4
CERTIFIED PERSONNEL DATA
Positions Number Average Contract Days
Personnel Sex
Certificate
Years Experience
Full-time Part-time
Male Female
4 Yr Bachelor's 5 Yr Master's 6 Yr Specialist's 7 Yr Doctoral Other*
<1 1-10 11-20 21-30 >30
Average
Administrators
3.00 210.00
3 0
0 3
0 0 3 0 0 0 1 0 0 2 25.33
Support Personnel
3.00 190.00
3 0
0 3
0 3 0 0 0 0 1 1 0 1 17.00
PK-12 Teachers
62.75 189.44
61 3
2 62
44 18
2 0 0 0 31 22 8 3 11.89
*Includes One- and Two-Year Vocational Certificates.
ACCREDITATION DATA
Accredited with Quality by Georgia Accrediting Commission (GAC).
1998-99 GEORGIA PUBLIC EDUCATION REPORT CARD Quitman Elementary School - 6140193
Prepared by Georgia Department of Education
Page 5
1998-99 GEORGIA PUBLIC EDUCATION REPORT CARD BRYAN COUNTY SCHOOLS - 615
The Georgia Public Education Report Card is designed to assist systems and schools in educational improvement. This report card contains a variety of data elements. An explanation of the terms is provided as a companion to the report card data. Please refer to the definitions for the most effective use of the reported data.
Total
K-12
4,941
PK
186
STUDENT DATA
Enrollment, by Race/Ethnicity and Sex
Black
White Hispanic
American Multi-
Asian Indian
racial
812 16.4%
3,971 80.4%
46 0.9%
37 0.7%
7 0.1%
68 1.4%
27 14.5%
151 81.2%
2 1.1%
1 0.5%
0 0.0%
5 2.7%
Male
2,532 51.2%
110 59.1%
Female
2,409 48.8%
76 40.9%
Enrollment in Selected Programs
Program
Program % of Student Enrollment Population
Gifted (Grades K-12)
374
7.6%
Non-Vocational Labs (Grades 9-12)
1,048
72.8%
Vocational Labs (Grades 9-12)
758
52.6%
Alternative Programs (Grades 6-12)
18
< 1%
Students Eligible to Receive Free/Reduced Lunches
Number
Percent
1,851
36.1%
Dropout Rate
Number
Percent
6-12
117
4.0%
9-12
105
6.8%
Enrollment in Compensatory Programs
Program
Program % of Student Enrollment Population
Special Education
(Grades K-12)
410
PK
20
English to Speakers of
Other Languages (ESOL)
1
(Grades K-12)
Remedial Education (Grades 2-5, 9-12)
180
Special Instructional
Assistance (SIA)
57
(Grades K-3)
Title I (Grades K-12) Number of schools with: Schoolwide program Targeted Assistance program No Title I program
8.3% N/A < 1%
6.0%
3.8%
0 3 4
Total 348
Retained Students, by Race/Ethnicity and Sex
Black
White Hispanic
American MultiAsian Indian racial
115 33.0%
223 64.1%
4 1.1%
0 0.0%
2 0.6%
4 1.1%
Male Female 205 143
58.9% 41.1%
Prepared by Georgia Department of Education
Page 1
STATE-REQUIRED TEST DATA
NORM-REFERENCED TESTS
Grade 3 Iowa Tests of Basic Skills (ITBS) Each chart reflects data for three years of testing.
Reading Comprehension
Mathematics
50
60 54 58 53 56 52 0
98-99 97-98 96-97
System State
50
65 61 61 61 59 59 0
98-99 97-98 96-97
System State
Reading Vocabulary
50
58 50 54 50 53 49 0
98-99 97-98 96-97
System State
Social Studies
50
63 56 58 55 56 55 0
98-99 97-98 96-97
System State
Language Arts
50
61 64 59 62 61 59 0
98-99 97-98 96-97
System State
Science
50
65 59 64 59 61 58 0
98-99 97-98 96-97
System State
Sources of Information
Composite Score
50
64 57 0
98-99
System
50
59 56 58 55 97-98 96-97
State
63 58 59 57 0
98-99 97-98
1998-99 GEORGIA PUBLIC EDUCATION REPORT CARD Bryan County Schools
Prepared by Georgia Department of Education
System State Scores Reported 58 56 in Percentiles 96-97
Page 2
STATE-REQUIRED TEST DATA
NORM-REFERENCED TESTS
Grade 5 Iowa Tests of Basic Skills (ITBS) Each chart reflects data for three years of testing.
Reading Comprehension
Mathematics
50
56 53 57 53 56 52 0
98-99 97-98 96-97
System State
50
60 59 57 58 60 57 0
98-99 97-98 96-97
System State
Reading Vocabulary
50
52 48 48 48 53 46 0
98-99 97-98 96-97
System State
Social Studies
50
62 57 61 56 59 55 0
98-99 97-98 96-97
System State
Language Arts
50
61 63 60 61 58 58 0
98-99 97-98 96-97
System State
Science
50
63 60 62 59 69 59 0
98-99 97-98 96-97
System State
Sources of Information
Composite Score
50
61 58 0
98-99
System
50
60 58 62 57 97-98 96-97
State
60 57 58 56 0
98-99 97-98
1998-99 GEORGIA PUBLIC EDUCATION REPORT CARD Bryan County Schools
Prepared by Georgia Department of Education
System State Scores Reported 60 55 in Percentiles 96-97
Page 3
STATE-REQUIRED TEST DATA
NORM-REFERENCED TESTS Grade 8
Iowa Tests of Basic Skills (ITBS) Each chart reflects data for three years of testing.
Reading Comprehension
Mathematics
50
54 49 54 48 50 48 0
98-99 97-98 96-97
System State
50
53 56 51 55 51 54 0
98-99 97-98 96-97
System State
Reading Vocabulary
50
51 46 51 45 47 44 0
98-99 97-98 96-97
System State
Language Arts
50
60 60 60 58 55 56 0
98-99 97-98 96-97
System State
Social Studies
50
55 54 54 53 54 53 0
98-99 97-98 96-97
System State
Science
50
59 56 57 55 57 53 0
98-99 97-98 96-97
System State
Sources of Information
Composite Score
50
57 57 0
98-99
System
50
57 56 56 55 97-98 96-97
State
57 56 55 54 0
98-99 97-98
1998-99 GEORGIA PUBLIC EDUCATION REPORT CARD Bryan County Schools
Prepared by Georgia Department of Education
System State Scores Reported 54 54 in Percentiles 96-97
Page 4
STATE-REQUIRED TEST DATA
PERFORMANCE ASSESSMENTS
Grade 5 Writing Assessment
1998-99
1997-98
1996-97
Percent at Developmental Stages:
Comparison
Comparison
Comparison
System Group State System Group State System Group State
Stage Stage Stage Stage Stage Stage
1: The Emerging Writer 2: The Developing Writer 3: The Focusing Writer 4: The Experimenting Writer 5: The Engaging Writer 6: The Extending Writer
0% 1% 13% 47% 29% 10%
0% 1% 16% 44% 29% 10%
0% 1% 16% 41% 29% 12%
0% 3% 19% 36% 29% 12%
0% 1% 18% 44% 27% 9%
0% 3% 19% 41% 27% 10%
0% 1% 21% 40% 29% 8%
0% 2% 18% 39% 29% 12%
0% 3% 21% 37% 26% 12%
Grade 8 Writing Assessment
1998-99 Percent Scoring 1997-98 Percent Scoring 1996-97 Percent Scoring
Categories of Scaled Scores
Comparison
Comparison
Comparison
System Group State System Group State System Group State
Inadequate (less than 162)
Minimal (162-209)
Good
(210-247)
Very Good (greater than 247)
2% 36% 51% 11%
6% 40% 44% 10%
8% 40% 41% 11%
10% 48% 35%
7%
9% 49% 35%
7%
11% 46% 34%
8%
15% 42% 34%
9%
14% 49% 30%
7%
15% 46% 30%
8%
Average Scaled Score: (Range 100-300)
215
209 208
202
202 202
201
198 198
GEORGIA HIGH SCHOOL GRADUATION TESTS (GHSGT)
Percent of Regular Program 11th Graders Passing the Georgia High School Graduation Tests on First Administration
1998-99
1997-98
1996-97
Comparison
Comparison
Comparison
System Group State System Group State System Group State
English Language Arts Mathematics Social Studies Science
98% 94% 86% 74%
96% 90% 81% 77%
96% 88% 80% 72%
96% 95% 85% 79%
96% 92% 80% 78%
94% 88% 78% 74%
97% 91% 85% 82%
94% 89% 80% 74%
94% 87% 78% 74%
All Components listed above 7 1 %
72% 68% 74%
72% 68% 75%
68% 67%
Writing
94%
95% 93% 97%
94% 92% 98%
93% 93%
1998-99 GEORGIA PUBLIC EDUCATION REPORT CARD
Bryan County Schools
Prepared by Georgia Department of Education
Page 5
GRADUATE DATA
1999 Graduates by Credentials, Race/Ethnicity and Sex
Diplomas with Both College Prep. & Voc. Endorsements
Diplomas with College Prep. Endorsements Diplomas with Vocational Endorsements General High School Diplomas Special Education Diplomas
Total All Diplomas
Certificates of Performance
Total Graduates
Total 3
195 52 5 10
265 9
274
Black
American MultiWhite Hispanic Asian Indian racial
0 0.0%
17 8.7%
10 19.2%
2 40.0%
1 10.0%
3 100.0%
172 88.2%
42 80.8%
3 60.0%
9 90.0%
0 0.0%
2 1.0%
0 0.0%
0 0.0%
0 0.0%
0 0.0%
0 0.0%
0 0.0%
0 0.0%
0 0.0%
0 0.0%
0 0.0%
0 0.0%
0 0.0%
0 0.0%
0 0.0%
4 2.1%
0 0.0%
0 0.0%
0 0.0%
30
229
2
0
0
4
11.3% 86.4% 0.8% 0.0% 0.0% 1.5%
2
7
0
0
0
0
22.2% 77.8% 0.0% 0.0% 0.0% 0.0%
32
236
2
0
0
4
11.7% 86.1% 0.7% 0.0% 0.0% 1.5%
Male Female
0
3
0.0% 100.0%
86 109 44.1% 55.9%
28
24
53.8% 46.2%
3
2
60.0% 40.0%
7
3
70.0% 30.0%
124 141 46.8% 53.2%
1
8
11.1% 88.9%
125 149 45.6% 54.4%
HOPE Scholarships
System State
Number of 1999 Graduates 2 7 4
Number Eligible
168
Percent Eligible
61.3%
65,548 40,292 61.5%
High School Completion Rate Percent of 1995Grade 9 Enrollment
in Graduating Class of1999
System
State
Completion Rate '95-'99 64.5% 68.9%
COLLEGE ADMISSIONS / CREDIT TEST DATA
Scholastic Assessment Test (SAT)
No. Taking
Average Score
Tests
Verbal Math Total
Based on students' highest verbal and highest math scores
System College Prep. Endorsement Other Diplomas
507 491 998 501 485 986 403 383 786
Georgia
492 488 980
Based on students' last test administration
System Georgia
193
501 485
986
41,958 483 479 962
Nation
952,913 502 508 1010
American College Testing (ACT)
System State Nation
English
19.5
19.1 20.4
Mathematics
21.7
19.9 20.7
Reading
21.3
20.2 21.3
Science Reasoning 20.8
19.9 21.0
CompositeScore 21.0
19.9 21.9
Advanced Placement Exams (AP)
No. of Students Taking Tests
No. of Tests Taken No. of Test Scores
3 or Higher Percent of Test
Scores 3 or Higher
System State 70 15,225 96 23,969 55 13,024
57.3% 54.3%
1998-99 GEORGIA PUBLIC EDUCATION REPORT CARD Bryan County Schools
Prepared by Georgia Department of Education
Page 6
POSTSECONDARY DATA
Graduates Entering Georgia Public Colleges and Universities
Graduates Entering Georgia Public Colleges and Universities and
Requiring Learning Support (LS)
1998 Graduates Entering 1998-99
1997 Graduates Entering 1997-98
Percent of Graduating Number Class
88
37.9%
113
49.1%
Number Requiring
LS
17
25
Percent of those attending Georgia
Public Colleges
19.3%
22.1%
In previous years, the Report Card presented College Prep Curriculum information provided by the Board of Regents on students requiring Learning Support. Due to inconsistencies in the data provided by the Board of Regents in defining College Prep Completers versus Local Board of Education data defining College Prep Endorsements, the Department of Education Report Card will not provide this information until discrepancies can be reconciled.
Graduates Entering Georgia Public Technical and Adult Schools
Entering 1998-99 Entering 1997-98
Number Percent
Number Percent
1998 Graduates 1997 Graduates
18
7.8%
1
0.4%
N/A 11
N/A 4.8%
ACCREDITATION / RECOGNITION DATA
Southern Association of Colleges and Schools (SACS) Accrediting Commission
Secondary/Middle Commission Elementary/Middle Commission Both Elementary/Secondary Commissions Joint Commission Candidate for Accreditation
Accreditation by Georgia Accrediting Commission (GAC)
Accredited by GAC Accredited with Quality by GAC
Number of Schools
1 5 1 0 0
Number of Schools
0 7
Awards / Recognition
State Recognized Program
Number of Schools
Charter School
0
Pay for Performance Recipient
0
Georgia School of Excellence
0
National Blue Ribbon School
0
COMMUNITY DATA
Number of Children Eligible for Migrant Education Number of Families-At-Risk * Number of Food Stamp Participants * Number of Families Receiving TANF * ** Per Capita Income * Unemployment Rate * 1990 Population * Projected 2000 Population * Projected 2010 Population *
* Data Available at County Level Only ** Known as AFDC before January 1997
0 71 1,275 140 $17,590 3.3% 15,438 20,656 23,610
1998-99 GEORGIA PUBLIC EDUCATION REPORT CARD Bryan County Schools
Prepared by Georgia Department of Education
Page 7
FISCAL DATA
Millage Rate
16.53
* Fall 1998 Property Tax Digest is used to calculate the 98-99 Value of One Mill
FTE Count
FTE Count used for Allotment Calculation 4,855.0 Fall '98 FTE Count 4,941
Value of One Mill
$391,684 $80.67 per Allotment FTE
Sources: Local State-QBE State-
Lottery State-
Other Federal Other
Total
PerGeneral Fund cent Per FTE
$7,351,706 30.0% $1,514 $16,563,051 67.7% $3,412
K-12 Revenues
Lottery K-12
and
Title
All Other
Programs
K-12
$0 $500,852
Bonded Debt
$1,816,103
$0
$0
$0
$0 0.0%
$0
$0 $105,198
$0
$230,329 0.9% $47
$324,634 1.3% $67
$3,735 0.0%
$1
$24,473,457 100% $5,041
$0 $1,185,655
$0 $1,185,655
$0 $0 $0 $606,050
$0 $0 $0 $1,816,103
Capital Projects
$409,534 $0
$0
$0 $0 $0 $409,534
School Nutrition
$702,053 $0
$0
$134,998 $971,295
$0 $1,808,346
Grand Total
Total
Per-
Amount cent
$10,780,249 35.6%
$16,563,051 54.7%
$105,198 0.3%
$365,327 1.2% $2,481,585 8.2%
$3,735 0.0% $30,299,147 100%
Instruction
Media Instruction
Support Pupil Services General Admin. School Admin. Trans-
portation Maint. & Ops. Capital Projects School Food Debt Service
Total
$15,763,489 64.7% $3,247 $714,731 2.9% $147
$643,954 2.6% $133
$978,957 4.0% $202
$641,052 2.6% $132
$1,873,184 7.7% $386
$1,067,935 4.4% $220
$2,436,554 10.0% $502
$232,209 1.0% $48
$0 0.0%
$0
$0 0.0%
$0
K-12 Expenditures
$971,260 $105,344
$0
$0
$0
$0
$0
$0
$0
$0
$55,984
$0
$0
$0
$0
$36,374
$0
$0
$0
$0
$40,897
$0
$0
$15,416
$0
$0
$0
$0
$0
$0
$53
$1,321
$0
$0
$0
$0
$0
$0
$0
$0
$0
$0
$0 $2,060,420
$0
$0
$0
$0
$0 $1,865,755
$0
$0 $389,192 $196,716
$0
$24,352,069 100% $5,017 $1,104,570 $106,665 $389,192 $2,272,553 $1,865,755
$16,840,094 56.0% $714,731 2.4% $699,938 2.3%
$1,015,331 3.4% $697,367 2.3%
$1,873,184 6.2% $1,069,310 3.6% $2,436,554 8.1% $2,292,629 7.6% $1,865,755 6.2%
$585,909 1.9%
$30,090,807 100%
Salaries and Benefits as Percentages of Revenues and of Expenditures
Teachers and Paraprofessionals
Salaries $12,109,528
Benefits $2,844,065
Percentage of Revenues Percentage of Expenditures
Total of
Total of
General Fund
General Fund
Title Programs
Title Programs
Lottery K-12
Lottery K-12
Total Salaries
and
Total
and
Total
and Benefits All Other K-12 K - 12 All Other K-12 K - 12
$14,953,593
56.9%
49.4%
58.5%
49.7%
School Administration
$1,046,251
$254,554
$1,300,805
5.0%
4.3%
5.1%
4.3%
General Administration
$244,687
$76,412
$321,099
1.2%
1.1%
1.3%
1.1%
1998-99 GEORGIA PUBLIC EDUCATION REPORT CARD
Bryan County Schools - 615
Prepared by Georgia Department of Education
Page 8
CERTIFIED PERSONNEL DATA
Number
Average Annual Salary Positions Average Contract Days
Average Daily Salary
Full-time Personnel Part-time
Sex Male Female
4 Yr Bachelor's Certificate 5 Yr Master's
Level 6 Yr Specialist's 7 Yr Doctoral Other*
Black
White Race/ Hispanic Ethnicity Asian
American Indian
Multiracial
Years Experience
<1 1-10 11-20 21-30 >30
Average
Administrators
24.00
$65,045.88 212.50
$306.10
24 0
10 14
0 7 14 3 0
1 23
0 0 0 0
0 1 5 17 1
22.88
Support Personnel PK-12 Teachers
31.00
300.00
$44,647.61 192.26
$232.23
$36,867.13 190.14
$193.89
31
299
0
0
4
43
27
256
0
174
19
101
12
24
0
0
0
0
1
22
30
275
0
1
0
0
0
0
0
1
0
18
8
121
11
93
12
65
0
2
16.19
12.83
*Includes One- and Two-Year Vocational Certificates.
Certified Staff Position Ratios
Teacher/Administrator Ratio 13:1
Teacher/Support Person Ratio 10:1
Teacher/Staff Ratio 5:1
Student Enrollment/All Teachers 16:1
Certified Personnel by Category
84.5% 100%
6.8%
8.8%
80% 60%
40%
20%
0%
Teachers
Administrators
Support Personnel
1998-99 GEORGIA PUBLIC EDUCATION REPORT CARD
Bryan County Schools - 615
Prepared by Georgia Department of Education
Page 9
1998-99 GEORGIA PUBLIC EDUCATION REPORT CARD
BRYAN COUNTY SCHOOLS
Bryan County Elementary School - 6150286
Grade Range 3-5
The Georgia Public Education Report Card is designed to assist systems and schools in educational improvement. This report card contains a variety of data elements. An explanation of the terms is provided as a companion to the report card data. Please refer to the definitions for the most effective use of the reported data.
STUDENT DATA
Total 462
3-5 Enrollment, by Race/Ethnicity and Sex
Black
White Hispanic
American Multi-
Asian Indian
racial
148 32.0%
310 67.1%
1 0.2%
0 0.0%
0 0.0%
3 0.6%
Male Female
231 50.0%
231 50.0%
Enrollment in Selected Programs
Program
Program % of Student Enrollment Population
Gifted (Grades K-12)
21
4.5%
Alternative Programs (Grades 6-12)
N/A
N/A
Students Eligible to Receive Free/Reduced Lunches
Number
Percent
School System
304 1,851
65.8% 36.1%
Dropout Rate *
Number
Rate
School System
N/A N/A
N/A N/A
* Dropout rates are not applicable for grades PK-5.
Enrollment in Compensatory Programs
Program
Program % of Student Enrollment Population
Special Education (Grades K-12)
57 12.3%
(PK)
0
N/A
English to Speakers of Other Languages (ESOL) (Grades K-12)
0
0.0%
Remedial Education (Grades 2-5, 9-12)
58 12.6%
Special Instructional Assistance (SIA) (Grades K-3)
0
0.0%
Title I (Grades K-12)
This school has a Targeted Assistance program.
Total 23
Retained Students, by Race/Ethnicity and Sex
Black
White Hispanic
American Multi-
Asian Indian
racial
11 47.8%
12 52.2%
0 0.0%
0 0.0%
0 0.0%
0 0.0%
Male Female
16
7
69.6% 30.4%
Prepared by Georgia Department of Education
Page 1
STATE-REQUIRED TEST DATA
NORM-REFERENCED TESTS Grade 3
Iowa Tests of Basic Skills (ITBS) Each chart reflects data for three years of testing.
Reading Comprehension 50
51 60 54 0
98-99
41 58 53 97-98
45 56 52 96-97
Mathematics
School 50
System
State
0
51 65 61 98-99
46 61 61 97-98
46 59 59 96-97
School System State
Reading Vocabulary 50
48 58 50 0
98-99
38 54 50 97-98
44 53 49 96-97
Language Arts
School 50
System
State
0
46 61 64 98-99
43 59 62 97-98
43 61 59 96-97
School System State
Social Studies 50
50 63 56 0
98-99
41 58 55 97-98
47 56 55 96-97
Science
School 50
System
State
0
58 65 59 98-99
50 64 59 97-98
50 61 58 96-97
School System State
Sources of Information
Composite Score
50
52 64 57 0
98-99
School 50
System
46 59 56 97-98
47 58 55 96-97
State 0
50 63 58 98-99
43 59 57 97-98
1998-99 GEORGIA PUBLIC EDUCATION REPORT CARD Bryan County Elementary School - 6150286
Prepared by Georgia Department of Education
45 58 56 96-97
Scores Reported in Percentiles
School System State
Page 2
STATE-REQUIRED TEST DATA
NORM-REFERENCED TESTS Grade 5
Iowa Tests of Basic Skills (ITBS) Each chart reflects data for three years of testing.
Reading Comprehension
Mathematics
50
47 56 53 0
98-99
45 57 53 97-98
49 56 52 96-97
School 50
System
State
0
53 60 59 98-99
40 57 58 97-98
45 60 57 96-97
School System State
Reading Vocabulary 50
43 52 48 0
98-99
34 48 48 97-98
44 53 46 96-97
Language Arts
School 50
System
State
0
47 61 63 98-99
42 60 61 97-98
46 58 58 96-97
School System State
Social Studies 50
56 62 57 0
98-99
47 61 56 97-98
47 59 55 96-97
Science
School 50
System
State
0
59 63 60 98-99
53 62 59 97-98
64 69 59 96-97
School System State
Sources of Information
Composite Score
50
55 61 58 0
98-99
School 50
System
50 60 58 97-98
56 62 57 96-97
State 0
51 60 57 98-99
43 58 56 97-98
50 60 55 96-97
1998-99 GEORGIA PUBLIC EDUCATION REPORT CARD Bryan County Elementary School - 6150286
Prepared by Georgia Department of Education
Scores Reported in Percentiles
School System State
Page 3
STATE-REQUIRED TEST DATA
PERFORMANCE ASSESSMENTS
Grade 5 Writing Assessment
Percent at Developmental Stages:
1998-99 School System State
1997-98 School System State
1996-97 School System State
Stage Stage Stage Stage Stage Stage
1:The Emerging Writer 2:The Developing Writer 3:The Focusing Writer 4:The Experimenting 5:The Engaging Writer 6:The Extending Writer
0% 2% 22% 47% 19% 9%
0% 1% 13% 47% 29% 10%
0% 1% 16% 41% 29% 12%
0% 7% 37% 38% 13% 4%
0% 3% 19% 36% 29% 12%
0% 3% 19% 41% 27% 10%
0% 3% 38% 37% 17% 5%
0% 1% 21% 40% 29% 8%
0% 3% 21% 37% 26% 12%
AWARDS / RECOGNITION DATA
Schools in Georgia may receive recognition in the following programs: Charter School Pay for Performance Program Georgia School of Excellence National Blue Ribbon School Bryan County Elementary School did not receive recognition in any of these programs during the 1998-99 school year.
1998-99 GEORGIA PUBLIC EDUCATION REPORT CARD Bryan County Elementary School - 6150286
Prepared by Georgia Department of Education
Page 4
CERTIFIED PERSONNEL DATA
Positions Number Average Contract Days
Personnel Sex
Certificate
Years Experience
Full-time Part-time
Male Female
4 Yr Bachelor's 5 Yr Master's 6 Yr Specialist's 7 Yr Doctoral Other*
<1 1-10 11-20 21-30 >30
Average
Administrators
2.00 200.00
2 0
1 1
0 1 1 0 0 0 1 0 1 0 14.00
Support Personnel
4.00 190.00
4 0
0 4
0 2 2 0 0 0 1 2 1 0 14.75
PK-12 Teachers
27.00 190.00
27 0
1 26
15 9 3 0 0 2
13 7 4 1
12.04
*Includes One- and Two-Year Vocational Certificates.
ACCREDITATION DATA
Accredited by Southern Association of Colleges and Schools (SACS):
Elementary/Middle Commission. Accredited with Quality by Georgia
Accrediting Commission (GAC).
1998-99 GEORGIA PUBLIC EDUCATION REPORT CARD Bryan County Elementary School - 6150286
Prepared by Georgia Department of Education
Page 5
1998-99 GEORGIA PUBLIC EDUCATION REPORT CARD
BRYAN COUNTY SCHOOLS
Bryan County Middle/High School - 6150186
Grade Range 6-12
The Georgia Public Education Report Card is designed to assist systems and schools in educational improvement. This report card contains a variety of data elements. An explanation of the terms is provided as a companion to the report card data. Please refer to the definitions for the most effective use of the reported data.
STUDENT DATA
Total 943
6-12 Enrollment, by Race/Ethnicity and Sex
Black
White Hispanic
American Multi-
Asian Indian
racial
252 26.7%
686 72.7%
2 0.2%
2 0.2%
0 0.0%
1 0.1%
Male 463
49.1%
Female 480
50.9%
Enrollment in Selected Programs
Program
Program % of Student Enrollment Population
Gifted (Grades K-12)
34
3.6%
Non-Vocational Labs (Grades 9-12)
442
89.3%
Vocational Labs (Grades 9-12)
339
68.5%
Alternative Programs (Grades 6-12)
13
1.4%
Students Eligible to Receive Free/Reduced Lunches
Number
Percent
School System
548 1,851
58.1% 36.1%
Enrollment in Compensatory Programs
Program
Program % of Student Enrollment Population
Special Education (Grades K-12) PK
96 10.2%
0
N/A
English to Speakers of Other Languages (ESOL) (Grades K-12)
0
0.0%
Remedial Education (Grades 2-5, 9-12)
31
6.3%
Special Instructional Assistance (SIA) (Grades K-3)
N/A
N/A
Title I (Grades K-12) This school has a Targeted Assistance program.
Dropout Rate for Grades 6-12
Number
Rate
School System
61
6.1%
117
4.0%
Total 122
Retained Students, by Race/Ethnicity and Sex
Black
White Hispanic
American MultiAsian Indian racial
54 44.3%
68 55.7%
0 0.0%
0 0.0%
0 0.0%
0 0.0%
Male Female
71
51
58.2% 41.8%
Prepared by Georgia Department of Education
Page 1
STATE-REQUIRED TEST DATA
NORM-REFERENCED TESTS
Grade 3 Iowa Tests of Basic Skills (ITBS) Each chart reflects data for three years of testing.
No third-grade students are enrolled at Bryan County Middle/High School.
Reading Comprehension
Mathematics
50
N/A 60 54 0
98-99
N/A 58 53 97-98
N/A 56 52 96-97
School 50
System
State
N/A 65 61 0
98-99
N/A 61 61 97-98
N/A 59 59 96-97
School System State
Reading Vocabulary 50
N/A 58 50 0
98-99
N/A 54 50 97-98
N/A 53 49 96-97
Language Arts
School 50
System
State
N/A 61 64 0
98-99
N/A 59 62 97-98
N/A 61 59 96-97
School System State
Social Studies 50
N/A 63 56 0
98-99
N/A 58 55 97-98
N/A 56 55 96-97
Science
School 50
System
State
N/A 65 59 0
98-99
N/A 64 59 97-98
N/A 61 58 96-97
School System State
Sources of Information
Composite Score
School
50
50
System
N/A 64 57 0
98-99
N/A 59 56 N/A 58 55
97-98
96-97
State
N/A 63 58 0
98-99
N/A 59 57 97-98
N/A 58 56 96-97
1998-99 GEORGIA PUBLIC EDUCATION REPORT CARD Bryan County Middle/High School - 6150186
Prepared by Georgia Department of Education
Scores Reported in Percentiles
School System State
Page 2
STATE-REQUIRED TEST DATA
NORM-REFERENCED TESTS
Grade 5 Iowa Tests of Basic Skills (ITBS) Each chart reflects data for three years of testing. No fifth-grade students are enrolled at Bryan County Middle/High School.
Reading Comprehension
Mathematics
50
N/A 56 53 0
98-99
N/A 57 53 97-98
N/A 56 52 96-97
School 50
System
State
N/A 60 59 0
98-99
N/A 57 58 97-98
N/A 60 57 96-97
School System State
Reading Vocabulary 50
N/A 52 48 0
98-99
N/A 48 48 97-98
N/A 53 46 96-97
Language Arts
School 50
System
State
N/A 61 63 0
98-99
N/A 60 61 97-98
N/A 58 58 96-97
School System State
Social Studies 50
N/A 62 57 0
98-99
N/A 61 56 97-98
N/A 59 55 96-97
Science
School 50
System
State
N/A 63 60 0
98-99
N/A 62 59 97-98
N/A 69 59 96-97
School System State
Sources of Information
Composite Score
School
50
50
System
N/A 61 58 0
98-99
N/A 60 58 N/A 62 57
97-98
96-97
State
N/A 60 57 0
98-99
N/A 58 56 97-98
N/A 60 55 96-97
1998-99 GEORGIA PUBLIC EDUCATION REPORT CARD Bryan County Middle/High School - 6150186
Prepared by Georgia Department of Education
Scores Reported in Percentiles
School System State
Page 3
STATE-REQUIRED TEST DATA
NORM-REFERENCED TESTS Grade 8
Iowa Tests of Basic Skills (ITBS) Each chart reflects data for three years of testing.
Reading Comprehension 50
41 54 49 0
98-99
43 54 48 97-98
40 50 48 96-97
Mathematics
School 50
System
State
0
42 53 56 98-99
42 51 55 97-98
37 51 54 96-97
School System State
Reading Vocabulary 50
40 51 46 0
98-99
38 51 45 97-98
35 47 44 96-97
Language Arts
School 50
System
State
0
51 60 60 98-99
48 60 58 97-98
40 55 56 96-97
School System State
Social Studies 50
49 55 54 0
98-99
49 54 53 97-98
46 54 53 96-97
Science
School 50
System
State
0
46 59 56 98-99
46 57 55 97-98
40 57 53 96-97
School System State
Sources of Information
Composite Score
50
49 57 57 0
98-99
School 50
System
50 57 56 97-98
44 56 55 96-97
State 0
46 57 56 98-99
45 55 54 97-98
1998-99 GEORGIA PUBLIC EDUCATION REPORT CARD Bryan County Middle/High School - 6150186
Prepared by Georgia Department of Education
39 54 54 96-97
Scores Reported in Percentiles
School System State
Page 4
STATE-REQUIRED TEST DATA
PERFORMANCE ASSESSMENTS
Grade 5 Writing Assessment
Percent at Developmental Stages:
1998-99 School System State
1997-98 School System State
1996-97 School System State
Stage Stage Stage Stage Stage Stage
1:The Emerging Writer 2:The Developing Writer 3:The Focusing Writer 4:The Experimenting 5:The Engaging Writer 6:The Extending Writer
N/A N/A N/A N/A N/A N/A
0% 1% 13% 47% 29% 10%
0% 1% 16% 41% 29% 12%
N/A N/A N/A N/A N/A N/A
0% 3% 19% 36% 29% 12%
0% 3% 19% 41% 27% 10%
N/A N/A N/A N/A N/A N/A
0% 1% 21% 40% 29% 8%
0% 3% 21% 37% 26% 12%
No fifth-grade students are enrolled at Bryan County Middle/High School.
Categories of Scaled Scores
Inadequate (less than 162)
Minimal (162-209)
Good
(210-247)
Very Good (greater than 247)
Average Scaled Score: (Range 100-300)
Grade 8 Writing Assessment
1998-99 Percent Scoring
1997-98 Percent Scoring
1996-97 Percent Scoring
School System State School System State School System State
1% 37% 48% 13%
2% 36% 51% 11%
8% 40% 41% 11%
14% 53% 26%
7%
10% 48% 35%
7%
11% 46% 34%
8%
30% 41% 24%
4%
15% 42% 34%
9%
15% 46% 30%
8%
215
215
208 197
202 202 185
201 198
GEORGIA HIGH SCHOOL GRADUATION TESTS (GHSGT)
Percent of Regular Program 11th Graders Passing the Georgia High School Graduation Tests on First Administration
English Language Arts Mathematics Social Studies Science
All Components listed above
Writing
1998-99
School System State
97% 89% 75% 59%
56%
98% 94% 86% 74%
71%
96% 88% 80% 72%
68%
89% 94% 93%
1997-98
School System State
92% 92% 81% 77%
70%
96% 95% 85% 79%
74%
94% 88% 78% 74%
68%
92% 97% 92%
1996-97
School System State
97% 92% 87% 79%
72%
97% 91% 85% 82%
75%
94% 87% 78% 74%
67%
94% 98% 93%
1998-99 GEORGIA PUBLIC EDUCATION REPORT CARD Bryan County Middle/High School - 6150186
Prepared by Georgia Department of Education
Page 5
GRADUATE DATA
1999 Graduates by Credentials, Race/Ethnicity and Sex
Diplomas with Both College Prep. & Voc. Endorsements
Diplomas with College Prep. Endorsements Diplomas with Vocational Endorsements General High School Diplomas Special Education Diplomas
Total All Diplomas
Certificates of Performance
Total Graduates
Total 0
Black 0
American MultiWhite Hispanic Asian Indian racial
0
0
0
0
0
52
7
45
0
0
0
0
13.5% 86.5% 0.0% 0.0% 0.0% 0.0%
28
7
21
0
0
0
0
25.0% 75.0% 0.0% 0.0% 0.0% 0.0%
0
0
0
0
0
0
0
7
1
6
0
0
0
0
14.3% 85.7% 0.0% 0.0% 0.0% 0.0%
87
15
72
0
0
0
0
17.2% 82.8% 0.0% 0.0% 0.0% 0.0%
0
0
0
0
0
0
0
87
15
72
0
0
0
0
17.2% 82.8% 0.0% 0.0% 0.0% 0.0%
Male Female
0
0
18 34.6%
16 57.1%
0
34 65.4%
12 42.9%
0
6 85.7%
40 46.0%
0
1 14.3%
47 54.0%
0
40
47
46.0% 54.0%
HOPE Scholarships
School System
Number of 1999 Graduates 8 7
Number Eligible
43
Percent Eligible
49.4%
274 168 61.3%
State
65,548 40,292 61.5%
High School Completion Rate
Percent of 1995Grade 9 Enrollment in Graduating Class of1999 School System State
Completion Rate '95-'99 47.0% 64.5% 68.9%
1998-99 GEORGIA PUBLIC EDUCATION REPORT CARD
Bryan County Middle/High School - 6150186
Prepared by Georgia Department of Education
Page 6
COLLEGE ADMISSIONS / CREDIT TEST DATA
Scholastic Assessment Test (SAT)
Based on students' highest verbal and highest math scores
No. Taking
Average Score
Tests Verbal Math Total
Based on students' last test administration
Average Score Verbal Math Total
School College Prep. Endorsement Other Diplomas
43 477 446
923
488 452
940
391 384
775
System
193 507 491
998
College Prep. Endorsement
501 485
986
Other Diplomas
403 383
786
Georgia
41,958 492 488
980
477 N/A N/A
501 N/A N/A
483
446 N/A N/A
485 N/A N/A
479
923 N/A N/A
986 N/A N/A
962
Nation
952,913 N/A N/A N/A
502 508 1010
American College Testing (ACT)
Advanced Placement Exams (AP)
Number taking tests: English Mathematics Reading Science Reasoning
3 * School N/A N/A N/A N/A
System 19.5 21.7 21.3 20.8
State 19.1 19.9 20.2 19.9
CompositeScore
N/A 21.0 19.9
* Scores are not reported when fewer than 5 take the ACT
No. of Students Taking Tests
No. of Tests Taken No. of Test Scores
3 or Higher Percent of Test
Scores 3 or Higher
School 10 10 2
20.0%
System State 70 15,225 96 23,969 55 13,024
57.3% 54.3%
POST-SECONDARY DATA
Graduates Entering Georgia Public Colleges
Graduates Entering Georgia Public Colleges and Requiring Learning Support (LS)
1998 Graduates Entering in 1998-99
1997 Graduates Entering in 1997-98
Percent of Graduating Number Class
School
21
26.6%
System 8 8
37.9%
School
32
39.0%
System 113
49.1%
Number Requiring
LS 3 17
4 25
Percent of those attending Georgia
Public Colleges
14.3%
19.3%
12.5%
22.1%
In previous years, the Report Card presented College Prep Curriculum information provided by the Board of Regents on students requiring Learning Support. Due to inconsistencies in the data provided by the Board of Regents in defining College Prep Completers versus Local Board of Education data defining College Prep Endorsements, the Department of Education Report Card will not provide this information until discrepancies can be reconciled.
Graduates Entering Georgia Public Technical and Adult Schools
1998 Graduates School System
Entering Number 12 18
1998-99 Percent 15.2%
7.8%
Entering Number N/A N/A
1997-98 Percent
N/A N/A
1997 Graduates School
0
0.0%
System
1
0.4%
5
6.1%
11
4.8%
1998-99 GEORGIA PUBLIC EDUCATION REPORT CARD Bryan County Middle/High School - 6150186
Prepared by Georgia Department of Education
Page 7
CERTIFIED PERSONNEL DATA
Positions Number Average Contract Days
Administrators
4.00 205.00
Support Personnel
6.00 193.33
PK-12 Teachers
63.40 190.32
Personnel Sex
Certificate
Years Experience
Full-time Part-time
Male Female
4 Yr Bachelor's 5 Yr Master's 6 Yr Specialist's 7 Yr Doctoral Other*
<1 1-10 11-20 21-30 >30
Average
4 0
0 4
0 1 3 0 0
0 0 0 3 1
26.75
6 0
2 4
0 5 1 0 0
0 2 2 2 0
15.17
63 0
14 49
38 18
7 0 0
9 21 11 21
1
13.21
*Includes One- and Two-Year Vocational Certificates.
ACCREDITATION DATA
Accredited by Southern Association of Colleges and Schools (SACS): Secondary/Middle Commission and
Elementary/Middle Commission. Accredited with Quality by Georgia Accrediting
Commission (GAC).
AWARDS / RECOGNITION DATA
Schools in Georgia may receive recognition in the following programs: Charter School Pay for Performance Program Georgia School of Excellence National Blue Ribbon School Bryan County Middle/High School did not receive recognition in any of these programs during the 1998-99 school year.
1998-99 GEORGIA PUBLIC EDUCATION REPORT CARD Bryan County Middle/High School - 6150186
Prepared by Georgia Department of Education
Page 8
1998-99 GEORGIA PUBLIC EDUCATION REPORT CARD
BRYAN COUNTY SCHOOLS
Lanier Primary School - 6150282
Grade Range PK-2
The Georgia Public Education Report Card is designed to assist systems and schools in educational improvement. This report card contains a variety of data elements. An explanation of the terms is provided as a companion to the report card data. Please refer to the definitions for the most effective use of the reported data.
STUDENT DATA
Total
K-2
450
PK
82
Enrollment, by Race/Ethnicity and Sex
Black
White Hispanic
American Asian Indian
Multiracial
113 25.1%
333 74.0%
0 0.0%
0 0.0%
0 0.0%
4 0.9%
10 12.2%
71 86.6%
0 0.0%
0 0.0%
0 0.0%
1 1.2%
Male Female
242 53.8%
208 46.2%
48 58.5%
34 41.5%
Enrollment in Selected Programs
Program
Program % of Student Enrollment Population
Gifted (Grades K-12)
11
2.4%
Alternative Programs (Grades 6-12)
N/A
N/A
Students Eligible to Receive Free/Reduced Lunches
Number
Percent
School System
379 1,851
71.2% 36.1%
Dropout Rate *
Number
Rate
School System
N/A N/A
N/A N/A
* Dropout rates are not applicable for grades PK-5.
Enrollment in Compensatory Programs
Program
Program % of Student Enrollment Population
Special Education (Grades K-12)
51 11.3%
(PK)
10
N/A
English to Speakers of Other Languages (ESOL) (Grades K-12)
0
0.0%
Remedial Education (Grades 2-5, 9-12)
0
0.0%
Special Instructional Assistance (SIA) (Grades K-3)
20
4.4%
Title I (Grades K-12)
This school has a Targeted Assistance program.
Total 37
Retained Students, by Race/Ethnicity and Sex
Black
White Hispanic
American MultiAsian Indian racial
17 45.9%
20 54.1%
0 0.0%
0 0.0%
0 0.0%
0 0.0%
Male Female
22
15
59.5% 40.5%
Prepared by Georgia Department of Education
Page 1
STATE-REQUIRED TEST DATA
NORM-REFERENCED TESTS
Grade 3 Iowa Tests of Basic Skills (ITBS) Each chart reflects data for three years of testing.
No third-grade students are enrolled at Lanier Primary School.
Reading Comprehension
Mathematics
50
N/A 60 54 0
98-99
N/A 58 53 97-98
N/A 56 52 96-97
School 50
System
State
N/A 65 61 0
98-99
N/A 61 61 97-98
N/A 59 59 96-97
School System State
Reading Vocabulary 50
N/A 58 50 0
98-99
N/A 54 50 97-98
N/A 53 49 96-97
Language Arts
School 50
System
State
N/A 61 64 0
98-99
N/A 59 62 97-98
N/A 61 59 96-97
School System State
Social Studies 50
N/A 63 56 0
98-99
N/A 58 55 97-98
N/A 56 55 96-97
Science
School 50
System
State
N/A 65 59 0
98-99
N/A 64 59 97-98
N/A 61 58 96-97
School System State
Sources of Information
Composite Score
School
50
50
System
N/A 64 57 0
98-99
N/A 59 56 N/A 58 55
97-98
96-97
State
N/A 63 58 0
98-99
N/A 59 57 97-98
N/A 58 56 96-97
1998-99 GEORGIA PUBLIC EDUCATION REPORT CARD Lanier Primary School - 6150282
Prepared by Georgia Department of Education
Scores Reported in Percentiles
School System State
Page 2
STATE-REQUIRED TEST DATA
NORM-REFERENCED TESTS
Grade 5 Iowa Tests of Basic Skills (ITBS) Each chart reflects data for three years of testing. No fifth-grade students are enrolled at Lanier Primary School.
Reading Comprehension
Mathematics
50
N/A 56 53 0
98-99
N/A 57 53 97-98
N/A 56 52 96-97
School 50
System
State
N/A 60 59 0
98-99
N/A 57 58 97-98
N/A 60 57 96-97
School System State
Reading Vocabulary 50
N/A 52 48 0
98-99
N/A 48 48 97-98
N/A 53 46 96-97
Language Arts
School 50
System
State
N/A 61 63 0
98-99
N/A 60 61 97-98
N/A 58 58 96-97
School System State
Social Studies 50
N/A 62 57 0
98-99
N/A 61 56 97-98
N/A 59 55 96-97
Science
School 50
System
State
N/A 63 60 0
98-99
N/A 62 59 97-98
N/A 69 59 96-97
School System State
Sources of Information
Composite Score
School
50
50
System
N/A 61 58 0
98-99
N/A 60 58 N/A 62 57
97-98
96-97
State
N/A 60 57 0
98-99
N/A 58 56 97-98
N/A 60 55 96-97
1998-99 GEORGIA PUBLIC EDUCATION REPORT CARD Lanier Primary School - 6150282
Prepared by Georgia Department of Education
Scores Reported in Percentiles
School System State
Page 3
STATE-REQUIRED TEST DATA
PERFORMANCE ASSESSMENTS
Grade 5 Writing Assessment
Percent at Developmental Stages:
1998-99 School System State
1997-98 School System State
1996-97 School System State
Stage Stage Stage Stage Stage Stage
1:The Emerging Writer 2:The Developing Writer 3:The Focusing Writer 4:The Experimenting 5:The Engaging Writer 6:The Extending Writer
N/A N/A N/A N/A N/A N/A
0% 1% 13% 47% 29% 10%
0% 1% 16% 41% 29% 12%
N/A N/A N/A N/A N/A N/A
0% 3% 19% 36% 29% 12%
0% 3% 19% 41% 27% 10%
N/A N/A N/A N/A N/A N/A
No fifth-grade students are enrolled at Lanier Primary School.
0% 1% 21% 40% 29% 8%
0% 3% 21% 37% 26% 12%
AWARDS / RECOGNITION DATA
Schools in Georgia may receive recognition in the following programs: Charter School Pay for Performance Program Georgia School of Excellence National Blue Ribbon School Lanier Primary School did not receive recognition in any of these programs during the 1998-99 school year.
1998-99 GEORGIA PUBLIC EDUCATION REPORT CARD Lanier Primary School - 6150282
Prepared by Georgia Department of Education
Page 4
CERTIFIED PERSONNEL DATA
Positions Number Average Contract Days
Personnel Sex
Certificate
Years Experience
Full-time Part-time
Male Female
4 Yr Bachelor's 5 Yr Master's 6 Yr Specialist's 7 Yr Doctoral Other*
<1 1-10 11-20 21-30 >30
Average
Administrators
2.00 200.00
2 0
0 2
0 1 0 1 0 0 0 0 2 0 25.00
Support Personnel
3.00 190.00
3 0
0 3
0 1 2 0 0 0 1 1 1 0 16.67
PK-12 Teachers
31.00 190.00
31 0
1 30
18 12
1 0 0 0 13 13 5 0 13.52
*Includes One- and Two-Year Vocational Certificates.
ACCREDITATION DATA
Accredited by Southern Association of Colleges and Schools (SACS):
Elementary/Middle Commission. Accredited with Quality by Georgia
Accrediting Commission (GAC).
1998-99 GEORGIA PUBLIC EDUCATION REPORT CARD Lanier Primary School - 6150282
Prepared by Georgia Department of Education
Page 5
1998-99 GEORGIA PUBLIC EDUCATION REPORT CARD
BRYAN COUNTY SCHOOLS
Richmond Hill Elementary School - 6154050
Grade Range 3-5
The Georgia Public Education Report Card is designed to assist systems and schools in educational improvement. This report card contains a variety of data elements. An explanation of the terms is provided as a companion to the report card data. Please refer to the definitions for the most effective use of the reported data.
STUDENT DATA
Total 721
3-5 Enrollment, by Race/Ethnicity and Sex
Black
White Hispanic
American Multi-
Asian Indian
racial
68 9.4%
621 86.1%
12 1.7%
7 1.0%
1 0.1%
12 1.7%
Male Female
366 50.8%
355 49.2%
Enrollment in Selected Programs
Program
Program % of Student Enrollment Population
Gifted (Grades K-12)
39
5.4%
Alternative Programs (Grades 6-12)
N/A
N/A
Students Eligible to Receive Free/Reduced Lunches
Number
Percent
School System
195 1,851
27.0% 36.1%
Dropout Rate *
Number
Rate
School System
N/A N/A
N/A N/A
* Dropout rates are not applicable for grades PK-5.
Enrollment in Compensatory Programs
Program
Program % of Student Enrollment Population
Special Education (Grades K-12)
51
7.1%
(PK)
0
N/A
English to Speakers of Other Languages (ESOL) (Grades K-12)
1
< 1%
Remedial Education (Grades 2-5, 9-12)
65
9.0%
Special Instructional Assistance (SIA) (Grades K-3)
0
0.0%
Title I (Grades K-12)
This school has no Title I program.
Total 20
Retained Students, by Race/Ethnicity and Sex
Black
White Hispanic
American Multi-
Asian Indian
racial
5 25.0%
13 65.0%
1 5.0%
0 0.0%
0 0.0%
1 5.0%
Male Female
14
6
70.0% 30.0%
Prepared by Georgia Department of Education
Page 1
STATE-REQUIRED TEST DATA
NORM-REFERENCED TESTS Grade 3
Iowa Tests of Basic Skills (ITBS) Each chart reflects data for three years of testing.
Reading Comprehension 50
64 60 54 0
98-99
64 58 53 97-98
62 56 52 96-97
Mathematics
School 50
System
State
0
73 65 61 98-99
67 61 61 97-98
67 59 59 96-97
School System State
Reading Vocabulary 50
64 58 50 0
98-99
61 54 50 97-98
59 53 49 96-97
Language Arts
School 50
System
State
0
70 61 64 98-99
66 59 62 97-98
71 61 59 96-97
School System State
Social Studies 50
69 63 56 0
98-99
66 58 55 97-98
62 56 55 96-97
Science
School 50
System
State
0
69 65 59 98-99
70 64 59 97-98
68 61 58 96-97
School System State
Sources of Information
Composite Score
50
71 64 57 0
98-99
School 50
System
65 59 56 97-98
64 58 55 96-97
State 0
69 63 58 98-99
67 59 57 97-98
1998-99 GEORGIA PUBLIC EDUCATION REPORT CARD Richmond Hill Elementary School - 6154050
Prepared by Georgia Department of Education
65 58 56 96-97
Scores Reported in Percentiles
School System State
Page 2
STATE-REQUIRED TEST DATA
NORM-REFERENCED TESTS Grade 5
Iowa Tests of Basic Skills (ITBS) Each chart reflects data for three years of testing.
Reading Comprehension
Mathematics
50
60 56 53 0
98-99
63 57 53 97-98
60 56 52 96-97
School 50
System
State
0
64 60 59 98-99
66 57 58 97-98
68 60 57 96-97
School System State
Reading Vocabulary 50
57 52 48 0
98-99
56 48 48 97-98
59 53 46 96-97
Language Arts
School 50
System
State
0
67 61 63 98-99
67 60 61 97-98
64 58 58 96-97
School System State
Social Studies 50
65 62 57 0
98-99
67 61 56 97-98
65 59 55 96-97
Science
School 50
System
State
0
65 63 60 98-99
66 62 59 97-98
72 69 59 96-97
School System State
Sources of Information
Composite Score
50
63 61 58 0
98-99
School 50
System
65 60 58 97-98
65 62 57 96-97
State 0
64 60 57 98-99
65 58 56 97-98
65 60 55 96-97
1998-99 GEORGIA PUBLIC EDUCATION REPORT CARD Richmond Hill Elementary School - 6154050
Prepared by Georgia Department of Education
Scores Reported in Percentiles
School System State
Page 3
STATE-REQUIRED TEST DATA
PERFORMANCE ASSESSMENTS
Grade 5 Writing Assessment
Percent at Developmental Stages:
1998-99 School System State
1997-98 School System State
1996-97 School System State
Stage Stage Stage Stage Stage Stage
1:The Emerging Writer 2:The Developing Writer 3:The Focusing Writer 4:The Experimenting 5:The Engaging Writer 6:The Extending Writer
0% 0% 7% 48% 36% 10%
0% 1% 13% 47% 29% 10%
0% 1% 16% 41% 29% 12%
0% 1% 9% 35% 38% 16%
0% 3% 19% 36% 29% 12%
0% 3% 19% 41% 27% 10%
0% 0% 11% 42% 36% 11%
0% 1% 21% 40% 29% 8%
0% 3% 21% 37% 26% 12%
AWARDS / RECOGNITION DATA
Schools in Georgia may receive recognition in the following programs: Charter School Pay for Performance Program Georgia School of Excellence National Blue Ribbon School Richmond Hill Elementary School did not receive recognition in any of these programs during the 1998-99 school year.
1998-99 GEORGIA PUBLIC EDUCATION REPORT CARD Richmond Hill Elementary School - 6154050
Prepared by Georgia Department of Education
Page 4
CERTIFIED PERSONNEL DATA
Positions Number Average Contract Days
Personnel Sex
Certificate
Years Experience
Full-time Part-time
Male Female
4 Yr Bachelor's 5 Yr Master's 6 Yr Specialist's 7 Yr Doctoral Other*
<1 1-10 11-20 21-30 >30
Average
Administrators
2.00 220.00
2 0
1 1
0 0 1 1 0 0 0 0 2 0 26.00
Support Personnel
4.00 190.00
4 0
0 4
0 3 1 0 0 0 0 2 2 0 20.00
PK-12 Teachers
37.00 190.00
37 0
0 37
21 14
2 0 0 2 12 16 7 0 13.78
*Includes One- and Two-Year Vocational Certificates.
ACCREDITATION DATA
Accredited by Southern Association of Colleges and Schools (SACS):
Elementary/Middle Commission. Accredited with Quality by Georgia
Accrediting Commission (GAC).
1998-99 GEORGIA PUBLIC EDUCATION REPORT CARD Richmond Hill Elementary School - 6154050
Prepared by Georgia Department of Education
Page 5
1998-99 GEORGIA PUBLIC EDUCATION REPORT CARD
BRYAN COUNTY SCHOOLS
Richmond Hill High School - 6150182
Grade Range 9-12
The Georgia Public Education Report Card is designed to assist systems and schools in educational improvement. This report card contains a variety of data elements. An explanation of the terms is provided as a companion to the report card data. Please refer to the definitions for the most effective use of the reported data.
Total 945
STUDENT DATA
9-12 Enrollment, by Race/Ethnicity and Sex
Black
White Hispanic
American Multi-
Asian Indian
racial
100 10.6%
802 84.9%
13 1.4%
9 1.0%
4 0.4%
17 1.8%
Male Female
487 51.5%
458 48.5%
Enrollment in Selected Programs
Program
Gifted (Grades K-12)
Program % of Student Enrollment Population
181
19.2%
Non-Vocational Labs (Grades 9-12)
606
Vocational Labs
(Grades 9-12)
419
Alternative Programs (Grades 6-12)
4
64.1% 44.3%
< 1%
Students Eligible to Receive Free/Reduced Lunches
Number
Percent
School System
102 1,851
10.8% 36.1%
Enrollment in Compensatory Programs
Program
Program % of Student Enrollment Population
Special Education (Grades K-12) PK
65
6.9%
0
N/A
English to Speakers of Other Languages (ESOL) (Grades K-12)
0
0.0%
Remedial Education (Grades 2-5, 9-12)
26
2.8%
Title I (Grades K-12)
This school has no Title I program.
Dropout Rate for Grades 9-12
Number
Rate
School System
53
5.1%
105
6.8%
Total 104
Retained Students, by Race/Ethnicity and Sex
Black
White Hispanic
American MultiAsian Indian racial
22 21.2%
76 73.1%
2 1.9%
0 0.0%
2 1.9%
2 1.9%
Male Female
57
47
54.8% 45.2%
Prepared by Georgia Department of Education
Page 1
STATE-REQUIRED TEST DATA
GEORGIA HIGH SCHOOL GRADUATION TESTS (GHSGT)
Percent of Regular Program 11th Graders Passing the Georgia High School Graduation Tests on First Administration
English Language Arts Mathematics Social Studies Science
All Components listed above
Writing
1998-99
School System State
99% 96% 91% 81%
98% 94% 86% 74%
96% 88% 80% 72%
77% 71% 68%
97% 94% 93%
1997-98
School System State
97% 96% 86% 81%
96% 95% 85% 79%
94% 88% 78% 74%
75% 74% 68%
98% 97% 92%
1996-97
School System State
97% 90% 84% 83%
97% 91% 85% 82%
94% 87% 78% 74%
77% 75% 67%
100% 98% 93%
GRADUATE DATA
1999 Graduates by Credentials, Race/Ethnicity and Sex
Diplomas with Both College Prep. & Voc. Endorsements
Diplomas with College Prep. Endorsements Diplomas with Vocational Endorsements General High School Diplomas Special Education Diplomas
Total All Diplomas
Certificates of Performance
Total Graduates
Total 3
143 24 5 3
178 9
187
Black
0 0.0%
10 7.0%
3 12.5%
2 40.0%
0 0.0%
15 8.4%
2 22.2%
17 9.1%
White Hispanic
3 100.0%
127 88.8%
0 0.0%
2 1.4%
21 87.5%
3 60.0%
3 100.0%
0 0.0%
0 0.0%
0 0.0%
157 88.2%
2 1.1%
7 77.8%
0 0.0%
164 87.7%
2 1.1%
American MultiAsian Indian racial
0 0.0%
0 0.0%
0 0.0%
0 0.0%
0 0.0%
4 2.8%
0 0.0%
0 0.0%
0 0.0%
0 0.0%
0 0.0%
0 0.0%
0 0.0%
0 0.0%
0 0.0%
0 0.0%
0 0.0%
4 2.2%
0 0.0%
0 0.0%
0 0.0%
0 0.0%
0 0.0%
4 2.1%
Male Female
0 0.0%
68 47.6%
3 100.0%
75 52.4%
12 50.0%
3 60.0%
1 33.3%
12 50.0%
2 40.0%
2 66.7%
84
94
47.2% 52.8%
1
8
11.1% 88.9%
85
102
45.5% 54.5%
HOPE Scholarships
School System
Number of 1999 Graduates 1 8 7
Number Eligible
125
Percent Eligible
66.8%
274 168 61.3%
State
65,548 40,292 61.5%
High School Completion Rate
Percent of 1995Grade 9 Enrollment in Graduating Class of1999 School System State
Completion Rate '95-'99 77.9% 64.5% 68.9%
1998-99 GEORGIA PUBLIC EDUCATION REPORT CARD
Richmond Hill High School - 6150182
Prepared by Georgia Department of Education
Page 2
COLLEGE ADMISSIONS / CREDIT TEST DATA
Scholastic Assessment Test (SAT)
Based on students' highest verbal and highest math scores
No. Taking
Average Score
Tests Verbal Math Total
Based on students' last test administration
Average Score Verbal Math Total
School
150
College Prep. Endorsement
Other Diplomas
System
193
College Prep. Endorsement
Other Diplomas
Georgia
41,958
516 504 1020
504 494
998
413 383
796
507 491
998
501 485
986
403 383
786
492 488
980
507 N/A N/A
501 N/A N/A
483
496 N/A N/A
485 N/A N/A
479
1003 N/A N/A
986 N/A N/A
962
Nation
952,913 N/A N/A N/A
502 508 1010
American College Testing (ACT)
Advanced Placement Exams (AP)
Number taking tests: English Mathematics Reading Science Reasoning CompositeScore
2 5 School System State
20.4 19.5 19.1
22.2 21.7 19.9
22.3 21.4
21.3 20.8
20.2 19.9
21.8 21.0 19.9
No. of Students Taking Tests
No. of Tests Taken No. of Test Scores
3 or Higher Percent of Test
Scores 3 or Higher
School 60 86 53
61.6%
System State 70 15,225 96 23,969 55 13,024
57.3% 54.3%
POST-SECONDARY DATA
Graduates Entering Georgia Public Colleges
Graduates Entering Georgia Public Colleges and Requiring Learning Support (LS)
1998 Graduates Entering in 1998-99
1997 Graduates Entering in 1997-98
Percent of Graduating Number Class
School
67
43.8%
System 8 8
37.9%
School
81
54.7%
System 113
49.1%
Number Requiring
LS 14 17
21 25
Percent of those attending Georgia
Public Colleges
20.9%
19.3%
25.9%
22.1%
In previous years, the Report Card presented College Prep Curriculum information provided by the Board of Regents on students requiring Learning Support. Due to inconsistencies in the data provided by the Board of Regents in defining College Prep Completers versus Local Board of Education data defining College Prep Endorsements, the Department of Education Report Card will not provide this information until discrepancies can be reconciled.
Graduates Entering Georgia Public Technical and Adult Schools
1998 Graduates School System
Entering Number 6 18
1998-99 Percent
3.9% 7.8%
Entering Number N/A N/A
1997-98 Percent
N/A N/A
1997 Graduates School
1
0.7%
System
1
0.4%
6
4.1%
11
4.8%
1998-99 GEORGIA PUBLIC EDUCATION REPORT CARD Richmond Hill High School - 6150182
Prepared by Georgia Department of Education
Page 3
CERTIFIED PERSONNEL DATA
Positions Number Average Contract Days
Administrators
3.00 203.33
Support Personnel
4.00 190.00
PK-12 Teachers
50.50 190.44
Personnel Sex
Certificate
Years Experience
Full-time Part-time
Male Female
4 Yr Bachelor's 5 Yr Master's 6 Yr Specialist's 7 Yr Doctoral Other*
<1 1-10 11-20 21-30 >30
Average
3 0
3 0
0 1 2 0 0
0 0 3 0 0
12.67
4 0
1 3
0 1 3 0 0
0 1 1 2 0
16.25
50 0
18 32
26 19
5 0 0
1 25 13 11
0
12.32
*Includes One- and Two-Year Vocational Certificates.
ACCREDITATION DATA
Accredited by Southern Association of Colleges and Schools (SACS): Secondary/Middle Commission. Accredited with Quality by Georgia Accrediting Commission (GAC).
AWARDS / RECOGNITION DATA
Schools in Georgia may receive recognition in the following programs: Charter School Pay for Performance Program Georgia School of Excellence National Blue Ribbon School Richmond Hill High School did not receive recognition in any of these programs during the 1998-99 school year.
1998-99 GEORGIA PUBLIC EDUCATION REPORT CARD Richmond Hill High School - 6150182
Prepared by Georgia Department of Education
Page 4
1998-99 GEORGIA PUBLIC EDUCATION REPORT CARD
BRYAN COUNTY SCHOOLS
Richmond Hill Middle School - 6150199
Grade Range 6-8
The Georgia Public Education Report Card is designed to assist systems and schools in educational improvement. This report card contains a variety of data elements. An explanation of the terms is provided as a companion to the report card data. Please refer to the definitions for the most effective use of the reported data.
STUDENT DATA
Total 771
6-8 Enrollment, by Race/Ethnicity and Sex
Black
White Hispanic
American Multi-
Asian Indian
racial
65 8.4%
666 86.4%
11 1.4%
12 1.6%
1 0.1%
16 2.1%
Male 403
52.3%
Female 368
47.7%
Enrollment in Selected Programs
Program
Gifted (Grades K-12)
Program % of Student Enrollment Population
64
8.3%
Alternative Programs (Grades 6-12)
1
< 1%
Students Eligible to Receive Free/Reduced Lunches
Number
Percent
School System
139 1,851
18.0% 36.1%
Enrollment in Compensatory Programs
Program
Program % of Student Enrollment Population
Special Education (Grades K-12) (PK)
48
6.2%
0
N/A
English to Speakers of Other Languages (ESOL) (Grades K-12)
0
0.0%
Title I (Grades K-12)
This school has no Title I program.
Dropout Rate for Grades 6-8
Number
Rate
School System
3
0.3%
12
0.9%
Total 21
Retained Students, by Race/Ethnicity and Sex
Black
White Hispanic
American MultiAsian Indian racial
4 19.0%
16 76.2%
0 0.0%
0 0.0%
0 0.0%
1 4.8%
Male Female
12
9
57.1% 42.9%
Prepared by Georgia Department of Education
Page 1
STATE-REQUIRED TEST DATA
NORM-REFERENCED TESTS Grade 8
Iowa Tests of Basic Skills (ITBS) Each chart reflects data for three years of testing.
Reading Comprehension 50
61 54 49 0
98-99
60 54 48 97-98
56 50 48 96-97
Mathematics
School 50
System
State
0
59 53 56 98-99
56 51 55 97-98
59 51 54 96-97
School System State
Reading Vocabulary 50
58 51 46 0
98-99
58 51 45 97-98
54 47 44 96-97
Language Arts
School 50
System
State
0
64 60 60 98-99
66 60 58 97-98
63 55 56 96-97
School System State
Social Studies 50
59 55 54 0
98-99
58 54 53 97-98
59 54 53 96-97
Science
School 50
System
State
0
66 59 56 98-99
63 57 55 97-98
65 57 53 96-97
School System State
Sources of Information
Composite Score
50
62 57 57 0
98-99
School 50
System
61 57 56 97-98
63 56 55 96-97
State 0
62 57 56 98-99
61 55 54 97-98
1998-99 GEORGIA PUBLIC EDUCATION REPORT CARD Richmond Hill Middle School - 6150199
Prepared by Georgia Department of Education
62 54 54 96-97
Scores Reported in Percentiles
School System State
Page 2
STATE-REQUIRED TEST DATA
PERFORMANCE ASSESSMENTS
Grade 8 Writing Assessment
1998-99 Percent Scoring
1997-98 Percent Scoring
1996-97 Percent Scoring
Categories of Scaled Scores
School System State School System State School System State
Inadequate (less than 162)
Minimal (162-209)
Good
(210-247)
Very Good (greater than 247)
N/A N/A N/A N/A
2% 36% 51% 11%
8% 40% 41% 11%
7% 46% 40%
7%
10% 48% 35%
7%
11% 46% 34%
8%
7% 42% 40% 11%
15% 42% 34%
9%
15% 46% 30%
8%
Average Scaled Score: (Range 100-300)
N/A
215
208 205
202 202 210
201 198
No Grade Eight Writing Assessment Scores were reported for Richmond Hill Middle School.
AWARDS / RECOGNITION DATA
Schools in Georgia may receive recognition in the following programs: Charter School Pay for Performance Program Georgia School of Excellence National Blue Ribbon School Richmond Hill Middle School did not receive recognition in any of these programs during the 1998-99 school year.
1998-99 GEORGIA PUBLIC EDUCATION REPORT CARD Richmond Hill Middle School - 6150199
Prepared by Georgia Department of Education
Page 3
CERTIFIED PERSONNEL DATA
Positions Number Average Contract Days
Personnel Sex
Certificate
Years Experience
Full-time Part-time
Male Female
4 Yr Bachelor's 5 Yr Master's 6 Yr Specialist's 7 Yr Doctoral Other*
<1 1-10 11-20 21-30 >30
Average
Administrators
2.00 210.00
2 0
2 0
0 1 1 0 0 0 0 1 1 0 22.50
Support Personnel
3.00 190.00
3 0
0 3
0 2 1 0 0 0 1 1 1 0 13.33
PK-12 Teachers
47.00 190.00
47 0
8 39
32 14
1 0 0 4 22 10 11 0 11.45
*Includes One- and Two-Year Vocational Certificates.
ACCREDITATION DATA
Accredited by Southern Association of Colleges and Schools (SACS):
Elementary/Middle Commission. Accredited with Quality by Georgia
Accrediting Commission (GAC).
1998-99 GEORGIA PUBLIC EDUCATION REPORT CARD Richmond Hill Middle School - 6150199
Prepared by Georgia Department of Education
Page 4
1998-99 GEORGIA PUBLIC EDUCATION REPORT CARD
BRYAN COUNTY SCHOOLS
Richmond Hill Primary School - 6150193
Grade Range PK-2
The Georgia Public Education Report Card is designed to assist systems and schools in educational improvement. This report card contains a variety of data elements. An explanation of the terms is provided as a companion to the report card data. Please refer to the definitions for the most effective use of the reported data.
STUDENT DATA
Total
K-2
649
PK
104
Enrollment, by Race/Ethnicity and Sex
Black
White Hispanic
American Asian Indian
Multiracial
66 10.2%
553 85.2%
7 1.1%
7 1.1%
1 0.2%
15 2.3%
17 16.3%
80 76.9%
2 1.9%
1 1.0%
0 0.0%
4 3.8%
Male Female
340 52.4%
309 47.6%
62 59.6%
42 40.4%
Enrollment in Selected Programs
Program
Program % of Student Enrollment Population
Gifted (Grades K-12)
24
3.7%
Alternative Programs (Grades 6-12)
N/A
N/A
Students Eligible to Receive Free/Reduced Lunches
Number
Percent
School System
184 1,851
24.4% 36.1%
Dropout Rate *
Number
Rate
School System
N/A N/A
N/A N/A
* Dropout rates are not applicable for grades PK-5.
Enrollment in Compensatory Programs
Program
Program % of Student Enrollment Population
Special Education (Grades K-12)
42
6.5%
(PK)
10
N/A
English to Speakers of Other Languages (ESOL) (Grades K-12)
0
0.0%
Remedial Education (Grades 2-5, 9-12)
0
0.0%
Special Instructional Assistance (SIA) (Grades K-3)
37
5.7%
Title I (Grades K-12)
This school has no Title I program.
Total 21
Retained Students, by Race/Ethnicity and Sex
Black
White Hispanic
American MultiAsian Indian racial
2 9.5%
18 85.7%
1 4.8%
0 0.0%
0 0.0%
0 0.0%
Male Female
13
8
61.9% 38.1%
Prepared by Georgia Department of Education
Page 1
STATE-REQUIRED TEST DATA
NORM-REFERENCED TESTS
Grade 3 Iowa Tests of Basic Skills (ITBS) Each chart reflects data for three years of testing.
No third-grade students are enrolled at Richmond Hill Primary School.
Reading Comprehension
Mathematics
50
N/A 60 54 0
98-99
N/A 58 53 97-98
N/A 56 52 96-97
School 50
System
State
N/A 65 61 0
98-99
N/A 61 61 97-98
N/A 59 59 96-97
School System State
Reading Vocabulary 50
N/A 58 50 0
98-99
N/A 54 50 97-98
N/A 53 49 96-97
Language Arts
School 50
System
State
N/A 61 64 0
98-99
N/A 59 62 97-98
N/A 61 59 96-97
School System State
Social Studies 50
N/A 63 56 0
98-99
N/A 58 55 97-98
N/A 56 55 96-97
Science
School 50
System
State
N/A 65 59 0
98-99
N/A 64 59 97-98
N/A 61 58 96-97
School System State
Sources of Information
Composite Score
School
50
50
System
N/A 64 57 0
98-99
N/A 59 56 N/A 58 55
97-98
96-97
State
N/A 63 58 0
98-99
N/A 59 57 97-98
N/A 58 56 96-97
1998-99 GEORGIA PUBLIC EDUCATION REPORT CARD Richmond Hill Primary School - 6150193
Prepared by Georgia Department of Education
Scores Reported in Percentiles
School System State
Page 2
STATE-REQUIRED TEST DATA
NORM-REFERENCED TESTS
Grade 5 Iowa Tests of Basic Skills (ITBS) Each chart reflects data for three years of testing. No fifth-grade students are enrolled at Richmond Hill Primary School.
Reading Comprehension
Mathematics
50
N/A 56 53 0
98-99
N/A 57 53 97-98
N/A 56 52 96-97
School 50
System
State
N/A 60 59 0
98-99
N/A 57 58 97-98
N/A 60 57 96-97
School System State
Reading Vocabulary 50
N/A 52 48 0
98-99
N/A 48 48 97-98
N/A 53 46 96-97
Language Arts
School 50
System
State
N/A 61 63 0
98-99
N/A 60 61 97-98
N/A 58 58 96-97
School System State
Social Studies 50
N/A 62 57 0
98-99
N/A 61 56 97-98
N/A 59 55 96-97
Science
School 50
System
State
N/A 63 60 0
98-99
N/A 62 59 97-98
N/A 69 59 96-97
School System State
Sources of Information
Composite Score
School
50
50
System
N/A 61 58 0
98-99
N/A 60 58 N/A 62 57
97-98
96-97
State
N/A 60 57 0
98-99
N/A 58 56 97-98
N/A 60 55 96-97
1998-99 GEORGIA PUBLIC EDUCATION REPORT CARD Richmond Hill Primary School - 6150193
Prepared by Georgia Department of Education
Scores Reported in Percentiles
School System State
Page 3
STATE-REQUIRED TEST DATA
PERFORMANCE ASSESSMENTS
Grade 5 Writing Assessment
Percent at Developmental Stages:
1998-99 School System State
1997-98 School System State
1996-97 School System State
Stage Stage Stage Stage Stage Stage
1:The Emerging Writer 2:The Developing Writer 3:The Focusing Writer 4:The Experimenting 5:The Engaging Writer 6:The Extending Writer
N/A N/A N/A N/A N/A N/A
0% 1% 13% 47% 29% 10%
0% 1% 16% 41% 29% 12%
N/A N/A N/A N/A N/A N/A
0% 3% 19% 36% 29% 12%
0% 3% 19% 41% 27% 10%
N/A N/A N/A N/A N/A N/A
No fifth-grade students are enrolled at Richmond Hill Primary School.
0% 1% 21% 40% 29% 8%
0% 3% 21% 37% 26% 12%
AWARDS / RECOGNITION DATA
Schools in Georgia may receive recognition in the following programs: Charter School Pay for Performance Program Georgia School of Excellence National Blue Ribbon School Richmond Hill Primary School did not receive recognition in any of these programs during the 1998-99 school year.
1998-99 GEORGIA PUBLIC EDUCATION REPORT CARD Richmond Hill Primary School - 6150193
Prepared by Georgia Department of Education
Page 4
CERTIFIED PERSONNEL DATA
Positions Number Average Contract Days
Personnel Sex
Certificate
Years Experience
Full-time Part-time
Male Female
4 Yr Bachelor's 5 Yr Master's 6 Yr Specialist's 7 Yr Doctoral Other*
<1 1-10 11-20 21-30 >30
Average
Administrators
2.00 210.00
2 0
0 2
0 1 1 0 0 0 0 0 2 0 26.50
Support Personnel
4.00 190.00
4 0
0 4
0 4 0 0 0 0 2 1 1 0 12.00
PK-12 Teachers
35.00 190.00
35 0
1 34
16 14
5 0 0 0 7 22 6 0 15.71
*Includes One- and Two-Year Vocational Certificates.
ACCREDITATION DATA
Accredited by Southern Association of Colleges and Schools (SACS):
Elementary/Middle Commission. Accredited with Quality by Georgia
Accrediting Commission (GAC).
1998-99 GEORGIA PUBLIC EDUCATION REPORT CARD Richmond Hill Primary School - 6150193
Prepared by Georgia Department of Education
Page 5
1998-99 GEORGIA PUBLIC EDUCATION REPORT CARD BUFORD CITY SCHOOLS - 764
The Georgia Public Education Report Card is designed to assist systems and schools in educational improvement. This report card contains a variety of data elements. An explanation of the terms is provided as a companion to the report card data. Please refer to the definitions for the most effective use of the reported data.
Total
K-12
1,935
PK
2
STUDENT DATA
Enrollment, by Race/Ethnicity and Sex
Black
White Hispanic
American Multi-
Asian Indian
racial
358 18.5%
1,290 66.7%
220 11.4%
15 0.8%
10 0.5%
42 2.2%
0 0.0%
1 50.0%
1 50.0%
0 0.0%
0 0.0%
0 0.0%
Male
977 50.5%
1 50.0%
Female
958 49.5%
1 50.0%
Enrollment in Selected Programs
Program
Program % of Student Enrollment Population
Gifted (Grades K-12)
154
8.0%
Non-Vocational Labs (Grades 9-12)
436
95.4%
Vocational Labs (Grades 9-12)
399
87.3%
Alternative Programs (Grades 6-12)
0
0.0%
Students Eligible to Receive Free/Reduced Lunches
Number
Percent
821
42.4%
Dropout Rate
Number
Percent
6-12 9-12
9
0.9%
9
1.8%
Enrollment in Compensatory Programs
Program
Program % of Student Enrollment Population
Special Education
(Grades K-12)
227
PK
3
English to Speakers of
Other Languages (ESOL)
110
(Grades K-12)
Remedial Education (Grades 2-5, 9-12)
245
Special Instructional
Assistance (SIA)
88
(Grades K-3)
Title I (Grades K-12) Number of schools with: Schoolwide program Targeted Assistance program No Title I program
11.7% N/A
5.7%
21.4%
12.9%
1 0 2
Total 31
Retained Students, by Race/Ethnicity and Sex
Black
White Hispanic
American MultiAsian Indian racial
16 51.6%
13 41.9%
2 6.5%
0 0.0%
0 0.0%
0 0.0%
Male Female
21
10
67.7% 32.3%
Prepared by Georgia Department of Education
Page 1
STATE-REQUIRED TEST DATA
NORM-REFERENCED TESTS
Grade 3 Iowa Tests of Basic Skills (ITBS) Each chart reflects data for three years of testing.
Reading Comprehension
Mathematics
50
57 54 66 53 60 52 0
98-99 97-98 96-97
System State
50
64 61 68 61 63 59 0
98-99 97-98 96-97
System State
Reading Vocabulary
50
52 50 55 50 50 49 0
98-99 97-98 96-97
System State
Social Studies
50
64 56 71 55 57 55 0
98-99 97-98 96-97
System State
Language Arts
50
61 64 68 62 60 59 0
98-99 97-98 96-97
System State
Science
50
68 59 73 59 62 58 0
98-99 97-98 96-97
System State
Sources of Information
Composite Score
50
57 57 0
98-99
System
50
64 56 55 55 97-98 96-97
State
61 58 69 57 0
98-99 97-98
1998-99 GEORGIA PUBLIC EDUCATION REPORT CARD Buford City Schools
Prepared by Georgia Department of Education
System State Scores Reported 59 56 in Percentiles 96-97
Page 2
STATE-REQUIRED TEST DATA
NORM-REFERENCED TESTS
Grade 5 Iowa Tests of Basic Skills (ITBS) Each chart reflects data for three years of testing.
Reading Comprehension
Mathematics
50
56 53 57 53 49 52 0
98-99 97-98 96-97
System State
50
69 59 68 58 60 57 0
98-99 97-98 96-97
System State
Reading Vocabulary
50
53 48 53 48 50 46 0
98-99 97-98 96-97
System State
Social Studies
50
61 57 62 56 54 55 0
98-99 97-98 96-97
System State
Language Arts
50
66 63 57 61 49 58 0
98-99 97-98 96-97
System State
Science
50
67 60 67 59 58 59 0
98-99 97-98 96-97
System State
Sources of Information
Composite Score
50
60 58 0
98-99
System
50
59 58 51 57 97-98 96-97
State
62 57 61 56 0
98-99 97-98
1998-99 GEORGIA PUBLIC EDUCATION REPORT CARD Buford City Schools
Prepared by Georgia Department of Education
System State Scores Reported 52 55 in Percentiles 96-97
Page 3
STATE-REQUIRED TEST DATA
NORM-REFERENCED TESTS Grade 8
Iowa Tests of Basic Skills (ITBS) Each chart reflects data for three years of testing.
Reading Comprehension
Mathematics
50
54 49 56 48 56 48 0
98-99 97-98 96-97
System State
50
71 56 74 55 67 54 0
98-99 97-98 96-97
System State
Reading Vocabulary
50
55 46 65 45 56 44 0
98-99 97-98 96-97
System State
Language Arts
50
73 60 73 58 64 56 0
98-99 97-98 96-97
System State
Social Studies
50
62 54 77 53 56 53 0
98-99 97-98 96-97
System State
Science
50
61 56 60 55 51 53 0
98-99 97-98 96-97
System State
Sources of Information
Composite Score
50
60 57 0
98-99
System
50
65 56 55 55 97-98 96-97
State
64 56 70 54 0
98-99 97-98
1998-99 GEORGIA PUBLIC EDUCATION REPORT CARD Buford City Schools
Prepared by Georgia Department of Education
System State Scores Reported 58 54 in Percentiles 96-97
Page 4
STATE-REQUIRED TEST DATA
PERFORMANCE ASSESSMENTS
Grade 5 Writing Assessment
1998-99
1997-98
1996-97
Percent at Developmental Stages:
Comparison
Comparison
Comparison
System Group State System Group State System Group State
Stage Stage Stage Stage Stage Stage
1: The Emerging Writer 2: The Developing Writer 3: The Focusing Writer 4: The Experimenting Writer 5: The Engaging Writer 6: The Extending Writer
2% 3% 38% 32% 18% 8%
0% 2% 19% 43% 26% 9%
0% 1% 16% 41% 29% 12%
0% 2% 29% 46% 15% 8%
0% 3% 22% 45% 24% 6%
0% 3% 19% 41% 27% 10%
1% 7% 33% 44% 13% 3%
0% 3% 21% 42% 24% 10%
0% 3% 21% 37% 26% 12%
Grade 8 Writing Assessment
1998-99 Percent Scoring 1997-98 Percent Scoring 1996-97 Percent Scoring
Categories of Scaled Scores
Comparison
Comparison
Comparison
System Group State System Group State System Group State
Inadequate (less than 162)
Minimal (162-209)
Good
(210-247)
Very Good (greater than 247)
7% 28% 49% 16%
5% 33% 49% 14%
8% 40% 41% 11%
4% 33% 44% 19%
10% 51% 32%
6%
11% 46% 34%
8%
8% 46% 36%
9%
10% 51% 33%
6%
15% 46% 30%
8%
Average Scaled Score: (Range 100-300)
215
215 208
217
200 202
204
201 198
GEORGIA HIGH SCHOOL GRADUATION TESTS (GHSGT)
Percent of Regular Program 11th Graders Passing the Georgia High School Graduation Tests on First Administration
1998-99
1997-98
1996-97
Comparison
Comparison
Comparison
System Group State System Group State System Group State
English Language Arts Mathematics Social Studies Science
100% 99% 89% 80%
98% 93% 84% 76%
96% 88% 80% 72%
99% 91% 88% 82%
93% 85% 72% 69%
94% 88% 78% 74%
97% 92% 81% 80%
97% 92% 82% 79%
94% 87% 78% 74%
All Components listed above 7 9 %
71% 68% 75%
59% 68% 76%
72% 67%
Writing
97%
96% 93% 95%
90% 92% 98%
97% 93%
1998-99 GEORGIA PUBLIC EDUCATION REPORT CARD
Buford City Schools
Prepared by Georgia Department of Education
Page 5
GRADUATE DATA
1999 Graduates by Credentials, Race/Ethnicity and Sex
Diplomas with Both College Prep. & Voc. Endorsements
Diplomas with College Prep. Endorsements Diplomas with Vocational Endorsements General High School Diplomas Special Education Diplomas
Total All Diplomas
Certificates of Performance
Total Graduates
Total 28 15 22 0 0
Black
6 21.4%
1 6.7%
5 22.7%
0
American MultiWhite Hispanic Asian Indian racial
17 60.7%
12 80.0%
16 72.7%
0
3 10.7%
1 6.7%
1 4.5%
0
0 0.0%
1 6.7%
0 0.0%
0
0 0.0%
0 0.0%
0 0.0%
0
2 7.1%
0 0.0%
0 0.0%
0
Male Female
8 28.6%
11 73.3%
10 45.5%
0
20 71.4%
4 26.7%
12 54.5%
0
0
0
0
0
0
0
0
0
65
12
45
5
1
0
2
29
36
18.5% 69.2% 7.7% 1.5% 0.0% 3.1% 44.6% 55.4%
0
0
0
0
0
0
0
0
0
65
12
45
5
1
0
2
29
36
18.5% 69.2% 7.7% 1.5% 0.0% 3.1% 44.6% 55.4%
HOPE Scholarships
System State
Number of 1999 Graduates 6 5
Number Eligible
46
Percent Eligible
70.8%
65,548 40,292 61.5%
High School Completion Rate Percent of 1995Grade 9 Enrollment
in Graduating Class of1999
System
State
Completion Rate '95-'99 76.5% 68.9%
COLLEGE ADMISSIONS / CREDIT TEST DATA
Scholastic Assessment Test (SAT)
No. Taking
Average Score
Tests
Verbal Math Total
Based on students' highest verbal and highest math scores
System College Prep. Endorsement Other Diplomas
472 483 955 481 487 968 404 424 828
Georgia
492 488 980
Based on students' last test administration
System Georgia
44
456 472
928
41,958 483 479 962
Nation
952,913 502 508 1010
American College Testing (ACT)
System State Nation
English
17.9
19.1 20.4
Mathematics
19.6
19.9 20.7
Reading
18.6
20.2 21.3
Science Reasoning 19.1
19.9 21.0
CompositeScore 18.9
19.9 21.9
Advanced Placement Exams (AP)
No. of Students Taking Tests
No. of Tests Taken No. of Test Scores
3 or Higher Percent of Test
Scores 3 or Higher
System State 6 15,225 6 23,969 1 13,024
16.7% 54.3%
1998-99 GEORGIA PUBLIC EDUCATION REPORT CARD Buford City Schools
Prepared by Georgia Department of Education
Page 6
POSTSECONDARY DATA
Graduates Entering Georgia Public Colleges and Universities
Graduates Entering Georgia Public Colleges and Universities and
Requiring Learning Support (LS)
1998 Graduates Entering 1998-99
1997 Graduates Entering 1997-98
Percent of Graduating Number Class
24
35.8%
29
41.4%
Number Requiring
LS
7
10
Percent of those attending Georgia
Public Colleges
29.2%
34.5%
In previous years, the Report Card presented College Prep Curriculum information provided by the Board of Regents on students requiring Learning Support. Due to inconsistencies in the data provided by the Board of Regents in defining College Prep Completers versus Local Board of Education data defining College Prep Endorsements, the Department of Education Report Card will not provide this information until discrepancies can be reconciled.
Graduates Entering Georgia Public Technical and Adult Schools
Entering 1998-99 Entering 1997-98
Number Percent
Number Percent
1998 Graduates 1997 Graduates
1
1.5%
0
0.0%
N/A 0
N/A 0.0%
ACCREDITATION / RECOGNITION DATA
Southern Association of Colleges and Schools (SACS) Accrediting Commission
Secondary/Middle Commission Elementary/Middle Commission Both Elementary/Secondary Commissions Joint Commission Candidate for Accreditation
Accreditation by Georgia Accrediting Commission (GAC)
Accredited by GAC Accredited with Quality by GAC
Number of Schools
1 2 0 0 0
Number of Schools
0 3
Awards / Recognition
State Recognized Program
Number of Schools
Charter School
0
Pay for Performance Recipient
0
Georgia School of Excellence
0
National Blue Ribbon School
0
COMMUNITY DATA
Number of Children Eligible for Migrant Education Number of Families-At-Risk * Number of Food Stamp Participants * Number of Families Receiving TANF * ** Per Capita Income * Unemployment Rate * 1990 Population * Projected 2000 Population * Projected 2010 Population *
* Data Available at County Level Only ** Known as AFDC before January 1997
14 1,175 7,471
740 $28,067
2.5% 352,910 531,971 650,732
1998-99 GEORGIA PUBLIC EDUCATION REPORT CARD Buford City Schools
Prepared by Georgia Department of Education
Page 7
FISCAL DATA
Millage Rate
11.60
* Fall 1998 Property Tax Digest is used to calculate the 98-99 Value of One Mill
FTE Count
FTE Count used for Allotment Calculation 1,916.0 Fall '98 FTE Count 1,935
Value of One Mill
$221,947 $115.83 per Allotment FTE
Sources: Local State-QBE State-
Lottery State-
Other Federal Other
Total
PerGeneral Fund cent Per FTE
$5,388,312 44.2% $2,812 $6,785,013 55.7% $3,541
K-12 Revenues
Lottery K-12
and
Title
All Other
Programs
K-12
$0
$0
Bonded Debt $0
$0
$0
$0
$0 0.0%
$0
$0
$42,694
$0
$10,143 0.1%
$5
$4,114
$0
$0
$0 0.0%
$0 $736,181
$0
$0
$0 0.0%
$0
$0
$0
$0
$12,183,469 100% $6,358 $740,295
$42,694
$0
Capital Projects
$0 $0
$0
$0 $0 $0 $0
School Nutrition
$268,795 $0
$0
$47,922 $390,135
$0 $706,853
Grand Total
Total
Per-
Amount cent
$5,657,108 41.4%
$6,785,013 49.6%
$42,694 0.3%
$62,180 0.5% $1,126,317 8.2%
$0 0.0% $13,673,313 100%
Instruction
Media Instruction
Support Pupil Services General Admin. School Admin. Trans-
portation Maint. & Ops. Capital Projects School Food Debt Service
Total
$8,011,345 63.8% $4,181 $303,021 2.4% $158
$364,120 2.9% $190
$870,173 6.9% $454
$524,905 4.2% $274
$965,941 7.7% $504
$366,393 2.9% $191
$1,159,896 9.2% $605
$0 0.0%
$0
$0 0.0%
$0
$0 0.0%
$0
$12,565,797 100% $6,557
K-12 Expenditures
$550,136
$42,714
$0
$10,170
$0
$0
$44,488
$0
$0
$86,998
$0
$0
$5,517
$0
$0
$0
$0
$0
$6,717
$0
$0
$0
$0
$0
$0
$0
$0
$0
$0
$0
$0
$0
$0
$704,028
$42,714
$0
$0
$0 $8,604,196 61.6%
$0
$0
$313,192 2.2%
$0
$0
$408,608 2.9%
$0
$0
$957,172 6.9%
$0
$0
$530,422 3.8%
$0
$0
$965,941 6.9%
$0
$0
$373,110 2.7%
$0
$0 $1,159,896 8.3%
$0
$0
$0 0.0%
$0 $650,900
$650,900 4.7%
$0
$0
$0 0.0%
$0 $650,900 $13,963,441 100%
Salaries and Benefits as Percentages of Revenues and of Expenditures
Teachers and Paraprofessionals
Salaries $6,140,052
Benefits $1,747,584
Percentage of Revenues Percentage of Expenditures
Total of
Total of
General Fund
General Fund
Title Programs
Title Programs
Lottery K-12
Lottery K-12
Total Salaries
and
Total
and
Total
and Benefits All Other K-12 K - 12 All Other K-12 K - 12
$7,887,636
60.8%
57.7%
59.2%
56.5%
School Administration
$505,318
$186,849
$692,167
5.3%
5.1%
5.2%
5.0%
General Administration
$170,431
$71,354
$241,785
1.9%
1.8%
1.8%
1.7%
1998-99 GEORGIA PUBLIC EDUCATION REPORT CARD
Buford City Schools - 764
Prepared by Georgia Department of Education
Page 8
CERTIFIED PERSONNEL DATA
Number
Average Annual Salary Positions Average Contract Days
Average Daily Salary
Full-time Personnel Part-time
Sex Male Female
4 Yr Bachelor's Certificate 5 Yr Master's
Level 6 Yr Specialist's 7 Yr Doctoral Other*
Black
White Race/ Hispanic Ethnicity Asian
American Indian
Multiracial
Years Experience
<1 1-10 11-20 21-30 >30
Average
Administrators
13.40
$74,941.03 224.33
$334.07
13 1
8 6
0 3 9 2 0
2 12
0 0 0 0
0 0 5 9 0
23.57
Support Personnel PK-12 Teachers
10.35
128.75
$52,461.94 197.49
$265.65
$43,722.59 190.50
$229.51
10
128
1
2
2
25
9
105
0
55
7
67
4
5
0
2
0
1
2
10
9
120
0
0
0
0
0
0
0
0
0
4
2
45
6
52
2
25
1
4
18.55
14.12
*Includes One- and Two-Year Vocational Certificates.
Certified Staff Position Ratios
Teacher/Administrator Ratio 10:1
Teacher/Support Person Ratio 12:1
Teacher/Staff Ratio 5:1
Student Enrollment/All Teachers 15:1
Certified Personnel by Category
83.9% 100%
9.0%
7.1%
80% 60%
40%
20%
0%
Teachers
Administrators
Support Personnel
1998-99 GEORGIA PUBLIC EDUCATION REPORT CARD
Buford City Schools - 764
Prepared by Georgia Department of Education
Page 9
1998-99 GEORGIA PUBLIC EDUCATION REPORT CARD
BUFORD CITY SCHOOLS
Buford Elementary School - 7640196
Grade Range PK-4
The Georgia Public Education Report Card is designed to assist systems and schools in educational improvement. This report card contains a variety of data elements. An explanation of the terms is provided as a companion to the report card data. Please refer to the definitions for the most effective use of the reported data.
STUDENT DATA
Total
K-4
851
PK
2
Enrollment, by Race/Ethnicity and Sex
Black
White Hispanic
American Asian Indian
Multiracial
148 17.4%
538 63.2%
116 13.6%
5 0.6%
9 1.1%
35 4.1%
0 0.0%
1 50.0%
1 50.0%
0 0.0%
0 0.0%
0 0.0%
Male Female
426 50.1%
425 49.9%
1 50.0%
1 50.0%
Enrollment in Selected Programs
Program
Program % of Student Enrollment Population
Gifted (Grades K-12)
55
6.5%
Alternative Programs (Grades 6-12)
N/A
N/A
Students Eligible to Receive Free/Reduced Lunches
Number
Percent
School System
429
50.3%
821
42.4%
Dropout Rate *
Number
Rate
School System
N/A N/A
N/A N/A
* Dropout rates are not applicable for grades PK-5.
Enrollment in Compensatory Programs
Program
Program % of Student Enrollment Population
Special Education (Grades K-12)
83
9.8%
(PK)
3
N/A
English to Speakers of Other Languages (ESOL) (Grades K-12)
48
5.6%
Remedial Education (Grades 2-5, 9-12)
146 27.7%
Special Instructional Assistance (SIA) (Grades K-3)
88 12.9%
Title I (Grades K-12)
This school has a schoolwide program.
Total 4
Retained Students, by Race/Ethnicity and Sex
Black
White Hispanic
American MultiAsian Indian racial
1 25.0%
2
1
50.0% 25.0%
0 0.0%
0 0.0%
0 0.0%
Male Female
2
2
50.0% 50.0%
Prepared by Georgia Department of Education
Page 1
STATE-REQUIRED TEST DATA
NORM-REFERENCED TESTS Grade 3
Iowa Tests of Basic Skills (ITBS) Each chart reflects data for three years of testing.
Reading Comprehension 50
57 57 54 0
98-99
66 66 53 97-98
60 60 52 96-97
Mathematics
School 50
System
State
0
64 64 61 98-99
68 68 61 97-98
63 63 59 96-97
School System State
Reading Vocabulary 50
52 52 50 0
98-99
55 55 50 97-98
50 50 49 96-97
Language Arts
School 50
System
State
0
61 61 64 98-99
68 68 62 97-98
60 60 59 96-97
School System State
Social Studies 50
64 64 56 0
98-99
71 71 55 97-98
57 57 55 96-97
Science
School 50
System
State
0
68 68 59 98-99
73 73 59 97-98
62 62 58 96-97
School System State
Sources of Information
Composite Score
50
57 57 57 0
98-99
School 50
System
64 64 56 97-98
55 55 55 96-97
State 0
61 61 58 98-99
69 69 57 97-98
1998-99 GEORGIA PUBLIC EDUCATION REPORT CARD Buford Elementary School - 7640196
Prepared by Georgia Department of Education
59 59 56 96-97
Scores Reported in Percentiles
School System State
Page 2
STATE-REQUIRED TEST DATA
NORM-REFERENCED TESTS
Grade 5 Iowa Tests of Basic Skills (ITBS) Each chart reflects data for three years of testing. No fifth-grade students are enrolled at Buford Elementary School.
Reading Comprehension
Mathematics
50
N/A 56 53 0
98-99
N/A 57 53 97-98
N/A 49 52 96-97
School 50
System
State
N/A 69 59 0
98-99
N/A 68 58 97-98
N/A 60 57 96-97
School System State
Reading Vocabulary 50
N/A 53 48 0
98-99
N/A 53 48 97-98
N/A 50 46 96-97
Language Arts
School 50
System
State
N/A 66 63 0
98-99
N/A 57 61 97-98
N/A 49 58 96-97
School System State
Social Studies 50
N/A 61 57 0
98-99
N/A 62 56 97-98
N/A 54 55 96-97
Science
School 50
System
State
N/A 67 60 0
98-99
N/A 67 59 97-98
N/A 58 59 96-97
School System State
Sources of Information
Composite Score
School
50
50
System
N/A 60 58 0
98-99
N/A 59 58 N/A 51 57
97-98
96-97
State
N/A 62 57 0
98-99
N/A 61 56 97-98
N/A 52 55 96-97
1998-99 GEORGIA PUBLIC EDUCATION REPORT CARD Buford Elementary School - 7640196
Prepared by Georgia Department of Education
Scores Reported in Percentiles
School System State
Page 3
STATE-REQUIRED TEST DATA
PERFORMANCE ASSESSMENTS
Grade 5 Writing Assessment
Percent at Developmental Stages:
1998-99 School System State
1997-98 School System State
1996-97 School System State
Stage Stage Stage Stage Stage Stage
1:The Emerging Writer 2:The Developing Writer 3:The Focusing Writer 4:The Experimenting 5:The Engaging Writer 6:The Extending Writer
N/A N/A N/A N/A N/A N/A
2% 3% 38% 32% 18% 8%
0% 1% 16% 41% 29% 12%
N/A N/A N/A N/A N/A N/A
0% 2% 29% 46% 15% 8%
0% 3% 19% 41% 27% 10%
N/A N/A N/A N/A N/A N/A
No fifth-grade students are enrolled at Buford Elementary School.
1% 7% 33% 44% 13% 3%
0% 3% 21% 37% 26% 12%
AWARDS / RECOGNITION DATA
Schools in Georgia may receive recognition in the following programs: Charter School Pay for Performance Program Georgia School of Excellence National Blue Ribbon School Buford Elementary School did not receive recognition in any of these programs during the 1998-99 school year.
1998-99 GEORGIA PUBLIC EDUCATION REPORT CARD Buford Elementary School - 7640196
Prepared by Georgia Department of Education
Page 4
CERTIFIED PERSONNEL DATA
Positions Number Average Contract Days
Personnel Sex
Certificate
Years Experience
Full-time Part-time
Male Female
4 Yr Bachelor's 5 Yr Master's 6 Yr Specialist's 7 Yr Doctoral Other*
<1 1-10 11-20 21-30 >30
Average
Administrators
2.00 230.00
2 0
0 2
0 0 2 0 0 0 0 1 1 0 21.00
Support Personnel
3.00 190.00
3 0
1 2
0 2 1 0 0 0 1 2 0 0 12.67
PK-12 Teachers
53.00 190.00
53 0
4 49
19 32
2 0 0 1 21 22 6 3 13.94
*Includes One- and Two-Year Vocational Certificates.
ACCREDITATION DATA
Accredited by Southern Association of Colleges and Schools (SACS):
Elementary/Middle Commission. Accredited with Quality by Georgia
Accrediting Commission (GAC).
1998-99 GEORGIA PUBLIC EDUCATION REPORT CARD Buford Elementary School - 7640196
Prepared by Georgia Department of Education
Page 5
1998-99 GEORGIA PUBLIC EDUCATION REPORT CARD
BUFORD CITY SCHOOLS
Buford High School - 7640191
Grade Range 9-12
The Georgia Public Education Report Card is designed to assist systems and schools in educational improvement. This report card contains a variety of data elements. An explanation of the terms is provided as a companion to the report card data. Please refer to the definitions for the most effective use of the reported data.
Total 457
STUDENT DATA
9-12 Enrollment, by Race/Ethnicity and Sex
Black
White Hispanic
American Multi-
Asian Indian
racial
100 21.9%
310 67.8%
33 7.2%
7 1.5%
0 0.0%
7 1.5%
Male Female
231 50.5%
226 49.5%
Enrollment in Selected Programs
Program
Gifted (Grades K-12)
Program % of Student Enrollment Population
27
5.9%
Non-Vocational Labs (Grades 9-12)
436
Vocational Labs
(Grades 9-12)
399
Alternative Programs (Grades 6-12)
0
95.4% 87.3%
0.0%
Students Eligible to Receive Free/Reduced Lunches
Number
Percent
School System
122
26.7%
821
42.4%
Enrollment in Compensatory Programs
Program
Program % of Student Enrollment Population
Special Education (Grades K-12) PK
47 10.3%
0
N/A
English to Speakers of Other Languages (ESOL) (Grades K-12)
9
2.0%
Remedial Education (Grades 2-5, 9-12)
46 10.1%
Title I (Grades K-12)
This school has no Title I program.
Dropout Rate for Grades 9-12
Number
Rate
School System
9
1.8%
9
1.8%
Total 26
Retained Students, by Race/Ethnicity and Sex
Black
White Hispanic
American MultiAsian Indian racial
15 57.7%
10 38.5%
1 3.8%
0 0.0%
0 0.0%
0 0.0%
Male Female
18
8
69.2% 30.8%
Prepared by Georgia Department of Education
Page 1
STATE-REQUIRED TEST DATA
GEORGIA HIGH SCHOOL GRADUATION TESTS (GHSGT)
Percent of Regular Program 11th Graders Passing the Georgia High School Graduation Tests on First Administration
English Language Arts Mathematics Social Studies Science
All Components listed above
Writing
1998-99
School System State
100% 99% 89% 80%
100% 99% 89% 80%
96% 88% 80% 72%
79% 79% 68%
97% 97% 93%
1997-98
School System State
99% 91% 88% 82%
99% 91% 88% 82%
94% 88% 78% 74%
75% 75% 68%
95% 95% 92%
1996-97
School System State
97% 92% 81% 80%
97% 92% 81% 80%
94% 87% 78% 74%
76% 76% 67%
98% 98% 93%
GRADUATE DATA
1999 Graduates by Credentials, Race/Ethnicity and Sex
Diplomas with Both College Prep. & Voc. Endorsements
Diplomas with College Prep. Endorsements Diplomas with Vocational Endorsements General High School Diplomas Special Education Diplomas
Total All Diplomas
Certificates of Performance
Total Graduates
Total 28 15 22 0
Black
6 21.4%
1 6.7%
5 22.7%
0
White Hispanic
17
3
60.7% 10.7%
12 80.0%
1 6.7%
16 72.7%
1 4.5%
0
0
American MultiAsian Indian racial
0 0.0%
0 0.0%
2 7.1%
1 6.7%
0 0.0%
0 0.0%
0 0.0%
0 0.0%
0 0.0%
0
0
0
0
0
0
0
0
0
0
65
12
45
5
1
0
2
18.5% 69.2% 7.7% 1.5% 0.0% 3.1%
0
0
0
0
0
0
0
65
12
45
5
1
0
2
18.5% 69.2% 7.7% 1.5% 0.0% 3.1%
Male Female
8
20
28.6% 71.4%
11
4
73.3% 26.7%
10
12
45.5% 54.5%
0
0
0
0
29 44.6%
0
36 55.4%
0
29
36
44.6% 55.4%
HOPE Scholarships
School System
Number of 1999 Graduates 6 5
Number Eligible
46
Percent Eligible
70.8%
65 46 70.8%
State
65,548 40,292 61.5%
High School Completion Rate
Percent of 1995Grade 9 Enrollment in Graduating Class of1999 School System State
Completion Rate '95-'99 76.5% 76.5% 68.9%
1998-99 GEORGIA PUBLIC EDUCATION REPORT CARD
Buford High School - 7640191
Prepared by Georgia Department of Education
Page 2
COLLEGE ADMISSIONS / CREDIT TEST DATA
Scholastic Assessment Test (SAT)
Based on students' highest verbal and highest math scores
No. Taking
Average Score
Tests Verbal Math Total
Based on students' last test administration
Average Score Verbal Math Total
School College Prep. Endorsement Other Diplomas
44 472 483
955
481 487
968
404 424
828
System College Prep. Endorsement Other Diplomas
44 472 483
955
481 487
968
404 424
828
Georgia
41,958 492 488
980
456 N/A N/A
456 N/A N/A
483
472 N/A N/A
472 N/A N/A
479
928 N/A N/A
928 N/A N/A
962
Nation
952,913 N/A N/A N/A
502 508 1010
American College Testing (ACT)
Advanced Placement Exams (AP)
Number taking tests: English Mathematics Reading Science Reasoning CompositeScore
1 5 School System State
17.9 17.9 19.1
19.6 19.6 19.9
18.6 19.1
18.6 19.1
20.2 19.9
18.9 18.9 19.9
No. of Students Taking Tests
No. of Tests Taken No. of Test Scores
3 or Higher Percent of Test
Scores 3 or Higher
School 6 6 1
16.7%
System State 6 15,225 6 23,969 1 13,024
16.7% 54.3%
POST-SECONDARY DATA
Graduates Entering Georgia Public Colleges
Graduates Entering Georgia Public Colleges and Requiring Learning Support (LS)
1998 Graduates Entering in 1998-99
1997 Graduates Entering in 1997-98
Percent of Graduating Number Class
School
24
35.8%
System 2 4
35.8%
School
29
41.4%
System 2 9
41.4%
Number Requiring
LS 7 7
10 10
Percent of those attending Georgia
Public Colleges
29.2%
29.2%
34.5%
34.5%
In previous years, the Report Card presented College Prep Curriculum information provided by the Board of Regents on students requiring Learning Support. Due to inconsistencies in the data provided by the Board of Regents in defining College Prep Completers versus Local Board of Education data defining College Prep Endorsements, the Department of Education Report Card will not provide this information until discrepancies can be reconciled.
Graduates Entering Georgia Public Technical and Adult Schools
1998 Graduates School System
Entering Number 1 1
1998-99 Percent
1.5% 1.5%
Entering Number N/A N/A
1997-98 Percent
N/A N/A
1997 Graduates School
0
0.0%
System
0
0.0%
0
0.0%
0
0.0%
1998-99 GEORGIA PUBLIC EDUCATION REPORT CARD Buford High School - 7640191
Prepared by Georgia Department of Education
Page 3
CERTIFIED PERSONNEL DATA
Positions Number Average Contract Days
Administrators
4.40 224.09
Support Personnel
4.35 200.92
PK-12 Teachers
34.25 193.28
Personnel Sex
Certificate
Years Experience
Full-time Part-time
Male Female
4 Yr Bachelor's 5 Yr Master's 6 Yr Specialist's 7 Yr Doctoral Other*
<1 1-10 11-20 21-30 >30
Average
4 1
4 1
0 1 4 0 0
0 0 1 4 0
25.60
4 1
1 4
0 4 1 0 0
0 0 3 1 1
24.20
34 1
14 21
18 12
2 2 1
1 12
9 12
1
15.14
*Includes One- and Two-Year Vocational Certificates.
ACCREDITATION DATA
Accredited by Southern Association of Colleges and Schools (SACS): Secondary/Middle Commission. Accredited with Quality by Georgia Accrediting Commission (GAC).
AWARDS / RECOGNITION DATA
Schools in Georgia may receive recognition in the following programs: Charter School Pay for Performance Program Georgia School of Excellence National Blue Ribbon School Buford High School did not receive recognition in any of these programs during the 1998-99 school year.
1998-99 GEORGIA PUBLIC EDUCATION REPORT CARD Buford High School - 7640191
Prepared by Georgia Department of Education
Page 4
1998-99 GEORGIA PUBLIC EDUCATION REPORT CARD
BUFORD CITY SCHOOLS
Buford Middle School - 7640291
Grade Range 5-8
The Georgia Public Education Report Card is designed to assist systems and schools in educational improvement. This report card contains a variety of data elements. An explanation of the terms is provided as a companion to the report card data. Please refer to the definitions for the most effective use of the reported data.
STUDENT DATA
Total 627
5-8 Enrollment, by Race/Ethnicity and Sex
Black
White Hispanic
American Multi-
Asian Indian
racial
110 17.5%
442 70.5%
71 11.3%
3 0.5%
1 0.2%
0 0.0%
Male 320
51.0%
Female 307
49.0%
Enrollment in Selected Programs
Program
Program % of Student Enrollment Population
Gifted (Grades K-12)
72
11.5%
Non-Vocational Labs (Grades 9-12)
N/A
N/A
Vocational Labs (Grades 9-12)
N/A
N/A
Alternative Programs (Grades 6-12)
0
0.0%
Students Eligible to Receive Free/Reduced Lunches
Number
Percent
School System
270
43.1%
821
42.4%
Enrollment in Compensatory Programs
Program
Program % of Student Enrollment Population
Special Education (Grades K-12) PK
97 15.5%
0
N/A
English to Speakers of Other Languages (ESOL) (Grades K-12)
53
8.5%
Remedial Education (Grades 2-5, 9-12)
53 33.1%
Special Instructional Assistance (SIA) (Grades K-3)
N/A
N/A
Title I (Grades K-12) This school has no Title I program.
Dropout Rate for Grades 6-8
Number
Rate
School System
0
0.0%
0
0.0%
Total 1
Retained Students, by Race/Ethnicity and Sex
Black
White Hispanic
American MultiAsian Indian racial
0
1
0.0% 100.0%
0 0.0%
0 0.0%
0 0.0%
0 0.0%
Male Female
1 100.0%
0 0.0%
Prepared by Georgia Department of Education
Page 1
STATE-REQUIRED TEST DATA
NORM-REFERENCED TESTS
Grade 3 Iowa Tests of Basic Skills (ITBS) Each chart reflects data for three years of testing.
No third-grade students are enrolled at Buford Middle School.
Reading Comprehension
Mathematics
50
N/A 57 54 0
98-99
N/A 66 53 97-98
N/A 60 52 96-97
School 50
System
State
N/A 64 61 0
98-99
N/A 68 61 97-98
N/A 63 59 96-97
School System State
Reading Vocabulary 50
N/A 52 50 0
98-99
N/A 55 50 97-98
N/A 50 49 96-97
Language Arts
School 50
System
State
N/A 61 64 0
98-99
N/A 68 62 97-98
N/A 60 59 96-97
School System State
Social Studies 50
N/A 64 56 0
98-99
N/A 71 55 97-98
N/A 57 55 96-97
Science
School 50
System
State
N/A 68 59 0
98-99
N/A 73 59 97-98
N/A 62 58 96-97
School System State
Sources of Information
Composite Score
School
50
50
System
N/A 57 57 0
98-99
N/A 64 56 N/A 55 55
97-98
96-97
State
N/A 61 58 0
98-99
N/A 69 57 97-98
N/A 59 56 96-97
1998-99 GEORGIA PUBLIC EDUCATION REPORT CARD Buford Middle School - 7640291
Prepared by Georgia Department of Education
Scores Reported in Percentiles
School System State
Page 2
STATE-REQUIRED TEST DATA
NORM-REFERENCED TESTS Grade 5
Iowa Tests of Basic Skills (ITBS) Each chart reflects data for three years of testing.
Reading Comprehension
Mathematics
50
56 56 53 0
98-99
57 57 53 97-98
49 49 52 96-97
School 50
System
State
0
69 69 59 98-99
68 68 58 97-98
60 60 57 96-97
School System State
Reading Vocabulary 50
53 53 48 0
98-99
53 53 48 97-98
50 50 46 96-97
Language Arts
School 50
System
State
0
66 66 63 98-99
57 57 61 97-98
49 49 58 96-97
School System State
Social Studies 50
61 61 57 0
98-99
62 62 56 97-98
54 54 55 96-97
Science
School 50
System
State
0
67 67 60 98-99
67 67 59 97-98
58 58 59 96-97
School System State
Sources of Information
Composite Score
50
60 60 58 0
98-99
School 50
System
59 59 58 97-98
51 51 57 96-97
State 0
62 62 57 98-99
61 61 56 97-98
52 52 55 96-97
1998-99 GEORGIA PUBLIC EDUCATION REPORT CARD Buford Middle School - 7640291
Prepared by Georgia Department of Education
Scores Reported in Percentiles
School System State
Page 3
STATE-REQUIRED TEST DATA
NORM-REFERENCED TESTS Grade 8
Iowa Tests of Basic Skills (ITBS) Each chart reflects data for three years of testing.
Reading Comprehension 50
54 54 49 0
98-99
56 56 48 97-98
56 56 48 96-97
Mathematics
School 50
System
State
0
71 71 56 98-99
74 74 55 97-98
67 67 54 96-97
School System State
Reading Vocabulary 50
55 55 46 0
98-99
65 65 45 97-98
56 56 44 96-97
Language Arts
School 50
System
State
0
73 73 60 98-99
73 73 58 97-98
64 64 56 96-97
School System State
Social Studies 50
62 62 54 0
98-99
77 77 53 97-98
56 56 53 96-97
Science
School 50
System
State
0
61 61 56 98-99
60 60 55 97-98
51 51 53 96-97
School System State
Sources of Information
Composite Score
50
60 60 57 0
98-99
School 50
System
65 65 56 97-98
55 55 55 96-97
State 0
64 64 56 98-99
70 70 54 97-98
1998-99 GEORGIA PUBLIC EDUCATION REPORT CARD Buford Middle School - 7640291
Prepared by Georgia Department of Education
58 58 54 96-97
Scores Reported in Percentiles
School System State
Page 4
STATE-REQUIRED TEST DATA
PERFORMANCE ASSESSMENTS
Percent at Developmental Stages:
Stage Stage Stage Stage Stage Stage
1:The Emerging Writer 2:The Developing Writer 3:The Focusing Writer 4:The Experimenting 5:The Engaging Writer 6:The Extending Writer
Grade 5 Writing Assessment
1998-99
1997-98
School System State School System State
2% 3% 38% 32% 18% 8%
2% 3% 38% 32% 18% 8%
0% 1% 16% 41% 29% 12%
0% 2% 29% 46% 15% 8%
0% 2% 29% 46% 15% 8%
0% 3% 19% 41% 27% 10%
1996-97 School System State
1% 7% 33% 44% 13% 3%
1% 7% 33% 44% 13% 3%
0% 3% 21% 37% 26% 12%
Categories of Scaled Scores
Inadequate (less than 162)
Minimal (162-209)
Good
(210-247)
Very Good (greater than 247)
Average Scaled Score: (Range 100-300)
Grade 8 Writing Assessment
1998-99 Percent Scoring
1997-98 Percent Scoring
1996-97 Percent Scoring
School System State School System State School System State
7% 28% 49% 16%
7% 28% 49% 16%
8% 40% 41% 11%
4% 33% 44% 19%
4% 33% 44% 19%
11% 46% 34%
8%
8% 46% 36%
9%
8% 46% 36%
9%
15% 46% 30%
8%
215
215
208 217
217 202 204
204 198
GEORGIA HIGH SCHOOL GRADUATION TESTS (GHSGT)
Percent of Regular Program 11th Graders Passing the Georgia High School Graduation Tests on First Administration
1998-99
1997-98
1996-97
School System State School System State School System State
English Language Arts Mathematics Social Studies Science
All Components listed above
N/A N/A N/A N/A
N/A
100% 99% 89% 80%
79%
96% 88% 80% 72%
68%
N/A N/A N/A N/A
N/A
99% 91% 88% 82%
75%
94% 88% 78% 74%
68%
N/A N/A N/A N/A
N/A
97% 92% 81% 80%
76%
94% 87% 78% 74%
67%
Writing
N/A 97% 93% N/A 95% 92% N/A 98% 93%
No eleventh-grade students are enrolled at Buford Middle School.
1998-99 GEORGIA PUBLIC EDUCATION REPORT CARD Buford Middle School - 7640291
Prepared by Georgia Department of Education
Page 5
GRADUATE DATA
1999 Graduates by Credentials, Race/Ethnicity and Sex
Diplomas with Both College Prep. & Voc. Endorsements
Diplomas with College Prep. Endorsements
Diplomas with Vocational Endorsements
General High School Diplomas
Special Education Diplomas
Total All Diplomas
Total N/A
Black N/A
White Hispanic N/A N/A
American MultiAsian Indian racial
N/A N/A N/A
N/A
N/A
N/A N/A N/A N/A N/A
N/A
N/A
N/A N/A N/A N/A N/A
N/A
N/A
N/A N/A N/A N/A N/A
N/A
N/A
N/A N/A N/A N/A N/A
N/A
Male Female N/A N/A N/A N/A N/A N/A N/A N/A N/A N/A
Certificates of Performance
Total Graduates
N/A
N/A
N/A N/A N/A N/A N/A
N/A N/A
N/A
HOPE Scholarships
School System
Number of 1999 Graduates Number Eligible Percent Eligible
N/A N/A N/A
65 46 70.8%
State
65,548 40,292 61.5%
High School Completion Rate
Percent of 1995Grade 9 Enrollment in Graduating Class of1999 School System State
Completion Rate '95-'99 N / A 76.5% 68.9%
1998-99 GEORGIA PUBLIC EDUCATION REPORT CARD
Buford Middle School - 7640291
Prepared by Georgia Department of Education
Page 6
COLLEGE ADMISSIONS / CREDIT TEST DATA
Scholastic Assessment Test (SAT)
Based on students' highest verbal and highest math scores
No. Taking
Average Score
Tests Verbal Math Total
Based on students' last test administration
Average Score Verbal Math Total
School
N/A
College Prep. Endorsement
Other Diplomas
System
44
College Prep. Endorsement
Other Diplomas
Georgia
41,958
N/A N/A N/A
472 481 404
492
N/A N/A N/A
483 487 424
488
N/A N/A N/A
955 968 828
980
N/A N/A N/A
456 N/A N/A
483
N/A N/A N/A
472 N/A N/A
479
N/A N/A N/A
928 N/A N/A
962
Nation
952,913 N/A N/A N/A
502 508 1010
American College Testing (ACT)
Advanced Placement Exams (AP)
Number taking tests: English Mathematics Reading Science Reasoning CompositeScore
N/A
School System
N/A 17.9
N/A 19.6
N/A N/A
18.6 19.1
N/A 18.9
State 19.1 19.9 20.2 19.9 19.9
No. of Students Taking Tests
No. of Tests Taken No. of Test Scores
3 or Higher Percent of Test
Scores 3 or Higher
School N/A 6 1
16.7%
System State 6 15,225 6 23,969 1 13,024
16.7% 54.3%
POST-SECONDARY DATA
Graduates Entering Georgia Public Colleges
Graduates Entering Georgia Public Colleges and Requiring Learning Support (LS)
1998 Graduates Entering in 1998-99
1997 Graduates Entering in 1997-98
Percent of Graduating Number Class
School N / A
N/A
System 2 4
35.8%
School N / A
N/A
System 2 9
41.4%
Number Requiring
LS N/A
7
N/A 10
Percent of those attending Georgia
Public Colleges
N/A
29.2%
N/A
34.5%
In previous years, the Report Card presented College Prep Curriculum information provided by the Board of Regents on students requiring Learning Support. Due to inconsistencies in the data provided by the Board of Regents in defining College Prep Completers versus Local Board of Education data defining College Prep Endorsements, the Department of Education Report Card will not provide this information until discrepancies can be reconciled.
Graduates Entering Georgia Public Technical and Adult Schools
1998 Graduates School System
Entering Number N/A 1
1998-99 Percent
N/A 1.5%
Entering Number N/A N/A
1997-98 Percent
N/A N/A
1997 Graduates School System
N/A 0
N/A 0.0%
N/A 0
N/A 0.0%
1998-99 GEORGIA PUBLIC EDUCATION REPORT CARD Buford Middle School - 7640291
Prepared by Georgia Department of Education
Page 7
CERTIFIED PERSONNEL DATA
Positions Number Average Contract Days
Administrators
2.00 220.00
Support Personnel
2.00 205.00
PK-12 Teachers
41.50 188.86
Personnel Sex
Certificate
Years Experience
Full-time Part-time
Male Female
4 Yr Bachelor's 5 Yr Master's 6 Yr Specialist's 7 Yr Doctoral Other*
<1 1-10 11-20 21-30 >30
Average
2 0
1 1
0 2 0 0 0
0 0 0 2 0
26.00
2 0
0 2
0 0 2 0 0
0 1 0 1 0
14.00
41 1
7 35
18 23
1 0 0
2 12 21
7 0
13.48
*Includes One- and Two-Year Vocational Certificates.
ACCREDITATION DATA
Accredited by Southern Association of Colleges and Schools (SACS): Elementary/Middle Commission. Accredited with Quality by Georgia Accrediting Commission (GAC).
AWARDS / RECOGNITION DATA
Schools in Georgia may receive recognition in the following programs: Charter School Pay for Performance Program Georgia School of Excellence National Blue Ribbon School Buford Middle School did not receive recognition in any of these programs during the 1998-99 school year.
1998-99 GEORGIA PUBLIC EDUCATION REPORT CARD Buford Middle School - 7640291
Prepared by Georgia Department of Education
Page 8
1998-99 GEORGIA PUBLIC EDUCATION REPORT CARD BULLOCH COUNTY SCHOOLS - 616
The Georgia Public Education Report Card is designed to assist systems and schools in educational improvement. This report card contains a variety of data elements. An explanation of the terms is provided as a companion to the report card data. Please refer to the definitions for the most effective use of the reported data.
Total
K-12
8,317
PK
55
STUDENT DATA
Enrollment, by Race/Ethnicity and Sex
Black
White Hispanic
American Multi-
Asian Indian
racial
3,241 39.0%
4,894 58.8%
53 0.6%
45 0.5%
7 0.1%
77 0.9%
17 30.9%
37 67.3%
0 0.0%
0 0.0%
0 0.0%
1 1.8%
Male
4,256 51.2%
27 49.1%
Female
4,061 48.8%
28 50.9%
Enrollment in Selected Programs
Program
Program % of Student Enrollment Population
Gifted (Grades K-12)
319
3.8%
Non-Vocational Labs (Grades 9-12)
1,778
77.2%
Vocational Labs (Grades 9-12)
1,489
64.7%
Alternative Programs (Grades 6-12)
14
< 1%
Students Eligible to Receive Free/Reduced Lunches
Number
Percent
4,233
50.6%
Dropout Rate
Number
Percent
6-12 9-12
268
5.1%
253
10.2%
Enrollment in Compensatory Programs
Program
Program % of Student Enrollment Population
Special Education (Grades K-12)
PK
1,077 33
English to Speakers of
Other Languages (ESOL)
1
(Grades K-12)
Remedial Education (Grades 2-5, 9-12)
547
Special Instructional
Assistance (SIA)
530
(Grades K-3)
Title I (Grades K-12) Number of schools with: Schoolwide program Targeted Assistance program No Title I program
12.9% N/A < 1%
11.0%
20.0%
4 4 5
Total 433
Retained Students, by Race/Ethnicity and Sex
Black
White Hispanic
American MultiAsian Indian racial
229 52.9%
200 46.2%
2 0.5%
1 0.2%
0 0.0%
1 0.2%
Male Female 270 163
62.4% 37.6%
Prepared by Georgia Department of Education
Page 1
STATE-REQUIRED TEST DATA
NORM-REFERENCED TESTS
Grade 3 Iowa Tests of Basic Skills (ITBS) Each chart reflects data for three years of testing.
Reading Comprehension
Mathematics
50
53 54 57 53 53 52 0
98-99 97-98 96-97
System State
50
59 61 67 61 60 59 0
98-99 97-98 96-97
System State
Reading Vocabulary
50
48 50 51 50 46 49 0
98-99 97-98 96-97
System State
Social Studies
50
51 56 60 55 56 55 0
98-99 97-98 96-97
System State
Language Arts
50
61 64 66 62 62 59 0
98-99 97-98 96-97
System State
Science
50
63 59 66 59 60 58 0
98-99 97-98 96-97
System State
Sources of Information
Composite Score
50
57 57 0
98-99
System
50
64 56 58 55 97-98 96-97
State
56 58 63 57 0
98-99 97-98
1998-99 GEORGIA PUBLIC EDUCATION REPORT CARD Bulloch County Schools
Prepared by Georgia Department of Education
System State Scores Reported 57 56 in Percentiles 96-97
Page 2
STATE-REQUIRED TEST DATA
NORM-REFERENCED TESTS
Grade 5 Iowa Tests of Basic Skills (ITBS) Each chart reflects data for three years of testing.
Reading Comprehension
Mathematics
50
54 53 50 53 48 52 0
98-99 97-98 96-97
System State
50
62 59 59 58 54 57 0
98-99 97-98 96-97
System State
Reading Vocabulary
50
49 48 45 48 42 46 0
98-99 97-98 96-97
System State
Social Studies
50
58 57 57 56 53 55 0
98-99 97-98 96-97
System State
Language Arts
50
67 63 63 61 61 58 0
98-99 97-98 96-97
System State
Science
50
66 60 63 59 62 59 0
98-99 97-98 96-97
System State
Sources of Information
Composite Score
50
61 58 0
98-99
System
50
57 58 56 57 97-98 96-97
State
61 57 58 56 0
98-99 97-98
1998-99 GEORGIA PUBLIC EDUCATION REPORT CARD Bulloch County Schools
Prepared by Georgia Department of Education
System State Scores Reported 55 55 in Percentiles 96-97
Page 3
STATE-REQUIRED TEST DATA
NORM-REFERENCED TESTS Grade 8
Iowa Tests of Basic Skills (ITBS) Each chart reflects data for three years of testing.
Reading Comprehension
Mathematics
50
53 49 46 48 46 48 0
98-99 97-98 96-97
System State
50
56 56 51 55 53 54 0
98-99 97-98 96-97
System State
Reading Vocabulary
50
51 46 42 45 42 44 0
98-99 97-98 96-97
System State
Language Arts
50
60 60 56 58 56 56 0
98-99 97-98 96-97
System State
Social Studies
50
53 54 49 53 48 53 0
98-99 97-98 96-97
System State
Science
50
57 56 54 55 51 53 0
98-99 97-98 96-97
System State
Sources of Information
Composite Score
50
58 57 0
98-99
System
50
53 56 50 55 97-98 96-97
State
56 56 51 54 0
98-99 97-98
1998-99 GEORGIA PUBLIC EDUCATION REPORT CARD Bulloch County Schools
Prepared by Georgia Department of Education
System State Scores Reported 51 54 in Percentiles 96-97
Page 4
STATE-REQUIRED TEST DATA
PERFORMANCE ASSESSMENTS
Grade 5 Writing Assessment
1998-99
1997-98
1996-97
Percent at Developmental Stages:
Comparison
Comparison
Comparison
System Group State System Group State System Group State
Stage Stage Stage Stage Stage Stage
1: The Emerging Writer 2: The Developing Writer 3: The Focusing Writer 4: The Experimenting Writer 5: The Engaging Writer 6: The Extending Writer
0% 1% 17% 43% 28% 11%
0% 1% 19% 43% 27% 10%
0% 1% 16% 41% 29% 12%
0% 3% 20% 42% 24% 10%
0% 3% 22% 43% 23% 7%
0% 3% 19% 41% 27% 10%
0% 4% 26% 36% 22% 11%
0% 4% 24% 41% 23% 8%
0% 3% 21% 37% 26% 12%
Grade 8 Writing Assessment
1998-99 Percent Scoring 1997-98 Percent Scoring 1996-97 Percent Scoring
Categories of Scaled Scores
Comparison
Comparison
Comparison
System Group State System Group State System Group State
Inadequate (less than 162)
Minimal (162-209)
Good
(210-247)
Very Good (greater than 247)
12% 47% 34%
8%
8% 45% 39%
9%
8% 40% 41% 11%
19% 49% 25%
6%
13% 50% 31%
6%
11% 46% 34%
8%
23% 46% 25%
6%
18% 49% 28%
6%
15% 46% 30%
8%
Average Scaled Score: (Range 100-300)
200
205 208
192
197 202
191
194 198
GEORGIA HIGH SCHOOL GRADUATION TESTS (GHSGT)
Percent of Regular Program 11th Graders Passing the Georgia High School Graduation Tests on First Administration
1998-99
1997-98
1996-97
Comparison
Comparison
Comparison
System Group State System Group State System Group State
English Language Arts Mathematics Social Studies Science
96% 91% 80% 76%
95% 86% 76% 68%
96% 88% 80% 72%
93% 89% 78% 76%
93% 86% 73% 71%
94% 88% 78% 74%
93% 89% 78% 74%
93% 87% 76% 73%
94% 87% 78% 74%
All Components listed above 7 2 %
63% 68% 69%
63% 68% 70%
67% 67%
Writing
92%
92% 93% 92%
91% 92% 96%
94% 93%
1998-99 GEORGIA PUBLIC EDUCATION REPORT CARD
Bulloch County Schools
Prepared by Georgia Department of Education
Page 5
GRADUATE DATA
1999 Graduates by Credentials, Race/Ethnicity and Sex
Diplomas with Both College Prep. & Voc. Endorsements
Diplomas with College Prep. Endorsements Diplomas with Vocational Endorsements General High School Diplomas Special Education Diplomas
Total All Diplomas
Certificates of Performance
Total Graduates
Total 115 95 122 9 29 370 26 396
Black
27 23.5%
19 20.0%
58 47.5%
9 100.0%
19 65.5%
132 35.7%
23 88.5%
155 39.1%
American MultiWhite Hispanic Asian Indian racial
85 73.9%
72 75.8%
63 51.6%
0 0.0%
8 27.6%
228 61.6%
0 0.0%
1 1.1%
0 0.0%
0 0.0%
0 0.0%
1 0.3%
1 0.9%
2 2.1%
0 0.0%
0 0.0%
0 0.0%
3 0.8%
0 0.0%
0 0.0%
1 0.8%
0 0.0%
2 6.9%
3 0.8%
2 1.7%
1 1.1%
0 0.0%
0 0.0%
0 0.0%
3 0.8%
3
0
0
0
0
11.5% 0.0% 0.0% 0.0% 0.0%
231
1
3
3
3
58.3% 0.3% 0.8% 0.8% 0.8%
Male Female
46 40.0%
36 37.9%
67 54.9%
2 22.2%
21 72.4%
172 46.5%
69 60.0%
59 62.1%
55 45.1%
7 77.8%
8 27.6%
198 53.5%
9
17
34.6% 65.4%
181 215 45.7% 54.3%
HOPE Scholarships
System State
Number of 1999 Graduates 3 9 6
Number Eligible
208
Percent Eligible
52.5%
65,548 40,292 61.5%
High School Completion Rate Percent of 1995Grade 9 Enrollment
in Graduating Class of1999
System
State
Completion Rate '95-'99 61.8% 68.9%
COLLEGE ADMISSIONS / CREDIT TEST DATA
Scholastic Assessment Test (SAT)
No. Taking
Average Score
Tests
Verbal Math Total
Based on students' highest verbal and highest math scores
System College Prep. Endorsement Other Diplomas
494 499 993 505 516 1021 400 383 783
Georgia
492 488 980
Based on students' last test administration
System Georgia
229
484 489
973
41,958 483 479 962
Nation
952,913 502 508 1010
American College Testing (ACT)
System State Nation
English
15.6
19.1 20.4
Mathematics
17.2
19.9 20.7
Reading
16.3
20.2 21.3
Science Reasoning 16.8
19.9 21.0
CompositeScore 16.5
19.9 21.9
Advanced Placement Exams (AP)
No. of Students Taking Tests
No. of Tests Taken No. of Test Scores
3 or Higher Percent of Test
Scores 3 or Higher
System State 41 15,225 45 23,969 38 13,024
84.4% 54.3%
1998-99 GEORGIA PUBLIC EDUCATION REPORT CARD Bulloch County Schools
Prepared by Georgia Department of Education
Page 6
POSTSECONDARY DATA
Graduates Entering Georgia Public Colleges and Universities
Graduates Entering Georgia Public Colleges and Universities and
Requiring Learning Support (LS)
1998 Graduates Entering 1998-99
1997 Graduates Entering 1997-98
Percent of Graduating Number Class
164
39.7%
160
42.9%
Number Requiring
LS
37
26
Percent of those attending Georgia
Public Colleges
22.6%
16.3%
In previous years, the Report Card presented College Prep Curriculum information provided by the Board of Regents on students requiring Learning Support. Due to inconsistencies in the data provided by the Board of Regents in defining College Prep Completers versus Local Board of Education data defining College Prep Endorsements, the Department of Education Report Card will not provide this information until discrepancies can be reconciled.
Graduates Entering Georgia Public Technical and Adult Schools
Entering 1998-99 Entering 1997-98
Number Percent
Number Percent
1998 Graduates 1997 Graduates
29
7.0%
2
0.5%
N/A 50
N/A 13.4%
ACCREDITATION / RECOGNITION DATA
Southern Association of Colleges and Schools (SACS) Accrediting Commission
Secondary/Middle Commission Elementary/Middle Commission Both Elementary/Secondary Commissions Joint Commission Candidate for Accreditation
Accreditation by Georgia Accrediting Commission (GAC)
Accredited by GAC Accredited with Quality by GAC
Number of Schools
4 7 0 1 0
Number of Schools
0 0
Awards / Recognition
State Recognized Program
Number of Schools
Charter School
0
Pay for Performance Recipient
0
Georgia School of Excellence
0
National Blue Ribbon School
0
COMMUNITY DATA
Number of Children Eligible for Migrant Education Number of Families-At-Risk * Number of Food Stamp Participants * Number of Families Receiving TANF * ** Per Capita Income * Unemployment Rate * 1990 Population * Projected 2000 Population * Projected 2010 Population *
* Data Available at County Level Only ** Known as AFDC before January 1997
91 166 4,334 476 $17,112 3.5% 43,125 50,292 57,849
1998-99 GEORGIA PUBLIC EDUCATION REPORT CARD Bulloch County Schools
Prepared by Georgia Department of Education
Page 7
FISCAL DATA
Millage Rate
9.40
* Fall 1998 Property Tax Digest is used to calculate the 98-99 Value of One Mill
FTE Count
FTE Count used for Allotment Calculation 8,220.0 Fall '98 FTE Count 8,317
Value of One Mill
$816,668 $99.35 per Allotment FTE
Sources: Local State-QBE State-
Lottery State-
Other Federal Other
Total
PerGeneral Fund cent Per FTE
$15,323,560 33.2% $1,864 $30,296,309 65.6% $3,686
K-12 Revenues
Lottery K-12
and
Title
All Other
Programs
K-12
$0
$41,373
Bonded Debt
$1,658,927
$0
$0
$0
$0 0.0%
$0
$0 $179,702
$0
$472,164 1.0% $57
$0 0.0%
$0
$101,531 0.2% $12
$46,193,566 100% $5,619
$77,303 $2,384,092
-$364 $2,461,031
$133,391 $26,468 $-74
$380,860
$0 $0 $0 $1,658,927
Capital Projects
$471,316 $0
$0
$6,556,528 $0 $0
$7,027,844
School Nutrition $1,023,643
$0
$0
$250,826 $1,921,037
$2,952 $3,198,459
Grand Total
Total
Per-
Amount cent
$18,518,820 30.4%
$30,296,309 49.7%
$179,702 0.3%
$7,490,213 12.3% $4,331,598 7.1%
$104,045 0.2% $60,920,689 100%
Instruction
Media Instruction
Support Pupil Services General Admin. School Admin. Trans-
portation Maint. & Ops. Capital Projects School Food Debt Service
Total
K-12 Expenditures
$29,504,943 66.0% $3,589 $2,033,853 $215,134
$0
$0
$0
$1,292,799 2.9% $157
$55,463
$0
$0
$0
$0
$1,704,684 3.8% $207 $140,073
$10,070
$0
$0
$0
$2,064,433 4.6% $251 $227,007 $248,497
$0
$0
$0
$629,060 1.4% $77
$86,489
$0
$0
$0
$0
$3,191,538 7.1% $388
$878
$0
$0
$0
$0
$2,335,666 5.2% $284
$0
$348
$0
$0
$0
$3,710,877 8.3% $451
$0
$0
$0
$0
$0
$297,549 0.7% $36
$0
$0
$0 $19,282,183
$0
$615 0.0%
$0
$43,344
$0
$0 $105,737 $3,312,907
$0 0.0%
$0
$0
$0 $1,647,477
$0
$0
$44,732,171 100% $5,440 $2,587,109 $474,050 $1,647,477 $19,387,921 $3,312,907
$31,753,931 44.0% $1,348,263 1.9% $1,854,828 2.6% $2,539,938 3.5% $715,549 1.0% $3,192,417 4.4% $2,336,014 3.2% $3,710,877 5.1%
$19,579,733 27.1% $3,462,605 4.8% $1,647,477 2.3%
$72,141,638 100%
Salaries and Benefits as Percentages of Revenues and of Expenditures
Teachers and Paraprofessionals
Salaries $23,298,582
Benefits $5,146,408
Percentage of Revenues Percentage of Expenditures
Total of
Total of
General Fund
General Fund
Title Programs
Title Programs
Lottery K-12
Lottery K-12
Total Salaries
and
Total
and
Total
and Benefits All Other K-12 K - 12 All Other K-12 K - 12
$28,444,990
58.0%
46.7%
59.5%
39.4%
School Administration
$2,017,036
$516,462
$2,533,498
5.2%
4.2%
5.3%
3.5%
General Administration
$284,721
$75,507
$360,228
0.7%
0.6%
0.8%
0.5%
1998-99 GEORGIA PUBLIC EDUCATION REPORT CARD
Bulloch County Schools - 616
Prepared by Georgia Department of Education
Page 8
CERTIFIED PERSONNEL DATA
Number
Average Annual Salary Positions Average Contract Days
Average Daily Salary
Full-time Personnel Part-time
Sex Male Female
4 Yr Bachelor's Certificate 5 Yr Master's
Level 6 Yr Specialist's 7 Yr Doctoral Other*
Black
White Race/ Hispanic Ethnicity Asian
American Indian
Multiracial
Years Experience
<1 1-10 11-20 21-30 >30
Average
Administrators
43.20
$62,593.92 212.18
$295.01
43 0
20 23
2 9 24 8 0
12 31
0 0 0 0
0 3 19 17 4
21.09
Support Personnel PK-12 Teachers
42.25
571.41
$47,419.94 199.97
$237.14
$38,686.56 190.90
$202.65
40
561
2
19
6
82
36
498
2
254
17
211
23
113
0
1
0
1
5
85
37
494
0
1
0
0
0
0
0
0
0
43
6
209
16
193
18
124
2
11
18.90
13.20
*Includes One- and Two-Year Vocational Certificates.
Certified Staff Position Ratios
Teacher/Administrator Ratio 13:1
Teacher/Support Person Ratio 14:1
Teacher/Staff Ratio 7:1
Student Enrollment/All Teachers 15:1
Certified Personnel by Category
87.2% 100%
6.5%
6.3%
80% 60%
40%
20%
0%
Teachers
Administrators
Support Personnel
1998-99 GEORGIA PUBLIC EDUCATION REPORT CARD
Bulloch County Schools - 616
Prepared by Georgia Department of Education
Page 9
1998-99 GEORGIA PUBLIC EDUCATION REPORT CARD
BULLOCH COUNTY SCHOOLS
Brooklet Elementary School - 6161050
Grade Range K-7
The Georgia Public Education Report Card is designed to assist systems and schools in educational improvement. This report card contains a variety of data elements. An explanation of the terms is provided as a companion to the report card data. Please refer to the definitions for the most effective use of the reported data.
STUDENT DATA
Total 480
K-7 Enrollment, by Race/Ethnicity and Sex
Black
White Hispanic
American Multi-
Asian Indian
racial
72 15.0%
390 81.3%
9 1.9%
0 0.0%
0 0.0%
9 1.9%
Male Female
246 51.3%
234 48.8%
Enrollment in Selected Programs
Program
Program % of Student Enrollment Population
Gifted (Grades K-12)
9
1.9%
Alternative Programs (Grades 6-12)
0
0.0%
Students Eligible to Receive Free/Reduced Lunches
Number
Percent
School System
252 4,233
52.5% 50.6%
Dropout Rate for Grades 6-7
Number
Rate
School System
0
0.0%
6
0.4%
Enrollment in Compensatory Programs
Program
Program % of Student Enrollment Population
Special Education (Grades K-12)
59 12.3%
(PK)
0
N/A
English to Speakers of Other Languages (ESOL) (Grades K-12)
0
0.0%
Remedial Education (Grades 2-5, 9-12)
36 15.0%
Special Instructional Assistance (SIA) (Grades K-3)
84 34.1%
Title I (Grades K-12)
This school has a schoolwide program.
Total 22
Retained Students, by Race/Ethnicity and Sex
Black
White Hispanic
American Multi-
Asian Indian
racial
7 31.8%
15 68.2%
0 0.0%
0 0.0%
0 0.0%
0 0.0%
Male Female
16
6
72.7% 27.3%
Prepared by Georgia Department of Education
Page 1
STATE-REQUIRED TEST DATA
NORM-REFERENCED TESTS Grade 3
Iowa Tests of Basic Skills (ITBS) Each chart reflects data for three years of testing.
Reading Comprehension 50
51 53 54 0
98-99
57 57 53 97-98
47 53 52 96-97
Mathematics
School 50
System
State
0
54 59 61 98-99
46 67 61 97-98
50 60 59 96-97
School System State
Reading Vocabulary 50
50 48 50 0
98-99
51 51 50 97-98
41 46 49 96-97
Language Arts
School 50
System
State
0
53 61 64 98-99
42 66 62 97-98
51 62 59 96-97
School System State
Social Studies 50
44 51 56 0
98-99
44 60 55 97-98
54 56 55 96-97
Science
School 50
System
State
0
54 63 59 98-99
53 66 59 97-98
56 60 58 96-97
School System State
Sources of Information
Composite Score
50
54 57 57 0
98-99
School 50
System
47 64 56 97-98
49 58 55 96-97
State 0
50 56 58 98-99
46 63 57 97-98
1998-99 GEORGIA PUBLIC EDUCATION REPORT CARD Brooklet Elementary School - 6161050
Prepared by Georgia Department of Education
50 57 56 96-97
Scores Reported in Percentiles
School System State
Page 2
STATE-REQUIRED TEST DATA
NORM-REFERENCED TESTS Grade 5
Iowa Tests of Basic Skills (ITBS) Each chart reflects data for three years of testing.
Reading Comprehension
Mathematics
50
55 54 53 0
98-99
48 50 53 97-98
50 48 52 96-97
School 50
System
State
0
61 62 59 98-99
47 59 58 97-98
56 54 57 96-97
School System State
Reading Vocabulary 50
57 49 48 0
98-99
45 45 48 97-98
45 42 46 96-97
Language Arts
School 50
System
State
0
60 67 63 98-99
53 63 61 97-98
57 61 58 96-97
School System State
Social Studies 50
60 58 57 0
98-99
53 57 56 97-98
55 53 55 96-97
Science
School 50
System
State
0
71 66 60 98-99
62 63 59 97-98
60 62 59 96-97
School System State
Sources of Information
Composite Score
50
56 61 58 0
98-99
School 50
System
46 57 58 97-98
51 56 57 96-97
State 0
60 61 57 98-99
51 58 56 97-98
54 55 55 96-97
1998-99 GEORGIA PUBLIC EDUCATION REPORT CARD Brooklet Elementary School - 6161050
Prepared by Georgia Department of Education
Scores Reported in Percentiles
School System State
Page 3
STATE-REQUIRED TEST DATA
PERFORMANCE ASSESSMENTS
Grade 5 Writing Assessment
Percent at Developmental Stages:
1998-99 School System State
1997-98 School System State
1996-97 School System State
Stage Stage Stage Stage Stage Stage
1:The Emerging Writer 2:The Developing Writer 3:The Focusing Writer 4:The Experimenting 5:The Engaging Writer 6:The Extending Writer
0% 0% 9% 51% 31% 9%
0% 1% 17% 43% 28% 11%
0% 1% 16% 41% 29% 12%
0% 2% 19% 48% 25% 6%
0% 3% 20% 42% 24% 10%
0% 3% 19% 41% 27% 10%
0% 3% 16% 31% 31% 18%
0% 4% 26% 36% 22% 11%
0% 3% 21% 37% 26% 12%
AWARDS / RECOGNITION DATA
Schools in Georgia may receive recognition in the following programs: Charter School Pay for Performance Program Georgia School of Excellence National Blue Ribbon School Brooklet Elementary School did not receive recognition in any of these programs during the 1998-99 school year.
1998-99 GEORGIA PUBLIC EDUCATION REPORT CARD Brooklet Elementary School - 6161050
Prepared by Georgia Department of Education
Page 4
CERTIFIED PERSONNEL DATA
Positions Number Average Contract Days
Personnel Sex
Certificate
Years Experience
Full-time Part-time
Male Female
4 Yr Bachelor's 5 Yr Master's 6 Yr Specialist's 7 Yr Doctoral Other*
<1 1-10 11-20 21-30 >30
Average
Administrators
2.00 205.00
2 0
0 2
0 1 0 1 0 0 0 1 1 0 21.50
Support Personnel
2.00 190.00
2 0
0 2
1 0 1 0 0 0 0 2 0 0 18.50
PK-12 Teachers
36.00 190.28
36 0
3 33
13 15
8 0 0 2 19 9 5 1 10.89
*Includes One- and Two-Year Vocational Certificates.
ACCREDITATION DATA
Accredited by Southern Association of Colleges and Schools (SACS):
Elementary/Middle Commission.
1998-99 GEORGIA PUBLIC EDUCATION REPORT CARD Brooklet Elementary School - 6161050
Prepared by Georgia Department of Education
Page 5
1998-99 GEORGIA PUBLIC EDUCATION REPORT CARD
BULLOCH COUNTY SCHOOLS
Bryant Elementary School - 6162050
Grade Range K-5
The Georgia Public Education Report Card is designed to assist systems and schools in educational improvement. This report card contains a variety of data elements. An explanation of the terms is provided as a companion to the report card data. Please refer to the definitions for the most effective use of the reported data.
STUDENT DATA
Total 891
K-5 Enrollment, by Race/Ethnicity and Sex
Black
White Hispanic
American Multi-
Asian Indian
racial
435 48.8%
443 49.7%
1 0.1%
4 0.4%
1 0.1%
7 0.8%
Male Female
476 53.4%
415 46.6%
Enrollment in Selected Programs
Program
Program % of Student Enrollment Population
Gifted (Grades K-12)
22
2.5%
Alternative Programs (Grades 6-12)
N/A
N/A
Students Eligible to Receive Free/Reduced Lunches
Number
Percent
School System
496 4,233
55.7% 50.6%
Dropout Rate *
Number
Rate
School System
N/A N/A
N/A N/A
* Dropout rates are not applicable for grades PK-5.
Enrollment in Compensatory Programs
Program
Program % of Student Enrollment Population
Special Education (Grades K-12)
105 11.8%
(PK)
0
N/A
English to Speakers of Other Languages (ESOL) (Grades K-12)
0
0.0%
Remedial Education (Grades 2-5, 9-12)
120 19.9%
Special Instructional Assistance (SIA) (Grades K-3)
111 19.3%
Title I (Grades K-12)
This school has a schoolwide program.
Total 0
Retained Students, by Race/Ethnicity and Sex
Black
White Hispanic
American Multi-
Asian Indian
racial
0
0
0
0
0
0
Male Female
0
0
Prepared by Georgia Department of Education
Page 1
STATE-REQUIRED TEST DATA
NORM-REFERENCED TESTS Grade 3
Iowa Tests of Basic Skills (ITBS) Each chart reflects data for three years of testing.
Reading Comprehension 50
58 53 54 0
98-99
57 57 53 97-98
51 53 52 96-97
Mathematics
School 50
System
State
0
65 59 61 98-99
69 67 61 97-98
59 60 59 96-97
School System State
Reading Vocabulary 50
51 48 50 0
98-99
52 51 50 97-98
44 46 49 96-97
Language Arts
School 50
System
State
0
69 61 64 98-99
67 66 62 97-98
62 62 59 96-97
School System State
Social Studies 50
56 51 56 0
98-99
62 60 55 97-98
53 56 55 96-97
Science
School 50
System
State
0
70 63 59 98-99
68 66 59 97-98
59 60 58 96-97
School System State
Sources of Information
Composite Score
50
62 57 57 0
98-99
School 50
System
67 64 56 97-98
56 58 55 96-97
State 0
63 56 58 98-99
65 63 57 97-98
1998-99 GEORGIA PUBLIC EDUCATION REPORT CARD Bryant Elementary School - 6162050
Prepared by Georgia Department of Education
56 57 56 96-97
Scores Reported in Percentiles
School System State
Page 2
STATE-REQUIRED TEST DATA
NORM-REFERENCED TESTS Grade 5
Iowa Tests of Basic Skills (ITBS) Each chart reflects data for three years of testing.
Reading Comprehension
Mathematics
50
55 54 53 0
98-99
52 50 53 97-98
46 48 52 96-97
School 50
System
State
0
68 62 59 98-99
61 59 58 97-98
52 54 57 96-97
School System State
Reading Vocabulary 50
48 49 48 0
98-99
45 45 48 97-98
39 42 46 96-97
Language Arts
School 50
System
State
0
74 67 63 98-99
64 63 61 97-98
59 61 58 96-97
School System State
Social Studies 50
62 58 57 0
98-99
54 57 56 97-98
49 53 55 96-97
Science
School 50
System
State
0
66 66 60 98-99
63 63 59 97-98
58 62 59 96-97
School System State
Sources of Information
Composite Score
50
67 61 58 0
98-99
School 50
System
58 57 58 97-98
55 56 57 96-97
State 0
65 61 57 98-99
58 58 56 97-98
52 55 55 96-97
1998-99 GEORGIA PUBLIC EDUCATION REPORT CARD Bryant Elementary School - 6162050
Prepared by Georgia Department of Education
Scores Reported in Percentiles
School System State
Page 3
STATE-REQUIRED TEST DATA
PERFORMANCE ASSESSMENTS
Grade 5 Writing Assessment
Percent at Developmental Stages:
1998-99 School System State
1997-98 School System State
1996-97 School System State
Stage Stage Stage Stage Stage Stage
1:The Emerging Writer 2:The Developing Writer 3:The Focusing Writer 4:The Experimenting 5:The Engaging Writer 6:The Extending Writer
0% 1% 12% 49% 26% 13%
0% 1% 17% 43% 28% 11%
0% 1% 16% 41% 29% 12%
0% 4% 21% 39% 24% 11%
0% 3% 20% 42% 24% 10%
0% 3% 19% 41% 27% 10%
0% 5% 28% 34% 23% 9%
0% 4% 26% 36% 22% 11%
0% 3% 21% 37% 26% 12%
AWARDS / RECOGNITION DATA
Schools in Georgia may receive recognition in the following programs: Charter School Pay for Performance Program Georgia School of Excellence National Blue Ribbon School Bryant Elementary School did not receive recognition in any of these programs during the 1998-99 school year.
1998-99 GEORGIA PUBLIC EDUCATION REPORT CARD Bryant Elementary School - 6162050
Prepared by Georgia Department of Education
Page 4
CERTIFIED PERSONNEL DATA
Positions Number Average Contract Days
Personnel Sex
Certificate
Years Experience
Full-time Part-time
Male Female
4 Yr Bachelor's 5 Yr Master's 6 Yr Specialist's 7 Yr Doctoral Other*
<1 1-10 11-20 21-30 >30
Average
Administrators
3.00 210.00
3 0
2 1
0 1 2 0 0 0 0 0 3 0 26.00
Support Personnel
4.00 195.00
4 0
0 4
0 1 3 0 0 0 1 0 2 1 20.25
PK-12 Teachers
56.00 190.27
56 0
5 51
24 25
7 0 0 2 13 28 11 2 15.21
*Includes One- and Two-Year Vocational Certificates.
ACCREDITATION DATA
Accredited by Southern Association of Colleges and Schools (SACS):
Elementary/Middle Commission.
1998-99 GEORGIA PUBLIC EDUCATION REPORT CARD Bryant Elementary School - 6162050
Prepared by Georgia Department of Education
Page 5
1998-99 GEORGIA PUBLIC EDUCATION REPORT CARD
BULLOCH COUNTY SCHOOLS
Langston Chapel Elementary School - 6160199
Grade Range PK-5
The Georgia Public Education Report Card is designed to assist systems and schools in educational improvement. This report card contains a variety of data elements. An explanation of the terms is provided as a companion to the report card data. Please refer to the definitions for the most effective use of the reported data.
STUDENT DATA
Total
K-5
536
PK
1
Enrollment, by Race/Ethnicity and Sex
Black
White Hispanic
American Asian Indian
Multiracial
246 45.9%
273 50.9%
13 2.4%
3 0.6%
0 0.0%
1 0.2%
1 100.0%
0 0.0%
0 0.0%
0 0.0%
0 0.0%
0 0.0%
Male 279
52.1% 1
100.0%
Female 257
47.9% 0
0.0%
Enrollment in Selected Programs
Program
Program % of Student Enrollment Population
Gifted (Grades K-12)
21
3.9%
Alternative Programs (Grades 6-12)
N/A
N/A
Students Eligible to Receive Free/Reduced Lunches
Number
Percent
School System
315 4,233
58.7% 50.6%
Dropout Rate *
Number
Rate
School System
N/A N/A
N/A N/A
* Dropout rates are not applicable for grades PK-5.
Enrollment in Compensatory Programs
Program
Program % of Student Enrollment Population
Special Education (Grades K-12)
97 18.1%
(PK)
1
N/A
English to Speakers of Other Languages (ESOL) (Grades K-12)
0
0.0%
Remedial Education (Grades 2-5, 9-12)
92 26.4%
Special Instructional Assistance (SIA) (Grades K-3)
44 12.0%
Title I (Grades K-12)
This school has no Title I program.
Total 16
Retained Students, by Race/Ethnicity and Sex
Black
White Hispanic
American MultiAsian Indian racial
9 56.3%
6 37.5%
1 6.3%
0 0.0%
0 0.0%
0 0.0%
Male Female
12
4
75.0% 25.0%
Prepared by Georgia Department of Education
Page 1
STATE-REQUIRED TEST DATA
NORM-REFERENCED TESTS Grade 3
Iowa Tests of Basic Skills (ITBS) Each chart reflects data for three years of testing.
Reading Comprehension 50
44 53 54 N/A 57 53 N/A 53 52
0
98-99
97-98
96-97
Mathematics
School 50
System
State
0
46 59 61 N/A 67 61 N/A 60 59
98-99
97-98
96-97
School System State
Reading Vocabulary 50
39 48 50 N/A 51 50 N/A 46 49
0
98-99
97-98
96-97
Language Arts
School 50
System
State
0
49 61 64 N/A 66 62 N/A 62 59
98-99
97-98
96-97
School System State
Social Studies 50
43 51 56 N/A 60 55 N/A 56 55
0
98-99
97-98
96-97
Science
School 50
System
State
0
48 63 59 N/A 66 59 N/A 60 58
98-99
97-98
96-97
School System State
Sources of Information
Composite Score
School
50
50
System
41 57 57 N/A 64 56 N/A 58 55
0
98-99
97-98
96-97
State 0
43 56 58 N/A 63 57 N/A 57 56
98-99
97-98
96-97
1998-99 GEORGIA PUBLIC EDUCATION REPORT CARD Langston Chapel Elementary School - 6160199
Prepared by Georgia Department of Education
Scores Reported in Percentiles
School System State
Page 2
STATE-REQUIRED TEST DATA
NORM-REFERENCED TESTS Grade 5
Iowa Tests of Basic Skills (ITBS) Each chart reflects data for three years of testing.
Reading Comprehension
Mathematics
50
56 54 53 N/A 50 53 N/A 48 52
0
98-99
97-98
96-97
School 50
System
State
0
55 62 59 N/A 59 58 N/A 54 57
98-99
97-98
96-97
School System State
Reading Vocabulary 50
53 49 48 N/A 45 48 N/A 42 46 0
98-99
97-98
96-97
Language Arts
School 50
System
State
0
68 67 63 N/A 63 61 N/A 61 58
98-99
97-98
96-97
School System State
Social Studies 50
60 58 57 N/A 57 56 N/A 53 55
0
98-99
97-98
96-97
Science
School 50
System
State
0
67 66 60 N/A 63 59 N/A 62 59
98-99
97-98
96-97
School System State
Sources of Information
Composite Score
School
50
50
System
56 61 58 N/A 57 58 N/A 56 57 0
98-99
97-98
96-97
State 0
60 61 57 N/A 58 56 N/A 55 55
98-99
97-98
96-97
1998-99 GEORGIA PUBLIC EDUCATION REPORT CARD Langston Chapel Elementary School - 6160199
Prepared by Georgia Department of Education
Scores Reported in Percentiles
School System State
Page 3
STATE-REQUIRED TEST DATA
PERFORMANCE ASSESSMENTS
Grade 5 Writing Assessment
Percent at Developmental Stages:
1998-99 School System State
1997-98 School System State
1996-97 School System State
Stage Stage Stage Stage Stage Stage
1:The Emerging Writer 2:The Developing Writer 3:The Focusing Writer 4:The Experimenting 5:The Engaging Writer 6:The Extending Writer
0% 2% 10% 48% 22% 19%
0% 1% 17% 43% 28% 11%
0% 1% 16% 41% 29% 12%
N/A N/A N/A N/A N/A N/A
0% 3% 20% 42% 24% 10%
0% 3% 19% 41% 27% 10%
N/A N/A N/A N/A N/A N/A
0% 4% 26% 36% 22% 11%
0% 3% 21% 37% 26% 12%
AWARDS / RECOGNITION DATA
Schools in Georgia may receive recognition in the following programs: Charter School Pay for Performance Program Georgia School of Excellence National Blue Ribbon School Langston Chapel Elementary School did not receive recognition in any of these programs during the 1998-99 school year.
1998-99 GEORGIA PUBLIC EDUCATION REPORT CARD Langston Chapel Elementary School - 6160199
Prepared by Georgia Department of Education
Page 4
CERTIFIED PERSONNEL DATA
Positions Number Average Contract Days
Personnel Sex
Certificate
Years Experience
Full-time Part-time
Male Female
4 Yr Bachelor's 5 Yr Master's 6 Yr Specialist's 7 Yr Doctoral Other*
<1 1-10 11-20 21-30 >30
Average
Administrators
2.00 215.00
2 0
1 1
0 0 2 0 0 0 0 1 1 0 22.50
Support Personnel
2.00 195.00
2 0
0 2
0 0 2 0 0 0 0 2 0 0 13.50
PK-12 Teachers
40.50 190.00
40 1
2 39
16 13 12
0 0 2 14 13 12 0 14.63
*Includes One- and Two-Year Vocational Certificates.
ACCREDITATION DATA
Not accredited by Southern Association of Colleges and Schools (SACS) or Georgia Accrediting Commission (GAC).
1998-99 GEORGIA PUBLIC EDUCATION REPORT CARD Langston Chapel Elementary School - 6160199
Prepared by Georgia Department of Education
Page 5
1998-99 GEORGIA PUBLIC EDUCATION REPORT CARD
BULLOCH COUNTY SCHOOLS
Langston Chapel Middle School - 6160299
Grade Range 6-8
The Georgia Public Education Report Card is designed to assist systems and schools in educational improvement. This report card contains a variety of data elements. An explanation of the terms is provided as a companion to the report card data. Please refer to the definitions for the most effective use of the reported data.
STUDENT DATA
Total 614
6-8 Enrollment, by Race/Ethnicity and Sex
Black
White Hispanic
American Multi-
Asian Indian
racial
265 43.2%
329 53.6%
5 0.8%
7 1.1%
1 0.2%
7 1.1%
Male 317
51.6%
Female 297
48.4%
Enrollment in Selected Programs
Program
Gifted (Grades K-12)
Program % of Student Enrollment Population
88
14.3%
Alternative Programs (Grades 6-12)
3
< 1%
Students Eligible to Receive Free/Reduced Lunches
Number
Percent
School System
358 4,233
58.3% 50.6%
Enrollment in Compensatory Programs
Program
Program % of Student Enrollment Population
Special Education (Grades K-12) (PK)
91 14.8%
0
N/A
English to Speakers of Other Languages (ESOL) (Grades K-12)
0
0.0%
Title I (Grades K-12)
This school has no Title I program.
Dropout Rate for Grades 6-8
Number
Rate
School System
4
0.6%
15
0.5%
Total 15
Retained Students, by Race/Ethnicity and Sex
Black
White Hispanic
American MultiAsian Indian racial
11 73.3%
4 26.7%
0 0.0%
0 0.0%
0 0.0%
0 0.0%
Male Female
10
5
66.7% 33.3%
Prepared by Georgia Department of Education
Page 1
STATE-REQUIRED TEST DATA
NORM-REFERENCED TESTS Grade 8
Iowa Tests of Basic Skills (ITBS) Each chart reflects data for three years of testing.
Reading Comprehension 50
53 53 49 N/A 46 48 N/A 46 48
0
98-99
97-98
96-97
Mathematics
School 50
System
State
0
55 56 56 N/A 51 55 N/A 53 54
98-99
97-98
96-97
School System State
Reading Vocabulary 50
54 51 46 N/A 42 45 N/A 42 44
0
98-99
97-98
96-97
Language Arts
School 50
System
State
0
62 60 60 N/A 56 58 N/A 56 56
98-99
97-98
96-97
School System State
Social Studies 50
54 53 54 N/A 49 53 N/A 48 53
0
98-99
97-98
96-97
Science
School 50
System
State
0
56 57 56 N/A 54 55 N/A 51 53
98-99
97-98
96-97
School System State
Sources of Information
Composite Score
School
50
50
System
58 58 57 N/A 53 56 N/A 50 55
0
98-99
97-98
96-97
State 0
57 56 56 N/A 51 54 N/A 51 54
98-99
97-98
96-97
1998-99 GEORGIA PUBLIC EDUCATION REPORT CARD Langston Chapel Middle School - 6160299
Prepared by Georgia Department of Education
Scores Reported in Percentiles
School System State
Page 2
STATE-REQUIRED TEST DATA
Categories of Scaled Scores
Inadequate (less than 162)
Minimal (162-209)
Good
(210-247)
Very Good (greater than 247)
Average Scaled Score: (Range 100-300)
PERFORMANCE ASSESSMENTS
Grade 8 Writing Assessment
1998-99 Percent Scoring
1997-98 Percent Scoring
1996-97 Percent Scoring
School System State School System State School System State
8% 40% 43%
9%
12% 47% 34%
8%
8% 40% 41% 11%
N/A N/A N/A N/A
19% 49% 25%
6%
11% 46% 34%
8%
N/A N/A N/A N/A
23% 46% 25%
6%
15% 46% 30%
8%
207
200
208 N/A
192 202 N/A
191 198
AWARDS / RECOGNITION DATA
Schools in Georgia may receive recognition in the following programs: Charter School Pay for Performance Program Georgia School of Excellence National Blue Ribbon School Langston Chapel Middle School did not receive recognition in any of these programs during the 1998-99 school year.
1998-99 GEORGIA PUBLIC EDUCATION REPORT CARD Langston Chapel Middle School - 6160299
Prepared by Georgia Department of Education
Page 3
CERTIFIED PERSONNEL DATA
Positions Number Average Contract Days
Personnel Sex
Certificate
Years Experience
Full-time Part-time
Male Female
4 Yr Bachelor's 5 Yr Master's 6 Yr Specialist's 7 Yr Doctoral Other*
<1 1-10 11-20 21-30 >30
Average
Administrators
2.00 215.00
2 0
1 1
0 0 2 0 0 0 0 1 1 0 20.00
Support Personnel
1.84 211.74
1 1
0 2
0 0 2 0 0 0 0 1 1 0 22.50
PK-12 Teachers
43.16 190.23
43 1
4 40
18 21
5 0 0 2 15 16 10 1 13.66
*Includes One- and Two-Year Vocational Certificates.
ACCREDITATION DATA
Accredited by Southern Association of Colleges and Schools (SACS): Secondary/Middle Commission.
1998-99 GEORGIA PUBLIC EDUCATION REPORT CARD Langston Chapel Middle School - 6160299
Prepared by Georgia Department of Education
Page 4
1998-99 GEORGIA PUBLIC EDUCATION REPORT CARD
BULLOCH COUNTY SCHOOLS
Mattie Lively Elementary School - 6165050
Grade Range K-5
The Georgia Public Education Report Card is designed to assist systems and schools in educational improvement. This report card contains a variety of data elements. An explanation of the terms is provided as a companion to the report card data. Please refer to the definitions for the most effective use of the reported data.
STUDENT DATA
Total 605
K-5 Enrollment, by Race/Ethnicity and Sex
Black
White Hispanic
American Multi-
Asian Indian
racial
350 57.9%
241 39.8%
0 0.0%
5 0.8%
0 0.0%
9 1.5%
Male Female
328 54.2%
277 45.8%
Enrollment in Selected Programs
Program
Program % of Student Enrollment Population
Gifted (Grades K-12)
16
2.6%
Alternative Programs (Grades 6-12)
N/A
N/A
Students Eligible to Receive Free/Reduced Lunches
Number
Percent
School System
410 4,233
67.8% 50.6%
Dropout Rate *
Number
Rate
School System
N/A N/A
N/A N/A
* Dropout rates are not applicable for grades PK-5.
Enrollment in Compensatory Programs
Program
Program % of Student Enrollment Population
Special Education (Grades K-12)
63 10.4%
(PK)
0
N/A
English to Speakers of Other Languages (ESOL) (Grades K-12)
0
0.0%
Remedial Education (Grades 2-5, 9-12)
70 17.5%
Special Instructional Assistance (SIA) (Grades K-3)
79 18.4%
Title I (Grades K-12)
This school has a Targeted Assistance program.
Total 27
Retained Students, by Race/Ethnicity and Sex
Black
White Hispanic
American Multi-
Asian Indian
racial
22 81.5%
5 18.5%
0 0.0%
0 0.0%
0 0.0%
0 0.0%
Male Female
17
10
63.0% 37.0%
Prepared by Georgia Department of Education
Page 1
STATE-REQUIRED TEST DATA
NORM-REFERENCED TESTS Grade 3
Iowa Tests of Basic Skills (ITBS) Each chart reflects data for three years of testing.
Reading Comprehension 50
47 53 54 N/A 57 53 N/A 53 52
0
98-99
97-98
96-97
Mathematics
School 50
System
State
0
51 59 61 N/A 67 61 N/A 60 59
98-99
97-98
96-97
School System State
Reading Vocabulary 50
44 48 50 N/A 51 50 N/A 46 49
0
98-99
97-98
96-97
Language Arts
School 50
System
State
0
46 61 64 N/A 66 62 N/A 62 59
98-99
97-98
96-97
School System State
Social Studies 50
46 51 56 N/A 60 55 N/A 56 55
0
98-99
97-98
96-97
Science
School 50
System
State
0
64 63 59 N/A 66 59 N/A 60 58
98-99
97-98
96-97
School System State
Sources of Information
Composite Score
School
50
50
System
55 57 57 N/A 64 56 N/A 58 55
0
98-99
97-98
96-97
State 0
51 56 58 N/A 63 57 N/A 57 56
98-99
97-98
96-97
1998-99 GEORGIA PUBLIC EDUCATION REPORT CARD Mattie Lively Elementary School - 6165050
Prepared by Georgia Department of Education
Scores Reported in Percentiles
School System State
Page 2
STATE-REQUIRED TEST DATA
NORM-REFERENCED TESTS Grade 5
Iowa Tests of Basic Skills (ITBS) Each chart reflects data for three years of testing.
Reading Comprehension
Mathematics
50
48 54 53 N/A 50 53 N/A 48 52
0
98-99
97-98
96-97
School 50
System
State
0
53 62 59 N/A 59 58 N/A 54 57
98-99
97-98
96-97
School System State
Reading Vocabulary 50
40 49 48 N/A 45 48 N/A 42 46 0
98-99
97-98
96-97
Language Arts
School 50
System
State
0
62 67 63 N/A 63 61 N/A 61 58
98-99
97-98
96-97
School System State
Social Studies 50
51 58 57 N/A 57 56 N/A 53 55
0
98-99
97-98
96-97
Science
School 50
System
State
0
56 66 60 N/A 63 59 N/A 62 59
98-99
97-98
96-97
School System State
Sources of Information
Composite Score
School
50
50
System
58 61 58 N/A 57 58 N/A 56 57 0
98-99
97-98
96-97
State 0
54 61 57 N/A 58 56 N/A 55 55
98-99
97-98
96-97
1998-99 GEORGIA PUBLIC EDUCATION REPORT CARD Mattie Lively Elementary School - 6165050
Prepared by Georgia Department of Education
Scores Reported in Percentiles
School System State
Page 3
STATE-REQUIRED TEST DATA
PERFORMANCE ASSESSMENTS
Grade 5 Writing Assessment
Percent at Developmental Stages:
1998-99 School System State
1997-98 School System State
1996-97 School System State
Stage Stage Stage Stage Stage Stage
1:The Emerging Writer 2:The Developing Writer 3:The Focusing Writer 4:The Experimenting 5:The Engaging Writer 6:The Extending Writer
0% 1% 19% 42% 23% 15%
0% 1% 17% 43% 28% 11%
0% 1% 16% 41% 29% 12%
N/A N/A N/A N/A N/A N/A
0% 3% 20% 42% 24% 10%
0% 3% 19% 41% 27% 10%
N/A N/A N/A N/A N/A N/A
0% 4% 26% 36% 22% 11%
0% 3% 21% 37% 26% 12%
AWARDS / RECOGNITION DATA
Schools in Georgia may receive recognition in the following programs: Charter School Pay for Performance Program Georgia School of Excellence National Blue Ribbon School Mattie Lively Elementary School did not receive recognition in any of these programs during the 1998-99 school year.
1998-99 GEORGIA PUBLIC EDUCATION REPORT CARD Mattie Lively Elementary School - 6165050
Prepared by Georgia Department of Education
Page 4
CERTIFIED PERSONNEL DATA
Positions Number Average Contract Days
Personnel Sex
Certificate
Years Experience
Full-time Part-time
Male Female
4 Yr Bachelor's 5 Yr Master's 6 Yr Specialist's 7 Yr Doctoral Other*
<1 1-10 11-20 21-30 >30
Average
Administrators
2.00 200.00
2 0
1 1
0 0 1 1 0 0 0 1 1 0 21.00
Support Personnel
1.00 200.00
1 0
0 1
0 1 0 0 0 0 0 1 0 0 19.00
PK-12 Teachers
40.50 190.00
39 3
1 41
25 12
5 0 0 2 18 14 8 0 12.57
*Includes One- and Two-Year Vocational Certificates.
ACCREDITATION DATA
Accredited by Southern Association of Colleges and Schools (SACS):
Elementary/Middle Commission.
1998-99 GEORGIA PUBLIC EDUCATION REPORT CARD Mattie Lively Elementary School - 6165050
Prepared by Georgia Department of Education
Page 5
1998-99 GEORGIA PUBLIC EDUCATION REPORT CARD
BULLOCH COUNTY SCHOOLS
Nevils Elementary School - 6161052
Grade Range K-7
The Georgia Public Education Report Card is designed to assist systems and schools in educational improvement. This report card contains a variety of data elements. An explanation of the terms is provided as a companion to the report card data. Please refer to the definitions for the most effective use of the reported data.
STUDENT DATA
Total 387
K-7 Enrollment, by Race/Ethnicity and Sex
Black
White Hispanic
American Multi-
Asian Indian
racial
104 26.9%
278 71.8%
1 0.3%
1 0.3%
0 0.0%
3 0.8%
Male Female
182 47.0%
205 53.0%
Enrollment in Selected Programs
Program
Program % of Student Enrollment Population
Gifted (Grades K-12)
7
1.8%
Alternative Programs (Grades 6-12)
0
0.0%
Students Eligible to Receive Free/Reduced Lunches
Number
Percent
School System
204 4,233
52.7% 50.6%
Dropout Rate for Grades 6-7
Number
Rate
School System
0
0.0%
6
0.4%
Enrollment in Compensatory Programs
Program
Program % of Student Enrollment Population
Special Education (Grades K-12)
51 13.2%
(PK)
0
N/A
English to Speakers of Other Languages (ESOL) (Grades K-12)
1
< 1%
Remedial Education (Grades 2-5, 9-12)
26 14.0%
Special Instructional Assistance (SIA) (Grades K-3)
39 21.3%
Title I (Grades K-12)
This school has a Targeted Assistance program.
Total 27
Retained Students, by Race/Ethnicity and Sex
Black
White Hispanic
American Multi-
Asian Indian
racial
9 33.3%
17 63.0%
1 3.7%
0 0.0%
0 0.0%
0 0.0%
Male Female
17
10
63.0% 37.0%
Prepared by Georgia Department of Education
Page 1
STATE-REQUIRED TEST DATA
NORM-REFERENCED TESTS Grade 3
Iowa Tests of Basic Skills (ITBS) Each chart reflects data for three years of testing.
Reading Comprehension 50
57 53 54 0
98-99
51 57 53 97-98
63 53 52 96-97
Mathematics
School 50
System
State
0
71 59 61 98-99
66 67 61 97-98
73 60 59 96-97
School System State
Reading Vocabulary 50
44 48 50 0
98-99
48 51 50 97-98
62 46 49 96-97
Language Arts
School 50
System
State
0
66 61 64 98-99
69 66 62 97-98
76 62 59 96-97
School System State
Social Studies 50
49 51 56 0
98-99
61 60 55 97-98
74 56 55 96-97
Science
School 50
System
State
0
57 63 59 98-99
60 66 59 97-98
68 60 58 96-97
School System State
Sources of Information
Composite Score
50
57 57 57 0
98-99
School 50
System
59 64 56 97-98
71 58 55 96-97
State 0
58 56 58 98-99
60 63 57 97-98
1998-99 GEORGIA PUBLIC EDUCATION REPORT CARD Nevils Elementary School - 6161052
Prepared by Georgia Department of Education
71 57 56 96-97
Scores Reported in Percentiles
School System State
Page 2
STATE-REQUIRED TEST DATA
NORM-REFERENCED TESTS Grade 5
Iowa Tests of Basic Skills (ITBS) Each chart reflects data for three years of testing.
Reading Comprehension
Mathematics
50
60 54 53 0
98-99
49 50 53 97-98
45 48 52 96-97
School 50
System
State
0
67 62 59 98-99
59 59 58 97-98
48 54 57 96-97
School System State
Reading Vocabulary 50
63 49 48 0
98-99
45 45 48 97-98
42 42 46 96-97
Language Arts
School 50
System
State
0
74 67 63 98-99
66 63 61 97-98
59 61 58 96-97
School System State
Social Studies 50
66 58 57 0
98-99
64 57 56 97-98
54 53 55 96-97
Science
School 50
System
State
0
72 66 60 98-99
60 63 59 97-98
60 62 59 96-97
School System State
Sources of Information
Composite Score
50
64 61 58 0
98-99
School 50
System
57 57 58 97-98
59 56 57 96-97
State 0
68 61 57 98-99
58 58 56 97-98
53 55 55 96-97
1998-99 GEORGIA PUBLIC EDUCATION REPORT CARD Nevils Elementary School - 6161052
Prepared by Georgia Department of Education
Scores Reported in Percentiles
School System State
Page 3
STATE-REQUIRED TEST DATA
PERFORMANCE ASSESSMENTS
Grade 5 Writing Assessment
Percent at Developmental Stages:
1998-99 School System State
1997-98 School System State
1996-97 School System State
Stage Stage Stage Stage Stage Stage
1:The Emerging Writer 2:The Developing Writer 3:The Focusing Writer 4:The Experimenting 5:The Engaging Writer 6:The Extending Writer
0% 0% 25% 42% 25% 8%
0% 1% 17% 43% 28% 11%
0% 1% 16% 41% 29% 12%
0% 0% 17% 50% 29% 5%
0% 3% 20% 42% 24% 10%
0% 3% 19% 41% 27% 10%
0% 9% 16% 45% 20% 7%
0% 4% 26% 36% 22% 11%
0% 3% 21% 37% 26% 12%
AWARDS / RECOGNITION DATA
Schools in Georgia may receive recognition in the following programs: Charter School Pay for Performance Program Georgia School of Excellence National Blue Ribbon School Nevils Elementary School did not receive recognition in any of these programs during the 1998-99 school year.
1998-99 GEORGIA PUBLIC EDUCATION REPORT CARD Nevils Elementary School - 6161052
Prepared by Georgia Department of Education
Page 4
CERTIFIED PERSONNEL DATA
Positions Number Average Contract Days
Personnel Sex
Certificate
Years Experience
Full-time Part-time
Male Female
4 Yr Bachelor's 5 Yr Master's 6 Yr Specialist's 7 Yr Doctoral Other*
<1 1-10 11-20 21-30 >30
Average
Administrators
2.00 205.00
2 0
1 1
0 0 2 0 0 0 0 2 0 0 16.50
Support Personnel
2.00 190.00
2 0
0 2
0 1 1 0 0 0 0 1 1 0 21.00
PK-12 Teachers
25.97 190.00
25 2
2 25
9 12
6 0 0 3 9 7 8 0 12.56
*Includes One- and Two-Year Vocational Certificates.
ACCREDITATION DATA
Accredited by Southern Association of Colleges and Schools (SACS):
Elementary/Middle Commission.
1998-99 GEORGIA PUBLIC EDUCATION REPORT CARD Nevils Elementary School - 6161052
Prepared by Georgia Department of Education
Page 5
1998-99 GEORGIA PUBLIC EDUCATION REPORT CARD
BULLOCH COUNTY SCHOOLS
Portal Primary/High School - 6164052
Grade Range PK-3, 8-12
The Georgia Public Education Report Card is designed to assist systems and schools in educational improvement. This report card contains a variety of data elements. An explanation of the terms is provided as a companion to the report card data. Please refer to the definitions for the most effective use of the reported data.
STUDENT DATA
Total K-3, 8-12 488
PK
17
Enrollment, by Race/Ethnicity and Sex
Black
American Multi-
White Hispanic Asian Indian
racial
216 44.3%
268 54.9%
4 0.8%
0 0.0%
0 0.0%
0 0.0%
7 41.2%
10 58.8%
0 0.0%
0 0.0%
0 0.0%
0 0.0%
Male 242
49.6% 8
47.1%
Female 246
50.4% 9
52.9%
Enrollment in Selected Programs
Program
Gifted (Grades K-12)
Non-Vocational Labs (Grades 9-12)
Vocational Labs (Grades 9-12)
Program % of Student Enrollment Population
0
0.0%
115
54.0%
127
59.6%
Alternative Programs (Grades 6-12)
0
0.0%
Students Eligible to Receive Free/Reduced Lunches
Number
Percent
School System
341 4,233
67.5% 50.6%
Enrollment in Compensatory Programs
Program
Program % of Student Enrollment Population
Special Education (Grades K-12) PK
71 14.5%
3
N/A
English to Speakers of Other Languages (ESOL) (Grades K-12)
0
0.0%
Remedial Education (Grades 2-5, 9-12)
44 14.0%
Special Instructional Assistance (SIA) (Grades K-3)
39 18.2%
Title I (Grades K-12)
This school has a schoolwide program.
Dropout Rate for Grades 8-12
Number
Rate
School System
12
4.1%
262
7.3%
Total 40
Retained Students, by Race/Ethnicity and Sex
Black
White Hispanic
American Multi-
Asian Indian
racial
29 72.5%
11 27.5%
0 0.0%
0 0.0%
0 0.0%
0 0.0%
Male Female
24
16
60.0% 40.0%
Prepared by Georgia Department of Education
Page 1
STATE-REQUIRED TEST DATA
NORM-REFERENCED TESTS Grade 3
Iowa Tests of Basic Skills (ITBS) Each chart reflects data for three years of testing.
Reading Comprehension 50
49 53 54 0
98-99
52 57 53 97-98
42 53 52 96-97
Mathematics
School 50
System
State
0
51 59 61 98-99
57 67 61 97-98
52 60 59 96-97
School System State
Reading Vocabulary 50
41 48 50 0
98-99
36 51 50 97-98
37 46 49 96-97
Language Arts
School 50
System
State
0
59 61 64 98-99
61 66 62 97-98
42 62 59 96-97
School System State
Social Studies 50
55 51 56 0
98-99
45 60 55 97-98
43 56 55 96-97
Science
School 50
System
State
0
65 63 59 98-99
47 66 59 97-98
46 60 58 96-97
School System State
Sources of Information
Composite Score
50
51 57 57 0
98-99
School 50
System
56 64 56 97-98
45 58 55 96-97
State 0
54 56 58 98-99
50 63 57 97-98
1998-99 GEORGIA PUBLIC EDUCATION REPORT CARD Portal Primary/High School - 6164052
Prepared by Georgia Department of Education
41 57 56 96-97
Scores Reported in Percentiles
School System State
Page 2
STATE-REQUIRED TEST DATA
NORM-REFERENCED TESTS
Grade 5 Iowa Tests of Basic Skills (ITBS) Each chart reflects data for three years of testing. No fifth-grade students are enrolled at Portal Primary/High School.
Reading Comprehension
Mathematics
50
N/A 54 53 0
98-99
N/A 50 53 97-98
N/A 48 52 96-97
School 50
System
State
N/A 62 59 0
98-99
N/A 59 58 97-98
N/A 54 57 96-97
School System State
Reading Vocabulary 50
N/A 49 48 0
98-99
N/A 45 48 97-98
N/A 42 46 96-97
Language Arts
School 50
System
State
N/A 67 63 0
98-99
N/A 63 61 97-98
N/A 61 58 96-97
School System State
Social Studies 50
N/A 58 57 0
98-99
N/A 57 56 97-98
N/A 53 55 96-97
Science
School 50
System
State
N/A 66 60 0
98-99
N/A 63 59 97-98
N/A 62 59 96-97
School System State
Sources of Information
Composite Score
School
50
50
System
N/A 61 58 0
98-99
N/A 57 58 N/A 56 57
97-98
96-97
State
N/A 61 57 0
98-99
N/A 58 56 97-98
N/A 55 55 96-97
1998-99 GEORGIA PUBLIC EDUCATION REPORT CARD Portal Primary/High School - 6164052
Prepared by Georgia Department of Education
Scores Reported in Percentiles
School System State
Page 3
STATE-REQUIRED TEST DATA
NORM-REFERENCED TESTS Grade 8
Iowa Tests of Basic Skills (ITBS) Each chart reflects data for three years of testing.
Reading Comprehension 50
45 53 49 0
98-99
41 46 48 97-98
44 46 48 96-97
Mathematics
School 50
System
State
0
42 56 56 98-99
47 51 55 97-98
56 53 54 96-97
School System State
Reading Vocabulary 50
33 51 46 0
98-99
40 42 45 97-98
41 42 44 96-97
Language Arts
School 50
System
State
0
53 60 60 98-99
60 56 58 97-98
56 56 56 96-97
School System State
Social Studies 50
44 53 54 0
98-99
45 49 53 97-98
52 48 53 96-97
Science
School 50
System
State
0
44 57 56 98-99
54 54 55 97-98
52 51 53 96-97
School System State
Sources of Information
Composite Score
50
50 58 57 0
98-99
School 50
System
52 53 56 97-98
49 50 55 96-97
State 0
43 56 56 98-99
48 51 54 97-98
1998-99 GEORGIA PUBLIC EDUCATION REPORT CARD Portal Primary/High School - 6164052
Prepared by Georgia Department of Education
52 51 54 96-97
Scores Reported in Percentiles
School System State
Page 4
STATE-REQUIRED TEST DATA
PERFORMANCE ASSESSMENTS
Grade 5 Writing Assessment
Percent at Developmental Stages:
1998-99 School System State
1997-98 School System State
1996-97 School System State
Stage Stage Stage Stage Stage Stage
1:The Emerging Writer 2:The Developing Writer 3:The Focusing Writer 4:The Experimenting 5:The Engaging Writer 6:The Extending Writer
N/A N/A N/A N/A N/A N/A
0% 1% 17% 43% 28% 11%
0% 1% 16% 41% 29% 12%
N/A N/A N/A N/A N/A N/A
0% 3% 20% 42% 24% 10%
0% 3% 19% 41% 27% 10%
N/A N/A N/A N/A N/A N/A
0% 4% 26% 36% 22% 11%
0% 3% 21% 37% 26% 12%
No fifth-grade students are enrolled at Portal Primary/High School.
Categories of Scaled Scores
Inadequate (less than 162)
Minimal (162-209)
Good
(210-247)
Very Good (greater than 247)
Average Scaled Score: (Range 100-300)
Grade 8 Writing Assessment
1998-99 Percent Scoring
1997-98 Percent Scoring
1996-97 Percent Scoring
School System State School System State School System State
21% 70%
9% 0%
12% 47% 34%
8%
8% 40% 41% 11%
22% 52% 22%
4%
19% 49% 25%
6%
11% 46% 34%
8%
33% 41% 22%
4%
23% 46% 25%
6%
15% 46% 30%
8%
181
200
208 192
192 202 182
191 198
GEORGIA HIGH SCHOOL GRADUATION TESTS (GHSGT)
Percent of Regular Program 11th Graders Passing the Georgia High School Graduation Tests on First Administration
English Language Arts Mathematics Social Studies Science
All Components listed above
Writing
1998-99
School System State
85% 75% 63% 55%
48%
96% 91% 80% 76%
72%
96% 88% 80% 72%
68%
90% 92% 93%
1997-98
School System State
96% 87% 76% 67%
62%
93% 89% 78% 76%
69%
94% 88% 78% 74%
68%
98% 92% 92%
1996-97
School System State
86% 78% 65% 57%
57%
93% 89% 78% 74%
70%
94% 87% 78% 74%
67%
94% 96% 93%
1998-99 GEORGIA PUBLIC EDUCATION REPORT CARD Portal Primary/High School - 6164052
Prepared by Georgia Department of Education
Page 5
GRADUATE DATA
1999 Graduates by Credentials, Race/Ethnicity and Sex
Diplomas with Both College Prep. & Voc. Endorsements
Diplomas with College Prep. Endorsements Diplomas with Vocational Endorsements General High School Diplomas Special Education Diplomas
Total All Diplomas
Certificates of Performance
Total Graduates
Total 19 2 25 0
Black
4 21.1%
1 50.0%
12 48.0%
0
White Hispanic
15 78.9%
0 0.0%
1 50.0%
0 0.0%
13 52.0%
0 0.0%
0
0
American MultiAsian Indian racial
0 0.0%
0 0.0%
0 0.0%
0 0.0%
0 0.0%
0 0.0%
0 0.0%
0 0.0%
0 0.0%
0
0
0
1
1
100.0%
0 0.0%
0 0.0%
0 0.0%
0 0.0%
0 0.0%
47
18
29
0
0
0
0
38.3% 61.7% 0.0% 0.0% 0.0% 0.0%
0
0
0
0
0
0
0
47
18
29
0
0
0
0
38.3% 61.7% 0.0% 0.0% 0.0% 0.0%
Male Female
11
8
57.9% 42.1%
1
1
50.0% 50.0%
9
16
36.0% 64.0%
0
0
0 0.0%
21 44.7%
1 100.0%
26 55.3%
0
0
21
26
44.7% 55.3%
HOPE Scholarships
School System
Number of 1999 Graduates 4 7
Number Eligible
28
Percent Eligible
59.6%
396 208 52.5%
State
65,548 40,292 61.5%
High School Completion Rate
Percent of 1995Grade 9 Enrollment in Graduating Class of1999 School System State
Completion Rate '95-'99 74.6% 61.8% 68.9%
1998-99 GEORGIA PUBLIC EDUCATION REPORT CARD
Portal Primary/High School - 6164052
Prepared by Georgia Department of Education
Page 6
COLLEGE ADMISSIONS / CREDIT TEST DATA
Scholastic Assessment Test (SAT)
Based on students' highest verbal and highest math scores
No. Taking
Average Score
Tests Verbal Math Total
Based on students' last test administration
Average Score Verbal Math Total
School
21
College Prep. Endorsement
Other Diplomas
System
229
College Prep. Endorsement
Other Diplomas
Georgia
41,958
432 449
881
448 479
927
382 376
758
494 499
993
505 516 1021
400 383
783
492 488
980
425 N/A N/A
484 N/A N/A
483
437 N/A N/A
489 N/A N/A
479
862 N/A N/A
973 N/A N/A
962
Nation
952,913 N/A N/A N/A
502 508 1010
American College Testing (ACT)
Advanced Placement Exams (AP)
Number taking tests: English Mathematics Reading Science Reasoning
1 * School N/A N/A N/A N/A
System 15.6 17.2 16.3 16.8
State 19.1 19.9 20.2 19.9
CompositeScore
N/A 16.5 19.9
* Scores are not reported when fewer than 5 take the ACT
No. of Students Taking Tests
No. of Tests Taken No. of Test Scores
3 or Higher Percent of Test
Scores 3 or Higher
School 0
N/A N/A
N/A
System State 41 15,225 45 23,969 38 13,024
84.4% 54.3%
POST-SECONDARY DATA
Graduates Entering Georgia Public Colleges
Graduates Entering Georgia Public Colleges and Requiring Learning Support (LS)
1998 Graduates Entering in 1998-99
1997 Graduates Entering in 1997-98
Percent of Graduating Number Class
School
16
42.1%
System 164
39.7%
School
9
24.3%
System 160
42.9%
Number Requiring
LS 6 37
1 26
Percent of those attending Georgia
Public Colleges
37.5%
22.6%
11.1%
16.3%
In previous years, the Report Card presented College Prep Curriculum information provided by the Board of Regents on students requiring Learning Support. Due to inconsistencies in the data provided by the Board of Regents in defining College Prep Completers versus Local Board of Education data defining College Prep Endorsements, the Department of Education Report Card will not provide this information until discrepancies can be reconciled.
Graduates Entering Georgia Public Technical and Adult Schools
1998 Graduates School System
Entering Number 3 29
1998-99 Percent
7.9% 7.0%
Entering Number N/A N/A
1997-98 Percent
N/A N/A
1997 Graduates School
0
0.0%
System
2
0.5%
6
16.2%
50
13.4%
1998-99 GEORGIA PUBLIC EDUCATION REPORT CARD Portal Primary/High School - 6164052
Prepared by Georgia Department of Education
Page 7
CERTIFIED PERSONNEL DATA
Positions Number Average Contract Days
Administrators
3.00 210.00
Support Personnel
2.00 205.00
PK-12 Teachers
38.20 191.15
Personnel Sex
Certificate
Years Experience
Full-time Part-time
Male Female
4 Yr Bachelor's 5 Yr Master's 6 Yr Specialist's 7 Yr Doctoral Other*
<1 1-10 11-20 21-30 >30
Average
3 0
1 2
1 1 1 0 0
0 1 0 2 0
18.67
2 0
0 2
0 0 2 0 0
0 0 0 2 0
28.00
37 2
8 31
18 13
7 1 0
3 20 10
5 1
11.38
*Includes One- and Two-Year Vocational Certificates.
ACCREDITATION DATA
Accredited by Southern Association of Colleges and Schools (SACS): Joint Commission.
AWARDS / RECOGNITION DATA
Schools in Georgia may receive recognition in the following programs: Charter School Pay for Performance Program Georgia School of Excellence National Blue Ribbon School Portal Primary/High School did not receive recognition in any of these programs during the 1998-99 school year.
1998-99 GEORGIA PUBLIC EDUCATION REPORT CARD Portal Primary/High School - 6164052
Prepared by Georgia Department of Education
Page 8
1998-99 GEORGIA PUBLIC EDUCATION REPORT CARD
BULLOCH COUNTY SCHOOLS
Sallie Zetterower Elementary School - 6165054
Grade Range PK-5
The Georgia Public Education Report Card is designed to assist systems and schools in educational improvement. This report card contains a variety of data elements. An explanation of the terms is provided as a companion to the report card data. Please refer to the definitions for the most effective use of the reported data.
STUDENT DATA
Total
K-5
526
PK
18
Enrollment, by Race/Ethnicity and Sex
Black
White Hispanic
American Asian Indian
Multiracial
221 42.0%
292 55.5%
6 1.1%
4 0.8%
0 0.0%
3 0.6%
9 50.0%
9 50.0%
0 0.0%
0 0.0%
0 0.0%
0 0.0%
Male Female
252 47.9%
274 52.1%
10 55.6%
8 44.4%
Enrollment in Selected Programs
Program
Program % of Student Enrollment Population
Gifted (Grades K-12)
10
1.9%
Alternative Programs (Grades 6-12)
N/A
N/A
Students Eligible to Receive Free/Reduced Lunches
Number
Percent
School System
231 4,233
42.5% 50.6%
Dropout Rate *
Number
Rate
School System
N/A N/A
N/A N/A
* Dropout rates are not applicable for grades PK-5.
Enrollment in Compensatory Programs
Program
Program % of Student Enrollment Population
Special Education (Grades K-12)
60 11.4%
(PK)
28
N/A
English to Speakers of Other Languages (ESOL) (Grades K-12)
0
0.0%
Remedial Education (Grades 2-5, 9-12)
59 17.1%
Special Instructional Assistance (SIA) (Grades K-3)
84 23.9%
Title I (Grades K-12)
This school has a Targeted Assistance program.
Total 11
Retained Students, by Race/Ethnicity and Sex
Black
White Hispanic
American MultiAsian Indian racial
7 63.6%
4 36.4%
0 0.0%
0 0.0%
0 0.0%
0 0.0%
Male Female
7
4
63.6% 36.4%
Prepared by Georgia Department of Education
Page 1
STATE-REQUIRED TEST DATA
NORM-REFERENCED TESTS Grade 3
Iowa Tests of Basic Skills (ITBS) Each chart reflects data for three years of testing.
Reading Comprehension 50
51 53 54 N/A 57 53 N/A 53 52
0
98-99
97-98
96-97
Mathematics
School 50
System
State
0
53 59 61 N/A 67 61 N/A 60 59
98-99
97-98
96-97
School System State
Reading Vocabulary 50
49 48 50 N/A 51 50 N/A 46 49
0
98-99
97-98
96-97
Language Arts
School 50
System
State
0
58 61 64 N/A 66 62 N/A 62 59
98-99
97-98
96-97
School System State
Social Studies 50
48 51 56 N/A 60 55 N/A 56 55
0
98-99
97-98
96-97
Science
School 50
System
State
0
58 63 59 N/A 66 59 N/A 60 58
98-99
97-98
96-97
School System State
Sources of Information
Composite Score
School
50
50
System
55 57 57 N/A 64 56 N/A 58 55
0
98-99
97-98
96-97
State 0
53 56 58 N/A 63 57 N/A 57 56
98-99
97-98
96-97
1998-99 GEORGIA PUBLIC EDUCATION REPORT CARD Sallie Zetterower Elementary School - 6165054
Prepared by Georgia Department of Education
Scores Reported in Percentiles
School System State
Page 2
STATE-REQUIRED TEST DATA
NORM-REFERENCED TESTS Grade 5
Iowa Tests of Basic Skills (ITBS) Each chart reflects data for three years of testing.
Reading Comprehension
Mathematics
50
57 54 53 N/A 50 53 N/A 48 52
0
98-99
97-98
96-97
School 50
System
State
0
71 62 59 N/A 59 58 N/A 54 57
98-99
97-98
96-97
School System State
Reading Vocabulary 50
51 49 48 N/A 45 48 N/A 42 46 0
98-99
97-98
96-97
Language Arts
School 50
System
State
0
73 67 63 N/A 63 61 N/A 61 58
98-99
97-98
96-97
School System State
Social Studies 50
61 58 57 N/A 57 56 N/A 53 55
0
98-99
97-98
96-97
Science
School 50
System
State
0
71 66 60 N/A 63 59 N/A 62 59
98-99
97-98
96-97
School System State
Sources of Information
Composite Score
School
50
50
System
64 61 58 N/A 57 58 N/A 56 57 0
98-99
97-98
96-97
State 0
66 61 57 N/A 58 56 N/A 55 55
98-99
97-98
96-97
1998-99 GEORGIA PUBLIC EDUCATION REPORT CARD Sallie Zetterower Elementary School - 6165054
Prepared by Georgia Department of Education
Scores Reported in Percentiles
School System State
Page 3
STATE-REQUIRED TEST DATA
PERFORMANCE ASSESSMENTS
Grade 5 Writing Assessment
Percent at Developmental Stages:
1998-99 School System State
1997-98 School System State
1996-97 School System State
Stage Stage Stage Stage Stage Stage
1:The Emerging Writer 2:The Developing Writer 3:The Focusing Writer 4:The Experimenting 5:The Engaging Writer 6:The Extending Writer
0% 1% 15% 36% 38% 9%
0% 1% 17% 43% 28% 11%
0% 1% 16% 41% 29% 12%
N/A N/A N/A N/A N/A N/A
0% 3% 20% 42% 24% 10%
0% 3% 19% 41% 27% 10%
N/A N/A N/A N/A N/A N/A
0% 4% 26% 36% 22% 11%
0% 3% 21% 37% 26% 12%
AWARDS / RECOGNITION DATA
Schools in Georgia may receive recognition in the following programs: Charter School Pay for Performance Program Georgia School of Excellence National Blue Ribbon School Sallie Zetterower Elementary School did not receive recognition in any of these programs during the 1998-99 school year.
1998-99 GEORGIA PUBLIC EDUCATION REPORT CARD Sallie Zetterower Elementary School - 6165054
Prepared by Georgia Department of Education
Page 4
CERTIFIED PERSONNEL DATA
Positions Number Average Contract Days
Personnel Sex
Certificate
Years Experience
Full-time Part-time
Male Female
4 Yr Bachelor's 5 Yr Master's 6 Yr Specialist's 7 Yr Doctoral Other*
<1 1-10 11-20 21-30 >30
Average
Administrators
2.00 205.00
2 0
0 2
0 0 1 1 0 0 0 1 0 1 26.00
Support Personnel
2.00 195.00
2 0
0 2
0 1 1 0 0 0 1 0 1 0 16.00
PK-12 Teachers
41.00 190.00
41 0
2 39
16 13 12
0 0 4 15 13 8 1 12.78
*Includes One- and Two-Year Vocational Certificates.
ACCREDITATION DATA
Accredited by Southern Association of Colleges and Schools (SACS):
Elementary/Middle Commission.
1998-99 GEORGIA PUBLIC EDUCATION REPORT CARD Sallie Zetterower Elementary School - 6165054
Prepared by Georgia Department of Education
Page 5
1998-99 GEORGIA PUBLIC EDUCATION REPORT CARD
BULLOCH COUNTY SCHOOLS
Southeast Bulloch High School - 6165052
Grade Range 8-12
The Georgia Public Education Report Card is designed to assist systems and schools in educational improvement. This report card contains a variety of data elements. An explanation of the terms is provided as a companion to the report card data. Please refer to the definitions for the most effective use of the reported data.
STUDENT DATA
Total 908
8-12 Enrollment, by Race/Ethnicity and Sex
Black
White Hispanic
American Multi-
Asian Indian
racial
169 18.6%
725 79.8%
1 0.1%
0 0.0%
5 0.6%
8 0.9%
Male 474
52.2%
Female 434
47.8%
Enrollment in Selected Programs
Program
Program % of Student Enrollment Population
Gifted (Grades K-12)
0
0.0%
Non-Vocational Labs (Grades 9-12)
439
63.8%
Vocational Labs (Grades 9-12)
434
63.1%
Alternative Programs (Grades 6-12)
1
< 1%
Students Eligible to Receive Free/Reduced Lunches
Number
Percent
School System
334 4,233
36.8% 50.6%
Enrollment in Compensatory Programs
Program
Program % of Student Enrollment Population
Special Education (Grades K-12) PK
122 13.4%
0
N/A
English to Speakers of Other Languages (ESOL) (Grades K-12)
0
0.0%
Remedial Education (Grades 2-5, 9-12)
15
2.2%
Special Instructional Assistance (SIA) (Grades K-3)
N/A
N/A
Title I (Grades K-12) This school has no Title I program.
Dropout Rate for Grades 8-12
Number
Rate
School System
63
6.7%
262
7.3%
Total 91
Retained Students, by Race/Ethnicity and Sex
Black
White Hispanic
American MultiAsian Indian racial
20 22.0%
70 76.9%
0 0.0%
0 0.0%
0 0.0%
1 1.1%
Male Female
57
34
62.6% 37.4%
Prepared by Georgia Department of Education
Page 1
STATE-REQUIRED TEST DATA
NORM-REFERENCED TESTS
Grade 3 Iowa Tests of Basic Skills (ITBS) Each chart reflects data for three years of testing.
No third-grade students are enrolled at Southeast Bulloch High School.
Reading Comprehension
Mathematics
50
N/A 53 54 0
98-99
N/A 57 53 97-98
N/A 53 52 96-97
School 50
System
State
N/A 59 61 0
98-99
N/A 67 61 97-98
N/A 60 59 96-97
School System State
Reading Vocabulary 50
N/A 48 50 0
98-99
N/A 51 50 97-98
N/A 46 49 96-97
Language Arts
School 50
System
State
N/A 61 64 0
98-99
N/A 66 62 97-98
N/A 62 59 96-97
School System State
Social Studies 50
N/A 51 56 0
98-99
N/A 60 55 97-98
N/A 56 55 96-97
Science
School 50
System
State
N/A 63 59 0
98-99
N/A 66 59 97-98
N/A 60 58 96-97
School System State
Sources of Information
Composite Score
School
50
50
System
N/A 57 57 0
98-99
N/A 64 56 N/A 58 55
97-98
96-97
State
N/A 56 58 0
98-99
N/A 63 57 97-98
N/A 57 56 96-97
1998-99 GEORGIA PUBLIC EDUCATION REPORT CARD Southeast Bulloch High School - 6165052
Prepared by Georgia Department of Education
Scores Reported in Percentiles
School System State
Page 2
STATE-REQUIRED TEST DATA
NORM-REFERENCED TESTS
Grade 5 Iowa Tests of Basic Skills (ITBS) Each chart reflects data for three years of testing. No fifth-grade students are enrolled at Southeast Bulloch High School.
Reading Comprehension
Mathematics
50
N/A 54 53 0
98-99
N/A 50 53 97-98
N/A 48 52 96-97
School 50
System
State
N/A 62 59 0
98-99
N/A 59 58 97-98
N/A 54 57 96-97
School System State
Reading Vocabulary 50
N/A 49 48 0
98-99
N/A 45 48 97-98
N/A 42 46 96-97
Language Arts
School 50
System
State
N/A 67 63 0
98-99
N/A 63 61 97-98
N/A 61 58 96-97
School System State
Social Studies 50
N/A 58 57 0
98-99
N/A 57 56 97-98
N/A 53 55 96-97
Science
School 50
System
State
N/A 66 60 0
98-99
N/A 63 59 97-98
N/A 62 59 96-97
School System State
Sources of Information
Composite Score
School
50
50
System
N/A 61 58 0
98-99
N/A 57 58 N/A 56 57
97-98
96-97
State
N/A 61 57 0
98-99
N/A 58 56 97-98
N/A 55 55 96-97
1998-99 GEORGIA PUBLIC EDUCATION REPORT CARD Southeast Bulloch High School - 6165052
Prepared by Georgia Department of Education
Scores Reported in Percentiles
School System State
Page 3
STATE-REQUIRED TEST DATA
NORM-REFERENCED TESTS Grade 8
Iowa Tests of Basic Skills (ITBS) Each chart reflects data for three years of testing.
Reading Comprehension 50
61 53 49 0
98-99
40 46 48 97-98
48 46 48 96-97
Mathematics
School 50
System
State
0
54 56 56 98-99
48 51 55 97-98
56 53 54 96-97
School System State
Reading Vocabulary 50
54 51 46 0
98-99
38 42 45 97-98
45 42 44 96-97
Language Arts
School 50
System
State
0
60 60 60 98-99
47 56 58 97-98
51 56 56 96-97
School System State
Social Studies 50
59 53 54 0
98-99
43 49 53 97-98
47 48 53 96-97
Science
School 50
System
State
0
64 57 56 98-99
48 54 55 97-98
56 51 53 96-97
School System State
Sources of Information
Composite Score
50
61 58 57 0
98-99
School 50
System
45 53 56 97-98
50 50 55 96-97
State 0
61 56 56 98-99
44 51 54 97-98
1998-99 GEORGIA PUBLIC EDUCATION REPORT CARD Southeast Bulloch High School - 6165052
Prepared by Georgia Department of Education
51 51 54 96-97
Scores Reported in Percentiles
School System State
Page 4
STATE-REQUIRED TEST DATA
PERFORMANCE ASSESSMENTS
Grade 5 Writing Assessment
Percent at Developmental Stages:
1998-99 School System State
1997-98 School System State
1996-97 School System State
Stage Stage Stage Stage Stage Stage
1:The Emerging Writer 2:The Developing Writer 3:The Focusing Writer 4:The Experimenting 5:The Engaging Writer 6:The Extending Writer
N/A N/A N/A N/A N/A N/A
0% 1% 17% 43% 28% 11%
0% 1% 16% 41% 29% 12%
N/A N/A N/A N/A N/A N/A
0% 3% 20% 42% 24% 10%
0% 3% 19% 41% 27% 10%
N/A N/A N/A N/A N/A N/A
0% 4% 26% 36% 22% 11%
0% 3% 21% 37% 26% 12%
No fifth-grade students are enrolled at Southeast Bulloch High School.
Categories of Scaled Scores
Inadequate (less than 162)
Minimal (162-209)
Good
(210-247)
Very Good (greater than 247)
Average Scaled Score: (Range 100-300)
Grade 8 Writing Assessment
1998-99 Percent Scoring
1997-98 Percent Scoring
1996-97 Percent Scoring
School System State School System State School System State
14% 49% 31%
7%
12% 47% 34%
8%
8% 40% 41% 11%
21% 50% 23%
6%
19% 49% 25%
6%
11% 46% 34%
8%
19% 47% 31%
3%
23% 46% 25%
6%
15% 46% 30%
8%
197
200
208 190
192 202 193
191 198
GEORGIA HIGH SCHOOL GRADUATION TESTS (GHSGT)
Percent of Regular Program 11th Graders Passing the Georgia High School Graduation Tests on First Administration
English Language Arts Mathematics Social Studies Science
All Components listed above
Writing
1998-99
School System State
98% 92% 86% 83%
80%
96% 91% 80% 76%
72%
96% 88% 80% 72%
68%
93% 92% 93%
1997-98
School System State
91% 91% 75% 78%
66%
93% 89% 78% 76%
69%
94% 88% 78% 74%
68%
94% 92% 92%
1996-97
School System State
95% 93% 81% 78%
73%
93% 89% 78% 74%
70%
94% 87% 78% 74%
67%
97% 96% 93%
1998-99 GEORGIA PUBLIC EDUCATION REPORT CARD Southeast Bulloch High School - 6165052
Prepared by Georgia Department of Education
Page 5
GRADUATE DATA
1999 Graduates by Credentials, Race/Ethnicity and Sex
Diplomas with Both College Prep. & Voc. Endorsements
Diplomas with College Prep. Endorsements Diplomas with Vocational Endorsements General High School Diplomas Special Education Diplomas
Total All Diplomas
Certificates of Performance
Total Graduates
Total 34 19 41 3 9
106 6
112
Black
American MultiWhite Hispanic Asian Indian racial
2 5.9%
32 94.1%
0 0.0%
0 0.0%
0 0.0%
0 0.0%
2 10.5%
17 89.5%
0 0.0%
0 0.0%
0 0.0%
0 0.0%
12 29.3%
28 68.3%
0 0.0%
0 0.0%
1 2.4%
0 0.0%
3 100.0%
0 0.0%
0 0.0%
0 0.0%
0 0.0%
0 0.0%
6 66.7%
25 23.6%
1 11.1%
78 73.6%
0 0.0%
0 0.0%
0 0.0%
0 0.0%
2 22.2%
3 2.8%
0 0.0%
0 0.0%
3 50.0%
3 50.0%
0 0.0%
0 0.0%
0 0.0%
0 0.0%
28 25.0%
81 72.3%
0 0.0%
0 0.0%
3 2.7%
0 0.0%
Male Female
14
20
41.2% 58.8%
5
14
26.3% 73.7%
29
12
70.7% 29.3%
0
3
0.0% 100.0%
7 77.8%
55 51.9%
2 22.2%
51 48.1%
1
5
16.7% 83.3%
56
56
50.0% 50.0%
HOPE Scholarships
School System
Number of 1999 Graduates 1 1 2
Number Eligible
55
Percent Eligible
49.1%
396 208 52.5%
State
65,548 40,292 61.5%
High School Completion Rate
Percent of 1995Grade 9 Enrollment in Graduating Class of1999 School System State
Completion Rate '95-'99 61.5% 61.8% 68.9%
1998-99 GEORGIA PUBLIC EDUCATION REPORT CARD
Southeast Bulloch High School - 6165052
Prepared by Georgia Department of Education
Page 6
COLLEGE ADMISSIONS / CREDIT TEST DATA
Scholastic Assessment Test (SAT)
Based on students' highest verbal and highest math scores
No. Taking
Average Score
Tests Verbal Math Total
Based on students' last test administration
Average Score Verbal Math Total
School
67
College Prep. Endorsement
Other Diplomas
System
229
College Prep. Endorsement
Other Diplomas
Georgia
41,958
502 505 1007
529 529 1058
420 435
855
494 499
993
505 516 1021
400 383
783
492 488
980
487 N/A N/A
484 N/A N/A
483
495 N/A N/A
489 N/A N/A
479
982 N/A N/A
973 N/A N/A
962
Nation
952,913 N/A N/A N/A
502 508 1010
American College Testing (ACT)
Advanced Placement Exams (AP)
Number taking tests: English Mathematics Reading Science Reasoning
3 * School N/A N/A N/A N/A
System 15.6 17.2 16.3 16.8
State 19.1 19.9 20.2 19.9
CompositeScore
N/A 16.5 19.9
* Scores are not reported when fewer than 5 take the ACT
No. of Students Taking Tests
No. of Tests Taken No. of Test Scores
3 or Higher Percent of Test
Scores 3 or Higher
School 0
N/A N/A
N/A
System State 41 15,225 45 23,969 38 13,024
84.4% 54.3%
POST-SECONDARY DATA
Graduates Entering Georgia Public Colleges
Graduates Entering Georgia Public Colleges and Requiring Learning Support (LS)
1998 Graduates Entering in 1998-99
1997 Graduates Entering in 1997-98
Percent of Graduating Number Class
School
36
31.3%
System 164
39.7%
School
39
34.5%
System 160
42.9%
Number Requiring
LS 9 37
5 26
Percent of those attending Georgia
Public Colleges
25.0%
22.6%
12.8%
16.3%
In previous years, the Report Card presented College Prep Curriculum information provided by the Board of Regents on students requiring Learning Support. Due to inconsistencies in the data provided by the Board of Regents in defining College Prep Completers versus Local Board of Education data defining College Prep Endorsements, the Department of Education Report Card will not provide this information until discrepancies can be reconciled.
Graduates Entering Georgia Public Technical and Adult Schools
1998 Graduates School System
Entering Number 9 29
1998-99 Percent
7.8% 7.0%
Entering Number N/A N/A
1997-98 Percent
N/A N/A
1997 Graduates School
0
0.0%
System
2
0.5%
17
15.0%
50
13.4%
1998-99 GEORGIA PUBLIC EDUCATION REPORT CARD Southeast Bulloch High School - 6165052
Prepared by Georgia Department of Education
Page 7
CERTIFIED PERSONNEL DATA
Positions Number Average Contract Days
Administrators
4.00 215.00
Support Personnel
3.00 193.33
PK-12 Teachers
48.05 191.96
Personnel Sex
Certificate
Years Experience
Full-time Part-time
Male Female
4 Yr Bachelor's 5 Yr Master's 6 Yr Specialist's 7 Yr Doctoral Other*
<1 1-10 11-20 21-30 >30
Average
4 0
3 1
1 0 2 1 0
0 0 2 2 0
19.50
3 0
1 2
0 1 2 0 0
0 0 2 1 0
19.00
46 3
16 33
25 14 10
0 0
5 15 18 10
1
13.39
*Includes One- and Two-Year Vocational Certificates.
ACCREDITATION DATA
Accredited by Southern Association of Colleges and Schools (SACS): Secondary/Middle Commission.
AWARDS / RECOGNITION DATA
Schools in Georgia may receive recognition in the following programs: Charter School Pay for Performance Program Georgia School of Excellence National Blue Ribbon School Southeast Bulloch High School did not receive recognition in any of these programs during the 1998-99 school year.
1998-99 GEORGIA PUBLIC EDUCATION REPORT CARD Southeast Bulloch High School - 6165052
Prepared by Georgia Department of Education
Page 8
1998-99 GEORGIA PUBLIC EDUCATION REPORT CARD
BULLOCH COUNTY SCHOOLS
Statesboro High School - 6162054
Grade Range 9-12
The Georgia Public Education Report Card is designed to assist systems and schools in educational improvement. This report card contains a variety of data elements. An explanation of the terms is provided as a companion to the report card data. Please refer to the definitions for the most effective use of the reported data.
Total 1,402
STUDENT DATA
9-12 Enrollment, by Race/Ethnicity and Sex
Black
White Hispanic
American Multi-
Asian Indian
racial
662 47.2%
702 50.1%
5 0.4%
13 0.9%
0 0.0%
20 1.4%
Male Female
696 49.6%
706 50.4%
Enrollment in Selected Programs
Program
Gifted (Grades K-12)
Program % of Student Enrollment Population
28
2.0%
Non-Vocational Labs (Grades 9-12)
Vocational Labs (Grades 9-12)
Alternative Programs (Grades 6-12)
1,224 928 8
87.3% 66.2%
< 1%
Students Eligible to Receive Free/Reduced Lunches
Number
Percent
School System
571 4,233
40.7% 50.6%
Enrollment in Compensatory Programs
Program
Program % of Student Enrollment Population
Special Education (Grades K-12) PK
144 10.3%
0
N/A
English to Speakers of Other Languages (ESOL) (Grades K-12)
0
0.0%
Remedial Education (Grades 2-5, 9-12)
4
< 1%
Title I (Grades K-12)
This school has no Title I program.
Dropout Rate for Grades 9-12
Number
Rate
School System
178
11.5%
253
10.2%
Total 155
Retained Students, by Race/Ethnicity and Sex
Black
White Hispanic
American MultiAsian Indian racial
103 66.5%
51 32.9%
0 0.0%
1 0.6%
0 0.0%
0 0.0%
Male Female
91
64
58.7% 41.3%
Prepared by Georgia Department of Education
Page 1
STATE-REQUIRED TEST DATA
GEORGIA HIGH SCHOOL GRADUATION TESTS (GHSGT)
Percent of Regular Program 11th Graders Passing the Georgia High School Graduation Tests on First Administration
English Language Arts Mathematics Social Studies Science
All Components listed above
Writing
1998-99
School System State
98% 93% 80% 76%
96% 91% 80% 76%
96% 88% 80% 72%
72% 72% 68%
92% 92% 93%
1997-98
School System State
94% 88% 80% 77%
93% 89% 78% 76%
94% 88% 78% 74%
72% 69% 68%
89% 92% 92%
1996-97
School System State
93% 89% 78% 74%
93% 89% 78% 74%
94% 87% 78% 74%
70% 70% 67%
95% 96% 93%
GRADUATE DATA
1999 Graduates by Credentials, Race/Ethnicity and Sex
Diplomas with Both College Prep. & Voc. Endorsements
Diplomas with College Prep. Endorsements Diplomas with Vocational Endorsements General High School Diplomas Special Education Diplomas
Total All Diplomas
Certificates of Performance
Total Graduates
Total 62 74 56 6 19
217 20
237
Black
21 33.9%
16 21.6%
34 60.7%
6 100.0%
12 63.2%
89 41.0%
20 100.0%
109 46.0%
White Hispanic
38 61.3%
54 73.0%
0 0.0%
1 1.4%
22 39.3%
0 0.0%
7 36.8%
0 0.0%
0 0.0%
0 0.0%
121 55.8%
1 0.5%
0 0.0%
0 0.0%
121 51.1%
1 0.4%
American MultiAsian Indian racial
1 1.6%
2 2.7%
0 0.0%
0 0.0%
2 3.2%
1 1.4%
0 0.0%
0 0.0%
0 0.0%
0 0.0%
0 0.0%
0 0.0%
0 0.0%
0 0.0%
0 0.0%
3 1.4%
0 0.0%
3 1.4%
0 0.0%
0 0.0%
0 0.0%
3 1.3%
0 0.0%
3 1.3%
Male Female
21 33.9%
30 40.5%
41 66.1%
44 59.5%
29 51.8%
2 33.3%
14 73.7%
27 48.2%
4 66.7%
5 26.3%
96
121
44.2% 55.8%
8
12
40.0% 60.0%
104
133
43.9% 56.1%
HOPE Scholarships
School System
Number of 1999 Graduates 2 3 7
Number Eligible
125
Percent Eligible
52.7%
396 208 52.5%
State
65,548 40,292 61.5%
High School Completion Rate
Percent of 1995Grade 9 Enrollment in Graduating Class of1999 School System State
Completion Rate '95-'99 59.8% 61.8% 68.9%
1998-99 GEORGIA PUBLIC EDUCATION REPORT CARD
Statesboro High School - 6162054
Prepared by Georgia Department of Education
Page 2
COLLEGE ADMISSIONS / CREDIT TEST DATA
Scholastic Assessment Test (SAT)
Based on students' highest verbal and highest math scores
No. Taking
Average Score
Tests Verbal Math Total
Based on students' last test administration
Average Score Verbal Math Total
School
141
College Prep. Endorsement
Other Diplomas
System
229
College Prep. Endorsement
Other Diplomas
Georgia
41,958
500 503 1003
502 515 1017
394 360
754
494 499
993
505 516 1021
400 383
783
492 488
980
492 N/A N/A
484 N/A N/A
483
493 N/A N/A
489 N/A N/A
479
985 N/A N/A
973 N/A N/A
962
Nation
952,913 N/A N/A N/A
502 508 1010
American College Testing (ACT)
Advanced Placement Exams (AP)
Number taking tests: English Mathematics Reading Science Reasoning CompositeScore
1 8 School System State
15.3 15.6 19.1
16.1 17.2 19.9
15.9 16.3
16.3 16.8
20.2 19.9
16.0 16.5 19.9
No. of Students Taking Tests
No. of Tests Taken No. of Test Scores
3 or Higher Percent of Test
Scores 3 or Higher
School 41 45 38
84.4%
System State 41 15,225 45 23,969 38 13,024
84.4% 54.3%
POST-SECONDARY DATA
Graduates Entering Georgia Public Colleges
Graduates Entering Georgia Public Colleges and Requiring Learning Support (LS)
1998 Graduates Entering in 1998-99
1997 Graduates Entering in 1997-98
Percent of Graduating Number Class
School
112
43.1%
System 164
39.7%
School
112
50.2%
System 160
42.9%
Number Requiring
LS 22 37
20 26
Percent of those attending Georgia
Public Colleges
19.6%
22.6%
17.9%
16.3%
In previous years, the Report Card presented College Prep Curriculum information provided by the Board of Regents on students requiring Learning Support. Due to inconsistencies in the data provided by the Board of Regents in defining College Prep Completers versus Local Board of Education data defining College Prep Endorsements, the Department of Education Report Card will not provide this information until discrepancies can be reconciled.
Graduates Entering Georgia Public Technical and Adult Schools
1998 Graduates School System
Entering Number 17 29
1998-99 Percent
6.5% 7.0%
Entering Number N/A N/A
1997-98 Percent
N/A N/A
1997 Graduates School
2
0.9%
System
2
0.5%
27
12.1%
50
13.4%
1998-99 GEORGIA PUBLIC EDUCATION REPORT CARD Statesboro High School - 6162054
Prepared by Georgia Department of Education
Page 3
CERTIFIED PERSONNEL DATA
Positions Number Average Contract Days
Administrators
5.20 212.69
Support Personnel
6.61 205.01
PK-12 Teachers
89.31 192.93
Personnel Sex
Certificate
Years Experience
Full-time Part-time
Male Female
4 Yr Bachelor's 5 Yr Master's 6 Yr Specialist's 7 Yr Doctoral Other*
<1 1-10 11-20 21-30 >30
Average
5 0
3 2
0 1 3 1 0
0 0 3 1 1
20.80
6 1
2 5
0 4 3 0 0
0 1 1 5 0
19.29
86 5
26 65
34 36 20
0 1
8 28 26 28
1
14.01
*Includes One- and Two-Year Vocational Certificates.
ACCREDITATION DATA
Accredited by Southern Association of Colleges and Schools (SACS): Secondary/Middle Commission.
AWARDS / RECOGNITION DATA
Schools in Georgia may receive recognition in the following programs: Charter School Pay for Performance Program Georgia School of Excellence National Blue Ribbon School Statesboro High School did not receive recognition in any of these programs during the 1998-99 school year.
1998-99 GEORGIA PUBLIC EDUCATION REPORT CARD Statesboro High School - 6162054
Prepared by Georgia Department of Education
Page 4
1998-99 GEORGIA PUBLIC EDUCATION REPORT CARD
BULLOCH COUNTY SCHOOLS
Stilson Elementary School - 6163054
Grade Range PK-7
The Georgia Public Education Report Card is designed to assist systems and schools in educational improvement. This report card contains a variety of data elements. An explanation of the terms is provided as a companion to the report card data. Please refer to the definitions for the most effective use of the reported data.
STUDENT DATA
Total
K-7
604
PK
19
Enrollment, by Race/Ethnicity and Sex
Black
White Hispanic
American Asian Indian
Multiracial
72 11.9%
526 87.1%
3 0.5%
0 0.0%
0 0.0%
3 0.5%
0 0.0%
18 94.7%
0 0.0%
0 0.0%
0 0.0%
1 5.3%
Male Female
312 51.7%
292 48.3%
8 42.1%
11 57.9%
Enrollment in Selected Programs
Program
Program % of Student Enrollment Population
Gifted (Grades K-12)
11
1.8%
Alternative Programs (Grades 6-12)
0
0.0%
Students Eligible to Receive Free/Reduced Lunches
Number
Percent
School System
228 4,233
36.6% 50.6%
Dropout Rate for Grades 6-7
Number
Rate
School System
0
0.0%
6
0.4%
Enrollment in Compensatory Programs
Program
Program % of Student Enrollment Population
Special Education (Grades K-12)
71 11.8%
(PK)
1
N/A
English to Speakers of Other Languages (ESOL) (Grades K-12)
0
0.0%
Remedial Education (Grades 2-5, 9-12)
42 13.7%
Special Instructional Assistance (SIA) (Grades K-3)
50 18.0%
Title I (Grades K-12)
This school has no Title I program.
Total 18
Retained Students, by Race/Ethnicity and Sex
Black
White Hispanic
American MultiAsian Indian racial
2 11.1%
16 88.9%
0 0.0%
0 0.0%
0 0.0%
0 0.0%
Male Female
13
5
72.2% 27.8%
Prepared by Georgia Department of Education
Page 1
STATE-REQUIRED TEST DATA
NORM-REFERENCED TESTS Grade 3
Iowa Tests of Basic Skills (ITBS) Each chart reflects data for three years of testing.
Reading Comprehension 50
63 53 54 0
98-99
61 57 53 97-98
57 53 52 96-97
Mathematics
School 50
System
State
0
76 59 61 98-99
76 67 61 97-98
63 60 59 96-97
School System State
Reading Vocabulary 50
62 48 50 0
98-99
53 51 50 97-98
46 46 49 96-97
Language Arts
School 50
System
State
0
76 61 64 98-99
71 66 62 97-98
63 62 59 96-97
School System State
Social Studies 50
69 51 56 0
98-99
65 60 55 97-98
58 56 55 96-97
Science
School 50
System
State
0
74 63 59 98-99
76 66 59 97-98
61 60 58 96-97
School System State
Sources of Information
Composite Score
50
73 57 57 0
98-99
School 50
System
70 64 56 97-98
63 58 55 96-97
State 0
72 56 58 98-99
70 63 57 97-98
1998-99 GEORGIA PUBLIC EDUCATION REPORT CARD Stilson Elementary School - 6163054
Prepared by Georgia Department of Education
59 57 56 96-97
Scores Reported in Percentiles
School System State
Page 2
STATE-REQUIRED TEST DATA
NORM-REFERENCED TESTS Grade 5
Iowa Tests of Basic Skills (ITBS) Each chart reflects data for three years of testing.
Reading Comprehension
Mathematics
50
49 54 53 0
98-99
48 50 53 97-98
54 48 52 96-97
School 50
System
State
0
52 62 59 98-99
55 59 58 97-98
51 54 57 96-97
School System State
Reading Vocabulary 50
49 49 48 0
98-99
48 45 48 97-98
45 42 46 96-97
Language Arts
School 50
System
State
0
55 67 63 98-99
62 63 61 97-98
56 61 58 96-97
School System State
Social Studies 50
51 58 57 0
98-99
62 57 56 97-98
57 53 55 96-97
Science
School 50
System
State
0
60 66 60 98-99
64 63 59 97-98
67 62 59 96-97
School System State
Sources of Information
Composite Score
50
54 61 58 0
98-99
School 50
System
59 57 58 97-98
54 56 57 96-97
State 0
52 61 57 98-99
59 58 56 97-98
55 55 55 96-97
1998-99 GEORGIA PUBLIC EDUCATION REPORT CARD Stilson Elementary School - 6163054
Prepared by Georgia Department of Education
Scores Reported in Percentiles
School System State
Page 3
STATE-REQUIRED TEST DATA
PERFORMANCE ASSESSMENTS
Grade 5 Writing Assessment
Percent at Developmental Stages:
1998-99 School System State
1997-98 School System State
1996-97 School System State
Stage Stage Stage Stage Stage Stage
1:The Emerging Writer 2:The Developing Writer 3:The Focusing Writer 4:The Experimenting 5:The Engaging Writer 6:The Extending Writer
0% 1% 31% 40% 22% 1%
0% 1% 17% 43% 28% 11%
0% 1% 16% 41% 29% 12%
0% 0% 20% 37% 28% 12%
0% 3% 20% 42% 24% 10%
0% 3% 19% 41% 27% 10%
0% 0% 27% 51% 18% 4%
0% 4% 26% 36% 22% 11%
0% 3% 21% 37% 26% 12%
AWARDS / RECOGNITION DATA
Schools in Georgia may receive recognition in the following programs: Charter School Pay for Performance Program Georgia School of Excellence National Blue Ribbon School Stilson Elementary School did not receive recognition in any of these programs during the 1998-99 school year.
1998-99 GEORGIA PUBLIC EDUCATION REPORT CARD Stilson Elementary School - 6163054
Prepared by Georgia Department of Education
Page 4
CERTIFIED PERSONNEL DATA
Positions Number Average Contract Days
Personnel Sex
Certificate
Years Experience
Full-time Part-time
Male Female
4 Yr Bachelor's 5 Yr Master's 6 Yr Specialist's 7 Yr Doctoral Other*
<1 1-10 11-20 21-30 >30
Average
Administrators
2.00 205.00
2 0
0 2
0 1 0 1 0 0 0 2 0 0 17.50
Support Personnel
2.00 190.00
2 0
0 2
0 0 2 0 0 0 0 1 1 0 19.50
PK-12 Teachers
38.50 190.00
38 1
2 37
25 8 6 0 0 4
15 16
3 1 10.79
*Includes One- and Two-Year Vocational Certificates.
ACCREDITATION DATA
Accredited by Southern Association of Colleges and Schools (SACS):
Elementary/Middle Commission.
1998-99 GEORGIA PUBLIC EDUCATION REPORT CARD Stilson Elementary School - 6163054
Prepared by Georgia Department of Education
Page 5
1998-99 GEORGIA PUBLIC EDUCATION REPORT CARD
BULLOCH COUNTY SCHOOLS
William James Middle School - 6160198
Grade Range 6-8
The Georgia Public Education Report Card is designed to assist systems and schools in educational improvement. This report card contains a variety of data elements. An explanation of the terms is provided as a companion to the report card data. Please refer to the definitions for the most effective use of the reported data.
STUDENT DATA
Total 606
6-8 Enrollment, by Race/Ethnicity and Sex
Black
White Hispanic
American Multi-
Asian Indian
racial
308 50.8%
284 46.9%
0 0.0%
8 1.3%
0 0.0%
6 1.0%
Male 307
50.7%
Female 299
49.3%
Enrollment in Selected Programs
Program
Gifted (Grades K-12)
Program % of Student Enrollment Population
93
15.3%
Alternative Programs (Grades 6-12)
2
< 1%
Students Eligible to Receive Free/Reduced Lunches
Number
Percent
School System
304 4,233
50.2% 50.6%
Enrollment in Compensatory Programs
Program
Program % of Student Enrollment Population
Special Education (Grades K-12) (PK)
94 15.5%
0
N/A
English to Speakers of Other Languages (ESOL) (Grades K-12)
0
0.0%
Title I (Grades K-12)
This school has a Targeted Assistance program.
Dropout Rate for Grades 6-8
Number
Rate
School System
9
0.9%
15
0.5%
Total 10
Retained Students, by Race/Ethnicity and Sex
Black
White Hispanic
American MultiAsian Indian racial
9 90.0%
1 10.0%
0 0.0%
0 0.0%
0 0.0%
0 0.0%
Male Female
6
4
60.0% 40.0%
Prepared by Georgia Department of Education
Page 1
STATE-REQUIRED TEST DATA
NORM-REFERENCED TESTS Grade 8
Iowa Tests of Basic Skills (ITBS) Each chart reflects data for three years of testing.
Reading Comprehension 50
49 53 49 0
98-99
49 46 48 97-98
43 46 48 96-97
Mathematics
School 50
System
State
0
61 56 56 98-99
54 51 55 97-98
48 53 54 96-97
School System State
Reading Vocabulary 50
50 51 46 0
98-99
43 42 45 97-98
39 42 44 96-97
Language Arts
School 50
System
State
0
59 60 60 98-99
61 56 58 97-98
56 56 56 96-97
School System State
Social Studies 50
50 53 54 0
98-99
52 49 53 97-98
45 48 53 96-97
Science
School 50
System
State
0
54 57 56 98-99
54 54 55 97-98
45 51 53 96-97
School System State
Sources of Information
Composite Score
50
57 58 57 0
98-99
School 50
System
56 53 56 97-98
47 50 55 96-97
State 0
55 56 56 98-99
54 51 54 97-98
1998-99 GEORGIA PUBLIC EDUCATION REPORT CARD William James Middle School - 6160198
Prepared by Georgia Department of Education
47 51 54 96-97
Scores Reported in Percentiles
School System State
Page 2
STATE-REQUIRED TEST DATA
Categories of Scaled Scores
Inadequate (less than 162)
Minimal (162-209)
Good
(210-247)
Very Good (greater than 247)
Average Scaled Score: (Range 100-300)
PERFORMANCE ASSESSMENTS
Grade 8 Writing Assessment
1998-99 Percent Scoring
1997-98 Percent Scoring
1996-97 Percent Scoring
School System State School System State School System State
11% 45% 34% 10%
12% 47% 34%
8%
8% 40% 41% 11%
20% 48% 26%
7%
19% 49% 25%
6%
11% 46% 34%
8%
26% 45% 20%
8%
23% 46% 25%
6%
15% 46% 30%
8%
200
200
208 191
192 202 189
191 198
AWARDS / RECOGNITION DATA
Schools in Georgia may receive recognition in the following programs: Charter School Pay for Performance Program Georgia School of Excellence National Blue Ribbon School William James Middle School did not receive recognition in any of these programs during the 1998-99 school year.
1998-99 GEORGIA PUBLIC EDUCATION REPORT CARD William James Middle School - 6160198
Prepared by Georgia Department of Education
Page 3
CERTIFIED PERSONNEL DATA
Positions Number Average Contract Days
Personnel Sex
Certificate
Years Experience
Full-time Part-time
Male Female
4 Yr Bachelor's 5 Yr Master's 6 Yr Specialist's 7 Yr Doctoral Other*
<1 1-10 11-20 21-30 >30
Average
Administrators
4.00 207.50
4 0
2 2
0 0 4 0 0 0 1 1 2 0 21.25
Support Personnel
3.00 190.00
3 0
0 3
1 2 0 0 0 0 2 1 0 0 9.00
PK-12 Teachers
47.58 190.63
46 3
9 40
18 19 12
0 0 4 16 16 12 1 14.35
*Includes One- and Two-Year Vocational Certificates.
ACCREDITATION DATA
Accredited by Southern Association of Colleges and Schools (SACS): Secondary/Middle Commission.
1998-99 GEORGIA PUBLIC EDUCATION REPORT CARD William James Middle School - 6160198
Prepared by Georgia Department of Education
Page 4
1998-99 GEORGIA PUBLIC EDUCATION REPORT CARD
BULLOCH COUNTY SCHOOLS
Willow Hill Elementary School - 6164054
Grade Range 4-7
The Georgia Public Education Report Card is designed to assist systems and schools in educational improvement. This report card contains a variety of data elements. An explanation of the terms is provided as a companion to the report card data. Please refer to the definitions for the most effective use of the reported data.
STUDENT DATA
Total 270
4-7 Enrollment, by Race/Ethnicity and Sex
Black
White Hispanic
American Multi-
Asian Indian
racial
121 44.8%
143 53.0%
5 1.9%
0 0.0%
0 0.0%
1 0.4%
Male Female
145 53.7%
125 46.3%
Enrollment in Selected Programs
Program
Program % of Student Enrollment Population
Gifted (Grades K-12)
14
5.2%
Alternative Programs (Grades 6-12)
0
0.0%
Students Eligible to Receive Free/Reduced Lunches
Number
Percent
School System
189 4,233
70.0% 50.6%
Dropout Rate for Grades 6-7
Number
Rate
School System
0
0.0%
6
0.4%
Enrollment in Compensatory Programs
Program
Program % of Student Enrollment Population
Special Education (Grades K-12)
49 18.1%
(PK)
0
N/A
English to Speakers of Other Languages (ESOL) (Grades K-12)
0
0.0%
Remedial Education (Grades 2-5, 9-12)
39 27.5%
Special Instructional Assistance (SIA) (Grades K-3)
N/A
N/A
Title I (Grades K-12)
This school has a schoolwide program.
Total 1
Retained Students, by Race/Ethnicity and Sex
Black
White Hispanic
American Multi-
Asian Indian
racial
1 100.0%
0 0.0%
0 0.0%
0 0.0%
0 0.0%
0 0.0%
Male Female
0
1
0.0% 100.0%
Prepared by Georgia Department of Education
Page 1
STATE-REQUIRED TEST DATA
NORM-REFERENCED TESTS
Grade 3 Iowa Tests of Basic Skills (ITBS) Each chart reflects data for three years of testing.
No third-grade students are enrolled at Willow Hill Elementary School.
Reading Comprehension
Mathematics
50
N/A 53 54 0
98-99
N/A 57 53 97-98
N/A 53 52 96-97
School 50
System
State
N/A 59 61 0
98-99
N/A 67 61 97-98
N/A 60 59 96-97
School System State
Reading Vocabulary 50
N/A 48 50 0
98-99
N/A 51 50 97-98
N/A 46 49 96-97
Language Arts
School 50
System
State
N/A 61 64 0
98-99
N/A 66 62 97-98
N/A 62 59 96-97
School System State
Social Studies 50
N/A 51 56 0
98-99
N/A 60 55 97-98
N/A 56 55 96-97
Science
School 50
System
State
N/A 63 59 0
98-99
N/A 66 59 97-98
N/A 60 58 96-97
School System State
Sources of Information
Composite Score
School
50
50
System
N/A 57 57 0
98-99
N/A 64 56 N/A 58 55
97-98
96-97
State
N/A 56 58 0
98-99
N/A 63 57 97-98
N/A 57 56 96-97
1998-99 GEORGIA PUBLIC EDUCATION REPORT CARD Willow Hill Elementary School - 6164054
Prepared by Georgia Department of Education
Scores Reported in Percentiles
School System State
Page 2
STATE-REQUIRED TEST DATA
NORM-REFERENCED TESTS Grade 5
Iowa Tests of Basic Skills (ITBS) Each chart reflects data for three years of testing.
Reading Comprehension
Mathematics
50
50 54 53 0
98-99
42 50 53 97-98
42 48 52 96-97
School 50
System
State
0
63 62 59 98-99
48 59 58 97-98
52 54 57 96-97
School System State
Reading Vocabulary 50
44 49 48 0
98-99
34 45 48 97-98
36 42 46 96-97
Language Arts
School 50
System
State
0
60 67 63 98-99
61 63 61 97-98
64 61 58 96-97
School System State
Social Studies 50
54 58 57 0
98-99
48 57 56 97-98
54 53 55 96-97
Science
School 50
System
State
0
64 66 60 98-99
52 63 59 97-98
64 62 59 96-97
School System State
Sources of Information
Composite Score
50
57 61 58 0
98-99
School 50
System
53 57 58 97-98
57 56 57 96-97
State 0
57 61 57 98-99
49 58 56 97-98
55 55 55 96-97
1998-99 GEORGIA PUBLIC EDUCATION REPORT CARD Willow Hill Elementary School - 6164054
Prepared by Georgia Department of Education
Scores Reported in Percentiles
School System State
Page 3
STATE-REQUIRED TEST DATA
PERFORMANCE ASSESSMENTS
Grade 5 Writing Assessment
Percent at Developmental Stages:
1998-99 School System State
1997-98 School System State
1996-97 School System State
Stage Stage Stage Stage Stage Stage
1:The Emerging Writer 2:The Developing Writer 3:The Focusing Writer 4:The Experimenting 5:The Engaging Writer 6:The Extending Writer
0% 0% 27% 31% 34% 8%
0% 1% 17% 43% 28% 11%
0% 1% 16% 41% 29% 12%
0% 5% 26% 57% 7% 5%
0% 3% 20% 42% 24% 10%
0% 3% 19% 41% 27% 10%
0% 2% 36% 38% 14% 10%
0% 4% 26% 36% 22% 11%
0% 3% 21% 37% 26% 12%
AWARDS / RECOGNITION DATA
Schools in Georgia may receive recognition in the following programs: Charter School Pay for Performance Program Georgia School of Excellence National Blue Ribbon School Willow Hill Elementary School did not receive recognition in any of these programs during the 1998-99 school year.
1998-99 GEORGIA PUBLIC EDUCATION REPORT CARD Willow Hill Elementary School - 6164054
Prepared by Georgia Department of Education
Page 4
CERTIFIED PERSONNEL DATA
Positions Number Average Contract Days
Personnel Sex
Certificate
Years Experience
Full-time Part-time
Male Female
4 Yr Bachelor's 5 Yr Master's 6 Yr Specialist's 7 Yr Doctoral Other*
<1 1-10 11-20 21-30 >30
Average
Administrators
1.00 210.00
1 0
0 1
0 0 1 0 0 0 0 0 1 0 27.00
Support Personnel
2.00 190.00
2 0
0 2
0 2 0 0 0 0 0 1 1 0 20.00
PK-12 Teachers
20.10 190.00
19 3
2 20
10 10
2 0 0 2 9 7 3 1 12.95
*Includes One- and Two-Year Vocational Certificates.
ACCREDITATION DATA
Accredited by Southern Association of Colleges and Schools (SACS):
Elementary/Middle Commission.
1998-99 GEORGIA PUBLIC EDUCATION REPORT CARD Willow Hill Elementary School - 6164054
Prepared by Georgia Department of Education
Page 5
1998-99 GEORGIA PUBLIC EDUCATION REPORT CARD BURKE COUNTY SCHOOLS - 617
The Georgia Public Education Report Card is designed to assist systems and schools in educational improvement. This report card contains a variety of data elements. An explanation of the terms is provided as a companion to the report card data. Please refer to the definitions for the most effective use of the reported data.
Total
K-12
4,755
PK
133
STUDENT DATA
Enrollment, by Race/Ethnicity and Sex
Black
White Hispanic
American Multi-
Asian Indian
racial
3,251 68.4%
1,435 30.2%
44 0.9%
10 0.2%
0 0.0%
15 0.3%
90 67.7%
42 31.6%
0 0.0%
0 0.0%
0 0.0%
1 0.8%
Male
2,435 51.2%
68 51.1%
Female
2,320 48.8%
65 48.9%
Enrollment in Selected Programs
Program
Program % of Student Enrollment Population
Gifted (Grades K-12)
29
< 1%
Non-Vocational Labs (Grades 9-12)
1,079
82.4%
Vocational Labs (Grades 9-12)
801
61.2%
Alternative Programs (Grades 6-12)
70
2.8%
Students Eligible to Receive Free/Reduced Lunches
Number
Percent
3,717
76.0%
Dropout Rate
Number
Percent
6-12 9-12
197
7.4%
157
11.3%
Enrollment in Compensatory Programs
Program
Program % of Student Enrollment Population
Special Education
(Grades K-12)
347
PK
33
English to Speakers of
Other Languages (ESOL)
0
(Grades K-12)
Remedial Education (Grades 2-5, 9-12)
406
Special Instructional
Assistance (SIA)
320
(Grades K-3)
Title I (Grades K-12) Number of schools with: Schoolwide program Targeted Assistance program No Title I program
7.3% N/A
0.0%
14.2%
21.6%
2 1 2
Total 305
Retained Students, by Race/Ethnicity and Sex
Black
White Hispanic
American MultiAsian Indian racial
237 77.7%
64 21.0%
3 1.0%
1 0.3%
0 0.0%
0 0.0%
Male Female 176 129
57.7% 42.3%
Prepared by Georgia Department of Education
Page 1
STATE-REQUIRED TEST DATA
NORM-REFERENCED TESTS
Grade 3 Iowa Tests of Basic Skills (ITBS) Each chart reflects data for three years of testing.
Reading Comprehension
Mathematics
50
42 54 37 53 33 52 0
98-99 97-98 96-97
System State
50
49 61 44 61 43 59 0
98-99 97-98 96-97
System State
Reading Vocabulary
50
35 50 34 50 26 49 0
98-99 97-98 96-97
System State
Social Studies
50
50 56 43 55 38 55 0
98-99 97-98 96-97
System State
Language Arts
50
58 64 55 62 48 59 0
98-99 97-98 96-97
System State
Science
50
49 59 42 59 39 58 0
98-99 97-98 96-97
System State
Sources of Information
Composite Score
50
52 57 0
98-99
System
50
46 56 39 55 97-98 96-97
State
48 58 42 57 0
98-99 97-98
1998-99 GEORGIA PUBLIC EDUCATION REPORT CARD Burke County Schools
Prepared by Georgia Department of Education
System State Scores Reported 37 56 in Percentiles 96-97
Page 2
STATE-REQUIRED TEST DATA
NORM-REFERENCED TESTS
Grade 5 Iowa Tests of Basic Skills (ITBS) Each chart reflects data for three years of testing.
Reading Comprehension
Mathematics
50
41 53 40 53 37 52 0
98-99 97-98 96-97
System State
50
48 59 45 58 49 57 0
98-99 97-98 96-97
System State
Reading Vocabulary
50
28 48 29 48 23 46 0
98-99 97-98 96-97
System State
Social Studies
50
41 57 41 56 38 55 0
98-99 97-98 96-97
System State
Language Arts
50
54 63 52 61 47 58 0
98-99 97-98 96-97
System State
Science
50
42 60 37 59 38 59 0
98-99 97-98 96-97
System State
Sources of Information
Composite Score
50
42 58 0
98-99
System
50
43 58 38 57 97-98 96-97
State
42 57 40 56 0
98-99 97-98
1998-99 GEORGIA PUBLIC EDUCATION REPORT CARD Burke County Schools
Prepared by Georgia Department of Education
System State Scores Reported 38 55 in Percentiles 96-97
Page 3
STATE-REQUIRED TEST DATA
NORM-REFERENCED TESTS Grade 8
Iowa Tests of Basic Skills (ITBS) Each chart reflects data for three years of testing.
Reading Comprehension
Mathematics
50
37 49 32 48 31 48 0
98-99 97-98 96-97
System State
50
57 56 52 55 47 54 0
98-99 97-98 96-97
System State
Reading Vocabulary
50
27 46 25 45 21 44 0
98-99 97-98 96-97
System State
Language Arts
50
52 60 50 58 40 56 0
98-99 97-98 96-97
System State
Social Studies
50
44 54 42 53 38 53 0
98-99 97-98 96-97
System State
Science
50
41 56 34 55 31 53 0
98-99 97-98 96-97
System State
Sources of Information
Composite Score
50
47 57 0
98-99
System
50
42 56 37 55 97-98 96-97
State
44 56 40 54 0
98-99 97-98
1998-99 GEORGIA PUBLIC EDUCATION REPORT CARD Burke County Schools
Prepared by Georgia Department of Education
System State Scores Reported 34 54 in Percentiles 96-97
Page 4
STATE-REQUIRED TEST DATA
PERFORMANCE ASSESSMENTS
Grade 5 Writing Assessment
1998-99
1997-98
1996-97
Percent at Developmental Stages:
Comparison
Comparison
Comparison
System Group State System Group State System Group State
Stage Stage Stage Stage Stage Stage
1: The Emerging Writer 2: The Developing Writer 3: The Focusing Writer 4: The Experimenting Writer 5: The Engaging Writer 6: The Extending Writer
0% 2% 30% 48% 15% 5%
0% 3% 27% 45% 19% 5%
0% 1% 16% 41% 29% 12%
0% 4% 36% 46% 13% 1%
1% 7% 34% 40% 14% 3%
0% 3% 19% 41% 27% 10%
0% 8% 35% 39% 12% 5%
1% 8% 35% 35% 15% 6%
0% 3% 21% 37% 26% 12%
Grade 8 Writing Assessment
1998-99 Percent Scoring 1997-98 Percent Scoring 1996-97 Percent Scoring
Categories of Scaled Scores
Comparison
Comparison
Comparison
System Group State System Group State System Group State
Inadequate (less than 162)
Minimal (162-209)
Good
(210-247)
Very Good (greater than 247)
16% 52% 28%
4%
19% 52% 26%
3%
8% 40% 41% 11%
30% 54% 15%
1%
29% 54% 16%
1%
11% 46% 34%
8%
36% 44% 16%
4%
37% 46% 14%
3%
15% 46% 30%
8%
Average Scaled Score: (Range 100-300)
193
190 208
178
179 202
177
175 198
GEORGIA HIGH SCHOOL GRADUATION TESTS (GHSGT)
Percent of Regular Program 11th Graders Passing the Georgia High School Graduation Tests on First Administration
1998-99
1997-98
1996-97
Comparison
Comparison
Comparison
System Group State System Group State System Group State
English Language Arts Mathematics Social Studies Science
96% 92% 77% 67%
89% 75% 62% 50%
96% 88% 80% 72%
93% 84% 73% 65%
86% 75% 57% 50%
94% 88% 78% 74%
93% 87% 66% 70%
88% 74% 60% 55%
94% 87% 78% 74%
All Components listed above 6 3 %
45% 68% 58%
41% 68% 63%
46% 67%
Writing
86%
84% 93% 87%
82% 92% 82%
84% 93%
1998-99 GEORGIA PUBLIC EDUCATION REPORT CARD
Burke County Schools
Prepared by Georgia Department of Education
Page 5
GRADUATE DATA
1999 Graduates by Credentials, Race/Ethnicity and Sex
Diplomas with Both College Prep. & Voc. Endorsements
Diplomas with College Prep. Endorsements Diplomas with Vocational Endorsements General High School Diplomas Special Education Diplomas
Total All Diplomas
Certificates of Performance
Total Graduates
Total 25 41
112 11 11
200 31
231
Black
15 60.0%
14 34.1%
78 69.6%
11 100.0%
11 100.0%
129 64.5%
29 93.5%
158 68.4%
American MultiWhite Hispanic Asian Indian racial
10 40.0%
27 65.9%
34 30.4%
0 0.0%
0 0.0%
71 35.5%
0 0.0%
0 0.0%
0 0.0%
0 0.0%
0 0.0%
0 0.0%
0 0.0%
0 0.0%
0 0.0%
0 0.0%
0 0.0%
0 0.0%
0 0.0%
0 0.0%
0 0.0%
0 0.0%
0 0.0%
0 0.0%
0 0.0%
0 0.0%
0 0.0%
0 0.0%
0 0.0%
0 0.0%
2
0
0
0
0
6.5% 0.0% 0.0% 0.0% 0.0%
73
0
0
0
0
31.6% 0.0% 0.0% 0.0% 0.0%
Male Female
8 32.0%
17 41.5%
58 51.8%
7 63.6%
10 90.9%
17 68.0%
24 58.5%
54 48.2%
4 36.4%
1 9.1%
100 100 50.0% 50.0%
9
22
29.0% 71.0%
109 122 47.2% 52.8%
HOPE Scholarships
System State
Number of 1999 Graduates 2 3 1
Number Eligible
85
Percent Eligible
36.8%
65,548 40,292 61.5%
High School Completion Rate Percent of 1995Grade 9 Enrollment
in Graduating Class of1999
System
State
Completion Rate '95-'99 62.6% 68.9%
COLLEGE ADMISSIONS / CREDIT TEST DATA
Scholastic Assessment Test (SAT)
No. Taking
Average Score
Tests
Verbal Math Total
Based on students' highest verbal and highest math scores
System College Prep. Endorsement Other Diplomas
451 450 901 510 494 1004 362 357 719
Georgia
492 488 980
Based on students' last test administration
System Georgia
106
445 440
885
41,958 483 479 962
Nation
952,913 502 508 1010
American College Testing (ACT)
System State Nation
English
15.8
19.1 20.4
Mathematics
18.0
19.9 20.7
Reading
18.2
20.2 21.3
Science Reasoning 17.7
19.9 21.0
CompositeScore 17.7
19.9 21.9
Advanced Placement Exams (AP)
No. of Students Taking Tests
No. of Tests Taken No. of Test Scores
3 or Higher Percent of Test
Scores 3 or Higher
System State 6 15,225 6 23,969 6 13,024
100.0% 54.3%
1998-99 GEORGIA PUBLIC EDUCATION REPORT CARD Burke County Schools
Prepared by Georgia Department of Education
Page 6
POSTSECONDARY DATA
Graduates Entering Georgia Public Colleges and Universities
Graduates Entering Georgia Public Colleges and Universities and
Requiring Learning Support (LS)
1998 Graduates Entering 1998-99
1997 Graduates Entering 1997-98
Percent of Graduating Number Class
57
21.8%
61
26.3%
Number Requiring
LS
6
15
Percent of those attending Georgia
Public Colleges
10.5%
24.6%
In previous years, the Report Card presented College Prep Curriculum information provided by the Board of Regents on students requiring Learning Support. Due to inconsistencies in the data provided by the Board of Regents in defining College Prep Completers versus Local Board of Education data defining College Prep Endorsements, the Department of Education Report Card will not provide this information until discrepancies can be reconciled.
Graduates Entering Georgia Public Technical and Adult Schools
Entering 1998-99 Entering 1997-98
Number Percent
Number Percent
1998 Graduates 1997 Graduates
32
12.2%
4
1.7%
N/A 17
N/A 7.3%
ACCREDITATION / RECOGNITION DATA
Southern Association of Colleges and Schools (SACS) Accrediting Commission
Secondary/Middle Commission Elementary/Middle Commission Both Elementary/Secondary Commissions Joint Commission Candidate for Accreditation
Accreditation by Georgia Accrediting Commission (GAC)
Accredited by GAC Accredited with Quality by GAC
Number of Schools
1 3 0 0 0
Number of Schools
1 4
Awards / Recognition
State Recognized Program
Number of Schools
Charter School
0
Pay for Performance Recipient
0
Georgia School of Excellence
0
National Blue Ribbon School
0
COMMUNITY DATA
Number of Children Eligible for Migrant Education Number of Families-At-Risk * Number of Food Stamp Participants * Number of Families Receiving TANF * ** Per Capita Income * Unemployment Rate * 1990 Population * Projected 2000 Population * Projected 2010 Population *
* Data Available at County Level Only ** Known as AFDC before January 1997
0 133 4,063 449 $15,636 12.7% 20,579 20,981 21,720
1998-99 GEORGIA PUBLIC EDUCATION REPORT CARD Burke County Schools
Prepared by Georgia Department of Education
Page 7
FISCAL DATA
Millage Rate
10.90
* Fall 1998 Property Tax Digest is used to calculate the 98-99 Value of One Mill
FTE Count
FTE Count used for Allotment Calculation 4,691.0 Fall '98 FTE Count 4,755
Value of One Mill
$1,727,119 $368.17 per Allotment FTE
Sources: Local State-QBE State-
Lottery State-
Other Federal Other
Total
PerGeneral Fund cent Per FTE
$20,462,700 70.6% $4,362 $8,204,342 28.3% $1,749
K-12 Revenues
Lottery K-12
and
Title
All Other
Programs
K-12
$0
$0
Bonded Debt $0
$0
$0
$0
$0 0.0%
$0
$0
$84,408
$0
$297,035 1.0% $63
$0
$0
$0
$2,500 0.0%
$1 $2,068,019
$45,636
$0
$0 0.0%
$0
$0
$0
$0
$28,966,578 100% $6,175 $2,068,019 $130,044
$0
Capital Projects
$225,818 $0
$0
$0 $0 $0 $225,818
School Nutrition
$159,894 $0
$0
$150,582 $1,558,335
$0 $1,868,812
Grand Total
Total
Per-
Amount cent
$20,848,413 62.7%
$8,204,342 24.7%
$84,408 0.3%
$447,617 1.3% $3,674,492 11.0%
$0 0.0% $33,259,274 100%
Instruction
Media Instruction
Support Pupil Services General Admin. School Admin. Trans-
portation Maint. & Ops. Capital Projects School Food Debt Service
Total
K-12 Expenditures
$15,334,829 60.6% $3,269 $1,582,143
$77,565
$0
$0
$0
$530,978 2.1% $113
$23,374
$0
$0
$0
$0
$1,021,775 4.0% $218 $154,952
$499
$0
$0
$0
$1,370,116 5.4% $292 $165,498
$1,321
$0
$0
$0
$943,851 3.7% $201 $148,443
$9,451
$0
$0
$0
$1,671,717 6.6% $356
$0
$55,233
$0
$0
$0
$1,789,428 7.1% $381
$9,365
$0
$0
$0
$0
$2,653,871 10.5% $566
$0
$0
$0
$69,300
$0
$0 0.0%
$0
$0
$0
$0 $2,416,017
$0
$0 0.0%
$0
$0
$0
$0
$0 $1,872,275
$0 0.0%
$0
$0
$0
$0
$0
$0
$25,316,568 100% $5,396 $2,083,779 $144,071
$0 $2,485,318 $1,872,275
$16,994,537 53.3% $554,353 1.7%
$1,177,227 3.7% $1,536,936 4.8% $1,101,746 3.5% $1,726,951 5.4% $1,798,794 5.6% $2,723,172 8.5% $2,416,017 7.6% $1,872,275 5.9%
$0 0.0%
$31,902,013 100%
Salaries and Benefits as Percentages of Revenues and of Expenditures
Teachers and Paraprofessionals
Salaries $12,311,242
Benefits $3,443,631
Percentage of Revenues Percentage of Expenditures
Total of
Total of
General Fund
General Fund
Title Programs
Title Programs
Lottery K-12
Lottery K-12
Total Salaries
and
Total
and
Total
and Benefits All Other K-12 K - 12 All Other K-12 K - 12
$15,754,873
50.6%
47.4%
57.2%
49.4%
School Administration
$945,272
$319,665
$1,264,937
4.1%
3.8%
4.6%
4.0%
General Administration
$429,444
$146,933
$576,377
1.8%
1.7%
2.1%
1.8%
1998-99 GEORGIA PUBLIC EDUCATION REPORT CARD
Burke County Schools - 617
Prepared by Georgia Department of Education
Page 8
CERTIFIED PERSONNEL DATA
Number
Average Annual Salary Positions Average Contract Days
Average Daily Salary
Full-time Personnel Part-time
Sex Male Female
4 Yr Bachelor's Certificate 5 Yr Master's
Level 6 Yr Specialist's 7 Yr Doctoral Other*
Black
White Race/ Hispanic Ethnicity Asian
American Indian
Multiracial
Years Experience
<1 1-10 11-20 21-30 >30
Average
Administrators
29.00
$62,424.02 215.14
$290.16
29 0
12 17
0 9 18 2 0
8 21
0 0 0 0
0 2 10 11 6
22.48
Support Personnel PK-12 Teachers
22.49
295.00
$45,155.32 194.27
$232.44
$36,369.58 190.54
$190.87
22
295
1
0
2
55
21
240
1
190
13
85
9
19
0
0
0
1
10
82
13
210
0
2
0
1
0
0
0
0
2
17
5
146
7
78
8
47
1
7
16.65
11.50
*Includes One- and Two-Year Vocational Certificates.
Certified Staff Position Ratios
Teacher/Administrator Ratio 10:1
Teacher/Support Person Ratio 13:1
Teacher/Staff Ratio 6:1
Student Enrollment/All Teachers 16:1
Certified Personnel by Category
85.0% 100%
8.4%
6.6%
80% 60%
40%
20%
0%
Teachers
Administrators
Support Personnel
1998-99 GEORGIA PUBLIC EDUCATION REPORT CARD
Burke County Schools - 617
Prepared by Georgia Department of Education
Page 9
1998-99 GEORGIA PUBLIC EDUCATION REPORT CARD
BURKE COUNTY SCHOOLS
Blakeney Elementary School - 6174050
Grade Range PK, 3-5
The Georgia Public Education Report Card is designed to assist systems and schools in educational improvement. This report card contains a variety of data elements. An explanation of the terms is provided as a companion to the report card data. Please refer to the definitions for the most effective use of the reported data.
STUDENT DATA
Total
3-5
977
PK
93
Enrollment, by Race/Ethnicity and Sex
Black
White Hispanic
American Asian Indian
Multiracial
696 71.2%
267 27.3%
10 1.0%
1 0.1%
0 0.0%
3 0.3%
66 71.0%
26 28.0%
0 0.0%
0 0.0%
0 0.0%
1 1.1%
Male Female
507 51.9%
470 48.1%
50 53.8%
43 46.2%
Enrollment in Selected Programs
Program
Program % of Student Enrollment Population
Gifted (Grades K-12)
5
< 1%
Alternative Programs (Grades 6-12)
N/A
N/A
Students Eligible to Receive Free/Reduced Lunches
Number
Percent
School System
836 3,717
78.1% 76.0%
Dropout Rate *
Number
Rate
School System
N/A N/A
N/A N/A
* Dropout rates are not applicable for grades PK-5.
Enrollment in Compensatory Programs
Program
Program % of Student Enrollment Population
Special Education (Grades K-12)
84
8.6%
(PK)
31
N/A
English to Speakers of Other Languages (ESOL) (Grades K-12)
0
0.0%
Remedial Education (Grades 2-5, 9-12)
226 23.1%
Special Instructional Assistance (SIA) (Grades K-3)
68 22.8%
Title I (Grades K-12)
This school has a schoolwide program.
Total 1
Retained Students, by Race/Ethnicity and Sex
Black
White Hispanic
American MultiAsian Indian racial
Male Female
0
1
0.0% 100.0%
0 0.0%
0 0.0%
0 0.0%
0
1
0.0% 100.0%
0 0.0%
Prepared by Georgia Department of Education
Page 1
STATE-REQUIRED TEST DATA
NORM-REFERENCED TESTS Grade 3
Iowa Tests of Basic Skills (ITBS) Each chart reflects data for three years of testing.
Reading Comprehension 50
41 42 54 0
98-99
36 37 53 97-98
32 33 52 96-97
Mathematics
School 50
System
State
0
47 49 61 98-99
43 44 61 97-98
41 43 59 96-97
School System State
Reading Vocabulary 50
34 35 50 0
98-99
33 34 50 97-98
25 26 49 96-97
Language Arts
School 50
System
State
0
53 58 64 98-99
53 55 62 97-98
46 48 59 96-97
School System State
Social Studies 50
52 50 56 0
98-99
42 43 55 97-98
36 38 55 96-97
Science
School 50
System
State
0
48 49 59 98-99
42 42 59 97-98
38 39 58 96-97
School System State
Sources of Information
Composite Score
50
52 52 57 0
98-99
School 50
System
45 46 56 97-98
39 39 55 96-97
State 0
47 48 58 98-99
41 42 57 97-98
1998-99 GEORGIA PUBLIC EDUCATION REPORT CARD Blakeney Elementary School - 6174050
Prepared by Georgia Department of Education
36 37 56 96-97
Scores Reported in Percentiles
School System State
Page 2
STATE-REQUIRED TEST DATA
NORM-REFERENCED TESTS Grade 5
Iowa Tests of Basic Skills (ITBS) Each chart reflects data for three years of testing.
Reading Comprehension
Mathematics
50
41 41 53 0
98-99
42 40 53 97-98
36 37 52 96-97
School 50
System
State
0
48 48 59 98-99
46 45 58 97-98
48 49 57 96-97
School System State
Reading Vocabulary 50
28 28 48 0
98-99
32 29 48 97-98
23 23 46 96-97
Language Arts
School 50
System
State
0
54 54 63 98-99
53 52 61 97-98
46 47 58 96-97
School System State
Social Studies 50
41 41 57 0
98-99
43 41 56 97-98
38 38 55 96-97
Science
School 50
System
State
0
42 42 60 98-99
38 37 59 97-98
36 38 59 96-97
School System State
Sources of Information
Composite Score
50
43 42 58 0
98-99
School 50
System
45 43 58 97-98
38 38 57 96-97
State 0
42 42 57 98-99
42 40 56 97-98
37 38 55 96-97
1998-99 GEORGIA PUBLIC EDUCATION REPORT CARD Blakeney Elementary School - 6174050
Prepared by Georgia Department of Education
Scores Reported in Percentiles
School System State
Page 3
STATE-REQUIRED TEST DATA
PERFORMANCE ASSESSMENTS
Grade 5 Writing Assessment
Percent at Developmental Stages:
1998-99 School System State
1997-98 School System State
1996-97 School System State
Stage Stage Stage Stage Stage Stage
1:The Emerging Writer 2:The Developing Writer 3:The Focusing Writer 4:The Experimenting 5:The Engaging Writer 6:The Extending Writer
0% 1% 31% 47% 16% 4%
0% 2% 30% 48% 15% 5%
0% 1% 16% 41% 29% 12%
0% 3% 32% 48% 14% 2%
0% 4% 36% 46% 13% 1%
0% 3% 19% 41% 27% 10%
0% 7% 34% 40% 13% 5%
0% 8% 35% 39% 12% 5%
0% 3% 21% 37% 26% 12%
AWARDS / RECOGNITION DATA
Schools in Georgia may receive recognition in the following programs: Charter School Pay for Performance Program Georgia School of Excellence National Blue Ribbon School Blakeney Elementary School did not receive recognition in any of these programs during the 1998-99 school year.
1998-99 GEORGIA PUBLIC EDUCATION REPORT CARD Blakeney Elementary School - 6174050
Prepared by Georgia Department of Education
Page 4
CERTIFIED PERSONNEL DATA
Positions Number Average Contract Days
Personnel Sex
Certificate
Years Experience
Full-time Part-time
Male Female
4 Yr Bachelor's 5 Yr Master's 6 Yr Specialist's 7 Yr Doctoral Other*
<1 1-10 11-20 21-30 >30
Average
Administrators
3.00 210.00
3 0
2 1
0 2 1 0 0 0 0 1 1 1 25.00
Support Personnel
3.49 190.00
3 1
1 3
1 3 0 0 0 0 1 0 2 1 23.50
PK-12 Teachers
63.33 190.00
63 1
8 56
45 14
5 0 0 6 32 14 11 1 10.84
*Includes One- and Two-Year Vocational Certificates.
ACCREDITATION DATA
Accredited by Southern Association of Colleges and Schools (SACS):
Elementary/Middle Commission. Accredited with Quality by Georgia
Accrediting Commission (GAC).
1998-99 GEORGIA PUBLIC EDUCATION REPORT CARD Blakeney Elementary School - 6174050
Prepared by Georgia Department of Education
Page 5
1998-99 GEORGIA PUBLIC EDUCATION REPORT CARD
BURKE COUNTY SCHOOLS
Burke County High School - 6170288
Grade Range 9-12
The Georgia Public Education Report Card is designed to assist systems and schools in educational improvement. This report card contains a variety of data elements. An explanation of the terms is provided as a companion to the report card data. Please refer to the definitions for the most effective use of the reported data.
Total 1,309
STUDENT DATA
9-12 Enrollment, by Race/Ethnicity and Sex
Black
White Hispanic
American Multi-
Asian Indian
racial
865 66.1%
426 32.5%
10 0.8%
7 0.5%
0 0.0%
1 0.1%
Male Female
621 47.4%
688 52.6%
Enrollment in Selected Programs
Program
Gifted (Grades K-12)
Program % of Student Enrollment Population
3
< 1%
Non-Vocational Labs (Grades 9-12)
Vocational Labs (Grades 9-12)
Alternative Programs (Grades 6-12)
1,079 801 32
82.4% 61.2%
2.4%
Students Eligible to Receive Free/Reduced Lunches
Number
Percent
School System
936 3,717
71.5% 76.0%
Enrollment in Compensatory Programs
Program
Program % of Student Enrollment Population
Special Education (Grades K-12) PK
81
6.2%
0
N/A
English to Speakers of Other Languages (ESOL) (Grades K-12)
0
0.0%
Remedial Education (Grades 2-5, 9-12)
97
7.4%
Title I (Grades K-12)
This school has no Title I program.
Dropout Rate for Grades 9-12
Number
Rate
School System
157
11.3%
157
11.3%
Total 172
Retained Students, by Race/Ethnicity and Sex
Black
White Hispanic
American MultiAsian Indian racial
130 75.6%
39 22.7%
2 1.2%
1 0.6%
0 0.0%
0 0.0%
Male Female
90
82
52.3% 47.7%
Prepared by Georgia Department of Education
Page 1
STATE-REQUIRED TEST DATA
GEORGIA HIGH SCHOOL GRADUATION TESTS (GHSGT)
Percent of Regular Program 11th Graders Passing the Georgia High School Graduation Tests on First Administration
English Language Arts Mathematics Social Studies Science
All Components listed above
Writing
1998-99
School System State
96% 92% 77% 67%
96% 92% 77% 67%
96% 88% 80% 72%
63% 63% 68%
86% 86% 93%
1997-98
School System State
93% 84% 73% 65%
93% 84% 73% 65%
94% 88% 78% 74%
58% 58% 68%
87% 87% 92%
1996-97
School System State
93% 87% 66% 70%
93% 87% 66% 70%
94% 87% 78% 74%
63% 63% 67%
82% 82% 93%
GRADUATE DATA
1999 Graduates by Credentials, Race/Ethnicity and Sex
Diplomas with Both College Prep. & Voc. Endorsements
Diplomas with College Prep. Endorsements Diplomas with Vocational Endorsements General High School Diplomas Special Education Diplomas
Total All Diplomas
Certificates of Performance
Total Graduates
Total 25 41
112 11 11
200 31
231
Black
15 60.0%
14 34.1%
78 69.6%
11 100.0%
11 100.0%
129 64.5%
29 93.5%
158 68.4%
White Hispanic
10 40.0%
27 65.9%
0 0.0%
0 0.0%
34 30.4%
0 0.0%
0 0.0%
0 0.0%
0 0.0%
0 0.0%
71 35.5%
0 0.0%
2 6.5%
0 0.0%
73 31.6%
0 0.0%
American MultiAsian Indian racial
0 0.0%
0 0.0%
0 0.0%
0 0.0%
0 0.0%
0 0.0%
0 0.0%
0 0.0%
0 0.0%
0 0.0%
0 0.0%
0 0.0%
0 0.0%
0 0.0%
0 0.0%
0 0.0%
0 0.0%
0 0.0%
0 0.0%
0 0.0%
0 0.0%
0 0.0%
0 0.0%
0 0.0%
Male Female
8 32.0%
17 41.5%
17 68.0%
24 58.5%
58 51.8%
7 63.6%
10 90.9%
54 48.2%
4 36.4%
1 9.1%
100
100
50.0% 50.0%
9
22
29.0% 71.0%
109
122
47.2% 52.8%
HOPE Scholarships
School System
Number of 1999 Graduates 2 3 1
Number Eligible
85
Percent Eligible
36.8%
231 85
36.8%
State
65,548 40,292 61.5%
High School Completion Rate
Percent of 1995Grade 9 Enrollment in Graduating Class of1999 School System State
Completion Rate '95-'99 62.6% 62.6% 68.9%
1998-99 GEORGIA PUBLIC EDUCATION REPORT CARD
Burke County High School - 6170288
Prepared by Georgia Department of Education
Page 2
COLLEGE ADMISSIONS / CREDIT TEST DATA
Scholastic Assessment Test (SAT)
Based on students' highest verbal and highest math scores
No. Taking
Average Score
Tests Verbal Math Total
Based on students' last test administration
Average Score Verbal Math Total
School
106
College Prep. Endorsement
Other Diplomas
System
106
College Prep. Endorsement
Other Diplomas
Georgia
41,958
451 450
901
510 494 1004
362 357
719
451 450
901
510 494 1004
362 357
719
492 488
980
445 N/A N/A
445 N/A N/A
483
440 N/A N/A
440 N/A N/A
479
885 N/A N/A
885 N/A N/A
962
Nation
952,913 N/A N/A N/A
502 508 1010
American College Testing (ACT)
Advanced Placement Exams (AP)
Number taking tests: English Mathematics Reading Science Reasoning CompositeScore
6 School System State
15.8 15.8 19.1
18.0 18.0 19.9
18.2 17.7
18.2 17.7
20.2 19.9
17.7 17.7 19.9
School System State
No. of Students Taking Tests
6
No. of Tests Taken
6
No. of Test Scores 3 or Higher
6
Percent of Test Scores 3 or Higher
100.0%
6 6 6
100.0%
15,225 23,969 13,024
54.3%
POST-SECONDARY DATA
Graduates Entering Georgia Public Colleges
Graduates Entering Georgia Public Colleges and Requiring Learning Support (LS)
1998 Graduates Entering in 1998-99
1997 Graduates Entering in 1997-98
Percent of Graduating Number Class
School
57
21.8%
System 5 7
21.8%
School
61
26.3%
System 6 1
26.3%
Number Requiring
LS 6 6
15 15
Percent of those attending Georgia
Public Colleges
10.5%
10.5%
24.6%
24.6%
In previous years, the Report Card presented College Prep Curriculum information provided by the Board of Regents on students requiring Learning Support. Due to inconsistencies in the data provided by the Board of Regents in defining College Prep Completers versus Local Board of Education data defining College Prep Endorsements, the Department of Education Report Card will not provide this information until discrepancies can be reconciled.
Graduates Entering Georgia Public Technical and Adult Schools
1998 Graduates School System
Entering Number 32 32
1998-99 Percent 12.2% 12.2%
Entering Number N/A N/A
1997-98 Percent
N/A N/A
1997 Graduates School
4
1.7%
System
4
1.7%
17
7.3%
17
7.3%
1998-99 GEORGIA PUBLIC EDUCATION REPORT CARD Burke County High School - 6170288
Prepared by Georgia Department of Education
Page 3
CERTIFIED PERSONNEL DATA
Positions Number Average Contract Days
Administrators
8.50 212.00
Support Personnel
5.50 195.45
PK-12 Teachers
73.83 192.03
Personnel Sex
Certificate
Years Experience
Full-time Part-time
Male Female
4 Yr Bachelor's 5 Yr Master's 6 Yr Specialist's 7 Yr Doctoral Other*
<1 1-10 11-20 21-30 >30
Average
8 1
6 3
0 4 5 0 0
0 2 2 3 2
22.56
5 1
0 6
0 3 3 0 0
1 0 3 2 0
17.50
73 2
26 49
47 22
5 0 1
1 33 24 14
3
13.01
*Includes One- and Two-Year Vocational Certificates.
ACCREDITATION DATA
Accredited by Southern Association of Colleges and Schools (SACS): Secondary/Middle Commission. Accredited with Quality by Georgia Accrediting Commission (GAC).
AWARDS / RECOGNITION DATA
Schools in Georgia may receive recognition in the following programs: Charter School Pay for Performance Program Georgia School of Excellence National Blue Ribbon School Burke County High School did not receive recognition in any of these programs during the 1998-99 school year.
1998-99 GEORGIA PUBLIC EDUCATION REPORT CARD Burke County High School - 6170288
Prepared by Georgia Department of Education
Page 4
1998-99 GEORGIA PUBLIC EDUCATION REPORT CARD
BURKE COUNTY SCHOOLS
Burke County Middle School - 6170188
Grade Range 6-8
The Georgia Public Education Report Card is designed to assist systems and schools in educational improvement. This report card contains a variety of data elements. An explanation of the terms is provided as a companion to the report card data. Please refer to the definitions for the most effective use of the reported data.
STUDENT DATA
Total 1,174
6-8 Enrollment, by Race/Ethnicity and Sex
Black
White Hispanic
American Multi-
Asian Indian
racial
779 66.4%
379 32.3%
10 0.9%
2 0.2%
0 0.0%
4 0.3%
Male 637
54.3%
Female 537
45.7%
Enrollment in Selected Programs
Program
Gifted (Grades K-12)
Program % of Student Enrollment Population
12
1.0%
Alternative Programs
38
(Grades 6-12)
3.2%
Students Eligible to Receive Free/Reduced Lunches
Number
Percent
School System
855 3,717
72.8% 76.0%
Enrollment in Compensatory Programs
Program
Program % of Student Enrollment Population
Special Education (Grades K-12) (PK)
80
6.8%
0
N/A
English to Speakers of Other Languages (ESOL) (Grades K-12)
0
0.0%
Title I (Grades K-12)
This school has no Title I program.
Dropout Rate for Grades 6-8
Number
Rate
School System
40
3.2%
40
3.2%
Total 98
Retained Students, by Race/Ethnicity and Sex
Black
White Hispanic
American MultiAsian Indian racial
77 78.6%
21 21.4%
0 0.0%
0 0.0%
0 0.0%
0 0.0%
Male Female
62
36
63.3% 36.7%
Prepared by Georgia Department of Education
Page 1
STATE-REQUIRED TEST DATA
NORM-REFERENCED TESTS Grade 8
Iowa Tests of Basic Skills (ITBS) Each chart reflects data for three years of testing.
Reading Comprehension 50
38 37 49 0
98-99
33 32 48 97-98
32 31 48 96-97
Mathematics
School 50
System
State
0
58 57 56 98-99
53 52 55 97-98
47 47 54 96-97
School System State
Reading Vocabulary 50
28 27 46 0
98-99
25 25 45 97-98
22 21 44 96-97
Language Arts
School 50
System
State
0
54 52 60 98-99
51 50 58 97-98
41 40 56 96-97
School System State
Social Studies 50
45 44 54 0
98-99
42 42 53 97-98
39 38 53 96-97
Science
School 50
System
State
0
42 41 56 98-99
35 34 55 97-98
32 31 53 96-97
School System State
Sources of Information
Composite Score
50
48 47 57 0
98-99
School 50
System
43 42 56 97-98
38 37 55 96-97
State 0
46 44 56 98-99
40 40 54 97-98
1998-99 GEORGIA PUBLIC EDUCATION REPORT CARD Burke County Middle School - 6170188
Prepared by Georgia Department of Education
35 34 54 96-97
Scores Reported in Percentiles
School System State
Page 2
STATE-REQUIRED TEST DATA
Categories of Scaled Scores
Inadequate (less than 162)
Minimal (162-209)
Good
(210-247)
Very Good (greater than 247)
Average Scaled Score: (Range 100-300)
PERFORMANCE ASSESSMENTS
Grade 8 Writing Assessment
1998-99 Percent Scoring
1997-98 Percent Scoring
1996-97 Percent Scoring
School System State School System State School System State
15% 52% 28%
5%
16% 52% 28%
4%
8% 40% 41% 11%
28% 55% 16%
1%
30% 54% 15%
1%
11% 46% 34%
8%
35% 44% 16%
5%
36% 44% 16%
4%
15% 46% 30%
8%
193
193
208 179
178 202 178
177 198
AWARDS / RECOGNITION DATA
Schools in Georgia may receive recognition in the following programs: Charter School Pay for Performance Program Georgia School of Excellence National Blue Ribbon School Burke County Middle School did not receive recognition in any of these programs during the 1998-99 school year.
1998-99 GEORGIA PUBLIC EDUCATION REPORT CARD Burke County Middle School - 6170188
Prepared by Georgia Department of Education
Page 3
CERTIFIED PERSONNEL DATA
Positions Number Average Contract Days
Personnel Sex
Certificate
Years Experience
Full-time Part-time
Male Female
4 Yr Bachelor's 5 Yr Master's 6 Yr Specialist's 7 Yr Doctoral Other*
<1 1-10 11-20 21-30 >30
Average
Administrators
4.00 215.00
4 0
1 3
0 0 4 0 0 0 0 2 1 1 21.75
Support Personnel
4.50 193.56
4 1
0 5
0 3 2 0 0 0 1 1 3 0 16.80
PK-12 Teachers
70.83 190.14
70 2
17 55
49 18
5 0 0 6 37 14 12 3 11.24
*Includes One- and Two-Year Vocational Certificates.
ACCREDITATION DATA
Accredited by Southern Association of Colleges and Schools (SACS):
Elementary/Middle Commission. Accredited by Georgia Accrediting
Commission (GAC).
1998-99 GEORGIA PUBLIC EDUCATION REPORT CARD Burke County Middle School - 6170188
Prepared by Georgia Department of Education
Page 4
1998-99 GEORGIA PUBLIC EDUCATION REPORT CARD
BURKE COUNTY SCHOOLS
S G A Elementary School - 6170196
Grade Range PK-5
The Georgia Public Education Report Card is designed to assist systems and schools in educational improvement. This report card contains a variety of data elements. An explanation of the terms is provided as a companion to the report card data. Please refer to the definitions for the most effective use of the reported data.
STUDENT DATA
Total
K-5
369
PK
40
Enrollment, by Race/Ethnicity and Sex
Black
White Hispanic
American Asian Indian
Multiracial
268 72.6%
101 27.4%
0 0.0%
0 0.0%
0 0.0%
0 0.0%
24 60.0%
16 40.0%
0 0.0%
0 0.0%
0 0.0%
0 0.0%
Male Female
184 49.9%
185 50.1%
18 45.0%
22 55.0%
Enrollment in Selected Programs
Program
Program % of Student Enrollment Population
Gifted (Grades K-12)
4
1.1%
Alternative Programs (Grades 6-12)
N/A
N/A
Students Eligible to Receive Free/Reduced Lunches
Number
Percent
School System
351 3,717
85.8% 76.0%
Dropout Rate *
Number
Rate
School System
N/A N/A
N/A N/A
* Dropout rates are not applicable for grades PK-5.
Enrollment in Compensatory Programs
Program
Program % of Student Enrollment Population
Special Education (Grades K-12)
33
8.9%
(PK)
2
N/A
English to Speakers of Other Languages (ESOL) (Grades K-12)
0
0.0%
Remedial Education (Grades 2-5, 9-12)
41 16.6%
Special Instructional Assistance (SIA) (Grades K-3)
36 13.9%
Title I (Grades K-12)
This school has a schoolwide program.
Total 7
Retained Students, by Race/Ethnicity and Sex
Black
White Hispanic
American MultiAsian Indian racial
7 100.0%
0 0.0%
0 0.0%
0 0.0%
0 0.0%
0 0.0%
Male Female
3
4
42.9% 57.1%
Prepared by Georgia Department of Education
Page 1
STATE-REQUIRED TEST DATA
NORM-REFERENCED TESTS Grade 3
Iowa Tests of Basic Skills (ITBS) Each chart reflects data for three years of testing.
Reading Comprehension 50
47 42 54 0
98-99
45 37 53 97-98
38 33 52 96-97
Mathematics
School 50
System
State
0
59 49 61 98-99
49 44 61 97-98
51 43 59 96-97
School System State
Reading Vocabulary 50
39 35 50 0
98-99
38 34 50 97-98
30 26 49 96-97
Language Arts
School 50
System
State
0
73 58 64 98-99
64 55 62 97-98
57 48 59 96-97
School System State
Social Studies 50
44 50 56 0
98-99
51 43 55 97-98
50 38 55 96-97
Science
School 50
System
State
0
54 49 59 98-99
44 42 59 97-98
44 39 58 96-97
School System State
Sources of Information
Composite Score
50
57 52 57 0
98-99
School 50
System
49 46 56 97-98
44 39 55 96-97
State 0
55 48 58 98-99
49 42 57 97-98
1998-99 GEORGIA PUBLIC EDUCATION REPORT CARD S G A Elementary School - 6170196
Prepared by Georgia Department of Education
45 37 56 96-97
Scores Reported in Percentiles
School System State
Page 2
STATE-REQUIRED TEST DATA
NORM-REFERENCED TESTS Grade 5
Iowa Tests of Basic Skills (ITBS) Each chart reflects data for three years of testing.
Reading Comprehension
Mathematics
50
40 41 53 0
98-99
36 40 53 97-98
38 37 52 96-97
School 50
System
State
0
51 48 59 98-99
40 45 58 97-98
57 49 57 96-97
School System State
Reading Vocabulary 50
25 28 48 0
98-99
21 29 48 97-98
23 23 46 96-97
Language Arts
School 50
System
State
0
53 54 63 98-99
49 52 61 97-98
52 47 58 96-97
School System State
Social Studies 50
41 41 57 0
98-99
33 41 56 97-98
40 38 55 96-97
Science
School 50
System
State
0
43 42 60 98-99
33 37 59 97-98
46 38 59 96-97
School System State
Sources of Information
Composite Score
50
38 42 58 0
98-99
School 50
System
35 43 58 97-98
41 38 57 96-97
State 0
41 42 57 98-99
34 40 56 97-98
42 38 55 96-97
1998-99 GEORGIA PUBLIC EDUCATION REPORT CARD S G A Elementary School - 6170196
Prepared by Georgia Department of Education
Scores Reported in Percentiles
School System State
Page 3
STATE-REQUIRED TEST DATA
PERFORMANCE ASSESSMENTS
Grade 5 Writing Assessment
Percent at Developmental Stages:
1998-99 School System State
1997-98 School System State
1996-97 School System State
Stage Stage Stage Stage Stage Stage
1:The Emerging Writer 2:The Developing Writer 3:The Focusing Writer 4:The Experimenting 5:The Engaging Writer 6:The Extending Writer
0% 4% 22% 59% 8% 6%
0% 2% 30% 48% 15% 5%
0% 1% 16% 41% 29% 12%
0% 5% 51% 37% 8% 0%
0% 4% 36% 46% 13% 1%
0% 3% 19% 41% 27% 10%
0% 10% 42% 36%
8% 4%
0% 8% 35% 39% 12% 5%
0% 3% 21% 37% 26% 12%
AWARDS / RECOGNITION DATA
Schools in Georgia may receive recognition in the following programs: Charter School Pay for Performance Program Georgia School of Excellence National Blue Ribbon School S G A Elementary School did not receive recognition in any of these programs during the 1998-99 school year.
1998-99 GEORGIA PUBLIC EDUCATION REPORT CARD S G A Elementary School - 6170196
Prepared by Georgia Department of Education
Page 4
CERTIFIED PERSONNEL DATA
Positions Number Average Contract Days
Personnel Sex
Certificate
Years Experience
Full-time Part-time
Male Female
4 Yr Bachelor's 5 Yr Master's 6 Yr Specialist's 7 Yr Doctoral Other*
<1 1-10 11-20 21-30 >30
Average
Administrators
1.00 210.00
1 0
0 1
0 0 1 0 0 0 0 1 0 0 19.00
Support Personnel
2.00 195.00
2 0
0 2
0 2 0 0 0 1 1 0 0 0 5.00
PK-12 Teachers
29.00 190.00
29 0
1 28
15 13
1 0 0 1 18 4 6 0 10.59
*Includes One- and Two-Year Vocational Certificates.
ACCREDITATION DATA
Accredited by Southern Association of Colleges and Schools (SACS):
Elementary/Middle Commission. Accredited with Quality by Georgia
Accrediting Commission (GAC).
1998-99 GEORGIA PUBLIC EDUCATION REPORT CARD S G A Elementary School - 6170196
Prepared by Georgia Department of Education
Page 5
1998-99 GEORGIA PUBLIC EDUCATION REPORT CARD
BURKE COUNTY SCHOOLS
Waynesboro Primary School - 6172056
Grade Range K-2
The Georgia Public Education Report Card is designed to assist systems and schools in educational improvement. This report card contains a variety of data elements. An explanation of the terms is provided as a companion to the report card data. Please refer to the definitions for the most effective use of the reported data.
STUDENT DATA
Total 926
K-2 Enrollment, by Race/Ethnicity and Sex
Black
White Hispanic
American Multi-
Asian Indian
racial
643 69.4%
262 28.3%
14 1.5%
0 0.0%
0 0.0%
7 0.8%
Male Female
486 52.5%
440 47.5%
Enrollment in Selected Programs
Program
Program % of Student Enrollment Population
Gifted (Grades K-12)
5
< 1%
Alternative Programs (Grades 6-12)
N/A
N/A
Students Eligible to Receive Free/Reduced Lunches
Number
Percent
School System
739 3,717
79.8% 76.0%
Dropout Rate *
Number
Rate
School System
N/A N/A
N/A N/A
* Dropout rates are not applicable for grades PK-5.
Enrollment in Compensatory Programs
Program
Program % of Student Enrollment Population
Special Education (Grades K-12)
69
7.5%
(PK)
0
N/A
English to Speakers of Other Languages (ESOL) (Grades K-12)
0
0.0%
Remedial Education (Grades 2-5, 9-12)
42 13.2%
Special Instructional Assistance (SIA) (Grades K-3)
216 23.3%
Title I (Grades K-12)
This school has a Targeted Assistance program.
Total 27
Retained Students, by Race/Ethnicity and Sex
Black
White Hispanic
American Multi-
Asian Indian
racial
23 85.2%
3 11.1%
1 3.7%
0 0.0%
0 0.0%
0 0.0%
Male Female
20
7
74.1% 25.9%
Prepared by Georgia Department of Education
Page 1
STATE-REQUIRED TEST DATA
NORM-REFERENCED TESTS
Grade 3 Iowa Tests of Basic Skills (ITBS) Each chart reflects data for three years of testing.
No third-grade students are enrolled at Waynesboro Primary School.
Reading Comprehension
Mathematics
50
N/A 42 54 0
98-99
N/A 37 53 97-98
N/A 33 52 96-97
School 50
System
State
N/A 49 61 0
98-99
N/A 44 61 97-98
N/A 43 59 96-97
School System State
Reading Vocabulary 50
N/A 35 50 0
98-99
N/A 34 50 97-98
N/A 26 49 96-97
Language Arts
School 50
System
State
N/A 58 64 0
98-99
N/A 55 62 97-98
N/A 48 59 96-97
School System State
Social Studies 50
N/A 50 56 0
98-99
N/A 43 55 97-98
N/A 38 55 96-97
Science
School 50
System
State
N/A 49 59 0
98-99
N/A 42 59 97-98
N/A 39 58 96-97
School System State
Sources of Information
Composite Score
School
50
50
System
N/A 52 57 0
98-99
N/A 46 56 N/A 39 55
97-98
96-97
State
N/A 48 58 0
98-99
N/A 42 57 97-98
N/A 37 56 96-97
1998-99 GEORGIA PUBLIC EDUCATION REPORT CARD Waynesboro Primary School - 6172056
Prepared by Georgia Department of Education
Scores Reported in Percentiles
School System State
Page 2
STATE-REQUIRED TEST DATA
NORM-REFERENCED TESTS
Grade 5 Iowa Tests of Basic Skills (ITBS) Each chart reflects data for three years of testing. No fifth-grade students are enrolled at Waynesboro Primary School.
Reading Comprehension
Mathematics
50
N/A 41 53 0
98-99
N/A 40 53 97-98
N/A 37 52 96-97
School 50
System
State
N/A 48 59 0
98-99
N/A 45 58 97-98
N/A 49 57 96-97
School System State
Reading Vocabulary 50
N/A 28 48 0
98-99
N/A 29 48 97-98
N/A 23 46 96-97
Language Arts
School 50
System
State
N/A 54 63 0
98-99
N/A 52 61 97-98
N/A 47 58 96-97
School System State
Social Studies 50
N/A 41 57 0
98-99
N/A 41 56 97-98
N/A 38 55 96-97
Science
School 50
System
State
N/A 42 60 0
98-99
N/A 37 59 97-98
N/A 38 59 96-97
School System State
Sources of Information
Composite Score
School
50
50
System
N/A 42 58 0
98-99
N/A 43 58 N/A 38 57
97-98
96-97
State
N/A 42 57 0
98-99
N/A 40 56 97-98
N/A 38 55 96-97
1998-99 GEORGIA PUBLIC EDUCATION REPORT CARD Waynesboro Primary School - 6172056
Prepared by Georgia Department of Education
Scores Reported in Percentiles
School System State
Page 3
STATE-REQUIRED TEST DATA
PERFORMANCE ASSESSMENTS
Grade 5 Writing Assessment
Percent at Developmental Stages:
1998-99 School System State
1997-98 School System State
1996-97 School System State
Stage Stage Stage Stage Stage Stage
1:The Emerging Writer 2:The Developing Writer 3:The Focusing Writer 4:The Experimenting 5:The Engaging Writer 6:The Extending Writer
N/A N/A N/A N/A N/A N/A
0% 2% 30% 48% 15% 5%
0% 1% 16% 41% 29% 12%
N/A N/A N/A N/A N/A N/A
0% 4% 36% 46% 13% 1%
0% 3% 19% 41% 27% 10%
N/A N/A N/A N/A N/A N/A
No fifth-grade students are enrolled at Waynesboro Primary School.
0% 8% 35% 39% 12% 5%
0% 3% 21% 37% 26% 12%
AWARDS / RECOGNITION DATA
Schools in Georgia may receive recognition in the following programs: Charter School Pay for Performance Program Georgia School of Excellence National Blue Ribbon School Waynesboro Primary School did not receive recognition in any of these programs during the 1998-99 school year.
1998-99 GEORGIA PUBLIC EDUCATION REPORT CARD Waynesboro Primary School - 6172056
Prepared by Georgia Department of Education
Page 4
CERTIFIED PERSONNEL DATA
Positions Number Average Contract Days
Personnel Sex
Certificate
Years Experience
Full-time Part-time
Male Female
4 Yr Bachelor's 5 Yr Master's 6 Yr Specialist's 7 Yr Doctoral Other*
<1 1-10 11-20 21-30 >30
Average
Administrators
4.00 202.50
4 0
2 2
0 1 3 0 0 0 0 3 1 0 15.25
Support Personnel
4.00 190.00
4 0
0 4
0 2 2 0 0 0 1 2 1 0 16.25
PK-12 Teachers
58.00 190.00
58 0
5 53
34 19
5 0 0 3 26 24 5 0 11.52
*Includes One- and Two-Year Vocational Certificates.
ACCREDITATION DATA
Accredited with Quality by Georgia Accrediting Commission (GAC).
1998-99 GEORGIA PUBLIC EDUCATION REPORT CARD Waynesboro Primary School - 6172056
Prepared by Georgia Department of Education
Page 5
1998-99 GEORGIA PUBLIC EDUCATION REPORT CARD BUTTS COUNTY SCHOOLS - 618
The Georgia Public Education Report Card is designed to assist systems and schools in educational improvement. This report card contains a variety of data elements. An explanation of the terms is provided as a companion to the report card data. Please refer to the definitions for the most effective use of the reported data.
Total
K-12
3,175
PK
0
STUDENT DATA
Enrollment, by Race/Ethnicity and Sex
Black
White Hispanic
American Multi-
Asian Indian
racial
1,220 38.4%
1,910 60.2%
14 0.4%
12 0.4%
4 0.1%
15 0.5%
0
0
0
0
0
0
Male 1,605 50.6%
0
Female 1,570 49.4% 0
Enrollment in Selected Programs
Program
Program % of Student Enrollment Population
Gifted (Grades K-12)
73
2.3%
Non-Vocational Labs (Grades 9-12)
633
71.5%
Vocational Labs (Grades 9-12)
694
78.4%
Alternative Programs (Grades 6-12)
15
< 1%
Students Eligible to Receive Free/Reduced Lunches
Number
Percent
1,475
46.5%
Dropout Rate
Number
Percent
6-12 9-12
79
4.4%
78
8.2%
Enrollment in Compensatory Programs
Program
Program % of Student Enrollment Population
Special Education
(Grades K-12)
288
PK
0
English to Speakers of
Other Languages (ESOL)
0
(Grades K-12)
Remedial Education (Grades 2-5, 9-12)
251
Special Instructional
Assistance (SIA)
143
(Grades K-3)
Title I (Grades K-12) Number of schools with: Schoolwide program Targeted Assistance program No Title I program
9.1% N/A
0.0%
13.1%
14.6%
3 0 1
Total 122
Retained Students, by Race/Ethnicity and Sex
Black
White Hispanic
American MultiAsian Indian racial
61 50.0%
55 45.1%
3 2.5%
1 0.8%
0 0.0%
2 1.6%
Male Female
82
40
67.2% 32.8%
Prepared by Georgia Department of Education
Page 1
STATE-REQUIRED TEST DATA
NORM-REFERENCED TESTS
Grade 3 Iowa Tests of Basic Skills (ITBS) Each chart reflects data for three years of testing.
Reading Comprehension
Mathematics
50
42 54 38 53 34 52 0
98-99 97-98 96-97
System State
50
46 61 49 61 34 59 0
98-99 97-98 96-97
System State
Reading Vocabulary
50
38 50 33 50 30 49 0
98-99 97-98 96-97
System State
Social Studies
50
40 56 39 55 33 55 0
98-99 97-98 96-97
System State
Language Arts
50
57 64 52 62 27 59 0
98-99 97-98 96-97
System State
Science
50
43 59 44 59 41 58 0
98-99 97-98 96-97
System State
Sources of Information
Composite Score
50
47 57 0
98-99
System
50
45 56 34 55 97-98 96-97
State
44 58 43 57 0
98-99 97-98
1998-99 GEORGIA PUBLIC EDUCATION REPORT CARD Butts County Schools
Prepared by Georgia Department of Education
System State Scores Reported 31 56 in Percentiles 96-97
Page 2
STATE-REQUIRED TEST DATA
NORM-REFERENCED TESTS
Grade 5 Iowa Tests of Basic Skills (ITBS) Each chart reflects data for three years of testing.
Reading Comprehension
Mathematics
50
39 53 36 53 35 52 0
98-99 97-98 96-97
System State
50
34 59 31 58 25 57 0
98-99 97-98 96-97
System State
Reading Vocabulary
50
29 48 26 48 24 46 0
98-99 97-98 96-97
System State
Social Studies
50
35 57 33 56 31 55 0
98-99 97-98 96-97
System State
Language Arts
50
46 63 37 61 28 58 0
98-99 97-98 96-97
System State
Science
50
38 60 42 59 40 59 0
98-99 97-98 96-97
System State
Sources of Information
Composite Score
50
40 58 0
98-99
System
50
38 58 35 57 97-98 96-97
State
36 57 34 56 0
98-99 97-98
1998-99 GEORGIA PUBLIC EDUCATION REPORT CARD Butts County Schools
Prepared by Georgia Department of Education
System State Scores Reported 28 55 in Percentiles 96-97
Page 3
STATE-REQUIRED TEST DATA
NORM-REFERENCED TESTS Grade 8
Iowa Tests of Basic Skills (ITBS) Each chart reflects data for three years of testing.
Reading Comprehension
Mathematics
50
43 49 45 48 37 48 0
98-99 97-98 96-97
System State
50
45 56 42 55 38 54 0
98-99 97-98 96-97
System State
Reading Vocabulary
50
41 46 56 45 45 44 0
98-99 97-98 96-97
System State
Language Arts
50
63 60 54 58 42 56 0
98-99 97-98 96-97
System State
Social Studies
50
44 54 45 53 47 53 0
98-99 97-98 96-97
System State
Science
50
48 56 48 55 42 53 0
98-99 97-98 96-97
System State
Sources of Information
Composite Score
50
50 57 0
98-99
System
50
46 56 46 55 97-98 96-97
State
48 56 47 54 0
98-99 97-98
1998-99 GEORGIA PUBLIC EDUCATION REPORT CARD Butts County Schools
Prepared by Georgia Department of Education
System State Scores Reported 42 54 in Percentiles 96-97
Page 4
STATE-REQUIRED TEST DATA
PERFORMANCE ASSESSMENTS
Grade 5 Writing Assessment
1998-99
1997-98
1996-97
Percent at Developmental Stages:
Comparison
Comparison
Comparison
System Group State System Group State System Group State
Stage Stage Stage Stage Stage Stage
1: The Emerging Writer 2: The Developing Writer 3: The Focusing Writer 4: The Experimenting Writer 5: The Engaging Writer 6: The Extending Writer
0% 5% 34% 39% 18% 4%
0% 1% 19% 43% 27% 10%
0% 1% 16% 41% 29% 12%
0% 6% 32% 45% 13% 3%
0% 3% 22% 43% 23% 7%
0% 3% 19% 41% 27% 10%
1% 12% 33% 33% 14%
5%
0% 5% 22% 34% 26% 12%
0% 3% 21% 37% 26% 12%
Grade 8 Writing Assessment
1998-99 Percent Scoring 1997-98 Percent Scoring 1996-97 Percent Scoring
Categories of Scaled Scores
Comparison
Comparison
Comparison
System Group State System Group State System Group State
Inadequate (less than 162)
Minimal (162-209)
Good
(210-247)
Very Good (greater than 247)
7% 56% 33%
5%
8% 45% 39%
9%
8% 40% 41% 11%
22% 49% 22%
7%
13% 50% 31%
6%
11% 46% 34%
8%
24% 52% 23%
1%
16% 49% 28%
7%
15% 46% 30%
8%
Average Scaled Score: (Range 100-300)
200
205 208
191
197 202
186
196 198
GEORGIA HIGH SCHOOL GRADUATION TESTS (GHSGT)
Percent of Regular Program 11th Graders Passing the Georgia High School Graduation Tests on First Administration
1998-99
1997-98
1996-97
Comparison
Comparison
Comparison
System Group State System Group State System Group State
English Language Arts Mathematics Social Studies Science
95% 82% 77% 68%
95% 86% 76% 68%
96% 88% 80% 72%
94% 80% 72% 65%
93% 86% 73% 71%
94% 88% 78% 74%
89% 73% 69% 66%
93% 86% 76% 74%
94% 87% 78% 74%
All Components listed above 6 3 %
63% 68% 57%
63% 68% 59%
66% 67%
Writing
84%
92% 93% 86%
91% 92% 85%
92% 93%
1998-99 GEORGIA PUBLIC EDUCATION REPORT CARD
Butts County Schools
Prepared by Georgia Department of Education
Page 5
GRADUATE DATA
1999 Graduates by Credentials, Race/Ethnicity and Sex
Diplomas with Both College Prep. & Voc. Endorsements
Diplomas with College Prep. Endorsements Diplomas with Vocational Endorsements General High School Diplomas Special Education Diplomas
Total All Diplomas
Certificates of Performance
Total Graduates
Total 0
Black 0
American MultiWhite Hispanic Asian Indian racial
0
0
0
0
0
Male Female
0
0
67
20
45
0
1
0
1
20
47
29.9% 67.2% 0.0% 1.5% 0.0% 1.5% 29.9% 70.1%
99
54
45
0
0
0
0
38
61
54.5% 45.5% 0.0% 0.0% 0.0% 0.0% 38.4% 61.6%
0
0
0
0
0
0
0
0
0
4
0
4
0
0
0
0
2
2
0.0% 100.0% 0.0% 0.0% 0.0% 0.0% 50.0% 50.0%
170
74
94
0
1
0
1
60 110
43.5% 55.3% 0.0% 0.6% 0.0% 0.6% 35.3% 64.7%
0
0
0
0
0
0
0
0
0
170
74
94
0
1
0
1
60 110
43.5% 55.3% 0.0% 0.6% 0.0% 0.6% 35.3% 64.7%
HOPE Scholarships
System State
Number of 1999 Graduates 1 7 0
Number Eligible
73
Percent Eligible
42.9%
65,548 40,292 61.5%
High School Completion Rate Percent of 1995Grade 9 Enrollment
in Graduating Class of1999
System
State
Completion Rate '95-'99 68.8% 68.9%
COLLEGE ADMISSIONS / CREDIT TEST DATA
Scholastic Assessment Test (SAT)
No. Taking
Average Score
Tests
Verbal Math Total
Based on students' highest verbal and highest math scores
System College Prep. Endorsement Other Diplomas
441 424 865 479 454 933 358 363 721
Georgia
492 488 980
Based on students' last test administration
System Georgia
91
429 415
844
41,958 483 479 962
Nation
952,913 502 508 1010
American College Testing (ACT)
System State Nation
English
16.0
19.1 20.4
Mathematics
16.4
19.9 20.7
Reading
16.8
20.2 21.3
Science Reasoning 17.3
19.9 21.0
CompositeScore 16.7
19.9 21.9
Advanced Placement Exams (AP)
No. of Students Taking Tests
No. of Tests Taken No. of Test Scores
3 or Higher Percent of Test
Scores 3 or Higher
System State 45 15,225 51 23,969 11 13,024
21.6% 54.3%
1998-99 GEORGIA PUBLIC EDUCATION REPORT CARD Butts County Schools
Prepared by Georgia Department of Education
Page 6
POSTSECONDARY DATA
Graduates Entering Georgia Public Colleges and Universities
Graduates Entering Georgia Public Colleges and Universities and
Requiring Learning Support (LS)
1998 Graduates Entering 1998-99
1997 Graduates Entering 1997-98
Percent of Graduating Number Class
54
36.7%
32
29.1%
Number Requiring
LS
16
12
Percent of those attending Georgia
Public Colleges
29.6%
37.5%
In previous years, the Report Card presented College Prep Curriculum information provided by the Board of Regents on students requiring Learning Support. Due to inconsistencies in the data provided by the Board of Regents in defining College Prep Completers versus Local Board of Education data defining College Prep Endorsements, the Department of Education Report Card will not provide this information until discrepancies can be reconciled.
Graduates Entering Georgia Public Technical and Adult Schools
Entering 1998-99 Entering 1997-98
Number Percent
Number Percent
1998 Graduates 1997 Graduates
11
7.5%
0
0.0%
N/A 5
N/A 4.5%
ACCREDITATION / RECOGNITION DATA
Southern Association of Colleges and Schools (SACS) Accrediting Commission
Secondary/Middle Commission Elementary/Middle Commission Both Elementary/Secondary Commissions Joint Commission Candidate for Accreditation
Accreditation by Georgia Accrediting Commission (GAC)
Accredited by GAC Accredited with Quality by GAC
Number of Schools
1 3 0 0 0
Number of Schools
0 4
Awards / Recognition
State Recognized Program
Number of Schools
Charter School
0
Pay for Performance Recipient
0
Georgia School of Excellence
0
National Blue Ribbon School
0
COMMUNITY DATA
Number of Children Eligible for Migrant Education Number of Families-At-Risk * Number of Food Stamp Participants * Number of Families Receiving TANF * ** Per Capita Income * Unemployment Rate * 1990 Population * Projected 2000 Population * Projected 2010 Population *
* Data Available at County Level Only ** Known as AFDC before January 1997
0 56 1,240 92 $18,302 4.6% 15,326 16,763 17,623
1998-99 GEORGIA PUBLIC EDUCATION REPORT CARD Butts County Schools
Prepared by Georgia Department of Education
Page 7
FISCAL DATA
Millage Rate
17.62
* Fall 1998 Property Tax Digest is used to calculate the 98-99 Value of One Mill
FTE Count
FTE Count used for Allotment Calculation 3,129.0 Fall '98 FTE Count 3,175
Value of One Mill
$294,289 $94.05 per Allotment FTE
Sources: Local State-QBE State-
Lottery State-
Other Federal Other
Total
PerGeneral Fund cent Per FTE
$5,377,312 34.1% $1,719 $10,329,232 65.4% $3,301
K-12 Revenues
Lottery K-12
and
Title
All Other
Programs
K-12
$0
$59,350
Bonded Debt $0
$0
$0
$0
$0 0.0%
$0
$0
$67,936
$0
$71,407 0.5% $23
$0
$0
$0
$0 0.0%
$0 $930,789
$0
$0
$4,155 0.0%
$1
$0
$0
$0
$15,782,107 100% $5,044 $930,789 $127,286
$0
Capital Projects $2,096,070
$0
$0
$4,094,543 $0 $0
$6,190,613
School Nutrition
$342,060 $0
$0
$86,356 $647,027
$0 $1,075,444
Grand Total
Total
Per-
Amount cent
$7,874,792 32.7%
$10,329,232 42.8%
$67,936 0.3%
$4,252,307 17.6% $1,577,817 6.5%
$4,155 0.0% $24,106,241 100%
Instruction
Media Instruction
Support Pupil Services General Admin. School Admin. Trans-
portation Maint. & Ops. Capital Projects School Food Debt Service
Total
$9,996,303 61.2% $3,195 $462,608 2.8% $148
$779,610 4.8% $249
$838,996 5.1% $268
$498,808 3.1% $159
$1,287,269 7.9% $411
$856,299 5.2% $274
$1,424,299 8.7% $455
$134,754 0.8% $43
$58,232 0.4% $19
$0 0.0%
$0
$16,337,182 100% $5,221
K-12 Expenditures
$599,989
$66,267
$0
$0
$0 $10,662,560 38.1%
$0
$0
$0
$0
$0
$462,608 1.7%
$273,674
$7,347
$0
$0
$0 $1,060,633 3.8%
$59,661
$42,789
$0
$0
$0
$941,447 3.4%
$10,390
$0
$0
$28,228
$0
$537,427 1.9%
$0
$0
$0
$0
$0 $1,287,269 4.6%
$8,286
$0
$0
$0
$0
$864,586 3.1%
$0
$0
$0
$25,105
$0 $1,449,404 5.2%
$0
$0
$0 $7,757,834
$0 $7,892,589 28.2%
$0
$0
$0
$0 $1,043,685 $1,101,917 3.9%
$0
$0 $1,710,947
$0
$0 $1,710,947 6.1%
$952,003 $116,404 $1,710,947 $7,811,168 $1,043,685 $27,971,391 100%
Salaries and Benefits as Percentages of Revenues and of Expenditures
Teachers and Paraprofessionals
Salaries $7,313,802
Benefits $2,144,713
Percentage of Revenues Percentage of Expenditures
Total of
Total of
General Fund
General Fund
Title Programs
Title Programs
Lottery K-12
Lottery K-12
Total Salaries
and
Total
and
Total
and Benefits All Other K-12 K - 12 All Other K-12 K - 12
$9,458,515
56.2%
39.2%
54.3%
33.8%
School Administration
$688,381
$251,244
$939,625
5.6%
3.9%
5.4%
3.4%
General Administration
$162,879
$99,365
$262,244
1.6%
1.1%
1.5%
0.9%
1998-99 GEORGIA PUBLIC EDUCATION REPORT CARD
Butts County Schools - 618
Prepared by Georgia Department of Education
Page 8
CERTIFIED PERSONNEL DATA
Number
Average Annual Salary Positions Average Contract Days
Average Daily Salary
Full-time Personnel Part-time
Sex Male Female
4 Yr Bachelor's Certificate 5 Yr Master's
Level 6 Yr Specialist's 7 Yr Doctoral Other*
Black
White Race/ Hispanic Ethnicity Asian
American Indian
Multiracial
Years Experience
<1 1-10 11-20 21-30 >30
Average
Administrators
18.63
$65,026.92 217.48
$299.00
16 27
10 33
12 12 16
3 0
8 35
0 0 0 0
0 9 12 21 1
18.86
Support Personnel PK-12 Teachers
19.62
186.08
$44,281.25 200.20
$221.18
$37,751.07 191.23
$197.42
15
139
56
52
24
36
47
155
34
112
31
68
5
11
1
0
0
0
15
38
56
153
0
0
0
0
0
0
0
0
0
11
38
86
16
46
17
43
0
5
12.07
12.64
*Includes One- and Two-Year Vocational Certificates.
Certified Staff Position Ratios
Teacher/Administrator Ratio 10:1
Teacher/Support Person Ratio 9:1
Teacher/Staff Ratio 5:1
Student Enrollment/All Teachers 17:1
Certified Personnel by Category
62.6% 100%
14.1%
23.3%
80% 60%
40%
20%
0%
Teachers
Administrators
Support Personnel
1998-99 GEORGIA PUBLIC EDUCATION REPORT CARD
Butts County Schools - 618
Prepared by Georgia Department of Education
Page 9
1998-99 GEORGIA PUBLIC EDUCATION REPORT CARD
BUTTS COUNTY SCHOOLS
Henderson Middle School - 6184050
Grade Range 6-8
The Georgia Public Education Report Card is designed to assist systems and schools in educational improvement. This report card contains a variety of data elements. An explanation of the terms is provided as a companion to the report card data. Please refer to the definitions for the most effective use of the reported data.
STUDENT DATA
Total 764
6-8 Enrollment, by Race/Ethnicity and Sex
Black
White Hispanic
American Multi-
Asian Indian
racial
274 35.9%
477 62.4%
7 0.9%
3 0.4%
1 0.1%
2 0.3%
Male 381
49.9%
Female 383
50.1%
Enrollment in Selected Programs
Program
Gifted (Grades K-12)
Program % of Student Enrollment Population
11
1.4%
Alternative Programs (Grades 6-12)
4
< 1%
Students Eligible to Receive Free/Reduced Lunches
Number
Percent
School System
360 1,475
47.1% 46.5%
Enrollment in Compensatory Programs
Program
Program % of Student Enrollment Population
Special Education (Grades K-12) (PK)
49
6.4%
0
N/A
English to Speakers of Other Languages (ESOL) (Grades K-12)
0
0.0%
Title I (Grades K-12)
This school has a schoolwide program.
Dropout Rate for Grades 6-8
Number
Rate
School System
1
0.1%
1
0.1%
Total 3
Retained Students, by Race/Ethnicity and Sex
Black
White Hispanic
American MultiAsian Indian racial
2 66.7%
0
1
0.0% 33.3%
0 0.0%
0 0.0%
0 0.0%
Male Female
3 100.0%
0 0.0%
Prepared by Georgia Department of Education
Page 1
STATE-REQUIRED TEST DATA
NORM-REFERENCED TESTS Grade 8
Iowa Tests of Basic Skills (ITBS) Each chart reflects data for three years of testing.
Reading Comprehension 50
43 43 49 0
98-99
45 45 48 97-98
37 37 48 96-97
Mathematics
School 50
System
State
0
45 45 56 98-99
42 42 55 97-98
38 38 54 96-97
School System State
Reading Vocabulary 50
41 41 46 0
98-99
56 56 45 97-98
45 45 44 96-97
Language Arts
School 50
System
State
0
63 63 60 98-99
54 54 58 97-98
42 42 56 96-97
School System State
Social Studies 50
44 44 54 0
98-99
45 45 53 97-98
47 47 53 96-97
Science
School 50
System
State
0
48 48 56 98-99
48 48 55 97-98
42 42 53 96-97
School System State
Sources of Information
Composite Score
50
50 50 57 0
98-99
School 50
System
46 46 56 97-98
46 46 55 96-97
State 0
48 48 56 98-99
47 47 54 97-98
1998-99 GEORGIA PUBLIC EDUCATION REPORT CARD Henderson Middle School - 6184050
Prepared by Georgia Department of Education
42 42 54 96-97
Scores Reported in Percentiles
School System State
Page 2
STATE-REQUIRED TEST DATA
Categories of Scaled Scores
Inadequate (less than 162)
Minimal (162-209)
Good
(210-247)
Very Good (greater than 247)
Average Scaled Score: (Range 100-300)
PERFORMANCE ASSESSMENTS
Grade 8 Writing Assessment
1998-99 Percent Scoring
1997-98 Percent Scoring
1996-97 Percent Scoring
School System State School System State School System State
7% 56% 33%
5%
7% 56% 33%
5%
8% 40% 41% 11%
22% 49% 22%
7%
22% 49% 22%
7%
11% 46% 34%
8%
24% 52% 23%
1%
24% 52% 23%
1%
15% 46% 30%
8%
200
200
208 191
191 202 186
186 198
AWARDS / RECOGNITION DATA
Schools in Georgia may receive recognition in the following programs: Charter School Pay for Performance Program Georgia School of Excellence National Blue Ribbon School Henderson Middle School did not receive recognition in any of these programs during the 1998-99 school year.
1998-99 GEORGIA PUBLIC EDUCATION REPORT CARD Henderson Middle School - 6184050
Prepared by Georgia Department of Education
Page 3
CERTIFIED PERSONNEL DATA
Positions Number Average Contract Days
Personnel Sex
Certificate
Years Experience
Full-time Part-time
Male Female
4 Yr Bachelor's 5 Yr Master's 6 Yr Specialist's 7 Yr Doctoral Other*
<1 1-10 11-20 21-30 >30
Average
Administrators
3.55 212.61
3 11
3 11
4 7 3 0 0 0 5 5 4 0 16.21
Support Personnel
4.76 195.48
3 23
8 18
17 8 1 0 0 0
16 7 3 0
10.50
PK-12 Teachers
49.44 191.07
32 20
9 43
36 15
1 0 0 4 30 12 5 1 9.96
*Includes One- and Two-Year Vocational Certificates.
ACCREDITATION DATA
Accredited by Southern Association of Colleges and Schools (SACS):
Elementary/Middle Commission. Accredited with Quality by Georgia
Accrediting Commission (GAC).
1998-99 GEORGIA PUBLIC EDUCATION REPORT CARD Henderson Middle School - 6184050
Prepared by Georgia Department of Education
Page 4
1998-99 GEORGIA PUBLIC EDUCATION REPORT CARD
BUTTS COUNTY SCHOOLS
Jackson Elementary School - 6180290
Grade Range 3-5
The Georgia Public Education Report Card is designed to assist systems and schools in educational improvement. This report card contains a variety of data elements. An explanation of the terms is provided as a companion to the report card data. Please refer to the definitions for the most effective use of the reported data.
STUDENT DATA
Total 785
3-5 Enrollment, by Race/Ethnicity and Sex
Black
White Hispanic
American Multi-
Asian Indian
racial
301 38.3%
473 60.3%
1 0.1%
4 0.5%
1 0.1%
5 0.6%
Male Female
380 48.4%
405 51.6%
Enrollment in Selected Programs
Program
Program % of Student Enrollment Population
Gifted (Grades K-12)
21
2.7%
Alternative Programs (Grades 6-12)
N/A
N/A
Students Eligible to Receive Free/Reduced Lunches
Number
Percent
School System
423 1,475
53.9% 46.5%
Dropout Rate *
Number
Rate
School System
N/A N/A
N/A N/A
* Dropout rates are not applicable for grades PK-5.
Enrollment in Compensatory Programs
Program
Program % of Student Enrollment Population
Special Education (Grades K-12)
60
7.6%
(PK)
0
N/A
English to Speakers of Other Languages (ESOL) (Grades K-12)
0
0.0%
Remedial Education (Grades 2-5, 9-12)
251 32.0%
Special Instructional Assistance (SIA) (Grades K-3)
0
0.0%
Title I (Grades K-12)
This school has a schoolwide program.
Total 18
Retained Students, by Race/Ethnicity and Sex
Black
White Hispanic
American Multi-
Asian Indian
racial
7 38.9%
11 61.1%
0 0.0%
0 0.0%
0 0.0%
0 0.0%
Male Female
14
4
77.8% 22.2%
Prepared by Georgia Department of Education
Page 1
STATE-REQUIRED TEST DATA
NORM-REFERENCED TESTS Grade 3
Iowa Tests of Basic Skills (ITBS) Each chart reflects data for three years of testing.
Reading Comprehension 50
42 42 54 0
98-99
38 38 53 97-98
34 34 52 96-97
Mathematics
School 50
System
State
0
46 46 61 98-99
49 49 61 97-98
34 34 59 96-97
School System State
Reading Vocabulary 50
38 38 50 0
98-99
33 33 50 97-98
30 30 49 96-97
Language Arts
School 50
System
State
0
57 57 64 98-99
52 52 62 97-98
27 27 59 96-97
School System State
Social Studies 50
40 40 56 0
98-99
39 39 55 97-98
33 33 55 96-97
Science
School 50
System
State
0
43 43 59 98-99
44 44 59 97-98
41 41 58 96-97
School System State
Sources of Information
Composite Score
50
47 47 57 0
98-99
School 50
System
45 45 56 97-98
34 34 55 96-97
State 0
44 44 58 98-99
43 43 57 97-98
1998-99 GEORGIA PUBLIC EDUCATION REPORT CARD Jackson Elementary School - 6180290
Prepared by Georgia Department of Education
31 31 56 96-97
Scores Reported in Percentiles
School System State
Page 2
STATE-REQUIRED TEST DATA
NORM-REFERENCED TESTS Grade 5
Iowa Tests of Basic Skills (ITBS) Each chart reflects data for three years of testing.
Reading Comprehension
Mathematics
50
39 39 53 0
98-99
36 36 53 97-98
35 35 52 96-97
School 50
System
State
0
34 34 59 98-99
31 31 58 97-98
25 25 57 96-97
School System State
Reading Vocabulary 50
29 29 48 0
98-99
26 26 48 97-98
24 24 46 96-97
Language Arts
School 50
System
State
0
46 46 63 98-99
37 37 61 97-98
28 28 58 96-97
School System State
Social Studies 50
35 35 57 0
98-99
33 33 56 97-98
31 31 55 96-97
Science
School 50
System
State
0
38 38 60 98-99
42 42 59 97-98
40 40 59 96-97
School System State
Sources of Information
Composite Score
50
40 40 58 0
98-99
School 50
System
38 38 58 97-98
35 35 57 96-97
State 0
36 36 57 98-99
34 34 56 97-98
28 28 55 96-97
1998-99 GEORGIA PUBLIC EDUCATION REPORT CARD Jackson Elementary School - 6180290
Prepared by Georgia Department of Education
Scores Reported in Percentiles
School System State
Page 3
STATE-REQUIRED TEST DATA
PERFORMANCE ASSESSMENTS
Grade 5 Writing Assessment
Percent at Developmental Stages:
1998-99 School System State
1997-98 School System State
1996-97 School System State
Stage Stage Stage Stage Stage Stage
1:The Emerging Writer 2:The Developing Writer 3:The Focusing Writer 4:The Experimenting 5:The Engaging Writer 6:The Extending Writer
0% 5% 34% 39% 18% 4%
0% 5% 34% 39% 18% 4%
0% 1% 16% 41% 29% 12%
0% 6% 32% 45% 13% 3%
0% 6% 32% 45% 13% 3%
0% 3% 19% 41% 27% 10%
1% 12% 33% 33% 14%
5%
1% 12% 33% 33% 14%
5%
0% 3% 21% 37% 26% 12%
AWARDS / RECOGNITION DATA
Schools in Georgia may receive recognition in the following programs: Charter School Pay for Performance Program Georgia School of Excellence National Blue Ribbon School Jackson Elementary School did not receive recognition in any of these programs during the 1998-99 school year.
1998-99 GEORGIA PUBLIC EDUCATION REPORT CARD Jackson Elementary School - 6180290
Prepared by Georgia Department of Education
Page 4
CERTIFIED PERSONNEL DATA
Positions Number Average Contract Days
Personnel Sex
Certificate
Years Experience
Full-time Part-time
Male Female
4 Yr Bachelor's 5 Yr Master's 6 Yr Specialist's 7 Yr Doctoral Other*
<1 1-10 11-20 21-30 >30
Average
Administrators
2.20 217.27
2 4
1 5
2 2 2 0 0 0 1 3 2 0 17.33
Support Personnel
3.37 203.35
3 5
0 8
2 5 1 0 0 0 4 2 2 0 12.25
PK-12 Teachers
40.19 190.00
34 7
1 40
21 18
2 0 0 3 17 9 12 0 13.44
*Includes One- and Two-Year Vocational Certificates.
ACCREDITATION DATA
Accredited by Southern Association of Colleges and Schools (SACS):
Elementary/Middle Commission. Accredited with Quality by Georgia
Accrediting Commission (GAC).
1998-99 GEORGIA PUBLIC EDUCATION REPORT CARD Jackson Elementary School - 6180290
Prepared by Georgia Department of Education
Page 5
1998-99 GEORGIA PUBLIC EDUCATION REPORT CARD
BUTTS COUNTY SCHOOLS
Jackson High School - 6180190
Grade Range 9-12
The Georgia Public Education Report Card is designed to assist systems and schools in educational improvement. This report card contains a variety of data elements. An explanation of the terms is provided as a companion to the report card data. Please refer to the definitions for the most effective use of the reported data.
Total 885
STUDENT DATA
9-12 Enrollment, by Race/Ethnicity and Sex
Black
White Hispanic
American Multi-
Asian Indian
racial
346 39.1%
530 59.9%
3 0.3%
3 0.3%
0 0.0%
3 0.3%
Male Female
445 50.3%
440 49.7%
Enrollment in Selected Programs
Program
Gifted (Grades K-12)
Program % of Student Enrollment Population
40
4.5%
Non-Vocational Labs (Grades 9-12)
633
Vocational Labs
(Grades 9-12)
694
Alternative Programs (Grades 6-12)
11
71.5% 78.4%
1.2%
Students Eligible to Receive Free/Reduced Lunches
Number
Percent
School System
278 1,475
31.4% 46.5%
Enrollment in Compensatory Programs
Program
Program % of Student Enrollment Population
Special Education (Grades K-12) PK
71
8.0%
0
N/A
English to Speakers of Other Languages (ESOL) (Grades K-12)
0
0.0%
Remedial Education (Grades 2-5, 9-12)
0
0.0%
Title I (Grades K-12)
This school has no Title I program.
Dropout Rate for Grades 9-12
Number
Rate
School System
78
8.2%
78
8.2%
Total 86
Retained Students, by Race/Ethnicity and Sex
Black
White Hispanic
American MultiAsian Indian racial
44 51.2%
38 44.2%
2 2.3%
0 0.0%
0 0.0%
2 2.3%
Male Female
54
32
62.8% 37.2%
Prepared by Georgia Department of Education
Page 1
STATE-REQUIRED TEST DATA
GEORGIA HIGH SCHOOL GRADUATION TESTS (GHSGT)
Percent of Regular Program 11th Graders Passing the Georgia High School Graduation Tests on First Administration
English Language Arts Mathematics Social Studies Science
All Components listed above
Writing
1998-99
School System State
95% 82% 77% 68%
95% 82% 77% 68%
96% 88% 80% 72%
63% 63% 68%
84% 84% 93%
1997-98
School System State
94% 80% 72% 65%
94% 80% 72% 65%
94% 88% 78% 74%
57% 57% 68%
86% 86% 92%
1996-97
School System State
89% 73% 69% 66%
89% 73% 69% 66%
94% 87% 78% 74%
59% 59% 67%
85% 85% 93%
GRADUATE DATA
1999 Graduates by Credentials, Race/Ethnicity and Sex
Diplomas with Both College Prep. & Voc. Endorsements
Diplomas with College Prep. Endorsements Diplomas with Vocational Endorsements General High School Diplomas Special Education Diplomas
Total All Diplomas
Certificates of Performance
Total Graduates
Total 0
Black 0
White Hispanic
0
0
American MultiAsian Indian racial
0
0
0
67
20
45
0
1
0
1
29.9% 67.2% 0.0% 1.5% 0.0% 1.5%
99
54
45
0
0
0
0
54.5% 45.5% 0.0% 0.0% 0.0% 0.0%
0
0
0
0
0
0
0
4
0
4
0
0
0
0
0.0% 100.0% 0.0% 0.0% 0.0% 0.0%
170
74
94
0
1
0
1
43.5% 55.3% 0.0% 0.6% 0.0% 0.6%
0
0
0
0
0
0
0
170
74
94
0
1
0
1
43.5% 55.3% 0.0% 0.6% 0.0% 0.6%
Male Female
0
0
20 29.9%
38 38.4%
0
47 70.1%
61 61.6%
0
2 50.0%
60 35.3%
0
2 50.0%
110 64.7%
0
60
110
35.3% 64.7%
HOPE Scholarships
School System
Number of 1999 Graduates 1 7 0
Number Eligible
73
Percent Eligible
42.9%
170 73
42.9%
State
65,548 40,292 61.5%
High School Completion Rate
Percent of 1995Grade 9 Enrollment in Graduating Class of1999 School System State
Completion Rate '95-'99 68.8% 68.8% 68.9%
1998-99 GEORGIA PUBLIC EDUCATION REPORT CARD
Jackson High School - 6180190
Prepared by Georgia Department of Education
Page 2
COLLEGE ADMISSIONS / CREDIT TEST DATA
Scholastic Assessment Test (SAT)
Based on students' highest verbal and highest math scores
No. Taking
Average Score
Tests Verbal Math Total
Based on students' last test administration
Average Score Verbal Math Total
School College Prep. Endorsement Other Diplomas
91 441 424
865
479 454
933
358 363
721
System College Prep. Endorsement Other Diplomas
91 441 424
865
479 454
933
358 363
721
Georgia
41,958 492 488
980
429 N/A N/A
429 N/A N/A
483
415 N/A N/A
415 N/A N/A
479
844 N/A N/A
844 N/A N/A
962
Nation
952,913 N/A N/A N/A
502 508 1010
American College Testing (ACT)
Advanced Placement Exams (AP)
Number taking tests: English Mathematics Reading Science Reasoning CompositeScore
3 0 School System State
16.0 16.0 19.1
16.4 16.4 19.9
16.8 17.3
16.8 17.3
20.2 19.9
16.7 16.7 19.9
No. of Students Taking Tests
No. of Tests Taken No. of Test Scores
3 or Higher Percent of Test
Scores 3 or Higher
School 45 51 11
21.6%
System State 45 15,225 51 23,969 11 13,024
21.6% 54.3%
POST-SECONDARY DATA
Graduates Entering Georgia Public Colleges
Graduates Entering Georgia Public Colleges and Requiring Learning Support (LS)
1998 Graduates Entering in 1998-99
1997 Graduates Entering in 1997-98
Percent of Graduating Number Class
School
54
36.7%
System 5 4
36.7%
School
32
29.1%
System 3 2
29.1%
Number Requiring
LS 16 16
12 12
Percent of those attending Georgia
Public Colleges
29.6%
29.6%
37.5%
37.5%
In previous years, the Report Card presented College Prep Curriculum information provided by the Board of Regents on students requiring Learning Support. Due to inconsistencies in the data provided by the Board of Regents in defining College Prep Completers versus Local Board of Education data defining College Prep Endorsements, the Department of Education Report Card will not provide this information until discrepancies can be reconciled.
Graduates Entering Georgia Public Technical and Adult Schools
1998 Graduates School System
Entering Number 11 11
1998-99 Percent
7.5% 7.5%
Entering Number N/A N/A
1997-98 Percent
N/A N/A
1997 Graduates School
0
0.0%
System
0
0.0%
5
4.5%
5
4.5%
1998-99 GEORGIA PUBLIC EDUCATION REPORT CARD Jackson High School - 6180190
Prepared by Georgia Department of Education
Page 3
CERTIFIED PERSONNEL DATA
Positions Number Average Contract Days
Administrators
3.68 210.04
Support Personnel
5.38 207.17
PK-12 Teachers
50.60 194.16
Personnel Sex
Certificate
Years Experience
Full-time Part-time
Male Female
4 Yr Bachelor's 5 Yr Master's 6 Yr Specialist's 7 Yr Doctoral Other*
<1 1-10 11-20 21-30 >30
Average
3 6
3 6
4 1 4 0 0
0 1 1 6 1
22.67
2 32
20 14
20 12
2 0 0
0 16 11
7 0
12.41
33 21
25 29
29 20
5 0 0
3 20 12 16
3
14.31
*Includes One- and Two-Year Vocational Certificates.
ACCREDITATION DATA
Accredited by Southern Association of Colleges and Schools (SACS): Secondary/Middle Commission. Accredited with Quality by Georgia Accrediting Commission (GAC).
AWARDS / RECOGNITION DATA
Schools in Georgia may receive recognition in the following programs: Charter School Pay for Performance Program Georgia School of Excellence National Blue Ribbon School Jackson High School did not receive recognition in any of these programs during the 1998-99 school year.
1998-99 GEORGIA PUBLIC EDUCATION REPORT CARD Jackson High School - 6180190
Prepared by Georgia Department of Education
Page 4
1998-99 GEORGIA PUBLIC EDUCATION REPORT CARD
BUTTS COUNTY SCHOOLS
Jackson Primary School - 6180194
Grade Range K-2
The Georgia Public Education Report Card is designed to assist systems and schools in educational improvement. This report card contains a variety of data elements. An explanation of the terms is provided as a companion to the report card data. Please refer to the definitions for the most effective use of the reported data.
STUDENT DATA
Total 741
K-2 Enrollment, by Race/Ethnicity and Sex
Black
White Hispanic
American Multi-
Asian Indian
racial
299 40.4%
430 58.0%
3 0.4%
2 0.3%
2 0.3%
5 0.7%
Male Female
399 53.8%
342 46.2%
Enrollment in Selected Programs
Program
Program % of Student Enrollment Population
Gifted (Grades K-12)
1
< 1%
Alternative Programs (Grades 6-12)
N/A
N/A
Students Eligible to Receive Free/Reduced Lunches
Number
Percent
School System
414 1,475
55.9% 46.5%
Dropout Rate *
Number
Rate
School System
N/A N/A
N/A N/A
* Dropout rates are not applicable for grades PK-5.
Enrollment in Compensatory Programs
Program
Program % of Student Enrollment Population
Special Education (Grades K-12)
108 14.6%
(PK)
0
N/A
English to Speakers of Other Languages (ESOL) (Grades K-12)
0
0.0%
Remedial Education (Grades 2-5, 9-12)
0
0.0%
Special Instructional Assistance (SIA) (Grades K-3)
143 19.3%
Title I (Grades K-12)
This school has a schoolwide program.
Total 15
Retained Students, by Race/Ethnicity and Sex
Black
White Hispanic
American Multi-
Asian Indian
racial
8 53.3%
6 40.0%
0 0.0%
1 6.7%
0 0.0%
0 0.0%
Male Female
11
4
73.3% 26.7%
Prepared by Georgia Department of Education
Page 1
STATE-REQUIRED TEST DATA
NORM-REFERENCED TESTS
Grade 3 Iowa Tests of Basic Skills (ITBS) Each chart reflects data for three years of testing.
No third-grade students are enrolled at Jackson Primary School.
Reading Comprehension
Mathematics
50
N/A 42 54 0
98-99
N/A 38 53 97-98
N/A 34 52 96-97
School 50
System
State
N/A 46 61 0
98-99
N/A 49 61 97-98
N/A 34 59 96-97
School System State
Reading Vocabulary 50
N/A 38 50 0
98-99
N/A 33 50 97-98
N/A 30 49 96-97
Language Arts
School 50
System
State
N/A 57 64 0
98-99
N/A 52 62 97-98
N/A 27 59 96-97
School System State
Social Studies 50
N/A 40 56 0
98-99
N/A 39 55 97-98
N/A 33 55 96-97
Science
School 50
System
State
N/A 43 59 0
98-99
N/A 44 59 97-98
N/A 41 58 96-97
School System State
Sources of Information
Composite Score
School
50
50
System
N/A 47 57 0
98-99
N/A 45 56 N/A 34 55
97-98
96-97
State
N/A 44 58 0
98-99
N/A 43 57 97-98
N/A 31 56 96-97
1998-99 GEORGIA PUBLIC EDUCATION REPORT CARD Jackson Primary School - 6180194
Prepared by Georgia Department of Education
Scores Reported in Percentiles
School System State
Page 2
STATE-REQUIRED TEST DATA
NORM-REFERENCED TESTS
Grade 5 Iowa Tests of Basic Skills (ITBS) Each chart reflects data for three years of testing. No fifth-grade students are enrolled at Jackson Primary School.
Reading Comprehension
Mathematics
50
N/A 39 53 0
98-99
N/A 36 53 97-98
N/A 35 52 96-97
School 50
System
State
N/A 34 59 0
98-99
N/A 31 58 97-98
N/A 25 57 96-97
School System State
Reading Vocabulary 50
N/A 29 48 0
98-99
N/A 26 48 97-98
N/A 24 46 96-97
Language Arts
School 50
System
State
N/A 46 63 0
98-99
N/A 37 61 97-98
N/A 28 58 96-97
School System State
Social Studies 50
N/A 35 57 0
98-99
N/A 33 56 97-98
N/A 31 55 96-97
Science
School 50
System
State
N/A 38 60 0
98-99
N/A 42 59 97-98
N/A 40 59 96-97
School System State
Sources of Information
Composite Score
School
50
50
System
N/A 40 58 0
98-99
N/A 38 58 N/A 35 57
97-98
96-97
State
N/A 36 57 0
98-99
N/A 34 56 97-98
N/A 28 55 96-97
1998-99 GEORGIA PUBLIC EDUCATION REPORT CARD Jackson Primary School - 6180194
Prepared by Georgia Department of Education
Scores Reported in Percentiles
School System State
Page 3
STATE-REQUIRED TEST DATA
PERFORMANCE ASSESSMENTS
Grade 5 Writing Assessment
Percent at Developmental Stages:
1998-99 School System State
1997-98 School System State
1996-97 School System State
Stage Stage Stage Stage Stage Stage
1:The Emerging Writer 2:The Developing Writer 3:The Focusing Writer 4:The Experimenting 5:The Engaging Writer 6:The Extending Writer
N/A N/A N/A N/A N/A N/A
0% 5% 34% 39% 18% 4%
0% 1% 16% 41% 29% 12%
N/A N/A N/A N/A N/A N/A
0% 6% 32% 45% 13% 3%
0% 3% 19% 41% 27% 10%
N/A N/A N/A N/A N/A N/A
No fifth-grade students are enrolled at Jackson Primary School.
1% 12% 33% 33% 14%
5%
0% 3% 21% 37% 26% 12%
AWARDS / RECOGNITION DATA
Schools in Georgia may receive recognition in the following programs: Charter School Pay for Performance Program Georgia School of Excellence National Blue Ribbon School Jackson Primary School did not receive recognition in any of these programs during the 1998-99 school year.
1998-99 GEORGIA PUBLIC EDUCATION REPORT CARD Jackson Primary School - 6180194
Prepared by Georgia Department of Education
Page 4
CERTIFIED PERSONNEL DATA
Positions Number Average Contract Days
Personnel Sex
Certificate
Years Experience
Full-time Part-time
Male Female
4 Yr Bachelor's 5 Yr Master's 6 Yr Specialist's 7 Yr Doctoral Other*
<1 1-10 11-20 21-30 >30
Average
Administrators
2.25 216.67
2 5
0 7
2 2 3 0 0 0 2 3 2 0 14.86
Support Personnel
4.05 193.60
4 5
0 9
2 7 0 0 0 0 4 0 5 0 15.33
PK-12 Teachers
45.85 189.22
39 8
2 45
28 16
3 0 0 1 21 14 10 1 12.83
*Includes One- and Two-Year Vocational Certificates.
ACCREDITATION DATA
Accredited by Southern Association of Colleges and Schools (SACS):
Elementary/Middle Commission. Accredited with Quality by Georgia
Accrediting Commission (GAC).
1998-99 GEORGIA PUBLIC EDUCATION REPORT CARD Jackson Primary School - 6180194
Prepared by Georgia Department of Education
Page 5
1998-99 GEORGIA PUBLIC EDUCATION REPORT CARD CALHOUN CITY SCHOOLS - 765
The Georgia Public Education Report Card is designed to assist systems and schools in educational improvement. This report card contains a variety of data elements. An explanation of the terms is provided as a companion to the report card data. Please refer to the definitions for the most effective use of the reported data.
Total
K-12
2,238
PK
129
STUDENT DATA
Enrollment, by Race/Ethnicity and Sex
Black
White Hispanic
American Multi-
Asian Indian
racial
226 10.1%
1,786 79.8%
150 6.7%
54 2.4%
1 0.0%
21 0.9%
12 9.3%
103 79.8%
13 10.1%
0 0.0%
0 0.0%
1 0.8%
Male
1,145 51.2%
75 58.1%
Female
1,093 48.8%
54 41.9%
Enrollment in Selected Programs
Program
Program % of Student Enrollment Population
Gifted (Grades K-12)
276
12.3%
Non-Vocational Labs (Grades 9-12)
381
67.3%
Vocational Labs (Grades 9-12)
450
79.5%
Alternative Programs (Grades 6-12)
20
1.8%
Students Eligible to Receive Free/Reduced Lunches
Number
Percent
708
29.9%
Dropout Rate
Number
Percent
6-12 9-12
31
2.6%
29
4.7%
Enrollment in Compensatory Programs
Program
Program % of Student Enrollment Population
Special Education
(Grades K-12)
229
PK
22
English to Speakers of
Other Languages (ESOL)
0
(Grades K-12)
Remedial Education (Grades 2-5, 9-12)
137
Special Instructional
Assistance (SIA)
225
(Grades K-3)
Title I (Grades K-12) Number of schools with: Schoolwide program Targeted Assistance program No Title I program
10.2% N/A
0.0%
10.3%
29.5%
0 2 2
Total 37
Retained Students, by Race/Ethnicity and Sex
Black
White Hispanic
American MultiAsian Indian racial
5 13.5%
25
6
67.6% 16.2%
0 0.0%
0 0.0%
1 2.7%
Male Female
25
12
67.6% 32.4%
Prepared by Georgia Department of Education
Page 1
STATE-REQUIRED TEST DATA
NORM-REFERENCED TESTS
Grade 3 Iowa Tests of Basic Skills (ITBS) Each chart reflects data for three years of testing.
Reading Comprehension
Mathematics
50
51 54 63 53 62 52 0
98-99 97-98 96-97
System State
50
59 61 67 61 59 59 0
98-99 97-98 96-97
System State
Reading Vocabulary
50
51 50 60 50 58 49 0
98-99 97-98 96-97
System State
Social Studies
50
48 56 66 55 54 55 0
98-99 97-98 96-97
System State
Language Arts
50
59 64 68 62 63 59 0
98-99 97-98 96-97
System State
Science
50
57 59 67 59 63 58 0
98-99 97-98 96-97
System State
Sources of Information
Composite Score
50
50 57 0
98-99
System
50
61 56 60 55 97-98 96-97
State
53 58 65 57 0
98-99 97-98
1998-99 GEORGIA PUBLIC EDUCATION REPORT CARD Calhoun City Schools
Prepared by Georgia Department of Education
System State Scores Reported 59 56 in Percentiles 96-97
Page 2
STATE-REQUIRED TEST DATA
NORM-REFERENCED TESTS
Grade 5 Iowa Tests of Basic Skills (ITBS) Each chart reflects data for three years of testing.
Reading Comprehension
Mathematics
50
60 53 68 53 56 52 0
98-99 97-98 96-97
System State
50
63 59 74 58 62 57 0
98-99 97-98 96-97
System State
Reading Vocabulary
50
57 48 62 48 51 46 0
98-99 97-98 96-97
System State
Social Studies
50
66 57 71 56 60 55 0
98-99 97-98 96-97
System State
Language Arts
50
72 63 76 61 63 58 0
98-99 97-98 96-97
System State
Science
50
70 60 78 59 68 59 0
98-99 97-98 96-97
System State
Sources of Information
Composite Score
50
68 58 0
98-99
System
50
73 58 66 57 97-98 96-97
State
67 57 74 56 0
98-99 97-98
1998-99 GEORGIA PUBLIC EDUCATION REPORT CARD Calhoun City Schools
Prepared by Georgia Department of Education
System State Scores Reported 62 55 in Percentiles 96-97
Page 3
STATE-REQUIRED TEST DATA
NORM-REFERENCED TESTS Grade 8
Iowa Tests of Basic Skills (ITBS) Each chart reflects data for three years of testing.
Reading Comprehension
Mathematics
50
60 49 56 48 62 48 0
98-99 97-98 96-97
System State
50
71 56 66 55 71 54 0
98-99 97-98 96-97
System State
Reading Vocabulary
50
53 46 51 45 55 44 0
98-99 97-98 96-97
System State
Language Arts
50
74 60 76 58 77 56 0
98-99 97-98 96-97
System State
Social Studies
50
63 54 60 53 64 53 0
98-99 97-98 96-97
System State
Science
50
64 56 63 55 69 53 0
98-99 97-98 96-97
System State
Sources of Information
Composite Score
50
64 57 0
98-99
System
50
61 56 69 55 97-98 96-97
State
67 56 65 54 0
98-99 97-98
1998-99 GEORGIA PUBLIC EDUCATION REPORT CARD Calhoun City Schools
Prepared by Georgia Department of Education
System State Scores Reported 70 54 in Percentiles 96-97
Page 4
STATE-REQUIRED TEST DATA
PERFORMANCE ASSESSMENTS
Grade 5 Writing Assessment
1998-99
1997-98
1996-97
Percent at Developmental Stages:
Comparison
Comparison
Comparison
System Group State System Group State System Group State
Stage Stage Stage Stage Stage Stage
1: The Emerging Writer 2: The Developing Writer 3: The Focusing Writer 4: The Experimenting Writer 5: The Engaging Writer 6: The Extending Writer
0% 1% 18% 45% 26% 10%
0% 1% 17% 40% 30% 11%
0% 1% 16% 41% 29% 12%
0% 1% 12% 40% 29% 18%
0% 1% 16% 39% 30% 13%
0% 3% 19% 41% 27% 10%
0% 3% 19% 48% 24% 7%
0% 3% 19% 37% 29% 12%
0% 3% 21% 37% 26% 12%
Grade 8 Writing Assessment
1998-99 Percent Scoring 1997-98 Percent Scoring 1996-97 Percent Scoring
Categories of Scaled Scores
Comparison
Comparison
Comparison
System Group State System Group State System Group State
Inadequate (less than 162)
Minimal (162-209)
Good
(210-247)
Very Good (greater than 247)
3% 28% 54% 16%
5% 39% 47% 10%
8% 40% 41% 11%
4% 40% 41% 15%
7% 43% 41% 10%
11% 46% 34%
8%
8% 36% 47%
9%
10% 45% 35%
9%
15% 46% 30%
8%
Average Scaled Score: (Range 100-300)
219
211 208
212
209 202
211
204 198
GEORGIA HIGH SCHOOL GRADUATION TESTS (GHSGT)
Percent of Regular Program 11th Graders Passing the Georgia High School Graduation Tests on First Administration
1998-99
1997-98
1996-97
Comparison
Comparison
Comparison
System Group State System Group State System Group State
English Language Arts Mathematics Social Studies Science
97% 96% 83% 82%
97% 92% 82% 76%
96% 88% 80% 72%
94% 92% 82% 82%
96% 93% 81% 81%
94% 88% 78% 74%
93% 91% 83% 75%
95% 92% 83% 79%
94% 87% 78% 74%
All Components listed above 7 7 %
71% 68% 76%
74% 68% 72%
74% 67%
Writing
96%
95% 93% 97%
96% 92% 94%
95% 93%
1998-99 GEORGIA PUBLIC EDUCATION REPORT CARD
Calhoun City Schools
Prepared by Georgia Department of Education
Page 5
GRADUATE DATA
1999 Graduates by Credentials, Race/Ethnicity and Sex
Diplomas with Both College Prep. & Voc. Endorsements
Diplomas with College Prep. Endorsements Diplomas with Vocational Endorsements General High School Diplomas Special Education Diplomas
Total All Diplomas
Certificates of Performance
Total Graduates
Total 22 54 57 0 1
134 5
139
Black
1 4.5%
0 0.0%
5 8.8%
0
American MultiWhite Hispanic Asian Indian racial
19 86.4%
52 96.3%
47 82.5%
0
0 0.0%
0 0.0%
2 3.5%
0
2 9.1%
2 3.7%
1 1.8%
0
0 0.0%
0 0.0%
0 0.0%
0
0 0.0%
0 0.0%
2 3.5%
0
Male Female
14 63.6%
23 42.6%
28 49.1%
0
8 36.4%
31 57.4%
29 50.9%
0
0 0.0%
6 4.5%
0 0.0%
6 4.3%
1 100.0%
119 88.8%
3 60.0%
122 87.8%
0 0.0%
2 1.5%
1 20.0%
3 2.2%
0 0.0%
5 3.7%
1 20.0%
6 4.3%
0 0.0%
0 0.0%
0 0.0%
0 0.0%
0
1
0.0% 100.0%
2
66
1.5% 49.3%
0
1
0.0% 20.0%
2
67
1.4% 48.2%
0 0.0%
68 50.7%
4 80.0%
72 51.8%
HOPE Scholarships
System State
Number of 1999 Graduates 1 3 9
Number Eligible
83
Percent Eligible
59.7%
65,548 40,292 61.5%
High School Completion Rate Percent of 1995Grade 9 Enrollment
in Graduating Class of1999
System
State
Completion Rate '95-'99 80.8% 68.9%
COLLEGE ADMISSIONS / CREDIT TEST DATA
Scholastic Assessment Test (SAT)
No. Taking
Average Score
Tests
Verbal Math Total
Based on students' highest verbal and highest math scores
System College Prep. Endorsement Other Diplomas
495 488 983 529 521 1050 414 406 820
Georgia
492 488 980
Based on students' last test administration
System Georgia
98
485 481
966
41,958 483 479 962
Nation
952,913 502 508 1010
American College Testing (ACT)
System State Nation
English
18.5
19.1 20.4
Mathematics
20.4
19.9 20.7
Reading
18.5
20.2 21.3
Science Reasoning 20.5
19.9 21.0
CompositeScore 19.5
19.9 21.9
Advanced Placement Exams (AP)
No. of Students Taking Tests
No. of Tests Taken No. of Test Scores
3 or Higher Percent of Test
Scores 3 or Higher
System State 24 15,225 28 23,969 14 13,024
50.0% 54.3%
1998-99 GEORGIA PUBLIC EDUCATION REPORT CARD Calhoun City Schools
Prepared by Georgia Department of Education
Page 6
POSTSECONDARY DATA
Graduates Entering Georgia Public Colleges and Universities
Graduates Entering Georgia Public Colleges and Universities and
Requiring Learning Support (LS)
1998 Graduates Entering 1998-99
1997 Graduates Entering 1997-98
Percent of Graduating Number Class
45
46.9%
55
45.8%
Number Requiring
LS
10
13
Percent of those attending Georgia
Public Colleges
22.2%
23.6%
In previous years, the Report Card presented College Prep Curriculum information provided by the Board of Regents on students requiring Learning Support. Due to inconsistencies in the data provided by the Board of Regents in defining College Prep Completers versus Local Board of Education data defining College Prep Endorsements, the Department of Education Report Card will not provide this information until discrepancies can be reconciled.
Graduates Entering Georgia Public Technical and Adult Schools
Entering 1998-99 Entering 1997-98
Number Percent
Number Percent
1998 Graduates 1997 Graduates
1
1.0%
1
0.8%
N/A 1
N/A 0.8%
ACCREDITATION / RECOGNITION DATA
Southern Association of Colleges and Schools (SACS) Accrediting Commission
Secondary/Middle Commission Elementary/Middle Commission Both Elementary/Secondary Commissions Joint Commission Candidate for Accreditation
Accreditation by Georgia Accrediting Commission (GAC)
Accredited by GAC Accredited with Quality by GAC
Number of Schools
1 1 0 0 1
Number of Schools
0 0
Awards / Recognition
State Recognized Program
Number of Schools
Charter School
0
Pay for Performance Recipient
0
Georgia School of Excellence
0
National Blue Ribbon School
0
COMMUNITY DATA
Number of Children Eligible for Migrant Education Number of Families-At-Risk * Number of Food Stamp Participants * Number of Families Receiving TANF * ** Per Capita Income * Unemployment Rate * 1990 Population * Projected 2000 Population * Projected 2010 Population *
* Data Available at County Level Only ** Known as AFDC before January 1997
0 177 2,164 171 $19,802 4.4% 35,072 43,369 50,483
1998-99 GEORGIA PUBLIC EDUCATION REPORT CARD Calhoun City Schools
Prepared by Georgia Department of Education
Page 7
FISCAL DATA
Millage Rate
12.55
* Fall 1998 Property Tax Digest is used to calculate the 98-99 Value of One Mill
FTE Count
FTE Count used for Allotment Calculation 2,218.0 Fall '98 FTE Count 2,238
Value of One Mill
$435,390 $196.29 per Allotment FTE
Sources: Local State-QBE State-
Lottery State-
Other Federal Other
Total
PerGeneral Fund cent Per FTE
$5,294,976 40.9% $2,387 $7,315,495 56.5% $3,298
K-12 Revenues
Lottery K-12
and
Title
All Other
Programs
K-12
$0
$0
Bonded Debt $0
$0
$0
$0
$0 0.0%
$0
$0
$47,941
$0
$347,378 2.7% $157
$0
$0
$0
$0 0.0%
$0 $482,529
$4,455
$0
$0 0.0%
$0
$0
$0
$0
$12,957,850 100% $5,842 $482,529
$52,396
$0
Capital Projects $1,840,860
$0
$0
$0 $0 $0 $1,840,860
School Nutrition
$536,806 $0
$0
$57,070 $326,954
$0 $920,830
Grand Total
Total
Per-
Amount cent
$7,672,643 47.2%
$7,315,495 45.0%
$47,941 0.3%
$404,448 2.5% $813,940 5.0%
$0 0.0% $16,254,468 100%
Instruction
Media Instruction
Support Pupil Services General Admin. School Admin. Trans-
portation Maint. & Ops. Capital Projects School Food Debt Service
Total
$8,784,598 66.0% $3,961 $300,514 2.3% $135
$448,023 3.4% $202
$883,232 6.6% $398
$464,282 3.5% $209
$1,021,843 7.7% $461
$327,683 2.5% $148
$1,034,855 7.8% $467
$0 0.0%
$0
$40,000 0.3% $18
$0 0.0%
$0
$13,305,033 100% $5,999
K-12 Expenditures
$311,811
$47,955
$0
$0
$0
$300
$0
$0
$0
$0
$100,957
$0
$0
$0
$0
$50,272
$4,506
$0
$0
$0
$0
$0
$0
$0
$0
$0
$0
$0
$0
$0
$3,206
$0
$0
$0
$0
$0
$0
$0
$0
$0
$0
$0
$0 $1,427,895
$0
$0
$0
$0
$0 $1,008,265
$0
$0
$0 $771,312
$0
$9,144,365 53.7% $300,814 1.8% $548,981 3.2% $938,011 5.5% $464,282 2.7%
$1,021,843 6.0% $330,890 1.9%
$1,034,855 6.1% $1,427,895 8.4% $1,048,265 6.2%
$771,312 4.5%
$466,547
$52,462
$0 $2,199,207 $1,008,265 $17,031,516 100%
Salaries and Benefits as Percentages of Revenues and of Expenditures
Teachers and Paraprofessionals
Salaries $6,566,298
Benefits $1,893,548
Percentage of Revenues Percentage of Expenditures
Total of
Total of
General Fund
General Fund
Title Programs
Title Programs
Lottery K-12
Lottery K-12
Total Salaries
and
Total
and
Total
and Benefits All Other K-12 K - 12 All Other K-12 K - 12
$8,459,846
62.7%
52.0%
61.2%
49.7%
School Administration
$541,838
$194,955
$736,793
5.5%
4.5%
5.3%
4.3%
General Administration
$170,058
$57,856
$227,914
1.7%
1.4%
1.6%
1.3%
1998-99 GEORGIA PUBLIC EDUCATION REPORT CARD
Calhoun City Schools - 765
Prepared by Georgia Department of Education
Page 8
CERTIFIED PERSONNEL DATA
Number
Average Annual Salary Positions Average Contract Days
Average Daily Salary
Full-time Personnel Part-time
Sex Male Female
4 Yr Bachelor's Certificate 5 Yr Master's
Level 6 Yr Specialist's 7 Yr Doctoral Other*
Black
White Race/ Hispanic Ethnicity Asian
American Indian
Multiracial
Years Experience
<1 1-10 11-20 21-30 >30
Average
Administrators
13.00
$62,847.31 228.77
$274.72
13 0
7 6
0 4 8 1 0
0 13
0 0 0 0
0 1 2 8 2
25.15
Support Personnel PK-12 Teachers
12.83
143.23
$46,035.50 198.73
$231.65
$38,020.99 190.00
$200.11
12
139
1
8
3
36
10
111
1
67
10
68
2
8
0
1
0
3
0
0
13
145
0
2
0
0
0
0
0
0
1
9
2
56
3
38
7
39
0
5
18.85
14.33
*Includes One- and Two-Year Vocational Certificates.
Certified Staff Position Ratios
Teacher/Administrator Ratio 11:1
Teacher/Support Person Ratio 11:1
Teacher/Staff Ratio 6:1
Student Enrollment/All Teachers 16:1
Certified Personnel by Category
85.0% 100%
7.5%
7.5%
80% 60%
40%
20%
0%
Teachers
Administrators
Support Personnel
1998-99 GEORGIA PUBLIC EDUCATION REPORT CARD
Calhoun City Schools - 765
Prepared by Georgia Department of Education
Page 9
1998-99 GEORGIA PUBLIC EDUCATION REPORT CARD
CALHOUN CITY SCHOOLS
Calhoun Elementary School - 7650192
Grade Range 3-5
The Georgia Public Education Report Card is designed to assist systems and schools in educational improvement. This report card contains a variety of data elements. An explanation of the terms is provided as a companion to the report card data. Please refer to the definitions for the most effective use of the reported data.
STUDENT DATA
Total 564
3-5 Enrollment, by Race/Ethnicity and Sex
Black
White Hispanic
American Multi-
Asian Indian
racial
70 12.4%
438 77.7%
44 7.8%
10 1.8%
0 0.0%
2 0.4%
Male Female
284 50.4%
280 49.6%
Enrollment in Selected Programs
Program
Program % of Student Enrollment Population
Gifted (Grades K-12)
77
13.7%
Alternative Programs (Grades 6-12)
N/A
N/A
Students Eligible to Receive Free/Reduced Lunches
Number
Percent
School System
207
36.7%
708
29.9%
Dropout Rate *
Number
Rate
School System
N/A N/A
N/A N/A
* Dropout rates are not applicable for grades PK-5.
Enrollment in Compensatory Programs
Program
Program % of Student Enrollment Population
Special Education (Grades K-12)
73 12.9%
(PK)
0
N/A
English to Speakers of Other Languages (ESOL) (Grades K-12)
0
0.0%
Remedial Education (Grades 2-5, 9-12)
43
7.6%
Special Instructional Assistance (SIA) (Grades K-3)
35 19.9%
Title I (Grades K-12)
This school has a Targeted Assistance program.
Total 0
Retained Students, by Race/Ethnicity and Sex
Black
White Hispanic
American Multi-
Asian Indian
racial
0
0
0
0
0
0
Male Female
0
0
Prepared by Georgia Department of Education
Page 1
STATE-REQUIRED TEST DATA
NORM-REFERENCED TESTS Grade 3
Iowa Tests of Basic Skills (ITBS) Each chart reflects data for three years of testing.
Reading Comprehension 50
51 51 54 0
98-99
63 63 53 97-98
62 62 52 96-97
Mathematics
School 50
System
State
0
59 59 61 98-99
67 67 61 97-98
59 59 59 96-97
School System State
Reading Vocabulary 50
51 51 50 0
98-99
60 60 50 97-98
58 58 49 96-97
Language Arts
School 50
System
State
0
59 59 64 98-99
68 68 62 97-98
63 63 59 96-97
School System State
Social Studies 50
48 48 56 0
98-99
66 66 55 97-98
54 54 55 96-97
Science
School 50
System
State
0
57 57 59 98-99
67 67 59 97-98
63 63 58 96-97
School System State
Sources of Information
Composite Score
50
50 50 57 0
98-99
School 50
System
61 61 56 97-98
60 60 55 96-97
State 0
53 53 58 98-99
65 65 57 97-98
1998-99 GEORGIA PUBLIC EDUCATION REPORT CARD Calhoun Elementary School - 7650192
Prepared by Georgia Department of Education
59 59 56 96-97
Scores Reported in Percentiles
School System State
Page 2
STATE-REQUIRED TEST DATA
NORM-REFERENCED TESTS Grade 5
Iowa Tests of Basic Skills (ITBS) Each chart reflects data for three years of testing.
Reading Comprehension
Mathematics
50
60 60 53 0
98-99
68 68 53 97-98
56 56 52 96-97
School 50
System
State
0
63 63 59 98-99
74 74 58 97-98
62 62 57 96-97
School System State
Reading Vocabulary 50
57 57 48 0
98-99
62 62 48 97-98
51 51 46 96-97
Language Arts
School 50
System
State
0
72 72 63 98-99
76 76 61 97-98
63 63 58 96-97
School System State
Social Studies 50
66 66 57 0
98-99
71 71 56 97-98
60 60 55 96-97
Science
School 50
System
State
0
70 70 60 98-99
78 78 59 97-98
68 68 59 96-97
School System State
Sources of Information
Composite Score
50
68 68 58 0
98-99
School 50
System
73 73 58 97-98
66 66 57 96-97
State 0
67 67 57 98-99
74 74 56 97-98
62 62 55 96-97
1998-99 GEORGIA PUBLIC EDUCATION REPORT CARD Calhoun Elementary School - 7650192
Prepared by Georgia Department of Education
Scores Reported in Percentiles
School System State
Page 3
STATE-REQUIRED TEST DATA
PERFORMANCE ASSESSMENTS
Grade 5 Writing Assessment
Percent at Developmental Stages:
1998-99 School System State
1997-98 School System State
1996-97 School System State
Stage Stage Stage Stage Stage Stage
1:The Emerging Writer 2:The Developing Writer 3:The Focusing Writer 4:The Experimenting 5:The Engaging Writer 6:The Extending Writer
0% 1% 18% 45% 26% 10%
0% 1% 18% 45% 26% 10%
0% 1% 16% 41% 29% 12%
0% 1% 12% 40% 29% 18%
0% 1% 12% 40% 29% 18%
0% 3% 19% 41% 27% 10%
0% 3% 19% 48% 24% 7%
0% 3% 19% 48% 24% 7%
0% 3% 21% 37% 26% 12%
AWARDS / RECOGNITION DATA
Schools in Georgia may receive recognition in the following programs: Charter School Pay for Performance Program Georgia School of Excellence National Blue Ribbon School Calhoun Elementary School did not receive recognition in any of these programs during the 1998-99 school year.
1998-99 GEORGIA PUBLIC EDUCATION REPORT CARD Calhoun Elementary School - 7650192
Prepared by Georgia Department of Education
Page 4
CERTIFIED PERSONNEL DATA
Positions Number Average Contract Days
Personnel Sex
Certificate
Years Experience
Full-time Part-time
Male Female
4 Yr Bachelor's 5 Yr Master's 6 Yr Specialist's 7 Yr Doctoral Other*
<1 1-10 11-20 21-30 >30
Average
Administrators
2.00 226.00
2 0
0 2
0 1 1 0 0 0 0 0 1 1 28.00
Support Personnel
2.00 190.00
2 0
0 2
0 2 0 0 0 0 1 1 0 0 11.50
PK-12 Teachers
28.50 190.00
28 1
2 27
13 15
1 0 0 0 15 7 7 0 13.48
*Includes One- and Two-Year Vocational Certificates.
ACCREDITATION DATA
Candidate for accreditation by Southern Association of Colleges and Schools (SACS):
Elementary/Middle Commission.
1998-99 GEORGIA PUBLIC EDUCATION REPORT CARD Calhoun Elementary School - 7650192
Prepared by Georgia Department of Education
Page 5
1998-99 GEORGIA PUBLIC EDUCATION REPORT CARD
CALHOUN CITY SCHOOLS
Calhoun High School - 7653050
Grade Range 9-12
The Georgia Public Education Report Card is designed to assist systems and schools in educational improvement. This report card contains a variety of data elements. An explanation of the terms is provided as a companion to the report card data. Please refer to the definitions for the most effective use of the reported data.
Total 566
STUDENT DATA
9-12 Enrollment, by Race/Ethnicity and Sex
Black
White Hispanic
American Multi-
Asian Indian
racial
37 6.5%
480 84.8%
24 4.2%
21 3.7%
0 0.0%
4 0.7%
Male Female
300 53.0%
266 47.0%
Enrollment in Selected Programs
Program
Gifted (Grades K-12)
Program % of Student Enrollment Population
82
14.5%
Non-Vocational Labs (Grades 9-12)
381
Vocational Labs
(Grades 9-12)
450
Alternative Programs (Grades 6-12)
15
67.3% 79.5%
2.7%
Students Eligible to Receive Free/Reduced Lunches
Number
Percent
School System
83
14.7%
708
29.9%
Enrollment in Compensatory Programs
Program
Program % of Student Enrollment Population
Special Education (Grades K-12) PK
33
5.8%
0
N/A
English to Speakers of Other Languages (ESOL) (Grades K-12)
0
0.0%
Remedial Education (Grades 2-5, 9-12)
68 12.0%
Title I (Grades K-12)
This school has no Title I program.
Dropout Rate for Grades 9-12
Number
Rate
School System
29
4.7%
29
4.7%
Total 28
Retained Students, by Race/Ethnicity and Sex
Black
White Hispanic
American MultiAsian Indian racial
5 17.9%
17
5
60.7% 17.9%
0 0.0%
0 0.0%
1 3.6%
Male Female
20
8
71.4% 28.6%
Prepared by Georgia Department of Education
Page 1
STATE-REQUIRED TEST DATA
GEORGIA HIGH SCHOOL GRADUATION TESTS (GHSGT)
Percent of Regular Program 11th Graders Passing the Georgia High School Graduation Tests on First Administration
English Language Arts Mathematics Social Studies Science
All Components listed above
Writing
1998-99
School System State
98% 96% 83% 83%
97% 96% 83% 82%
96% 88% 80% 72%
78% 77% 68%
97% 96% 93%
1997-98
School System State
97% 95% 84% 85%
94% 92% 82% 82%
94% 88% 78% 74%
80% 76% 68%
97% 97% 92%
1996-97
School System State
93% 91% 83% 75%
93% 91% 83% 75%
94% 87% 78% 74%
72% 72% 67%
95% 94% 93%
GRADUATE DATA
1999 Graduates by Credentials, Race/Ethnicity and Sex
Diplomas with Both College Prep. & Voc. Endorsements
Diplomas with College Prep. Endorsements Diplomas with Vocational Endorsements General High School Diplomas Special Education Diplomas
Total All Diplomas
Certificates of Performance
Total Graduates
Total 22 54 57 0
Black
1 4.5%
0 0.0%
5 8.8%
0
White Hispanic
19 86.4%
0 0.0%
52 96.3%
0 0.0%
47 82.5%
2 3.5%
0
0
American MultiAsian Indian racial
2 9.1%
0 0.0%
0 0.0%
2 3.7%
0 0.0%
0 0.0%
1 1.8%
0 0.0%
2 3.5%
0
0
0
Male Female
14
8
63.6% 36.4%
23
31
42.6% 57.4%
28
29
49.1% 50.9%
0
0
1
0
1
0
0
0
0
1
0
0.0% 100.0% 0.0% 0.0% 0.0% 0.0% 100.0% 0.0%
134
6
119
2
5
0
2
66
68
4.5% 88.8% 1.5% 3.7% 0.0% 1.5% 49.3% 50.7%
5
0
3
1
1
0
0
1
4
0.0% 60.0% 20.0% 20.0% 0.0% 0.0% 20.0% 80.0%
139
6
122
3
6
0
2
67
72
4.3% 87.8% 2.2% 4.3% 0.0% 1.4% 48.2% 51.8%
HOPE Scholarships
School System
Number of 1999 Graduates 1 3 9
Number Eligible
83
Percent Eligible
59.7%
139 83
59.7%
State
65,548 40,292 61.5%
High School Completion Rate
Percent of 1995Grade 9 Enrollment in Graduating Class of1999 School System State
Completion Rate '95-'99 80.8% 80.8% 68.9%
1998-99 GEORGIA PUBLIC EDUCATION REPORT CARD
Calhoun High School - 7653050
Prepared by Georgia Department of Education
Page 2
COLLEGE ADMISSIONS / CREDIT TEST DATA
Scholastic Assessment Test (SAT)
Based on students' highest verbal and highest math scores
No. Taking
Average Score
Tests Verbal Math Total
Based on students' last test administration
Average Score Verbal Math Total
School
98
College Prep. Endorsement
Other Diplomas
System
98
College Prep. Endorsement
Other Diplomas
Georgia
41,958
495 488
983
529 521 1050
414 406
820
495 488
983
529 521 1050
414 406
820
492 488
980
485 N/A N/A
485 N/A N/A
483
481 N/A N/A
481 N/A N/A
479
966 N/A N/A
966 N/A N/A
962
Nation
952,913 N/A N/A N/A
502 508 1010
American College Testing (ACT)
Advanced Placement Exams (AP)
Number taking tests: English Mathematics Reading Science Reasoning CompositeScore
1 1 School System State
18.5 18.5 19.1
20.4 20.4 19.9
18.5 20.5
18.5 20.5
20.2 19.9
19.5 19.5 19.9
No. of Students Taking Tests
No. of Tests Taken No. of Test Scores
3 or Higher Percent of Test
Scores 3 or Higher
School 24 28 14
50.0%
System State 24 15,225 28 23,969 14 13,024
50.0% 54.3%
POST-SECONDARY DATA
Graduates Entering Georgia Public Colleges
Graduates Entering Georgia Public Colleges and Requiring Learning Support (LS)
1998 Graduates Entering in 1998-99
1997 Graduates Entering in 1997-98
Percent of Graduating Number Class
School
45
46.9%
System 4 5
46.9%
School
55
45.8%
System 5 5
45.8%
Number Requiring
LS 10 10
13 13
Percent of those attending Georgia
Public Colleges
22.2%
22.2%
23.6%
23.6%
In previous years, the Report Card presented College Prep Curriculum information provided by the Board of Regents on students requiring Learning Support. Due to inconsistencies in the data provided by the Board of Regents in defining College Prep Completers versus Local Board of Education data defining College Prep Endorsements, the Department of Education Report Card will not provide this information until discrepancies can be reconciled.
Graduates Entering Georgia Public Technical and Adult Schools
1998 Graduates School System
Entering Number 1 1
1998-99 Percent
1.0% 1.0%
Entering Number N/A N/A
1997-98 Percent
N/A N/A
1997 Graduates School
1
0.8%
System
1
0.8%
1
0.8%
1
0.8%
1998-99 GEORGIA PUBLIC EDUCATION REPORT CARD Calhoun High School - 7653050
Prepared by Georgia Department of Education
Page 3
CERTIFIED PERSONNEL DATA
Positions Number Average Contract Days
Administrators
3.00 234.67
Support Personnel
1.50 210.67
PK-12 Teachers
38.32 190.00
Personnel Sex
Certificate
Years Experience
Full-time Part-time
Male Female
4 Yr Bachelor's 5 Yr Master's 6 Yr Specialist's 7 Yr Doctoral Other*
<1 1-10 11-20 21-30 >30
Average
3 0
3 0
0 0 3 0 0
0 0 0 3 0
27.33
1 1
0 2
0 2 0 0 0
0 0 0 2 0
25.00
34 7
21 20
23 12
2 1 3
5 13 11 11
1
13.73
*Includes One- and Two-Year Vocational Certificates.
ACCREDITATION DATA
Accredited by Southern Association of Colleges and Schools (SACS): Secondary/Middle Commission.
AWARDS / RECOGNITION DATA
Schools in Georgia may receive recognition in the following programs: Charter School Pay for Performance Program Georgia School of Excellence National Blue Ribbon School Calhoun High School did not receive recognition in any of these programs during the 1998-99 school year.
1998-99 GEORGIA PUBLIC EDUCATION REPORT CARD Calhoun High School - 7653050
Prepared by Georgia Department of Education
Page 4
1998-99 GEORGIA PUBLIC EDUCATION REPORT CARD
CALHOUN CITY SCHOOLS
Calhoun Middle School - 7654050
Grade Range 6-8
The Georgia Public Education Report Card is designed to assist systems and schools in educational improvement. This report card contains a variety of data elements. An explanation of the terms is provided as a companion to the report card data. Please refer to the definitions for the most effective use of the reported data.
STUDENT DATA
Total 520
6-8 Enrollment, by Race/Ethnicity and Sex
Black
White Hispanic
American Multi-
Asian Indian
racial
56 10.8%
415 79.8%
28 5.4%
14 2.7%
1 0.2%
6 1.2%
Male 277
53.3%
Female 243
46.7%
Enrollment in Selected Programs
Program
Gifted (Grades K-12)
Program % of Student Enrollment Population
87
16.7%
Alternative Programs (Grades 6-12)
5
1.0%
Students Eligible to Receive Free/Reduced Lunches
Number
Percent
School System
152
29.2%
708
29.9%
Enrollment in Compensatory Programs
Program
Program % of Student Enrollment Population
Special Education (Grades K-12) (PK)
64 12.3%
0
N/A
English to Speakers of Other Languages (ESOL) (Grades K-12)
0
0.0%
Title I (Grades K-12)
This school has no Title I program.
Dropout Rate for Grades 6-8
Number
Rate
School System
2
0.3%
2
0.3%
Total 1
Retained Students, by Race/Ethnicity and Sex
Black
White Hispanic
American MultiAsian Indian racial
0
1
0.0% 100.0%
0 0.0%
0 0.0%
0 0.0%
0 0.0%
Male Female
0
1
0.0% 100.0%
Prepared by Georgia Department of Education
Page 1
STATE-REQUIRED TEST DATA
NORM-REFERENCED TESTS Grade 8
Iowa Tests of Basic Skills (ITBS) Each chart reflects data for three years of testing.
Reading Comprehension 50
60 60 49 0
98-99
56 56 48 97-98
62 62 48 96-97
Mathematics
School 50
System
State
0
71 71 56 98-99
66 66 55 97-98
71 71 54 96-97
School System State
Reading Vocabulary 50
53 53 46 0
98-99
51 51 45 97-98
55 55 44 96-97
Language Arts
School 50
System
State
0
74 74 60 98-99
77 76 58 97-98
77 77 56 96-97
School System State
Social Studies 50
63 63 54 0
98-99
60 60 53 97-98
64 64 53 96-97
Science
School 50
System
State
0
64 64 56 98-99
64 63 55 97-98
69 69 53 96-97
School System State
Sources of Information
Composite Score
50
64 64 57 0
98-99
School 50
System
62 61 56 97-98
69 69 55 96-97
State 0
67 67 56 98-99
65 65 54 97-98
1998-99 GEORGIA PUBLIC EDUCATION REPORT CARD Calhoun Middle School - 7654050
Prepared by Georgia Department of Education
70 70 54 96-97
Scores Reported in Percentiles
School System State
Page 2
STATE-REQUIRED TEST DATA
Categories of Scaled Scores
Inadequate (less than 162)
Minimal (162-209)
Good
(210-247)
Very Good (greater than 247)
Average Scaled Score: (Range 100-300)
PERFORMANCE ASSESSMENTS
Grade 8 Writing Assessment
1998-99 Percent Scoring
1997-98 Percent Scoring
1996-97 Percent Scoring
School System State School System State School System State
3% 28% 53% 16%
3% 28% 54% 16%
8% 40% 41% 11%
4% 39% 42% 15%
4% 40% 41% 15%
11% 46% 34%
8%
6% 37% 48%
9%
8% 36% 47%
9%
15% 46% 30%
8%
219
219
208 213
212 202 213
211 198
AWARDS / RECOGNITION DATA
Schools in Georgia may receive recognition in the following programs: Charter School Pay for Performance Program Georgia School of Excellence National Blue Ribbon School Calhoun Middle School did not receive recognition in any of these programs during the 1998-99 school year.
1998-99 GEORGIA PUBLIC EDUCATION REPORT CARD Calhoun Middle School - 7654050
Prepared by Georgia Department of Education
Page 3
CERTIFIED PERSONNEL DATA
Positions Number Average Contract Days
Personnel Sex
Certificate
Years Experience
Full-time Part-time
Male Female
4 Yr Bachelor's 5 Yr Master's 6 Yr Specialist's 7 Yr Doctoral Other*
<1 1-10 11-20 21-30 >30
Average
Administrators
2.00 226.00
2 0
1 1
0 1 1 0 0 0 0 1 1 0 23.00
Support Personnel
1.50 210.67
1 1
0 2
0 1 1 0 0 0 0 0 2 0 23.00
PK-12 Teachers
31.26 190.00
27 9
13 23
19 16
1 0 0 3 13 8 9 3 14.61
*Includes One- and Two-Year Vocational Certificates.
ACCREDITATION DATA
Not accredited by Southern Association of Colleges and Schools (SACS) or Georgia Accrediting Commission (GAC).
1998-99 GEORGIA PUBLIC EDUCATION REPORT CARD Calhoun Middle School - 7654050
Prepared by Georgia Department of Education
Page 4
1998-99 GEORGIA PUBLIC EDUCATION REPORT CARD
CALHOUN CITY SCHOOLS
Eastside Primary School - 7654550
Grade Range PK-2
The Georgia Public Education Report Card is designed to assist systems and schools in educational improvement. This report card contains a variety of data elements. An explanation of the terms is provided as a companion to the report card data. Please refer to the definitions for the most effective use of the reported data.
STUDENT DATA
Total
K-2
588
PK
129
Enrollment, by Race/Ethnicity and Sex
Black
White Hispanic
American Asian Indian
Multiracial
63 10.7%
453 77.0%
54 9.2%
9 1.5%
0 0.0%
9 1.5%
12 9.3%
103 79.8%
13 10.1%
0 0.0%
0 0.0%
1 0.8%
Male Female
284 48.3%
304 51.7%
75 58.1%
54 41.9%
Enrollment in Selected Programs
Program
Program % of Student Enrollment Population
Gifted (Grades K-12)
30
5.1%
Alternative Programs (Grades 6-12)
N/A
N/A
Students Eligible to Receive Free/Reduced Lunches
Number
Percent
School System
266
37.1%
708
29.9%
Dropout Rate *
Number
Rate
School System
N/A N/A
N/A N/A
* Dropout rates are not applicable for grades PK-5.
Enrollment in Compensatory Programs
Program
Program % of Student Enrollment Population
Special Education (Grades K-12)
59 10.0%
(PK)
22
N/A
English to Speakers of Other Languages (ESOL) (Grades K-12)
0
0.0%
Remedial Education (Grades 2-5, 9-12)
26 13.3%
Special Instructional Assistance (SIA) (Grades K-3)
190 32.3%
Title I (Grades K-12)
This school has a Targeted Assistance program.
Total 8
Retained Students, by Race/Ethnicity and Sex
Black
White Hispanic
American MultiAsian Indian racial
0 0.0%
7
1
87.5% 12.5%
0 0.0%
0 0.0%
0 0.0%
Male Female
5
3
62.5% 37.5%
Prepared by Georgia Department of Education
Page 1
STATE-REQUIRED TEST DATA
NORM-REFERENCED TESTS
Grade 3 Iowa Tests of Basic Skills (ITBS) Each chart reflects data for three years of testing.
No third-grade students are enrolled at Eastside Primary School.
Reading Comprehension
Mathematics
50
N/A 51 54 0
98-99
N/A 63 53 97-98
N/A 62 52 96-97
School 50
System
State
N/A 59 61 0
98-99
N/A 67 61 97-98
N/A 59 59 96-97
School System State
Reading Vocabulary 50
N/A 51 50 0
98-99
N/A 60 50 97-98
N/A 58 49 96-97
Language Arts
School 50
System
State
N/A 59 64 0
98-99
N/A 68 62 97-98
N/A 63 59 96-97
School System State
Social Studies 50
N/A 48 56 0
98-99
N/A 66 55 97-98
N/A 54 55 96-97
Science
School 50
System
State
N/A 57 59 0
98-99
N/A 67 59 97-98
N/A 63 58 96-97
School System State
Sources of Information
Composite Score
School
50
50
System
N/A 50 57 0
98-99
N/A 61 56 N/A 60 55
97-98
96-97
State
N/A 53 58 0
98-99
N/A 65 57 97-98
N/A 59 56 96-97
1998-99 GEORGIA PUBLIC EDUCATION REPORT CARD Eastside Primary School - 7654550
Prepared by Georgia Department of Education
Scores Reported in Percentiles
School System State
Page 2
STATE-REQUIRED TEST DATA
NORM-REFERENCED TESTS
Grade 5 Iowa Tests of Basic Skills (ITBS) Each chart reflects data for three years of testing. No fifth-grade students are enrolled at Eastside Primary School.
Reading Comprehension
Mathematics
50
N/A 60 53 0
98-99
N/A 68 53 97-98
N/A 56 52 96-97
School 50
System
State
N/A 63 59 0
98-99
N/A 74 58 97-98
N/A 62 57 96-97
School System State
Reading Vocabulary 50
N/A 57 48 0
98-99
N/A 62 48 97-98
N/A 51 46 96-97
Language Arts
School 50
System
State
N/A 72 63 0
98-99
N/A 76 61 97-98
N/A 63 58 96-97
School System State
Social Studies 50
N/A 66 57 0
98-99
N/A 71 56 97-98
N/A 60 55 96-97
Science
School 50
System
State
N/A 70 60 0
98-99
N/A 78 59 97-98
N/A 68 59 96-97
School System State
Sources of Information
Composite Score
School
50
50
System
N/A 68 58 0
98-99
N/A 73 58 N/A 66 57
97-98
96-97
State
N/A 67 57 0
98-99
N/A 74 56 97-98
N/A 62 55 96-97
1998-99 GEORGIA PUBLIC EDUCATION REPORT CARD Eastside Primary School - 7654550
Prepared by Georgia Department of Education
Scores Reported in Percentiles
School System State
Page 3
STATE-REQUIRED TEST DATA
PERFORMANCE ASSESSMENTS
Grade 5 Writing Assessment
Percent at Developmental Stages:
1998-99 School System State
1997-98 School System State
1996-97 School System State
Stage Stage Stage Stage Stage Stage
1:The Emerging Writer 2:The Developing Writer 3:The Focusing Writer 4:The Experimenting 5:The Engaging Writer 6:The Extending Writer
N/A N/A N/A N/A N/A N/A
0% 1% 18% 45% 26% 10%
0% 1% 16% 41% 29% 12%
N/A N/A N/A N/A N/A N/A
0% 1% 12% 40% 29% 18%
0% 3% 19% 41% 27% 10%
N/A N/A N/A N/A N/A N/A
No fifth-grade students are enrolled at Eastside Primary School.
0% 3% 19% 48% 24% 7%
0% 3% 21% 37% 26% 12%
AWARDS / RECOGNITION DATA
Schools in Georgia may receive recognition in the following programs: Charter School Pay for Performance Program Georgia School of Excellence National Blue Ribbon School Eastside Primary School did not receive recognition in any of these programs during the 1998-99 school year.
1998-99 GEORGIA PUBLIC EDUCATION REPORT CARD Eastside Primary School - 7654550
Prepared by Georgia Department of Education
Page 4
CERTIFIED PERSONNEL DATA
Positions Number Average Contract Days
Personnel Sex
Certificate
Years Experience
Full-time Part-time
Male Female
4 Yr Bachelor's 5 Yr Master's 6 Yr Specialist's 7 Yr Doctoral Other*
<1 1-10 11-20 21-30 >30
Average
Administrators
2.00 226.00
2 0
1 1
0 2 0 0 0 0 1 0 1 0 18.00
Support Personnel
3.00 190.00
3 0
0 3
0 3 0 0 0 1 0 0 2 0 17.33
PK-12 Teachers
35.49 190.00
33 5
2 36
15 19
4 0 0 3 14 13 8 0 13.39
*Includes One- and Two-Year Vocational Certificates.
ACCREDITATION DATA
Accredited by Southern Association of Colleges and Schools (SACS):
Elementary/Middle Commission.
1998-99 GEORGIA PUBLIC EDUCATION REPORT CARD Eastside Primary School - 7654550
Prepared by Georgia Department of Education
Page 5
1998-99 GEORGIA PUBLIC EDUCATION REPORT CARD CALHOUN COUNTY SCHOOLS - 619
The Georgia Public Education Report Card is designed to assist systems and schools in educational improvement. This report card contains a variety of data elements. An explanation of the terms is provided as a companion to the report card data. Please refer to the definitions for the most effective use of the reported data.
Total
K-12
782
PK
23
STUDENT DATA
Enrollment, by Race/Ethnicity and Sex
Black
White Hispanic
American Multi-
Asian Indian
racial
728 93.1%
43 5.5%
11 1.4%
0 0.0%
0 0.0%
0 0.0%
21 91.3%
2 8.7%
0 0.0%
0 0.0%
0 0.0%
0 0.0%
Male
386 49.4%
12 52.2%
Female
396 50.6%
11 47.8%
Enrollment in Selected Programs
Program
Program % of Student Enrollment Population
Gifted (Grades K-12)
18
2.3%
Non-Vocational Labs (Grades 9-12)
174
76.3%
Vocational Labs (Grades 9-12)
183
80.3%
Alternative Programs (Grades 6-12)
4
1.0%
Students Eligible to Receive Free/Reduced Lunches
Number
Percent
805
100.0%
Dropout Rate
Number
Percent
6-12 9-12
24
5.7%
21
8.9%
Enrollment in Compensatory Programs
Program
Program % of Student Enrollment Population
Special Education
(Grades K-12)
99
PK
14
English to Speakers of
Other Languages (ESOL)
0
(Grades K-12)
Remedial Education (Grades 2-5, 9-12)
135
Special Instructional
Assistance (SIA)
71
(Grades K-3)
Title I (Grades K-12) Number of schools with: Schoolwide program Targeted Assistance program No Title I program
12.7% N/A
0.0%
27.4%
28.4%
2 0 0
Total 35
Retained Students, by Race/Ethnicity and Sex
Black
White Hispanic
American MultiAsian Indian racial
34 97.1%
1 2.9%
0 0.0%
0 0.0%
0 0.0%
0 0.0%
Male Female
21
14
60.0% 40.0%
Prepared by Georgia Department of Education
Page 1
STATE-REQUIRED TEST DATA
NORM-REFERENCED TESTS
Grade 3 Iowa Tests of Basic Skills (ITBS) Each chart reflects data for three years of testing.
Reading Comprehension
Mathematics
50
30 54 31 53 26 52 0
98-99 97-98 96-97
System State
50
37 61 43 61 30 59 0
98-99 97-98 96-97
System State
Reading Vocabulary
50
30 50 23 50 16 49 0
98-99 97-98 96-97
System State
Social Studies
50
38 56 35 55 27 55 0
98-99 97-98 96-97
System State
Language Arts
50
49 64 45 62 29 59 0
98-99 97-98 96-97
System State
Science
50
30 59 38 59 26 58 0
98-99 97-98 96-97
System State
Sources of Information
Composite Score
50
39 57 0
98-99
System
50
40 56 27 55 97-98 96-97
State
34 58 35 57 0
98-99 97-98
1998-99 GEORGIA PUBLIC EDUCATION REPORT CARD Calhoun County Schools
Prepared by Georgia Department of Education
System State Scores Reported 24 56 in Percentiles 96-97
Page 2
STATE-REQUIRED TEST DATA
NORM-REFERENCED TESTS
Grade 5 Iowa Tests of Basic Skills (ITBS) Each chart reflects data for three years of testing.
Reading Comprehension
Mathematics
50
31 53 34 53 35 52 0
98-99 97-98 96-97
System State
50
33 59 25 58 32 57 0
98-99 97-98 96-97
System State
Reading Vocabulary
50
16 48 15 48 21 46 0
98-99 97-98 96-97
System State
Social Studies
50
30 57 23 56 34 55 0
98-99 97-98 96-97
System State
Language Arts
50
41 63 37 61 38 58 0
98-99 97-98 96-97
System State
Science
50
27 60 32 59 39 59 0
98-99 97-98 96-97
System State
Sources of Information
Composite Score
50
28 58 0
98-99
System
50
28 58 33 57 97-98 96-97
State
28 57 26 56 0
98-99 97-98
1998-99 GEORGIA PUBLIC EDUCATION REPORT CARD Calhoun County Schools
Prepared by Georgia Department of Education
System State Scores Reported 32 55 in Percentiles 96-97
Page 3
STATE-REQUIRED TEST DATA
NORM-REFERENCED TESTS Grade 8
Iowa Tests of Basic Skills (ITBS) Each chart reflects data for three years of testing.
Reading Comprehension
Mathematics
50
27 49 34 48 20 48 0
98-99 97-98 96-97
System State
50
38 56 34 55 25 54 0
98-99 97-98 96-97
System State
Reading Vocabulary
50
16 46 22 45 14 44 0
98-99 97-98 96-97
System State
Language Arts
50
50 60 50 58 N/A 56 0
98-99 97-98 96-97
System State
Social Studies
50
34 54 36 53 N/A 53 0
98-99 97-98 96-97
System State
Science
50
28 56 31 55 N/A 53 0
98-99 97-98 96-97
System State
Sources of Information
Composite Score
50
38 57 0
98-99
System
50
System
34 56 N/A 55 97-98 96-97
State
State
33 56 0
Scores Reported 33 54 N/A 54 in Percentiles
98-99 97-98 96-97
1998-99 GEORGIA PUBLIC EDUCATION REPORT CARD Calhoun County Schools
Prepared by Georgia Department of Education
Page 4
STATE-REQUIRED TEST DATA
PERFORMANCE ASSESSMENTS
Grade 5 Writing Assessment
1998-99
1997-98
1996-97
Percent at Developmental Stages:
Comparison
Comparison
Comparison
System Group State System Group State System Group State
Stage Stage Stage Stage Stage Stage
1: The Emerging Writer 2: The Developing Writer 3: The Focusing Writer 4: The Experimenting Writer 5: The Engaging Writer 6: The Extending Writer
0% 2% 48% 33% 13% 2%
0% 3% 38% 40% 16% 3%
0% 1% 16% 41% 29% 12%
0% 16% 40% 28% 14%
3%
1% 15% 38% 35% 10%
2%
0% 3% 19% 41% 27% 10%
0% 11% 39% 34% 14%
0%
1% 8% 33% 35% 17% 6%
0% 3% 21% 37% 26% 12%
Grade 8 Writing Assessment
1998-99 Percent Scoring 1997-98 Percent Scoring 1996-97 Percent Scoring
Categories of Scaled Scores
Comparison
Comparison
Comparison
System Group State System Group State System Group State
Inadequate (less than 162)
Minimal (162-209)
Good
(210-247)
Very Good (greater than 247)
11% 74% 15%
0%
26% 55% 17%
2%
8% 40% 41% 11%
23% 65% 12%
0%
36% 52% 11%
1%
11% 46% 34%
8%
53% 44%
3% 0%
36% 49% 14%
2%
15% 46% 30%
8%
Average Scaled Score: (Range 100-300)
190
184 208
178
172 202
157
176 198
GEORGIA HIGH SCHOOL GRADUATION TESTS (GHSGT)
Percent of Regular Program 11th Graders Passing the Georgia High School Graduation Tests on First Administration
1998-99
1997-98
1996-97
Comparison
Comparison
Comparison
System Group State System Group State System Group State
English Language Arts Mathematics Social Studies Science
80% 67% 54% 50%
75% 59% 42% 38%
96% 88% 80% 72%
86% 70% 54% 57%
81% 67% 47% 41%
94% 88% 78% 74%
65% 55% 47% 35%
88% 74% 59% 46%
94% 87% 78% 74%
All Components listed above 3 7 %
28% 68% 46%
32% 68% 27%
39% 67%
Writing
68%
77% 93% 89%
79% 92% 60%
84% 93%
1998-99 GEORGIA PUBLIC EDUCATION REPORT CARD
Calhoun County Schools
Prepared by Georgia Department of Education
Page 5
GRADUATE DATA
1999 Graduates by Credentials, Race/Ethnicity and Sex
Diplomas with Both College Prep. & Voc. Endorsements
Diplomas with College Prep. Endorsements Diplomas with Vocational Endorsements General High School Diplomas Special Education Diplomas
Total All Diplomas
Certificates of Performance
Total Graduates
Total 9 6
22 1 0
Black
American MultiWhite Hispanic Asian Indian racial
9 100.0%
5 83.3%
21 95.5%
0 0.0%
0
0 0.0%
1 16.7%
1 4.5%
1 100.0%
0
0 0.0%
0 0.0%
0 0.0%
0 0.0%
0
0 0.0%
0 0.0%
0 0.0%
0 0.0%
0
0 0.0%
0 0.0%
0 0.0%
0 0.0%
0
0 0.0%
0 0.0%
0 0.0%
0 0.0%
0
Male Female
1
8
11.1% 88.9%
2
4
33.3% 66.7%
14
8
63.6% 36.4%
0
1
0.0% 100.0%
0
0
38
35
3
0
0
0
0
17
21
92.1% 7.9% 0.0% 0.0% 0.0% 0.0% 44.7% 55.3%
0
0
0
0
0
0
0
0
0
38
35
3
0
0
0
0
17
21
92.1% 7.9% 0.0% 0.0% 0.0% 0.0% 44.7% 55.3%
HOPE Scholarships
System State
Number of 1999 Graduates 3 8
Number Eligible
17
Percent Eligible
44.7%
65,548 40,292 61.5%
High School Completion Rate Percent of 1995Grade 9 Enrollment
in Graduating Class of1999
System
State
Completion Rate '95-'99 59.4% 68.9%
COLLEGE ADMISSIONS / CREDIT TEST DATA
Scholastic Assessment Test (SAT)
No. Taking
Average Score
Tests
Verbal Math Total
Based on students' highest verbal and highest math scores
System College Prep. Endorsement Other Diplomas
377 373 750 398 399 797 339 361 700
Georgia
492 488 980
Based on students' last test administration
System Georgia
23
372 365
737
41,958 483 479 962
Nation
952,913 502 508 1010
American College Testing (ACT)
System State Nation
English Mathematics Reading Science Reasoning
N/A N/A N/A N/A
19.1 19.9 20.2 19.9
20.4 20.7 21.3 21.0
CompositeScore N/A * 19.9 21.9
* Scores not reported when fewer than 5 tests taken.
Advanced Placement Exams (AP)
No. of Students Taking Tests
No. of Tests Taken No. of Test Scores
3 or Higher Percent of Test
Scores 3 or Higher
System State 0 15,225
N/A 23,969 N/A 13,024
N/A 54.3%
1998-99 GEORGIA PUBLIC EDUCATION REPORT CARD Calhoun County Schools
Prepared by Georgia Department of Education
Page 6
POSTSECONDARY DATA
Graduates Entering Georgia Public Colleges and Universities
Graduates Entering Georgia Public Colleges and Universities and
Requiring Learning Support (LS)
1998 Graduates Entering 1998-99
1997 Graduates Entering 1997-98
Percent of Graduating Number Class
14
36.8%
12
20.0%
Number Requiring
LS
10
5
Percent of those attending Georgia
Public Colleges
71.4%
41.7%
In previous years, the Report Card presented College Prep Curriculum information provided by the Board of Regents on students requiring Learning Support. Due to inconsistencies in the data provided by the Board of Regents in defining College Prep Completers versus Local Board of Education data defining College Prep Endorsements, the Department of Education Report Card will not provide this information until discrepancies can be reconciled.
Graduates Entering Georgia Public Technical and Adult Schools
Entering 1998-99 Entering 1997-98
Number Percent
Number Percent
1998 Graduates 1997 Graduates
6
15.8%
1
1.7%
N/A 11
N/A 18.3%
ACCREDITATION / RECOGNITION DATA
Southern Association of Colleges and Schools (SACS) Accrediting Commission
Secondary/Middle Commission Elementary/Middle Commission Both Elementary/Secondary Commissions Joint Commission Candidate for Accreditation
Accreditation by Georgia Accrediting Commission (GAC)
Accredited by GAC Accredited with Quality by GAC
Number of Schools
1 0 0 0 0
Number of Schools
0 0
Awards / Recognition
State Recognized Program
Number of Schools
Charter School
0
Pay for Performance Recipient
0
Georgia School of Excellence
0
National Blue Ribbon School
0
COMMUNITY DATA
Number of Children Eligible for Migrant Education Number of Families-At-Risk * Number of Food Stamp Participants * Number of Families Receiving TANF * ** Per Capita Income * Unemployment Rate * 1990 Population * Projected 2000 Population * Projected 2010 Population *
* Data Available at County Level Only ** Known as AFDC before January 1997
7 30 1,065 112 $18,421 8.1% 5,013 4,733 4,826
1998-99 GEORGIA PUBLIC EDUCATION REPORT CARD Calhoun County Schools
Prepared by Georgia Department of Education
Page 7
FISCAL DATA
Millage Rate
10.18
* Fall 1998 Property Tax Digest is used to calculate the 98-99 Value of One Mill
FTE Count
FTE Count used for Allotment Calculation 776.0 Fall '98 FTE Count 782
Value of One Mill
$93,146 $120.03 per Allotment FTE
Sources: Local State-QBE State-
Lottery State-
Other Federal Other
Total
PerGeneral Fund cent Per FTE
$1,240,627 25.4% $1,599 $3,559,649 72.8% $4,587
K-12 Revenues
Lottery K-12
and
Title
All Other
Programs
K-12
$0
$0
Bonded Debt $4,585
$0
$0
$0
$0 0.0%
$0
$0
$20,575
$0
$89,455 1.8% $115
$0 0.0%
$0
$0 0.0%
$0
$4,889,731 100% $6,301
$0 $599,212
$0 $599,212
$24,206 $11,286
$0 $56,069
$0 $0 $0 $4,585
Capital Projects
$7,171 $0
$0
$0 $0 $1,600,000 $1,607,171
School Nutrition
$21,638 $0
$0
$33,581 $350,303
$0 $405,522
Grand Total
Total
Per-
Amount cent
$1,274,023 16.8%
$3,559,649 47.1%
$20,575 0.3%
$147,242 1.9% $960,801 12.7% $1,600,000 21.2% $7,562,292 100%
Instruction
Media Instruction
Support Pupil Services General Admin. School Admin. Trans-
portation Maint. & Ops. Capital Projects School Food Debt Service
Total
$2,990,098 57.5% $3,853 $170,021 3.3% $219
$77,810 1.5% $100
$224,173 4.3% $289
$355,689 6.8% $458
$537,327 10.3% $692
$290,128 5.6% $374
$551,959 10.6% $711
$6,760 0.1%
$9
$135 0.0%
$0
$0 0.0%
$0
$5,204,104 100% $6,705
K-12 Expenditures
$544,534
$40,345
$0
$3,077
$0
$0
$71,774
$5,815
$0
$5,104
$4,134
$0
$4,726
$5,991
$0
$0
$1,593
$0
$0
$520
$0
$0
$0
$0
$0
$0
$0
$0
$0
$0
$0
$0
$0
$629,218
$58,399
$0
$0 $0 $0 $0 $44,925 $0 $0 $0 $0 $0 $3,750
$48,675
$0 $0 $0 $0 $0 $0 $0 $0 $0 $333,382 $0
$333,382
$3,574,978 57.0% $173,098 2.8% $155,400 2.5% $233,413 3.7% $411,332 6.6% $538,920 8.6% $290,649 4.6% $551,959 8.8% $6,760 0.1% $333,517 5.3% $3,750 0.1%
$6,273,780 100%
Salaries and Benefits as Percentages of Revenues and of Expenditures
Teachers and Paraprofessionals
Salaries $2,434,122
Benefits $682,212
Percentage of Revenues Percentage of Expenditures
Total of
Total of
General Fund
General Fund
Title Programs
Title Programs
Lottery K-12
Lottery K-12
Total Salaries
and
Total
and
Total
and Benefits All Other K-12 K - 12 All Other K-12 K - 12
$3,116,334
56.2%
41.2%
52.9%
49.7%
School Administration
$275,763
$103,167
$378,930
6.8%
5.0%
6.4%
6.0%
General Administration
$208,348
$56,058
$264,406
4.8%
3.5%
4.5%
4.2%
1998-99 GEORGIA PUBLIC EDUCATION REPORT CARD
Calhoun County Schools - 619
Prepared by Georgia Department of Education
Page 8
CERTIFIED PERSONNEL DATA
Number
Average Annual Salary Positions Average Contract Days
Average Daily Salary
Full-time Personnel Part-time
Sex Male Female
4 Yr Bachelor's Certificate 5 Yr Master's
Level 6 Yr Specialist's 7 Yr Doctoral Other*
Black
White Race/ Hispanic Ethnicity Asian
American Indian
Multiracial
Years Experience
<1 1-10 11-20 21-30 >30
Average
Administrators
7.86
$62,390.37 217.53
$286.81
6 5
7 4
0 5 6 0 0
5 6 0 0 0 0
0 0 1 6 4
30.27
Support Personnel PK-12 Teachers
4.59
62.24
$43,972.98 198.50
$221.53
$38,153.04 191.31
$199.43
4
57
2
9
1
15
5
51
0
31
4
32
2
2
0
0
0
1
1
22
5
44
0
0
0
0
0
0
0
0
1
2
2
21
0
17
3
23
0
3
14.17
16.53
*Includes One- and Two-Year Vocational Certificates.
Certified Staff Position Ratios
Teacher/Administrator Ratio 8:1
Teacher/Support Person Ratio 14:1
Teacher/Staff Ratio 5:1
Student Enrollment/All Teachers 13:1
Certified Personnel by Category
79.5% 100%
13.3%
7.2%
80% 60%
40%
20%
0%
Teachers
Administrators
Support Personnel
1998-99 GEORGIA PUBLIC EDUCATION REPORT CARD
Calhoun County Schools - 619
Prepared by Georgia Department of Education
Page 9
1998-99 GEORGIA PUBLIC EDUCATION REPORT CARD
CALHOUN COUNTY SCHOOLS
Calhoun County Elementary School - 6190179
Grade Range PK-5
The Georgia Public Education Report Card is designed to assist systems and schools in educational improvement. This report card contains a variety of data elements. An explanation of the terms is provided as a companion to the report card data. Please refer to the definitions for the most effective use of the reported data.
STUDENT DATA
Total
K-5
382
PK
23
Enrollment, by Race/Ethnicity and Sex
Black
White Hispanic
American Asian Indian
Multiracial
342 89.5%
31 8.1%
9 2.4%
0 0.0%
0 0.0%
0 0.0%
21 91.3%
2 8.7%
0 0.0%
0 0.0%
0 0.0%
0 0.0%
Male Female
199 52.1%
183 47.9%
12 52.2%
11 47.8%
Enrollment in Selected Programs
Program
Program % of Student Enrollment Population
Gifted (Grades K-12)
13
3.4%
Alternative Programs (Grades 6-12)
N/A
N/A
Students Eligible to Receive Free/Reduced Lunches
Number
Percent
School System
405 100.0% 805 100.0%
Dropout Rate *
Number
Rate
School System
N/A N/A
N/A N/A
* Dropout rates are not applicable for grades PK-5.
Enrollment in Compensatory Programs
Program
Program % of Student Enrollment Population
Special Education (Grades K-12)
51 13.4%
(PK)
14
N/A
English to Speakers of Other Languages (ESOL) (Grades K-12)
0
0.0%
Remedial Education (Grades 2-5, 9-12)
67 25.4%
Special Instructional Assistance (SIA) (Grades K-3)
71 28.4%
Title I (Grades K-12)
This school has a schoolwide program.
Total 10
Retained Students, by Race/Ethnicity and Sex
Black
White Hispanic
American MultiAsian Indian racial
9 90.0%
1 10.0%
0 0.0%
0 0.0%
0 0.0%
0 0.0%
Male Female
5
5
50.0% 50.0%
Prepared by Georgia Department of Education
Page 1
STATE-REQUIRED TEST DATA
NORM-REFERENCED TESTS Grade 3
Iowa Tests of Basic Skills (ITBS) Each chart reflects data for three years of testing.
Reading Comprehension 50
30 30 54 0
98-99
31 31 53 97-98
26 26 52 96-97
Mathematics
School 50
System
State
0
37 37 61 98-99
43 43 61 97-98
30 30 59 96-97
School System State
Reading Vocabulary 50
30 30 50 0
98-99
23 23 50 97-98
16 16 49 96-97
Language Arts
School 50
System
State
0
49 49 64 98-99
45 45 62 97-98
29 29 59 96-97
School System State
Social Studies 50
38 38 56 0
98-99
35 35 55 97-98
27 27 55 96-97
Science
School 50
System
State
0
30 30 59 98-99
38 38 59 97-98
26 26 58 96-97
School System State
Sources of Information
Composite Score
50
39 39 57 0
98-99
School 50
System
40 40 56 97-98
27 27 55 96-97
State 0
34 34 58 98-99
35 35 57 97-98
1998-99 GEORGIA PUBLIC EDUCATION REPORT CARD Calhoun County Elementary School - 6190179
Prepared by Georgia Department of Education
24 24 56 96-97
Scores Reported in Percentiles
School System State
Page 2
STATE-REQUIRED TEST DATA
NORM-REFERENCED TESTS Grade 5
Iowa Tests of Basic Skills (ITBS) Each chart reflects data for three years of testing.
Reading Comprehension
Mathematics
50
31 31 53 0
98-99
34 34 53 97-98
35 35 52 96-97
School 50
System
State
0
33 33 59 98-99
25 25 58 97-98
32 32 57 96-97
School System State
Reading Vocabulary 50
16 16 48 0
98-99
15 15 48 97-98
21 21 46 96-97
Language Arts
School 50
System
State
0
41 41 63 98-99
37 37 61 97-98
38 38 58 96-97
School System State
Social Studies 50
30 30 57 0
98-99
23 23 56 97-98
34 34 55 96-97
Science
School 50
System
State
0
27 27 60 98-99
32 32 59 97-98
39 39 59 96-97
School System State
Sources of Information
Composite Score
50
28 28 58 0
98-99
School 50
System
28 28 58 97-98
33 33 57 96-97
State 0
28 28 57 98-99
26 26 56 97-98
32 32 55 96-97
1998-99 GEORGIA PUBLIC EDUCATION REPORT CARD Calhoun County Elementary School - 6190179
Prepared by Georgia Department of Education
Scores Reported in Percentiles
School System State
Page 3
STATE-REQUIRED TEST DATA
PERFORMANCE ASSESSMENTS
Grade 5 Writing Assessment
Percent at Developmental Stages:
1998-99 School System State
1997-98 School System State
1996-97 School System State
Stage Stage Stage Stage Stage Stage
1:The Emerging Writer 2:The Developing Writer 3:The Focusing Writer 4:The Experimenting 5:The Engaging Writer 6:The Extending Writer
0% 2% 48% 33% 13% 2%
0% 2% 48% 33% 13% 2%
0% 1% 16% 41% 29% 12%
0% 16% 40% 28% 14%
3%
0% 16% 40% 28% 14%
3%
0% 3% 19% 41% 27% 10%
0% 11% 39% 34% 14%
0%
0% 11% 39% 34% 14%
0%
0% 3% 21% 37% 26% 12%
AWARDS / RECOGNITION DATA
Schools in Georgia may receive recognition in the following programs: Charter School Pay for Performance Program Georgia School of Excellence National Blue Ribbon School Calhoun County Elementary School did not receive recognition in any of these programs during the 1998-99 school year.
1998-99 GEORGIA PUBLIC EDUCATION REPORT CARD Calhoun County Elementary School - 6190179
Prepared by Georgia Department of Education
Page 4
CERTIFIED PERSONNEL DATA
Positions Number Average Contract Days
Personnel Sex
Certificate
Years Experience
Full-time Part-time
Male Female
4 Yr Bachelor's 5 Yr Master's 6 Yr Specialist's 7 Yr Doctoral Other*
<1 1-10 11-20 21-30 >30
Average
Administrators
1.59 201.95
1 2
1 2
0 1 2 0 0 0 0 0 2 1 31.00
Support Personnel
2.59 190.00
2 2
1 3
0 3 1 0 0 1 2 0 1 0 9.25
PK-12 Teachers
30.78 190.00
27 7
2 32
16 16
2 0 0 1 12 10 10 1 15.56
*Includes One- and Two-Year Vocational Certificates.
ACCREDITATION DATA
Not accredited by Southern Association of Colleges and Schools (SACS) or Georgia Accrediting Commission (GAC).
1998-99 GEORGIA PUBLIC EDUCATION REPORT CARD Calhoun County Elementary School - 6190179
Prepared by Georgia Department of Education
Page 5
1998-99 GEORGIA PUBLIC EDUCATION REPORT CARD
CALHOUN COUNTY SCHOOLS
Calhoun County Middle/High School - 6194050
Grade Range 6-12
The Georgia Public Education Report Card is designed to assist systems and schools in educational improvement. This report card contains a variety of data elements. An explanation of the terms is provided as a companion to the report card data. Please refer to the definitions for the most effective use of the reported data.
STUDENT DATA
Total 400
6-12 Enrollment, by Race/Ethnicity and Sex
Black
White Hispanic
American Multi-
Asian Indian
racial
386 96.5%
12 3.0%
2 0.5%
0 0.0%
0 0.0%
0 0.0%
Male 187
46.8%
Female 213
53.3%
Enrollment in Selected Programs
Program
Program % of Student Enrollment Population
Gifted (Grades K-12)
5
1.3%
Non-Vocational Labs (Grades 9-12)
174
76.3%
Vocational Labs (Grades 9-12)
183
80.3%
Alternative Programs (Grades 6-12)
4
1.0%
Students Eligible to Receive Free/Reduced Lunches
Number
Percent
School System
400 100.0% 805 100.0%
Enrollment in Compensatory Programs
Program
Program % of Student Enrollment Population
Special Education (Grades K-12) PK
48 12.0%
0
N/A
English to Speakers of Other Languages (ESOL) (Grades K-12)
0
0.0%
Remedial Education (Grades 2-5, 9-12)
68 29.8%
Special Instructional Assistance (SIA) (Grades K-3)
N/A
N/A
Title I (Grades K-12) This school has a schoolwide program.
Dropout Rate for Grades 6-12
Number
Rate
School System
24
5.7%
24
5.7%
Total 25
Retained Students, by Race/Ethnicity and Sex
Black
White Hispanic
American MultiAsian Indian racial
25 100.0%
0 0.0%
0 0.0%
0 0.0%
0 0.0%
0 0.0%
Male Female
16
9
64.0% 36.0%
Prepared by Georgia Department of Education
Page 1
STATE-REQUIRED TEST DATA
NORM-REFERENCED TESTS
Grade 3 Iowa Tests of Basic Skills (ITBS) Each chart reflects data for three years of testing.
No third-grade students are enrolled at Calhoun County Middle/High School.
Reading Comprehension
Mathematics
50
N/A 30 54 0
98-99
N/A 31 53 97-98
N/A 26 52 96-97
School 50
System
State
N/A 37 61 0
98-99
N/A 43 61 97-98
N/A 30 59 96-97
School System State
Reading Vocabulary 50
N/A 30 50 0
98-99
N/A 23 50 97-98
N/A 16 49 96-97
Language Arts
School 50
System
State
N/A 49 64 0
98-99
N/A 45 62 97-98
N/A 29 59 96-97
School System State
Social Studies 50
N/A 38 56 0
98-99
N/A 35 55 97-98
N/A 27 55 96-97
Science
School 50
System
State
N/A 30 59 0
98-99
N/A 38 59 97-98
N/A 26 58 96-97
School System State
Sources of Information
Composite Score
School
50
50
System
N/A 39 57 0
98-99
N/A 40 56 N/A 27 55
97-98
96-97
State
N/A 34 58 0
98-99
N/A 35 57 97-98
N/A 24 56 96-97
1998-99 GEORGIA PUBLIC EDUCATION REPORT CARD Calhoun County Middle/High School - 6194050
Prepared by Georgia Department of Education
Scores Reported in Percentiles
School System State
Page 2
STATE-REQUIRED TEST DATA
NORM-REFERENCED TESTS
Grade 5 Iowa Tests of Basic Skills (ITBS) Each chart reflects data for three years of testing. No fifth-grade students are enrolled at Calhoun County Middle/High School.
Reading Comprehension
Mathematics
50
N/A 31 53 0
98-99
N/A 34 53 97-98
N/A 35 52 96-97
School 50
System
State
N/A 33 59 0
98-99
N/A 25 58 97-98
N/A 32 57 96-97
School System State
Reading Vocabulary 50
N/A 16 48 0
98-99
N/A 15 48 97-98
N/A 21 46 96-97
Language Arts
School 50
System
State
N/A 41 63 0
98-99
N/A 37 61 97-98
N/A 38 58 96-97
School System State
Social Studies 50
N/A 30 57 0
98-99
N/A 23 56 97-98
N/A 34 55 96-97
Science
School 50
System
State
N/A 27 60 0
98-99
N/A 32 59 97-98
N/A 39 59 96-97
School System State
Sources of Information
Composite Score
School
50
50
System
N/A 28 58 0
98-99
N/A 28 58 N/A 33 57
97-98
96-97
State
N/A 28 57 0
98-99
N/A 26 56 97-98
N/A 32 55 96-97
1998-99 GEORGIA PUBLIC EDUCATION REPORT CARD Calhoun County Middle/High School - 6194050
Prepared by Georgia Department of Education
Scores Reported in Percentiles
School System State
Page 3
STATE-REQUIRED TEST DATA
NORM-REFERENCED TESTS Grade 8
Iowa Tests of Basic Skills (ITBS) Each chart reflects data for three years of testing.
Reading Comprehension 50
27 27 49 0
98-99
34 34 48 97-98
20 20 48 96-97
Mathematics
School 50
System
State
0
38 38 56 98-99
34 34 55 97-98
25 25 54 96-97
School System State
Reading Vocabulary 50
16 16 46 0
98-99
22 22 45 97-98
14 14 44 96-97
Language Arts
School 50
System
State
0
50 50 60 98-99
50 50 58 N/A N/A 56
97-98
96-97
School System State
Social Studies 50
34 34 54 0
98-99
36 36 53 N/A N/A 53
97-98
96-97
Science
School 50
System
State
0
28 28 56 98-99
31 31 55 N/A N/A 53
97-98
96-97
School System State
Sources of Information
Composite Score
50
38 38 57 0
98-99
School 50
System
34 34 56 N/A N/A 55
97-98
96-97
State 0
33 33 56 98-99
33 33 54 N/A N/A 54
97-98
96-97
1998-99 GEORGIA PUBLIC EDUCATION REPORT CARD Calhoun County Middle/High School - 6194050
Prepared by Georgia Department of Education
Scores Reported in Percentiles
School System State
Page 4
STATE-REQUIRED TEST DATA
PERFORMANCE ASSESSMENTS
Grade 5 Writing Assessment
Percent at Developmental Stages:
1998-99 School System State
1997-98 School System State
1996-97 School System State
Stage Stage Stage Stage Stage Stage
1:The Emerging Writer 2:The Developing Writer 3:The Focusing Writer 4:The Experimenting 5:The Engaging Writer 6:The Extending Writer
N/A N/A N/A N/A N/A N/A
0% 2% 48% 33% 13% 2%
0% 1% 16% 41% 29% 12%
N/A N/A N/A N/A N/A N/A
0% 16% 40% 28% 14%
3%
0% 3% 19% 41% 27% 10%
N/A N/A N/A N/A N/A N/A
0% 11% 39% 34% 14%
0%
0% 3% 21% 37% 26% 12%
No fifth-grade students are enrolled at Calhoun County Middle/High School.
Categories of Scaled Scores
Inadequate (less than 162)
Minimal (162-209)
Good
(210-247)
Very Good (greater than 247)
Average Scaled Score: (Range 100-300)
Grade 8 Writing Assessment
1998-99 Percent Scoring
1997-98 Percent Scoring
1996-97 Percent Scoring
School System State School System State School System State
11% 74% 15%
0%
11% 74% 15%
0%
8% 40% 41% 11%
23% 65% 12%
0%
23% 65% 12%
0%
11% 46% 34%
8%
53% 44%
3% 0%
53% 44%
3% 0%
15% 46% 30%
8%
190
190
208 178
178 202 157
157 198
GEORGIA HIGH SCHOOL GRADUATION TESTS (GHSGT)
Percent of Regular Program 11th Graders Passing the Georgia High School Graduation Tests on First Administration
English Language Arts Mathematics Social Studies Science
All Components listed above
Writing
1998-99
School System State
80% 67% 54% 50%
37%
80% 67% 54% 50%
37%
96% 88% 80% 72%
68%
68% 68% 93%
1997-98
School System State
86% 70% 54% 57%
46%
86% 70% 54% 57%
46%
94% 88% 78% 74%
68%
89% 89% 92%
1996-97
School System State
65% 55% 47% 35%
27%
65% 55% 47% 35%
27%
94% 87% 78% 74%
67%
60% 60% 93%
1998-99 GEORGIA PUBLIC EDUCATION REPORT CARD Calhoun County Middle/High School - 6194050
Prepared by Georgia Department of Education
Page 5
GRADUATE DATA
1999 Graduates by Credentials, Race/Ethnicity and Sex
Diplomas with Both College Prep. & Voc. Endorsements
Diplomas with College Prep. Endorsements Diplomas with Vocational Endorsements General High School Diplomas Special Education Diplomas
Total All Diplomas
Certificates of Performance
Total Graduates
Total 9 6
22 1 0
Black
9 100.0%
5 83.3%
21 95.5%
0 0.0%
0
White Hispanic
0 0.0%
0 0.0%
1 16.7%
0 0.0%
1 4.5%
0 0.0%
1 100.0%
0 0.0%
0
0
American MultiAsian Indian racial
0 0.0%
0 0.0%
0 0.0%
0 0.0%
0 0.0%
0 0.0%
0 0.0%
0 0.0%
0 0.0%
0 0.0%
0 0.0%
0 0.0%
0
0
0
38
35
3
0
0
0
0
92.1%
7.9% 0.0% 0.0% 0.0% 0.0%
0
0
0
0
0
0
0
38
35
3
0
0
0
0
92.1%
7.9% 0.0% 0.0% 0.0% 0.0%
Male Female
1
8
11.1% 88.9%
2
4
33.3% 66.7%
14
8
63.6% 36.4%
0
1
0.0% 100.0%
0
0
17 44.7%
0
21 55.3%
0
17
21
44.7% 55.3%
HOPE Scholarships
School System
Number of 1999 Graduates 3 8
Number Eligible
17
Percent Eligible
44.7%
38 17 44.7%
State
65,548 40,292 61.5%
High School Completion Rate
Percent of 1995Grade 9 Enrollment in Graduating Class of1999 School System State
Completion Rate '95-'99 59.4% 59.4% 68.9%
1998-99 GEORGIA PUBLIC EDUCATION REPORT CARD
Calhoun County Middle/High School - 6194050
Prepared by Georgia Department of Education
Page 6
COLLEGE ADMISSIONS / CREDIT TEST DATA
Scholastic Assessment Test (SAT)
Based on students' highest verbal and highest math scores
No. Taking
Average Score
Tests Verbal Math Total
Based on students' last test administration
Average Score Verbal Math Total
School College Prep. Endorsement Other Diplomas
23 377 373
750
398 399
797
339 361
700
System College Prep. Endorsement Other Diplomas
23 377 373
750
398 399
797
339 361
700
Georgia
41,958 492 488
980
372 N/A N/A
372 N/A N/A
483
365 N/A N/A
365 N/A N/A
479
737 N/A N/A
737 N/A N/A
962
Nation
952,913 N/A N/A N/A
502 508 1010
American College Testing (ACT)
Advanced Placement Exams (AP)
Number taking tests: English Mathematics Reading Science Reasoning
3 * School N/A N/A N/A N/A
System N/A N/A N/A N/A
State 19.1 19.9 20.2 19.9
CompositeScore
N/A
N/A 19.9
* Scores are not reported when fewer than 5 take the ACT
No. of Students Taking Tests
No. of Tests Taken No. of Test Scores
3 or Higher Percent of Test
Scores 3 or Higher
School 0
N/A N/A
N/A
System State 0 15,225
N/A 23,969 N/A 13,024
N/A 54.3%
POST-SECONDARY DATA
Graduates Entering Georgia Public Colleges
Graduates Entering Georgia Public Colleges and Requiring Learning Support (LS)
1998 Graduates Entering in 1998-99
1997 Graduates Entering in 1997-98
Percent of Graduating Number Class
School
14
36.8%
System 1 4
36.8%
School
12
20.0%
System 1 2
20.0%
Number Requiring
LS 10 10
5 5
Percent of those attending Georgia
Public Colleges
71.4%
71.4%
41.7%
41.7%
In previous years, the Report Card presented College Prep Curriculum information provided by the Board of Regents on students requiring Learning Support. Due to inconsistencies in the data provided by the Board of Regents in defining College Prep Completers versus Local Board of Education data defining College Prep Endorsements, the Department of Education Report Card will not provide this information until discrepancies can be reconciled.
Graduates Entering Georgia Public Technical and Adult Schools
1998 Graduates School System
Entering Number 6 6
1998-99 Percent 15.8% 15.8%
Entering Number N/A N/A
1997-98 Percent
N/A N/A
1997 Graduates School
1
1.7%
System
1
1.7%
11
18.3%
11
18.3%
1998-99 GEORGIA PUBLIC EDUCATION REPORT CARD Calhoun County Middle/High School - 6194050
Prepared by Georgia Department of Education
Page 7
CERTIFIED PERSONNEL DATA
Positions Number Average Contract Days
Administrators
4.07 217.37
Support Personnel
2.00 209.50
PK-12 Teachers
30.46 192.68
Personnel Sex
Certificate
Years Experience
Full-time Part-time
Male Female
4 Yr Bachelor's 5 Yr Master's 6 Yr Specialist's 7 Yr Doctoral Other*
<1 1-10 11-20 21-30 >30
Average
3 2
3 2
0 3 2 0 0
0 0 1 3 1
28.60
2 0
0 2
0 1 1 0 0
0 0 0 2 0
24.00
28 4
13 19
14 17
0 0 1
1 9 7 13 2
17.34
*Includes One- and Two-Year Vocational Certificates.
ACCREDITATION DATA
Accredited by Southern Association of Colleges and Schools (SACS): Secondary/Middle Commission.
AWARDS / RECOGNITION DATA
Schools in Georgia may receive recognition in the following programs: Charter School Pay for Performance Program Georgia School of Excellence National Blue Ribbon School Calhoun County Middle/High School did not receive recognition in any of these programs during the 1998-99 school year.
1998-99 GEORGIA PUBLIC EDUCATION REPORT CARD Calhoun County Middle/High School - 6194050
Prepared by Georgia Department of Education
Page 8
1998-99 GEORGIA PUBLIC EDUCATION REPORT CARD CAMDEN COUNTY SCHOOLS - 620
The Georgia Public Education Report Card is designed to assist systems and schools in educational improvement. This report card contains a variety of data elements. An explanation of the terms is provided as a companion to the report card data. Please refer to the definitions for the most effective use of the reported data.
Total
K-12
9,409
PK
289
STUDENT DATA
Enrollment, by Race/Ethnicity and Sex
Black
White Hispanic
American Multi-
Asian Indian
racial
2,208 23.5%
6,648 70.7%
223 2.4%
76 0.8%
35 0.4%
219 2.3%
74 25.6%
194 67.1%
6 2.1%
2 0.7%
2 0.7%
11 3.8%
Male
4,816 51.2%
154 53.3%
Female
4,593 48.8%
135 46.7%
Enrollment in Selected Programs
Program
Program % of Student Enrollment Population
Gifted (Grades K-12)
462
4.9%
Non-Vocational Labs (Grades 9-12)
2,112
88.9%
Vocational Labs (Grades 9-12)
1,656
69.7%
Alternative Programs (Grades 6-12)
38
< 1%
Students Eligible to Receive Free/Reduced Lunches
Number
Percent
3,467
35.7%
Dropout Rate
Number
Percent
6-12
283
5.6%
9-12
251
9.7%
Enrollment in Compensatory Programs
Program
Program % of Student Enrollment Population
Special Education
(Grades K-12)
900
PK
94
English to Speakers of
Other Languages (ESOL)
22
(Grades K-12)
Remedial Education (Grades 2-5, 9-12)
612
Special Instructional
Assistance (SIA)
279
(Grades K-3)
Title I (Grades K-12) Number of schools with: Schoolwide program Targeted Assistance program No Title I program
9.6% N/A < 1%
11.0%
8.7%
1 4 6
Total 373
Retained Students, by Race/Ethnicity and Sex
Black
White Hispanic
American MultiAsian Indian racial
108 29.0%
236 63.3%
13 3.5%
5 1.3%
0 0.0%
11 2.9%
Male Female 238 135
63.8% 36.2%
Prepared by Georgia Department of Education
Page 1
STATE-REQUIRED TEST DATA
NORM-REFERENCED TESTS
Grade 3 Iowa Tests of Basic Skills (ITBS) Each chart reflects data for three years of testing.
Reading Comprehension
Mathematics
50
53 54 53 53 52 52 0
98-99 97-98 96-97
System State
50
63 61 63 61 62 59 0
98-99 97-98 96-97
System State
Reading Vocabulary
50
53 50 50 50 50 49 0
98-99 97-98 96-97
System State
Social Studies
50
56 56 53 55 58 55 0
98-99 97-98 96-97
System State
Language Arts
50
76 64 72 62 63 59 0
98-99 97-98 96-97
System State
Science
50
60 59 61 59 61 58 0
98-99 97-98 96-97
System State
Sources of Information
Composite Score
50
61 57 0
98-99
System
50
60 56 58 55 97-98 96-97
State
62 58 60 57 0
98-99 97-98
1998-99 GEORGIA PUBLIC EDUCATION REPORT CARD Camden County Schools
Prepared by Georgia Department of Education
System State Scores Reported 59 56 in Percentiles 96-97
Page 2
STATE-REQUIRED TEST DATA
NORM-REFERENCED TESTS
Grade 5 Iowa Tests of Basic Skills (ITBS) Each chart reflects data for three years of testing.
Reading Comprehension
Mathematics
50
54 53 53 53 51 52 0
98-99 97-98 96-97
System State
50
63 59 65 58 63 57 0
98-99 97-98 96-97
System State
Reading Vocabulary
50
46 48 48 48 46 46 0
98-99 97-98 96-97
System State
Social Studies
50
59 57 58 56 59 55 0
98-99 97-98 96-97
System State
Language Arts
50
70 63 63 61 52 58 0
98-99 97-98 96-97
System State
Science
50
61 60 64 59 62 59 0
98-99 97-98 96-97
System State
Sources of Information
Composite Score
50
61 58 0
98-99
System
50
61 58 61 57 97-98 96-97
State
61 57 60 56 0
98-99 97-98
1998-99 GEORGIA PUBLIC EDUCATION REPORT CARD Camden County Schools
Prepared by Georgia Department of Education
System State Scores Reported 57 55 in Percentiles 96-97
Page 3
STATE-REQUIRED TEST DATA
NORM-REFERENCED TESTS Grade 8
Iowa Tests of Basic Skills (ITBS) Each chart reflects data for three years of testing.
Reading Comprehension
Mathematics
50
52 49 52 48 52 48 0
98-99 97-98 96-97
System State
50
57 56 55 55 55 54 0
98-99 97-98 96-97
System State
Reading Vocabulary
50
50 46 52 45 51 44 0
98-99 97-98 96-97
System State
Language Arts
50
60 60 60 58 58 56 0
98-99 97-98 96-97
System State
Social Studies
50
56 54 53 53 55 53 0
98-99 97-98 96-97
System State
Science
50
58 56 58 55 56 53 0
98-99 97-98 96-97
System State
Sources of Information
Composite Score
50
59 57 0
98-99
System
50
58 56 57 55 97-98 96-97
State
57 56 57 54 0
98-99 97-98
1998-99 GEORGIA PUBLIC EDUCATION REPORT CARD Camden County Schools
Prepared by Georgia Department of Education
System State Scores Reported 56 54 in Percentiles 96-97
Page 4
STATE-REQUIRED TEST DATA
PERFORMANCE ASSESSMENTS
Grade 5 Writing Assessment
1998-99
1997-98
1996-97
Percent at Developmental Stages:
Comparison
Comparison
Comparison
System Group State System Group State System Group State
Stage Stage Stage Stage Stage Stage
1: The Emerging Writer 2: The Developing Writer 3: The Focusing Writer 4: The Experimenting Writer 5: The Engaging Writer 6: The Extending Writer
0% 1% 15% 45% 28% 11%
0% 1% 16% 44% 29% 10%
0% 1% 16% 41% 29% 12%
0% 2% 16% 44% 27% 10%
0% 1% 18% 44% 27% 9%
0% 3% 19% 41% 27% 10%
0% 3% 22% 35% 29% 10%
0% 3% 21% 38% 26% 11%
0% 3% 21% 37% 26% 12%
Grade 8 Writing Assessment
1998-99 Percent Scoring 1997-98 Percent Scoring 1996-97 Percent Scoring
Categories of Scaled Scores
Comparison
Comparison
Comparison
System Group State System Group State System Group State
Inadequate (less than 162)
Minimal (162-209)
Good
(210-247)
Very Good (greater than 247)
6% 37% 45% 12%
6% 40% 44% 10%
8% 40% 41% 11%
8% 51% 35%
6%
9% 49% 35%
7%
11% 46% 34%
8%
10% 46% 35% 10%
12% 49% 32%
7%
15% 46% 30%
8%
Average Scaled Score: (Range 100-300)
211
209 208
202
202 202
203
200 198
GEORGIA HIGH SCHOOL GRADUATION TESTS (GHSGT)
Percent of Regular Program 11th Graders Passing the Georgia High School Graduation Tests on First Administration
1998-99
1997-98
1996-97
Comparison
Comparison
Comparison
System Group State System Group State System Group State
English Language Arts Mathematics Social Studies Science
96% 88% 81% 80%
96% 90% 81% 77%
96% 88% 80% 72%
96% 91% 79% 80%
96% 92% 80% 78%
94% 88% 78% 74%
94% 89% 83% 80%
96% 91% 82% 81%
94% 87% 78% 74%
All Components listed above 7 4 %
72% 68% 71%
72% 68% 71%
74% 67%
Writing
93%
95% 93% 91%
94% 92% 93%
94% 93%
1998-99 GEORGIA PUBLIC EDUCATION REPORT CARD
Camden County Schools
Prepared by Georgia Department of Education
Page 5
GRADUATE DATA
1999 Graduates by Credentials, Race/Ethnicity and Sex
Diplomas with Both College Prep. & Voc. Endorsements
Diplomas with College Prep. Endorsements Diplomas with Vocational Endorsements General High School Diplomas Special Education Diplomas
Total All Diplomas
Certificates of Performance
Total Graduates
Total 60
171 108
5 2 346 23 369
Black
13 21.7%
35 20.5%
24 22.2%
2 40.0%
2 100.0%
76 22.0%
13 56.5%
89 24.1%
American MultiWhite Hispanic Asian Indian racial
46 76.7%
127 74.3%
80 74.1%
2 40.0%
0 0.0%
255 73.7%
0 0.0%
4 2.3%
3 2.8%
1 20.0%
0 0.0%
8 2.3%
1 1.7%
4 2.3%
0 0.0%
0 0.0%
0 0.0%
5 1.4%
0 0.0%
0 0.0%
0 0.0%
0 0.0%
0 0.0%
0 0.0%
0 0.0%
1 0.6%
1 0.9%
0 0.0%
0 0.0%
2 0.6%
8
0
1
1
0
34.8% 0.0% 4.3% 4.3% 0.0%
263
8
6
1
2
71.3% 2.2% 1.6% 0.3% 0.5%
Male Female
25 41.7%
74 43.3%
72 66.7%
4 80.0%
1 50.0%
176 50.9%
35 58.3%
97 56.7%
36 33.3%
1 20.0%
1 50.0%
170 49.1%
7
16
30.4% 69.6%
183 186 49.6% 50.4%
HOPE Scholarships
System State
Number of 1999 Graduates 3 6 9
Number Eligible
221
Percent Eligible
59.9%
65,548 40,292 61.5%
High School Completion Rate Percent of 1995Grade 9 Enrollment
in Graduating Class of1999
System
State
Completion Rate '95-'99 58.0% 68.9%
COLLEGE ADMISSIONS / CREDIT TEST DATA
Scholastic Assessment Test (SAT)
No. Taking
Average Score
Tests
Verbal Math Total
Based on students' highest verbal and highest math scores
System College Prep. Endorsement Other Diplomas
485 476 961 496 488 984 367 376 743
Georgia
492 488 980
Based on students' last test administration
System Georgia
251
476 467
943
41,958 483 479 962
Nation
952,913 502 508 1010
American College Testing (ACT)
System State Nation
English
17.7
19.1 20.4
Mathematics
19.9
19.9 20.7
Reading
20.9
20.2 21.3
Science Reasoning 18.8
19.9 21.0
CompositeScore 19.4
19.9 21.9
Advanced Placement Exams (AP)
No. of Students Taking Tests
No. of Tests Taken No. of Test Scores
3 or Higher Percent of Test
Scores 3 or Higher
System State 34 15,225 44 23,969 18 13,024
40.9% 54.3%
1998-99 GEORGIA PUBLIC EDUCATION REPORT CARD Camden County Schools
Prepared by Georgia Department of Education
Page 6
POSTSECONDARY DATA
Graduates Entering Georgia Public Colleges and Universities
Graduates Entering Georgia Public Colleges and Universities and
Requiring Learning Support (LS)
1998 Graduates Entering 1998-99
1997 Graduates Entering 1997-98
Percent of Graduating Number Class
157
46.0%
117
38.7%
Number Requiring
LS
46
24
Percent of those attending Georgia
Public Colleges
29.3%
20.5%
In previous years, the Report Card presented College Prep Curriculum information provided by the Board of Regents on students requiring Learning Support. Due to inconsistencies in the data provided by the Board of Regents in defining College Prep Completers versus Local Board of Education data defining College Prep Endorsements, the Department of Education Report Card will not provide this information until discrepancies can be reconciled.
Graduates Entering Georgia Public Technical and Adult Schools
Entering 1998-99 Entering 1997-98
Number Percent
Number Percent
1998 Graduates 1997 Graduates
5
1.5%
0
0.0%
N/A 2
N/A 0.7%
ACCREDITATION / RECOGNITION DATA
Southern Association of Colleges and Schools (SACS) Accrediting Commission
Secondary/Middle Commission Elementary/Middle Commission Both Elementary/Secondary Commissions Joint Commission Candidate for Accreditation
Accreditation by Georgia Accrediting Commission (GAC)
Accredited by GAC Accredited with Quality by GAC
Number of Schools
1 10
0 0 0
Number of Schools
0 11
Awards / Recognition
State Recognized Program
Number of Schools
Charter School
0
Pay for Performance Recipient
0
Georgia School of Excellence
1
National Blue Ribbon School
0
COMMUNITY DATA
Number of Children Eligible for Migrant Education Number of Families-At-Risk * Number of Food Stamp Participants * Number of Families Receiving TANF * ** Per Capita Income * Unemployment Rate * 1990 Population * Projected 2000 Population * Projected 2010 Population *
* Data Available at County Level Only ** Known as AFDC before January 1997
0 171 2,072 112 $13,664 3.9% 30,167 41,986 47,610
1998-99 GEORGIA PUBLIC EDUCATION REPORT CARD Camden County Schools
Prepared by Georgia Department of Education
Page 7
FISCAL DATA
Millage Rate
15.00
* Fall 1998 Property Tax Digest is used to calculate the 98-99 Value of One Mill
FTE Count
FTE Count used for Allotment Calculation 9,312.0 Fall '98 FTE Count 9,409
Value of One Mill
$633,895 $68.07 per Allotment FTE
Sources: Local State-QBE State-
Lottery State-
Other Federal Other
Total
PerGeneral Fund cent Per FTE
$9,848,152 21.0% $1,058 $32,274,364 69.0% $3,466
K-12 Revenues
Lottery K-12
and
Title
All Other
Programs
K-12
$0 $408,922
Bonded Debt
$4,525,854
$0
$0
$0
$0 0.0%
$0
$0 $197,768
$0
$279,653 0.6% $30
$4,387,945 9.4% $471
$1,679 0.0%
$0
$46,791,795 100% $5,025
$0 $1,681,230
$0 $1,681,230
$1,355,767 $149,699 $0
$2,112,157
$0 $0 $0 $4,525,854
Capital Projects $1,125,255
$0
$0
$0 $0 $0 $1,125,255
School Nutrition $1,308,913
$0
$0
$233,662 $1,528,676
$875 $3,072,126
Grand Total
Total
Per-
Amount cent
$17,217,098 29.0%
$32,274,364 54.4%
$197,768 0.3%
$1,869,082 3.2% $7,747,551 13.1%
$2,554 0.0% $59,308,419 100%
Instruction
Media Instruction
Support Pupil Services General Admin. School Admin. Trans-
portation Maint. & Ops. Capital Projects School Food Debt Service
Total
K-12 Expenditures
$27,949,094 62.2% $3,001 $1,424,456 $370,956
$0 $113,820
$0
$1,160,473 2.6% $125
$40,748
$0
$0
$30,759
$0
$1,881,593 4.2% $202 $125,210 $240,895
$0
$0
$0
$3,011,849 6.7% $323 $161,867
$34,802
$0
$0
$0
$794,376 1.8% $85
$81,658
$10,311
$0 $133,082
$0
$3,485,901 7.8% $374
$24,892
$209
$0 $130,343
$0
$2,955,651 6.6% $317
$14,912
$0
$0
$0
$0
$3,522,692 7.8% $378
$0
$22,368
$0
$0
$0
$166,930 0.4% $18
$0
$0
$0 $5,686,954
$0
$0 0.0%
$0
$0
$22,709
$0
$0 $3,184,321
$1,800 0.0%
$0
$0
$0 $2,756,339
$0
$0
$44,930,362 100% $4,823 $1,873,747 $702,252 $2,756,339 $6,094,959 $3,184,321
$29,858,328 50.1% $1,231,980 2.1% $2,247,698 3.8% $3,208,519 5.4% $1,019,428 1.7% $3,641,347 6.1% $2,970,564 5.0% $3,545,060 6.0% $5,853,885 9.8% $3,207,030 5.4% $2,758,139 4.6%
$59,541,984 100%
Salaries and Benefits as Percentages of Revenues and of Expenditures
Teachers and Paraprofessionals
Salaries $22,650,754
Benefits $4,911,307
Percentage of Revenues Percentage of Expenditures
Total of
Total of
General Fund
General Fund
Title Programs
Title Programs
Lottery K-12
Lottery K-12
Total Salaries
and
Total
and
Total
and Benefits All Other K-12 K - 12 All Other K-12 K - 12
$27,562,061
54.5%
46.5%
58.0%
46.3%
School Administration
$2,070,913
$527,820
$2,598,733
5.1%
4.4%
5.5%
4.4%
General Administration
$258,001
$80,978
$338,979
0.7%
0.6%
0.7%
0.6%
1998-99 GEORGIA PUBLIC EDUCATION REPORT CARD
Camden County Schools - 620
Prepared by Georgia Department of Education
Page 8
CERTIFIED PERSONNEL DATA
Number
Average Annual Salary Positions Average Contract Days
Average Daily Salary
Full-time Personnel Part-time
Sex Male Female
4 Yr Bachelor's Certificate 5 Yr Master's
Level 6 Yr Specialist's 7 Yr Doctoral Other*
Black
White Race/ Hispanic Ethnicity Asian
American Indian
Multiracial
Years Experience
<1 1-10 11-20 21-30 >30
Average
Administrators
45.60
$69,107.22 212.24
$325.61
44 2
31 15
0 10 30
6 0
11 35
0 0 0 0
0 1 19 22 4
22.20
Support Personnel PK-12 Teachers
56.00
561.55
$46,991.95 194.82
$241.21
$38,427.56 190.51
$201.71
55
561
2
2
13
99
44
464
9
299
27
214
18
42
3
6
0
2
6
68
51
492
0
2
0
0
0
1
0
0
3
39
19
281
24
148
7
83
4
12
14.12
10.82
*Includes One- and Two-Year Vocational Certificates.
Certified Staff Position Ratios
Teacher/Administrator Ratio 12:1
Teacher/Support Person Ratio 10:1
Teacher/Staff Ratio 6:1
Student Enrollment/All Teachers 17:1
Certified Personnel by Category
84.5% 100%
6.9%
8.6%
80% 60%
40%
20%
0%
Teachers
Administrators
Support Personnel
1998-99 GEORGIA PUBLIC EDUCATION REPORT CARD
Camden County Schools - 620
Prepared by Georgia Department of Education
Page 9
1998-99 GEORGIA PUBLIC EDUCATION REPORT CARD
CAMDEN COUNTY SCHOOLS
Camden County High School - 6200295
Grade Range 9-12
The Georgia Public Education Report Card is designed to assist systems and schools in educational improvement. This report card contains a variety of data elements. An explanation of the terms is provided as a companion to the report card data. Please refer to the definitions for the most effective use of the reported data.
Total 2,377
STUDENT DATA
9-12 Enrollment, by Race/Ethnicity and Sex
Black
White Hispanic
American Multi-
Asian Indian
racial
554 23.3%
1,722 72.4%
38 1.6%
24 1.0%
8 0.3%
31 1.3%
Male Female
1,204 50.7%
1,173 49.3%
Enrollment in Selected Programs
Program
Gifted (Grades K-12)
Program % of Student Enrollment Population
152
6.4%
Non-Vocational Labs (Grades 9-12)
Vocational Labs (Grades 9-12)
Alternative Programs (Grades 6-12)
2,112 1,656
26
88.9% 69.7%
1.1%
Students Eligible to Receive Free/Reduced Lunches
Number
Percent
School System
534 3,467
22.5% 35.7%
Enrollment in Compensatory Programs
Program
Program % of Student Enrollment Population
Special Education (Grades K-12) PK
166
7.0%
0
N/A
English to Speakers of Other Languages (ESOL) (Grades K-12)
4
< 1%
Remedial Education (Grades 2-5, 9-12)
72
3.0%
Title I (Grades K-12)
This school has no Title I program.
Dropout Rate for Grades 9-12
Number
Rate
School System
251
9.7%
251
9.7%
Total 144
Retained Students, by Race/Ethnicity and Sex
Black
White Hispanic
American MultiAsian Indian racial
44 30.6%
92 63.9%
2 1.4%
2 1.4%
0 0.0%
4 2.8%
Male Female
92
52
63.9% 36.1%
Prepared by Georgia Department of Education
Page 1
STATE-REQUIRED TEST DATA
GEORGIA HIGH SCHOOL GRADUATION TESTS (GHSGT)
Percent of Regular Program 11th Graders Passing the Georgia High School Graduation Tests on First Administration
English Language Arts Mathematics Social Studies Science
All Components listed above
Writing
1998-99
School System State
96% 88% 81% 80%
96% 88% 81% 80%
96% 88% 80% 72%
74% 74% 68%
93% 93% 93%
1997-98
School System State
96% 91% 79% 80%
96% 91% 79% 80%
94% 88% 78% 74%
71% 71% 68%
91% 91% 92%
1996-97
School System State
94% 89% 83% 80%
94% 89% 83% 80%
94% 87% 78% 74%
71% 71% 67%
93% 93% 93%
GRADUATE DATA
1999 Graduates by Credentials, Race/Ethnicity and Sex
Diplomas with Both College Prep. & Voc. Endorsements
Diplomas with College Prep. Endorsements Diplomas with Vocational Endorsements General High School Diplomas Special Education Diplomas
Total All Diplomas
Certificates of Performance
Total Graduates
Total 60
171 108
5 2 346 23 369
Black
13 21.7%
35 20.5%
24 22.2%
2 40.0%
2 100.0%
76 22.0%
13 56.5%
89 24.1%
White Hispanic
46 76.7%
127 74.3%
0 0.0%
4 2.3%
80 74.1%
2 40.0%
0 0.0%
3 2.8%
1 20.0%
0 0.0%
255 73.7%
8 2.3%
8 34.8%
0 0.0%
263 71.3%
8 2.2%
American MultiAsian Indian racial
1 1.7%
4 2.3%
0 0.0%
0 0.0%
0 0.0%
1 0.6%
0 0.0%
0 0.0%
0 0.0%
0 0.0%
0 0.0%
0 0.0%
1 0.9%
0 0.0%
0 0.0%
5 1.4%
0 0.0%
2 0.6%
1 4.3%
1 4.3%
0 0.0%
6 1.6%
1 0.3%
2 0.5%
Male Female
25 41.7%
74 43.3%
35 58.3%
97 56.7%
72 66.7%
4 80.0%
1 50.0%
36 33.3%
1 20.0%
1 50.0%
176
170
50.9% 49.1%
7
16
30.4% 69.6%
183
186
49.6% 50.4%
HOPE Scholarships
School System
Number of 1999 Graduates 3 6 9
Number Eligible
221
Percent Eligible
59.9%
369 221 59.9%
State
65,548 40,292 61.5%
High School Completion Rate
Percent of 1995Grade 9 Enrollment in Graduating Class of1999 School System State
Completion Rate '95-'99 58.0% 58.0% 68.9%
1998-99 GEORGIA PUBLIC EDUCATION REPORT CARD
Camden County High School - 6200295
Prepared by Georgia Department of Education
Page 2
COLLEGE ADMISSIONS / CREDIT TEST DATA
Scholastic Assessment Test (SAT)
Based on students' highest verbal and highest math scores
No. Taking
Average Score
Tests Verbal Math Total
Based on students' last test administration
Average Score Verbal Math Total
School
251 485 476
961
College Prep. Endorsement
496 488
984
Other Diplomas
367 376
743
System
251 485 476
961
College Prep. Endorsement
496 488
984
Other Diplomas
367 376
743
Georgia
41,958 492 488
980
476 N/A N/A
476 N/A N/A
483
467 N/A N/A
467 N/A N/A
479
943 N/A N/A
943 N/A N/A
962
Nation
952,913 N/A N/A N/A
502 508 1010
American College Testing (ACT)
Advanced Placement Exams (AP)
Number taking tests: English Mathematics Reading Science Reasoning CompositeScore
1 0 School System State
17.7 17.7 19.1
19.9 19.9 19.9
20.9 18.8
20.9 18.8
20.2 19.9
19.4 19.4 19.9
No. of Students Taking Tests
No. of Tests Taken No. of Test Scores
3 or Higher Percent of Test
Scores 3 or Higher
School 34 44 18
40.9%
System State 34 15,225 44 23,969 18 13,024
40.9% 54.3%
POST-SECONDARY DATA
Graduates Entering Georgia Public Colleges
Graduates Entering Georgia Public Colleges and Requiring Learning Support (LS)
1998 Graduates Entering in 1998-99
1997 Graduates Entering in 1997-98
Percent of Graduating Number Class
School
157
46.0%
System 157
46.0%
School
117
38.7%
System 117
38.7%
Number Requiring
LS 46 46
24 24
Percent of those attending Georgia
Public Colleges
29.3%
29.3%
20.5%
20.5%
In previous years, the Report Card presented College Prep Curriculum information provided by the Board of Regents on students requiring Learning Support. Due to inconsistencies in the data provided by the Board of Regents in defining College Prep Completers versus Local Board of Education data defining College Prep Endorsements, the Department of Education Report Card will not provide this information until discrepancies can be reconciled.
Graduates Entering Georgia Public Technical and Adult Schools
1998 Graduates School System
Entering Number 5 5
1998-99 Percent
1.5% 1.5%
Entering Number N/A N/A
1997-98 Percent
N/A N/A
1997 Graduates School
0
0.0%
System
0
0.0%
2
0.7%
2
0.7%
1998-99 GEORGIA PUBLIC EDUCATION REPORT CARD Camden County High School - 6200295
Prepared by Georgia Department of Education
Page 3
CERTIFIED PERSONNEL DATA
Positions Number Average Contract Days
Administrators
8.80 211.82
Support Personnel
6.80 200.59
PK-12 Teachers
123.77 192.33
Personnel Sex
Certificate
Years Experience
Full-time Part-time
Male Female
4 Yr Bachelor's 5 Yr Master's 6 Yr Specialist's 7 Yr Doctoral Other*
<1 1-10 11-20 21-30 >30
Average
8 1
8 1
0 2 7 0 0
0 0 1 7 1
25.44
6 1
2 5
1 4 2 0 0
0 1 3 3 0
17.86
123 3
42 84
55 55 13
1 2
5 51 43 20
7
13.11
*Includes One- and Two-Year Vocational Certificates.
ACCREDITATION DATA
Accredited by Southern Association of Colleges and Schools (SACS): Secondary/Middle Commission. Accredited with Quality by Georgia Accrediting Commission (GAC).
AWARDS / RECOGNITION DATA
Schools in Georgia may receive recognition in the following programs: Charter School Pay for Performance Program Georgia School of Excellence National Blue Ribbon School Camden County High School did not receive recognition in any of these programs during the 1998-99 school year.
1998-99 GEORGIA PUBLIC EDUCATION REPORT CARD Camden County High School - 6200295
Prepared by Georgia Department of Education
Page 4
1998-99 GEORGIA PUBLIC EDUCATION REPORT CARD
CAMDEN COUNTY SCHOOLS
Camden Middle School - 6200182
Grade Range 6-8
The Georgia Public Education Report Card is designed to assist systems and schools in educational improvement. This report card contains a variety of data elements. An explanation of the terms is provided as a companion to the report card data. Please refer to the definitions for the most effective use of the reported data.
STUDENT DATA
Total 1,271
6-8 Enrollment, by Race/Ethnicity and Sex
Black
White Hispanic
American Multi-
Asian Indian
racial
357 28.1%
871 68.5%
16 1.3%
7 0.6%
4 0.3%
16 1.3%
Male 643
50.6%
Female 628
49.4%
Enrollment in Selected Programs
Program
Gifted (Grades K-12)
Program % of Student Enrollment Population
94
7.4%
Alternative Programs (Grades 6-12)
8
< 1%
Students Eligible to Receive Free/Reduced Lunches
Number
Percent
School System
493 3,467
38.8% 35.7%
Enrollment in Compensatory Programs
Program
Program % of Student Enrollment Population
Special Education (Grades K-12) (PK)
141 11.1%
0
N/A
English to Speakers of Other Languages (ESOL) (Grades K-12)
0
0.0%
Title I (Grades K-12)
This school has a Targeted Assistance program.
Dropout Rate for Grades 6-8
Number
Rate
School System
7
0.5%
32
1.3%
Total 36
Retained Students, by Race/Ethnicity and Sex
Black
White Hispanic
American MultiAsian Indian racial
9 25.0%
24 66.7%
3 8.3%
0 0.0%
0 0.0%
0 0.0%
Male Female
24
12
66.7% 33.3%
Prepared by Georgia Department of Education
Page 1
STATE-REQUIRED TEST DATA
NORM-REFERENCED TESTS Grade 8
Iowa Tests of Basic Skills (ITBS) Each chart reflects data for three years of testing.
Reading Comprehension 50
53 52 49 0
98-99
49 52 48 97-98
46 52 48 96-97
Mathematics
School 50
System
State
0
57 57 56 98-99
52 55 55 97-98
51 55 54 96-97
School System State
Reading Vocabulary 50
48 50 46 0
98-99
49 52 45 97-98
46 51 44 96-97
Language Arts
School 50
System
State
0
60 60 60 98-99
58 60 58 97-98
52 58 56 96-97
School System State
Social Studies 50
55 56 54 0
98-99
52 53 53 97-98
53 55 53 96-97
Science
School 50
System
State
0
59 58 56 98-99
57 58 55 97-98
50 56 53 96-97
School System State
Sources of Information
Composite Score
50
59 59 57 0
98-99
School 50
System
58 58 56 97-98
53 57 55 96-97
State 0
58 57 56 98-99
56 57 54 97-98
1998-99 GEORGIA PUBLIC EDUCATION REPORT CARD Camden Middle School - 6200182
Prepared by Georgia Department of Education
50 56 54 96-97
Scores Reported in Percentiles
School System State
Page 2
STATE-REQUIRED TEST DATA
Categories of Scaled Scores
Inadequate (less than 162)
Minimal (162-209)
Good
(210-247)
Very Good (greater than 247)
Average Scaled Score: (Range 100-300)
PERFORMANCE ASSESSMENTS
Grade 8 Writing Assessment
1998-99 Percent Scoring
1997-98 Percent Scoring
1996-97 Percent Scoring
School System State School System State School System State
5% 37% 45% 13%
6% 37% 45% 12%
8% 40% 41% 11%
9% 45% 40%
6%
8% 51% 35%
6%
11% 46% 34%
8%
9% 44% 35% 11%
10% 46% 35% 10%
15% 46% 30%
8%
211
211
208 204
202 202 204
203 198
AWARDS / RECOGNITION DATA
Schools in Georgia may receive recognition in the following programs: Charter School Pay for Performance Program Georgia School of Excellence National Blue Ribbon School Camden Middle School did not receive recognition in any of these programs during the 1998-99 school year.
1998-99 GEORGIA PUBLIC EDUCATION REPORT CARD Camden Middle School - 6200182
Prepared by Georgia Department of Education
Page 3
CERTIFIED PERSONNEL DATA
Positions Number Average Contract Days
Personnel Sex
Certificate
Years Experience
Full-time Part-time
Male Female
4 Yr Bachelor's 5 Yr Master's 6 Yr Specialist's 7 Yr Doctoral Other*
<1 1-10 11-20 21-30 >30
Average
Administrators
4.00 200.00
4 0
4 0
0 1 3 0 0 0 0 2 1 1 22.25
Support Personnel
5.00 190.00
5 0
1 4
0 3 2 0 0 0 2 2 0 1 14.80
PK-12 Teachers
72.67 190.00
72 2
16 58
39 25 10
0 0 5 37 16 15 1 10.78
*Includes One- and Two-Year Vocational Certificates.
ACCREDITATION DATA
Accredited by Southern Association of Colleges and Schools (SACS):
Elementary/Middle Commission. Accredited with Quality by Georgia
Accrediting Commission (GAC).
1998-99 GEORGIA PUBLIC EDUCATION REPORT CARD Camden Middle School - 6200182
Prepared by Georgia Department of Education
Page 4
1998-99 GEORGIA PUBLIC EDUCATION REPORT CARD
CAMDEN COUNTY SCHOOLS
Crooked River Elementary School - 6200187
Grade Range PK-5
The Georgia Public Education Report Card is designed to assist systems and schools in educational improvement. This report card contains a variety of data elements. An explanation of the terms is provided as a companion to the report card data. Please refer to the definitions for the most effective use of the reported data.
STUDENT DATA
Total
K-5
676
PK
22
Enrollment, by Race/Ethnicity and Sex
Black
White Hispanic
American Asian Indian
Multiracial
140 20.7%
461 68.2%
35 5.2%
3 0.4%
4 0.6%
33 4.9%
4 18.2%
13 59.1%
1 4.5%
0 0.0%
1 4.5%
3 13.6%
Male Female
354 52.4%
322 47.6%
13 59.1%
9 40.9%
Enrollment in Selected Programs
Program
Program % of Student Enrollment Population
Gifted (Grades K-12)
18
2.7%
Alternative Programs (Grades 6-12)
N/A
N/A
Students Eligible to Receive Free/Reduced Lunches
Number
Percent
School System
357 3,467
51.1% 35.7%
Dropout Rate *
Number
Rate
School System
N/A N/A
N/A N/A
* Dropout rates are not applicable for grades PK-5.
Enrollment in Compensatory Programs
Program
Program % of Student Enrollment Population
Special Education (Grades K-12)
99 14.6%
(PK)
7
N/A
English to Speakers of Other Languages (ESOL) (Grades K-12)
8
1.2%
Remedial Education (Grades 2-5, 9-12)
43 10.0%
Special Instructional Assistance (SIA) (Grades K-3)
33
7.0%
Title I (Grades K-12)
This school has a Targeted Assistance program.
Total 9
Retained Students, by Race/Ethnicity and Sex
Black
White Hispanic
American MultiAsian Indian racial
2 22.2%
6
1
66.7% 11.1%
0 0.0%
0 0.0%
0 0.0%
Male Female
8
1
88.9% 11.1%
Prepared by Georgia Department of Education
Page 1
STATE-REQUIRED TEST DATA
NORM-REFERENCED TESTS Grade 3
Iowa Tests of Basic Skills (ITBS) Each chart reflects data for three years of testing.
Reading Comprehension 50
60 53 54 0
98-99
47 53 53 97-98
55 52 52 96-97
Mathematics
School 50
System
State
0
68 63 61 98-99
62 63 61 97-98
64 62 59 96-97
School System State
Reading Vocabulary 50
58 53 50 0
98-99
51 50 50 97-98
53 50 49 96-97
Language Arts
School 50
System
State
0
77 76 64 98-99
63 72 62 97-98
61 63 59 96-97
School System State
Social Studies 50
55 56 56 0
98-99
49 53 55 97-98
57 58 55 96-97
Science
School 50
System
State
0
65 60 59 98-99
65 61 59 97-98
57 61 58 96-97
School System State
Sources of Information
Composite Score
50
62 61 57 0
98-99
School 50
System
55 60 56 97-98
57 58 55 96-97
State 0
64 62 58 98-99
57 60 57 97-98
1998-99 GEORGIA PUBLIC EDUCATION REPORT CARD Crooked River Elementary School - 6200187
Prepared by Georgia Department of Education
57 59 56 96-97
Scores Reported in Percentiles
School System State
Page 2
STATE-REQUIRED TEST DATA
NORM-REFERENCED TESTS Grade 5
Iowa Tests of Basic Skills (ITBS) Each chart reflects data for three years of testing.
Reading Comprehension
Mathematics
50
54 54 53 0
98-99
57 53 53 97-98
60 51 52 96-97
School 50
System
State
0
69 63 59 98-99
71 65 58 97-98
73 63 57 96-97
School System State
Reading Vocabulary 50
45 46 48 0
98-99
54 48 48 97-98
52 46 46 96-97
Language Arts
School 50
System
State
0
68 70 63 98-99
70 63 61 97-98
64 52 58 96-97
School System State
Social Studies 50
64 59 57 0
98-99
63 58 56 97-98
70 59 55 96-97
Science
School 50
System
State
0
66 61 60 98-99
75 64 59 97-98
74 62 59 96-97
School System State
Sources of Information
Composite Score
50
65 61 58 0
98-99
School 50
System
63 61 58 97-98
68 61 57 96-97
State 0
64 61 57 98-99
67 60 56 97-98
68 57 55 96-97
1998-99 GEORGIA PUBLIC EDUCATION REPORT CARD Crooked River Elementary School - 6200187
Prepared by Georgia Department of Education
Scores Reported in Percentiles
School System State
Page 3
STATE-REQUIRED TEST DATA
PERFORMANCE ASSESSMENTS
Grade 5 Writing Assessment
Percent at Developmental Stages:
1998-99 School System State
1997-98 School System State
1996-97 School System State
Stage Stage Stage Stage Stage Stage
1:The Emerging Writer 2:The Developing Writer 3:The Focusing Writer 4:The Experimenting 5:The Engaging Writer 6:The Extending Writer
0% 1% 3% 42% 38% 14%
0% 1% 15% 45% 28% 11%
0% 1% 16% 41% 29% 12%
0% 3% 7% 46% 34% 10%
0% 2% 16% 44% 27% 10%
0% 3% 19% 41% 27% 10%
0% 0% 17% 34% 37% 11%
0% 3% 22% 35% 29% 10%
0% 3% 21% 37% 26% 12%
AWARDS / RECOGNITION DATA
Schools in Georgia may receive recognition in the following programs: Charter School Pay for Performance Program Georgia School of Excellence National Blue Ribbon School Crooked River Elementary School did not receive recognition in any of these programs during the 1998-99 school year.
1998-99 GEORGIA PUBLIC EDUCATION REPORT CARD Crooked River Elementary School - 6200187
Prepared by Georgia Department of Education
Page 4
CERTIFIED PERSONNEL DATA
Positions Number Average Contract Days
Personnel Sex
Certificate
Years Experience
Full-time Part-time
Male Female
4 Yr Bachelor's 5 Yr Master's 6 Yr Specialist's 7 Yr Doctoral Other*
<1 1-10 11-20 21-30 >30
Average
Administrators
2.00 210.00
2 0
1 1
0 0 2 0 0 0 0 1 1 0 20.50
Support Personnel
5.30 190.00
5 1
1 5
2 2 1 1 0 1 1 3 1 0 13.67
PK-12 Teachers
41.49 190.00
41 1
1 41
16 23
3 0 0 2 24 8 7 1 11.26
*Includes One- and Two-Year Vocational Certificates.
ACCREDITATION DATA
Accredited by Southern Association of Colleges and Schools (SACS):
Elementary/Middle Commission. Accredited with Quality by Georgia
Accrediting Commission (GAC).
1998-99 GEORGIA PUBLIC EDUCATION REPORT CARD Crooked River Elementary School - 6200187
Prepared by Georgia Department of Education
Page 5
1998-99 GEORGIA PUBLIC EDUCATION REPORT CARD
CAMDEN COUNTY SCHOOLS
David L Rainer Elementary School - 6200195
Grade Range PK-5
The Georgia Public Education Report Card is designed to assist systems and schools in educational improvement. This report card contains a variety of data elements. An explanation of the terms is provided as a companion to the report card data. Please refer to the definitions for the most effective use of the reported data.
STUDENT DATA
Total
K-5
591
PK
44
Enrollment, by Race/Ethnicity and Sex
Black
White Hispanic
American Asian Indian
Multiracial
118 20.0%
436 73.8%
3 0.5%
3 0.5%
5 0.8%
26 4.4%
8 18.2%
34 77.3%
2 4.5%
0 0.0%
0 0.0%
0 0.0%
Male Female
293 49.6%
298 50.4%
24 54.5%
20 45.5%
Enrollment in Selected Programs
Program
Program % of Student Enrollment Population
Gifted (Grades K-12)
6
1.0%
Alternative Programs (Grades 6-12)
N/A
N/A
Students Eligible to Receive Free/Reduced Lunches
Number
Percent
School System
283 3,467
44.6% 35.7%
Dropout Rate *
Number
Rate
School System
N/A N/A
N/A N/A
* Dropout rates are not applicable for grades PK-5.
Enrollment in Compensatory Programs
Program
Program % of Student Enrollment Population
Special Education (Grades K-12)
56
9.5%
(PK)
11
N/A
English to Speakers of Other Languages (ESOL) (Grades K-12)
0
0.0%
Remedial Education (Grades 2-5, 9-12)
37
9.8%
Special Instructional Assistance (SIA) (Grades K-3)
48 12.0%
Title I (Grades K-12)
This school has a Targeted Assistance program.
Total 28
Retained Students, by Race/Ethnicity and Sex
Black
White Hispanic
American MultiAsian Indian racial
9 32.1%
16 57.1%
0 0.0%
0 0.0%
0
3
0.0% 10.7%
Male Female
17
11
60.7% 39.3%
Prepared by Georgia Department of Education
Page 1
STATE-REQUIRED TEST DATA
NORM-REFERENCED TESTS Grade 3
Iowa Tests of Basic Skills (ITBS) Each chart reflects data for three years of testing.
Reading Comprehension 50
56 53 54 0
98-99
57 53 53 97-98
43 52 52 96-97
Mathematics
School 50
System
State
0
74 63 61 98-99
61 63 61 97-98
50 62 59 96-97
School System State
Reading Vocabulary 50
55 53 50 0
98-99
52 50 50 97-98
43 50 49 96-97
Language Arts
School 50
System
State
0
82 76 64 98-99
74 72 62 97-98
49 63 59 96-97
School System State
Social Studies 50
60 56 56 0
98-99
55 53 55 97-98
48 58 55 96-97
Science
School 50
System
State
0
65 60 59 98-99
60 61 59 97-98
49 61 58 96-97
School System State
Sources of Information
Composite Score
50
71 61 57 0
98-99
School 50
System
65 60 56 97-98
52 58 55 96-97
State 0
68 62 58 98-99
62 60 57 97-98
1998-99 GEORGIA PUBLIC EDUCATION REPORT CARD David L Rainer Elementary School - 6200195
Prepared by Georgia Department of Education
47 59 56 96-97
Scores Reported in Percentiles
School System State
Page 2
STATE-REQUIRED TEST DATA
NORM-REFERENCED TESTS Grade 5
Iowa Tests of Basic Skills (ITBS) Each chart reflects data for three years of testing.
Reading Comprehension
Mathematics
50
54 54 53 0
98-99
52 53 53 97-98
54 51 52 96-97
School 50
System
State
0
65 63 59 98-99
71 65 58 97-98
67 63 57 96-97
School System State
Reading Vocabulary 50
42 46 48 0
98-99
40 48 48 97-98
44 46 46 96-97
Language Arts
School 50
System
State
0
76 70 63 98-99
59 63 61 97-98
55 52 58 96-97
School System State
Social Studies 50
56 59 57 0
98-99
59 58 56 97-98
62 59 55 96-97
Science
School 50
System
State
0
61 61 60 98-99
60 64 59 97-98
64 62 59 96-97
School System State
Sources of Information
Composite Score
50
66 61 58 0
98-99
School 50
System
64 61 58 97-98
66 61 57 96-97
State 0
62 61 57 98-99
59 60 56 97-98
60 57 55 96-97
1998-99 GEORGIA PUBLIC EDUCATION REPORT CARD David L Rainer Elementary School - 6200195
Prepared by Georgia Department of Education
Scores Reported in Percentiles
School System State
Page 3
STATE-REQUIRED TEST DATA
PERFORMANCE ASSESSMENTS
Grade 5 Writing Assessment
Percent at Developmental Stages:
1998-99 School System State
1997-98 School System State
1996-97 School System State
Stage Stage Stage Stage Stage Stage
1:The Emerging Writer 2:The Developing Writer 3:The Focusing Writer 4:The Experimenting 5:The Engaging Writer 6:The Extending Writer
0% 1% 14% 43% 29% 12%
0% 1% 15% 45% 28% 11%
0% 1% 16% 41% 29% 12%
2% 2% 18% 48% 26% 5%
0% 2% 16% 44% 27% 10%
0% 3% 19% 41% 27% 10%
0% 2% 18% 35% 33% 12%
0% 3% 22% 35% 29% 10%
0% 3% 21% 37% 26% 12%
AWARDS / RECOGNITION DATA
Schools in Georgia may receive recognition in the following programs: Charter School Pay for Performance Program Georgia School of Excellence National Blue Ribbon School David L Rainer Elementary School did not receive recognition in any of these programs during the 1998-99 school year.
1998-99 GEORGIA PUBLIC EDUCATION REPORT CARD David L Rainer Elementary School - 6200195
Prepared by Georgia Department of Education
Page 4
CERTIFIED PERSONNEL DATA
Positions Number Average Contract Days
Personnel Sex
Certificate
Years Experience
Full-time Part-time
Male Female
4 Yr Bachelor's 5 Yr Master's 6 Yr Specialist's 7 Yr Doctoral Other*
<1 1-10 11-20 21-30 >30
Average
Administrators
3.00 210.00
3 0
1 2
0 1 2 0 0 0 0 2 1 0 19.33
Support Personnel
3.25 190.00
3 1
1 3
2 1 0 1 0 0 1 2 0 1 18.50
PK-12 Teachers
37.66 190.00
37 2
2 37
26 10
3 0 0 3 22 9 5 0 8.79
*Includes One- and Two-Year Vocational Certificates.
ACCREDITATION DATA
Accredited by Southern Association of Colleges and Schools (SACS):
Elementary/Middle Commission. Accredited with Quality by Georgia
Accrediting Commission (GAC).
1998-99 GEORGIA PUBLIC EDUCATION REPORT CARD David L Rainer Elementary School - 6200195
Prepared by Georgia Department of Education
Page 5
1998-99 GEORGIA PUBLIC EDUCATION REPORT CARD
CAMDEN COUNTY SCHOOLS
Kingsland Elementary School - 6200193
Grade Range PK-5
The Georgia Public Education Report Card is designed to assist systems and schools in educational improvement. This report card contains a variety of data elements. An explanation of the terms is provided as a companion to the report card data. Please refer to the definitions for the most effective use of the reported data.
STUDENT DATA
Total
K-5
665
PK
31
Enrollment, by Race/Ethnicity and Sex
Black
White Hispanic
American Asian Indian
Multiracial
150 22.6%
493 74.1%
11 1.7%
2 0.3%
0 0.0%
9 1.4%
7 22.6%
23 74.2%
0 0.0%
0 0.0%
0 0.0%
1 3.2%
Male Female
338 50.8%
327 49.2%
17 54.8%
14 45.2%
Enrollment in Selected Programs
Program
Program % of Student Enrollment Population
Gifted (Grades K-12)
5
< 1%
Alternative Programs (Grades 6-12)
N/A
N/A
Students Eligible to Receive Free/Reduced Lunches
Number
Percent
School System
299 3,467
43.0% 35.7%
Dropout Rate *
Number
Rate
School System
N/A N/A
N/A N/A
* Dropout rates are not applicable for grades PK-5.
Enrollment in Compensatory Programs
Program
Program % of Student Enrollment Population
Special Education (Grades K-12)
55
8.3%
(PK)
21
N/A
English to Speakers of Other Languages (ESOL) (Grades K-12)
0
0.0%
Remedial Education (Grades 2-5, 9-12)
40
9.1%
Special Instructional Assistance (SIA) (Grades K-3)
46 10.6%
Title I (Grades K-12)
This school has a Targeted Assistance program.
Total 33
Retained Students, by Race/Ethnicity and Sex
Black
White Hispanic
American MultiAsian Indian racial
8 24.2%
23 69.7%
1 3.0%
0 0.0%
0 0.0%
1 3.0%
Male Female
17
16
51.5% 48.5%
Prepared by Georgia Department of Education
Page 1
STATE-REQUIRED TEST DATA
NORM-REFERENCED TESTS Grade 3
Iowa Tests of Basic Skills (ITBS) Each chart reflects data for three years of testing.
Reading Comprehension 50
55 53 54 0
98-99
51 53 53 97-98
59 52 52 96-97
Mathematics
School 50
System
State
0
64 63 61 98-99
63 63 61 97-98
77 62 59 96-97
School System State
Reading Vocabulary 50
53 53 50 0
98-99
53 50 50 97-98
57 50 49 96-97
Language Arts
School 50
System
State
0
80 76 64 98-99
70 72 62 97-98
79 63 59 96-97
School System State
Social Studies 50
53 56 56 0
98-99
57 53 55 97-98
69 58 55 96-97
Science
School 50
System
State
0
56 60 59 98-99
57 61 59 97-98
74 61 58 96-97
School System State
Sources of Information
Composite Score
50
58 61 57 0
98-99
School 50
System
59 60 56 97-98
74 58 55 96-97
State 0
61 62 58 98-99
59 60 57 97-98
1998-99 GEORGIA PUBLIC EDUCATION REPORT CARD Kingsland Elementary School - 6200193
Prepared by Georgia Department of Education
73 59 56 96-97
Scores Reported in Percentiles
School System State
Page 2
STATE-REQUIRED TEST DATA
NORM-REFERENCED TESTS Grade 5
Iowa Tests of Basic Skills (ITBS) Each chart reflects data for three years of testing.
Reading Comprehension
Mathematics
50
53 54 53 0
98-99
49 53 53 97-98
53 51 52 96-97
School 50
System
State
0
57 63 59 98-99
54 65 58 97-98
58 63 57 96-97
School System State
Reading Vocabulary 50
50 46 48 0
98-99
47 48 48 97-98
47 46 46 96-97
Language Arts
School 50
System
State
0
62 70 63 98-99
61 63 61 97-98
48 52 58 96-97
School System State
Social Studies 50
54 59 57 0
98-99
54 58 56 97-98
54 59 55 96-97
Science
School 50
System
State
0
56 61 60 98-99
63 64 59 97-98
60 62 59 96-97
School System State
Sources of Information
Composite Score
50
56 61 58 0
98-99
School 50
System
61 61 58 97-98
60 61 57 96-97
State 0
55 61 57 98-99
56 60 56 97-98
54 57 55 96-97
1998-99 GEORGIA PUBLIC EDUCATION REPORT CARD Kingsland Elementary School - 6200193
Prepared by Georgia Department of Education
Scores Reported in Percentiles
School System State
Page 3
STATE-REQUIRED TEST DATA
PERFORMANCE ASSESSMENTS
Grade 5 Writing Assessment
Percent at Developmental Stages:
1998-99 School System State
1997-98 School System State
1996-97 School System State
Stage Stage Stage Stage Stage Stage
1:The Emerging Writer 2:The Developing Writer 3:The Focusing Writer 4:The Experimenting 5:The Engaging Writer 6:The Extending Writer
0% 0% 17% 52% 25% 5%
0% 1% 15% 45% 28% 11%
0% 1% 16% 41% 29% 12%
0% 1% 16% 48% 27% 8%
0% 2% 16% 44% 27% 10%
0% 3% 19% 41% 27% 10%
1% 7% 24% 36% 27% 4%
0% 3% 22% 35% 29% 10%
0% 3% 21% 37% 26% 12%
AWARDS / RECOGNITION DATA
Schools in Georgia may receive recognition in the following programs: Charter School Pay for Performance Program Georgia School of Excellence National Blue Ribbon School Kingsland Elementary School did not receive recognition in any of these programs during the 1998-99 school year.
1998-99 GEORGIA PUBLIC EDUCATION REPORT CARD Kingsland Elementary School - 6200193
Prepared by Georgia Department of Education
Page 4
CERTIFIED PERSONNEL DATA
Positions Number Average Contract Days
Personnel Sex
Certificate
Years Experience
Full-time Part-time
Male Female
4 Yr Bachelor's 5 Yr Master's 6 Yr Specialist's 7 Yr Doctoral Other*
<1 1-10 11-20 21-30 >30
Average
Administrators
2.00 210.00
2 0
1 1
0 1 1 0 0 0 0 2 0 0 16.00
Support Personnel
2.30 190.00
2 1
0 3
1 1 1 0 0 0 0 2 0 1 23.00
PK-12 Teachers
40.67 190.00
40 2
1 41
24 16
2 0 0 4 20 13 5 0 9.95
*Includes One- and Two-Year Vocational Certificates.
ACCREDITATION DATA
Accredited by Southern Association of Colleges and Schools (SACS):
Elementary/Middle Commission. Accredited with Quality by Georgia
Accrediting Commission (GAC).
1998-99 GEORGIA PUBLIC EDUCATION REPORT CARD Kingsland Elementary School - 6200193
Prepared by Georgia Department of Education
Page 5
1998-99 GEORGIA PUBLIC EDUCATION REPORT CARD
CAMDEN COUNTY SCHOOLS
Mary Lee Clark Elementary School - 6200495
Grade Range PK-5
The Georgia Public Education Report Card is designed to assist systems and schools in educational improvement. This report card contains a variety of data elements. An explanation of the terms is provided as a companion to the report card data. Please refer to the definitions for the most effective use of the reported data.
STUDENT DATA
Total
K-5
662
PK
30
Enrollment, by Race/Ethnicity and Sex
Black
White Hispanic
American Asian Indian
Multiracial
178 26.9%
430 65.0%
23 3.5%
7 1.1%
3 0.5%
21 3.2%
10 33.3%
17 56.7%
1 3.3%
0 0.0%
0 0.0%
2 6.7%
Male Female
347 52.4%
315 47.6%
18 60.0%
12 40.0%
Enrollment in Selected Programs
Program
Program % of Student Enrollment Population
Gifted (Grades K-12)
24
3.6%
Alternative Programs (Grades 6-12)
N/A
N/A
Students Eligible to Receive Free/Reduced Lunches
Number
Percent
School System
237 3,467
34.2% 35.7%
Dropout Rate *
Number
Rate
School System
N/A N/A
N/A N/A
* Dropout rates are not applicable for grades PK-5.
Enrollment in Compensatory Programs
Program
Program % of Student Enrollment Population
Special Education (Grades K-12)
58
8.8%
(PK)
17
N/A
English to Speakers of Other Languages (ESOL) (Grades K-12)
2
< 1%
Remedial Education (Grades 2-5, 9-12)
79 19.0%
Special Instructional Assistance (SIA) (Grades K-3)
35
7.6%
Title I (Grades K-12)
This school has no Title I program.
Total 15
Retained Students, by Race/Ethnicity and Sex
Black
White Hispanic
American MultiAsian Indian racial
4 26.7%
9 60.0%
1 6.7%
0 0.0%
0 0.0%
1 6.7%
Male Female
12
3
80.0% 20.0%
Prepared by Georgia Department of Education
Page 1
STATE-REQUIRED TEST DATA
NORM-REFERENCED TESTS Grade 3
Iowa Tests of Basic Skills (ITBS) Each chart reflects data for three years of testing.
Reading Comprehension 50
42 53 54 0
98-99
49 53 53 97-98
43 52 52 96-97
Mathematics
School 50
System
State
0
55 63 61 98-99
68 63 61 97-98
50 62 59 96-97
School System State
Reading Vocabulary 50
51 53 50 0
98-99
49 50 50 97-98
49 50 49 96-97
Language Arts
School 50
System
State
0
69 76 64 98-99
69 72 62 97-98
47 63 59 96-97
School System State
Social Studies 50
50 56 56 0
98-99
47 53 55 97-98
54 58 55 96-97
Science
School 50
System
State
0
47 60 59 98-99
61 61 59 97-98
53 61 58 96-97
School System State
Sources of Information
Composite Score
50
55 61 57 0
98-99
School 50
System
59 60 56 97-98
44 58 55 96-97
State 0
54 62 58 98-99
58 60 57 97-98
1998-99 GEORGIA PUBLIC EDUCATION REPORT CARD Mary Lee Clark Elementary School - 6200495
Prepared by Georgia Department of Education
48 59 56 96-97
Scores Reported in Percentiles
School System State
Page 2
STATE-REQUIRED TEST DATA
NORM-REFERENCED TESTS Grade 5
Iowa Tests of Basic Skills (ITBS) Each chart reflects data for three years of testing.
Reading Comprehension
Mathematics
50
47 54 53 0
98-99
53 53 53 97-98
42 51 52 96-97
School 50
System
State
0
64 63 59 98-99
69 65 58 97-98
54 63 57 96-97
School System State
Reading Vocabulary 50
41 46 48 0
98-99
49 48 48 97-98
46 46 46 96-97
Language Arts
School 50
System
State
0
65 70 63 98-99
66 63 61 97-98
44 52 58 96-97
School System State
Social Studies 50
53 59 57 0
98-99
60 58 56 97-98
58 59 55 96-97
Science
School 50
System
State
0
53 61 60 98-99
63 64 59 97-98
57 62 59 96-97
School System State
Sources of Information
Composite Score
50
56 61 58 0
98-99
School 50
System
64 61 58 97-98
55 61 57 96-97
State 0
55 61 57 98-99
62 60 56 97-98
51 57 55 96-97
1998-99 GEORGIA PUBLIC EDUCATION REPORT CARD Mary Lee Clark Elementary School - 6200495
Prepared by Georgia Department of Education
Scores Reported in Percentiles
School System State
Page 3
STATE-REQUIRED TEST DATA
PERFORMANCE ASSESSMENTS
Grade 5 Writing Assessment
Percent at Developmental Stages:
1998-99 School System State
1997-98 School System State
1996-97 School System State
Stage Stage Stage Stage Stage Stage
1:The Emerging Writer 2:The Developing Writer 3:The Focusing Writer 4:The Experimenting 5:The Engaging Writer 6:The Extending Writer
0% 0% 14% 50% 22% 13%
0% 1% 15% 45% 28% 11%
0% 1% 16% 41% 29% 12%
0% 2% 13% 35% 30% 20%
0% 2% 16% 44% 27% 10%
0% 3% 19% 41% 27% 10%
0% 6% 24% 38% 22% 9%
0% 3% 22% 35% 29% 10%
0% 3% 21% 37% 26% 12%
AWARDS / RECOGNITION DATA
Schools in Georgia may receive recognition in the following programs: Charter School Pay for Performance Program Georgia School of Excellence National Blue Ribbon School Mary Lee Clark Elementary School did not receive recognition in any of these programs during the 1998-99 school year.
1998-99 GEORGIA PUBLIC EDUCATION REPORT CARD Mary Lee Clark Elementary School - 6200495
Prepared by Georgia Department of Education
Page 4
CERTIFIED PERSONNEL DATA
Positions Number Average Contract Days
Personnel Sex
Certificate
Years Experience
Full-time Part-time
Male Female
4 Yr Bachelor's 5 Yr Master's 6 Yr Specialist's 7 Yr Doctoral Other*
<1 1-10 11-20 21-30 >30
Average
Administrators
2.00 210.00
2 0
2 0
0 0 2 0 0 0 0 1 0 1 22.50
Support Personnel
2.35 190.00
2 2
0 4
2 1 1 0 0 0 0 3 0 1 19.75
PK-12 Teachers
37.65 190.00
37 2
3 36
24 13
0 2 0 4 25 7 2 1 8.00
*Includes One- and Two-Year Vocational Certificates.
ACCREDITATION DATA
Accredited by Southern Association of Colleges and Schools (SACS):
Elementary/Middle Commission. Accredited with Quality by Georgia
Accrediting Commission (GAC).
1998-99 GEORGIA PUBLIC EDUCATION REPORT CARD Mary Lee Clark Elementary School - 6200495
Prepared by Georgia Department of Education
Page 5
1998-99 GEORGIA PUBLIC EDUCATION REPORT CARD
CAMDEN COUNTY SCHOOLS
Matilda Harris Elementary School - 6200189
Grade Range PK-5
The Georgia Public Education Report Card is designed to assist systems and schools in educational improvement. This report card contains a variety of data elements. An explanation of the terms is provided as a companion to the report card data. Please refer to the definitions for the most effective use of the reported data.
STUDENT DATA
Total
K-5
792
PK
28
Enrollment, by Race/Ethnicity and Sex
Black
White Hispanic
American Asian Indian
Multiracial
132 16.7%
612 77.3%
18 2.3%
14 1.8%
2 0.3%
14 1.8%
3 10.7%
23 82.1%
0 0.0%
1 3.6%
0 0.0%
1 3.6%
Male Female
420 53.0%
372 47.0%
17 60.7%
11 39.3%
Enrollment in Selected Programs
Program
Program % of Student Enrollment Population
Gifted (Grades K-12)
22
2.8%
Alternative Programs (Grades 6-12)
N/A
N/A
Students Eligible to Receive Free/Reduced Lunches
Number
Percent
School System
251 3,467
30.6% 35.7%
Dropout Rate *
Number
Rate
School System
N/A N/A
N/A N/A
* Dropout rates are not applicable for grades PK-5.
Enrollment in Compensatory Programs
Program
Program % of Student Enrollment Population
Special Education (Grades K-12)
75
9.5%
(PK)
13
N/A
English to Speakers of Other Languages (ESOL) (Grades K-12)
0
0.0%
Remedial Education (Grades 2-5, 9-12)
100 18.7%
Special Instructional Assistance (SIA) (Grades K-3)
20
3.9%
Title I (Grades K-12)
This school has no Title I program.
Total 24
Retained Students, by Race/Ethnicity and Sex
Black
White Hispanic
American MultiAsian Indian racial
4 16.7%
19 79.2%
0 0.0%
1 4.2%
0 0.0%
0 0.0%
Male Female
15
9
62.5% 37.5%
Prepared by Georgia Department of Education
Page 1
STATE-REQUIRED TEST DATA
NORM-REFERENCED TESTS Grade 3
Iowa Tests of Basic Skills (ITBS) Each chart reflects data for three years of testing.
Reading Comprehension 50
59 53 54 0
98-99
59 53 53 97-98
58 52 52 96-97
Mathematics
School 50
System
State
0
74 63 61 98-99
70 63 61 97-98
70 62 59 96-97
School System State
Reading Vocabulary 50
60 53 50 0
98-99
52 50 50 97-98
53 50 49 96-97
Language Arts
School 50
System
State
0
83 76 64 98-99
82 72 62 97-98
75 63 59 96-97
School System State
Social Studies 50
68 56 56 0
98-99
63 53 55 97-98
66 58 55 96-97
Science
School 50
System
State
0
77 60 59 98-99
72 61 59 97-98
74 61 58 96-97
School System State
Sources of Information
Composite Score
50
72 61 57 0
98-99
School 50
System
63 60 56 97-98
68 58 55 96-97
State 0
74 62 58 98-99
68 60 57 97-98
1998-99 GEORGIA PUBLIC EDUCATION REPORT CARD Matilda Harris Elementary School - 6200189
Prepared by Georgia Department of Education
68 59 56 96-97
Scores Reported in Percentiles
School System State
Page 2
STATE-REQUIRED TEST DATA
NORM-REFERENCED TESTS Grade 5
Iowa Tests of Basic Skills (ITBS) Each chart reflects data for three years of testing.
Reading Comprehension
Mathematics
50
57 54 53 0
98-99
55 53 53 97-98
54 51 52 96-97
School 50
System
State
0
69 63 59 98-99
67 65 58 97-98
70 63 57 96-97
School System State
Reading Vocabulary 50
52 46 48 0
98-99
48 48 48 97-98
49 46 46 96-97
Language Arts
School 50
System
State
0
72 70 63 98-99
60 63 61 97-98
58 52 58 96-97
School System State
Social Studies 50
63 59 57 0
98-99
59 58 56 97-98
61 59 55 96-97
Science
School 50
System
State
0
64 61 60 98-99
67 64 59 97-98
65 62 59 96-97
School System State
Sources of Information
Composite Score
50
64 61 58 0
98-99
School 50
System
56 61 58 97-98
63 61 57 96-97
State 0
65 61 57 98-99
60 60 56 97-98
61 57 55 96-97
1998-99 GEORGIA PUBLIC EDUCATION REPORT CARD Matilda Harris Elementary School - 6200189
Prepared by Georgia Department of Education
Scores Reported in Percentiles
School System State
Page 3
STATE-REQUIRED TEST DATA
PERFORMANCE ASSESSMENTS
Grade 5 Writing Assessment
Percent at Developmental Stages:
1998-99 School System State
1997-98 School System State
1996-97 School System State
Stage Stage Stage Stage Stage Stage
1:The Emerging Writer 2:The Developing Writer 3:The Focusing Writer 4:The Experimenting 5:The Engaging Writer 6:The Extending Writer
0% 2% 21% 40% 27% 10%
0% 1% 15% 45% 28% 11%
0% 1% 16% 41% 29% 12%
0% 0% 15% 39% 37% 9%
0% 2% 16% 44% 27% 10%
0% 3% 19% 41% 27% 10%
0% 3% 21% 33% 30% 14%
0% 3% 22% 35% 29% 10%
0% 3% 21% 37% 26% 12%
AWARDS / RECOGNITION DATA
The Georgia School of Excellence Program recognizes exemplary schools that have excellent, successful programs in many areas of school life. Each year, in a statewide competition, one elementary, one middle and one high school from each of Georgia's 11 congressional districts may be selected for this honor.
Matilda Harris Elementary School was designated a 1998-99 Georgia School of Excellence.
1998-99 GEORGIA PUBLIC EDUCATION REPORT CARD Matilda Harris Elementary School - 6200189
Prepared by Georgia Department of Education
Page 4
CERTIFIED PERSONNEL DATA
Positions Number Average Contract Days
Personnel Sex
Certificate
Years Experience
Full-time Part-time
Male Female
4 Yr Bachelor's 5 Yr Master's 6 Yr Specialist's 7 Yr Doctoral Other*
<1 1-10 11-20 21-30 >30
Average
Administrators
3.00 203.33
3 0
2 1
0 1 1 1 0 0 0 2 1 0 20.00
Support Personnel
3.30 190.00
3 1
1 3
1 2 1 0 0 1 1 2 0 0 11.25
PK-12 Teachers
39.69 190.00
39 2
4 37
20 17
4 0 0 2 22 11 6 0 10.05
*Includes One- and Two-Year Vocational Certificates.
ACCREDITATION DATA
Accredited by Southern Association of Colleges and Schools (SACS):
Elementary/Middle Commission. Accredited with Quality by Georgia
Accrediting Commission (GAC).
1998-99 GEORGIA PUBLIC EDUCATION REPORT CARD Matilda Harris Elementary School - 6200189
Prepared by Georgia Department of Education
Page 5
1998-99 GEORGIA PUBLIC EDUCATION REPORT CARD
CAMDEN COUNTY SCHOOLS
Saint Marys Elementary School - 6203050
Grade Range PK-5
The Georgia Public Education Report Card is designed to assist systems and schools in educational improvement. This report card contains a variety of data elements. An explanation of the terms is provided as a companion to the report card data. Please refer to the definitions for the most effective use of the reported data.
STUDENT DATA
Total
K-5
560
PK
22
Enrollment, by Race/Ethnicity and Sex
Black
White Hispanic
American Asian Indian
Multiracial
93 16.6%
435 77.7%
10 1.8%
4 0.7%
3 0.5%
15 2.7%
4 18.2%
16 72.7%
1 4.5%
0 0.0%
0 0.0%
1 4.5%
Male Female
300 53.6%
260 46.4%
10 45.5%
12 54.5%
Enrollment in Selected Programs
Program
Program % of Student Enrollment Population
Gifted (Grades K-12)
33
5.9%
Alternative Programs (Grades 6-12)
N/A
N/A
Students Eligible to Receive Free/Reduced Lunches
Number
Percent
School System
186 3,467
32.0% 35.7%
Dropout Rate *
Number
Rate
School System
N/A N/A
N/A N/A
* Dropout rates are not applicable for grades PK-5.
Enrollment in Compensatory Programs
Program
Program % of Student Enrollment Population
Special Education (Grades K-12)
42
7.5%
(PK)
3
N/A
English to Speakers of Other Languages (ESOL) (Grades K-12)
3
< 1%
Remedial Education (Grades 2-5, 9-12)
77 19.6%
Special Instructional Assistance (SIA) (Grades K-3)
39 10.8%
Title I (Grades K-12)
This school has no Title I program.
Total 10
Retained Students, by Race/Ethnicity and Sex
Black
White Hispanic
American MultiAsian Indian racial
4 40.0%
5 50.0%
0 0.0%
0 0.0%
0
1
0.0% 10.0%
Male Female
6
4
60.0% 40.0%
Prepared by Georgia Department of Education
Page 1
STATE-REQUIRED TEST DATA
NORM-REFERENCED TESTS Grade 3
Iowa Tests of Basic Skills (ITBS) Each chart reflects data for three years of testing.
Reading Comprehension 50
63 53 54 0
98-99
53 53 53 97-98
56 52 52 96-97
Mathematics
School 50
System
State
0
66 63 61 98-99
65 63 61 97-98
70 62 59 96-97
School System State
Reading Vocabulary 50
55 53 50 0
98-99
49 50 50 97-98
56 50 49 96-97
Language Arts
School 50
System
State
0
84 76 64 98-99
74 72 62 97-98
73 63 59 96-97
School System State
Social Studies 50
67 56 56 0
98-99
51 53 55 97-98
61 58 55 96-97
Science
School 50
System
State
0
67 60 59 98-99
61 61 59 97-98
65 61 58 96-97
School System State
Sources of Information
Composite Score
50
68 61 57 0
98-99
School 50
System
58 60 56 97-98
59 58 55 96-97
State 0
70 62 58 98-99
60 60 57 97-98
1998-99 GEORGIA PUBLIC EDUCATION REPORT CARD Saint Marys Elementary School - 6203050
Prepared by Georgia Department of Education
64 59 56 96-97
Scores Reported in Percentiles
School System State
Page 2
STATE-REQUIRED TEST DATA
NORM-REFERENCED TESTS Grade 5
Iowa Tests of Basic Skills (ITBS) Each chart reflects data for three years of testing.
Reading Comprehension
Mathematics
50
59 54 53 0
98-99
57 53 53 97-98
55 51 52 96-97
School 50
System
State
0
71 63 59 98-99
67 65 58 97-98
67 63 57 96-97
School System State
Reading Vocabulary 50
54 46 48 0
98-99
57 48 48 97-98
51 46 46 96-97
Language Arts
School 50
System
State
0
78 70 63 98-99
65 63 61 97-98
54 52 58 96-97
School System State
Social Studies 50
68 59 57 0
98-99
64 58 56 97-98
62 59 55 96-97
Science
School 50
System
State
0
69 61 60 98-99
66 64 59 97-98
67 62 59 96-97
School System State
Sources of Information
Composite Score
50
67 61 58 0
98-99
School 50
System
67 61 58 97-98
67 61 57 96-97
State 0
70 61 57 98-99
64 60 56 97-98
62 57 55 96-97
1998-99 GEORGIA PUBLIC EDUCATION REPORT CARD Saint Marys Elementary School - 6203050
Prepared by Georgia Department of Education
Scores Reported in Percentiles
School System State
Page 3
STATE-REQUIRED TEST DATA
PERFORMANCE ASSESSMENTS
Grade 5 Writing Assessment
Percent at Developmental Stages:
1998-99 School System State
1997-98 School System State
1996-97 School System State
Stage Stage Stage Stage Stage Stage
1:The Emerging Writer 2:The Developing Writer 3:The Focusing Writer 4:The Experimenting 5:The Engaging Writer 6:The Extending Writer
0% 0% 4% 46% 38% 12%
0% 1% 15% 45% 28% 11%
0% 1% 16% 41% 29% 12%
0% 4% 23% 36% 24% 13%
0% 2% 16% 44% 27% 10%
0% 3% 19% 41% 27% 10%
0% 1% 12% 34% 36% 15%
0% 3% 22% 35% 29% 10%
0% 3% 21% 37% 26% 12%
AWARDS / RECOGNITION DATA
Schools in Georgia may receive recognition in the following programs: Charter School Pay for Performance Program Georgia School of Excellence National Blue Ribbon School Saint Marys Elementary School did not receive recognition in any of these programs during the 1998-99 school year.
1998-99 GEORGIA PUBLIC EDUCATION REPORT CARD Saint Marys Elementary School - 6203050
Prepared by Georgia Department of Education
Page 4
CERTIFIED PERSONNEL DATA
Positions Number Average Contract Days
Personnel Sex
Certificate
Years Experience
Full-time Part-time
Male Female
4 Yr Bachelor's 5 Yr Master's 6 Yr Specialist's 7 Yr Doctoral Other*
<1 1-10 11-20 21-30 >30
Average
Administrators
2.00 200.00
2 0
1 1
0 1 1 0 0 0 0 2 0 0 15.00
Support Personnel
3.25 190.00
3 1
0 4
1 2 1 0 0 0 0 2 1 1 24.00
PK-12 Teachers
33.50 190.00
33 1
0 34
22 11
1 0 0 0 16 9 8 1 14.00
*Includes One- and Two-Year Vocational Certificates.
ACCREDITATION DATA
Accredited by Southern Association of Colleges and Schools (SACS):
Elementary/Middle Commission. Accredited with Quality by Georgia
Accrediting Commission (GAC).
1998-99 GEORGIA PUBLIC EDUCATION REPORT CARD Saint Marys Elementary School - 6203050
Prepared by Georgia Department of Education
Page 5
1998-99 GEORGIA PUBLIC EDUCATION REPORT CARD
CAMDEN COUNTY SCHOOLS
Saint Marys Middle School - 6200395
Grade Range 6-8
The Georgia Public Education Report Card is designed to assist systems and schools in educational improvement. This report card contains a variety of data elements. An explanation of the terms is provided as a companion to the report card data. Please refer to the definitions for the most effective use of the reported data.
STUDENT DATA
Total 957
6-8 Enrollment, by Race/Ethnicity and Sex
Black
White Hispanic
American Multi-
Asian Indian
racial
203 21.2%
673 70.3%
40 4.2%
9 0.9%
6 0.6%
26 2.7%
Male 487
50.9%
Female 470
49.1%
Enrollment in Selected Programs
Program
Gifted (Grades K-12)
Program % of Student Enrollment Population
95
9.9%
Alternative Programs (Grades 6-12)
4
< 1%
Students Eligible to Receive Free/Reduced Lunches
Number
Percent
School System
321 3,467
33.5% 35.7%
Enrollment in Compensatory Programs
Program
Program % of Student Enrollment Population
Special Education (Grades K-12) (PK)
99 10.3%
0
N/A
English to Speakers of Other Languages (ESOL) (Grades K-12)
4
< 1%
Title I (Grades K-12)
This school has no Title I program.
Dropout Rate for Grades 6-8
Number
Rate
School System
25
2.4%
32
1.3%
Total 42
Retained Students, by Race/Ethnicity and Sex
Black
White Hispanic
American MultiAsian Indian racial
6 14.3%
30 71.4%
4 9.5%
1 2.4%
0 0.0%
1 2.4%
Male Female
28
14
66.7% 33.3%
Prepared by Georgia Department of Education
Page 1
STATE-REQUIRED TEST DATA
NORM-REFERENCED TESTS Grade 8
Iowa Tests of Basic Skills (ITBS) Each chart reflects data for three years of testing.
Reading Comprehension 50
52 52 49 0
98-99
56 52 48 97-98
61 52 48 96-97
Mathematics
School 50
System
State
0
58 57 56 98-99
59 55 55 97-98
59 55 54 96-97
School System State
Reading Vocabulary 50
53 50 46 0
98-99
56 52 45 97-98
56 51 44 96-97
Language Arts
School 50
System
State
0
60 60 60 98-99
61 60 58 97-98
66 58 56 96-97
School System State
Social Studies 50
58 56 54 0
98-99
53 53 53 97-98
59 55 53 96-97
Science
School 50
System
State
0
55 58 56 98-99
59 58 55 97-98
64 56 53 96-97
School System State
Sources of Information
Composite Score
50
58 59 57 0
98-99
School 50
System
58 58 56 97-98
62 57 55 96-97
State 0
57 57 56 98-99
58 57 54 97-98
1998-99 GEORGIA PUBLIC EDUCATION REPORT CARD Saint Marys Middle School - 6200395
Prepared by Georgia Department of Education
62 56 54 96-97
Scores Reported in Percentiles
School System State
Page 2
STATE-REQUIRED TEST DATA
Categories of Scaled Scores
Inadequate (less than 162)
Minimal (162-209)
Good
(210-247)
Very Good (greater than 247)
Average Scaled Score: (Range 100-300)
PERFORMANCE ASSESSMENTS
Grade 8 Writing Assessment
1998-99 Percent Scoring
1997-98 Percent Scoring
1996-97 Percent Scoring
School System State School System State School System State
6% 37% 45% 12%
6% 37% 45% 12%
8% 40% 41% 11%
7% 60% 28%
5%
8% 51% 35%
6%
11% 46% 34%
8%
10% 47% 35%
8%
10% 46% 35% 10%
15% 46% 30%
8%
211
211
208 199
202 202 202
203 198
AWARDS / RECOGNITION DATA
Schools in Georgia may receive recognition in the following programs: Charter School Pay for Performance Program Georgia School of Excellence National Blue Ribbon School Saint Marys Middle School did not receive recognition in any of these programs during the 1998-99 school year.
1998-99 GEORGIA PUBLIC EDUCATION REPORT CARD Saint Marys Middle School - 6200395
Prepared by Georgia Department of Education
Page 3
CERTIFIED PERSONNEL DATA
Positions Number Average Contract Days
Personnel Sex
Certificate
Years Experience
Full-time Part-time
Male Female
4 Yr Bachelor's 5 Yr Master's 6 Yr Specialist's 7 Yr Doctoral Other*
<1 1-10 11-20 21-30 >30
Average
Administrators
3.00 206.67
3 0
3 0
0 0 3 0 0 0 1 1 1 0 16.67
Support Personnel
5.00 192.00
5 0
2 3
0 4 1 0 0 0 2 3 0 0 11.40
PK-12 Teachers
56.66 190.00
56 2
19 39
33 20
3 2 0 4 32 15 7 0 9.74
*Includes One- and Two-Year Vocational Certificates.
ACCREDITATION DATA
Accredited by Southern Association of Colleges and Schools (SACS):
Elementary/Middle Commission. Accredited with Quality by Georgia
Accrediting Commission (GAC).
1998-99 GEORGIA PUBLIC EDUCATION REPORT CARD Saint Marys Middle School - 6200395
Prepared by Georgia Department of Education
Page 4
1998-99 GEORGIA PUBLIC EDUCATION REPORT CARD
CAMDEN COUNTY SCHOOLS
Sugarmill Elementary School - 6200197
Grade Range PK-5
The Georgia Public Education Report Card is designed to assist systems and schools in educational improvement. This report card contains a variety of data elements. An explanation of the terms is provided as a companion to the report card data. Please refer to the definitions for the most effective use of the reported data.
STUDENT DATA
Total
K-5
405
PK
88
Enrollment, by Race/Ethnicity and Sex
Black
White Hispanic
American Asian Indian
Multiracial
86 21.2%
277 68.4%
22 5.4%
2 0.5%
0 0.0%
18 4.4%
27 30.7%
55 62.5%
1 1.1%
1 1.1%
1 1.1%
3 3.4%
Male Female
185 45.7%
220 54.3%
43 48.9%
45 51.1%
Enrollment in Selected Programs
Program
Program % of Student Enrollment Population
Gifted (Grades K-12)
10
2.5%
Alternative Programs (Grades 6-12)
N/A
N/A
Students Eligible to Receive Free/Reduced Lunches
Number
Percent
School System
216 3,467
43.8% 35.7%
Dropout Rate *
Number
Rate
School System
N/A N/A
N/A N/A
* Dropout rates are not applicable for grades PK-5.
Enrollment in Compensatory Programs
Program
Program % of Student Enrollment Population
Special Education (Grades K-12)
43 10.6%
(PK)
19
N/A
English to Speakers of Other Languages (ESOL) (Grades K-12)
1
< 1%
Remedial Education (Grades 2-5, 9-12)
64 24.0%
Special Instructional Assistance (SIA) (Grades K-3)
22
8.2%
Title I (Grades K-12)
This school has no Title I program.
Total 10
Retained Students, by Race/Ethnicity and Sex
Black
White Hispanic
American MultiAsian Indian racial
1 10.0%
7 70.0%
1 10.0%
1 10.0%
0 0.0%
0 0.0%
Male Female
7
3
70.0% 30.0%
Prepared by Georgia Department of Education
Page 1
STATE-REQUIRED TEST DATA
NORM-REFERENCED TESTS Grade 3
Iowa Tests of Basic Skills (ITBS) Each chart reflects data for three years of testing.
Reading Comprehension 50
44 53 54 0
98-99
50 53 53 N/A 52 52
97-98
96-97
Mathematics
School 50
System
State
0
54 63 61 98-99
56 63 61 N/A 62 59
97-98
96-97
School System State
Reading Vocabulary 50
46 53 50 0
98-99
44 50 50 N/A 50 49
97-98
96-97
Language Arts
School 50
System
State
0
64 76 64 98-99
67 72 62 N/A 63 59
97-98
96-97
School System State
Social Studies 50
48 56 56 0
98-99
51 53 55 N/A 58 55
97-98
96-97
Science
School 50
System
State
0
50 60 59 98-99
52 61 59 N/A 61 58
97-98
96-97
School System State
Sources of Information
Composite Score
50
45 61 57 0
98-99
School 50
System
60 60 56 N/A 58 55
97-98
96-97
State 0
51 62 58 98-99
56 60 57 N/A 59 56
97-98
96-97
1998-99 GEORGIA PUBLIC EDUCATION REPORT CARD Sugarmill Elementary School - 6200197
Prepared by Georgia Department of Education
Scores Reported in Percentiles
School System State
Page 2
STATE-REQUIRED TEST DATA
NORM-REFERENCED TESTS Grade 5
Iowa Tests of Basic Skills (ITBS) Each chart reflects data for three years of testing.
Reading Comprehension
Mathematics
50
57 54 53 0
98-99
55 53 53 N/A 51 52
97-98
96-97
School 50
System
State
0
67 63 59 98-99
67 65 58 N/A 63 57
97-98
96-97
School System State
Reading Vocabulary 50
48 46 48 0
98-99
52 48 48 N/A 46 46
97-98
96-97
Language Arts
School 50
System
State
0
72 70 63 98-99
63 63 61 N/A 52 58
97-98
96-97
School System State
Social Studies 50
64 59 57 0
98-99
64 58 56 N/A 59 55
97-98
96-97
Science
School 50
System
State
0
66 61 60 98-99
68 64 59 N/A 62 59
97-98
96-97
School System State
Sources of Information
Composite Score
50
65 61 58 0
98-99
School 50
System
64 61 58 N/A 61 57
97-98
96-97
State 0
64 61 57 98-99
63 60 56 N/A 57 55
97-98
96-97
1998-99 GEORGIA PUBLIC EDUCATION REPORT CARD Sugarmill Elementary School - 6200197
Prepared by Georgia Department of Education
Scores Reported in Percentiles
School System State
Page 3
STATE-REQUIRED TEST DATA
PERFORMANCE ASSESSMENTS
Grade 5 Writing Assessment
Percent at Developmental Stages:
1998-99 School System State
1997-98 School System State
1996-97 School System State
Stage Stage Stage Stage Stage Stage
1:The Emerging Writer 2:The Developing Writer 3:The Focusing Writer 4:The Experimenting 5:The Engaging Writer 6:The Extending Writer
0% 0% 9% 50% 26% 15%
0% 1% 15% 45% 28% 11%
0% 1% 16% 41% 29% 12%
1% 3% 10% 50% 22% 14%
0% 2% 16% 44% 27% 10%
0% 3% 19% 41% 27% 10%
N/A N/A N/A N/A N/A N/A
0% 3% 22% 35% 29% 10%
0% 3% 21% 37% 26% 12%
AWARDS / RECOGNITION DATA
Schools in Georgia may receive recognition in the following programs: Charter School Pay for Performance Program Georgia School of Excellence National Blue Ribbon School Sugarmill Elementary School did not receive recognition in any of these programs during the 1998-99 school year.
1998-99 GEORGIA PUBLIC EDUCATION REPORT CARD Sugarmill Elementary School - 6200197
Prepared by Georgia Department of Education
Page 4
CERTIFIED PERSONNEL DATA
Positions Number Average Contract Days
Personnel Sex
Certificate
Years Experience
Full-time Part-time
Male Female
4 Yr Bachelor's 5 Yr Master's 6 Yr Specialist's 7 Yr Doctoral Other*
<1 1-10 11-20 21-30 >30
Average
Administrators
2.00 220.00
2 0
1 1
0 0 2 0 0 0 0 0 2 0 24.50
Support Personnel
5.00 190.00
5 0
0 5
1 4 0 0 0 0 4 0 1 0 9.00
PK-12 Teachers
31.00 190.00
30 2
4 28
20 9 3 0 0 4
18 6 4 0
8.00
*Includes One- and Two-Year Vocational Certificates.
ACCREDITATION DATA
Accredited by Southern Association of Colleges and Schools (SACS):
Elementary/Middle Commission. Accredited with Quality by Georgia
Accrediting Commission (GAC).
1998-99 GEORGIA PUBLIC EDUCATION REPORT CARD Sugarmill Elementary School - 6200197
Prepared by Georgia Department of Education
Page 5
1998-99 GEORGIA PUBLIC EDUCATION REPORT CARD
CAMDEN COUNTY SCHOOLS
Woodbine Elementary School - 6200192
Grade Range PK-5
The Georgia Public Education Report Card is designed to assist systems and schools in educational improvement. This report card contains a variety of data elements. An explanation of the terms is provided as a companion to the report card data. Please refer to the definitions for the most effective use of the reported data.
STUDENT DATA
Total
K-5
453
PK
24
Enrollment, by Race/Ethnicity and Sex
Black
White Hispanic
American Asian Indian
Multiracial
197 43.5%
238 52.5%
7 1.5%
1 0.2%
0 0.0%
10 2.2%
11 45.8%
13 54.2%
0 0.0%
0 0.0%
0 0.0%
0 0.0%
Male Female
245 54.1%
208 45.9%
12 50.0%
12 50.0%
Enrollment in Selected Programs
Program
Program % of Student Enrollment Population
Gifted (Grades K-12)
3
< 1%
Alternative Programs (Grades 6-12)
N/A
N/A
Students Eligible to Receive Free/Reduced Lunches
Number
Percent
School System
290 3,467
60.8% 35.7%
Dropout Rate *
Number
Rate
School System
N/A N/A
N/A N/A
* Dropout rates are not applicable for grades PK-5.
Enrollment in Compensatory Programs
Program
Program % of Student Enrollment Population
Special Education (Grades K-12)
66 14.6%
(PK)
3
N/A
English to Speakers of Other Languages (ESOL) (Grades K-12)
0
0.0%
Remedial Education (Grades 2-5, 9-12)
100 32.2%
Special Instructional Assistance (SIA) (Grades K-3)
36 12.3%
Title I (Grades K-12)
This school has a schoolwide program.
Total 22
Retained Students, by Race/Ethnicity and Sex
Black
White Hispanic
American MultiAsian Indian racial
17 77.3%
5 22.7%
0 0.0%
0 0.0%
0 0.0%
0 0.0%
Male Female
12
10
54.5% 45.5%
Prepared by Georgia Department of Education
Page 1
STATE-REQUIRED TEST DATA
NORM-REFERENCED TESTS Grade 3
Iowa Tests of Basic Skills (ITBS) Each chart reflects data for three years of testing.
Reading Comprehension 50
41 53 54 0
98-99
54 53 53 97-98
43 52 52 96-97
Mathematics
School 50
System
State
0
44 63 61 98-99
49 63 61 97-98
47 62 59 96-97
School System State
Reading Vocabulary 50
37 53 50 0
98-99
43 50 50 97-98
37 50 49 96-97
Language Arts
School 50
System
State
0
62 76 64 98-99
73 72 62 97-98
46 63 59 96-97
School System State
Social Studies 50
34 56 56 0
98-99
46 53 55 97-98
42 58 55 96-97
Science
School 50
System
State
0
42 60 59 98-99
51 61 59 97-98
46 61 58 96-97
School System State
Sources of Information
Composite Score
50
38 61 57 0
98-99
School 50
System
52 60 56 97-98
45 58 55 96-97
State 0
41 62 58 98-99
53 60 57 97-98
1998-99 GEORGIA PUBLIC EDUCATION REPORT CARD Woodbine Elementary School - 6200192
Prepared by Georgia Department of Education
44 59 56 96-97
Scores Reported in Percentiles
School System State
Page 2
STATE-REQUIRED TEST DATA
NORM-REFERENCED TESTS Grade 5
Iowa Tests of Basic Skills (ITBS) Each chart reflects data for three years of testing.
Reading Comprehension
Mathematics
50
44 54 53 0
98-99
48 53 53 97-98
42 51 52 96-97
School 50
System
State
0
41 63 59 98-99
50 65 58 97-98
47 63 57 96-97
School System State
Reading Vocabulary 50
33 46 48 0
98-99
38 48 48 97-98
36 46 46 96-97
Language Arts
School 50
System
State
0
64 70 63 98-99
57 63 61 97-98
41 52 58 96-97
School System State
Social Studies 50
42 59 57 0
98-99
41 58 56 97-98
43 59 55 96-97
Science
School 50
System
State
0
48 61 60 98-99
53 64 59 97-98
51 62 59 96-97
School System State
Sources of Information
Composite Score
50
44 61 58 0
98-99
School 50
System
47 61 58 97-98
43 61 57 96-97
State 0
45 61 57 98-99
47 60 56 97-98
42 57 55 96-97
1998-99 GEORGIA PUBLIC EDUCATION REPORT CARD Woodbine Elementary School - 6200192
Prepared by Georgia Department of Education
Scores Reported in Percentiles
School System State
Page 3
STATE-REQUIRED TEST DATA
PERFORMANCE ASSESSMENTS
Grade 5 Writing Assessment
Percent at Developmental Stages:
1998-99 School System State
1997-98 School System State
1996-97 School System State
Stage Stage Stage Stage Stage Stage
1:The Emerging Writer 2:The Developing Writer 3:The Focusing Writer 4:The Experimenting 5:The Engaging Writer 6:The Extending Writer
1% 1% 34% 33% 16% 14%
0% 1% 15% 45% 28% 11%
0% 1% 16% 41% 29% 12%
0% 3% 30% 56% 11% 0%
0% 2% 16% 44% 27% 10%
0% 3% 19% 41% 27% 10%
0% 0% 34% 39% 22% 6%
0% 3% 22% 35% 29% 10%
0% 3% 21% 37% 26% 12%
AWARDS / RECOGNITION DATA
Schools in Georgia may receive recognition in the following programs: Charter School Pay for Performance Program Georgia School of Excellence National Blue Ribbon School Woodbine Elementary School did not receive recognition in any of these programs during the 1998-99 school year.
1998-99 GEORGIA PUBLIC EDUCATION REPORT CARD Woodbine Elementary School - 6200192
Prepared by Georgia Department of Education
Page 4
CERTIFIED PERSONNEL DATA
Positions Number Average Contract Days
Personnel Sex
Certificate
Years Experience
Full-time Part-time
Male Female
4 Yr Bachelor's 5 Yr Master's 6 Yr Specialist's 7 Yr Doctoral Other*
<1 1-10 11-20 21-30 >30
Average
Administrators
3.00 206.67
3 0
0 3
0 1 1 1 0 0 0 2 1 0 19.33
Support Personnel
3.25 190.00
3 1
0 4
2 2 0 0 0 0 1 2 0 1 15.75
PK-12 Teachers
37.80 190.00
36 3
4 35
19 16
3 1 0 5 14 13 6 1 11.95
*Includes One- and Two-Year Vocational Certificates.
ACCREDITATION DATA
Accredited by Southern Association of Colleges and Schools (SACS):
Elementary/Middle Commission. Accredited with Quality by Georgia
Accrediting Commission (GAC).
1998-99 GEORGIA PUBLIC EDUCATION REPORT CARD Woodbine Elementary School - 6200192
Prepared by Georgia Department of Education
Page 5
1998-99 GEORGIA PUBLIC EDUCATION REPORT CARD CANDLER COUNTY SCHOOLS - 621
The Georgia Public Education Report Card is designed to assist systems and schools in educational improvement. This report card contains a variety of data elements. An explanation of the terms is provided as a companion to the report card data. Please refer to the definitions for the most effective use of the reported data.
Total
K-12
1,838
PK
95
STUDENT DATA
Enrollment, by Race/Ethnicity and Sex
Black
White Hispanic
American Multi-
Asian Indian
racial
665 36.2%
1,016 55.3%
149 8.1%
2 0.1%
0 0.0%
6 0.3%
43 45.3%
48 50.5%
3 3.2%
1 1.1%
0 0.0%
0 0.0%
Male
982 53.4%
48 50.5%
Female
856 46.6%
47 49.5%
Enrollment in Selected Programs
Program
Program % of Student Enrollment Population
Gifted (Grades K-12)
28
1.5%
Non-Vocational Labs (Grades 9-12)
393
88.7%
Vocational Labs (Grades 9-12)
390
88.0%
Alternative Programs (Grades 6-12)
10
1.1%
Students Eligible to Receive Free/Reduced Lunches
Number
Percent
1,253
64.8%
Dropout Rate
Number
Percent
6-12 9-12
59
5.9%
59
12.0%
Enrollment in Compensatory Programs
Program
Program % of Student Enrollment Population
Special Education
(Grades K-12)
244
PK
14
English to Speakers of
Other Languages (ESOL)
0
(Grades K-12)
Remedial Education (Grades 2-5, 9-12)
192
Special Instructional
Assistance (SIA)
218
(Grades K-3)
Title I (Grades K-12) Number of schools with: Schoolwide program Targeted Assistance program No Title I program
13.3% N/A
0.0%
18.0%
35.2%
2 0 1
Total 75
Retained Students, by Race/Ethnicity and Sex
Black
White Hispanic
American MultiAsian Indian racial
44 58.7%
22
9
29.3% 12.0%
0 0.0%
0 0.0%
0 0.0%
Male Female
48
27
64.0% 36.0%
Prepared by Georgia Department of Education
Page 1
STATE-REQUIRED TEST DATA
NORM-REFERENCED TESTS
Grade 3 Iowa Tests of Basic Skills (ITBS) Each chart reflects data for three years of testing.
Reading Comprehension
Mathematics
50
46 54 46 53 32 52 0
98-99 97-98 96-97
System State
50
51 61 54 61 42 59 0
98-99 97-98 96-97
System State
Reading Vocabulary
50
40 50 36 50 26 49 0
98-99 97-98 96-97
System State
Social Studies
50
41 56 43 55 32 55 0
98-99 97-98 96-97
System State
Language Arts
50
45 64 39 62 30 59 0
98-99 97-98 96-97
System State
Science
50
49 59 51 59 45 58 0
98-99 97-98 96-97
System State
Sources of Information
Composite Score
50
46 57 0
98-99
System
50
46 56 35 55 97-98 96-97
State
44 58 45 57 0
98-99 97-98
1998-99 GEORGIA PUBLIC EDUCATION REPORT CARD Candler County Schools
Prepared by Georgia Department of Education
System State Scores Reported 34 56 in Percentiles 96-97
Page 2
STATE-REQUIRED TEST DATA
NORM-REFERENCED TESTS
Grade 5 Iowa Tests of Basic Skills (ITBS) Each chart reflects data for three years of testing.
Reading Comprehension
Mathematics
50
42 53 47 53 44 52 0
98-99 97-98 96-97
System State
50
46 59 60 58 46 57 0
98-99 97-98 96-97
System State
Reading Vocabulary
50
36 48 40 48 34 46 0
98-99 97-98 96-97
System State
Social Studies
50
45 57 53 56 46 55 0
98-99 97-98 96-97
System State
Language Arts
50
46 63 55 61 51 58 0
98-99 97-98 96-97
System State
Science
50
50 60 61 59 53 59 0
98-99 97-98 96-97
System State
Sources of Information
Composite Score
50
48 58 0
98-99
System
50
59 58 53 57 97-98 96-97
State
44 57 54 56 0
98-99 97-98
1998-99 GEORGIA PUBLIC EDUCATION REPORT CARD Candler County Schools
Prepared by Georgia Department of Education
System State Scores Reported 47 55 in Percentiles 96-97
Page 3
STATE-REQUIRED TEST DATA
NORM-REFERENCED TESTS Grade 8
Iowa Tests of Basic Skills (ITBS) Each chart reflects data for three years of testing.
Reading Comprehension
Mathematics
50
36 49 31 48 39 48 0
98-99 97-98 96-97
System State
50
42 56 36 55 44 54 0
98-99 97-98 96-97
System State
Reading Vocabulary
50
30 46 27 45 30 44 0
98-99 97-98 96-97
System State
Language Arts
50
45 60 43 58 46 56 0
98-99 97-98 96-97
System State
Social Studies
50
43 54 38 53 47 53 0
98-99 97-98 96-97
System State
Science
50
46 56 50 55 46 53 0
98-99 97-98 96-97
System State
Sources of Information
Composite Score
50
48 57 0
98-99
System
50
40 56 48 55 97-98 96-97
State
42 56 39 54 0
98-99 97-98
1998-99 GEORGIA PUBLIC EDUCATION REPORT CARD Candler County Schools
Prepared by Georgia Department of Education
System State Scores Reported 43 54 in Percentiles 96-97
Page 4
STATE-REQUIRED TEST DATA
PERFORMANCE ASSESSMENTS
Grade 5 Writing Assessment
1998-99
1997-98
1996-97
Percent at Developmental Stages:
Comparison
Comparison
Comparison
System Group State System Group State System Group State
Stage Stage Stage Stage Stage Stage
1: The Emerging Writer 2: The Developing Writer 3: The Focusing Writer 4: The Experimenting Writer 5: The Engaging Writer 6: The Extending Writer
0% 0% 14% 41% 33% 12%
0% 2% 27% 45% 20% 5%
0% 1% 16% 41% 29% 12%
0% 1% 13% 52% 25% 6%
0% 2% 23% 44% 23% 6%
0% 3% 19% 41% 27% 10%
0% 1% 23% 50% 21% 5%
0% 5% 24% 42% 23% 6%
0% 3% 21% 37% 26% 12%
Grade 8 Writing Assessment
1998-99 Percent Scoring 1997-98 Percent Scoring 1996-97 Percent Scoring
Categories of Scaled Scores
Comparison
Comparison
Comparison
System Group State System Group State System Group State
Inadequate (less than 162)
Minimal (162-209)
Good
(210-247)
Very Good (greater than 247)
9% 55% 32%
4%
14% 52% 30%
4%
8% 40% 41% 11%
15% 63% 20%
2%
10% 53% 32%
5%
11% 46% 34%
8%
7% 65% 24%
5%
13% 55% 25%
6%
15% 46% 30%
8%
Average Scaled Score: (Range 100-300)
196
194 208
189
199 202
198
196 198
GEORGIA HIGH SCHOOL GRADUATION TESTS (GHSGT)
Percent of Regular Program 11th Graders Passing the Georgia High School Graduation Tests on First Administration
1998-99
1997-98
1996-97
Comparison
Comparison
Comparison
System Group State System Group State System Group State
English Language Arts Mathematics Social Studies Science
94% 86% 86% 77%
93% 81% 71% 62%
96% 88% 80% 72%
87% 84% 71% 76%
92% 84% 71% 68%
94% 88% 78% 74%
86% 85% 71% 65%
88% 79% 65% 59%
94% 87% 78% 74%
All Components listed above 7 2 %
56% 68% 67%
61% 68% 58%
51% 67%
Writing
95%
89% 93% 87%
90% 92% 90%
87% 93%
1998-99 GEORGIA PUBLIC EDUCATION REPORT CARD
Candler County Schools
Prepared by Georgia Department of Education
Page 5
GRADUATE DATA
1999 Graduates by Credentials, Race/Ethnicity and Sex
Diplomas with Both College Prep. & Voc. Endorsements
Diplomas with College Prep. Endorsements Diplomas with Vocational Endorsements General High School Diplomas Special Education Diplomas
Total All Diplomas
Certificates of Performance
Total Graduates
Total 0
24 34
0 2 60 4 64
Black 0
American MultiWhite Hispanic Asian Indian racial
0
0
0
0
0
Male Female
0
0
3 12.5%
16 47.1%
0
21 87.5%
15 44.1%
0
0 0.0%
3 8.8%
0
0 0.0%
0 0.0%
0
0 0.0%
0 0.0%
0
0 0.0%
0 0.0%
0
13 54.2%
17 50.0%
0
11 45.8%
17 50.0%
0
1 50.0%
20 33.3%
3 75.0%
23 35.9%
1
0
50.0% 0.0%
37
3
61.7% 5.0%
0
1
0.0% 25.0%
37
4
57.8% 6.3%
0 0.0%
0 0.0%
0 0.0%
0 0.0%
0 0.0%
0 0.0%
0 0.0%
0 0.0%
0
2
0
0.0% 100.0% 0.0%
0
32
28
0.0% 53.3% 46.7%
0 0.0%
0
4
0.0% 100.0%
0
32
32
0.0% 50.0% 50.0%
HOPE Scholarships
System State
Number of 1999 Graduates 6 4
Number Eligible
36
Percent Eligible
56.3%
65,548 40,292 61.5%
High School Completion Rate Percent of 1995Grade 9 Enrollment
in Graduating Class of1999
System
State
Completion Rate '95-'99 61.0% 68.9%
COLLEGE ADMISSIONS / CREDIT TEST DATA
Scholastic Assessment Test (SAT)
No. Taking
Average Score
Tests
Verbal Math Total
Based on students' highest verbal and highest math scores
System College Prep. Endorsement Other Diplomas
505 494 999 528 510 1038 420 447 867
Georgia
492 488 980
Based on students' last test administration
System Georgia
24
498 488
986
41,958 483 479 962
Nation
952,913 502 508 1010
American College Testing (ACT)
System State Nation
English Mathematics Reading Science Reasoning
N/A N/A N/A N/A
19.1 19.9 20.2 19.9
20.4 20.7 21.3 21.0
CompositeScore N/A * 19.9 21.9
* Scores not reported when fewer than 5 tests taken.
Advanced Placement Exams (AP)
No. of Students Taking Tests
No. of Tests Taken No. of Test Scores
3 or Higher Percent of Test
Scores 3 or Higher
System State 0 15,225
N/A 23,969 N/A 13,024
N/A 54.3%
1998-99 GEORGIA PUBLIC EDUCATION REPORT CARD Candler County Schools
Prepared by Georgia Department of Education
Page 6
POSTSECONDARY DATA
Graduates Entering Georgia Public Colleges and Universities
Graduates Entering Georgia Public Colleges and Universities and
Requiring Learning Support (LS)
1998 Graduates Entering 1998-99
1997 Graduates Entering 1997-98
Percent of Graduating Number Class
21
32.8%
34
44.2%
Number Requiring
LS
9
4
Percent of those attending Georgia
Public Colleges
42.9%
11.8%
In previous years, the Report Card presented College Prep Curriculum information provided by the Board of Regents on students requiring Learning Support. Due to inconsistencies in the data provided by the Board of Regents in defining College Prep Completers versus Local Board of Education data defining College Prep Endorsements, the Department of Education Report Card will not provide this information until discrepancies can be reconciled.
Graduates Entering Georgia Public Technical and Adult Schools
Entering 1998-99 Entering 1997-98
Number Percent
Number Percent
1998 Graduates 1997 Graduates
10
15.6%
0
0.0%
N/A 11
N/A 14.3%
ACCREDITATION / RECOGNITION DATA
Southern Association of Colleges and Schools (SACS) Accrediting Commission
Secondary/Middle Commission Elementary/Middle Commission Both Elementary/Secondary Commissions Joint Commission Candidate for Accreditation
Accreditation by Georgia Accrediting Commission (GAC)
Accredited by GAC Accredited with Quality by GAC
Number of Schools
1 1 0 0 0
Number of Schools
0 3
Awards / Recognition
State Recognized Program
Number of Schools
Charter School
0
Pay for Performance Recipient
0
Georgia School of Excellence
0
National Blue Ribbon School
0
COMMUNITY DATA
Number of Children Eligible for Migrant Education Number of Families-At-Risk * Number of Food Stamp Participants * Number of Families Receiving TANF * ** Per Capita Income * Unemployment Rate * 1990 Population * Projected 2000 Population * Projected 2010 Population *
* Data Available at County Level Only ** Known as AFDC before January 1997
346 39
1,279 119
$18,500 5.6%
7,744 8,173 8,479
1998-99 GEORGIA PUBLIC EDUCATION REPORT CARD Candler County Schools
Prepared by Georgia Department of Education
Page 7
FISCAL DATA
Millage Rate
11.50
* Fall 1998 Property Tax Digest is used to calculate the 98-99 Value of One Mill
FTE Count
FTE Count used for Allotment Calculation 1,826.0 Fall '98 FTE Count 1,838
Value of One Mill
$138,920 $76.07 per Allotment FTE
Sources: Local State-QBE State-
Lottery State-
Other Federal Other
Total
PerGeneral Fund cent Per FTE
$1,749,156 19.5% $958 $6,924,826 77.2% $3,792
K-12 Revenues
Lottery K-12
and
Title
All Other
Programs
K-12
$0
$86,271
Bonded Debt $879,529
$0
$0
$0
$0 0.0%
$0
$0
$45,099
$0
$292,264 3.3% $160
$0 0.0%
$0
$1,941 0.0%
$1
$8,968,187 100% $4,911
$25,837 $656,084
$0 $681,921
$0 $5,018
$0 $136,389
$140,383 $0 $0
$1,019,913
Capital Projects
$252,720 $0
$0
$0 $0 $0 $252,720
School Nutrition
$227,417 $0
$0
$51,138 $627,060
$129 $905,745
Grand Total
Total
Per-
Amount cent
$3,195,094 26.7%
$6,924,826 57.9%
$45,099 0.4%
$509,623 4.3% $1,288,163 10.8%
$2,071 0.0% $11,964,878 100%
Instruction
Media Instruction
Support Pupil Services General Admin. School Admin. Trans-
portation Maint. & Ops. Capital Projects School Food Debt Service
Total
$5,851,222 66.6% $3,204 $167,684 1.9% $92
$279,955 3.2% $153
$246,691 2.8% $135
$419,868 4.8% $230
$652,176 7.4% $357
$381,758 4.3% $209
$764,719 8.7% $419
$15,075 0.2%
$8
$0 0.0%
$0
$0 0.0%
$0
$8,779,151 100% $4,807
K-12 Expenditures
$730,686
$98,830
$0
$0
$0
$0
$49,310
$54,972
$0
$38,598
$0
$0
$1,393
$0
$52
$3,598
$1,199
$0
$0
$2,002
$0
$0
$732
$0
$0
$0
$0
$0
$923
$0
$0
$0 $289,779
$823,587 $158,661 $289,831
$0 $0 $0 $0 $0 $0 $0 $0 $769,026 $0 $0
$0 $0 $0 $0 $0 $0 $0 $0 $0 $889,683 $0
$6,680,739 57.1% $167,684 1.4% $384,239 3.3% $285,290 2.4% $421,314 3.6% $656,973 5.6% $383,761 3.3% $765,451 6.5% $784,101 6.7% $890,606 7.6% $289,779 2.5%
$769,026 $889,683 $11,709,941 100%
Salaries and Benefits as Percentages of Revenues and of Expenditures
Teachers and Paraprofessionals
Salaries $4,649,291
Benefits $1,328,884
Percentage of Revenues Percentage of Expenditures
Total of
Total of
General Fund
General Fund
Title Programs
Title Programs
Lottery K-12
Lottery K-12
Total Salaries
and
Total
and
Total
and Benefits All Other K-12 K - 12 All Other K-12 K - 12
$5,978,175
61.1%
50.0%
61.2%
51.1%
School Administration
$365,745
$134,045
$499,790
5.1%
4.2%
5.1%
4.3%
General Administration
$75,000
$59,532
$134,532
1.4%
1.1%
1.4%
1.1%
1998-99 GEORGIA PUBLIC EDUCATION REPORT CARD
Candler County Schools - 621
Prepared by Georgia Department of Education
Page 8
CERTIFIED PERSONNEL DATA
Number
Average Annual Salary Positions Average Contract Days
Average Daily Salary
Full-time Personnel Part-time
Sex Male Female
4 Yr Bachelor's Certificate 5 Yr Master's
Level 6 Yr Specialist's 7 Yr Doctoral Other*
Black
White Race/ Hispanic Ethnicity Asian
American Indian
Multiracial
Years Experience
<1 1-10 11-20 21-30 >30
Average
Administrators
11.00
$57,345.73 207.27
$276.67
11 0
6 5
0 3 6 2 0
2 9 0 0 0 0
0 2 3 4 2
20.82
Support Personnel PK-12 Teachers
6.50
112.00
$39,098.77 190.00
$205.78
$37,209.78 188.93
$196.95
6
111
1
2
0
19
7
94
1
66
6
24
0
21
0
2
0
0
0
17
7
96
0
0
0
0
0
0
0
0
0
0
2
49
3
31
2
31
0
2
15.00
13.56
*Includes One- and Two-Year Vocational Certificates.
Certified Staff Position Ratios
Teacher/Administrator Ratio 10:1
Teacher/Support Person Ratio 17:1
Teacher/Staff Ratio 6:1
Student Enrollment/All Teachers 16:1
Certified Personnel by Category
86.3% 100%
8.4%
5.3%
80% 60%
40%
20%
0%
Teachers
Administrators
Support Personnel
1998-99 GEORGIA PUBLIC EDUCATION REPORT CARD
Candler County Schools - 621
Prepared by Georgia Department of Education
Page 9
1998-99 GEORGIA PUBLIC EDUCATION REPORT CARD
CANDLER COUNTY SCHOOLS
Metter Elementary School - 6213050
Grade Range PK-5
The Georgia Public Education Report Card is designed to assist systems and schools in educational improvement. This report card contains a variety of data elements. An explanation of the terms is provided as a companion to the report card data. Please refer to the definitions for the most effective use of the reported data.
STUDENT DATA
Total
K-5
921
PK
95
Enrollment, by Race/Ethnicity and Sex
Black
White Hispanic
American Asian Indian
Multiracial
342 37.1%
493 53.5%
81 8.8%
1 0.1%
0 0.0%
4 0.4%
43 45.3%
48 50.5%
3 3.2%
1 1.1%
0 0.0%
0 0.0%
Male Female
503 54.6%
418 45.4%
48 50.5%
47 49.5%
Enrollment in Selected Programs
Program
Program % of Student Enrollment Population
Gifted (Grades K-12)
0
0.0%
Alternative Programs (Grades 6-12)
N/A
N/A
Students Eligible to Receive Free/Reduced Lunches
Number
Percent
School System
688 1,253
67.7% 64.8%
Dropout Rate *
Number
Rate
School System
N/A N/A
N/A N/A
* Dropout rates are not applicable for grades PK-5.
Enrollment in Compensatory Programs
Program
Program % of Student Enrollment Population
Special Education (Grades K-12)
121 13.1%
(PK)
14
N/A
English to Speakers of Other Languages (ESOL) (Grades K-12)
0
0.0%
Remedial Education (Grades 2-5, 9-12)
107 17.2%
Special Instructional Assistance (SIA) (Grades K-3)
218 35.2%
Title I (Grades K-12)
This school has a schoolwide program.
Total 43
Retained Students, by Race/Ethnicity and Sex
Black
White Hispanic
American MultiAsian Indian racial
25 58.1%
12
6
27.9% 14.0%
0 0.0%
0 0.0%
0 0.0%
Male Female
27
16
62.8% 37.2%
Prepared by Georgia Department of Education
Page 1
STATE-REQUIRED TEST DATA
NORM-REFERENCED TESTS Grade 3
Iowa Tests of Basic Skills (ITBS) Each chart reflects data for three years of testing.
Reading Comprehension 50
46 46 54 0
98-99
46 46 53 97-98
32 32 52 96-97
Mathematics
School 50
System
State
0
51 51 61 98-99
54 54 61 97-98
42 42 59 96-97
School System State
Reading Vocabulary 50
40 40 50 0
98-99
36 36 50 97-98
26 26 49 96-97
Language Arts
School 50
System
State
0
45 45 64 98-99
39 39 62 97-98
30 30 59 96-97
School System State
Social Studies 50
41 41 56 0
98-99
43 43 55 97-98
32 32 55 96-97
Science
School 50
System
State
0
49 49 59 98-99
51 51 59 97-98
45 45 58 96-97
School System State
Sources of Information
Composite Score
50
46 46 57 0
98-99
School 50
System
46 46 56 97-98
35 35 55 96-97
State 0
44 44 58 98-99
45 45 57 97-98
1998-99 GEORGIA PUBLIC EDUCATION REPORT CARD Metter Elementary School - 6213050
Prepared by Georgia Department of Education
34 34 56 96-97
Scores Reported in Percentiles
School System State
Page 2
STATE-REQUIRED TEST DATA
NORM-REFERENCED TESTS Grade 5
Iowa Tests of Basic Skills (ITBS) Each chart reflects data for three years of testing.
Reading Comprehension
Mathematics
50
42 42 53 0
98-99
47 47 53 97-98
44 44 52 96-97
School 50
System
State
0
46 46 59 98-99
60 60 58 97-98
46 46 57 96-97
School System State
Reading Vocabulary 50
36 36 48 0
98-99
40 40 48 97-98
34 34 46 96-97
Language Arts
School 50
System
State
0
46 46 63 98-99
55 55 61 97-98
51 51 58 96-97
School System State
Social Studies 50
45 45 57 0
98-99
53 53 56 97-98
46 46 55 96-97
Science
School 50
System
State
0
50 50 60 98-99
61 61 59 97-98
53 53 59 96-97
School System State
Sources of Information
Composite Score
50
48 48 58 0
98-99
School 50
System
59 59 58 97-98
53 53 57 96-97
State 0
44 44 57 98-99
54 54 56 97-98
47 47 55 96-97
1998-99 GEORGIA PUBLIC EDUCATION REPORT CARD Metter Elementary School - 6213050
Prepared by Georgia Department of Education
Scores Reported in Percentiles
School System State
Page 3
STATE-REQUIRED TEST DATA
PERFORMANCE ASSESSMENTS
Grade 5 Writing Assessment
Percent at Developmental Stages:
1998-99 School System State
1997-98 School System State
1996-97 School System State
Stage Stage Stage Stage Stage Stage
1:The Emerging Writer 2:The Developing Writer 3:The Focusing Writer 4:The Experimenting 5:The Engaging Writer 6:The Extending Writer
0% 0% 14% 41% 33% 12%
0% 0% 14% 41% 33% 12%
0% 1% 16% 41% 29% 12%
0% 1% 13% 52% 25% 6%
0% 1% 13% 52% 25% 6%
0% 3% 19% 41% 27% 10%
0% 1% 23% 50% 21% 5%
0% 1% 23% 50% 21% 5%
0% 3% 21% 37% 26% 12%
AWARDS / RECOGNITION DATA
Schools in Georgia may receive recognition in the following programs: Charter School Pay for Performance Program Georgia School of Excellence National Blue Ribbon School Metter Elementary School did not receive recognition in any of these programs during the 1998-99 school year.
1998-99 GEORGIA PUBLIC EDUCATION REPORT CARD Metter Elementary School - 6213050
Prepared by Georgia Department of Education
Page 4
CERTIFIED PERSONNEL DATA
Positions Number Average Contract Days
Personnel Sex
Certificate
Years Experience
Full-time Part-time
Male Female
4 Yr Bachelor's 5 Yr Master's 6 Yr Specialist's 7 Yr Doctoral Other*
<1 1-10 11-20 21-30 >30
Average
Administrators
3.00 203.33
3 0
1 2
0 1 2 0 0 0 1 1 1 0 16.00
Support Personnel
4.00 190.00
4 0
0 4
1 3 0 0 0 0 2 2 0 0 9.75
PK-12 Teachers
52.00 190.00
52 0
4 48
33 8
11 0 0 0
22 13 17
0 14.12
*Includes One- and Two-Year Vocational Certificates.
ACCREDITATION DATA
Accredited by Southern Association of Colleges and Schools (SACS):
Elementary/Middle Commission. Accredited with Quality by Georgia
Accrediting Commission (GAC).
1998-99 GEORGIA PUBLIC EDUCATION REPORT CARD Metter Elementary School - 6213050
Prepared by Georgia Department of Education
Page 5
1998-99 GEORGIA PUBLIC EDUCATION REPORT CARD
CANDLER COUNTY SCHOOLS
Metter High School - 6212050
Grade Range 9-12
The Georgia Public Education Report Card is designed to assist systems and schools in educational improvement. This report card contains a variety of data elements. An explanation of the terms is provided as a companion to the report card data. Please refer to the definitions for the most effective use of the reported data.
Total 443
STUDENT DATA
9-12 Enrollment, by Race/Ethnicity and Sex
Black
White Hispanic
American Multi-
Asian Indian
racial
164 37.0%
255 57.6%
24 5.4%
0 0.0%
0 0.0%
0 0.0%
Male Female
246 55.5%
197 44.5%
Enrollment in Selected Programs
Program
Gifted (Grades K-12)
Program % of Student Enrollment Population
0
0.0%
Non-Vocational Labs (Grades 9-12)
393
Vocational Labs
(Grades 9-12)
390
Alternative Programs (Grades 6-12)
7
88.7% 88.0%
1.6%
Students Eligible to Receive Free/Reduced Lunches
Number
Percent
School System
259 1,253
58.5% 64.8%
Enrollment in Compensatory Programs
Program
Program % of Student Enrollment Population
Special Education (Grades K-12) PK
43
9.7%
0
N/A
English to Speakers of Other Languages (ESOL) (Grades K-12)
0
0.0%
Remedial Education (Grades 2-5, 9-12)
85 19.2%
Title I (Grades K-12)
This school has no Title I program.
Dropout Rate for Grades 9-12
Number
Rate
School System
59
12.0%
59
12.0%
Total 32
Retained Students, by Race/Ethnicity and Sex
Black
White Hispanic
American MultiAsian Indian racial
19 59.4%
10 31.3%
3 9.4%
0 0.0%
0 0.0%
0 0.0%
Male Female
21
11
65.6% 34.4%
Prepared by Georgia Department of Education
Page 1
STATE-REQUIRED TEST DATA
GEORGIA HIGH SCHOOL GRADUATION TESTS (GHSGT)
Percent of Regular Program 11th Graders Passing the Georgia High School Graduation Tests on First Administration
English Language Arts Mathematics Social Studies Science
All Components listed above
Writing
1998-99
School System State
94% 86% 86% 77%
94% 86% 86% 77%
96% 88% 80% 72%
72% 72% 68%
95% 95% 93%
1997-98
School System State
87% 84% 71% 76%
87% 84% 71% 76%
94% 88% 78% 74%
67% 67% 68%
87% 87% 92%
1996-97
School System State
86% 85% 71% 65%
86% 85% 71% 65%
94% 87% 78% 74%
58% 58% 67%
90% 90% 93%
GRADUATE DATA
1999 Graduates by Credentials, Race/Ethnicity and Sex
Diplomas with Both College Prep. & Voc. Endorsements
Diplomas with College Prep. Endorsements Diplomas with Vocational Endorsements General High School Diplomas Special Education Diplomas
Total All Diplomas
Certificates of Performance
Total Graduates
Total 0
Black 0
White Hispanic
0
0
American MultiAsian Indian racial
0
0
0
Male Female
0
0
24
3
21
0
0
0
0
13
11
12.5% 87.5% 0.0% 0.0% 0.0% 0.0% 54.2% 45.8%
34
16
15
3
0
0
0
17
17
47.1% 44.1% 8.8% 0.0% 0.0% 0.0% 50.0% 50.0%
0
0
0
0
0
0
0
0
0
2
1
1
0
0
0
0
2
0
50.0% 50.0% 0.0% 0.0% 0.0% 0.0% 100.0% 0.0%
60
20
37
3
0
0
0
32
28
33.3% 61.7% 5.0% 0.0% 0.0% 0.0% 53.3% 46.7%
4
3
0
1
0
0
0
0
4
75.0%
0.0% 25.0% 0.0% 0.0% 0.0% 0.0% 100.0%
64
23
37
4
0
0
0
32
32
35.9% 57.8% 6.3% 0.0% 0.0% 0.0% 50.0% 50.0%
HOPE Scholarships
School System
Number of 1999 Graduates 6 4
Number Eligible
36
Percent Eligible
56.3%
64 36 56.3%
State
65,548 40,292 61.5%
High School Completion Rate
Percent of 1995Grade 9 Enrollment in Graduating Class of1999 School System State
Completion Rate '95-'99 61.0% 61.0% 68.9%
1998-99 GEORGIA PUBLIC EDUCATION REPORT CARD
Metter High School - 6212050
Prepared by Georgia Department of Education
Page 2
COLLEGE ADMISSIONS / CREDIT TEST DATA
Scholastic Assessment Test (SAT)
Based on students' highest verbal and highest math scores
No. Taking
Average Score
Tests Verbal Math Total
Based on students' last test administration
Average Score Verbal Math Total
School
24
College Prep. Endorsement
Other Diplomas
System
24
College Prep. Endorsement
Other Diplomas
Georgia
41,958
505 494
999
528 510 1038
420 447
867
505 494
999
528 510 1038
420 447
867
492 488
980
498 N/A N/A
498 N/A N/A
483
488 N/A N/A
488 N/A N/A
479
986 N/A N/A
986 N/A N/A
962
Nation
952,913 N/A N/A N/A
502 508 1010
American College Testing (ACT)
Advanced Placement Exams (AP)
Number taking tests: English Mathematics Reading Science Reasoning
1 * School N/A N/A N/A N/A
System N/A N/A N/A N/A
State 19.1 19.9 20.2 19.9
CompositeScore
N/A
N/A 19.9
* Scores are not reported when fewer than 5 take the ACT
No. of Students Taking Tests
No. of Tests Taken No. of Test Scores
3 or Higher Percent of Test
Scores 3 or Higher
School 0
N/A N/A
N/A
System State 0 15,225
N/A 23,969 N/A 13,024
N/A 54.3%
POST-SECONDARY DATA
Graduates Entering Georgia Public Colleges
Graduates Entering Georgia Public Colleges and Requiring Learning Support (LS)
1998 Graduates Entering in 1998-99
1997 Graduates Entering in 1997-98
Percent of Graduating Number Class
School
21
32.8%
System 2 1
32.8%
School
34
44.2%
System 3 4
44.2%
Number Requiring
LS 9 9
4 4
Percent of those attending Georgia
Public Colleges
42.9%
42.9%
11.8%
11.8%
In previous years, the Report Card presented College Prep Curriculum information provided by the Board of Regents on students requiring Learning Support. Due to inconsistencies in the data provided by the Board of Regents in defining College Prep Completers versus Local Board of Education data defining College Prep Endorsements, the Department of Education Report Card will not provide this information until discrepancies can be reconciled.
Graduates Entering Georgia Public Technical and Adult Schools
1998 Graduates School System
Entering Number 10 10
1998-99 Percent 15.6% 15.6%
Entering Number N/A N/A
1997-98 Percent
N/A N/A
1997 Graduates School
0
0.0%
System
0
0.0%
11
14.3%
11
14.3%
1998-99 GEORGIA PUBLIC EDUCATION REPORT CARD Metter High School - 6212050
Prepared by Georgia Department of Education
Page 3
CERTIFIED PERSONNEL DATA
Positions Number Average Contract Days
Administrators
2.00 210.00
Support Personnel
2.00 190.00
PK-12 Teachers
27.00 190.74
Personnel Sex
Certificate
Years Experience
Full-time Part-time
Male Female
4 Yr Bachelor's 5 Yr Master's 6 Yr Specialist's 7 Yr Doctoral Other*
<1 1-10 11-20 21-30 >30
Average
2 0
2 0
0 0 2 0 0
0 0 1 1 0
21.00
2 0
0 2
0 2 0 0 0
0 0 0 2 0
23.00
27 0
9 18
11 9 6 1 0
0 9 9 8 1
15.89
*Includes One- and Two-Year Vocational Certificates.
ACCREDITATION DATA
Accredited by Southern Association of Colleges and Schools (SACS): Secondary/Middle Commission. Accredited with Quality by Georgia Accrediting Commission (GAC).
AWARDS / RECOGNITION DATA
Schools in Georgia may receive recognition in the following programs: Charter School Pay for Performance Program Georgia School of Excellence National Blue Ribbon School Metter High School did not receive recognition in any of these programs during the 1998-99 school year.
1998-99 GEORGIA PUBLIC EDUCATION REPORT CARD Metter High School - 6212050
Prepared by Georgia Department of Education
Page 4
1998-99 GEORGIA PUBLIC EDUCATION REPORT CARD
CANDLER COUNTY SCHOOLS
Metter Middle School - 6211050
Grade Range 6-8
The Georgia Public Education Report Card is designed to assist systems and schools in educational improvement. This report card contains a variety of data elements. An explanation of the terms is provided as a companion to the report card data. Please refer to the definitions for the most effective use of the reported data.
STUDENT DATA
Total 474
6-8 Enrollment, by Race/Ethnicity and Sex
Black
White Hispanic
American Multi-
Asian Indian
racial
159 33.5%
268 56.5%
44 9.3%
1 0.2%
0 0.0%
2 0.4%
Male 233
49.2%
Female 241
50.8%
Enrollment in Selected Programs
Program
Gifted (Grades K-12)
Program % of Student Enrollment Population
28
5.9%
Alternative Programs (Grades 6-12)
3
< 1%
Students Eligible to Receive Free/Reduced Lunches
Number
Percent
School System
306 1,253
64.6% 64.8%
Enrollment in Compensatory Programs
Program
Program % of Student Enrollment Population
Special Education (Grades K-12) (PK)
80 16.9%
0
N/A
English to Speakers of Other Languages (ESOL) (Grades K-12)
0
0.0%
Title I (Grades K-12)
This school has a schoolwide program.
Dropout Rate for Grades 6-8
Number
Rate
School System
0
0.0%
0
0.0%
Total 0
Retained Students, by Race/Ethnicity and Sex
Black
White Hispanic
American MultiAsian Indian racial
0
0
0
0
0
0
Male Female
0
0
Prepared by Georgia Department of Education
Page 1
STATE-REQUIRED TEST DATA
NORM-REFERENCED TESTS Grade 8
Iowa Tests of Basic Skills (ITBS) Each chart reflects data for three years of testing.
Reading Comprehension 50
36 36 49 0
98-99
31 31 48 97-98
39 39 48 96-97
Mathematics
School 50
System
State
0
42 42 56 98-99
36 36 55 97-98
44 44 54 96-97
School System State
Reading Vocabulary 50
30 30 46 0
98-99
27 27 45 97-98
30 30 44 96-97
Language Arts
School 50
System
State
0
45 45 60 98-99
43 43 58 97-98
46 46 56 96-97
School System State
Social Studies 50
43 43 54 0
98-99
38 38 53 97-98
47 47 53 96-97
Science
School 50
System
State
0
46 46 56 98-99
50 50 55 97-98
46 46 53 96-97
School System State
Sources of Information
Composite Score
50
48 48 57 0
98-99
School 50
System
40 40 56 97-98
48 48 55 96-97
State 0
42 42 56 98-99
39 39 54 97-98
1998-99 GEORGIA PUBLIC EDUCATION REPORT CARD Metter Middle School - 6211050
Prepared by Georgia Department of Education
43 43 54 96-97
Scores Reported in Percentiles
School System State
Page 2
STATE-REQUIRED TEST DATA
Categories of Scaled Scores
Inadequate (less than 162)
Minimal (162-209)
Good
(210-247)
Very Good (greater than 247)
Average Scaled Score: (Range 100-300)
PERFORMANCE ASSESSMENTS
Grade 8 Writing Assessment
1998-99 Percent Scoring
1997-98 Percent Scoring
1996-97 Percent Scoring
School System State School System State School System State
9% 55% 32%
4%
9% 55% 32%
4%
8% 40% 41% 11%
15% 63% 20%
2%
15% 63% 20%
2%
11% 46% 34%
8%
7% 65% 24%
5%
7% 65% 24%
5%
15% 46% 30%
8%
196
196
208 189
189 202 198
198 198
AWARDS / RECOGNITION DATA
Schools in Georgia may receive recognition in the following programs: Charter School Pay for Performance Program Georgia School of Excellence National Blue Ribbon School Metter Middle School did not receive recognition in any of these programs during the 1998-99 school year.
1998-99 GEORGIA PUBLIC EDUCATION REPORT CARD Metter Middle School - 6211050
Prepared by Georgia Department of Education
Page 3
CERTIFIED PERSONNEL DATA
Positions Number Average Contract Days
Personnel Sex
Certificate
Years Experience
Full-time Part-time
Male Female
4 Yr Bachelor's 5 Yr Master's 6 Yr Specialist's 7 Yr Doctoral Other*
<1 1-10 11-20 21-30 >30
Average
Administrators
2.00 190.00
2 0
1 1
0 1 1 0 0 0 1 0 1 0 16.50
Support Personnel
0.50 190.00
0 1
0 1
0 1 0 0 0 0 0 1 0 0 20.00
PK-12 Teachers
28.50 183.68
28 1
4 25
18 7 4 0 0 0
13 9 6 1
11.86
*Includes One- and Two-Year Vocational Certificates.
ACCREDITATION DATA
Accredited with Quality by Georgia Accrediting Commission (GAC).
1998-99 GEORGIA PUBLIC EDUCATION REPORT CARD Metter Middle School - 6211050
Prepared by Georgia Department of Education
Page 4
1998-99 GEORGIA PUBLIC EDUCATION REPORT CARD CARROLL COUNTY SCHOOLS - 622
The Georgia Public Education Report Card is designed to assist systems and schools in educational improvement. This report card contains a variety of data elements. An explanation of the terms is provided as a companion to the report card data. Please refer to the definitions for the most effective use of the reported data.
Total
K-12
11,007
PK
501
STUDENT DATA
Enrollment, by Race/Ethnicity and Sex
Black
White Hispanic
American Multi-
Asian Indian
racial
1,796 16.3%
8,951 81.3%
76 0.7%
45 0.4%
43 0.4%
96 0.9%
72 14.4%
405 80.8%
5 1.0%
1 0.2%
0 0.0%
18 3.6%
Male
5,734 52.1%
268 53.5%
Female
5,273 47.9%
233 46.5%
Enrollment in Selected Programs
Program
Program % of Student Enrollment Population
Gifted (Grades K-12)
714
6.5%
Non-Vocational Labs (Grades 9-12)
2,753
87.0%
Vocational Labs (Grades 9-12)
2,104
66.5%
Alternative Programs (Grades 6-12)
35
< 1%
Students Eligible to Receive Free/Reduced Lunches
Number
Percent
4,597
39.9%
Dropout Rate
Number
Percent
6-12 9-12
98
1.6%
96
2.8%
Enrollment in Compensatory Programs
Program
Program % of Student Enrollment Population
Special Education (Grades K-12)
PK
1,594 82
English to Speakers of
Other Languages (ESOL)
0
(Grades K-12)
Remedial Education (Grades 2-5, 9-12)
1,117
Special Instructional Assistance (SIA) (Grades K-3)
1,446
Title I (Grades K-12) Number of schools with: Schoolwide program Targeted Assistance program No Title I program
14.5% N/A
0.0%
16.6%
40.5%
4 5 9
Total 274
Retained Students, by Race/Ethnicity and Sex
Black
White Hispanic
American MultiAsian Indian racial
62 22.6%
206 75.2%
2 0.7%
0 0.0%
1 0.4%
3 1.1%
Male Female 173 101
63.1% 36.9%
Prepared by Georgia Department of Education
Page 1
STATE-REQUIRED TEST DATA
NORM-REFERENCED TESTS
Grade 3 Iowa Tests of Basic Skills (ITBS) Each chart reflects data for three years of testing.
Reading Comprehension
Mathematics
50
46 54 48 53 41 52 0
98-99 97-98 96-97
System State
50
50 61 52 61 46 59 0
98-99 97-98 96-97
System State
Reading Vocabulary
50
43 50 45 50 38 49 0
98-99 97-98 96-97
System State
Social Studies
50
45 56 47 55 45 55 0
98-99 97-98 96-97
System State
Language Arts
50
53 64 56 62 44 59 0
98-99 97-98 96-97
System State
Science
50
50 59 52 59 47 58 0
98-99 97-98 96-97
System State
Sources of Information
Composite Score
50
46 57 0
98-99
System
50
46 56 43 55 97-98 96-97
State
47 58 49 57 0
98-99 97-98
1998-99 GEORGIA PUBLIC EDUCATION REPORT CARD Carroll County Schools
Prepared by Georgia Department of Education
System State Scores Reported 43 56 in Percentiles 96-97
Page 2
STATE-REQUIRED TEST DATA
NORM-REFERENCED TESTS
Grade 5 Iowa Tests of Basic Skills (ITBS) Each chart reflects data for three years of testing.
Reading Comprehension
Mathematics
50
46 53 48 53 48 52 0
98-99 97-98 96-97
System State
50
45 59 46 58 49 57 0
98-99 97-98 96-97
System State
Reading Vocabulary
50
44 48 43 48 42 46 0
98-99 97-98 96-97
System State
Social Studies
50
46 57 52 56 51 55 0
98-99 97-98 96-97
System State
Language Arts
50
54 63 55 61 53 58 0
98-99 97-98 96-97
System State
Science
50
51 60 55 59 55 59 0
98-99 97-98 96-97
System State
Sources of Information
Composite Score
50
47 58 0
98-99
System
50
50 58 53 57 97-98 96-97
State
46 57 50 56 0
98-99 97-98
1998-99 GEORGIA PUBLIC EDUCATION REPORT CARD Carroll County Schools
Prepared by Georgia Department of Education
System State Scores Reported 50 55 in Percentiles 96-97
Page 3
STATE-REQUIRED TEST DATA
NORM-REFERENCED TESTS Grade 8
Iowa Tests of Basic Skills (ITBS) Each chart reflects data for three years of testing.
Reading Comprehension
Mathematics
50
51 49 48 48 48 48 0
98-99 97-98 96-97
System State
50
51 56 48 55 51 54 0
98-99 97-98 96-97
System State
Reading Vocabulary
50
46 46 44 45 45 44 0
98-99 97-98 96-97
System State
Language Arts
50
59 60 54 58 54 56 0
98-99 97-98 96-97
System State
Social Studies
50
53 54 50 53 50 53 0
98-99 97-98 96-97
System State
Science
50
57 56 51 55 55 53 0
98-99 97-98 96-97
System State
Sources of Information
Composite Score
50
54 57 0
98-99
System
50
51 56 52 55 97-98 96-97
State
54 56 50 54 0
98-99 97-98
1998-99 GEORGIA PUBLIC EDUCATION REPORT CARD Carroll County Schools
Prepared by Georgia Department of Education
System State Scores Reported 52 54 in Percentiles 96-97
Page 4
STATE-REQUIRED TEST DATA
PERFORMANCE ASSESSMENTS
Grade 5 Writing Assessment
1998-99
1997-98
1996-97
Percent at Developmental Stages:
Comparison
Comparison
Comparison
System Group State System Group State System Group State
Stage Stage Stage Stage Stage Stage
1: The Emerging Writer 2: The Developing Writer 3: The Focusing Writer 4: The Experimenting Writer 5: The Engaging Writer 6: The Extending Writer
0% 1% 20% 46% 24% 8%
0% 1% 15% 40% 30% 14%
0% 1% 16% 41% 29% 12%
0% 2% 22% 47% 22% 5%
0% 2% 17% 38% 29% 13%
0% 3% 19% 41% 27% 10%
0% 4% 22% 40% 25% 8%
0% 3% 20% 38% 27% 11%
0% 3% 21% 37% 26% 12%
Grade 8 Writing Assessment
1998-99 Percent Scoring 1997-98 Percent Scoring 1996-97 Percent Scoring
Categories of Scaled Scores
Comparison
Comparison
Comparison
System Group State System Group State System Group State
Inadequate (less than 162)
Minimal (162-209)
Good
(210-247)
Very Good (greater than 247)
6% 51% 35%
8%
6% 37% 45% 13%
8% 40% 41% 11%
10% 52% 33%
5%
9% 43% 38% 10%
11% 46% 34%
8%
9% 54% 32%
5%
16% 49% 28%
7%
15% 46% 30%
8%
Average Scaled Score: (Range 100-300)
205
212 208
200
206 202
200
196 198
GEORGIA HIGH SCHOOL GRADUATION TESTS (GHSGT)
Percent of Regular Program 11th Graders Passing the Georgia High School Graduation Tests on First Administration
1998-99
1997-98
1996-97
Comparison
Comparison
Comparison
System Group State System Group State System Group State
English Language Arts Mathematics Social Studies Science
96% 85% 75% 70%
96% 89% 82% 75%
96% 88% 80% 72%
93% 85% 75% 72%
94% 90% 81% 78%
94% 88% 78% 74%
92% 86% 80% 77%
94% 86% 77% 72%
94% 87% 78% 74%
All Components listed above 6 5 %
71% 68% 64%
72% 68% 69%
66% 67%
Writing
90%
94% 93% 89%
93% 92% 95%
93% 93%
1998-99 GEORGIA PUBLIC EDUCATION REPORT CARD
Carroll County Schools
Prepared by Georgia Department of Education
Page 5
GRADUATE DATA
1999 Graduates by Credentials, Race/Ethnicity and Sex
Diplomas with Both College Prep. & Voc. Endorsements
Diplomas with College Prep. Endorsements Diplomas with Vocational Endorsements General High School Diplomas Special Education Diplomas
Total All Diplomas
Certificates of Performance
Total Graduates
Total 82
234 132
1 22 471 27 498
Black
American MultiWhite Hispanic Asian Indian racial
14 17.1%
31 13.2%
22 16.7%
0 0.0%
8 36.4%
67 81.7%
200 85.5%
110 83.3%
1 100.0%
14 63.6%
0 0.0%
1 0.4%
0 0.0%
0 0.0%
0 0.0%
1 1.2%
2 0.9%
0 0.0%
0 0.0%
0 0.0%
0 0.0%
0 0.0%
0 0.0%
0 0.0%
0 0.0%
0 0.0%
0 0.0%
0 0.0%
0 0.0%
0 0.0%
75
392
1
3
0
0
15.9% 83.2% 0.2% 0.6% 0.0% 0.0%
20
6
1
0
0
0
74.1% 22.2% 3.7% 0.0% 0.0% 0.0%
95
398
2
3
0
0
19.1% 79.9% 0.4% 0.6% 0.0% 0.0%
Male Female
21
61
25.6% 74.4%
113 121 48.3% 51.7%
83
49
62.9% 37.1%
0
1
0.0% 100.0%
16
6
72.7% 27.3%
233 238 49.5% 50.5%
12
15
44.4% 55.6%
245 253 49.2% 50.8%
HOPE Scholarships
System State
Number of 1999 Graduates 4 9 8
Number Eligible
322
Percent Eligible
64.7%
65,548 40,292 61.5%
High School Completion Rate Percent of 1995Grade 9 Enrollment
in Graduating Class of1999
System
State
Completion Rate '95-'99 67.3% 68.9%
COLLEGE ADMISSIONS / CREDIT TEST DATA
Scholastic Assessment Test (SAT)
No. Taking
Average Score
Tests
Verbal Math Total
Based on students' highest verbal and highest math scores
System College Prep. Endorsement Other Diplomas
483 477 960 492 499 991 331 376 707
Georgia
492 488 980
Based on students' last test administration
System Georgia
254
475 468
943
41,958 483 479 962
Nation
952,913 502 508 1010
American College Testing (ACT)
System State Nation
English
18.5
19.1 20.4
Mathematics
18.5
19.9 20.7
Reading
20.0
20.2 21.3
Science Reasoning 19.8
19.9 21.0
CompositeScore 19.4
19.9 21.9
Advanced Placement Exams (AP)
No. of Students Taking Tests
No. of Tests Taken No. of Test Scores
3 or Higher Percent of Test
Scores 3 or Higher
System State 173 15,225 289 23,969 73 13,024
25.3% 54.3%
1998-99 GEORGIA PUBLIC EDUCATION REPORT CARD Carroll County Schools
Prepared by Georgia Department of Education
Page 6
POSTSECONDARY DATA
Graduates Entering Georgia Public Colleges and Universities
Graduates Entering Georgia Public Colleges and Universities and
Requiring Learning Support (LS)
1998 Graduates Entering 1998-99
1997 Graduates Entering 1997-98
Percent of Graduating Number Class
193
36.3%
169
34.4%
Number Requiring
LS
38
30
Percent of those attending Georgia
Public Colleges
19.7%
17.8%
In previous years, the Report Card presented College Prep Curriculum information provided by the Board of Regents on students requiring Learning Support. Due to inconsistencies in the data provided by the Board of Regents in defining College Prep Completers versus Local Board of Education data defining College Prep Endorsements, the Department of Education Report Card will not provide this information until discrepancies can be reconciled.
Graduates Entering Georgia Public Technical and Adult Schools
Entering 1998-99 Entering 1997-98
Number Percent
Number Percent
1998 Graduates 1997 Graduates
51
9.6%
9
1.8%
N/A 31
N/A 6.3%
ACCREDITATION / RECOGNITION DATA
Southern Association of Colleges and Schools (SACS) Accrediting Commission
Secondary/Middle Commission Elementary/Middle Commission Both Elementary/Secondary Commissions Joint Commission Candidate for Accreditation
Accreditation by Georgia Accrediting Commission (GAC)
Accredited by GAC Accredited with Quality by GAC
Number of Schools
6 12
0 0 0
Number of Schools
0 1
Awards / Recognition
State Recognized Program
Number of Schools
Charter School
0
Pay for Performance Recipient
0
Georgia School of Excellence
0
National Blue Ribbon School
0
COMMUNITY DATA
Number of Children Eligible for Migrant Education Number of Families-At-Risk * Number of Food Stamp Participants * Number of Families Receiving TANF * ** Per Capita Income * Unemployment Rate * 1990 Population * Projected 2000 Population * Projected 2010 Population *
* Data Available at County Level Only ** Known as AFDC before January 1997
0 302 5,451 428 $18,840 4.5% 71,422 85,974 105,839
1998-99 GEORGIA PUBLIC EDUCATION REPORT CARD Carroll County Schools
Prepared by Georgia Department of Education
Page 7
FISCAL DATA
Millage Rate
17.85
* Fall 1998 Property Tax Digest is used to calculate the 98-99 Value of One Mill
FTE Count
FTE Count used for Allotment Calculation 10,905.0 Fall '98 FTE Count 11,007
Value of One Mill
$856,509 $78.54 per Allotment FTE
Sources: Local State-QBE State-
Lottery State-
Other Federal Other
Total
PerGeneral Fund cent Per FTE
$17,005,928 27.9% $1,559 $43,017,235 70.7% $3,945
K-12 Revenues
Lottery K-12
and
Title
All Other
Programs
K-12
$0
$77,806
Bonded Debt $215
$0
$0
$0
Capital Projects $7,722,180
$0
$0 0.0%
$0
$0 $232,828
$0
$0
$839,116 1.4% $77
$0 0.0%
$0
$6,680 0.0%
$1
$60,868,960 100% $5,582
$0 $2,859,254
$0 $2,859,254
$1,972,983 $272,134 $0
$2,555,753
$0
$0
$0
$0
$0 $9,976,887
$215 $17,699,068
School Nutrition $1,620,081
$0
$0
$300,828 $2,310,076
$0 $4,230,986
Grand Total
Total
Per-
Amount cent
$26,426,212 30.0%
$43,017,235 48.8%
$232,828 0.3%
$3,112,927 3.5% $5,441,465 6.2% $9,983,567 11.3% $88,214,237 100%
Instruction
Media Instruction
Support Pupil Services General Admin. School Admin. Trans-
portation Maint. & Ops. Capital Projects School Food Debt Service
Total
K-12 Expenditures
$40,600,340 66.2% $3,723 $1,691,237 $1,119,528
$0
$0
$0
$1,526,649 2.5% $140
$630
$0
$0
$0
$0
$2,149,220 3.5% $197 $674,339 $293,569
$0
$72,568
$0
$2,870,747 4.7% $263 $345,248 $394,243
$0
$0
$0
$816,558 1.3% $75 $163,596 $430,648
$0
$0
$0
$4,732,883 7.7% $434
$0
$1,152
$0
$0
$0
$3,259,100 5.3% $299
$1,530
$0
$0
$0
$0
$5,031,026 8.2% $461
$406 $104,505
$0
$0
$0
$232,388 0.4% $21
$0
$0
$0 $8,412,769
$0
$84,815 0.1%
$8
$5,000
$0
$0
$0 $4,027,931
$0 0.0%
$0
$0
$0 $4,092,120
$0
$0
$61,303,731 100% $5,621 $2,881,989 $2,343,647 $4,092,120 $8,485,337 $4,027,931
$43,411,106 52.2% $1,527,279 1.8% $3,189,697 3.8% $3,610,240 4.3% $1,410,803 1.7% $4,734,036 5.7% $3,260,631 3.9% $5,135,937 6.2% $8,645,158 10.4% $4,117,746 5.0% $4,092,120 4.9%
$83,134,757 100%
Salaries and Benefits as Percentages of Revenues and of Expenditures
Teachers and Paraprofessionals
Salaries $31,538,621
Benefits $8,782,911
Percentage of Revenues Percentage of Expenditures
Total of
Total of
General Fund
General Fund
Title Programs
Title Programs
Lottery K-12
Lottery K-12
Total Salaries
and
Total
and
Total
and Benefits All Other K-12 K - 12 All Other K-12 K - 12
$40,321,532
60.8%
45.7%
60.6%
48.5%
School Administration
$2,746,197
$935,475
$3,681,672
5.6%
4.2%
5.5%
4.4%
General Administration
$420,522
$226,100
$646,622
1.0%
0.7%
1.0%
0.8%
1998-99 GEORGIA PUBLIC EDUCATION REPORT CARD
Carroll County Schools - 622
Prepared by Georgia Department of Education
Page 8
CERTIFIED PERSONNEL DATA
Number
Average Annual Salary Positions Average Contract Days
Average Daily Salary
Full-time Personnel Part-time
Sex Male Female
4 Yr Bachelor's Certificate 5 Yr Master's
Level 6 Yr Specialist's 7 Yr Doctoral Other*
Black
White Race/ Hispanic Ethnicity Asian
American Indian
Multiracial
Years Experience
<1 1-10 11-20 21-30 >30
Average
Administrators
59.95
$64,822.59 230.07
$281.75
56 11
35 32
2 18 43
4 0
6 61
0 0 0 0
0 6 20 36 5
21.63
Support Personnel PK-12 Teachers
67.14
701.91
$48,375.10 195.23
$247.79
$39,939.22 190.65
$209.49
66
693
2
13
19
135
49
571
1
273
31
303
33
121
3
5
0
4
2
34
66
669
0
2
0
0
0
0
0
1
0
58
16
256
28
223
23
151
1
18
16.63
13.19
*Includes One- and Two-Year Vocational Certificates.
Certified Staff Position Ratios
Teacher/Administrator Ratio 12:1
Teacher/Support Person Ratio 10:1
Teacher/Staff Ratio 6:1
Student Enrollment/All Teachers 16:1
Certified Personnel by Category
83.9% 100%
8.0%
8.1%
80% 60%
40%
20%
0%
Teachers
Administrators
Support Personnel
1998-99 GEORGIA PUBLIC EDUCATION REPORT CARD
Carroll County Schools - 622
Prepared by Georgia Department of Education
Page 9
1998-99 GEORGIA PUBLIC EDUCATION REPORT CARD
CARROLL COUNTY SCHOOLS
Bay Springs Middle School - 6220198
Grade Range 6-8
The Georgia Public Education Report Card is designed to assist systems and schools in educational improvement. This report card contains a variety of data elements. An explanation of the terms is provided as a companion to the report card data. Please refer to the definitions for the most effective use of the reported data.
STUDENT DATA
Total 827
6-8 Enrollment, by Race/Ethnicity and Sex
Black
White Hispanic
American Multi-
Asian Indian
racial
147 17.8%
660 79.8%
7 0.8%
5 0.6%
4 0.5%
4 0.5%
Male 453
54.8%
Female 374
45.2%
Enrollment in Selected Programs
Program
Gifted (Grades K-12)
Program % of Student Enrollment Population
70
8.5%
Alternative Programs (Grades 6-12)
1
< 1%
Students Eligible to Receive Free/Reduced Lunches
Number
Percent
School System
341 4,597
41.2% 39.9%
Enrollment in Compensatory Programs
Program
Program % of Student Enrollment Population
Special Education (Grades K-12) (PK)
146 17.7%
0
N/A
English to Speakers of Other Languages (ESOL) (Grades K-12)
0
0.0%
Title I (Grades K-12)
This school has no Title I program.
Dropout Rate for Grades 6-8
Number
Rate
School System
0
0.0%
2
0.1%
Total 3
Retained Students, by Race/Ethnicity and Sex
Black
White Hispanic
American MultiAsian Indian racial
0
3
0.0% 100.0%
0 0.0%
0 0.0%
0 0.0%
0 0.0%
Male Female
2
1
66.7% 33.3%
Prepared by Georgia Department of Education
Page 1
STATE-REQUIRED TEST DATA
NORM-REFERENCED TESTS Grade 8
Iowa Tests of Basic Skills (ITBS) Each chart reflects data for three years of testing.
Reading Comprehension 50
49 51 49 0
98-99
46 48 48 97-98
42 48 48 96-97
Mathematics
School 50
System
State
0
52 51 56 98-99
42 48 55 97-98
47 51 54 96-97
School System State
Reading Vocabulary 50
46 46 46 0
98-99
39 44 45 97-98
37 45 44 96-97
Language Arts
School 50
System
State
0
57 59 60 98-99
46 54 58 97-98
46 54 56 96-97
School System State
Social Studies 50
53 53 54 0
98-99
48 50 53 97-98
45 50 53 96-97
Science
School 50
System
State
0
58 57 56 98-99
49 51 55 97-98
53 55 53 96-97
School System State
Sources of Information
Composite Score
50
55 54 57 0
98-99
School 50
System
46 51 56 97-98
49 52 55 96-97
State 0
54 54 56 98-99
46 50 54 97-98
1998-99 GEORGIA PUBLIC EDUCATION REPORT CARD Bay Springs Middle School - 6220198
Prepared by Georgia Department of Education
46 52 54 96-97
Scores Reported in Percentiles
School System State
Page 2
STATE-REQUIRED TEST DATA
Categories of Scaled Scores
Inadequate (less than 162)
Minimal (162-209)
Good
(210-247)
Very Good (greater than 247)
Average Scaled Score: (Range 100-300)
PERFORMANCE ASSESSMENTS
Grade 8 Writing Assessment
1998-99 Percent Scoring
1997-98 Percent Scoring
1996-97 Percent Scoring
School System State School System State School System State
7% 55% 30%
8%
6% 51% 35%
8%
8% 40% 41% 11%
16% 51% 29%
4%
10% 52% 33%
5%
11% 46% 34%
8%
10% 60% 27%
3%
9% 54% 32%
5%
15% 46% 30%
8%
203
205
208 194
200 202 194
200 198
AWARDS / RECOGNITION DATA
Schools in Georgia may receive recognition in the following programs: Charter School Pay for Performance Program Georgia School of Excellence National Blue Ribbon School Bay Springs Middle School did not receive recognition in any of these programs during the 1998-99 school year.
1998-99 GEORGIA PUBLIC EDUCATION REPORT CARD Bay Springs Middle School - 6220198
Prepared by Georgia Department of Education
Page 3
CERTIFIED PERSONNEL DATA
Positions Number Average Contract Days
Personnel Sex
Certificate
Years Experience
Full-time Part-time
Male Female
4 Yr Bachelor's 5 Yr Master's 6 Yr Specialist's 7 Yr Doctoral Other*
<1 1-10 11-20 21-30 >30
Average
Administrators
3.00 226.67
3 0
2 1
0 0 3 0 0 0 0 3 0 0 17.33
Support Personnel
3.00 190.00
3 0
1 2
0 2 1 0 0 0 2 1 0 0 8.33
PK-12 Teachers
47.50 190.21
47 1
14 34
26 16
6 0 0 11 13 13 11 0 11.35
*Includes One- and Two-Year Vocational Certificates.
ACCREDITATION DATA
Accredited by Southern Association of Colleges and Schools (SACS):
Elementary/Middle Commission.
1998-99 GEORGIA PUBLIC EDUCATION REPORT CARD Bay Springs Middle School - 6220198
Prepared by Georgia Department of Education
Page 4
1998-99 GEORGIA PUBLIC EDUCATION REPORT CARD
CARROLL COUNTY SCHOOLS
Bowdon Elementary School - 6222050
Grade Range 3-8
The Georgia Public Education Report Card is designed to assist systems and schools in educational improvement. This report card contains a variety of data elements. An explanation of the terms is provided as a companion to the report card data. Please refer to the definitions for the most effective use of the reported data.
STUDENT DATA
Total 686
3-8 Enrollment, by Race/Ethnicity and Sex
Black
White Hispanic
American Multi-
Asian Indian
racial
122 17.8%
551 80.3%
8 1.2%
1 0.1%
0 0.0%
4 0.6%
Male 343
50.0%
Female 343
50.0%
Enrollment in Selected Programs
Program
Program % of Student Enrollment Population
Gifted (Grades K-12)
44
6.4%
Non-Vocational Labs (Grades 9-12)
N/A
N/A
Vocational Labs (Grades 9-12)
N/A
N/A
Alternative Programs (Grades 6-12)
1
< 1%
Students Eligible to Receive Free/Reduced Lunches
Number
Percent
School System
311 4,597
45.3% 39.9%
Enrollment in Compensatory Programs
Program
Program % of Student Enrollment Population
Special Education (Grades K-12) PK
121 17.6%
0
N/A
English to Speakers of Other Languages (ESOL) (Grades K-12)
0
0.0%
Remedial Education (Grades 2-5, 9-12)
82 24.7%
Special Instructional Assistance (SIA) (Grades K-3)
38 34.9%
Title I (Grades K-12) This school has a Targeted Assistance program.
Dropout Rate for Grades 6-8
Number
Rate
School System
0
0.0%
2
0.1%
Total 0
Retained Students, by Race/Ethnicity and Sex
Black
White Hispanic
American MultiAsian Indian racial
0
0
0
0
0
0
Male Female
0
0
Prepared by Georgia Department of Education
Page 1
STATE-REQUIRED TEST DATA
NORM-REFERENCED TESTS Grade 3
Iowa Tests of Basic Skills (ITBS) Each chart reflects data for three years of testing.
Reading Comprehension 50
56 46 54 0
98-99
64 48 53 97-98
33 41 52 96-97
Mathematics
School 50
System
State
0
71 50 61 98-99
72 52 61 97-98
43 46 59 96-97
School System State
Reading Vocabulary 50
54 43 50 0
98-99
69 45 50 97-98
37 38 49 96-97
Language Arts
School 50
System
State
0
75 53 64 98-99
78 56 62 97-98
36 44 59 96-97
School System State
Social Studies 50
57 45 56 0
98-99
54 47 55 97-98
43 45 55 96-97
Science
School 50
System
State
0
67 50 59 98-99
61 52 59 97-98
43 47 58 96-97
School System State
Sources of Information
Composite Score
50
59 46 57 0
98-99
School 50
System
58 46 56 97-98
40 43 55 96-97
State 0
64 47 58 98-99
65 49 57 97-98
1998-99 GEORGIA PUBLIC EDUCATION REPORT CARD Bowdon Elementary School - 6222050
Prepared by Georgia Department of Education
38 43 56 96-97
Scores Reported in Percentiles
School System State
Page 2
STATE-REQUIRED TEST DATA
NORM-REFERENCED TESTS Grade 5
Iowa Tests of Basic Skills (ITBS) Each chart reflects data for three years of testing.
Reading Comprehension
Mathematics
50
49 46 53 0
98-99
45 48 53 97-98
45 48 52 96-97
School 50
System
State
0
49 45 59 98-99
46 46 58 97-98
48 49 57 96-97
School System State
Reading Vocabulary 50
45 44 48 0
98-99
38 43 48 97-98
41 42 46 96-97
Language Arts
School 50
System
State
0
57 54 63 98-99
57 55 61 97-98
58 53 58 96-97
School System State
Social Studies 50
43 46 57 0
98-99
45 52 56 97-98
46 51 55 96-97
Science
School 50
System
State
0
50 51 60 98-99
47 55 59 97-98
48 55 59 96-97
School System State
Sources of Information
Composite Score
50
52 47 58 0
98-99
School 50
System
52 50 58 97-98
52 53 57 96-97
State 0
48 46 57 98-99
47 50 56 97-98
47 50 55 96-97
1998-99 GEORGIA PUBLIC EDUCATION REPORT CARD Bowdon Elementary School - 6222050
Prepared by Georgia Department of Education
Scores Reported in Percentiles
School System State
Page 3
STATE-REQUIRED TEST DATA
NORM-REFERENCED TESTS Grade 8
Iowa Tests of Basic Skills (ITBS) Each chart reflects data for three years of testing.
Reading Comprehension 50
55 51 49 0
98-99
48 48 48 97-98
51 48 48 96-97
Mathematics
School 50
System
State
0
54 51 56 98-99
50 48 55 97-98
59 51 54 96-97
School System State
Reading Vocabulary 50
43 46 46 0
98-99
38 44 45 97-98
44 45 44 96-97
Language Arts
School 50
System
State
0
61 59 60 98-99
61 54 58 97-98
70 54 56 96-97
School System State
Social Studies 50
52 53 54 0
98-99
51 50 53 97-98
51 50 53 96-97
Science
School 50
System
State
0
62 57 56 98-99
48 51 55 97-98
60 55 53 96-97
School System State
Sources of Information
Composite Score
50
58 54 57 0
98-99
School 50
System
51 51 56 97-98
59 52 55 96-97
State 0
56 54 56 98-99
51 50 54 97-98
1998-99 GEORGIA PUBLIC EDUCATION REPORT CARD Bowdon Elementary School - 6222050
Prepared by Georgia Department of Education
59 52 54 96-97
Scores Reported in Percentiles
School System State
Page 4
STATE-REQUIRED TEST DATA
PERFORMANCE ASSESSMENTS
Percent at Developmental Stages:
Stage Stage Stage Stage Stage Stage
1:The Emerging Writer 2:The Developing Writer 3:The Focusing Writer 4:The Experimenting 5:The Engaging Writer 6:The Extending Writer
Grade 5 Writing Assessment
1998-99
1997-98
School System State School System State
0% 3% 21% 47% 22% 7%
0% 1% 20% 46% 24% 8%
0% 1% 16% 41% 29% 12%
0% 5% 17% 45% 25% 8%
0% 2% 22% 47% 22% 5%
0% 3% 19% 41% 27% 10%
1996-97 School System State
0% 4% 18% 43% 28% 5%
0% 4% 22% 40% 25% 8%
0% 3% 21% 37% 26% 12%
Categories of Scaled Scores
Inadequate (less than 162)
Minimal (162-209)
Good
(210-247)
Very Good (greater than 247)
Average Scaled Score: (Range 100-300)
Grade 8 Writing Assessment
1998-99 Percent Scoring
1997-98 Percent Scoring
1996-97 Percent Scoring
School System State School System State School System State
2% 40% 48%
9%
6% 51% 35%
8%
8% 40% 41% 11%
8% 51% 36%
5%
10% 52% 33%
5%
11% 46% 34%
8%
4% 56% 35%
5%
9% 54% 32%
5%
15% 46% 30%
8%
214
205
208 203
200 202 207
200 198
GEORGIA HIGH SCHOOL GRADUATION TESTS (GHSGT)
Percent of Regular Program 11th Graders Passing the Georgia High School Graduation Tests on First Administration
1998-99
1997-98
1996-97
School System State School System State School System State
English Language Arts Mathematics Social Studies Science
All Components listed above
N/A N/A N/A N/A
N/A
96% 85% 75% 70%
65%
96% 88% 80% 72%
68%
N/A N/A N/A N/A
N/A
93% 85% 75% 72%
64%
94% 88% 78% 74%
68%
N/A N/A N/A N/A
N/A
92% 86% 80% 77%
69%
94% 87% 78% 74%
67%
Writing
N/A 90% 93% N/A 89% 92% N/A 95% 93%
No eleventh-grade students are enrolled at Bowdon Elementary School.
1998-99 GEORGIA PUBLIC EDUCATION REPORT CARD Bowdon Elementary School - 6222050
Prepared by Georgia Department of Education
Page 5
GRADUATE DATA
1999 Graduates by Credentials, Race/Ethnicity and Sex
Diplomas with Both College Prep. & Voc. Endorsements
Diplomas with College Prep. Endorsements
Diplomas with Vocational Endorsements
General High School Diplomas
Special Education Diplomas
Total All Diplomas
Total N/A
Black N/A
White Hispanic N/A N/A
American MultiAsian Indian racial
N/A N/A N/A
N/A
N/A
N/A N/A N/A N/A N/A
N/A
N/A
N/A N/A N/A N/A N/A
N/A
N/A
N/A N/A N/A N/A N/A
N/A
N/A
N/A N/A N/A N/A N/A
N/A
Male Female N/A N/A N/A N/A N/A N/A N/A N/A N/A N/A
Certificates of Performance
Total Graduates
N/A
N/A
N/A N/A N/A N/A N/A
N/A N/A
N/A
HOPE Scholarships
School System
Number of 1999 Graduates Number Eligible Percent Eligible
N/A N/A N/A
498 322 64.7%
State
65,548 40,292 61.5%
High School Completion Rate
Percent of 1995Grade 9 Enrollment in Graduating Class of1999 School System State
Completion Rate '95-'99 N / A 67.3% 68.9%
1998-99 GEORGIA PUBLIC EDUCATION REPORT CARD
Bowdon Elementary School - 6222050
Prepared by Georgia Department of Education
Page 6
COLLEGE ADMISSIONS / CREDIT TEST DATA
Scholastic Assessment Test (SAT)
Based on students' highest verbal and highest math scores
No. Taking
Average Score
Tests Verbal Math Total
Based on students' last test administration
Average Score Verbal Math Total
School
N/A
College Prep. Endorsement
Other Diplomas
System
254
College Prep. Endorsement
Other Diplomas
Georgia
41,958
N/A N/A N/A
483 492 331
492
N/A N/A N/A
477 499 376
488
N/A N/A N/A
960 991 707
980
N/A N/A N/A
475 N/A N/A
483
N/A N/A N/A
468 N/A N/A
479
N/A N/A N/A
943 N/A N/A
962
Nation
952,913 N/A N/A N/A
502 508 1010
American College Testing (ACT)
Advanced Placement Exams (AP)
Number taking tests: English Mathematics Reading Science Reasoning CompositeScore
N/A
School System
N/A 18.5
N/A 18.5
N/A N/A
20.0 19.8
N/A 19.4
State 19.1 19.9 20.2 19.9 19.9
No. of Students Taking Tests
No. of Tests Taken No. of Test Scores
3 or Higher Percent of Test
Scores 3 or Higher
School N/A N/A N/A
N/A
System State 173 15,225 289 23,969 73 13,024
25.3% 54.3%
POST-SECONDARY DATA
Graduates Entering Georgia Public Colleges
Graduates Entering Georgia Public Colleges and Requiring Learning Support (LS)
1998 Graduates Entering in 1998-99
1997 Graduates Entering in 1997-98
Percent of Graduating Number Class
School N / A
N/A
System 193
36.3%
School N / A
N/A
System 169
34.4%
Number Requiring
LS N/A 38
N/A 30
Percent of those attending Georgia
Public Colleges
N/A
19.7%
N/A
17.8%
In previous years, the Report Card presented College Prep Curriculum information provided by the Board of Regents on students requiring Learning Support. Due to inconsistencies in the data provided by the Board of Regents in defining College Prep Completers versus Local Board of Education data defining College Prep Endorsements, the Department of Education Report Card will not provide this information until discrepancies can be reconciled.
Graduates Entering Georgia Public Technical and Adult Schools
1998 Graduates School System
Entering Number N/A 51
1998-99 Percent
N/A 9.6%
Entering Number N/A N/A
1997-98 Percent
N/A N/A
1997 Graduates School System
N/A 9
N/A 1.8%
N/A 31
N/A 6.3%
1998-99 GEORGIA PUBLIC EDUCATION REPORT CARD Bowdon Elementary School - 6222050
Prepared by Georgia Department of Education
Page 7
CERTIFIED PERSONNEL DATA
Positions Number Average Contract Days
Administrators
2.00 230.00
Support Personnel
2.00 190.00
PK-12 Teachers
41.25 190.12
Personnel Sex
Certificate
Years Experience
Full-time Part-time
Male Female
4 Yr Bachelor's 5 Yr Master's 6 Yr Specialist's 7 Yr Doctoral Other*
<1 1-10 11-20 21-30 >30
Average
2 0
0 2
0 0 2 0 0
0 0 1 1 0
21.00
2 0
1 1
0 0 2 0 0
0 0 1 1 0
20.00
40 2
7 35
11 23
7 1 0
0 16
9 16
1
16.33
*Includes One- and Two-Year Vocational Certificates.
ACCREDITATION DATA
Accredited by Southern Association of Colleges and Schools (SACS): Elementary/Middle Commission.
AWARDS / RECOGNITION DATA
Schools in Georgia may receive recognition in the following programs: Charter School Pay for Performance Program Georgia School of Excellence National Blue Ribbon School Bowdon Elementary School did not receive recognition in any of these programs during the 1998-99 school year.
1998-99 GEORGIA PUBLIC EDUCATION REPORT CARD Bowdon Elementary School - 6222050
Prepared by Georgia Department of Education
Page 8
1998-99 GEORGIA PUBLIC EDUCATION REPORT CARD
CARROLL COUNTY SCHOOLS
Bowdon High School - 6223050
Grade Range 9-12
The Georgia Public Education Report Card is designed to assist systems and schools in educational improvement. This report card contains a variety of data elements. An explanation of the terms is provided as a companion to the report card data. Please refer to the definitions for the most effective use of the reported data.
Total 420
STUDENT DATA
9-12 Enrollment, by Race/Ethnicity and Sex
Black
White Hispanic
American Multi-
Asian Indian
racial
96 22.9%
318 75.7%
2 0.5%
3 0.7%
0 0.0%
1 0.2%
Male Female
237 56.4%
183 43.6%
Enrollment in Selected Programs
Program
Gifted (Grades K-12)
Program % of Student Enrollment Population
36
8.6%
Non-Vocational Labs (Grades 9-12)
397
Vocational Labs
(Grades 9-12)
307
Alternative Programs (Grades 6-12)
1
94.5% 73.1%
< 1%
Students Eligible to Receive Free/Reduced Lunches
Number
Percent
School System
138 4,597
32.9% 39.9%
Enrollment in Compensatory Programs
Program
Program % of Student Enrollment Population
Special Education (Grades K-12) PK
56 13.3%
0
N/A
English to Speakers of Other Languages (ESOL) (Grades K-12)
0
0.0%
Remedial Education (Grades 2-5, 9-12)
76 18.1%
Title I (Grades K-12)
This school has no Title I program.
Dropout Rate for Grades 9-12
Number
Rate
School System
16
3.6%
96
2.8%
Total 17
Retained Students, by Race/Ethnicity and Sex
Black
White Hispanic
American MultiAsian Indian racial
5 29.4%
12 70.6%
0 0.0%
0 0.0%
0 0.0%
0 0.0%
Male Female
13
4
76.5% 23.5%
Prepared by Georgia Department of Education
Page 1
STATE-REQUIRED TEST DATA
GEORGIA HIGH SCHOOL GRADUATION TESTS (GHSGT)
Percent of Regular Program 11th Graders Passing the Georgia High School Graduation Tests on First Administration
English Language Arts Mathematics Social Studies Science
All Components listed above
Writing
1998-99
School System State
99% 85% 75% 73%
96% 85% 75% 70%
96% 88% 80% 72%
65% 65% 68%
89% 90% 93%
1997-98
School System State
97% 92% 77% 78%
93% 85% 75% 72%
94% 88% 78% 74%
68% 64% 68%
89% 89% 92%
1996-97
School System State
98% 94% 86% 88%
92% 86% 80% 77%
94% 87% 78% 74%
77% 69% 67%
93% 95% 93%
GRADUATE DATA
1999 Graduates by Credentials, Race/Ethnicity and Sex
Diplomas with Both College Prep. & Voc. Endorsements
Diplomas with College Prep. Endorsements Diplomas with Vocational Endorsements General High School Diplomas Special Education Diplomas
Total All Diplomas
Certificates of Performance
Total Graduates
Total 5
39 23
0
Black
0 0.0%
6 15.4%
4 17.4%
0
White Hispanic
5 100.0%
0 0.0%
33 84.6%
0 0.0%
19 82.6%
0 0.0%
0
0
American MultiAsian Indian racial
0 0.0%
0 0.0%
0 0.0%
0 0.0%
0 0.0%
0 0.0%
0 0.0%
0 0.0%
0 0.0%
0
0
0
6
4
2
0
0
0
0
66.7% 33.3% 0.0% 0.0% 0.0% 0.0%
73
14
59
0
0
0
0
19.2% 80.8% 0.0% 0.0% 0.0% 0.0%
6
5
1
0
0
0
0
83.3% 16.7% 0.0% 0.0% 0.0% 0.0%
79
19
60
0
0
0
0
24.1% 75.9% 0.0% 0.0% 0.0% 0.0%
Male Female
3
2
60.0% 40.0%
19
20
48.7% 51.3%
18
5
78.3% 21.7%
0
0
4 66.7%
44 60.3%
2 33.3%
46 58.2%
2 33.3%
29 39.7%
4 66.7%
33 41.8%
HOPE Scholarships
School System
Number of 1999 Graduates 7 9
Number Eligible
48
Percent Eligible
60.8%
498 322 64.7%
State
65,548 40,292 61.5%
High School Completion Rate
Percent of 1995Grade 9 Enrollment in Graduating Class of1999 School System State
Completion Rate '95-'99 71.2% 67.3% 68.9%
1998-99 GEORGIA PUBLIC EDUCATION REPORT CARD
Bowdon High School - 6223050
Prepared by Georgia Department of Education
Page 2
COLLEGE ADMISSIONS / CREDIT TEST DATA
Scholastic Assessment Test (SAT)
Based on students' highest verbal and highest math scores
No. Taking
Average Score
Tests Verbal Math Total
Based on students' last test administration
Average Score Verbal Math Total
School
36
College Prep. Endorsement
Other Diplomas
System
254
College Prep. Endorsement
Other Diplomas
Georgia
41,958
494 487
981
496 509 1005
360 450
810
483 477
960
492 499
991
331 376
707
492 488
980
483 N/A N/A
475 N/A N/A
483
482 N/A N/A
468 N/A N/A
479
965 N/A N/A
943 N/A N/A
962
Nation
952,913 N/A N/A N/A
502 508 1010
American College Testing (ACT)
Advanced Placement Exams (AP)
Number taking tests: English Mathematics Reading Science Reasoning CompositeScore
1 7 School System State
19.1 18.5 19.1
19.1 18.5 19.9
19.1 20.2
20.0 19.8
20.2 19.9
19.6 19.4 19.9
No. of Students Taking Tests
No. of Tests Taken No. of Test Scores
3 or Higher Percent of Test
Scores 3 or Higher
School 28 40 5
12.5%
System State 173 15,225 289 23,969 73 13,024
25.3% 54.3%
POST-SECONDARY DATA
Graduates Entering Georgia Public Colleges
Graduates Entering Georgia Public Colleges and Requiring Learning Support (LS)
1998 Graduates Entering in 1998-99
1997 Graduates Entering in 1997-98
Percent of Graduating Number Class
School
23
36.5%
System 193
36.3%
School
34
48.6%
System 169
34.4%
Number Requiring
LS 5 38
6 30
Percent of those attending Georgia
Public Colleges
21.7%
19.7%
17.6%
17.8%
In previous years, the Report Card presented College Prep Curriculum information provided by the Board of Regents on students requiring Learning Support. Due to inconsistencies in the data provided by the Board of Regents in defining College Prep Completers versus Local Board of Education data defining College Prep Endorsements, the Department of Education Report Card will not provide this information until discrepancies can be reconciled.
Graduates Entering Georgia Public Technical and Adult Schools
1998 Graduates School System
Entering Number 10 51
1998-99 Percent 15.9%
9.6%
Entering Number N/A N/A
1997-98 Percent
N/A N/A
1997 Graduates School
0
0.0%
System
9
1.8%
4
5.7%
31
6.3%
1998-99 GEORGIA PUBLIC EDUCATION REPORT CARD Bowdon High School - 6223050
Prepared by Georgia Department of Education
Page 3
CERTIFIED PERSONNEL DATA
Positions Number Average Contract Days
Administrators
2.11 230.52
Support Personnel
2.47 190.00
PK-12 Teachers
23.73 192.53
Personnel Sex
Certificate
Years Experience
Full-time Part-time
Male Female
4 Yr Bachelor's 5 Yr Master's 6 Yr Specialist's 7 Yr Doctoral Other*
<1 1-10 11-20 21-30 >30
Average
2 1
3 0
0 1 2 0 0
0 0 0 2 1
29.00
2 1
0 3
0 1 2 0 0
0 0 0 3 0
27.00
23 1
14 10
6 11
6 1 0
0 10
7 7 0
14.92
*Includes One- and Two-Year Vocational Certificates.
ACCREDITATION DATA
Accredited by Southern Association of Colleges and Schools (SACS): Secondary/Middle Commission.
AWARDS / RECOGNITION DATA
Schools in Georgia may receive recognition in the following programs: Charter School Pay for Performance Program Georgia School of Excellence National Blue Ribbon School Bowdon High School did not receive recognition in any of these programs during the 1998-99 school year.
1998-99 GEORGIA PUBLIC EDUCATION REPORT CARD Bowdon High School - 6223050
Prepared by Georgia Department of Education
Page 4
1998-99 GEORGIA PUBLIC EDUCATION REPORT CARD
CARROLL COUNTY SCHOOLS
Bowdon Primary School - 6220180
Grade Range PK-2
The Georgia Public Education Report Card is designed to assist systems and schools in educational improvement. This report card contains a variety of data elements. An explanation of the terms is provided as a companion to the report card data. Please refer to the definitions for the most effective use of the reported data.
STUDENT DATA
Total
K-2
334
PK
63
Enrollment, by Race/Ethnicity and Sex
Black
White Hispanic
American Asian Indian
Multiracial
64 19.2%
251 75.1%
7 2.1%
0 0.0%
1 0.3%
11 3.3%
18 28.6%
41 65.1%
0 0.0%
0 0.0%
0 0.0%
4 6.3%
Male Female
179 53.6%
155 46.4%
37 58.7%
26 41.3%
Enrollment in Selected Programs
Program
Program % of Student Enrollment Population
Gifted (Grades K-12)
10
3.0%
Alternative Programs (Grades 6-12)
N/A
N/A
Students Eligible to Receive Free/Reduced Lunches
Number
Percent
School System
212 4,597
53.4% 39.9%
Dropout Rate *
Number
Rate
School System
N/A N/A
N/A N/A
* Dropout rates are not applicable for grades PK-5.
Enrollment in Compensatory Programs
Program
Program % of Student Enrollment Population
Special Education (Grades K-12)
33
9.9%
(PK)
16
N/A
English to Speakers of Other Languages (ESOL) (Grades K-12)
0
0.0%
Remedial Education (Grades 2-5, 9-12)
7
5.9%
Special Instructional Assistance (SIA) (Grades K-3)
156 46.7%
Title I (Grades K-12)
This school has a Targeted Assistance program.
Total 14
Retained Students, by Race/Ethnicity and Sex
Black
White Hispanic
American MultiAsian Indian racial
3 21.4%
9 64.3%
1 7.1%
0 0.0%
0 0.0%
1 7.1%
Male Female
10
4
71.4% 28.6%
Prepared by Georgia Department of Education
Page 1
STATE-REQUIRED TEST DATA
NORM-REFERENCED TESTS
Grade 3 Iowa Tests of Basic Skills (ITBS) Each chart reflects data for three years of testing.
No third-grade students are enrolled at Bowdon Primary School.
Reading Comprehension
Mathematics
50
N/A 46 54 0
98-99
N/A 48 53 97-98
N/A 41 52 96-97
School 50
System
State
N/A 50 61 0
98-99
N/A 52 61 97-98
N/A 46 59 96-97
School System State
Reading Vocabulary 50
N/A 43 50 0
98-99
N/A 45 50 97-98
N/A 38 49 96-97
Language Arts
School 50
System
State
N/A 53 64 0
98-99
N/A 56 62 97-98
N/A 44 59 96-97
School System State
Social Studies 50
N/A 45 56 0
98-99
N/A 47 55 97-98
N/A 45 55 96-97
Science
School 50
System
State
N/A 50 59 0
98-99
N/A 52 59 97-98
N/A 47 58 96-97
School System State
Sources of Information
Composite Score
School
50
50
System
N/A 46 57 0
98-99
N/A 46 56 N/A 43 55
97-98
96-97
State
N/A 47 58 0
98-99
N/A 49 57 97-98
N/A 43 56 96-97
1998-99 GEORGIA PUBLIC EDUCATION REPORT CARD Bowdon Primary School - 6220180
Prepared by Georgia Department of Education
Scores Reported in Percentiles
School System State
Page 2
STATE-REQUIRED TEST DATA
NORM-REFERENCED TESTS
Grade 5 Iowa Tests of Basic Skills (ITBS) Each chart reflects data for three years of testing. No fifth-grade students are enrolled at Bowdon Primary School.
Reading Comprehension
Mathematics
50
N/A 46 53 0
98-99
N/A 48 53 97-98
N/A 48 52 96-97
School 50
System
State
N/A 45 59 0
98-99
N/A 46 58 97-98
N/A 49 57 96-97
School System State
Reading Vocabulary 50
N/A 44 48 0
98-99
N/A 43 48 97-98
N/A 42 46 96-97
Language Arts
School 50
System
State
N/A 54 63 0
98-99
N/A 55 61 97-98
N/A 53 58 96-97
School System State
Social Studies 50
N/A 46 57 0
98-99
N/A 52 56 97-98
N/A 51 55 96-97
Science
School 50
System
State
N/A 51 60 0
98-99
N/A 55 59 97-98
N/A 55 59 96-97
School System State
Sources of Information
Composite Score
School
50
50
System
N/A 47 58 0
98-99
N/A 50 58 N/A 53 57
97-98
96-97
State
N/A 46 57 0
98-99
N/A 50 56 97-98
N/A 50 55 96-97
1998-99 GEORGIA PUBLIC EDUCATION REPORT CARD Bowdon Primary School - 6220180
Prepared by Georgia Department of Education
Scores Reported in Percentiles
School System State
Page 3
STATE-REQUIRED TEST DATA
PERFORMANCE ASSESSMENTS
Grade 5 Writing Assessment
Percent at Developmental Stages:
1998-99 School System State
1997-98 School System State
1996-97 School System State
Stage Stage Stage Stage Stage Stage
1:The Emerging Writer 2:The Developing Writer 3:The Focusing Writer 4:The Experimenting 5:The Engaging Writer 6:The Extending Writer
N/A N/A N/A N/A N/A N/A
0% 1% 20% 46% 24% 8%
0% 1% 16% 41% 29% 12%
N/A N/A N/A N/A N/A N/A
0% 2% 22% 47% 22% 5%
0% 3% 19% 41% 27% 10%
N/A N/A N/A N/A N/A N/A
No fifth-grade students are enrolled at Bowdon Primary School.
0% 4% 22% 40% 25% 8%
0% 3% 21% 37% 26% 12%
AWARDS / RECOGNITION DATA
Schools in Georgia may receive recognition in the following programs: Charter School Pay for Performance Program Georgia School of Excellence National Blue Ribbon School Bowdon Primary School did not receive recognition in any of these programs during the 1998-99 school year.
1998-99 GEORGIA PUBLIC EDUCATION REPORT CARD Bowdon Primary School - 6220180
Prepared by Georgia Department of Education
Page 4
CERTIFIED PERSONNEL DATA
Positions Number Average Contract Days
Personnel Sex
Certificate
Years Experience
Full-time Part-time
Male Female
4 Yr Bachelor's 5 Yr Master's 6 Yr Specialist's 7 Yr Doctoral Other*
<1 1-10 11-20 21-30 >30
Average
Administrators
2.00 230.00
2 0
0 2
0 0 2 0 0 0 0 1 1 0 24.00
Support Personnel
2.00 190.00
2 0
0 2
0 2 0 0 0 0 0 0 2 0 22.00
PK-12 Teachers
20.25 190.00
20 1
0 21
5 11
5 0 0 0 5 8 8 0 17.48
*Includes One- and Two-Year Vocational Certificates.
ACCREDITATION DATA
Accredited by Southern Association of Colleges and Schools (SACS):
Elementary/Middle Commission.
1998-99 GEORGIA PUBLIC EDUCATION REPORT CARD Bowdon Primary School - 6220180
Prepared by Georgia Department of Education
Page 5
1998-99 GEORGIA PUBLIC EDUCATION REPORT CARD
CARROLL COUNTY SCHOOLS
Carroll County Open Campus/Night School - 6220190
Grade Range 9-12
The Georgia Public Education Report Card is designed to assist systems and schools in educational improvement. This report card contains a variety of data elements. An explanation of the terms is provided as a companion to the report card data. Please refer to the definitions for the most effective use of the reported data.
Total 115
STUDENT DATA
9-12 Enrollment, by Race/Ethnicity and Sex
Black
White Hispanic
American Multi-
Asian Indian
racial
12 10.4%
101 87.8%
1 0.9%
0 0.0%
0 0.0%
1 0.9%
Male Female
60 52.2%
55 47.8%
Enrollment in Selected Programs
Program
Gifted (Grades K-12)
Program % of Student Enrollment Population
0
0.0%
Non-Vocational Labs (Grades 9-12)
Vocational Labs (Grades 9-12)
Alternative Programs (Grades 6-12)
62
53.9%
53
46.1%
1
< 1%
Students Eligible to Receive Free/Reduced Lunches
Number
Percent
School System
0 4,597
0.0% 39.9%
Enrollment in Compensatory Programs
Program
Program % of Student Enrollment Population
Special Education (Grades K-12) PK
0
0.0%
0
N/A
English to Speakers of Other Languages (ESOL) (Grades K-12)
0
0.0%
Remedial Education (Grades 2-5, 9-12)
0
0.0%
Title I (Grades K-12)
This school has no Title I program.
Dropout Rate for Grades 9-12
Number
Rate
School System
0
0.0%
96
2.8%
Total 11
Retained Students, by Race/Ethnicity and Sex
Black
White Hispanic
American MultiAsian Indian racial
0 0.0%
10 90.9%
0 0.0%
0 0.0%
0 0.0%
1 9.1%
Male Female
7
4
63.6% 36.4%
Prepared by Georgia Department of Education
Page 1
STATE-REQUIRED TEST DATA
GEORGIA HIGH SCHOOL GRADUATION TESTS (GHSGT)
Percent of Regular Program 11th Graders Passing the Georgia High School Graduation Tests on First Administration
English Language Arts Mathematics Social Studies Science
All Components listed above
Writing
1998-99
School System State
100% 89% 75% 44%
96% 85% 75% 70%
96% 88% 80% 72%
57% 65% 68%
100% 90% 93%
1997-98
School System State
79% 80% 60% 63%
93% 85% 75% 72%
94% 88% 78% 74%
42% 64% 68%
0%
89% 92%
1996-97
School System State
81% 75% 69% 67%
92% 86% 80% 77%
94% 87% 78% 74%
53% 69% 67%
100% 95% 93%
GRADUATE DATA
1999 Graduates by Credentials, Race/Ethnicity and Sex
Diplomas with Both College Prep. & Voc. Endorsements
Diplomas with College Prep. Endorsements Diplomas with Vocational Endorsements General High School Diplomas Special Education Diplomas
Total All Diplomas
Certificates of Performance
Total Graduates
Total 2
11 10
1 0
Black
1 50.0%
2 18.2%
0 0.0%
0 0.0%
0
White
1 50.0%
9 81.8%
10 100.0%
1 100.0%
0
Hispanic
0 0.0%
0 0.0%
0 0.0%
0 0.0%
0
American MultiAsian Indian racial
0 0.0%
0 0.0%
0 0.0%
0 0.0%
0 0.0%
0 0.0%
0 0.0%
0 0.0%
0 0.0%
0 0.0%
0 0.0%
0 0.0%
0
0
0
Male Female
2 100.0%
0 0.0%
2
9
18.2% 81.8%
4
6
40.0% 60.0%
0
1
0.0% 100.0%
0
0
24
3
21
0
0
0
0
8
16
12.5% 87.5% 0.0% 0.0% 0.0% 0.0% 33.3% 66.7%
0
0
0
0
0
0
0
0
0
24
3
21
0
0
0
0
8
16
12.5% 87.5% 0.0% 0.0% 0.0% 0.0% 33.3% 66.7%
HOPE Scholarships
School System
Number of 1999 Graduates 2 4
Number Eligible
9
Percent Eligible
37.5%
498 322 64.7%
State
65,548 40,292 61.5%
High School Completion Rate
Percent of 1995Grade 9 Enrollment in Graduating Class of1999 School System State
Completion Rate '95-'99 32.4% 67.3% 68.9%
1998-99 GEORGIA PUBLIC EDUCATION REPORT CARD
Carroll County Open Campus/Night School - 6220190
Prepared by Georgia Department of Education
Page 2
COLLEGE ADMISSIONS / CREDIT TEST DATA
Scholastic Assessment Test (SAT)
Based on students' highest verbal and highest math scores
No. Taking
Average Score
Tests Verbal Math Total
Based on students' last test administration
Average Score Verbal Math Total
School
3
College Prep. Endorsement
Other Diplomas
System
254
College Prep. Endorsement
Other Diplomas
Georgia
41,958
563 425 N/A
483 492 331
492
500 450 N/A
477 499 376
488
1063 875 N/A
960 991 707
980
563 N/A N/A
475 N/A N/A
483
487 N/A N/A
468 N/A N/A
479
1050 N/A N/A
943 N/A N/A
962
Nation
952,913 N/A N/A N/A
502 508 1010
American College Testing (ACT)
Advanced Placement Exams (AP)
Number taking tests: English Mathematics Reading Science Reasoning CompositeScore
N/A
School System
N/A 18.5
N/A 18.5
N/A N/A
20.0 19.8
N/A 19.4
State 19.1 19.9 20.2 19.9 19.9
No. of Students Taking Tests
No. of Tests Taken No. of Test Scores
3 or Higher Percent of Test
Scores 3 or Higher
School 0
N/A N/A
N/A
System State 173 15,225 289 23,969 73 13,024
25.3% 54.3%
POST-SECONDARY DATA
Graduates Entering Georgia Public Colleges
Graduates Entering Georgia Public Colleges and Requiring Learning Support (LS)
1998 Graduates Entering in 1998-99
1997 Graduates Entering in 1997-98
Percent of Graduating Number Class
School
3
6.7%
System 193
36.3%
School
2
4.8%
System 169
34.4%
Number Requiring
LS 1 38
1 30
Percent of those attending Georgia
Public Colleges
33.3%
19.7%
50.0%
17.8%
In previous years, the Report Card presented College Prep Curriculum information provided by the Board of Regents on students requiring Learning Support. Due to inconsistencies in the data provided by the Board of Regents in defining College Prep Completers versus Local Board of Education data defining College Prep Endorsements, the Department of Education Report Card will not provide this information until discrepancies can be reconciled.
Graduates Entering Georgia Public Technical and Adult Schools
1998 Graduates School System
Entering Number 7 51
1998-99 Percent 15.6%
9.6%
Entering Number N/A N/A
1997-98 Percent
N/A N/A
1997 Graduates School
1
2.4%
System
9
1.8%
4
9.5%
31
6.3%
1998-99 GEORGIA PUBLIC EDUCATION REPORT CARD Carroll County Open Campus/Night School - 6220190
Prepared by Georgia Department of Education
Page 3
CERTIFIED PERSONNEL DATA
Positions Number Average Contract Days
Administrators
1.00 240.00
Support Personnel
1.67 190.00
PK-12 Teachers
2.33 190.00
Personnel Sex
Certificate
Years Experience
Full-time Part-time
Male Female
4 Yr Bachelor's 5 Yr Master's 6 Yr Specialist's 7 Yr Doctoral Other*
<1 1-10 11-20 21-30 >30
Average
1 0
1 0
0 0 0 1 0
0 0 0 1 0
24.00
1 1
2 0
0 1 1 0 0
0 0 1 1 0
21.50
2 1
2 1
0 1 2 0 0
0 0 2 1 0
20.00
*Includes One- and Two-Year Vocational Certificates.
ACCREDITATION DATA
Accredited by Southern Association of Colleges and Schools (SACS): Secondary/Middle Commission. Accredited with Quality by Georgia Accrediting Commission (GAC).
AWARDS / RECOGNITION DATA
Schools in Georgia may receive recognition in the following programs: Charter School Pay for Performance Program Georgia School of Excellence National Blue Ribbon School Carroll County Open Campus/Night School did not receive recognition in any of these programs during the 1998-99 school year.
1998-99 GEORGIA PUBLIC EDUCATION REPORT CARD Carroll County Open Campus/Night School - 6220190
Prepared by Georgia Department of Education
Page 4
1998-99 GEORGIA PUBLIC EDUCATION REPORT CARD
CARROLL COUNTY SCHOOLS
Central Elementary School - 6225050
Grade Range PK-5
The Georgia Public Education Report Card is designed to assist systems and schools in educational improvement. This report card contains a variety of data elements. An explanation of the terms is provided as a companion to the report card data. Please refer to the definitions for the most effective use of the reported data.
STUDENT DATA
Total
K-5
916
PK
76
Enrollment, by Race/Ethnicity and Sex
Black
White Hispanic
American Asian Indian
Multiracial
229 25.0%
660 72.1%
1 0.1%
1 0.1%
11 1.2%
14 1.5%
14 18.4%
61 80.3%
0 0.0%
0 0.0%
0 0.0%
1 1.3%
Male Female
485 52.9%
431 47.1%
41 53.9%
35 46.1%
Enrollment in Selected Programs
Program
Program % of Student Enrollment Population
Gifted (Grades K-12)
33
3.6%
Alternative Programs (Grades 6-12)
N/A
N/A
Students Eligible to Receive Free/Reduced Lunches
Number
Percent
School System
327 4,597
33.0% 39.9%
Dropout Rate *
Number
Rate
School System
N/A N/A
N/A N/A
* Dropout rates are not applicable for grades PK-5.
Enrollment in Compensatory Programs
Program
Program % of Student Enrollment Population
Special Education (Grades K-12)
165 18.0%
(PK)
24
N/A
English to Speakers of Other Languages (ESOL) (Grades K-12)
0
0.0%
Remedial Education (Grades 2-5, 9-12)
124 19.5%
Special Instructional Assistance (SIA) (Grades K-3)
220 37.4%
Title I (Grades K-12)
This school has no Title I program.
Total 5
Retained Students, by Race/Ethnicity and Sex
Black
White Hispanic
American MultiAsian Indian racial
1 20.0%
3 60.0%
0 0.0%
0 0.0%
1 20.0%
0 0.0%
Male Female
1
4
20.0% 80.0%
Prepared by Georgia Department of Education
Page 1
STATE-REQUIRED TEST DATA
NORM-REFERENCED TESTS Grade 3
Iowa Tests of Basic Skills (ITBS) Each chart reflects data for three years of testing.
Reading Comprehension 50
46 46 54 0
98-99
55 48 53 97-98
48 41 52 96-97
Mathematics
School 50
System
State
0
51 50 61 98-99
57 52 61 97-98
51 46 59 96-97
School System State
Reading Vocabulary 50
47 43 50 0
98-99
49 45 50 97-98
39 38 49 96-97
Language Arts
School 50
System
State
0
58 53 64 98-99
59 56 62 97-98
51 44 59 96-97
School System State
Social Studies 50
49 45 56 0
98-99
58 47 55 97-98
56 45 55 96-97
Science
School 50
System
State
0
50 50 59 98-99
65 52 59 97-98
60 47 58 96-97
School System State
Sources of Information
Composite Score
50
48 46 57 0
98-99
School 50
System
55 46 56 97-98
53 43 55 96-97
State 0
49 47 58 98-99
58 49 57 97-98
1998-99 GEORGIA PUBLIC EDUCATION REPORT CARD Central Elementary School - 6225050
Prepared by Georgia Department of Education
52 43 56 96-97
Scores Reported in Percentiles
School System State
Page 2
STATE-REQUIRED TEST DATA
NORM-REFERENCED TESTS Grade 5
Iowa Tests of Basic Skills (ITBS) Each chart reflects data for three years of testing.
Reading Comprehension
Mathematics
50
47 46 53 0
98-99
56 48 53 97-98
56 48 52 96-97
School 50
System
State
0
48 45 59 98-99
55 46 58 97-98
58 49 57 96-97
School System State
Reading Vocabulary 50
49 44 48 0
98-99
55 43 48 97-98
46 42 46 96-97
Language Arts
School 50
System
State
0
62 54 63 98-99
67 55 61 97-98
64 53 58 96-97
School System State
Social Studies 50
51 46 57 0
98-99
63 52 56 97-98
63 51 55 96-97
Science
School 50
System
State
0
57 51 60 98-99
67 55 59 97-98
67 55 59 96-97
School System State
Sources of Information
Composite Score
50
53 47 58 0
98-99
School 50
System
62 50 58 97-98
63 53 57 96-97
State 0
52 46 57 98-99
62 50 56 97-98
62 50 55 96-97
1998-99 GEORGIA PUBLIC EDUCATION REPORT CARD Central Elementary School - 6225050
Prepared by Georgia Department of Education
Scores Reported in Percentiles
School System State
Page 3
STATE-REQUIRED TEST DATA
PERFORMANCE ASSESSMENTS
Grade 5 Writing Assessment
Percent at Developmental Stages:
1998-99 School System State
1997-98 School System State
1996-97 School System State
Stage Stage Stage Stage Stage Stage
1:The Emerging Writer 2:The Developing Writer 3:The Focusing Writer 4:The Experimenting 5:The Engaging Writer 6:The Extending Writer
0% 0% 16% 44% 28% 11%
0% 1% 20% 46% 24% 8%
0% 1% 16% 41% 29% 12%
0% 0% 7% 56% 31% 6%
0% 2% 22% 47% 22% 5%
0% 3% 19% 41% 27% 10%
0% 3% 11% 40% 34% 11%
0% 4% 22% 40% 25% 8%
0% 3% 21% 37% 26% 12%
AWARDS / RECOGNITION DATA
Schools in Georgia may receive recognition in the following programs: Charter School Pay for Performance Program Georgia School of Excellence National Blue Ribbon School Central Elementary School did not receive recognition in any of these programs during the 1998-99 school year.
1998-99 GEORGIA PUBLIC EDUCATION REPORT CARD Central Elementary School - 6225050
Prepared by Georgia Department of Education
Page 4
CERTIFIED PERSONNEL DATA
Positions Number Average Contract Days
Personnel Sex
Certificate
Years Experience
Full-time Part-time
Male Female
4 Yr Bachelor's 5 Yr Master's 6 Yr Specialist's 7 Yr Doctoral Other*
<1 1-10 11-20 21-30 >30
Average
Administrators
3.00 226.67
3 0
1 2
0 1 2 0 0 0 1 0 2 0 19.00
Support Personnel
3.50 191.43
3 1
0 4
0 0 4 0 0 0 1 2 1 0 14.50
PK-12 Teachers
64.50 190.00
64 1
3 62
13 32 20
0 0 2 18 29 15 1 15.22
*Includes One- and Two-Year Vocational Certificates.
ACCREDITATION DATA
Accredited by Southern Association of Colleges and Schools (SACS):
Elementary/Middle Commission.
1998-99 GEORGIA PUBLIC EDUCATION REPORT CARD Central Elementary School - 6225050
Prepared by Georgia Department of Education
Page 5
1998-99 GEORGIA PUBLIC EDUCATION REPORT CARD
CARROLL COUNTY SCHOOLS
Central High School - 6222052
Grade Range 9-12
The Georgia Public Education Report Card is designed to assist systems and schools in educational improvement. This report card contains a variety of data elements. An explanation of the terms is provided as a companion to the report card data. Please refer to the definitions for the most effective use of the reported data.
Total 1,068
STUDENT DATA
9-12 Enrollment, by Race/Ethnicity and Sex
Black
White Hispanic
American Multi-
Asian Indian
racial
183 17.1%
876 82.0%
3 0.3%
1 0.1%
2 0.2%
3 0.3%
Male Female
549 51.4%
519 48.6%
Enrollment in Selected Programs
Program
Gifted (Grades K-12)
Program % of Student Enrollment Population
111
10.4%
Non-Vocational Labs (Grades 9-12)
895
Vocational Labs
(Grades 9-12)
702
Alternative Programs (Grades 6-12)
9
83.8% 65.7%
< 1%
Students Eligible to Receive Free/Reduced Lunches
Number
Percent
School System
241 4,597
22.6% 39.9%
Enrollment in Compensatory Programs
Program
Program % of Student Enrollment Population
Special Education (Grades K-12) PK
176 16.5%
0
N/A
English to Speakers of Other Languages (ESOL) (Grades K-12)
0
0.0%
Remedial Education (Grades 2-5, 9-12)
29
2.7%
Title I (Grades K-12)
This school has no Title I program.
Dropout Rate for Grades 9-12
Number
Rate
School System
18
1.6%
96
2.8%
Total 49
Retained Students, by Race/Ethnicity and Sex
Black
White Hispanic
American MultiAsian Indian racial
12 24.5%
37 75.5%
0 0.0%
0 0.0%
0 0.0%
0 0.0%
Male Female
22
27
44.9% 55.1%
Prepared by Georgia Department of Education
Page 1
STATE-REQUIRED TEST DATA
GEORGIA HIGH SCHOOL GRADUATION TESTS (GHSGT)
Percent of Regular Program 11th Graders Passing the Georgia High School Graduation Tests on First Administration
English Language Arts Mathematics Social Studies Science
All Components listed above
Writing
1998-99
School System State
96% 86% 81% 75%
96% 85% 75% 70%
96% 88% 80% 72%
71% 65% 68%
97% 90% 93%
1997-98
School System State
97% 88% 85% 84%
93% 85% 75% 72%
94% 88% 78% 74%
78% 64% 68%
93% 89% 92%
1996-97
School System State
92% 86% 83% 79%
92% 86% 80% 77%
94% 87% 78% 74%
72% 69% 67%
95% 95% 93%
GRADUATE DATA
1999 Graduates by Credentials, Race/Ethnicity and Sex
Diplomas with Both College Prep. & Voc. Endorsements
Diplomas with College Prep. Endorsements Diplomas with Vocational Endorsements General High School Diplomas Special Education Diplomas
Total All Diplomas
Certificates of Performance
Total Graduates
Total 52 82 27 0
Black
6 11.5%
11 13.4%
6 22.2%
0
White Hispanic
46 88.5%
0 0.0%
70 85.4%
0 0.0%
21 77.8%
0 0.0%
0
0
American MultiAsian Indian racial
0 0.0%
0 0.0%
0 0.0%
1 1.2%
0 0.0%
0 0.0%
0 0.0%
0 0.0%
0 0.0%
0
0
0
13
2
11
0
0
0
0
15.4% 84.6% 0.0% 0.0% 0.0% 0.0%
174
25
148
0
1
0
0
14.4% 85.1% 0.0% 0.6% 0.0% 0.0%
0
0
0
0
0
0
0
174
25
148
0
1
0
0
14.4% 85.1% 0.0% 0.6% 0.0% 0.0%
Male Female
12
40
23.1% 76.9%
42
40
51.2% 48.8%
15
12
55.6% 44.4%
0
0
9 69.2%
78 44.8%
0
4 30.8%
96 55.2%
0
78
96
44.8% 55.2%
HOPE Scholarships
School System
Number of 1999 Graduates 1 7 4
Number Eligible
128
Percent Eligible
73.6%
498 322 64.7%
State
65,548 40,292 61.5%
High School Completion Rate
Percent of 1995Grade 9 Enrollment in Graduating Class of1999 School System State
Completion Rate '95-'99 77.0% 67.3% 68.9%
1998-99 GEORGIA PUBLIC EDUCATION REPORT CARD
Central High School - 6222052
Prepared by Georgia Department of Education
Page 2
COLLEGE ADMISSIONS / CREDIT TEST DATA
Scholastic Assessment Test (SAT)
Based on students' highest verbal and highest math scores
No. Taking
Average Score
Tests Verbal Math Total
Based on students' last test administration
Average Score Verbal Math Total
School
121
College Prep. Endorsement
Other Diplomas
System
254
College Prep. Endorsement
Other Diplomas
Georgia
41,958
490 482
972
502 512 1014
318 334
652
483 477
960
492 499
991
331 376
707
492 488
980
483 N/A N/A
475 N/A N/A
483
473 N/A N/A
468 N/A N/A
479
956 N/A N/A
943 N/A N/A
962
Nation
952,913 N/A N/A N/A
502 508 1010
American College Testing (ACT)
Advanced Placement Exams (AP)
Number taking tests: English Mathematics Reading Science Reasoning CompositeScore
1 8 School System State
20.1 18.5 19.1
19.3 18.5 19.9
22.4 20.6
20.0 19.8
20.2 19.9
20.9 19.4 19.9
No. of Students Taking Tests
No. of Tests Taken No. of Test Scores
3 or Higher Percent of Test
Scores 3 or Higher
School 45 72 51
70.8%
System State 173 15,225 289 23,969 73 13,024
25.3% 54.3%
POST-SECONDARY DATA
Graduates Entering Georgia Public Colleges
Graduates Entering Georgia Public Colleges and Requiring Learning Support (LS)
1998 Graduates Entering in 1998-99
1997 Graduates Entering in 1997-98
Percent of Graduating Number Class
School
94
42.2%
System 193
36.3%
School
56
31.6%
System 169
34.4%
Number Requiring
LS 21 38
6 30
Percent of those attending Georgia
Public Colleges
22.3%
19.7%
10.7%
17.8%
In previous years, the Report Card presented College Prep Curriculum information provided by the Board of Regents on students requiring Learning Support. Due to inconsistencies in the data provided by the Board of Regents in defining College Prep Completers versus Local Board of Education data defining College Prep Endorsements, the Department of Education Report Card will not provide this information until discrepancies can be reconciled.
Graduates Entering Georgia Public Technical and Adult Schools
1998 Graduates School System
Entering Number 12 51
1998-99 Percent
5.4% 9.6%
Entering Number N/A N/A
1997-98 Percent
N/A N/A
1997 Graduates School
3
1.7%
System
9
1.8%
14
7.9%
31
6.3%
1998-99 GEORGIA PUBLIC EDUCATION REPORT CARD Central High School - 6222052
Prepared by Georgia Department of Education
Page 3
CERTIFIED PERSONNEL DATA
Positions Number Average Contract Days
Administrators
4.54 229.91
Support Personnel
5.50 190.00
PK-12 Teachers
58.95 191.15
Personnel Sex
Certificate
Years Experience
Full-time Part-time
Male Female
4 Yr Bachelor's 5 Yr Master's 6 Yr Specialist's 7 Yr Doctoral Other*
<1 1-10 11-20 21-30 >30
Average
4 2
5 1
1 2 2 1 0
0 1 2 3 0
20.00
5 1
2 4
0 4 1 1 0
0 1 3 1 1
18.83
57 4
24 37
22 29
9 1 0
2 26 18 10
5
13.97
*Includes One- and Two-Year Vocational Certificates.
ACCREDITATION DATA
Accredited by Southern Association of Colleges and Schools (SACS): Secondary/Middle Commission.
AWARDS / RECOGNITION DATA
Schools in Georgia may receive recognition in the following programs: Charter School Pay for Performance Program Georgia School of Excellence National Blue Ribbon School Central High School did not receive recognition in any of these programs during the 1998-99 school year.
1998-99 GEORGIA PUBLIC EDUCATION REPORT CARD Central High School - 6222052
Prepared by Georgia Department of Education
Page 4
1998-99 GEORGIA PUBLIC EDUCATION REPORT CARD
CARROLL COUNTY SCHOOLS
Central Middle School - 6220177
Grade Range 6-8
The Georgia Public Education Report Card is designed to assist systems and schools in educational improvement. This report card contains a variety of data elements. An explanation of the terms is provided as a companion to the report card data. Please refer to the definitions for the most effective use of the reported data.
STUDENT DATA
Total 840
6-8 Enrollment, by Race/Ethnicity and Sex
Black
White Hispanic
American Multi-
Asian Indian
racial
119 14.2%
707 84.2%
6 0.7%
1 0.1%
2 0.2%
5 0.6%
Male 453
53.9%
Female 387
46.1%
Enrollment in Selected Programs
Program
Gifted (Grades K-12)
Program % of Student Enrollment Population
143
17.0%
Alternative Programs (Grades 6-12)
0
0.0%
Students Eligible to Receive Free/Reduced Lunches
Number
Percent
School System
216 4,597
25.7% 39.9%
Enrollment in Compensatory Programs
Program
Program % of Student Enrollment Population
Special Education (Grades K-12) (PK)
156 18.6%
0
N/A
English to Speakers of Other Languages (ESOL) (Grades K-12)
0
0.0%
Title I (Grades K-12)
This school has no Title I program.
Dropout Rate for Grades 6-8
Number
Rate
School System
0
0.0%
2
0.1%
Total 1
Retained Students, by Race/Ethnicity and Sex
Black
White Hispanic
American MultiAsian Indian racial
0
1
0.0% 100.0%
0 0.0%
0 0.0%
0 0.0%
0 0.0%
Male Female
1 100.0%
0 0.0%
Prepared by Georgia Department of Education
Page 1
STATE-REQUIRED TEST DATA
NORM-REFERENCED TESTS Grade 8
Iowa Tests of Basic Skills (ITBS) Each chart reflects data for three years of testing.
Reading Comprehension 50
58 51 49 0
98-99
56 48 48 97-98
58 48 48 96-97
Mathematics
School 50
System
State
0
56 51 56 98-99
60 48 55 97-98
59 51 54 96-97
School System State
Reading Vocabulary 50
56 46 46 0
98-99
58 44 45 97-98
59 45 44 96-97
Language Arts
School 50
System
State
0
67 59 60 98-99
68 54 58 97-98
60 54 56 96-97
School System State
Social Studies 50
60 53 54 0
98-99
58 50 53 97-98
60 50 53 96-97
Science
School 50
System
State
0
61 57 56 98-99
60 51 55 97-98
63 55 53 96-97
School System State
Sources of Information
Composite Score
50
58 54 57 0
98-99
School 50
System
63 51 56 97-98
60 52 55 96-97
State 0
61 54 56 98-99
62 50 54 97-98
1998-99 GEORGIA PUBLIC EDUCATION REPORT CARD Central Middle School - 6220177
Prepared by Georgia Department of Education
61 52 54 96-97
Scores Reported in Percentiles
School System State
Page 2
STATE-REQUIRED TEST DATA
Categories of Scaled Scores
Inadequate (less than 162)
Minimal (162-209)
Good
(210-247)
Very Good (greater than 247)
Average Scaled Score: (Range 100-300)
PERFORMANCE ASSESSMENTS
Grade 8 Writing Assessment
1998-99 Percent Scoring
1997-98 Percent Scoring
1996-97 Percent Scoring
School System State School System State School System State
4% 49% 40%
8%
6% 51% 35%
8%
8% 40% 41% 11%
3% 48% 41%
8%
10% 52% 33%
5%
11% 46% 34%
8%
5% 46% 42%
7%
9% 54% 32%
5%
15% 46% 30%
8%
209
205
208 209
200 202 209
200 198
AWARDS / RECOGNITION DATA
Schools in Georgia may receive recognition in the following programs: Charter School Pay for Performance Program Georgia School of Excellence National Blue Ribbon School Central Middle School did not receive recognition in any of these programs during the 1998-99 school year.
1998-99 GEORGIA PUBLIC EDUCATION REPORT CARD Central Middle School - 6220177
Prepared by Georgia Department of Education
Page 3
CERTIFIED PERSONNEL DATA
Positions Number Average Contract Days
Personnel Sex
Certificate
Years Experience
Full-time Part-time
Male Female
4 Yr Bachelor's 5 Yr Master's 6 Yr Specialist's 7 Yr Doctoral Other*
<1 1-10 11-20 21-30 >30
Average
Administrators
3.00 216.67
3 0
1 2
0 2 1 0 0 0 1 1 1 0 16.33
Support Personnel
3.00 190.00
3 0
0 3
0 0 3 0 0 0 0 3 0 0 16.67
PK-12 Teachers
55.00 190.18
55 0
8 47
19 23 13
0 0 3 23 11 16 2 14.56
*Includes One- and Two-Year Vocational Certificates.
ACCREDITATION DATA
Accredited by Southern Association of Colleges and Schools (SACS):
Elementary/Middle Commission.
1998-99 GEORGIA PUBLIC EDUCATION REPORT CARD Central Middle School - 6220177
Prepared by Georgia Department of Education
Page 4
1998-99 GEORGIA PUBLIC EDUCATION REPORT CARD
CARROLL COUNTY SCHOOLS
Mount Zion Elementary School - 6220176
Grade Range PK-5
The Georgia Public Education Report Card is designed to assist systems and schools in educational improvement. This report card contains a variety of data elements. An explanation of the terms is provided as a companion to the report card data. Please refer to the definitions for the most effective use of the reported data.
STUDENT DATA
Total
K-5
575
PK
61
Enrollment, by Race/Ethnicity and Sex
Black
White Hispanic
American Asian Indian
Multiracial
77 13.4%
481 83.7%
5 0.9%
5 0.9%
0 0.0%
7 1.2%
4 6.6%
53 86.9%
0 0.0%
0 0.0%
0 0.0%
4 6.6%
Male Female
296 51.5%
279 48.5%
35 57.4%
26 42.6%
Enrollment in Selected Programs
Program
Program % of Student Enrollment Population
Gifted (Grades K-12)
0
0.0%
Alternative Programs (Grades 6-12)
N/A
N/A
Students Eligible to Receive Free/Reduced Lunches
Number
Percent
School System
358 4,597
56.3% 39.9%
Dropout Rate *
Number
Rate
School System
N/A N/A
N/A N/A
* Dropout rates are not applicable for grades PK-5.
Enrollment in Compensatory Programs
Program
Program % of Student Enrollment Population
Special Education (Grades K-12)
79 13.7%
(PK)
3
N/A
English to Speakers of Other Languages (ESOL) (Grades K-12)
0
0.0%
Remedial Education (Grades 2-5, 9-12)
99 25.8%
Special Instructional Assistance (SIA) (Grades K-3)
172 43.9%
Title I (Grades K-12)
This school has a schoolwide program.
Total 1
Retained Students, by Race/Ethnicity and Sex
Black
White Hispanic
American MultiAsian Indian racial
0
1
0.0% 100.0%
0 0.0%
0 0.0%
0 0.0%
0 0.0%
Male Female
0
1
0.0% 100.0%
Prepared by Georgia Department of Education
Page 1
STATE-REQUIRED TEST DATA
NORM-REFERENCED TESTS Grade 3
Iowa Tests of Basic Skills (ITBS) Each chart reflects data for three years of testing.
Reading Comprehension 50
38 46 54 0
98-99
47 48 53 97-98
42 41 52 96-97
Mathematics
School 50
System
State
0
43 50 61 98-99
50 52 61 97-98
48 46 59 96-97
School System State
Reading Vocabulary 50
32 43 50 0
98-99
35 45 50 97-98
38 38 49 96-97
Language Arts
School 50
System
State
0
34 53 64 98-99
62 56 62 97-98
45 44 59 96-97
School System State
Social Studies 50
34 45 56 0
98-99
46 47 55 97-98
37 45 55 96-97
Science
School 50
System
State
0
38 50 59 98-99
52 52 59 97-98
49 47 58 96-97
School System State
Sources of Information
Composite Score
50
34 46 57 0
98-99
School 50
System
44 46 56 97-98
39 43 55 96-97
State 0
34 47 58 98-99
48 49 57 97-98
1998-99 GEORGIA PUBLIC EDUCATION REPORT CARD Mount Zion Elementary School - 6220176
Prepared by Georgia Department of Education
41 43 56 96-97
Scores Reported in Percentiles
School System State
Page 2
STATE-REQUIRED TEST DATA
NORM-REFERENCED TESTS Grade 5
Iowa Tests of Basic Skills (ITBS) Each chart reflects data for three years of testing.
Reading Comprehension
Mathematics
50
43 46 53 0
98-99
51 48 53 97-98
48 48 52 96-97
School 50
System
State
0
42 45 59 98-99
46 46 58 97-98
47 49 57 96-97
School System State
Reading Vocabulary 50
42 44 48 0
98-99
51 43 48 97-98
44 42 46 96-97
Language Arts
School 50
System
State
0
50 54 63 98-99
46 55 61 97-98
50 53 58 96-97
School System State
Social Studies 50
43 46 57 0
98-99
58 52 56 97-98
43 51 55 96-97
Science
School 50
System
State
0
50 51 60 98-99
65 55 59 97-98
54 55 59 96-97
School System State
Sources of Information
Composite Score
50
42 47 58 0
98-99
School 50
System
46 50 58 97-98
50 53 57 96-97
State 0
43 46 57 98-99
51 50 56 97-98
46 50 55 96-97
1998-99 GEORGIA PUBLIC EDUCATION REPORT CARD Mount Zion Elementary School - 6220176
Prepared by Georgia Department of Education
Scores Reported in Percentiles
School System State
Page 3
STATE-REQUIRED TEST DATA
PERFORMANCE ASSESSMENTS
Grade 5 Writing Assessment
Percent at Developmental Stages:
1998-99 School System State
1997-98 School System State
1996-97 School System State
Stage Stage Stage Stage Stage Stage
1:The Emerging Writer 2:The Developing Writer 3:The Focusing Writer 4:The Experimenting 5:The Engaging Writer 6:The Extending Writer
1% 3% 18% 51% 18% 8%
0% 1% 20% 46% 24% 8%
0% 1% 16% 41% 29% 12%
0% 3% 34% 48% 11% 0%
0% 2% 22% 47% 22% 5%
0% 3% 19% 41% 27% 10%
0% 1% 25% 48% 21% 5%
0% 4% 22% 40% 25% 8%
0% 3% 21% 37% 26% 12%
AWARDS / RECOGNITION DATA
Schools in Georgia may receive recognition in the following programs: Charter School Pay for Performance Program Georgia School of Excellence National Blue Ribbon School Mount Zion Elementary School did not receive recognition in any of these programs during the 1998-99 school year.
1998-99 GEORGIA PUBLIC EDUCATION REPORT CARD Mount Zion Elementary School - 6220176
Prepared by Georgia Department of Education
Page 4
CERTIFIED PERSONNEL DATA
Positions Number Average Contract Days
Personnel Sex
Certificate
Years Experience
Full-time Part-time
Male Female
4 Yr Bachelor's 5 Yr Master's 6 Yr Specialist's 7 Yr Doctoral Other*
<1 1-10 11-20 21-30 >30
Average
Administrators
3.00 220.00
3 0
1 2
0 2 1 0 0 0 1 0 2 0 18.67
Support Personnel
2.00 190.00
2 0
1 1
0 1 1 0 0 0 0 2 0 0 14.50
PK-12 Teachers
36.50 190.00
36 1
3 34
17 12
7 1 0 5 11 15 6 0 11.76
*Includes One- and Two-Year Vocational Certificates.
ACCREDITATION DATA
Accredited by Southern Association of Colleges and Schools (SACS):
Elementary/Middle Commission.
1998-99 GEORGIA PUBLIC EDUCATION REPORT CARD Mount Zion Elementary School - 6220176
Prepared by Georgia Department of Education
Page 5
1998-99 GEORGIA PUBLIC EDUCATION REPORT CARD
CARROLL COUNTY SCHOOLS
Mount Zion High School - 6220276
Grade Range 6-12
The Georgia Public Education Report Card is designed to assist systems and schools in educational improvement. This report card contains a variety of data elements. An explanation of the terms is provided as a companion to the report card data. Please refer to the definitions for the most effective use of the reported data.
STUDENT DATA
Total 605
6-12 Enrollment, by Race/Ethnicity and Sex
Black
White Hispanic
American Multi-
Asian Indian
racial
92 15.2%
499 82.5%
5 0.8%
6 1.0%
0 0.0%
3 0.5%
Male 337
55.7%
Female 268
44.3%
Enrollment in Selected Programs
Program
Program % of Student Enrollment Population
Gifted (Grades K-12)
33
5.5%
Non-Vocational Labs (Grades 9-12)
302
90.7%
Vocational Labs (Grades 9-12)
251
75.4%
Alternative Programs (Grades 6-12)
4
< 1%
Students Eligible to Receive Free/Reduced Lunches
Number
Percent
School System
283 4,597
46.8% 39.9%
Enrollment in Compensatory Programs
Program
Program % of Student Enrollment Population
Special Education (Grades K-12) PK
90 14.9%
0
N/A
English to Speakers of Other Languages (ESOL) (Grades K-12)
0
0.0%
Remedial Education (Grades 2-5, 9-12)
70 21.0%
Special Instructional Assistance (SIA) (Grades K-3)
N/A
N/A
Title I (Grades K-12) This school has no Title I program.
Dropout Rate for Grades 6-12
Number
Rate
School System
18
2.8%
98
1.6%
Total 34
Retained Students, by Race/Ethnicity and Sex
Black
White Hispanic
American MultiAsian Indian racial
8 23.5%
25 73.5%
1 2.9%
0 0.0%
0 0.0%
0 0.0%
Male Female
23
11
67.6% 32.4%
Prepared by Georgia Department of Education
Page 1
STATE-REQUIRED TEST DATA
NORM-REFERENCED TESTS
Grade 3 Iowa Tests of Basic Skills (ITBS) Each chart reflects data for three years of testing.
No third-grade students are enrolled at Mount Zion High School.
Reading Comprehension
Mathematics
50
N/A 46 54 0
98-99
N/A 48 53 97-98
N/A 41 52 96-97
School 50
System
State
N/A 50 61 0
98-99
N/A 52 61 97-98
N/A 46 59 96-97
School System State
Reading Vocabulary 50
N/A 43 50 0
98-99
N/A 45 50 97-98
N/A 38 49 96-97
Language Arts
School 50
System
State
N/A 53 64 0
98-99
N/A 56 62 97-98
N/A 44 59 96-97
School System State
Social Studies 50
N/A 45 56 0
98-99
N/A 47 55 97-98
N/A 45 55 96-97
Science
School 50
System
State
N/A 50 59 0
98-99
N/A 52 59 97-98
N/A 47 58 96-97
School System State
Sources of Information
Composite Score
School
50
50
System
N/A 46 57 0
98-99
N/A 46 56 N/A 43 55
97-98
96-97
State
N/A 47 58 0
98-99
N/A 49 57 97-98
N/A 43 56 96-97
1998-99 GEORGIA PUBLIC EDUCATION REPORT CARD Mount Zion High School - 6220276
Prepared by Georgia Department of Education
Scores Reported in Percentiles
School System State
Page 2
STATE-REQUIRED TEST DATA
NORM-REFERENCED TESTS
Grade 5 Iowa Tests of Basic Skills (ITBS) Each chart reflects data for three years of testing. No fifth-grade students are enrolled at Mount Zion High School.
Reading Comprehension
Mathematics
50
N/A 46 53 0
98-99
N/A 48 53 97-98
N/A 48 52 96-97
School 50
System
State
N/A 45 59 0
98-99
N/A 46 58 97-98
N/A 49 57 96-97
School System State
Reading Vocabulary 50
N/A 44 48 0
98-99
N/A 43 48 97-98
N/A 42 46 96-97
Language Arts
School 50
System
State
N/A 54 63 0
98-99
N/A 55 61 97-98
N/A 53 58 96-97
School System State
Social Studies 50
N/A 46 57 0
98-99
N/A 52 56 97-98
N/A 51 55 96-97
Science
School 50
System
State
N/A 51 60 0
98-99
N/A 55 59 97-98
N/A 55 59 96-97
School System State
Sources of Information
Composite Score
School
50
50
System
N/A 47 58 0
98-99
N/A 50 58 N/A 53 57
97-98
96-97
State
N/A 46 57 0
98-99
N/A 50 56 97-98
N/A 50 55 96-97
1998-99 GEORGIA PUBLIC EDUCATION REPORT CARD Mount Zion High School - 6220276
Prepared by Georgia Department of Education
Scores Reported in Percentiles
School System State
Page 3
STATE-REQUIRED TEST DATA
NORM-REFERENCED TESTS Grade 8
Iowa Tests of Basic Skills (ITBS) Each chart reflects data for three years of testing.
Reading Comprehension 50
38 51 49 0
98-99
45 48 48 97-98
40 48 48 96-97
Mathematics
School 50
System
State
0
36 51 56 98-99
48 48 55 97-98
48 51 54 96-97
School System State
Reading Vocabulary 50
28 46 46 0
98-99
36 44 45 97-98
36 45 44 96-97
Language Arts
School 50
System
State
0
44 59 60 98-99
45 54 58 97-98
46 54 56 96-97
School System State
Social Studies 50
32 53 54 0
98-99
44 50 53 97-98
43 50 53 96-97
Science
School 50
System
State
0
35 57 56 98-99
46 51 55 97-98
42 55 53 96-97
School System State
Sources of Information
Composite Score
50
37 54 57 0
98-99
School 50
System
45 51 56 97-98
40 52 55 96-97
State 0
35 54 56 98-99
45 50 54 97-98
1998-99 GEORGIA PUBLIC EDUCATION REPORT CARD Mount Zion High School - 6220276
Prepared by Georgia Department of Education
41 52 54 96-97
Scores Reported in Percentiles
School System State
Page 4
STATE-REQUIRED TEST DATA
PERFORMANCE ASSESSMENTS
Grade 5 Writing Assessment
Percent at Developmental Stages:
1998-99 School System State
1997-98 School System State
1996-97 School System State
Stage Stage Stage Stage Stage Stage
1:The Emerging Writer 2:The Developing Writer 3:The Focusing Writer 4:The Experimenting 5:The Engaging Writer 6:The Extending Writer
N/A N/A N/A N/A N/A N/A
0% 1% 20% 46% 24% 8%
0% 1% 16% 41% 29% 12%
N/A N/A N/A N/A N/A N/A
0% 2% 22% 47% 22% 5%
0% 3% 19% 41% 27% 10%
N/A N/A N/A N/A N/A N/A
0% 4% 22% 40% 25% 8%
0% 3% 21% 37% 26% 12%
No fifth-grade students are enrolled at Mount Zion High School.
Categories of Scaled Scores
Inadequate (less than 162)
Minimal (162-209)
Good
(210-247)
Very Good (greater than 247)
Average Scaled Score: (Range 100-300)
Grade 8 Writing Assessment
1998-99 Percent Scoring
1997-98 Percent Scoring
1996-97 Percent Scoring
School System State School System State School System State
12% 66% 19%
3%
6% 51% 35%
8%
8% 40% 41% 11%
14% 51% 30%
5%
10% 52% 33%
5%
11% 46% 34%
8%
11% 56% 25%
8%
9% 54% 32%
5%
15% 46% 30%
8%
192
205
208 198
200 202 195
200 198
GEORGIA HIGH SCHOOL GRADUATION TESTS (GHSGT)
Percent of Regular Program 11th Graders Passing the Georgia High School Graduation Tests on First Administration
English Language Arts Mathematics Social Studies Science
All Components listed above
Writing
1998-99
School System State
93% 89% 72% 58%
56%
96% 85% 75% 70%
65%
96% 88% 80% 72%
68%
82% 90% 93%
1997-98
School System State
89% 82% 78% 73%
63%
93% 85% 75% 72%
64%
94% 88% 78% 74%
68%
85% 89% 92%
1996-97
School System State
90% 87% 81% 88%
72%
92% 86% 80% 77%
69%
94% 87% 78% 74%
67%
92% 95% 93%
1998-99 GEORGIA PUBLIC EDUCATION REPORT CARD Mount Zion High School - 6220276
Prepared by Georgia Department of Education
Page 5
GRADUATE DATA
1999 Graduates by Credentials, Race/Ethnicity and Sex
Diplomas with Both College Prep. & Voc. Endorsements
Diplomas with College Prep. Endorsements Diplomas with Vocational Endorsements General High School Diplomas Special Education Diplomas
Total All Diplomas
Certificates of Performance
Total Graduates
Total 5
15 18
0
Black
1 20.0%
4 26.7%
2 11.1%
0
White Hispanic
3 60.0%
0 0.0%
11 73.3%
0 0.0%
16 88.9%
0 0.0%
0
0
American MultiAsian Indian racial
1 20.0%
0 0.0%
0 0.0%
0 0.0%
0 0.0%
0 0.0%
0 0.0%
0 0.0%
0 0.0%
0
0
0
0
0
0
0
0
0
0
38
7
30
0
1
0
0
18.4% 78.9% 0.0% 2.6% 0.0% 0.0%
4
3
1
0
0
0
0
75.0% 25.0% 0.0% 0.0% 0.0% 0.0%
42
10
31
0
1
0
0
23.8% 73.8% 0.0% 2.4% 0.0% 0.0%
Male Female
2
3
40.0% 60.0%
4
11
26.7% 73.3%
13
5
72.2% 27.8%
0
0
0
0
19 50.0%
2 50.0%
21 50.0%
19 50.0%
2 50.0%
21 50.0%
HOPE Scholarships
School System
Number of 1999 Graduates 4 2
Number Eligible
31
Percent Eligible
73.8%
498 322 64.7%
State
65,548 40,292 61.5%
High School Completion Rate
Percent of 1995Grade 9 Enrollment in Graduating Class of1999 School System State
Completion Rate '95-'99 54.5% 67.3% 68.9%
1998-99 GEORGIA PUBLIC EDUCATION REPORT CARD
Mount Zion High School - 6220276
Prepared by Georgia Department of Education
Page 6
COLLEGE ADMISSIONS / CREDIT TEST DATA
Scholastic Assessment Test (SAT)
Based on students' highest verbal and highest math scores
No. Taking
Average Score
Tests Verbal Math Total
Based on students' last test administration
Average Score Verbal Math Total
School
17
College Prep. Endorsement
Other Diplomas
System
254
College Prep. Endorsement
Other Diplomas
Georgia
41,958
505 522 N/A
483 492 331
492
511 507 N/A
477 499 376
488
1016 1029
N/A
960 991 707
980
499 N/A N/A
475 N/A N/A
483
509 N/A N/A
468 N/A N/A
479
1008 N/A N/A
943 N/A N/A
962
Nation
952,913 N/A N/A N/A
502 508 1010
American College Testing (ACT)
Advanced Placement Exams (AP)
Number taking tests: English Mathematics Reading Science Reasoning
4 * School N/A N/A N/A N/A
System 18.5 18.5 20.0 19.8
State 19.1 19.9 20.2 19.9
CompositeScore
N/A 19.4 19.9
* Scores are not reported when fewer than 5 take the ACT
No. of Students Taking Tests
No. of Tests Taken No. of Test Scores
3 or Higher Percent of Test
Scores 3 or Higher
School 0
N/A N/A
N/A
System State 173 15,225 289 23,969 73 13,024
25.3% 54.3%
POST-SECONDARY DATA
Graduates Entering Georgia Public Colleges
Graduates Entering Georgia Public Colleges and Requiring Learning Support (LS)
1998 Graduates Entering in 1998-99
1997 Graduates Entering in 1997-98
Percent of Graduating Number Class
School
28
65.1%
System 193
36.3%
School
16
48.5%
System 169
34.4%
Number Requiring
LS 4 38
1 30
Percent of those attending Georgia
Public Colleges
14.3%
19.7%
6.3%
17.8%
In previous years, the Report Card presented College Prep Curriculum information provided by the Board of Regents on students requiring Learning Support. Due to inconsistencies in the data provided by the Board of Regents in defining College Prep Completers versus Local Board of Education data defining College Prep Endorsements, the Department of Education Report Card will not provide this information until discrepancies can be reconciled.
Graduates Entering Georgia Public Technical and Adult Schools
1998 Graduates School System
Entering Number 1 51
1998-99 Percent
2.3% 9.6%
Entering Number N/A N/A
1997-98 Percent
N/A N/A
1997 Graduates School
0
0.0%
System
9
1.8%
2
6.1%
31
6.3%
1998-99 GEORGIA PUBLIC EDUCATION REPORT CARD Mount Zion High School - 6220276
Prepared by Georgia Department of Education
Page 7
CERTIFIED PERSONNEL DATA
Positions Number Average Contract Days
Administrators
2.11 230.52
Support Personnel
2.50 190.00
PK-12 Teachers
32.49 191.83
Personnel Sex
Certificate
Years Experience
Full-time Part-time
Male Female
4 Yr Bachelor's 5 Yr Master's 6 Yr Specialist's 7 Yr Doctoral Other*
<1 1-10 11-20 21-30 >30
Average
2 1
2 1
0 0 3 0 0
0 1 2 0 0
12.33
2 1
0 3
0 2 1 0 0
0 0 2 1 0
17.67
32 1
9 24
13 15
5 0 0
1 13 14
5 0
11.91
*Includes One- and Two-Year Vocational Certificates.
ACCREDITATION DATA
Accredited by Southern Association of Colleges and Schools (SACS): Secondary/Middle Commission.
AWARDS / RECOGNITION DATA
Schools in Georgia may receive recognition in the following programs: Charter School Pay for Performance Program Georgia School of Excellence National Blue Ribbon School Mount Zion High School did not receive recognition in any of these programs during the 1998-99 school year.
1998-99 GEORGIA PUBLIC EDUCATION REPORT CARD Mount Zion High School - 6220276
Prepared by Georgia Department of Education
Page 8
1998-99 GEORGIA PUBLIC EDUCATION REPORT CARD
CARROLL COUNTY SCHOOLS
Roopville Elementary School - 6220377
Grade Range PK-5
The Georgia Public Education Report Card is designed to assist systems and schools in educational improvement. This report card contains a variety of data elements. An explanation of the terms is provided as a companion to the report card data. Please refer to the definitions for the most effective use of the reported data.
STUDENT DATA
Total
K-5
404
PK
40
Enrollment, by Race/Ethnicity and Sex
Black
White Hispanic
American Asian Indian
Multiracial
33 8.2%
364 90.1%
4 1.0%
0 0.0%
0 0.0%
3 0.7%
3 7.5%
33 82.5%
2 5.0%
0 0.0%
0 0.0%
2 5.0%
Male Female
219 54.2%
185 45.8%
22 55.0%
18 45.0%
Enrollment in Selected Programs
Program
Program % of Student Enrollment Population
Gifted (Grades K-12)
40
9.9%
Alternative Programs (Grades 6-12)
N/A
N/A
Students Eligible to Receive Free/Reduced Lunches
Number
Percent
School System
194 4,597
43.7% 39.9%
Dropout Rate *
Number
Rate
School System
N/A N/A
N/A N/A
* Dropout rates are not applicable for grades PK-5.
Enrollment in Compensatory Programs
Program
Program % of Student Enrollment Population
Special Education (Grades K-12)
58 14.4%
(PK)
5
N/A
English to Speakers of Other Languages (ESOL) (Grades K-12)
0
0.0%
Remedial Education (Grades 2-5, 9-12)
78 27.9%
Special Instructional Assistance (SIA) (Grades K-3)
115 42.3%
Title I (Grades K-12)
This school has a Targeted Assistance program.
Total 5
Retained Students, by Race/Ethnicity and Sex
Black
White Hispanic
American MultiAsian Indian racial
1 20.0%
4 80.0%
0 0.0%
0 0.0%
0 0.0%
0 0.0%
Male Female
2
3
40.0% 60.0%
Prepared by Georgia Department of Education
Page 1
STATE-REQUIRED TEST DATA
NORM-REFERENCED TESTS Grade 3
Iowa Tests of Basic Skills (ITBS) Each chart reflects data for three years of testing.
Reading Comprehension 50
49 46 54 0
98-99
45 48 53 97-98
42 41 52 96-97
Mathematics
School 50
System
State
0
57 50 61 98-99
47 52 61 97-98
49 46 59 96-97
School System State
Reading Vocabulary 50
47 43 50 0
98-99
45 45 50 97-98
37 38 49 96-97
Language Arts
School 50
System
State
0
63 53 64 98-99
45 56 62 97-98
36 44 59 96-97
School System State
Social Studies 50
48 45 56 0
98-99
41 47 55 97-98
40 45 55 96-97
Science
School 50
System
State
0
53 50 59 98-99
43 52 59 97-98
44 47 58 96-97
School System State
Sources of Information
Composite Score
50
50 46 57 0
98-99
School 50
System
36 46 56 97-98
34 43 55 96-97
State 0
52 47 58 98-99
42 49 57 97-98
1998-99 GEORGIA PUBLIC EDUCATION REPORT CARD Roopville Elementary School - 6220377
Prepared by Georgia Department of Education
38 43 56 96-97
Scores Reported in Percentiles
School System State
Page 2
STATE-REQUIRED TEST DATA
NORM-REFERENCED TESTS Grade 5
Iowa Tests of Basic Skills (ITBS) Each chart reflects data for three years of testing.
Reading Comprehension
Mathematics
50
49 46 53 0
98-99
48 48 53 97-98
39 48 52 96-97
School 50
System
State
0
48 45 59 98-99
46 46 58 97-98
40 49 57 96-97
School System State
Reading Vocabulary 50
46 44 48 0
98-99
48 43 48 97-98
35 42 46 96-97
Language Arts
School 50
System
State
0
54 54 63 98-99
44 55 61 97-98
30 53 58 96-97
School System State
Social Studies 50
46 46 57 0
98-99
49 52 56 97-98
43 51 55 96-97
Science
School 50
System
State
0
52 51 60 98-99
58 55 59 97-98
50 55 59 96-97
School System State
Sources of Information
Composite Score
50
48 47 58 0
98-99
School 50
System
50 50 58 97-98
45 53 57 96-97
State 0
49 46 57 98-99
48 50 56 97-98
38 50 55 96-97
1998-99 GEORGIA PUBLIC EDUCATION REPORT CARD Roopville Elementary School - 6220377
Prepared by Georgia Department of Education
Scores Reported in Percentiles
School System State
Page 3
STATE-REQUIRED TEST DATA
PERFORMANCE ASSESSMENTS
Grade 5 Writing Assessment
Percent at Developmental Stages:
1998-99 School System State
1997-98 School System State
1996-97 School System State
Stage Stage Stage Stage Stage Stage
1:The Emerging Writer 2:The Developing Writer 3:The Focusing Writer 4:The Experimenting 5:The Engaging Writer 6:The Extending Writer
0% 0% 18% 61% 16% 4%
0% 1% 20% 46% 24% 8%
0% 1% 16% 41% 29% 12%
0% 0% 38% 49% 13% 0%
0% 2% 22% 47% 22% 5%
0% 3% 19% 41% 27% 10%
0% 8% 37% 44% 8% 4%
0% 4% 22% 40% 25% 8%
0% 3% 21% 37% 26% 12%
AWARDS / RECOGNITION DATA
Schools in Georgia may receive recognition in the following programs: Charter School Pay for Performance Program Georgia School of Excellence National Blue Ribbon School Roopville Elementary School did not receive recognition in any of these programs during the 1998-99 school year.
1998-99 GEORGIA PUBLIC EDUCATION REPORT CARD Roopville Elementary School - 6220377
Prepared by Georgia Department of Education
Page 4
CERTIFIED PERSONNEL DATA
Positions Number Average Contract Days
Personnel Sex
Certificate
Years Experience
Full-time Part-time
Male Female
4 Yr Bachelor's 5 Yr Master's 6 Yr Specialist's 7 Yr Doctoral Other*
<1 1-10 11-20 21-30 >30
Average
Administrators
2.00 220.00
2 0
0 2
0 0 2 0 0 0 0 2 0 0 17.50
Support Personnel
2.00 190.00
2 0
1 1
0 1 1 0 0 0 1 0 1 0 14.00
PK-12 Teachers
28.87 190.94
27 3
2 28
10 16
3 1 0 2 13 7 7 1 12.93
*Includes One- and Two-Year Vocational Certificates.
ACCREDITATION DATA
Accredited by Southern Association of Colleges and Schools (SACS):
Elementary/Middle Commission.
1998-99 GEORGIA PUBLIC EDUCATION REPORT CARD Roopville Elementary School - 6220377
Prepared by Georgia Department of Education
Page 5
1998-99 GEORGIA PUBLIC EDUCATION REPORT CARD
CARROLL COUNTY SCHOOLS
Sand Hill Elementary School - 6225052
Grade Range PK-5
The Georgia Public Education Report Card is designed to assist systems and schools in educational improvement. This report card contains a variety of data elements. An explanation of the terms is provided as a companion to the report card data. Please refer to the definitions for the most effective use of the reported data.
STUDENT DATA
Total
K-5
829
PK
81
Enrollment, by Race/Ethnicity and Sex
Black
White Hispanic
American Asian Indian
Multiracial
166 20.0%
631 76.1%
2 0.2%
4 0.5%
6 0.7%
20 2.4%
11 13.6%
64 79.0%
3 3.7%
0 0.0%
0 0.0%
3 3.7%
Male Female
394 47.5%
435 52.5%
46 56.8%
35 43.2%
Enrollment in Selected Programs
Program
Program % of Student Enrollment Population
Gifted (Grades K-12)
67
8.1%
Alternative Programs (Grades 6-12)
N/A
N/A
Students Eligible to Receive Free/Reduced Lunches
Number
Percent
School System
407 4,597
44.7% 39.9%
Dropout Rate *
Number
Rate
School System
N/A N/A
N/A N/A
* Dropout rates are not applicable for grades PK-5.
Enrollment in Compensatory Programs
Program
Program % of Student Enrollment Population
Special Education (Grades K-12)
116 14.0%
(PK)
12
N/A
English to Speakers of Other Languages (ESOL) (Grades K-12)
0
0.0%
Remedial Education (Grades 2-5, 9-12)
152 28.0%
Special Instructional Assistance (SIA) (Grades K-3)
247 43.0%
Title I (Grades K-12)
This school has a Targeted Assistance program.
Total 2
Retained Students, by Race/Ethnicity and Sex
Black
White Hispanic
American MultiAsian Indian racial
0 0.0%
1 50.0%
0 0.0%
0 0.0%
0
1
0.0% 50.0%
Male Female
0
2
0.0% 100.0%
Prepared by Georgia Department of Education
Page 1
STATE-REQUIRED TEST DATA
NORM-REFERENCED TESTS Grade 3
Iowa Tests of Basic Skills (ITBS) Each chart reflects data for three years of testing.
Reading Comprehension 50
43 46 54 0
98-99
35 48 53 97-98
41 41 52 96-97
Mathematics
School 50
System
State
0
41 50 61 98-99
39 52 61 97-98
47 46 59 96-97
School System State
Reading Vocabulary 50
44 43 50 0
98-99
34 45 50 97-98
38 38 49 96-97
Language Arts
School 50
System
State
0
46 53 64 98-99
39 56 62 97-98
48 44 59 96-97
School System State
Social Studies 50
44 45 56 0
98-99
38 47 55 97-98
49 45 55 96-97
Science
School 50
System
State
0
47 50 59 98-99
41 52 59 97-98
48 47 58 96-97
School System State
Sources of Information
Composite Score
50
44 46 57 0
98-99
School 50
System
33 46 56 97-98
45 43 55 96-97
State 0
43 47 58 98-99
35 49 57 97-98
1998-99 GEORGIA PUBLIC EDUCATION REPORT CARD Sand Hill Elementary School - 6225052
Prepared by Georgia Department of Education
44 43 56 96-97
Scores Reported in Percentiles
School System State
Page 2
STATE-REQUIRED TEST DATA
NORM-REFERENCED TESTS Grade 5
Iowa Tests of Basic Skills (ITBS) Each chart reflects data for three years of testing.
Reading Comprehension
Mathematics
50
51 46 53 0
98-99
45 48 53 97-98
46 48 52 96-97
School 50
System
State
0
51 45 59 98-99
46 46 58 97-98
57 49 57 96-97
School System State
Reading Vocabulary 50
44 44 48 0
98-99
38 43 48 97-98
36 42 46 96-97
Language Arts
School 50
System
State
0
55 54 63 98-99
51 55 61 97-98
59 53 58 96-97
School System State
Social Studies 50
54 46 57 0
98-99
49 52 56 97-98
57 51 55 96-97
Science
School 50
System
State
0
56 51 60 98-99
49 55 59 97-98
59 55 59 96-97
School System State
Sources of Information
Composite Score
50
50 47 58 0
98-99
School 50
System
42 50 58 97-98
59 53 57 96-97
State 0
51 46 57 98-99
45 50 56 97-98
55 50 55 96-97
1998-99 GEORGIA PUBLIC EDUCATION REPORT CARD Sand Hill Elementary School - 6225052
Prepared by Georgia Department of Education
Scores Reported in Percentiles
School System State
Page 3
STATE-REQUIRED TEST DATA
PERFORMANCE ASSESSMENTS
Grade 5 Writing Assessment
Percent at Developmental Stages:
1998-99 School System State
1997-98 School System State
1996-97 School System State
Stage Stage Stage Stage Stage Stage
1:The Emerging Writer 2:The Developing Writer 3:The Focusing Writer 4:The Experimenting 5:The Engaging Writer 6:The Extending Writer
1% 1% 20% 43% 25% 10%
0% 1% 20% 46% 24% 8%
0% 1% 16% 41% 29% 12%
1% 3% 36% 46% 10% 2%
0% 2% 22% 47% 22% 5%
0% 3% 19% 41% 27% 10%
0% 3% 24% 44% 23% 6%
0% 4% 22% 40% 25% 8%
0% 3% 21% 37% 26% 12%
AWARDS / RECOGNITION DATA
Schools in Georgia may receive recognition in the following programs: Charter School Pay for Performance Program Georgia School of Excellence National Blue Ribbon School Sand Hill Elementary School did not receive recognition in any of these programs during the 1998-99 school year.
1998-99 GEORGIA PUBLIC EDUCATION REPORT CARD Sand Hill Elementary School - 6225052
Prepared by Georgia Department of Education
Page 4
CERTIFIED PERSONNEL DATA
Positions Number Average Contract Days
Personnel Sex
Certificate
Years Experience
Full-time Part-time
Male Female
4 Yr Bachelor's 5 Yr Master's 6 Yr Specialist's 7 Yr Doctoral Other*
<1 1-10 11-20 21-30 >30
Average
Administrators
3.00 226.67
3 0
1 2
0 1 2 0 0 0 0 0 3 0 24.67
Support Personnel
2.50 190.00
2 1
0 3
0 1 2 0 0 0 0 2 1 0 18.33
PK-12 Teachers
49.00 190.00
49 0
7 42
17 19 12
1 0 6 18 11 14 0 12.06
*Includes One- and Two-Year Vocational Certificates.
ACCREDITATION DATA
Accredited by Southern Association of Colleges and Schools (SACS):
Elementary/Middle Commission.
1998-99 GEORGIA PUBLIC EDUCATION REPORT CARD Sand Hill Elementary School - 6225052
Prepared by Georgia Department of Education
Page 5
1998-99 GEORGIA PUBLIC EDUCATION REPORT CARD
CARROLL COUNTY SCHOOLS
Temple Elementary School - 6221054
Grade Range PK-5
The Georgia Public Education Report Card is designed to assist systems and schools in educational improvement. This report card contains a variety of data elements. An explanation of the terms is provided as a companion to the report card data. Please refer to the definitions for the most effective use of the reported data.
STUDENT DATA
Total
K-5
559
PK
60
Enrollment, by Race/Ethnicity and Sex
Black
White Hispanic
American Asian Indian
Multiracial
34 6.1%
504 90.2%
0 0.0%
4 0.7%
10 1.8%
7 1.3%
5 8.3%
55 91.7%
0 0.0%
0 0.0%
0 0.0%
0 0.0%
Male Female
282 50.4%
277 49.6%
32 53.3%
28 46.7%
Enrollment in Selected Programs
Program
Program % of Student Enrollment Population
Gifted (Grades K-12)
0
0.0%
Alternative Programs (Grades 6-12)
N/A
N/A
Students Eligible to Receive Free/Reduced Lunches
Number
Percent
School System
341 4,597
55.1% 39.9%
Dropout Rate *
Number
Rate
School System
N/A N/A
N/A N/A
* Dropout rates are not applicable for grades PK-5.
Enrollment in Compensatory Programs
Program
Program % of Student Enrollment Population
Special Education (Grades K-12)
71 12.7%
(PK)
4
N/A
English to Speakers of Other Languages (ESOL) (Grades K-12)
0
0.0%
Remedial Education (Grades 2-5, 9-12)
113 30.5%
Special Instructional Assistance (SIA) (Grades K-3)
151 39.1%
Title I (Grades K-12)
This school has a schoolwide program.
Total 6
Retained Students, by Race/Ethnicity and Sex
Black
White Hispanic
American MultiAsian Indian racial
0
6
0.0% 100.0%
0 0.0%
0 0.0%
0 0.0%
0 0.0%
Male Female
4
2
66.7% 33.3%
Prepared by Georgia Department of Education
Page 1
STATE-REQUIRED TEST DATA
NORM-REFERENCED TESTS Grade 3
Iowa Tests of Basic Skills (ITBS) Each chart reflects data for three years of testing.
Reading Comprehension 50
50 46 54 0
98-99
51 48 53 97-98
37 41 52 96-97
Mathematics
School 50
System
State
0
50 50 61 98-99
54 52 61 97-98
41 46 59 96-97
School System State
Reading Vocabulary 50
43 43 50 0
98-99
43 45 50 97-98
34 38 49 96-97
Language Arts
School 50
System
State
0
49 53 64 98-99
50 56 62 97-98
42 44 59 96-97
School System State
Social Studies 50
45 45 56 0
98-99
47 47 55 97-98
39 45 55 96-97
Science
School 50
System
State
0
52 50 59 98-99
47 52 59 97-98
38 47 58 96-97
School System State
Sources of Information
Composite Score
50
51 46 57 0
98-99
School 50
System
51 46 56 97-98
40 43 55 96-97
State 0
48 47 58 98-99
48 49 57 97-98
1998-99 GEORGIA PUBLIC EDUCATION REPORT CARD Temple Elementary School - 6221054
Prepared by Georgia Department of Education
38 43 56 96-97
Scores Reported in Percentiles
School System State
Page 2
STATE-REQUIRED TEST DATA
NORM-REFERENCED TESTS Grade 5
Iowa Tests of Basic Skills (ITBS) Each chart reflects data for three years of testing.
Reading Comprehension
Mathematics
50
37 46 53 0
98-99
41 48 53 N/A 48 52
97-98
96-97
School 50
System
State
0
35 45 59 98-99
32 46 58 N/A 49 57
97-98
96-97
School System State
Reading Vocabulary 50
36 44 48 0
98-99
36 43 48 N/A 42 46
97-98
96-97
Language Arts
School 50
System
State
0
45 54 63 98-99
32 55 61 N/A 53 58
97-98
96-97
School System State
Social Studies 50
38 46 57 0
98-99
37 52 56 N/A 51 55
97-98
96-97
Science
School 50
System
State
0
36 51 60 98-99
46 55 59 N/A 55 59
97-98
96-97
School System State
Sources of Information
Composite Score
50
40 47 58 0
98-99
School 50
System
39 50 58 N/A 53 57
97-98
96-97
State 0
37 46 57 98-99
35 50 56 N/A 50 55
97-98
96-97
1998-99 GEORGIA PUBLIC EDUCATION REPORT CARD Temple Elementary School - 6221054
Prepared by Georgia Department of Education
Scores Reported in Percentiles
School System State
Page 3
STATE-REQUIRED TEST DATA
PERFORMANCE ASSESSMENTS
Grade 5 Writing Assessment
Percent at Developmental Stages:
1998-99 School System State
1997-98 School System State
1996-97 School System State
Stage Stage Stage Stage Stage Stage
1:The Emerging Writer 2:The Developing Writer 3:The Focusing Writer 4:The Experimenting 5:The Engaging Writer 6:The Extending Writer
0% 1% 7% 46% 40% 4%
0% 1% 20% 46% 24% 8%
0% 1% 16% 41% 29% 12%
0% 2% 30% 49% 15% 1%
0% 2% 22% 47% 22% 5%
0% 3% 19% 41% 27% 10%
N/A N/A N/A N/A N/A N/A
0% 4% 22% 40% 25% 8%
0% 3% 21% 37% 26% 12%
AWARDS / RECOGNITION DATA
Schools in Georgia may receive recognition in the following programs: Charter School Pay for Performance Program Georgia School of Excellence National Blue Ribbon School Temple Elementary School did not receive recognition in any of these programs during the 1998-99 school year.
1998-99 GEORGIA PUBLIC EDUCATION REPORT CARD Temple Elementary School - 6221054
Prepared by Georgia Department of Education
Page 4
CERTIFIED PERSONNEL DATA
Positions Number Average Contract Days
Personnel Sex
Certificate
Years Experience
Full-time Part-time
Male Female
4 Yr Bachelor's 5 Yr Master's 6 Yr Specialist's 7 Yr Doctoral Other*
<1 1-10 11-20 21-30 >30
Average
Administrators
2.47 231.90
2 1
2 1
0 1 2 0 0 0 0 0 2 1 28.00
Support Personnel
2.00 190.00
2 0
0 2
0 2 0 0 0 0 1 1 0 0 6.50
PK-12 Teachers
37.00 190.00
37 0
1 36
21 12
4 0 0 7 13 12 3 2 10.14
*Includes One- and Two-Year Vocational Certificates.
ACCREDITATION DATA
Accredited by Southern Association of Colleges and Schools (SACS):
Elementary/Middle Commission.
1998-99 GEORGIA PUBLIC EDUCATION REPORT CARD Temple Elementary School - 6221054
Prepared by Georgia Department of Education
Page 5
1998-99 GEORGIA PUBLIC EDUCATION REPORT CARD
CARROLL COUNTY SCHOOLS
Temple High School - 6220189
Grade Range 6-12
The Georgia Public Education Report Card is designed to assist systems and schools in educational improvement. This report card contains a variety of data elements. An explanation of the terms is provided as a companion to the report card data. Please refer to the definitions for the most effective use of the reported data.
STUDENT DATA
Total 599
6-12 Enrollment, by Race/Ethnicity and Sex
Black
White Hispanic
American Multi-
Asian Indian
racial
46 7.7%
534 89.1%
5 0.8%
9 1.5%
5 0.8%
0 0.0%
Male 298
49.7%
Female 301
50.3%
Enrollment in Selected Programs
Program
Program % of Student Enrollment Population
Gifted (Grades K-12)
31
5.2%
Non-Vocational Labs (Grades 9-12)
296
87.6%
Vocational Labs (Grades 9-12)
246
72.8%
Alternative Programs (Grades 6-12)
3
< 1%
Students Eligible to Receive Free/Reduced Lunches
Number
Percent
School System
283 4,597
47.2% 39.9%
Enrollment in Compensatory Programs
Program
Program % of Student Enrollment Population
Special Education (Grades K-12) PK
66 11.0%
0
N/A
English to Speakers of Other Languages (ESOL) (Grades K-12)
0
0.0%
Remedial Education (Grades 2-5, 9-12)
52 15.4%
Special Instructional Assistance (SIA) (Grades K-3)
N/A
N/A
Title I (Grades K-12) This school has no Title I program.
Dropout Rate for Grades 6-12
Number
Rate
School System
22
3.4%
98
1.6%
Total 14
Retained Students, by Race/Ethnicity and Sex
Black
White Hispanic
American MultiAsian Indian racial
1 7.1%
13 92.9%
0 0.0%
0 0.0%
0 0.0%
0 0.0%
Male Female
11
3
78.6% 21.4%
Prepared by Georgia Department of Education
Page 1
STATE-REQUIRED TEST DATA
NORM-REFERENCED TESTS
Grade 3 Iowa Tests of Basic Skills (ITBS) Each chart reflects data for three years of testing.
No third-grade students are enrolled at Temple High School.
Reading Comprehension
Mathematics
50
N/A 46 54 0
98-99
N/A 48 53 97-98
N/A 41 52 96-97
School 50
System
State
N/A 50 61 0
98-99
N/A 52 61 97-98
N/A 46 59 96-97
School System State
Reading Vocabulary 50
N/A 43 50 0
98-99
N/A 45 50 97-98
N/A 38 49 96-97
Language Arts
School 50
System
State
N/A 53 64 0
98-99
N/A 56 62 97-98
N/A 44 59 96-97
School System State
Social Studies 50
N/A 45 56 0
98-99
N/A 47 55 97-98
N/A 45 55 96-97
Science
School 50
System
State
N/A 50 59 0
98-99
N/A 52 59 97-98
N/A 47 58 96-97
School System State
Sources of Information
Composite Score
School
50
50
System
N/A 46 57 0
98-99
N/A 46 56 N/A 43 55
97-98
96-97
State
N/A 47 58 0
98-99
N/A 49 57 97-98
N/A 43 56 96-97
1998-99 GEORGIA PUBLIC EDUCATION REPORT CARD Temple High School - 6220189
Prepared by Georgia Department of Education
Scores Reported in Percentiles
School System State
Page 2
STATE-REQUIRED TEST DATA
NORM-REFERENCED TESTS
Grade 5 Iowa Tests of Basic Skills (ITBS) Each chart reflects data for three years of testing. No fifth-grade students are enrolled at Temple High School.
Reading Comprehension
Mathematics
50
N/A 46 53 0
98-99
N/A 48 53 97-98
39 48 52 96-97
School 50
System
State
N/A 45 59 0
98-99
N/A 46 58 97-98
32 49 57 96-97
School System State
Reading Vocabulary 50
N/A 44 48 0
98-99
N/A 43 48 97-98
34 42 46 96-97
Language Arts
School 50
System
State
N/A 54 63 0
98-99
N/A 55 61 97-98
31 53 58 96-97
School System State
Social Studies 50
N/A 46 57 0
98-99
N/A 52 56 97-98
35 51 55 96-97
Science
School 50
System
State
N/A 51 60 0
98-99
N/A 55 59 97-98
38 55 59 96-97
School System State
Sources of Information
Composite Score
School
50
50
System
N/A 47 58 0
98-99
N/A 50 58 97-98
36 53 57 96-97
State
N/A 46 57 0
98-99
N/A 50 56 97-98
1998-99 GEORGIA PUBLIC EDUCATION REPORT CARD Temple High School - 6220189
Prepared by Georgia Department of Education
34 50 55 96-97
Scores Reported in Percentiles
School System State
Page 3
STATE-REQUIRED TEST DATA
NORM-REFERENCED TESTS Grade 8
Iowa Tests of Basic Skills (ITBS) Each chart reflects data for three years of testing.
Reading Comprehension 50
48 51 49 0
98-99
37 48 48 97-98
42 48 48 96-97
Mathematics
School 50
System
State
0
47 51 56 98-99
33 48 55 97-98
37 51 54 96-97
School System State
Reading Vocabulary 50
43 46 46 0
98-99
34 44 45 97-98
37 45 44 96-97
Language Arts
School 50
System
State
0
54 59 60 98-99
42 54 58 97-98
46 54 56 96-97
School System State
Social Studies 50
53 53 54 0
98-99
41 50 53 97-98
46 50 53 96-97
Science
School 50
System
State
0
56 57 56 98-99
40 51 55 97-98
43 55 53 96-97
School System State
Sources of Information
Composite Score
50
55 54 57 0
98-99
School 50
System
39 51 56 97-98
41 52 55 96-97
State 0
48 54 56 98-99
37 50 54 97-98
1998-99 GEORGIA PUBLIC EDUCATION REPORT CARD Temple High School - 6220189
Prepared by Georgia Department of Education
42 52 54 96-97
Scores Reported in Percentiles
School System State
Page 4
STATE-REQUIRED TEST DATA
PERFORMANCE ASSESSMENTS
Grade 5 Writing Assessment
Percent at Developmental Stages:
1998-99 School System State
1997-98 School System State
1996-97 School System State
Stage Stage Stage Stage Stage Stage
1:The Emerging Writer 2:The Developing Writer 3:The Focusing Writer 4:The Experimenting 5:The Engaging Writer 6:The Extending Writer
N/A N/A N/A N/A N/A N/A
0% 1% 20% 46% 24% 8%
0% 1% 16% 41% 29% 12%
N/A N/A N/A N/A N/A N/A
0% 2% 22% 47% 22% 5%
0% 3% 19% 41% 27% 10%
1% 5% 29% 29% 28% 6%
0% 4% 22% 40% 25% 8%
0% 3% 21% 37% 26% 12%
No fifth-grade students are enrolled at Temple High School.
Categories of Scaled Scores
Inadequate (less than 162)
Minimal (162-209)
Good
(210-247)
Very Good (greater than 247)
Average Scaled Score: (Range 100-300)
Grade 8 Writing Assessment
1998-99 Percent Scoring
1997-98 Percent Scoring
1996-97 Percent Scoring
School System State School System State School System State
5% 49% 37%
9%
6% 51% 35%
8%
8% 40% 41% 11%
15% 64% 18%
3%
10% 52% 33%
5%
11% 46% 34%
8%
19% 57% 20%
4%
9% 54% 32%
5%
15% 46% 30%
8%
207
205
208 188
200 202 190
200 198
GEORGIA HIGH SCHOOL GRADUATION TESTS (GHSGT)
Percent of Regular Program 11th Graders Passing the Georgia High School Graduation Tests on First Administration
English Language Arts Mathematics Social Studies Science
All Components listed above
Writing
1998-99
School System State
97% 86% 65% 66%
59%
96% 85% 75% 70%
65%
96% 88% 80% 72%
68%
89% 90% 93%
1997-98
School System State
95% 84% 68% 67%
55%
93% 85% 75% 72%
64%
94% 88% 78% 74%
68%
93% 89% 92%
1996-97
School System State
93% 78% 82% 65%
58%
92% 86% 80% 77%
69%
94% 87% 78% 74%
67%
97% 95% 93%
1998-99 GEORGIA PUBLIC EDUCATION REPORT CARD Temple High School - 6220189
Prepared by Georgia Department of Education
Page 5
GRADUATE DATA
1999 Graduates by Credentials, Race/Ethnicity and Sex
Diplomas with Both College Prep. & Voc. Endorsements
Diplomas with College Prep. Endorsements Diplomas with Vocational Endorsements General High School Diplomas Special Education Diplomas
Total All Diplomas
Certificates of Performance
Total Graduates
Total 0
Black 0
American MultiWhite Hispanic Asian Indian racial
0
0
0
0
0
46
5
41
0
0
0
0
10.9% 89.1% 0.0% 0.0% 0.0% 0.0%
18
0
18
0
0
0
0
0.0% 100.0% 0.0% 0.0% 0.0% 0.0%
0
0
0
0
0
0
0
0
0
0
0
0
0
0
64
5
59
0
0
0
0
7.8% 92.2% 0.0% 0.0% 0.0% 0.0%
0
0
0
0
0
0
0
64
5
59
0
0
0
0
7.8% 92.2% 0.0% 0.0% 0.0% 0.0%
Male Female
0
0
25 54.3%
12 66.7%
0
21 45.7%
6 33.3%
0
0
0
37 57.8%
0
27 42.2%
0
37
27
57.8% 42.2%
HOPE Scholarships
School System
Number of 1999 Graduates 6 4
Number Eligible
39
Percent Eligible
60.9%
498 322 64.7%
State
65,548 40,292 61.5%
High School Completion Rate
Percent of 1995Grade 9 Enrollment in Graduating Class of1999 School System State
Completion Rate '95-'99 70.3% 67.3% 68.9%
1998-99 GEORGIA PUBLIC EDUCATION REPORT CARD
Temple High School - 6220189
Prepared by Georgia Department of Education
Page 6
COLLEGE ADMISSIONS / CREDIT TEST DATA
Scholastic Assessment Test (SAT)
Based on students' highest verbal and highest math scores
No. Taking
Average Score
Tests Verbal Math Total
Based on students' last test administration
Average Score Verbal Math Total
School
28
College Prep. Endorsement
Other Diplomas
System
254
College Prep. Endorsement
Other Diplomas
Georgia
41,958
449 423 N/A
483 492 331
492
439 436 N/A
477 499 376
488
888 859 N/A
960 991 707
980
436 N/A N/A
475 N/A N/A
483
423 N/A N/A
468 N/A N/A
479
859 N/A N/A
943 N/A N/A
962
Nation
952,913 N/A N/A N/A
502 508 1010
American College Testing (ACT)
Advanced Placement Exams (AP)
Number taking tests: English Mathematics Reading Science Reasoning CompositeScore
1 2 School System State
19.0 18.5 19.1
18.1 18.5 19.9
21.3 20.7
20.0 19.8
20.2 19.9
19.9 19.4 19.9
No. of Students Taking Tests
No. of Tests Taken No. of Test Scores
3 or Higher Percent of Test
Scores 3 or Higher
School 20 21 1
4.8%
System State 173 15,225 289 23,969 73 13,024
25.3% 54.3%
POST-SECONDARY DATA
Graduates Entering Georgia Public Colleges
Graduates Entering Georgia Public Colleges and Requiring Learning Support (LS)
1998 Graduates Entering in 1998-99
1997 Graduates Entering in 1997-98
Percent of Graduating Number Class
School
15
26.8%
System 193
36.3%
School
15
27.3%
System 169
34.4%
Number Requiring
LS 3 38
6 30
Percent of those attending Georgia
Public Colleges
20.0%
19.7%
40.0%
17.8%
In previous years, the Report Card presented College Prep Curriculum information provided by the Board of Regents on students requiring Learning Support. Due to inconsistencies in the data provided by the Board of Regents in defining College Prep Completers versus Local Board of Education data defining College Prep Endorsements, the Department of Education Report Card will not provide this information until discrepancies can be reconciled.
Graduates Entering Georgia Public Technical and Adult Schools
1998 Graduates School System
Entering Number 2 51
1998-99 Percent
3.6% 9.6%
Entering Number N/A N/A
1997-98 Percent
N/A N/A
1997 Graduates School
2
3.6%
System
9
1.8%
3
5.5%
31
6.3%
1998-99 GEORGIA PUBLIC EDUCATION REPORT CARD Temple High School - 6220189
Prepared by Georgia Department of Education
Page 7
CERTIFIED PERSONNEL DATA
Positions Number Average Contract Days
Administrators
2.22 229.28
Support Personnel
2.50 190.00
PK-12 Teachers
33.88 190.55
Personnel Sex
Certificate
Years Experience
Full-time Part-time
Male Female
4 Yr Bachelor's 5 Yr Master's 6 Yr Specialist's 7 Yr Doctoral Other*
<1 1-10 11-20 21-30 >30
Average
2 1
3 0
0 1 2 0 0
0 0 0 3 0
23.67
2 1
0 3
0 3 0 0 0
0 2 1 0 0
7.00
33 1
13 21
20 13
1 0 0
4 16 11
3 0
10.15
*Includes One- and Two-Year Vocational Certificates.
ACCREDITATION DATA
Accredited by Southern Association of Colleges and Schools (SACS): Secondary/Middle Commission.
AWARDS / RECOGNITION DATA
Schools in Georgia may receive recognition in the following programs: Charter School Pay for Performance Program Georgia School of Excellence National Blue Ribbon School Temple High School did not receive recognition in any of these programs during the 1998-99 school year.
1998-99 GEORGIA PUBLIC EDUCATION REPORT CARD Temple High School - 6220189
Prepared by Georgia Department of Education
Page 8
1998-99 GEORGIA PUBLIC EDUCATION REPORT CARD
CARROLL COUNTY SCHOOLS
Villa Rica Elementary School - 6220199
Grade Range 3-5
The Georgia Public Education Report Card is designed to assist systems and schools in educational improvement. This report card contains a variety of data elements. An explanation of the terms is provided as a companion to the report card data. Please refer to the definitions for the most effective use of the reported data.
STUDENT DATA
Total 483
3-5 Enrollment, by Race/Ethnicity and Sex
Black
White Hispanic
American Multi-
Asian Indian
racial
79 16.4%
396 82.0%
5 1.0%
1 0.2%
0 0.0%
2 0.4%
Male Female
257 53.2%
226 46.8%
Enrollment in Selected Programs
Program
Program % of Student Enrollment Population
Gifted (Grades K-12)
36
7.5%
Alternative Programs (Grades 6-12)
N/A
N/A
Students Eligible to Receive Free/Reduced Lunches
Number
Percent
School System
206 4,597
42.7% 39.9%
Dropout Rate *
Number
Rate
School System
N/A N/A
N/A N/A
* Dropout rates are not applicable for grades PK-5.
Enrollment in Compensatory Programs
Program
Program % of Student Enrollment Population
Special Education (Grades K-12)
82 17.0%
(PK)
0
N/A
English to Speakers of Other Languages (ESOL) (Grades K-12)
0
0.0%
Remedial Education (Grades 2-5, 9-12)
96 19.9%
Special Instructional Assistance (SIA) (Grades K-3)
69 39.0%
Title I (Grades K-12)
This school has a Targeted Assistance program.
Total 0
Retained Students, by Race/Ethnicity and Sex
Black
White Hispanic
American Multi-
Asian Indian
racial
0
0
0
0
0
0
Male Female
0
0
Prepared by Georgia Department of Education
Page 1
STATE-REQUIRED TEST DATA
NORM-REFERENCED TESTS Grade 3
Iowa Tests of Basic Skills (ITBS) Each chart reflects data for three years of testing.
Reading Comprehension 50
44 46 54 0
98-99
45 48 53 97-98
45 41 52 96-97
Mathematics
School 50
System
State
0
48 50 61 98-99
53 52 61 97-98
49 46 59 96-97
School System State
Reading Vocabulary 50
40 43 50 0
98-99
43 45 50 97-98
40 38 49 96-97
Language Arts
School 50
System
State
0
48 53 64 98-99
55 56 62 97-98
46 44 59 96-97
School System State
Social Studies 50
44 45 56 0
98-99
46 47 55 97-98
44 45 55 96-97
Science
School 50
System
State
0
49 50 59 98-99
51 52 59 97-98
45 47 58 96-97
School System State
Sources of Information
Composite Score
50
43 46 57 0
98-99
School 50
System
45 46 56 97-98
40 43 55 96-97
State 0
45 47 58 98-99
48 49 57 97-98
1998-99 GEORGIA PUBLIC EDUCATION REPORT CARD Villa Rica Elementary School - 6220199
Prepared by Georgia Department of Education
43 43 56 96-97
Scores Reported in Percentiles
School System State
Page 2
STATE-REQUIRED TEST DATA
NORM-REFERENCED TESTS Grade 5
Iowa Tests of Basic Skills (ITBS) Each chart reflects data for three years of testing.
Reading Comprehension
Mathematics
50
45 46 53 0
98-99
49 48 53 97-98
48 48 52 96-97
School 50
System
State
0
40 45 59 98-99
43 46 58 97-98
48 49 57 96-97
School System State
Reading Vocabulary 50
45 44 48 0
98-99
43 43 48 97-98
47 42 46 96-97
Language Arts
School 50
System
State
0
51 54 63 98-99
55 55 61 97-98
47 53 58 96-97
School System State
Social Studies 50
41 46 57 0
98-99
52 52 56 97-98
50 51 55 96-97
Science
School 50
System
State
0
51 51 60 98-99
49 55 59 97-98
55 55 59 96-97
School System State
Sources of Information
Composite Score
50
42 47 58 0
98-99
School 50
System
50 50 58 97-98
49 53 57 96-97
State 0
43 46 57 98-99
47 50 56 97-98
48 50 55 96-97
1998-99 GEORGIA PUBLIC EDUCATION REPORT CARD Villa Rica Elementary School - 6220199
Prepared by Georgia Department of Education
Scores Reported in Percentiles
School System State
Page 3
STATE-REQUIRED TEST DATA
PERFORMANCE ASSESSMENTS
Grade 5 Writing Assessment
Percent at Developmental Stages:
1998-99 School System State
1997-98 School System State
1996-97 School System State
Stage Stage Stage Stage Stage Stage
1:The Emerging Writer 2:The Developing Writer 3:The Focusing Writer 4:The Experimenting 5:The Engaging Writer 6:The Extending Writer
0% 0% 31% 46% 20% 2%
0% 1% 20% 46% 24% 8%
0% 1% 16% 41% 29% 12%
0% 1% 23% 43% 24% 7%
0% 2% 22% 47% 22% 5%
0% 3% 19% 41% 27% 10%
1% 5% 25% 36% 24% 8%
0% 4% 22% 40% 25% 8%
0% 3% 21% 37% 26% 12%
AWARDS / RECOGNITION DATA
Schools in Georgia may receive recognition in the following programs: Charter School Pay for Performance Program Georgia School of Excellence National Blue Ribbon School Villa Rica Elementary School did not receive recognition in any of these programs during the 1998-99 school year.
1998-99 GEORGIA PUBLIC EDUCATION REPORT CARD Villa Rica Elementary School - 6220199
Prepared by Georgia Department of Education
Page 4
CERTIFIED PERSONNEL DATA
Positions Number Average Contract Days
Personnel Sex
Certificate
Years Experience
Full-time Part-time
Male Female
4 Yr Bachelor's 5 Yr Master's 6 Yr Specialist's 7 Yr Doctoral Other*
<1 1-10 11-20 21-30 >30
Average
Administrators
2.00 230.00
2 0
1 1
0 0 2 0 0 0 0 0 2 0 27.00
Support Personnel
2.00 190.00
2 0
0 2
0 1 1 0 0 0 1 0 1 0 14.50
PK-12 Teachers
29.00 190.00
28 2
2 28
13 14
3 0 0 5 9 8 8 0 12.73
*Includes One- and Two-Year Vocational Certificates.
ACCREDITATION DATA
Accredited by Southern Association of Colleges and Schools (SACS):
Elementary/Middle Commission.
1998-99 GEORGIA PUBLIC EDUCATION REPORT CARD Villa Rica Elementary School - 6220199
Prepared by Georgia Department of Education
Page 5
1998-99 GEORGIA PUBLIC EDUCATION REPORT CARD
CARROLL COUNTY SCHOOLS
Villa Rica High School - 6225054
Grade Range 9-12
The Georgia Public Education Report Card is designed to assist systems and schools in educational improvement. This report card contains a variety of data elements. An explanation of the terms is provided as a companion to the report card data. Please refer to the definitions for the most effective use of the reported data.
Total 889
STUDENT DATA
9-12 Enrollment, by Race/Ethnicity and Sex
Black
White Hispanic
American Multi-
Asian Indian
racial
189 21.3%
688 77.4%
8 0.9%
3 0.3%
0 0.0%
1 0.1%
Male Female
437 49.2%
452 50.8%
Enrollment in Selected Programs
Program
Gifted (Grades K-12)
Program % of Student Enrollment Population
43
4.8%
Non-Vocational Labs (Grades 9-12)
801
Vocational Labs
(Grades 9-12)
545
Alternative Programs (Grades 6-12)
15
90.1% 61.3%
1.7%
Students Eligible to Receive Free/Reduced Lunches
Number
Percent
School System
267 4,597
30.0% 39.9%
Enrollment in Compensatory Programs
Program
Program % of Student Enrollment Population
Special Education (Grades K-12) PK
76
8.5%
0
N/A
English to Speakers of Other Languages (ESOL) (Grades K-12)
0
0.0%
Remedial Education (Grades 2-5, 9-12)
74
8.3%
Title I (Grades K-12)
This school has no Title I program.
Dropout Rate for Grades 9-12
Number
Rate
School System
24
2.5%
96
2.8%
Total 101
Retained Students, by Race/Ethnicity and Sex
Black
White Hispanic
American MultiAsian Indian racial
31 30.7%
70 69.3%
0 0.0%
0 0.0%
0 0.0%
0 0.0%
Male Female
69
32
68.3% 31.7%
Prepared by Georgia Department of Education
Page 1
STATE-REQUIRED TEST DATA
GEORGIA HIGH SCHOOL GRADUATION TESTS (GHSGT)
Percent of Regular Program 11th Graders Passing the Georgia High School Graduation Tests on First Administration
English Language Arts Mathematics Social Studies Science
All Components listed above
Writing
1998-99
School System State
95% 82% 75% 71%
96% 85% 75% 70%
96% 88% 80% 72%
65% 65% 68%
89% 90% 93%
1997-98
School System State
91% 80% 64% 55%
93% 85% 75% 72%
94% 88% 78% 74%
53% 64% 68%
85% 89% 92%
1996-97
School System State
91% 85% 72% 70%
92% 86% 80% 77%
94% 87% 78% 74%
66% 69% 67%
96% 95% 93%
GRADUATE DATA
1999 Graduates by Credentials, Race/Ethnicity and Sex
Diplomas with Both College Prep. & Voc. Endorsements
Diplomas with College Prep. Endorsements Diplomas with Vocational Endorsements General High School Diplomas Special Education Diplomas
Total All Diplomas
Certificates of Performance
Total Graduates
Total 18 41 36 0
Black
6 33.3%
3 7.3%
10 27.8%
0
White Hispanic
12 66.7%
0 0.0%
36 87.8%
1 2.4%
26 72.2%
0 0.0%
0
0
American MultiAsian Indian racial
0 0.0%
0 0.0%
0 0.0%
1 2.4%
0 0.0%
0 0.0%
0 0.0%
0 0.0%
0 0.0%
0
0
0
Male Female
2
16
11.1% 88.9%
21
20
51.2% 48.8%
21
15
58.3% 41.7%
0
0
3
2
1
0
0
0
0
3
0
66.7% 33.3% 0.0% 0.0% 0.0% 0.0% 100.0% 0.0%
98
21
75
1
1
0
0
47
51
21.4% 76.5% 1.0% 1.0% 0.0% 0.0% 48.0% 52.0%
17
12
4
1
0
0
0
8
9
70.6% 23.5% 5.9% 0.0% 0.0% 0.0% 47.1% 52.9%
115
33
79
2
1
0
0
55
60
28.7% 68.7% 1.7% 0.9% 0.0% 0.0% 47.8% 52.2%
HOPE Scholarships
School System
Number of 1999 Graduates 1 1 5
Number Eligible
67
Percent Eligible
58.3%
498 322 64.7%
State
65,548 40,292 61.5%
High School Completion Rate
Percent of 1995Grade 9 Enrollment in Graduating Class of1999 School System State
Completion Rate '95-'99 71.4% 67.3% 68.9%
1998-99 GEORGIA PUBLIC EDUCATION REPORT CARD
Villa Rica High School - 6225054
Prepared by Georgia Department of Education
Page 2
COLLEGE ADMISSIONS / CREDIT TEST DATA
Scholastic Assessment Test (SAT)
Based on students' highest verbal and highest math scores
No. Taking
Average Score
Tests Verbal Math Total
Based on students' last test administration
Average Score Verbal Math Total
School
49
College Prep. Endorsement
Other Diplomas
System
254
College Prep. Endorsement
Other Diplomas
Georgia
41,958
466 464
930
507 501 1008
343 420
763
483 477
960
492 499
991
331 376
707
492 488
980
458 N/A N/A
475 N/A N/A
483
456 N/A N/A
468 N/A N/A
479
914 N/A N/A
943 N/A N/A
962
Nation
952,913 N/A N/A N/A
502 508 1010
American College Testing (ACT)
Advanced Placement Exams (AP)
Number taking tests: English Mathematics Reading Science Reasoning CompositeScore
2 9 School System State
17.1 18.5 19.1
18.1 18.5 19.9
18.9 19.0
20.0 19.8
20.2 19.9
18.4 19.4 19.9
No. of Students Taking Tests
No. of Tests Taken No. of Test Scores
3 or Higher Percent of Test
Scores 3 or Higher
School 80
156 16
10.3%
System State 173 15,225 289 23,969 73 13,024
25.3% 54.3%
POST-SECONDARY DATA
Graduates Entering Georgia Public Colleges
Graduates Entering Georgia Public Colleges and Requiring Learning Support (LS)
1998 Graduates Entering in 1998-99
1997 Graduates Entering in 1997-98
Percent of Graduating Number Class
School
30
29.7%
System 193
36.3%
School
46
40.4%
System 169
34.4%
Number Requiring
LS 4 38
10 30
Percent of those attending Georgia
Public Colleges
13.3%
19.7%
21.7%
17.8%
In previous years, the Report Card presented College Prep Curriculum information provided by the Board of Regents on students requiring Learning Support. Due to inconsistencies in the data provided by the Board of Regents in defining College Prep Completers versus Local Board of Education data defining College Prep Endorsements, the Department of Education Report Card will not provide this information until discrepancies can be reconciled.
Graduates Entering Georgia Public Technical and Adult Schools
1998 Graduates School System
Entering Number 19 51
1998-99 Percent 18.8%
9.6%
Entering Number N/A N/A
1997-98 Percent
N/A N/A
1997 Graduates School
3
2.6%
System
9
1.8%
4
3.5%
31
6.3%
1998-99 GEORGIA PUBLIC EDUCATION REPORT CARD Villa Rica High School - 6225054
Prepared by Georgia Department of Education
Page 3
CERTIFIED PERSONNEL DATA
Positions Number Average Contract Days
Administrators
3.11 233.14
Support Personnel
3.50 190.00
PK-12 Teachers
45.23 191.55
Personnel Sex
Certificate
Years Experience
Full-time Part-time
Male Female
4 Yr Bachelor's 5 Yr Master's 6 Yr Specialist's 7 Yr Doctoral Other*
<1 1-10 11-20 21-30 >30
Average
3 1
3 1
1 2 1 0 0
0 0 3 1 0
16.00
3 1
1 3
0 2 2 0 0
0 2 0 2 0
16.25
45 0
17 28
21 18
6 0 0
2 17 16
7 3
13.20
*Includes One- and Two-Year Vocational Certificates.
ACCREDITATION DATA
Accredited by Southern Association of Colleges and Schools (SACS): Secondary/Middle Commission.
AWARDS / RECOGNITION DATA
Schools in Georgia may receive recognition in the following programs: Charter School Pay for Performance Program Georgia School of Excellence National Blue Ribbon School Villa Rica High School did not receive recognition in any of these programs during the 1998-99 school year.
1998-99 GEORGIA PUBLIC EDUCATION REPORT CARD Villa Rica High School - 6225054
Prepared by Georgia Department of Education
Page 4
1998-99 GEORGIA PUBLIC EDUCATION REPORT CARD
CARROLL COUNTY SCHOOLS
Villa Rica Primary School - 6223054
Grade Range PK-2
The Georgia Public Education Report Card is designed to assist systems and schools in educational improvement. This report card contains a variety of data elements. An explanation of the terms is provided as a companion to the report card data. Please refer to the definitions for the most effective use of the reported data.
STUDENT DATA
Total
K-2
492
PK
80
Enrollment, by Race/Ethnicity and Sex
Black
White Hispanic
American Asian Indian
Multiracial
62 12.6%
413 83.9%
7 1.4%
1 0.2%
1 0.2%
8 1.6%
14 17.5%
61 76.3%
0 0.0%
1 1.3%
0 0.0%
4 5.0%
Male Female
258 52.4%
234 47.6%
36 45.0%
44 55.0%
Enrollment in Selected Programs
Program
Program % of Student Enrollment Population
Gifted (Grades K-12)
0
0.0%
Alternative Programs (Grades 6-12)
N/A
N/A
Students Eligible to Receive Free/Reduced Lunches
Number
Percent
School System
257 4,597
44.9% 39.9%
Dropout Rate *
Number
Rate
School System
N/A N/A
N/A N/A
* Dropout rates are not applicable for grades PK-5.
Enrollment in Compensatory Programs
Program
Program % of Student Enrollment Population
Special Education (Grades K-12)
47
9.6%
(PK)
12
N/A
English to Speakers of Other Languages (ESOL) (Grades K-12)
0
0.0%
Remedial Education (Grades 2-5, 9-12)
17 10.6%
Special Instructional Assistance (SIA) (Grades K-3)
179 36.4%
Title I (Grades K-12)
This school has a schoolwide program.
Total 11
Retained Students, by Race/Ethnicity and Sex
Black
White Hispanic
American MultiAsian Indian racial
0
11
0.0% 100.0%
0 0.0%
0 0.0%
0 0.0%
0 0.0%
Male Female
8
3
72.7% 27.3%
Prepared by Georgia Department of Education
Page 1
STATE-REQUIRED TEST DATA
NORM-REFERENCED TESTS
Grade 3 Iowa Tests of Basic Skills (ITBS) Each chart reflects data for three years of testing.
No third-grade students are enrolled at Villa Rica Primary School.
Reading Comprehension
Mathematics
50
N/A 46 54 0
98-99
45 48 53 97-98
45 41 52 96-97
School 50
System
State
N/A 50 61
0
98-99
53 52 61 97-98
49 46 59 96-97
School System State
Reading Vocabulary 50
N/A 43 50 0
98-99
43 45 50 97-98
40 38 49 96-97
Language Arts
School 50
System
State
N/A 53 64
0
98-99
55 56 62 97-98
46 44 59 96-97
School System State
Social Studies 50
N/A 45 56 0
98-99
46 47 55 97-98
44 45 55 96-97
Science
School 50
System
State
N/A 50 59
0
98-99
51 52 59 97-98
45 47 58 96-97
School System State
Sources of Information
Composite Score
50
N/A 46 57 0
98-99
School 50
System
45 46 56 97-98
40 43 55 96-97
State
N/A 47 58
0
98-99
48 49 57 97-98
1998-99 GEORGIA PUBLIC EDUCATION REPORT CARD Villa Rica Primary School - 6223054
Prepared by Georgia Department of Education
43 43 56 96-97
Scores Reported in Percentiles
School System State
Page 2
STATE-REQUIRED TEST DATA
NORM-REFERENCED TESTS
Grade 5 Iowa Tests of Basic Skills (ITBS) Each chart reflects data for three years of testing. No fifth-grade students are enrolled at Villa Rica Primary School.
Reading Comprehension
Mathematics
50
N/A 46 53 0
98-99
N/A 48 53 97-98
N/A 48 52 96-97
School 50
System
State
N/A 45 59 0
98-99
N/A 46 58 97-98
N/A 49 57 96-97
School System State
Reading Vocabulary 50
N/A 44 48 0
98-99
N/A 43 48 97-98
N/A 42 46 96-97
Language Arts
School 50
System
State
N/A 54 63 0
98-99
N/A 55 61 97-98
N/A 53 58 96-97
School System State
Social Studies 50
N/A 46 57 0
98-99
N/A 52 56 97-98
N/A 51 55 96-97
Science
School 50
System
State
N/A 51 60 0
98-99
N/A 55 59 97-98
N/A 55 59 96-97
School System State
Sources of Information
Composite Score
School
50
50
System
N/A 47 58 0
98-99
N/A 50 58 N/A 53 57
97-98
96-97
State
N/A 46 57 0
98-99
N/A 50 56 97-98
N/A 50 55 96-97
1998-99 GEORGIA PUBLIC EDUCATION REPORT CARD Villa Rica Primary School - 6223054
Prepared by Georgia Department of Education
Scores Reported in Percentiles
School System State
Page 3
STATE-REQUIRED TEST DATA
PERFORMANCE ASSESSMENTS
Grade 5 Writing Assessment
Percent at Developmental Stages:
1998-99 School System State
1997-98 School System State
1996-97 School System State
Stage Stage Stage Stage Stage Stage
1:The Emerging Writer 2:The Developing Writer 3:The Focusing Writer 4:The Experimenting 5:The Engaging Writer 6:The Extending Writer
N/A N/A N/A N/A N/A N/A
0% 1% 20% 46% 24% 8%
0% 1% 16% 41% 29% 12%
N/A N/A N/A N/A N/A N/A
0% 2% 22% 47% 22% 5%
0% 3% 19% 41% 27% 10%
N/A N/A N/A N/A N/A N/A
No fifth-grade students are enrolled at Villa Rica Primary School.
0% 4% 22% 40% 25% 8%
0% 3% 21% 37% 26% 12%
AWARDS / RECOGNITION DATA
Schools in Georgia may receive recognition in the following programs: Charter School Pay for Performance Program Georgia School of Excellence National Blue Ribbon School Villa Rica Primary School did not receive recognition in any of these programs during the 1998-99 school year.
1998-99 GEORGIA PUBLIC EDUCATION REPORT CARD Villa Rica Primary School - 6223054
Prepared by Georgia Department of Education
Page 4
CERTIFIED PERSONNEL DATA
Positions Number Average Contract Days
Personnel Sex
Certificate
Years Experience
Full-time Part-time
Male Female
4 Yr Bachelor's 5 Yr Master's 6 Yr Specialist's 7 Yr Doctoral Other*
<1 1-10 11-20 21-30 >30
Average
Administrators
2.00 230.00
2 0
0 2
0 1 1 0 0 0 0 1 1 0 21.00
Support Personnel
2.00 190.00
2 0
0 2
0 1 1 0 0 0 1 0 1 0 18.00
PK-12 Teachers
31.50 190.00
31 1
0 32
14 13
5 0 0 2 11 11 8 0 13.56
*Includes One- and Two-Year Vocational Certificates.
ACCREDITATION DATA
Accredited by Southern Association of Colleges and Schools (SACS):
Elementary/Middle Commission.
1998-99 GEORGIA PUBLIC EDUCATION REPORT CARD Villa Rica Primary School - 6223054
Prepared by Georgia Department of Education
Page 5
1998-99 GEORGIA PUBLIC EDUCATION REPORT CARD
CARROLL COUNTY SCHOOLS
Whitesburg Elementary School - 6220477
Grade Range PK-5
The Georgia Public Education Report Card is designed to assist systems and schools in educational improvement. This report card contains a variety of data elements. An explanation of the terms is provided as a companion to the report card data. Please refer to the definitions for the most effective use of the reported data.
STUDENT DATA
Total
K-5
366
PK
40
Enrollment, by Race/Ethnicity and Sex
Black
White Hispanic
American Asian Indian
Multiracial
46 12.6%
317 86.6%
0 0.0%
0 0.0%
1 0.3%
2 0.5%
3 7.5%
37 92.5%
0 0.0%
0 0.0%
0 0.0%
0 0.0%
Male Female
197 53.8%
169 46.2%
19 47.5%
21 52.5%
Enrollment in Selected Programs
Program
Program % of Student Enrollment Population
Gifted (Grades K-12)
17
4.6%
Alternative Programs (Grades 6-12)
N/A
N/A
Students Eligible to Receive Free/Reduced Lunches
Number
Percent
School System
215 4,597
53.0% 39.9%
Dropout Rate *
Number
Rate
School System
N/A N/A
N/A N/A
* Dropout rates are not applicable for grades PK-5.
Enrollment in Compensatory Programs
Program
Program % of Student Enrollment Population
Special Education (Grades K-12)
56 15.3%
(PK)
6
N/A
English to Speakers of Other Languages (ESOL) (Grades K-12)
0
0.0%
Remedial Education (Grades 2-5, 9-12)
48 20.0%
Special Instructional Assistance (SIA) (Grades K-3)
99 40.1%
Title I (Grades K-12)
This school has a schoolwide program.
Total 0
Retained Students, by Race/Ethnicity and Sex
Black
White Hispanic
American MultiAsian Indian racial
0
0
0
0
0
0
Male Female
0
0
Prepared by Georgia Department of Education
Page 1
STATE-REQUIRED TEST DATA
NORM-REFERENCED TESTS Grade 3
Iowa Tests of Basic Skills (ITBS) Each chart reflects data for three years of testing.
Reading Comprehension 50
34 46 54 0
98-99
40 48 53 97-98
37 41 52 96-97
Mathematics
School 50
System
State
0
37 50 61 98-99
39 52 61 97-98
30 46 59 96-97
School System State
Reading Vocabulary 50
34 43 50 0
98-99
39 45 50 97-98
37 38 49 96-97
Language Arts
School 50
System
State
0
41 53 64 98-99
43 56 62 97-98
37 44 59 96-97
School System State
Social Studies 50
31 45 56 0
98-99
39 47 55 97-98
41 45 55 96-97
Science
School 50
System
State
0
36 50 59 98-99
44 52 59 97-98
41 47 58 96-97
School System State
Sources of Information
Composite Score
50
34 46 57 0
98-99
School 50
System
37 46 56 97-98
37 43 55 96-97
State 0
33 47 58 98-99
38 49 57 97-98
1998-99 GEORGIA PUBLIC EDUCATION REPORT CARD Whitesburg Elementary School - 6220477
Prepared by Georgia Department of Education
35 43 56 96-97
Scores Reported in Percentiles
School System State
Page 2
STATE-REQUIRED TEST DATA
NORM-REFERENCED TESTS Grade 5
Iowa Tests of Basic Skills (ITBS) Each chart reflects data for three years of testing.
Reading Comprehension
Mathematics
50
42 46 53 0
98-99
49 48 53 97-98
55 48 52 96-97
School 50
System
State
0
42 45 59 98-99
50 46 58 97-98
58 49 57 96-97
School System State
Reading Vocabulary 50
32 44 48 0
98-99
38 43 48 97-98
56 42 46 96-97
Language Arts
School 50
System
State
0
50 54 63 98-99
64 55 61 97-98
69 53 58 96-97
School System State
Social Studies 50
41 46 57 0
98-99
55 52 56 97-98
58 51 55 96-97
Science
School 50
System
State
0
41 51 60 98-99
57 55 59 97-98
58 55 59 96-97
School System State
Sources of Information
Composite Score
50
45 47 58 0
98-99
School 50
System
56 50 58 97-98
68 53 57 96-97
State 0
41 46 57 98-99
58 50 56 97-98
61 50 55 96-97
1998-99 GEORGIA PUBLIC EDUCATION REPORT CARD Whitesburg Elementary School - 6220477
Prepared by Georgia Department of Education
Scores Reported in Percentiles
School System State
Page 3
STATE-REQUIRED TEST DATA
PERFORMANCE ASSESSMENTS
Grade 5 Writing Assessment
Percent at Developmental Stages:
1998-99 School System State
1997-98 School System State
1996-97 School System State
Stage Stage Stage Stage Stage Stage
1:The Emerging Writer 2:The Developing Writer 3:The Focusing Writer 4:The Experimenting 5:The Engaging Writer 6:The Extending Writer
0% 0% 25% 34% 25% 17%
0% 1% 20% 46% 24% 8%
0% 1% 16% 41% 29% 12%
0% 2% 3% 41% 45% 9%
0% 2% 22% 47% 22% 5%
0% 3% 19% 41% 27% 10%
0% 0% 10% 35% 28% 28%
0% 4% 22% 40% 25% 8%
0% 3% 21% 37% 26% 12%
AWARDS / RECOGNITION DATA
Schools in Georgia may receive recognition in the following programs: Charter School Pay for Performance Program Georgia School of Excellence National Blue Ribbon School Whitesburg Elementary School did not receive recognition in any of these programs during the 1998-99 school year.
1998-99 GEORGIA PUBLIC EDUCATION REPORT CARD Whitesburg Elementary School - 6220477
Prepared by Georgia Department of Education
Page 4
CERTIFIED PERSONNEL DATA
Positions Number Average Contract Days
Personnel Sex
Certificate
Years Experience
Full-time Part-time
Male Female
4 Yr Bachelor's 5 Yr Master's 6 Yr Specialist's 7 Yr Doctoral Other*
<1 1-10 11-20 21-30 >30
Average
Administrators
2.00 215.00
2 0
0 2
0 1 1 0 0 0 1 1 0 0 14.50
Support Personnel
2.00 190.00
2 0
0 2
0 0 2 0 0 0 0 2 0 0 13.00
PK-12 Teachers
27.50 190.00
27 1
1 27
14 11
3 0 0 6 10 6 5 1 11.04
*Includes One- and Two-Year Vocational Certificates.
ACCREDITATION DATA
Accredited by Southern Association of Colleges and Schools (SACS):
Elementary/Middle Commission.
1998-99 GEORGIA PUBLIC EDUCATION REPORT CARD Whitesburg Elementary School - 6220477
Prepared by Georgia Department of Education
Page 5
1998-99 GEORGIA PUBLIC EDUCATION REPORT CARD CARROLLTON CITY SCHOOLS - 766
The Georgia Public Education Report Card is designed to assist systems and schools in educational improvement. This report card contains a variety of data elements. An explanation of the terms is provided as a companion to the report card data. Please refer to the definitions for the most effective use of the reported data.
Total
K-12
3,519
PK
185
STUDENT DATA
Enrollment, by Race/Ethnicity and Sex
Black
White Hispanic
American Multi-
Asian Indian
racial
1,385 39.4%
1,952 55.5%
83 2.4%
42 1.2%
1 0.0%
56 1.6%
116 62.7%
49 26.5%
10 5.4%
4 2.2%
0 0.0%
6 3.2%
Male
1,770 50.3%
101 54.6%
Female
1,749 49.7%
84 45.4%
Enrollment in Selected Programs
Program
Program % of Student Enrollment Population
Gifted (Grades K-12)
204
5.8%
Non-Vocational Labs (Grades 9-12)
809
84.8%
Vocational Labs (Grades 9-12)
563
59.0%
Alternative Programs (Grades 6-12)
13
< 1%
Students Eligible to Receive Free/Reduced Lunches
Number
Percent
1,494
40.3%
Dropout Rate
Number
Percent
6-12 9-12
36
1.8%
36
3.5%
Enrollment in Compensatory Programs
Program
Program % of Student Enrollment Population
Special Education
(Grades K-12)
549
PK
46
English to Speakers of
Other Languages (ESOL)
3
(Grades K-12)
Remedial Education (Grades 2-5, 9-12)
212
Special Instructional
Assistance (SIA)
220
(Grades K-3)
Title I (Grades K-12) Number of schools with: Schoolwide program Targeted Assistance program No Title I program
15.6% N/A < 1%
10.0%
19.2%
0 2 1
Total 148
Retained Students, by Race/Ethnicity and Sex
Black
White Hispanic
American MultiAsian Indian racial
87 58.8%
50 33.8%
10 6.8%
0 0.0%
0 0.0%
1 0.7%
Male Female
95
53
64.2% 35.8%
Prepared by Georgia Department of Education
Page 1
STATE-REQUIRED TEST DATA
NORM-REFERENCED TESTS
Grade 3 Iowa Tests of Basic Skills (ITBS) Each chart reflects data for three years of testing.
Reading Comprehension
Mathematics
50
50 54 48 53 48 52 0
98-99 97-98 96-97
System State
50
46 61 52 61 55 59 0
98-99 97-98 96-97
System State
Reading Vocabulary
50
41 50 43 50 48 49 0
98-99 97-98 96-97
System State
Social Studies
50
41 56 48 55 50 55 0
98-99 97-98 96-97
System State
Language Arts
50
39 64 61 62 63 59 0
98-99 97-98 96-97
System State
Science
50
51 59 50 59 54 58 0
98-99 97-98 96-97
System State
Sources of Information
Composite Score
50
46 57 0
98-99
System
50
51 56 56 55 97-98 96-97
State
44 58 50 57 0
98-99 97-98
1998-99 GEORGIA PUBLIC EDUCATION REPORT CARD Carrollton City Schools
Prepared by Georgia Department of Education
System State Scores Reported 54 56 in Percentiles 96-97
Page 2
STATE-REQUIRED TEST DATA
NORM-REFERENCED TESTS
Grade 5 Iowa Tests of Basic Skills (ITBS) Each chart reflects data for three years of testing.
Reading Comprehension
Mathematics
50
53 53 50 53 55 52 0
98-99 97-98 96-97
System State
50
59 59 54 58 63 57 0
98-99 97-98 96-97
System State
Reading Vocabulary
50
51 48 45 48 53 46 0
98-99 97-98 96-97
System State
Social Studies
50
58 57 54 56 62 55 0
98-99 97-98 96-97
System State
Language Arts
50
64 63 57 61 61 58 0
98-99 97-98 96-97
System State
Science
50
60 60 58 59 63 59 0
98-99 97-98 96-97
System State
Sources of Information
Composite Score
50
60 58 0
98-99
System
50
57 58 61 57 97-98 96-97
State
58 57 53 56 0
98-99 97-98
1998-99 GEORGIA PUBLIC EDUCATION REPORT CARD Carrollton City Schools
Prepared by Georgia Department of Education
System State Scores Reported 60 55 in Percentiles 96-97
Page 3
STATE-REQUIRED TEST DATA
NORM-REFERENCED TESTS Grade 8
Iowa Tests of Basic Skills (ITBS) Each chart reflects data for three years of testing.
Reading Comprehension
Mathematics
50
54 49 46 48 53 48 0
98-99 97-98 96-97
System State
50
57 56 50 55 54 54 0
98-99 97-98 96-97
System State
Reading Vocabulary
50
49 46 41 45 50 44 0
98-99 97-98 96-97
System State
Language Arts
50
65 60 56 58 61 56 0
98-99 97-98 96-97
System State
Social Studies
50
60 54 51 53 58 53 0
98-99 97-98 96-97
System State
Science
50
58 56 52 55 55 53 0
98-99 97-98 96-97
System State
Sources of Information
Composite Score
50
62 57 0
98-99
System
50
54 56 60 55 97-98 96-97
State
60 56 51 54 0
98-99 97-98
1998-99 GEORGIA PUBLIC EDUCATION REPORT CARD Carrollton City Schools
Prepared by Georgia Department of Education
System State Scores Reported 57 54 in Percentiles 96-97
Page 4
STATE-REQUIRED TEST DATA
PERFORMANCE ASSESSMENTS
Grade 5 Writing Assessment
1998-99
1997-98
1996-97
Percent at Developmental Stages:
Comparison
Comparison
Comparison
System Group State System Group State System Group State
Stage Stage Stage Stage Stage Stage
1: The Emerging Writer 2: The Developing Writer 3: The Focusing Writer 4: The Experimenting Writer 5: The Engaging Writer 6: The Extending Writer
0% 0% 15% 45% 24% 15%
0% 2% 19% 43% 26% 9%
0% 1% 16% 41% 29% 12%
0% 4% 23% 38% 24% 10%
0% 3% 21% 42% 26% 8%
0% 3% 19% 41% 27% 10%
0% 4% 19% 34% 25% 16%
0% 3% 21% 38% 26% 11%
0% 3% 21% 37% 26% 12%
Grade 8 Writing Assessment
1998-99 Percent Scoring 1997-98 Percent Scoring 1996-97 Percent Scoring
Categories of Scaled Scores
Comparison
Comparison
Comparison
System Group State System Group State System Group State
Inadequate (less than 162)
Minimal (162-209)
Good
(210-247)
Very Good (greater than 247)
3% 29% 51% 17%
8% 45% 39%
8%
8% 40% 41% 11%
8% 43% 37% 12%
12% 48% 34%
6%
11% 46% 34%
8%
14% 34% 38% 14%
12% 49% 32%
7%
15% 46% 30%
8%
Average Scaled Score: (Range 100-300)
219
205 208
208
200 202
207
200 198
GEORGIA HIGH SCHOOL GRADUATION TESTS (GHSGT)
Percent of Regular Program 11th Graders Passing the Georgia High School Graduation Tests on First Administration
1998-99
1997-98
1996-97
Comparison
Comparison
Comparison
System Group State System Group State System Group State
English Language Arts Mathematics Social Studies Science
95% 86% 84% 74%
96% 89% 81% 73%
96% 88% 80% 72%
92% 91% 81% 80%
94% 90% 77% 76%
94% 88% 78% 74%
94% 87% 80% 76%
96% 91% 82% 81%
94% 87% 78% 74%
All Components listed above 7 1 %
69% 68% 75%
68% 68% 72%
74% 67%
Writing
97%
94% 93% 91%
92% 92% 96%
94% 93%
1998-99 GEORGIA PUBLIC EDUCATION REPORT CARD
Carrollton City Schools
Prepared by Georgia Department of Education
Page 5
GRADUATE DATA
1999 Graduates by Credentials, Race/Ethnicity and Sex
Diplomas with Both College Prep. & Voc. Endorsements
Diplomas with College Prep. Endorsements Diplomas with Vocational Endorsements General High School Diplomas Special Education Diplomas
Total All Diplomas
Certificates of Performance
Total Graduates
Total 41
102 40 0 6
189 13
202
Black
11 26.8%
10 9.8%
15 37.5%
0
American MultiWhite Hispanic Asian Indian racial
28 68.3%
91 89.2%
23 57.5%
0
1 2.4%
0 0.0%
1 2.5%
0
1 2.4%
1 1.0%
0 0.0%
0
0 0.0%
0 0.0%
0 0.0%
0
0 0.0%
0 0.0%
1 2.5%
0
Male Female
14 34.1%
43 42.2%
28 70.0%
0
27 65.9%
59 57.8%
12 30.0%
0
4 66.7%
40 21.2%
9 69.2%
49 24.3%
1 16.7%
143 75.7%
3 23.1%
146 72.3%
0 0.0%
2 1.1%
0 0.0%
2 1.0%
1 16.7%
3 1.6%
1 7.7%
4 2.0%
0 0.0%
0 0.0%
0 0.0%
0 0.0%
0 0.0%
1 0.5%
0 0.0%
1 0.5%
3 50.0%
88 46.6%
8 61.5%
96 47.5%
3 50.0%
101 53.4%
5 38.5%
106 52.5%
HOPE Scholarships
System State
Number of 1999 Graduates 2 0 2
Number Eligible
146
Percent Eligible
72.3%
65,548 40,292 61.5%
High School Completion Rate Percent of 1995Grade 9 Enrollment
in Graduating Class of1999
System
State
Completion Rate '95-'99 76.2% 68.9%
COLLEGE ADMISSIONS / CREDIT TEST DATA
Scholastic Assessment Test (SAT)
No. Taking
Average Score
Tests
Verbal Math Total
Based on students' highest verbal and highest math scores
System College Prep. Endorsement Other Diplomas
498 492 990 509 498 1007 358 366 724
Georgia
492 488 980
Based on students' last test administration
System Georgia
150
487 480
967
41,958 483 479 962
Nation
952,913 502 508 1010
American College Testing (ACT)
System State Nation
English
20.5
19.1 20.4
Mathematics
20.8
19.9 20.7
Reading
19.0
20.2 21.3
Science Reasoning 20.5
19.9 21.0
CompositeScore 20.4
19.9 21.9
Advanced Placement Exams (AP)
No. of Students Taking Tests
No. of Tests Taken No. of Test Scores
3 or Higher Percent of Test
Scores 3 or Higher
System State 34 15,225 46 23,969 20 13,024
43.5% 54.3%
1998-99 GEORGIA PUBLIC EDUCATION REPORT CARD Carrollton City Schools
Prepared by Georgia Department of Education
Page 6
POSTSECONDARY DATA
Graduates Entering Georgia Public Colleges and Universities
Graduates Entering Georgia Public Colleges and Universities and
Requiring Learning Support (LS)
1998 Graduates Entering 1998-99
1997 Graduates Entering 1997-98
Percent of Graduating Number Class
93
52.8%
88
44.7%
Number Requiring
LS
16
13
Percent of those attending Georgia
Public Colleges
17.2%
14.8%
In previous years, the Report Card presented College Prep Curriculum information provided by the Board of Regents on students requiring Learning Support. Due to inconsistencies in the data provided by the Board of Regents in defining College Prep Completers versus Local Board of Education data defining College Prep Endorsements, the Department of Education Report Card will not provide this information until discrepancies can be reconciled.
Graduates Entering Georgia Public Technical and Adult Schools
Entering 1998-99 Entering 1997-98
Number Percent
Number Percent
1998 Graduates 1997 Graduates
12
6.8%
3
1.5%
N/A 11
N/A 5.6%
ACCREDITATION / RECOGNITION DATA
Southern Association of Colleges and Schools (SACS) Accrediting Commission
Secondary/Middle Commission Elementary/Middle Commission Both Elementary/Secondary Commissions Joint Commission Candidate for Accreditation
Accreditation by Georgia Accrediting Commission (GAC)
Accredited by GAC Accredited with Quality by GAC
Number of Schools
2 1 0 0 0
Number of Schools
0 3
Awards / Recognition
State Recognized Program
Number of Schools
Charter School
0
Pay for Performance Recipient
0
Georgia School of Excellence
1
National Blue Ribbon School
0
COMMUNITY DATA
Number of Children Eligible for Migrant Education Number of Families-At-Risk * Number of Food Stamp Participants * Number of Families Receiving TANF * ** Per Capita Income * Unemployment Rate * 1990 Population * Projected 2000 Population * Projected 2010 Population *
* Data Available at County Level Only ** Known as AFDC before January 1997
34 302 5,451 428 $18,840 4.5% 71,422 85,974 105,839
1998-99 GEORGIA PUBLIC EDUCATION REPORT CARD Carrollton City Schools
Prepared by Georgia Department of Education
Page 7
FISCAL DATA
Millage Rate
18.34
* Fall 1998 Property Tax Digest is used to calculate the 98-99 Value of One Mill
FTE Count
FTE Count used for Allotment Calculation 3,482.0 Fall '98 FTE Count 3,519
Value of One Mill
$388,330 $111.52 per Allotment FTE
Sources: Local State-QBE State-
Lottery State-
Other Federal Other
Total
PerGeneral Fund cent Per FTE
$7,940,216 39.3% $2,280 $12,154,000 60.1% $3,491
K-12 Revenues
Lottery K-12
and
Title
All Other
Programs
K-12
$0
$36,122
Bonded Debt $0
$0
$0
$0
$0 0.0%
$0
$0
$79,214
$0
$120,502 0.6% $35
$0
$27,936
$0
$2,306 0.0%
$1 $1,240,069
$12,624
$0
$2,100 0.0%
$1
$0
$0
$0
$20,219,125 100% $5,808 $1,240,069 $155,897
$0
Capital Projects
$0 $0
$0
$0 $0 $0 $0
School Nutrition
$479,509 $0
$0
$102,938 $619,916
$0 $1,202,364
Grand Total
Total
Per-
Amount cent
$8,455,847 37.1%
$12,154,000 53.3%
$79,214 0.3%
$251,377 1.1% $1,874,916 8.2%
$2,100 0.0% $22,817,456 100%
Instruction
Media Instruction
Support Pupil Services General Admin. School Admin. Trans-
portation Maint. & Ops. Capital Projects School Food Debt Service
Total
$12,660,062 66.7% $3,636 $441,430 2.3% $127
$904,777 4.8% $260
$702,720 3.7% $202
$577,612 3.0% $166
$1,253,061 6.6% $360
$608,359 3.2% $175
$1,587,851 8.4% $456
$222,993 1.2% $64
$31,173 0.2%
$9
$0 0.0%
$0
K-12 Expenditures
$699,104
$79,214
$0
$0
$0
$0
$309,207
$56,483
$0
$0
$25
$0
$171
$0
$0
$169,559
$23,657
$0
$0
$0
$44,110
$562
$0
$0
$1,179
$72
$58
$0
$0
$0
$19,032
$0
$0
$0
$0
$0
$0
$0
$0
$336
$0
$0
$0 $1,678,939
$0
$0
$0
$0
$0 $1,266,191
$0
$0
$0
$0
$0
$18,990,042 100% $5,455 $1,241,087 $159,976
$0 $1,678,939 $1,267,903
$13,438,407 57.6% $441,601 1.9%
$1,270,469 5.4% $895,936 3.8% $623,464 2.7%
$1,253,192 5.4% $627,391 2.7%
$1,588,188 6.8% $1,901,933 8.1% $1,297,364 5.6%
$0 0.0%
$23,337,950 100%
Salaries and Benefits as Percentages of Revenues and of Expenditures
Teachers and Paraprofessionals
Salaries $8,826,929
Benefits $2,600,302
Percentage of Revenues Percentage of Expenditures
Total of
Total of
General Fund
General Fund
Title Programs
Title Programs
Lottery K-12
Lottery K-12
Total Salaries
and
Total
and
Total
and Benefits All Other K-12 K - 12 All Other K-12 K - 12
$11,427,231
52.9%
50.1%
56.0%
49.0%
School Administration
$681,860
$228,410
$910,270
4.2%
4.0%
4.5%
3.9%
General Administration
$294,481
$96,853
$391,334
1.8%
1.7%
1.9%
1.7%
1998-99 GEORGIA PUBLIC EDUCATION REPORT CARD
Carrollton City Schools - 766
Prepared by Georgia Department of Education
Page 8
CERTIFIED PERSONNEL DATA
Number
Average Annual Salary Positions Average Contract Days
Average Daily Salary
Full-time Personnel Part-time
Sex Male Female
4 Yr Bachelor's Certificate 5 Yr Master's
Level 6 Yr Specialist's 7 Yr Doctoral Other*
Black
White Race/ Hispanic Ethnicity Asian
American Indian
Multiracial
Years Experience
<1 1-10 11-20 21-30 >30
Average
Administrators
17.00
$71,748.12 221.76
$323.53
17 0
9 8
0 5 10 2 0
3 14
0 0 0 0
0 2 4 11 0
21.29
Support Personnel PK-12 Teachers
21.95
210.66
$45,961.51 198.20
$231.89
$39,108.21 190.57
$205.22
21
209
2
3
3
44
20
168
2
89
10
90
9
32
2
0
0
1
0
19
23
193
0
0
0
0
0
0
0
0
3
21
4
85
6
64
8
40
2
2
16.09
12.05
*Includes One- and Two-Year Vocational Certificates.
Certified Staff Position Ratios
Teacher/Administrator Ratio 12:1
Teacher/Support Person Ratio 10:1
Teacher/Staff Ratio 5:1
Student Enrollment/All Teachers 17:1
Certified Personnel by Category
84.1% 100%
6.7%
9.1%
80% 60%
40%
20%
0%
Teachers
Administrators
Support Personnel
1998-99 GEORGIA PUBLIC EDUCATION REPORT CARD
Carrollton City Schools - 766
Prepared by Georgia Department of Education
Page 9
1998-99 GEORGIA PUBLIC EDUCATION REPORT CARD
CARROLLTON CITY SCHOOLS
Carrollton Elementary School - 7660193
Grade Range PK-5
The Georgia Public Education Report Card is designed to assist systems and schools in educational improvement. This report card contains a variety of data elements. An explanation of the terms is provided as a companion to the report card data. Please refer to the definitions for the most effective use of the reported data.
STUDENT DATA
Total
K-5
1,709
PK
185
Enrollment, by Race/Ethnicity and Sex
Black
White Hispanic
American Asian Indian
Multiracial
728 42.6%
859 50.3%
53 3.1%
20 1.2%
1 0.1%
48 2.8%
116 62.7%
49 26.5%
10 5.4%
4 2.2%
0 0.0%
6 3.2%
Male Female
880 51.5%
829 48.5%
101 54.6%
84 45.4%
Enrollment in Selected Programs
Program
Program % of Student Enrollment Population
Gifted (Grades K-12)
86
5.0%
Alternative Programs (Grades 6-12)
N/A
N/A
Students Eligible to Receive Free/Reduced Lunches
Number
Percent
School System
941 1,494
49.7% 40.3%
Dropout Rate *
Number
Rate
School System
N/A N/A
N/A N/A
* Dropout rates are not applicable for grades PK-5.
Enrollment in Compensatory Programs
Program
Program % of Student Enrollment Population
Special Education (Grades K-12)
361 21.1%
(PK)
46
N/A
English to Speakers of Other Languages (ESOL) (Grades K-12)
1
< 1%
Remedial Education (Grades 2-5, 9-12)
212 18.3%
Special Instructional Assistance (SIA) (Grades K-3)
220 19.2%
Title I (Grades K-12)
This school has a Targeted Assistance program.
Total 80
Retained Students, by Race/Ethnicity and Sex
Black
White Hispanic
American MultiAsian Indian racial
44 55.0%
27
9
33.8% 11.3%
0 0.0%
0 0.0%
0 0.0%
Male Female
50
30
62.5% 37.5%
Prepared by Georgia Department of Education
Page 1
STATE-REQUIRED TEST DATA
NORM-REFERENCED TESTS Grade 3
Iowa Tests of Basic Skills (ITBS) Each chart reflects data for three years of testing.
Reading Comprehension 50
50 50 54 0
98-99
48 48 53 97-98
48 48 52 96-97
Mathematics
School 50
System
State
0
46 46 61 98-99
52 52 61 97-98
55 55 59 96-97
School System State
Reading Vocabulary 50
41 41 50 0
98-99
43 43 50 97-98
48 48 49 96-97
Language Arts
School 50
System
State
0
39 39 64 98-99
61 61 62 97-98
63 63 59 96-97
School System State
Social Studies 50
41 41 56 0
98-99
48 48 55 97-98
50 50 55 96-97
Science
School 50
System
State
0
51 51 59 98-99
50 50 59 97-98
54 54 58 96-97
School System State
Sources of Information
Composite Score
50
46 46 57 0
98-99
School 50
System
51 51 56 97-98
56 56 55 96-97
State 0
44 44 58 98-99
50 50 57 97-98
1998-99 GEORGIA PUBLIC EDUCATION REPORT CARD Carrollton Elementary School - 7660193
Prepared by Georgia Department of Education
54 54 56 96-97
Scores Reported in Percentiles
School System State
Page 2
STATE-REQUIRED TEST DATA
NORM-REFERENCED TESTS Grade 5
Iowa Tests of Basic Skills (ITBS) Each chart reflects data for three years of testing.
Reading Comprehension
Mathematics
50
53 53 53 0
98-99
50 50 53 97-98
55 55 52 96-97
School 50
System
State
0
59 59 59 98-99
54 54 58 97-98
63 63 57 96-97
School System State
Reading Vocabulary 50
51 51 48 0
98-99
45 45 48 97-98
53 53 46 96-97
Language Arts
School 50
System
State
0
64 64 63 98-99
57 57 61 97-98
61 61 58 96-97
School System State
Social Studies 50
58 58 57 0
98-99
54 54 56 97-98
62 62 55 96-97
Science
School 50
System
State
0
60 60 60 98-99
58 58 59 97-98
63 63 59 96-97
School System State
Sources of Information
Composite Score
50
60 60 58 0
98-99
School 50
System
57 57 58 97-98
61 61 57 96-97
State 0
58 58 57 98-99
53 53 56 97-98
60 60 55 96-97
1998-99 GEORGIA PUBLIC EDUCATION REPORT CARD Carrollton Elementary School - 7660193
Prepared by Georgia Department of Education
Scores Reported in Percentiles
School System State
Page 3
STATE-REQUIRED TEST DATA
PERFORMANCE ASSESSMENTS
Grade 5 Writing Assessment
Percent at Developmental Stages:
1998-99 School System State
1997-98 School System State
1996-97 School System State
Stage Stage Stage Stage Stage Stage
1:The Emerging Writer 2:The Developing Writer 3:The Focusing Writer 4:The Experimenting 5:The Engaging Writer 6:The Extending Writer
0% 0% 15% 45% 24% 15%
0% 0% 15% 45% 24% 15%
0% 1% 16% 41% 29% 12%
0% 4% 23% 38% 24% 10%
0% 4% 23% 38% 24% 10%
0% 3% 19% 41% 27% 10%
0% 4% 19% 34% 25% 16%
0% 4% 19% 34% 25% 16%
0% 3% 21% 37% 26% 12%
AWARDS / RECOGNITION DATA
Schools in Georgia may receive recognition in the following programs: Charter School Pay for Performance Program Georgia School of Excellence National Blue Ribbon School Carrollton Elementary School did not receive recognition in any of these programs during the 1998-99 school year.
1998-99 GEORGIA PUBLIC EDUCATION REPORT CARD Carrollton Elementary School - 7660193
Prepared by Georgia Department of Education
Page 4
CERTIFIED PERSONNEL DATA
Positions Number Average Contract Days
Personnel Sex
Certificate
Years Experience
Full-time Part-time
Male Female
4 Yr Bachelor's 5 Yr Master's 6 Yr Specialist's 7 Yr Doctoral Other*
<1 1-10 11-20 21-30 >30
Average
Administrators
3.00 216.67
3 0
1 2
0 1 2 0 0 0 1 1 1 0 18.33
Support Personnel
7.00 196.43
7 0
1 6
2 3 2 0 0 1 2 2 2 0 11.71
PK-12 Teachers
109.50 190.23
109 1
6 104
52 43 15
0 0 14 43 33 18 2 11.66
*Includes One- and Two-Year Vocational Certificates.
ACCREDITATION DATA
Accredited by Southern Association of Colleges and Schools (SACS):
Elementary/Middle Commission. Accredited with Quality by Georgia
Accrediting Commission (GAC).
1998-99 GEORGIA PUBLIC EDUCATION REPORT CARD Carrollton Elementary School - 7660193
Prepared by Georgia Department of Education
Page 5
1998-99 GEORGIA PUBLIC EDUCATION REPORT CARD
CARROLLTON CITY SCHOOLS
Carrollton High School - 7661050
Grade Range 9-12
The Georgia Public Education Report Card is designed to assist systems and schools in educational improvement. This report card contains a variety of data elements. An explanation of the terms is provided as a companion to the report card data. Please refer to the definitions for the most effective use of the reported data.
Total 954
STUDENT DATA
9-12 Enrollment, by Race/Ethnicity and Sex
Black
White Hispanic
American Multi-
Asian Indian
racial
317 33.2%
608 63.7%
13 1.4%
13 1.4%
0 0.0%
3 0.3%
Male Female
443 46.4%
511 53.6%
Enrollment in Selected Programs
Program
Gifted (Grades K-12)
Program % of Student Enrollment Population
32
3.4%
Non-Vocational Labs (Grades 9-12)
809
Vocational Labs
(Grades 9-12)
563
Alternative Programs (Grades 6-12)
9
84.8% 59.0%
< 1%
Students Eligible to Receive Free/Reduced Lunches
Number
Percent
School System
241 1,494
25.3% 40.3%
Enrollment in Compensatory Programs
Program
Program % of Student Enrollment Population
Special Education (Grades K-12) PK
59
6.2%
0
N/A
English to Speakers of Other Languages (ESOL) (Grades K-12)
2
< 1%
Remedial Education (Grades 2-5, 9-12)
0
0.0%
Title I (Grades K-12)
This school has no Title I program.
Dropout Rate for Grades 9-12
Number
Rate
School System
36
3.5%
36
3.5%
Total 62
Retained Students, by Race/Ethnicity and Sex
Black
White Hispanic
American MultiAsian Indian racial
38 61.3%
22 35.5%
1 1.6%
0 0.0%
0 0.0%
1 1.6%
Male Female
40
22
64.5% 35.5%
Prepared by Georgia Department of Education
Page 1
STATE-REQUIRED TEST DATA
GEORGIA HIGH SCHOOL GRADUATION TESTS (GHSGT)
Percent of Regular Program 11th Graders Passing the Georgia High School Graduation Tests on First Administration
English Language Arts Mathematics Social Studies Science
All Components listed above
Writing
1998-99
School System State
95% 86% 84% 74%
95% 86% 84% 74%
96% 88% 80% 72%
71% 71% 68%
97% 97% 93%
1997-98
School System State
92% 91% 81% 80%
92% 91% 81% 80%
94% 88% 78% 74%
75% 75% 68%
91% 91% 92%
1996-97
School System State
94% 87% 80% 76%
94% 87% 80% 76%
94% 87% 78% 74%
72% 72% 67%
96% 96% 93%
GRADUATE DATA
1999 Graduates by Credentials, Race/Ethnicity and Sex
Diplomas with Both College Prep. & Voc. Endorsements
Diplomas with College Prep. Endorsements Diplomas with Vocational Endorsements General High School Diplomas Special Education Diplomas
Total All Diplomas
Certificates of Performance
Total Graduates
Total 41
102 40 0
Black
11 26.8%
10 9.8%
15 37.5%
0
White Hispanic
28 68.3%
1 2.4%
91 89.2%
0 0.0%
23 57.5%
1 2.5%
0
0
American MultiAsian Indian racial
1 2.4%
0 0.0%
0 0.0%
1 1.0%
0 0.0%
0 0.0%
0 0.0%
0 0.0%
1 2.5%
0
0
0
6
4
1
0
1
0
0
66.7% 16.7% 0.0% 16.7% 0.0% 0.0%
189
40
143
2
3
0
1
21.2% 75.7% 1.1% 1.6% 0.0% 0.5%
13
9
3
0
1
0
0
69.2% 23.1% 0.0% 7.7% 0.0% 0.0%
202
49
146
2
4
0
1
24.3% 72.3% 1.0% 2.0% 0.0% 0.5%
Male Female
14
27
34.1% 65.9%
43
59
42.2% 57.8%
28
12
70.0% 30.0%
0
0
3 50.0%
88 46.6%
8 61.5%
96 47.5%
3 50.0%
101 53.4%
5 38.5%
106 52.5%
HOPE Scholarships
School System
Number of 1999 Graduates 2 0 2
Number Eligible
146
Percent Eligible
72.3%
202 146 72.3%
State
65,548 40,292 61.5%
High School Completion Rate
Percent of 1995Grade 9 Enrollment in Graduating Class of1999 School System State
Completion Rate '95-'99 76.2% 76.2% 68.9%
1998-99 GEORGIA PUBLIC EDUCATION REPORT CARD
Carrollton High School - 7661050
Prepared by Georgia Department of Education
Page 2
COLLEGE ADMISSIONS / CREDIT TEST DATA
Scholastic Assessment Test (SAT)
Based on students' highest verbal and highest math scores
No. Taking
Average Score
Tests Verbal Math Total
Based on students' last test administration
Average Score Verbal Math Total
School
150
College Prep. Endorsement
Other Diplomas
System
150
College Prep. Endorsement
Other Diplomas
Georgia
41,958
498 492
990
509 498 1007
358 366
724
498 492
990
509 498 1007
358 366
724
492 488
980
487 N/A N/A
487 N/A N/A
483
480 N/A N/A
480 N/A N/A
479
967 N/A N/A
967 N/A N/A
962
Nation
952,913 N/A N/A N/A
502 508 1010
American College Testing (ACT)
Advanced Placement Exams (AP)
Number taking tests: English Mathematics Reading Science Reasoning CompositeScore
3 2 School System State
20.5 20.5 19.1
20.8 20.8 19.9
19.0 20.5
19.0 20.5
20.2 19.9
20.4 20.4 19.9
No. of Students Taking Tests
No. of Tests Taken No. of Test Scores
3 or Higher Percent of Test
Scores 3 or Higher
School 34 46 20
43.5%
System State 34 15,225 46 23,969 20 13,024
43.5% 54.3%
POST-SECONDARY DATA
Graduates Entering Georgia Public Colleges
Graduates Entering Georgia Public Colleges and Requiring Learning Support (LS)
1998 Graduates Entering in 1998-99
1997 Graduates Entering in 1997-98
Percent of Graduating Number Class
School
93
52.8%
System 9 3
52.8%
School
88
44.7%
System 8 8
44.7%
Number Requiring
LS 16 16
13 13
Percent of those attending Georgia
Public Colleges
17.2%
17.2%
14.8%
14.8%
In previous years, the Report Card presented College Prep Curriculum information provided by the Board of Regents on students requiring Learning Support. Due to inconsistencies in the data provided by the Board of Regents in defining College Prep Completers versus Local Board of Education data defining College Prep Endorsements, the Department of Education Report Card will not provide this information until discrepancies can be reconciled.
Graduates Entering Georgia Public Technical and Adult Schools
1998 Graduates School System
Entering Number 12 12
1998-99 Percent
6.8% 6.8%
Entering Number N/A N/A
1997-98 Percent
N/A N/A
1997 Graduates School
3
1.5%
System
3
1.5%
11
5.6%
11
5.6%
1998-99 GEORGIA PUBLIC EDUCATION REPORT CARD Carrollton High School - 7661050
Prepared by Georgia Department of Education
Page 3
CERTIFIED PERSONNEL DATA
Positions Number Average Contract Days
Administrators
3.00 223.33
Support Personnel
5.00 208.00
PK-12 Teachers
52.16 191.34
Personnel Sex
Certificate
Years Experience
Full-time Part-time
Male Female
4 Yr Bachelor's 5 Yr Master's 6 Yr Specialist's 7 Yr Doctoral Other*
<1 1-10 11-20 21-30 >30
Average
3 0
3 0
0 1 2 0 0
0 0 1 2 0
22.33
5 0
1 4
0 1 3 1 0
0 1 0 3 1
22.80
51 2
26 27
17 24 11
0 1
3 19 14 17
0
14.36
*Includes One- and Two-Year Vocational Certificates.
ACCREDITATION DATA
Accredited by Southern Association of Colleges and Schools (SACS): Secondary/Middle Commission. Accredited with Quality by Georgia Accrediting Commission (GAC).
AWARDS / RECOGNITION DATA
The Georgia School of Excellence Program recognizes exemplary schools that have excellent, successful programs in many areas of school life. Each year, in a statewide competition, one elementary, one middle and one high school from each of Georgia's 11 congressional districts may be selected for this honor.
Carrollton High School was designated a 1998-99 Georgia School of Excellence.
1998-99 GEORGIA PUBLIC EDUCATION REPORT CARD Carrollton High School - 7661050
Prepared by Georgia Department of Education
Page 4
1998-99 GEORGIA PUBLIC EDUCATION REPORT CARD
CARROLLTON CITY SCHOOLS
Carrollton Jr High School - 7661550
Grade Range 6-8
The Georgia Public Education Report Card is designed to assist systems and schools in educational improvement. This report card contains a variety of data elements. An explanation of the terms is provided as a companion to the report card data. Please refer to the definitions for the most effective use of the reported data.
STUDENT DATA
Total 856
6-8 Enrollment, by Race/Ethnicity and Sex
Black
White Hispanic
American Multi-
Asian Indian
racial
340 39.7%
485 56.7%
17 2.0%
9 1.1%
0 0.0%
5 0.6%
Male 447
52.2%
Female 409
47.8%
Enrollment in Selected Programs
Program
Gifted (Grades K-12)
Program % of Student Enrollment Population
86
10.0%
Alternative Programs (Grades 6-12)
4
< 1%
Students Eligible to Receive Free/Reduced Lunches
Number
Percent
School System
312 1,494
36.4% 40.3%
Enrollment in Compensatory Programs
Program
Program % of Student Enrollment Population
Special Education (Grades K-12) (PK)
129 15.1%
0
N/A
English to Speakers of Other Languages (ESOL) (Grades K-12)
0
0.0%
Title I (Grades K-12)
This school has a Targeted Assistance program.
Dropout Rate for Grades 6-8
Number
Rate
School System
0
0.0%
0
0.0%
Total 6
Retained Students, by Race/Ethnicity and Sex
Black
White Hispanic
American MultiAsian Indian racial
5 83.3%
1 16.7%
0 0.0%
0 0.0%
0 0.0%
0 0.0%
Male Female
5
1
83.3% 16.7%
Prepared by Georgia Department of Education
Page 1
STATE-REQUIRED TEST DATA
NORM-REFERENCED TESTS Grade 8
Iowa Tests of Basic Skills (ITBS) Each chart reflects data for three years of testing.
Reading Comprehension 50
54 54 49 0
98-99
46 46 48 97-98
53 53 48 96-97
Mathematics
School 50
System
State
0
57 57 56 98-99
50 50 55 97-98
54 54 54 96-97
School System State
Reading Vocabulary 50
49 49 46 0
98-99
41 41 45 97-98
50 50 44 96-97
Language Arts
School 50
System
State
0
65 65 60 98-99
56 56 58 97-98
61 61 56 96-97
School System State
Social Studies 50
60 60 54 0
98-99
51 51 53 97-98
58 58 53 96-97
Science
School 50
System
State
0
58 58 56 98-99
52 52 55 97-98
55 55 53 96-97
School System State
Sources of Information
Composite Score
50
62 62 57 0
98-99
School 50
System
54 54 56 97-98
60 60 55 96-97
State 0
60 60 56 98-99
51 51 54 97-98
1998-99 GEORGIA PUBLIC EDUCATION REPORT CARD Carrollton Jr High School - 7661550
Prepared by Georgia Department of Education
57 57 54 96-97
Scores Reported in Percentiles
School System State
Page 2
STATE-REQUIRED TEST DATA
Categories of Scaled Scores
Inadequate (less than 162)
Minimal (162-209)
Good
(210-247)
Very Good (greater than 247)
Average Scaled Score: (Range 100-300)
PERFORMANCE ASSESSMENTS
Grade 8 Writing Assessment
1998-99 Percent Scoring
1997-98 Percent Scoring
1996-97 Percent Scoring
School System State School System State School System State
3% 29% 51% 17%
3% 29% 51% 17%
8% 40% 41% 11%
8% 43% 37% 12%
8% 43% 37% 12%
11% 46% 34%
8%
14% 34% 38% 14%
14% 34% 38% 14%
15% 46% 30%
8%
219
219
208 208
208 202 207
207 198
AWARDS / RECOGNITION DATA
Schools in Georgia may receive recognition in the following programs: Charter School Pay for Performance Program Georgia School of Excellence National Blue Ribbon School Carrollton Jr High School did not receive recognition in any of these programs during the 1998-99 school year.
1998-99 GEORGIA PUBLIC EDUCATION REPORT CARD Carrollton Jr High School - 7661550
Prepared by Georgia Department of Education
Page 3
CERTIFIED PERSONNEL DATA
Positions Number Average Contract Days
Personnel Sex
Certificate
Years Experience
Full-time Part-time
Male Female
4 Yr Bachelor's 5 Yr Master's 6 Yr Specialist's 7 Yr Doctoral Other*
<1 1-10 11-20 21-30 >30
Average
Administrators
3.00 210.00
3 0
1 2
0 1 2 0 0 0 1 0 2 0 18.67
Support Personnel
3.00 200.00
3 0
1 2
0 1 2 0 0 0 0 1 2 0 22.33
PK-12 Teachers
47.00 190.53
47 0
12 35
19 22
6 0 0 3 22 17 5 0 10.77
*Includes One- and Two-Year Vocational Certificates.
ACCREDITATION DATA
Accredited by Southern Association of Colleges and Schools (SACS): Secondary/Middle Commission.
Accredited with Quality by Georgia Accrediting Commission (GAC).
1998-99 GEORGIA PUBLIC EDUCATION REPORT CARD Carrollton Jr High School - 7661550
Prepared by Georgia Department of Education
Page 4
1998-99 GEORGIA PUBLIC EDUCATION REPORT CARD CARTERSVILLE CITY SCHOOLS - 767
The Georgia Public Education Report Card is designed to assist systems and schools in educational improvement. This report card contains a variety of data elements. An explanation of the terms is provided as a companion to the report card data. Please refer to the definitions for the most effective use of the reported data.
Total
K-12
3,242
PK
125
STUDENT DATA
Enrollment, by Race/Ethnicity and Sex
Black
White Hispanic
American Multi-
Asian Indian
racial
789 24.3%
2,250 69.4%
135 4.2%
30 0.9%
3 0.1%
35 1.1%
25 20.0%
86 68.8%
11 8.8%
0 0.0%
0 0.0%
3 2.4%
Male
1,647 50.8%
58 46.4%
Female
1,595 49.2%
67 53.6%
Enrollment in Selected Programs
Program
Program % of Student Enrollment Population
Gifted (Grades K-12)
303
9.3%
Non-Vocational Labs (Grades 9-12)
792
92.7%
Vocational Labs (Grades 9-12)
395
46.3%
Alternative Programs (Grades 6-12)
0
0.0%
Students Eligible to Receive Free/Reduced Lunches
Number
Percent
1,160
34.5%
Dropout Rate
Number
Percent
6-12 9-12
33
1.8%
33
3.4%
Enrollment in Compensatory Programs
Program
Program % of Student Enrollment Population
Special Education
(Grades K-12)
316
PK
16
English to Speakers of
Other Languages (ESOL)
59
(Grades K-12)
Remedial Education (Grades 2-5, 9-12)
281
Special Instructional
Assistance (SIA)
85
(Grades K-3)
Title I (Grades K-12) Number of schools with: Schoolwide program Targeted Assistance program No Title I program
9.7% N/A
1.8%
14.7%
7.6%
0 3 1
Total 179
Retained Students, by Race/Ethnicity and Sex
Black
White Hispanic
American MultiAsian Indian racial
71 39.7%
92 51.4%
12 6.7%
1 0.6%
0 0.0%
3 1.7%
Male Female
102
77
57.0% 43.0%
Prepared by Georgia Department of Education
Page 1
STATE-REQUIRED TEST DATA
NORM-REFERENCED TESTS
Grade 3 Iowa Tests of Basic Skills (ITBS) Each chart reflects data for three years of testing.
Reading Comprehension
Mathematics
50
65 54 64 53 65 52 0
98-99 97-98 96-97
System State
50
74 61 74 61 77 59 0
98-99 97-98 96-97
System State
Reading Vocabulary
50
57 50 55 50 62 49 0
98-99 97-98 96-97
System State
Social Studies
50
60 56 60 55 63 55 0
98-99 97-98 96-97
System State
Language Arts
50
66 64 64 62 69 59 0
98-99 97-98 96-97
System State
Science
50
66 59 69 59 71 58 0
98-99 97-98 96-97
System State
Sources of Information
Composite Score
50
63 57 0
98-99
System
50
64 56 70 55 97-98 96-97
State
65 58 65 57 0
98-99 97-98
1998-99 GEORGIA PUBLIC EDUCATION REPORT CARD Cartersville City Schools
Prepared by Georgia Department of Education
System State Scores Reported 69 56 in Percentiles 96-97
Page 2
STATE-REQUIRED TEST DATA
NORM-REFERENCED TESTS
Grade 5 Iowa Tests of Basic Skills (ITBS) Each chart reflects data for three years of testing.
Reading Comprehension
Mathematics
50
60 53 66 53 60 52 0
98-99 97-98 96-97
System State
50
70 59 72 58 70 57 0
98-99 97-98 96-97
System State
Reading Vocabulary
50
60 48 62 48 59 46 0
98-99 97-98 96-97
System State
Social Studies
50
65 57 67 56 62 55 0
98-99 97-98 96-97
System State
Language Arts
50
67 63 67 61 58 58 0
98-99 97-98 96-97
System State
Science
50
70 60 73 59 68 59 0
98-99 97-98 96-97
System State
Sources of Information
Composite Score
50
65 58 0
98-99
System
50
65 58 64 57 97-98 96-97
State
66 57 69 56 0
98-99 97-98
1998-99 GEORGIA PUBLIC EDUCATION REPORT CARD Cartersville City Schools
Prepared by Georgia Department of Education
System State Scores Reported 64 55 in Percentiles 96-97
Page 3
STATE-REQUIRED TEST DATA
NORM-REFERENCED TESTS Grade 8
Iowa Tests of Basic Skills (ITBS) Each chart reflects data for three years of testing.
Reading Comprehension
Mathematics
50
60 49 55 48 55 48 0
98-99 97-98 96-97
System State
50
74 56 74 55 76 54 0
98-99 97-98 96-97
System State
Reading Vocabulary
50
56 46 49 45 52 44 0
98-99 97-98 96-97
System State
Language Arts
50
70 60 65 58 67 56 0
98-99 97-98 96-97
System State
Social Studies
50
63 54 60 53 64 53 0
98-99 97-98 96-97
System State
Science
50
60 56 62 55 63 53 0
98-99 97-98 96-97
System State
Sources of Information
Composite Score
50
63 57 0
98-99
System
50
59 56 65 55 97-98 96-97
State
67 56 63 54 0
98-99 97-98
1998-99 GEORGIA PUBLIC EDUCATION REPORT CARD Cartersville City Schools
Prepared by Georgia Department of Education
System State Scores Reported 66 54 in Percentiles 96-97
Page 4
STATE-REQUIRED TEST DATA
PERFORMANCE ASSESSMENTS
Grade 5 Writing Assessment
1998-99
1997-98
1996-97
Percent at Developmental Stages:
Comparison
Comparison
Comparison
System Group State System Group State System Group State
Stage Stage Stage Stage Stage Stage
1: The Emerging Writer 2: The Developing Writer 3: The Focusing Writer 4: The Experimenting Writer 5: The Engaging Writer 6: The Extending Writer
0% 1% 13% 40% 35% 11%
0% 1% 16% 44% 29% 10%
0% 1% 16% 41% 29% 12%
0% 1% 8% 41% 39% 11%
0% 1% 18% 44% 27% 9%
0% 3% 19% 41% 27% 10%
0% 2% 17% 29% 38% 12%
0% 3% 19% 37% 29% 12%
0% 3% 21% 37% 26% 12%
Grade 8 Writing Assessment
1998-99 Percent Scoring 1997-98 Percent Scoring 1996-97 Percent Scoring
Categories of Scaled Scores
Comparison
Comparison
Comparison
System Group State System Group State System Group State
Inadequate (less than 162)
Minimal (162-209)
Good
(210-247)
Very Good (greater than 247)
5% 36% 48% 11%
6% 40% 44% 10%
8% 40% 41% 11%
13% 39% 42%
6%
9% 49% 35%
7%
11% 46% 34%
8%
8% 40% 37% 15%
10% 45% 35%
9%
15% 46% 30%
8%
Average Scaled Score: (Range 100-300)
212
209 208
203
202 202
211
204 198
GEORGIA HIGH SCHOOL GRADUATION TESTS (GHSGT)
Percent of Regular Program 11th Graders Passing the Georgia High School Graduation Tests on First Administration
1998-99
1997-98
1996-97
Comparison
Comparison
Comparison
System Group State System Group State System Group State
English Language Arts Mathematics Social Studies Science
99% 95% 88% 79%
96% 90% 81% 77%
96% 88% 80% 72%
98% 93% 82% 82%
96% 92% 80% 78%
94% 88% 78% 74%
96% 96% 88% 86%
95% 92% 83% 79%
94% 87% 78% 74%
All Components listed above 7 7 %
72% 68% 77%
72% 68% 82%
74% 67%
Writing
100% 95% 93% 95%
94% 92% 95%
95% 93%
1998-99 GEORGIA PUBLIC EDUCATION REPORT CARD
Cartersville City Schools
Prepared by Georgia Department of Education
Page 5
GRADUATE DATA
1999 Graduates by Credentials, Race/Ethnicity and Sex
Diplomas with Both College Prep. & Voc. Endorsements
Diplomas with College Prep. Endorsements Diplomas with Vocational Endorsements General High School Diplomas Special Education Diplomas
Total All Diplomas
Certificates of Performance
Total Graduates
Total 42 59 56 0 3
160 0
Black
3 7.1%
2 3.4%
19 33.9%
0
American MultiWhite Hispanic Asian Indian racial
36 85.7%
55 93.2%
35 62.5%
0
1 2.4%
0 0.0%
2 3.6%
0
0 0.0%
0 0.0%
0 0.0%
0
2 4.8%
2 3.4%
0 0.0%
0
0 0.0%
0 0.0%
0 0.0%
0
Male Female
24 57.1%
23 39.0%
30 53.6%
0
18 42.9%
36 61.0%
26 46.4%
0
2 66.7%
26 16.3%
0
1 33.3%
127 79.4%
0
0 0.0%
3 1.9%
0
0 0.0%
0 0.0%
0
0 0.0%
4 2.5%
0
0 0.0%
0 0.0%
0
0
3
0.0% 100.0%
77
83
48.1% 51.9%
0
0
160
26
127
3
0
4
0
77
83
16.3% 79.4% 1.9% 0.0% 2.5% 0.0% 48.1% 51.9%
HOPE Scholarships
System State
Number of 1999 Graduates 1 6 0
Number Eligible
109
Percent Eligible
68.1%
65,548 40,292 61.5%
High School Completion Rate Percent of 1995Grade 9 Enrollment
in Graduating Class of1999
System
State
Completion Rate '95-'99 76.9% 68.9%
COLLEGE ADMISSIONS / CREDIT TEST DATA
Scholastic Assessment Test (SAT)
No. Taking
Average Score
Tests
Verbal Math Total
Based on students' highest verbal and highest math scores
System College Prep. Endorsement Other Diplomas
514 522 1036 538 552 1090 411 400 811
Georgia
492 488 980
Based on students' last test administration
System Georgia
129 41,958
503 510 1013 483 479 962
Nation
952,913 502 508 1010
American College Testing (ACT)
System State Nation
English
19.6
19.1 20.4
Mathematics
20.5
19.9 20.7
Reading
22.5
20.2 21.3
Science Reasoning 21.0
19.9 21.0
CompositeScore 21.1
19.9 21.9
Advanced Placement Exams (AP)
No. of Students Taking Tests
No. of Tests Taken No. of Test Scores
3 or Higher Percent of Test
Scores 3 or Higher
System State 30 15,225 30 23,969 15 13,024
50.0% 54.3%
1998-99 GEORGIA PUBLIC EDUCATION REPORT CARD Cartersville City Schools
Prepared by Georgia Department of Education
Page 6
POSTSECONDARY DATA
Graduates Entering Georgia Public Colleges and Universities
Graduates Entering Georgia Public Colleges and Universities and
Requiring Learning Support (LS)
1998 Graduates Entering 1998-99
1997 Graduates Entering 1997-98
Percent of Graduating Number Class
80
49.7%
74
48.7%
Number Requiring
LS
13
15
Percent of those attending Georgia
Public Colleges
16.3%
20.3%
In previous years, the Report Card presented College Prep Curriculum information provided by the Board of Regents on students requiring Learning Support. Due to inconsistencies in the data provided by the Board of Regents in defining College Prep Completers versus Local Board of Education data defining College Prep Endorsements, the Department of Education Report Card will not provide this information until discrepancies can be reconciled.
Graduates Entering Georgia Public Technical and Adult Schools
Entering 1998-99 Entering 1997-98
Number Percent
Number Percent
1998 Graduates 1997 Graduates
7
4.3%
0
0.0%
N/A 3
N/A 2.0%
ACCREDITATION / RECOGNITION DATA
Southern Association of Colleges and Schools (SACS) Accrediting Commission
Secondary/Middle Commission Elementary/Middle Commission Both Elementary/Secondary Commissions Joint Commission Candidate for Accreditation
Accreditation by Georgia Accrediting Commission (GAC)
Accredited by GAC Accredited with Quality by GAC
Number of Schools
1 3 0 0 0
Number of Schools
0 4
Awards / Recognition
State Recognized Program
Number of Schools
Charter School
4
Pay for Performance Recipient
0
Georgia School of Excellence
1
National Blue Ribbon School
0
COMMUNITY DATA
Number of Children Eligible for Migrant Education Number of Families-At-Risk * Number of Food Stamp Participants * Number of Families Receiving TANF * ** Per Capita Income * Unemployment Rate * 1990 Population * Projected 2000 Population * Projected 2010 Population *
* Data Available at County Level Only ** Known as AFDC before January 1997
0 264 2,542 207 $19,729 4.4% 55,911 71,220 79,747
1998-99 GEORGIA PUBLIC EDUCATION REPORT CARD Cartersville City Schools
Prepared by Georgia Department of Education
Page 7
FISCAL DATA
Millage Rate
15.56
* Fall 1998 Property Tax Digest is used to calculate the 98-99 Value of One Mill
FTE Count
FTE Count used for Allotment Calculation 3,176.0 Fall '98 FTE Count 3,242
Value of One Mill
$623,091 $196.18 per Allotment FTE
Sources: Local State-QBE State-
Lottery State-
Other Federal Other
Total
PerGeneral Fund cent Per FTE
$10,229,252 55.8% $3,221 $7,933,519 43.3% $2,498
K-12 Revenues
Lottery K-12
and
Title
All Other
Programs
K-12
$0
$0
Bonded Debt $0
$0
$0
$0
$0 0.0%
$0
$0
$69,541
$0
$157,338 0.9% $50
$0
$830
$0
$6,842 0.0%
$2 $1,074,118
$0
$0
$2,850 0.0%
$1
$0
$0
$0
$18,329,801 100% $5,772 $1,074,118
$70,371
$0
Capital Projects $2,766,296
$0
$0
$0 $0 $0 $2,766,296
School Nutrition
$647,318 $0
$0
$70,806 $549,092
$0 $1,267,217
Grand Total
Total
Per-
Amount cent
$13,642,867 58.0%
$7,933,519 33.7%
$69,541 0.3%
$228,974 1.0% $1,630,052 6.9%
$2,850 0.0% $23,507,805 100%
Instruction
Media Instruction
Support Pupil Services General Admin. School Admin. Trans-
portation Maint. & Ops. Capital Projects School Food Debt Service
Total
$11,482,583 65.2% $3,615 $427,089 2.4% $134
$591,651 3.4% $186
$1,085,897 6.2% $342
$855,891 4.9% $269
$1,070,272 6.1% $337
$485,028 2.8% $153
$1,609,315 9.1% $507
$0 0.0%
$0
$0 0.0%
$0
$0 0.0%
$0
K-12 Expenditures
$771,233
$70,591
$0
$0
$0
$3,310
$0
$0
$0
$0
$115,357
$0
$0
$0
$0
$131,850
$0
$0
$0
$0
$47,220
$0
$0
$0
$0
$1,923
$0
$0
$0
$0
$789
$0
$0
$0
$0
$0
$0
$0
$0
$0
$0
$0
$0 $2,665,787
$0
$0
$0
$0
$0 $1,166,319
$0
$0
$0
$0
$0
$17,607,729 100% $5,543 $1,071,685
$70,591
$0 $2,665,787 $1,166,319
$12,324,408 54.6% $430,399 1.9% $707,009 3.1%
$1,217,748 5.4% $903,111 4.0%
$1,072,196 4.7% $485,817 2.2%
$1,609,315 7.1% $2,665,787 11.8% $1,166,319 5.2%
$0 0.0%
$22,582,114 100%
Salaries and Benefits as Percentages of Revenues and of Expenditures
Teachers and Paraprofessionals
Salaries $8,639,133
Benefits $2,577,631
Percentage of Revenues Percentage of Expenditures
Total of
Total of
General Fund
General Fund
Title Programs
Title Programs
Lottery K-12
Lottery K-12
Total Salaries
and
Total
and
Total
and Benefits All Other K-12 K - 12 All Other K-12 K - 12
$11,216,764
57.6%
47.7%
59.8%
49.7%
School Administration
$616,718
$218,441
$835,159
4.3%
3.6%
4.5%
3.7%
General Administration
$207,740
$242,249
$449,989
2.3%
1.9%
2.4%
2.0%
1998-99 GEORGIA PUBLIC EDUCATION REPORT CARD
Cartersville City Schools - 767
Prepared by Georgia Department of Education
Page 8
CERTIFIED PERSONNEL DATA
Number
Average Annual Salary Positions Average Contract Days
Average Daily Salary
Full-time Personnel Part-time
Sex Male Female
4 Yr Bachelor's Certificate 5 Yr Master's
Level 6 Yr Specialist's 7 Yr Doctoral Other*
Black
White Race/ Hispanic Ethnicity Asian
American Indian
Multiracial
Years Experience
<1 1-10 11-20 21-30 >30
Average
Administrators
13.33
$72,160.27 238.12
$303.04
13 1
11 3
0 4 7 3 0
2 12
0 0 0 0
0 2 5 4 3
20.64
Support Personnel PK-12 Teachers
16.04
206.94
$45,734.54 196.88
$232.29
$40,481.37 190.53
$212.46
16
205
0
2
2
44
14
163
0
102
13
92
3
13
0
0
0
0
1
10
15
191
0
3
0
1
0
2
0
0
0
14
5
71
5
72
5
46
1
4
16.63
13.72
*Includes One- and Two-Year Vocational Certificates.
Certified Staff Position Ratios
Teacher/Administrator Ratio 16:1
Teacher/Support Person Ratio 13:1
Teacher/Staff Ratio 7:1
Student Enrollment/All Teachers 16:1
Certified Personnel by Category
87.3% 100%
5.9%
6.8%
80% 60%
40%
20%
0%
Teachers
Administrators
Support Personnel
1998-99 GEORGIA PUBLIC EDUCATION REPORT CARD
Cartersville City Schools - 767
Prepared by Georgia Department of Education
Page 9
1998-99 GEORGIA PUBLIC EDUCATION REPORT CARD
CARTERSVILLE CITY SCHOOLS
Cartersville Elementary School - 7670191
Grade Range 3-5
The Georgia Public Education Report Card is designed to assist systems and schools in educational improvement. This report card contains a variety of data elements. An explanation of the terms is provided as a companion to the report card data. Please refer to the definitions for the most effective use of the reported data.
STUDENT DATA
Total 822
3-5 Enrollment, by Race/Ethnicity and Sex
Black
White Hispanic
American Multi-
Asian Indian
racial
197 24.0%
569 69.2%
41 5.0%
6 0.7%
2 0.2%
7 0.9%
Male Female
430 52.3%
392 47.7%
Enrollment in Selected Programs
Program
Program % of Student Enrollment Population
Gifted (Grades K-12)
86
10.5%
Alternative Programs (Grades 6-12)
N/A
N/A
Students Eligible to Receive Free/Reduced Lunches
Number
Percent
School System
327 1,160
39.8% 34.5%
Dropout Rate *
Number
Rate
School System
N/A N/A
N/A N/A
* Dropout rates are not applicable for grades PK-5.
Enrollment in Compensatory Programs
Program
Program % of Student Enrollment Population
Special Education (Grades K-12)
107 13.0%
(PK)
0
N/A
English to Speakers of Other Languages (ESOL) (Grades K-12)
21
2.6%
Remedial Education (Grades 2-5, 9-12)
137 16.7%
Special Instructional Assistance (SIA) (Grades K-3)
0
0.0%
Title I (Grades K-12)
This school has a Targeted Assistance program.
Total 22
Retained Students, by Race/Ethnicity and Sex
Black
White Hispanic
American Multi-
Asian Indian
racial
8 36.4%
13 59.1%
1 4.5%
0 0.0%
0 0.0%
0 0.0%
Male Female
13
9
59.1% 40.9%
Prepared by Georgia Department of Education
Page 1
STATE-REQUIRED TEST DATA
NORM-REFERENCED TESTS Grade 3
Iowa Tests of Basic Skills (ITBS) Each chart reflects data for three years of testing.
Reading Comprehension 50
65 65 54 0
98-99
64 64 53 97-98
65 65 52 96-97
Mathematics
School 50
System
State
0
74 74 61 98-99
74 74 61 97-98
77 77 59 96-97
School System State
Reading Vocabulary 50
57 57 50 0
98-99
55 55 50 97-98
62 62 49 96-97
Language Arts
School 50
System
State
0
66 66 64 98-99
64 64 62 97-98
69 69 59 96-97
School System State
Social Studies 50
60 60 56 0
98-99
60 60 55 97-98
63 63 55 96-97
Science
School 50
System
State
0
66 66 59 98-99
69 69 59 97-98
71 71 58 96-97
School System State
Sources of Information
Composite Score
50
63 63 57 0
98-99
School 50
System
64 64 56 97-98
70 70 55 96-97
State 0
65 65 58 98-99
65 65 57 97-98
1998-99 GEORGIA PUBLIC EDUCATION REPORT CARD Cartersville Elementary School - 7670191
Prepared by Georgia Department of Education
69 69 56 96-97
Scores Reported in Percentiles
School System State
Page 2
STATE-REQUIRED TEST DATA
NORM-REFERENCED TESTS Grade 5
Iowa Tests of Basic Skills (ITBS) Each chart reflects data for three years of testing.
Reading Comprehension
Mathematics
50
60 60 53 0
98-99
66 66 53 97-98
60 60 52 96-97
School 50
System
State
0
70 70 59 98-99
72 72 58 97-98
70 70 57 96-97
School System State
Reading Vocabulary 50
60 60 48 0
98-99
62 62 48 97-98
59 59 46 96-97
Language Arts
School 50
System
State
0
67 67 63 98-99
67 67 61 97-98
58 58 58 96-97
School System State
Social Studies 50
65 65 57 0
98-99
67 67 56 97-98
62 62 55 96-97
Science
School 50
System
State
0
70 70 60 98-99
73 73 59 97-98
68 68 59 96-97
School System State
Sources of Information
Composite Score
50
65 65 58 0
98-99
School 50
System
65 65 58 97-98
64 64 57 96-97
State 0
66 66 57 98-99
69 69 56 97-98
64 64 55 96-97
1998-99 GEORGIA PUBLIC EDUCATION REPORT CARD Cartersville Elementary School - 7670191
Prepared by Georgia Department of Education
Scores Reported in Percentiles
School System State
Page 3
STATE-REQUIRED TEST DATA
PERFORMANCE ASSESSMENTS
Grade 5 Writing Assessment
Percent at Developmental Stages:
1998-99 School System State
1997-98 School System State
1996-97 School System State
Stage Stage Stage Stage Stage Stage
1:The Emerging Writer 2:The Developing Writer 3:The Focusing Writer 4:The Experimenting 5:The Engaging Writer 6:The Extending Writer
0% 1% 13% 40% 35% 11%
0% 1% 13% 40% 35% 11%
0% 1% 16% 41% 29% 12%
0% 1% 8% 41% 39% 11%
0% 1% 8% 41% 39% 11%
0% 3% 19% 41% 27% 10%
0% 2% 17% 29% 38% 12%
0% 2% 17% 29% 38% 12%
0% 3% 21% 37% 26% 12%
AWARDS / RECOGNITION DATA
Schools that become a Charter School have a unique opportunity to rethink how they structure and deliver education programs for improving the learning of their students while being freed from the state laws, State Board of Education rules and regulations, and local board of education rules and regulations that govern other schools. A 'charter' is a binding contract that, when approved by the faculty and parents of the school, the local board of education and the State Board of Education, substitutes for state education statutes, state and local rules, policies, regulations and standards.
Cartersville Elementary School is a Charter School for 1998-99.
1998-99 GEORGIA PUBLIC EDUCATION REPORT CARD Cartersville Elementary School - 7670191
Prepared by Georgia Department of Education
Page 4
CERTIFIED PERSONNEL DATA
Positions Number Average Contract Days
Personnel Sex
Certificate
Years Experience
Full-time Part-time
Male Female
4 Yr Bachelor's 5 Yr Master's 6 Yr Specialist's 7 Yr Doctoral Other*
<1 1-10 11-20 21-30 >30
Average
Administrators
2.00 240.00
2 0
1 1
0 0 2 0 0 0 1 1 0 0 11.00
Support Personnel
2.50 204.00
2 1
0 3
0 3 0 0 0 0 2 0 1 0 13.67
PK-12 Teachers
51.75 190.00
50 4
7 47
26 26
2 0 0 5 20 15 13 1 13.19
*Includes One- and Two-Year Vocational Certificates.
ACCREDITATION DATA
Accredited by Southern Association of Colleges and Schools (SACS):
Elementary/Middle Commission. Accredited with Quality by Georgia
Accrediting Commission (GAC).
1998-99 GEORGIA PUBLIC EDUCATION REPORT CARD Cartersville Elementary School - 7670191
Prepared by Georgia Department of Education
Page 5
1998-99 GEORGIA PUBLIC EDUCATION REPORT CARD
CARTERSVILLE CITY SCHOOLS
Cartersville High School - 7672050
Grade Range 9-12
The Georgia Public Education Report Card is designed to assist systems and schools in educational improvement. This report card contains a variety of data elements. An explanation of the terms is provided as a companion to the report card data. Please refer to the definitions for the most effective use of the reported data.
Total 854
STUDENT DATA
9-12 Enrollment, by Race/Ethnicity and Sex
Black
White Hispanic
American Multi-
Asian Indian
racial
191 22.4%
621 72.7%
19 2.2%
15 1.8%
1 0.1%
7 0.8%
Male Female
435 50.9%
419 49.1%
Enrollment in Selected Programs
Program
Gifted (Grades K-12)
Program % of Student Enrollment Population
77
9.0%
Non-Vocational Labs (Grades 9-12)
792
Vocational Labs
(Grades 9-12)
395
Alternative Programs (Grades 6-12)
0
92.7% 46.3%
0.0%
Students Eligible to Receive Free/Reduced Lunches
Number
Percent
School System
149 1,160
17.4% 34.5%
Enrollment in Compensatory Programs
Program
Program % of Student Enrollment Population
Special Education (Grades K-12) PK
37
4.3%
0
N/A
English to Speakers of Other Languages (ESOL) (Grades K-12)
0
0.0%
Remedial Education (Grades 2-5, 9-12)
108 12.6%
Title I (Grades K-12)
This school has no Title I program.
Dropout Rate for Grades 9-12
Number
Rate
School System
33
3.4%
33
3.4%
Total 68
Retained Students, by Race/Ethnicity and Sex
Black
White Hispanic
American MultiAsian Indian racial
27 39.7%
38 55.9%
2 2.9%
1 1.5%
0 0.0%
0 0.0%
Male Female
38
30
55.9% 44.1%
Prepared by Georgia Department of Education
Page 1
STATE-REQUIRED TEST DATA
GEORGIA HIGH SCHOOL GRADUATION TESTS (GHSGT)
Percent of Regular Program 11th Graders Passing the Georgia High School Graduation Tests on First Administration
English Language Arts Mathematics Social Studies Science
All Components listed above
Writing
1998-99
School System State
99% 95% 88% 79%
99% 95% 88% 79%
96% 88% 80% 72%
77% 77% 68%
100% 100% 93%
1997-98
School System State
98% 93% 82% 82%
98% 93% 82% 82%
94% 88% 78% 74%
77% 77% 68%
95% 95% 92%
1996-97
School System State
96% 96% 88% 86%
96% 96% 88% 86%
94% 87% 78% 74%
82% 82% 67%
95% 95% 93%
GRADUATE DATA
1999 Graduates by Credentials, Race/Ethnicity and Sex
Diplomas with Both College Prep. & Voc. Endorsements
Diplomas with College Prep. Endorsements Diplomas with Vocational Endorsements General High School Diplomas Special Education Diplomas
Total All Diplomas
Certificates of Performance
Total Graduates
Total 42 59 56 0
Black
3 7.1%
2 3.4%
19 33.9%
0
White Hispanic
36 85.7%
1 2.4%
55 93.2%
0 0.0%
35 62.5%
2 3.6%
0
0
American MultiAsian Indian racial
0 0.0%
2 4.8%
0 0.0%
0 0.0%
2 3.4%
0 0.0%
0 0.0%
0 0.0%
0 0.0%
0
0
0
3
2
1
0
0
0
0
66.7% 33.3% 0.0% 0.0% 0.0% 0.0%
160
26
127
3
0
4
0
16.3% 79.4% 1.9% 0.0% 2.5% 0.0%
0
0
0
0
0
0
0
160
26
127
3
0
4
0
16.3% 79.4% 1.9% 0.0% 2.5% 0.0%
Male Female
24
18
57.1% 42.9%
23
36
39.0% 61.0%
30
26
53.6% 46.4%
0
0
0
3
0.0% 100.0%
77
83
48.1% 51.9%
0
0
77
83
48.1% 51.9%
HOPE Scholarships
School System
Number of 1999 Graduates 1 6 0
Number Eligible
109
Percent Eligible
68.1%
160 109 68.1%
State
65,548 40,292 61.5%
High School Completion Rate
Percent of 1995Grade 9 Enrollment in Graduating Class of1999 School System State
Completion Rate '95-'99 76.9% 76.9% 68.9%
1998-99 GEORGIA PUBLIC EDUCATION REPORT CARD
Cartersville High School - 7672050
Prepared by Georgia Department of Education
Page 2
COLLEGE ADMISSIONS / CREDIT TEST DATA
Scholastic Assessment Test (SAT)
Based on students' highest verbal and highest math scores
No. Taking
Average Score
Tests Verbal Math Total
Based on students' last test administration
Average Score Verbal Math Total
School
129
College Prep. Endorsement
Other Diplomas
System
129
College Prep. Endorsement
Other Diplomas
Georgia
41,958
514 522 1036
538 552 1090
411 400
811
514 522 1036 538 552 1090
411 400
811
492 488
980
503 N/A N/A
503 N/A N/A
483
510 N/A N/A
510 N/A N/A
479
1013 N/A N/A
1013 N/A N/A
962
Nation
952,913 N/A N/A N/A
502 508 1010
American College Testing (ACT)
Advanced Placement Exams (AP)
Number taking tests: English Mathematics Reading Science Reasoning CompositeScore
1 8 School System State
19.6 19.6 19.1
20.5 20.5 19.9
22.5 21.0
22.5 21.0
20.2 19.9
21.1 21.1 19.9
No. of Students Taking Tests
No. of Tests Taken No. of Test Scores
3 or Higher Percent of Test
Scores 3 or Higher
School 30 30 15
50.0%
System State 30 15,225 30 23,969 15 13,024
50.0% 54.3%
POST-SECONDARY DATA
Graduates Entering Georgia Public Colleges
Graduates Entering Georgia Public Colleges and Requiring Learning Support (LS)
1998 Graduates Entering in 1998-99
1997 Graduates Entering in 1997-98
Percent of Graduating Number Class
School
80
49.7%
System 8 0
49.7%
School
74
48.7%
System 7 4
48.7%
Number Requiring
LS 13 13
15 15
Percent of those attending Georgia
Public Colleges
16.3%
16.3%
20.3%
20.3%
In previous years, the Report Card presented College Prep Curriculum information provided by the Board of Regents on students requiring Learning Support. Due to inconsistencies in the data provided by the Board of Regents in defining College Prep Completers versus Local Board of Education data defining College Prep Endorsements, the Department of Education Report Card will not provide this information until discrepancies can be reconciled.
Graduates Entering Georgia Public Technical and Adult Schools
1998 Graduates School System
Entering Number 7 7
1998-99 Percent
4.3% 4.3%
Entering Number N/A N/A
1997-98 Percent
N/A N/A
1997 Graduates School
0
0.0%
System
0
0.0%
3
2.0%
3
2.0%
1998-99 GEORGIA PUBLIC EDUCATION REPORT CARD Cartersville High School - 7672050
Prepared by Georgia Department of Education
Page 3
CERTIFIED PERSONNEL DATA
Positions Number Average Contract Days
Administrators
3.33 240.00
Support Personnel
3.04 200.00
PK-12 Teachers
51.57 192.14
Personnel Sex
Certificate
Years Experience
Full-time Part-time
Male Female
4 Yr Bachelor's 5 Yr Master's 6 Yr Specialist's 7 Yr Doctoral Other*
<1 1-10 11-20 21-30 >30
Average
3 1
4 0
0 2 2 0 0
0 0 2 1 1
21.25
3 0
0 3
0 2 1 0 0
0 1 1 0 1
18.00
49 3
22 30
24 24
4 0 0
3 15 18 13
3
15.75
*Includes One- and Two-Year Vocational Certificates.
ACCREDITATION DATA
Accredited by Southern Association of Colleges and Schools (SACS): Secondary/Middle Commission. Accredited with Quality by Georgia Accrediting Commission (GAC).
AWARDS / RECOGNITION DATA
Schools that become a Charter School have a unique opportunity to rethink how they structure and deliver education programs for improving the learning of their students while being freed from the state laws, State Board of Education rules and regulations, and local board of education rules and regulations that govern other schools. A 'charter' is a binding contract that, when approved by the faculty and parents of the school, the local board of education and the State Board of Education, substitutes for state education statutes, state and local rules, policies, regulations and standards.
Cartersville High School is a Charter School for 1998-99.
1998-99 GEORGIA PUBLIC EDUCATION REPORT CARD Cartersville High School - 7672050
Prepared by Georgia Department of Education
Page 4
1998-99 GEORGIA PUBLIC EDUCATION REPORT CARD
CARTERSVILLE CITY SCHOOLS
Cartersville Middle School - 7670277
Grade Range 6-8
The Georgia Public Education Report Card is designed to assist systems and schools in educational improvement. This report card contains a variety of data elements. An explanation of the terms is provided as a companion to the report card data. Please refer to the definitions for the most effective use of the reported data.
STUDENT DATA
Total 746
6-8 Enrollment, by Race/Ethnicity and Sex
Black
White Hispanic
American Multi-
Asian Indian
racial
179 24.0%
526 70.5%
23 3.1%
7 0.9%
0 0.0%
11 1.5%
Male 366
49.1%
Female 380
50.9%
Enrollment in Selected Programs
Program
Gifted (Grades K-12)
Program % of Student Enrollment Population
127
17.0%
Alternative Programs (Grades 6-12)
0
0.0%
Students Eligible to Receive Free/Reduced Lunches
Number
Percent
School System
266 1,160
35.7% 34.5%
Enrollment in Compensatory Programs
Program
Program % of Student Enrollment Population
Special Education (Grades K-12) (PK)
72
9.7%
0
N/A
English to Speakers of Other Languages (ESOL) (Grades K-12)
8
1.1%
Title I (Grades K-12)
This school has a Targeted Assistance program.
Dropout Rate for Grades 6-8
Number
Rate
School System
0
0.0%
0
0.0%
Total 3
Retained Students, by Race/Ethnicity and Sex
Black
White Hispanic
American MultiAsian Indian racial
2 66.7%
1 33.3%
0 0.0%
0 0.0%
0 0.0%
0 0.0%
Male Female
2
1
66.7% 33.3%
Prepared by Georgia Department of Education
Page 1
STATE-REQUIRED TEST DATA
NORM-REFERENCED TESTS Grade 8
Iowa Tests of Basic Skills (ITBS) Each chart reflects data for three years of testing.
Reading Comprehension 50
60 60 49 0
98-99
55 55 48 97-98
55 55 48 96-97
Mathematics
School 50
System
State
0
74 74 56 98-99
74 74 55 97-98
76 76 54 96-97
School System State
Reading Vocabulary 50
56 56 46 0
98-99
49 49 45 97-98
52 52 44 96-97
Language Arts
School 50
System
State
0
70 70 60 98-99
65 65 58 97-98
67 67 56 96-97
School System State
Social Studies 50
63 63 54 0
98-99
60 60 53 97-98
64 64 53 96-97
Science
School 50
System
State
0
60 60 56 98-99
62 62 55 97-98
63 63 53 96-97
School System State
Sources of Information
Composite Score
50
63 63 57 0
98-99
School 50
System
59 59 56 97-98
65 65 55 96-97
State 0
67 67 56 98-99
63 63 54 97-98
1998-99 GEORGIA PUBLIC EDUCATION REPORT CARD Cartersville Middle School - 7670277
Prepared by Georgia Department of Education
66 66 54 96-97
Scores Reported in Percentiles
School System State
Page 2
STATE-REQUIRED TEST DATA
Categories of Scaled Scores
Inadequate (less than 162)
Minimal (162-209)
Good
(210-247)
Very Good (greater than 247)
Average Scaled Score: (Range 100-300)
PERFORMANCE ASSESSMENTS
Grade 8 Writing Assessment
1998-99 Percent Scoring
1997-98 Percent Scoring
1996-97 Percent Scoring
School System State School System State School System State
5% 36% 48% 11%
5% 36% 48% 11%
8% 40% 41% 11%
13% 39% 42%
6%
13% 39% 42%
6%
11% 46% 34%
8%
8% 40% 37% 15%
8% 40% 37% 15%
15% 46% 30%
8%
212
212
208 203
203 202 211
211 198
AWARDS / RECOGNITION DATA
Schools that become a Charter School have a unique opportunity to rethink how they structure and deliver education programs for improving the learning of their students while being freed from the state laws, State Board of Education rules and regulations, and local board of education rules and regulations that govern other schools.
The Georgia School of Excellence Program recognizes exemplary schools that have excellent, successful programs in many areas of school life. Each year, in a statewide competition, one elementary, one middle and one high school from each of Georgia's 11 congressional districts may be selected for this honor.
Cartersville Middle School is a Charter School and was designated a 1998-99 Georgia School of Excellence.
1998-99 GEORGIA PUBLIC EDUCATION REPORT CARD Cartersville Middle School - 7670277
Prepared by Georgia Department of Education
Page 3
CERTIFIED PERSONNEL DATA
Positions Number Average Contract Days
Personnel Sex
Certificate
Years Experience
Full-time Part-time
Male Female
4 Yr Bachelor's 5 Yr Master's 6 Yr Specialist's 7 Yr Doctoral Other*
<1 1-10 11-20 21-30 >30
Average
Administrators
2.00 240.00
2 0
2 0
0 0 2 0 0 0 1 0 0 1 20.50
Support Personnel
3.00 196.67
3 0
1 2
0 2 1 0 0 0 0 0 3 0 25.33
PK-12 Teachers
44.75 190.00
44 2
12 34
22 20
4 0 0 4 9 24 9 0 14.26
*Includes One- and Two-Year Vocational Certificates.
ACCREDITATION DATA
Accredited by Southern Association of Colleges and Schools (SACS):
Elementary/Middle Commission. Accredited with Quality by Georgia
Accrediting Commission (GAC).
1998-99 GEORGIA PUBLIC EDUCATION REPORT CARD Cartersville Middle School - 7670277
Prepared by Georgia Department of Education
Page 4
1998-99 GEORGIA PUBLIC EDUCATION REPORT CARD
CARTERSVILLE CITY SCHOOLS
Cartersville Primary School - 7670177
Grade Range PK-2
The Georgia Public Education Report Card is designed to assist systems and schools in educational improvement. This report card contains a variety of data elements. An explanation of the terms is provided as a companion to the report card data. Please refer to the definitions for the most effective use of the reported data.
STUDENT DATA
Total
K-2
820
PK
125
Enrollment, by Race/Ethnicity and Sex
Black
White Hispanic
American Asian Indian
Multiracial
222 27.1%
534 65.1%
52 6.3%
2 0.2%
0 0.0%
10 1.2%
25 20.0%
86 68.8%
11 8.8%
0 0.0%
0 0.0%
3 2.4%
Male Female
416 50.7%
404 49.3%
58 46.4%
67 53.6%
Enrollment in Selected Programs
Program
Program % of Student Enrollment Population
Gifted (Grades K-12)
13
1.6%
Alternative Programs (Grades 6-12)
N/A
N/A
Students Eligible to Receive Free/Reduced Lunches
Number
Percent
School System
418 1,160
44.2% 34.5%
Dropout Rate *
Number
Rate
School System
N/A N/A
N/A N/A
* Dropout rates are not applicable for grades PK-5.
Enrollment in Compensatory Programs
Program
Program % of Student Enrollment Population
Special Education (Grades K-12)
100 12.2%
(PK)
16
N/A
English to Speakers of Other Languages (ESOL) (Grades K-12)
30
3.7%
Remedial Education (Grades 2-5, 9-12)
36 15.6%
Special Instructional Assistance (SIA) (Grades K-3)
85 10.4%
Title I (Grades K-12)
This school has a Targeted Assistance program.
Total 86
Retained Students, by Race/Ethnicity and Sex
Black
White Hispanic
American MultiAsian Indian racial
34 39.5%
40
9
46.5% 10.5%
0 0.0%
0 0.0%
3 3.5%
Male Female
49
37
57.0% 43.0%
Prepared by Georgia Department of Education
Page 1
STATE-REQUIRED TEST DATA
NORM-REFERENCED TESTS
Grade 3 Iowa Tests of Basic Skills (ITBS) Each chart reflects data for three years of testing.
No third-grade students are enrolled at Cartersville Primary School.
Reading Comprehension
Mathematics
50
N/A 65 54 0
98-99
N/A 64 53 97-98
N/A 65 52 96-97
School 50
System
State
N/A 74 61 0
98-99
N/A 74 61 97-98
N/A 77 59 96-97
School System State
Reading Vocabulary 50
N/A 57 50 0
98-99
N/A 55 50 97-98
N/A 62 49 96-97
Language Arts
School 50
System
State
N/A 66 64 0
98-99
N/A 64 62 97-98
N/A 69 59 96-97
School System State
Social Studies 50
N/A 60 56 0
98-99
N/A 60 55 97-98
N/A 63 55 96-97
Science
School 50
System
State
N/A 66 59 0
98-99
N/A 69 59 97-98
N/A 71 58 96-97
School System State
Sources of Information
Composite Score
School
50
50
System
N/A 63 57 0
98-99
N/A 64 56 N/A 70 55
97-98
96-97
State
N/A 65 58 0
98-99
N/A 65 57 97-98
N/A 69 56 96-97
1998-99 GEORGIA PUBLIC EDUCATION REPORT CARD Cartersville Primary School - 7670177
Prepared by Georgia Department of Education
Scores Reported in Percentiles
School System State
Page 2
STATE-REQUIRED TEST DATA
NORM-REFERENCED TESTS
Grade 5 Iowa Tests of Basic Skills (ITBS) Each chart reflects data for three years of testing. No fifth-grade students are enrolled at Cartersville Primary School.
Reading Comprehension
Mathematics
50
N/A 60 53 0
98-99
N/A 66 53 97-98
N/A 60 52 96-97
School 50
System
State
N/A 70 59 0
98-99
N/A 72 58 97-98
N/A 70 57 96-97
School System State
Reading Vocabulary 50
N/A 60 48 0
98-99
N/A 62 48 97-98
N/A 59 46 96-97
Language Arts
School 50
System
State
N/A 67 63 0
98-99
N/A 67 61 97-98
N/A 58 58 96-97
School System State
Social Studies 50
N/A 65 57 0
98-99
N/A 67 56 97-98
N/A 62 55 96-97
Science
School 50
System
State
N/A 70 60 0
98-99
N/A 73 59 97-98
N/A 68 59 96-97
School System State
Sources of Information
Composite Score
School
50
50
System
N/A 65 58 0
98-99
N/A 65 58 N/A 64 57
97-98
96-97
State
N/A 66 57 0
98-99
N/A 69 56 97-98
N/A 64 55 96-97
1998-99 GEORGIA PUBLIC EDUCATION REPORT CARD Cartersville Primary School - 7670177
Prepared by Georgia Department of Education
Scores Reported in Percentiles
School System State
Page 3
STATE-REQUIRED TEST DATA
PERFORMANCE ASSESSMENTS
Grade 5 Writing Assessment
Percent at Developmental Stages:
1998-99 School System State
1997-98 School System State
1996-97 School System State
Stage Stage Stage Stage Stage Stage
1:The Emerging Writer 2:The Developing Writer 3:The Focusing Writer 4:The Experimenting 5:The Engaging Writer 6:The Extending Writer
N/A N/A N/A N/A N/A N/A
0% 1% 13% 40% 35% 11%
0% 1% 16% 41% 29% 12%
N/A N/A N/A N/A N/A N/A
0% 1% 8% 41% 39% 11%
0% 3% 19% 41% 27% 10%
N/A N/A N/A N/A N/A N/A
No fifth-grade students are enrolled at Cartersville Primary School.
0% 2% 17% 29% 38% 12%
0% 3% 21% 37% 26% 12%
AWARDS / RECOGNITION DATA
Schools that become a Charter School have a unique opportunity to rethink how they structure and deliver education programs for improving the learning of their students while being freed from the state laws, State Board of Education rules and regulations, and local board of education rules and regulations that govern other schools. A 'charter' is a binding contract that, when approved by the faculty and parents of the school, the local board of education and the State Board of Education, substitutes for state education statutes, state and local rules, policies, regulations and standards.
Cartersville Primary School is a Charter School for 1998-99.
1998-99 GEORGIA PUBLIC EDUCATION REPORT CARD Cartersville Primary School - 7670177
Prepared by Georgia Department of Education
Page 4
CERTIFIED PERSONNEL DATA
Positions Number Average Contract Days
Personnel Sex
Certificate
Years Experience
Full-time Part-time
Male Female
4 Yr Bachelor's 5 Yr Master's 6 Yr Specialist's 7 Yr Doctoral Other*
<1 1-10 11-20 21-30 >30
Average
Administrators
2.00 240.00
2 0
2 0
0 1 0 1 0 0 0 0 1 1 26.00
Support Personnel
4.50 195.56
4 1
0 5
0 5 0 0 0 0 2 2 1 0 14.60
PK-12 Teachers
58.87 190.00
58 2
3 57
31 26
3 0 0 3 28 17 12 0 11.92
*Includes One- and Two-Year Vocational Certificates.
ACCREDITATION DATA
Accredited by Southern Association of Colleges and Schools (SACS):
Elementary/Middle Commission. Accredited with Quality by Georgia
Accrediting Commission (GAC).
1998-99 GEORGIA PUBLIC EDUCATION REPORT CARD Cartersville Primary School - 7670177
Prepared by Georgia Department of Education
Page 5
1998-99 GEORGIA PUBLIC EDUCATION REPORT CARD CATOOSA COUNTY SCHOOLS - 623
The Georgia Public Education Report Card is designed to assist systems and schools in educational improvement. This report card contains a variety of data elements. An explanation of the terms is provided as a companion to the report card data. Please refer to the definitions for the most effective use of the reported data.
Total
K-12
9,079
PK
86
STUDENT DATA
Enrollment, by Race/Ethnicity and Sex
Black
White Hispanic
American Multi-
Asian Indian
racial
90 1.0%
8,829 97.2%
51 0.6%
73 0.8%
8 0.1%
28 0.3%
0 0.0%
84 97.7%
0 0.0%
0 0.0%
0 0.0%
2 2.3%
Male
4,585 50.5%
58 67.4%
Female
4,494 49.5%
28 32.6%
Enrollment in Selected Programs
Program
Program % of Student Enrollment Population
Gifted (Grades K-12)
704
7.8%
Non-Vocational Labs (Grades 9-12)
1,980
82.8%
Vocational Labs (Grades 9-12)
2,117
88.5%
Alternative Programs (Grades 6-12)
73
1.6%
Students Eligible to Receive Free/Reduced Lunches
Number
Percent
2,712
29.6%
Dropout Rate
Number
Percent
6-12
207
4.3%
9-12
194
7.7%
Enrollment in Compensatory Programs
Program
Program % of Student Enrollment Population
Special Education
(Grades K-12)
929
PK
49
English to Speakers of
Other Languages (ESOL)
26
(Grades K-12)
Remedial Education (Grades 2-5, 9-12)
292
Special Instructional
Assistance (SIA)
593
(Grades K-3)
Title I (Grades K-12) Number of schools with: Schoolwide program Targeted Assistance program No Title I program
10.2% N/A < 1%
5.4%
19.0%
0 6 5
Total 296
Retained Students, by Race/Ethnicity and Sex
Black
White Hispanic
American MultiAsian Indian racial
1 0.3%
290 98.0%
2 0.7%
3 1.0%
0 0.0%
0 0.0%
Male Female 180 116
60.8% 39.2%
Prepared by Georgia Department of Education
Page 1
STATE-REQUIRED TEST DATA
NORM-REFERENCED TESTS
Grade 3 Iowa Tests of Basic Skills (ITBS) Each chart reflects data for three years of testing.
Reading Comprehension
Mathematics
50
61 54 58 53 55 52 0
98-99 97-98 96-97
System State
50
65 61 61 61 61 59 0
98-99 97-98 96-97
System State
Reading Vocabulary
50
58 50 60 50 56 49 0
98-99 97-98 96-97
System State
Social Studies
50
63 56 61 55 59 55 0
98-99 97-98 96-97
System State
Language Arts
50
68 64 65 62 60 59 0
98-99 97-98 96-97
System State
Science
50
64 59 62 59 60 58 0
98-99 97-98 96-97
System State
Sources of Information
Composite Score
50
62 57 0
98-99
System
50
61 56 59 55 97-98 96-97
State
64 58 61 57 0
98-99 97-98
1998-99 GEORGIA PUBLIC EDUCATION REPORT CARD Catoosa County Schools
Prepared by Georgia Department of Education
System State Scores Reported 59 56 in Percentiles 96-97
Page 2
STATE-REQUIRED TEST DATA
NORM-REFERENCED TESTS
Grade 5 Iowa Tests of Basic Skills (ITBS) Each chart reflects data for three years of testing.
Reading Comprehension
Mathematics
50
57 53 54 53 54 52 0
98-99 97-98 96-97
System State
50
61 59 58 58 56 57 0
98-99 97-98 96-97
System State
Reading Vocabulary
50
57 48 54 48 53 46 0
98-99 97-98 96-97
System State
Social Studies
50
61 57 58 56 59 55 0
98-99 97-98 96-97
System State
Language Arts
50
66 63 63 61 59 58 0
98-99 97-98 96-97
System State
Science
50
65 60 62 59 62 59 0
98-99 97-98 96-97
System State
Sources of Information
Composite Score
50
63 58 0
98-99
System
50
60 58 59 57 97-98 96-97
State
62 57 59 56 0
98-99 97-98
1998-99 GEORGIA PUBLIC EDUCATION REPORT CARD Catoosa County Schools
Prepared by Georgia Department of Education
System State Scores Reported 58 55 in Percentiles 96-97
Page 3
STATE-REQUIRED TEST DATA
NORM-REFERENCED TESTS Grade 8
Iowa Tests of Basic Skills (ITBS) Each chart reflects data for three years of testing.
Reading Comprehension
Mathematics
50
55 49 52 48 53 48 0
98-99 97-98 96-97
System State
50
59 56 55 55 51 54 0
98-99 97-98 96-97
System State
Reading Vocabulary
50
53 46 48 45 52 44 0
98-99 97-98 96-97
System State
Language Arts
50
61 60 58 58 57 56 0
98-99 97-98 96-97
System State
Social Studies
50
56 54 55 53 53 53 0
98-99 97-98 96-97
System State
Science
50
62 56 58 55 56 53 0
98-99 97-98 96-97
System State
Sources of Information
Composite Score
50
61 57 0
98-99
System
50
56 56 54 55 97-98 96-97
State
60 56 56 54 0
98-99 97-98
1998-99 GEORGIA PUBLIC EDUCATION REPORT CARD Catoosa County Schools
Prepared by Georgia Department of Education
System State Scores Reported 54 54 in Percentiles 96-97
Page 4
STATE-REQUIRED TEST DATA
PERFORMANCE ASSESSMENTS
Grade 5 Writing Assessment
1998-99
1997-98
1996-97
Percent at Developmental Stages:
Comparison
Comparison
Comparison
System Group State System Group State System Group State
Stage Stage Stage Stage Stage Stage
1: The Emerging Writer 2: The Developing Writer 3: The Focusing Writer 4: The Experimenting Writer 5: The Engaging Writer 6: The Extending Writer
0% 2% 15% 41% 32% 11%
0% 1% 17% 40% 30% 11%
0% 1% 16% 41% 29% 12%
0% 2% 16% 39% 31% 12%
0% 1% 16% 39% 30% 13%
0% 3% 19% 41% 27% 10%
0% 2% 20% 39% 27% 11%
0% 3% 19% 37% 29% 12%
0% 3% 21% 37% 26% 12%
Grade 8 Writing Assessment
1998-99 Percent Scoring 1997-98 Percent Scoring 1996-97 Percent Scoring
Categories of Scaled Scores
Comparison
Comparison
Comparison
System Group State System Group State System Group State
Inadequate (less than 162)
Minimal (162-209)
Good
(210-247)
Very Good (greater than 247)
6% 38% 50%
7%
5% 39% 47% 10%
8% 40% 41% 11%
11% 51% 34%
5%
7% 43% 41% 10%
11% 46% 34%
8%
7% 52% 35%
6%
10% 45% 35%
9%
15% 46% 30%
8%
Average Scaled Score: (Range 100-300)
209
211 208
200
209 202
203
204 198
GEORGIA HIGH SCHOOL GRADUATION TESTS (GHSGT)
Percent of Regular Program 11th Graders Passing the Georgia High School Graduation Tests on First Administration
1998-99
1997-98
1996-97
Comparison
Comparison
Comparison
System Group State System Group State System Group State
English Language Arts Mathematics Social Studies Science
96% 90% 76% 72%
97% 92% 82% 76%
96% 88% 80% 72%
95% 91% 77% 80%
96% 93% 81% 81%
94% 88% 78% 74%
94% 92% 84% 79%
95% 92% 83% 79%
94% 87% 78% 74%
All Components listed above 6 5 %
71% 68% 70%
74% 68% 73%
74% 67%
Writing
96%
95% 93% 95%
96% 92% 95%
95% 93%
1998-99 GEORGIA PUBLIC EDUCATION REPORT CARD
Catoosa County Schools
Prepared by Georgia Department of Education
Page 5
GRADUATE DATA
1999 Graduates by Credentials, Race/Ethnicity and Sex
Diplomas with Both College Prep. & Voc. Endorsements
Diplomas with College Prep. Endorsements Diplomas with Vocational Endorsements General High School Diplomas Special Education Diplomas
Total All Diplomas
Certificates of Performance
Total Graduates
Total 189 83 172 1 13 458 32 490
Black
American MultiWhite Hispanic Asian Indian racial
2 1.1%
1 1.2%
3 1.7%
0 0.0%
1 7.7%
184 97.4%
82 98.8%
166 96.5%
1 100.0%
12 92.3%
1 0.5%
0 0.0%
1 0.6%
0 0.0%
0 0.0%
2 1.1%
0 0.0%
0 0.0%
0 0.0%
0 0.0%
0 0.0%
0 0.0%
1 0.6%
0 0.0%
0 0.0%
0 0.0%
0 0.0%
1 0.6%
0 0.0%
0 0.0%
7
445
2
2
1
1
1.5% 97.2% 0.4% 0.4% 0.2% 0.2%
3
27
1
1
0
0
9.4% 84.4% 3.1% 3.1% 0.0% 0.0%
10
472
3
3
1
1
2.0% 96.3% 0.6% 0.6% 0.2% 0.2%
Male Female
59 130 31.2% 68.8%
40
43
48.2% 51.8%
115
57
66.9% 33.1%
0
1
0.0% 100.0%
9
4
69.2% 30.8%
223 235 48.7% 51.3%
11
21
34.4% 65.6%
234 256 47.8% 52.2%
HOPE Scholarships
System State
Number of 1999 Graduates 4 9 0
Number Eligible
344
Percent Eligible
70.2%
65,548 40,292 61.5%
High School Completion Rate Percent of 1995Grade 9 Enrollment
in Graduating Class of1999
System
State
Completion Rate '95-'99 72.8% 68.9%
COLLEGE ADMISSIONS / CREDIT TEST DATA
Scholastic Assessment Test (SAT)
No. Taking
Average Score
Tests
Verbal Math Total
Based on students' highest verbal and highest math scores
System College Prep. Endorsement Other Diplomas
487 466 953 502 476 978 386 394 780
Georgia
492 488 980
Based on students' last test administration
System Georgia
241
480 460
940
41,958 483 479 962
Nation
952,913 502 508 1010
American College Testing (ACT)
System State Nation
English
19.8
19.1 20.4
Mathematics
20.0
19.9 20.7
Reading
20.4
20.2 21.3
Science Reasoning 20.1
19.9 21.0
CompositeScore 20.2
19.9 21.9
Advanced Placement Exams (AP)
No. of Students Taking Tests
No. of Tests Taken No. of Test Scores
3 or Higher Percent of Test
Scores 3 or Higher
System State 54 15,225 80 23,969 37 13,024
46.3% 54.3%
1998-99 GEORGIA PUBLIC EDUCATION REPORT CARD Catoosa County Schools
Prepared by Georgia Department of Education
Page 6
POSTSECONDARY DATA
Graduates Entering Georgia Public Colleges and Universities
Graduates Entering Georgia Public Colleges and Universities and
Requiring Learning Support (LS)
1998 Graduates Entering 1998-99
1997 Graduates Entering 1997-98
Percent of Graduating Number Class
151
32.5%
134
31.2%
Number Requiring
LS
36
44
Percent of those attending Georgia
Public Colleges
23.8%
32.8%
In previous years, the Report Card presented College Prep Curriculum information provided by the Board of Regents on students requiring Learning Support. Due to inconsistencies in the data provided by the Board of Regents in defining College Prep Completers versus Local Board of Education data defining College Prep Endorsements, the Department of Education Report Card will not provide this information until discrepancies can be reconciled.
Graduates Entering Georgia Public Technical and Adult Schools
Entering 1998-99 Entering 1997-98
Number Percent
Number Percent
1998 Graduates 1997 Graduates
38
8.2%
0
0.0%
N/A 16
N/A 3.7%
ACCREDITATION / RECOGNITION DATA
Southern Association of Colleges and Schools (SACS) Accrediting Commission
Secondary/Middle Commission Elementary/Middle Commission Both Elementary/Secondary Commissions Joint Commission Candidate for Accreditation
Accreditation by Georgia Accrediting Commission (GAC)
Accredited by GAC Accredited with Quality by GAC
Number of Schools
0 0 0 0 0
Number of Schools
0 11
Awards / Recognition
State Recognized Program
Number of Schools
Charter School
0
Pay for Performance Recipient
0
Georgia School of Excellence
0
National Blue Ribbon School
0
COMMUNITY DATA
Number of Children Eligible for Migrant Education Number of Families-At-Risk * Number of Food Stamp Participants * Number of Families Receiving TANF * ** Per Capita Income * Unemployment Rate * 1990 Population * Projected 2000 Population * Projected 2010 Population *
* Data Available at County Level Only ** Known as AFDC before January 1997
0 125 2,355 124 $17,259 4.1% 42,464 50,777 58,234
1998-99 GEORGIA PUBLIC EDUCATION REPORT CARD Catoosa County Schools
Prepared by Georgia Department of Education
Page 7
FISCAL DATA
Millage Rate
14.00
* Fall 1998 Property Tax Digest is used to calculate the 98-99 Value of One Mill
FTE Count
FTE Count used for Allotment Calculation 9,040.0 Fall '98 FTE Count 9,079
Value of One Mill
$749,552 $82.91 per Allotment FTE
Sources: Local State-QBE State-
Lottery State-
Other Federal Other
Total
PerGeneral Fund cent Per FTE
$11,660,261 26.5% $1,290 $31,120,528 70.7% $3,443
K-12 Revenues
Lottery K-12
and
Title
All Other
Programs
K-12
$0
$0
Bonded Debt $0
$0
$0
$0
$0 0.0%
$0
$0 $187,745
$0
$1,168,185 2.7% $129
$0
$0
$0
$0 0.0%
$0 $1,746,136
$0
$0
$48,384 0.1%
$5
$0
$11,760
$0
$43,997,359 100% $4,867 $1,746,136 $199,505
$0
Capital Projects $6,089,084
$0
$0
$0 $0 $0 $6,089,084
School Nutrition $1,398,443
$0
$0
$218,264 $1,409,687
$0 $3,026,395
Grand Total
Total
Per-
Amount cent
$19,147,790 34.8%
$31,120,528 56.5%
$187,745 0.3%
$1,386,449 2.5% $3,155,823 5.7%
$60,144 0.1% $55,058,481 100%
Instruction
Media Instruction
Support Pupil Services General Admin. School Admin. Trans-
portation Maint. & Ops. Capital Projects School Food Debt Service
Total
K-12 Expenditures
$29,396,867 67.1% $3,252 $1,516,167 $187,694
$0
$0
$0
$1,302,738 3.0% $144
$20,836
$0
$0
$0
$0
$1,488,165 3.4% $165 $179,812
$0
$0
$0
$0
$1,840,214 4.2% $204 $131,376
$0
$0
$0
$0
$913,056 2.1% $101
$68,912
$0
$0
$0
$0
$3,546,574 8.1% $392
$3,369
$0
$0
$0
$0
$2,231,837 5.1% $247
$87,242
$0
$0
$0
$0
$2,971,343 6.8% $329
$399
$0
$0
$0
$0
$104,269 0.2% $12
$0
$0
$0 $6,934,257
$0
$76 0.0%
$0
$0
$0
$0
$0 $2,941,945
$0 0.0%
$0
$0
$0
$0
$0
$0
$43,795,142 100% $4,846 $2,008,116 $187,694
$0 $6,934,257 $2,941,945
$31,100,728 55.7% $1,323,575 2.4% $1,667,977 3.0% $1,971,590 3.5% $981,968 1.8% $3,549,943 6.4% $2,319,080 4.2% $2,971,743 5.3% $7,038,527 12.6% $2,942,021 5.3% $0 0.0%
$55,867,156 100%
Salaries and Benefits as Percentages of Revenues and of Expenditures
Teachers and Paraprofessionals
Salaries $22,098,112
Benefits $6,611,729
Percentage of Revenues Percentage of Expenditures
Total of
Total of
General Fund
General Fund
Title Programs
Title Programs
Lottery K-12
Lottery K-12
Total Salaries
and
Total
and
Total
and Benefits All Other K-12 K - 12 All Other K-12 K - 12
$28,709,841
62.5%
52.1%
62.4%
51.4%
School Administration
$2,011,229
$721,689
$2,732,918
5.9%
5.0%
5.9%
4.9%
General Administration
$195,451
$112,328
$307,779
0.7%
0.6%
0.7%
0.6%
1998-99 GEORGIA PUBLIC EDUCATION REPORT CARD
Catoosa County Schools - 623
Prepared by Georgia Department of Education
Page 8
CERTIFIED PERSONNEL DATA
Number
Average Annual Salary Positions Average Contract Days
Average Daily Salary
Full-time Personnel Part-time
Sex Male Female
4 Yr Bachelor's Certificate 5 Yr Master's
Level 6 Yr Specialist's 7 Yr Doctoral Other*
Black
White Race/ Hispanic Ethnicity Asian
American Indian
Multiracial
Years Experience
<1 1-10 11-20 21-30 >30
Average
Administrators
41.58
$64,947.01 211.28
$307.40
38 24
33 29
5 16 32
8 1
0 62
0 0 0 0
0 3 21 32 6
22.29
Support Personnel PK-12 Teachers
39.20
551.19
$47,048.32 196.73
$239.16
$38,578.96 190.48
$202.53
32
502
88
53
54
107
66
448
48
251
44
243
26
50
2
4
0
7
0
1
119
551
0
1
0
0
1
2
0
0
4
24
43
191
39
197
27
127
7
16
14.62
14.13
*Includes One- and Two-Year Vocational Certificates.
Certified Staff Position Ratios
Teacher/Administrator Ratio 13:1
Teacher/Support Person Ratio 14:1
Teacher/Staff Ratio 7:1
Student Enrollment/All Teachers 16:1
Certified Personnel by Category
75.3% 100%
8.4% 16.3%
80% 60%
40%
20%
0%
Teachers
Administrators
Support Personnel
1998-99 GEORGIA PUBLIC EDUCATION REPORT CARD
Catoosa County Schools - 623
Prepared by Georgia Department of Education
Page 9
1998-99 GEORGIA PUBLIC EDUCATION REPORT CARD
CATOOSA COUNTY SCHOOLS
Battlefield Elementary School - 6230177
Grade Range K-5
The Georgia Public Education Report Card is designed to assist systems and schools in educational improvement. This report card contains a variety of data elements. An explanation of the terms is provided as a companion to the report card data. Please refer to the definitions for the most effective use of the reported data.
STUDENT DATA
Total 656
K-5 Enrollment, by Race/Ethnicity and Sex
Black
White Hispanic
American Multi-
Asian Indian
racial
11 1.7%
629 95.9%
4 0.6%
12 1.8%
0 0.0%
0 0.0%
Male Female
349 53.2%
307 46.8%
Enrollment in Selected Programs
Program
Program % of Student Enrollment Population
Gifted (Grades K-12)
66
10.1%
Alternative Programs (Grades 6-12)
N/A
N/A
Students Eligible to Receive Free/Reduced Lunches
Number
Percent
School System
188 2,712
28.7% 29.6%
Dropout Rate *
Number
Rate
School System
N/A N/A
N/A N/A
* Dropout rates are not applicable for grades PK-5.
Enrollment in Compensatory Programs
Program
Program % of Student Enrollment Population
Special Education (Grades K-12)
72 11.0%
(PK)
2
N/A
English to Speakers of Other Languages (ESOL) (Grades K-12)
13
2.0%
Remedial Education (Grades 2-5, 9-12)
19
4.1%
Special Instructional Assistance (SIA) (Grades K-3)
76 17.6%
Title I (Grades K-12)
This school has no Title I program.
Total 16
Retained Students, by Race/Ethnicity and Sex
Black
White Hispanic
American Multi-
Asian Indian
racial
0 0.0%
15 93.8%
0 0.0%
1 6.3%
0 0.0%
0 0.0%
Male Female
12
4
75.0% 25.0%
Prepared by Georgia Department of Education
Page 1
STATE-REQUIRED TEST DATA
NORM-REFERENCED TESTS Grade 3
Iowa Tests of Basic Skills (ITBS) Each chart reflects data for three years of testing.
Reading Comprehension 50
64 61 54 0
98-99
67 58 53 97-98
67 55 52 96-97
Mathematics
School 50
System
State
0
68 65 61 98-99
71 61 61 97-98
70 61 59 96-97
School System State
Reading Vocabulary 50
57 58 50 0
98-99
62 60 50 97-98
64 56 49 96-97
Language Arts
School 50
System
State
0
70 68 64 98-99
72 65 62 97-98
67 60 59 96-97
School System State
Social Studies 50
69 63 56 0
98-99
72 61 55 97-98
77 59 55 96-97
Science
School 50
System
State
0
67 64 59 98-99
72 62 59 97-98
69 60 58 96-97
School System State
Sources of Information
Composite Score
50
66 62 57 0
98-99
School 50
System
73 61 56 97-98
70 59 55 96-97
State 0
67 64 58 98-99
71 61 57 97-98
1998-99 GEORGIA PUBLIC EDUCATION REPORT CARD Battlefield Elementary School - 6230177
Prepared by Georgia Department of Education
70 59 56 96-97
Scores Reported in Percentiles
School System State
Page 2
STATE-REQUIRED TEST DATA
NORM-REFERENCED TESTS Grade 5
Iowa Tests of Basic Skills (ITBS) Each chart reflects data for three years of testing.
Reading Comprehension
Mathematics
50
59 57 53 0
98-99
58 54 53 97-98
56 54 52 96-97
School 50
System
State
0
63 61 59 98-99
65 58 58 97-98
60 56 57 96-97
School System State
Reading Vocabulary 50
60 57 48 0
98-99
60 54 48 97-98
61 53 46 96-97
Language Arts
School 50
System
State
0
68 66 63 98-99
69 63 61 97-98
62 59 58 96-97
School System State
Social Studies 50
66 61 57 0
98-99
65 58 56 97-98
62 59 55 96-97
Science
School 50
System
State
0
69 65 60 98-99
67 62 59 97-98
68 62 59 96-97
School System State
Sources of Information
Composite Score
50
64 63 58 0
98-99
School 50
System
63 60 58 97-98
61 59 57 96-97
State 0
65 62 57 98-99
64 59 56 97-98
61 58 55 96-97
1998-99 GEORGIA PUBLIC EDUCATION REPORT CARD Battlefield Elementary School - 6230177
Prepared by Georgia Department of Education
Scores Reported in Percentiles
School System State
Page 3
STATE-REQUIRED TEST DATA
PERFORMANCE ASSESSMENTS
Grade 5 Writing Assessment
Percent at Developmental Stages:
1998-99 School System State
1997-98 School System State
1996-97 School System State
Stage Stage Stage Stage Stage Stage
1:The Emerging Writer 2:The Developing Writer 3:The Focusing Writer 4:The Experimenting 5:The Engaging Writer 6:The Extending Writer
0% 0% 13% 43% 32% 12%
0% 2% 15% 41% 32% 11%
0% 1% 16% 41% 29% 12%
0% 0% 22% 39% 31% 7%
0% 2% 16% 39% 31% 12%
0% 3% 19% 41% 27% 10%
1% 1% 27% 30% 34% 6%
0% 2% 20% 39% 27% 11%
0% 3% 21% 37% 26% 12%
AWARDS / RECOGNITION DATA
Schools in Georgia may receive recognition in the following programs: Charter School Pay for Performance Program Georgia School of Excellence National Blue Ribbon School Battlefield Elementary School did not receive recognition in any of these programs during the 1998-99 school year.
1998-99 GEORGIA PUBLIC EDUCATION REPORT CARD Battlefield Elementary School - 6230177
Prepared by Georgia Department of Education
Page 4
CERTIFIED PERSONNEL DATA
Positions Number Average Contract Days
Personnel Sex
Certificate
Years Experience
Full-time Part-time
Male Female
4 Yr Bachelor's 5 Yr Master's 6 Yr Specialist's 7 Yr Doctoral Other*
<1 1-10 11-20 21-30 >30
Average
Administrators
2.00 205.00
2 0
1 1
0 0 1 1 0 0 0 1 0 1 23.50
Support Personnel
1.03 190.00
1 1
1 1
1 1 0 0 0 0 2 0 0 0 6.50
PK-12 Teachers
38.09 190.00
37 2
2 37
23 12
4 0 0 3 7 17 12 0 15.49
*Includes One- and Two-Year Vocational Certificates.
ACCREDITATION DATA
Accredited with Quality by Georgia Accrediting Commission (GAC).
1998-99 GEORGIA PUBLIC EDUCATION REPORT CARD Battlefield Elementary School - 6230177
Prepared by Georgia Department of Education
Page 5
1998-99 GEORGIA PUBLIC EDUCATION REPORT CARD
CATOOSA COUNTY SCHOOLS
Boynton Elementary School - 6231050
Grade Range K-5
The Georgia Public Education Report Card is designed to assist systems and schools in educational improvement. This report card contains a variety of data elements. An explanation of the terms is provided as a companion to the report card data. Please refer to the definitions for the most effective use of the reported data.
STUDENT DATA
Total 719
K-5 Enrollment, by Race/Ethnicity and Sex
Black
White Hispanic
American Multi-
Asian Indian
racial
1 0.1%
717 99.7%
0 0.0%
1 0.1%
0 0.0%
0 0.0%
Male Female
354 49.2%
365 50.8%
Enrollment in Selected Programs
Program
Program % of Student Enrollment Population
Gifted (Grades K-12)
60
8.3%
Alternative Programs (Grades 6-12)
N/A
N/A
Students Eligible to Receive Free/Reduced Lunches
Number
Percent
School System
130 2,712
18.1% 29.6%
Dropout Rate *
Number
Rate
School System
N/A N/A
N/A N/A
* Dropout rates are not applicable for grades PK-5.
Enrollment in Compensatory Programs
Program
Program % of Student Enrollment Population
Special Education (Grades K-12)
88 12.2%
(PK)
0
N/A
English to Speakers of Other Languages (ESOL) (Grades K-12)
0
0.0%
Remedial Education (Grades 2-5, 9-12)
37
7.7%
Special Instructional Assistance (SIA) (Grades K-3)
58 11.6%
Title I (Grades K-12)
This school has no Title I program.
Total 29
Retained Students, by Race/Ethnicity and Sex
Black
White Hispanic
American Multi-
Asian Indian
racial
0
29
0.0% 100.0%
0 0.0%
0 0.0%
0 0.0%
0 0.0%
Male Female
21
8
72.4% 27.6%
Prepared by Georgia Department of Education
Page 1
STATE-REQUIRED TEST DATA
NORM-REFERENCED TESTS Grade 3
Iowa Tests of Basic Skills (ITBS) Each chart reflects data for three years of testing.
Reading Comprehension 50
63 61 54 0
98-99
63 58 53 97-98
54 55 52 96-97
Mathematics
School 50
System
State
0
71 65 61 98-99
66 61 61 97-98
71 61 59 96-97
School System State
Reading Vocabulary 50
67 58 50 0
98-99
63 60 50 97-98
60 56 49 96-97
Language Arts
School 50
System
State
0
76 68 64 98-99
66 65 62 97-98
66 60 59 96-97
School System State
Social Studies 50
72 63 56 0
98-99
63 61 55 97-98
65 59 55 96-97
Science
School 50
System
State
0
69 64 59 98-99
64 62 59 97-98
65 60 58 96-97
School System State
Sources of Information
Composite Score
50
69 62 57 0
98-99
School 50
System
62 61 56 97-98
65 59 55 96-97
State 0
71 64 58 98-99
64 61 57 97-98
1998-99 GEORGIA PUBLIC EDUCATION REPORT CARD Boynton Elementary School - 6231050
Prepared by Georgia Department of Education
67 59 56 96-97
Scores Reported in Percentiles
School System State
Page 2
STATE-REQUIRED TEST DATA
NORM-REFERENCED TESTS Grade 5
Iowa Tests of Basic Skills (ITBS) Each chart reflects data for three years of testing.
Reading Comprehension
Mathematics
50
56 57 53 0
98-99
61 54 53 97-98
55 54 52 96-97
School 50
System
State
0
68 61 59 98-99
74 58 58 97-98
59 56 57 96-97
School System State
Reading Vocabulary 50
56 57 48 0
98-99
54 54 48 97-98
55 53 46 96-97
Language Arts
School 50
System
State
0
71 66 63 98-99
72 63 61 97-98
65 59 58 96-97
School System State
Social Studies 50
63 61 57 0
98-99
69 58 56 97-98
65 59 55 96-97
Science
School 50
System
State
0
67 65 60 98-99
73 62 59 97-98
66 62 59 96-97
School System State
Sources of Information
Composite Score
50
65 63 58 0
98-99
School 50
System
71 60 58 97-98
67 59 57 96-97
State 0
65 62 57 98-99
70 59 56 97-98
64 58 55 96-97
1998-99 GEORGIA PUBLIC EDUCATION REPORT CARD Boynton Elementary School - 6231050
Prepared by Georgia Department of Education
Scores Reported in Percentiles
School System State
Page 3
STATE-REQUIRED TEST DATA
PERFORMANCE ASSESSMENTS
Grade 5 Writing Assessment
Percent at Developmental Stages:
1998-99 School System State
1997-98 School System State
1996-97 School System State
Stage Stage Stage Stage Stage Stage
1:The Emerging Writer 2:The Developing Writer 3:The Focusing Writer 4:The Experimenting 5:The Engaging Writer 6:The Extending Writer
0% 1% 12% 42% 38% 7%
0% 2% 15% 41% 32% 11%
0% 1% 16% 41% 29% 12%
0% 1% 9% 28% 35% 27%
0% 2% 16% 39% 31% 12%
0% 3% 19% 41% 27% 10%
0% 0% 16% 37% 32% 15%
0% 2% 20% 39% 27% 11%
0% 3% 21% 37% 26% 12%
AWARDS / RECOGNITION DATA
Schools in Georgia may receive recognition in the following programs: Charter School Pay for Performance Program Georgia School of Excellence National Blue Ribbon School Boynton Elementary School did not receive recognition in any of these programs during the 1998-99 school year.
1998-99 GEORGIA PUBLIC EDUCATION REPORT CARD Boynton Elementary School - 6231050
Prepared by Georgia Department of Education
Page 4
CERTIFIED PERSONNEL DATA
Positions Number Average Contract Days
Personnel Sex
Certificate
Years Experience
Full-time Part-time
Male Female
4 Yr Bachelor's 5 Yr Master's 6 Yr Specialist's 7 Yr Doctoral Other*
<1 1-10 11-20 21-30 >30
Average
Administrators
2.00 205.00
2 0
0 2
0 1 1 0 0 0 0 2 0 0 15.00
Support Personnel
2.00 190.00
2 0
0 2
0 0 2 0 0 0 0 0 0 2 32.00
PK-12 Teachers
42.47 190.00
41 2
3 40
16 22
5 0 0 2 17 13 10 1 13.49
*Includes One- and Two-Year Vocational Certificates.
ACCREDITATION DATA
Accredited with Quality by Georgia Accrediting Commission (GAC).
1998-99 GEORGIA PUBLIC EDUCATION REPORT CARD Boynton Elementary School - 6231050
Prepared by Georgia Department of Education
Page 5
1998-99 GEORGIA PUBLIC EDUCATION REPORT CARD
CATOOSA COUNTY SCHOOLS
Cloud Springs Elementary School - 6233050
Grade Range PK-5
The Georgia Public Education Report Card is designed to assist systems and schools in educational improvement. This report card contains a variety of data elements. An explanation of the terms is provided as a companion to the report card data. Please refer to the definitions for the most effective use of the reported data.
STUDENT DATA
Total
K-5
613
PK
84
Enrollment, by Race/Ethnicity and Sex
Black
White Hispanic
American Asian Indian
Multiracial
5 0.8%
591 96.4%
4 0.7%
7 1.1%
3 0.5%
3 0.5%
0 0.0%
82 97.6%
0 0.0%
0 0.0%
0 0.0%
2 2.4%
Male Female
282 46.0%
331 54.0%
57 67.9%
27 32.1%
Enrollment in Selected Programs
Program
Program % of Student Enrollment Population
Gifted (Grades K-12)
40
6.5%
Alternative Programs (Grades 6-12)
N/A
N/A
Students Eligible to Receive Free/Reduced Lunches
Number
Percent
School System
294 2,712
42.2% 29.6%
Dropout Rate *
Number
Rate
School System
N/A N/A
N/A N/A
* Dropout rates are not applicable for grades PK-5.
Enrollment in Compensatory Programs
Program
Program % of Student Enrollment Population
Special Education (Grades K-12)
94 15.3%
(PK)
37
N/A
English to Speakers of Other Languages (ESOL) (Grades K-12)
4
< 1%
Remedial Education (Grades 2-5, 9-12)
12
3.0%
Special Instructional Assistance (SIA) (Grades K-3)
56 13.3%
Title I (Grades K-12)
This school has a Targeted Assistance program.
Total 24
Retained Students, by Race/Ethnicity and Sex
Black
White Hispanic
American MultiAsian Indian racial
0 0.0%
23 95.8%
0 0.0%
1 4.2%
0 0.0%
0 0.0%
Male Female
17
7
70.8% 29.2%
Prepared by Georgia Department of Education
Page 1
STATE-REQUIRED TEST DATA
NORM-REFERENCED TESTS Grade 3
Iowa Tests of Basic Skills (ITBS) Each chart reflects data for three years of testing.
Reading Comprehension 50
60 61 54 0
98-99
55 58 53 97-98
53 55 52 96-97
Mathematics
School 50
System
State
0
55 65 61 98-99
60 61 61 97-98
48 61 59 96-97
School System State
Reading Vocabulary 50
52 58 50 0
98-99
54 60 50 97-98
52 56 49 96-97
Language Arts
School 50
System
State
0
63 68 64 98-99
60 65 62 97-98
47 60 59 96-97
School System State
Social Studies 50
58 63 56 0
98-99
60 61 55 97-98
52 59 55 96-97
Science
School 50
System
State
0
57 64 59 98-99
56 62 59 97-98
60 60 58 96-97
School System State
Sources of Information
Composite Score
50
59 62 57 0
98-99
School 50
System
60 61 56 97-98
55 59 55 96-97
State 0
57 64 58 98-99
58 61 57 97-98
1998-99 GEORGIA PUBLIC EDUCATION REPORT CARD Cloud Springs Elementary School - 6233050
Prepared by Georgia Department of Education
52 59 56 96-97
Scores Reported in Percentiles
School System State
Page 2
STATE-REQUIRED TEST DATA
NORM-REFERENCED TESTS Grade 5
Iowa Tests of Basic Skills (ITBS) Each chart reflects data for three years of testing.
Reading Comprehension
Mathematics
50
58 57 53 0
98-99
51 54 53 97-98
53 54 52 96-97
School 50
System
State
0
59 61 59 98-99
52 58 58 97-98
46 56 57 96-97
School System State
Reading Vocabulary 50
55 57 48 0
98-99
52 54 48 97-98
48 53 46 96-97
Language Arts
School 50
System
State
0
69 66 63 98-99
56 63 61 97-98
49 59 58 96-97
School System State
Social Studies 50
58 61 57 0
98-99
55 58 56 97-98
58 59 55 96-97
Science
School 50
System
State
0
64 65 60 98-99
60 62 59 97-98
63 62 59 96-97
School System State
Sources of Information
Composite Score
50
66 63 58 0
98-99
School 50
System
54 60 58 97-98
55 59 57 96-97
State 0
62 62 57 98-99
54 59 56 97-98
53 58 55 96-97
1998-99 GEORGIA PUBLIC EDUCATION REPORT CARD Cloud Springs Elementary School - 6233050
Prepared by Georgia Department of Education
Scores Reported in Percentiles
School System State
Page 3
STATE-REQUIRED TEST DATA
PERFORMANCE ASSESSMENTS
Grade 5 Writing Assessment
Percent at Developmental Stages:
1998-99 School System State
1997-98 School System State
1996-97 School System State
Stage Stage Stage Stage Stage Stage
1:The Emerging Writer 2:The Developing Writer 3:The Focusing Writer 4:The Experimenting 5:The Engaging Writer 6:The Extending Writer
0% 0% 10% 39% 35% 17%
0% 2% 15% 41% 32% 11%
0% 1% 16% 41% 29% 12%
1% 3% 15% 40% 29% 11%
0% 2% 16% 39% 31% 12%
0% 3% 19% 41% 27% 10%
0% 3% 18% 35% 32% 13%
0% 2% 20% 39% 27% 11%
0% 3% 21% 37% 26% 12%
AWARDS / RECOGNITION DATA
Schools in Georgia may receive recognition in the following programs: Charter School Pay for Performance Program Georgia School of Excellence National Blue Ribbon School Cloud Springs Elementary School did not receive recognition in any of these programs during the 1998-99 school year.
1998-99 GEORGIA PUBLIC EDUCATION REPORT CARD Cloud Springs Elementary School - 6233050
Prepared by Georgia Department of Education
Page 4
CERTIFIED PERSONNEL DATA
Positions Number Average Contract Days
Personnel Sex
Certificate
Years Experience
Full-time Part-time
Male Female
4 Yr Bachelor's 5 Yr Master's 6 Yr Specialist's 7 Yr Doctoral Other*
<1 1-10 11-20 21-30 >30
Average
Administrators
2.00 205.00
2 0
2 0
0 0 2 0 0 0 0 1 1 0 21.00
Support Personnel
1.00 190.00
1 0
0 1
0 1 0 0 0 0 0 0 1 0 25.00
PK-12 Teachers
36.84 190.00
36 3
2 37
12 24
3 0 0 2 7 17 12 1 16.23
*Includes One- and Two-Year Vocational Certificates.
ACCREDITATION DATA
Accredited with Quality by Georgia Accrediting Commission (GAC).
1998-99 GEORGIA PUBLIC EDUCATION REPORT CARD Cloud Springs Elementary School - 6233050
Prepared by Georgia Department of Education
Page 5
1998-99 GEORGIA PUBLIC EDUCATION REPORT CARD
CATOOSA COUNTY SCHOOLS
Graysville Elementary School - 6235050
Grade Range K-5
The Georgia Public Education Report Card is designed to assist systems and schools in educational improvement. This report card contains a variety of data elements. An explanation of the terms is provided as a companion to the report card data. Please refer to the definitions for the most effective use of the reported data.
STUDENT DATA
Total 707
K-5 Enrollment, by Race/Ethnicity and Sex
Black
White Hispanic
American Multi-
Asian Indian
racial
0 0.0%
701 99.2%
1 0.1%
4 0.6%
0 0.0%
1 0.1%
Male Female
389 55.0%
318 45.0%
Enrollment in Selected Programs
Program
Program % of Student Enrollment Population
Gifted (Grades K-12)
80
11.3%
Alternative Programs (Grades 6-12)
N/A
N/A
Students Eligible to Receive Free/Reduced Lunches
Number
Percent
School System
192 2,712
27.2% 29.6%
Dropout Rate *
Number
Rate
School System
N/A N/A
N/A N/A
* Dropout rates are not applicable for grades PK-5.
Enrollment in Compensatory Programs
Program
Program % of Student Enrollment Population
Special Education (Grades K-12)
74 10.5%
(PK)
0
N/A
English to Speakers of Other Languages (ESOL) (Grades K-12)
0
0.0%
Remedial Education (Grades 2-5, 9-12)
46
9.8%
Special Instructional Assistance (SIA) (Grades K-3)
76 16.2%
Title I (Grades K-12)
This school has a Targeted Assistance program.
Total 18
Retained Students, by Race/Ethnicity and Sex
Black
White Hispanic
American Multi-
Asian Indian
racial
0
18
0.0% 100.0%
0 0.0%
0 0.0%
0 0.0%
0 0.0%
Male Female
12
6
66.7% 33.3%
Prepared by Georgia Department of Education
Page 1
STATE-REQUIRED TEST DATA
NORM-REFERENCED TESTS Grade 3
Iowa Tests of Basic Skills (ITBS) Each chart reflects data for three years of testing.
Reading Comprehension 50
64 61 54 0
98-99
61 58 53 97-98
51 55 52 96-97
Mathematics
School 50
System
State
0
81 65 61 98-99
71 61 61 97-98
59 61 59 96-97
School System State
Reading Vocabulary 50
72 58 50 0
98-99
77 60 50 97-98
59 56 49 96-97
Language Arts
School 50
System
State
0
72 68 64 98-99
70 65 62 97-98
61 60 59 96-97
School System State
Social Studies 50
63 63 56 0
98-99
60 61 55 97-98
52 59 55 96-97
Science
School 50
System
State
0
67 64 59 98-99
60 62 59 97-98
51 60 58 96-97
School System State
Sources of Information
Composite Score
50
62 62 57 0
98-99
School 50
System
60 61 56 97-98
52 59 55 96-97
State 0
69 64 58 98-99
65 61 57 97-98
1998-99 GEORGIA PUBLIC EDUCATION REPORT CARD Graysville Elementary School - 6235050
Prepared by Georgia Department of Education
54 59 56 96-97
Scores Reported in Percentiles
School System State
Page 2
STATE-REQUIRED TEST DATA
NORM-REFERENCED TESTS Grade 5
Iowa Tests of Basic Skills (ITBS) Each chart reflects data for three years of testing.
Reading Comprehension
Mathematics
50
56 57 53 0
98-99
63 54 53 97-98
61 54 52 96-97
School 50
System
State
0
61 61 59 98-99
66 58 58 97-98
64 56 57 96-97
School System State
Reading Vocabulary 50
57 57 48 0
98-99
61 54 48 97-98
59 53 46 96-97
Language Arts
School 50
System
State
0
58 66 63 98-99
73 63 61 97-98
68 59 58 96-97
School System State
Social Studies 50
58 61 57 0
98-99
64 58 56 97-98
68 59 55 96-97
Science
School 50
System
State
0
61 65 60 98-99
69 62 59 97-98
66 62 59 96-97
School System State
Sources of Information
Composite Score
50
58 63 58 0
98-99
School 50
System
67 60 58 97-98
61 59 57 96-97
State 0
58 62 57 98-99
67 59 56 97-98
65 58 55 96-97
1998-99 GEORGIA PUBLIC EDUCATION REPORT CARD Graysville Elementary School - 6235050
Prepared by Georgia Department of Education
Scores Reported in Percentiles
School System State
Page 3
STATE-REQUIRED TEST DATA
PERFORMANCE ASSESSMENTS
Grade 5 Writing Assessment
Percent at Developmental Stages:
1998-99 School System State
1997-98 School System State
1996-97 School System State
Stage Stage Stage Stage Stage Stage
1:The Emerging Writer 2:The Developing Writer 3:The Focusing Writer 4:The Experimenting 5:The Engaging Writer 6:The Extending Writer
1% 2% 32% 43% 18% 4%
0% 2% 15% 41% 32% 11%
0% 1% 16% 41% 29% 12%
0% 1% 14% 39% 32% 9%
0% 2% 16% 39% 31% 12%
0% 3% 19% 41% 27% 10%
0% 1% 14% 40% 29% 15%
0% 2% 20% 39% 27% 11%
0% 3% 21% 37% 26% 12%
AWARDS / RECOGNITION DATA
Schools in Georgia may receive recognition in the following programs: Charter School Pay for Performance Program Georgia School of Excellence National Blue Ribbon School Graysville Elementary School did not receive recognition in any of these programs during the 1998-99 school year.
1998-99 GEORGIA PUBLIC EDUCATION REPORT CARD Graysville Elementary School - 6235050
Prepared by Georgia Department of Education
Page 4
CERTIFIED PERSONNEL DATA
Positions Number Average Contract Days
Personnel Sex
Certificate
Years Experience
Full-time Part-time
Male Female
4 Yr Bachelor's 5 Yr Master's 6 Yr Specialist's 7 Yr Doctoral Other*
<1 1-10 11-20 21-30 >30
Average
Administrators
2.00 205.00
2 0
0 2
0 0 2 0 0 0 0 2 0 0 16.50
Support Personnel
1.05 190.00
1 1
0 2
0 2 0 0 0 0 1 0 1 0 15.00
PK-12 Teachers
41.08 190.00
38 6
3 41
20 18
6 0 0 0 20 17 6 1 12.32
*Includes One- and Two-Year Vocational Certificates.
ACCREDITATION DATA
Accredited with Quality by Georgia Accrediting Commission (GAC).
1998-99 GEORGIA PUBLIC EDUCATION REPORT CARD Graysville Elementary School - 6235050
Prepared by Georgia Department of Education
Page 5
1998-99 GEORGIA PUBLIC EDUCATION REPORT CARD
CATOOSA COUNTY SCHOOLS
Lakeview Middle School - 6232552
Grade Range 6-8
The Georgia Public Education Report Card is designed to assist systems and schools in educational improvement. This report card contains a variety of data elements. An explanation of the terms is provided as a companion to the report card data. Please refer to the definitions for the most effective use of the reported data.
STUDENT DATA
Total 919
6-8 Enrollment, by Race/Ethnicity and Sex
Black
White Hispanic
American Multi-
Asian Indian
racial
7 0.8%
891 97.0%
1 0.1%
18 2.0%
0 0.0%
2 0.2%
Male 461
50.2%
Female 458
49.8%
Enrollment in Selected Programs
Program
Gifted (Grades K-12)
Program % of Student Enrollment Population
109
11.9%
Alternative Programs
12
(Grades 6-12)
1.3%
Students Eligible to Receive Free/Reduced Lunches
Number
Percent
School System
302 2,712
32.9% 29.6%
Enrollment in Compensatory Programs
Program
Program % of Student Enrollment Population
Special Education (Grades K-12) (PK)
74
8.1%
0
N/A
English to Speakers of Other Languages (ESOL) (Grades K-12)
4
< 1%
Title I (Grades K-12)
This school has no Title I program.
Dropout Rate for Grades 6-8
Number
Rate
School System
0
0.0%
13
0.6%
Total 10
Retained Students, by Race/Ethnicity and Sex
Black
White Hispanic
American MultiAsian Indian racial
0 0.0%
9 90.0%
0 0.0%
1 10.0%
0 0.0%
0 0.0%
Male Female
5
5
50.0% 50.0%
Prepared by Georgia Department of Education
Page 1
STATE-REQUIRED TEST DATA
NORM-REFERENCED TESTS Grade 8
Iowa Tests of Basic Skills (ITBS) Each chart reflects data for three years of testing.
Reading Comprehension 50
56 55 49 0
98-99
52 52 48 97-98
57 53 48 96-97
Mathematics
School 50
System
State
0
56 59 56 98-99
53 55 55 97-98
50 51 54 96-97
School System State
Reading Vocabulary 50
57 53 46 0
98-99
53 48 45 97-98
57 52 44 96-97
Language Arts
School 50
System
State
0
59 61 60 98-99
63 58 58 97-98
60 57 56 96-97
School System State
Social Studies 50
57 56 54 0
98-99
55 55 53 97-98
55 53 53 96-97
Science
School 50
System
State
0
65 62 56 98-99
59 58 55 97-98
58 56 53 96-97
School System State
Sources of Information
Composite Score
50
59 61 57 0
98-99
School 50
System
56 56 56 97-98
56 54 55 96-97
State 0
60 60 56 98-99
57 56 54 97-98
1998-99 GEORGIA PUBLIC EDUCATION REPORT CARD Lakeview Middle School - 6232552
Prepared by Georgia Department of Education
56 54 54 96-97
Scores Reported in Percentiles
School System State
Page 2
STATE-REQUIRED TEST DATA
Categories of Scaled Scores
Inadequate (less than 162)
Minimal (162-209)
Good
(210-247)
Very Good (greater than 247)
Average Scaled Score: (Range 100-300)
PERFORMANCE ASSESSMENTS
Grade 8 Writing Assessment
1998-99 Percent Scoring
1997-98 Percent Scoring
1996-97 Percent Scoring
School System State School System State School System State
4% 42% 48%
6%
6% 38% 50%
7%
8% 40% 41% 11%
9% 44% 43%
4%
11% 51% 34%
5%
11% 46% 34%
8%
7% 51% 37%
5%
7% 52% 35%
6%
15% 46% 30%
8%
209
209
208 204
200 202 204
203 198
AWARDS / RECOGNITION DATA
Schools in Georgia may receive recognition in the following programs: Charter School Pay for Performance Program Georgia School of Excellence National Blue Ribbon School Lakeview Middle School did not receive recognition in any of these programs during the 1998-99 school year.
1998-99 GEORGIA PUBLIC EDUCATION REPORT CARD Lakeview Middle School - 6232552
Prepared by Georgia Department of Education
Page 3
CERTIFIED PERSONNEL DATA
Positions Number Average Contract Days
Personnel Sex
Certificate
Years Experience
Full-time Part-time
Male Female
4 Yr Bachelor's 5 Yr Master's 6 Yr Specialist's 7 Yr Doctoral Other*
<1 1-10 11-20 21-30 >30
Average
Administrators
3.02 209.86
3 1
3 1
0 0 3 1 0 0 0 0 4 0 24.50
Support Personnel
3.69 190.00
3 15
8 10
10 5 3 0 0 0 9 4 4 1
13.94
PK-12 Teachers
49.77 190.13
41 12
17 36
16 33
4 0 0 2 15 15 20 1 16.53
*Includes One- and Two-Year Vocational Certificates.
ACCREDITATION DATA
Accredited with Quality by Georgia Accrediting Commission (GAC).
1998-99 GEORGIA PUBLIC EDUCATION REPORT CARD Lakeview Middle School - 6232552
Prepared by Georgia Department of Education
Page 4
1998-99 GEORGIA PUBLIC EDUCATION REPORT CARD
CATOOSA COUNTY SCHOOLS
Lakeview-Fort Oglethorpe High School - 6231052
Grade Range 9-12
The Georgia Public Education Report Card is designed to assist systems and schools in educational improvement. This report card contains a variety of data elements. An explanation of the terms is provided as a companion to the report card data. Please refer to the definitions for the most effective use of the reported data.
Total 1,063
STUDENT DATA
9-12 Enrollment, by Race/Ethnicity and Sex
Black
White Hispanic
American Multi-
Asian Indian
racial
17 1.6%
1,025 96.4%
4 0.4%
13 1.2%
2 0.2%
2 0.2%
Male Female
537 50.5%
526 49.5%
Enrollment in Selected Programs
Program
Gifted (Grades K-12)
Program % of Student Enrollment Population
65
6.1%
Non-Vocational Labs (Grades 9-12)
956
Vocational Labs
(Grades 9-12)
968
Alternative Programs (Grades 6-12)
18
89.9% 91.1%
1.7%
Students Eligible to Receive Free/Reduced Lunches
Number
Percent
School System
170 2,712
16.0% 29.6%
Enrollment in Compensatory Programs
Program
Program % of Student Enrollment Population
Special Education (Grades K-12) PK
71
6.7%
0
N/A
English to Speakers of Other Languages (ESOL) (Grades K-12)
5
< 1%
Remedial Education (Grades 2-5, 9-12)
55
5.2%
Title I (Grades K-12)
This school has no Title I program.
Dropout Rate for Grades 9-12
Number
Rate
School System
69
6.2%
194
7.7%
Total 45
Retained Students, by Race/Ethnicity and Sex
Black
White Hispanic
American MultiAsian Indian racial
1 2.2%
43 95.6%
1 2.2%
0 0.0%
0 0.0%
0 0.0%
Male Female
26
19
57.8% 42.2%
Prepared by Georgia Department of Education
Page 1
STATE-REQUIRED TEST DATA
GEORGIA HIGH SCHOOL GRADUATION TESTS (GHSGT)
Percent of Regular Program 11th Graders Passing the Georgia High School Graduation Tests on First Administration
English Language Arts Mathematics Social Studies Science
All Components listed above
Writing
1998-99
School System State
95% 87% 76% 71%
96% 90% 76% 72%
96% 88% 80% 72%
62% 65% 68%
98% 96% 93%
1997-98
School System State
95% 91% 78% 81%
95% 91% 77% 80%
94% 88% 78% 74%
70% 70% 68%
97% 95% 92%
1996-97
School System State
95% 92% 85% 81%
94% 92% 84% 79%
94% 87% 78% 74%
74% 73% 67%
95% 95% 93%
GRADUATE DATA
1999 Graduates by Credentials, Race/Ethnicity and Sex
Diplomas with Both College Prep. & Voc. Endorsements
Diplomas with College Prep. Endorsements Diplomas with Vocational Endorsements General High School Diplomas Special Education Diplomas
Total All Diplomas
Certificates of Performance
Total Graduates
Total 81 45 68 1 1
196 11
207
Black
0 0.0%
1 2.2%
1 1.5%
0 0.0%
0 0.0%
2 1.0%
2 18.2%
4 1.9%
American MultiWhite Hispanic Asian Indian racial
80 98.8%
44 97.8%
0 0.0%
0 0.0%
1 1.2%
0 0.0%
0 0.0%
0 0.0%
0 0.0%
0 0.0%
66 97.1%
1 100.0%
1 100.0%
0 0.0%
0 0.0%
0 0.0%
0 0.0%
0 0.0%
0 0.0%
0 0.0%
0 0.0%
0 0.0%
1 1.5%
0 0.0%
0 0.0%
192 98.0%
0 0.0%
1 0.5%
0 0.0%
1 0.5%
8 72.7%
1 9.1%
0 0.0%
0 0.0%
0 0.0%
200 96.6%
1 0.5%
1 0.5%
0 0.0%
1 0.5%
Male Female
27 33.3%
21 46.7%
54 66.7%
24 53.3%
47 69.1%
0 0.0%
1 100.0%
21 30.9%
1 100.0%
0 0.0%
96
100
49.0% 51.0%
6
5
54.5% 45.5%
102
105
49.3% 50.7%
HOPE Scholarships
School System
Number of 1999 Graduates 2 0 7
Number Eligible
159
Percent Eligible
76.8%
490 344 70.2%
State
65,548 40,292 61.5%
High School Completion Rate
Percent of 1995Grade 9 Enrollment in Graduating Class of1999 School System State
Completion Rate '95-'99 74.5% 72.8% 68.9%
1998-99 GEORGIA PUBLIC EDUCATION REPORT CARD
Lakeview-Fort Oglethorpe High School - 6231052
Prepared by Georgia Department of Education
Page 2
COLLEGE ADMISSIONS / CREDIT TEST DATA
Scholastic Assessment Test (SAT)
Based on students' highest verbal and highest math scores
No. Taking
Average Score
Tests Verbal Math Total
Based on students' last test administration
Average Score Verbal Math Total
School
103 489 450
939
College Prep. Endorsement
505 460
965
Other Diplomas
359 404
763
System
241 487 466
953
College Prep. Endorsement
502 476
978
Other Diplomas
386 394
780
Georgia
41,958 492 488
980
483 N/A N/A
480 N/A N/A
483
446 N/A N/A
460 N/A N/A
479
929 N/A N/A
940 N/A N/A
962
Nation
952,913 N/A N/A N/A
502 508 1010
American College Testing (ACT)
Advanced Placement Exams (AP)
Number taking tests: English Mathematics Reading Science Reasoning CompositeScore
5 1 School System State
19.5 19.8 19.1
18.9 20.0 19.9
19.7 19.3
20.4 20.1
20.2 19.9
19.5 20.2 19.9
No. of Students Taking Tests
No. of Tests Taken No. of Test Scores
3 or Higher Percent of Test
Scores 3 or Higher
School 36 51 20
39.2%
System State 54 15,225 80 23,969 37 13,024
46.3% 54.3%
POST-SECONDARY DATA
Graduates Entering Georgia Public Colleges
Graduates Entering Georgia Public Colleges and Requiring Learning Support (LS)
1998 Graduates Entering in 1998-99
1997 Graduates Entering in 1997-98
Percent of Graduating Number Class
School
62
28.4%
System 151
32.5%
School
55
27.1%
System 134
31.2%
Number Requiring
LS 15 36
25 44
Percent of those attending Georgia
Public Colleges
24.2%
23.8%
45.5%
32.8%
In previous years, the Report Card presented College Prep Curriculum information provided by the Board of Regents on students requiring Learning Support. Due to inconsistencies in the data provided by the Board of Regents in defining College Prep Completers versus Local Board of Education data defining College Prep Endorsements, the Department of Education Report Card will not provide this information until discrepancies can be reconciled.
Graduates Entering Georgia Public Technical and Adult Schools
1998 Graduates School System
Entering Number 15 38
1998-99 Percent
6.9% 8.2%
Entering Number N/A N/A
1997-98 Percent
N/A N/A
1997 Graduates School
0
0.0%
System
0
0.0%
8
3.9%
16
3.7%
1998-99 GEORGIA PUBLIC EDUCATION REPORT CARD Lakeview-Fort Oglethorpe High School - 6231052
Prepared by Georgia Department of Education
Page 3
CERTIFIED PERSONNEL DATA
Positions Number Average Contract Days
Administrators
4.67 211.16
Support Personnel
6.84 200.17
PK-12 Teachers
64.18 192.46
Personnel Sex
Certificate
Years Experience
Full-time Part-time
Male Female
4 Yr Bachelor's 5 Yr Master's 6 Yr Specialist's 7 Yr Doctoral Other*
<1 1-10 11-20 21-30 >30
Average
4 11
8 7
3 5 6 0 1
0 1 5 7 2
22.13
5 25
22 8
12 9 9 0 0
2 8 14 4 2
14.37
46 22
30 38
38 17
9 0 4
3 25 25 13
2
13.51
*Includes One- and Two-Year Vocational Certificates.
ACCREDITATION DATA
Accredited with Quality by Georgia Accrediting Commission (GAC).
AWARDS / RECOGNITION DATA
Schools in Georgia may receive recognition in the following programs: Charter School Pay for Performance Program Georgia School of Excellence National Blue Ribbon School Lakeview-Fort Oglethorpe High School did not receive recognition in any of these programs during the 1998-99 school year.
1998-99 GEORGIA PUBLIC EDUCATION REPORT CARD Lakeview-Fort Oglethorpe High School - 6231052
Prepared by Georgia Department of Education
Page 4
1998-99 GEORGIA PUBLIC EDUCATION REPORT CARD
CATOOSA COUNTY SCHOOLS
Ringgold Elementary School - 6233052
Grade Range K-5
The Georgia Public Education Report Card is designed to assist systems and schools in educational improvement. This report card contains a variety of data elements. An explanation of the terms is provided as a companion to the report card data. Please refer to the definitions for the most effective use of the reported data.
STUDENT DATA
Total 844
K-5 Enrollment, by Race/Ethnicity and Sex
Black
White Hispanic
American Multi-
Asian Indian
racial
18 2.1%
812 96.2%
7 0.8%
0 0.0%
0 0.0%
7 0.8%
Male Female
416 49.3%
428 50.7%
Enrollment in Selected Programs
Program
Program % of Student Enrollment Population
Gifted (Grades K-12)
51
6.0%
Alternative Programs (Grades 6-12)
N/A
N/A
Students Eligible to Receive Free/Reduced Lunches
Number
Percent
School System
358 2,712
42.4% 29.6%
Dropout Rate *
Number
Rate
School System
N/A N/A
N/A N/A
* Dropout rates are not applicable for grades PK-5.
Enrollment in Compensatory Programs
Program
Program % of Student Enrollment Population
Special Education (Grades K-12)
85 10.1%
(PK)
0
N/A
English to Speakers of Other Languages (ESOL) (Grades K-12)
0
0.0%
Remedial Education (Grades 2-5, 9-12)
41
7.3%
Special Instructional Assistance (SIA) (Grades K-3)
138 23.8%
Title I (Grades K-12)
This school has a Targeted Assistance program.
Total 38
Retained Students, by Race/Ethnicity and Sex
Black
White Hispanic
American Multi-
Asian Indian
racial
0 0.0%
37 97.4%
1 2.6%
0 0.0%
0 0.0%
0 0.0%
Male Female
21
17
55.3% 44.7%
Prepared by Georgia Department of Education
Page 1
STATE-REQUIRED TEST DATA
NORM-REFERENCED TESTS Grade 3
Iowa Tests of Basic Skills (ITBS) Each chart reflects data for three years of testing.
Reading Comprehension 50
63 61 54 0
98-99
60 58 53 97-98
53 55 52 96-97
Mathematics
School 50
System
State
0
62 65 61 98-99
61 61 61 97-98
62 61 59 96-97
School System State
Reading Vocabulary 50
54 58 50 0
98-99
61 60 50 97-98
53 56 49 96-97
Language Arts
School 50
System
State
0
67 68 64 98-99
71 65 62 97-98
59 60 59 96-97
School System State
Social Studies 50
63 63 56 0
98-99
63 61 55 97-98
54 59 55 96-97
Science
School 50
System
State
0
69 64 59 98-99
68 62 59 97-98
61 60 58 96-97
School System State
Sources of Information
Composite Score
50
64 62 57 0
98-99
School 50
System
65 61 56 97-98
57 59 55 96-97
State 0
64 64 58 98-99
65 61 57 97-98
1998-99 GEORGIA PUBLIC EDUCATION REPORT CARD Ringgold Elementary School - 6233052
Prepared by Georgia Department of Education
57 59 56 96-97
Scores Reported in Percentiles
School System State
Page 2
STATE-REQUIRED TEST DATA
NORM-REFERENCED TESTS Grade 5
Iowa Tests of Basic Skills (ITBS) Each chart reflects data for three years of testing.
Reading Comprehension
Mathematics
50
61 57 53 0
98-99
46 54 53 97-98
45 54 52 96-97
School 50
System
State
0
65 61 59 98-99
49 58 58 97-98
48 56 57 96-97
School System State
Reading Vocabulary 50
62 57 48 0
98-99
49 54 48 97-98
45 53 46 96-97
Language Arts
School 50
System
State
0
74 66 63 98-99
55 63 61 97-98
51 59 58 96-97
School System State
Social Studies 50
63 61 57 0
98-99
47 58 56 97-98
45 59 55 96-97
Science
School 50
System
State
0
68 65 60 98-99
52 62 59 97-98
50 62 59 96-97
School System State
Sources of Information
Composite Score
50
63 63 58 0
98-99
School 50
System
53 60 58 97-98
44 59 57 96-97
State 0
66 62 57 98-99
49 59 56 97-98
45 58 55 96-97
1998-99 GEORGIA PUBLIC EDUCATION REPORT CARD Ringgold Elementary School - 6233052
Prepared by Georgia Department of Education
Scores Reported in Percentiles
School System State
Page 3
STATE-REQUIRED TEST DATA
PERFORMANCE ASSESSMENTS
Grade 5 Writing Assessment
Percent at Developmental Stages:
1998-99 School System State
1997-98 School System State
1996-97 School System State
Stage Stage Stage Stage Stage Stage
1:The Emerging Writer 2:The Developing Writer 3:The Focusing Writer 4:The Experimenting 5:The Engaging Writer 6:The Extending Writer
0% 4% 6% 35% 39% 16%
0% 2% 15% 41% 32% 11%
0% 1% 16% 41% 29% 12%
0% 3% 13% 42% 34% 6%
0% 2% 16% 39% 31% 12%
0% 3% 19% 41% 27% 10%
0% 3% 22% 44% 22% 9%
0% 2% 20% 39% 27% 11%
0% 3% 21% 37% 26% 12%
AWARDS / RECOGNITION DATA
Schools in Georgia may receive recognition in the following programs: Charter School Pay for Performance Program Georgia School of Excellence National Blue Ribbon School Ringgold Elementary School did not receive recognition in any of these programs during the 1998-99 school year.
1998-99 GEORGIA PUBLIC EDUCATION REPORT CARD Ringgold Elementary School - 6233052
Prepared by Georgia Department of Education
Page 4
CERTIFIED PERSONNEL DATA
Positions Number Average Contract Days
Personnel Sex
Certificate
Years Experience
Full-time Part-time
Male Female
4 Yr Bachelor's 5 Yr Master's 6 Yr Specialist's 7 Yr Doctoral Other*
<1 1-10 11-20 21-30 >30
Average
Administrators
2.00 205.00
2 0
1 1
0 0 1 1 0 0 0 1 1 0 22.50
Support Personnel
1.00 190.00
1 0
0 1
0 0 0 1 0 0 0 0 1 0 28.00
PK-12 Teachers
48.18 190.00
46 3
2 47
24 21
3 1 0 4 12 19 12 2 15.16
*Includes One- and Two-Year Vocational Certificates.
ACCREDITATION DATA
Accredited with Quality by Georgia Accrediting Commission (GAC).
1998-99 GEORGIA PUBLIC EDUCATION REPORT CARD Ringgold Elementary School - 6233052
Prepared by Georgia Department of Education
Page 5
1998-99 GEORGIA PUBLIC EDUCATION REPORT CARD
CATOOSA COUNTY SCHOOLS
Ringgold High School - 6234052
Grade Range 9-12
The Georgia Public Education Report Card is designed to assist systems and schools in educational improvement. This report card contains a variety of data elements. An explanation of the terms is provided as a companion to the report card data. Please refer to the definitions for the most effective use of the reported data.
Total 1,328
STUDENT DATA
9-12 Enrollment, by Race/Ethnicity and Sex
Black
White Hispanic
American Multi-
Asian Indian
racial
12 0.9%
1,296 97.6%
6 0.5%
9 0.7%
2 0.2%
3 0.2%
Male Female
662 49.8%
666 50.2%
Enrollment in Selected Programs
Program
Gifted (Grades K-12)
Program % of Student Enrollment Population
49
3.7%
Non-Vocational Labs (Grades 9-12)
Vocational Labs (Grades 9-12)
Alternative Programs (Grades 6-12)
1,024 1,149
25
77.1% 86.5%
1.9%
Students Eligible to Receive Free/Reduced Lunches
Number
Percent
School System
203 2,712
15.3% 29.6%
Enrollment in Compensatory Programs
Program
Program % of Student Enrollment Population
Special Education (Grades K-12) PK
95
7.2%
0
N/A
English to Speakers of Other Languages (ESOL) (Grades K-12)
0
0.0%
Remedial Education (Grades 2-5, 9-12)
26
2.0%
Title I (Grades K-12)
This school has no Title I program.
Dropout Rate for Grades 9-12
Number
Rate
School System
125
8.8%
194
7.7%
Total 61
Retained Students, by Race/Ethnicity and Sex
Black
White Hispanic
American MultiAsian Indian racial
0
61
0.0% 100.0%
0 0.0%
0 0.0%
0 0.0%
0 0.0%
Male Female
33
28
54.1% 45.9%
Prepared by Georgia Department of Education
Page 1
STATE-REQUIRED TEST DATA
GEORGIA HIGH SCHOOL GRADUATION TESTS (GHSGT)
Percent of Regular Program 11th Graders Passing the Georgia High School Graduation Tests on First Administration
English Language Arts Mathematics Social Studies Science
All Components listed above
Writing
1998-99
School System State
98% 93% 76% 74%
96% 90% 76% 72%
96% 88% 80% 72%
67% 65% 68%
95% 96% 93%
1997-98
School System State
94% 91% 77% 79%
95% 91% 77% 80%
94% 88% 78% 74%
70% 70% 68%
94% 95% 92%
1996-97
School System State
94% 93% 83% 78%
94% 92% 84% 79%
94% 87% 78% 74%
72% 73% 67%
96% 95% 93%
GRADUATE DATA
1999 Graduates by Credentials, Race/Ethnicity and Sex
Diplomas with Both College Prep. & Voc. Endorsements
Diplomas with College Prep. Endorsements Diplomas with Vocational Endorsements General High School Diplomas Special Education Diplomas
Total All Diplomas
Certificates of Performance
Total Graduates
Total 108 38 104 0
Black
2 1.9%
0 0.0%
2 1.9%
0
White Hispanic
104 96.3%
1 0.9%
38 100.0%
0 0.0%
100 96.2%
1 1.0%
0
0
American MultiAsian Indian racial
1 0.9%
0 0.0%
0 0.0%
0 0.0%
0 0.0%
0 0.0%
0 0.0%
1 1.0%
0 0.0%
0
0
0
12
1
11
0
0
0
0
8.3% 91.7% 0.0% 0.0% 0.0% 0.0%
262
5
253
2
1
1
0
1.9% 96.6% 0.8% 0.4% 0.4% 0.0%
21
1
19
0
1
0
0
4.8% 90.5% 0.0% 4.8% 0.0% 0.0%
283
6
272
2
2
1
0
2.1% 96.1% 0.7% 0.7% 0.4% 0.0%
Male Female
32
76
29.6% 70.4%
19
19
50.0% 50.0%
68
36
65.4% 34.6%
0
0
8 66.7%
127 48.5%
5 23.8%
132 46.6%
4 33.3%
135 51.5%
16 76.2%
151 53.4%
HOPE Scholarships
School System
Number of 1999 Graduates 2 8 3
Number Eligible
185
Percent Eligible
65.4%
490 344 70.2%
State
65,548 40,292 61.5%
High School Completion Rate
Percent of 1995Grade 9 Enrollment in Graduating Class of1999 School System State
Completion Rate '95-'99 71.6% 72.8% 68.9%
1998-99 GEORGIA PUBLIC EDUCATION REPORT CARD
Ringgold High School - 6234052
Prepared by Georgia Department of Education
Page 2
COLLEGE ADMISSIONS / CREDIT TEST DATA
Scholastic Assessment Test (SAT)
Based on students' highest verbal and highest math scores
No. Taking
Average Score
Tests Verbal Math Total
Based on students' last test administration
Average Score Verbal Math Total
School
138 485 477
962
College Prep. Endorsement
499 490
989
Other Diplomas
396 390
786
System
241 487 466
953
College Prep. Endorsement
502 476
978
Other Diplomas
386 394
780
Georgia
41,958 492 488
980
479 N/A N/A
480 N/A N/A
483
470 N/A N/A
460 N/A N/A
479
949 N/A N/A
940 N/A N/A
962
Nation
952,913 N/A N/A N/A
502 508 1010
American College Testing (ACT)
Advanced Placement Exams (AP)
Number taking tests: English Mathematics Reading Science Reasoning CompositeScore
4 3 School System State
20.2 19.8 19.1
21.3 20.0 19.9
21.3 21.0
20.4 20.1
20.2 19.9
21.0 20.2 19.9
No. of Students Taking Tests
No. of Tests Taken No. of Test Scores
3 or Higher Percent of Test
Scores 3 or Higher
School 18 29 17
58.6%
System State 54 15,225 80 23,969 37 13,024
46.3% 54.3%
POST-SECONDARY DATA
Graduates Entering Georgia Public Colleges
Graduates Entering Georgia Public Colleges and Requiring Learning Support (LS)
1998 Graduates Entering in 1998-99
1997 Graduates Entering in 1997-98
Percent of Graduating Number Class
School
89
36.2%
System 151
32.5%
School
79
35.0%
System 134
31.2%
Number Requiring
LS 21 36
19 44
Percent of those attending Georgia
Public Colleges
23.6%
23.8%
24.1%
32.8%
In previous years, the Report Card presented College Prep Curriculum information provided by the Board of Regents on students requiring Learning Support. Due to inconsistencies in the data provided by the Board of Regents in defining College Prep Completers versus Local Board of Education data defining College Prep Endorsements, the Department of Education Report Card will not provide this information until discrepancies can be reconciled.
Graduates Entering Georgia Public Technical and Adult Schools
1998 Graduates School System
Entering Number 23 38
1998-99 Percent
9.3% 8.2%
Entering Number N/A N/A
1997-98 Percent
N/A N/A
1997 Graduates School
0
0.0%
System
0
0.0%
8
3.5%
16
3.7%
1998-99 GEORGIA PUBLIC EDUCATION REPORT CARD Ringgold High School - 6234052
Prepared by Georgia Department of Education
Page 3
CERTIFIED PERSONNEL DATA
Positions Number Average Contract Days
Administrators
5.64 214.28
Support Personnel
6.74 199.21
PK-12 Teachers
74.67 190.99
Personnel Sex
Certificate
Years Experience
Full-time Part-time
Male Female
4 Yr Bachelor's 5 Yr Master's 6 Yr Specialist's 7 Yr Doctoral Other*
<1 1-10 11-20 21-30 >30
Average
4 11
10 5
2 8 4 1 0
0 1 5 7 2
21.80
5 28
14 19
14 11
8 0 0
0 14 11
8 0
13.58
60 20
23 57
35 31 10
1 3
3 29 26 20
2
14.04
*Includes One- and Two-Year Vocational Certificates.
ACCREDITATION DATA
Accredited with Quality by Georgia Accrediting Commission (GAC).
AWARDS / RECOGNITION DATA
Schools in Georgia may receive recognition in the following programs: Charter School Pay for Performance Program Georgia School of Excellence National Blue Ribbon School Ringgold High School did not receive recognition in any of these programs during the 1998-99 school year.
1998-99 GEORGIA PUBLIC EDUCATION REPORT CARD Ringgold High School - 6234052
Prepared by Georgia Department of Education
Page 4
1998-99 GEORGIA PUBLIC EDUCATION REPORT CARD
CATOOSA COUNTY SCHOOLS
Ringgold Middle School - 6235052
Grade Range 6-8
The Georgia Public Education Report Card is designed to assist systems and schools in educational improvement. This report card contains a variety of data elements. An explanation of the terms is provided as a companion to the report card data. Please refer to the definitions for the most effective use of the reported data.
STUDENT DATA
Total 1,198
6-8 Enrollment, by Race/Ethnicity and Sex
Black
White Hispanic
American Multi-
Asian Indian
racial
16 1.3%
1,160 96.8%
10 0.8%
7 0.6%
0 0.0%
5 0.4%
Male 600
50.1%
Female 598
49.9%
Enrollment in Selected Programs
Program
Gifted (Grades K-12)
Program % of Student Enrollment Population
113
9.4%
Alternative Programs
18
(Grades 6-12)
1.5%
Students Eligible to Receive Free/Reduced Lunches
Number
Percent
School System
377 2,712
31.5% 29.6%
Enrollment in Compensatory Programs
Program
Program % of Student Enrollment Population
Special Education (Grades K-12) (PK)
135 11.3%
0
N/A
English to Speakers of Other Languages (ESOL) (Grades K-12)
0
0.0%
Title I (Grades K-12)
This school has a Targeted Assistance program.
Dropout Rate for Grades 6-8
Number
Rate
School System
13
1.0%
13
0.6%
Total 11
Retained Students, by Race/Ethnicity and Sex
Black
White Hispanic
American MultiAsian Indian racial
0
11
0.0% 100.0%
0 0.0%
0 0.0%
0 0.0%
0 0.0%
Male Female
5
6
45.5% 54.5%
Prepared by Georgia Department of Education
Page 1
STATE-REQUIRED TEST DATA
NORM-REFERENCED TESTS Grade 8
Iowa Tests of Basic Skills (ITBS) Each chart reflects data for three years of testing.
Reading Comprehension 50
54 55 49 0
98-99
52 52 48 97-98
49 53 48 96-97
Mathematics
School 50
System
State
0
61 59 56 98-99
56 55 55 97-98
51 51 54 96-97
School System State
Reading Vocabulary 50
51 53 46 0
98-99
44 48 45 97-98
47 52 44 96-97
Language Arts
School 50
System
State
0
63 61 60 98-99
55 58 58 97-98
54 57 56 96-97
School System State
Social Studies 50
55 56 54 0
98-99
55 55 53 97-98
52 53 53 96-97
Science
School 50
System
State
0
58 62 56 98-99
58 58 55 97-98
55 56 53 96-97
School System State
Sources of Information
Composite Score
50
63 61 57 0
98-99
School 50
System
56 56 56 97-98
52 54 55 96-97
State 0
59 60 56 98-99
55 56 54 97-98
1998-99 GEORGIA PUBLIC EDUCATION REPORT CARD Ringgold Middle School - 6235052
Prepared by Georgia Department of Education
52 54 54 96-97
Scores Reported in Percentiles
School System State
Page 2
STATE-REQUIRED TEST DATA
Categories of Scaled Scores
Inadequate (less than 162)
Minimal (162-209)
Good
(210-247)
Very Good (greater than 247)
Average Scaled Score: (Range 100-300)
PERFORMANCE ASSESSMENTS
Grade 8 Writing Assessment
1998-99 Percent Scoring
1997-98 Percent Scoring
1996-97 Percent Scoring
School System State School System State School System State
7% 34% 52%
7%
6% 38% 50%
7%
8% 40% 41% 11%
12% 55% 28%
6%
11% 51% 34%
5%
11% 46% 34%
8%
7% 52% 33%
7%
7% 52% 35%
6%
15% 46% 30%
8%
209
209
208 197
200 202 203
203 198
AWARDS / RECOGNITION DATA
Schools in Georgia may receive recognition in the following programs: Charter School Pay for Performance Program Georgia School of Excellence National Blue Ribbon School Ringgold Middle School did not receive recognition in any of these programs during the 1998-99 school year.
1998-99 GEORGIA PUBLIC EDUCATION REPORT CARD Ringgold Middle School - 6235052
Prepared by Georgia Department of Education
Page 3
CERTIFIED PERSONNEL DATA
Positions Number Average Contract Days
Personnel Sex
Certificate
Years Experience
Full-time Part-time
Male Female
4 Yr Bachelor's 5 Yr Master's 6 Yr Specialist's 7 Yr Doctoral Other*
<1 1-10 11-20 21-30 >30
Average
Administrators
5.05 204.06
5 0
3 2
0 0 5 0 0 0 1 2 2 0 18.80
Support Personnel
4.51 190.00
4 15
10 9
10 8 1 0 0 2 6 6 3 2
14.74
PK-12 Teachers
74.06 190.06
67 10
23 54
38 35
2 2 0 4 28 27 12 6 13.99
*Includes One- and Two-Year Vocational Certificates.
ACCREDITATION DATA
Accredited with Quality by Georgia Accrediting Commission (GAC).
1998-99 GEORGIA PUBLIC EDUCATION REPORT CARD Ringgold Middle School - 6235052
Prepared by Georgia Department of Education
Page 4
1998-99 GEORGIA PUBLIC EDUCATION REPORT CARD
CATOOSA COUNTY SCHOOLS
Tiger Creek Elementary School - 6230185
Grade Range PK-5
The Georgia Public Education Report Card is designed to assist systems and schools in educational improvement. This report card contains a variety of data elements. An explanation of the terms is provided as a companion to the report card data. Please refer to the definitions for the most effective use of the reported data.
STUDENT DATA
Total
K-5
559
PK
2
Enrollment, by Race/Ethnicity and Sex
Black
White Hispanic
American Asian Indian
Multiracial
0 0.0%
542 97.0%
13 2.3%
1 0.2%
1 0.2%
2 0.4%
0
2
0.0% 100.0%
0 0.0%
0 0.0%
0 0.0%
0 0.0%
Male Female
290 51.9%
269 48.1%
1 50.0%
1 50.0%
Enrollment in Selected Programs
Program
Program % of Student Enrollment Population
Gifted (Grades K-12)
36
6.4%
Alternative Programs (Grades 6-12)
N/A
N/A
Students Eligible to Receive Free/Reduced Lunches
Number
Percent
School System
259 2,712
46.2% 29.6%
Dropout Rate *
Number
Rate
School System
N/A N/A
N/A N/A
* Dropout rates are not applicable for grades PK-5.
Enrollment in Compensatory Programs
Program
Program % of Student Enrollment Population
Special Education (Grades K-12)
74 13.2%
(PK)
5
N/A
English to Speakers of Other Languages (ESOL) (Grades K-12)
0
0.0%
Remedial Education (Grades 2-5, 9-12)
41 11.6%
Special Instructional Assistance (SIA) (Grades K-3)
93 23.8%
Title I (Grades K-12)
This school has a Targeted Assistance program.
Total 23
Retained Students, by Race/Ethnicity and Sex
Black
White Hispanic
American MultiAsian Indian racial
0
23
0.0% 100.0%
0 0.0%
0 0.0%
0 0.0%
0 0.0%
Male Female
15
8
65.2% 34.8%
Prepared by Georgia Department of Education
Page 1
STATE-REQUIRED TEST DATA
NORM-REFERENCED TESTS Grade 3
Iowa Tests of Basic Skills (ITBS) Each chart reflects data for three years of testing.
Reading Comprehension 50
51 61 54 0
98-99
45 58 53 97-98
42 55 52 96-97
Mathematics
School 50
System
State
0
52 65 61 98-99
46 61 61 97-98
47 61 59 96-97
School System State
Reading Vocabulary 50
45 58 50 0
98-99
44 60 50 97-98
47 56 49 96-97
Language Arts
School 50
System
State
0
57 68 64 98-99
44 65 62 97-98
38 60 59 96-97
School System State
Social Studies 50
51 63 56 0
98-99
50 61 55 97-98
42 59 55 96-97
Science
School 50
System
State
0
50 64 59 98-99
52 62 59 97-98
45 60 58 96-97
School System State
Sources of Information
Composite Score
50
53 62 57 0
98-99
School 50
System
52 61 56 97-98
43 59 55 96-97
State 0
51 64 58 98-99
47 61 57 97-98
1998-99 GEORGIA PUBLIC EDUCATION REPORT CARD Tiger Creek Elementary School - 6230185
Prepared by Georgia Department of Education
44 59 56 96-97
Scores Reported in Percentiles
School System State
Page 2
STATE-REQUIRED TEST DATA
NORM-REFERENCED TESTS Grade 5
Iowa Tests of Basic Skills (ITBS) Each chart reflects data for three years of testing.
Reading Comprehension
Mathematics
50
52 57 53 0
98-99
47 54 53 97-98
44 54 52 96-97
School 50
System
State
0
42 61 59 98-99
38 58 58 97-98
50 56 57 96-97
School System State
Reading Vocabulary 50
45 57 48 0
98-99
47 54 48 97-98
46 53 46 96-97
Language Arts
School 50
System
State
0
49 66 63 98-99
47 63 61 97-98
45 59 58 96-97
School System State
Social Studies 50
52 61 57 0
98-99
46 58 56 97-98
49 59 55 96-97
Science
School 50
System
State
0
55 65 60 98-99
53 62 59 97-98
56 62 59 96-97
School System State
Sources of Information
Composite Score
50
58 63 58 0
98-99
School 50
System
48 60 58 97-98
55 59 57 96-97
State 0
50 62 57 98-99
45 59 56 97-98
48 58 55 96-97
1998-99 GEORGIA PUBLIC EDUCATION REPORT CARD Tiger Creek Elementary School - 6230185
Prepared by Georgia Department of Education
Scores Reported in Percentiles
School System State
Page 3
STATE-REQUIRED TEST DATA
PERFORMANCE ASSESSMENTS
Grade 5 Writing Assessment
Percent at Developmental Stages:
1998-99 School System State
1997-98 School System State
1996-97 School System State
Stage Stage Stage Stage Stage Stage
1:The Emerging Writer 2:The Developing Writer 3:The Focusing Writer 4:The Experimenting 5:The Engaging Writer 6:The Extending Writer
0% 3% 20% 48% 24% 5%
0% 2% 15% 41% 32% 11%
0% 1% 16% 41% 29% 12%
2% 5% 30% 45% 15% 3%
0% 2% 16% 39% 31% 12%
0% 3% 19% 41% 27% 10%
1% 4% 21% 43% 21% 7%
0% 2% 20% 39% 27% 11%
0% 3% 21% 37% 26% 12%
AWARDS / RECOGNITION DATA
Schools in Georgia may receive recognition in the following programs: Charter School Pay for Performance Program Georgia School of Excellence National Blue Ribbon School Tiger Creek Elementary School did not receive recognition in any of these programs during the 1998-99 school year.
1998-99 GEORGIA PUBLIC EDUCATION REPORT CARD Tiger Creek Elementary School - 6230185
Prepared by Georgia Department of Education
Page 4
CERTIFIED PERSONNEL DATA
Positions Number Average Contract Days
Personnel Sex
Certificate
Years Experience
Full-time Part-time
Male Female
4 Yr Bachelor's 5 Yr Master's 6 Yr Specialist's 7 Yr Doctoral Other*
<1 1-10 11-20 21-30 >30
Average
Administrators
2.00 205.00
2 0
0 2
0 0 2 0 0 0 0 1 1 0 21.50
Support Personnel
1.17 190.00
1 1
0 2
1 1 0 0 0 0 0 2 0 0 15.00
PK-12 Teachers
34.87 190.00
31 8
1 38
17 20
2 0 0 0 18 16 5 0 11.87
*Includes One- and Two-Year Vocational Certificates.
ACCREDITATION DATA
Accredited with Quality by Georgia Accrediting Commission (GAC).
1998-99 GEORGIA PUBLIC EDUCATION REPORT CARD Tiger Creek Elementary School - 6230185
Prepared by Georgia Department of Education
Page 5
1998-99 GEORGIA PUBLIC EDUCATION REPORT CARD
CATOOSA COUNTY SCHOOLS
West Side Elementary School - 6231054
Grade Range K-5
The Georgia Public Education Report Card is designed to assist systems and schools in educational improvement. This report card contains a variety of data elements. An explanation of the terms is provided as a companion to the report card data. Please refer to the definitions for the most effective use of the reported data.
STUDENT DATA
Total 473
K-5 Enrollment, by Race/Ethnicity and Sex
Black
White Hispanic
American Multi-
Asian Indian
racial
3 0.6%
465 98.3%
1 0.2%
1 0.2%
0 0.0%
3 0.6%
Male Female
245 51.8%
228 48.2%
Enrollment in Selected Programs
Program
Program % of Student Enrollment Population
Gifted (Grades K-12)
35
7.4%
Alternative Programs (Grades 6-12)
N/A
N/A
Students Eligible to Receive Free/Reduced Lunches
Number
Percent
School System
239 2,712
50.5% 29.6%
Dropout Rate *
Number
Rate
School System
N/A N/A
N/A N/A
* Dropout rates are not applicable for grades PK-5.
Enrollment in Compensatory Programs
Program
Program % of Student Enrollment Population
Special Education (Grades K-12)
67 14.2%
(PK)
5
N/A
English to Speakers of Other Languages (ESOL) (Grades K-12)
0
0.0%
Remedial Education (Grades 2-5, 9-12)
15
4.8%
Special Instructional Assistance (SIA) (Grades K-3)
96 28.9%
Title I (Grades K-12)
This school has a Targeted Assistance program.
Total 21
Retained Students, by Race/Ethnicity and Sex
Black
White Hispanic
American Multi-
Asian Indian
racial
0
21
0.0% 100.0%
0 0.0%
0 0.0%
0 0.0%
0 0.0%
Male Female
13
8
61.9% 38.1%
Prepared by Georgia Department of Education
Page 1
STATE-REQUIRED TEST DATA
NORM-REFERENCED TESTS Grade 3
Iowa Tests of Basic Skills (ITBS) Each chart reflects data for three years of testing.
Reading Comprehension 50
57 61 54 0
98-99
48 58 53 97-98
61 55 52 96-97
Mathematics
School 50
System
State
0
59 65 61 98-99
46 61 61 97-98
65 61 59 96-97
School System State
Reading Vocabulary 50
54 58 50 0
98-99
51 60 50 97-98
58 56 49 96-97
Language Arts
School 50
System
State
0
64 68 64 98-99
54 65 62 97-98
73 60 59 96-97
School System State
Social Studies 50
57 63 56 0
98-99
56 61 55 97-98
67 59 55 96-97
Science
School 50
System
State
0
56 64 59 98-99
52 62 59 97-98
60 60 58 96-97
School System State
Sources of Information
Composite Score
50
57 62 57 0
98-99
School 50
System
50 61 56 97-98
64 59 55 96-97
State 0
57 64 58 98-99
50 61 57 97-98
1998-99 GEORGIA PUBLIC EDUCATION REPORT CARD West Side Elementary School - 6231054
Prepared by Georgia Department of Education
65 59 56 96-97
Scores Reported in Percentiles
School System State
Page 2
STATE-REQUIRED TEST DATA
NORM-REFERENCED TESTS Grade 5
Iowa Tests of Basic Skills (ITBS) Each chart reflects data for three years of testing.
Reading Comprehension
Mathematics
50
60 57 53 0
98-99
51 54 53 97-98
61 54 52 96-97
School 50
System
State
0
58 61 59 98-99
39 58 58 97-98
62 56 57 96-97
School System State
Reading Vocabulary 50
57 57 48 0
98-99
48 54 48 97-98
57 53 46 96-97
Language Arts
School 50
System
State
0
69 66 63 98-99
57 63 61 97-98
70 59 58 96-97
School System State
Social Studies 50
64 61 57 0
98-99
54 58 56 97-98
63 59 55 96-97
Science
School 50
System
State
0
69 65 60 98-99
55 62 59 97-98
69 62 59 96-97
School System State
Sources of Information
Composite Score
50
66 63 58 0
98-99
School 50
System
54 60 58 97-98
69 59 57 96-97
State 0
64 62 57 98-99
51 59 56 97-98
66 58 55 96-97
1998-99 GEORGIA PUBLIC EDUCATION REPORT CARD West Side Elementary School - 6231054
Prepared by Georgia Department of Education
Scores Reported in Percentiles
School System State
Page 3
STATE-REQUIRED TEST DATA
PERFORMANCE ASSESSMENTS
Grade 5 Writing Assessment
Percent at Developmental Stages:
1998-99 School System State
1997-98 School System State
1996-97 School System State
Stage Stage Stage Stage Stage Stage
1:The Emerging Writer 2:The Developing Writer 3:The Focusing Writer 4:The Experimenting 5:The Engaging Writer 6:The Extending Writer
0% 0% 7% 33% 41% 19%
0% 2% 15% 41% 32% 11%
0% 1% 16% 41% 29% 12%
0% 0% 13% 39% 31% 16%
0% 2% 16% 39% 31% 12%
0% 3% 19% 41% 27% 10%
0% 5% 20% 42% 17% 14%
0% 2% 20% 39% 27% 11%
0% 3% 21% 37% 26% 12%
AWARDS / RECOGNITION DATA
Schools in Georgia may receive recognition in the following programs: Charter School Pay for Performance Program Georgia School of Excellence National Blue Ribbon School West Side Elementary School did not receive recognition in any of these programs during the 1998-99 school year.
1998-99 GEORGIA PUBLIC EDUCATION REPORT CARD West Side Elementary School - 6231054
Prepared by Georgia Department of Education
Page 4
CERTIFIED PERSONNEL DATA
Positions Number Average Contract Days
Personnel Sex
Certificate
Years Experience
Full-time Part-time
Male Female
4 Yr Bachelor's 5 Yr Master's 6 Yr Specialist's 7 Yr Doctoral Other*
<1 1-10 11-20 21-30 >30
Average
Administrators
2.00 205.00
2 0
1 1
0 1 1 0 0 0 0 1 1 0 19.50
Support Personnel
1.17 190.00
1 1
0 2
0 1 1 0 0 0 0 1 1 0 16.00
PK-12 Teachers
33.66 190.00
32 4
5 31
15 18
3 0 0 0 14 13 9 0 13.97
*Includes One- and Two-Year Vocational Certificates.
ACCREDITATION DATA
Accredited with Quality by Georgia Accrediting Commission (GAC).
1998-99 GEORGIA PUBLIC EDUCATION REPORT CARD West Side Elementary School - 6231054
Prepared by Georgia Department of Education
Page 5
1998-99 GEORGIA PUBLIC EDUCATION REPORT CARD CHARLTON COUNTY SCHOOLS - 624
The Georgia Public Education Report Card is designed to assist systems and schools in educational improvement. This report card contains a variety of data elements. An explanation of the terms is provided as a companion to the report card data. Please refer to the definitions for the most effective use of the reported data.
Total
K-12
1,978
PK
89
STUDENT DATA
Enrollment, by Race/Ethnicity and Sex
Black
White Hispanic
American Multi-
Asian Indian
racial
671 33.9%
1,281 64.8%
6 0.3%
6 0.3%
4 0.2%
10 0.5%
24 27.0%
63 70.8%
0 0.0%
1 1.1%
0 0.0%
1 1.1%
Male
1,035 52.3%
51 57.3%
Female
943 47.7%
38 42.7%
Enrollment in Selected Programs
Program
Program % of Student Enrollment Population
Gifted (Grades K-12)
82
4.1%
Non-Vocational Labs (Grades 9-12)
486
95.5%
Vocational Labs (Grades 9-12)
318
62.5%
Alternative Programs (Grades 6-12)
7
< 1%
Students Eligible to Receive Free/Reduced Lunches
Number
Percent
1,179
57.0%
Dropout Rate
Number
Percent
6-12 9-12
55
5.3%
51
9.5%
Enrollment in Compensatory Programs
Program
Program % of Student Enrollment Population
Special Education
(Grades K-12)
217
PK
33
English to Speakers of
Other Languages (ESOL)
0
(Grades K-12)
Remedial Education (Grades 2-5, 9-12)
234
Special Instructional
Assistance (SIA)
229
(Grades K-3)
Title I (Grades K-12) Number of schools with: Schoolwide program Targeted Assistance program No Title I program
11.0% N/A
0.0%
19.5%
34.1%
1 2 1
Total 101
Retained Students, by Race/Ethnicity and Sex
Black
White Hispanic
American MultiAsian Indian racial
37 36.6%
64 63.4%
0 0.0%
0 0.0%
0 0.0%
0 0.0%
Male Female
57
44
56.4% 43.6%
Prepared by Georgia Department of Education
Page 1
STATE-REQUIRED TEST DATA
NORM-REFERENCED TESTS
Grade 3 Iowa Tests of Basic Skills (ITBS) Each chart reflects data for three years of testing.
Reading Comprehension
Mathematics
50
43 54 37 53 45 52 0
98-99 97-98 96-97
System State
50
52 61 46 61 59 59 0
98-99 97-98 96-97
System State
Reading Vocabulary
50
47 50 41 50 46 49 0
98-99 97-98 96-97
System State
Social Studies
50
53 56 38 55 54 55 0
98-99 97-98 96-97
System State
Language Arts
50
48 64 40 62 60 59 0
98-99 97-98 96-97
System State
Science
50
55 59 48 59 67 58 0
98-99 97-98 96-97
System State
Sources of Information
Composite Score
50
50 57 0
98-99
System
50
42 56 55 55 97-98 96-97
State
50 58 41 57 0
98-99 97-98
1998-99 GEORGIA PUBLIC EDUCATION REPORT CARD Charlton County Schools
Prepared by Georgia Department of Education
System State Scores Reported 56 56 in Percentiles 96-97
Page 2
STATE-REQUIRED TEST DATA
NORM-REFERENCED TESTS
Grade 5 Iowa Tests of Basic Skills (ITBS) Each chart reflects data for three years of testing.
Reading Comprehension
Mathematics
50
43 53 40 53 42 52 0
98-99 97-98 96-97
System State
50
45 59 38 58 39 57 0
98-99 97-98 96-97
System State
Reading Vocabulary
50
37 48 32 48 31 46 0
98-99 97-98 96-97
System State
Social Studies
50
41 57 38 56 40 55 0
98-99 97-98 96-97
System State
Language Arts
50
46 63 40 61 35 58 0
98-99 97-98 96-97
System State
Science
50
43 60 41 59 45 59 0
98-99 97-98 96-97
System State
Sources of Information
Composite Score
50
47 58 0
98-99
System
50
39 58 39 57 97-98 96-97
State
42 57 37 56 0
98-99 97-98
1998-99 GEORGIA PUBLIC EDUCATION REPORT CARD Charlton County Schools
Prepared by Georgia Department of Education
System State Scores Reported 37 55 in Percentiles 96-97
Page 3
STATE-REQUIRED TEST DATA
NORM-REFERENCED TESTS Grade 8
Iowa Tests of Basic Skills (ITBS) Each chart reflects data for three years of testing.
Reading Comprehension
Mathematics
50
43 49 40 48 39 48 0
98-99 97-98 96-97
System State
50
46 56 47 55 36 54 0
98-99 97-98 96-97
System State
Reading Vocabulary
50
34 46 36 45 31 44 0
98-99 97-98 96-97
System State
Language Arts
50
61 60 57 58 38 56 0
98-99 97-98 96-97
System State
Social Studies
50
53 54 45 53 45 53 0
98-99 97-98 96-97
System State
Science
50
47 56 44 55 41 53 0
98-99 97-98 96-97
System State
Sources of Information
Composite Score
50
50 57 0
98-99
System
50
47 56 39 55 97-98 96-97
State
49 56 45 54 0
98-99 97-98
1998-99 GEORGIA PUBLIC EDUCATION REPORT CARD Charlton County Schools
Prepared by Georgia Department of Education
System State Scores Reported 37 54 in Percentiles 96-97
Page 4
STATE-REQUIRED TEST DATA
PERFORMANCE ASSESSMENTS
Grade 5 Writing Assessment
1998-99
1997-98
1996-97
Percent at Developmental Stages:
Comparison
Comparison
Comparison
System Group State System Group State System Group State
Stage Stage Stage Stage Stage Stage
1: The Emerging Writer 2: The Developing Writer 3: The Focusing Writer 4: The Experimenting Writer 5: The Engaging Writer 6: The Extending Writer
1% 3% 19% 47% 27% 4%
0% 2% 21% 44% 25% 7%
0% 1% 16% 41% 29% 12%
0% 6% 29% 47% 18% 0%
0% 2% 23% 44% 23% 6%
0% 3% 19% 41% 27% 10%
1% 6% 17% 41% 24% 12%
1% 5% 23% 39% 24% 8%
0% 3% 21% 37% 26% 12%
Grade 8 Writing Assessment
1998-99 Percent Scoring 1997-98 Percent Scoring 1996-97 Percent Scoring
Categories of Scaled Scores
Comparison
Comparison
Comparison
System Group State System Group State System Group State
Inadequate (less than 162)
Minimal (162-209)
Good
(210-247)
Very Good (greater than 247)
5% 48% 42%
5%
8% 48% 38%
6%
8% 40% 41% 11%
11% 53% 31%
5%
10% 53% 32%
5%
11% 46% 34%
8%
31% 44% 21%
3%
16% 49% 28%
7%
15% 46% 30%
8%
Average Scaled Score: (Range 100-300)
206
203 208
197
199 202
181
195 198
GEORGIA HIGH SCHOOL GRADUATION TESTS (GHSGT)
Percent of Regular Program 11th Graders Passing the Georgia High School Graduation Tests on First Administration
1998-99
1997-98
1996-97
Comparison
Comparison
Comparison
System Group State System Group State System Group State
English Language Arts Mathematics Social Studies Science
91% 90% 66% 72%
94% 85% 74% 66%
96% 88% 80% 72%
90% 85% 73% 72%
92% 84% 71% 68%
94% 88% 78% 74%
89% 83% 66% 63%
91% 84% 70% 68%
94% 87% 78% 74%
All Components listed above 5 8 %
60% 68% 68%
61% 68% 58%
59% 67%
Writing
89%
90% 93% 84%
90% 92% 88%
91% 93%
1998-99 GEORGIA PUBLIC EDUCATION REPORT CARD
Charlton County Schools
Prepared by Georgia Department of Education
Page 5
GRADUATE DATA
1999 Graduates by Credentials, Race/Ethnicity and Sex
Diplomas with Both College Prep. & Voc. Endorsements
Diplomas with College Prep. Endorsements Diplomas with Vocational Endorsements General High School Diplomas Special Education Diplomas
Total All Diplomas
Certificates of Performance
Total Graduates
Total 0
34 25
0 7 66 7 73
Black 0
American MultiWhite Hispanic Asian Indian racial
0
0
0
0
0
Male Female
0
0
6 17.6%
12 48.0%
0
28 82.4%
13 52.0%
0
0 0.0%
0 0.0%
0
0 0.0%
0 0.0%
0
0 0.0%
0 0.0%
0
0 0.0%
0 0.0%
0
20 58.8%
16 64.0%
0
14 41.2%
9 36.0%
0
4 57.1%
22 33.3%
5 71.4%
27 37.0%
3 42.9%
44 66.7%
2 28.6%
46 63.0%
0 0.0%
0 0.0%
0 0.0%
0 0.0%
0 0.0%
0 0.0%
0 0.0%
0 0.0%
0 0.0%
0 0.0%
0 0.0%
0 0.0%
0 0.0%
0 0.0%
0 0.0%
0 0.0%
5 71.4%
41 62.1%
4 57.1%
45 61.6%
2 28.6%
25 37.9%
3 42.9%
28 38.4%
HOPE Scholarships
System State
Number of 1999 Graduates 7 3
Number Eligible
37
Percent Eligible
50.7%
65,548 40,292 61.5%
High School Completion Rate Percent of 1995Grade 9 Enrollment
in Graduating Class of1999
System
State
Completion Rate '95-'99 56.6% 68.9%
COLLEGE ADMISSIONS / CREDIT TEST DATA
Scholastic Assessment Test (SAT)
No. Taking
Average Score
Tests
Verbal Math Total
Based on students' highest verbal and highest math scores
System College Prep. Endorsement Other Diplomas
462 468 930 484 474 958 352 394 746
Georgia
492 488 980
Based on students' last test administration
System Georgia
38
458 459
917
41,958 483 479 962
Nation
952,913 502 508 1010
American College Testing (ACT)
System State Nation
English Mathematics Reading Science Reasoning
N/A N/A N/A N/A
19.1 19.9 20.2 19.9
20.4 20.7 21.3 21.0
CompositeScore N/A * 19.9 21.9
* Scores not reported when fewer than 5 tests taken.
Advanced Placement Exams (AP)
No. of Students Taking Tests
No. of Tests Taken No. of Test Scores
3 or Higher Percent of Test
Scores 3 or Higher
System State 0 15,225
N/A 23,969 N/A 13,024
N/A 54.3%
1998-99 GEORGIA PUBLIC EDUCATION REPORT CARD Charlton County Schools
Prepared by Georgia Department of Education
Page 6
POSTSECONDARY DATA
Graduates Entering Georgia Public Colleges and Universities
Graduates Entering Georgia Public Colleges and Universities and
Requiring Learning Support (LS)
1998 Graduates Entering 1998-99
1997 Graduates Entering 1997-98
Percent of Graduating Number Class
36
38.3%
27
31.0%
Number Requiring
LS
14
4
Percent of those attending Georgia
Public Colleges
38.9%
14.8%
In previous years, the Report Card presented College Prep Curriculum information provided by the Board of Regents on students requiring Learning Support. Due to inconsistencies in the data provided by the Board of Regents in defining College Prep Completers versus Local Board of Education data defining College Prep Endorsements, the Department of Education Report Card will not provide this information until discrepancies can be reconciled.
Graduates Entering Georgia Public Technical and Adult Schools
Entering 1998-99 Entering 1997-98
Number Percent
Number Percent
1998 Graduates 1997 Graduates
2
2.1%
0
0.0%
N/A 0
N/A 0.0%
ACCREDITATION / RECOGNITION DATA
Southern Association of Colleges and Schools (SACS) Accrediting Commission
Secondary/Middle Commission Elementary/Middle Commission Both Elementary/Secondary Commissions Joint Commission Candidate for Accreditation
Accreditation by Georgia Accrediting Commission (GAC)
Accredited by GAC Accredited with Quality by GAC
Number of Schools
1 0 0 0 0
Number of Schools
0 4
Awards / Recognition
State Recognized Program
Number of Schools
Charter School
0
Pay for Performance Recipient
0
Georgia School of Excellence
0
National Blue Ribbon School
0
COMMUNITY DATA
Number of Children Eligible for Migrant Education Number of Families-At-Risk * Number of Food Stamp Participants * Number of Families Receiving TANF * ** Per Capita Income * Unemployment Rate * 1990 Population * Projected 2000 Population * Projected 2010 Population *
* Data Available at County Level Only ** Known as AFDC before January 1997
0 39 1,017 49 $14,988 4.7% 8,496 9,396 10,095
1998-99 GEORGIA PUBLIC EDUCATION REPORT CARD Charlton County Schools
Prepared by Georgia Department of Education
Page 7
FISCAL DATA
Millage Rate
13.32
* Fall 1998 Property Tax Digest is used to calculate the 98-99 Value of One Mill
FTE Count
FTE Count used for Allotment Calculation 1,963.0 Fall '98 FTE Count 1,978
Value of One Mill
$168,781 $85.98 per Allotment FTE
Sources: Local State-QBE State-
Lottery State-
Other Federal Other
Total
PerGeneral Fund cent Per FTE
$2,297,214 23.8% $1,170 $7,173,463 74.2% $3,654
K-12 Revenues
Lottery K-12
and
Title
All Other
Programs
K-12
$0
$0
Bonded Debt $247,748
$0
$0
$0
$0 0.0%
$0
$0
$44,803
$0
$86,018 0.9% $44
$107,705 1.1% $55
$0 0.0%
$0
$9,664,401 100% $4,923
$99,074 $616,630
$0 $715,704
$122,500 $30,737 $0
$198,040
$321 $0 $0
$248,069
Capital Projects
$978,979 $0
$0
$263,124 $0
$4,992 $1,247,096
School Nutrition
$213,520 $0
$0
$51,317 $494,699
$0 $759,537
Grand Total
Total
Per-
Amount cent
$3,737,463 29.1%
$7,173,463 55.9%
$44,803 0.3%
$622,354 4.8% $1,249,772 9.7%
$4,992 0.0% $12,832,849 100%
Instruction
Media Instruction
Support Pupil Services General Admin. School Admin. Trans-
portation Maint. & Ops. Capital Projects School Food Debt Service
Total
$5,705,771 62.0% $2,907 $314,054 3.4% $160
$351,118 3.8% $179
$326,484 3.5% $166
$330,198 3.6% $168
$730,250 7.9% $372
$590,935 6.4% $301
$859,114 9.3% $438
$715 0.0%
$0
$0 0.0%
$0
$0 0.0%
$0
$9,208,644 100% $4,691
K-12 Expenditures
$532,341
$71,101
$0
$0
$6,603
$0
$0
$0
$97,051
$0
$0
$0
$51,794
$99,725
$0
$0
$36,362
$927
$0
$0
$639
$0
$0
$0
$115
$0
$0
$0
$0
$0
$0
$377
$0
$0
$0 $2,143,725
$0
$0
$0
$0
$0
$0 $959,705
$2,742
$0 $0 $0 $0 $0 $0 $0 $0 $0 $725,587 $0
$6,309,214 45.3% $320,657 2.3% $448,170 3.2% $478,004 3.4% $367,488 2.6% $730,889 5.2% $591,051 4.2% $859,491 6.2%
$2,144,441 15.4% $725,587 5.2% $962,447 6.9%
$724,908 $171,753 $959,705 $2,146,844 $725,587 $13,937,443 100%
Salaries and Benefits as Percentages of Revenues and of Expenditures
Teachers and Paraprofessionals
Salaries $4,430,514
Benefits $1,265,133
Percentage of Revenues Percentage of Expenditures
Total of
Total of
General Fund
General Fund
Title Programs
Title Programs
Lottery K-12
Lottery K-12
Total Salaries
and
Total
and
Total
and Benefits All Other K-12 K - 12 All Other K-12 K - 12
$5,695,647
53.8%
44.4%
56.4%
40.9%
School Administration
$393,861
$128,467
$522,328
4.9%
4.1%
5.2%
3.7%
General Administration
$174,902
$57,350
$232,252
2.2%
1.8%
2.3%
1.7%
1998-99 GEORGIA PUBLIC EDUCATION REPORT CARD
Charlton County Schools - 624
Prepared by Georgia Department of Education
Page 8
CERTIFIED PERSONNEL DATA
Number
Average Annual Salary Positions Average Contract Days
Average Daily Salary
Full-time Personnel Part-time
Sex Male Female
4 Yr Bachelor's Certificate 5 Yr Master's
Level 6 Yr Specialist's 7 Yr Doctoral Other*
Black
White Race/ Hispanic Ethnicity Asian
American Indian
Multiracial
Years Experience
<1 1-10 11-20 21-30 >30
Average
Administrators
10.99
$63,617.22 231.34
$275.00
9 4
9 4
0 4 7 2 0
1 12
0 0 0 0
0 1 4 6 2
22.23
Support Personnel PK-12 Teachers
10.50
120.12
$44,624.82 203.81
$218.95
$37,234.42 190.45
$195.51
10
117
1
2
1
24
10
95
0
63
7
42
4
12
0
1
0
1
0
13
11
104
0
1
0
1
0
0
0
0
1
11
5
47
2
36
2
24
1
1
13.09
12.61
*Includes One- and Two-Year Vocational Certificates.
Certified Staff Position Ratios
Teacher/Administrator Ratio 11:1
Teacher/Support Person Ratio 11:1
Teacher/Staff Ratio 6:1
Student Enrollment/All Teachers 16:1
Certified Personnel by Category
83.2% 100%
9.1%
7.7%
80% 60%
40%
20%
0%
Teachers
Administrators
Support Personnel
1998-99 GEORGIA PUBLIC EDUCATION REPORT CARD
Charlton County Schools - 624
Prepared by Georgia Department of Education
Page 9
1998-99 GEORGIA PUBLIC EDUCATION REPORT CARD
CHARLTON COUNTY SCHOOLS
Bethune Elementary School - 6240387
Grade Range PK-2
The Georgia Public Education Report Card is designed to assist systems and schools in educational improvement. This report card contains a variety of data elements. An explanation of the terms is provided as a companion to the report card data. Please refer to the definitions for the most effective use of the reported data.
STUDENT DATA
Total
K-2
409
PK
70
Enrollment, by Race/Ethnicity and Sex
Black
White Hispanic
American Asian Indian
Multiracial
167 40.8%
235 57.5%
1 0.2%
2 0.5%
0 0.0%
4 1.0%
24 34.3%
44 62.9%
0 0.0%
1 1.4%
0 0.0%
1 1.4%
Male Female
211 51.6%
198 48.4%
43 61.4%
27 38.6%
Enrollment in Selected Programs
Program
Program % of Student Enrollment Population
Gifted (Grades K-12)
9
2.2%
Alternative Programs (Grades 6-12)
N/A
N/A
Students Eligible to Receive Free/Reduced Lunches
Number
Percent
School System
318 1,179
66.4% 57.0%
Dropout Rate *
Number
Rate
School System
N/A N/A
N/A N/A
* Dropout rates are not applicable for grades PK-5.
Enrollment in Compensatory Programs
Program
Program % of Student Enrollment Population
Special Education (Grades K-12)
52 12.7%
(PK)
26
N/A
English to Speakers of Other Languages (ESOL) (Grades K-12)
0
0.0%
Remedial Education (Grades 2-5, 9-12)
22 15.6%
Special Instructional Assistance (SIA) (Grades K-3)
153 37.4%
Title I (Grades K-12)
This school has a schoolwide program.
Total 19
Retained Students, by Race/Ethnicity and Sex
Black
White Hispanic
American MultiAsian Indian racial
13 68.4%
6 31.6%
0 0.0%
0 0.0%
0 0.0%
0 0.0%
Male Female
13
6
68.4% 31.6%
Prepared by Georgia Department of Education
Page 1
STATE-REQUIRED TEST DATA
NORM-REFERENCED TESTS
Grade 3 Iowa Tests of Basic Skills (ITBS) Each chart reflects data for three years of testing.
No third-grade students are enrolled at Bethune Elementary School.
Reading Comprehension
Mathematics
50
N/A 43 54 0
98-99
37 37 53 97-98
46 45 52 96-97
School 50
System
State
N/A 52 61
0
98-99
45 46 61 97-98
56 59 59 96-97
School System State
Reading Vocabulary 50
N/A 47 50 0
98-99
44 41 50 97-98
47 46 49 96-97
Language Arts
School 50
System
State
N/A 48 64
0
98-99
42 40 62 97-98
60 60 59 96-97
School System State
Social Studies 50
N/A 53 56 0
98-99
38 38 55 97-98
53 54 55 96-97
Science
School 50
System
State
N/A 55 59
0
98-99
49 48 59 97-98
68 67 58 96-97
School System State
Sources of Information
Composite Score
50
N/A 50 57 0
98-99
School 50
System
41 42 56 97-98
56 55 55 96-97
State
N/A 50 58
0
98-99
41 41 57 97-98
1998-99 GEORGIA PUBLIC EDUCATION REPORT CARD Bethune Elementary School - 6240387
Prepared by Georgia Department of Education
56 56 56 96-97
Scores Reported in Percentiles
School System State
Page 2
STATE-REQUIRED TEST DATA
NORM-REFERENCED TESTS
Grade 5 Iowa Tests of Basic Skills (ITBS) Each chart reflects data for three years of testing. No fifth-grade students are enrolled at Bethune Elementary School.
Reading Comprehension
Mathematics
50
N/A 43 53 0
98-99
N/A 40 53 97-98
N/A 42 52 96-97
School 50
System
State
N/A 45 59 0
98-99
N/A 38 58 97-98
N/A 39 57 96-97
School System State
Reading Vocabulary 50
N/A 37 48 0
98-99
N/A 32 48 97-98
N/A 31 46 96-97
Language Arts
School 50
System
State
N/A 46 63 0
98-99
N/A 40 61 97-98
N/A 35 58 96-97
School System State
Social Studies 50
N/A 41 57 0
98-99
N/A 38 56 97-98
N/A 40 55 96-97
Science
School 50
System
State
N/A 43 60 0
98-99
N/A 41 59 97-98
N/A 45 59 96-97
School System State
Sources of Information
Composite Score
School
50
50
System
N/A 47 58 0
98-99
N/A 39 58 N/A 39 57
97-98
96-97
State
N/A 42 57 0
98-99
N/A 37 56 97-98
N/A 37 55 96-97
1998-99 GEORGIA PUBLIC EDUCATION REPORT CARD Bethune Elementary School - 6240387
Prepared by Georgia Department of Education
Scores Reported in Percentiles
School System State
Page 3
STATE-REQUIRED TEST DATA
PERFORMANCE ASSESSMENTS
Grade 5 Writing Assessment
Percent at Developmental Stages:
1998-99 School System State
1997-98 School System State
1996-97 School System State
Stage Stage Stage Stage Stage Stage
1:The Emerging Writer 2:The Developing Writer 3:The Focusing Writer 4:The Experimenting 5:The Engaging Writer 6:The Extending Writer
N/A N/A N/A N/A N/A N/A
1% 3% 19% 47% 27% 4%
0% 1% 16% 41% 29% 12%
N/A N/A N/A N/A N/A N/A
0% 6% 29% 47% 18% 0%
0% 3% 19% 41% 27% 10%
N/A N/A N/A N/A N/A N/A
No fifth-grade students are enrolled at Bethune Elementary School.
1% 6% 17% 41% 24% 12%
0% 3% 21% 37% 26% 12%
AWARDS / RECOGNITION DATA
Schools in Georgia may receive recognition in the following programs: Charter School Pay for Performance Program Georgia School of Excellence National Blue Ribbon School Bethune Elementary School did not receive recognition in any of these programs during the 1998-99 school year.
1998-99 GEORGIA PUBLIC EDUCATION REPORT CARD Bethune Elementary School - 6240387
Prepared by Georgia Department of Education
Page 4
CERTIFIED PERSONNEL DATA
Positions Number Average Contract Days
Personnel Sex
Certificate
Years Experience
Full-time Part-time
Male Female
4 Yr Bachelor's 5 Yr Master's 6 Yr Specialist's 7 Yr Doctoral Other*
<1 1-10 11-20 21-30 >30
Average
Administrators
1.50 233.33
1 1
1 1
0 0 2 0 0 0 0 0 2 0 26.00
Support Personnel
3.00 190.00
3 0
0 3
0 2 1 0 0 0 1 1 1 0 14.67
PK-12 Teachers
32.50 190.46
32 1
1 32
12 15
6 0 0 0 14 10 9 0 14.39
*Includes One- and Two-Year Vocational Certificates.
ACCREDITATION DATA
Accredited with Quality by Georgia Accrediting Commission (GAC).
1998-99 GEORGIA PUBLIC EDUCATION REPORT CARD Bethune Elementary School - 6240387
Prepared by Georgia Department of Education
Page 5
1998-99 GEORGIA PUBLIC EDUCATION REPORT CARD
CHARLTON COUNTY SCHOOLS
Charlton County High School - 6240287
Grade Range 7-12
The Georgia Public Education Report Card is designed to assist systems and schools in educational improvement. This report card contains a variety of data elements. An explanation of the terms is provided as a companion to the report card data. Please refer to the definitions for the most effective use of the reported data.
STUDENT DATA
Total 808
7-12 Enrollment, by Race/Ethnicity and Sex
Black
White Hispanic
American Multi-
Asian Indian
racial
258 31.9%
544 67.3%
3 0.4%
0 0.0%
3 0.4%
0 0.0%
Male 418
51.7%
Female 390
48.3%
Enrollment in Selected Programs
Program
Program % of Student Enrollment Population
Gifted (Grades K-12)
32
4.0%
Non-Vocational Labs (Grades 9-12)
486
95.5%
Vocational Labs (Grades 9-12)
318
62.5%
Alternative Programs (Grades 6-12)
7
< 1%
Students Eligible to Receive Free/Reduced Lunches
Number
Percent
School System
360 1,179
44.6% 57.0%
Enrollment in Compensatory Programs
Program
Program % of Student Enrollment Population
Special Education (Grades K-12) PK
74
9.2%
0
N/A
English to Speakers of Other Languages (ESOL) (Grades K-12)
0
0.0%
Remedial Education (Grades 2-5, 9-12)
77 15.1%
Special Instructional Assistance (SIA) (Grades K-3)
N/A
N/A
Title I (Grades K-12) This school has no Title I program.
Dropout Rate for Grades 7-12
Number
Rate
School System
55
6.4%
55
6.4%
Total 70
Retained Students, by Race/Ethnicity and Sex
Black
White Hispanic
American MultiAsian Indian racial
22 31.4%
48 68.6%
0 0.0%
0 0.0%
0 0.0%
0 0.0%
Male Female
36
34
51.4% 48.6%
Prepared by Georgia Department of Education
Page 1
STATE-REQUIRED TEST DATA
NORM-REFERENCED TESTS
Grade 3 Iowa Tests of Basic Skills (ITBS) Each chart reflects data for three years of testing.
No third-grade students are enrolled at Charlton County High School.
Reading Comprehension
Mathematics
50
N/A 43 54 0
98-99
N/A 37 53 97-98
N/A 45 52 96-97
School 50
System
State
N/A 52 61 0
98-99
N/A 46 61 97-98
N/A 59 59 96-97
School System State
Reading Vocabulary 50
N/A 47 50 0
98-99
N/A 41 50 97-98
N/A 46 49 96-97
Language Arts
School 50
System
State
N/A 48 64 0
98-99
N/A 40 62 97-98
N/A 60 59 96-97
School System State
Social Studies 50
N/A 53 56 0
98-99
N/A 38 55 97-98
N/A 54 55 96-97
Science
School 50
System
State
N/A 55 59 0
98-99
N/A 48 59 97-98
N/A 67 58 96-97
School System State
Sources of Information
Composite Score
School
50
50
System
N/A 50 57 0
98-99
N/A 42 56 N/A 55 55
97-98
96-97
State
N/A 50 58 0
98-99
N/A 41 57 97-98
N/A 56 56 96-97
1998-99 GEORGIA PUBLIC EDUCATION REPORT CARD Charlton County High School - 6240287
Prepared by Georgia Department of Education
Scores Reported in Percentiles
School System State
Page 2
STATE-REQUIRED TEST DATA
NORM-REFERENCED TESTS
Grade 5 Iowa Tests of Basic Skills (ITBS) Each chart reflects data for three years of testing. No fifth-grade students are enrolled at Charlton County High School.
Reading Comprehension
Mathematics
50
N/A 43 53 0
98-99
N/A 40 53 97-98
N/A 42 52 96-97
School 50
System
State
N/A 45 59 0
98-99
N/A 38 58 97-98
N/A 39 57 96-97
School System State
Reading Vocabulary 50
N/A 37 48 0
98-99
N/A 32 48 97-98
N/A 31 46 96-97
Language Arts
School 50
System
State
N/A 46 63 0
98-99
N/A 40 61 97-98
N/A 35 58 96-97
School System State
Social Studies 50
N/A 41 57 0
98-99
N/A 38 56 97-98
N/A 40 55 96-97
Science
School 50
System
State
N/A 43 60 0
98-99
N/A 41 59 97-98
N/A 45 59 96-97
School System State
Sources of Information
Composite Score
School
50
50
System
N/A 47 58 0
98-99
N/A 39 58 N/A 39 57
97-98
96-97
State
N/A 42 57 0
98-99
N/A 37 56 97-98
N/A 37 55 96-97
1998-99 GEORGIA PUBLIC EDUCATION REPORT CARD Charlton County High School - 6240287
Prepared by Georgia Department of Education
Scores Reported in Percentiles
School System State
Page 3
STATE-REQUIRED TEST DATA
NORM-REFERENCED TESTS Grade 8
Iowa Tests of Basic Skills (ITBS) Each chart reflects data for three years of testing.
Reading Comprehension 50
43 43 49 0
98-99
40 40 48 97-98
39 39 48 96-97
Mathematics
School 50
System
State
0
46 46 56 98-99
47 47 55 97-98
36 36 54 96-97
School System State
Reading Vocabulary 50
34 34 46 0
98-99
36 36 45 97-98
31 31 44 96-97
Language Arts
School 50
System
State
0
61 61 60 98-99
57 57 58 97-98
38 38 56 96-97
School System State
Social Studies 50
53 53 54 0
98-99
45 45 53 97-98
45 45 53 96-97
Science
School 50
System
State
0
47 47 56 98-99
44 44 55 97-98
41 41 53 96-97
School System State
Sources of Information
Composite Score
50
50 50 57 0
98-99
School 50
System
47 47 56 97-98
39 39 55 96-97
State 0
49 49 56 98-99
45 45 54 97-98
1998-99 GEORGIA PUBLIC EDUCATION REPORT CARD Charlton County High School - 6240287
Prepared by Georgia Department of Education
37 37 54 96-97
Scores Reported in Percentiles
School System State
Page 4
STATE-REQUIRED TEST DATA
PERFORMANCE ASSESSMENTS
Grade 5 Writing Assessment
Percent at Developmental Stages:
1998-99 School System State
1997-98 School System State
1996-97 School System State
Stage Stage Stage Stage Stage Stage
1:The Emerging Writer 2:The Developing Writer 3:The Focusing Writer 4:The Experimenting 5:The Engaging Writer 6:The Extending Writer
N/A N/A N/A N/A N/A N/A
1% 3% 19% 47% 27% 4%
0% 1% 16% 41% 29% 12%
N/A N/A N/A N/A N/A N/A
0% 6% 29% 47% 18% 0%
0% 3% 19% 41% 27% 10%
N/A N/A N/A N/A N/A N/A
1% 6% 17% 41% 24% 12%
0% 3% 21% 37% 26% 12%
No fifth-grade students are enrolled at Charlton County High School.
Categories of Scaled Scores
Inadequate (less than 162)
Minimal (162-209)
Good
(210-247)
Very Good (greater than 247)
Average Scaled Score: (Range 100-300)
Grade 8 Writing Assessment
1998-99 Percent Scoring
1997-98 Percent Scoring
1996-97 Percent Scoring
School System State School System State School System State
5% 48% 42%
5%
5% 48% 42%
5%
8% 40% 41% 11%
11% 53% 31%
5%
11% 53% 31%
5%
11% 46% 34%
8%
31% 44% 21%
3%
31% 44% 21%
3%
15% 46% 30%
8%
206
206
208 197
197 202 181
181 198
GEORGIA HIGH SCHOOL GRADUATION TESTS (GHSGT)
Percent of Regular Program 11th Graders Passing the Georgia High School Graduation Tests on First Administration
English Language Arts Mathematics Social Studies Science
All Components listed above
Writing
1998-99
School System State
91% 90% 66% 72%
58%
91% 90% 66% 72%
58%
96% 88% 80% 72%
68%
89% 89% 93%
1997-98
School System State
90% 85% 73% 72%
68%
90% 85% 73% 72%
68%
94% 88% 78% 74%
68%
84% 84% 92%
1996-97
School System State
89% 83% 66% 63%
58%
89% 83% 66% 63%
58%
94% 87% 78% 74%
67%
88% 88% 93%
1998-99 GEORGIA PUBLIC EDUCATION REPORT CARD Charlton County High School - 6240287
Prepared by Georgia Department of Education
Page 5
GRADUATE DATA
1999 Graduates by Credentials, Race/Ethnicity and Sex
Diplomas with Both College Prep. & Voc. Endorsements
Diplomas with College Prep. Endorsements Diplomas with Vocational Endorsements General High School Diplomas Special Education Diplomas
Total All Diplomas
Certificates of Performance
Total Graduates
Total 0
Black 0
American MultiWhite Hispanic Asian Indian racial
0
0
0
0
0
34
6
28
0
0
0
0
17.6% 82.4% 0.0% 0.0% 0.0% 0.0%
25
12
13
0
0
0
0
48.0% 52.0% 0.0% 0.0% 0.0% 0.0%
0
0
0
0
0
0
0
7
4
3
0
0
0
0
57.1% 42.9% 0.0% 0.0% 0.0% 0.0%
66
22
44
0
0
0
0
33.3% 66.7% 0.0% 0.0% 0.0% 0.0%
7
5
2
0
0
0
0
71.4% 28.6% 0.0% 0.0% 0.0% 0.0%
73
27
46
0
0
0
0
37.0% 63.0% 0.0% 0.0% 0.0% 0.0%
Male Female
0
0
20 58.8%
16 64.0%
0
14 41.2%
9 36.0%
0
5 71.4%
41 62.1%
4 57.1%
45 61.6%
2 28.6%
25 37.9%
3 42.9%
28 38.4%
HOPE Scholarships
School System
Number of 1999 Graduates 7 3
Number Eligible
37
Percent Eligible
50.7%
73 37 50.7%
State
65,548 40,292 61.5%
High School Completion Rate
Percent of 1995Grade 9 Enrollment in Graduating Class of1999 School System State
Completion Rate '95-'99 56.6% 56.6% 68.9%
1998-99 GEORGIA PUBLIC EDUCATION REPORT CARD
Charlton County High School - 6240287
Prepared by Georgia Department of Education
Page 6
COLLEGE ADMISSIONS / CREDIT TEST DATA
Scholastic Assessment Test (SAT)
Based on students' highest verbal and highest math scores
No. Taking
Average Score
Tests Verbal Math Total
Based on students' last test administration
Average Score Verbal Math Total
School College Prep. Endorsement Other Diplomas
38 462 468
930
484 474
958
352 394
746
System College Prep. Endorsement Other Diplomas
38 462 468
930
484 474
958
352 394
746
Georgia
41,958 492 488
980
458 N/A N/A
458 N/A N/A
483
459 N/A N/A
459 N/A N/A
479
917 N/A N/A
917 N/A N/A
962
Nation
952,913 N/A N/A N/A
502 508 1010
American College Testing (ACT)
Advanced Placement Exams (AP)
Number taking tests: English Mathematics Reading Science Reasoning
3 * School N/A N/A N/A N/A
System N/A N/A N/A N/A
State 19.1 19.9 20.2 19.9
CompositeScore
N/A
N/A 19.9
* Scores are not reported when fewer than 5 take the ACT
No. of Students Taking Tests
No. of Tests Taken No. of Test Scores
3 or Higher Percent of Test
Scores 3 or Higher
School 0
N/A N/A
N/A
System State 0 15,225
N/A 23,969 N/A 13,024
N/A 54.3%
POST-SECONDARY DATA
Graduates Entering Georgia Public Colleges
Graduates Entering Georgia Public Colleges and Requiring Learning Support (LS)
1998 Graduates Entering in 1998-99
1997 Graduates Entering in 1997-98
Percent of Graduating Number Class
School
36
38.3%
System 3 6
38.3%
School
27
31.0%
System 2 7
31.0%
Number Requiring
LS 14 14
4 4
Percent of those attending Georgia
Public Colleges
38.9%
38.9%
14.8%
14.8%
In previous years, the Report Card presented College Prep Curriculum information provided by the Board of Regents on students requiring Learning Support. Due to inconsistencies in the data provided by the Board of Regents in defining College Prep Completers versus Local Board of Education data defining College Prep Endorsements, the Department of Education Report Card will not provide this information until discrepancies can be reconciled.
Graduates Entering Georgia Public Technical and Adult Schools
1998 Graduates School System
Entering Number 2 2
1998-99 Percent
2.1% 2.1%
Entering Number N/A N/A
1997-98 Percent
N/A N/A
1997 Graduates School
0
0.0%
System
0
0.0%
0
0.0%
0
0.0%
1998-99 GEORGIA PUBLIC EDUCATION REPORT CARD Charlton County High School - 6240287
Prepared by Georgia Department of Education
Page 7
CERTIFIED PERSONNEL DATA
Positions Number Average Contract Days
Administrators
2.49 225.87
Support Personnel
2.50 208.00
PK-12 Teachers
43.12 190.56
Personnel Sex
Certificate
Years Experience
Full-time Part-time
Male Female
4 Yr Bachelor's 5 Yr Master's 6 Yr Specialist's 7 Yr Doctoral Other*
<1 1-10 11-20 21-30 >30
Average
2 1
3 0
0 3 0 0 0
0 1 1 0 1
20.00
2 1
0 3
0 2 1 0 0
0 1 1 1 0
15.33
40 2
17 25
24 16
0 1 1
3 15 14 10
0
12.93
*Includes One- and Two-Year Vocational Certificates.
ACCREDITATION DATA
Accredited by Southern Association of Colleges and Schools (SACS): Secondary/Middle Commission. Accredited with Quality by Georgia Accrediting Commission (GAC).
AWARDS / RECOGNITION DATA
Schools in Georgia may receive recognition in the following programs: Charter School Pay for Performance Program Georgia School of Excellence National Blue Ribbon School Charlton County High School did not receive recognition in any of these programs during the 1998-99 school year.
1998-99 GEORGIA PUBLIC EDUCATION REPORT CARD Charlton County High School - 6240287
Prepared by Georgia Department of Education
Page 8
1998-99 GEORGIA PUBLIC EDUCATION REPORT CARD
CHARLTON COUNTY SCHOOLS
Folkston Elementary School - 6240199
Grade Range 3-6
The Georgia Public Education Report Card is designed to assist systems and schools in educational improvement. This report card contains a variety of data elements. An explanation of the terms is provided as a companion to the report card data. Please refer to the definitions for the most effective use of the reported data.
STUDENT DATA
Total 567
3-6 Enrollment, by Race/Ethnicity and Sex
Black
White Hispanic
American Multi-
Asian Indian
racial
241 42.5%
323 57.0%
0 0.0%
0 0.0%
0 0.0%
3 0.5%
Male Female
294 51.9%
273 48.1%
Enrollment in Selected Programs
Program
Program % of Student Enrollment Population
Gifted (Grades K-12)
41
7.2%
Alternative Programs (Grades 6-12)
0
0.0%
Students Eligible to Receive Free/Reduced Lunches
Number
Percent
School System
366 1,179
64.6% 57.0%
Dropout Rate for Grade 6
Number
Rate
School System
0
0.0%
0
0.0%
Enrollment in Compensatory Programs
Program
Program % of Student Enrollment Population
Special Education (Grades K-12)
69 12.2%
(PK)
0
N/A
English to Speakers of Other Languages (ESOL) (Grades K-12)
0
0.0%
Remedial Education (Grades 2-5, 9-12)
135 30.8%
Special Instructional Assistance (SIA) (Grades K-3)
36 24.7%
Title I (Grades K-12)
This school has a Targeted Assistance program.
Total 5
Retained Students, by Race/Ethnicity and Sex
Black
White Hispanic
American Multi-
Asian Indian
racial
2 40.0%
3 60.0%
0 0.0%
0 0.0%
0 0.0%
0 0.0%
Male Female
3
2
60.0% 40.0%
Prepared by Georgia Department of Education
Page 1
STATE-REQUIRED TEST DATA
NORM-REFERENCED TESTS Grade 3
Iowa Tests of Basic Skills (ITBS) Each chart reflects data for three years of testing.
Reading Comprehension 50
44 43 54 0
98-99
37 37 53 97-98
46 45 52 96-97
Mathematics
School 50
System
State
0
50 52 61 98-99
45 46 61 97-98
56 59 59 96-97
School System State
Reading Vocabulary 50
47 47 50 0
98-99
44 41 50 97-98
47 46 49 96-97
Language Arts
School 50
System
State
0
48 48 64 98-99
42 40 62 97-98
60 60 59 96-97
School System State
Social Studies 50
55 53 56 0
98-99
38 38 55 97-98
53 54 55 96-97
Science
School 50
System
State
0
57 55 59 98-99
49 48 59 97-98
68 67 58 96-97
School System State
Sources of Information
Composite Score
50
49 50 57 0
98-99
School 50
System
41 42 56 97-98
56 55 55 96-97
State 0
50 50 58 98-99
41 41 57 97-98
1998-99 GEORGIA PUBLIC EDUCATION REPORT CARD Folkston Elementary School - 6240199
Prepared by Georgia Department of Education
56 56 56 96-97
Scores Reported in Percentiles
School System State
Page 2
STATE-REQUIRED TEST DATA
NORM-REFERENCED TESTS Grade 5
Iowa Tests of Basic Skills (ITBS) Each chart reflects data for three years of testing.
Reading Comprehension
Mathematics
50
43 43 53 0
98-99
40 40 53 97-98
43 42 52 96-97
School 50
System
State
0
47 45 59 98-99
37 38 58 97-98
40 39 57 96-97
School System State
Reading Vocabulary 50
38 37 48 0
98-99
31 32 48 97-98
32 31 46 96-97
Language Arts
School 50
System
State
0
48 46 63 98-99
41 40 61 97-98
37 35 58 96-97
School System State
Social Studies 50
43 41 57 0
98-99
37 38 56 97-98
41 40 55 96-97
Science
School 50
System
State
0
45 43 60 98-99
40 41 59 97-98
46 45 59 96-97
School System State
Sources of Information
Composite Score
50
48 47 58 0
98-99
School 50
System
41 39 58 97-98
41 39 57 96-97
State 0
44 42 57 98-99
37 37 56 97-98
39 37 55 96-97
1998-99 GEORGIA PUBLIC EDUCATION REPORT CARD Folkston Elementary School - 6240199
Prepared by Georgia Department of Education
Scores Reported in Percentiles
School System State
Page 3
STATE-REQUIRED TEST DATA
PERFORMANCE ASSESSMENTS
Grade 5 Writing Assessment
Percent at Developmental Stages:
1998-99 School System State
1997-98 School System State
1996-97 School System State
Stage Stage Stage Stage Stage Stage
1:The Emerging Writer 2:The Developing Writer 3:The Focusing Writer 4:The Experimenting 5:The Engaging Writer 6:The Extending Writer
0% 3% 18% 46% 28% 5%
1% 3% 19% 47% 27% 4%
0% 1% 16% 41% 29% 12%
0% 5% 26% 49% 20% 0%
0% 6% 29% 47% 18% 0%
0% 3% 19% 41% 27% 10%
1% 6% 18% 39% 23% 13%
1% 6% 17% 41% 24% 12%
0% 3% 21% 37% 26% 12%
AWARDS / RECOGNITION DATA
Schools in Georgia may receive recognition in the following programs: Charter School Pay for Performance Program Georgia School of Excellence National Blue Ribbon School Folkston Elementary School did not receive recognition in any of these programs during the 1998-99 school year.
1998-99 GEORGIA PUBLIC EDUCATION REPORT CARD Folkston Elementary School - 6240199
Prepared by Georgia Department of Education
Page 4
CERTIFIED PERSONNEL DATA
Positions Number Average Contract Days
Personnel Sex
Certificate
Years Experience
Full-time Part-time
Male Female
4 Yr Bachelor's 5 Yr Master's 6 Yr Specialist's 7 Yr Doctoral Other*
<1 1-10 11-20 21-30 >30
Average
Administrators
1.50 233.33
1 1
1 1
0 0 2 0 0 0 0 1 1 0 19.50
Support Personnel
1.50 200.00
1 1
0 2
0 2 0 0 0 0 2 0 0 0 7.00
PK-12 Teachers
31.10 190.48
30 3
5 28
21 7 5 0 0 5
16 7 4 1
10.70
*Includes One- and Two-Year Vocational Certificates.
ACCREDITATION DATA
Accredited with Quality by Georgia Accrediting Commission (GAC).
1998-99 GEORGIA PUBLIC EDUCATION REPORT CARD Folkston Elementary School - 6240199
Prepared by Georgia Department of Education
Page 5
1998-99 GEORGIA PUBLIC EDUCATION REPORT CARD
CHARLTON COUNTY SCHOOLS
Saint George Elementary School - 6244050
Grade Range PK-6
The Georgia Public Education Report Card is designed to assist systems and schools in educational improvement. This report card contains a variety of data elements. An explanation of the terms is provided as a companion to the report card data. Please refer to the definitions for the most effective use of the reported data.
STUDENT DATA
Total
K-6
194
PK
19
Enrollment, by Race/Ethnicity and Sex
Black
White Hispanic
American Asian Indian
Multiracial
5 2.6%
179 92.3%
2 1.0%
4 2.1%
1 0.5%
3 1.5%
0
19
0.0% 100.0%
0 0.0%
0 0.0%
0 0.0%
0 0.0%
Male Female
112 57.7%
82 42.3%
8 42.1%
11 57.9%
Enrollment in Selected Programs
Program
Program % of Student Enrollment Population
Gifted (Grades K-12)
0
0.0%
Alternative Programs (Grades 6-12)
0
0.0%
Students Eligible to Receive Free/Reduced Lunches
Number
Percent
School System
135 1,179
63.4% 57.0%
Dropout Rate for Grade 6
Number
Rate
School System
0
0.0%
0
0.0%
Enrollment in Compensatory Programs
Program
Program % of Student Enrollment Population
Special Education (Grades K-12)
22 11.3%
(PK)
7
N/A
English to Speakers of Other Languages (ESOL) (Grades K-12)
0
0.0%
Remedial Education (Grades 2-5, 9-12)
0
0.0%
Special Instructional Assistance (SIA) (Grades K-3)
40 34.2%
Title I (Grades K-12)
This school has a Targeted Assistance program.
Total 7
Retained Students, by Race/Ethnicity and Sex
Black
White Hispanic
American MultiAsian Indian racial
0
7
0.0% 100.0%
0 0.0%
0 0.0%
0 0.0%
0 0.0%
Male Female
5
2
71.4% 28.6%
Prepared by Georgia Department of Education
Page 1
STATE-REQUIRED TEST DATA
NORM-REFERENCED TESTS Grade 3
Iowa Tests of Basic Skills (ITBS) Each chart reflects data for three years of testing.
Reading Comprehension 50
40 43 54 0
98-99
36 37 53 97-98
41 45 52 96-97
Mathematics
School 50
System
State
0
56 52 61 98-99
51 46 61 97-98
70 59 59 96-97
School System State
Reading Vocabulary 50
50 47 50 0
98-99
28 41 50 97-98
43 46 49 96-97
Language Arts
School 50
System
State
0
50 48 64 98-99
31 40 62 97-98
61 60 59 96-97
School System State
Social Studies 50
42 53 56 0
98-99
40 38 55 97-98
54 54 55 96-97
Science
School 50
System
State
0
45 55 59 98-99
44 48 59 97-98
57 67 58 96-97
School System State
Sources of Information
Composite Score
50
52 50 57 0
98-99
School 50
System
49 42 56 97-98
52 55 55 96-97
State 0
49 50 58 98-99
43 41 57 97-98
1998-99 GEORGIA PUBLIC EDUCATION REPORT CARD Saint George Elementary School - 6244050
Prepared by Georgia Department of Education
56 56 56 96-97
Scores Reported in Percentiles
School System State
Page 2
STATE-REQUIRED TEST DATA
NORM-REFERENCED TESTS Grade 5
Iowa Tests of Basic Skills (ITBS) Each chart reflects data for three years of testing.
Reading Comprehension
Mathematics
50
39 43 53 0
98-99
40 40 53 97-98
39 42 52 96-97
School 50
System
State
0
35 45 59 98-99
40 38 58 97-98
33 39 57 96-97
School System State
Reading Vocabulary 50
33 37 48 0
98-99
34 32 48 97-98
26 31 46 96-97
Language Arts
School 50
System
State
0
32 46 63 98-99
35 40 61 97-98
27 35 58 96-97
School System State
Social Studies 50
33 41 57 0
98-99
42 38 56 97-98
30 40 55 96-97
Science
School 50
System
State
0
34 43 60 98-99
46 41 59 97-98
43 45 59 96-97
School System State
Sources of Information
Composite Score
50
37 47 58 0
98-99
School 50
System
33 39 58 97-98
32 39 57 96-97
State 0
32 42 57 98-99
39 37 56 97-98
31 37 55 96-97
1998-99 GEORGIA PUBLIC EDUCATION REPORT CARD Saint George Elementary School - 6244050
Prepared by Georgia Department of Education
Scores Reported in Percentiles
School System State
Page 3
STATE-REQUIRED TEST DATA
PERFORMANCE ASSESSMENTS
Grade 5 Writing Assessment
Percent at Developmental Stages:
1998-99 School System State
1997-98 School System State
1996-97 School System State
Stage Stage Stage Stage Stage Stage
1:The Emerging Writer 2:The Developing Writer 3:The Focusing Writer 4:The Experimenting 5:The Engaging Writer 6:The Extending Writer
4% 0% 22% 52% 22% 0%
1% 3% 19% 47% 27% 4%
0% 1% 16% 41% 29% 12%
0% 8% 42% 38% 8% 0%
0% 6% 29% 47% 18% 0%
0% 3% 19% 41% 27% 10%
0% 5% 14% 48% 29% 5%
1% 6% 17% 41% 24% 12%
0% 3% 21% 37% 26% 12%
AWARDS / RECOGNITION DATA
Schools in Georgia may receive recognition in the following programs: Charter School Pay for Performance Program Georgia School of Excellence National Blue Ribbon School Saint George Elementary School did not receive recognition in any of these programs during the 1998-99 school year.
1998-99 GEORGIA PUBLIC EDUCATION REPORT CARD Saint George Elementary School - 6244050
Prepared by Georgia Department of Education
Page 4
CERTIFIED PERSONNEL DATA
Positions Number Average Contract Days
Personnel Sex
Certificate
Years Experience
Full-time Part-time
Male Female
4 Yr Bachelor's 5 Yr Master's 6 Yr Specialist's 7 Yr Doctoral Other*
<1 1-10 11-20 21-30 >30
Average
Administrators
1.00 220.00
1 0
1 0
0 0 1 0 0 0 0 1 0 0 11.00
Support Personnel
1.00 200.00
1 0
0 1
0 1 0 0 0 0 1 0 0 0 8.00
PK-12 Teachers
13.40 190.00
13 1
3 11
9 4 1 0 0 3 5 5 1 0 9.93
*Includes One- and Two-Year Vocational Certificates.
ACCREDITATION DATA
Accredited with Quality by Georgia Accrediting Commission (GAC).
1998-99 GEORGIA PUBLIC EDUCATION REPORT CARD Saint George Elementary School - 6244050
Prepared by Georgia Department of Education
Page 5
1998-99 GEORGIA PUBLIC EDUCATION REPORT CARD CHATHAM COUNTY SCHOOLS - 625
The Georgia Public Education Report Card is designed to assist systems and schools in educational improvement. This report card contains a variety of data elements. An explanation of the terms is provided as a companion to the report card data. Please refer to the definitions for the most effective use of the reported data.
Total
K-12
35,618
PK
1,111
STUDENT DATA
Enrollment, by Race/Ethnicity and Sex
Black
White Hispanic
American Multi-
Asian Indian
racial
22,618 63.5%
11,491 32.3%
515 1.4%
551 1.5%
52 0.1%
391 1.1%
745 67.1%
306 27.5%
22 2.0%
17 1.5%
0 0.0%
21 1.9%
Male
18,089 50.8%
583 52.5%
Female
17,529 49.2%
528 47.5%
Enrollment in Selected Programs
Program
Program % of Student Enrollment Population
Gifted (Grades K-12)
2,143
6.0%
Non-Vocational Labs (Grades 9-12)
7,336
79.3%
Vocational Labs (Grades 9-12)
4,373
47.3%
Alternative Programs (Grades 6-12)
598
3.5%
Students Eligible to Receive Free/Reduced Lunches
Number
Percent
19,220
52.3%
Dropout Rate
Number
Percent
6-12
852
4.5%
9-12
784
7.8%
Enrollment in Compensatory Programs
Program
Program % of Student Enrollment Population
Special Education (Grades K-12)
PK
3,696 227
English to Speakers of
Other Languages (ESOL)
163
(Grades K-12)
Remedial Education (Grades 2-5, 9-12)
2,782
Special Instructional Assistance (SIA) (Grades K-3)
3,044
Title I (Grades K-12) Number of schools with: Schoolwide program Targeted Assistance program No Title I program
10.4% N/A < 1%
13.0%
24.2%
16 10 20
Total 2,527
Retained Students, by Race/Ethnicity and Sex
Black
White Hispanic
American MultiAsian Indian racial
1,899 75.1%
561 22.2%
25 1.0%
23 0.9%
2 0.1%
17 0.7%
Male Female 1,543 984 61.1% 38.9%
Prepared by Georgia Department of Education
Page 1
STATE-REQUIRED TEST DATA
NORM-REFERENCED TESTS
Grade 3 Iowa Tests of Basic Skills (ITBS) Each chart reflects data for three years of testing.
Reading Comprehension
Mathematics
50
47 54 44 53 43 52 0
98-99 97-98 96-97
System State
50
56 61 54 61 51 59 0
98-99 97-98 96-97
System State
Reading Vocabulary
50
43 50 44 50 42 49 0
98-99 97-98 96-97
System State
Social Studies
50
47 56 49 55 46 55 0
98-99 97-98 96-97
System State
Language Arts
50
57 64 56 62 50 59 0
98-99 97-98 96-97
System State
Science
50
50 59 51 59 49 58 0
98-99 97-98 96-97
System State
Sources of Information
Composite Score
50
52 57 0
98-99
System
50
49 56 47 55 97-98 96-97
State
50 58 49 57 0
98-99 97-98
1998-99 GEORGIA PUBLIC EDUCATION REPORT CARD Chatham County Schools
Prepared by Georgia Department of Education
System State Scores Reported 47 56 in Percentiles 96-97
Page 2
STATE-REQUIRED TEST DATA
NORM-REFERENCED TESTS
Grade 5 Iowa Tests of Basic Skills (ITBS) Each chart reflects data for three years of testing.
Reading Comprehension
Mathematics
50
47 53 47 53 44 52 0
98-99 97-98 96-97
System State
50
51 59 53 58 49 57 0
98-99 97-98 96-97
System State
Reading Vocabulary
50
39 48 44 48 38 46 0
98-99 97-98 96-97
System State
Social Studies
50
49 57 49 56 45 55 0
98-99 97-98 96-97
System State
Language Arts
50
58 63 57 61 49 58 0
98-99 97-98 96-97
System State
Science
50
55 60 54 59 51 59 0
98-99 97-98 96-97
System State
Sources of Information
Composite Score
50
55 58 0
98-99
System
50
54 58 50 57 97-98 96-97
State
51 57 51 56 0
98-99 97-98
1998-99 GEORGIA PUBLIC EDUCATION REPORT CARD Chatham County Schools
Prepared by Georgia Department of Education
System State Scores Reported 46 55 in Percentiles 96-97
Page 3
STATE-REQUIRED TEST DATA
NORM-REFERENCED TESTS Grade 8
Iowa Tests of Basic Skills (ITBS) Each chart reflects data for three years of testing.
Reading Comprehension
Mathematics
50
34 49 35 48 34 48 0
98-99 97-98 96-97
System State
50
40 56 43 55 41 54 0
98-99 97-98 96-97
System State
Reading Vocabulary
50
30 46 31 45 31 44 0
98-99 97-98 96-97
System State
Language Arts
50
48 60 48 58 44 56 0
98-99 97-98 96-97
System State
Social Studies
50
41 54 43 53 40 53 0
98-99 97-98 96-97
System State
Science
50
38 56 38 55 38 53 0
98-99 97-98 96-97
System State
Sources of Information
Composite Score
50
47 57 0
98-99
System
50
48 56 47 55 97-98 96-97
State
40 56 42 54 0
98-99 97-98
1998-99 GEORGIA PUBLIC EDUCATION REPORT CARD Chatham County Schools
Prepared by Georgia Department of Education
System State Scores Reported 40 54 in Percentiles 96-97
Page 4
STATE-REQUIRED TEST DATA
PERFORMANCE ASSESSMENTS
Grade 5 Writing Assessment
1998-99
1997-98
1996-97
Percent at Developmental Stages:
Comparison
Comparison
Comparison
System Group State System Group State System Group State
Stage Stage Stage Stage Stage Stage
1: The Emerging Writer 2: The Developing Writer 3: The Focusing Writer 4: The Experimenting Writer 5: The Engaging Writer 6: The Extending Writer
0% 1% 22% 46% 23% 7%
0% 1% 19% 44% 25% 9%
0% 1% 16% 41% 29% 12%
0% 3% 24% 43% 22% 7%
1% 3% 22% 43% 23% 8%
0% 3% 19% 41% 27% 10%
0% 4% 26% 39% 22% 8%
1% 5% 28% 39% 20% 7%
0% 3% 21% 37% 26% 12%
Grade 8 Writing Assessment
1998-99 Percent Scoring 1997-98 Percent Scoring 1996-97 Percent Scoring
Categories of Scaled Scores
Comparison
Comparison
Comparison
System Group State System Group State System Group State
Inadequate (less than 162)
Minimal (162-209)
Good
(210-247)
Very Good (greater than 247)
14% 51% 31%
4%
12% 48% 34%
7%
8% 40% 41% 11%
17% 53% 25%
4%
16% 53% 27%
4%
11% 46% 34%
8%
23% 50% 23%
5%
24% 51% 21%
5%
15% 46% 30%
8%
Average Scaled Score: (Range 100-300)
196
200 208
192
194 202
189
187 198
GEORGIA HIGH SCHOOL GRADUATION TESTS (GHSGT)
Percent of Regular Program 11th Graders Passing the Georgia High School Graduation Tests on First Administration
1998-99
1997-98
1996-97
Comparison
Comparison
Comparison
System Group State System Group State System Group State
English Language Arts Mathematics Social Studies Science
93% 75% 69% 55%
94% 83% 76% 63%
96% 88% 80% 72%
89% 79% 64% 55%
93% 84% 72% 66%
94% 88% 78% 74%
91% 77% 65% 58%
90% 77% 68% 58%
94% 87% 78% 74%
All Components listed above 5 1 %
59% 68% 49%
60% 68% 52%
52% 67%
Writing
87%
90% 93% 87%
89% 92% 90%
88% 93%
1998-99 GEORGIA PUBLIC EDUCATION REPORT CARD
Chatham County Schools
Prepared by Georgia Department of Education
Page 5
GRADUATE DATA
1999 Graduates by Credentials, Race/Ethnicity and Sex
Diplomas with Both College Prep. & Voc. Endorsements
Diplomas with College Prep. Endorsements Diplomas with Vocational Endorsements General High School Diplomas Special Education Diplomas
Total All Diplomas
Certificates of Performance
Total Graduates
Total 161 666 235 51 54
1,167 269
1,436
Black
87 54.0%
352 52.9%
169 71.9%
36 70.6%
32 59.3%
676 57.9%
230 85.5%
906 63.1%
American MultiWhite Hispanic Asian Indian racial
68 42.2%
268 40.2%
64 27.2%
12 23.5%
20 37.0%
432 37.0%
1 0.6%
8 1.2%
1 0.4%
0 0.0%
1 1.9%
11 0.9%
4 2.5%
33 5.0%
1 0.4%
0 0.0%
0 0.0%
38 3.3%
0 0.0%
1 0.2%
0 0.0%
1 2.0%
0 0.0%
2 0.2%
1 0.6%
4 0.6%
0 0.0%
2 3.9%
1 1.9%
8 0.7%
21
16
1
0
1
7.8% 5.9% 0.4% 0.0% 0.4%
453
27
39
2
9
31.5% 1.9% 2.7% 0.1% 0.6%
Male Female
70 43.5%
279 41.9%
128 54.5%
31 60.8%
36 66.7%
544 46.6%
91 56.5%
387 58.1%
107 45.5%
20 39.2%
18 33.3%
623 53.4%
88 181 32.7% 67.3%
632 804 44.0% 56.0%
HOPE Scholarships
System State
Number of 1999 Graduates 1 , 4 3 6
Number Eligible
749
Percent Eligible
52.2%
65,548 40,292 61.5%
High School Completion Rate Percent of 1995Grade 9 Enrollment
in Graduating Class of1999
System
State
Completion Rate '95-'99 62.1% 68.9%
COLLEGE ADMISSIONS / CREDIT TEST DATA
Scholastic Assessment Test (SAT)
No. Taking
Average Score
Tests
Verbal Math Total
Based on students' highest verbal and highest math scores
System College Prep. Endorsement Other Diplomas
489 473 962 483 469 952 419 379 798
Georgia
492 488 980
Based on students' last test administration
System Georgia
578
480 464
944
41,958 483 479 962
Nation
952,913 502 508 1010
American College Testing (ACT)
System State Nation
English
16.0
19.1 20.4
Mathematics
17.1
19.9 20.7
Reading
17.5
20.2 21.3
Science Reasoning 17.7
19.9 21.0
CompositeScore 17.2
19.9 21.9
Advanced Placement Exams (AP)
No. of Students Taking Tests
No. of Tests Taken No. of Test Scores
3 or Higher Percent of Test
Scores 3 or Higher
System State 291 15,225 509 23,969 254 13,024
49.9% 54.3%
1998-99 GEORGIA PUBLIC EDUCATION REPORT CARD Chatham County Schools
Prepared by Georgia Department of Education
Page 6
POSTSECONDARY DATA
Graduates Entering Georgia Public Colleges and Universities
Graduates Entering Georgia Public Colleges and Universities and
Requiring Learning Support (LS)
1998 Graduates Entering 1998-99
1997 Graduates Entering 1997-98
Percent of Graduating Number Class
470
30.4%
565
37.0%
Number Requiring
LS
159
232
Percent of those attending Georgia
Public Colleges
33.8%
41.1%
In previous years, the Report Card presented College Prep Curriculum information provided by the Board of Regents on students requiring Learning Support. Due to inconsistencies in the data provided by the Board of Regents in defining College Prep Completers versus Local Board of Education data defining College Prep Endorsements, the Department of Education Report Card will not provide this information until discrepancies can be reconciled.
Graduates Entering Georgia Public Technical and Adult Schools
Entering 1998-99 Entering 1997-98
Number Percent
Number Percent
1998 Graduates 1997 Graduates
78
5.0%
15
1.0%
N/A 89
N/A 5.8%
ACCREDITATION / RECOGNITION DATA
Southern Association of Colleges and Schools (SACS) Accrediting Commission
Secondary/Middle Commission Elementary/Middle Commission Both Elementary/Secondary Commissions Joint Commission Candidate for Accreditation
Accreditation by Georgia Accrediting Commission (GAC)
Accredited by GAC Accredited with Quality by GAC
Number of Schools
7 39
0 0 0
Number of Schools
0 0
Awards / Recognition
State Recognized Program
Number of Schools
Charter School
3
Pay for Performance Recipient
2
Georgia School of Excellence
1
National Blue Ribbon School
0
COMMUNITY DATA
Number of Children Eligible for Migrant Education Number of Families-At-Risk * Number of Food Stamp Participants * Number of Families Receiving TANF * ** Per Capita Income * Unemployment Rate * 1990 Population * Projected 2000 Population * Projected 2010 Population *
* Data Available at County Level Only ** Known as AFDC before January 1997
0 916 23,694 2,606 $24,320 4.7% 216,935 244,684 273,391
1998-99 GEORGIA PUBLIC EDUCATION REPORT CARD Chatham County Schools
Prepared by Georgia Department of Education
Page 7
FISCAL DATA
Millage Rate
16.66
* Fall 1998 Property Tax Digest is used to calculate the 98-99 Value of One Mill
FTE Count
FTE Count used for Allotment Calculation 35,040.0 Fall '98 FTE Count 35,618
Value of One Mill
$5,127,119 $146.32 per Allotment FTE
Sources: Local State-QBE State-
Lottery State-
Other Federal Other
Total
PerGeneral Fund cent Per FTE
$90,315,324 44.4% $2,577 $107,434,204 52.8% $3,066
K-12 Revenues
Lottery K-12
and
Title
All Other
Programs
K-12
$0 $4,517,888
Bonded Debt
$13,467,829
$0
$0
$0
Capital Projects
$431,600 $0
$0 0.0%
$0
$0 $709,899
$0
$0
$1,337,208 0.7% $38 $792,977 0.4% $23
$3,508,911 1.7% $100 $203,388,626 100% $5,804
$55,000 $2,920,183
$0
$0
$8,543,635 $9,716,464
$0
$0
$0
$0 $26,363,488 $24,625,000
$8,598,635 $17,864,436 $39,831,317 $25,056,600
School Nutrition
$0 $0
$0
$0 $0 $0 $0
Grand Total
Total
Per-
Amount cent
$108,732,643 36.9%
$107,434,204 36.5%
$709,899 0.2%
$4,312,392 1.5% $19,053,077 6.5% $54,497,399 18.5% $294,739,615 100%
Instruction
Media
Instruction Support
Pupil Services General Admin. School Admin. Trans-
portation Maint. & Ops. Capital Projects School Food Debt Service
$121,345,661 66.0% $3,463 $4,272,112 2.3% $122
$4,646,523 2.5% $133
$8,743,052 4.8% $250
$7,114,514 3.9% $203
$10,507,887 5.7% $300
$11,504,530 6.3% $328
$15,593,909 8.5% $445
$212,854 0.1%
$6
$1,926 0.0%
$0
$0 0.0%
$0
K-12 Expenditures
$7,926,507 $9,542,731
$0
$0
$0 $709,438
$0
$0
$981,303 $474,698
$0
$0
$567,053 $879,408
$0
$0
$185,259 $457,526
$0 $178,408
$11,713 $389,631
$0
$743
$25,643
$200
$0
$0
$38,981 $181,911
$0
$1,225
$0
$36,260 $105,402 $32,100,845
$24,802 $13,040,150
$0
$0
$0 $798,571 $16,132,421
$0
Total
$183,942,973 100% $5,250 $9,761,264 $26,510,529 $16,237,824 $32,281,222
$0 $138,814,901 51.7% $0 $4,981,551 1.9% $0 $6,102,525 2.3% $0 $10,189,515 3.8% $0 $7,935,708 3.0% $0 $10,909,976 4.1% $0 $11,530,373 4.3% $0 $15,816,027 5.9% $0 $32,455,363 12.1% $0 $13,066,879 4.9% $0 $16,930,993 6.3%
$0 $268,733,814 100%
Salaries and Benefits as Percentages of Revenues and of Expenditures
Teachers and Paraprofessionals
Salaries $99,176,940
Benefits $25,211,128
Percentage of Revenues Percentage of Expenditures
Total of
Total of
General Fund
General Fund
Title Programs
Title Programs
Lottery K-12
Lottery K-12
Total Salaries
and
Total
and
Total
and Benefits All Other K-12 K - 12 All Other K-12 K - 12
$124,388,068
54.1%
42.2%
56.5%
46.3%
School Administration
$5,596,232 $2,034,745
$7,630,977
3.3%
2.6%
3.5%
2.8%
General Administration
$3,102,525 $1,558,338
$4,660,863
2.0%
1.6%
2.1%
1.7%
1998-99 GEORGIA PUBLIC EDUCATION REPORT CARD
Chatham County Schools - 625
Prepared by Georgia Department of Education
Page 8
CERTIFIED PERSONNEL DATA
Number
Average Annual Salary Positions Average Contract Days
Average Daily Salary
Full-time Personnel Part-time
Sex Male Female
4 Yr Bachelor's Certificate 5 Yr Master's
Level 6 Yr Specialist's 7 Yr Doctoral Other*
Black
White Race/ Hispanic Ethnicity Asian
American Indian
Multiracial
Years Experience
<1 1-10 11-20 21-30 >30
Average
Administrators
121.00
$59,028.84 215.02
$274.52
120 2
36 86
0 49 55 18
0
53 69
0 0 0 0
0 8 30 77 7
22.54
Support Personnel PK-12 Teachers
169.90
2,291.30
$47,731.86 200.41
$238.18
$37,858.18 190.08
$199.17
166
2,273
8
35
29
368
145
1,940
9
1,274
96
894
64
123
5
13
0
4
43
880
130
1,403
0
14
1
9
0
2
0
0
4
105
31
924
54
696
78
523
7
60
18.40
13.53
*Includes One- and Two-Year Vocational Certificates.
Certified Staff Position Ratios
Teacher/Administrator Ratio 19:1
Teacher/Support Person Ratio 13:1
Teacher/Staff Ratio 8:1
Student Enrollment/All Teachers 16:1
Certified Personnel by Category
88.6% 100%
4.7%
6.7%
80% 60%
40%
20%
0%
Teachers
Administrators
Support Personnel
1998-99 GEORGIA PUBLIC EDUCATION REPORT CARD
Chatham County Schools - 625
Prepared by Georgia Department of Education
Page 9
1998-99 GEORGIA PUBLIC EDUCATION REPORT CARD
CHATHAM COUNTY SCHOOLS
Bartlett Middle School - 6255050
Grade Range 6-8
The Georgia Public Education Report Card is designed to assist systems and schools in educational improvement. This report card contains a variety of data elements. An explanation of the terms is provided as a companion to the report card data. Please refer to the definitions for the most effective use of the reported data.
STUDENT DATA
Total 981
6-8 Enrollment, by Race/Ethnicity and Sex
Black
White Hispanic
American Multi-
Asian Indian
racial
529 53.9%
402 41.0%
17 1.7%
20 2.0%
1 0.1%
12 1.2%
Male 513
52.3%
Female 468
47.7%
Enrollment in Selected Programs
Program
Gifted (Grades K-12)
Program % of Student Enrollment Population
61
6.2%
Alternative Programs
17
(Grades 6-12)
1.7%
Students Eligible to Receive Free/Reduced Lunches
Number
Percent
School System
449 19,220
45.8% 52.3%
Enrollment in Compensatory Programs
Program
Program % of Student Enrollment Population
Special Education (Grades K-12) (PK)
121 12.3%
0
N/A
English to Speakers of Other Languages (ESOL) (Grades K-12)
1
< 1%
Title I (Grades K-12)
This school has no Title I program.
Dropout Rate for Grades 6-8
Number
Rate
School System
11
1.0%
68
0.8%
Total 54
Retained Students, by Race/Ethnicity and Sex
Black
White Hispanic
American MultiAsian Indian racial
32 59.3%
22 40.7%
0 0.0%
0 0.0%
0 0.0%
0 0.0%
Male Female
38
16
70.4% 29.6%
Prepared by Georgia Department of Education
Page 1
STATE-REQUIRED TEST DATA
NORM-REFERENCED TESTS Grade 8
Iowa Tests of Basic Skills (ITBS) Each chart reflects data for three years of testing.
Reading Comprehension 50
38 34 49 0
98-99
43 35 48 97-98
43 34 48 96-97
Mathematics
School 50
System
State
0
45 40 56 98-99
48 43 55 97-98
50 41 54 96-97
School System State
Reading Vocabulary 50
35 30 46 0
98-99
38 31 45 97-98
36 31 44 96-97
Language Arts
School 50
System
State
0
52 48 60 98-99
58 48 58 97-98
49 44 56 96-97
School System State
Social Studies 50
45 41 54 0
98-99
49 43 53 97-98
46 40 53 96-97
Science
School 50
System
State
0
41 38 56 98-99
46 38 55 97-98
46 38 53 96-97
School System State
Sources of Information
Composite Score
50
52 47 57 0
98-99
School 50
System
56 48 56 97-98
55 47 55 96-97
State 0
45 40 56 98-99
50 42 54 97-98
1998-99 GEORGIA PUBLIC EDUCATION REPORT CARD Bartlett Middle School - 6255050
Prepared by Georgia Department of Education
48 40 54 96-97
Scores Reported in Percentiles
School System State
Page 2
STATE-REQUIRED TEST DATA
Categories of Scaled Scores
Inadequate (less than 162)
Minimal (162-209)
Good
(210-247)
Very Good (greater than 247)
Average Scaled Score: (Range 100-300)
PERFORMANCE ASSESSMENTS
Grade 8 Writing Assessment
1998-99 Percent Scoring
1997-98 Percent Scoring
1996-97 Percent Scoring
School System State School System State School System State
10% 49% 37%
4%
14% 51% 31%
4%
8% 40% 41% 11%
10% 44% 37%
8%
17% 53% 25%
4%
11% 46% 34%
8%
16% 50% 27%
7%
23% 50% 23%
5%
15% 46% 30%
8%
200
196
208 204
192 202 195
189 198
AWARDS / RECOGNITION DATA
Schools in Georgia may receive recognition in the following programs: Charter School Pay for Performance Program Georgia School of Excellence National Blue Ribbon School Bartlett Middle School did not receive recognition in any of these programs during the 1998-99 school year.
1998-99 GEORGIA PUBLIC EDUCATION REPORT CARD Bartlett Middle School - 6255050
Prepared by Georgia Department of Education
Page 3
CERTIFIED PERSONNEL DATA
Positions Number Average Contract Days
Personnel Sex
Certificate
Years Experience
Full-time Part-time
Male Female
4 Yr Bachelor's 5 Yr Master's 6 Yr Specialist's 7 Yr Doctoral Other*
<1 1-10 11-20 21-30 >30
Average
Administrators
2.00 209.50
2 0
2 0
0 2 0 0 0 0 0 1 1 0 22.00
Support Personnel
4.25 190.00
4 1
2 3
1 4 0 0 0 0 1 1 3 0 20.80
PK-12 Teachers
55.00 190.00
55 0
12 43
27 24
3 1 0 1 25 14 15 0 13.53
*Includes One- and Two-Year Vocational Certificates.
ACCREDITATION DATA
Accredited by Southern Association of Colleges and Schools (SACS):
Elementary/Middle Commission.
1998-99 GEORGIA PUBLIC EDUCATION REPORT CARD Bartlett Middle School - 6255050
Prepared by Georgia Department of Education
Page 4
1998-99 GEORGIA PUBLIC EDUCATION REPORT CARD
CHATHAM COUNTY SCHOOLS
Bartow Elementary School - 6251052
Grade Range PK-5
The Georgia Public Education Report Card is designed to assist systems and schools in educational improvement. This report card contains a variety of data elements. An explanation of the terms is provided as a companion to the report card data. Please refer to the definitions for the most effective use of the reported data.
STUDENT DATA
Total
K-5
557
PK
20
Enrollment, by Race/Ethnicity and Sex
Black
White Hispanic
American Asian Indian
Multiracial
421 75.6%
126 22.6%
0 0.0%
7 1.3%
0 0.0%
3 0.5%
20 100.0%
0 0.0%
0 0.0%
0 0.0%
0 0.0%
0 0.0%
Male Female
271 48.7%
286 51.3%
11 55.0%
9 45.0%
Enrollment in Selected Programs
Program
Program % of Student Enrollment Population
Gifted (Grades K-12)
118
21.2%
Alternative Programs (Grades 6-12)
N/A
N/A
Students Eligible to Receive Free/Reduced Lunches
Number
Percent
School System
332 19,220
57.5% 52.3%
Dropout Rate *
Number
Rate
School System
N/A N/A
N/A N/A
* Dropout rates are not applicable for grades PK-5.
Enrollment in Compensatory Programs
Program
Program % of Student Enrollment Population
Special Education (Grades K-12)
31
5.6%
(PK)
0
N/A
English to Speakers of Other Languages (ESOL) (Grades K-12)
0
0.0%
Remedial Education (Grades 2-5, 9-12)
68 18.3%
Special Instructional Assistance (SIA) (Grades K-3)
53 14.0%
Title I (Grades K-12)
This school has a Targeted Assistance program.
Total 15
Retained Students, by Race/Ethnicity and Sex
Black
White Hispanic
American MultiAsian Indian racial
15 100.0%
0 0.0%
0 0.0%
0 0.0%
0 0.0%
0 0.0%
Male Female
5
10
33.3% 66.7%
Prepared by Georgia Department of Education
Page 1
STATE-REQUIRED TEST DATA
NORM-REFERENCED TESTS Grade 3
Iowa Tests of Basic Skills (ITBS) Each chart reflects data for three years of testing.
Reading Comprehension 50
58 47 54 0
98-99
63 44 53 97-98
56 43 52 96-97
Mathematics
School 50
System
State
0
70 56 61 98-99
69 54 61 97-98
65 51 59 96-97
School System State
Reading Vocabulary 50
52 43 50 0
98-99
64 44 50 97-98
50 42 49 96-97
Language Arts
School 50
System
State
0
70 57 64 98-99
71 56 62 97-98
58 50 59 96-97
School System State
Social Studies 50
58 47 56 0
98-99
64 49 55 97-98
54 46 55 96-97
Science
School 50
System
State
0
62 50 59 98-99
66 51 59 97-98
55 49 58 96-97
School System State
Sources of Information
Composite Score
50
62 52 57 0
98-99
School 50
System
66 49 56 97-98
56 47 55 96-97
State 0
63 50 58 98-99
67 49 57 97-98
1998-99 GEORGIA PUBLIC EDUCATION REPORT CARD Bartow Elementary School - 6251052
Prepared by Georgia Department of Education
58 47 56 96-97
Scores Reported in Percentiles
School System State
Page 2
STATE-REQUIRED TEST DATA
NORM-REFERENCED TESTS Grade 5
Iowa Tests of Basic Skills (ITBS) Each chart reflects data for three years of testing.
Reading Comprehension
Mathematics
50
50 47 53 0
98-99
56 47 53 97-98
45 44 52 96-97
School 50
System
State
0
59 51 59 98-99
63 53 58 97-98
51 49 57 96-97
School System State
Reading Vocabulary 50
45 39 48 0
98-99
52 44 48 97-98
38 38 46 96-97
Language Arts
School 50
System
State
0
72 58 63 98-99
72 57 61 97-98
58 49 58 96-97
School System State
Social Studies 50
56 49 57 0
98-99
61 49 56 97-98
54 45 55 96-97
Science
School 50
System
State
0
56 55 60 98-99
64 54 59 97-98
54 51 59 96-97
School System State
Sources of Information
Composite Score
50
63 55 58 0
98-99
School 50
System
67 54 58 97-98
60 50 57 96-97
State 0
59 51 57 98-99
64 51 56 97-98
52 46 55 96-97
1998-99 GEORGIA PUBLIC EDUCATION REPORT CARD Bartow Elementary School - 6251052
Prepared by Georgia Department of Education
Scores Reported in Percentiles
School System State
Page 3
STATE-REQUIRED TEST DATA
PERFORMANCE ASSESSMENTS
Grade 5 Writing Assessment
Percent at Developmental Stages:
1998-99 School System State
1997-98 School System State
1996-97 School System State
Stage Stage Stage Stage Stage Stage
1:The Emerging Writer 2:The Developing Writer 3:The Focusing Writer 4:The Experimenting 5:The Engaging Writer 6:The Extending Writer
0% 0% 9% 42% 29% 19%
0% 1% 22% 46% 23% 7%
0% 1% 16% 41% 29% 12%
0% 0% 16% 29% 21% 34%
0% 3% 24% 43% 22% 7%
0% 3% 19% 41% 27% 10%
0% 2% 16% 38% 20% 25%
0% 4% 26% 39% 22% 8%
0% 3% 21% 37% 26% 12%
AWARDS / RECOGNITION DATA
Schools in Georgia may receive recognition in the following programs: Charter School Pay for Performance Program Georgia School of Excellence National Blue Ribbon School Bartow Elementary School did not receive recognition in any of these programs during the 1998-99 school year.
1998-99 GEORGIA PUBLIC EDUCATION REPORT CARD Bartow Elementary School - 6251052
Prepared by Georgia Department of Education
Page 4
CERTIFIED PERSONNEL DATA
Positions Number Average Contract Days
Personnel Sex
Certificate
Years Experience
Full-time Part-time
Male Female
4 Yr Bachelor's 5 Yr Master's 6 Yr Specialist's 7 Yr Doctoral Other*
<1 1-10 11-20 21-30 >30
Average
Administrators
2.00 199.50
2 0
1 1
0 1 1 0 0 0 1 0 0 1 20.00
Support Personnel
2.30 190.00
2 1
0 3
1 2 0 0 0 0 1 0 2 0 16.33
PK-12 Teachers
34.80 190.00
32 5
3 34
23 12
2 0 0 3 17 8 8 1 12.16
*Includes One- and Two-Year Vocational Certificates.
ACCREDITATION DATA
Accredited by Southern Association of Colleges and Schools (SACS):
Elementary/Middle Commission.
1998-99 GEORGIA PUBLIC EDUCATION REPORT CARD Bartow Elementary School - 6251052
Prepared by Georgia Department of Education
Page 5
1998-99 GEORGIA PUBLIC EDUCATION REPORT CARD
CHATHAM COUNTY SCHOOLS
Beach High School - 6252052
Grade Range 9-12
The Georgia Public Education Report Card is designed to assist systems and schools in educational improvement. This report card contains a variety of data elements. An explanation of the terms is provided as a companion to the report card data. Please refer to the definitions for the most effective use of the reported data.
Total 1,744
STUDENT DATA
9-12 Enrollment, by Race/Ethnicity and Sex
Black
White Hispanic
American Multi-
Asian Indian
racial
1,563 89.6%
141 8.1%
18 1.0%
6 0.3%
0 0.0%
16 0.9%
Male Female
822 47.1%
922 52.9%
Enrollment in Selected Programs
Program
Gifted (Grades K-12)
Program % of Student Enrollment Population
19
1.1%
Non-Vocational Labs (Grades 9-12)
Vocational Labs (Grades 9-12)
Alternative Programs (Grades 6-12)
1,416 875 86
81.2% 50.2%
4.9%
Students Eligible to Receive Free/Reduced Lunches
Number
Percent
School System
818 19,220
46.9% 52.3%
Enrollment in Compensatory Programs
Program
Program % of Student Enrollment Population
Special Education (Grades K-12) PK
90
5.2%
0
N/A
English to Speakers of Other Languages (ESOL) (Grades K-12)
0
0.0%
Remedial Education (Grades 2-5, 9-12)
192 11.0%
Title I (Grades K-12)
This school has no Title I program.
Dropout Rate for Grades 9-12
Number
Rate
School System
146
7.7%
784
7.8%
Total 333
Retained Students, by Race/Ethnicity and Sex
Black
White Hispanic
American MultiAsian Indian racial
297 89.2%
29 8.7%
5 1.5%
0 0.0%
0 0.0%
2 0.6%
Male Female 193 140
58.0% 42.0%
Prepared by Georgia Department of Education
Page 1
STATE-REQUIRED TEST DATA
GEORGIA HIGH SCHOOL GRADUATION TESTS (GHSGT)
Percent of Regular Program 11th Graders Passing the Georgia High School Graduation Tests on First Administration
English Language Arts Mathematics Social Studies Science
All Components listed above
Writing
1998-99
School System State
91% 62% 48% 34%
93% 75% 69% 55%
96% 88% 80% 72%
28% 51% 68%
77% 87% 93%
1997-98
School System State
87% 72% 57% 46%
89% 79% 64% 55%
94% 88% 78% 74%
38% 49% 68%
82% 87% 92%
1996-97
School System State
92% 73% 59% 54%
91% 77% 65% 58%
94% 87% 78% 74%
44% 52% 67%
87% 90% 93%
GRADUATE DATA
1999 Graduates by Credentials, Race/Ethnicity and Sex
Diplomas with Both College Prep. & Voc. Endorsements
Diplomas with College Prep. Endorsements Diplomas with Vocational Endorsements General High School Diplomas Special Education Diplomas
Total All Diplomas
Certificates of Performance
Total Graduates
Total 18
154 34 9 1
216 86
302
Black
15 83.3%
133 86.4%
31 91.2%
8 88.9%
1 100.0%
188 87.0%
82 95.3%
270 89.4%
White Hispanic
3 16.7%
16 10.4%
0 0.0%
2 1.3%
3 8.8%
0 0.0%
0 0.0%
0 0.0%
0 0.0%
0 0.0%
22 10.2%
2 0.9%
3 3.5%
1 1.2%
25 8.3%
3 1.0%
American MultiAsian Indian racial
0 0.0%
3 1.9%
0 0.0%
0 0.0%
0 0.0%
0 0.0%
0 0.0%
0 0.0%
0 0.0%
0 0.0%
0 0.0%
0 0.0%
0 0.0%
1 11.1%
0 0.0%
3 1.4%
0 0.0%
1 0.5%
0 0.0%
0 0.0%
0 0.0%
3 1.0%
0 0.0%
1 0.3%
Male Female
8 44.4%
70 45.5%
10 55.6%
84 54.5%
20 58.8%
4 44.4%
0 0.0%
14 41.2%
5 55.6%
1 100.0%
102
114
47.2% 52.8%
26
60
30.2% 69.8%
128
174
42.4% 57.6%
HOPE Scholarships
School System
Number of 1999 Graduates 3 0 2
Number Eligible
150
Percent Eligible
49.7%
1,436 749
52.2%
State
65,548 40,292 61.5%
High School Completion Rate
Percent of 1995Grade 9 Enrollment in Graduating Class of1999 School System State
Completion Rate '95-'99 71.2% 62.1% 68.9%
1998-99 GEORGIA PUBLIC EDUCATION REPORT CARD
Beach High School - 6252052
Prepared by Georgia Department of Education
Page 2
COLLEGE ADMISSIONS / CREDIT TEST DATA
Scholastic Assessment Test (SAT)
Based on students' highest verbal and highest math scores
No. Taking
Average Score
Tests Verbal Math Total
Based on students' last test administration
Average Score Verbal Math Total
School
131
College Prep. Endorsement
Other Diplomas
System
578
College Prep. Endorsement
Other Diplomas
Georgia
41,958
433 413 N/A
489 483 419
492
414 403 N/A
473 469 379
488
847 816 N/A
962 952 798
980
420 N/A N/A
480 N/A N/A
483
405 N/A N/A
464 N/A N/A
479
825 N/A N/A
944 N/A N/A
962
Nation
952,913 N/A N/A N/A
502 508 1010
American College Testing (ACT)
Advanced Placement Exams (AP)
Number taking tests: English Mathematics Reading Science Reasoning CompositeScore
2 9 School System State
14.4 16.0 19.1
15.8 17.1 19.9
15.1 16.9
17.5 17.7
20.2 19.9
15.8 17.2 19.9
No. of Students Taking Tests
No. of Tests Taken No. of Test Scores
3 or Higher Percent of Test
Scores 3 or Higher
School 12 13 4
30.8%
System State 291 15,225 509 23,969 254 13,024
49.9% 54.3%
POST-SECONDARY DATA
Graduates Entering Georgia Public Colleges
Graduates Entering Georgia Public Colleges and Requiring Learning Support (LS)
1998 Graduates Entering in 1998-99
1997 Graduates Entering in 1997-98
Percent of Graduating Number Class
School
72
26.1%
System 470
30.4%
School
101
32.4%
System 565
37.0%
Number Requiring
LS 26 159
47 232
Percent of those attending Georgia
Public Colleges
36.1%
33.8%
46.5%
41.1%
In previous years, the Report Card presented College Prep Curriculum information provided by the Board of Regents on students requiring Learning Support. Due to inconsistencies in the data provided by the Board of Regents in defining College Prep Completers versus Local Board of Education data defining College Prep Endorsements, the Department of Education Report Card will not provide this information until discrepancies can be reconciled.
Graduates Entering Georgia Public Technical and Adult Schools
1998 Graduates School System
Entering Number 11 78
1998-99 Percent
4.0% 5.0%
Entering Number N/A N/A
1997-98 Percent
N/A N/A
1997 Graduates School
3
1.0%
System
15
1.0%
14
4.5%
89
5.8%
1998-99 GEORGIA PUBLIC EDUCATION REPORT CARD Beach High School - 6252052
Prepared by Georgia Department of Education
Page 3
CERTIFIED PERSONNEL DATA
Positions Number Average Contract Days
Administrators
3.00 203.00
Support Personnel
6.00 190.00
PK-12 Teachers
79.05 190.00
Personnel Sex
Certificate
Years Experience
Full-time Part-time
Male Female
4 Yr Bachelor's 5 Yr Master's 6 Yr Specialist's 7 Yr Doctoral Other*
<1 1-10 11-20 21-30 >30
Average
3 0
1 2
0 0 2 1 0
0 1 0 2 0
21.00
6 0
1 5
0 6 0 0 0
1 1 0 4 0
18.33
79 1
20 60
46 26
7 1 0
3 28 19 26
4
15.61
*Includes One- and Two-Year Vocational Certificates.
ACCREDITATION DATA
Accredited by Southern Association of Colleges and Schools (SACS): Secondary/Middle Commission.
AWARDS / RECOGNITION DATA
Schools in Georgia may receive recognition in the following programs: Charter School Pay for Performance Program Georgia School of Excellence National Blue Ribbon School Beach High School did not receive recognition in any of these programs during the 1998-99 school year.
1998-99 GEORGIA PUBLIC EDUCATION REPORT CARD Beach High School - 6252052
Prepared by Georgia Department of Education
Page 4
1998-99 GEORGIA PUBLIC EDUCATION REPORT CARD
CHATHAM COUNTY SCHOOLS
Bloomingdale Elementary School - 6254052
Grade Range K-5
The Georgia Public Education Report Card is designed to assist systems and schools in educational improvement. This report card contains a variety of data elements. An explanation of the terms is provided as a companion to the report card data. Please refer to the definitions for the most effective use of the reported data.
STUDENT DATA
Total 497
K-5 Enrollment, by Race/Ethnicity and Sex
Black
White Hispanic
American Multi-
Asian Indian
racial
143 28.8%
336 67.6%
8 1.6%
0 0.0%
1 0.2%
9 1.8%
Male Female
234 47.1%
263 52.9%
Enrollment in Selected Programs
Program
Program % of Student Enrollment Population
Gifted (Grades K-12)
35
7.0%
Alternative Programs (Grades 6-12)
N/A
N/A
Students Eligible to Receive Free/Reduced Lunches
Number
Percent
School System
229 19,220
46.1% 52.3%
Dropout Rate *
Number
Rate
School System
N/A N/A
N/A N/A
* Dropout rates are not applicable for grades PK-5.
Enrollment in Compensatory Programs
Program
Program % of Student Enrollment Population
Special Education (Grades K-12)
41
8.2%
(PK)
0
N/A
English to Speakers of Other Languages (ESOL) (Grades K-12)
0
0.0%
Remedial Education (Grades 2-5, 9-12)
77 22.5%
Special Instructional Assistance (SIA) (Grades K-3)
89 26.5%
Title I (Grades K-12)
This school has no Title I program.
Total 13
Retained Students, by Race/Ethnicity and Sex
Black
White Hispanic
American Multi-
Asian Indian
racial
4 30.8%
9 69.2%
0 0.0%
0 0.0%
0 0.0%
0 0.0%
Male Female
7
6
53.8% 46.2%
Prepared by Georgia Department of Education
Page 1
STATE-REQUIRED TEST DATA
NORM-REFERENCED TESTS Grade 3
Iowa Tests of Basic Skills (ITBS) Each chart reflects data for three years of testing.
Reading Comprehension 50
56 47 54 0
98-99
56 44 53 97-98
57 43 52 96-97
Mathematics
School 50
System
State
0
62 56 61 98-99
62 54 61 97-98
60 51 59 96-97
School System State
Reading Vocabulary 50
51 43 50 0
98-99
63 44 50 97-98
52 42 49 96-97
Language Arts
School 50
System
State
0
65 57 64 98-99
63 56 62 97-98
56 50 59 96-97
School System State
Social Studies 50
52 47 56 0
98-99
57 49 55 97-98
59 46 55 96-97
Science
School 50
System
State
0
53 50 59 98-99
59 51 59 97-98
62 49 58 96-97
School System State
Sources of Information
Composite Score
50
58 52 57 0
98-99
School 50
System
58 49 56 97-98
59 47 55 96-97
State 0
56 50 58 98-99
59 49 57 97-98
1998-99 GEORGIA PUBLIC EDUCATION REPORT CARD Bloomingdale Elementary School - 6254052
Prepared by Georgia Department of Education
58 47 56 96-97
Scores Reported in Percentiles
School System State
Page 2
STATE-REQUIRED TEST DATA
NORM-REFERENCED TESTS Grade 5
Iowa Tests of Basic Skills (ITBS) Each chart reflects data for three years of testing.
Reading Comprehension
Mathematics
50
56 47 53 0
98-99
55 47 53 97-98
56 44 52 96-97
School 50
System
State
0
68 51 59 98-99
63 53 58 97-98
62 49 57 96-97
School System State
Reading Vocabulary 50
54 39 48 0
98-99
68 44 48 97-98
53 38 46 96-97
Language Arts
School 50
System
State
0
59 58 63 98-99
66 57 61 97-98
57 49 58 96-97
School System State
Social Studies 50
60 49 57 0
98-99
62 49 56 97-98
62 45 55 96-97
Science
School 50
System
State
0
64 55 60 98-99
63 54 59 97-98
61 51 59 96-97
School System State
Sources of Information
Composite Score
50
63 55 58 0
98-99
School 50
System
60 54 58 97-98
61 50 57 96-97
State 0
61 51 57 98-99
62 51 56 97-98
59 46 55 96-97
1998-99 GEORGIA PUBLIC EDUCATION REPORT CARD Bloomingdale Elementary School - 6254052
Prepared by Georgia Department of Education
Scores Reported in Percentiles
School System State
Page 3
STATE-REQUIRED TEST DATA
PERFORMANCE ASSESSMENTS
Grade 5 Writing Assessment
Percent at Developmental Stages:
1998-99 School System State
1997-98 School System State
1996-97 School System State
Stage Stage Stage Stage Stage Stage
1:The Emerging Writer 2:The Developing Writer 3:The Focusing Writer 4:The Experimenting 5:The Engaging Writer 6:The Extending Writer
0% 0% 6% 37% 46% 11%
0% 1% 22% 46% 23% 7%
0% 1% 16% 41% 29% 12%
0% 3% 11% 34% 43% 9%
0% 3% 24% 43% 22% 7%
0% 3% 19% 41% 27% 10%
0% 0% 14% 39% 36% 11%
0% 4% 26% 39% 22% 8%
0% 3% 21% 37% 26% 12%
AWARDS / RECOGNITION DATA
Schools in Georgia may receive recognition in the following programs: Charter School Pay for Performance Program Georgia School of Excellence National Blue Ribbon School Bloomingdale Elementary School did not receive recognition in any of these programs during the 1998-99 school year.
1998-99 GEORGIA PUBLIC EDUCATION REPORT CARD Bloomingdale Elementary School - 6254052
Prepared by Georgia Department of Education
Page 4
CERTIFIED PERSONNEL DATA
Positions Number Average Contract Days
Personnel Sex
Certificate
Years Experience
Full-time Part-time
Male Female
4 Yr Bachelor's 5 Yr Master's 6 Yr Specialist's 7 Yr Doctoral Other*
<1 1-10 11-20 21-30 >30
Average
Administrators
2.00 204.50
2 0
1 1
0 1 1 0 0 0 0 1 1 0 25.00
Support Personnel
2.70 190.00
2 1
0 3
1 1 1 0 0 0 1 2 0 0 12.67
PK-12 Teachers
30.05 190.00
28 4
3 29
16 16
0 0 0 1 9 16 6 0 13.38
*Includes One- and Two-Year Vocational Certificates.
ACCREDITATION DATA
Accredited by Southern Association of Colleges and Schools (SACS):
Elementary/Middle Commission.
1998-99 GEORGIA PUBLIC EDUCATION REPORT CARD Bloomingdale Elementary School - 6254052
Prepared by Georgia Department of Education
Page 5
1998-99 GEORGIA PUBLIC EDUCATION REPORT CARD
CHATHAM COUNTY SCHOOLS
Butler Elementary School - 6255052
Grade Range PK-5
The Georgia Public Education Report Card is designed to assist systems and schools in educational improvement. This report card contains a variety of data elements. An explanation of the terms is provided as a companion to the report card data. Please refer to the definitions for the most effective use of the reported data.
STUDENT DATA
Total
K-5
615
PK
47
Enrollment, by Race/Ethnicity and Sex
Black
White Hispanic
American Asian Indian
Multiracial
534 86.8%
63 10.2%
2 0.3%
0 0.0%
1 0.2%
15 2.4%
43 91.5%
4 8.5%
0 0.0%
0 0.0%
0 0.0%
0 0.0%
Male Female
306 49.8%
309 50.2%
25 53.2%
22 46.8%
Enrollment in Selected Programs
Program
Program % of Student Enrollment Population
Gifted (Grades K-12)
31
5.0%
Alternative Programs (Grades 6-12)
N/A
N/A
Students Eligible to Receive Free/Reduced Lunches
Number
Percent
School System
468 19,220
70.7% 52.3%
Dropout Rate *
Number
Rate
School System
N/A N/A
N/A N/A
* Dropout rates are not applicable for grades PK-5.
Enrollment in Compensatory Programs
Program
Program % of Student Enrollment Population
Special Education (Grades K-12)
87 14.1%
(PK)
9
N/A
English to Speakers of Other Languages (ESOL) (Grades K-12)
0
0.0%
Remedial Education (Grades 2-5, 9-12)
100 23.9%
Special Instructional Assistance (SIA) (Grades K-3)
76 18.0%
Title I (Grades K-12)
This school has a schoolwide program.
Total 17
Retained Students, by Race/Ethnicity and Sex
Black
White Hispanic
American MultiAsian Indian racial
15 88.2%
1 5.9%
0 0.0%
0 0.0%
0 0.0%
1 5.9%
Male Female
8
9
47.1% 52.9%
Prepared by Georgia Department of Education
Page 1
STATE-REQUIRED TEST DATA
NORM-REFERENCED TESTS Grade 3
Iowa Tests of Basic Skills (ITBS) Each chart reflects data for three years of testing.
Reading Comprehension 50
42 47 54 0
98-99
27 44 53 97-98
29 43 52 96-97
Mathematics
School 50
System
State
0
47 56 61 98-99
37 54 61 97-98
32 51 59 96-97
School System State
Reading Vocabulary 50
34 43 50 0
98-99
30 44 50 97-98
24 42 49 96-97
Language Arts
School 50
System
State
0
65 57 64 98-99
54 56 62 97-98
35 50 59 96-97
School System State
Social Studies 50
42 47 56 0
98-99
36 49 55 97-98
29 46 55 96-97
Science
School 50
System
State
0
45 50 59 98-99
36 51 59 97-98
36 49 58 96-97
School System State
Sources of Information
Composite Score
50
46 52 57 0
98-99
School 50
System
35 49 56 97-98
34 47 55 96-97
State 0
46 50 58 98-99
36 49 57 97-98
1998-99 GEORGIA PUBLIC EDUCATION REPORT CARD Butler Elementary School - 6255052
Prepared by Georgia Department of Education
31 47 56 96-97
Scores Reported in Percentiles
School System State
Page 2
STATE-REQUIRED TEST DATA
NORM-REFERENCED TESTS Grade 5
Iowa Tests of Basic Skills (ITBS) Each chart reflects data for three years of testing.
Reading Comprehension
Mathematics
50
35 47 53 0
98-99
34 47 53 97-98
31 44 52 96-97
School 50
System
State
0
32 51 59 98-99
37 53 58 97-98
35 49 57 96-97
School System State
Reading Vocabulary 50
52 39 48 0
98-99
57 44 48 97-98
20 38 46 96-97
Language Arts
School 50
System
State
0
45 58 63 98-99
43 57 61 97-98
41 49 58 96-97
School System State
Social Studies 50
48 49 57 0
98-99
59 49 56 97-98
39 45 55 96-97
Science
School 50
System
State
0
56 55 60 98-99
52 54 59 97-98
38 51 59 96-97
School System State
Sources of Information
Composite Score
50
48 55 58 0
98-99
School 50
System
39 54 58 97-98
38 50 57 96-97
State 0
45 51 57 98-99
44 51 56 97-98
34 46 55 96-97
1998-99 GEORGIA PUBLIC EDUCATION REPORT CARD Butler Elementary School - 6255052
Prepared by Georgia Department of Education
Scores Reported in Percentiles
School System State
Page 3
STATE-REQUIRED TEST DATA
PERFORMANCE ASSESSMENTS
Grade 5 Writing Assessment
Percent at Developmental Stages:
1998-99 School System State
1997-98 School System State
1996-97 School System State
Stage Stage Stage Stage Stage Stage
1:The Emerging Writer 2:The Developing Writer 3:The Focusing Writer 4:The Experimenting 5:The Engaging Writer 6:The Extending Writer
0% 0% 15% 46% 34% 4%
0% 1% 22% 46% 23% 7%
0% 1% 16% 41% 29% 12%
0% 1% 19% 51% 24% 5%
0% 3% 24% 43% 22% 7%
0% 3% 19% 41% 27% 10%
0% 8% 22% 55% 10% 5%
0% 4% 26% 39% 22% 8%
0% 3% 21% 37% 26% 12%
AWARDS / RECOGNITION DATA
Schools in Georgia may receive recognition in the following programs: Charter School Pay for Performance Program Georgia School of Excellence National Blue Ribbon School Butler Elementary School did not receive recognition in any of these programs during the 1998-99 school year.
1998-99 GEORGIA PUBLIC EDUCATION REPORT CARD Butler Elementary School - 6255052
Prepared by Georgia Department of Education
Page 4
CERTIFIED PERSONNEL DATA
Positions Number Average Contract Days
Personnel Sex
Certificate
Years Experience
Full-time Part-time
Male Female
4 Yr Bachelor's 5 Yr Master's 6 Yr Specialist's 7 Yr Doctoral Other*
<1 1-10 11-20 21-30 >30
Average
Administrators
1.00 200.00
1 0
0 1
0 0 1 0 0 0 0 0 1 0 27.00
Support Personnel
2.00 190.00
2 0
0 2
0 2 0 0 0 0 0 1 1 0 19.50
PK-12 Teachers
50.50 190.00
48 5
1 52
30 21
2 0 0 2 26 13 10 2 12.43
*Includes One- and Two-Year Vocational Certificates.
ACCREDITATION DATA
Accredited by Southern Association of Colleges and Schools (SACS):
Elementary/Middle Commission.
1998-99 GEORGIA PUBLIC EDUCATION REPORT CARD Butler Elementary School - 6255052
Prepared by Georgia Department of Education
Page 5
1998-99 GEORGIA PUBLIC EDUCATION REPORT CARD
CHATHAM COUNTY SCHOOLS
Coastal Middle School - 6250198
Grade Range 6-8
The Georgia Public Education Report Card is designed to assist systems and schools in educational improvement. This report card contains a variety of data elements. An explanation of the terms is provided as a companion to the report card data. Please refer to the definitions for the most effective use of the reported data.
STUDENT DATA
Total 1,006
6-8 Enrollment, by Race/Ethnicity and Sex
Black
White Hispanic
American Multi-
Asian Indian
racial
435 43.2%
537 53.4%
4 0.4%
19 1.9%
3 0.3%
8 0.8%
Male 496
49.3%
Female 510
50.7%
Enrollment in Selected Programs
Program
Gifted (Grades K-12)
Program % of Student Enrollment Population
128
12.7%
Alternative Programs
14
(Grades 6-12)
1.4%
Students Eligible to Receive Free/Reduced Lunches
Number
Percent
School System
366 19,220
36.4% 52.3%
Enrollment in Compensatory Programs
Program
Program % of Student Enrollment Population
Special Education (Grades K-12) (PK)
116 11.5%
0
N/A
English to Speakers of Other Languages (ESOL) (Grades K-12)
0
0.0%
Title I (Grades K-12)
This school has no Title I program.
Dropout Rate for Grades 6-8
Number
Rate
School System
4
0.4%
68
0.8%
Total 68
Retained Students, by Race/Ethnicity and Sex
Black
White Hispanic
American MultiAsian Indian racial
31 45.6%
35 51.5%
0 0.0%
0 0.0%
0 0.0%
2 2.9%
Male Female
39
29
57.4% 42.6%
Prepared by Georgia Department of Education
Page 1
STATE-REQUIRED TEST DATA
NORM-REFERENCED TESTS Grade 8
Iowa Tests of Basic Skills (ITBS) Each chart reflects data for three years of testing.
Reading Comprehension 50
44 34 49 0
98-99
45 35 48 N/A 34 48
97-98
96-97
Mathematics
School 50
System
State
0
47 40 56 98-99
50 43 55 N/A 41 54
97-98
96-97
School System State
Reading Vocabulary 50
44 30 46 0
98-99
43 31 45 N/A 31 44
97-98
96-97
Language Arts
School 50
System
State
0
59 48 60 98-99
57 48 58 N/A 44 56
97-98
96-97
School System State
Social Studies 50
52 41 54 0
98-99
52 43 53 N/A 40 53
97-98
96-97
Science
School 50
System
State
0
55 38 56 98-99
50 38 55 N/A 38 53
97-98
96-97
School System State
Sources of Information
Composite Score
50
54 47 57 0
98-99
School 50
System
54 48 56 N/A 47 55
97-98
96-97
State 0
52 40 56 98-99
54 42 54 N/A 40 54
97-98
96-97
1998-99 GEORGIA PUBLIC EDUCATION REPORT CARD Coastal Middle School - 6250198
Prepared by Georgia Department of Education
Scores Reported in Percentiles
School System State
Page 2
STATE-REQUIRED TEST DATA
Categories of Scaled Scores
Inadequate (less than 162)
Minimal (162-209)
Good
(210-247)
Very Good (greater than 247)
Average Scaled Score: (Range 100-300)
PERFORMANCE ASSESSMENTS
Grade 8 Writing Assessment
1998-99 Percent Scoring
1997-98 Percent Scoring
1996-97 Percent Scoring
School System State School System State School System State
11% 47% 40%
2%
14% 51% 31%
4%
8% 40% 41% 11%
15% 47% 33%
5%
17% 53% 25%
4%
11% 46% 34%
8%
N/A N/A N/A N/A
23% 50% 23%
5%
15% 46% 30%
8%
200
196
208 197
192 202 N/A
189 198
AWARDS / RECOGNITION DATA
Schools in Georgia may receive recognition in the following programs: Charter School Pay for Performance Program Georgia School of Excellence National Blue Ribbon School Coastal Middle School did not receive recognition in any of these programs during the 1998-99 school year.
1998-99 GEORGIA PUBLIC EDUCATION REPORT CARD Coastal Middle School - 6250198
Prepared by Georgia Department of Education
Page 3
CERTIFIED PERSONNEL DATA
Positions Number Average Contract Days
Personnel Sex
Certificate
Years Experience
Full-time Part-time
Male Female
4 Yr Bachelor's 5 Yr Master's 6 Yr Specialist's 7 Yr Doctoral Other*
<1 1-10 11-20 21-30 >30
Average
Administrators
2.00 209.50
2 0
1 1
0 1 1 0 0 0 0 0 2 0 24.00
Support Personnel
2.00 190.00
2 0
0 2
0 2 0 0 0 0 0 0 2 0 26.00
PK-12 Teachers
49.80 190.00
49 1
12 38
33 15
2 0 0 0 23 16 9 2 13.58
*Includes One- and Two-Year Vocational Certificates.
ACCREDITATION DATA
Accredited by Southern Association of Colleges and Schools (SACS):
Elementary/Middle Commission.
1998-99 GEORGIA PUBLIC EDUCATION REPORT CARD Coastal Middle School - 6250198
Prepared by Georgia Department of Education
Page 4
1998-99 GEORGIA PUBLIC EDUCATION REPORT CARD
CHATHAM COUNTY SCHOOLS
DeRenne Middle School - 6253054
Grade Range 6-8
The Georgia Public Education Report Card is designed to assist systems and schools in educational improvement. This report card contains a variety of data elements. An explanation of the terms is provided as a companion to the report card data. Please refer to the definitions for the most effective use of the reported data.
STUDENT DATA
Total 802
6-8 Enrollment, by Race/Ethnicity and Sex
Black
White Hispanic
American Multi-
Asian Indian
racial
666 83.0%
99 12.3%
9 1.1%
17 2.1%
2 0.2%
9 1.1%
Male 383
47.8%
Female 419
52.2%
Enrollment in Selected Programs
Program
Gifted (Grades K-12)
Program % of Student Enrollment Population
128
16.0%
Alternative Programs
21
(Grades 6-12)
2.6%
Students Eligible to Receive Free/Reduced Lunches
Number
Percent
School System
493 19,220
61.5% 52.3%
Enrollment in Compensatory Programs
Program
Program % of Student Enrollment Population
Special Education (Grades K-12) (PK)
84 10.5%
0
N/A
English to Speakers of Other Languages (ESOL) (Grades K-12)
0
0.0%
Title I (Grades K-12)
This school has a Targeted Assistance program.
Dropout Rate for Grades 6-8
Number
Rate
School System
8
0.9%
68
0.8%
Total 46
Retained Students, by Race/Ethnicity and Sex
Black
White Hispanic
American MultiAsian Indian racial
45 97.8%
1 2.2%
0 0.0%
0 0.0%
0 0.0%
0 0.0%
Male Female
31
15
67.4% 32.6%
Prepared by Georgia Department of Education
Page 1
STATE-REQUIRED TEST DATA
NORM-REFERENCED TESTS Grade 8
Iowa Tests of Basic Skills (ITBS) Each chart reflects data for three years of testing.
Reading Comprehension 50
45 34 49 0
98-99
38 35 48 97-98
42 34 48 96-97
Mathematics
School 50
System
State
0
55 40 56 98-99
48 43 55 97-98
46 41 54 96-97
School System State
Reading Vocabulary 50
42 30 46 0
98-99
33 31 45 97-98
41 31 44 96-97
Language Arts
School 50
System
State
0
64 48 60 98-99
53 48 58 97-98
57 44 56 96-97
School System State
Social Studies 50
53 41 54 0
98-99
45 43 53 97-98
48 40 53 96-97
Science
School 50
System
State
0
46 38 56 98-99
38 38 55 97-98
48 38 53 96-97
School System State
Sources of Information
Composite Score
50
55 47 57 0
98-99
School 50
System
53 48 56 97-98
56 47 55 96-97
State 0
52 40 56 98-99
46 42 54 97-98
1998-99 GEORGIA PUBLIC EDUCATION REPORT CARD DeRenne Middle School - 6253054
Prepared by Georgia Department of Education
51 40 54 96-97
Scores Reported in Percentiles
School System State
Page 2
STATE-REQUIRED TEST DATA
Categories of Scaled Scores
Inadequate (less than 162)
Minimal (162-209)
Good
(210-247)
Very Good (greater than 247)
Average Scaled Score: (Range 100-300)
PERFORMANCE ASSESSMENTS
Grade 8 Writing Assessment
1998-99 Percent Scoring
1997-98 Percent Scoring
1996-97 Percent Scoring
School System State School System State School System State
10% 44% 31% 15%
14% 51% 31%
4%
8% 40% 41% 11%
14% 50% 27%
8%
17% 53% 25%
4%
11% 46% 34%
8%
18% 45% 27% 11%
23% 50% 23%
5%
15% 46% 30%
8%
205
196
208 196
192 202 199
189 198
AWARDS / RECOGNITION DATA
Schools in Georgia may receive recognition in the following programs: Charter School Pay for Performance Program Georgia School of Excellence National Blue Ribbon School DeRenne Middle School did not receive recognition in any of these programs during the 1998-99 school year.
1998-99 GEORGIA PUBLIC EDUCATION REPORT CARD DeRenne Middle School - 6253054
Prepared by Georgia Department of Education
Page 3
CERTIFIED PERSONNEL DATA
Positions Number Average Contract Days
Personnel Sex
Certificate
Years Experience
Full-time Part-time
Male Female
4 Yr Bachelor's 5 Yr Master's 6 Yr Specialist's 7 Yr Doctoral Other*
<1 1-10 11-20 21-30 >30
Average
Administrators
2.00 209.50
2 0
1 1
0 0 1 1 0 0 0 0 2 0 27.00
Support Personnel
2.00 190.00
2 0
0 2
0 0 2 0 0 0 0 0 2 0 25.00
PK-12 Teachers
50.00 186.26
50 0
13 37
27 23
0 0 0 3 26 10 11 0 11.86
*Includes One- and Two-Year Vocational Certificates.
ACCREDITATION DATA
Accredited by Southern Association of Colleges and Schools (SACS):
Elementary/Middle Commission.
1998-99 GEORGIA PUBLIC EDUCATION REPORT CARD DeRenne Middle School - 6253054
Prepared by Georgia Department of Education
Page 4
1998-99 GEORGIA PUBLIC EDUCATION REPORT CARD
CHATHAM COUNTY SCHOOLS
East Broad Street Elementary School - 6250191
Grade Range PK-5
The Georgia Public Education Report Card is designed to assist systems and schools in educational improvement. This report card contains a variety of data elements. An explanation of the terms is provided as a companion to the report card data. Please refer to the definitions for the most effective use of the reported data.
STUDENT DATA
Total
K-5
863
PK
20
Enrollment, by Race/Ethnicity and Sex
Black
White Hispanic
American Asian Indian
Multiracial
724 83.9%
128 14.8%
3 0.3%
0 0.0%
0 0.0%
8 0.9%
15 75.0%
5 25.0%
0 0.0%
0 0.0%
0 0.0%
0 0.0%
Male Female
457 53.0%
406 47.0%
10 50.0%
10 50.0%
Enrollment in Selected Programs
Program
Program % of Student Enrollment Population
Gifted (Grades K-12)
18
2.1%
Alternative Programs (Grades 6-12)
N/A
N/A
Students Eligible to Receive Free/Reduced Lunches
Number
Percent
School System
725 19,220
82.1% 52.3%
Dropout Rate *
Number
Rate
School System
N/A N/A
N/A N/A
* Dropout rates are not applicable for grades PK-5.
Enrollment in Compensatory Programs
Program
Program % of Student Enrollment Population
Special Education (Grades K-12)
118 13.7%
(PK)
1
N/A
English to Speakers of Other Languages (ESOL) (Grades K-12)
0
0.0%
Remedial Education (Grades 2-5, 9-12)
121 21.6%
Special Instructional Assistance (SIA) (Grades K-3)
209 35.4%
Title I (Grades K-12)
This school has a schoolwide program.
Total 43
Retained Students, by Race/Ethnicity and Sex
Black
White Hispanic
American MultiAsian Indian racial
40 93.0%
2 4.7%
0 0.0%
0 0.0%
0 0.0%
1 2.3%
Male Female
26
17
60.5% 39.5%
Prepared by Georgia Department of Education
Page 1
STATE-REQUIRED TEST DATA
NORM-REFERENCED TESTS Grade 3
Iowa Tests of Basic Skills (ITBS) Each chart reflects data for three years of testing.
Reading Comprehension 50
38 47 54 0
98-99
42 44 53 97-98
44 43 52 96-97
Mathematics
School 50
System
State
0
49 56 61 98-99
47 54 61 97-98
56 51 59 96-97
School System State
Reading Vocabulary 50
37 43 50 0
98-99
42 44 50 97-98
47 42 49 96-97
Language Arts
School 50
System
State
0
48 57 64 98-99
57 56 62 97-98
60 50 59 96-97
School System State
Social Studies 50
42 47 56 0
98-99
42 49 55 97-98
40 46 55 96-97
Science
School 50
System
State
0
43 50 59 98-99
44 51 59 97-98
45 49 58 96-97
School System State
Sources of Information
Composite Score
50
43 52 57 0
98-99
School 50
System
43 49 56 97-98
46 47 55 96-97
State 0
42 50 58 98-99
44 49 57 97-98
1998-99 GEORGIA PUBLIC EDUCATION REPORT CARD East Broad Street Elementary School - 6250191
Prepared by Georgia Department of Education
47 47 56 96-97
Scores Reported in Percentiles
School System State
Page 2
STATE-REQUIRED TEST DATA
NORM-REFERENCED TESTS Grade 5
Iowa Tests of Basic Skills (ITBS) Each chart reflects data for three years of testing.
Reading Comprehension
Mathematics
50
36 47 53 0
98-99
41 47 53 97-98
36 44 52 96-97
School 50
System
State
0
42 51 59 98-99
47 53 58 97-98
39 49 57 96-97
School System State
Reading Vocabulary 50
24 39 48 0
98-99
38 44 48 97-98
36 38 46 96-97
Language Arts
School 50
System
State
0
41 58 63 98-99
51 57 61 97-98
45 49 58 96-97
School System State
Social Studies 50
33 49 57 0
98-99
30 49 56 97-98
34 45 55 96-97
Science
School 50
System
State
0
38 55 60 98-99
39 54 59 97-98
39 51 59 96-97
School System State
Sources of Information
Composite Score
50
46 55 58 0
98-99
School 50
System
40 54 58 97-98
39 50 57 96-97
State 0
37 51 57 98-99
39 51 56 97-98
37 46 55 96-97
1998-99 GEORGIA PUBLIC EDUCATION REPORT CARD East Broad Street Elementary School - 6250191
Prepared by Georgia Department of Education
Scores Reported in Percentiles
School System State
Page 3
STATE-REQUIRED TEST DATA
PERFORMANCE ASSESSMENTS
Grade 5 Writing Assessment
Percent at Developmental Stages:
1998-99 School System State
1997-98 School System State
1996-97 School System State
Stage Stage Stage Stage Stage Stage
1:The Emerging Writer 2:The Developing Writer 3:The Focusing Writer 4:The Experimenting 5:The Engaging Writer 6:The Extending Writer
0% 5% 37% 40% 16% 2%
0% 1% 22% 46% 23% 7%
0% 1% 16% 41% 29% 12%
0% 5% 19% 53% 19% 3%
0% 3% 24% 43% 22% 7%
0% 3% 19% 41% 27% 10%
0% 0% 37% 48% 11% 4%
0% 4% 26% 39% 22% 8%
0% 3% 21% 37% 26% 12%
AWARDS / RECOGNITION DATA
Schools in Georgia may receive recognition in the following programs: Charter School Pay for Performance Program Georgia School of Excellence National Blue Ribbon School East Broad Street Elementary School did not receive recognition in any of these programs during the 1998-99 school year.
1998-99 GEORGIA PUBLIC EDUCATION REPORT CARD East Broad Street Elementary School - 6250191
Prepared by Georgia Department of Education
Page 4
CERTIFIED PERSONNEL DATA
Positions Number Average Contract Days
Personnel Sex
Certificate
Years Experience
Full-time Part-time
Male Female
4 Yr Bachelor's 5 Yr Master's 6 Yr Specialist's 7 Yr Doctoral Other*
<1 1-10 11-20 21-30 >30
Average
Administrators
2.00 204.50
2 0
0 2
0 0 1 1 0 0 0 0 2 0 25.50
Support Personnel
3.50 190.00
3 1
1 3
0 4 0 0 0 0 1 1 2 0 17.75
PK-12 Teachers
61.05 190.00
59 6
4 61
42 19
4 0 0 8 35 13 9 0 9.37
*Includes One- and Two-Year Vocational Certificates.
ACCREDITATION DATA
Accredited by Southern Association of Colleges and Schools (SACS):
Elementary/Middle Commission.
1998-99 GEORGIA PUBLIC EDUCATION REPORT CARD East Broad Street Elementary School - 6250191
Prepared by Georgia Department of Education
Page 5
1998-99 GEORGIA PUBLIC EDUCATION REPORT CARD
CHATHAM COUNTY SCHOOLS
Ellis Elementary School - 6254054
Grade Range PK-6
The Georgia Public Education Report Card is designed to assist systems and schools in educational improvement. This report card contains a variety of data elements. An explanation of the terms is provided as a companion to the report card data. Please refer to the definitions for the most effective use of the reported data.
STUDENT DATA
Total
K-6
390
PK
40
Enrollment, by Race/Ethnicity and Sex
Black
White Hispanic
American Asian Indian
Multiracial
220 56.4%
162 41.5%
4 1.0%
1 0.3%
1 0.3%
2 0.5%
21 52.5%
18 45.0%
1 2.5%
0 0.0%
0 0.0%
0 0.0%
Male Female
183 46.9%
207 53.1%
23 57.5%
17 42.5%
Enrollment in Selected Programs
Program
Program % of Student Enrollment Population
Gifted (Grades K-12)
28
7.2%
Alternative Programs (Grades 6-12)
0
0.0%
Students Eligible to Receive Free/Reduced Lunches
Number
Percent
School System
207 19,220
48.1% 52.3%
Dropout Rate for Grade 6
Number
Rate
School System
0
0.0%
14
0.4%
Enrollment in Compensatory Programs
Program
Program % of Student Enrollment Population
Special Education (Grades K-12)
40 10.3%
(PK)
0
N/A
English to Speakers of Other Languages (ESOL) (Grades K-12)
0
0.0%
Remedial Education (Grades 2-5, 9-12)
0
0.0%
Special Instructional Assistance (SIA) (Grades K-3)
139 49.1%
Title I (Grades K-12)
This school has a Targeted Assistance program.
Total 5
Retained Students, by Race/Ethnicity and Sex
Black
White Hispanic
American MultiAsian Indian racial
5 100.0%
0 0.0%
0 0.0%
0 0.0%
0 0.0%
0 0.0%
Male Female
2
3
40.0% 60.0%
Prepared by Georgia Department of Education
Page 1
STATE-REQUIRED TEST DATA
NORM-REFERENCED TESTS Grade 3
Iowa Tests of Basic Skills (ITBS) Each chart reflects data for three years of testing.
Reading Comprehension 50
52 47 54 0
98-99
37 44 53 97-98
36 43 52 96-97
Mathematics
School 50
System
State
0
45 56 61 98-99
47 54 61 97-98
31 51 59 96-97
School System State
Reading Vocabulary 50
50 43 50 0
98-99
34 44 50 97-98
34 42 49 96-97
Language Arts
School 50
System
State
0
44 57 64 98-99
40 56 62 97-98
24 50 59 96-97
School System State
Social Studies 50
46 47 56 0
98-99
43 49 55 97-98
36 46 55 96-97
Science
School 50
System
State
0
54 50 59 98-99
50 51 59 97-98
38 49 58 96-97
School System State
Sources of Information
Composite Score
50
51 52 57 0
98-99
School 50
System
40 49 56 97-98
38 47 55 96-97
State 0
48 50 58 98-99
41 49 57 97-98
1998-99 GEORGIA PUBLIC EDUCATION REPORT CARD Ellis Elementary School - 6254054
Prepared by Georgia Department of Education
31 47 56 96-97
Scores Reported in Percentiles
School System State
Page 2
STATE-REQUIRED TEST DATA
NORM-REFERENCED TESTS Grade 5
Iowa Tests of Basic Skills (ITBS) Each chart reflects data for three years of testing.
Reading Comprehension
Mathematics
50
46 47 53 0
98-99
37 47 53 97-98
33 44 52 96-97
School 50
System
State
0
35 51 59 98-99
35 53 58 97-98
28 49 57 96-97
School System State
Reading Vocabulary 50
37 39 48 0
98-99
29 44 48 97-98
25 38 46 96-97
Language Arts
School 50
System
State
0
44 58 63 98-99
37 57 61 97-98
24 49 58 96-97
School System State
Social Studies 50
49 49 57 0
98-99
40 49 56 97-98
30 45 55 96-97
Science
School 50
System
State
0
42 55 60 98-99
49 54 59 97-98
29 51 59 96-97
School System State
Sources of Information
Composite Score
50
51 55 58 0
98-99
School 50
System
50 54 58 97-98
39 50 57 96-97
State 0
43 51 57 98-99
39 51 56 97-98
29 46 55 96-97
1998-99 GEORGIA PUBLIC EDUCATION REPORT CARD Ellis Elementary School - 6254054
Prepared by Georgia Department of Education
Scores Reported in Percentiles
School System State
Page 3
STATE-REQUIRED TEST DATA
PERFORMANCE ASSESSMENTS
Grade 5 Writing Assessment
Percent at Developmental Stages:
1998-99 School System State
1997-98 School System State
1996-97 School System State
Stage Stage Stage Stage Stage Stage
1:The Emerging Writer 2:The Developing Writer 3:The Focusing Writer 4:The Experimenting 5:The Engaging Writer 6:The Extending Writer
2% 2% 37% 33% 21% 5%
0% 1% 22% 46% 23% 7%
0% 1% 16% 41% 29% 12%
0% 3% 41% 31% 17% 7%
0% 3% 24% 43% 22% 7%
0% 3% 19% 41% 27% 10%
0% 3% 36% 39% 12% 9%
0% 4% 26% 39% 22% 8%
0% 3% 21% 37% 26% 12%
AWARDS / RECOGNITION DATA
Schools that become a Charter School have a unique opportunity to rethink how they structure and deliver education programs for improving the learning of their students while being freed from the state laws, State Board of Education rules and regulations, and local board of education rules and regulations that govern other schools. A 'charter' is a binding contract that, when approved by the faculty and parents of the school, the local board of education and the State Board of Education, substitutes for state education statutes, state and local rules, policies, regulations and standards.
Ellis Elementary School is a Charter School for 1998-99.
1998-99 GEORGIA PUBLIC EDUCATION REPORT CARD Ellis Elementary School - 6254054
Prepared by Georgia Department of Education
Page 4
CERTIFIED PERSONNEL DATA
Positions Number Average Contract Days
Personnel Sex
Certificate
Years Experience
Full-time Part-time
Male Female
4 Yr Bachelor's 5 Yr Master's 6 Yr Specialist's 7 Yr Doctoral Other*
<1 1-10 11-20 21-30 >30
Average
Administrators
1.50 202.67
1 1
1 1
0 1 1 0 0 0 0 0 2 0 23.00
Support Personnel
2.00 190.00
2 0
0 2
0 1 1 0 0 0 0 2 0 0 15.50
PK-12 Teachers
23.80 190.00
21 6
2 25
16 10
1 0 0 1 11 10 5 0 12.96
*Includes One- and Two-Year Vocational Certificates.
ACCREDITATION DATA
Accredited by Southern Association of Colleges and Schools (SACS):
Elementary/Middle Commission.
1998-99 GEORGIA PUBLIC EDUCATION REPORT CARD Ellis Elementary School - 6254054
Prepared by Georgia Department of Education
Page 5
1998-99 GEORGIA PUBLIC EDUCATION REPORT CARD
CHATHAM COUNTY SCHOOLS
Gadsden Elementary School - 6251056
Grade Range PK-5
The Georgia Public Education Report Card is designed to assist systems and schools in educational improvement. This report card contains a variety of data elements. An explanation of the terms is provided as a companion to the report card data. Please refer to the definitions for the most effective use of the reported data.
STUDENT DATA
Total
K-5
540
PK
83
Enrollment, by Race/Ethnicity and Sex
Black
White Hispanic
American Asian Indian
Multiracial
441 81.7%
92 17.0%
1 0.2%
0 0.0%
0 0.0%
6 1.1%
78 94.0%
5 6.0%
0 0.0%
0 0.0%
0 0.0%
0 0.0%
Male Female
243 45.0%
297 55.0%
40 48.2%
43 51.8%
Enrollment in Selected Programs
Program
Program % of Student Enrollment Population
Gifted (Grades K-12)
32
5.9%
Alternative Programs (Grades 6-12)
N/A
N/A
Students Eligible to Receive Free/Reduced Lunches
Number
Percent
School System
498 19,220
79.9% 52.3%
Dropout Rate *
Number
Rate
School System
N/A N/A
N/A N/A
* Dropout rates are not applicable for grades PK-5.
Enrollment in Compensatory Programs
Program
Program % of Student Enrollment Population
Special Education (Grades K-12)
74 13.7%
(PK)
6
N/A
English to Speakers of Other Languages (ESOL) (Grades K-12)
0
0.0%
Remedial Education (Grades 2-5, 9-12)
57 16.4%
Special Instructional Assistance (SIA) (Grades K-3)
100 27.2%
Title I (Grades K-12)
This school has a schoolwide program.
Total 21
Retained Students, by Race/Ethnicity and Sex
Black
White Hispanic
American MultiAsian Indian racial
19 90.5%
2 9.5%
0 0.0%
0 0.0%
0 0.0%
0 0.0%
Male Female
11
10
52.4% 47.6%
Prepared by Georgia Department of Education
Page 1
STATE-REQUIRED TEST DATA
NORM-REFERENCED TESTS Grade 3
Iowa Tests of Basic Skills (ITBS) Each chart reflects data for three years of testing.
Reading Comprehension 50
29 47 54 0
98-99
31 44 53 97-98
36 43 52 96-97
Mathematics
School 50
System
State
0
43 56 61 98-99
40 54 61 97-98
45 51 59 96-97
School System State
Reading Vocabulary 50
30 43 50 0
98-99
35 44 50 97-98
42 42 49 96-97
Language Arts
School 50
System
State
0
39 57 64 98-99
37 56 62 97-98
37 50 59 96-97
School System State
Social Studies 50
29 47 56 0
98-99
26 49 55 97-98
43 46 55 96-97
Science
School 50
System
State
0
33 50 59 98-99
34 51 59 97-98
46 49 58 96-97
School System State
Sources of Information
Composite Score
50
32 52 57 0
98-99
School 50
System
30 49 56 97-98
32 47 55 96-97
State 0
32 50 58 98-99
30 49 57 97-98
1998-99 GEORGIA PUBLIC EDUCATION REPORT CARD Gadsden Elementary School - 6251056
Prepared by Georgia Department of Education
38 47 56 96-97
Scores Reported in Percentiles
School System State
Page 2
STATE-REQUIRED TEST DATA
NORM-REFERENCED TESTS Grade 5
Iowa Tests of Basic Skills (ITBS) Each chart reflects data for three years of testing.
Reading Comprehension
Mathematics
50
32 47 53 0
98-99
35 47 53 97-98
43 44 52 96-97
School 50
System
State
0
38 51 59 98-99
40 53 58 97-98
45 49 57 96-97
School System State
Reading Vocabulary 50
24 39 48 0
98-99
42 44 48 97-98
29 38 46 96-97
Language Arts
School 50
System
State
0
42 58 63 98-99
44 57 61 97-98
43 49 58 96-97
School System State
Social Studies 50
27 49 57 0
98-99
24 49 56 97-98
40 45 55 96-97
Science
School 50
System
State
0
37 55 60 98-99
32 54 59 97-98
46 51 59 96-97
School System State
Sources of Information
Composite Score
50
33 55 58 0
98-99
School 50
System
39 54 58 97-98
51 50 57 96-97
State 0
32 51 57 98-99
32 51 56 97-98
41 46 55 96-97
1998-99 GEORGIA PUBLIC EDUCATION REPORT CARD Gadsden Elementary School - 6251056
Prepared by Georgia Department of Education
Scores Reported in Percentiles
School System State
Page 3
STATE-REQUIRED TEST DATA
PERFORMANCE ASSESSMENTS
Grade 5 Writing Assessment
Percent at Developmental Stages:
1998-99 School System State
1997-98 School System State
1996-97 School System State
Stage Stage Stage Stage Stage Stage
1:The Emerging Writer 2:The Developing Writer 3:The Focusing Writer 4:The Experimenting 5:The Engaging Writer 6:The Extending Writer
0% 0% 35% 46% 17% 1%
0% 1% 22% 46% 23% 7%
0% 1% 16% 41% 29% 12%
0% 3% 30% 45% 17% 2%
0% 3% 24% 43% 22% 7%
0% 3% 19% 41% 27% 10%
1% 9% 25% 38% 23% 4%
0% 4% 26% 39% 22% 8%
0% 3% 21% 37% 26% 12%
AWARDS / RECOGNITION DATA
Schools in Georgia may receive recognition in the following programs: Charter School Pay for Performance Program Georgia School of Excellence National Blue Ribbon School Gadsden Elementary School did not receive recognition in any of these programs during the 1998-99 school year.
1998-99 GEORGIA PUBLIC EDUCATION REPORT CARD Gadsden Elementary School - 6251056
Prepared by Georgia Department of Education
Page 4
CERTIFIED PERSONNEL DATA
Positions Number Average Contract Days
Personnel Sex
Certificate
Years Experience
Full-time Part-time
Male Female
4 Yr Bachelor's 5 Yr Master's 6 Yr Specialist's 7 Yr Doctoral Other*
<1 1-10 11-20 21-30 >30
Average
Administrators
2.00 195.00
2 0
1 1
0 2 0 0 0 0 0 2 0 0 14.00
Support Personnel
2.00 190.00
2 0
0 2
0 2 0 0 0 0 0 0 1 1 28.00
PK-12 Teachers
51.80 190.56
49 6
4 51
40 14
0 1 0 2 27 19 7 0 11.11
*Includes One- and Two-Year Vocational Certificates.
ACCREDITATION DATA
Accredited by Southern Association of Colleges and Schools (SACS):
Elementary/Middle Commission.
1998-99 GEORGIA PUBLIC EDUCATION REPORT CARD Gadsden Elementary School - 6251056
Prepared by Georgia Department of Education
Page 5
1998-99 GEORGIA PUBLIC EDUCATION REPORT CARD
CHATHAM COUNTY SCHOOLS
Garden City Elementary School - 6250197
Grade Range PK-5
The Georgia Public Education Report Card is designed to assist systems and schools in educational improvement. This report card contains a variety of data elements. An explanation of the terms is provided as a companion to the report card data. Please refer to the definitions for the most effective use of the reported data.
STUDENT DATA
Total
K-5
777
PK
40
Enrollment, by Race/Ethnicity and Sex
Black
White Hispanic
American Asian Indian
Multiracial
530 68.2%
219 28.2%
18 2.3%
6 0.8%
2 0.3%
2 0.3%
11 27.5%
26 65.0%
3 7.5%
0 0.0%
0 0.0%
0 0.0%
Male Female
402 51.7%
375 48.3%
22 55.0%
18 45.0%
Enrollment in Selected Programs
Program
Program % of Student Enrollment Population
Gifted (Grades K-12)
17
2.2%
Alternative Programs (Grades 6-12)
N/A
N/A
Students Eligible to Receive Free/Reduced Lunches
Number
Percent
School System
591 19,220
72.3% 52.3%
Dropout Rate *
Number
Rate
School System
N/A N/A
N/A N/A
* Dropout rates are not applicable for grades PK-5.
Enrollment in Compensatory Programs
Program
Program % of Student Enrollment Population
Special Education (Grades K-12)
99 12.7%
(PK)
4
N/A
English to Speakers of Other Languages (ESOL) (Grades K-12)
0
0.0%
Remedial Education (Grades 2-5, 9-12)
69 14.0%
Special Instructional Assistance (SIA) (Grades K-3)
130 23.5%
Title I (Grades K-12)
This school has a schoolwide program.
Total 27
Retained Students, by Race/Ethnicity and Sex
Black
White Hispanic
American MultiAsian Indian racial
21 77.8%
6 22.2%
0 0.0%
0 0.0%
0 0.0%
0 0.0%
Male Female
17
10
63.0% 37.0%
Prepared by Georgia Department of Education
Page 1
STATE-REQUIRED TEST DATA
NORM-REFERENCED TESTS Grade 3
Iowa Tests of Basic Skills (ITBS) Each chart reflects data for three years of testing.
Reading Comprehension 50
37 47 54 0
98-99
35 44 53 97-98
32 43 52 96-97
Mathematics
School 50
System
State
0
38 56 61 98-99
43 54 61 97-98
43 51 59 96-97
School System State
Reading Vocabulary 50
31 43 50 0
98-99
28 44 50 97-98
30 42 49 96-97
Language Arts
School 50
System
State
0
39 57 64 98-99
32 56 62 97-98
44 50 59 96-97
School System State
Social Studies 50
35 47 56 0
98-99
34 49 55 97-98
43 46 55 96-97
Science
School 50
System
State
0
38 50 59 98-99
34 51 59 97-98
44 49 58 96-97
School System State
Sources of Information
Composite Score
50
32 52 57 0
98-99
School 50
System
32 49 56 97-98
43 47 55 96-97
State 0
33 50 58 98-99
32 49 57 97-98
1998-99 GEORGIA PUBLIC EDUCATION REPORT CARD Garden City Elementary School - 6250197
Prepared by Georgia Department of Education
41 47 56 96-97
Scores Reported in Percentiles
School System State
Page 2
STATE-REQUIRED TEST DATA
NORM-REFERENCED TESTS Grade 5
Iowa Tests of Basic Skills (ITBS) Each chart reflects data for three years of testing.
Reading Comprehension
Mathematics
50
41 47 53 0
98-99
39 47 53 97-98
43 44 52 96-97
School 50
System
State
0
33 51 59 98-99
39 53 58 97-98
44 49 57 96-97
School System State
Reading Vocabulary 50
27 39 48 0
98-99
24 44 48 97-98
29 38 46 96-97
Language Arts
School 50
System
State
0
44 58 63 98-99
44 57 61 97-98
49 49 58 96-97
School System State
Social Studies 50
34 49 57 0
98-99
34 49 56 97-98
44 45 55 96-97
Science
School 50
System
State
0
36 55 60 98-99
31 54 59 97-98
40 51 59 96-97
School System State
Sources of Information
Composite Score
50
39 55 58 0
98-99
School 50
System
39 54 58 97-98
50 50 57 96-97
State 0
35 51 57 98-99
34 51 56 97-98
42 46 55 96-97
1998-99 GEORGIA PUBLIC EDUCATION REPORT CARD Garden City Elementary School - 6250197
Prepared by Georgia Department of Education
Scores Reported in Percentiles
School System State
Page 3
STATE-REQUIRED TEST DATA
PERFORMANCE ASSESSMENTS
Grade 5 Writing Assessment
Percent at Developmental Stages:
1998-99 School System State
1997-98 School System State
1996-97 School System State
Stage Stage Stage Stage Stage Stage
1:The Emerging Writer 2:The Developing Writer 3:The Focusing Writer 4:The Experimenting 5:The Engaging Writer 6:The Extending Writer
0% 1% 36% 57% 4% 1%
0% 1% 22% 46% 23% 7%
0% 1% 16% 41% 29% 12%
0% 2% 33% 45% 17% 2%
0% 3% 24% 43% 22% 7%
0% 3% 19% 41% 27% 10%
0% 1% 40% 40% 16% 3%
0% 4% 26% 39% 22% 8%
0% 3% 21% 37% 26% 12%
AWARDS / RECOGNITION DATA
Schools in Georgia may receive recognition in the following programs: Charter School Pay for Performance Program Georgia School of Excellence National Blue Ribbon School Garden City Elementary School did not receive recognition in any of these programs during the 1998-99 school year.
1998-99 GEORGIA PUBLIC EDUCATION REPORT CARD Garden City Elementary School - 6250197
Prepared by Georgia Department of Education
Page 4
CERTIFIED PERSONNEL DATA
Positions Number Average Contract Days
Personnel Sex
Certificate
Years Experience
Full-time Part-time
Male Female
4 Yr Bachelor's 5 Yr Master's 6 Yr Specialist's 7 Yr Doctoral Other*
<1 1-10 11-20 21-30 >30
Average
Administrators
2.00 204.50
2 0
1 1
0 0 2 0 0 0 0 0 2 0 26.00
Support Personnel
1.00 190.00
1 0
1 0
0 1 0 0 0 0 0 0 1 0 27.00
PK-12 Teachers
46.75 190.00
45 4
3 46
32 15
2 0 0 8 12 15 13 1 12.98
*Includes One- and Two-Year Vocational Certificates.
ACCREDITATION DATA
Accredited by Southern Association of Colleges and Schools (SACS):
Elementary/Middle Commission.
1998-99 GEORGIA PUBLIC EDUCATION REPORT CARD Garden City Elementary School - 6250197
Prepared by Georgia Department of Education
Page 5
1998-99 GEORGIA PUBLIC EDUCATION REPORT CARD
CHATHAM COUNTY SCHOOLS
Garrison Elementary School - 6250192
Grade Range PK-5
The Georgia Public Education Report Card is designed to assist systems and schools in educational improvement. This report card contains a variety of data elements. An explanation of the terms is provided as a companion to the report card data. Please refer to the definitions for the most effective use of the reported data.
STUDENT DATA
Total
K-5
751
PK
40
Enrollment, by Race/Ethnicity and Sex
Black
White Hispanic
American Asian Indian
Multiracial
674 89.7%
70 9.3%
2 0.3%
0 0.0%
0 0.0%
5 0.7%
38 95.0%
1 2.5%
0 0.0%
0 0.0%
0 0.0%
1 2.5%
Male Female
398 53.0%
353 47.0%
17 42.5%
23 57.5%
Enrollment in Selected Programs
Program
Program % of Student Enrollment Population
Gifted (Grades K-12)
13
1.7%
Alternative Programs (Grades 6-12)
N/A
N/A
Students Eligible to Receive Free/Reduced Lunches
Number
Percent
School System
691 19,220
87.4% 52.3%
Dropout Rate *
Number
Rate
School System
N/A N/A
N/A N/A
* Dropout rates are not applicable for grades PK-5.
Enrollment in Compensatory Programs
Program
Program % of Student Enrollment Population
Special Education (Grades K-12)
70
9.3%
(PK)
0
N/A
English to Speakers of Other Languages (ESOL) (Grades K-12)
0
0.0%
Remedial Education (Grades 2-5, 9-12)
92 18.7%
Special Instructional Assistance (SIA) (Grades K-3)
192 37.0%
Title I (Grades K-12)
This school has a schoolwide program.
Total 37
Retained Students, by Race/Ethnicity and Sex
Black
White Hispanic
American MultiAsian Indian racial
36 97.3%
1 2.7%
0 0.0%
0 0.0%
0 0.0%
0 0.0%
Male Female
23
14
62.2% 37.8%
Prepared by Georgia Department of Education
Page 1
STATE-REQUIRED TEST DATA
NORM-REFERENCED TESTS Grade 3
Iowa Tests of Basic Skills (ITBS) Each chart reflects data for three years of testing.
Reading Comprehension 50
34 47 54 0
98-99
33 44 53 97-98
26 43 52 96-97
Mathematics
School 50
System
State
0
34 56 61 98-99
46 54 61 97-98
35 51 59 96-97
School System State
Reading Vocabulary 50
23 43 50 0
98-99
26 44 50 97-98
21 42 49 96-97
Language Arts
School 50
System
State
0
43 57 64 98-99
48 56 62 97-98
31 50 59 96-97
School System State
Social Studies 50
27 47 56 0
98-99
32 49 55 97-98
30 46 55 96-97
Science
School 50
System
State
0
34 50 59 98-99
38 51 59 97-98
36 49 58 96-97
School System State
Sources of Information
Composite Score
50
32 52 57 0
98-99
School 50
System
35 49 56 97-98
33 47 55 96-97
State 0
31 50 58 98-99
35 49 57 97-98
1998-99 GEORGIA PUBLIC EDUCATION REPORT CARD Garrison Elementary School - 6250192
Prepared by Georgia Department of Education
30 47 56 96-97
Scores Reported in Percentiles
School System State
Page 2
STATE-REQUIRED TEST DATA
NORM-REFERENCED TESTS Grade 5
Iowa Tests of Basic Skills (ITBS) Each chart reflects data for three years of testing.
Reading Comprehension
Mathematics
50
32 47 53 0
98-99
36 47 53 97-98
31 44 52 96-97
School 50
System
State
0
30 51 59 98-99
39 53 58 97-98
37 49 57 96-97
School System State
Reading Vocabulary 50
23 39 48 0
98-99
27 44 48 97-98
18 38 46 96-97
Language Arts
School 50
System
State
0
46 58 63 98-99
42 57 61 97-98
29 49 58 96-97
School System State
Social Studies 50
29 49 57 0
98-99
37 49 56 97-98
28 45 55 96-97
Science
School 50
System
State
0
35 55 60 98-99
42 54 59 97-98
28 51 59 96-97
School System State
Sources of Information
Composite Score
50
40 55 58 0
98-99
School 50
System
44 54 58 97-98
38 50 57 96-97
State 0
34 51 57 98-99
40 51 56 97-98
29 46 55 96-97
1998-99 GEORGIA PUBLIC EDUCATION REPORT CARD Garrison Elementary School - 6250192
Prepared by Georgia Department of Education
Scores Reported in Percentiles
School System State
Page 3
STATE-REQUIRED TEST DATA
PERFORMANCE ASSESSMENTS
Grade 5 Writing Assessment
Percent at Developmental Stages:
1998-99 School System State
1997-98 School System State
1996-97 School System State
Stage Stage Stage Stage Stage Stage
1:The Emerging Writer 2:The Developing Writer 3:The Focusing Writer 4:The Experimenting 5:The Engaging Writer 6:The Extending Writer
0% 0% 19% 65% 12% 1%
0% 1% 22% 46% 23% 7%
0% 1% 16% 41% 29% 12%
0% 4% 27% 50% 17% 2%
0% 3% 24% 43% 22% 7%
0% 3% 19% 41% 27% 10%
2% 7% 44% 35% 10% 2%
0% 4% 26% 39% 22% 8%
0% 3% 21% 37% 26% 12%
AWARDS / RECOGNITION DATA
Schools in Georgia may receive recognition in the following programs: Charter School Pay for Performance Program Georgia School of Excellence National Blue Ribbon School Garrison Elementary School did not receive recognition in any of these programs during the 1998-99 school year.
1998-99 GEORGIA PUBLIC EDUCATION REPORT CARD Garrison Elementary School - 6250192
Prepared by Georgia Department of Education
Page 4
CERTIFIED PERSONNEL DATA
Positions Number Average Contract Days
Personnel Sex
Certificate
Years Experience
Full-time Part-time
Male Female
4 Yr Bachelor's 5 Yr Master's 6 Yr Specialist's 7 Yr Doctoral Other*
<1 1-10 11-20 21-30 >30
Average
Administrators
1.00 209.00
1 0
0 1
0 1 0 0 0 0 0 1 0 0 15.00
Support Personnel
2.00 190.00
2 0
0 2
0 0 2 0 0 0 0 1 1 0 20.00
PK-12 Teachers
58.45 190.00
57 3
5 55
41 16
3 0 0 5 34 12 9 0 9.53
*Includes One- and Two-Year Vocational Certificates.
ACCREDITATION DATA
Accredited by Southern Association of Colleges and Schools (SACS):
Elementary/Middle Commission.
1998-99 GEORGIA PUBLIC EDUCATION REPORT CARD Garrison Elementary School - 6250192
Prepared by Georgia Department of Education
Page 5
1998-99 GEORGIA PUBLIC EDUCATION REPORT CARD
CHATHAM COUNTY SCHOOLS
Georgetown Elementary School - 6250194
Grade Range K-5
The Georgia Public Education Report Card is designed to assist systems and schools in educational improvement. This report card contains a variety of data elements. An explanation of the terms is provided as a companion to the report card data. Please refer to the definitions for the most effective use of the reported data.
STUDENT DATA
Total 1,120
K-5 Enrollment, by Race/Ethnicity and Sex
Black
White Hispanic
American Multi-
Asian Indian
racial
466 41.6%
584 52.1%
27 2.4%
28 2.5%
0 0.0%
15 1.3%
Male Female
571 51.0%
549 49.0%
Enrollment in Selected Programs
Program
Program % of Student Enrollment Population
Gifted (Grades K-12)
71
6.3%
Alternative Programs (Grades 6-12)
N/A
N/A
Students Eligible to Receive Free/Reduced Lunches
Number
Percent
School System
402 19,220
35.9% 52.3%
Dropout Rate *
Number
Rate
School System
N/A N/A
N/A N/A
* Dropout rates are not applicable for grades PK-5.
Enrollment in Compensatory Programs
Program
Program % of Student Enrollment Population
Special Education (Grades K-12)
93
8.3%
(PK)
0
N/A
English to Speakers of Other Languages (ESOL) (Grades K-12)
0
0.0%
Remedial Education (Grades 2-5, 9-12)
105 14.3%
Special Instructional Assistance (SIA) (Grades K-3)
132 18.2%
Title I (Grades K-12)
This school has no Title I program.
Total 32
Retained Students, by Race/Ethnicity and Sex
Black
White Hispanic
American Multi-
Asian Indian
racial
20 62.5%
11 34.4%
0 0.0%
0 0.0%
0 0.0%
1 3.1%
Male Female
21
11
65.6% 34.4%
Prepared by Georgia Department of Education
Page 1
STATE-REQUIRED TEST DATA
NORM-REFERENCED TESTS Grade 3
Iowa Tests of Basic Skills (ITBS) Each chart reflects data for three years of testing.
Reading Comprehension 50
51 47 54 0
98-99
48 44 53 97-98
48 43 52 96-97
Mathematics
School 50
System
State
0
58 56 61 98-99
55 54 61 97-98
53 51 59 96-97
School System State
Reading Vocabulary 50
44 43 50 0
98-99
43 44 50 97-98
45 42 49 96-97
Language Arts
School 50
System
State
0
53 57 64 98-99
52 56 62 97-98
48 50 59 96-97
School System State
Social Studies 50
47 47 56 0
98-99
56 49 55 97-98
51 46 55 96-97
Science
School 50
System
State
0
51 50 59 98-99
58 51 59 97-98
51 49 58 96-97
School System State
Sources of Information
Composite Score
50
54 52 57 0
98-99
School 50
System
53 49 56 97-98
52 47 55 96-97
State 0
50 50 58 98-99
52 49 57 97-98
1998-99 GEORGIA PUBLIC EDUCATION REPORT CARD Georgetown Elementary School - 6250194
Prepared by Georgia Department of Education
51 47 56 96-97
Scores Reported in Percentiles
School System State
Page 2
STATE-REQUIRED TEST DATA
NORM-REFERENCED TESTS Grade 5
Iowa Tests of Basic Skills (ITBS) Each chart reflects data for three years of testing.
Reading Comprehension
Mathematics
50
57 47 53 0
98-99
51 47 53 97-98
50 44 52 96-97
School 50
System
State
0
58 51 59 98-99
55 53 58 97-98
45 49 57 96-97
School System State
Reading Vocabulary 50
48 39 48 0
98-99
43 44 48 97-98
40 38 46 96-97
Language Arts
School 50
System
State
0
61 58 63 98-99
57 57 61 97-98
42 49 58 96-97
School System State
Social Studies 50
62 49 57 0
98-99
49 49 56 97-98
46 45 55 96-97
Science
School 50
System
State
0
65 55 60 98-99
58 54 59 97-98
53 51 59 96-97
School System State
Sources of Information
Composite Score
50
59 55 58 0
98-99
School 50
System
56 54 58 97-98
48 50 57 96-97
State 0
60 51 57 98-99
53 51 56 97-98
46 46 55 96-97
1998-99 GEORGIA PUBLIC EDUCATION REPORT CARD Georgetown Elementary School - 6250194
Prepared by Georgia Department of Education
Scores Reported in Percentiles
School System State
Page 3
STATE-REQUIRED TEST DATA
PERFORMANCE ASSESSMENTS
Grade 5 Writing Assessment
Percent at Developmental Stages:
1998-99 School System State
1997-98 School System State
1996-97 School System State
Stage Stage Stage Stage Stage Stage
1:The Emerging Writer 2:The Developing Writer 3:The Focusing Writer 4:The Experimenting 5:The Engaging Writer 6:The Extending Writer
0% 1% 21% 39% 30% 10%
0% 1% 22% 46% 23% 7%
0% 1% 16% 41% 29% 12%
0% 3% 21% 49% 20% 7%
0% 3% 24% 43% 22% 7%
0% 3% 19% 41% 27% 10%
0% 7% 36% 26% 21% 10%
0% 4% 26% 39% 22% 8%
0% 3% 21% 37% 26% 12%
AWARDS / RECOGNITION DATA
Schools in Georgia may receive recognition in the following programs: Charter School Pay for Performance Program Georgia School of Excellence National Blue Ribbon School Georgetown Elementary School did not receive recognition in any of these programs during the 1998-99 school year.
1998-99 GEORGIA PUBLIC EDUCATION REPORT CARD Georgetown Elementary School - 6250194
Prepared by Georgia Department of Education
Page 4
CERTIFIED PERSONNEL DATA
Positions Number Average Contract Days
Personnel Sex
Certificate
Years Experience
Full-time Part-time
Male Female
4 Yr Bachelor's 5 Yr Master's 6 Yr Specialist's 7 Yr Doctoral Other*
<1 1-10 11-20 21-30 >30
Average
Administrators
1.00 209.00
1 0
0 1
0 0 1 0 0 0 0 1 0 0 19.00
Support Personnel
2.00 190.00
2 0
0 2
0 2 0 0 0 0 1 1 0 0 9.50
PK-12 Teachers
57.80 190.00
55 5
3 57
33 25
1 1 0 1 38 18 3 0 9.05
*Includes One- and Two-Year Vocational Certificates.
ACCREDITATION DATA
Accredited by Southern Association of Colleges and Schools (SACS):
Elementary/Middle Commission.
1998-99 GEORGIA PUBLIC EDUCATION REPORT CARD Georgetown Elementary School - 6250194
Prepared by Georgia Department of Education
Page 5
1998-99 GEORGIA PUBLIC EDUCATION REPORT CARD
CHATHAM COUNTY SCHOOLS
Gould Elementary School - 6252056
Grade Range PK-5
The Georgia Public Education Report Card is designed to assist systems and schools in educational improvement. This report card contains a variety of data elements. An explanation of the terms is provided as a companion to the report card data. Please refer to the definitions for the most effective use of the reported data.
STUDENT DATA
Total
K-5
718
PK
64
Enrollment, by Race/Ethnicity and Sex
Black
White Hispanic
American Asian Indian
Multiracial
400 55.7%
303 42.2%
7 1.0%
1 0.1%
4 0.6%
3 0.4%
27 42.2%
35 54.7%
1 1.6%
0 0.0%
0 0.0%
1 1.6%
Male Female
375 52.2%
343 47.8%
34 53.1%
30 46.9%
Enrollment in Selected Programs
Program
Program % of Student Enrollment Population
Gifted (Grades K-12)
39
5.4%
Alternative Programs (Grades 6-12)
N/A
N/A
Students Eligible to Receive Free/Reduced Lunches
Number
Percent
School System
466 19,220
59.6% 52.3%
Dropout Rate *
Number
Rate
School System
N/A N/A
N/A N/A
* Dropout rates are not applicable for grades PK-5.
Enrollment in Compensatory Programs
Program
Program % of Student Enrollment Population
Special Education (Grades K-12)
72 10.0%
(PK)
31
N/A
English to Speakers of Other Languages (ESOL) (Grades K-12)
0
0.0%
Remedial Education (Grades 2-5, 9-12)
117 23.5%
Special Instructional Assistance (SIA) (Grades K-3)
140 28.3%
Title I (Grades K-12)
This school has a schoolwide program.
Total 39
Retained Students, by Race/Ethnicity and Sex
Black
White Hispanic
American MultiAsian Indian racial
26 66.7%
13 33.3%
0 0.0%
0 0.0%
0 0.0%
0 0.0%
Male Female
25
14
64.1% 35.9%
Prepared by Georgia Department of Education
Page 1
STATE-REQUIRED TEST DATA
NORM-REFERENCED TESTS Grade 3
Iowa Tests of Basic Skills (ITBS) Each chart reflects data for three years of testing.
Reading Comprehension 50
39 47 54 0
98-99
39 44 53 97-98
42 43 52 96-97
Mathematics
School 50
System
State
0
43 56 61 98-99
50 54 61 97-98
46 51 59 96-97
School System State
Reading Vocabulary 50
36 43 50 0
98-99
38 44 50 97-98
41 42 49 96-97
Language Arts
School 50
System
State
0
46 57 64 98-99
53 56 62 97-98
45 50 59 96-97
School System State
Social Studies 50
41 47 56 0
98-99
48 49 55 97-98
52 46 55 96-97
Science
School 50
System
State
0
37 50 59 98-99
47 51 59 97-98
48 49 58 96-97
School System State
Sources of Information
Composite Score
50
49 52 57 0
98-99
School 50
System
52 49 56 97-98
45 47 55 96-97
State 0
41 50 58 98-99
46 49 57 97-98
1998-99 GEORGIA PUBLIC EDUCATION REPORT CARD Gould Elementary School - 6252056
Prepared by Georgia Department of Education
46 47 56 96-97
Scores Reported in Percentiles
School System State
Page 2
STATE-REQUIRED TEST DATA
NORM-REFERENCED TESTS Grade 5
Iowa Tests of Basic Skills (ITBS) Each chart reflects data for three years of testing.
Reading Comprehension
Mathematics
50
41 47 53 0
98-99
41 47 53 97-98
42 44 52 96-97
School 50
System
State
0
47 51 59 98-99
46 53 58 97-98
52 49 57 96-97
School System State
Reading Vocabulary 50
37 39 48 0
98-99
38 44 48 97-98
39 38 46 96-97
Language Arts
School 50
System
State
0
57 58 63 98-99
56 57 61 97-98
43 49 58 96-97
School System State
Social Studies 50
48 49 57 0
98-99
43 49 56 97-98
48 45 55 96-97
Science
School 50
System
State
0
49 55 60 98-99
52 54 59 97-98
53 51 59 96-97
School System State
Sources of Information
Composite Score
50
61 55 58 0
98-99
School 50
System
53 54 58 97-98
56 50 57 96-97
State 0
50 51 57 98-99
47 51 56 97-98
47 46 55 96-97
1998-99 GEORGIA PUBLIC EDUCATION REPORT CARD Gould Elementary School - 6252056
Prepared by Georgia Department of Education
Scores Reported in Percentiles
School System State
Page 3
STATE-REQUIRED TEST DATA
PERFORMANCE ASSESSMENTS
Grade 5 Writing Assessment
Percent at Developmental Stages:
1998-99 School System State
1997-98 School System State
1996-97 School System State
Stage Stage Stage Stage Stage Stage
1:The Emerging Writer 2:The Developing Writer 3:The Focusing Writer 4:The Experimenting 5:The Engaging Writer 6:The Extending Writer
0% 1% 24% 55% 19% 1%
0% 1% 22% 46% 23% 7%
0% 1% 16% 41% 29% 12%
0% 0% 32% 44% 18% 4%
0% 3% 24% 43% 22% 7%
0% 3% 19% 41% 27% 10%
0% 1% 25% 47% 20% 7%
0% 4% 26% 39% 22% 8%
0% 3% 21% 37% 26% 12%
AWARDS / RECOGNITION DATA
Schools in Georgia may receive recognition in the following programs: Charter School Pay for Performance Program Georgia School of Excellence National Blue Ribbon School Gould Elementary School did not receive recognition in any of these programs during the 1998-99 school year.
1998-99 GEORGIA PUBLIC EDUCATION REPORT CARD Gould Elementary School - 6252056
Prepared by Georgia Department of Education
Page 4
CERTIFIED PERSONNEL DATA
Positions Number Average Contract Days
Personnel Sex
Certificate
Years Experience
Full-time Part-time
Male Female
4 Yr Bachelor's 5 Yr Master's 6 Yr Specialist's 7 Yr Doctoral Other*
<1 1-10 11-20 21-30 >30
Average
Administrators
2.00 200.00
2 0
1 1
0 2 0 0 0 0 0 1 1 0 20.50
Support Personnel
2.00 190.00
2 0
0 2
0 1 1 0 0 0 0 0 2 0 23.50
PK-12 Teachers
45.40 190.00
44 4
2 46
31 16
1 0 0 4 18 16 8 2 12.33
*Includes One- and Two-Year Vocational Certificates.
ACCREDITATION DATA
Accredited by Southern Association of Colleges and Schools (SACS):
Elementary/Middle Commission.
1998-99 GEORGIA PUBLIC EDUCATION REPORT CARD Gould Elementary School - 6252056
Prepared by Georgia Department of Education
Page 5
1998-99 GEORGIA PUBLIC EDUCATION REPORT CARD
CHATHAM COUNTY SCHOOLS
Groves High School - 6253056
Grade Range 9-12
The Georgia Public Education Report Card is designed to assist systems and schools in educational improvement. This report card contains a variety of data elements. An explanation of the terms is provided as a companion to the report card data. Please refer to the definitions for the most effective use of the reported data.
Total 1,224
STUDENT DATA
9-12 Enrollment, by Race/Ethnicity and Sex
Black
White Hispanic
American Multi-
Asian Indian
racial
655 53.5%
541 44.2%
10 0.8%
10 0.8%
3 0.2%
5 0.4%
Male Female
618 50.5%
606 49.5%
Enrollment in Selected Programs
Program
Gifted (Grades K-12)
Program % of Student Enrollment Population
45
3.7%
Non-Vocational Labs (Grades 9-12)
883
Vocational Labs
(Grades 9-12)
658
Alternative Programs (Grades 6-12)
51
72.1% 53.8%
4.2%
Students Eligible to Receive Free/Reduced Lunches
Number
Percent
School System
502 19,220
41.0% 52.3%
Enrollment in Compensatory Programs
Program
Program % of Student Enrollment Population
Special Education (Grades K-12) PK
141 11.5%
0
N/A
English to Speakers of Other Languages (ESOL) (Grades K-12)
0
0.0%
Remedial Education (Grades 2-5, 9-12)
47
3.8%
Title I (Grades K-12)
This school has no Title I program.
Dropout Rate for Grades 9-12
Number
Rate
School System
136
10.0%
784
7.8%
Total 195
Retained Students, by Race/Ethnicity and Sex
Black
White Hispanic
American MultiAsian Indian racial
114 58.5%
77 39.5%
0 0.0%
2 1.0%
1 0.5%
1 0.5%
Male Female
115
80
59.0% 41.0%
Prepared by Georgia Department of Education
Page 1
STATE-REQUIRED TEST DATA
GEORGIA HIGH SCHOOL GRADUATION TESTS (GHSGT)
Percent of Regular Program 11th Graders Passing the Georgia High School Graduation Tests on First Administration
English Language Arts Mathematics Social Studies Science
All Components listed above
Writing
1998-99
School System State
95% 81% 73% 58%
93% 75% 69% 55%
96% 88% 80% 72%
57% 51% 68%
95% 87% 93%
1997-98
School System State
90% 79% 63% 60%
89% 79% 64% 55%
94% 88% 78% 74%
52% 49% 68%
94% 87% 92%
1996-97
School System State
89% 75% 59% 53%
91% 77% 65% 58%
94% 87% 78% 74%
48% 52% 67%
94% 90% 93%
GRADUATE DATA
1999 Graduates by Credentials, Race/Ethnicity and Sex
Diplomas with Both College Prep. & Voc. Endorsements
Diplomas with College Prep. Endorsements Diplomas with Vocational Endorsements General High School Diplomas Special Education Diplomas
Total All Diplomas
Certificates of Performance
Total Graduates
Total 17 75 46 11 17
166 33
199
Black
6 35.3%
31 41.3%
31 67.4%
6 54.5%
7 41.2%
81 48.8%
29 87.9%
110 55.3%
White Hispanic
9 52.9%
43 57.3%
1 5.9%
0 0.0%
15 32.6%
4 36.4%
9 52.9%
0 0.0%
0 0.0%
1 5.9%
80 48.2%
2 1.2%
4 12.1%
0 0.0%
84 42.2%
2 1.0%
American MultiAsian Indian racial
1 5.9%
1 1.3%
0 0.0%
0 0.0%
0 0.0%
0 0.0%
0 0.0%
0 0.0%
0 0.0%
0 0.0%
1 9.1%
0 0.0%
0 0.0%
0 0.0%
0 0.0%
2 1.2%
1 0.6%
0 0.0%
0 0.0%
0 0.0%
0 0.0%
2 1.0%
1 0.5%
0 0.0%
Male Female
9 52.9%
28 37.3%
8 47.1%
47 62.7%
27 58.7%
7 63.6%
13 76.5%
19 41.3%
4 36.4%
4 23.5%
84
82
50.6% 49.4%
12
21
36.4% 63.6%
96
103
48.2% 51.8%
HOPE Scholarships
School System
Number of 1999 Graduates 1 9 9
Number Eligible
93
Percent Eligible
46.7%
1,436 749
52.2%
State
65,548 40,292 61.5%
High School Completion Rate
Percent of 1995Grade 9 Enrollment in Graduating Class of1999 School System State
Completion Rate '95-'99 64.0% 62.1% 68.9%
1998-99 GEORGIA PUBLIC EDUCATION REPORT CARD
Groves High School - 6253056
Prepared by Georgia Department of Education
Page 2
COLLEGE ADMISSIONS / CREDIT TEST DATA
Scholastic Assessment Test (SAT)
Based on students' highest verbal and highest math scores
No. Taking
Average Score
Tests Verbal Math Total
Based on students' last test administration
Average Score Verbal Math Total
School
66
College Prep. Endorsement
Other Diplomas
System
578
College Prep. Endorsement
Other Diplomas
Georgia
41,958
512 492 1004
503 487
990
420 380
800
489 473
962
483 469
952
419 379
798
492 488
980
503 N/A N/A
480 N/A N/A
483
483 N/A N/A
464 N/A N/A
479
986 N/A N/A
944 N/A N/A
962
Nation
952,913 N/A N/A N/A
502 508 1010
American College Testing (ACT)
Advanced Placement Exams (AP)
Number taking tests: English Mathematics Reading Science Reasoning CompositeScore
4 3 School System State
15.3 16.0 19.1
16.4 17.1 19.9
16.4 16.9
17.5 17.7
20.2 19.9
16.4 17.2 19.9
No. of Students Taking Tests
No. of Tests Taken No. of Test Scores
3 or Higher Percent of Test
Scores 3 or Higher
School 33 62 14
22.6%
System State 291 15,225 509 23,969 254 13,024
49.9% 54.3%
POST-SECONDARY DATA
Graduates Entering Georgia Public Colleges
Graduates Entering Georgia Public Colleges and Requiring Learning Support (LS)
1998 Graduates Entering in 1998-99
1997 Graduates Entering in 1997-98
Percent of Graduating Number Class
School
55
23.5%
System 470
30.4%
School
61
29.9%
System 565
37.0%
Number Requiring
LS 19 159
33 232
Percent of those attending Georgia
Public Colleges
34.5%
33.8%
54.1%
41.1%
In previous years, the Report Card presented College Prep Curriculum information provided by the Board of Regents on students requiring Learning Support. Due to inconsistencies in the data provided by the Board of Regents in defining College Prep Completers versus Local Board of Education data defining College Prep Endorsements, the Department of Education Report Card will not provide this information until discrepancies can be reconciled.
Graduates Entering Georgia Public Technical and Adult Schools
1998 Graduates School System
Entering Number 14 78
1998-99 Percent
6.0% 5.0%
Entering Number N/A N/A
1997-98 Percent
N/A N/A
1997 Graduates School
3
1.5%
System
15
1.0%
7
3.4%
89
5.8%
1998-99 GEORGIA PUBLIC EDUCATION REPORT CARD Groves High School - 6253056
Prepared by Georgia Department of Education
Page 3
CERTIFIED PERSONNEL DATA
Positions Number Average Contract Days
Administrators
2.00 209.50
Support Personnel
1.00 190.00
PK-12 Teachers
69.14 190.00
Personnel Sex
Certificate
Years Experience
Full-time Part-time
Male Female
4 Yr Bachelor's 5 Yr Master's 6 Yr Specialist's 7 Yr Doctoral Other*
<1 1-10 11-20 21-30 >30
Average
2 0
2 0
0 1 1 0 0
0 0 2 0 0
19.00
1 0
1 0
0 1 0 0 0
0 0 0 1 0
22.00
68 3
23 48
36 30
4 1 0
1 28 22 18
2
15.11
*Includes One- and Two-Year Vocational Certificates.
ACCREDITATION DATA
Accredited by Southern Association of Colleges and Schools (SACS): Secondary/Middle Commission.
AWARDS / RECOGNITION DATA
Schools in Georgia may receive recognition in the following programs: Charter School Pay for Performance Program Georgia School of Excellence National Blue Ribbon School Groves High School did not receive recognition in any of these programs during the 1998-99 school year.
1998-99 GEORGIA PUBLIC EDUCATION REPORT CARD Groves High School - 6253056
Prepared by Georgia Department of Education
Page 4
1998-99 GEORGIA PUBLIC EDUCATION REPORT CARD
CHATHAM COUNTY SCHOOLS
Haven Elementary School - 6254056
Grade Range PK-5
The Georgia Public Education Report Card is designed to assist systems and schools in educational improvement. This report card contains a variety of data elements. An explanation of the terms is provided as a companion to the report card data. Please refer to the definitions for the most effective use of the reported data.
STUDENT DATA
Total
K-5
396
PK
40
Enrollment, by Race/Ethnicity and Sex
Black
White Hispanic
American Asian Indian
Multiracial
365 92.2%
25 6.3%
3 0.8%
0 0.0%
0 0.0%
3 0.8%
40 100.0%
0 0.0%
0 0.0%
0 0.0%
0 0.0%
0 0.0%
Male Female
230 58.1%
166 41.9%
22 55.0%
18 45.0%
Enrollment in Selected Programs
Program
Program % of Student Enrollment Population
Gifted (Grades K-12)
4
1.0%
Alternative Programs (Grades 6-12)
N/A
N/A
Students Eligible to Receive Free/Reduced Lunches
Number
Percent
School System
357 19,220
81.9% 52.3%
Dropout Rate *
Number
Rate
School System
N/A N/A
N/A N/A
* Dropout rates are not applicable for grades PK-5.
Enrollment in Compensatory Programs
Program
Program % of Student Enrollment Population
Special Education (Grades K-12)
28
7.1%
(PK)
0
N/A
English to Speakers of Other Languages (ESOL) (Grades K-12)
0
0.0%
Remedial Education (Grades 2-5, 9-12)
59 23.0%
Special Instructional Assistance (SIA) (Grades K-3)
86 31.2%
Title I (Grades K-12)
This school has a schoolwide program.
Total 11
Retained Students, by Race/Ethnicity and Sex
Black
White Hispanic
American MultiAsian Indian racial
11 100.0%
0 0.0%
0 0.0%
0 0.0%
0 0.0%
0 0.0%
Male Female
7
4
63.6% 36.4%
Prepared by Georgia Department of Education
Page 1
STATE-REQUIRED TEST DATA
NORM-REFERENCED TESTS Grade 3
Iowa Tests of Basic Skills (ITBS) Each chart reflects data for three years of testing.
Reading Comprehension 50
31 47 54 0
98-99
19 44 53 97-98
34 43 52 96-97
Mathematics
School 50
System
State
0
39 56 61 98-99
41 54 61 97-98
40 51 59 96-97
School System State
Reading Vocabulary 50
29 43 50 0
98-99
22 44 50 97-98
77 42 49 96-97
Language Arts
School 50
System
State
0
49 57 64 98-99
23 56 62 97-98
41 50 59 96-97
School System State
Social Studies 50
33 47 56 0
98-99
24 49 55 97-98
32 46 55 96-97
Science
School 50
System
State
0
40 50 59 98-99
28 51 59 97-98
33 49 58 96-97
School System State
Sources of Information
Composite Score
50
36 52 57 0
98-99
School 50
System
28 49 56 97-98
34 47 55 96-97
State 0
37 50 58 98-99
25 49 57 97-98
1998-99 GEORGIA PUBLIC EDUCATION REPORT CARD Haven Elementary School - 6254056
Prepared by Georgia Department of Education
37 47 56 96-97
Scores Reported in Percentiles
School System State
Page 2
STATE-REQUIRED TEST DATA
NORM-REFERENCED TESTS Grade 5
Iowa Tests of Basic Skills (ITBS) Each chart reflects data for three years of testing.
Reading Comprehension
Mathematics
50
33 47 53 0
98-99
43 47 53 97-98
36 44 52 96-97
School 50
System
State
0
37 51 59 98-99
44 53 58 97-98
39 49 57 96-97
School System State
Reading Vocabulary 50
26 39 48 0
98-99
39 44 48 97-98
31 38 46 96-97
Language Arts
School 50
System
State
0
54 58 63 98-99
50 57 61 97-98
49 49 58 96-97
School System State
Social Studies 50
39 49 57 0
98-99
54 49 56 97-98
45 45 55 96-97
Science
School 50
System
State
0
40 55 60 98-99
53 54 59 97-98
46 51 59 96-97
School System State
Sources of Information
Composite Score
50
46 55 58 0
98-99
School 50
System
47 54 58 97-98
44 50 57 96-97
State 0
39 51 57 98-99
48 51 56 97-98
41 46 55 96-97
1998-99 GEORGIA PUBLIC EDUCATION REPORT CARD Haven Elementary School - 6254056
Prepared by Georgia Department of Education
Scores Reported in Percentiles
School System State
Page 3
STATE-REQUIRED TEST DATA
PERFORMANCE ASSESSMENTS
Grade 5 Writing Assessment
Percent at Developmental Stages:
1998-99 School System State
1997-98 School System State
1996-97 School System State
Stage Stage Stage Stage Stage Stage
1:The Emerging Writer 2:The Developing Writer 3:The Focusing Writer 4:The Experimenting 5:The Engaging Writer 6:The Extending Writer
0% 2% 25% 56% 14% 0%
0% 1% 22% 46% 23% 7%
0% 1% 16% 41% 29% 12%
2% 10% 43% 38%
5% 0%
0% 3% 24% 43% 22% 7%
0% 3% 19% 41% 27% 10%
0% 14% 33% 33% 16%
3%
0% 4% 26% 39% 22% 8%
0% 3% 21% 37% 26% 12%
AWARDS / RECOGNITION DATA
Schools in Georgia may receive recognition in the following programs: Charter School Pay for Performance Program Georgia School of Excellence National Blue Ribbon School Haven Elementary School did not receive recognition in any of these programs during the 1998-99 school year.
1998-99 GEORGIA PUBLIC EDUCATION REPORT CARD Haven Elementary School - 6254056
Prepared by Georgia Department of Education
Page 4
CERTIFIED PERSONNEL DATA
Positions Number Average Contract Days
Personnel Sex
Certificate
Years Experience
Full-time Part-time
Male Female
4 Yr Bachelor's 5 Yr Master's 6 Yr Specialist's 7 Yr Doctoral Other*
<1 1-10 11-20 21-30 >30
Average
Administrators
2.00 204.50
2 0
0 2
0 0 2 0 0 0 0 0 2 0 22.00
Support Personnel
2.00 195.00
2 0
0 2
1 1 0 0 0 0 1 1 0 0 13.00
PK-12 Teachers
29.60 190.00
27 5
1 31
21 10
1 0 0 7 6 13 5 1 11.59
*Includes One- and Two-Year Vocational Certificates.
ACCREDITATION DATA
Accredited by Southern Association of Colleges and Schools (SACS):
Elementary/Middle Commission.
1998-99 GEORGIA PUBLIC EDUCATION REPORT CARD Haven Elementary School - 6254056
Prepared by Georgia Department of Education
Page 5
1998-99 GEORGIA PUBLIC EDUCATION REPORT CARD
CHATHAM COUNTY SCHOOLS
Heard Elementary School - 6251058
Grade Range PK-5
The Georgia Public Education Report Card is designed to assist systems and schools in educational improvement. This report card contains a variety of data elements. An explanation of the terms is provided as a companion to the report card data. Please refer to the definitions for the most effective use of the reported data.
STUDENT DATA
Total
K-5
465
PK
46
Enrollment, by Race/Ethnicity and Sex
Black
White Hispanic
American Asian Indian
Multiracial
346 74.4%
103 22.2%
6 1.3%
1 0.2%
3 0.6%
6 1.3%
30 65.2%
12 26.1%
1 2.2%
2 4.3%
0 0.0%
1 2.2%
Male Female
247 53.1%
218 46.9%
22 47.8%
24 52.2%
Enrollment in Selected Programs
Program
Program % of Student Enrollment Population
Gifted (Grades K-12)
21
4.5%
Alternative Programs (Grades 6-12)
N/A
N/A
Students Eligible to Receive Free/Reduced Lunches
Number
Percent
School System
347 19,220
67.9% 52.3%
Dropout Rate *
Number
Rate
School System
N/A N/A
N/A N/A
* Dropout rates are not applicable for grades PK-5.
Enrollment in Compensatory Programs
Program
Program % of Student Enrollment Population
Special Education (Grades K-12)
53 11.4%
(PK)
8
N/A
English to Speakers of Other Languages (ESOL) (Grades K-12)
0
0.0%
Remedial Education (Grades 2-5, 9-12)
75 24.0%
Special Instructional Assistance (SIA) (Grades K-3)
126 40.4%
Title I (Grades K-12)
This school has a schoolwide program.
Total 14
Retained Students, by Race/Ethnicity and Sex
Black
White Hispanic
American MultiAsian Indian racial
12 85.7%
2 14.3%
0 0.0%
0 0.0%
0 0.0%
0 0.0%
Male Female
12
2
85.7% 14.3%
Prepared by Georgia Department of Education
Page 1
STATE-REQUIRED TEST DATA
NORM-REFERENCED TESTS Grade 3
Iowa Tests of Basic Skills (ITBS) Each chart reflects data for three years of testing.
Reading Comprehension 50
32 47 54 0
98-99
41 44 53 97-98
29 43 52 96-97
Mathematics
School 50
System
State
0
43 56 61 98-99
47 54 61 97-98
42 51 59 96-97
School System State
Reading Vocabulary 50
36 43 50 0
98-99
37 44 50 97-98
30 42 49 96-97
Language Arts
School 50
System
State
0
43 57 64 98-99
50 56 62 97-98
41 50 59 96-97
School System State
Social Studies 50
34 47 56 0
98-99
42 49 55 97-98
43 46 55 96-97
Science
School 50
System
State
0
43 50 59 98-99
54 51 59 97-98
37 49 58 96-97
School System State
Sources of Information
Composite Score
50
45 52 57 0
98-99
School 50
System
45 49 56 97-98
37 47 55 96-97
State 0
38 50 58 98-99
45 49 57 97-98
1998-99 GEORGIA PUBLIC EDUCATION REPORT CARD Heard Elementary School - 6251058
Prepared by Georgia Department of Education
36 47 56 96-97
Scores Reported in Percentiles
School System State
Page 2
STATE-REQUIRED TEST DATA
NORM-REFERENCED TESTS Grade 5
Iowa Tests of Basic Skills (ITBS) Each chart reflects data for three years of testing.
Reading Comprehension
Mathematics
50
33 47 53 0
98-99
37 47 53 97-98
37 44 52 96-97
School 50
System
State
0
40 51 59 98-99
48 53 58 97-98
46 49 57 96-97
School System State
Reading Vocabulary 50
33 39 48 0
98-99
23 44 48 97-98
28 38 46 96-97
Language Arts
School 50
System
State
0
42 58 63 98-99
43 57 61 97-98
45 49 58 96-97
School System State
Social Studies 50
29 49 57 0
98-99
38 49 56 97-98
43 45 55 96-97
Science
School 50
System
State
0
36 55 60 98-99
43 54 59 97-98
43 51 59 96-97
School System State
Sources of Information
Composite Score
50
52 55 58 0
98-99
School 50
System
47 54 58 97-98
50 50 57 96-97
State 0
37 51 57 98-99
40 51 56 97-98
41 46 55 96-97
1998-99 GEORGIA PUBLIC EDUCATION REPORT CARD Heard Elementary School - 6251058
Prepared by Georgia Department of Education
Scores Reported in Percentiles
School System State
Page 3
STATE-REQUIRED TEST DATA
PERFORMANCE ASSESSMENTS
Grade 5 Writing Assessment
Percent at Developmental Stages:
1998-99 School System State
1997-98 School System State
1996-97 School System State
Stage Stage Stage Stage Stage Stage
1:The Emerging Writer 2:The Developing Writer 3:The Focusing Writer 4:The Experimenting 5:The Engaging Writer 6:The Extending Writer
0% 5% 29% 45% 18% 3%
0% 1% 22% 46% 23% 7%
0% 1% 16% 41% 29% 12%
1% 8% 35% 43% 13% 0%
0% 3% 24% 43% 22% 7%
0% 3% 19% 41% 27% 10%
0% 0% 25% 47% 21% 7%
0% 4% 26% 39% 22% 8%
0% 3% 21% 37% 26% 12%
AWARDS / RECOGNITION DATA
Schools in Georgia may receive recognition in the following programs: Charter School Pay for Performance Program Georgia School of Excellence National Blue Ribbon School Heard Elementary School did not receive recognition in any of these programs during the 1998-99 school year.
1998-99 GEORGIA PUBLIC EDUCATION REPORT CARD Heard Elementary School - 6251058
Prepared by Georgia Department of Education
Page 4
CERTIFIED PERSONNEL DATA
Positions Number Average Contract Days
Personnel Sex
Certificate
Years Experience
Full-time Part-time
Male Female
4 Yr Bachelor's 5 Yr Master's 6 Yr Specialist's 7 Yr Doctoral Other*
<1 1-10 11-20 21-30 >30
Average
Administrators
2.00 200.00
1 2
0 3
0 1 2 0 0 0 0 2 0 1 23.67
Support Personnel
2.00 190.00
2 0
0 2
0 2 0 0 0 0 0 1 1 0 17.50
PK-12 Teachers
34.40 190.00
31 6
1 36
15 20
2 0 0 3 12 12 9 1 13.70
*Includes One- and Two-Year Vocational Certificates.
ACCREDITATION DATA
Accredited by Southern Association of Colleges and Schools (SACS):
Elementary/Middle Commission.
1998-99 GEORGIA PUBLIC EDUCATION REPORT CARD Heard Elementary School - 6251058
Prepared by Georgia Department of Education
Page 5
1998-99 GEORGIA PUBLIC EDUCATION REPORT CARD
CHATHAM COUNTY SCHOOLS
Hesse Elementary School - 6254058
Grade Range PK-5
The Georgia Public Education Report Card is designed to assist systems and schools in educational improvement. This report card contains a variety of data elements. An explanation of the terms is provided as a companion to the report card data. Please refer to the definitions for the most effective use of the reported data.
STUDENT DATA
Total
K-5
846
PK
27
Enrollment, by Race/Ethnicity and Sex
Black
White Hispanic
American Asian Indian
Multiracial
385 45.5%
419 49.5%
16 1.9%
10 1.2%
3 0.4%
13 1.5%
13 48.1%
12 44.4%
0 0.0%
0 0.0%
0 0.0%
2 7.4%
Male Female
452 53.4%
394 46.6%
13 48.1%
14 51.9%
Enrollment in Selected Programs
Program
Program % of Student Enrollment Population
Gifted (Grades K-12)
62
7.3%
Alternative Programs (Grades 6-12)
N/A
N/A
Students Eligible to Receive Free/Reduced Lunches
Number
Percent
School System
398 19,220
45.6% 52.3%
Dropout Rate *
Number
Rate
School System
N/A N/A
N/A N/A
* Dropout rates are not applicable for grades PK-5.
Enrollment in Compensatory Programs
Program
Program % of Student Enrollment Population
Special Education (Grades K-12)
112 13.2%
(PK)
9
N/A
English to Speakers of Other Languages (ESOL) (Grades K-12)
0
0.0%
Remedial Education (Grades 2-5, 9-12)
128 21.9%
Special Instructional Assistance (SIA) (Grades K-3)
76 13.2%
Title I (Grades K-12)
This school has no Title I program.
Total 15
Retained Students, by Race/Ethnicity and Sex
Black
White Hispanic
American MultiAsian Indian racial
10 66.7%
5 33.3%
0 0.0%
0 0.0%
0 0.0%
0 0.0%
Male Female
9
6
60.0% 40.0%
Prepared by Georgia Department of Education
Page 1
STATE-REQUIRED TEST DATA
NORM-REFERENCED TESTS Grade 3
Iowa Tests of Basic Skills (ITBS) Each chart reflects data for three years of testing.
Reading Comprehension 50
60 47 54 0
98-99
53 44 53 97-98
56 43 52 96-97
Mathematics
School 50
System
State
0
71 56 61 98-99
71 54 61 97-98
72 51 59 96-97
School System State
Reading Vocabulary 50
48 43 50 0
98-99
49 44 50 97-98
50 42 49 96-97
Language Arts
School 50
System
State
0
73 57 64 98-99
72 56 62 97-98
61 50 59 96-97
School System State
Social Studies 50
58 47 56 0
98-99
67 49 55 97-98
60 46 55 96-97
Science
School 50
System
State
0
56 50 59 98-99
57 51 59 97-98
57 49 58 96-97
School System State
Sources of Information
Composite Score
50
65 52 57 0
98-99
School 50
System
62 49 56 97-98
58 47 55 96-97
State 0
63 50 58 98-99
63 49 57 97-98
1998-99 GEORGIA PUBLIC EDUCATION REPORT CARD Hesse Elementary School - 6254058
Prepared by Georgia Department of Education
59 47 56 96-97
Scores Reported in Percentiles
School System State
Page 2
STATE-REQUIRED TEST DATA
NORM-REFERENCED TESTS Grade 5
Iowa Tests of Basic Skills (ITBS) Each chart reflects data for three years of testing.
Reading Comprehension
Mathematics
50
60 47 53 0
98-99
55 47 53 97-98
48 44 52 96-97
School 50
System
State
0
67 51 59 98-99
63 53 58 97-98
56 49 57 96-97
School System State
Reading Vocabulary 50
49 39 48 0
98-99
47 44 48 97-98
36 38 46 96-97
Language Arts
School 50
System
State
0
68 58 63 98-99
65 57 61 97-98
54 49 58 96-97
School System State
Social Studies 50
62 49 57 0
98-99
61 49 56 97-98
52 45 55 96-97
Science
School 50
System
State
0
66 55 60 98-99
64 54 59 97-98
56 51 59 96-97
School System State
Sources of Information
Composite Score
50
69 55 58 0
98-99
School 50
System
63 54 58 97-98
56 50 57 96-97
State 0
65 51 57 98-99
62 51 56 97-98
52 46 55 96-97
1998-99 GEORGIA PUBLIC EDUCATION REPORT CARD Hesse Elementary School - 6254058
Prepared by Georgia Department of Education
Scores Reported in Percentiles
School System State
Page 3
STATE-REQUIRED TEST DATA
PERFORMANCE ASSESSMENTS
Grade 5 Writing Assessment
Percent at Developmental Stages:
1998-99 School System State
1997-98 School System State
1996-97 School System State
Stage Stage Stage Stage Stage Stage
1:The Emerging Writer 2:The Developing Writer 3:The Focusing Writer 4:The Experimenting 5:The Engaging Writer 6:The Extending Writer
0% 2% 21% 39% 30% 8%
0% 1% 22% 46% 23% 7%
0% 1% 16% 41% 29% 12%
0% 2% 16% 48% 27% 7%
0% 3% 24% 43% 22% 7%
0% 3% 19% 41% 27% 10%
0% 2% 24% 51% 19% 4%
0% 4% 26% 39% 22% 8%
0% 3% 21% 37% 26% 12%
AWARDS / RECOGNITION DATA
Schools in Georgia may receive recognition in the following programs: Charter School Pay for Performance Program Georgia School of Excellence National Blue Ribbon School Hesse Elementary School did not receive recognition in any of these programs during the 1998-99 school year.
1998-99 GEORGIA PUBLIC EDUCATION REPORT CARD Hesse Elementary School - 6254058
Prepared by Georgia Department of Education
Page 4
CERTIFIED PERSONNEL DATA
Positions Number Average Contract Days
Personnel Sex
Certificate
Years Experience
Full-time Part-time
Male Female
4 Yr Bachelor's 5 Yr Master's 6 Yr Specialist's 7 Yr Doctoral Other*
<1 1-10 11-20 21-30 >30
Average
Administrators
2.00 199.50
2 0
1 1
0 1 1 0 0 0 0 1 1 0 24.00
Support Personnel
2.50 190.00
2 1
1 2
0 2 1 0 0 0 0 1 2 0 19.00
PK-12 Teachers
48.20 190.00
46 5
3 48
21 27
3 0 0 0 18 22 11 0 13.98
*Includes One- and Two-Year Vocational Certificates.
ACCREDITATION DATA
Accredited by Southern Association of Colleges and Schools (SACS):
Elementary/Middle Commission.
1998-99 GEORGIA PUBLIC EDUCATION REPORT CARD Hesse Elementary School - 6254058
Prepared by Georgia Department of Education
Page 5
1998-99 GEORGIA PUBLIC EDUCATION REPORT CARD
CHATHAM COUNTY SCHOOLS
Hodge Elementary School - 6255058
Grade Range PK-5
The Georgia Public Education Report Card is designed to assist systems and schools in educational improvement. This report card contains a variety of data elements. An explanation of the terms is provided as a companion to the report card data. Please refer to the definitions for the most effective use of the reported data.
STUDENT DATA
Total
K-5
519
PK
60
Enrollment, by Race/Ethnicity and Sex
Black
White Hispanic
American Asian Indian
Multiracial
488 94.0%
18 3.5%
1 0.2%
0 0.0%
0 0.0%
12 2.3%
55 91.7%
4 6.7%
1 1.7%
0 0.0%
0 0.0%
0 0.0%
Male Female
269 51.8%
250 48.2%
35 58.3%
25 41.7%
Enrollment in Selected Programs
Program
Program % of Student Enrollment Population
Gifted (Grades K-12)
16
3.1%
Alternative Programs (Grades 6-12)
N/A
N/A
Students Eligible to Receive Free/Reduced Lunches
Number
Percent
School System
471 19,220
81.3% 52.3%
Dropout Rate *
Number
Rate
School System
N/A N/A
N/A N/A
* Dropout rates are not applicable for grades PK-5.
Enrollment in Compensatory Programs
Program
Program % of Student Enrollment Population
Special Education (Grades K-12)
28
5.4%
(PK)
0
N/A
English to Speakers of Other Languages (ESOL) (Grades K-12)
0
0.0%
Remedial Education (Grades 2-5, 9-12)
28
8.1%
Special Instructional Assistance (SIA) (Grades K-3)
129 37.0%
Title I (Grades K-12)
This school has a schoolwide program.
Total 21
Retained Students, by Race/Ethnicity and Sex
Black
White Hispanic
American MultiAsian Indian racial
20 95.2%
1 4.8%
0 0.0%
0 0.0%
0 0.0%
0 0.0%
Male Female
17
4
81.0% 19.0%
Prepared by Georgia Department of Education
Page 1
STATE-REQUIRED TEST DATA
NORM-REFERENCED TESTS Grade 3
Iowa Tests of Basic Skills (ITBS) Each chart reflects data for three years of testing.
Reading Comprehension 50
36 47 54 0
98-99
25 44 53 97-98
29 43 52 96-97
Mathematics
School 50
System
State
0
46 56 61 98-99
43 54 61 97-98
36 51 59 96-97
School System State
Reading Vocabulary 50
26 43 50 0
98-99
27 44 50 97-98
27 42 49 96-97
Language Arts
School 50
System
State
0
55 57 64 98-99
50 56 62 97-98
43 50 59 96-97
School System State
Social Studies 50
37 47 56 0
98-99
30 49 55 97-98
35 46 55 96-97
Science
School 50
System
State
0
39 50 59 98-99
38 51 59 97-98
38 49 58 96-97
School System State
Sources of Information
Composite Score
50
44 52 57 0
98-99
School 50
System
39 49 56 97-98
38 47 55 96-97
State 0
41 50 58 98-99
35 49 57 97-98
1998-99 GEORGIA PUBLIC EDUCATION REPORT CARD Hodge Elementary School - 6255058
Prepared by Georgia Department of Education
35 47 56 96-97
Scores Reported in Percentiles
School System State
Page 2
STATE-REQUIRED TEST DATA
NORM-REFERENCED TESTS Grade 5
Iowa Tests of Basic Skills (ITBS) Each chart reflects data for three years of testing.
Reading Comprehension
Mathematics
50
39 47 53 0
98-99
39 47 53 97-98
34 44 52 96-97
School 50
System
State
0
49 51 59 98-99
38 53 58 97-98
31 49 57 96-97
School System State
Reading Vocabulary 50
31 39 48 0
98-99
27 44 48 97-98
21 38 46 96-97
Language Arts
School 50
System
State
0
56 58 63 98-99
46 57 61 97-98
46 49 58 96-97
School System State
Social Studies 50
36 49 57 0
98-99
33 49 56 97-98
32 45 55 96-97
Science
School 50
System
State
0
43 55 60 98-99
41 54 59 97-98
38 51 59 96-97
School System State
Sources of Information
Composite Score
50
48 55 58 0
98-99
School 50
System
47 54 58 97-98
40 50 57 96-97
State 0
43 51 57 98-99
39 51 56 97-98
36 46 55 96-97
1998-99 GEORGIA PUBLIC EDUCATION REPORT CARD Hodge Elementary School - 6255058
Prepared by Georgia Department of Education
Scores Reported in Percentiles
School System State
Page 3
STATE-REQUIRED TEST DATA
PERFORMANCE ASSESSMENTS
Grade 5 Writing Assessment
Percent at Developmental Stages:
1998-99 School System State
1997-98 School System State
1996-97 School System State
Stage Stage Stage Stage Stage Stage
1:The Emerging Writer 2:The Developing Writer 3:The Focusing Writer 4:The Experimenting 5:The Engaging Writer 6:The Extending Writer
0% 0% 22% 50% 21% 7%
0% 1% 22% 46% 23% 7%
0% 1% 16% 41% 29% 12%
0% 4% 32% 48% 16% 0%
0% 3% 24% 43% 22% 7%
0% 3% 19% 41% 27% 10%
0% 9% 19% 38% 23% 8%
0% 4% 26% 39% 22% 8%
0% 3% 21% 37% 26% 12%
AWARDS / RECOGNITION DATA
Schools in Georgia may receive recognition in the following programs: Charter School Pay for Performance Program Georgia School of Excellence National Blue Ribbon School Hodge Elementary School did not receive recognition in any of these programs during the 1998-99 school year.
1998-99 GEORGIA PUBLIC EDUCATION REPORT CARD Hodge Elementary School - 6255058
Prepared by Georgia Department of Education
Page 4
CERTIFIED PERSONNEL DATA
Positions Number Average Contract Days
Personnel Sex
Certificate
Years Experience
Full-time Part-time
Male Female
4 Yr Bachelor's 5 Yr Master's 6 Yr Specialist's 7 Yr Doctoral Other*
<1 1-10 11-20 21-30 >30
Average
Administrators
1.50 240.00
1 1
0 2
0 1 1 0 0 0 0 0 1 1 32.00
Support Personnel
2.00 190.00
2 0
0 2
0 2 0 0 0 0 1 0 1 0 16.00
PK-12 Teachers
38.80 190.00
37 4
4 37
28 13
0 0 0 1 22 7 10 1 12.80
*Includes One- and Two-Year Vocational Certificates.
ACCREDITATION DATA
Accredited by Southern Association of Colleges and Schools (SACS):
Elementary/Middle Commission.
1998-99 GEORGIA PUBLIC EDUCATION REPORT CARD Hodge Elementary School - 6255058
Prepared by Georgia Department of Education
Page 5
1998-99 GEORGIA PUBLIC EDUCATION REPORT CARD
CHATHAM COUNTY SCHOOLS
Howard Elementary School - 6251060
Grade Range PK-5
The Georgia Public Education Report Card is designed to assist systems and schools in educational improvement. This report card contains a variety of data elements. An explanation of the terms is provided as a companion to the report card data. Please refer to the definitions for the most effective use of the reported data.
STUDENT DATA
Total
K-5
880
PK
29
Enrollment, by Race/Ethnicity and Sex
Black
White Hispanic
American Asian Indian
Multiracial
281 31.9%
566 64.3%
10 1.1%
13 1.5%
2 0.2%
8 0.9%
10 34.5%
19 65.5%
0 0.0%
0 0.0%
0 0.0%
0 0.0%
Male Female
463 52.6%
417 47.4%
14 48.3%
15 51.7%
Enrollment in Selected Programs
Program
Program % of Student Enrollment Population
Gifted (Grades K-12)
103
11.7%
Alternative Programs (Grades 6-12)
N/A
N/A
Students Eligible to Receive Free/Reduced Lunches
Number
Percent
School System
235 19,220
25.9% 52.3%
Dropout Rate *
Number
Rate
School System
N/A N/A
N/A N/A
* Dropout rates are not applicable for grades PK-5.
Enrollment in Compensatory Programs
Program
Program % of Student Enrollment Population
Special Education (Grades K-12)
88 10.0%
(PK)
11
N/A
English to Speakers of Other Languages (ESOL) (Grades K-12)
0
0.0%
Remedial Education (Grades 2-5, 9-12)
106 17.8%
Special Instructional Assistance (SIA) (Grades K-3)
78 13.2%
Title I (Grades K-12)
This school has no Title I program.
Total 17
Retained Students, by Race/Ethnicity and Sex
Black
White Hispanic
American MultiAsian Indian racial
7 41.2%
10 58.8%
0 0.0%
0 0.0%
0 0.0%
0 0.0%
Male Female
9
8
52.9% 47.1%
Prepared by Georgia Department of Education
Page 1
STATE-REQUIRED TEST DATA
NORM-REFERENCED TESTS Grade 3
Iowa Tests of Basic Skills (ITBS) Each chart reflects data for three years of testing.
Reading Comprehension 50
69 47 54 0
98-99
65 44 53 97-98
64 43 52 96-97
Mathematics
School 50
System
State
0
80 56 61 98-99
75 54 61 97-98
66 51 59 96-97
School System State
Reading Vocabulary 50
61 43 50 0
98-99
63 44 50 97-98
56 42 49 96-97
Language Arts
School 50
System
State
0
74 57 64 98-99
78 56 62 97-98
70 50 59 96-97
School System State
Social Studies 50
71 47 56 0
98-99
74 49 55 97-98
68 46 55 96-97
Science
School 50
System
State
0
78 50 59 98-99
76 51 59 97-98
78 49 58 96-97
School System State
Sources of Information
Composite Score
50
72 52 57 0
98-99
School 50
System
71 49 56 97-98
69 47 55 96-97
State 0
75 50 58 98-99
74 49 57 97-98
1998-99 GEORGIA PUBLIC EDUCATION REPORT CARD Howard Elementary School - 6251060
Prepared by Georgia Department of Education
71 47 56 96-97
Scores Reported in Percentiles
School System State
Page 2
STATE-REQUIRED TEST DATA
NORM-REFERENCED TESTS Grade 5
Iowa Tests of Basic Skills (ITBS) Each chart reflects data for three years of testing.
Reading Comprehension
Mathematics
50
62 47 53 0
98-99
59 47 53 97-98
58 44 52 96-97
School 50
System
State
0
72 51 59 98-99
69 53 58 97-98
65 49 57 96-97
School System State
Reading Vocabulary 50
58 39 48 0
98-99
57 44 48 97-98
53 38 46 96-97
Language Arts
School 50
System
State
0
72 58 63 98-99
71 57 61 97-98
67 49 58 96-97
School System State
Social Studies 50
72 49 57 0
98-99
65 49 56 97-98
63 45 55 96-97
Science
School 50
System
State
0
75 55 60 98-99
74 54 59 97-98
72 51 59 96-97
School System State
Sources of Information
Composite Score
50
75 55 58 0
98-99
School 50
System
70 54 58 97-98
70 50 57 96-97
State 0
73 51 57 98-99
69 51 56 97-98
66 46 55 96-97
1998-99 GEORGIA PUBLIC EDUCATION REPORT CARD Howard Elementary School - 6251060
Prepared by Georgia Department of Education
Scores Reported in Percentiles
School System State
Page 3
STATE-REQUIRED TEST DATA
PERFORMANCE ASSESSMENTS
Grade 5 Writing Assessment
Percent at Developmental Stages:
1998-99 School System State
1997-98 School System State
1996-97 School System State
Stage Stage Stage Stage Stage Stage
1:The Emerging Writer 2:The Developing Writer 3:The Focusing Writer 4:The Experimenting 5:The Engaging Writer 6:The Extending Writer
0% 0% 7% 42% 35% 16%
0% 1% 22% 46% 23% 7%
0% 1% 16% 41% 29% 12%
0% 0% 5% 40% 40% 14%
0% 3% 24% 43% 22% 7%
0% 3% 19% 41% 27% 10%
0% 0% 12% 31% 39% 18%
0% 4% 26% 39% 22% 8%
0% 3% 21% 37% 26% 12%
AWARDS / RECOGNITION DATA
Schools in Georgia may receive recognition in the following programs: Charter School Pay for Performance Program Georgia School of Excellence National Blue Ribbon School Howard Elementary School did not receive recognition in any of these programs during the 1998-99 school year.
1998-99 GEORGIA PUBLIC EDUCATION REPORT CARD Howard Elementary School - 6251060
Prepared by Georgia Department of Education
Page 4
CERTIFIED PERSONNEL DATA
Positions Number Average Contract Days
Personnel Sex
Certificate
Years Experience
Full-time Part-time
Male Female
4 Yr Bachelor's 5 Yr Master's 6 Yr Specialist's 7 Yr Doctoral Other*
<1 1-10 11-20 21-30 >30
Average
Administrators
3.00 223.00
3 0
0 3
0 0 3 0 0 0 1 0 1 1 23.00
Support Personnel
2.50 190.00
2 1
0 3
0 2 1 0 0 0 0 1 2 0 22.67
PK-12 Teachers
51.90 190.00
51 2
2 51
26 25
2 0 0 0 14 26 12 1 14.91
*Includes One- and Two-Year Vocational Certificates.
ACCREDITATION DATA
Accredited by Southern Association of Colleges and Schools (SACS):
Elementary/Middle Commission.
1998-99 GEORGIA PUBLIC EDUCATION REPORT CARD Howard Elementary School - 6251060
Prepared by Georgia Department of Education
Page 5
1998-99 GEORGIA PUBLIC EDUCATION REPORT CARD
CHATHAM COUNTY SCHOOLS
Hubert Middle School - 6252060
Grade Range 6-8
The Georgia Public Education Report Card is designed to assist systems and schools in educational improvement. This report card contains a variety of data elements. An explanation of the terms is provided as a companion to the report card data. Please refer to the definitions for the most effective use of the reported data.
STUDENT DATA
Total 572
6-8 Enrollment, by Race/Ethnicity and Sex
Black
White Hispanic
American Multi-
Asian Indian
racial
501 87.6%
63 11.0%
4 0.7%
0 0.0%
0 0.0%
4 0.7%
Male 283
49.5%
Female 289
50.5%
Enrollment in Selected Programs
Program
Gifted (Grades K-12)
Program % of Student Enrollment Population
23
4.0%
Alternative Programs
30
(Grades 6-12)
5.2%
Students Eligible to Receive Free/Reduced Lunches
Number
Percent
School System
444 19,220
77.6% 52.3%
Enrollment in Compensatory Programs
Program
Program % of Student Enrollment Population
Special Education (Grades K-12) (PK)
92 16.1%
0
N/A
English to Speakers of Other Languages (ESOL) (Grades K-12)
1
< 1%
Title I (Grades K-12)
This school has a schoolwide program.
Dropout Rate for Grades 6-8
Number
Rate
School System
10
1.6%
68
0.8%
Total 10
Retained Students, by Race/Ethnicity and Sex
Black
White Hispanic
American MultiAsian Indian racial
10 100.0%
0 0.0%
0 0.0%
0 0.0%
0 0.0%
0 0.0%
Male Female
5
5
50.0% 50.0%
Prepared by Georgia Department of Education
Page 1
STATE-REQUIRED TEST DATA
NORM-REFERENCED TESTS Grade 8
Iowa Tests of Basic Skills (ITBS) Each chart reflects data for three years of testing.
Reading Comprehension 50
20 34 49 0
98-99
21 35 48 97-98
19 34 48 96-97
Mathematics
School 50
System
State
0
32 40 56 98-99
29 43 55 97-98
28 41 54 96-97
School System State
Reading Vocabulary 50
18 30 46 0
98-99
14 31 45 97-98
18 31 44 96-97
Language Arts
School 50
System
State
0
37 48 60 98-99
31 48 58 97-98
28 44 56 96-97
School System State
Social Studies 50
27 41 54 0
98-99
30 43 53 97-98
27 40 53 96-97
Science
School 50
System
State
0
24 38 56 98-99
21 38 55 97-98
20 38 53 96-97
School System State
Sources of Information
Composite Score
50
30 47 57 0
98-99
School 50
System
35 48 56 97-98
31 47 55 96-97
State 0
26 40 56 98-99
25 42 54 97-98
1998-99 GEORGIA PUBLIC EDUCATION REPORT CARD Hubert Middle School - 6252060
Prepared by Georgia Department of Education
23 40 54 96-97
Scores Reported in Percentiles
School System State
Page 2
STATE-REQUIRED TEST DATA
Categories of Scaled Scores
Inadequate (less than 162)
Minimal (162-209)
Good
(210-247)
Very Good (greater than 247)
Average Scaled Score: (Range 100-300)
PERFORMANCE ASSESSMENTS
Grade 8 Writing Assessment
1998-99 Percent Scoring
1997-98 Percent Scoring
1996-97 Percent Scoring
School System State School System State School System State
22% 55% 22%
1%
14% 51% 31%
4%
8% 40% 41% 11%
21% 63% 14%
2%
17% 53% 25%
4%
11% 46% 34%
8%
41% 47%
9% 3%
23% 50% 23%
5%
15% 46% 30%
8%
186
196
208 183
192 202 175
189 198
AWARDS / RECOGNITION DATA
Schools in Georgia may receive recognition in the following programs: Charter School Pay for Performance Program Georgia School of Excellence National Blue Ribbon School Hubert Middle School did not receive recognition in any of these programs during the 1998-99 school year.
1998-99 GEORGIA PUBLIC EDUCATION REPORT CARD Hubert Middle School - 6252060
Prepared by Georgia Department of Education
Page 3
CERTIFIED PERSONNEL DATA
Positions Number Average Contract Days
Personnel Sex
Certificate
Years Experience
Full-time Part-time
Male Female
4 Yr Bachelor's 5 Yr Master's 6 Yr Specialist's 7 Yr Doctoral Other*
<1 1-10 11-20 21-30 >30
Average
Administrators
1.00 209.00
1 0
0 1
0 0 1 0 0 0 0 1 0 0 18.00
Support Personnel
1.00 190.00
1 0
0 1
0 1 0 0 0 0 1 0 0 0 3.00
PK-12 Teachers
48.00 190.00
48 0
11 37
26 18
2 2 0 6 22 10 10 0 10.83
*Includes One- and Two-Year Vocational Certificates.
ACCREDITATION DATA
Accredited by Southern Association of Colleges and Schools (SACS):
Elementary/Middle Commission.
1998-99 GEORGIA PUBLIC EDUCATION REPORT CARD Hubert Middle School - 6252060
Prepared by Georgia Department of Education
Page 4
1998-99 GEORGIA PUBLIC EDUCATION REPORT CARD
CHATHAM COUNTY SCHOOLS
Islands Elementary School - 6250193
Grade Range PK-5
The Georgia Public Education Report Card is designed to assist systems and schools in educational improvement. This report card contains a variety of data elements. An explanation of the terms is provided as a companion to the report card data. Please refer to the definitions for the most effective use of the reported data.
STUDENT DATA
Total
K-5
855
PK
20
Enrollment, by Race/Ethnicity and Sex
Black
White Hispanic
American Asian Indian
Multiracial
549 64.2%
279 32.6%
4 0.5%
14 1.6%
2 0.2%
7 0.8%
7 35.0%
13 65.0%
0 0.0%
0 0.0%
0 0.0%
0 0.0%
Male Female
432 50.5%
423 49.5%
10 50.0%
10 50.0%
Enrollment in Selected Programs
Program
Program % of Student Enrollment Population
Gifted (Grades K-12)
46
5.4%
Alternative Programs (Grades 6-12)
N/A
N/A
Students Eligible to Receive Free/Reduced Lunches
Number
Percent
School System
509 19,220
58.2% 52.3%
Dropout Rate *
Number
Rate
School System
N/A N/A
N/A N/A
* Dropout rates are not applicable for grades PK-5.
Enrollment in Compensatory Programs
Program
Program % of Student Enrollment Population
Special Education (Grades K-12)
82
9.6%
(PK)
5
N/A
English to Speakers of Other Languages (ESOL) (Grades K-12)
0
0.0%
Remedial Education (Grades 2-5, 9-12)
108 19.7%
Special Instructional Assistance (SIA) (Grades K-3)
178 29.9%
Title I (Grades K-12)
This school has a Targeted Assistance program.
Total 31
Retained Students, by Race/Ethnicity and Sex
Black
White Hispanic
American MultiAsian Indian racial
24 77.4%
7 22.6%
0 0.0%
0 0.0%
0 0.0%
0 0.0%
Male Female
14
17
45.2% 54.8%
Prepared by Georgia Department of Education
Page 1
STATE-REQUIRED TEST DATA
NORM-REFERENCED TESTS Grade 3
Iowa Tests of Basic Skills (ITBS) Each chart reflects data for three years of testing.
Reading Comprehension 50
42 47 54 0
98-99
49 44 53 97-98
49 43 52 96-97
Mathematics
School 50
System
State
0
54 56 61 98-99
55 54 61 97-98
56 51 59 96-97
School System State
Reading Vocabulary 50
45 43 50 0
98-99
62 44 50 97-98
58 42 49 96-97
Language Arts
School 50
System
State
0
50 57 64 98-99
56 56 62 97-98
57 50 59 96-97
School System State
Social Studies 50
47 47 56 0
98-99
55 49 55 97-98
55 46 55 96-97
Science
School 50
System
State
0
43 50 59 98-99
57 51 59 97-98
60 49 58 96-97
School System State
Sources of Information
Composite Score
50
48 52 57 0
98-99
School 50
System
50 49 56 97-98
55 47 55 96-97
State 0
46 50 58 98-99
54 49 57 97-98
1998-99 GEORGIA PUBLIC EDUCATION REPORT CARD Islands Elementary School - 6250193
Prepared by Georgia Department of Education
55 47 56 96-97
Scores Reported in Percentiles
School System State
Page 2
STATE-REQUIRED TEST DATA
NORM-REFERENCED TESTS Grade 5
Iowa Tests of Basic Skills (ITBS) Each chart reflects data for three years of testing.
Reading Comprehension
Mathematics
50
52 47 53 0
98-99
53 47 53 97-98
51 44 52 96-97
School 50
System
State
0
58 51 59 98-99
59 53 58 97-98
59 49 57 96-97
School System State
Reading Vocabulary 50
44 39 48 0
98-99
43 44 48 97-98
49 38 46 96-97
Language Arts
School 50
System
State
0
61 58 63 98-99
56 57 61 97-98
54 49 58 96-97
School System State
Social Studies 50
53 49 57 0
98-99
56 49 56 97-98
53 45 55 96-97
Science
School 50
System
State
0
57 55 60 98-99
62 54 59 97-98
66 51 59 96-97
School System State
Sources of Information
Composite Score
50
54 55 58 0
98-99
School 50
System
58 54 58 97-98
55 50 57 96-97
State 0
54 51 57 98-99
55 51 56 97-98
56 46 55 96-97
1998-99 GEORGIA PUBLIC EDUCATION REPORT CARD Islands Elementary School - 6250193
Prepared by Georgia Department of Education
Scores Reported in Percentiles
School System State
Page 3
STATE-REQUIRED TEST DATA
PERFORMANCE ASSESSMENTS
Grade 5 Writing Assessment
Percent at Developmental Stages:
1998-99 School System State
1997-98 School System State
1996-97 School System State
Stage Stage Stage Stage Stage Stage
1:The Emerging Writer 2:The Developing Writer 3:The Focusing Writer 4:The Experimenting 5:The Engaging Writer 6:The Extending Writer
0% 0% 22% 47% 20% 10%
0% 1% 22% 46% 23% 7%
0% 1% 16% 41% 29% 12%
0% 3% 29% 33% 21% 13%
0% 3% 24% 43% 22% 7%
0% 3% 19% 41% 27% 10%
1% 3% 11% 38% 32% 12%
0% 4% 26% 39% 22% 8%
0% 3% 21% 37% 26% 12%
AWARDS / RECOGNITION DATA
Schools in Georgia may receive recognition in the following programs: Charter School Pay for Performance Program Georgia School of Excellence National Blue Ribbon School Islands Elementary School did not receive recognition in any of these programs during the 1998-99 school year.
1998-99 GEORGIA PUBLIC EDUCATION REPORT CARD Islands Elementary School - 6250193
Prepared by Georgia Department of Education
Page 4
CERTIFIED PERSONNEL DATA
Positions Number Average Contract Days
Personnel Sex
Certificate
Years Experience
Full-time Part-time
Male Female
4 Yr Bachelor's 5 Yr Master's 6 Yr Specialist's 7 Yr Doctoral Other*
<1 1-10 11-20 21-30 >30
Average
Administrators
1.00 209.00
1 0
0 1
0 0 1 0 0 0 0 0 1 0 26.00
Support Personnel
2.60 190.00
2 2
0 4
1 3 0 0 0 1 1 2 0 0 9.50
PK-12 Teachers
47.50 190.00
47 1
0 48
30 17
1 0 0 0 24 15 9 0 12.29
*Includes One- and Two-Year Vocational Certificates.
ACCREDITATION DATA
Accredited by Southern Association of Colleges and Schools (SACS):
Elementary/Middle Commission.
1998-99 GEORGIA PUBLIC EDUCATION REPORT CARD Islands Elementary School - 6250193
Prepared by Georgia Department of Education
Page 5
1998-99 GEORGIA PUBLIC EDUCATION REPORT CARD
CHATHAM COUNTY SCHOOLS
Isle of Hope Elementary School - 6253060
Grade Range PK-5
The Georgia Public Education Report Card is designed to assist systems and schools in educational improvement. This report card contains a variety of data elements. An explanation of the terms is provided as a companion to the report card data. Please refer to the definitions for the most effective use of the reported data.
STUDENT DATA
Total
K-5
684
PK
26
Enrollment, by Race/Ethnicity and Sex
Black
White Hispanic
American Asian Indian
Multiracial
354 51.8%
315 46.1%
2 0.3%
7 1.0%
0 0.0%
6 0.9%
14 53.8%
9 34.6%
0 0.0%
0 0.0%
0 0.0%
3 11.5%
Male Female
339 49.6%
345 50.4%
20 76.9%
6 23.1%
Enrollment in Selected Programs
Program
Program % of Student Enrollment Population
Gifted (Grades K-12)
61
8.9%
Alternative Programs (Grades 6-12)
N/A
N/A
Students Eligible to Receive Free/Reduced Lunches
Number
Percent
School System
304 19,220
42.8% 52.3%
Dropout Rate *
Number
Rate
School System
N/A N/A
N/A N/A
* Dropout rates are not applicable for grades PK-5.
Enrollment in Compensatory Programs
Program
Program % of Student Enrollment Population
Special Education (Grades K-12)
84 12.3%
(PK)
26
N/A
English to Speakers of Other Languages (ESOL) (Grades K-12)
0
0.0%
Remedial Education (Grades 2-5, 9-12)
72 15.8%
Special Instructional Assistance (SIA) (Grades K-3)
96 21.1%
Title I (Grades K-12)
This school has no Title I program.
Total 21
Retained Students, by Race/Ethnicity and Sex
Black
White Hispanic
American MultiAsian Indian racial
13 61.9%
8 38.1%
0 0.0%
0 0.0%
0 0.0%
0 0.0%
Male Female
8
13
38.1% 61.9%
Prepared by Georgia Department of Education
Page 1
STATE-REQUIRED TEST DATA
NORM-REFERENCED TESTS Grade 3
Iowa Tests of Basic Skills (ITBS) Each chart reflects data for three years of testing.
Reading Comprehension 50
54 47 54 0
98-99
51 44 53 97-98
41 43 52 96-97
Mathematics
School 50
System
State
0
58 56 61 98-99
61 54 61 97-98
50 51 59 96-97
School System State
Reading Vocabulary 50
48 43 50 0
98-99
46 44 50 97-98
43 42 49 96-97
Language Arts
School 50
System
State
0
60 57 64 98-99
55 56 62 97-98
52 50 59 96-97
School System State
Social Studies 50
53 47 56 0
98-99
56 49 55 97-98
45 46 55 96-97
Science
School 50
System
State
0
61 50 59 98-99
56 51 59 97-98
50 49 58 96-97
School System State
Sources of Information
Composite Score
50
54 52 57 0
98-99
School 50
System
54 49 56 97-98
50 47 55 96-97
State 0
56 50 58 98-99
54 49 57 97-98
1998-99 GEORGIA PUBLIC EDUCATION REPORT CARD Isle of Hope Elementary School - 6253060
Prepared by Georgia Department of Education
47 47 56 96-97
Scores Reported in Percentiles
School System State
Page 2
STATE-REQUIRED TEST DATA
NORM-REFERENCED TESTS Grade 5
Iowa Tests of Basic Skills (ITBS) Each chart reflects data for three years of testing.
Reading Comprehension
Mathematics
50
42 47 53 0
98-99
50 47 53 97-98
48 44 52 96-97
School 50
System
State
0
44 51 59 98-99
53 53 58 97-98
53 49 57 96-97
School System State
Reading Vocabulary 50
37 39 48 0
98-99
45 44 48 97-98
47 38 46 96-97
Language Arts
School 50
System
State
0
52 58 63 98-99
64 57 61 97-98
60 49 58 96-97
School System State
Social Studies 50
46 49 57 0
98-99
54 49 56 97-98
50 45 55 96-97
Science
School 50
System
State
0
52 55 60 98-99
60 54 59 97-98
59 51 59 96-97
School System State
Sources of Information
Composite Score
50
54 55 58 0
98-99
School 50
System
58 54 58 97-98
58 50 57 96-97
State 0
46 51 57 98-99
56 51 56 97-98
54 46 55 96-97
1998-99 GEORGIA PUBLIC EDUCATION REPORT CARD Isle of Hope Elementary School - 6253060
Prepared by Georgia Department of Education
Scores Reported in Percentiles
School System State
Page 3
STATE-REQUIRED TEST DATA
PERFORMANCE ASSESSMENTS
Grade 5 Writing Assessment
Percent at Developmental Stages:
1998-99 School System State
1997-98 School System State
1996-97 School System State
Stage Stage Stage Stage Stage Stage
1:The Emerging Writer 2:The Developing Writer 3:The Focusing Writer 4:The Experimenting 5:The Engaging Writer 6:The Extending Writer
0% 3% 23% 48% 22% 4%
0% 1% 22% 46% 23% 7%
0% 1% 16% 41% 29% 12%
1% 0% 17% 37% 34% 9%
0% 3% 24% 43% 22% 7%
0% 3% 19% 41% 27% 10%
2% 1% 13% 39% 27% 17%
0% 4% 26% 39% 22% 8%
0% 3% 21% 37% 26% 12%
AWARDS / RECOGNITION DATA
Schools in Georgia may receive recognition in the following programs: Charter School Pay for Performance Program Georgia School of Excellence National Blue Ribbon School Isle of Hope Elementary School did not receive recognition in any of these programs during the 1998-99 school year.
1998-99 GEORGIA PUBLIC EDUCATION REPORT CARD Isle of Hope Elementary School - 6253060
Prepared by Georgia Department of Education
Page 4
CERTIFIED PERSONNEL DATA
Positions Number Average Contract Days
Personnel Sex
Certificate
Years Experience
Full-time Part-time
Male Female
4 Yr Bachelor's 5 Yr Master's 6 Yr Specialist's 7 Yr Doctoral Other*
<1 1-10 11-20 21-30 >30
Average
Administrators
3.25 196.62
3 1
1 3
0 2 2 0 0 0 0 1 3 0 23.75
Support Personnel
3.50 190.00
3 1
0 4
0 3 1 0 0 0 0 2 2 0 20.50
PK-12 Teachers
40.80 190.00
40 1
3 38
27 12
2 0 0 2 8 19 11 1 16.00
*Includes One- and Two-Year Vocational Certificates.
ACCREDITATION DATA
Accredited by Southern Association of Colleges and Schools (SACS):
Elementary/Middle Commission.
1998-99 GEORGIA PUBLIC EDUCATION REPORT CARD Isle of Hope Elementary School - 6253060
Prepared by Georgia Department of Education
Page 5
1998-99 GEORGIA PUBLIC EDUCATION REPORT CARD
CHATHAM COUNTY SCHOOLS
Jacob G Smith Elementary School - 6255066
Grade Range K-5
The Georgia Public Education Report Card is designed to assist systems and schools in educational improvement. This report card contains a variety of data elements. An explanation of the terms is provided as a companion to the report card data. Please refer to the definitions for the most effective use of the reported data.
STUDENT DATA
Total 431
K-5 Enrollment, by Race/Ethnicity and Sex
Black
White Hispanic
American Multi-
Asian Indian
racial
276 64.0%
135 31.3%
9 2.1%
5 1.2%
0 0.0%
6 1.4%
Male Female
210 48.7%
221 51.3%
Enrollment in Selected Programs
Program
Program % of Student Enrollment Population
Gifted (Grades K-12)
50
11.6%
Alternative Programs (Grades 6-12)
N/A
N/A
Students Eligible to Receive Free/Reduced Lunches
Number
Percent
School System
252 19,220
58.5% 52.3%
Dropout Rate *
Number
Rate
School System
N/A N/A
N/A N/A
* Dropout rates are not applicable for grades PK-5.
Enrollment in Compensatory Programs
Program
Program % of Student Enrollment Population
Special Education (Grades K-12)
36
8.4%
(PK)
0
N/A
English to Speakers of Other Languages (ESOL) (Grades K-12)
0
0.0%
Remedial Education (Grades 2-5, 9-12)
50 17.0%
Special Instructional Assistance (SIA) (Grades K-3)
70 24.7%
Title I (Grades K-12)
This school has a Targeted Assistance program.
Total 5
Retained Students, by Race/Ethnicity and Sex
Black
White Hispanic
American Multi-
Asian Indian
racial
4 80.0%
1 20.0%
0 0.0%
0 0.0%
0 0.0%
0 0.0%
Male Female
2
3
40.0% 60.0%
Prepared by Georgia Department of Education
Page 1
STATE-REQUIRED TEST DATA
NORM-REFERENCED TESTS Grade 3
Iowa Tests of Basic Skills (ITBS) Each chart reflects data for three years of testing.
Reading Comprehension 50
59 47 54 0
98-99
39 44 53 97-98
35 43 52 96-97
Mathematics
School 50
System
State
0
64 56 61 98-99
45 54 61 97-98
43 51 59 96-97
School System State
Reading Vocabulary 50
47 43 50 0
98-99
38 44 50 97-98
33 42 49 96-97
Language Arts
School 50
System
State
0
71 57 64 98-99
54 56 62 97-98
52 50 59 96-97
School System State
Social Studies 50
59 47 56 0
98-99
43 49 55 97-98
35 46 55 96-97
Science
School 50
System
State
0
63 50 59 98-99
48 51 59 97-98
44 49 58 96-97
School System State
Sources of Information
Composite Score
50
61 52 57 0
98-99
School 50
System
46 49 56 97-98
39 47 55 96-97
State 0
61 50 58 98-99
45 49 57 97-98
1998-99 GEORGIA PUBLIC EDUCATION REPORT CARD Jacob G Smith Elementary School - 6255066
Prepared by Georgia Department of Education
39 47 56 96-97
Scores Reported in Percentiles
School System State
Page 2
STATE-REQUIRED TEST DATA
NORM-REFERENCED TESTS Grade 5
Iowa Tests of Basic Skills (ITBS) Each chart reflects data for three years of testing.
Reading Comprehension
Mathematics
50
52 47 53 0
98-99
46 47 53 97-98
43 44 52 96-97
School 50
System
State
0
58 51 59 98-99
41 53 58 97-98
57 49 57 96-97
School System State
Reading Vocabulary 50
38 39 48 0
98-99
38 44 48 97-98
92 38 46 96-97
Language Arts
School 50
System
State
0
62 58 63 98-99
60 57 61 97-98
58 49 58 96-97
School System State
Social Studies 50
52 49 57 0
98-99
35 49 56 97-98
46 45 55 96-97
Science
School 50
System
State
0
64 55 60 98-99
50 54 59 97-98
56 51 59 96-97
School System State
Sources of Information
Composite Score
50
63 55 58 0
98-99
School 50
System
55 54 58 97-98
53 50 57 96-97
State 0
58 51 57 98-99
46 51 56 97-98
55 46 55 96-97
1998-99 GEORGIA PUBLIC EDUCATION REPORT CARD Jacob G Smith Elementary School - 6255066
Prepared by Georgia Department of Education
Scores Reported in Percentiles
School System State
Page 3
STATE-REQUIRED TEST DATA
PERFORMANCE ASSESSMENTS
Grade 5 Writing Assessment
Percent at Developmental Stages:
1998-99 School System State
1997-98 School System State
1996-97 School System State
Stage Stage Stage Stage Stage Stage
1:The Emerging Writer 2:The Developing Writer 3:The Focusing Writer 4:The Experimenting 5:The Engaging Writer 6:The Extending Writer
2% 2% 21% 38% 26% 11%
0% 1% 22% 46% 23% 7%
0% 1% 16% 41% 29% 12%
0% 5% 30% 49% 14% 2%
0% 3% 24% 43% 22% 7%
0% 3% 19% 41% 27% 10%
0% 3% 16% 48% 27% 5%
0% 4% 26% 39% 22% 8%
0% 3% 21% 37% 26% 12%
AWARDS / RECOGNITION DATA
Schools in Georgia may receive recognition in the following programs: Charter School Pay for Performance Program Georgia School of Excellence National Blue Ribbon School Jacob G Smith Elementary School did not receive recognition in any of these programs during the 1998-99 school year.
1998-99 GEORGIA PUBLIC EDUCATION REPORT CARD Jacob G Smith Elementary School - 6255066
Prepared by Georgia Department of Education
Page 4
CERTIFIED PERSONNEL DATA
Positions Number Average Contract Days
Personnel Sex
Certificate
Years Experience
Full-time Part-time
Male Female
4 Yr Bachelor's 5 Yr Master's 6 Yr Specialist's 7 Yr Doctoral Other*
<1 1-10 11-20 21-30 >30
Average
Administrators
2.00 202.00
1 2
0 3
0 1 1 1 0 0 0 0 3 0 23.67
Support Personnel
2.00 190.00
2 0
0 2
0 2 0 0 0 0 0 1 1 0 19.50
PK-12 Teachers
27.15 190.00
25 4
2 27
19 8 2 0 0 1 8
11 7 2
14.86
*Includes One- and Two-Year Vocational Certificates.
ACCREDITATION DATA
Accredited by Southern Association of Colleges and Schools (SACS):
Elementary/Middle Commission.
1998-99 GEORGIA PUBLIC EDUCATION REPORT CARD Jacob G Smith Elementary School - 6255066
Prepared by Georgia Department of Education
Page 5
1998-99 GEORGIA PUBLIC EDUCATION REPORT CARD
CHATHAM COUNTY SCHOOLS
Jenkins High School - 6255060
Grade Range 9-12
The Georgia Public Education Report Card is designed to assist systems and schools in educational improvement. This report card contains a variety of data elements. An explanation of the terms is provided as a companion to the report card data. Please refer to the definitions for the most effective use of the reported data.
Total 1,785
STUDENT DATA
9-12 Enrollment, by Race/Ethnicity and Sex
Black
White Hispanic
American Multi-
Asian Indian
racial
969 54.3%
724 40.6%
18 1.0%
59 3.3%
5 0.3%
10 0.6%
Male Female
926 51.9%
859 48.1%
Enrollment in Selected Programs
Program
Gifted (Grades K-12)
Program % of Student Enrollment Population
166
9.3%
Non-Vocational Labs (Grades 9-12)
Vocational Labs (Grades 9-12)
Alternative Programs (Grades 6-12)
1,477 617 73
82.7% 34.6%
4.1%
Students Eligible to Receive Free/Reduced Lunches
Number
Percent
School System
516 19,220
28.9% 52.3%
Enrollment in Compensatory Programs
Program
Program % of Student Enrollment Population
Special Education (Grades K-12) PK
167
9.4%
0
N/A
English to Speakers of Other Languages (ESOL) (Grades K-12)
0
0.0%
Remedial Education (Grades 2-5, 9-12)
94
5.3%
Title I (Grades K-12)
This school has no Title I program.
Dropout Rate for Grades 9-12
Number
Rate
School System
87
4.5%
784
7.8%
Total 291
Retained Students, by Race/Ethnicity and Sex
Black
White Hispanic
American MultiAsian Indian racial
203 69.8%
84 28.9%
0 0.0%
2 0.7%
0 0.0%
2 0.7%
Male Female 164 127
56.4% 43.6%
Prepared by Georgia Department of Education
Page 1
STATE-REQUIRED TEST DATA
GEORGIA HIGH SCHOOL GRADUATION TESTS (GHSGT)
Percent of Regular Program 11th Graders Passing the Georgia High School Graduation Tests on First Administration
English Language Arts Mathematics Social Studies Science
All Components listed above
Writing
1998-99
School System State
95% 85% 86% 71%
93% 75% 69% 55%
96% 88% 80% 72%
70% 51% 68%
91% 87% 93%
1997-98
School System State
93% 85% 78% 71%
89% 79% 64% 55%
94% 88% 78% 74%
65% 49% 68%
88% 87% 92%
1996-97
School System State
91% 85% 77% 75%
91% 77% 65% 58%
94% 87% 78% 74%
72% 52% 67%
94% 90% 93%
GRADUATE DATA
1999 Graduates by Credentials, Race/Ethnicity and Sex
Diplomas with Both College Prep. & Voc. Endorsements
Diplomas with College Prep. Endorsements Diplomas with Vocational Endorsements General High School Diplomas Special Education Diplomas
Total All Diplomas
Certificates of Performance
Total Graduates
Total 26
157 37 5 9
234 18
252
Black
11 42.3%
57 36.3%
29 78.4%
2 40.0%
5 55.6%
104 44.4%
11 61.1%
115 45.6%
White Hispanic
15 57.7%
83 52.9%
0 0.0%
2 1.3%
8 21.6%
2 40.0%
4 44.4%
0 0.0%
0 0.0%
0 0.0%
112 47.9%
2 0.9%
2
5
11.1% 27.8%
114 45.2%
7 2.8%
American MultiAsian Indian racial
0 0.0%
11 7.0%
0 0.0%
1 0.6%
0 0.0%
3 1.9%
0 0.0%
0 0.0%
0 0.0%
0 0.0%
0 0.0%
0 0.0%
0 0.0%
1 20.0%
0 0.0%
11 4.7%
1 0.4%
4 1.7%
0 0.0%
0 0.0%
0 0.0%
11 4.4%
1 0.4%
4 1.6%
Male Female
11 42.3%
67 42.7%
15 57.7%
90 57.3%
21 56.8%
3 60.0%
8 88.9%
16 43.2%
2 40.0%
1 11.1%
110
124
47.0% 53.0%
5
13
27.8% 72.2%
115
137
45.6% 54.4%
HOPE Scholarships
School System
Number of 1999 Graduates 2 5 2
Number Eligible
174
Percent Eligible
69.0%
1,436 749
52.2%
State
65,548 40,292 61.5%
High School Completion Rate
Percent of 1995Grade 9 Enrollment in Graduating Class of1999 School System State
Completion Rate '95-'99 69.6% 62.1% 68.9%
1998-99 GEORGIA PUBLIC EDUCATION REPORT CARD
Jenkins High School - 6255060
Prepared by Georgia Department of Education
Page 2
COLLEGE ADMISSIONS / CREDIT TEST DATA
Scholastic Assessment Test (SAT)
Based on students' highest verbal and highest math scores
No. Taking
Average Score
Tests Verbal Math Total
Based on students' last test administration
Average Score Verbal Math Total
School
155
College Prep. Endorsement
Other Diplomas
System
578
College Prep. Endorsement
Other Diplomas
Georgia
41,958
551 533 1084
543 528 1071
428 400
828
489 473
962
483 469
952
419 379
798
492 488
980
540 N/A N/A
480 N/A N/A
483
522 N/A N/A
464 N/A N/A
479
1062 N/A N/A
944 N/A N/A
962
Nation
952,913 N/A N/A N/A
502 508 1010
American College Testing (ACT)
Advanced Placement Exams (AP)
Number taking tests: English Mathematics Reading Science Reasoning CompositeScore
6 7 School System State
18.5 16.0 19.1
19.4 17.1 19.9
20.0 19.7
17.5 17.7
20.2 19.9
19.5 17.2 19.9
No. of Students Taking Tests
No. of Tests Taken No. of Test Scores
3 or Higher Percent of Test
Scores 3 or Higher
School 111 220 143
65.0%
System State 291 15,225 509 23,969 254 13,024
49.9% 54.3%
POST-SECONDARY DATA
Graduates Entering Georgia Public Colleges
Graduates Entering Georgia Public Colleges and Requiring Learning Support (LS)
1998 Graduates Entering in 1998-99
1997 Graduates Entering in 1997-98
Percent of Graduating Number Class
School
139
45.0%
System 470
30.4%
School
140
46.4%
System 565
37.0%
Number Requiring
LS 32 159
34 232
Percent of those attending Georgia
Public Colleges
23.0%
33.8%
24.3%
41.1%
In previous years, the Report Card presented College Prep Curriculum information provided by the Board of Regents on students requiring Learning Support. Due to inconsistencies in the data provided by the Board of Regents in defining College Prep Completers versus Local Board of Education data defining College Prep Endorsements, the Department of Education Report Card will not provide this information until discrepancies can be reconciled.
Graduates Entering Georgia Public Technical and Adult Schools
1998 Graduates School System
Entering Number 11 78
1998-99 Percent
3.6% 5.0%
Entering Number N/A N/A
1997-98 Percent
N/A N/A
1997 Graduates School
0
0.0%
System
15
1.0%
14
4.6%
89
5.8%
1998-99 GEORGIA PUBLIC EDUCATION REPORT CARD Jenkins High School - 6255060
Prepared by Georgia Department of Education
Page 3
CERTIFIED PERSONNEL DATA
Positions Number Average Contract Days
Administrators
2.00 200.00
Support Personnel
4.90 190.00
PK-12 Teachers
84.00 190.00
Personnel Sex
Certificate
Years Experience
Full-time Part-time
Male Female
4 Yr Bachelor's 5 Yr Master's 6 Yr Specialist's 7 Yr Doctoral Other*
<1 1-10 11-20 21-30 >30
Average
2 0
1 1
0 1 1 0 0
0 0 1 1 0
19.00
4 2
2 4
0 3 3 0 0
0 0 2 3 1
24.67
84 0
34 50
41 36
6 1 0
0 32 24 21
7
16.37
*Includes One- and Two-Year Vocational Certificates.
ACCREDITATION DATA
Accredited by Southern Association of Colleges and Schools (SACS): Secondary/Middle Commission.
AWARDS / RECOGNITION DATA
Schools in Georgia may receive recognition in the following programs: Charter School Pay for Performance Program Georgia School of Excellence National Blue Ribbon School Jenkins High School did not receive recognition in any of these programs during the 1998-99 school year.
1998-99 GEORGIA PUBLIC EDUCATION REPORT CARD Jenkins High School - 6255060
Prepared by Georgia Department of Education
Page 4
1998-99 GEORGIA PUBLIC EDUCATION REPORT CARD
CHATHAM COUNTY SCHOOLS
Johnson High School - 6251062
Grade Range 9-12
The Georgia Public Education Report Card is designed to assist systems and schools in educational improvement. This report card contains a variety of data elements. An explanation of the terms is provided as a companion to the report card data. Please refer to the definitions for the most effective use of the reported data.
Total 1,087
STUDENT DATA
9-12 Enrollment, by Race/Ethnicity and Sex
Black
White Hispanic
American Multi-
Asian Indian
racial
618 56.9%
436 40.1%
7 0.6%
20 1.8%
0 0.0%
6 0.6%
Male Female
579 53.3%
508 46.7%
Enrollment in Selected Programs
Program
Gifted (Grades K-12)
Program % of Student Enrollment Population
29
2.7%
Non-Vocational Labs (Grades 9-12)
812
Vocational Labs
(Grades 9-12)
492
Alternative Programs (Grades 6-12)
52
74.7% 45.3%
4.8%
Students Eligible to Receive Free/Reduced Lunches
Number
Percent
School System
374 19,220
34.4% 52.3%
Enrollment in Compensatory Programs
Program
Program % of Student Enrollment Population
Special Education (Grades K-12) PK
159 14.6%
0
N/A
English to Speakers of Other Languages (ESOL) (Grades K-12)
0
0.0%
Remedial Education (Grades 2-5, 9-12)
60
5.5%
Title I (Grades K-12)
This school has no Title I program.
Dropout Rate for Grades 9-12
Number
Rate
School System
155
12.8%
784
7.8%
Total 241
Retained Students, by Race/Ethnicity and Sex
Black
White Hispanic
American MultiAsian Indian racial
164 68.0%
75 31.1%
0 0.0%
1 0.4%
0 0.0%
1 0.4%
Male Female
145
96
60.2% 39.8%
Prepared by Georgia Department of Education
Page 1
STATE-REQUIRED TEST DATA
GEORGIA HIGH SCHOOL GRADUATION TESTS (GHSGT)
Percent of Regular Program 11th Graders Passing the Georgia High School Graduation Tests on First Administration
English Language Arts Mathematics Social Studies Science
All Components listed above
Writing
1998-99
School System State
91% 73% 65% 50%
93% 75% 69% 55%
96% 88% 80% 72%
47% 51% 68%
88% 87% 93%
1997-98
School System State
89% 75% 59% 45%
89% 79% 64% 55%
94% 88% 78% 74%
41% 49% 68%
80% 87% 92%
1996-97
School System State
93% 79% 63% 58%
91% 77% 65% 58%
94% 87% 78% 74%
49% 52% 67%
94% 90% 93%
GRADUATE DATA
1999 Graduates by Credentials, Race/Ethnicity and Sex
Diplomas with Both College Prep. & Voc. Endorsements
Diplomas with College Prep. Endorsements Diplomas with Vocational Endorsements General High School Diplomas Special Education Diplomas
Total All Diplomas
Certificates of Performance
Total Graduates
Total 8
84 22
5 12 131 21 152
Black
3 37.5%
35 41.7%
16 72.7%
5 100.0%
5 41.7%
64 48.9%
17 81.0%
81 53.3%
White Hispanic
5 62.5%
43 51.2%
0 0.0%
0 0.0%
5 22.7%
0 0.0%
6 50.0%
0 0.0%
0 0.0%
0 0.0%
59 45.0%
0 0.0%
3 14.3%
1 4.8%
62 40.8%
1 0.7%
American MultiAsian Indian racial
0 0.0%
6 7.1%
0 0.0%
0 0.0%
0 0.0%
0 0.0%
1 4.5%
0 0.0%
0 0.0%
0 0.0%
0 0.0%
0 0.0%
0 0.0%
0 0.0%
1 8.3%
7 5.3%
0 0.0%
1 0.8%
0 0.0%
0 0.0%
0 0.0%
7 4.6%
0 0.0%
1 0.7%
Male Female
3 37.5%
40 47.6%
5 62.5%
44 52.4%
14 63.6%
4 80.0%
7 58.3%
8 36.4%
1 20.0%
5 41.7%
68
63
51.9% 48.1%
8
13
38.1% 61.9%
76
76
50.0% 50.0%
HOPE Scholarships
School System
Number of 1999 Graduates 1 5 2
Number Eligible
71
Percent Eligible
46.7%
1,436 749
52.2%
State
65,548 40,292 61.5%
High School Completion Rate
Percent of 1995Grade 9 Enrollment in Graduating Class of1999 School System State
Completion Rate '95-'99 52.2% 62.1% 68.9%
1998-99 GEORGIA PUBLIC EDUCATION REPORT CARD
Johnson High School - 6251062
Prepared by Georgia Department of Education
Page 2
COLLEGE ADMISSIONS / CREDIT TEST DATA
Scholastic Assessment Test (SAT)
Based on students' highest verbal and highest math scores
No. Taking
Average Score
Tests Verbal Math Total
Based on students' last test administration
Average Score Verbal Math Total
School
47
College Prep. Endorsement
Other Diplomas
System
578
College Prep. Endorsement
Other Diplomas
Georgia
41,958
478 477 N/A
489 483 419
492
444 436 N/A
473 469 379
488
922 913 N/A
962 952 798
980
470 N/A N/A
480 N/A N/A
483
438 N/A N/A
464 N/A N/A
479
908 N/A N/A
944 N/A N/A
962
Nation
952,913 N/A N/A N/A
502 508 1010
American College Testing (ACT)
Advanced Placement Exams (AP)
Number taking tests: English Mathematics Reading Science Reasoning CompositeScore
4 1 School System State
14.1 16.0 19.1
15.7 17.1 19.9
15.6 16.0
17.5 17.7
20.2 19.9
15.4 17.2 19.9
No. of Students Taking Tests
No. of Tests Taken No. of Test Scores
3 or Higher Percent of Test
Scores 3 or Higher
School 19 20 3
15.0%
System State 291 15,225 509 23,969 254 13,024
49.9% 54.3%
POST-SECONDARY DATA
Graduates Entering Georgia Public Colleges
Graduates Entering Georgia Public Colleges and Requiring Learning Support (LS)
1998 Graduates Entering in 1998-99
1997 Graduates Entering in 1997-98
Percent of Graduating Number Class
School
52
29.7%
System 470
30.4%
School
44
28.0%
System 565
37.0%
Number Requiring
LS 20 159
15 232
Percent of those attending Georgia
Public Colleges
38.5%
33.8%
34.1%
41.1%
In previous years, the Report Card presented College Prep Curriculum information provided by the Board of Regents on students requiring Learning Support. Due to inconsistencies in the data provided by the Board of Regents in defining College Prep Completers versus Local Board of Education data defining College Prep Endorsements, the Department of Education Report Card will not provide this information until discrepancies can be reconciled.
Graduates Entering Georgia Public Technical and Adult Schools
1998 Graduates School System
Entering Number 10 78
1998-99 Percent
5.7% 5.0%
Entering Number N/A N/A
1997-98 Percent
N/A N/A
1997 Graduates School
2
1.3%
System
15
1.0%
10
6.4%
89
5.8%
1998-99 GEORGIA PUBLIC EDUCATION REPORT CARD Johnson High School - 6251062
Prepared by Georgia Department of Education
Page 3
CERTIFIED PERSONNEL DATA
Positions Number Average Contract Days
Administrators
2.25 208.44
Support Personnel
5.40 190.00
PK-12 Teachers
65.50 190.00
Personnel Sex
Certificate
Years Experience
Full-time Part-time
Male Female
4 Yr Bachelor's 5 Yr Master's 6 Yr Specialist's 7 Yr Doctoral Other*
<1 1-10 11-20 21-30 >30
Average
2 1
2 1
0 2 1 0 0
0 0 0 2 1
29.33
4 2
1 5
1 5 0 0 0
1 0 1 2 2
22.33
65 1
21 45
32 30
4 0 0
0 21 24 16
5
16.58
*Includes One- and Two-Year Vocational Certificates.
ACCREDITATION DATA
Accredited by Southern Association of Colleges and Schools (SACS): Secondary/Middle Commission.
AWARDS / RECOGNITION DATA
Schools in Georgia may receive recognition in the following programs: Charter School Pay for Performance Program Georgia School of Excellence National Blue Ribbon School Johnson High School did not receive recognition in any of these programs during the 1998-99 school year.
1998-99 GEORGIA PUBLIC EDUCATION REPORT CARD Johnson High School - 6251062
Prepared by Georgia Department of Education
Page 4
1998-99 GEORGIA PUBLIC EDUCATION REPORT CARD
CHATHAM COUNTY SCHOOLS
Largo-Tibet Elementary School - 6252062
Grade Range PK-5
The Georgia Public Education Report Card is designed to assist systems and schools in educational improvement. This report card contains a variety of data elements. An explanation of the terms is provided as a companion to the report card data. Please refer to the definitions for the most effective use of the reported data.
STUDENT DATA
Total
K-5
612
PK
40
Enrollment, by Race/Ethnicity and Sex
Black
White Hispanic
American Asian Indian
Multiracial
351 57.4%
188 30.7%
21 3.4%
23 3.8%
1 0.2%
28 4.6%
26 65.0%
10 25.0%
2 5.0%
0 0.0%
0 0.0%
2 5.0%
Male Female
310 50.7%
302 49.3%
15 37.5%
25 62.5%
Enrollment in Selected Programs
Program
Program % of Student Enrollment Population
Gifted (Grades K-12)
56
9.2%
Alternative Programs (Grades 6-12)
N/A
N/A
Students Eligible to Receive Free/Reduced Lunches
Number
Percent
School System
297 19,220
45.6% 52.3%
Dropout Rate *
Number
Rate
School System
N/A N/A
N/A N/A
* Dropout rates are not applicable for grades PK-5.
Enrollment in Compensatory Programs
Program
Program % of Student Enrollment Population
Special Education (Grades K-12)
52
8.5%
(PK)
1
N/A
English to Speakers of Other Languages (ESOL) (Grades K-12)
0
0.0%
Remedial Education (Grades 2-5, 9-12)
49 12.1%
Special Instructional Assistance (SIA) (Grades K-3)
82 20.1%
Title I (Grades K-12)
This school has no Title I program.
Total 17
Retained Students, by Race/Ethnicity and Sex
Black
White Hispanic
American MultiAsian Indian racial
12 70.6%
2
3
11.8% 17.6%
0 0.0%
0 0.0%
0 0.0%
Male Female
11
6
64.7% 35.3%
Prepared by Georgia Department of Education
Page 1
STATE-REQUIRED TEST DATA
NORM-REFERENCED TESTS Grade 3
Iowa Tests of Basic Skills (ITBS) Each chart reflects data for three years of testing.
Reading Comprehension 50
51 47 54 0
98-99
52 44 53 97-98
59 43 52 96-97
Mathematics
School 50
System
State
0
67 56 61 98-99
65 54 61 97-98
61 51 59 96-97
School System State
Reading Vocabulary 50
49 43 50 0
98-99
52 44 50 97-98
50 42 49 96-97
Language Arts
School 50
System
State
0
66 57 64 98-99
63 56 62 97-98
57 50 59 96-97
School System State
Social Studies 50
50 47 56 0
98-99
57 49 55 97-98
55 46 55 96-97
Science
School 50
System
State
0
53 50 59 98-99
61 51 59 97-98
60 49 58 96-97
School System State
Sources of Information
Composite Score
50
59 52 57 0
98-99
School 50
System
61 49 56 97-98
56 47 55 96-97
State 0
57 50 58 98-99
59 49 57 97-98
1998-99 GEORGIA PUBLIC EDUCATION REPORT CARD Largo-Tibet Elementary School - 6252062
Prepared by Georgia Department of Education
57 47 56 96-97
Scores Reported in Percentiles
School System State
Page 2
STATE-REQUIRED TEST DATA
NORM-REFERENCED TESTS Grade 5
Iowa Tests of Basic Skills (ITBS) Each chart reflects data for three years of testing.
Reading Comprehension
Mathematics
50
55 47 53 0
98-99
57 47 53 97-98
53 44 52 96-97
School 50
System
State
0
57 51 59 98-99
67 53 58 97-98
57 49 57 96-97
School System State
Reading Vocabulary 50
46 39 48 0
98-99
49 44 48 97-98
44 38 46 96-97
Language Arts
School 50
System
State
0
62 58 63 98-99
63 57 61 97-98
59 49 58 96-97
School System State
Social Studies 50
56 49 57 0
98-99
60 49 56 97-98
51 45 55 96-97
Science
School 50
System
State
0
60 55 60 98-99
63 54 59 97-98
60 51 59 96-97
School System State
Sources of Information
Composite Score
50
55 55 58 0
98-99
School 50
System
62 54 58 97-98
58 50 57 96-97
State 0
56 51 57 98-99
61 51 56 97-98
55 46 55 96-97
1998-99 GEORGIA PUBLIC EDUCATION REPORT CARD Largo-Tibet Elementary School - 6252062
Prepared by Georgia Department of Education
Scores Reported in Percentiles
School System State
Page 3
STATE-REQUIRED TEST DATA
PERFORMANCE ASSESSMENTS
Grade 5 Writing Assessment
Percent at Developmental Stages:
1998-99 School System State
1997-98 School System State
1996-97 School System State
Stage Stage Stage Stage Stage Stage
1:The Emerging Writer 2:The Developing Writer 3:The Focusing Writer 4:The Experimenting 5:The Engaging Writer 6:The Extending Writer
0% 0% 19% 40% 33% 8%
0% 1% 22% 46% 23% 7%
0% 1% 16% 41% 29% 12%
0% 1% 18% 43% 24% 14%
0% 3% 24% 43% 22% 7%
0% 3% 19% 41% 27% 10%
0% 0% 26% 46% 26% 3%
0% 4% 26% 39% 22% 8%
0% 3% 21% 37% 26% 12%
AWARDS / RECOGNITION DATA
Schools in Georgia may receive recognition in the following programs: Charter School Pay for Performance Program Georgia School of Excellence National Blue Ribbon School Largo-Tibet Elementary School did not receive recognition in any of these programs during the 1998-99 school year.
1998-99 GEORGIA PUBLIC EDUCATION REPORT CARD Largo-Tibet Elementary School - 6252062
Prepared by Georgia Department of Education
Page 4
CERTIFIED PERSONNEL DATA
Positions Number Average Contract Days
Personnel Sex
Certificate
Years Experience
Full-time Part-time
Male Female
4 Yr Bachelor's 5 Yr Master's 6 Yr Specialist's 7 Yr Doctoral Other*
<1 1-10 11-20 21-30 >30
Average
Administrators
2.00 204.50
2 0
1 1
0 1 1 0 0 0 0 1 1 0 18.50
Support Personnel
2.00 190.00
2 0
0 2
0 0 2 0 0 0 0 1 1 0 22.00
PK-12 Teachers
42.20 190.00
41 2
6 37
23 12
7 1 0 4 9 18 12 0 14.98
*Includes One- and Two-Year Vocational Certificates.
ACCREDITATION DATA
Accredited by Southern Association of Colleges and Schools (SACS):
Elementary/Middle Commission.
1998-99 GEORGIA PUBLIC EDUCATION REPORT CARD Largo-Tibet Elementary School - 6252062
Prepared by Georgia Department of Education
Page 5
1998-99 GEORGIA PUBLIC EDUCATION REPORT CARD
CHATHAM COUNTY SCHOOLS
Low Elementary School - 6253062
Grade Range PK-5
The Georgia Public Education Report Card is designed to assist systems and schools in educational improvement. This report card contains a variety of data elements. An explanation of the terms is provided as a companion to the report card data. Please refer to the definitions for the most effective use of the reported data.
STUDENT DATA
Total
K-5
660
PK
21
Enrollment, by Race/Ethnicity and Sex
Black
White Hispanic
American Asian Indian
Multiracial
492 74.5%
160 24.2%
0 0.0%
1 0.2%
0 0.0%
7 1.1%
9 42.9%
12 57.1%
0 0.0%
0 0.0%
0 0.0%
0 0.0%
Male Female
346 52.4%
314 47.6%
9 42.9%
12 57.1%
Enrollment in Selected Programs
Program
Program % of Student Enrollment Population
Gifted (Grades K-12)
15
2.3%
Alternative Programs (Grades 6-12)
N/A
N/A
Students Eligible to Receive Free/Reduced Lunches
Number
Percent
School System
425 19,220
62.4% 52.3%
Dropout Rate *
Number
Rate
School System
N/A N/A
N/A N/A
* Dropout rates are not applicable for grades PK-5.
Enrollment in Compensatory Programs
Program
Program % of Student Enrollment Population
Special Education (Grades K-12)
85 12.9%
(PK)
1
N/A
English to Speakers of Other Languages (ESOL) (Grades K-12)
0
0.0%
Remedial Education (Grades 2-5, 9-12)
0
0.0%
Special Instructional Assistance (SIA) (Grades K-3)
116 25.8%
Title I (Grades K-12)
This school has a Targeted Assistance program.
Total 24
Retained Students, by Race/Ethnicity and Sex
Black
White Hispanic
American MultiAsian Indian racial
20 83.3%
4 16.7%
0 0.0%
0 0.0%
0 0.0%
0 0.0%
Male Female
16
8
66.7% 33.3%
Prepared by Georgia Department of Education
Page 1
STATE-REQUIRED TEST DATA
NORM-REFERENCED TESTS Grade 3
Iowa Tests of Basic Skills (ITBS) Each chart reflects data for three years of testing.
Reading Comprehension 50
42 47 54 0
98-99
39 44 53 97-98
36 43 52 96-97
Mathematics
School 50
System
State
0
55 56 61 98-99
52 54 61 97-98
47 51 59 96-97
School System State
Reading Vocabulary 50
39 43 50 0
98-99
35 44 50 97-98
31 42 49 96-97
Language Arts
School 50
System
State
0
43 57 64 98-99
47 56 62 97-98
35 50 59 96-97
School System State
Social Studies 50
43 47 56 0
98-99
45 49 55 97-98
32 46 55 96-97
Science
School 50
System
State
0
47 50 59 98-99
44 51 59 97-98
42 49 58 96-97
School System State
Sources of Information
Composite Score
50
43 52 57 0
98-99
School 50
System
40 49 56 97-98
38 47 55 96-97
State 0
44 50 58 98-99
42 49 57 97-98
1998-99 GEORGIA PUBLIC EDUCATION REPORT CARD Low Elementary School - 6253062
Prepared by Georgia Department of Education
36 47 56 96-97
Scores Reported in Percentiles
School System State
Page 2
STATE-REQUIRED TEST DATA
NORM-REFERENCED TESTS Grade 5
Iowa Tests of Basic Skills (ITBS) Each chart reflects data for three years of testing.
Reading Comprehension
Mathematics
50
41 47 53 0
98-99
47 47 53 97-98
38 44 52 96-97
School 50
System
State
0
55 51 59 98-99
57 53 58 97-98
53 49 57 96-97
School System State
Reading Vocabulary 50
31 39 48 0
98-99
40 44 48 97-98
31 38 46 96-97
Language Arts
School 50
System
State
0
58 58 63 98-99
54 57 61 97-98
46 49 58 96-97
School System State
Social Studies 50
39 49 57 0
98-99
48 49 56 97-98
33 45 55 96-97
Science
School 50
System
State
0
47 55 60 98-99
48 54 59 97-98
44 51 59 96-97
School System State
Sources of Information
Composite Score
50
49 55 58 0
98-99
School 50
System
52 54 58 97-98
43 50 57 96-97
State 0
46 51 57 98-99
48 51 56 97-98
40 46 55 96-97
1998-99 GEORGIA PUBLIC EDUCATION REPORT CARD Low Elementary School - 6253062
Prepared by Georgia Department of Education
Scores Reported in Percentiles
School System State
Page 3
STATE-REQUIRED TEST DATA
PERFORMANCE ASSESSMENTS
Grade 5 Writing Assessment
Percent at Developmental Stages:
1998-99 School System State
1997-98 School System State
1996-97 School System State
Stage Stage Stage Stage Stage Stage
1:The Emerging Writer 2:The Developing Writer 3:The Focusing Writer 4:The Experimenting 5:The Engaging Writer 6:The Extending Writer
0% 2% 20% 54% 18% 6%
0% 1% 22% 46% 23% 7%
0% 1% 16% 41% 29% 12%
0% 2% 9% 46% 30% 14%
0% 3% 24% 43% 22% 7%
0% 3% 19% 41% 27% 10%
1% 4% 19% 38% 32% 4%
0% 4% 26% 39% 22% 8%
0% 3% 21% 37% 26% 12%
AWARDS / RECOGNITION DATA
Schools in Georgia may receive recognition in the following programs: Charter School Pay for Performance Program Georgia School of Excellence National Blue Ribbon School Low Elementary School did not receive recognition in any of these programs during the 1998-99 school year.
1998-99 GEORGIA PUBLIC EDUCATION REPORT CARD Low Elementary School - 6253062
Prepared by Georgia Department of Education
Page 4
CERTIFIED PERSONNEL DATA
Positions Number Average Contract Days
Personnel Sex
Certificate
Years Experience
Full-time Part-time
Male Female
4 Yr Bachelor's 5 Yr Master's 6 Yr Specialist's 7 Yr Doctoral Other*
<1 1-10 11-20 21-30 >30
Average
Administrators
1.50 200.00
1 1
0 2
0 1 1 0 0 0 0 1 1 0 16.00
Support Personnel
2.00 190.00
2 0
0 2
0 1 1 0 0 0 0 1 0 1 25.50
PK-12 Teachers
39.00 190.00
38 2
3 37
26 13
1 0 0 1 13 12 13 1 15.78
*Includes One- and Two-Year Vocational Certificates.
ACCREDITATION DATA
Accredited by Southern Association of Colleges and Schools (SACS):
Elementary/Middle Commission.
1998-99 GEORGIA PUBLIC EDUCATION REPORT CARD Low Elementary School - 6253062
Prepared by Georgia Department of Education
Page 5
1998-99 GEORGIA PUBLIC EDUCATION REPORT CARD
CHATHAM COUNTY SCHOOLS
Marshpoint Elementary School - 6250298
Grade Range PK-5
The Georgia Public Education Report Card is designed to assist systems and schools in educational improvement. This report card contains a variety of data elements. An explanation of the terms is provided as a companion to the report card data. Please refer to the definitions for the most effective use of the reported data.
STUDENT DATA
Total
K-5
679
PK
46
Enrollment, by Race/Ethnicity and Sex
Black
White Hispanic
American Asian Indian
Multiracial
252 37.1%
384 56.6%
5 0.7%
27 4.0%
2 0.3%
9 1.3%
15 32.6%
29 63.0%
0 0.0%
1 2.2%
0 0.0%
1 2.2%
Male Female
356 52.4%
323 47.6%
29 63.0%
17 37.0%
Enrollment in Selected Programs
Program
Program % of Student Enrollment Population
Gifted (Grades K-12)
62
9.1%
Alternative Programs (Grades 6-12)
N/A
N/A
Students Eligible to Receive Free/Reduced Lunches
Number
Percent
School System
232 19,220
32.0% 52.3%
Dropout Rate *
Number
Rate
School System
N/A N/A
N/A N/A
* Dropout rates are not applicable for grades PK-5.
Enrollment in Compensatory Programs
Program
Program % of Student Enrollment Population
Special Education (Grades K-12)
82 12.1%
(PK)
30
N/A
English to Speakers of Other Languages (ESOL) (Grades K-12)
0
0.0%
Remedial Education (Grades 2-5, 9-12)
56 12.8%
Special Instructional Assistance (SIA) (Grades K-3)
64 13.7%
Title I (Grades K-12)
This school has no Title I program.
Total 16
Retained Students, by Race/Ethnicity and Sex
Black
White Hispanic
American MultiAsian Indian racial
11 68.8%
4 25.0%
0 0.0%
1 6.3%
0 0.0%
0 0.0%
Male Female
8
8
50.0% 50.0%
Prepared by Georgia Department of Education
Page 1
STATE-REQUIRED TEST DATA
NORM-REFERENCED TESTS Grade 3
Iowa Tests of Basic Skills (ITBS) Each chart reflects data for three years of testing.
Reading Comprehension 50
63 47 54 0
98-99
59 44 53 N/A 43 52
97-98
96-97
Mathematics
School 50
System
State
0
75 56 61 98-99
62 54 61 N/A 51 59
97-98
96-97
School System State
Reading Vocabulary 50
67 43 50 0
98-99
51 44 50 N/A 42 49
97-98
96-97
Language Arts
School 50
System
State
0
73 57 64 98-99
67 56 62 N/A 50 59
97-98
96-97
School System State
Social Studies 50
61 47 56 0
98-99
53 49 55 N/A 46 55
97-98
96-97
Science
School 50
System
State
0
68 50 59 98-99
70 51 59 N/A 49 58
97-98
96-97
School System State
Sources of Information
Composite Score
50
65 52 57 0
98-99
School 50
System
63 49 56 N/A 47 55
97-98
96-97
State 0
68 50 58 98-99
62 49 57 N/A 47 56
97-98
96-97
1998-99 GEORGIA PUBLIC EDUCATION REPORT CARD Marshpoint Elementary School - 6250298
Prepared by Georgia Department of Education
Scores Reported in Percentiles
School System State
Page 2
STATE-REQUIRED TEST DATA
NORM-REFERENCED TESTS Grade 5
Iowa Tests of Basic Skills (ITBS) Each chart reflects data for three years of testing.
Reading Comprehension
Mathematics
50
57 47 53 0
98-99
59 47 53 N/A 44 52
97-98
96-97
School 50
System
State
0
54 51 59 98-99
59 53 58 N/A 49 57
97-98
96-97
School System State
Reading Vocabulary 50
48 39 48 0
98-99
54 44 48 N/A 38 46
97-98
96-97
Language Arts
School 50
System
State
0
61 58 63 98-99
67 57 61 N/A 49 58
97-98
96-97
School System State
Social Studies 50
61 49 57 0
98-99
61 49 56 N/A 45 55
97-98
96-97
Science
School 50
System
State
0
70 55 60 98-99
73 54 59 N/A 51 59
97-98
96-97
School System State
Sources of Information
Composite Score
50
60 55 58 0
98-99
School 50
System
65 54 58 N/A 50 57
97-98
96-97
State 0
60 51 57 98-99
64 51 56 N/A 46 55
97-98
96-97
1998-99 GEORGIA PUBLIC EDUCATION REPORT CARD Marshpoint Elementary School - 6250298
Prepared by Georgia Department of Education
Scores Reported in Percentiles
School System State
Page 3
STATE-REQUIRED TEST DATA
PERFORMANCE ASSESSMENTS
Grade 5 Writing Assessment
Percent at Developmental Stages:
1998-99 School System State
1997-98 School System State
1996-97 School System State
Stage Stage Stage Stage Stage Stage
1:The Emerging Writer 2:The Developing Writer 3:The Focusing Writer 4:The Experimenting 5:The Engaging Writer 6:The Extending Writer
0% 0% 18% 44% 27% 10%
0% 1% 22% 46% 23% 7%
0% 1% 16% 41% 29% 12%
0% 0% 10% 33% 51% 7%
0% 3% 24% 43% 22% 7%
0% 3% 19% 41% 27% 10%
N/A N/A N/A N/A N/A N/A
0% 4% 26% 39% 22% 8%
0% 3% 21% 37% 26% 12%
AWARDS / RECOGNITION DATA
Schools in Georgia may receive recognition in the following programs: Charter School Pay for Performance Program Georgia School of Excellence National Blue Ribbon School Marshpoint Elementary School did not receive recognition in any of these programs during the 1998-99 school year.
1998-99 GEORGIA PUBLIC EDUCATION REPORT CARD Marshpoint Elementary School - 6250298
Prepared by Georgia Department of Education
Page 4
CERTIFIED PERSONNEL DATA
Positions Number Average Contract Days
Personnel Sex
Certificate
Years Experience
Full-time Part-time
Male Female
4 Yr Bachelor's 5 Yr Master's 6 Yr Specialist's 7 Yr Doctoral Other*
<1 1-10 11-20 21-30 >30
Average
Administrators
1.00 209.00
1 0
0 1
0 0 1 0 0 0 0 1 0 0 17.00
Support Personnel
2.00 190.00
2 0
0 2
0 2 0 0 0 0 0 1 1 0 22.00
PK-12 Teachers
41.00 190.00
41 0
1 40
17 21
3 0 0 0 15 16 9 1 15.15
*Includes One- and Two-Year Vocational Certificates.
ACCREDITATION DATA
Accredited by Southern Association of Colleges and Schools (SACS):
Elementary/Middle Commission.
1998-99 GEORGIA PUBLIC EDUCATION REPORT CARD Marshpoint Elementary School - 6250298
Prepared by Georgia Department of Education
Page 5
1998-99 GEORGIA PUBLIC EDUCATION REPORT CARD
CHATHAM COUNTY SCHOOLS
Mercer Middle School - 6255062
Grade Range 6-8
The Georgia Public Education Report Card is designed to assist systems and schools in educational improvement. This report card contains a variety of data elements. An explanation of the terms is provided as a companion to the report card data. Please refer to the definitions for the most effective use of the reported data.
STUDENT DATA
Total 667
6-8 Enrollment, by Race/Ethnicity and Sex
Black
White Hispanic
American Multi-
Asian Indian
racial
423 63.4%
219 32.8%
12 1.8%
8 1.2%
0 0.0%
5 0.7%
Male 373
55.9%
Female 294
44.1%
Enrollment in Selected Programs
Program
Gifted (Grades K-12)
Program % of Student Enrollment Population
51
7.6%
Alternative Programs
19
(Grades 6-12)
2.8%
Students Eligible to Receive Free/Reduced Lunches
Number
Percent
School System
380 19,220
57.0% 52.3%
Enrollment in Compensatory Programs
Program
Program % of Student Enrollment Population
Special Education (Grades K-12) (PK)
99 14.8%
0
N/A
English to Speakers of Other Languages (ESOL) (Grades K-12)
0
0.0%
Title I (Grades K-12)
This school has a schoolwide program.
Dropout Rate for Grades 6-8
Number
Rate
School System
6
0.8%
68
0.8%
Total 13
Retained Students, by Race/Ethnicity and Sex
Black
White Hispanic
American MultiAsian Indian racial
9 69.2%
3 23.1%
0 0.0%
0 0.0%
0 0.0%
1 7.7%
Male Female
12 92.3%
1 7.7%
Prepared by Georgia Department of Education
Page 1
STATE-REQUIRED TEST DATA
NORM-REFERENCED TESTS Grade 8
Iowa Tests of Basic Skills (ITBS) Each chart reflects data for three years of testing.
Reading Comprehension 50
29 34 49 0
98-99
39 35 48 97-98
36 34 48 96-97
Mathematics
School 50
System
State
0
36 40 56 98-99
48 43 55 97-98
41 41 54 96-97
School System State
Reading Vocabulary 50
24 30 46 0
98-99
36 31 45 97-98
35 31 44 96-97
Language Arts
School 50
System
State
0
44 48 60 98-99
49 48 58 97-98
43 44 56 96-97
School System State
Social Studies 50
38 41 54 0
98-99
43 43 53 97-98
40 40 53 96-97
Science
School 50
System
State
0
39 38 56 98-99
45 38 55 97-98
41 38 53 96-97
School System State
Sources of Information
Composite Score
50
45 47 57 0
98-99
School 50
System
48 48 56 97-98
47 47 55 96-97
State 0
36 40 56 98-99
44 42 54 97-98
1998-99 GEORGIA PUBLIC EDUCATION REPORT CARD Mercer Middle School - 6255062
Prepared by Georgia Department of Education
40 40 54 96-97
Scores Reported in Percentiles
School System State
Page 2
STATE-REQUIRED TEST DATA
Categories of Scaled Scores
Inadequate (less than 162)
Minimal (162-209)
Good
(210-247)
Very Good (greater than 247)
Average Scaled Score: (Range 100-300)
PERFORMANCE ASSESSMENTS
Grade 8 Writing Assessment
1998-99 Percent Scoring
1997-98 Percent Scoring
1996-97 Percent Scoring
School System State School System State School System State
20% 52% 25%
3%
14% 51% 31%
4%
8% 40% 41% 11%
12% 55% 28%
5%
17% 53% 25%
4%
11% 46% 34%
8%
16% 48% 29%
7%
23% 50% 23%
5%
15% 46% 30%
8%
187
196
208 193
192 202 195
189 198
AWARDS / RECOGNITION DATA
Schools that become a Charter School have a unique opportunity to rethink how they structure and deliver education programs for improving the learning of their students while being freed from the state laws, State Board of Education rules and regulations, and local board of education rules and regulations that govern other schools.
Through the Pay for Performance Program, exemplary public schools and schools making outstanding progress toward becoming exemplary may be rewarded. Not a merit pay program, the Pay for Performance Program motivates and rewards entire school faculties for working together to make their schools exemplary.
Mercer Middle School was identified as a Charter School and was a Pay for Performance recipient in 1998-99.
1998-99 GEORGIA PUBLIC EDUCATION REPORT CARD Mercer Middle School - 6255062
Prepared by Georgia Department of Education
Page 3
CERTIFIED PERSONNEL DATA
Positions Number Average Contract Days
Personnel Sex
Certificate
Years Experience
Full-time Part-time
Male Female
4 Yr Bachelor's 5 Yr Master's 6 Yr Specialist's 7 Yr Doctoral Other*
<1 1-10 11-20 21-30 >30
Average
Administrators
2.00 209.50
2 0
1 1
0 1 1 0 0 0 0 0 2 0 26.00
Support Personnel
5.10 190.00
5 1
2 4
1 2 3 0 0 0 1 2 3 0 18.17
PK-12 Teachers
44.50 190.00
44 1
11 34
26 16
3 0 0 0 18 13 11 3 15.49
*Includes One- and Two-Year Vocational Certificates.
ACCREDITATION DATA
Accredited by Southern Association of Colleges and Schools (SACS):
Elementary/Middle Commission.
1998-99 GEORGIA PUBLIC EDUCATION REPORT CARD Mercer Middle School - 6255062
Prepared by Georgia Department of Education
Page 4
1998-99 GEORGIA PUBLIC EDUCATION REPORT CARD
CHATHAM COUNTY SCHOOLS
Myers Middle School - 6251064
Grade Range 6-8
The Georgia Public Education Report Card is designed to assist systems and schools in educational improvement. This report card contains a variety of data elements. An explanation of the terms is provided as a companion to the report card data. Please refer to the definitions for the most effective use of the reported data.
STUDENT DATA
Total 975
6-8 Enrollment, by Race/Ethnicity and Sex
Black
White Hispanic
American Multi-
Asian Indian
racial
800 82.1%
155 15.9%
4 0.4%
9 0.9%
0 0.0%
7 0.7%
Male 493
50.6%
Female 482
49.4%
Enrollment in Selected Programs
Program
Gifted (Grades K-12)
Program % of Student Enrollment Population
18
1.8%
Alternative Programs
25
(Grades 6-12)
2.6%
Students Eligible to Receive Free/Reduced Lunches
Number
Percent
School System
626 19,220
64.2% 52.3%
Enrollment in Compensatory Programs
Program
Program % of Student Enrollment Population
Special Education (Grades K-12) (PK)
118 12.1%
0
N/A
English to Speakers of Other Languages (ESOL) (Grades K-12)
0
0.0%
Title I (Grades K-12)
This school has no Title I program.
Dropout Rate for Grades 6-8
Number
Rate
School System
6
0.6%
68
0.8%
Total 112
Retained Students, by Race/Ethnicity and Sex
Black
White Hispanic
American MultiAsian Indian racial
98 87.5%
11 9.8%
0 0.0%
2 1.8%
0 0.0%
1 0.9%
Male Female
81
31
72.3% 27.7%
Prepared by Georgia Department of Education
Page 1
STATE-REQUIRED TEST DATA
NORM-REFERENCED TESTS Grade 8
Iowa Tests of Basic Skills (ITBS) Each chart reflects data for three years of testing.
Reading Comprehension 50
29 34 49 0
98-99
29 35 48 97-98
39 34 48 96-97
Mathematics
School 50
System
State
0
32 40 56 98-99
38 43 55 97-98
46 41 54 96-97
School System State
Reading Vocabulary 50
24 30 46 0
98-99
26 31 45 97-98
35 31 44 96-97
Language Arts
School 50
System
State
0
39 48 60 98-99
43 48 58 97-98
51 44 56 96-97
School System State
Social Studies 50
38 41 54 0
98-99
40 43 53 97-98
46 40 53 96-97
Science
School 50
System
State
0
30 38 56 98-99
34 38 55 97-98
43 38 53 96-97
School System State
Sources of Information
Composite Score
50
39 47 57 0
98-99
School 50
System
41 48 56 97-98
53 47 55 96-97
State 0
33 40 56 98-99
37 42 54 97-98
1998-99 GEORGIA PUBLIC EDUCATION REPORT CARD Myers Middle School - 6251064
Prepared by Georgia Department of Education
46 40 54 96-97
Scores Reported in Percentiles
School System State
Page 2
STATE-REQUIRED TEST DATA
Categories of Scaled Scores
Inadequate (less than 162)
Minimal (162-209)
Good
(210-247)
Very Good (greater than 247)
Average Scaled Score: (Range 100-300)
PERFORMANCE ASSESSMENTS
Grade 8 Writing Assessment
1998-99 Percent Scoring
1997-98 Percent Scoring
1996-97 Percent Scoring
School System State School System State School System State
19% 52% 25%
4%
14% 51% 31%
4%
8% 40% 41% 11%
21% 57% 20%
3%
17% 53% 25%
4%
11% 46% 34%
8%
19% 47% 26%
8%
23% 50% 23%
5%
15% 46% 30%
8%
190
196
208 188
192 202 192
189 198
AWARDS / RECOGNITION DATA
Schools in Georgia may receive recognition in the following programs: Charter School Pay for Performance Program Georgia School of Excellence National Blue Ribbon School Myers Middle School did not receive recognition in any of these programs during the 1998-99 school year.
1998-99 GEORGIA PUBLIC EDUCATION REPORT CARD Myers Middle School - 6251064
Prepared by Georgia Department of Education
Page 3
CERTIFIED PERSONNEL DATA
Positions Number Average Contract Days
Personnel Sex
Certificate
Years Experience
Full-time Part-time
Male Female
4 Yr Bachelor's 5 Yr Master's 6 Yr Specialist's 7 Yr Doctoral Other*
<1 1-10 11-20 21-30 >30
Average
Administrators
3.00 203.00
3 0
2 1
0 2 1 0 0 0 2 1 0 0 8.67
Support Personnel
3.25 190.00
3 1
1 3
0 3 1 0 0 0 0 1 3 0 20.75
PK-12 Teachers
58.00 190.00
58 0
15 43
37 17
4 0 0 2 29 15 12 0 12.24
*Includes One- and Two-Year Vocational Certificates.
ACCREDITATION DATA
Accredited by Southern Association of Colleges and Schools (SACS):
Elementary/Middle Commission.
1998-99 GEORGIA PUBLIC EDUCATION REPORT CARD Myers Middle School - 6251064
Prepared by Georgia Department of Education
Page 4
1998-99 GEORGIA PUBLIC EDUCATION REPORT CARD
CHATHAM COUNTY SCHOOLS
Pooler Elementary School - 6253064
Grade Range K-5
The Georgia Public Education Report Card is designed to assist systems and schools in educational improvement. This report card contains a variety of data elements. An explanation of the terms is provided as a companion to the report card data. Please refer to the definitions for the most effective use of the reported data.
STUDENT DATA
Total 736
K-5 Enrollment, by Race/Ethnicity and Sex
Black
White Hispanic
American Multi-
Asian Indian
racial
208 28.3%
488 66.3%
12 1.6%
12 1.6%
1 0.1%
15 2.0%
Male Female
381 51.8%
355 48.2%
Enrollment in Selected Programs
Program
Program % of Student Enrollment Population
Gifted (Grades K-12)
81
11.0%
Alternative Programs (Grades 6-12)
N/A
N/A
Students Eligible to Receive Free/Reduced Lunches
Number
Percent
School System
250 19,220
34.0% 52.3%
Dropout Rate *
Number
Rate
School System
N/A N/A
N/A N/A
* Dropout rates are not applicable for grades PK-5.
Enrollment in Compensatory Programs
Program
Program % of Student Enrollment Population
Special Education (Grades K-12)
67
9.1%
(PK)
0
N/A
English to Speakers of Other Languages (ESOL) (Grades K-12)
0
0.0%
Remedial Education (Grades 2-5, 9-12)
62 12.5%
Special Instructional Assistance (SIA) (Grades K-3)
69 13.9%
Title I (Grades K-12)
This school has no Title I program.
Total 23
Retained Students, by Race/Ethnicity and Sex
Black
White Hispanic
American Multi-
Asian Indian
racial
9 39.1%
11 47.8%
1 4.3%
0 0.0%
0 0.0%
2 8.7%
Male Female
16
7
69.6% 30.4%
Prepared by Georgia Department of Education
Page 1
STATE-REQUIRED TEST DATA
NORM-REFERENCED TESTS Grade 3
Iowa Tests of Basic Skills (ITBS) Each chart reflects data for three years of testing.
Reading Comprehension 50
64 47 54 0
98-99
57 44 53 97-98
58 43 52 96-97
Mathematics
School 50
System
State
0
79 56 61 98-99
69 54 61 97-98
77 51 59 96-97
School System State
Reading Vocabulary 50
60 43 50 0
98-99
54 44 50 97-98
57 42 49 96-97
Language Arts
School 50
System
State
0
71 57 64 98-99
61 56 62 97-98
71 50 59 96-97
School System State
Social Studies 50
62 47 56 0
98-99
58 49 55 97-98
61 46 55 96-97
Science
School 50
System
State
0
66 50 59 98-99
66 51 59 97-98
65 49 58 96-97
School System State
Sources of Information
Composite Score
50
66 52 57 0
98-99
School 50
System
60 49 56 97-98
63 47 55 96-97
State 0
68 50 58 98-99
61 49 57 97-98
1998-99 GEORGIA PUBLIC EDUCATION REPORT CARD Pooler Elementary School - 6253064
Prepared by Georgia Department of Education
66 47 56 96-97
Scores Reported in Percentiles
School System State
Page 2
STATE-REQUIRED TEST DATA
NORM-REFERENCED TESTS Grade 5
Iowa Tests of Basic Skills (ITBS) Each chart reflects data for three years of testing.
Reading Comprehension
Mathematics
50
60 47 53 0
98-99
57 47 53 97-98
57 44 52 96-97
School 50
System
State
0
73 51 59 98-99
74 53 58 97-98
69 49 57 96-97
School System State
Reading Vocabulary 50
58 39 48 0
98-99
56 44 48 97-98
58 38 46 96-97
Language Arts
School 50
System
State
0
81 58 63 98-99
72 57 61 97-98
67 49 58 96-97
School System State
Social Studies 50
62 49 57 0
98-99
60 49 56 97-98
55 45 55 96-97
Science
School 50
System
State
0
71 55 60 98-99
67 54 59 97-98
63 51 59 96-97
School System State
Sources of Information
Composite Score
50
67 55 58 0
98-99
School 50
System
66 54 58 97-98
58 50 57 96-97
State 0
71 51 57 98-99
66 51 56 97-98
61 46 55 96-97
1998-99 GEORGIA PUBLIC EDUCATION REPORT CARD Pooler Elementary School - 6253064
Prepared by Georgia Department of Education
Scores Reported in Percentiles
School System State
Page 3
STATE-REQUIRED TEST DATA
PERFORMANCE ASSESSMENTS
Grade 5 Writing Assessment
Percent at Developmental Stages:
1998-99 School System State
1997-98 School System State
1996-97 School System State
Stage Stage Stage Stage Stage Stage
1:The Emerging Writer 2:The Developing Writer 3:The Focusing Writer 4:The Experimenting 5:The Engaging Writer 6:The Extending Writer
0% 0% 19% 50% 23% 7%
0% 1% 22% 46% 23% 7%
0% 1% 16% 41% 29% 12%
0% 1% 19% 46% 27% 7%
0% 3% 24% 43% 22% 7%
0% 3% 19% 41% 27% 10%
0% 1% 20% 42% 35% 2%
0% 4% 26% 39% 22% 8%
0% 3% 21% 37% 26% 12%
AWARDS / RECOGNITION DATA
Schools in Georgia may receive recognition in the following programs: Charter School Pay for Performance Program Georgia School of Excellence National Blue Ribbon School Pooler Elementary School did not receive recognition in any of these programs during the 1998-99 school year.
1998-99 GEORGIA PUBLIC EDUCATION REPORT CARD Pooler Elementary School - 6253064
Prepared by Georgia Department of Education
Page 4
CERTIFIED PERSONNEL DATA
Positions Number Average Contract Days
Personnel Sex
Certificate
Years Experience
Full-time Part-time
Male Female
4 Yr Bachelor's 5 Yr Master's 6 Yr Specialist's 7 Yr Doctoral Other*
<1 1-10 11-20 21-30 >30
Average
Administrators
2.00 230.00
2 0
0 2
0 0 1 1 0 0 0 1 1 0 22.00
Support Personnel
1.00 190.00
1 0
0 1
0 0 0 1 0 0 0 1 0 0 18.00
PK-12 Teachers
37.75 190.00
37 2
1 38
17 18
4 0 0 3 12 15 9 0 13.62
*Includes One- and Two-Year Vocational Certificates.
ACCREDITATION DATA
Accredited by Southern Association of Colleges and Schools (SACS):
Elementary/Middle Commission.
1998-99 GEORGIA PUBLIC EDUCATION REPORT CARD Pooler Elementary School - 6253064
Prepared by Georgia Department of Education
Page 5
1998-99 GEORGIA PUBLIC EDUCATION REPORT CARD
CHATHAM COUNTY SCHOOLS
Port Wentworth Elementary School - 6254068
Grade Range PK-5
The Georgia Public Education Report Card is designed to assist systems and schools in educational improvement. This report card contains a variety of data elements. An explanation of the terms is provided as a companion to the report card data. Please refer to the definitions for the most effective use of the reported data.
STUDENT DATA
Total
K-5
421
PK
45
Enrollment, by Race/Ethnicity and Sex
Black
White Hispanic
American Asian Indian
Multiracial
246 58.4%
169 40.1%
2 0.5%
3 0.7%
0 0.0%
1 0.2%
19 42.2%
25 55.6%
1 2.2%
0 0.0%
0 0.0%
0 0.0%
Male Female
210 49.9%
211 50.1%
20 44.4%
25 55.6%
Enrollment in Selected Programs
Program
Program % of Student Enrollment Population
Gifted (Grades K-12)
12
2.9%
Alternative Programs (Grades 6-12)
N/A
N/A
Students Eligible to Receive Free/Reduced Lunches
Number
Percent
School System
307 19,220
65.9% 52.3%
Dropout Rate *
Number
Rate
School System
N/A N/A
N/A N/A
* Dropout rates are not applicable for grades PK-5.
Enrollment in Compensatory Programs
Program
Program % of Student Enrollment Population
Special Education (Grades K-12)
92 21.9%
(PK)
9
N/A
English to Speakers of Other Languages (ESOL) (Grades K-12)
0
0.0%
Remedial Education (Grades 2-5, 9-12)
51 20.1%
Special Instructional Assistance (SIA) (Grades K-3)
76 25.0%
Title I (Grades K-12)
This school has a Targeted Assistance program.
Total 22
Retained Students, by Race/Ethnicity and Sex
Black
White Hispanic
American MultiAsian Indian racial
18 81.8%
4 18.2%
0 0.0%
0 0.0%
0 0.0%
0 0.0%
Male Female
15
7
68.2% 31.8%
Prepared by Georgia Department of Education
Page 1
STATE-REQUIRED TEST DATA
NORM-REFERENCED TESTS Grade 3
Iowa Tests of Basic Skills (ITBS) Each chart reflects data for three years of testing.
Reading Comprehension 50
56 47 54 0
98-99
37 44 53 97-98
30 43 52 96-97
Mathematics
School 50
System
State
0
71 56 61 98-99
53 54 61 97-98
29 51 59 96-97
School System State
Reading Vocabulary 50
52 43 50 0
98-99
69 44 50 97-98
27 42 49 96-97
Language Arts
School 50
System
State
0
69 57 64 98-99
47 56 62 97-98
34 50 59 96-97
School System State
Social Studies 50
66 47 56 0
98-99
52 49 55 97-98
27 46 55 96-97
Science
School 50
System
State
0
74 50 59 98-99
58 51 59 97-98
36 49 58 96-97
School System State
Sources of Information
Composite Score
50
61 52 57 0
98-99
School 50
System
45 49 56 97-98
34 47 55 96-97
State 0
67 50 58 98-99
51 49 57 97-98
1998-99 GEORGIA PUBLIC EDUCATION REPORT CARD Port Wentworth Elementary School - 6254068
Prepared by Georgia Department of Education
29 47 56 96-97
Scores Reported in Percentiles
School System State
Page 2
STATE-REQUIRED TEST DATA
NORM-REFERENCED TESTS Grade 5
Iowa Tests of Basic Skills (ITBS) Each chart reflects data for three years of testing.
Reading Comprehension
Mathematics
50
39 47 53 0
98-99
47 47 53 97-98
33 44 52 96-97
School 50
System
State
0
46 51 59 98-99
56 53 58 97-98
42 49 57 96-97
School System State
Reading Vocabulary 50
31 39 48 0
98-99
53 44 48 97-98
23 38 46 96-97
Language Arts
School 50
System
State
0
51 58 63 98-99
57 57 61 97-98
38 49 58 96-97
School System State
Social Studies 50
41 49 57 0
98-99
42 49 56 97-98
29 45 55 96-97
Science
School 50
System
State
0
43 55 60 98-99
54 54 59 97-98
32 51 59 96-97
School System State
Sources of Information
Composite Score
50
43 55 58 0
98-99
School 50
System
52 54 58 97-98
36 50 57 96-97
State 0
41 51 57 98-99
54 51 56 97-98
32 46 55 96-97
1998-99 GEORGIA PUBLIC EDUCATION REPORT CARD Port Wentworth Elementary School - 6254068
Prepared by Georgia Department of Education
Scores Reported in Percentiles
School System State
Page 3
STATE-REQUIRED TEST DATA
PERFORMANCE ASSESSMENTS
Grade 5 Writing Assessment
Percent at Developmental Stages:
1998-99 School System State
1997-98 School System State
1996-97 School System State
Stage Stage Stage Stage Stage Stage
1:The Emerging Writer 2:The Developing Writer 3:The Focusing Writer 4:The Experimenting 5:The Engaging Writer 6:The Extending Writer
0% 0% 17% 56% 17% 10%
0% 1% 22% 46% 23% 7%
0% 1% 16% 41% 29% 12%
0% 4% 24% 53% 18% 2%
0% 3% 24% 43% 22% 7%
0% 3% 19% 41% 27% 10%
1% 6% 36% 36% 14% 6%
0% 4% 26% 39% 22% 8%
0% 3% 21% 37% 26% 12%
AWARDS / RECOGNITION DATA
Schools in Georgia may receive recognition in the following programs: Charter School Pay for Performance Program Georgia School of Excellence National Blue Ribbon School Port Wentworth Elementary School did not receive recognition in any of these programs during the 1998-99 school year.
1998-99 GEORGIA PUBLIC EDUCATION REPORT CARD Port Wentworth Elementary School - 6254068
Prepared by Georgia Department of Education
Page 4
CERTIFIED PERSONNEL DATA
Positions Number Average Contract Days
Personnel Sex
Certificate
Years Experience
Full-time Part-time
Male Female
4 Yr Bachelor's 5 Yr Master's 6 Yr Specialist's 7 Yr Doctoral Other*
<1 1-10 11-20 21-30 >30
Average
Administrators
1.50 202.67
1 1
0 2
0 1 1 0 0 0 0 0 2 0 26.50
Support Personnel
0.50 190.00
0 1
0 1
1 0 0 0 0 1 0 0 0 0 0.00
PK-12 Teachers
13.30 190.00
12 3
0 15
12 3 0 0 0 4 6 3 2 0
8.20
*Includes One- and Two-Year Vocational Certificates.
ACCREDITATION DATA
Accredited by Southern Association of Colleges and Schools (SACS):
Elementary/Middle Commission.
1998-99 GEORGIA PUBLIC EDUCATION REPORT CARD Port Wentworth Elementary School - 6254068
Prepared by Georgia Department of Education
Page 5
1998-99 GEORGIA PUBLIC EDUCATION REPORT CARD
CHATHAM COUNTY SCHOOLS
Pulaski Elementary School - 6255064
Grade Range PK-5
The Georgia Public Education Report Card is designed to assist systems and schools in educational improvement. This report card contains a variety of data elements. An explanation of the terms is provided as a companion to the report card data. Please refer to the definitions for the most effective use of the reported data.
STUDENT DATA
Total
K-5
432
PK
115
Enrollment, by Race/Ethnicity and Sex
Black
White Hispanic
American Asian Indian
Multiracial
332 76.9%
63 14.6%
18 4.2%
2 0.5%
3 0.7%
14 3.2%
90 78.3%
14 12.2%
4 3.5%
0 0.0%
0 0.0%
7 6.1%
Male Female
238 55.1%
194 44.9%
70 60.9%
45 39.1%
Enrollment in Selected Programs
Program
Program % of Student Enrollment Population
Gifted (Grades K-12)
19
4.4%
Alternative Programs (Grades 6-12)
N/A
N/A
Students Eligible to Receive Free/Reduced Lunches
Number
Percent
School System
400 19,220
73.1% 52.3%
Dropout Rate *
Number
Rate
School System
N/A N/A
N/A N/A
* Dropout rates are not applicable for grades PK-5.
Enrollment in Compensatory Programs
Program
Program % of Student Enrollment Population
Special Education (Grades K-12)
56 13.0%
(PK)
46
N/A
English to Speakers of Other Languages (ESOL) (Grades K-12)
0
0.0%
Remedial Education (Grades 2-5, 9-12)
52 19.8%
Special Instructional Assistance (SIA) (Grades K-3)
80 25.9%
Title I (Grades K-12)
This school has a Targeted Assistance program.
Total 5
Retained Students, by Race/Ethnicity and Sex
Black
White Hispanic
American MultiAsian Indian racial
4 80.0%
1 20.0%
0 0.0%
0 0.0%
0 0.0%
0 0.0%
Male Female
4
1
80.0% 20.0%
Prepared by Georgia Department of Education
Page 1
STATE-REQUIRED TEST DATA
NORM-REFERENCED TESTS Grade 3
Iowa Tests of Basic Skills (ITBS) Each chart reflects data for three years of testing.
Reading Comprehension 50
42 47 54 0
98-99
39 44 53 97-98
39 43 52 96-97
Mathematics
School 50
System
State
0
43 56 61 98-99
50 54 61 97-98
52 51 59 96-97
School System State
Reading Vocabulary 50
38 43 50 0
98-99
37 44 50 97-98
35 42 49 96-97
Language Arts
School 50
System
State
0
55 57 64 98-99
49 56 62 97-98
42 50 59 96-97
School System State
Social Studies 50
40 47 56 0
98-99
43 49 55 97-98
41 46 55 96-97
Science
School 50
System
State
0
41 50 59 98-99
39 51 59 97-98
40 49 58 96-97
School System State
Sources of Information
Composite Score
50
44 52 57 0
98-99
School 50
System
43 49 56 97-98
43 47 55 96-97
State 0
43 50 58 98-99
41 49 57 97-98
1998-99 GEORGIA PUBLIC EDUCATION REPORT CARD Pulaski Elementary School - 6255064
Prepared by Georgia Department of Education
40 47 56 96-97
Scores Reported in Percentiles
School System State
Page 2
STATE-REQUIRED TEST DATA
NORM-REFERENCED TESTS Grade 5
Iowa Tests of Basic Skills (ITBS) Each chart reflects data for three years of testing.
Reading Comprehension
Mathematics
50
40 47 53 0
98-99
36 47 53 97-98
32 44 52 96-97
School 50
System
State
0
35 51 59 98-99
33 53 58 97-98
35 49 57 96-97
School System State
Reading Vocabulary 50
40 39 48 0
98-99
37 44 48 97-98
28 38 46 96-97
Language Arts
School 50
System
State
0
50 58 63 98-99
41 57 61 97-98
32 49 58 96-97
School System State
Social Studies 50
44 49 57 0
98-99
36 49 56 97-98
30 45 55 96-97
Science
School 50
System
State
0
45 55 60 98-99
35 54 59 97-98
32 51 59 96-97
School System State
Sources of Information
Composite Score
50
44 55 58 0
98-99
School 50
System
40 54 58 97-98
39 50 57 96-97
State 0
41 51 57 98-99
35 51 56 97-98
31 46 55 96-97
1998-99 GEORGIA PUBLIC EDUCATION REPORT CARD Pulaski Elementary School - 6255064
Prepared by Georgia Department of Education
Scores Reported in Percentiles
School System State
Page 3
STATE-REQUIRED TEST DATA
PERFORMANCE ASSESSMENTS
Grade 5 Writing Assessment
Percent at Developmental Stages:
1998-99 School System State
1997-98 School System State
1996-97 School System State
Stage Stage Stage Stage Stage Stage
1:The Emerging Writer 2:The Developing Writer 3:The Focusing Writer 4:The Experimenting 5:The Engaging Writer 6:The Extending Writer
0% 2% 15% 43% 35% 4%
0% 1% 22% 46% 23% 7%
0% 1% 16% 41% 29% 12%
0% 7% 21% 57% 16% 0%
0% 3% 24% 43% 22% 7%
0% 3% 19% 41% 27% 10%
2% 7% 28% 36% 21% 7%
0% 4% 26% 39% 22% 8%
0% 3% 21% 37% 26% 12%
AWARDS / RECOGNITION DATA
Schools in Georgia may receive recognition in the following programs: Charter School Pay for Performance Program Georgia School of Excellence National Blue Ribbon School Pulaski Elementary School did not receive recognition in any of these programs during the 1998-99 school year.
1998-99 GEORGIA PUBLIC EDUCATION REPORT CARD Pulaski Elementary School - 6255064
Prepared by Georgia Department of Education
Page 4
CERTIFIED PERSONNEL DATA
Positions Number Average Contract Days
Personnel Sex
Certificate
Years Experience
Full-time Part-time
Male Female
4 Yr Bachelor's 5 Yr Master's 6 Yr Specialist's 7 Yr Doctoral Other*
<1 1-10 11-20 21-30 >30
Average
Administrators
2.00 202.00
1 2
1 2
0 2 1 0 0 0 0 1 2 0 22.67
Support Personnel
2.00 190.00
2 0
0 2
0 1 1 0 0 0 0 0 2 0 27.00
PK-12 Teachers
35.05 190.00
32 6
2 36
23 14
1 0 0 3 14 14 7 0 12.03
*Includes One- and Two-Year Vocational Certificates.
ACCREDITATION DATA
Accredited by Southern Association of Colleges and Schools (SACS):
Elementary/Middle Commission.
1998-99 GEORGIA PUBLIC EDUCATION REPORT CARD Pulaski Elementary School - 6255064
Prepared by Georgia Department of Education
Page 5
1998-99 GEORGIA PUBLIC EDUCATION REPORT CARD
CHATHAM COUNTY SCHOOLS
Savannah Arts Academy - 6250499
Grade Range 9-12
The Georgia Public Education Report Card is designed to assist systems and schools in educational improvement. This report card contains a variety of data elements. An explanation of the terms is provided as a companion to the report card data. Please refer to the definitions for the most effective use of the reported data.
Total 397
STUDENT DATA
9-12 Enrollment, by Race/Ethnicity and Sex
Black
White Hispanic
American Multi-
Asian Indian
racial
174 43.8%
204 51.4%
7 1.8%
3 0.8%
1 0.3%
8 2.0%
Male Female
157 39.5%
240 60.5%
Enrollment in Selected Programs
Program
Gifted (Grades K-12)
Program % of Student Enrollment Population
27
6.8%
Non-Vocational Labs (Grades 9-12)
382
Vocational Labs
(Grades 9-12)
92
Alternative Programs (Grades 6-12)
0
96.2% 23.2%
0.0%
Students Eligible to Receive Free/Reduced Lunches
Number
Percent
School System
137 19,220
34.5% 52.3%
Enrollment in Compensatory Programs
Program
Program % of Student Enrollment Population
Special Education (Grades K-12) PK
16
4.0%
0
N/A
English to Speakers of Other Languages (ESOL) (Grades K-12)
2
< 1%
Remedial Education (Grades 2-5, 9-12)
0
0.0%
Title I (Grades K-12)
This school has no Title I program.
Dropout Rate for Grades 9-12
Number
Rate
School System
15
3.4%
784
7.8%
Total 19
Retained Students, by Race/Ethnicity and Sex
Black
White Hispanic
American MultiAsian Indian racial
6 31.6%
13 68.4%
0 0.0%
0 0.0%
0 0.0%
0 0.0%
Male Female
9
10
47.4% 52.6%
Prepared by Georgia Department of Education
Page 1
STATE-REQUIRED TEST DATA
GEORGIA HIGH SCHOOL GRADUATION TESTS (GHSGT)
Percent of Regular Program 11th Graders Passing the Georgia High School Graduation Tests on First Administration
English Language Arts Mathematics Social Studies Science
All Components listed above
Writing
1998-99
School System State
97% 90% 88% 74%
93% 75% 69% 55%
96% 88% 80% 72%
72% 51% 68%
95% 87% 93%
1997-98
School System State
N/A N/A N/A N/A
89% 79% 64% 55%
94% 88% 78% 74%
N/A 49% 68%
N/A 87% 92%
1996-97
School System State
N/A N/A N/A N/A
91% 77% 65% 58%
94% 87% 78% 74%
N/A 52% 67%
N/A 90% 93%
GRADUATE DATA
1999 Graduates by Credentials, Race/Ethnicity and Sex
Diplomas with Both College Prep. & Voc. Endorsements
Diplomas with College Prep. Endorsements Diplomas with Vocational Endorsements General High School Diplomas Special Education Diplomas
Total All Diplomas
Certificates of Performance
Total Graduates
Total 30 7 3 0
Black
11 36.7%
0 0.0%
0 0.0%
0
White Hispanic
18 60.0%
0 0.0%
6 85.7%
0 0.0%
3 100.0%
0 0.0%
0
0
American MultiAsian Indian racial
0 0.0%
0 0.0%
1 3.3%
1 14.3%
0 0.0%
0 0.0%
0 0.0%
0 0.0%
0 0.0%
0
0
0
Male Female
13
17
43.3% 56.7%
4
3
57.1% 42.9%
1
2
33.3% 66.7%
0
0
1
1
100.0%
0 0.0%
0 0.0%
0 0.0%
0 0.0%
0
1
0.0% 100.0%
0 0.0%
41
12
27
0
1
0
1
19
22
29.3% 65.9% 0.0% 2.4% 0.0% 2.4% 46.3% 53.7%
6
1
1
3
0
0
1
1
5
16.7% 16.7% 50.0% 0.0% 0.0% 16.7% 16.7% 83.3%
47
13
28
3
1
0
2
20
27
27.7% 59.6% 6.4% 2.1% 0.0% 4.3% 42.6% 57.4%
HOPE Scholarships
School System
Number of 1999 Graduates 4 7
Number Eligible
43
Percent Eligible
91.5%
1,436 749
52.2%
State
65,548 40,292 61.5%
High School Completion Rate
Percent of 1995Grade 9 Enrollment in Graduating Class of1999 School System State
Completion Rate '95-'99 0.0% 62.1% 68.9%
1998-99 GEORGIA PUBLIC EDUCATION REPORT CARD
Savannah Arts Academy - 6250499
Prepared by Georgia Department of Education
Page 2
COLLEGE ADMISSIONS / CREDIT TEST DATA
Scholastic Assessment Test (SAT)
Based on students' highest verbal and highest math scores
No. Taking
Average Score
Tests Verbal Math Total
Based on students' last test administration
Average Score Verbal Math Total
School
27
College Prep. Endorsement
Other Diplomas
System
578
College Prep. Endorsement
Other Diplomas
Georgia
41,958
504 473
977
502 479
981
610 440 1050
489 473
962
483 469
952
419 379
798
492 488
980
501 N/A N/A
480 N/A N/A
483
469 N/A N/A
464 N/A N/A
479
970 N/A N/A
944 N/A N/A
962
Nation
952,913 N/A N/A N/A
502 508 1010
American College Testing (ACT)
Advanced Placement Exams (AP)
Number taking tests: English Mathematics Reading Science Reasoning CompositeScore
1 1 School System State
17.0 16.0 19.1
16.5 17.1 19.9
16.5 18.5
17.5 17.7
20.2 19.9
17.2 17.2 19.9
No. of Students Taking Tests
No. of Tests Taken No. of Test Scores
3 or Higher Percent of Test
Scores 3 or Higher
School 50 82 37
45.1%
System State 291 15,225 509 23,969 254 13,024
49.9% 54.3%
POST-SECONDARY DATA
Graduates Entering Georgia Public Colleges
Graduates Entering Georgia Public Colleges and Requiring Learning Support (LS)
1998 Graduates Entering in 1998-99
1997 Graduates Entering in 1997-98
Percent of Graduating Number Class
School N / A
N/A
System 470
30.4%
School N / A
N/A
System 565
37.0%
Number Requiring
LS N/A 159
N/A 232
Percent of those attending Georgia
Public Colleges
N/A
33.8%
N/A
41.1%
In previous years, the Report Card presented College Prep Curriculum information provided by the Board of Regents on students requiring Learning Support. Due to inconsistencies in the data provided by the Board of Regents in defining College Prep Completers versus Local Board of Education data defining College Prep Endorsements, the Department of Education Report Card will not provide this information until discrepancies can be reconciled.
Graduates Entering Georgia Public Technical and Adult Schools
1998 Graduates School System
Entering Number N/A 78
1998-99 Percent
N/A 5.0%
Entering Number N/A N/A
1997-98 Percent
N/A N/A
1997 Graduates School System
N/A 15
N/A 1.0%
N/A 89
N/A 5.8%
1998-99 GEORGIA PUBLIC EDUCATION REPORT CARD Savannah Arts Academy - 6250499
Prepared by Georgia Department of Education
Page 3
CERTIFIED PERSONNEL DATA
Positions Number Average Contract Days
Administrators
2.00 204.50
Support Personnel
2.00 190.00
PK-12 Teachers
31.00 190.00
Personnel Sex
Certificate
Years Experience
Full-time Part-time
Male Female
4 Yr Bachelor's 5 Yr Master's 6 Yr Specialist's 7 Yr Doctoral Other*
<1 1-10 11-20 21-30 >30
Average
2 0
0 2
0 1 0 1 0
0 0 0 2 0
25.50
2 0
0 2
0 1 1 0 0
0 1 0 0 1
18.00
31 0
8 23
14 14
2 0 1
0 16
4 11
0
13.90
*Includes One- and Two-Year Vocational Certificates.
ACCREDITATION DATA
Accredited by Southern Association of Colleges and Schools (SACS): Secondary/Middle Commission.
AWARDS / RECOGNITION DATA
Schools that become a Charter School have a unique opportunity to rethink how they structure and deliver education programs for improving the learning of their students while being freed from the state laws, State Board of Education rules and regulations, and local board of education rules and regulations that govern other schools. A 'charter' is a binding contract that, when approved by the faculty and parents of the school, the local board of education and the State Board of Education, substitutes for state education statutes, state and local rules, policies, regulations and standards.
Savannah Arts Academy is a Charter School for 1998-99.
1998-99 GEORGIA PUBLIC EDUCATION REPORT CARD Savannah Arts Academy - 6250499
Prepared by Georgia Department of Education
Page 4
1998-99 GEORGIA PUBLIC EDUCATION REPORT CARD
CHATHAM COUNTY SCHOOLS
Savannah High School - 6250399
Grade Range 9-12
The Georgia Public Education Report Card is designed to assist systems and schools in educational improvement. This report card contains a variety of data elements. An explanation of the terms is provided as a companion to the report card data. Please refer to the definitions for the most effective use of the reported data.
Total 1,429
STUDENT DATA
9-12 Enrollment, by Race/Ethnicity and Sex
Black
White Hispanic
American Multi-
Asian Indian
racial
1,279 89.5%
82 5.7%
20 1.4%
42 2.9%
0 0.0%
6 0.4%
Male Female
673 47.1%
756 52.9%
Enrollment in Selected Programs
Program
Gifted (Grades K-12)
Program % of Student Enrollment Population
5
< 1%
Non-Vocational Labs (Grades 9-12)
Vocational Labs (Grades 9-12)
Alternative Programs (Grades 6-12)
1,130 840 62
79.1% 58.8%
4.3%
Students Eligible to Receive Free/Reduced Lunches
Number
Percent
School System
794 19,220
55.6% 52.3%
Enrollment in Compensatory Programs
Program
Program % of Student Enrollment Population
Special Education (Grades K-12) PK
66
4.6%
0
N/A
English to Speakers of Other Languages (ESOL) (Grades K-12)
47
3.3%
Remedial Education (Grades 2-5, 9-12)
249 17.4%
Title I (Grades K-12)
This school has a Targeted Assistance program.
Dropout Rate for Grades 9-12
Number
Rate
School System
131
8.4%
784
7.8%
Total 287
Retained Students, by Race/Ethnicity and Sex
Black
White Hispanic
American MultiAsian Indian racial
258 89.9%
11 3.8%
8 2.8%
10 3.5%
0 0.0%
0 0.0%
Male Female 170 117
59.2% 40.8%
Prepared by Georgia Department of Education
Page 1
STATE-REQUIRED TEST DATA
GEORGIA HIGH SCHOOL GRADUATION TESTS (GHSGT)
Percent of Regular Program 11th Graders Passing the Georgia High School Graduation Tests on First Administration
English Language Arts Mathematics Social Studies Science
All Components listed above
Writing
1998-99
School System State
88% 60% 53% 39%
93% 75% 69% 55%
96% 88% 80% 72%
33% 51% 68%
78% 87% 93%
1997-98
School System State
85% 74% 56% 41%
89% 79% 64% 55%
94% 88% 78% 74%
36% 49% 68%
85% 87% 92%
1996-97
School System State
86% 66% 50% 44%
91% 77% 65% 58%
94% 87% 78% 74%
35% 52% 67%
82% 90% 93%
GRADUATE DATA
1999 Graduates by Credentials, Race/Ethnicity and Sex
Diplomas with Both College Prep. & Voc. Endorsements
Diplomas with College Prep. Endorsements Diplomas with Vocational Endorsements General High School Diplomas Special Education Diplomas
Total All Diplomas
Certificates of Performance
Total Graduates
Total 38 75 19 12 7
151 75
226
Black
28 73.7%
67 89.3%
18 94.7%
12 100.0%
6 85.7%
131 86.8%
67 89.3%
198 87.6%
White Hispanic
9 23.7%
4 5.3%
0 0.0%
0 0.0%
1 5.3%
0 0.0%
1 14.3%
0 0.0%
0 0.0%
0 0.0%
15 9.9%
0 0.0%
2 2.7%
5 6.7%
17 7.5%
5 2.2%
American MultiAsian Indian racial
1 2.6%
4 5.3%
0 0.0%
0 0.0%
0 0.0%
0 0.0%
0 0.0%
0 0.0%
0 0.0%
0 0.0%
0 0.0%
0 0.0%
0 0.0%
0 0.0%
0 0.0%
5 3.3%
0 0.0%
0 0.0%
1 1.3%
0 0.0%
0 0.0%
6 2.7%
0 0.0%
0 0.0%
Male Female
13 34.2%
24 32.0%
25 65.8%
51 68.0%
8 42.1%
7 58.3%
2 28.6%
11 57.9%
5 41.7%
5 71.4%
54
97
35.8% 64.2%
23
52
30.7% 69.3%
77
149
34.1% 65.9%
HOPE Scholarships
School System
Number of 1999 Graduates 2 2 6
Number Eligible
109
Percent Eligible
48.2%
1,436 749
52.2%
State
65,548 40,292 61.5%
High School Completion Rate
Percent of 1995Grade 9 Enrollment in Graduating Class of1999 School System State
Completion Rate '95-'99 47.8% 62.1% 68.9%
1998-99 GEORGIA PUBLIC EDUCATION REPORT CARD
Savannah High School - 6250399
Prepared by Georgia Department of Education
Page 2
COLLEGE ADMISSIONS / CREDIT TEST DATA
Scholastic Assessment Test (SAT)
Based on students' highest verbal and highest math scores
No. Taking
Average Score
Tests Verbal Math Total
Based on students' last test administration
Average Score Verbal Math Total
School College Prep. Endorsement Other Diplomas
72 414 408
822
412 408
820
343 330
673
System
578 489 473
962
College Prep. Endorsement
483 469
952
Other Diplomas
419 379
798
Georgia
41,958 492 488
980
410 N/A N/A
480 N/A N/A
483
401 N/A N/A
464 N/A N/A
479
811 N/A N/A
944 N/A N/A
962
Nation
952,913 N/A N/A N/A
502 508 1010
American College Testing (ACT)
Advanced Placement Exams (AP)
Number taking tests: English Mathematics Reading Science Reasoning CompositeScore
4 6 School System State
12.9 16.0 19.1
15.3 17.1 19.9
14.9 15.9
17.5 17.7
20.2 19.9
14.9 17.2 19.9
No. of Students Taking Tests
No. of Tests Taken No. of Test Scores
3 or Higher Percent of Test
Scores 3 or Higher
School 8
11 2
18.2%
System State 291 15,225 509 23,969 254 13,024
49.9% 54.3%
POST-SECONDARY DATA
Graduates Entering Georgia Public Colleges
Graduates Entering Georgia Public Colleges and Requiring Learning Support (LS)
1998 Graduates Entering in 1998-99
1997 Graduates Entering in 1997-98
Percent of Graduating Number Class
School
69
25.7%
System 470
30.4%
School
88
29.1%
System 565
37.0%
Number Requiring
LS 41 159
57 232
Percent of those attending Georgia
Public Colleges
59.4%
33.8%
64.8%
41.1%
In previous years, the Report Card presented College Prep Curriculum information provided by the Board of Regents on students requiring Learning Support. Due to inconsistencies in the data provided by the Board of Regents in defining College Prep Completers versus Local Board of Education data defining College Prep Endorsements, the Department of Education Report Card will not provide this information until discrepancies can be reconciled.
Graduates Entering Georgia Public Technical and Adult Schools
1998 Graduates School System
Entering Number 10 78
1998-99 Percent
3.7% 5.0%
Entering Number N/A N/A
1997-98 Percent
N/A N/A
1997 Graduates School
7
2.3%
System
15
1.0%
29
9.6%
89
5.8%
1998-99 GEORGIA PUBLIC EDUCATION REPORT CARD Savannah High School - 6250399
Prepared by Georgia Department of Education
Page 3
CERTIFIED PERSONNEL DATA
Positions Number Average Contract Days
Administrators
3.00 226.33
Support Personnel
4.50 190.00
PK-12 Teachers
70.05 190.00
Personnel Sex
Certificate
Years Experience
Full-time Part-time
Male Female
4 Yr Bachelor's 5 Yr Master's 6 Yr Specialist's 7 Yr Doctoral Other*
<1 1-10 11-20 21-30 >30
Average
3 0
1 2
0 2 0 1 0
0 0 0 2 1
27.00
4 1
2 3
0 3 2 0 0
0 0 2 2 1
22.20
70 1
24 47
27 38
5 1 0
0 22 16 29
4
17.41
*Includes One- and Two-Year Vocational Certificates.
ACCREDITATION DATA
Accredited by Southern Association of Colleges and Schools (SACS): Secondary/Middle Commission.
AWARDS / RECOGNITION DATA
Schools in Georgia may receive recognition in the following programs: Charter School Pay for Performance Program Georgia School of Excellence National Blue Ribbon School Savannah High School did not receive recognition in any of these programs during the 1998-99 school year.
1998-99 GEORGIA PUBLIC EDUCATION REPORT CARD Savannah High School - 6250399
Prepared by Georgia Department of Education
Page 4
1998-99 GEORGIA PUBLIC EDUCATION REPORT CARD
CHATHAM COUNTY SCHOOLS
Shuman Middle School - 6254066
Grade Range 6-8
The Georgia Public Education Report Card is designed to assist systems and schools in educational improvement. This report card contains a variety of data elements. An explanation of the terms is provided as a companion to the report card data. Please refer to the definitions for the most effective use of the reported data.
STUDENT DATA
Total 776
6-8 Enrollment, by Race/Ethnicity and Sex
Black
White Hispanic
American Multi-
Asian Indian
racial
554 71.4%
166 21.4%
22 2.8%
26 3.4%
1 0.1%
7 0.9%
Male 371
47.8%
Female 405
52.2%
Enrollment in Selected Programs
Program
Gifted (Grades K-12)
Program % of Student Enrollment Population
47
6.1%
Alternative Programs
22
(Grades 6-12)
2.8%
Students Eligible to Receive Free/Reduced Lunches
Number
Percent
School System
462 19,220
59.5% 52.3%
Enrollment in Compensatory Programs
Program
Program % of Student Enrollment Population
Special Education (Grades K-12) (PK)
74
9.5%
0
N/A
English to Speakers of Other Languages (ESOL) (Grades K-12)
36
4.6%
Title I (Grades K-12)
This school has a schoolwide program.
Dropout Rate for Grades 6-8
Number
Rate
School System
8
1.0%
68
0.8%
Total 8
Retained Students, by Race/Ethnicity and Sex
Black
White Hispanic
American MultiAsian Indian racial
7 87.5%
1 12.5%
0 0.0%
0 0.0%
0 0.0%
0 0.0%
Male Female
6
2
75.0% 25.0%
Prepared by Georgia Department of Education
Page 1
STATE-REQUIRED TEST DATA
NORM-REFERENCED TESTS Grade 8
Iowa Tests of Basic Skills (ITBS) Each chart reflects data for three years of testing.
Reading Comprehension 50
37 34 49 0
98-99
40 35 48 97-98
33 34 48 96-97
Mathematics
School 50
System
State
0
46 40 56 98-99
50 43 55 97-98
50 41 54 96-97
School System State
Reading Vocabulary 50
31 30 46 0
98-99
35 31 45 97-98
30 31 44 96-97
Language Arts
School 50
System
State
0
51 48 60 98-99
53 48 58 97-98
47 44 56 96-97
School System State
Social Studies 50
42 41 54 0
98-99
50 43 53 97-98
43 40 53 96-97
Science
School 50
System
State
0
39 38 56 98-99
43 38 55 97-98
39 38 53 96-97
School System State
Sources of Information
Composite Score
50
53 47 57 0
98-99
School 50
System
55 48 56 97-98
47 47 55 96-97
State 0
43 40 56 98-99
48 42 54 97-98
1998-99 GEORGIA PUBLIC EDUCATION REPORT CARD Shuman Middle School - 6254066
Prepared by Georgia Department of Education
42 40 54 96-97
Scores Reported in Percentiles
School System State
Page 2
STATE-REQUIRED TEST DATA
Categories of Scaled Scores
Inadequate (less than 162)
Minimal (162-209)
Good
(210-247)
Very Good (greater than 247)
Average Scaled Score: (Range 100-300)
PERFORMANCE ASSESSMENTS
Grade 8 Writing Assessment
1998-99 Percent Scoring
1997-98 Percent Scoring
1996-97 Percent Scoring
School System State School System State School System State
9% 50% 37%
4%
14% 51% 31%
4%
8% 40% 41% 11%
12% 59% 28%
2%
17% 53% 25%
4%
11% 46% 34%
8%
21% 55% 22%
2%
23% 50% 23%
5%
15% 46% 30%
8%
200
196
208 194
192 202 187
189 198
AWARDS / RECOGNITION DATA
The Georgia School of Excellence Program recognizes exemplary schools that have excellent, successful programs in many areas of school life. Each year, in a statewide competition, one elementary, one middle and one high school from each of Georgia's 11 congressional districts may be selected for this honor.
Shuman Middle School was designated a 1998-99 Georgia School of Excellence.
1998-99 GEORGIA PUBLIC EDUCATION REPORT CARD Shuman Middle School - 6254066
Prepared by Georgia Department of Education
Page 3
CERTIFIED PERSONNEL DATA
Positions Number Average Contract Days
Personnel Sex
Certificate
Years Experience
Full-time Part-time
Male Female
4 Yr Bachelor's 5 Yr Master's 6 Yr Specialist's 7 Yr Doctoral Other*
<1 1-10 11-20 21-30 >30
Average
Administrators
2.00 209.50
2 0
1 1
0 1 1 0 0 0 0 0 1 1 32.00
Support Personnel
5.00 190.00
5 0
0 5
0 3 2 0 0 0 0 2 3 0 19.20
PK-12 Teachers
73.56 190.00
73 2
15 60
39 28
8 0 0 3 36 17 13 6 13.37
*Includes One- and Two-Year Vocational Certificates.
ACCREDITATION DATA
Accredited by Southern Association of Colleges and Schools (SACS):
Elementary/Middle Commission.
1998-99 GEORGIA PUBLIC EDUCATION REPORT CARD Shuman Middle School - 6254066
Prepared by Georgia Department of Education
Page 4
1998-99 GEORGIA PUBLIC EDUCATION REPORT CARD
CHATHAM COUNTY SCHOOLS
Southwest Middle School - 6250299
Grade Range 6-8
The Georgia Public Education Report Card is designed to assist systems and schools in educational improvement. This report card contains a variety of data elements. An explanation of the terms is provided as a companion to the report card data. Please refer to the definitions for the most effective use of the reported data.
STUDENT DATA
Total 801
6-8 Enrollment, by Race/Ethnicity and Sex
Black
White Hispanic
American Multi-
Asian Indian
racial
350 43.7%
400 49.9%
27 3.4%
12 1.5%
2 0.2%
10 1.2%
Male 416
51.9%
Female 385
48.1%
Enrollment in Selected Programs
Program
Gifted (Grades K-12)
Program % of Student Enrollment Population
58
7.2%
Alternative Programs (Grades 6-12)
8
1.0%
Students Eligible to Receive Free/Reduced Lunches
Number
Percent
School System
272 19,220
34.0% 52.3%
Enrollment in Compensatory Programs
Program
Program % of Student Enrollment Population
Special Education (Grades K-12) (PK)
89 11.1%
0
N/A
English to Speakers of Other Languages (ESOL) (Grades K-12)
1
< 1%
Title I (Grades K-12)
This school has no Title I program.
Dropout Rate for Grades 6-8
Number
Rate
School System
0
0.0%
68
0.8%
Total 1
Retained Students, by Race/Ethnicity and Sex
Black
White Hispanic
American MultiAsian Indian racial
1 100.0%
0 0.0%
0 0.0%
0 0.0%
0 0.0%
0 0.0%
Male Female
1 100.0%
0 0.0%
Prepared by Georgia Department of Education
Page 1
STATE-REQUIRED TEST DATA
NORM-REFERENCED TESTS Grade 8
Iowa Tests of Basic Skills (ITBS) Each chart reflects data for three years of testing.
Reading Comprehension 50
47 34 49 N/A 35 48 N/A 34 48
0
98-99
97-98
96-97
Mathematics
School 50
System
State
0
49 40 56 N/A 43 55 N/A 41 54
98-99
97-98
96-97
School System State
Reading Vocabulary 50
40 30 46 N/A 31 45 N/A 31 44
0
98-99
97-98
96-97
Language Arts
School 50
System
State
0
56 48 60 N/A 48 58 N/A 44 56
98-99
97-98
96-97
School System State
Social Studies 50
52 41 54 N/A 43 53 N/A 40 53
0
98-99
97-98
96-97
Science
School 50
System
State
0
49 38 56 N/A 38 55 N/A 38 53
98-99
97-98
96-97
School System State
Sources of Information
Composite Score
School
50
50
System
59 47 57 N/A 48 56 N/A 47 55
0
98-99
97-98
96-97
State 0
52 40 56 N/A 42 54 N/A 40 54
98-99
97-98
96-97
1998-99 GEORGIA PUBLIC EDUCATION REPORT CARD Southwest Middle School - 6250299
Prepared by Georgia Department of Education
Scores Reported in Percentiles
School System State
Page 2
STATE-REQUIRED TEST DATA
Categories of Scaled Scores
Inadequate (less than 162)
Minimal (162-209)
Good
(210-247)
Very Good (greater than 247)
Average Scaled Score: (Range 100-300)
PERFORMANCE ASSESSMENTS
Grade 8 Writing Assessment
1998-99 Percent Scoring
1997-98 Percent Scoring
1996-97 Percent Scoring
School System State School System State School System State
4% 50% 39%
7%
14% 51% 31%
4%
8% 40% 41% 11%
N/A N/A N/A N/A
17% 53% 25%
4%
11% 46% 34%
8%
N/A N/A N/A N/A
23% 50% 23%
5%
15% 46% 30%
8%
209
196
208 N/A
192 202 N/A
189 198
AWARDS / RECOGNITION DATA
Schools in Georgia may receive recognition in the following programs: Charter School Pay for Performance Program Georgia School of Excellence National Blue Ribbon School Southwest Middle School did not receive recognition in any of these programs during the 1998-99 school year.
1998-99 GEORGIA PUBLIC EDUCATION REPORT CARD Southwest Middle School - 6250299
Prepared by Georgia Department of Education
Page 3
CERTIFIED PERSONNEL DATA
Positions Number Average Contract Days
Personnel Sex
Certificate
Years Experience
Full-time Part-time
Male Female
4 Yr Bachelor's 5 Yr Master's 6 Yr Specialist's 7 Yr Doctoral Other*
<1 1-10 11-20 21-30 >30
Average
Administrators
2.00 199.50
2 0
0 2
0 1 1 0 0 0 0 1 1 0 19.00
Support Personnel
2.00 104.50
2 0
1 1
0 2 0 0 0 0 1 1 0 0 14.00
PK-12 Teachers
45.00 191.56
44 2
13 33
26 19
1 0 0 6 26 9 5 0 8.46
*Includes One- and Two-Year Vocational Certificates.
ACCREDITATION DATA
Accredited by Southern Association of Colleges and Schools (SACS):
Elementary/Middle Commission.
1998-99 GEORGIA PUBLIC EDUCATION REPORT CARD Southwest Middle School - 6250299
Prepared by Georgia Department of Education
Page 4
1998-99 GEORGIA PUBLIC EDUCATION REPORT CARD
CHATHAM COUNTY SCHOOLS
Spencer Elementary School - 6252068
Grade Range PK-5
The Georgia Public Education Report Card is designed to assist systems and schools in educational improvement. This report card contains a variety of data elements. An explanation of the terms is provided as a companion to the report card data. Please refer to the definitions for the most effective use of the reported data.
STUDENT DATA
Total
K-5
401
PK
59
Enrollment, by Race/Ethnicity and Sex
Black
White Hispanic
American Asian Indian
Multiracial
376 93.8%
19 4.7%
2 0.5%
0 0.0%
0 0.0%
4 1.0%
57 96.6%
1 1.7%
0 0.0%
1 1.7%
0 0.0%
0 0.0%
Male Female
198 49.4%
203 50.6%
32 54.2%
27 45.8%
Enrollment in Selected Programs
Program
Program % of Student Enrollment Population
Gifted (Grades K-12)
3
< 1%
Alternative Programs (Grades 6-12)
N/A
N/A
Students Eligible to Receive Free/Reduced Lunches
Number
Percent
School System
400 19,220
87.0% 52.3%
Dropout Rate *
Number
Rate
School System
N/A N/A
N/A N/A
* Dropout rates are not applicable for grades PK-5.
Enrollment in Compensatory Programs
Program
Program % of Student Enrollment Population
Special Education (Grades K-12)
39
9.7%
(PK)
3
N/A
English to Speakers of Other Languages (ESOL) (Grades K-12)
0
0.0%
Remedial Education (Grades 2-5, 9-12)
79 31.7%
Special Instructional Assistance (SIA) (Grades K-3)
57 20.1%
Title I (Grades K-12)
This school has a schoolwide program.
Total 33
Retained Students, by Race/Ethnicity and Sex
Black
White Hispanic
American MultiAsian Indian racial
33 100.0%
0 0.0%
0 0.0%
0 0.0%
0 0.0%
0 0.0%
Male Female
25
8
75.8% 24.2%
Prepared by Georgia Department of Education
Page 1
STATE-REQUIRED TEST DATA
NORM-REFERENCED TESTS Grade 3
Iowa Tests of Basic Skills (ITBS) Each chart reflects data for three years of testing.
Reading Comprehension 50
36 47 54 0
98-99
24 44 53 97-98
23 43 52 96-97
Mathematics
School 50
System
State
0
44 56 61 98-99
31 54 61 97-98
27 51 59 96-97
School System State
Reading Vocabulary 50
34 43 50 0
98-99
21 44 50 97-98
18 42 49 96-97
Language Arts
School 50
System
State
0
47 57 64 98-99
36 56 62 97-98
27 50 59 96-97
School System State
Social Studies 50
40 47 56 0
98-99
35 49 55 97-98
24 46 55 96-97
Science
School 50
System
State
0
35 50 59 98-99
35 51 59 97-98
31 49 58 96-97
School System State
Sources of Information
Composite Score
50
42 52 57 0
98-99
School 50
System
33 49 56 97-98
27 47 55 96-97
State 0
38 50 58 98-99
29 49 57 97-98
1998-99 GEORGIA PUBLIC EDUCATION REPORT CARD Spencer Elementary School - 6252068
Prepared by Georgia Department of Education
24 47 56 96-97
Scores Reported in Percentiles
School System State
Page 2
STATE-REQUIRED TEST DATA
NORM-REFERENCED TESTS Grade 5
Iowa Tests of Basic Skills (ITBS) Each chart reflects data for three years of testing.
Reading Comprehension
Mathematics
50
33 47 53 0
98-99
46 47 53 97-98
30 44 52 96-97
School 50
System
State
0
38 51 59 98-99
52 53 58 97-98
31 49 57 96-97
School System State
Reading Vocabulary 50
22 39 48 0
98-99
58 44 48 97-98
16 38 46 96-97
Language Arts
School 50
System
State
0
46 58 63 98-99
62 57 61 97-98
33 49 58 96-97
School System State
Social Studies 50
32 49 57 0
98-99
48 49 56 97-98
24 45 55 96-97
Science
School 50
System
State
0
28 55 60 98-99
48 54 59 97-98
34 51 59 96-97
School System State
Sources of Information
Composite Score
50
45 55 58 0
98-99
School 50
System
55 54 58 97-98
35 50 57 96-97
State 0
34 51 57 98-99
52 51 56 97-98
28 46 55 96-97
1998-99 GEORGIA PUBLIC EDUCATION REPORT CARD Spencer Elementary School - 6252068
Prepared by Georgia Department of Education
Scores Reported in Percentiles
School System State
Page 3
STATE-REQUIRED TEST DATA
PERFORMANCE ASSESSMENTS
Grade 5 Writing Assessment
Percent at Developmental Stages:
1998-99 School System State
1997-98 School System State
1996-97 School System State
Stage Stage Stage Stage Stage Stage
1:The Emerging Writer 2:The Developing Writer 3:The Focusing Writer 4:The Experimenting 5:The Engaging Writer 6:The Extending Writer
0% 2% 37% 51% 10% 0%
0% 1% 22% 46% 23% 7%
0% 1% 16% 41% 29% 12%
2% 5% 42% 39% 11% 2%
0% 3% 24% 43% 22% 7%
0% 3% 19% 41% 27% 10%
1% 6% 43% 36% 13% 0%
0% 4% 26% 39% 22% 8%
0% 3% 21% 37% 26% 12%
AWARDS / RECOGNITION DATA
Schools in Georgia may receive recognition in the following programs: Charter School Pay for Performance Program Georgia School of Excellence National Blue Ribbon School Spencer Elementary School did not receive recognition in any of these programs during the 1998-99 school year.
1998-99 GEORGIA PUBLIC EDUCATION REPORT CARD Spencer Elementary School - 6252068
Prepared by Georgia Department of Education
Page 4
CERTIFIED PERSONNEL DATA
Positions Number Average Contract Days
Personnel Sex
Certificate
Years Experience
Full-time Part-time
Male Female
4 Yr Bachelor's 5 Yr Master's 6 Yr Specialist's 7 Yr Doctoral Other*
<1 1-10 11-20 21-30 >30
Average
Administrators
2.00 204.50
2 0
0 2
0 1 1 0 0 0 0 0 2 0 28.50
Support Personnel
3.00 190.00
3 0
0 3
0 2 1 0 0 0 2 0 1 0 10.67
PK-12 Teachers
33.55 190.00
30 8
1 37
24 14
0 0 0 1 22 10 4 1 10.45
*Includes One- and Two-Year Vocational Certificates.
ACCREDITATION DATA
Accredited by Southern Association of Colleges and Schools (SACS):
Elementary/Middle Commission.
1998-99 GEORGIA PUBLIC EDUCATION REPORT CARD Spencer Elementary School - 6252068
Prepared by Georgia Department of Education
Page 5
1998-99 GEORGIA PUBLIC EDUCATION REPORT CARD
CHATHAM COUNTY SCHOOLS
Thunderbolt Elementary School - 6252069
Grade Range PK-5
The Georgia Public Education Report Card is designed to assist systems and schools in educational improvement. This report card contains a variety of data elements. An explanation of the terms is provided as a companion to the report card data. Please refer to the definitions for the most effective use of the reported data.
STUDENT DATA
Total
K-5
614
PK
40
Enrollment, by Race/Ethnicity and Sex
Black
White Hispanic
American Asian Indian
Multiracial
534 87.0%
69 11.2%
1 0.2%
3 0.5%
0 0.0%
7 1.1%
34 85.0%
6 15.0%
0 0.0%
0 0.0%
0 0.0%
0 0.0%
Male Female
312 50.8%
302 49.2%
19 47.5%
21 52.5%
Enrollment in Selected Programs
Program
Program % of Student Enrollment Population
Gifted (Grades K-12)
9
1.5%
Alternative Programs (Grades 6-12)
N/A
N/A
Students Eligible to Receive Free/Reduced Lunches
Number
Percent
School System
487 19,220
74.5% 52.3%
Dropout Rate *
Number
Rate
School System
N/A N/A
N/A N/A
* Dropout rates are not applicable for grades PK-5.
Enrollment in Compensatory Programs
Program
Program % of Student Enrollment Population
Special Education (Grades K-12)
51
8.3%
(PK)
2
N/A
English to Speakers of Other Languages (ESOL) (Grades K-12)
0
0.0%
Remedial Education (Grades 2-5, 9-12)
98 25.1%
Special Instructional Assistance (SIA) (Grades K-3)
142 33.2%
Title I (Grades K-12)
This school has a schoolwide program.
Total 10
Retained Students, by Race/Ethnicity and Sex
Black
White Hispanic
American MultiAsian Indian racial
10 100.0%
0 0.0%
0 0.0%
0 0.0%
0 0.0%
0 0.0%
Male Female
7
3
70.0% 30.0%
Prepared by Georgia Department of Education
Page 1
STATE-REQUIRED TEST DATA
NORM-REFERENCED TESTS Grade 3
Iowa Tests of Basic Skills (ITBS) Each chart reflects data for three years of testing.
Reading Comprehension 50
26 47 54 0
98-99
29 44 53 97-98
25 43 52 96-97
Mathematics
School 50
System
State
0
37 56 61 98-99
41 54 61 97-98
27 51 59 96-97
School System State
Reading Vocabulary 50
28 43 50 0
98-99
27 44 50 97-98
18 42 49 96-97
Language Arts
School 50
System
State
0
35 57 64 98-99
37 56 62 97-98
27 50 59 96-97
School System State
Social Studies 50
26 47 56 0
98-99
30 49 55 97-98
27 46 55 96-97
Science
School 50
System
State
0
32 50 59 98-99
30 51 59 97-98
32 49 58 96-97
School System State
Sources of Information
Composite Score
50
36 52 57 0
98-99
School 50
System
32 49 56 97-98
25 47 55 96-97
State 0
29 50 58 98-99
30 49 57 97-98
1998-99 GEORGIA PUBLIC EDUCATION REPORT CARD Thunderbolt Elementary School - 6252069
Prepared by Georgia Department of Education
24 47 56 96-97
Scores Reported in Percentiles
School System State
Page 2
STATE-REQUIRED TEST DATA
NORM-REFERENCED TESTS Grade 5
Iowa Tests of Basic Skills (ITBS) Each chart reflects data for three years of testing.
Reading Comprehension
Mathematics
50
32 47 53 0
98-99
32 47 53 97-98
32 44 52 96-97
School 50
System
State
0
26 51 59 98-99
33 53 58 97-98
33 49 57 96-97
School System State
Reading Vocabulary 50
16 39 48 0
98-99
28 44 48 97-98
22 38 46 96-97
Language Arts
School 50
System
State
0
30 58 63 98-99
41 57 61 97-98
30 49 58 96-97
School System State
Social Studies 50
24 49 57 0
98-99
23 49 56 97-98
29 45 55 96-97
Science
School 50
System
State
0
28 55 60 98-99
23 54 59 97-98
35 51 59 96-97
School System State
Sources of Information
Composite Score
50
35 55 58 0
98-99
School 50
System
34 54 58 97-98
34 50 57 96-97
State 0
26 51 57 98-99
28 51 56 97-98
29 46 55 96-97
1998-99 GEORGIA PUBLIC EDUCATION REPORT CARD Thunderbolt Elementary School - 6252069
Prepared by Georgia Department of Education
Scores Reported in Percentiles
School System State
Page 3
STATE-REQUIRED TEST DATA
PERFORMANCE ASSESSMENTS
Grade 5 Writing Assessment
Percent at Developmental Stages:
1998-99 School System State
1997-98 School System State
1996-97 School System State
Stage Stage Stage Stage Stage Stage
1:The Emerging Writer 2:The Developing Writer 3:The Focusing Writer 4:The Experimenting 5:The Engaging Writer 6:The Extending Writer
0% 6% 58% 32% 4% 0%
0% 1% 22% 46% 23% 7%
0% 1% 16% 41% 29% 12%
2% 13% 39% 31%
9% 1%
0% 3% 24% 43% 22% 7%
0% 3% 19% 41% 27% 10%
0% 7% 36% 44% 10% 3%
0% 4% 26% 39% 22% 8%
0% 3% 21% 37% 26% 12%
AWARDS / RECOGNITION DATA
Schools in Georgia may receive recognition in the following programs: Charter School Pay for Performance Program Georgia School of Excellence National Blue Ribbon School Thunderbolt Elementary School did not receive recognition in any of these programs during the 1998-99 school year.
1998-99 GEORGIA PUBLIC EDUCATION REPORT CARD Thunderbolt Elementary School - 6252069
Prepared by Georgia Department of Education
Page 4
CERTIFIED PERSONNEL DATA
Positions Number Average Contract Days
Personnel Sex
Certificate
Years Experience
Full-time Part-time
Male Female
4 Yr Bachelor's 5 Yr Master's 6 Yr Specialist's 7 Yr Doctoral Other*
<1 1-10 11-20 21-30 >30
Average
Administrators
2.50 207.20
2 1
1 2
0 2 1 0 0 0 0 2 1 0 20.00
Support Personnel
2.00 190.00
2 0
0 2
0 2 0 0 0 0 0 1 1 0 20.00
PK-12 Teachers
40.70 190.86
40 2
6 36
28 12
1 1 0 4 18 11 9 0 12.02
*Includes One- and Two-Year Vocational Certificates.
ACCREDITATION DATA
Accredited by Southern Association of Colleges and Schools (SACS):
Elementary/Middle Commission.
1998-99 GEORGIA PUBLIC EDUCATION REPORT CARD Thunderbolt Elementary School - 6252069
Prepared by Georgia Department of Education
Page 5
1998-99 GEORGIA PUBLIC EDUCATION REPORT CARD
CHATHAM COUNTY SCHOOLS
Tompkins Middle School - 6250190
Grade Range 6-8
The Georgia Public Education Report Card is designed to assist systems and schools in educational improvement. This report card contains a variety of data elements. An explanation of the terms is provided as a companion to the report card data. Please refer to the definitions for the most effective use of the reported data.
STUDENT DATA
Total 594
6-8 Enrollment, by Race/Ethnicity and Sex
Black
White Hispanic
American Multi-
Asian Indian
racial
555 93.4%
35 5.9%
0 0.0%
1 0.2%
0 0.0%
3 0.5%
Male 330
55.6%
Female 264
44.4%
Enrollment in Selected Programs
Program
Gifted (Grades K-12)
Program % of Student Enrollment Population
5
< 1%
Alternative Programs
24
(Grades 6-12)
4.0%
Students Eligible to Receive Free/Reduced Lunches
Number
Percent
School System
439 19,220
73.9% 52.3%
Enrollment in Compensatory Programs
Program
Program % of Student Enrollment Population
Special Education (Grades K-12) (PK)
79 13.3%
0
N/A
English to Speakers of Other Languages (ESOL) (Grades K-12)
0
0.0%
Title I (Grades K-12)
This school has a schoolwide program.
Dropout Rate for Grades 6-8
Number
Rate
School System
9
1.4%
68
0.8%
Total 51
Retained Students, by Race/Ethnicity and Sex
Black
White Hispanic
American MultiAsian Indian racial
49 96.1%
2 3.9%
0 0.0%
0 0.0%
0 0.0%
0 0.0%
Male Female
36
15
70.6% 29.4%
Prepared by Georgia Department of Education
Page 1
STATE-REQUIRED TEST DATA
NORM-REFERENCED TESTS Grade 8
Iowa Tests of Basic Skills (ITBS) Each chart reflects data for three years of testing.
Reading Comprehension 50
20 34 49 0
98-99
28 35 48 97-98
23 34 48 96-97
Mathematics
School 50
System
State
0
24 40 56 98-99
36 43 55 97-98
28 41 54 96-97
School System State
Reading Vocabulary 50
15 30 46 0
98-99
23 31 45 97-98
21 31 44 96-97
Language Arts
School 50
System
State
0
34 48 60 98-99
39 48 58 97-98
38 44 56 96-97
School System State
Social Studies 50
26 41 54 0
98-99
37 43 53 97-98
29 40 53 96-97
Science
School 50
System
State
0
22 38 56 98-99
31 38 55 97-98
29 38 53 96-97
School System State
Sources of Information
Composite Score
50
36 47 57 0
98-99
School 50
System
39 48 56 97-98
38 47 55 96-97
State 0
24 40 56 98-99
33 42 54 97-98
1998-99 GEORGIA PUBLIC EDUCATION REPORT CARD Tompkins Middle School - 6250190
Prepared by Georgia Department of Education
29 40 54 96-97
Scores Reported in Percentiles
School System State
Page 2
STATE-REQUIRED TEST DATA
Categories of Scaled Scores
Inadequate (less than 162)
Minimal (162-209)
Good
(210-247)
Very Good (greater than 247)
Average Scaled Score: (Range 100-300)
PERFORMANCE ASSESSMENTS
Grade 8 Writing Assessment
1998-99 Percent Scoring
1997-98 Percent Scoring
1996-97 Percent Scoring
School System State School System State School System State
22% 56% 19%
2%
14% 51% 31%
4%
8% 40% 41% 11%
27% 60% 12%
0%
17% 53% 25%
4%
11% 46% 34%
8%
30% 54% 15%
1%
23% 50% 23%
5%
15% 46% 30%
8%
184
196
208 177
192 202 178
189 198
AWARDS / RECOGNITION DATA
Schools in Georgia may receive recognition in the following programs: Charter School Pay for Performance Program Georgia School of Excellence National Blue Ribbon School Tompkins Middle School did not receive recognition in any of these programs during the 1998-99 school year.
1998-99 GEORGIA PUBLIC EDUCATION REPORT CARD Tompkins Middle School - 6250190
Prepared by Georgia Department of Education
Page 3
CERTIFIED PERSONNEL DATA
Positions Number Average Contract Days
Personnel Sex
Certificate
Years Experience
Full-time Part-time
Male Female
4 Yr Bachelor's 5 Yr Master's 6 Yr Specialist's 7 Yr Doctoral Other*
<1 1-10 11-20 21-30 >30
Average
Administrators
2.00 204.50
2 0
1 1
0 1 1 0 0 0 0 0 2 0 23.50
Support Personnel
3.90 190.00
3 1
1 3
1 1 2 0 0 0 1 1 2 0 14.75
PK-12 Teachers
53.50 190.00
53 1
9 45
26 28
0 0 0 1 16 20 16 1 14.91
*Includes One- and Two-Year Vocational Certificates.
ACCREDITATION DATA
Accredited by Southern Association of Colleges and Schools (SACS):
Elementary/Middle Commission.
1998-99 GEORGIA PUBLIC EDUCATION REPORT CARD Tompkins Middle School - 6250190
Prepared by Georgia Department of Education
Page 4
1998-99 GEORGIA PUBLIC EDUCATION REPORT CARD
CHATHAM COUNTY SCHOOLS
West Chatham Middle School - 6250199
Grade Range 6-8
The Georgia Public Education Report Card is designed to assist systems and schools in educational improvement. This report card contains a variety of data elements. An explanation of the terms is provided as a companion to the report card data. Please refer to the definitions for the most effective use of the reported data.
STUDENT DATA
Total 709
6-8 Enrollment, by Race/Ethnicity and Sex
Black
White Hispanic
American Multi-
Asian Indian
racial
248 35.0%
438 61.8%
7 1.0%
4 0.6%
4 0.6%
8 1.1%
Male 379
53.5%
Female 330
46.5%
Enrollment in Selected Programs
Program
Gifted (Grades K-12)
Program % of Student Enrollment Population
61
8.6%
Alternative Programs
20
(Grades 6-12)
2.8%
Students Eligible to Receive Free/Reduced Lunches
Number
Percent
School System
295 19,220
41.6% 52.3%
Enrollment in Compensatory Programs
Program
Program % of Student Enrollment Population
Special Education (Grades K-12) (PK)
75 10.6%
0
N/A
English to Speakers of Other Languages (ESOL) (Grades K-12)
0
0.0%
Title I (Grades K-12)
This school has no Title I program.
Dropout Rate for Grades 6-8
Number
Rate
School System
6
0.8%
68
0.8%
Total 1
Retained Students, by Race/Ethnicity and Sex
Black
White Hispanic
American MultiAsian Indian racial
0
1
0.0% 100.0%
0 0.0%
0 0.0%
0 0.0%
0 0.0%
Male Female
1 100.0%
0 0.0%
Prepared by Georgia Department of Education
Page 1
STATE-REQUIRED TEST DATA
NORM-REFERENCED TESTS Grade 8
Iowa Tests of Basic Skills (ITBS) Each chart reflects data for three years of testing.
Reading Comprehension 50
43 34 49 N/A 35 48 N/A 34 48
0
98-99
97-98
96-97
Mathematics
School 50
System
State
0
41 40 56 N/A 43 55 N/A 41 54
98-99
97-98
96-97
School System State
Reading Vocabulary 50
41 30 46 N/A 31 45 N/A 31 44
0
98-99
97-98
96-97
Language Arts
School 50
System
State
0
54 48 60 N/A 48 58 N/A 44 56
98-99
97-98
96-97
School System State
Social Studies 50
43 41 54 N/A 43 53 N/A 40 53
0
98-99
97-98
96-97
Science
School 50
System
State
0
43 38 56 N/A 38 55 N/A 38 53
98-99
97-98
96-97
School System State
Sources of Information
Composite Score
School
50
50
System
51 47 57 N/A 48 56 N/A 47 55
0
98-99
97-98
96-97
State 0
45 40 56 N/A 42 54 N/A 40 54
98-99
97-98
96-97
1998-99 GEORGIA PUBLIC EDUCATION REPORT CARD West Chatham Middle School - 6250199
Prepared by Georgia Department of Education
Scores Reported in Percentiles
School System State
Page 2
STATE-REQUIRED TEST DATA
Categories of Scaled Scores
Inadequate (less than 162)
Minimal (162-209)
Good
(210-247)
Very Good (greater than 247)
Average Scaled Score: (Range 100-300)
PERFORMANCE ASSESSMENTS
Grade 8 Writing Assessment
1998-99 Percent Scoring
1997-98 Percent Scoring
1996-97 Percent Scoring
School System State School System State School System State
13% 61% 26%
1%
14% 51% 31%
4%
8% 40% 41% 11%
N/A N/A N/A N/A
17% 53% 25%
4%
11% 46% 34%
8%
N/A N/A N/A N/A
23% 50% 23%
5%
15% 46% 30%
8%
191
196
208 N/A
192 202 N/A
189 198
AWARDS / RECOGNITION DATA
Schools in Georgia may receive recognition in the following programs: Charter School Pay for Performance Program Georgia School of Excellence National Blue Ribbon School West Chatham Middle School did not receive recognition in any of these programs during the 1998-99 school year.
1998-99 GEORGIA PUBLIC EDUCATION REPORT CARD West Chatham Middle School - 6250199
Prepared by Georgia Department of Education
Page 3
CERTIFIED PERSONNEL DATA
Positions Number Average Contract Days
Personnel Sex
Certificate
Years Experience
Full-time Part-time
Male Female
4 Yr Bachelor's 5 Yr Master's 6 Yr Specialist's 7 Yr Doctoral Other*
<1 1-10 11-20 21-30 >30
Average
Administrators
2.00 204.50
2 0
0 2
0 1 0 1 0 0 1 0 1 0 17.00
Support Personnel
1.00 190.00
1 0
1 0
0 1 0 0 0 0 0 0 1 0 24.00
PK-12 Teachers
41.50 191.69
41 1
11 31
29 13
0 0 0 2 27 6 6 1 10.19
*Includes One- and Two-Year Vocational Certificates.
ACCREDITATION DATA
Accredited by Southern Association of Colleges and Schools (SACS):
Elementary/Middle Commission.
1998-99 GEORGIA PUBLIC EDUCATION REPORT CARD West Chatham Middle School - 6250199
Prepared by Georgia Department of Education
Page 4
1998-99 GEORGIA PUBLIC EDUCATION REPORT CARD
CHATHAM COUNTY SCHOOLS
White Bluff Elementary School - 6251070
Grade Range PK-5
The Georgia Public Education Report Card is designed to assist systems and schools in educational improvement. This report card contains a variety of data elements. An explanation of the terms is provided as a companion to the report card data. Please refer to the definitions for the most effective use of the reported data.
STUDENT DATA
Total
K-5
828
PK
42
Enrollment, by Race/Ethnicity and Sex
Black
White Hispanic
American Asian Indian
Multiracial
472 57.0%
291 35.1%
26 3.1%
17 2.1%
1 0.1%
21 2.5%
18 42.9%
21 50.0%
3 7.1%
0 0.0%
0 0.0%
0 0.0%
Male Female
442 53.4%
386 46.6%
26 61.9%
16 38.1%
Enrollment in Selected Programs
Program
Program % of Student Enrollment Population
Gifted (Grades K-12)
69
8.3%
Alternative Programs (Grades 6-12)
N/A
N/A
Students Eligible to Receive Free/Reduced Lunches
Number
Percent
School System
415 19,220
47.7% 52.3%
Dropout Rate *
Number
Rate
School System
N/A N/A
N/A N/A
* Dropout rates are not applicable for grades PK-5.
Enrollment in Compensatory Programs
Program
Program % of Student Enrollment Population
Special Education (Grades K-12)
107 12.9%
(PK)
22
N/A
English to Speakers of Other Languages (ESOL) (Grades K-12)
0
0.0%
Remedial Education (Grades 2-5, 9-12)
32
5.9%
Special Instructional Assistance (SIA) (Grades K-3)
96 17.6%
Title I (Grades K-12)
This school has a Targeted Assistance program.
Total 17
Retained Students, by Race/Ethnicity and Sex
Black
White Hispanic
American MultiAsian Indian racial
10 58.8%
7 41.2%
0 0.0%
0 0.0%
0 0.0%
0 0.0%
Male Female
9
8
52.9% 47.1%
Prepared by Georgia Department of Education
Page 1
STATE-REQUIRED TEST DATA
NORM-REFERENCED TESTS Grade 3
Iowa Tests of Basic Skills (ITBS) Each chart reflects data for three years of testing.
Reading Comprehension 50
50 47 54 0
98-99
53 44 53 97-98
45 43 52 96-97
Mathematics
School 50
System
State
0
54 56 61 98-99
63 54 61 97-98
55 51 59 96-97
School System State
Reading Vocabulary 50
48 43 50 0
98-99
55 44 50 97-98
53 42 49 96-97
Language Arts
School 50
System
State
0
62 57 64 98-99
74 56 62 97-98
63 50 59 96-97
School System State
Social Studies 50
51 47 56 0
98-99
57 49 55 97-98
50 46 55 96-97
Science
School 50
System
State
0
49 50 59 98-99
56 51 59 97-98
48 49 58 96-97
School System State
Sources of Information
Composite Score
50
52 52 57 0
98-99
School 50
System
62 49 56 97-98
53 47 55 96-97
State 0
52 50 58 98-99
61 49 57 97-98
1998-99 GEORGIA PUBLIC EDUCATION REPORT CARD White Bluff Elementary School - 6251070
Prepared by Georgia Department of Education
53 47 56 96-97
Scores Reported in Percentiles
School System State
Page 2
STATE-REQUIRED TEST DATA
NORM-REFERENCED TESTS Grade 5
Iowa Tests of Basic Skills (ITBS) Each chart reflects data for three years of testing.
Reading Comprehension
Mathematics
50
51 47 53 0
98-99
51 47 53 97-98
48 44 52 96-97
School 50
System
State
0
57 51 59 98-99
53 53 58 97-98
54 49 57 96-97
School System State
Reading Vocabulary 50
40 39 48 0
98-99
58 44 48 97-98
61 38 46 96-97
Language Arts
School 50
System
State
0
64 58 63 98-99
69 57 61 97-98
57 49 58 96-97
School System State
Social Studies 50
57 49 57 0
98-99
52 49 56 97-98
52 45 55 96-97
Science
School 50
System
State
0
63 55 60 98-99
58 54 59 97-98
58 51 59 96-97
School System State
Sources of Information
Composite Score
50
57 55 58 0
98-99
School 50
System
58 54 58 97-98
56 50 57 96-97
State 0
58 51 57 98-99
58 51 56 97-98
54 46 55 96-97
1998-99 GEORGIA PUBLIC EDUCATION REPORT CARD White Bluff Elementary School - 6251070
Prepared by Georgia Department of Education
Scores Reported in Percentiles
School System State
Page 3
STATE-REQUIRED TEST DATA
PERFORMANCE ASSESSMENTS
Grade 5 Writing Assessment
Percent at Developmental Stages:
1998-99 School System State
1997-98 School System State
1996-97 School System State
Stage Stage Stage Stage Stage Stage
1:The Emerging Writer 2:The Developing Writer 3:The Focusing Writer 4:The Experimenting 5:The Engaging Writer 6:The Extending Writer
0% 1% 12% 46% 28% 14%
0% 1% 22% 46% 23% 7%
0% 1% 16% 41% 29% 12%
1% 0% 27% 39% 21% 12%
0% 3% 24% 43% 22% 7%
0% 3% 19% 41% 27% 10%
0% 5% 26% 38% 24% 7%
0% 4% 26% 39% 22% 8%
0% 3% 21% 37% 26% 12%
AWARDS / RECOGNITION DATA
Schools in Georgia may receive recognition in the following programs: Charter School Pay for Performance Program Georgia School of Excellence National Blue Ribbon School White Bluff Elementary School did not receive recognition in any of these programs during the 1998-99 school year.
1998-99 GEORGIA PUBLIC EDUCATION REPORT CARD White Bluff Elementary School - 6251070
Prepared by Georgia Department of Education
Page 4
CERTIFIED PERSONNEL DATA
Positions Number Average Contract Days
Personnel Sex
Certificate
Years Experience
Full-time Part-time
Male Female
4 Yr Bachelor's 5 Yr Master's 6 Yr Specialist's 7 Yr Doctoral Other*
<1 1-10 11-20 21-30 >30
Average
Administrators
2.00 195.00
2 0
0 2
0 1 0 1 0 0 0 1 1 0 20.00
Support Personnel
1.50 190.00
1 1
0 2
0 1 1 0 0 0 1 0 1 0 19.00
PK-12 Teachers
55.20 190.00
55 1
4 52
32 21
3 0 0 2 15 22 16 1 15.84
*Includes One- and Two-Year Vocational Certificates.
ACCREDITATION DATA
Accredited by Southern Association of Colleges and Schools (SACS):
Elementary/Middle Commission.
1998-99 GEORGIA PUBLIC EDUCATION REPORT CARD White Bluff Elementary School - 6251070
Prepared by Georgia Department of Education
Page 5
1998-99 GEORGIA PUBLIC EDUCATION REPORT CARD
CHATHAM COUNTY SCHOOLS
Whitney Elementary School - 6252070
Grade Range PK-5
The Georgia Public Education Report Card is designed to assist systems and schools in educational improvement. This report card contains a variety of data elements. An explanation of the terms is provided as a companion to the report card data. Please refer to the definitions for the most effective use of the reported data.
STUDENT DATA
Total
K-5
475
PK
60
Enrollment, by Race/Ethnicity and Sex
Black
White Hispanic
American Asian Indian
Multiracial
341 71.8%
50 10.5%
38 8.0%
46 9.7%
0 0.0%
0 0.0%
41 68.3%
6 10.0%
4
9
6.7% 15.0%
0 0.0%
0 0.0%
Male Female
245 51.6%
230 48.4%
24 40.0%
36 60.0%
Enrollment in Selected Programs
Program
Program % of Student Enrollment Population
Gifted (Grades K-12)
4
< 1%
Alternative Programs (Grades 6-12)
N/A
N/A
Students Eligible to Receive Free/Reduced Lunches
Number
Percent
School System
466 19,220
87.1% 52.3%
Dropout Rate *
Number
Rate
School System
N/A N/A
N/A N/A
* Dropout rates are not applicable for grades PK-5.
Enrollment in Compensatory Programs
Program
Program % of Student Enrollment Population
Special Education (Grades K-12)
45
9.5%
(PK)
0
N/A
English to Speakers of Other Languages (ESOL) (Grades K-12)
75 15.8%
Remedial Education (Grades 2-5, 9-12)
66 22.4%
Special Instructional Assistance (SIA) (Grades K-3)
83 24.0%
Title I (Grades K-12)
This school has a schoolwide program.
Total 14
Retained Students, by Race/Ethnicity and Sex
Black
White Hispanic
American MultiAsian Indian racial
12 85.7%
2 14.3%
0 0.0%
0 0.0%
0 0.0%
0 0.0%
Male Female
10
4
71.4% 28.6%
Prepared by Georgia Department of Education
Page 1
STATE-REQUIRED TEST DATA
NORM-REFERENCED TESTS Grade 3
Iowa Tests of Basic Skills (ITBS) Each chart reflects data for three years of testing.
Reading Comprehension 50
32 47 54 0
98-99
29 44 53 97-98
32 43 52 96-97
Mathematics
School 50
System
State
0
47 56 61 98-99
28 54 61 97-98
48 51 59 96-97
School System State
Reading Vocabulary 50
23 43 50 0
98-99
17 44 50 97-98
26 42 49 96-97
Language Arts
School 50
System
State
0
43 57 64 98-99
27 56 62 97-98
35 50 59 96-97
School System State
Social Studies 50
28 47 56 0
98-99
26 49 55 97-98
37 46 55 96-97
Science
School 50
System
State
0
35 50 59 98-99
32 51 59 97-98
39 49 58 96-97
School System State
Sources of Information
Composite Score
50
38 52 57 0
98-99
School 50
System
31 49 56 97-98
44 47 55 96-97
State 0
34 50 58 98-99
26 49 57 97-98
1998-99 GEORGIA PUBLIC EDUCATION REPORT CARD Whitney Elementary School - 6252070
Prepared by Georgia Department of Education
36 47 56 96-97
Scores Reported in Percentiles
School System State
Page 2
STATE-REQUIRED TEST DATA
NORM-REFERENCED TESTS Grade 5
Iowa Tests of Basic Skills (ITBS) Each chart reflects data for three years of testing.
Reading Comprehension
Mathematics
50
50 47 53 0
98-99
29 47 53 97-98
29 44 52 96-97
School 50
System
State
0
33 51 59 98-99
38 53 58 97-98
31 49 57 96-97
School System State
Reading Vocabulary 50
33 39 48 0
98-99
19 44 48 97-98
18 38 46 96-97
Language Arts
School 50
System
State
0
60 58 63 98-99
34 57 61 97-98
29 49 58 96-97
School System State
Social Studies 50
32 49 57 0
98-99
27 49 56 97-98
24 45 55 96-97
Science
School 50
System
State
0
38 55 60 98-99
30 54 59 97-98
31 51 59 96-97
School System State
Sources of Information
Composite Score
50
42 55 58 0
98-99
School 50
System
38 54 58 97-98
35 50 57 96-97
State 0
40 51 57 98-99
29 51 56 97-98
27 46 55 96-97
1998-99 GEORGIA PUBLIC EDUCATION REPORT CARD Whitney Elementary School - 6252070
Prepared by Georgia Department of Education
Scores Reported in Percentiles
School System State
Page 3
STATE-REQUIRED TEST DATA
PERFORMANCE ASSESSMENTS
Grade 5 Writing Assessment
Percent at Developmental Stages:
1998-99 School System State
1997-98 School System State
1996-97 School System State
Stage Stage Stage Stage Stage Stage
1:The Emerging Writer 2:The Developing Writer 3:The Focusing Writer 4:The Experimenting 5:The Engaging Writer 6:The Extending Writer
0% 5% 21% 63% 9% 2%
0% 1% 22% 46% 23% 7%
0% 1% 16% 41% 29% 12%
2% 2% 48% 44% 4% 0%
0% 3% 24% 43% 22% 7%
0% 3% 19% 41% 27% 10%
3% 10% 41% 36%
5% 3%
0% 4% 26% 39% 22% 8%
0% 3% 21% 37% 26% 12%
AWARDS / RECOGNITION DATA
Schools in Georgia may receive recognition in the following programs: Charter School Pay for Performance Program Georgia School of Excellence National Blue Ribbon School Whitney Elementary School did not receive recognition in any of these programs during the 1998-99 school year.
1998-99 GEORGIA PUBLIC EDUCATION REPORT CARD Whitney Elementary School - 6252070
Prepared by Georgia Department of Education
Page 4
CERTIFIED PERSONNEL DATA
Positions Number Average Contract Days
Personnel Sex
Certificate
Years Experience
Full-time Part-time
Male Female
4 Yr Bachelor's 5 Yr Master's 6 Yr Specialist's 7 Yr Doctoral Other*
<1 1-10 11-20 21-30 >30
Average
Administrators
2.00 200.00
1 2
0 3
0 1 1 1 0 0 0 0 3 0 26.00
Support Personnel
1.00 190.00
1 0
0 1
0 0 1 0 0 0 0 0 1 0 21.00
PK-12 Teachers
43.10 190.12
40 5
5 40
23 21
1 0 0 2 14 19 8 2 15.18
*Includes One- and Two-Year Vocational Certificates.
ACCREDITATION DATA
Accredited by Southern Association of Colleges and Schools (SACS):
Elementary/Middle Commission.
1998-99 GEORGIA PUBLIC EDUCATION REPORT CARD Whitney Elementary School - 6252070
Prepared by Georgia Department of Education
Page 5
1998-99 GEORGIA PUBLIC EDUCATION REPORT CARD
CHATHAM COUNTY SCHOOLS
Windsor Forest Elementary School - 6254070
Grade Range PK-5
The Georgia Public Education Report Card is designed to assist systems and schools in educational improvement. This report card contains a variety of data elements. An explanation of the terms is provided as a companion to the report card data. Please refer to the definitions for the most effective use of the reported data.
STUDENT DATA
Total
K-5
734
PK
21
Enrollment, by Race/Ethnicity and Sex
Black
White Hispanic
American Asian Indian
Multiracial
363 49.5%
315 42.9%
26 3.5%
19 2.6%
0 0.0%
11 1.5%
9 42.9%
9 42.9%
0 0.0%
2 9.5%
0 0.0%
1 4.8%
Male Female
360 49.0%
374 51.0%
11 52.4%
10 47.6%
Enrollment in Selected Programs
Program
Program % of Student Enrollment Population
Gifted (Grades K-12)
70
9.5%
Alternative Programs (Grades 6-12)
N/A
N/A
Students Eligible to Receive Free/Reduced Lunches
Number
Percent
School System
312 19,220
41.3% 52.3%
Dropout Rate *
Number
Rate
School System
N/A N/A
N/A N/A
* Dropout rates are not applicable for grades PK-5.
Enrollment in Compensatory Programs
Program
Program % of Student Enrollment Population
Special Education (Grades K-12)
97 13.2%
(PK)
3
N/A
English to Speakers of Other Languages (ESOL) (Grades K-12)
0
0.0%
Remedial Education (Grades 2-5, 9-12)
52 10.4%
Special Instructional Assistance (SIA) (Grades K-3)
80 17.4%
Title I (Grades K-12)
This school has no Title I program.
Total 20
Retained Students, by Race/Ethnicity and Sex
Black
White Hispanic
American MultiAsian Indian racial
10 50.0%
10 50.0%
0 0.0%
0 0.0%
0 0.0%
0 0.0%
Male Female
12
8
60.0% 40.0%
Prepared by Georgia Department of Education
Page 1
STATE-REQUIRED TEST DATA
NORM-REFERENCED TESTS Grade 3
Iowa Tests of Basic Skills (ITBS) Each chart reflects data for three years of testing.
Reading Comprehension 50
59 47 54 0
98-99
50 44 53 97-98
51 43 52 96-97
Mathematics
School 50
System
State
0
62 56 61 98-99
57 54 61 97-98
55 51 59 96-97
School System State
Reading Vocabulary 50
51 43 50 0
98-99
48 44 50 97-98
48 42 49 96-97
Language Arts
School 50
System
State
0
64 57 64 98-99
56 56 62 97-98
59 50 59 96-97
School System State
Social Studies 50
56 47 56 0
98-99
55 49 55 97-98
53 46 55 96-97
Science
School 50
System
State
0
60 50 59 98-99
57 51 59 97-98
57 49 58 96-97
School System State
Sources of Information
Composite Score
50
62 52 57 0
98-99
School 50
System
53 49 56 97-98
54 47 55 96-97
State 0
60 50 58 98-99
53 49 57 97-98
1998-99 GEORGIA PUBLIC EDUCATION REPORT CARD Windsor Forest Elementary School - 6254070
Prepared by Georgia Department of Education
54 47 56 96-97
Scores Reported in Percentiles
School System State
Page 2
STATE-REQUIRED TEST DATA
NORM-REFERENCED TESTS Grade 5
Iowa Tests of Basic Skills (ITBS) Each chart reflects data for three years of testing.
Reading Comprehension
Mathematics
50
52 47 53 0
98-99
46 47 53 97-98
49 44 52 96-97
School 50
System
State
0
52 51 59 98-99
55 53 58 97-98
52 49 57 96-97
School System State
Reading Vocabulary 50
46 39 48 0
98-99
47 44 48 97-98
38 38 46 96-97
Language Arts
School 50
System
State
0
61 58 63 98-99
55 57 61 97-98
51 49 58 96-97
School System State
Social Studies 50
57 49 57 0
98-99
52 49 56 97-98
49 45 55 96-97
Science
School 50
System
State
0
57 55 60 98-99
57 54 59 97-98
53 51 59 96-97
School System State
Sources of Information
Composite Score
50
59 55 58 0
98-99
School 50
System
54 54 58 97-98
51 50 57 96-97
State 0
56 51 57 98-99
52 51 56 97-98
49 46 55 96-97
1998-99 GEORGIA PUBLIC EDUCATION REPORT CARD Windsor Forest Elementary School - 6254070
Prepared by Georgia Department of Education
Scores Reported in Percentiles
School System State
Page 3
STATE-REQUIRED TEST DATA
PERFORMANCE ASSESSMENTS
Grade 5 Writing Assessment
Percent at Developmental Stages:
1998-99 School System State
1997-98 School System State
1996-97 School System State
Stage Stage Stage Stage Stage Stage
1:The Emerging Writer 2:The Developing Writer 3:The Focusing Writer 4:The Experimenting 5:The Engaging Writer 6:The Extending Writer
0% 1% 14% 48% 28% 10%
0% 1% 22% 46% 23% 7%
0% 1% 16% 41% 29% 12%
0% 4% 28% 42% 20% 6%
0% 3% 24% 43% 22% 7%
0% 3% 19% 41% 27% 10%
0% 1% 22% 36% 27% 14%
0% 4% 26% 39% 22% 8%
0% 3% 21% 37% 26% 12%
AWARDS / RECOGNITION DATA
Schools in Georgia may receive recognition in the following programs: Charter School Pay for Performance Program Georgia School of Excellence National Blue Ribbon School Windsor Forest Elementary School did not receive recognition in any of these programs during the 1998-99 school year.
1998-99 GEORGIA PUBLIC EDUCATION REPORT CARD Windsor Forest Elementary School - 6254070
Prepared by Georgia Department of Education
Page 4
CERTIFIED PERSONNEL DATA
Positions Number Average Contract Days
Personnel Sex
Certificate
Years Experience
Full-time Part-time
Male Female
4 Yr Bachelor's 5 Yr Master's 6 Yr Specialist's 7 Yr Doctoral Other*
<1 1-10 11-20 21-30 >30
Average
Administrators
1.00 209.00
1 0
1 0
0 1 0 0 0 0 0 1 0 0 12.00
Support Personnel
2.00 190.00
2 0
1 1
0 1 1 0 0 0 0 1 1 0 19.00
PK-12 Teachers
46.20 190.00
45 3
3 45
22 19
7 0 0 1 18 18 10 1 14.44
*Includes One- and Two-Year Vocational Certificates.
ACCREDITATION DATA
Accredited by Southern Association of Colleges and Schools (SACS):
Elementary/Middle Commission.
1998-99 GEORGIA PUBLIC EDUCATION REPORT CARD Windsor Forest Elementary School - 6254070
Prepared by Georgia Department of Education
Page 5
1998-99 GEORGIA PUBLIC EDUCATION REPORT CARD
CHATHAM COUNTY SCHOOLS
Windsor Forest High School - 6255070
Grade Range PK, 9-12
The Georgia Public Education Report Card is designed to assist systems and schools in educational improvement. This report card contains a variety of data elements. An explanation of the terms is provided as a companion to the report card data. Please refer to the definitions for the most effective use of the reported data.
STUDENT DATA
Total
9-12
1,573
PK
20
Enrollment, by Race/Ethnicity and Sex
Black
American Multi-
White Hispanic Asian Indian
racial
735 46.7%
710 45.1%
55 3.5%
49 3.1%
3 0.2%
21 1.3%
5 25.0%
10 50.0%
1
2
5.0% 10.0%
0 0.0%
2 10.0%
Male 797
50.7% 10
50.0%
Female 776
49.3% 10
50.0%
Enrollment in Selected Programs
Program
Gifted (Grades K-12)
Non-Vocational Labs (Grades 9-12)
Program % of Student Enrollment Population
107
6.8%
1,236
78.6%
Vocational Labs (Grades 9-12)
799
50.8%
Alternative Programs (Grades 6-12)
74
4.7%
Students Eligible to Receive Free/Reduced Lunches
Number
Percent
School System
380 19,220
23.9% 52.3%
Enrollment in Compensatory Programs
Program
Program % of Student Enrollment Population
Special Education (Grades K-12) PK
101
6.4%
0
N/A
English to Speakers of Other Languages (ESOL) (Grades K-12)
0
0.0%
Remedial Education (Grades 2-5, 9-12)
111
7.1%
Title I (Grades K-12)
This school has no Title I program.
Dropout Rate for Grades 9-12
Number
Rate
School System
114
6.6%
784
7.8%
Total 212
Retained Students, by Race/Ethnicity and Sex
Black
White Hispanic
American Multi-
Asian Indian
racial
124 58.5%
72 34.0%
8 3.8%
5 2.4%
1 0.5%
2 0.9%
Male Female
141
71
66.5% 33.5%
Prepared by Georgia Department of Education
Page 1
STATE-REQUIRED TEST DATA
GEORGIA HIGH SCHOOL GRADUATION TESTS (GHSGT)
Percent of Regular Program 11th Graders Passing the Georgia High School Graduation Tests on First Administration
English Language Arts Mathematics Social Studies Science
All Components listed above
Writing
1998-99
School System State
95% 84% 78% 67%
93% 75% 69% 55%
96% 88% 80% 72%
63% 51% 68%
95% 87% 93%
1997-98
School System State
95% 89% 73% 69%
89% 79% 64% 55%
94% 88% 78% 74%
62% 49% 68%
95% 87% 92%
1996-97
School System State
95% 89% 83% 72%
91% 77% 65% 58%
94% 87% 78% 74%
69% 52% 67%
95% 90% 93%
GRADUATE DATA
1999 Graduates by Credentials, Race/Ethnicity and Sex
Diplomas with Both College Prep. & Voc. Endorsements
Diplomas with College Prep. Endorsements Diplomas with Vocational Endorsements General High School Diplomas Special Education Diplomas
Total All Diplomas
Certificates of Performance
Total Graduates
Total 24
114 74 9 7
228 30
258
Black
13 54.2%
29 25.4%
44 59.5%
3 33.3%
7 100.0%
96 42.1%
23 76.7%
119 46.1%
White Hispanic
9 37.5%
73 64.0%
0 0.0%
4 3.5%
29 39.2%
6 66.7%
0 0.0%
1 1.4%
0 0.0%
0 0.0%
117 51.3%
5 2.2%
6 20.0%
1 3.3%
123 47.7%
6 2.3%
American MultiAsian Indian racial
2 8.3%
7 6.1%
0 0.0%
0 0.0%
0 0.0%
1 0.9%
0 0.0%
0 0.0%
0 0.0%
0 0.0%
0 0.0%
0 0.0%
0 0.0%
0 0.0%
0 0.0%
9 3.9%
0 0.0%
1 0.4%
0 0.0%
0 0.0%
0 0.0%
9 3.5%
0 0.0%
1 0.4%
Male Female
13 54.2%
46 40.4%
11 45.8%
68 59.6%
37 50.0%
6 66.7%
5 71.4%
37 50.0%
3 33.3%
2 28.6%
107
121
46.9% 53.1%
13
17
43.3% 56.7%
120
138
46.5% 53.5%
HOPE Scholarships
School System
Number of 1999 Graduates 2 5 8
Number Eligible
109
Percent Eligible
42.2%
1,436 749
52.2%
State
65,548 40,292 61.5%
High School Completion Rate
Percent of 1995Grade 9 Enrollment in Graduating Class of1999 School System State
Completion Rate '95-'99 65.0% 62.1% 68.9%
1998-99 GEORGIA PUBLIC EDUCATION REPORT CARD
Windsor Forest High School - 6255070
Prepared by Georgia Department of Education
Page 2
COLLEGE ADMISSIONS / CREDIT TEST DATA
Scholastic Assessment Test (SAT)
Based on students' highest verbal and highest math scores
No. Taking
Average Score
Tests Verbal Math Total
Based on students' last test administration
Average Score Verbal Math Total
School
80
College Prep. Endorsement
Other Diplomas
System
578
College Prep. Endorsement
Other Diplomas
Georgia
41,958
513 511 N/A
489 483 419
492
511 505 N/A
473 469 379
488
1024 1016
N/A
962 952 798
980
507 N/A N/A
480 N/A N/A
483
501 N/A N/A
464 N/A N/A
479
1008 N/A N/A
944 N/A N/A
962
Nation
952,913 N/A N/A N/A
502 508 1010
American College Testing (ACT)
Advanced Placement Exams (AP)
Number taking tests: English Mathematics Reading Science Reasoning CompositeScore
8 1 School System State
17.6 16.0 19.1
17.8 17.1 19.9
19.4 18.4
17.5 17.7
20.2 19.9
18.4 17.2 19.9
No. of Students Taking Tests
No. of Tests Taken No. of Test Scores
3 or Higher Percent of Test
Scores 3 or Higher
School 56 99 49
49.5%
System State 291 15,225 509 23,969 254 13,024
49.9% 54.3%
POST-SECONDARY DATA
Graduates Entering Georgia Public Colleges
Graduates Entering Georgia Public Colleges and Requiring Learning Support (LS)
1998 Graduates Entering in 1998-99
1997 Graduates Entering in 1997-98
Percent of Graduating Number Class
School
83
29.3%
System 470
30.4%
School
131
52.8%
System 565
37.0%
Number Requiring
LS 21 159
46 232
Percent of those attending Georgia
Public Colleges
25.3%
33.8%
35.1%
41.1%
In previous years, the Report Card presented College Prep Curriculum information provided by the Board of Regents on students requiring Learning Support. Due to inconsistencies in the data provided by the Board of Regents in defining College Prep Completers versus Local Board of Education data defining College Prep Endorsements, the Department of Education Report Card will not provide this information until discrepancies can be reconciled.
Graduates Entering Georgia Public Technical and Adult Schools
1998 Graduates School System
Entering Number 22 78
1998-99 Percent
7.8% 5.0%
Entering Number N/A N/A
1997-98 Percent
N/A N/A
1997 Graduates School
0
0.0%
System
15
1.0%
14
5.6%
89
5.8%
1998-99 GEORGIA PUBLIC EDUCATION REPORT CARD Windsor Forest High School - 6255070
Prepared by Georgia Department of Education
Page 3
CERTIFIED PERSONNEL DATA
Positions Number Average Contract Days
Administrators
2.00 209.50
Support Personnel
2.00 190.00
PK-12 Teachers
74.40 190.00
Personnel Sex
Certificate
Years Experience
Full-time Part-time
Male Female
4 Yr Bachelor's 5 Yr Master's 6 Yr Specialist's 7 Yr Doctoral Other*
<1 1-10 11-20 21-30 >30
Average
2 0
1 1
0 0 2 0 0
0 0 1 1 0
18.50
2 0
1 1
0 2 0 0 0
0 0 1 1 0
18.50
73 4
18 59
30 36 10
1 0
1 20 23 29
4
17.81
*Includes One- and Two-Year Vocational Certificates.
ACCREDITATION DATA
Accredited by Southern Association of Colleges and Schools (SACS): Secondary/Middle Commission.
AWARDS / RECOGNITION DATA
Through the Pay for Performance Program, exemplary public schools and schools making outstanding progress toward becoming exemplary may be rewarded. Not a merit pay program, the Pay for Performance Program motivates and rewards entire school faculties for working together to make their schools exemplary. A school selected for participation in the program has one school year to attain at least 80% of its previously-approved performance objectives in order to receive an award based on $2,000 per certified faculty member.
Windsor Forest High School was a Pay for Performance recipient in 1998-99.
1998-99 GEORGIA PUBLIC EDUCATION REPORT CARD Windsor Forest High School - 6255070
Prepared by Georgia Department of Education
Page 4
1998-99 GEORGIA PUBLIC EDUCATION REPORT CARD CHATTAHOOCHEE COUNTY SCHOOLS - 626
The Georgia Public Education Report Card is designed to assist systems and schools in educational improvement. This report card contains a variety of data elements. An explanation of the terms is provided as a companion to the report card data. Please refer to the definitions for the most effective use of the reported data.
Total
K-8
474
PK
35
STUDENT DATA
Enrollment, by Race/Ethnicity and Sex
Black
White Hispanic
American Multi-
Asian Indian
racial
165 34.8%
292 61.6%
4 0.8%
5 1.1%
1 0.2%
7 1.5%
14 40.0%
20 57.1%
0 0.0%
0 0.0%
0 0.0%
1 2.9%
Male
242 51.1%
21 60.0%
Female
232 48.9%
14 40.0%
Enrollment in Selected Programs
Program
Program % of Student Enrollment Population
Gifted (Grades K-12)
23
4.9%
Non-Vocational Labs (Grades 9-12)
N/A
N/A
Vocational Labs (Grades 9-12)
N/A
N/A
Alternative Programs (Grades 6-12)
0
0.0%
Students Eligible to Receive Free/Reduced Lunches
Number
Percent
364
71.5%
Dropout Rate
Number
Percent
6-12 9-12
0 N/A
0.0% N/A
Enrollment in Compensatory Programs
Program
Program % of Student Enrollment Population
Special Education
(Grades K-12)
65
PK
4
English to Speakers of
Other Languages (ESOL)
0
(Grades K-12)
Remedial Education (Grades 2-5, 9-12)
34
Special Instructional
Assistance (SIA)
58
(Grades K-3)
Title I (Grades K-12) Number of schools with: Schoolwide program Targeted Assistance program No Title I program
13.7% N/A
0.0%
15.9%
26.0%
0 1 0
Total 4
Retained Students, by Race/Ethnicity and Sex
Black
White Hispanic
American MultiAsian Indian racial
3 75.0%
1 25.0%
0 0.0%
0 0.0%
0 0.0%
0 0.0%
Male Female
3
1
75.0% 25.0%
Prepared by Georgia Department of Education
Page 1
STATE-REQUIRED TEST DATA
NORM-REFERENCED TESTS
Grade 3 Iowa Tests of Basic Skills (ITBS) Each chart reflects data for three years of testing.
Reading Comprehension
Mathematics
50
40 54 50 53 31 52 0
98-99 97-98 96-97
System State
50
38 61 68 61 43 59 0
98-99 97-98 96-97
System State
Reading Vocabulary
50
34 50 47 50 30 49 0
98-99 97-98 96-97
System State
Social Studies
50
33 56 53 55 42 55 0
98-99 97-98 96-97
System State
Language Arts
50
38 64 69 62 44 59 0
98-99 97-98 96-97
System State
Science
50
36 59 48 59 46 58 0
98-99 97-98 96-97
System State
Sources of Information
Composite Score
50
40 57 0
98-99
System
50
60 56 37 55 97-98 96-97
State
39 58 57 57 0
98-99 97-98
1998-99 GEORGIA PUBLIC EDUCATION REPORT CARD Chattahoochee County Schools
Prepared by Georgia Department of Education
System State Scores Reported 40 56 in Percentiles 96-97
Page 2
STATE-REQUIRED TEST DATA
NORM-REFERENCED TESTS
Grade 5 Iowa Tests of Basic Skills (ITBS) Each chart reflects data for three years of testing.
Reading Comprehension
Mathematics
50
44 53 45 53 45 52 0
98-99 97-98 96-97
System State
50
36 59 42 58 50 57 0
98-99 97-98 96-97
System State
Reading Vocabulary
50
36 48 28 48 34 46 0
98-99 97-98 96-97
System State
Social Studies
50
50 57 48 56 46 55 0
98-99 97-98 96-97
System State
Language Arts
50
42 63 56 61 44 58 0
98-99 97-98 96-97
System State
Science
50
53 60 53 59 52 59 0
98-99 97-98 96-97
System State
Sources of Information
Composite Score
50
44 58 0
98-99
System
50
47 58 49 57 97-98 96-97
State
43 57 46 56 0
98-99 97-98
1998-99 GEORGIA PUBLIC EDUCATION REPORT CARD Chattahoochee County Schools
Prepared by Georgia Department of Education
System State Scores Reported 45 55 in Percentiles 96-97
Page 3
STATE-REQUIRED TEST DATA
NORM-REFERENCED TESTS Grade 8
Iowa Tests of Basic Skills (ITBS) Each chart reflects data for three years of testing.
Reading Comprehension
Mathematics
50
40 49 40 48 47 48 0
98-99 97-98 96-97
System State
50
54 56 51 55 54 54 0
98-99 97-98 96-97
System State
Reading Vocabulary
50
34 46 37 45 41 44 0
98-99 97-98 96-97
System State
Language Arts
50
56 60 49 58 61 56 0
98-99 97-98 96-97
System State
Social Studies
50
47 54 46 53 59 53 0
98-99 97-98 96-97
System State
Science
50
35 56 51 55 54 53 0
98-99 97-98 96-97
System State
Sources of Information
Composite Score
50
48 57 0
98-99
System
50
55 56 56 55 97-98 96-97
State
45 56 47 54 0
98-99 97-98
1998-99 GEORGIA PUBLIC EDUCATION REPORT CARD Chattahoochee County Schools
Prepared by Georgia Department of Education
System State Scores Reported 56 54 in Percentiles 96-97
Page 4
STATE-REQUIRED TEST DATA
PERFORMANCE ASSESSMENTS
Grade 5 Writing Assessment
1998-99
1997-98
1996-97
Percent at Developmental Stages:
Comparison
Comparison
Comparison
System Group State System Group State System Group State
Stage Stage Stage Stage Stage Stage
1: The Emerging Writer 2: The Developing Writer 3: The Focusing Writer 4: The Experimenting Writer 5: The Engaging Writer 6: The Extending Writer
2% 9% 28% 41% 15% 4%
0% 2% 26% 48% 19% 5%
0% 1% 16% 41% 29% 12%
0% 11% 30% 35% 19%
5%
0% 5% 29% 41% 20% 4%
0% 3% 19% 41% 27% 10%
0% 21% 33% 23% 19%
5%
1% 7% 33% 39% 17% 4%
0% 3% 21% 37% 26% 12%
Grade 8 Writing Assessment
1998-99 Percent Scoring 1997-98 Percent Scoring 1996-97 Percent Scoring
Categories of Scaled Scores
Comparison
Comparison
Comparison
System Group State System Group State System Group State
Inadequate (less than 162)
Minimal (162-209)
Good
(210-247)
Very Good (greater than 247)
6% 58% 27%
8%
13% 50% 32%
5%
8% 40% 41% 11%
35% 35% 26%
3%
23% 53% 20%
4%
11% 46% 34%
8%
24% 47% 21%
8%
23% 52% 21%
5%
15% 46% 30%
8%
Average Scaled Score: (Range 100-300)
200
196 208
181
186 202
189
188 198
GEORGIA HIGH SCHOOL GRADUATION TESTS (GHSGT)
Percent of Regular Program 11th Graders Passing the Georgia High School Graduation Tests on First Administration
1998-99
1997-98
1996-97
Comparison
Comparison
Comparison
System Group State System Group State System Group State
English Language Arts Mathematics Social Studies Science
All Components listed above Writing
N/A N/A N/A N/A N/A N/A
N/A N/A N/A N/A N/A N/A
96% 88% 80% 72% 68% 93%
N/A N/A N/A N/A N/A N/A
N/A N/A N/A N/A N/A N/A
94% 88% 78% 74% 68% 92%
N/A N/A N/A N/A N/A N/A
92% 80% 66% 64% 54% 85%
94% 87% 78% 74% 67% 93%
No eleventh-grade students are enrolled at Chattahoochee County schools.
1998-99 GEORGIA PUBLIC EDUCATION REPORT CARD
Chattahoochee County Schools
Prepared by Georgia Department of Education
Page 5
GRADUATE DATA
1999 Graduates by Credentials, Race/Ethnicity and Sex
Diplomas with Both College Prep. & Voc. Endorsements
Diplomas with College Prep. Endorsements
Diplomas with Vocational Endorsements
General High School Diplomas
Special Education Diplomas
Total All Diplomas
Total N/A
Black N/A
American MultiWhite Hispanic Asian Indian racial
N/A N/A N/A N/A N/A
Male Female N/A N/A
N/A
N/A
N/A N/A N/A N/A N/A
N/A N/A
N/A
N/A
N/A N/A N/A N/A N/A
N/A N/A
N/A
N/A
N/A N/A N/A N/A N/A
N/A N/A
N/A
N/A
N/A N/A N/A N/A N/A
N/A N/A
N/A
Certificates of Performance
Total Graduates
N/A N/A
N/A
N/A N/A N/A N/A N/A
N/A N/A
HOPE Scholarships
System State
Number of 1999 Graduates Number Eligible Percent Eligible
N/A N/A N/A
65,548 40,292 61.5%
High School Completion Rate Percent of 1995Grade 9 Enrollment
in Graduating Class of1999
System
State
Completion Rate '95-'99 N / A
68.9%
COLLEGE ADMISSIONS / CREDIT TEST DATA
Scholastic Assessment Test (SAT)
No. Taking
Average Score
Tests
Verbal Math Total
Based on students' highest verbal and highest math scores
System College Prep. Endorsement Other Diplomas
N/A N/A N/A
N/A N/A N/A
N/A N/A N/A
Georgia
492 488 980
Based on students' last test administration
System Georgia
N/A 41,958
N/A N/A 483 479
N/A 962
Nation
952,913 502 508 1010
American College Testing (ACT)
System State Nation
English Mathematics Reading Science Reasoning
N/A N/A N/A N/A
19.1 19.9 20.2 19.9
20.4 20.7 21.3 21.0
CompositeScore N/A * 19.9 21.9
* Scores not reported when fewer than 5 tests taken.
Advanced Placement Exams (AP)
No. of Students Taking Tests
No. of Tests Taken No. of Test Scores
3 or Higher Percent of Test
Scores 3 or Higher
System State N/A 15,225 N/A 23,969 N/A 13,024
N/A 54.3%
1998-99 GEORGIA PUBLIC EDUCATION REPORT CARD Chattahoochee County Schools
Prepared by Georgia Department of Education
Page 6
POSTSECONDARY DATA
Graduates Entering Georgia Public Colleges and Universities
Graduates Entering Georgia Public Colleges and Universities and
Requiring Learning Support (LS)
1998 Graduates Entering 1998-99
1997 Graduates Entering 1997-98
Percent of Graduating Number Class
N/A
N/A
N/A
N/A
Number Requiring
LS
N/A
N/A
Percent of those attending Georgia
Public Colleges
N/A
N/A
In previous years, the Report Card presented College Prep Curriculum information provided by the Board of Regents on students requiring Learning Support. Due to inconsistencies in the data provided by the Board of Regents in defining College Prep Completers versus Local Board of Education data defining College Prep Endorsements, the Department of Education Report Card will not provide this information until discrepancies can be reconciled.
Graduates Entering Georgia Public Technical and Adult Schools
Entering 1998-99 Entering 1997-98
Number Percent
Number Percent
1998 Graduates 1997 Graduates
N/A N/A
N/A N/A
N/A N/A
N/A N/A
ACCREDITATION / RECOGNITION DATA
Southern Association of Colleges and Schools (SACS) Accrediting Commission
Secondary/Middle Commission Elementary/Middle Commission Both Elementary/Secondary Commissions Joint Commission Candidate for Accreditation
Accreditation by Georgia Accrediting Commission (GAC)
Accredited by GAC Accredited with Quality by GAC
Number of Schools
0 1 0 0 0
Number of Schools
0 1
Awards / Recognition
State Recognized Program
Number of Schools
Charter School
0
Pay for Performance Recipient
0
Georgia School of Excellence
0
National Blue Ribbon School
0
COMMUNITY DATA
Number of Children Eligible for Migrant Education Number of Families-At-Risk * Number of Food Stamp Participants * Number of Families Receiving TANF * ** Per Capita Income * Unemployment Rate * 1990 Population * Projected 2000 Population * Projected 2010 Population *
* Data Available at County Level Only ** Known as AFDC before January 1997
0 35 701 52 $19,068 7.4% 16,934 18,280 18,943
1998-99 GEORGIA PUBLIC EDUCATION REPORT CARD Chattahoochee County Schools
Prepared by Georgia Department of Education
Page 7
FISCAL DATA
Millage Rate
10.21
* Fall 1998 Property Tax Digest is used to calculate the 98-99 Value of One Mill
FTE Count
FTE Count used for Allotment Calculation 470.0 Fall '98 FTE Count 474
Value of One Mill
$36,167 $76.95 per Allotment FTE
Sources: Local State-QBE State-
Lottery State-
Other Federal Other
Total
PerGeneral Fund cent Per FTE
$473,182 16.6% $1,007 $2,252,003 79.2% $4,791
K-12 Revenues
Lottery K-12
and
Title
All Other
Programs
K-12
$0
$0
Bonded Debt $-72,265
$0
$0
$0
$3,125 0.1%
$7
$0
$12,541
$0
$110,164 3.9% $234
$4,879 0.2% $10
$751 0.0%
$2
$2,844,105 100% $6,051
$0 $546,973
$1,726 $548,699
$13,868 $0 $0
$26,409
$0 $0 $0 $-72,265
Capital Projects
$352,126 $0
$129,880
$791,728 $0 $0
$1,273,734
School Nutrition
$17,588 $0
$0
$19,507 $151,814
$0 $188,911
Grand Total
Total
Per-
Amount cent
$770,631 16.0%
$2,252,003 46.8%
$145,546 3.0%
$935,269 19.4% $703,667 14.6%
$2,477 0.1% $4,809,594 100%
Instruction
Media Instruction
Support Pupil Services General Admin. School Admin. Trans-
portation Maint. & Ops. Capital Projects School Food Debt Service
Total
$1,723,049 62.7% $3,666 $64,472 2.3% $137
$155,657 5.7% $331
$113,460 4.1% $241
$215,010 7.8% $457
$116,973 4.3% $249
$184,500 6.7% $393
$166,861 6.1% $355
$8,221 0.3% $17
$0 0.0%
$0
$0 0.0%
$0
$2,748,206 100% $5,846
K-12 Expenditures
$427,942
$21,065
$0
$0
$0
$0
$0
$0
$80,415
$8,413
$0
$0
$1,543
$0
$0
$0
$32,658
$0
$0
$78
$0
$0
$0
$0
$11,848
$519
$0
$0
$0
$0
$0
$0
$0
$0
$0 $1,355,692
$0
$0
$0
$0
$0
$0 $251,398
$0
$0 $0 $0 $0 $0 $0 $0 $0 $0 $177,984 $0
$554,408
$29,998 $251,398 $1,355,771 $177,984
$2,172,057 42.4% $64,472 1.3%
$244,485 4.8% $115,003 2.2% $247,747 4.8% $116,973 2.3% $196,867 3.8% $166,861 3.3% $1,363,913 26.7% $177,984 3.5% $251,398 4.9%
$5,117,766 100%
Salaries and Benefits as Percentages of Revenues and of Expenditures
Teachers and Paraprofessionals
Salaries $1,528,241
Benefits $324,376
Percentage of Revenues Percentage of Expenditures
Total of
Total of
General Fund
General Fund
Title Programs
Title Programs
Lottery K-12
Lottery K-12
Total Salaries
and
Total
and
Total
and Benefits All Other K-12 K - 12 All Other K-12 K - 12
$1,852,617
54.2%
38.5%
55.6%
36.2%
School Administration
$69,887
$18,318
$88,205
2.6%
1.8%
2.6%
1.7%
General Administration
$150,551
$31,502
$182,053
5.3%
3.8%
5.5%
3.6%
1998-99 GEORGIA PUBLIC EDUCATION REPORT CARD
Chattahoochee County Schools - 626
Prepared by Georgia Department of Education
Page 8
CERTIFIED PERSONNEL DATA
Number
Average Annual Salary Positions Average Contract Days
Average Daily Salary
Full-time Personnel Part-time
Sex Male Female
4 Yr Bachelor's Certificate 5 Yr Master's
Level 6 Yr Specialist's 7 Yr Doctoral Other*
Black
White Race/ Hispanic Ethnicity Asian
American Indian
Multiracial
Years Experience
<1 1-10 11-20 21-30 >30
Average
Administrators
2.00
$58,674.21 190.00
$308.81
2 0
2 0
0 0 2 0 0
0 2 0 0 0 0
0 0 1 1 0
20.50
Support Personnel PK-12 Teachers
5.00
37.00
$48,923.60 190.00
$257.49
$39,197.25 188.11
$208.38
5
37
0
0
0
8
5
29
0
10
1
17
4
9
0
1
0
0
0
10
5
27
0
0
0
0
0
0
0
0
0
2
0
13
3
15
2
7
0
0
20.00
12.59
*Includes One- and Two-Year Vocational Certificates.
Certified Staff Position Ratios
Teacher/Administrator Ratio 19:1
Teacher/Support Person Ratio 7:1
Teacher/Staff Ratio 5:1
Student Enrollment/All Teachers 13:1
Certified Personnel by Category
84.1% 100%
4.5% 11.4%
80% 60%
40%
20%
0%
Teachers
Administrators
Support Personnel
1998-99 GEORGIA PUBLIC EDUCATION REPORT CARD
Chattahoochee County Schools - 626
Prepared by Georgia Department of Education
Page 9
1998-99 GEORGIA PUBLIC EDUCATION REPORT CARD
CHATTAHOOCHEE COUNTY SCHOOLS
Chattahoochee County Education Center - 6260177
Grade Range PK-8
The Georgia Public Education Report Card is designed to assist systems and schools in educational improvement. This report card contains a variety of data elements. An explanation of the terms is provided as a companion to the report card data. Please refer to the definitions for the most effective use of the reported data.
STUDENT DATA
Total
K-8
474
PK
35
Enrollment, by Race/Ethnicity and Sex
Black
American Multi-
White Hispanic Asian Indian
racial
165 34.8%
292 61.6%
4 0.8%
5 1.1%
1 0.2%
7 1.5%
14 40.0%
20 57.1%
0 0.0%
0 0.0%
0 0.0%
1 2.9%
Male 242
51.1% 21
60.0%
Female 232
48.9% 14
40.0%
Enrollment in Selected Programs
Program
Gifted (Grades K-12)
Non-Vocational Labs (Grades 9-12)
Vocational Labs (Grades 9-12)
Program % of Student Enrollment Population
23
4.9%
N/A
N/A
N/A
N/A
Alternative Programs (Grades 6-12)
0
0.0%
Students Eligible to Receive Free/Reduced Lunches
Number
Percent
School System
364
71.5%
364
71.5%
Enrollment in Compensatory Programs
Program
Program % of Student Enrollment Population
Special Education (Grades K-12) PK
65 13.7%
4
N/A
English to Speakers of Other Languages (ESOL) (Grades K-12)
0
0.0%
Remedial Education (Grades 2-5, 9-12)
34 15.9%
Special Instructional Assistance (SIA) (Grades K-3)
58 26.0%
Title I (Grades K-12)
This school has a Targeted Assistance program.
Dropout Rate for Grades 6-8
Number
Rate
School System
0
0.0%
0
0.0%
Total 4
Retained Students, by Race/Ethnicity and Sex
Black
White Hispanic
American Multi-
Asian Indian
racial
3 75.0%
1 25.0%
0 0.0%
0 0.0%
0 0.0%
0 0.0%
Male Female
3
1
75.0% 25.0%
Prepared by Georgia Department of Education
Page 1
STATE-REQUIRED TEST DATA
NORM-REFERENCED TESTS Grade 3
Iowa Tests of Basic Skills (ITBS) Each chart reflects data for three years of testing.
Reading Comprehension 50
40 40 54 0
98-99
50 50 53 97-98
31 31 52 96-97
Mathematics
School 50
System
State
0
38 38 61 98-99
68 68 61 97-98
43 43 59 96-97
School System State
Reading Vocabulary 50
34 34 50 0
98-99
47 47 50 97-98
30 30 49 96-97
Language Arts
School 50
System
State
0
38 38 64 98-99
69 69 62 97-98
44 44 59 96-97
School System State
Social Studies 50
33 33 56 0
98-99
53 53 55 97-98
42 42 55 96-97
Science
School 50
System
State
0
36 36 59 98-99
48 48 59 97-98
46 46 58 96-97
School System State
Sources of Information
Composite Score
50
40 40 57 0
98-99
School 50
System
60 60 56 97-98
37 37 55 96-97
State 0
39 39 58 98-99
57 57 57 97-98
1998-99 GEORGIA PUBLIC EDUCATION REPORT CARD Chattahoochee County Education Center - 6260177
Prepared by Georgia Department of Education
40 40 56 96-97
Scores Reported in Percentiles
School System State
Page 2
STATE-REQUIRED TEST DATA
NORM-REFERENCED TESTS Grade 5
Iowa Tests of Basic Skills (ITBS) Each chart reflects data for three years of testing.
Reading Comprehension
Mathematics
50
44 44 53 0
98-99
45 45 53 97-98
45 45 52 96-97
School 50
System
State
0
36 36 59 98-99
42 42 58 97-98
50 50 57 96-97
School System State
Reading Vocabulary 50
36 36 48 0
98-99
28 28 48 97-98
34 34 46 96-97
Language Arts
School 50
System
State
0
42 42 63 98-99
56 56 61 97-98
44 44 58 96-97
School System State
Social Studies 50
50 50 57 0
98-99
48 48 56 97-98
46 46 55 96-97
Science
School 50
System
State
0
53 53 60 98-99
53 53 59 97-98
52 52 59 96-97
School System State
Sources of Information
Composite Score
50
44 44 58 0
98-99
School 50
System
47 47 58 97-98
49 49 57 96-97
State 0
43 43 57 98-99
46 46 56 97-98
45 45 55 96-97
1998-99 GEORGIA PUBLIC EDUCATION REPORT CARD Chattahoochee County Education Center - 6260177
Prepared by Georgia Department of Education
Scores Reported in Percentiles
School System State
Page 3
STATE-REQUIRED TEST DATA
NORM-REFERENCED TESTS Grade 8
Iowa Tests of Basic Skills (ITBS) Each chart reflects data for three years of testing.
Reading Comprehension 50
40 40 49 0
98-99
40 40 48 97-98
47 47 48 96-97
Mathematics
School 50
System
State
0
54 54 56 98-99
51 51 55 97-98
54 54 54 96-97
School System State
Reading Vocabulary 50
34 34 46 0
98-99
37 37 45 97-98
41 41 44 96-97
Language Arts
School 50
System
State
0
56 56 60 98-99
49 49 58 97-98
61 61 56 96-97
School System State
Social Studies 50
47 47 54 0
98-99
46 46 53 97-98
59 59 53 96-97
Science
School 50
System
State
0
35 35 56 98-99
51 51 55 97-98
54 54 53 96-97
School System State
Sources of Information
Composite Score
50
48 48 57 0
98-99
School 50
System
55 55 56 97-98
56 56 55 96-97
State 0
45 45 56 98-99
47 47 54 97-98
1998-99 GEORGIA PUBLIC EDUCATION REPORT CARD Chattahoochee County Education Center - 6260177
Prepared by Georgia Department of Education
56 56 54 96-97
Scores Reported in Percentiles
School System State
Page 4
STATE-REQUIRED TEST DATA
PERFORMANCE ASSESSMENTS
Percent at Developmental Stages:
Stage Stage Stage Stage Stage Stage
1:The Emerging Writer 2:The Developing Writer 3:The Focusing Writer 4:The Experimenting 5:The Engaging Writer 6:The Extending Writer
Grade 5 Writing Assessment
1998-99
1997-98
School System State School System State
2% 9% 28% 41% 15% 4%
2% 9% 28% 41% 15% 4%
0% 1% 16% 41% 29% 12%
0% 11% 30% 35% 19%
5%
0% 11% 30% 35% 19%
5%
0% 3% 19% 41% 27% 10%
1996-97 School System State
0% 21% 33% 23% 19%
5%
0% 21% 33% 23% 19%
5%
0% 3% 21% 37% 26% 12%
Categories of Scaled Scores
Inadequate (less than 162)
Minimal (162-209)
Good
(210-247)
Very Good (greater than 247)
Average Scaled Score: (Range 100-300)
Grade 8 Writing Assessment
1998-99 Percent Scoring
1997-98 Percent Scoring
1996-97 Percent Scoring
School System State School System State School System State
6% 58% 27%
8%
6% 58% 27%
8%
8% 40% 41% 11%
35% 35% 26%
3%
35% 35% 26%
3%
11% 46% 34%
8%
24% 47% 21%
8%
24% 47% 21%
8%
15% 46% 30%
8%
200
200
208 181
181 202 189
189 198
GEORGIA HIGH SCHOOL GRADUATION TESTS (GHSGT)
Percent of Regular Program 11th Graders Passing the Georgia High School Graduation Tests on First Administration
1998-99
1997-98
1996-97
School System State School System State School System State
English Language Arts Mathematics Social Studies Science
All Components listed above
N/A N/A N/A N/A
N/A
N/A N/A N/A N/A
N/A
96% 88% 80% 72%
68%
N/A N/A N/A N/A
N/A
N/A N/A N/A N/A
N/A
94% 88% 78% 74%
68%
N/A N/A N/A N/A
N/A
N/A N/A N/A N/A
N/A
94% 87% 78% 74%
67%
Writing
N/A
N/A 93% N/A
N/A 92% N/A
N/A 93%
No eleventh-grade students are enrolled at Chattahoochee County Education Center.
1998-99 GEORGIA PUBLIC EDUCATION REPORT CARD Chattahoochee County Education Center - 6260177
Prepared by Georgia Department of Education
Page 5
GRADUATE DATA
1999 Graduates by Credentials, Race/Ethnicity and Sex
Diplomas with Both College Prep. & Voc. Endorsements
Diplomas with College Prep. Endorsements
Diplomas with Vocational Endorsements
General High School Diplomas
Special Education Diplomas
Total All Diplomas
Total N/A
Black N/A
White Hispanic N/A N/A
American MultiAsian Indian racial
N/A N/A N/A
N/A
N/A
N/A N/A N/A N/A N/A
N/A
N/A
N/A N/A N/A N/A N/A
N/A
N/A
N/A N/A N/A N/A N/A
N/A
N/A
N/A N/A N/A N/A N/A
N/A
Male Female N/A N/A N/A N/A N/A N/A N/A N/A N/A N/A
Certificates of Performance
Total Graduates
N/A
N/A
N/A N/A N/A N/A N/A
N/A N/A
N/A
HOPE Scholarships
School System
Number of 1999 Graduates Number Eligible Percent Eligible
N/A N/A N/A
N/A N/A N/A
State
65,548 40,292 61.5%
High School Completion Rate
Percent of 1995Grade 9 Enrollment in Graduating Class of1999 School System State
Completion Rate '95-'99 N / A N / A 68.9%
1998-99 GEORGIA PUBLIC EDUCATION REPORT CARD
Chattahoochee County Education Center - 6260177
Prepared by Georgia Department of Education
Page 6
COLLEGE ADMISSIONS / CREDIT TEST DATA
Scholastic Assessment Test (SAT)
Based on students' highest verbal and highest math scores
No. Taking
Average Score
Tests Verbal Math Total
Based on students' last test administration
Average Score Verbal Math Total
School
N/A
College Prep. Endorsement
Other Diplomas
System College Prep. Endorsement
N/A
Other Diplomas
Georgia
41,958
N/A N/A N/A
N/A N/A N/A
492
N/A N/A N/A
N/A N/A N/A
488
N/A N/A N/A
N/A N/A N/A
980
N/A N/A N/A
N/A N/A N/A
483
N/A N/A N/A
N/A N/A N/A
479
N/A N/A N/A
N/A N/A N/A
962
Nation
952,913 N/A N/A N/A
502 508 1010
American College Testing (ACT)
Advanced Placement Exams (AP)
Number taking tests: English Mathematics Reading Science Reasoning CompositeScore
N/A
School System
N/A
N/A
N/A
N/A
N/A N/A
N/A N/A
N/A
N/A
State 19.1 19.9 20.2 19.9 19.9
No. of Students Taking Tests
No. of Tests Taken No. of Test Scores
3 or Higher Percent of Test
Scores 3 or Higher
School N/A 99 49
49.5%
System State N/A 15,225 N/A 23,969 N/A 13,024
N/A 54.3%
POST-SECONDARY DATA
Graduates Entering Georgia Public Colleges
Graduates Entering Georgia Public Colleges and Requiring Learning Support (LS)
1998 Graduates Entering in 1998-99
1997 Graduates Entering in 1997-98
Percent of Graduating Number Class
School N / A
N/A
System N / A
N/A
School N / A
N/A
System N / A
N/A
Number Requiring
LS N/A N/A
N/A N/A
Percent of those attending Georgia
Public Colleges
N/A
N/A
N/A
N/A
In previous years, the Report Card presented College Prep Curriculum information provided by the Board of Regents on students requiring Learning Support. Due to inconsistencies in the data provided by the Board of Regents in defining College Prep Completers versus Local Board of Education data defining College Prep Endorsements, the Department of Education Report Card will not provide this information until discrepancies can be reconciled.
Graduates Entering Georgia Public Technical and Adult Schools
1998 Graduates School System
Entering Number N/A N/A
1998-99 Percent
N/A N/A
Entering Number N/A N/A
1997-98 Percent
N/A N/A
1997 Graduates School System
N/A N/A
N/A N/A
N/A N/A
N/A N/A
1998-99 GEORGIA PUBLIC EDUCATION REPORT CARD Chattahoochee County Education Center - 6260177
Prepared by Georgia Department of Education
Page 7
CERTIFIED PERSONNEL DATA
Positions Number Average Contract Days
Administrators
2.00 190.00
Support Personnel
5.00 190.00
PK-12 Teachers
37.00 188.11
Personnel Sex
Certificate
Years Experience
Full-time Part-time
Male Female
4 Yr Bachelor's 5 Yr Master's 6 Yr Specialist's 7 Yr Doctoral Other*
<1 1-10 11-20 21-30 >30
Average
2 0
2 0
0 0 2 0 0
0 0 1 1 0
20.50
5 0
0 5
0 1 4 0 0
0 0 3 2 0
20.00
37 0
8 29
10 17
9 1 0
2 13 15
7 0
12.59
*Includes One- and Two-Year Vocational Certificates.
ACCREDITATION DATA
Accredited by Southern Association of Colleges and Schools (SACS): Elementary/Middle Commission. Accredited with Quality by Georgia Accrediting Commission (GAC).
AWARDS / RECOGNITION DATA
Schools in Georgia may receive recognition in the following programs: Charter School Pay for Performance Program Georgia School of Excellence National Blue Ribbon School Chattahoochee County Education Center did not receive recognition in any of these programs during the 1998-99 school year.
1998-99 GEORGIA PUBLIC EDUCATION REPORT CARD Chattahoochee County Education Center - 6260177
Prepared by Georgia Department of Education
Page 8
1998-99 GEORGIA PUBLIC EDUCATION REPORT CARD CHATTOOGA COUNTY SCHOOLS - 627
The Georgia Public Education Report Card is designed to assist systems and schools in educational improvement. This report card contains a variety of data elements. An explanation of the terms is provided as a companion to the report card data. Please refer to the definitions for the most effective use of the reported data.
Total
K-12
2,788
PK
100
STUDENT DATA
Enrollment, by Race/Ethnicity and Sex
Black
White Hispanic
American Multi-
Asian Indian
racial
390 14.0%
2,342 84.0%
19 0.7%
1 0.0%
1 0.0%
35 1.3%
15 15.0%
78 78.0%
0 0.0%
0 0.0%
0 0.0%
7 7.0%
Male
1,482 53.2%
56 56.0%
Female
1,306 46.8%
44 44.0%
Enrollment in Selected Programs
Program
Program % of Student Enrollment Population
Gifted (Grades K-12)
234
8.4%
Non-Vocational Labs (Grades 9-12)
678
90.6%
Vocational Labs (Grades 9-12)
606
81.0%
Alternative Programs (Grades 6-12)
3
< 1%
Students Eligible to Receive Free/Reduced Lunches
Number
Percent
1,495
51.8%
Dropout Rate
Number
Percent
6-12 9-12
95
6.2%
94
11.6%
Enrollment in Compensatory Programs
Program
Program % of Student Enrollment Population
Special Education
(Grades K-12)
478
PK
43
English to Speakers of
Other Languages (ESOL)
0
(Grades K-12)
Remedial Education (Grades 2-5, 9-12)
185
Special Instructional
Assistance (SIA)
211
(Grades K-3)
Title I (Grades K-12) Number of schools with: Schoolwide program Targeted Assistance program No Title I program
17.1% N/A
0.0%
11.0%
22.7%
1 2 4
Total 72
Retained Students, by Race/Ethnicity and Sex
Black
White Hispanic
American MultiAsian Indian racial
8 11.1%
63 87.5%
1 1.4%
0 0.0%
0 0.0%
0 0.0%
Male Female
38
34
52.8% 47.2%
Prepared by Georgia Department of Education
Page 1
STATE-REQUIRED TEST DATA
NORM-REFERENCED TESTS
Grade 3 Iowa Tests of Basic Skills (ITBS) Each chart reflects data for three years of testing.
Reading Comprehension
Mathematics
50
55 54 47 53 47 52 0
98-99 97-98 96-97
System State
50
52 61 50 61 48 59 0
98-99 97-98 96-97
System State
Reading Vocabulary
50
48 50 56 50 37 49 0
98-99 97-98 96-97
System State
Social Studies
50
51 56 48 55 44 55 0
98-99 97-98 96-97
System State
Language Arts
50
45 64 43 62 37 59 0
98-99 97-98 96-97
System State
Science
50
57 59 50 59 51 58 0
98-99 97-98 96-97
System State
Sources of Information
Composite Score
50
51 57 0
98-99
System
50
43 56 44 55 97-98 96-97
State
50 58 46 57 0
98-99 97-98
1998-99 GEORGIA PUBLIC EDUCATION REPORT CARD Chattooga County Schools
Prepared by Georgia Department of Education
System State Scores Reported 43 56 in Percentiles 96-97
Page 2
STATE-REQUIRED TEST DATA
NORM-REFERENCED TESTS
Grade 5 Iowa Tests of Basic Skills (ITBS) Each chart reflects data for three years of testing.
Reading Comprehension
Mathematics
50
49 53 48 53 48 52 0
98-99 97-98 96-97
System State
50
46 59 43 58 46 57 0
98-99 97-98 96-97
System State
Reading Vocabulary
50
45 48 42 48 45 46 0
98-99 97-98 96-97
System State
Social Studies
50
53 57 50 56 50 55 0
98-99 97-98 96-97
System State
Language Arts
50
53 63 46 61 48 58 0
98-99 97-98 96-97
System State
Science
50
60 60 53 59 50 59 0
98-99 97-98 96-97
System State
Sources of Information
Composite Score
50
51 58 0
98-99
System
50
47 58 53 57 97-98 96-97
State
51 57 46 56 0
98-99 97-98
1998-99 GEORGIA PUBLIC EDUCATION REPORT CARD Chattooga County Schools
Prepared by Georgia Department of Education
System State Scores Reported 47 55 in Percentiles 96-97
Page 3
STATE-REQUIRED TEST DATA
NORM-REFERENCED TESTS Grade 8
Iowa Tests of Basic Skills (ITBS) Each chart reflects data for three years of testing.
Reading Comprehension
Mathematics
50
45 49 44 48 45 48 0
98-99 97-98 96-97
System State
50
45 56 44 55 43 54 0
98-99 97-98 96-97
System State
Reading Vocabulary
50
45 46 42 45 47 44 0
98-99 97-98 96-97
System State
Language Arts
50
55 60 55 58 44 56 0
98-99 97-98 96-97
System State
Social Studies
50
50 54 48 53 47 53 0
98-99 97-98 96-97
System State
Science
50
49 56 46 55 49 53 0
98-99 97-98 96-97
System State
Sources of Information
Composite Score
50
49 57 0
98-99
System
50
46 56 46 55 97-98 96-97
State
48 56 47 54 0
98-99 97-98
1998-99 GEORGIA PUBLIC EDUCATION REPORT CARD Chattooga County Schools
Prepared by Georgia Department of Education
System State Scores Reported 44 54 in Percentiles 96-97
Page 4
STATE-REQUIRED TEST DATA
PERFORMANCE ASSESSMENTS
Grade 5 Writing Assessment
1998-99
1997-98
1996-97
Percent at Developmental Stages:
Comparison
Comparison
Comparison
System Group State System Group State System Group State
Stage Stage Stage Stage Stage Stage
1: The Emerging Writer 2: The Developing Writer 3: The Focusing Writer 4: The Experimenting Writer 5: The Engaging Writer 6: The Extending Writer
0% 2% 27% 45% 23% 2%
0% 1% 19% 43% 27% 10%
0% 1% 16% 41% 29% 12%
1% 2% 26% 48% 20% 3%
0% 3% 22% 43% 23% 7%
0% 3% 19% 41% 27% 10%
0% 5% 26% 47% 19% 3%
0% 4% 24% 41% 23% 8%
0% 3% 21% 37% 26% 12%
Grade 8 Writing Assessment
1998-99 Percent Scoring 1997-98 Percent Scoring 1996-97 Percent Scoring
Categories of Scaled Scores
Comparison
Comparison
Comparison
System Group State System Group State System Group State
Inadequate (less than 162)
Minimal (162-209)
Good
(210-247)
Very Good (greater than 247)
4% 44% 43%
9%
8% 45% 39%
9%
8% 40% 41% 11%
11% 53% 31%
5%
13% 50% 31%
6%
11% 46% 34%
8%
13% 54% 28%
4%
18% 49% 28%
6%
15% 46% 30%
8%
Average Scaled Score: (Range 100-300)
209
205 208
201
197 202
197
194 198
GEORGIA HIGH SCHOOL GRADUATION TESTS (GHSGT)
Percent of Regular Program 11th Graders Passing the Georgia High School Graduation Tests on First Administration
1998-99
1997-98
1996-97
Comparison
Comparison
Comparison
System Group State System Group State System Group State
English Language Arts Mathematics Social Studies Science
94% 84% 83% 74%
95% 86% 76% 68%
96% 88% 80% 72%
92% 74% 69% 66%
93% 86% 73% 71%
94% 88% 78% 74%
87% 73% 68% 66%
93% 87% 76% 73%
94% 87% 78% 74%
All Components listed above 6 9 %
63% 68% 55%
63% 68% 56%
67% 67%
Writing
97%
92% 93% 94%
91% 92% 92%
94% 93%
1998-99 GEORGIA PUBLIC EDUCATION REPORT CARD
Chattooga County Schools
Prepared by Georgia Department of Education
Page 5
GRADUATE DATA
1999 Graduates by Credentials, Race/Ethnicity and Sex
Diplomas with Both College Prep. & Voc. Endorsements
Diplomas with College Prep. Endorsements Diplomas with Vocational Endorsements General High School Diplomas Special Education Diplomas
Total All Diplomas
Certificates of Performance
Total Graduates
Total 32 23 39 3 8
105 16
121
Black
4 12.5%
3 13.0%
4 10.3%
1 33.3%
2 25.0%
14 13.3%
3 18.8%
17 14.0%
American MultiWhite Hispanic Asian Indian racial
Male Female
28 87.5%
20 87.0%
35 89.7%
2 66.7%
6 75.0%
0 0.0%
0 0.0%
0 0.0%
0 0.0%
0 0.0%
0 0.0%
0 0.0%
0 0.0%
0 0.0%
0 0.0%
0 0.0%
0 0.0%
0 0.0%
0 0.0%
0 0.0%
0
14
0.0% 43.8%
0
11
0.0% 47.8%
0
25
0.0% 64.1%
0
3
0.0% 100.0%
0
7
0.0% 87.5%
18 56.3%
12 52.2%
14 35.9%
0 0.0%
1 12.5%
91
0
0
0
0
60
45
86.7% 0.0% 0.0% 0.0% 0.0% 57.1% 42.9%
12
0
0
0
1
4
12
75.0% 0.0% 0.0% 0.0% 6.3% 25.0% 75.0%
103
0
0
0
1
64
57
85.1% 0.0% 0.0% 0.0% 0.8% 52.9% 47.1%
HOPE Scholarships
System State
Number of 1999 Graduates 1 2 1
Number Eligible
58
Percent Eligible
47.9%
65,548 40,292 61.5%
High School Completion Rate Percent of 1995Grade 9 Enrollment
in Graduating Class of1999
System
State
Completion Rate '95-'99 52.6% 68.9%
COLLEGE ADMISSIONS / CREDIT TEST DATA
Scholastic Assessment Test (SAT)
No. Taking
Average Score
Tests
Verbal Math Total
Based on students' highest verbal and highest math scores
System College Prep. Endorsement Other Diplomas
469 452 921 482 472 954 382 362 744
Georgia
492 488 980
Based on students' last test administration
System Georgia
53
460 440
900
41,958 483 479 962
Nation
952,913 502 508 1010
American College Testing (ACT)
System State Nation
English
15.2
19.1 20.4
Mathematics
18.1
19.9 20.7
Reading
15.5
20.2 21.3
Science Reasoning 17.8
19.9 21.0
CompositeScore 16.7
19.9 21.9
Advanced Placement Exams (AP)
No. of Students Taking Tests
No. of Tests Taken No. of Test Scores
3 or Higher Percent of Test
Scores 3 or Higher
System State 0 15,225
N/A 23,969 N/A 13,024
N/A 54.3%
1998-99 GEORGIA PUBLIC EDUCATION REPORT CARD Chattooga County Schools
Prepared by Georgia Department of Education
Page 6
POSTSECONDARY DATA
Graduates Entering Georgia Public Colleges and Universities
Graduates Entering Georgia Public Colleges and Universities and
Requiring Learning Support (LS)
1998 Graduates Entering 1998-99
1997 Graduates Entering 1997-98
Percent of Graduating Number Class
23
18.0%
31
24.4%
Number Requiring
LS
11
8
Percent of those attending Georgia
Public Colleges
47.8%
25.8%
In previous years, the Report Card presented College Prep Curriculum information provided by the Board of Regents on students requiring Learning Support. Due to inconsistencies in the data provided by the Board of Regents in defining College Prep Completers versus Local Board of Education data defining College Prep Endorsements, the Department of Education Report Card will not provide this information until discrepancies can be reconciled.
Graduates Entering Georgia Public Technical and Adult Schools
Entering 1998-99 Entering 1997-98
Number Percent
Number Percent
1998 Graduates 1997 Graduates
13
10.2%
1
0.8%
N/A 7
N/A 5.5%
ACCREDITATION / RECOGNITION DATA
Southern Association of Colleges and Schools (SACS) Accrediting Commission
Secondary/Middle Commission Elementary/Middle Commission Both Elementary/Secondary Commissions Joint Commission Candidate for Accreditation
Accreditation by Georgia Accrediting Commission (GAC)
Accredited by GAC Accredited with Quality by GAC
Number of Schools
1 6 0 0 0
Number of Schools
0 0
Awards / Recognition
State Recognized Program
Number of Schools
Charter School
0
Pay for Performance Recipient
0
Georgia School of Excellence
0
National Blue Ribbon School
0
COMMUNITY DATA
Number of Children Eligible for Migrant Education Number of Families-At-Risk * Number of Food Stamp Participants * Number of Families Receiving TANF * ** Per Capita Income * Unemployment Rate * 1990 Population * Projected 2000 Population * Projected 2010 Population *
* Data Available at County Level Only ** Known as AFDC before January 1997
0 94 1,269 56 $17,750 3.9% 22,242 22,374 22,697
1998-99 GEORGIA PUBLIC EDUCATION REPORT CARD Chattooga County Schools
Prepared by Georgia Department of Education
Page 7
FISCAL DATA
Millage Rate
10.00
* Fall 1998 Property Tax Digest is used to calculate the 98-99 Value of One Mill
FTE Count
FTE Count used for Allotment Calculation 2,715.0 Fall '98 FTE Count 2,788
Value of One Mill
$275,721 $101.55 per Allotment FTE
Sources: Local State-QBE State-
Lottery State-
Other Federal Other
Total
PerGeneral Fund cent Per FTE
$4,705,120 29.9% $1,733 $10,763,976 68.3% $3,965
K-12 Revenues
Lottery K-12
and
Title
All Other
Programs
K-12
$0
$60
Bonded Debt $353,604
$0
$63,543
$0
$0 0.0%
$0
$0
$0
$0
$291,802 1.9% $107
$0 0.0%
$0
$1,500 0.0%
$1
$15,762,399 100% $5,806
$0 $1,135,344
$0 $1,135,344
$13,500 $53,915
$0 $131,019
$0 $0 $0 $353,604
Capital Projects $4,261,854
$0
$0
$0 $0 $0 $4,261,854
School Nutrition
$369,758 $0
$0
$86,349 $707,852
$138 $1,164,098
Grand Total
Total
Per-
Amount cent
$9,690,398 42.5%
$10,827,519 47.5%
$0 0.0%
$391,651 1.7% $1,897,112 8.3%
$1,638 0.0% $22,808,320 100%
Instruction
Media Instruction
Support Pupil Services General Admin. School Admin. Trans-
portation Maint. & Ops. Capital Projects School Food Debt Service
Total
$10,366,450 67.2% $3,818 $466,886 3.0% $172
$460,869 3.0% $170
$653,732 4.2% $241
$450,198 2.9% $166
$1,078,949 7.0% $397
$747,995 4.8% $276
$1,198,925 7.8% $442
$2,368 0.0%
$1
$0 0.0%
$0
$0 0.0%
$0
K-12 Expenditures
$830,618 $134,875
$0
$51,890
$0
$0
$129,857
$1,115
$0
$96,617
$2,850
$0
$1,679
$0
$0
$0
$0
$0
$16,036
$0
$0
$0
$0
$0
$0
$0
$0
$0
$0
$0
$0
$0
$0
$15,426,377 100% $5,683 $1,126,700 $138,841
$0
$0 $0
$20,182
$0 $11,331,944 63.1%
$0
$518,777 2.9%
$0
$612,026 3.4%
$0
$0
$753,200 4.2%
$102,429
$0
$554,307 3.1%
$0
$0 $1,078,949 6.0%
$0
$0
$764,032 4.3%
$0
$0 $1,198,925 6.7%
$1,348
$0
$3,717 0.0%
$0 $1,145,266 $1,145,266 6.4%
$0
$0
$0 0.0%
$123,961 $1,145,266 $17,961,146 100%
Salaries and Benefits as Percentages of Revenues and of Expenditures
Teachers and Paraprofessionals
Salaries $8,086,281
Benefits $2,306,269
Percentage of Revenues Percentage of Expenditures
Total of
Total of
General Fund
General Fund
Title Programs
Title Programs
Lottery K-12
Lottery K-12
Total Salaries
and
Total
and
Total
and Benefits All Other K-12 K - 12 All Other K-12 K - 12
$10,392,550
61.0%
45.6%
62.3%
57.9%
School Administration
$692,086
$231,779
$923,865
5.4%
4.1%
5.5%
5.1%
General Administration
$152,467
$40,537
$193,004
1.1%
0.8%
1.2%
1.1%
1998-99 GEORGIA PUBLIC EDUCATION REPORT CARD
Chattooga County Schools - 627
Prepared by Georgia Department of Education
Page 8
CERTIFIED PERSONNEL DATA
Number
Average Annual Salary Positions Average Contract Days
Average Daily Salary
Full-time Personnel Part-time
Sex Male Female
4 Yr Bachelor's Certificate 5 Yr Master's
Level 6 Yr Specialist's 7 Yr Doctoral Other*
Black
White Race/ Hispanic Ethnicity Asian
American Indian
Multiracial
Years Experience
<1 1-10 11-20 21-30 >30
Average
Administrators
16.25
$59,118.38 214.55
$275.54
16 1
12 5
0 3 13 1 0
2 15
0 0 0 0
0 1 5 10 1
23.06
Support Personnel PK-12 Teachers
20.71
208.17
$41,978.08 192.74
$217.80
$37,885.49 191.06
$198.29
19
206
3
4
4
52
18
158
2
101
16
87
4
18
0
0
0
4
1
11
21
199
0
0
0
0
0
0
0
0
1
11
6
81
8
70
5
44
2
4
15.73
12.99
*Includes One- and Two-Year Vocational Certificates.
Certified Staff Position Ratios
Teacher/Administrator Ratio 13:1
Teacher/Support Person Ratio 10:1
Teacher/Staff Ratio 6:1
Student Enrollment/All Teachers 13:1
Certified Personnel by Category
84.3% 100%
6.8%
8.8%
80% 60%
40%
20%
0%
Teachers
Administrators
Support Personnel
1998-99 GEORGIA PUBLIC EDUCATION REPORT CARD
Chattooga County Schools - 627
Prepared by Georgia Department of Education
Page 9
1998-99 GEORGIA PUBLIC EDUCATION REPORT CARD
CHATTOOGA COUNTY SCHOOLS
Chattooga High School - 6271050
Grade Range 9-12
The Georgia Public Education Report Card is designed to assist systems and schools in educational improvement. This report card contains a variety of data elements. An explanation of the terms is provided as a companion to the report card data. Please refer to the definitions for the most effective use of the reported data.
Total 748
STUDENT DATA
9-12 Enrollment, by Race/Ethnicity and Sex
Black
White Hispanic
American Multi-
Asian Indian
racial
104 13.9%
637 85.2%
1 0.1%
0 0.0%
0 0.0%
6 0.8%
Male Female
406 54.3%
342 45.7%
Enrollment in Selected Programs
Program
Gifted (Grades K-12)
Program % of Student Enrollment Population
65
8.7%
Non-Vocational Labs (Grades 9-12)
678
Vocational Labs
(Grades 9-12)
606
Alternative Programs (Grades 6-12)
1
90.6% 81.0%
< 1%
Students Eligible to Receive Free/Reduced Lunches
Number
Percent
School System
251 1,495
33.6% 51.8%
Enrollment in Compensatory Programs
Program
Program % of Student Enrollment Population
Special Education (Grades K-12) PK
99 13.2%
0
N/A
English to Speakers of Other Languages (ESOL) (Grades K-12)
0
0.0%
Remedial Education (Grades 2-5, 9-12)
76 10.2%
Title I (Grades K-12)
This school has no Title I program.
Dropout Rate for Grades 9-12
Number
Rate
School System
94
11.6%
94
11.6%
Total 0
Retained Students, by Race/Ethnicity and Sex
Black
White Hispanic
American MultiAsian Indian racial
0
0
0
0
0
0
Male Female
0
0
Prepared by Georgia Department of Education
Page 1
STATE-REQUIRED TEST DATA
GEORGIA HIGH SCHOOL GRADUATION TESTS (GHSGT)
Percent of Regular Program 11th Graders Passing the Georgia High School Graduation Tests on First Administration
English Language Arts Mathematics Social Studies Science
All Components listed above
Writing
1998-99
School System State
94% 84% 83% 74%
94% 84% 83% 74%
96% 88% 80% 72%
69% 69% 68%
97% 97% 93%
1997-98
School System State
92% 74% 69% 66%
92% 74% 69% 66%
94% 88% 78% 74%
55% 55% 68%
94% 94% 92%
1996-97
School System State
87% 73% 68% 66%
87% 73% 68% 66%
94% 87% 78% 74%
56% 56% 67%
92% 92% 93%
GRADUATE DATA
1999 Graduates by Credentials, Race/Ethnicity and Sex
Diplomas with Both College Prep. & Voc. Endorsements
Diplomas with College Prep. Endorsements Diplomas with Vocational Endorsements General High School Diplomas Special Education Diplomas
Total All Diplomas
Certificates of Performance
Total Graduates
Total 32 23 39 3 8
105 16
121
Black
4 12.5%
3 13.0%
4 10.3%
1 33.3%
2 25.0%
14 13.3%
3 18.8%
17 14.0%
American MultiWhite Hispanic Asian Indian racial
28 87.5%
20 87.0%
0 0.0%
0 0.0%
0 0.0%
0 0.0%
0 0.0%
0 0.0%
0 0.0%
0 0.0%
35 89.7%
2 66.7%
6 75.0%
0 0.0%
0 0.0%
0 0.0%
0 0.0%
0 0.0%
0 0.0%
0 0.0%
0 0.0%
0 0.0%
0 0.0%
0 0.0%
0 0.0%
91 86.7%
0 0.0%
0 0.0%
0 0.0%
0 0.0%
12 75.0%
0 0.0%
0 0.0%
0 0.0%
1 6.3%
103 85.1%
0 0.0%
0 0.0%
0 0.0%
1 0.8%
Male Female
14 43.8%
11 47.8%
18 56.3%
12 52.2%
25 64.1%
3 100.0%
7 87.5%
14 35.9%
0 0.0%
1 12.5%
60
45
57.1% 42.9%
4
12
25.0% 75.0%
64
57
52.9% 47.1%
HOPE Scholarships
School System
Number of 1999 Graduates 1 2 1
Number Eligible
58
Percent Eligible
47.9%
121 58
47.9%
State
65,548 40,292 61.5%
High School Completion Rate
Percent of 1995Grade 9 Enrollment in Graduating Class of1999 School System State
Completion Rate '95-'99 52.6% 52.6% 68.9%
1998-99 GEORGIA PUBLIC EDUCATION REPORT CARD
Chattooga High School - 6271050
Prepared by Georgia Department of Education
Page 2
COLLEGE ADMISSIONS / CREDIT TEST DATA
Scholastic Assessment Test (SAT)
Based on students' highest verbal and highest math scores
No. Taking
Average Score
Tests Verbal Math Total
Based on students' last test administration
Average Score Verbal Math Total
School College Prep. Endorsement Other Diplomas
53 469 452
921
482 472
954
382 362
744
System College Prep. Endorsement Other Diplomas
53 469 452
921
482 472
954
382 362
744
Georgia
41,958 492 488
980
460 N/A N/A
460 N/A N/A
483
440 N/A N/A
440 N/A N/A
479
900 N/A N/A
900 N/A N/A
962
Nation
952,913 N/A N/A N/A
502 508 1010
American College Testing (ACT)
Advanced Placement Exams (AP)
Number taking tests: English Mathematics Reading Science Reasoning CompositeScore
1 0 School System State
15.2 15.2 19.1
18.1 18.1 19.9
15.5 17.8
15.5 17.8
20.2 19.9
16.7 16.7 19.9
No. of Students Taking Tests
No. of Tests Taken No. of Test Scores
3 or Higher Percent of Test
Scores 3 or Higher
School 0
N/A N/A
N/A
System State 0 15,225
N/A 23,969 N/A 13,024
N/A 54.3%
POST-SECONDARY DATA
Graduates Entering Georgia Public Colleges
Graduates Entering Georgia Public Colleges and Requiring Learning Support (LS)
1998 Graduates Entering in 1998-99
1997 Graduates Entering in 1997-98
Percent of Graduating Number Class
School
23
18.0%
System 2 3
18.0%
School
31
24.4%
System 3 1
24.4%
Number Requiring
LS 11 11
8 8
Percent of those attending Georgia
Public Colleges
47.8%
47.8%
25.8%
25.8%
In previous years, the Report Card presented College Prep Curriculum information provided by the Board of Regents on students requiring Learning Support. Due to inconsistencies in the data provided by the Board of Regents in defining College Prep Completers versus Local Board of Education data defining College Prep Endorsements, the Department of Education Report Card will not provide this information until discrepancies can be reconciled.
Graduates Entering Georgia Public Technical and Adult Schools
1998 Graduates School System
Entering Number 13 13
1998-99 Percent 10.2% 10.2%
Entering Number N/A N/A
1997-98 Percent
N/A N/A
1997 Graduates School
1
0.8%
System
1
0.8%
7
5.5%
7
5.5%
1998-99 GEORGIA PUBLIC EDUCATION REPORT CARD Chattooga High School - 6271050
Prepared by Georgia Department of Education
Page 3
CERTIFIED PERSONNEL DATA
Positions Number Average Contract Days
Administrators
4.00 217.25
Support Personnel
3.33 192.00
PK-12 Teachers
49.47 194.11
Personnel Sex
Certificate
Years Experience
Full-time Part-time
Male Female
4 Yr Bachelor's 5 Yr Master's 6 Yr Specialist's 7 Yr Doctoral Other*
<1 1-10 11-20 21-30 >30
Average
4 0
4 0
0 1 3 0 0
0 0 1 3 0
26.25
3 1
2 2
0 4 0 0 0
0 1 1 2 0
17.50
48 3
27 24
26 14
7 0 4
5 17 17 11
1
12.10
*Includes One- and Two-Year Vocational Certificates.
ACCREDITATION DATA
Accredited by Southern Association of Colleges and Schools (SACS): Secondary/Middle Commission.
AWARDS / RECOGNITION DATA
Schools in Georgia may receive recognition in the following programs: Charter School Pay for Performance Program Georgia School of Excellence National Blue Ribbon School Chattooga High School did not receive recognition in any of these programs during the 1998-99 school year.
1998-99 GEORGIA PUBLIC EDUCATION REPORT CARD Chattooga High School - 6271050
Prepared by Georgia Department of Education
Page 4
1998-99 GEORGIA PUBLIC EDUCATION REPORT CARD
CHATTOOGA COUNTY SCHOOLS
Lyerly Elementary School - 6272050
Grade Range K-8
The Georgia Public Education Report Card is designed to assist systems and schools in educational improvement. This report card contains a variety of data elements. An explanation of the terms is provided as a companion to the report card data. Please refer to the definitions for the most effective use of the reported data.
STUDENT DATA
Total 264
K-8 Enrollment, by Race/Ethnicity and Sex
Black
White Hispanic
American Multi-
Asian Indian
racial
15 5.7%
243 92.0%
0 0.0%
0 0.0%
0 0.0%
6 2.3%
Male 149
56.4%
Female 115
43.6%
Enrollment in Selected Programs
Program
Program % of Student Enrollment Population
Gifted (Grades K-12)
27
10.2%
Non-Vocational Labs (Grades 9-12)
N/A
N/A
Vocational Labs (Grades 9-12)
N/A
N/A
Alternative Programs (Grades 6-12)
1
1.1%
Students Eligible to Receive Free/Reduced Lunches
Number
Percent
School System
118 1,495
44.7% 51.8%
Enrollment in Compensatory Programs
Program
Program % of Student Enrollment Population
Special Education (Grades K-12) PK
31 11.7%
0
N/A
English to Speakers of Other Languages (ESOL) (Grades K-12)
0
0.0%
Remedial Education (Grades 2-5, 9-12)
12
9.7%
Special Instructional Assistance (SIA) (Grades K-3)
26 23.9%
Title I (Grades K-12) This school has no Title I program.
Dropout Rate for Grades 6-8
Number
Rate
School System
0
0.0%
1
0.1%
Total 11
Retained Students, by Race/Ethnicity and Sex
Black
White Hispanic
American MultiAsian Indian racial
0
11
0.0% 100.0%
0 0.0%
0 0.0%
0 0.0%
0 0.0%
Male Female
6
5
54.5% 45.5%
Prepared by Georgia Department of Education
Page 1
STATE-REQUIRED TEST DATA
NORM-REFERENCED TESTS Grade 3
Iowa Tests of Basic Skills (ITBS) Each chart reflects data for three years of testing.
Reading Comprehension 50
42 55 54 0
98-99
59 47 53 97-98
46 47 52 96-97
Mathematics
School 50
System
State
0
46 52 61 98-99
62 50 61 97-98
47 48 59 96-97
School System State
Reading Vocabulary 50
56 48 50 0
98-99
85 56 50 97-98
32 37 49 96-97
Language Arts
School 50
System
State
0
36 45 64 98-99
69 43 62 97-98
42 37 59 96-97
School System State
Social Studies 50
50 51 56 0
98-99
75 48 55 97-98
47 44 55 96-97
Science
School 50
System
State
0
52 57 59 98-99
74 50 59 97-98
49 51 58 96-97
School System State
Sources of Information
Composite Score
50
47 51 57 0
98-99
School 50
System
66 43 56 97-98
41 44 55 96-97
State 0
46 50 58 98-99
71 46 57 97-98
1998-99 GEORGIA PUBLIC EDUCATION REPORT CARD Lyerly Elementary School - 6272050
Prepared by Georgia Department of Education
43 43 56 96-97
Scores Reported in Percentiles
School System State
Page 2
STATE-REQUIRED TEST DATA
NORM-REFERENCED TESTS Grade 5
Iowa Tests of Basic Skills (ITBS) Each chart reflects data for three years of testing.
Reading Comprehension
Mathematics
50
48 49 53 N/A 48 53
0
98-99
97-98
49 48 52 96-97
School 50
System
State
0
41 46 59 N/A 43 58
98-99
97-98
64 46 57 96-97
School System State
Reading Vocabulary 50
43 45 48 N/A 42 48
0
98-99
97-98
51 45 46 96-97
Language Arts
School 50
System
State
0
55 53 63 N/A 46 61
98-99
97-98
44 48 58 96-97
School System State
Social Studies 50
62 53 57 N/A 50 56
0
98-99
97-98
63 50 55 96-97
Science
School 50
System
State
0
55 60 60 N/A 53 59
98-99
97-98
61 50 59 96-97
School System State
Sources of Information
Composite Score
School
50
50
System
49 51 58 N/A 47 58
0
98-99
97-98
62 53 57 96-97
State 0
50 51 57 N/A 46 56
98-99
97-98
56 47 55 96-97
1998-99 GEORGIA PUBLIC EDUCATION REPORT CARD Lyerly Elementary School - 6272050
Prepared by Georgia Department of Education
Scores Reported in Percentiles
School System State
Page 3
STATE-REQUIRED TEST DATA
NORM-REFERENCED TESTS Grade 8
Iowa Tests of Basic Skills (ITBS) Each chart reflects data for three years of testing.
Reading Comprehension 50
51 45 49 0
98-99
49 44 48 97-98
42 45 48 96-97
Mathematics
School 50
System
State
0
49 45 56 98-99
44 44 55 97-98
46 43 54 96-97
School System State
Reading Vocabulary 50
44 45 46 0
98-99
73 42 45 97-98
83 47 44 96-97
Language Arts
School 50
System
State
0
61 55 60 98-99
54 55 58 97-98
41 44 56 96-97
School System State
Social Studies 50
55 50 54 0
98-99
68 48 53 97-98
43 47 53 96-97
Science
School 50
System
State
0
54 49 56 98-99
54 46 55 97-98
54 49 53 96-97
School System State
Sources of Information
Composite Score
50
50 49 57 0
98-99
School 50
System
43 46 56 97-98
43 46 55 96-97
State 0
53 48 56 98-99
54 47 54 97-98
1998-99 GEORGIA PUBLIC EDUCATION REPORT CARD Lyerly Elementary School - 6272050
Prepared by Georgia Department of Education
46 44 54 96-97
Scores Reported in Percentiles
School System State
Page 4
STATE-REQUIRED TEST DATA
PERFORMANCE ASSESSMENTS
Percent at Developmental Stages:
Stage Stage Stage Stage Stage Stage
1:The Emerging Writer 2:The Developing Writer 3:The Focusing Writer 4:The Experimenting 5:The Engaging Writer 6:The Extending Writer
Grade 5 Writing Assessment
1998-99
1997-98
School System State School System State
0% 4% 14% 36% 43% 4%
0% 2% 27% 45% 23% 2%
0% 1% 16% 41% 29% 12%
0% 0% 3% 60% 33% 3%
1% 2% 26% 48% 20% 3%
0% 3% 19% 41% 27% 10%
1996-97 School System State
0% 4% 23% 65% 4% 4%
0% 5% 26% 47% 19% 3%
0% 3% 21% 37% 26% 12%
Categories of Scaled Scores
Inadequate (less than 162)
Minimal (162-209)
Good
(210-247)
Very Good (greater than 247)
Average Scaled Score: (Range 100-300)
Grade 8 Writing Assessment
1998-99 Percent Scoring
1997-98 Percent Scoring
1996-97 Percent Scoring
School System State School System State School System State
3% 48% 42%
6%
4% 44% 43%
9%
8% 40% 41% 11%
13% 44% 44%
0%
11% 53% 31%
5%
11% 46% 34%
8%
25% 61% 11%
4%
13% 54% 28%
4%
15% 46% 30%
8%
209
209
208 203
201 202 187
197 198
GEORGIA HIGH SCHOOL GRADUATION TESTS (GHSGT)
Percent of Regular Program 11th Graders Passing the Georgia High School Graduation Tests on First Administration
1998-99
1997-98
1996-97
School System State School System State School System State
English Language Arts Mathematics Social Studies Science
All Components listed above
N/A N/A N/A N/A
N/A
94% 84% 83% 74%
69%
96% 88% 80% 72%
68%
N/A N/A N/A N/A
N/A
92% 74% 69% 66%
55%
94% 88% 78% 74%
68%
N/A N/A N/A N/A
N/A
87% 73% 68% 66%
56%
94% 87% 78% 74%
67%
Writing
N/A 97% 93% N/A 94% 92% N/A 92% 93%
No eleventh-grade students are enrolled at Lyerly Elementary School.
1998-99 GEORGIA PUBLIC EDUCATION REPORT CARD Lyerly Elementary School - 6272050
Prepared by Georgia Department of Education
Page 5
GRADUATE DATA
1999 Graduates by Credentials, Race/Ethnicity and Sex
Diplomas with Both College Prep. & Voc. Endorsements
Diplomas with College Prep. Endorsements
Diplomas with Vocational Endorsements
General High School Diplomas
Special Education Diplomas
Total All Diplomas
Total N/A
Black N/A
White Hispanic N/A N/A
American MultiAsian Indian racial
N/A N/A N/A
N/A
N/A
N/A N/A N/A N/A N/A
N/A
N/A
N/A N/A N/A N/A N/A
N/A
N/A
N/A N/A N/A N/A N/A
N/A
N/A
N/A N/A N/A N/A N/A
N/A
Male Female N/A N/A N/A N/A N/A N/A N/A N/A N/A N/A
Certificates of Performance
Total Graduates
N/A
N/A
N/A N/A N/A N/A N/A
N/A N/A
N/A
HOPE Scholarships
School System
Number of 1999 Graduates Number Eligible Percent Eligible
N/A N/A N/A
121 58
47.9%
State
65,548 40,292 61.5%
High School Completion Rate
Percent of 1995Grade 9 Enrollment in Graduating Class of1999 School System State
Completion Rate '95-'99 N / A 52.6% 68.9%
1998-99 GEORGIA PUBLIC EDUCATION REPORT CARD
Lyerly Elementary School - 6272050
Prepared by Georgia Department of Education
Page 6
COLLEGE ADMISSIONS / CREDIT TEST DATA
Scholastic Assessment Test (SAT)
Based on students' highest verbal and highest math scores
No. Taking
Average Score
Tests Verbal Math Total
Based on students' last test administration
Average Score Verbal Math Total
School
N/A
College Prep. Endorsement
Other Diplomas
System
53
College Prep. Endorsement
Other Diplomas
Georgia
41,958
N/A N/A N/A
469 482 382
492
N/A N/A N/A
452 472 362
488
N/A N/A N/A
921 954 744
980
N/A N/A N/A
460 N/A N/A
483
N/A N/A N/A
440 N/A N/A
479
N/A N/A N/A
900 N/A N/A
962
Nation
952,913 N/A N/A N/A
502 508 1010
American College Testing (ACT)
Advanced Placement Exams (AP)
Number taking tests: English Mathematics Reading Science Reasoning CompositeScore
N/A
School System
N/A 15.2
N/A 18.1
N/A N/A
15.5 17.8
N/A 16.7
State 19.1 19.9 20.2 19.9 19.9
No. of Students Taking Tests
No. of Tests Taken No. of Test Scores
3 or Higher Percent of Test
Scores 3 or Higher
School N/A N/A N/A
N/A
System State 0 15,225
N/A 23,969 N/A 13,024
N/A 54.3%
POST-SECONDARY DATA
Graduates Entering Georgia Public Colleges
Graduates Entering Georgia Public Colleges and Requiring Learning Support (LS)
1998 Graduates Entering in 1998-99
1997 Graduates Entering in 1997-98
Percent of Graduating Number Class
School N / A
N/A
System 2 3
18.0%
School N / A
N/A
System 3 1
24.4%
Number Requiring
LS N/A 11
N/A 8
Percent of those attending Georgia
Public Colleges
N/A
47.8%
N/A
25.8%
In previous years, the Report Card presented College Prep Curriculum information provided by the Board of Regents on students requiring Learning Support. Due to inconsistencies in the data provided by the Board of Regents in defining College Prep Completers versus Local Board of Education data defining College Prep Endorsements, the Department of Education Report Card will not provide this information until discrepancies can be reconciled.
Graduates Entering Georgia Public Technical and Adult Schools
1998 Graduates School System
Entering Number N/A 13
1998-99 Percent
N/A 10.2%
Entering Number N/A N/A
1997-98 Percent
N/A N/A
1997 Graduates School System
N/A 1
N/A 0.8%
N/A 7
N/A 5.5%
1998-99 GEORGIA PUBLIC EDUCATION REPORT CARD Lyerly Elementary School - 6272050
Prepared by Georgia Department of Education
Page 7
CERTIFIED PERSONNEL DATA
Positions Number Average Contract Days
Administrators
1.00 210.00
Support Personnel
1.50 190.00
PK-12 Teachers
19.40 190.00
Personnel Sex
Certificate
Years Experience
Full-time Part-time
Male Female
4 Yr Bachelor's 5 Yr Master's 6 Yr Specialist's 7 Yr Doctoral Other*
<1 1-10 11-20 21-30 >30
Average
1 0
1 0
0 0 1 0 0
0 0 0 1 0
28.00
1 1
0 2
0 2 0 0 0
0 1 1 0 0
11.50
19 2
4 17
10 9 2 0 0
0 5 12 2 2
15.10
*Includes One- and Two-Year Vocational Certificates.
ACCREDITATION DATA
Accredited by Southern Association of Colleges and Schools (SACS): Elementary/Middle Commission.
AWARDS / RECOGNITION DATA
Schools in Georgia may receive recognition in the following programs: Charter School Pay for Performance Program Georgia School of Excellence National Blue Ribbon School Lyerly Elementary School did not receive recognition in any of these programs during the 1998-99 school year.
1998-99 GEORGIA PUBLIC EDUCATION REPORT CARD Lyerly Elementary School - 6272050
Prepared by Georgia Department of Education
Page 8
1998-99 GEORGIA PUBLIC EDUCATION REPORT CARD
CHATTOOGA COUNTY SCHOOLS
Menlo Elementary School - 6273050
Grade Range PK-8
The Georgia Public Education Report Card is designed to assist systems and schools in educational improvement. This report card contains a variety of data elements. An explanation of the terms is provided as a companion to the report card data. Please refer to the definitions for the most effective use of the reported data.
STUDENT DATA
Total
K-8
354
PK
20
Enrollment, by Race/Ethnicity and Sex
Black
American Multi-
White Hispanic Asian Indian
racial
10 2.8%
343 96.9%
0 0.0%
0 0.0%
0 0.0%
1 0.3%
0 0.0%
20 100.0%
0 0.0%
0 0.0%
0 0.0%
0 0.0%
Male 187
52.8% 10
50.0%
Female 167
47.2% 10
50.0%
Enrollment in Selected Programs
Program
Gifted (Grades K-12)
Non-Vocational Labs (Grades 9-12)
Vocational Labs (Grades 9-12)
Program % of Student Enrollment Population
35
9.9%
N/A
N/A
N/A
N/A
Alternative Programs (Grades 6-12)
0
0.0%
Students Eligible to Receive Free/Reduced Lunches
Number
Percent
School System
145 1,495
38.8% 51.8%
Enrollment in Compensatory Programs
Program
Program % of Student Enrollment Population
Special Education (Grades K-12) PK
68 19.2%
4
N/A
English to Speakers of Other Languages (ESOL) (Grades K-12)
0
0.0%
Remedial Education (Grades 2-5, 9-12)
23 13.9%
Special Instructional Assistance (SIA) (Grades K-3)
34 20.1%
Title I (Grades K-12)
This school has no Title I program.
Dropout Rate for Grades 6-8
Number
Rate
School System
0
0.0%
1
0.1%
Total 11
Retained Students, by Race/Ethnicity and Sex
Black
White Hispanic
American Multi-
Asian Indian
racial
0
11
0.0% 100.0%
0 0.0%
0 0.0%
0 0.0%
0 0.0%
Male Female
7
4
63.6% 36.4%
Prepared by Georgia Department of Education
Page 1
STATE-REQUIRED TEST DATA
NORM-REFERENCED TESTS Grade 3
Iowa Tests of Basic Skills (ITBS) Each chart reflects data for three years of testing.
Reading Comprehension 50
59 55 54 0
98-99
47 47 53 97-98
49 47 52 96-97
Mathematics
School 50
System
State
0
57 52 61 98-99
45 50 61 97-98
43 48 59 96-97
School System State
Reading Vocabulary 50
52 48 50 0
98-99
46 56 50 97-98
38 37 49 96-97
Language Arts
School 50
System
State
0
45 45 64 98-99
40 43 62 97-98
32 37 59 96-97
School System State
Social Studies 50
67 51 56 0
98-99
56 48 55 97-98
43 44 55 96-97
Science
School 50
System
State
0
75 57 59 98-99
59 50 59 97-98
54 51 58 96-97
School System State
Sources of Information
Composite Score
50
62 51 57 0
98-99
School 50
System
48 43 56 97-98
47 44 55 96-97
State 0
61 50 58 98-99
48 46 57 97-98
1998-99 GEORGIA PUBLIC EDUCATION REPORT CARD Menlo Elementary School - 6273050
Prepared by Georgia Department of Education
42 43 56 96-97
Scores Reported in Percentiles
School System State
Page 2
STATE-REQUIRED TEST DATA
NORM-REFERENCED TESTS Grade 5
Iowa Tests of Basic Skills (ITBS) Each chart reflects data for three years of testing.
Reading Comprehension
Mathematics
50
49 49 53 0
98-99
54 48 53 97-98
53 48 52 96-97
School 50
System
State
0
51 46 59 98-99
54 43 58 97-98
55 46 57 96-97
School System State
Reading Vocabulary 50
45 45 48 0
98-99
50 42 48 97-98
50 45 46 96-97
Language Arts
School 50
System
State
0
65 53 63 98-99
61 46 61 97-98
64 48 58 96-97
School System State
Social Studies 50
59 53 57 0
98-99
55 50 56 97-98
58 50 55 96-97
Science
School 50
System
State
0
67 60 60 98-99
61 53 59 97-98
56 50 59 96-97
School System State
Sources of Information
Composite Score
50
61 51 58 0
98-99
School 50
System
56 47 58 97-98
59 53 57 96-97
State 0
58 51 57 98-99
56 46 56 97-98
57 47 55 96-97
1998-99 GEORGIA PUBLIC EDUCATION REPORT CARD Menlo Elementary School - 6273050
Prepared by Georgia Department of Education
Scores Reported in Percentiles
School System State
Page 3
STATE-REQUIRED TEST DATA
NORM-REFERENCED TESTS Grade 8
Iowa Tests of Basic Skills (ITBS) Each chart reflects data for three years of testing.
Reading Comprehension 50
45 45 49 0
98-99
48 44 48 97-98
54 45 48 96-97
Mathematics
School 50
System
State
0
32 45 56 98-99
42 44 55 97-98
47 43 54 96-97
School System State
Reading Vocabulary 50
32 45 46 0
98-99
52 42 45 97-98
58 47 44 96-97
Language Arts
School 50
System
State
0
49 55 60 98-99
53 55 58 97-98
58 44 56 96-97
School System State
Social Studies 50
46 50 54 0
98-99
57 48 53 97-98
55 47 53 96-97
Science
School 50
System
State
0
41 49 56 98-99
60 46 55 97-98
55 49 53 96-97
School System State
Sources of Information
Composite Score
50
45 49 57 0
98-99
School 50
System
54 46 56 97-98
53 46 55 96-97
State 0
41 48 56 98-99
52 47 54 97-98
1998-99 GEORGIA PUBLIC EDUCATION REPORT CARD Menlo Elementary School - 6273050
Prepared by Georgia Department of Education
54 44 54 96-97
Scores Reported in Percentiles
School System State
Page 4
STATE-REQUIRED TEST DATA
PERFORMANCE ASSESSMENTS
Percent at Developmental Stages:
Stage Stage Stage Stage Stage Stage
1:The Emerging Writer 2:The Developing Writer 3:The Focusing Writer 4:The Experimenting 5:The Engaging Writer 6:The Extending Writer
Grade 5 Writing Assessment
1998-99
1997-98
School System State School System State
0% 0% 4% 56% 33% 7%
0% 2% 27% 45% 23% 2%
0% 1% 16% 41% 29% 12%
3% 0% 21% 38% 29% 9%
1% 2% 26% 48% 20% 3%
0% 3% 19% 41% 27% 10%
1996-97 School System State
0% 6% 9% 40% 37% 9%
0% 5% 26% 47% 19% 3%
0% 3% 21% 37% 26% 12%
Categories of Scaled Scores
Inadequate (less than 162)
Minimal (162-209)
Good
(210-247)
Very Good (greater than 247)
Average Scaled Score: (Range 100-300)
Grade 8 Writing Assessment
1998-99 Percent Scoring
1997-98 Percent Scoring
1996-97 Percent Scoring
School System State School System State School System State
4% 48% 35% 13%
4% 44% 43%
9%
8% 40% 41% 11%
14% 68% 11%
7%
11% 53% 31%
5%
11% 46% 34%
8%
9% 53% 32%
6%
13% 54% 28%
4%
15% 46% 30%
8%
208
209
208 191
201 202 199
197 198
GEORGIA HIGH SCHOOL GRADUATION TESTS (GHSGT)
Percent of Regular Program 11th Graders Passing the Georgia High School Graduation Tests on First Administration
1998-99
1997-98
1996-97
School System State School System State School System State
English Language Arts Mathematics Social Studies Science
All Components listed above
N/A N/A N/A N/A
N/A
94% 84% 83% 74%
69%
96% 88% 80% 72%
68%
N/A N/A N/A N/A
N/A
92% 74% 69% 66%
55%
94% 88% 78% 74%
68%
N/A N/A N/A N/A
N/A
87% 73% 68% 66%
56%
94% 87% 78% 74%
67%
Writing
N/A 97% 93% N/A 94% 92% N/A 92% 93%
No eleventh-grade students are enrolled at Menlo Elementary School.
1998-99 GEORGIA PUBLIC EDUCATION REPORT CARD Menlo Elementary School - 6273050
Prepared by Georgia Department of Education
Page 5
GRADUATE DATA
1999 Graduates by Credentials, Race/Ethnicity and Sex
Diplomas with Both College Prep. & Voc. Endorsements
Diplomas with College Prep. Endorsements
Diplomas with Vocational Endorsements
General High School Diplomas
Special Education Diplomas
Total All Diplomas
Total N/A
Black N/A
White Hispanic N/A N/A
American MultiAsian Indian racial
N/A N/A N/A
N/A
N/A
N/A N/A N/A N/A N/A
N/A
N/A
N/A N/A N/A N/A N/A
N/A
N/A
N/A N/A N/A N/A N/A
N/A
N/A
N/A N/A N/A N/A N/A
N/A
Male Female N/A N/A N/A N/A N/A N/A N/A N/A N/A N/A
Certificates of Performance
Total Graduates
N/A
N/A
N/A N/A N/A N/A N/A
N/A N/A
N/A
HOPE Scholarships
School System
Number of 1999 Graduates Number Eligible Percent Eligible
N/A N/A N/A
121 58
47.9%
State
65,548 40,292 61.5%
High School Completion Rate
Percent of 1995Grade 9 Enrollment in Graduating Class of1999 School System State
Completion Rate '95-'99 N / A 52.6% 68.9%
1998-99 GEORGIA PUBLIC EDUCATION REPORT CARD
Menlo Elementary School - 6273050
Prepared by Georgia Department of Education
Page 6
COLLEGE ADMISSIONS / CREDIT TEST DATA
Scholastic Assessment Test (SAT)
Based on students' highest verbal and highest math scores
No. Taking
Average Score
Tests Verbal Math Total
Based on students' last test administration
Average Score Verbal Math Total
School
N/A
College Prep. Endorsement
Other Diplomas
System
53
College Prep. Endorsement
Other Diplomas
Georgia
41,958
N/A N/A N/A
469 482 382
492
N/A N/A N/A
452 472 362
488
N/A N/A N/A
921 954 744
980
N/A N/A N/A
460 N/A N/A
483
N/A N/A N/A
440 N/A N/A
479
N/A N/A N/A
900 N/A N/A
962
Nation
952,913 N/A N/A N/A
502 508 1010
American College Testing (ACT)
Advanced Placement Exams (AP)
Number taking tests: English Mathematics Reading Science Reasoning CompositeScore
N/A
School System
N/A 15.2
N/A 18.1
N/A N/A
15.5 17.8
N/A 16.7
State 19.1 19.9 20.2 19.9 19.9
No. of Students Taking Tests
No. of Tests Taken No. of Test Scores
3 or Higher Percent of Test
Scores 3 or Higher
School N/A N/A N/A
N/A
System State 0 15,225
N/A 23,969 N/A 13,024
N/A 54.3%
POST-SECONDARY DATA
Graduates Entering Georgia Public Colleges
Graduates Entering Georgia Public Colleges and Requiring Learning Support (LS)
1998 Graduates Entering in 1998-99
1997 Graduates Entering in 1997-98
Percent of Graduating Number Class
School N / A
N/A
System 2 3
18.0%
School N / A
N/A
System 3 1
24.4%
Number Requiring
LS N/A 11
N/A 8
Percent of those attending Georgia
Public Colleges
N/A
47.8%
N/A
25.8%
In previous years, the Report Card presented College Prep Curriculum information provided by the Board of Regents on students requiring Learning Support. Due to inconsistencies in the data provided by the Board of Regents in defining College Prep Completers versus Local Board of Education data defining College Prep Endorsements, the Department of Education Report Card will not provide this information until discrepancies can be reconciled.
Graduates Entering Georgia Public Technical and Adult Schools
1998 Graduates School System
Entering Number N/A 13
1998-99 Percent
N/A 10.2%
Entering Number N/A N/A
1997-98 Percent
N/A N/A
1997 Graduates School System
N/A 1
N/A 0.8%
N/A 7
N/A 5.5%
1998-99 GEORGIA PUBLIC EDUCATION REPORT CARD Menlo Elementary School - 6273050
Prepared by Georgia Department of Education
Page 7
CERTIFIED PERSONNEL DATA
Positions Number Average Contract Days
Administrators
1.00 210.00
Support Personnel
2.50 190.00
PK-12 Teachers
23.90 190.00
Personnel Sex
Certificate
Years Experience
Full-time Part-time
Male Female
4 Yr Bachelor's 5 Yr Master's 6 Yr Specialist's 7 Yr Doctoral Other*
<1 1-10 11-20 21-30 >30
Average
1 0
1 0
0 0 1 0 0
0 0 1 0 0
13.00
2 1
0 3
0 2 1 0 0
1 0 2 0 0
10.00
23 3
4 22
10 16
0 0 0
2 7 8 9 0
14.35
*Includes One- and Two-Year Vocational Certificates.
ACCREDITATION DATA
Accredited by Southern Association of Colleges and Schools (SACS): Elementary/Middle Commission.
AWARDS / RECOGNITION DATA
Schools in Georgia may receive recognition in the following programs: Charter School Pay for Performance Program Georgia School of Excellence National Blue Ribbon School Menlo Elementary School did not receive recognition in any of these programs during the 1998-99 school year.
1998-99 GEORGIA PUBLIC EDUCATION REPORT CARD Menlo Elementary School - 6273050
Prepared by Georgia Department of Education
Page 8
1998-99 GEORGIA PUBLIC EDUCATION REPORT CARD
CHATTOOGA COUNTY SCHOOLS
North Summerville Elementary School - 6273550
Grade Range 4-5
The Georgia Public Education Report Card is designed to assist systems and schools in educational improvement. This report card contains a variety of data elements. An explanation of the terms is provided as a companion to the report card data. Please refer to the definitions for the most effective use of the reported data.
STUDENT DATA
Total 239
4-5 Enrollment, by Race/Ethnicity and Sex
Black
White Hispanic
American Multi-
Asian Indian
racial
60 25.1%
173 72.4%
1 0.4%
0 0.0%
0 0.0%
5 2.1%
Male Female
114 47.7%
125 52.3%
Enrollment in Selected Programs
Program
Program % of Student Enrollment Population
Gifted (Grades K-12)
24
10.0%
Alternative Programs (Grades 6-12)
N/A
N/A
Students Eligible to Receive Free/Reduced Lunches
Number
Percent
School System
194 1,495
81.2% 51.8%
Dropout Rate *
Number
Rate
School System
N/A N/A
N/A N/A
* Dropout rates are not applicable for grades PK-5.
Enrollment in Compensatory Programs
Program
Program % of Student Enrollment Population
Special Education (Grades K-12)
58 24.3%
(PK)
0
N/A
English to Speakers of Other Languages (ESOL) (Grades K-12)
0
0.0%
Remedial Education (Grades 2-5, 9-12)
54 22.6%
Special Instructional Assistance (SIA) (Grades K-3)
N/A
N/A
Title I (Grades K-12)
This school has a Targeted Assistance program.
Total 2
Retained Students, by Race/Ethnicity and Sex
Black
White Hispanic
American Multi-
Asian Indian
racial
0
2
0.0% 100.0%
0 0.0%
0 0.0%
0 0.0%
0 0.0%
Male Female
0
2
0.0% 100.0%
Prepared by Georgia Department of Education
Page 1
STATE-REQUIRED TEST DATA
NORM-REFERENCED TESTS
Grade 3 Iowa Tests of Basic Skills (ITBS) Each chart reflects data for three years of testing.
No third-grade students are enrolled at North Summerville Elementary School.
Reading Comprehension
Mathematics
50
N/A 55 54 0
98-99
N/A 47 53 97-98
N/A 47 52 96-97
School 50
System
State
N/A 52 61 0
98-99
N/A 50 61 97-98
N/A 48 59 96-97
School System State
Reading Vocabulary 50
N/A 48 50 0
98-99
N/A 56 50 97-98
N/A 37 49 96-97
Language Arts
School 50
System
State
N/A 45 64 0
98-99
N/A 43 62 97-98
N/A 37 59 96-97
School System State
Social Studies 50
N/A 51 56 0
98-99
N/A 48 55 97-98
N/A 44 55 96-97
Science
School 50
System
State
N/A 57 59 0
98-99
N/A 50 59 97-98
N/A 51 58 96-97
School System State
Sources of Information
Composite Score
School
50
50
System
N/A 51 57 0
98-99
N/A 43 56 N/A 44 55
97-98
96-97
State
N/A 50 58 0
98-99
N/A 46 57 97-98
N/A 43 56 96-97
1998-99 GEORGIA PUBLIC EDUCATION REPORT CARD North Summerville Elementary School - 6273550
Prepared by Georgia Department of Education
Scores Reported in Percentiles
School System State
Page 2
STATE-REQUIRED TEST DATA
NORM-REFERENCED TESTS Grade 5
Iowa Tests of Basic Skills (ITBS) Each chart reflects data for three years of testing.
Reading Comprehension
Mathematics
50
54 49 53 0
98-99
48 48 53 97-98
46 48 52 96-97
School 50
System
State
0
50 46 59 98-99
44 43 58 97-98
41 46 57 96-97
School System State
Reading Vocabulary 50
50 45 48 0
98-99
43 42 48 97-98
43 45 46 96-97
Language Arts
School 50
System
State
0
53 53 63 98-99
44 46 61 97-98
43 48 58 96-97
School System State
Social Studies 50
54 53 57 0
98-99
53 50 56 97-98
45 50 55 96-97
Science
School 50
System
State
0
64 60 60 98-99
54 53 59 97-98
45 50 59 96-97
School System State
Sources of Information
Composite Score
50
52 51 58 0
98-99
School 50
System
48 47 58 97-98
50 53 57 96-97
State 0
53 51 57 98-99
47 46 56 97-98
43 47 55 96-97
1998-99 GEORGIA PUBLIC EDUCATION REPORT CARD North Summerville Elementary School - 6273550
Prepared by Georgia Department of Education
Scores Reported in Percentiles
School System State
Page 3
STATE-REQUIRED TEST DATA
PERFORMANCE ASSESSMENTS
Grade 5 Writing Assessment
Percent at Developmental Stages:
1998-99 School System State
1997-98 School System State
1996-97 School System State
Stage Stage Stage Stage Stage Stage
1:The Emerging Writer 2:The Developing Writer 3:The Focusing Writer 4:The Experimenting 5:The Engaging Writer 6:The Extending Writer
0% 1% 38% 46% 14% 1%
0% 2% 27% 45% 23% 2%
0% 1% 16% 41% 29% 12%
0% 4% 33% 51% 11% 1%
1% 2% 26% 48% 20% 3%
0% 3% 19% 41% 27% 10%
0% 5% 36% 45% 13% 1%
0% 5% 26% 47% 19% 3%
0% 3% 21% 37% 26% 12%
AWARDS / RECOGNITION DATA
Schools in Georgia may receive recognition in the following programs: Charter School Pay for Performance Program Georgia School of Excellence National Blue Ribbon School North Summerville Elementary School did not receive recognition in any of these programs during the 1998-99 school year.
1998-99 GEORGIA PUBLIC EDUCATION REPORT CARD North Summerville Elementary School - 6273550
Prepared by Georgia Department of Education
Page 4
CERTIFIED PERSONNEL DATA
Positions Number Average Contract Days
Personnel Sex
Certificate
Years Experience
Full-time Part-time
Male Female
4 Yr Bachelor's 5 Yr Master's 6 Yr Specialist's 7 Yr Doctoral Other*
<1 1-10 11-20 21-30 >30
Average
Administrators
1.00 210.00
1 0
0 1
0 0 1 0 0 0 0 0 1 0 25.00
Support Personnel
1.40 190.00
1 1
0 2
0 2 0 0 0 0 0 2 0 0 15.00
PK-12 Teachers
16.50 190.00
16 1
5 12
9 6 2 0 0 0 7 3 7 0 17.00
*Includes One- and Two-Year Vocational Certificates.
ACCREDITATION DATA
Accredited by Southern Association of Colleges and Schools (SACS):
Elementary/Middle Commission.
1998-99 GEORGIA PUBLIC EDUCATION REPORT CARD North Summerville Elementary School - 6273550
Prepared by Georgia Department of Education
Page 5
1998-99 GEORGIA PUBLIC EDUCATION REPORT CARD
CHATTOOGA COUNTY SCHOOLS
Pennville Elementary School - 6274050
Grade Range PK-8
The Georgia Public Education Report Card is designed to assist systems and schools in educational improvement. This report card contains a variety of data elements. An explanation of the terms is provided as a companion to the report card data. Please refer to the definitions for the most effective use of the reported data.
STUDENT DATA
Total
K-8
320
PK
12
Enrollment, by Race/Ethnicity and Sex
Black
American Multi-
White Hispanic Asian Indian
racial
13 4.1%
294 91.9%
10 3.1%
0 0.0%
0 0.0%
3 0.9%
0 0.0%
12 100.0%
0 0.0%
0 0.0%
0 0.0%
0 0.0%
Male 178
55.6% 6
50.0%
Female 142
44.4% 6
50.0%
Enrollment in Selected Programs
Program
Gifted (Grades K-12)
Non-Vocational Labs (Grades 9-12)
Vocational Labs (Grades 9-12)
Program % of Student Enrollment Population
8
2.5%
N/A
N/A
N/A
N/A
Alternative Programs (Grades 6-12)
0
0.0%
Students Eligible to Receive Free/Reduced Lunches
Number
Percent
School System
249 1,495
75.0% 51.8%
Enrollment in Compensatory Programs
Program
Program % of Student Enrollment Population
Special Education (Grades K-12) PK
90 28.1%
14
N/A
English to Speakers of Other Languages (ESOL) (Grades K-12)
0
0.0%
Remedial Education (Grades 2-5, 9-12)
20 15.0%
Special Instructional Assistance (SIA) (Grades K-3)
47 32.2%
Title I (Grades K-12)
This school has a Targeted Assistance program.
Dropout Rate for Grades 6-8
Number
Rate
School System
0
0.0%
1
0.1%
Total 16
Retained Students, by Race/Ethnicity and Sex
Black
White Hispanic
American Multi-
Asian Indian
racial
0
16
0.0% 100.0%
0 0.0%
0 0.0%
0 0.0%
0 0.0%
Male Female
13
3
81.3% 18.8%
Prepared by Georgia Department of Education
Page 1
STATE-REQUIRED TEST DATA
NORM-REFERENCED TESTS Grade 3
Iowa Tests of Basic Skills (ITBS) Each chart reflects data for three years of testing.
Reading Comprehension 50
42 55 54 0
98-99
31 47 53 97-98
27 47 52 96-97
Mathematics
School 50
System
State
0
50 52 61 98-99
42 50 61 97-98
29 48 59 96-97
School System State
Reading Vocabulary 50
33 48 50 0
98-99
38 56 50 97-98
26 37 49 96-97
Language Arts
School 50
System
State
0
51 45 64 98-99
33 43 62 97-98
27 37 59 96-97
School System State
Social Studies 50
37 51 56 0
98-99
32 48 55 97-98
35 44 55 96-97
Science
School 50
System
State
0
39 57 59 98-99
30 50 59 97-98
44 51 58 96-97
School System State
Sources of Information
Composite Score
50
37 51 57 0
98-99
School 50
System
24 43 56 97-98
31 44 55 96-97
State 0
39 50 58 98-99
30 46 57 97-98
1998-99 GEORGIA PUBLIC EDUCATION REPORT CARD Pennville Elementary School - 6274050
Prepared by Georgia Department of Education
30 43 56 96-97
Scores Reported in Percentiles
School System State
Page 2
STATE-REQUIRED TEST DATA
NORM-REFERENCED TESTS Grade 5
Iowa Tests of Basic Skills (ITBS) Each chart reflects data for three years of testing.
Reading Comprehension
Mathematics
50
30 49 53 0
98-99
40 48 53 97-98
41 48 52 96-97
School 50
System
State
0
28 46 59 98-99
29 43 58 97-98
33 46 57 96-97
School System State
Reading Vocabulary 50
25 45 48 0
98-99
28 42 48 97-98
40 45 46 96-97
Language Arts
School 50
System
State
0
28 53 63 98-99
36 46 61 97-98
39 48 58 96-97
School System State
Social Studies 50
21 53 57 0
98-99
35 50 56 97-98
41 50 55 96-97
Science
School 50
System
State
0
31 60 60 98-99
37 53 59 97-98
44 50 59 96-97
School System State
Sources of Information
Composite Score
50
31 51 58 0
98-99
School 50
System
35 47 58 97-98
41 53 57 96-97
State 0
25 51 57 98-99
32 46 56 97-98
40 47 55 96-97
1998-99 GEORGIA PUBLIC EDUCATION REPORT CARD Pennville Elementary School - 6274050
Prepared by Georgia Department of Education
Scores Reported in Percentiles
School System State
Page 3
STATE-REQUIRED TEST DATA
NORM-REFERENCED TESTS Grade 8
Iowa Tests of Basic Skills (ITBS) Each chart reflects data for three years of testing.
Reading Comprehension 50
46 45 49 0
98-99
37 44 48 97-98
34 45 48 96-97
Mathematics
School 50
System
State
0
50 45 56 98-99
35 44 55 97-98
38 43 54 96-97
School System State
Reading Vocabulary 50
58 45 46 0
98-99
33 42 45 97-98
23 47 44 96-97
Language Arts
School 50
System
State
0
55 55 60 98-99
46 55 58 97-98
41 44 56 96-97
School System State
Social Studies 50
48 50 54 0
98-99
32 48 53 97-98
35 47 53 96-97
Science
School 50
System
State
0
54 49 56 98-99
40 46 55 97-98
37 49 53 96-97
School System State
Sources of Information
Composite Score
50
50 49 57 0
98-99
School 50
System
35 46 56 97-98
34 46 55 96-97
State 0
52 48 56 98-99
36 47 54 97-98
1998-99 GEORGIA PUBLIC EDUCATION REPORT CARD Pennville Elementary School - 6274050
Prepared by Georgia Department of Education
34 44 54 96-97
Scores Reported in Percentiles
School System State
Page 4
STATE-REQUIRED TEST DATA
PERFORMANCE ASSESSMENTS
Percent at Developmental Stages:
Stage Stage Stage Stage Stage Stage
1:The Emerging Writer 2:The Developing Writer 3:The Focusing Writer 4:The Experimenting 5:The Engaging Writer 6:The Extending Writer
Grade 5 Writing Assessment
1998-99
1997-98
School System State School System State
0% 6% 29% 41% 24% 0%
0% 2% 27% 45% 23% 2%
0% 1% 16% 41% 29% 12%
0% 0% 34% 41% 24% 0%
1% 2% 26% 48% 20% 3%
0% 3% 19% 41% 27% 10%
1996-97 School System State
0% 0% 14% 48% 33% 5%
0% 5% 26% 47% 19% 3%
0% 3% 21% 37% 26% 12%
Categories of Scaled Scores
Inadequate (less than 162)
Minimal (162-209)
Good
(210-247)
Very Good (greater than 247)
Average Scaled Score: (Range 100-300)
Grade 8 Writing Assessment
1998-99 Percent Scoring
1997-98 Percent Scoring
1996-97 Percent Scoring
School System State School System State School System State
0% 58% 38%
4%
4% 44% 43%
9%
8% 40% 41% 11%
12% 61% 24%
3%
11% 53% 31%
5%
11% 46% 34%
8%
24% 67% 10%
0%
13% 54% 28%
4%
15% 46% 30%
8%
204
209
208 195
201 202 180
197 198
GEORGIA HIGH SCHOOL GRADUATION TESTS (GHSGT)
Percent of Regular Program 11th Graders Passing the Georgia High School Graduation Tests on First Administration
1998-99
1997-98
1996-97
School System State School System State School System State
English Language Arts Mathematics Social Studies Science
All Components listed above
N/A N/A N/A N/A
N/A
94% 84% 83% 74%
69%
96% 88% 80% 72%
68%
N/A N/A N/A N/A
N/A
92% 74% 69% 66%
55%
94% 88% 78% 74%
68%
N/A N/A N/A N/A
N/A
87% 73% 68% 66%
56%
94% 87% 78% 74%
67%
Writing
N/A 97% 93% N/A 94% 92% N/A 92% 93%
No eleventh-grade students are enrolled at Pennville Elementary School.
1998-99 GEORGIA PUBLIC EDUCATION REPORT CARD Pennville Elementary School - 6274050
Prepared by Georgia Department of Education
Page 5
GRADUATE DATA
1999 Graduates by Credentials, Race/Ethnicity and Sex
Diplomas with Both College Prep. & Voc. Endorsements
Diplomas with College Prep. Endorsements
Diplomas with Vocational Endorsements
General High School Diplomas
Special Education Diplomas
Total All Diplomas
Total N/A
Black N/A
White Hispanic N/A N/A
American MultiAsian Indian racial
N/A N/A N/A
N/A
N/A
N/A N/A N/A N/A N/A
N/A
N/A
N/A N/A N/A N/A N/A
N/A
N/A
N/A N/A N/A N/A N/A
N/A
N/A
N/A N/A N/A N/A N/A
N/A
Male Female N/A N/A N/A N/A N/A N/A N/A N/A N/A N/A
Certificates of Performance
Total Graduates
N/A
N/A
N/A N/A N/A N/A N/A
N/A N/A
N/A
HOPE Scholarships
School System
Number of 1999 Graduates Number Eligible Percent Eligible
N/A N/A N/A
121 58
47.9%
State
65,548 40,292 61.5%
High School Completion Rate
Percent of 1995Grade 9 Enrollment in Graduating Class of1999 School System State
Completion Rate '95-'99 N / A 52.6% 68.9%
1998-99 GEORGIA PUBLIC EDUCATION REPORT CARD
Pennville Elementary School - 6274050
Prepared by Georgia Department of Education
Page 6
COLLEGE ADMISSIONS / CREDIT TEST DATA
Scholastic Assessment Test (SAT)
Based on students' highest verbal and highest math scores
No. Taking
Average Score
Tests Verbal Math Total
Based on students' last test administration
Average Score Verbal Math Total
School
N/A
College Prep. Endorsement
Other Diplomas
System
53
College Prep. Endorsement
Other Diplomas
Georgia
41,958
N/A N/A N/A
469 482 382
492
N/A N/A N/A
452 472 362
488
N/A N/A N/A
921 954 744
980
N/A N/A N/A
460 N/A N/A
483
N/A N/A N/A
440 N/A N/A
479
N/A N/A N/A
900 N/A N/A
962
Nation
952,913 N/A N/A N/A
502 508 1010
American College Testing (ACT)
Advanced Placement Exams (AP)
Number taking tests: English Mathematics Reading Science Reasoning CompositeScore
N/A
School System
N/A 15.2
N/A 18.1
N/A N/A
15.5 17.8
N/A 16.7
State 19.1 19.9 20.2 19.9 19.9
No. of Students Taking Tests
No. of Tests Taken No. of Test Scores
3 or Higher Percent of Test
Scores 3 or Higher
School N/A N/A N/A
N/A
System State 0 15,225
N/A 23,969 N/A 13,024
N/A 54.3%
POST-SECONDARY DATA
Graduates Entering Georgia Public Colleges
Graduates Entering Georgia Public Colleges and Requiring Learning Support (LS)
1998 Graduates Entering in 1998-99
1997 Graduates Entering in 1997-98
Percent of Graduating Number Class
School N / A
N/A
System 2 3
18.0%
School N / A
N/A
System 3 1
24.4%
Number Requiring
LS N/A 11
N/A 8
Percent of those attending Georgia
Public Colleges
N/A
47.8%
N/A
25.8%
In previous years, the Report Card presented College Prep Curriculum information provided by the Board of Regents on students requiring Learning Support. Due to inconsistencies in the data provided by the Board of Regents in defining College Prep Completers versus Local Board of Education data defining College Prep Endorsements, the Department of Education Report Card will not provide this information until discrepancies can be reconciled.
Graduates Entering Georgia Public Technical and Adult Schools
1998 Graduates School System
Entering Number N/A 13
1998-99 Percent
N/A 10.2%
Entering Number N/A N/A
1997-98 Percent
N/A N/A
1997 Graduates School System
N/A 1
N/A 0.8%
N/A 7
N/A 5.5%
1998-99 GEORGIA PUBLIC EDUCATION REPORT CARD Pennville Elementary School - 6274050
Prepared by Georgia Department of Education
Page 7
CERTIFIED PERSONNEL DATA
Positions Number Average Contract Days
Administrators
1.00 210.00
Support Personnel
2.60 190.00
PK-12 Teachers
23.40 190.00
Personnel Sex
Certificate
Years Experience
Full-time Part-time
Male Female
4 Yr Bachelor's 5 Yr Master's 6 Yr Specialist's 7 Yr Doctoral Other*
<1 1-10 11-20 21-30 >30
Average
1 0
1 0
0 0 1 0 0
0 0 0 1 0
27.00
2 1
0 3
1 2 0 0 0
0 1 2 0 0
10.33
23 2
4 21
9 15
1 0 0
1 9 8 6 1
14.40
*Includes One- and Two-Year Vocational Certificates.
ACCREDITATION DATA
Accredited by Southern Association of Colleges and Schools (SACS): Elementary/Middle Commission.
AWARDS / RECOGNITION DATA
Schools in Georgia may receive recognition in the following programs: Charter School Pay for Performance Program Georgia School of Excellence National Blue Ribbon School Pennville Elementary School did not receive recognition in any of these programs during the 1998-99 school year.
1998-99 GEORGIA PUBLIC EDUCATION REPORT CARD Pennville Elementary School - 6274050
Prepared by Georgia Department of Education
Page 8
1998-99 GEORGIA PUBLIC EDUCATION REPORT CARD
CHATTOOGA COUNTY SCHOOLS
Summerville Elementary School - 6275050
Grade Range PK-3
The Georgia Public Education Report Card is designed to assist systems and schools in educational improvement. This report card contains a variety of data elements. An explanation of the terms is provided as a companion to the report card data. Please refer to the definitions for the most effective use of the reported data.
STUDENT DATA
Total
K-3
506
PK
68
Enrollment, by Race/Ethnicity and Sex
Black
White Hispanic
American Asian Indian
Multiracial
106 20.9%
387 76.5%
5 1.0%
0 0.0%
1 0.2%
7 1.4%
15 22.1%
46 67.6%
0 0.0%
0 0.0%
0 0.0%
7 10.3%
Male Female
277 54.7%
229 45.3%
40 58.8%
28 41.2%
Enrollment in Selected Programs
Program
Program % of Student Enrollment Population
Gifted (Grades K-12)
31
6.1%
Alternative Programs (Grades 6-12)
N/A
N/A
Students Eligible to Receive Free/Reduced Lunches
Number
Percent
School System
307 1,495
53.5% 51.8%
Dropout Rate *
Number
Rate
School System
N/A N/A
N/A N/A
* Dropout rates are not applicable for grades PK-5.
Enrollment in Compensatory Programs
Program
Program % of Student Enrollment Population
Special Education (Grades K-12)
78 15.4%
(PK)
25
N/A
English to Speakers of Other Languages (ESOL) (Grades K-12)
0
0.0%
Remedial Education (Grades 2-5, 9-12)
0
0.0%
Special Instructional Assistance (SIA) (Grades K-3)
104 20.6%
Title I (Grades K-12)
This school has a schoolwide program.
Total 31
Retained Students, by Race/Ethnicity and Sex
Black
White Hispanic
American MultiAsian Indian racial
7 22.6%
23 74.2%
1 3.2%
0 0.0%
0 0.0%
0 0.0%
Male Female
11
20
35.5% 64.5%
Prepared by Georgia Department of Education
Page 1
STATE-REQUIRED TEST DATA
NORM-REFERENCED TESTS Grade 3
Iowa Tests of Basic Skills (ITBS) Each chart reflects data for three years of testing.
Reading Comprehension 50
60 55 54 0
98-99
50 47 53 97-98
52 47 52 96-97
Mathematics
School 50
System
State
0
52 52 61 98-99
50 50 61 97-98
56 48 59 96-97
School System State
Reading Vocabulary 50
47 48 50 0
98-99
56 56 50 97-98
40 37 49 96-97
Language Arts
School 50
System
State
0
48 45 64 98-99
40 43 62 97-98
41 37 59 96-97
School System State
Social Studies 50
50 51 56 0
98-99
39 48 55 97-98
46 44 55 96-97
Science
School 50
System
State
0
57 57 59 98-99
46 50 59 97-98
52 51 58 96-97
School System State
Sources of Information
Composite Score
50
52 51 57 0
98-99
School 50
System
39 43 56 97-98
47 44 55 96-97
State 0
51 50 58 98-99
43 46 57 97-98
1998-99 GEORGIA PUBLIC EDUCATION REPORT CARD Summerville Elementary School - 6275050
Prepared by Georgia Department of Education
46 43 56 96-97
Scores Reported in Percentiles
School System State
Page 2
STATE-REQUIRED TEST DATA
NORM-REFERENCED TESTS
Grade 5 Iowa Tests of Basic Skills (ITBS) Each chart reflects data for three years of testing. No fifth-grade students are enrolled at Summerville Elementary School.
Reading Comprehension
Mathematics
50
N/A 49 53 0
98-99
N/A 48 53 97-98
N/A 48 52 96-97
School 50
System
State
N/A 46 59 0
98-99
N/A 43 58 97-98
N/A 46 57 96-97
School System State
Reading Vocabulary 50
N/A 45 48 0
98-99
N/A 42 48 97-98
N/A 45 46 96-97
Language Arts
School 50
System
State
N/A 53 63 0
98-99
N/A 46 61 97-98
N/A 48 58 96-97
School System State
Social Studies 50
N/A 53 57 0
98-99
N/A 50 56 97-98
N/A 50 55 96-97
Science
School 50
System
State
N/A 60 60 0
98-99
N/A 53 59 97-98
N/A 50 59 96-97
School System State
Sources of Information
Composite Score
School
50
50
System
N/A 51 58 0
98-99
N/A 47 58 N/A 53 57
97-98
96-97
State
N/A 51 57 0
98-99
N/A 46 56 97-98
N/A 47 55 96-97
1998-99 GEORGIA PUBLIC EDUCATION REPORT CARD Summerville Elementary School - 6275050
Prepared by Georgia Department of Education
Scores Reported in Percentiles
School System State
Page 3
STATE-REQUIRED TEST DATA
PERFORMANCE ASSESSMENTS
Grade 5 Writing Assessment
Percent at Developmental Stages:
1998-99 School System State
1997-98 School System State
1996-97 School System State
Stage Stage Stage Stage Stage Stage
1:The Emerging Writer 2:The Developing Writer 3:The Focusing Writer 4:The Experimenting 5:The Engaging Writer 6:The Extending Writer
N/A N/A N/A N/A N/A N/A
0% 2% 27% 45% 23% 2%
0% 1% 16% 41% 29% 12%
N/A N/A N/A N/A N/A N/A
1% 2% 26% 48% 20% 3%
0% 3% 19% 41% 27% 10%
N/A N/A N/A N/A N/A N/A
No fifth-grade students are enrolled at Summerville Elementary School.
0% 5% 26% 47% 19% 3%
0% 3% 21% 37% 26% 12%
AWARDS / RECOGNITION DATA
Schools in Georgia may receive recognition in the following programs: Charter School Pay for Performance Program Georgia School of Excellence National Blue Ribbon School Summerville Elementary School did not receive recognition in any of these programs during the 1998-99 school year.
1998-99 GEORGIA PUBLIC EDUCATION REPORT CARD Summerville Elementary School - 6275050
Prepared by Georgia Department of Education
Page 4
CERTIFIED PERSONNEL DATA
Positions Number Average Contract Days
Personnel Sex
Certificate
Years Experience
Full-time Part-time
Male Female
4 Yr Bachelor's 5 Yr Master's 6 Yr Specialist's 7 Yr Doctoral Other*
<1 1-10 11-20 21-30 >30
Average
Administrators
2.00 205.00
2 0
1 1
0 1 1 0 0 0 0 0 2 0 26.00
Support Personnel
3.63 190.00
3 1
0 4
1 2 1 0 0 0 2 1 1 0 12.00
PK-12 Teachers
41.50 190.00
41 1
1 41
16 24
2 0 0 0 18 18 6 0 12.29
*Includes One- and Two-Year Vocational Certificates.
ACCREDITATION DATA
Accredited by Southern Association of Colleges and Schools (SACS):
Elementary/Middle Commission.
1998-99 GEORGIA PUBLIC EDUCATION REPORT CARD Summerville Elementary School - 6275050
Prepared by Georgia Department of Education
Page 5
1998-99 GEORGIA PUBLIC EDUCATION REPORT CARD
CHATTOOGA COUNTY SCHOOLS
Summerville Middle School - 6272052
Grade Range 6-8
The Georgia Public Education Report Card is designed to assist systems and schools in educational improvement. This report card contains a variety of data elements. An explanation of the terms is provided as a companion to the report card data. Please refer to the definitions for the most effective use of the reported data.
STUDENT DATA
Total 357
6-8 Enrollment, by Race/Ethnicity and Sex
Black
White Hispanic
American Multi-
Asian Indian
racial
82 23.0%
265 74.2%
2 0.6%
1 0.3%
0 0.0%
7 2.0%
Male 171
47.9%
Female 186
52.1%
Enrollment in Selected Programs
Program
Gifted (Grades K-12)
Program % of Student Enrollment Population
44
12.3%
Alternative Programs (Grades 6-12)
1
< 1%
Students Eligible to Receive Free/Reduced Lunches
Number
Percent
School System
231 1,495
64.7% 51.8%
Enrollment in Compensatory Programs
Program
Program % of Student Enrollment Population
Special Education (Grades K-12) (PK)
54 15.1%
0
N/A
English to Speakers of Other Languages (ESOL) (Grades K-12)
0
0.0%
Title I (Grades K-12)
This school has no Title I program.
Dropout Rate for Grades 6-8
Number
Rate
School System
1
0.2%
1
0.1%
Total 1
Retained Students, by Race/Ethnicity and Sex
Black
White Hispanic
American MultiAsian Indian racial
1 100.0%
0 0.0%
0 0.0%
0 0.0%
0 0.0%
0 0.0%
Male Female
1 100.0%
0 0.0%
Prepared by Georgia Department of Education
Page 1
STATE-REQUIRED TEST DATA
NORM-REFERENCED TESTS Grade 8
Iowa Tests of Basic Skills (ITBS) Each chart reflects data for three years of testing.
Reading Comprehension 50
43 45 49 0
98-99
45 44 48 97-98
45 45 48 96-97
Mathematics
School 50
System
State
0
45 45 56 98-99
48 44 55 97-98
42 43 54 96-97
School System State
Reading Vocabulary 50
47 45 46 0
98-99
37 42 45 97-98
39 47 44 96-97
Language Arts
School 50
System
State
0
55 55 60 98-99
58 55 58 97-98
40 44 56 96-97
School System State
Social Studies 50
51 50 54 0
98-99
49 48 53 97-98
48 47 53 96-97
Science
School 50
System
State
0
49 49 56 98-99
44 46 55 97-98
48 49 53 96-97
School System State
Sources of Information
Composite Score
50
50 49 57 0
98-99
School 50
System
49 46 56 97-98
47 46 55 96-97
State 0
48 48 56 98-99
48 47 54 97-98
1998-99 GEORGIA PUBLIC EDUCATION REPORT CARD Summerville Middle School - 6272052
Prepared by Georgia Department of Education
43 44 54 96-97
Scores Reported in Percentiles
School System State
Page 2
STATE-REQUIRED TEST DATA
Categories of Scaled Scores
Inadequate (less than 162)
Minimal (162-209)
Good
(210-247)
Very Good (greater than 247)
Average Scaled Score: (Range 100-300)
PERFORMANCE ASSESSMENTS
Grade 8 Writing Assessment
1998-99 Percent Scoring
1997-98 Percent Scoring
1996-97 Percent Scoring
School System State School System State School System State
6% 38% 46% 11%
4% 44% 43%
9%
8% 40% 41% 11%
9% 47% 38%
6%
11% 53% 31%
5%
11% 46% 34%
8%
9% 50% 36%
5%
13% 54% 28%
4%
15% 46% 30%
8%
211
209
208 205
201 202 202
197 198
AWARDS / RECOGNITION DATA
Schools in Georgia may receive recognition in the following programs: Charter School Pay for Performance Program Georgia School of Excellence National Blue Ribbon School Summerville Middle School did not receive recognition in any of these programs during the 1998-99 school year.
1998-99 GEORGIA PUBLIC EDUCATION REPORT CARD Summerville Middle School - 6272052
Prepared by Georgia Department of Education
Page 3
CERTIFIED PERSONNEL DATA
Positions Number Average Contract Days
Personnel Sex
Certificate
Years Experience
Full-time Part-time
Male Female
4 Yr Bachelor's 5 Yr Master's 6 Yr Specialist's 7 Yr Doctoral Other*
<1 1-10 11-20 21-30 >30
Average
Administrators
2.00 210.00
2 0
2 0
0 0 2 0 0 0 0 2 0 0 16.50
Support Personnel
2.00 190.00
2 0
0 2
0 1 1 0 0 0 0 1 1 0 20.50
PK-12 Teachers
28.60 190.63
28 1
9 20
17 8 4 0 0 2
15 9 3 0
11.03
*Includes One- and Two-Year Vocational Certificates.
ACCREDITATION DATA
Accredited by Southern Association of Colleges and Schools (SACS):
Elementary/Middle Commission.
1998-99 GEORGIA PUBLIC EDUCATION REPORT CARD Summerville Middle School - 6272052
Prepared by Georgia Department of Education
Page 4
1998-99 GEORGIA PUBLIC EDUCATION REPORT CARD CHEROKEE COUNTY SCHOOLS - 628
The Georgia Public Education Report Card is designed to assist systems and schools in educational improvement. This report card contains a variety of data elements. An explanation of the terms is provided as a companion to the report card data. Please refer to the definitions for the most effective use of the reported data.
Total
K-12
24,165
PK
176
STUDENT DATA
Enrollment, by Race/Ethnicity and Sex
Black
White Hispanic
American Multi-
Asian Indian
racial
674 2.8%
22,524 93.2%
688 2.8%
174 0.7%
50 0.2%
55 0.2%
16 9.1%
136 77.3%
22 12.5%
0 0.0%
0 0.0%
2 1.1%
Male
12,528 51.8%
107 60.8%
Female
11,637 48.2%
69 39.2%
Enrollment in Selected Programs
Program
Program % of Student Enrollment Population
Gifted (Grades K-12)
1,515
6.3%
Non-Vocational Labs (Grades 9-12)
5,498
88.5%
Vocational Labs (Grades 9-12)
3,355
54.0%
Alternative Programs (Grades 6-12)
49
< 1%
Students Eligible to Receive Free/Reduced Lunches
Number
Percent
3,428
14.1%
Dropout Rate
Number
Percent
6-12
279
2.1%
9-12
275
3.9%
Enrollment in Compensatory Programs
Program
Program % of Student Enrollment Population
Special Education (Grades K-12)
PK
2,759 170
English to Speakers of
Other Languages (ESOL)
217
(Grades K-12)
Remedial Education (Grades 2-5, 9-12)
864
Special Instructional
Assistance (SIA)
600
(Grades K-3)
Title I (Grades K-12) Number of schools with: Schoolwide program Targeted Assistance program No Title I program
11.4% N/A
0.9%
6.0%
7.2%
0 10 20
Total 307
Retained Students, by Race/Ethnicity and Sex
Black
White Hispanic
American MultiAsian Indian racial
8 2.6%
268 87.3%
29 9.4%
0 0.0%
1 0.3%
1 0.3%
Male Female 189 118
61.6% 38.4%
Prepared by Georgia Department of Education
Page 1
STATE-REQUIRED TEST DATA
NORM-REFERENCED TESTS
Grade 3 Iowa Tests of Basic Skills (ITBS) Each chart reflects data for three years of testing.
Reading Comprehension
Mathematics
50
65 54 63 53 61 52 0
98-99 97-98 96-97
System State
50
75 61 71 61 68 59 0
98-99 97-98 96-97
System State
Reading Vocabulary
50
62 50 58 50 59 49 0
98-99 97-98 96-97
System State
Social Studies
50
67 56 64 55 64 55 0
98-99 97-98 96-97
System State
Language Arts
50
74 64 66 62 61 59 0
98-99 97-98 96-97
System State
Science
50
74 59 70 59 68 58 0
98-99 97-98 96-97
System State
Sources of Information
Composite Score
50
70 57 0
98-99
System
50
66 56 65 55 97-98 96-97
State
71 58 67 57 0
98-99 97-98
1998-99 GEORGIA PUBLIC EDUCATION REPORT CARD Cherokee County Schools
Prepared by Georgia Department of Education
System State Scores Reported 64 56 in Percentiles 96-97
Page 2
STATE-REQUIRED TEST DATA
NORM-REFERENCED TESTS
Grade 5 Iowa Tests of Basic Skills (ITBS) Each chart reflects data for three years of testing.
Reading Comprehension
Mathematics
50
61 53 60 53 61 52 0
98-99 97-98 96-97
System State
50
68 59 67 58 65 57 0
98-99 97-98 96-97
System State
Reading Vocabulary
50
59 48 58 48 59 46 0
98-99 97-98 96-97
System State
Social Studies
50
67 57 66 56 64 55 0
98-99 97-98 96-97
System State
Language Arts
50
70 63 67 61 66 58 0
98-99 97-98 96-97
System State
Science
50
71 60 70 59 70 59 0
98-99 97-98 96-97
System State
Sources of Information
Composite Score
50
67 58 0
98-99
System
50
66 58 67 57 97-98 96-97
State
67 57 66 56 0
98-99 97-98
1998-99 GEORGIA PUBLIC EDUCATION REPORT CARD Cherokee County Schools
Prepared by Georgia Department of Education
System State Scores Reported 66 55 in Percentiles 96-97
Page 3
STATE-REQUIRED TEST DATA
NORM-REFERENCED TESTS Grade 8
Iowa Tests of Basic Skills (ITBS) Each chart reflects data for three years of testing.
Reading Comprehension
Mathematics
50
60 49 60 48 60 48 0
98-99 97-98 96-97
System State
50
63 56 61 55 59 54 0
98-99 97-98 96-97
System State
Reading Vocabulary
50
58 46 57 45 61 44 0
98-99 97-98 96-97
System State
Language Arts
50
69 60 65 58 66 56 0
98-99 97-98 96-97
System State
Social Studies
50
60 54 61 53 62 53 0
98-99 97-98 96-97
System State
Science
50
63 56 62 55 61 53 0
98-99 97-98 96-97
System State
Sources of Information
Composite Score
50
65 57 0
98-99
System
50
65 56 64 55 97-98 96-97
State
64 56 63 54 0
98-99 97-98
1998-99 GEORGIA PUBLIC EDUCATION REPORT CARD Cherokee County Schools
Prepared by Georgia Department of Education
System State Scores Reported 63 54 in Percentiles 96-97
Page 4
STATE-REQUIRED TEST DATA
PERFORMANCE ASSESSMENTS
Grade 5 Writing Assessment
1998-99
1997-98
1996-97
Percent at Developmental Stages:
Comparison
Comparison
Comparison
System Group State System Group State System Group State
Stage Stage Stage Stage Stage Stage
1: The Emerging Writer 2: The Developing Writer 3: The Focusing Writer 4: The Experimenting Writer 5: The Engaging Writer 6: The Extending Writer
0% 1% 12% 36% 34% 17%
0% 0% 8% 34% 36% 21%
0% 1% 16% 41% 29% 12%
0% 1% 11% 45% 33% 9%
0% 1% 11% 37% 35% 16%
0% 3% 19% 41% 27% 10%
0% 2% 14% 37% 34% 14%
0% 2% 15% 34% 31% 18%
0% 3% 21% 37% 26% 12%
Grade 8 Writing Assessment
1998-99 Percent Scoring 1997-98 Percent Scoring 1996-97 Percent Scoring
Categories of Scaled Scores
Comparison
Comparison
Comparison
System Group State System Group State System Group State
Inadequate (less than 162)
Minimal (162-209)
Good
(210-247)
Very Good (greater than 247)
2% 33% 51% 13%
2% 28% 51% 19%
8% 40% 41% 11%
4% 44% 44%
8%
4% 35% 46% 14%
11% 46% 34%
8%
8% 47% 36%
9%
7% 39% 39% 14%
15% 46% 30%
8%
Average Scaled Score: (Range 100-300)
217
221 208
209
216 202
205
211 198
GEORGIA HIGH SCHOOL GRADUATION TESTS (GHSGT)
Percent of Regular Program 11th Graders Passing the Georgia High School Graduation Tests on First Administration
1998-99
1997-98
1996-97
Comparison
Comparison
Comparison
System Group State System Group State System Group State
English Language Arts Mathematics Social Studies Science
98% 95% 87% 84%
98% 95% 89% 84%
96% 88% 80% 72%
98% 95% 87% 84%
98% 96% 88% 87%
94% 88% 78% 74%
99% 96% 87% 86%
97% 93% 87% 85%
94% 87% 78% 74%
All Components listed above 8 0 %
81% 68% 80%
83% 68% 81%
80% 67%
Writing
96%
97% 93% 94%
96% 92% 96%
96% 93%
1998-99 GEORGIA PUBLIC EDUCATION REPORT CARD
Cherokee County Schools
Prepared by Georgia Department of Education
Page 5
GRADUATE DATA
1999 Graduates by Credentials, Race/Ethnicity and Sex
Diplomas with Both College Prep. & Voc. Endorsements
Diplomas with College Prep. Endorsements Diplomas with Vocational Endorsements General High School Diplomas Special Education Diplomas
Total All Diplomas
Certificates of Performance
Total Graduates
Total 148 639 349 21 13
1,170 0
Black
American MultiWhite Hispanic Asian Indian racial
7 4.7%
18 2.8%
13 3.7%
0 0.0%
1 7.7%
39 3.3%
140 94.6%
609 95.3%
329 94.3%
21 100.0%
12 92.3%
1,111 95.0%
0 0.0%
6 0.9%
5 1.4%
0 0.0%
0 0.0%
11 0.9%
1 0.7%
5 0.8%
2 0.6%
0 0.0%
0 0.0%
8 0.7%
0 0.0%
1 0.2%
0 0.0%
0 0.0%
0 0.0%
1 0.1%
0 0.0%
0 0.0%
0 0.0%
0 0.0%
0 0.0%
0 0.0%
0
0
0
0
0
0
Male Female
67 45.3%
269 42.1%
213 61.0%
13 61.9%
9 69.2%
81 54.7%
370 57.9%
136 39.0%
8 38.1%
4 30.8%
571 599 48.8% 51.2%
0
0
1,170
39 1,111
11
8
1
0
571 599
3.3% 95.0% 0.9% 0.7% 0.1% 0.0% 48.8% 51.2%
HOPE Scholarships
System State
Number of 1999 Graduates 1 , 1 7 0
Number Eligible
853
Percent Eligible
72.9%
65,548 40,292 61.5%
High School Completion Rate Percent of 1995Grade 9 Enrollment
in Graduating Class of1999
System
State
Completion Rate '95-'99 80.0% 68.9%
COLLEGE ADMISSIONS / CREDIT TEST DATA
Scholastic Assessment Test (SAT)
No. Taking
Average Score
Tests
Verbal Math Total
Based on students' highest verbal and highest math scores
System College Prep. Endorsement Other Diplomas
515 505 1020 521 511 1032 429 407 836
Georgia
492 488 980
Based on students' last test administration
System Georgia
762 41,958
507 498 1005 483 479 962
Nation
952,913 502 508 1010
American College Testing (ACT)
System State Nation
English
19.5
19.1 20.4
Mathematics
20.2
19.9 20.7
Reading
20.6
20.2 21.3
Science Reasoning 20.4
19.9 21.0
CompositeScore 20.3
19.9 21.9
Advanced Placement Exams (AP)
No. of Students Taking Tests
No. of Tests Taken No. of Test Scores
3 or Higher Percent of Test
Scores 3 or Higher
System State 255 15,225 433 23,969 283 13,024
65.4% 54.3%
1998-99 GEORGIA PUBLIC EDUCATION REPORT CARD Cherokee County Schools
Prepared by Georgia Department of Education
Page 6
POSTSECONDARY DATA
Graduates Entering Georgia Public Colleges and Universities
Graduates Entering Georgia Public Colleges and Universities and
Requiring Learning Support (LS)
1998 Graduates Entering 1998-99
1997 Graduates Entering 1997-98
Percent of Graduating Number Class
373
37.9%
358
39.0%
Number Requiring
LS
33
68
Percent of those attending Georgia
Public Colleges
8.8%
19.0%
In previous years, the Report Card presented College Prep Curriculum information provided by the Board of Regents on students requiring Learning Support. Due to inconsistencies in the data provided by the Board of Regents in defining College Prep Completers versus Local Board of Education data defining College Prep Endorsements, the Department of Education Report Card will not provide this information until discrepancies can be reconciled.
Graduates Entering Georgia Public Technical and Adult Schools
Entering 1998-99 Entering 1997-98
Number Percent
Number Percent
1998 Graduates 1997 Graduates
36
3.7%
3
0.3%
N/A 93
N/A 10.1%
ACCREDITATION / RECOGNITION DATA
Southern Association of Colleges and Schools (SACS) Accrediting Commission
Secondary/Middle Commission Elementary/Middle Commission Both Elementary/Secondary Commissions Joint Commission Candidate for Accreditation
Accreditation by Georgia Accrediting Commission (GAC)
Accredited by GAC Accredited with Quality by GAC
Number of Schools
4 24
0 0 0
Number of Schools
13 15
Awards / Recognition
State Recognized Program
Number of Schools
Charter School
0
Pay for Performance Recipient
0
Georgia School of Excellence
0
National Blue Ribbon School
0
COMMUNITY DATA
Number of Children Eligible for Migrant Education Number of Families-At-Risk * Number of Food Stamp Participants * Number of Families Receiving TANF * ** Per Capita Income * Unemployment Rate * 1990 Population * Projected 2000 Population * Projected 2010 Population *
* Data Available at County Level Only ** Known as AFDC before January 1997
57 258 1,702 150 $24,149 2.3% 90,204 130,650 149,690
1998-99 GEORGIA PUBLIC EDUCATION REPORT CARD Cherokee County Schools
Prepared by Georgia Department of Education
Page 7
FISCAL DATA
Millage Rate
18.79
* Fall 1998 Property Tax Digest is used to calculate the 98-99 Value of One Mill
FTE Count
FTE Count used for Allotment Calculation 23,974.0 Fall '98 FTE Count 24,165
Value of One Mill
$3,006,088 $125.38 per Allotment FTE
Sources: Local State-QBE State-
Lottery State-
Other Federal Other
Total
PerGeneral Fund cent Per FTE
$57,634,465 41.8% $2,404 $75,184,035 54.6% $3,136
K-12 Revenues
Lottery K-12
and
Title
All Other
Programs
K-12
$0
$21,284
Bonded Debt
$21,324,289
$0
$0
$0
Capital Projects $1,753,041
$0
$20,000 0.0%
$1
$0 $491,256
$0
$0
$2,528,632 1.8% $105
$144,004 0.1%
$6
$2,241,097 1.6% $93
$137,752,234 100% $5,745
$64,967 $2,717,171
$0 $2,782,138
$0
$0 $8,818,450
$176,865
$0
$0
$0
$58,271
$0
$689,406 $21,382,561 $10,571,492
School Nutrition $4,194,998
$0
$0
$498,750 $2,178,880
$4,336 $6,876,964
Grand Total
Total
Per-
Amount cent
$84,928,079 47.2%
$75,184,035 41.8%
$511,256 0.3%
$11,910,800 6.6% $5,216,922 2.9% $2,303,705 1.3%
$180,054,798 100%
Instruction
Media
Instruction Support
Pupil Services General Admin. School Admin. Trans-
portation Maint. & Ops. Capital Projects School Food Debt Service
K-12 Expenditures
$85,500,354 65.1% $3,566 $2,315,075 $690,857
$0
$29,709
$0
$2,908,363 2.2% $121
$49,904
$0
$0
$0
$0
$3,591,243 2.7% $150 $173,691
$0
$0
$0
$0
$5,995,094 4.6% $250 $392,985
$0
$0
$0
$0
$2,065,966 1.6% $86
$33,844
$0
$0
$0
$0
$10,174,500 7.7% $424
$199
$0
$0
$0
$0
$7,053,508 5.4% $294
$76,914
$0
$0
$0
$0
$9,371,006 7.1% $391
$0
$0
$0
$0
$0
$622,398 0.5% $26
$0
$0
$0 $19,527,477
$0
$3,086,915 2.4% $129
$0
$9,953
$0
$0 $6,968,218
$957,188 0.7% $40
$0
$0 $16,613,500
$0
$0
$88,535,996 49.7% $2,958,267 1.7% $3,764,934 2.1% $6,388,079 3.6% $2,099,810 1.2%
$10,174,700 5.7% $7,130,423 4.0% $9,371,006 5.3%
$20,149,876 11.3% $10,065,087 5.6% $17,570,688 9.9%
Total
$131,326,538 100% $5,477 $3,042,616 $700,811 $16,613,500 $19,557,187 $6,968,218 $178,208,872 100%
Salaries and Benefits as Percentages of Revenues and of Expenditures
Teachers and Paraprofessionals
Salaries $64,074,375
Benefits $18,518,893
Percentage of Revenues Percentage of Expenditures
Total of
Total of
General Fund
General Fund
Title Programs
Title Programs
Lottery K-12
Lottery K-12
Total Salaries
and
Total
and
Total
and Benefits All Other K-12 K - 12 All Other K-12 K - 12
$82,593,268
58.5%
45.9%
61.1%
46.3%
School Administration
$5,204,387 $2,045,717
$7,250,104
5.1%
4.0%
5.4%
4.1%
General Administration
$585,203
$271,491
$856,694
0.6%
0.5%
0.6%
0.5%
1998-99 GEORGIA PUBLIC EDUCATION REPORT CARD
Cherokee County Schools - 628
Prepared by Georgia Department of Education
Page 8
CERTIFIED PERSONNEL DATA
Number
Average Annual Salary Positions Average Contract Days
Average Daily Salary
Full-time Personnel Part-time
Sex Male Female
4 Yr Bachelor's Certificate 5 Yr Master's
Level 6 Yr Specialist's 7 Yr Doctoral Other*
Black
White Race/ Hispanic Ethnicity Asian
American Indian
Multiracial
Years Experience
<1 1-10 11-20 21-30 >30
Average
Administrators
89.50
$67,565.97 208.77
$323.64
89 1
46 44
0 24 55 11
0
1 89
0 0 0 0
1 7 31 47 4
21.18
Support Personnel PK-12 Teachers
149.83
1,461.55
$48,082.18 191.48
$251.11
$40,676.43 190.05
$214.03
144
1,458
10
7
19
233
135
1,232
16
792
93
576
40
85
5
5
0
7
1
17
152
1,442
1
4
0
0
0
2
0
0
9
103
35
624
72
516
35
205
3
17
14.81
11.63
*Includes One- and Two-Year Vocational Certificates.
Certified Staff Position Ratios
Teacher/Administrator Ratio 16:1
Teacher/Support Person Ratio 10:1
Teacher/Staff Ratio 6:1
Student Enrollment/All Teachers 17:1
Certified Personnel by Category
85.7% 100%
5.3%
9.0%
80% 60%
40%
20%
0%
Teachers
Administrators
Support Personnel
1998-99 GEORGIA PUBLIC EDUCATION REPORT CARD
Cherokee County Schools - 628
Prepared by Georgia Department of Education
Page 9
1998-99 GEORGIA PUBLIC EDUCATION REPORT CARD
CHEROKEE COUNTY SCHOOLS
Arnold Mill Elementary School - 6280397
Grade Range PK-6
The Georgia Public Education Report Card is designed to assist systems and schools in educational improvement. This report card contains a variety of data elements. An explanation of the terms is provided as a companion to the report card data. Please refer to the definitions for the most effective use of the reported data.
STUDENT DATA
Total
K-6
936
PK
7
Enrollment, by Race/Ethnicity and Sex
Black
White Hispanic
American Asian Indian
Multiracial
10 1.1%
884 94.4%
19 2.0%
6 0.6%
8 0.9%
9 1.0%
0
7
0.0% 100.0%
0 0.0%
0 0.0%
0 0.0%
0 0.0%
Male Female
493 52.7%
443 47.3%
5 71.4%
2 28.6%
Enrollment in Selected Programs
Program
Program % of Student Enrollment Population
Gifted (Grades K-12)
36
3.8%
Alternative Programs (Grades 6-12)
0
0.0%
Students Eligible to Receive Free/Reduced Lunches
Number
Percent
School System
123 3,428
13.0% 14.1%
Dropout Rate for Grade 6
Number
Rate
School System
0
0.0%
1
0.0%
Enrollment in Compensatory Programs
Program
Program % of Student Enrollment Population
Special Education (Grades K-12)
101 10.8%
(PK)
6
N/A
English to Speakers of Other Languages (ESOL) (Grades K-12)
7
< 1%
Remedial Education (Grades 2-5, 9-12)
34
6.1%
Special Instructional Assistance (SIA) (Grades K-3)
0
0.0%
Title I (Grades K-12)
This school has no Title I program.
Total 14
Retained Students, by Race/Ethnicity and Sex
Black
White Hispanic
American MultiAsian Indian racial
1 7.1%
11 78.6%
1 7.1%
0 0.0%
1 7.1%
0 0.0%
Male Female
8
6
57.1% 42.9%
Prepared by Georgia Department of Education
Page 1
STATE-REQUIRED TEST DATA
NORM-REFERENCED TESTS Grade 3
Iowa Tests of Basic Skills (ITBS) Each chart reflects data for three years of testing.
Reading Comprehension 50
71 65 54 0
98-99
67 63 53 97-98
66 61 52 96-97
Mathematics
School 50
System
State
0
81 75 61 98-99
76 71 61 97-98
75 68 59 96-97
School System State
Reading Vocabulary 50
63 62 50 0
98-99
63 58 50 97-98
65 59 49 96-97
Language Arts
School 50
System
State
0
79 74 64 98-99
70 66 62 97-98
70 61 59 96-97
School System State
Social Studies 50
76 67 56 0
98-99
69 64 55 97-98
70 64 55 96-97
Science
School 50
System
State
0
84 74 59 98-99
75 70 59 97-98
77 68 58 96-97
School System State
Sources of Information
Composite Score
50
76 70 57 0
98-99
School 50
System
69 66 56 97-98
72 65 55 96-97
State 0
79 71 58 98-99
72 67 57 97-98
1998-99 GEORGIA PUBLIC EDUCATION REPORT CARD Arnold Mill Elementary School - 6280397
Prepared by Georgia Department of Education
72 64 56 96-97
Scores Reported in Percentiles
School System State
Page 2
STATE-REQUIRED TEST DATA
NORM-REFERENCED TESTS Grade 5
Iowa Tests of Basic Skills (ITBS) Each chart reflects data for three years of testing.
Reading Comprehension
Mathematics
50
59 61 53 0
98-99
62 60 53 97-98
61 61 52 96-97
School 50
System
State
0
69 68 59 98-99
67 67 58 97-98
61 65 57 96-97
School System State
Reading Vocabulary 50
62 59 48 0
98-99
61 58 48 97-98
58 59 46 96-97
Language Arts
School 50
System
State
0
76 70 63 98-99
64 67 61 97-98
65 66 58 96-97
School System State
Social Studies 50
64 67 57 0
98-99
68 66 56 97-98
65 64 55 96-97
Science
School 50
System
State
0
72 71 60 98-99
70 70 59 97-98
71 70 59 96-97
School System State
Sources of Information
Composite Score
50
65 67 58 0
98-99
School 50
System
64 66 58 97-98
64 67 57 96-97
State 0
69 67 57 98-99
66 66 56 97-98
66 66 55 96-97
1998-99 GEORGIA PUBLIC EDUCATION REPORT CARD Arnold Mill Elementary School - 6280397
Prepared by Georgia Department of Education
Scores Reported in Percentiles
School System State
Page 3
STATE-REQUIRED TEST DATA
PERFORMANCE ASSESSMENTS
Grade 5 Writing Assessment
Percent at Developmental Stages:
1998-99 School System State
1997-98 School System State
1996-97 School System State
Stage Stage Stage Stage Stage Stage
1:The Emerging Writer 2:The Developing Writer 3:The Focusing Writer 4:The Experimenting 5:The Engaging Writer 6:The Extending Writer
1% 0% 15% 33% 27% 23%
0% 1% 12% 36% 34% 17%
0% 1% 16% 41% 29% 12%
0% 1% 11% 45% 25% 14%
0% 1% 11% 45% 33% 9%
0% 3% 19% 41% 27% 10%
0% 2% 19% 34% 30% 13%
0% 2% 14% 37% 34% 14%
0% 3% 21% 37% 26% 12%
AWARDS / RECOGNITION DATA
Schools in Georgia may receive recognition in the following programs: Charter School Pay for Performance Program Georgia School of Excellence National Blue Ribbon School Arnold Mill Elementary School did not receive recognition in any of these programs during the 1998-99 school year.
1998-99 GEORGIA PUBLIC EDUCATION REPORT CARD Arnold Mill Elementary School - 6280397
Prepared by Georgia Department of Education
Page 4
CERTIFIED PERSONNEL DATA
Positions Number Average Contract Days
Personnel Sex
Certificate
Years Experience
Full-time Part-time
Male Female
4 Yr Bachelor's 5 Yr Master's 6 Yr Specialist's 7 Yr Doctoral Other*
<1 1-10 11-20 21-30 >30
Average
Administrators
3.00 200.00
3 0
2 1
0 1 2 0 0 0 0 2 1 0 20.33
Support Personnel
4.10 167.29
3 2
0 5
0 3 2 0 0 0 3 2 0 0 9.80
PK-12 Teachers
52.00 190.00
52 0
6 46
29 18
5 0 0 5 18 22 7 0 11.54
*Includes One- and Two-Year Vocational Certificates.
ACCREDITATION DATA
Accredited by Southern Association of Colleges and Schools (SACS):
Elementary/Middle Commission. Accredited by Georgia Accrediting
Commission (GAC).
1998-99 GEORGIA PUBLIC EDUCATION REPORT CARD Arnold Mill Elementary School - 6280397
Prepared by Georgia Department of Education
Page 5
1998-99 GEORGIA PUBLIC EDUCATION REPORT CARD
CHEROKEE COUNTY SCHOOLS
Ball Ground Elementary School - 6281050
Grade Range PK-6
The Georgia Public Education Report Card is designed to assist systems and schools in educational improvement. This report card contains a variety of data elements. An explanation of the terms is provided as a companion to the report card data. Please refer to the definitions for the most effective use of the reported data.
STUDENT DATA
Total
K-6
387
PK
20
Enrollment, by Race/Ethnicity and Sex
Black
White Hispanic
American Asian Indian
Multiracial
1 0.3%
383 99.0%
2 0.5%
0 0.0%
0 0.0%
1 0.3%
0
20
0.0% 100.0%
0 0.0%
0 0.0%
0 0.0%
0 0.0%
Male Female
198 51.2%
189 48.8%
11 55.0%
9 45.0%
Enrollment in Selected Programs
Program
Program % of Student Enrollment Population
Gifted (Grades K-12)
8
2.1%
Alternative Programs (Grades 6-12)
0
0.0%
Students Eligible to Receive Free/Reduced Lunches
Number
Percent
School System
126 3,428
31.0% 14.1%
Dropout Rate for Grade 6
Number
Rate
School System
0
0.0%
1
0.0%
Enrollment in Compensatory Programs
Program
Program % of Student Enrollment Population
Special Education (Grades K-12)
41 10.6%
(PK)
1
N/A
English to Speakers of Other Languages (ESOL) (Grades K-12)
0
0.0%
Remedial Education (Grades 2-5, 9-12)
24 11.4%
Special Instructional Assistance (SIA) (Grades K-3)
42 18.8%
Title I (Grades K-12)
This school has a Targeted Assistance program.
Total 3
Retained Students, by Race/Ethnicity and Sex
Black
White Hispanic
American MultiAsian Indian racial
0
3
0.0% 100.0%
0 0.0%
0 0.0%
0 0.0%
0 0.0%
Male Female
2
1
66.7% 33.3%
Prepared by Georgia Department of Education
Page 1
STATE-REQUIRED TEST DATA
NORM-REFERENCED TESTS Grade 3
Iowa Tests of Basic Skills (ITBS) Each chart reflects data for three years of testing.
Reading Comprehension 50
75 65 54 0
98-99
64 63 53 97-98
66 61 52 96-97
Mathematics
School 50
System
State
0
77 75 61 98-99
78 71 61 97-98
75 68 59 96-97
School System State
Reading Vocabulary 50
67 62 50 0
98-99
63 58 50 97-98
67 59 49 96-97
Language Arts
School 50
System
State
0
76 74 64 98-99
75 66 62 97-98
64 61 59 96-97
School System State
Social Studies 50
82 67 56 0
98-99
76 64 55 97-98
67 64 55 96-97
Science
School 50
System
State
0
73 74 59 98-99
69 70 59 97-98
68 68 58 96-97
School System State
Sources of Information
Composite Score
50
72 70 57 0
98-99
School 50
System
67 66 56 97-98
62 65 55 96-97
State 0
76 71 58 98-99
71 67 57 97-98
1998-99 GEORGIA PUBLIC EDUCATION REPORT CARD Ball Ground Elementary School - 6281050
Prepared by Georgia Department of Education
67 64 56 96-97
Scores Reported in Percentiles
School System State
Page 2
STATE-REQUIRED TEST DATA
NORM-REFERENCED TESTS Grade 5
Iowa Tests of Basic Skills (ITBS) Each chart reflects data for three years of testing.
Reading Comprehension
Mathematics
50
63 61 53 0
98-99
59 60 53 97-98
47 61 52 96-97
School 50
System
State
0
67 68 59 98-99
65 67 58 97-98
49 65 57 96-97
School System State
Reading Vocabulary 50
62 59 48 0
98-99
70 58 48 97-98
44 59 46 96-97
Language Arts
School 50
System
State
0
74 70 63 98-99
69 67 61 97-98
52 66 58 96-97
School System State
Social Studies 50
75 67 57 0
98-99
74 66 56 97-98
60 64 55 96-97
Science
School 50
System
State
0
72 71 60 98-99
70 70 59 97-98
63 70 59 96-97
School System State
Sources of Information
Composite Score
50
65 67 58 0
98-99
School 50
System
70 66 58 97-98
54 67 57 96-97
State 0
70 67 57 98-99
70 66 56 97-98
53 66 55 96-97
1998-99 GEORGIA PUBLIC EDUCATION REPORT CARD Ball Ground Elementary School - 6281050
Prepared by Georgia Department of Education
Scores Reported in Percentiles
School System State
Page 3
STATE-REQUIRED TEST DATA
PERFORMANCE ASSESSMENTS
Grade 5 Writing Assessment
Percent at Developmental Stages:
1998-99 School System State
1997-98 School System State
1996-97 School System State
Stage Stage Stage Stage Stage Stage
1:The Emerging Writer 2:The Developing Writer 3:The Focusing Writer 4:The Experimenting 5:The Engaging Writer 6:The Extending Writer
0% 0% 14% 35% 35% 16%
0% 1% 12% 36% 34% 17%
0% 1% 16% 41% 29% 12%
0% 0% 14% 53% 25% 9%
0% 1% 11% 45% 33% 9%
0% 3% 19% 41% 27% 10%
0% 3% 9% 34% 50% 3%
0% 2% 14% 37% 34% 14%
0% 3% 21% 37% 26% 12%
AWARDS / RECOGNITION DATA
Schools in Georgia may receive recognition in the following programs: Charter School Pay for Performance Program Georgia School of Excellence National Blue Ribbon School Ball Ground Elementary School did not receive recognition in any of these programs during the 1998-99 school year.
1998-99 GEORGIA PUBLIC EDUCATION REPORT CARD Ball Ground Elementary School - 6281050
Prepared by Georgia Department of Education
Page 4
CERTIFIED PERSONNEL DATA
Positions Number Average Contract Days
Personnel Sex
Certificate
Years Experience
Full-time Part-time
Male Female
4 Yr Bachelor's 5 Yr Master's 6 Yr Specialist's 7 Yr Doctoral Other*
<1 1-10 11-20 21-30 >30
Average
Administrators
1.00 210.00
1 0
1 0
0 0 1 0 0 0 0 0 1 0 21.00
Support Personnel
2.00 190.00
2 0
1 1
0 1 1 0 0 0 0 2 0 0 13.50
PK-12 Teachers
24.00 190.00
24 0
0 24
12 11
1 0 0 1 11 8 4 0 12.08
*Includes One- and Two-Year Vocational Certificates.
ACCREDITATION DATA
Accredited by Southern Association of Colleges and Schools (SACS):
Elementary/Middle Commission. Accredited with Quality by Georgia
Accrediting Commission (GAC).
1998-99 GEORGIA PUBLIC EDUCATION REPORT CARD Ball Ground Elementary School - 6281050
Prepared by Georgia Department of Education
Page 5
1998-99 GEORGIA PUBLIC EDUCATION REPORT CARD
CHEROKEE COUNTY SCHOOLS
Bascomb Elementary School - 6280196
Grade Range PK-6
The Georgia Public Education Report Card is designed to assist systems and schools in educational improvement. This report card contains a variety of data elements. An explanation of the terms is provided as a companion to the report card data. Please refer to the definitions for the most effective use of the reported data.
STUDENT DATA
Total
K-6
1,708
PK
6
Enrollment, by Race/Ethnicity and Sex
Black
White Hispanic
American Asian Indian
Multiracial
28 1.6%
1628 95.3%
27 1.6%
16 0.9%
8 0.5%
1 0.1%
0
6
0.0% 100.0%
0 0.0%
0 0.0%
0 0.0%
0 0.0%
Male Female
886 51.9%
822 48.1%
4 66.7%
2 33.3%
Enrollment in Selected Programs
Program
Program % of Student Enrollment Population
Gifted (Grades K-12)
63
3.7%
Alternative Programs (Grades 6-12)
0
0.0%
Students Eligible to Receive Free/Reduced Lunches
Number
Percent
School System
16 3,428
0.9% 14.1%
Dropout Rate for Grade 6
Number
Rate
School System
0
0.0%
1
0.0%
Enrollment in Compensatory Programs
Program
Program % of Student Enrollment Population
Special Education (Grades K-12)
101
5.9%
(PK)
12
N/A
English to Speakers of Other Languages (ESOL) (Grades K-12)
4
< 1%
Remedial Education (Grades 2-5, 9-12)
27
2.9%
Special Instructional Assistance (SIA) (Grades K-3)
0
0.0%
Title I (Grades K-12)
This school has no Title I program.
Total 10
Retained Students, by Race/Ethnicity and Sex
Black
White Hispanic
American MultiAsian Indian racial
0
10
0.0% 100.0%
0 0.0%
0 0.0%
0 0.0%
0 0.0%
Male Female
6
4
60.0% 40.0%
Prepared by Georgia Department of Education
Page 1
STATE-REQUIRED TEST DATA
NORM-REFERENCED TESTS Grade 3
Iowa Tests of Basic Skills (ITBS) Each chart reflects data for three years of testing.
Reading Comprehension 50
71 65 54 0
98-99
70 63 53 97-98
69 61 52 96-97
Mathematics
School 50
System
State
0
82 75 61 98-99
80 71 61 97-98
80 68 59 96-97
School System State
Reading Vocabulary 50
69 62 50 0
98-99
67 58 50 97-98
68 59 49 96-97
Language Arts
School 50
System
State
0
85 74 64 98-99
82 66 62 97-98
73 61 59 96-97
School System State
Social Studies 50
74 67 56 0
98-99
71 64 55 97-98
72 64 55 96-97
Science
School 50
System
State
0
80 74 59 98-99
79 70 59 97-98
78 68 58 96-97
School System State
Sources of Information
Composite Score
50
79 70 57 0
98-99
School 50
System
75 66 56 97-98
77 65 55 96-97
State 0
80 71 58 98-99
77 67 57 97-98
1998-99 GEORGIA PUBLIC EDUCATION REPORT CARD Bascomb Elementary School - 6280196
Prepared by Georgia Department of Education
76 64 56 96-97
Scores Reported in Percentiles
School System State
Page 2
STATE-REQUIRED TEST DATA
NORM-REFERENCED TESTS Grade 5
Iowa Tests of Basic Skills (ITBS) Each chart reflects data for three years of testing.
Reading Comprehension
Mathematics
50
68 61 53 0
98-99
68 60 53 97-98
68 61 52 96-97
School 50
System
State
0
76 68 59 98-99
72 67 58 97-98
73 65 57 96-97
School System State
Reading Vocabulary 50
63 59 48 0
98-99
64 58 48 97-98
63 59 46 96-97
Language Arts
School 50
System
State
0
79 70 63 98-99
72 67 61 97-98
73 66 58 96-97
School System State
Social Studies 50
75 67 57 0
98-99
73 66 56 97-98
72 64 55 96-97
Science
School 50
System
State
0
80 71 60 98-99
78 70 59 97-98
75 70 59 96-97
School System State
Sources of Information
Composite Score
50
77 67 58 0
98-99
School 50
System
70 66 58 97-98
77 67 57 96-97
State 0
77 67 57 98-99
73 66 56 97-98
74 66 55 96-97
1998-99 GEORGIA PUBLIC EDUCATION REPORT CARD Bascomb Elementary School - 6280196
Prepared by Georgia Department of Education
Scores Reported in Percentiles
School System State
Page 3
STATE-REQUIRED TEST DATA
PERFORMANCE ASSESSMENTS
Grade 5 Writing Assessment
Percent at Developmental Stages:
1998-99 School System State
1997-98 School System State
1996-97 School System State
Stage Stage Stage Stage Stage Stage
1:The Emerging Writer 2:The Developing Writer 3:The Focusing Writer 4:The Experimenting 5:The Engaging Writer 6:The Extending Writer
0% 0% 6% 27% 35% 31%
0% 1% 12% 36% 34% 17%
0% 1% 16% 41% 29% 12%
0% 0% 5% 38% 45% 11%
0% 1% 11% 45% 33% 9%
0% 3% 19% 41% 27% 10%
1% 1% 9% 31% 36% 20%
0% 2% 14% 37% 34% 14%
0% 3% 21% 37% 26% 12%
AWARDS / RECOGNITION DATA
Schools in Georgia may receive recognition in the following programs: Charter School Pay for Performance Program Georgia School of Excellence National Blue Ribbon School Bascomb Elementary School did not receive recognition in any of these programs during the 1998-99 school year.
1998-99 GEORGIA PUBLIC EDUCATION REPORT CARD Bascomb Elementary School - 6280196
Prepared by Georgia Department of Education
Page 4
CERTIFIED PERSONNEL DATA
Positions Number Average Contract Days
Personnel Sex
Certificate
Years Experience
Full-time Part-time
Male Female
4 Yr Bachelor's 5 Yr Master's 6 Yr Specialist's 7 Yr Doctoral Other*
<1 1-10 11-20 21-30 >30
Average
Administrators
3.00 200.00
3 0
1 2
0 0 1 2 0 0 0 2 1 0 22.00
Support Personnel
5.00 190.00
5 0
1 4
1 3 0 1 0 1 2 0 2 0 12.60
PK-12 Teachers
84.00 190.00
84 0
5 79
51 31
2 0 0 7 48 23 5 1 8.85
*Includes One- and Two-Year Vocational Certificates.
ACCREDITATION DATA
Accredited by Southern Association of Colleges and Schools (SACS):
Elementary/Middle Commission. Accredited by Georgia Accrediting
Commission (GAC).
1998-99 GEORGIA PUBLIC EDUCATION REPORT CARD Bascomb Elementary School - 6280196
Prepared by Georgia Department of Education
Page 5
1998-99 GEORGIA PUBLIC EDUCATION REPORT CARD
CHEROKEE COUNTY SCHOOLS
Booth Middle School - 6280181
Grade Range 7-8
The Georgia Public Education Report Card is designed to assist systems and schools in educational improvement. This report card contains a variety of data elements. An explanation of the terms is provided as a companion to the report card data. Please refer to the definitions for the most effective use of the reported data.
STUDENT DATA
Total 898
7-8 Enrollment, by Race/Ethnicity and Sex
Black
White Hispanic
American Multi-
Asian Indian
racial
34 3.8%
831 92.5%
26 2.9%
5 0.6%
1 0.1%
1 0.1%
Male 469
52.2%
Female 429
47.8%
Enrollment in Selected Programs
Program
Gifted (Grades K-12)
Program % of Student Enrollment Population
144
16.0%
Alternative Programs (Grades 6-12)
4
< 1%
Students Eligible to Receive Free/Reduced Lunches
Number
Percent
School System
103 3,428
11.5% 14.1%
Enrollment in Compensatory Programs
Program
Program % of Student Enrollment Population
Special Education (Grades K-12) (PK)
126 14.0%
0
N/A
English to Speakers of Other Languages (ESOL) (Grades K-12)
3
< 1%
Title I (Grades K-12)
This school has no Title I program.
Dropout Rate for Grades 7-8
Number
Rate
School System
2
0.2%
3
0.1%
Total 4
Retained Students, by Race/Ethnicity and Sex
Black
White Hispanic
American MultiAsian Indian racial
0
4
0.0% 100.0%
0 0.0%
0 0.0%
0 0.0%
0 0.0%
Male Female
3
1
75.0% 25.0%
Prepared by Georgia Department of Education
Page 1
STATE-REQUIRED TEST DATA
NORM-REFERENCED TESTS Grade 8
Iowa Tests of Basic Skills (ITBS) Each chart reflects data for three years of testing.
Reading Comprehension 50
60 60 49 0
98-99
59 60 48 97-98
61 60 48 96-97
Mathematics
School 50
System
State
0
64 63 56 98-99
59 61 55 97-98
60 59 54 96-97
School System State
Reading Vocabulary 50
56 58 46 0
98-99
53 57 45 97-98
60 61 44 96-97
Language Arts
School 50
System
State
0
69 69 60 98-99
63 65 58 97-98
64 66 56 96-97
School System State
Social Studies 50
55 60 54 0
98-99
55 61 53 97-98
60 62 53 96-97
Science
School 50
System
State
0
64 63 56 98-99
62 62 55 97-98
62 61 53 96-97
School System State
Sources of Information
Composite Score
50
64 65 57 0
98-99
School 50
System
64 65 56 97-98
67 64 55 96-97
State 0
63 64 56 98-99
61 63 54 97-98
1998-99 GEORGIA PUBLIC EDUCATION REPORT CARD Booth Middle School - 6280181
Prepared by Georgia Department of Education
63 63 54 96-97
Scores Reported in Percentiles
School System State
Page 2
STATE-REQUIRED TEST DATA
Categories of Scaled Scores
Inadequate (less than 162)
Minimal (162-209)
Good
(210-247)
Very Good (greater than 247)
Average Scaled Score: (Range 100-300)
PERFORMANCE ASSESSMENTS
Grade 8 Writing Assessment
1998-99 Percent Scoring
1997-98 Percent Scoring
1996-97 Percent Scoring
School System State School System State School System State
3% 46% 46%
5%
2% 33% 51% 13%
8% 40% 41% 11%
3% 48% 43%
5%
4% 44% 44%
8%
11% 46% 34%
8%
3% 49% 38% 10%
8% 47% 36%
9%
15% 46% 30%
8%
208
217
208 207
209 202 208
205 198
AWARDS / RECOGNITION DATA
Schools in Georgia may receive recognition in the following programs: Charter School Pay for Performance Program Georgia School of Excellence National Blue Ribbon School Booth Middle School did not receive recognition in any of these programs during the 1998-99 school year.
1998-99 GEORGIA PUBLIC EDUCATION REPORT CARD Booth Middle School - 6280181
Prepared by Georgia Department of Education
Page 3
CERTIFIED PERSONNEL DATA
Positions Number Average Contract Days
Personnel Sex
Certificate
Years Experience
Full-time Part-time
Male Female
4 Yr Bachelor's 5 Yr Master's 6 Yr Specialist's 7 Yr Doctoral Other*
<1 1-10 11-20 21-30 >30
Average
Administrators
3.00 205.00
3 0
3 0
0 0 3 0 0 0 0 1 2 0 20.33
Support Personnel
4.00 190.00
4 0
1 3
1 1 2 0 0 0 1 2 1 0 15.50
PK-12 Teachers
56.98 190.00
57 0
5 52
32 23
2 0 0 2 25 26 4 0 11.02
*Includes One- and Two-Year Vocational Certificates.
ACCREDITATION DATA
Accredited by Southern Association of Colleges and Schools (SACS):
Elementary/Middle Commission. Accredited with Quality by Georgia
Accrediting Commission (GAC).
1998-99 GEORGIA PUBLIC EDUCATION REPORT CARD Booth Middle School - 6280181
Prepared by Georgia Department of Education
Page 4
1998-99 GEORGIA PUBLIC EDUCATION REPORT CARD
CHEROKEE COUNTY SCHOOLS
Boston Elementary School - 6280189
Grade Range K-6
The Georgia Public Education Report Card is designed to assist systems and schools in educational improvement. This report card contains a variety of data elements. An explanation of the terms is provided as a companion to the report card data. Please refer to the definitions for the most effective use of the reported data.
STUDENT DATA
Total 1,250
K-6 Enrollment, by Race/Ethnicity and Sex
Black
White Hispanic
American Multi-
Asian Indian
racial
37 3.0%
1,121 89.7%
73 5.8%
11 0.9%
5 0.4%
3 0.2%
Male Female
637 51.0%
613 49.0%
Enrollment in Selected Programs
Program
Program % of Student Enrollment Population
Gifted (Grades K-12)
28
2.2%
Alternative Programs (Grades 6-12)
0
0.0%
Students Eligible to Receive Free/Reduced Lunches
Number
Percent
School System
276 3,428
22.1% 14.1%
Dropout Rate for Grade 6
Number
Rate
School System
0
0.0%
1
0.0%
Enrollment in Compensatory Programs
Program
Program % of Student Enrollment Population
Special Education (Grades K-12)
132 10.6%
(PK)
3
N/A
English to Speakers of Other Languages (ESOL) (Grades K-12)
24
1.9%
Remedial Education (Grades 2-5, 9-12)
37
5.0%
Special Instructional Assistance (SIA) (Grades K-3)
48
6.5%
Title I (Grades K-12)
This school has no Title I program.
Total 14
Retained Students, by Race/Ethnicity and Sex
Black
White Hispanic
American Multi-
Asian Indian
racial
2 14.3%
10 71.4%
2 14.3%
0 0.0%
0 0.0%
0 0.0%
Male Female
8
6
57.1% 42.9%
Prepared by Georgia Department of Education
Page 1
STATE-REQUIRED TEST DATA
NORM-REFERENCED TESTS Grade 3
Iowa Tests of Basic Skills (ITBS) Each chart reflects data for three years of testing.
Reading Comprehension 50
60 65 54 0
98-99
58 63 53 97-98
56 61 52 96-97
Mathematics
School 50
System
State
0
70 75 61 98-99
60 71 61 97-98
55 68 59 96-97
School System State
Reading Vocabulary 50
58 62 50 0
98-99
56 58 50 97-98
54 59 49 96-97
Language Arts
School 50
System
State
0
66 74 64 98-99
57 66 62 97-98
50 61 59 96-97
School System State
Social Studies 50
63 67 56 0
98-99
62 64 55 97-98
58 64 55 96-97
Science
School 50
System
State
0
66 74 59 98-99
69 70 59 97-98
57 68 58 96-97
School System State
Sources of Information
Composite Score
50
63 70 57 0
98-99
School 50
System
59 66 56 97-98
61 65 55 96-97
State 0
64 71 58 98-99
61 67 57 97-98
1998-99 GEORGIA PUBLIC EDUCATION REPORT CARD Boston Elementary School - 6280189
Prepared by Georgia Department of Education
56 64 56 96-97
Scores Reported in Percentiles
School System State
Page 2
STATE-REQUIRED TEST DATA
NORM-REFERENCED TESTS Grade 5
Iowa Tests of Basic Skills (ITBS) Each chart reflects data for three years of testing.
Reading Comprehension
Mathematics
50
55 61 53 0
98-99
61 60 53 97-98
60 61 52 96-97
School 50
System
State
0
58 68 59 98-99
66 67 58 97-98
63 65 57 96-97
School System State
Reading Vocabulary 50
52 59 48 0
98-99
60 58 48 97-98
59 59 46 96-97
Language Arts
School 50
System
State
0
62 70 63 98-99
65 67 61 97-98
63 66 58 96-97
School System State
Social Studies 50
61 67 57 0
98-99
67 66 56 97-98
64 64 55 96-97
Science
School 50
System
State
0
63 71 60 98-99
69 70 59 97-98
66 70 59 96-97
School System State
Sources of Information
Composite Score
50
55 67 58 0
98-99
School 50
System
67 66 58 97-98
72 67 57 96-97
State 0
58 67 57 98-99
66 66 56 97-98
65 66 55 96-97
1998-99 GEORGIA PUBLIC EDUCATION REPORT CARD Boston Elementary School - 6280189
Prepared by Georgia Department of Education
Scores Reported in Percentiles
School System State
Page 3
STATE-REQUIRED TEST DATA
PERFORMANCE ASSESSMENTS
Grade 5 Writing Assessment
Percent at Developmental Stages:
1998-99 School System State
1997-98 School System State
1996-97 School System State
Stage Stage Stage Stage Stage Stage
1:The Emerging Writer 2:The Developing Writer 3:The Focusing Writer 4:The Experimenting 5:The Engaging Writer 6:The Extending Writer
1% 6% 29% 33% 24% 7%
0% 1% 12% 36% 34% 17%
0% 1% 16% 41% 29% 12%
0% 3% 19% 49% 23% 6%
0% 1% 11% 45% 33% 9%
0% 3% 19% 41% 27% 10%
0% 4% 19% 40% 28% 9%
0% 2% 14% 37% 34% 14%
0% 3% 21% 37% 26% 12%
AWARDS / RECOGNITION DATA
Schools in Georgia may receive recognition in the following programs: Charter School Pay for Performance Program Georgia School of Excellence National Blue Ribbon School Boston Elementary School did not receive recognition in any of these programs during the 1998-99 school year.
1998-99 GEORGIA PUBLIC EDUCATION REPORT CARD Boston Elementary School - 6280189
Prepared by Georgia Department of Education
Page 4
CERTIFIED PERSONNEL DATA
Positions Number Average Contract Days
Personnel Sex
Certificate
Years Experience
Full-time Part-time
Male Female
4 Yr Bachelor's 5 Yr Master's 6 Yr Specialist's 7 Yr Doctoral Other*
<1 1-10 11-20 21-30 >30
Average
Administrators
3.00 200.00
3 0
1 2
0 1 1 1 0 0 0 2 1 0 18.33
Support Personnel
5.00 190.00
5 0
0 5
0 4 1 0 0 0 0 4 1 0 17.20
PK-12 Teachers
67.00 190.00
67 0
3 64
47 18
2 0 0 5 33 20 8 1 10.76
*Includes One- and Two-Year Vocational Certificates.
ACCREDITATION DATA
Accredited by Southern Association of Colleges and Schools (SACS):
Elementary/Middle Commission. Accredited by Georgia Accrediting
Commission (GAC).
1998-99 GEORGIA PUBLIC EDUCATION REPORT CARD Boston Elementary School - 6280189
Prepared by Georgia Department of Education
Page 5
1998-99 GEORGIA PUBLIC EDUCATION REPORT CARD
CHEROKEE COUNTY SCHOOLS
Buffington Elementary School - 6282050
Grade Range K-6
The Georgia Public Education Report Card is designed to assist systems and schools in educational improvement. This report card contains a variety of data elements. An explanation of the terms is provided as a companion to the report card data. Please refer to the definitions for the most effective use of the reported data.
STUDENT DATA
Total 251
K-6 Enrollment, by Race/Ethnicity and Sex
Black
White Hispanic
American Multi-
Asian Indian
racial
6 2.4%
235 93.6%
7 2.8%
2 0.8%
0 0.0%
1 0.4%
Male Female
122 48.6%
129 51.4%
Enrollment in Selected Programs
Program
Program % of Student Enrollment Population
Gifted (Grades K-12)
13
5.2%
Alternative Programs (Grades 6-12)
0
0.0%
Students Eligible to Receive Free/Reduced Lunches
Number
Percent
School System
57 3,428
22.7% 14.1%
Dropout Rate for Grade 6
Number
Rate
School System
0
0.0%
1
0.0%
Enrollment in Compensatory Programs
Program
Program % of Student Enrollment Population
Special Education (Grades K-12)
47 18.7%
(PK)
3
N/A
English to Speakers of Other Languages (ESOL) (Grades K-12)
3
1.2%
Remedial Education (Grades 2-5, 9-12)
15 11.2%
Special Instructional Assistance (SIA) (Grades K-3)
20 13.4%
Title I (Grades K-12)
This school has a Targeted Assistance program.
Total 6
Retained Students, by Race/Ethnicity and Sex
Black
White Hispanic
American Multi-
Asian Indian
racial
0 0.0%
5 83.3%
1 16.7%
0 0.0%
0 0.0%
0 0.0%
Male Female
4
2
66.7% 33.3%
Prepared by Georgia Department of Education
Page 1
STATE-REQUIRED TEST DATA
NORM-REFERENCED TESTS Grade 3
Iowa Tests of Basic Skills (ITBS) Each chart reflects data for three years of testing.
Reading Comprehension 50
69 65 54 0
98-99
61 63 53 97-98
61 61 52 96-97
Mathematics
School 50
System
State
0
81 75 61 98-99
62 71 61 97-98
65 68 59 96-97
School System State
Reading Vocabulary 50
66 62 50 0
98-99
46 58 50 97-98
49 59 49 96-97
Language Arts
School 50
System
State
0
73 74 64 98-99
59 66 62 97-98
60 61 59 96-97
School System State
Social Studies 50
70 67 56 0
98-99
53 64 55 97-98
56 64 55 96-97
Science
School 50
System
State
0
75 74 59 98-99
57 70 59 97-98
64 68 58 96-97
School System State
Sources of Information
Composite Score
50
75 70 57 0
98-99
School 50
System
50 66 56 97-98
68 65 55 96-97
State 0
74 71 58 98-99
59 67 57 97-98
1998-99 GEORGIA PUBLIC EDUCATION REPORT CARD Buffington Elementary School - 6282050
Prepared by Georgia Department of Education
61 64 56 96-97
Scores Reported in Percentiles
School System State
Page 2
STATE-REQUIRED TEST DATA
NORM-REFERENCED TESTS Grade 5
Iowa Tests of Basic Skills (ITBS) Each chart reflects data for three years of testing.
Reading Comprehension
Mathematics
50
63 61 53 0
98-99
62 60 53 97-98
64 61 52 96-97
School 50
System
State
0
79 68 59 98-99
62 67 58 97-98
75 65 57 96-97
School System State
Reading Vocabulary 50
58 59 48 0
98-99
61 58 48 97-98
62 59 46 96-97
Language Arts
School 50
System
State
0
70 70 63 98-99
68 67 61 97-98
73 66 58 96-97
School System State
Social Studies 50
68 67 57 0
98-99
67 66 56 97-98
61 64 55 96-97
Science
School 50
System
State
0
75 71 60 98-99
82 70 59 97-98
86 70 59 96-97
School System State
Sources of Information
Composite Score
50
75 67 58 0
98-99
School 50
System
67 66 58 97-98
76 67 57 96-97
State 0
72 67 57 98-99
70 66 56 97-98
75 66 55 96-97
1998-99 GEORGIA PUBLIC EDUCATION REPORT CARD Buffington Elementary School - 6282050
Prepared by Georgia Department of Education
Scores Reported in Percentiles
School System State
Page 3
STATE-REQUIRED TEST DATA
PERFORMANCE ASSESSMENTS
Grade 5 Writing Assessment
Percent at Developmental Stages:
1998-99 School System State
1997-98 School System State
1996-97 School System State
Stage Stage Stage Stage Stage Stage
1:The Emerging Writer 2:The Developing Writer 3:The Focusing Writer 4:The Experimenting 5:The Engaging Writer 6:The Extending Writer
0% 0% 8% 54% 17% 21%
0% 1% 12% 36% 34% 17%
0% 1% 16% 41% 29% 12%
0% 0% 3% 61% 29% 6%
0% 1% 11% 45% 33% 9%
0% 3% 19% 41% 27% 10%
0% 0% 12% 39% 27% 21%
0% 2% 14% 37% 34% 14%
0% 3% 21% 37% 26% 12%
AWARDS / RECOGNITION DATA
Schools in Georgia may receive recognition in the following programs: Charter School Pay for Performance Program Georgia School of Excellence National Blue Ribbon School Buffington Elementary School did not receive recognition in any of these programs during the 1998-99 school year.
1998-99 GEORGIA PUBLIC EDUCATION REPORT CARD Buffington Elementary School - 6282050
Prepared by Georgia Department of Education
Page 4
CERTIFIED PERSONNEL DATA
Positions Number Average Contract Days
Personnel Sex
Certificate
Years Experience
Full-time Part-time
Male Female
4 Yr Bachelor's 5 Yr Master's 6 Yr Specialist's 7 Yr Doctoral Other*
<1 1-10 11-20 21-30 >30
Average
Administrators
1.00 210.00
1 0
0 1
0 0 1 0 0 0 0 0 1 0 24.00
Support Personnel
1.00 190.00
1 0
0 1
0 1 0 0 0 0 0 0 1 0 25.00
PK-12 Teachers
15.00 190.00
15 0
2 13
5 9 1 0 0 0 11 0 4 0 10.73
*Includes One- and Two-Year Vocational Certificates.
ACCREDITATION DATA
Accredited by Southern Association of Colleges and Schools (SACS):
Elementary/Middle Commission. Accredited with Quality by Georgia
Accrediting Commission (GAC).
1998-99 GEORGIA PUBLIC EDUCATION REPORT CARD Buffington Elementary School - 6282050
Prepared by Georgia Department of Education
Page 5
1998-99 GEORGIA PUBLIC EDUCATION REPORT CARD
CHEROKEE COUNTY SCHOOLS
Canton Elementary School - 6280174
Grade Range K-6
The Georgia Public Education Report Card is designed to assist systems and schools in educational improvement. This report card contains a variety of data elements. An explanation of the terms is provided as a companion to the report card data. Please refer to the definitions for the most effective use of the reported data.
STUDENT DATA
Total 551
K-6 Enrollment, by Race/Ethnicity and Sex
Black
White Hispanic
American Multi-
Asian Indian
racial
61 11.1%
422 76.6%
64 11.6%
2 0.4%
1 0.2%
1 0.2%
Male Female
312 56.6%
239 43.4%
Enrollment in Selected Programs
Program
Program % of Student Enrollment Population
Gifted (Grades K-12)
10
1.8%
Alternative Programs (Grades 6-12)
0
0.0%
Students Eligible to Receive Free/Reduced Lunches
Number
Percent
School System
232 3,428
42.1% 14.1%
Dropout Rate for Grade 6
Number
Rate
School System
0
0.0%
1
0.0%
Enrollment in Compensatory Programs
Program
Program % of Student Enrollment Population
Special Education (Grades K-12)
83 15.1%
(PK)
1
N/A
English to Speakers of Other Languages (ESOL) (Grades K-12)
22
4.0%
Remedial Education (Grades 2-5, 9-12)
38 12.6%
Special Instructional Assistance (SIA) (Grades K-3)
43 13.9%
Title I (Grades K-12)
This school has a Targeted Assistance program.
Total 26
Retained Students, by Race/Ethnicity and Sex
Black
White Hispanic
American Multi-
Asian Indian
racial
0 0.0%
15 57.7%
11 42.3%
0 0.0%
0 0.0%
0 0.0%
Male Female
18
8
69.2% 30.8%
Prepared by Georgia Department of Education
Page 1
STATE-REQUIRED TEST DATA
NORM-REFERENCED TESTS Grade 3
Iowa Tests of Basic Skills (ITBS) Each chart reflects data for three years of testing.
Reading Comprehension 50
48 65 54 0
98-99
50 63 53 97-98
54 61 52 96-97
Mathematics
School 50
System
State
0
58 75 61 98-99
55 71 61 97-98
47 68 59 96-97
School System State
Reading Vocabulary 50
52 62 50 0
98-99
44 58 50 97-98
48 59 49 96-97
Language Arts
School 50
System
State
0
60 74 64 98-99
58 66 62 97-98
47 61 59 96-97
School System State
Social Studies 50
53 67 56 0
98-99
57 64 55 97-98
52 64 55 96-97
Science
School 50
System
State
0
57 74 59 98-99
44 70 59 97-98
48 68 58 96-97
School System State
Sources of Information
Composite Score
50
61 70 57 0
98-99
School 50
System
60 66 56 97-98
54 65 55 96-97
State 0
57 71 58 98-99
54 67 57 97-98
1998-99 GEORGIA PUBLIC EDUCATION REPORT CARD Canton Elementary School - 6280174
Prepared by Georgia Department of Education
48 64 56 96-97
Scores Reported in Percentiles
School System State
Page 2
STATE-REQUIRED TEST DATA
NORM-REFERENCED TESTS Grade 5
Iowa Tests of Basic Skills (ITBS) Each chart reflects data for three years of testing.
Reading Comprehension
Mathematics
50
58 61 53 0
98-99
54 60 53 97-98
53 61 52 96-97
School 50
System
State
0
53 68 59 98-99
57 67 58 97-98
48 65 57 96-97
School System State
Reading Vocabulary 50
48 59 48 0
98-99
47 58 48 97-98
48 59 46 96-97
Language Arts
School 50
System
State
0
65 70 63 98-99
66 67 61 97-98
59 66 58 96-97
School System State
Social Studies 50
63 67 57 0
98-99
65 66 56 97-98
62 64 55 96-97
Science
School 50
System
State
0
72 71 60 98-99
71 70 59 97-98
65 70 59 96-97
School System State
Sources of Information
Composite Score
50
62 67 58 0
98-99
School 50
System
65 66 58 97-98
59 67 57 96-97
State 0
63 67 57 98-99
64 66 56 97-98
57 66 55 96-97
1998-99 GEORGIA PUBLIC EDUCATION REPORT CARD Canton Elementary School - 6280174
Prepared by Georgia Department of Education
Scores Reported in Percentiles
School System State
Page 3
STATE-REQUIRED TEST DATA
PERFORMANCE ASSESSMENTS
Grade 5 Writing Assessment
Percent at Developmental Stages:
1998-99 School System State
1997-98 School System State
1996-97 School System State
Stage Stage Stage Stage Stage Stage
1:The Emerging Writer 2:The Developing Writer 3:The Focusing Writer 4:The Experimenting 5:The Engaging Writer 6:The Extending Writer
0% 0% 6% 42% 42% 10%
0% 1% 12% 36% 34% 17%
0% 1% 16% 41% 29% 12%
0% 4% 15% 36% 36% 9%
0% 1% 11% 45% 33% 9%
0% 3% 19% 41% 27% 10%
0% 2% 10% 48% 32% 8%
0% 2% 14% 37% 34% 14%
0% 3% 21% 37% 26% 12%
AWARDS / RECOGNITION DATA
Schools in Georgia may receive recognition in the following programs: Charter School Pay for Performance Program Georgia School of Excellence National Blue Ribbon School Canton Elementary School did not receive recognition in any of these programs during the 1998-99 school year.
1998-99 GEORGIA PUBLIC EDUCATION REPORT CARD Canton Elementary School - 6280174
Prepared by Georgia Department of Education
Page 4
CERTIFIED PERSONNEL DATA
Positions Number Average Contract Days
Personnel Sex
Certificate
Years Experience
Full-time Part-time
Male Female
4 Yr Bachelor's 5 Yr Master's 6 Yr Specialist's 7 Yr Doctoral Other*
<1 1-10 11-20 21-30 >30
Average
Administrators
2.00 202.50
2 0
1 1
0 0 2 0 0 0 0 0 2 0 25.00
Support Personnel
3.00 190.00
3 0
0 3
0 0 3 0 0 0 1 0 2 0 16.67
PK-12 Teachers
37.00 190.00
37 0
3 34
19 13
5 0 0 1 18 10 7 1 12.97
*Includes One- and Two-Year Vocational Certificates.
ACCREDITATION DATA
Accredited by Southern Association of Colleges and Schools (SACS):
Elementary/Middle Commission. Accredited with Quality by Georgia
Accrediting Commission (GAC).
1998-99 GEORGIA PUBLIC EDUCATION REPORT CARD Canton Elementary School - 6280174
Prepared by Georgia Department of Education
Page 5
1998-99 GEORGIA PUBLIC EDUCATION REPORT CARD
CHEROKEE COUNTY SCHOOLS
Chapman Elementary School - 6280173
Grade Range PK-6
The Georgia Public Education Report Card is designed to assist systems and schools in educational improvement. This report card contains a variety of data elements. An explanation of the terms is provided as a companion to the report card data. Please refer to the definitions for the most effective use of the reported data.
STUDENT DATA
Total
K-6
1,280
PK
1
Enrollment, by Race/Ethnicity and Sex
Black
White Hispanic
American Asian Indian
Multiracial
52 4.1%
1145 89.5%
49 3.8%
21 1.6%
7 0.5%
6 0.5%
0
1
0.0% 100.0%
0 0.0%
0 0.0%
0 0.0%
0 0.0%
Male 681
53.2% 1
100.0%
Female 599
46.8% 0
0.0%
Enrollment in Selected Programs
Program
Program % of Student Enrollment Population
Gifted (Grades K-12)
22
1.7%
Alternative Programs (Grades 6-12)
0
0.0%
Students Eligible to Receive Free/Reduced Lunches
Number
Percent
School System
263 3,428
20.5% 14.1%
Dropout Rate for Grade 6
Number
Rate
School System
0
0.0%
1
0.0%
Enrollment in Compensatory Programs
Program
Program % of Student Enrollment Population
Special Education (Grades K-12)
155 12.1%
(PK)
6
N/A
English to Speakers of Other Languages (ESOL) (Grades K-12)
19
1.5%
Remedial Education (Grades 2-5, 9-12)
68
9.4%
Special Instructional Assistance (SIA) (Grades K-3)
100 12.8%
Title I (Grades K-12)
This school has a Targeted Assistance program.
Total 12
Retained Students, by Race/Ethnicity and Sex
Black
White Hispanic
American MultiAsian Indian racial
1 8.3%
10 83.3%
1 8.3%
0 0.0%
0 0.0%
0 0.0%
Male Female
7
5
58.3% 41.7%
Prepared by Georgia Department of Education
Page 1
STATE-REQUIRED TEST DATA
NORM-REFERENCED TESTS Grade 3
Iowa Tests of Basic Skills (ITBS) Each chart reflects data for three years of testing.
Reading Comprehension 50
59 65 54 0
98-99
58 63 53 97-98
57 61 52 96-97
Mathematics
School 50
System
State
0
68 75 61 98-99
66 71 61 97-98
58 68 59 96-97
School System State
Reading Vocabulary 50
52 62 50 0
98-99
59 58 50 97-98
56 59 49 96-97
Language Arts
School 50
System
State
0
69 74 64 98-99
72 66 62 97-98
65 61 59 96-97
School System State
Social Studies 50
65 67 56 0
98-99
62 64 55 97-98
62 64 55 96-97
Science
School 50
System
State
0
74 74 59 98-99
66 70 59 97-98
65 68 58 96-97
School System State
Sources of Information
Composite Score
50
66 70 57 0
98-99
School 50
System
60 66 56 97-98
60 65 55 96-97
State 0
67 71 58 98-99
64 67 57 97-98
1998-99 GEORGIA PUBLIC EDUCATION REPORT CARD Chapman Elementary School - 6280173
Prepared by Georgia Department of Education
61 64 56 96-97
Scores Reported in Percentiles
School System State
Page 2
STATE-REQUIRED TEST DATA
NORM-REFERENCED TESTS Grade 5
Iowa Tests of Basic Skills (ITBS) Each chart reflects data for three years of testing.
Reading Comprehension
Mathematics
50
54 61 53 0
98-99
56 60 53 97-98
69 61 52 96-97
School 50
System
State
0
62 68 59 98-99
61 67 58 97-98
64 65 57 96-97
School System State
Reading Vocabulary 50
54 59 48 0
98-99
52 58 48 97-98
68 59 46 96-97
Language Arts
School 50
System
State
0
65 70 63 98-99
67 67 61 97-98
72 66 58 96-97
School System State
Social Studies 50
59 67 57 0
98-99
61 66 56 97-98
63 64 55 96-97
Science
School 50
System
State
0
63 71 60 98-99
61 70 59 97-98
69 70 59 96-97
School System State
Sources of Information
Composite Score
50
56 67 58 0
98-99
School 50
System
59 66 58 97-98
64 67 57 96-97
State 0
59 67 57 98-99
61 66 56 97-98
67 66 55 96-97
1998-99 GEORGIA PUBLIC EDUCATION REPORT CARD Chapman Elementary School - 6280173
Prepared by Georgia Department of Education
Scores Reported in Percentiles
School System State
Page 3
STATE-REQUIRED TEST DATA
PERFORMANCE ASSESSMENTS
Grade 5 Writing Assessment
Percent at Developmental Stages:
1998-99 School System State
1997-98 School System State
1996-97 School System State
Stage Stage Stage Stage Stage Stage
1:The Emerging Writer 2:The Developing Writer 3:The Focusing Writer 4:The Experimenting 5:The Engaging Writer 6:The Extending Writer
0% 1% 10% 41% 33% 14%
0% 1% 12% 36% 34% 17%
0% 1% 16% 41% 29% 12%
2% 2% 14% 45% 30% 7%
0% 1% 11% 45% 33% 9%
0% 3% 19% 41% 27% 10%
0% 1% 15% 46% 30% 9%
0% 2% 14% 37% 34% 14%
0% 3% 21% 37% 26% 12%
AWARDS / RECOGNITION DATA
Schools in Georgia may receive recognition in the following programs: Charter School Pay for Performance Program Georgia School of Excellence National Blue Ribbon School Chapman Elementary School did not receive recognition in any of these programs during the 1998-99 school year.
1998-99 GEORGIA PUBLIC EDUCATION REPORT CARD Chapman Elementary School - 6280173
Prepared by Georgia Department of Education
Page 4
CERTIFIED PERSONNEL DATA
Positions Number Average Contract Days
Personnel Sex
Certificate
Years Experience
Full-time Part-time
Male Female
4 Yr Bachelor's 5 Yr Master's 6 Yr Specialist's 7 Yr Doctoral Other*
<1 1-10 11-20 21-30 >30
Average
Administrators
3.00 200.00
3 0
1 2
0 0 2 1 0 0 0 1 2 0 20.33
Support Personnel
6.50 190.00
6 1
0 7
0 6 1 0 0 0 1 4 2 0 16.14
PK-12 Teachers
77.00 190.00
77 0
2 75
53 22
2 0 0 3 40 25 9 0 10.79
*Includes One- and Two-Year Vocational Certificates.
ACCREDITATION DATA
Accredited by Southern Association of Colleges and Schools (SACS):
Elementary/Middle Commission. Accredited by Georgia Accrediting
Commission (GAC).
1998-99 GEORGIA PUBLIC EDUCATION REPORT CARD Chapman Elementary School - 6280173
Prepared by Georgia Department of Education
Page 5
1998-99 GEORGIA PUBLIC EDUCATION REPORT CARD
CHEROKEE COUNTY SCHOOLS
Cherokee High School - 6285050
Grade Range 9-12
The Georgia Public Education Report Card is designed to assist systems and schools in educational improvement. This report card contains a variety of data elements. An explanation of the terms is provided as a companion to the report card data. Please refer to the definitions for the most effective use of the reported data.
Total 1,555
STUDENT DATA
9-12 Enrollment, by Race/Ethnicity and Sex
Black
White Hispanic
American Multi-
Asian Indian
racial
43 2.8%
1,477 95.0%
26 1.7%
7 0.5%
2 0.1%
0 0.0%
Male Female
824 53.0%
731 47.0%
Enrollment in Selected Programs
Program
Gifted (Grades K-12)
Program % of Student Enrollment Population
129
8.3%
Non-Vocational Labs (Grades 9-12)
Vocational Labs (Grades 9-12)
Alternative Programs (Grades 6-12)
1,378 1,044
8
88.6% 67.1%
< 1%
Students Eligible to Receive Free/Reduced Lunches
Number
Percent
School System
133 3,428
8.6% 14.1%
Enrollment in Compensatory Programs
Program
Program % of Student Enrollment Population
Special Education (Grades K-12) PK
212 13.6%
0
N/A
English to Speakers of Other Languages (ESOL) (Grades K-12)
13
< 1%
Remedial Education (Grades 2-5, 9-12)
10
< 1%
Title I (Grades K-12)
This school has no Title I program.
Dropout Rate for Grades 9-12
Number
Rate
School System
91
5.2%
275
3.9%
Total 31
Retained Students, by Race/Ethnicity and Sex
Black
White Hispanic
American MultiAsian Indian racial
0 0.0%
29 93.5%
2 6.5%
0 0.0%
0 0.0%
0 0.0%
Male Female
21
10
67.7% 32.3%
Prepared by Georgia Department of Education
Page 1
STATE-REQUIRED TEST DATA
GEORGIA HIGH SCHOOL GRADUATION TESTS (GHSGT)
Percent of Regular Program 11th Graders Passing the Georgia High School Graduation Tests on First Administration
English Language Arts Mathematics Social Studies Science
All Components listed above
Writing
1998-99
School System State
99% 95% 82% 79%
98% 95% 87% 84%
96% 88% 80% 72%
76% 80% 68%
96% 96% 93%
1997-98
School System State
99% 98% 90% 85%
98% 95% 87% 84%
94% 88% 78% 74%
81% 80% 68%
95% 94% 92%
1996-97
School System State
99% 98% 87% 85%
99% 96% 87% 86%
94% 87% 78% 74%
80% 81% 67%
97% 96% 93%
GRADUATE DATA
1999 Graduates by Credentials, Race/Ethnicity and Sex
Diplomas with Both College Prep. & Voc. Endorsements
Diplomas with College Prep. Endorsements Diplomas with Vocational Endorsements General High School Diplomas Special Education Diplomas
Total All Diplomas
Certificates of Performance
Total Graduates
Total 32
126 107
0
Black
2 6.3%
2 1.6%
3 2.8%
0
White Hispanic
30 93.8%
0 0.0%
121 96.0%
1 0.8%
101 94.4%
3 2.8%
0
0
American MultiAsian Indian racial
0 0.0%
0 0.0%
0 0.0%
1 0.8%
1 0.8%
0 0.0%
0 0.0%
0 0.0%
0 0.0%
0
0
0
6
1
5
0
0
0
0
16.7% 83.3% 0.0% 0.0% 0.0% 0.0%
271
8
257
4
1
1
0
3.0% 94.8% 1.5% 0.4% 0.4% 0.0%
0
0
0
0
0
0
0
271
8
257
4
1
1
0
3.0% 94.8% 1.5% 0.4% 0.4% 0.0%
Male Female
13
19
40.6% 59.4%
48
78
38.1% 61.9%
61
46
57.0% 43.0%
0
0
4 66.7%
126 46.5%
0
2 33.3%
145 53.5%
0
126
145
46.5% 53.5%
HOPE Scholarships
School System
Number of 1999 Graduates 2 7 1
Number Eligible
207
Percent Eligible
76.4%
1,170 853
72.9%
State
65,548 40,292 61.5%
High School Completion Rate
Percent of 1995Grade 9 Enrollment in Graduating Class of1999 School System State
Completion Rate '95-'99 74.7% 80.0% 68.9%
1998-99 GEORGIA PUBLIC EDUCATION REPORT CARD
Cherokee High School - 6285050
Prepared by Georgia Department of Education
Page 2
COLLEGE ADMISSIONS / CREDIT TEST DATA
Scholastic Assessment Test (SAT)
Based on students' highest verbal and highest math scores
No. Taking
Average Score
Tests Verbal Math Total
Based on students' last test administration
Average Score Verbal Math Total
School
162
College Prep. Endorsement
Other Diplomas
System
762
College Prep. Endorsement
Other Diplomas
Georgia
41,958
521 508 1029
527 514 1041
446 427
873
515 505 1020 521 511 1032
429 407
836
492 488
980
514 N/A N/A
507 N/A N/A
483
500 N/A N/A
498 N/A N/A
479
1014 N/A N/A
1005 N/A N/A
962
Nation
952,913 N/A N/A N/A
502 508 1010
American College Testing (ACT)
Advanced Placement Exams (AP)
Number taking tests: English Mathematics Reading Science Reasoning CompositeScore
1 3 School System State
21.0 19.5 19.1
20.8 20.2 19.9
19.8 19.5
20.6 20.4
20.2 19.9
20.4 20.3 19.9
No. of Students Taking Tests
No. of Tests Taken No. of Test Scores
3 or Higher Percent of Test
Scores 3 or Higher
School 62 99 72
72.7%
System State 255 15,225 433 23,969 283 13,024
65.4% 54.3%
POST-SECONDARY DATA
Graduates Entering Georgia Public Colleges
Graduates Entering Georgia Public Colleges and Requiring Learning Support (LS)
1998 Graduates Entering in 1998-99
1997 Graduates Entering in 1997-98
Percent of Graduating Number Class
School
89
34.1%
System 373
37.9%
School
93
38.3%
System 358
39.0%
Number Requiring
LS 11 33
13 68
Percent of those attending Georgia
Public Colleges
12.4%
8.8%
14.0%
19.0%
In previous years, the Report Card presented College Prep Curriculum information provided by the Board of Regents on students requiring Learning Support. Due to inconsistencies in the data provided by the Board of Regents in defining College Prep Completers versus Local Board of Education data defining College Prep Endorsements, the Department of Education Report Card will not provide this information until discrepancies can be reconciled.
Graduates Entering Georgia Public Technical and Adult Schools
1998 Graduates School System
Entering Number 24 36
1998-99 Percent
9.2% 3.7%
Entering Number N/A N/A
1997-98 Percent
N/A N/A
1997 Graduates School
2
0.8%
System
3
0.3%
44
18.1%
93
10.1%
1998-99 GEORGIA PUBLIC EDUCATION REPORT CARD Cherokee High School - 6285050
Prepared by Georgia Department of Education
Page 3
CERTIFIED PERSONNEL DATA
Positions Number Average Contract Days
Administrators
5.00 210.00
Support Personnel
7.00 192.86
PK-12 Teachers
96.48 190.52
Personnel Sex
Certificate
Years Experience
Full-time Part-time
Male Female
4 Yr Bachelor's 5 Yr Master's 6 Yr Specialist's 7 Yr Doctoral Other*
<1 1-10 11-20 21-30 >30
Average
5 0
2 3
0 1 4 0 0
0 1 2 2 0
17.80
7 0
2 5
0 5 2 0 0
0 1 4 2 0
16.43
96 1
40 57
47 41
7 2 0
7 36 34 16
4
12.81
*Includes One- and Two-Year Vocational Certificates.
ACCREDITATION DATA
Accredited by Southern Association of Colleges and Schools (SACS): Secondary/Middle Commission. Accredited with Quality by Georgia Accrediting Commission (GAC).
AWARDS / RECOGNITION DATA
Schools in Georgia may receive recognition in the following programs: Charter School Pay for Performance Program Georgia School of Excellence National Blue Ribbon School Cherokee High School did not receive recognition in any of these programs during the 1998-99 school year.
1998-99 GEORGIA PUBLIC EDUCATION REPORT CARD Cherokee High School - 6285050
Prepared by Georgia Department of Education
Page 4
1998-99 GEORGIA PUBLIC EDUCATION REPORT CARD
CHEROKEE COUNTY SCHOOLS
Clayton Elementary School - 6281052
Grade Range PK-6
The Georgia Public Education Report Card is designed to assist systems and schools in educational improvement. This report card contains a variety of data elements. An explanation of the terms is provided as a companion to the report card data. Please refer to the definitions for the most effective use of the reported data.
STUDENT DATA
Total
K-6
359
PK
2
Enrollment, by Race/Ethnicity and Sex
Black
White Hispanic
American Asian Indian
Multiracial
0 0.0%
358 99.7%
1 0.3%
0 0.0%
0 0.0%
0 0.0%
0
2
0.0% 100.0%
0 0.0%
0 0.0%
0 0.0%
0 0.0%
Male 181
50.4% 2
100.0%
Female 178
49.6% 0
0.0%
Enrollment in Selected Programs
Program
Program % of Student Enrollment Population
Gifted (Grades K-12)
1
< 1%
Alternative Programs (Grades 6-12)
0
0.0%
Students Eligible to Receive Free/Reduced Lunches
Number
Percent
School System
81 3,428
22.4% 14.1%
Dropout Rate for Grade 6
Number
Rate
School System
0
0.0%
1
0.0%
Enrollment in Compensatory Programs
Program
Program % of Student Enrollment Population
Special Education (Grades K-12)
41 11.4%
(PK)
2
N/A
English to Speakers of Other Languages (ESOL) (Grades K-12)
0
0.0%
Remedial Education (Grades 2-5, 9-12)
16
8.9%
Special Instructional Assistance (SIA) (Grades K-3)
48 22.1%
Title I (Grades K-12)
This school has a Targeted Assistance program.
Total 10
Retained Students, by Race/Ethnicity and Sex
Black
White Hispanic
American MultiAsian Indian racial
0
10
0.0% 100.0%
0 0.0%
0 0.0%
0 0.0%
0 0.0%
Male Female
6
4
60.0% 40.0%
Prepared by Georgia Department of Education
Page 1
STATE-REQUIRED TEST DATA
NORM-REFERENCED TESTS Grade 3
Iowa Tests of Basic Skills (ITBS) Each chart reflects data for three years of testing.
Reading Comprehension 50
61 65 54 0
98-99
55 63 53 97-98
56 61 52 96-97
Mathematics
School 50
System
State
0
64 75 61 98-99
57 71 61 97-98
62 68 59 96-97
School System State
Reading Vocabulary 50
50 62 50 0
98-99
49 58 50 97-98
54 59 49 96-97
Language Arts
School 50
System
State
0
64 74 64 98-99
45 66 62 97-98
47 61 59 96-97
School System State
Social Studies 50
54 67 56 0
98-99
62 64 55 97-98
63 64 55 96-97
Science
School 50
System
State
0
65 74 59 98-99
63 70 59 97-98
75 68 58 96-97
School System State
Sources of Information
Composite Score
50
67 70 57 0
98-99
School 50
System
57 66 56 97-98
58 65 55 96-97
State 0
61 71 58 98-99
55 67 57 97-98
1998-99 GEORGIA PUBLIC EDUCATION REPORT CARD Clayton Elementary School - 6281052
Prepared by Georgia Department of Education
60 64 56 96-97
Scores Reported in Percentiles
School System State
Page 2
STATE-REQUIRED TEST DATA
NORM-REFERENCED TESTS Grade 5
Iowa Tests of Basic Skills (ITBS) Each chart reflects data for three years of testing.
Reading Comprehension
Mathematics
50
58 61 53 0
98-99
61 60 53 97-98
62 61 52 96-97
School 50
System
State
0
55 68 59 98-99
69 67 58 97-98
62 65 57 96-97
School System State
Reading Vocabulary 50
47 59 48 0
98-99
54 58 48 97-98
55 59 46 96-97
Language Arts
School 50
System
State
0
50 70 63 98-99
64 67 61 97-98
49 66 58 96-97
School System State
Social Studies 50
64 67 57 0
98-99
63 66 56 97-98
54 64 55 96-97
Science
School 50
System
State
0
61 71 60 98-99
65 70 59 97-98
62 70 59 96-97
School System State
Sources of Information
Composite Score
50
61 67 58 0
98-99
School 50
System
64 66 58 97-98
58 67 57 96-97
State 0
57 67 57 98-99
64 66 56 97-98
56 66 55 96-97
1998-99 GEORGIA PUBLIC EDUCATION REPORT CARD Clayton Elementary School - 6281052
Prepared by Georgia Department of Education
Scores Reported in Percentiles
School System State
Page 3
STATE-REQUIRED TEST DATA
PERFORMANCE ASSESSMENTS
Grade 5 Writing Assessment
Percent at Developmental Stages:
1998-99 School System State
1997-98 School System State
1996-97 School System State
Stage Stage Stage Stage Stage Stage
1:The Emerging Writer 2:The Developing Writer 3:The Focusing Writer 4:The Experimenting 5:The Engaging Writer 6:The Extending Writer
3% 3% 16% 37% 37% 5%
0% 1% 12% 36% 34% 17%
0% 1% 16% 41% 29% 12%
0% 0% 5% 50% 43% 3%
0% 1% 11% 45% 33% 9%
0% 3% 19% 41% 27% 10%
0% 4% 15% 47% 26% 9%
0% 2% 14% 37% 34% 14%
0% 3% 21% 37% 26% 12%
AWARDS / RECOGNITION DATA
Schools in Georgia may receive recognition in the following programs: Charter School Pay for Performance Program Georgia School of Excellence National Blue Ribbon School Clayton Elementary School did not receive recognition in any of these programs during the 1998-99 school year.
1998-99 GEORGIA PUBLIC EDUCATION REPORT CARD Clayton Elementary School - 6281052
Prepared by Georgia Department of Education
Page 4
CERTIFIED PERSONNEL DATA
Positions Number Average Contract Days
Personnel Sex
Certificate
Years Experience
Full-time Part-time
Male Female
4 Yr Bachelor's 5 Yr Master's 6 Yr Specialist's 7 Yr Doctoral Other*
<1 1-10 11-20 21-30 >30
Average
Administrators
1.00 210.00
1 0
1 0
0 1 0 0 0 0 0 0 0 1 37.00
Support Personnel
1.00 190.00
1 0
0 1
1 0 0 0 0 0 0 0 0 1 37.00
PK-12 Teachers
20.00 190.00
20 0
1 19
9 8 3 0 0 1 7 8 4 0 13.55
*Includes One- and Two-Year Vocational Certificates.
ACCREDITATION DATA
Accredited by Southern Association of Colleges and Schools (SACS):
Elementary/Middle Commission. Accredited with Quality by Georgia
Accrediting Commission (GAC).
1998-99 GEORGIA PUBLIC EDUCATION REPORT CARD Clayton Elementary School - 6281052
Prepared by Georgia Department of Education
Page 5
1998-99 GEORGIA PUBLIC EDUCATION REPORT CARD
CHEROKEE COUNTY SCHOOLS
Etowah High School - 6280176
Grade Range 9-12
The Georgia Public Education Report Card is designed to assist systems and schools in educational improvement. This report card contains a variety of data elements. An explanation of the terms is provided as a companion to the report card data. Please refer to the definitions for the most effective use of the reported data.
Total 1,408
STUDENT DATA
9-12 Enrollment, by Race/Ethnicity and Sex
Black
White Hispanic
American Multi-
Asian Indian
racial
40 2.8%
1,332 94.6%
25 1.8%
11 0.8%
0 0.0%
0 0.0%
Male Female
729 51.8%
679 48.2%
Enrollment in Selected Programs
Program
Gifted (Grades K-12)
Program % of Student Enrollment Population
140
9.9%
Non-Vocational Labs (Grades 9-12)
Vocational Labs (Grades 9-12)
Alternative Programs (Grades 6-12)
1,223 740 12
86.9% 52.6%
< 1%
Students Eligible to Receive Free/Reduced Lunches
Number
Percent
School System
57 3,428
4.0% 14.1%
Enrollment in Compensatory Programs
Program
Program % of Student Enrollment Population
Special Education (Grades K-12) PK
120
8.5%
0
N/A
English to Speakers of Other Languages (ESOL) (Grades K-12)
3
< 1%
Remedial Education (Grades 2-5, 9-12)
20
1.4%
Title I (Grades K-12)
This school has no Title I program.
Dropout Rate for Grades 9-12
Number
Rate
School System
28
1.8%
275
3.9%
Total 0
Retained Students, by Race/Ethnicity and Sex
Black
White Hispanic
American MultiAsian Indian racial
0
0
0
0
0
0
Male Female
0
0
Prepared by Georgia Department of Education
Page 1
STATE-REQUIRED TEST DATA
GEORGIA HIGH SCHOOL GRADUATION TESTS (GHSGT)
Percent of Regular Program 11th Graders Passing the Georgia High School Graduation Tests on First Administration
English Language Arts Mathematics Social Studies Science
All Components listed above
Writing
1998-99
School System State
98% 95% 90% 87%
98% 95% 87% 84%
96% 88% 80% 72%
82% 80% 68%
97% 96% 93%
1997-98
School System State
99% 96% 85% 86%
98% 95% 87% 84%
94% 88% 78% 74%
80% 80% 68%
94% 94% 92%
1996-97
School System State
98% 95% 87% 85%
99% 96% 87% 86%
94% 87% 78% 74%
80% 81% 67%
97% 96% 93%
GRADUATE DATA
1999 Graduates by Credentials, Race/Ethnicity and Sex
Diplomas with Both College Prep. & Voc. Endorsements
Diplomas with College Prep. Endorsements Diplomas with Vocational Endorsements General High School Diplomas Special Education Diplomas
Total All Diplomas
Certificates of Performance
Total Graduates
Total 53
133 69 4 1
260 0
Black
4 7.5%
4 3.0%
3 4.3%
0 0.0%
0 0.0%
11 4.2%
0
American MultiWhite Hispanic Asian Indian racial
49 92.5%
0 0.0%
0 0.0%
0 0.0%
0 0.0%
127 95.5%
0 0.0%
2 1.5%
0 0.0%
0 0.0%
64 92.8%
1 1.4%
1 1.4%
0 0.0%
0 0.0%
4 100.0%
0 0.0%
0 0.0%
0 0.0%
0 0.0%
1 100.0%
0 0.0%
0 0.0%
0 0.0%
0 0.0%
245 94.2%
1 0.4%
3 1.2%
0 0.0%
0 0.0%
0
0
0
0
0
Male Female
23
30
43.4% 56.6%
59
74
44.4% 55.6%
45
24
65.2% 34.8%
3
1
75.0% 25.0%
1 100.0%
0 0.0%
131
129
50.4% 49.6%
0
0
260
11
245
1
3
0
0
131
129
4.2% 94.2% 0.4% 1.2% 0.0% 0.0% 50.4% 49.6%
HOPE Scholarships
School System
Number of 1999 Graduates 2 6 0
Number Eligible
199
Percent Eligible
76.5%
1,170 853
72.9%
State
65,548 40,292 61.5%
High School Completion Rate
Percent of 1995Grade 9 Enrollment in Graduating Class of1999 School System State
Completion Rate '95-'99 83.1% 80.0% 68.9%
1998-99 GEORGIA PUBLIC EDUCATION REPORT CARD
Etowah High School - 6280176
Prepared by Georgia Department of Education
Page 2
COLLEGE ADMISSIONS / CREDIT TEST DATA
Scholastic Assessment Test (SAT)
Based on students' highest verbal and highest math scores
No. Taking
Average Score
Tests Verbal Math Total
Based on students' last test administration
Average Score Verbal Math Total
School
200
College Prep. Endorsement
Other Diplomas
System
762
College Prep. Endorsement
Other Diplomas
Georgia
41,958
512 502 1014
518 507 1025
408 379
787
515 505 1020 521 511 1032
429 407
836
492 488
980
502 N/A N/A
507 N/A N/A
483
493 N/A N/A
498 N/A N/A
479
995 N/A N/A
1005 N/A N/A
962
Nation
952,913 N/A N/A N/A
502 508 1010
American College Testing (ACT)
Advanced Placement Exams (AP)
Number taking tests: English Mathematics Reading Science Reasoning CompositeScore
9 1 School System State
18.9 19.5 19.1
19.8 20.2 19.9
20.6 20.3
20.6 20.4
20.2 19.9
20.0 20.3 19.9
No. of Students Taking Tests
No. of Tests Taken No. of Test Scores
3 or Higher Percent of Test
Scores 3 or Higher
School 51 93 57
61.3%
System State 255 15,225 433 23,969 283 13,024
65.4% 54.3%
POST-SECONDARY DATA
Graduates Entering Georgia Public Colleges
Graduates Entering Georgia Public Colleges and Requiring Learning Support (LS)
1998 Graduates Entering in 1998-99
1997 Graduates Entering in 1997-98
Percent of Graduating Number Class
School
122
42.5%
System 373
37.9%
School
133
40.8%
System 358
39.0%
Number Requiring
LS 9 33
29 68
Percent of those attending Georgia
Public Colleges
7.4%
8.8%
21.8%
19.0%
In previous years, the Report Card presented College Prep Curriculum information provided by the Board of Regents on students requiring Learning Support. Due to inconsistencies in the data provided by the Board of Regents in defining College Prep Completers versus Local Board of Education data defining College Prep Endorsements, the Department of Education Report Card will not provide this information until discrepancies can be reconciled.
Graduates Entering Georgia Public Technical and Adult Schools
1998 Graduates School System
Entering Number 10 36
1998-99 Percent
3.5% 3.7%
Entering Number N/A N/A
1997-98 Percent
N/A N/A
1997 Graduates School
1
0.3%
System
3
0.3%
20
6.1%
93
10.1%
1998-99 GEORGIA PUBLIC EDUCATION REPORT CARD Etowah High School - 6280176
Prepared by Georgia Department of Education
Page 3
CERTIFIED PERSONNEL DATA
Positions Number Average Contract Days
Administrators
4.00 215.00
Support Personnel
7.00 192.86
PK-12 Teachers
87.97 190.57
Personnel Sex
Certificate
Years Experience
Full-time Part-time
Male Female
4 Yr Bachelor's 5 Yr Master's 6 Yr Specialist's 7 Yr Doctoral Other*
<1 1-10 11-20 21-30 >30
Average
4 0
3 1
0 1 3 0 0
0 0 1 3 0
23.00
7 0
1 6
1 5 1 0 0
0 2 4 1 0
15.57
88 0
30 58
36 39
8 1 4
2 31 35 19
1
14.34
*Includes One- and Two-Year Vocational Certificates.
ACCREDITATION DATA
Accredited by Southern Association of Colleges and Schools (SACS): Secondary/Middle Commission. Accredited with Quality by Georgia Accrediting Commission (GAC).
AWARDS / RECOGNITION DATA
Schools in Georgia may receive recognition in the following programs: Charter School Pay for Performance Program Georgia School of Excellence National Blue Ribbon School Etowah High School did not receive recognition in any of these programs during the 1998-99 school year.
1998-99 GEORGIA PUBLIC EDUCATION REPORT CARD Etowah High School - 6280176
Prepared by Georgia Department of Education
Page 4
1998-99 GEORGIA PUBLIC EDUCATION REPORT CARD
CHEROKEE COUNTY SCHOOLS
Free Home Elementary School - 6282052
Grade Range K-6
The Georgia Public Education Report Card is designed to assist systems and schools in educational improvement. This report card contains a variety of data elements. An explanation of the terms is provided as a companion to the report card data. Please refer to the definitions for the most effective use of the reported data.
STUDENT DATA
Total 360
K-6 Enrollment, by Race/Ethnicity and Sex
Black
White Hispanic
American Multi-
Asian Indian
racial
2 0.6%
354 98.3%
4 1.1%
0 0.0%
0 0.0%
0 0.0%
Male Female
179 49.7%
181 50.3%
Enrollment in Selected Programs
Program
Program % of Student Enrollment Population
Gifted (Grades K-12)
15
4.2%
Alternative Programs (Grades 6-12)
0
0.0%
Students Eligible to Receive Free/Reduced Lunches
Number
Percent
School System
52 3,428
14.4% 14.1%
Dropout Rate for Grade 6
Number
Rate
School System
0
0.0%
1
0.0%
Enrollment in Compensatory Programs
Program
Program % of Student Enrollment Population
Special Education (Grades K-12)
43 11.9%
(PK)
0
N/A
English to Speakers of Other Languages (ESOL) (Grades K-12)
0
0.0%
Remedial Education (Grades 2-5, 9-12)
37 16.4%
Special Instructional Assistance (SIA) (Grades K-3)
19
9.5%
Title I (Grades K-12)
This school has no Title I program.
Total 10
Retained Students, by Race/Ethnicity and Sex
Black
White Hispanic
American Multi-
Asian Indian
racial
0
10
0.0% 100.0%
0 0.0%
0 0.0%
0 0.0%
0 0.0%
Male Female
5
5
50.0% 50.0%
Prepared by Georgia Department of Education
Page 1
STATE-REQUIRED TEST DATA
NORM-REFERENCED TESTS Grade 3
Iowa Tests of Basic Skills (ITBS) Each chart reflects data for three years of testing.
Reading Comprehension 50
68 65 54 0
98-99
73 63 53 97-98
57 61 52 96-97
Mathematics
School 50
System
State
0
79 75 61 98-99
84 71 61 97-98
76 68 59 96-97
School System State
Reading Vocabulary 50
68 62 50 0
98-99
67 58 50 97-98
58 59 49 96-97
Language Arts
School 50
System
State
0
76 74 64 98-99
73 66 62 97-98
54 61 59 96-97
School System State
Social Studies 50
73 67 56 0
98-99
73 64 55 97-98
69 64 55 96-97
Science
School 50
System
State
0
77 74 59 98-99
81 70 59 97-98
69 68 58 96-97
School System State
Sources of Information
Composite Score
50
71 70 57 0
98-99
School 50
System
77 66 56 97-98
69 65 55 96-97
State 0
75 71 58 98-99
78 67 57 97-98
1998-99 GEORGIA PUBLIC EDUCATION REPORT CARD Free Home Elementary School - 6282052
Prepared by Georgia Department of Education
66 64 56 96-97
Scores Reported in Percentiles
School System State
Page 2
STATE-REQUIRED TEST DATA
NORM-REFERENCED TESTS Grade 5
Iowa Tests of Basic Skills (ITBS) Each chart reflects data for three years of testing.
Reading Comprehension
Mathematics
50
56 61 53 0
98-99
53 60 53 97-98
59 61 52 96-97
School 50
System
State
0
65 68 59 98-99
65 67 58 97-98
52 65 57 96-97
School System State
Reading Vocabulary 50
57 59 48 0
98-99
56 58 48 97-98
52 59 46 96-97
Language Arts
School 50
System
State
0
69 70 63 98-99
54 67 61 97-98
44 66 58 96-97
School System State
Social Studies 50
65 67 57 0
98-99
61 66 56 97-98
59 64 55 96-97
Science
School 50
System
State
0
67 71 60 98-99
64 70 59 97-98
67 70 59 96-97
School System State
Sources of Information
Composite Score
50
65 67 58 0
98-99
School 50
System
56 66 58 97-98
56 67 57 96-97
State 0
64 67 57 98-99
58 66 56 97-98
55 66 55 96-97
1998-99 GEORGIA PUBLIC EDUCATION REPORT CARD Free Home Elementary School - 6282052
Prepared by Georgia Department of Education
Scores Reported in Percentiles
School System State
Page 3
STATE-REQUIRED TEST DATA
PERFORMANCE ASSESSMENTS
Grade 5 Writing Assessment
Percent at Developmental Stages:
1998-99 School System State
1997-98 School System State
1996-97 School System State
Stage Stage Stage Stage Stage Stage
1:The Emerging Writer 2:The Developing Writer 3:The Focusing Writer 4:The Experimenting 5:The Engaging Writer 6:The Extending Writer
0% 0% 15% 51% 30% 4%
0% 1% 12% 36% 34% 17%
0% 1% 16% 41% 29% 12%
0% 0% 15% 44% 33% 5%
0% 1% 11% 45% 33% 9%
0% 3% 19% 41% 27% 10%
0% 0% 23% 38% 29% 10%
0% 2% 14% 37% 34% 14%
0% 3% 21% 37% 26% 12%
AWARDS / RECOGNITION DATA
Schools in Georgia may receive recognition in the following programs: Charter School Pay for Performance Program Georgia School of Excellence National Blue Ribbon School Free Home Elementary School did not receive recognition in any of these programs during the 1998-99 school year.
1998-99 GEORGIA PUBLIC EDUCATION REPORT CARD Free Home Elementary School - 6282052
Prepared by Georgia Department of Education
Page 4
CERTIFIED PERSONNEL DATA
Positions Number Average Contract Days
Personnel Sex
Certificate
Years Experience
Full-time Part-time
Male Female
4 Yr Bachelor's 5 Yr Master's 6 Yr Specialist's 7 Yr Doctoral Other*
<1 1-10 11-20 21-30 >30
Average
Administrators
1.00 210.00
1 0
1 0
0 0 1 0 0 0 0 0 1 0 27.00
Support Personnel
2.00 190.00
2 0
1 1
0 2 0 0 0 0 0 1 1 0 16.50
PK-12 Teachers
23.00 190.00
23 0
2 21
8 13
2 0 0 1 2 14 5 1 16.96
*Includes One- and Two-Year Vocational Certificates.
ACCREDITATION DATA
Accredited by Southern Association of Colleges and Schools (SACS):
Elementary/Middle Commission. Accredited by Georgia Accrediting
Commission (GAC).
1998-99 GEORGIA PUBLIC EDUCATION REPORT CARD Free Home Elementary School - 6282052
Prepared by Georgia Department of Education
Page 5
1998-99 GEORGIA PUBLIC EDUCATION REPORT CARD
CHEROKEE COUNTY SCHOOLS
Hickory Flat Elementary School - 6283052
Grade Range K-6
The Georgia Public Education Report Card is designed to assist systems and schools in educational improvement. This report card contains a variety of data elements. An explanation of the terms is provided as a companion to the report card data. Please refer to the definitions for the most effective use of the reported data.
STUDENT DATA
Total 887
K-6 Enrollment, by Race/Ethnicity and Sex
Black
White Hispanic
American Multi-
Asian Indian
racial
9 1.0%
863 97.3%
10 1.1%
1 0.1%
2 0.2%
2 0.2%
Male Female
444 50.1%
443 49.9%
Enrollment in Selected Programs
Program
Program % of Student Enrollment Population
Gifted (Grades K-12)
35
3.9%
Alternative Programs (Grades 6-12)
0
0.0%
Students Eligible to Receive Free/Reduced Lunches
Number
Percent
School System
86 3,428
9.7% 14.1%
Dropout Rate for Grade 6
Number
Rate
School System
0
0.0%
1
0.0%
Enrollment in Compensatory Programs
Program
Program % of Student Enrollment Population
Special Education (Grades K-12)
84
9.5%
(PK)
5
N/A
English to Speakers of Other Languages (ESOL) (Grades K-12)
7
< 1%
Remedial Education (Grades 2-5, 9-12)
41
8.1%
Special Instructional Assistance (SIA) (Grades K-3)
0
0.0%
Title I (Grades K-12)
This school has no Title I program.
Total 9
Retained Students, by Race/Ethnicity and Sex
Black
White Hispanic
American Multi-
Asian Indian
racial
0
9
0.0% 100.0%
0 0.0%
0 0.0%
0 0.0%
0 0.0%
Male Female
6
3
66.7% 33.3%
Prepared by Georgia Department of Education
Page 1
STATE-REQUIRED TEST DATA
NORM-REFERENCED TESTS Grade 3
Iowa Tests of Basic Skills (ITBS) Each chart reflects data for three years of testing.
Reading Comprehension 50
63 65 54 0
98-99
66 63 53 97-98
60 61 52 96-97
Mathematics
School 50
System
State
0
73 75 61 98-99
75 71 61 97-98
63 68 59 96-97
School System State
Reading Vocabulary 50
69 62 50 0
98-99
62 58 50 97-98
55 59 49 96-97
Language Arts
School 50
System
State
0
79 74 64 98-99
75 66 62 97-98
57 61 59 96-97
School System State
Social Studies 50
71 67 56 0
98-99
67 64 55 97-98
70 64 55 96-97
Science
School 50
System
State
0
73 74 59 98-99
77 70 59 97-98
71 68 58 96-97
School System State
Sources of Information
Composite Score
50
72 70 57 0
98-99
School 50
System
73 66 56 97-98
64 65 55 96-97
State 0
74 71 58 98-99
74 67 57 97-98
1998-99 GEORGIA PUBLIC EDUCATION REPORT CARD Hickory Flat Elementary School - 6283052
Prepared by Georgia Department of Education
64 64 56 96-97
Scores Reported in Percentiles
School System State
Page 2
STATE-REQUIRED TEST DATA
NORM-REFERENCED TESTS Grade 5
Iowa Tests of Basic Skills (ITBS) Each chart reflects data for three years of testing.
Reading Comprehension
Mathematics
50
63 61 53 0
98-99
68 60 53 97-98
62 61 52 96-97
School 50
System
State
0
71 68 59 98-99
73 67 58 97-98
68 65 57 96-97
School System State
Reading Vocabulary 50
62 59 48 0
98-99
61 58 48 97-98
58 59 46 96-97
Language Arts
School 50
System
State
0
73 70 63 98-99
76 67 61 97-98
67 66 58 96-97
School System State
Social Studies 50
70 67 57 0
98-99
73 66 56 97-98
67 64 55 96-97
Science
School 50
System
State
0
72 71 60 98-99
77 70 59 97-98
72 70 59 96-97
School System State
Sources of Information
Composite Score
50
71 67 58 0
98-99
School 50
System
72 66 58 97-98
65 67 57 96-97
State 0
72 67 57 98-99
74 66 56 97-98
67 66 55 96-97
1998-99 GEORGIA PUBLIC EDUCATION REPORT CARD Hickory Flat Elementary School - 6283052
Prepared by Georgia Department of Education
Scores Reported in Percentiles
School System State
Page 3
STATE-REQUIRED TEST DATA
PERFORMANCE ASSESSMENTS
Grade 5 Writing Assessment
Percent at Developmental Stages:
1998-99 School System State
1997-98 School System State
1996-97 School System State
Stage Stage Stage Stage Stage Stage
1:The Emerging Writer 2:The Developing Writer 3:The Focusing Writer 4:The Experimenting 5:The Engaging Writer 6:The Extending Writer
0% 0% 9% 39% 36% 16%
0% 1% 12% 36% 34% 17%
0% 1% 16% 41% 29% 12%
0% 0% 9% 44% 35% 12%
0% 1% 11% 45% 33% 9%
0% 3% 19% 41% 27% 10%
0% 2% 22% 35% 29% 11%
0% 2% 14% 37% 34% 14%
0% 3% 21% 37% 26% 12%
AWARDS / RECOGNITION DATA
Schools in Georgia may receive recognition in the following programs: Charter School Pay for Performance Program Georgia School of Excellence National Blue Ribbon School Hickory Flat Elementary School did not receive recognition in any of these programs during the 1998-99 school year.
1998-99 GEORGIA PUBLIC EDUCATION REPORT CARD Hickory Flat Elementary School - 6283052
Prepared by Georgia Department of Education
Page 4
CERTIFIED PERSONNEL DATA
Positions Number Average Contract Days
Personnel Sex
Certificate
Years Experience
Full-time Part-time
Male Female
4 Yr Bachelor's 5 Yr Master's 6 Yr Specialist's 7 Yr Doctoral Other*
<1 1-10 11-20 21-30 >30
Average
Administrators
2.00 202.50
2 0
1 1
0 1 1 0 0 0 0 1 1 0 17.00
Support Personnel
3.00 190.00
3 0
0 3
0 3 0 0 0 0 0 2 1 0 20.33
PK-12 Teachers
46.00 190.00
46 0
3 43
25 18
3 0 0 3 14 17 12 0 14.33
*Includes One- and Two-Year Vocational Certificates.
ACCREDITATION DATA
Accredited by Southern Association of Colleges and Schools (SACS):
Elementary/Middle Commission. Accredited by Georgia Accrediting
Commission (GAC).
1998-99 GEORGIA PUBLIC EDUCATION REPORT CARD Hickory Flat Elementary School - 6283052
Prepared by Georgia Department of Education
Page 5
1998-99 GEORGIA PUBLIC EDUCATION REPORT CARD
CHEROKEE COUNTY SCHOOLS
Holly Springs Elementary School - 6284052
Grade Range K-6
The Georgia Public Education Report Card is designed to assist systems and schools in educational improvement. This report card contains a variety of data elements. An explanation of the terms is provided as a companion to the report card data. Please refer to the definitions for the most effective use of the reported data.
STUDENT DATA
Total 693
K-6 Enrollment, by Race/Ethnicity and Sex
Black
White Hispanic
American Multi-
Asian Indian
racial
5 0.7%
663 95.7%
24 3.5%
0 0.0%
0 0.0%
1 0.1%
Male Female
361 52.1%
332 47.9%
Enrollment in Selected Programs
Program
Program % of Student Enrollment Population
Gifted (Grades K-12)
17
2.5%
Alternative Programs (Grades 6-12)
0
0.0%
Students Eligible to Receive Free/Reduced Lunches
Number
Percent
School System
134 3,428
19.3% 14.1%
Dropout Rate for Grade 6
Number
Rate
School System
0
0.0%
1
0.0%
Enrollment in Compensatory Programs
Program
Program % of Student Enrollment Population
Special Education (Grades K-12)
79 11.4%
(PK)
3
N/A
English to Speakers of Other Languages (ESOL) (Grades K-12)
5
< 1%
Remedial Education (Grades 2-5, 9-12)
74 18.5%
Special Instructional Assistance (SIA) (Grades K-3)
49 12.1%
Title I (Grades K-12)
This school has a Targeted Assistance program.
Total 7
Retained Students, by Race/Ethnicity and Sex
Black
White Hispanic
American Multi-
Asian Indian
racial
0
7
0.0% 100.0%
0 0.0%
0 0.0%
0 0.0%
0 0.0%
Male Female
5
2
71.4% 28.6%
Prepared by Georgia Department of Education
Page 1
STATE-REQUIRED TEST DATA
NORM-REFERENCED TESTS Grade 3
Iowa Tests of Basic Skills (ITBS) Each chart reflects data for three years of testing.
Reading Comprehension 50
74 65 54 0
98-99
62 63 53 97-98
62 61 52 96-97
Mathematics
School 50
System
State
0
88 75 61 98-99
70 71 61 97-98
74 68 59 96-97
School System State
Reading Vocabulary 50
68 62 50 0
98-99
58 58 50 97-98
61 59 49 96-97
Language Arts
School 50
System
State
0
89 74 64 98-99
65 66 62 97-98
61 61 59 96-97
School System State
Social Studies 50
76 67 56 0
98-99
65 64 55 97-98
66 64 55 96-97
Science
School 50
System
State
0
86 74 59 98-99
74 70 59 97-98
69 68 58 96-97
School System State
Sources of Information
Composite Score
50
84 70 57 0
98-99
School 50
System
66 66 56 97-98
69 65 55 96-97
State 0
85 71 58 98-99
67 67 57 97-98
1998-99 GEORGIA PUBLIC EDUCATION REPORT CARD Holly Springs Elementary School - 6284052
Prepared by Georgia Department of Education
67 64 56 96-97
Scores Reported in Percentiles
School System State
Page 2
STATE-REQUIRED TEST DATA
NORM-REFERENCED TESTS Grade 5
Iowa Tests of Basic Skills (ITBS) Each chart reflects data for three years of testing.
Reading Comprehension
Mathematics
50
60 61 53 0
98-99
50 60 53 97-98
55 61 52 96-97
School 50
System
State
0
67 68 59 98-99
62 67 58 97-98
56 65 57 96-97
School System State
Reading Vocabulary 50
54 59 48 0
98-99
53 58 48 97-98
56 59 46 96-97
Language Arts
School 50
System
State
0
66 70 63 98-99
52 67 61 97-98
56 66 58 96-97
School System State
Social Studies 50
66 67 57 0
98-99
58 66 56 97-98
55 64 55 96-97
Science
School 50
System
State
0
71 71 60 98-99
64 70 59 97-98
59 70 59 96-97
School System State
Sources of Information
Composite Score
50
69 67 58 0
98-99
School 50
System
57 66 58 97-98
64 67 57 96-97
State 0
66 67 57 98-99
56 66 56 97-98
58 66 55 96-97
1998-99 GEORGIA PUBLIC EDUCATION REPORT CARD Holly Springs Elementary School - 6284052
Prepared by Georgia Department of Education
Scores Reported in Percentiles
School System State
Page 3
STATE-REQUIRED TEST DATA
PERFORMANCE ASSESSMENTS
Grade 5 Writing Assessment
Percent at Developmental Stages:
1998-99 School System State
1997-98 School System State
1996-97 School System State
Stage Stage Stage Stage Stage Stage
1:The Emerging Writer 2:The Developing Writer 3:The Focusing Writer 4:The Experimenting 5:The Engaging Writer 6:The Extending Writer
1% 2% 24% 32% 24% 15%
0% 1% 12% 36% 34% 17%
0% 1% 16% 41% 29% 12%
0% 1% 19% 45% 31% 3%
0% 1% 11% 45% 33% 9%
0% 3% 19% 41% 27% 10%
0% 4% 16% 34% 29% 16%
0% 2% 14% 37% 34% 14%
0% 3% 21% 37% 26% 12%
AWARDS / RECOGNITION DATA
Schools in Georgia may receive recognition in the following programs: Charter School Pay for Performance Program Georgia School of Excellence National Blue Ribbon School Holly Springs Elementary School did not receive recognition in any of these programs during the 1998-99 school year.
1998-99 GEORGIA PUBLIC EDUCATION REPORT CARD Holly Springs Elementary School - 6284052
Prepared by Georgia Department of Education
Page 4
CERTIFIED PERSONNEL DATA
Positions Number Average Contract Days
Personnel Sex
Certificate
Years Experience
Full-time Part-time
Male Female
4 Yr Bachelor's 5 Yr Master's 6 Yr Specialist's 7 Yr Doctoral Other*
<1 1-10 11-20 21-30 >30
Average
Administrators
2.00 202.50
2 0
1 1
0 1 1 0 0 0 0 1 1 0 19.50
Support Personnel
2.60 172.46
2 1
0 3
0 2 1 0 0 0 2 1 0 0 8.67
PK-12 Teachers
42.00 190.00
42 0
0 42
22 19
1 0 0 3 12 15 12 0 14.05
*Includes One- and Two-Year Vocational Certificates.
ACCREDITATION DATA
Accredited by Southern Association of Colleges and Schools (SACS):
Elementary/Middle Commission. Accredited by Georgia Accrediting
Commission (GAC).
1998-99 GEORGIA PUBLIC EDUCATION REPORT CARD Holly Springs Elementary School - 6284052
Prepared by Georgia Department of Education
Page 5
1998-99 GEORGIA PUBLIC EDUCATION REPORT CARD
CHEROKEE COUNTY SCHOOLS
Johnston Elementary School - 6280182
Grade Range K-6
The Georgia Public Education Report Card is designed to assist systems and schools in educational improvement. This report card contains a variety of data elements. An explanation of the terms is provided as a companion to the report card data. Please refer to the definitions for the most effective use of the reported data.
STUDENT DATA
Total 834
K-6 Enrollment, by Race/Ethnicity and Sex
Black
White Hispanic
American Multi-
Asian Indian
racial
17 2.0%
792 95.0%
20 2.4%
2 0.2%
1 0.1%
2 0.2%
Male Female
434 52.0%
400 48.0%
Enrollment in Selected Programs
Program
Program % of Student Enrollment Population
Gifted (Grades K-12)
20
2.4%
Alternative Programs (Grades 6-12)
0
0.0%
Students Eligible to Receive Free/Reduced Lunches
Number
Percent
School System
145 3,428
17.4% 14.1%
Dropout Rate for Grade 6
Number
Rate
School System
1
0.9%
1
0.0%
Enrollment in Compensatory Programs
Program
Program % of Student Enrollment Population
Special Education (Grades K-12)
103 12.4%
(PK)
45
N/A
English to Speakers of Other Languages (ESOL) (Grades K-12)
8
1.0%
Remedial Education (Grades 2-5, 9-12)
87 17.8%
Special Instructional Assistance (SIA) (Grades K-3)
47
9.5%
Title I (Grades K-12)
This school has no Title I program.
Total 29
Retained Students, by Race/Ethnicity and Sex
Black
White Hispanic
American Multi-
Asian Indian
racial
1 3.4%
24 82.8%
4 13.8%
0 0.0%
0 0.0%
0 0.0%
Male Female
18
11
62.1% 37.9%
Prepared by Georgia Department of Education
Page 1
STATE-REQUIRED TEST DATA
NORM-REFERENCED TESTS Grade 3
Iowa Tests of Basic Skills (ITBS) Each chart reflects data for three years of testing.
Reading Comprehension 50
64 65 54 0
98-99
55 63 53 97-98
60 61 52 96-97
Mathematics
School 50
System
State
0
72 75 61 98-99
64 71 61 97-98
73 68 59 96-97
School System State
Reading Vocabulary 50
68 62 50 0
98-99
54 58 50 97-98
66 59 49 96-97
Language Arts
School 50
System
State
0
72 74 64 98-99
66 66 62 97-98
70 61 59 96-97
School System State
Social Studies 50
68 67 56 0
98-99
59 64 55 97-98
69 64 55 96-97
Science
School 50
System
State
0
74 74 59 98-99
60 70 59 97-98
76 68 58 96-97
School System State
Sources of Information
Composite Score
50
72 70 57 0
98-99
School 50
System
63 66 56 97-98
69 65 55 96-97
State 0
71 71 58 98-99
61 67 57 97-98
1998-99 GEORGIA PUBLIC EDUCATION REPORT CARD Johnston Elementary School - 6280182
Prepared by Georgia Department of Education
71 64 56 96-97
Scores Reported in Percentiles
School System State
Page 2
STATE-REQUIRED TEST DATA
NORM-REFERENCED TESTS Grade 5
Iowa Tests of Basic Skills (ITBS) Each chart reflects data for three years of testing.
Reading Comprehension
Mathematics
50
61 61 53 0
98-99
60 60 53 97-98
57 61 52 96-97
School 50
System
State
0
70 68 59 98-99
72 67 58 97-98
66 65 57 96-97
School System State
Reading Vocabulary 50
61 59 48 0
98-99
61 58 48 97-98
60 59 46 96-97
Language Arts
School 50
System
State
0
72 70 63 98-99
71 67 61 97-98
66 66 58 96-97
School System State
Social Studies 50
70 67 57 0
98-99
68 66 56 97-98
64 64 55 96-97
Science
School 50
System
State
0
73 71 60 98-99
74 70 59 97-98
70 70 59 96-97
School System State
Sources of Information
Composite Score
50
72 67 58 0
98-99
School 50
System
73 66 58 97-98
67 67 57 96-97
State 0
70 67 57 98-99
71 66 56 97-98
65 66 55 96-97
1998-99 GEORGIA PUBLIC EDUCATION REPORT CARD Johnston Elementary School - 6280182
Prepared by Georgia Department of Education
Scores Reported in Percentiles
School System State
Page 3
STATE-REQUIRED TEST DATA
PERFORMANCE ASSESSMENTS
Grade 5 Writing Assessment
Percent at Developmental Stages:
1998-99 School System State
1997-98 School System State
1996-97 School System State
Stage Stage Stage Stage Stage Stage
1:The Emerging Writer 2:The Developing Writer 3:The Focusing Writer 4:The Experimenting 5:The Engaging Writer 6:The Extending Writer
0% 0% 9% 38% 42% 11%
0% 1% 12% 36% 34% 17%
0% 1% 16% 41% 29% 12%
0% 0% 4% 51% 36% 9%
0% 1% 11% 45% 33% 9%
0% 3% 19% 41% 27% 10%
1% 1% 3% 49% 36% 10%
0% 2% 14% 37% 34% 14%
0% 3% 21% 37% 26% 12%
AWARDS / RECOGNITION DATA
Schools in Georgia may receive recognition in the following programs: Charter School Pay for Performance Program Georgia School of Excellence National Blue Ribbon School Johnston Elementary School did not receive recognition in any of these programs during the 1998-99 school year.
1998-99 GEORGIA PUBLIC EDUCATION REPORT CARD Johnston Elementary School - 6280182
Prepared by Georgia Department of Education
Page 4
CERTIFIED PERSONNEL DATA
Positions Number Average Contract Days
Personnel Sex
Certificate
Years Experience
Full-time Part-time
Male Female
4 Yr Bachelor's 5 Yr Master's 6 Yr Specialist's 7 Yr Doctoral Other*
<1 1-10 11-20 21-30 >30
Average
Administrators
3.00 200.00
3 0
0 3
0 0 2 1 0 0 0 1 2 0 21.00
Support Personnel
4.10 178.88
3 2
0 5
0 5 0 0 0 0 1 4 0 0 12.00
PK-12 Teachers
48.40 188.13
47 3
1 49
27 19
4 0 0 6 22 15 7 0 10.78
*Includes One- and Two-Year Vocational Certificates.
ACCREDITATION DATA
Accredited by Southern Association of Colleges and Schools (SACS):
Elementary/Middle Commission. Accredited with Quality by Georgia
Accrediting Commission (GAC).
1998-99 GEORGIA PUBLIC EDUCATION REPORT CARD Johnston Elementary School - 6280182
Prepared by Georgia Department of Education
Page 5
1998-99 GEORGIA PUBLIC EDUCATION REPORT CARD
CHEROKEE COUNTY SCHOOLS
Little River Elementary School - 6280177
Grade Range PK-6
The Georgia Public Education Report Card is designed to assist systems and schools in educational improvement. This report card contains a variety of data elements. An explanation of the terms is provided as a companion to the report card data. Please refer to the definitions for the most effective use of the reported data.
STUDENT DATA
Total
K-6
746
PK
15
Enrollment, by Race/Ethnicity and Sex
Black
White Hispanic
American Asian Indian
Multiracial
16 2.1%
694 93.0%
27 3.6%
7 0.9%
1 0.1%
1 0.1%
2 13.3%
13 86.7%
0 0.0%
0 0.0%
0 0.0%
0 0.0%
Male Female
368 49.3%
378 50.7%
12 80.0%
3 20.0%
Enrollment in Selected Programs
Program
Program % of Student Enrollment Population
Gifted (Grades K-12)
38
5.1%
Alternative Programs (Grades 6-12)
0
0.0%
Students Eligible to Receive Free/Reduced Lunches
Number
Percent
School System
84 3,428
11.0% 14.1%
Dropout Rate for Grade 6
Number
Rate
School System
0
0.0%
1
0.0%
Enrollment in Compensatory Programs
Program
Program % of Student Enrollment Population
Special Education (Grades K-12)
70
9.4%
(PK)
17
N/A
English to Speakers of Other Languages (ESOL) (Grades K-12)
7
< 1%
Remedial Education (Grades 2-5, 9-12)
58 13.2%
Special Instructional Assistance (SIA) (Grades K-3)
0
0.0%
Title I (Grades K-12)
This school has no Title I program.
Total 18
Retained Students, by Race/Ethnicity and Sex
Black
White Hispanic
American MultiAsian Indian racial
0 0.0%
17 94.4%
1 5.6%
0 0.0%
0 0.0%
0 0.0%
Male Female
6
12
33.3% 66.7%
Prepared by Georgia Department of Education
Page 1
STATE-REQUIRED TEST DATA
NORM-REFERENCED TESTS Grade 3
Iowa Tests of Basic Skills (ITBS) Each chart reflects data for three years of testing.
Reading Comprehension 50
63 65 54 0
98-99
64 63 53 97-98
68 61 52 96-97
Mathematics
School 50
System
State
0
77 75 61 98-99
68 71 61 97-98
74 68 59 96-97
School System State
Reading Vocabulary 50
62 62 50 0
98-99
62 58 50 97-98
65 59 49 96-97
Language Arts
School 50
System
State
0
66 74 64 98-99
56 66 62 97-98
62 61 59 96-97
School System State
Social Studies 50
64 67 56 0
98-99
61 64 55 97-98
65 64 55 96-97
Science
School 50
System
State
0
73 74 59 98-99
70 70 59 97-98
77 68 58 96-97
School System State
Sources of Information
Composite Score
50
69 70 57 0
98-99
School 50
System
67 66 56 97-98
68 65 55 96-97
State 0
68 71 58 98-99
64 67 57 97-98
1998-99 GEORGIA PUBLIC EDUCATION REPORT CARD Little River Elementary School - 6280177
Prepared by Georgia Department of Education
70 64 56 96-97
Scores Reported in Percentiles
School System State
Page 2
STATE-REQUIRED TEST DATA
NORM-REFERENCED TESTS Grade 5
Iowa Tests of Basic Skills (ITBS) Each chart reflects data for three years of testing.
Reading Comprehension
Mathematics
50
67 61 53 0
98-99
66 60 53 97-98
58 61 52 96-97
School 50
System
State
0
74 68 59 98-99
73 67 58 97-98
66 65 57 96-97
School System State
Reading Vocabulary 50
67 59 48 0
98-99
68 58 48 97-98
59 59 46 96-97
Language Arts
School 50
System
State
0
73 70 63 98-99
64 67 61 97-98
63 66 58 96-97
School System State
Social Studies 50
73 67 57 0
98-99
69 66 56 97-98
63 64 55 96-97
Science
School 50
System
State
0
78 71 60 98-99
77 70 59 97-98
66 70 59 96-97
School System State
Sources of Information
Composite Score
50
75 67 58 0
98-99
School 50
System
74 66 58 97-98
70 67 57 96-97
State 0
75 67 57 98-99
72 66 56 97-98
64 66 55 96-97
1998-99 GEORGIA PUBLIC EDUCATION REPORT CARD Little River Elementary School - 6280177
Prepared by Georgia Department of Education
Scores Reported in Percentiles
School System State
Page 3
STATE-REQUIRED TEST DATA
PERFORMANCE ASSESSMENTS
Grade 5 Writing Assessment
Percent at Developmental Stages:
1998-99 School System State
1997-98 School System State
1996-97 School System State
Stage Stage Stage Stage Stage Stage
1:The Emerging Writer 2:The Developing Writer 3:The Focusing Writer 4:The Experimenting 5:The Engaging Writer 6:The Extending Writer
0% 0% 8% 40% 33% 19%
0% 1% 12% 36% 34% 17%
0% 1% 16% 41% 29% 12%
0% 0% 5% 49% 36% 10%
0% 1% 11% 45% 33% 9%
0% 3% 19% 41% 27% 10%
0% 1% 12% 40% 35% 13%
0% 2% 14% 37% 34% 14%
0% 3% 21% 37% 26% 12%
AWARDS / RECOGNITION DATA
Schools in Georgia may receive recognition in the following programs: Charter School Pay for Performance Program Georgia School of Excellence National Blue Ribbon School Little River Elementary School did not receive recognition in any of these programs during the 1998-99 school year.
1998-99 GEORGIA PUBLIC EDUCATION REPORT CARD Little River Elementary School - 6280177
Prepared by Georgia Department of Education
Page 4
CERTIFIED PERSONNEL DATA
Positions Number Average Contract Days
Personnel Sex
Certificate
Years Experience
Full-time Part-time
Male Female
4 Yr Bachelor's 5 Yr Master's 6 Yr Specialist's 7 Yr Doctoral Other*
<1 1-10 11-20 21-30 >30
Average
Administrators
2.00 202.50
2 0
0 2
0 0 1 1 0 0 1 0 1 0 14.00
Support Personnel
4.00 190.00
4 0
1 3
0 4 0 0 0 0 1 3 0 0 10.75
PK-12 Teachers
43.80 189.31
43 1
2 42
29 14
1 0 0 10 12 17 4 1 10.23
*Includes One- and Two-Year Vocational Certificates.
ACCREDITATION DATA
Accredited by Southern Association of Colleges and Schools (SACS):
Elementary/Middle Commission. Accredited with Quality by Georgia
Accrediting Commission (GAC).
1998-99 GEORGIA PUBLIC EDUCATION REPORT CARD Little River Elementary School - 6280177
Prepared by Georgia Department of Education
Page 5
1998-99 GEORGIA PUBLIC EDUCATION REPORT CARD
CHEROKEE COUNTY SCHOOLS
Macedonia Elementary School - 6285052
Grade Range K-6
The Georgia Public Education Report Card is designed to assist systems and schools in educational improvement. This report card contains a variety of data elements. An explanation of the terms is provided as a companion to the report card data. Please refer to the definitions for the most effective use of the reported data.
STUDENT DATA
Total 287
K-6 Enrollment, by Race/Ethnicity and Sex
Black
White Hispanic
American Multi-
Asian Indian
racial
0 0.0%
285 99.3%
0 0.0%
0 0.0%
1 0.3%
1 0.3%
Male Female
139 48.4%
148 51.6%
Enrollment in Selected Programs
Program
Program % of Student Enrollment Population
Gifted (Grades K-12)
15
5.2%
Alternative Programs (Grades 6-12)
0
0.0%
Students Eligible to Receive Free/Reduced Lunches
Number
Percent
School System
39 3,428
13.6% 14.1%
Dropout Rate for Grade 6
Number
Rate
School System
0
0.0%
1
0.0%
Enrollment in Compensatory Programs
Program
Program % of Student Enrollment Population
Special Education (Grades K-12)
39 13.6%
(PK)
0
N/A
English to Speakers of Other Languages (ESOL) (Grades K-12)
0
0.0%
Remedial Education (Grades 2-5, 9-12)
6
3.4%
Special Instructional Assistance (SIA) (Grades K-3)
0
0.0%
Title I (Grades K-12)
This school has no Title I program.
Total 9
Retained Students, by Race/Ethnicity and Sex
Black
White Hispanic
American Multi-
Asian Indian
racial
0
9
0.0% 100.0%
0 0.0%
0 0.0%
0 0.0%
0 0.0%
Male Female
4
5
44.4% 55.6%
Prepared by Georgia Department of Education
Page 1
STATE-REQUIRED TEST DATA
NORM-REFERENCED TESTS Grade 3
Iowa Tests of Basic Skills (ITBS) Each chart reflects data for three years of testing.
Reading Comprehension 50
59 65 54 0
98-99
57 63 53 97-98
56 61 52 96-97
Mathematics
School 50
System
State
0
73 75 61 98-99
68 71 61 97-98
61 68 59 96-97
School System State
Reading Vocabulary 50
51 62 50 0
98-99
46 58 50 97-98
58 59 49 96-97
Language Arts
School 50
System
State
0
70 74 64 98-99
60 66 62 97-98
55 61 59 96-97
School System State
Social Studies 50
59 67 56 0
98-99
57 64 55 97-98
58 64 55 96-97
Science
School 50
System
State
0
67 74 59 98-99
67 70 59 97-98
64 68 58 96-97
School System State
Sources of Information
Composite Score
50
64 70 57 0
98-99
School 50
System
60 66 56 97-98
63 65 55 96-97
State 0
65 71 58 98-99
60 67 57 97-98
1998-99 GEORGIA PUBLIC EDUCATION REPORT CARD Macedonia Elementary School - 6285052
Prepared by Georgia Department of Education
59 64 56 96-97
Scores Reported in Percentiles
School System State
Page 2
STATE-REQUIRED TEST DATA
NORM-REFERENCED TESTS Grade 5
Iowa Tests of Basic Skills (ITBS) Each chart reflects data for three years of testing.
Reading Comprehension
Mathematics
50
63 61 53 0
98-99
62 60 53 97-98
68 61 52 96-97
School 50
System
State
0
73 68 59 98-99
67 67 58 97-98
69 65 57 96-97
School System State
Reading Vocabulary 50
61 59 48 0
98-99
56 58 48 97-98
64 59 46 96-97
Language Arts
School 50
System
State
0
78 70 63 98-99
77 67 61 97-98
73 66 58 96-97
School System State
Social Studies 50
69 67 57 0
98-99
61 66 56 97-98
63 64 55 96-97
Science
School 50
System
State
0
72 71 60 98-99
67 70 59 97-98
72 70 59 96-97
School System State
Sources of Information
Composite Score
50
71 67 58 0
98-99
School 50
System
67 66 58 97-98
70 67 57 96-97
State 0
72 67 57 98-99
67 66 56 97-98
70 66 55 96-97
1998-99 GEORGIA PUBLIC EDUCATION REPORT CARD Macedonia Elementary School - 6285052
Prepared by Georgia Department of Education
Scores Reported in Percentiles
School System State
Page 3
STATE-REQUIRED TEST DATA
PERFORMANCE ASSESSMENTS
Grade 5 Writing Assessment
Percent at Developmental Stages:
1998-99 School System State
1997-98 School System State
1996-97 School System State
Stage Stage Stage Stage Stage Stage
1:The Emerging Writer 2:The Developing Writer 3:The Focusing Writer 4:The Experimenting 5:The Engaging Writer 6:The Extending Writer
0% 0% 0% 35% 47% 19%
0% 1% 12% 36% 34% 17%
0% 1% 16% 41% 29% 12%
0% 0% 5% 46% 39% 10%
0% 1% 11% 45% 33% 9%
0% 3% 19% 41% 27% 10%
0% 0% 3% 26% 53% 18%
0% 2% 14% 37% 34% 14%
0% 3% 21% 37% 26% 12%
AWARDS / RECOGNITION DATA
Schools in Georgia may receive recognition in the following programs: Charter School Pay for Performance Program Georgia School of Excellence National Blue Ribbon School Macedonia Elementary School did not receive recognition in any of these programs during the 1998-99 school year.
1998-99 GEORGIA PUBLIC EDUCATION REPORT CARD Macedonia Elementary School - 6285052
Prepared by Georgia Department of Education
Page 4
CERTIFIED PERSONNEL DATA
Positions Number Average Contract Days
Personnel Sex
Certificate
Years Experience
Full-time Part-time
Male Female
4 Yr Bachelor's 5 Yr Master's 6 Yr Specialist's 7 Yr Doctoral Other*
<1 1-10 11-20 21-30 >30
Average
Administrators
1.00 210.00
1 0
1 0
0 1 0 0 0 0 0 0 1 0 28.00
Support Personnel
3.00 190.00
3 0
0 3
0 2 1 0 0 0 0 2 1 0 22.33
PK-12 Teachers
16.50 190.00
16 1
1 16
5 11
1 0 0 0 4 7 5 1 17.29
*Includes One- and Two-Year Vocational Certificates.
ACCREDITATION DATA
Accredited by Southern Association of Colleges and Schools (SACS):
Elementary/Middle Commission. Accredited with Quality by Georgia
Accrediting Commission (GAC).
1998-99 GEORGIA PUBLIC EDUCATION REPORT CARD Macedonia Elementary School - 6285052
Prepared by Georgia Department of Education
Page 5
1998-99 GEORGIA PUBLIC EDUCATION REPORT CARD
CHEROKEE COUNTY SCHOOLS
Mountain Road Elementary School - 6280190
Grade Range PK-6
The Georgia Public Education Report Card is designed to assist systems and schools in educational improvement. This report card contains a variety of data elements. An explanation of the terms is provided as a companion to the report card data. Please refer to the definitions for the most effective use of the reported data.
STUDENT DATA
Total
K-6
548
PK
2
Enrollment, by Race/Ethnicity and Sex
Black
White Hispanic
American Asian Indian
Multiracial
4 0.7%
532 97.1%
6 1.1%
0 0.0%
0 0.0%
6 1.1%
0
2
0.0% 100.0%
0 0.0%
0 0.0%
0 0.0%
0 0.0%
Male Female
301 54.9%
247 45.1%
1 50.0%
1 50.0%
Enrollment in Selected Programs
Program
Program % of Student Enrollment Population
Gifted (Grades K-12)
18
3.3%
Alternative Programs (Grades 6-12)
0
0.0%
Students Eligible to Receive Free/Reduced Lunches
Number
Percent
School System
37 3,428
6.7% 14.1%
Dropout Rate for Grade 6
Number
Rate
School System
0
0.0%
1
0.0%
Enrollment in Compensatory Programs
Program
Program % of Student Enrollment Population
Special Education (Grades K-12)
96 17.5%
(PK)
2
N/A
English to Speakers of Other Languages (ESOL) (Grades K-12)
0
0.0%
Remedial Education (Grades 2-5, 9-12)
26
7.9%
Special Instructional Assistance (SIA) (Grades K-3)
0
0.0%
Title I (Grades K-12)
This school has no Title I program.
Total 11
Retained Students, by Race/Ethnicity and Sex
Black
White Hispanic
American MultiAsian Indian racial
0
11
0.0% 100.0%
0 0.0%
0 0.0%
0 0.0%
0 0.0%
Male Female
8
3
72.7% 27.3%
Prepared by Georgia Department of Education
Page 1
STATE-REQUIRED TEST DATA
NORM-REFERENCED TESTS Grade 3
Iowa Tests of Basic Skills (ITBS) Each chart reflects data for three years of testing.
Reading Comprehension 50
73 65 54 0
98-99
68 63 53 97-98
67 61 52 96-97
Mathematics
School 50
System
State
0
88 75 61 98-99
81 71 61 97-98
80 68 59 96-97
School System State
Reading Vocabulary 50
72 62 50 0
98-99
64 58 50 97-98
71 59 49 96-97
Language Arts
School 50
System
State
0
82 74 64 98-99
60 66 62 97-98
65 61 59 96-97
School System State
Social Studies 50
76 67 56 0
98-99
73 64 55 97-98
69 64 55 96-97
Science
School 50
System
State
0
81 74 59 98-99
79 70 59 97-98
75 68 58 96-97
School System State
Sources of Information
Composite Score
50
76 70 57 0
98-99
School 50
System
71 66 56 97-98
72 65 55 96-97
State 0
81 71 58 98-99
74 67 57 97-98
1998-99 GEORGIA PUBLIC EDUCATION REPORT CARD Mountain Road Elementary School - 6280190
Prepared by Georgia Department of Education
72 64 56 96-97
Scores Reported in Percentiles
School System State
Page 2
STATE-REQUIRED TEST DATA
NORM-REFERENCED TESTS Grade 5
Iowa Tests of Basic Skills (ITBS) Each chart reflects data for three years of testing.
Reading Comprehension
Mathematics
50
66 61 53 0
98-99
69 60 53 97-98
71 61 52 96-97
School 50
System
State
0
77 68 59 98-99
79 67 58 97-98
77 65 57 96-97
School System State
Reading Vocabulary 50
62 59 48 0
98-99
66 58 48 97-98
74 59 46 96-97
Language Arts
School 50
System
State
0
68 70 63 98-99
78 67 61 97-98
73 66 58 96-97
School System State
Social Studies 50
73 67 57 0
98-99
74 66 56 97-98
76 64 55 96-97
Science
School 50
System
State
0
75 71 60 98-99
77 70 59 97-98
81 70 59 96-97
School System State
Sources of Information
Composite Score
50
71 67 58 0
98-99
School 50
System
73 66 58 97-98
79 67 57 96-97
State 0
73 67 57 98-99
76 66 56 97-98
78 66 55 96-97
1998-99 GEORGIA PUBLIC EDUCATION REPORT CARD Mountain Road Elementary School - 6280190
Prepared by Georgia Department of Education
Scores Reported in Percentiles
School System State
Page 3
STATE-REQUIRED TEST DATA
PERFORMANCE ASSESSMENTS
Grade 5 Writing Assessment
Percent at Developmental Stages:
1998-99 School System State
1997-98 School System State
1996-97 School System State
Stage Stage Stage Stage Stage Stage
1:The Emerging Writer 2:The Developing Writer 3:The Focusing Writer 4:The Experimenting 5:The Engaging Writer 6:The Extending Writer
0% 0% 19% 46% 22% 13%
0% 1% 12% 36% 34% 17%
0% 1% 16% 41% 29% 12%
0% 0% 7% 42% 35% 16%
0% 1% 11% 45% 33% 9%
0% 3% 19% 41% 27% 10%
0% 1% 7% 31% 43% 16%
0% 2% 14% 37% 34% 14%
0% 3% 21% 37% 26% 12%
AWARDS / RECOGNITION DATA
Schools in Georgia may receive recognition in the following programs: Charter School Pay for Performance Program Georgia School of Excellence National Blue Ribbon School Mountain Road Elementary School did not receive recognition in any of these programs during the 1998-99 school year.
1998-99 GEORGIA PUBLIC EDUCATION REPORT CARD Mountain Road Elementary School - 6280190
Prepared by Georgia Department of Education
Page 4
CERTIFIED PERSONNEL DATA
Positions Number Average Contract Days
Personnel Sex
Certificate
Years Experience
Full-time Part-time
Male Female
4 Yr Bachelor's 5 Yr Master's 6 Yr Specialist's 7 Yr Doctoral Other*
<1 1-10 11-20 21-30 >30
Average
Administrators
2.00 202.50
2 0
1 1
0 1 1 0 0 0 0 0 1 1 27.50
Support Personnel
3.00 190.00
3 0
0 3
0 2 1 0 0 0 1 1 1 0 15.00
PK-12 Teachers
39.00 190.00
39 0
1 38
18 20
1 0 0 2 12 19 6 0 13.00
*Includes One- and Two-Year Vocational Certificates.
ACCREDITATION DATA
Accredited by Southern Association of Colleges and Schools (SACS):
Elementary/Middle Commission. Accredited by Georgia Accrediting
Commission (GAC).
1998-99 GEORGIA PUBLIC EDUCATION REPORT CARD Mountain Road Elementary School - 6280190
Prepared by Georgia Department of Education
Page 5
1998-99 GEORGIA PUBLIC EDUCATION REPORT CARD
CHEROKEE COUNTY SCHOOLS
Oak Grove Elementary School - 6282054
Grade Range PK-6
The Georgia Public Education Report Card is designed to assist systems and schools in educational improvement. This report card contains a variety of data elements. An explanation of the terms is provided as a companion to the report card data. Please refer to the definitions for the most effective use of the reported data.
STUDENT DATA
Total
K-6
1,007
PK
2
Enrollment, by Race/Ethnicity and Sex
Black
White Hispanic
American Asian Indian
Multiracial
31 3.1%
924 91.8%
30 3.0%
9 0.9%
3 0.3%
10 1.0%
0
2
0.0% 100.0%
0 0.0%
0 0.0%
0 0.0%
0 0.0%
Male Female
498 49.5%
509 50.5%
1 50.0%
1 50.0%
Enrollment in Selected Programs
Program
Program % of Student Enrollment Population
Gifted (Grades K-12)
27
2.7%
Alternative Programs (Grades 6-12)
0
0.0%
Students Eligible to Receive Free/Reduced Lunches
Number
Percent
School System
201 3,428
19.9% 14.1%
Dropout Rate for Grade 6
Number
Rate
School System
0
0.0%
1
0.0%
Enrollment in Compensatory Programs
Program
Program % of Student Enrollment Population
Special Education (Grades K-12)
98
9.7%
(PK)
15
N/A
English to Speakers of Other Languages (ESOL) (Grades K-12)
14
1.4%
Remedial Education (Grades 2-5, 9-12)
82 14.1%
Special Instructional Assistance (SIA) (Grades K-3)
0
0.0%
Title I (Grades K-12)
This school has no Title I program.
Total 30
Retained Students, by Race/Ethnicity and Sex
Black
White Hispanic
American MultiAsian Indian racial
0 0.0%
27 90.0%
2 6.7%
0 0.0%
0 0.0%
1 3.3%
Male Female
23
7
76.7% 23.3%
Prepared by Georgia Department of Education
Page 1
STATE-REQUIRED TEST DATA
NORM-REFERENCED TESTS Grade 3
Iowa Tests of Basic Skills (ITBS) Each chart reflects data for three years of testing.
Reading Comprehension 50
61 65 54 0
98-99
61 63 53 97-98
47 61 52 96-97
Mathematics
School 50
System
State
0
63 75 61 98-99
69 71 61 97-98
51 68 59 96-97
School System State
Reading Vocabulary 50
56 62 50 0
98-99
55 58 50 97-98
46 59 49 96-97
Language Arts
School 50
System
State
0
61 74 64 98-99
65 66 62 97-98
44 61 59 96-97
School System State
Social Studies 50
56 67 56 0
98-99
60 64 55 97-98
48 64 55 96-97
Science
School 50
System
State
0
66 74 59 98-99
67 70 59 97-98
52 68 58 96-97
School System State
Sources of Information
Composite Score
50
61 70 57 0
98-99
School 50
System
65 66 56 97-98
52 65 55 96-97
State 0
61 71 58 98-99
63 67 57 97-98
1998-99 GEORGIA PUBLIC EDUCATION REPORT CARD Oak Grove Elementary School - 6282054
Prepared by Georgia Department of Education
47 64 56 96-97
Scores Reported in Percentiles
School System State
Page 2
STATE-REQUIRED TEST DATA
NORM-REFERENCED TESTS Grade 5
Iowa Tests of Basic Skills (ITBS) Each chart reflects data for three years of testing.
Reading Comprehension
Mathematics
50
56 61 53 0
98-99
57 60 53 97-98
62 61 52 96-97
School 50
System
State
0
59 68 59 98-99
58 67 58 97-98
67 65 57 96-97
School System State
Reading Vocabulary 50
55 59 48 0
98-99
53 58 48 97-98
63 59 46 96-97
Language Arts
School 50
System
State
0
62 70 63 98-99
61 67 61 97-98
68 66 58 96-97
School System State
Social Studies 50
58 67 57 0
98-99
55 66 56 97-98
66 64 55 96-97
Science
School 50
System
State
0
64 71 60 98-99
64 70 59 97-98
72 70 59 96-97
School System State
Sources of Information
Composite Score
50
62 67 58 0
98-99
School 50
System
60 66 58 97-98
67 67 57 96-97
State 0
60 67 57 98-99
58 66 56 97-98
68 66 55 96-97
1998-99 GEORGIA PUBLIC EDUCATION REPORT CARD Oak Grove Elementary School - 6282054
Prepared by Georgia Department of Education
Scores Reported in Percentiles
School System State
Page 3
STATE-REQUIRED TEST DATA
PERFORMANCE ASSESSMENTS
Grade 5 Writing Assessment
Percent at Developmental Stages:
1998-99 School System State
1997-98 School System State
1996-97 School System State
Stage Stage Stage Stage Stage Stage
1:The Emerging Writer 2:The Developing Writer 3:The Focusing Writer 4:The Experimenting 5:The Engaging Writer 6:The Extending Writer
0% 1% 14% 40% 25% 20%
0% 1% 12% 36% 34% 17%
0% 1% 16% 41% 29% 12%
0% 0% 22% 48% 23% 7%
0% 1% 11% 45% 33% 9%
0% 3% 19% 41% 27% 10%
0% 3% 20% 35% 31% 12%
0% 2% 14% 37% 34% 14%
0% 3% 21% 37% 26% 12%
AWARDS / RECOGNITION DATA
Schools in Georgia may receive recognition in the following programs: Charter School Pay for Performance Program Georgia School of Excellence National Blue Ribbon School Oak Grove Elementary School did not receive recognition in any of these programs during the 1998-99 school year.
1998-99 GEORGIA PUBLIC EDUCATION REPORT CARD Oak Grove Elementary School - 6282054
Prepared by Georgia Department of Education
Page 4
CERTIFIED PERSONNEL DATA
Positions Number Average Contract Days
Personnel Sex
Certificate
Years Experience
Full-time Part-time
Male Female
4 Yr Bachelor's 5 Yr Master's 6 Yr Specialist's 7 Yr Doctoral Other*
<1 1-10 11-20 21-30 >30
Average
Administrators
3.00 200.00
3 0
1 2
0 0 2 1 0 0 0 2 1 0 19.00
Support Personnel
4.00 190.00
4 0
0 4
0 3 0 1 0 1 0 3 0 0 10.00
PK-12 Teachers
56.00 190.00
56 0
4 52
31 22
3 0 0 2 23 23 8 0 11.75
*Includes One- and Two-Year Vocational Certificates.
ACCREDITATION DATA
Accredited by Southern Association of Colleges and Schools (SACS):
Elementary/Middle Commission. Accredited by Georgia Accrediting
Commission (GAC).
1998-99 GEORGIA PUBLIC EDUCATION REPORT CARD Oak Grove Elementary School - 6282054
Prepared by Georgia Department of Education
Page 5
1998-99 GEORGIA PUBLIC EDUCATION REPORT CARD
CHEROKEE COUNTY SCHOOLS
Open Campus/Night School - 6280194
Grade Range 10-12
The Georgia Public Education Report Card is designed to assist systems and schools in educational improvement. This report card contains a variety of data elements. An explanation of the terms is provided as a companion to the report card data. Please refer to the definitions for the most effective use of the reported data.
Total 120
STUDENT DATA
10-12 Enrollment, by Race/Ethnicity and Sex
Black
White Hispanic
American Multi-
Asian Indian
racial
Male Female
3 2.5%
115 95.8%
2 1.7%
0 0.0%
0 0.0%
0 0.0%
58 48.3%
62 51.7%
Enrollment in Selected Programs
Program
Gifted (Grades K-12)
Program % of Student Enrollment Population
0
0.0%
Non-Vocational Labs (Grades 9-12)
Vocational Labs (Grades 9-12)
Alternative Programs (Grades 6-12)
37
30.8%
41
34.2%
0
0.0%
Students Eligible to Receive Free/Reduced Lunches
Number
Percent
School System
0 3,428
0.0% 14.1%
Enrollment in Compensatory Programs
Program
Program % of Student Enrollment Population
Special Education (Grades K-12) PK
0
0.0%
0
N/A
English to Speakers of Other Languages (ESOL) (Grades K-12)
0
0.0%
Remedial Education (Grades 2-5, 9-12)
0
0.0%
Title I (Grades K-12)
This school has no Title I program.
Dropout Rate for Grades 10-12
Number
Rate
School System
52
18.2%
269
5.4%
Total 2
Retained Students, by Race/Ethnicity and Sex
Black
White Hispanic
American MultiAsian Indian racial
0
2
0.0% 100.0%
0 0.0%
0 0.0%
0 0.0%
0 0.0%
Male Female
0
2
0.0% 100.0%
Prepared by Georgia Department of Education
Page 1
STATE-REQUIRED TEST DATA
GEORGIA HIGH SCHOOL GRADUATION TESTS (GHSGT)
Percent of Regular Program 11th Graders Passing the Georgia High School Graduation Tests on First Administration
English Language Arts Mathematics Social Studies Science
All Components listed above
Writing
1998-99
School System State
75% 71% 61% 58%
98% 95% 87% 84%
96% 88% 80% 72%
46% 80% 68%
85% 96% 93%
1997-98
School System State
88% 56% 47% 44%
98% 95% 87% 84%
94% 88% 78% 74%
35% 80% 68%
100% 94% 92%
1996-97
School System State
96% 88% 70% 75%
99% 96% 87% 86%
94% 87% 78% 74%
55% 81% 67%
85% 96% 93%
GRADUATE DATA
1999 Graduates by Credentials, Race/Ethnicity and Sex
Diplomas with Both College Prep. & Voc. Endorsements
Diplomas with College Prep. Endorsements Diplomas with Vocational Endorsements General High School Diplomas Special Education Diplomas
Total All Diplomas
Certificates of Performance
Total Graduates
Total 5
28 34 12
0
Black
0 0.0%
0 0.0%
1 2.9%
0 0.0%
0
White Hispanic
5 100.0%
0 0.0%
27 96.4%
1 3.6%
32 94.1%
0 0.0%
12 100.0%
0 0.0%
0
0
American MultiAsian Indian racial
0 0.0%
0 0.0%
0 0.0%
0 0.0%
0 0.0%
0 0.0%
1 2.9%
0 0.0%
0 0.0%
0 0.0%
0 0.0%
0 0.0%
0
0
0
79
1
76
1
1
0
0
1.3% 96.2% 1.3% 1.3% 0.0% 0.0%
0
0
0
0
0
0
0
79
1
76
1
1
0
0
1.3% 96.2% 1.3% 1.3% 0.0% 0.0%
Male Female
3
2
60.0% 40.0%
8
20
28.6% 71.4%
20
14
58.8% 41.2%
7
5
58.3% 41.7%
0
0
38 48.1%
0
41 51.9%
0
38
41
48.1% 51.9%
HOPE Scholarships
School System
Number of 1999 Graduates Number Eligible Percent Eligible
79 0
0.0%
1,170 853
72.9%
State
65,548 40,292 61.5%
High School Completion Rate
Percent of 1995Grade 9 Enrollment in Graduating Class of1999 School System State
Completion Rate '95-'99 60.3% 80.0% 68.9%
1998-99 GEORGIA PUBLIC EDUCATION REPORT CARD
Open Campus/Night School - 6280194
Prepared by Georgia Department of Education
Page 2
COLLEGE ADMISSIONS / CREDIT TEST DATA
Scholastic Assessment Test (SAT)
Based on students' highest verbal and highest math scores
No. Taking
Average Score
Tests Verbal Math Total
Based on students' last test administration
Average Score Verbal Math Total
School
1
College Prep. Endorsement
Other Diplomas
System
762
College Prep. Endorsement
Other Diplomas
Georgia
41,958
490 N/A N/A
515 521 429
492
440 N/A N/A
505 511 407
488
930 N/A N/A
1020 1032
836
980
490 N/A N/A
507 N/A N/A
483
390 N/A N/A
498 N/A N/A
479
880 N/A N/A
1005 N/A N/A
962
Nation
952,913 N/A N/A N/A
502 508 1010
American College Testing (ACT)
Advanced Placement Exams (AP)
Number taking tests: English Mathematics Reading Science Reasoning
1 * School N/A N/A N/A N/A
System 19.5 20.2 20.6 20.4
State 19.1 19.9 20.2 19.9
CompositeScore
N/A 20.3 19.9
* Scores are not reported when fewer than 5 take the ACT
No. of Students Taking Tests
No. of Tests Taken No. of Test Scores
3 or Higher Percent of Test
Scores 3 or Higher
School 0
N/A N/A
N/A
System State 255 15,225 433 23,969 283 13,024
65.4% 54.3%
POST-SECONDARY DATA
Graduates Entering Georgia Public Colleges
Graduates Entering Georgia Public Colleges and Requiring Learning Support (LS)
1998 Graduates Entering in 1998-99
1997 Graduates Entering in 1997-98
Percent of Graduating Number Class
School
0
0.0%
System 373
37.9%
School
0
0.0%
System 358
39.0%
Number Requiring
LS N/A 33
N/A 68
Percent of those attending Georgia
Public Colleges
N/A
8.8%
N/A
19.0%
In previous years, the Report Card presented College Prep Curriculum information provided by the Board of Regents on students requiring Learning Support. Due to inconsistencies in the data provided by the Board of Regents in defining College Prep Completers versus Local Board of Education data defining College Prep Endorsements, the Department of Education Report Card will not provide this information until discrepancies can be reconciled.
Graduates Entering Georgia Public Technical and Adult Schools
1998 Graduates School System
Entering Number 0 36
1998-99 Percent
0.0% 3.7%
Entering Number N/A N/A
1997-98 Percent
N/A N/A
1997 Graduates School
0
0.0%
System
3
0.3%
1
4.2%
93
10.1%
1998-99 GEORGIA PUBLIC EDUCATION REPORT CARD Open Campus/Night School - 6280194
Prepared by Georgia Department of Education
Page 3
CERTIFIED PERSONNEL DATA
Positions Number Average Contract Days
Administrators
1.00 210.00
Support Personnel
0.00 0.00
PK-12 Teachers
2.99 190.00
Personnel Sex
Certificate
Years Experience
Full-time Part-time
Male Female
4 Yr Bachelor's 5 Yr Master's 6 Yr Specialist's 7 Yr Doctoral Other*
<1 1-10 11-20 21-30 >30
Average
1 0
1 0
0 1 0 0 0
0 1 0 0 0
10.00
0 0
0 0
0 0 0 0 0
0 0 0 0 0
0.00
3 0
1 2
3 0 0 0 0
0 3 0 0 0
6.33
*Includes One- and Two-Year Vocational Certificates.
ACCREDITATION DATA
Not accredited by Southern Association of Colleges and Schools (SACS) or Georgia Accrediting Commission (GAC).
AWARDS / RECOGNITION DATA
Schools in Georgia may receive recognition in the following programs: Charter School Pay for Performance Program Georgia School of Excellence National Blue Ribbon School Open Campus/Night School did not receive recognition in any of these programs during the 1998-99 school year.
1998-99 GEORGIA PUBLIC EDUCATION REPORT CARD Open Campus/Night School - 6280194
Prepared by Georgia Department of Education
Page 4
1998-99 GEORGIA PUBLIC EDUCATION REPORT CARD
CHEROKEE COUNTY SCHOOLS
R M Moore Elementary School - 6280198
Grade Range PK-6
The Georgia Public Education Report Card is designed to assist systems and schools in educational improvement. This report card contains a variety of data elements. An explanation of the terms is provided as a companion to the report card data. Please refer to the definitions for the most effective use of the reported data.
STUDENT DATA
Total
K-6
427
PK
40
Enrollment, by Race/Ethnicity and Sex
Black
White Hispanic
American Asian Indian
Multiracial
3 0.7%
415 97.2%
6 1.4%
1 0.2%
0 0.0%
2 0.5%
0
40
0.0% 100.0%
0 0.0%
0 0.0%
0 0.0%
0 0.0%
Male Female
233 54.6%
194 45.4%
23 57.5%
17 42.5%
Enrollment in Selected Programs
Program
Program % of Student Enrollment Population
Gifted (Grades K-12)
2
< 1%
Alternative Programs (Grades 6-12)
0
0.0%
Students Eligible to Receive Free/Reduced Lunches
Number
Percent
School System
154 3,428
33.0% 14.1%
Dropout Rate for Grade 6
Number
Rate
School System
0
0.0%
1
0.0%
Enrollment in Compensatory Programs
Program
Program % of Student Enrollment Population
Special Education (Grades K-12)
73 17.1%
(PK)
5
N/A
English to Speakers of Other Languages (ESOL) (Grades K-12)
0
0.0%
Remedial Education (Grades 2-5, 9-12)
26 10.9%
Special Instructional Assistance (SIA) (Grades K-3)
44 17.3%
Title I (Grades K-12)
This school has a Targeted Assistance program.
Total 11
Retained Students, by Race/Ethnicity and Sex
Black
White Hispanic
American MultiAsian Indian racial
0
11
0.0% 100.0%
0 0.0%
0 0.0%
0 0.0%
0 0.0%
Male Female
9
2
81.8% 18.2%
Prepared by Georgia Department of Education
Page 1
STATE-REQUIRED TEST DATA
NORM-REFERENCED TESTS Grade 3
Iowa Tests of Basic Skills (ITBS) Each chart reflects data for three years of testing.
Reading Comprehension 50
51 65 54 0
98-99
57 63 53 97-98
47 61 52 96-97
Mathematics
School 50
System
State
0
64 75 61 98-99
57 71 61 97-98
49 68 59 96-97
School System State
Reading Vocabulary 50
53 62 50 0
98-99
52 58 50 97-98
48 59 49 96-97
Language Arts
School 50
System
State
0
55 74 64 98-99
46 66 62 97-98
33 61 59 96-97
School System State
Social Studies 50
53 67 56 0
98-99
60 64 55 97-98
57 64 55 96-97
Science
School 50
System
State
0
61 74 59 98-99
52 70 59 97-98
45 68 58 96-97
School System State
Sources of Information
Composite Score
50
61 70 57 0
98-99
School 50
System
55 66 56 97-98
41 65 55 96-97
State 0
57 71 58 98-99
53 67 57 97-98
1998-99 GEORGIA PUBLIC EDUCATION REPORT CARD R M Moore Elementary School - 6280198
Prepared by Georgia Department of Education
43 64 56 96-97
Scores Reported in Percentiles
School System State
Page 2
STATE-REQUIRED TEST DATA
NORM-REFERENCED TESTS Grade 5
Iowa Tests of Basic Skills (ITBS) Each chart reflects data for three years of testing.
Reading Comprehension
Mathematics
50
51 61 53 0
98-99
57 60 53 97-98
63 61 52 96-97
School 50
System
State
0
55 68 59 98-99
63 67 58 97-98
68 65 57 96-97
School System State
Reading Vocabulary 50
50 59 48 0
98-99
52 58 48 97-98
56 59 46 96-97
Language Arts
School 50
System
State
0
50 70 63 98-99
64 67 61 97-98
69 66 58 96-97
School System State
Social Studies 50
53 67 57 0
98-99
60 66 56 97-98
72 64 55 96-97
Science
School 50
System
State
0
64 71 60 98-99
61 70 59 97-98
82 70 59 96-97
School System State
Sources of Information
Composite Score
50
53 67 58 0
98-99
School 50
System
58 66 58 97-98
70 67 57 96-97
State 0
54 67 57 98-99
60 66 56 97-98
72 66 55 96-97
1998-99 GEORGIA PUBLIC EDUCATION REPORT CARD R M Moore Elementary School - 6280198
Prepared by Georgia Department of Education
Scores Reported in Percentiles
School System State
Page 3
STATE-REQUIRED TEST DATA
PERFORMANCE ASSESSMENTS
Grade 5 Writing Assessment
Percent at Developmental Stages:
1998-99 School System State
1997-98 School System State
1996-97 School System State
Stage Stage Stage Stage Stage Stage
1:The Emerging Writer 2:The Developing Writer 3:The Focusing Writer 4:The Experimenting 5:The Engaging Writer 6:The Extending Writer
0% 0% 2% 43% 50% 5%
0% 1% 12% 36% 34% 17%
0% 1% 16% 41% 29% 12%
0% 0% 19% 34% 38% 9%
0% 1% 11% 45% 33% 9%
0% 3% 19% 41% 27% 10%
0% 2% 20% 27% 41% 10%
0% 2% 14% 37% 34% 14%
0% 3% 21% 37% 26% 12%
AWARDS / RECOGNITION DATA
Schools in Georgia may receive recognition in the following programs: Charter School Pay for Performance Program Georgia School of Excellence National Blue Ribbon School R M Moore Elementary School did not receive recognition in any of these programs during the 1998-99 school year.
1998-99 GEORGIA PUBLIC EDUCATION REPORT CARD R M Moore Elementary School - 6280198
Prepared by Georgia Department of Education
Page 4
CERTIFIED PERSONNEL DATA
Positions Number Average Contract Days
Personnel Sex
Certificate
Years Experience
Full-time Part-time
Male Female
4 Yr Bachelor's 5 Yr Master's 6 Yr Specialist's 7 Yr Doctoral Other*
<1 1-10 11-20 21-30 >30
Average
Administrators
1.00 210.00
1 0
1 0
0 0 1 0 0 0 0 0 1 0 28.00
Support Personnel
1.80 173.11
1 1
0 2
0 2 0 0 0 0 0 1 1 0 17.00
PK-12 Teachers
29.00 190.00
29 0
1 28
11 11
7 0 0 1 17 7 4 0 9.86
*Includes One- and Two-Year Vocational Certificates.
ACCREDITATION DATA
Accredited by Southern Association of Colleges and Schools (SACS):
Elementary/Middle Commission. Accredited with Quality by Georgia
Accrediting Commission (GAC).
1998-99 GEORGIA PUBLIC EDUCATION REPORT CARD R M Moore Elementary School - 6280198
Prepared by Georgia Department of Education
Page 5
1998-99 GEORGIA PUBLIC EDUCATION REPORT CARD
CHEROKEE COUNTY SCHOOLS
Ralph Bunche Center - 6280291
Grade Range PK
The Georgia Public Education Report Card is designed to assist systems and schools in educational improvement. This report card contains a variety of data elements. An explanation of the terms is provided as a companion to the report card data. Please refer to the definitions for the most effective use of the reported data.
STUDENT DATA
Total
PK
78
Enrollment, by Race/Ethnicity and Sex
Black
American Multi-
White Hispanic Asian Indian
racial
14
40
22
0
0
2
17.9% 51.3% 28.2% 0.0% 0.0% 2.6%
Male 44
56.4%
Female 34
43.6%
Enrollment in Selected Programs
Program
Program Enrollment
Gifted (Grades K-12)
N/A
Alternative Programs (Grades 6-12)
N/A
% of Student Population N/A
N/A
Students Eligible to Receive Free/Reduced Lunches
Number
Percent
School
11
14.1%
System
3,428
14.1%
Dropout Rate *
Number
Rate
School
N/A
N/A
System
N/A
N/A
* Dropout rates are not applicable for grades PK-5.
Enrollment in Compensatory Programs
Program
Program % of Student Enrollment Population
Special Education
(Grades K-12)
N/A
N/A
(PK)
3
N/A
English to Speakers of Other Languages (ESOL) (Grades K-12)
Remedial Education (Grades 2-5, 9-12)
N/A N/A
N/A N/A
Special Instructional Assistance (SIA) (Grades K-3)
N/A
N/A
Title I (Grades K-12) This school has no Title I program.
Total 0
Retained Students, by Race/Ethnicity and Sex
Black 0
White Hispanic
0
0
American Asian Indian
0
0
Multiracial
0
Male Female
0
0
Prepared by Georgia Department of Education
Page 1
STATE-REQUIRED TEST DATA
NORM-REFERENCED TESTS
Grade 3 Iowa Tests of Basic Skills (ITBS) Each chart reflects data for three years of testing.
No third-grade students are enrolled at Ralph Bunche Center.
Reading Comprehension
Mathematics
50
N/A 65 54 0
98-99
N/A 63 53 97-98
N/A 61 52 96-97
School 50
System
State
N/A 75 61 0
98-99
N/A 71 61 97-98
N/A 68 59 96-97
School System State
Reading Vocabulary 50
N/A 62 50 0
98-99
N/A 58 50 97-98
N/A 59 49 96-97
Language Arts
School 50
System
State
N/A 74 64 0
98-99
N/A 66 62 97-98
N/A 61 59 96-97
School System State
Social Studies 50
N/A 67 56 0
98-99
N/A 64 55 97-98
N/A 64 55 96-97
Science
School 50
System
State
N/A 74 59 0
98-99
N/A 70 59 97-98
N/A 68 58 96-97
School System State
Sources of Information
Composite Score
School
50
50
System
N/A 70 57 0
98-99
N/A 66 56 N/A 65 55
97-98
96-97
State
N/A 71 58 0
98-99
N/A 67 57 97-98
N/A 64 56 96-97
1998-99 GEORGIA PUBLIC EDUCATION REPORT CARD Ralph Bunche Center - 6280291
Prepared by Georgia Department of Education
Scores Reported in Percentiles
School System State
Page 2
STATE-REQUIRED TEST DATA
NORM-REFERENCED TESTS
Grade 5 Iowa Tests of Basic Skills (ITBS) Each chart reflects data for three years of testing. No fifth-grade students are enrolled at Ralph Bunche Center.
Reading Comprehension
Mathematics
50
N/A 61 53 0
98-99
N/A 60 53 97-98
N/A 61 52 96-97
School 50
System
State
N/A 68 59 0
98-99
N/A 67 58 97-98
N/A 65 57 96-97
School System State
Reading Vocabulary 50
N/A 59 48 0
98-99
N/A 58 48 97-98
N/A 59 46 96-97
Language Arts
School 50
System
State
N/A 70 63 0
98-99
N/A 67 61 97-98
N/A 66 58 96-97
School System State
Social Studies 50
N/A 67 57 0
98-99
N/A 66 56 97-98
N/A 64 55 96-97
Science
School 50
System
State
N/A 71 60 0
98-99
N/A 70 59 97-98
N/A 70 59 96-97
School System State
Sources of Information
Composite Score
School
50
50
System
N/A 67 58 0
98-99
N/A 66 58 N/A 67 57
97-98
96-97
State
N/A 67 57 0
98-99
N/A 66 56 97-98
N/A 66 55 96-97
1998-99 GEORGIA PUBLIC EDUCATION REPORT CARD Ralph Bunche Center - 6280291
Prepared by Georgia Department of Education
Scores Reported in Percentiles
School System State
Page 3
STATE-REQUIRED TEST DATA
PERFORMANCE ASSESSMENTS
Grade 5 Writing Assessment
Percent at Developmental Stages:
1998-99 School System State
1997-98 School System State
1996-97 School System State
Stage Stage Stage Stage Stage Stage
1:The Emerging Writer 2:The Developing Writer 3:The Focusing Writer 4:The Experimenting 5:The Engaging Writer 6:The Extending Writer
N/A N/A N/A N/A N/A N/A
0% 1% 12% 36% 34% 17%
0% 1% 16% 41% 29% 12%
N/A N/A N/A N/A N/A N/A
0% 1% 11% 45% 33% 9%
0% 3% 19% 41% 27% 10%
N/A N/A N/A N/A N/A N/A
No fifth-grade students are enrolled at Ralph Bunche Center.
0% 2% 14% 37% 34% 14%
0% 3% 21% 37% 26% 12%
AWARDS / RECOGNITION DATA
Schools in Georgia may receive recognition in the following programs: Charter School Pay for Performance Program Georgia School of Excellence National Blue Ribbon School Ralph Bunche Center did not receive recognition in any of these programs during the 1998-99 school year.
1998-99 GEORGIA PUBLIC EDUCATION REPORT CARD Ralph Bunche Center - 6280291
Prepared by Georgia Department of Education
Page 4
CERTIFIED PERSONNEL DATA
Positions Number Average Contract Days
Personnel Sex
Certificate
Years Experience
Full-time Part-time
Male Female
4 Yr Bachelor's 5 Yr Master's 6 Yr Specialist's 7 Yr Doctoral Other*
<1 1-10 11-20 21-30 >30
Average
Administrators
1.00 210.00
1 0
0 1
0 0 1 0 0 0 0 0 1 0 30.00
Support Personnel
2.00 190.00
2 0
0 2
0 2 0 0 0 2 0 0 0 0 0.00
PK-12 Teachers
0.00 0.00
0 0
0 0
0 0 0 0 0 0 0 0 0 0 0.00
*Includes One- and Two-Year Vocational Certificates.
ACCREDITATION DATA
Not accredited by Southern Association of Colleges and Schools (SACS) or Georgia Accrediting Commission (GAC).
1998-99 GEORGIA PUBLIC EDUCATION REPORT CARD Ralph Bunche Center - 6280291
Prepared by Georgia Department of Education
Page 5
1998-99 GEORGIA PUBLIC EDUCATION REPORT CARD
CHEROKEE COUNTY SCHOOLS
Rusk Middle School - 6280187
Grade Range 7-8
The Georgia Public Education Report Card is designed to assist systems and schools in educational improvement. This report card contains a variety of data elements. An explanation of the terms is provided as a companion to the report card data. Please refer to the definitions for the most effective use of the reported data.
STUDENT DATA
Total 823
7-8 Enrollment, by Race/Ethnicity and Sex
Black
White Hispanic
American Multi-
Asian Indian
racial
4 0.5%
795 96.6%
13 1.6%
5 0.6%
5 0.6%
1 0.1%
Male 407
49.5%
Female 416
50.5%
Enrollment in Selected Programs
Program
Gifted (Grades K-12)
Program % of Student Enrollment Population
152
18.5%
Alternative Programs (Grades 6-12)
0
0.0%
Students Eligible to Receive Free/Reduced Lunches
Number
Percent
School System
47 3,428
5.7% 14.1%
Enrollment in Compensatory Programs
Program
Program % of Student Enrollment Population
Special Education (Grades K-12) (PK)
69
8.4%
0
N/A
English to Speakers of Other Languages (ESOL) (Grades K-12)
0
0.0%
Title I (Grades K-12)
This school has no Title I program.
Dropout Rate for Grades 7-8
Number
Rate
School System
0
0.0%
3
0.1%
Total 1
Retained Students, by Race/Ethnicity and Sex
Black
White Hispanic
American MultiAsian Indian racial
0
1
0.0% 100.0%
0 0.0%
0 0.0%
0 0.0%
0 0.0%
Male Female
1 100.0%
0 0.0%
Prepared by Georgia Department of Education
Page 1
STATE-REQUIRED TEST DATA
NORM-REFERENCED TESTS Grade 8
Iowa Tests of Basic Skills (ITBS) Each chart reflects data for three years of testing.
Reading Comprehension 50
68 60 49 0
98-99
67 60 48 97-98
67 60 48 96-97
Mathematics
School 50
System
State
0
68 63 56 98-99
65 61 55 97-98
63 59 54 96-97
School System State
Reading Vocabulary 50
64 58 46 0
98-99
63 57 45 97-98
66 61 44 96-97
Language Arts
School 50
System
State
0
76 69 60 98-99
71 65 58 97-98
74 66 56 96-97
School System State
Social Studies 50
65 60 54 0
98-99
66 61 53 97-98
67 62 53 96-97
Science
School 50
System
State
0
68 63 56 98-99
68 62 55 97-98
70 61 53 96-97
School System State
Sources of Information
Composite Score
50
73 65 57 0
98-99
School 50
System
71 65 56 97-98
68 64 55 96-97
State 0
71 64 56 98-99
69 63 54 97-98
1998-99 GEORGIA PUBLIC EDUCATION REPORT CARD Rusk Middle School - 6280187
Prepared by Georgia Department of Education
69 63 54 96-97
Scores Reported in Percentiles
School System State
Page 2
STATE-REQUIRED TEST DATA
Categories of Scaled Scores
Inadequate (less than 162)
Minimal (162-209)
Good
(210-247)
Very Good (greater than 247)
Average Scaled Score: (Range 100-300)
PERFORMANCE ASSESSMENTS
Grade 8 Writing Assessment
1998-99 Percent Scoring
1997-98 Percent Scoring
1996-97 Percent Scoring
School System State School System State School System State
1% 22% 58% 19%
2% 33% 51% 13%
8% 40% 41% 11%
3% 39% 48%
9%
4% 44% 44%
8%
11% 46% 34%
8%
5% 47% 37% 11%
8% 47% 36%
9%
15% 46% 30%
8%
225
217
208 212
209 202 208
205 198
AWARDS / RECOGNITION DATA
Schools in Georgia may receive recognition in the following programs: Charter School Pay for Performance Program Georgia School of Excellence National Blue Ribbon School Rusk Middle School did not receive recognition in any of these programs during the 1998-99 school year.
1998-99 GEORGIA PUBLIC EDUCATION REPORT CARD Rusk Middle School - 6280187
Prepared by Georgia Department of Education
Page 3
CERTIFIED PERSONNEL DATA
Positions Number Average Contract Days
Personnel Sex
Certificate
Years Experience
Full-time Part-time
Male Female
4 Yr Bachelor's 5 Yr Master's 6 Yr Specialist's 7 Yr Doctoral Other*
<1 1-10 11-20 21-30 >30
Average
Administrators
3.00 205.00
3 0
2 1
0 0 1 2 0 0 0 0 3 0 25.33
Support Personnel
3.00 190.00
3 0
0 3
0 1 2 0 0 0 1 1 1 0 16.67
PK-12 Teachers
55.00 190.00
55 0
13 42
27 25
3 0 0 4 22 23 6 0 11.89
*Includes One- and Two-Year Vocational Certificates.
ACCREDITATION DATA
Accredited by Southern Association of Colleges and Schools (SACS):
Elementary/Middle Commission. Accredited by Georgia Accrediting
Commission (GAC).
1998-99 GEORGIA PUBLIC EDUCATION REPORT CARD Rusk Middle School - 6280187
Prepared by Georgia Department of Education
Page 4
1998-99 GEORGIA PUBLIC EDUCATION REPORT CARD
CHEROKEE COUNTY SCHOOLS
Sequoyah High School - 6280191
Grade Range 9-12
The Georgia Public Education Report Card is designed to assist systems and schools in educational improvement. This report card contains a variety of data elements. An explanation of the terms is provided as a companion to the report card data. Please refer to the definitions for the most effective use of the reported data.
Total 1,525
STUDENT DATA
9-12 Enrollment, by Race/Ethnicity and Sex
Black
White Hispanic
American Multi-
Asian Indian
racial
16 1.0%
1,484 97.3%
11 0.7%
13 0.9%
1 0.1%
0 0.0%
Male Female
785 51.5%
740 48.5%
Enrollment in Selected Programs
Program
Gifted (Grades K-12)
Program % of Student Enrollment Population
210
13.8%
Non-Vocational Labs (Grades 9-12)
Vocational Labs (Grades 9-12)
Alternative Programs (Grades 6-12)
1,357 674 15
89.0% 44.2%
1.0%
Students Eligible to Receive Free/Reduced Lunches
Number
Percent
School System
47 3,428
3.1% 14.1%
Enrollment in Compensatory Programs
Program
Program % of Student Enrollment Population
Special Education (Grades K-12) PK
115
7.5%
0
N/A
English to Speakers of Other Languages (ESOL) (Grades K-12)
2
< 1%
Remedial Education (Grades 2-5, 9-12)
14
< 1%
Title I (Grades K-12)
This school has no Title I program.
Dropout Rate for Grades 9-12
Number
Rate
School System
41
2.5%
275
3.9%
Total 2
Retained Students, by Race/Ethnicity and Sex
Black
White Hispanic
American MultiAsian Indian racial
0
2
0.0% 100.0%
0 0.0%
0 0.0%
0 0.0%
0 0.0%
Male Female
0
2
0.0% 100.0%
Prepared by Georgia Department of Education
Page 1
STATE-REQUIRED TEST DATA
GEORGIA HIGH SCHOOL GRADUATION TESTS (GHSGT)
Percent of Regular Program 11th Graders Passing the Georgia High School Graduation Tests on First Administration
English Language Arts Mathematics Social Studies Science
All Components listed above
Writing
1998-99
School System State
100% 97% 90% 88%
98% 95% 87% 84%
96% 88% 80% 72%
85% 80% 68%
96% 96% 93%
1997-98
School System State
99% 94% 89% 85%
98% 95% 87% 84%
94% 88% 78% 74%
82% 80% 68%
95% 94% 92%
1996-97
School System State
99% 96% 88% 90%
99% 96% 87% 86%
94% 87% 78% 74%
84% 81% 67%
96% 96% 93%
GRADUATE DATA
1999 Graduates by Credentials, Race/Ethnicity and Sex
Diplomas with Both College Prep. & Voc. Endorsements
Diplomas with College Prep. Endorsements Diplomas with Vocational Endorsements General High School Diplomas Special Education Diplomas
Total All Diplomas
Certificates of Performance
Total Graduates
Total 25
217 61 5 3
311 0
Black
0 0.0%
5 2.3%
0 0.0%
0 0.0%
0 0.0%
5 1.6%
0
White Hispanic
25 100.0%
0 0.0%
210 96.8%
1 0.5%
61 100.0%
0 0.0%
5 100.0%
0 0.0%
3 100.0%
0 0.0%
304 97.7%
1 0.3%
0
0
American MultiAsian Indian racial
0 0.0%
0 0.0%
0 0.0%
1 0.5%
0 0.0%
0 0.0%
0 0.0%
0 0.0%
0 0.0%
0 0.0%
0 0.0%
0 0.0%
0 0.0%
0 0.0%
0 0.0%
1 0.3%
0 0.0%
0 0.0%
0
0
0
311
5
304
1
1
0
0
1.6% 97.7% 0.3% 0.3% 0.0% 0.0%
Male Female
12
13
48.0% 52.0%
94
123
43.3% 56.7%
36
25
59.0% 41.0%
3
2
60.0% 40.0%
1
2
33.3% 66.7%
146
165
46.9% 53.1%
0
0
146
165
46.9% 53.1%
HOPE Scholarships
School System
Number of 1999 Graduates 3 1 1
Number Eligible
268
Percent Eligible
86.2%
1,170 853
72.9%
State
65,548 40,292 61.5%
High School Completion Rate
Percent of 1995Grade 9 Enrollment in Graduating Class of1999 School System State
Completion Rate '95-'99 91.5% 80.0% 68.9%
1998-99 GEORGIA PUBLIC EDUCATION REPORT CARD
Sequoyah High School - 6280191
Prepared by Georgia Department of Education
Page 2
COLLEGE ADMISSIONS / CREDIT TEST DATA
Scholastic Assessment Test (SAT)
Based on students' highest verbal and highest math scores
No. Taking
Average Score
Tests Verbal Math Total
Based on students' last test administration
Average Score Verbal Math Total
School
238
College Prep. Endorsement
Other Diplomas
System
762
College Prep. Endorsement
Other Diplomas
Georgia
41,958
513 503 1016
516 506 1022
438 412
850
515 505 1020 521 511 1032
429 407
836
492 488
980
506 N/A N/A
507 N/A N/A
483
497 N/A N/A
498 N/A N/A
479
1003 N/A N/A
1005 N/A N/A
962
Nation
952,913 N/A N/A N/A
502 508 1010
American College Testing (ACT)
Advanced Placement Exams (AP)
Number taking tests: English Mathematics Reading Science Reasoning CompositeScore
5 1 School System State
19.2 19.5 19.1
20.4 20.2 19.9
20.3 20.6
20.6 20.4
20.2 19.9
20.2 20.3 19.9
No. of Students Taking Tests
No. of Tests Taken No. of Test Scores
3 or Higher Percent of Test
Scores 3 or Higher
School 77
142 103
72.5%
System State 255 15,225 433 23,969 283 13,024
65.4% 54.3%
POST-SECONDARY DATA
Graduates Entering Georgia Public Colleges
Graduates Entering Georgia Public Colleges and Requiring Learning Support (LS)
1998 Graduates Entering in 1998-99
1997 Graduates Entering in 1997-98
Percent of Graduating Number Class
School
162
46.2%
System 373
37.9%
School
132
41.0%
System 358
39.0%
Number Requiring
LS 13 33
26 68
Percent of those attending Georgia
Public Colleges
8.0%
8.8%
19.7%
19.0%
In previous years, the Report Card presented College Prep Curriculum information provided by the Board of Regents on students requiring Learning Support. Due to inconsistencies in the data provided by the Board of Regents in defining College Prep Completers versus Local Board of Education data defining College Prep Endorsements, the Department of Education Report Card will not provide this information until discrepancies can be reconciled.
Graduates Entering Georgia Public Technical and Adult Schools
1998 Graduates School System
Entering Number 2 36
1998-99 Percent
0.6% 3.7%
Entering Number N/A N/A
1997-98 Percent
N/A N/A
1997 Graduates School
0
0.0%
System
3
0.3%
28
8.7%
93
10.1%
1998-99 GEORGIA PUBLIC EDUCATION REPORT CARD Sequoyah High School - 6280191
Prepared by Georgia Department of Education
Page 3
CERTIFIED PERSONNEL DATA
Positions Number Average Contract Days
Administrators
5.00 210.00
Support Personnel
7.00 192.86
PK-12 Teachers
91.98 190.54
Personnel Sex
Certificate
Years Experience
Full-time Part-time
Male Female
4 Yr Bachelor's 5 Yr Master's 6 Yr Specialist's 7 Yr Doctoral Other*
<1 1-10 11-20 21-30 >30
Average
5 0
2 3
0 3 2 0 0
0 0 3 2 0
19.20
7 0
1 6
1 2 4 0 0
0 1 5 1 0
16.29
92 0
40 52
40 45
5 0 2
4 43 28 16
1
12.14
*Includes One- and Two-Year Vocational Certificates.
ACCREDITATION DATA
Accredited by Southern Association of Colleges and Schools (SACS): Secondary/Middle Commission. Accredited with Quality by Georgia Accrediting Commission (GAC).
AWARDS / RECOGNITION DATA
Schools in Georgia may receive recognition in the following programs: Charter School Pay for Performance Program Georgia School of Excellence National Blue Ribbon School Sequoyah High School did not receive recognition in any of these programs during the 1998-99 school year.
1998-99 GEORGIA PUBLIC EDUCATION REPORT CARD Sequoyah High School - 6280191
Prepared by Georgia Department of Education
Page 4
1998-99 GEORGIA PUBLIC EDUCATION REPORT CARD
CHEROKEE COUNTY SCHOOLS
Sixes Elementary School - 6280193
Grade Range K-6
The Georgia Public Education Report Card is designed to assist systems and schools in educational improvement. This report card contains a variety of data elements. An explanation of the terms is provided as a companion to the report card data. Please refer to the definitions for the most effective use of the reported data.
STUDENT DATA
Total 989
K-6 Enrollment, by Race/Ethnicity and Sex
Black
White Hispanic
American Multi-
Asian Indian
racial
10 1.0%
961 97.2%
15 1.5%
1 0.1%
0 0.0%
2 0.2%
Male Female
529 53.5%
460 46.5%
Enrollment in Selected Programs
Program
Program % of Student Enrollment Population
Gifted (Grades K-12)
32
3.2%
Alternative Programs (Grades 6-12)
0
0.0%
Students Eligible to Receive Free/Reduced Lunches
Number
Percent
School System
136 3,428
13.8% 14.1%
Dropout Rate for Grade 6
Number
Rate
School System
0
0.0%
1
0.0%
Enrollment in Compensatory Programs
Program
Program % of Student Enrollment Population
Special Education (Grades K-12)
145 14.7%
(PK)
19
N/A
English to Speakers of Other Languages (ESOL) (Grades K-12)
0
0.0%
Remedial Education (Grades 2-5, 9-12)
51
8.9%
Special Instructional Assistance (SIA) (Grades K-3)
50
8.9%
Title I (Grades K-12)
This school has no Title I program.
Total 17
Retained Students, by Race/Ethnicity and Sex
Black
White Hispanic
American Multi-
Asian Indian
racial
0
17
0.0% 100.0%
0 0.0%
0 0.0%
0 0.0%
0 0.0%
Male Female
6
11
35.3% 64.7%
Prepared by Georgia Department of Education
Page 1
STATE-REQUIRED TEST DATA
NORM-REFERENCED TESTS Grade 3
Iowa Tests of Basic Skills (ITBS) Each chart reflects data for three years of testing.
Reading Comprehension 50
69 65 54 0
98-99
70 63 53 97-98
72 61 52 96-97
Mathematics
School 50
System
State
0
80 75 61 98-99
84 71 61 97-98
83 68 59 96-97
School System State
Reading Vocabulary 50
68 62 50 0
98-99
64 58 50 97-98
68 59 49 96-97
Language Arts
School 50
System
State
0
81 74 64 98-99
73 66 62 97-98
72 61 59 96-97
School System State
Social Studies 50
68 67 56 0
98-99
68 64 55 97-98
67 64 55 96-97
Science
School 50
System
State
0
74 74 59 98-99
71 70 59 97-98
74 68 58 96-97
School System State
Sources of Information
Composite Score
50
72 70 57 0
98-99
School 50
System
72 66 56 97-98
74 65 55 96-97
State 0
75 71 58 98-99
74 67 57 97-98
1998-99 GEORGIA PUBLIC EDUCATION REPORT CARD Sixes Elementary School - 6280193
Prepared by Georgia Department of Education
74 64 56 96-97
Scores Reported in Percentiles
School System State
Page 2
STATE-REQUIRED TEST DATA
NORM-REFERENCED TESTS Grade 5
Iowa Tests of Basic Skills (ITBS) Each chart reflects data for three years of testing.
Reading Comprehension
Mathematics
50
67 61 53 0
98-99
59 60 53 97-98
57 61 52 96-97
School 50
System
State
0
68 68 59 98-99
66 67 58 97-98
71 65 57 96-97
School System State
Reading Vocabulary 50
65 59 48 0
98-99
57 58 48 97-98
56 59 46 96-97
Language Arts
School 50
System
State
0
72 70 63 98-99
69 67 61 97-98
71 66 58 96-97
School System State
Social Studies 50
71 67 57 0
98-99
68 66 56 97-98
64 64 55 96-97
Science
School 50
System
State
0
73 71 60 98-99
70 70 59 97-98
70 70 59 96-97
School System State
Sources of Information
Composite Score
50
65 67 58 0
98-99
School 50
System
68 66 58 97-98
70 67 57 96-97
State 0
70 67 57 98-99
67 66 56 97-98
68 66 55 96-97
1998-99 GEORGIA PUBLIC EDUCATION REPORT CARD Sixes Elementary School - 6280193
Prepared by Georgia Department of Education
Scores Reported in Percentiles
School System State
Page 3
STATE-REQUIRED TEST DATA
PERFORMANCE ASSESSMENTS
Grade 5 Writing Assessment
Percent at Developmental Stages:
1998-99 School System State
1997-98 School System State
1996-97 School System State
Stage Stage Stage Stage Stage Stage
1:The Emerging Writer 2:The Developing Writer 3:The Focusing Writer 4:The Experimenting 5:The Engaging Writer 6:The Extending Writer
0% 0% 1% 19% 57% 24%
0% 1% 12% 36% 34% 17%
0% 1% 16% 41% 29% 12%
0% 1% 7% 37% 40% 15%
0% 1% 11% 45% 33% 9%
0% 3% 19% 41% 27% 10%
0% 0% 6% 20% 48% 26%
0% 2% 14% 37% 34% 14%
0% 3% 21% 37% 26% 12%
AWARDS / RECOGNITION DATA
Schools in Georgia may receive recognition in the following programs: Charter School Pay for Performance Program Georgia School of Excellence National Blue Ribbon School Sixes Elementary School did not receive recognition in any of these programs during the 1998-99 school year.
1998-99 GEORGIA PUBLIC EDUCATION REPORT CARD Sixes Elementary School - 6280193
Prepared by Georgia Department of Education
Page 4
CERTIFIED PERSONNEL DATA
Positions Number Average Contract Days
Personnel Sex
Certificate
Years Experience
Full-time Part-time
Male Female
4 Yr Bachelor's 5 Yr Master's 6 Yr Specialist's 7 Yr Doctoral Other*
<1 1-10 11-20 21-30 >30
Average
Administrators
3.00 211.67
3 0
1 2
0 0 3 0 0 0 0 1 2 0 22.00
Support Personnel
7.00 190.00
7 0
0 7
1 5 0 1 0 1 2 3 1 0 11.29
PK-12 Teachers
60.00 190.00
60 0
4 56
40 15
5 0 0 1 34 22 3 0 9.57
*Includes One- and Two-Year Vocational Certificates.
ACCREDITATION DATA
Accredited by Southern Association of Colleges and Schools (SACS):
Elementary/Middle Commission. Accredited by Georgia Accrediting
Commission (GAC).
1998-99 GEORGIA PUBLIC EDUCATION REPORT CARD Sixes Elementary School - 6280193
Prepared by Georgia Department of Education
Page 5
1998-99 GEORGIA PUBLIC EDUCATION REPORT CARD
CHEROKEE COUNTY SCHOOLS
Teasley Middle School - 6280287
Grade Range 7-8
The Georgia Public Education Report Card is designed to assist systems and schools in educational improvement. This report card contains a variety of data elements. An explanation of the terms is provided as a companion to the report card data. Please refer to the definitions for the most effective use of the reported data.
STUDENT DATA
Total 950
7-8 Enrollment, by Race/Ethnicity and Sex
Black
White Hispanic
American Multi-
Asian Indian
racial
39 4.1%
878 92.4%
28 2.9%
5 0.5%
0 0.0%
0 0.0%
Male 487
51.3%
Female 463
48.7%
Enrollment in Selected Programs
Program
Gifted (Grades K-12)
Program % of Student Enrollment Population
75
7.9%
Alternative Programs (Grades 6-12)
1
< 1%
Students Eligible to Receive Free/Reduced Lunches
Number
Percent
School System
170 3,428
17.9% 14.1%
Enrollment in Compensatory Programs
Program
Program % of Student Enrollment Population
Special Education (Grades K-12) (PK)
149 15.7%
0
N/A
English to Speakers of Other Languages (ESOL) (Grades K-12)
11
1.2%
Title I (Grades K-12)
This school has a Targeted Assistance program.
Dropout Rate for Grades 7-8
Number
Rate
School System
0
0.0%
3
0.1%
Total 7
Retained Students, by Race/Ethnicity and Sex
Black
White Hispanic
American MultiAsian Indian racial
0
7
0.0% 100.0%
0 0.0%
0 0.0%
0 0.0%
0 0.0%
Male Female
5
2
71.4% 28.6%
Prepared by Georgia Department of Education
Page 1
STATE-REQUIRED TEST DATA
NORM-REFERENCED TESTS Grade 8
Iowa Tests of Basic Skills (ITBS) Each chart reflects data for three years of testing.
Reading Comprehension 50
54 60 49 0
98-99
54 60 48 97-98
51 60 48 96-97
Mathematics
School 50
System
State
0
56 63 56 98-99
57 61 55 97-98
55 59 54 96-97
School System State
Reading Vocabulary 50
56 58 46 0
98-99
55 57 45 97-98
56 61 44 96-97
Language Arts
School 50
System
State
0
62 69 60 98-99
61 65 58 97-98
60 66 56 96-97
School System State
Social Studies 50
60 60 54 0
98-99
60 61 53 97-98
55 62 53 96-97
Science
School 50
System
State
0
57 63 56 98-99
56 62 55 97-98
53 61 53 96-97
School System State
Sources of Information
Composite Score
50
59 65 57 0
98-99
School 50
System
61 65 56 97-98
62 64 55 96-97
State 0
59 64 56 98-99
59 63 54 97-98
1998-99 GEORGIA PUBLIC EDUCATION REPORT CARD Teasley Middle School - 6280287
Prepared by Georgia Department of Education
58 63 54 96-97
Scores Reported in Percentiles
School System State
Page 2
STATE-REQUIRED TEST DATA
Categories of Scaled Scores
Inadequate (less than 162)
Minimal (162-209)
Good
(210-247)
Very Good (greater than 247)
Average Scaled Score: (Range 100-300)
PERFORMANCE ASSESSMENTS
Grade 8 Writing Assessment
1998-99 Percent Scoring
1997-98 Percent Scoring
1996-97 Percent Scoring
School System State School System State School System State
4% 31% 51% 14%
2% 33% 51% 13%
8% 40% 41% 11%
7% 46% 40%
7%
4% 44% 44%
8%
11% 46% 34%
8%
17% 47% 30%
6%
8% 47% 36%
9%
15% 46% 30%
8%
216
217
208 207
209 202 196
205 198
AWARDS / RECOGNITION DATA
Schools in Georgia may receive recognition in the following programs: Charter School Pay for Performance Program Georgia School of Excellence National Blue Ribbon School Teasley Middle School did not receive recognition in any of these programs during the 1998-99 school year.
1998-99 GEORGIA PUBLIC EDUCATION REPORT CARD Teasley Middle School - 6280287
Prepared by Georgia Department of Education
Page 3
CERTIFIED PERSONNEL DATA
Positions Number Average Contract Days
Personnel Sex
Certificate
Years Experience
Full-time Part-time
Male Female
4 Yr Bachelor's 5 Yr Master's 6 Yr Specialist's 7 Yr Doctoral Other*
<1 1-10 11-20 21-30 >30
Average
Administrators
3.00 205.00
3 0
3 0
0 1 2 0 0 0 1 1 1 0 18.00
Support Personnel
3.00 190.00
3 0
0 3
1 2 0 0 0 0 1 0 2 0 23.00
PK-12 Teachers
63.00 190.00
63 0
16 47
31 30
2 0 0 4 24 25 8 2 12.59
*Includes One- and Two-Year Vocational Certificates.
ACCREDITATION DATA
Accredited by Southern Association of Colleges and Schools (SACS):
Elementary/Middle Commission. Accredited with Quality by Georgia
Accrediting Commission (GAC).
1998-99 GEORGIA PUBLIC EDUCATION REPORT CARD Teasley Middle School - 6280287
Prepared by Georgia Department of Education
Page 4
1998-99 GEORGIA PUBLIC EDUCATION REPORT CARD
CHEROKEE COUNTY SCHOOLS
Tippens Elementary School - 6281554
Grade Range PK-6
The Georgia Public Education Report Card is designed to assist systems and schools in educational improvement. This report card contains a variety of data elements. An explanation of the terms is provided as a companion to the report card data. Please refer to the definitions for the most effective use of the reported data.
STUDENT DATA
Total
K-6
214
PK
3
Enrollment, by Race/Ethnicity and Sex
Black
White Hispanic
American Asian Indian
Multiracial
56 26.2%
94 43.9%
61 28.5%
2 0.9%
0 0.0%
1 0.5%
0
3
0.0% 100.0%
0 0.0%
0 0.0%
0 0.0%
0 0.0%
Male 105
49.1% 3
100.0%
Female 109
50.9% 0
0.0%
Enrollment in Selected Programs
Program
Program % of Student Enrollment Population
Gifted (Grades K-12)
1
< 1%
Alternative Programs (Grades 6-12)
0
0.0%
Students Eligible to Receive Free/Reduced Lunches
Number
Percent
School System
183 3,428
84.3% 14.1%
Dropout Rate for Grade 6
Number
Rate
School System
0
0.0%
1
0.0%
Enrollment in Compensatory Programs
Program
Program % of Student Enrollment Population
Special Education (Grades K-12)
36 16.8%
(PK)
22
N/A
English to Speakers of Other Languages (ESOL) (Grades K-12)
33 15.4%
Remedial Education (Grades 2-5, 9-12)
28 24.6%
Special Instructional Assistance (SIA) (Grades K-3)
40 32.0%
Title I (Grades K-12)
This school has a Targeted Assistance program.
Total 14
Retained Students, by Race/Ethnicity and Sex
Black
White Hispanic
American MultiAsian Indian racial
3 21.4%
7
4
50.0% 28.6%
0 0.0%
0 0.0%
0 0.0%
Male Female
10
4
71.4% 28.6%
Prepared by Georgia Department of Education
Page 1
STATE-REQUIRED TEST DATA
NORM-REFERENCED TESTS Grade 3
Iowa Tests of Basic Skills (ITBS) Each chart reflects data for three years of testing.
Reading Comprehension 50
47 65 54 0
98-99
43 63 53 97-98
24 61 52 96-97
Mathematics
School 50
System
State
0
47 75 61 98-99
43 71 61 97-98
29 68 59 96-97
School System State
Reading Vocabulary 50
24 62 50 0
98-99
38 58 50 97-98
21 59 49 96-97
Language Arts
School 50
System
State
0
35 74 64 98-99
42 66 62 97-98
20 61 59 96-97
School System State
Social Studies 50
38 67 56 0
98-99
36 64 55 97-98
35 64 55 96-97
Science
School 50
System
State
0
42 74 59 98-99
41 70 59 97-98
33 68 58 96-97
School System State
Sources of Information
Composite Score
50
34 70 57 0
98-99
School 50
System
35 66 56 97-98
26 65 55 96-97
State 0
36 71 58 98-99
40 67 57 97-98
1998-99 GEORGIA PUBLIC EDUCATION REPORT CARD Tippens Elementary School - 6281554
Prepared by Georgia Department of Education
25 64 56 96-97
Scores Reported in Percentiles
School System State
Page 2
STATE-REQUIRED TEST DATA
NORM-REFERENCED TESTS Grade 5
Iowa Tests of Basic Skills (ITBS) Each chart reflects data for three years of testing.
Reading Comprehension
Mathematics
50
33 61 53 0
98-99
33 60 53 97-98
33 61 52 96-97
School 50
System
State
0
27 68 59 98-99
18 67 58 97-98
17 65 57 96-97
School System State
Reading Vocabulary 50
23 59 48 0
98-99
29 58 48 97-98
25 59 46 96-97
Language Arts
School 50
System
State
0
27 70 63 98-99
35 67 61 97-98
24 66 58 96-97
School System State
Social Studies 50
29 67 57 0
98-99
24 66 56 97-98
27 64 55 96-97
Science
School 50
System
State
0
32 71 60 98-99
22 70 59 97-98
32 70 59 96-97
School System State
Sources of Information
Composite Score
50
35 67 58 0
98-99
School 50
System
29 66 58 97-98
27 67 57 96-97
State 0
29 67 57 98-99
24 66 56 97-98
24 66 55 96-97
1998-99 GEORGIA PUBLIC EDUCATION REPORT CARD Tippens Elementary School - 6281554
Prepared by Georgia Department of Education
Scores Reported in Percentiles
School System State
Page 3
STATE-REQUIRED TEST DATA
PERFORMANCE ASSESSMENTS
Grade 5 Writing Assessment
Percent at Developmental Stages:
1998-99 School System State
1997-98 School System State
1996-97 School System State
Stage Stage Stage Stage Stage Stage
1:The Emerging Writer 2:The Developing Writer 3:The Focusing Writer 4:The Experimenting 5:The Engaging Writer 6:The Extending Writer
10% 0%
20% 60% 10%
0%
0% 1% 12% 36% 34% 17%
0% 1% 16% 41% 29% 12%
0% 8% 50% 25% 17% 0%
0% 1% 11% 45% 33% 9%
0% 3% 19% 41% 27% 10%
0% 19% 35% 35%
8% 4%
0% 2% 14% 37% 34% 14%
0% 3% 21% 37% 26% 12%
AWARDS / RECOGNITION DATA
Schools in Georgia may receive recognition in the following programs: Charter School Pay for Performance Program Georgia School of Excellence National Blue Ribbon School Tippens Elementary School did not receive recognition in any of these programs during the 1998-99 school year.
1998-99 GEORGIA PUBLIC EDUCATION REPORT CARD Tippens Elementary School - 6281554
Prepared by Georgia Department of Education
Page 4
CERTIFIED PERSONNEL DATA
Positions Number Average Contract Days
Personnel Sex
Certificate
Years Experience
Full-time Part-time
Male Female
4 Yr Bachelor's 5 Yr Master's 6 Yr Specialist's 7 Yr Doctoral Other*
<1 1-10 11-20 21-30 >30
Average
Administrators
1.00 210.00
1 0
1 0
0 0 1 0 0 0 0 0 1 0 27.00
Support Personnel
2.50 190.00
2 1
0 3
0 2 1 0 0 1 0 2 0 0 10.67
PK-12 Teachers
22.00 190.00
22 0
0 22
16 6 0 0 0 5 6 7 3 1
11.09
*Includes One- and Two-Year Vocational Certificates.
ACCREDITATION DATA
Accredited by Southern Association of Colleges and Schools (SACS):
Elementary/Middle Commission. Accredited by Georgia Accrediting
Commission (GAC).
1998-99 GEORGIA PUBLIC EDUCATION REPORT CARD Tippens Elementary School - 6281554
Prepared by Georgia Department of Education
Page 5
1998-99 GEORGIA PUBLIC EDUCATION REPORT CARD
CHEROKEE COUNTY SCHOOLS
Woodstock Elementary School - 6283054
Grade Range K-6
The Georgia Public Education Report Card is designed to assist systems and schools in educational improvement. This report card contains a variety of data elements. An explanation of the terms is provided as a companion to the report card data. Please refer to the definitions for the most effective use of the reported data.
STUDENT DATA
Total 566
K-6 Enrollment, by Race/Ethnicity and Sex
Black
White Hispanic
American Multi-
Asian Indian
racial
46 8.1%
467 82.5%
41 7.2%
11 1.9%
1 0.2%
0 0.0%
Male Female
304 53.7%
262 46.3%
Enrollment in Selected Programs
Program
Program % of Student Enrollment Population
Gifted (Grades K-12)
10
1.8%
Alternative Programs (Grades 6-12)
0
0.0%
Students Eligible to Receive Free/Reduced Lunches
Number
Percent
School System
180 3,428
31.8% 14.1%
Dropout Rate for Grade 6
Number
Rate
School System
0
0.0%
1
0.0%
Enrollment in Compensatory Programs
Program
Program % of Student Enrollment Population
Special Education (Grades K-12)
78 13.8%
(PK)
0
N/A
English to Speakers of Other Languages (ESOL) (Grades K-12)
21
3.7%
Remedial Education (Grades 2-5, 9-12)
19
6.2%
Special Instructional Assistance (SIA) (Grades K-3)
50 13.8%
Title I (Grades K-12)
This school has a Targeted Assistance program.
Total 0
Retained Students, by Race/Ethnicity and Sex
Black
White Hispanic
American Multi-
Asian Indian
racial
0
0
0
0
0
0
Male Female
0
0
Prepared by Georgia Department of Education
Page 1
STATE-REQUIRED TEST DATA
NORM-REFERENCED TESTS Grade 3
Iowa Tests of Basic Skills (ITBS) Each chart reflects data for three years of testing.
Reading Comprehension 50
56 65 54 0
98-99
50 63 53 97-98
50 61 52 96-97
Mathematics
School 50
System
State
0
71 75 61 98-99
55 71 61 97-98
63 68 59 96-97
School System State
Reading Vocabulary 50
55 62 50 0
98-99
53 58 50 97-98
54 59 49 96-97
Language Arts
School 50
System
State
0
70 74 64 98-99
48 66 62 97-98
55 61 59 96-97
School System State
Social Studies 50
56 67 56 0
98-99
51 64 55 97-98
62 64 55 96-97
Science
School 50
System
State
0
59 74 59 98-99
57 70 59 97-98
54 68 58 96-97
School System State
Sources of Information
Composite Score
50
62 70 57 0
98-99
School 50
System
48 66 56 97-98
62 65 55 96-97
State 0
61 71 58 98-99
52 67 57 97-98
1998-99 GEORGIA PUBLIC EDUCATION REPORT CARD Woodstock Elementary School - 6283054
Prepared by Georgia Department of Education
58 64 56 96-97
Scores Reported in Percentiles
School System State
Page 2
STATE-REQUIRED TEST DATA
NORM-REFERENCED TESTS Grade 5
Iowa Tests of Basic Skills (ITBS) Each chart reflects data for three years of testing.
Reading Comprehension
Mathematics
50
64 61 53 0
98-99
60 60 53 97-98
63 61 52 96-97
School 50
System
State
0
79 68 59 98-99
75 67 58 97-98
74 65 57 96-97
School System State
Reading Vocabulary 50
61 59 48 0
98-99
51 58 48 97-98
54 59 46 96-97
Language Arts
School 50
System
State
0
81 70 63 98-99
66 67 61 97-98
68 66 58 96-97
School System State
Social Studies 50
68 67 57 0
98-99
60 66 56 97-98
66 64 55 96-97
Science
School 50
System
State
0
73 71 60 98-99
66 70 59 97-98
64 70 59 96-97
School System State
Sources of Information
Composite Score
50
74 67 58 0
98-99
School 50
System
61 66 58 97-98
67 67 57 96-97
State 0
75 67 57 98-99
64 66 56 97-98
67 66 55 96-97
1998-99 GEORGIA PUBLIC EDUCATION REPORT CARD Woodstock Elementary School - 6283054
Prepared by Georgia Department of Education
Scores Reported in Percentiles
School System State
Page 3
STATE-REQUIRED TEST DATA
PERFORMANCE ASSESSMENTS
Grade 5 Writing Assessment
Percent at Developmental Stages:
1998-99 School System State
1997-98 School System State
1996-97 School System State
Stage Stage Stage Stage Stage Stage
1:The Emerging Writer 2:The Developing Writer 3:The Focusing Writer 4:The Experimenting 5:The Engaging Writer 6:The Extending Writer
0% 0% 21% 44% 26% 9%
0% 1% 12% 36% 34% 17%
0% 1% 16% 41% 29% 12%
0% 0% 2% 56% 41% 2%
0% 1% 11% 45% 33% 9%
0% 3% 19% 41% 27% 10%
0% 0% 8% 44% 26% 21%
0% 2% 14% 37% 34% 14%
0% 3% 21% 37% 26% 12%
AWARDS / RECOGNITION DATA
Schools in Georgia may receive recognition in the following programs: Charter School Pay for Performance Program Georgia School of Excellence National Blue Ribbon School Woodstock Elementary School did not receive recognition in any of these programs during the 1998-99 school year.
1998-99 GEORGIA PUBLIC EDUCATION REPORT CARD Woodstock Elementary School - 6283054
Prepared by Georgia Department of Education
Page 4
CERTIFIED PERSONNEL DATA
Positions Number Average Contract Days
Personnel Sex
Certificate
Years Experience
Full-time Part-time
Male Female
4 Yr Bachelor's 5 Yr Master's 6 Yr Specialist's 7 Yr Doctoral Other*
<1 1-10 11-20 21-30 >30
Average
Administrators
2.00 202.50
2 0
1 1
0 0 2 0 0 0 0 2 0 0 18.00
Support Personnel
4.00 190.00
4 0
0 4
1 3 0 0 0 1 2 1 0 0 5.75
PK-12 Teachers
33.50 189.70
33 1
0 34
23 8 3 0 0 4
15 14
0 1 9.91
*Includes One- and Two-Year Vocational Certificates.
ACCREDITATION DATA
Accredited by Southern Association of Colleges and Schools (SACS):
Elementary/Middle Commission. Accredited by Georgia Accrediting
Commission (GAC).
1998-99 GEORGIA PUBLIC EDUCATION REPORT CARD Woodstock Elementary School - 6283054
Prepared by Georgia Department of Education
Page 5
1998-99 GEORGIA PUBLIC EDUCATION REPORT CARD
CHEROKEE COUNTY SCHOOLS
Woodstock High School - 6280197
Grade Range 9-12
The Georgia Public Education Report Card is designed to assist systems and schools in educational improvement. This report card contains a variety of data elements. An explanation of the terms is provided as a companion to the report card data. Please refer to the definitions for the most effective use of the reported data.
Total 1,601
STUDENT DATA
9-12 Enrollment, by Race/Ethnicity and Sex
Black
White Hispanic
American Multi-
Asian Indian
racial
66 4.1%
1,466 91.6%
42 2.6%
25 1.6%
0 0.0%
2 0.1%
Male Female
849 53.0%
752 47.0%
Enrollment in Selected Programs
Program
Gifted (Grades K-12)
Program % of Student Enrollment Population
139
8.7%
Non-Vocational Labs (Grades 9-12)
Vocational Labs (Grades 9-12)
Alternative Programs (Grades 6-12)
1,503 856 9
93.9% 53.5%
< 1%
Students Eligible to Receive Free/Reduced Lunches
Number
Percent
School System
112 3,428
7.0% 14.1%
Enrollment in Compensatory Programs
Program
Program % of Student Enrollment Population
Special Education (Grades K-12) PK
169 10.6%
0
N/A
English to Speakers of Other Languages (ESOL) (Grades K-12)
7
< 1%
Remedial Education (Grades 2-5, 9-12)
26
1.6%
Title I (Grades K-12)
This school has no Title I program.
Dropout Rate for Grades 9-12
Number
Rate
School System
63
3.5%
275
3.9%
Total 0
Retained Students, by Race/Ethnicity and Sex
Black
White Hispanic
American MultiAsian Indian racial
0
0
0
0
0
0
Male Female
0
0
Prepared by Georgia Department of Education
Page 1
STATE-REQUIRED TEST DATA
GEORGIA HIGH SCHOOL GRADUATION TESTS (GHSGT)
Percent of Regular Program 11th Graders Passing the Georgia High School Graduation Tests on First Administration
English Language Arts Mathematics Social Studies Science
All Components listed above
Writing
1998-99
School System State
98% 96% 88% 83%
98% 95% 87% 84%
96% 88% 80% 72%
80% 80% 68%
98% 96% 93%
1997-98
School System State
96% 96% 86% 84%
98% 95% 87% 84%
94% 88% 78% 74%
80% 80% 68%
94% 94% 92%
1996-97
School System State
N/A N/A N/A N/A
99% 96% 87% 86%
94% 87% 78% 74%
N/A 81% 67%
N/A 96% 93%
GRADUATE DATA
1999 Graduates by Credentials, Race/Ethnicity and Sex
Diplomas with Both College Prep. & Voc. Endorsements
Diplomas with College Prep. Endorsements Diplomas with Vocational Endorsements General High School Diplomas Special Education Diplomas
Total All Diplomas
Certificates of Performance
Total Graduates
Total 33
135 78 0
Black
1 3.0%
7 5.2%
6 7.7%
0
White Hispanic
31 93.9%
0 0.0%
124 91.9%
3 2.2%
71 91.0%
1 1.3%
0
0
American MultiAsian Indian racial
1 3.0%
0 0.0%
0 0.0%
1 0.7%
0 0.0%
0 0.0%
0 0.0%
0 0.0%
0 0.0%
0
0
0
Male Female
16
17
48.5% 51.5%
60
75
44.4% 55.6%
51
27
65.4% 34.6%
0
0
3
0
3
0
0
0
0
3
0
0.0% 100.0% 0.0% 0.0% 0.0% 0.0% 100.0% 0.0%
249
14
229
4
2
0
0
130
119
5.6% 92.0% 1.6% 0.8% 0.0% 0.0% 52.2% 47.8%
0
0
0
0
0
0
0
0
0
249
14
229
4
2
0
0
130
119
5.6% 92.0% 1.6% 0.8% 0.0% 0.0% 52.2% 47.8%
HOPE Scholarships
School System
Number of 1999 Graduates 2 4 9
Number Eligible
179
Percent Eligible
71.9%
1,170 853
72.9%
State
65,548 40,292 61.5%
High School Completion Rate
Percent of 1995Grade 9 Enrollment in Graduating Class of1999 School System State
Completion Rate '95-'99 N / A 80.0% 68.9%
1998-99 GEORGIA PUBLIC EDUCATION REPORT CARD
Woodstock High School - 6280197
Prepared by Georgia Department of Education
Page 2
COLLEGE ADMISSIONS / CREDIT TEST DATA
Scholastic Assessment Test (SAT)
Based on students' highest verbal and highest math scores
No. Taking
Average Score
Tests Verbal Math Total
Based on students' last test administration
Average Score Verbal Math Total
School
161
College Prep. Endorsement
Other Diplomas
System
762
College Prep. Endorsement
Other Diplomas
Georgia
41,958
516 511 1027
528 520 1048
410 393
803
515 505 1020 521 511 1032
429 407
836
492 488
980
510 N/A N/A
507 N/A N/A
483
506 N/A N/A
498 N/A N/A
479
1016 N/A N/A
1005 N/A N/A
962
Nation
952,913 N/A N/A N/A
502 508 1010
American College Testing (ACT)
Advanced Placement Exams (AP)
Number taking tests: English Mathematics Reading Science Reasoning CompositeScore
5 4 School System State
20.5 19.5 19.1
20.4 20.2 19.9
21.2 20.5
20.6 20.4
20.2 19.9
20.7 20.3 19.9
No. of Students Taking Tests
No. of Tests Taken No. of Test Scores
3 or Higher Percent of Test
Scores 3 or Higher
School 65 99 51
51.5%
System State 255 15,225 433 23,969 283 13,024
65.4% 54.3%
POST-SECONDARY DATA
Graduates Entering Georgia Public Colleges
Graduates Entering Georgia Public Colleges and Requiring Learning Support (LS)
1998 Graduates Entering in 1998-99
1997 Graduates Entering in 1997-98
Percent of Graduating Number Class
School
0
0.0%
System 373
37.9%
School
0
0.0%
System 358
39.0%
Number Requiring
LS N/A 33
N/A 68
Percent of those attending Georgia
Public Colleges
N/A
8.8%
N/A
19.0%
In previous years, the Report Card presented College Prep Curriculum information provided by the Board of Regents on students requiring Learning Support. Due to inconsistencies in the data provided by the Board of Regents in defining College Prep Completers versus Local Board of Education data defining College Prep Endorsements, the Department of Education Report Card will not provide this information until discrepancies can be reconciled.
Graduates Entering Georgia Public Technical and Adult Schools
1998 Graduates School System
Entering Number 0 36
1998-99 Percent
0.0% 3.7%
Entering Number N/A N/A
1997-98 Percent
N/A N/A
1997 Graduates School
0
0.0%
System
3
0.3%
0
0.0%
93
10.1%
1998-99 GEORGIA PUBLIC EDUCATION REPORT CARD Woodstock High School - 6280197
Prepared by Georgia Department of Education
Page 3
CERTIFIED PERSONNEL DATA
Positions Number Average Contract Days
Administrators
6.00 210.00
Support Personnel
9.00 192.22
PK-12 Teachers
89.98 190.56
Personnel Sex
Certificate
Years Experience
Full-time Part-time
Male Female
4 Yr Bachelor's 5 Yr Master's 6 Yr Specialist's 7 Yr Doctoral Other*
<1 1-10 11-20 21-30 >30
Average
6 0
4 2
0 4 2 0 0
0 2 1 3 0
18.33
9 0
2 7
1 5 3 0 0
1 3 2 3 0
13.56
90 0
29 61
56 32
1 0 1
14 41 24 10
1
9.59
*Includes One- and Two-Year Vocational Certificates.
ACCREDITATION DATA
Accredited by Southern Association of Colleges and Schools (SACS): Secondary/Middle Commission. Accredited with Quality by Georgia Accrediting Commission (GAC).
AWARDS / RECOGNITION DATA
Schools in Georgia may receive recognition in the following programs: Charter School Pay for Performance Program Georgia School of Excellence National Blue Ribbon School Woodstock High School did not receive recognition in any of these programs during the 1998-99 school year.
1998-99 GEORGIA PUBLIC EDUCATION REPORT CARD Woodstock High School - 6280197
Prepared by Georgia Department of Education
Page 4
1998-99 GEORGIA PUBLIC EDUCATION REPORT CARD
CHEROKEE COUNTY SCHOOLS
Woodstock Middle School - 6280297
Grade Range 7-8
The Georgia Public Education Report Card is designed to assist systems and schools in educational improvement. This report card contains a variety of data elements. An explanation of the terms is provided as a companion to the report card data. Please refer to the definitions for the most effective use of the reported data.
STUDENT DATA
Total 1,005
7-8 Enrollment, by Race/Ethnicity and Sex
Black
White Hispanic
American Multi-
Asian Indian
racial
35 3.5%
926 92.1%
29 2.9%
11 1.1%
3 0.3%
1 0.1%
Male 515
51.2%
Female 490
48.8%
Enrollment in Selected Programs
Program
Gifted (Grades K-12)
Program % of Student Enrollment Population
115
11.4%
Alternative Programs (Grades 6-12)
0
0.0%
Students Eligible to Receive Free/Reduced Lunches
Number
Percent
School System
143 3,428
14.2% 14.1%
Enrollment in Compensatory Programs
Program
Program % of Student Enrollment Population
Special Education (Grades K-12) (PK)
154 15.3%
0
N/A
English to Speakers of Other Languages (ESOL) (Grades K-12)
4
< 1%
Title I (Grades K-12)
This school has no Title I program.
Dropout Rate for Grades 7-8
Number
Rate
School System
1
0.1%
3
0.1%
Total 0
Retained Students, by Race/Ethnicity and Sex
Black
White Hispanic
American MultiAsian Indian racial
0
0
0
0
0
0
Male Female
0
0
Prepared by Georgia Department of Education
Page 1
STATE-REQUIRED TEST DATA
NORM-REFERENCED TESTS Grade 8
Iowa Tests of Basic Skills (ITBS) Each chart reflects data for three years of testing.
Reading Comprehension 50
58 60 49 0
98-99
59 60 48 97-98
59 60 48 96-97
Mathematics
School 50
System
State
0
65 63 56 98-99
63 61 55 97-98
58 59 54 96-97
School System State
Reading Vocabulary 50
57 58 46 0
98-99
59 57 45 97-98
60 61 44 96-97
Language Arts
School 50
System
State
0
68 69 60 98-99
67 65 58 97-98
65 66 56 96-97
School System State
Social Studies 50
59 60 54 0
98-99
63 61 53 97-98
65 62 53 96-97
Science
School 50
System
State
0
65 63 56 98-99
62 62 55 97-98
58 61 53 96-97
School System State
Sources of Information
Composite Score
50
65 65 57 0
98-99
School 50
System
66 65 56 97-98
59 64 55 96-97
State 0
64 64 56 98-99
64 63 54 97-98
1998-99 GEORGIA PUBLIC EDUCATION REPORT CARD Woodstock Middle School - 6280297
Prepared by Georgia Department of Education
62 63 54 96-97
Scores Reported in Percentiles
School System State
Page 2
STATE-REQUIRED TEST DATA
Categories of Scaled Scores
Inadequate (less than 162)
Minimal (162-209)
Good
(210-247)
Very Good (greater than 247)
Average Scaled Score: (Range 100-300)
PERFORMANCE ASSESSMENTS
Grade 8 Writing Assessment
1998-99 Percent Scoring
1997-98 Percent Scoring
1996-97 Percent Scoring
School System State School System State School System State
1% 33% 49% 17%
2% 33% 51% 13%
8% 40% 41% 11%
3% 42% 46%
9%
4% 44% 44%
8%
11% 46% 34%
8%
6% 46% 40%
8%
8% 47% 36%
9%
15% 46% 30%
8%
219
217
208 211
209 202 207
205 198
AWARDS / RECOGNITION DATA
Schools in Georgia may receive recognition in the following programs: Charter School Pay for Performance Program Georgia School of Excellence National Blue Ribbon School Woodstock Middle School did not receive recognition in any of these programs during the 1998-99 school year.
1998-99 GEORGIA PUBLIC EDUCATION REPORT CARD Woodstock Middle School - 6280297
Prepared by Georgia Department of Education
Page 3
CERTIFIED PERSONNEL DATA
Positions Number Average Contract Days
Personnel Sex
Certificate
Years Experience
Full-time Part-time
Male Female
4 Yr Bachelor's 5 Yr Master's 6 Yr Specialist's 7 Yr Doctoral Other*
<1 1-10 11-20 21-30 >30
Average
Administrators
3.00 205.00
3 0
0 3
0 1 2 0 0 0 0 3 0 0 18.00
Support Personnel
4.00 190.00
4 0
1 3
0 3 1 0 0 0 1 3 0 0 13.75
PK-12 Teachers
65.98 190.00
66 0
15 51
33 30
2 1 0 3 34 24 5 0 9.77
*Includes One- and Two-Year Vocational Certificates.
ACCREDITATION DATA
Accredited by Southern Association of Colleges and Schools (SACS):
Elementary/Middle Commission. Accredited with Quality by Georgia
Accrediting Commission (GAC).
1998-99 GEORGIA PUBLIC EDUCATION REPORT CARD Woodstock Middle School - 6280297
Prepared by Georgia Department of Education
Page 4
1998-99 GEORGIA PUBLIC EDUCATION REPORT CARD CHICKAMAUGA CITY SCHOOLS - 769
The Georgia Public Education Report Card is designed to assist systems and schools in educational improvement. This report card contains a variety of data elements. An explanation of the terms is provided as a companion to the report card data. Please refer to the definitions for the most effective use of the reported data.
Total
K-12
1,269
PK
0
STUDENT DATA
Enrollment, by Race/Ethnicity and Sex
Black
White Hispanic
American Multi-
Asian Indian
racial
0 0.0%
1,256 99.0%
0 0.0%
2 0.2%
1 0.1%
10 0.8%
0
0
0
0
0
0
Male 622
49.0% 0
Female 647
51.0% 0
Enrollment in Selected Programs
Program
Program % of Student Enrollment Population
Gifted (Grades K-12)
193
15.2%
Non-Vocational Labs (Grades 9-12)
377
87.7%
Vocational Labs (Grades 9-12)
301
70.0%
Alternative Programs (Grades 6-12)
0
0.0%
Students Eligible to Receive Free/Reduced Lunches
Number
Percent
179
14.1%
Dropout Rate
Number
Percent
6-12 9-12
16
2.0%
16
3.6%
Enrollment in Compensatory Programs
Program
Program % of Student Enrollment Population
Special Education
(Grades K-12)
82
PK
0
English to Speakers of
Other Languages (ESOL)
0
(Grades K-12)
Remedial Education (Grades 2-5, 9-12)
58
Special Instructional
Assistance (SIA)
0
(Grades K-3)
Title I (Grades K-12) Number of schools with: Schoolwide program Targeted Assistance program No Title I program
6.5% N/A
0.0%
7.6%
0.0%
0 1 1
Total 30
Retained Students, by Race/Ethnicity and Sex
Black
White Hispanic
American MultiAsian Indian racial
0 0.0%
28 93.3%
0 0.0%
0 0.0%
0 0.0%
2 6.7%
Male Female
19
11
63.3% 36.7%
Prepared by Georgia Department of Education
Page 1
STATE-REQUIRED TEST DATA
NORM-REFERENCED TESTS
Grade 3 Iowa Tests of Basic Skills (ITBS) Each chart reflects data for three years of testing.
Reading Comprehension
Mathematics
50
60 54 66 53 72 52 0
98-99 97-98 96-97
System State
50
61 61 73 61 75 59 0
98-99 97-98 96-97
System State
Reading Vocabulary
50
59 50 67 50 71 49 0
98-99 97-98 96-97
System State
Social Studies
50
59 56 73 55 77 55 0
98-99 97-98 96-97
System State
Language Arts
50
62 64 67 62 77 59 0
98-99 97-98 96-97
System State
Science
50
54 59 68 59 79 58 0
98-99 97-98 96-97
System State
Sources of Information
Composite Score
50
56 57 0
98-99
System
50
68 56 74 55 97-98 96-97
State
58 58 69 57 0
98-99 97-98
1998-99 GEORGIA PUBLIC EDUCATION REPORT CARD Chickamauga City Schools
Prepared by Georgia Department of Education
System State Scores Reported 77 56 in Percentiles 96-97
Page 2
STATE-REQUIRED TEST DATA
NORM-REFERENCED TESTS
Grade 5 Iowa Tests of Basic Skills (ITBS) Each chart reflects data for three years of testing.
Reading Comprehension
Mathematics
50
63 53 60 53 59 52 0
98-99 97-98 96-97
System State
50
61 59 61 58 65 57 0
98-99 97-98 96-97
System State
Reading Vocabulary
50
62 48 59 48 61 46 0
98-99 97-98 96-97
System State
Social Studies
50
70 57 63 56 63 55 0
98-99 97-98 96-97
System State
Language Arts
50
64 63 58 61 65 58 0
98-99 97-98 96-97
System State
Science
50
74 60 67 59 72 59 0
98-99 97-98 96-97
System State
Sources of Information
Composite Score
50
64 58 0
98-99
System
50
62 58 66 57 97-98 96-97
State
67 57 61 56 0
98-99 97-98
1998-99 GEORGIA PUBLIC EDUCATION REPORT CARD Chickamauga City Schools
Prepared by Georgia Department of Education
System State Scores Reported 65 55 in Percentiles 96-97
Page 3
STATE-REQUIRED TEST DATA
NORM-REFERENCED TESTS Grade 8
Iowa Tests of Basic Skills (ITBS) Each chart reflects data for three years of testing.
Reading Comprehension
Mathematics
50
60 49 63 48 68 48 0
98-99 97-98 96-97
System State
50
63 56 66 55 71 54 0
98-99 97-98 96-97
System State
Reading Vocabulary
50
65 46 62 45 64 44 0
98-99 97-98 96-97
System State
Language Arts
50
65 60 70 58 72 56 0
98-99 97-98 96-97
System State
Social Studies
50
65 54 63 53 64 53 0
98-99 97-98 96-97
System State
Science
50
67 56 71 55 67 53 0
98-99 97-98 96-97
System State
Sources of Information
Composite Score
50
65 57 0
98-99
System
50
62 56 66 55 97-98 96-97
State
65 56 66 54 0
98-99 97-98
1998-99 GEORGIA PUBLIC EDUCATION REPORT CARD Chickamauga City Schools
Prepared by Georgia Department of Education
System State Scores Reported 68 54 in Percentiles 96-97
Page 4
STATE-REQUIRED TEST DATA
PERFORMANCE ASSESSMENTS
Grade 5 Writing Assessment
1998-99
1997-98
1996-97
Percent at Developmental Stages:
Comparison
Comparison
Comparison
System Group State System Group State System Group State
Stage Stage Stage Stage Stage Stage
1: The Emerging Writer 2: The Developing Writer 3: The Focusing Writer 4: The Experimenting Writer 5: The Engaging Writer 6: The Extending Writer
0% 0% 8% 38% 38% 16%
0% 0% 3% 34% 42% 19%
0% 1% 16% 41% 29% 12%
0% 0% 14% 40% 36% 10%
0% 0% 11% 34% 43% 12%
0% 3% 19% 41% 27% 10%
0% 0% 12% 39% 44% 5%
0% 0% 7% 36% 41% 17%
0% 3% 21% 37% 26% 12%
Grade 8 Writing Assessment
1998-99 Percent Scoring 1997-98 Percent Scoring 1996-97 Percent Scoring
Categories of Scaled Scores
Comparison
Comparison
Comparison
System Group State System Group State System Group State
Inadequate (less than 162)
Minimal (162-209)
Good
(210-247)
Very Good (greater than 247)
1% 21% 63% 15%
1% 24% 57% 18%
8% 40% 41% 11%
5% 49% 38%
8%
4% 45% 41% 10%
11% 46% 34%
8%
8% 39% 45%
7%
5% 47% 39% 10%
15% 46% 30%
8%
Average Scaled Score: (Range 100-300)
224
224 208
208
211 202
207
209 198
GEORGIA HIGH SCHOOL GRADUATION TESTS (GHSGT)
Percent of Regular Program 11th Graders Passing the Georgia High School Graduation Tests on First Administration
1998-99
1997-98
1996-97
Comparison
Comparison
Comparison
System Group State System Group State System Group State
English Language Arts Mathematics Social Studies Science
100% 100% 93% 85%
99% 98% 87% 85%
96% 88% 80% 72%
100% 92% 88% 85%
99% 92% 86% 84%
94% 88% 78% 74%
97% 95% 85% 82%
97% 92% 82% 82%
94% 87% 78% 74%
All Components listed above 8 3 %
81% 68% 79%
78% 68% 70%
73% 67%
Writing
91%
95% 93% 92%
94% 92% 96%
96% 93%
1998-99 GEORGIA PUBLIC EDUCATION REPORT CARD
Chickamauga City Schools
Prepared by Georgia Department of Education
Page 5
GRADUATE DATA
1999 Graduates by Credentials, Race/Ethnicity and Sex
Diplomas with Both College Prep. & Voc. Endorsements
Diplomas with College Prep. Endorsements Diplomas with Vocational Endorsements General High School Diplomas Special Education Diplomas
Total All Diplomas
Certificates of Performance
Total Graduates
Total 16 44 29 2 0
Black
American MultiWhite Hispanic Asian Indian racial
Male Female
0 0.0%
0 0.0%
0 0.0%
0 0.0%
0
16 100.0%
44 100.0%
29 100.0%
2 100.0%
0
0 0.0%
0 0.0%
0 0.0%
0 0.0%
0
0 0.0%
0 0.0%
0 0.0%
0 0.0%
0
0 0.0%
0 0.0%
0 0.0%
0 0.0%
0
0
7
0.0% 43.8%
0
11
0.0% 25.0%
0
18
0.0% 62.1%
0
2
0.0% 100.0%
0
0
9 56.3%
33 75.0%
11 37.9%
0 0.0%
0
91
0
91
0
0
0
0
38
53
0.0% 100.0% 0.0% 0.0% 0.0% 0.0% 41.8% 58.2%
0
0
0
0
0
0
0
0
0
91
0
91
0
0
0
0
38
53
0.0% 100.0% 0.0% 0.0% 0.0% 0.0% 41.8% 58.2%
HOPE Scholarships
System State
Number of 1999 Graduates 9 1
Number Eligible
62
Percent Eligible
68.1%
65,548 40,292 61.5%
High School Completion Rate Percent of 1995Grade 9 Enrollment
in Graduating Class of1999
System
State
Completion Rate '95-'99 91.9% 68.9%
COLLEGE ADMISSIONS / CREDIT TEST DATA
Scholastic Assessment Test (SAT)
No. Taking
Average Score
Tests
Verbal Math Total
Based on students' highest verbal and highest math scores
System College Prep. Endorsement Other Diplomas
507 481 988 519 490 1009 344 362 706
Georgia
492 488 980
Based on students' last test administration
System Georgia
57
499 476
975
41,958 483 479 962
Nation
952,913 502 508 1010
American College Testing (ACT)
System State Nation
English
21.0
19.1 20.4
Mathematics
20.1
19.9 20.7
Reading
20.6
20.2 21.3
Science Reasoning 20.6
19.9 21.0
CompositeScore 20.7
19.9 21.9
Advanced Placement Exams (AP)
No. of Students Taking Tests
No. of Tests Taken No. of Test Scores
3 or Higher Percent of Test
Scores 3 or Higher
System State 36 15,225 37 23,969 11 13,024
29.7% 54.3%
1998-99 GEORGIA PUBLIC EDUCATION REPORT CARD Chickamauga City Schools
Prepared by Georgia Department of Education
Page 6
POSTSECONDARY DATA
Graduates Entering Georgia Public Colleges and Universities
Graduates Entering Georgia Public Colleges and Universities and
Requiring Learning Support (LS)
1998 Graduates Entering 1998-99
1997 Graduates Entering 1997-98
Percent of Graduating Number Class
31
31.3%
35
33.0%
Number Requiring
LS
12
8
Percent of those attending Georgia
Public Colleges
38.7%
22.9%
In previous years, the Report Card presented College Prep Curriculum information provided by the Board of Regents on students requiring Learning Support. Due to inconsistencies in the data provided by the Board of Regents in defining College Prep Completers versus Local Board of Education data defining College Prep Endorsements, the Department of Education Report Card will not provide this information until discrepancies can be reconciled.
Graduates Entering Georgia Public Technical and Adult Schools
Entering 1998-99 Entering 1997-98
Number Percent
Number Percent
1998 Graduates 1997 Graduates
17
17.2%
2
1.9%
N/A 15
N/A 14.2%
ACCREDITATION / RECOGNITION DATA
Southern Association of Colleges and Schools (SACS) Accrediting Commission
Secondary/Middle Commission Elementary/Middle Commission Both Elementary/Secondary Commissions Joint Commission Candidate for Accreditation
Accreditation by Georgia Accrediting Commission (GAC)
Accredited by GAC Accredited with Quality by GAC
Number of Schools
1 0 0 0 0
Number of Schools
0 2
Awards / Recognition
State Recognized Program
Number of Schools
Charter School
0
Pay for Performance Recipient
0
Georgia School of Excellence
0
National Blue Ribbon School
0
COMMUNITY DATA
Number of Children Eligible for Migrant Education Number of Families-At-Risk * Number of Food Stamp Participants * Number of Families Receiving TANF * ** Per Capita Income * Unemployment Rate * 1990 Population * Projected 2000 Population * Projected 2010 Population *
* Data Available at County Level Only ** Known as AFDC before January 1997
0 190 2,924 246 $17,856 4.7% 58,340 62,579 65,156
1998-99 GEORGIA PUBLIC EDUCATION REPORT CARD Chickamauga City Schools
Prepared by Georgia Department of Education
Page 7
FISCAL DATA
Millage Rate
9.56
* Fall 1998 Property Tax Digest is used to calculate the 98-99 Value of One Mill
FTE Count
FTE Count used for Allotment Calculation 1,264.0 Fall '98 FTE Count 1,269
Value of One Mill
$34,439 $27.24 per Allotment FTE
Sources: Local State-QBE State-
Lottery State-
Other Federal Other
Total
PerGeneral Fund cent Per FTE
$650,635 12.5% $515 $4,539,598 87.3% $3,591
K-12 Revenues
Lottery K-12
and
Title
All Other
Programs
K-12
$0
$0
Bonded Debt $561,146
$0
$0
$0
$0 0.0%
$0
$0
$29,209
$0
$9,526 0.2%
$8
$0 0.0%
$0
$0 0.0%
$0
$5,199,759 100% $4,114
$0 $412,299
$0 $412,299
$0 $0 $0 $29,209
$0 $0 $0 $561,146
Capital Projects
$203,996 $0
$0
$29,887 $0 $0
$233,883
School Nutrition
$288,437 $0
$0
$36,328 $112,680
$0 $437,446
Grand Total
Total
Per-
Amount cent
$1,704,215 24.8%
$4,539,598 66.0%
$29,209 0.4%
$75,742 1.1% $524,979 7.6%
$0 0.0% $6,873,745 100%
Instruction
Media Instruction
Support Pupil Services General Admin. School Admin. Trans-
portation Maint. & Ops. Capital Projects School Food Debt Service
Total
$3,589,835 69.3% $2,840 $147,897 2.9% $117
$192,050 3.7% $152
$229,380 4.4% $181
$205,898 4.0% $163
$341,969 6.6% $271
$0 0.0%
$0
$473,150 9.1% $374
$0 0.0%
$0
$0 0.0%
$0
$0 0.0%
$0
$5,180,182 100% $4,098
K-12 Expenditures
$322,847
$28,994
$0
$4,308
$0
$0
$16,830
$0
$0
$66,714
$0
$0
$0
$0
$0
$0
$0
$0
$49
$0
$0
$49
$0
$0
$0
$0
$0
$0
$0
$0
$0
$0 $513,895
$410,799
$28,994 $513,895
$39,868 $0 $0 $0 $0 $0 $0
$38,864 $826,039
$0 $0
$0 $0 $0 $0 $0 $0 $0 $0 $0 $458,820 $0
$904,771 $458,820
$3,981,545 53.1% $152,205 2.0% $208,881 2.8% $296,094 3.9% $205,898 2.7% $341,969 4.6% $49 0.0% $512,064 6.8% $826,039 11.0% $458,820 6.1% $513,895 6.9%
$7,497,464 100%
Salaries and Benefits as Percentages of Revenues and of Expenditures
Teachers and Paraprofessionals
Salaries $2,636,535
Benefits $747,804
Percentage of Revenues Percentage of Expenditures
Total of
Total of
General Fund
General Fund
Title Programs
Title Programs
Lottery K-12
Lottery K-12
Total Salaries
and
Total
and
Total
and Benefits All Other K-12 K - 12 All Other K-12 K - 12
$3,384,339
60.0%
49.2%
60.2%
45.1%
School Administration
$198,569
$69,098
$267,667
4.7%
3.9%
4.8%
3.6%
General Administration
$117,484
$39,603
$157,087
2.8%
2.3%
2.8%
2.1%
1998-99 GEORGIA PUBLIC EDUCATION REPORT CARD
Chickamauga City Schools - 769
Prepared by Georgia Department of Education
Page 8
CERTIFIED PERSONNEL DATA
Number
Average Annual Salary Positions Average Contract Days
Average Daily Salary
Full-time Personnel Part-time
Sex Male Female
4 Yr Bachelor's Certificate 5 Yr Master's
Level 6 Yr Specialist's 7 Yr Doctoral Other*
Black
White Race/ Hispanic Ethnicity Asian
American Indian
Multiracial
Years Experience
<1 1-10 11-20 21-30 >30
Average
Administrators
6.43
$61,609.32 215.19
$286.30
5 3
3 5
0 3 4 1 0
0 8 0 0 0 0
0 0 2 3 3
28.13
Support Personnel PK-12 Teachers
4.94
64.92
$46,182.23 199.51
$231.47
$39,273.76 189.98
$206.73
4
64
2
3
3
19
3
48
0
28
5
31
1
6
0
2
0
0
0
0
6
67
0
0
0
0
0
0
0
0
0
0
0
29
3
20
2
16
1
2
21.83
13.61
*Includes One- and Two-Year Vocational Certificates.
Certified Staff Position Ratios
Teacher/Administrator Ratio 10:1
Teacher/Support Person Ratio 13:1
Teacher/Staff Ratio 6:1
Student Enrollment/All Teachers 20:1
Certified Personnel by Category
82.7% 100%
9.9%
7.4%
80% 60%
40%
20%
0%
Teachers
Administrators
Support Personnel
1998-99 GEORGIA PUBLIC EDUCATION REPORT CARD
Chickamauga City Schools - 769
Prepared by Georgia Department of Education
Page 9
1998-99 GEORGIA PUBLIC EDUCATION REPORT CARD
CHICKAMAUGA CITY SCHOOLS
Chickamauga Elementary School - 7691050
Grade Range K-5
The Georgia Public Education Report Card is designed to assist systems and schools in educational improvement. This report card contains a variety of data elements. An explanation of the terms is provided as a companion to the report card data. Please refer to the definitions for the most effective use of the reported data.
STUDENT DATA
Total 496
K-5 Enrollment, by Race/Ethnicity and Sex
Black
White Hispanic
American Multi-
Asian Indian
racial
0 0.0%
489 98.6%
0 0.0%
0 0.0%
0 0.0%
7 1.4%
Male Female
230 46.4%
266 53.6%
Enrollment in Selected Programs
Program
Program % of Student Enrollment Population
Gifted (Grades K-12)
41
8.3%
Alternative Programs (Grades 6-12)
N/A
N/A
Students Eligible to Receive Free/Reduced Lunches
Number
Percent
School System
82
16.5%
179
14.1%
Dropout Rate *
Number
Rate
School System
N/A N/A
N/A N/A
* Dropout rates are not applicable for grades PK-5.
Enrollment in Compensatory Programs
Program
Program % of Student Enrollment Population
Special Education (Grades K-12)
50 10.1%
(PK)
0
N/A
English to Speakers of Other Languages (ESOL) (Grades K-12)
0
0.0%
Remedial Education (Grades 2-5, 9-12)
47 13.9%
Special Instructional Assistance (SIA) (Grades K-3)
0
0.0%
Title I (Grades K-12)
This school has a Targeted Assistance program.
Total 8
Retained Students, by Race/Ethnicity and Sex
Black
White Hispanic
American Multi-
Asian Indian
racial
0 0.0%
7 87.5%
0 0.0%
0 0.0%
0
1
0.0% 12.5%
Male Female
5
3
62.5% 37.5%
Prepared by Georgia Department of Education
Page 1
STATE-REQUIRED TEST DATA
NORM-REFERENCED TESTS Grade 3
Iowa Tests of Basic Skills (ITBS) Each chart reflects data for three years of testing.
Reading Comprehension 50
60 60 54 0
98-99
66 66 53 97-98
72 72 52 96-97
Mathematics
School 50
System
State
0
61 61 61 98-99
73 73 61 97-98
75 75 59 96-97
School System State
Reading Vocabulary 50
59 59 50 0
98-99
67 67 50 97-98
71 71 49 96-97
Language Arts
School 50
System
State
0
62 62 64 98-99
67 67 62 97-98
77 77 59 96-97
School System State
Social Studies 50
59 59 56 0
98-99
73 73 55 97-98
77 77 55 96-97
Science
School 50
System
State
0
54 54 59 98-99
68 68 59 97-98
79 79 58 96-97
School System State
Sources of Information
Composite Score
50
56 56 57 0
98-99
School 50
System
68 68 56 97-98
74 74 55 96-97
State 0
58 58 58 98-99
69 69 57 97-98
1998-99 GEORGIA PUBLIC EDUCATION REPORT CARD Chickamauga Elementary School - 7691050
Prepared by Georgia Department of Education
77 77 56 96-97
Scores Reported in Percentiles
School System State
Page 2
STATE-REQUIRED TEST DATA
NORM-REFERENCED TESTS Grade 5
Iowa Tests of Basic Skills (ITBS) Each chart reflects data for three years of testing.
Reading Comprehension
Mathematics
50
63 63 53 0
98-99
60 60 53 97-98
59 59 52 96-97
School 50
System
State
0
61 61 59 98-99
61 61 58 97-98
65 65 57 96-97
School System State
Reading Vocabulary 50
62 62 48 0
98-99
59 59 48 97-98
61 61 46 96-97
Language Arts
School 50
System
State
0
64 64 63 98-99
58 58 61 97-98
65 65 58 96-97
School System State
Social Studies 50
70 70 57 0
98-99
63 63 56 97-98
63 63 55 96-97
Science
School 50
System
State
0
74 74 60 98-99
67 67 59 97-98
72 72 59 96-97
School System State
Sources of Information
Composite Score
50
64 64 58 0
98-99
School 50
System
62 62 58 97-98
66 66 57 96-97
State 0
67 67 57 98-99
61 61 56 97-98
65 65 55 96-97
1998-99 GEORGIA PUBLIC EDUCATION REPORT CARD Chickamauga Elementary School - 7691050
Prepared by Georgia Department of Education
Scores Reported in Percentiles
School System State
Page 3
STATE-REQUIRED TEST DATA
PERFORMANCE ASSESSMENTS
Grade 5 Writing Assessment
Percent at Developmental Stages:
1998-99 School System State
1997-98 School System State
1996-97 School System State
Stage Stage Stage Stage Stage Stage
1:The Emerging Writer 2:The Developing Writer 3:The Focusing Writer 4:The Experimenting 5:The Engaging Writer 6:The Extending Writer
0% 0% 8% 38% 38% 16%
0% 0% 8% 38% 38% 16%
0% 1% 16% 41% 29% 12%
0% 0% 14% 40% 36% 10%
0% 0% 14% 40% 36% 10%
0% 3% 19% 41% 27% 10%
0% 0% 12% 39% 44% 5%
0% 0% 12% 39% 44% 5%
0% 3% 21% 37% 26% 12%
AWARDS / RECOGNITION DATA
Schools in Georgia may receive recognition in the following programs: Charter School Pay for Performance Program Georgia School of Excellence National Blue Ribbon School Chickamauga Elementary School did not receive recognition in any of these programs during the 1998-99 school year.
1998-99 GEORGIA PUBLIC EDUCATION REPORT CARD Chickamauga Elementary School - 7691050
Prepared by Georgia Department of Education
Page 4
CERTIFIED PERSONNEL DATA
Positions Number Average Contract Days
Personnel Sex
Certificate
Years Experience
Full-time Part-time
Male Female
4 Yr Bachelor's 5 Yr Master's 6 Yr Specialist's 7 Yr Doctoral Other*
<1 1-10 11-20 21-30 >30
Average
Administrators
1.00 210.00
1 0
1 0
0 1 0 0 0 0 0 0 1 0 28.00
Support Personnel
2.00 190.00
2 0
1 1
0 2 0 0 0 0 0 0 2 0 23.50
PK-12 Teachers
23.50 190.00
23 1
2 22
8 15
0 1 0 0 11 4 9 0 13.42
*Includes One- and Two-Year Vocational Certificates.
ACCREDITATION DATA
Accredited with Quality by Georgia Accrediting Commission (GAC).
1998-99 GEORGIA PUBLIC EDUCATION REPORT CARD Chickamauga Elementary School - 7691050
Prepared by Georgia Department of Education
Page 5
1998-99 GEORGIA PUBLIC EDUCATION REPORT CARD
CHICKAMAUGA CITY SCHOOLS
Gordon Lee Middle/High School - 7692050
Grade Range 6-12
The Georgia Public Education Report Card is designed to assist systems and schools in educational improvement. This report card contains a variety of data elements. An explanation of the terms is provided as a companion to the report card data. Please refer to the definitions for the most effective use of the reported data.
STUDENT DATA
Total 773
6-12 Enrollment, by Race/Ethnicity and Sex
Black
White Hispanic
American Multi-
Asian Indian
racial
0 0.0%
767 99.2%
0 0.0%
2 0.3%
1 0.1%
3 0.4%
Male 392
50.7%
Female 381
49.3%
Enrollment in Selected Programs
Program
Program % of Student Enrollment Population
Gifted (Grades K-12)
152
19.7%
Non-Vocational Labs (Grades 9-12)
377
87.7%
Vocational Labs (Grades 9-12)
301
70.0%
Alternative Programs (Grades 6-12)
0
0.0%
Students Eligible to Receive Free/Reduced Lunches
Number
Percent
School System
97
12.5%
179
14.1%
Enrollment in Compensatory Programs
Program
Program % of Student Enrollment Population
Special Education (Grades K-12) PK
32
4.1%
0
N/A
English to Speakers of Other Languages (ESOL) (Grades K-12)
0
0.0%
Remedial Education (Grades 2-5, 9-12)
11
2.6%
Special Instructional Assistance (SIA) (Grades K-3)
N/A
N/A
Title I (Grades K-12) This school has no Title I program.
Dropout Rate for Grades 6-12
Number
Rate
School System
16
2.0%
16
2.0%
Total 22
Retained Students, by Race/Ethnicity and Sex
Black
White Hispanic
American MultiAsian Indian racial
0 0.0%
21 95.5%
0 0.0%
0 0.0%
0 0.0%
1 4.5%
Male Female
14
8
63.6% 36.4%
Prepared by Georgia Department of Education
Page 1
STATE-REQUIRED TEST DATA
NORM-REFERENCED TESTS
Grade 3 Iowa Tests of Basic Skills (ITBS) Each chart reflects data for three years of testing.
No third-grade students are enrolled at Gordon Lee Middle/High School.
Reading Comprehension
Mathematics
50
N/A 60 54 0
98-99
N/A 66 53 97-98
N/A 72 52 96-97
School 50
System
State
N/A 61 61 0
98-99
N/A 73 61 97-98
N/A 75 59 96-97
School System State
Reading Vocabulary 50
N/A 59 50 0
98-99
N/A 67 50 97-98
N/A 71 49 96-97
Language Arts
School 50
System
State
N/A 62 64 0
98-99
N/A 67 62 97-98
N/A 77 59 96-97
School System State
Social Studies 50
N/A 59 56 0
98-99
N/A 73 55 97-98
N/A 77 55 96-97
Science
School 50
System
State
N/A 54 59 0
98-99
N/A 68 59 97-98
N/A 79 58 96-97
School System State
Sources of Information
Composite Score
School
50
50
System
N/A 56 57 0
98-99
N/A 68 56 N/A 74 55
97-98
96-97
State
N/A 58 58 0
98-99
N/A 69 57 97-98
N/A 77 56 96-97
1998-99 GEORGIA PUBLIC EDUCATION REPORT CARD Gordon Lee Middle/High School - 7692050
Prepared by Georgia Department of Education
Scores Reported in Percentiles
School System State
Page 2
STATE-REQUIRED TEST DATA
NORM-REFERENCED TESTS
Grade 5 Iowa Tests of Basic Skills (ITBS) Each chart reflects data for three years of testing. No fifth-grade students are enrolled at Gordon Lee Middle/High School.
Reading Comprehension
Mathematics
50
N/A 63 53 0
98-99
N/A 60 53 97-98
N/A 59 52 96-97
School 50
System
State
N/A 61 59 0
98-99
N/A 61 58 97-98
N/A 65 57 96-97
School System State
Reading Vocabulary 50
N/A 62 48 0
98-99
N/A 59 48 97-98
N/A 61 46 96-97
Language Arts
School 50
System
State
N/A 64 63 0
98-99
N/A 58 61 97-98
N/A 65 58 96-97
School System State
Social Studies 50
N/A 70 57 0
98-99
N/A 63 56 97-98
N/A 63 55 96-97
Science
School 50
System
State
N/A 74 60 0
98-99
N/A 67 59 97-98
N/A 72 59 96-97
School System State
Sources of Information
Composite Score
School
50
50
System
N/A 64 58 0
98-99
N/A 62 58 N/A 66 57
97-98
96-97
State
N/A 67 57 0
98-99
N/A 61 56 97-98
N/A 65 55 96-97
1998-99 GEORGIA PUBLIC EDUCATION REPORT CARD Gordon Lee Middle/High School - 7692050
Prepared by Georgia Department of Education
Scores Reported in Percentiles
School System State
Page 3
STATE-REQUIRED TEST DATA
NORM-REFERENCED TESTS Grade 8
Iowa Tests of Basic Skills (ITBS) Each chart reflects data for three years of testing.
Reading Comprehension 50
60 60 49 0
98-99
63 63 48 97-98
68 68 48 96-97
Mathematics
School 50
System
State
0
63 63 56 98-99
66 66 55 97-98
71 71 54 96-97
School System State
Reading Vocabulary 50
65 65 46 0
98-99
62 62 45 97-98
64 64 44 96-97
Language Arts
School 50
System
State
0
65 65 60 98-99
70 70 58 97-98
72 72 56 96-97
School System State
Social Studies 50
65 65 54 0
98-99
63 63 53 97-98
64 64 53 96-97
Science
School 50
System
State
0
67 67 56 98-99
71 71 55 97-98
67 67 53 96-97
School System State
Sources of Information
Composite Score
50
65 65 57 0
98-99
School 50
System
62 62 56 97-98
66 66 55 96-97
State 0
65 65 56 98-99
66 66 54 97-98
1998-99 GEORGIA PUBLIC EDUCATION REPORT CARD Gordon Lee Middle/High School - 7692050
Prepared by Georgia Department of Education
68 68 54 96-97
Scores Reported in Percentiles
School System State
Page 4
STATE-REQUIRED TEST DATA
PERFORMANCE ASSESSMENTS
Grade 5 Writing Assessment
Percent at Developmental Stages:
1998-99 School System State
1997-98 School System State
1996-97 School System State
Stage Stage Stage Stage Stage Stage
1:The Emerging Writer 2:The Developing Writer 3:The Focusing Writer 4:The Experimenting 5:The Engaging Writer 6:The Extending Writer
N/A N/A N/A N/A N/A N/A
0% 0% 8% 38% 38% 16%
0% 1% 16% 41% 29% 12%
N/A N/A N/A N/A N/A N/A
0% 0% 14% 40% 36% 10%
0% 3% 19% 41% 27% 10%
N/A N/A N/A N/A N/A N/A
0% 0% 12% 39% 44% 5%
0% 3% 21% 37% 26% 12%
No fifth-grade students are enrolled at Gordon Lee Middle/High School.
Categories of Scaled Scores
Inadequate (less than 162)
Minimal (162-209)
Good
(210-247)
Very Good (greater than 247)
Average Scaled Score: (Range 100-300)
Grade 8 Writing Assessment
1998-99 Percent Scoring
1997-98 Percent Scoring
1996-97 Percent Scoring
School System State School System State School System State
1% 21% 63% 15%
1% 21% 63% 15%
8% 40% 41% 11%
5% 49% 38%
8%
5% 49% 38%
8%
11% 46% 34%
8%
8% 39% 45%
7%
8% 39% 45%
7%
15% 46% 30%
8%
224
224
208 208
208 202 207
207 198
GEORGIA HIGH SCHOOL GRADUATION TESTS (GHSGT)
Percent of Regular Program 11th Graders Passing the Georgia High School Graduation Tests on First Administration
English Language Arts Mathematics Social Studies Science
All Components listed above
Writing
1998-99
School System State
100% 100% 93% 85%
83%
100% 100% 93% 85%
83%
96% 88% 80% 72%
68%
91% 91% 93%
1997-98
School System State
100% 92% 88% 85%
79%
100% 92% 88% 85%
79%
94% 88% 78% 74%
68%
92% 92% 92%
1996-97
School System State
97% 95% 85% 82%
70%
97% 95% 85% 82%
70%
94% 87% 78% 74%
67%
96% 96% 93%
1998-99 GEORGIA PUBLIC EDUCATION REPORT CARD Gordon Lee Middle/High School - 7692050
Prepared by Georgia Department of Education
Page 5
GRADUATE DATA
1999 Graduates by Credentials, Race/Ethnicity and Sex
Diplomas with Both College Prep. & Voc. Endorsements
Diplomas with College Prep. Endorsements Diplomas with Vocational Endorsements General High School Diplomas Special Education Diplomas
Total All Diplomas
Certificates of Performance
Total Graduates
Total 16 44 29 2 0
Black
0 0.0%
0 0.0%
0 0.0%
0 0.0%
0
American MultiWhite Hispanic Asian Indian racial
16 100.0%
0 0.0%
0 0.0%
0 0.0%
0 0.0%
44 100.0%
0 0.0%
0 0.0%
0 0.0%
0 0.0%
29 100.0%
0 0.0%
0 0.0%
0 0.0%
0 0.0%
2 100.0%
0 0.0%
0 0.0%
0 0.0%
0 0.0%
0
0
0
0
0
Male Female
7
9
43.8% 56.3%
11
33
25.0% 75.0%
18
11
62.1% 37.9%
2 100.0%
0 0.0%
0
0
91
0
91
0
0
0
0
38
53
0.0% 100.0% 0.0% 0.0% 0.0% 0.0% 41.8% 58.2%
0
0
0
0
0
0
0
0
0
91
0
91
0
0
0
0
38
53
0.0% 100.0% 0.0% 0.0% 0.0% 0.0% 41.8% 58.2%
HOPE Scholarships
School System
Number of 1999 Graduates 9 1
Number Eligible
62
Percent Eligible
68.1%
91 62 68.1%
State
65,548 40,292 61.5%
High School Completion Rate
Percent of 1995Grade 9 Enrollment in Graduating Class of1999 School System State
Completion Rate '95-'99 91.9% 91.9% 68.9%
1998-99 GEORGIA PUBLIC EDUCATION REPORT CARD
Gordon Lee Middle/High School - 7692050
Prepared by Georgia Department of Education
Page 6
COLLEGE ADMISSIONS / CREDIT TEST DATA
Scholastic Assessment Test (SAT)
Based on students' highest verbal and highest math scores
No. Taking
Average Score
Tests Verbal Math Total
Based on students' last test administration
Average Score Verbal Math Total
School
57
College Prep. Endorsement
Other Diplomas
System
57
College Prep. Endorsement
Other Diplomas
Georgia
41,958
507 481
988
519 490 1009
344 362
706
507 481
988
519 490 1009
344 362
706
492 488
980
499 N/A N/A
499 N/A N/A
483
476 N/A N/A
476 N/A N/A
479
975 N/A N/A
975 N/A N/A
962
Nation
952,913 N/A N/A N/A
502 508 1010
American College Testing (ACT)
Advanced Placement Exams (AP)
Number taking tests: English Mathematics Reading Science Reasoning CompositeScore
2 9 School System State
21.0 21.0 19.1
20.1 20.1 19.9
20.6 20.6
20.6 20.6
20.2 19.9
20.7 20.7 19.9
No. of Students Taking Tests
No. of Tests Taken No. of Test Scores
3 or Higher Percent of Test
Scores 3 or Higher
School 36 37 11
29.7%
System State 36 15,225 37 23,969 11 13,024
29.7% 54.3%
POST-SECONDARY DATA
Graduates Entering Georgia Public Colleges
Graduates Entering Georgia Public Colleges and Requiring Learning Support (LS)
1998 Graduates Entering in 1998-99
1997 Graduates Entering in 1997-98
Percent of Graduating Number Class
School
31
31.3%
System 3 1
31.3%
School
35
33.0%
System 3 5
33.0%
Number Requiring
LS 12 12
8 8
Percent of those attending Georgia
Public Colleges
38.7%
38.7%
22.9%
22.9%
In previous years, the Report Card presented College Prep Curriculum information provided by the Board of Regents on students requiring Learning Support. Due to inconsistencies in the data provided by the Board of Regents in defining College Prep Completers versus Local Board of Education data defining College Prep Endorsements, the Department of Education Report Card will not provide this information until discrepancies can be reconciled.
Graduates Entering Georgia Public Technical and Adult Schools
1998 Graduates School System
Entering Number 17 17
1998-99 Percent 17.2% 17.2%
Entering Number N/A N/A
1997-98 Percent
N/A N/A
1997 Graduates School
2
1.9%
System
2
1.9%
15
14.2%
15
14.2%
1998-99 GEORGIA PUBLIC EDUCATION REPORT CARD Gordon Lee Middle/High School - 7692050
Prepared by Georgia Department of Education
Page 7
CERTIFIED PERSONNEL DATA
Positions Number Average Contract Days
Administrators
2.00 200.00
Support Personnel
2.00 190.00
PK-12 Teachers
41.30 189.82
Personnel Sex
Certificate
Years Experience
Full-time Part-time
Male Female
4 Yr Bachelor's 5 Yr Master's 6 Yr Specialist's 7 Yr Doctoral Other*
<1 1-10 11-20 21-30 >30
Average
2 0
0 2
0 0 2 0 0
0 0 1 1 0
23.50
2 0
1 1
0 2 0 0 0
0 0 2 0 0
16.50
41 1
16 26
20 15
6 1 0
0 18 16
7 1
13.31
*Includes One- and Two-Year Vocational Certificates.
ACCREDITATION DATA
Accredited by Southern Association of Colleges and Schools (SACS): Secondary/Middle Commission. Accredited with Quality by Georgia Accrediting Commission (GAC).
AWARDS / RECOGNITION DATA
Schools in Georgia may receive recognition in the following programs: Charter School Pay for Performance Program Georgia School of Excellence National Blue Ribbon School Gordon Lee Middle/High School did not receive recognition in any of these programs during the 1998-99 school year.
1998-99 GEORGIA PUBLIC EDUCATION REPORT CARD Gordon Lee Middle/High School - 7692050
Prepared by Georgia Department of Education
Page 8
1998-99 GEORGIA PUBLIC EDUCATION REPORT CARD CLARKE COUNTY SCHOOLS - 629
The Georgia Public Education Report Card is designed to assist systems and schools in educational improvement. This report card contains a variety of data elements. An explanation of the terms is provided as a companion to the report card data. Please refer to the definitions for the most effective use of the reported data.
Total
K-12
10,655
PK
567
STUDENT DATA
Enrollment, by Race/Ethnicity and Sex
Black
White Hispanic
American Multi-
Asian Indian
racial
6,113 57.4%
3,555 33.4%
555 5.2%
260 2.4%
15 0.1%
157 1.5%
359 63.3%
124 21.9%
55 9.7%
24 4.2%
1 0.2%
4 0.7%
Male
5,465 51.3%
305 53.8%
Female
5,190 48.7%
262 46.2%
Enrollment in Selected Programs
Program
Program % of Student Enrollment Population
Gifted (Grades K-12)
1,507
14.1%
Non-Vocational Labs (Grades 9-12)
2,469
82.4%
Vocational Labs (Grades 9-12)
1,457
48.6%
Alternative Programs (Grades 6-12)
24
< 1%
Students Eligible to Receive Free/Reduced Lunches
Number
Percent
6,528
58.2%
Dropout Rate
Number
Percent
6-12
310
5.2%
9-12
230
7.0%
Enrollment in Compensatory Programs
Program
Program % of Student Enrollment Population
Special Education (Grades K-12)
PK
1,489 47
English to Speakers of
Other Languages (ESOL)
248
(Grades K-12)
Remedial Education (Grades 2-5, 9-12)
496
Special Instructional Assistance (SIA) (Grades K-3)
1,164
Title I (Grades K-12) Number of schools with: Schoolwide program Targeted Assistance program No Title I program
14.0% N/A
2.3%
7.7%
31.7%
10 3 7
Total 476
Retained Students, by Race/Ethnicity and Sex
Black
White Hispanic
American MultiAsian Indian racial
374 78.6%
73 15.3%
23 4.8%
5 1.1%
1 0.2%
0 0.0%
Male Female 280 196
58.8% 41.2%
Prepared by Georgia Department of Education
Page 1
STATE-REQUIRED TEST DATA
NORM-REFERENCED TESTS
Grade 3 Iowa Tests of Basic Skills (ITBS) Each chart reflects data for three years of testing.
Reading Comprehension
Mathematics
50
49 54 48 53 49 52 0
98-99 97-98 96-97
System State
50
51 61 51 61 55 59 0
98-99 97-98 96-97
System State
Reading Vocabulary
50
41 50 41 50 47 49 0
98-99 97-98 96-97
System State
Social Studies
50
46 56 47 55 50 55 0
98-99 97-98 96-97
System State
Language Arts
50
51 64 45 62 48 59 0
98-99 97-98 96-97
System State
Science
50
50 59 52 59 57 58 0
98-99 97-98 96-97
System State
Sources of Information
Composite Score
50
52 57 0
98-99
System
50
47 56 50 55 97-98 96-97
State
48 58 47 57 0
98-99 97-98
1998-99 GEORGIA PUBLIC EDUCATION REPORT CARD Clarke County Schools
Prepared by Georgia Department of Education
System State Scores Reported 51 56 in Percentiles 96-97
Page 2
STATE-REQUIRED TEST DATA
NORM-REFERENCED TESTS
Grade 5 Iowa Tests of Basic Skills (ITBS) Each chart reflects data for three years of testing.
Reading Comprehension
Mathematics
50
51 53 52 53 51 52 0
98-99 97-98 96-97
System State
50
54 59 55 58 55 57 0
98-99 97-98 96-97
System State
Reading Vocabulary
50
41 48 42 48 44 46 0
98-99 97-98 96-97
System State
Social Studies
50
55 57 57 56 55 55 0
98-99 97-98 96-97
System State
Language Arts
50
57 63 56 61 55 58 0
98-99 97-98 96-97
System State
Science
50
54 60 59 59 59 59 0
98-99 97-98 96-97
System State
Sources of Information
Composite Score
50
57 58 0
98-99
System
50
57 58 57 57 97-98 96-97
State
53 57 55 56 0
98-99 97-98
1998-99 GEORGIA PUBLIC EDUCATION REPORT CARD Clarke County Schools
Prepared by Georgia Department of Education
System State Scores Reported 54 55 in Percentiles 96-97
Page 3
STATE-REQUIRED TEST DATA
NORM-REFERENCED TESTS Grade 8
Iowa Tests of Basic Skills (ITBS) Each chart reflects data for three years of testing.
Reading Comprehension
Mathematics
50
46 49 45 48 47 48 0
98-99 97-98 96-97
System State
50
49 56 48 55 46 54 0
98-99 97-98 96-97
System State
Reading Vocabulary
50
38 46 36 45 43 44 0
98-99 97-98 96-97
System State
Language Arts
50
55 60 52 58 53 56 0
98-99 97-98 96-97
System State
Social Studies
50
53 54 50 53 53 53 0
98-99 97-98 96-97
System State
Science
50
52 56 53 55 56 53 0
98-99 97-98 96-97
System State
Sources of Information
Composite Score
50
55 57 0
98-99
System
50
51 56 55 55 97-98 96-97
State
52 56 51 54 0
98-99 97-98
1998-99 GEORGIA PUBLIC EDUCATION REPORT CARD Clarke County Schools
Prepared by Georgia Department of Education
System State Scores Reported 52 54 in Percentiles 96-97
Page 4
STATE-REQUIRED TEST DATA
PERFORMANCE ASSESSMENTS
Grade 5 Writing Assessment
1998-99
1997-98
1996-97
Percent at Developmental Stages:
Comparison
Comparison
Comparison
System Group State System Group State System Group State
Stage Stage Stage Stage Stage Stage
1: The Emerging Writer 2: The Developing Writer 3: The Focusing Writer 4: The Experimenting Writer 5: The Engaging Writer 6: The Extending Writer
0% 1% 11% 44% 27% 16%
0% 1% 19% 44% 25% 9%
0% 1% 16% 41% 29% 12%
1% 2% 20% 37% 24% 15%
1% 3% 22% 43% 23% 8%
0% 3% 19% 41% 27% 10%
0% 3% 19% 36% 25% 15%
1% 5% 28% 39% 20% 7%
0% 3% 21% 37% 26% 12%
Grade 8 Writing Assessment
1998-99 Percent Scoring 1997-98 Percent Scoring 1996-97 Percent Scoring
Categories of Scaled Scores
Comparison
Comparison
Comparison
System Group State System Group State System Group State
Inadequate (less than 162)
Minimal (162-209)
Good
(210-247)
Very Good (greater than 247)
10% 36% 36% 18%
12% 48% 34%
7%
8% 40% 41% 11%
15% 42% 31% 12%
16% 53% 27%
4%
11% 46% 34%
8%
18% 41% 28% 13%
24% 51% 21%
5%
15% 46% 30%
8%
Average Scaled Score: (Range 100-300)
210
200 208
201
194 202
199
187 198
GEORGIA HIGH SCHOOL GRADUATION TESTS (GHSGT)
Percent of Regular Program 11th Graders Passing the Georgia High School Graduation Tests on First Administration
1998-99
1997-98
1996-97
Comparison
Comparison
Comparison
System Group State System Group State System Group State
English Language Arts Mathematics Social Studies Science
96% 89% 81% 70%
94% 83% 76% 63%
96% 88% 80% 72%
92% 87% 75% 73%
93% 84% 72% 66%
94% 88% 78% 74%
93% 84% 73% 68%
90% 77% 68% 58%
94% 87% 78% 74%
All Components listed above 6 8 %
59% 68% 69%
60% 68% 63%
52% 67%
Writing
91%
90% 93% 90%
89% 92% 92%
88% 93%
1998-99 GEORGIA PUBLIC EDUCATION REPORT CARD
Clarke County Schools
Prepared by Georgia Department of Education
Page 5
GRADUATE DATA
1999 Graduates by Credentials, Race/Ethnicity and Sex
Diplomas with Both College Prep. & Voc. Endorsements
Diplomas with College Prep. Endorsements Diplomas with Vocational Endorsements General High School Diplomas Special Education Diplomas
Total All Diplomas
Certificates of Performance
Total Graduates
Total 66
258 51 3 26
404 35
439
Black
30 45.5%
78 30.2%
33 64.7%
1 33.3%
19 73.1%
161 39.9%
31 88.6%
192 43.7%
American MultiWhite Hispanic Asian Indian racial
Male Female
34 51.5%
159 61.6%
16 31.4%
2 66.7%
5 19.2%
1 1.5%
10 3.9%
2 3.9%
0 0.0%
1 3.8%
1 1.5%
10 3.9%
0 0.0%
0 0.0%
0 0.0%
0 0.0%
1 0.4%
0 0.0%
0 0.0%
1 3.8%
0
30
0.0% 45.5%
0
124
0.0% 48.1%
0
28
0.0% 54.9%
0
3
0.0% 100.0%
0
19
0.0% 73.1%
36 54.5%
134 51.9%
23 45.1%
0 0.0%
7 26.9%
216
14
11
2
0
204 200
53.5% 3.5% 2.7% 0.5% 0.0% 50.5% 49.5%
2
1
1
0
0
13
22
5.7% 2.9% 2.9% 0.0% 0.0% 37.1% 62.9%
218
15
12
2
0
217 222
49.7% 3.4% 2.7% 0.5% 0.0% 49.4% 50.6%
HOPE Scholarships
System State
Number of 1999 Graduates 4 3 9
Number Eligible
285
Percent Eligible
64.9%
65,548 40,292 61.5%
High School Completion Rate Percent of 1995Grade 9 Enrollment
in Graduating Class of1999
System
State
Completion Rate '95-'99 51.2% 68.9%
COLLEGE ADMISSIONS / CREDIT TEST DATA
Scholastic Assessment Test (SAT)
No. Taking
Average Score
Tests
Verbal Math Total
Based on students' highest verbal and highest math scores
System College Prep. Endorsement Other Diplomas
502 492 994 521 513 1034 357 353 710
Georgia
492 488 980
Based on students' last test administration
System Georgia
352
494 483
977
41,958 483 479 962
Nation
952,913 502 508 1010
American College Testing (ACT)
System State Nation
English
17.7
19.1 20.4
Mathematics
18.6
19.9 20.7
Reading
18.6
20.2 21.3
Science Reasoning 18.8
19.9 21.0
CompositeScore 18.5
19.9 21.9
Advanced Placement Exams (AP)
No. of Students Taking Tests
No. of Tests Taken No. of Test Scores
3 or Higher Percent of Test
Scores 3 or Higher
System State 188 15,225 305 23,969 213 13,024
69.8% 54.3%
1998-99 GEORGIA PUBLIC EDUCATION REPORT CARD Clarke County Schools
Prepared by Georgia Department of Education
Page 6
POSTSECONDARY DATA
Graduates Entering Georgia Public Colleges and Universities
Graduates Entering Georgia Public Colleges and Universities and
Requiring Learning Support (LS)
1998 Graduates Entering 1998-99
1997 Graduates Entering 1997-98
Percent of Graduating Number Class
179
37.0%
199
38.6%
Number Requiring
LS
28
35
Percent of those attending Georgia
Public Colleges
15.6%
17.6%
In previous years, the Report Card presented College Prep Curriculum information provided by the Board of Regents on students requiring Learning Support. Due to inconsistencies in the data provided by the Board of Regents in defining College Prep Completers versus Local Board of Education data defining College Prep Endorsements, the Department of Education Report Card will not provide this information until discrepancies can be reconciled.
Graduates Entering Georgia Public Technical and Adult Schools
Entering 1998-99 Entering 1997-98
Number Percent
Number Percent
1998 Graduates 1997 Graduates
28
5.8%
8
1.6%
N/A 12
N/A 2.3%
ACCREDITATION / RECOGNITION DATA
Southern Association of Colleges and Schools (SACS) Accrediting Commission
Secondary/Middle Commission Elementary/Middle Commission Both Elementary/Secondary Commissions Joint Commission Candidate for Accreditation
Accreditation by Georgia Accrediting Commission (GAC)
Accredited by GAC Accredited with Quality by GAC
Number of Schools
2 17
0 0 0
Number of Schools
0 19
Awards / Recognition
State Recognized Program
Number of Schools
Charter School
0
Pay for Performance Recipient
0
Georgia School of Excellence
0
National Blue Ribbon School
0
COMMUNITY DATA
Number of Children Eligible for Migrant Education Number of Families-At-Risk * Number of Food Stamp Participants * Number of Families Receiving TANF * ** Per Capita Income * Unemployment Rate * 1990 Population * Projected 2000 Population * Projected 2010 Population *
* Data Available at County Level Only ** Known as AFDC before January 1997
581 330 6,362 721 $21,313 3.2% 87,594 102,775 114,035
1998-99 GEORGIA PUBLIC EDUCATION REPORT CARD Clarke County Schools
Prepared by Georgia Department of Education
Page 7
FISCAL DATA
Millage Rate
18.50
* Fall 1998 Property Tax Digest is used to calculate the 98-99 Value of One Mill
FTE Count
FTE Count used for Allotment Calculation 10,514.0 Fall '98 FTE Count 10,655
Value of One Mill
$1,695,938 $161.30 per Allotment FTE
Sources: Local State-QBE State-
Lottery State-
Other Federal Other
Total
PerGeneral Fund cent Per FTE
$32,351,243 45.3% $3,077 $38,002,968 53.2% $3,615
K-12 Revenues
Lottery K-12
and
Title
All Other
Programs
K-12
$0 $205,767
Bonded Debt $123,836
$0
$0
$0
Capital Projects $18,524,056
$0
$0 0.0%
$0
$0 $232,114
$0
$0
$1,004,574 1.4% $96
$50,655 0.1%
$5
$15,768 0.0%
$1
$71,425,209 100% $6,794
$0 $4,069,928
$0 $4,069,928
$24,286 $35,071
$0 $497,240
$0
$0
$0
$0
$0
$0
$123,836 $18,524,056
School Nutrition $1,289,230
$0
$0
$306,446 $3,059,491
$2,327 $4,657,495
Grand Total
Total
Per-
Amount cent
$52,494,135 52.9%
$38,002,968 38.3%
$232,114 0.2%
$1,335,306 1.3% $7,215,146 7.3%
$18,096 0.0% $99,297,766 100%
Instruction
Media Instruction
Support Pupil Services General Admin. School Admin. Trans-
portation Maint. & Ops. Capital Projects School Food Debt Service
Total
K-12 Expenditures
$42,948,028 61.3% $4,085 $3,099,114 $396,442
$0
$0
$0
$1,748,835 2.5% $166
$2,076
$4,609
$0
$0
$0
$3,313,119 4.7% $315 $614,586
$13,074
$0
$0
$0
$2,652,124 3.8% $252 $331,828
$15,885
$0
$0
$0
$1,568,150 2.2% $149 $179,713
$2,115
$0
$0
$0
$4,913,601 7.0% $467
$5,450
$10,529
$0
$0
$0
$5,347,069 7.6% $509
$1,660
$224
$0
$0
$0
$7,548,214 10.8% $718
$95
$42,145
$0
$0
$0
$0 0.0%
$0
$0
$15,882
$0 $13,294,356
$0
$0 0.0%
$0
$3,480
$0
$0
$0 $4,499,452
$0 0.0%
$0
$0
$0
$3,400 $5,148,496
$0
$70,039,143 100% $6,661 $4,238,006 $500,908
$3,400 $18,442,853 $4,499,452
$46,443,585 47.5% $1,755,521 1.8% $3,940,780 4.0% $2,999,837 3.1% $1,749,980 1.8% $4,929,580 5.0% $5,348,954 5.5% $7,590,454 7.8%
$13,310,238 13.6% $4,502,932 4.6% $5,151,896 5.3%
$97,723,763 100%
Salaries and Benefits as Percentages of Revenues and of Expenditures
Teachers and Paraprofessionals
Salaries $33,345,109
Benefits $10,221,581
Percentage of Revenues Percentage of Expenditures
Total of
Total of
General Fund
General Fund
Title Programs
Title Programs
Lottery K-12
Lottery K-12
Total Salaries
and
Total
and
Total
and Benefits All Other K-12 K - 12 All Other K-12 K - 12
$43,566,690
57.3%
43.9%
58.3%
44.6%
School Administration
$2,701,945 $1,097,933
$3,799,878
5.0%
3.8%
5.1%
3.9%
General Administration
$546,738
$255,028
$801,766
1.1%
0.8%
1.1%
0.8%
1998-99 GEORGIA PUBLIC EDUCATION REPORT CARD
Clarke County Schools - 629
Prepared by Georgia Department of Education
Page 8
CERTIFIED PERSONNEL DATA
Number
Average Annual Salary Positions Average Contract Days
Average Daily Salary
Full-time Personnel Part-time
Sex Male Female
4 Yr Bachelor's Certificate 5 Yr Master's
Level 6 Yr Specialist's 7 Yr Doctoral Other*
Black
White Race/ Hispanic Ethnicity Asian
American Indian
Multiracial
Years Experience
<1 1-10 11-20 21-30 >30
Average
Administrators
58.49
$63,611.15 221.38
$287.34
58 1
16 43
1 16 26 16
0
19 40
0 0 0 0
0 3 19 32 5
22.19
Support Personnel PK-12 Teachers
106.28
806.80
$39,601.57 193.22
$204.96
$38,876.06 190.47
$204.11
100
770
35
48
46
140
89
678
35
346
61
366
28
87
10
19
1
0
26
144
109
660
0
5
0
9
0
0
0
0
19
67
40
293
47
253
26
182
3
23
12.48
13.39
*Includes One- and Two-Year Vocational Certificates.
Certified Staff Position Ratios
Teacher/Administrator Ratio 14:1
Teacher/Support Person Ratio 8:1
Teacher/Staff Ratio 5:1
Student Enrollment/All Teachers 13:1
Certified Personnel by Category
80.8% 100%
5.8% 13.3%
80% 60%
40%
20%
0%
Teachers
Administrators
Support Personnel
1998-99 GEORGIA PUBLIC EDUCATION REPORT CARD
Clarke County Schools - 629
Prepared by Georgia Department of Education
Page 9
1998-99 GEORGIA PUBLIC EDUCATION REPORT CARD
CLARKE COUNTY SCHOOLS
Alps Road Elementary School - 6295054
Grade Range PK-5
The Georgia Public Education Report Card is designed to assist systems and schools in educational improvement. This report card contains a variety of data elements. An explanation of the terms is provided as a companion to the report card data. Please refer to the definitions for the most effective use of the reported data.
STUDENT DATA
Total
K-5
431
PK
40
Enrollment, by Race/Ethnicity and Sex
Black
White Hispanic
American Asian Indian
Multiracial
239 55.5%
139 32.3%
21 4.9%
29 6.7%
0 0.0%
3 0.7%
28 70.0%
9 22.5%
2 5.0%
1 2.5%
0 0.0%
0 0.0%
Male Female
216 50.1%
215 49.9%
24 60.0%
16 40.0%
Enrollment in Selected Programs
Program
Program % of Student Enrollment Population
Gifted (Grades K-12)
66
15.3%
Alternative Programs (Grades 6-12)
N/A
N/A
Students Eligible to Receive Free/Reduced Lunches
Number
Percent
School System
326 6,528
69.2% 58.2%
Dropout Rate *
Number
Rate
School System
N/A N/A
N/A N/A
* Dropout rates are not applicable for grades PK-5.
Enrollment in Compensatory Programs
Program
Program % of Student Enrollment Population
Special Education (Grades K-12)
63 14.6%
(PK)
2
N/A
English to Speakers of Other Languages (ESOL) (Grades K-12)
21
4.9%
Remedial Education (Grades 2-5, 9-12)
40 13.8%
Special Instructional Assistance (SIA) (Grades K-3)
80 26.3%
Title I (Grades K-12)
This school has a schoolwide program.
Total 5
Retained Students, by Race/Ethnicity and Sex
Black
White Hispanic
American MultiAsian Indian racial
3 60.0%
1 20.0%
0 0.0%
1 20.0%
0 0.0%
0 0.0%
Male Female
4
1
80.0% 20.0%
Prepared by Georgia Department of Education
Page 1
STATE-REQUIRED TEST DATA
NORM-REFERENCED TESTS Grade 3
Iowa Tests of Basic Skills (ITBS) Each chart reflects data for three years of testing.
Reading Comprehension 50
61 49 54 0
98-99
68 48 53 97-98
51 49 52 96-97
Mathematics
School 50
System
State
0
56 51 61 98-99
60 51 61 97-98
51 55 59 96-97
School System State
Reading Vocabulary 50
53 41 50 0
98-99
54 41 50 97-98
42 47 49 96-97
Language Arts
School 50
System
State
0
62 51 64 98-99
62 45 62 97-98
44 48 59 96-97
School System State
Social Studies 50
59 46 56 0
98-99
60 47 55 97-98
47 50 55 96-97
Science
School 50
System
State
0
61 50 59 98-99
69 52 59 97-98
53 57 58 96-97
School System State
Sources of Information
Composite Score
50
61 52 57 0
98-99
School 50
System
62 47 56 97-98
50 50 55 96-97
State 0
57 48 58 98-99
63 47 57 97-98
1998-99 GEORGIA PUBLIC EDUCATION REPORT CARD Alps Road Elementary School - 6295054
Prepared by Georgia Department of Education
49 51 56 96-97
Scores Reported in Percentiles
School System State
Page 2
STATE-REQUIRED TEST DATA
NORM-REFERENCED TESTS Grade 5
Iowa Tests of Basic Skills (ITBS) Each chart reflects data for three years of testing.
Reading Comprehension
Mathematics
50
48 51 53 0
98-99
54 52 53 97-98
48 51 52 96-97
School 50
System
State
0
47 54 59 98-99
47 55 58 97-98
43 55 57 96-97
School System State
Reading Vocabulary 50
39 41 48 0
98-99
46 42 48 97-98
36 44 46 96-97
Language Arts
School 50
System
State
0
53 57 63 98-99
56 56 61 97-98
44 55 58 96-97
School System State
Social Studies 50
49 55 57 0
98-99
56 57 56 97-98
44 55 55 96-97
Science
School 50
System
State
0
49 54 60 98-99
56 59 59 97-98
51 59 59 96-97
School System State
Sources of Information
Composite Score
50
54 57 58 0
98-99
School 50
System
55 57 58 97-98
47 57 57 96-97
State 0
48 53 57 98-99
52 55 56 97-98
44 54 55 96-97
1998-99 GEORGIA PUBLIC EDUCATION REPORT CARD Alps Road Elementary School - 6295054
Prepared by Georgia Department of Education
Scores Reported in Percentiles
School System State
Page 3
STATE-REQUIRED TEST DATA
PERFORMANCE ASSESSMENTS
Grade 5 Writing Assessment
Percent at Developmental Stages:
1998-99 School System State
1997-98 School System State
1996-97 School System State
Stage Stage Stage Stage Stage Stage
1:The Emerging Writer 2:The Developing Writer 3:The Focusing Writer 4:The Experimenting 5:The Engaging Writer 6:The Extending Writer
0% 0% 4% 52% 31% 13%
0% 1% 11% 44% 27% 16%
0% 1% 16% 41% 29% 12%
0% 4% 24% 36% 25% 11%
1% 2% 20% 37% 24% 15%
0% 3% 19% 41% 27% 10%
2% 7% 23% 38% 18% 13%
0% 3% 19% 36% 25% 15%
0% 3% 21% 37% 26% 12%
AWARDS / RECOGNITION DATA
Schools in Georgia may receive recognition in the following programs: Charter School Pay for Performance Program Georgia School of Excellence National Blue Ribbon School Alps Road Elementary School did not receive recognition in any of these programs during the 1998-99 school year.
1998-99 GEORGIA PUBLIC EDUCATION REPORT CARD Alps Road Elementary School - 6295054
Prepared by Georgia Department of Education
Page 4
CERTIFIED PERSONNEL DATA
Positions Number Average Contract Days
Personnel Sex
Certificate
Years Experience
Full-time Part-time
Male Female
4 Yr Bachelor's 5 Yr Master's 6 Yr Specialist's 7 Yr Doctoral Other*
<1 1-10 11-20 21-30 >30
Average
Administrators
2.00 210.50
2 0
0 2
0 1 0 1 0 0 0 1 1 0 20.00
Support Personnel
2.00 190.00
2 0
1 1
0 0 1 1 0 0 0 1 1 0 21.50
PK-12 Teachers
36.10 190.00
36 1
0 37
11 20
5 1 0 1 12 17 7 0 14.05
*Includes One- and Two-Year Vocational Certificates.
ACCREDITATION DATA
Accredited by Southern Association of Colleges and Schools (SACS):
Elementary/Middle Commission. Accredited with Quality by Georgia
Accrediting Commission (GAC).
1998-99 GEORGIA PUBLIC EDUCATION REPORT CARD Alps Road Elementary School - 6295054
Prepared by Georgia Department of Education
Page 5
1998-99 GEORGIA PUBLIC EDUCATION REPORT CARD
CLARKE COUNTY SCHOOLS
Barnett Shoals Elementary School - 6292056
Grade Range PK-5
The Georgia Public Education Report Card is designed to assist systems and schools in educational improvement. This report card contains a variety of data elements. An explanation of the terms is provided as a companion to the report card data. Please refer to the definitions for the most effective use of the reported data.
STUDENT DATA
Total
K-5
523
PK
20
Enrollment, by Race/Ethnicity and Sex
Black
White Hispanic
American Asian Indian
Multiracial
314 60.0%
179 34.2%
6 1.1%
22 4.2%
0 0.0%
2 0.4%
10 50.0%
9 45.0%
1 5.0%
0 0.0%
0 0.0%
0 0.0%
Male Female
287 54.9%
236 45.1%
10 50.0%
10 50.0%
Enrollment in Selected Programs
Program
Program % of Student Enrollment Population
Gifted (Grades K-12)
61
11.7%
Alternative Programs (Grades 6-12)
N/A
N/A
Students Eligible to Receive Free/Reduced Lunches
Number
Percent
School System
311 6,528
57.3% 58.2%
Dropout Rate *
Number
Rate
School System
N/A N/A
N/A N/A
* Dropout rates are not applicable for grades PK-5.
Enrollment in Compensatory Programs
Program
Program % of Student Enrollment Population
Special Education (Grades K-12)
70 13.4%
(PK)
1
N/A
English to Speakers of Other Languages (ESOL) (Grades K-12)
0
0.0%
Remedial Education (Grades 2-5, 9-12)
40 11.7%
Special Instructional Assistance (SIA) (Grades K-3)
120 32.5%
Title I (Grades K-12)
This school has a schoolwide program.
Total 5
Retained Students, by Race/Ethnicity and Sex
Black
White Hispanic
American MultiAsian Indian racial
4 80.0%
1 20.0%
0 0.0%
0 0.0%
0 0.0%
0 0.0%
Male Female
4
1
80.0% 20.0%
Prepared by Georgia Department of Education
Page 1
STATE-REQUIRED TEST DATA
NORM-REFERENCED TESTS Grade 3
Iowa Tests of Basic Skills (ITBS) Each chart reflects data for three years of testing.
Reading Comprehension 50
37 49 54 0
98-99
58 48 53 97-98
55 49 52 96-97
Mathematics
School 50
System
State
0
43 51 61 98-99
61 51 61 97-98
69 55 59 96-97
School System State
Reading Vocabulary 50
33 41 50 0
98-99
49 41 50 97-98
55 47 49 96-97
Language Arts
School 50
System
State
0
35 51 64 98-99
49 45 62 97-98
53 48 59 96-97
School System State
Social Studies 50
39 46 56 0
98-99
48 47 55 97-98
56 50 55 96-97
Science
School 50
System
State
0
45 50 59 98-99
57 52 59 97-98
66 57 58 96-97
School System State
Sources of Information
Composite Score
50
46 52 57 0
98-99
School 50
System
52 47 56 97-98
54 50 55 96-97
State 0
39 48 58 98-99
53 47 57 97-98
1998-99 GEORGIA PUBLIC EDUCATION REPORT CARD Barnett Shoals Elementary School - 6292056
Prepared by Georgia Department of Education
60 51 56 96-97
Scores Reported in Percentiles
School System State
Page 2
STATE-REQUIRED TEST DATA
NORM-REFERENCED TESTS Grade 5
Iowa Tests of Basic Skills (ITBS) Each chart reflects data for three years of testing.
Reading Comprehension
Mathematics
50
54 51 53 0
98-99
60 52 53 97-98
61 51 52 96-97
School 50
System
State
0
61 54 59 98-99
66 55 58 97-98
65 55 57 96-97
School System State
Reading Vocabulary 50
46 41 48 0
98-99
52 42 48 97-98
52 44 46 96-97
Language Arts
School 50
System
State
0
58 57 63 98-99
64 56 61 97-98
60 55 58 96-97
School System State
Social Studies 50
56 55 57 0
98-99
65 57 56 97-98
58 55 55 96-97
Science
School 50
System
State
0
57 54 60 98-99
70 59 59 97-98
62 59 59 96-97
School System State
Sources of Information
Composite Score
50
59 57 58 0
98-99
School 50
System
66 57 58 97-98
62 57 57 96-97
State 0
56 53 57 98-99
66 55 56 97-98
61 54 55 96-97
1998-99 GEORGIA PUBLIC EDUCATION REPORT CARD Barnett Shoals Elementary School - 6292056
Prepared by Georgia Department of Education
Scores Reported in Percentiles
School System State
Page 3
STATE-REQUIRED TEST DATA
PERFORMANCE ASSESSMENTS
Grade 5 Writing Assessment
Percent at Developmental Stages:
1998-99 School System State
1997-98 School System State
1996-97 School System State
Stage Stage Stage Stage Stage Stage
1:The Emerging Writer 2:The Developing Writer 3:The Focusing Writer 4:The Experimenting 5:The Engaging Writer 6:The Extending Writer
0% 2% 16% 50% 23% 9%
0% 1% 11% 44% 27% 16%
0% 1% 16% 41% 29% 12%
0% 5% 23% 25% 28% 20%
1% 2% 20% 37% 24% 15%
0% 3% 19% 41% 27% 10%
0% 2% 14% 30% 38% 16%
0% 3% 19% 36% 25% 15%
0% 3% 21% 37% 26% 12%
AWARDS / RECOGNITION DATA
Schools in Georgia may receive recognition in the following programs: Charter School Pay for Performance Program Georgia School of Excellence National Blue Ribbon School Barnett Shoals Elementary School did not receive recognition in any of these programs during the 1998-99 school year.
1998-99 GEORGIA PUBLIC EDUCATION REPORT CARD Barnett Shoals Elementary School - 6292056
Prepared by Georgia Department of Education
Page 4
CERTIFIED PERSONNEL DATA
Positions Number Average Contract Days
Personnel Sex
Certificate
Years Experience
Full-time Part-time
Male Female
4 Yr Bachelor's 5 Yr Master's 6 Yr Specialist's 7 Yr Doctoral Other*
<1 1-10 11-20 21-30 >30
Average
Administrators
2.00 210.50
2 0
2 0
0 1 0 1 0 0 0 0 2 0 22.50
Support Personnel
2.00 190.00
2 0
0 2
0 1 1 0 0 1 0 1 0 0 6.00
PK-12 Teachers
37.20 190.00
37 1
6 32
17 18
3 0 0 5 13 9 9 2 13.82
*Includes One- and Two-Year Vocational Certificates.
ACCREDITATION DATA
Accredited by Southern Association of Colleges and Schools (SACS):
Elementary/Middle Commission. Accredited with Quality by Georgia
Accrediting Commission (GAC).
1998-99 GEORGIA PUBLIC EDUCATION REPORT CARD Barnett Shoals Elementary School - 6292056
Prepared by Georgia Department of Education
Page 5
1998-99 GEORGIA PUBLIC EDUCATION REPORT CARD
CLARKE COUNTY SCHOOLS
Barrow Elementary School - 6293056
Grade Range PK-5
The Georgia Public Education Report Card is designed to assist systems and schools in educational improvement. This report card contains a variety of data elements. An explanation of the terms is provided as a companion to the report card data. Please refer to the definitions for the most effective use of the reported data.
STUDENT DATA
Total
K-5
334
PK
40
Enrollment, by Race/Ethnicity and Sex
Black
White Hispanic
American Asian Indian
Multiracial
176 52.7%
92 27.5%
16 4.8%
30 9.0%
0 0.0%
20 6.0%
18 45.0%
10 25.0%
2
10
5.0% 25.0%
0 0.0%
0 0.0%
Male Female
173 51.8%
161 48.2%
16 40.0%
24 60.0%
Enrollment in Selected Programs
Program
Program % of Student Enrollment Population
Gifted (Grades K-12)
74
22.2%
Alternative Programs (Grades 6-12)
N/A
N/A
Students Eligible to Receive Free/Reduced Lunches
Number
Percent
School System
254 6,528
67.9% 58.2%
Dropout Rate *
Number
Rate
School System
N/A N/A
N/A N/A
* Dropout rates are not applicable for grades PK-5.
Enrollment in Compensatory Programs
Program
Program % of Student Enrollment Population
Special Education (Grades K-12)
48 14.4%
(PK)
0
N/A
English to Speakers of Other Languages (ESOL) (Grades K-12)
12
3.6%
Remedial Education (Grades 2-5, 9-12)
30 15.4%
Special Instructional Assistance (SIA) (Grades K-3)
79 31.3%
Title I (Grades K-12)
This school has a schoolwide program.
Total 3
Retained Students, by Race/Ethnicity and Sex
Black
White Hispanic
American MultiAsian Indian racial
2 66.7%
0
1
0.0% 33.3%
0 0.0%
0 0.0%
0 0.0%
Male Female
2
1
66.7% 33.3%
Prepared by Georgia Department of Education
Page 1
STATE-REQUIRED TEST DATA
NORM-REFERENCED TESTS Grade 3
Iowa Tests of Basic Skills (ITBS) Each chart reflects data for three years of testing.
Reading Comprehension 50
68 49 54 0
98-99
64 48 53 97-98
74 49 52 96-97
Mathematics
School 50
System
State
0
74 51 61 98-99
78 51 61 97-98
85 55 59 96-97
School System State
Reading Vocabulary 50
56 41 50 0
98-99
59 41 50 97-98
75 47 49 96-97
Language Arts
School 50
System
State
0
72 51 64 98-99
61 45 62 97-98
84 48 59 96-97
School System State
Social Studies 50
59 46 56 0
98-99
67 47 55 97-98
76 50 55 96-97
Science
School 50
System
State
0
70 50 59 98-99
73 52 59 97-98
79 57 58 96-97
School System State
Sources of Information
Composite Score
50
75 52 57 0
98-99
School 50
System
73 47 56 97-98
83 50 55 96-97
State 0
69 48 58 98-99
69 47 57 97-98
1998-99 GEORGIA PUBLIC EDUCATION REPORT CARD Barrow Elementary School - 6293056
Prepared by Georgia Department of Education
83 51 56 96-97
Scores Reported in Percentiles
School System State
Page 2
STATE-REQUIRED TEST DATA
NORM-REFERENCED TESTS Grade 5
Iowa Tests of Basic Skills (ITBS) Each chart reflects data for three years of testing.
Reading Comprehension
Mathematics
50
62 51 53 0
98-99
55 52 53 97-98
59 51 52 96-97
School 50
System
State
0
75 54 59 98-99
76 55 58 97-98
65 55 57 96-97
School System State
Reading Vocabulary 50
59 41 48 0
98-99
56 42 48 97-98
50 44 46 96-97
Language Arts
School 50
System
State
0
69 57 63 98-99
65 56 61 97-98
61 55 58 96-97
School System State
Social Studies 50
70 55 57 0
98-99
64 57 56 97-98
60 55 55 96-97
Science
School 50
System
State
0
69 54 60 98-99
66 59 59 97-98
68 59 59 96-97
School System State
Sources of Information
Composite Score
50
73 57 58 0
98-99
School 50
System
72 57 58 97-98
71 57 57 96-97
State 0
69 53 57 98-99
67 55 56 97-98
64 54 55 96-97
1998-99 GEORGIA PUBLIC EDUCATION REPORT CARD Barrow Elementary School - 6293056
Prepared by Georgia Department of Education
Scores Reported in Percentiles
School System State
Page 3
STATE-REQUIRED TEST DATA
PERFORMANCE ASSESSMENTS
Grade 5 Writing Assessment
Percent at Developmental Stages:
1998-99 School System State
1997-98 School System State
1996-97 School System State
Stage Stage Stage Stage Stage Stage
1:The Emerging Writer 2:The Developing Writer 3:The Focusing Writer 4:The Experimenting 5:The Engaging Writer 6:The Extending Writer
3% 0% 6% 31% 28% 25%
0% 1% 11% 44% 27% 16%
0% 1% 16% 41% 29% 12%
0% 0% 33% 33% 15% 19%
1% 2% 20% 37% 24% 15%
0% 3% 19% 41% 27% 10%
0% 8% 33% 25% 14% 19%
0% 3% 19% 36% 25% 15%
0% 3% 21% 37% 26% 12%
AWARDS / RECOGNITION DATA
Schools in Georgia may receive recognition in the following programs: Charter School Pay for Performance Program Georgia School of Excellence National Blue Ribbon School Barrow Elementary School did not receive recognition in any of these programs during the 1998-99 school year.
1998-99 GEORGIA PUBLIC EDUCATION REPORT CARD Barrow Elementary School - 6293056
Prepared by Georgia Department of Education
Page 4
CERTIFIED PERSONNEL DATA
Positions Number Average Contract Days
Personnel Sex
Certificate
Years Experience
Full-time Part-time
Male Female
4 Yr Bachelor's 5 Yr Master's 6 Yr Specialist's 7 Yr Doctoral Other*
<1 1-10 11-20 21-30 >30
Average
Administrators
2.00 210.50
2 0
0 2
0 0 2 0 0 0 0 1 1 0 20.50
Support Personnel
5.00 186.40
5 0
0 5
2 2 1 0 0 1 3 0 1 0 7.60
PK-12 Teachers
28.10 190.00
28 1
1 28
11 16
2 0 0 1 8 14 5 1 13.52
*Includes One- and Two-Year Vocational Certificates.
ACCREDITATION DATA
Accredited by Southern Association of Colleges and Schools (SACS):
Elementary/Middle Commission. Accredited with Quality by Georgia
Accrediting Commission (GAC).
1998-99 GEORGIA PUBLIC EDUCATION REPORT CARD Barrow Elementary School - 6293056
Prepared by Georgia Department of Education
Page 5
1998-99 GEORGIA PUBLIC EDUCATION REPORT CARD
CLARKE COUNTY SCHOOLS
Burney-Harris-Lyons Middle School - 6290296
Grade Range 6-8
The Georgia Public Education Report Card is designed to assist systems and schools in educational improvement. This report card contains a variety of data elements. An explanation of the terms is provided as a companion to the report card data. Please refer to the definitions for the most effective use of the reported data.
STUDENT DATA
Total 511
6-8 Enrollment, by Race/Ethnicity and Sex
Black
White Hispanic
American Multi-
Asian Indian
racial
332 65.0%
119 23.3%
46 9.0%
7 1.4%
2 0.4%
5 1.0%
Male 269
52.6%
Female 242
47.4%
Enrollment in Selected Programs
Program
Gifted (Grades K-12)
Program % of Student Enrollment Population
57
11.2%
Alternative Programs (Grades 6-12)
0
0.0%
Students Eligible to Receive Free/Reduced Lunches
Number
Percent
School System
356 6,528
69.7% 58.2%
Enrollment in Compensatory Programs
Program
Program % of Student Enrollment Population
Special Education (Grades K-12) (PK)
99 19.4%
0
N/A
English to Speakers of Other Languages (ESOL) (Grades K-12)
0
0.0%
Title I (Grades K-12)
This school has no Title I program.
Dropout Rate for Grades 6-8
Number
Rate
School System
23
3.6%
80
2.9%
Total 1
Retained Students, by Race/Ethnicity and Sex
Black
White Hispanic
American MultiAsian Indian racial
1 100.0%
0 0.0%
0 0.0%
0 0.0%
0 0.0%
0 0.0%
Male Female
0
1
0.0% 100.0%
Prepared by Georgia Department of Education
Page 1
STATE-REQUIRED TEST DATA
NORM-REFERENCED TESTS Grade 8
Iowa Tests of Basic Skills (ITBS) Each chart reflects data for three years of testing.
Reading Comprehension 50
40 46 49 0
98-99
39 45 48 97-98
43 47 48 96-97
Mathematics
School 50
System
State
0
40 49 56 98-99
45 48 55 97-98
40 46 54 96-97
School System State
Reading Vocabulary 50
31 38 46 0
98-99
29 36 45 97-98
36 43 44 96-97
Language Arts
School 50
System
State
0
51 55 60 98-99
48 52 58 97-98
54 53 56 96-97
School System State
Social Studies 50
46 53 54 0
98-99
44 50 53 97-98
48 53 53 96-97
Science
School 50
System
State
0
44 52 56 98-99
44 53 55 97-98
46 56 53 96-97
School System State
Sources of Information
Composite Score
50
50 55 57 0
98-99
School 50
System
45 51 56 97-98
51 55 55 96-97
State 0
44 52 56 98-99
43 51 54 97-98
1998-99 GEORGIA PUBLIC EDUCATION REPORT CARD Burney-Harris-Lyons Middle School - 6290296
Prepared by Georgia Department of Education
46 52 54 96-97
Scores Reported in Percentiles
School System State
Page 2
STATE-REQUIRED TEST DATA
Categories of Scaled Scores
Inadequate (less than 162)
Minimal (162-209)
Good
(210-247)
Very Good (greater than 247)
Average Scaled Score: (Range 100-300)
PERFORMANCE ASSESSMENTS
Grade 8 Writing Assessment
1998-99 Percent Scoring
1997-98 Percent Scoring
1996-97 Percent Scoring
School System State School System State School System State
9% 45% 38%
9%
10% 36% 36% 18%
8% 40% 41% 11%
22% 45% 24%
9%
15% 42% 31% 12%
11% 46% 34%
8%
14% 53% 24%
9%
18% 41% 28% 13%
15% 46% 30%
8%
206
210
208 192
201 202 196
199 198
AWARDS / RECOGNITION DATA
Schools in Georgia may receive recognition in the following programs: Charter School Pay for Performance Program Georgia School of Excellence National Blue Ribbon School Burney-Harris-Lyons Middle School did not receive recognition in any of these programs during the 1998-99 school year.
1998-99 GEORGIA PUBLIC EDUCATION REPORT CARD Burney-Harris-Lyons Middle School - 6290296
Prepared by Georgia Department of Education
Page 3
CERTIFIED PERSONNEL DATA
Positions Number Average Contract Days
Personnel Sex
Certificate
Years Experience
Full-time Part-time
Male Female
4 Yr Bachelor's 5 Yr Master's 6 Yr Specialist's 7 Yr Doctoral Other*
<1 1-10 11-20 21-30 >30
Average
Administrators
2.00 210.50
2 0
1 1
0 1 1 0 0 0 0 1 1 0 23.00
Support Personnel
3.00 190.00
3 0
0 3
0 2 1 0 0 0 0 1 1 1 25.67
PK-12 Teachers
49.98 190.00
46 6
9 43
28 21
3 0 0 8 18 15 10 1 12.10
*Includes One- and Two-Year Vocational Certificates.
ACCREDITATION DATA
Accredited by Southern Association of Colleges and Schools (SACS):
Elementary/Middle Commission. Accredited with Quality by Georgia
Accrediting Commission (GAC).
1998-99 GEORGIA PUBLIC EDUCATION REPORT CARD Burney-Harris-Lyons Middle School - 6290296
Prepared by Georgia Department of Education
Page 4
1998-99 GEORGIA PUBLIC EDUCATION REPORT CARD
CLARKE COUNTY SCHOOLS
Cedar Shoals High School - 6294556
Grade Range 9-12
The Georgia Public Education Report Card is designed to assist systems and schools in educational improvement. This report card contains a variety of data elements. An explanation of the terms is provided as a companion to the report card data. Please refer to the definitions for the most effective use of the reported data.
Total 1,453
STUDENT DATA
9-12 Enrollment, by Race/Ethnicity and Sex
Black
White Hispanic
American Multi-
Asian Indian
racial
858 59.1%
527 36.3%
36 2.5%
25 1.7%
1 0.1%
6 0.4%
Male Female
735 50.6%
718 49.4%
Enrollment in Selected Programs
Program
Gifted (Grades K-12)
Program % of Student Enrollment Population
235
16.2%
Non-Vocational Labs (Grades 9-12)
Vocational Labs (Grades 9-12)
Alternative Programs (Grades 6-12)
1,234 699 20
84.9% 48.1%
1.4%
Students Eligible to Receive Free/Reduced Lunches
Number
Percent
School System
658 6,528
45.3% 58.2%
Enrollment in Compensatory Programs
Program
Program % of Student Enrollment Population
Special Education (Grades K-12) PK
182 12.5%
0
N/A
English to Speakers of Other Languages (ESOL) (Grades K-12)
7
< 1%
Remedial Education (Grades 2-5, 9-12)
0
0.0%
Title I (Grades K-12)
This school has no Title I program.
Dropout Rate for Grades 9-12
Number
Rate
School System
102
6.6%
230
7.0%
Total 210
Retained Students, by Race/Ethnicity and Sex
Black
White Hispanic
American MultiAsian Indian racial
172 81.9%
30 14.3%
4 1.9%
4 1.9%
0 0.0%
0 0.0%
Male Female
127
83
60.5% 39.5%
Prepared by Georgia Department of Education
Page 1
STATE-REQUIRED TEST DATA
GEORGIA HIGH SCHOOL GRADUATION TESTS (GHSGT)
Percent of Regular Program 11th Graders Passing the Georgia High School Graduation Tests on First Administration
English Language Arts Mathematics Social Studies Science
All Components listed above
Writing
1998-99
School System State
94% 89% 84% 73%
96% 89% 81% 70%
96% 88% 80% 72%
72% 68% 68%
91% 91% 93%
1997-98
School System State
91% 86% 72% 68%
92% 87% 75% 73%
94% 88% 78% 74%
65% 69% 68%
88% 90% 92%
1996-97
School System State
93% 87% 73% 66%
93% 84% 73% 68%
94% 87% 78% 74%
62% 63% 67%
93% 92% 93%
GRADUATE DATA
1999 Graduates by Credentials, Race/Ethnicity and Sex
Diplomas with Both College Prep. & Voc. Endorsements
Diplomas with College Prep. Endorsements Diplomas with Vocational Endorsements General High School Diplomas Special Education Diplomas
Total All Diplomas
Certificates of Performance
Total Graduates
Total 8
123 33 0
Black
4 50.0%
39 31.7%
20 60.6%
0
White Hispanic
3 37.5%
0 0.0%
71 57.7%
7 5.7%
11 33.3%
2 6.1%
0
0
American MultiAsian Indian racial
1 12.5%
0 0.0%
0 0.0%
6 4.9%
0 0.0%
0 0.0%
0 0.0%
0 0.0%
0 0.0%
0
0
0
11
9
2
0
0
0
0
81.8% 18.2% 0.0% 0.0% 0.0% 0.0%
175
72
87
9
7
0
0
41.1% 49.7% 5.1% 4.0% 0.0% 0.0%
19
16
2
0
1
0
0
84.2% 10.5% 0.0% 5.3% 0.0% 0.0%
194
88
89
9
8
0
0
45.4% 45.9% 4.6% 4.1% 0.0% 0.0%
Male Female
4
4
50.0% 50.0%
52
71
42.3% 57.7%
19
14
57.6% 42.4%
0
0
8 72.7%
83 47.4%
7 36.8%
90 46.4%
3 27.3%
92 52.6%
12 63.2%
104 53.6%
HOPE Scholarships
School System
Number of 1999 Graduates 1 9 4
Number Eligible
128
Percent Eligible
66.0%
439 285 64.9%
State
65,548 40,292 61.5%
High School Completion Rate
Percent of 1995Grade 9 Enrollment in Graduating Class of1999 School System State
Completion Rate '95-'99 50.9% 51.2% 68.9%
1998-99 GEORGIA PUBLIC EDUCATION REPORT CARD
Cedar Shoals High School - 6294556
Prepared by Georgia Department of Education
Page 2
COLLEGE ADMISSIONS / CREDIT TEST DATA
Scholastic Assessment Test (SAT)
Based on students' highest verbal and highest math scores
No. Taking
Average Score
Tests Verbal Math Total
Based on students' last test administration
Average Score Verbal Math Total
School
157
College Prep. Endorsement
Other Diplomas
System
352
College Prep. Endorsement
Other Diplomas
Georgia
41,958
502 500 1002
528 528 1056
347 353
700
502 492
994
521 513 1034
357 353
710
492 488
980
492 N/A N/A
494 N/A N/A
483
491 N/A N/A
483 N/A N/A
479
983 N/A N/A
977 N/A N/A
962
Nation
952,913 N/A N/A N/A
502 508 1010
American College Testing (ACT)
Advanced Placement Exams (AP)
Number taking tests: English Mathematics Reading Science Reasoning CompositeScore
2 3 School System State
17.8 17.7 19.1
19.4 18.6 19.9
19.2 19.5
18.6 18.8
20.2 19.9
19.1 18.5 19.9
No. of Students Taking Tests
No. of Tests Taken No. of Test Scores
3 or Higher Percent of Test
Scores 3 or Higher
School 115 211 170
80.6%
System State 188 15,225 305 23,969 213 13,024
69.8% 54.3%
POST-SECONDARY DATA
Graduates Entering Georgia Public Colleges
Graduates Entering Georgia Public Colleges and Requiring Learning Support (LS)
1998 Graduates Entering in 1998-99
1997 Graduates Entering in 1997-98
Percent of Graduating Number Class
School
80
38.3%
System 179
37.0%
School
99
39.8%
System 199
38.6%
Number Requiring
LS 10 28
18 35
Percent of those attending Georgia
Public Colleges
12.5%
15.6%
18.2%
17.6%
In previous years, the Report Card presented College Prep Curriculum information provided by the Board of Regents on students requiring Learning Support. Due to inconsistencies in the data provided by the Board of Regents in defining College Prep Completers versus Local Board of Education data defining College Prep Endorsements, the Department of Education Report Card will not provide this information until discrepancies can be reconciled.
Graduates Entering Georgia Public Technical and Adult Schools
1998 Graduates School System
Entering Number 12 28
1998-99 Percent
5.7% 5.8%
Entering Number N/A N/A
1997-98 Percent
N/A N/A
1997 Graduates School
3
1.2%
System
8
1.6%
4
1.6%
12
2.3%
1998-99 GEORGIA PUBLIC EDUCATION REPORT CARD Cedar Shoals High School - 6294556
Prepared by Georgia Department of Education
Page 3
CERTIFIED PERSONNEL DATA
Positions Number Average Contract Days
Administrators
4.00 226.50
Support Personnel
7.54 194.32
PK-12 Teachers
84.60 191.67
Personnel Sex
Certificate
Years Experience
Full-time Part-time
Male Female
4 Yr Bachelor's 5 Yr Master's 6 Yr Specialist's 7 Yr Doctoral Other*
<1 1-10 11-20 21-30 >30
Average
4 0
2 2
0 1 2 1 0
0 0 2 1 1
21.75
6 18
15 9
10 9 4 1 0
0 6 10 7 1
16.42
71 15
33 53
30 38 15
3 0
4 28 28 21
5
14.67
*Includes One- and Two-Year Vocational Certificates.
ACCREDITATION DATA
Accredited by Southern Association of Colleges and Schools (SACS): Secondary/Middle Commission. Accredited with Quality by Georgia Accrediting Commission (GAC).
AWARDS / RECOGNITION DATA
Schools in Georgia may receive recognition in the following programs: Charter School Pay for Performance Program Georgia School of Excellence National Blue Ribbon School Cedar Shoals High School did not receive recognition in any of these programs during the 1998-99 school year.
1998-99 GEORGIA PUBLIC EDUCATION REPORT CARD Cedar Shoals High School - 6294556
Prepared by Georgia Department of Education
Page 4
1998-99 GEORGIA PUBLIC EDUCATION REPORT CARD
CLARKE COUNTY SCHOOLS
Chase Street Elementary School - 6295056
Grade Range PK-5
The Georgia Public Education Report Card is designed to assist systems and schools in educational improvement. This report card contains a variety of data elements. An explanation of the terms is provided as a companion to the report card data. Please refer to the definitions for the most effective use of the reported data.
STUDENT DATA
Total
K-5
280
PK
40
Enrollment, by Race/Ethnicity and Sex
Black
White Hispanic
American Asian Indian
Multiracial
157 56.1%
52 18.6%
66 23.6%
1 0.4%
0 0.0%
4 1.4%
27 67.5%
2 5.0%
10 25.0%
0 0.0%
0 0.0%
1 2.5%
Male Female
141 50.4%
139 49.6%
22 55.0%
18 45.0%
Enrollment in Selected Programs
Program
Program % of Student Enrollment Population
Gifted (Grades K-12)
19
6.8%
Alternative Programs (Grades 6-12)
N/A
N/A
Students Eligible to Receive Free/Reduced Lunches
Number
Percent
School System
275 6,528
85.9% 58.2%
Dropout Rate *
Number
Rate
School System
N/A N/A
N/A N/A
* Dropout rates are not applicable for grades PK-5.
Enrollment in Compensatory Programs
Program
Program % of Student Enrollment Population
Special Education (Grades K-12)
53 18.9%
(PK)
0
N/A
English to Speakers of Other Languages (ESOL) (Grades K-12)
39 13.9%
Remedial Education (Grades 2-5, 9-12)
26 13.7%
Special Instructional Assistance (SIA) (Grades K-3)
75 38.1%
Title I (Grades K-12)
This school has a schoolwide program.
Total 4
Retained Students, by Race/Ethnicity and Sex
Black
White Hispanic
American MultiAsian Indian racial
2 50.0%
0
2
0.0% 50.0%
0 0.0%
0 0.0%
0 0.0%
Male Female
0
4
0.0% 100.0%
Prepared by Georgia Department of Education
Page 1
STATE-REQUIRED TEST DATA
NORM-REFERENCED TESTS Grade 3
Iowa Tests of Basic Skills (ITBS) Each chart reflects data for three years of testing.
Reading Comprehension 50
43 49 54 0
98-99
41 48 53 97-98
70 49 52 96-97
Mathematics
School 50
System
State
0
62 51 61 98-99
47 51 61 97-98
64 55 59 96-97
School System State
Reading Vocabulary 50
30 41 50 0
98-99
30 41 50 97-98
54 47 49 96-97
Language Arts
School 50
System
State
0
48 51 64 98-99
34 45 62 97-98
43 48 59 96-97
School System State
Social Studies 50
45 46 56 0
98-99
42 47 55 97-98
66 50 55 96-97
Science
School 50
System
State
0
46 50 59 98-99
44 52 59 97-98
61 57 58 96-97
School System State
Sources of Information
Composite Score
50
51 52 57 0
98-99
School 50
System
42 47 56 97-98
64 50 55 96-97
State 0
45 48 58 98-99
40 47 57 97-98
1998-99 GEORGIA PUBLIC EDUCATION REPORT CARD Chase Street Elementary School - 6295056
Prepared by Georgia Department of Education
60 51 56 96-97
Scores Reported in Percentiles
School System State
Page 2
STATE-REQUIRED TEST DATA
NORM-REFERENCED TESTS Grade 5
Iowa Tests of Basic Skills (ITBS) Each chart reflects data for three years of testing.
Reading Comprehension
Mathematics
50
45 51 53 0
98-99
46 52 53 97-98
56 51 52 96-97
School 50
System
State
0
37 54 59 98-99
54 55 58 97-98
59 55 57 96-97
School System State
Reading Vocabulary 50
29 41 48 0
98-99
38 42 48 97-98
54 44 46 96-97
Language Arts
School 50
System
State
0
40 57 63 98-99
43 56 61 97-98
42 55 58 96-97
School System State
Social Studies 50
46 55 57 0
98-99
48 57 56 97-98
61 55 55 96-97
Science
School 50
System
State
0
43 54 60 98-99
44 59 59 97-98
63 59 59 96-97
School System State
Sources of Information
Composite Score
50
47 57 58 0
98-99
School 50
System
48 57 58 97-98
65 57 57 96-97
State 0
40 53 57 98-99
45 55 56 97-98
59 54 55 96-97
1998-99 GEORGIA PUBLIC EDUCATION REPORT CARD Chase Street Elementary School - 6295056
Prepared by Georgia Department of Education
Scores Reported in Percentiles
School System State
Page 3
STATE-REQUIRED TEST DATA
PERFORMANCE ASSESSMENTS
Grade 5 Writing Assessment
Percent at Developmental Stages:
1998-99 School System State
1997-98 School System State
1996-97 School System State
Stage Stage Stage Stage Stage Stage
1:The Emerging Writer 2:The Developing Writer 3:The Focusing Writer 4:The Experimenting 5:The Engaging Writer 6:The Extending Writer
0% 0% 19% 41% 33% 7%
0% 1% 11% 44% 27% 16%
0% 1% 16% 41% 29% 12%
0% 0% 20% 40% 23% 13%
1% 2% 20% 37% 24% 15%
0% 3% 19% 41% 27% 10%
0% 5% 9% 32% 41% 14%
0% 3% 19% 36% 25% 15%
0% 3% 21% 37% 26% 12%
AWARDS / RECOGNITION DATA
Schools in Georgia may receive recognition in the following programs: Charter School Pay for Performance Program Georgia School of Excellence National Blue Ribbon School Chase Street Elementary School did not receive recognition in any of these programs during the 1998-99 school year.
1998-99 GEORGIA PUBLIC EDUCATION REPORT CARD Chase Street Elementary School - 6295056
Prepared by Georgia Department of Education
Page 4
CERTIFIED PERSONNEL DATA
Positions Number Average Contract Days
Personnel Sex
Certificate
Years Experience
Full-time Part-time
Male Female
4 Yr Bachelor's 5 Yr Master's 6 Yr Specialist's 7 Yr Doctoral Other*
<1 1-10 11-20 21-30 >30
Average
Administrators
2.00 210.50
2 0
0 2
0 0 2 0 0 0 0 1 1 0 21.00
Support Personnel
2.00 190.00
2 0
0 2
0 2 0 0 0 1 0 1 0 0 8.00
PK-12 Teachers
28.60 190.00
27 4
3 28
18 11
2 0 0 5 12 7 7 0 11.48
*Includes One- and Two-Year Vocational Certificates.
ACCREDITATION DATA
Accredited by Southern Association of Colleges and Schools (SACS):
Elementary/Middle Commission. Accredited with Quality by Georgia
Accrediting Commission (GAC).
1998-99 GEORGIA PUBLIC EDUCATION REPORT CARD Chase Street Elementary School - 6295056
Prepared by Georgia Department of Education
Page 5
1998-99 GEORGIA PUBLIC EDUCATION REPORT CARD
CLARKE COUNTY SCHOOLS
Clarke Central High School - 6295556
Grade Range 9-12
The Georgia Public Education Report Card is designed to assist systems and schools in educational improvement. This report card contains a variety of data elements. An explanation of the terms is provided as a companion to the report card data. Please refer to the definitions for the most effective use of the reported data.
Total 1,486
STUDENT DATA
9-12 Enrollment, by Race/Ethnicity and Sex
Black
White Hispanic
American Multi-
Asian Indian
racial
775 52.2%
633 42.6%
45 3.0%
27 1.8%
4 0.3%
2 0.1%
Male Female
800 53.8%
686 46.2%
Enrollment in Selected Programs
Program
Gifted (Grades K-12)
Program % of Student Enrollment Population
273
18.4%
Non-Vocational Labs (Grades 9-12)
Vocational Labs (Grades 9-12)
Alternative Programs (Grades 6-12)
1,224 740 3
82.4% 49.8%
< 1%
Students Eligible to Receive Free/Reduced Lunches
Number
Percent
School System
550 6,528
37.0% 58.2%
Enrollment in Compensatory Programs
Program
Program % of Student Enrollment Population
Special Education (Grades K-12) PK
110
7.4%
0
N/A
English to Speakers of Other Languages (ESOL) (Grades K-12)
12
< 1%
Remedial Education (Grades 2-5, 9-12)
0
0.0%
Title I (Grades K-12)
This school has no Title I program.
Dropout Rate for Grades 9-12
Number
Rate
School System
76
4.7%
230
7.0%
Total 156
Retained Students, by Race/Ethnicity and Sex
Black
White Hispanic
American MultiAsian Indian racial
122 78.2%
28 17.9%
5 3.2%
0 0.0%
1 0.6%
0 0.0%
Male Female
84
72
53.8% 46.2%
Prepared by Georgia Department of Education
Page 1
STATE-REQUIRED TEST DATA
GEORGIA HIGH SCHOOL GRADUATION TESTS (GHSGT)
Percent of Regular Program 11th Graders Passing the Georgia High School Graduation Tests on First Administration
English Language Arts Mathematics Social Studies Science
All Components listed above
Writing
1998-99
School System State
97% 89% 78% 67%
96% 89% 81% 70%
96% 88% 80% 72%
64% 68% 68%
91% 91% 93%
1997-98
School System State
94% 88% 79% 78%
92% 87% 75% 73%
94% 88% 78% 74%
72% 69% 68%
93% 90% 92%
1996-97
School System State
92% 82% 75% 70%
93% 84% 73% 68%
94% 87% 78% 74%
64% 63% 67%
92% 92% 93%
GRADUATE DATA
1999 Graduates by Credentials, Race/Ethnicity and Sex
Diplomas with Both College Prep. & Voc. Endorsements
Diplomas with College Prep. Endorsements Diplomas with Vocational Endorsements General High School Diplomas Special Education Diplomas
Total All Diplomas
Certificates of Performance
Total Graduates
Total 57
132 15 2 14
220 14
234
Black
25 43.9%
36 27.3%
10 66.7%
0 0.0%
9 64.3%
80 36.4%
13 92.9%
93 39.7%
American MultiWhite Hispanic Asian Indian racial
31 54.4%
88 66.7%
1 1.8%
3 2.3%
0 0.0%
4 3.0%
0 0.0%
1 0.8%
0 0.0%
0 0.0%
5 33.3%
2 100.0%
3 21.4%
0 0.0%
0 0.0%
1 7.1%
0 0.0%
0 0.0%
0 0.0%
0 0.0%
0 0.0%
1 7.1%
0 0.0%
0 0.0%
0 0.0%
129 58.6%
5 2.3%
4 1.8%
2 0.9%
0 0.0%
0 0.0%
1 7.1%
0 0.0%
0 0.0%
0 0.0%
129 55.1%
6 2.6%
4 1.7%
2 0.9%
0 0.0%
Male Female
26 45.6%
70 53.0%
31 54.4%
62 47.0%
7 46.7%
2 100.0%
10 71.4%
8 53.3%
0 0.0%
4 28.6%
115
105
52.3% 47.7%
5
9
35.7% 64.3%
120
114
51.3% 48.7%
HOPE Scholarships
School System
Number of 1999 Graduates 2 3 4
Number Eligible
157
Percent Eligible
67.1%
439 285 64.9%
State
65,548 40,292 61.5%
High School Completion Rate
Percent of 1995Grade 9 Enrollment in Graduating Class of1999 School System State
Completion Rate '95-'99 59.8% 51.2% 68.9%
1998-99 GEORGIA PUBLIC EDUCATION REPORT CARD
Clarke Central High School - 6295556
Prepared by Georgia Department of Education
Page 2
COLLEGE ADMISSIONS / CREDIT TEST DATA
Scholastic Assessment Test (SAT)
Based on students' highest verbal and highest math scores
No. Taking
Average Score
Tests Verbal Math Total
Based on students' last test administration
Average Score Verbal Math Total
School
195
College Prep. Endorsement
Other Diplomas
System
352
College Prep. Endorsement
Other Diplomas
Georgia
41,958
503 486
989
517 503 1020
368 350
718
502 492
994
521 513 1034
357 353
710
492 488
980
496 N/A N/A
494 N/A N/A
483
478 N/A N/A
483 N/A N/A
479
974 N/A N/A
977 N/A N/A
962
Nation
952,913 N/A N/A N/A
502 508 1010
American College Testing (ACT)
Advanced Placement Exams (AP)
Number taking tests: English Mathematics Reading Science Reasoning CompositeScore
6 6 School System State
17.6 17.7 19.1
18.3 18.6 19.9
18.4 18.6
18.6 18.8
20.2 19.9
18.3 18.5 19.9
No. of Students Taking Tests
No. of Tests Taken No. of Test Scores
3 or Higher Percent of Test
Scores 3 or Higher
School 73 94 43
45.7%
System State 188 15,225 305 23,969 213 13,024
69.8% 54.3%
POST-SECONDARY DATA
Graduates Entering Georgia Public Colleges
Graduates Entering Georgia Public Colleges and Requiring Learning Support (LS)
1998 Graduates Entering in 1998-99
1997 Graduates Entering in 1997-98
Percent of Graduating Number Class
School
99
36.5%
System 179
37.0%
School
100
38.2%
System 199
38.6%
Number Requiring
LS 18 28
17 35
Percent of those attending Georgia
Public Colleges
18.2%
15.6%
17.0%
17.6%
In previous years, the Report Card presented College Prep Curriculum information provided by the Board of Regents on students requiring Learning Support. Due to inconsistencies in the data provided by the Board of Regents in defining College Prep Completers versus Local Board of Education data defining College Prep Endorsements, the Department of Education Report Card will not provide this information until discrepancies can be reconciled.
Graduates Entering Georgia Public Technical and Adult Schools
1998 Graduates School System
Entering Number 16 28
1998-99 Percent
5.9% 5.8%
Entering Number N/A N/A
1997-98 Percent
N/A N/A
1997 Graduates School
5
1.9%
System
8
1.6%
8
3.1%
12
2.3%
1998-99 GEORGIA PUBLIC EDUCATION REPORT CARD Clarke Central High School - 6295556
Prepared by Georgia Department of Education
Page 3
CERTIFIED PERSONNEL DATA
Positions Number Average Contract Days
Administrators
4.00 234.00
Support Personnel
6.84 197.41
PK-12 Teachers
75.56 192.31
Personnel Sex
Certificate
Years Experience
Full-time Part-time
Male Female
4 Yr Bachelor's 5 Yr Master's 6 Yr Specialist's 7 Yr Doctoral Other*
<1 1-10 11-20 21-30 >30
Average
4 0
2 2
0 1 3 0 0
0 0 1 3 0
25.50
6 10
13 3
7 7 2 0 0
1 7 5 3 0
12.00
65 14
33 46
26 37 12
4 0
8 21 28 20
2
14.24
*Includes One- and Two-Year Vocational Certificates.
ACCREDITATION DATA
Accredited by Southern Association of Colleges and Schools (SACS): Secondary/Middle Commission. Accredited with Quality by Georgia Accrediting Commission (GAC).
AWARDS / RECOGNITION DATA
Schools in Georgia may receive recognition in the following programs: Charter School Pay for Performance Program Georgia School of Excellence National Blue Ribbon School Clarke Central High School did not receive recognition in any of these programs during the 1998-99 school year.
1998-99 GEORGIA PUBLIC EDUCATION REPORT CARD Clarke Central High School - 6295556
Prepared by Georgia Department of Education
Page 4
1998-99 GEORGIA PUBLIC EDUCATION REPORT CARD
CLARKE COUNTY SCHOOLS
Clarke Evening Program - 6290195
Grade Range 9-12
The Georgia Public Education Report Card is designed to assist systems and schools in educational improvement. This report card contains a variety of data elements. An explanation of the terms is provided as a companion to the report card data. Please refer to the definitions for the most effective use of the reported data.
Total 59
STUDENT DATA
9-12 Enrollment, by Race/Ethnicity and Sex
Black
White Hispanic
American Multi-
Asian Indian
racial
42 71.2%
14 23.7%
2 3.4%
1 1.7%
0 0.0%
0 0.0%
Male Female
32 54.2%
27 45.8%
Enrollment in Selected Programs
Program
Gifted (Grades K-12)
Program % of Student Enrollment Population
0
0.0%
Non-Vocational Labs (Grades 9-12)
Vocational Labs (Grades 9-12)
Alternative Programs (Grades 6-12)
11
18.6%
18
30.5%
0
0.0%
Students Eligible to Receive Free/Reduced Lunches
Number
Percent
School System
0 6,528
0.0% 58.2%
Enrollment in Compensatory Programs
Program
Program % of Student Enrollment Population
Special Education (Grades K-12) PK
0
0.0%
0
N/A
English to Speakers of Other Languages (ESOL) (Grades K-12)
0
0.0%
Remedial Education (Grades 2-5, 9-12)
0
0.0%
Title I (Grades K-12)
This school has no Title I program.
Dropout Rate for Grades 9-12
Number
Rate
School System
52
52.5%
230
7.0%
Total 0
Retained Students, by Race/Ethnicity and Sex
Black
White Hispanic
American MultiAsian Indian racial
0
0
0
0
0
0
Male Female
0
0
Prepared by Georgia Department of Education
Page 1
STATE-REQUIRED TEST DATA
GEORGIA HIGH SCHOOL GRADUATION TESTS (GHSGT)
Percent of Regular Program 11th Graders Passing the Georgia High School Graduation Tests on First Administration
English Language Arts Mathematics Social Studies Science
All Components listed above
Writing
1998-99
School System State
100% N/A N/A 100%
96% 89% 81% 70%
96% 88% 80% 72%
N/A 68% 68%
N/A 91% 93%
1997-98
School System State
0% 0% 50% 0%
92% 87% 75% 73%
94% 88% 78% 74%
0%
69% 68%
100% 90% 92%
1996-97
School System State
100% 67% 43% 50%
93% 84% 73% 68%
94% 87% 78% 74%
0%
63% 67%
50% 92% 93%
GRADUATE DATA
1999 Graduates by Credentials, Race/Ethnicity and Sex
Diplomas with Both College Prep. & Voc. Endorsements
Diplomas with College Prep. Endorsements Diplomas with Vocational Endorsements General High School Diplomas Special Education Diplomas
Total All Diplomas
Certificates of Performance
Total Graduates
Total 1 3 3 1 1 9 2
11
Black
1 100.0%
3 100.0%
3 100.0%
1 100.0%
1 100.0%
9 100.0%
2 100.0%
11 100.0%
American MultiWhite Hispanic Asian Indian racial
0 0.0%
0 0.0%
0 0.0%
0 0.0%
0 0.0%
0 0.0%
0 0.0%
0 0.0%
0 0.0%
0 0.0%
0 0.0%
0 0.0%
0 0.0%
0 0.0%
0 0.0%
0 0.0%
0 0.0%
0 0.0%
0 0.0%
0 0.0%
0 0.0%
0 0.0%
0 0.0%
0 0.0%
0 0.0%
0 0.0%
0 0.0%
0 0.0%
0 0.0%
0 0.0%
0 0.0%
0 0.0%
0 0.0%
0 0.0%
0 0.0%
0 0.0%
0 0.0%
0 0.0%
0 0.0%
0 0.0%
Male Female
0 0.0%
2 66.7%
1 100.0%
1 33.3%
2 66.7%
1 100.0%
1 100.0%
1 33.3%
0 0.0%
0 0.0%
6
3
66.7% 33.3%
1
1
50.0% 50.0%
7
4
63.6% 36.4%
HOPE Scholarships
School System
Number of 1999 Graduates Number Eligible Percent Eligible
11 0
0.0%
439 285 64.9%
State
65,548 40,292 61.5%
High School Completion Rate
Percent of 1995Grade 9 Enrollment in Graduating Class of1999 School System State
Completion Rate '95-'99 15.5% 51.2% 68.9%
1998-99 GEORGIA PUBLIC EDUCATION REPORT CARD
Clarke Evening Program - 6290195
Prepared by Georgia Department of Education
Page 2
COLLEGE ADMISSIONS / CREDIT TEST DATA
Scholastic Assessment Test (SAT)
Based on students' highest verbal and highest math scores
No. Taking
Average Score
Tests Verbal Math Total
Based on students' last test administration
Average Score Verbal Math Total
School
N/A
College Prep. Endorsement
Other Diplomas
System
352
College Prep. Endorsement
Other Diplomas
Georgia
41,958
N/A 320 370
502 521 357
492
N/A 370 380
492 513 353
488
N/A 690 750
994 1034
710
980
N/A N/A N/A
494 N/A N/A
483
N/A N/A N/A
483 N/A N/A
479
N/A N/A N/A
977 N/A N/A
962
Nation
952,913 N/A N/A N/A
502 508 1010
American College Testing (ACT)
Advanced Placement Exams (AP)
Number taking tests: English Mathematics Reading Science Reasoning CompositeScore
N/A
School System
N/A 17.7
N/A 18.6
N/A N/A
18.6 18.8
N/A 18.5
State 19.1 19.9 20.2 19.9 19.9
No. of Students Taking Tests
No. of Tests Taken No. of Test Scores
3 or Higher Percent of Test
Scores 3 or Higher
School 0
N/A N/A
N/A
System State 188 15,225 305 23,969 213 13,024
69.8% 54.3%
POST-SECONDARY DATA
Graduates Entering Georgia Public Colleges
Graduates Entering Georgia Public Colleges and Requiring Learning Support (LS)
1998 Graduates Entering in 1998-99
1997 Graduates Entering in 1997-98
Percent of Graduating Number Class
School
0
0.0%
System 179
37.0%
School
0
0.0%
System 199
38.6%
Number Requiring
LS N/A 28
N/A 35
Percent of those attending Georgia
Public Colleges
N/A
15.6%
N/A
17.6%
In previous years, the Report Card presented College Prep Curriculum information provided by the Board of Regents on students requiring Learning Support. Due to inconsistencies in the data provided by the Board of Regents in defining College Prep Completers versus Local Board of Education data defining College Prep Endorsements, the Department of Education Report Card will not provide this information until discrepancies can be reconciled.
Graduates Entering Georgia Public Technical and Adult Schools
1998 Graduates School System
Entering Number 0 28
1998-99 Percent
0.0% 5.8%
Entering Number N/A N/A
1997-98 Percent
N/A N/A
1997 Graduates School
0
0.0%
System
8
1.6%
0
0.0%
12
2.3%
1998-99 GEORGIA PUBLIC EDUCATION REPORT CARD Clarke Evening Program - 6290195
Prepared by Georgia Department of Education
Page 3
CERTIFIED PERSONNEL DATA
Positions Number Average Contract Days
Administrators
0.00 0.00
Support Personnel
0.00 0.00
PK-12 Teachers
2.00 205.00
Personnel Sex
Certificate
Years Experience
Full-time Part-time
Male Female
4 Yr Bachelor's 5 Yr Master's 6 Yr Specialist's 7 Yr Doctoral Other*
<1 1-10 11-20 21-30 >30
Average
0 0
0 0
0 0 0 0 0
0 0 0 0 0
0.00
0 0
0 0
0 0 0 0 0
0 0 0 0 0
0.00
2 0
1 1
1 0 0 1 0
0 1 0 0 1
26.00
*Includes One- and Two-Year Vocational Certificates.
ACCREDITATION DATA
Not accredited by Southern Association of Colleges and Schools (SACS) or Georgia Accrediting Commission (GAC).
AWARDS / RECOGNITION DATA
Schools in Georgia may receive recognition in the following programs: Charter School Pay for Performance Program Georgia School of Excellence National Blue Ribbon School Clarke Evening Program did not receive recognition in any of these programs during the 1998-99 school year.
1998-99 GEORGIA PUBLIC EDUCATION REPORT CARD Clarke Evening Program - 6290195
Prepared by Georgia Department of Education
Page 4
1998-99 GEORGIA PUBLIC EDUCATION REPORT CARD
CLARKE COUNTY SCHOOLS
Clarke Middle School - 6291058
Grade Range 6-8
The Georgia Public Education Report Card is designed to assist systems and schools in educational improvement. This report card contains a variety of data elements. An explanation of the terms is provided as a companion to the report card data. Please refer to the definitions for the most effective use of the reported data.
STUDENT DATA
Total 660
6-8 Enrollment, by Race/Ethnicity and Sex
Black
White Hispanic
American Multi-
Asian Indian
racial
327 49.5%
276 41.8%
25 3.8%
22 3.3%
3 0.5%
7 1.1%
Male 351
53.2%
Female 309
46.8%
Enrollment in Selected Programs
Program
Gifted (Grades K-12)
Program % of Student Enrollment Population
183
27.7%
Alternative Programs (Grades 6-12)
0
0.0%
Students Eligible to Receive Free/Reduced Lunches
Number
Percent
School System
348 6,528
52.7% 58.2%
Enrollment in Compensatory Programs
Program
Program % of Student Enrollment Population
Special Education (Grades K-12) (PK)
123 18.6%
0
N/A
English to Speakers of Other Languages (ESOL) (Grades K-12)
0
0.0%
Title I (Grades K-12)
This school has no Title I program.
Dropout Rate for Grades 6-8
Number
Rate
School System
16
2.3%
80
2.9%
Total 0
Retained Students, by Race/Ethnicity and Sex
Black
White Hispanic
American MultiAsian Indian racial
0
0
0
0
0
0
Male Female
0
0
Prepared by Georgia Department of Education
Page 1
STATE-REQUIRED TEST DATA
NORM-REFERENCED TESTS Grade 8
Iowa Tests of Basic Skills (ITBS) Each chart reflects data for three years of testing.
Reading Comprehension 50
57 46 49 0
98-99
53 45 48 97-98
54 47 48 96-97
Mathematics
School 50
System
State
0
62 49 56 98-99
58 48 55 97-98
59 46 54 96-97
School System State
Reading Vocabulary 50
47 38 46 0
98-99
47 36 45 97-98
54 43 44 96-97
Language Arts
School 50
System
State
0
59 55 60 98-99
53 52 58 97-98
60 53 56 96-97
School System State
Social Studies 50
60 53 54 0
98-99
57 50 53 97-98
64 53 53 96-97
Science
School 50
System
State
0
63 52 56 98-99
64 53 55 97-98
68 56 53 96-97
School System State
Sources of Information
Composite Score
50
62 55 57 0
98-99
School 50
System
56 51 56 97-98
65 55 55 96-97
State 0
61 52 56 98-99
57 51 54 97-98
1998-99 GEORGIA PUBLIC EDUCATION REPORT CARD Clarke Middle School - 6291058
Prepared by Georgia Department of Education
63 52 54 96-97
Scores Reported in Percentiles
School System State
Page 2
STATE-REQUIRED TEST DATA
Categories of Scaled Scores
Inadequate (less than 162)
Minimal (162-209)
Good
(210-247)
Very Good (greater than 247)
Average Scaled Score: (Range 100-300)
PERFORMANCE ASSESSMENTS
Grade 8 Writing Assessment
1998-99 Percent Scoring
1997-98 Percent Scoring
1996-97 Percent Scoring
School System State School System State School System State
9% 28% 41% 22%
10% 36% 36% 18%
8% 40% 41% 11%
8% 39% 37% 16%
15% 42% 31% 12%
11% 46% 34%
8%
14% 28% 38% 20%
18% 41% 28% 13%
15% 46% 30%
8%
216
210
208 211
201 202 209
199 198
AWARDS / RECOGNITION DATA
Schools in Georgia may receive recognition in the following programs: Charter School Pay for Performance Program Georgia School of Excellence National Blue Ribbon School Clarke Middle School did not receive recognition in any of these programs during the 1998-99 school year.
1998-99 GEORGIA PUBLIC EDUCATION REPORT CARD Clarke Middle School - 6291058
Prepared by Georgia Department of Education
Page 3
CERTIFIED PERSONNEL DATA
Positions Number Average Contract Days
Personnel Sex
Certificate
Years Experience
Full-time Part-time
Male Female
4 Yr Bachelor's 5 Yr Master's 6 Yr Specialist's 7 Yr Doctoral Other*
<1 1-10 11-20 21-30 >30
Average
Administrators
2.00 210.50
2 0
1 1
0 0 1 1 0 0 0 2 0 0 15.00
Support Personnel
4.00 190.00
4 0
1 3
0 3 1 0 0 0 1 1 2 0 16.00
PK-12 Teachers
52.48 190.00
51 2
12 41
19 28
3 3 0 6 21 13 12 1 12.51
*Includes One- and Two-Year Vocational Certificates.
ACCREDITATION DATA
Accredited by Southern Association of Colleges and Schools (SACS):
Elementary/Middle Commission. Accredited with Quality by Georgia
Accrediting Commission (GAC).
1998-99 GEORGIA PUBLIC EDUCATION REPORT CARD Clarke Middle School - 6291058
Prepared by Georgia Department of Education
Page 4
1998-99 GEORGIA PUBLIC EDUCATION REPORT CARD
CLARKE COUNTY SCHOOLS
Cleveland Road Elementary School - 6290191
Grade Range PK-5
The Georgia Public Education Report Card is designed to assist systems and schools in educational improvement. This report card contains a variety of data elements. An explanation of the terms is provided as a companion to the report card data. Please refer to the definitions for the most effective use of the reported data.
STUDENT DATA
Total
K-5
302
PK
40
Enrollment, by Race/Ethnicity and Sex
Black
White Hispanic
American Asian Indian
Multiracial
168 55.6%
102 33.8%
22 7.3%
4 1.3%
2 0.7%
4 1.3%
18 45.0%
17 42.5%
4 10.0%
0 0.0%
0 0.0%
1 2.5%
Male Female
168 55.6%
134 44.4%
22 55.0%
18 45.0%
Enrollment in Selected Programs
Program
Program % of Student Enrollment Population
Gifted (Grades K-12)
28
9.3%
Alternative Programs (Grades 6-12)
N/A
N/A
Students Eligible to Receive Free/Reduced Lunches
Number
Percent
School System
250 6,528
73.1% 58.2%
Dropout Rate *
Number
Rate
School System
N/A N/A
N/A N/A
* Dropout rates are not applicable for grades PK-5.
Enrollment in Compensatory Programs
Program
Program % of Student Enrollment Population
Special Education (Grades K-12)
55 18.2%
(PK)
3
N/A
English to Speakers of Other Languages (ESOL) (Grades K-12)
0
0.0%
Remedial Education (Grades 2-5, 9-12)
26 14.7%
Special Instructional Assistance (SIA) (Grades K-3)
61 27.0%
Title I (Grades K-12)
This school has a schoolwide program.
Total 2
Retained Students, by Race/Ethnicity and Sex
Black
White Hispanic
American MultiAsian Indian racial
Male Female
1 50.0%
1 50.0%
0 0.0%
0 0.0%
0 0.0%
0
2
0.0% 100.0%
0 0.0%
Prepared by Georgia Department of Education
Page 1
STATE-REQUIRED TEST DATA
NORM-REFERENCED TESTS Grade 3
Iowa Tests of Basic Skills (ITBS) Each chart reflects data for three years of testing.
Reading Comprehension 50
45 49 54 0
98-99
40 48 53 97-98
50 49 52 96-97
Mathematics
School 50
System
State
0
48 51 61 98-99
42 51 61 97-98
49 55 59 96-97
School System State
Reading Vocabulary 50
35 41 50 0
98-99
36 41 50 97-98
42 47 49 96-97
Language Arts
School 50
System
State
0
42 51 64 98-99
29 45 62 97-98
30 48 59 96-97
School System State
Social Studies 50
40 46 56 0
98-99
39 47 55 97-98
45 50 55 96-97
Science
School 50
System
State
0
41 50 59 98-99
47 52 59 97-98
54 57 58 96-97
School System State
Sources of Information
Composite Score
50
35 52 57 0
98-99
School 50
System
34 47 56 97-98
42 50 55 96-97
State 0
40 48 58 98-99
36 47 57 97-98
1998-99 GEORGIA PUBLIC EDUCATION REPORT CARD Cleveland Road Elementary School - 6290191
Prepared by Georgia Department of Education
48 51 56 96-97
Scores Reported in Percentiles
School System State
Page 2
STATE-REQUIRED TEST DATA
NORM-REFERENCED TESTS Grade 5
Iowa Tests of Basic Skills (ITBS) Each chart reflects data for three years of testing.
Reading Comprehension
Mathematics
50
51 51 53 0
98-99
39 52 53 97-98
36 51 52 96-97
School 50
System
State
0
54 54 59 98-99
41 55 58 97-98
34 55 57 96-97
School System State
Reading Vocabulary 50
39 41 48 0
98-99
31 42 48 97-98
29 44 46 96-97
Language Arts
School 50
System
State
0
44 57 63 98-99
25 56 61 97-98
34 55 58 96-97
School System State
Social Studies 50
43 55 57 0
98-99
40 57 56 97-98
37 55 55 96-97
Science
School 50
System
State
0
50 54 60 98-99
45 59 59 97-98
36 59 59 96-97
School System State
Sources of Information
Composite Score
50
50 57 58 0
98-99
School 50
System
37 57 58 97-98
41 57 57 96-97
State 0
45 53 57 98-99
35 55 56 97-98
34 54 55 96-97
1998-99 GEORGIA PUBLIC EDUCATION REPORT CARD Cleveland Road Elementary School - 6290191
Prepared by Georgia Department of Education
Scores Reported in Percentiles
School System State
Page 3
STATE-REQUIRED TEST DATA
PERFORMANCE ASSESSMENTS
Grade 5 Writing Assessment
Percent at Developmental Stages:
1998-99 School System State
1997-98 School System State
1996-97 School System State
Stage Stage Stage Stage Stage Stage
1:The Emerging Writer 2:The Developing Writer 3:The Focusing Writer 4:The Experimenting 5:The Engaging Writer 6:The Extending Writer
0% 4% 8% 42% 23% 23%
0% 1% 11% 44% 27% 16%
0% 1% 16% 41% 29% 12%
0% 9% 23% 27% 32% 9%
1% 2% 20% 37% 24% 15%
0% 3% 19% 41% 27% 10%
0% 3% 35% 41% 16% 3%
0% 3% 19% 36% 25% 15%
0% 3% 21% 37% 26% 12%
AWARDS / RECOGNITION DATA
Schools in Georgia may receive recognition in the following programs: Charter School Pay for Performance Program Georgia School of Excellence National Blue Ribbon School Cleveland Road Elementary School did not receive recognition in any of these programs during the 1998-99 school year.
1998-99 GEORGIA PUBLIC EDUCATION REPORT CARD Cleveland Road Elementary School - 6290191
Prepared by Georgia Department of Education
Page 4
CERTIFIED PERSONNEL DATA
Positions Number Average Contract Days
Personnel Sex
Certificate
Years Experience
Full-time Part-time
Male Female
4 Yr Bachelor's 5 Yr Master's 6 Yr Specialist's 7 Yr Doctoral Other*
<1 1-10 11-20 21-30 >30
Average
Administrators
2.00 210.50
2 0
0 2
0 1 1 0 0 0 1 0 1 0 15.00
Support Personnel
5.00 187.60
5 0
1 4
2 1 1 1 0 2 1 2 0 0 7.40
PK-12 Teachers
28.10 190.00
27 3
0 30
15 14
1 0 0 2 16 9 2 1 10.70
*Includes One- and Two-Year Vocational Certificates.
ACCREDITATION DATA
Accredited by Southern Association of Colleges and Schools (SACS):
Elementary/Middle Commission. Accredited with Quality by Georgia
Accrediting Commission (GAC).
1998-99 GEORGIA PUBLIC EDUCATION REPORT CARD Cleveland Road Elementary School - 6290191
Prepared by Georgia Department of Education
Page 5
1998-99 GEORGIA PUBLIC EDUCATION REPORT CARD
CLARKE COUNTY SCHOOLS
Coile Middle School - 6290196
Grade Range 6-8
The Georgia Public Education Report Card is designed to assist systems and schools in educational improvement. This report card contains a variety of data elements. An explanation of the terms is provided as a companion to the report card data. Please refer to the definitions for the most effective use of the reported data.
STUDENT DATA
Total 654
6-8 Enrollment, by Race/Ethnicity and Sex
Black
White Hispanic
American Multi-
Asian Indian
racial
337 51.5%
293 44.8%
10 1.5%
12 1.8%
0 0.0%
2 0.3%
Male 318
48.6%
Female 336
51.4%
Enrollment in Selected Programs
Program
Gifted (Grades K-12)
Program % of Student Enrollment Population
166
25.4%
Alternative Programs (Grades 6-12)
0
0.0%
Students Eligible to Receive Free/Reduced Lunches
Number
Percent
School System
328 6,528
50.2% 58.2%
Enrollment in Compensatory Programs
Program
Program % of Student Enrollment Population
Special Education (Grades K-12) (PK)
100 15.3%
0
N/A
English to Speakers of Other Languages (ESOL) (Grades K-12)
0
0.0%
Title I (Grades K-12)
This school has no Title I program.
Dropout Rate for Grades 6-8
Number
Rate
School System
5
0.7%
80
2.9%
Total 0
Retained Students, by Race/Ethnicity and Sex
Black
White Hispanic
American MultiAsian Indian racial
0
0
0
0
0
0
Male Female
0
0
Prepared by Georgia Department of Education
Page 1
STATE-REQUIRED TEST DATA
NORM-REFERENCED TESTS Grade 8
Iowa Tests of Basic Skills (ITBS) Each chart reflects data for three years of testing.
Reading Comprehension 50
51 46 49 0
98-99
51 45 48 97-98
46 47 48 96-97
Mathematics
School 50
System
State
0
55 49 56 98-99
54 48 55 97-98
44 46 54 96-97
School System State
Reading Vocabulary 50
47 38 46 0
98-99
45 36 45 97-98
41 43 44 96-97
Language Arts
School 50
System
State
0
63 55 60 98-99
56 52 58 97-98
47 53 56 96-97
School System State
Social Studies 50
58 53 54 0
98-99
55 50 53 97-98
52 53 53 96-97
Science
School 50
System
State
0
57 52 56 98-99
58 53 55 97-98
56 56 53 96-97
School System State
Sources of Information
Composite Score
50
61 55 57 0
98-99
School 50
System
57 51 56 97-98
53 55 55 96-97
State 0
58 52 56 98-99
57 51 54 97-98
1998-99 GEORGIA PUBLIC EDUCATION REPORT CARD Coile Middle School - 6290196
Prepared by Georgia Department of Education
49 52 54 96-97
Scores Reported in Percentiles
School System State
Page 2
STATE-REQUIRED TEST DATA
Categories of Scaled Scores
Inadequate (less than 162)
Minimal (162-209)
Good
(210-247)
Very Good (greater than 247)
Average Scaled Score: (Range 100-300)
PERFORMANCE ASSESSMENTS
Grade 8 Writing Assessment
1998-99 Percent Scoring
1997-98 Percent Scoring
1996-97 Percent Scoring
School System State School System State School System State
5% 39% 29% 27%
10% 36% 36% 18%
8% 40% 41% 11%
15% 41% 28% 15%
15% 42% 31% 12%
11% 46% 34%
8%
25% 40% 22% 13%
18% 41% 28% 13%
15% 46% 30%
8%
216
210
208 203
201 202 194
199 198
AWARDS / RECOGNITION DATA
Schools in Georgia may receive recognition in the following programs: Charter School Pay for Performance Program Georgia School of Excellence National Blue Ribbon School Coile Middle School did not receive recognition in any of these programs during the 1998-99 school year.
1998-99 GEORGIA PUBLIC EDUCATION REPORT CARD Coile Middle School - 6290196
Prepared by Georgia Department of Education
Page 3
CERTIFIED PERSONNEL DATA
Positions Number Average Contract Days
Personnel Sex
Certificate
Years Experience
Full-time Part-time
Male Female
4 Yr Bachelor's 5 Yr Master's 6 Yr Specialist's 7 Yr Doctoral Other*
<1 1-10 11-20 21-30 >30
Average
Administrators
2.00 210.50
2 0
0 2
0 1 0 1 0 0 0 0 1 1 27.50
Support Personnel
3.00 190.00
3 0
1 2
0 2 1 0 0 0 0 2 1 0 17.67
PK-12 Teachers
50.28 190.00
46 7
12 41
19 26
6 2 0 6 25 12 10 0 10.30
*Includes One- and Two-Year Vocational Certificates.
ACCREDITATION DATA
Accredited by Southern Association of Colleges and Schools (SACS):
Elementary/Middle Commission. Accredited with Quality by Georgia
Accrediting Commission (GAC).
1998-99 GEORGIA PUBLIC EDUCATION REPORT CARD Coile Middle School - 6290196
Prepared by Georgia Department of Education
Page 4
1998-99 GEORGIA PUBLIC EDUCATION REPORT CARD
CLARKE COUNTY SCHOOLS
Fourth Street Elementary School - 6290291
Grade Range PK-5
The Georgia Public Education Report Card is designed to assist systems and schools in educational improvement. This report card contains a variety of data elements. An explanation of the terms is provided as a companion to the report card data. Please refer to the definitions for the most effective use of the reported data.
STUDENT DATA
Total
K-5
317
PK
184
Enrollment, by Race/Ethnicity and Sex
Black
White Hispanic
American Asian Indian
Multiracial
201 63.4%
40 12.6%
64 20.2%
2 0.6%
1 0.3%
9 2.8%
130 70.7%
21 11.4%
28 15.2%
2 1.1%
1 0.5%
2 1.1%
Male Female
165 52.1%
152 47.9%
94 51.1%
90 48.9%
Enrollment in Selected Programs
Program
Program % of Student Enrollment Population
Gifted (Grades K-12)
6
1.9%
Alternative Programs (Grades 6-12)
N/A
N/A
Students Eligible to Receive Free/Reduced Lunches
Number
Percent
School System
362 6,528
72.3% 58.2%
Dropout Rate *
Number
Rate
School System
N/A N/A
N/A N/A
* Dropout rates are not applicable for grades PK-5.
Enrollment in Compensatory Programs
Program
Program % of Student Enrollment Population
Special Education (Grades K-12)
55 17.4%
(PK)
34
N/A
English to Speakers of Other Languages (ESOL) (Grades K-12)
40 12.6%
Remedial Education (Grades 2-5, 9-12)
30 16.4%
Special Instructional Assistance (SIA) (Grades K-3)
102 44.3%
Title I (Grades K-12)
This school has a schoolwide program.
Total 9
Retained Students, by Race/Ethnicity and Sex
Black
White Hispanic
American MultiAsian Indian racial
3 33.3%
2
4
22.2% 44.4%
0 0.0%
0 0.0%
0 0.0%
Male Female
3
6
33.3% 66.7%
Prepared by Georgia Department of Education
Page 1
STATE-REQUIRED TEST DATA
NORM-REFERENCED TESTS Grade 3
Iowa Tests of Basic Skills (ITBS) Each chart reflects data for three years of testing.
Reading Comprehension 50
40 49 54 0
98-99
26 48 53 97-98
46 49 52 96-97
Mathematics
School 50
System
State
0
43 51 61 98-99
29 51 61 97-98
49 55 59 96-97
School System State
Reading Vocabulary 50
42 41 50 0
98-99
44 41 50 97-98
32 47 49 96-97
Language Arts
School 50
System
State
0
52 51 64 98-99
32 45 62 97-98
58 48 59 96-97
School System State
Social Studies 50
37 46 56 0
98-99
25 47 55 97-98
44 50 55 96-97
Science
School 50
System
State
0
35 50 59 98-99
32 52 59 97-98
52 57 58 96-97
School System State
Sources of Information
Composite Score
50
42 52 57 0
98-99
School 50
System
22 47 56 97-98
41 50 55 96-97
State 0
39 48 58 98-99
26 47 57 97-98
1998-99 GEORGIA PUBLIC EDUCATION REPORT CARD Fourth Street Elementary School - 6290291
Prepared by Georgia Department of Education
46 51 56 96-97
Scores Reported in Percentiles
School System State
Page 2
STATE-REQUIRED TEST DATA
NORM-REFERENCED TESTS Grade 5
Iowa Tests of Basic Skills (ITBS) Each chart reflects data for three years of testing.
Reading Comprehension
Mathematics
50
50 51 53 0
98-99
50 52 53 97-98
45 51 52 96-97
School 50
System
State
0
58 54 59 98-99
57 55 58 97-98
58 55 57 96-97
School System State
Reading Vocabulary 50
36 41 48 0
98-99
42 42 48 97-98
32 44 46 96-97
Language Arts
School 50
System
State
0
66 57 63 98-99
59 56 61 97-98
54 55 58 96-97
School System State
Social Studies 50
44 55 57 0
98-99
47 57 56 97-98
43 55 55 96-97
Science
School 50
System
State
0
50 54 60 98-99
53 59 59 97-98
48 59 59 96-97
School System State
Sources of Information
Composite Score
50
52 57 58 0
98-99
School 50
System
43 57 58 97-98
49 57 57 96-97
State 0
53 53 57 98-99
49 55 56 97-98
47 54 55 96-97
1998-99 GEORGIA PUBLIC EDUCATION REPORT CARD Fourth Street Elementary School - 6290291
Prepared by Georgia Department of Education
Scores Reported in Percentiles
School System State
Page 3
STATE-REQUIRED TEST DATA
PERFORMANCE ASSESSMENTS
Grade 5 Writing Assessment
Percent at Developmental Stages:
1998-99 School System State
1997-98 School System State
1996-97 School System State
Stage Stage Stage Stage Stage Stage
1:The Emerging Writer 2:The Developing Writer 3:The Focusing Writer 4:The Experimenting 5:The Engaging Writer 6:The Extending Writer
0% 0% 3% 38% 48% 10%
0% 1% 11% 44% 27% 16%
0% 1% 16% 41% 29% 12%
0% 0% 23% 40% 27% 7%
1% 2% 20% 37% 24% 15%
0% 3% 19% 41% 27% 10%
0% 0% 16% 54% 22% 8%
0% 3% 19% 36% 25% 15%
0% 3% 21% 37% 26% 12%
AWARDS / RECOGNITION DATA
Schools in Georgia may receive recognition in the following programs: Charter School Pay for Performance Program Georgia School of Excellence National Blue Ribbon School Fourth Street Elementary School did not receive recognition in any of these programs during the 1998-99 school year.
1998-99 GEORGIA PUBLIC EDUCATION REPORT CARD Fourth Street Elementary School - 6290291
Prepared by Georgia Department of Education
Page 4
CERTIFIED PERSONNEL DATA
Positions Number Average Contract Days
Personnel Sex
Certificate
Years Experience
Full-time Part-time
Male Female
4 Yr Bachelor's 5 Yr Master's 6 Yr Specialist's 7 Yr Doctoral Other*
<1 1-10 11-20 21-30 >30
Average
Administrators
2.00 210.50
2 0
0 2
0 1 1 0 0 0 0 0 2 0 23.50
Support Personnel
4.00 187.00
4 0
0 4
2 2 0 0 0 2 0 0 2 0 13.00
PK-12 Teachers
38.15 190.79
37 2
2 37
18 18
3 0 0 2 15 14 8 0 13.41
*Includes One- and Two-Year Vocational Certificates.
ACCREDITATION DATA
Accredited by Southern Association of Colleges and Schools (SACS):
Elementary/Middle Commission. Accredited with Quality by Georgia
Accrediting Commission (GAC).
1998-99 GEORGIA PUBLIC EDUCATION REPORT CARD Fourth Street Elementary School - 6290291
Prepared by Georgia Department of Education
Page 5
1998-99 GEORGIA PUBLIC EDUCATION REPORT CARD
CLARKE COUNTY SCHOOLS
Fowler Drive Elementary School - 6293058
Grade Range PK-5
The Georgia Public Education Report Card is designed to assist systems and schools in educational improvement. This report card contains a variety of data elements. An explanation of the terms is provided as a companion to the report card data. Please refer to the definitions for the most effective use of the reported data.
STUDENT DATA
Total
K-5
371
PK
20
Enrollment, by Race/Ethnicity and Sex
Black
White Hispanic
American Asian Indian
Multiracial
242 65.2%
68 18.3%
52 14.0%
0 0.0%
0 0.0%
9 2.4%
15 75.0%
4 20.0%
0 0.0%
1 5.0%
0 0.0%
0 0.0%
Male Female
179 48.2%
192 51.8%
12 60.0%
8 40.0%
Enrollment in Selected Programs
Program
Program % of Student Enrollment Population
Gifted (Grades K-12)
40
10.8%
Alternative Programs (Grades 6-12)
N/A
N/A
Students Eligible to Receive Free/Reduced Lunches
Number
Percent
School System
328 6,528
83.9% 58.2%
Dropout Rate *
Number
Rate
School System
N/A N/A
N/A N/A
* Dropout rates are not applicable for grades PK-5.
Enrollment in Compensatory Programs
Program
Program % of Student Enrollment Population
Special Education (Grades K-12)
63 17.0%
(PK)
1
N/A
English to Speakers of Other Languages (ESOL) (Grades K-12)
31
8.4%
Remedial Education (Grades 2-5, 9-12)
38 14.9%
Special Instructional Assistance (SIA) (Grades K-3)
86 35.5%
Title I (Grades K-12)
This school has a schoolwide program.
Total 7
Retained Students, by Race/Ethnicity and Sex
Black
White Hispanic
American MultiAsian Indian racial
3 42.9%
1
3
14.3% 42.9%
0 0.0%
0 0.0%
0 0.0%
Male Female
4
3
57.1% 42.9%
Prepared by Georgia Department of Education
Page 1
STATE-REQUIRED TEST DATA
NORM-REFERENCED TESTS Grade 3
Iowa Tests of Basic Skills (ITBS) Each chart reflects data for three years of testing.
Reading Comprehension 50
40 49 54 0
98-99
30 48 53 97-98
30 49 52 96-97
Mathematics
School 50
System
State
0
45 51 61 98-99
32 51 61 97-98
38 55 59 96-97
School System State
Reading Vocabulary 50
27 41 50 0
98-99
25 41 50 97-98
25 47 49 96-97
Language Arts
School 50
System
State
0
38 51 64 98-99
27 45 62 97-98
25 48 59 96-97
School System State
Social Studies 50
42 46 56 0
98-99
32 47 55 97-98
33 50 55 96-97
Science
School 50
System
State
0
38 50 59 98-99
38 52 59 97-98
39 57 58 96-97
School System State
Sources of Information
Composite Score
50
44 52 57 0
98-99
School 50
System
27 47 56 97-98
32 50 55 96-97
State 0
38 48 58 98-99
27 47 57 97-98
1998-99 GEORGIA PUBLIC EDUCATION REPORT CARD Fowler Drive Elementary School - 6293058
Prepared by Georgia Department of Education
31 51 56 96-97
Scores Reported in Percentiles
School System State
Page 2
STATE-REQUIRED TEST DATA
NORM-REFERENCED TESTS Grade 5
Iowa Tests of Basic Skills (ITBS) Each chart reflects data for three years of testing.
Reading Comprehension
Mathematics
50
40 51 53 0
98-99
45 52 53 97-98
38 51 52 96-97
School 50
System
State
0
36 54 59 98-99
47 55 58 97-98
37 55 57 96-97
School System State
Reading Vocabulary 50
25 41 48 0
98-99
28 42 48 97-98
20 44 46 96-97
Language Arts
School 50
System
State
0
38 57 63 98-99
46 56 61 97-98
36 55 58 96-97
School System State
Social Studies 50
35 55 57 0
98-99
44 57 56 97-98
46 55 55 96-97
Science
School 50
System
State
0
42 54 60 98-99
50 59 59 97-98
45 59 59 96-97
School System State
Sources of Information
Composite Score
50
36 57 58 0
98-99
School 50
System
45 57 58 97-98
42 57 57 96-97
State 0
32 53 57 98-99
44 55 56 97-98
37 54 55 96-97
1998-99 GEORGIA PUBLIC EDUCATION REPORT CARD Fowler Drive Elementary School - 6293058
Prepared by Georgia Department of Education
Scores Reported in Percentiles
School System State
Page 3
STATE-REQUIRED TEST DATA
PERFORMANCE ASSESSMENTS
Grade 5 Writing Assessment
Percent at Developmental Stages:
1998-99 School System State
1997-98 School System State
1996-97 School System State
Stage Stage Stage Stage Stage Stage
1:The Emerging Writer 2:The Developing Writer 3:The Focusing Writer 4:The Experimenting 5:The Engaging Writer 6:The Extending Writer
2% 0% 14% 55% 19% 10%
0% 1% 11% 44% 27% 16%
0% 1% 16% 41% 29% 12%
0% 0% 18% 49% 18% 16%
1% 2% 20% 37% 24% 15%
0% 3% 19% 41% 27% 10%
2% 2% 20% 46% 22% 7%
0% 3% 19% 36% 25% 15%
0% 3% 21% 37% 26% 12%
AWARDS / RECOGNITION DATA
Schools in Georgia may receive recognition in the following programs: Charter School Pay for Performance Program Georgia School of Excellence National Blue Ribbon School Fowler Drive Elementary School did not receive recognition in any of these programs during the 1998-99 school year.
1998-99 GEORGIA PUBLIC EDUCATION REPORT CARD Fowler Drive Elementary School - 6293058
Prepared by Georgia Department of Education
Page 4
CERTIFIED PERSONNEL DATA
Positions Number Average Contract Days
Personnel Sex
Certificate
Years Experience
Full-time Part-time
Male Female
4 Yr Bachelor's 5 Yr Master's 6 Yr Specialist's 7 Yr Doctoral Other*
<1 1-10 11-20 21-30 >30
Average
Administrators
2.00 210.50
2 0
0 2
0 0 1 1 0 0 0 2 0 0 17.50
Support Personnel
3.50 186.57
3 1
0 4
2 2 0 0 0 1 2 0 0 1 9.25
PK-12 Teachers
34.60 190.00
34 2
4 32
17 14
5 0 0 4 11 17 3 1 11.89
*Includes One- and Two-Year Vocational Certificates.
ACCREDITATION DATA
Accredited by Southern Association of Colleges and Schools (SACS):
Elementary/Middle Commission. Accredited with Quality by Georgia
Accrediting Commission (GAC).
1998-99 GEORGIA PUBLIC EDUCATION REPORT CARD Fowler Drive Elementary School - 6293058
Prepared by Georgia Department of Education
Page 5
1998-99 GEORGIA PUBLIC EDUCATION REPORT CARD
CLARKE COUNTY SCHOOLS
Gaines Elementary School - 6294058
Grade Range PK-5
The Georgia Public Education Report Card is designed to assist systems and schools in educational improvement. This report card contains a variety of data elements. An explanation of the terms is provided as a companion to the report card data. Please refer to the definitions for the most effective use of the reported data.
STUDENT DATA
Total
K-5
408
PK
99
Enrollment, by Race/Ethnicity and Sex
Black
White Hispanic
American Asian Indian
Multiracial
263 64.5%
88 21.6%
26 6.4%
12 2.9%
1 0.2%
18 4.4%
70 70.7%
18 18.2%
7 7.1%
4 4.0%
0 0.0%
0 0.0%
Male Female
188 46.1%
220 53.9%
57 57.6%
42 42.4%
Enrollment in Selected Programs
Program
Program % of Student Enrollment Population
Gifted (Grades K-12)
27
6.6%
Alternative Programs (Grades 6-12)
N/A
N/A
Students Eligible to Receive Free/Reduced Lunches
Number
Percent
School System
387 6,528
76.3% 58.2%
Dropout Rate *
Number
Rate
School System
N/A N/A
N/A N/A
* Dropout rates are not applicable for grades PK-5.
Enrollment in Compensatory Programs
Program
Program % of Student Enrollment Population
Special Education (Grades K-12)
60 14.7%
(PK)
2
N/A
English to Speakers of Other Languages (ESOL) (Grades K-12)
25
6.1%
Remedial Education (Grades 2-5, 9-12)
48 17.0%
Special Instructional Assistance (SIA) (Grades K-3)
92 34.5%
Title I (Grades K-12)
This school has a schoolwide program.
Total 1
Retained Students, by Race/Ethnicity and Sex
Black
White Hispanic
American MultiAsian Indian racial
Male Female
0
1
0.0% 100.0%
0 0.0%
0 0.0%
0 0.0%
0
1
0.0% 100.0%
0 0.0%
Prepared by Georgia Department of Education
Page 1
STATE-REQUIRED TEST DATA
NORM-REFERENCED TESTS Grade 3
Iowa Tests of Basic Skills (ITBS) Each chart reflects data for three years of testing.
Reading Comprehension 50
32 49 54 0
98-99
36 48 53 97-98
40 49 52 96-97
Mathematics
School 50
System
State
0
28 51 61 98-99
41 51 61 97-98
45 55 59 96-97
School System State
Reading Vocabulary 50
26 41 50 0
98-99
23 41 50 97-98
40 47 49 96-97
Language Arts
School 50
System
State
0
33 51 64 98-99
38 45 62 97-98
45 48 59 96-97
School System State
Social Studies 50
32 46 56 0
98-99
38 47 55 97-98
40 50 55 96-97
Science
School 50
System
State
0
34 50 59 98-99
35 52 59 97-98
43 57 58 96-97
School System State
Sources of Information
Composite Score
50
29 52 57 0
98-99
School 50
System
36 47 56 97-98
44 50 55 96-97
State 0
29 48 58 98-99
35 47 57 97-98
1998-99 GEORGIA PUBLIC EDUCATION REPORT CARD Gaines Elementary School - 6294058
Prepared by Georgia Department of Education
41 51 56 96-97
Scores Reported in Percentiles
School System State
Page 2
STATE-REQUIRED TEST DATA
NORM-REFERENCED TESTS Grade 5
Iowa Tests of Basic Skills (ITBS) Each chart reflects data for three years of testing.
Reading Comprehension
Mathematics
50
42 51 53 0
98-99
46 52 53 97-98
42 51 52 96-97
School 50
System
State
0
38 54 59 98-99
40 55 58 97-98
45 55 57 96-97
School System State
Reading Vocabulary 50
30 41 48 0
98-99
33 42 48 97-98
39 44 46 96-97
Language Arts
School 50
System
State
0
57 57 63 98-99
57 56 61 97-98
61 55 58 96-97
School System State
Social Studies 50
53 55 57 0
98-99
60 57 56 97-98
46 55 55 96-97
Science
School 50
System
State
0
48 54 60 98-99
58 59 59 97-98
66 59 59 96-97
School System State
Sources of Information
Composite Score
50
50 57 58 0
98-99
School 50
System
51 57 58 97-98
52 57 57 96-97
State 0
46 53 57 98-99
50 55 56 97-98
52 54 55 96-97
1998-99 GEORGIA PUBLIC EDUCATION REPORT CARD Gaines Elementary School - 6294058
Prepared by Georgia Department of Education
Scores Reported in Percentiles
School System State
Page 3
STATE-REQUIRED TEST DATA
PERFORMANCE ASSESSMENTS
Grade 5 Writing Assessment
Percent at Developmental Stages:
1998-99 School System State
1997-98 School System State
1996-97 School System State
Stage Stage Stage Stage Stage Stage
1:The Emerging Writer 2:The Developing Writer 3:The Focusing Writer 4:The Experimenting 5:The Engaging Writer 6:The Extending Writer
0% 2% 14% 48% 23% 13%
0% 1% 11% 44% 27% 16%
0% 1% 16% 41% 29% 12%
2% 3% 17% 43% 21% 10%
1% 2% 20% 37% 24% 15%
0% 3% 19% 41% 27% 10%
0% 5% 27% 32% 18% 12%
0% 3% 19% 36% 25% 15%
0% 3% 21% 37% 26% 12%
AWARDS / RECOGNITION DATA
Schools in Georgia may receive recognition in the following programs: Charter School Pay for Performance Program Georgia School of Excellence National Blue Ribbon School Gaines Elementary School did not receive recognition in any of these programs during the 1998-99 school year.
1998-99 GEORGIA PUBLIC EDUCATION REPORT CARD Gaines Elementary School - 6294058
Prepared by Georgia Department of Education
Page 4
CERTIFIED PERSONNEL DATA
Positions Number Average Contract Days
Personnel Sex
Certificate
Years Experience
Full-time Part-time
Male Female
4 Yr Bachelor's 5 Yr Master's 6 Yr Specialist's 7 Yr Doctoral Other*
<1 1-10 11-20 21-30 >30
Average
Administrators
2.00 210.50
2 0
0 2
0 1 1 0 0 0 0 1 1 0 20.50
Support Personnel
2.00 190.00
2 0
0 2
0 1 0 1 0 0 0 2 0 0 18.50
PK-12 Teachers
40.70 190.00
40 2
3 39
21 17
2 2 0 4 21 5 10 2 11.88
*Includes One- and Two-Year Vocational Certificates.
ACCREDITATION DATA
Accredited by Southern Association of Colleges and Schools (SACS):
Elementary/Middle Commission. Accredited with Quality by Georgia
Accrediting Commission (GAC).
1998-99 GEORGIA PUBLIC EDUCATION REPORT CARD Gaines Elementary School - 6294058
Prepared by Georgia Department of Education
Page 5
1998-99 GEORGIA PUBLIC EDUCATION REPORT CARD
CLARKE COUNTY SCHOOLS
Hilsman Middle School - 6295058
Grade Range 6-8
The Georgia Public Education Report Card is designed to assist systems and schools in educational improvement. This report card contains a variety of data elements. An explanation of the terms is provided as a companion to the report card data. Please refer to the definitions for the most effective use of the reported data.
STUDENT DATA
Total 571
6-8 Enrollment, by Race/Ethnicity and Sex
Black
White Hispanic
American Multi-
Asian Indian
racial
368 64.4%
134 23.5%
48 8.4%
14 2.5%
0 0.0%
7 1.2%
Male 299
52.4%
Female 272
47.6%
Enrollment in Selected Programs
Program
Gifted (Grades K-12)
Program % of Student Enrollment Population
62
10.9%
Alternative Programs (Grades 6-12)
1
< 1%
Students Eligible to Receive Free/Reduced Lunches
Number
Percent
School System
434 6,528
76.0% 58.2%
Enrollment in Compensatory Programs
Program
Program % of Student Enrollment Population
Special Education (Grades K-12) (PK)
112 19.6%
0
N/A
English to Speakers of Other Languages (ESOL) (Grades K-12)
19
3.3%
Title I (Grades K-12)
This school has no Title I program.
Dropout Rate for Grades 6-8
Number
Rate
School System
36
5.6%
80
2.9%
Total 45
Retained Students, by Race/Ethnicity and Sex
Black
White Hispanic
American MultiAsian Indian racial
38 84.4%
4 8.9%
3 6.7%
0 0.0%
0 0.0%
0 0.0%
Male Female
34
11
75.6% 24.4%
Prepared by Georgia Department of Education
Page 1
STATE-REQUIRED TEST DATA
NORM-REFERENCED TESTS Grade 8
Iowa Tests of Basic Skills (ITBS) Each chart reflects data for three years of testing.
Reading Comprehension 50
35 46 49 0
98-99
37 45 48 97-98
43 47 48 96-97
Mathematics
School 50
System
State
0
36 49 56 98-99
36 48 55 97-98
39 46 54 96-97
School System State
Reading Vocabulary 50
26 38 46 0
98-99
27 36 45 97-98
39 43 44 96-97
Language Arts
School 50
System
State
0
48 55 60 98-99
47 52 58 97-98
49 53 56 96-97
School System State
Social Studies 50
46 53 54 0
98-99
44 50 53 97-98
47 53 53 96-97
Science
School 50
System
State
0
41 52 56 98-99
44 53 55 97-98
50 56 53 96-97
School System State
Sources of Information
Composite Score
50
47 55 57 0
98-99
School 50
System
45 51 56 97-98
53 55 55 96-97
State 0
42 52 56 98-99
42 51 54 97-98
1998-99 GEORGIA PUBLIC EDUCATION REPORT CARD Hilsman Middle School - 6295058
Prepared by Georgia Department of Education
48 52 54 96-97
Scores Reported in Percentiles
School System State
Page 2
STATE-REQUIRED TEST DATA
Categories of Scaled Scores
Inadequate (less than 162)
Minimal (162-209)
Good
(210-247)
Very Good (greater than 247)
Average Scaled Score: (Range 100-300)
PERFORMANCE ASSESSMENTS
Grade 8 Writing Assessment
1998-99 Percent Scoring
1997-98 Percent Scoring
1996-97 Percent Scoring
School System State School System State School System State
18% 36% 37%
9%
10% 36% 36% 18%
8% 40% 41% 11%
15% 44% 34%
7%
15% 42% 31% 12%
11% 46% 34%
8%
20% 42% 30%
8%
18% 41% 28% 13%
15% 46% 30%
8%
201
210
208 198
201 202 196
199 198
AWARDS / RECOGNITION DATA
Schools in Georgia may receive recognition in the following programs: Charter School Pay for Performance Program Georgia School of Excellence National Blue Ribbon School Hilsman Middle School did not receive recognition in any of these programs during the 1998-99 school year.
1998-99 GEORGIA PUBLIC EDUCATION REPORT CARD Hilsman Middle School - 6295058
Prepared by Georgia Department of Education
Page 3
CERTIFIED PERSONNEL DATA
Positions Number Average Contract Days
Personnel Sex
Certificate
Years Experience
Full-time Part-time
Male Female
4 Yr Bachelor's 5 Yr Master's 6 Yr Specialist's 7 Yr Doctoral Other*
<1 1-10 11-20 21-30 >30
Average
Administrators
2.00 210.50
2 0
0 2
0 1 1 0 0 0 0 1 1 0 23.00
Support Personnel
3.00 191.67
3 0
2 1
0 3 0 0 0 0 0 2 1 0 17.67
PK-12 Teachers
45.95 190.00
45 1
9 37
19 20
7 0 0 2 25 8 10 1 12.57
*Includes One- and Two-Year Vocational Certificates.
ACCREDITATION DATA
Accredited by Southern Association of Colleges and Schools (SACS):
Elementary/Middle Commission. Accredited with Quality by Georgia
Accrediting Commission (GAC).
1998-99 GEORGIA PUBLIC EDUCATION REPORT CARD Hilsman Middle School - 6295058
Prepared by Georgia Department of Education
Page 4
1998-99 GEORGIA PUBLIC EDUCATION REPORT CARD
CLARKE COUNTY SCHOOLS
Oglethorpe Avenue Elementary School - 6294060
Grade Range PK-5
The Georgia Public Education Report Card is designed to assist systems and schools in educational improvement. This report card contains a variety of data elements. An explanation of the terms is provided as a companion to the report card data. Please refer to the definitions for the most effective use of the reported data.
STUDENT DATA
Total
K-5
402
PK
23
Enrollment, by Race/Ethnicity and Sex
Black
White Hispanic
American Asian Indian
Multiracial
237 59.0%
94 23.4%
47 11.7%
5 1.2%
0 0.0%
19 4.7%
16 69.6%
6 26.1%
0 0.0%
1 4.3%
0 0.0%
0 0.0%
Male Female
213 53.0%
189 47.0%
14 60.9%
9 39.1%
Enrollment in Selected Programs
Program
Program % of Student Enrollment Population
Gifted (Grades K-12)
16
4.0%
Alternative Programs (Grades 6-12)
N/A
N/A
Students Eligible to Receive Free/Reduced Lunches
Number
Percent
School System
298 6,528
70.1% 58.2%
Dropout Rate *
Number
Rate
School System
N/A N/A
N/A N/A
* Dropout rates are not applicable for grades PK-5.
Enrollment in Compensatory Programs
Program
Program % of Student Enrollment Population
Special Education (Grades K-12)
64 15.9%
(PK)
2
N/A
English to Speakers of Other Languages (ESOL) (Grades K-12)
41 10.2%
Remedial Education (Grades 2-5, 9-12)
36 13.3%
Special Instructional Assistance (SIA) (Grades K-3)
100 34.1%
Title I (Grades K-12)
This school has a Targeted Assistance program.
Total 6
Retained Students, by Race/Ethnicity and Sex
Black
White Hispanic
American MultiAsian Indian racial
4 66.7%
1
1
16.7% 16.7%
0 0.0%
0 0.0%
0 0.0%
Male Female
3
3
50.0% 50.0%
Prepared by Georgia Department of Education
Page 1
STATE-REQUIRED TEST DATA
NORM-REFERENCED TESTS Grade 3
Iowa Tests of Basic Skills (ITBS) Each chart reflects data for three years of testing.
Reading Comprehension 50
46 49 54 0
98-99
40 48 53 97-98
50 49 52 96-97
Mathematics
School 50
System
State
0
50 51 61 98-99
42 51 61 97-98
56 55 59 96-97
School System State
Reading Vocabulary 50
42 41 50 0
98-99
36 41 50 97-98
47 47 49 96-97
Language Arts
School 50
System
State
0
52 51 64 98-99
36 45 62 97-98
59 48 59 96-97
School System State
Social Studies 50
38 46 56 0
98-99
45 47 55 97-98
48 50 55 96-97
Science
School 50
System
State
0
47 50 59 98-99
47 52 59 97-98
53 57 58 96-97
School System State
Sources of Information
Composite Score
50
49 52 57 0
98-99
School 50
System
45 47 56 97-98
49 50 55 96-97
State 0
44 48 58 98-99
41 47 57 97-98
1998-99 GEORGIA PUBLIC EDUCATION REPORT CARD Oglethorpe Avenue Elementary School - 6294060
Prepared by Georgia Department of Education
51 51 56 96-97
Scores Reported in Percentiles
School System State
Page 2
STATE-REQUIRED TEST DATA
NORM-REFERENCED TESTS Grade 5
Iowa Tests of Basic Skills (ITBS) Each chart reflects data for three years of testing.
Reading Comprehension
Mathematics
50
55 51 53 0
98-99
43 52 53 97-98
48 51 52 96-97
School 50
System
State
0
53 54 59 98-99
43 55 58 97-98
43 55 57 96-97
School System State
Reading Vocabulary 50
47 41 48 0
98-99
34 42 48 97-98
45 44 46 96-97
Language Arts
School 50
System
State
0
65 57 63 98-99
47 56 61 97-98
55 55 58 96-97
School System State
Social Studies 50
61 55 57 0
98-99
57 57 56 97-98
48 55 55 96-97
Science
School 50
System
State
0
57 54 60 98-99
53 59 59 97-98
56 59 59 96-97
School System State
Sources of Information
Composite Score
50
63 57 58 0
98-99
School 50
System
55 57 58 97-98
55 57 57 96-97
State 0
59 53 57 98-99
47 55 56 97-98
49 54 55 96-97
1998-99 GEORGIA PUBLIC EDUCATION REPORT CARD Oglethorpe Avenue Elementary School - 6294060
Prepared by Georgia Department of Education
Scores Reported in Percentiles
School System State
Page 3
STATE-REQUIRED TEST DATA
PERFORMANCE ASSESSMENTS
Grade 5 Writing Assessment
Percent at Developmental Stages:
1998-99 School System State
1997-98 School System State
1996-97 School System State
Stage Stage Stage Stage Stage Stage
1:The Emerging Writer 2:The Developing Writer 3:The Focusing Writer 4:The Experimenting 5:The Engaging Writer 6:The Extending Writer
0% 0% 13% 50% 17% 20%
0% 1% 11% 44% 27% 16%
0% 1% 16% 41% 29% 12%
0% 9% 29% 36% 11% 16%
1% 2% 20% 37% 24% 15%
0% 3% 19% 41% 27% 10%
0% 3% 23% 46% 18% 10%
0% 3% 19% 36% 25% 15%
0% 3% 21% 37% 26% 12%
AWARDS / RECOGNITION DATA
Schools in Georgia may receive recognition in the following programs: Charter School Pay for Performance Program Georgia School of Excellence National Blue Ribbon School Oglethorpe Avenue Elementary School did not receive recognition in any of these programs during the 1998-99 school year.
1998-99 GEORGIA PUBLIC EDUCATION REPORT CARD Oglethorpe Avenue Elementary School - 6294060
Prepared by Georgia Department of Education
Page 4
CERTIFIED PERSONNEL DATA
Positions Number Average Contract Days
Personnel Sex
Certificate
Years Experience
Full-time Part-time
Male Female
4 Yr Bachelor's 5 Yr Master's 6 Yr Specialist's 7 Yr Doctoral Other*
<1 1-10 11-20 21-30 >30
Average
Administrators
2.00 210.50
2 0
1 1
0 0 0 2 0 0 0 0 2 0 24.50
Support Personnel
3.50 186.57
3 1
0 4
2 1 1 0 0 2 0 2 0 0 6.50
PK-12 Teachers
31.10 190.00
30 3
2 31
18 10
5 0 0 2 7 12 12 0 16.67
*Includes One- and Two-Year Vocational Certificates.
ACCREDITATION DATA
Accredited by Southern Association of Colleges and Schools (SACS):
Elementary/Middle Commission. Accredited with Quality by Georgia
Accrediting Commission (GAC).
1998-99 GEORGIA PUBLIC EDUCATION REPORT CARD Oglethorpe Avenue Elementary School - 6294060
Prepared by Georgia Department of Education
Page 5
1998-99 GEORGIA PUBLIC EDUCATION REPORT CARD
CLARKE COUNTY SCHOOLS
Timothy Elementary School - 6290178
Grade Range PK-5
The Georgia Public Education Report Card is designed to assist systems and schools in educational improvement. This report card contains a variety of data elements. An explanation of the terms is provided as a companion to the report card data. Please refer to the definitions for the most effective use of the reported data.
STUDENT DATA
Total
K-5
416
PK
21
Enrollment, by Race/Ethnicity and Sex
Black
White Hispanic
American Asian Indian
Multiracial
208 50.0%
169 40.6%
4 1.0%
24 5.8%
1 0.2%
10 2.4%
5 23.8%
11 52.4%
1
4
4.8% 19.0%
0 0.0%
0 0.0%
Male Female
200 48.1%
216 51.9%
14 66.7%
7 33.3%
Enrollment in Selected Programs
Program
Program % of Student Enrollment Population
Gifted (Grades K-12)
54
13.0%
Alternative Programs (Grades 6-12)
N/A
N/A
Students Eligible to Receive Free/Reduced Lunches
Number
Percent
School System
177 6,528
40.5% 58.2%
Dropout Rate *
Number
Rate
School System
N/A N/A
N/A N/A
* Dropout rates are not applicable for grades PK-5.
Enrollment in Compensatory Programs
Program
Program % of Student Enrollment Population
Special Education (Grades K-12)
42 10.1%
(PK)
0
N/A
English to Speakers of Other Languages (ESOL) (Grades K-12)
0
0.0%
Remedial Education (Grades 2-5, 9-12)
31 11.4%
Special Instructional Assistance (SIA) (Grades K-3)
78 26.6%
Title I (Grades K-12)
This school has a Targeted Assistance program.
Total 10
Retained Students, by Race/Ethnicity and Sex
Black
White Hispanic
American MultiAsian Indian racial
8 80.0%
2 20.0%
0 0.0%
0 0.0%
0 0.0%
0 0.0%
Male Female
6
4
60.0% 40.0%
Prepared by Georgia Department of Education
Page 1
STATE-REQUIRED TEST DATA
NORM-REFERENCED TESTS Grade 3
Iowa Tests of Basic Skills (ITBS) Each chart reflects data for three years of testing.
Reading Comprehension 50
65 49 54 0
98-99
65 48 53 97-98
51 49 52 96-97
Mathematics
School 50
System
State
0
70 51 61 98-99
66 51 61 97-98
62 55 59 96-97
School System State
Reading Vocabulary 50
58 41 50 0
98-99
54 41 50 97-98
51 47 49 96-97
Language Arts
School 50
System
State
0
72 51 64 98-99
65 45 62 97-98
53 48 59 96-97
School System State
Social Studies 50
63 46 56 0
98-99
63 47 55 97-98
53 50 55 96-97
Science
School 50
System
State
0
67 50 59 98-99
67 52 59 97-98
65 57 58 96-97
School System State
Sources of Information
Composite Score
50
68 52 57 0
98-99
School 50
System
62 47 56 97-98
59 50 55 96-97
State 0
69 48 58 98-99
65 47 57 97-98
1998-99 GEORGIA PUBLIC EDUCATION REPORT CARD Timothy Elementary School - 6290178
Prepared by Georgia Department of Education
57 51 56 96-97
Scores Reported in Percentiles
School System State
Page 2
STATE-REQUIRED TEST DATA
NORM-REFERENCED TESTS Grade 5
Iowa Tests of Basic Skills (ITBS) Each chart reflects data for three years of testing.
Reading Comprehension
Mathematics
50
55 51 53 0
98-99
60 52 53 97-98
69 51 52 96-97
School 50
System
State
0
69 54 59 98-99
72 55 58 97-98
77 55 57 96-97
School System State
Reading Vocabulary 50
55 41 48 0
98-99
57 42 48 97-98
63 44 46 96-97
Language Arts
School 50
System
State
0
62 57 63 98-99
67 56 61 97-98
71 55 58 96-97
School System State
Social Studies 50
72 55 57 0
98-99
68 57 56 97-98
75 55 55 96-97
Science
School 50
System
State
0
67 54 60 98-99
73 59 59 97-98
76 59 59 96-97
School System State
Sources of Information
Composite Score
50
73 57 58 0
98-99
School 50
System
74 57 58 97-98
80 57 57 96-97
State 0
67 53 57 98-99
71 55 56 97-98
76 54 55 96-97
1998-99 GEORGIA PUBLIC EDUCATION REPORT CARD Timothy Elementary School - 6290178
Prepared by Georgia Department of Education
Scores Reported in Percentiles
School System State
Page 3
STATE-REQUIRED TEST DATA
PERFORMANCE ASSESSMENTS
Grade 5 Writing Assessment
Percent at Developmental Stages:
1998-99 School System State
1997-98 School System State
1996-97 School System State
Stage Stage Stage Stage Stage Stage
1:The Emerging Writer 2:The Developing Writer 3:The Focusing Writer 4:The Experimenting 5:The Engaging Writer 6:The Extending Writer
0% 0% 2% 37% 35% 27%
0% 1% 11% 44% 27% 16%
0% 1% 16% 41% 29% 12%
0% 0% 8% 31% 32% 28%
1% 2% 20% 37% 24% 15%
0% 3% 19% 41% 27% 10%
0% 2% 13% 32% 30% 23%
0% 3% 19% 36% 25% 15%
0% 3% 21% 37% 26% 12%
AWARDS / RECOGNITION DATA
Schools in Georgia may receive recognition in the following programs: Charter School Pay for Performance Program Georgia School of Excellence National Blue Ribbon School Timothy Elementary School did not receive recognition in any of these programs during the 1998-99 school year.
1998-99 GEORGIA PUBLIC EDUCATION REPORT CARD Timothy Elementary School - 6290178
Prepared by Georgia Department of Education
Page 4
CERTIFIED PERSONNEL DATA
Positions Number Average Contract Days
Personnel Sex
Certificate
Years Experience
Full-time Part-time
Male Female
4 Yr Bachelor's 5 Yr Master's 6 Yr Specialist's 7 Yr Doctoral Other*
<1 1-10 11-20 21-30 >30
Average
Administrators
2.00 210.50
2 0
0 2
0 1 1 0 0 0 0 1 0 1 25.00
Support Personnel
4.50 186.00
4 1
1 4
3 1 1 0 0 2 1 2 0 0 5.60
PK-12 Teachers
28.00 190.00
26 4
3 27
16 11
3 0 0 2 19 6 2 1 9.03
*Includes One- and Two-Year Vocational Certificates.
ACCREDITATION DATA
Accredited by Southern Association of Colleges and Schools (SACS):
Elementary/Middle Commission. Accredited with Quality by Georgia
Accrediting Commission (GAC).
1998-99 GEORGIA PUBLIC EDUCATION REPORT CARD Timothy Elementary School - 6290178
Prepared by Georgia Department of Education
Page 5
1998-99 GEORGIA PUBLIC EDUCATION REPORT CARD
CLARKE COUNTY SCHOOLS
Whit Davis Road Elementary School - 6290391
Grade Range K-5
The Georgia Public Education Report Card is designed to assist systems and schools in educational improvement. This report card contains a variety of data elements. An explanation of the terms is provided as a companion to the report card data. Please refer to the definitions for the most effective use of the reported data.
STUDENT DATA
Total 591
K-5 Enrollment, by Race/Ethnicity and Sex
Black
White Hispanic
American Multi-
Asian Indian
racial
364 61.6%
200 33.8%
1 0.2%
13 2.2%
0 0.0%
13 2.2%
Male Female
296 50.1%
295 49.9%
Enrollment in Selected Programs
Program
Program % of Student Enrollment Population
Gifted (Grades K-12)
55
9.3%
Alternative Programs (Grades 6-12)
N/A
N/A
Students Eligible to Receive Free/Reduced Lunches
Number
Percent
School System
334 6,528
56.5% 58.2%
Dropout Rate *
Number
Rate
School System
N/A N/A
N/A N/A
* Dropout rates are not applicable for grades PK-5.
Enrollment in Compensatory Programs
Program
Program % of Student Enrollment Population
Special Education (Grades K-12)
84 14.2%
(PK)
0
N/A
English to Speakers of Other Languages (ESOL) (Grades K-12)
0
0.0%
Remedial Education (Grades 2-5, 9-12)
62 15.0%
Special Instructional Assistance (SIA) (Grades K-3)
107 27.0%
Title I (Grades K-12)
This school has a schoolwide program.
Total 7
Retained Students, by Race/Ethnicity and Sex
Black
White Hispanic
American Multi-
Asian Indian
racial
7 100.0%
0 0.0%
0 0.0%
0 0.0%
0 0.0%
0 0.0%
Male Female
3
4
42.9% 57.1%
Prepared by Georgia Department of Education
Page 1
STATE-REQUIRED TEST DATA
NORM-REFERENCED TESTS Grade 3
Iowa Tests of Basic Skills (ITBS) Each chart reflects data for three years of testing.
Reading Comprehension 50
59 49 54 0
98-99
49 48 53 97-98
53 49 52 96-97
Mathematics
School 50
System
State
0
62 51 61 98-99
59 51 61 97-98
56 55 59 96-97
School System State
Reading Vocabulary 50
45 41 50 0
98-99
46 41 50 97-98
52 47 49 96-97
Language Arts
School 50
System
State
0
56 51 64 98-99
47 45 62 97-98
53 48 59 96-97
School System State
Social Studies 50
54 46 56 0
98-99
56 47 55 97-98
54 50 55 96-97
Science
School 50
System
State
0
60 50 59 98-99
58 52 59 97-98
63 57 58 96-97
School System State
Sources of Information
Composite Score
50
58 52 57 0
98-99
School 50
System
50 47 56 97-98
52 50 55 96-97
State 0
58 48 58 98-99
53 47 57 97-98
1998-99 GEORGIA PUBLIC EDUCATION REPORT CARD Whit Davis Road Elementary School - 6290391
Prepared by Georgia Department of Education
56 51 56 96-97
Scores Reported in Percentiles
School System State
Page 2
STATE-REQUIRED TEST DATA
NORM-REFERENCED TESTS Grade 5
Iowa Tests of Basic Skills (ITBS) Each chart reflects data for three years of testing.
Reading Comprehension
Mathematics
50
55 51 53 0
98-99
57 52 53 97-98
56 51 52 96-97
School 50
System
State
0
59 54 59 98-99
63 55 58 97-98
64 55 57 96-97
School System State
Reading Vocabulary 50
44 41 48 0
98-99
48 42 48 97-98
44 44 46 96-97
Language Arts
School 50
System
State
0
64 57 63 98-99
64 56 61 97-98
67 55 58 96-97
School System State
Social Studies 50
57 55 57 0
98-99
63 57 56 97-98
64 55 55 96-97
Science
School 50
System
State
0
58 54 60 98-99
66 59 59 97-98
69 59 59 96-97
School System State
Sources of Information
Composite Score
50
61 57 58 0
98-99
School 50
System
62 57 58 97-98
65 57 57 96-97
State 0
58 53 57 98-99
62 55 56 97-98
65 54 55 96-97
1998-99 GEORGIA PUBLIC EDUCATION REPORT CARD Whit Davis Road Elementary School - 6290391
Prepared by Georgia Department of Education
Scores Reported in Percentiles
School System State
Page 3
STATE-REQUIRED TEST DATA
PERFORMANCE ASSESSMENTS
Grade 5 Writing Assessment
Percent at Developmental Stages:
1998-99 School System State
1997-98 School System State
1996-97 School System State
Stage Stage Stage Stage Stage Stage
1:The Emerging Writer 2:The Developing Writer 3:The Focusing Writer 4:The Experimenting 5:The Engaging Writer 6:The Extending Writer
0% 2% 10% 38% 29% 19%
0% 1% 11% 44% 27% 16%
0% 1% 16% 41% 29% 12%
2% 1% 13% 31% 27% 25%
1% 2% 20% 37% 24% 15%
0% 3% 19% 41% 27% 10%
0% 4% 13% 24% 31% 25%
0% 3% 19% 36% 25% 15%
0% 3% 21% 37% 26% 12%
AWARDS / RECOGNITION DATA
Schools in Georgia may receive recognition in the following programs: Charter School Pay for Performance Program Georgia School of Excellence National Blue Ribbon School Whit Davis Road Elementary School did not receive recognition in any of these programs during the 1998-99 school year.
1998-99 GEORGIA PUBLIC EDUCATION REPORT CARD Whit Davis Road Elementary School - 6290391
Prepared by Georgia Department of Education
Page 4
CERTIFIED PERSONNEL DATA
Positions Number Average Contract Days
Personnel Sex
Certificate
Years Experience
Full-time Part-time
Male Female
4 Yr Bachelor's 5 Yr Master's 6 Yr Specialist's 7 Yr Doctoral Other*
<1 1-10 11-20 21-30 >30
Average
Administrators
2.00 210.50
2 0
0 2
0 0 1 1 0 0 0 0 2 0 23.50
Support Personnel
2.00 190.00
2 0
0 2
0 1 1 0 0 0 1 1 0 0 10.50
PK-12 Teachers
39.20 190.00
39 1
1 39
12 23
5 0 0 2 7 16 13 2 16.75
*Includes One- and Two-Year Vocational Certificates.
ACCREDITATION DATA
Accredited by Southern Association of Colleges and Schools (SACS):
Elementary/Middle Commission. Accredited with Quality by Georgia
Accrediting Commission (GAC).
1998-99 GEORGIA PUBLIC EDUCATION REPORT CARD Whit Davis Road Elementary School - 6290391
Prepared by Georgia Department of Education
Page 5
1998-99 GEORGIA PUBLIC EDUCATION REPORT CARD
CLARKE COUNTY SCHOOLS
Whitehead Road Elementary School - 6291062
Grade Range PK-5
The Georgia Public Education Report Card is designed to assist systems and schools in educational improvement. This report card contains a variety of data elements. An explanation of the terms is provided as a companion to the report card data. Please refer to the definitions for the most effective use of the reported data.
STUDENT DATA
Total
K-5
430
PK
20
Enrollment, by Race/Ethnicity and Sex
Black
White Hispanic
American Asian Indian
Multiracial
237 55.1%
163 37.9%
12 2.8%
10 2.3%
0 0.0%
8 1.9%
13 65.0%
6 30.0%
0 0.0%
1 5.0%
0 0.0%
0 0.0%
Male Female
216 50.2%
214 49.8%
12 60.0%
8 40.0%
Enrollment in Selected Programs
Program
Program % of Student Enrollment Population
Gifted (Grades K-12)
31
7.2%
Alternative Programs (Grades 6-12)
N/A
N/A
Students Eligible to Receive Free/Reduced Lunches
Number
Percent
School System
256 6,528
56.9% 58.2%
Dropout Rate *
Number
Rate
School System
N/A N/A
N/A N/A
* Dropout rates are not applicable for grades PK-5.
Enrollment in Compensatory Programs
Program
Program % of Student Enrollment Population
Special Education (Grades K-12)
49 11.4%
(PK)
2
N/A
English to Speakers of Other Languages (ESOL) (Grades K-12)
0
0.0%
Remedial Education (Grades 2-5, 9-12)
42 14.0%
Special Instructional Assistance (SIA) (Grades K-3)
69 23.3%
Title I (Grades K-12)
This school has a Targeted Assistance program.
Total 3
Retained Students, by Race/Ethnicity and Sex
Black
White Hispanic
American MultiAsian Indian racial
2 66.7%
1 33.3%
0 0.0%
0 0.0%
0 0.0%
0 0.0%
Male Female
1
2
33.3% 66.7%
Prepared by Georgia Department of Education
Page 1
STATE-REQUIRED TEST DATA
NORM-REFERENCED TESTS Grade 3
Iowa Tests of Basic Skills (ITBS) Each chart reflects data for three years of testing.
Reading Comprehension 50
51 49 54 0
98-99
57 48 53 97-98
54 49 52 96-97
Mathematics
School 50
System
State
0
46 51 61 98-99
57 51 61 97-98
52 55 59 96-97
School System State
Reading Vocabulary 50
44 41 50 0
98-99
48 41 50 97-98
53 47 49 96-97
Language Arts
School 50
System
State
0
58 51 64 98-99
57 45 62 97-98
47 48 59 96-97
School System State
Social Studies 50
46 46 56 0
98-99
53 47 55 97-98
58 50 55 96-97
Science
School 50
System
State
0
53 50 59 98-99
54 52 59 97-98
61 57 58 96-97
School System State
Sources of Information
Composite Score
50
58 52 57 0
98-99
School 50
System
56 47 56 97-98
51 50 55 96-97
State 0
48 48 58 98-99
56 47 57 97-98
1998-99 GEORGIA PUBLIC EDUCATION REPORT CARD Whitehead Road Elementary School - 6291062
Prepared by Georgia Department of Education
53 51 56 96-97
Scores Reported in Percentiles
School System State
Page 2
STATE-REQUIRED TEST DATA
NORM-REFERENCED TESTS Grade 5
Iowa Tests of Basic Skills (ITBS) Each chart reflects data for three years of testing.
Reading Comprehension
Mathematics
50
55 51 53 0
98-99
50 52 53 97-98
43 51 52 96-97
School 50
System
State
0
51 54 59 98-99
52 55 58 97-98
43 55 57 96-97
School System State
Reading Vocabulary 50
44 41 48 0
98-99
36 42 48 97-98
33 44 46 96-97
Language Arts
School 50
System
State
0
54 57 63 98-99
50 56 61 97-98
33 55 58 96-97
School System State
Social Studies 50
54 55 57 0
98-99
55 57 56 97-98
52 55 55 96-97
Science
School 50
System
State
0
54 54 60 98-99
55 59 59 97-98
48 59 59 96-97
School System State
Sources of Information
Composite Score
50
53 57 58 0
98-99
School 50
System
54 57 58 97-98
45 57 57 96-97
State 0
51 53 57 98-99
51 55 56 97-98
41 54 55 96-97
1998-99 GEORGIA PUBLIC EDUCATION REPORT CARD Whitehead Road Elementary School - 6291062
Prepared by Georgia Department of Education
Scores Reported in Percentiles
School System State
Page 3
STATE-REQUIRED TEST DATA
PERFORMANCE ASSESSMENTS
Grade 5 Writing Assessment
Percent at Developmental Stages:
1998-99 School System State
1997-98 School System State
1996-97 School System State
Stage Stage Stage Stage Stage Stage
1:The Emerging Writer 2:The Developing Writer 3:The Focusing Writer 4:The Experimenting 5:The Engaging Writer 6:The Extending Writer
0% 0% 13% 48% 24% 14%
0% 1% 11% 44% 27% 16%
0% 1% 16% 41% 29% 12%
0% 2% 25% 47% 19% 7%
1% 2% 20% 37% 24% 15%
0% 3% 19% 41% 27% 10%
2% 3% 19% 50% 16% 9%
0% 3% 19% 36% 25% 15%
0% 3% 21% 37% 26% 12%
AWARDS / RECOGNITION DATA
Schools in Georgia may receive recognition in the following programs: Charter School Pay for Performance Program Georgia School of Excellence National Blue Ribbon School Whitehead Road Elementary School did not receive recognition in any of these programs during the 1998-99 school year.
1998-99 GEORGIA PUBLIC EDUCATION REPORT CARD Whitehead Road Elementary School - 6291062
Prepared by Georgia Department of Education
Page 4
CERTIFIED PERSONNEL DATA
Positions Number Average Contract Days
Personnel Sex
Certificate
Years Experience
Full-time Part-time
Male Female
4 Yr Bachelor's 5 Yr Master's 6 Yr Specialist's 7 Yr Doctoral Other*
<1 1-10 11-20 21-30 >30
Average
Administrators
2.00 210.50
2 0
0 2
0 1 1 0 0 0 0 2 0 0 16.00
Support Personnel
3.00 188.00
3 0
1 2
1 1 1 0 0 1 1 1 0 0 6.33
PK-12 Teachers
32.10 190.00
31 3
3 31
14 16
4 0 0 1 10 10 13 0 15.56
*Includes One- and Two-Year Vocational Certificates.
ACCREDITATION DATA
Accredited by Southern Association of Colleges and Schools (SACS):
Elementary/Middle Commission. Accredited with Quality by Georgia
Accrediting Commission (GAC).
1998-99 GEORGIA PUBLIC EDUCATION REPORT CARD Whitehead Road Elementary School - 6291062
Prepared by Georgia Department of Education
Page 5
1998-99 GEORGIA PUBLIC EDUCATION REPORT CARD
CLARKE COUNTY SCHOOLS
Winterville Elementary School - 6292062
Grade Range PK-5
The Georgia Public Education Report Card is designed to assist systems and schools in educational improvement. This report card contains a variety of data elements. An explanation of the terms is provided as a companion to the report card data. Please refer to the definitions for the most effective use of the reported data.
STUDENT DATA
Total
K-5
456
PK
20
Enrollment, by Race/Ethnicity and Sex
Black
White Hispanic
American Asian Indian
Multiracial
268 58.8%
173 37.9%
6 1.3%
0 0.0%
0 0.0%
9 2.0%
9 45.0%
11 55.0%
0 0.0%
0 0.0%
0 0.0%
0 0.0%
Male Female
219 48.0%
237 52.0%
8 40.0%
12 60.0%
Enrollment in Selected Programs
Program
Program % of Student Enrollment Population
Gifted (Grades K-12)
54
11.8%
Alternative Programs (Grades 6-12)
N/A
N/A
Students Eligible to Receive Free/Reduced Lunches
Number
Percent
School System
296 6,528
62.2% 58.2%
Dropout Rate *
Number
Rate
School System
N/A N/A
N/A N/A
* Dropout rates are not applicable for grades PK-5.
Enrollment in Compensatory Programs
Program
Program % of Student Enrollment Population
Special Education (Grades K-12)
57 12.5%
(PK)
0
N/A
English to Speakers of Other Languages (ESOL) (Grades K-12)
1
< 1%
Remedial Education (Grades 2-5, 9-12)
47 15.0%
Special Instructional Assistance (SIA) (Grades K-3)
115 36.9%
Title I (Grades K-12)
This school has a schoolwide program.
Total 2
Retained Students, by Race/Ethnicity and Sex
Black
White Hispanic
American MultiAsian Indian racial
Male Female
2 100.0%
0 0.0%
0 0.0%
0 0.0%
0 0.0%
0
2
0.0% 100.0%
0 0.0%
Prepared by Georgia Department of Education
Page 1
STATE-REQUIRED TEST DATA
NORM-REFERENCED TESTS Grade 3
Iowa Tests of Basic Skills (ITBS) Each chart reflects data for three years of testing.
Reading Comprehension 50
43 49 54 0
98-99
40 48 53 97-98
44 49 52 96-97
Mathematics
School 50
System
State
0
42 51 61 98-99
42 51 61 97-98
52 55 59 96-97
School System State
Reading Vocabulary 50
36 41 50 0
98-99
36 41 50 97-98
43 47 49 96-97
Language Arts
School 50
System
State
0
42 51 64 98-99
41 45 62 97-98
41 48 59 96-97
School System State
Social Studies 50
42 46 56 0
98-99
39 47 55 97-98
44 50 55 96-97
Science
School 50
System
State
0
42 50 59 98-99
44 52 59 97-98
49 57 58 96-97
School System State
Sources of Information
Composite Score
50
45 52 57 0
98-99
School 50
System
44 47 56 97-98
45 50 55 96-97
State 0
40 48 58 98-99
40 47 57 97-98
1998-99 GEORGIA PUBLIC EDUCATION REPORT CARD Winterville Elementary School - 6292062
Prepared by Georgia Department of Education
45 51 56 96-97
Scores Reported in Percentiles
School System State
Page 2
STATE-REQUIRED TEST DATA
NORM-REFERENCED TESTS Grade 5
Iowa Tests of Basic Skills (ITBS) Each chart reflects data for three years of testing.
Reading Comprehension
Mathematics
50
52 51 53 0
98-99
49 52 53 97-98
56 51 52 96-97
School 50
System
State
0
57 54 59 98-99
45 55 58 97-98
60 55 57 96-97
School System State
Reading Vocabulary 50
39 41 48 0
98-99
34 42 48 97-98
68 44 46 96-97
Language Arts
School 50
System
State
0
63 57 63 98-99
49 56 61 97-98
60 55 58 96-97
School System State
Social Studies 50
58 55 57 0
98-99
49 57 56 97-98
58 55 55 96-97
Science
School 50
System
State
0
55 54 60 98-99
49 59 59 97-98
60 59 59 96-97
School System State
Sources of Information
Composite Score
50
63 57 58 0
98-99
School 50
System
51 57 58 97-98
61 57 57 96-97
State 0
56 53 57 98-99
46 55 56 97-98
59 54 55 96-97
1998-99 GEORGIA PUBLIC EDUCATION REPORT CARD Winterville Elementary School - 6292062
Prepared by Georgia Department of Education
Scores Reported in Percentiles
School System State
Page 3
STATE-REQUIRED TEST DATA
PERFORMANCE ASSESSMENTS
Grade 5 Writing Assessment
Percent at Developmental Stages:
1998-99 School System State
1997-98 School System State
1996-97 School System State
Stage Stage Stage Stage Stage Stage
1:The Emerging Writer 2:The Developing Writer 3:The Focusing Writer 4:The Experimenting 5:The Engaging Writer 6:The Extending Writer
0% 0% 14% 35% 29% 22%
0% 1% 11% 44% 27% 16%
0% 1% 16% 41% 29% 12%
3% 0% 22% 45% 28% 3%
1% 2% 20% 37% 24% 15%
0% 3% 19% 41% 27% 10%
0% 0% 11% 33% 33% 23%
0% 3% 19% 36% 25% 15%
0% 3% 21% 37% 26% 12%
AWARDS / RECOGNITION DATA
Schools in Georgia may receive recognition in the following programs: Charter School Pay for Performance Program Georgia School of Excellence National Blue Ribbon School Winterville Elementary School did not receive recognition in any of these programs during the 1998-99 school year.
1998-99 GEORGIA PUBLIC EDUCATION REPORT CARD Winterville Elementary School - 6292062
Prepared by Georgia Department of Education
Page 4
CERTIFIED PERSONNEL DATA
Positions Number Average Contract Days
Personnel Sex
Certificate
Years Experience
Full-time Part-time
Male Female
4 Yr Bachelor's 5 Yr Master's 6 Yr Specialist's 7 Yr Doctoral Other*
<1 1-10 11-20 21-30 >30
Average
Administrators
2.00 210.50
2 0
1 1
0 1 1 0 0 0 0 0 1 1 27.00
Support Personnel
2.00 187.00
2 0
0 2
1 1 0 0 0 0 1 1 0 0 6.50
PK-12 Teachers
29.00 190.00
28 2
0 30
13 14
2 1 0 1 6 13 9 1 16.50
*Includes One- and Two-Year Vocational Certificates.
ACCREDITATION DATA
Accredited by Southern Association of Colleges and Schools (SACS):
Elementary/Middle Commission. Accredited with Quality by Georgia
Accrediting Commission (GAC).
1998-99 GEORGIA PUBLIC EDUCATION REPORT CARD Winterville Elementary School - 6292062
Prepared by Georgia Department of Education
Page 5
1998-99 GEORGIA PUBLIC EDUCATION REPORT CARD CLAY COUNTY SCHOOLS - 630
The Georgia Public Education Report Card is designed to assist systems and schools in educational improvement. This report card contains a variety of data elements. An explanation of the terms is provided as a companion to the report card data. Please refer to the definitions for the most effective use of the reported data.
Total
K-7
353
PK
37
STUDENT DATA
Enrollment, by Race/Ethnicity and Sex
Black
White Hispanic
American Multi-
Asian Indian
racial
334 94.6%
19 5.4%
0 0.0%
0 0.0%
0 0.0%
0 0.0%
35 94.6%
2 5.4%
0 0.0%
0 0.0%
0 0.0%
0 0.0%
Male
183 51.8%
22 59.5%
Female
170 48.2%
15 40.5%
Enrollment in Selected Programs
Program
Program % of Student Enrollment Population
Gifted (Grades K-12)
0
0.0%
Non-Vocational Labs (Grades 9-12)
N/A
N/A
Vocational Labs (Grades 9-12)
N/A
N/A
Alternative Programs (Grades 6-12)
0
0.0%
Students Eligible to Receive Free/Reduced Lunches
Number
Percent
346
88.7%
Dropout Rate
Number
Percent
6-12 9-12
0 N/A
0.0% N/A
Enrollment in Compensatory Programs
Program
Program % of Student Enrollment Population
Special Education
(Grades K-12)
44
PK
11
English to Speakers of
Other Languages (ESOL)
0
(Grades K-12)
Remedial Education (Grades 2-5, 9-12)
41
Special Instructional
Assistance (SIA)
62
(Grades K-3)
Title I (Grades K-12) Number of schools with: Schoolwide program Targeted Assistance program No Title I program
12.5% N/A
0.0%
23.0%
34.4%
0 1 0
Total 31
Retained Students, by Race/Ethnicity and Sex
Black
White Hispanic
American MultiAsian Indian racial
31 100.0%
0 0.0%
0 0.0%
0 0.0%
0 0.0%
0 0.0%
Male Female
20
11
64.5% 35.5%
Prepared by Georgia Department of Education
Page 1
STATE-REQUIRED TEST DATA
NORM-REFERENCED TESTS
Grade 3 Iowa Tests of Basic Skills (ITBS) Each chart reflects data for three years of testing.
Reading Comprehension
Mathematics
50
55 54 50 53 34 52 0
98-99 97-98 96-97
System State
50
52 61 59 61 46 59 0
98-99 97-98 96-97
System State
Reading Vocabulary
50
63 50 59 50 33 49 0
98-99 97-98 96-97
System State
Social Studies
50
42 56 48 55 38 55 0
98-99 97-98 96-97
System State
Language Arts
50
53 64 53 62 41 59 0
98-99 97-98 96-97
System State
Science
50
45 59 64 59 71 58 0
98-99 97-98 96-97
System State
Sources of Information
Composite Score
50
43 57 0
98-99
System
50
56 56 44 55 97-98 96-97
State
48 58 55 57 0
98-99 97-98
1998-99 GEORGIA PUBLIC EDUCATION REPORT CARD Clay County Schools
Prepared by Georgia Department of Education
System State Scores Reported 45 56 in Percentiles 96-97
Page 2
STATE-REQUIRED TEST DATA
NORM-REFERENCED TESTS
Grade 5 Iowa Tests of Basic Skills (ITBS) Each chart reflects data for three years of testing.
Reading Comprehension
Mathematics
50
36 53 33 53 30 52 0
98-99 97-98 96-97
System State
50
53 59 53 58 40 57 0
98-99 97-98 96-97
System State
Reading Vocabulary
50
45 48 29 48 34 46 0
98-99 97-98 96-97
System State
Social Studies
50
41 57 50 56 42 55 0
98-99 97-98 96-97
System State
Language Arts
50
60 63 53 61 41 58 0
98-99 97-98 96-97
System State
Science
50
64 60 58 59 65 59 0
98-99 97-98 96-97
System State
Sources of Information
Composite Score
50
41 58 0
98-99
System
50
37 58 36 57 97-98 96-97
State
49 57 46 56 0
98-99 97-98
1998-99 GEORGIA PUBLIC EDUCATION REPORT CARD Clay County Schools
Prepared by Georgia Department of Education
System State Scores Reported 41 55 in Percentiles 96-97
Page 3
STATE-REQUIRED TEST DATA
NORM-REFERENCED TESTS
Grade 8 Iowa Tests of Basic Skills (ITBS) Each chart reflects data for three years of testing.
No eighth-grade students are enrolled at Clay County schools.
Reading Comprehension
Mathematics
50
N/A 49 N/A 48 N/A 48 0
98-99 97-98 96-97
System State
50
N/A 56 N/A 55 N/A 54 0
98-99 97-98 96-97
System State
Reading Vocabulary
50
N/A 46 N/A 45 N/A 44 0
98-99 97-98 96-97
System State
Language Arts
50
N/A 60 N/A 58 N/A 56 0
98-99 97-98 96-97
System State
Social Studies
50
N/A 54 N/A 53 N/A 53 0
98-99 97-98 96-97
System State
Science
50
N/A 56 N/A 55 N/A 53 0
98-99 97-98 96-97
System State
Sources of Information
Composite Score
50
System
50
System
N/A 57 N/A 56 N/A 55 0
98-99 97-98 96-97
State
State
N/A 56 0
N/A 54
Scores Reported N/A 54 in Percentiles
98-99 97-98 96-97
1998-99 GEORGIA PUBLIC EDUCATION REPORT CARD Clay County Schools
Prepared by Georgia Department of Education
Page 4
STATE-REQUIRED TEST DATA
PERFORMANCE ASSESSMENTS
Grade 5 Writing Assessment
1998-99
1997-98
1996-97
Percent at Developmental Stages:
Comparison
Comparison
Comparison
System Group State System Group State System Group State
Stage Stage Stage Stage Stage Stage
1: The Emerging Writer 2: The Developing Writer 3: The Focusing Writer 4: The Experimenting Writer 5: The Engaging Writer 6: The Extending Writer
0% 3% 24% 38% 32% 3%
0% 3% 38% 40% 16% 3%
0% 1% 16% 41% 29% 12%
0% 11% 18% 50% 21%
0%
1% 15% 38% 35% 10%
2%
0% 3% 19% 41% 27% 10%
0% 9% 6% 59% 25% 0%
2% 11% 36% 36% 14%
2%
0% 3% 21% 37% 26% 12%
Grade 8 Writing Assessment
1998-99 Percent Scoring 1997-98 Percent Scoring 1996-97 Percent Scoring
Categories of Scaled Scores
Comparison
Comparison
Comparison
System Group State System Group State System Group State
Inadequate (less than 162)
Minimal (162-209)
Good
(210-247)
Very Good (greater than 247)
N/A N/A N/A N/A
N/A N/A N/A N/A
8% 40% 41% 11%
N/A N/A N/A N/A
36% 52% 11%
1%
11% 46% 34%
8%
N/A N/A N/A N/A
40% 45% 13%
2%
15% 46% 30%
8%
Average Scaled Score: (Range 100-300)
N/A
N/A
208 N/A
172 202 N/A
173 198
No eighth-grade students are enrolled at Clay County schools.
GEORGIA HIGH SCHOOL GRADUATION TESTS (GHSGT)
Percent of Regular Program 11th Graders Passing the Georgia High School Graduation Tests on First Administration
1998-99
1997-98
1996-97
Comparison
Comparison
Comparison
System Group State System Group State System Group State
English Language Arts Mathematics Social Studies Science
All Components listed above Writing
N/A N/A N/A N/A N/A N/A
N/A N/A N/A N/A N/A N/A
96% 88% 80% 72% 68% 93%
N/A N/A N/A N/A N/A N/A
N/A N/A N/A N/A N/A N/A
94% 88% 78% 74% 68% 92%
N/A N/A N/A N/A N/A N/A
82% 64% 40% 37% 26% 84%
94% 87% 78% 74% 67% 93%
No eleventh-grade students are enrolled at Clay County schools.
1998-99 GEORGIA PUBLIC EDUCATION REPORT CARD
Clay County Schools
Prepared by Georgia Department of Education
Page 5
GRADUATE DATA
1999 Graduates by Credentials, Race/Ethnicity and Sex
Diplomas with Both College Prep. & Voc. Endorsements
Diplomas with College Prep. Endorsements
Diplomas with Vocational Endorsements
General High School Diplomas
Special Education Diplomas
Total All Diplomas
Total N/A
Black N/A
American MultiWhite Hispanic Asian Indian racial
N/A N/A N/A N/A N/A
Male Female N/A N/A
N/A
N/A
N/A N/A N/A N/A N/A
N/A N/A
N/A
N/A
N/A N/A N/A N/A N/A
N/A N/A
N/A
N/A
N/A N/A N/A N/A N/A
N/A N/A
N/A
N/A
N/A N/A N/A N/A N/A
N/A N/A
N/A
Certificates of Performance
Total Graduates
N/A N/A
N/A
N/A N/A N/A N/A N/A
N/A N/A
HOPE Scholarships
System State
Number of 1999 Graduates Number Eligible Percent Eligible
N/A N/A N/A
65,548 40,292 61.5%
High School Completion Rate Percent of 1995Grade 9 Enrollment
in Graduating Class of1999
System
State
Completion Rate '95-'99 N / A
68.9%
COLLEGE ADMISSIONS / CREDIT TEST DATA
Scholastic Assessment Test (SAT)
No. Taking
Average Score
Tests
Verbal Math Total
Based on students' highest verbal and highest math scores
System College Prep. Endorsement Other Diplomas
N/A N/A N/A
N/A N/A N/A
N/A N/A N/A
Georgia
492 488 980
Based on students' last test administration
System Georgia
N/A 41,958
N/A N/A 483 479
N/A 962
Nation
952,913 502 508 1010
American College Testing (ACT)
System State Nation
English Mathematics Reading Science Reasoning
N/A N/A N/A N/A
19.1 19.9 20.2 19.9
20.4 20.7 21.3 21.0
CompositeScore N/A * 19.9 21.9
* Scores not reported when fewer than 5 tests taken.
Advanced Placement Exams (AP)
No. of Students Taking Tests
No. of Tests Taken No. of Test Scores
3 or Higher Percent of Test
Scores 3 or Higher
System State N/A 15,225 N/A 23,969 N/A 13,024
N/A 54.3%
1998-99 GEORGIA PUBLIC EDUCATION REPORT CARD Clay County Schools
Prepared by Georgia Department of Education
Page 6
POSTSECONDARY DATA
Graduates Entering Georgia Public Colleges and Universities
Graduates Entering Georgia Public Colleges and Universities and
Requiring Learning Support (LS)
1998 Graduates Entering 1998-99
1997 Graduates Entering 1997-98
Percent of Graduating Number Class
N/A
N/A
N/A
N/A
Number Requiring
LS
N/A
N/A
Percent of those attending Georgia
Public Colleges
N/A
N/A
In previous years, the Report Card presented College Prep Curriculum information provided by the Board of Regents on students requiring Learning Support. Due to inconsistencies in the data provided by the Board of Regents in defining College Prep Completers versus Local Board of Education data defining College Prep Endorsements, the Department of Education Report Card will not provide this information until discrepancies can be reconciled.
Graduates Entering Georgia Public Technical and Adult Schools
Entering 1998-99 Entering 1997-98
Number Percent
Number Percent
1998 Graduates 1997 Graduates
N/A N/A
N/A N/A
N/A N/A
N/A N/A
ACCREDITATION / RECOGNITION DATA
Southern Association of Colleges and Schools (SACS) Accrediting Commission
Secondary/Middle Commission Elementary/Middle Commission Both Elementary/Secondary Commissions Joint Commission Candidate for Accreditation
Accreditation by Georgia Accrediting Commission (GAC)
Accredited by GAC Accredited with Quality by GAC
Number of Schools
0 0 0 0 0
Number of Schools
0 1
Awards / Recognition
State Recognized Program
Number of Schools
Charter School
0
Pay for Performance Recipient
0
Georgia School of Excellence
0
National Blue Ribbon School
0
COMMUNITY DATA
Number of Children Eligible for Migrant Education Number of Families-At-Risk * Number of Food Stamp Participants * Number of Families Receiving TANF * ** Per Capita Income * Unemployment Rate * 1990 Population * Projected 2000 Population * Projected 2010 Population *
* Data Available at County Level Only ** Known as AFDC before January 1997
0 11 976 108 $14,148 7.1% 3,364 3,344 3,373
1998-99 GEORGIA PUBLIC EDUCATION REPORT CARD Clay County Schools
Prepared by Georgia Department of Education
Page 7
FISCAL DATA
Millage Rate
9.35
* Fall 1998 Property Tax Digest is used to calculate the 98-99 Value of One Mill
FTE Count
FTE Count used for Allotment Calculation 349.0 Fall '98 FTE Count 353
Value of One Mill
$64,103 $183.67 per Allotment FTE
Sources: Local State-QBE State-
Lottery State-
Other Federal Other
Total
PerGeneral Fund cent Per FTE
$605,809 25.4% $1,736 $1,632,647 68.4% $4,678
K-12 Revenues
Lottery K-12
and
Title
All Other
Programs
K-12
$253
$0
Bonded Debt $47,787
$0
$0
$0
$0 0.0%
$0
$0
$9,918
$0
$35,387 1.5% $101 $106,536 4.5% $305
$5,888 0.2% $17 $2,386,268 100% $6,837
$0 $480,632
$0 $480,885
$0 $2,000
$0 $11,918
$0 $0 $0 $47,787
Capital Projects
$468,099 $0
$0
$158,241 $0 $0
$626,340
School Nutrition
$8,659 $0
$0
$12,290 $187,805
$0 $208,755
Grand Total
Total
Per-
Amount cent
$1,130,608 30.1%
$1,632,647 43.4%
$9,918 0.3%
$205,918 5.5% $776,974 20.7%
$5,888 0.2% $3,761,955 100%
Instruction
Media
Instruction Support
Pupil Services General Admin. School Admin. Trans-
portation Maint. & Ops. Capital Projects School Food Debt Service
$1,420,479 62.3% $4,070 $61,823 2.7% $177
$58,818 2.6% $169
$37,640 1.7% $108
$169,181 7.4% $485
$130,863 5.7% $375
$204,869 9.0% $587
$195,082 8.6% $559
$0 0.0%
$0
$0 0.0%
$0
$0 0.0%
$0
K-12 Expenditures
$243,323
$11,917
$0
$0
$0
$0
$192,751
$0
$0
$0
$0
$0
$5,121
$0
$0
$0
$0
$0
$205
$0
$0
$234
$0
$0
$0
$0
$0
$0
$0
$0
$0
$0
$75,280
$0 $0 $0 $0 $0 $0 $0 $0 $923,724 $0 $0
$0 $0 $0 $0 $0 $0 $0 $0 $0 $236,260 $0
$1,675,720 42.2% $61,823 1.6%
$251,570 6.3% $37,640 0.9%
$174,303 4.4% $130,863 3.3% $205,075 5.2% $195,317 4.9% $923,724 23.3% $236,260 6.0%
$75,280 1.9%
Total
$2,278,760 100% $6,530 $441,637
$11,917
$75,280
* This system received funds that followed students to other systems.
$923,724
$236,260
$3,967,580 100%
Salaries and Benefits as Percentages of Revenues and of Expenditures
Teachers and Paraprofessionals
Salaries $1,089,152
Benefits $248,469
Percentage of Revenues Percentage of Expenditures
Total of
Total of
General Fund
General Fund
Title Programs
Title Programs
Lottery K-12
Lottery K-12
Total Salaries
and
Total
and
Total
and Benefits All Other K-12 K - 12 All Other K-12 K - 12
$1,337,621
46.5%
35.6%
49.0%
33.7%
School Administration
$52,140
$13,365
$65,505
2.3%
1.7%
2.4%
1.7%
General Administration
$88,601
$21,699
$110,300
3.8%
2.9%
4.0%
2.8%
1998-99 GEORGIA PUBLIC EDUCATION REPORT CARD
Clay County Schools - 630
Prepared by Georgia Department of Education
Page 8
CERTIFIED PERSONNEL DATA
Number
Average Annual Salary Positions Average Contract Days
Average Daily Salary
Full-time Personnel Part-time
Sex Male Female
4 Yr Bachelor's Certificate 5 Yr Master's
Level 6 Yr Specialist's 7 Yr Doctoral Other*
Black
White Race/ Hispanic Ethnicity Asian
American Indian
Multiracial
Years Experience
<1 1-10 11-20 21-30 >30
Average
Administrators
2.00
$58,833.90 220.00
$267.43
2 0
1 1
0 1 1 0 0
1 1 0 0 0 0
0 0 0 2 0
25.00
Support Personnel PK-12 Teachers
4.00
24.00
$39,897.75 185.75
$214.79
$38,825.71 190.00
$204.35
4
24
0
0
0
3
4
21
0
9
4
14
0
1
0
0
0
0
1
14
3
10
0
0
0
0
0
0
0
0
0
0
1
4
2
9
0
8
1
3
18.75
19.08
*Includes One- and Two-Year Vocational Certificates.
Certified Staff Position Ratios
Teacher/Administrator Ratio 12:1
Teacher/Support Person Ratio 6:1
Teacher/Staff Ratio 4:1
Student Enrollment/All Teachers 15:1
Certified Personnel by Category
80.0% 100%
6.7% 13.3%
80% 60%
40%
20%
0%
Teachers
Administrators
Support Personnel
1998-99 GEORGIA PUBLIC EDUCATION REPORT CARD
Clay County Schools - 630
Prepared by Georgia Department of Education
Page 9
1998-99 GEORGIA PUBLIC EDUCATION REPORT CARD
CLAY COUNTY SCHOOLS
Clay County Elementary School - 6301050
Grade Range PK-7
The Georgia Public Education Report Card is designed to assist systems and schools in educational improvement. This report card contains a variety of data elements. An explanation of the terms is provided as a companion to the report card data. Please refer to the definitions for the most effective use of the reported data.
STUDENT DATA
Total
K-7
353
PK
37
Enrollment, by Race/Ethnicity and Sex
Black
White Hispanic
American Asian Indian
Multiracial
334 94.6%
19 5.4%
0 0.0%
0 0.0%
0 0.0%
0 0.0%
35 94.6%
2 5.4%
0 0.0%
0 0.0%
0 0.0%
0 0.0%
Male Female
183 51.8%
170 48.2%
22 59.5%
15 40.5%
Enrollment in Selected Programs
Program
Program % of Student Enrollment Population
Gifted (Grades K-12)
0
0.0%
Alternative Programs (Grades 6-12)
0
0.0%
Students Eligible to Receive Free/Reduced Lunches
Number
Percent
School System
346
88.7%
346
88.7%
Dropout Rate for Grades 6-7
Number
Rate
School System
0
0.0%
0
0.0%
Enrollment in Compensatory Programs
Program
Program % of Student Enrollment Population
Special Education (Grades K-12)
44 12.5%
(PK)
11
N/A
English to Speakers of Other Languages (ESOL) (Grades K-12)
0
0.0%
Remedial Education (Grades 2-5, 9-12)
41 23.0%
Special Instructional Assistance (SIA) (Grades K-3)
62 34.4%
Title I (Grades K-12)
This school has a Targeted Assistance program.
Total 31
Retained Students, by Race/Ethnicity and Sex
Black
White Hispanic
American MultiAsian Indian racial
31 100.0%
0 0.0%
0 0.0%
0 0.0%
0 0.0%
0 0.0%
Male Female
20
11
64.5% 35.5%
Prepared by Georgia Department of Education
Page 1
STATE-REQUIRED TEST DATA
NORM-REFERENCED TESTS Grade 3
Iowa Tests of Basic Skills (ITBS) Each chart reflects data for three years of testing.
Reading Comprehension 50
55 55 54 0
98-99
50 50 53 97-98
34 34 52 96-97
Mathematics
School 50
System
State
0
52 52 61 98-99
59 59 61 97-98
46 46 59 96-97
School System State
Reading Vocabulary 50
63 63 50 0
98-99
59 59 50 97-98
33 33 49 96-97
Language Arts
School 50
System
State
0
53 53 64 98-99
53 53 62 97-98
41 41 59 96-97
School System State
Social Studies 50
42 42 56 0
98-99
48 48 55 97-98
38 38 55 96-97
Science
School 50
System
State
0
45 45 59 98-99
64 64 59 97-98
71 71 58 96-97
School System State
Sources of Information
Composite Score
50
43 43 57 0
98-99
School 50
System
56 56 56 97-98
44 44 55 96-97
State 0
48 48 58 98-99
55 55 57 97-98
1998-99 GEORGIA PUBLIC EDUCATION REPORT CARD Clay County Elementary School - 6301050
Prepared by Georgia Department of Education
45 45 56 96-97
Scores Reported in Percentiles
School System State
Page 2
STATE-REQUIRED TEST DATA
NORM-REFERENCED TESTS Grade 5
Iowa Tests of Basic Skills (ITBS) Each chart reflects data for three years of testing.
Reading Comprehension
Mathematics
50
36 36 53 0
98-99
33 33 53 97-98
30 30 52 96-97
School 50
System
State
0
53 53 59 98-99
53 53 58 97-98
40 40 57 96-97
School System State
Reading Vocabulary 50
45 45 48 0
98-99
29 29 48 97-98
34 34 46 96-97
Language Arts
School 50
System
State
0
60 60 63 98-99
53 53 61 97-98
41 41 58 96-97
School System State
Social Studies 50
41 41 57 0
98-99
50 50 56 97-98
42 42 55 96-97
Science
School 50
System
State
0
64 64 60 98-99
58 58 59 97-98
65 65 59 96-97
School System State
Sources of Information
Composite Score
50
41 41 58 0
98-99
School 50
System
37 37 58 97-98
36 36 57 96-97
State 0
49 49 57 98-99
46 46 56 97-98
41 41 55 96-97
1998-99 GEORGIA PUBLIC EDUCATION REPORT CARD Clay County Elementary School - 6301050
Prepared by Georgia Department of Education
Scores Reported in Percentiles
School System State
Page 3
STATE-REQUIRED TEST DATA
PERFORMANCE ASSESSMENTS
Grade 5 Writing Assessment
Percent at Developmental Stages:
1998-99 School System State
1997-98 School System State
1996-97 School System State
Stage Stage Stage Stage Stage Stage
1:The Emerging Writer 2:The Developing Writer 3:The Focusing Writer 4:The Experimenting 5:The Engaging Writer 6:The Extending Writer
0% 3% 24% 38% 32% 3%
0% 3% 24% 38% 32% 3%
0% 1% 16% 41% 29% 12%
0% 11% 18% 50% 21%
0%
0% 11% 18% 50% 21%
0%
0% 3% 19% 41% 27% 10%
0% 9% 6% 59% 25% 0%
0% 9% 6% 59% 25% 0%
0% 3% 21% 37% 26% 12%
AWARDS / RECOGNITION DATA
Schools in Georgia may receive recognition in the following programs: Charter School Pay for Performance Program Georgia School of Excellence National Blue Ribbon School Clay County Elementary School did not receive recognition in any of these programs during the 1998-99 school year.
1998-99 GEORGIA PUBLIC EDUCATION REPORT CARD Clay County Elementary School - 6301050
Prepared by Georgia Department of Education
Page 4
CERTIFIED PERSONNEL DATA
Positions Number Average Contract Days
Personnel Sex
Certificate
Years Experience
Full-time Part-time
Male Female
4 Yr Bachelor's 5 Yr Master's 6 Yr Specialist's 7 Yr Doctoral Other*
<1 1-10 11-20 21-30 >30
Average
Administrators
1.00 210.00
1 0
0 1
0 1 0 0 0 0 0 0 1 0 23.00
Support Personnel
4.00 185.75
4 0
0 4
0 4 0 0 0 0 1 2 0 1 18.75
PK-12 Teachers
24.00 190.00
24 0
3 21
9 14
1 0 0 0 4 9 8 3 19.08
*Includes One- and Two-Year Vocational Certificates.
ACCREDITATION DATA
Accredited with Quality by Georgia Accrediting Commission (GAC).
1998-99 GEORGIA PUBLIC EDUCATION REPORT CARD Clay County Elementary School - 6301050
Prepared by Georgia Department of Education
Page 5
1998-99 GEORGIA PUBLIC EDUCATION REPORT CARD CLAYTON COUNTY SCHOOLS - 631
The Georgia Public Education Report Card is designed to assist systems and schools in educational improvement. This report card contains a variety of data elements. An explanation of the terms is provided as a companion to the report card data. Please refer to the definitions for the most effective use of the reported data.
Total
K-12
43,447
PK
621
STUDENT DATA
Enrollment, by Race/Ethnicity and Sex
Black
White Hispanic
American Multi-
Asian Indian
racial
25,238 58.1%
13,216 30.4%
1,819 4.2%
2,036 4.7%
58 0.1%
1,080 2.5%
370 59.6%
142 22.9%
57 9.2%
30 4.8%
0 0.0%
22 3.5%
Male
22,233 51.2%
339 54.6%
Female
21,214 48.8%
282 45.4%
Enrollment in Selected Programs
Program
Program % of Student Enrollment Population
Gifted (Grades K-12)
2,281
5.3%
Non-Vocational Labs (Grades 9-12)
9,944
88.7%
Vocational Labs (Grades 9-12)
6,695
59.7%
Alternative Programs (Grades 6-12)
96
< 1%
Students Eligible to Receive Free/Reduced Lunches
Number
Percent
23,194
52.6%
Dropout Rate
Number
Percent
6-12 9-12
1,237 1,191
4.8% 9.1%
Enrollment in Compensatory Programs
Program
Program % of Student Enrollment Population
Special Education (Grades K-12)
PK
4,383 170
English to Speakers of Other Languages (ESOL) (Grades K-12)
1,352
Remedial Education (Grades 2-5, 9-12)
5,913
Special Instructional Assistance (SIA) (Grades K-3)
1,239
Title I (Grades K-12) Number of schools with: Schoolwide program Targeted Assistance program No Title I program
10.1% N/A
3.1%
23.0%
8.5%
21 0
25
Total 2,258
Retained Students, by Race/Ethnicity and Sex
Black
White Hispanic
American MultiAsian Indian racial
1,378 61.0%
649 28.7%
111 4.9%
84 3.7%
3 0.1%
33 1.5%
Male Female 1,438 820 63.7% 36.3%
Prepared by Georgia Department of Education
Page 1
STATE-REQUIRED TEST DATA
NORM-REFERENCED TESTS
Grade 3 Iowa Tests of Basic Skills (ITBS) Each chart reflects data for three years of testing.
Reading Comprehension
Mathematics
50
42 54 43 53 41 52 0
98-99 97-98 96-97
System State
50
46 61 48 61 51 59 0
98-99 97-98 96-97
System State
Reading Vocabulary
50
35 50 37 50 39 49 0
98-99 97-98 96-97
System State
Social Studies
50
44 56 45 55 48 55 0
98-99 97-98 96-97
System State
Language Arts
50
55 64 56 62 56 59 0
98-99 97-98 96-97
System State
Science
50
44 59 45 59 48 58 0
98-99 97-98 96-97
System State
Sources of Information
Composite Score
50
46 57 0
98-99
System
50
46 56 48 55 97-98 96-97
State
44 58 46 57 0
98-99 97-98
1998-99 GEORGIA PUBLIC EDUCATION REPORT CARD Clayton County Schools
Prepared by Georgia Department of Education
System State Scores Reported 47 56 in Percentiles 96-97
Page 2
STATE-REQUIRED TEST DATA
NORM-REFERENCED TESTS
Grade 5 Iowa Tests of Basic Skills (ITBS) Each chart reflects data for three years of testing.
Reading Comprehension
Mathematics
50
44 53 43 53 45 52 0
98-99 97-98 96-97
System State
50
47 59 49 58 50 57 0
98-99 97-98 96-97
System State
Reading Vocabulary
50
36 48 34 48 37 46 0
98-99 97-98 96-97
System State
Social Studies
50
45 57 46 56 48 55 0
98-99 97-98 96-97
System State
Language Arts
50
57 63 56 61 57 58 0
98-99 97-98 96-97
System State
Science
50
47 60 49 59 50 59 0
98-99 97-98 96-97
System State
Sources of Information
Composite Score
50
50 58 0
98-99
System
50
51 58 52 57 97-98 96-97
State
46 57 47 56 0
98-99 97-98
1998-99 GEORGIA PUBLIC EDUCATION REPORT CARD Clayton County Schools
Prepared by Georgia Department of Education
System State Scores Reported 48 55 in Percentiles 96-97
Page 3
STATE-REQUIRED TEST DATA
NORM-REFERENCED TESTS Grade 8
Iowa Tests of Basic Skills (ITBS) Each chart reflects data for three years of testing.
Reading Comprehension
Mathematics
50
42 49 43 48 44 48 0
98-99 97-98 96-97
System State
50
47 56 48 55 49 54 0
98-99 97-98 96-97
System State
Reading Vocabulary
50
36 46 38 45 40 44 0
98-99 97-98 96-97
System State
Language Arts
50
55 60 55 58 53 56 0
98-99 97-98 96-97
System State
Social Studies
50
47 54 48 53 51 53 0
98-99 97-98 96-97
System State
Science
50
46 56 48 55 48 53 0
98-99 97-98 96-97
System State
Sources of Information
Composite Score
50
52 57 0
98-99
System
50
53 56 53 55 97-98 96-97
State
48 56 49 54 0
98-99 97-98
1998-99 GEORGIA PUBLIC EDUCATION REPORT CARD Clayton County Schools
Prepared by Georgia Department of Education
System State Scores Reported 50 54 in Percentiles 96-97
Page 4
STATE-REQUIRED TEST DATA
PERFORMANCE ASSESSMENTS
Grade 5 Writing Assessment
1998-99
1997-98
1996-97
Percent at Developmental Stages:
Comparison
Comparison
Comparison
System Group State System Group State System Group State
Stage Stage Stage Stage Stage Stage
1: The Emerging Writer 2: The Developing Writer 3: The Focusing Writer 4: The Experimenting Writer 5: The Engaging Writer 6: The Extending Writer
0% 1% 17% 41% 28% 12%
0% 1% 19% 44% 25% 9%
0% 1% 16% 41% 29% 12%
1% 3% 21% 42% 25% 8%
1% 3% 22% 43% 23% 8%
0% 3% 19% 41% 27% 10%
0% 3% 21% 40% 26% 8%
0% 3% 20% 38% 27% 11%
0% 3% 21% 37% 26% 12%
Grade 8 Writing Assessment
1998-99 Percent Scoring 1997-98 Percent Scoring 1996-97 Percent Scoring
Categories of Scaled Scores
Comparison
Comparison
Comparison
System Group State System Group State System Group State
Inadequate (less than 162)
Minimal (162-209)
Good
(210-247)
Very Good (greater than 247)
10% 45% 38%
7%
12% 48% 34%
7%
8% 40% 41% 11%
10% 52% 33%
4%
16% 53% 27%
4%
11% 46% 34%
8%
13% 51% 30%
6%
16% 49% 28%
7%
15% 46% 30%
8%
Average Scaled Score: (Range 100-300)
203
200 208
199
194 202
198
196 198
GEORGIA HIGH SCHOOL GRADUATION TESTS (GHSGT)
Percent of Regular Program 11th Graders Passing the Georgia High School Graduation Tests on First Administration
1998-99
1997-98
1996-97
Comparison
Comparison
Comparison
System Group State System Group State System Group State
English Language Arts Mathematics Social Studies Science
96% 88% 82% 70%
94% 83% 76% 63%
96% 88% 80% 72%
97% 91% 78% 75%
93% 84% 72% 66%
94% 88% 78% 74%
96% 91% 80% 76%
94% 86% 77% 72%
94% 87% 78% 74%
All Components listed above 6 7 %
59% 68% 70%
60% 68% 71%
66% 67%
Writing
92%
90% 93% 94%
89% 92% 95%
93% 93%
1998-99 GEORGIA PUBLIC EDUCATION REPORT CARD
Clayton County Schools
Prepared by Georgia Department of Education
Page 5
GRADUATE DATA
1999 Graduates by Credentials, Race/Ethnicity and Sex
Diplomas with Both College Prep. & Voc. Endorsements
Diplomas with College Prep. Endorsements Diplomas with Vocational Endorsements General High School Diplomas Special Education Diplomas
Total All Diplomas
Certificates of Performance
Total Graduates
Total 348 964 340 30 59
1,741 9
1,750
Black
169 48.6%
447 46.4%
178 52.4%
20 66.7%
29 49.2%
843 48.4%
4 44.4%
847 48.4%
American MultiWhite Hispanic Asian Indian racial
129 37.1%
416 43.2%
136 40.0%
9 30.0%
27 45.8%
717 41.2%
4 1.1%
26 2.7%
9 2.6%
0 0.0%
2 3.4%
41 2.4%
42 12.1%
65 6.7%
13 3.8%
1 3.3%
1 1.7%
122 7.0%
1 0.3%
0 0.0%
2 0.6%
0 0.0%
0 0.0%
3 0.2%
3 0.9%
10 1.0%
2 0.6%
0 0.0%
0 0.0%
15 0.9%
2
1
2
0
0
22.2% 11.1% 22.2% 0.0% 0.0%
719
42 124
3
15
41.1% 2.4% 7.1% 0.2% 0.9%
Male Female
130 37.4%
413 42.8%
180 52.9%
18 60.0%
35 59.3%
776 44.6%
218 62.6%
551 57.2%
160 47.1%
12 40.0%
24 40.7%
965 55.4%
3
6
33.3% 66.7%
779 971 44.5% 55.5%
HOPE Scholarships
System State
Number of 1999 Graduates 1 , 7 5 0
Number Eligible
1017
Percent Eligible
58.1%
65,548 40,292 61.5%
High School Completion Rate Percent of 1995Grade 9 Enrollment
in Graduating Class of1999
System
State
Completion Rate '95-'99 59.9% 68.9%
COLLEGE ADMISSIONS / CREDIT TEST DATA
Scholastic Assessment Test (SAT)
No. Taking
Average Score
Tests
Verbal Math Total
Based on students' highest verbal and highest math scores
System College Prep. Endorsement Other Diplomas
478 474 952 480 478 958 377 378 755
Georgia
492 488 980
Based on students' last test administration
System Georgia
1,093
470 468
938
41,958 483 479 962
Nation
952,913 502 508 1010
American College Testing (ACT)
System State Nation
English
17.9
19.1 20.4
Mathematics
18.6
19.9 20.7
Reading
18.9
20.2 21.3
Science Reasoning 19.0
19.9 21.0
CompositeScore 18.7
19.9 21.9
Advanced Placement Exams (AP)
No. of Students Taking Tests
No. of Tests Taken No. of Test Scores
3 or Higher Percent of Test
Scores 3 or Higher
System State 456 15,225 621 23,969 221 13,024
35.6% 54.3%
1998-99 GEORGIA PUBLIC EDUCATION REPORT CARD Clayton County Schools
Prepared by Georgia Department of Education
Page 6
POSTSECONDARY DATA
Graduates Entering Georgia Public Colleges and Universities
Graduates Entering Georgia Public Colleges and Universities and
Requiring Learning Support (LS)
1998 Graduates Entering 1998-99
1997 Graduates Entering 1997-98
Percent of Graduating Number Class
702
41.2%
664
40.7%
Number Requiring
LS
149
156
Percent of those attending Georgia
Public Colleges
21.2%
23.5%
In previous years, the Report Card presented College Prep Curriculum information provided by the Board of Regents on students requiring Learning Support. Due to inconsistencies in the data provided by the Board of Regents in defining College Prep Completers versus Local Board of Education data defining College Prep Endorsements, the Department of Education Report Card will not provide this information until discrepancies can be reconciled.
Graduates Entering Georgia Public Technical and Adult Schools
Entering 1998-99 Entering 1997-98
Number Percent
Number Percent
1998 Graduates 1997 Graduates
42
2.5%
4
0.2%
N/A 19
N/A 1.2%
ACCREDITATION / RECOGNITION DATA
Southern Association of Colleges and Schools (SACS) Accrediting Commission
Secondary/Middle Commission Elementary/Middle Commission Both Elementary/Secondary Commissions Joint Commission Candidate for Accreditation
Accreditation by Georgia Accrediting Commission (GAC)
Accredited by GAC Accredited with Quality by GAC
Number of Schools
7 39
0 0 0
Number of Schools
0 0
Awards / Recognition
State Recognized Program
Number of Schools
Charter School
0
Pay for Performance Recipient
0
Georgia School of Excellence
0
National Blue Ribbon School
0
COMMUNITY DATA
Number of Children Eligible for Migrant Education Number of Families-At-Risk * Number of Food Stamp Participants * Number of Families Receiving TANF * ** Per Capita Income * Unemployment Rate * 1990 Population * Projected 2000 Population * Projected 2010 Population *
* Data Available at County Level Only ** Known as AFDC before January 1997
0 1,207 16,362 1,678 $20,236
3.8% 182,052 224,314 265,253
1998-99 GEORGIA PUBLIC EDUCATION REPORT CARD Clayton County Schools
Prepared by Georgia Department of Education
Page 7
FISCAL DATA
Millage Rate
18.34
* Fall 1998 Property Tax Digest is used to calculate the 98-99 Value of One Mill
FTE Count
FTE Count used for Allotment Calculation 43,111.0 Fall '98 FTE Count 43,447
Value of One Mill
$4,613,676 $107.01 per Allotment FTE
Sources: Local State-QBE State-
Lottery State-
Other Federal Other
Total
PerGeneral Fund cent Per FTE
$89,997,800 39.5% $2,088 $135,228,953 59.4% $3,137
K-12 Revenues
Lottery K-12
and
Title
All Other
Programs
K-12
$55,048 $2,690,981
Bonded Debt $140,471
$0
$0
$0
Capital Projects $47,210,037
$0
School Nutrition $5,530,853
$0
$0 0.0%
$0
$0 $887,424
$0 $5,062,085
$0
$2,101,430 0.9% $49
$345,267 0.2%
$8
$8,306 0.0%
$0
$227,681,757 100% $5,282
$0 $8,386,933
$0 $8,441,981
$3,300,083 $1,358,359
$0 $8,236,849
$0 $3,340,420 $989,597
$0
$0 $9,341,020
$0
$0
$0
$140,471 $55,612,543 $15,861,471
Grand Total
Total
Per-
Amount cent
$145,625,192 46.1%
$135,228,953 42.8%
$5,949,510 1.9%
$9,731,532 3.1% $19,431,581 6.1%
$8,306 0.0% $315,975,075 100%
Instruction
Media
Instruction Support
Pupil Services General Admin. School Admin. Trans-
portation Maint. & Ops. Capital Projects School Food Debt Service
$146,160,860 66.6% $3,390 $5,004,536 2.3% $116
$10,768,234 4.9% $250
$8,280,390 3.8% $192
$3,305,294 1.5% $77
$17,169,108 7.8% $398
$8,487,082 3.9% $197
$20,172,362 9.2% $468
$27,007 0.0%
$1
$0 0.0%
$0
$0 0.0%
$0
K-12 Expenditures
$6,099,969 $4,376,233
$0
$0
$0 $156,637,063 53.6%
$0
$441
$0
$0
$0 $5,004,977 1.7%
$819,752 $985,125
$0
$0
$0 $12,573,112 4.3%
$964,236 $1,075,178
$0
$0
$0 $10,319,805 3.5%
$502,913 $422,305
$0
$0
$0 $4,230,513 1.4%
$0 $235,279
$0
$0
$0 $17,404,387 6.0%
$7,279
$0
$0
$0
$0 $8,494,362 2.9%
$65,393 $1,530,225
$0
$0 $115,294 $21,883,275 7.5%
$0
$0
$0 $33,175,300
$0 $33,202,308 11.4%
$0
$0
$0
$0 $14,169,735 $14,169,735 4.8%
$0
$0 $8,279,603
$0
$0 $8,279,603 2.8%
Total
$219,374,876 100% $5,089 $8,459,545 $8,624,790 $8,279,603 $33,175,300 $14,285,030 $292,199,147 100%
Salaries and Benefits as Percentages of Revenues and of Expenditures
Teachers and Paraprofessionals
Salaries $118,425,269
Benefits $25,588,269
Percentage of Revenues Percentage of Expenditures
Total of
Total of
General Fund
General Fund
Title Programs
Title Programs
Lottery K-12
Lottery K-12
Total Salaries
and
Total
and
Total
and Benefits All Other K-12 K - 12 All Other K-12 K - 12
$144,013,538
58.9%
45.6%
60.9%
49.3%
School Administration
$10,597,432 $2,571,006 $13,168,438
5.4%
4.2%
5.6%
4.5%
General Administration
$1,623,774
$459,837
$2,083,611
0.9%
0.7%
0.9%
0.7%
1998-99 GEORGIA PUBLIC EDUCATION REPORT CARD
Clayton County Schools - 631
Prepared by Georgia Department of Education
Page 8
CERTIFIED PERSONNEL DATA
Number
Average Annual Salary Positions Average Contract Days
Average Daily Salary
Full-time Personnel Part-time
Sex Male Female
4 Yr Bachelor's Certificate 5 Yr Master's
Level 6 Yr Specialist's 7 Yr Doctoral Other*
Black
White Race/ Hispanic Ethnicity Asian
American Indian
Multiracial
Years Experience
<1 1-10 11-20 21-30 >30
Average
Administrators
221.00
$68,954.21 230.54
$299.09
221 0
88 133
0 55 139 27
0
55 166
0 0 0 0
1 17 50 128 25
22.99
Support Personnel PK-12 Teachers
188.10
2,690.13
$51,255.80 201.75
$254.06
$40,135.26 190.23
$210.98
187
2,689
2
2
29
536
160
2,155
5
1,462
99
1,032
79
158
6
19
0
20
39
696
149
1,954
1
22
0
17
0
2
0
0
8
270
53
1,165
50
640
65
559
13
57
16.70
11.44
*Includes One- and Two-Year Vocational Certificates.
Certified Staff Position Ratios
Teacher/Administrator Ratio 12:1
Teacher/Support Person Ratio 14:1
Teacher/Staff Ratio 7:1
Student Enrollment/All Teachers 16:1
Certified Personnel by Category
86.8% 100%
7.1%
6.1%
80% 60%
40%
20%
0%
Teachers
Administrators
Support Personnel
1998-99 GEORGIA PUBLIC EDUCATION REPORT CARD
Clayton County Schools - 631
Prepared by Georgia Department of Education
Page 9
1998-99 GEORGIA PUBLIC EDUCATION REPORT CARD
CLAYTON COUNTY SCHOOLS
Adamson Middle School - 6310177
Grade Range 6-8
The Georgia Public Education Report Card is designed to assist systems and schools in educational improvement. This report card contains a variety of data elements. An explanation of the terms is provided as a companion to the report card data. Please refer to the definitions for the most effective use of the reported data.
STUDENT DATA
Total 1,127
6-8 Enrollment, by Race/Ethnicity and Sex
Black
White Hispanic
American Multi-
Asian Indian
racial
534 47.4%
509 45.2%
36 3.2%
34 3.0%
0 0.0%
14 1.2%
Male 546
48.4%
Female 581
51.6%
Enrollment in Selected Programs
Program
Gifted (Grades K-12)
Program % of Student Enrollment Population
155
13.8%
Alternative Programs (Grades 6-12)
0
0.0%
Students Eligible to Receive Free/Reduced Lunches
Number
Percent
School System
431 23,194
38.2% 52.6%
Enrollment in Compensatory Programs
Program
Program % of Student Enrollment Population
Special Education (Grades K-12) (PK)
137 12.2%
0
N/A
English to Speakers of Other Languages (ESOL) (Grades K-12)
8
< 1%
Title I (Grades K-12)
This school has no Title I program.
Dropout Rate for Grades 6-8
Number
Rate
School System
2
0.2%
46
0.4%
Total 26
Retained Students, by Race/Ethnicity and Sex
Black
White Hispanic
American MultiAsian Indian racial
15 57.7%
10 38.5%
1 3.8%
0 0.0%
0 0.0%
0 0.0%
Male Female
19
7
73.1% 26.9%
Prepared by Georgia Department of Education
Page 1
STATE-REQUIRED TEST DATA
NORM-REFERENCED TESTS Grade 8
Iowa Tests of Basic Skills (ITBS) Each chart reflects data for three years of testing.
Reading Comprehension 50
50 42 49 0
98-99
50 43 48 97-98
56 44 48 96-97
Mathematics
School 50
System
State
0
54 47 56 98-99
51 48 55 97-98
56 49 54 96-97
School System State
Reading Vocabulary 50
46 36 46 0
98-99
46 38 45 97-98
53 40 44 96-97
Language Arts
School 50
System
State
0
59 55 60 98-99
60 55 58 97-98
62 53 56 96-97
School System State
Social Studies 50
54 47 54 0
98-99
54 48 53 97-98
58 51 53 96-97
Science
School 50
System
State
0
55 46 56 98-99
56 48 55 97-98
60 48 53 96-97
School System State
Sources of Information
Composite Score
50
61 52 57 0
98-99
School 50
System
57 53 56 97-98
61 53 55 96-97
State 0
55 48 56 98-99
55 49 54 97-98
1998-99 GEORGIA PUBLIC EDUCATION REPORT CARD Adamson Middle School - 6310177
Prepared by Georgia Department of Education
60 50 54 96-97
Scores Reported in Percentiles
School System State
Page 2
STATE-REQUIRED TEST DATA
Categories of Scaled Scores
Inadequate (less than 162)
Minimal (162-209)
Good
(210-247)
Very Good (greater than 247)
Average Scaled Score: (Range 100-300)
PERFORMANCE ASSESSMENTS
Grade 8 Writing Assessment
1998-99 Percent Scoring
1997-98 Percent Scoring
1996-97 Percent Scoring
School System State School System State School System State
4% 43% 48%
5%
10% 45% 38%
7%
8% 40% 41% 11%
8% 50% 37%
4%
10% 52% 33%
4%
11% 46% 34%
8%
6% 47% 37% 10%
13% 51% 30%
6%
15% 46% 30%
8%
208
203
208 203
199 202 208
198 198
AWARDS / RECOGNITION DATA
Schools in Georgia may receive recognition in the following programs: Charter School Pay for Performance Program Georgia School of Excellence National Blue Ribbon School Adamson Middle School did not receive recognition in any of these programs during the 1998-99 school year.
1998-99 GEORGIA PUBLIC EDUCATION REPORT CARD Adamson Middle School - 6310177
Prepared by Georgia Department of Education
Page 3
CERTIFIED PERSONNEL DATA
Positions Number Average Contract Days
Personnel Sex
Certificate
Years Experience
Full-time Part-time
Male Female
4 Yr Bachelor's 5 Yr Master's 6 Yr Specialist's 7 Yr Doctoral Other*
<1 1-10 11-20 21-30 >30
Average
Administrators
4.00 230.00
4 0
1 3
0 1 3 0 0 0 1 0 3 0 21.50
Support Personnel
3.63 197.24
3 1
0 4
0 4 0 0 0 1 0 3 0 0 11.25
PK-12 Teachers
73.85 190.00
71 6
16 61
45 27
5 0 0 8 42 14 12 1 9.34
*Includes One- and Two-Year Vocational Certificates.
ACCREDITATION DATA
Accredited by Southern Association of Colleges and Schools (SACS):
Elementary/Middle Commission.
1998-99 GEORGIA PUBLIC EDUCATION REPORT CARD Adamson Middle School - 6310177
Prepared by Georgia Department of Education
Page 4
1998-99 GEORGIA PUBLIC EDUCATION REPORT CARD
CLAYTON COUNTY SCHOOLS
Anderson Elementary School - 6311050
Grade Range PK-5
The Georgia Public Education Report Card is designed to assist systems and schools in educational improvement. This report card contains a variety of data elements. An explanation of the terms is provided as a companion to the report card data. Please refer to the definitions for the most effective use of the reported data.
STUDENT DATA
Total
K-5
409
PK
20
Enrollment, by Race/Ethnicity and Sex
Black
White Hispanic
American Asian Indian
Multiracial
226 55.3%
119 29.1%
30 7.3%
8 2.0%
0 0.0%
26 6.4%
13 65.0%
4 20.0%
1 5.0%
0 0.0%
0 0.0%
2 10.0%
Male Female
203 49.6%
206 50.4%
13 65.0%
7 35.0%
Enrollment in Selected Programs
Program
Program % of Student Enrollment Population
Gifted (Grades K-12)
7
1.7%
Alternative Programs (Grades 6-12)
N/A
N/A
Students Eligible to Receive Free/Reduced Lunches
Number
Percent
School System
353 23,194
82.3% 52.6%
Dropout Rate *
Number
Rate
School System
N/A N/A
N/A N/A
* Dropout rates are not applicable for grades PK-5.
Enrollment in Compensatory Programs
Program
Program % of Student Enrollment Population
Special Education (Grades K-12)
42 10.3%
(PK)
3
N/A
English to Speakers of Other Languages (ESOL) (Grades K-12)
13
3.2%
Remedial Education (Grades 2-5, 9-12)
98 34.1%
Special Instructional Assistance (SIA) (Grades K-3)
50 19.3%
Title I (Grades K-12)
This school has a schoolwide program.
Total 20
Retained Students, by Race/Ethnicity and Sex
Black
White Hispanic
American MultiAsian Indian racial
11 55.0%
5 25.0%
1 5.0%
1 5.0%
0
2
0.0% 10.0%
Male Female
13
7
65.0% 35.0%
Prepared by Georgia Department of Education
Page 1
STATE-REQUIRED TEST DATA
NORM-REFERENCED TESTS Grade 3
Iowa Tests of Basic Skills (ITBS) Each chart reflects data for three years of testing.
Reading Comprehension 50
36 42 54 0
98-99
44 43 53 97-98
30 41 52 96-97
Mathematics
School 50
System
State
0
41 46 61 98-99
38 48 61 97-98
36 51 59 96-97
School System State
Reading Vocabulary 50
37 35 50 0
98-99
33 37 50 97-98
38 39 49 96-97
Language Arts
School 50
System
State
0
38 55 64 98-99
42 56 62 97-98
35 56 59 96-97
School System State
Social Studies 50
45 44 56 0
98-99
36 45 55 97-98
34 48 55 96-97
Science
School 50
System
State
0
35 44 59 98-99
36 45 59 97-98
30 48 58 96-97
School System State
Sources of Information
Composite Score
50
38 46 57 0
98-99
School 50
System
35 46 56 97-98
28 48 55 96-97
State 0
36 44 58 98-99
35 46 57 97-98
1998-99 GEORGIA PUBLIC EDUCATION REPORT CARD Anderson Elementary School - 6311050
Prepared by Georgia Department of Education
30 47 56 96-97
Scores Reported in Percentiles
School System State
Page 2
STATE-REQUIRED TEST DATA
NORM-REFERENCED TESTS Grade 5
Iowa Tests of Basic Skills (ITBS) Each chart reflects data for three years of testing.
Reading Comprehension
Mathematics
50
36 44 53 0
98-99
29 43 53 97-98
34 45 52 96-97
School 50
System
State
0
29 47 59 98-99
32 49 58 97-98
32 50 57 96-97
School System State
Reading Vocabulary 50
25 36 48 0
98-99
14 34 48 97-98
23 37 46 96-97
Language Arts
School 50
System
State
0
35 57 63 98-99
26 56 61 97-98
31 57 58 96-97
School System State
Social Studies 50
38 45 57 0
98-99
25 46 56 97-98
34 48 55 96-97
Science
School 50
System
State
0
28 47 60 98-99
20 49 59 97-98
39 50 59 96-97
School System State
Sources of Information
Composite Score
50
37 50 58 0
98-99
School 50
System
29 51 58 97-98
31 52 57 96-97
State 0
31 46 57 98-99
23 47 56 97-98
30 48 55 96-97
1998-99 GEORGIA PUBLIC EDUCATION REPORT CARD Anderson Elementary School - 6311050
Prepared by Georgia Department of Education
Scores Reported in Percentiles
School System State
Page 3
STATE-REQUIRED TEST DATA
PERFORMANCE ASSESSMENTS
Grade 5 Writing Assessment
Percent at Developmental Stages:
1998-99 School System State
1997-98 School System State
1996-97 School System State
Stage Stage Stage Stage Stage Stage
1:The Emerging Writer 2:The Developing Writer 3:The Focusing Writer 4:The Experimenting 5:The Engaging Writer 6:The Extending Writer
0% 0% 26% 48% 25% 2%
0% 1% 17% 41% 28% 12%
0% 1% 16% 41% 29% 12%
0% 5% 46% 43% 5% 0%
1% 3% 21% 42% 25% 8%
0% 3% 19% 41% 27% 10%
0% 7% 30% 43% 17% 2%
0% 3% 21% 40% 26% 8%
0% 3% 21% 37% 26% 12%
AWARDS / RECOGNITION DATA
Schools in Georgia may receive recognition in the following programs: Charter School Pay for Performance Program Georgia School of Excellence National Blue Ribbon School Anderson Elementary School did not receive recognition in any of these programs during the 1998-99 school year.
1998-99 GEORGIA PUBLIC EDUCATION REPORT CARD Anderson Elementary School - 6311050
Prepared by Georgia Department of Education
Page 4
CERTIFIED PERSONNEL DATA
Positions Number Average Contract Days
Personnel Sex
Certificate
Years Experience
Full-time Part-time
Male Female
4 Yr Bachelor's 5 Yr Master's 6 Yr Specialist's 7 Yr Doctoral Other*
<1 1-10 11-20 21-30 >30
Average
Administrators
2.00 220.00
2 0
0 2
0 1 1 0 0 0 0 1 1 0 18.50
Support Personnel
2.00 195.00
2 0
0 2
0 0 2 0 0 0 0 0 2 0 23.50
PK-12 Teachers
29.08 190.00
28 4
2 30
23 7 2 0 0 3
15 9 4 1
11.41
*Includes One- and Two-Year Vocational Certificates.
ACCREDITATION DATA
Accredited by Southern Association of Colleges and Schools (SACS):
Elementary/Middle Commission.
1998-99 GEORGIA PUBLIC EDUCATION REPORT CARD Anderson Elementary School - 6311050
Prepared by Georgia Department of Education
Page 5
1998-99 GEORGIA PUBLIC EDUCATION REPORT CARD
CLAYTON COUNTY SCHOOLS
Arnold Elementary School - 6311550
Grade Range K-5
The Georgia Public Education Report Card is designed to assist systems and schools in educational improvement. This report card contains a variety of data elements. An explanation of the terms is provided as a companion to the report card data. Please refer to the definitions for the most effective use of the reported data.
STUDENT DATA
Total 491
K-5 Enrollment, by Race/Ethnicity and Sex
Black
White Hispanic
American Multi-
Asian Indian
racial
181 36.9%
280 57.0%
7 1.4%
11 2.2%
1 0.2%
11 2.2%
Male Female
249 50.7%
242 49.3%
Enrollment in Selected Programs
Program
Program % of Student Enrollment Population
Gifted (Grades K-12)
48
9.8%
Alternative Programs (Grades 6-12)
N/A
N/A
Students Eligible to Receive Free/Reduced Lunches
Number
Percent
School System
176 23,194
35.8% 52.6%
Dropout Rate *
Number
Rate
School System
N/A N/A
N/A N/A
* Dropout rates are not applicable for grades PK-5.
Enrollment in Compensatory Programs
Program
Program % of Student Enrollment Population
Special Education (Grades K-12)
85 17.3%
(PK)
0
N/A
English to Speakers of Other Languages (ESOL) (Grades K-12)
7
1.4%
Remedial Education (Grades 2-5, 9-12)
106 29.6%
Special Instructional Assistance (SIA) (Grades K-3)
49 16.1%
Title I (Grades K-12)
This school has no Title I program.
Total 3
Retained Students, by Race/Ethnicity and Sex
Black
White Hispanic
American Multi-
Asian Indian
racial
2 66.7%
1 33.3%
0 0.0%
0 0.0%
0 0.0%
0 0.0%
Male Female
2
1
66.7% 33.3%
Prepared by Georgia Department of Education
Page 1
STATE-REQUIRED TEST DATA
NORM-REFERENCED TESTS Grade 3
Iowa Tests of Basic Skills (ITBS) Each chart reflects data for three years of testing.
Reading Comprehension 50
63 42 54 0
98-99
59 43 53 97-98
50 41 52 96-97
Mathematics
School 50
System
State
0
64 46 61 98-99
63 48 61 97-98
61 51 59 96-97
School System State
Reading Vocabulary 50
58 35 50 0
98-99
55 37 50 97-98
52 39 49 96-97
Language Arts
School 50
System
State
0
70 55 64 98-99
73 56 62 97-98
61 56 59 96-97
School System State
Social Studies 50
59 44 56 0
98-99
60 45 55 97-98
58 48 55 96-97
Science
School 50
System
State
0
64 44 59 98-99
63 45 59 97-98
60 48 58 96-97
School System State
Sources of Information
Composite Score
50
63 46 57 0
98-99
School 50
System
60 46 56 97-98
60 48 55 96-97
State 0
64 44 58 98-99
63 46 57 97-98
1998-99 GEORGIA PUBLIC EDUCATION REPORT CARD Arnold Elementary School - 6311550
Prepared by Georgia Department of Education
58 47 56 96-97
Scores Reported in Percentiles
School System State
Page 2
STATE-REQUIRED TEST DATA
NORM-REFERENCED TESTS Grade 5
Iowa Tests of Basic Skills (ITBS) Each chart reflects data for three years of testing.
Reading Comprehension
Mathematics
50
61 44 53 0
98-99
59 43 53 97-98
60 45 52 96-97
School 50
System
State
0
78 47 59 98-99
80 49 58 97-98
74 50 57 96-97
School System State
Reading Vocabulary 50
49 36 48 0
98-99
53 34 48 97-98
54 37 46 96-97
Language Arts
School 50
System
State
0
83 57 63 98-99
80 56 61 97-98
83 57 58 96-97
School System State
Social Studies 50
61 45 57 0
98-99
68 46 56 97-98
64 48 55 96-97
Science
School 50
System
State
0
66 47 60 98-99
68 49 59 97-98
64 50 59 96-97
School System State
Sources of Information
Composite Score
50
72 50 58 0
98-99
School 50
System
72 51 58 97-98
76 52 57 96-97
State 0
71 46 57 98-99
72 47 56 97-98
71 48 55 96-97
1998-99 GEORGIA PUBLIC EDUCATION REPORT CARD Arnold Elementary School - 6311550
Prepared by Georgia Department of Education
Scores Reported in Percentiles
School System State
Page 3
STATE-REQUIRED TEST DATA
PERFORMANCE ASSESSMENTS
Grade 5 Writing Assessment
Percent at Developmental Stages:
1998-99 School System State
1997-98 School System State
1996-97 School System State
Stage Stage Stage Stage Stage Stage
1:The Emerging Writer 2:The Developing Writer 3:The Focusing Writer 4:The Experimenting 5:The Engaging Writer 6:The Extending Writer
0% 0% 4% 18% 33% 45%
0% 1% 17% 41% 28% 12%
0% 1% 16% 41% 29% 12%
0% 1% 4% 18% 46% 30%
1% 3% 21% 42% 25% 8%
0% 3% 19% 41% 27% 10%
0% 0% 6% 27% 43% 24%
0% 3% 21% 40% 26% 8%
0% 3% 21% 37% 26% 12%
AWARDS / RECOGNITION DATA
Schools in Georgia may receive recognition in the following programs: Charter School Pay for Performance Program Georgia School of Excellence National Blue Ribbon School Arnold Elementary School did not receive recognition in any of these programs during the 1998-99 school year.
1998-99 GEORGIA PUBLIC EDUCATION REPORT CARD Arnold Elementary School - 6311550
Prepared by Georgia Department of Education
Page 4
CERTIFIED PERSONNEL DATA
Positions Number Average Contract Days
Personnel Sex
Certificate
Years Experience
Full-time Part-time
Male Female
4 Yr Bachelor's 5 Yr Master's 6 Yr Specialist's 7 Yr Doctoral Other*
<1 1-10 11-20 21-30 >30
Average
Administrators
2.00 220.00
2 0
0 2
0 1 1 0 0 0 0 0 1 1 31.00
Support Personnel
2.00 195.00
2 0
0 2
0 2 0 0 0 0 0 1 1 0 21.50
PK-12 Teachers
31.63 190.00
31 2
2 31
16 15
2 0 0 2 12 14 4 1 12.30
*Includes One- and Two-Year Vocational Certificates.
ACCREDITATION DATA
Accredited by Southern Association of Colleges and Schools (SACS):
Elementary/Middle Commission.
1998-99 GEORGIA PUBLIC EDUCATION REPORT CARD Arnold Elementary School - 6311550
Prepared by Georgia Department of Education
Page 5
1998-99 GEORGIA PUBLIC EDUCATION REPORT CARD
CLAYTON COUNTY SCHOOLS
Babb Middle School - 6313050
Grade Range 6-8
The Georgia Public Education Report Card is designed to assist systems and schools in educational improvement. This report card contains a variety of data elements. An explanation of the terms is provided as a companion to the report card data. Please refer to the definitions for the most effective use of the reported data.
STUDENT DATA
Total 998
6-8 Enrollment, by Race/Ethnicity and Sex
Black
White Hispanic
American Multi-
Asian Indian
racial
531 53.2%
277 27.8%
71
105
7.1% 10.5%
2 0.2%
12 1.2%
Male 540
54.1%
Female 458
45.9%
Enrollment in Selected Programs
Program
Gifted (Grades K-12)
Program % of Student Enrollment Population
44
4.4%
Alternative Programs (Grades 6-12)
0
0.0%
Students Eligible to Receive Free/Reduced Lunches
Number
Percent
School System
700 23,194
70.1% 52.6%
Enrollment in Compensatory Programs
Program
Program % of Student Enrollment Population
Special Education (Grades K-12) (PK)
114 11.4%
0
N/A
English to Speakers of Other Languages (ESOL) (Grades K-12)
50
5.0%
Title I (Grades K-12)
This school has no Title I program.
Dropout Rate for Grades 6-8
Number
Rate
School System
7
0.6%
46
0.4%
Total 55
Retained Students, by Race/Ethnicity and Sex
Black
White Hispanic
American MultiAsian Indian racial
28 50.9%
17
9
30.9% 16.4%
1 1.8%
0 0.0%
0 0.0%
Male Female
36
19
65.5% 34.5%
Prepared by Georgia Department of Education
Page 1
STATE-REQUIRED TEST DATA
NORM-REFERENCED TESTS Grade 8
Iowa Tests of Basic Skills (ITBS) Each chart reflects data for three years of testing.
Reading Comprehension 50
38 42 49 0
98-99
33 43 48 97-98
41 44 48 96-97
Mathematics
School 50
System
State
0
38 47 56 98-99
40 48 55 97-98
46 49 54 96-97
School System State
Reading Vocabulary 50
30 36 46 0
98-99
26 38 45 97-98
34 40 44 96-97
Language Arts
School 50
System
State
0
54 55 60 98-99
40 55 58 97-98
45 53 56 96-97
School System State
Social Studies 50
44 47 54 0
98-99
38 48 53 97-98
45 51 53 96-97
Science
School 50
System
State
0
40 46 56 98-99
41 48 55 97-98
45 48 53 96-97
School System State
Sources of Information
Composite Score
50
45 52 57 0
98-99
School 50
System
41 53 56 97-98
46 53 55 96-97
State 0
43 48 56 98-99
37 49 54 97-98
1998-99 GEORGIA PUBLIC EDUCATION REPORT CARD Babb Middle School - 6313050
Prepared by Georgia Department of Education
43 50 54 96-97
Scores Reported in Percentiles
School System State
Page 2
STATE-REQUIRED TEST DATA
Categories of Scaled Scores
Inadequate (less than 162)
Minimal (162-209)
Good
(210-247)
Very Good (greater than 247)
Average Scaled Score: (Range 100-300)
PERFORMANCE ASSESSMENTS
Grade 8 Writing Assessment
1998-99 Percent Scoring
1997-98 Percent Scoring
1996-97 Percent Scoring
School System State School System State School System State
17% 51% 28%
4%
10% 45% 38%
7%
8% 40% 41% 11%
16% 61% 22%
1%
10% 52% 33%
4%
11% 46% 34%
8%
18% 52% 27%
4%
13% 51% 30%
6%
15% 46% 30%
8%
193
203
208 189
199 202 192
198 198
AWARDS / RECOGNITION DATA
Schools in Georgia may receive recognition in the following programs: Charter School Pay for Performance Program Georgia School of Excellence National Blue Ribbon School Babb Middle School did not receive recognition in any of these programs during the 1998-99 school year.
1998-99 GEORGIA PUBLIC EDUCATION REPORT CARD Babb Middle School - 6313050
Prepared by Georgia Department of Education
Page 3
CERTIFIED PERSONNEL DATA
Positions Number Average Contract Days
Personnel Sex
Certificate
Years Experience
Full-time Part-time
Male Female
4 Yr Bachelor's 5 Yr Master's 6 Yr Specialist's 7 Yr Doctoral Other*
<1 1-10 11-20 21-30 >30
Average
Administrators
4.00 230.00
4 0
2 2
0 0 3 1 0 0 0 0 4 0 24.50
Support Personnel
3.00 196.67
3 0
0 3
0 1 2 0 0 0 0 3 0 0 18.00
PK-12 Teachers
62.88 190.00
60 6
19 47
40 22
4 0 0 6 30 19 9 2 10.89
*Includes One- and Two-Year Vocational Certificates.
ACCREDITATION DATA
Accredited by Southern Association of Colleges and Schools (SACS):
Elementary/Middle Commission.
1998-99 GEORGIA PUBLIC EDUCATION REPORT CARD Babb Middle School - 6313050
Prepared by Georgia Department of Education
Page 4
1998-99 GEORGIA PUBLIC EDUCATION REPORT CARD
CLAYTON COUNTY SCHOOLS
Brown Elementary School - 6310175
Grade Range PK-5
The Georgia Public Education Report Card is designed to assist systems and schools in educational improvement. This report card contains a variety of data elements. An explanation of the terms is provided as a companion to the report card data. Please refer to the definitions for the most effective use of the reported data.
STUDENT DATA
Total
K-5
896
PK
1
Enrollment, by Race/Ethnicity and Sex
Black
White Hispanic
American Asian Indian
Multiracial
539 60.2%
287 32.0%
17 1.9%
17 1.9%
1 0.1%
35 3.9%
1 100.0%
0 0.0%
0 0.0%
0 0.0%
0 0.0%
0 0.0%
Male Female
452 50.4%
444 49.6%
0
1
0.0% 100.0%
Enrollment in Selected Programs
Program
Program % of Student Enrollment Population
Gifted (Grades K-12)
38
4.2%
Alternative Programs (Grades 6-12)
N/A
N/A
Students Eligible to Receive Free/Reduced Lunches
Number
Percent
School System
437 23,194
48.7% 52.6%
Dropout Rate *
Number
Rate
School System
N/A N/A
N/A N/A
* Dropout rates are not applicable for grades PK-5.
Enrollment in Compensatory Programs
Program
Program % of Student Enrollment Population
Special Education (Grades K-12)
118 13.2%
(PK)
2
N/A
English to Speakers of Other Languages (ESOL) (Grades K-12)
6
< 1%
Remedial Education (Grades 2-5, 9-12)
182 30.1%
Special Instructional Assistance (SIA) (Grades K-3)
50
8.6%
Title I (Grades K-12)
This school has no Title I program.
Total 21
Retained Students, by Race/Ethnicity and Sex
Black
White Hispanic
American MultiAsian Indian racial
10 47.6%
10 47.6%
1 4.8%
0 0.0%
0 0.0%
0 0.0%
Male Female
9
12
42.9% 57.1%
Prepared by Georgia Department of Education
Page 1
STATE-REQUIRED TEST DATA
NORM-REFERENCED TESTS Grade 3
Iowa Tests of Basic Skills (ITBS) Each chart reflects data for three years of testing.
Reading Comprehension 50
43 42 54 0
98-99
49 43 53 97-98
55 41 52 96-97
Mathematics
School 50
System
State
0
42 46 61 98-99
53 48 61 97-98
61 51 59 96-97
School System State
Reading Vocabulary 50
39 35 50 0
98-99
36 37 50 97-98
42 39 49 96-97
Language Arts
School 50
System
State
0
53 55 64 98-99
57 56 62 97-98
61 56 59 96-97
School System State
Social Studies 50
39 44 56 0
98-99
43 45 55 97-98
51 48 55 96-97
Science
School 50
System
State
0
41 44 59 98-99
46 45 59 97-98
54 48 58 96-97
School System State
Sources of Information
Composite Score
50
43 46 57 0
98-99
School 50
System
48 46 56 97-98
55 48 55 96-97
State 0
41 44 58 98-99
47 46 57 97-98
1998-99 GEORGIA PUBLIC EDUCATION REPORT CARD Brown Elementary School - 6310175
Prepared by Georgia Department of Education
54 47 56 96-97
Scores Reported in Percentiles
School System State
Page 2
STATE-REQUIRED TEST DATA
NORM-REFERENCED TESTS Grade 5
Iowa Tests of Basic Skills (ITBS) Each chart reflects data for three years of testing.
Reading Comprehension
Mathematics
50
42 44 53 0
98-99
45 43 53 97-98
46 45 52 96-97
School 50
System
State
0
44 47 59 98-99
41 49 58 97-98
46 50 57 96-97
School System State
Reading Vocabulary 50
36 36 48 0
98-99
32 34 48 97-98
37 37 46 96-97
Language Arts
School 50
System
State
0
56 57 63 98-99
48 56 61 97-98
56 57 58 96-97
School System State
Social Studies 50
35 45 57 0
98-99
34 46 56 97-98
46 48 55 96-97
Science
School 50
System
State
0
42 47 60 98-99
45 49 59 97-98
51 50 59 96-97
School System State
Sources of Information
Composite Score
50
48 50 58 0
98-99
School 50
System
47 51 58 97-98
52 52 57 96-97
State 0
43 46 57 98-99
41 47 56 97-98
47 48 55 96-97
1998-99 GEORGIA PUBLIC EDUCATION REPORT CARD Brown Elementary School - 6310175
Prepared by Georgia Department of Education
Scores Reported in Percentiles
School System State
Page 3
STATE-REQUIRED TEST DATA
PERFORMANCE ASSESSMENTS
Grade 5 Writing Assessment
Percent at Developmental Stages:
1998-99 School System State
1997-98 School System State
1996-97 School System State
Stage Stage Stage Stage Stage Stage
1:The Emerging Writer 2:The Developing Writer 3:The Focusing Writer 4:The Experimenting 5:The Engaging Writer 6:The Extending Writer
0% 0% 12% 45% 25% 15%
0% 1% 17% 41% 28% 12%
0% 1% 16% 41% 29% 12%
1% 1% 14% 44% 36% 4%
1% 3% 21% 42% 25% 8%
0% 3% 19% 41% 27% 10%
0% 2% 25% 48% 21% 4%
0% 3% 21% 40% 26% 8%
0% 3% 21% 37% 26% 12%
AWARDS / RECOGNITION DATA
Schools in Georgia may receive recognition in the following programs: Charter School Pay for Performance Program Georgia School of Excellence National Blue Ribbon School Brown Elementary School did not receive recognition in any of these programs during the 1998-99 school year.
1998-99 GEORGIA PUBLIC EDUCATION REPORT CARD Brown Elementary School - 6310175
Prepared by Georgia Department of Education
Page 4
CERTIFIED PERSONNEL DATA
Positions Number Average Contract Days
Personnel Sex
Certificate
Years Experience
Full-time Part-time
Male Female
4 Yr Bachelor's 5 Yr Master's 6 Yr Specialist's 7 Yr Doctoral Other*
<1 1-10 11-20 21-30 >30
Average
Administrators
3.00 226.67
3 0
0 3
0 0 3 0 0 0 0 0 2 1 28.00
Support Personnel
2.00 195.00
2 0
0 2
0 0 2 0 0 0 0 1 1 0 20.00
PK-12 Teachers
52.00 190.00
51 3
7 47
28 23
2 1 0 6 16 20 11 1 12.70
*Includes One- and Two-Year Vocational Certificates.
ACCREDITATION DATA
Accredited by Southern Association of Colleges and Schools (SACS):
Elementary/Middle Commission.
1998-99 GEORGIA PUBLIC EDUCATION REPORT CARD Brown Elementary School - 6310175
Prepared by Georgia Department of Education
Page 5
1998-99 GEORGIA PUBLIC EDUCATION REPORT CARD
CLAYTON COUNTY SCHOOLS
Church Street Elementary School - 6314050
Grade Range K-5
The Georgia Public Education Report Card is designed to assist systems and schools in educational improvement. This report card contains a variety of data elements. An explanation of the terms is provided as a companion to the report card data. Please refer to the definitions for the most effective use of the reported data.
STUDENT DATA
Total 981
K-5 Enrollment, by Race/Ethnicity and Sex
Black
White Hispanic
American Multi-
Asian Indian
racial
746 76.0%
99 10.1%
13 1.3%
91 9.3%
3 0.3%
29 3.0%
Male Female
529 53.9%
452 46.1%
Enrollment in Selected Programs
Program
Program % of Student Enrollment Population
Gifted (Grades K-12)
57
5.8%
Alternative Programs (Grades 6-12)
N/A
N/A
Students Eligible to Receive Free/Reduced Lunches
Number
Percent
School System
657 23,194
67.0% 52.6%
Dropout Rate *
Number
Rate
School System
N/A N/A
N/A N/A
* Dropout rates are not applicable for grades PK-5.
Enrollment in Compensatory Programs
Program
Program % of Student Enrollment Population
Special Education (Grades K-12)
86
8.8%
(PK)
0
N/A
English to Speakers of Other Languages (ESOL) (Grades K-12)
49
5.0%
Remedial Education (Grades 2-5, 9-12)
213 31.7%
Special Instructional Assistance (SIA) (Grades K-3)
50
7.8%
Title I (Grades K-12)
This school has a schoolwide program.
Total 19
Retained Students, by Race/Ethnicity and Sex
Black
White Hispanic
American Multi-
Asian Indian
racial
14 73.7%
2 10.5%
0
3
0.0% 15.8%
0 0.0%
0 0.0%
Male Female
12
7
63.2% 36.8%
Prepared by Georgia Department of Education
Page 1
STATE-REQUIRED TEST DATA
NORM-REFERENCED TESTS Grade 3
Iowa Tests of Basic Skills (ITBS) Each chart reflects data for three years of testing.
Reading Comprehension 50
39 42 54 0
98-99
35 43 53 97-98
35 41 52 96-97
Mathematics
School 50
System
State
0
40 46 61 98-99
41 48 61 97-98
42 51 59 96-97
School System State
Reading Vocabulary 50
32 35 50 0
98-99
32 37 50 97-98
33 39 49 96-97
Language Arts
School 50
System
State
0
51 55 64 98-99
49 56 62 97-98
48 56 59 96-97
School System State
Social Studies 50
40 44 56 0
98-99
40 45 55 97-98
45 48 55 96-97
Science
School 50
System
State
0
39 44 59 98-99
43 45 59 97-98
46 48 58 96-97
School System State
Sources of Information
Composite Score
50
46 46 57 0
98-99
School 50
System
46 46 56 97-98
45 48 55 96-97
State 0
41 44 58 98-99
40 46 57 97-98
1998-99 GEORGIA PUBLIC EDUCATION REPORT CARD Church Street Elementary School - 6314050
Prepared by Georgia Department of Education
41 47 56 96-97
Scores Reported in Percentiles
School System State
Page 2
STATE-REQUIRED TEST DATA
NORM-REFERENCED TESTS Grade 5
Iowa Tests of Basic Skills (ITBS) Each chart reflects data for three years of testing.
Reading Comprehension
Mathematics
50
40 44 53 0
98-99
43 43 53 97-98
45 45 52 96-97
School 50
System
State
0
44 47 59 98-99
45 49 58 97-98
47 50 57 96-97
School System State
Reading Vocabulary 50
34 36 48 0
98-99
32 34 48 97-98
36 37 46 96-97
Language Arts
School 50
System
State
0
55 57 63 98-99
58 56 61 97-98
54 57 58 96-97
School System State
Social Studies 50
43 45 57 0
98-99
48 46 56 97-98
48 48 55 96-97
Science
School 50
System
State
0
52 47 60 98-99
47 49 59 97-98
54 50 59 96-97
School System State
Sources of Information
Composite Score
50
51 50 58 0
98-99
School 50
System
54 51 58 97-98
51 52 57 96-97
State 0
46 46 57 98-99
47 47 56 97-98
48 48 55 96-97
1998-99 GEORGIA PUBLIC EDUCATION REPORT CARD Church Street Elementary School - 6314050
Prepared by Georgia Department of Education
Scores Reported in Percentiles
School System State
Page 3
STATE-REQUIRED TEST DATA
PERFORMANCE ASSESSMENTS
Grade 5 Writing Assessment
Percent at Developmental Stages:
1998-99 School System State
1997-98 School System State
1996-97 School System State
Stage Stage Stage Stage Stage Stage
1:The Emerging Writer 2:The Developing Writer 3:The Focusing Writer 4:The Experimenting 5:The Engaging Writer 6:The Extending Writer
1% 2% 17% 43% 29% 6%
0% 1% 17% 41% 28% 12%
0% 1% 16% 41% 29% 12%
0% 1% 28% 39% 24% 7%
1% 3% 21% 42% 25% 8%
0% 3% 19% 41% 27% 10%
0% 4% 28% 33% 29% 6%
0% 3% 21% 40% 26% 8%
0% 3% 21% 37% 26% 12%
AWARDS / RECOGNITION DATA
Schools in Georgia may receive recognition in the following programs: Charter School Pay for Performance Program Georgia School of Excellence National Blue Ribbon School Church Street Elementary School did not receive recognition in any of these programs during the 1998-99 school year.
1998-99 GEORGIA PUBLIC EDUCATION REPORT CARD Church Street Elementary School - 6314050
Prepared by Georgia Department of Education
Page 4
CERTIFIED PERSONNEL DATA
Positions Number Average Contract Days
Personnel Sex
Certificate
Years Experience
Full-time Part-time
Male Female
4 Yr Bachelor's 5 Yr Master's 6 Yr Specialist's 7 Yr Doctoral Other*
<1 1-10 11-20 21-30 >30
Average
Administrators
3.00 226.67
3 0
0 3
0 2 1 0 0 0 0 0 2 1 26.33
Support Personnel
2.65 196.23
2 2
2 2
0 3 1 0 0 1 1 1 1 0 14.25
PK-12 Teachers
57.79 190.00
56 2
4 54
36 19
3 0 0 9 22 15 12 0 10.43
*Includes One- and Two-Year Vocational Certificates.
ACCREDITATION DATA
Accredited by Southern Association of Colleges and Schools (SACS):
Elementary/Middle Commission.
1998-99 GEORGIA PUBLIC EDUCATION REPORT CARD Church Street Elementary School - 6314050
Prepared by Georgia Department of Education
Page 5
1998-99 GEORGIA PUBLIC EDUCATION REPORT CARD
CLAYTON COUNTY SCHOOLS
East Clayton Elementary School - 6311052
Grade Range PK-5
The Georgia Public Education Report Card is designed to assist systems and schools in educational improvement. This report card contains a variety of data elements. An explanation of the terms is provided as a companion to the report card data. Please refer to the definitions for the most effective use of the reported data.
STUDENT DATA
Total
K-5
998
PK
4
Enrollment, by Race/Ethnicity and Sex
Black
White Hispanic
American Asian Indian
Multiracial
488 48.9%
426 42.7%
24 2.4%
26 2.6%
0 0.0%
34 3.4%
1 25.0%
3 75.0%
0 0.0%
0 0.0%
0 0.0%
0 0.0%
Male 485
48.6% 4
100.0%
Female 513
51.4% 0
0.0%
Enrollment in Selected Programs
Program
Program % of Student Enrollment Population
Gifted (Grades K-12)
63
6.3%
Alternative Programs (Grades 6-12)
N/A
N/A
Students Eligible to Receive Free/Reduced Lunches
Number
Percent
School System
434 23,194
43.3% 52.6%
Dropout Rate *
Number
Rate
School System
N/A N/A
N/A N/A
* Dropout rates are not applicable for grades PK-5.
Enrollment in Compensatory Programs
Program
Program % of Student Enrollment Population
Special Education (Grades K-12)
117 11.7%
(PK)
4
N/A
English to Speakers of Other Languages (ESOL) (Grades K-12)
20
2.0%
Remedial Education (Grades 2-5, 9-12)
194 30.0%
Special Instructional Assistance (SIA) (Grades K-3)
50
7.3%
Title I (Grades K-12)
This school has no Title I program.
Total 28
Retained Students, by Race/Ethnicity and Sex
Black
White Hispanic
American MultiAsian Indian racial
12 42.9%
12 42.9%
1 3.6%
1 3.6%
0 0.0%
2 7.1%
Male Female
16
12
57.1% 42.9%
Prepared by Georgia Department of Education
Page 1
STATE-REQUIRED TEST DATA
NORM-REFERENCED TESTS Grade 3
Iowa Tests of Basic Skills (ITBS) Each chart reflects data for three years of testing.
Reading Comprehension 50
46 42 54 0
98-99
43 43 53 97-98
48 41 52 96-97
Mathematics
School 50
System
State
0
47 46 61 98-99
44 48 61 97-98
54 51 59 96-97
School System State
Reading Vocabulary 50
39 35 50 0
98-99
39 37 50 97-98
46 39 49 96-97
Language Arts
School 50
System
State
0
54 55 64 98-99
52 56 62 97-98
58 56 59 96-97
School System State
Social Studies 50
49 44 56 0
98-99
43 45 55 97-98
51 48 55 96-97
Science
School 50
System
State
0
49 44 59 98-99
47 45 59 97-98
55 48 58 96-97
School System State
Sources of Information
Composite Score
50
47 46 57 0
98-99
School 50
System
44 46 56 97-98
54 48 55 96-97
State 0
46 44 58 98-99
44 46 57 97-98
1998-99 GEORGIA PUBLIC EDUCATION REPORT CARD East Clayton Elementary School - 6311052
Prepared by Georgia Department of Education
52 47 56 96-97
Scores Reported in Percentiles
School System State
Page 2
STATE-REQUIRED TEST DATA
NORM-REFERENCED TESTS Grade 5
Iowa Tests of Basic Skills (ITBS) Each chart reflects data for three years of testing.
Reading Comprehension
Mathematics
50
50 44 53 0
98-99
53 43 53 97-98
53 45 52 96-97
School 50
System
State
0
56 47 59 98-99
55 49 58 97-98
60 50 57 96-97
School System State
Reading Vocabulary 50
43 36 48 0
98-99
43 34 48 97-98
51 37 46 96-97
Language Arts
School 50
System
State
0
62 57 63 98-99
63 56 61 97-98
61 57 58 96-97
School System State
Social Studies 50
53 45 57 0
98-99
52 46 56 97-98
52 48 55 96-97
Science
School 50
System
State
0
57 47 60 98-99
59 49 59 97-98
59 50 59 96-97
School System State
Sources of Information
Composite Score
50
55 50 58 0
98-99
School 50
System
57 51 58 97-98
58 52 57 96-97
State 0
54 46 57 98-99
55 47 56 97-98
56 48 55 96-97
1998-99 GEORGIA PUBLIC EDUCATION REPORT CARD East Clayton Elementary School - 6311052
Prepared by Georgia Department of Education
Scores Reported in Percentiles
School System State
Page 3
STATE-REQUIRED TEST DATA
PERFORMANCE ASSESSMENTS
Grade 5 Writing Assessment
Percent at Developmental Stages:
1998-99 School System State
1997-98 School System State
1996-97 School System State
Stage Stage Stage Stage Stage Stage
1:The Emerging Writer 2:The Developing Writer 3:The Focusing Writer 4:The Experimenting 5:The Engaging Writer 6:The Extending Writer
0% 1% 10% 46% 29% 13%
0% 1% 17% 41% 28% 12%
0% 1% 16% 41% 29% 12%
1% 2% 12% 45% 31% 10%
1% 3% 21% 42% 25% 8%
0% 3% 19% 41% 27% 10%
0% 1% 22% 50% 22% 6%
0% 3% 21% 40% 26% 8%
0% 3% 21% 37% 26% 12%
AWARDS / RECOGNITION DATA
Schools in Georgia may receive recognition in the following programs: Charter School Pay for Performance Program Georgia School of Excellence National Blue Ribbon School East Clayton Elementary School did not receive recognition in any of these programs during the 1998-99 school year.
1998-99 GEORGIA PUBLIC EDUCATION REPORT CARD East Clayton Elementary School - 6311052
Prepared by Georgia Department of Education
Page 4
CERTIFIED PERSONNEL DATA
Positions Number Average Contract Days
Personnel Sex
Certificate
Years Experience
Full-time Part-time
Male Female
4 Yr Bachelor's 5 Yr Master's 6 Yr Specialist's 7 Yr Doctoral Other*
<1 1-10 11-20 21-30 >30
Average
Administrators
3.00 226.67
3 0
0 3
0 2 1 0 0 0 0 1 2 0 20.33
Support Personnel
2.65 196.23
2 2
0 4
0 3 1 0 0 0 2 1 1 0 13.00
PK-12 Teachers
54.58 190.00
54 2
4 52
31 20
5 0 0 4 17 16 17 2 14.71
*Includes One- and Two-Year Vocational Certificates.
ACCREDITATION DATA
Accredited by Southern Association of Colleges and Schools (SACS):
Elementary/Middle Commission.
1998-99 GEORGIA PUBLIC EDUCATION REPORT CARD East Clayton Elementary School - 6311052
Prepared by Georgia Department of Education
Page 5
1998-99 GEORGIA PUBLIC EDUCATION REPORT CARD
CLAYTON COUNTY SCHOOLS
Edmonds Elementary School - 6315052
Grade Range PK-5
The Georgia Public Education Report Card is designed to assist systems and schools in educational improvement. This report card contains a variety of data elements. An explanation of the terms is provided as a companion to the report card data. Please refer to the definitions for the most effective use of the reported data.
STUDENT DATA
Total
K-5
529
PK
40
Enrollment, by Race/Ethnicity and Sex
Black
White Hispanic
American Asian Indian
Multiracial
290 54.8%
169 31.9%
38 7.2%
16 3.0%
0 0.0%
16 3.0%
18 45.0%
13 32.5%
5 12.5%
1 2.5%
0 0.0%
3 7.5%
Male Female
291 55.0%
238 45.0%
22 55.0%
18 45.0%
Enrollment in Selected Programs
Program
Program % of Student Enrollment Population
Gifted (Grades K-12)
10
1.9%
Alternative Programs (Grades 6-12)
N/A
N/A
Students Eligible to Receive Free/Reduced Lunches
Number
Percent
School System
470 23,194
82.6% 52.6%
Dropout Rate *
Number
Rate
School System
N/A N/A
N/A N/A
* Dropout rates are not applicable for grades PK-5.
Enrollment in Compensatory Programs
Program
Program % of Student Enrollment Population
Special Education (Grades K-12)
63 11.9%
(PK)
6
N/A
English to Speakers of Other Languages (ESOL) (Grades K-12)
24
4.5%
Remedial Education (Grades 2-5, 9-12)
117 33.3%
Special Instructional Assistance (SIA) (Grades K-3)
49 13.6%
Title I (Grades K-12)
This school has a schoolwide program.
Total 11
Retained Students, by Race/Ethnicity and Sex
Black
White Hispanic
American MultiAsian Indian racial
3 27.3%
5
3
45.5% 27.3%
0 0.0%
0 0.0%
0 0.0%
Male Female
9
2
81.8% 18.2%
Prepared by Georgia Department of Education
Page 1
STATE-REQUIRED TEST DATA
NORM-REFERENCED TESTS Grade 3
Iowa Tests of Basic Skills (ITBS) Each chart reflects data for three years of testing.
Reading Comprehension 50
34 42 54 0
98-99
35 43 53 97-98
29 41 52 96-97
Mathematics
School 50
System
State
0
39 46 61 98-99
29 48 61 97-98
40 51 59 96-97
School System State
Reading Vocabulary 50
24 35 50 0
98-99
24 37 50 97-98
23 39 49 96-97
Language Arts
School 50
System
State
0
34 55 64 98-99
32 56 62 97-98
32 56 59 96-97
School System State
Social Studies 50
36 44 56 0
98-99
37 45 55 97-98
36 48 55 96-97
Science
School 50
System
State
0
40 44 59 98-99
39 45 59 97-98
38 48 58 96-97
School System State
Sources of Information
Composite Score
50
36 46 57 0
98-99
School 50
System
31 46 56 97-98
38 48 55 96-97
State 0
35 44 58 98-99
31 46 57 97-98
1998-99 GEORGIA PUBLIC EDUCATION REPORT CARD Edmonds Elementary School - 6315052
Prepared by Georgia Department of Education
32 47 56 96-97
Scores Reported in Percentiles
School System State
Page 2
STATE-REQUIRED TEST DATA
NORM-REFERENCED TESTS Grade 5
Iowa Tests of Basic Skills (ITBS) Each chart reflects data for three years of testing.
Reading Comprehension
Mathematics
50
28 44 53 0
98-99
39 43 53 97-98
39 45 52 96-97
School 50
System
State
0
30 47 59 98-99
39 49 58 97-98
36 50 57 96-97
School System State
Reading Vocabulary 50
20 36 48 0
98-99
22 34 48 97-98
25 37 46 96-97
Language Arts
School 50
System
State
0
37 57 63 98-99
54 56 61 97-98
37 57 58 96-97
School System State
Social Studies 50
28 45 57 0
98-99
38 46 56 97-98
37 48 55 96-97
Science
School 50
System
State
0
27 47 60 98-99
39 49 59 97-98
40 50 59 96-97
School System State
Sources of Information
Composite Score
50
35 50 58 0
98-99
School 50
System
45 51 58 97-98
40 52 57 96-97
State 0
28 46 57 98-99
39 47 56 97-98
35 48 55 96-97
1998-99 GEORGIA PUBLIC EDUCATION REPORT CARD Edmonds Elementary School - 6315052
Prepared by Georgia Department of Education
Scores Reported in Percentiles
School System State
Page 3
STATE-REQUIRED TEST DATA
PERFORMANCE ASSESSMENTS
Grade 5 Writing Assessment
Percent at Developmental Stages:
1998-99 School System State
1997-98 School System State
1996-97 School System State
Stage Stage Stage Stage Stage Stage
1:The Emerging Writer 2:The Developing Writer 3:The Focusing Writer 4:The Experimenting 5:The Engaging Writer 6:The Extending Writer
0% 3% 23% 53% 20% 1%
0% 1% 17% 41% 28% 12%
0% 1% 16% 41% 29% 12%
0% 5% 13% 50% 25% 7%
1% 3% 21% 42% 25% 8%
0% 3% 19% 41% 27% 10%
0% 4% 30% 36% 24% 6%
0% 3% 21% 40% 26% 8%
0% 3% 21% 37% 26% 12%
AWARDS / RECOGNITION DATA
Schools in Georgia may receive recognition in the following programs: Charter School Pay for Performance Program Georgia School of Excellence National Blue Ribbon School Edmonds Elementary School did not receive recognition in any of these programs during the 1998-99 school year.
1998-99 GEORGIA PUBLIC EDUCATION REPORT CARD Edmonds Elementary School - 6315052
Prepared by Georgia Department of Education
Page 4
CERTIFIED PERSONNEL DATA
Positions Number Average Contract Days
Personnel Sex
Certificate
Years Experience
Full-time Part-time
Male Female
4 Yr Bachelor's 5 Yr Master's 6 Yr Specialist's 7 Yr Doctoral Other*
<1 1-10 11-20 21-30 >30
Average
Administrators
2.00 220.00
2 0
0 2
0 1 1 0 0 0 0 0 2 0 24.00
Support Personnel
2.00 195.00
2 0
0 2
0 2 0 0 0 0 2 0 0 0 5.50
PK-12 Teachers
34.50 190.00
33 4
2 35
26 10
1 0 0 5 19 8 4 1 8.41
*Includes One- and Two-Year Vocational Certificates.
ACCREDITATION DATA
Accredited by Southern Association of Colleges and Schools (SACS):
Elementary/Middle Commission.
1998-99 GEORGIA PUBLIC EDUCATION REPORT CARD Edmonds Elementary School - 6315052
Prepared by Georgia Department of Education
Page 5
1998-99 GEORGIA PUBLIC EDUCATION REPORT CARD
CLAYTON COUNTY SCHOOLS
Forest Park High School - 6311054
Grade Range 9-12
The Georgia Public Education Report Card is designed to assist systems and schools in educational improvement. This report card contains a variety of data elements. An explanation of the terms is provided as a companion to the report card data. Please refer to the definitions for the most effective use of the reported data.
Total 1,618
STUDENT DATA
9-12 Enrollment, by Race/Ethnicity and Sex
Black
White Hispanic
American Multi-
Asian Indian
racial
870 53.8%
487 30.1%
73
167
4.5% 10.3%
0 0.0%
21 1.3%
Male Female
840 51.9%
778 48.1%
Enrollment in Selected Programs
Program
Gifted (Grades K-12)
Program % of Student Enrollment Population
63
3.9%
Non-Vocational Labs (Grades 9-12)
Vocational Labs (Grades 9-12)
Alternative Programs (Grades 6-12)
1,375 1,297
59
85.0% 80.2%
3.6%
Students Eligible to Receive Free/Reduced Lunches
Number
Percent
School System
851 23,194
52.6% 52.6%
Enrollment in Compensatory Programs
Program
Program % of Student Enrollment Population
Special Education (Grades K-12) PK
115
7.1%
0
N/A
English to Speakers of Other Languages (ESOL) (Grades K-12)
78
4.8%
Remedial Education (Grades 2-5, 9-12)
272 16.8%
Title I (Grades K-12)
This school has a schoolwide program.
Dropout Rate for Grades 9-12
Number
Rate
School System
275 1,191
14.2% 9.1%
Total 251
Retained Students, by Race/Ethnicity and Sex
Black
White Hispanic
American MultiAsian Indian racial
149 59.4%
67 26.7%
12 4.8%
18 7.2%
0 0.0%
5 2.0%
Male Female
168
83
66.9% 33.1%
Prepared by Georgia Department of Education
Page 1
STATE-REQUIRED TEST DATA
GEORGIA HIGH SCHOOL GRADUATION TESTS (GHSGT)
Percent of Regular Program 11th Graders Passing the Georgia High School Graduation Tests on First Administration
English Language Arts Mathematics Social Studies Science
All Components listed above
Writing
1998-99
School System State
94% 87% 75% 63%
96% 88% 82% 70%
96% 88% 80% 72%
59% 67% 68%
91% 92% 93%
1997-98
School System State
94% 91% 72% 67%
97% 91% 78% 75%
94% 88% 78% 74%
60% 70% 68%
91% 94% 92%
1996-97
School System State
94% 90% 75% 75%
96% 91% 80% 76%
94% 87% 78% 74%
68% 71% 67%
94% 95% 93%
GRADUATE DATA
1999 Graduates by Credentials, Race/Ethnicity and Sex
Diplomas with Both College Prep. & Voc. Endorsements
Diplomas with College Prep. Endorsements Diplomas with Vocational Endorsements General High School Diplomas Special Education Diplomas
Total All Diplomas
Certificates of Performance
Total Graduates
Total 99 36 57 5 5
202 0
Black
51 51.5%
16 44.4%
36 63.2%
3 60.0%
2 40.0%
108 53.5%
0
White Hispanic
30 30.3%
1 1.0%
19 52.8%
0 0.0%
16 28.1%
1 1.8%
1 20.0%
0 0.0%
3 60.0%
0 0.0%
69 34.2%
2 1.0%
0
0
American MultiAsian Indian racial
15 15.2%
0 0.0%
2 2.0%
1 2.8%
0 0.0%
0 0.0%
3 5.3%
0 0.0%
1 1.8%
1 20.0%
0 0.0%
0 0.0%
0 0.0%
0 0.0%
0 0.0%
20 9.9%
0 0.0%
3 1.5%
0
0
0
202
108
69
2
20
0
3
53.5% 34.2% 1.0% 9.9% 0.0% 1.5%
Male Female
39
60
39.4% 60.6%
17
19
47.2% 52.8%
30
27
52.6% 47.4%
1
4
20.0% 80.0%
3
2
60.0% 40.0%
90
112
44.6% 55.4%
0
0
90
112
44.6% 55.4%
HOPE Scholarships
School System
Number of 1999 Graduates 2 0 2
Number Eligible
95
Percent Eligible
47.0%
1,750 1,017 58.1%
State
65,548 40,292 61.5%
High School Completion Rate
Percent of 1995Grade 9 Enrollment in Graduating Class of1999 School System State
Completion Rate '95-'99 41.4% 59.9% 68.9%
1998-99 GEORGIA PUBLIC EDUCATION REPORT CARD
Forest Park High School - 6311054
Prepared by Georgia Department of Education
Page 2
COLLEGE ADMISSIONS / CREDIT TEST DATA
Scholastic Assessment Test (SAT)
Based on students' highest verbal and highest math scores
No. Taking
Average Score
Tests Verbal Math Total
Based on students' last test administration
Average Score Verbal Math Total
School
116 453 459
912
College Prep. Endorsement
458 467
925
Other Diplomas
406 404
810
System
1,093 478 474
952
College Prep. Endorsement
480 478
958
Other Diplomas
377 378
755
Georgia
41,958 492 488
980
446 N/A N/A
470 N/A N/A
483
451 N/A N/A
468 N/A N/A
479
897 N/A N/A
938 N/A N/A
962
Nation
952,913 N/A N/A N/A
502 508 1010
American College Testing (ACT)
Advanced Placement Exams (AP)
Number taking tests: English Mathematics Reading Science Reasoning CompositeScore
1 9 School System State
15.0 17.9 19.1
17.3 18.6 19.9
16.1 16.6
18.9 19.0
20.2 19.9
16.3 18.7 19.9
No. of Students Taking Tests
No. of Tests Taken No. of Test Scores
3 or Higher Percent of Test
Scores 3 or Higher
School 53 61 7
11.5%
System State 456 15,225 621 23,969 221 13,024
35.6% 54.3%
POST-SECONDARY DATA
Graduates Entering Georgia Public Colleges
Graduates Entering Georgia Public Colleges and Requiring Learning Support (LS)
1998 Graduates Entering in 1998-99
1997 Graduates Entering in 1997-98
Percent of Graduating Number Class
School
64
33.2%
System 702
41.2%
School
54
27.8%
System 664
40.7%
Number Requiring
LS 11 149
12 156
Percent of those attending Georgia
Public Colleges
17.2%
21.2%
22.2%
23.5%
In previous years, the Report Card presented College Prep Curriculum information provided by the Board of Regents on students requiring Learning Support. Due to inconsistencies in the data provided by the Board of Regents in defining College Prep Completers versus Local Board of Education data defining College Prep Endorsements, the Department of Education Report Card will not provide this information until discrepancies can be reconciled.
Graduates Entering Georgia Public Technical and Adult Schools
1998 Graduates School System
Entering Number 9 42
1998-99 Percent
4.7% 2.5%
Entering Number N/A N/A
1997-98 Percent
N/A N/A
1997 Graduates School
2
1.0%
System
4
0.2%
5
2.6%
19
1.2%
1998-99 GEORGIA PUBLIC EDUCATION REPORT CARD Forest Park High School - 6311054
Prepared by Georgia Department of Education
Page 3
CERTIFIED PERSONNEL DATA
Positions Number Average Contract Days
Administrators
5.00 232.00
Support Personnel
5.00 200.00
PK-12 Teachers
93.67 190.00
Personnel Sex
Certificate
Years Experience
Full-time Part-time
Male Female
4 Yr Bachelor's 5 Yr Master's 6 Yr Specialist's 7 Yr Doctoral Other*
<1 1-10 11-20 21-30 >30
Average
5 0
2 3
0 2 3 0 0
0 1 2 2 0
18.40
5 0
0 5
1 2 2 0 0
1 0 1 3 0
19.00
92 5
34 63
42 44
4 1 6
14 41 19 22
1
10.88
*Includes One- and Two-Year Vocational Certificates.
ACCREDITATION DATA
Accredited by Southern Association of Colleges and Schools (SACS): Secondary/Middle Commission.
AWARDS / RECOGNITION DATA
Schools in Georgia may receive recognition in the following programs: Charter School Pay for Performance Program Georgia School of Excellence National Blue Ribbon School Forest Park High School did not receive recognition in any of these programs during the 1998-99 school year.
1998-99 GEORGIA PUBLIC EDUCATION REPORT CARD Forest Park High School - 6311054
Prepared by Georgia Department of Education
Page 4
1998-99 GEORGIA PUBLIC EDUCATION REPORT CARD
CLAYTON COUNTY SCHOOLS
Forest Park Middle School - 6312054
Grade Range 6-8
The Georgia Public Education Report Card is designed to assist systems and schools in educational improvement. This report card contains a variety of data elements. An explanation of the terms is provided as a companion to the report card data. Please refer to the definitions for the most effective use of the reported data.
STUDENT DATA
Total 800
6-8 Enrollment, by Race/Ethnicity and Sex
Black
White Hispanic
American Multi-
Asian Indian
racial
505 63.1%
193 24.1%
50 6.3%
39 4.9%
0 0.0%
13 1.6%
Male 415
51.9%
Female 385
48.1%
Enrollment in Selected Programs
Program
Gifted (Grades K-12)
Program % of Student Enrollment Population
33
4.1%
Alternative Programs (Grades 6-12)
0
0.0%
Students Eligible to Receive Free/Reduced Lunches
Number
Percent
School System
643 23,194
80.4% 52.6%
Enrollment in Compensatory Programs
Program
Program % of Student Enrollment Population
Special Education (Grades K-12) (PK)
64
8.0%
0
N/A
English to Speakers of Other Languages (ESOL) (Grades K-12)
36
4.5%
Title I (Grades K-12)
This school has a schoolwide program.
Dropout Rate for Grades 6-8
Number
Rate
School System
6
0.6%
46
0.4%
Total 39
Retained Students, by Race/Ethnicity and Sex
Black
White Hispanic
American MultiAsian Indian racial
23 59.0%
13 33.3%
2 5.1%
1 2.6%
0 0.0%
0 0.0%
Male Female
24
15
61.5% 38.5%
Prepared by Georgia Department of Education
Page 1
STATE-REQUIRED TEST DATA
NORM-REFERENCED TESTS Grade 8
Iowa Tests of Basic Skills (ITBS) Each chart reflects data for three years of testing.
Reading Comprehension 50
36 42 49 0
98-99
36 43 48 97-98
33 44 48 96-97
Mathematics
School 50
System
State
0
38 47 56 98-99
39 48 55 97-98
34 49 54 96-97
School System State
Reading Vocabulary 50
28 36 46 0
98-99
25 38 45 97-98
26 40 44 96-97
Language Arts
School 50
System
State
0
49 55 60 98-99
47 55 58 97-98
43 53 56 96-97
School System State
Social Studies 50
44 47 54 0
98-99
38 48 53 97-98
40 51 53 96-97
Science
School 50
System
State
0
37 46 56 98-99
38 48 55 97-98
37 48 53 96-97
School System State
Sources of Information
Composite Score
50
48 52 57 0
98-99
School 50
System
45 53 56 97-98
39 53 55 96-97
State 0
41 48 56 98-99
38 49 54 97-98
1998-99 GEORGIA PUBLIC EDUCATION REPORT CARD Forest Park Middle School - 6312054
Prepared by Georgia Department of Education
37 50 54 96-97
Scores Reported in Percentiles
School System State
Page 2
STATE-REQUIRED TEST DATA
Categories of Scaled Scores
Inadequate (less than 162)
Minimal (162-209)
Good
(210-247)
Very Good (greater than 247)
Average Scaled Score: (Range 100-300)
PERFORMANCE ASSESSMENTS
Grade 8 Writing Assessment
1998-99 Percent Scoring
1997-98 Percent Scoring
1996-97 Percent Scoring
School System State School System State School System State
20% 52% 25%
3%
10% 45% 38%
7%
8% 40% 41% 11%
18% 61% 20%
1%
10% 52% 33%
4%
11% 46% 34%
8%
14% 62% 23%
1%
13% 51% 30%
6%
15% 46% 30%
8%
191
203
208 187
199 202 191
198 198
AWARDS / RECOGNITION DATA
Schools in Georgia may receive recognition in the following programs: Charter School Pay for Performance Program Georgia School of Excellence National Blue Ribbon School Forest Park Middle School did not receive recognition in any of these programs during the 1998-99 school year.
1998-99 GEORGIA PUBLIC EDUCATION REPORT CARD Forest Park Middle School - 6312054
Prepared by Georgia Department of Education
Page 3
CERTIFIED PERSONNEL DATA
Positions Number Average Contract Days
Personnel Sex
Certificate
Years Experience
Full-time Part-time
Male Female
4 Yr Bachelor's 5 Yr Master's 6 Yr Specialist's 7 Yr Doctoral Other*
<1 1-10 11-20 21-30 >30
Average
Administrators
4.00 230.00
4 0
3 1
0 2 2 0 0 0 2 1 0 1 16.00
Support Personnel
2.50 196.00
2 1
1 2
0 3 0 0 0 0 1 1 0 1 19.67
PK-12 Teachers
51.84 190.00
50 4
11 43
35 17
2 0 0 7 30 11 4 2 8.44
*Includes One- and Two-Year Vocational Certificates.
ACCREDITATION DATA
Accredited by Southern Association of Colleges and Schools (SACS):
Elementary/Middle Commission.
1998-99 GEORGIA PUBLIC EDUCATION REPORT CARD Forest Park Middle School - 6312054
Prepared by Georgia Department of Education
Page 4
1998-99 GEORGIA PUBLIC EDUCATION REPORT CARD
CLAYTON COUNTY SCHOOLS
Fountain Elementary School - 6312554
Grade Range PK-5
The Georgia Public Education Report Card is designed to assist systems and schools in educational improvement. This report card contains a variety of data elements. An explanation of the terms is provided as a companion to the report card data. Please refer to the definitions for the most effective use of the reported data.
STUDENT DATA
Total
K-5
777
PK
20
Enrollment, by Race/Ethnicity and Sex
Black
White Hispanic
American Asian Indian
Multiracial
561 72.2%
76 9.8%
91 11.7%
19 2.4%
1 0.1%
29 3.7%
10 50.0%
1 5.0%
8 40.0%
1 5.0%
0 0.0%
0 0.0%
Male Female
406 52.3%
371 47.7%
10 50.0%
10 50.0%
Enrollment in Selected Programs
Program
Program % of Student Enrollment Population
Gifted (Grades K-12)
14
1.8%
Alternative Programs (Grades 6-12)
N/A
N/A
Students Eligible to Receive Free/Reduced Lunches
Number
Percent
School System
654 23,194
82.1% 52.6%
Dropout Rate *
Number
Rate
School System
N/A N/A
N/A N/A
* Dropout rates are not applicable for grades PK-5.
Enrollment in Compensatory Programs
Program
Program % of Student Enrollment Population
Special Education (Grades K-12)
133 17.1%
(PK)
4
N/A
English to Speakers of Other Languages (ESOL) (Grades K-12)
70
9.0%
Remedial Education (Grades 2-5, 9-12)
176 34.6%
Special Instructional Assistance (SIA) (Grades K-3)
49
9.1%
Title I (Grades K-12)
This school has a schoolwide program.
Total 16
Retained Students, by Race/Ethnicity and Sex
Black
White Hispanic
American MultiAsian Indian racial
11 68.8%
1
4
6.3% 25.0%
0 0.0%
0 0.0%
0 0.0%
Male Female
11
5
68.8% 31.3%
Prepared by Georgia Department of Education
Page 1
STATE-REQUIRED TEST DATA
NORM-REFERENCED TESTS Grade 3
Iowa Tests of Basic Skills (ITBS) Each chart reflects data for three years of testing.
Reading Comprehension 50
N/A 42 54 0
98-99
30 43 53 97-98
32 41 52 96-97
Mathematics
School 50
System
State
N/A 46 61
0
98-99
35 48 61 97-98
39 51 59 96-97
School System State
Reading Vocabulary 50
N/A 35 50 0
98-99
26 37 50 97-98
42 39 49 96-97
Language Arts
School 50
System
State
N/A 55 64
0
98-99
33 56 62 97-98
42 56 59 96-97
School System State
Social Studies 50
N/A 44 56 0
98-99
35 45 55 97-98
47 48 55 96-97
Science
School 50
System
State
N/A 44 59
0
98-99
35 45 59 97-98
40 48 58 96-97
School System State
Sources of Information
Composite Score
50
N/A 46 57 0
98-99
School 50
System
31 46 56 97-98
38 48 55 96-97
State
N/A 44 58
0
98-99
30 46 57 97-98
1998-99 GEORGIA PUBLIC EDUCATION REPORT CARD Fountain Elementary School - 6312554
Prepared by Georgia Department of Education
38 47 56 96-97
Scores Reported in Percentiles
School System State
Page 2
STATE-REQUIRED TEST DATA
NORM-REFERENCED TESTS Grade 5
Iowa Tests of Basic Skills (ITBS) Each chart reflects data for three years of testing.
Reading Comprehension
Mathematics
50
N/A 44 53 0
98-99
32 43 53 97-98
40 45 52 96-97
School 50
System
State
N/A 47 59
0
98-99
40 49 58 97-98
48 50 57 96-97
School System State
Reading Vocabulary 50
N/A 36 48 0
98-99
22 34 48 97-98
31 37 46 96-97
Language Arts
School 50
System
State
N/A 57 63
0
98-99
40 56 61 97-98
45 57 58 96-97
School System State
Social Studies 50
N/A 45 57 0
98-99
33 46 56 97-98
48 48 55 96-97
Science
School 50
System
State
N/A 47 60
0
98-99
42 49 59 97-98
38 50 59 96-97
School System State
Sources of Information
Composite Score
50
N/A 50 58 0
98-99
School 50
System
39 51 58 97-98
48 52 57 96-97
State
N/A 46 57
0
98-99
35 47 56 97-98
42 48 55 96-97
1998-99 GEORGIA PUBLIC EDUCATION REPORT CARD Fountain Elementary School - 6312554
Prepared by Georgia Department of Education
Scores Reported in Percentiles
School System State
Page 3
STATE-REQUIRED TEST DATA
PERFORMANCE ASSESSMENTS
Grade 5 Writing Assessment
Percent at Developmental Stages:
1998-99 School System State
1997-98 School System State
1996-97 School System State
Stage Stage Stage Stage Stage Stage
1:The Emerging Writer 2:The Developing Writer 3:The Focusing Writer 4:The Experimenting 5:The Engaging Writer 6:The Extending Writer
0% 1% 27% 35% 32% 4%
0% 1% 17% 41% 28% 12%
0% 1% 16% 41% 29% 12%
0% 4% 20% 48% 22% 5%
1% 3% 21% 42% 25% 8%
0% 3% 19% 41% 27% 10%
0% 2% 16% 51% 25% 6%
0% 3% 21% 40% 26% 8%
0% 3% 21% 37% 26% 12%
AWARDS / RECOGNITION DATA
Schools in Georgia may receive recognition in the following programs: Charter School Pay for Performance Program Georgia School of Excellence National Blue Ribbon School Fountain Elementary School did not receive recognition in any of these programs during the 1998-99 school year.
1998-99 GEORGIA PUBLIC EDUCATION REPORT CARD Fountain Elementary School - 6312554
Prepared by Georgia Department of Education
Page 4
CERTIFIED PERSONNEL DATA
Positions Number Average Contract Days
Personnel Sex
Certificate
Years Experience
Full-time Part-time
Male Female
4 Yr Bachelor's 5 Yr Master's 6 Yr Specialist's 7 Yr Doctoral Other*
<1 1-10 11-20 21-30 >30
Average
Administrators
3.00 226.67
3 0
0 3
0 1 2 0 0 1 0 0 2 0 18.33
Support Personnel
2.50 196.00
2 1
0 3
0 1 2 0 0 0 0 0 3 0 22.67
PK-12 Teachers
53.84 190.00
53 3
6 50
32 21
3 0 0 3 31 14 7 1 10.14
*Includes One- and Two-Year Vocational Certificates.
ACCREDITATION DATA
Accredited by Southern Association of Colleges and Schools (SACS):
Elementary/Middle Commission.
1998-99 GEORGIA PUBLIC EDUCATION REPORT CARD Fountain Elementary School - 6312554
Prepared by Georgia Department of Education
Page 5
1998-99 GEORGIA PUBLIC EDUCATION REPORT CARD
CLAYTON COUNTY SCHOOLS
Hawthorne Elementary School - 6310199
Grade Range K-5
The Georgia Public Education Report Card is designed to assist systems and schools in educational improvement. This report card contains a variety of data elements. An explanation of the terms is provided as a companion to the report card data. Please refer to the definitions for the most effective use of the reported data.
STUDENT DATA
Total 691
K-5 Enrollment, by Race/Ethnicity and Sex
Black
White Hispanic
American Multi-
Asian Indian
racial
261 37.8%
362 52.4%
20 2.9%
29 4.2%
1 0.1%
18 2.6%
Male Female
372 53.8%
319 46.2%
Enrollment in Selected Programs
Program
Program % of Student Enrollment Population
Gifted (Grades K-12)
37
5.4%
Alternative Programs (Grades 6-12)
N/A
N/A
Students Eligible to Receive Free/Reduced Lunches
Number
Percent
School System
265 23,194
38.4% 52.6%
Dropout Rate *
Number
Rate
School System
N/A N/A
N/A N/A
* Dropout rates are not applicable for grades PK-5.
Enrollment in Compensatory Programs
Program
Program % of Student Enrollment Population
Special Education (Grades K-12)
74 10.7%
(PK)
0
N/A
English to Speakers of Other Languages (ESOL) (Grades K-12)
16
2.3%
Remedial Education (Grades 2-5, 9-12)
145 30.6%
Special Instructional Assistance (SIA) (Grades K-3)
0
0.0%
Title I (Grades K-12)
This school has no Title I program.
Total 6
Retained Students, by Race/Ethnicity and Sex
Black
White Hispanic
American Multi-
Asian Indian
racial
3 50.0%
3 50.0%
0 0.0%
0 0.0%
0 0.0%
0 0.0%
Male Female
4
2
66.7% 33.3%
Prepared by Georgia Department of Education
Page 1
STATE-REQUIRED TEST DATA
NORM-REFERENCED TESTS Grade 3
Iowa Tests of Basic Skills (ITBS) Each chart reflects data for three years of testing.
Reading Comprehension 50
50 42 54 N/A 43 53 N/A 41 52
0
98-99
97-98
96-97
Mathematics
School 50
System
State
0
57 46 61 N/A 48 61 N/A 51 59
98-99
97-98
96-97
School System State
Reading Vocabulary 50
44 35 50 N/A 37 50 N/A 39 49
0
98-99
97-98
96-97
Language Arts
School 50
System
State
0
69 55 64 N/A 56 62 N/A 56 59
98-99
97-98
96-97
School System State
Social Studies 50
52 44 56 N/A 45 55 N/A 48 55
0
98-99
97-98
96-97
Science
School 50
System
State
0
54 44 59 N/A 45 59 N/A 48 58
98-99
97-98
96-97
School System State
Sources of Information
Composite Score
School
50
50
System
57 46 57 N/A 46 56 N/A 48 55
0
98-99
97-98
96-97
State 0
55 44 58 N/A 46 57 N/A 47 56
98-99
97-98
96-97
1998-99 GEORGIA PUBLIC EDUCATION REPORT CARD Hawthorne Elementary School - 6310199
Prepared by Georgia Department of Education
Scores Reported in Percentiles
School System State
Page 2
STATE-REQUIRED TEST DATA
NORM-REFERENCED TESTS Grade 5
Iowa Tests of Basic Skills (ITBS) Each chart reflects data for three years of testing.
Reading Comprehension
Mathematics
50
54 44 53 N/A 43 53 N/A 45 52
0
98-99
97-98
96-97
School 50
System
State
0
64 47 59 N/A 49 58 N/A 50 57
98-99
97-98
96-97
School System State
Reading Vocabulary 50
49 36 48 N/A 34 48 N/A 37 46 0
98-99
97-98
96-97
Language Arts
School 50
System
State
0
72 57 63 N/A 56 61 N/A 57 58
98-99
97-98
96-97
School System State
Social Studies 50
60 45 57 N/A 46 56 N/A 48 55
0
98-99
97-98
96-97
Science
School 50
System
State
0
64 47 60 N/A 49 59 N/A 50 59
98-99
97-98
96-97
School System State
Sources of Information
Composite Score
School
50
50
System
66 50 58 N/A 51 58 N/A 52 57 0
98-99
97-98
96-97
State 0
63 46 57 N/A 47 56 N/A 48 55
98-99
97-98
96-97
1998-99 GEORGIA PUBLIC EDUCATION REPORT CARD Hawthorne Elementary School - 6310199
Prepared by Georgia Department of Education
Scores Reported in Percentiles
School System State
Page 3
STATE-REQUIRED TEST DATA
PERFORMANCE ASSESSMENTS
Grade 5 Writing Assessment
Percent at Developmental Stages:
1998-99 School System State
1997-98 School System State
1996-97 School System State
Stage Stage Stage Stage Stage Stage
1:The Emerging Writer 2:The Developing Writer 3:The Focusing Writer 4:The Experimenting 5:The Engaging Writer 6:The Extending Writer
0% 0% 6% 38% 40% 17%
0% 1% 17% 41% 28% 12%
0% 1% 16% 41% 29% 12%
N/A N/A N/A N/A N/A N/A
1% 3% 21% 42% 25% 8%
0% 3% 19% 41% 27% 10%
N/A N/A N/A N/A N/A N/A
0% 3% 21% 40% 26% 8%
0% 3% 21% 37% 26% 12%
AWARDS / RECOGNITION DATA
Schools in Georgia may receive recognition in the following programs: Charter School Pay for Performance Program Georgia School of Excellence National Blue Ribbon School Hawthorne Elementary School did not receive recognition in any of these programs during the 1998-99 school year.
1998-99 GEORGIA PUBLIC EDUCATION REPORT CARD Hawthorne Elementary School - 6310199
Prepared by Georgia Department of Education
Page 4
CERTIFIED PERSONNEL DATA
Positions Number Average Contract Days
Personnel Sex
Certificate
Years Experience
Full-time Part-time
Male Female
4 Yr Bachelor's 5 Yr Master's 6 Yr Specialist's 7 Yr Doctoral Other*
<1 1-10 11-20 21-30 >30
Average
Administrators
3.00 226.67
3 0
1 2
0 1 2 0 0 0 0 1 2 0 22.33
Support Personnel
3.00 193.33
3 0
0 3
0 3 0 0 0 0 0 3 0 0 17.33
PK-12 Teachers
39.00 190.00
39 0
0 39
22 15
2 0 0 5 15 7 10 2 12.15
*Includes One- and Two-Year Vocational Certificates.
ACCREDITATION DATA
Accredited by Southern Association of Colleges and Schools (SACS):
Elementary/Middle Commission.
1998-99 GEORGIA PUBLIC EDUCATION REPORT CARD Hawthorne Elementary School - 6310199
Prepared by Georgia Department of Education
Page 5
1998-99 GEORGIA PUBLIC EDUCATION REPORT CARD
CLAYTON COUNTY SCHOOLS
Haynie Elementary School - 6313054
Grade Range K-5
The Georgia Public Education Report Card is designed to assist systems and schools in educational improvement. This report card contains a variety of data elements. An explanation of the terms is provided as a companion to the report card data. Please refer to the definitions for the most effective use of the reported data.
STUDENT DATA
Total 1,033
K-5 Enrollment, by Race/Ethnicity and Sex
Black
White Hispanic
American Multi-
Asian Indian
racial
569 55.1%
258 25.0%
101 9.8%
64 6.2%
0 0.0%
41 4.0%
Male Female
500 48.4%
533 51.6%
Enrollment in Selected Programs
Program
Program % of Student Enrollment Population
Gifted (Grades K-12)
16
1.5%
Alternative Programs (Grades 6-12)
N/A
N/A
Students Eligible to Receive Free/Reduced Lunches
Number
Percent
School System
726 23,194
70.3% 52.6%
Dropout Rate *
Number
Rate
School System
N/A N/A
N/A N/A
* Dropout rates are not applicable for grades PK-5.
Enrollment in Compensatory Programs
Program
Program % of Student Enrollment Population
Special Education (Grades K-12)
90
8.7%
(PK)
0
N/A
English to Speakers of Other Languages (ESOL) (Grades K-12)
111 10.7%
Remedial Education (Grades 2-5, 9-12)
236 35.6%
Special Instructional Assistance (SIA) (Grades K-3)
50
7.0%
Title I (Grades K-12)
This school has a schoolwide program.
Total 18
Retained Students, by Race/Ethnicity and Sex
Black
White Hispanic
American Multi-
Asian Indian
racial
8 44.4%
5 27.8%
5 27.8%
0 0.0%
0 0.0%
0 0.0%
Male Female
9
9
50.0% 50.0%
Prepared by Georgia Department of Education
Page 1
STATE-REQUIRED TEST DATA
NORM-REFERENCED TESTS Grade 3
Iowa Tests of Basic Skills (ITBS) Each chart reflects data for three years of testing.
Reading Comprehension 50
34 42 54 0
98-99
38 43 53 97-98
33 41 52 96-97
Mathematics
School 50
System
State
0
39 46 61 98-99
40 48 61 97-98
39 51 59 96-97
School System State
Reading Vocabulary 50
26 35 50 0
98-99
27 37 50 97-98
33 39 49 96-97
Language Arts
School 50
System
State
0
47 55 64 98-99
49 56 62 97-98
40 56 59 96-97
School System State
Social Studies 50
42 44 56 0
98-99
36 45 55 97-98
42 48 55 96-97
Science
School 50
System
State
0
36 44 59 98-99
36 45 59 97-98
39 48 58 96-97
School System State
Sources of Information
Composite Score
50
44 46 57 0
98-99
School 50
System
40 46 56 97-98
43 48 55 96-97
State 0
38 44 58 98-99
36 46 57 97-98
1998-99 GEORGIA PUBLIC EDUCATION REPORT CARD Haynie Elementary School - 6313054
Prepared by Georgia Department of Education
37 47 56 96-97
Scores Reported in Percentiles
School System State
Page 2
STATE-REQUIRED TEST DATA
NORM-REFERENCED TESTS Grade 5
Iowa Tests of Basic Skills (ITBS) Each chart reflects data for three years of testing.
Reading Comprehension
Mathematics
50
44 44 53 0
98-99
40 43 53 97-98
36 45 52 96-97
School 50
System
State
0
46 47 59 98-99
41 49 58 97-98
34 50 57 96-97
School System State
Reading Vocabulary 50
29 36 48 0
98-99
33 34 48 97-98
26 37 46 96-97
Language Arts
School 50
System
State
0
55 57 63 98-99
52 56 61 97-98
43 57 58 96-97
School System State
Social Studies 50
44 45 57 0
98-99
40 46 56 97-98
30 48 55 96-97
Science
School 50
System
State
0
37 47 60 98-99
38 49 59 97-98
37 50 59 96-97
School System State
Sources of Information
Composite Score
50
52 50 58 0
98-99
School 50
System
47 51 58 97-98
39 52 57 96-97
State 0
44 46 57 98-99
40 47 56 97-98
34 48 55 96-97
1998-99 GEORGIA PUBLIC EDUCATION REPORT CARD Haynie Elementary School - 6313054
Prepared by Georgia Department of Education
Scores Reported in Percentiles
School System State
Page 3
STATE-REQUIRED TEST DATA
PERFORMANCE ASSESSMENTS
Grade 5 Writing Assessment
Percent at Developmental Stages:
1998-99 School System State
1997-98 School System State
1996-97 School System State
Stage Stage Stage Stage Stage Stage
1:The Emerging Writer 2:The Developing Writer 3:The Focusing Writer 4:The Experimenting 5:The Engaging Writer 6:The Extending Writer
0% 0% 25% 48% 20% 7%
0% 1% 17% 41% 28% 12%
0% 1% 16% 41% 29% 12%
1% 6% 35% 40% 15% 3%
1% 3% 21% 42% 25% 8%
0% 3% 19% 41% 27% 10%
0% 5% 29% 31% 28% 8%
0% 3% 21% 40% 26% 8%
0% 3% 21% 37% 26% 12%
AWARDS / RECOGNITION DATA
Schools in Georgia may receive recognition in the following programs: Charter School Pay for Performance Program Georgia School of Excellence National Blue Ribbon School Haynie Elementary School did not receive recognition in any of these programs during the 1998-99 school year.
1998-99 GEORGIA PUBLIC EDUCATION REPORT CARD Haynie Elementary School - 6313054
Prepared by Georgia Department of Education
Page 4
CERTIFIED PERSONNEL DATA
Positions Number Average Contract Days
Personnel Sex
Certificate
Years Experience
Full-time Part-time
Male Female
4 Yr Bachelor's 5 Yr Master's 6 Yr Specialist's 7 Yr Doctoral Other*
<1 1-10 11-20 21-30 >30
Average
Administrators
3.00 226.67
3 0
1 2
0 1 2 0 0 0 0 1 2 0 21.67
Support Personnel
3.35 197.01
2 2
0 4
0 3 1 0 0 1 2 0 1 0 7.75
PK-12 Teachers
58.05 190.00
56 4
4 56
40 18
2 0 0 8 25 10 14 3 11.50
*Includes One- and Two-Year Vocational Certificates.
ACCREDITATION DATA
Accredited by Southern Association of Colleges and Schools (SACS):
Elementary/Middle Commission.
1998-99 GEORGIA PUBLIC EDUCATION REPORT CARD Haynie Elementary School - 6313054
Prepared by Georgia Department of Education
Page 5
1998-99 GEORGIA PUBLIC EDUCATION REPORT CARD
CLAYTON COUNTY SCHOOLS
Hendrix Drive Elementary School - 6314054
Grade Range PK-5
The Georgia Public Education Report Card is designed to assist systems and schools in educational improvement. This report card contains a variety of data elements. An explanation of the terms is provided as a companion to the report card data. Please refer to the definitions for the most effective use of the reported data.
STUDENT DATA
Total
K-5
459
PK
20
Enrollment, by Race/Ethnicity and Sex
Black
White Hispanic
American Asian Indian
Multiracial
217 47.3%
132 28.8%
45 9.8%
42 9.2%
0 0.0%
23 5.0%
7 35.0%
4 20.0%
5 25.0%
3 15.0%
0 0.0%
1 5.0%
Male Female
226 49.2%
233 50.8%
13 65.0%
7 35.0%
Enrollment in Selected Programs
Program
Program % of Student Enrollment Population
Gifted (Grades K-12)
10
2.2%
Alternative Programs (Grades 6-12)
N/A
N/A
Students Eligible to Receive Free/Reduced Lunches
Number
Percent
School System
403 23,194
84.1% 52.6%
Dropout Rate *
Number
Rate
School System
N/A N/A
N/A N/A
* Dropout rates are not applicable for grades PK-5.
Enrollment in Compensatory Programs
Program
Program % of Student Enrollment Population
Special Education (Grades K-12)
42
9.2%
(PK)
0
N/A
English to Speakers of Other Languages (ESOL) (Grades K-12)
55 12.0%
Remedial Education (Grades 2-5, 9-12)
96 33.4%
Special Instructional Assistance (SIA) (Grades K-3)
50 15.6%
Title I (Grades K-12)
This school has a schoolwide program.
Total 10
Retained Students, by Race/Ethnicity and Sex
Black
White Hispanic
American MultiAsian Indian racial
4 40.0%
5
1
50.0% 10.0%
0 0.0%
0 0.0%
0 0.0%
Male Female
3
7
30.0% 70.0%
Prepared by Georgia Department of Education
Page 1
STATE-REQUIRED TEST DATA
NORM-REFERENCED TESTS Grade 3
Iowa Tests of Basic Skills (ITBS) Each chart reflects data for three years of testing.
Reading Comprehension 50
39 42 54 0
98-99
35 43 53 97-98
34 41 52 96-97
Mathematics
School 50
System
State
0
37 46 61 98-99
46 48 61 97-98
45 51 59 96-97
School System State
Reading Vocabulary 50
34 35 50 0
98-99
24 37 50 97-98
28 39 49 96-97
Language Arts
School 50
System
State
0
52 55 64 98-99
45 56 62 97-98
44 56 59 96-97
School System State
Social Studies 50
40 44 56 0
98-99
40 45 55 97-98
36 48 55 96-97
Science
School 50
System
State
0
38 44 59 98-99
35 45 59 97-98
40 48 58 96-97
School System State
Sources of Information
Composite Score
50
39 46 57 0
98-99
School 50
System
37 46 56 97-98
42 48 55 96-97
State 0
38 44 58 98-99
37 46 57 97-98
1998-99 GEORGIA PUBLIC EDUCATION REPORT CARD Hendrix Drive Elementary School - 6314054
Prepared by Georgia Department of Education
38 47 56 96-97
Scores Reported in Percentiles
School System State
Page 2
STATE-REQUIRED TEST DATA
NORM-REFERENCED TESTS Grade 5
Iowa Tests of Basic Skills (ITBS) Each chart reflects data for three years of testing.
Reading Comprehension
Mathematics
50
38 44 53 0
98-99
54 43 53 97-98
40 45 52 96-97
School 50
System
State
0
37 47 59 98-99
61 49 58 97-98
43 50 57 96-97
School System State
Reading Vocabulary 50
19 36 48 0
98-99
39 34 48 97-98
29 37 46 96-97
Language Arts
School 50
System
State
0
55 57 63 98-99
69 56 61 97-98
55 57 58 96-97
School System State
Social Studies 50
26 45 57 0
98-99
53 46 56 97-98
37 48 55 96-97
Science
School 50
System
State
0
28 47 60 98-99
57 49 59 97-98
43 50 59 96-97
School System State
Sources of Information
Composite Score
50
44 50 58 0
98-99
School 50
System
56 51 58 97-98
45 52 57 96-97
State 0
35 46 57 98-99
57 47 56 97-98
41 48 55 96-97
1998-99 GEORGIA PUBLIC EDUCATION REPORT CARD Hendrix Drive Elementary School - 6314054
Prepared by Georgia Department of Education
Scores Reported in Percentiles
School System State
Page 3
STATE-REQUIRED TEST DATA
PERFORMANCE ASSESSMENTS
Grade 5 Writing Assessment
Percent at Developmental Stages:
1998-99 School System State
1997-98 School System State
1996-97 School System State
Stage Stage Stage Stage Stage Stage
1:The Emerging Writer 2:The Developing Writer 3:The Focusing Writer 4:The Experimenting 5:The Engaging Writer 6:The Extending Writer
2% 0% 20% 47% 24% 7%
0% 1% 17% 41% 28% 12%
0% 1% 16% 41% 29% 12%
0% 4% 12% 50% 27% 8%
1% 3% 21% 42% 25% 8%
0% 3% 19% 41% 27% 10%
0% 4% 29% 38% 24% 4%
0% 3% 21% 40% 26% 8%
0% 3% 21% 37% 26% 12%
AWARDS / RECOGNITION DATA
Schools in Georgia may receive recognition in the following programs: Charter School Pay for Performance Program Georgia School of Excellence National Blue Ribbon School Hendrix Drive Elementary School did not receive recognition in any of these programs during the 1998-99 school year.
1998-99 GEORGIA PUBLIC EDUCATION REPORT CARD Hendrix Drive Elementary School - 6314054
Prepared by Georgia Department of Education
Page 4
CERTIFIED PERSONNEL DATA
Positions Number Average Contract Days
Personnel Sex
Certificate
Years Experience
Full-time Part-time
Male Female
4 Yr Bachelor's 5 Yr Master's 6 Yr Specialist's 7 Yr Doctoral Other*
<1 1-10 11-20 21-30 >30
Average
Administrators
2.00 220.00
2 0
1 1
0 0 2 0 0 0 0 1 1 0 19.00
Support Personnel
2.00 195.00
2 0
0 2
0 0 2 0 0 0 0 0 2 0 26.50
PK-12 Teachers
30.00 190.00
29 2
1 30
18 12
1 0 0 2 17 5 7 0 10.10
*Includes One- and Two-Year Vocational Certificates.
ACCREDITATION DATA
Accredited by Southern Association of Colleges and Schools (SACS):
Elementary/Middle Commission.
1998-99 GEORGIA PUBLIC EDUCATION REPORT CARD Hendrix Drive Elementary School - 6314054
Prepared by Georgia Department of Education
Page 5
1998-99 GEORGIA PUBLIC EDUCATION REPORT CARD
CLAYTON COUNTY SCHOOLS
Huie Elementary School - 6315054
Grade Range PK-5
The Georgia Public Education Report Card is designed to assist systems and schools in educational improvement. This report card contains a variety of data elements. An explanation of the terms is provided as a companion to the report card data. Please refer to the definitions for the most effective use of the reported data.
STUDENT DATA
Total
K-5
783
PK
60
Enrollment, by Race/Ethnicity and Sex
Black
White Hispanic
American Asian Indian
Multiracial
492 62.8%
100 12.8%
121 15.5%
41 5.2%
2 0.3%
27 3.4%
33 55.0%
8 13.3%
14 23.3%
4 6.7%
0 0.0%
1 1.7%
Male Female
412 52.6%
371 47.4%
35 58.3%
25 41.7%
Enrollment in Selected Programs
Program
Program % of Student Enrollment Population
Gifted (Grades K-12)
8
1.0%
Alternative Programs (Grades 6-12)
N/A
N/A
Students Eligible to Receive Free/Reduced Lunches
Number
Percent
School System
741 23,194
87.9% 52.6%
Dropout Rate *
Number
Rate
School System
N/A N/A
N/A N/A
* Dropout rates are not applicable for grades PK-5.
Enrollment in Compensatory Programs
Program
Program % of Student Enrollment Population
Special Education (Grades K-12)
75
9.6%
(PK)
3
N/A
English to Speakers of Other Languages (ESOL) (Grades K-12)
97 12.4%
Remedial Education (Grades 2-5, 9-12)
176 35.1%
Special Instructional Assistance (SIA) (Grades K-3)
50
9.2%
Title I (Grades K-12)
This school has a schoolwide program.
Total 53
Retained Students, by Race/Ethnicity and Sex
Black
White Hispanic
American MultiAsian Indian racial
35 66.0%
2
15
3.8% 28.3%
1 1.9%
0 0.0%
0 0.0%
Male Female
37
16
69.8% 30.2%
Prepared by Georgia Department of Education
Page 1
STATE-REQUIRED TEST DATA
NORM-REFERENCED TESTS Grade 3
Iowa Tests of Basic Skills (ITBS) Each chart reflects data for three years of testing.
Reading Comprehension 50
40 42 54 0
98-99
41 43 53 97-98
27 41 52 96-97
Mathematics
School 50
System
State
0
52 46 61 98-99
49 48 61 97-98
34 51 59 96-97
School System State
Reading Vocabulary 50
30 35 50 0
98-99
27 37 50 97-98
18 39 49 96-97
Language Arts
School 50
System
State
0
57 55 64 98-99
57 56 62 97-98
39 56 59 96-97
School System State
Social Studies 50
43 44 56 0
98-99
38 45 55 97-98
26 48 55 96-97
Science
School 50
System
State
0
43 44 59 98-99
38 45 59 97-98
24 48 58 96-97
School System State
Sources of Information
Composite Score
50
44 46 57 0
98-99
School 50
System
46 46 56 97-98
33 48 55 96-97
State 0
44 44 58 98-99
42 46 57 97-98
1998-99 GEORGIA PUBLIC EDUCATION REPORT CARD Huie Elementary School - 6315054
Prepared by Georgia Department of Education
28 47 56 96-97
Scores Reported in Percentiles
School System State
Page 2
STATE-REQUIRED TEST DATA
NORM-REFERENCED TESTS Grade 5
Iowa Tests of Basic Skills (ITBS) Each chart reflects data for three years of testing.
Reading Comprehension
Mathematics
50
36 44 53 0
98-99
35 43 53 97-98
37 45 52 96-97
School 50
System
State
0
34 47 59 98-99
38 49 58 97-98
39 50 57 96-97
School System State
Reading Vocabulary 50
22 36 48 0
98-99
21 34 48 97-98
24 37 46 96-97
Language Arts
School 50
System
State
0
37 57 63 98-99
37 56 61 97-98
47 57 58 96-97
School System State
Social Studies 50
30 45 57 0
98-99
30 46 56 97-98
36 48 55 96-97
Science
School 50
System
State
0
28 47 60 98-99
29 49 59 97-98
36 50 59 96-97
School System State
Sources of Information
Composite Score
50
34 50 58 0
98-99
School 50
System
36 51 58 97-98
40 52 57 96-97
State 0
30 46 57 98-99
31 47 56 97-98
36 48 55 96-97
1998-99 GEORGIA PUBLIC EDUCATION REPORT CARD Huie Elementary School - 6315054
Prepared by Georgia Department of Education
Scores Reported in Percentiles
School System State
Page 3
STATE-REQUIRED TEST DATA
PERFORMANCE ASSESSMENTS
Grade 5 Writing Assessment
Percent at Developmental Stages:
1998-99 School System State
1997-98 School System State
1996-97 School System State
Stage Stage Stage Stage Stage Stage
1:The Emerging Writer 2:The Developing Writer 3:The Focusing Writer 4:The Experimenting 5:The Engaging Writer 6:The Extending Writer
0% 0% 19% 51% 25% 4%
0% 1% 17% 41% 28% 12%
0% 1% 16% 41% 29% 12%
1% 6% 26% 41% 18% 8%
1% 3% 21% 42% 25% 8%
0% 3% 19% 41% 27% 10%
0% 9% 24% 40% 23% 3%
0% 3% 21% 40% 26% 8%
0% 3% 21% 37% 26% 12%
AWARDS / RECOGNITION DATA
Schools in Georgia may receive recognition in the following programs: Charter School Pay for Performance Program Georgia School of Excellence National Blue Ribbon School Huie Elementary School did not receive recognition in any of these programs during the 1998-99 school year.
1998-99 GEORGIA PUBLIC EDUCATION REPORT CARD Huie Elementary School - 6315054
Prepared by Georgia Department of Education
Page 4
CERTIFIED PERSONNEL DATA
Positions Number Average Contract Days
Personnel Sex
Certificate
Years Experience
Full-time Part-time
Male Female
4 Yr Bachelor's 5 Yr Master's 6 Yr Specialist's 7 Yr Doctoral Other*
<1 1-10 11-20 21-30 >30
Average
Administrators
3.00 226.67
3 0
1 2
0 1 2 0 0 0 0 1 2 0 21.67
Support Personnel
2.50 196.00
2 1
0 3
0 2 1 0 0 0 1 1 1 0 14.33
PK-12 Teachers
50.38 190.00
50 2
5 47
40 12
0 0 0 9 24 16 3 0 8.71
*Includes One- and Two-Year Vocational Certificates.
ACCREDITATION DATA
Accredited by Southern Association of Colleges and Schools (SACS):
Elementary/Middle Commission.
1998-99 GEORGIA PUBLIC EDUCATION REPORT CARD Huie Elementary School - 6315054
Prepared by Georgia Department of Education
Page 5
1998-99 GEORGIA PUBLIC EDUCATION REPORT CARD
CLAYTON COUNTY SCHOOLS
Jonesboro High School - 6311056
Grade Range 9-12
The Georgia Public Education Report Card is designed to assist systems and schools in educational improvement. This report card contains a variety of data elements. An explanation of the terms is provided as a companion to the report card data. Please refer to the definitions for the most effective use of the reported data.
Total 1,597
STUDENT DATA
9-12 Enrollment, by Race/Ethnicity and Sex
Black
White Hispanic
American Multi-
Asian Indian
racial
564 35.3%
889 55.7%
44 2.8%
79 4.9%
1 0.1%
20 1.3%
Male Female
768 48.1%
829 51.9%
Enrollment in Selected Programs
Program
Gifted (Grades K-12)
Program % of Student Enrollment Population
93
5.8%
Non-Vocational Labs (Grades 9-12)
Vocational Labs (Grades 9-12)
Alternative Programs (Grades 6-12)
1,475 848 0
92.4% 53.1%
0.0%
Students Eligible to Receive Free/Reduced Lunches
Number
Percent
School System
393 23,194
24.6% 52.6%
Enrollment in Compensatory Programs
Program
Program % of Student Enrollment Population
Special Education (Grades K-12) PK
106
6.6%
0
N/A
English to Speakers of Other Languages (ESOL) (Grades K-12)
30
1.9%
Remedial Education (Grades 2-5, 9-12)
136
8.5%
Title I (Grades K-12)
This school has no Title I program.
Dropout Rate for Grades 9-12
Number
Rate
School System
144 1,191
7.9% 9.1%
Total 185
Retained Students, by Race/Ethnicity and Sex
Black
White Hispanic
American MultiAsian Indian racial
98 53.0%
72 38.9%
7 3.8%
6 3.2%
0 0.0%
2 1.1%
Male Female
116
69
62.7% 37.3%
Prepared by Georgia Department of Education
Page 1
STATE-REQUIRED TEST DATA
GEORGIA HIGH SCHOOL GRADUATION TESTS (GHSGT)
Percent of Regular Program 11th Graders Passing the Georgia High School Graduation Tests on First Administration
English Language Arts Mathematics Social Studies Science
All Components listed above
Writing
1998-99
School System State
96% 92% 85% 77%
96% 88% 82% 70%
96% 88% 80% 72%
75% 67% 68%
94% 92% 93%
1997-98
School System State
98% 94% 87% 84%
97% 91% 78% 75%
94% 88% 78% 74%
81% 70% 68%
94% 94% 92%
1996-97
School System State
97% 95% 84% 82%
96% 91% 80% 76%
94% 87% 78% 74%
78% 71% 67%
95% 95% 93%
GRADUATE DATA
1999 Graduates by Credentials, Race/Ethnicity and Sex
Diplomas with Both College Prep. & Voc. Endorsements
Diplomas with College Prep. Endorsements Diplomas with Vocational Endorsements General High School Diplomas Special Education Diplomas
Total All Diplomas
Certificates of Performance
Total Graduates
Total 28
191 43 6 10
278 0
Black
6 21.4%
46 24.1%
17 39.5%
4 66.7%
5 50.0%
78 28.1%
0
White Hispanic
18 64.3%
1 3.6%
126 66.0%
6 3.1%
25 58.1%
0 0.0%
2 33.3%
0 0.0%
4 40.0%
0 0.0%
175 62.9%
7 2.5%
0
0
American MultiAsian Indian racial
3 10.7%
0 0.0%
0 0.0%
13 6.8%
0 0.0%
0 0.0%
1 2.3%
0 0.0%
0 0.0%
0 0.0%
0 0.0%
0 0.0%
1 10.0%
0 0.0%
0 0.0%
18 6.5%
0 0.0%
0 0.0%
0
0
0
278
78
175
7
18
0
0
28.1% 62.9% 2.5% 6.5% 0.0% 0.0%
Male Female
13
15
46.4% 53.6%
80
111
41.9% 58.1%
24
19
55.8% 44.2%
2
4
33.3% 66.7%
6
4
60.0% 40.0%
125
153
45.0% 55.0%
0
0
125
153
45.0% 55.0%
HOPE Scholarships
School System
Number of 1999 Graduates 2 7 8
Number Eligible
181
Percent Eligible
65.1%
1,750 1,017 58.1%
State
65,548 40,292 61.5%
High School Completion Rate
Percent of 1995Grade 9 Enrollment in Graduating Class of1999 School System State
Completion Rate '95-'99 63.8% 59.9% 68.9%
1998-99 GEORGIA PUBLIC EDUCATION REPORT CARD
Jonesboro High School - 6311056
Prepared by Georgia Department of Education
Page 2
COLLEGE ADMISSIONS / CREDIT TEST DATA
Scholastic Assessment Test (SAT)
Based on students' highest verbal and highest math scores
No. Taking
Average Score
Tests Verbal Math Total
Based on students' last test administration
Average Score Verbal Math Total
School
160
College Prep. Endorsement
Other Diplomas
System
1,093
College Prep. Endorsement
Other Diplomas
Georgia
41,958
522 532 1054
518 527 1045
393 423
816
478 474
952
480 478
958
377 378
755
492 488
980
515 N/A N/A
470 N/A N/A
483
524 N/A N/A
468 N/A N/A
479
1039 N/A N/A
938 N/A N/A
962
Nation
952,913 N/A N/A N/A
502 508 1010
American College Testing (ACT)
Advanced Placement Exams (AP)
Number taking tests: English Mathematics Reading Science Reasoning CompositeScore
3 8 School System State
16.8 17.9 19.1
18.6 18.6 19.9
18.7 19.5
18.9 19.0
20.2 19.9
18.6 18.7 19.9
No. of Students Taking Tests
No. of Tests Taken No. of Test Scores
3 or Higher Percent of Test
Scores 3 or Higher
School 129 192 89
46.4%
System State 456 15,225 621 23,969 221 13,024
35.6% 54.3%
POST-SECONDARY DATA
Graduates Entering Georgia Public Colleges
Graduates Entering Georgia Public Colleges and Requiring Learning Support (LS)
1998 Graduates Entering in 1998-99
1997 Graduates Entering in 1997-98
Percent of Graduating Number Class
School
107
49.3%
System 702
41.2%
School
107
45.1%
System 664
40.7%
Number Requiring
LS 20 149
18 156
Percent of those attending Georgia
Public Colleges
18.7%
21.2%
16.8%
23.5%
In previous years, the Report Card presented College Prep Curriculum information provided by the Board of Regents on students requiring Learning Support. Due to inconsistencies in the data provided by the Board of Regents in defining College Prep Completers versus Local Board of Education data defining College Prep Endorsements, the Department of Education Report Card will not provide this information until discrepancies can be reconciled.
Graduates Entering Georgia Public Technical and Adult Schools
1998 Graduates School System
Entering Number 3 42
1998-99 Percent
1.4% 2.5%
Entering Number N/A N/A
1997-98 Percent
N/A N/A
1997 Graduates School
0
0.0%
System
4
0.2%
3
1.3%
19
1.2%
1998-99 GEORGIA PUBLIC EDUCATION REPORT CARD Jonesboro High School - 6311056
Prepared by Georgia Department of Education
Page 3
CERTIFIED PERSONNEL DATA
Positions Number Average Contract Days
Administrators
5.00 232.00
Support Personnel
5.00 200.00
PK-12 Teachers
91.72 190.00
Personnel Sex
Certificate
Years Experience
Full-time Part-time
Male Female
4 Yr Bachelor's 5 Yr Master's 6 Yr Specialist's 7 Yr Doctoral Other*
<1 1-10 11-20 21-30 >30
Average
5 0
3 2
0 3 2 0 0
0 0 2 2 1
26.00
5 0
1 4
0 2 3 0 0
0 0 1 3 1
24.60
89 6
43 52
47 35
8 2 3
7 29 24 28
7
15.16
*Includes One- and Two-Year Vocational Certificates.
ACCREDITATION DATA
Accredited by Southern Association of Colleges and Schools (SACS): Secondary/Middle Commission.
AWARDS / RECOGNITION DATA
Schools in Georgia may receive recognition in the following programs: Charter School Pay for Performance Program Georgia School of Excellence National Blue Ribbon School Jonesboro High School did not receive recognition in any of these programs during the 1998-99 school year.
1998-99 GEORGIA PUBLIC EDUCATION REPORT CARD Jonesboro High School - 6311056
Prepared by Georgia Department of Education
Page 4
1998-99 GEORGIA PUBLIC EDUCATION REPORT CARD
CLAYTON COUNTY SCHOOLS
Jonesboro Middle School - 6312056
Grade Range 6-8
The Georgia Public Education Report Card is designed to assist systems and schools in educational improvement. This report card contains a variety of data elements. An explanation of the terms is provided as a companion to the report card data. Please refer to the definitions for the most effective use of the reported data.
STUDENT DATA
Total 651
6-8 Enrollment, by Race/Ethnicity and Sex
Black
White Hispanic
American Multi-
Asian Indian
racial
283 43.5%
308 47.3%
27 4.1%
19 2.9%
4 0.6%
10 1.5%
Male 351
53.9%
Female 300
46.1%
Enrollment in Selected Programs
Program
Gifted (Grades K-12)
Program % of Student Enrollment Population
66
10.1%
Alternative Programs
37
(Grades 6-12)
5.7%
Students Eligible to Receive Free/Reduced Lunches
Number
Percent
School System
315 23,194
48.4% 52.6%
Enrollment in Compensatory Programs
Program
Program % of Student Enrollment Population
Special Education (Grades K-12) (PK)
56
8.6%
0
N/A
English to Speakers of Other Languages (ESOL) (Grades K-12)
12
1.8%
Title I (Grades K-12)
This school has no Title I program.
Dropout Rate for Grades 6-8
Number
Rate
School System
16
1.8%
46
0.4%
Total 28
Retained Students, by Race/Ethnicity and Sex
Black
White Hispanic
American MultiAsian Indian racial
10 35.7%
14
4
50.0% 14.3%
0 0.0%
0 0.0%
0 0.0%
Male Female
21
7
75.0% 25.0%
Prepared by Georgia Department of Education
Page 1
STATE-REQUIRED TEST DATA
NORM-REFERENCED TESTS Grade 8
Iowa Tests of Basic Skills (ITBS) Each chart reflects data for three years of testing.
Reading Comprehension 50
52 42 49 0
98-99
69 43 48 97-98
60 44 48 96-97
Mathematics
School 50
System
State
0
59 47 56 98-99
73 48 55 97-98
71 49 54 96-97
School System State
Reading Vocabulary 50
47 36 46 0
98-99
59 38 45 97-98
52 40 44 96-97
Language Arts
School 50
System
State
0
71 55 60 98-99
73 55 58 97-98
76 53 56 96-97
School System State
Social Studies 50
56 47 54 0
98-99
73 48 53 97-98
65 51 53 96-97
Science
School 50
System
State
0
60 46 56 98-99
71 48 55 97-98
70 48 53 96-97
School System State
Sources of Information
Composite Score
50
63 52 57 0
98-99
School 50
System
80 53 56 97-98
78 53 55 96-97
State 0
61 48 56 98-99
76 49 54 97-98
1998-99 GEORGIA PUBLIC EDUCATION REPORT CARD Jonesboro Middle School - 6312056
Prepared by Georgia Department of Education
73 50 54 96-97
Scores Reported in Percentiles
School System State
Page 2
STATE-REQUIRED TEST DATA
Categories of Scaled Scores
Inadequate (less than 162)
Minimal (162-209)
Good
(210-247)
Very Good (greater than 247)
Average Scaled Score: (Range 100-300)
PERFORMANCE ASSESSMENTS
Grade 8 Writing Assessment
1998-99 Percent Scoring
1997-98 Percent Scoring
1996-97 Percent Scoring
School System State School System State School System State
1% 29% 48% 21%
10% 45% 38%
7%
8% 40% 41% 11%
2% 45% 45%
8%
10% 52% 33%
4%
11% 46% 34%
8%
8% 43% 42%
7%
13% 51% 30%
6%
15% 46% 30%
8%
223
203
208 211
199 202 206
198 198
AWARDS / RECOGNITION DATA
Schools in Georgia may receive recognition in the following programs: Charter School Pay for Performance Program Georgia School of Excellence National Blue Ribbon School Jonesboro Middle School did not receive recognition in any of these programs during the 1998-99 school year.
1998-99 GEORGIA PUBLIC EDUCATION REPORT CARD Jonesboro Middle School - 6312056
Prepared by Georgia Department of Education
Page 3
CERTIFIED PERSONNEL DATA
Positions Number Average Contract Days
Personnel Sex
Certificate
Years Experience
Full-time Part-time
Male Female
4 Yr Bachelor's 5 Yr Master's 6 Yr Specialist's 7 Yr Doctoral Other*
<1 1-10 11-20 21-30 >30
Average
Administrators
4.00 230.00
4 0
1 3
0 0 4 0 0 0 0 1 3 0 22.00
Support Personnel
2.50 196.00
2 1
1 2
0 1 2 0 0 0 2 0 1 0 15.00
PK-12 Teachers
43.20 190.00
41 4
11 34
19 21
4 1 0 3 13 12 13 4 16.24
*Includes One- and Two-Year Vocational Certificates.
ACCREDITATION DATA
Accredited by Southern Association of Colleges and Schools (SACS):
Elementary/Middle Commission.
1998-99 GEORGIA PUBLIC EDUCATION REPORT CARD Jonesboro Middle School - 6312056
Prepared by Georgia Department of Education
Page 4
1998-99 GEORGIA PUBLIC EDUCATION REPORT CARD
CLAYTON COUNTY SCHOOLS
Kemp Elementary School - 6310184
Grade Range PK-5
The Georgia Public Education Report Card is designed to assist systems and schools in educational improvement. This report card contains a variety of data elements. An explanation of the terms is provided as a companion to the report card data. Please refer to the definitions for the most effective use of the reported data.
STUDENT DATA
Total
K-5
674
PK
1
Enrollment, by Race/Ethnicity and Sex
Black
White Hispanic
American Asian Indian
Multiracial
196 29.1%
426 63.2%
18 2.7%
12 1.8%
1 0.1%
21 3.1%
0
1
0.0% 100.0%
0 0.0%
0 0.0%
0 0.0%
0 0.0%
Male 365
54.2% 1
100.0%
Female 309
45.8% 0
0.0%
Enrollment in Selected Programs
Program
Program % of Student Enrollment Population
Gifted (Grades K-12)
56
8.3%
Alternative Programs (Grades 6-12)
N/A
N/A
Students Eligible to Receive Free/Reduced Lunches
Number
Percent
School System
202 23,194
29.9% 52.6%
Dropout Rate *
Number
Rate
School System
N/A N/A
N/A N/A
* Dropout rates are not applicable for grades PK-5.
Enrollment in Compensatory Programs
Program
Program % of Student Enrollment Population
Special Education (Grades K-12)
85 12.6%
(PK)
1
N/A
English to Speakers of Other Languages (ESOL) (Grades K-12)
13
1.9%
Remedial Education (Grades 2-5, 9-12)
146 30.9%
Special Instructional Assistance (SIA) (Grades K-3)
0
0.0%
Title I (Grades K-12)
This school has no Title I program.
Total 6
Retained Students, by Race/Ethnicity and Sex
Black
White Hispanic
American MultiAsian Indian racial
0 0.0%
5
1
83.3% 16.7%
0 0.0%
0 0.0%
0 0.0%
Male Female
5
1
83.3% 16.7%
Prepared by Georgia Department of Education
Page 1
STATE-REQUIRED TEST DATA
NORM-REFERENCED TESTS Grade 3
Iowa Tests of Basic Skills (ITBS) Each chart reflects data for three years of testing.
Reading Comprehension 50
62 42 54 0
98-99
60 43 53 97-98
65 41 52 96-97
Mathematics
School 50
System
State
0
70 46 61 98-99
66 48 61 97-98
77 51 59 96-97
School System State
Reading Vocabulary 50
53 35 50 0
98-99
48 37 50 97-98
57 39 49 96-97
Language Arts
School 50
System
State
0
79 55 64 98-99
74 56 62 97-98
83 56 59 96-97
School System State
Social Studies 50
62 44 56 0
98-99
59 45 55 97-98
71 48 55 96-97
Science
School 50
System
State
0
66 44 59 98-99
64 45 59 97-98
76 48 58 96-97
School System State
Sources of Information
Composite Score
50
68 46 57 0
98-99
School 50
System
65 46 56 97-98
75 48 55 96-97
State 0
67 44 58 98-99
64 46 57 97-98
1998-99 GEORGIA PUBLIC EDUCATION REPORT CARD Kemp Elementary School - 6310184
Prepared by Georgia Department of Education
76 47 56 96-97
Scores Reported in Percentiles
School System State
Page 2
STATE-REQUIRED TEST DATA
NORM-REFERENCED TESTS Grade 5
Iowa Tests of Basic Skills (ITBS) Each chart reflects data for three years of testing.
Reading Comprehension
Mathematics
50
58 44 53 0
98-99
53 43 53 97-98
55 45 52 96-97
School 50
System
State
0
71 47 59 98-99
69 49 58 97-98
73 50 57 96-97
School System State
Reading Vocabulary 50
60 36 48 0
98-99
50 34 48 97-98
45 37 46 96-97
Language Arts
School 50
System
State
0
74 57 63 98-99
66 56 61 97-98
67 57 58 96-97
School System State
Social Studies 50
65 45 57 0
98-99
62 46 56 97-98
60 48 55 96-97
Science
School 50
System
State
0
75 47 60 98-99
69 49 59 97-98
75 50 59 96-97
School System State
Sources of Information
Composite Score
50
68 50 58 0
98-99
School 50
System
63 51 58 97-98
65 52 57 96-97
State 0
70 46 57 98-99
64 47 56 97-98
65 48 55 96-97
1998-99 GEORGIA PUBLIC EDUCATION REPORT CARD Kemp Elementary School - 6310184
Prepared by Georgia Department of Education
Scores Reported in Percentiles
School System State
Page 3
STATE-REQUIRED TEST DATA
PERFORMANCE ASSESSMENTS
Grade 5 Writing Assessment
Percent at Developmental Stages:
1998-99 School System State
1997-98 School System State
1996-97 School System State
Stage Stage Stage Stage Stage Stage
1:The Emerging Writer 2:The Developing Writer 3:The Focusing Writer 4:The Experimenting 5:The Engaging Writer 6:The Extending Writer
0% 0% 8% 38% 36% 18%
0% 1% 17% 41% 28% 12%
0% 1% 16% 41% 29% 12%
1% 0% 19% 43% 31% 6%
1% 3% 21% 42% 25% 8%
0% 3% 19% 41% 27% 10%
1% 0% 17% 36% 39% 6%
0% 3% 21% 40% 26% 8%
0% 3% 21% 37% 26% 12%
AWARDS / RECOGNITION DATA
Schools in Georgia may receive recognition in the following programs: Charter School Pay for Performance Program Georgia School of Excellence National Blue Ribbon School Kemp Elementary School did not receive recognition in any of these programs during the 1998-99 school year.
1998-99 GEORGIA PUBLIC EDUCATION REPORT CARD Kemp Elementary School - 6310184
Prepared by Georgia Department of Education
Page 4
CERTIFIED PERSONNEL DATA
Positions Number Average Contract Days
Personnel Sex
Certificate
Years Experience
Full-time Part-time
Male Female
4 Yr Bachelor's 5 Yr Master's 6 Yr Specialist's 7 Yr Doctoral Other*
<1 1-10 11-20 21-30 >30
Average
Administrators
3.00 226.67
3 0
1 2
0 1 2 0 0 0 1 0 2 0 19.67
Support Personnel
3.00 196.67
3 0
0 3
0 2 1 0 0 0 0 3 0 0 14.33
PK-12 Teachers
42.50 190.00
42 1
4 39
19 20
4 0 0 0 20 14 9 0 12.79
*Includes One- and Two-Year Vocational Certificates.
ACCREDITATION DATA
Accredited by Southern Association of Colleges and Schools (SACS):
Elementary/Middle Commission.
1998-99 GEORGIA PUBLIC EDUCATION REPORT CARD Kemp Elementary School - 6310184
Prepared by Georgia Department of Education
Page 5
1998-99 GEORGIA PUBLIC EDUCATION REPORT CARD
CLAYTON COUNTY SCHOOLS
Kendrick Middle School - 6310197
Grade Range 6-8
The Georgia Public Education Report Card is designed to assist systems and schools in educational improvement. This report card contains a variety of data elements. An explanation of the terms is provided as a companion to the report card data. Please refer to the definitions for the most effective use of the reported data.
STUDENT DATA
Total 965
6-8 Enrollment, by Race/Ethnicity and Sex
Black
White Hispanic
American Multi-
Asian Indian
racial
693 71.8%
192 19.9%
37 3.8%
21 2.2%
1 0.1%
21 2.2%
Male 487
50.5%
Female 478
49.5%
Enrollment in Selected Programs
Program
Gifted (Grades K-12)
Program % of Student Enrollment Population
49
5.1%
Alternative Programs (Grades 6-12)
0
0.0%
Students Eligible to Receive Free/Reduced Lunches
Number
Percent
School System
575 23,194
59.6% 52.6%
Enrollment in Compensatory Programs
Program
Program % of Student Enrollment Population
Special Education (Grades K-12) (PK)
111 11.5%
0
N/A
English to Speakers of Other Languages (ESOL) (Grades K-12)
20
2.1%
Title I (Grades K-12)
This school has no Title I program.
Dropout Rate for Grades 6-8
Number
Rate
School System
2
0.2%
46
0.4%
Total 25
Retained Students, by Race/Ethnicity and Sex
Black
White Hispanic
American MultiAsian Indian racial
17 68.0%
7 28.0%
0 0.0%
0 0.0%
0 0.0%
1 4.0%
Male Female
15
10
60.0% 40.0%
Prepared by Georgia Department of Education
Page 1
STATE-REQUIRED TEST DATA
NORM-REFERENCED TESTS Grade 8
Iowa Tests of Basic Skills (ITBS) Each chart reflects data for three years of testing.
Reading Comprehension 50
32 42 49 0
98-99
37 43 48 N/A 44 48
97-98
96-97
Mathematics
School 50
System
State
0
34 47 56 98-99
35 48 55 N/A 49 54
97-98
96-97
School System State
Reading Vocabulary 50
28 36 46 0
98-99
35 38 45 N/A 40 44
97-98
96-97
Language Arts
School 50
System
State
0
40 55 60 98-99
47 55 58 N/A 53 56
97-98
96-97
School System State
Social Studies 50
41 47 54 0
98-99
42 48 53 N/A 51 53
97-98
96-97
Science
School 50
System
State
0
38 46 56 98-99
37 48 55 N/A 48 53
97-98
96-97
School System State
Sources of Information
Composite Score
50
47 52 57 0
98-99
School 50
System
49 53 56 N/A 53 55
97-98
96-97
State 0
40 48 56 98-99
40 49 54 N/A 50 54
97-98
96-97
1998-99 GEORGIA PUBLIC EDUCATION REPORT CARD Kendrick Middle School - 6310197
Prepared by Georgia Department of Education
Scores Reported in Percentiles
School System State
Page 2
STATE-REQUIRED TEST DATA
Categories of Scaled Scores
Inadequate (less than 162)
Minimal (162-209)
Good
(210-247)
Very Good (greater than 247)
Average Scaled Score: (Range 100-300)
PERFORMANCE ASSESSMENTS
Grade 8 Writing Assessment
1998-99 Percent Scoring
1997-98 Percent Scoring
1996-97 Percent Scoring
School System State School System State School System State
16% 53% 28%
3%
10% 45% 38%
7%
8% 40% 41% 11%
19% 51% 25%
5%
10% 52% 33%
4%
11% 46% 34%
8%
N/A N/A N/A N/A
13% 51% 30%
6%
15% 46% 30%
8%
192
203
208 192
199 202 N/A
198 198
AWARDS / RECOGNITION DATA
Schools in Georgia may receive recognition in the following programs: Charter School Pay for Performance Program Georgia School of Excellence National Blue Ribbon School Kendrick Middle School did not receive recognition in any of these programs during the 1998-99 school year.
1998-99 GEORGIA PUBLIC EDUCATION REPORT CARD Kendrick Middle School - 6310197
Prepared by Georgia Department of Education
Page 3
CERTIFIED PERSONNEL DATA
Positions Number Average Contract Days
Personnel Sex
Certificate
Years Experience
Full-time Part-time
Male Female
4 Yr Bachelor's 5 Yr Master's 6 Yr Specialist's 7 Yr Doctoral Other*
<1 1-10 11-20 21-30 >30
Average
Administrators
4.00 230.00
4 0
2 2
0 2 2 0 0 0 0 2 2 0 19.50
Support Personnel
3.00 196.67
3 0
0 3
0 2 1 0 0 0 2 0 1 0 13.67
PK-12 Teachers
60.30 190.00
59 3
21 41
34 25
3 0 0 7 32 15 8 0 9.00
*Includes One- and Two-Year Vocational Certificates.
ACCREDITATION DATA
Accredited by Southern Association of Colleges and Schools (SACS):
Elementary/Middle Commission.
1998-99 GEORGIA PUBLIC EDUCATION REPORT CARD Kendrick Middle School - 6310197
Prepared by Georgia Department of Education
Page 4
1998-99 GEORGIA PUBLIC EDUCATION REPORT CARD
CLAYTON COUNTY SCHOOLS
Kilpatrick Elementary School - 6310173
Grade Range PK-5
The Georgia Public Education Report Card is designed to assist systems and schools in educational improvement. This report card contains a variety of data elements. An explanation of the terms is provided as a companion to the report card data. Please refer to the definitions for the most effective use of the reported data.
STUDENT DATA
Total
K-5
752
PK
2
Enrollment, by Race/Ethnicity and Sex
Black
White Hispanic
American Asian Indian
Multiracial
391 52.0%
277 36.8%
26 3.5%
25 3.3%
6 0.8%
27 3.6%
1 50.0%
0 0.0%
1 50.0%
0 0.0%
0 0.0%
0 0.0%
Male 388
51.6% 2
100.0%
Female 364
48.4% 0
0.0%
Enrollment in Selected Programs
Program
Program % of Student Enrollment Population
Gifted (Grades K-12)
15
2.0%
Alternative Programs (Grades 6-12)
N/A
N/A
Students Eligible to Receive Free/Reduced Lunches
Number
Percent
School System
438 23,194
58.1% 52.6%
Dropout Rate *
Number
Rate
School System
N/A N/A
N/A N/A
* Dropout rates are not applicable for grades PK-5.
Enrollment in Compensatory Programs
Program
Program % of Student Enrollment Population
Special Education (Grades K-12)
130 17.3%
(PK)
3
N/A
English to Speakers of Other Languages (ESOL) (Grades K-12)
13
1.7%
Remedial Education (Grades 2-5, 9-12)
170 34.4%
Special Instructional Assistance (SIA) (Grades K-3)
50
9.8%
Title I (Grades K-12)
This school has no Title I program.
Total 8
Retained Students, by Race/Ethnicity and Sex
Black
White Hispanic
American MultiAsian Indian racial
2 25.0%
6 75.0%
0 0.0%
0 0.0%
0 0.0%
0 0.0%
Male Female
4
4
50.0% 50.0%
Prepared by Georgia Department of Education
Page 1
STATE-REQUIRED TEST DATA
NORM-REFERENCED TESTS Grade 3
Iowa Tests of Basic Skills (ITBS) Each chart reflects data for three years of testing.
Reading Comprehension 50
44 42 54 0
98-99
40 43 53 97-98
47 41 52 96-97
Mathematics
School 50
System
State
0
56 46 61 98-99
50 48 61 97-98
55 51 59 96-97
School System State
Reading Vocabulary 50
38 35 50 0
98-99
37 37 50 97-98
39 39 49 96-97
Language Arts
School 50
System
State
0
54 55 64 98-99
55 56 62 97-98
52 56 59 96-97
School System State
Social Studies 50
50 44 56 0
98-99
47 45 55 97-98
53 48 55 96-97
Science
School 50
System
State
0
47 44 59 98-99
44 45 59 97-98
55 48 58 96-97
School System State
Sources of Information
Composite Score
50
51 46 57 0
98-99
School 50
System
49 46 56 97-98
57 48 55 96-97
State 0
48 44 58 98-99
47 46 57 97-98
1998-99 GEORGIA PUBLIC EDUCATION REPORT CARD Kilpatrick Elementary School - 6310173
Prepared by Georgia Department of Education
52 47 56 96-97
Scores Reported in Percentiles
School System State
Page 2
STATE-REQUIRED TEST DATA
NORM-REFERENCED TESTS Grade 5
Iowa Tests of Basic Skills (ITBS) Each chart reflects data for three years of testing.
Reading Comprehension
Mathematics
50
44 44 53 0
98-99
43 43 53 97-98
45 45 52 96-97
School 50
System
State
0
50 47 59 98-99
59 49 58 97-98
54 50 57 96-97
School System State
Reading Vocabulary 50
36 36 48 0
98-99
38 34 48 97-98
35 37 46 96-97
Language Arts
School 50
System
State
0
52 57 63 98-99
62 56 61 97-98
54 57 58 96-97
School System State
Social Studies 50
46 45 57 0
98-99
53 46 56 97-98
47 48 55 96-97
Science
School 50
System
State
0
47 47 60 98-99
55 49 59 97-98
51 50 59 96-97
School System State
Sources of Information
Composite Score
50
50 50 58 0
98-99
School 50
System
55 51 58 97-98
57 52 57 96-97
State 0
46 46 57 98-99
53 47 56 97-98
49 48 55 96-97
1998-99 GEORGIA PUBLIC EDUCATION REPORT CARD Kilpatrick Elementary School - 6310173
Prepared by Georgia Department of Education
Scores Reported in Percentiles
School System State
Page 3
STATE-REQUIRED TEST DATA
PERFORMANCE ASSESSMENTS
Grade 5 Writing Assessment
Percent at Developmental Stages:
1998-99 School System State
1997-98 School System State
1996-97 School System State
Stage Stage Stage Stage Stage Stage
1:The Emerging Writer 2:The Developing Writer 3:The Focusing Writer 4:The Experimenting 5:The Engaging Writer 6:The Extending Writer
1% 0% 15% 47% 30% 8%
0% 1% 17% 41% 28% 12%
0% 1% 16% 41% 29% 12%
0% 3% 14% 43% 28% 11%
1% 3% 21% 42% 25% 8%
0% 3% 19% 41% 27% 10%
0% 5% 21% 33% 31% 11%
0% 3% 21% 40% 26% 8%
0% 3% 21% 37% 26% 12%
AWARDS / RECOGNITION DATA
Schools in Georgia may receive recognition in the following programs: Charter School Pay for Performance Program Georgia School of Excellence National Blue Ribbon School Kilpatrick Elementary School did not receive recognition in any of these programs during the 1998-99 school year.
1998-99 GEORGIA PUBLIC EDUCATION REPORT CARD Kilpatrick Elementary School - 6310173
Prepared by Georgia Department of Education
Page 4
CERTIFIED PERSONNEL DATA
Positions Number Average Contract Days
Personnel Sex
Certificate
Years Experience
Full-time Part-time
Male Female
4 Yr Bachelor's 5 Yr Master's 6 Yr Specialist's 7 Yr Doctoral Other*
<1 1-10 11-20 21-30 >30
Average
Administrators
3.00 226.67
3 0
1 2
0 0 2 1 0 0 0 2 1 0 21.00
Support Personnel
2.00 195.00
2 0
0 2
0 1 1 0 0 0 1 0 1 0 18.50
PK-12 Teachers
46.65 190.00
46 4
1 49
17 31
2 0 0 3 20 10 17 0 12.98
*Includes One- and Two-Year Vocational Certificates.
ACCREDITATION DATA
Accredited by Southern Association of Colleges and Schools (SACS):
Elementary/Middle Commission.
1998-99 GEORGIA PUBLIC EDUCATION REPORT CARD Kilpatrick Elementary School - 6310173
Prepared by Georgia Department of Education
Page 5
1998-99 GEORGIA PUBLIC EDUCATION REPORT CARD
CLAYTON COUNTY SCHOOLS
Lake City Elementary School - 6314056
Grade Range K-5
The Georgia Public Education Report Card is designed to assist systems and schools in educational improvement. This report card contains a variety of data elements. An explanation of the terms is provided as a companion to the report card data. Please refer to the definitions for the most effective use of the reported data.
STUDENT DATA
Total 508
K-5 Enrollment, by Race/Ethnicity and Sex
Black
White Hispanic
American Multi-
Asian Indian
racial
256 50.4%
171 33.7%
27 5.3%
46 9.1%
0 0.0%
8 1.6%
Male Female
270 53.1%
238 46.9%
Enrollment in Selected Programs
Program
Program % of Student Enrollment Population
Gifted (Grades K-12)
5
1.0%
Alternative Programs (Grades 6-12)
N/A
N/A
Students Eligible to Receive Free/Reduced Lunches
Number
Percent
School System
383 23,194
75.4% 52.6%
Dropout Rate *
Number
Rate
School System
N/A N/A
N/A N/A
* Dropout rates are not applicable for grades PK-5.
Enrollment in Compensatory Programs
Program
Program % of Student Enrollment Population
Special Education (Grades K-12)
39
7.7%
(PK)
0
N/A
English to Speakers of Other Languages (ESOL) (Grades K-12)
26
5.1%
Remedial Education (Grades 2-5, 9-12)
112 34.8%
Special Instructional Assistance (SIA) (Grades K-3)
50 14.1%
Title I (Grades K-12)
This school has a schoolwide program.
Total 13
Retained Students, by Race/Ethnicity and Sex
Black
White Hispanic
American Multi-
Asian Indian
racial
9 69.2%
4 30.8%
0 0.0%
0 0.0%
0 0.0%
0 0.0%
Male Female
9
4
69.2% 30.8%
Prepared by Georgia Department of Education
Page 1
STATE-REQUIRED TEST DATA
NORM-REFERENCED TESTS Grade 3
Iowa Tests of Basic Skills (ITBS) Each chart reflects data for three years of testing.
Reading Comprehension 50
36 42 54 0
98-99
30 43 53 97-98
32 41 52 96-97
Mathematics
School 50
System
State
0
38 46 61 98-99
30 48 61 97-98
36 51 59 96-97
School System State
Reading Vocabulary 50
23 35 50 0
98-99
20 37 50 97-98
31 39 49 96-97
Language Arts
School 50
System
State
0
47 55 64 98-99
36 56 62 97-98
36 56 59 96-97
School System State
Social Studies 50
35 44 56 0
98-99
23 45 55 97-98
34 48 55 96-97
Science
School 50
System
State
0
35 44 59 98-99
30 45 59 97-98
36 48 58 96-97
School System State
Sources of Information
Composite Score
50
40 46 57 0
98-99
School 50
System
33 46 56 97-98
34 48 55 96-97
State 0
35 44 58 98-99
29 46 57 97-98
1998-99 GEORGIA PUBLIC EDUCATION REPORT CARD Lake City Elementary School - 6314056
Prepared by Georgia Department of Education
34 47 56 96-97
Scores Reported in Percentiles
School System State
Page 2
STATE-REQUIRED TEST DATA
NORM-REFERENCED TESTS Grade 5
Iowa Tests of Basic Skills (ITBS) Each chart reflects data for three years of testing.
Reading Comprehension
Mathematics
50
39 44 53 0
98-99
40 43 53 97-98
45 45 52 96-97
School 50
System
State
0
39 47 59 98-99
37 49 58 97-98
52 50 57 96-97
School System State
Reading Vocabulary 50
26 36 48 0
98-99
26 34 48 97-98
34 37 46 96-97
Language Arts
School 50
System
State
0
48 57 63 98-99
43 56 61 97-98
53 57 58 96-97
School System State
Social Studies 50
34 45 57 0
98-99
32 46 56 97-98
49 48 55 96-97
Science
School 50
System
State
0
38 47 60 98-99
33 49 59 97-98
49 50 59 96-97
School System State
Sources of Information
Composite Score
50
39 50 58 0
98-99
School 50
System
39 51 58 97-98
47 52 57 96-97
State 0
37 46 57 98-99
35 47 56 97-98
47 48 55 96-97
1998-99 GEORGIA PUBLIC EDUCATION REPORT CARD Lake City Elementary School - 6314056
Prepared by Georgia Department of Education
Scores Reported in Percentiles
School System State
Page 3
STATE-REQUIRED TEST DATA
PERFORMANCE ASSESSMENTS
Grade 5 Writing Assessment
Percent at Developmental Stages:
1998-99 School System State
1997-98 School System State
1996-97 School System State
Stage Stage Stage Stage Stage Stage
1:The Emerging Writer 2:The Developing Writer 3:The Focusing Writer 4:The Experimenting 5:The Engaging Writer 6:The Extending Writer
0% 0% 20% 54% 17% 9%
0% 1% 17% 41% 28% 12%
0% 1% 16% 41% 29% 12%
1% 7% 45% 34% 13% 0%
1% 3% 21% 42% 25% 8%
0% 3% 19% 41% 27% 10%
0% 8% 47% 36% 8% 2%
0% 3% 21% 40% 26% 8%
0% 3% 21% 37% 26% 12%
AWARDS / RECOGNITION DATA
Schools in Georgia may receive recognition in the following programs: Charter School Pay for Performance Program Georgia School of Excellence National Blue Ribbon School Lake City Elementary School did not receive recognition in any of these programs during the 1998-99 school year.
1998-99 GEORGIA PUBLIC EDUCATION REPORT CARD Lake City Elementary School - 6314056
Prepared by Georgia Department of Education
Page 4
CERTIFIED PERSONNEL DATA
Positions Number Average Contract Days
Personnel Sex
Certificate
Years Experience
Full-time Part-time
Male Female
4 Yr Bachelor's 5 Yr Master's 6 Yr Specialist's 7 Yr Doctoral Other*
<1 1-10 11-20 21-30 >30
Average
Administrators
2.00 220.00
2 0
1 1
0 1 1 0 0 0 0 0 2 0 25.50
Support Personnel
2.00 195.00
2 0
0 2
0 2 0 0 0 0 0 1 1 0 23.00
PK-12 Teachers
31.82 190.00
29 8
5 32
22 13
2 0 0 3 14 11 8 1 12.32
*Includes One- and Two-Year Vocational Certificates.
ACCREDITATION DATA
Accredited by Southern Association of Colleges and Schools (SACS):
Elementary/Middle Commission.
1998-99 GEORGIA PUBLIC EDUCATION REPORT CARD Lake City Elementary School - 6314056
Prepared by Georgia Department of Education
Page 5
1998-99 GEORGIA PUBLIC EDUCATION REPORT CARD
CLAYTON COUNTY SCHOOLS
Lake Ridge Elementary School - 6310295
Grade Range PK-5
The Georgia Public Education Report Card is designed to assist systems and schools in educational improvement. This report card contains a variety of data elements. An explanation of the terms is provided as a companion to the report card data. Please refer to the definitions for the most effective use of the reported data.
STUDENT DATA
Total
K-5
970
PK
41
Enrollment, by Race/Ethnicity and Sex
Black
White Hispanic
American Asian Indian
Multiracial
702 72.4%
154 15.9%
67 6.9%
26 2.7%
0 0.0%
21 2.2%
34 82.9%
3 7.3%
2 4.9%
1 2.4%
0 0.0%
1 2.4%
Male Female
474 48.9%
496 51.1%
14 34.1%
27 65.9%
Enrollment in Selected Programs
Program
Program % of Student Enrollment Population
Gifted (Grades K-12)
36
3.7%
Alternative Programs (Grades 6-12)
N/A
N/A
Students Eligible to Receive Free/Reduced Lunches
Number
Percent
School System
571 23,194
56.5% 52.6%
Dropout Rate *
Number
Rate
School System
N/A N/A
N/A N/A
* Dropout rates are not applicable for grades PK-5.
Enrollment in Compensatory Programs
Program
Program % of Student Enrollment Population
Special Education (Grades K-12)
98 10.1%
(PK)
2
N/A
English to Speakers of Other Languages (ESOL) (Grades K-12)
42
4.3%
Remedial Education (Grades 2-5, 9-12)
222 35.1%
Special Instructional Assistance (SIA) (Grades K-3)
50
7.3%
Title I (Grades K-12)
This school has a schoolwide program.
Total 20
Retained Students, by Race/Ethnicity and Sex
Black
White Hispanic
American MultiAsian Indian racial
13 65.0%
5
2
25.0% 10.0%
0 0.0%
0 0.0%
0 0.0%
Male Female
11
9
55.0% 45.0%
Prepared by Georgia Department of Education
Page 1
STATE-REQUIRED TEST DATA
NORM-REFERENCED TESTS Grade 3
Iowa Tests of Basic Skills (ITBS) Each chart reflects data for three years of testing.
Reading Comprehension 50
39 42 54 0
98-99
44 43 53 97-98
43 41 52 96-97
Mathematics
School 50
System
State
0
35 46 61 98-99
57 48 61 97-98
48 51 59 96-97
School System State
Reading Vocabulary 50
29 35 50 0
98-99
35 37 50 97-98
36 39 49 96-97
Language Arts
School 50
System
State
0
39 55 64 98-99
66 56 62 97-98
57 56 59 96-97
School System State
Social Studies 50
38 44 56 0
98-99
42 45 55 97-98
46 48 55 96-97
Science
School 50
System
State
0
41 44 59 98-99
48 45 59 97-98
49 48 58 96-97
School System State
Sources of Information
Composite Score
50
34 46 57 0
98-99
School 50
System
49 46 56 97-98
47 48 55 96-97
State 0
35 44 58 98-99
49 46 57 97-98
1998-99 GEORGIA PUBLIC EDUCATION REPORT CARD Lake Ridge Elementary School - 6310295
Prepared by Georgia Department of Education
47 47 56 96-97
Scores Reported in Percentiles
School System State
Page 2
STATE-REQUIRED TEST DATA
NORM-REFERENCED TESTS Grade 5
Iowa Tests of Basic Skills (ITBS) Each chart reflects data for three years of testing.
Reading Comprehension
Mathematics
50
43 44 53 0
98-99
42 43 53 97-98
51 45 52 96-97
School 50
System
State
0
40 47 59 98-99
41 49 58 97-98
53 50 57 96-97
School System State
Reading Vocabulary 50
34 36 48 0
98-99
36 34 48 97-98
42 37 46 96-97
Language Arts
School 50
System
State
0
58 57 63 98-99
54 56 61 97-98
60 57 58 96-97
School System State
Social Studies 50
47 45 57 0
98-99
48 46 56 97-98
54 48 55 96-97
Science
School 50
System
State
0
41 47 60 98-99
44 49 59 97-98
55 50 59 96-97
School System State
Sources of Information
Composite Score
50
43 50 58 0
98-99
School 50
System
45 51 58 97-98
52 52 57 96-97
State 0
43 46 57 98-99
44 47 56 97-98
52 48 55 96-97
1998-99 GEORGIA PUBLIC EDUCATION REPORT CARD Lake Ridge Elementary School - 6310295
Prepared by Georgia Department of Education
Scores Reported in Percentiles
School System State
Page 3
STATE-REQUIRED TEST DATA
PERFORMANCE ASSESSMENTS
Grade 5 Writing Assessment
Percent at Developmental Stages:
1998-99 School System State
1997-98 School System State
1996-97 School System State
Stage Stage Stage Stage Stage Stage
1:The Emerging Writer 2:The Developing Writer 3:The Focusing Writer 4:The Experimenting 5:The Engaging Writer 6:The Extending Writer
0% 0% 33% 39% 20% 6%
0% 1% 17% 41% 28% 12%
0% 1% 16% 41% 29% 12%
0% 3% 16% 43% 27% 12%
1% 3% 21% 42% 25% 8%
0% 3% 19% 41% 27% 10%
0% 2% 18% 45% 27% 8%
0% 3% 21% 40% 26% 8%
0% 3% 21% 37% 26% 12%
AWARDS / RECOGNITION DATA
Schools in Georgia may receive recognition in the following programs: Charter School Pay for Performance Program Georgia School of Excellence National Blue Ribbon School Lake Ridge Elementary School did not receive recognition in any of these programs during the 1998-99 school year.
1998-99 GEORGIA PUBLIC EDUCATION REPORT CARD Lake Ridge Elementary School - 6310295
Prepared by Georgia Department of Education
Page 4
CERTIFIED PERSONNEL DATA
Positions Number Average Contract Days
Personnel Sex
Certificate
Years Experience
Full-time Part-time
Male Female
4 Yr Bachelor's 5 Yr Master's 6 Yr Specialist's 7 Yr Doctoral Other*
<1 1-10 11-20 21-30 >30
Average
Administrators
3.00 226.67
3 0
0 3
0 2 0 1 0 0 0 2 1 0 16.00
Support Personnel
2.50 196.00
2 1
1 2
0 3 0 0 0 1 1 0 1 0 9.00
PK-12 Teachers
55.55 190.00
54 3
6 51
40 15
2 0 0 8 30 11 8 0 8.04
*Includes One- and Two-Year Vocational Certificates.
ACCREDITATION DATA
Accredited by Southern Association of Colleges and Schools (SACS):
Elementary/Middle Commission.
1998-99 GEORGIA PUBLIC EDUCATION REPORT CARD Lake Ridge Elementary School - 6310295
Prepared by Georgia Department of Education
Page 5
1998-99 GEORGIA PUBLIC EDUCATION REPORT CARD
CLAYTON COUNTY SCHOOLS
Lee Street Elementary School - 6311058
Grade Range PK-5
The Georgia Public Education Report Card is designed to assist systems and schools in educational improvement. This report card contains a variety of data elements. An explanation of the terms is provided as a companion to the report card data. Please refer to the definitions for the most effective use of the reported data.
STUDENT DATA
Total
K-5
677
PK
20
Enrollment, by Race/Ethnicity and Sex
Black
White Hispanic
American Asian Indian
Multiracial
286 42.2%
258 38.1%
81 12.0%
20 3.0%
2 0.3%
30 4.4%
8 40.0%
5 25.0%
2 10.0%
3 15.0%
0 0.0%
2 10.0%
Male Female
353 52.1%
324 47.9%
8 40.0%
12 60.0%
Enrollment in Selected Programs
Program
Program % of Student Enrollment Population
Gifted (Grades K-12)
33
4.9%
Alternative Programs (Grades 6-12)
N/A
N/A
Students Eligible to Receive Free/Reduced Lunches
Number
Percent
School System
558 23,194
80.1% 52.6%
Dropout Rate *
Number
Rate
School System
N/A N/A
N/A N/A
* Dropout rates are not applicable for grades PK-5.
Enrollment in Compensatory Programs
Program
Program % of Student Enrollment Population
Special Education (Grades K-12)
78 11.5%
(PK)
3
N/A
English to Speakers of Other Languages (ESOL) (Grades K-12)
65
9.6%
Remedial Education (Grades 2-5, 9-12)
151 35.0%
Special Instructional Assistance (SIA) (Grades K-3)
48 10.0%
Title I (Grades K-12)
This school has a schoolwide program.
Total 16
Retained Students, by Race/Ethnicity and Sex
Black
White Hispanic
American MultiAsian Indian racial
3 18.8%
9
3
56.3% 18.8%
0 0.0%
0 0.0%
1 6.3%
Male Female
10
6
62.5% 37.5%
Prepared by Georgia Department of Education
Page 1
STATE-REQUIRED TEST DATA
NORM-REFERENCED TESTS Grade 3
Iowa Tests of Basic Skills (ITBS) Each chart reflects data for three years of testing.
Reading Comprehension 50
38 42 54 0
98-99
45 43 53 97-98
37 41 52 96-97
Mathematics
School 50
System
State
0
42 46 61 98-99
50 48 61 97-98
48 51 59 96-97
School System State
Reading Vocabulary 50
32 35 50 0
98-99
43 37 50 97-98
28 39 49 96-97
Language Arts
School 50
System
State
0
56 55 64 98-99
66 56 62 97-98
68 56 59 96-97
School System State
Social Studies 50
33 44 56 0
98-99
46 45 55 97-98
46 48 55 96-97
Science
School 50
System
State
0
42 44 59 98-99
49 45 59 97-98
48 48 58 96-97
School System State
Sources of Information
Composite Score
50
46 46 57 0
98-99
School 50
System
46 46 56 97-98
44 48 55 96-97
State 0
40 44 58 98-99
49 46 57 97-98
1998-99 GEORGIA PUBLIC EDUCATION REPORT CARD Lee Street Elementary School - 6311058
Prepared by Georgia Department of Education
47 47 56 96-97
Scores Reported in Percentiles
School System State
Page 2
STATE-REQUIRED TEST DATA
NORM-REFERENCED TESTS Grade 5
Iowa Tests of Basic Skills (ITBS) Each chart reflects data for three years of testing.
Reading Comprehension
Mathematics
50
47 44 53 0
98-99
39 43 53 97-98
42 45 52 96-97
School 50
System
State
0
50 47 59 98-99
40 49 58 97-98
40 50 57 96-97
School System State
Reading Vocabulary 50
32 36 48 0
98-99
26 34 48 97-98
28 37 46 96-97
Language Arts
School 50
System
State
0
64 57 63 98-99
56 56 61 97-98
59 57 58 96-97
School System State
Social Studies 50
50 45 57 0
98-99
47 46 56 97-98
40 48 55 96-97
Science
School 50
System
State
0
51 47 60 98-99
49 49 59 97-98
45 50 59 96-97
School System State
Sources of Information
Composite Score
50
57 50 58 0
98-99
School 50
System
52 51 58 97-98
51 52 57 96-97
State 0
52 46 57 98-99
45 47 56 97-98
44 48 55 96-97
1998-99 GEORGIA PUBLIC EDUCATION REPORT CARD Lee Street Elementary School - 6311058
Prepared by Georgia Department of Education
Scores Reported in Percentiles
School System State
Page 3
STATE-REQUIRED TEST DATA
PERFORMANCE ASSESSMENTS
Grade 5 Writing Assessment
Percent at Developmental Stages:
1998-99 School System State
1997-98 School System State
1996-97 School System State
Stage Stage Stage Stage Stage Stage
1:The Emerging Writer 2:The Developing Writer 3:The Focusing Writer 4:The Experimenting 5:The Engaging Writer 6:The Extending Writer
0% 1% 9% 41% 40% 8%
0% 1% 17% 41% 28% 12%
0% 1% 16% 41% 29% 12%
0% 4% 14% 52% 25% 4%
1% 3% 21% 42% 25% 8%
0% 3% 19% 41% 27% 10%
2% 2% 20% 43% 24% 7%
0% 3% 21% 40% 26% 8%
0% 3% 21% 37% 26% 12%
AWARDS / RECOGNITION DATA
Schools in Georgia may receive recognition in the following programs: Charter School Pay for Performance Program Georgia School of Excellence National Blue Ribbon School Lee Street Elementary School did not receive recognition in any of these programs during the 1998-99 school year.
1998-99 GEORGIA PUBLIC EDUCATION REPORT CARD Lee Street Elementary School - 6311058
Prepared by Georgia Department of Education
Page 4
CERTIFIED PERSONNEL DATA
Positions Number Average Contract Days
Personnel Sex
Certificate
Years Experience
Full-time Part-time
Male Female
4 Yr Bachelor's 5 Yr Master's 6 Yr Specialist's 7 Yr Doctoral Other*
<1 1-10 11-20 21-30 >30
Average
Administrators
3.00 226.67
3 0
1 2
0 2 1 0 0 0 1 0 0 2 23.67
Support Personnel
2.00 195.00
2 0
1 1
0 1 1 0 0 0 2 0 0 0 5.50
PK-12 Teachers
41.13 190.00
40 3
4 39
26 11
6 0 0 3 20 10 9 1 11.95
*Includes One- and Two-Year Vocational Certificates.
ACCREDITATION DATA
Accredited by Southern Association of Colleges and Schools (SACS):
Elementary/Middle Commission.
1998-99 GEORGIA PUBLIC EDUCATION REPORT CARD Lee Street Elementary School - 6311058
Prepared by Georgia Department of Education
Page 5
1998-99 GEORGIA PUBLIC EDUCATION REPORT CARD
CLAYTON COUNTY SCHOOLS
Lovejoy High School - 6310190
Grade Range 9-12
The Georgia Public Education Report Card is designed to assist systems and schools in educational improvement. This report card contains a variety of data elements. An explanation of the terms is provided as a companion to the report card data. Please refer to the definitions for the most effective use of the reported data.
Total 2,084
STUDENT DATA
9-12 Enrollment, by Race/Ethnicity and Sex
Black
White Hispanic
American Multi-
Asian Indian
racial
892 42.8%
1,026 49.2%
47 2.3%
69 3.3%
4 0.2%
46 2.2%
Male Female
1,098 52.7%
986 47.3%
Enrollment in Selected Programs
Program
Gifted (Grades K-12)
Program % of Student Enrollment Population
178
8.5%
Non-Vocational Labs (Grades 9-12)
Vocational Labs (Grades 9-12)
Alternative Programs (Grades 6-12)
1,811 1,012
0
86.9% 48.6%
0.0%
Students Eligible to Receive Free/Reduced Lunches
Number
Percent
School System
413 23,194
19.8% 52.6%
Enrollment in Compensatory Programs
Program
Program % of Student Enrollment Population
Special Education (Grades K-12) PK
191
9.2%
0
N/A
English to Speakers of Other Languages (ESOL) (Grades K-12)
7
< 1%
Remedial Education (Grades 2-5, 9-12)
176
8.4%
Title I (Grades K-12)
This school has no Title I program.
Dropout Rate for Grades 9-12
Number
Rate
School System
138 1,191
5.8% 9.1%
Total 220
Retained Students, by Race/Ethnicity and Sex
Black
White Hispanic
American MultiAsian Indian racial
110 50.0%
99 45.0%
3 1.4%
5 2.3%
1 0.5%
2 0.9%
Male Female
136
84
61.8% 38.2%
Prepared by Georgia Department of Education
Page 1
STATE-REQUIRED TEST DATA
GEORGIA HIGH SCHOOL GRADUATION TESTS (GHSGT)
Percent of Regular Program 11th Graders Passing the Georgia High School Graduation Tests on First Administration
English Language Arts Mathematics Social Studies Science
All Components listed above
Writing
1998-99
School System State
97% 93% 88% 79%
96% 88% 82% 70%
96% 88% 80% 72%
78% 67% 68%
95% 92% 93%
1997-98
School System State
98% 94% 83% 80%
97% 91% 78% 75%
94% 88% 78% 74%
74% 70% 68%
97% 94% 92%
1996-97
School System State
98% 95% 88% 88%
96% 91% 80% 76%
94% 87% 78% 74%
82% 71% 67%
97% 95% 93%
GRADUATE DATA
1999 Graduates by Credentials, Race/Ethnicity and Sex
Diplomas with Both College Prep. & Voc. Endorsements
Diplomas with College Prep. Endorsements Diplomas with Vocational Endorsements General High School Diplomas Special Education Diplomas
Total All Diplomas
Certificates of Performance
Total Graduates
Total 45
244 58 7 11
365 2
367
Black
13 28.9%
101 41.4%
17 29.3%
2 28.6%
3 27.3%
136 37.3%
1 50.0%
137 37.3%
American MultiWhite Hispanic Asian Indian racial
26 57.8%
122 50.0%
1 2.2%
5 2.0%
4 8.9%
10 4.1%
1 2.2%
0 0.0%
0 0.0%
6 2.5%
38 65.5%
5 71.4%
6 54.5%
2 3.4%
0 0.0%
2 18.2%
0 0.0%
0 0.0%
0 0.0%
0 0.0%
0 0.0%
0 0.0%
1 1.7%
0 0.0%
0 0.0%
197 54.0%
10 2.7%
14 3.8%
1 0.3%
7 1.9%
1 50.0%
0 0.0%
0 0.0%
0 0.0%
0 0.0%
198 54.0%
10 2.7%
14 3.8%
1 0.3%
7 1.9%
Male Female
18 40.0%
112 45.9%
27 60.0%
132 54.1%
35 60.3%
7 100.0%
7 63.6%
23 39.7%
0 0.0%
4 36.4%
179
186
49.0% 51.0%
0
2
0.0% 100.0%
179
188
48.8% 51.2%
HOPE Scholarships
School System
Number of 1999 Graduates 3 6 7
Number Eligible
225
Percent Eligible
61.3%
1,750 1,017 58.1%
State
65,548 40,292 61.5%
High School Completion Rate
Percent of 1995Grade 9 Enrollment in Graduating Class of1999 School System State
Completion Rate '95-'99 70.4% 59.9% 68.9%
1998-99 GEORGIA PUBLIC EDUCATION REPORT CARD
Lovejoy High School - 6310190
Prepared by Georgia Department of Education
Page 2
COLLEGE ADMISSIONS / CREDIT TEST DATA
Scholastic Assessment Test (SAT)
Based on students' highest verbal and highest math scores
No. Taking
Average Score
Tests Verbal Math Total
Based on students' last test administration
Average Score Verbal Math Total
School
241 500 491
991
College Prep. Endorsement
496 490
986
Other Diplomas
391 415
806
System
1,093 478 474
952
College Prep. Endorsement
480 478
958
Other Diplomas
377 378
755
Georgia
41,958 492 488
980
492 N/A N/A
470 N/A N/A
483
486 N/A N/A
468 N/A N/A
479
978 N/A N/A
938 N/A N/A
962
Nation
952,913 N/A N/A N/A
502 508 1010
American College Testing (ACT)
Advanced Placement Exams (AP)
Number taking tests: English Mathematics Reading Science Reasoning CompositeScore
9 2 School System State
20.4 17.9 19.1
19.7 18.6 19.9
21.4 20.3
18.9 19.0
20.2 19.9
20.6 18.7 19.9
No. of Students Taking Tests
No. of Tests Taken No. of Test Scores
3 or Higher Percent of Test
Scores 3 or Higher
School 74
101 60
59.4%
System State 456 15,225 621 23,969 221 13,024
35.6% 54.3%
POST-SECONDARY DATA
Graduates Entering Georgia Public Colleges
Graduates Entering Georgia Public Colleges and Requiring Learning Support (LS)
1998 Graduates Entering in 1998-99
1997 Graduates Entering in 1997-98
Percent of Graduating Number Class
School
168
48.4%
System 702
41.2%
School
165
50.8%
System 664
40.7%
Number Requiring
LS 31 149
32 156
Percent of those attending Georgia
Public Colleges
18.5%
21.2%
19.4%
23.5%
In previous years, the Report Card presented College Prep Curriculum information provided by the Board of Regents on students requiring Learning Support. Due to inconsistencies in the data provided by the Board of Regents in defining College Prep Completers versus Local Board of Education data defining College Prep Endorsements, the Department of Education Report Card will not provide this information until discrepancies can be reconciled.
Graduates Entering Georgia Public Technical and Adult Schools
1998 Graduates School System
Entering Number 11 42
1998-99 Percent
3.2% 2.5%
Entering Number N/A N/A
1997-98 Percent
N/A N/A
1997 Graduates School
0
0.0%
System
4
0.2%
0
0.0%
19
1.2%
1998-99 GEORGIA PUBLIC EDUCATION REPORT CARD Lovejoy High School - 6310190
Prepared by Georgia Department of Education
Page 3
CERTIFIED PERSONNEL DATA
Positions Number Average Contract Days
Administrators
6.00 233.33
Support Personnel
6.00 200.00
PK-12 Teachers
112.83 190.00
Personnel Sex
Certificate
Years Experience
Full-time Part-time
Male Female
4 Yr Bachelor's 5 Yr Master's 6 Yr Specialist's 7 Yr Doctoral Other*
<1 1-10 11-20 21-30 >30
Average
6 0
4 2
0 1 4 1 0
0 2 0 3 1
20.50
6 0
1 5
1 4 1 0 0
0 1 1 3 1
22.00
111 4
48 67
46 62
5 2 0
8 38 31 34
4
14.23
*Includes One- and Two-Year Vocational Certificates.
ACCREDITATION DATA
Accredited by Southern Association of Colleges and Schools (SACS): Secondary/Middle Commission.
AWARDS / RECOGNITION DATA
Schools in Georgia may receive recognition in the following programs: Charter School Pay for Performance Program Georgia School of Excellence National Blue Ribbon School Lovejoy High School did not receive recognition in any of these programs during the 1998-99 school year.
1998-99 GEORGIA PUBLIC EDUCATION REPORT CARD Lovejoy High School - 6310190
Prepared by Georgia Department of Education
Page 4
1998-99 GEORGIA PUBLIC EDUCATION REPORT CARD
CLAYTON COUNTY SCHOOLS
Lovejoy Middle School - 6310191
Grade Range 6-8
The Georgia Public Education Report Card is designed to assist systems and schools in educational improvement. This report card contains a variety of data elements. An explanation of the terms is provided as a companion to the report card data. Please refer to the definitions for the most effective use of the reported data.
STUDENT DATA
Total 909
6-8 Enrollment, by Race/Ethnicity and Sex
Black
White Hispanic
American Multi-
Asian Indian
racial
263 28.9%
566 62.3%
30 3.3%
22 2.4%
5 0.6%
23 2.5%
Male 473
52.0%
Female 436
48.0%
Enrollment in Selected Programs
Program
Gifted (Grades K-12)
Program % of Student Enrollment Population
131
14.4%
Alternative Programs (Grades 6-12)
0
0.0%
Students Eligible to Receive Free/Reduced Lunches
Number
Percent
School System
216 23,194
23.8% 52.6%
Enrollment in Compensatory Programs
Program
Program % of Student Enrollment Population
Special Education (Grades K-12) (PK)
126 13.9%
0
N/A
English to Speakers of Other Languages (ESOL) (Grades K-12)
5
< 1%
Title I (Grades K-12)
This school has no Title I program.
Dropout Rate for Grades 6-8
Number
Rate
School System
0
0.0%
46
0.4%
Total 21
Retained Students, by Race/Ethnicity and Sex
Black
White Hispanic
American MultiAsian Indian racial
9 42.9%
10 47.6%
1 4.8%
0 0.0%
1 4.8%
0 0.0%
Male Female
13
8
61.9% 38.1%
Prepared by Georgia Department of Education
Page 1
STATE-REQUIRED TEST DATA
NORM-REFERENCED TESTS Grade 8
Iowa Tests of Basic Skills (ITBS) Each chart reflects data for three years of testing.
Reading Comprehension 50
55 42 49 0
98-99
51 43 48 97-98
58 44 48 96-97
Mathematics
School 50
System
State
0
66 47 56 98-99
57 48 55 97-98
65 49 54 96-97
School System State
Reading Vocabulary 50
52 36 46 0
98-99
48 38 45 97-98
53 40 44 96-97
Language Arts
School 50
System
State
0
68 55 60 98-99
66 55 58 97-98
68 53 56 96-97
School System State
Social Studies 50
61 47 54 0
98-99
53 48 53 97-98
65 51 53 96-97
Science
School 50
System
State
0
61 46 56 98-99
58 48 55 97-98
61 48 53 96-97
School System State
Sources of Information
Composite Score
50
65 52 57 0
98-99
School 50
System
58 53 56 97-98
63 53 55 96-97
State 0
63 48 56 98-99
57 49 54 97-98
1998-99 GEORGIA PUBLIC EDUCATION REPORT CARD Lovejoy Middle School - 6310191
Prepared by Georgia Department of Education
64 50 54 96-97
Scores Reported in Percentiles
School System State
Page 2
STATE-REQUIRED TEST DATA
Categories of Scaled Scores
Inadequate (less than 162)
Minimal (162-209)
Good
(210-247)
Very Good (greater than 247)
Average Scaled Score: (Range 100-300)
PERFORMANCE ASSESSMENTS
Grade 8 Writing Assessment
1998-99 Percent Scoring
1997-98 Percent Scoring
1996-97 Percent Scoring
School System State School System State School System State
4% 26% 48% 22%
10% 45% 38%
7%
8% 40% 41% 11%
2% 36% 52% 11%
10% 52% 33%
4%
11% 46% 34%
8%
3% 38% 42% 17%
13% 51% 30%
6%
15% 46% 30%
8%
222
203
208 216
199 202 217
198 198
AWARDS / RECOGNITION DATA
Schools in Georgia may receive recognition in the following programs: Charter School Pay for Performance Program Georgia School of Excellence National Blue Ribbon School Lovejoy Middle School did not receive recognition in any of these programs during the 1998-99 school year.
1998-99 GEORGIA PUBLIC EDUCATION REPORT CARD Lovejoy Middle School - 6310191
Prepared by Georgia Department of Education
Page 3
CERTIFIED PERSONNEL DATA
Positions Number Average Contract Days
Personnel Sex
Certificate
Years Experience
Full-time Part-time
Male Female
4 Yr Bachelor's 5 Yr Master's 6 Yr Specialist's 7 Yr Doctoral Other*
<1 1-10 11-20 21-30 >30
Average
Administrators
4.00 230.00
4 0
1 3
0 0 3 1 0 0 2 0 2 0 16.75
Support Personnel
3.00 196.67
3 0
0 3
0 1 1 1 0 0 0 1 2 0 23.67
PK-12 Teachers
60.62 190.00
59 4
14 49
20 36
7 0 0 5 25 12 20 1 13.84
*Includes One- and Two-Year Vocational Certificates.
ACCREDITATION DATA
Accredited by Southern Association of Colleges and Schools (SACS):
Elementary/Middle Commission.
1998-99 GEORGIA PUBLIC EDUCATION REPORT CARD Lovejoy Middle School - 6310191
Prepared by Georgia Department of Education
Page 4
1998-99 GEORGIA PUBLIC EDUCATION REPORT CARD
CLAYTON COUNTY SCHOOLS
Morrow Elementary School - 6312058
Grade Range PK-5
The Georgia Public Education Report Card is designed to assist systems and schools in educational improvement. This report card contains a variety of data elements. An explanation of the terms is provided as a companion to the report card data. Please refer to the definitions for the most effective use of the reported data.
STUDENT DATA
Total
K-5
541
PK
41
Enrollment, by Race/Ethnicity and Sex
Black
White Hispanic
American Asian Indian
Multiracial
305 56.4%
149 27.5%
33 6.1%
43 7.9%
0 0.0%
11 2.0%
23 56.1%
9 22.0%
2
5
4.9% 12.2%
0 0.0%
2 4.9%
Male Female
276 51.0%
265 49.0%
21 51.2%
20 48.8%
Enrollment in Selected Programs
Program
Program % of Student Enrollment Population
Gifted (Grades K-12)
27
5.0%
Alternative Programs (Grades 6-12)
N/A
N/A
Students Eligible to Receive Free/Reduced Lunches
Number
Percent
School System
365 23,194
62.7% 52.6%
Dropout Rate *
Number
Rate
School System
N/A N/A
N/A N/A
* Dropout rates are not applicable for grades PK-5.
Enrollment in Compensatory Programs
Program
Program % of Student Enrollment Population
Special Education (Grades K-12)
80 14.8%
(PK)
1
N/A
English to Speakers of Other Languages (ESOL) (Grades K-12)
30
5.5%
Remedial Education (Grades 2-5, 9-12)
126 34.1%
Special Instructional Assistance (SIA) (Grades K-3)
48 13.5%
Title I (Grades K-12)
This school has a schoolwide program.
Total 12
Retained Students, by Race/Ethnicity and Sex
Black
White Hispanic
American MultiAsian Indian racial
9 75.0%
2 16.7%
1 8.3%
0 0.0%
0 0.0%
0 0.0%
Male Female
8
4
66.7% 33.3%
Prepared by Georgia Department of Education
Page 1
STATE-REQUIRED TEST DATA
NORM-REFERENCED TESTS Grade 3
Iowa Tests of Basic Skills (ITBS) Each chart reflects data for three years of testing.
Reading Comprehension 50
57 42 54 0
98-99
59 43 53 97-98
33 41 52 96-97
Mathematics
School 50
System
State
0
62 46 61 98-99
71 48 61 97-98
46 51 59 96-97
School System State
Reading Vocabulary 50
49 35 50 0
98-99
40 37 50 97-98
30 39 49 96-97
Language Arts
School 50
System
State
0
69 55 64 98-99
67 56 62 97-98
43 56 59 96-97
School System State
Social Studies 50
50 44 56 0
98-99
55 45 55 97-98
35 48 55 96-97
Science
School 50
System
State
0
51 44 59 98-99
62 45 59 97-98
43 48 58 96-97
School System State
Sources of Information
Composite Score
50
63 46 57 0
98-99
School 50
System
68 46 56 97-98
41 48 55 96-97
State 0
57 44 58 98-99
62 46 57 97-98
1998-99 GEORGIA PUBLIC EDUCATION REPORT CARD Morrow Elementary School - 6312058
Prepared by Georgia Department of Education
38 47 56 96-97
Scores Reported in Percentiles
School System State
Page 2
STATE-REQUIRED TEST DATA
NORM-REFERENCED TESTS Grade 5
Iowa Tests of Basic Skills (ITBS) Each chart reflects data for three years of testing.
Reading Comprehension
Mathematics
50
50 44 53 0
98-99
45 43 53 97-98
50 45 52 96-97
School 50
System
State
0
55 47 59 98-99
61 49 58 97-98
63 50 57 96-97
School System State
Reading Vocabulary 50
53 36 48 0
98-99
51 34 48 97-98
57 37 46 96-97
Language Arts
School 50
System
State
0
56 57 63 98-99
54 56 61 97-98
62 57 58 96-97
School System State
Social Studies 50
48 45 57 0
98-99
40 46 56 97-98
51 48 55 96-97
Science
School 50
System
State
0
51 47 60 98-99
42 49 59 97-98
52 50 59 96-97
School System State
Sources of Information
Composite Score
50
53 50 58 0
98-99
School 50
System
52 51 58 97-98
63 52 57 96-97
State 0
51 46 57 98-99
49 47 56 97-98
56 48 55 96-97
1998-99 GEORGIA PUBLIC EDUCATION REPORT CARD Morrow Elementary School - 6312058
Prepared by Georgia Department of Education
Scores Reported in Percentiles
School System State
Page 3
STATE-REQUIRED TEST DATA
PERFORMANCE ASSESSMENTS
Grade 5 Writing Assessment
Percent at Developmental Stages:
1998-99 School System State
1997-98 School System State
1996-97 School System State
Stage Stage Stage Stage Stage Stage
1:The Emerging Writer 2:The Developing Writer 3:The Focusing Writer 4:The Experimenting 5:The Engaging Writer 6:The Extending Writer
0% 1% 18% 24% 35% 21%
0% 1% 17% 41% 28% 12%
0% 1% 16% 41% 29% 12%
0% 0% 3% 40% 36% 20%
1% 3% 21% 42% 25% 8%
0% 3% 19% 41% 27% 10%
0% 1% 16% 38% 22% 22%
0% 3% 21% 40% 26% 8%
0% 3% 21% 37% 26% 12%
AWARDS / RECOGNITION DATA
Schools in Georgia may receive recognition in the following programs: Charter School Pay for Performance Program Georgia School of Excellence National Blue Ribbon School Morrow Elementary School did not receive recognition in any of these programs during the 1998-99 school year.
1998-99 GEORGIA PUBLIC EDUCATION REPORT CARD Morrow Elementary School - 6312058
Prepared by Georgia Department of Education
Page 4
CERTIFIED PERSONNEL DATA
Positions Number Average Contract Days
Personnel Sex
Certificate
Years Experience
Full-time Part-time
Male Female
4 Yr Bachelor's 5 Yr Master's 6 Yr Specialist's 7 Yr Doctoral Other*
<1 1-10 11-20 21-30 >30
Average
Administrators
2.00 220.00
2 0
1 1
0 0 2 0 0 0 0 1 0 1 22.00
Support Personnel
2.00 195.00
2 0
0 2
0 1 1 0 0 0 0 1 1 0 18.50
PK-12 Teachers
37.71 190.00
37 3
2 38
25 13
2 0 0 8 21 4 6 1 8.58
*Includes One- and Two-Year Vocational Certificates.
ACCREDITATION DATA
Accredited by Southern Association of Colleges and Schools (SACS):
Elementary/Middle Commission.
1998-99 GEORGIA PUBLIC EDUCATION REPORT CARD Morrow Elementary School - 6312058
Prepared by Georgia Department of Education
Page 5
1998-99 GEORGIA PUBLIC EDUCATION REPORT CARD
CLAYTON COUNTY SCHOOLS
Morrow High School - 6314058
Grade Range 9-12
The Georgia Public Education Report Card is designed to assist systems and schools in educational improvement. This report card contains a variety of data elements. An explanation of the terms is provided as a companion to the report card data. Please refer to the definitions for the most effective use of the reported data.
Total 1,651
STUDENT DATA
9-12 Enrollment, by Race/Ethnicity and Sex
Black
White Hispanic
American Multi-
Asian Indian
racial
810 49.1%
631 38.2%
65 3.9%
116 7.0%
2 0.1%
27 1.6%
Male Female
817 49.5%
834 50.5%
Enrollment in Selected Programs
Program
Gifted (Grades K-12)
Program % of Student Enrollment Population
103
6.2%
Non-Vocational Labs (Grades 9-12)
Vocational Labs (Grades 9-12)
Alternative Programs (Grades 6-12)
1,433 872 0
86.8% 52.8%
0.0%
Students Eligible to Receive Free/Reduced Lunches
Number
Percent
School System
482 23,194
29.2% 52.6%
Enrollment in Compensatory Programs
Program
Program % of Student Enrollment Population
Special Education (Grades K-12) PK
190 11.5%
0
N/A
English to Speakers of Other Languages (ESOL) (Grades K-12)
32
1.9%
Remedial Education (Grades 2-5, 9-12)
195 11.8%
Title I (Grades K-12)
This school has no Title I program.
Dropout Rate for Grades 9-12
Number
Rate
School System
154 1,191
8.0% 9.1%
Total 188
Retained Students, by Race/Ethnicity and Sex
Black
White Hispanic
American MultiAsian Indian racial
104 55.3%
69 36.7%
6 3.2%
5 2.7%
0 0.0%
4 2.1%
Male Female
121
67
64.4% 35.6%
Prepared by Georgia Department of Education
Page 1
STATE-REQUIRED TEST DATA
GEORGIA HIGH SCHOOL GRADUATION TESTS (GHSGT)
Percent of Regular Program 11th Graders Passing the Georgia High School Graduation Tests on First Administration
English Language Arts Mathematics Social Studies Science
All Components listed above
Writing
1998-99
School System State
98% 91% 83% 68%
96% 88% 82% 70%
96% 88% 80% 72%
66% 67% 68%
92% 92% 93%
1997-98
School System State
98% 92% 78% 75%
97% 91% 78% 75%
94% 88% 78% 74%
69% 70% 68%
95% 94% 92%
1996-97
School System State
98% 91% 79% 74%
96% 91% 80% 76%
94% 87% 78% 74%
68% 71% 67%
95% 95% 93%
GRADUATE DATA
1999 Graduates by Credentials, Race/Ethnicity and Sex
Diplomas with Both College Prep. & Voc. Endorsements
Diplomas with College Prep. Endorsements Diplomas with Vocational Endorsements General High School Diplomas Special Education Diplomas
Total All Diplomas
Certificates of Performance
Total Graduates
Total 49
129 56 2 14
250 0
Black
22 44.9%
45 34.9%
25 44.6%
2 100.0%
4 28.6%
98 39.2%
0
American MultiWhite Hispanic Asian Indian racial
21 42.9%
0
6
0.0% 12.2%
0 0.0%
0 0.0%
71 55.0%
6 4.7%
7 5.4%
0 0.0%
0 0.0%
26 46.4%
2 3.6%
2 3.6%
1 1.8%
0 0.0%
0 0.0%
0 0.0%
0 0.0%
0 0.0%
0 0.0%
10 71.4%
0 0.0%
0 0.0%
0 0.0%
0 0.0%
128 51.2%
8 3.2%
15 6.0%
1 0.4%
0 0.0%
0
0
0
0
0
Male Female
17
32
34.7% 65.3%
55
74
42.6% 57.4%
26
30
46.4% 53.6%
2 100.0%
0 0.0%
6
8
42.9% 57.1%
106
144
42.4% 57.6%
0
0
250
98
128
8
15
1
0
106
144
39.2% 51.2% 3.2% 6.0% 0.4% 0.0% 42.4% 57.6%
HOPE Scholarships
School System
Number of 1999 Graduates 2 5 0
Number Eligible
144
Percent Eligible
57.6%
1,750 1,017 58.1%
State
65,548 40,292 61.5%
High School Completion Rate
Percent of 1995Grade 9 Enrollment in Graduating Class of1999 School System State
Completion Rate '95-'99 63.9% 59.9% 68.9%
1998-99 GEORGIA PUBLIC EDUCATION REPORT CARD
Morrow High School - 6314058
Prepared by Georgia Department of Education
Page 2
COLLEGE ADMISSIONS / CREDIT TEST DATA
Scholastic Assessment Test (SAT)
Based on students' highest verbal and highest math scores
No. Taking
Average Score
Tests Verbal Math Total
Based on students' last test administration
Average Score Verbal Math Total
School
149 481 471
952
College Prep. Endorsement
481 474
955
Other Diplomas
375 355
730
System
1,093 478 474
952
College Prep. Endorsement
480 478
958
Other Diplomas
377 378
755
Georgia
41,958 492 488
980
476 N/A N/A
470 N/A N/A
483
468 N/A N/A
468 N/A N/A
479
944 N/A N/A
938 N/A N/A
962
Nation
952,913 N/A N/A N/A
502 508 1010
American College Testing (ACT)
Advanced Placement Exams (AP)
Number taking tests: English Mathematics Reading Science Reasoning CompositeScore
3 2 School System State
16.8 17.9 19.1
17.4 18.6 19.9
17.8 18.4
18.9 19.0
20.2 19.9
17.8 18.7 19.9
No. of Students Taking Tests
No. of Tests Taken No. of Test Scores
3 or Higher Percent of Test
Scores 3 or Higher
School 61 80 32
40.0%
System State 456 15,225 621 23,969 221 13,024
35.6% 54.3%
POST-SECONDARY DATA
Graduates Entering Georgia Public Colleges
Graduates Entering Georgia Public Colleges and Requiring Learning Support (LS)
1998 Graduates Entering in 1998-99
1997 Graduates Entering in 1997-98
Percent of Graduating Number Class
School
117
41.1%
System 702
41.2%
School
108
41.5%
System 664
40.7%
Number Requiring
LS 19 149
17 156
Percent of those attending Georgia
Public Colleges
16.2%
21.2%
15.7%
23.5%
In previous years, the Report Card presented College Prep Curriculum information provided by the Board of Regents on students requiring Learning Support. Due to inconsistencies in the data provided by the Board of Regents in defining College Prep Completers versus Local Board of Education data defining College Prep Endorsements, the Department of Education Report Card will not provide this information until discrepancies can be reconciled.
Graduates Entering Georgia Public Technical and Adult Schools
1998 Graduates School System
Entering Number 3 42
1998-99 Percent
1.1% 2.5%
Entering Number N/A N/A
1997-98 Percent
N/A N/A
1997 Graduates School
1
0.4%
System
4
0.2%
1
0.4%
19
1.2%
1998-99 GEORGIA PUBLIC EDUCATION REPORT CARD Morrow High School - 6314058
Prepared by Georgia Department of Education
Page 3
CERTIFIED PERSONNEL DATA
Positions Number Average Contract Days
Administrators
6.00 233.33
Support Personnel
5.00 200.00
PK-12 Teachers
89.85 190.56
Personnel Sex
Certificate
Years Experience
Full-time Part-time
Male Female
4 Yr Bachelor's 5 Yr Master's 6 Yr Specialist's 7 Yr Doctoral Other*
<1 1-10 11-20 21-30 >30
Average
6 0
4 2
0 0 4 2 0
0 1 0 4 1
24.00
5 0
1 4
0 4 1 0 0
0 1 1 3 0
19.20
89 3
39 53
47 31
8 1 5
7 38 24 18
5
13.01
*Includes One- and Two-Year Vocational Certificates.
ACCREDITATION DATA
Accredited by Southern Association of Colleges and Schools (SACS): Secondary/Middle Commission.
AWARDS / RECOGNITION DATA
Schools in Georgia may receive recognition in the following programs: Charter School Pay for Performance Program Georgia School of Excellence National Blue Ribbon School Morrow High School did not receive recognition in any of these programs during the 1998-99 school year.
1998-99 GEORGIA PUBLIC EDUCATION REPORT CARD Morrow High School - 6314058
Prepared by Georgia Department of Education
Page 4
1998-99 GEORGIA PUBLIC EDUCATION REPORT CARD
CLAYTON COUNTY SCHOOLS
Morrow Middle School - 6313058
Grade Range 6-8
The Georgia Public Education Report Card is designed to assist systems and schools in educational improvement. This report card contains a variety of data elements. An explanation of the terms is provided as a companion to the report card data. Please refer to the definitions for the most effective use of the reported data.
STUDENT DATA
Total 1,128
6-8 Enrollment, by Race/Ethnicity and Sex
Black
White Hispanic
American Multi-
Asian Indian
racial
612 54.3%
367 32.5%
45 4.0%
73 6.5%
0 0.0%
31 2.7%
Male 636
56.4%
Female 492
43.6%
Enrollment in Selected Programs
Program
Gifted (Grades K-12)
Program % of Student Enrollment Population
53
4.7%
Alternative Programs (Grades 6-12)
0
0.0%
Students Eligible to Receive Free/Reduced Lunches
Number
Percent
School System
631 23,194
55.9% 52.6%
Enrollment in Compensatory Programs
Program
Program % of Student Enrollment Population
Special Education (Grades K-12) (PK)
179 15.9%
0
N/A
English to Speakers of Other Languages (ESOL) (Grades K-12)
30
2.7%
Title I (Grades K-12)
This school has no Title I program.
Dropout Rate for Grades 6-8
Number
Rate
School System
7
0.5%
46
0.4%
Total 41
Retained Students, by Race/Ethnicity and Sex
Black
White Hispanic
American MultiAsian Indian racial
25 61.0%
11 26.8%
3 7.3%
1 2.4%
0 0.0%
1 2.4%
Male Female
31
10
75.6% 24.4%
Prepared by Georgia Department of Education
Page 1
STATE-REQUIRED TEST DATA
NORM-REFERENCED TESTS Grade 8
Iowa Tests of Basic Skills (ITBS) Each chart reflects data for three years of testing.
Reading Comprehension 50
47 42 49 0
98-99
44 43 48 97-98
40 44 48 96-97
Mathematics
School 50
System
State
0
48 47 56 98-99
53 48 55 97-98
45 49 54 96-97
School System State
Reading Vocabulary 50
39 36 46 0
98-99
39 38 45 97-98
36 40 44 96-97
Language Arts
School 50
System
State
0
58 55 60 98-99
59 55 58 97-98
49 53 56 96-97
School System State
Social Studies 50
49 47 54 0
98-99
51 48 53 97-98
49 51 53 96-97
Science
School 50
System
State
0
50 46 56 98-99
52 48 55 97-98
42 48 53 96-97
School System State
Sources of Information
Composite Score
50
50 52 57 0
98-99
School 50
System
53 53 56 97-98
47 53 55 96-97
State 0
49 48 56 98-99
52 49 54 97-98
1998-99 GEORGIA PUBLIC EDUCATION REPORT CARD Morrow Middle School - 6313058
Prepared by Georgia Department of Education
47 50 54 96-97
Scores Reported in Percentiles
School System State
Page 2
STATE-REQUIRED TEST DATA
Categories of Scaled Scores
Inadequate (less than 162)
Minimal (162-209)
Good
(210-247)
Very Good (greater than 247)
Average Scaled Score: (Range 100-300)
PERFORMANCE ASSESSMENTS
Grade 8 Writing Assessment
1998-99 Percent Scoring
1997-98 Percent Scoring
1996-97 Percent Scoring
School System State School System State School System State
9% 45% 40%
6%
10% 45% 38%
7%
8% 40% 41% 11%
10% 53% 34%
3%
10% 52% 33%
4%
11% 46% 34%
8%
13% 54% 27%
6%
13% 51% 30%
6%
15% 46% 30%
8%
203
203
208 198
199 202 196
198 198
AWARDS / RECOGNITION DATA
Schools in Georgia may receive recognition in the following programs: Charter School Pay for Performance Program Georgia School of Excellence National Blue Ribbon School Morrow Middle School did not receive recognition in any of these programs during the 1998-99 school year.
1998-99 GEORGIA PUBLIC EDUCATION REPORT CARD Morrow Middle School - 6313058
Prepared by Georgia Department of Education
Page 3
CERTIFIED PERSONNEL DATA
Positions Number Average Contract Days
Personnel Sex
Certificate
Years Experience
Full-time Part-time
Male Female
4 Yr Bachelor's 5 Yr Master's 6 Yr Specialist's 7 Yr Doctoral Other*
<1 1-10 11-20 21-30 >30
Average
Administrators
4.00 230.00
4 0
1 3
0 3 1 0 0 0 0 1 3 0 23.75
Support Personnel
3.38 197.04
3 1
0 4
0 3 1 0 0 0 0 2 1 1 22.50
PK-12 Teachers
65.50 190.00
63 5
14 54
37 28
3 0 0 7 33 16 11 1 9.99
*Includes One- and Two-Year Vocational Certificates.
ACCREDITATION DATA
Accredited by Southern Association of Colleges and Schools (SACS):
Elementary/Middle Commission.
1998-99 GEORGIA PUBLIC EDUCATION REPORT CARD Morrow Middle School - 6313058
Prepared by Georgia Department of Education
Page 4
1998-99 GEORGIA PUBLIC EDUCATION REPORT CARD
CLAYTON COUNTY SCHOOLS
Mount Zion Elementary School - 6310176
Grade Range K-5
The Georgia Public Education Report Card is designed to assist systems and schools in educational improvement. This report card contains a variety of data elements. An explanation of the terms is provided as a companion to the report card data. Please refer to the definitions for the most effective use of the reported data.
STUDENT DATA
Total 1,148
K-5 Enrollment, by Race/Ethnicity and Sex
Black
White Hispanic
American Multi-
Asian Indian
racial
559 48.7%
475 41.4%
42 3.7%
25 2.2%
0 0.0%
47 4.1%
Male Female
549 47.8%
599 52.2%
Enrollment in Selected Programs
Program
Program % of Student Enrollment Population
Gifted (Grades K-12)
66
5.7%
Alternative Programs (Grades 6-12)
N/A
N/A
Students Eligible to Receive Free/Reduced Lunches
Number
Percent
School System
481 23,194
41.9% 52.6%
Dropout Rate *
Number
Rate
School System
N/A N/A
N/A N/A
* Dropout rates are not applicable for grades PK-5.
Enrollment in Compensatory Programs
Program
Program % of Student Enrollment Population
Special Education (Grades K-12)
90
7.8%
(PK)
0
N/A
English to Speakers of Other Languages (ESOL) (Grades K-12)
42
3.7%
Remedial Education (Grades 2-5, 9-12)
254 33.0%
Special Instructional Assistance (SIA) (Grades K-3)
50
6.6%
Title I (Grades K-12)
This school has no Title I program.
Total 47
Retained Students, by Race/Ethnicity and Sex
Black
White Hispanic
American Multi-
Asian Indian
racial
22 46.8%
22 46.8%
2 4.3%
0 0.0%
0 0.0%
1 2.1%
Male Female
25
22
53.2% 46.8%
Prepared by Georgia Department of Education
Page 1
STATE-REQUIRED TEST DATA
NORM-REFERENCED TESTS Grade 3
Iowa Tests of Basic Skills (ITBS) Each chart reflects data for three years of testing.
Reading Comprehension 50
49 42 54 0
98-99
50 43 53 97-98
49 41 52 96-97
Mathematics
School 50
System
State
0
54 46 61 98-99
63 48 61 97-98
62 51 59 96-97
School System State
Reading Vocabulary 50
43 35 50 0
98-99
44 37 50 97-98
51 39 49 96-97
Language Arts
School 50
System
State
0
64 55 64 98-99
67 56 62 97-98
65 56 59 96-97
School System State
Social Studies 50
56 44 56 0
98-99
57 45 55 97-98
59 48 55 96-97
Science
School 50
System
State
0
52 44 59 98-99
53 45 59 97-98
58 48 58 96-97
School System State
Sources of Information
Composite Score
50
58 46 57 0
98-99
School 50
System
61 46 56 97-98
62 48 55 96-97
State 0
55 44 58 98-99
57 46 57 97-98
1998-99 GEORGIA PUBLIC EDUCATION REPORT CARD Mount Zion Elementary School - 6310176
Prepared by Georgia Department of Education
59 47 56 96-97
Scores Reported in Percentiles
School System State
Page 2
STATE-REQUIRED TEST DATA
NORM-REFERENCED TESTS Grade 5
Iowa Tests of Basic Skills (ITBS) Each chart reflects data for three years of testing.
Reading Comprehension
Mathematics
50
47 44 53 0
98-99
50 43 53 97-98
47 45 52 96-97
School 50
System
State
0
48 47 59 98-99
59 49 58 97-98
56 50 57 96-97
School System State
Reading Vocabulary 50
47 36 48 0
98-99
49 34 48 97-98
52 37 46 96-97
Language Arts
School 50
System
State
0
57 57 63 98-99
64 56 61 97-98
63 57 58 96-97
School System State
Social Studies 50
57 45 57 0
98-99
64 46 56 97-98
60 48 55 96-97
Science
School 50
System
State
0
59 47 60 98-99
63 49 59 97-98
51 50 59 96-97
School System State
Sources of Information
Composite Score
50
50 50 58 0
98-99
School 50
System
61 51 58 97-98
56 52 57 96-97
State 0
53 46 57 98-99
60 47 56 97-98
55 48 55 96-97
1998-99 GEORGIA PUBLIC EDUCATION REPORT CARD Mount Zion Elementary School - 6310176
Prepared by Georgia Department of Education
Scores Reported in Percentiles
School System State
Page 3
STATE-REQUIRED TEST DATA
PERFORMANCE ASSESSMENTS
Grade 5 Writing Assessment
Percent at Developmental Stages:
1998-99 School System State
1997-98 School System State
1996-97 School System State
Stage Stage Stage Stage Stage Stage
1:The Emerging Writer 2:The Developing Writer 3:The Focusing Writer 4:The Experimenting 5:The Engaging Writer 6:The Extending Writer
0% 0% 20% 41% 29% 10%
0% 1% 17% 41% 28% 12%
0% 1% 16% 41% 29% 12%
0% 3% 22% 40% 29% 7%
1% 3% 21% 42% 25% 8%
0% 3% 19% 41% 27% 10%
0% 3% 18% 45% 26% 8%
0% 3% 21% 40% 26% 8%
0% 3% 21% 37% 26% 12%
AWARDS / RECOGNITION DATA
Schools in Georgia may receive recognition in the following programs: Charter School Pay for Performance Program Georgia School of Excellence National Blue Ribbon School Mount Zion Elementary School did not receive recognition in any of these programs during the 1998-99 school year.
1998-99 GEORGIA PUBLIC EDUCATION REPORT CARD Mount Zion Elementary School - 6310176
Prepared by Georgia Department of Education
Page 4
CERTIFIED PERSONNEL DATA
Positions Number Average Contract Days
Personnel Sex
Certificate
Years Experience
Full-time Part-time
Male Female
4 Yr Bachelor's 5 Yr Master's 6 Yr Specialist's 7 Yr Doctoral Other*
<1 1-10 11-20 21-30 >30
Average
Administrators
3.00 226.67
3 0
1 2
0 0 2 1 0 0 0 2 1 0 21.00
Support Personnel
3.00 196.67
3 0
0 3
0 2 1 0 0 0 0 2 1 0 18.67
PK-12 Teachers
58.50 190.00
58 1
4 55
30 25
3 1 0 7 21 21 8 2 11.49
*Includes One- and Two-Year Vocational Certificates.
ACCREDITATION DATA
Accredited by Southern Association of Colleges and Schools (SACS):
Elementary/Middle Commission.
1998-99 GEORGIA PUBLIC EDUCATION REPORT CARD Mount Zion Elementary School - 6310176
Prepared by Georgia Department of Education
Page 5
1998-99 GEORGIA PUBLIC EDUCATION REPORT CARD
CLAYTON COUNTY SCHOOLS
Mount Zion High School - 6310290
Grade Range 9-12
The Georgia Public Education Report Card is designed to assist systems and schools in educational improvement. This report card contains a variety of data elements. An explanation of the terms is provided as a companion to the report card data. Please refer to the definitions for the most effective use of the reported data.
Total 1,611
STUDENT DATA
9-12 Enrollment, by Race/Ethnicity and Sex
Black
White Hispanic
American Multi-
Asian Indian
racial
822 51.0%
607 37.7%
74 4.6%
81 5.0%
3 0.2%
24 1.5%
Male Female
819 50.8%
792 49.2%
Enrollment in Selected Programs
Program
Gifted (Grades K-12)
Program % of Student Enrollment Population
104
6.5%
Non-Vocational Labs (Grades 9-12)
Vocational Labs (Grades 9-12)
Alternative Programs (Grades 6-12)
1,421 917 0
88.2% 56.9%
0.0%
Students Eligible to Receive Free/Reduced Lunches
Number
Percent
School System
483 23,194
30.0% 52.6%
Enrollment in Compensatory Programs
Program
Program % of Student Enrollment Population
Special Education (Grades K-12) PK
183 11.4%
0
N/A
English to Speakers of Other Languages (ESOL) (Grades K-12)
36
2.2%
Remedial Education (Grades 2-5, 9-12)
197 12.2%
Title I (Grades K-12)
This school has no Title I program.
Dropout Rate for Grades 9-12
Number
Rate
School System
193 1,191
10.2% 9.1%
Total 173
Retained Students, by Race/Ethnicity and Sex
Black
White Hispanic
American MultiAsian Indian racial
98 56.6%
57 32.9%
7 4.0%
8 4.6%
1 0.6%
2 1.2%
Male Female
108
65
62.4% 37.6%
Prepared by Georgia Department of Education
Page 1
STATE-REQUIRED TEST DATA
GEORGIA HIGH SCHOOL GRADUATION TESTS (GHSGT)
Percent of Regular Program 11th Graders Passing the Georgia High School Graduation Tests on First Administration
English Language Arts Mathematics Social Studies Science
All Components listed above
Writing
1998-99
School System State
98% 92% 86% 75%
96% 88% 82% 70%
96% 88% 80% 72%
72% 67% 68%
92% 92% 93%
1997-98
School System State
98% 95% 80% 79%
97% 91% 78% 75%
94% 88% 78% 74%
70% 70% 68%
95% 94% 92%
1996-97
School System State
95% 91% 75% 74%
96% 91% 80% 76%
94% 87% 78% 74%
68% 71% 67%
98% 95% 93%
GRADUATE DATA
1999 Graduates by Credentials, Race/Ethnicity and Sex
Diplomas with Both College Prep. & Voc. Endorsements
Diplomas with College Prep. Endorsements Diplomas with Vocational Endorsements General High School Diplomas Special Education Diplomas
Total All Diplomas
Certificates of Performance
Total Graduates
Total 62
100 51 6 8
227 7
234
Black
31 50.0%
43 43.0%
20 39.2%
5 83.3%
5 62.5%
104 45.8%
3 42.9%
107 45.7%
White Hispanic
22 35.5%
44 44.0%
1 1.6%
5 5.0%
25 49.0%
1 16.7%
3 37.5%
2 3.9%
0 0.0%
0 0.0%
95 41.9%
8 3.5%
1
1
14.3% 14.3%
96 41.0%
9 3.8%
American MultiAsian Indian racial
8 12.9%
8 8.0%
0 0.0%
0 0.0%
0 0.0%
0 0.0%
3 5.9%
0 0.0%
0 0.0%
1 2.0%
0 0.0%
0 0.0%
0 0.0%
0 0.0%
0 0.0%
19 8.4%
1 0.4%
0 0.0%
2 28.6%
0 0.0%
0 0.0%
21 9.0%
1 0.4%
0 0.0%
Male Female
19 30.6%
46 46.0%
43 69.4%
54 54.0%
29 56.9%
2 33.3%
4 50.0%
22 43.1%
4 66.7%
4 50.0%
100
127
44.1% 55.9%
3
4
42.9% 57.1%
103
131
44.0% 56.0%
HOPE Scholarships
School System
Number of 1999 Graduates 2 3 4
Number Eligible
139
Percent Eligible
59.4%
1,750 1,017 58.1%
State
65,548 40,292 61.5%
High School Completion Rate
Percent of 1995Grade 9 Enrollment in Graduating Class of1999 School System State
Completion Rate '95-'99 61.7% 59.9% 68.9%
1998-99 GEORGIA PUBLIC EDUCATION REPORT CARD
Mount Zion High School - 6310290
Prepared by Georgia Department of Education
Page 2
COLLEGE ADMISSIONS / CREDIT TEST DATA
Scholastic Assessment Test (SAT)
Based on students' highest verbal and highest math scores
No. Taking
Average Score
Tests Verbal Math Total
Based on students' last test administration
Average Score Verbal Math Total
School
141 474 468
942
College Prep. Endorsement
486 480
966
Other Diplomas
357 348
705
System
1,093 478 474
952
College Prep. Endorsement
480 478
958
Other Diplomas
377 378
755
Georgia
41,958 492 488
980
469 N/A N/A
470 N/A N/A
483
463 N/A N/A
468 N/A N/A
479
932 N/A N/A
938 N/A N/A
962
Nation
952,913 N/A N/A N/A
502 508 1010
American College Testing (ACT)
Advanced Placement Exams (AP)
Number taking tests: English Mathematics Reading Science Reasoning CompositeScore
2 5 School System State
17.4 17.9 19.1
19.0 18.6 19.9
18.2 18.9
18.9 19.0
20.2 19.9
18.6 18.7 19.9
No. of Students Taking Tests
No. of Tests Taken No. of Test Scores
3 or Higher Percent of Test
Scores 3 or Higher
School 46 60 16
26.7%
System State 456 15,225 621 23,969 221 13,024
35.6% 54.3%
POST-SECONDARY DATA
Graduates Entering Georgia Public Colleges
Graduates Entering Georgia Public Colleges and Requiring Learning Support (LS)
1998 Graduates Entering in 1998-99
1997 Graduates Entering in 1997-98
Percent of Graduating Number Class
School
99
35.1%
System 702
41.2%
School
96
44.9%
System 664
40.7%
Number Requiring
LS 24 149
24 156
Percent of those attending Georgia
Public Colleges
24.2%
21.2%
25.0%
23.5%
In previous years, the Report Card presented College Prep Curriculum information provided by the Board of Regents on students requiring Learning Support. Due to inconsistencies in the data provided by the Board of Regents in defining College Prep Completers versus Local Board of Education data defining College Prep Endorsements, the Department of Education Report Card will not provide this information until discrepancies can be reconciled.
Graduates Entering Georgia Public Technical and Adult Schools
1998 Graduates School System
Entering Number 9 42
1998-99 Percent
3.2% 2.5%
Entering Number N/A N/A
1997-98 Percent
N/A N/A
1997 Graduates School
0
0.0%
System
4
0.2%
1
0.5%
19
1.2%
1998-99 GEORGIA PUBLIC EDUCATION REPORT CARD Mount Zion High School - 6310290
Prepared by Georgia Department of Education
Page 3
CERTIFIED PERSONNEL DATA
Positions Number Average Contract Days
Administrators
5.00 232.00
Support Personnel
6.00 206.67
PK-12 Teachers
92.69 190.54
Personnel Sex
Certificate
Years Experience
Full-time Part-time
Male Female
4 Yr Bachelor's 5 Yr Master's 6 Yr Specialist's 7 Yr Doctoral Other*
<1 1-10 11-20 21-30 >30
Average
5 0
3 2
0 1 4 0 0
0 1 1 3 0
19.60
6 0
2 4
2 2 1 1 0
0 1 2 3 0
18.50
90 6
33 63
45 39
6 4 2
10 40 18 26
2
12.33
*Includes One- and Two-Year Vocational Certificates.
ACCREDITATION DATA
Accredited by Southern Association of Colleges and Schools (SACS): Secondary/Middle Commission.
AWARDS / RECOGNITION DATA
Schools in Georgia may receive recognition in the following programs: Charter School Pay for Performance Program Georgia School of Excellence National Blue Ribbon School Mount Zion High School did not receive recognition in any of these programs during the 1998-99 school year.
1998-99 GEORGIA PUBLIC EDUCATION REPORT CARD Mount Zion High School - 6310290
Prepared by Georgia Department of Education
Page 4
1998-99 GEORGIA PUBLIC EDUCATION REPORT CARD
CLAYTON COUNTY SCHOOLS
Mundy's Mill Middle School - 6310174
Grade Range 6-8
The Georgia Public Education Report Card is designed to assist systems and schools in educational improvement. This report card contains a variety of data elements. An explanation of the terms is provided as a companion to the report card data. Please refer to the definitions for the most effective use of the reported data.
STUDENT DATA
Total 962
6-8 Enrollment, by Race/Ethnicity and Sex
Black
White Hispanic
American Multi-
Asian Indian
racial
418 43.5%
467 48.5%
33 3.4%
29 3.0%
2 0.2%
13 1.4%
Male 488
50.7%
Female 474
49.3%
Enrollment in Selected Programs
Program
Gifted (Grades K-12)
Program % of Student Enrollment Population
116
12.1%
Alternative Programs (Grades 6-12)
0
0.0%
Students Eligible to Receive Free/Reduced Lunches
Number
Percent
School System
338 23,194
35.1% 52.6%
Enrollment in Compensatory Programs
Program
Program % of Student Enrollment Population
Special Education (Grades K-12) (PK)
124 12.9%
0
N/A
English to Speakers of Other Languages (ESOL) (Grades K-12)
29
3.0%
Title I (Grades K-12)
This school has no Title I program.
Dropout Rate for Grades 6-8
Number
Rate
School System
0
0.0%
46
0.4%
Total 23
Retained Students, by Race/Ethnicity and Sex
Black
White Hispanic
American MultiAsian Indian racial
12 52.2%
8 34.8%
2 8.7%
1 4.3%
0 0.0%
0 0.0%
Male Female
15
8
65.2% 34.8%
Prepared by Georgia Department of Education
Page 1
STATE-REQUIRED TEST DATA
NORM-REFERENCED TESTS Grade 8
Iowa Tests of Basic Skills (ITBS) Each chart reflects data for three years of testing.
Reading Comprehension 50
48 42 49 0
98-99
50 43 48 97-98
57 44 48 96-97
Mathematics
School 50
System
State
0
58 47 56 98-99
57 48 55 97-98
62 49 54 96-97
School System State
Reading Vocabulary 50
50 36 46 0
98-99
48 38 45 97-98
51 40 44 96-97
Language Arts
School 50
System
State
0
61 55 60 98-99
62 55 58 97-98
62 53 56 96-97
School System State
Social Studies 50
55 47 54 0
98-99
56 48 53 97-98
61 51 53 96-97
Science
School 50
System
State
0
56 46 56 98-99
58 48 55 97-98
62 48 53 96-97
School System State
Sources of Information
Composite Score
50
62 52 57 0
98-99
School 50
System
62 53 56 97-98
69 53 55 96-97
State 0
58 48 56 98-99
58 49 54 97-98
1998-99 GEORGIA PUBLIC EDUCATION REPORT CARD Mundy's Mill Middle School - 6310174
Prepared by Georgia Department of Education
63 50 54 96-97
Scores Reported in Percentiles
School System State
Page 2
STATE-REQUIRED TEST DATA
Categories of Scaled Scores
Inadequate (less than 162)
Minimal (162-209)
Good
(210-247)
Very Good (greater than 247)
Average Scaled Score: (Range 100-300)
PERFORMANCE ASSESSMENTS
Grade 8 Writing Assessment
1998-99 Percent Scoring
1997-98 Percent Scoring
1996-97 Percent Scoring
School System State School System State School System State
5% 41% 45%
9%
10% 45% 38%
7%
8% 40% 41% 11%
4% 48% 43%
5%
10% 52% 33%
4%
11% 46% 34%
8%
9% 47% 31% 13%
13% 51% 30%
6%
15% 46% 30%
8%
210
203
208 208
199 202 206
198 198
AWARDS / RECOGNITION DATA
Schools in Georgia may receive recognition in the following programs: Charter School Pay for Performance Program Georgia School of Excellence National Blue Ribbon School Mundy's Mill Middle School did not receive recognition in any of these programs during the 1998-99 school year.
1998-99 GEORGIA PUBLIC EDUCATION REPORT CARD Mundy's Mill Middle School - 6310174
Prepared by Georgia Department of Education
Page 3
CERTIFIED PERSONNEL DATA
Positions Number Average Contract Days
Personnel Sex
Certificate
Years Experience
Full-time Part-time
Male Female
4 Yr Bachelor's 5 Yr Master's 6 Yr Specialist's 7 Yr Doctoral Other*
<1 1-10 11-20 21-30 >30
Average
Administrators
4.00 230.00
4 0
1 3
0 1 3 0 0 0 0 2 2 0 21.00
Support Personnel
3.50 197.14
3 1
2 2
0 3 1 0 0 0 2 1 1 0 15.50
PK-12 Teachers
66.82 190.00
64 5
15 54
35 28
6 0 0 5 20 19 24 1 14.91
*Includes One- and Two-Year Vocational Certificates.
ACCREDITATION DATA
Accredited by Southern Association of Colleges and Schools (SACS):
Elementary/Middle Commission.
1998-99 GEORGIA PUBLIC EDUCATION REPORT CARD Mundy's Mill Middle School - 6310174
Prepared by Georgia Department of Education
Page 4
1998-99 GEORGIA PUBLIC EDUCATION REPORT CARD
CLAYTON COUNTY SCHOOLS
North Clayton High School - 6312052
Grade Range 9-12
The Georgia Public Education Report Card is designed to assist systems and schools in educational improvement. This report card contains a variety of data elements. An explanation of the terms is provided as a companion to the report card data. Please refer to the definitions for the most effective use of the reported data.
Total 1,211
STUDENT DATA
9-12 Enrollment, by Race/Ethnicity and Sex
Black
White Hispanic
American Multi-
Asian Indian
racial
1,096 90.5%
16 1.3%
11 0.9%
77 6.4%
0 0.0%
11 0.9%
Male Female
607 50.1%
604 49.9%
Enrollment in Selected Programs
Program
Gifted (Grades K-12)
Program % of Student Enrollment Population
32
2.6%
Non-Vocational Labs (Grades 9-12)
Vocational Labs (Grades 9-12)
Alternative Programs (Grades 6-12)
1,127 812 0
93.1% 67.1%
0.0%
Students Eligible to Receive Free/Reduced Lunches
Number
Percent
School System
461 23,194
38.1% 52.6%
Enrollment in Compensatory Programs
Program
Program % of Student Enrollment Population
Special Education (Grades K-12) PK
40
3.3%
0
N/A
English to Speakers of Other Languages (ESOL) (Grades K-12)
17
1.4%
Remedial Education (Grades 2-5, 9-12)
163 13.5%
Title I (Grades K-12)
This school has a schoolwide program.
Dropout Rate for Grades 9-12
Number
Rate
School System
90 1,191
6.1% 9.1%
Total 176
Retained Students, by Race/Ethnicity and Sex
Black
White Hispanic
American MultiAsian Indian racial
161 91.5%
3 1.7%
1 0.6%
10 5.7%
0 0.0%
1 0.6%
Male Female
117
59
66.5% 33.5%
Prepared by Georgia Department of Education
Page 1
STATE-REQUIRED TEST DATA
GEORGIA HIGH SCHOOL GRADUATION TESTS (GHSGT)
Percent of Regular Program 11th Graders Passing the Georgia High School Graduation Tests on First Administration
English Language Arts Mathematics Social Studies Science
All Components listed above
Writing
1998-99
School System State
91% 81% 74% 56%
96% 88% 82% 70%
96% 88% 80% 72%
51% 67% 68%
86% 92% 93%
1997-98
School System State
94% 80% 67% 58%
97% 91% 78% 75%
94% 88% 78% 74%
56% 70% 68%
90% 94% 92%
1996-97
School System State
93% 81% 73% 61%
96% 91% 80% 76%
94% 87% 78% 74%
54% 71% 67%
83% 95% 93%
GRADUATE DATA
1999 Graduates by Credentials, Race/Ethnicity and Sex
Diplomas with Both College Prep. & Voc. Endorsements
Diplomas with College Prep. Endorsements Diplomas with Vocational Endorsements General High School Diplomas Special Education Diplomas
Total All Diplomas
Certificates of Performance
Total Graduates
Total 29
113 36 0
Black
26 89.7%
103 91.2%
36 100.0%
0
White Hispanic
0 0.0%
0 0.0%
0 0.0%
0 0.0%
0 0.0%
0 0.0%
0
0
American MultiAsian Indian racial
3 10.3%
0 0.0%
0 0.0%
7 6.2%
0 0.0%
3 2.7%
0 0.0%
0 0.0%
0 0.0%
0
0
0
4
4
100.0%
182
169
92.9%
0
0
0 0.0%
0 0.0%
0
0 0.0%
0 0.0%
0
0 0.0%
10 5.5%
0
0 0.0%
0 0.0%
0
0 0.0%
3 1.6%
0
182
169
0
0
10
0
3
92.9%
0.0% 0.0% 5.5% 0.0% 1.6%
Male Female
13
16
44.8% 55.2%
42
71
37.2% 62.8%
15
21
41.7% 58.3%
0
0
3 75.0%
73 40.1%
0
1 25.0%
109 59.9%
0
73
109
40.1% 59.9%
HOPE Scholarships
School System
Number of 1999 Graduates 1 8 2
Number Eligible
103
Percent Eligible
56.6%
1,750 1,017 58.1%
State
65,548 40,292 61.5%
High School Completion Rate
Percent of 1995Grade 9 Enrollment in Graduating Class of1999 School System State
Completion Rate '95-'99 61.3% 59.9% 68.9%
1998-99 GEORGIA PUBLIC EDUCATION REPORT CARD
North Clayton High School - 6312052
Prepared by Georgia Department of Education
Page 2
COLLEGE ADMISSIONS / CREDIT TEST DATA
Scholastic Assessment Test (SAT)
Based on students' highest verbal and highest math scores
No. Taking
Average Score
Tests Verbal Math Total
Based on students' last test administration
Average Score Verbal Math Total
School
128 433 415
848
College Prep. Endorsement
437 418
855
Other Diplomas
347 381
728
System
1,093 478 474
952
College Prep. Endorsement
480 478
958
Other Diplomas
377 378
755
Georgia
41,958 492 488
980
423 N/A N/A
470 N/A N/A
483
406 N/A N/A
468 N/A N/A
479
829 N/A N/A
938 N/A N/A
962
Nation
952,913 N/A N/A N/A
502 508 1010
American College Testing (ACT)
Advanced Placement Exams (AP)
Number taking tests: English Mathematics Reading Science Reasoning CompositeScore
2 3 School System State
15.5 17.9 19.1
17.3 18.6 19.9
15.7 17.7
18.9 19.0
20.2 19.9
16.7 18.7 19.9
No. of Students Taking Tests
No. of Tests Taken No. of Test Scores
3 or Higher Percent of Test
Scores 3 or Higher
School 39 49 0
0.0%
System State 456 15,225 621 23,969 221 13,024
35.6% 54.3%
POST-SECONDARY DATA
Graduates Entering Georgia Public Colleges
Graduates Entering Georgia Public Colleges and Requiring Learning Support (LS)
1998 Graduates Entering in 1998-99
1997 Graduates Entering in 1997-98
Percent of Graduating Number Class
School
62
32.5%
System 702
41.2%
School
60
35.3%
System 664
40.7%
Number Requiring
LS 28 149
24 156
Percent of those attending Georgia
Public Colleges
45.2%
21.2%
40.0%
23.5%
In previous years, the Report Card presented College Prep Curriculum information provided by the Board of Regents on students requiring Learning Support. Due to inconsistencies in the data provided by the Board of Regents in defining College Prep Completers versus Local Board of Education data defining College Prep Endorsements, the Department of Education Report Card will not provide this information until discrepancies can be reconciled.
Graduates Entering Georgia Public Technical and Adult Schools
1998 Graduates School System
Entering Number 2 42
1998-99 Percent
1.0% 2.5%
Entering Number N/A N/A
1997-98 Percent
N/A N/A
1997 Graduates School
0
0.0%
System
4
0.2%
4
2.4%
19
1.2%
1998-99 GEORGIA PUBLIC EDUCATION REPORT CARD North Clayton High School - 6312052
Prepared by Georgia Department of Education
Page 3
CERTIFIED PERSONNEL DATA
Positions Number Average Contract Days
Administrators
5.00 232.00
Support Personnel
5.00 200.00
PK-12 Teachers
72.15 190.69
Personnel Sex
Certificate
Years Experience
Full-time Part-time
Male Female
4 Yr Bachelor's 5 Yr Master's 6 Yr Specialist's 7 Yr Doctoral Other*
<1 1-10 11-20 21-30 >30
Average
5 0
5 0
0 2 3 0 0
0 0 0 4 1
26.40
5 0
2 3
0 4 1 0 0
0 2 0 2 1
18.00
71 3
32 42
38 28
3 2 3
2 32 25 13
2
12.31
*Includes One- and Two-Year Vocational Certificates.
ACCREDITATION DATA
Accredited by Southern Association of Colleges and Schools (SACS): Secondary/Middle Commission.
AWARDS / RECOGNITION DATA
Schools in Georgia may receive recognition in the following programs: Charter School Pay for Performance Program Georgia School of Excellence National Blue Ribbon School North Clayton High School did not receive recognition in any of these programs during the 1998-99 school year.
1998-99 GEORGIA PUBLIC EDUCATION REPORT CARD North Clayton High School - 6312052
Prepared by Georgia Department of Education
Page 4
1998-99 GEORGIA PUBLIC EDUCATION REPORT CARD
CLAYTON COUNTY SCHOOLS
North Clayton Middle School - 6313052
Grade Range 6-8
The Georgia Public Education Report Card is designed to assist systems and schools in educational improvement. This report card contains a variety of data elements. An explanation of the terms is provided as a companion to the report card data. Please refer to the definitions for the most effective use of the reported data.
STUDENT DATA
Total 950
6-8 Enrollment, by Race/Ethnicity and Sex
Black
White Hispanic
American Multi-
Asian Indian
racial
847 89.2%
22 2.3%
6 0.6%
58 6.1%
2 0.2%
15 1.6%
Male 473
49.8%
Female 477
50.2%
Enrollment in Selected Programs
Program
Gifted (Grades K-12)
Program % of Student Enrollment Population
31
3.3%
Alternative Programs (Grades 6-12)
0
0.0%
Students Eligible to Receive Free/Reduced Lunches
Number
Percent
School System
677 23,194
71.3% 52.6%
Enrollment in Compensatory Programs
Program
Program % of Student Enrollment Population
Special Education (Grades K-12) (PK)
52
5.5%
0
N/A
English to Speakers of Other Languages (ESOL) (Grades K-12)
18
1.9%
Title I (Grades K-12)
This school has a schoolwide program.
Dropout Rate for Grades 6-8
Number
Rate
School System
0
0.0%
46
0.4%
Total 13
Retained Students, by Race/Ethnicity and Sex
Black
White Hispanic
American MultiAsian Indian racial
10 76.9%
0 0.0%
1 7.7%
2 15.4%
0 0.0%
0 0.0%
Male Female
9
4
69.2% 30.8%
Prepared by Georgia Department of Education
Page 1
STATE-REQUIRED TEST DATA
NORM-REFERENCED TESTS Grade 8
Iowa Tests of Basic Skills (ITBS) Each chart reflects data for three years of testing.
Reading Comprehension 50
28 42 49 0
98-99
33 43 48 97-98
32 44 48 96-97
Mathematics
School 50
System
State
0
33 47 56 98-99
41 48 55 97-98
38 49 54 96-97
School System State
Reading Vocabulary 50
21 36 46 0
98-99
28 38 45 97-98
28 40 44 96-97
Language Arts
School 50
System
State
0
37 55 60 98-99
43 55 58 97-98
39 53 56 96-97
School System State
Social Studies 50
30 47 54 0
98-99
42 48 53 97-98
42 51 53 96-97
Science
School 50
System
State
0
29 46 56 98-99
35 48 55 97-98
34 48 53 96-97
School System State
Sources of Information
Composite Score
50
35 52 57 0
98-99
School 50
System
40 53 56 97-98
41 53 55 96-97
State 0
29 48 56 98-99
37 49 54 97-98
1998-99 GEORGIA PUBLIC EDUCATION REPORT CARD North Clayton Middle School - 6313052
Prepared by Georgia Department of Education
36 50 54 96-97
Scores Reported in Percentiles
School System State
Page 2
STATE-REQUIRED TEST DATA
Categories of Scaled Scores
Inadequate (less than 162)
Minimal (162-209)
Good
(210-247)
Very Good (greater than 247)
Average Scaled Score: (Range 100-300)
PERFORMANCE ASSESSMENTS
Grade 8 Writing Assessment
1998-99 Percent Scoring
1997-98 Percent Scoring
1996-97 Percent Scoring
School System State School System State School System State
15% 56% 27%
2%
10% 45% 38%
7%
8% 40% 41% 11%
11% 63% 25%
0%
10% 52% 33%
4%
11% 46% 34%
8%
31% 49% 19%
1%
13% 51% 30%
6%
15% 46% 30%
8%
192
203
208 193
199 202 180
198 198
AWARDS / RECOGNITION DATA
Schools in Georgia may receive recognition in the following programs: Charter School Pay for Performance Program Georgia School of Excellence National Blue Ribbon School North Clayton Middle School did not receive recognition in any of these programs during the 1998-99 school year.
1998-99 GEORGIA PUBLIC EDUCATION REPORT CARD North Clayton Middle School - 6313052
Prepared by Georgia Department of Education
Page 3
CERTIFIED PERSONNEL DATA
Positions Number Average Contract Days
Personnel Sex
Certificate
Years Experience
Full-time Part-time
Male Female
4 Yr Bachelor's 5 Yr Master's 6 Yr Specialist's 7 Yr Doctoral Other*
<1 1-10 11-20 21-30 >30
Average
Administrators
4.00 230.00
4 0
3 1
0 3 1 0 0 0 0 2 2 0 21.50
Support Personnel
3.50 197.14
3 1
1 3
0 4 0 0 0 0 2 1 0 1 12.75
PK-12 Teachers
58.27 190.00
55 7
19 43
39 20
2 1 0 6 35 13 8 0 8.97
*Includes One- and Two-Year Vocational Certificates.
ACCREDITATION DATA
Accredited by Southern Association of Colleges and Schools (SACS):
Elementary/Middle Commission.
1998-99 GEORGIA PUBLIC EDUCATION REPORT CARD North Clayton Middle School - 6313052
Prepared by Georgia Department of Education
Page 4
1998-99 GEORGIA PUBLIC EDUCATION REPORT CARD
CLAYTON COUNTY SCHOOLS
Northcutt Elementary School - 6311060
Grade Range PK-5
The Georgia Public Education Report Card is designed to assist systems and schools in educational improvement. This report card contains a variety of data elements. An explanation of the terms is provided as a companion to the report card data. Please refer to the definitions for the most effective use of the reported data.
STUDENT DATA
Total
K-5
788
PK
41
Enrollment, by Race/Ethnicity and Sex
Black
White Hispanic
American Asian Indian
Multiracial
750 95.2%
4 0.5%
12 1.5%
10 1.3%
0 0.0%
12 1.5%
35 85.4%
2 4.9%
1 2.4%
1 2.4%
0 0.0%
2 4.9%
Male Female
385 48.9%
403 51.1%
22 53.7%
19 46.3%
Enrollment in Selected Programs
Program
Program % of Student Enrollment Population
Gifted (Grades K-12)
7
< 1%
Alternative Programs (Grades 6-12)
N/A
N/A
Students Eligible to Receive Free/Reduced Lunches
Number
Percent
School System
731 23,194
88.2% 52.6%
Dropout Rate *
Number
Rate
School System
N/A N/A
N/A N/A
* Dropout rates are not applicable for grades PK-5.
Enrollment in Compensatory Programs
Program
Program % of Student Enrollment Population
Special Education (Grades K-12)
18
2.3%
(PK)
1
N/A
English to Speakers of Other Languages (ESOL) (Grades K-12)
24
3.0%
Remedial Education (Grades 2-5, 9-12)
181 34.7%
Special Instructional Assistance (SIA) (Grades K-3)
50
9.2%
Title I (Grades K-12)
This school has a schoolwide program.
Total 26
Retained Students, by Race/Ethnicity and Sex
Black
White Hispanic
American MultiAsian Indian racial
24 92.3%
0 0.0%
0 0.0%
0 0.0%
0 0.0%
2 7.7%
Male Female
15
11
57.7% 42.3%
Prepared by Georgia Department of Education
Page 1
STATE-REQUIRED TEST DATA
NORM-REFERENCED TESTS Grade 3
Iowa Tests of Basic Skills (ITBS) Each chart reflects data for three years of testing.
Reading Comprehension 50
27 42 54 0
98-99
25 43 53 97-98
32 41 52 96-97
Mathematics
School 50
System
State
0
30 46 61 98-99
28 48 61 97-98
41 51 59 96-97
School System State
Reading Vocabulary 50
20 35 50 0
98-99
18 37 50 97-98
23 39 49 96-97
Language Arts
School 50
System
State
0
37 55 64 98-99
30 56 62 97-98
47 56 59 96-97
School System State
Social Studies 50
33 44 56 0
98-99
28 45 55 97-98
33 48 55 96-97
Science
School 50
System
State
0
36 44 59 98-99
30 45 59 97-98
33 48 58 96-97
School System State
Sources of Information
Composite Score
50
30 46 57 0
98-99
School 50
System
29 46 56 97-98
39 48 55 96-97
State 0
30 44 58 98-99
25 46 57 97-98
1998-99 GEORGIA PUBLIC EDUCATION REPORT CARD Northcutt Elementary School - 6311060
Prepared by Georgia Department of Education
34 47 56 96-97
Scores Reported in Percentiles
School System State
Page 2
STATE-REQUIRED TEST DATA
NORM-REFERENCED TESTS Grade 5
Iowa Tests of Basic Skills (ITBS) Each chart reflects data for three years of testing.
Reading Comprehension
Mathematics
50
32 44 53 0
98-99
34 43 53 97-98
38 45 52 96-97
School 50
System
State
0
21 47 59 98-99
34 49 58 97-98
32 50 57 96-97
School System State
Reading Vocabulary 50
17 36 48 0
98-99
22 34 48 97-98
27 37 46 96-97
Language Arts
School 50
System
State
0
32 57 63 98-99
40 56 61 97-98
42 57 58 96-97
School System State
Social Studies 50
23 45 57 0
98-99
30 46 56 97-98
35 48 55 96-97
Science
School 50
System
State
0
29 47 60 98-99
44 49 59 97-98
36 50 59 96-97
School System State
Sources of Information
Composite Score
50
29 50 58 0
98-99
School 50
System
38 51 58 97-98
39 52 57 96-97
State 0
24 46 57 98-99
35 47 56 97-98
35 48 55 96-97
1998-99 GEORGIA PUBLIC EDUCATION REPORT CARD Northcutt Elementary School - 6311060
Prepared by Georgia Department of Education
Scores Reported in Percentiles
School System State
Page 3
STATE-REQUIRED TEST DATA
PERFORMANCE ASSESSMENTS
Grade 5 Writing Assessment
Percent at Developmental Stages:
1998-99 School System State
1997-98 School System State
1996-97 School System State
Stage Stage Stage Stage Stage Stage
1:The Emerging Writer 2:The Developing Writer 3:The Focusing Writer 4:The Experimenting 5:The Engaging Writer 6:The Extending Writer
3% 2% 25% 51% 17% 2%
0% 1% 17% 41% 28% 12%
0% 1% 16% 41% 29% 12%
0% 8% 43% 36% 12% 1%
1% 3% 21% 42% 25% 8%
0% 3% 19% 41% 27% 10%
1% 5% 31% 39% 18% 5%
0% 3% 21% 40% 26% 8%
0% 3% 21% 37% 26% 12%
AWARDS / RECOGNITION DATA
Schools in Georgia may receive recognition in the following programs: Charter School Pay for Performance Program Georgia School of Excellence National Blue Ribbon School Northcutt Elementary School did not receive recognition in any of these programs during the 1998-99 school year.
1998-99 GEORGIA PUBLIC EDUCATION REPORT CARD Northcutt Elementary School - 6311060
Prepared by Georgia Department of Education
Page 4
CERTIFIED PERSONNEL DATA
Positions Number Average Contract Days
Personnel Sex
Certificate
Years Experience
Full-time Part-time
Male Female
4 Yr Bachelor's 5 Yr Master's 6 Yr Specialist's 7 Yr Doctoral Other*
<1 1-10 11-20 21-30 >30
Average
Administrators
3.00 226.67
3 0
1 2
0 1 1 1 0 0 0 1 2 0 23.33
Support Personnel
2.50 196.00
2 1
0 3
0 2 1 0 0 0 1 0 1 1 18.00
PK-12 Teachers
50.20 190.00
48 4
9 43
39 13
0 0 0 7 31 10 3 1 6.37
*Includes One- and Two-Year Vocational Certificates.
ACCREDITATION DATA
Accredited by Southern Association of Colleges and Schools (SACS):
Elementary/Middle Commission.
1998-99 GEORGIA PUBLIC EDUCATION REPORT CARD Northcutt Elementary School - 6311060
Prepared by Georgia Department of Education
Page 5
1998-99 GEORGIA PUBLIC EDUCATION REPORT CARD
CLAYTON COUNTY SCHOOLS
Oliver Elementary School - 6310276
Grade Range PK-5
The Georgia Public Education Report Card is designed to assist systems and schools in educational improvement. This report card contains a variety of data elements. An explanation of the terms is provided as a companion to the report card data. Please refer to the definitions for the most effective use of the reported data.
STUDENT DATA
Total
K-5
857
PK
39
Enrollment, by Race/Ethnicity and Sex
Black
White Hispanic
American Asian Indian
Multiracial
783 91.4%
22 2.6%
4 0.5%
22 2.6%
1 0.1%
25 2.9%
35 89.7%
1 2.6%
0 0.0%
2 5.1%
0 0.0%
1 2.6%
Male Female
436 50.9%
421 49.1%
19 48.7%
20 51.3%
Enrollment in Selected Programs
Program
Program % of Student Enrollment Population
Gifted (Grades K-12)
21
2.5%
Alternative Programs (Grades 6-12)
N/A
N/A
Students Eligible to Receive Free/Reduced Lunches
Number
Percent
School System
525 23,194
58.6% 52.6%
Dropout Rate *
Number
Rate
School System
N/A N/A
N/A N/A
* Dropout rates are not applicable for grades PK-5.
Enrollment in Compensatory Programs
Program
Program % of Student Enrollment Population
Special Education (Grades K-12)
57
6.7%
(PK)
1
N/A
English to Speakers of Other Languages (ESOL) (Grades K-12)
13
1.5%
Remedial Education (Grades 2-5, 9-12)
199 34.4%
Special Instructional Assistance (SIA) (Grades K-3)
50
9.0%
Title I (Grades K-12)
This school has no Title I program.
Total 10
Retained Students, by Race/Ethnicity and Sex
Black
White Hispanic
American MultiAsian Indian racial
10 100.0%
0 0.0%
0 0.0%
0 0.0%
0 0.0%
0 0.0%
Male Female
3
7
30.0% 70.0%
Prepared by Georgia Department of Education
Page 1
STATE-REQUIRED TEST DATA
NORM-REFERENCED TESTS Grade 3
Iowa Tests of Basic Skills (ITBS) Each chart reflects data for three years of testing.
Reading Comprehension 50
40 42 54 0
98-99
46 43 53 97-98
36 41 52 96-97
Mathematics
School 50
System
State
0
51 46 61 98-99
55 48 61 97-98
44 51 59 96-97
School System State
Reading Vocabulary 50
27 35 50 0
98-99
36 37 50 97-98
35 39 49 96-97
Language Arts
School 50
System
State
0
50 55 64 98-99
57 56 62 97-98
47 56 59 96-97
School System State
Social Studies 50
40 44 56 0
98-99
50 45 55 97-98
45 48 55 96-97
Science
School 50
System
State
0
34 44 59 98-99
44 45 59 97-98
37 48 58 96-97
School System State
Sources of Information
Composite Score
50
39 46 57 0
98-99
School 50
System
50 46 56 97-98
46 48 55 96-97
State 0
39 44 58 98-99
48 46 57 97-98
1998-99 GEORGIA PUBLIC EDUCATION REPORT CARD Oliver Elementary School - 6310276
Prepared by Georgia Department of Education
40 47 56 96-97
Scores Reported in Percentiles
School System State
Page 2
STATE-REQUIRED TEST DATA
NORM-REFERENCED TESTS Grade 5
Iowa Tests of Basic Skills (ITBS) Each chart reflects data for three years of testing.
Reading Comprehension
Mathematics
50
47 44 53 0
98-99
47 43 53 97-98
46 45 52 96-97
School 50
System
State
0
53 47 59 98-99
50 49 58 97-98
52 50 57 96-97
School System State
Reading Vocabulary 50
35 36 48 0
98-99
33 34 48 97-98
39 37 46 96-97
Language Arts
School 50
System
State
0
56 57 63 98-99
56 56 61 97-98
64 57 58 96-97
School System State
Social Studies 50
38 45 57 0
98-99
45 46 56 97-98
49 48 55 96-97
Science
School 50
System
State
0
49 47 60 98-99
46 49 59 97-98
48 50 59 96-97
School System State
Sources of Information
Composite Score
50
53 50 58 0
98-99
School 50
System
48 51 58 97-98
55 52 57 96-97
State 0
46 46 57 98-99
48 47 56 97-98
51 48 55 96-97
1998-99 GEORGIA PUBLIC EDUCATION REPORT CARD Oliver Elementary School - 6310276
Prepared by Georgia Department of Education
Scores Reported in Percentiles
School System State
Page 3
STATE-REQUIRED TEST DATA
PERFORMANCE ASSESSMENTS
Grade 5 Writing Assessment
Percent at Developmental Stages:
1998-99 School System State
1997-98 School System State
1996-97 School System State
Stage Stage Stage Stage Stage Stage
1:The Emerging Writer 2:The Developing Writer 3:The Focusing Writer 4:The Experimenting 5:The Engaging Writer 6:The Extending Writer
0% 0% 6% 27% 38% 28%
0% 1% 17% 41% 28% 12%
0% 1% 16% 41% 29% 12%
0% 2% 26% 39% 23% 10%
1% 3% 21% 42% 25% 8%
0% 3% 19% 41% 27% 10%
0% 2% 14% 37% 36% 11%
0% 3% 21% 40% 26% 8%
0% 3% 21% 37% 26% 12%
AWARDS / RECOGNITION DATA
Schools in Georgia may receive recognition in the following programs: Charter School Pay for Performance Program Georgia School of Excellence National Blue Ribbon School Oliver Elementary School did not receive recognition in any of these programs during the 1998-99 school year.
1998-99 GEORGIA PUBLIC EDUCATION REPORT CARD Oliver Elementary School - 6310276
Prepared by Georgia Department of Education
Page 4
CERTIFIED PERSONNEL DATA
Positions Number Average Contract Days
Personnel Sex
Certificate
Years Experience
Full-time Part-time
Male Female
4 Yr Bachelor's 5 Yr Master's 6 Yr Specialist's 7 Yr Doctoral Other*
<1 1-10 11-20 21-30 >30
Average
Administrators
3.00 226.67
3 0
1 2
0 0 2 1 0 0 2 0 1 0 14.00
Support Personnel
1.85 194.59
1 1
1 1
0 2 0 0 0 0 2 0 0 0 8.00
PK-12 Teachers
49.89 190.00
48 4
10 42
29 21
2 0 0 9 29 8 6 0 7.56
*Includes One- and Two-Year Vocational Certificates.
ACCREDITATION DATA
Accredited by Southern Association of Colleges and Schools (SACS):
Elementary/Middle Commission.
1998-99 GEORGIA PUBLIC EDUCATION REPORT CARD Oliver Elementary School - 6310276
Prepared by Georgia Department of Education
Page 5
1998-99 GEORGIA PUBLIC EDUCATION REPORT CARD
CLAYTON COUNTY SCHOOLS
Pointe South Elementary School - 6310181
Grade Range PK-5
The Georgia Public Education Report Card is designed to assist systems and schools in educational improvement. This report card contains a variety of data elements. An explanation of the terms is provided as a companion to the report card data. Please refer to the definitions for the most effective use of the reported data.
STUDENT DATA
Total
K-5
872
PK
20
Enrollment, by Race/Ethnicity and Sex
Black
White Hispanic
American Asian Indian
Multiracial
660 75.7%
138 15.8%
26 3.0%
14 1.6%
1 0.1%
33 3.8%
13 65.0%
6 30.0%
0 0.0%
0 0.0%
0 0.0%
1 5.0%
Male Female
454 52.1%
418 47.9%
7 35.0%
13 65.0%
Enrollment in Selected Programs
Program
Program % of Student Enrollment Population
Gifted (Grades K-12)
54
6.2%
Alternative Programs (Grades 6-12)
N/A
N/A
Students Eligible to Receive Free/Reduced Lunches
Number
Percent
School System
546 23,194
61.2% 52.6%
Dropout Rate *
Number
Rate
School System
N/A N/A
N/A N/A
* Dropout rates are not applicable for grades PK-5.
Enrollment in Compensatory Programs
Program
Program % of Student Enrollment Population
Special Education (Grades K-12)
77
8.8%
(PK)
1
N/A
English to Speakers of Other Languages (ESOL) (Grades K-12)
13
1.5%
Remedial Education (Grades 2-5, 9-12)
1
< 1%
Special Instructional Assistance (SIA) (Grades K-3)
50
8.7%
Title I (Grades K-12)
This school has no Title I program.
Total 12
Retained Students, by Race/Ethnicity and Sex
Black
White Hispanic
American MultiAsian Indian racial
11 91.7%
0 0.0%
0 0.0%
1 8.3%
0 0.0%
0 0.0%
Male Female
4
8
33.3% 66.7%
Prepared by Georgia Department of Education
Page 1
STATE-REQUIRED TEST DATA
NORM-REFERENCED TESTS Grade 3
Iowa Tests of Basic Skills (ITBS) Each chart reflects data for three years of testing.
Reading Comprehension 50
37 42 54 0
98-99
40 43 53 97-98
53 41 52 96-97
Mathematics
School 50
System
State
0
37 46 61 98-99
50 48 61 97-98
72 51 59 96-97
School System State
Reading Vocabulary 50
36 35 50 0
98-99
58 37 50 97-98
80 39 49 96-97
Language Arts
School 50
System
State
0
43 55 64 98-99
57 56 62 97-98
72 56 59 96-97
School System State
Social Studies 50
37 44 56 0
98-99
48 45 55 97-98
70 48 55 96-97
Science
School 50
System
State
0
42 44 59 98-99
57 45 59 97-98
77 48 58 96-97
School System State
Sources of Information
Composite Score
50
37 46 57 0
98-99
School 50
System
47 46 56 97-98
61 48 55 96-97
State 0
37 44 58 98-99
50 46 57 97-98
1998-99 GEORGIA PUBLIC EDUCATION REPORT CARD Pointe South Elementary School - 6310181
Prepared by Georgia Department of Education
70 47 56 96-97
Scores Reported in Percentiles
School System State
Page 2
STATE-REQUIRED TEST DATA
NORM-REFERENCED TESTS Grade 5
Iowa Tests of Basic Skills (ITBS) Each chart reflects data for three years of testing.
Reading Comprehension
Mathematics
50
46 44 53 0
98-99
37 43 53 97-98
46 45 52 96-97
School 50
System
State
0
42 47 59 98-99
33 49 58 97-98
51 50 57 96-97
School System State
Reading Vocabulary 50
36 36 48 0
98-99
31 34 48 97-98
43 37 46 96-97
Language Arts
School 50
System
State
0
55 57 63 98-99
44 56 61 97-98
56 57 58 96-97
School System State
Social Studies 50
46 45 57 0
98-99
40 46 56 97-98
55 48 55 96-97
Science
School 50
System
State
0
49 47 60 98-99
42 49 59 97-98
59 50 59 96-97
School System State
Sources of Information
Composite Score
50
51 50 58 0
98-99
School 50
System
44 51 58 97-98
54 52 57 96-97
State 0
47 46 57 98-99
38 47 56 97-98
52 48 55 96-97
1998-99 GEORGIA PUBLIC EDUCATION REPORT CARD Pointe South Elementary School - 6310181
Prepared by Georgia Department of Education
Scores Reported in Percentiles
School System State
Page 3
STATE-REQUIRED TEST DATA
PERFORMANCE ASSESSMENTS
Grade 5 Writing Assessment
Percent at Developmental Stages:
1998-99 School System State
1997-98 School System State
1996-97 School System State
Stage Stage Stage Stage Stage Stage
1:The Emerging Writer 2:The Developing Writer 3:The Focusing Writer 4:The Experimenting 5:The Engaging Writer 6:The Extending Writer
2% 1% 18% 43% 27% 8%
0% 1% 17% 41% 28% 12%
0% 1% 16% 41% 29% 12%
0% 4% 28% 56% 10% 1%
1% 3% 21% 42% 25% 8%
0% 3% 19% 41% 27% 10%
0% 1% 14% 54% 24% 7%
0% 3% 21% 40% 26% 8%
0% 3% 21% 37% 26% 12%
AWARDS / RECOGNITION DATA
Schools in Georgia may receive recognition in the following programs: Charter School Pay for Performance Program Georgia School of Excellence National Blue Ribbon School Pointe South Elementary School did not receive recognition in any of these programs during the 1998-99 school year.
1998-99 GEORGIA PUBLIC EDUCATION REPORT CARD Pointe South Elementary School - 6310181
Prepared by Georgia Department of Education
Page 4
CERTIFIED PERSONNEL DATA
Positions Number Average Contract Days
Personnel Sex
Certificate
Years Experience
Full-time Part-time
Male Female
4 Yr Bachelor's 5 Yr Master's 6 Yr Specialist's 7 Yr Doctoral Other*
<1 1-10 11-20 21-30 >30
Average
Administrators
3.00 226.67
3 0
1 2
0 1 2 0 0 0 1 1 1 0 17.67
Support Personnel
3.00 196.67
3 0
0 3
0 3 0 0 0 1 1 0 1 0 11.67
PK-12 Teachers
46.58 190.00
46 2
1 47
30 15
3 0 0 5 21 16 6 0 10.00
*Includes One- and Two-Year Vocational Certificates.
ACCREDITATION DATA
Accredited by Southern Association of Colleges and Schools (SACS):
Elementary/Middle Commission.
1998-99 GEORGIA PUBLIC EDUCATION REPORT CARD Pointe South Elementary School - 6310181
Prepared by Georgia Department of Education
Page 5
1998-99 GEORGIA PUBLIC EDUCATION REPORT CARD
CLAYTON COUNTY SCHOOLS
Pointe South Middle School - 6310277
Grade Range 6-8
The Georgia Public Education Report Card is designed to assist systems and schools in educational improvement. This report card contains a variety of data elements. An explanation of the terms is provided as a companion to the report card data. Please refer to the definitions for the most effective use of the reported data.
STUDENT DATA
Total 1,000
6-8 Enrollment, by Race/Ethnicity and Sex
Black
White Hispanic
American Multi-
Asian Indian
racial
674 67.4%
263 26.3%
24 2.4%
17 1.7%
0 0.0%
22 2.2%
Male 517
51.7%
Female 483
48.3%
Enrollment in Selected Programs
Program
Gifted (Grades K-12)
Program % of Student Enrollment Population
42
4.2%
Alternative Programs (Grades 6-12)
0
0.0%
Students Eligible to Receive Free/Reduced Lunches
Number
Percent
School System
605 23,194
60.5% 52.6%
Enrollment in Compensatory Programs
Program
Program % of Student Enrollment Population
Special Education (Grades K-12) (PK)
102 10.2%
0
N/A
English to Speakers of Other Languages (ESOL) (Grades K-12)
4
< 1%
Title I (Grades K-12)
This school has no Title I program.
Dropout Rate for Grades 6-8
Number
Rate
School System
4
0.3%
46
0.4%
Total 67
Retained Students, by Race/Ethnicity and Sex
Black
White Hispanic
American MultiAsian Indian racial
37 55.2%
24 35.8%
4 6.0%
0 0.0%
0 0.0%
2 3.0%
Male Female
40
27
59.7% 40.3%
Prepared by Georgia Department of Education
Page 1
STATE-REQUIRED TEST DATA
NORM-REFERENCED TESTS Grade 8
Iowa Tests of Basic Skills (ITBS) Each chart reflects data for three years of testing.
Reading Comprehension 50
39 42 49 0
98-99
41 43 48 97-98
39 44 48 96-97
Mathematics
School 50
System
State
0
38 47 56 98-99
38 48 55 97-98
43 49 54 96-97
School System State
Reading Vocabulary 50
36 36 46 0
98-99
36 38 45 97-98
44 40 44 96-97
Language Arts
School 50
System
State
0
52 55 60 98-99
48 55 58 97-98
47 53 56 96-97
School System State
Social Studies 50
47 47 54 0
98-99
43 48 53 97-98
44 51 53 96-97
Science
School 50
System
State
0
42 46 56 98-99
42 48 55 97-98
38 48 53 96-97
School System State
Sources of Information
Composite Score
50
49 52 57 0
98-99
School 50
System
48 53 56 97-98
50 53 55 96-97
State 0
44 48 56 98-99
41 49 54 97-98
1998-99 GEORGIA PUBLIC EDUCATION REPORT CARD Pointe South Middle School - 6310277
Prepared by Georgia Department of Education
43 50 54 96-97
Scores Reported in Percentiles
School System State
Page 2
STATE-REQUIRED TEST DATA
Categories of Scaled Scores
Inadequate (less than 162)
Minimal (162-209)
Good
(210-247)
Very Good (greater than 247)
Average Scaled Score: (Range 100-300)
PERFORMANCE ASSESSMENTS
Grade 8 Writing Assessment
1998-99 Percent Scoring
1997-98 Percent Scoring
1996-97 Percent Scoring
School System State School System State School System State
5% 47% 45%
4%
10% 45% 38%
7%
8% 40% 41% 11%
12% 51% 30%
7%
10% 52% 33%
4%
11% 46% 34%
8%
14% 58% 25%
3%
13% 51% 30%
6%
15% 46% 30%
8%
205
203
208 199
199 202 194
198 198
AWARDS / RECOGNITION DATA
Schools in Georgia may receive recognition in the following programs: Charter School Pay for Performance Program Georgia School of Excellence National Blue Ribbon School Pointe South Middle School did not receive recognition in any of these programs during the 1998-99 school year.
1998-99 GEORGIA PUBLIC EDUCATION REPORT CARD Pointe South Middle School - 6310277
Prepared by Georgia Department of Education
Page 3
CERTIFIED PERSONNEL DATA
Positions Number Average Contract Days
Personnel Sex
Certificate
Years Experience
Full-time Part-time
Male Female
4 Yr Bachelor's 5 Yr Master's 6 Yr Specialist's 7 Yr Doctoral Other*
<1 1-10 11-20 21-30 >30
Average
Administrators
4.00 230.00
4 0
2 2
0 2 2 0 0 0 0 2 1 1 23.75
Support Personnel
3.00 196.67
3 0
0 3
0 1 1 1 0 0 1 1 0 1 18.00
PK-12 Teachers
58.71 190.00
58 3
16 45
32 26
2 1 0 9 29 15 8 0 8.97
*Includes One- and Two-Year Vocational Certificates.
ACCREDITATION DATA
Accredited by Southern Association of Colleges and Schools (SACS):
Elementary/Middle Commission.
1998-99 GEORGIA PUBLIC EDUCATION REPORT CARD Pointe South Middle School - 6310277
Prepared by Georgia Department of Education
Page 4
1998-99 GEORGIA PUBLIC EDUCATION REPORT CARD
CLAYTON COUNTY SCHOOLS
River's Edge Elementary School - 6310195
Grade Range PK-5
The Georgia Public Education Report Card is designed to assist systems and schools in educational improvement. This report card contains a variety of data elements. An explanation of the terms is provided as a companion to the report card data. Please refer to the definitions for the most effective use of the reported data.
STUDENT DATA
Total
K-5
754
PK
1
Enrollment, by Race/Ethnicity and Sex
Black
White Hispanic
American Asian Indian
Multiracial
337 44.7%
356 47.2%
22 2.9%
11 1.5%
0 0.0%
28 3.7%
0
1
0.0% 100.0%
0 0.0%
0 0.0%
0 0.0%
0 0.0%
Male Female
381 50.5%
373 49.5%
0
1
0.0% 100.0%
Enrollment in Selected Programs
Program
Program % of Student Enrollment Population
Gifted (Grades K-12)
67
8.9%
Alternative Programs (Grades 6-12)
N/A
N/A
Students Eligible to Receive Free/Reduced Lunches
Number
Percent
School System
195 23,194
25.8% 52.6%
Dropout Rate *
Number
Rate
School System
N/A N/A
N/A N/A
* Dropout rates are not applicable for grades PK-5.
Enrollment in Compensatory Programs
Program
Program % of Student Enrollment Population
Special Education (Grades K-12)
57
7.6%
(PK)
2
N/A
English to Speakers of Other Languages (ESOL) (Grades K-12)
2
< 1%
Remedial Education (Grades 2-5, 9-12)
144 27.7%
Special Instructional Assistance (SIA) (Grades K-3)
0
0.0%
Title I (Grades K-12)
This school has no Title I program.
Total 3
Retained Students, by Race/Ethnicity and Sex
Black
White Hispanic
American MultiAsian Indian racial
0 0.0%
2
1
66.7% 33.3%
0 0.0%
0 0.0%
0 0.0%
Male Female
2
1
66.7% 33.3%
Prepared by Georgia Department of Education
Page 1
STATE-REQUIRED TEST DATA
NORM-REFERENCED TESTS Grade 3
Iowa Tests of Basic Skills (ITBS) Each chart reflects data for three years of testing.
Reading Comprehension 50
42 42 54 0
98-99
54 43 53 97-98
61 41 52 96-97
Mathematics
School 50
System
State
0
46 46 61 98-99
60 48 61 97-98
68 51 59 96-97
School System State
Reading Vocabulary 50
32 35 50 0
98-99
54 37 50 97-98
49 39 49 96-97
Language Arts
School 50
System
State
0
55 55 64 98-99
70 56 62 97-98
75 56 59 96-97
School System State
Social Studies 50
44 44 56 0
98-99
56 45 55 97-98
64 48 55 96-97
Science
School 50
System
State
0
50 44 59 98-99
61 45 59 97-98
63 48 58 96-97
School System State
Sources of Information
Composite Score
50
46 46 57 0
98-99
School 50
System
60 46 56 97-98
65 48 55 96-97
State 0
46 44 58 98-99
60 46 57 97-98
1998-99 GEORGIA PUBLIC EDUCATION REPORT CARD River's Edge Elementary School - 6310195
Prepared by Georgia Department of Education
66 47 56 96-97
Scores Reported in Percentiles
School System State
Page 2
STATE-REQUIRED TEST DATA
NORM-REFERENCED TESTS Grade 5
Iowa Tests of Basic Skills (ITBS) Each chart reflects data for three years of testing.
Reading Comprehension
Mathematics
50
49 44 53 0
98-99
51 43 53 97-98
51 45 52 96-97
School 50
System
State
0
52 47 59 98-99
59 49 58 97-98
57 50 57 96-97
School System State
Reading Vocabulary 50
41 36 48 0
98-99
45 34 48 97-98
45 37 46 96-97
Language Arts
School 50
System
State
0
62 57 63 98-99
69 56 61 97-98
65 57 58 96-97
School System State
Social Studies 50
50 45 57 0
98-99
56 46 56 97-98
57 48 55 96-97
Science
School 50
System
State
0
54 47 60 98-99
58 49 59 97-98
56 50 59 96-97
School System State
Sources of Information
Composite Score
50
51 50 58 0
98-99
School 50
System
62 51 58 97-98
61 52 57 96-97
State 0
51 46 57 98-99
59 47 56 97-98
57 48 55 96-97
1998-99 GEORGIA PUBLIC EDUCATION REPORT CARD River's Edge Elementary School - 6310195
Prepared by Georgia Department of Education
Scores Reported in Percentiles
School System State
Page 3
STATE-REQUIRED TEST DATA
PERFORMANCE ASSESSMENTS
Grade 5 Writing Assessment
Percent at Developmental Stages:
1998-99 School System State
1997-98 School System State
1996-97 School System State
Stage Stage Stage Stage Stage Stage
1:The Emerging Writer 2:The Developing Writer 3:The Focusing Writer 4:The Experimenting 5:The Engaging Writer 6:The Extending Writer
0% 2% 6% 26% 40% 27%
0% 1% 17% 41% 28% 12%
0% 1% 16% 41% 29% 12%
0% 0% 3% 35% 42% 20%
1% 3% 21% 42% 25% 8%
0% 3% 19% 41% 27% 10%
0% 1% 10% 37% 34% 19%
0% 3% 21% 40% 26% 8%
0% 3% 21% 37% 26% 12%
AWARDS / RECOGNITION DATA
Schools in Georgia may receive recognition in the following programs: Charter School Pay for Performance Program Georgia School of Excellence National Blue Ribbon School River's Edge Elementary School did not receive recognition in any of these programs during the 1998-99 school year.
1998-99 GEORGIA PUBLIC EDUCATION REPORT CARD River's Edge Elementary School - 6310195
Prepared by Georgia Department of Education
Page 4
CERTIFIED PERSONNEL DATA
Positions Number Average Contract Days
Personnel Sex
Certificate
Years Experience
Full-time Part-time
Male Female
4 Yr Bachelor's 5 Yr Master's 6 Yr Specialist's 7 Yr Doctoral Other*
<1 1-10 11-20 21-30 >30
Average
Administrators
3.00 226.67
3 0
0 3
0 0 3 0 0 0 0 0 3 0 24.67
Support Personnel
3.00 196.67
3 0
1 2
0 0 2 1 0 0 0 1 2 0 23.33
PK-12 Teachers
41.50 190.00
40 3
3 40
16 20
7 0 0 0 12 12 19 0 17.02
*Includes One- and Two-Year Vocational Certificates.
ACCREDITATION DATA
Accredited by Southern Association of Colleges and Schools (SACS):
Elementary/Middle Commission.
1998-99 GEORGIA PUBLIC EDUCATION REPORT CARD River's Edge Elementary School - 6310195
Prepared by Georgia Department of Education
Page 5
1998-99 GEORGIA PUBLIC EDUCATION REPORT CARD
CLAYTON COUNTY SCHOOLS
Riverdale Elementary School - 6312060
Grade Range K-5
The Georgia Public Education Report Card is designed to assist systems and schools in educational improvement. This report card contains a variety of data elements. An explanation of the terms is provided as a companion to the report card data. Please refer to the definitions for the most effective use of the reported data.
STUDENT DATA
Total 758
K-5 Enrollment, by Race/Ethnicity and Sex
Black
White Hispanic
American Multi-
Asian Indian
racial
540 71.2%
92 12.1%
39 5.1%
63 8.3%
1 0.1%
23 3.0%
Male Female
384 50.7%
374 49.3%
Enrollment in Selected Programs
Program
Program % of Student Enrollment Population
Gifted (Grades K-12)
29
3.8%
Alternative Programs (Grades 6-12)
N/A
N/A
Students Eligible to Receive Free/Reduced Lunches
Number
Percent
School System
550 23,194
72.6% 52.6%
Dropout Rate *
Number
Rate
School System
N/A N/A
N/A N/A
* Dropout rates are not applicable for grades PK-5.
Enrollment in Compensatory Programs
Program
Program % of Student Enrollment Population
Special Education (Grades K-12)
92 12.1%
(PK)
0
N/A
English to Speakers of Other Languages (ESOL) (Grades K-12)
42
5.5%
Remedial Education (Grades 2-5, 9-12)
181 35.2%
Special Instructional Assistance (SIA) (Grades K-3)
50
9.9%
Title I (Grades K-12)
This school has a schoolwide program.
Total 2
Retained Students, by Race/Ethnicity and Sex
Black
White Hispanic
American Multi-
Asian Indian
racial
1 50.0%
0 0.0%
0 0.0%
0 0.0%
0
1
0.0% 50.0%
Male Female
2
0
100.0% 0.0%
Prepared by Georgia Department of Education
Page 1
STATE-REQUIRED TEST DATA
NORM-REFERENCED TESTS Grade 3
Iowa Tests of Basic Skills (ITBS) Each chart reflects data for three years of testing.
Reading Comprehension 50
32 42 54 0
98-99
32 43 53 97-98
33 41 52 96-97
Mathematics
School 50
System
State
0
43 46 61 98-99
36 48 61 97-98
40 51 59 96-97
School System State
Reading Vocabulary 50
37 35 50 0
98-99
30 37 50 97-98
36 39 49 96-97
Language Arts
School 50
System
State
0
49 55 64 98-99
41 56 62 97-98
38 56 59 96-97
School System State
Social Studies 50
35 44 56 0
98-99
34 45 55 97-98
41 48 55 96-97
Science
School 50
System
State
0
38 44 59 98-99
34 45 59 97-98
36 48 58 96-97
School System State
Sources of Information
Composite Score
50
40 46 57 0
98-99
School 50
System
34 46 56 97-98
35 48 55 96-97
State 0
38 44 58 98-99
33 46 57 97-98
1998-99 GEORGIA PUBLIC EDUCATION REPORT CARD Riverdale Elementary School - 6312060
Prepared by Georgia Department of Education
35 47 56 96-97
Scores Reported in Percentiles
School System State
Page 2
STATE-REQUIRED TEST DATA
NORM-REFERENCED TESTS Grade 5
Iowa Tests of Basic Skills (ITBS) Each chart reflects data for three years of testing.
Reading Comprehension
Mathematics
50
40 44 53 0
98-99
35 43 53 97-98
38 45 52 96-97
School 50
System
State
0
48 47 59 98-99
47 49 58 97-98
52 50 57 96-97
School System State
Reading Vocabulary 50
28 36 48 0
98-99
24 34 48 97-98
31 37 46 96-97
Language Arts
School 50
System
State
0
58 57 63 98-99
44 56 61 97-98
53 57 58 96-97
School System State
Social Studies 50
43 45 57 0
98-99
37 46 56 97-98
40 48 55 96-97
Science
School 50
System
State
0
38 47 60 98-99
37 49 59 97-98
35 50 59 96-97
School System State
Sources of Information
Composite Score
50
52 50 58 0
98-99
School 50
System
42 51 58 97-98
45 52 57 96-97
State 0
44 46 57 98-99
37 47 56 97-98
41 48 55 96-97
1998-99 GEORGIA PUBLIC EDUCATION REPORT CARD Riverdale Elementary School - 6312060
Prepared by Georgia Department of Education
Scores Reported in Percentiles
School System State
Page 3
STATE-REQUIRED TEST DATA
PERFORMANCE ASSESSMENTS
Grade 5 Writing Assessment
Percent at Developmental Stages:
1998-99 School System State
1997-98 School System State
1996-97 School System State
Stage Stage Stage Stage Stage Stage
1:The Emerging Writer 2:The Developing Writer 3:The Focusing Writer 4:The Experimenting 5:The Engaging Writer 6:The Extending Writer
0% 3% 24% 38% 29% 5%
0% 1% 17% 41% 28% 12%
0% 1% 16% 41% 29% 12%
3% 5% 36% 42% 10% 1%
1% 3% 21% 42% 25% 8%
0% 3% 19% 41% 27% 10%
2% 4% 27% 43% 20% 4%
0% 3% 21% 40% 26% 8%
0% 3% 21% 37% 26% 12%
AWARDS / RECOGNITION DATA
Schools in Georgia may receive recognition in the following programs: Charter School Pay for Performance Program Georgia School of Excellence National Blue Ribbon School Riverdale Elementary School did not receive recognition in any of these programs during the 1998-99 school year.
1998-99 GEORGIA PUBLIC EDUCATION REPORT CARD Riverdale Elementary School - 6312060
Prepared by Georgia Department of Education
Page 4
CERTIFIED PERSONNEL DATA
Positions Number Average Contract Days
Personnel Sex
Certificate
Years Experience
Full-time Part-time
Male Female
4 Yr Bachelor's 5 Yr Master's 6 Yr Specialist's 7 Yr Doctoral Other*
<1 1-10 11-20 21-30 >30
Average
Administrators
3.00 226.67
3 0
1 2
0 1 2 0 0 0 0 2 1 0 18.67
Support Personnel
2.50 196.00
2 1
0 3
0 1 2 0 0 0 0 0 2 1 28.67
PK-12 Teachers
45.75 190.00
44 3
3 44
23 19
5 0 0 1 20 10 16 0 13.51
*Includes One- and Two-Year Vocational Certificates.
ACCREDITATION DATA
Accredited by Southern Association of Colleges and Schools (SACS):
Elementary/Middle Commission.
1998-99 GEORGIA PUBLIC EDUCATION REPORT CARD Riverdale Elementary School - 6312060
Prepared by Georgia Department of Education
Page 5
1998-99 GEORGIA PUBLIC EDUCATION REPORT CARD
CLAYTON COUNTY SCHOOLS
Riverdale High School - 6310377
Grade Range 9-12
The Georgia Public Education Report Card is designed to assist systems and schools in educational improvement. This report card contains a variety of data elements. An explanation of the terms is provided as a companion to the report card data. Please refer to the definitions for the most effective use of the reported data.
Total 1,436
STUDENT DATA
9-12 Enrollment, by Race/Ethnicity and Sex
Black
White Hispanic
American Multi-
Asian Indian
racial
1,002 69.8%
251 17.5%
37 2.6%
121 8.4%
3 0.2%
22 1.5%
Male Female
750 52.2%
686 47.8%
Enrollment in Selected Programs
Program
Gifted (Grades K-12)
Program % of Student Enrollment Population
42
2.9%
Non-Vocational Labs (Grades 9-12)
Vocational Labs (Grades 9-12)
Alternative Programs (Grades 6-12)
1,302 937 0
90.7% 65.3%
0.0%
Students Eligible to Receive Free/Reduced Lunches
Number
Percent
School System
561 23,194
39.1% 52.6%
Enrollment in Compensatory Programs
Program
Program % of Student Enrollment Population
Special Education (Grades K-12) PK
83
5.8%
0
N/A
English to Speakers of Other Languages (ESOL) (Grades K-12)
37
2.6%
Remedial Education (Grades 2-5, 9-12)
156 10.9%
Title I (Grades K-12)
This school has no Title I program.
Dropout Rate for Grades 9-12
Number
Rate
School System
197 1,191
11.5% 9.1%
Total 203
Retained Students, by Race/Ethnicity and Sex
Black
White Hispanic
American MultiAsian Indian racial
157 77.3%
32 15.8%
3 1.5%
9 4.4%
0 0.0%
2 1.0%
Male Female
134
69
66.0% 34.0%
Prepared by Georgia Department of Education
Page 1
STATE-REQUIRED TEST DATA
GEORGIA HIGH SCHOOL GRADUATION TESTS (GHSGT)
Percent of Regular Program 11th Graders Passing the Georgia High School Graduation Tests on First Administration
English Language Arts Mathematics Social Studies Science
All Components listed above
Writing
1998-99
School System State
95% 80% 74% 63%
96% 88% 82% 70%
96% 88% 80% 72%
58% 67% 68%
93% 92% 93%
1997-98
School System State
96% 91% 75% 74%
97% 91% 78% 75%
94% 88% 78% 74%
70% 70% 68%
95% 94% 92%
1996-97
School System State
97% 94% 81% 75%
96% 91% 80% 76%
94% 87% 78% 74%
72% 71% 67%
98% 95% 93%
GRADUATE DATA
1999 Graduates by Credentials, Race/Ethnicity and Sex
Diplomas with Both College Prep. & Voc. Endorsements
Diplomas with College Prep. Endorsements Diplomas with Vocational Endorsements General High School Diplomas Special Education Diplomas
Total All Diplomas
Certificates of Performance
Total Graduates
Total 36
151 39 4 7
237 0
Black
20 55.6%
93 61.6%
27 69.2%
4 100.0%
6 85.7%
150 63.3%
0
American MultiWhite Hispanic Asian Indian racial
12 33.3%
0 0.0%
3 8.3%
0 0.0%
1 2.8%
34 22.5%
4
19
2.6% 12.6%
0 0.0%
1 0.7%
6 15.4%
2
4
5.1% 10.3%
0 0.0%
0 0.0%
0 0.0%
0 0.0%
0 0.0%
0 0.0%
0 0.0%
1 14.3%
0 0.0%
0 0.0%
0 0.0%
0 0.0%
53 22.4%
6
26
2.5% 11.0%
0 0.0%
2 0.8%
0
0
0
0
0
Male Female
11
25
30.6% 69.4%
61
90
40.4% 59.6%
21
18
53.8% 46.2%
4 100.0%
0 0.0%
6
1
85.7% 14.3%
103
134
43.5% 56.5%
0
0
237
150
53
6
26
0
2
103
134
63.3% 22.4% 2.5% 11.0% 0.0% 0.8% 43.5% 56.5%
HOPE Scholarships
School System
Number of 1999 Graduates 2 3 7
Number Eligible
130
Percent Eligible
54.9%
1,750 1,017 58.1%
State
65,548 40,292 61.5%
High School Completion Rate
Percent of 1995Grade 9 Enrollment in Graduating Class of1999 School System State
Completion Rate '95-'99 57.8% 59.9% 68.9%
1998-99 GEORGIA PUBLIC EDUCATION REPORT CARD
Riverdale High School - 6310377
Prepared by Georgia Department of Education
Page 2
COLLEGE ADMISSIONS / CREDIT TEST DATA
Scholastic Assessment Test (SAT)
Based on students' highest verbal and highest math scores
No. Taking
Average Score
Tests Verbal Math Total
Based on students' last test administration
Average Score Verbal Math Total
School
158 452 456
908
College Prep. Endorsement
455 461
916
Other Diplomas
408 343
751
System
1,093 478 474
952
College Prep. Endorsement
480 478
958
Other Diplomas
377 378
755
Georgia
41,958 492 488
980
443 N/A N/A
470 N/A N/A
483
450 N/A N/A
468 N/A N/A
479
893 N/A N/A
938 N/A N/A
962
Nation
952,913 N/A N/A N/A
502 508 1010
American College Testing (ACT)
Advanced Placement Exams (AP)
Number taking tests: English Mathematics Reading Science Reasoning CompositeScore
3 5 School System State
17.2 17.9 19.1
17.8 18.6 19.9
17.7 17.8
18.9 19.0
20.2 19.9
17.7 18.7 19.9
No. of Students Taking Tests
No. of Tests Taken No. of Test Scores
3 or Higher Percent of Test
Scores 3 or Higher
School 54 78 17
21.8%
System State 456 15,225 621 23,969 221 13,024
35.6% 54.3%
POST-SECONDARY DATA
Graduates Entering Georgia Public Colleges
Graduates Entering Georgia Public Colleges and Requiring Learning Support (LS)
1998 Graduates Entering in 1998-99
1997 Graduates Entering in 1997-98
Percent of Graduating Number Class
School
85
45.2%
System 702
41.2%
School
74
31.8%
System 664
40.7%
Number Requiring
LS 16 149
29 156
Percent of those attending Georgia
Public Colleges
18.8%
21.2%
39.2%
23.5%
In previous years, the Report Card presented College Prep Curriculum information provided by the Board of Regents on students requiring Learning Support. Due to inconsistencies in the data provided by the Board of Regents in defining College Prep Completers versus Local Board of Education data defining College Prep Endorsements, the Department of Education Report Card will not provide this information until discrepancies can be reconciled.
Graduates Entering Georgia Public Technical and Adult Schools
1998 Graduates School System
Entering Number 5 42
1998-99 Percent
2.7% 2.5%
Entering Number N/A N/A
1997-98 Percent
N/A N/A
1997 Graduates School
1
0.4%
System
4
0.2%
5
2.1%
19
1.2%
1998-99 GEORGIA PUBLIC EDUCATION REPORT CARD Riverdale High School - 6310377
Prepared by Georgia Department of Education
Page 3
CERTIFIED PERSONNEL DATA
Positions Number Average Contract Days
Administrators
6.00 233.33
Support Personnel
5.00 200.00
PK-12 Teachers
81.90 190.00
Personnel Sex
Certificate
Years Experience
Full-time Part-time
Male Female
4 Yr Bachelor's 5 Yr Master's 6 Yr Specialist's 7 Yr Doctoral Other*
<1 1-10 11-20 21-30 >30
Average
6 0
4 2
0 1 4 1 0
0 0 3 3 0
18.67
5 0
1 4
0 2 3 0 0
0 1 0 1 3
27.40
80 3
32 51
43 33
4 2 1
8 38 14 21
2
12.49
*Includes One- and Two-Year Vocational Certificates.
ACCREDITATION DATA
Accredited by Southern Association of Colleges and Schools (SACS): Secondary/Middle Commission.
AWARDS / RECOGNITION DATA
Schools in Georgia may receive recognition in the following programs: Charter School Pay for Performance Program Georgia School of Excellence National Blue Ribbon School Riverdale High School did not receive recognition in any of these programs during the 1998-99 school year.
1998-99 GEORGIA PUBLIC EDUCATION REPORT CARD Riverdale High School - 6310377
Prepared by Georgia Department of Education
Page 4
1998-99 GEORGIA PUBLIC EDUCATION REPORT CARD
CLAYTON COUNTY SCHOOLS
Riverdale Middle School - 6313060
Grade Range 6-8
The Georgia Public Education Report Card is designed to assist systems and schools in educational improvement. This report card contains a variety of data elements. An explanation of the terms is provided as a companion to the report card data. Please refer to the definitions for the most effective use of the reported data.
STUDENT DATA
Total 1,000
6-8 Enrollment, by Race/Ethnicity and Sex
Black
White Hispanic
American Multi-
Asian Indian
racial
767 76.7%
123 12.3%
22 2.2%
67 6.7%
3 0.3%
18 1.8%
Male 508
50.8%
Female 492
49.2%
Enrollment in Selected Programs
Program
Gifted (Grades K-12)
Program % of Student Enrollment Population
69
6.9%
Alternative Programs (Grades 6-12)
0
0.0%
Students Eligible to Receive Free/Reduced Lunches
Number
Percent
School System
596 23,194
59.6% 52.6%
Enrollment in Compensatory Programs
Program
Program % of Student Enrollment Population
Special Education (Grades K-12) (PK)
80
8.0%
0
N/A
English to Speakers of Other Languages (ESOL) (Grades K-12)
18
1.8%
Title I (Grades K-12)
This school has no Title I program.
Dropout Rate for Grades 6-8
Number
Rate
School System
2
0.2%
46
0.4%
Total 38
Retained Students, by Race/Ethnicity and Sex
Black
White Hispanic
American MultiAsian Indian racial
26 68.4%
9 23.7%
1 2.6%
2 5.3%
0 0.0%
0 0.0%
Male Female
30
8
78.9% 21.1%
Prepared by Georgia Department of Education
Page 1
STATE-REQUIRED TEST DATA
NORM-REFERENCED TESTS Grade 8
Iowa Tests of Basic Skills (ITBS) Each chart reflects data for three years of testing.
Reading Comprehension 50
36 42 49 0
98-99
41 43 48 97-98
37 44 48 96-97
Mathematics
School 50
System
State
0
41 47 56 98-99
48 48 55 97-98
39 49 54 96-97
School System State
Reading Vocabulary 50
30 36 46 0
98-99
38 38 45 97-98
34 40 44 96-97
Language Arts
School 50
System
State
0
57 55 60 98-99
62 55 58 97-98
55 53 56 96-97
School System State
Social Studies 50
39 47 54 0
98-99
47 48 53 97-98
47 51 53 96-97
Science
School 50
System
State
0
40 46 56 98-99
46 48 55 97-98
46 48 53 96-97
School System State
Sources of Information
Composite Score
50
45 52 57 0
98-99
School 50
System
51 53 56 97-98
50 53 55 96-97
State 0
42 48 56 98-99
49 49 54 97-98
1998-99 GEORGIA PUBLIC EDUCATION REPORT CARD Riverdale Middle School - 6313060
Prepared by Georgia Department of Education
45 50 54 96-97
Scores Reported in Percentiles
School System State
Page 2
STATE-REQUIRED TEST DATA
Categories of Scaled Scores
Inadequate (less than 162)
Minimal (162-209)
Good
(210-247)
Very Good (greater than 247)
Average Scaled Score: (Range 100-300)
PERFORMANCE ASSESSMENTS
Grade 8 Writing Assessment
1998-99 Percent Scoring
1997-98 Percent Scoring
1996-97 Percent Scoring
School System State School System State School System State
10% 48% 34%
8%
10% 45% 38%
7%
8% 40% 41% 11%
10% 56% 32%
2%
10% 52% 33%
4%
11% 46% 34%
8%
13% 56% 27%
4%
13% 51% 30%
6%
15% 46% 30%
8%
201
203
208 198
199 202 194
198 198
AWARDS / RECOGNITION DATA
Schools in Georgia may receive recognition in the following programs: Charter School Pay for Performance Program Georgia School of Excellence National Blue Ribbon School Riverdale Middle School did not receive recognition in any of these programs during the 1998-99 school year.
1998-99 GEORGIA PUBLIC EDUCATION REPORT CARD Riverdale Middle School - 6313060
Prepared by Georgia Department of Education
Page 3
CERTIFIED PERSONNEL DATA
Positions Number Average Contract Days
Personnel Sex
Certificate
Years Experience
Full-time Part-time
Male Female
4 Yr Bachelor's 5 Yr Master's 6 Yr Specialist's 7 Yr Doctoral Other*
<1 1-10 11-20 21-30 >30
Average
Administrators
4.00 230.00
4 0
2 2
0 0 3 1 0 0 1 2 1 0 18.75
Support Personnel
4.00 197.50
4 0
0 4
0 3 1 0 0 0 3 1 0 0 7.00
PK-12 Teachers
58.48 190.00
57 5
14 48
43 16
3 0 0 7 30 11 14 0 10.71
*Includes One- and Two-Year Vocational Certificates.
ACCREDITATION DATA
Accredited by Southern Association of Colleges and Schools (SACS):
Elementary/Middle Commission.
1998-99 GEORGIA PUBLIC EDUCATION REPORT CARD Riverdale Middle School - 6313060
Prepared by Georgia Department of Education
Page 4
1998-99 GEORGIA PUBLIC EDUCATION REPORT CARD
CLAYTON COUNTY SCHOOLS
Suder Elementary School - 6314060
Grade Range PK-5
The Georgia Public Education Report Card is designed to assist systems and schools in educational improvement. This report card contains a variety of data elements. An explanation of the terms is provided as a companion to the report card data. Please refer to the definitions for the most effective use of the reported data.
STUDENT DATA
Total
K-5
753
PK
19
Enrollment, by Race/Ethnicity and Sex
Black
White Hispanic
American Asian Indian
Multiracial
269 35.7%
425 56.4%
22 2.9%
15 2.0%
0 0.0%
22 2.9%
7 36.8%
6 31.6%
4 21.1%
1 5.3%
0 0.0%
1 5.3%
Male Female
403 53.5%
350 46.5%
12 63.2%
7 36.8%
Enrollment in Selected Programs
Program
Program % of Student Enrollment Population
Gifted (Grades K-12)
38
5.0%
Alternative Programs (Grades 6-12)
N/A
N/A
Students Eligible to Receive Free/Reduced Lunches
Number
Percent
School System
309 23,194
40.0% 52.6%
Dropout Rate *
Number
Rate
School System
N/A N/A
N/A N/A
* Dropout rates are not applicable for grades PK-5.
Enrollment in Compensatory Programs
Program
Program % of Student Enrollment Population
Special Education (Grades K-12)
100 13.3%
(PK)
1
N/A
English to Speakers of Other Languages (ESOL) (Grades K-12)
12
1.6%
Remedial Education (Grades 2-5, 9-12)
193 35.1%
Special Instructional Assistance (SIA) (Grades K-3)
47
9.9%
Title I (Grades K-12)
This school has no Title I program.
Total 5
Retained Students, by Race/Ethnicity and Sex
Black
White Hispanic
American MultiAsian Indian racial
1 20.0%
4 80.0%
0 0.0%
0 0.0%
0 0.0%
0 0.0%
Male Female
4
1
80.0% 20.0%
Prepared by Georgia Department of Education
Page 1
STATE-REQUIRED TEST DATA
NORM-REFERENCED TESTS Grade 3
Iowa Tests of Basic Skills (ITBS) Each chart reflects data for three years of testing.
Reading Comprehension 50
43 42 54 0
98-99
55 43 53 97-98
59 41 52 96-97
Mathematics
School 50
System
State
0
50 46 61 98-99
66 48 61 97-98
66 51 59 96-97
School System State
Reading Vocabulary 50
38 35 50 0
98-99
45 37 50 97-98
53 39 49 96-97
Language Arts
School 50
System
State
0
50 55 64 98-99
72 56 62 97-98
70 56 59 96-97
School System State
Social Studies 50
46 44 56 0
98-99
61 45 55 97-98
63 48 55 96-97
Science
School 50
System
State
0
49 44 59 98-99
56 45 59 97-98
63 48 58 96-97
School System State
Sources of Information
Composite Score
50
46 46 57 0
98-99
School 50
System
60 46 56 97-98
65 48 55 96-97
State 0
47 44 58 98-99
64 46 57 97-98
1998-99 GEORGIA PUBLIC EDUCATION REPORT CARD Suder Elementary School - 6314060
Prepared by Georgia Department of Education
65 47 56 96-97
Scores Reported in Percentiles
School System State
Page 2
STATE-REQUIRED TEST DATA
NORM-REFERENCED TESTS Grade 5
Iowa Tests of Basic Skills (ITBS) Each chart reflects data for three years of testing.
Reading Comprehension
Mathematics
50
56 44 53 0
98-99
54 43 53 97-98
54 45 52 96-97
School 50
System
State
0
70 47 59 98-99
63 49 58 97-98
66 50 57 96-97
School System State
Reading Vocabulary 50
58 36 48 0
98-99
49 34 48 97-98
51 37 46 96-97
Language Arts
School 50
System
State
0
73 57 63 98-99
76 56 61 97-98
69 57 58 96-97
School System State
Social Studies 50
60 45 57 0
98-99
60 46 56 97-98
65 48 55 96-97
Science
School 50
System
State
0
58 47 60 98-99
62 49 59 97-98
71 50 59 96-97
School System State
Sources of Information
Composite Score
50
64 50 58 0
98-99
School 50
System
67 51 58 97-98
72 52 57 96-97
State 0
64 46 57 98-99
64 47 56 97-98
68 48 55 96-97
1998-99 GEORGIA PUBLIC EDUCATION REPORT CARD Suder Elementary School - 6314060
Prepared by Georgia Department of Education
Scores Reported in Percentiles
School System State
Page 3
STATE-REQUIRED TEST DATA
PERFORMANCE ASSESSMENTS
Grade 5 Writing Assessment
Percent at Developmental Stages:
1998-99 School System State
1997-98 School System State
1996-97 School System State
Stage Stage Stage Stage Stage Stage
1:The Emerging Writer 2:The Developing Writer 3:The Focusing Writer 4:The Experimenting 5:The Engaging Writer 6:The Extending Writer
0% 1% 12% 31% 30% 26%
0% 1% 17% 41% 28% 12%
0% 1% 16% 41% 29% 12%
1% 3% 13% 33% 33% 17%
1% 3% 21% 42% 25% 8%
0% 3% 19% 41% 27% 10%
0% 5% 21% 37% 26% 12%
0% 3% 21% 40% 26% 8%
0% 3% 21% 37% 26% 12%
AWARDS / RECOGNITION DATA
Schools in Georgia may receive recognition in the following programs: Charter School Pay for Performance Program Georgia School of Excellence National Blue Ribbon School Suder Elementary School did not receive recognition in any of these programs during the 1998-99 school year.
1998-99 GEORGIA PUBLIC EDUCATION REPORT CARD Suder Elementary School - 6314060
Prepared by Georgia Department of Education
Page 4
CERTIFIED PERSONNEL DATA
Positions Number Average Contract Days
Personnel Sex
Certificate
Years Experience
Full-time Part-time
Male Female
4 Yr Bachelor's 5 Yr Master's 6 Yr Specialist's 7 Yr Doctoral Other*
<1 1-10 11-20 21-30 >30
Average
Administrators
3.00 226.67
3 0
1 2
0 1 2 0 0 0 0 1 1 1 22.67
Support Personnel
3.65 194.52
3 2
1 4
0 4 1 0 0 0 2 0 3 0 14.20
PK-12 Teachers
51.88 190.00
51 3
4 50
24 27
3 0 0 3 11 19 19 2 15.81
*Includes One- and Two-Year Vocational Certificates.
ACCREDITATION DATA
Accredited by Southern Association of Colleges and Schools (SACS):
Elementary/Middle Commission.
1998-99 GEORGIA PUBLIC EDUCATION REPORT CARD Suder Elementary School - 6314060
Prepared by Georgia Department of Education
Page 5
1998-99 GEORGIA PUBLIC EDUCATION REPORT CARD
CLAYTON COUNTY SCHOOLS
Swint Elementary School - 6315060
Grade Range K-5
The Georgia Public Education Report Card is designed to assist systems and schools in educational improvement. This report card contains a variety of data elements. An explanation of the terms is provided as a companion to the report card data. Please refer to the definitions for the most effective use of the reported data.
STUDENT DATA
Total 907
K-5 Enrollment, by Race/Ethnicity and Sex
Black
White Hispanic
American Multi-
Asian Indian
racial
573 63.2%
255 28.1%
24 2.6%
21 2.3%
0 0.0%
34 3.7%
Male Female
465 51.3%
442 48.7%
Enrollment in Selected Programs
Program
Program % of Student Enrollment Population
Gifted (Grades K-12)
7
< 1%
Alternative Programs (Grades 6-12)
N/A
N/A
Students Eligible to Receive Free/Reduced Lunches
Number
Percent
School System
524 23,194
57.8% 52.6%
Dropout Rate *
Number
Rate
School System
N/A N/A
N/A N/A
* Dropout rates are not applicable for grades PK-5.
Enrollment in Compensatory Programs
Program
Program % of Student Enrollment Population
Special Education (Grades K-12)
111 12.2%
(PK)
1
N/A
English to Speakers of Other Languages (ESOL) (Grades K-12)
4
< 1%
Remedial Education (Grades 2-5, 9-12)
216 35.6%
Special Instructional Assistance (SIA) (Grades K-3)
50
7.9%
Title I (Grades K-12)
This school has a schoolwide program.
Total 14
Retained Students, by Race/Ethnicity and Sex
Black
White Hispanic
American Multi-
Asian Indian
racial
7 50.0%
7 50.0%
0 0.0%
0 0.0%
0 0.0%
0 0.0%
Male Female
6
8
42.9% 57.1%
Prepared by Georgia Department of Education
Page 1
STATE-REQUIRED TEST DATA
NORM-REFERENCED TESTS Grade 3
Iowa Tests of Basic Skills (ITBS) Each chart reflects data for three years of testing.
Reading Comprehension 50
39 42 54 0
98-99
41 43 53 97-98
36 41 52 96-97
Mathematics
School 50
System
State
0
41 46 61 98-99
43 48 61 97-98
42 51 59 96-97
School System State
Reading Vocabulary 50
45 35 50 0
98-99
46 37 50 97-98
31 39 49 96-97
Language Arts
School 50
System
State
0
51 55 64 98-99
56 56 62 97-98
52 56 59 96-97
School System State
Social Studies 50
47 44 56 0
98-99
48 45 55 97-98
46 48 55 96-97
Science
School 50
System
State
0
45 44 59 98-99
49 45 59 97-98
45 48 58 96-97
School System State
Sources of Information
Composite Score
50
44 46 57 0
98-99
School 50
System
43 46 56 97-98
44 48 55 96-97
State 0
44 44 58 98-99
46 46 57 97-98
1998-99 GEORGIA PUBLIC EDUCATION REPORT CARD Swint Elementary School - 6315060
Prepared by Georgia Department of Education
41 47 56 96-97
Scores Reported in Percentiles
School System State
Page 2
STATE-REQUIRED TEST DATA
NORM-REFERENCED TESTS Grade 5
Iowa Tests of Basic Skills (ITBS) Each chart reflects data for three years of testing.
Reading Comprehension
Mathematics
50
38 44 53 0
98-99
38 43 53 97-98
39 45 52 96-97
School 50
System
State
0
40 47 59 98-99
47 49 58 97-98
38 50 57 96-97
School System State
Reading Vocabulary 50
28 36 48 0
98-99
32 34 48 97-98
31 37 46 96-97
Language Arts
School 50
System
State
0
53 57 63 98-99
58 56 61 97-98
48 57 58 96-97
School System State
Social Studies 50
38 45 57 0
98-99
39 46 56 97-98
37 48 55 96-97
Science
School 50
System
State
0
40 47 60 98-99
47 49 59 97-98
36 50 59 96-97
School System State
Sources of Information
Composite Score
50
41 50 58 0
98-99
School 50
System
44 51 58 97-98
42 52 57 96-97
State 0
39 46 57 98-99
43 47 56 97-98
37 48 55 96-97
1998-99 GEORGIA PUBLIC EDUCATION REPORT CARD Swint Elementary School - 6315060
Prepared by Georgia Department of Education
Scores Reported in Percentiles
School System State
Page 3
STATE-REQUIRED TEST DATA
PERFORMANCE ASSESSMENTS
Grade 5 Writing Assessment
Percent at Developmental Stages:
1998-99 School System State
1997-98 School System State
1996-97 School System State
Stage Stage Stage Stage Stage Stage
1:The Emerging Writer 2:The Developing Writer 3:The Focusing Writer 4:The Experimenting 5:The Engaging Writer 6:The Extending Writer
0% 1% 17% 48% 25% 6%
0% 1% 17% 41% 28% 12%
0% 1% 16% 41% 29% 12%
2% 3% 18% 46% 27% 5%
1% 3% 21% 42% 25% 8%
0% 3% 19% 41% 27% 10%
0% 8% 30% 35% 24% 3%
0% 3% 21% 40% 26% 8%
0% 3% 21% 37% 26% 12%
AWARDS / RECOGNITION DATA
Schools in Georgia may receive recognition in the following programs: Charter School Pay for Performance Program Georgia School of Excellence National Blue Ribbon School Swint Elementary School did not receive recognition in any of these programs during the 1998-99 school year.
1998-99 GEORGIA PUBLIC EDUCATION REPORT CARD Swint Elementary School - 6315060
Prepared by Georgia Department of Education
Page 4
CERTIFIED PERSONNEL DATA
Positions Number Average Contract Days
Personnel Sex
Certificate
Years Experience
Full-time Part-time
Male Female
4 Yr Bachelor's 5 Yr Master's 6 Yr Specialist's 7 Yr Doctoral Other*
<1 1-10 11-20 21-30 >30
Average
Administrators
3.00 226.67
3 0
1 2
0 0 3 0 0 0 0 0 2 1 28.33
Support Personnel
2.35 195.74
1 2
1 2
0 2 1 0 0 0 2 0 1 0 10.67
PK-12 Teachers
56.00 190.00
55 3
5 53
31 24
3 0 0 6 24 10 18 0 12.09
*Includes One- and Two-Year Vocational Certificates.
ACCREDITATION DATA
Accredited by Southern Association of Colleges and Schools (SACS):
Elementary/Middle Commission.
1998-99 GEORGIA PUBLIC EDUCATION REPORT CARD Swint Elementary School - 6315060
Prepared by Georgia Department of Education
Page 5
1998-99 GEORGIA PUBLIC EDUCATION REPORT CARD
CLAYTON COUNTY SCHOOLS
Tara Elementary School - 6311062
Grade Range PK-5
The Georgia Public Education Report Card is designed to assist systems and schools in educational improvement. This report card contains a variety of data elements. An explanation of the terms is provided as a companion to the report card data. Please refer to the definitions for the most effective use of the reported data.
STUDENT DATA
Total
K-5
900
PK
20
Enrollment, by Race/Ethnicity and Sex
Black
White Hispanic
American Asian Indian
Multiracial
591 65.7%
195 21.7%
65 7.2%
22 2.4%
1 0.1%
26 2.9%
12 60.0%
3 15.0%
5 25.0%
0 0.0%
0 0.0%
0 0.0%
Male Female
452 50.2%
448 49.8%
10 50.0%
10 50.0%
Enrollment in Selected Programs
Program
Program % of Student Enrollment Population
Gifted (Grades K-12)
15
1.7%
Alternative Programs (Grades 6-12)
N/A
N/A
Students Eligible to Receive Free/Reduced Lunches
Number
Percent
School System
677 23,194
73.6% 52.6%
Dropout Rate *
Number
Rate
School System
N/A N/A
N/A N/A
* Dropout rates are not applicable for grades PK-5.
Enrollment in Compensatory Programs
Program
Program % of Student Enrollment Population
Special Education (Grades K-12)
110 12.2%
(PK)
3
N/A
English to Speakers of Other Languages (ESOL) (Grades K-12)
23
2.6%
Remedial Education (Grades 2-5, 9-12)
215 35.2%
Special Instructional Assistance (SIA) (Grades K-3)
49
8.2%
Title I (Grades K-12)
This school has a schoolwide program.
Total 2
Retained Students, by Race/Ethnicity and Sex
Black
White Hispanic
American MultiAsian Indian racial
2 100.0%
0 0.0%
0 0.0%
0 0.0%
0 0.0%
0 0.0%
Male Female
1
1
50.0% 50.0%
Prepared by Georgia Department of Education
Page 1
STATE-REQUIRED TEST DATA
NORM-REFERENCED TESTS Grade 3
Iowa Tests of Basic Skills (ITBS) Each chart reflects data for three years of testing.
Reading Comprehension 50
35 42 54 0
98-99
36 43 53 97-98
32 41 52 96-97
Mathematics
School 50
System
State
0
35 46 61 98-99
38 48 61 97-98
39 51 59 96-97
School System State
Reading Vocabulary 50
27 35 50 0
98-99
28 37 50 97-98
29 39 49 96-97
Language Arts
School 50
System
State
0
52 55 64 98-99
48 56 62 97-98
52 56 59 96-97
School System State
Social Studies 50
35 44 56 0
98-99
40 45 55 97-98
36 48 55 96-97
Science
School 50
System
State
0
38 44 59 98-99
37 45 59 97-98
38 48 58 96-97
School System State
Sources of Information
Composite Score
50
36 46 57 0
98-99
School 50
System
43 46 56 97-98
37 48 55 96-97
State 0
36 44 58 98-99
38 46 57 97-98
1998-99 GEORGIA PUBLIC EDUCATION REPORT CARD Tara Elementary School - 6311062
Prepared by Georgia Department of Education
36 47 56 96-97
Scores Reported in Percentiles
School System State
Page 2
STATE-REQUIRED TEST DATA
NORM-REFERENCED TESTS Grade 5
Iowa Tests of Basic Skills (ITBS) Each chart reflects data for three years of testing.
Reading Comprehension
Mathematics
50
37 44 53 0
98-99
34 43 53 97-98
44 45 52 96-97
School 50
System
State
0
33 47 59 98-99
42 49 58 97-98
47 50 57 96-97
School System State
Reading Vocabulary 50
28 36 48 0
98-99
24 34 48 97-98
31 37 46 96-97
Language Arts
School 50
System
State
0
49 57 63 98-99
54 56 61 97-98
66 57 58 96-97
School System State
Social Studies 50
35 45 57 0
98-99
35 46 56 97-98
54 48 55 96-97
Science
School 50
System
State
0
34 47 60 98-99
38 49 59 97-98
43 50 59 96-97
School System State
Sources of Information
Composite Score
50
40 50 58 0
98-99
School 50
System
50 51 58 97-98
54 52 57 96-97
State 0
36 46 57 98-99
40 47 56 97-98
50 48 55 96-97
1998-99 GEORGIA PUBLIC EDUCATION REPORT CARD Tara Elementary School - 6311062
Prepared by Georgia Department of Education
Scores Reported in Percentiles
School System State
Page 3
STATE-REQUIRED TEST DATA
PERFORMANCE ASSESSMENTS
Grade 5 Writing Assessment
Percent at Developmental Stages:
1998-99 School System State
1997-98 School System State
1996-97 School System State
Stage Stage Stage Stage Stage Stage
1:The Emerging Writer 2:The Developing Writer 3:The Focusing Writer 4:The Experimenting 5:The Engaging Writer 6:The Extending Writer
1% 1% 10% 37% 38% 12%
0% 1% 17% 41% 28% 12%
0% 1% 16% 41% 29% 12%
2% 3% 18% 37% 29% 11%
1% 3% 21% 42% 25% 8%
0% 3% 19% 41% 27% 10%
1% 0% 5% 30% 44% 19%
0% 3% 21% 40% 26% 8%
0% 3% 21% 37% 26% 12%
AWARDS / RECOGNITION DATA
Schools in Georgia may receive recognition in the following programs: Charter School Pay for Performance Program Georgia School of Excellence National Blue Ribbon School Tara Elementary School did not receive recognition in any of these programs during the 1998-99 school year.
1998-99 GEORGIA PUBLIC EDUCATION REPORT CARD Tara Elementary School - 6311062
Prepared by Georgia Department of Education
Page 4
CERTIFIED PERSONNEL DATA
Positions Number Average Contract Days
Personnel Sex
Certificate
Years Experience
Full-time Part-time
Male Female
4 Yr Bachelor's 5 Yr Master's 6 Yr Specialist's 7 Yr Doctoral Other*
<1 1-10 11-20 21-30 >30
Average
Administrators
3.00 226.67
3 0
1 2
0 1 1 1 0 0 1 0 1 1 22.00
Support Personnel
2.00 197.50
1 2
0 3
0 1 2 0 0 0 1 2 0 0 11.33
PK-12 Teachers
54.22 190.00
53 3
4 52
35 18
3 0 0 6 32 11 6 1 8.39
*Includes One- and Two-Year Vocational Certificates.
ACCREDITATION DATA
Accredited by Southern Association of Colleges and Schools (SACS):
Elementary/Middle Commission.
1998-99 GEORGIA PUBLIC EDUCATION REPORT CARD Tara Elementary School - 6311062
Prepared by Georgia Department of Education
Page 5
1998-99 GEORGIA PUBLIC EDUCATION REPORT CARD
CLAYTON COUNTY SCHOOLS
West Clayton Elementary School - 6312062
Grade Range PK-5
The Georgia Public Education Report Card is designed to assist systems and schools in educational improvement. This report card contains a variety of data elements. An explanation of the terms is provided as a companion to the report card data. Please refer to the definitions for the most effective use of the reported data.
STUDENT DATA
Total
K-5
893
PK
20
Enrollment, by Race/Ethnicity and Sex
Black
White Hispanic
American Asian Indian
Multiracial
790 88.5%
7 0.8%
7 0.8%
62 6.9%
4 0.4%
23 2.6%
18 90.0%
0 0.0%
0
2
0.0% 10.0%
0 0.0%
0 0.0%
Male Female
453 50.7%
440 49.3%
10 50.0%
10 50.0%
Enrollment in Selected Programs
Program
Program % of Student Enrollment Population
Gifted (Grades K-12)
24
2.7%
Alternative Programs (Grades 6-12)
N/A
N/A
Students Eligible to Receive Free/Reduced Lunches
Number
Percent
School System
725 23,194
79.4% 52.6%
Dropout Rate *
Number
Rate
School System
N/A N/A
N/A N/A
* Dropout rates are not applicable for grades PK-5.
Enrollment in Compensatory Programs
Program
Program % of Student Enrollment Population
Special Education (Grades K-12)
51
5.7%
(PK)
1
N/A
English to Speakers of Other Languages (ESOL) (Grades K-12)
22
2.5%
Remedial Education (Grades 2-5, 9-12)
165 29.0%
Special Instructional Assistance (SIA) (Grades K-3)
50
8.1%
Title I (Grades K-12)
This school has a schoolwide program.
Total 58
Retained Students, by Race/Ethnicity and Sex
Black
White Hispanic
American MultiAsian Indian racial
49 84.5%
0 0.0%
0 0.0%
8 13.8%
0 0.0%
1 1.7%
Male Female
34
24
58.6% 41.4%
Prepared by Georgia Department of Education
Page 1
STATE-REQUIRED TEST DATA
NORM-REFERENCED TESTS Grade 3
Iowa Tests of Basic Skills (ITBS) Each chart reflects data for three years of testing.
Reading Comprehension 50
41 42 54 0
98-99
37 43 53 97-98
34 41 52 96-97
Mathematics
School 50
System
State
0
55 46 61 98-99
44 48 61 97-98
46 51 59 96-97
School System State
Reading Vocabulary 50
30 35 50 0
98-99
30 37 50 97-98
27 39 49 96-97
Language Arts
School 50
System
State
0
63 55 64 98-99
53 56 62 97-98
56 56 59 96-97
School System State
Social Studies 50
39 44 56 0
98-99
33 45 55 97-98
34 48 55 96-97
Science
School 50
System
State
0
38 44 59 98-99
37 45 59 97-98
31 48 58 96-97
School System State
Sources of Information
Composite Score
50
48 46 57 0
98-99
School 50
System
38 46 56 97-98
38 48 55 96-97
State 0
44 44 58 98-99
38 46 57 97-98
1998-99 GEORGIA PUBLIC EDUCATION REPORT CARD West Clayton Elementary School - 6312062
Prepared by Georgia Department of Education
37 47 56 96-97
Scores Reported in Percentiles
School System State
Page 2
STATE-REQUIRED TEST DATA
NORM-REFERENCED TESTS Grade 5
Iowa Tests of Basic Skills (ITBS) Each chart reflects data for three years of testing.
Reading Comprehension
Mathematics
50
37 44 53 0
98-99
32 43 53 97-98
35 45 52 96-97
School 50
System
State
0
37 47 59 98-99
35 49 58 97-98
37 50 57 96-97
School System State
Reading Vocabulary 50
28 36 48 0
98-99
22 34 48 97-98
23 37 46 96-97
Language Arts
School 50
System
State
0
47 57 63 98-99
44 56 61 97-98
40 57 58 96-97
School System State
Social Studies 50
36 45 57 0
98-99
33 46 56 97-98
33 48 55 96-97
Science
School 50
System
State
0
31 47 60 98-99
32 49 59 97-98
31 50 59 96-97
School System State
Sources of Information
Composite Score
50
38 50 58 0
98-99
School 50
System
40 51 58 97-98
35 52 57 96-97
State 0
35 46 57 98-99
34 47 56 97-98
32 48 55 96-97
1998-99 GEORGIA PUBLIC EDUCATION REPORT CARD West Clayton Elementary School - 6312062
Prepared by Georgia Department of Education
Scores Reported in Percentiles
School System State
Page 3
STATE-REQUIRED TEST DATA
PERFORMANCE ASSESSMENTS
Grade 5 Writing Assessment
Percent at Developmental Stages:
1998-99 School System State
1997-98 School System State
1996-97 School System State
Stage Stage Stage Stage Stage Stage
1:The Emerging Writer 2:The Developing Writer 3:The Focusing Writer 4:The Experimenting 5:The Engaging Writer 6:The Extending Writer
0% 5% 23% 50% 19% 4%
0% 1% 17% 41% 28% 12%
0% 1% 16% 41% 29% 12%
3% 4% 18% 54% 17% 4%
1% 3% 21% 42% 25% 8%
0% 3% 19% 41% 27% 10%
1% 3% 28% 46% 21% 1%
0% 3% 21% 40% 26% 8%
0% 3% 21% 37% 26% 12%
AWARDS / RECOGNITION DATA
Schools in Georgia may receive recognition in the following programs: Charter School Pay for Performance Program Georgia School of Excellence National Blue Ribbon School West Clayton Elementary School did not receive recognition in any of these programs during the 1998-99 school year.
1998-99 GEORGIA PUBLIC EDUCATION REPORT CARD West Clayton Elementary School - 6312062
Prepared by Georgia Department of Education
Page 4
CERTIFIED PERSONNEL DATA
Positions Number Average Contract Days
Personnel Sex
Certificate
Years Experience
Full-time Part-time
Male Female
4 Yr Bachelor's 5 Yr Master's 6 Yr Specialist's 7 Yr Doctoral Other*
<1 1-10 11-20 21-30 >30
Average
Administrators
3.00 226.67
3 0
1 2
0 1 1 1 0 0 0 1 1 1 24.00
Support Personnel
2.50 196.00
2 1
0 3
0 0 3 0 0 0 1 0 2 0 20.67
PK-12 Teachers
49.83 190.00
49 2
3 48
41 10
0 0 0 9 26 11 5 0 7.98
*Includes One- and Two-Year Vocational Certificates.
ACCREDITATION DATA
Accredited by Southern Association of Colleges and Schools (SACS):
Elementary/Middle Commission.
1998-99 GEORGIA PUBLIC EDUCATION REPORT CARD West Clayton Elementary School - 6312062
Prepared by Georgia Department of Education
Page 5
1998-99 GEORGIA PUBLIC EDUCATION REPORT CARD
CLAYTON COUNTY SCHOOLS
William M McGarrah Elementary School - 6315056
Grade Range PK-5
The Georgia Public Education Report Card is designed to assist systems and schools in educational improvement. This report card contains a variety of data elements. An explanation of the terms is provided as a companion to the report card data. Please refer to the definitions for the most effective use of the reported data.
STUDENT DATA
Total
K-5
950
PK
191
Enrollment, by Race/Ethnicity and Sex
Black
White Hispanic
American Asian Indian
Multiracial
497 52.3%
310 32.6%
65 6.8%
41 4.3%
0 0.0%
37 3.9%
101 52.9%
72 37.7%
7 3.7%
6 3.1%
0 0.0%
5 2.6%
Male Female
487 51.3%
463 48.7%
116 60.7%
75 39.3%
Enrollment in Selected Programs
Program
Program % of Student Enrollment Population
Gifted (Grades K-12)
69
7.3%
Alternative Programs (Grades 6-12)
N/A
N/A
Students Eligible to Receive Free/Reduced Lunches
Number
Percent
School System
727 23,194
63.7% 52.6%
Dropout Rate *
Number
Rate
School System
N/A N/A
N/A N/A
* Dropout rates are not applicable for grades PK-5.
Enrollment in Compensatory Programs
Program
Program % of Student Enrollment Population
Special Education (Grades K-12)
132 13.9%
(PK)
127
N/A
English to Speakers of Other Languages (ESOL) (Grades K-12)
31
3.3%
Remedial Education (Grades 2-5, 9-12)
203 32.9%
Special Instructional Assistance (SIA) (Grades K-3)
50
7.6%
Title I (Grades K-12)
This school has a schoolwide program.
Total 27
Retained Students, by Race/Ethnicity and Sex
Black
White Hispanic
American MultiAsian Indian racial
13 48.1%
10
3
37.0% 11.1%
0 0.0%
0 0.0%
1 3.7%
Male Female
17
10
63.0% 37.0%
Prepared by Georgia Department of Education
Page 1
STATE-REQUIRED TEST DATA
NORM-REFERENCED TESTS Grade 3
Iowa Tests of Basic Skills (ITBS) Each chart reflects data for three years of testing.
Reading Comprehension 50
45 42 54 0
98-99
45 43 53 97-98
40 41 52 96-97
Mathematics
School 50
System
State
0
46 46 61 98-99
52 48 61 97-98
51 51 59 96-97
School System State
Reading Vocabulary 50
38 35 50 0
98-99
39 37 50 97-98
37 39 49 96-97
Language Arts
School 50
System
State
0
61 55 64 98-99
64 56 62 97-98
62 56 59 96-97
School System State
Social Studies 50
55 44 56 0
98-99
51 45 55 97-98
52 48 55 96-97
Science
School 50
System
State
0
49 44 59 98-99
44 45 59 97-98
46 48 58 96-97
School System State
Sources of Information
Composite Score
50
51 46 57 0
98-99
School 50
System
49 46 56 97-98
50 48 55 96-97
State 0
49 44 58 98-99
49 46 57 97-98
1998-99 GEORGIA PUBLIC EDUCATION REPORT CARD William M McGarrah Elementary School - 6315056
Prepared by Georgia Department of Education
48 47 56 96-97
Scores Reported in Percentiles
School System State
Page 2
STATE-REQUIRED TEST DATA
NORM-REFERENCED TESTS Grade 5
Iowa Tests of Basic Skills (ITBS) Each chart reflects data for three years of testing.
Reading Comprehension
Mathematics
50
38 44 53 0
98-99
44 43 53 97-98
43 45 52 96-97
School 50
System
State
0
38 47 59 98-99
45 49 58 97-98
47 50 57 96-97
School System State
Reading Vocabulary 50
32 36 48 0
98-99
45 34 48 97-98
39 37 46 96-97
Language Arts
School 50
System
State
0
53 57 63 98-99
60 56 61 97-98
58 57 58 96-97
School System State
Social Studies 50
45 45 57 0
98-99
46 46 56 97-98
45 48 55 96-97
Science
School 50
System
State
0
43 47 60 98-99
50 49 59 97-98
53 50 59 96-97
School System State
Sources of Information
Composite Score
50
47 50 58 0
98-99
School 50
System
50 51 58 97-98
50 52 57 96-97
State 0
42 46 57 98-99
48 47 56 97-98
48 48 55 96-97
1998-99 GEORGIA PUBLIC EDUCATION REPORT CARD William M McGarrah Elementary School - 6315056
Prepared by Georgia Department of Education
Scores Reported in Percentiles
School System State
Page 3
STATE-REQUIRED TEST DATA
PERFORMANCE ASSESSMENTS
Grade 5 Writing Assessment
Percent at Developmental Stages:
1998-99 School System State
1997-98 School System State
1996-97 School System State
Stage Stage Stage Stage Stage Stage
1:The Emerging Writer 2:The Developing Writer 3:The Focusing Writer 4:The Experimenting 5:The Engaging Writer 6:The Extending Writer
0% 2% 29% 47% 18% 4%
0% 1% 17% 41% 28% 12%
0% 1% 16% 41% 29% 12%
0% 3% 16% 50% 24% 6%
1% 3% 21% 42% 25% 8%
0% 3% 19% 41% 27% 10%
0% 7% 25% 41% 23% 5%
0% 3% 21% 40% 26% 8%
0% 3% 21% 37% 26% 12%
AWARDS / RECOGNITION DATA
Schools in Georgia may receive recognition in the following programs: Charter School Pay for Performance Program Georgia School of Excellence National Blue Ribbon School William M McGarrah Elementary School did not receive recognition in any of these programs during the 1998-99 school year.
1998-99 GEORGIA PUBLIC EDUCATION REPORT CARD William M McGarrah Elementary School - 6315056
Prepared by Georgia Department of Education
Page 4
CERTIFIED PERSONNEL DATA
Positions Number Average Contract Days
Personnel Sex
Certificate
Years Experience
Full-time Part-time
Male Female
4 Yr Bachelor's 5 Yr Master's 6 Yr Specialist's 7 Yr Doctoral Other*
<1 1-10 11-20 21-30 >30
Average
Administrators
3.00 226.67
3 0
1 2
0 1 2 0 0 0 0 1 2 0 22.67
Support Personnel
2.00 195.00
2 0
1 1
0 2 0 0 0 0 0 2 0 0 17.50
PK-12 Teachers
53.15 190.00
52 3
5 50
31 23
1 0 0 5 27 4 18 1 11.82
*Includes One- and Two-Year Vocational Certificates.
ACCREDITATION DATA
Accredited by Southern Association of Colleges and Schools (SACS):
Elementary/Middle Commission.
1998-99 GEORGIA PUBLIC EDUCATION REPORT CARD William M McGarrah Elementary School - 6315056
Prepared by Georgia Department of Education
Page 5
1998-99 GEORGIA PUBLIC EDUCATION REPORT CARD CLINCH COUNTY SCHOOLS - 632
The Georgia Public Education Report Card is designed to assist systems and schools in educational improvement. This report card contains a variety of data elements. An explanation of the terms is provided as a companion to the report card data. Please refer to the definitions for the most effective use of the reported data.
Total
K-12
1,433
PK
87
STUDENT DATA
Enrollment, by Race/Ethnicity and Sex
Black
White Hispanic
American Multi-
Asian Indian
racial
562 39.2%
868 60.6%
0 0.0%
0 0.0%
0 0.0%
3 0.2%
32 36.8%
55 63.2%
0 0.0%
0 0.0%
0 0.0%
0 0.0%
Male
740 51.6%
36 41.4%
Female
693 48.4%
51 58.6%
Enrollment in Selected Programs
Program
Program % of Student Enrollment Population
Gifted (Grades K-12)
35
2.4%
Non-Vocational Labs (Grades 9-12)
339
86.0%
Vocational Labs (Grades 9-12)
304
77.2%
Alternative Programs (Grades 6-12)
6
< 1%
Students Eligible to Receive Free/Reduced Lunches
Number
Percent
979
64.4%
Dropout Rate
Number
Percent
6-12 9-12
50
6.4%
47
11.2%
Enrollment in Compensatory Programs
Program
Program % of Student Enrollment Population
Special Education
(Grades K-12)
271
PK
36
English to Speakers of
Other Languages (ESOL)
0
(Grades K-12)
Remedial Education (Grades 2-5, 9-12)
100
Special Instructional
Assistance (SIA)
67
(Grades K-3)
Title I (Grades K-12) Number of schools with: Schoolwide program Targeted Assistance program No Title I program
18.9% N/A
0.0%
11.4%
14.5%
1 0 1
Total 103
Retained Students, by Race/Ethnicity and Sex
Black
White Hispanic
American MultiAsian Indian racial
56 54.4%
47 45.6%
0 0.0%
0 0.0%
0 0.0%
0 0.0%
Male Female
73
30
70.9% 29.1%
Prepared by Georgia Department of Education
Page 1
STATE-REQUIRED TEST DATA
NORM-REFERENCED TESTS
Grade 3 Iowa Tests of Basic Skills (ITBS) Each chart reflects data for three years of testing.
Reading Comprehension
Mathematics
50
48 54 48 53 44 52 0
98-99 97-98 96-97
System State
50
70 61 55 61 62 59 0
98-99 97-98 96-97
System State
Reading Vocabulary
50
83 50 51 50 42 49 0
98-99 97-98 96-97
System State
Social Studies
50
68 56 47 55 61 55 0
98-99 97-98 96-97
System State
Language Arts
50
68 64 58 62 57 59 0
98-99 97-98 96-97
System State
Science
50
77 59 59 59 71 58 0
98-99 97-98 96-97
System State
Sources of Information
Composite Score
50
59 57 0
98-99
System
50
47 56 58 55 97-98 96-97
State
69 58 52 57 0
98-99 97-98
1998-99 GEORGIA PUBLIC EDUCATION REPORT CARD Clinch County Schools
Prepared by Georgia Department of Education
System State Scores Reported 59 56 in Percentiles 96-97
Page 2
STATE-REQUIRED TEST DATA
NORM-REFERENCED TESTS
Grade 5 Iowa Tests of Basic Skills (ITBS) Each chart reflects data for three years of testing.
Reading Comprehension
Mathematics
50
39 53 41 53 36 52 0
98-99 97-98 96-97
System State
50
51 59 53 58 49 57 0
98-99 97-98 96-97
System State
Reading Vocabulary
50
35 48 31 48 26 46 0
98-99 97-98 96-97
System State
Social Studies
50
38 57 43 56 37 55 0
98-99 97-98 96-97
System State
Language Arts
50
63 63 55 61 49 58 0
98-99 97-98 96-97
System State
Science
50
38 60 36 59 34 59 0
98-99 97-98 96-97
System State
Sources of Information
Composite Score
50
43 58 0
98-99
System
50
42 58 39 57 97-98 96-97
State
44 57 42 56 0
98-99 97-98
1998-99 GEORGIA PUBLIC EDUCATION REPORT CARD Clinch County Schools
Prepared by Georgia Department of Education
System State Scores Reported 38 55 in Percentiles 96-97
Page 3
STATE-REQUIRED TEST DATA
NORM-REFERENCED TESTS Grade 8
Iowa Tests of Basic Skills (ITBS) Each chart reflects data for three years of testing.
Reading Comprehension
Mathematics
50
38 49 32 48 39 48 0
98-99 97-98 96-97
System State
50
49 56 45 55 50 54 0
98-99 97-98 96-97
System State
Reading Vocabulary
50
31 46 27 45 30 44 0
98-99 97-98 96-97
System State
Language Arts
50
56 60 38 58 44 56 0
98-99 97-98 96-97
System State
Social Studies
50
36 54 30 53 38 53 0
98-99 97-98 96-97
System State
Science
50
41 56 35 55 47 53 0
98-99 97-98 96-97
System State
Sources of Information
Composite Score
50
46 57 0
98-99
System
50
33 56 45 55 97-98 96-97
State
43 56 34 54 0
98-99 97-98
1998-99 GEORGIA PUBLIC EDUCATION REPORT CARD Clinch County Schools
Prepared by Georgia Department of Education
System State Scores Reported 42 54 in Percentiles 96-97
Page 4
STATE-REQUIRED TEST DATA
PERFORMANCE ASSESSMENTS
Grade 5 Writing Assessment
1998-99
1997-98
1996-97
Percent at Developmental Stages:
Comparison
Comparison
Comparison
System Group State System Group State System Group State
Stage Stage Stage Stage Stage Stage
1: The Emerging Writer 2: The Developing Writer 3: The Focusing Writer 4: The Experimenting Writer 5: The Engaging Writer 6: The Extending Writer
0% 2% 32% 46% 16% 3%
0% 2% 26% 48% 19% 5%
0% 1% 16% 41% 29% 12%
0% 6% 38% 37% 15% 2%
0% 5% 29% 41% 20% 4%
0% 3% 19% 41% 27% 10%
0% 5% 40% 39% 12% 5%
1% 7% 33% 39% 17% 4%
0% 3% 21% 37% 26% 12%
Grade 8 Writing Assessment
1998-99 Percent Scoring 1997-98 Percent Scoring 1996-97 Percent Scoring
Categories of Scaled Scores
Comparison
Comparison
Comparison
System Group State System Group State System Group State
Inadequate (less than 162)
Minimal (162-209)
Good
(210-247)
Very Good (greater than 247)
28% 47% 24%
1%
13% 50% 32%
5%
8% 40% 41% 11%
27% 54% 19%
0%
23% 53% 20%
4%
11% 46% 34%
8%
27% 43% 23%
7%
23% 52% 21%
5%
15% 46% 30%
8%
Average Scaled Score: (Range 100-300)
182
196 208
182
186 202
185
188 198
GEORGIA HIGH SCHOOL GRADUATION TESTS (GHSGT)
Percent of Regular Program 11th Graders Passing the Georgia High School Graduation Tests on First Administration
1998-99
1997-98
1996-97
Comparison
Comparison
Comparison
System Group State System Group State System Group State
English Language Arts Mathematics Social Studies Science
80% 76% 57% 55%
92% 83% 68% 63%
96% 88% 80% 72%
91% 91% 73% 57%
89% 83% 66% 62%
94% 88% 78% 74%
92% 91% 62% 70%
92% 80% 66% 64%
94% 87% 78% 74%
All Components listed above 4 7 %
57% 68% 50%
53% 68% 57%
54% 67%
Writing
86%
88% 93% 92%
89% 92% 81%
85% 93%
1998-99 GEORGIA PUBLIC EDUCATION REPORT CARD
Clinch County Schools
Prepared by Georgia Department of Education
Page 5
GRADUATE DATA
1999 Graduates by Credentials, Race/Ethnicity and Sex
Diplomas with Both College Prep. & Voc. Endorsements
Diplomas with College Prep. Endorsements Diplomas with Vocational Endorsements General High School Diplomas Special Education Diplomas
Total All Diplomas
Certificates of Performance
Total Graduates
Total 15 24 26 0
Black
3 20.0%
5 20.8%
8 30.8%
0
American MultiWhite Hispanic Asian Indian racial
12 80.0%
19 79.2%
18 69.2%
0
0 0.0%
0 0.0%
0 0.0%
0
0 0.0%
0 0.0%
0 0.0%
0
0 0.0%
0 0.0%
0 0.0%
0
0 0.0%
0 0.0%
0 0.0%
0
Male Female
5 33.3%
6 25.0%
12 46.2%
0
10 66.7%
18 75.0%
14 53.8%
0
2
2
100.0%
67
18
26.9%
15
8
53.3%
82
26
31.7%
0 0.0%
49 73.1%
7 46.7%
56 68.3%
0 0.0%
0 0.0%
0 0.0%
0 0.0%
0 0.0%
0 0.0%
0 0.0%
0 0.0%
0 0.0%
0 0.0%
0 0.0%
0 0.0%
0 0.0%
0 0.0%
0 0.0%
0 0.0%
1 50.0%
24 35.8%
8 53.3%
32 39.0%
1 50.0%
43 64.2%
7 46.7%
50 61.0%
HOPE Scholarships
System State
Number of 1999 Graduates 8 2
Number Eligible
51
Percent Eligible
62.2%
65,548 40,292 61.5%
High School Completion Rate Percent of 1995Grade 9 Enrollment
in Graduating Class of1999
System
State
Completion Rate '95-'99 71.9% 68.9%
COLLEGE ADMISSIONS / CREDIT TEST DATA
Scholastic Assessment Test (SAT)
No. Taking
Average Score
Tests
Verbal Math Total
Based on students' highest verbal and highest math scores
System College Prep. Endorsement Other Diplomas
451 473 924 455 482 937 434 378 812
Georgia
492 488 980
Based on students' last test administration
System Georgia
43
443 469
912
41,958 483 479 962
Nation
952,913 502 508 1010
American College Testing (ACT)
System State Nation
English Mathematics Reading Science Reasoning
N/A N/A N/A N/A
19.1 19.9 20.2 19.9
20.4 20.7 21.3 21.0
CompositeScore N/A * 19.9 21.9
* Scores not reported when fewer than 5 tests taken.
Advanced Placement Exams (AP)
No. of Students Taking Tests
No. of Tests Taken No. of Test Scores
3 or Higher Percent of Test
Scores 3 or Higher
System State 0 15,225
N/A 23,969 N/A 13,024
N/A 54.3%
1998-99 GEORGIA PUBLIC EDUCATION REPORT CARD Clinch County Schools
Prepared by Georgia Department of Education
Page 6
POSTSECONDARY DATA
Graduates Entering Georgia Public Colleges and Universities
Graduates Entering Georgia Public Colleges and Universities and
Requiring Learning Support (LS)
1998 Graduates Entering 1998-99
1997 Graduates Entering 1997-98
Percent of Graduating Number Class
16
23.2%
22
27.5%
Number Requiring
LS
5
5
Percent of those attending Georgia
Public Colleges
31.3%
22.7%
In previous years, the Report Card presented College Prep Curriculum information provided by the Board of Regents on students requiring Learning Support. Due to inconsistencies in the data provided by the Board of Regents in defining College Prep Completers versus Local Board of Education data defining College Prep Endorsements, the Department of Education Report Card will not provide this information until discrepancies can be reconciled.
Graduates Entering Georgia Public Technical and Adult Schools
Entering 1998-99 Entering 1997-98
Number Percent
Number Percent
1998 Graduates 1997 Graduates
6
8.7%
0
0.0%
N/A 7
N/A 8.8%
ACCREDITATION / RECOGNITION DATA
Southern Association of Colleges and Schools (SACS) Accrediting Commission
Secondary/Middle Commission Elementary/Middle Commission Both Elementary/Secondary Commissions Joint Commission Candidate for Accreditation
Accreditation by Georgia Accrediting Commission (GAC)
Accredited by GAC Accredited with Quality by GAC
Number of Schools
1 1 0 0 0
Number of Schools
2 0
Awards / Recognition
State Recognized Program
Number of Schools
Charter School
0
Pay for Performance Recipient
0
Georgia School of Excellence
0
National Blue Ribbon School
0
COMMUNITY DATA
Number of Children Eligible for Migrant Education Number of Families-At-Risk * Number of Food Stamp Participants * Number of Families Receiving TANF * ** Per Capita Income * Unemployment Rate * 1990 Population * Projected 2000 Population * Projected 2010 Population *
* Data Available at County Level Only ** Known as AFDC before January 1997
58 25 979 124 $17,087 3.3% 6,160 5,987 5,975
1998-99 GEORGIA PUBLIC EDUCATION REPORT CARD Clinch County Schools
Prepared by Georgia Department of Education
Page 7
FISCAL DATA
Millage Rate
14.00
* Fall 1998 Property Tax Digest is used to calculate the 98-99 Value of One Mill
FTE Count
FTE Count used for Allotment Calculation 1,424.0 Fall '98 FTE Count 1,433
Value of One Mill
$129,441 $90.89 per Allotment FTE
Sources: Local State-QBE State-
Lottery State-
Other Federal Other
Total
PerGeneral Fund cent Per FTE
$2,308,778 28.4% $1,621 $5,676,851 69.9% $3,987
K-12 Revenues
Lottery K-12
and
Title
All Other
Programs
K-12
$0
$0
Bonded Debt $0
$0
$0
$0
$0 0.0%
$0
$0
$34,697
$0
$134,293 1.7% $94
$0
$7,871
$0
$0 0.0%
$0 $862,802
$0
$0
$4,360 0.1%
$3
$0
$0
$0
$8,124,283 100% $5,705 $862,802
$42,569
$0
Capital Projects
$0 $0
$0
$0 $0 $0 $0
School Nutrition
$147,048 $0
$0
$39,172 $352,318
$0 $538,539
Grand Total
Total
Per-
Amount cent
$2,455,827 25.7%
$5,676,851 59.3%
$34,697 0.4%
$181,337 1.9% $1,215,121 12.7%
$4,360 0.0% $9,568,195 100%
Instruction
Media Instruction
Support Pupil Services General Admin. School Admin. Trans-
portation Maint. & Ops. Capital Projects School Food Debt Service
Total
$5,234,124 65.1% $3,676 $158,366 2.0% $111
$263,097 3.3% $185
$361,242 4.5% $254
$440,429 5.5% $309
$511,017 6.4% $359
$380,412 4.7% $267
$597,647 7.4% $420
$87,393 1.1% $61
$4,959 0.1%
$3
$0 0.0%
$0
$8,038,690 100% $5,645
K-12 Expenditures
$349,983
$63,399
$0
$10,645
$0
$0
$319,678
$0
$0
$69,678
$0
$0
$87,965
$0
$0
$599
$862
$0
$15,669
$0
$0
$0
$4,924
$0
$0
$0
$0
$0
$2,383
$0
$0
$0
$0
$854,220
$71,569
$0
$0
$0 $5,647,507 59.4%
$0
$0
$169,011 1.8%
$0
$0
$582,775 6.1%
$0
$0
$430,921 4.5%
$0
$0
$528,395 5.6%
$0
$0
$512,478 5.4%
$0
$0
$396,081 4.2%
$0
$0
$602,571 6.3%
$0
$0
$87,393 0.9%
$0 $536,968
$544,311 5.7%
$0
$0
$0 0.0%
$0 $536,968 $9,501,449 100%
Salaries and Benefits as Percentages of Revenues and of Expenditures
Teachers and Paraprofessionals
Salaries $4,015,628
Benefits $1,155,985
Percentage of Revenues Percentage of Expenditures
Total of
Total of
General Fund
General Fund
Title Programs
Title Programs
Lottery K-12
Lottery K-12
Total Salaries
and
Total
and
Total
and Benefits All Other K-12 K - 12 All Other K-12 K - 12
$5,171,613
57.3%
54.1%
57.7%
54.4%
School Administration
$281,837
$96,233
$378,070
4.2%
4.0%
4.2%
4.0%
General Administration
$126,723
$75,566
$202,289
2.2%
2.1%
2.3%
2.1%
1998-99 GEORGIA PUBLIC EDUCATION REPORT CARD
Clinch County Schools - 632
Prepared by Georgia Department of Education
Page 8
CERTIFIED PERSONNEL DATA
Number
Average Annual Salary Positions Average Contract Days
Average Daily Salary
Full-time Personnel Part-time
Sex Male Female
4 Yr Bachelor's Certificate 5 Yr Master's
Level 6 Yr Specialist's 7 Yr Doctoral Other*
Black
White Race/ Hispanic Ethnicity Asian
American Indian
Multiracial
Years Experience
<1 1-10 11-20 21-30 >30
Average
Administrators
8.73
$59,296.56 218.61
$271.24
8 2
6 4
0 3 6 1 0
1 9 0 0 0 0
0 0 2 7 1
23.40
Support Personnel PK-12 Teachers
6.51
104.96
$44,422.89 196.18
$226.45
$38,237.20 190.76
$200.44
6
104
2
1
2
18
6
87
1
49
4
48
2
6
1
2
0
0
0
14
8
91
0
0
0
0
0
0
0
0
0
6
2
37
1
32
5
25
0
5
18.25
14.24
*Includes One- and Two-Year Vocational Certificates.
Certified Staff Position Ratios
Teacher/Administrator Ratio 12:1
Teacher/Support Person Ratio 16:1
Teacher/Staff Ratio 7:1
Student Enrollment/All Teachers 14:1
Certified Personnel by Category
85.4% 100%
8.1%
6.5%
80% 60%
40%
20%
0%
Teachers
Administrators
Support Personnel
1998-99 GEORGIA PUBLIC EDUCATION REPORT CARD
Clinch County Schools - 632
Prepared by Georgia Department of Education
Page 9
1998-99 GEORGIA PUBLIC EDUCATION REPORT CARD
CLINCH COUNTY SCHOOLS
Clinch County Elementary School - 6320190
Grade Range PK-7
The Georgia Public Education Report Card is designed to assist systems and schools in educational improvement. This report card contains a variety of data elements. An explanation of the terms is provided as a companion to the report card data. Please refer to the definitions for the most effective use of the reported data.
STUDENT DATA
Total
K-7
933
PK
87
Enrollment, by Race/Ethnicity and Sex
Black
White Hispanic
American Asian Indian
Multiracial
380 40.7%
550 58.9%
0 0.0%
0 0.0%
0 0.0%
3 0.3%
32 36.8%
55 63.2%
0 0.0%
0 0.0%
0 0.0%
0 0.0%
Male Female
495 53.1%
438 46.9%
36 41.4%
51 58.6%
Enrollment in Selected Programs
Program
Program % of Student Enrollment Population
Gifted (Grades K-12)
12
1.3%
Alternative Programs (Grades 6-12)
3
1.3%
Students Eligible to Receive Free/Reduced Lunches
Number
Percent
School System
730
71.6%
979
64.4%
Dropout Rate for Grades 6-7
Number
Rate
School System
0
0.0%
0
0.0%
Enrollment in Compensatory Programs
Program
Program % of Student Enrollment Population
Special Education (Grades K-12)
198 21.2%
(PK)
36
N/A
English to Speakers of Other Languages (ESOL) (Grades K-12)
0
0.0%
Remedial Education (Grades 2-5, 9-12)
93 19.1%
Special Instructional Assistance (SIA) (Grades K-3)
67 14.5%
Title I (Grades K-12)
This school has a schoolwide program.
Total 51
Retained Students, by Race/Ethnicity and Sex
Black
White Hispanic
American MultiAsian Indian racial
27 52.9%
24 47.1%
0 0.0%
0 0.0%
0 0.0%
0 0.0%
Male Female
36
15
70.6% 29.4%
Prepared by Georgia Department of Education
Page 1
STATE-REQUIRED TEST DATA
NORM-REFERENCED TESTS Grade 3
Iowa Tests of Basic Skills (ITBS) Each chart reflects data for three years of testing.
Reading Comprehension 50
48 48 54 0
98-99
48 48 53 97-98
44 44 52 96-97
Mathematics
School 50
System
State
0
70 70 61 98-99
55 55 61 97-98
62 62 59 96-97
School System State
Reading Vocabulary 50
83 83 50 0
98-99
51 51 50 97-98
42 42 49 96-97
Language Arts
School 50
System
State
0
68 68 64 98-99
58 58 62 97-98
57 57 59 96-97
School System State
Social Studies 50
68 68 56 0
98-99
47 47 55 97-98
61 61 55 96-97
Science
School 50
System
State
0
77 77 59 98-99
59 59 59 97-98
71 71 58 96-97
School System State
Sources of Information
Composite Score
50
59 59 57 0
98-99
School 50
System
47 47 56 97-98
58 58 55 96-97
State 0
69 69 58 98-99
52 52 57 97-98
1998-99 GEORGIA PUBLIC EDUCATION REPORT CARD Clinch County Elementary School - 6320190
Prepared by Georgia Department of Education
59 59 56 96-97
Scores Reported in Percentiles
School System State
Page 2
STATE-REQUIRED TEST DATA
NORM-REFERENCED TESTS Grade 5
Iowa Tests of Basic Skills (ITBS) Each chart reflects data for three years of testing.
Reading Comprehension
Mathematics
50
39 39 53 0
98-99
41 41 53 97-98
36 36 52 96-97
School 50
System
State
0
51 51 59 98-99
53 53 58 97-98
49 49 57 96-97
School System State
Reading Vocabulary 50
35 35 48 0
98-99
31 31 48 97-98
26 26 46 96-97
Language Arts
School 50
System
State
0
63 63 63 98-99
55 55 61 97-98
49 49 58 96-97
School System State
Social Studies 50
38 38 57 0
98-99
43 43 56 97-98
37 37 55 96-97
Science
School 50
System
State
0
38 38 60 98-99
36 36 59 97-98
34 34 59 96-97
School System State
Sources of Information
Composite Score
50
43 43 58 0
98-99
School 50
System
42 42 58 97-98
39 39 57 96-97
State 0
44 44 57 98-99
42 42 56 97-98
38 38 55 96-97
1998-99 GEORGIA PUBLIC EDUCATION REPORT CARD Clinch County Elementary School - 6320190
Prepared by Georgia Department of Education
Scores Reported in Percentiles
School System State
Page 3
STATE-REQUIRED TEST DATA
PERFORMANCE ASSESSMENTS
Grade 5 Writing Assessment
Percent at Developmental Stages:
1998-99 School System State
1997-98 School System State
1996-97 School System State
Stage Stage Stage Stage Stage Stage
1:The Emerging Writer 2:The Developing Writer 3:The Focusing Writer 4:The Experimenting 5:The Engaging Writer 6:The Extending Writer
0% 2% 32% 46% 16% 3%
0% 2% 32% 46% 16% 3%
0% 1% 16% 41% 29% 12%
0% 6% 38% 37% 15% 2%
0% 6% 38% 37% 15% 2%
0% 3% 19% 41% 27% 10%
0% 5% 40% 39% 12% 5%
0% 5% 40% 39% 12% 5%
0% 3% 21% 37% 26% 12%
AWARDS / RECOGNITION DATA
Schools in Georgia may receive recognition in the following programs: Charter School Pay for Performance Program Georgia School of Excellence National Blue Ribbon School Clinch County Elementary School did not receive recognition in any of these programs during the 1998-99 school year.
1998-99 GEORGIA PUBLIC EDUCATION REPORT CARD Clinch County Elementary School - 6320190
Prepared by Georgia Department of Education
Page 4
CERTIFIED PERSONNEL DATA
Positions Number Average Contract Days
Personnel Sex
Certificate
Years Experience
Full-time Part-time
Male Female
4 Yr Bachelor's 5 Yr Master's 6 Yr Specialist's 7 Yr Doctoral Other*
<1 1-10 11-20 21-30 >30
Average
Administrators
2.99 216.69
3 0
2 1
0 1 2 0 0 0 0 1 2 0 23.33
Support Personnel
4.01 195.04
4 1
1 4
1 2 1 1 0 0 1 1 3 0 19.80
PK-12 Teachers
64.00 190.31
64 0
5 59
27 32
4 1 0 2 23 25 12 2 13.94
*Includes One- and Two-Year Vocational Certificates.
ACCREDITATION DATA
Accredited by Southern Association of Colleges and Schools (SACS):
Elementary/Middle Commission. Accredited by Georgia Accrediting
Commission (GAC).
1998-99 GEORGIA PUBLIC EDUCATION REPORT CARD Clinch County Elementary School - 6320190
Prepared by Georgia Department of Education
Page 5
1998-99 GEORGIA PUBLIC EDUCATION REPORT CARD
CLINCH COUNTY SCHOOLS
Clinch County High School - 6321050
Grade Range 8-12
The Georgia Public Education Report Card is designed to assist systems and schools in educational improvement. This report card contains a variety of data elements. An explanation of the terms is provided as a companion to the report card data. Please refer to the definitions for the most effective use of the reported data.
STUDENT DATA
Total 500
8-12 Enrollment, by Race/Ethnicity and Sex
Black
White Hispanic
American Multi-
Asian Indian
racial
182 36.4%
318 63.6%
0 0.0%
0 0.0%
0 0.0%
0 0.0%
Male 245
49.0%
Female 255
51.0%
Enrollment in Selected Programs
Program
Program % of Student Enrollment Population
Gifted (Grades K-12)
23
4.6%
Non-Vocational Labs (Grades 9-12)
339
86.0%
Vocational Labs (Grades 9-12)
304
77.2%
Alternative Programs (Grades 6-12)
3
< 1%
Students Eligible to Receive Free/Reduced Lunches
Number
Percent
School System
249
49.8%
979
64.4%
Enrollment in Compensatory Programs
Program
Program % of Student Enrollment Population
Special Education (Grades K-12) PK
73 14.6%
0
N/A
English to Speakers of Other Languages (ESOL) (Grades K-12)
0
0.0%
Remedial Education (Grades 2-5, 9-12)
7
1.8%
Special Instructional Assistance (SIA) (Grades K-3)
N/A
N/A
Title I (Grades K-12) This school has no Title I program.
Dropout Rate for Grades 8-12
Number
Rate
School System
50
9.3%
50
9.3%
Total 52
Retained Students, by Race/Ethnicity and Sex
Black
White Hispanic
American MultiAsian Indian racial
29 55.8%
23 44.2%
0 0.0%
0 0.0%
0 0.0%
0 0.0%
Male Female
37
15
71.2% 28.8%
Prepared by Georgia Department of Education
Page 1
STATE-REQUIRED TEST DATA
NORM-REFERENCED TESTS
Grade 3 Iowa Tests of Basic Skills (ITBS) Each chart reflects data for three years of testing.
No third-grade students are enrolled at Clinch County High School.
Reading Comprehension
Mathematics
50
N/A 48 54 0
98-99
N/A 48 53 97-98
N/A 44 52 96-97
School 50
System
State
N/A 70 61 0
98-99
N/A 55 61 97-98
N/A 62 59 96-97
School System State
Reading Vocabulary 50
N/A 83 50 0
98-99
N/A 51 50 97-98
N/A 42 49 96-97
Language Arts
School 50
System
State
N/A 68 64 0
98-99
N/A 58 62 97-98
N/A 57 59 96-97
School System State
Social Studies 50
N/A 68 56 0
98-99
N/A 47 55 97-98
N/A 61 55 96-97
Science
School 50
System
State
N/A 77 59 0
98-99
N/A 59 59 97-98
N/A 71 58 96-97
School System State
Sources of Information
Composite Score
School
50
50
System
N/A 59 57 0
98-99
N/A 47 56 N/A 58 55
97-98
96-97
State
N/A 69 58 0
98-99
N/A 52 57 97-98
N/A 59 56 96-97
1998-99 GEORGIA PUBLIC EDUCATION REPORT CARD Clinch County High School - 6321050
Prepared by Georgia Department of Education
Scores Reported in Percentiles
School System State
Page 2
STATE-REQUIRED TEST DATA
NORM-REFERENCED TESTS
Grade 5 Iowa Tests of Basic Skills (ITBS) Each chart reflects data for three years of testing. No fifth-grade students are enrolled at Clinch County High School.
Reading Comprehension
Mathematics
50
N/A 39 53 0
98-99
N/A 41 53 97-98
N/A 36 52 96-97
School 50
System
State
N/A 51 59 0
98-99
N/A 53 58 97-98
N/A 49 57 96-97
School System State
Reading Vocabulary 50
N/A 35 48 0
98-99
N/A 31 48 97-98
N/A 26 46 96-97
Language Arts
School 50
System
State
N/A 63 63 0
98-99
N/A 55 61 97-98
N/A 49 58 96-97
School System State
Social Studies 50
N/A 38 57 0
98-99
N/A 43 56 97-98
N/A 37 55 96-97
Science
School 50
System
State
N/A 38 60 0
98-99
N/A 36 59 97-98
N/A 34 59 96-97
School System State
Sources of Information
Composite Score
School
50
50
System
N/A 43 58 0
98-99
N/A 42 58 N/A 39 57
97-98
96-97
State
N/A 44 57 0
98-99
N/A 42 56 97-98
N/A 38 55 96-97
1998-99 GEORGIA PUBLIC EDUCATION REPORT CARD Clinch County High School - 6321050
Prepared by Georgia Department of Education
Scores Reported in Percentiles
School System State
Page 3
STATE-REQUIRED TEST DATA
NORM-REFERENCED TESTS Grade 8
Iowa Tests of Basic Skills (ITBS) Each chart reflects data for three years of testing.
Reading Comprehension 50
38 38 49 0
98-99
32 32 48 97-98
39 39 48 96-97
Mathematics
School 50
System
State
0
49 49 56 98-99
45 45 55 97-98
50 50 54 96-97
School System State
Reading Vocabulary 50
31 31 46 0
98-99
27 27 45 97-98
30 30 44 96-97
Language Arts
School 50
System
State
0
56 56 60 98-99
38 38 58 97-98
44 44 56 96-97
School System State
Social Studies 50
36 36 54 0
98-99
30 30 53 97-98
38 38 53 96-97
Science
School 50
System
State
0
41 41 56 98-99
35 35 55 97-98
47 47 53 96-97
School System State
Sources of Information
Composite Score
50
46 46 57 0
98-99
School 50
System
33 33 56 97-98
45 45 55 96-97
State 0
43 43 56 98-99
34 34 54 97-98
1998-99 GEORGIA PUBLIC EDUCATION REPORT CARD Clinch County High School - 6321050
Prepared by Georgia Department of Education
42 42 54 96-97
Scores Reported in Percentiles
School System State
Page 4
STATE-REQUIRED TEST DATA
PERFORMANCE ASSESSMENTS
Grade 5 Writing Assessment
Percent at Developmental Stages:
1998-99 School System State
1997-98 School System State
1996-97 School System State
Stage Stage Stage Stage Stage Stage
1:The Emerging Writer 2:The Developing Writer 3:The Focusing Writer 4:The Experimenting 5:The Engaging Writer 6:The Extending Writer
N/A N/A N/A N/A N/A N/A
0% 2% 32% 46% 16% 3%
0% 1% 16% 41% 29% 12%
N/A N/A N/A N/A N/A N/A
0% 6% 38% 37% 15% 2%
0% 3% 19% 41% 27% 10%
N/A N/A N/A N/A N/A N/A
0% 5% 40% 39% 12% 5%
0% 3% 21% 37% 26% 12%
No fifth-grade students are enrolled at Clinch County High School.
Categories of Scaled Scores
Inadequate (less than 162)
Minimal (162-209)
Good
(210-247)
Very Good (greater than 247)
Average Scaled Score: (Range 100-300)
Grade 8 Writing Assessment
1998-99 Percent Scoring
1997-98 Percent Scoring
1996-97 Percent Scoring
School System State School System State School System State
28% 47% 24%
1%
28% 47% 24%
1%
8% 40% 41% 11%
27% 54% 19%
0%
27% 54% 19%
0%
11% 46% 34%
8%
27% 43% 23%
7%
27% 43% 23%
7%
15% 46% 30%
8%
182
182
208 182
182 202 185
185 198
GEORGIA HIGH SCHOOL GRADUATION TESTS (GHSGT)
Percent of Regular Program 11th Graders Passing the Georgia High School Graduation Tests on First Administration
English Language Arts Mathematics Social Studies Science
All Components listed above
Writing
1998-99
School System State
80% 76% 57% 55%
47%
80% 76% 57% 55%
47%
96% 88% 80% 72%
68%
86% 86% 93%
1997-98
School System State
91% 91% 73% 57%
50%
91% 91% 73% 57%
50%
94% 88% 78% 74%
68%
92% 92% 92%
1996-97
School System State
92% 91% 62% 70%
57%
92% 91% 62% 70%
57%
94% 87% 78% 74%
67%
81% 81% 93%
1998-99 GEORGIA PUBLIC EDUCATION REPORT CARD Clinch County High School - 6321050
Prepared by Georgia Department of Education
Page 5
GRADUATE DATA
1999 Graduates by Credentials, Race/Ethnicity and Sex
Diplomas with Both College Prep. & Voc. Endorsements
Diplomas with College Prep. Endorsements Diplomas with Vocational Endorsements General High School Diplomas Special Education Diplomas
Total All Diplomas
Certificates of Performance
Total Graduates
Total 15 24 26 0
Black
3 20.0%
5 20.8%
8 30.8%
0
White Hispanic
12 80.0%
0 0.0%
19 79.2%
0 0.0%
18 69.2%
0 0.0%
0
0
American MultiAsian Indian racial
0 0.0%
0 0.0%
0 0.0%
0 0.0%
0 0.0%
0 0.0%
0 0.0%
0 0.0%
0 0.0%
0
0
0
2
2
100.0%
0 0.0%
0 0.0%
0 0.0%
0 0.0%
0 0.0%
67
18
49
0
0
0
0
26.9% 73.1% 0.0% 0.0% 0.0% 0.0%
15
8
7
0
0
0
0
53.3% 46.7% 0.0% 0.0% 0.0% 0.0%
82
26
56
0
0
0
0
31.7% 68.3% 0.0% 0.0% 0.0% 0.0%
Male Female
5
10
33.3% 66.7%
6
18
25.0% 75.0%
12
14
46.2% 53.8%
0
0
1 50.0%
24 35.8%
8 53.3%
32 39.0%
1 50.0%
43 64.2%
7 46.7%
50 61.0%
HOPE Scholarships
School System
Number of 1999 Graduates 8 2
Number Eligible
51
Percent Eligible
62.2%
82 51 62.2%
State
65,548 40,292 61.5%
High School Completion Rate
Percent of 1995Grade 9 Enrollment in Graduating Class of1999 School System State
Completion Rate '95-'99 71.9% 71.9% 68.9%
1998-99 GEORGIA PUBLIC EDUCATION REPORT CARD
Clinch County High School - 6321050
Prepared by Georgia Department of Education
Page 6
COLLEGE ADMISSIONS / CREDIT TEST DATA
Scholastic Assessment Test (SAT)
Based on students' highest verbal and highest math scores
No. Taking
Average Score
Tests Verbal Math Total
Based on students' last test administration
Average Score Verbal Math Total
School College Prep. Endorsement Other Diplomas
43 451 473
924
455 482
937
434 378
812
System College Prep. Endorsement Other Diplomas
43 451 473
924
455 482
937
434 378
812
Georgia
41,958 492 488
980
443 N/A N/A
443 N/A N/A
483
469 N/A N/A
469 N/A N/A
479
912 N/A N/A
912 N/A N/A
962
Nation
952,913 N/A N/A N/A
502 508 1010
American College Testing (ACT)
Advanced Placement Exams (AP)
Number taking tests: English Mathematics Reading Science Reasoning
2 * School N/A N/A N/A N/A
System N/A N/A N/A N/A
State 19.1 19.9 20.2 19.9
CompositeScore
N/A
N/A 19.9
* Scores are not reported when fewer than 5 take the ACT
No. of Students Taking Tests
No. of Tests Taken No. of Test Scores
3 or Higher Percent of Test
Scores 3 or Higher
School 0
N/A N/A
N/A
System State 0 15,225
N/A 23,969 N/A 13,024
N/A 54.3%
POST-SECONDARY DATA
Graduates Entering Georgia Public Colleges
Graduates Entering Georgia Public Colleges and Requiring Learning Support (LS)
1998 Graduates Entering in 1998-99
1997 Graduates Entering in 1997-98
Percent of Graduating Number Class
School
16
23.2%
System 1 6
23.2%
School
22
27.5%
System 2 2
27.5%
Number Requiring
LS 5 5
5 5
Percent of those attending Georgia
Public Colleges
31.3%
31.3%
22.7%
22.7%
In previous years, the Report Card presented College Prep Curriculum information provided by the Board of Regents on students requiring Learning Support. Due to inconsistencies in the data provided by the Board of Regents in defining College Prep Completers versus Local Board of Education data defining College Prep Endorsements, the Department of Education Report Card will not provide this information until discrepancies can be reconciled.
Graduates Entering Georgia Public Technical and Adult Schools
1998 Graduates School System
Entering Number 6 6
1998-99 Percent
8.7% 8.7%
Entering Number N/A N/A
1997-98 Percent
N/A N/A
1997 Graduates School
0
0.0%
System
0
0.0%
7
8.8%
7
8.8%
1998-99 GEORGIA PUBLIC EDUCATION REPORT CARD Clinch County High School - 6321050
Prepared by Georgia Department of Education
Page 7
CERTIFIED PERSONNEL DATA
Positions Number Average Contract Days
Administrators
2.24 221.25
Support Personnel
2.00 195.00
PK-12 Teachers
34.96 191.72
Personnel Sex
Certificate
Years Experience
Full-time Part-time
Male Female
4 Yr Bachelor's 5 Yr Master's 6 Yr Specialist's 7 Yr Doctoral Other*
<1 1-10 11-20 21-30 >30
Average
2 1
2 1
0 1 2 0 0
0 0 1 2 0
22.33
2 0
1 1
0 2 0 0 0
0 1 0 1 0
12.00
34 1
12 23
19 13
2 1 0
4 10
5 13
3
15.80
*Includes One- and Two-Year Vocational Certificates.
ACCREDITATION DATA
Accredited by Southern Association of Colleges and Schools (SACS): Secondary/Middle Commission.
Accredited by Georgia Accrediting Commission (GAC).
AWARDS / RECOGNITION DATA
Schools in Georgia may receive recognition in the following programs: Charter School Pay for Performance Program Georgia School of Excellence National Blue Ribbon School Clinch County High School did not receive recognition in any of these programs during the 1998-99 school year.
1998-99 GEORGIA PUBLIC EDUCATION REPORT CARD Clinch County High School - 6321050
Prepared by Georgia Department of Education
Page 8
1998-99 GEORGIA PUBLIC EDUCATION REPORT CARD COBB COUNTY SCHOOLS - 633
The Georgia Public Education Report Card is designed to assist systems and schools in educational improvement. This report card contains a variety of data elements. An explanation of the terms is provided as a companion to the report card data. Please refer to the definitions for the most effective use of the reported data.
Total
K-12
90,774
PK
434
STUDENT DATA
Enrollment, by Race/Ethnicity and Sex
Black
White Hispanic
American Multi-
Asian Indian
racial
18,848 20.8%
63,251 69.7%
4,127 4.5%
2,771 3.1%
184 0.2%
1,593 1.8%
64 14.7%
334 77.0%
14 3.2%
8 1.8%
1 0.2%
13 3.0%
Male
46,532 51.3%
294 67.7%
Female
44,242 48.7%
140 32.3%
Enrollment in Selected Programs
Program
Program % of Student Enrollment Population
Gifted (Grades K-12)
7,993
8.8%
Non-Vocational Labs (Grades 9-12)
17,697
67.5%
Vocational Labs (Grades 9-12)
10,238
39.1%
Alternative Programs (Grades 6-12)
64
< 1%
Students Eligible to Receive Free/Reduced Lunches
Number
Percent
16,221
17.8%
Dropout Rate
Number
Percent
6-12 9-12
1,074 1,055
2.0% 3.7%
Enrollment in Compensatory Programs
Program
Program % of Student Enrollment Population
Special Education (Grades K-12)
PK
10,285 531
English to Speakers of Other Languages (ESOL) (Grades K-12)
1,897
Remedial Education (Grades 2-5, 9-12)
6,252
Special Instructional Assistance (SIA) (Grades K-3)
7,136
Title I (Grades K-12) Number of schools with: Schoolwide program Targeted Assistance program No Title I program
11.3% N/A
2.1%
11.2%
24.9%
13 3
77
Total 1,817
Retained Students, by Race/Ethnicity and Sex
Black
White Hispanic
American MultiAsian Indian racial
562 30.9%
1,058 58.2%
122 6.7%
44 2.4%
3 0.2%
28 1.5%
Male Female 1,150 667 63.3% 36.7%
Prepared by Georgia Department of Education
Page 1
STATE-REQUIRED TEST DATA
NORM-REFERENCED TESTS
Grade 3 Iowa Tests of Basic Skills (ITBS) Each chart reflects data for three years of testing.
Reading Comprehension
Mathematics
50
63 54 62 53 60 52 0
98-99 97-98 96-97
System State
50
70 61 68 61 68 59 0
98-99 97-98 96-97
System State
Reading Vocabulary
50
58 50 58 50 58 49 0
98-99 97-98 96-97
System State
Social Studies
50
64 56 64 55 64 55 0
98-99 97-98 96-97
System State
Language Arts
50
70 64 69 62 67 59 0
98-99 97-98 96-97
System State
Science
50
70 59 70 59 69 58 0
98-99 97-98 96-97
System State
Sources of Information
Composite Score
50
66 57 0
98-99
System
50
65 56 64 55 97-98 96-97
State
67 58 67 57 0
98-99 97-98
1998-99 GEORGIA PUBLIC EDUCATION REPORT CARD Cobb County Schools
Prepared by Georgia Department of Education
System State Scores Reported 66 56 in Percentiles 96-97
Page 2
STATE-REQUIRED TEST DATA
NORM-REFERENCED TESTS
Grade 5 Iowa Tests of Basic Skills (ITBS) Each chart reflects data for three years of testing.
Reading Comprehension
Mathematics
50
59 53 60 53 60 52 0
98-99 97-98 96-97
System State
50
68 59 68 58 69 57 0
98-99 97-98 96-97
System State
Reading Vocabulary
50
57 48 58 48 58 46 0
98-99 97-98 96-97
System State
Social Studies
50
64 57 64 56 65 55 0
98-99 97-98 96-97
System State
Language Arts
50
71 63 70 61 69 58 0
98-99 97-98 96-97
System State
Science
50
68 60 69 59 70 59 0
98-99 97-98 96-97
System State
Sources of Information
Composite Score
50
67 58 0
98-99
System
50
65 58 66 57 97-98 96-97
State
66 57 66 56 0
98-99 97-98
1998-99 GEORGIA PUBLIC EDUCATION REPORT CARD Cobb County Schools
Prepared by Georgia Department of Education
System State Scores Reported 67 55 in Percentiles 96-97
Page 3
STATE-REQUIRED TEST DATA
NORM-REFERENCED TESTS Grade 8
Iowa Tests of Basic Skills (ITBS) Each chart reflects data for three years of testing.
Reading Comprehension
Mathematics
50
61 49 61 48 62 48 0
98-99 97-98 96-97
System State
50
66 56 66 55 67 54 0
98-99 97-98 96-97
System State
Reading Vocabulary
50
57 46 57 45 58 44 0
98-99 97-98 96-97
System State
Language Arts
50
70 60 68 58 68 56 0
98-99 97-98 96-97
System State
Social Studies
50
64 54 64 53 65 53 0
98-99 97-98 96-97
System State
Science
50
66 56 67 55 67 53 0
98-99 97-98 96-97
System State
Sources of Information
Composite Score
50
67 57 0
98-99
System
50
66 56 67 55 97-98 96-97
State
67 56 66 54 0
98-99 97-98
1998-99 GEORGIA PUBLIC EDUCATION REPORT CARD Cobb County Schools
Prepared by Georgia Department of Education
System State Scores Reported 67 54 in Percentiles 96-97
Page 4
STATE-REQUIRED TEST DATA
PERFORMANCE ASSESSMENTS
Grade 5 Writing Assessment
1998-99
1997-98
1996-97
Percent at Developmental Stages:
Comparison
Comparison
Comparison
System Group State System Group State System Group State
Stage Stage Stage Stage Stage Stage
1: The Emerging Writer 2: The Developing Writer 3: The Focusing Writer 4: The Experimenting Writer 5: The Engaging Writer 6: The Extending Writer
0% 1% 10% 36% 34% 19%
0% 0% 8% 34% 36% 21%
0% 1% 16% 41% 29% 12%
0% 1% 12% 37% 33% 16%
0% 1% 11% 37% 35% 16%
0% 3% 19% 41% 27% 10%
0% 1% 14% 34% 32% 18%
0% 2% 15% 34% 31% 18%
0% 3% 21% 37% 26% 12%
Grade 8 Writing Assessment
1998-99 Percent Scoring 1997-98 Percent Scoring 1996-97 Percent Scoring
Categories of Scaled Scores
Comparison
Comparison
Comparison
System Group State System Group State System Group State
Inadequate (less than 162)
Minimal (162-209)
Good
(210-247)
Very Good (greater than 247)
2% 25% 50% 24%
2% 28% 51% 19%
8% 40% 41% 11%
3% 33% 47% 17%
4% 35% 46% 14%
11% 46% 34%
8%
5% 36% 43% 16%
7% 39% 39% 14%
15% 46% 30%
8%
Average Scaled Score: (Range 100-300)
225
221 208
218
216 202
215
211 198
GEORGIA HIGH SCHOOL GRADUATION TESTS (GHSGT)
Percent of Regular Program 11th Graders Passing the Georgia High School Graduation Tests on First Administration
1998-99
1997-98
1996-97
Comparison
Comparison
Comparison
System Group State System Group State System Group State
English Language Arts Mathematics Social Studies Science
98% 94% 90% 85%
98% 95% 89% 84%
96% 88% 80% 72%
98% 95% 89% 88%
98% 96% 88% 87%
94% 88% 78% 74%
97% 94% 89% 89%
97% 93% 87% 85%
94% 87% 78% 74%
All Components listed above 8 2 %
81% 68% 84%
83% 68% 84%
80% 67%
Writing
97%
97% 93% 96%
96% 92% 97%
96% 93%
1998-99 GEORGIA PUBLIC EDUCATION REPORT CARD
Cobb County Schools
Prepared by Georgia Department of Education
Page 5
GRADUATE DATA
1999 Graduates by Credentials, Race/Ethnicity and Sex
Diplomas with Both College Prep. & Voc. Endorsements
Diplomas with College Prep. Endorsements Diplomas with Vocational Endorsements General High School Diplomas Special Education Diplomas
Total All Diplomas
Certificates of Performance
Total Graduates
Total 505
3,802 412 75 84
4,878 144
5,022
Black
157 31.1%
456 12.0%
74 18.0%
20 26.7%
25 29.8%
732 15.0%
79 54.9%
811 16.1%
American MultiWhite Hispanic Asian Indian racial
317 62.8% 3,079 81.0%
320 77.7%
46 61.3%
56 66.7%
3,818 78.3%
12 2.4%
78 2.1%
9 2.2%
4 5.3%
1 1.2%
104 2.1%
14 2.8%
157 4.1%
5 1.2%
3 4.0%
2 2.4%
181 3.7%
1 0.2%
7 0.2%
1 0.2%
0 0.0%
0 0.0%
9 0.2%
4 0.8%
25 0.7%
3 0.7%
2 2.7%
0 0.0%
34 0.7%
43
11
9
0
2
29.9% 7.6% 6.3% 0.0% 1.4%
3,861 115 190
9
36
76.9% 2.3% 3.8% 0.2% 0.7%
Male Female
255 50.5% 1,707 44.9%
277 67.2%
53 70.7%
59 70.2%
2,351 48.2%
250 49.5% 2,095 55.1%
135 32.8%
22 29.3%
25 29.8%
2,527 51.8%
54
90
37.5% 62.5%
2,405 2,617 47.9% 52.1%
HOPE Scholarships
System State
Number of 1999 Graduates 5 , 0 2 2
Number Eligible
3850
Percent Eligible
76.7%
65,548 40,292 61.5%
High School Completion Rate Percent of 1995Grade 9 Enrollment
in Graduating Class of1999
System
State
Completion Rate '95-'99 83.6% 68.9%
COLLEGE ADMISSIONS / CREDIT TEST DATA
Scholastic Assessment Test (SAT)
No. Taking
Average Score
Tests
Verbal Math Total
Based on students' highest verbal and highest math scores
System College Prep. Endorsement Other Diplomas
523 522 1045 532 532 1064 402 387 789
Georgia
492 488 980
Based on students' last test administration
System Georgia
4,180 41,958
514 513 1027 483 479 962
Nation
952,913 502 508 1010
American College Testing (ACT)
System State Nation
English
20.2
19.1 20.4
Mathematics
21.2
19.9 20.7
Reading
21.4
20.2 21.3
Science Reasoning 21.1
19.9 21.0
CompositeScore 21.1
19.9 21.9
Advanced Placement Exams (AP)
No. of Students Taking Tests
No. of Tests Taken No. of Test Scores
3 or Higher Percent of Test
Scores 3 or Higher
System State 1,291 15,225 2,524 23,969 1,885 13,024
74.7% 54.3%
1998-99 GEORGIA PUBLIC EDUCATION REPORT CARD Cobb County Schools
Prepared by Georgia Department of Education
Page 6
POSTSECONDARY DATA
Graduates Entering Georgia Public Colleges and Universities
Graduates Entering Georgia Public Colleges and Universities and
Requiring Learning Support (LS)
1998 Graduates Entering 1998-99
1997 Graduates Entering 1997-98
Percent of Graduating Number Class
2,220 46.3%
2,229 48.4%
Number Requiring
LS
213
312
Percent of those attending Georgia
Public Colleges
9.6%
14.0%
In previous years, the Report Card presented College Prep Curriculum information provided by the Board of Regents on students requiring Learning Support. Due to inconsistencies in the data provided by the Board of Regents in defining College Prep Completers versus Local Board of Education data defining College Prep Endorsements, the Department of Education Report Card will not provide this information until discrepancies can be reconciled.
Graduates Entering Georgia Public Technical and Adult Schools
Entering 1998-99 Entering 1997-98
Number Percent
Number Percent
1998 Graduates 1997 Graduates
213
4.4%
22
0.5%
N/A 192
N/A 4.2%
ACCREDITATION / RECOGNITION DATA
Southern Association of Colleges and Schools (SACS) Accrediting Commission
Secondary/Middle Commission Elementary/Middle Commission Both Elementary/Secondary Commissions Joint Commission Candidate for Accreditation
Accreditation by Georgia Accrediting Commission (GAC)
Accredited by GAC Accredited with Quality by GAC
Number of Schools
12 79
0 0 0
Number of Schools
0 0
Awards / Recognition
State Recognized Program
Number of Schools
Charter School
7
Pay for Performance Recipient
1
Georgia School of Excellence
2
National Blue Ribbon School
0
COMMUNITY DATA
Number of Children Eligible for Migrant Education Number of Families-At-Risk * Number of Food Stamp Participants * Number of Families Receiving TANF * ** Per Capita Income * Unemployment Rate * 1990 Population * Projected 2000 Population * Projected 2010 Population *
* Data Available at County Level Only ** Known as AFDC before January 1997
7 1,545 9,434 1,029 $30,263
2.7% 447,745 607,776 720,209
1998-99 GEORGIA PUBLIC EDUCATION REPORT CARD Cobb County Schools
Prepared by Georgia Department of Education
Page 7
FISCAL DATA
Millage Rate
17.83
* Fall 1998 Property Tax Digest is used to calculate the 98-99 Value of One Mill
FTE Count
FTE Count used for Allotment Calculation 90,144.0 Fall '98 FTE Count 90,774
Value of One Mill
$11,711,659 $129.92 per Allotment FTE
Sources: Local State-QBE State-
Lottery State-
Other Federal Other
Total
PerGeneral Fund cent Per FTE $220,331,184 41.0% $2,444 $307,250,221 57.1% $3,408
K-12 Revenues
Lottery K-12
and
Title
All Other
Programs
K-12
$4,107 $8,475,345
Bonded Debt
$46,095,636
$0
$0
$0
Capital Projects $32,116,978
$0
School Nutrition $14,638,377
$0
$0 0.0%
$0
$0 $1,853,857
$0 $5,282,556
$0
$2,332,475 0.4% $26 $813,089 $2,565,156
$0 $4,501,095 $1,584,981
$1,117,783 0.2% $6,997,431 1.3%
$12 $9,562,767 $1,673,627
$78
$0
$49,043
$235 $0
$0 $7,870,065 $145,454 $154,825
$538,029,095 100% $5,968 $10,379,964 $14,617,030 $46,095,871 $42,046,084 $24,248,249
Grand Total
Total
Per-
Amount cent
$321,661,629 47.6%
$307,250,221 45.5%
$7,136,413 1.1%
$11,796,798 1.7% $20,224,479 3.0%
$7,346,753 1.1% $675,416,296 100%
Instruction
Media
Instruction Support
Pupil Services General Admin. School Admin. Trans-
portation Maint. & Ops. Capital Projects School Food Debt Service
$400,047,711 71.9% $4,438 $11,260,403 2.0% $125
$18,329,500 3.3% $203
$20,022,883 3.6% $222
$7,430,685 1.3% $82
$28,957,272 5.2% $321
$25,709,790 4.6% $285
$39,558,125 7.1% $439
$642,626 0.1%
$7
$0 0.0%
$0
$4,214,697 0.8% $47
K-12 Expenditures
$6,002,329 $8,771,749
$0
$0
$0 $414,821,790 59.0%
$83,032
$20,417
$0
$0
$0 $11,363,853 1.6%
$1,187,564 $236,212
$0
$0
$0 $19,753,277 2.8%
$2,336,891 $633,252
$0
$0
$0 $22,993,027 3.3%
$489,494 $243,848
$0
$0
$0 $8,164,028 1.2%
$36,259
$68,320
$0
$0
$0 $29,061,852 4.1%
$243,243
$21,608
$0
$0
$0 $25,974,643 3.7%
$533 $1,642,352
$0
$0
$0 $41,201,012 5.9%
$0
$0
$0 $41,599,134
$0 $42,241,760 6.0%
$106
$0
$0
$0 $24,819,762 $24,819,868 3.5%
$0
$0 $45,050,998 $13,472,333
$0 $62,738,029 8.9%
Total
$556,173,698 100% $6,169 $10,379,456 $11,637,761 $45,050,998 $55,071,467 $24,819,762 $703,133,144 100%
Salaries and Benefits as Percentages of Revenues and of Expenditures
Teachers and Paraprofessionals
Salaries $302,049,959
Benefits $82,145,390
Percentage of Revenues Percentage of Expenditures
Total of
Total of
General Fund
General Fund
Title Programs
Title Programs
Lottery K-12
Lottery K-12
Total Salaries
and
Total
and
Total
and Benefits All Other K-12 K - 12 All Other K-12 K - 12
$384,195,349
68.2%
56.9%
66.4%
54.6%
School Administration
$15,329,573 $5,943,748 $21,273,321
3.8%
3.1%
3.7%
3.0%
General Administration
$2,946,961 $1,208,442
$4,155,403
0.7%
0.6%
0.7%
0.6%
1998-99 GEORGIA PUBLIC EDUCATION REPORT CARD
Cobb County Schools - 633
Prepared by Georgia Department of Education
Page 8
CERTIFIED PERSONNEL DATA
Number
Average Annual Salary Positions Average Contract Days
Average Daily Salary
Full-time Personnel Part-time
Sex Male Female
4 Yr Bachelor's Certificate 5 Yr Master's
Level 6 Yr Specialist's 7 Yr Doctoral Other*
Black
White Race/ Hispanic Ethnicity Asian
American Indian
Multiracial
Years Experience
<1 1-10 11-20 21-30 >30
Average
Administrators
342.30
$67,632.01 232.21
$291.26
334 20
101 253
2 78 227 47
0
50 303
1 0 0 0
0 17 114 185 38
22.31
Support Personnel PK-12 Teachers
629.21
5,583.32
$46,892.63 193.83
$241.92
$41,036.60 191.04
$214.81
566
5,049
486
701
310
834
742
4,916
334
3,188
502
2,205
188
296
24
45
4
16
81
370
959
5,291
8
54
2
19
0
2
2
14
0
0
454
2,898
314
1,677
251
1,064
33
111
13.97
12.19
*Includes One- and Two-Year Vocational Certificates.
Certified Staff Position Ratios
Teacher/Administrator Ratio 16:1
Teacher/Support Person Ratio 9:1
Teacher/Staff Ratio 6:1
Student Enrollment/All Teachers 16:1
Certified Personnel by Category
80.4% 100%
4.9% 14.7%
80% 60%
40%
20%
0%
Teachers
Administrators
Support Personnel
1998-99 GEORGIA PUBLIC EDUCATION REPORT CARD
Cobb County Schools - 633
Prepared by Georgia Department of Education
Page 9
1998-99 GEORGIA PUBLIC EDUCATION REPORT CARD
COBB COUNTY SCHOOLS
Acworth Elementary School - 6331050
Grade Range K-5
The Georgia Public Education Report Card is designed to assist systems and schools in educational improvement. This report card contains a variety of data elements. An explanation of the terms is provided as a companion to the report card data. Please refer to the definitions for the most effective use of the reported data.
STUDENT DATA
Total 497
K-5 Enrollment, by Race/Ethnicity and Sex
Black
White Hispanic
American Multi-
Asian Indian
racial
70 14.1%
407 81.9%
14 2.8%
2 0.4%
0 0.0%
4 0.8%
Male Female
261 52.5%
236 47.5%
Enrollment in Selected Programs
Program
Program % of Student Enrollment Population
Gifted (Grades K-12)
4
< 1%
Alternative Programs (Grades 6-12)
N/A
N/A
Students Eligible to Receive Free/Reduced Lunches
Number
Percent
School System
190 16,221
38.2% 17.8%
Dropout Rate *
Number
Rate
School System
N/A N/A
N/A N/A
* Dropout rates are not applicable for grades PK-5.
Enrollment in Compensatory Programs
Program
Program % of Student Enrollment Population
Special Education (Grades K-12)
64 12.9%
(PK)
0
N/A
English to Speakers of Other Languages (ESOL) (Grades K-12)
0
0.0%
Remedial Education (Grades 2-5, 9-12)
42 12.7%
Special Instructional Assistance (SIA) (Grades K-3)
83 24.5%
Title I (Grades K-12)
This school has no Title I program.
Total 9
Retained Students, by Race/Ethnicity and Sex
Black
White Hispanic
American Multi-
Asian Indian
racial
1 11.1%
8 88.9%
0 0.0%
0 0.0%
0 0.0%
0 0.0%
Male Female
7
2
77.8% 22.2%
Prepared by Georgia Department of Education
Page 1
STATE-REQUIRED TEST DATA
NORM-REFERENCED TESTS Grade 3
Iowa Tests of Basic Skills (ITBS) Each chart reflects data for three years of testing.
Reading Comprehension 50
55 63 54 0
98-99
47 62 53 97-98
55 60 52 96-97
Mathematics
School 50
System
State
0
52 70 61 98-99
53 68 61 97-98
66 68 59 96-97
School System State
Reading Vocabulary 50
48 58 50 0
98-99
44 58 50 97-98
55 58 49 96-97
Language Arts
School 50
System
State
0
58 70 64 98-99
68 69 62 97-98
63 67 59 96-97
School System State
Social Studies 50
57 64 56 0
98-99
58 64 55 97-98
65 64 55 96-97
Science
School 50
System
State
0
53 70 59 98-99
57 70 59 97-98
68 69 58 96-97
School System State
Sources of Information
Composite Score
50
52 66 57 0
98-99
School 50
System
54 65 56 97-98
64 64 55 96-97
State 0
54 67 58 98-99
55 67 57 97-98
1998-99 GEORGIA PUBLIC EDUCATION REPORT CARD Acworth Elementary School - 6331050
Prepared by Georgia Department of Education
64 66 56 96-97
Scores Reported in Percentiles
School System State
Page 2
STATE-REQUIRED TEST DATA
NORM-REFERENCED TESTS Grade 5
Iowa Tests of Basic Skills (ITBS) Each chart reflects data for three years of testing.
Reading Comprehension
Mathematics
50
47 59 53 0
98-99
47 60 53 97-98
46 60 52 96-97
School 50
System
State
0
54 68 59 98-99
50 68 58 97-98
50 69 57 96-97
School System State
Reading Vocabulary 50
41 57 48 0
98-99
51 58 48 97-98
42 58 46 96-97
Language Arts
School 50
System
State
0
58 71 63 98-99
59 70 61 97-98
49 69 58 96-97
School System State
Social Studies 50
49 64 57 0
98-99
45 64 56 97-98
50 65 55 96-97
Science
School 50
System
State
0
59 68 60 98-99
59 69 59 97-98
54 70 59 96-97
School System State
Sources of Information
Composite Score
50
55 67 58 0
98-99
School 50
System
47 65 58 97-98
50 66 57 96-97
State 0
52 66 57 98-99
50 66 56 97-98
48 67 55 96-97
1998-99 GEORGIA PUBLIC EDUCATION REPORT CARD Acworth Elementary School - 6331050
Prepared by Georgia Department of Education
Scores Reported in Percentiles
School System State
Page 3
STATE-REQUIRED TEST DATA
PERFORMANCE ASSESSMENTS
Grade 5 Writing Assessment
Percent at Developmental Stages:
1998-99 School System State
1997-98 School System State
1996-97 School System State
Stage Stage Stage Stage Stage Stage
1:The Emerging Writer 2:The Developing Writer 3:The Focusing Writer 4:The Experimenting 5:The Engaging Writer 6:The Extending Writer
0% 1% 19% 46% 29% 4%
0% 1% 10% 36% 34% 19%
0% 1% 16% 41% 29% 12%
0% 0% 8% 65% 27% 0%
0% 1% 12% 37% 33% 16%
0% 3% 19% 41% 27% 10%
0% 1% 26% 51% 18% 1%
0% 1% 14% 34% 32% 18%
0% 3% 21% 37% 26% 12%
AWARDS / RECOGNITION DATA
Schools in Georgia may receive recognition in the following programs: Charter School Pay for Performance Program Georgia School of Excellence National Blue Ribbon School Acworth Elementary School did not receive recognition in any of these programs during the 1998-99 school year.
1998-99 GEORGIA PUBLIC EDUCATION REPORT CARD Acworth Elementary School - 6331050
Prepared by Georgia Department of Education
Page 4
CERTIFIED PERSONNEL DATA
Positions Number Average Contract Days
Personnel Sex
Certificate
Years Experience
Full-time Part-time
Male Female
4 Yr Bachelor's 5 Yr Master's 6 Yr Specialist's 7 Yr Doctoral Other*
<1 1-10 11-20 21-30 >30
Average
Administrators
2.00 225.50
2 0
1 1
0 2 0 0 0 0 0 1 0 1 22.00
Support Personnel
4.50 191.00
4 1
0 5
1 2 2 0 0 0 1 2 2 0 19.80
PK-12 Teachers
29.00 191.00
27 4
0 31
19 10
2 0 0 0 11 8 10 2 15.48
*Includes One- and Two-Year Vocational Certificates.
ACCREDITATION DATA
Accredited by Southern Association of Colleges and Schools (SACS):
Elementary/Middle Commission.
1998-99 GEORGIA PUBLIC EDUCATION REPORT CARD Acworth Elementary School - 6331050
Prepared by Georgia Department of Education
Page 5
1998-99 GEORGIA PUBLIC EDUCATION REPORT CARD
COBB COUNTY SCHOOLS
Addison Elementary School - 6330289
Grade Range PK-5
The Georgia Public Education Report Card is designed to assist systems and schools in educational improvement. This report card contains a variety of data elements. An explanation of the terms is provided as a companion to the report card data. Please refer to the definitions for the most effective use of the reported data.
STUDENT DATA
Total
K-5
667
PK
9
Enrollment, by Race/Ethnicity and Sex
Black
White Hispanic
American Asian Indian
Multiracial
57 8.5%
547 82.0%
25 3.7%
19 2.8%
1 0.1%
18 2.7%
1 11.1%
7 77.8%
0
1
0.0% 11.1%
0 0.0%
0 0.0%
Male Female
360 54.0%
307 46.0%
6 66.7%
3 33.3%
Enrollment in Selected Programs
Program
Program % of Student Enrollment Population
Gifted (Grades K-12)
65
9.7%
Alternative Programs (Grades 6-12)
N/A
N/A
Students Eligible to Receive Free/Reduced Lunches
Number
Percent
School System
75 16,221
11.1% 17.8%
Dropout Rate *
Number
Rate
School System
N/A N/A
N/A N/A
* Dropout rates are not applicable for grades PK-5.
Enrollment in Compensatory Programs
Program
Program % of Student Enrollment Population
Special Education (Grades K-12)
90 13.5%
(PK)
11
N/A
English to Speakers of Other Languages (ESOL) (Grades K-12)
0
0.0%
Remedial Education (Grades 2-5, 9-12)
86 18.4%
Special Instructional Assistance (SIA) (Grades K-3)
145 33.0%
Title I (Grades K-12)
This school has no Title I program.
Total 3
Retained Students, by Race/Ethnicity and Sex
Black
White Hispanic
American MultiAsian Indian racial
0
3
0.0% 100.0%
0 0.0%
0 0.0%
0 0.0%
0 0.0%
Male Female
2
1
66.7% 33.3%
Prepared by Georgia Department of Education
Page 1
STATE-REQUIRED TEST DATA
NORM-REFERENCED TESTS Grade 3
Iowa Tests of Basic Skills (ITBS) Each chart reflects data for three years of testing.
Reading Comprehension 50
N/A 63 54 0
98-99
N/A 62 53 97-98
N/A 60 52 96-97
Mathematics
School 50
System
State
N/A 70 61 0
98-99
N/A 68 61 97-98
N/A 68 59 96-97
School System State
Reading Vocabulary 50
N/A 58 50 0
98-99
N/A 58 50 97-98
N/A 58 49 96-97
Language Arts
School 50
System
State
N/A 70 64 0
98-99
N/A 69 62 97-98
N/A 67 59 96-97
School System State
Social Studies 50
N/A 64 56 0
98-99
N/A 64 55 97-98
N/A 64 55 96-97
Science
School 50
System
State
N/A 70 59 0
98-99
N/A 70 59 97-98
N/A 69 58 96-97
School System State
Sources of Information
Composite Score
School
50
50
System
N/A 66 57 0
98-99
N/A 65 56 N/A 64 55
97-98
96-97
State
N/A 67 58 0
98-99
N/A 67 57 97-98
N/A 66 56 96-97
1998-99 GEORGIA PUBLIC EDUCATION REPORT CARD Addison Elementary School - 6330289
Prepared by Georgia Department of Education
Scores Reported in Percentiles
School System State
Page 2
STATE-REQUIRED TEST DATA
NORM-REFERENCED TESTS Grade 5
Iowa Tests of Basic Skills (ITBS) Each chart reflects data for three years of testing.
Reading Comprehension
Mathematics
50
N/A 59 53 0
98-99
N/A 60 53 97-98
N/A 60 52 96-97
School 50
System
State
N/A 68 59 0
98-99
N/A 68 58 97-98
N/A 69 57 96-97
School System State
Reading Vocabulary 50
N/A 57 48 0
98-99
N/A 58 48 97-98
N/A 58 46 96-97
Language Arts
School 50
System
State
N/A 71 63 0
98-99
N/A 70 61 97-98
N/A 69 58 96-97
School System State
Social Studies 50
N/A 64 57 0
98-99
N/A 64 56 97-98
N/A 65 55 96-97
Science
School 50
System
State
N/A 68 60 0
98-99
N/A 69 59 97-98
N/A 70 59 96-97
School System State
Sources of Information
Composite Score
School
50
50
System
N/A 67 58 0
98-99
N/A 65 58 N/A 66 57
97-98
96-97
State
N/A 66 57 0
98-99
N/A 66 56 97-98
N/A 67 55 96-97
1998-99 GEORGIA PUBLIC EDUCATION REPORT CARD Addison Elementary School - 6330289
Prepared by Georgia Department of Education
Scores Reported in Percentiles
School System State
Page 3
STATE-REQUIRED TEST DATA
PERFORMANCE ASSESSMENTS
Grade 5 Writing Assessment
Percent at Developmental Stages:
1998-99 School System State
1997-98 School System State
1996-97 School System State
Stage Stage Stage Stage Stage Stage
1:The Emerging Writer 2:The Developing Writer 3:The Focusing Writer 4:The Experimenting 5:The Engaging Writer 6:The Extending Writer
0% 0% 13% 38% 33% 16%
0% 1% 10% 36% 34% 19%
0% 1% 16% 41% 29% 12%
0% 0% 8% 48% 31% 13%
0% 1% 12% 37% 33% 16%
0% 3% 19% 41% 27% 10%
0% 1% 11% 42% 29% 17%
0% 1% 14% 34% 32% 18%
0% 3% 21% 37% 26% 12%
AWARDS / RECOGNITION DATA
Schools that become a Charter School have a unique opportunity to rethink how they structure and deliver education programs for improving the learning of their students while being freed from the state laws, State Board of Education rules and regulations, and local board of education rules and regulations that govern other schools. A 'charter' is a binding contract that, when approved by the faculty and parents of the school, the local board of education and the State Board of Education, substitutes for state education statutes, state and local rules, policies, regulations and standards.
Addison Elementary School is a Charter School for 1998-99.
1998-99 GEORGIA PUBLIC EDUCATION REPORT CARD Addison Elementary School - 6330289
Prepared by Georgia Department of Education
Page 4
CERTIFIED PERSONNEL DATA
Positions Number Average Contract Days
Personnel Sex
Certificate
Years Experience
Full-time Part-time
Male Female
4 Yr Bachelor's 5 Yr Master's 6 Yr Specialist's 7 Yr Doctoral Other*
<1 1-10 11-20 21-30 >30
Average
Administrators
2.00 235.00
2 0
0 2
0 1 1 0 0 0 0 1 1 0 20.00
Support Personnel
3.60 191.00
2 3
0 5
1 4 0 0 0 0 3 1 1 0 11.80
PK-12 Teachers
47.53 191.00
45 6
1 50
27 22
2 0 0 0 24 14 11 2 13.14
*Includes One- and Two-Year Vocational Certificates.
ACCREDITATION DATA
Accredited by Southern Association of Colleges and Schools (SACS):
Elementary/Middle Commission.
1998-99 GEORGIA PUBLIC EDUCATION REPORT CARD Addison Elementary School - 6330289
Prepared by Georgia Department of Education
Page 5
1998-99 GEORGIA PUBLIC EDUCATION REPORT CARD
COBB COUNTY SCHOOLS
Argyle Elementary School - 6332050
Grade Range PK-5
The Georgia Public Education Report Card is designed to assist systems and schools in educational improvement. This report card contains a variety of data elements. An explanation of the terms is provided as a companion to the report card data. Please refer to the definitions for the most effective use of the reported data.
STUDENT DATA
Total
K-5
562
PK
7
Enrollment, by Race/Ethnicity and Sex
Black
White Hispanic
American Asian Indian
Multiracial
296 52.7%
83 14.8%
135 24.0%
17 3.0%
2 0.4%
29 5.2%
2 28.6%
1 14.3%
2 28.6%
2 28.6%
0 0.0%
0 0.0%
Male Female
277 49.3%
285 50.7%
5 71.4%
2 28.6%
Enrollment in Selected Programs
Program
Program % of Student Enrollment Population
Gifted (Grades K-12)
7
1.2%
Alternative Programs (Grades 6-12)
N/A
N/A
Students Eligible to Receive Free/Reduced Lunches
Number
Percent
School System
316 16,221
55.5% 17.8%
Dropout Rate *
Number
Rate
School System
N/A N/A
N/A N/A
* Dropout rates are not applicable for grades PK-5.
Enrollment in Compensatory Programs
Program
Program % of Student Enrollment Population
Special Education (Grades K-12)
48
8.5%
(PK)
6
N/A
English to Speakers of Other Languages (ESOL) (Grades K-12)
101 18.0%
Remedial Education (Grades 2-5, 9-12)
71 20.7%
Special Instructional Assistance (SIA) (Grades K-3)
213 52.6%
Title I (Grades K-12)
This school has a schoolwide program.
Total 1
Retained Students, by Race/Ethnicity and Sex
Black
White Hispanic
American MultiAsian Indian racial
0
1
0.0% 100.0%
0 0.0%
0 0.0%
0 0.0%
0 0.0%
Male Female
0
1
0.0% 100.0%
Prepared by Georgia Department of Education
Page 1
STATE-REQUIRED TEST DATA
NORM-REFERENCED TESTS Grade 3
Iowa Tests of Basic Skills (ITBS) Each chart reflects data for three years of testing.
Reading Comprehension 50
42 63 54 0
98-99
43 62 53 97-98
46 60 52 96-97
Mathematics
School 50
System
State
0
35 70 61 98-99
41 68 61 97-98
58 68 59 96-97
School System State
Reading Vocabulary 50
40 58 50 0
98-99
39 58 50 97-98
44 58 49 96-97
Language Arts
School 50
System
State
0
46 70 64 98-99
50 69 62 97-98
68 67 59 96-97
School System State
Social Studies 50
42 64 56 0
98-99
47 64 55 97-98
56 64 55 96-97
Science
School 50
System
State
0
42 70 59 98-99
47 70 59 97-98
57 69 58 96-97
School System State
Sources of Information
Composite Score
50
39 66 57 0
98-99
School 50
System
44 65 56 97-98
53 64 55 96-97
State 0
39 67 58 98-99
44 67 57 97-98
1998-99 GEORGIA PUBLIC EDUCATION REPORT CARD Argyle Elementary School - 6332050
Prepared by Georgia Department of Education
55 66 56 96-97
Scores Reported in Percentiles
School System State
Page 2
STATE-REQUIRED TEST DATA
NORM-REFERENCED TESTS Grade 5
Iowa Tests of Basic Skills (ITBS) Each chart reflects data for three years of testing.
Reading Comprehension
Mathematics
50
45 59 53 0
98-99
48 60 53 97-98
48 60 52 96-97
School 50
System
State
0
52 68 59 98-99
45 68 58 97-98
50 69 57 96-97
School System State
Reading Vocabulary 50
38 57 48 0
98-99
48 58 48 97-98
41 58 46 96-97
Language Arts
School 50
System
State
0
66 71 63 98-99
66 70 61 97-98
59 69 58 96-97
School System State
Social Studies 50
46 64 57 0
98-99
45 64 56 97-98
52 65 55 96-97
Science
School 50
System
State
0
44 68 60 98-99
50 69 59 97-98
57 70 59 96-97
School System State
Sources of Information
Composite Score
50
50 67 58 0
98-99
School 50
System
55 65 58 97-98
50 66 57 96-97
State 0
49 66 57 98-99
51 66 56 97-98
52 67 55 96-97
1998-99 GEORGIA PUBLIC EDUCATION REPORT CARD Argyle Elementary School - 6332050
Prepared by Georgia Department of Education
Scores Reported in Percentiles
School System State
Page 3
STATE-REQUIRED TEST DATA
PERFORMANCE ASSESSMENTS
Grade 5 Writing Assessment
Percent at Developmental Stages:
1998-99 School System State
1997-98 School System State
1996-97 School System State
Stage Stage Stage Stage Stage Stage
1:The Emerging Writer 2:The Developing Writer 3:The Focusing Writer 4:The Experimenting 5:The Engaging Writer 6:The Extending Writer
0% 0% 11% 55% 28% 6%
0% 1% 10% 36% 34% 19%
0% 1% 16% 41% 29% 12%
0% 1% 9% 57% 28% 4%
0% 1% 12% 37% 33% 16%
0% 3% 19% 41% 27% 10%
0% 5% 17% 44% 24% 8%
0% 1% 14% 34% 32% 18%
0% 3% 21% 37% 26% 12%
AWARDS / RECOGNITION DATA
Schools in Georgia may receive recognition in the following programs: Charter School Pay for Performance Program Georgia School of Excellence National Blue Ribbon School Argyle Elementary School did not receive recognition in any of these programs during the 1998-99 school year.
1998-99 GEORGIA PUBLIC EDUCATION REPORT CARD Argyle Elementary School - 6332050
Prepared by Georgia Department of Education
Page 4
CERTIFIED PERSONNEL DATA
Positions Number Average Contract Days
Personnel Sex
Certificate
Years Experience
Full-time Part-time
Male Female
4 Yr Bachelor's 5 Yr Master's 6 Yr Specialist's 7 Yr Doctoral Other*
<1 1-10 11-20 21-30 >30
Average
Administrators
2.00 225.50
2 0
1 1
0 1 1 0 0 0 0 1 1 0 18.50
Support Personnel
3.04 191.00
3 1
0 4
1 2 1 0 0 0 1 2 1 0 16.75
PK-12 Teachers
42.96 191.00
42 1
1 42
20 18
4 1 0 0 20 11 11 1 12.91
*Includes One- and Two-Year Vocational Certificates.
ACCREDITATION DATA
Accredited by Southern Association of Colleges and Schools (SACS):
Elementary/Middle Commission.
1998-99 GEORGIA PUBLIC EDUCATION REPORT CARD Argyle Elementary School - 6332050
Prepared by Georgia Department of Education
Page 5
1998-99 GEORGIA PUBLIC EDUCATION REPORT CARD
COBB COUNTY SCHOOLS
Austell Elementary School - 6333050
Grade Range K-5
The Georgia Public Education Report Card is designed to assist systems and schools in educational improvement. This report card contains a variety of data elements. An explanation of the terms is provided as a companion to the report card data. Please refer to the definitions for the most effective use of the reported data.
STUDENT DATA
Total 457
K-5 Enrollment, by Race/Ethnicity and Sex
Black
White Hispanic
American Multi-
Asian Indian
racial
127 27.8%
275 60.2%
40 8.8%
3 0.7%
3 0.7%
9 2.0%
Male Female
235 51.4%
222 48.6%
Enrollment in Selected Programs
Program
Program % of Student Enrollment Population
Gifted (Grades K-12)
7
1.5%
Alternative Programs (Grades 6-12)
N/A
N/A
Students Eligible to Receive Free/Reduced Lunches
Number
Percent
School System
222 16,221
48.6% 17.8%
Dropout Rate *
Number
Rate
School System
N/A N/A
N/A N/A
* Dropout rates are not applicable for grades PK-5.
Enrollment in Compensatory Programs
Program
Program % of Student Enrollment Population
Special Education (Grades K-12)
68 14.9%
(PK)
0
N/A
English to Speakers of Other Languages (ESOL) (Grades K-12)
36
7.9%
Remedial Education (Grades 2-5, 9-12)
73 24.7%
Special Instructional Assistance (SIA) (Grades K-3)
84 27.5%
Title I (Grades K-12)
This school has a schoolwide program.
Total 2
Retained Students, by Race/Ethnicity and Sex
Black
White Hispanic
American Multi-
Asian Indian
racial
0
2
0.0% 100.0%
0 0.0%
0 0.0%
0 0.0%
0 0.0%
Male Female
2
0
100.0% 0.0%
Prepared by Georgia Department of Education
Page 1
STATE-REQUIRED TEST DATA
NORM-REFERENCED TESTS Grade 3
Iowa Tests of Basic Skills (ITBS) Each chart reflects data for three years of testing.
Reading Comprehension 50
32 63 54 0
98-99
38 62 53 97-98
43 60 52 96-97
Mathematics
School 50
System
State
0
32 70 61 98-99
41 68 61 97-98
46 68 59 96-97
School System State
Reading Vocabulary 50
30 58 50 0
98-99
38 58 50 97-98
44 58 49 96-97
Language Arts
School 50
System
State
0
27 70 64 98-99
44 69 62 97-98
53 67 59 96-97
School System State
Social Studies 50
37 64 56 0
98-99
41 64 55 97-98
54 64 55 96-97
Science
School 50
System
State
0
39 70 59 98-99
41 70 59 97-98
55 69 58 96-97
School System State
Sources of Information
Composite Score
50
29 66 57 0
98-99
School 50
System
41 65 56 97-98
47 64 55 96-97
State 0
30 67 58 98-99
39 67 57 97-98
1998-99 GEORGIA PUBLIC EDUCATION REPORT CARD Austell Elementary School - 6333050
Prepared by Georgia Department of Education
48 66 56 96-97
Scores Reported in Percentiles
School System State
Page 2
STATE-REQUIRED TEST DATA
NORM-REFERENCED TESTS Grade 5
Iowa Tests of Basic Skills (ITBS) Each chart reflects data for three years of testing.
Reading Comprehension
Mathematics
50
39 59 53 0
98-99
47 60 53 97-98
50 60 52 96-97
School 50
System
State
0
35 68 59 98-99
47 68 58 97-98
53 69 57 96-97
School System State
Reading Vocabulary 50
34 57 48 0
98-99
48 58 48 97-98
41 58 46 96-97
Language Arts
School 50
System
State
0
45 71 63 98-99
52 70 61 97-98
56 69 58 96-97
School System State
Social Studies 50
34 64 57 0
98-99
54 64 56 97-98
52 65 55 96-97
Science
School 50
System
State
0
42 68 60 98-99
58 69 59 97-98
57 70 59 96-97
School System State
Sources of Information
Composite Score
50
43 67 58 0
98-99
School 50
System
51 65 58 97-98
56 66 57 96-97
State 0
37 66 57 98-99
50 66 56 97-98
52 67 55 96-97
1998-99 GEORGIA PUBLIC EDUCATION REPORT CARD Austell Elementary School - 6333050
Prepared by Georgia Department of Education
Scores Reported in Percentiles
School System State
Page 3
STATE-REQUIRED TEST DATA
PERFORMANCE ASSESSMENTS
Grade 5 Writing Assessment
Percent at Developmental Stages:
1998-99 School System State
1997-98 School System State
1996-97 School System State
Stage Stage Stage Stage Stage Stage
1:The Emerging Writer 2:The Developing Writer 3:The Focusing Writer 4:The Experimenting 5:The Engaging Writer 6:The Extending Writer
0% 0% 17% 43% 28% 10%
0% 1% 10% 36% 34% 19%
0% 1% 16% 41% 29% 12%
0% 0% 16% 47% 25% 8%
0% 1% 12% 37% 33% 16%
0% 3% 19% 41% 27% 10%
0% 4% 26% 38% 23% 8%
0% 1% 14% 34% 32% 18%
0% 3% 21% 37% 26% 12%
AWARDS / RECOGNITION DATA
Schools in Georgia may receive recognition in the following programs: Charter School Pay for Performance Program Georgia School of Excellence National Blue Ribbon School Austell Elementary School did not receive recognition in any of these programs during the 1998-99 school year.
1998-99 GEORGIA PUBLIC EDUCATION REPORT CARD Austell Elementary School - 6333050
Prepared by Georgia Department of Education
Page 4
CERTIFIED PERSONNEL DATA
Positions Number Average Contract Days
Personnel Sex
Certificate
Years Experience
Full-time Part-time
Male Female
4 Yr Bachelor's 5 Yr Master's 6 Yr Specialist's 7 Yr Doctoral Other*
<1 1-10 11-20 21-30 >30
Average
Administrators
2.00 225.50
2 0
0 2
0 0 1 1 0 0 0 0 2 0 26.50
Support Personnel
4.00 191.00
4 0
0 4
0 2 2 0 0 0 1 1 2 0 20.75
PK-12 Teachers
28.50 191.00
27 3
2 28
20 9 1 0 0 0
16 8 6 0
10.70
*Includes One- and Two-Year Vocational Certificates.
ACCREDITATION DATA
Accredited by Southern Association of Colleges and Schools (SACS):
Elementary/Middle Commission.
1998-99 GEORGIA PUBLIC EDUCATION REPORT CARD Austell Elementary School - 6333050
Prepared by Georgia Department of Education
Page 5
1998-99 GEORGIA PUBLIC EDUCATION REPORT CARD
COBB COUNTY SCHOOLS
Awtrey Middle School - 6334050
Grade Range 6-8
The Georgia Public Education Report Card is designed to assist systems and schools in educational improvement. This report card contains a variety of data elements. An explanation of the terms is provided as a companion to the report card data. Please refer to the definitions for the most effective use of the reported data.
STUDENT DATA
Total 1,466
6-8 Enrollment, by Race/Ethnicity and Sex
Black
White Hispanic
American Multi-
Asian Indian
racial
191 13.0%
1,166 79.5%
36 2.5%
44 3.0%
5 0.3%
24 1.6%
Male 722
49.2%
Female 744
50.8%
Enrollment in Selected Programs
Program
Gifted (Grades K-12)
Program % of Student Enrollment Population
212
14.5%
Alternative Programs (Grades 6-12)
0
0.0%
Students Eligible to Receive Free/Reduced Lunches
Number
Percent
School System
185 16,221
12.6% 17.8%
Enrollment in Compensatory Programs
Program
Program % of Student Enrollment Population
Special Education (Grades K-12) (PK)
186 12.7%
0
N/A
English to Speakers of Other Languages (ESOL) (Grades K-12)
14
1.0%
Title I (Grades K-12)
This school has no Title I program.
Dropout Rate for Grades 6-8
Number
Rate
School System
1
0.1%
19
0.1%
Total 18
Retained Students, by Race/Ethnicity and Sex
Black
White Hispanic
American MultiAsian Indian racial
4 22.2%
12 66.7%
1 5.6%
0 0.0%
1 5.6%
0 0.0%
Male Female
15
3
83.3% 16.7%
Prepared by Georgia Department of Education
Page 1
STATE-REQUIRED TEST DATA
NORM-REFERENCED TESTS Grade 8
Iowa Tests of Basic Skills (ITBS) Each chart reflects data for three years of testing.
Reading Comprehension 50
56 61 49 0
98-99
60 61 48 97-98
59 62 48 96-97
Mathematics
School 50
System
State
0
60 66 56 98-99
65 66 55 97-98
65 67 54 96-97
School System State
Reading Vocabulary 50
54 57 46 0
98-99
59 57 45 97-98
60 58 44 96-97
Language Arts
School 50
System
State
0
65 70 60 98-99
69 68 58 97-98
67 68 56 96-97
School System State
Social Studies 50
60 64 54 0
98-99
65 64 53 97-98
63 65 53 96-97
Science
School 50
System
State
0
59 66 56 98-99
65 67 55 97-98
68 67 53 96-97
School System State
Sources of Information
Composite Score
50
63 67 57 0
98-99
School 50
System
65 66 56 97-98
66 67 55 96-97
State 0
63 67 56 98-99
66 66 54 97-98
1998-99 GEORGIA PUBLIC EDUCATION REPORT CARD Awtrey Middle School - 6334050
Prepared by Georgia Department of Education
66 67 54 96-97
Scores Reported in Percentiles
School System State
Page 2
STATE-REQUIRED TEST DATA
Categories of Scaled Scores
Inadequate (less than 162)
Minimal (162-209)
Good
(210-247)
Very Good (greater than 247)
Average Scaled Score: (Range 100-300)
PERFORMANCE ASSESSMENTS
Grade 8 Writing Assessment
1998-99 Percent Scoring
1997-98 Percent Scoring
1996-97 Percent Scoring
School System State School System State School System State
1% 30% 55% 15%
2% 25% 50% 24%
8% 40% 41% 11%
2% 44% 47%
7%
3% 33% 47% 17%
11% 46% 34%
8%
7% 45% 35% 13%
5% 36% 43% 16%
15% 46% 30%
8%
220
225
208 211
218 202 208
215 198
AWARDS / RECOGNITION DATA
Schools in Georgia may receive recognition in the following programs: Charter School Pay for Performance Program Georgia School of Excellence National Blue Ribbon School Awtrey Middle School did not receive recognition in any of these programs during the 1998-99 school year.
1998-99 GEORGIA PUBLIC EDUCATION REPORT CARD Awtrey Middle School - 6334050
Prepared by Georgia Department of Education
Page 3
CERTIFIED PERSONNEL DATA
Positions Number Average Contract Days
Personnel Sex
Certificate
Years Experience
Full-time Part-time
Male Female
4 Yr Bachelor's 5 Yr Master's 6 Yr Specialist's 7 Yr Doctoral Other*
<1 1-10 11-20 21-30 >30
Average
Administrators
3.49 221.66
3 1
0 4
0 0 4 0 0 0 0 1 2 1 25.75
Support Personnel
6.56 191.00
6 2
1 7
1 4 3 0 0 0 1 3 3 1 19.25
PK-12 Teachers
86.10 191.00
84 4
11 77
49 38
1 0 0 0 50 21 16 1 10.55
*Includes One- and Two-Year Vocational Certificates.
ACCREDITATION DATA
Accredited by Southern Association of Colleges and Schools (SACS):
Elementary/Middle Commission.
1998-99 GEORGIA PUBLIC EDUCATION REPORT CARD Awtrey Middle School - 6334050
Prepared by Georgia Department of Education
Page 4
1998-99 GEORGIA PUBLIC EDUCATION REPORT CARD
COBB COUNTY SCHOOLS
Baker Elementary School - 6330189
Grade Range PK-5
The Georgia Public Education Report Card is designed to assist systems and schools in educational improvement. This report card contains a variety of data elements. An explanation of the terms is provided as a companion to the report card data. Please refer to the definitions for the most effective use of the reported data.
STUDENT DATA
Total
K-5
1,065
PK
15
Enrollment, by Race/Ethnicity and Sex
Black
White Hispanic
American Asian Indian
Multiracial
170 16.0%
773 72.6%
33 3.1%
50 4.7%
4 0.4%
35 3.3%
2 13.3%
12 80.0%
0 0.0%
1 6.7%
0 0.0%
0 0.0%
Male Female
549 51.5%
516 48.5%
12 80.0%
3 20.0%
Enrollment in Selected Programs
Program
Program % of Student Enrollment Population
Gifted (Grades K-12)
26
2.4%
Alternative Programs (Grades 6-12)
N/A
N/A
Students Eligible to Receive Free/Reduced Lunches
Number
Percent
School System
89 16,221
8.2% 17.8%
Dropout Rate *
Number
Rate
School System
N/A N/A
N/A N/A
* Dropout rates are not applicable for grades PK-5.
Enrollment in Compensatory Programs
Program
Program % of Student Enrollment Population
Special Education (Grades K-12)
135 12.7%
(PK)
15
N/A
English to Speakers of Other Languages (ESOL) (Grades K-12)
0
0.0%
Remedial Education (Grades 2-5, 9-12)
59
8.9%
Special Instructional Assistance (SIA) (Grades K-3)
109 14.6%
Title I (Grades K-12)
This school has no Title I program.
Total 17
Retained Students, by Race/Ethnicity and Sex
Black
White Hispanic
American MultiAsian Indian racial
3 17.6%
12 70.6%
0 0.0%
0 0.0%
0
2
0.0% 11.8%
Male Female
10
7
58.8% 41.2%
Prepared by Georgia Department of Education
Page 1
STATE-REQUIRED TEST DATA
NORM-REFERENCED TESTS Grade 3
Iowa Tests of Basic Skills (ITBS) Each chart reflects data for three years of testing.
Reading Comprehension 50
68 63 54 0
98-99
68 62 53 97-98
67 60 52 96-97
Mathematics
School 50
System
State
0
83 70 61 98-99
78 68 61 97-98
79 68 59 96-97
School System State
Reading Vocabulary 50
62 58 50 0
98-99
65 58 50 97-98
63 58 49 96-97
Language Arts
School 50
System
State
0
75 70 64 98-99
72 69 62 97-98
74 67 59 96-97
School System State
Social Studies 50
74 64 56 0
98-99
68 64 55 97-98
71 64 55 96-97
Science
School 50
System
State
0
79 70 59 98-99
83 70 59 97-98
76 69 58 96-97
School System State
Sources of Information
Composite Score
50
73 66 57 0
98-99
School 50
System
70 65 56 97-98
69 64 55 96-97
State 0
76 67 58 98-99
74 67 57 97-98
1998-99 GEORGIA PUBLIC EDUCATION REPORT CARD Baker Elementary School - 6330189
Prepared by Georgia Department of Education
73 66 56 96-97
Scores Reported in Percentiles
School System State
Page 2
STATE-REQUIRED TEST DATA
NORM-REFERENCED TESTS Grade 5
Iowa Tests of Basic Skills (ITBS) Each chart reflects data for three years of testing.
Reading Comprehension
Mathematics
50
66 59 53 0
98-99
60 60 53 97-98
66 60 52 96-97
School 50
System
State
0
77 68 59 98-99
69 68 58 97-98
78 69 57 96-97
School System State
Reading Vocabulary 50
65 57 48 0
98-99
58 58 48 97-98
64 58 46 96-97
Language Arts
School 50
System
State
0
80 71 63 98-99
68 70 61 97-98
73 69 58 96-97
School System State
Social Studies 50
70 64 57 0
98-99
65 64 56 97-98
69 65 55 96-97
Science
School 50
System
State
0
73 68 60 98-99
68 69 59 97-98
75 70 59 96-97
School System State
Sources of Information
Composite Score
50
72 67 58 0
98-99
School 50
System
65 65 58 97-98
69 66 57 96-97
State 0
74 66 57 98-99
65 66 56 97-98
72 67 55 96-97
1998-99 GEORGIA PUBLIC EDUCATION REPORT CARD Baker Elementary School - 6330189
Prepared by Georgia Department of Education
Scores Reported in Percentiles
School System State
Page 3
STATE-REQUIRED TEST DATA
PERFORMANCE ASSESSMENTS
Grade 5 Writing Assessment
Percent at Developmental Stages:
1998-99 School System State
1997-98 School System State
1996-97 School System State
Stage Stage Stage Stage Stage Stage
1:The Emerging Writer 2:The Developing Writer 3:The Focusing Writer 4:The Experimenting 5:The Engaging Writer 6:The Extending Writer
0% 0% 7% 33% 42% 18%
0% 1% 10% 36% 34% 19%
0% 1% 16% 41% 29% 12%
0% 2% 10% 39% 38% 11%
0% 1% 12% 37% 33% 16%
0% 3% 19% 41% 27% 10%
0% 2% 14% 30% 29% 24%
0% 1% 14% 34% 32% 18%
0% 3% 21% 37% 26% 12%
AWARDS / RECOGNITION DATA
Schools in Georgia may receive recognition in the following programs: Charter School Pay for Performance Program Georgia School of Excellence National Blue Ribbon School Baker Elementary School did not receive recognition in any of these programs during the 1998-99 school year.
1998-99 GEORGIA PUBLIC EDUCATION REPORT CARD Baker Elementary School - 6330189
Prepared by Georgia Department of Education
Page 4
CERTIFIED PERSONNEL DATA
Positions Number Average Contract Days
Personnel Sex
Certificate
Years Experience
Full-time Part-time
Male Female
4 Yr Bachelor's 5 Yr Master's 6 Yr Specialist's 7 Yr Doctoral Other*
<1 1-10 11-20 21-30 >30
Average
Administrators
3.00 226.67
3 0
0 3
0 0 3 0 0 0 0 1 1 1 24.67
Support Personnel
8.00 190.00
8 0
0 8
2 4 2 0 0 0 3 3 2 0 14.13
PK-12 Teachers
63.50 191.00
61 5
1 65
43 22
1 0 0 0 22 34 9 1 13.36
*Includes One- and Two-Year Vocational Certificates.
ACCREDITATION DATA
Accredited by Southern Association of Colleges and Schools (SACS):
Elementary/Middle Commission.
1998-99 GEORGIA PUBLIC EDUCATION REPORT CARD Baker Elementary School - 6330189
Prepared by Georgia Department of Education
Page 5
1998-99 GEORGIA PUBLIC EDUCATION REPORT CARD
COBB COUNTY SCHOOLS
Bells Ferry Elementary School - 6335050
Grade Range PK-5
The Georgia Public Education Report Card is designed to assist systems and schools in educational improvement. This report card contains a variety of data elements. An explanation of the terms is provided as a companion to the report card data. Please refer to the definitions for the most effective use of the reported data.
STUDENT DATA
Total
K-5
419
PK
7
Enrollment, by Race/Ethnicity and Sex
Black
White Hispanic
American Asian Indian
Multiracial
52 12.4%
323 77.1%
10 2.4%
22 5.3%
0 0.0%
12 2.9%
0 0.0%
6 85.7%
0 0.0%
0 0.0%
0 0.0%
1 14.3%
Male Female
227 54.2%
192 45.8%
5 71.4%
2 28.6%
Enrollment in Selected Programs
Program
Program % of Student Enrollment Population
Gifted (Grades K-12)
20
4.8%
Alternative Programs (Grades 6-12)
N/A
N/A
Students Eligible to Receive Free/Reduced Lunches
Number
Percent
School System
48 16,221
11.3% 17.8%
Dropout Rate *
Number
Rate
School System
N/A N/A
N/A N/A
* Dropout rates are not applicable for grades PK-5.
Enrollment in Compensatory Programs
Program
Program % of Student Enrollment Population
Special Education (Grades K-12)
77 18.4%
(PK)
8
N/A
English to Speakers of Other Languages (ESOL) (Grades K-12)
0
0.0%
Remedial Education (Grades 2-5, 9-12)
32 10.7%
Special Instructional Assistance (SIA) (Grades K-3)
73 27.5%
Title I (Grades K-12)
This school has no Title I program.
Total 7
Retained Students, by Race/Ethnicity and Sex
Black
White Hispanic
American MultiAsian Indian racial
1 14.3%
6 85.7%
0 0.0%
0 0.0%
0 0.0%
0 0.0%
Male Female
4
3
57.1% 42.9%
Prepared by Georgia Department of Education
Page 1
STATE-REQUIRED TEST DATA
NORM-REFERENCED TESTS Grade 3
Iowa Tests of Basic Skills (ITBS) Each chart reflects data for three years of testing.
Reading Comprehension 50
64 63 54 0
98-99
63 62 53 97-98
67 60 52 96-97
Mathematics
School 50
System
State
0
73 70 61 98-99
63 68 61 97-98
75 68 59 96-97
School System State
Reading Vocabulary 50
58 58 50 0
98-99
59 58 50 97-98
67 58 49 96-97
Language Arts
School 50
System
State
0
69 70 64 98-99
68 69 62 97-98
72 67 59 96-97
School System State
Social Studies 50
63 64 56 0
98-99
62 64 55 97-98
70 64 55 96-97
Science
School 50
System
State
0
70 70 59 98-99
68 70 59 97-98
78 69 58 96-97
School System State
Sources of Information
Composite Score
50
71 66 57 0
98-99
School 50
System
66 65 56 97-98
70 64 55 96-97
State 0
67 67 58 98-99
64 67 57 97-98
1998-99 GEORGIA PUBLIC EDUCATION REPORT CARD Bells Ferry Elementary School - 6335050
Prepared by Georgia Department of Education
73 66 56 96-97
Scores Reported in Percentiles
School System State
Page 2
STATE-REQUIRED TEST DATA
NORM-REFERENCED TESTS Grade 5
Iowa Tests of Basic Skills (ITBS) Each chart reflects data for three years of testing.
Reading Comprehension
Mathematics
50
63 59 53 0
98-99
64 60 53 97-98
64 60 52 96-97
School 50
System
State
0
66 68 59 98-99
72 68 58 97-98
78 69 57 96-97
School System State
Reading Vocabulary 50
60 57 48 0
98-99
60 58 48 97-98
59 58 46 96-97
Language Arts
School 50
System
State
0
71 71 63 98-99
74 70 61 97-98
74 69 58 96-97
School System State
Social Studies 50
70 64 57 0
98-99
66 64 56 97-98
70 65 55 96-97
Science
School 50
System
State
0
70 68 60 98-99
73 69 59 97-98
75 70 59 96-97
School System State
Sources of Information
Composite Score
50
68 67 58 0
98-99
School 50
System
68 65 58 97-98
71 66 57 96-97
State 0
69 66 57 98-99
70 66 56 97-98
73 67 55 96-97
1998-99 GEORGIA PUBLIC EDUCATION REPORT CARD Bells Ferry Elementary School - 6335050
Prepared by Georgia Department of Education
Scores Reported in Percentiles
School System State
Page 3
STATE-REQUIRED TEST DATA
PERFORMANCE ASSESSMENTS
Grade 5 Writing Assessment
Percent at Developmental Stages:
1998-99 School System State
1997-98 School System State
1996-97 School System State
Stage Stage Stage Stage Stage Stage
1:The Emerging Writer 2:The Developing Writer 3:The Focusing Writer 4:The Experimenting 5:The Engaging Writer 6:The Extending Writer
0% 0% 13% 47% 18% 22%
0% 1% 10% 36% 34% 19%
0% 1% 16% 41% 29% 12%
0% 0% 4% 43% 33% 20%
0% 1% 12% 37% 33% 16%
0% 3% 19% 41% 27% 10%
0% 3% 8% 30% 39% 21%
0% 1% 14% 34% 32% 18%
0% 3% 21% 37% 26% 12%
AWARDS / RECOGNITION DATA
Schools in Georgia may receive recognition in the following programs: Charter School Pay for Performance Program Georgia School of Excellence National Blue Ribbon School Bells Ferry Elementary School did not receive recognition in any of these programs during the 1998-99 school year.
1998-99 GEORGIA PUBLIC EDUCATION REPORT CARD Bells Ferry Elementary School - 6335050
Prepared by Georgia Department of Education
Page 4
CERTIFIED PERSONNEL DATA
Positions Number Average Contract Days
Personnel Sex
Certificate
Years Experience
Full-time Part-time
Male Female
4 Yr Bachelor's 5 Yr Master's 6 Yr Specialist's 7 Yr Doctoral Other*
<1 1-10 11-20 21-30 >30
Average
Administrators
2.00 225.50
2 0
1 1
0 0 1 1 0 0 0 0 2 0 26.50
Support Personnel
4.25 191.00
3 2
0 5
1 3 1 0 0 0 3 2 0 0 10.40
PK-12 Teachers
31.00 191.00
30 2
1 31
14 17
0 1 0 0 8 16 7 1 15.19
*Includes One- and Two-Year Vocational Certificates.
ACCREDITATION DATA
Accredited by Southern Association of Colleges and Schools (SACS):
Elementary/Middle Commission.
1998-99 GEORGIA PUBLIC EDUCATION REPORT CARD Bells Ferry Elementary School - 6335050
Prepared by Georgia Department of Education
Page 5
1998-99 GEORGIA PUBLIC EDUCATION REPORT CARD
COBB COUNTY SCHOOLS
Belmont Hills Elementary School - 6331052
Grade Range PK-5
The Georgia Public Education Report Card is designed to assist systems and schools in educational improvement. This report card contains a variety of data elements. An explanation of the terms is provided as a companion to the report card data. Please refer to the definitions for the most effective use of the reported data.
STUDENT DATA
Total
K-5
440
PK
2
Enrollment, by Race/Ethnicity and Sex
Black
White Hispanic
American Asian Indian
Multiracial
194 44.1%
76 17.3%
145 33.0%
12 2.7%
2 0.5%
11 2.5%
0
2
0.0% 100.0%
0 0.0%
0 0.0%
0 0.0%
0 0.0%
Male 229
52.0% 2
100.0%
Female 211
48.0% 0
0.0%
Enrollment in Selected Programs
Program
Program % of Student Enrollment Population
Gifted (Grades K-12)
4
< 1%
Alternative Programs (Grades 6-12)
N/A
N/A
Students Eligible to Receive Free/Reduced Lunches
Number
Percent
School System
361 16,221
81.7% 17.8%
Dropout Rate *
Number
Rate
School System
N/A N/A
N/A N/A
* Dropout rates are not applicable for grades PK-5.
Enrollment in Compensatory Programs
Program
Program % of Student Enrollment Population
Special Education (Grades K-12)
56 12.7%
(PK)
5
N/A
English to Speakers of Other Languages (ESOL) (Grades K-12)
69 15.7%
Remedial Education (Grades 2-5, 9-12)
54 18.5%
Special Instructional Assistance (SIA) (Grades K-3)
188 61.4%
Title I (Grades K-12)
This school has a schoolwide program.
Total 3
Retained Students, by Race/Ethnicity and Sex
Black
White Hispanic
American MultiAsian Indian racial
Male Female
1 33.3%
0
1
0.0% 33.3%
0 0.0%
0 0.0%
1
3
33.3% 100.0%
0 0.0%
Prepared by Georgia Department of Education
Page 1
STATE-REQUIRED TEST DATA
NORM-REFERENCED TESTS Grade 3
Iowa Tests of Basic Skills (ITBS) Each chart reflects data for three years of testing.
Reading Comprehension 50
35 63 54 0
98-99
36 62 53 97-98
31 60 52 96-97
Mathematics
School 50
System
State
0
39 70 61 98-99
39 68 61 97-98
31 68 59 96-97
School System State
Reading Vocabulary 50
33 58 50 0
98-99
34 58 50 97-98
26 58 49 96-97
Language Arts
School 50
System
State
0
43 70 64 98-99
49 69 62 97-98
35 67 59 96-97
School System State
Social Studies 50
33 64 56 0
98-99
42 64 55 97-98
43 64 55 96-97
Science
School 50
System
State
0
33 70 59 98-99
43 70 59 97-98
36 69 58 96-97
School System State
Sources of Information
Composite Score
50
35 66 57 0
98-99
School 50
System
43 65 56 97-98
34 64 55 96-97
State 0
34 67 58 98-99
41 67 57 97-98
1998-99 GEORGIA PUBLIC EDUCATION REPORT CARD Belmont Hills Elementary School - 6331052
Prepared by Georgia Department of Education
33 66 56 96-97
Scores Reported in Percentiles
School System State
Page 2
STATE-REQUIRED TEST DATA
NORM-REFERENCED TESTS Grade 5
Iowa Tests of Basic Skills (ITBS) Each chart reflects data for three years of testing.
Reading Comprehension
Mathematics
50
41 59 53 0
98-99
41 60 53 97-98
39 60 52 96-97
School 50
System
State
0
45 68 59 98-99
46 68 58 97-98
35 69 57 96-97
School System State
Reading Vocabulary 50
29 57 48 0
98-99
35 58 48 97-98
27 58 46 96-97
Language Arts
School 50
System
State
0
45 71 63 98-99
47 70 61 97-98
49 69 58 96-97
School System State
Social Studies 50
42 64 57 0
98-99
40 64 56 97-98
40 65 55 96-97
Science
School 50
System
State
0
45 68 60 98-99
51 69 59 97-98
49 70 59 96-97
School System State
Sources of Information
Composite Score
50
50 67 58 0
98-99
School 50
System
45 65 58 97-98
44 66 57 96-97
State 0
43 66 57 98-99
43 66 56 97-98
40 67 55 96-97
1998-99 GEORGIA PUBLIC EDUCATION REPORT CARD Belmont Hills Elementary School - 6331052
Prepared by Georgia Department of Education
Scores Reported in Percentiles
School System State
Page 3
STATE-REQUIRED TEST DATA
PERFORMANCE ASSESSMENTS
Grade 5 Writing Assessment
Percent at Developmental Stages:
1998-99 School System State
1997-98 School System State
1996-97 School System State
Stage Stage Stage Stage Stage Stage
1:The Emerging Writer 2:The Developing Writer 3:The Focusing Writer 4:The Experimenting 5:The Engaging Writer 6:The Extending Writer
2% 2% 22% 44% 22% 5%
0% 1% 10% 36% 34% 19%
0% 1% 16% 41% 29% 12%
0% 3% 24% 36% 33% 3%
0% 1% 12% 37% 33% 16%
0% 3% 19% 41% 27% 10%
0% 6% 44% 31% 17% 3%
0% 1% 14% 34% 32% 18%
0% 3% 21% 37% 26% 12%
AWARDS / RECOGNITION DATA
Schools in Georgia may receive recognition in the following programs: Charter School Pay for Performance Program Georgia School of Excellence National Blue Ribbon School Belmont Hills Elementary School did not receive recognition in any of these programs during the 1998-99 school year.
1998-99 GEORGIA PUBLIC EDUCATION REPORT CARD Belmont Hills Elementary School - 6331052
Prepared by Georgia Department of Education
Page 4
CERTIFIED PERSONNEL DATA
Positions Number Average Contract Days
Personnel Sex
Certificate
Years Experience
Full-time Part-time
Male Female
4 Yr Bachelor's 5 Yr Master's 6 Yr Specialist's 7 Yr Doctoral Other*
<1 1-10 11-20 21-30 >30
Average
Administrators
2.00 225.50
2 0
0 2
0 0 2 0 0 0 0 1 1 0 18.00
Support Personnel
4.00 191.00
4 0
0 4
1 2 1 0 0 0 1 2 1 0 14.50
PK-12 Teachers
37.00 191.00
36 2
6 32
19 18
1 0 0 0 27 7 3 1 8.34
*Includes One- and Two-Year Vocational Certificates.
ACCREDITATION DATA
Accredited by Southern Association of Colleges and Schools (SACS):
Elementary/Middle Commission.
1998-99 GEORGIA PUBLIC EDUCATION REPORT CARD Belmont Hills Elementary School - 6331052
Prepared by Georgia Department of Education
Page 5
1998-99 GEORGIA PUBLIC EDUCATION REPORT CARD
COBB COUNTY SCHOOLS
Big Shanty Elementary School - 6332052
Grade Range PK-5
The Georgia Public Education Report Card is designed to assist systems and schools in educational improvement. This report card contains a variety of data elements. An explanation of the terms is provided as a companion to the report card data. Please refer to the definitions for the most effective use of the reported data.
STUDENT DATA
Total
K-5
720
PK
16
Enrollment, by Race/Ethnicity and Sex
Black
White Hispanic
American Asian Indian
Multiracial
59 8.2%
593 82.4%
13 1.8%
33 4.6%
3 0.4%
19 2.6%
3 18.8%
11 68.8%
0 0.0%
0 0.0%
0 0.0%
2 12.5%
Male Female
391 54.3%
329 45.7%
9 56.3%
7 43.8%
Enrollment in Selected Programs
Program
Program % of Student Enrollment Population
Gifted (Grades K-12)
34
4.7%
Alternative Programs (Grades 6-12)
N/A
N/A
Students Eligible to Receive Free/Reduced Lunches
Number
Percent
School System
78 16,221
10.6% 17.8%
Dropout Rate *
Number
Rate
School System
N/A N/A
N/A N/A
* Dropout rates are not applicable for grades PK-5.
Enrollment in Compensatory Programs
Program
Program % of Student Enrollment Population
Special Education (Grades K-12)
77 10.7%
(PK)
22
N/A
English to Speakers of Other Languages (ESOL) (Grades K-12)
0
0.0%
Remedial Education (Grades 2-5, 9-12)
63 12.5%
Special Instructional Assistance (SIA) (Grades K-3)
84 18.1%
Title I (Grades K-12)
This school has no Title I program.
Total 5
Retained Students, by Race/Ethnicity and Sex
Black
White Hispanic
American MultiAsian Indian racial
1 20.0%
4 80.0%
0 0.0%
0 0.0%
0 0.0%
0 0.0%
Male Female
2
3
40.0% 60.0%
Prepared by Georgia Department of Education
Page 1
STATE-REQUIRED TEST DATA
NORM-REFERENCED TESTS Grade 3
Iowa Tests of Basic Skills (ITBS) Each chart reflects data for three years of testing.
Reading Comprehension 50
71 63 54 0
98-99
67 62 53 97-98
68 60 52 96-97
Mathematics
School 50
System
State
0
79 70 61 98-99
80 68 61 97-98
80 68 59 96-97
School System State
Reading Vocabulary 50
62 58 50 0
98-99
64 58 50 97-98
69 58 49 96-97
Language Arts
School 50
System
State
0
81 70 64 98-99
78 69 62 97-98
79 67 59 96-97
School System State
Social Studies 50
76 64 56 0
98-99
72 64 55 97-98
73 64 55 96-97
Science
School 50
System
State
0
79 70 59 98-99
75 70 59 97-98
74 69 58 96-97
School System State
Sources of Information
Composite Score
50
77 66 57 0
98-99
School 50
System
73 65 56 97-98
73 64 55 96-97
State 0
78 67 58 98-99
75 67 57 97-98
1998-99 GEORGIA PUBLIC EDUCATION REPORT CARD Big Shanty Elementary School - 6332052
Prepared by Georgia Department of Education
75 66 56 96-97
Scores Reported in Percentiles
School System State
Page 2
STATE-REQUIRED TEST DATA
NORM-REFERENCED TESTS Grade 5
Iowa Tests of Basic Skills (ITBS) Each chart reflects data for three years of testing.
Reading Comprehension
Mathematics
50
67 59 53 0
98-99
64 60 53 97-98
66 60 52 96-97
School 50
System
State
0
72 68 59 98-99
73 68 58 97-98
80 69 57 96-97
School System State
Reading Vocabulary 50
63 57 48 0
98-99
62 58 48 97-98
66 58 46 96-97
Language Arts
School 50
System
State
0
79 71 63 98-99
71 70 61 97-98
78 69 58 96-97
School System State
Social Studies 50
70 64 57 0
98-99
70 64 56 97-98
74 65 55 96-97
Science
School 50
System
State
0
74 68 60 98-99
76 69 59 97-98
75 70 59 96-97
School System State
Sources of Information
Composite Score
50
75 67 58 0
98-99
School 50
System
72 65 58 97-98
76 66 57 96-97
State 0
74 66 57 98-99
72 66 56 97-98
77 67 55 96-97
1998-99 GEORGIA PUBLIC EDUCATION REPORT CARD Big Shanty Elementary School - 6332052
Prepared by Georgia Department of Education
Scores Reported in Percentiles
School System State
Page 3
STATE-REQUIRED TEST DATA
PERFORMANCE ASSESSMENTS
Grade 5 Writing Assessment
Percent at Developmental Stages:
1998-99 School System State
1997-98 School System State
1996-97 School System State
Stage Stage Stage Stage Stage Stage
1:The Emerging Writer 2:The Developing Writer 3:The Focusing Writer 4:The Experimenting 5:The Engaging Writer 6:The Extending Writer
0% 0% 6% 37% 37% 19%
0% 1% 10% 36% 34% 19%
0% 1% 16% 41% 29% 12%
0% 1% 9% 45% 29% 15%
0% 1% 12% 37% 33% 16%
0% 3% 19% 41% 27% 10%
0% 3% 6% 25% 36% 29%
0% 1% 14% 34% 32% 18%
0% 3% 21% 37% 26% 12%
AWARDS / RECOGNITION DATA
Schools in Georgia may receive recognition in the following programs: Charter School Pay for Performance Program Georgia School of Excellence National Blue Ribbon School Big Shanty Elementary School did not receive recognition in any of these programs during the 1998-99 school year.
1998-99 GEORGIA PUBLIC EDUCATION REPORT CARD Big Shanty Elementary School - 6332052
Prepared by Georgia Department of Education
Page 4
CERTIFIED PERSONNEL DATA
Positions Number Average Contract Days
Personnel Sex
Certificate
Years Experience
Full-time Part-time
Male Female
4 Yr Bachelor's 5 Yr Master's 6 Yr Specialist's 7 Yr Doctoral Other*
<1 1-10 11-20 21-30 >30
Average
Administrators
2.00 235.00
2 0
0 2
0 0 2 0 0 0 0 1 1 0 21.00
Support Personnel
4.50 191.00
4 1
0 5
0 4 1 0 0 0 4 1 0 0 6.80
PK-12 Teachers
44.50 191.00
42 5
0 47
25 20
2 0 0 0 14 13 17 3 17.60
*Includes One- and Two-Year Vocational Certificates.
ACCREDITATION DATA
Accredited by Southern Association of Colleges and Schools (SACS):
Elementary/Middle Commission.
1998-99 GEORGIA PUBLIC EDUCATION REPORT CARD Big Shanty Elementary School - 6332052
Prepared by Georgia Department of Education
Page 5
1998-99 GEORGIA PUBLIC EDUCATION REPORT CARD
COBB COUNTY SCHOOLS
Birney Elementary School - 6330173
Grade Range PK-5
The Georgia Public Education Report Card is designed to assist systems and schools in educational improvement. This report card contains a variety of data elements. An explanation of the terms is provided as a companion to the report card data. Please refer to the definitions for the most effective use of the reported data.
STUDENT DATA
Total
K-5
824
PK
6
Enrollment, by Race/Ethnicity and Sex
Black
White Hispanic
American Asian Indian
Multiracial
377 45.8%
325 39.4%
76 9.2%
13 1.6%
3 0.4%
30 3.6%
5 83.3%
1 16.7%
0 0.0%
0 0.0%
0 0.0%
0 0.0%
Male Female
415 50.4%
409 49.6%
5 83.3%
1 16.7%
Enrollment in Selected Programs
Program
Program % of Student Enrollment Population
Gifted (Grades K-12)
9
1.1%
Alternative Programs (Grades 6-12)
N/A
N/A
Students Eligible to Receive Free/Reduced Lunches
Number
Percent
School System
402 16,221
48.4% 17.8%
Dropout Rate *
Number
Rate
School System
N/A N/A
N/A N/A
* Dropout rates are not applicable for grades PK-5.
Enrollment in Compensatory Programs
Program
Program % of Student Enrollment Population
Special Education (Grades K-12)
108 13.1%
(PK)
8
N/A
English to Speakers of Other Languages (ESOL) (Grades K-12)
38
4.6%
Remedial Education (Grades 2-5, 9-12)
105 18.3%
Special Instructional Assistance (SIA) (Grades K-3)
176 32.0%
Title I (Grades K-12)
This school has a Targeted Assistance program.
Total 5
Retained Students, by Race/Ethnicity and Sex
Black
White Hispanic
American MultiAsian Indian racial
1 20.0%
3
1
60.0% 20.0%
0 0.0%
0 0.0%
0 0.0%
Male Female
3
2
60.0% 40.0%
Prepared by Georgia Department of Education
Page 1
STATE-REQUIRED TEST DATA
NORM-REFERENCED TESTS Grade 3
Iowa Tests of Basic Skills (ITBS) Each chart reflects data for three years of testing.
Reading Comprehension 50
49 63 54 0
98-99
58 62 53 97-98
50 60 52 96-97
Mathematics
School 50
System
State
0
61 70 61 98-99
68 68 61 97-98
56 68 59 96-97
School System State
Reading Vocabulary 50
56 58 50 0
98-99
73 58 50 97-98
47 58 49 96-97
Language Arts
School 50
System
State
0
66 70 64 98-99
70 69 62 97-98
58 67 59 96-97
School System State
Social Studies 50
55 64 56 0
98-99
71 64 55 97-98
58 64 55 96-97
Science
School 50
System
State
0
58 70 59 98-99
73 70 59 97-98
55 69 58 96-97
School System State
Sources of Information
Composite Score
50
51 66 57 0
98-99
School 50
System
66 65 56 97-98
55 64 55 96-97
State 0
57 67 58 98-99
70 67 57 97-98
1998-99 GEORGIA PUBLIC EDUCATION REPORT CARD Birney Elementary School - 6330173
Prepared by Georgia Department of Education
55 66 56 96-97
Scores Reported in Percentiles
School System State
Page 2
STATE-REQUIRED TEST DATA
NORM-REFERENCED TESTS Grade 5
Iowa Tests of Basic Skills (ITBS) Each chart reflects data for three years of testing.
Reading Comprehension
Mathematics
50
39 59 53 0
98-99
51 60 53 97-98
49 60 52 96-97
School 50
System
State
0
49 68 59 98-99
58 68 58 97-98
51 69 57 96-97
School System State
Reading Vocabulary 50
32 57 48 0
98-99
48 58 48 97-98
41 58 46 96-97
Language Arts
School 50
System
State
0
58 71 63 98-99
59 70 61 97-98
56 69 58 96-97
School System State
Social Studies 50
41 64 57 0
98-99
54 64 56 97-98
50 65 55 96-97
Science
School 50
System
State
0
47 68 60 98-99
60 69 59 97-98
58 70 59 96-97
School System State
Sources of Information
Composite Score
50
50 67 58 0
98-99
School 50
System
56 65 58 97-98
50 66 57 96-97
State 0
45 66 57 98-99
55 66 56 97-98
51 67 55 96-97
1998-99 GEORGIA PUBLIC EDUCATION REPORT CARD Birney Elementary School - 6330173
Prepared by Georgia Department of Education
Scores Reported in Percentiles
School System State
Page 3
STATE-REQUIRED TEST DATA
PERFORMANCE ASSESSMENTS
Grade 5 Writing Assessment
Percent at Developmental Stages:
1998-99 School System State
1997-98 School System State
1996-97 School System State
Stage Stage Stage Stage Stage Stage
1:The Emerging Writer 2:The Developing Writer 3:The Focusing Writer 4:The Experimenting 5:The Engaging Writer 6:The Extending Writer
0% 2% 15% 46% 28% 10%
0% 1% 10% 36% 34% 19%
0% 1% 16% 41% 29% 12%
0% 1% 18% 35% 27% 18%
0% 1% 12% 37% 33% 16%
0% 3% 19% 41% 27% 10%
0% 2% 18% 35% 28% 17%
0% 1% 14% 34% 32% 18%
0% 3% 21% 37% 26% 12%
AWARDS / RECOGNITION DATA
Schools in Georgia may receive recognition in the following programs: Charter School Pay for Performance Program Georgia School of Excellence National Blue Ribbon School Birney Elementary School did not receive recognition in any of these programs during the 1998-99 school year.
1998-99 GEORGIA PUBLIC EDUCATION REPORT CARD Birney Elementary School - 6330173
Prepared by Georgia Department of Education
Page 4
CERTIFIED PERSONNEL DATA
Positions Number Average Contract Days
Personnel Sex
Certificate
Years Experience
Full-time Part-time
Male Female
4 Yr Bachelor's 5 Yr Master's 6 Yr Specialist's 7 Yr Doctoral Other*
<1 1-10 11-20 21-30 >30
Average
Administrators
2.51 226.10
2 1
1 2
0 2 1 0 0 0 0 1 2 0 19.33
Support Personnel
9.50 191.00
9 1
0 10
2 8 0 0 0 0 5 2 2 1 14.10
PK-12 Teachers
54.49 191.00
52 5
7 50
38 19
0 0 0 0 44 8 5 0 7.47
*Includes One- and Two-Year Vocational Certificates.
ACCREDITATION DATA
Accredited by Southern Association of Colleges and Schools (SACS):
Elementary/Middle Commission.
1998-99 GEORGIA PUBLIC EDUCATION REPORT CARD Birney Elementary School - 6330173
Prepared by Georgia Department of Education
Page 5
1998-99 GEORGIA PUBLIC EDUCATION REPORT CARD
COBB COUNTY SCHOOLS
Blackwell Elementary School - 6330399
Grade Range PK-5
The Georgia Public Education Report Card is designed to assist systems and schools in educational improvement. This report card contains a variety of data elements. An explanation of the terms is provided as a companion to the report card data. Please refer to the definitions for the most effective use of the reported data.
STUDENT DATA
Total
K-5
860
PK
24
Enrollment, by Race/Ethnicity and Sex
Black
White Hispanic
American Asian Indian
Multiracial
94 10.9%
661 76.9%
35 4.1%
46 5.3%
2 0.2%
22 2.6%
0 0.0%
21 87.5%
0 0.0%
0 0.0%
1 4.2%
2 8.3%
Male Female
433 50.3%
427 49.7%
19 79.2%
5 20.8%
Enrollment in Selected Programs
Program
Program % of Student Enrollment Population
Gifted (Grades K-12)
32
3.7%
Alternative Programs (Grades 6-12)
N/A
N/A
Students Eligible to Receive Free/Reduced Lunches
Number
Percent
School System
141 16,221
16.0% 17.8%
Dropout Rate *
Number
Rate
School System
N/A N/A
N/A N/A
* Dropout rates are not applicable for grades PK-5.
Enrollment in Compensatory Programs
Program
Program % of Student Enrollment Population
Special Education (Grades K-12)
79
9.2%
(PK)
27
N/A
English to Speakers of Other Languages (ESOL) (Grades K-12)
1
< 1%
Remedial Education (Grades 2-5, 9-12)
80 13.6%
Special Instructional Assistance (SIA) (Grades K-3)
120 21.5%
Title I (Grades K-12)
This school has no Title I program.
Total 5
Retained Students, by Race/Ethnicity and Sex
Black
White Hispanic
American MultiAsian Indian racial
0 0.0%
4 80.0%
0 0.0%
1 20.0%
0 0.0%
0 0.0%
Male Female
3
2
60.0% 40.0%
Prepared by Georgia Department of Education
Page 1
STATE-REQUIRED TEST DATA
NORM-REFERENCED TESTS Grade 3
Iowa Tests of Basic Skills (ITBS) Each chart reflects data for three years of testing.
Reading Comprehension 50
61 63 54 0
98-99
64 62 53 97-98
55 60 52 96-97
Mathematics
School 50
System
State
0
68 70 61 98-99
75 68 61 97-98
64 68 59 96-97
School System State
Reading Vocabulary 50
60 58 50 0
98-99
60 58 50 97-98
54 58 49 96-97
Language Arts
School 50
System
State
0
65 70 64 98-99
72 69 62 97-98
68 67 59 96-97
School System State
Social Studies 50
61 64 56 0
98-99
69 64 55 97-98
63 64 55 96-97
Science
School 50
System
State
0
70 70 59 98-99
73 70 59 97-98
65 69 58 96-97
School System State
Sources of Information
Composite Score
50
63 66 57 0
98-99
School 50
System
68 65 56 97-98
55 64 55 96-97
State 0
66 67 58 98-99
71 67 57 97-98
1998-99 GEORGIA PUBLIC EDUCATION REPORT CARD Blackwell Elementary School - 6330399
Prepared by Georgia Department of Education
62 66 56 96-97
Scores Reported in Percentiles
School System State
Page 2
STATE-REQUIRED TEST DATA
NORM-REFERENCED TESTS Grade 5
Iowa Tests of Basic Skills (ITBS) Each chart reflects data for three years of testing.
Reading Comprehension
Mathematics
50
56 59 53 0
98-99
59 60 53 97-98
63 60 52 96-97
School 50
System
State
0
65 68 59 98-99
67 68 58 97-98
75 69 57 96-97
School System State
Reading Vocabulary 50
54 57 48 0
98-99
60 58 48 97-98
60 58 46 96-97
Language Arts
School 50
System
State
0
64 71 63 98-99
71 70 61 97-98
72 69 58 96-97
School System State
Social Studies 50
60 64 57 0
98-99
65 64 56 97-98
66 65 55 96-97
Science
School 50
System
State
0
64 68 60 98-99
70 69 59 97-98
71 70 59 96-97
School System State
Sources of Information
Composite Score
50
59 67 58 0
98-99
School 50
System
64 65 58 97-98
65 66 57 96-97
State 0
61 66 57 98-99
67 66 56 97-98
69 67 55 96-97
1998-99 GEORGIA PUBLIC EDUCATION REPORT CARD Blackwell Elementary School - 6330399
Prepared by Georgia Department of Education
Scores Reported in Percentiles
School System State
Page 3
STATE-REQUIRED TEST DATA
PERFORMANCE ASSESSMENTS
Grade 5 Writing Assessment
Percent at Developmental Stages:
1998-99 School System State
1997-98 School System State
1996-97 School System State
Stage Stage Stage Stage Stage Stage
1:The Emerging Writer 2:The Developing Writer 3:The Focusing Writer 4:The Experimenting 5:The Engaging Writer 6:The Extending Writer
0% 1% 18% 38% 30% 14%
0% 1% 10% 36% 34% 19%
0% 1% 16% 41% 29% 12%
1% 3% 16% 42% 29% 8%
0% 1% 12% 37% 33% 16%
0% 3% 19% 41% 27% 10%
0% 0% 10% 32% 48% 10%
0% 1% 14% 34% 32% 18%
0% 3% 21% 37% 26% 12%
AWARDS / RECOGNITION DATA
Schools in Georgia may receive recognition in the following programs: Charter School Pay for Performance Program Georgia School of Excellence National Blue Ribbon School Blackwell Elementary School did not receive recognition in any of these programs during the 1998-99 school year.
1998-99 GEORGIA PUBLIC EDUCATION REPORT CARD Blackwell Elementary School - 6330399
Prepared by Georgia Department of Education
Page 4
CERTIFIED PERSONNEL DATA
Positions Number Average Contract Days
Personnel Sex
Certificate
Years Experience
Full-time Part-time
Male Female
4 Yr Bachelor's 5 Yr Master's 6 Yr Specialist's 7 Yr Doctoral Other*
<1 1-10 11-20 21-30 >30
Average
Administrators
2.00 235.00
2 0
0 2
0 1 1 0 0 0 0 1 1 0 21.50
Support Personnel
5.63 189.58
5 2
1 6
3 4 0 0 0 0 4 2 1 0 12.14
PK-12 Teachers
51.87 191.00
49 5
3 51
32 21
1 0 0 0 21 22 10 1 13.56
*Includes One- and Two-Year Vocational Certificates.
ACCREDITATION DATA
Accredited by Southern Association of Colleges and Schools (SACS):
Elementary/Middle Commission.
1998-99 GEORGIA PUBLIC EDUCATION REPORT CARD Blackwell Elementary School - 6330399
Prepared by Georgia Department of Education
Page 5
1998-99 GEORGIA PUBLIC EDUCATION REPORT CARD
COBB COUNTY SCHOOLS
Brown Elementary School - 6334052
Grade Range K-5
The Georgia Public Education Report Card is designed to assist systems and schools in educational improvement. This report card contains a variety of data elements. An explanation of the terms is provided as a companion to the report card data. Please refer to the definitions for the most effective use of the reported data.
STUDENT DATA
Total 319
K-5 Enrollment, by Race/Ethnicity and Sex
Black
White Hispanic
American Multi-
Asian Indian
racial
115 36.1%
133 41.7%
52 16.3%
2 0.6%
3 0.9%
14 4.4%
Male Female
188 58.9%
131 41.1%
Enrollment in Selected Programs
Program
Program % of Student Enrollment Population
Gifted (Grades K-12)
6
1.9%
Alternative Programs (Grades 6-12)
N/A
N/A
Students Eligible to Receive Free/Reduced Lunches
Number
Percent
School System
181 16,221
56.7% 17.8%
Dropout Rate *
Number
Rate
School System
N/A N/A
N/A N/A
* Dropout rates are not applicable for grades PK-5.
Enrollment in Compensatory Programs
Program
Program % of Student Enrollment Population
Special Education (Grades K-12)
70 21.9%
(PK)
1
N/A
English to Speakers of Other Languages (ESOL) (Grades K-12)
19
6.0%
Remedial Education (Grades 2-5, 9-12)
35 16.2%
Special Instructional Assistance (SIA) (Grades K-3)
76 35.8%
Title I (Grades K-12)
This school has a schoolwide program.
Total 12
Retained Students, by Race/Ethnicity and Sex
Black
White Hispanic
American Multi-
Asian Indian
racial
4 33.3%
3 25.0%
5 41.7%
0 0.0%
0 0.0%
0 0.0%
Male Female
7
5
58.3% 41.7%
Prepared by Georgia Department of Education
Page 1
STATE-REQUIRED TEST DATA
NORM-REFERENCED TESTS Grade 3
Iowa Tests of Basic Skills (ITBS) Each chart reflects data for three years of testing.
Reading Comprehension 50
43 63 54 0
98-99
51 62 53 97-98
46 60 52 96-97
Mathematics
School 50
System
State
0
55 70 61 98-99
54 68 61 97-98
42 68 59 96-97
School System State
Reading Vocabulary 50
40 58 50 0
98-99
41 58 50 97-98
43 58 49 96-97
Language Arts
School 50
System
State
0
55 70 64 98-99
57 69 62 97-98
43 67 59 96-97
School System State
Social Studies 50
53 64 56 0
98-99
52 64 55 97-98
50 64 55 96-97
Science
School 50
System
State
0
48 70 59 98-99
49 70 59 97-98
48 69 58 96-97
School System State
Sources of Information
Composite Score
50
48 66 57 0
98-99
School 50
System
50 65 56 97-98
46 64 55 96-97
State 0
48 67 58 98-99
50 67 57 97-98
1998-99 GEORGIA PUBLIC EDUCATION REPORT CARD Brown Elementary School - 6334052
Prepared by Georgia Department of Education
45 66 56 96-97
Scores Reported in Percentiles
School System State
Page 2
STATE-REQUIRED TEST DATA
NORM-REFERENCED TESTS Grade 5
Iowa Tests of Basic Skills (ITBS) Each chart reflects data for three years of testing.
Reading Comprehension
Mathematics
50
41 59 53 0
98-99
47 60 53 97-98
56 60 52 96-97
School 50
System
State
0
43 68 59 98-99
41 68 58 97-98
46 69 57 96-97
School System State
Reading Vocabulary 50
39 57 48 0
98-99
39 58 48 97-98
53 58 46 96-97
Language Arts
School 50
System
State
0
54 71 63 98-99
52 70 61 97-98
60 69 58 96-97
School System State
Social Studies 50
34 64 57 0
98-99
49 64 56 97-98
54 65 55 96-97
Science
School 50
System
State
0
42 68 60 98-99
53 69 59 97-98
58 70 59 96-97
School System State
Sources of Information
Composite Score
50
42 67 58 0
98-99
School 50
System
39 65 58 97-98
52 66 57 96-97
State 0
41 66 57 98-99
45 66 56 97-98
53 67 55 96-97
1998-99 GEORGIA PUBLIC EDUCATION REPORT CARD Brown Elementary School - 6334052
Prepared by Georgia Department of Education
Scores Reported in Percentiles
School System State
Page 3
STATE-REQUIRED TEST DATA
PERFORMANCE ASSESSMENTS
Grade 5 Writing Assessment
Percent at Developmental Stages:
1998-99 School System State
1997-98 School System State
1996-97 School System State
Stage Stage Stage Stage Stage Stage
1:The Emerging Writer 2:The Developing Writer 3:The Focusing Writer 4:The Experimenting 5:The Engaging Writer 6:The Extending Writer
0% 5% 8% 45% 39% 3%
0% 1% 10% 36% 34% 19%
0% 1% 16% 41% 29% 12%
0% 0% 24% 46% 22% 5%
0% 1% 12% 37% 33% 16%
0% 3% 19% 41% 27% 10%
0% 0% 25% 36% 31% 8%
0% 1% 14% 34% 32% 18%
0% 3% 21% 37% 26% 12%
AWARDS / RECOGNITION DATA
Schools in Georgia may receive recognition in the following programs: Charter School Pay for Performance Program Georgia School of Excellence National Blue Ribbon School Brown Elementary School did not receive recognition in any of these programs during the 1998-99 school year.
1998-99 GEORGIA PUBLIC EDUCATION REPORT CARD Brown Elementary School - 6334052
Prepared by Georgia Department of Education
Page 4
CERTIFIED PERSONNEL DATA
Positions Number Average Contract Days
Personnel Sex
Certificate
Years Experience
Full-time Part-time
Male Female
4 Yr Bachelor's 5 Yr Master's 6 Yr Specialist's 7 Yr Doctoral Other*
<1 1-10 11-20 21-30 >30
Average
Administrators
1.51 236.79
1 1
0 2
0 1 1 0 0 0 0 1 1 0 20.50
Support Personnel
4.00 191.00
4 0
0 4
2 1 1 0 0 0 3 1 0 0 10.75
PK-12 Teachers
25.49 191.00
23 5
2 26
13 15
0 0 0 0 18 7 2 1 10.68
*Includes One- and Two-Year Vocational Certificates.
ACCREDITATION DATA
Accredited by Southern Association of Colleges and Schools (SACS):
Elementary/Middle Commission.
1998-99 GEORGIA PUBLIC EDUCATION REPORT CARD Brown Elementary School - 6334052
Prepared by Georgia Department of Education
Page 5
1998-99 GEORGIA PUBLIC EDUCATION REPORT CARD
COBB COUNTY SCHOOLS
Brumby Elementary School - 6335052
Grade Range PK-5
The Georgia Public Education Report Card is designed to assist systems and schools in educational improvement. This report card contains a variety of data elements. An explanation of the terms is provided as a companion to the report card data. Please refer to the definitions for the most effective use of the reported data.
STUDENT DATA
Total
K-5
905
PK
2
Enrollment, by Race/Ethnicity and Sex
Black
White Hispanic
American Asian Indian
Multiracial
492 54.4%
182 20.1%
156 17.2%
33 3.6%
1 0.1%
41 4.5%
0
2
0.0% 100.0%
0 0.0%
0 0.0%
0 0.0%
0 0.0%
Male 447
49.4% 2
100.0%
Female 458
50.6% 0
0.0%
Enrollment in Selected Programs
Program
Program % of Student Enrollment Population
Gifted (Grades K-12)
0
0.0%
Alternative Programs (Grades 6-12)
N/A
N/A
Students Eligible to Receive Free/Reduced Lunches
Number
Percent
School System
405 16,221
44.7% 17.8%
Dropout Rate *
Number
Rate
School System
N/A N/A
N/A N/A
* Dropout rates are not applicable for grades PK-5.
Enrollment in Compensatory Programs
Program
Program % of Student Enrollment Population
Special Education (Grades K-12)
55
6.1%
(PK)
4
N/A
English to Speakers of Other Languages (ESOL) (Grades K-12)
129 14.3%
Remedial Education (Grades 2-5, 9-12)
71 11.9%
Special Instructional Assistance (SIA) (Grades K-3)
266 42.5%
Title I (Grades K-12)
This school has no Title I program.
Total 5
Retained Students, by Race/Ethnicity and Sex
Black
White Hispanic
American MultiAsian Indian racial
2 40.0%
1 20.0%
1 20.0%
1 20.0%
0 0.0%
0 0.0%
Male Female
3
2
60.0% 40.0%
Prepared by Georgia Department of Education
Page 1
STATE-REQUIRED TEST DATA
NORM-REFERENCED TESTS Grade 3
Iowa Tests of Basic Skills (ITBS) Each chart reflects data for three years of testing.
Reading Comprehension 50
46 63 54 0
98-99
44 62 53 97-98
45 60 52 96-97
Mathematics
School 50
System
State
0
44 70 61 98-99
53 68 61 97-98
49 68 59 96-97
School System State
Reading Vocabulary 50
38 58 50 0
98-99
36 58 50 97-98
42 58 49 96-97
Language Arts
School 50
System
State
0
42 70 64 98-99
47 69 62 97-98
48 67 59 96-97
School System State
Social Studies 50
44 64 56 0
98-99
48 64 55 97-98
53 64 55 96-97
Science
School 50
System
State
0
49 70 59 98-99
49 70 59 97-98
48 69 58 96-97
School System State
Sources of Information
Composite Score
50
43 66 57 0
98-99
School 50
System
45 65 56 97-98
44 64 55 96-97
State 0
43 67 58 98-99
46 67 57 97-98
1998-99 GEORGIA PUBLIC EDUCATION REPORT CARD Brumby Elementary School - 6335052
Prepared by Georgia Department of Education
46 66 56 96-97
Scores Reported in Percentiles
School System State
Page 2
STATE-REQUIRED TEST DATA
NORM-REFERENCED TESTS Grade 5
Iowa Tests of Basic Skills (ITBS) Each chart reflects data for three years of testing.
Reading Comprehension
Mathematics
50
49 59 53 0
98-99
47 60 53 97-98
46 60 52 96-97
School 50
System
State
0
50 68 59 98-99
49 68 58 97-98
44 69 57 96-97
School System State
Reading Vocabulary 50
45 57 48 0
98-99
42 58 48 97-98
41 58 46 96-97
Language Arts
School 50
System
State
0
53 71 63 98-99
53 70 61 97-98
54 69 58 96-97
School System State
Social Studies 50
53 64 57 0
98-99
41 64 56 97-98
50 65 55 96-97
Science
School 50
System
State
0
52 68 60 98-99
48 69 59 97-98
59 70 59 96-97
School System State
Sources of Information
Composite Score
50
53 67 58 0
98-99
School 50
System
49 65 58 97-98
52 66 57 96-97
State 0
50 66 57 98-99
46 66 56 97-98
49 67 55 96-97
1998-99 GEORGIA PUBLIC EDUCATION REPORT CARD Brumby Elementary School - 6335052
Prepared by Georgia Department of Education
Scores Reported in Percentiles
School System State
Page 3
STATE-REQUIRED TEST DATA
PERFORMANCE ASSESSMENTS
Grade 5 Writing Assessment
Percent at Developmental Stages:
1998-99 School System State
1997-98 School System State
1996-97 School System State
Stage Stage Stage Stage Stage Stage
1:The Emerging Writer 2:The Developing Writer 3:The Focusing Writer 4:The Experimenting 5:The Engaging Writer 6:The Extending Writer
0% 2% 15% 37% 31% 15%
0% 1% 10% 36% 34% 19%
0% 1% 16% 41% 29% 12%
1% 5% 23% 45% 23% 4%
0% 1% 12% 37% 33% 16%
0% 3% 19% 41% 27% 10%
1% 4% 21% 36% 30% 4%
0% 1% 14% 34% 32% 18%
0% 3% 21% 37% 26% 12%
AWARDS / RECOGNITION DATA
Schools in Georgia may receive recognition in the following programs: Charter School Pay for Performance Program Georgia School of Excellence National Blue Ribbon School Brumby Elementary School did not receive recognition in any of these programs during the 1998-99 school year.
1998-99 GEORGIA PUBLIC EDUCATION REPORT CARD Brumby Elementary School - 6335052
Prepared by Georgia Department of Education
Page 4
CERTIFIED PERSONNEL DATA
Positions Number Average Contract Days
Personnel Sex
Certificate
Years Experience
Full-time Part-time
Male Female
4 Yr Bachelor's 5 Yr Master's 6 Yr Specialist's 7 Yr Doctoral Other*
<1 1-10 11-20 21-30 >30
Average
Administrators
3.00 220.33
3 0
1 2
0 0 3 0 0 0 0 1 2 0 20.33
Support Personnel
8.75 190.09
8 1
0 9
1 7 1 0 0 0 3 3 3 0 15.78
PK-12 Teachers
56.75 191.00
54 5
4 55
39 18
1 1 0 0 39 15 4 1 9.03
*Includes One- and Two-Year Vocational Certificates.
ACCREDITATION DATA
Accredited by Southern Association of Colleges and Schools (SACS):
Elementary/Middle Commission.
1998-99 GEORGIA PUBLIC EDUCATION REPORT CARD Brumby Elementary School - 6335052
Prepared by Georgia Department of Education
Page 5
1998-99 GEORGIA PUBLIC EDUCATION REPORT CARD
COBB COUNTY SCHOOLS
Bryant Elementary School - 6330592
Grade Range PK-5
The Georgia Public Education Report Card is designed to assist systems and schools in educational improvement. This report card contains a variety of data elements. An explanation of the terms is provided as a companion to the report card data. Please refer to the definitions for the most effective use of the reported data.
STUDENT DATA
Total
K-5
961
PK
2
Enrollment, by Race/Ethnicity and Sex
Black
White Hispanic
American Asian Indian
Multiracial
742 77.2%
125 13.0%
63 6.6%
8 0.8%
1 0.1%
22 2.3%
1 50.0%
1 50.0%
0 0.0%
0 0.0%
0 0.0%
0 0.0%
Male Female
494 51.4%
467 48.6%
1 50.0%
1 50.0%
Enrollment in Selected Programs
Program
Program % of Student Enrollment Population
Gifted (Grades K-12)
16
1.7%
Alternative Programs (Grades 6-12)
N/A
N/A
Students Eligible to Receive Free/Reduced Lunches
Number
Percent
School System
560 16,221
58.2% 17.8%
Dropout Rate *
Number
Rate
School System
N/A N/A
N/A N/A
* Dropout rates are not applicable for grades PK-5.
Enrollment in Compensatory Programs
Program
Program % of Student Enrollment Population
Special Education (Grades K-12)
110 11.4%
(PK)
1
N/A
English to Speakers of Other Languages (ESOL) (Grades K-12)
23
2.4%
Remedial Education (Grades 2-5, 9-12)
161 24.1%
Special Instructional Assistance (SIA) (Grades K-3)
295 46.1%
Title I (Grades K-12)
This school has a schoolwide program.
Total 5
Retained Students, by Race/Ethnicity and Sex
Black
White Hispanic
American MultiAsian Indian racial
3 60.0%
1
1
20.0% 20.0%
0 0.0%
0 0.0%
0 0.0%
Male Female
3
2
60.0% 40.0%
Prepared by Georgia Department of Education
Page 1
STATE-REQUIRED TEST DATA
NORM-REFERENCED TESTS Grade 3
Iowa Tests of Basic Skills (ITBS) Each chart reflects data for three years of testing.
Reading Comprehension 50
31 63 54 0
98-99
31 62 53 97-98
30 60 52 96-97
Mathematics
School 50
System
State
0
40 70 61 98-99
33 68 61 97-98
36 68 59 96-97
School System State
Reading Vocabulary 50
25 58 50 0
98-99
28 58 50 97-98
24 58 49 96-97
Language Arts
School 50
System
State
0
42 70 64 98-99
36 69 62 97-98
38 67 59 96-97
School System State
Social Studies 50
31 64 56 0
98-99
31 64 55 97-98
33 64 55 96-97
Science
School 50
System
State
0
35 70 59 98-99
33 70 59 97-98
38 69 58 96-97
School System State
Sources of Information
Composite Score
50
37 66 57 0
98-99
School 50
System
31 65 56 97-98
36 64 55 96-97
State 0
33 67 58 98-99
31 67 57 97-98
1998-99 GEORGIA PUBLIC EDUCATION REPORT CARD Bryant Elementary School - 6330592
Prepared by Georgia Department of Education
33 66 56 96-97
Scores Reported in Percentiles
School System State
Page 2
STATE-REQUIRED TEST DATA
NORM-REFERENCED TESTS Grade 5
Iowa Tests of Basic Skills (ITBS) Each chart reflects data for three years of testing.
Reading Comprehension
Mathematics
50
37 59 53 0
98-99
32 60 53 97-98
40 60 52 96-97
School 50
System
State
0
40 68 59 98-99
37 68 58 97-98
43 69 57 96-97
School System State
Reading Vocabulary 50
31 57 48 0
98-99
29 58 48 97-98
31 58 46 96-97
Language Arts
School 50
System
State
0
47 71 63 98-99
47 70 61 97-98
46 69 58 96-97
School System State
Social Studies 50
34 64 57 0
98-99
29 64 56 97-98
39 65 55 96-97
Science
School 50
System
State
0
39 68 60 98-99
34 69 59 97-98
38 70 59 96-97
School System State
Sources of Information
Composite Score
50
42 67 58 0
98-99
School 50
System
39 65 58 97-98
39 66 57 96-97
State 0
38 66 57 98-99
35 66 56 97-98
38 67 55 96-97
1998-99 GEORGIA PUBLIC EDUCATION REPORT CARD Bryant Elementary School - 6330592
Prepared by Georgia Department of Education
Scores Reported in Percentiles
School System State
Page 3
STATE-REQUIRED TEST DATA
PERFORMANCE ASSESSMENTS
Grade 5 Writing Assessment
Percent at Developmental Stages:
1998-99 School System State
1997-98 School System State
1996-97 School System State
Stage Stage Stage Stage Stage Stage
1:The Emerging Writer 2:The Developing Writer 3:The Focusing Writer 4:The Experimenting 5:The Engaging Writer 6:The Extending Writer
0% 1% 31% 46% 17% 4%
0% 1% 10% 36% 34% 19%
0% 1% 16% 41% 29% 12%
1% 3% 31% 45% 17% 1%
0% 1% 12% 37% 33% 16%
0% 3% 19% 41% 27% 10%
1% 6% 42% 31% 14% 3%
0% 1% 14% 34% 32% 18%
0% 3% 21% 37% 26% 12%
AWARDS / RECOGNITION DATA
Schools that become a Charter School have a unique opportunity to rethink how they structure and deliver education programs for improving the learning of their students while being freed from the state laws, State Board of Education rules and regulations, and local board of education rules and regulations that govern other schools. A 'charter' is a binding contract that, when approved by the faculty and parents of the school, the local board of education and the State Board of Education, substitutes for state education statutes, state and local rules, policies, regulations and standards.
Bryant Elementary School is a Charter School for 1998-99.
1998-99 GEORGIA PUBLIC EDUCATION REPORT CARD Bryant Elementary School - 6330592
Prepared by Georgia Department of Education
Page 4
CERTIFIED PERSONNEL DATA
Positions Number Average Contract Days
Personnel Sex
Certificate
Years Experience
Full-time Part-time
Male Female
4 Yr Bachelor's 5 Yr Master's 6 Yr Specialist's 7 Yr Doctoral Other*
<1 1-10 11-20 21-30 >30
Average
Administrators
2.00 235.00
2 0
0 2
0 0 2 0 0 0 0 1 1 0 18.50
Support Personnel
9.00 191.00
9 0
2 7
2 4 2 1 0 0 3 5 1 0 11.22
PK-12 Teachers
63.00 191.00
63 0
0 63
41 18
4 0 0 0 44 13 6 0 9.16
*Includes One- and Two-Year Vocational Certificates.
ACCREDITATION DATA
Accredited by Southern Association of Colleges and Schools (SACS):
Elementary/Middle Commission.
1998-99 GEORGIA PUBLIC EDUCATION REPORT CARD Bryant Elementary School - 6330592
Prepared by Georgia Department of Education
Page 5
1998-99 GEORGIA PUBLIC EDUCATION REPORT CARD
COBB COUNTY SCHOOLS
Campbell High School - 6331054
Grade Range 9-12
The Georgia Public Education Report Card is designed to assist systems and schools in educational improvement. This report card contains a variety of data elements. An explanation of the terms is provided as a companion to the report card data. Please refer to the definitions for the most effective use of the reported data.
Total 1,936
STUDENT DATA
9-12 Enrollment, by Race/Ethnicity and Sex
Black
White Hispanic
American Multi-
Asian Indian
racial
799 41.3%
854 44.1%
173 8.9%
87 4.5%
2 0.1%
21 1.1%
Male Female
992 51.2%
944 48.8%
Enrollment in Selected Programs
Program
Gifted (Grades K-12)
Program % of Student Enrollment Population
217
11.2%
Non-Vocational Labs (Grades 9-12)
973
Vocational Labs
(Grades 9-12)
678
Alternative Programs (Grades 6-12)
8
50.3% 35.0%
< 1%
Students Eligible to Receive Free/Reduced Lunches
Number
Percent
School System
437 16,221
22.6% 17.8%
Enrollment in Compensatory Programs
Program
Program % of Student Enrollment Population
Special Education (Grades K-12) PK
169
8.7%
0
N/A
English to Speakers of Other Languages (ESOL) (Grades K-12)
97
5.0%
Remedial Education (Grades 2-5, 9-12)
332 17.1%
Title I (Grades K-12)
This school has no Title I program.
Dropout Rate for Grades 9-12
Number
Rate
School System
84 1,055
3.9% 3.7%
Total 144
Retained Students, by Race/Ethnicity and Sex
Black
White Hispanic
American MultiAsian Indian racial
77 53.5%
50 34.7%
14 9.7%
3 2.1%
0 0.0%
0 0.0%
Male Female
92
52
63.9% 36.1%
Prepared by Georgia Department of Education
Page 1
STATE-REQUIRED TEST DATA
GEORGIA HIGH SCHOOL GRADUATION TESTS (GHSGT)
Percent of Regular Program 11th Graders Passing the Georgia High School Graduation Tests on First Administration
English Language Arts Mathematics Social Studies Science
All Components listed above
Writing
1998-99
School System State
96% 85% 81% 73%
98% 94% 90% 85%
96% 88% 80% 72%
67% 82% 68%
95% 97% 93%
1997-98
School System State
95% 85% 80% 77%
98% 95% 89% 88%
94% 88% 78% 74%
67% 84% 68%
93% 96% 92%
1996-97
School System State
95% 86% 75% 76%
97% 94% 89% 89%
94% 87% 78% 74%
67% 84% 67%
96% 97% 93%
GRADUATE DATA
1999 Graduates by Credentials, Race/Ethnicity and Sex
Diplomas with Both College Prep. & Voc. Endorsements
Diplomas with College Prep. Endorsements Diplomas with Vocational Endorsements General High School Diplomas Special Education Diplomas
Total All Diplomas
Certificates of Performance
Total Graduates
Total 33
182 15 5 7
242 33
275
Black
18 54.5%
69 37.9%
6 40.0%
1 20.0%
4 57.1%
98 40.5%
21 63.6%
119 43.3%
White Hispanic
11 33.3%
97 53.3%
3 9.1%
11 6.0%
8 53.3%
2 40.0%
2 28.6%
1 6.7%
2 40.0%
1 14.3%
120 49.6%
18 7.4%
5
6
15.2% 18.2%
125 45.5%
24 8.7%
American MultiAsian Indian racial
0 0.0%
4 2.2%
0 0.0%
0 0.0%
1 3.0%
1 0.5%
0 0.0%
0 0.0%
0 0.0%
0 0.0%
0 0.0%
0 0.0%
0 0.0%
0 0.0%
0 0.0%
4 1.7%
0 0.0%
2 0.8%
1 3.0%
0 0.0%
0 0.0%
5 1.8%
0 0.0%
2 0.7%
Male Female
14 42.4%
75 41.2%
19 57.6%
107 58.8%
8 53.3%
3 60.0%
5 71.4%
7 46.7%
2 40.0%
2 28.6%
105
137
43.4% 56.6%
9
24
27.3% 72.7%
114
161
41.5% 58.5%
HOPE Scholarships
School System
Number of 1999 Graduates 2 7 5
Number Eligible
195
Percent Eligible
70.9%
5,022 3,850 76.7%
State
65,548 40,292 61.5%
High School Completion Rate
Percent of 1995Grade 9 Enrollment in Graduating Class of1999 School System State
Completion Rate '95-'99 74.7% 83.6% 68.9%
1998-99 GEORGIA PUBLIC EDUCATION REPORT CARD
Campbell High School - 6331054
Prepared by Georgia Department of Education
Page 2
COLLEGE ADMISSIONS / CREDIT TEST DATA
Scholastic Assessment Test (SAT)
Based on students' highest verbal and highest math scores
No. Taking
Average Score
Tests Verbal Math Total
Based on students' last test administration
Average Score Verbal Math Total
School
193
College Prep. Endorsement
Other Diplomas
System
4,180
College Prep. Endorsement
Other Diplomas
Georgia
41,958
478 463
941
494 476
970
453 373
826
523 522 1045 532 532 1064
402 387
789
492 488
980
467 N/A N/A
514 N/A N/A
483
457 N/A N/A
513 N/A N/A
479
924 N/A N/A
1027 N/A N/A
962
Nation
952,913 N/A N/A N/A
502 508 1010
American College Testing (ACT)
Advanced Placement Exams (AP)
Number taking tests: English Mathematics Reading Science Reasoning CompositeScore
5 0 School System State
16.7 20.2 19.1
17.6 21.2 19.9
18.3 18.5
21.4 21.1
20.2 19.9
17.9 21.1 19.9
No. of Students Taking Tests
No. of Tests Taken No. of Test Scores
3 or Higher Percent of Test
Scores 3 or Higher
School 66
113 64
56.6%
System State 1,291 15,225 2,524 23,969 1,885 13,024
74.7% 54.3%
POST-SECONDARY DATA
Graduates Entering Georgia Public Colleges
Graduates Entering Georgia Public Colleges and Requiring Learning Support (LS)
1998 Graduates Entering in 1998-99
1997 Graduates Entering in 1997-98
Percent of Graduating Number Class
School
100
33.7%
System 2,220 46.3%
School
90
35.7%
System 2,229 48.4%
Number Requiring
LS 16 213
21 312
Percent of those attending Georgia
Public Colleges
16.0%
9.6%
23.3%
14.0%
In previous years, the Report Card presented College Prep Curriculum information provided by the Board of Regents on students requiring Learning Support. Due to inconsistencies in the data provided by the Board of Regents in defining College Prep Completers versus Local Board of Education data defining College Prep Endorsements, the Department of Education Report Card will not provide this information until discrepancies can be reconciled.
Graduates Entering Georgia Public Technical and Adult Schools
1998 Graduates School System
Entering Number 22 213
1998-99 Percent
7.4% 4.4%
Entering Number N/A N/A
1997-98 Percent
N/A N/A
1997 Graduates School
3
1.2%
System
22
0.5%
19
7.5%
192
4.2%
1998-99 GEORGIA PUBLIC EDUCATION REPORT CARD Campbell High School - 6331054
Prepared by Georgia Department of Education
Page 3
CERTIFIED PERSONNEL DATA
Positions Number Average Contract Days
Administrators
5.00 214.40
Support Personnel
9.77 192.95
PK-12 Teachers
105.23 191.00
Personnel Sex
Certificate
Years Experience
Full-time Part-time
Male Female
4 Yr Bachelor's 5 Yr Master's 6 Yr Specialist's 7 Yr Doctoral Other*
<1 1-10 11-20 21-30 >30
Average
5 0
2 3
0 3 2 0 0
0 1 1 2 1
20.60
8 28
18 18
20 11
3 2 0
0 21 10
3 2
11.42
78 30
42 66
56 37
9 5 1
0 59 31 16
2
11.27
*Includes One- and Two-Year Vocational Certificates.
ACCREDITATION DATA
Accredited by Southern Association of Colleges and Schools (SACS): Secondary/Middle Commission.
AWARDS / RECOGNITION DATA
Schools in Georgia may receive recognition in the following programs: Charter School Pay for Performance Program Georgia School of Excellence National Blue Ribbon School Campbell High School did not receive recognition in any of these programs during the 1998-99 school year.
1998-99 GEORGIA PUBLIC EDUCATION REPORT CARD Campbell High School - 6331054
Prepared by Georgia Department of Education
Page 4
1998-99 GEORGIA PUBLIC EDUCATION REPORT CARD
COBB COUNTY SCHOOLS
Campbell Middle School - 6330290
Grade Range 6-8
The Georgia Public Education Report Card is designed to assist systems and schools in educational improvement. This report card contains a variety of data elements. An explanation of the terms is provided as a companion to the report card data. Please refer to the definitions for the most effective use of the reported data.
STUDENT DATA
Total 1,117
6-8 Enrollment, by Race/Ethnicity and Sex
Black
White Hispanic
American Multi-
Asian Indian
racial
516 46.2%
384 34.4%
174 15.6%
27 2.4%
1 0.1%
15 1.3%
Male 602
53.9%
Female 515
46.1%
Enrollment in Selected Programs
Program
Gifted (Grades K-12)
Program % of Student Enrollment Population
68
6.1%
Alternative Programs (Grades 6-12)
0
0.0%
Students Eligible to Receive Free/Reduced Lunches
Number
Percent
School System
660 16,221
59.1% 17.8%
Enrollment in Compensatory Programs
Program
Program % of Student Enrollment Population
Special Education (Grades K-12) (PK)
186 16.7%
0
N/A
English to Speakers of Other Languages (ESOL) (Grades K-12)
102
9.1%
Title I (Grades K-12)
This school has no Title I program.
Dropout Rate for Grades 6-8
Number
Rate
School System
4
0.3%
19
0.1%
Total 33
Retained Students, by Race/Ethnicity and Sex
Black
White Hispanic
American MultiAsian Indian racial
15 45.5%
10
8
30.3% 24.2%
0 0.0%
0 0.0%
0 0.0%
Male Female
26
7
78.8% 21.2%
Prepared by Georgia Department of Education
Page 1
STATE-REQUIRED TEST DATA
NORM-REFERENCED TESTS Grade 8
Iowa Tests of Basic Skills (ITBS) Each chart reflects data for three years of testing.
Reading Comprehension 50
38 61 49 0
98-99
40 61 48 97-98
39 62 48 96-97
Mathematics
School 50
System
State
0
36 66 56 98-99
40 66 55 97-98
40 67 54 96-97
School System State
Reading Vocabulary 50
37 57 46 0
98-99
34 57 45 97-98
33 58 44 96-97
Language Arts
School 50
System
State
0
45 70 60 98-99
51 68 58 97-98
41 68 56 96-97
School System State
Social Studies 50
41 64 54 0
98-99
44 64 53 97-98
42 65 53 96-97
Science
School 50
System
State
0
41 66 56 98-99
44 67 55 97-98
43 67 53 96-97
School System State
Sources of Information
Composite Score
50
46 67 57 0
98-99
School 50
System
48 66 56 97-98
44 67 55 96-97
State 0
40 67 56 98-99
44 66 54 97-98
1998-99 GEORGIA PUBLIC EDUCATION REPORT CARD Campbell Middle School - 6330290
Prepared by Georgia Department of Education
41 67 54 96-97
Scores Reported in Percentiles
School System State
Page 2
STATE-REQUIRED TEST DATA
Categories of Scaled Scores
Inadequate (less than 162)
Minimal (162-209)
Good
(210-247)
Very Good (greater than 247)
Average Scaled Score: (Range 100-300)
PERFORMANCE ASSESSMENTS
Grade 8 Writing Assessment
1998-99 Percent Scoring
1997-98 Percent Scoring
1996-97 Percent Scoring
School System State School System State School System State
7% 44% 41%
8%
2% 25% 50% 24%
8% 40% 41% 11%
14% 55% 29%
2%
3% 33% 47% 17%
11% 46% 34%
8%
12% 56% 31%
1%
5% 36% 43% 16%
15% 46% 30%
8%
206
225
208 194
218 202 196
215 198
AWARDS / RECOGNITION DATA
Schools in Georgia may receive recognition in the following programs: Charter School Pay for Performance Program Georgia School of Excellence National Blue Ribbon School Campbell Middle School did not receive recognition in any of these programs during the 1998-99 school year.
1998-99 GEORGIA PUBLIC EDUCATION REPORT CARD Campbell Middle School - 6330290
Prepared by Georgia Department of Education
Page 3
CERTIFIED PERSONNEL DATA
Positions Number Average Contract Days
Personnel Sex
Certificate
Years Experience
Full-time Part-time
Male Female
4 Yr Bachelor's 5 Yr Master's 6 Yr Specialist's 7 Yr Doctoral Other*
<1 1-10 11-20 21-30 >30
Average
Administrators
5.00 212.40
5 0
0 5
0 2 3 0 0 0 1 4 0 0 13.40
Support Personnel
5.26 191.00
5 4
4 5
3 3 2 1 0 0 5 4 0 0 10.44
PK-12 Teachers
79.24 191.00
74 7
17 64
49 30
2 0 0 0 53 17 11 0 8.79
*Includes One- and Two-Year Vocational Certificates.
ACCREDITATION DATA
Accredited by Southern Association of Colleges and Schools (SACS):
Elementary/Middle Commission.
1998-99 GEORGIA PUBLIC EDUCATION REPORT CARD Campbell Middle School - 6330290
Prepared by Georgia Department of Education
Page 4
1998-99 GEORGIA PUBLIC EDUCATION REPORT CARD
COBB COUNTY SCHOOLS
Chalker Elementary School - 6330198
Grade Range K-5
The Georgia Public Education Report Card is designed to assist systems and schools in educational improvement. This report card contains a variety of data elements. An explanation of the terms is provided as a companion to the report card data. Please refer to the definitions for the most effective use of the reported data.
STUDENT DATA
Total 920
K-5 Enrollment, by Race/Ethnicity and Sex
Black
White Hispanic
American Multi-
Asian Indian
racial
98 10.7%
722 78.5%
27 2.9%
56 6.1%
3 0.3%
14 1.5%
Male Female
468 50.9%
452 49.1%
Enrollment in Selected Programs
Program
Program % of Student Enrollment Population
Gifted (Grades K-12)
37
4.0%
Alternative Programs (Grades 6-12)
N/A
N/A
Students Eligible to Receive Free/Reduced Lunches
Number
Percent
School System
64 16,221
7.0% 17.8%
Dropout Rate *
Number
Rate
School System
N/A N/A
N/A N/A
* Dropout rates are not applicable for grades PK-5.
Enrollment in Compensatory Programs
Program
Program % of Student Enrollment Population
Special Education (Grades K-12)
75
8.2%
(PK)
1
N/A
English to Speakers of Other Languages (ESOL) (Grades K-12)
0
0.0%
Remedial Education (Grades 2-5, 9-12)
67 11.0%
Special Instructional Assistance (SIA) (Grades K-3)
79 12.5%
Title I (Grades K-12)
This school has no Title I program.
Total 5
Retained Students, by Race/Ethnicity and Sex
Black
White Hispanic
American Multi-
Asian Indian
racial
0
5
0.0% 100.0%
0 0.0%
0 0.0%
0 0.0%
0 0.0%
Male Female
4
1
80.0% 20.0%
Prepared by Georgia Department of Education
Page 1
STATE-REQUIRED TEST DATA
NORM-REFERENCED TESTS Grade 3
Iowa Tests of Basic Skills (ITBS) Each chart reflects data for three years of testing.
Reading Comprehension 50
66 63 54 0
98-99
69 62 53 N/A 60 52
97-98
96-97
Mathematics
School 50
System
State
0
70 70 61 98-99
85 68 61 N/A 68 59
97-98
96-97
School System State
Reading Vocabulary 50
63 58 50 0
98-99
68 58 50 N/A 58 49
97-98
96-97
Language Arts
School 50
System
State
0
75 70 64 98-99
76 69 62 N/A 67 59
97-98
96-97
School System State
Social Studies 50
69 64 56 0
98-99
78 64 55 N/A 64 55
97-98
96-97
Science
School 50
System
State
0
70 70 59 98-99
83 70 59 N/A 69 58
97-98
96-97
School System State
Sources of Information
Composite Score
50
69 66 57 0
98-99
School 50
System
76 65 56 N/A 64 55
97-98
96-97
State 0
70 67 58 98-99
79 67 57 N/A 66 56
97-98
96-97
1998-99 GEORGIA PUBLIC EDUCATION REPORT CARD Chalker Elementary School - 6330198
Prepared by Georgia Department of Education
Scores Reported in Percentiles
School System State
Page 2
STATE-REQUIRED TEST DATA
NORM-REFERENCED TESTS Grade 5
Iowa Tests of Basic Skills (ITBS) Each chart reflects data for three years of testing.
Reading Comprehension
Mathematics
50
60 59 53 0
98-99
66 60 53 N/A 60 52
97-98
96-97
School 50
System
State
0
69 68 59 98-99
76 68 58 N/A 69 57
97-98
96-97
School System State
Reading Vocabulary 50
60 57 48 0
98-99
65 58 48 N/A 58 46
97-98
96-97
Language Arts
School 50
System
State
0
71 71 63 98-99
75 70 61 N/A 69 58
97-98
96-97
School System State
Social Studies 50
67 64 57 0
98-99
68 64 56 N/A 65 55
97-98
96-97
Science
School 50
System
State
0
73 68 60 98-99
77 69 59 N/A 70 59
97-98
96-97
School System State
Sources of Information
Composite Score
50
65 67 58 0
98-99
School 50
System
71 65 58 N/A 66 57
97-98
96-97
State 0
69 66 57 98-99
74 66 56 N/A 67 55
97-98
96-97
1998-99 GEORGIA PUBLIC EDUCATION REPORT CARD Chalker Elementary School - 6330198
Prepared by Georgia Department of Education
Scores Reported in Percentiles
School System State
Page 3
STATE-REQUIRED TEST DATA
PERFORMANCE ASSESSMENTS
Grade 5 Writing Assessment
Percent at Developmental Stages:
1998-99 School System State
1997-98 School System State
1996-97 School System State
Stage Stage Stage Stage Stage Stage
1:The Emerging Writer 2:The Developing Writer 3:The Focusing Writer 4:The Experimenting 5:The Engaging Writer 6:The Extending Writer
0% 1% 9% 34% 39% 17%
0% 1% 10% 36% 34% 19%
0% 1% 16% 41% 29% 12%
0% 2% 2% 39% 35% 20%
0% 1% 12% 37% 33% 16%
0% 3% 19% 41% 27% 10%
N/A N/A N/A N/A N/A N/A
0% 1% 14% 34% 32% 18%
0% 3% 21% 37% 26% 12%
AWARDS / RECOGNITION DATA
Schools in Georgia may receive recognition in the following programs: Charter School Pay for Performance Program Georgia School of Excellence National Blue Ribbon School Chalker Elementary School did not receive recognition in any of these programs during the 1998-99 school year.
1998-99 GEORGIA PUBLIC EDUCATION REPORT CARD Chalker Elementary School - 6330198
Prepared by Georgia Department of Education
Page 4
CERTIFIED PERSONNEL DATA
Positions Number Average Contract Days
Personnel Sex
Certificate
Years Experience
Full-time Part-time
Male Female
4 Yr Bachelor's 5 Yr Master's 6 Yr Specialist's 7 Yr Doctoral Other*
<1 1-10 11-20 21-30 >30
Average
Administrators
3.00 220.33
3 0
0 3
0 0 3 0 0 0 0 1 2 0 23.67
Support Personnel
6.00 189.67
6 0
1 5
1 5 0 0 0 0 2 3 1 0 13.17
PK-12 Teachers
52.50 191.00
52 1
2 51
35 18
0 0 0 0 46 6 1 0 6.83
*Includes One- and Two-Year Vocational Certificates.
ACCREDITATION DATA
Accredited by Southern Association of Colleges and Schools (SACS):
Elementary/Middle Commission.
1998-99 GEORGIA PUBLIC EDUCATION REPORT CARD Chalker Elementary School - 6330198
Prepared by Georgia Department of Education
Page 5
1998-99 GEORGIA PUBLIC EDUCATION REPORT CARD
COBB COUNTY SCHOOLS
Cheatham Hill Elementary School - 6330298
Grade Range PK-5
The Georgia Public Education Report Card is designed to assist systems and schools in educational improvement. This report card contains a variety of data elements. An explanation of the terms is provided as a companion to the report card data. Please refer to the definitions for the most effective use of the reported data.
STUDENT DATA
Total
K-5
1,007
PK
26
Enrollment, by Race/Ethnicity and Sex
Black
White Hispanic
American Asian Indian
Multiracial
155 15.4%
792 78.6%
18 1.8%
19 1.9%
2 0.2%
21 2.1%
2 7.7%
24 92.3%
0 0.0%
0 0.0%
0 0.0%
0 0.0%
Male Female
510 50.6%
497 49.4%
18 69.2%
8 30.8%
Enrollment in Selected Programs
Program
Program % of Student Enrollment Population
Gifted (Grades K-12)
57
5.7%
Alternative Programs (Grades 6-12)
N/A
N/A
Students Eligible to Receive Free/Reduced Lunches
Number
Percent
School System
108 16,221
10.5% 17.8%
Dropout Rate *
Number
Rate
School System
N/A N/A
N/A N/A
* Dropout rates are not applicable for grades PK-5.
Enrollment in Compensatory Programs
Program
Program % of Student Enrollment Population
Special Education (Grades K-12)
101 10.0%
(PK)
33
N/A
English to Speakers of Other Languages (ESOL) (Grades K-12)
0
0.0%
Remedial Education (Grades 2-5, 9-12)
88 13.3%
Special Instructional Assistance (SIA) (Grades K-3)
76 11.0%
Title I (Grades K-12)
This school has no Title I program.
Total 9
Retained Students, by Race/Ethnicity and Sex
Black
White Hispanic
American MultiAsian Indian racial
4 44.4%
4
1
44.4% 11.1%
0 0.0%
0 0.0%
0 0.0%
Male Female
6
3
66.7% 33.3%
Prepared by Georgia Department of Education
Page 1
STATE-REQUIRED TEST DATA
NORM-REFERENCED TESTS Grade 3
Iowa Tests of Basic Skills (ITBS) Each chart reflects data for three years of testing.
Reading Comprehension 50
64 63 54 0
98-99
64 62 53 N/A 60 52
97-98
96-97
Mathematics
School 50
System
State
0
70 70 61 98-99
67 68 61 N/A 68 59
97-98
96-97
School System State
Reading Vocabulary 50
58 58 50 0
98-99
63 58 50 N/A 58 49
97-98
96-97
Language Arts
School 50
System
State
0
59 70 64 98-99
65 69 62 N/A 67 59
97-98
96-97
School System State
Social Studies 50
61 64 56 0
98-99
65 64 55 N/A 64 55
97-98
96-97
Science
School 50
System
State
0
67 70 59 98-99
72 70 59 N/A 69 58
97-98
96-97
School System State
Sources of Information
Composite Score
50
60 66 57 0
98-99
School 50
System
62 65 56 N/A 64 55
97-98
96-97
State 0
63 67 58 98-99
67 67 57 N/A 66 56
97-98
96-97
1998-99 GEORGIA PUBLIC EDUCATION REPORT CARD Cheatham Hill Elementary School - 6330298
Prepared by Georgia Department of Education
Scores Reported in Percentiles
School System State
Page 2
STATE-REQUIRED TEST DATA
NORM-REFERENCED TESTS Grade 5
Iowa Tests of Basic Skills (ITBS) Each chart reflects data for three years of testing.
Reading Comprehension
Mathematics
50
63 59 53 0
98-99
64 60 53 N/A 60 52
97-98
96-97
School 50
System
State
0
71 68 59 98-99
68 68 58 N/A 69 57
97-98
96-97
School System State
Reading Vocabulary 50
58 57 48 0
98-99
60 58 48 N/A 58 46
97-98
96-97
Language Arts
School 50
System
State
0
76 71 63 98-99
72 70 61 N/A 69 58
97-98
96-97
School System State
Social Studies 50
67 64 57 0
98-99
70 64 56 N/A 65 55
97-98
96-97
Science
School 50
System
State
0
71 68 60 98-99
73 69 59 N/A 70 59
97-98
96-97
School System State
Sources of Information
Composite Score
50
70 67 58 0
98-99
School 50
System
65 65 58 N/A 66 57
97-98
96-97
State 0
70 66 57 98-99
69 66 56 N/A 67 55
97-98
96-97
1998-99 GEORGIA PUBLIC EDUCATION REPORT CARD Cheatham Hill Elementary School - 6330298
Prepared by Georgia Department of Education
Scores Reported in Percentiles
School System State
Page 3
STATE-REQUIRED TEST DATA
PERFORMANCE ASSESSMENTS
Grade 5 Writing Assessment
Percent at Developmental Stages:
1998-99 School System State
1997-98 School System State
1996-97 School System State
Stage Stage Stage Stage Stage Stage
1:The Emerging Writer 2:The Developing Writer 3:The Focusing Writer 4:The Experimenting 5:The Engaging Writer 6:The Extending Writer
0% 1% 3% 27% 42% 27%
0% 1% 10% 36% 34% 19%
0% 1% 16% 41% 29% 12%
0% 0% 6% 32% 41% 21%
0% 1% 12% 37% 33% 16%
0% 3% 19% 41% 27% 10%
N/A N/A N/A N/A N/A N/A
0% 1% 14% 34% 32% 18%
0% 3% 21% 37% 26% 12%
AWARDS / RECOGNITION DATA
Schools in Georgia may receive recognition in the following programs: Charter School Pay for Performance Program Georgia School of Excellence National Blue Ribbon School Cheatham Hill Elementary School did not receive recognition in any of these programs during the 1998-99 school year.
1998-99 GEORGIA PUBLIC EDUCATION REPORT CARD Cheatham Hill Elementary School - 6330298
Prepared by Georgia Department of Education
Page 4
CERTIFIED PERSONNEL DATA
Positions Number Average Contract Days
Personnel Sex
Certificate
Years Experience
Full-time Part-time
Male Female
4 Yr Bachelor's 5 Yr Master's 6 Yr Specialist's 7 Yr Doctoral Other*
<1 1-10 11-20 21-30 >30
Average
Administrators
3.00 220.33
3 0
0 3
0 1 2 0 0 0 0 2 1 0 18.33
Support Personnel
7.20 191.00
6 2
0 8
1 6 0 1 0 0 4 4 0 0 10.88
PK-12 Teachers
54.50 191.00
53 3
3 53
34 18
4 0 0 0 36 14 5 1 9.91
*Includes One- and Two-Year Vocational Certificates.
ACCREDITATION DATA
Accredited by Southern Association of Colleges and Schools (SACS):
Elementary/Middle Commission.
1998-99 GEORGIA PUBLIC EDUCATION REPORT CARD Cheatham Hill Elementary School - 6330298
Prepared by Georgia Department of Education
Page 5
1998-99 GEORGIA PUBLIC EDUCATION REPORT CARD
COBB COUNTY SCHOOLS
Clarkdale Elementary School - 6332054
Grade Range PK-5
The Georgia Public Education Report Card is designed to assist systems and schools in educational improvement. This report card contains a variety of data elements. An explanation of the terms is provided as a companion to the report card data. Please refer to the definitions for the most effective use of the reported data.
STUDENT DATA
Total
K-5
426
PK
1
Enrollment, by Race/Ethnicity and Sex
Black
White Hispanic
American Asian Indian
Multiracial
151 35.4%
250 58.7%
14 3.3%
2 0.5%
0 0.0%
9 2.1%
0
1
0.0% 100.0%
0 0.0%
0 0.0%
0 0.0%
0 0.0%
Male Female
217 50.9%
209 49.1%
0
1
0.0% 100.0%
Enrollment in Selected Programs
Program
Program % of Student Enrollment Population
Gifted (Grades K-12)
7
1.6%
Alternative Programs (Grades 6-12)
N/A
N/A
Students Eligible to Receive Free/Reduced Lunches
Number
Percent
School System
121 16,221
28.3% 17.8%
Dropout Rate *
Number
Rate
School System
N/A N/A
N/A N/A
* Dropout rates are not applicable for grades PK-5.
Enrollment in Compensatory Programs
Program
Program % of Student Enrollment Population
Special Education (Grades K-12)
73 17.1%
(PK)
1
N/A
English to Speakers of Other Languages (ESOL) (Grades K-12)
0
0.0%
Remedial Education (Grades 2-5, 9-12)
54 17.8%
Special Instructional Assistance (SIA) (Grades K-3)
71 26.0%
Title I (Grades K-12)
This school has no Title I program.
Total 13
Retained Students, by Race/Ethnicity and Sex
Black
White Hispanic
American MultiAsian Indian racial
0 0.0%
11
2
84.6% 15.4%
0 0.0%
0 0.0%
0 0.0%
Male Female
6
7
46.2% 53.8%
Prepared by Georgia Department of Education
Page 1
STATE-REQUIRED TEST DATA
NORM-REFERENCED TESTS Grade 3
Iowa Tests of Basic Skills (ITBS) Each chart reflects data for three years of testing.
Reading Comprehension 50
47 63 54 0
98-99
43 62 53 97-98
48 60 52 96-97
Mathematics
School 50
System
State
0
47 70 61 98-99
49 68 61 97-98
45 68 59 96-97
School System State
Reading Vocabulary 50
39 58 50 0
98-99
42 58 50 97-98
41 58 49 96-97
Language Arts
School 50
System
State
0
51 70 64 98-99
55 69 62 97-98
47 67 59 96-97
School System State
Social Studies 50
49 64 56 0
98-99
47 64 55 97-98
48 64 55 96-97
Science
School 50
System
State
0
55 70 59 98-99
59 70 59 97-98
49 69 58 96-97
School System State
Sources of Information
Composite Score
50
45 66 57 0
98-99
School 50
System
49 65 56 97-98
47 64 55 96-97
State 0
46 67 58 98-99
49 67 57 97-98
1998-99 GEORGIA PUBLIC EDUCATION REPORT CARD Clarkdale Elementary School - 6332054
Prepared by Georgia Department of Education
46 66 56 96-97
Scores Reported in Percentiles
School System State
Page 2
STATE-REQUIRED TEST DATA
NORM-REFERENCED TESTS Grade 5
Iowa Tests of Basic Skills (ITBS) Each chart reflects data for three years of testing.
Reading Comprehension
Mathematics
50
54 59 53 0
98-99
50 60 53 97-98
49 60 52 96-97
School 50
System
State
0
63 68 59 98-99
59 68 58 97-98
57 69 57 96-97
School System State
Reading Vocabulary 50
43 57 48 0
98-99
46 58 48 97-98
47 58 46 96-97
Language Arts
School 50
System
State
0
64 71 63 98-99
64 70 61 97-98
64 69 58 96-97
School System State
Social Studies 50
53 64 57 0
98-99
57 64 56 97-98
53 65 55 96-97
Science
School 50
System
State
0
58 68 60 98-99
61 69 59 97-98
59 70 59 96-97
School System State
Sources of Information
Composite Score
50
57 67 58 0
98-99
School 50
System
52 65 58 97-98
54 66 57 96-97
State 0
57 66 57 98-99
56 66 56 97-98
55 67 55 96-97
1998-99 GEORGIA PUBLIC EDUCATION REPORT CARD Clarkdale Elementary School - 6332054
Prepared by Georgia Department of Education
Scores Reported in Percentiles
School System State
Page 3
STATE-REQUIRED TEST DATA
PERFORMANCE ASSESSMENTS
Grade 5 Writing Assessment
Percent at Developmental Stages:
1998-99 School System State
1997-98 School System State
1996-97 School System State
Stage Stage Stage Stage Stage Stage
1:The Emerging Writer 2:The Developing Writer 3:The Focusing Writer 4:The Experimenting 5:The Engaging Writer 6:The Extending Writer
0% 0% 11% 40% 43% 6%
0% 1% 10% 36% 34% 19%
0% 1% 16% 41% 29% 12%
0% 2% 19% 45% 29% 5%
0% 1% 12% 37% 33% 16%
0% 3% 19% 41% 27% 10%
0% 9% 20% 32% 29% 11%
0% 1% 14% 34% 32% 18%
0% 3% 21% 37% 26% 12%
AWARDS / RECOGNITION DATA
Schools in Georgia may receive recognition in the following programs: Charter School Pay for Performance Program Georgia School of Excellence National Blue Ribbon School Clarkdale Elementary School did not receive recognition in any of these programs during the 1998-99 school year.
1998-99 GEORGIA PUBLIC EDUCATION REPORT CARD Clarkdale Elementary School - 6332054
Prepared by Georgia Department of Education
Page 4
CERTIFIED PERSONNEL DATA
Positions Number Average Contract Days
Personnel Sex
Certificate
Years Experience
Full-time Part-time
Male Female
4 Yr Bachelor's 5 Yr Master's 6 Yr Specialist's 7 Yr Doctoral Other*
<1 1-10 11-20 21-30 >30
Average
Administrators
2.00 225.50
2 0
0 2
0 0 2 0 0 0 0 2 0 0 16.00
Support Personnel
5.00 191.00
5 0
0 5
3 1 1 0 0 0 1 4 0 0 12.60
PK-12 Teachers
26.50 191.00
24 5
2 27
18 11
0 0 0 0 15 9 5 0 11.34
*Includes One- and Two-Year Vocational Certificates.
ACCREDITATION DATA
Accredited by Southern Association of Colleges and Schools (SACS):
Elementary/Middle Commission.
1998-99 GEORGIA PUBLIC EDUCATION REPORT CARD Clarkdale Elementary School - 6332054
Prepared by Georgia Department of Education
Page 5
1998-99 GEORGIA PUBLIC EDUCATION REPORT CARD
COBB COUNTY SCHOOLS
Clay Elementary School - 6333054
Grade Range PK-5
The Georgia Public Education Report Card is designed to assist systems and schools in educational improvement. This report card contains a variety of data elements. An explanation of the terms is provided as a companion to the report card data. Please refer to the definitions for the most effective use of the reported data.
STUDENT DATA
Total
K-5
576
PK
1
Enrollment, by Race/Ethnicity and Sex
Black
White Hispanic
American Asian Indian
Multiracial
291 50.5%
140 24.3%
124 21.5%
0 0.0%
1 0.2%
20 3.5%
1 100.0%
0 0.0%
0 0.0%
0 0.0%
0 0.0%
0 0.0%
Male Female
306 53.1%
270 46.9%
0
1
0.0% 100.0%
Enrollment in Selected Programs
Program
Program % of Student Enrollment Population
Gifted (Grades K-12)
4
< 1%
Alternative Programs (Grades 6-12)
N/A
N/A
Students Eligible to Receive Free/Reduced Lunches
Number
Percent
School System
352 16,221
61.0% 17.8%
Dropout Rate *
Number
Rate
School System
N/A N/A
N/A N/A
* Dropout rates are not applicable for grades PK-5.
Enrollment in Compensatory Programs
Program
Program % of Student Enrollment Population
Special Education (Grades K-12)
58 10.1%
(PK)
1
N/A
English to Speakers of Other Languages (ESOL) (Grades K-12)
76 13.2%
Remedial Education (Grades 2-5, 9-12)
87 22.8%
Special Instructional Assistance (SIA) (Grades K-3)
228 57.3%
Title I (Grades K-12)
This school has a schoolwide program.
Total 1
Retained Students, by Race/Ethnicity and Sex
Black
White Hispanic
American MultiAsian Indian racial
0 0.0%
0
1
0.0% 100.0%
0 0.0%
0 0.0%
0 0.0%
Male Female
0
1
0.0% 100.0%
Prepared by Georgia Department of Education
Page 1
STATE-REQUIRED TEST DATA
NORM-REFERENCED TESTS Grade 3
Iowa Tests of Basic Skills (ITBS) Each chart reflects data for three years of testing.
Reading Comprehension 50
27 63 54 0
98-99
31 62 53 97-98
37 60 52 96-97
Mathematics
School 50
System
State
0
32 70 61 98-99
33 68 61 97-98
39 68 59 96-97
School System State
Reading Vocabulary 50
25 58 50 0
98-99
24 58 50 97-98
36 58 49 96-97
Language Arts
School 50
System
State
0
32 70 64 98-99
38 69 62 97-98
43 67 59 96-97
School System State
Social Studies 50
31 64 56 0
98-99
36 64 55 97-98
39 64 55 96-97
Science
School 50
System
State
0
37 70 59 98-99
38 70 59 97-98
46 69 58 96-97
School System State
Sources of Information
Composite Score
50
32 66 57 0
98-99
School 50
System
28 65 56 97-98
39 64 55 96-97
State 0
29 67 58 98-99
31 67 57 97-98
1998-99 GEORGIA PUBLIC EDUCATION REPORT CARD Clay Elementary School - 6333054
Prepared by Georgia Department of Education
40 66 56 96-97
Scores Reported in Percentiles
School System State
Page 2
STATE-REQUIRED TEST DATA
NORM-REFERENCED TESTS Grade 5
Iowa Tests of Basic Skills (ITBS) Each chart reflects data for three years of testing.
Reading Comprehension
Mathematics
50
36 59 53 0
98-99
40 60 53 97-98
35 60 52 96-97
School 50
System
State
0
41 68 59 98-99
41 68 58 97-98
32 69 57 96-97
School System State
Reading Vocabulary 50
31 57 48 0
98-99
39 58 48 97-98
25 58 46 96-97
Language Arts
School 50
System
State
0
55 71 63 98-99
46 70 61 97-98
40 69 58 96-97
School System State
Social Studies 50
36 64 57 0
98-99
36 64 56 97-98
35 65 55 96-97
Science
School 50
System
State
0
38 68 60 98-99
46 69 59 97-98
38 70 59 96-97
School System State
Sources of Information
Composite Score
50
44 67 58 0
98-99
School 50
System
38 65 58 97-98
36 66 57 96-97
State 0
40 66 57 98-99
40 66 56 97-98
33 67 55 96-97
1998-99 GEORGIA PUBLIC EDUCATION REPORT CARD Clay Elementary School - 6333054
Prepared by Georgia Department of Education
Scores Reported in Percentiles
School System State
Page 3
STATE-REQUIRED TEST DATA
PERFORMANCE ASSESSMENTS
Grade 5 Writing Assessment
Percent at Developmental Stages:
1998-99 School System State
1997-98 School System State
1996-97 School System State
Stage Stage Stage Stage Stage Stage
1:The Emerging Writer 2:The Developing Writer 3:The Focusing Writer 4:The Experimenting 5:The Engaging Writer 6:The Extending Writer
0% 2% 10% 54% 31% 3%
0% 1% 10% 36% 34% 19%
0% 1% 16% 41% 29% 12%
1% 0% 17% 40% 33% 9%
0% 1% 12% 37% 33% 16%
0% 3% 19% 41% 27% 10%
0% 3% 42% 29% 17% 5%
0% 1% 14% 34% 32% 18%
0% 3% 21% 37% 26% 12%
AWARDS / RECOGNITION DATA
Schools in Georgia may receive recognition in the following programs: Charter School Pay for Performance Program Georgia School of Excellence National Blue Ribbon School Clay Elementary School did not receive recognition in any of these programs during the 1998-99 school year.
1998-99 GEORGIA PUBLIC EDUCATION REPORT CARD Clay Elementary School - 6333054
Prepared by Georgia Department of Education
Page 4
CERTIFIED PERSONNEL DATA
Positions Number Average Contract Days
Personnel Sex
Certificate
Years Experience
Full-time Part-time
Male Female
4 Yr Bachelor's 5 Yr Master's 6 Yr Specialist's 7 Yr Doctoral Other*
<1 1-10 11-20 21-30 >30
Average
Administrators
2.00 225.50
2 0
0 2
0 0 2 0 0 0 0 2 0 0 18.50
Support Personnel
5.50 191.00
5 1
0 6
3 3 0 0 0 0 4 2 0 0 7.83
PK-12 Teachers
37.92 191.00
37 2
3 36
25 13
1 0 0 0 33 2 4 0 7.18
*Includes One- and Two-Year Vocational Certificates.
ACCREDITATION DATA
Accredited by Southern Association of Colleges and Schools (SACS):
Elementary/Middle Commission.
1998-99 GEORGIA PUBLIC EDUCATION REPORT CARD Clay Elementary School - 6333054
Prepared by Georgia Department of Education
Page 5
1998-99 GEORGIA PUBLIC EDUCATION REPORT CARD
COBB COUNTY SCHOOLS
Compton Elementary School - 6333556
Grade Range K-5
The Georgia Public Education Report Card is designed to assist systems and schools in educational improvement. This report card contains a variety of data elements. An explanation of the terms is provided as a companion to the report card data. Please refer to the definitions for the most effective use of the reported data.
STUDENT DATA
Total 902
K-5 Enrollment, by Race/Ethnicity and Sex
Black
White Hispanic
American Multi-
Asian Indian
racial
420 46.6%
420 46.6%
35 3.9%
4 0.4%
1 0.1%
22 2.4%
Male Female
469 52.0%
433 48.0%
Enrollment in Selected Programs
Program
Program % of Student Enrollment Population
Gifted (Grades K-12)
13
1.4%
Alternative Programs (Grades 6-12)
N/A
N/A
Students Eligible to Receive Free/Reduced Lunches
Number
Percent
School System
367 16,221
40.7% 17.8%
Dropout Rate *
Number
Rate
School System
N/A N/A
N/A N/A
* Dropout rates are not applicable for grades PK-5.
Enrollment in Compensatory Programs
Program
Program % of Student Enrollment Population
Special Education (Grades K-12)
103 11.4%
(PK)
1
N/A
English to Speakers of Other Languages (ESOL) (Grades K-12)
16
1.8%
Remedial Education (Grades 2-5, 9-12)
77 12.2%
Special Instructional Assistance (SIA) (Grades K-3)
177 29.5%
Title I (Grades K-12)
This school has no Title I program.
Total 13
Retained Students, by Race/Ethnicity and Sex
Black
White Hispanic
American Multi-
Asian Indian
racial
7 53.8%
5 38.5%
1 7.7%
0 0.0%
0 0.0%
0 0.0%
Male Female
9
4
69.2% 30.8%
Prepared by Georgia Department of Education
Page 1
STATE-REQUIRED TEST DATA
NORM-REFERENCED TESTS Grade 3
Iowa Tests of Basic Skills (ITBS) Each chart reflects data for three years of testing.
Reading Comprehension 50
48 63 54 0
98-99
39 62 53 97-98
45 60 52 96-97
Mathematics
School 50
System
State
0
51 70 61 98-99
38 68 61 97-98
40 68 59 96-97
School System State
Reading Vocabulary 50
44 58 50 0
98-99
36 58 50 97-98
43 58 49 96-97
Language Arts
School 50
System
State
0
61 70 64 98-99
43 69 62 97-98
41 67 59 96-97
School System State
Social Studies 50
51 64 56 0
98-99
39 64 55 97-98
49 64 55 96-97
Science
School 50
System
State
0
53 70 59 98-99
40 70 59 97-98
52 69 58 96-97
School System State
Sources of Information
Composite Score
50
55 66 57 0
98-99
School 50
System
34 65 56 97-98
44 64 55 96-97
State 0
53 67 58 98-99
38 67 57 97-98
1998-99 GEORGIA PUBLIC EDUCATION REPORT CARD Compton Elementary School - 6333556
Prepared by Georgia Department of Education
44 66 56 96-97
Scores Reported in Percentiles
School System State
Page 2
STATE-REQUIRED TEST DATA
NORM-REFERENCED TESTS Grade 5
Iowa Tests of Basic Skills (ITBS) Each chart reflects data for three years of testing.
Reading Comprehension
Mathematics
50
46 59 53 0
98-99
49 60 53 97-98
51 60 52 96-97
School 50
System
State
0
47 68 59 98-99
50 68 58 97-98
55 69 57 96-97
School System State
Reading Vocabulary 50
44 57 48 0
98-99
44 58 48 97-98
49 58 46 96-97
Language Arts
School 50
System
State
0
56 71 63 98-99
59 70 61 97-98
58 69 58 96-97
School System State
Social Studies 50
47 64 57 0
98-99
52 64 56 97-98
53 65 55 96-97
Science
School 50
System
State
0
49 68 60 98-99
53 69 59 97-98
56 70 59 96-97
School System State
Sources of Information
Composite Score
50
51 67 58 0
98-99
School 50
System
55 65 58 97-98
54 66 57 96-97
State 0
47 66 57 98-99
51 66 56 97-98
54 67 55 96-97
1998-99 GEORGIA PUBLIC EDUCATION REPORT CARD Compton Elementary School - 6333556
Prepared by Georgia Department of Education
Scores Reported in Percentiles
School System State
Page 3
STATE-REQUIRED TEST DATA
PERFORMANCE ASSESSMENTS
Grade 5 Writing Assessment
Percent at Developmental Stages:
1998-99 School System State
1997-98 School System State
1996-97 School System State
Stage Stage Stage Stage Stage Stage
1:The Emerging Writer 2:The Developing Writer 3:The Focusing Writer 4:The Experimenting 5:The Engaging Writer 6:The Extending Writer
0% 0% 16% 52% 23% 9%
0% 1% 10% 36% 34% 19%
0% 1% 16% 41% 29% 12%
0% 1% 14% 54% 25% 5%
0% 1% 12% 37% 33% 16%
0% 3% 19% 41% 27% 10%
0% 3% 24% 37% 28% 8%
0% 1% 14% 34% 32% 18%
0% 3% 21% 37% 26% 12%
AWARDS / RECOGNITION DATA
Schools in Georgia may receive recognition in the following programs: Charter School Pay for Performance Program Georgia School of Excellence National Blue Ribbon School Compton Elementary School did not receive recognition in any of these programs during the 1998-99 school year.
1998-99 GEORGIA PUBLIC EDUCATION REPORT CARD Compton Elementary School - 6333556
Prepared by Georgia Department of Education
Page 4
CERTIFIED PERSONNEL DATA
Positions Number Average Contract Days
Personnel Sex
Certificate
Years Experience
Full-time Part-time
Male Female
4 Yr Bachelor's 5 Yr Master's 6 Yr Specialist's 7 Yr Doctoral Other*
<1 1-10 11-20 21-30 >30
Average
Administrators
2.53 225.81
2 1
1 2
0 1 1 1 0 0 0 1 2 0 20.00
Support Personnel
5.00 191.00
4 2
0 6
2 3 1 0 0 0 3 1 2 0 11.17
PK-12 Teachers
52.97 191.00
51 4
3 52
38 16
1 0 0 0 35 10 9 1 9.80
*Includes One- and Two-Year Vocational Certificates.
ACCREDITATION DATA
Accredited by Southern Association of Colleges and Schools (SACS):
Elementary/Middle Commission.
1998-99 GEORGIA PUBLIC EDUCATION REPORT CARD Compton Elementary School - 6333556
Prepared by Georgia Department of Education
Page 5
1998-99 GEORGIA PUBLIC EDUCATION REPORT CARD
COBB COUNTY SCHOOLS
Daniell Middle School - 6334056
Grade Range 6-8
The Georgia Public Education Report Card is designed to assist systems and schools in educational improvement. This report card contains a variety of data elements. An explanation of the terms is provided as a companion to the report card data. Please refer to the definitions for the most effective use of the reported data.
STUDENT DATA
Total 1,190
6-8 Enrollment, by Race/Ethnicity and Sex
Black
White Hispanic
American Multi-
Asian Indian
racial
148 12.4%
887 74.5%
42 3.5%
79 6.6%
4 0.3%
30 2.5%
Male 624
52.4%
Female 566
47.6%
Enrollment in Selected Programs
Program
Gifted (Grades K-12)
Program % of Student Enrollment Population
192
16.1%
Alternative Programs (Grades 6-12)
0
0.0%
Students Eligible to Receive Free/Reduced Lunches
Number
Percent
School System
122 16,221
10.3% 17.8%
Enrollment in Compensatory Programs
Program
Program % of Student Enrollment Population
Special Education (Grades K-12) (PK)
179 15.0%
0
N/A
English to Speakers of Other Languages (ESOL) (Grades K-12)
16
1.3%
Title I (Grades K-12)
This school has no Title I program.
Dropout Rate for Grades 6-8
Number
Rate
School System
0
0.0%
19
0.1%
Total 8
Retained Students, by Race/Ethnicity and Sex
Black
White Hispanic
American MultiAsian Indian racial
2 25.0%
6 75.0%
0 0.0%
0 0.0%
0 0.0%
0 0.0%
Male Female
5
3
62.5% 37.5%
Prepared by Georgia Department of Education
Page 1
STATE-REQUIRED TEST DATA
NORM-REFERENCED TESTS Grade 8
Iowa Tests of Basic Skills (ITBS) Each chart reflects data for three years of testing.
Reading Comprehension 50
57 61 49 0
98-99
67 61 48 97-98
66 62 48 96-97
Mathematics
School 50
System
State
0
70 66 56 98-99
75 66 55 97-98
76 67 54 96-97
School System State
Reading Vocabulary 50
54 57 46 0
98-99
61 57 45 97-98
63 58 44 96-97
Language Arts
School 50
System
State
0
69 70 60 98-99
78 68 58 97-98
76 68 56 96-97
School System State
Social Studies 50
66 64 54 0
98-99
72 64 53 97-98
71 65 53 96-97
Science
School 50
System
State
0
66 66 56 98-99
74 67 55 97-98
71 67 53 96-97
School System State
Sources of Information
Composite Score
50
66 67 57 0
98-99
School 50
System
72 66 56 97-98
73 67 55 96-97
State 0
67 67 56 98-99
74 66 54 97-98
1998-99 GEORGIA PUBLIC EDUCATION REPORT CARD Daniell Middle School - 6334056
Prepared by Georgia Department of Education
74 67 54 96-97
Scores Reported in Percentiles
School System State
Page 2
STATE-REQUIRED TEST DATA
Categories of Scaled Scores
Inadequate (less than 162)
Minimal (162-209)
Good
(210-247)
Very Good (greater than 247)
Average Scaled Score: (Range 100-300)
PERFORMANCE ASSESSMENTS
Grade 8 Writing Assessment
1998-99 Percent Scoring
1997-98 Percent Scoring
1996-97 Percent Scoring
School System State School System State School System State
2% 17% 56% 24%
2% 25% 50% 24%
8% 40% 41% 11%
1% 25% 48% 25%
3% 33% 47% 17%
11% 46% 34%
8%
3% 32% 49% 16%
5% 36% 43% 16%
15% 46% 30%
8%
228
225
208 226
218 202 219
215 198
AWARDS / RECOGNITION DATA
Schools in Georgia may receive recognition in the following programs: Charter School Pay for Performance Program Georgia School of Excellence National Blue Ribbon School Daniell Middle School did not receive recognition in any of these programs during the 1998-99 school year.
1998-99 GEORGIA PUBLIC EDUCATION REPORT CARD Daniell Middle School - 6334056
Prepared by Georgia Department of Education
Page 3
CERTIFIED PERSONNEL DATA
Positions Number Average Contract Days
Personnel Sex
Certificate
Years Experience
Full-time Part-time
Male Female
4 Yr Bachelor's 5 Yr Master's 6 Yr Specialist's 7 Yr Doctoral Other*
<1 1-10 11-20 21-30 >30
Average
Administrators
3.00 226.67
3 0
1 2
0 1 0 2 0 0 1 0 2 0 19.00
Support Personnel
7.38 191.00
7 7
3 11
6 6 2 0 0 0 6 3 4 1 16.43
PK-12 Teachers
75.64 191.00
68 9
11 66
48 26
3 0 0 0 39 17 20 1 12.75
*Includes One- and Two-Year Vocational Certificates.
ACCREDITATION DATA
Accredited by Southern Association of Colleges and Schools (SACS):
Elementary/Middle Commission.
1998-99 GEORGIA PUBLIC EDUCATION REPORT CARD Daniell Middle School - 6334056
Prepared by Georgia Department of Education
Page 4
1998-99 GEORGIA PUBLIC EDUCATION REPORT CARD
COBB COUNTY SCHOOLS
Davis Elementary School - 6330388
Grade Range PK-5
The Georgia Public Education Report Card is designed to assist systems and schools in educational improvement. This report card contains a variety of data elements. An explanation of the terms is provided as a companion to the report card data. Please refer to the definitions for the most effective use of the reported data.
STUDENT DATA
Total
K-5
740
PK
2
Enrollment, by Race/Ethnicity and Sex
Black
White Hispanic
American Asian Indian
Multiracial
15 2.0%
693 93.6%
8 1.1%
15 2.0%
3 0.4%
6 0.8%
0
2
0.0% 100.0%
0 0.0%
0 0.0%
0 0.0%
0 0.0%
Male 335
45.3% 2
100.0%
Female 405
54.7% 0
0.0%
Enrollment in Selected Programs
Program
Program % of Student Enrollment Population
Gifted (Grades K-12)
55
7.4%
Alternative Programs (Grades 6-12)
N/A
N/A
Students Eligible to Receive Free/Reduced Lunches
Number
Percent
School System
12 16,221
1.6% 17.8%
Dropout Rate *
Number
Rate
School System
N/A N/A
N/A N/A
* Dropout rates are not applicable for grades PK-5.
Enrollment in Compensatory Programs
Program
Program % of Student Enrollment Population
Special Education (Grades K-12)
83 11.2%
(PK)
3
N/A
English to Speakers of Other Languages (ESOL) (Grades K-12)
0
0.0%
Remedial Education (Grades 2-5, 9-12)
22
4.1%
Special Instructional Assistance (SIA) (Grades K-3)
57 12.7%
Title I (Grades K-12)
This school has no Title I program.
Total 5
Retained Students, by Race/Ethnicity and Sex
Black
White Hispanic
American MultiAsian Indian racial
1 20.0%
4 80.0%
0 0.0%
0 0.0%
0 0.0%
0 0.0%
Male Female
2
3
40.0% 60.0%
Prepared by Georgia Department of Education
Page 1
STATE-REQUIRED TEST DATA
NORM-REFERENCED TESTS Grade 3
Iowa Tests of Basic Skills (ITBS) Each chart reflects data for three years of testing.
Reading Comprehension 50
73 63 54 0
98-99
73 62 53 97-98
77 60 52 96-97
Mathematics
School 50
System
State
0
79 70 61 98-99
76 68 61 97-98
85 68 59 96-97
School System State
Reading Vocabulary 50
73 58 50 0
98-99
75 58 50 97-98
79 58 49 96-97
Language Arts
School 50
System
State
0
77 70 64 98-99
79 69 62 97-98
87 67 59 96-97
School System State
Social Studies 50
74 64 56 0
98-99
71 64 55 97-98
81 64 55 96-97
Science
School 50
System
State
0
76 70 59 98-99
78 70 59 97-98
86 69 58 96-97
School System State
Sources of Information
Composite Score
50
77 66 57 0
98-99
School 50
System
78 65 56 97-98
85 64 55 96-97
State 0
77 67 58 98-99
77 67 57 97-98
1998-99 GEORGIA PUBLIC EDUCATION REPORT CARD Davis Elementary School - 6330388
Prepared by Georgia Department of Education
86 66 56 96-97
Scores Reported in Percentiles
School System State
Page 2
STATE-REQUIRED TEST DATA
NORM-REFERENCED TESTS Grade 5
Iowa Tests of Basic Skills (ITBS) Each chart reflects data for three years of testing.
Reading Comprehension
Mathematics
50
74 59 53 0
98-99
67 60 53 97-98
69 60 52 96-97
School 50
System
State
0
85 68 59 98-99
76 68 58 97-98
83 69 57 96-97
School System State
Reading Vocabulary 50
72 57 48 0
98-99
65 58 48 97-98
68 58 46 96-97
Language Arts
School 50
System
State
0
82 71 63 98-99
72 70 61 97-98
76 69 58 96-97
School System State
Social Studies 50
79 64 57 0
98-99
72 64 56 97-98
74 65 55 96-97
Science
School 50
System
State
0
80 68 60 98-99
75 69 59 97-98
80 70 59 96-97
School System State
Sources of Information
Composite Score
50
78 67 58 0
98-99
School 50
System
70 65 58 97-98
77 66 57 96-97
State 0
82 66 57 98-99
73 66 56 97-98
78 67 55 96-97
1998-99 GEORGIA PUBLIC EDUCATION REPORT CARD Davis Elementary School - 6330388
Prepared by Georgia Department of Education
Scores Reported in Percentiles
School System State
Page 3
STATE-REQUIRED TEST DATA
PERFORMANCE ASSESSMENTS
Grade 5 Writing Assessment
Percent at Developmental Stages:
1998-99 School System State
1997-98 School System State
1996-97 School System State
Stage Stage Stage Stage Stage Stage
1:The Emerging Writer 2:The Developing Writer 3:The Focusing Writer 4:The Experimenting 5:The Engaging Writer 6:The Extending Writer
0% 1% 5% 24% 42% 25%
0% 1% 10% 36% 34% 19%
0% 1% 16% 41% 29% 12%
0% 3% 3% 33% 45% 16%
0% 1% 12% 37% 33% 16%
0% 3% 19% 41% 27% 10%
0% 1% 9% 24% 36% 30%
0% 1% 14% 34% 32% 18%
0% 3% 21% 37% 26% 12%
AWARDS / RECOGNITION DATA
Schools in Georgia may receive recognition in the following programs: Charter School Pay for Performance Program Georgia School of Excellence National Blue Ribbon School Davis Elementary School did not receive recognition in any of these programs during the 1998-99 school year.
1998-99 GEORGIA PUBLIC EDUCATION REPORT CARD Davis Elementary School - 6330388
Prepared by Georgia Department of Education
Page 4
CERTIFIED PERSONNEL DATA
Positions Number Average Contract Days
Personnel Sex
Certificate
Years Experience
Full-time Part-time
Male Female
4 Yr Bachelor's 5 Yr Master's 6 Yr Specialist's 7 Yr Doctoral Other*
<1 1-10 11-20 21-30 >30
Average
Administrators
2.00 235.00
2 0
0 2
0 0 2 0 0 0 0 0 2 0 23.00
Support Personnel
5.10 190.06
4 2
0 6
2 1 3 0 0 0 2 3 1 0 14.17
PK-12 Teachers
46.00 191.00
46 0
1 45
23 23
0 0 0 0 11 21 13 1 16.52
*Includes One- and Two-Year Vocational Certificates.
ACCREDITATION DATA
Accredited by Southern Association of Colleges and Schools (SACS):
Elementary/Middle Commission.
1998-99 GEORGIA PUBLIC EDUCATION REPORT CARD Davis Elementary School - 6330388
Prepared by Georgia Department of Education
Page 5
1998-99 GEORGIA PUBLIC EDUCATION REPORT CARD
COBB COUNTY SCHOOLS
Dickerson Middle School - 6330281
Grade Range 6-8
The Georgia Public Education Report Card is designed to assist systems and schools in educational improvement. This report card contains a variety of data elements. An explanation of the terms is provided as a companion to the report card data. Please refer to the definitions for the most effective use of the reported data.
STUDENT DATA
Total 1,305
6-8 Enrollment, by Race/Ethnicity and Sex
Black
White Hispanic
American Multi-
Asian Indian
racial
22 1.7%
1,172 89.8%
26 2.0%
68 5.2%
2 0.2%
15 1.1%
Male 683
52.3%
Female 622
47.7%
Enrollment in Selected Programs
Program
Gifted (Grades K-12)
Program % of Student Enrollment Population
496
38.0%
Alternative Programs (Grades 6-12)
0
0.0%
Students Eligible to Receive Free/Reduced Lunches
Number
Percent
School System
16 16,221
1.2% 17.8%
Enrollment in Compensatory Programs
Program
Program % of Student Enrollment Population
Special Education (Grades K-12) (PK)
140 10.7%
0
N/A
English to Speakers of Other Languages (ESOL) (Grades K-12)
11
< 1%
Title I (Grades K-12)
This school has no Title I program.
Dropout Rate for Grades 6-8
Number
Rate
School System
0
0.0%
19
0.1%
Total 4
Retained Students, by Race/Ethnicity and Sex
Black
White Hispanic
American MultiAsian Indian racial
1 25.0%
2
1
50.0% 25.0%
0 0.0%
0 0.0%
0 0.0%
Male Female
2
2
50.0% 50.0%
Prepared by Georgia Department of Education
Page 1
STATE-REQUIRED TEST DATA
NORM-REFERENCED TESTS Grade 8
Iowa Tests of Basic Skills (ITBS) Each chart reflects data for three years of testing.
Reading Comprehension 50
80 61 49 0
98-99
80 61 48 97-98
76 62 48 96-97
Mathematics
School 50
System
State
0
88 66 56 98-99
89 66 55 97-98
86 67 54 96-97
School System State
Reading Vocabulary 50
78 57 46 0
98-99
76 57 45 97-98
72 58 44 96-97
Language Arts
School 50
System
State
0
88 70 60 98-99
84 68 58 97-98
84 68 56 96-97
School System State
Social Studies 50
79 64 54 0
98-99
80 64 53 97-98
79 65 53 96-97
Science
School 50
System
State
0
82 66 56 98-99
83 67 55 97-98
80 67 53 96-97
School System State
Sources of Information
Composite Score
50
83 67 57 0
98-99
School 50
System
84 66 56 97-98
81 67 55 96-97
State 0
86 67 56 98-99
85 66 54 97-98
1998-99 GEORGIA PUBLIC EDUCATION REPORT CARD Dickerson Middle School - 6330281
Prepared by Georgia Department of Education
83 67 54 96-97
Scores Reported in Percentiles
School System State
Page 2
STATE-REQUIRED TEST DATA
Categories of Scaled Scores
Inadequate (less than 162)
Minimal (162-209)
Good
(210-247)
Very Good (greater than 247)
Average Scaled Score: (Range 100-300)
PERFORMANCE ASSESSMENTS
Grade 8 Writing Assessment
1998-99 Percent Scoring
1997-98 Percent Scoring
1996-97 Percent Scoring
School System State School System State School System State
0% 6% 49% 45%
2% 25% 50% 24%
8% 40% 41% 11%
0% 12% 58% 30%
3% 33% 47% 17%
11% 46% 34%
8%
1% 20% 58% 22%
5% 36% 43% 16%
15% 46% 30%
8%
242
225
208 234
218 202 227
215 198
AWARDS / RECOGNITION DATA
Schools in Georgia may receive recognition in the following programs: Charter School Pay for Performance Program Georgia School of Excellence National Blue Ribbon School Dickerson Middle School did not receive recognition in any of these programs during the 1998-99 school year.
1998-99 GEORGIA PUBLIC EDUCATION REPORT CARD Dickerson Middle School - 6330281
Prepared by Georgia Department of Education
Page 3
CERTIFIED PERSONNEL DATA
Positions Number Average Contract Days
Personnel Sex
Certificate
Years Experience
Full-time Part-time
Male Female
4 Yr Bachelor's 5 Yr Master's 6 Yr Specialist's 7 Yr Doctoral Other*
<1 1-10 11-20 21-30 >30
Average
Administrators
3.00 226.67
3 0
0 3
0 1 2 0 0 0 0 1 2 0 22.67
Support Personnel
5.58 191.00
5 3
2 6
2 5 1 0 0 0 2 3 3 0 14.63
PK-12 Teachers
77.93 191.00
76 2
9 69
39 36
3 0 0 0 30 24 24 0 14.23
*Includes One- and Two-Year Vocational Certificates.
ACCREDITATION DATA
Accredited by Southern Association of Colleges and Schools (SACS):
Elementary/Middle Commission.
1998-99 GEORGIA PUBLIC EDUCATION REPORT CARD Dickerson Middle School - 6330281
Prepared by Georgia Department of Education
Page 4
1998-99 GEORGIA PUBLIC EDUCATION REPORT CARD
COBB COUNTY SCHOOLS
Dodgen Middle School - 6330275
Grade Range 6-8
The Georgia Public Education Report Card is designed to assist systems and schools in educational improvement. This report card contains a variety of data elements. An explanation of the terms is provided as a companion to the report card data. Please refer to the definitions for the most effective use of the reported data.
STUDENT DATA
Total 798
6-8 Enrollment, by Race/Ethnicity and Sex
Black
White Hispanic
American Multi-
Asian Indian
racial
62 7.8%
680 85.2%
11 1.4%
39 4.9%
0 0.0%
6 0.8%
Male 416
52.1%
Female 382
47.9%
Enrollment in Selected Programs
Program
Gifted (Grades K-12)
Program % of Student Enrollment Population
221
27.7%
Alternative Programs (Grades 6-12)
0
0.0%
Students Eligible to Receive Free/Reduced Lunches
Number
Percent
School System
23 16,221
2.9% 17.8%
Enrollment in Compensatory Programs
Program
Program % of Student Enrollment Population
Special Education (Grades K-12) (PK)
127 15.9%
0
N/A
English to Speakers of Other Languages (ESOL) (Grades K-12)
5
< 1%
Title I (Grades K-12)
This school has no Title I program.
Dropout Rate for Grades 6-8
Number
Rate
School System
1
0.1%
19
0.1%
Total 1
Retained Students, by Race/Ethnicity and Sex
Black
White Hispanic
American MultiAsian Indian racial
1 100.0%
0 0.0%
0 0.0%
0 0.0%
0 0.0%
0 0.0%
Male Female
0
1
0.0% 100.0%
Prepared by Georgia Department of Education
Page 1
STATE-REQUIRED TEST DATA
NORM-REFERENCED TESTS Grade 8
Iowa Tests of Basic Skills (ITBS) Each chart reflects data for three years of testing.
Reading Comprehension 50
74 61 49 0
98-99
74 61 48 97-98
72 62 48 96-97
Mathematics
School 50
System
State
0
82 66 56 98-99
81 66 55 97-98
83 67 54 96-97
School System State
Reading Vocabulary 50
72 57 46 0
98-99
72 57 45 97-98
65 58 44 96-97
Language Arts
School 50
System
State
0
79 70 60 98-99
79 68 58 97-98
77 68 56 96-97
School System State
Social Studies 50
78 64 54 0
98-99
76 64 53 97-98
76 65 53 96-97
Science
School 50
System
State
0
80 66 56 98-99
75 67 55 97-98
77 67 53 96-97
School System State
Sources of Information
Composite Score
50
78 67 57 0
98-99
School 50
System
75 66 56 97-98
77 67 55 96-97
State 0
81 67 56 98-99
78 66 54 97-98
1998-99 GEORGIA PUBLIC EDUCATION REPORT CARD Dodgen Middle School - 6330275
Prepared by Georgia Department of Education
78 67 54 96-97
Scores Reported in Percentiles
School System State
Page 2
STATE-REQUIRED TEST DATA
Categories of Scaled Scores
Inadequate (less than 162)
Minimal (162-209)
Good
(210-247)
Very Good (greater than 247)
Average Scaled Score: (Range 100-300)
PERFORMANCE ASSESSMENTS
Grade 8 Writing Assessment
1998-99 Percent Scoring
1997-98 Percent Scoring
1996-97 Percent Scoring
School System State School System State School System State
0% 11% 50% 38%
2% 25% 50% 24%
8% 40% 41% 11%
0% 22% 59% 20%
3% 33% 47% 17%
11% 46% 34%
8%
1% 29% 53% 17%
5% 36% 43% 16%
15% 46% 30%
8%
237
225
208 227
218 202 223
215 198
AWARDS / RECOGNITION DATA
Schools in Georgia may receive recognition in the following programs: Charter School Pay for Performance Program Georgia School of Excellence National Blue Ribbon School Dodgen Middle School did not receive recognition in any of these programs during the 1998-99 school year.
1998-99 GEORGIA PUBLIC EDUCATION REPORT CARD Dodgen Middle School - 6330275
Prepared by Georgia Department of Education
Page 3
CERTIFIED PERSONNEL DATA
Positions Number Average Contract Days
Personnel Sex
Certificate
Years Experience
Full-time Part-time
Male Female
4 Yr Bachelor's 5 Yr Master's 6 Yr Specialist's 7 Yr Doctoral Other*
<1 1-10 11-20 21-30 >30
Average
Administrators
3.00 220.33
3 0
1 2
0 0 2 1 0 0 0 0 2 1 28.00
Support Personnel
5.59 191.00
5 4
1 8
1 7 1 0 0 0 3 4 2 0 14.89
PK-12 Teachers
51.42 191.00
48 4
6 46
25 23
4 0 0 0 21 17 11 3 14.29
*Includes One- and Two-Year Vocational Certificates.
ACCREDITATION DATA
Accredited by Southern Association of Colleges and Schools (SACS):
Elementary/Middle Commission.
1998-99 GEORGIA PUBLIC EDUCATION REPORT CARD Dodgen Middle School - 6330275
Prepared by Georgia Department of Education
Page 4
1998-99 GEORGIA PUBLIC EDUCATION REPORT CARD
COBB COUNTY SCHOOLS
Dowell Elementary School - 6330190
Grade Range PK-5
The Georgia Public Education Report Card is designed to assist systems and schools in educational improvement. This report card contains a variety of data elements. An explanation of the terms is provided as a companion to the report card data. Please refer to the definitions for the most effective use of the reported data.
STUDENT DATA
Total
K-5
861
PK
7
Enrollment, by Race/Ethnicity and Sex
Black
White Hispanic
American Asian Indian
Multiracial
188 21.8%
620 72.0%
16 1.9%
13 1.5%
3 0.3%
21 2.4%
1 14.3%
6 85.7%
0 0.0%
0 0.0%
0 0.0%
0 0.0%
Male Female
462 53.7%
399 46.3%
6 85.7%
1 14.3%
Enrollment in Selected Programs
Program
Program % of Student Enrollment Population
Gifted (Grades K-12)
30
3.5%
Alternative Programs (Grades 6-12)
N/A
N/A
Students Eligible to Receive Free/Reduced Lunches
Number
Percent
School System
151 16,221
17.4% 17.8%
Dropout Rate *
Number
Rate
School System
N/A N/A
N/A N/A
* Dropout rates are not applicable for grades PK-5.
Enrollment in Compensatory Programs
Program
Program % of Student Enrollment Population
Special Education (Grades K-12)
125 14.5%
(PK)
6
N/A
English to Speakers of Other Languages (ESOL) (Grades K-12)
0
0.0%
Remedial Education (Grades 2-5, 9-12)
66 10.9%
Special Instructional Assistance (SIA) (Grades K-3)
151 26.8%
Title I (Grades K-12)
This school has no Title I program.
Total 18
Retained Students, by Race/Ethnicity and Sex
Black
White Hispanic
American MultiAsian Indian racial
5 27.8%
12 66.7%
0 0.0%
0 0.0%
0 0.0%
1 5.6%
Male Female
13
5
72.2% 27.8%
Prepared by Georgia Department of Education
Page 1
STATE-REQUIRED TEST DATA
NORM-REFERENCED TESTS Grade 3
Iowa Tests of Basic Skills (ITBS) Each chart reflects data for three years of testing.
Reading Comprehension 50
54 63 54 0
98-99
59 62 53 97-98
63 60 52 96-97
Mathematics
School 50
System
State
0
66 70 61 98-99
67 68 61 97-98
68 68 59 96-97
School System State
Reading Vocabulary 50
55 58 50 0
98-99
61 58 50 97-98
66 58 49 96-97
Language Arts
School 50
System
State
0
68 70 64 98-99
69 69 62 97-98
72 67 59 96-97
School System State
Social Studies 50
55 64 56 0
98-99
60 64 55 97-98
62 64 55 96-97
Science
School 50
System
State
0
62 70 59 98-99
71 70 59 97-98
71 69 58 96-97
School System State
Sources of Information
Composite Score
50
54 66 57 0
98-99
School 50
System
61 65 56 97-98
65 64 55 96-97
State 0
59 67 58 98-99
65 67 57 97-98
1998-99 GEORGIA PUBLIC EDUCATION REPORT CARD Dowell Elementary School - 6330190
Prepared by Georgia Department of Education
67 66 56 96-97
Scores Reported in Percentiles
School System State
Page 2
STATE-REQUIRED TEST DATA
NORM-REFERENCED TESTS Grade 5
Iowa Tests of Basic Skills (ITBS) Each chart reflects data for three years of testing.
Reading Comprehension
Mathematics
50
57 59 53 0
98-99
57 60 53 97-98
63 60 52 96-97
School 50
System
State
0
63 68 59 98-99
63 68 58 97-98
73 69 57 96-97
School System State
Reading Vocabulary 50
57 57 48 0
98-99
54 58 48 97-98
63 58 46 96-97
Language Arts
School 50
System
State
0
70 71 63 98-99
66 70 61 97-98
67 69 58 96-97
School System State
Social Studies 50
61 64 57 0
98-99
58 64 56 97-98
70 65 55 96-97
Science
School 50
System
State
0
70 68 60 98-99
69 69 59 97-98
74 70 59 96-97
School System State
Sources of Information
Composite Score
50
63 67 58 0
98-99
School 50
System
63 65 58 97-98
70 66 57 96-97
State 0
64 66 57 98-99
63 66 56 97-98
71 67 55 96-97
1998-99 GEORGIA PUBLIC EDUCATION REPORT CARD Dowell Elementary School - 6330190
Prepared by Georgia Department of Education
Scores Reported in Percentiles
School System State
Page 3
STATE-REQUIRED TEST DATA
PERFORMANCE ASSESSMENTS
Grade 5 Writing Assessment
Percent at Developmental Stages:
1998-99 School System State
1997-98 School System State
1996-97 School System State
Stage Stage Stage Stage Stage Stage
1:The Emerging Writer 2:The Developing Writer 3:The Focusing Writer 4:The Experimenting 5:The Engaging Writer 6:The Extending Writer
0% 0% 10% 41% 33% 16%
0% 1% 10% 36% 34% 19%
0% 1% 16% 41% 29% 12%
0% 0% 9% 42% 34% 15%
0% 1% 12% 37% 33% 16%
0% 3% 19% 41% 27% 10%
0% 1% 12% 24% 34% 29%
0% 1% 14% 34% 32% 18%
0% 3% 21% 37% 26% 12%
AWARDS / RECOGNITION DATA
Schools in Georgia may receive recognition in the following programs: Charter School Pay for Performance Program Georgia School of Excellence National Blue Ribbon School Dowell Elementary School did not receive recognition in any of these programs during the 1998-99 school year.
1998-99 GEORGIA PUBLIC EDUCATION REPORT CARD Dowell Elementary School - 6330190
Prepared by Georgia Department of Education
Page 4
CERTIFIED PERSONNEL DATA
Positions Number Average Contract Days
Personnel Sex
Certificate
Years Experience
Full-time Part-time
Male Female
4 Yr Bachelor's 5 Yr Master's 6 Yr Specialist's 7 Yr Doctoral Other*
<1 1-10 11-20 21-30 >30
Average
Administrators
2.00 235.00
2 0
0 2
0 1 1 0 0 0 0 1 1 0 19.00
Support Personnel
5.50 191.00
5 1
1 5
1 4 1 0 0 0 4 2 0 0 8.17
PK-12 Teachers
58.50 191.00
58 1
3 56
34 22
3 0 0 0 18 26 14 1 14.05
*Includes One- and Two-Year Vocational Certificates.
ACCREDITATION DATA
Accredited by Southern Association of Colleges and Schools (SACS):
Elementary/Middle Commission.
1998-99 GEORGIA PUBLIC EDUCATION REPORT CARD Dowell Elementary School - 6330190
Prepared by Georgia Department of Education
Page 5
1998-99 GEORGIA PUBLIC EDUCATION REPORT CARD
COBB COUNTY SCHOOLS
Due West Elementary School - 6335056
Grade Range K-5
The Georgia Public Education Report Card is designed to assist systems and schools in educational improvement. This report card contains a variety of data elements. An explanation of the terms is provided as a companion to the report card data. Please refer to the definitions for the most effective use of the reported data.
STUDENT DATA
Total 493
K-5 Enrollment, by Race/Ethnicity and Sex
Black
White Hispanic
American Multi-
Asian Indian
racial
10 2.0%
467 94.7%
6 1.2%
4 0.8%
0 0.0%
6 1.2%
Male Female
248 50.3%
245 49.7%
Enrollment in Selected Programs
Program
Program % of Student Enrollment Population
Gifted (Grades K-12)
30
6.1%
Alternative Programs (Grades 6-12)
N/A
N/A
Students Eligible to Receive Free/Reduced Lunches
Number
Percent
School System
17 16,221
3.4% 17.8%
Dropout Rate *
Number
Rate
School System
N/A N/A
N/A N/A
* Dropout rates are not applicable for grades PK-5.
Enrollment in Compensatory Programs
Program
Program % of Student Enrollment Population
Special Education (Grades K-12)
46
9.3%
(PK)
0
N/A
English to Speakers of Other Languages (ESOL) (Grades K-12)
0
0.0%
Remedial Education (Grades 2-5, 9-12)
48 14.0%
Special Instructional Assistance (SIA) (Grades K-3)
32 10.1%
Title I (Grades K-12)
This school has no Title I program.
Total 1
Retained Students, by Race/Ethnicity and Sex
Black
White Hispanic
American Multi-
Asian Indian
racial
0
1
0.0% 100.0%
0 0.0%
0 0.0%
0 0.0%
0 0.0%
Male Female
1
0
100.0% 0.0%
Prepared by Georgia Department of Education
Page 1
STATE-REQUIRED TEST DATA
NORM-REFERENCED TESTS Grade 3
Iowa Tests of Basic Skills (ITBS) Each chart reflects data for three years of testing.
Reading Comprehension 50
75 63 54 0
98-99
73 62 53 97-98
78 60 52 96-97
Mathematics
School 50
System
State
0
87 70 61 98-99
84 68 61 97-98
85 68 59 96-97
School System State
Reading Vocabulary 50
78 58 50 0
98-99
76 58 50 97-98
76 58 49 96-97
Language Arts
School 50
System
State
0
87 70 64 98-99
84 69 62 97-98
86 67 59 96-97
School System State
Social Studies 50
83 64 56 0
98-99
77 64 55 97-98
75 64 55 96-97
Science
School 50
System
State
0
85 70 59 98-99
80 70 59 97-98
77 69 58 96-97
School System State
Sources of Information
Composite Score
50
86 66 57 0
98-99
School 50
System
82 65 56 97-98
81 64 55 96-97
State 0
86 67 58 98-99
81 67 57 97-98
1998-99 GEORGIA PUBLIC EDUCATION REPORT CARD Due West Elementary School - 6335056
Prepared by Georgia Department of Education
82 66 56 96-97
Scores Reported in Percentiles
School System State
Page 2
STATE-REQUIRED TEST DATA
NORM-REFERENCED TESTS Grade 5
Iowa Tests of Basic Skills (ITBS) Each chart reflects data for three years of testing.
Reading Comprehension
Mathematics
50
74 59 53 0
98-99
68 60 53 97-98
69 60 52 96-97
School 50
System
State
0
85 68 59 98-99
79 68 58 97-98
81 69 57 96-97
School System State
Reading Vocabulary 50
72 57 48 0
98-99
67 58 48 97-98
65 58 46 96-97
Language Arts
School 50
System
State
0
83 71 63 98-99
75 70 61 97-98
74 69 58 96-97
School System State
Social Studies 50
79 64 57 0
98-99
74 64 56 97-98
73 65 55 96-97
Science
School 50
System
State
0
81 68 60 98-99
79 69 59 97-98
80 70 59 96-97
School System State
Sources of Information
Composite Score
50
80 67 58 0
98-99
School 50
System
75 65 58 97-98
73 66 57 96-97
State 0
83 66 57 98-99
77 66 56 97-98
76 67 55 96-97
1998-99 GEORGIA PUBLIC EDUCATION REPORT CARD Due West Elementary School - 6335056
Prepared by Georgia Department of Education
Scores Reported in Percentiles
School System State
Page 3
STATE-REQUIRED TEST DATA
PERFORMANCE ASSESSMENTS
Grade 5 Writing Assessment
Percent at Developmental Stages:
1998-99 School System State
1997-98 School System State
1996-97 School System State
Stage Stage Stage Stage Stage Stage
1:The Emerging Writer 2:The Developing Writer 3:The Focusing Writer 4:The Experimenting 5:The Engaging Writer 6:The Extending Writer
0% 1% 9% 36% 36% 16%
0% 1% 10% 36% 34% 19%
0% 1% 16% 41% 29% 12%
0% 0% 14% 41% 34% 11%
0% 1% 12% 37% 33% 16%
0% 3% 19% 41% 27% 10%
0% 1% 6% 26% 44% 21%
0% 1% 14% 34% 32% 18%
0% 3% 21% 37% 26% 12%
AWARDS / RECOGNITION DATA
Schools in Georgia may receive recognition in the following programs: Charter School Pay for Performance Program Georgia School of Excellence National Blue Ribbon School Due West Elementary School did not receive recognition in any of these programs during the 1998-99 school year.
1998-99 GEORGIA PUBLIC EDUCATION REPORT CARD Due West Elementary School - 6335056
Prepared by Georgia Department of Education
Page 4
CERTIFIED PERSONNEL DATA
Positions Number Average Contract Days
Personnel Sex
Certificate
Years Experience
Full-time Part-time
Male Female
4 Yr Bachelor's 5 Yr Master's 6 Yr Specialist's 7 Yr Doctoral Other*
<1 1-10 11-20 21-30 >30
Average
Administrators
2.00 225.50
2 0
0 2
0 0 2 0 0 0 0 2 0 0 16.00
Support Personnel
2.57 191.00
2 2
1 3
2 1 1 0 0 0 2 1 1 0 15.25
PK-12 Teachers
26.93 191.00
25 3
1 27
13 14
1 0 0 0 6 11 11 0 17.79
*Includes One- and Two-Year Vocational Certificates.
ACCREDITATION DATA
Accredited by Southern Association of Colleges and Schools (SACS):
Elementary/Middle Commission.
1998-99 GEORGIA PUBLIC EDUCATION REPORT CARD Due West Elementary School - 6335056
Prepared by Georgia Department of Education
Page 5
1998-99 GEORGIA PUBLIC EDUCATION REPORT CARD
COBB COUNTY SCHOOLS
East Cobb Middle School - 6331056
Grade Range 6-8
The Georgia Public Education Report Card is designed to assist systems and schools in educational improvement. This report card contains a variety of data elements. An explanation of the terms is provided as a companion to the report card data. Please refer to the definitions for the most effective use of the reported data.
STUDENT DATA
Total 1,384
6-8 Enrollment, by Race/Ethnicity and Sex
Black
White Hispanic
American Multi-
Asian Indian
racial
421 30.4%
719 52.0%
108 7.8%
92 6.6%
5 0.4%
39 2.8%
Male 728
52.6%
Female 656
47.4%
Enrollment in Selected Programs
Program
Gifted (Grades K-12)
Program % of Student Enrollment Population
213
15.4%
Alternative Programs (Grades 6-12)
0
0.0%
Students Eligible to Receive Free/Reduced Lunches
Number
Percent
School System
320 16,221
23.1% 17.8%
Enrollment in Compensatory Programs
Program
Program % of Student Enrollment Population
Special Education (Grades K-12) (PK)
148 10.7%
0
N/A
English to Speakers of Other Languages (ESOL) (Grades K-12)
76
5.5%
Title I (Grades K-12)
This school has no Title I program.
Dropout Rate for Grades 6-8
Number
Rate
School System
5
0.3%
19
0.1%
Total 28
Retained Students, by Race/Ethnicity and Sex
Black
White Hispanic
American MultiAsian Indian racial
19 67.9%
5 17.9%
2 7.1%
0 0.0%
0 0.0%
2 7.1%
Male Female
19
9
67.9% 32.1%
Prepared by Georgia Department of Education
Page 1
STATE-REQUIRED TEST DATA
NORM-REFERENCED TESTS Grade 8
Iowa Tests of Basic Skills (ITBS) Each chart reflects data for three years of testing.
Reading Comprehension 50
62 61 49 0
98-99
57 61 48 97-98
64 62 48 96-97
Mathematics
School 50
System
State
0
62 66 56 98-99
64 66 55 97-98
68 67 54 96-97
School System State
Reading Vocabulary 50
58 57 46 0
98-99
56 57 45 97-98
62 58 44 96-97
Language Arts
School 50
System
State
0
70 70 60 98-99
66 68 58 97-98
70 68 56 96-97
School System State
Social Studies 50
65 64 54 0
98-99
63 64 53 97-98
66 65 53 96-97
Science
School 50
System
State
0
67 66 56 98-99
65 67 55 97-98
68 67 53 96-97
School System State
Sources of Information
Composite Score
50
64 67 57 0
98-99
School 50
System
65 66 56 97-98
69 67 55 96-97
State 0
66 67 56 98-99
64 66 54 97-98
1998-99 GEORGIA PUBLIC EDUCATION REPORT CARD East Cobb Middle School - 6331056
Prepared by Georgia Department of Education
68 67 54 96-97
Scores Reported in Percentiles
School System State
Page 2
STATE-REQUIRED TEST DATA
Categories of Scaled Scores
Inadequate (less than 162)
Minimal (162-209)
Good
(210-247)
Very Good (greater than 247)
Average Scaled Score: (Range 100-300)
PERFORMANCE ASSESSMENTS
Grade 8 Writing Assessment
1998-99 Percent Scoring
1997-98 Percent Scoring
1996-97 Percent Scoring
School System State School System State School System State
1% 28% 46% 25%
2% 25% 50% 24%
8% 40% 41% 11%
3% 37% 49% 11%
3% 33% 47% 17%
11% 46% 34%
8%
5% 32% 42% 20%
5% 36% 43% 16%
15% 46% 30%
8%
224
225
208 215
218 202 217
215 198
AWARDS / RECOGNITION DATA
Schools in Georgia may receive recognition in the following programs: Charter School Pay for Performance Program Georgia School of Excellence National Blue Ribbon School East Cobb Middle School did not receive recognition in any of these programs during the 1998-99 school year.
1998-99 GEORGIA PUBLIC EDUCATION REPORT CARD East Cobb Middle School - 6331056
Prepared by Georgia Department of Education
Page 3
CERTIFIED PERSONNEL DATA
Positions Number Average Contract Days
Personnel Sex
Certificate
Years Experience
Full-time Part-time
Male Female
4 Yr Bachelor's 5 Yr Master's 6 Yr Specialist's 7 Yr Doctoral Other*
<1 1-10 11-20 21-30 >30
Average
Administrators
4.00 217.75
4 0
4 0
0 2 2 0 0 0 0 3 0 1 18.25
Support Personnel
4.42 191.00
4 9
4 9
6 6 1 0 0 0 9 1 3 0 9.92
PK-12 Teachers
89.08 191.00
80 10
17 73
58 28
3 1 0 0 49 27 14 0 11.10
*Includes One- and Two-Year Vocational Certificates.
ACCREDITATION DATA
Accredited by Southern Association of Colleges and Schools (SACS):
Elementary/Middle Commission.
1998-99 GEORGIA PUBLIC EDUCATION REPORT CARD East Cobb Middle School - 6331056
Prepared by Georgia Department of Education
Page 4
1998-99 GEORGIA PUBLIC EDUCATION REPORT CARD
COBB COUNTY SCHOOLS
East Side Elementary School - 6331058
Grade Range K-5
The Georgia Public Education Report Card is designed to assist systems and schools in educational improvement. This report card contains a variety of data elements. An explanation of the terms is provided as a companion to the report card data. Please refer to the definitions for the most effective use of the reported data.
STUDENT DATA
Total 809
K-5 Enrollment, by Race/Ethnicity and Sex
Black
White Hispanic
American Multi-
Asian Indian
racial
31 3.8%
658 81.3%
11
97
1.4% 12.0%
0 0.0%
12 1.5%
Male Female
415 51.3%
394 48.7%
Enrollment in Selected Programs
Program
Program % of Student Enrollment Population
Gifted (Grades K-12)
63
7.8%
Alternative Programs (Grades 6-12)
N/A
N/A
Students Eligible to Receive Free/Reduced Lunches
Number
Percent
School System
31 16,221
3.8% 17.8%
Dropout Rate *
Number
Rate
School System
N/A N/A
N/A N/A
* Dropout rates are not applicable for grades PK-5.
Enrollment in Compensatory Programs
Program
Program % of Student Enrollment Population
Special Education (Grades K-12)
81 10.0%
(PK)
0
N/A
English to Speakers of Other Languages (ESOL) (Grades K-12)
23
2.8%
Remedial Education (Grades 2-5, 9-12)
53
9.4%
Special Instructional Assistance (SIA) (Grades K-3)
91 17.9%
Title I (Grades K-12)
This school has no Title I program.
Total 1
Retained Students, by Race/Ethnicity and Sex
Black
White Hispanic
American Multi-
Asian Indian
racial
0 0.0%
0 0.0%
0 0.0%
0 0.0%
0
1
0.0% 100.0%
Male Female
1
0
100.0% 0.0%
Prepared by Georgia Department of Education
Page 1
STATE-REQUIRED TEST DATA
NORM-REFERENCED TESTS Grade 3
Iowa Tests of Basic Skills (ITBS) Each chart reflects data for three years of testing.
Reading Comprehension 50
77 63 54 0
98-99
79 62 53 97-98
75 60 52 96-97
Mathematics
School 50
System
State
0
85 70 61 98-99
86 68 61 97-98
87 68 59 96-97
School System State
Reading Vocabulary 50
80 58 50 0
98-99
78 58 50 97-98
82 58 49 96-97
Language Arts
School 50
System
State
0
85 70 64 98-99
89 69 62 97-98
86 67 59 96-97
School System State
Social Studies 50
77 64 56 0
98-99
80 64 55 97-98
83 64 55 96-97
Science
School 50
System
State
0
83 70 59 98-99
84 70 59 97-98
85 69 58 96-97
School System State
Sources of Information
Composite Score
50
84 66 57 0
98-99
School 50
System
86 65 56 97-98
85 64 55 96-97
State 0
84 67 58 98-99
86 67 57 97-98
1998-99 GEORGIA PUBLIC EDUCATION REPORT CARD East Side Elementary School - 6331058
Prepared by Georgia Department of Education
86 66 56 96-97
Scores Reported in Percentiles
School System State
Page 2
STATE-REQUIRED TEST DATA
NORM-REFERENCED TESTS Grade 5
Iowa Tests of Basic Skills (ITBS) Each chart reflects data for three years of testing.
Reading Comprehension
Mathematics
50
73 59 53 0
98-99
72 60 53 97-98
70 60 52 96-97
School 50
System
State
0
82 68 59 98-99
80 68 58 97-98
79 69 57 96-97
School System State
Reading Vocabulary 50
71 57 48 0
98-99
75 58 48 97-98
69 58 46 96-97
Language Arts
School 50
System
State
0
84 71 63 98-99
85 70 61 97-98
80 69 58 96-97
School System State
Social Studies 50
78 64 57 0
98-99
77 64 56 97-98
77 65 55 96-97
Science
School 50
System
State
0
79 68 60 98-99
80 69 59 97-98
79 70 59 96-97
School System State
Sources of Information
Composite Score
50
80 67 58 0
98-99
School 50
System
77 65 58 97-98
80 66 57 96-97
State 0
82 66 57 98-99
81 66 56 97-98
79 67 55 96-97
1998-99 GEORGIA PUBLIC EDUCATION REPORT CARD East Side Elementary School - 6331058
Prepared by Georgia Department of Education
Scores Reported in Percentiles
School System State
Page 3
STATE-REQUIRED TEST DATA
PERFORMANCE ASSESSMENTS
Grade 5 Writing Assessment
Percent at Developmental Stages:
1998-99 School System State
1997-98 School System State
1996-97 School System State
Stage Stage Stage Stage Stage Stage
1:The Emerging Writer 2:The Developing Writer 3:The Focusing Writer 4:The Experimenting 5:The Engaging Writer 6:The Extending Writer
0% 0% 5% 21% 40% 34%
0% 1% 10% 36% 34% 19%
0% 1% 16% 41% 29% 12%
1% 0% 5% 17% 46% 32%
0% 1% 12% 37% 33% 16%
0% 3% 19% 41% 27% 10%
0% 1% 6% 32% 31% 30%
0% 1% 14% 34% 32% 18%
0% 3% 21% 37% 26% 12%
AWARDS / RECOGNITION DATA
Schools in Georgia may receive recognition in the following programs: Charter School Pay for Performance Program Georgia School of Excellence National Blue Ribbon School East Side Elementary School did not receive recognition in any of these programs during the 1998-99 school year.
1998-99 GEORGIA PUBLIC EDUCATION REPORT CARD East Side Elementary School - 6331058
Prepared by Georgia Department of Education
Page 4
CERTIFIED PERSONNEL DATA
Positions Number Average Contract Days
Personnel Sex
Certificate
Years Experience
Full-time Part-time
Male Female
4 Yr Bachelor's 5 Yr Master's 6 Yr Specialist's 7 Yr Doctoral Other*
<1 1-10 11-20 21-30 >30
Average
Administrators
2.00 235.00
2 0
0 2
0 0 2 0 0 0 0 0 2 0 24.50
Support Personnel
4.50 191.00
3 3
0 6
0 6 0 0 0 0 3 1 1 1 13.17
PK-12 Teachers
48.00 191.00
47 2
3 46
32 16
1 0 0 0 22 17 10 0 13.18
*Includes One- and Two-Year Vocational Certificates.
ACCREDITATION DATA
Accredited by Southern Association of Colleges and Schools (SACS):
Elementary/Middle Commission.
1998-99 GEORGIA PUBLIC EDUCATION REPORT CARD East Side Elementary School - 6331058
Prepared by Georgia Department of Education
Page 5
1998-99 GEORGIA PUBLIC EDUCATION REPORT CARD
COBB COUNTY SCHOOLS
Eastvalley Elementary School - 6335068
Grade Range PK-5
The Georgia Public Education Report Card is designed to assist systems and schools in educational improvement. This report card contains a variety of data elements. An explanation of the terms is provided as a companion to the report card data. Please refer to the definitions for the most effective use of the reported data.
STUDENT DATA
Total
K-5
604
PK
5
Enrollment, by Race/Ethnicity and Sex
Black
White Hispanic
American Asian Indian
Multiracial
93 15.4%
423 70.0%
16 2.6%
49 8.1%
1 0.2%
22 3.6%
0
5
0.0% 100.0%
0 0.0%
0 0.0%
0 0.0%
0 0.0%
Male Female
297 49.2%
307 50.8%
4 80.0%
1 20.0%
Enrollment in Selected Programs
Program
Program % of Student Enrollment Population
Gifted (Grades K-12)
30
5.0%
Alternative Programs (Grades 6-12)
N/A
N/A
Students Eligible to Receive Free/Reduced Lunches
Number
Percent
School System
61 16,221
10.0% 17.8%
Dropout Rate *
Number
Rate
School System
N/A N/A
N/A N/A
* Dropout rates are not applicable for grades PK-5.
Enrollment in Compensatory Programs
Program
Program % of Student Enrollment Population
Special Education (Grades K-12)
68 11.3%
(PK)
5
N/A
English to Speakers of Other Languages (ESOL) (Grades K-12)
15
2.5%
Remedial Education (Grades 2-5, 9-12)
41
9.6%
Special Instructional Assistance (SIA) (Grades K-3)
99 26.1%
Title I (Grades K-12)
This school has no Title I program.
Total 3
Retained Students, by Race/Ethnicity and Sex
Black
White Hispanic
American MultiAsian Indian racial
1 33.3%
2 66.7%
0 0.0%
0 0.0%
0 0.0%
0 0.0%
Male Female
1
2
33.3% 66.7%
Prepared by Georgia Department of Education
Page 1
STATE-REQUIRED TEST DATA
NORM-REFERENCED TESTS Grade 3
Iowa Tests of Basic Skills (ITBS) Each chart reflects data for three years of testing.
Reading Comprehension 50
73 63 54 N/A 62 53 N/A 60 52
0
98-99
97-98
96-97
Mathematics
School 50
System
State
0
83 70 61 N/A 68 61 N/A 68 59
98-99
97-98
96-97
School System State
Reading Vocabulary 50
65 58 50 N/A 58 50 N/A 58 49
0
98-99
97-98
96-97
Language Arts
School 50
System
State
0
76 70 64 N/A 69 62 N/A 67 59
98-99
97-98
96-97
School System State
Social Studies 50
69 64 56 N/A 64 55 N/A 64 55
0
98-99
97-98
96-97
Science
School 50
System
State
0
79 70 59 N/A 70 59 N/A 69 58
98-99
97-98
96-97
School System State
Sources of Information
Composite Score
School
50
50
System
74 66 57 N/A 65 56 N/A 64 55
0
98-99
97-98
96-97
State 0
76 67 58 N/A 67 57 N/A 66 56
98-99
97-98
96-97
1998-99 GEORGIA PUBLIC EDUCATION REPORT CARD Eastvalley Elementary School - 6335068
Prepared by Georgia Department of Education
Scores Reported in Percentiles
School System State
Page 2
STATE-REQUIRED TEST DATA
NORM-REFERENCED TESTS Grade 5
Iowa Tests of Basic Skills (ITBS) Each chart reflects data for three years of testing.
Reading Comprehension
Mathematics
50
73 59 53 N/A 60 53 N/A 60 52
0
98-99
97-98
96-97
School 50
System
State
0
84 68 59 N/A 68 58 N/A 69 57
98-99
97-98
96-97
School System State
Reading Vocabulary 50
72 57 48 N/A 58 48 N/A 58 46 0
98-99
97-98
96-97
Language Arts
School 50
System
State
0
81 71 63 N/A 70 61 N/A 69 58
98-99
97-98
96-97
School System State
Social Studies 50
73 64 57 N/A 64 56 N/A 65 55
0
98-99
97-98
96-97
Science
School 50
System
State
0
81 68 60 N/A 69 59 N/A 70 59
98-99
97-98
96-97
School System State
Sources of Information
Composite Score
School
50
50
System
78 67 58 N/A 65 58 N/A 66 57 0
98-99
97-98
96-97
State 0
81 66 57 N/A 66 56 N/A 67 55
98-99
97-98
96-97
1998-99 GEORGIA PUBLIC EDUCATION REPORT CARD Eastvalley Elementary School - 6335068
Prepared by Georgia Department of Education
Scores Reported in Percentiles
School System State
Page 3
STATE-REQUIRED TEST DATA
PERFORMANCE ASSESSMENTS
Grade 5 Writing Assessment
Percent at Developmental Stages:
1998-99 School System State
1997-98 School System State
1996-97 School System State
Stage Stage Stage Stage Stage Stage
1:The Emerging Writer 2:The Developing Writer 3:The Focusing Writer 4:The Experimenting 5:The Engaging Writer 6:The Extending Writer
0% 0% 6% 30% 35% 29%
0% 1% 10% 36% 34% 19%
0% 1% 16% 41% 29% 12%
0% 0% 10% 34% 37% 19%
0% 1% 12% 37% 33% 16%
0% 3% 19% 41% 27% 10%
0% 0% 5% 27% 38% 29%
0% 1% 14% 34% 32% 18%
0% 3% 21% 37% 26% 12%
AWARDS / RECOGNITION DATA
Schools that become a Charter School have a unique opportunity to rethink how they structure and deliver education programs for improving the learning of their students while being freed from the state laws, State Board of Education rules and regulations, and local board of education rules and regulations that govern other schools. A 'charter' is a binding contract that, when approved by the faculty and parents of the school, the local board of education and the State Board of Education, substitutes for state education statutes, state and local rules, policies, regulations and standards.
Eastvalley Elementary School is a Charter School for 1998-99.
1998-99 GEORGIA PUBLIC EDUCATION REPORT CARD Eastvalley Elementary School - 6335068
Prepared by Georgia Department of Education
Page 4
CERTIFIED PERSONNEL DATA
Positions Number Average Contract Days
Personnel Sex
Certificate
Years Experience
Full-time Part-time
Male Female
4 Yr Bachelor's 5 Yr Master's 6 Yr Specialist's 7 Yr Doctoral Other*
<1 1-10 11-20 21-30 >30
Average
Administrators
1.00 260.00
1 0
0 1
0 0 1 0 0 0 0 1 0 0 20.00
Support Personnel
4.53 191.00
4 1
0 5
1 2 2 0 0 0 0 5 0 0 16.40
PK-12 Teachers
37.47 191.00
36 3
0 39
18 19
2 0 0 0 17 12 10 0 13.18
*Includes One- and Two-Year Vocational Certificates.
ACCREDITATION DATA
Accredited by Southern Association of Colleges and Schools (SACS):
Elementary/Middle Commission.
1998-99 GEORGIA PUBLIC EDUCATION REPORT CARD Eastvalley Elementary School - 6335068
Prepared by Georgia Department of Education
Page 5
1998-99 GEORGIA PUBLIC EDUCATION REPORT CARD
COBB COUNTY SCHOOLS
Fair Oaks Elementary School - 6333058
Grade Range PK-5
The Georgia Public Education Report Card is designed to assist systems and schools in educational improvement. This report card contains a variety of data elements. An explanation of the terms is provided as a companion to the report card data. Please refer to the definitions for the most effective use of the reported data.
STUDENT DATA
Total
K-5
528
PK
5
Enrollment, by Race/Ethnicity and Sex
Black
White Hispanic
American Asian Indian
Multiracial
196 37.1%
155 29.4%
154 29.2%
4 0.8%
1 0.2%
18 3.4%
3 60.0%
1 20.0%
1 20.0%
0 0.0%
0 0.0%
0 0.0%
Male Female
270 51.1%
258 48.9%
1 20.0%
4 80.0%
Enrollment in Selected Programs
Program
Program % of Student Enrollment Population
Gifted (Grades K-12)
1
< 1%
Alternative Programs (Grades 6-12)
N/A
N/A
Students Eligible to Receive Free/Reduced Lunches
Number
Percent
School System
428 16,221
80.3% 17.8%
Dropout Rate *
Number
Rate
School System
N/A N/A
N/A N/A
* Dropout rates are not applicable for grades PK-5.
Enrollment in Compensatory Programs
Program
Program % of Student Enrollment Population
Special Education (Grades K-12)
53 10.0%
(PK)
5
N/A
English to Speakers of Other Languages (ESOL) (Grades K-12)
120 22.7%
Remedial Education (Grades 2-5, 9-12)
51 16.2%
Special Instructional Assistance (SIA) (Grades K-3)
288 77.4%
Title I (Grades K-12)
This school has a schoolwide program.
Total 6
Retained Students, by Race/Ethnicity and Sex
Black
White Hispanic
American MultiAsian Indian racial
2 33.3%
3
1
50.0% 16.7%
0 0.0%
0 0.0%
0 0.0%
Male Female
5
1
83.3% 16.7%
Prepared by Georgia Department of Education
Page 1
STATE-REQUIRED TEST DATA
NORM-REFERENCED TESTS Grade 3
Iowa Tests of Basic Skills (ITBS) Each chart reflects data for three years of testing.
Reading Comprehension 50
31 63 54 0
98-99
25 62 53 97-98
33 60 52 96-97
Mathematics
School 50
System
State
0
42 70 61 98-99
36 68 61 97-98
42 68 59 96-97
School System State
Reading Vocabulary 50
30 58 50 0
98-99
28 58 50 97-98
27 58 49 96-97
Language Arts
School 50
System
State
0
49 70 64 98-99
28 69 62 97-98
39 67 59 96-97
School System State
Social Studies 50
36 64 56 0
98-99
35 64 55 97-98
38 64 55 96-97
Science
School 50
System
State
0
36 70 59 98-99
36 70 59 97-98
39 69 58 96-97
School System State
Sources of Information
Composite Score
50
35 66 57 0
98-99
School 50
System
25 65 56 97-98
36 64 55 96-97
State 0
35 67 58 98-99
29 67 57 97-98
1998-99 GEORGIA PUBLIC EDUCATION REPORT CARD Fair Oaks Elementary School - 6333058
Prepared by Georgia Department of Education
35 66 56 96-97
Scores Reported in Percentiles
School System State
Page 2
STATE-REQUIRED TEST DATA
NORM-REFERENCED TESTS Grade 5
Iowa Tests of Basic Skills (ITBS) Each chart reflects data for three years of testing.
Reading Comprehension
Mathematics
50
42 59 53 0
98-99
32 60 53 97-98
44 60 52 96-97
School 50
System
State
0
50 68 59 98-99
45 68 58 97-98
41 69 57 96-97
School System State
Reading Vocabulary 50
46 57 48 0
98-99
35 58 48 97-98
43 58 46 96-97
Language Arts
School 50
System
State
0
53 71 63 98-99
46 70 61 97-98
51 69 58 96-97
School System State
Social Studies 50
48 64 57 0
98-99
36 64 56 97-98
52 65 55 96-97
Science
School 50
System
State
0
56 68 60 98-99
43 69 59 97-98
55 70 59 96-97
School System State
Sources of Information
Composite Score
50
49 67 58 0
98-99
School 50
System
39 65 58 97-98
42 66 57 96-97
State 0
50 66 57 98-99
38 66 56 97-98
47 67 55 96-97
1998-99 GEORGIA PUBLIC EDUCATION REPORT CARD Fair Oaks Elementary School - 6333058
Prepared by Georgia Department of Education
Scores Reported in Percentiles
School System State
Page 3
STATE-REQUIRED TEST DATA
PERFORMANCE ASSESSMENTS
Grade 5 Writing Assessment
Percent at Developmental Stages:
1998-99 School System State
1997-98 School System State
1996-97 School System State
Stage Stage Stage Stage Stage Stage
1:The Emerging Writer 2:The Developing Writer 3:The Focusing Writer 4:The Experimenting 5:The Engaging Writer 6:The Extending Writer
0% 0% 13% 47% 29% 11%
0% 1% 10% 36% 34% 19%
0% 1% 16% 41% 29% 12%
2% 13% 33% 38% 10%
2%
0% 1% 12% 37% 33% 16%
0% 3% 19% 41% 27% 10%
0% 9% 37% 31% 18% 5%
0% 1% 14% 34% 32% 18%
0% 3% 21% 37% 26% 12%
AWARDS / RECOGNITION DATA
Schools in Georgia may receive recognition in the following programs: Charter School Pay for Performance Program Georgia School of Excellence National Blue Ribbon School Fair Oaks Elementary School did not receive recognition in any of these programs during the 1998-99 school year.
1998-99 GEORGIA PUBLIC EDUCATION REPORT CARD Fair Oaks Elementary School - 6333058
Prepared by Georgia Department of Education
Page 4
CERTIFIED PERSONNEL DATA
Positions Number Average Contract Days
Personnel Sex
Certificate
Years Experience
Full-time Part-time
Male Female
4 Yr Bachelor's 5 Yr Master's 6 Yr Specialist's 7 Yr Doctoral Other*
<1 1-10 11-20 21-30 >30
Average
Administrators
2.00 235.00
2 0
0 2
0 0 2 0 0 0 0 0 1 1 29.50
Support Personnel
5.10 191.00
4 3
1 6
0 6 1 0 0 0 2 3 2 0 16.71
PK-12 Teachers
40.40 191.00
38 4
4 38
25 16
1 0 0 0 23 9 10 0 11.76
*Includes One- and Two-Year Vocational Certificates.
ACCREDITATION DATA
Accredited by Southern Association of Colleges and Schools (SACS):
Elementary/Middle Commission.
1998-99 GEORGIA PUBLIC EDUCATION REPORT CARD Fair Oaks Elementary School - 6333058
Prepared by Georgia Department of Education
Page 5
1998-99 GEORGIA PUBLIC EDUCATION REPORT CARD
COBB COUNTY SCHOOLS
Floyd Middle School - 6335058
Grade Range 6-8
The Georgia Public Education Report Card is designed to assist systems and schools in educational improvement. This report card contains a variety of data elements. An explanation of the terms is provided as a companion to the report card data. Please refer to the definitions for the most effective use of the reported data.
STUDENT DATA
Total 994
6-8 Enrollment, by Race/Ethnicity and Sex
Black
White Hispanic
American Multi-
Asian Indian
racial
353 35.5%
542 54.5%
53 5.3%
30 3.0%
2 0.2%
14 1.4%
Male 524
52.7%
Female 470
47.3%
Enrollment in Selected Programs
Program
Gifted (Grades K-12)
Program % of Student Enrollment Population
79
7.9%
Alternative Programs (Grades 6-12)
1
< 1%
Students Eligible to Receive Free/Reduced Lunches
Number
Percent
School System
346 16,221
34.8% 17.8%
Enrollment in Compensatory Programs
Program
Program % of Student Enrollment Population
Special Education (Grades K-12) (PK)
140 14.1%
0
N/A
English to Speakers of Other Languages (ESOL) (Grades K-12)
17
1.7%
Title I (Grades K-12)
This school has no Title I program.
Dropout Rate for Grades 6-8
Number
Rate
School System
0
0.0%
19
0.1%
Total 10
Retained Students, by Race/Ethnicity and Sex
Black
White Hispanic
American MultiAsian Indian racial
5 50.0%
4 40.0%
0 0.0%
1 10.0%
0 0.0%
0 0.0%
Male Female
6
4
60.0% 40.0%
Prepared by Georgia Department of Education
Page 1
STATE-REQUIRED TEST DATA
NORM-REFERENCED TESTS Grade 8
Iowa Tests of Basic Skills (ITBS) Each chart reflects data for three years of testing.
Reading Comprehension 50
52 61 49 0
98-99
49 61 48 97-98
54 62 48 96-97
Mathematics
School 50
System
State
0
49 66 56 98-99
48 66 55 97-98
55 67 54 96-97
School System State
Reading Vocabulary 50
47 57 46 0
98-99
45 57 45 97-98
51 58 44 96-97
Language Arts
School 50
System
State
0
56 70 60 98-99
59 68 58 97-98
56 68 56 96-97
School System State
Social Studies 50
54 64 54 0
98-99
50 64 53 97-98
56 65 53 96-97
Science
School 50
System
State
0
56 66 56 98-99
55 67 55 97-98
58 67 53 96-97
School System State
Sources of Information
Composite Score
50
57 67 57 0
98-99
School 50
System
54 66 56 97-98
58 67 55 96-97
State 0
55 67 56 98-99
52 66 54 97-98
1998-99 GEORGIA PUBLIC EDUCATION REPORT CARD Floyd Middle School - 6335058
Prepared by Georgia Department of Education
57 67 54 96-97
Scores Reported in Percentiles
School System State
Page 2
STATE-REQUIRED TEST DATA
Categories of Scaled Scores
Inadequate (less than 162)
Minimal (162-209)
Good
(210-247)
Very Good (greater than 247)
Average Scaled Score: (Range 100-300)
PERFORMANCE ASSESSMENTS
Grade 8 Writing Assessment
1998-99 Percent Scoring
1997-98 Percent Scoring
1996-97 Percent Scoring
School System State School System State School System State
3% 32% 52% 14%
2% 25% 50% 24%
8% 40% 41% 11%
2% 39% 46% 13%
3% 33% 47% 17%
11% 46% 34%
8%
16% 43% 33%
8%
5% 36% 43% 16%
15% 46% 30%
8%
218
225
208 215
218 202 200
215 198
AWARDS / RECOGNITION DATA
Schools in Georgia may receive recognition in the following programs: Charter School Pay for Performance Program Georgia School of Excellence National Blue Ribbon School Floyd Middle School did not receive recognition in any of these programs during the 1998-99 school year.
1998-99 GEORGIA PUBLIC EDUCATION REPORT CARD Floyd Middle School - 6335058
Prepared by Georgia Department of Education
Page 3
CERTIFIED PERSONNEL DATA
Positions Number Average Contract Days
Personnel Sex
Certificate
Years Experience
Full-time Part-time
Male Female
4 Yr Bachelor's 5 Yr Master's 6 Yr Specialist's 7 Yr Doctoral Other*
<1 1-10 11-20 21-30 >30
Average
Administrators
3.00 226.67
3 0
2 1
0 0 3 0 0 0 0 2 1 0 21.33
Support Personnel
4.05 191.00
4 1
0 5
1 2 2 0 0 0 2 0 3 0 15.80
PK-12 Teachers
56.95 191.00
56 1
13 44
38 15
4 0 0 0 31 17 9 0 10.91
*Includes One- and Two-Year Vocational Certificates.
ACCREDITATION DATA
Accredited by Southern Association of Colleges and Schools (SACS):
Elementary/Middle Commission.
1998-99 GEORGIA PUBLIC EDUCATION REPORT CARD Floyd Middle School - 6335058
Prepared by Georgia Department of Education
Page 4
1998-99 GEORGIA PUBLIC EDUCATION REPORT CARD
COBB COUNTY SCHOOLS
Ford Elementary School - 6330292
Grade Range K-5
The Georgia Public Education Report Card is designed to assist systems and schools in educational improvement. This report card contains a variety of data elements. An explanation of the terms is provided as a companion to the report card data. Please refer to the definitions for the most effective use of the reported data.
STUDENT DATA
Total 734
K-5 Enrollment, by Race/Ethnicity and Sex
Black
White Hispanic
American Multi-
Asian Indian
racial
9 1.2%
713 97.1%
3 0.4%
2 0.3%
1 0.1%
6 0.8%
Male Female
385 52.5%
349 47.5%
Enrollment in Selected Programs
Program
Program % of Student Enrollment Population
Gifted (Grades K-12)
78
10.6%
Alternative Programs (Grades 6-12)
N/A
N/A
Students Eligible to Receive Free/Reduced Lunches
Number
Percent
School System
7 16,221
1.0% 17.8%
Dropout Rate *
Number
Rate
School System
N/A N/A
N/A N/A
* Dropout rates are not applicable for grades PK-5.
Enrollment in Compensatory Programs
Program
Program % of Student Enrollment Population
Special Education (Grades K-12)
61
8.3%
(PK)
1
N/A
English to Speakers of Other Languages (ESOL) (Grades K-12)
0
0.0%
Remedial Education (Grades 2-5, 9-12)
28
5.3%
Special Instructional Assistance (SIA) (Grades K-3)
73 15.9%
Title I (Grades K-12)
This school has no Title I program.
Total 5
Retained Students, by Race/Ethnicity and Sex
Black
White Hispanic
American Multi-
Asian Indian
racial
0 0.0%
4 80.0%
0 0.0%
0 0.0%
0
1
0.0% 20.0%
Male Female
4
1
80.0% 20.0%
Prepared by Georgia Department of Education
Page 1
STATE-REQUIRED TEST DATA
NORM-REFERENCED TESTS Grade 3
Iowa Tests of Basic Skills (ITBS) Each chart reflects data for three years of testing.
Reading Comprehension 50
78 63 54 0
98-99
73 62 53 97-98
70 60 52 96-97
Mathematics
School 50
System
State
0
81 70 61 98-99
82 68 61 97-98
78 68 59 96-97
School System State
Reading Vocabulary 50
74 58 50 0
98-99
72 58 50 97-98
65 58 49 96-97
Language Arts
School 50
System
State
0
79 70 64 98-99
82 69 62 97-98
79 67 59 96-97
School System State
Social Studies 50
73 64 56 0
98-99
79 64 55 97-98
74 64 55 96-97
Science
School 50
System
State
0
78 70 59 98-99
82 70 59 97-98
80 69 58 96-97
School System State
Sources of Information
Composite Score
50
78 66 57 0
98-99
School 50
System
80 65 56 97-98
74 64 55 96-97
State 0
79 67 58 98-99
81 67 57 97-98
1998-99 GEORGIA PUBLIC EDUCATION REPORT CARD Ford Elementary School - 6330292
Prepared by Georgia Department of Education
77 66 56 96-97
Scores Reported in Percentiles
School System State
Page 2
STATE-REQUIRED TEST DATA
NORM-REFERENCED TESTS Grade 5
Iowa Tests of Basic Skills (ITBS) Each chart reflects data for three years of testing.
Reading Comprehension
Mathematics
50
69 59 53 0
98-99
70 60 53 97-98
67 60 52 96-97
School 50
System
State
0
73 68 59 98-99
81 68 58 97-98
78 69 57 96-97
School System State
Reading Vocabulary 50
66 57 48 0
98-99
68 58 48 97-98
66 58 46 96-97
Language Arts
School 50
System
State
0
78 71 63 98-99
81 70 61 97-98
78 69 58 96-97
School System State
Social Studies 50
74 64 57 0
98-99
75 64 56 97-98
71 65 55 96-97
Science
School 50
System
State
0
77 68 60 98-99
78 69 59 97-98
78 70 59 96-97
School System State
Sources of Information
Composite Score
50
75 67 58 0
98-99
School 50
System
75 65 58 97-98
72 66 57 96-97
State 0
76 66 57 98-99
78 66 56 97-98
75 67 55 96-97
1998-99 GEORGIA PUBLIC EDUCATION REPORT CARD Ford Elementary School - 6330292
Prepared by Georgia Department of Education
Scores Reported in Percentiles
School System State
Page 3
STATE-REQUIRED TEST DATA
PERFORMANCE ASSESSMENTS
Grade 5 Writing Assessment
Percent at Developmental Stages:
1998-99 School System State
1997-98 School System State
1996-97 School System State
Stage Stage Stage Stage Stage Stage
1:The Emerging Writer 2:The Developing Writer 3:The Focusing Writer 4:The Experimenting 5:The Engaging Writer 6:The Extending Writer
0% 0% 1% 27% 44% 27%
0% 1% 10% 36% 34% 19%
0% 1% 16% 41% 29% 12%
0% 0% 4% 33% 45% 18%
0% 1% 12% 37% 33% 16%
0% 3% 19% 41% 27% 10%
0% 0% 12% 35% 34% 16%
0% 1% 14% 34% 32% 18%
0% 3% 21% 37% 26% 12%
AWARDS / RECOGNITION DATA
Schools in Georgia may receive recognition in the following programs: Charter School Pay for Performance Program Georgia School of Excellence National Blue Ribbon School Ford Elementary School did not receive recognition in any of these programs during the 1998-99 school year.
1998-99 GEORGIA PUBLIC EDUCATION REPORT CARD Ford Elementary School - 6330292
Prepared by Georgia Department of Education
Page 4
CERTIFIED PERSONNEL DATA
Positions Number Average Contract Days
Personnel Sex
Certificate
Years Experience
Full-time Part-time
Male Female
4 Yr Bachelor's 5 Yr Master's 6 Yr Specialist's 7 Yr Doctoral Other*
<1 1-10 11-20 21-30 >30
Average
Administrators
2.00 225.50
2 0
0 2
0 1 0 1 0 0 0 1 1 0 20.50
Support Personnel
4.00 191.00
4 0
0 4
0 3 1 0 0 0 1 3 0 0 11.25
PK-12 Teachers
39.50 191.00
37 5
0 42
25 15
2 0 0 0 17 16 9 0 13.31
*Includes One- and Two-Year Vocational Certificates.
ACCREDITATION DATA
Accredited by Southern Association of Colleges and Schools (SACS):
Elementary/Middle Commission.
1998-99 GEORGIA PUBLIC EDUCATION REPORT CARD Ford Elementary School - 6330292
Prepared by Georgia Department of Education
Page 5
1998-99 GEORGIA PUBLIC EDUCATION REPORT CARD
COBB COUNTY SCHOOLS
Frey Elementary School - 6330297
Grade Range PK-5
The Georgia Public Education Report Card is designed to assist systems and schools in educational improvement. This report card contains a variety of data elements. An explanation of the terms is provided as a companion to the report card data. Please refer to the definitions for the most effective use of the reported data.
STUDENT DATA
Total
K-5
976
PK
30
Enrollment, by Race/Ethnicity and Sex
Black
White Hispanic
American Asian Indian
Multiracial
52 5.3%
873 89.4%
27 2.8%
6 0.6%
2 0.2%
16 1.6%
3 10.0%
24 80.0%
1 3.3%
0 0.0%
0 0.0%
2 6.7%
Male Female
497 50.9%
479 49.1%
19 63.3%
11 36.7%
Enrollment in Selected Programs
Program
Program % of Student Enrollment Population
Gifted (Grades K-12)
33
3.4%
Alternative Programs (Grades 6-12)
N/A
N/A
Students Eligible to Receive Free/Reduced Lunches
Number
Percent
School System
78 16,221
7.8% 17.8%
Dropout Rate *
Number
Rate
School System
N/A N/A
N/A N/A
* Dropout rates are not applicable for grades PK-5.
Enrollment in Compensatory Programs
Program
Program % of Student Enrollment Population
Special Education (Grades K-12)
85
8.7%
(PK)
36
N/A
English to Speakers of Other Languages (ESOL) (Grades K-12)
0
0.0%
Remedial Education (Grades 2-5, 9-12)
56
8.7%
Special Instructional Assistance (SIA) (Grades K-3)
97 14.8%
Title I (Grades K-12)
This school has no Title I program.
Total 11
Retained Students, by Race/Ethnicity and Sex
Black
White Hispanic
American MultiAsian Indian racial
1 9.1%
10 90.9%
0 0.0%
0 0.0%
0 0.0%
0 0.0%
Male Female
8
3
72.7% 27.3%
Prepared by Georgia Department of Education
Page 1
STATE-REQUIRED TEST DATA
NORM-REFERENCED TESTS Grade 3
Iowa Tests of Basic Skills (ITBS) Each chart reflects data for three years of testing.
Reading Comprehension 50
70 63 54 0
98-99
64 62 53 97-98
60 60 52 96-97
Mathematics
School 50
System
State
0
76 70 61 98-99
74 68 61 97-98
66 68 59 96-97
School System State
Reading Vocabulary 50
64 58 50 0
98-99
61 58 50 97-98
56 58 49 96-97
Language Arts
School 50
System
State
0
75 70 64 98-99
70 69 62 97-98
66 67 59 96-97
School System State
Social Studies 50
70 64 56 0
98-99
65 64 55 97-98
59 64 55 96-97
Science
School 50
System
State
0
78 70 59 98-99
72 70 59 97-98
70 69 58 96-97
School System State
Sources of Information
Composite Score
50
73 66 57 0
98-99
School 50
System
68 65 56 97-98
67 64 55 96-97
State 0
75 67 58 98-99
69 67 57 97-98
1998-99 GEORGIA PUBLIC EDUCATION REPORT CARD Frey Elementary School - 6330297
Prepared by Georgia Department of Education
65 66 56 96-97
Scores Reported in Percentiles
School System State
Page 2
STATE-REQUIRED TEST DATA
NORM-REFERENCED TESTS Grade 5
Iowa Tests of Basic Skills (ITBS) Each chart reflects data for three years of testing.
Reading Comprehension
Mathematics
50
61 59 53 0
98-99
64 60 53 97-98
61 60 52 96-97
School 50
System
State
0
72 68 59 98-99
73 68 58 97-98
65 69 57 96-97
School System State
Reading Vocabulary 50
62 57 48 0
98-99
60 58 48 97-98
58 58 46 96-97
Language Arts
School 50
System
State
0
70 71 63 98-99
73 70 61 97-98
68 69 58 96-97
School System State
Social Studies 50
65 64 57 0
98-99
66 64 56 97-98
61 65 55 96-97
Science
School 50
System
State
0
69 68 60 98-99
73 69 59 97-98
70 70 59 96-97
School System State
Sources of Information
Composite Score
50
67 67 58 0
98-99
School 50
System
69 65 58 97-98
63 66 57 96-97
State 0
68 66 57 98-99
71 66 56 97-98
64 67 55 96-97
1998-99 GEORGIA PUBLIC EDUCATION REPORT CARD Frey Elementary School - 6330297
Prepared by Georgia Department of Education
Scores Reported in Percentiles
School System State
Page 3
STATE-REQUIRED TEST DATA
PERFORMANCE ASSESSMENTS
Grade 5 Writing Assessment
Percent at Developmental Stages:
1998-99 School System State
1997-98 School System State
1996-97 School System State
Stage Stage Stage Stage Stage Stage
1:The Emerging Writer 2:The Developing Writer 3:The Focusing Writer 4:The Experimenting 5:The Engaging Writer 6:The Extending Writer
0% 0% 2% 29% 36% 32%
0% 1% 10% 36% 34% 19%
0% 1% 16% 41% 29% 12%
0% 1% 4% 29% 38% 29%
0% 1% 12% 37% 33% 16%
0% 3% 19% 41% 27% 10%
0% 0% 9% 45% 40% 5%
0% 1% 14% 34% 32% 18%
0% 3% 21% 37% 26% 12%
AWARDS / RECOGNITION DATA
Schools in Georgia may receive recognition in the following programs: Charter School Pay for Performance Program Georgia School of Excellence National Blue Ribbon School Frey Elementary School did not receive recognition in any of these programs during the 1998-99 school year.
1998-99 GEORGIA PUBLIC EDUCATION REPORT CARD Frey Elementary School - 6330297
Prepared by Georgia Department of Education
Page 4
CERTIFIED PERSONNEL DATA
Positions Number Average Contract Days
Personnel Sex
Certificate
Years Experience
Full-time Part-time
Male Female
4 Yr Bachelor's 5 Yr Master's 6 Yr Specialist's 7 Yr Doctoral Other*
<1 1-10 11-20 21-30 >30
Average
Administrators
2.00 235.00
2 0
1 1
0 0 2 0 0 0 0 1 1 0 18.00
Support Personnel
6.54 191.00
6 2
1 7
2 4 2 0 0 0 2 4 2 0 13.25
PK-12 Teachers
60.96 191.00
59 3
5 57
41 16
5 0 0 0 34 22 6 0 10.21
*Includes One- and Two-Year Vocational Certificates.
ACCREDITATION DATA
Accredited by Southern Association of Colleges and Schools (SACS):
Elementary/Middle Commission.
1998-99 GEORGIA PUBLIC EDUCATION REPORT CARD Frey Elementary School - 6330297
Prepared by Georgia Department of Education
Page 5
1998-99 GEORGIA PUBLIC EDUCATION REPORT CARD
COBB COUNTY SCHOOLS
Garrett Middle School - 6331060
Grade Range 6-8
The Georgia Public Education Report Card is designed to assist systems and schools in educational improvement. This report card contains a variety of data elements. An explanation of the terms is provided as a companion to the report card data. Please refer to the definitions for the most effective use of the reported data.
STUDENT DATA
Total 928
6-8 Enrollment, by Race/Ethnicity and Sex
Black
White Hispanic
American Multi-
Asian Indian
racial
299 32.2%
552 59.5%
47 5.1%
11 1.2%
0 0.0%
19 2.0%
Male 495
53.3%
Female 433
46.7%
Enrollment in Selected Programs
Program
Gifted (Grades K-12)
Program % of Student Enrollment Population
70
7.5%
Alternative Programs (Grades 6-12)
0
0.0%
Students Eligible to Receive Free/Reduced Lunches
Number
Percent
School System
370 16,221
39.9% 17.8%
Enrollment in Compensatory Programs
Program
Program % of Student Enrollment Population
Special Education (Grades K-12) (PK)
175 18.9%
0
N/A
English to Speakers of Other Languages (ESOL) (Grades K-12)
21
2.3%
Title I (Grades K-12)
This school has no Title I program.
Dropout Rate for Grades 6-8
Number
Rate
School System
4
0.4%
19
0.1%
Total 23
Retained Students, by Race/Ethnicity and Sex
Black
White Hispanic
American MultiAsian Indian racial
8 34.8%
13 56.5%
2 8.7%
0 0.0%
0 0.0%
0 0.0%
Male Female
12
11
52.2% 47.8%
Prepared by Georgia Department of Education
Page 1
STATE-REQUIRED TEST DATA
NORM-REFERENCED TESTS Grade 8
Iowa Tests of Basic Skills (ITBS) Each chart reflects data for three years of testing.
Reading Comprehension 50
42 61 49 0
98-99
41 61 48 97-98
50 62 48 96-97
Mathematics
School 50
System
State
0
47 66 56 98-99
47 66 55 97-98
56 67 54 96-97
School System State
Reading Vocabulary 50
42 57 46 0
98-99
36 57 45 97-98
45 58 44 96-97
Language Arts
School 50
System
State
0
49 70 60 98-99
46 68 58 97-98
54 68 56 96-97
School System State
Social Studies 50
48 64 54 0
98-99
45 64 53 97-98
52 65 53 96-97
Science
School 50
System
State
0
45 66 56 98-99
43 67 55 97-98
50 67 53 96-97
School System State
Sources of Information
Composite Score
50
52 67 57 0
98-99
School 50
System
47 66 56 97-98
54 67 55 96-97
State 0
47 67 56 98-99
44 66 54 97-98
1998-99 GEORGIA PUBLIC EDUCATION REPORT CARD Garrett Middle School - 6331060
Prepared by Georgia Department of Education
52 67 54 96-97
Scores Reported in Percentiles
School System State
Page 2
STATE-REQUIRED TEST DATA
Categories of Scaled Scores
Inadequate (less than 162)
Minimal (162-209)
Good
(210-247)
Very Good (greater than 247)
Average Scaled Score: (Range 100-300)
PERFORMANCE ASSESSMENTS
Grade 8 Writing Assessment
1998-99 Percent Scoring
1997-98 Percent Scoring
1996-97 Percent Scoring
School System State School System State School System State
3% 47% 43%
7%
2% 25% 50% 24%
8% 40% 41% 11%
5% 50% 37%
8%
3% 33% 47% 17%
11% 46% 34%
8%
7% 55% 33%
4%
5% 36% 43% 16%
15% 46% 30%
8%
209
225
208 206
218 202 201
215 198
AWARDS / RECOGNITION DATA
Schools in Georgia may receive recognition in the following programs: Charter School Pay for Performance Program Georgia School of Excellence National Blue Ribbon School Garrett Middle School did not receive recognition in any of these programs during the 1998-99 school year.
1998-99 GEORGIA PUBLIC EDUCATION REPORT CARD Garrett Middle School - 6331060
Prepared by Georgia Department of Education
Page 3
CERTIFIED PERSONNEL DATA
Positions Number Average Contract Days
Personnel Sex
Certificate
Years Experience
Full-time Part-time
Male Female
4 Yr Bachelor's 5 Yr Master's 6 Yr Specialist's 7 Yr Doctoral Other*
<1 1-10 11-20 21-30 >30
Average
Administrators
4.00 217.75
4 0
2 2
0 2 1 1 0 0 0 3 1 0 17.25
Support Personnel
6.03 191.00
6 1
1 6
0 7 0 0 0 0 4 2 0 1 12.00
PK-12 Teachers
61.49 191.00
59 4
11 52
35 26
1 1 0 0 47 11 4 1 7.86
*Includes One- and Two-Year Vocational Certificates.
ACCREDITATION DATA
Accredited by Southern Association of Colleges and Schools (SACS):
Elementary/Middle Commission.
1998-99 GEORGIA PUBLIC EDUCATION REPORT CARD Garrett Middle School - 6331060
Prepared by Georgia Department of Education
Page 4
1998-99 GEORGIA PUBLIC EDUCATION REPORT CARD
COBB COUNTY SCHOOLS
Garrison Mill Elementary School - 6330185
Grade Range PK-5
The Georgia Public Education Report Card is designed to assist systems and schools in educational improvement. This report card contains a variety of data elements. An explanation of the terms is provided as a companion to the report card data. Please refer to the definitions for the most effective use of the reported data.
STUDENT DATA
Total
K-5
652
PK
4
Enrollment, by Race/Ethnicity and Sex
Black
White Hispanic
American Asian Indian
Multiracial
30 4.6%
607 93.1%
2 0.3%
7 1.1%
0 0.0%
6 0.9%
0
4
0.0% 100.0%
0 0.0%
0 0.0%
0 0.0%
0 0.0%
Male Female
347 53.2%
305 46.8%
3 75.0%
1 25.0%
Enrollment in Selected Programs
Program
Program % of Student Enrollment Population
Gifted (Grades K-12)
58
8.9%
Alternative Programs (Grades 6-12)
N/A
N/A
Students Eligible to Receive Free/Reduced Lunches
Number
Percent
School System
14 16,221
2.1% 17.8%
Dropout Rate *
Number
Rate
School System
N/A N/A
N/A N/A
* Dropout rates are not applicable for grades PK-5.
Enrollment in Compensatory Programs
Program
Program % of Student Enrollment Population
Special Education (Grades K-12)
100 15.3%
(PK)
4
N/A
English to Speakers of Other Languages (ESOL) (Grades K-12)
0
0.0%
Remedial Education (Grades 2-5, 9-12)
36
7.5%
Special Instructional Assistance (SIA) (Grades K-3)
69 17.5%
Title I (Grades K-12)
This school has no Title I program.
Total 3
Retained Students, by Race/Ethnicity and Sex
Black
White Hispanic
American MultiAsian Indian racial
0
3
0.0% 100.0%
0 0.0%
0 0.0%
0 0.0%
0 0.0%
Male Female
2
1
66.7% 33.3%
Prepared by Georgia Department of Education
Page 1
STATE-REQUIRED TEST DATA
NORM-REFERENCED TESTS Grade 3
Iowa Tests of Basic Skills (ITBS) Each chart reflects data for three years of testing.
Reading Comprehension 50
70 63 54 0
98-99
76 62 53 97-98
65 60 52 96-97
Mathematics
School 50
System
State
0
81 70 61 98-99
83 68 61 97-98
77 68 59 96-97
School System State
Reading Vocabulary 50
69 58 50 0
98-99
76 58 50 97-98
71 58 49 96-97
Language Arts
School 50
System
State
0
85 70 64 98-99
83 69 62 97-98
75 67 59 96-97
School System State
Social Studies 50
72 64 56 0
98-99
73 64 55 97-98
67 64 55 96-97
Science
School 50
System
State
0
76 70 59 98-99
81 70 59 97-98
72 69 58 96-97
School System State
Sources of Information
Composite Score
50
76 66 57 0
98-99
School 50
System
79 65 56 97-98
73 64 55 96-97
State 0
78 67 58 98-99
80 67 57 97-98
1998-99 GEORGIA PUBLIC EDUCATION REPORT CARD Garrison Mill Elementary School - 6330185
Prepared by Georgia Department of Education
72 66 56 96-97
Scores Reported in Percentiles
School System State
Page 2
STATE-REQUIRED TEST DATA
NORM-REFERENCED TESTS Grade 5
Iowa Tests of Basic Skills (ITBS) Each chart reflects data for three years of testing.
Reading Comprehension
Mathematics
50
70 59 53 0
98-99
71 60 53 97-98
67 60 52 96-97
School 50
System
State
0
79 68 59 98-99
84 68 58 97-98
77 69 57 96-97
School System State
Reading Vocabulary 50
66 57 48 0
98-99
70 58 48 97-98
69 58 46 96-97
Language Arts
School 50
System
State
0
80 71 63 98-99
83 70 61 97-98
75 69 58 96-97
School System State
Social Studies 50
71 64 57 0
98-99
81 64 56 97-98
73 65 55 96-97
Science
School 50
System
State
0
77 68 60 98-99
84 69 59 97-98
77 70 59 96-97
School System State
Sources of Information
Composite Score
50
76 67 58 0
98-99
School 50
System
79 65 58 97-98
71 66 57 96-97
State 0
77 66 57 98-99
83 66 56 97-98
75 67 55 96-97
1998-99 GEORGIA PUBLIC EDUCATION REPORT CARD Garrison Mill Elementary School - 6330185
Prepared by Georgia Department of Education
Scores Reported in Percentiles
School System State
Page 3
STATE-REQUIRED TEST DATA
PERFORMANCE ASSESSMENTS
Grade 5 Writing Assessment
Percent at Developmental Stages:
1998-99 School System State
1997-98 School System State
1996-97 School System State
Stage Stage Stage Stage Stage Stage
1:The Emerging Writer 2:The Developing Writer 3:The Focusing Writer 4:The Experimenting 5:The Engaging Writer 6:The Extending Writer
0% 0% 7% 26% 38% 28%
0% 1% 10% 36% 34% 19%
0% 1% 16% 41% 29% 12%
0% 0% 16% 38% 33% 14%
0% 1% 12% 37% 33% 16%
0% 3% 19% 41% 27% 10%
0% 0% 12% 36% 29% 20%
0% 1% 14% 34% 32% 18%
0% 3% 21% 37% 26% 12%
AWARDS / RECOGNITION DATA
Schools in Georgia may receive recognition in the following programs: Charter School Pay for Performance Program Georgia School of Excellence National Blue Ribbon School Garrison Mill Elementary School did not receive recognition in any of these programs during the 1998-99 school year.
1998-99 GEORGIA PUBLIC EDUCATION REPORT CARD Garrison Mill Elementary School - 6330185
Prepared by Georgia Department of Education
Page 4
CERTIFIED PERSONNEL DATA
Positions Number Average Contract Days
Personnel Sex
Certificate
Years Experience
Full-time Part-time
Male Female
4 Yr Bachelor's 5 Yr Master's 6 Yr Specialist's 7 Yr Doctoral Other*
<1 1-10 11-20 21-30 >30
Average
Administrators
1.00 260.00
1 0
1 0
0 0 1 0 0 0 0 0 1 0 26.00
Support Personnel
5.56 191.00
5 2
1 6
0 7 0 0 0 0 1 3 3 0 16.57
PK-12 Teachers
41.44 191.00
40 2
1 41
18 23
1 0 0 0 10 21 10 1 16.21
*Includes One- and Two-Year Vocational Certificates.
ACCREDITATION DATA
Accredited by Southern Association of Colleges and Schools (SACS):
Elementary/Middle Commission.
1998-99 GEORGIA PUBLIC EDUCATION REPORT CARD Garrison Mill Elementary School - 6330185
Prepared by Georgia Department of Education
Page 5
1998-99 GEORGIA PUBLIC EDUCATION REPORT CARD
COBB COUNTY SCHOOLS
Green Acres Elementary School - 6330397
Grade Range PK-5
The Georgia Public Education Report Card is designed to assist systems and schools in educational improvement. This report card contains a variety of data elements. An explanation of the terms is provided as a companion to the report card data. Please refer to the definitions for the most effective use of the reported data.
STUDENT DATA
Total
K-5
853
PK
4
Enrollment, by Race/Ethnicity and Sex
Black
White Hispanic
American Asian Indian
Multiracial
428 50.2%
198 23.2%
180 21.1%
15 1.8%
2 0.2%
30 3.5%
0 0.0%
2 50.0%
2 50.0%
0 0.0%
0 0.0%
0 0.0%
Male 434
50.9% 4
100.0%
Female 419
49.1% 0
0.0%
Enrollment in Selected Programs
Program
Program % of Student Enrollment Population
Gifted (Grades K-12)
2
< 1%
Alternative Programs (Grades 6-12)
N/A
N/A
Students Eligible to Receive Free/Reduced Lunches
Number
Percent
School System
568 16,221
66.3% 17.8%
Dropout Rate *
Number
Rate
School System
N/A N/A
N/A N/A
* Dropout rates are not applicable for grades PK-5.
Enrollment in Compensatory Programs
Program
Program % of Student Enrollment Population
Special Education (Grades K-12)
105 12.3%
(PK)
15
N/A
English to Speakers of Other Languages (ESOL) (Grades K-12)
105 12.3%
Remedial Education (Grades 2-5, 9-12)
130 25.0%
Special Instructional Assistance (SIA) (Grades K-3)
267 43.8%
Title I (Grades K-12)
This school has a schoolwide program.
Total 9
Retained Students, by Race/Ethnicity and Sex
Black
White Hispanic
American MultiAsian Indian racial
6 66.7%
2
1
22.2% 11.1%
0 0.0%
0 0.0%
0 0.0%
Male Female
5
4
55.6% 44.4%
Prepared by Georgia Department of Education
Page 1
STATE-REQUIRED TEST DATA
NORM-REFERENCED TESTS Grade 3
Iowa Tests of Basic Skills (ITBS) Each chart reflects data for three years of testing.
Reading Comprehension 50
36 63 54 0
98-99
30 62 53 97-98
27 60 52 96-97
Mathematics
School 50
System
State
0
39 70 61 98-99
38 68 61 97-98
27 68 59 96-97
School System State
Reading Vocabulary 50
30 58 50 0
98-99
26 58 50 97-98
26 58 49 96-97
Language Arts
School 50
System
State
0
42 70 64 98-99
35 69 62 97-98
29 67 59 96-97
School System State
Social Studies 50
35 64 56 0
98-99
31 64 55 97-98
35 64 55 96-97
Science
School 50
System
State
0
39 70 59 98-99
34 70 59 97-98
38 69 58 96-97
School System State
Sources of Information
Composite Score
50
38 66 57 0
98-99
School 50
System
27 65 56 97-98
29 64 55 96-97
State 0
36 67 58 98-99
30 67 57 97-98
1998-99 GEORGIA PUBLIC EDUCATION REPORT CARD Green Acres Elementary School - 6330397
Prepared by Georgia Department of Education
28 66 56 96-97
Scores Reported in Percentiles
School System State
Page 2
STATE-REQUIRED TEST DATA
NORM-REFERENCED TESTS Grade 5
Iowa Tests of Basic Skills (ITBS) Each chart reflects data for three years of testing.
Reading Comprehension
Mathematics
50
45 59 53 0
98-99
41 60 53 97-98
36 60 52 96-97
School 50
System
State
0
40 68 59 98-99
47 68 58 97-98
43 69 57 96-97
School System State
Reading Vocabulary 50
33 57 48 0
98-99
38 58 48 97-98
29 58 46 96-97
Language Arts
School 50
System
State
0
56 71 63 98-99
57 70 61 97-98
44 69 58 96-97
School System State
Social Studies 50
36 64 57 0
98-99
43 64 56 97-98
37 65 55 96-97
Science
School 50
System
State
0
39 68 60 98-99
47 69 59 97-98
45 70 59 96-97
School System State
Sources of Information
Composite Score
50
43 67 58 0
98-99
School 50
System
49 65 58 97-98
42 66 57 96-97
State 0
41 66 57 98-99
45 66 56 97-98
38 67 55 96-97
1998-99 GEORGIA PUBLIC EDUCATION REPORT CARD Green Acres Elementary School - 6330397
Prepared by Georgia Department of Education
Scores Reported in Percentiles
School System State
Page 3
STATE-REQUIRED TEST DATA
PERFORMANCE ASSESSMENTS
Grade 5 Writing Assessment
Percent at Developmental Stages:
1998-99 School System State
1997-98 School System State
1996-97 School System State
Stage Stage Stage Stage Stage Stage
1:The Emerging Writer 2:The Developing Writer 3:The Focusing Writer 4:The Experimenting 5:The Engaging Writer 6:The Extending Writer
0% 0% 15% 33% 37% 14%
0% 1% 10% 36% 34% 19%
0% 1% 16% 41% 29% 12%
0% 0% 16% 47% 28% 9%
0% 1% 12% 37% 33% 16%
0% 3% 19% 41% 27% 10%
2% 2% 20% 50% 25% 0%
0% 1% 14% 34% 32% 18%
0% 3% 21% 37% 26% 12%
AWARDS / RECOGNITION DATA
Schools that become a Charter School have a unique opportunity to rethink how they structure and deliver education programs for improving the learning of their students while being freed from the state laws, State Board of Education rules and regulations, and local board of education rules and regulations that govern other schools. A 'charter' is a binding contract that, when approved by the faculty and parents of the school, the local board of education and the State Board of Education, substitutes for state education statutes, state and local rules, policies, regulations and standards.
Green Acres Elementary School is a Charter School for 1998-99.
1998-99 GEORGIA PUBLIC EDUCATION REPORT CARD Green Acres Elementary School - 6330397
Prepared by Georgia Department of Education
Page 4
CERTIFIED PERSONNEL DATA
Positions Number Average Contract Days
Personnel Sex
Certificate
Years Experience
Full-time Part-time
Male Female
4 Yr Bachelor's 5 Yr Master's 6 Yr Specialist's 7 Yr Doctoral Other*
<1 1-10 11-20 21-30 >30
Average
Administrators
2.00 235.00
2 0
0 2
0 0 2 0 0 0 0 0 2 0 22.50
Support Personnel
9.54 191.00
9 2
1 10
3 6 2 0 0 0 7 2 2 0 9.82
PK-12 Teachers
56.96 191.00
54 5
8 51
37 20
2 0 0 0 50 6 3 0 6.83
*Includes One- and Two-Year Vocational Certificates.
ACCREDITATION DATA
Accredited by Southern Association of Colleges and Schools (SACS):
Elementary/Middle Commission.
1998-99 GEORGIA PUBLIC EDUCATION REPORT CARD Green Acres Elementary School - 6330397
Prepared by Georgia Department of Education
Page 5
1998-99 GEORGIA PUBLIC EDUCATION REPORT CARD
COBB COUNTY SCHOOLS
Griffin Middle School - 6332560
Grade Range 6-8
The Georgia Public Education Report Card is designed to assist systems and schools in educational improvement. This report card contains a variety of data elements. An explanation of the terms is provided as a companion to the report card data. Please refer to the definitions for the most effective use of the reported data.
STUDENT DATA
Total 869
6-8 Enrollment, by Race/Ethnicity and Sex
Black
White Hispanic
American Multi-
Asian Indian
racial
305 35.1%
448 51.6%
78 9.0%
25 2.9%
2 0.2%
11 1.3%
Male 438
50.4%
Female 431
49.6%
Enrollment in Selected Programs
Program
Gifted (Grades K-12)
Program % of Student Enrollment Population
82
9.4%
Alternative Programs (Grades 6-12)
0
0.0%
Students Eligible to Receive Free/Reduced Lunches
Number
Percent
School System
446 16,221
51.3% 17.8%
Enrollment in Compensatory Programs
Program
Program % of Student Enrollment Population
Special Education (Grades K-12) (PK)
109 12.5%
0
N/A
English to Speakers of Other Languages (ESOL) (Grades K-12)
35
4.0%
Title I (Grades K-12)
This school has no Title I program.
Dropout Rate for Grades 6-8
Number
Rate
School System
1
0.1%
19
0.1%
Total 4
Retained Students, by Race/Ethnicity and Sex
Black
White Hispanic
American MultiAsian Indian racial
2 50.0%
2 50.0%
0 0.0%
0 0.0%
0 0.0%
0 0.0%
Male Female
1
3
25.0% 75.0%
Prepared by Georgia Department of Education
Page 1
STATE-REQUIRED TEST DATA
NORM-REFERENCED TESTS Grade 8
Iowa Tests of Basic Skills (ITBS) Each chart reflects data for three years of testing.
Reading Comprehension 50
41 61 49 0
98-99
48 61 48 97-98
50 62 48 96-97
Mathematics
School 50
System
State
0
49 66 56 98-99
48 66 55 97-98
58 67 54 96-97
School System State
Reading Vocabulary 50
36 57 46 0
98-99
43 57 45 97-98
47 58 44 96-97
Language Arts
School 50
System
State
0
52 70 60 98-99
54 68 58 97-98
55 68 56 96-97
School System State
Social Studies 50
48 64 54 0
98-99
52 64 53 97-98
53 65 53 96-97
Science
School 50
System
State
0
40 66 56 98-99
53 67 55 97-98
55 67 53 96-97
School System State
Sources of Information
Composite Score
50
48 67 57 0
98-99
School 50
System
52 66 56 97-98
56 67 55 96-97
State 0
46 67 56 98-99
51 66 54 97-98
1998-99 GEORGIA PUBLIC EDUCATION REPORT CARD Griffin Middle School - 6332560
Prepared by Georgia Department of Education
55 67 54 96-97
Scores Reported in Percentiles
School System State
Page 2
STATE-REQUIRED TEST DATA
Categories of Scaled Scores
Inadequate (less than 162)
Minimal (162-209)
Good
(210-247)
Very Good (greater than 247)
Average Scaled Score: (Range 100-300)
PERFORMANCE ASSESSMENTS
Grade 8 Writing Assessment
1998-99 Percent Scoring
1997-98 Percent Scoring
1996-97 Percent Scoring
School System State School System State School System State
5% 39% 45% 11%
2% 25% 50% 24%
8% 40% 41% 11%
8% 49% 37%
6%
3% 33% 47% 17%
11% 46% 34%
8%
10% 51% 28% 11%
5% 36% 43% 16%
15% 46% 30%
8%
211
225
208 204
218 202 202
215 198
AWARDS / RECOGNITION DATA
Schools in Georgia may receive recognition in the following programs: Charter School Pay for Performance Program Georgia School of Excellence National Blue Ribbon School Griffin Middle School did not receive recognition in any of these programs during the 1998-99 school year.
1998-99 GEORGIA PUBLIC EDUCATION REPORT CARD Griffin Middle School - 6332560
Prepared by Georgia Department of Education
Page 3
CERTIFIED PERSONNEL DATA
Positions Number Average Contract Days
Personnel Sex
Certificate
Years Experience
Full-time Part-time
Male Female
4 Yr Bachelor's 5 Yr Master's 6 Yr Specialist's 7 Yr Doctoral Other*
<1 1-10 11-20 21-30 >30
Average
Administrators
3.00 226.67
3 0
1 2
0 1 2 0 0 0 1 1 1 0 16.67
Support Personnel
4.11 191.00
4 2
0 6
2 2 2 0 0 0 4 1 1 0 9.17
PK-12 Teachers
58.38 191.00
56 3
12 47
32 25
1 1 0 0 32 16 10 1 10.92
*Includes One- and Two-Year Vocational Certificates.
ACCREDITATION DATA
Accredited by Southern Association of Colleges and Schools (SACS):
Elementary/Middle Commission.
1998-99 GEORGIA PUBLIC EDUCATION REPORT CARD Griffin Middle School - 6332560
Prepared by Georgia Department of Education
Page 4
1998-99 GEORGIA PUBLIC EDUCATION REPORT CARD
COBB COUNTY SCHOOLS
Harmony-Leland Elementary School - 6333060
Grade Range PK-5
The Georgia Public Education Report Card is designed to assist systems and schools in educational improvement. This report card contains a variety of data elements. An explanation of the terms is provided as a companion to the report card data. Please refer to the definitions for the most effective use of the reported data.
STUDENT DATA
Total
K-5
442
PK
19
Enrollment, by Race/Ethnicity and Sex
Black
White Hispanic
American Asian Indian
Multiracial
204 46.2%
199 45.0%
21 4.8%
2 0.5%
0 0.0%
16 3.6%
9 47.4%
8 42.1%
1 5.3%
0 0.0%
0 0.0%
1 5.3%
Male Female
236 53.4%
206 46.6%
14 73.7%
5 26.3%
Enrollment in Selected Programs
Program
Program % of Student Enrollment Population
Gifted (Grades K-12)
5
1.1%
Alternative Programs (Grades 6-12)
N/A
N/A
Students Eligible to Receive Free/Reduced Lunches
Number
Percent
School System
220 16,221
47.7% 17.8%
Dropout Rate *
Number
Rate
School System
N/A N/A
N/A N/A
* Dropout rates are not applicable for grades PK-5.
Enrollment in Compensatory Programs
Program
Program % of Student Enrollment Population
Special Education (Grades K-12)
54 12.2%
(PK)
23
N/A
English to Speakers of Other Languages (ESOL) (Grades K-12)
0
0.0%
Remedial Education (Grades 2-5, 9-12)
73 24.0%
Special Instructional Assistance (SIA) (Grades K-3)
76 26.7%
Title I (Grades K-12)
This school has a Targeted Assistance program.
Total 1
Retained Students, by Race/Ethnicity and Sex
Black
White Hispanic
American MultiAsian Indian racial
0
1
0.0% 100.0%
0 0.0%
0 0.0%
0 0.0%
0 0.0%
Male Female
0
1
0.0% 100.0%
Prepared by Georgia Department of Education
Page 1
STATE-REQUIRED TEST DATA
NORM-REFERENCED TESTS Grade 3
Iowa Tests of Basic Skills (ITBS) Each chart reflects data for three years of testing.
Reading Comprehension 50
38 63 54 0
98-99
39 62 53 97-98
36 60 52 96-97
Mathematics
School 50
System
State
0
41 70 61 98-99
38 68 61 97-98
36 68 59 96-97
School System State
Reading Vocabulary 50
35 58 50 0
98-99
33 58 50 97-98
30 58 49 96-97
Language Arts
School 50
System
State
0
41 70 64 98-99
36 69 62 97-98
34 67 59 96-97
School System State
Social Studies 50
42 64 56 0
98-99
42 64 55 97-98
40 64 55 96-97
Science
School 50
System
State
0
45 70 59 98-99
42 70 59 97-98
38 69 58 96-97
School System State
Sources of Information
Composite Score
50
45 66 57 0
98-99
School 50
System
40 65 56 97-98
37 64 55 96-97
State 0
40 67 58 98-99
37 67 57 97-98
1998-99 GEORGIA PUBLIC EDUCATION REPORT CARD Harmony-Leland Elementary School - 6333060
Prepared by Georgia Department of Education
34 66 56 96-97
Scores Reported in Percentiles
School System State
Page 2
STATE-REQUIRED TEST DATA
NORM-REFERENCED TESTS Grade 5
Iowa Tests of Basic Skills (ITBS) Each chart reflects data for three years of testing.
Reading Comprehension
Mathematics
50
43 59 53 0
98-99
39 60 53 97-98
55 60 52 96-97
School 50
System
State
0
43 68 59 98-99
43 68 58 97-98
55 69 57 96-97
School System State
Reading Vocabulary 50
39 57 48 0
98-99
37 58 48 97-98
48 58 46 96-97
Language Arts
School 50
System
State
0
54 71 63 98-99
53 70 61 97-98
70 69 58 96-97
School System State
Social Studies 50
37 64 57 0
98-99
35 64 56 97-98
57 65 55 96-97
Science
School 50
System
State
0
51 68 60 98-99
42 69 59 97-98
59 70 59 96-97
School System State
Sources of Information
Composite Score
50
50 67 58 0
98-99
School 50
System
48 65 58 97-98
61 66 57 96-97
State 0
45 66 57 98-99
41 66 56 97-98
59 67 55 96-97
1998-99 GEORGIA PUBLIC EDUCATION REPORT CARD Harmony-Leland Elementary School - 6333060
Prepared by Georgia Department of Education
Scores Reported in Percentiles
School System State
Page 3
STATE-REQUIRED TEST DATA
PERFORMANCE ASSESSMENTS
Grade 5 Writing Assessment
Percent at Developmental Stages:
1998-99 School System State
1997-98 School System State
1996-97 School System State
Stage Stage Stage Stage Stage Stage
1:The Emerging Writer 2:The Developing Writer 3:The Focusing Writer 4:The Experimenting 5:The Engaging Writer 6:The Extending Writer
0% 0% 22% 41% 27% 10%
0% 1% 10% 36% 34% 19%
0% 1% 16% 41% 29% 12%
0% 0% 9% 48% 40% 3%
0% 1% 12% 37% 33% 16%
0% 3% 19% 41% 27% 10%
0% 0% 14% 23% 48% 16%
0% 1% 14% 34% 32% 18%
0% 3% 21% 37% 26% 12%
AWARDS / RECOGNITION DATA
Schools in Georgia may receive recognition in the following programs: Charter School Pay for Performance Program Georgia School of Excellence National Blue Ribbon School Harmony-Leland Elementary School did not receive recognition in any of these programs during the 1998-99 school year.
1998-99 GEORGIA PUBLIC EDUCATION REPORT CARD Harmony-Leland Elementary School - 6333060
Prepared by Georgia Department of Education
Page 4
CERTIFIED PERSONNEL DATA
Positions Number Average Contract Days
Personnel Sex
Certificate
Years Experience
Full-time Part-time
Male Female
4 Yr Bachelor's 5 Yr Master's 6 Yr Specialist's 7 Yr Doctoral Other*
<1 1-10 11-20 21-30 >30
Average
Administrators
3.00 220.33
3 0
1 2
0 1 2 0 0 0 1 1 1 0 16.33
Support Personnel
6.00 191.00
6 0
1 5
1 4 1 0 0 0 3 1 2 0 12.83
PK-12 Teachers
28.50 191.00
28 1
1 28
20 8 0 1 0 0
23 2 4 0
6.66
*Includes One- and Two-Year Vocational Certificates.
ACCREDITATION DATA
Accredited by Southern Association of Colleges and Schools (SACS):
Elementary/Middle Commission.
1998-99 GEORGIA PUBLIC EDUCATION REPORT CARD Harmony-Leland Elementary School - 6333060
Prepared by Georgia Department of Education
Page 5
1998-99 GEORGIA PUBLIC EDUCATION REPORT CARD
COBB COUNTY SCHOOLS
Harrison High School - 6330192
Grade Range 10-12
The Georgia Public Education Report Card is designed to assist systems and schools in educational improvement. This report card contains a variety of data elements. An explanation of the terms is provided as a companion to the report card data. Please refer to the definitions for the most effective use of the reported data.
Total 2,171
STUDENT DATA
10-12 Enrollment, by Race/Ethnicity and Sex
Black
White Hispanic
American Multi-
Asian Indian
racial
Male Female
96 4.4%
1,998 92.0%
31 1.4%
30 1.4%
6 0.3%
10 0.5%
1,054 48.5%
1,117 51.5%
Enrollment in Selected Programs
Program
Gifted (Grades K-12)
Program % of Student Enrollment Population
181
8.3%
Non-Vocational Labs (Grades 9-12)
Vocational Labs (Grades 9-12)
Alternative Programs (Grades 6-12)
1,153 762 0
53.1% 35.1%
0.0%
Students Eligible to Receive Free/Reduced Lunches
Number
Percent
School System
36 16,221
1.7% 17.8%
Enrollment in Compensatory Programs
Program
Program % of Student Enrollment Population
Special Education (Grades K-12) PK
138
6.4%
0
N/A
English to Speakers of Other Languages (ESOL) (Grades K-12)
4
< 1%
Remedial Education (Grades 2-5, 9-12)
221 10.2%
Title I (Grades K-12)
This school has no Title I program.
Dropout Rate for Grades 10-12
Number
Rate
School System
37
1.6%
874
4.3%
Total 6
Retained Students, by Race/Ethnicity and Sex
Black
White Hispanic
American MultiAsian Indian racial
0 0.0%
5 83.3%
0 0.0%
1 16.7%
0 0.0%
0 0.0%
Male Female
4
2
66.7% 33.3%
Prepared by Georgia Department of Education
Page 1
STATE-REQUIRED TEST DATA
GEORGIA HIGH SCHOOL GRADUATION TESTS (GHSGT)
Percent of Regular Program 11th Graders Passing the Georgia High School Graduation Tests on First Administration
English Language Arts Mathematics Social Studies Science
All Components listed above
Writing
1998-99
School System State
99% 96% 92% 88%
98% 94% 90% 85%
96% 88% 80% 72%
85% 82% 68%
97% 97% 93%
1997-98
School System State
99% 98% 91% 92%
98% 95% 89% 88%
94% 88% 78% 74%
87% 84% 68%
98% 96% 92%
1996-97
School System State
99% 98% 94% 94%
97% 94% 89% 89%
94% 87% 78% 74%
92% 84% 67%
99% 97% 93%
GRADUATE DATA
1999 Graduates by Credentials, Race/Ethnicity and Sex
Diplomas with Both College Prep. & Voc. Endorsements
Diplomas with College Prep. Endorsements Diplomas with Vocational Endorsements General High School Diplomas Special Education Diplomas
Total All Diplomas
Certificates of Performance
Total Graduates
Total 44
509 48 7 4
612 7
619
Black
1 2.3%
23 4.5%
4 8.3%
0 0.0%
0 0.0%
28 4.6%
3 42.9%
31 5.0%
American MultiWhite Hispanic Asian Indian racial
40 90.9%
471 92.5%
0 0.0%
6 1.2%
3 6.8%
4 0.8%
0 0.0%
2 0.4%
0 0.0%
3 0.6%
43 89.6%
7 100.0%
4 100.0%
0 0.0%
0 0.0%
0 0.0%
0 0.0%
0 0.0%
0 0.0%
1 2.1%
0 0.0%
0 0.0%
0 0.0%
0 0.0%
0 0.0%
565 92.3%
6 1.0%
7 1.1%
3 0.5%
3 0.5%
4 57.1%
0 0.0%
0 0.0%
0 0.0%
0 0.0%
569 91.9%
6 1.0%
7 1.1%
3 0.5%
3 0.5%
Male Female
23 52.3%
230 45.2%
21 47.7%
279 54.8%
38 79.2%
5 71.4%
4 100.0%
10 20.8%
2 28.6%
0 0.0%
300
312
49.0% 51.0%
5
2
71.4% 28.6%
305
314
49.3% 50.7%
HOPE Scholarships
School System
Number of 1999 Graduates 6 1 9
Number Eligible
511
Percent Eligible
82.6%
5,022 3,850 76.7%
State
65,548 40,292 61.5%
High School Completion Rate
Percent of 1995Grade 9 Enrollment in Graduating Class of1999 School System State
Completion Rate '95-'99 92.4% 83.6% 68.9%
1998-99 GEORGIA PUBLIC EDUCATION REPORT CARD
Harrison High School - 6330192
Prepared by Georgia Department of Education
Page 2
COLLEGE ADMISSIONS / CREDIT TEST DATA
Scholastic Assessment Test (SAT)
Based on students' highest verbal and highest math scores
No. Taking
Average Score
Tests Verbal Math Total
Based on students' last test administration
Average Score Verbal Math Total
School
529
College Prep. Endorsement
Other Diplomas
System
4,180
College Prep. Endorsement
Other Diplomas
Georgia
41,958
530 518 1048
534 523 1057
439 436
875
523 522 1045 532 532 1064
402 387
789
492 488
980
521 N/A N/A
514 N/A N/A
483
509 N/A N/A
513 N/A N/A
479
1030 N/A N/A
1027 N/A N/A
962
Nation
952,913 N/A N/A N/A
502 508 1010
American College Testing (ACT)
Advanced Placement Exams (AP)
Number taking tests: 1 2 8 English Mathematics Reading Science Reasoning CompositeScore
School System
20.2 20.2
20.8 21.2
21.6 21.5
21.4 21.1
21.1 21.1
State 19.1 19.9 20.2 19.9 19.9
No. of Students Taking Tests
No. of Tests Taken No. of Test Scores
3 or Higher Percent of Test
Scores 3 or Higher
School 116 213 185
86.9%
System State 1,291 15,225 2,524 23,969 1,885 13,024
74.7% 54.3%
POST-SECONDARY DATA
Graduates Entering Georgia Public Colleges
Graduates Entering Georgia Public Colleges and Requiring Learning Support (LS)
1998 Graduates Entering in 1998-99
1997 Graduates Entering in 1997-98
Percent of Graduating Number Class
School
302
54.7%
System 2,220 46.3%
School
263
49.5%
System 2,229 48.4%
Number Requiring
LS 15 213
43 312
Percent of those attending Georgia
Public Colleges
5.0%
9.6%
16.3%
14.0%
In previous years, the Report Card presented College Prep Curriculum information provided by the Board of Regents on students requiring Learning Support. Due to inconsistencies in the data provided by the Board of Regents in defining College Prep Completers versus Local Board of Education data defining College Prep Endorsements, the Department of Education Report Card will not provide this information until discrepancies can be reconciled.
Graduates Entering Georgia Public Technical and Adult Schools
1998 Graduates School System
Entering Number 22 213
1998-99 Percent
4.0% 4.4%
Entering Number N/A N/A
1997-98 Percent
N/A N/A
1997 Graduates School
5
0.9%
System
22
0.5%
17
3.2%
192
4.2%
1998-99 GEORGIA PUBLIC EDUCATION REPORT CARD Harrison High School - 6330192
Prepared by Georgia Department of Education
Page 3
CERTIFIED PERSONNEL DATA
Positions Number Average Contract Days
Administrators
5.74 214.70
Support Personnel
6.71 191.00
PK-12 Teachers
113.05 191.00
Personnel Sex
Certificate
Years Experience
Full-time Part-time
Male Female
4 Yr Bachelor's 5 Yr Master's 6 Yr Specialist's 7 Yr Doctoral Other*
<1 1-10 11-20 21-30 >30
Average
5 1
4 2
0 2 4 0 0
0 1 2 2 1
19.83
5 28
19 14
12 17
4 0 0
0 17
6 10
0
13.85
86 32
33 85
52 55
9 2 0
0 51 35 31
1
13.90
*Includes One- and Two-Year Vocational Certificates.
ACCREDITATION DATA
Accredited by Southern Association of Colleges and Schools (SACS): Secondary/Middle Commission.
AWARDS / RECOGNITION DATA
Schools in Georgia may receive recognition in the following programs: Charter School Pay for Performance Program Georgia School of Excellence National Blue Ribbon School Harrison High School did not receive recognition in any of these programs during the 1998-99 school year.
1998-99 GEORGIA PUBLIC EDUCATION REPORT CARD Harrison High School - 6330192
Prepared by Georgia Department of Education
Page 4
1998-99 GEORGIA PUBLIC EDUCATION REPORT CARD
COBB COUNTY SCHOOLS
Hayes Elementary School - 6330194
Grade Range PK-5
The Georgia Public Education Report Card is designed to assist systems and schools in educational improvement. This report card contains a variety of data elements. An explanation of the terms is provided as a companion to the report card data. Please refer to the definitions for the most effective use of the reported data.
STUDENT DATA
Total
K-5
1,057
PK
36
Enrollment, by Race/Ethnicity and Sex
Black
White Hispanic
American Asian Indian
Multiracial
80 7.6%
868 82.1%
61 5.8%
29 2.7%
5 0.5%
14 1.3%
2 5.6%
33 91.7%
0 0.0%
0 0.0%
0 0.0%
1 2.8%
Male Female
554 52.4%
503 47.6%
22 61.1%
14 38.9%
Enrollment in Selected Programs
Program
Program % of Student Enrollment Population
Gifted (Grades K-12)
79
7.5%
Alternative Programs (Grades 6-12)
N/A
N/A
Students Eligible to Receive Free/Reduced Lunches
Number
Percent
School System
160 16,221
14.6% 17.8%
Dropout Rate *
Number
Rate
School System
N/A N/A
N/A N/A
* Dropout rates are not applicable for grades PK-5.
Enrollment in Compensatory Programs
Program
Program % of Student Enrollment Population
Special Education (Grades K-12)
76
7.2%
(PK)
39
N/A
English to Speakers of Other Languages (ESOL) (Grades K-12)
38
3.6%
Remedial Education (Grades 2-5, 9-12)
118 16.6%
Special Instructional Assistance (SIA) (Grades K-3)
161 23.0%
Title I (Grades K-12)
This school has no Title I program.
Total 13
Retained Students, by Race/Ethnicity and Sex
Black
White Hispanic
American MultiAsian Indian racial
0 0.0%
8
5
61.5% 38.5%
0 0.0%
0 0.0%
0 0.0%
Male Female
8
5
61.5% 38.5%
Prepared by Georgia Department of Education
Page 1
STATE-REQUIRED TEST DATA
NORM-REFERENCED TESTS Grade 3
Iowa Tests of Basic Skills (ITBS) Each chart reflects data for three years of testing.
Reading Comprehension 50
65 63 54 0
98-99
64 62 53 97-98
59 60 52 96-97
Mathematics
School 50
System
State
0
72 70 61 98-99
67 68 61 97-98
66 68 59 96-97
School System State
Reading Vocabulary 50
58 58 50 0
98-99
63 58 50 97-98
57 58 49 96-97
Language Arts
School 50
System
State
0
70 70 64 98-99
66 69 62 97-98
66 67 59 96-97
School System State
Social Studies 50
66 64 56 0
98-99
63 64 55 97-98
62 64 55 96-97
Science
School 50
System
State
0
69 70 59 98-99
68 70 59 97-98
69 69 58 96-97
School System State
Sources of Information
Composite Score
50
65 66 57 0
98-99
School 50
System
65 65 56 97-98
60 64 55 96-97
State 0
67 67 58 98-99
67 67 57 97-98
1998-99 GEORGIA PUBLIC EDUCATION REPORT CARD Hayes Elementary School - 6330194
Prepared by Georgia Department of Education
63 66 56 96-97
Scores Reported in Percentiles
School System State
Page 2
STATE-REQUIRED TEST DATA
NORM-REFERENCED TESTS Grade 5
Iowa Tests of Basic Skills (ITBS) Each chart reflects data for three years of testing.
Reading Comprehension
Mathematics
50
57 59 53 0
98-99
59 60 53 97-98
57 60 52 96-97
School 50
System
State
0
64 68 59 98-99
60 68 58 97-98
64 69 57 96-97
School System State
Reading Vocabulary 50
55 57 48 0
98-99
55 58 48 97-98
54 58 46 96-97
Language Arts
School 50
System
State
0
66 71 63 98-99
67 70 61 97-98
64 69 58 96-97
School System State
Social Studies 50
57 64 57 0
98-99
58 64 56 97-98
61 65 55 96-97
Science
School 50
System
State
0
63 68 60 98-99
65 69 59 97-98
66 70 59 96-97
School System State
Sources of Information
Composite Score
50
60 67 58 0
98-99
School 50
System
61 65 58 97-98
62 66 57 96-97
State 0
61 66 57 98-99
61 66 56 97-98
62 67 55 96-97
1998-99 GEORGIA PUBLIC EDUCATION REPORT CARD Hayes Elementary School - 6330194
Prepared by Georgia Department of Education
Scores Reported in Percentiles
School System State
Page 3
STATE-REQUIRED TEST DATA
PERFORMANCE ASSESSMENTS
Grade 5 Writing Assessment
Percent at Developmental Stages:
1998-99 School System State
1997-98 School System State
1996-97 School System State
Stage Stage Stage Stage Stage Stage
1:The Emerging Writer 2:The Developing Writer 3:The Focusing Writer 4:The Experimenting 5:The Engaging Writer 6:The Extending Writer
0% 0% 15% 42% 32% 11%
0% 1% 10% 36% 34% 19%
0% 1% 16% 41% 29% 12%
1% 1% 12% 37% 34% 14%
0% 1% 12% 37% 33% 16%
0% 3% 19% 41% 27% 10%
0% 1% 13% 38% 29% 19%
0% 1% 14% 34% 32% 18%
0% 3% 21% 37% 26% 12%
AWARDS / RECOGNITION DATA
Schools in Georgia may receive recognition in the following programs: Charter School Pay for Performance Program Georgia School of Excellence National Blue Ribbon School Hayes Elementary School did not receive recognition in any of these programs during the 1998-99 school year.
1998-99 GEORGIA PUBLIC EDUCATION REPORT CARD Hayes Elementary School - 6330194
Prepared by Georgia Department of Education
Page 4
CERTIFIED PERSONNEL DATA
Positions Number Average Contract Days
Personnel Sex
Certificate
Years Experience
Full-time Part-time
Male Female
4 Yr Bachelor's 5 Yr Master's 6 Yr Specialist's 7 Yr Doctoral Other*
<1 1-10 11-20 21-30 >30
Average
Administrators
3.00 220.33
3 0
0 3
0 1 2 0 0 0 0 2 1 0 21.67
Support Personnel
5.75 191.00
5 1
0 6
0 4 2 0 0 0 3 2 1 0 13.33
PK-12 Teachers
64.00 191.00
62 4
4 62
36 26
4 0 0 0 39 20 7 0 10.68
*Includes One- and Two-Year Vocational Certificates.
ACCREDITATION DATA
Accredited by Southern Association of Colleges and Schools (SACS):
Elementary/Middle Commission.
1998-99 GEORGIA PUBLIC EDUCATION REPORT CARD Hayes Elementary School - 6330194
Prepared by Georgia Department of Education
Page 5
1998-99 GEORGIA PUBLIC EDUCATION REPORT CARD
COBB COUNTY SCHOOLS
Hightower Trail Middle School - 6330394
Grade Range 6-8
The Georgia Public Education Report Card is designed to assist systems and schools in educational improvement. This report card contains a variety of data elements. An explanation of the terms is provided as a companion to the report card data. Please refer to the definitions for the most effective use of the reported data.
STUDENT DATA
Total 1,051
6-8 Enrollment, by Race/Ethnicity and Sex
Black
White Hispanic
American Multi-
Asian Indian
racial
41 3.9%
941 89.5%
13 1.2%
41 3.9%
0 0.0%
15 1.4%
Male 559
53.2%
Female 492
46.8%
Enrollment in Selected Programs
Program
Gifted (Grades K-12)
Program % of Student Enrollment Population
316
30.1%
Alternative Programs (Grades 6-12)
0
0.0%
Students Eligible to Receive Free/Reduced Lunches
Number
Percent
School System
11 16,221
1.0% 17.8%
Enrollment in Compensatory Programs
Program
Program % of Student Enrollment Population
Special Education (Grades K-12) (PK)
130 12.4%
0
N/A
English to Speakers of Other Languages (ESOL) (Grades K-12)
0
0.0%
Title I (Grades K-12)
This school has no Title I program.
Dropout Rate for Grades 6-8
Number
Rate
School System
0
0.0%
19
0.1%
Total 1
Retained Students, by Race/Ethnicity and Sex
Black
White Hispanic
American MultiAsian Indian racial
1 100.0%
0 0.0%
0 0.0%
0 0.0%
0 0.0%
0 0.0%
Male Female
0
1
0.0% 100.0%
Prepared by Georgia Department of Education
Page 1
STATE-REQUIRED TEST DATA
NORM-REFERENCED TESTS Grade 8
Iowa Tests of Basic Skills (ITBS) Each chart reflects data for three years of testing.
Reading Comprehension 50
75 61 49 0
98-99
73 61 48 97-98
74 62 48 96-97
Mathematics
School 50
System
State
0
82 66 56 98-99
80 66 55 97-98
75 67 54 96-97
School System State
Reading Vocabulary 50
74 57 46 0
98-99
69 57 45 97-98
72 58 44 96-97
Language Arts
School 50
System
State
0
84 70 60 98-99
79 68 58 97-98
79 68 56 96-97
School System State
Social Studies 50
77 64 54 0
98-99
76 64 53 97-98
78 65 53 96-97
Science
School 50
System
State
0
81 66 56 98-99
78 67 55 97-98
79 67 53 96-97
School System State
Sources of Information
Composite Score
50
80 67 57 0
98-99
School 50
System
80 66 56 97-98
81 67 55 96-97
State 0
82 67 56 98-99
80 66 54 97-98
1998-99 GEORGIA PUBLIC EDUCATION REPORT CARD Hightower Trail Middle School - 6330394
Prepared by Georgia Department of Education
80 67 54 96-97
Scores Reported in Percentiles
School System State
Page 2
STATE-REQUIRED TEST DATA
Categories of Scaled Scores
Inadequate (less than 162)
Minimal (162-209)
Good
(210-247)
Very Good (greater than 247)
Average Scaled Score: (Range 100-300)
PERFORMANCE ASSESSMENTS
Grade 8 Writing Assessment
1998-99 Percent Scoring
1997-98 Percent Scoring
1996-97 Percent Scoring
School System State School System State School System State
0% 6% 47% 48%
2% 25% 50% 24%
8% 40% 41% 11%
0% 12% 56% 32%
3% 33% 47% 17%
11% 46% 34%
8%
0% 16% 51% 32%
5% 36% 43% 16%
15% 46% 30%
8%
243
225
208 234
218 202 232
215 198
AWARDS / RECOGNITION DATA
Schools in Georgia may receive recognition in the following programs: Charter School Pay for Performance Program Georgia School of Excellence National Blue Ribbon School Hightower Trail Middle School did not receive recognition in any of these programs during the 1998-99 school year.
1998-99 GEORGIA PUBLIC EDUCATION REPORT CARD Hightower Trail Middle School - 6330394
Prepared by Georgia Department of Education
Page 3
CERTIFIED PERSONNEL DATA
Positions Number Average Contract Days
Personnel Sex
Certificate
Years Experience
Full-time Part-time
Male Female
4 Yr Bachelor's 5 Yr Master's 6 Yr Specialist's 7 Yr Doctoral Other*
<1 1-10 11-20 21-30 >30
Average
Administrators
3.00 220.33
3 0
0 3
0 1 2 0 0 0 0 0 1 2 29.33
Support Personnel
5.53 191.00
5 2
1 6
2 5 0 0 0 0 4 1 2 0 10.43
PK-12 Teachers
68.47 191.00
66 5
7 64
40 27
4 0 0 0 38 22 11 0 11.31
*Includes One- and Two-Year Vocational Certificates.
ACCREDITATION DATA
Accredited by Southern Association of Colleges and Schools (SACS):
Elementary/Middle Commission.
1998-99 GEORGIA PUBLIC EDUCATION REPORT CARD Hightower Trail Middle School - 6330394
Prepared by Georgia Department of Education
Page 4
1998-99 GEORGIA PUBLIC EDUCATION REPORT CARD
COBB COUNTY SCHOOLS
Hollydale Elementary School - 6334560
Grade Range PK-5
The Georgia Public Education Report Card is designed to assist systems and schools in educational improvement. This report card contains a variety of data elements. An explanation of the terms is provided as a companion to the report card data. Please refer to the definitions for the most effective use of the reported data.
STUDENT DATA
Total
K-5
773
PK
4
Enrollment, by Race/Ethnicity and Sex
Black
White Hispanic
American Asian Indian
Multiracial
376 48.6%
317 41.0%
29 3.8%
13 1.7%
3 0.4%
35 4.5%
0 0.0%
3 75.0%
0 0.0%
0 0.0%
0 0.0%
1 25.0%
Male Female
390 50.5%
383 49.5%
1 25.0%
3 75.0%
Enrollment in Selected Programs
Program
Program % of Student Enrollment Population
Gifted (Grades K-12)
11
1.4%
Alternative Programs (Grades 6-12)
N/A
N/A
Students Eligible to Receive Free/Reduced Lunches
Number
Percent
School System
170 16,221
21.9% 17.8%
Dropout Rate *
Number
Rate
School System
N/A N/A
N/A N/A
* Dropout rates are not applicable for grades PK-5.
Enrollment in Compensatory Programs
Program
Program % of Student Enrollment Population
Special Education (Grades K-12)
114 14.7%
(PK)
3
N/A
English to Speakers of Other Languages (ESOL) (Grades K-12)
0
0.0%
Remedial Education (Grades 2-5, 9-12)
86 16.7%
Special Instructional Assistance (SIA) (Grades K-3)
121 22.7%
Title I (Grades K-12)
This school has no Title I program.
Total 17
Retained Students, by Race/Ethnicity and Sex
Black
White Hispanic
American MultiAsian Indian racial
8 47.1%
6 35.3%
1 5.9%
1 5.9%
0 0.0%
1 5.9%
Male Female
13
4
76.5% 23.5%
Prepared by Georgia Department of Education
Page 1
STATE-REQUIRED TEST DATA
NORM-REFERENCED TESTS Grade 3
Iowa Tests of Basic Skills (ITBS) Each chart reflects data for three years of testing.
Reading Comprehension 50
59 63 54 0
98-99
60 62 53 97-98
52 60 52 96-97
Mathematics
School 50
System
State
0
55 70 61 98-99
60 68 61 97-98
55 68 59 96-97
School System State
Reading Vocabulary 50
51 58 50 0
98-99
57 58 50 97-98
52 58 49 96-97
Language Arts
School 50
System
State
0
61 70 64 98-99
59 69 62 97-98
52 67 59 96-97
School System State
Social Studies 50
57 64 56 0
98-99
59 64 55 97-98
57 64 55 96-97
Science
School 50
System
State
0
58 70 59 98-99
65 70 59 97-98
62 69 58 96-97
School System State
Sources of Information
Composite Score
50
57 66 57 0
98-99
School 50
System
61 65 56 97-98
55 64 55 96-97
State 0
57 67 58 98-99
60 67 57 97-98
1998-99 GEORGIA PUBLIC EDUCATION REPORT CARD Hollydale Elementary School - 6334560
Prepared by Georgia Department of Education
55 66 56 96-97
Scores Reported in Percentiles
School System State
Page 2
STATE-REQUIRED TEST DATA
NORM-REFERENCED TESTS Grade 5
Iowa Tests of Basic Skills (ITBS) Each chart reflects data for three years of testing.
Reading Comprehension
Mathematics
50
53 59 53 0
98-99
48 60 53 97-98
50 60 52 96-97
School 50
System
State
0
56 68 59 98-99
52 68 58 97-98
63 69 57 96-97
School System State
Reading Vocabulary 50
50 57 48 0
98-99
50 58 48 97-98
44 58 46 96-97
Language Arts
School 50
System
State
0
64 71 63 98-99
56 70 61 97-98
57 69 58 96-97
School System State
Social Studies 50
58 64 57 0
98-99
54 64 56 97-98
60 65 55 96-97
Science
School 50
System
State
0
55 68 60 98-99
56 69 59 97-98
60 70 59 96-97
School System State
Sources of Information
Composite Score
50
57 67 58 0
98-99
School 50
System
54 65 58 97-98
55 66 57 96-97
State 0
56 66 57 98-99
52 66 56 97-98
56 67 55 96-97
1998-99 GEORGIA PUBLIC EDUCATION REPORT CARD Hollydale Elementary School - 6334560
Prepared by Georgia Department of Education
Scores Reported in Percentiles
School System State
Page 3
STATE-REQUIRED TEST DATA
PERFORMANCE ASSESSMENTS
Grade 5 Writing Assessment
Percent at Developmental Stages:
1998-99 School System State
1997-98 School System State
1996-97 School System State
Stage Stage Stage Stage Stage Stage
1:The Emerging Writer 2:The Developing Writer 3:The Focusing Writer 4:The Experimenting 5:The Engaging Writer 6:The Extending Writer
0% 0% 17% 49% 29% 4%
0% 1% 10% 36% 34% 19%
0% 1% 16% 41% 29% 12%
0% 1% 30% 42% 22% 6%
0% 1% 12% 37% 33% 16%
0% 3% 19% 41% 27% 10%
0% 1% 21% 40% 30% 7%
0% 1% 14% 34% 32% 18%
0% 3% 21% 37% 26% 12%
AWARDS / RECOGNITION DATA
Schools in Georgia may receive recognition in the following programs: Charter School Pay for Performance Program Georgia School of Excellence National Blue Ribbon School Hollydale Elementary School did not receive recognition in any of these programs during the 1998-99 school year.
1998-99 GEORGIA PUBLIC EDUCATION REPORT CARD Hollydale Elementary School - 6334560
Prepared by Georgia Department of Education
Page 4
CERTIFIED PERSONNEL DATA
Positions Number Average Contract Days
Personnel Sex
Certificate
Years Experience
Full-time Part-time
Male Female
4 Yr Bachelor's 5 Yr Master's 6 Yr Specialist's 7 Yr Doctoral Other*
<1 1-10 11-20 21-30 >30
Average
Administrators
2.00 235.00
2 0
1 1
0 1 1 0 0 0 0 0 1 1 26.00
Support Personnel
6.00 191.00
6 0
0 6
1 3 0 2 0 0 3 1 2 0 14.17
PK-12 Teachers
51.00 191.00
49 4
1 52
32 18
3 0 0 0 25 22 5 1 11.45
*Includes One- and Two-Year Vocational Certificates.
ACCREDITATION DATA
Accredited by Southern Association of Colleges and Schools (SACS):
Elementary/Middle Commission.
1998-99 GEORGIA PUBLIC EDUCATION REPORT CARD Hollydale Elementary School - 6334560
Prepared by Georgia Department of Education
Page 5
1998-99 GEORGIA PUBLIC EDUCATION REPORT CARD
COBB COUNTY SCHOOLS
Keheley Elementary School - 6330187
Grade Range PK-5
The Georgia Public Education Report Card is designed to assist systems and schools in educational improvement. This report card contains a variety of data elements. An explanation of the terms is provided as a companion to the report card data. Please refer to the definitions for the most effective use of the reported data.
STUDENT DATA
Total
K-5
615
PK
1
Enrollment, by Race/Ethnicity and Sex
Black
White Hispanic
American Asian Indian
Multiracial
43 7.0%
535 87.0%
18 2.9%
7 1.1%
1 0.2%
11 1.8%
0
1
0.0% 100.0%
0 0.0%
0 0.0%
0 0.0%
0 0.0%
Male 313
50.9% 1
100.0%
Female 302
49.1% 0
0.0%
Enrollment in Selected Programs
Program
Program % of Student Enrollment Population
Gifted (Grades K-12)
30
4.9%
Alternative Programs (Grades 6-12)
N/A
N/A
Students Eligible to Receive Free/Reduced Lunches
Number
Percent
School System
43 16,221
7.0% 17.8%
Dropout Rate *
Number
Rate
School System
N/A N/A
N/A N/A
* Dropout rates are not applicable for grades PK-5.
Enrollment in Compensatory Programs
Program
Program % of Student Enrollment Population
Special Education (Grades K-12)
97 15.8%
(PK)
1
N/A
English to Speakers of Other Languages (ESOL) (Grades K-12)
0
0.0%
Remedial Education (Grades 2-5, 9-12)
56 12.9%
Special Instructional Assistance (SIA) (Grades K-3)
57 14.6%
Title I (Grades K-12)
This school has no Title I program.
Total 5
Retained Students, by Race/Ethnicity and Sex
Black
White Hispanic
American MultiAsian Indian racial
0 0.0%
4
1
80.0% 20.0%
0 0.0%
0 0.0%
0 0.0%
Male Female
4
1
80.0% 20.0%
Prepared by Georgia Department of Education
Page 1
STATE-REQUIRED TEST DATA
NORM-REFERENCED TESTS Grade 3
Iowa Tests of Basic Skills (ITBS) Each chart reflects data for three years of testing.
Reading Comprehension 50
73 63 54 0
98-99
66 62 53 97-98
64 60 52 96-97
Mathematics
School 50
System
State
0
85 70 61 98-99
85 68 61 97-98
75 68 59 96-97
School System State
Reading Vocabulary 50
72 58 50 0
98-99
61 58 50 97-98
61 58 49 96-97
Language Arts
School 50
System
State
0
81 70 64 98-99
74 69 62 97-98
67 67 59 96-97
School System State
Social Studies 50
77 64 56 0
98-99
77 64 55 97-98
71 64 55 96-97
Science
School 50
System
State
0
86 70 59 98-99
83 70 59 97-98
75 69 58 96-97
School System State
Sources of Information
Composite Score
50
78 66 57 0
98-99
School 50
System
79 65 56 97-98
68 64 55 96-97
State 0
82 67 58 98-99
79 67 57 97-98
1998-99 GEORGIA PUBLIC EDUCATION REPORT CARD Keheley Elementary School - 6330187
Prepared by Georgia Department of Education
70 66 56 96-97
Scores Reported in Percentiles
School System State
Page 2
STATE-REQUIRED TEST DATA
NORM-REFERENCED TESTS Grade 5
Iowa Tests of Basic Skills (ITBS) Each chart reflects data for three years of testing.
Reading Comprehension
Mathematics
50
63 59 53 0
98-99
62 60 53 97-98
63 60 52 96-97
School 50
System
State
0
80 68 59 98-99
73 68 58 97-98
75 69 57 96-97
School System State
Reading Vocabulary 50
57 57 48 0
98-99
63 58 48 97-98
62 58 46 96-97
Language Arts
School 50
System
State
0
69 71 63 98-99
68 70 61 97-98
69 69 58 96-97
School System State
Social Studies 50
71 64 57 0
98-99
70 64 56 97-98
69 65 55 96-97
Science
School 50
System
State
0
77 68 60 98-99
72 69 59 97-98
77 70 59 96-97
School System State
Sources of Information
Composite Score
50
76 67 58 0
98-99
School 50
System
69 65 58 97-98
70 66 57 96-97
State 0
74 66 57 98-99
70 66 56 97-98
71 67 55 96-97
1998-99 GEORGIA PUBLIC EDUCATION REPORT CARD Keheley Elementary School - 6330187
Prepared by Georgia Department of Education
Scores Reported in Percentiles
School System State
Page 3
STATE-REQUIRED TEST DATA
PERFORMANCE ASSESSMENTS
Grade 5 Writing Assessment
Percent at Developmental Stages:
1998-99 School System State
1997-98 School System State
1996-97 School System State
Stage Stage Stage Stage Stage Stage
1:The Emerging Writer 2:The Developing Writer 3:The Focusing Writer 4:The Experimenting 5:The Engaging Writer 6:The Extending Writer
0% 1% 1% 28% 45% 25%
0% 1% 10% 36% 34% 19%
0% 1% 16% 41% 29% 12%
0% 0% 8% 45% 35% 12%
0% 1% 12% 37% 33% 16%
0% 3% 19% 41% 27% 10%
0% 0% 6% 29% 39% 27%
0% 1% 14% 34% 32% 18%
0% 3% 21% 37% 26% 12%
AWARDS / RECOGNITION DATA
Schools in Georgia may receive recognition in the following programs: Charter School Pay for Performance Program Georgia School of Excellence National Blue Ribbon School Keheley Elementary School did not receive recognition in any of these programs during the 1998-99 school year.
1998-99 GEORGIA PUBLIC EDUCATION REPORT CARD Keheley Elementary School - 6330187
Prepared by Georgia Department of Education
Page 4
CERTIFIED PERSONNEL DATA
Positions Number Average Contract Days
Personnel Sex
Certificate
Years Experience
Full-time Part-time
Male Female
4 Yr Bachelor's 5 Yr Master's 6 Yr Specialist's 7 Yr Doctoral Other*
<1 1-10 11-20 21-30 >30
Average
Administrators
1.51 236.79
1 1
0 2
0 0 2 0 0 0 1 0 1 0 17.00
Support Personnel
2.50 191.00
2 1
0 3
0 3 0 0 0 0 2 1 0 0 7.00
PK-12 Teachers
37.99 191.00
35 6
1 40
27 12
2 0 0 0 14 23 4 0 12.95
*Includes One- and Two-Year Vocational Certificates.
ACCREDITATION DATA
Accredited by Southern Association of Colleges and Schools (SACS):
Elementary/Middle Commission.
1998-99 GEORGIA PUBLIC EDUCATION REPORT CARD Keheley Elementary School - 6330187
Prepared by Georgia Department of Education
Page 5
1998-99 GEORGIA PUBLIC EDUCATION REPORT CARD
COBB COUNTY SCHOOLS
Kennesaw Elementary School - 6330492
Grade Range PK-5
The Georgia Public Education Report Card is designed to assist systems and schools in educational improvement. This report card contains a variety of data elements. An explanation of the terms is provided as a companion to the report card data. Please refer to the definitions for the most effective use of the reported data.
STUDENT DATA
Total
K-5
913
PK
8
Enrollment, by Race/Ethnicity and Sex
Black
White Hispanic
American Asian Indian
Multiracial
67 7.3%
782 85.7%
22 2.4%
18 2.0%
2 0.2%
22 2.4%
1 12.5%
7 87.5%
0 0.0%
0 0.0%
0 0.0%
0 0.0%
Male Female
483 52.9%
430 47.1%
6 75.0%
2 25.0%
Enrollment in Selected Programs
Program
Program % of Student Enrollment Population
Gifted (Grades K-12)
29
3.2%
Alternative Programs (Grades 6-12)
N/A
N/A
Students Eligible to Receive Free/Reduced Lunches
Number
Percent
School System
105 16,221
11.4% 17.8%
Dropout Rate *
Number
Rate
School System
N/A N/A
N/A N/A
* Dropout rates are not applicable for grades PK-5.
Enrollment in Compensatory Programs
Program
Program % of Student Enrollment Population
Special Education (Grades K-12)
105 11.5%
(PK)
11
N/A
English to Speakers of Other Languages (ESOL) (Grades K-12)
16
1.8%
Remedial Education (Grades 2-5, 9-12)
48
8.3%
Special Instructional Assistance (SIA) (Grades K-3)
96 14.9%
Title I (Grades K-12)
This school has no Title I program.
Total 19
Retained Students, by Race/Ethnicity and Sex
Black
White Hispanic
American MultiAsian Indian racial
1 5.3%
15 78.9%
1 5.3%
0 0.0%
0
2
0.0% 10.5%
Male Female
9
10
47.4% 52.6%
Prepared by Georgia Department of Education
Page 1
STATE-REQUIRED TEST DATA
NORM-REFERENCED TESTS Grade 3
Iowa Tests of Basic Skills (ITBS) Each chart reflects data for three years of testing.
Reading Comprehension 50
69 63 54 0
98-99
66 62 53 97-98
65 60 52 96-97
Mathematics
School 50
System
State
0
81 70 61 98-99
74 68 61 97-98
76 68 59 96-97
School System State
Reading Vocabulary 50
65 58 50 0
98-99
60 58 50 97-98
60 58 49 96-97
Language Arts
School 50
System
State
0
75 70 64 98-99
71 69 62 97-98
76 67 59 96-97
School System State
Social Studies 50
72 64 56 0
98-99
64 64 55 97-98
67 64 55 96-97
Science
School 50
System
State
0
78 70 59 98-99
73 70 59 97-98
68 69 58 96-97
School System State
Sources of Information
Composite Score
50
77 66 57 0
98-99
School 50
System
67 65 56 97-98
67 64 55 96-97
State 0
76 67 58 98-99
69 67 57 97-98
1998-99 GEORGIA PUBLIC EDUCATION REPORT CARD Kennesaw Elementary School - 6330492
Prepared by Georgia Department of Education
70 66 56 96-97
Scores Reported in Percentiles
School System State
Page 2
STATE-REQUIRED TEST DATA
NORM-REFERENCED TESTS Grade 5
Iowa Tests of Basic Skills (ITBS) Each chart reflects data for three years of testing.
Reading Comprehension
Mathematics
50
67 59 53 0
98-99
60 60 53 97-98
55 60 52 96-97
School 50
System
State
0
74 68 59 98-99
68 68 58 97-98
58 69 57 96-97
School System State
Reading Vocabulary 50
68 57 48 0
98-99
58 58 48 97-98
53 58 46 96-97
Language Arts
School 50
System
State
0
76 71 63 98-99
73 70 61 97-98
62 69 58 96-97
School System State
Social Studies 50
68 64 57 0
98-99
62 64 56 97-98
61 65 55 96-97
Science
School 50
System
State
0
76 68 60 98-99
69 69 59 97-98
67 70 59 96-97
School System State
Sources of Information
Composite Score
50
69 67 58 0
98-99
School 50
System
67 65 58 97-98
55 66 57 96-97
State 0
73 66 57 98-99
67 66 56 97-98
60 67 55 96-97
1998-99 GEORGIA PUBLIC EDUCATION REPORT CARD Kennesaw Elementary School - 6330492
Prepared by Georgia Department of Education
Scores Reported in Percentiles
School System State
Page 3
STATE-REQUIRED TEST DATA
PERFORMANCE ASSESSMENTS
Grade 5 Writing Assessment
Percent at Developmental Stages:
1998-99 School System State
1997-98 School System State
1996-97 School System State
Stage Stage Stage Stage Stage Stage
1:The Emerging Writer 2:The Developing Writer 3:The Focusing Writer 4:The Experimenting 5:The Engaging Writer 6:The Extending Writer
0% 1% 7% 34% 35% 23%
0% 1% 10% 36% 34% 19%
0% 1% 16% 41% 29% 12%
0% 3% 9% 37% 42% 10%
0% 1% 12% 37% 33% 16%
0% 3% 19% 41% 27% 10%
0% 0% 8% 37% 34% 21%
0% 1% 14% 34% 32% 18%
0% 3% 21% 37% 26% 12%
AWARDS / RECOGNITION DATA
Schools in Georgia may receive recognition in the following programs: Charter School Pay for Performance Program Georgia School of Excellence National Blue Ribbon School Kennesaw Elementary School did not receive recognition in any of these programs during the 1998-99 school year.
1998-99 GEORGIA PUBLIC EDUCATION REPORT CARD Kennesaw Elementary School - 6330492
Prepared by Georgia Department of Education
Page 4
CERTIFIED PERSONNEL DATA
Positions Number Average Contract Days
Personnel Sex
Certificate
Years Experience
Full-time Part-time
Male Female
4 Yr Bachelor's 5 Yr Master's 6 Yr Specialist's 7 Yr Doctoral Other*
<1 1-10 11-20 21-30 >30
Average
Administrators
2.00 235.00
2 0
1 1
0 0 2 0 0 0 0 1 1 0 21.00
Support Personnel
5.50 191.00
5 1
0 6
1 3 1 1 0 0 1 1 2 2 22.17
PK-12 Teachers
57.50 191.00
56 3
4 55
29 26
4 0 0 0 31 16 11 1 12.02
*Includes One- and Two-Year Vocational Certificates.
ACCREDITATION DATA
Accredited by Southern Association of Colleges and Schools (SACS):
Elementary/Middle Commission.
1998-99 GEORGIA PUBLIC EDUCATION REPORT CARD Kennesaw Elementary School - 6330492
Prepared by Georgia Department of Education
Page 5
1998-99 GEORGIA PUBLIC EDUCATION REPORT CARD
COBB COUNTY SCHOOLS
Kincaid Elementary School - 6330273
Grade Range PK-5
The Georgia Public Education Report Card is designed to assist systems and schools in educational improvement. This report card contains a variety of data elements. An explanation of the terms is provided as a companion to the report card data. Please refer to the definitions for the most effective use of the reported data.
STUDENT DATA
Total
K-5
703
PK
5
Enrollment, by Race/Ethnicity and Sex
Black
White Hispanic
American Asian Indian
Multiracial
100 14.2%
545 77.5%
12 1.7%
28 4.0%
1 0.1%
17 2.4%
0 0.0%
4 80.0%
0 0.0%
0 0.0%
0 0.0%
1 20.0%
Male Female
322 45.8%
381 54.2%
2 40.0%
3 60.0%
Enrollment in Selected Programs
Program
Program % of Student Enrollment Population
Gifted (Grades K-12)
29
4.1%
Alternative Programs (Grades 6-12)
N/A
N/A
Students Eligible to Receive Free/Reduced Lunches
Number
Percent
School System
74 16,221
10.5% 17.8%
Dropout Rate *
Number
Rate
School System
N/A N/A
N/A N/A
* Dropout rates are not applicable for grades PK-5.
Enrollment in Compensatory Programs
Program
Program % of Student Enrollment Population
Special Education (Grades K-12)
117 16.6%
(PK)
5
N/A
English to Speakers of Other Languages (ESOL) (Grades K-12)
0
0.0%
Remedial Education (Grades 2-5, 9-12)
57 11.6%
Special Instructional Assistance (SIA) (Grades K-3)
87 18.7%
Title I (Grades K-12)
This school has no Title I program.
Total 6
Retained Students, by Race/Ethnicity and Sex
Black
White Hispanic
American MultiAsian Indian racial
0 0.0%
5 83.3%
0 0.0%
1 16.7%
0 0.0%
0 0.0%
Male Female
1
5
16.7% 83.3%
Prepared by Georgia Department of Education
Page 1
STATE-REQUIRED TEST DATA
NORM-REFERENCED TESTS Grade 3
Iowa Tests of Basic Skills (ITBS) Each chart reflects data for three years of testing.
Reading Comprehension 50
71 63 54 0
98-99
72 62 53 97-98
67 60 52 96-97
Mathematics
School 50
System
State
0
73 70 61 98-99
76 68 61 97-98
76 68 59 96-97
School System State
Reading Vocabulary 50
67 58 50 0
98-99
71 58 50 97-98
69 58 49 96-97
Language Arts
School 50
System
State
0
71 70 64 98-99
69 69 62 97-98
74 67 59 96-97
School System State
Social Studies 50
69 64 56 0
98-99
69 64 55 97-98
67 64 55 96-97
Science
School 50
System
State
0
76 70 59 98-99
78 70 59 97-98
73 69 58 96-97
School System State
Sources of Information
Composite Score
50
71 66 57 0
98-99
School 50
System
72 65 56 97-98
69 64 55 96-97
State 0
72 67 58 98-99
73 67 57 97-98
1998-99 GEORGIA PUBLIC EDUCATION REPORT CARD Kincaid Elementary School - 6330273
Prepared by Georgia Department of Education
71 66 56 96-97
Scores Reported in Percentiles
School System State
Page 2
STATE-REQUIRED TEST DATA
NORM-REFERENCED TESTS Grade 5
Iowa Tests of Basic Skills (ITBS) Each chart reflects data for three years of testing.
Reading Comprehension
Mathematics
50
63 59 53 0
98-99
73 60 53 97-98
68 60 52 96-97
School 50
System
State
0
75 68 59 98-99
82 68 58 97-98
78 69 57 96-97
School System State
Reading Vocabulary 50
66 57 48 0
98-99
78 58 48 97-98
75 58 46 96-97
Language Arts
School 50
System
State
0
76 71 63 98-99
80 70 61 97-98
81 69 58 96-97
School System State
Social Studies 50
78 64 57 0
98-99
85 64 56 97-98
74 65 55 96-97
Science
School 50
System
State
0
75 68 60 98-99
86 69 59 97-98
85 70 59 96-97
School System State
Sources of Information
Composite Score
50
74 67 58 0
98-99
School 50
System
80 65 58 97-98
77 66 57 96-97
State 0
75 66 57 98-99
85 66 56 97-98
80 67 55 96-97
1998-99 GEORGIA PUBLIC EDUCATION REPORT CARD Kincaid Elementary School - 6330273
Prepared by Georgia Department of Education
Scores Reported in Percentiles
School System State
Page 3
STATE-REQUIRED TEST DATA
PERFORMANCE ASSESSMENTS
Grade 5 Writing Assessment
Percent at Developmental Stages:
1998-99 School System State
1997-98 School System State
1996-97 School System State
Stage Stage Stage Stage Stage Stage
1:The Emerging Writer 2:The Developing Writer 3:The Focusing Writer 4:The Experimenting 5:The Engaging Writer 6:The Extending Writer
0% 0% 2% 21% 36% 41%
0% 1% 10% 36% 34% 19%
0% 1% 16% 41% 29% 12%
0% 0% 1% 17% 43% 39%
0% 1% 12% 37% 33% 16%
0% 3% 19% 41% 27% 10%
0% 0% 1% 23% 29% 47%
0% 1% 14% 34% 32% 18%
0% 3% 21% 37% 26% 12%
AWARDS / RECOGNITION DATA
Schools in Georgia may receive recognition in the following programs: Charter School Pay for Performance Program Georgia School of Excellence National Blue Ribbon School Kincaid Elementary School did not receive recognition in any of these programs during the 1998-99 school year.
1998-99 GEORGIA PUBLIC EDUCATION REPORT CARD Kincaid Elementary School - 6330273
Prepared by Georgia Department of Education
Page 4
CERTIFIED PERSONNEL DATA
Positions Number Average Contract Days
Personnel Sex
Certificate
Years Experience
Full-time Part-time
Male Female
4 Yr Bachelor's 5 Yr Master's 6 Yr Specialist's 7 Yr Doctoral Other*
<1 1-10 11-20 21-30 >30
Average
Administrators
2.00 235.00
2 0
0 2
0 0 2 0 0 0 0 1 1 0 22.50
Support Personnel
5.90 191.00
5 2
0 7
1 4 2 0 0 0 2 4 1 0 14.71
PK-12 Teachers
47.00 191.00
46 2
2 46
23 23
2 0 0 0 13 14 20 1 16.98
*Includes One- and Two-Year Vocational Certificates.
ACCREDITATION DATA
Accredited by Southern Association of Colleges and Schools (SACS):
Elementary/Middle Commission.
1998-99 GEORGIA PUBLIC EDUCATION REPORT CARD Kincaid Elementary School - 6330273
Prepared by Georgia Department of Education
Page 5
1998-99 GEORGIA PUBLIC EDUCATION REPORT CARD
COBB COUNTY SCHOOLS
King Springs Elementary School - 6332062
Grade Range PK-5
The Georgia Public Education Report Card is designed to assist systems and schools in educational improvement. This report card contains a variety of data elements. An explanation of the terms is provided as a companion to the report card data. Please refer to the definitions for the most effective use of the reported data.
STUDENT DATA
Total
K-5
639
PK
2
Enrollment, by Race/Ethnicity and Sex
Black
White Hispanic
American Asian Indian
Multiracial
233 36.5%
334 52.3%
28 4.4%
21 3.3%
2 0.3%
21 3.3%
0
2
0.0% 100.0%
0 0.0%
0 0.0%
0 0.0%
0 0.0%
Male Female
316 49.5%
323 50.5%
0
2
0.0% 100.0%
Enrollment in Selected Programs
Program
Program % of Student Enrollment Population
Gifted (Grades K-12)
29
4.5%
Alternative Programs (Grades 6-12)
N/A
N/A
Students Eligible to Receive Free/Reduced Lunches
Number
Percent
School System
166 16,221
25.9% 17.8%
Dropout Rate *
Number
Rate
School System
N/A N/A
N/A N/A
* Dropout rates are not applicable for grades PK-5.
Enrollment in Compensatory Programs
Program
Program % of Student Enrollment Population
Special Education (Grades K-12)
73 11.4%
(PK)
2
N/A
English to Speakers of Other Languages (ESOL) (Grades K-12)
17
2.7%
Remedial Education (Grades 2-5, 9-12)
82 20.4%
Special Instructional Assistance (SIA) (Grades K-3)
80 17.9%
Title I (Grades K-12)
This school has no Title I program.
Total 11
Retained Students, by Race/Ethnicity and Sex
Black
White Hispanic
American MultiAsian Indian racial
2 18.2%
5 45.5%
1 9.1%
1 9.1%
0
2
0.0% 18.2%
Male Female
7
4
63.6% 36.4%
Prepared by Georgia Department of Education
Page 1
STATE-REQUIRED TEST DATA
NORM-REFERENCED TESTS Grade 3
Iowa Tests of Basic Skills (ITBS) Each chart reflects data for three years of testing.
Reading Comprehension 50
64 63 54 0
98-99
59 62 53 97-98
63 60 52 96-97
Mathematics
School 50
System
State
0
70 70 61 98-99
66 68 61 97-98
65 68 59 96-97
School System State
Reading Vocabulary 50
56 58 50 0
98-99
53 58 50 97-98
61 58 49 96-97
Language Arts
School 50
System
State
0
62 70 64 98-99
70 69 62 97-98
73 67 59 96-97
School System State
Social Studies 50
63 64 56 0
98-99
68 64 55 97-98
58 64 55 96-97
Science
School 50
System
State
0
69 70 59 98-99
66 70 59 97-98
64 69 58 96-97
School System State
Sources of Information
Composite Score
50
62 66 57 0
98-99
School 50
System
66 65 56 97-98
66 64 55 96-97
State 0
64 67 58 98-99
66 67 57 97-98
1998-99 GEORGIA PUBLIC EDUCATION REPORT CARD King Springs Elementary School - 6332062
Prepared by Georgia Department of Education
65 66 56 96-97
Scores Reported in Percentiles
School System State
Page 2
STATE-REQUIRED TEST DATA
NORM-REFERENCED TESTS Grade 5
Iowa Tests of Basic Skills (ITBS) Each chart reflects data for three years of testing.
Reading Comprehension
Mathematics
50
64 59 53 0
98-99
64 60 53 97-98
65 60 52 96-97
School 50
System
State
0
75 68 59 98-99
75 68 58 97-98
74 69 57 96-97
School System State
Reading Vocabulary 50
55 57 48 0
98-99
60 58 48 97-98
60 58 46 96-97
Language Arts
School 50
System
State
0
78 71 63 98-99
76 70 61 97-98
80 69 58 96-97
School System State
Social Studies 50
65 64 57 0
98-99
63 64 56 97-98
68 65 55 96-97
Science
School 50
System
State
0
72 68 60 98-99
67 69 59 97-98
72 70 59 96-97
School System State
Sources of Information
Composite Score
50
73 67 58 0
98-99
School 50
System
70 65 58 97-98
67 66 57 96-97
State 0
72 66 57 98-99
70 66 56 97-98
72 67 55 96-97
1998-99 GEORGIA PUBLIC EDUCATION REPORT CARD King Springs Elementary School - 6332062
Prepared by Georgia Department of Education
Scores Reported in Percentiles
School System State
Page 3
STATE-REQUIRED TEST DATA
PERFORMANCE ASSESSMENTS
Grade 5 Writing Assessment
Percent at Developmental Stages:
1998-99 School System State
1997-98 School System State
1996-97 School System State
Stage Stage Stage Stage Stage Stage
1:The Emerging Writer 2:The Developing Writer 3:The Focusing Writer 4:The Experimenting 5:The Engaging Writer 6:The Extending Writer
0% 0% 9% 29% 35% 28%
0% 1% 10% 36% 34% 19%
0% 1% 16% 41% 29% 12%
0% 0% 11% 33% 37% 19%
0% 1% 12% 37% 33% 16%
0% 3% 19% 41% 27% 10%
0% 1% 9% 25% 39% 26%
0% 1% 14% 34% 32% 18%
0% 3% 21% 37% 26% 12%
AWARDS / RECOGNITION DATA
Schools in Georgia may receive recognition in the following programs: Charter School Pay for Performance Program Georgia School of Excellence National Blue Ribbon School King Springs Elementary School did not receive recognition in any of these programs during the 1998-99 school year.
1998-99 GEORGIA PUBLIC EDUCATION REPORT CARD King Springs Elementary School - 6332062
Prepared by Georgia Department of Education
Page 4
CERTIFIED PERSONNEL DATA
Positions Number Average Contract Days
Personnel Sex
Certificate
Years Experience
Full-time Part-time
Male Female
4 Yr Bachelor's 5 Yr Master's 6 Yr Specialist's 7 Yr Doctoral Other*
<1 1-10 11-20 21-30 >30
Average
Administrators
2.00 225.50
2 0
0 2
0 0 2 0 0 0 0 0 1 1 29.50
Support Personnel
4.00 191.00
4 0
0 4
0 2 1 1 0 0 0 3 1 0 19.75
PK-12 Teachers
37.42 191.00
36 3
2 37
23 16
0 0 0 0 13 10 13 3 16.90
*Includes One- and Two-Year Vocational Certificates.
ACCREDITATION DATA
Accredited by Southern Association of Colleges and Schools (SACS):
Elementary/Middle Commission.
1998-99 GEORGIA PUBLIC EDUCATION REPORT CARD King Springs Elementary School - 6332062
Prepared by Georgia Department of Education
Page 5
1998-99 GEORGIA PUBLIC EDUCATION REPORT CARD
COBB COUNTY SCHOOLS
LaBelle Elementary School - 6333062
Grade Range PK-5
The Georgia Public Education Report Card is designed to assist systems and schools in educational improvement. This report card contains a variety of data elements. An explanation of the terms is provided as a companion to the report card data. Please refer to the definitions for the most effective use of the reported data.
STUDENT DATA
Total
K-5
435
PK
1
Enrollment, by Race/Ethnicity and Sex
Black
White Hispanic
American Asian Indian
Multiracial
151 34.7%
162 37.2%
88 20.2%
16 3.7%
2 0.5%
16 3.7%
0
1
0.0% 100.0%
0 0.0%
0 0.0%
0 0.0%
0 0.0%
Male Female
231 53.1%
204 46.9%
0
1
0.0% 100.0%
Enrollment in Selected Programs
Program
Program % of Student Enrollment Population
Gifted (Grades K-12)
3
< 1%
Alternative Programs (Grades 6-12)
N/A
N/A
Students Eligible to Receive Free/Reduced Lunches
Number
Percent
School System
273 16,221
62.6% 17.8%
Dropout Rate *
Number
Rate
School System
N/A N/A
N/A N/A
* Dropout rates are not applicable for grades PK-5.
Enrollment in Compensatory Programs
Program
Program % of Student Enrollment Population
Special Education (Grades K-12)
91 20.9%
(PK)
1
N/A
English to Speakers of Other Languages (ESOL) (Grades K-12)
76 17.5%
Remedial Education (Grades 2-5, 9-12)
72 24.8%
Special Instructional Assistance (SIA) (Grades K-3)
116 39.1%
Title I (Grades K-12)
This school has a schoolwide program.
Total 2
Retained Students, by Race/Ethnicity and Sex
Black
White Hispanic
American MultiAsian Indian racial
0 0.0%
1
1
50.0% 50.0%
0 0.0%
0 0.0%
0 0.0%
Male Female
1
1
50.0% 50.0%
Prepared by Georgia Department of Education
Page 1
STATE-REQUIRED TEST DATA
NORM-REFERENCED TESTS Grade 3
Iowa Tests of Basic Skills (ITBS) Each chart reflects data for three years of testing.
Reading Comprehension 50
48 63 54 0
98-99
48 62 53 97-98
42 60 52 96-97
Mathematics
School 50
System
State
0
60 70 61 98-99
40 68 61 97-98
36 68 59 96-97
School System State
Reading Vocabulary 50
49 58 50 0
98-99
40 58 50 97-98
42 58 49 96-97
Language Arts
School 50
System
State
0
57 70 64 98-99
51 69 62 97-98
40 67 59 96-97
School System State
Social Studies 50
62 64 56 0
98-99
50 64 55 97-98
45 64 55 96-97
Science
School 50
System
State
0
65 70 59 98-99
54 70 59 97-98
53 69 58 96-97
School System State
Sources of Information
Composite Score
50
55 66 57 0
98-99
School 50
System
45 65 56 97-98
41 64 55 96-97
State 0
59 67 58 98-99
46 67 57 97-98
1998-99 GEORGIA PUBLIC EDUCATION REPORT CARD LaBelle Elementary School - 6333062
Prepared by Georgia Department of Education
41 66 56 96-97
Scores Reported in Percentiles
School System State
Page 2
STATE-REQUIRED TEST DATA
NORM-REFERENCED TESTS Grade 5
Iowa Tests of Basic Skills (ITBS) Each chart reflects data for three years of testing.
Reading Comprehension
Mathematics
50
37 59 53 0
98-99
47 60 53 97-98
44 60 52 96-97
School 50
System
State
0
42 68 59 98-99
45 68 58 97-98
45 69 57 96-97
School System State
Reading Vocabulary 50
36 57 48 0
98-99
40 58 48 97-98
41 58 46 96-97
Language Arts
School 50
System
State
0
45 71 63 98-99
57 70 61 97-98
46 69 58 96-97
School System State
Social Studies 50
37 64 57 0
98-99
47 64 56 97-98
48 65 55 96-97
Science
School 50
System
State
0
38 68 60 98-99
46 69 59 97-98
53 70 59 96-97
School System State
Sources of Information
Composite Score
50
39 67 58 0
98-99
School 50
System
50 65 58 97-98
51 66 57 96-97
State 0
38 66 57 98-99
46 66 56 97-98
46 67 55 96-97
1998-99 GEORGIA PUBLIC EDUCATION REPORT CARD LaBelle Elementary School - 6333062
Prepared by Georgia Department of Education
Scores Reported in Percentiles
School System State
Page 3
STATE-REQUIRED TEST DATA
PERFORMANCE ASSESSMENTS
Grade 5 Writing Assessment
Percent at Developmental Stages:
1998-99 School System State
1997-98 School System State
1996-97 School System State
Stage Stage Stage Stage Stage Stage
1:The Emerging Writer 2:The Developing Writer 3:The Focusing Writer 4:The Experimenting 5:The Engaging Writer 6:The Extending Writer
0% 0% 9% 50% 35% 7%
0% 1% 10% 36% 34% 19%
0% 1% 16% 41% 29% 12%
0% 3% 18% 44% 32% 3%
0% 1% 12% 37% 33% 16%
0% 3% 19% 41% 27% 10%
0% 2% 15% 57% 19% 6%
0% 1% 14% 34% 32% 18%
0% 3% 21% 37% 26% 12%
AWARDS / RECOGNITION DATA
Schools in Georgia may receive recognition in the following programs: Charter School Pay for Performance Program Georgia School of Excellence National Blue Ribbon School LaBelle Elementary School did not receive recognition in any of these programs during the 1998-99 school year.
1998-99 GEORGIA PUBLIC EDUCATION REPORT CARD LaBelle Elementary School - 6333062
Prepared by Georgia Department of Education
Page 4
CERTIFIED PERSONNEL DATA
Positions Number Average Contract Days
Personnel Sex
Certificate
Years Experience
Full-time Part-time
Male Female
4 Yr Bachelor's 5 Yr Master's 6 Yr Specialist's 7 Yr Doctoral Other*
<1 1-10 11-20 21-30 >30
Average
Administrators
2.00 225.50
2 0
0 2
0 0 2 0 0 0 0 1 1 0 22.00
Support Personnel
7.50 191.00
7 1
0 8
1 6 1 0 0 0 3 4 1 0 13.25
PK-12 Teachers
32.25 191.00
31 2
1 32
19 14
0 0 0 0 20 6 5 2 11.55
*Includes One- and Two-Year Vocational Certificates.
ACCREDITATION DATA
Accredited by Southern Association of Colleges and Schools (SACS):
Elementary/Middle Commission.
1998-99 GEORGIA PUBLIC EDUCATION REPORT CARD LaBelle Elementary School - 6333062
Prepared by Georgia Department of Education
Page 5
1998-99 GEORGIA PUBLIC EDUCATION REPORT CARD
COBB COUNTY SCHOOLS
Lassiter High School - 6330381
Grade Range 9-12
The Georgia Public Education Report Card is designed to assist systems and schools in educational improvement. This report card contains a variety of data elements. An explanation of the terms is provided as a companion to the report card data. Please refer to the definitions for the most effective use of the reported data.
Total 2,778
STUDENT DATA
9-12 Enrollment, by Race/Ethnicity and Sex
Black
White Hispanic
American Multi-
Asian Indian
racial
146 5.3%
2,499 90.0%
46 1.7%
54 1.9%
2 0.1%
31 1.1%
Male Female
1,382 49.7%
1,396 50.3%
Enrollment in Selected Programs
Program
Gifted (Grades K-12)
Program % of Student Enrollment Population
505
18.2%
Non-Vocational Labs (Grades 9-12)
Vocational Labs (Grades 9-12)
Alternative Programs (Grades 6-12)
2,357 759 2
84.8% 27.3%
< 1%
Students Eligible to Receive Free/Reduced Lunches
Number
Percent
School System
36 16,221
1.3% 17.8%
Enrollment in Compensatory Programs
Program
Program % of Student Enrollment Population
Special Education (Grades K-12) PK
239
8.6%
0
N/A
English to Speakers of Other Languages (ESOL) (Grades K-12)
6
< 1%
Remedial Education (Grades 2-5, 9-12)
197
7.1%
Title I (Grades K-12)
This school has no Title I program.
Dropout Rate for Grades 9-12
Number
Rate
School System
45 1,055
1.5% 3.7%
Total 78
Retained Students, by Race/Ethnicity and Sex
Black
White Hispanic
American MultiAsian Indian racial
12 15.4%
61 78.2%
0 0.0%
3 3.8%
0 0.0%
2 2.6%
Male Female
56
22
71.8% 28.2%
Prepared by Georgia Department of Education
Page 1
STATE-REQUIRED TEST DATA
GEORGIA HIGH SCHOOL GRADUATION TESTS (GHSGT)
Percent of Regular Program 11th Graders Passing the Georgia High School Graduation Tests on First Administration
English Language Arts Mathematics Social Studies Science
All Components listed above
Writing
1998-99
School System State
100% 98% 95% 95%
98% 94% 90% 85%
96% 88% 80% 72%
92% 82% 68%
99% 97% 93%
1997-98
School System State
99% 100% 98% 96%
98% 95% 89% 88%
94% 88% 78% 74%
95% 84% 68%
99% 96% 92%
1996-97
School System State
100% 99% 96% 95%
97% 94% 89% 89%
94% 87% 78% 74%
92% 84% 67%
99% 97% 93%
GRADUATE DATA
1999 Graduates by Credentials, Race/Ethnicity and Sex
Diplomas with Both College Prep. & Voc. Endorsements
Diplomas with College Prep. Endorsements Diplomas with Vocational Endorsements General High School Diplomas Special Education Diplomas
Total All Diplomas
Certificates of Performance
Total Graduates
Total 12
542 22 4 1
581 1
582
Black
0 0.0%
34 6.3%
3 13.6%
1 25.0%
0 0.0%
38 6.5%
0 0.0%
38 6.5%
American MultiWhite Hispanic Asian Indian racial
12 100.0%
483 89.1%
0 0.0%
7 1.3%
0 0.0%
10 1.8%
0 0.0%
0 0.0%
0 0.0%
8 1.5%
18 81.8%
3 75.0%
1 100.0%
0 0.0%
0 0.0%
0 0.0%
1 4.5%
0 0.0%
0 0.0%
0 0.0%
0 0.0%
0 0.0%
0 0.0%
0 0.0%
0 0.0%
517 89.0%
7 1.2%
11 1.9%
0 0.0%
8 1.4%
1 100.0%
0 0.0%
0 0.0%
0 0.0%
0 0.0%
518 89.0%
7 1.2%
11 1.9%
0 0.0%
8 1.4%
Male Female
7 58.3%
236 43.5%
5 41.7%
306 56.5%
14 63.6%
4 100.0%
0 0.0%
8 36.4%
0 0.0%
1 100.0%
261
320
44.9% 55.1%
1 100.0%
0 0.0%
262
320
45.0% 55.0%
HOPE Scholarships
School System
Number of 1999 Graduates 5 8 2
Number Eligible
495
Percent Eligible
85.1%
5,022 3,850 76.7%
State
65,548 40,292 61.5%
High School Completion Rate
Percent of 1995Grade 9 Enrollment in Graduating Class of1999 School System State
Completion Rate '95-'99 94.2% 83.6% 68.9%
1998-99 GEORGIA PUBLIC EDUCATION REPORT CARD
Lassiter High School - 6330381
Prepared by Georgia Department of Education
Page 2
COLLEGE ADMISSIONS / CREDIT TEST DATA
Scholastic Assessment Test (SAT)
Based on students' highest verbal and highest math scores
No. Taking
Average Score
Tests Verbal Math Total
Based on students' last test administration
Average Score Verbal Math Total
School
562
College Prep. Endorsement
Other Diplomas
System
4,180
College Prep. Endorsement
Other Diplomas
Georgia
41,958
540 549 1089
545 555 1100
402 349
751
523 522 1045 532 532 1064
402 387
789
492 488
980
528 N/A N/A
514 N/A N/A
483
539 N/A N/A
513 N/A N/A
479
1067 N/A N/A
1027 N/A N/A
962
Nation
952,913 N/A N/A N/A
502 508 1010
American College Testing (ACT)
Advanced Placement Exams (AP)
Number taking tests: 1 3 6 English Mathematics Reading Science Reasoning CompositeScore
School System
21.5 20.2
23.3 21.2
22.0 22.0
21.4 21.1
22.3 21.1
State 19.1 19.9 20.2 19.9 19.9
No. of Students Taking Tests
No. of Tests Taken No. of Test Scores
3 or Higher Percent of Test
Scores 3 or Higher
School 197 352 276
78.4%
System State 1,291 15,225 2,524 23,969 1,885 13,024
74.7% 54.3%
POST-SECONDARY DATA
Graduates Entering Georgia Public Colleges
Graduates Entering Georgia Public Colleges and Requiring Learning Support (LS)
1998 Graduates Entering in 1998-99
1997 Graduates Entering in 1997-98
Percent of Graduating Number Class
School
325
57.7%
System 2,220 46.3%
School
305
53.1%
System 2,229 48.4%
Number Requiring
LS 20 213
27 312
Percent of those attending Georgia
Public Colleges
6.2%
9.6%
8.9%
14.0%
In previous years, the Report Card presented College Prep Curriculum information provided by the Board of Regents on students requiring Learning Support. Due to inconsistencies in the data provided by the Board of Regents in defining College Prep Completers versus Local Board of Education data defining College Prep Endorsements, the Department of Education Report Card will not provide this information until discrepancies can be reconciled.
Graduates Entering Georgia Public Technical and Adult Schools
1998 Graduates School System
Entering Number 14 213
1998-99 Percent
2.5% 4.4%
Entering Number N/A N/A
1997-98 Percent
N/A N/A
1997 Graduates School
2
0.3%
System
22
0.5%
16
2.8%
192
4.2%
1998-99 GEORGIA PUBLIC EDUCATION REPORT CARD Lassiter High School - 6330381
Prepared by Georgia Department of Education
Page 3
CERTIFIED PERSONNEL DATA
Positions Number Average Contract Days
Administrators
7.00 215.86
Support Personnel
10.15 191.00
PK-12 Teachers
145.85 191.00
Personnel Sex
Certificate
Years Experience
Full-time Part-time
Male Female
4 Yr Bachelor's 5 Yr Master's 6 Yr Specialist's 7 Yr Doctoral Other*
<1 1-10 11-20 21-30 >30
Average
7 0
3 4
0 0 6 1 0
0 0 3 2 2
25.43
8 32
25 15
18 16
3 3 0
0 18 12 10
0
13.50
111 42
42 111
75 64 11
3 0
0 61 51 39
2
13.72
*Includes One- and Two-Year Vocational Certificates.
ACCREDITATION DATA
Accredited by Southern Association of Colleges and Schools (SACS): Secondary/Middle Commission.
AWARDS / RECOGNITION DATA
The Georgia School of Excellence Program recognizes exemplary schools that have excellent, successful programs in many areas of school life. Each year, in a statewide competition, one elementary, one middle and one high school from each of Georgia's 11 congressional districts may be selected for this honor.
Lassiter High School was designated a 1998-99 Georgia School of Excellence.
1998-99 GEORGIA PUBLIC EDUCATION REPORT CARD Lassiter High School - 6330381
Prepared by Georgia Department of Education
Page 4
1998-99 GEORGIA PUBLIC EDUCATION REPORT CARD
COBB COUNTY SCHOOLS
Lewis Elementary School - 6330287
Grade Range PK-5
The Georgia Public Education Report Card is designed to assist systems and schools in educational improvement. This report card contains a variety of data elements. An explanation of the terms is provided as a companion to the report card data. Please refer to the definitions for the most effective use of the reported data.
STUDENT DATA
Total
K-5
954
PK
1
Enrollment, by Race/Ethnicity and Sex
Black
White Hispanic
American Asian Indian
Multiracial
51 5.3%
852 89.3%
16 1.7%
17 1.8%
3 0.3%
15 1.6%
0
1
0.0% 100.0%
0 0.0%
0 0.0%
0 0.0%
0 0.0%
Male Female
507 53.1%
447 46.9%
0
1
0.0% 100.0%
Enrollment in Selected Programs
Program
Program % of Student Enrollment Population
Gifted (Grades K-12)
30
3.1%
Alternative Programs (Grades 6-12)
N/A
N/A
Students Eligible to Receive Free/Reduced Lunches
Number
Percent
School System
51 16,221
5.3% 17.8%
Dropout Rate *
Number
Rate
School System
N/A N/A
N/A N/A
* Dropout rates are not applicable for grades PK-5.
Enrollment in Compensatory Programs
Program
Program % of Student Enrollment Population
Special Education (Grades K-12)
100 10.5%
(PK)
1
N/A
English to Speakers of Other Languages (ESOL) (Grades K-12)
0
0.0%
Remedial Education (Grades 2-5, 9-12)
47
7.1%
Special Instructional Assistance (SIA) (Grades K-3)
79 12.9%
Title I (Grades K-12)
This school has no Title I program.
Total 8
Retained Students, by Race/Ethnicity and Sex
Black
White Hispanic
American MultiAsian Indian racial
0 0.0%
5 62.5%
1 12.5%
1 12.5%
0
1
0.0% 12.5%
Male Female
2
6
25.0% 75.0%
Prepared by Georgia Department of Education
Page 1
STATE-REQUIRED TEST DATA
NORM-REFERENCED TESTS Grade 3
Iowa Tests of Basic Skills (ITBS) Each chart reflects data for three years of testing.
Reading Comprehension 50
67 63 54 0
98-99
68 62 53 97-98
69 60 52 96-97
Mathematics
School 50
System
State
0
76 70 61 98-99
74 68 61 97-98
79 68 59 96-97
School System State
Reading Vocabulary 50
59 58 50 0
98-99
67 58 50 97-98
67 58 49 96-97
Language Arts
School 50
System
State
0
74 70 64 98-99
80 69 62 97-98
80 67 59 96-97
School System State
Social Studies 50
71 64 56 0
98-99
71 64 55 97-98
72 64 55 96-97
Science
School 50
System
State
0
78 70 59 98-99
79 70 59 97-98
79 69 58 96-97
School System State
Sources of Information
Composite Score
50
74 66 57 0
98-99
School 50
System
73 65 56 97-98
76 64 55 96-97
State 0
73 67 58 98-99
76 67 57 97-98
1998-99 GEORGIA PUBLIC EDUCATION REPORT CARD Lewis Elementary School - 6330287
Prepared by Georgia Department of Education
76 66 56 96-97
Scores Reported in Percentiles
School System State
Page 2
STATE-REQUIRED TEST DATA
NORM-REFERENCED TESTS Grade 5
Iowa Tests of Basic Skills (ITBS) Each chart reflects data for three years of testing.
Reading Comprehension
Mathematics
50
65 59 53 0
98-99
57 60 53 97-98
67 60 52 96-97
School 50
System
State
0
74 68 59 98-99
66 68 58 97-98
75 69 57 96-97
School System State
Reading Vocabulary 50
63 57 48 0
98-99
59 58 48 97-98
65 58 46 96-97
Language Arts
School 50
System
State
0
75 71 63 98-99
64 70 61 97-98
72 69 58 96-97
School System State
Social Studies 50
72 64 57 0
98-99
65 64 56 97-98
72 65 55 96-97
Science
School 50
System
State
0
75 68 60 98-99
70 69 59 97-98
74 70 59 96-97
School System State
Sources of Information
Composite Score
50
71 67 58 0
98-99
School 50
System
64 65 58 97-98
69 66 57 96-97
State 0
73 66 57 98-99
64 66 56 97-98
72 67 55 96-97
1998-99 GEORGIA PUBLIC EDUCATION REPORT CARD Lewis Elementary School - 6330287
Prepared by Georgia Department of Education
Scores Reported in Percentiles
School System State
Page 3
STATE-REQUIRED TEST DATA
PERFORMANCE ASSESSMENTS
Grade 5 Writing Assessment
Percent at Developmental Stages:
1998-99 School System State
1997-98 School System State
1996-97 School System State
Stage Stage Stage Stage Stage Stage
1:The Emerging Writer 2:The Developing Writer 3:The Focusing Writer 4:The Experimenting 5:The Engaging Writer 6:The Extending Writer
1% 0% 8% 28% 43% 21%
0% 1% 10% 36% 34% 19%
0% 1% 16% 41% 29% 12%
0% 0% 13% 36% 32% 19%
0% 1% 12% 37% 33% 16%
0% 3% 19% 41% 27% 10%
0% 0% 12% 30% 40% 18%
0% 1% 14% 34% 32% 18%
0% 3% 21% 37% 26% 12%
AWARDS / RECOGNITION DATA
Schools in Georgia may receive recognition in the following programs: Charter School Pay for Performance Program Georgia School of Excellence National Blue Ribbon School Lewis Elementary School did not receive recognition in any of these programs during the 1998-99 school year.
1998-99 GEORGIA PUBLIC EDUCATION REPORT CARD Lewis Elementary School - 6330287
Prepared by Georgia Department of Education
Page 4
CERTIFIED PERSONNEL DATA
Positions Number Average Contract Days
Personnel Sex
Certificate
Years Experience
Full-time Part-time
Male Female
4 Yr Bachelor's 5 Yr Master's 6 Yr Specialist's 7 Yr Doctoral Other*
<1 1-10 11-20 21-30 >30
Average
Administrators
2.00 235.00
2 0
0 2
0 0 2 0 0 0 0 0 2 0 27.00
Support Personnel
3.45 191.00
2 2
0 4
0 3 1 0 0 0 2 1 1 0 11.75
PK-12 Teachers
52.55 191.00
51 4
1 54
22 29
4 0 0 0 20 24 11 0 14.38
*Includes One- and Two-Year Vocational Certificates.
ACCREDITATION DATA
Accredited by Southern Association of Colleges and Schools (SACS):
Elementary/Middle Commission.
1998-99 GEORGIA PUBLIC EDUCATION REPORT CARD Lewis Elementary School - 6330287
Prepared by Georgia Department of Education
Page 5
1998-99 GEORGIA PUBLIC EDUCATION REPORT CARD
COBB COUNTY SCHOOLS
Lindley Middle School - 6334062
Grade Range 6-8
The Georgia Public Education Report Card is designed to assist systems and schools in educational improvement. This report card contains a variety of data elements. An explanation of the terms is provided as a companion to the report card data. Please refer to the definitions for the most effective use of the reported data.
STUDENT DATA
Total 1,039
6-8 Enrollment, by Race/Ethnicity and Sex
Black
White Hispanic
American Multi-
Asian Indian
racial
734 70.6%
202 19.4%
79 7.6%
8 0.8%
0 0.0%
16 1.5%
Male 541
52.1%
Female 498
47.9%
Enrollment in Selected Programs
Program
Gifted (Grades K-12)
Program % of Student Enrollment Population
29
2.8%
Alternative Programs (Grades 6-12)
1
< 1%
Students Eligible to Receive Free/Reduced Lunches
Number
Percent
School System
668 16,221
64.3% 17.8%
Enrollment in Compensatory Programs
Program
Program % of Student Enrollment Population
Special Education (Grades K-12) (PK)
151 14.5%
0
N/A
English to Speakers of Other Languages (ESOL) (Grades K-12)
34
3.3%
Title I (Grades K-12)
This school has no Title I program.
Dropout Rate for Grades 6-8
Number
Rate
School System
0
0.0%
19
0.1%
Total 16
Retained Students, by Race/Ethnicity and Sex
Black
White Hispanic
American MultiAsian Indian racial
13 81.3%
3 18.8%
0 0.0%
0 0.0%
0 0.0%
0 0.0%
Male Female
8
8
50.0% 50.0%
Prepared by Georgia Department of Education
Page 1
STATE-REQUIRED TEST DATA
NORM-REFERENCED TESTS Grade 8
Iowa Tests of Basic Skills (ITBS) Each chart reflects data for three years of testing.
Reading Comprehension 50
33 61 49 0
98-99
34 61 48 97-98
31 62 48 96-97
Mathematics
School 50
System
State
0
35 66 56 98-99
38 66 55 97-98
36 67 54 96-97
School System State
Reading Vocabulary 50
32 57 46 0
98-99
30 57 45 97-98
28 58 44 96-97
Language Arts
School 50
System
State
0
43 70 60 98-99
42 68 58 97-98
39 68 56 96-97
School System State
Social Studies 50
37 64 54 0
98-99
42 64 53 97-98
42 65 53 96-97
Science
School 50
System
State
0
36 66 56 98-99
33 67 55 97-98
37 67 53 96-97
School System State
Sources of Information
Composite Score
50
44 67 57 0
98-99
School 50
System
41 66 56 97-98
43 67 55 96-97
State 0
37 67 56 98-99
37 66 54 97-98
1998-99 GEORGIA PUBLIC EDUCATION REPORT CARD Lindley Middle School - 6334062
Prepared by Georgia Department of Education
37 67 54 96-97
Scores Reported in Percentiles
School System State
Page 2
STATE-REQUIRED TEST DATA
Categories of Scaled Scores
Inadequate (less than 162)
Minimal (162-209)
Good
(210-247)
Very Good (greater than 247)
Average Scaled Score: (Range 100-300)
PERFORMANCE ASSESSMENTS
Grade 8 Writing Assessment
1998-99 Percent Scoring
1997-98 Percent Scoring
1996-97 Percent Scoring
School System State School System State School System State
11% 56% 30%
3%
2% 25% 50% 24%
8% 40% 41% 11%
16% 61% 21%
2%
3% 33% 47% 17%
11% 46% 34%
8%
18% 55% 24%
3%
5% 36% 43% 16%
15% 46% 30%
8%
197
225
208 191
218 202 192
215 198
AWARDS / RECOGNITION DATA
Schools in Georgia may receive recognition in the following programs: Charter School Pay for Performance Program Georgia School of Excellence National Blue Ribbon School Lindley Middle School did not receive recognition in any of these programs during the 1998-99 school year.
1998-99 GEORGIA PUBLIC EDUCATION REPORT CARD Lindley Middle School - 6334062
Prepared by Georgia Department of Education
Page 3
CERTIFIED PERSONNEL DATA
Positions Number Average Contract Days
Personnel Sex
Certificate
Years Experience
Full-time Part-time
Male Female
4 Yr Bachelor's 5 Yr Master's 6 Yr Specialist's 7 Yr Doctoral Other*
<1 1-10 11-20 21-30 >30
Average
Administrators
3.00 226.67
3 0
0 3
0 2 1 0 0 0 0 2 1 0 20.00
Support Personnel
6.01 191.00
5 2
2 5
1 4 2 0 0 0 3 2 2 0 12.43
PK-12 Teachers
62.97 191.00
61 4
16 49
42 20
3 0 0 0 47 13 5 0 7.68
*Includes One- and Two-Year Vocational Certificates.
ACCREDITATION DATA
Accredited by Southern Association of Colleges and Schools (SACS):
Elementary/Middle Commission.
1998-99 GEORGIA PUBLIC EDUCATION REPORT CARD Lindley Middle School - 6334062
Prepared by Georgia Department of Education
Page 4
1998-99 GEORGIA PUBLIC EDUCATION REPORT CARD
COBB COUNTY SCHOOLS
Lost Mountain Middle School - 6330299
Grade Range 6-7
The Georgia Public Education Report Card is designed to assist systems and schools in educational improvement. This report card contains a variety of data elements. An explanation of the terms is provided as a companion to the report card data. Please refer to the definitions for the most effective use of the reported data.
STUDENT DATA
Total 1,319
6-7 Enrollment, by Race/Ethnicity and Sex
Black
White Hispanic
American Multi-
Asian Indian
racial
63 4.8%
1,224 92.8%
9 0.7%
9 0.7%
1 0.1%
13 1.0%
Male Female
685 51.9%
634 48.1%
Enrollment in Selected Programs
Program
Program % of Student Enrollment Population
Gifted (Grades K-12)
250
19.0%
Alternative Programs (Grades 6-12)
0
0.0%
Students Eligible to Receive Free/Reduced Lunches
Number
Percent
School System
50 16,221
3.8% 17.8%
Dropout Rate for Grades 6-7
Number
Rate
School System
0
0.0%
3
0.0%
Enrollment in Compensatory Programs
Program
Program % of Student Enrollment Population
Special Education (Grades K-12)
113
8.6%
(PK)
0
N/A
English to Speakers of Other Languages (ESOL) (Grades K-12)
0
0.0%
Remedial Education (Grades 2-5, 9-12)
0
0.0%
Special Instructional Assistance (SIA) (Grades K-3)
N/A
N/A
Title I (Grades K-12)
This school has no Title I program.
Total 14
Retained Students, by Race/Ethnicity and Sex
Black
White Hispanic
American Multi-
Asian Indian
racial
1 7.1%
13 92.9%
0 0.0%
0 0.0%
0 0.0%
0 0.0%
Male Female
11
3
78.6% 21.4%
Prepared by Georgia Department of Education
Page 1
STATE-REQUIRED TEST DATA
NORM-REFERENCED TESTS
Grade 3 Iowa Tests of Basic Skills (ITBS) Each chart reflects data for three years of testing.
No third-grade students are enrolled at Lost Mountain Middle School.
Reading Comprehension
Mathematics
50
N/A 63 54 0
98-99
N/A 62 53 97-98
N/A 60 52 96-97
School 50
System
State
N/A 70 61 0
98-99
N/A 68 61 97-98
N/A 68 59 96-97
School System State
Reading Vocabulary 50
N/A 58 50 0
98-99
N/A 58 50 97-98
N/A 58 49 96-97
Language Arts
School 50
System
State
N/A 70 64 0
98-99
N/A 69 62 97-98
N/A 67 59 96-97
School System State
Social Studies 50
N/A 64 56 0
98-99
N/A 64 55 97-98
N/A 64 55 96-97
Science
School 50
System
State
N/A 70 59 0
98-99
N/A 70 59 97-98
N/A 69 58 96-97
School System State
Sources of Information
Composite Score
School
50
50
System
N/A 66 57 0
98-99
N/A 65 56 N/A 64 55
97-98
96-97
State
N/A 67 58 0
98-99
N/A 67 57 97-98
N/A 66 56 96-97
1998-99 GEORGIA PUBLIC EDUCATION REPORT CARD Lost Mountain Middle School - 6330299
Prepared by Georgia Department of Education
Scores Reported in Percentiles
School System State
Page 2
STATE-REQUIRED TEST DATA
NORM-REFERENCED TESTS
Grade 5 Iowa Tests of Basic Skills (ITBS) Each chart reflects data for three years of testing. No fifth-grade students are enrolled at Lost Mountain Middle School.
Reading Comprehension
Mathematics
50
N/A 59 53 0
98-99
N/A 60 53 97-98
N/A 60 52 96-97
School 50
System
State
N/A 68 59 0
98-99
N/A 68 58 97-98
N/A 69 57 96-97
School System State
Reading Vocabulary 50
N/A 57 48 0
98-99
N/A 58 48 97-98
N/A 58 46 96-97
Language Arts
School 50
System
State
N/A 71 63 0
98-99
N/A 70 61 97-98
N/A 69 58 96-97
School System State
Social Studies 50
N/A 64 57 0
98-99
N/A 64 56 97-98
N/A 65 55 96-97
Science
School 50
System
State
N/A 68 60 0
98-99
N/A 69 59 97-98
N/A 70 59 96-97
School System State
Sources of Information
Composite Score
School
50
50
System
N/A 67 58 0
98-99
N/A 65 58 N/A 66 57
97-98
96-97
State
N/A 66 57 0
98-99
N/A 66 56 97-98
N/A 67 55 96-97
1998-99 GEORGIA PUBLIC EDUCATION REPORT CARD Lost Mountain Middle School - 6330299
Prepared by Georgia Department of Education
Scores Reported in Percentiles
School System State
Page 3
STATE-REQUIRED TEST DATA
PERFORMANCE ASSESSMENTS
Grade 5 Writing Assessment
Percent at Developmental Stages:
1998-99 School System State
1997-98 School System State
1996-97 School System State
Stage Stage Stage Stage Stage Stage
1:The Emerging Writer 2:The Developing Writer 3:The Focusing Writer 4:The Experimenting 5:The Engaging Writer 6:The Extending Writer
N/A N/A N/A N/A N/A N/A
0% 1% 10% 36% 34% 19%
0% 1% 16% 41% 29% 12%
N/A N/A N/A N/A N/A N/A
0% 1% 12% 37% 33% 16%
0% 3% 19% 41% 27% 10%
N/A N/A N/A N/A N/A N/A
No fifth-grade students are enrolled at Lost Mountain Middle School.
0% 1% 14% 34% 32% 18%
0% 3% 21% 37% 26% 12%
AWARDS / RECOGNITION DATA
Schools in Georgia may receive recognition in the following programs: Charter School Pay for Performance Program Georgia School of Excellence National Blue Ribbon School Lost Mountain Middle School did not receive recognition in any of these programs during the 1998-99 school year.
1998-99 GEORGIA PUBLIC EDUCATION REPORT CARD Lost Mountain Middle School - 6330299
Prepared by Georgia Department of Education
Page 4
CERTIFIED PERSONNEL DATA
Positions Number Average Contract Days
Personnel Sex
Certificate
Years Experience
Full-time Part-time
Male Female
4 Yr Bachelor's 5 Yr Master's 6 Yr Specialist's 7 Yr Doctoral Other*
<1 1-10 11-20 21-30 >30
Average
Administrators
3.00 226.67
3 0
0 3
0 0 3 0 0 0 0 0 3 0 24.33
Support Personnel
5.02 191.00
5 1
1 5
0 3 3 0 0 0 1 2 3 0 18.50
PK-12 Teachers
80.99 191.00
80 1
11 70
44 31
6 0 0 0 46 18 16 1 12.10
*Includes One- and Two-Year Vocational Certificates.
ACCREDITATION DATA
Accredited by Southern Association of Colleges and Schools (SACS):
Elementary/Middle Commission.
1998-99 GEORGIA PUBLIC EDUCATION REPORT CARD Lost Mountain Middle School - 6330299
Prepared by Georgia Department of Education
Page 5
1998-99 GEORGIA PUBLIC EDUCATION REPORT CARD
COBB COUNTY SCHOOLS
Mableton Elementary School - 6335062
Grade Range PK-5
The Georgia Public Education Report Card is designed to assist systems and schools in educational improvement. This report card contains a variety of data elements. An explanation of the terms is provided as a companion to the report card data. Please refer to the definitions for the most effective use of the reported data.
STUDENT DATA
Total
K-5
444
PK
3
Enrollment, by Race/Ethnicity and Sex
Black
White Hispanic
American Asian Indian
Multiracial
94 21.2%
319 71.8%
18 4.1%
4 0.9%
0 0.0%
9 2.0%
0
3
0.0% 100.0%
0 0.0%
0 0.0%
0 0.0%
0 0.0%
Male Female
219 49.3%
225 50.7%
2 66.7%
1 33.3%
Enrollment in Selected Programs
Program
Program % of Student Enrollment Population
Gifted (Grades K-12)
18
4.1%
Alternative Programs (Grades 6-12)
N/A
N/A
Students Eligible to Receive Free/Reduced Lunches
Number
Percent
School System
128 16,221
28.6% 17.8%
Dropout Rate *
Number
Rate
School System
N/A N/A
N/A N/A
* Dropout rates are not applicable for grades PK-5.
Enrollment in Compensatory Programs
Program
Program % of Student Enrollment Population
Special Education (Grades K-12)
46 10.4%
(PK)
3
N/A
English to Speakers of Other Languages (ESOL) (Grades K-12)
0
0.0%
Remedial Education (Grades 2-5, 9-12)
41 12.5%
Special Instructional Assistance (SIA) (Grades K-3)
68 24.5%
Title I (Grades K-12)
This school has no Title I program.
Total 4
Retained Students, by Race/Ethnicity and Sex
Black
White Hispanic
American MultiAsian Indian racial
1 25.0%
3 75.0%
0 0.0%
0 0.0%
0 0.0%
0 0.0%
Male Female
3
1
75.0% 25.0%
Prepared by Georgia Department of Education
Page 1
STATE-REQUIRED TEST DATA
NORM-REFERENCED TESTS Grade 3
Iowa Tests of Basic Skills (ITBS) Each chart reflects data for three years of testing.
Reading Comprehension 50
58 63 54 0
98-99
56 62 53 97-98
58 60 52 96-97
Mathematics
School 50
System
State
0
55 70 61 98-99
59 68 61 97-98
63 68 59 96-97
School System State
Reading Vocabulary 50
52 58 50 0
98-99
53 58 50 97-98
55 58 49 96-97
Language Arts
School 50
System
State
0
61 70 64 98-99
63 69 62 97-98
57 67 59 96-97
School System State
Social Studies 50
54 64 56 0
98-99
55 64 55 97-98
59 64 55 96-97
Science
School 50
System
State
0
54 70 59 98-99
57 70 59 97-98
65 69 58 96-97
School System State
Sources of Information
Composite Score
50
54 66 57 0
98-99
School 50
System
61 65 56 97-98
58 64 55 96-97
State 0
55 67 58 98-99
58 67 57 97-98
1998-99 GEORGIA PUBLIC EDUCATION REPORT CARD Mableton Elementary School - 6335062
Prepared by Georgia Department of Education
60 66 56 96-97
Scores Reported in Percentiles
School System State
Page 2
STATE-REQUIRED TEST DATA
NORM-REFERENCED TESTS Grade 5
Iowa Tests of Basic Skills (ITBS) Each chart reflects data for three years of testing.
Reading Comprehension
Mathematics
50
58 59 53 0
98-99
55 60 53 97-98
48 60 52 96-97
School 50
System
State
0
60 68 59 98-99
59 68 58 97-98
54 69 57 96-97
School System State
Reading Vocabulary 50
51 57 48 0
98-99
48 58 48 97-98
47 58 46 96-97
Language Arts
School 50
System
State
0
62 71 63 98-99
64 70 61 97-98
61 69 58 96-97
School System State
Social Studies 50
61 64 57 0
98-99
53 64 56 97-98
52 65 55 96-97
Science
School 50
System
State
0
64 68 60 98-99
64 69 59 97-98
62 70 59 96-97
School System State
Sources of Information
Composite Score
50
62 67 58 0
98-99
School 50
System
57 65 58 97-98
55 66 57 96-97
State 0
60 66 57 98-99
58 66 56 97-98
55 67 55 96-97
1998-99 GEORGIA PUBLIC EDUCATION REPORT CARD Mableton Elementary School - 6335062
Prepared by Georgia Department of Education
Scores Reported in Percentiles
School System State
Page 3
STATE-REQUIRED TEST DATA
PERFORMANCE ASSESSMENTS
Grade 5 Writing Assessment
Percent at Developmental Stages:
1998-99 School System State
1997-98 School System State
1996-97 School System State
Stage Stage Stage Stage Stage Stage
1:The Emerging Writer 2:The Developing Writer 3:The Focusing Writer 4:The Experimenting 5:The Engaging Writer 6:The Extending Writer
0% 1% 16% 45% 23% 14%
0% 1% 10% 36% 34% 19%
0% 1% 16% 41% 29% 12%
0% 1% 22% 41% 30% 6%
0% 1% 12% 37% 33% 16%
0% 3% 19% 41% 27% 10%
0% 3% 23% 35% 24% 14%
0% 1% 14% 34% 32% 18%
0% 3% 21% 37% 26% 12%
AWARDS / RECOGNITION DATA
Schools in Georgia may receive recognition in the following programs: Charter School Pay for Performance Program Georgia School of Excellence National Blue Ribbon School Mableton Elementary School did not receive recognition in any of these programs during the 1998-99 school year.
1998-99 GEORGIA PUBLIC EDUCATION REPORT CARD Mableton Elementary School - 6335062
Prepared by Georgia Department of Education
Page 4
CERTIFIED PERSONNEL DATA
Positions Number Average Contract Days
Personnel Sex
Certificate
Years Experience
Full-time Part-time
Male Female
4 Yr Bachelor's 5 Yr Master's 6 Yr Specialist's 7 Yr Doctoral Other*
<1 1-10 11-20 21-30 >30
Average
Administrators
2.00 225.50
2 0
0 2
0 0 2 0 0 0 0 1 1 0 23.00
Support Personnel
2.50 191.00
2 1
1 2
1 1 1 0 0 0 0 1 1 1 26.00
PK-12 Teachers
31.50 191.00
29 5
1 33
23 10
1 0 0 0 16 8 8 2 13.65
*Includes One- and Two-Year Vocational Certificates.
ACCREDITATION DATA
Accredited by Southern Association of Colleges and Schools (SACS):
Elementary/Middle Commission.
1998-99 GEORGIA PUBLIC EDUCATION REPORT CARD Mableton Elementary School - 6335062
Prepared by Georgia Department of Education
Page 5
1998-99 GEORGIA PUBLIC EDUCATION REPORT CARD
COBB COUNTY SCHOOLS
Mabry Middle School - 6330178
Grade Range 6-8
The Georgia Public Education Report Card is designed to assist systems and schools in educational improvement. This report card contains a variety of data elements. An explanation of the terms is provided as a companion to the report card data. Please refer to the definitions for the most effective use of the reported data.
STUDENT DATA
Total 1,032
6-8 Enrollment, by Race/Ethnicity and Sex
Black
White Hispanic
American Multi-
Asian Indian
racial
45 4.4%
957 92.7%
5 0.5%
18 1.7%
0 0.0%
7 0.7%
Male 543
52.6%
Female 489
47.4%
Enrollment in Selected Programs
Program
Gifted (Grades K-12)
Program % of Student Enrollment Population
289
28.0%
Alternative Programs (Grades 6-12)
0
0.0%
Students Eligible to Receive Free/Reduced Lunches
Number
Percent
School System
15 16,221
1.5% 17.8%
Enrollment in Compensatory Programs
Program
Program % of Student Enrollment Population
Special Education (Grades K-12) (PK)
134 13.0%
0
N/A
English to Speakers of Other Languages (ESOL) (Grades K-12)
0
0.0%
Title I (Grades K-12)
This school has no Title I program.
Dropout Rate for Grades 6-8
Number
Rate
School System
0
0.0%
19
0.1%
Total 4
Retained Students, by Race/Ethnicity and Sex
Black
White Hispanic
American MultiAsian Indian racial
1 25.0%
3 75.0%
0 0.0%
0 0.0%
0 0.0%
0 0.0%
Male Female
1
3
25.0% 75.0%
Prepared by Georgia Department of Education
Page 1
STATE-REQUIRED TEST DATA
NORM-REFERENCED TESTS Grade 8
Iowa Tests of Basic Skills (ITBS) Each chart reflects data for three years of testing.
Reading Comprehension 50
75 61 49 0
98-99
77 61 48 97-98
73 62 48 96-97
Mathematics
School 50
System
State
0
81 66 56 98-99
82 66 55 97-98
80 67 54 96-97
School System State
Reading Vocabulary 50
72 57 46 0
98-99
76 57 45 97-98
73 58 44 96-97
Language Arts
School 50
System
State
0
87 70 60 98-99
86 68 58 97-98
82 68 56 96-97
School System State
Social Studies 50
80 64 54 0
98-99
84 64 53 97-98
79 65 53 96-97
Science
School 50
System
State
0
76 66 56 98-99
80 67 55 97-98
75 67 53 96-97
School System State
Sources of Information
Composite Score
50
82 67 57 0
98-99
School 50
System
82 66 56 97-98
79 67 55 96-97
State 0
82 67 56 98-99
84 66 54 97-98
1998-99 GEORGIA PUBLIC EDUCATION REPORT CARD Mabry Middle School - 6330178
Prepared by Georgia Department of Education
80 67 54 96-97
Scores Reported in Percentiles
School System State
Page 2
STATE-REQUIRED TEST DATA
Categories of Scaled Scores
Inadequate (less than 162)
Minimal (162-209)
Good
(210-247)
Very Good (greater than 247)
Average Scaled Score: (Range 100-300)
PERFORMANCE ASSESSMENTS
Grade 8 Writing Assessment
1998-99 Percent Scoring
1997-98 Percent Scoring
1996-97 Percent Scoring
School System State School System State School System State
0% 3% 40% 57%
2% 25% 50% 24%
8% 40% 41% 11%
0% 8% 51% 41%
3% 33% 47% 17%
11% 46% 34%
8%
0% 16% 50% 34%
5% 36% 43% 16%
15% 46% 30%
8%
247
225
208 238
218 202 233
215 198
AWARDS / RECOGNITION DATA
Schools in Georgia may receive recognition in the following programs: Charter School Pay for Performance Program Georgia School of Excellence National Blue Ribbon School Mabry Middle School did not receive recognition in any of these programs during the 1998-99 school year.
1998-99 GEORGIA PUBLIC EDUCATION REPORT CARD Mabry Middle School - 6330178
Prepared by Georgia Department of Education
Page 3
CERTIFIED PERSONNEL DATA
Positions Number Average Contract Days
Personnel Sex
Certificate
Years Experience
Full-time Part-time
Male Female
4 Yr Bachelor's 5 Yr Master's 6 Yr Specialist's 7 Yr Doctoral Other*
<1 1-10 11-20 21-30 >30
Average
Administrators
2.00 235.00
2 0
0 2
0 0 2 0 0 0 0 0 2 0 25.50
Support Personnel
5.08 191.00
5 3
1 7
2 5 1 0 0 0 2 4 2 0 15.13
PK-12 Teachers
65.02 191.00
60 7
6 61
37 27
3 0 0 0 32 27 8 0 11.55
*Includes One- and Two-Year Vocational Certificates.
ACCREDITATION DATA
Accredited by Southern Association of Colleges and Schools (SACS):
Elementary/Middle Commission.
1998-99 GEORGIA PUBLIC EDUCATION REPORT CARD Mabry Middle School - 6330178
Prepared by Georgia Department of Education
Page 4
1998-99 GEORGIA PUBLIC EDUCATION REPORT CARD
COBB COUNTY SCHOOLS
McCleskey Middle School - 6330184
Grade Range 6-8
The Georgia Public Education Report Card is designed to assist systems and schools in educational improvement. This report card contains a variety of data elements. An explanation of the terms is provided as a companion to the report card data. Please refer to the definitions for the most effective use of the reported data.
STUDENT DATA
Total 1,071
6-8 Enrollment, by Race/Ethnicity and Sex
Black
White Hispanic
American Multi-
Asian Indian
racial
80 7.5%
920 85.9%
22 2.1%
31 2.9%
4 0.4%
14 1.3%
Male 535
50.0%
Female 536
50.0%
Enrollment in Selected Programs
Program
Gifted (Grades K-12)
Program % of Student Enrollment Population
203
19.0%
Alternative Programs (Grades 6-12)
0
0.0%
Students Eligible to Receive Free/Reduced Lunches
Number
Percent
School System
84 16,221
7.8% 17.8%
Enrollment in Compensatory Programs
Program
Program % of Student Enrollment Population
Special Education (Grades K-12) (PK)
121 11.3%
0
N/A
English to Speakers of Other Languages (ESOL) (Grades K-12)
0
0.0%
Title I (Grades K-12)
This school has no Title I program.
Dropout Rate for Grades 6-8
Number
Rate
School System
1
0.1%
19
0.1%
Total 4
Retained Students, by Race/Ethnicity and Sex
Black
White Hispanic
American MultiAsian Indian racial
0
4
0.0% 100.0%
0 0.0%
0 0.0%
0 0.0%
0 0.0%
Male Female
3
1
75.0% 25.0%
Prepared by Georgia Department of Education
Page 1
STATE-REQUIRED TEST DATA
NORM-REFERENCED TESTS Grade 8
Iowa Tests of Basic Skills (ITBS) Each chart reflects data for three years of testing.
Reading Comprehension 50
63 61 49 0
98-99
65 61 48 97-98
66 62 48 96-97
Mathematics
School 50
System
State
0
71 66 56 98-99
73 66 55 97-98
73 67 54 96-97
School System State
Reading Vocabulary 50
58 57 46 0
98-99
63 57 45 97-98
65 58 44 96-97
Language Arts
School 50
System
State
0
74 70 60 98-99
75 68 58 97-98
76 68 56 96-97
School System State
Social Studies 50
73 64 54 0
98-99
71 64 53 97-98
74 65 53 96-97
Science
School 50
System
State
0
70 66 56 98-99
74 67 55 97-98
74 67 53 96-97
School System State
Sources of Information
Composite Score
50
71 67 57 0
98-99
School 50
System
70 66 56 97-98
74 67 55 96-97
State 0
72 67 56 98-99
73 66 54 97-98
1998-99 GEORGIA PUBLIC EDUCATION REPORT CARD McCleskey Middle School - 6330184
Prepared by Georgia Department of Education
74 67 54 96-97
Scores Reported in Percentiles
School System State
Page 2
STATE-REQUIRED TEST DATA
Categories of Scaled Scores
Inadequate (less than 162)
Minimal (162-209)
Good
(210-247)
Very Good (greater than 247)
Average Scaled Score: (Range 100-300)
PERFORMANCE ASSESSMENTS
Grade 8 Writing Assessment
1998-99 Percent Scoring
1997-98 Percent Scoring
1996-97 Percent Scoring
School System State School System State School System State
1% 8% 61% 30%
2% 25% 50% 24%
8% 40% 41% 11%
1% 21% 55% 22%
3% 33% 47% 17%
11% 46% 34%
8%
2% 39% 46% 13%
5% 36% 43% 16%
15% 46% 30%
8%
235
225
208 227
218 202 216
215 198
AWARDS / RECOGNITION DATA
Schools in Georgia may receive recognition in the following programs: Charter School Pay for Performance Program Georgia School of Excellence National Blue Ribbon School McCleskey Middle School did not receive recognition in any of these programs during the 1998-99 school year.
1998-99 GEORGIA PUBLIC EDUCATION REPORT CARD McCleskey Middle School - 6330184
Prepared by Georgia Department of Education
Page 3
CERTIFIED PERSONNEL DATA
Positions Number Average Contract Days
Personnel Sex
Certificate
Years Experience
Full-time Part-time
Male Female
4 Yr Bachelor's 5 Yr Master's 6 Yr Specialist's 7 Yr Doctoral Other*
<1 1-10 11-20 21-30 >30
Average
Administrators
3.00 220.33
3 0
2 1
0 1 1 1 0 0 0 2 1 0 18.67
Support Personnel
4.62 191.00
4 3
1 6
1 4 2 0 0 0 1 2 3 1 20.71
PK-12 Teachers
64.36 191.00
61 5
13 53
33 29
3 1 0 0 22 27 16 1 14.95
*Includes One- and Two-Year Vocational Certificates.
ACCREDITATION DATA
Accredited by Southern Association of Colleges and Schools (SACS):
Elementary/Middle Commission.
1998-99 GEORGIA PUBLIC EDUCATION REPORT CARD McCleskey Middle School - 6330184
Prepared by Georgia Department of Education
Page 4
1998-99 GEORGIA PUBLIC EDUCATION REPORT CARD
COBB COUNTY SCHOOLS
McEachern High School - 6331064
Grade Range 9-12
The Georgia Public Education Report Card is designed to assist systems and schools in educational improvement. This report card contains a variety of data elements. An explanation of the terms is provided as a companion to the report card data. Please refer to the definitions for the most effective use of the reported data.
Total 2,826
STUDENT DATA
9-12 Enrollment, by Race/Ethnicity and Sex
Black
White Hispanic
American Multi-
Asian Indian
racial
646 22.9%
2,081 73.6%
46 1.6%
34 1.2%
3 0.1%
16 0.6%
Male Female
1,432 50.7%
1,394 49.3%
Enrollment in Selected Programs
Program
Gifted (Grades K-12)
Program % of Student Enrollment Population
189
6.7%
Non-Vocational Labs (Grades 9-12)
Vocational Labs (Grades 9-12)
Alternative Programs (Grades 6-12)
2,272 1,448
3
80.4% 51.2%
< 1%
Students Eligible to Receive Free/Reduced Lunches
Number
Percent
School System
242 16,221
8.6% 17.8%
Enrollment in Compensatory Programs
Program
Program % of Student Enrollment Population
Special Education (Grades K-12) PK
288 10.2%
0
N/A
English to Speakers of Other Languages (ESOL) (Grades K-12)
6
< 1%
Remedial Education (Grades 2-5, 9-12)
140
5.0%
Title I (Grades K-12)
This school has no Title I program.
Dropout Rate for Grades 9-12
Number
Rate
School System
92 1,055
3.0% 3.7%
Total 39
Retained Students, by Race/Ethnicity and Sex
Black
White Hispanic
American MultiAsian Indian racial
11 28.2%
25 64.1%
2 5.1%
1 2.6%
0 0.0%
0 0.0%
Male Female
21
18
53.8% 46.2%
Prepared by Georgia Department of Education
Page 1
STATE-REQUIRED TEST DATA
GEORGIA HIGH SCHOOL GRADUATION TESTS (GHSGT)
Percent of Regular Program 11th Graders Passing the Georgia High School Graduation Tests on First Administration
English Language Arts Mathematics Social Studies Science
All Components listed above
Writing
1998-99
School System State
99% 93% 87% 83%
98% 94% 90% 85%
96% 88% 80% 72%
80% 82% 68%
97% 97% 93%
1997-98
School System State
97% 93% 85% 85%
98% 95% 89% 88%
94% 88% 78% 74%
79% 84% 68%
96% 96% 92%
1996-97
School System State
96% 91% 86% 87%
97% 94% 89% 89%
94% 87% 78% 74%
79% 84% 67%
96% 97% 93%
GRADUATE DATA
1999 Graduates by Credentials, Race/Ethnicity and Sex
Diplomas with Both College Prep. & Voc. Endorsements
Diplomas with College Prep. Endorsements Diplomas with Vocational Endorsements General High School Diplomas Special Education Diplomas
Total All Diplomas
Certificates of Performance
Total Graduates
Total 51
354 76 1 18
500 22
522
Black
13 25.5%
62 17.5%
17 22.4%
0 0.0%
5 27.8%
97 19.4%
13 59.1%
110 21.1%
American MultiWhite Hispanic Asian Indian racial
36 70.6%
282 79.7%
0 0.0%
5 1.4%
2 3.9%
4 1.1%
0 0.0%
1 0.3%
0 0.0%
0 0.0%
59 77.6%
0 0.0%
13 72.2%
0 0.0%
1 100.0%
0 0.0%
0 0.0%
0 0.0%
0 0.0%
0 0.0%
0 0.0%
0 0.0%
0 0.0%
0 0.0%
0 0.0%
390 78.0%
6 1.2%
6 1.2%
1 0.2%
0 0.0%
8 36.4%
1 4.5%
0 0.0%
0 0.0%
0 0.0%
398 76.2%
7 1.3%
6 1.1%
1 0.2%
0 0.0%
Male Female
18 35.3%
153 43.2%
33 64.7%
201 56.8%
52 68.4%
1 100.0%
14 77.8%
24 31.6%
0 0.0%
4 22.2%
238
262
47.6% 52.4%
10
12
45.5% 54.5%
248
274
47.5% 52.5%
HOPE Scholarships
School System
Number of 1999 Graduates 5 2 2
Number Eligible
364
Percent Eligible
69.7%
5,022 3,850 76.7%
State
65,548 40,292 61.5%
High School Completion Rate
Percent of 1995Grade 9 Enrollment in Graduating Class of1999 School System State
Completion Rate '95-'99 87.9% 83.6% 68.9%
1998-99 GEORGIA PUBLIC EDUCATION REPORT CARD
McEachern High School - 6331064
Prepared by Georgia Department of Education
Page 2
COLLEGE ADMISSIONS / CREDIT TEST DATA
Scholastic Assessment Test (SAT)
Based on students' highest verbal and highest math scores
No. Taking
Average Score
Tests Verbal Math Total
Based on students' last test administration
Average Score Verbal Math Total
School
367
College Prep. Endorsement
Other Diplomas
System
4,180
College Prep. Endorsement
Other Diplomas
Georgia
41,958
506 494 1000
515 506 1021
394 378
772
523 522 1045 532 532 1064
402 387
789
492 488
980
498 N/A N/A
514 N/A N/A
483
486 N/A N/A
513 N/A N/A
479
984 N/A N/A
1027 N/A N/A
962
Nation
952,913 N/A N/A N/A
502 508 1010
American College Testing (ACT)
Advanced Placement Exams (AP)
Number taking tests: 1 0 4 English Mathematics Reading Science Reasoning CompositeScore
School System
19.2 20.2
19.2 21.2
20.7 20.3
21.4 21.1
20.0 21.1
State 19.1 19.9 20.2 19.9 19.9
No. of Students Taking Tests
No. of Tests Taken No. of Test Scores
3 or Higher Percent of Test
Scores 3 or Higher
School 82
145 112
77.2%
System State 1,291 15,225 2,524 23,969 1,885 13,024
74.7% 54.3%
POST-SECONDARY DATA
Graduates Entering Georgia Public Colleges
Graduates Entering Georgia Public Colleges and Requiring Learning Support (LS)
1998 Graduates Entering in 1998-99
1997 Graduates Entering in 1997-98
Percent of Graduating Number Class
School
205
41.6%
System 2,220 46.3%
School
179
41.1%
System 2,229 48.4%
Number Requiring
LS 28 213
32 312
Percent of those attending Georgia
Public Colleges
13.7%
9.6%
17.9%
14.0%
In previous years, the Report Card presented College Prep Curriculum information provided by the Board of Regents on students requiring Learning Support. Due to inconsistencies in the data provided by the Board of Regents in defining College Prep Completers versus Local Board of Education data defining College Prep Endorsements, the Department of Education Report Card will not provide this information until discrepancies can be reconciled.
Graduates Entering Georgia Public Technical and Adult Schools
1998 Graduates School System
Entering Number 36 213
1998-99 Percent
7.3% 4.4%
Entering Number N/A N/A
1997-98 Percent
N/A N/A
1997 Graduates School
3
0.7%
System
22
0.5%
39
9.0%
192
4.2%
1998-99 GEORGIA PUBLIC EDUCATION REPORT CARD McEachern High School - 6331064
Prepared by Georgia Department of Education
Page 3
CERTIFIED PERSONNEL DATA
Positions Number Average Contract Days
Administrators
6.00 216.82
Support Personnel
8.91 191.00
PK-12 Teachers
145.80 191.00
Personnel Sex
Certificate
Years Experience
Full-time Part-time
Male Female
4 Yr Bachelor's 5 Yr Master's 6 Yr Specialist's 7 Yr Doctoral Other*
<1 1-10 11-20 21-30 >30
Average
5 2
5 2
0 1 5 1 0
0 1 2 2 2
21.29
7 39
21 25
26 14
6 0 0
0 18 13 14
1
14.63
104 49
48 105
87 52 10
2 2
0 77 41 32
3
12.35
*Includes One- and Two-Year Vocational Certificates.
ACCREDITATION DATA
Accredited by Southern Association of Colleges and Schools (SACS): Secondary/Middle Commission.
AWARDS / RECOGNITION DATA
Schools in Georgia may receive recognition in the following programs: Charter School Pay for Performance Program Georgia School of Excellence National Blue Ribbon School McEachern High School did not receive recognition in any of these programs during the 1998-99 school year.
1998-99 GEORGIA PUBLIC EDUCATION REPORT CARD McEachern High School - 6331064
Prepared by Georgia Department of Education
Page 4
1998-99 GEORGIA PUBLIC EDUCATION REPORT CARD
COBB COUNTY SCHOOLS
Milford Elementary School - 6333064
Grade Range K-5
The Georgia Public Education Report Card is designed to assist systems and schools in educational improvement. This report card contains a variety of data elements. An explanation of the terms is provided as a companion to the report card data. Please refer to the definitions for the most effective use of the reported data.
STUDENT DATA
Total 480
K-5 Enrollment, by Race/Ethnicity and Sex
Black
White Hispanic
American Multi-
Asian Indian
racial
204 42.5%
144 30.0%
88 18.3%
22 4.6%
3 0.6%
19 4.0%
Male Female
237 49.4%
243 50.6%
Enrollment in Selected Programs
Program
Program % of Student Enrollment Population
Gifted (Grades K-12)
4
< 1%
Alternative Programs (Grades 6-12)
N/A
N/A
Students Eligible to Receive Free/Reduced Lunches
Number
Percent
School System
314 16,221
65.4% 17.8%
Dropout Rate *
Number
Rate
School System
N/A N/A
N/A N/A
* Dropout rates are not applicable for grades PK-5.
Enrollment in Compensatory Programs
Program
Program % of Student Enrollment Population
Special Education (Grades K-12)
50 10.4%
(PK)
0
N/A
English to Speakers of Other Languages (ESOL) (Grades K-12)
65 13.5%
Remedial Education (Grades 2-5, 9-12)
47 14.4%
Special Instructional Assistance (SIA) (Grades K-3)
180 53.9%
Title I (Grades K-12)
This school has a schoolwide program.
Total 6
Retained Students, by Race/Ethnicity and Sex
Black
White Hispanic
American Multi-
Asian Indian
racial
0 0.0%
5 83.3%
1 16.7%
0 0.0%
0 0.0%
0 0.0%
Male Female
5
1
83.3% 16.7%
Prepared by Georgia Department of Education
Page 1
STATE-REQUIRED TEST DATA
NORM-REFERENCED TESTS Grade 3
Iowa Tests of Basic Skills (ITBS) Each chart reflects data for three years of testing.
Reading Comprehension 50
33 63 54 0
98-99
42 62 53 97-98
44 60 52 96-97
Mathematics
School 50
System
State
0
36 70 61 98-99
43 68 61 97-98
46 68 59 96-97
School System State
Reading Vocabulary 50
32 58 50 0
98-99
46 58 50 97-98
40 58 49 96-97
Language Arts
School 50
System
State
0
32 70 64 98-99
55 69 62 97-98
56 67 59 96-97
School System State
Social Studies 50
38 64 56 0
98-99
49 64 55 97-98
47 64 55 96-97
Science
School 50
System
State
0
38 70 59 98-99
53 70 59 97-98
53 69 58 96-97
School System State
Sources of Information
Composite Score
50
37 66 57 0
98-99
School 50
System
46 65 56 97-98
49 64 55 96-97
State 0
35 67 58 98-99
46 67 57 97-98
1998-99 GEORGIA PUBLIC EDUCATION REPORT CARD Milford Elementary School - 6333064
Prepared by Georgia Department of Education
48 66 56 96-97
Scores Reported in Percentiles
School System State
Page 2
STATE-REQUIRED TEST DATA
NORM-REFERENCED TESTS Grade 5
Iowa Tests of Basic Skills (ITBS) Each chart reflects data for three years of testing.
Reading Comprehension
Mathematics
50
46 59 53 0
98-99
50 60 53 97-98
47 60 52 96-97
School 50
System
State
0
56 68 59 98-99
50 68 58 97-98
55 69 57 96-97
School System State
Reading Vocabulary 50
39 57 48 0
98-99
42 58 48 97-98
41 58 46 96-97
Language Arts
School 50
System
State
0
56 71 63 98-99
43 70 61 97-98
53 69 58 96-97
School System State
Social Studies 50
48 64 57 0
98-99
51 64 56 97-98
48 65 55 96-97
Science
School 50
System
State
0
52 68 60 98-99
55 69 59 97-98
57 70 59 96-97
School System State
Sources of Information
Composite Score
50
53 67 58 0
98-99
School 50
System
43 65 58 97-98
49 66 57 96-97
State 0
50 66 57 98-99
46 66 56 97-98
49 67 55 96-97
1998-99 GEORGIA PUBLIC EDUCATION REPORT CARD Milford Elementary School - 6333064
Prepared by Georgia Department of Education
Scores Reported in Percentiles
School System State
Page 3
STATE-REQUIRED TEST DATA
PERFORMANCE ASSESSMENTS
Grade 5 Writing Assessment
Percent at Developmental Stages:
1998-99 School System State
1997-98 School System State
1996-97 School System State
Stage Stage Stage Stage Stage Stage
1:The Emerging Writer 2:The Developing Writer 3:The Focusing Writer 4:The Experimenting 5:The Engaging Writer 6:The Extending Writer
0% 5% 22% 47% 17% 7%
0% 1% 10% 36% 34% 19%
0% 1% 16% 41% 29% 12%
2% 5% 41% 37% 13% 3%
0% 1% 12% 37% 33% 16%
0% 3% 19% 41% 27% 10%
0% 4% 27% 38% 19% 12%
0% 1% 14% 34% 32% 18%
0% 3% 21% 37% 26% 12%
AWARDS / RECOGNITION DATA
Schools in Georgia may receive recognition in the following programs: Charter School Pay for Performance Program Georgia School of Excellence National Blue Ribbon School Milford Elementary School did not receive recognition in any of these programs during the 1998-99 school year.
1998-99 GEORGIA PUBLIC EDUCATION REPORT CARD Milford Elementary School - 6333064
Prepared by Georgia Department of Education
Page 4
CERTIFIED PERSONNEL DATA
Positions Number Average Contract Days
Personnel Sex
Certificate
Years Experience
Full-time Part-time
Male Female
4 Yr Bachelor's 5 Yr Master's 6 Yr Specialist's 7 Yr Doctoral Other*
<1 1-10 11-20 21-30 >30
Average
Administrators
2.00 225.50
2 0
0 2
0 1 1 0 0 0 0 0 2 0 22.50
Support Personnel
3.50 191.00
3 1
0 4
1 1 2 0 0 0 1 1 2 0 15.50
PK-12 Teachers
38.25 191.00
36 5
2 39
22 18
1 0 0 0 22 11 7 1 11.34
*Includes One- and Two-Year Vocational Certificates.
ACCREDITATION DATA
Accredited by Southern Association of Colleges and Schools (SACS):
Elementary/Middle Commission.
1998-99 GEORGIA PUBLIC EDUCATION REPORT CARD Milford Elementary School - 6333064
Prepared by Georgia Department of Education
Page 5
1998-99 GEORGIA PUBLIC EDUCATION REPORT CARD
COBB COUNTY SCHOOLS
Mount Bethel Elementary School - 6330278
Grade Range PK-5
The Georgia Public Education Report Card is designed to assist systems and schools in educational improvement. This report card contains a variety of data elements. An explanation of the terms is provided as a companion to the report card data. Please refer to the definitions for the most effective use of the reported data.
STUDENT DATA
Total
K-5
1,128
PK
3
Enrollment, by Race/Ethnicity and Sex
Black
White Hispanic
American Asian Indian
Multiracial
21 1.9%
1027 91.0%
16 1.4%
41 3.6%
0 0.0%
23 2.0%
0
3
0.0% 100.0%
0 0.0%
0 0.0%
0 0.0%
0 0.0%
Male Female
568 50.4%
560 49.6%
1 33.3%
2 66.7%
Enrollment in Selected Programs
Program
Program % of Student Enrollment Population
Gifted (Grades K-12)
127
11.3%
Alternative Programs (Grades 6-12)
N/A
N/A
Students Eligible to Receive Free/Reduced Lunches
Number
Percent
School System
6 16,221
0.5% 17.8%
Dropout Rate *
Number
Rate
School System
N/A N/A
N/A N/A
* Dropout rates are not applicable for grades PK-5.
Enrollment in Compensatory Programs
Program
Program % of Student Enrollment Population
Special Education (Grades K-12)
94
8.3%
(PK)
5
N/A
English to Speakers of Other Languages (ESOL) (Grades K-12)
4
< 1%
Remedial Education (Grades 2-5, 9-12)
35
4.5%
Special Instructional Assistance (SIA) (Grades K-3)
53
7.2%
Title I (Grades K-12)
This school has no Title I program.
Total 5
Retained Students, by Race/Ethnicity and Sex
Black
White Hispanic
American MultiAsian Indian racial
0 0.0%
4 80.0%
0 0.0%
0 0.0%
0
1
0.0% 20.0%
Male Female
4
1
80.0% 20.0%
Prepared by Georgia Department of Education
Page 1
STATE-REQUIRED TEST DATA
NORM-REFERENCED TESTS Grade 3
Iowa Tests of Basic Skills (ITBS) Each chart reflects data for three years of testing.
Reading Comprehension 50
78 63 54 0
98-99
76 62 53 97-98
74 60 52 96-97
Mathematics
School 50
System
State
0
88 70 61 98-99
88 68 61 97-98
85 68 59 96-97
School System State
Reading Vocabulary 50
76 58 50 0
98-99
76 58 50 97-98
77 58 49 96-97
Language Arts
School 50
System
State
0
88 70 64 98-99
86 69 62 97-98
82 67 59 96-97
School System State
Social Studies 50
77 64 56 0
98-99
77 64 55 97-98
75 64 55 96-97
Science
School 50
System
State
0
83 70 59 98-99
84 70 59 97-98
80 69 58 96-97
School System State
Sources of Information
Composite Score
50
83 66 57 0
98-99
School 50
System
84 65 56 97-98
80 64 55 96-97
State 0
85 67 58 98-99
85 67 57 97-98
1998-99 GEORGIA PUBLIC EDUCATION REPORT CARD Mount Bethel Elementary School - 6330278
Prepared by Georgia Department of Education
81 66 56 96-97
Scores Reported in Percentiles
School System State
Page 2
STATE-REQUIRED TEST DATA
NORM-REFERENCED TESTS Grade 5
Iowa Tests of Basic Skills (ITBS) Each chart reflects data for three years of testing.
Reading Comprehension
Mathematics
50
74 59 53 0
98-99
71 60 53 97-98
77 60 52 96-97
School 50
System
State
0
85 68 59 98-99
85 68 58 97-98
87 69 57 96-97
School System State
Reading Vocabulary 50
77 57 48 0
98-99
71 58 48 97-98
76 58 46 96-97
Language Arts
School 50
System
State
0
85 71 63 98-99
84 70 61 97-98
83 69 58 96-97
School System State
Social Studies 50
80 64 57 0
98-99
79 64 56 97-98
82 65 55 96-97
Science
School 50
System
State
0
82 68 60 98-99
82 69 59 97-98
82 70 59 96-97
School System State
Sources of Information
Composite Score
50
81 67 58 0
98-99
School 50
System
82 65 58 97-98
82 66 57 96-97
State 0
84 66 57 98-99
83 66 56 97-98
85 67 55 96-97
1998-99 GEORGIA PUBLIC EDUCATION REPORT CARD Mount Bethel Elementary School - 6330278
Prepared by Georgia Department of Education
Scores Reported in Percentiles
School System State
Page 3
STATE-REQUIRED TEST DATA
PERFORMANCE ASSESSMENTS
Grade 5 Writing Assessment
Percent at Developmental Stages:
1998-99 School System State
1997-98 School System State
1996-97 School System State
Stage Stage Stage Stage Stage Stage
1:The Emerging Writer 2:The Developing Writer 3:The Focusing Writer 4:The Experimenting 5:The Engaging Writer 6:The Extending Writer
0% 1% 10% 28% 43% 19%
0% 1% 10% 36% 34% 19%
0% 1% 16% 41% 29% 12%
0% 0% 6% 29% 38% 26%
0% 1% 12% 37% 33% 16%
0% 3% 19% 41% 27% 10%
0% 0% 8% 32% 36% 23%
0% 1% 14% 34% 32% 18%
0% 3% 21% 37% 26% 12%
AWARDS / RECOGNITION DATA
Schools that become a Charter School have a unique opportunity to rethink how they structure and deliver education programs for improving the learning of their students while being freed from the state laws, State Board of Education rules and regulations, and local board of education rules and regulations that govern other schools. A 'charter' is a binding contract that, when approved by the faculty and parents of the school, the local board of education and the State Board of Education, substitutes for state education statutes, state and local rules, policies, regulations and standards.
Mount Bethel Elementary School is a Charter School for 1998-99.
1998-99 GEORGIA PUBLIC EDUCATION REPORT CARD Mount Bethel Elementary School - 6330278
Prepared by Georgia Department of Education
Page 4
CERTIFIED PERSONNEL DATA
Positions Number Average Contract Days
Personnel Sex
Certificate
Years Experience
Full-time Part-time
Male Female
4 Yr Bachelor's 5 Yr Master's 6 Yr Specialist's 7 Yr Doctoral Other*
<1 1-10 11-20 21-30 >30
Average
Administrators
3.00 220.33
3 0
0 3
0 1 1 1 0 0 0 1 1 1 23.00
Support Personnel
4.00 191.00
4 0
0 4
0 4 0 0 0 0 3 0 1 0 10.00
PK-12 Teachers
60.75 191.00
59 3
2 60
34 24
4 0 0 0 23 18 19 2 15.06
*Includes One- and Two-Year Vocational Certificates.
ACCREDITATION DATA
Accredited by Southern Association of Colleges and Schools (SACS):
Elementary/Middle Commission.
1998-99 GEORGIA PUBLIC EDUCATION REPORT CARD Mount Bethel Elementary School - 6330278
Prepared by Georgia Department of Education
Page 5
1998-99 GEORGIA PUBLIC EDUCATION REPORT CARD
COBB COUNTY SCHOOLS
Mountain View Elementary School - 6330288
Grade Range PK-5
The Georgia Public Education Report Card is designed to assist systems and schools in educational improvement. This report card contains a variety of data elements. An explanation of the terms is provided as a companion to the report card data. Please refer to the definitions for the most effective use of the reported data.
STUDENT DATA
Total
K-5
734
PK
2
Enrollment, by Race/Ethnicity and Sex
Black
White Hispanic
American Asian Indian
Multiracial
60 8.2%
607 82.7%
14 1.9%
44 6.0%
1 0.1%
8 1.1%
0
2
0.0% 100.0%
0 0.0%
0 0.0%
0 0.0%
0 0.0%
Male 409
55.7% 2
100.0%
Female 325
44.3% 0
0.0%
Enrollment in Selected Programs
Program
Program % of Student Enrollment Population
Gifted (Grades K-12)
32
4.4%
Alternative Programs (Grades 6-12)
N/A
N/A
Students Eligible to Receive Free/Reduced Lunches
Number
Percent
School System
46 16,221
6.3% 17.8%
Dropout Rate *
Number
Rate
School System
N/A N/A
N/A N/A
* Dropout rates are not applicable for grades PK-5.
Enrollment in Compensatory Programs
Program
Program % of Student Enrollment Population
Special Education (Grades K-12)
108 14.7%
(PK)
3
N/A
English to Speakers of Other Languages (ESOL) (Grades K-12)
0
0.0%
Remedial Education (Grades 2-5, 9-12)
35
6.8%
Special Instructional Assistance (SIA) (Grades K-3)
82 16.8%
Title I (Grades K-12)
This school has no Title I program.
Total 1
Retained Students, by Race/Ethnicity and Sex
Black
White Hispanic
American MultiAsian Indian racial
Male Female
0
1
0.0% 100.0%
0 0.0%
0 0.0%
0 0.0%
0
1
0.0% 100.0%
0 0.0%
Prepared by Georgia Department of Education
Page 1
STATE-REQUIRED TEST DATA
NORM-REFERENCED TESTS Grade 3
Iowa Tests of Basic Skills (ITBS) Each chart reflects data for three years of testing.
Reading Comprehension 50
72 63 54 0
98-99
75 62 53 97-98
68 60 52 96-97
Mathematics
School 50
System
State
0
79 70 61 98-99
87 68 61 97-98
87 68 59 96-97
School System State
Reading Vocabulary 50
66 58 50 0
98-99
73 58 50 97-98
69 58 49 96-97
Language Arts
School 50
System
State
0
76 70 64 98-99
85 69 62 97-98
76 67 59 96-97
School System State
Social Studies 50
72 64 56 0
98-99
79 64 55 97-98
72 64 55 96-97
Science
School 50
System
State
0
78 70 59 98-99
84 70 59 97-98
76 69 58 96-97
School System State
Sources of Information
Composite Score
50
75 66 57 0
98-99
School 50
System
83 65 56 97-98
78 64 55 96-97
State 0
76 67 58 98-99
84 67 57 97-98
1998-99 GEORGIA PUBLIC EDUCATION REPORT CARD Mountain View Elementary School - 6330288
Prepared by Georgia Department of Education
77 66 56 96-97
Scores Reported in Percentiles
School System State
Page 2
STATE-REQUIRED TEST DATA
NORM-REFERENCED TESTS Grade 5
Iowa Tests of Basic Skills (ITBS) Each chart reflects data for three years of testing.
Reading Comprehension
Mathematics
50
65 59 53 0
98-99
66 60 53 97-98
64 60 52 96-97
School 50
System
State
0
82 68 59 98-99
81 68 58 97-98
76 69 57 96-97
School System State
Reading Vocabulary 50
69 57 48 0
98-99
67 58 48 97-98
67 58 46 96-97
Language Arts
School 50
System
State
0
75 71 63 98-99
79 70 61 97-98
67 69 58 96-97
School System State
Social Studies 50
73 64 57 0
98-99
73 64 56 97-98
69 65 55 96-97
Science
School 50
System
State
0
76 68 60 98-99
78 69 59 97-98
73 70 59 96-97
School System State
Sources of Information
Composite Score
50
74 67 58 0
98-99
School 50
System
75 65 58 97-98
70 66 57 96-97
State 0
75 66 57 98-99
77 66 56 97-98
71 67 55 96-97
1998-99 GEORGIA PUBLIC EDUCATION REPORT CARD Mountain View Elementary School - 6330288
Prepared by Georgia Department of Education
Scores Reported in Percentiles
School System State
Page 3
STATE-REQUIRED TEST DATA
PERFORMANCE ASSESSMENTS
Grade 5 Writing Assessment
Percent at Developmental Stages:
1998-99 School System State
1997-98 School System State
1996-97 School System State
Stage Stage Stage Stage Stage Stage
1:The Emerging Writer 2:The Developing Writer 3:The Focusing Writer 4:The Experimenting 5:The Engaging Writer 6:The Extending Writer
0% 0% 8% 22% 41% 29%
0% 1% 10% 36% 34% 19%
0% 1% 16% 41% 29% 12%
0% 0% 4% 37% 43% 16%
0% 1% 12% 37% 33% 16%
0% 3% 19% 41% 27% 10%
0% 0% 11% 43% 33% 13%
0% 1% 14% 34% 32% 18%
0% 3% 21% 37% 26% 12%
AWARDS / RECOGNITION DATA
Schools in Georgia may receive recognition in the following programs: Charter School Pay for Performance Program Georgia School of Excellence National Blue Ribbon School Mountain View Elementary School did not receive recognition in any of these programs during the 1998-99 school year.
1998-99 GEORGIA PUBLIC EDUCATION REPORT CARD Mountain View Elementary School - 6330288
Prepared by Georgia Department of Education
Page 4
CERTIFIED PERSONNEL DATA
Positions Number Average Contract Days
Personnel Sex
Certificate
Years Experience
Full-time Part-time
Male Female
4 Yr Bachelor's 5 Yr Master's 6 Yr Specialist's 7 Yr Doctoral Other*
<1 1-10 11-20 21-30 >30
Average
Administrators
2.00 225.50
2 0
1 1
0 1 1 0 0 0 0 1 0 1 27.50
Support Personnel
6.68 191.00
6 2
0 8
2 5 1 0 0 0 3 4 1 0 13.13
PK-12 Teachers
44.42 191.00
42 4
2 44
24 19
3 0 0 0 19 19 7 1 13.00
*Includes One- and Two-Year Vocational Certificates.
ACCREDITATION DATA
Accredited by Southern Association of Colleges and Schools (SACS):
Elementary/Middle Commission.
1998-99 GEORGIA PUBLIC EDUCATION REPORT CARD Mountain View Elementary School - 6330288
Prepared by Georgia Department of Education
Page 5
1998-99 GEORGIA PUBLIC EDUCATION REPORT CARD
COBB COUNTY SCHOOLS
Murdock Elementary School - 6330375
Grade Range PK-5
The Georgia Public Education Report Card is designed to assist systems and schools in educational improvement. This report card contains a variety of data elements. An explanation of the terms is provided as a companion to the report card data. Please refer to the definitions for the most effective use of the reported data.
STUDENT DATA
Total
K-5
791
PK
17
Enrollment, by Race/Ethnicity and Sex
Black
White Hispanic
American Asian Indian
Multiracial
44 5.6%
664 83.9%
16 2.0%
48 6.1%
3 0.4%
16 2.0%
0
17
0.0% 100.0%
0 0.0%
0 0.0%
0 0.0%
0 0.0%
Male Female
404 51.1%
387 48.9%
13 76.5%
4 23.5%
Enrollment in Selected Programs
Program
Program % of Student Enrollment Population
Gifted (Grades K-12)
61
7.7%
Alternative Programs (Grades 6-12)
N/A
N/A
Students Eligible to Receive Free/Reduced Lunches
Number
Percent
School System
28 16,221
3.5% 17.8%
Dropout Rate *
Number
Rate
School System
N/A N/A
N/A N/A
* Dropout rates are not applicable for grades PK-5.
Enrollment in Compensatory Programs
Program
Program % of Student Enrollment Population
Special Education (Grades K-12)
102 12.9%
(PK)
18
N/A
English to Speakers of Other Languages (ESOL) (Grades K-12)
5
< 1%
Remedial Education (Grades 2-5, 9-12)
58 10.4%
Special Instructional Assistance (SIA) (Grades K-3)
72 13.6%
Title I (Grades K-12)
This school has no Title I program.
Total 1
Retained Students, by Race/Ethnicity and Sex
Black
White Hispanic
American MultiAsian Indian racial
0
1
0.0% 100.0%
0 0.0%
0 0.0%
0 0.0%
0 0.0%
Male Female
0
1
0.0% 100.0%
Prepared by Georgia Department of Education
Page 1
STATE-REQUIRED TEST DATA
NORM-REFERENCED TESTS Grade 3
Iowa Tests of Basic Skills (ITBS) Each chart reflects data for three years of testing.
Reading Comprehension 50
82 63 54 0
98-99
77 62 53 97-98
79 60 52 96-97
Mathematics
School 50
System
State
0
89 70 61 98-99
88 68 61 97-98
89 68 59 96-97
School System State
Reading Vocabulary 50
77 58 50 0
98-99
78 58 50 97-98
83 58 49 96-97
Language Arts
School 50
System
State
0
84 70 64 98-99
85 69 62 97-98
87 67 59 96-97
School System State
Social Studies 50
85 64 56 0
98-99
79 64 55 97-98
82 64 55 96-97
Science
School 50
System
State
0
85 70 59 98-99
84 70 59 97-98
85 69 58 96-97
School System State
Sources of Information
Composite Score
50
85 66 57 0
98-99
School 50
System
85 65 56 97-98
85 64 55 96-97
State 0
87 67 58 98-99
85 67 57 97-98
1998-99 GEORGIA PUBLIC EDUCATION REPORT CARD Murdock Elementary School - 6330375
Prepared by Georgia Department of Education
87 66 56 96-97
Scores Reported in Percentiles
School System State
Page 2
STATE-REQUIRED TEST DATA
NORM-REFERENCED TESTS Grade 5
Iowa Tests of Basic Skills (ITBS) Each chart reflects data for three years of testing.
Reading Comprehension
Mathematics
50
77 59 53 0
98-99
75 60 53 97-98
71 60 52 96-97
School 50
System
State
0
84 68 59 98-99
85 68 58 97-98
82 69 57 96-97
School System State
Reading Vocabulary 50
80 57 48 0
98-99
75 58 48 97-98
71 58 46 96-97
Language Arts
School 50
System
State
0
88 71 63 98-99
83 70 61 97-98
80 69 58 96-97
School System State
Social Studies 50
83 64 57 0
98-99
81 64 56 97-98
78 65 55 96-97
Science
School 50
System
State
0
85 68 60 98-99
82 69 59 97-98
80 70 59 96-97
School System State
Sources of Information
Composite Score
50
84 67 58 0
98-99
School 50
System
82 65 58 97-98
78 66 57 96-97
State 0
88 66 57 98-99
85 66 56 97-98
80 67 55 96-97
1998-99 GEORGIA PUBLIC EDUCATION REPORT CARD Murdock Elementary School - 6330375
Prepared by Georgia Department of Education
Scores Reported in Percentiles
School System State
Page 3
STATE-REQUIRED TEST DATA
PERFORMANCE ASSESSMENTS
Grade 5 Writing Assessment
Percent at Developmental Stages:
1998-99 School System State
1997-98 School System State
1996-97 School System State
Stage Stage Stage Stage Stage Stage
1:The Emerging Writer 2:The Developing Writer 3:The Focusing Writer 4:The Experimenting 5:The Engaging Writer 6:The Extending Writer
0% 0% 5% 20% 41% 35%
0% 1% 10% 36% 34% 19%
0% 1% 16% 41% 29% 12%
0% 0% 8% 36% 34% 21%
0% 1% 12% 37% 33% 16%
0% 3% 19% 41% 27% 10%
0% 0% 6% 35% 36% 24%
0% 1% 14% 34% 32% 18%
0% 3% 21% 37% 26% 12%
AWARDS / RECOGNITION DATA
Schools in Georgia may receive recognition in the following programs: Charter School Pay for Performance Program Georgia School of Excellence National Blue Ribbon School Murdock Elementary School did not receive recognition in any of these programs during the 1998-99 school year.
1998-99 GEORGIA PUBLIC EDUCATION REPORT CARD Murdock Elementary School - 6330375
Prepared by Georgia Department of Education
Page 4
CERTIFIED PERSONNEL DATA
Positions Number Average Contract Days
Personnel Sex
Certificate
Years Experience
Full-time Part-time
Male Female
4 Yr Bachelor's 5 Yr Master's 6 Yr Specialist's 7 Yr Doctoral Other*
<1 1-10 11-20 21-30 >30
Average
Administrators
2.00 235.00
2 0
0 2
0 0 2 0 0 0 0 0 1 1 26.00
Support Personnel
2.50 191.00
2 1
0 3
0 1 2 0 0 0 1 0 2 0 20.67
PK-12 Teachers
53.25 191.00
51 4
1 54
26 29
0 0 0 0 16 21 14 4 16.64
*Includes One- and Two-Year Vocational Certificates.
ACCREDITATION DATA
Accredited by Southern Association of Colleges and Schools (SACS):
Elementary/Middle Commission.
1998-99 GEORGIA PUBLIC EDUCATION REPORT CARD Murdock Elementary School - 6330375
Prepared by Georgia Department of Education
Page 5
1998-99 GEORGIA PUBLIC EDUCATION REPORT CARD
COBB COUNTY SCHOOLS
Nicholson Elementary School - 6330391
Grade Range PK-5
The Georgia Public Education Report Card is designed to assist systems and schools in educational improvement. This report card contains a variety of data elements. An explanation of the terms is provided as a companion to the report card data. Please refer to the definitions for the most effective use of the reported data.
STUDENT DATA
Total
K-5
646
PK
1
Enrollment, by Race/Ethnicity and Sex
Black
White Hispanic
American Asian Indian
Multiracial
54 8.4%
533 82.5%
26 4.0%
17 2.6%
1 0.2%
15 2.3%
0
1
0.0% 100.0%
0 0.0%
0 0.0%
0 0.0%
0 0.0%
Male Female
342 52.9%
304 47.1%
0
1
0.0% 100.0%
Enrollment in Selected Programs
Program
Program % of Student Enrollment Population
Gifted (Grades K-12)
31
4.8%
Alternative Programs (Grades 6-12)
N/A
N/A
Students Eligible to Receive Free/Reduced Lunches
Number
Percent
School System
70 16,221
10.8% 17.8%
Dropout Rate *
Number
Rate
School System
N/A N/A
N/A N/A
* Dropout rates are not applicable for grades PK-5.
Enrollment in Compensatory Programs
Program
Program % of Student Enrollment Population
Special Education (Grades K-12)
77 11.9%
(PK)
1
N/A
English to Speakers of Other Languages (ESOL) (Grades K-12)
0
0.0%
Remedial Education (Grades 2-5, 9-12)
55 12.8%
Special Instructional Assistance (SIA) (Grades K-3)
106 24.8%
Title I (Grades K-12)
This school has no Title I program.
Total 15
Retained Students, by Race/Ethnicity and Sex
Black
White Hispanic
American MultiAsian Indian racial
0 0.0%
13 86.7%
1 6.7%
1 6.7%
0 0.0%
0 0.0%
Male Female
9
6
60.0% 40.0%
Prepared by Georgia Department of Education
Page 1
STATE-REQUIRED TEST DATA
NORM-REFERENCED TESTS Grade 3
Iowa Tests of Basic Skills (ITBS) Each chart reflects data for three years of testing.
Reading Comprehension 50
69 63 54 0
98-99
67 62 53 97-98
67 60 52 96-97
Mathematics
School 50
System
State
0
80 70 61 98-99
75 68 61 97-98
82 68 59 96-97
School System State
Reading Vocabulary 50
67 58 50 0
98-99
67 58 50 97-98
63 58 49 96-97
Language Arts
School 50
System
State
0
84 70 64 98-99
78 69 62 97-98
78 67 59 96-97
School System State
Social Studies 50
73 64 56 0
98-99
79 64 55 97-98
79 64 55 96-97
Science
School 50
System
State
0
80 70 59 98-99
80 70 59 97-98
77 69 58 96-97
School System State
Sources of Information
Composite Score
50
80 66 57 0
98-99
School 50
System
77 65 56 97-98
77 64 55 96-97
State 0
79 67 58 98-99
77 67 57 97-98
1998-99 GEORGIA PUBLIC EDUCATION REPORT CARD Nicholson Elementary School - 6330391
Prepared by Georgia Department of Education
77 66 56 96-97
Scores Reported in Percentiles
School System State
Page 2
STATE-REQUIRED TEST DATA
NORM-REFERENCED TESTS Grade 5
Iowa Tests of Basic Skills (ITBS) Each chart reflects data for three years of testing.
Reading Comprehension
Mathematics
50
65 59 53 0
98-99
65 60 53 97-98
67 60 52 96-97
School 50
System
State
0
75 68 59 98-99
76 68 58 97-98
75 69 57 96-97
School System State
Reading Vocabulary 50
64 57 48 0
98-99
67 58 48 97-98
63 58 46 96-97
Language Arts
School 50
System
State
0
78 71 63 98-99
80 70 61 97-98
73 69 58 96-97
School System State
Social Studies 50
74 64 57 0
98-99
69 64 56 97-98
69 65 55 96-97
Science
School 50
System
State
0
77 68 60 98-99
78 69 59 97-98
74 70 59 96-97
School System State
Sources of Information
Composite Score
50
75 67 58 0
98-99
School 50
System
76 65 58 97-98
71 66 57 96-97
State 0
75 66 57 98-99
76 66 56 97-98
72 67 55 96-97
1998-99 GEORGIA PUBLIC EDUCATION REPORT CARD Nicholson Elementary School - 6330391
Prepared by Georgia Department of Education
Scores Reported in Percentiles
School System State
Page 3
STATE-REQUIRED TEST DATA
PERFORMANCE ASSESSMENTS
Grade 5 Writing Assessment
Percent at Developmental Stages:
1998-99 School System State
1997-98 School System State
1996-97 School System State
Stage Stage Stage Stage Stage Stage
1:The Emerging Writer 2:The Developing Writer 3:The Focusing Writer 4:The Experimenting 5:The Engaging Writer 6:The Extending Writer
0% 0% 7% 33% 37% 19%
0% 1% 10% 36% 34% 19%
0% 1% 16% 41% 29% 12%
0% 1% 16% 38% 35% 9%
0% 1% 12% 37% 33% 16%
0% 3% 19% 41% 27% 10%
0% 0% 7% 29% 42% 22%
0% 1% 14% 34% 32% 18%
0% 3% 21% 37% 26% 12%
AWARDS / RECOGNITION DATA
Schools in Georgia may receive recognition in the following programs: Charter School Pay for Performance Program Georgia School of Excellence National Blue Ribbon School Nicholson Elementary School did not receive recognition in any of these programs during the 1998-99 school year.
1998-99 GEORGIA PUBLIC EDUCATION REPORT CARD Nicholson Elementary School - 6330391
Prepared by Georgia Department of Education
Page 4
CERTIFIED PERSONNEL DATA
Positions Number Average Contract Days
Personnel Sex
Certificate
Years Experience
Full-time Part-time
Male Female
4 Yr Bachelor's 5 Yr Master's 6 Yr Specialist's 7 Yr Doctoral Other*
<1 1-10 11-20 21-30 >30
Average
Administrators
2.00 225.50
2 0
0 2
0 0 2 0 0 0 0 0 2 0 22.00
Support Personnel
3.00 191.00
3 0
0 3
0 3 0 0 0 0 3 0 0 0 7.33
PK-12 Teachers
41.00 191.00
40 2
1 41
25 15
2 0 0 0 15 16 10 1 14.81
*Includes One- and Two-Year Vocational Certificates.
ACCREDITATION DATA
Accredited by Southern Association of Colleges and Schools (SACS):
Elementary/Middle Commission.
1998-99 GEORGIA PUBLIC EDUCATION REPORT CARD Nicholson Elementary School - 6330391
Prepared by Georgia Department of Education
Page 5
1998-99 GEORGIA PUBLIC EDUCATION REPORT CARD
COBB COUNTY SCHOOLS
Nickajack Elementary School - 6330199
Grade Range PK-5
The Georgia Public Education Report Card is designed to assist systems and schools in educational improvement. This report card contains a variety of data elements. An explanation of the terms is provided as a companion to the report card data. Please refer to the definitions for the most effective use of the reported data.
STUDENT DATA
Total
K-5
432
PK
5
Enrollment, by Race/Ethnicity and Sex
Black
White Hispanic
American Asian Indian
Multiracial
223 51.6%
161 37.3%
13 3.0%
7 1.6%
7 1.6%
21 4.9%
3 60.0%
2 40.0%
0 0.0%
0 0.0%
0 0.0%
0 0.0%
Male 229
53.0% 5
100.0%
Female 203
47.0% 0
0.0%
Enrollment in Selected Programs
Program
Program % of Student Enrollment Population
Gifted (Grades K-12)
8
1.9%
Alternative Programs (Grades 6-12)
N/A
N/A
Students Eligible to Receive Free/Reduced Lunches
Number
Percent
School System
147 16,221
33.6% 17.8%
Dropout Rate *
Number
Rate
School System
N/A N/A
N/A N/A
* Dropout rates are not applicable for grades PK-5.
Enrollment in Compensatory Programs
Program
Program % of Student Enrollment Population
Special Education (Grades K-12)
43 10.0%
(PK)
5
N/A
English to Speakers of Other Languages (ESOL) (Grades K-12)
0
0.0%
Remedial Education (Grades 2-5, 9-12)
62 23.5%
Special Instructional Assistance (SIA) (Grades K-3)
57 19.0%
Title I (Grades K-12)
This school has no Title I program.
Total 2
Retained Students, by Race/Ethnicity and Sex
Black
White Hispanic
American MultiAsian Indian racial
Male Female
1 50.0%
0
1
0.0% 50.0%
0 0.0%
0 0.0%
0
2
0.0% 100.0%
0 0.0%
Prepared by Georgia Department of Education
Page 1
STATE-REQUIRED TEST DATA
NORM-REFERENCED TESTS Grade 3
Iowa Tests of Basic Skills (ITBS) Each chart reflects data for three years of testing.
Reading Comprehension 50
54 63 54 N/A 62 53 N/A 60 52
0
98-99
97-98
96-97
Mathematics
School 50
System
State
0
59 70 61 N/A 68 61 N/A 68 59
98-99
97-98
96-97
School System State
Reading Vocabulary 50
46 58 50 N/A 58 50 N/A 58 49
0
98-99
97-98
96-97
Language Arts
School 50
System
State
0
46 70 64 N/A 69 62 N/A 67 59
98-99
97-98
96-97
School System State
Social Studies 50
59 64 56 N/A 64 55 N/A 64 55
0
98-99
97-98
96-97
Science
School 50
System
State
0
57 70 59 N/A 70 59 N/A 69 58
98-99
97-98
96-97
School System State
Sources of Information
Composite Score
School
50
50
System
50 66 57 N/A 65 56 N/A 64 55
0
98-99
97-98
96-97
State 0
52 67 58 N/A 67 57 N/A 66 56
98-99
97-98
96-97
1998-99 GEORGIA PUBLIC EDUCATION REPORT CARD Nickajack Elementary School - 6330199
Prepared by Georgia Department of Education
Scores Reported in Percentiles
School System State
Page 2
STATE-REQUIRED TEST DATA
NORM-REFERENCED TESTS Grade 5
Iowa Tests of Basic Skills (ITBS) Each chart reflects data for three years of testing.
Reading Comprehension
Mathematics
50
46 59 53 N/A 60 53 N/A 60 52
0
98-99
97-98
96-97
School 50
System
State
0
49 68 59 N/A 68 58 N/A 69 57
98-99
97-98
96-97
School System State
Reading Vocabulary 50
41 57 48 N/A 58 48 N/A 58 46 0
98-99
97-98
96-97
Language Arts
School 50
System
State
0
46 71 63 N/A 70 61 N/A 69 58
98-99
97-98
96-97
School System State
Social Studies 50
48 64 57 N/A 64 56 N/A 65 55
0
98-99
97-98
96-97
Science
School 50
System
State
0
54 68 60 N/A 69 59 N/A 70 59
98-99
97-98
96-97
School System State
Sources of Information
Composite Score
School
50
50
System
45 67 58 N/A 65 58 N/A 66 57 0
98-99
97-98
96-97
State 0
46 66 57 N/A 66 56 N/A 67 55
98-99
97-98
96-97
1998-99 GEORGIA PUBLIC EDUCATION REPORT CARD Nickajack Elementary School - 6330199
Prepared by Georgia Department of Education
Scores Reported in Percentiles
School System State
Page 3
STATE-REQUIRED TEST DATA
PERFORMANCE ASSESSMENTS
Grade 5 Writing Assessment
Percent at Developmental Stages:
1998-99 School System State
1997-98 School System State
1996-97 School System State
Stage Stage Stage Stage Stage Stage
1:The Emerging Writer 2:The Developing Writer 3:The Focusing Writer 4:The Experimenting 5:The Engaging Writer 6:The Extending Writer
0% 2% 19% 46% 24% 9%
0% 1% 10% 36% 34% 19%
0% 1% 16% 41% 29% 12%
N/A N/A N/A N/A N/A N/A
0% 1% 12% 37% 33% 16%
0% 3% 19% 41% 27% 10%
N/A N/A N/A N/A N/A N/A
0% 1% 14% 34% 32% 18%
0% 3% 21% 37% 26% 12%
AWARDS / RECOGNITION DATA
Schools in Georgia may receive recognition in the following programs: Charter School Pay for Performance Program Georgia School of Excellence National Blue Ribbon School Nickajack Elementary School did not receive recognition in any of these programs during the 1998-99 school year.
1998-99 GEORGIA PUBLIC EDUCATION REPORT CARD Nickajack Elementary School - 6330199
Prepared by Georgia Department of Education
Page 4
CERTIFIED PERSONNEL DATA
Positions Number Average Contract Days
Personnel Sex
Certificate
Years Experience
Full-time Part-time
Male Female
4 Yr Bachelor's 5 Yr Master's 6 Yr Specialist's 7 Yr Doctoral Other*
<1 1-10 11-20 21-30 >30
Average
Administrators
1.51 236.79
1 1
0 2
0 1 1 0 0 0 0 0 2 0 25.50
Support Personnel
5.00 191.00
5 0
0 5
0 5 0 0 0 0 1 1 3 0 20.00
PK-12 Teachers
30.99 191.00
30 2
1 31
17 12
3 0 0 0 14 11 5 2 14.06
*Includes One- and Two-Year Vocational Certificates.
ACCREDITATION DATA
Accredited by Southern Association of Colleges and Schools (SACS):
Elementary/Middle Commission.
1998-99 GEORGIA PUBLIC EDUCATION REPORT CARD Nickajack Elementary School - 6330199
Prepared by Georgia Department of Education
Page 5
1998-99 GEORGIA PUBLIC EDUCATION REPORT CARD
COBB COUNTY SCHOOLS
North Cobb High School - 6332056
Grade Range 9-12
The Georgia Public Education Report Card is designed to assist systems and schools in educational improvement. This report card contains a variety of data elements. An explanation of the terms is provided as a companion to the report card data. Please refer to the definitions for the most effective use of the reported data.
Total 2,446
STUDENT DATA
9-12 Enrollment, by Race/Ethnicity and Sex
Black
White Hispanic
American Multi-
Asian Indian
racial
249 10.2%
1,998 81.7%
67 2.7%
108 4.4%
7 0.3%
17 0.7%
Male Female
1,277 52.2%
1,169 47.8%
Enrollment in Selected Programs
Program
Gifted (Grades K-12)
Program % of Student Enrollment Population
106
4.3%
Non-Vocational Labs (Grades 9-12)
Vocational Labs (Grades 9-12)
Alternative Programs (Grades 6-12)
1,503 1,075
6
61.4% 43.9%
< 1%
Students Eligible to Receive Free/Reduced Lunches
Number
Percent
School System
143 16,221
5.8% 17.8%
Enrollment in Compensatory Programs
Program
Program % of Student Enrollment Population
Special Education (Grades K-12) PK
209
8.5%
0
N/A
English to Speakers of Other Languages (ESOL) (Grades K-12)
25
1.0%
Remedial Education (Grades 2-5, 9-12)
72
2.9%
Title I (Grades K-12)
This school has no Title I program.
Dropout Rate for Grades 9-12
Number
Rate
School System
66 1,055
2.5% 3.7%
Total 163
Retained Students, by Race/Ethnicity and Sex
Black
White Hispanic
American MultiAsian Indian racial
25 15.3%
125 76.7%
8 4.9%
5 3.1%
0 0.0%
0 0.0%
Male Female
112
51
68.7% 31.3%
Prepared by Georgia Department of Education
Page 1
STATE-REQUIRED TEST DATA
GEORGIA HIGH SCHOOL GRADUATION TESTS (GHSGT)
Percent of Regular Program 11th Graders Passing the Georgia High School Graduation Tests on First Administration
English Language Arts Mathematics Social Studies Science
All Components listed above
Writing
1998-99
School System State
98% 93% 85% 84%
98% 94% 90% 85%
96% 88% 80% 72%
78% 82% 68%
97% 97% 93%
1997-98
School System State
99% 97% 93% 92%
98% 95% 89% 88%
94% 88% 78% 74%
90% 84% 68%
98% 96% 92%
1996-97
School System State
98% 95% 89% 85%
97% 94% 89% 89%
94% 87% 78% 74%
80% 84% 67%
97% 97% 93%
GRADUATE DATA
1999 Graduates by Credentials, Race/Ethnicity and Sex
Diplomas with Both College Prep. & Voc. Endorsements
Diplomas with College Prep. Endorsements Diplomas with Vocational Endorsements General High School Diplomas Special Education Diplomas
Total All Diplomas
Certificates of Performance
Total Graduates
Total 17
340 37 1 6
401 7
408
Black
1 5.9%
38 11.2%
2 5.4%
0 0.0%
0 0.0%
41 10.2%
1 14.3%
42 10.3%
American MultiWhite Hispanic Asian Indian racial
16 94.1%
267 78.5%
0 0.0%
10 2.9%
0 0.0%
20 5.9%
0 0.0%
3 0.9%
0 0.0%
2 0.6%
34 91.9%
1 100.0%
6 100.0%
0 0.0%
0 0.0%
0 0.0%
0 0.0%
0 0.0%
0 0.0%
0 0.0%
0 0.0%
0 0.0%
1 2.7%
0 0.0%
0 0.0%
324 80.8%
10 2.5%
20 5.0%
3 0.7%
3 0.7%
5 71.4%
0 0.0%
0 0.0%
0
1
0.0% 14.3%
329 80.6%
10 2.5%
20 4.9%
3 0.7%
4 1.0%
Male Female
12 70.6%
161 47.4%
5 29.4%
179 52.6%
25 67.6%
1 100.0%
3 50.0%
12 32.4%
0 0.0%
3 50.0%
202
199
50.4% 49.6%
3
4
42.9% 57.1%
205
203
50.2% 49.8%
HOPE Scholarships
School System
Number of 1999 Graduates 4 0 8
Number Eligible
314
Percent Eligible
77.0%
5,022 3,850 76.7%
State
65,548 40,292 61.5%
High School Completion Rate
Percent of 1995Grade 9 Enrollment in Graduating Class of1999 School System State
Completion Rate '95-'99 90.3% 83.6% 68.9%
1998-99 GEORGIA PUBLIC EDUCATION REPORT CARD
North Cobb High School - 6332056
Prepared by Georgia Department of Education
Page 2
COLLEGE ADMISSIONS / CREDIT TEST DATA
Scholastic Assessment Test (SAT)
Based on students' highest verbal and highest math scores
No. Taking
Average Score
Tests Verbal Math Total
Based on students' last test administration
Average Score Verbal Math Total
School
359
College Prep. Endorsement
Other Diplomas
System
4,180
College Prep. Endorsement
Other Diplomas
Georgia
41,958
508 506 1014
516 515 1031
404 375
779
523 522 1045 532 532 1064
402 387
789
492 488
980
503 N/A N/A
514 N/A N/A
483
499 N/A N/A
513 N/A N/A
479
1002 N/A N/A
1027 N/A N/A
962
Nation
952,913 N/A N/A N/A
502 508 1010
American College Testing (ACT)
Advanced Placement Exams (AP)
Number taking tests: English Mathematics Reading Science Reasoning CompositeScore
7 0 School System State
20.6 20.2 19.1
20.5 21.2 19.9
21.1 20.8
21.4 21.1
20.2 19.9
20.9 21.1 19.9
No. of Students Taking Tests
No. of Tests Taken No. of Test Scores
3 or Higher Percent of Test
Scores 3 or Higher
School 84
135 118
87.4%
System State 1,291 15,225 2,524 23,969 1,885 13,024
74.7% 54.3%
POST-SECONDARY DATA
Graduates Entering Georgia Public Colleges
Graduates Entering Georgia Public Colleges and Requiring Learning Support (LS)
1998 Graduates Entering in 1998-99
1997 Graduates Entering in 1997-98
Percent of Graduating Number Class
School
173
45.4%
System 2,220 46.3%
School
192
60.8%
System 2,229 48.4%
Number Requiring
LS 23 213
30 312
Percent of those attending Georgia
Public Colleges
13.3%
9.6%
15.6%
14.0%
In previous years, the Report Card presented College Prep Curriculum information provided by the Board of Regents on students requiring Learning Support. Due to inconsistencies in the data provided by the Board of Regents in defining College Prep Completers versus Local Board of Education data defining College Prep Endorsements, the Department of Education Report Card will not provide this information until discrepancies can be reconciled.
Graduates Entering Georgia Public Technical and Adult Schools
1998 Graduates School System
Entering Number 24 213
1998-99 Percent
6.3% 4.4%
Entering Number N/A N/A
1997-98 Percent
N/A N/A
1997 Graduates School
0
0.0%
System
22
0.5%
6
1.9%
192
4.2%
1998-99 GEORGIA PUBLIC EDUCATION REPORT CARD North Cobb High School - 6332056
Prepared by Georgia Department of Education
Page 3
CERTIFIED PERSONNEL DATA
Positions Number Average Contract Days
Administrators
5.02 216.12
Support Personnel
10.12 191.00
PK-12 Teachers
124.86 191.00
Personnel Sex
Certificate
Years Experience
Full-time Part-time
Male Female
4 Yr Bachelor's 5 Yr Master's 6 Yr Specialist's 7 Yr Doctoral Other*
<1 1-10 11-20 21-30 >30
Average
5 1
3 3
0 3 3 0 0
0 0 2 4 0
21.83
8 32
22 18
17 19
4 0 0
0 15 11 10
4
15.60
94 34
37 91
64 53
8 3 0
0 58 42 25
3
12.96
*Includes One- and Two-Year Vocational Certificates.
ACCREDITATION DATA
Accredited by Southern Association of Colleges and Schools (SACS): Secondary/Middle Commission.
AWARDS / RECOGNITION DATA
Schools in Georgia may receive recognition in the following programs: Charter School Pay for Performance Program Georgia School of Excellence National Blue Ribbon School North Cobb High School did not receive recognition in any of these programs during the 1998-99 school year.
1998-99 GEORGIA PUBLIC EDUCATION REPORT CARD North Cobb High School - 6332056
Prepared by Georgia Department of Education
Page 4
1998-99 GEORGIA PUBLIC EDUCATION REPORT CARD
COBB COUNTY SCHOOLS
Norton Park Elementary School - 6331066
Grade Range PK-5
The Georgia Public Education Report Card is designed to assist systems and schools in educational improvement. This report card contains a variety of data elements. An explanation of the terms is provided as a companion to the report card data. Please refer to the definitions for the most effective use of the reported data.
STUDENT DATA
Total
K-5
648
PK
11
Enrollment, by Race/Ethnicity and Sex
Black
White Hispanic
American Asian Indian
Multiracial
369 56.9%
137 21.1%
90 13.9%
18 2.8%
0 0.0%
34 5.2%
6 54.5%
4 36.4%
1 9.1%
0 0.0%
0 0.0%
0 0.0%
Male Female
326 50.3%
322 49.7%
10 90.9%
1 9.1%
Enrollment in Selected Programs
Program
Program % of Student Enrollment Population
Gifted (Grades K-12)
5
< 1%
Alternative Programs (Grades 6-12)
N/A
N/A
Students Eligible to Receive Free/Reduced Lunches
Number
Percent
School System
434 16,221
65.9% 17.8%
Dropout Rate *
Number
Rate
School System
N/A N/A
N/A N/A
* Dropout rates are not applicable for grades PK-5.
Enrollment in Compensatory Programs
Program
Program % of Student Enrollment Population
Special Education (Grades K-12)
65 10.0%
(PK)
13
N/A
English to Speakers of Other Languages (ESOL) (Grades K-12)
69 10.6%
Remedial Education (Grades 2-5, 9-12)
57 13.5%
Special Instructional Assistance (SIA) (Grades K-3)
280 63.8%
Title I (Grades K-12)
This school has a schoolwide program.
Total 3
Retained Students, by Race/Ethnicity and Sex
Black
White Hispanic
American MultiAsian Indian racial
0 0.0%
0
3
0.0% 100.0%
0 0.0%
0 0.0%
0 0.0%
Male Female
2
1
66.7% 33.3%
Prepared by Georgia Department of Education
Page 1
STATE-REQUIRED TEST DATA
NORM-REFERENCED TESTS Grade 3
Iowa Tests of Basic Skills (ITBS) Each chart reflects data for three years of testing.
Reading Comprehension 50
32 63 54 0
98-99
40 62 53 97-98
31 60 52 96-97
Mathematics
School 50
System
State
0
33 70 61 98-99
33 68 61 97-98
29 68 59 96-97
School System State
Reading Vocabulary 50
34 58 50 0
98-99
33 58 50 97-98
28 58 49 96-97
Language Arts
School 50
System
State
0
35 70 64 98-99
38 69 62 97-98
33 67 59 96-97
School System State
Social Studies 50
32 64 56 0
98-99
35 64 55 97-98
31 64 55 96-97
Science
School 50
System
State
0
40 70 59 98-99
38 70 59 97-98
35 69 58 96-97
School System State
Sources of Information
Composite Score
50
35 66 57 0
98-99
School 50
System
36 65 56 97-98
29 64 55 96-97
State 0
33 67 58 98-99
34 67 57 97-98
1998-99 GEORGIA PUBLIC EDUCATION REPORT CARD Norton Park Elementary School - 6331066
Prepared by Georgia Department of Education
29 66 56 96-97
Scores Reported in Percentiles
School System State
Page 2
STATE-REQUIRED TEST DATA
NORM-REFERENCED TESTS Grade 5
Iowa Tests of Basic Skills (ITBS) Each chart reflects data for three years of testing.
Reading Comprehension
Mathematics
50
32 59 53 0
98-99
40 60 53 97-98
46 60 52 96-97
School 50
System
State
0
29 68 59 98-99
37 68 58 97-98
47 69 57 96-97
School System State
Reading Vocabulary 50
27 57 48 0
98-99
30 58 48 97-98
42 58 46 96-97
Language Arts
School 50
System
State
0
42 71 63 98-99
54 70 61 97-98
58 69 58 96-97
School System State
Social Studies 50
32 64 57 0
98-99
37 64 56 97-98
44 65 55 96-97
Science
School 50
System
State
0
30 68 60 98-99
35 69 59 97-98
51 70 59 96-97
School System State
Sources of Information
Composite Score
50
38 67 58 0
98-99
School 50
System
41 65 58 97-98
48 66 57 96-97
State 0
31 66 57 98-99
39 66 56 97-98
47 67 55 96-97
1998-99 GEORGIA PUBLIC EDUCATION REPORT CARD Norton Park Elementary School - 6331066
Prepared by Georgia Department of Education
Scores Reported in Percentiles
School System State
Page 3
STATE-REQUIRED TEST DATA
PERFORMANCE ASSESSMENTS
Grade 5 Writing Assessment
Percent at Developmental Stages:
1998-99 School System State
1997-98 School System State
1996-97 School System State
Stage Stage Stage Stage Stage Stage
1:The Emerging Writer 2:The Developing Writer 3:The Focusing Writer 4:The Experimenting 5:The Engaging Writer 6:The Extending Writer
0% 0% 14% 52% 26% 7%
0% 1% 10% 36% 34% 19%
0% 1% 16% 41% 29% 12%
0% 1% 16% 46% 26% 11%
0% 1% 12% 37% 33% 16%
0% 3% 19% 41% 27% 10%
0% 1% 14% 40% 34% 10%
0% 1% 14% 34% 32% 18%
0% 3% 21% 37% 26% 12%
AWARDS / RECOGNITION DATA
Schools in Georgia may receive recognition in the following programs: Charter School Pay for Performance Program Georgia School of Excellence National Blue Ribbon School Norton Park Elementary School did not receive recognition in any of these programs during the 1998-99 school year.
1998-99 GEORGIA PUBLIC EDUCATION REPORT CARD Norton Park Elementary School - 6331066
Prepared by Georgia Department of Education
Page 4
CERTIFIED PERSONNEL DATA
Positions Number Average Contract Days
Personnel Sex
Certificate
Years Experience
Full-time Part-time
Male Female
4 Yr Bachelor's 5 Yr Master's 6 Yr Specialist's 7 Yr Doctoral Other*
<1 1-10 11-20 21-30 >30
Average
Administrators
2.00 225.50
2 0
1 1
0 1 0 1 0 0 0 1 1 0 20.50
Support Personnel
4.00 191.00
3 2
0 5
1 4 0 0 0 0 2 3 0 0 11.40
PK-12 Teachers
49.00 191.00
48 2
3 47
34 15
1 0 0 0 36 10 4 0 7.90
*Includes One- and Two-Year Vocational Certificates.
ACCREDITATION DATA
Accredited by Southern Association of Colleges and Schools (SACS):
Elementary/Middle Commission.
1998-99 GEORGIA PUBLIC EDUCATION REPORT CARD Norton Park Elementary School - 6331066
Prepared by Georgia Department of Education
Page 5
1998-99 GEORGIA PUBLIC EDUCATION REPORT CARD
COBB COUNTY SCHOOLS
Oakwood High School - 6330186
Grade Range 9-12
The Georgia Public Education Report Card is designed to assist systems and schools in educational improvement. This report card contains a variety of data elements. An explanation of the terms is provided as a companion to the report card data. Please refer to the definitions for the most effective use of the reported data.
Total 294
STUDENT DATA
9-12 Enrollment, by Race/Ethnicity and Sex
Black
White Hispanic
American Multi-
Asian Indian
racial
78 26.5%
198 67.3%
8 2.7%
2 0.7%
2 0.7%
6 2.0%
Male Female
157 53.4%
137 46.6%
Enrollment in Selected Programs
Program
Gifted (Grades K-12)
Program % of Student Enrollment Population
0
0.0%
Non-Vocational Labs (Grades 9-12)
200
Vocational Labs
(Grades 9-12)
94
Alternative Programs (Grades 6-12)
0
68.0% 32.0%
0.0%
Students Eligible to Receive Free/Reduced Lunches
Number
Percent
School System
3 16,221
1.0% 17.8%
Enrollment in Compensatory Programs
Program
Program % of Student Enrollment Population
Special Education (Grades K-12) PK
0
0.0%
0
N/A
English to Speakers of Other Languages (ESOL) (Grades K-12)
0
0.0%
Remedial Education (Grades 2-5, 9-12)
110 37.4%
Title I (Grades K-12)
This school has no Title I program.
Dropout Rate for Grades 9-12
Number
Rate
School System
276 1,055
44.4% 3.7%
Total 103
Retained Students, by Race/Ethnicity and Sex
Black
White Hispanic
American MultiAsian Indian racial
29 28.2%
70 68.0%
1 1.0%
1 1.0%
1 1.0%
1 1.0%
Male Female
63
40
61.2% 38.8%
Prepared by Georgia Department of Education
Page 1
STATE-REQUIRED TEST DATA
GEORGIA HIGH SCHOOL GRADUATION TESTS (GHSGT)
Percent of Regular Program 11th Graders Passing the Georgia High School Graduation Tests on First Administration
English Language Arts Mathematics Social Studies Science
All Components listed above
Writing
1998-99
School System State
80% 82% 61% 55%
98% 94% 90% 85%
96% 88% 80% 72%
35% 82% 68%
91% 97% 93%
1997-98
School System State
92% 82% 56% 52%
98% 95% 89% 88%
94% 88% 78% 74%
31% 84% 68%
90% 96% 92%
1996-97
School System State
76% 68% 55% 59%
97% 94% 89% 89%
94% 87% 78% 74%
32% 84% 67%
100% 97% 93%
GRADUATE DATA
1999 Graduates by Credentials, Race/Ethnicity and Sex
Diplomas with Both College Prep. & Voc. Endorsements
Diplomas with College Prep. Endorsements Diplomas with Vocational Endorsements General High School Diplomas Special Education Diplomas
Total All Diplomas
Certificates of Performance
Total Graduates
Total 7
45 24 39
0
Black
1 14.3%
5 11.1%
3 12.5%
11 28.2%
0
White Hispanic
4
1
57.1% 14.3%
34 75.6%
4 8.9%
19 79.2%
1 4.2%
25 64.1%
1 2.6%
0
0
American MultiAsian Indian racial
1 14.3%
0 0.0%
0 0.0%
0 0.0%
1 2.2%
1 2.2%
0 0.0%
0 0.0%
1 4.2%
1 2.6%
0 0.0%
1 2.6%
0
0
0
115
20
82
7
2
1
3
17.4% 71.3% 6.1% 1.7% 0.9% 2.6%
12
8
3
1
0
0
0
66.7% 25.0% 8.3% 0.0% 0.0% 0.0%
127
28
85
8
2
1
3
22.0% 66.9% 6.3% 1.6% 0.8% 2.4%
Male Female
4
3
57.1% 42.9%
20
25
44.4% 55.6%
14
10
58.3% 41.7%
25
14
64.1% 35.9%
0
0
63 54.8%
4 33.3%
67 52.8%
52 45.2%
8 66.7%
60 47.2%
HOPE Scholarships
School System
Number of 1999 Graduates 1 2 7
Number Eligible
28
Percent Eligible
22.0%
5,022 3,850 76.7%
State
65,548 40,292 61.5%
High School Completion Rate
Percent of 1995Grade 9 Enrollment in Graduating Class of1999 School System State
Completion Rate '95-'99 32.4% 83.6% 68.9%
1998-99 GEORGIA PUBLIC EDUCATION REPORT CARD
Oakwood High School - 6330186
Prepared by Georgia Department of Education
Page 2
COLLEGE ADMISSIONS / CREDIT TEST DATA
Scholastic Assessment Test (SAT)
Based on students' highest verbal and highest math scores
No. Taking
Average Score
Tests Verbal Math Total
Based on students' last test administration
Average Score Verbal Math Total
School
23
College Prep. Endorsement
Other Diplomas
System
4,180
College Prep. Endorsement
Other Diplomas
Georgia
41,958
470 N/A N/A
523 532 402
492
458 N/A N/A
522 532 387
488
928 N/A N/A
1045 1064
789
980
466 N/A N/A
514 N/A N/A
483
456 N/A N/A
513 N/A N/A
479
922 N/A N/A
1027 N/A N/A
962
Nation
952,913 N/A N/A N/A
502 508 1010
American College Testing (ACT)
Advanced Placement Exams (AP)
Number taking tests: English Mathematics Reading Science Reasoning
1 * School N/A N/A N/A N/A
System 20.2 21.2 21.4 21.1
State 19.1 19.9 20.2 19.9
CompositeScore
N/A 21.1 19.9
* Scores are not reported when fewer than 5 take the ACT
No. of Students Taking Tests
No. of Tests Taken No. of Test Scores
3 or Higher Percent of Test
Scores 3 or Higher
School 0
N/A N/A
N/A
System State 1,291 15,225 2,524 23,969 1,885 13,024
74.7% 54.3%
POST-SECONDARY DATA
Graduates Entering Georgia Public Colleges
Graduates Entering Georgia Public Colleges and Requiring Learning Support (LS)
1998 Graduates Entering in 1998-99
1997 Graduates Entering in 1997-98
Percent of Graduating Number Class
School N / A
N/A
System 2,220 46.3%
School N / A
N/A
System 2,229 48.4%
Number Requiring
LS 2 213
2 312
Percent of those attending Georgia
Public Colleges
25.0%
9.6%
18.2%
14.0%
In previous years, the Report Card presented College Prep Curriculum information provided by the Board of Regents on students requiring Learning Support. Due to inconsistencies in the data provided by the Board of Regents in defining College Prep Completers versus Local Board of Education data defining College Prep Endorsements, the Department of Education Report Card will not provide this information until discrepancies can be reconciled.
Graduates Entering Georgia Public Technical and Adult Schools
1998 Graduates School System
Entering Number N/A 213
1998-99 Percent
N/A 4.4%
Entering Number N/A N/A
1997-98 Percent
N/A N/A
1997 Graduates School System
N/A 22
N/A 0.5%
N/A 192
N/A 4.2%
1998-99 GEORGIA PUBLIC EDUCATION REPORT CARD Oakwood High School - 6330186
Prepared by Georgia Department of Education
Page 3
CERTIFIED PERSONNEL DATA
Positions Number Average Contract Days
Administrators
3.00 214.00
Support Personnel
4.77 191.00
PK-12 Teachers
21.23 191.00
Personnel Sex
Certificate
Years Experience
Full-time Part-time
Male Female
4 Yr Bachelor's 5 Yr Master's 6 Yr Specialist's 7 Yr Doctoral Other*
<1 1-10 11-20 21-30 >30
Average
3 0
2 1
0 0 2 1 0
0 0 1 2 0
19.33
2 5
3 4
1 4 2 0 0
0 1 2 2 2
21.43
20 3
6 17
4 13
4 1 1
0 3 9 8 3
20.35
*Includes One- and Two-Year Vocational Certificates.
ACCREDITATION DATA
Not accredited by Southern Association of Colleges and Schools (SACS) or Georgia Accrediting Commission (GAC).
AWARDS / RECOGNITION DATA
Schools in Georgia may receive recognition in the following programs: Charter School Pay for Performance Program Georgia School of Excellence National Blue Ribbon School Oakwood High School did not receive recognition in any of these programs during the 1998-99 school year.
1998-99 GEORGIA PUBLIC EDUCATION REPORT CARD Oakwood High School - 6330186
Prepared by Georgia Department of Education
Page 4
1998-99 GEORGIA PUBLIC EDUCATION REPORT CARD
COBB COUNTY SCHOOLS
Osborne High School - 6332066
Grade Range 9-12
The Georgia Public Education Report Card is designed to assist systems and schools in educational improvement. This report card contains a variety of data elements. An explanation of the terms is provided as a companion to the report card data. Please refer to the definitions for the most effective use of the reported data.
Total 1,672
STUDENT DATA
9-12 Enrollment, by Race/Ethnicity and Sex
Black
White Hispanic
American Multi-
Asian Indian
racial
647 38.7%
821 49.1%
120 7.2%
59 3.5%
3 0.2%
22 1.3%
Male Female
901 53.9%
771 46.1%
Enrollment in Selected Programs
Program
Gifted (Grades K-12)
Program % of Student Enrollment Population
21
1.3%
Non-Vocational Labs (Grades 9-12)
Vocational Labs (Grades 9-12)
Alternative Programs (Grades 6-12)
1,089 791 11
65.1% 47.3%
< 1%
Students Eligible to Receive Free/Reduced Lunches
Number
Percent
School System
278 16,221
16.6% 17.8%
Enrollment in Compensatory Programs
Program
Program % of Student Enrollment Population
Special Education (Grades K-12) PK
188 11.2%
0
N/A
English to Speakers of Other Languages (ESOL) (Grades K-12)
33
2.0%
Remedial Education (Grades 2-5, 9-12)
167 10.0%
Title I (Grades K-12)
This school has no Title I program.
Dropout Rate for Grades 9-12
Number
Rate
School System
137 1,055
7.1% 3.7%
Total 88
Retained Students, by Race/Ethnicity and Sex
Black
White Hispanic
American MultiAsian Indian racial
43 48.9%
32
9
36.4% 10.2%
2 2.3%
0 0.0%
2 2.3%
Male Female
46
42
52.3% 47.7%
Prepared by Georgia Department of Education
Page 1
STATE-REQUIRED TEST DATA
GEORGIA HIGH SCHOOL GRADUATION TESTS (GHSGT)
Percent of Regular Program 11th Graders Passing the Georgia High School Graduation Tests on First Administration
English Language Arts Mathematics Social Studies Science
All Components listed above
Writing
1998-99
School System State
95% 86% 82% 66%
98% 94% 90% 85%
96% 88% 80% 72%
64% 82% 68%
95% 97% 93%
1997-98
School System State
91% 87% 70% 71%
98% 95% 89% 88%
94% 88% 78% 74%
62% 84% 68%
91% 96% 92%
1996-97
School System State
93% 84% 75% 75%
97% 94% 89% 89%
94% 87% 78% 74%
68% 84% 67%
93% 97% 93%
GRADUATE DATA
1999 Graduates by Credentials, Race/Ethnicity and Sex
Diplomas with Both College Prep. & Voc. Endorsements
Diplomas with College Prep. Endorsements Diplomas with Vocational Endorsements General High School Diplomas Special Education Diplomas
Total All Diplomas
Certificates of Performance
Total Graduates
Total 170 59 25 2 16 272 20 292
Black
58 34.1%
19 32.2%
6 24.0%
1 50.0%
7 43.8%
91 33.5%
9 45.0%
100 34.2%
White Hispanic
99 58.2%
31 52.5%
5 2.9%
3 5.1%
14 56.0%
1 50.0%
8 50.0%
4 16.0%
0 0.0%
0 0.0%
153 56.3%
12 4.4%
7 35.0%
1 5.0%
160 54.8%
13 4.5%
American MultiAsian Indian racial
5 2.9%
6 10.2%
1 0.6%
0 0.0%
2 1.2%
0 0.0%
1 4.0%
0 0.0%
1 6.3%
0 0.0%
0 0.0%
0 0.0%
0 0.0%
0 0.0%
0 0.0%
13 4.8%
1 0.4%
2 0.7%
3 15.0%
0 0.0%
0 0.0%
16 5.5%
1 0.3%
2 0.7%
Male Female
95 55.9%
28 47.5%
75 44.1%
31 52.5%
14 56.0%
1 50.0%
12 75.0%
11 44.0%
1 50.0%
4 25.0%
150
122
55.1% 44.9%
6
14
30.0% 70.0%
156
136
53.4% 46.6%
HOPE Scholarships
School System
Number of 1999 Graduates 2 9 2
Number Eligible
199
Percent Eligible
68.2%
5,022 3,850 76.7%
State
65,548 40,292 61.5%
High School Completion Rate
Percent of 1995Grade 9 Enrollment in Graduating Class of1999 School System State
Completion Rate '95-'99 71.7% 83.6% 68.9%
1998-99 GEORGIA PUBLIC EDUCATION REPORT CARD
Osborne High School - 6332066
Prepared by Georgia Department of Education
Page 2
COLLEGE ADMISSIONS / CREDIT TEST DATA
Scholastic Assessment Test (SAT)
Based on students' highest verbal and highest math scores
No. Taking
Average Score
Tests Verbal Math Total
Based on students' last test administration
Average Score Verbal Math Total
School
189
College Prep. Endorsement
Other Diplomas
System
4,180
College Prep. Endorsement
Other Diplomas
Georgia
41,958
461 452
913
466 454
920
415 310
725
523 522 1045 532 532 1064
402 387
789
492 488
980
456 N/A N/A
514 N/A N/A
483
447 N/A N/A
513 N/A N/A
479
903 N/A N/A
1027 N/A N/A
962
Nation
952,913 N/A N/A N/A
502 508 1010
American College Testing (ACT)
Advanced Placement Exams (AP)
Number taking tests: English Mathematics Reading Science Reasoning CompositeScore
4 3 School System State
18.4 20.2 19.1
18.8 21.2 19.9
19.2 19.4
21.4 21.1
20.2 19.9
19.1 21.1 19.9
No. of Students Taking Tests
No. of Tests Taken No. of Test Scores
3 or Higher Percent of Test
Scores 3 or Higher
School 31 47 11
23.4%
System State 1,291 15,225 2,524 23,969 1,885 13,024
74.7% 54.3%
POST-SECONDARY DATA
Graduates Entering Georgia Public Colleges
Graduates Entering Georgia Public Colleges and Requiring Learning Support (LS)
1998 Graduates Entering in 1998-99
1997 Graduates Entering in 1997-98
Percent of Graduating Number Class
School
99
34.6%
System 2,220 46.3%
School
85
30.9%
System 2,229 48.4%
Number Requiring
LS 12 213
25 312
Percent of those attending Georgia
Public Colleges
12.1%
9.6%
29.4%
14.0%
In previous years, the Report Card presented College Prep Curriculum information provided by the Board of Regents on students requiring Learning Support. Due to inconsistencies in the data provided by the Board of Regents in defining College Prep Completers versus Local Board of Education data defining College Prep Endorsements, the Department of Education Report Card will not provide this information until discrepancies can be reconciled.
Graduates Entering Georgia Public Technical and Adult Schools
1998 Graduates School System
Entering Number 28 213
1998-99 Percent
9.8% 4.4%
Entering Number N/A N/A
1997-98 Percent
N/A N/A
1997 Graduates School
3
1.1%
System
22
0.5%
19
6.9%
192
4.2%
1998-99 GEORGIA PUBLIC EDUCATION REPORT CARD Osborne High School - 6332066
Prepared by Georgia Department of Education
Page 3
CERTIFIED PERSONNEL DATA
Positions Number Average Contract Days
Administrators
5.00 222.00
Support Personnel
8.76 191.00
PK-12 Teachers
102.24 191.00
Personnel Sex
Certificate
Years Experience
Full-time Part-time
Male Female
4 Yr Bachelor's 5 Yr Master's 6 Yr Specialist's 7 Yr Doctoral Other*
<1 1-10 11-20 21-30 >30
Average
5 0
4 1
0 0 5 0 0
0 1 2 2 0
20.20
7 28
18 17
22 8 3 1 1
0 14
8 9 4
16.49
76 28
33 71
53 39
8 2 2
0 62 17 21
4
11.94
*Includes One- and Two-Year Vocational Certificates.
ACCREDITATION DATA
Accredited by Southern Association of Colleges and Schools (SACS): Secondary/Middle Commission.
AWARDS / RECOGNITION DATA
Schools in Georgia may receive recognition in the following programs: Charter School Pay for Performance Program Georgia School of Excellence National Blue Ribbon School Osborne High School did not receive recognition in any of these programs during the 1998-99 school year.
1998-99 GEORGIA PUBLIC EDUCATION REPORT CARD Osborne High School - 6332066
Prepared by Georgia Department of Education
Page 4
1998-99 GEORGIA PUBLIC EDUCATION REPORT CARD
COBB COUNTY SCHOOLS
Pebblebrook High School - 6334066
Grade Range 9-12
The Georgia Public Education Report Card is designed to assist systems and schools in educational improvement. This report card contains a variety of data elements. An explanation of the terms is provided as a companion to the report card data. Please refer to the definitions for the most effective use of the reported data.
Total 1,509
STUDENT DATA
9-12 Enrollment, by Race/Ethnicity and Sex
Black
White Hispanic
American Multi-
Asian Indian
racial
837 55.5%
546 36.2%
89 5.9%
19 1.3%
1 0.1%
17 1.1%
Male Female
701 46.5%
808 53.5%
Enrollment in Selected Programs
Program
Gifted (Grades K-12)
Program % of Student Enrollment Population
62
4.1%
Non-Vocational Labs (Grades 9-12)
869
Vocational Labs
(Grades 9-12)
687
Alternative Programs (Grades 6-12)
5
57.6% 45.5%
< 1%
Students Eligible to Receive Free/Reduced Lunches
Number
Percent
School System
437 16,221
29.0% 17.8%
Enrollment in Compensatory Programs
Program
Program % of Student Enrollment Population
Special Education (Grades K-12) PK
139
9.2%
0
N/A
English to Speakers of Other Languages (ESOL) (Grades K-12)
33
2.2%
Remedial Education (Grades 2-5, 9-12)
324 21.5%
Title I (Grades K-12)
This school has no Title I program.
Dropout Rate for Grades 9-12
Number
Rate
School System
74 1,055
4.3% 3.7%
Total 133
Retained Students, by Race/Ethnicity and Sex
Black
White Hispanic
American MultiAsian Indian racial
82 61.7%
42 31.6%
8 6.0%
1 0.8%
0 0.0%
0 0.0%
Male Female
78
55
58.6% 41.4%
Prepared by Georgia Department of Education
Page 1
STATE-REQUIRED TEST DATA
GEORGIA HIGH SCHOOL GRADUATION TESTS (GHSGT)
Percent of Regular Program 11th Graders Passing the Georgia High School Graduation Tests on First Administration
English Language Arts Mathematics Social Studies Science
All Components listed above
Writing
1998-99
School System State
96% 81% 75% 69%
98% 94% 90% 85%
96% 88% 80% 72%
62% 82% 68%
91% 97% 93%
1997-98
School System State
94% 87% 71% 73%
98% 95% 89% 88%
94% 88% 78% 74%
63% 84% 68%
92% 96% 92%
1996-97
School System State
94% 85% 73% 76%
97% 94% 89% 89%
94% 87% 78% 74%
63% 84% 67%
96% 97% 93%
GRADUATE DATA
1999 Graduates by Credentials, Race/Ethnicity and Sex
Diplomas with Both College Prep. & Voc. Endorsements
Diplomas with College Prep. Endorsements Diplomas with Vocational Endorsements General High School Diplomas Special Education Diplomas
Total All Diplomas
Certificates of Performance
Total Graduates
Total 51
116 19 2 4
192 21
213
Black
40 78.4%
50 43.1%
7 36.8%
2 100.0%
3 75.0%
102 53.1%
16 76.2%
118 55.4%
American MultiWhite Hispanic Asian Indian racial
9 17.6%
59 50.9%
1 2.0%
5 4.3%
1 2.0%
1 0.9%
0 0.0%
0 0.0%
0 0.0%
1 0.9%
11 57.9%
0 0.0%
1 25.0%
1 5.3%
0 0.0%
0 0.0%
0 0.0%
0 0.0%
0 0.0%
0 0.0%
0 0.0%
0 0.0%
0 0.0%
0 0.0%
0 0.0%
80 41.7%
7 3.6%
2 1.0%
0 0.0%
1 0.5%
3 14.3%
0 0.0%
1 4.8%
0 0.0%
1 4.8%
83 39.0%
7 3.3%
3 1.4%
0 0.0%
2 0.9%
Male Female
15 29.4%
47 40.5%
36 70.6%
69 59.5%
10 52.6%
2 100.0%
2 50.0%
9 47.4%
0 0.0%
2 50.0%
76
116
39.6% 60.4%
5
16
23.8% 76.2%
81
132
38.0% 62.0%
HOPE Scholarships
School System
Number of 1999 Graduates 2 1 3
Number Eligible
141
Percent Eligible
66.2%
5,022 3,850 76.7%
State
65,548 40,292 61.5%
High School Completion Rate
Percent of 1995Grade 9 Enrollment in Graduating Class of1999 School System State
Completion Rate '95-'99 79.2% 83.6% 68.9%
1998-99 GEORGIA PUBLIC EDUCATION REPORT CARD
Pebblebrook High School - 6334066
Prepared by Georgia Department of Education
Page 2
COLLEGE ADMISSIONS / CREDIT TEST DATA
Scholastic Assessment Test (SAT)
Based on students' highest verbal and highest math scores
No. Taking
Average Score
Tests Verbal Math Total
Based on students' last test administration
Average Score Verbal Math Total
School
148
College Prep. Endorsement
Other Diplomas
System
4,180
College Prep. Endorsement
Other Diplomas
Georgia
41,958
483 474
957
498 491
989
355 360
715
523 522 1045 532 532 1064
402 387
789
492 488
980
476 N/A N/A
514 N/A N/A
483
465 N/A N/A
513 N/A N/A
479
941 N/A N/A
1027 N/A N/A
962
Nation
952,913 N/A N/A N/A
502 508 1010
American College Testing (ACT)
Advanced Placement Exams (AP)
Number taking tests: English Mathematics Reading Science Reasoning CompositeScore
3 7 School System State
18.3 20.2 19.1
19.4 21.2 19.9
20.4 19.5
21.4 21.1
20.2 19.9
19.5 21.1 19.9
No. of Students Taking Tests
No. of Tests Taken No. of Test Scores
3 or Higher Percent of Test
Scores 3 or Higher
School 32 32 13
40.6%
System State 1,291 15,225 2,524 23,969 1,885 13,024
74.7% 54.3%
POST-SECONDARY DATA
Graduates Entering Georgia Public Colleges
Graduates Entering Georgia Public Colleges and Requiring Learning Support (LS)
1998 Graduates Entering in 1998-99
1997 Graduates Entering in 1997-98
Percent of Graduating Number Class
School
67
28.3%
System 2,220 46.3%
School
67
32.4%
System 2,229 48.4%
Number Requiring
LS 14 213
9 312
Percent of those attending Georgia
Public Colleges
20.9%
9.6%
13.4%
14.0%
In previous years, the Report Card presented College Prep Curriculum information provided by the Board of Regents on students requiring Learning Support. Due to inconsistencies in the data provided by the Board of Regents in defining College Prep Completers versus Local Board of Education data defining College Prep Endorsements, the Department of Education Report Card will not provide this information until discrepancies can be reconciled.
Graduates Entering Georgia Public Technical and Adult Schools
1998 Graduates School System
Entering Number 10 213
1998-99 Percent
4.2% 4.4%
Entering Number N/A N/A
1997-98 Percent
N/A N/A
1997 Graduates School
1
0.5%
System
22
0.5%
21
10.1%
192
4.2%
1998-99 GEORGIA PUBLIC EDUCATION REPORT CARD Pebblebrook High School - 6334066
Prepared by Georgia Department of Education
Page 3
CERTIFIED PERSONNEL DATA
Positions Number Average Contract Days
Administrators
5.00 220.00
Support Personnel
7.85 191.00
PK-12 Teachers
87.96 191.00
Personnel Sex
Certificate
Years Experience
Full-time Part-time
Male Female
4 Yr Bachelor's 5 Yr Master's 6 Yr Specialist's 7 Yr Doctoral Other*
<1 1-10 11-20 21-30 >30
Average
5 0
1 4
0 1 3 1 0
0 0 2 3 0
20.40
6 25
15 16
14 12
5 0 0
0 14
6 10
1
14.55
61 32
28 65
47 37
5 2 2
0 61 14 14
4
10.31
*Includes One- and Two-Year Vocational Certificates.
ACCREDITATION DATA
Accredited by Southern Association of Colleges and Schools (SACS): Secondary/Middle Commission.
AWARDS / RECOGNITION DATA
Schools in Georgia may receive recognition in the following programs: Charter School Pay for Performance Program Georgia School of Excellence National Blue Ribbon School Pebblebrook High School did not receive recognition in any of these programs during the 1998-99 school year.
1998-99 GEORGIA PUBLIC EDUCATION REPORT CARD Pebblebrook High School - 6334066
Prepared by Georgia Department of Education
Page 4
1998-99 GEORGIA PUBLIC EDUCATION REPORT CARD
COBB COUNTY SCHOOLS
Pine Mountain Middle School - 6330280
Grade Range 6-8
The Georgia Public Education Report Card is designed to assist systems and schools in educational improvement. This report card contains a variety of data elements. An explanation of the terms is provided as a companion to the report card data. Please refer to the definitions for the most effective use of the reported data.
STUDENT DATA
Total 1,243
6-8 Enrollment, by Race/Ethnicity and Sex
Black
White Hispanic
American Multi-
Asian Indian
racial
100 8.0%
1,062 85.4%
30 2.4%
26 2.1%
7 0.6%
18 1.4%
Male 619
49.8%
Female 624
50.2%
Enrollment in Selected Programs
Program
Gifted (Grades K-12)
Program % of Student Enrollment Population
211
17.0%
Alternative Programs (Grades 6-12)
0
0.0%
Students Eligible to Receive Free/Reduced Lunches
Number
Percent
School System
98 16,221
7.9% 17.8%
Enrollment in Compensatory Programs
Program
Program % of Student Enrollment Population
Special Education (Grades K-12) (PK)
163 13.1%
0
N/A
English to Speakers of Other Languages (ESOL) (Grades K-12)
0
0.0%
Title I (Grades K-12)
This school has no Title I program.
Dropout Rate for Grades 6-8
Number
Rate
School System
0
0.0%
19
0.1%
Total 10
Retained Students, by Race/Ethnicity and Sex
Black
White Hispanic
American MultiAsian Indian racial
2 20.0%
8 80.0%
0 0.0%
0 0.0%
0 0.0%
0 0.0%
Male Female
8
2
80.0% 20.0%
Prepared by Georgia Department of Education
Page 1
STATE-REQUIRED TEST DATA
NORM-REFERENCED TESTS Grade 8
Iowa Tests of Basic Skills (ITBS) Each chart reflects data for three years of testing.
Reading Comprehension 50
70 61 49 0
98-99
67 61 48 97-98
73 62 48 96-97
Mathematics
School 50
System
State
0
70 66 56 98-99
67 66 55 97-98
72 67 54 96-97
School System State
Reading Vocabulary 50
68 57 46 0
98-99
60 57 45 97-98
67 58 44 96-97
Language Arts
School 50
System
State
0
76 70 60 98-99
76 68 58 97-98
73 68 56 96-97
School System State
Social Studies 50
73 64 54 0
98-99
69 64 53 97-98
71 65 53 96-97
Science
School 50
System
State
0
74 66 56 98-99
73 67 55 97-98
72 67 53 96-97
School System State
Sources of Information
Composite Score
50
74 67 57 0
98-99
School 50
System
71 66 56 97-98
76 67 55 96-97
State 0
74 67 56 98-99
71 66 54 97-98
1998-99 GEORGIA PUBLIC EDUCATION REPORT CARD Pine Mountain Middle School - 6330280
Prepared by Georgia Department of Education
74 67 54 96-97
Scores Reported in Percentiles
School System State
Page 2
STATE-REQUIRED TEST DATA
Categories of Scaled Scores
Inadequate (less than 162)
Minimal (162-209)
Good
(210-247)
Very Good (greater than 247)
Average Scaled Score: (Range 100-300)
PERFORMANCE ASSESSMENTS
Grade 8 Writing Assessment
1998-99 Percent Scoring
1997-98 Percent Scoring
1996-97 Percent Scoring
School System State School System State School System State
1% 24% 55% 20%
2% 25% 50% 24%
8% 40% 41% 11%
1% 33% 50% 16%
3% 33% 47% 17%
11% 46% 34%
8%
1% 32% 47% 21%
5% 36% 43% 16%
15% 46% 30%
8%
225
225
208 218
218 202 223
215 198
AWARDS / RECOGNITION DATA
Schools in Georgia may receive recognition in the following programs: Charter School Pay for Performance Program Georgia School of Excellence National Blue Ribbon School Pine Mountain Middle School did not receive recognition in any of these programs during the 1998-99 school year.
1998-99 GEORGIA PUBLIC EDUCATION REPORT CARD Pine Mountain Middle School - 6330280
Prepared by Georgia Department of Education
Page 3
CERTIFIED PERSONNEL DATA
Positions Number Average Contract Days
Personnel Sex
Certificate
Years Experience
Full-time Part-time
Male Female
4 Yr Bachelor's 5 Yr Master's 6 Yr Specialist's 7 Yr Doctoral Other*
<1 1-10 11-20 21-30 >30
Average
Administrators
3.00 220.33
3 0
1 2
0 1 2 0 0 0 0 2 1 0 20.67
Support Personnel
4.82 191.00
4 2
0 6
2 4 0 0 0 0 2 0 4 0 18.50
PK-12 Teachers
75.28 191.00
74 2
10 66
46 26
4 0 0 0 38 18 19 1 13.28
*Includes One- and Two-Year Vocational Certificates.
ACCREDITATION DATA
Accredited by Southern Association of Colleges and Schools (SACS):
Elementary/Middle Commission.
1998-99 GEORGIA PUBLIC EDUCATION REPORT CARD Pine Mountain Middle School - 6330280
Prepared by Georgia Department of Education
Page 4
1998-99 GEORGIA PUBLIC EDUCATION REPORT CARD
COBB COUNTY SCHOOLS
Pope High School - 6330188
Grade Range 9-12
The Georgia Public Education Report Card is designed to assist systems and schools in educational improvement. This report card contains a variety of data elements. An explanation of the terms is provided as a companion to the report card data. Please refer to the definitions for the most effective use of the reported data.
Total 2,126
STUDENT DATA
9-12 Enrollment, by Race/Ethnicity and Sex
Black
White Hispanic
American Multi-
Asian Indian
racial
115 5.4%
1,894 89.1%
29 1.4%
72 3.4%
2 0.1%
14 0.7%
Male Female
1,066 50.1%
1,060 49.9%
Enrollment in Selected Programs
Program
Gifted (Grades K-12)
Program % of Student Enrollment Population
292
13.7%
Non-Vocational Labs (Grades 9-12)
Vocational Labs (Grades 9-12)
Alternative Programs (Grades 6-12)
1,384 649 2
65.1% 30.5%
< 1%
Students Eligible to Receive Free/Reduced Lunches
Number
Percent
School System
16 16,221
0.8% 17.8%
Enrollment in Compensatory Programs
Program
Program % of Student Enrollment Population
Special Education (Grades K-12) PK
202
9.5%
0
N/A
English to Speakers of Other Languages (ESOL) (Grades K-12)
5
< 1%
Remedial Education (Grades 2-5, 9-12)
116
5.5%
Title I (Grades K-12)
This school has no Title I program.
Dropout Rate for Grades 9-12
Number
Rate
School System
31 1,055
1.4% 3.7%
Total 35
Retained Students, by Race/Ethnicity and Sex
Black
White Hispanic
American MultiAsian Indian racial
6 17.1%
26 74.3%
2 5.7%
0 0.0%
0 0.0%
1 2.9%
Male Female
23
12
65.7% 34.3%
Prepared by Georgia Department of Education
Page 1
STATE-REQUIRED TEST DATA
GEORGIA HIGH SCHOOL GRADUATION TESTS (GHSGT)
Percent of Regular Program 11th Graders Passing the Georgia High School Graduation Tests on First Administration
English Language Arts Mathematics Social Studies Science
All Components listed above
Writing
1998-99
School System State
100% 99% 98% 96%
98% 94% 90% 85%
96% 88% 80% 72%
95% 82% 68%
99% 97% 93%
1997-98
School System State
99% 99% 97% 97%
98% 95% 89% 88%
94% 88% 78% 74%
95% 84% 68%
99% 96% 92%
1996-97
School System State
100% 99% 96% 95%
97% 94% 89% 89%
94% 87% 78% 74%
93% 84% 67%
100% 97% 93%
GRADUATE DATA
1999 Graduates by Credentials, Race/Ethnicity and Sex
Diplomas with Both College Prep. & Voc. Endorsements
Diplomas with College Prep. Endorsements Diplomas with Vocational Endorsements General High School Diplomas Special Education Diplomas
Total All Diplomas
Certificates of Performance
Total Graduates
Total 6
441 28 3 3
481 1
482
Black
1 16.7%
15 3.4%
1 3.6%
0 0.0%
1 33.3%
18 3.7%
0 0.0%
18 3.7%
American MultiWhite Hispanic Asian Indian racial
5 83.3%
401 90.9%
0 0.0%
4 0.9%
0 0.0%
17 3.9%
0 0.0%
0 0.0%
0 0.0%
4 0.9%
26 92.9%
1 33.3%
2 66.7%
0 0.0%
0 0.0%
0 0.0%
1 3.6%
2 66.7%
0 0.0%
0 0.0%
0 0.0%
0 0.0%
0 0.0%
0 0.0%
0 0.0%
435 90.4%
4 0.8%
20 4.2%
0 0.0%
4 0.8%
1 100.0%
0 0.0%
0 0.0%
0 0.0%
0 0.0%
436 90.5%
4 0.8%
20 4.1%
0 0.0%
4 0.8%
Male Female
5 83.3%
199 45.1%
1 16.7%
242 54.9%
22 78.6%
2 66.7%
2 66.7%
6 21.4%
1 33.3%
1 33.3%
230
251
47.8% 52.2%
1 100.0%
0 0.0%
231
251
47.9% 52.1%
HOPE Scholarships
School System
Number of 1999 Graduates 4 8 2
Number Eligible
416
Percent Eligible
86.3%
5,022 3,850 76.7%
State
65,548 40,292 61.5%
High School Completion Rate
Percent of 1995Grade 9 Enrollment in Graduating Class of1999 School System State
Completion Rate '95-'99 95.3% 83.6% 68.9%
1998-99 GEORGIA PUBLIC EDUCATION REPORT CARD
Pope High School - 6330188
Prepared by Georgia Department of Education
Page 2
COLLEGE ADMISSIONS / CREDIT TEST DATA
Scholastic Assessment Test (SAT)
Based on students' highest verbal and highest math scores
No. Taking
Average Score
Tests Verbal Math Total
Based on students' last test administration
Average Score Verbal Math Total
School
464
College Prep. Endorsement
Other Diplomas
System
4,180
College Prep. Endorsement
Other Diplomas
Georgia
41,958
555 561 1116
565 572 1137
408 391
799
523 522 1045 532 532 1064
402 387
789
492 488
980
545 N/A N/A
514 N/A N/A
483
550 N/A N/A
513 N/A N/A
479
1095 N/A N/A
1027 N/A N/A
962
Nation
952,913 N/A N/A N/A
502 508 1010
American College Testing (ACT)
Advanced Placement Exams (AP)
Number taking tests: 1 0 9 English Mathematics Reading Science Reasoning CompositeScore
School System
21.8 20.2
23.1 21.2
23.3 22.6
21.4 21.1
22.8 21.1
State 19.1 19.9 20.2 19.9 19.9
No. of Students Taking Tests
No. of Tests Taken No. of Test Scores
3 or Higher Percent of Test
Scores 3 or Higher
School 103 231 209
90.5%
System State 1,291 15,225 2,524 23,969 1,885 13,024
74.7% 54.3%
POST-SECONDARY DATA
Graduates Entering Georgia Public Colleges
Graduates Entering Georgia Public Colleges and Requiring Learning Support (LS)
1998 Graduates Entering in 1998-99
1997 Graduates Entering in 1997-98
Percent of Graduating Number Class
School
266
52.5%
System 2,220 46.3%
School
269
57.1%
System 2,229 48.4%
Number Requiring
LS 22 213
24 312
Percent of those attending Georgia
Public Colleges
8.3%
9.6%
8.9%
14.0%
In previous years, the Report Card presented College Prep Curriculum information provided by the Board of Regents on students requiring Learning Support. Due to inconsistencies in the data provided by the Board of Regents in defining College Prep Completers versus Local Board of Education data defining College Prep Endorsements, the Department of Education Report Card will not provide this information until discrepancies can be reconciled.
Graduates Entering Georgia Public Technical and Adult Schools
1998 Graduates School System
Entering Number 5 213
1998-99 Percent
1.0% 4.4%
Entering Number N/A N/A
1997-98 Percent
N/A N/A
1997 Graduates School
0
0.0%
System
22
0.5%
9
1.9%
192
4.2%
1998-99 GEORGIA PUBLIC EDUCATION REPORT CARD Pope High School - 6330188
Prepared by Georgia Department of Education
Page 3
CERTIFIED PERSONNEL DATA
Positions Number Average Contract Days
Administrators
5.02 218.11
Support Personnel
8.99 191.00
PK-12 Teachers
113.00 191.00
Personnel Sex
Certificate
Years Experience
Full-time Part-time
Male Female
4 Yr Bachelor's 5 Yr Master's 6 Yr Specialist's 7 Yr Doctoral Other*
<1 1-10 11-20 21-30 >30
Average
5 1
4 2
0 3 2 1 0
0 1 4 1 0
16.00
7 28
19 16
17 10
7 1 0
0 18
8 8 1
13.00
81 40
31 90
54 49 14
4 0
0 45 50 22
4
13.98
*Includes One- and Two-Year Vocational Certificates.
ACCREDITATION DATA
Accredited by Southern Association of Colleges and Schools (SACS): Secondary/Middle Commission.
AWARDS / RECOGNITION DATA
Schools in Georgia may receive recognition in the following programs: Charter School Pay for Performance Program Georgia School of Excellence National Blue Ribbon School Pope High School did not receive recognition in any of these programs during the 1998-99 school year.
1998-99 GEORGIA PUBLIC EDUCATION REPORT CARD Pope High School - 6330188
Prepared by Georgia Department of Education
Page 4
1998-99 GEORGIA PUBLIC EDUCATION REPORT CARD
COBB COUNTY SCHOOLS
Powder Springs Elementary School - 6330489
Grade Range PK-5
The Georgia Public Education Report Card is designed to assist systems and schools in educational improvement. This report card contains a variety of data elements. An explanation of the terms is provided as a companion to the report card data. Please refer to the definitions for the most effective use of the reported data.
STUDENT DATA
Total
K-5
932
PK
16
Enrollment, by Race/Ethnicity and Sex
Black
White Hispanic
American Asian Indian
Multiracial
228 24.5%
651 69.8%
23 2.5%
6 0.6%
5 0.5%
19 2.0%
3 18.8%
12 75.0%
0 0.0%
0 0.0%
0 0.0%
1 6.3%
Male Female
496 53.2%
436 46.8%
10 62.5%
6 37.5%
Enrollment in Selected Programs
Program
Program % of Student Enrollment Population
Gifted (Grades K-12)
16
1.7%
Alternative Programs (Grades 6-12)
N/A
N/A
Students Eligible to Receive Free/Reduced Lunches
Number
Percent
School System
172 16,221
18.1% 17.8%
Dropout Rate *
Number
Rate
School System
N/A N/A
N/A N/A
* Dropout rates are not applicable for grades PK-5.
Enrollment in Compensatory Programs
Program
Program % of Student Enrollment Population
Special Education (Grades K-12)
132 14.2%
(PK)
29
N/A
English to Speakers of Other Languages (ESOL) (Grades K-12)
0
0.0%
Remedial Education (Grades 2-5, 9-12)
90 14.1%
Special Instructional Assistance (SIA) (Grades K-3)
165 27.0%
Title I (Grades K-12)
This school has no Title I program.
Total 6
Retained Students, by Race/Ethnicity and Sex
Black
White Hispanic
American MultiAsian Indian racial
3 50.0%
2 33.3%
0 0.0%
0 0.0%
0
1
0.0% 16.7%
Male Female
4
2
66.7% 33.3%
Prepared by Georgia Department of Education
Page 1
STATE-REQUIRED TEST DATA
NORM-REFERENCED TESTS Grade 3
Iowa Tests of Basic Skills (ITBS) Each chart reflects data for three years of testing.
Reading Comprehension 50
53 63 54 0
98-99
52 62 53 97-98
53 60 52 96-97
Mathematics
School 50
System
State
0
60 70 61 98-99
58 68 61 97-98
63 68 59 96-97
School System State
Reading Vocabulary 50
50 58 50 0
98-99
54 58 50 97-98
53 58 49 96-97
Language Arts
School 50
System
State
0
60 70 64 98-99
61 69 62 97-98
63 67 59 96-97
School System State
Social Studies 50
60 64 56 0
98-99
66 64 55 97-98
65 64 55 96-97
Science
School 50
System
State
0
69 70 59 98-99
66 70 59 97-98
68 69 58 96-97
School System State
Sources of Information
Composite Score
50
58 66 57 0
98-99
School 50
System
61 65 56 97-98
61 64 55 96-97
State 0
60 67 58 98-99
61 67 57 97-98
1998-99 GEORGIA PUBLIC EDUCATION REPORT CARD Powder Springs Elementary School - 6330489
Prepared by Georgia Department of Education
61 66 56 96-97
Scores Reported in Percentiles
School System State
Page 2
STATE-REQUIRED TEST DATA
NORM-REFERENCED TESTS Grade 5
Iowa Tests of Basic Skills (ITBS) Each chart reflects data for three years of testing.
Reading Comprehension
Mathematics
50
49 59 53 0
98-99
56 60 53 97-98
50 60 52 96-97
School 50
System
State
0
59 68 59 98-99
65 68 58 97-98
63 69 57 96-97
School System State
Reading Vocabulary 50
45 57 48 0
98-99
55 58 48 97-98
50 58 46 96-97
Language Arts
School 50
System
State
0
61 71 63 98-99
63 70 61 97-98
58 69 58 96-97
School System State
Social Studies 50
58 64 57 0
98-99
61 64 56 97-98
56 65 55 96-97
Science
School 50
System
State
0
61 68 60 98-99
69 69 59 97-98
64 70 59 96-97
School System State
Sources of Information
Composite Score
50
61 67 58 0
98-99
School 50
System
62 65 58 97-98
59 66 57 96-97
State 0
58 66 57 98-99
62 66 56 97-98
58 67 55 96-97
1998-99 GEORGIA PUBLIC EDUCATION REPORT CARD Powder Springs Elementary School - 6330489
Prepared by Georgia Department of Education
Scores Reported in Percentiles
School System State
Page 3
STATE-REQUIRED TEST DATA
PERFORMANCE ASSESSMENTS
Grade 5 Writing Assessment
Percent at Developmental Stages:
1998-99 School System State
1997-98 School System State
1996-97 School System State
Stage Stage Stage Stage Stage Stage
1:The Emerging Writer 2:The Developing Writer 3:The Focusing Writer 4:The Experimenting 5:The Engaging Writer 6:The Extending Writer
2% 1% 6% 43% 30% 16%
0% 1% 10% 36% 34% 19%
0% 1% 16% 41% 29% 12%
0% 0% 9% 34% 39% 18%
0% 1% 12% 37% 33% 16%
0% 3% 19% 41% 27% 10%
0% 1% 15% 44% 31% 8%
0% 1% 14% 34% 32% 18%
0% 3% 21% 37% 26% 12%
AWARDS / RECOGNITION DATA
Schools in Georgia may receive recognition in the following programs: Charter School Pay for Performance Program Georgia School of Excellence National Blue Ribbon School Powder Springs Elementary School did not receive recognition in any of these programs during the 1998-99 school year.
1998-99 GEORGIA PUBLIC EDUCATION REPORT CARD Powder Springs Elementary School - 6330489
Prepared by Georgia Department of Education
Page 4
CERTIFIED PERSONNEL DATA
Positions Number Average Contract Days
Personnel Sex
Certificate
Years Experience
Full-time Part-time
Male Female
4 Yr Bachelor's 5 Yr Master's 6 Yr Specialist's 7 Yr Doctoral Other*
<1 1-10 11-20 21-30 >30
Average
Administrators
2.00 235.00
2 0
0 2
0 0 2 0 0 0 0 1 1 0 19.50
Support Personnel
5.56 191.00
4 4
1 7
1 7 0 0 0 0 3 4 0 1 15.25
PK-12 Teachers
57.70 191.00
53 7
1 59
36 19
4 1 0 0 29 21 10 0 12.32
*Includes One- and Two-Year Vocational Certificates.
ACCREDITATION DATA
Accredited by Southern Association of Colleges and Schools (SACS):
Elementary/Middle Commission.
1998-99 GEORGIA PUBLIC EDUCATION REPORT CARD Powder Springs Elementary School - 6330489
Prepared by Georgia Department of Education
Page 5
1998-99 GEORGIA PUBLIC EDUCATION REPORT CARD
COBB COUNTY SCHOOLS
Powers Ferry Elementary School - 6331067
Grade Range K-5
The Georgia Public Education Report Card is designed to assist systems and schools in educational improvement. This report card contains a variety of data elements. An explanation of the terms is provided as a companion to the report card data. Please refer to the definitions for the most effective use of the reported data.
STUDENT DATA
Total 418
K-5 Enrollment, by Race/Ethnicity and Sex
Black
White Hispanic
American Multi-
Asian Indian
racial
200 47.8%
129 30.9%
51 12.2%
20 4.8%
5 1.2%
13 3.1%
Male Female
202 48.3%
216 51.7%
Enrollment in Selected Programs
Program
Program % of Student Enrollment Population
Gifted (Grades K-12)
0
0.0%
Alternative Programs (Grades 6-12)
N/A
N/A
Students Eligible to Receive Free/Reduced Lunches
Number
Percent
School System
227 16,221
54.3% 17.8%
Dropout Rate *
Number
Rate
School System
N/A N/A
N/A N/A
* Dropout rates are not applicable for grades PK-5.
Enrollment in Compensatory Programs
Program
Program % of Student Enrollment Population
Special Education (Grades K-12)
43 10.3%
(PK)
0
N/A
English to Speakers of Other Languages (ESOL) (Grades K-12)
36
8.6%
Remedial Education (Grades 2-5, 9-12)
78 26.6%
Special Instructional Assistance (SIA) (Grades K-3)
142 50.5%
Title I (Grades K-12)
This school has a schoolwide program.
Total 1
Retained Students, by Race/Ethnicity and Sex
Black
White Hispanic
American Multi-
Asian Indian
racial
1 100.0%
0 0.0%
0 0.0%
0 0.0%
0 0.0%
0 0.0%
Male Female
0
1
0.0% 100.0%
Prepared by Georgia Department of Education
Page 1
STATE-REQUIRED TEST DATA
NORM-REFERENCED TESTS Grade 3
Iowa Tests of Basic Skills (ITBS) Each chart reflects data for three years of testing.
Reading Comprehension 50
32 63 54 0
98-99
43 62 53 97-98
33 60 52 96-97
Mathematics
School 50
System
State
0
33 70 61 98-99
36 68 61 97-98
33 68 59 96-97
School System State
Reading Vocabulary 50
33 58 50 0
98-99
33 58 50 97-98
33 58 49 96-97
Language Arts
School 50
System
State
0
38 70 64 98-99
42 69 62 97-98
40 67 59 96-97
School System State
Social Studies 50
37 64 56 0
98-99
40 64 55 97-98
38 64 55 96-97
Science
School 50
System
State
0
31 70 59 98-99
41 70 59 97-98
40 69 58 96-97
School System State
Sources of Information
Composite Score
50
29 66 57 0
98-99
School 50
System
40 65 56 97-98
39 64 55 96-97
State 0
31 67 58 98-99
37 67 57 97-98
1998-99 GEORGIA PUBLIC EDUCATION REPORT CARD Powers Ferry Elementary School - 6331067
Prepared by Georgia Department of Education
38 66 56 96-97
Scores Reported in Percentiles
School System State
Page 2
STATE-REQUIRED TEST DATA
NORM-REFERENCED TESTS Grade 5
Iowa Tests of Basic Skills (ITBS) Each chart reflects data for three years of testing.
Reading Comprehension
Mathematics
50
39 59 53 0
98-99
40 60 53 97-98
50 60 52 96-97
School 50
System
State
0
49 68 59 98-99
45 68 58 97-98
56 69 57 96-97
School System State
Reading Vocabulary 50
34 57 48 0
98-99
33 58 48 97-98
49 58 46 96-97
Language Arts
School 50
System
State
0
54 71 63 98-99
47 70 61 97-98
61 69 58 96-97
School System State
Social Studies 50
37 64 57 0
98-99
36 64 56 97-98
50 65 55 96-97
Science
School 50
System
State
0
42 68 60 98-99
50 69 59 97-98
61 70 59 96-97
School System State
Sources of Information
Composite Score
50
43 67 58 0
98-99
School 50
System
45 65 58 97-98
61 66 57 96-97
State 0
44 66 57 98-99
42 66 56 97-98
56 67 55 96-97
1998-99 GEORGIA PUBLIC EDUCATION REPORT CARD Powers Ferry Elementary School - 6331067
Prepared by Georgia Department of Education
Scores Reported in Percentiles
School System State
Page 3
STATE-REQUIRED TEST DATA
PERFORMANCE ASSESSMENTS
Grade 5 Writing Assessment
Percent at Developmental Stages:
1998-99 School System State
1997-98 School System State
1996-97 School System State
Stage Stage Stage Stage Stage Stage
1:The Emerging Writer 2:The Developing Writer 3:The Focusing Writer 4:The Experimenting 5:The Engaging Writer 6:The Extending Writer
0% 2% 13% 39% 26% 20%
0% 1% 10% 36% 34% 19%
0% 1% 16% 41% 29% 12%
2% 4% 13% 57% 19% 6%
0% 1% 12% 37% 33% 16%
0% 3% 19% 41% 27% 10%
0% 2% 18% 31% 31% 18%
0% 1% 14% 34% 32% 18%
0% 3% 21% 37% 26% 12%
AWARDS / RECOGNITION DATA
Schools in Georgia may receive recognition in the following programs: Charter School Pay for Performance Program Georgia School of Excellence National Blue Ribbon School Powers Ferry Elementary School did not receive recognition in any of these programs during the 1998-99 school year.
1998-99 GEORGIA PUBLIC EDUCATION REPORT CARD Powers Ferry Elementary School - 6331067
Prepared by Georgia Department of Education
Page 4
CERTIFIED PERSONNEL DATA
Positions Number Average Contract Days
Personnel Sex
Certificate
Years Experience
Full-time Part-time
Male Female
4 Yr Bachelor's 5 Yr Master's 6 Yr Specialist's 7 Yr Doctoral Other*
<1 1-10 11-20 21-30 >30
Average
Administrators
2.00 225.50
2 0
2 0
0 0 1 1 0 0 0 1 0 1 23.50
Support Personnel
5.50 191.00
4 3
0 7
5 2 0 0 0 0 4 2 1 0 9.57
PK-12 Teachers
30.13 191.00
29 3
1 31
18 14
0 0 0 0 15 11 5 1 12.44
*Includes One- and Two-Year Vocational Certificates.
ACCREDITATION DATA
Accredited by Southern Association of Colleges and Schools (SACS):
Elementary/Middle Commission.
1998-99 GEORGIA PUBLIC EDUCATION REPORT CARD Powers Ferry Elementary School - 6331067
Prepared by Georgia Department of Education
Page 5
1998-99 GEORGIA PUBLIC EDUCATION REPORT CARD
COBB COUNTY SCHOOLS
Riverside Elementary School - 6332067
Grade Range K-5
The Georgia Public Education Report Card is designed to assist systems and schools in educational improvement. This report card contains a variety of data elements. An explanation of the terms is provided as a companion to the report card data. Please refer to the definitions for the most effective use of the reported data.
STUDENT DATA
Total 649
K-5 Enrollment, by Race/Ethnicity and Sex
Black
White Hispanic
American Multi-
Asian Indian
racial
569 87.7%
19 2.9%
43 6.6%
0 0.0%
0 0.0%
18 2.8%
Male Female
322 49.6%
327 50.4%
Enrollment in Selected Programs
Program
Program % of Student Enrollment Population
Gifted (Grades K-12)
0
0.0%
Alternative Programs (Grades 6-12)
N/A
N/A
Students Eligible to Receive Free/Reduced Lunches
Number
Percent
School System
489 16,221
75.3% 17.8%
Dropout Rate *
Number
Rate
School System
N/A N/A
N/A N/A
* Dropout rates are not applicable for grades PK-5.
Enrollment in Compensatory Programs
Program
Program % of Student Enrollment Population
Special Education (Grades K-12)
54
8.3%
(PK)
0
N/A
English to Speakers of Other Languages (ESOL) (Grades K-12)
23
3.5%
Remedial Education (Grades 2-5, 9-12)
63 14.3%
Special Instructional Assistance (SIA) (Grades K-3)
266 61.6%
Title I (Grades K-12)
This school has a schoolwide program.
Total 23
Retained Students, by Race/Ethnicity and Sex
Black
White Hispanic
American Multi-
Asian Indian
racial
18 78.3%
1 4.3%
4 17.4%
0 0.0%
0 0.0%
0 0.0%
Male Female
16
7
69.6% 30.4%
Prepared by Georgia Department of Education
Page 1
STATE-REQUIRED TEST DATA
NORM-REFERENCED TESTS Grade 3
Iowa Tests of Basic Skills (ITBS) Each chart reflects data for three years of testing.
Reading Comprehension 50
33 63 54 0
98-99
34 62 53 97-98
27 60 52 96-97
Mathematics
School 50
System
State
0
40 70 61 98-99
40 68 61 97-98
30 68 59 96-97
School System State
Reading Vocabulary 50
30 58 50 0
98-99
28 58 50 97-98
25 58 49 96-97
Language Arts
School 50
System
State
0
51 70 64 98-99
54 69 62 97-98
43 67 59 96-97
School System State
Social Studies 50
37 64 56 0
98-99
37 64 55 97-98
32 64 55 96-97
Science
School 50
System
State
0
40 70 59 98-99
38 70 59 97-98
33 69 58 96-97
School System State
Sources of Information
Composite Score
50
39 66 57 0
98-99
School 50
System
36 65 56 97-98
30 64 55 96-97
State 0
39 67 58 98-99
38 67 57 97-98
1998-99 GEORGIA PUBLIC EDUCATION REPORT CARD Riverside Elementary School - 6332067
Prepared by Georgia Department of Education
31 66 56 96-97
Scores Reported in Percentiles
School System State
Page 2
STATE-REQUIRED TEST DATA
NORM-REFERENCED TESTS Grade 5
Iowa Tests of Basic Skills (ITBS) Each chart reflects data for three years of testing.
Reading Comprehension
Mathematics
50
38 59 53 0
98-99
38 60 53 97-98
45 60 52 96-97
School 50
System
State
0
44 68 59 98-99
45 68 58 97-98
55 69 57 96-97
School System State
Reading Vocabulary 50
23 57 48 0
98-99
26 58 48 97-98
37 58 46 96-97
Language Arts
School 50
System
State
0
58 71 63 98-99
59 70 61 97-98
71 69 58 96-97
School System State
Social Studies 50
31 64 57 0
98-99
29 64 56 97-98
48 65 55 96-97
Science
School 50
System
State
0
34 68 60 98-99
34 69 59 97-98
43 70 59 96-97
School System State
Sources of Information
Composite Score
50
46 67 58 0
98-99
School 50
System
40 65 58 97-98
48 66 57 96-97
State 0
39 66 57 98-99
38 66 56 97-98
50 67 55 96-97
1998-99 GEORGIA PUBLIC EDUCATION REPORT CARD Riverside Elementary School - 6332067
Prepared by Georgia Department of Education
Scores Reported in Percentiles
School System State
Page 3
STATE-REQUIRED TEST DATA
PERFORMANCE ASSESSMENTS
Grade 5 Writing Assessment
Percent at Developmental Stages:
1998-99 School System State
1997-98 School System State
1996-97 School System State
Stage Stage Stage Stage Stage Stage
1:The Emerging Writer 2:The Developing Writer 3:The Focusing Writer 4:The Experimenting 5:The Engaging Writer 6:The Extending Writer
0% 2% 21% 49% 25% 2%
0% 1% 10% 36% 34% 19%
0% 1% 16% 41% 29% 12%
0% 3% 26% 43% 21% 3%
0% 1% 12% 37% 33% 16%
0% 3% 19% 41% 27% 10%
0% 3% 17% 42% 29% 10%
0% 1% 14% 34% 32% 18%
0% 3% 21% 37% 26% 12%
AWARDS / RECOGNITION DATA
Schools in Georgia may receive recognition in the following programs: Charter School Pay for Performance Program Georgia School of Excellence National Blue Ribbon School Riverside Elementary School did not receive recognition in any of these programs during the 1998-99 school year.
1998-99 GEORGIA PUBLIC EDUCATION REPORT CARD Riverside Elementary School - 6332067
Prepared by Georgia Department of Education
Page 4
CERTIFIED PERSONNEL DATA
Positions Number Average Contract Days
Personnel Sex
Certificate
Years Experience
Full-time Part-time
Male Female
4 Yr Bachelor's 5 Yr Master's 6 Yr Specialist's 7 Yr Doctoral Other*
<1 1-10 11-20 21-30 >30
Average
Administrators
2.00 225.50
2 0
0 2
0 1 1 0 0 0 0 1 1 0 20.00
Support Personnel
5.11 191.00
5 1
2 4
1 5 0 0 0 0 4 1 1 0 9.50
PK-12 Teachers
41.40 191.00
40 2
4 38
31 10
1 0 0 0 31 9 0 2 7.88
*Includes One- and Two-Year Vocational Certificates.
ACCREDITATION DATA
Accredited by Southern Association of Colleges and Schools (SACS):
Elementary/Middle Commission.
1998-99 GEORGIA PUBLIC EDUCATION REPORT CARD Riverside Elementary School - 6332067
Prepared by Georgia Department of Education
Page 5
1998-99 GEORGIA PUBLIC EDUCATION REPORT CARD
COBB COUNTY SCHOOLS
Rocky Mount Elementary School - 6330378
Grade Range PK-5
The Georgia Public Education Report Card is designed to assist systems and schools in educational improvement. This report card contains a variety of data elements. An explanation of the terms is provided as a companion to the report card data. Please refer to the definitions for the most effective use of the reported data.
STUDENT DATA
Total
K-5
682
PK
27
Enrollment, by Race/Ethnicity and Sex
Black
White Hispanic
American Asian Indian
Multiracial
33 4.8%
595 87.2%
18 2.6%
23 3.4%
0 0.0%
13 1.9%
0 0.0%
26 96.3%
0 0.0%
1 3.7%
0 0.0%
0 0.0%
Male Female
364 53.4%
318 46.6%
19 70.4%
8 29.6%
Enrollment in Selected Programs
Program
Program % of Student Enrollment Population
Gifted (Grades K-12)
42
6.2%
Alternative Programs (Grades 6-12)
N/A
N/A
Students Eligible to Receive Free/Reduced Lunches
Number
Percent
School System
34 16,221
4.8% 17.8%
Dropout Rate *
Number
Rate
School System
N/A N/A
N/A N/A
* Dropout rates are not applicable for grades PK-5.
Enrollment in Compensatory Programs
Program
Program % of Student Enrollment Population
Special Education (Grades K-12)
89 13.0%
(PK)
31
N/A
English to Speakers of Other Languages (ESOL) (Grades K-12)
0
0.0%
Remedial Education (Grades 2-5, 9-12)
33
7.0%
Special Instructional Assistance (SIA) (Grades K-3)
63 14.5%
Title I (Grades K-12)
This school has no Title I program.
Total 7
Retained Students, by Race/Ethnicity and Sex
Black
White Hispanic
American MultiAsian Indian racial
0
7
0.0% 100.0%
0 0.0%
0 0.0%
0 0.0%
0 0.0%
Male Female
5
2
71.4% 28.6%
Prepared by Georgia Department of Education
Page 1
STATE-REQUIRED TEST DATA
NORM-REFERENCED TESTS Grade 3
Iowa Tests of Basic Skills (ITBS) Each chart reflects data for three years of testing.
Reading Comprehension 50
69 63 54 0
98-99
72 62 53 97-98
68 60 52 96-97
Mathematics
School 50
System
State
0
76 70 61 98-99
83 68 61 97-98
74 68 59 96-97
School System State
Reading Vocabulary 50
65 58 50 0
98-99
71 58 50 97-98
71 58 49 96-97
Language Arts
School 50
System
State
0
68 70 64 98-99
80 69 62 97-98
66 67 59 96-97
School System State
Social Studies 50
69 64 56 0
98-99
71 64 55 97-98
67 64 55 96-97
Science
School 50
System
State
0
77 70 59 98-99
79 70 59 97-98
74 69 58 96-97
School System State
Sources of Information
Composite Score
50
71 66 57 0
98-99
School 50
System
75 65 56 97-98
69 64 55 96-97
State 0
72 67 58 98-99
78 67 57 97-98
1998-99 GEORGIA PUBLIC EDUCATION REPORT CARD Rocky Mount Elementary School - 6330378
Prepared by Georgia Department of Education
70 66 56 96-97
Scores Reported in Percentiles
School System State
Page 2
STATE-REQUIRED TEST DATA
NORM-REFERENCED TESTS Grade 5
Iowa Tests of Basic Skills (ITBS) Each chart reflects data for three years of testing.
Reading Comprehension
Mathematics
50
67 59 53 0
98-99
68 60 53 97-98
69 60 52 96-97
School 50
System
State
0
78 68 59 98-99
76 68 58 97-98
76 69 57 96-97
School System State
Reading Vocabulary 50
62 57 48 0
98-99
68 58 48 97-98
70 58 46 96-97
Language Arts
School 50
System
State
0
76 71 63 98-99
76 70 61 97-98
71 69 58 96-97
School System State
Social Studies 50
75 64 57 0
98-99
74 64 56 97-98
74 65 55 96-97
Science
School 50
System
State
0
74 68 60 98-99
78 69 59 97-98
76 70 59 96-97
School System State
Sources of Information
Composite Score
50
72 67 58 0
98-99
School 50
System
73 65 58 97-98
74 66 57 96-97
State 0
75 66 57 98-99
76 66 56 97-98
75 67 55 96-97
1998-99 GEORGIA PUBLIC EDUCATION REPORT CARD Rocky Mount Elementary School - 6330378
Prepared by Georgia Department of Education
Scores Reported in Percentiles
School System State
Page 3
STATE-REQUIRED TEST DATA
PERFORMANCE ASSESSMENTS
Grade 5 Writing Assessment
Percent at Developmental Stages:
1998-99 School System State
1997-98 School System State
1996-97 School System State
Stage Stage Stage Stage Stage Stage
1:The Emerging Writer 2:The Developing Writer 3:The Focusing Writer 4:The Experimenting 5:The Engaging Writer 6:The Extending Writer
0% 0% 4% 26% 34% 34%
0% 1% 10% 36% 34% 19%
0% 1% 16% 41% 29% 12%
0% 0% 15% 30% 40% 14%
0% 1% 12% 37% 33% 16%
0% 3% 19% 41% 27% 10%
0% 2% 17% 34% 35% 13%
0% 1% 14% 34% 32% 18%
0% 3% 21% 37% 26% 12%
AWARDS / RECOGNITION DATA
Schools in Georgia may receive recognition in the following programs: Charter School Pay for Performance Program Georgia School of Excellence National Blue Ribbon School Rocky Mount Elementary School did not receive recognition in any of these programs during the 1998-99 school year.
1998-99 GEORGIA PUBLIC EDUCATION REPORT CARD Rocky Mount Elementary School - 6330378
Prepared by Georgia Department of Education
Page 4
CERTIFIED PERSONNEL DATA
Positions Number Average Contract Days
Personnel Sex
Certificate
Years Experience
Full-time Part-time
Male Female
4 Yr Bachelor's 5 Yr Master's 6 Yr Specialist's 7 Yr Doctoral Other*
<1 1-10 11-20 21-30 >30
Average
Administrators
2.00 225.50
2 0
1 1
0 0 2 0 0 0 0 0 1 1 29.50
Support Personnel
3.64 191.00
3 2
2 3
2 2 1 0 0 0 3 1 1 0 11.40
PK-12 Teachers
42.96 191.00
41 3
1 43
24 16
4 0 0 0 17 11 15 1 14.86
*Includes One- and Two-Year Vocational Certificates.
ACCREDITATION DATA
Accredited by Southern Association of Colleges and Schools (SACS):
Elementary/Middle Commission.
1998-99 GEORGIA PUBLIC EDUCATION REPORT CARD Rocky Mount Elementary School - 6330378
Prepared by Georgia Department of Education
Page 5
1998-99 GEORGIA PUBLIC EDUCATION REPORT CARD
COBB COUNTY SCHOOLS
Russell Elementary School - 6333067
Grade Range PK-5
The Georgia Public Education Report Card is designed to assist systems and schools in educational improvement. This report card contains a variety of data elements. An explanation of the terms is provided as a companion to the report card data. Please refer to the definitions for the most effective use of the reported data.
STUDENT DATA
Total
K-5
623
PK
3
Enrollment, by Race/Ethnicity and Sex
Black
White Hispanic
American Asian Indian
Multiracial
185 29.7%
356 57.1%
35 5.6%
23 3.7%
3 0.5%
21 3.4%
1 33.3%
2 66.7%
0 0.0%
0 0.0%
0 0.0%
0 0.0%
Male Female
310 49.8%
313 50.2%
0
3
0.0% 100.0%
Enrollment in Selected Programs
Program
Program % of Student Enrollment Population
Gifted (Grades K-12)
16
2.6%
Alternative Programs (Grades 6-12)
N/A
N/A
Students Eligible to Receive Free/Reduced Lunches
Number
Percent
School System
166 16,221
26.5% 17.8%
Dropout Rate *
Number
Rate
School System
N/A N/A
N/A N/A
* Dropout rates are not applicable for grades PK-5.
Enrollment in Compensatory Programs
Program
Program % of Student Enrollment Population
Special Education (Grades K-12)
66 10.6%
(PK)
3
N/A
English to Speakers of Other Languages (ESOL) (Grades K-12)
19
3.0%
Remedial Education (Grades 2-5, 9-12)
97 22.6%
Special Instructional Assistance (SIA) (Grades K-3)
78 19.4%
Title I (Grades K-12)
This school has no Title I program.
Total 5
Retained Students, by Race/Ethnicity and Sex
Black
White Hispanic
American MultiAsian Indian racial
1 20.0%
4 80.0%
0 0.0%
0 0.0%
0 0.0%
0 0.0%
Male Female
3
2
60.0% 40.0%
Prepared by Georgia Department of Education
Page 1
STATE-REQUIRED TEST DATA
NORM-REFERENCED TESTS Grade 3
Iowa Tests of Basic Skills (ITBS) Each chart reflects data for three years of testing.
Reading Comprehension 50
54 63 54 0
98-99
50 62 53 97-98
48 60 52 96-97
Mathematics
School 50
System
State
0
72 70 61 98-99
63 68 61 97-98
52 68 59 96-97
School System State
Reading Vocabulary 50
53 58 50 0
98-99
47 58 50 97-98
47 58 49 96-97
Language Arts
School 50
System
State
0
69 70 64 98-99
57 69 62 97-98
55 67 59 96-97
School System State
Social Studies 50
64 64 56 0
98-99
59 64 55 97-98
55 64 55 96-97
Science
School 50
System
State
0
68 70 59 98-99
62 70 59 97-98
58 69 58 96-97
School System State
Sources of Information
Composite Score
50
64 66 57 0
98-99
School 50
System
55 65 56 97-98
52 64 55 96-97
State 0
65 67 58 98-99
57 67 57 97-98
1998-99 GEORGIA PUBLIC EDUCATION REPORT CARD Russell Elementary School - 6333067
Prepared by Georgia Department of Education
53 66 56 96-97
Scores Reported in Percentiles
School System State
Page 2
STATE-REQUIRED TEST DATA
NORM-REFERENCED TESTS Grade 5
Iowa Tests of Basic Skills (ITBS) Each chart reflects data for three years of testing.
Reading Comprehension
Mathematics
50
55 59 53 0
98-99
48 60 53 97-98
48 60 52 96-97
School 50
System
State
0
61 68 59 98-99
51 68 58 97-98
52 69 57 96-97
School System State
Reading Vocabulary 50
52 57 48 0
98-99
50 58 48 97-98
48 58 46 96-97
Language Arts
School 50
System
State
0
66 71 63 98-99
58 70 61 97-98
59 69 58 96-97
School System State
Social Studies 50
55 64 57 0
98-99
50 64 56 97-98
50 65 55 96-97
Science
School 50
System
State
0
64 68 60 98-99
57 69 59 97-98
50 70 59 96-97
School System State
Sources of Information
Composite Score
50
63 67 58 0
98-99
School 50
System
56 65 58 97-98
53 66 57 96-97
State 0
61 66 57 98-99
53 66 56 97-98
51 67 55 96-97
1998-99 GEORGIA PUBLIC EDUCATION REPORT CARD Russell Elementary School - 6333067
Prepared by Georgia Department of Education
Scores Reported in Percentiles
School System State
Page 3
STATE-REQUIRED TEST DATA
PERFORMANCE ASSESSMENTS
Grade 5 Writing Assessment
Percent at Developmental Stages:
1998-99 School System State
1997-98 School System State
1996-97 School System State
Stage Stage Stage Stage Stage Stage
1:The Emerging Writer 2:The Developing Writer 3:The Focusing Writer 4:The Experimenting 5:The Engaging Writer 6:The Extending Writer
0% 0% 12% 43% 38% 8%
0% 1% 10% 36% 34% 19%
0% 1% 16% 41% 29% 12%
0% 4% 13% 40% 32% 11%
0% 1% 12% 37% 33% 16%
0% 3% 19% 41% 27% 10%
1% 2% 23% 36% 28% 8%
0% 1% 14% 34% 32% 18%
0% 3% 21% 37% 26% 12%
AWARDS / RECOGNITION DATA
Schools in Georgia may receive recognition in the following programs: Charter School Pay for Performance Program Georgia School of Excellence National Blue Ribbon School Russell Elementary School did not receive recognition in any of these programs during the 1998-99 school year.
1998-99 GEORGIA PUBLIC EDUCATION REPORT CARD Russell Elementary School - 6333067
Prepared by Georgia Department of Education
Page 4
CERTIFIED PERSONNEL DATA
Positions Number Average Contract Days
Personnel Sex
Certificate
Years Experience
Full-time Part-time
Male Female
4 Yr Bachelor's 5 Yr Master's 6 Yr Specialist's 7 Yr Doctoral Other*
<1 1-10 11-20 21-30 >30
Average
Administrators
2.00 225.50
2 0
0 2
0 1 1 0 0 0 0 0 2 0 24.50
Support Personnel
4.00 191.00
4 0
0 4
0 4 0 0 0 0 1 0 3 0 20.25
PK-12 Teachers
37.50 191.00
37 1
2 36
23 14
1 0 0 0 16 10 10 2 14.34
*Includes One- and Two-Year Vocational Certificates.
ACCREDITATION DATA
Accredited by Southern Association of Colleges and Schools (SACS):
Elementary/Middle Commission.
1998-99 GEORGIA PUBLIC EDUCATION REPORT CARD Russell Elementary School - 6333067
Prepared by Georgia Department of Education
Page 5
1998-99 GEORGIA PUBLIC EDUCATION REPORT CARD
COBB COUNTY SCHOOLS
Sanders Elementary School - 6330398
Grade Range PK-5
The Georgia Public Education Report Card is designed to assist systems and schools in educational improvement. This report card contains a variety of data elements. An explanation of the terms is provided as a companion to the report card data. Please refer to the definitions for the most effective use of the reported data.
STUDENT DATA
Total
K-5
782
PK
21
Enrollment, by Race/Ethnicity and Sex
Black
White Hispanic
American Asian Indian
Multiracial
414 52.9%
306 39.1%
36 4.6%
6 0.8%
2 0.3%
18 2.3%
9 42.9%
10 47.6%
2 9.5%
0 0.0%
0 0.0%
0 0.0%
Male Female
380 48.6%
402 51.4%
16 76.2%
5 23.8%
Enrollment in Selected Programs
Program
Program % of Student Enrollment Population
Gifted (Grades K-12)
0
0.0%
Alternative Programs (Grades 6-12)
N/A
N/A
Students Eligible to Receive Free/Reduced Lunches
Number
Percent
School System
373 16,221
46.5% 17.8%
Dropout Rate *
Number
Rate
School System
N/A N/A
N/A N/A
* Dropout rates are not applicable for grades PK-5.
Enrollment in Compensatory Programs
Program
Program % of Student Enrollment Population
Special Education (Grades K-12)
95 12.1%
(PK)
20
N/A
English to Speakers of Other Languages (ESOL) (Grades K-12)
16
2.0%
Remedial Education (Grades 2-5, 9-12)
154 28.7%
Special Instructional Assistance (SIA) (Grades K-3)
98 18.9%
Title I (Grades K-12)
This school has no Title I program.
Total 6
Retained Students, by Race/Ethnicity and Sex
Black
White Hispanic
American MultiAsian Indian racial
2 33.3%
4 66.7%
0 0.0%
0 0.0%
0 0.0%
0 0.0%
Male Female
3
3
50.0% 50.0%
Prepared by Georgia Department of Education
Page 1
STATE-REQUIRED TEST DATA
NORM-REFERENCED TESTS Grade 3
Iowa Tests of Basic Skills (ITBS) Each chart reflects data for three years of testing.
Reading Comprehension 50
40 63 54 0
98-99
35 62 53 N/A 60 52
97-98
96-97
Mathematics
School 50
System
State
0
35 70 61 98-99
38 68 61 N/A 68 59
97-98
96-97
School System State
Reading Vocabulary 50
36 58 50 0
98-99
34 58 50 N/A 58 49
97-98
96-97
Language Arts
School 50
System
State
0
44 70 64 98-99
37 69 62 N/A 67 59
97-98
96-97
School System State
Social Studies 50
37 64 56 0
98-99
40 64 55 N/A 64 55
97-98
96-97
Science
School 50
System
State
0
42 70 59 98-99
41 70 59 N/A 69 58
97-98
96-97
School System State
Sources of Information
Composite Score
50
37 66 57 0
98-99
School 50
System
37 65 56 N/A 64 55
97-98
96-97
State 0
37 67 58 98-99
37 67 57 N/A 66 56
97-98
96-97
1998-99 GEORGIA PUBLIC EDUCATION REPORT CARD Sanders Elementary School - 6330398
Prepared by Georgia Department of Education
Scores Reported in Percentiles
School System State
Page 2
STATE-REQUIRED TEST DATA
NORM-REFERENCED TESTS Grade 5
Iowa Tests of Basic Skills (ITBS) Each chart reflects data for three years of testing.
Reading Comprehension
Mathematics
50
41 59 53 0
98-99
45 60 53 N/A 60 52
97-98
96-97
School 50
System
State
0
39 68 59 98-99
40 68 58 N/A 69 57
97-98
96-97
School System State
Reading Vocabulary 50
39 57 48 0
98-99
37 58 48 N/A 58 46
97-98
96-97
Language Arts
School 50
System
State
0
47 71 63 98-99
48 70 61 N/A 69 58
97-98
96-97
School System State
Social Studies 50
44 64 57 0
98-99
46 64 56 N/A 65 55
97-98
96-97
Science
School 50
System
State
0
48 68 60 98-99
48 69 59 N/A 70 59
97-98
96-97
School System State
Sources of Information
Composite Score
50
45 67 58 0
98-99
School 50
System
45 65 58 N/A 66 57
97-98
96-97
State 0
42 66 57 98-99
43 66 56 N/A 67 55
97-98
96-97
1998-99 GEORGIA PUBLIC EDUCATION REPORT CARD Sanders Elementary School - 6330398
Prepared by Georgia Department of Education
Scores Reported in Percentiles
School System State
Page 3
STATE-REQUIRED TEST DATA
PERFORMANCE ASSESSMENTS
Grade 5 Writing Assessment
Percent at Developmental Stages:
1998-99 School System State
1997-98 School System State
1996-97 School System State
Stage Stage Stage Stage Stage Stage
1:The Emerging Writer 2:The Developing Writer 3:The Focusing Writer 4:The Experimenting 5:The Engaging Writer 6:The Extending Writer
0% 4% 12% 44% 30% 10%
0% 1% 10% 36% 34% 19%
0% 1% 16% 41% 29% 12%
0% 1% 31% 44% 16% 8%
0% 1% 12% 37% 33% 16%
0% 3% 19% 41% 27% 10%
N/A N/A N/A N/A N/A N/A
0% 1% 14% 34% 32% 18%
0% 3% 21% 37% 26% 12%
AWARDS / RECOGNITION DATA
Schools in Georgia may receive recognition in the following programs: Charter School Pay for Performance Program Georgia School of Excellence National Blue Ribbon School Sanders Elementary School did not receive recognition in any of these programs during the 1998-99 school year.
1998-99 GEORGIA PUBLIC EDUCATION REPORT CARD Sanders Elementary School - 6330398
Prepared by Georgia Department of Education
Page 4
CERTIFIED PERSONNEL DATA
Positions Number Average Contract Days
Personnel Sex
Certificate
Years Experience
Full-time Part-time
Male Female
4 Yr Bachelor's 5 Yr Master's 6 Yr Specialist's 7 Yr Doctoral Other*
<1 1-10 11-20 21-30 >30
Average
Administrators
2.00 235.00
2 0
0 2
0 1 1 0 0 0 1 0 1 0 13.50
Support Personnel
10.00 191.00
10 0
1 9
2 6 2 0 0 0 6 3 1 0 9.10
PK-12 Teachers
51.50 191.00
50 3
5 48
38 14
1 0 0 0 44 6 2 1 6.57
*Includes One- and Two-Year Vocational Certificates.
ACCREDITATION DATA
Accredited by Southern Association of Colleges and Schools (SACS):
Elementary/Middle Commission.
1998-99 GEORGIA PUBLIC EDUCATION REPORT CARD Sanders Elementary School - 6330398
Prepared by Georgia Department of Education
Page 5
1998-99 GEORGIA PUBLIC EDUCATION REPORT CARD
COBB COUNTY SCHOOLS
Sedalia Park Elementary School - 6335067
Grade Range PK-5
The Georgia Public Education Report Card is designed to assist systems and schools in educational improvement. This report card contains a variety of data elements. An explanation of the terms is provided as a companion to the report card data. Please refer to the definitions for the most effective use of the reported data.
STUDENT DATA
Total
K-5
654
PK
25
Enrollment, by Race/Ethnicity and Sex
Black
White Hispanic
American Asian Indian
Multiracial
146 22.3%
343 52.4%
58
79
8.9% 12.1%
6 0.9%
22 3.4%
5 20.0%
15 60.0%
3 12.0%
1 4.0%
0 0.0%
1 4.0%
Male Female
311 47.6%
343 52.4%
14 56.0%
11 44.0%
Enrollment in Selected Programs
Program
Program % of Student Enrollment Population
Gifted (Grades K-12)
29
4.4%
Alternative Programs (Grades 6-12)
N/A
N/A
Students Eligible to Receive Free/Reduced Lunches
Number
Percent
School System
173 16,221
25.5% 17.8%
Dropout Rate *
Number
Rate
School System
N/A N/A
N/A N/A
* Dropout rates are not applicable for grades PK-5.
Enrollment in Compensatory Programs
Program
Program % of Student Enrollment Population
Special Education (Grades K-12)
74 11.3%
(PK)
26
N/A
English to Speakers of Other Languages (ESOL) (Grades K-12)
42
6.4%
Remedial Education (Grades 2-5, 9-12)
67 15.6%
Special Instructional Assistance (SIA) (Grades K-3)
97 21.9%
Title I (Grades K-12)
This school has no Title I program.
Total 6
Retained Students, by Race/Ethnicity and Sex
Black
White Hispanic
American MultiAsian Indian racial
0 0.0%
4
2
66.7% 33.3%
0 0.0%
0 0.0%
0 0.0%
Male Female
2
4
33.3% 66.7%
Prepared by Georgia Department of Education
Page 1
STATE-REQUIRED TEST DATA
NORM-REFERENCED TESTS Grade 3
Iowa Tests of Basic Skills (ITBS) Each chart reflects data for three years of testing.
Reading Comprehension 50
63 63 54 0
98-99
64 62 53 97-98
69 60 52 96-97
Mathematics
School 50
System
State
0
78 70 61 98-99
72 68 61 97-98
76 68 59 96-97
School System State
Reading Vocabulary 50
62 58 50 0
98-99
59 58 50 97-98
60 58 49 96-97
Language Arts
School 50
System
State
0
80 70 64 98-99
76 69 62 97-98
80 67 59 96-97
School System State
Social Studies 50
66 64 56 0
98-99
63 64 55 97-98
68 64 55 96-97
Science
School 50
System
State
0
67 70 59 98-99
65 70 59 97-98
67 69 58 96-97
School System State
Sources of Information
Composite Score
50
70 66 57 0
98-99
School 50
System
63 65 56 97-98
72 64 55 96-97
State 0
71 67 58 98-99
67 67 57 97-98
1998-99 GEORGIA PUBLIC EDUCATION REPORT CARD Sedalia Park Elementary School - 6335067
Prepared by Georgia Department of Education
72 66 56 96-97
Scores Reported in Percentiles
School System State
Page 2
STATE-REQUIRED TEST DATA
NORM-REFERENCED TESTS Grade 5
Iowa Tests of Basic Skills (ITBS) Each chart reflects data for three years of testing.
Reading Comprehension
Mathematics
50
62 59 53 0
98-99
56 60 53 97-98
54 60 52 96-97
School 50
System
State
0
74 68 59 98-99
70 68 58 97-98
65 69 57 96-97
School System State
Reading Vocabulary 50
62 57 48 0
98-99
57 58 48 97-98
54 58 46 96-97
Language Arts
School 50
System
State
0
77 71 63 98-99
72 70 61 97-98
68 69 58 96-97
School System State
Social Studies 50
67 64 57 0
98-99
64 64 56 97-98
60 65 55 96-97
Science
School 50
System
State
0
69 68 60 98-99
71 69 59 97-98
68 70 59 96-97
School System State
Sources of Information
Composite Score
50
70 67 58 0
98-99
School 50
System
68 65 58 97-98
63 66 57 96-97
State 0
71 66 57 98-99
67 66 56 97-98
63 67 55 96-97
1998-99 GEORGIA PUBLIC EDUCATION REPORT CARD Sedalia Park Elementary School - 6335067
Prepared by Georgia Department of Education
Scores Reported in Percentiles
School System State
Page 3
STATE-REQUIRED TEST DATA
PERFORMANCE ASSESSMENTS
Grade 5 Writing Assessment
Percent at Developmental Stages:
1998-99 School System State
1997-98 School System State
1996-97 School System State
Stage Stage Stage Stage Stage Stage
1:The Emerging Writer 2:The Developing Writer 3:The Focusing Writer 4:The Experimenting 5:The Engaging Writer 6:The Extending Writer
0% 0% 8% 42% 38% 12%
0% 1% 10% 36% 34% 19%
0% 1% 16% 41% 29% 12%
0% 1% 6% 49% 31% 13%
0% 1% 12% 37% 33% 16%
0% 3% 19% 41% 27% 10%
0% 4% 23% 30% 26% 17%
0% 1% 14% 34% 32% 18%
0% 3% 21% 37% 26% 12%
AWARDS / RECOGNITION DATA
Schools that become a Charter School have a unique opportunity to rethink how they structure and deliver education programs for improving the learning of their students while being freed from the state laws, State Board of Education rules and regulations, and local board of education rules and regulations that govern other schools. A 'charter' is a binding contract that, when approved by the faculty and parents of the school, the local board of education and the State Board of Education, substitutes for state education statutes, state and local rules, policies, regulations and standards.
Sedalia Park Elementary School is a Charter School for 1998-99.
1998-99 GEORGIA PUBLIC EDUCATION REPORT CARD Sedalia Park Elementary School - 6335067
Prepared by Georgia Department of Education
Page 4
CERTIFIED PERSONNEL DATA
Positions Number Average Contract Days
Personnel Sex
Certificate
Years Experience
Full-time Part-time
Male Female
4 Yr Bachelor's 5 Yr Master's 6 Yr Specialist's 7 Yr Doctoral Other*
<1 1-10 11-20 21-30 >30
Average
Administrators
2.00 225.50
2 0
0 2
0 1 1 0 0 0 0 2 0 0 17.50
Support Personnel
4.00 191.00
4 0
0 4
0 4 0 0 0 0 0 4 0 0 16.00
PK-12 Teachers
43.00 191.00
41 4
3 42
24 17
4 0 0 0 20 17 8 0 12.89
*Includes One- and Two-Year Vocational Certificates.
ACCREDITATION DATA
Accredited by Southern Association of Colleges and Schools (SACS):
Elementary/Middle Commission.
1998-99 GEORGIA PUBLIC EDUCATION REPORT CARD Sedalia Park Elementary School - 6335067
Prepared by Georgia Department of Education
Page 5
1998-99 GEORGIA PUBLIC EDUCATION REPORT CARD
COBB COUNTY SCHOOLS
Shallowford Falls Elementary School - 6330291
Grade Range K-5
The Georgia Public Education Report Card is designed to assist systems and schools in educational improvement. This report card contains a variety of data elements. An explanation of the terms is provided as a companion to the report card data. Please refer to the definitions for the most effective use of the reported data.
STUDENT DATA
Total 687
K-5 Enrollment, by Race/Ethnicity and Sex
Black
White Hispanic
American Multi-
Asian Indian
racial
14 2.0%
621 90.4%
17 2.5%
22 3.2%
0 0.0%
13 1.9%
Male Female
356 51.8%
331 48.2%
Enrollment in Selected Programs
Program
Program % of Student Enrollment Population
Gifted (Grades K-12)
61
8.9%
Alternative Programs (Grades 6-12)
N/A
N/A
Students Eligible to Receive Free/Reduced Lunches
Number
Percent
School System
15 16,221
2.2% 17.8%
Dropout Rate *
Number
Rate
School System
N/A N/A
N/A N/A
* Dropout rates are not applicable for grades PK-5.
Enrollment in Compensatory Programs
Program
Program % of Student Enrollment Population
Special Education (Grades K-12)
105 15.3%
(PK)
0
N/A
English to Speakers of Other Languages (ESOL) (Grades K-12)
0
0.0%
Remedial Education (Grades 2-5, 9-12)
25
5.1%
Special Instructional Assistance (SIA) (Grades K-3)
44 10.2%
Title I (Grades K-12)
This school has no Title I program.
Total 10
Retained Students, by Race/Ethnicity and Sex
Black
White Hispanic
American Multi-
Asian Indian
racial
1 10.0%
8 80.0%
1 10.0%
0 0.0%
0 0.0%
0 0.0%
Male Female
6
4
60.0% 40.0%
Prepared by Georgia Department of Education
Page 1
STATE-REQUIRED TEST DATA
NORM-REFERENCED TESTS Grade 3
Iowa Tests of Basic Skills (ITBS) Each chart reflects data for three years of testing.
Reading Comprehension 50
85 63 54 0
98-99
77 62 53 97-98
80 60 52 96-97
Mathematics
School 50
System
State
0
89 70 61 98-99
87 68 61 97-98
90 68 59 96-97
School System State
Reading Vocabulary 50
84 58 50 0
98-99
79 58 50 97-98
82 58 49 96-97
Language Arts
School 50
System
State
0
89 70 64 98-99
87 69 62 97-98
81 67 59 96-97
School System State
Social Studies 50
85 64 56 0
98-99
79 64 55 97-98
80 64 55 96-97
Science
School 50
System
State
0
87 70 59 98-99
86 70 59 97-98
87 69 58 96-97
School System State
Sources of Information
Composite Score
50
85 66 57 0
98-99
School 50
System
80 65 56 97-98
82 64 55 96-97
State 0
89 67 58 98-99
85 67 57 97-98
1998-99 GEORGIA PUBLIC EDUCATION REPORT CARD Shallowford Falls Elementary School - 6330291
Prepared by Georgia Department of Education
86 66 56 96-97
Scores Reported in Percentiles
School System State
Page 2
STATE-REQUIRED TEST DATA
NORM-REFERENCED TESTS Grade 5
Iowa Tests of Basic Skills (ITBS) Each chart reflects data for three years of testing.
Reading Comprehension
Mathematics
50
76 59 53 0
98-99
75 60 53 97-98
75 60 52 96-97
School 50
System
State
0
91 68 59 98-99
90 68 58 97-98
91 69 57 96-97
School System State
Reading Vocabulary 50
81 57 48 0
98-99
81 58 48 97-98
85 58 46 96-97
Language Arts
School 50
System
State
0
86 71 63 98-99
89 70 61 97-98
87 69 58 96-97
School System State
Social Studies 50
86 64 57 0
98-99
81 64 56 97-98
83 65 55 96-97
Science
School 50
System
State
0
86 68 60 98-99
86 69 59 97-98
84 70 59 96-97
School System State
Sources of Information
Composite Score
50
87 67 58 0
98-99
School 50
System
81 65 58 97-98
84 66 57 96-97
State 0
90 66 57 98-99
88 66 56 97-98
88 67 55 96-97
1998-99 GEORGIA PUBLIC EDUCATION REPORT CARD Shallowford Falls Elementary School - 6330291
Prepared by Georgia Department of Education
Scores Reported in Percentiles
School System State
Page 3
STATE-REQUIRED TEST DATA
PERFORMANCE ASSESSMENTS
Grade 5 Writing Assessment
Percent at Developmental Stages:
1998-99 School System State
1997-98 School System State
1996-97 School System State
Stage Stage Stage Stage Stage Stage
1:The Emerging Writer 2:The Developing Writer 3:The Focusing Writer 4:The Experimenting 5:The Engaging Writer 6:The Extending Writer
0% 0% 5% 24% 40% 30%
0% 1% 10% 36% 34% 19%
0% 1% 16% 41% 29% 12%
0% 0% 2% 19% 43% 36%
0% 1% 12% 37% 33% 16%
0% 3% 19% 41% 27% 10%
0% 0% 9% 20% 29% 41%
0% 1% 14% 34% 32% 18%
0% 3% 21% 37% 26% 12%
AWARDS / RECOGNITION DATA
Through the Pay for Performance Program, exemplary public schools and schools making outstanding progress toward becoming exemplary may be rewarded. Not a merit pay program, the Pay for Performance Program motivates and rewards entire school faculties for working together to make their schools exemplary.
The Georgia School of Excellence Program recognizes exemplary schools that have excellent, successful programs in many areas of school life.
Shallowford Falls Elementary School was a Pay for Performance recipient in 1998-99 and was designated a 1998-99 Georgia School of Excellence.
1998-99 GEORGIA PUBLIC EDUCATION REPORT CARD Shallowford Falls Elementary School - 6330291
Prepared by Georgia Department of Education
Page 4
CERTIFIED PERSONNEL DATA
Positions Number Average Contract Days
Personnel Sex
Certificate
Years Experience
Full-time Part-time
Male Female
4 Yr Bachelor's 5 Yr Master's 6 Yr Specialist's 7 Yr Doctoral Other*
<1 1-10 11-20 21-30 >30
Average
Administrators
2.00 225.50
2 0
0 2
0 0 1 1 0 0 0 1 1 0 19.00
Support Personnel
6.00 189.67
6 0
1 5
1 4 1 0 0 0 2 2 1 1 15.67
PK-12 Teachers
42.00 191.00
42 0
2 40
21 19
2 0 0 0 9 26 7 0 14.45
*Includes One- and Two-Year Vocational Certificates.
ACCREDITATION DATA
Accredited by Southern Association of Colleges and Schools (SACS):
Elementary/Middle Commission.
1998-99 GEORGIA PUBLIC EDUCATION REPORT CARD Shallowford Falls Elementary School - 6330291
Prepared by Georgia Department of Education
Page 5
1998-99 GEORGIA PUBLIC EDUCATION REPORT CARD
COBB COUNTY SCHOOLS
Simpson Middle School - 6330389
Grade Range 6-8
The Georgia Public Education Report Card is designed to assist systems and schools in educational improvement. This report card contains a variety of data elements. An explanation of the terms is provided as a companion to the report card data. Please refer to the definitions for the most effective use of the reported data.
STUDENT DATA
Total 914
6-8 Enrollment, by Race/Ethnicity and Sex
Black
White Hispanic
American Multi-
Asian Indian
racial
66 7.2%
777 85.0%
28 3.1%
27 3.0%
1 0.1%
15 1.6%
Male 452
49.5%
Female 462
50.5%
Enrollment in Selected Programs
Program
Gifted (Grades K-12)
Program % of Student Enrollment Population
225
24.6%
Alternative Programs (Grades 6-12)
0
0.0%
Students Eligible to Receive Free/Reduced Lunches
Number
Percent
School System
33 16,221
3.6% 17.8%
Enrollment in Compensatory Programs
Program
Program % of Student Enrollment Population
Special Education (Grades K-12) (PK)
141 15.4%
0
N/A
English to Speakers of Other Languages (ESOL) (Grades K-12)
5
< 1%
Title I (Grades K-12)
This school has no Title I program.
Dropout Rate for Grades 6-8
Number
Rate
School System
0
0.0%
19
0.1%
Total 9
Retained Students, by Race/Ethnicity and Sex
Black
White Hispanic
American MultiAsian Indian racial
1 11.1%
6 66.7%
0 0.0%
2 22.2%
0 0.0%
0 0.0%
Male Female
4
5
44.4% 55.6%
Prepared by Georgia Department of Education
Page 1
STATE-REQUIRED TEST DATA
NORM-REFERENCED TESTS Grade 8
Iowa Tests of Basic Skills (ITBS) Each chart reflects data for three years of testing.
Reading Comprehension 50
75 61 49 0
98-99
72 61 48 97-98
72 62 48 96-97
Mathematics
School 50
System
State
0
82 66 56 98-99
83 66 55 97-98
83 67 54 96-97
School System State
Reading Vocabulary 50
69 57 46 0
98-99
70 57 45 97-98
67 58 44 96-97
Language Arts
School 50
System
State
0
82 70 60 98-99
77 68 58 97-98
76 68 56 96-97
School System State
Social Studies 50
76 64 54 0
98-99
73 64 53 97-98
77 65 53 96-97
Science
School 50
System
State
0
80 66 56 98-99
78 67 55 97-98
76 67 53 96-97
School System State
Sources of Information
Composite Score
50
80 67 57 0
98-99
School 50
System
76 66 56 97-98
78 67 55 96-97
State 0
81 67 56 98-99
78 66 54 97-98
1998-99 GEORGIA PUBLIC EDUCATION REPORT CARD Simpson Middle School - 6330389
Prepared by Georgia Department of Education
78 67 54 96-97
Scores Reported in Percentiles
School System State
Page 2
STATE-REQUIRED TEST DATA
Categories of Scaled Scores
Inadequate (less than 162)
Minimal (162-209)
Good
(210-247)
Very Good (greater than 247)
Average Scaled Score: (Range 100-300)
PERFORMANCE ASSESSMENTS
Grade 8 Writing Assessment
1998-99 Percent Scoring
1997-98 Percent Scoring
1996-97 Percent Scoring
School System State School System State School System State
0% 11% 59% 30%
2% 25% 50% 24%
8% 40% 41% 11%
2% 23% 55% 21%
3% 33% 47% 17%
11% 46% 34%
8%
0% 27% 52% 21%
5% 36% 43% 16%
15% 46% 30%
8%
236
225
208 226
218 202 225
215 198
AWARDS / RECOGNITION DATA
Schools in Georgia may receive recognition in the following programs: Charter School Pay for Performance Program Georgia School of Excellence National Blue Ribbon School Simpson Middle School did not receive recognition in any of these programs during the 1998-99 school year.
1998-99 GEORGIA PUBLIC EDUCATION REPORT CARD Simpson Middle School - 6330389
Prepared by Georgia Department of Education
Page 3
CERTIFIED PERSONNEL DATA
Positions Number Average Contract Days
Personnel Sex
Certificate
Years Experience
Full-time Part-time
Male Female
4 Yr Bachelor's 5 Yr Master's 6 Yr Specialist's 7 Yr Doctoral Other*
<1 1-10 11-20 21-30 >30
Average
Administrators
3.00 220.33
3 0
1 2
0 0 2 1 0 0 0 2 1 0 22.67
Support Personnel
4.03 191.00
4 1
0 5
2 2 1 0 0 0 1 1 3 0 17.20
PK-12 Teachers
61.97 191.00
60 3
11 52
35 24
4 0 0 0 29 21 12 1 12.32
*Includes One- and Two-Year Vocational Certificates.
ACCREDITATION DATA
Accredited by Southern Association of Colleges and Schools (SACS):
Elementary/Middle Commission.
1998-99 GEORGIA PUBLIC EDUCATION REPORT CARD Simpson Middle School - 6330389
Prepared by Georgia Department of Education
Page 4
1998-99 GEORGIA PUBLIC EDUCATION REPORT CARD
COBB COUNTY SCHOOLS
Skyview Elementary School - 6331068
Grade Range PK-5
The Georgia Public Education Report Card is designed to assist systems and schools in educational improvement. This report card contains a variety of data elements. An explanation of the terms is provided as a companion to the report card data. Please refer to the definitions for the most effective use of the reported data.
STUDENT DATA
Total
K-5
462
PK
1
Enrollment, by Race/Ethnicity and Sex
Black
White Hispanic
American Asian Indian
Multiracial
114 24.7%
305 66.0%
24 5.2%
4 0.9%
1 0.2%
14 3.0%
0
1
0.0% 100.0%
0 0.0%
0 0.0%
0 0.0%
0 0.0%
Male 248
53.7% 1
100.0%
Female 214
46.3% 0
0.0%
Enrollment in Selected Programs
Program
Program % of Student Enrollment Population
Gifted (Grades K-12)
8
1.7%
Alternative Programs (Grades 6-12)
N/A
N/A
Students Eligible to Receive Free/Reduced Lunches
Number
Percent
School System
220 16,221
47.5% 17.8%
Dropout Rate *
Number
Rate
School System
N/A N/A
N/A N/A
* Dropout rates are not applicable for grades PK-5.
Enrollment in Compensatory Programs
Program
Program % of Student Enrollment Population
Special Education (Grades K-12)
69 14.9%
(PK)
3
N/A
English to Speakers of Other Languages (ESOL) (Grades K-12)
0
0.0%
Remedial Education (Grades 2-5, 9-12)
58 18.4%
Special Instructional Assistance (SIA) (Grades K-3)
88 29.4%
Title I (Grades K-12)
This school has a Targeted Assistance program.
Total 0
Retained Students, by Race/Ethnicity and Sex
Black
White Hispanic
American MultiAsian Indian racial
0
0
0
0
0
0
Male Female
0
0
Prepared by Georgia Department of Education
Page 1
STATE-REQUIRED TEST DATA
NORM-REFERENCED TESTS Grade 3
Iowa Tests of Basic Skills (ITBS) Each chart reflects data for three years of testing.
Reading Comprehension 50
38 63 54 0
98-99
36 62 53 97-98
41 60 52 96-97
Mathematics
School 50
System
State
0
43 70 61 98-99
36 68 61 97-98
44 68 59 96-97
School System State
Reading Vocabulary 50
34 58 50 0
98-99
31 58 50 97-98
37 58 49 96-97
Language Arts
School 50
System
State
0
42 70 64 98-99
44 69 62 97-98
44 67 59 96-97
School System State
Social Studies 50
42 64 56 0
98-99
38 64 55 97-98
46 64 55 96-97
Science
School 50
System
State
0
38 70 59 98-99
40 70 59 97-98
49 69 58 96-97
School System State
Sources of Information
Composite Score
50
33 66 57 0
98-99
School 50
System
37 65 56 97-98
46 64 55 96-97
State 0
38 67 58 98-99
36 67 57 97-98
1998-99 GEORGIA PUBLIC EDUCATION REPORT CARD Skyview Elementary School - 6331068
Prepared by Georgia Department of Education
45 66 56 96-97
Scores Reported in Percentiles
School System State
Page 2
STATE-REQUIRED TEST DATA
NORM-REFERENCED TESTS Grade 5
Iowa Tests of Basic Skills (ITBS) Each chart reflects data for three years of testing.
Reading Comprehension
Mathematics
50
44 59 53 0
98-99
42 60 53 97-98
57 60 52 96-97
School 50
System
State
0
47 68 59 98-99
30 68 58 97-98
58 69 57 96-97
School System State
Reading Vocabulary 50
42 57 48 0
98-99
36 58 48 97-98
54 58 46 96-97
Language Arts
School 50
System
State
0
57 71 63 98-99
49 70 61 97-98
74 69 58 96-97
School System State
Social Studies 50
46 64 57 0
98-99
37 64 56 97-98
65 65 55 96-97
Science
School 50
System
State
0
53 68 60 98-99
52 69 59 97-98
75 70 59 96-97
School System State
Sources of Information
Composite Score
50
50 67 58 0
98-99
School 50
System
41 65 58 97-98
64 66 57 96-97
State 0
49 66 57 98-99
40 66 56 97-98
67 67 55 96-97
1998-99 GEORGIA PUBLIC EDUCATION REPORT CARD Skyview Elementary School - 6331068
Prepared by Georgia Department of Education
Scores Reported in Percentiles
School System State
Page 3
STATE-REQUIRED TEST DATA
PERFORMANCE ASSESSMENTS
Grade 5 Writing Assessment
Percent at Developmental Stages:
1998-99 School System State
1997-98 School System State
1996-97 School System State
Stage Stage Stage Stage Stage Stage
1:The Emerging Writer 2:The Developing Writer 3:The Focusing Writer 4:The Experimenting 5:The Engaging Writer 6:The Extending Writer
0% 0% 25% 33% 30% 11%
0% 1% 10% 36% 34% 19%
0% 1% 16% 41% 29% 12%
2% 11% 30% 32% 15%
4%
0% 1% 12% 37% 33% 16%
0% 3% 19% 41% 27% 10%
0% 3% 13% 47% 26% 11%
0% 1% 14% 34% 32% 18%
0% 3% 21% 37% 26% 12%
AWARDS / RECOGNITION DATA
Schools in Georgia may receive recognition in the following programs: Charter School Pay for Performance Program Georgia School of Excellence National Blue Ribbon School Skyview Elementary School did not receive recognition in any of these programs during the 1998-99 school year.
1998-99 GEORGIA PUBLIC EDUCATION REPORT CARD Skyview Elementary School - 6331068
Prepared by Georgia Department of Education
Page 4
CERTIFIED PERSONNEL DATA
Positions Number Average Contract Days
Personnel Sex
Certificate
Years Experience
Full-time Part-time
Male Female
4 Yr Bachelor's 5 Yr Master's 6 Yr Specialist's 7 Yr Doctoral Other*
<1 1-10 11-20 21-30 >30
Average
Administrators
1.00 260.00
1 0
0 1
0 0 1 0 0 0 0 0 0 1 38.00
Support Personnel
6.07 191.00
6 2
1 7
3 5 0 0 0 0 5 2 1 0 11.00
PK-12 Teachers
36.43 191.00
33 5
2 36
20 15
3 0 0 0 24 9 3 2 10.03
*Includes One- and Two-Year Vocational Certificates.
ACCREDITATION DATA
Accredited by Southern Association of Colleges and Schools (SACS):
Elementary/Middle Commission.
1998-99 GEORGIA PUBLIC EDUCATION REPORT CARD Skyview Elementary School - 6331068
Prepared by Georgia Department of Education
Page 5
1998-99 GEORGIA PUBLIC EDUCATION REPORT CARD
COBB COUNTY SCHOOLS
Smitha Middle School - 6330294
Grade Range 6-8
The Georgia Public Education Report Card is designed to assist systems and schools in educational improvement. This report card contains a variety of data elements. An explanation of the terms is provided as a companion to the report card data. Please refer to the definitions for the most effective use of the reported data.
STUDENT DATA
Total 1,373
6-8 Enrollment, by Race/Ethnicity and Sex
Black
White Hispanic
American Multi-
Asian Indian
racial
445 32.4%
800 58.3%
70 5.1%
34 2.5%
5 0.4%
19 1.4%
Male 704
51.3%
Female 669
48.7%
Enrollment in Selected Programs
Program
Gifted (Grades K-12)
Program % of Student Enrollment Population
138
10.1%
Alternative Programs (Grades 6-12)
0
0.0%
Students Eligible to Receive Free/Reduced Lunches
Number
Percent
School System
370 16,221
26.9% 17.8%
Enrollment in Compensatory Programs
Program
Program % of Student Enrollment Population
Special Education (Grades K-12) (PK)
229 16.7%
0
N/A
English to Speakers of Other Languages (ESOL) (Grades K-12)
22
1.6%
Title I (Grades K-12)
This school has no Title I program.
Dropout Rate for Grades 6-8
Number
Rate
School System
0
0.0%
19
0.1%
Total 19
Retained Students, by Race/Ethnicity and Sex
Black
White Hispanic
American MultiAsian Indian racial
10 52.6%
6
2
31.6% 10.5%
0 0.0%
1 5.3%
0 0.0%
Male Female
11
8
57.9% 42.1%
Prepared by Georgia Department of Education
Page 1
STATE-REQUIRED TEST DATA
NORM-REFERENCED TESTS Grade 8
Iowa Tests of Basic Skills (ITBS) Each chart reflects data for three years of testing.
Reading Comprehension 50
54 61 49 0
98-99
53 61 48 97-98
54 62 48 96-97
Mathematics
School 50
System
State
0
55 66 56 98-99
56 66 55 97-98
54 67 54 96-97
School System State
Reading Vocabulary 50
47 57 46 0
98-99
48 57 45 97-98
51 58 44 96-97
Language Arts
School 50
System
State
0
63 70 60 98-99
59 68 58 97-98
57 68 56 96-97
School System State
Social Studies 50
57 64 54 0
98-99
55 64 53 97-98
54 65 53 96-97
Science
School 50
System
State
0
61 66 56 98-99
61 67 55 97-98
59 67 53 96-97
School System State
Sources of Information
Composite Score
50
58 67 57 0
98-99
School 50
System
60 66 56 97-98
57 67 55 96-97
State 0
59 67 56 98-99
58 66 54 97-98
1998-99 GEORGIA PUBLIC EDUCATION REPORT CARD Smitha Middle School - 6330294
Prepared by Georgia Department of Education
56 67 54 96-97
Scores Reported in Percentiles
School System State
Page 2
STATE-REQUIRED TEST DATA
Categories of Scaled Scores
Inadequate (less than 162)
Minimal (162-209)
Good
(210-247)
Very Good (greater than 247)
Average Scaled Score: (Range 100-300)
PERFORMANCE ASSESSMENTS
Grade 8 Writing Assessment
1998-99 Percent Scoring
1997-98 Percent Scoring
1996-97 Percent Scoring
School System State School System State School System State
3% 38% 47% 12%
2% 25% 50% 24%
8% 40% 41% 11%
7% 46% 38%
8%
3% 33% 47% 17%
11% 46% 34%
8%
4% 44% 40% 11%
5% 36% 43% 16%
15% 46% 30%
8%
213
225
208 206
218 202 210
215 198
AWARDS / RECOGNITION DATA
Schools in Georgia may receive recognition in the following programs: Charter School Pay for Performance Program Georgia School of Excellence National Blue Ribbon School Smitha Middle School did not receive recognition in any of these programs during the 1998-99 school year.
1998-99 GEORGIA PUBLIC EDUCATION REPORT CARD Smitha Middle School - 6330294
Prepared by Georgia Department of Education
Page 3
CERTIFIED PERSONNEL DATA
Positions Number Average Contract Days
Personnel Sex
Certificate
Years Experience
Full-time Part-time
Male Female
4 Yr Bachelor's 5 Yr Master's 6 Yr Specialist's 7 Yr Doctoral Other*
<1 1-10 11-20 21-30 >30
Average
Administrators
4.00 217.75
4 0
0 4
0 1 3 0 0 0 0 1 3 0 22.50
Support Personnel
8.15 191.00
7 4
2 9
1 8 2 0 0 0 3 5 3 0 15.55
PK-12 Teachers
87.35 191.00
82 9
13 78
66 24
1 0 0 0 69 17 5 0 8.18
*Includes One- and Two-Year Vocational Certificates.
ACCREDITATION DATA
Accredited by Southern Association of Colleges and Schools (SACS):
Elementary/Middle Commission.
1998-99 GEORGIA PUBLIC EDUCATION REPORT CARD Smitha Middle School - 6330294
Prepared by Georgia Department of Education
Page 4
1998-99 GEORGIA PUBLIC EDUCATION REPORT CARD
COBB COUNTY SCHOOLS
Sope Creek Elementary School - 6330478
Grade Range PK-5
The Georgia Public Education Report Card is designed to assist systems and schools in educational improvement. This report card contains a variety of data elements. An explanation of the terms is provided as a companion to the report card data. Please refer to the definitions for the most effective use of the reported data.
STUDENT DATA
Total
K-5
1,066
PK
1
Enrollment, by Race/Ethnicity and Sex
Black
White Hispanic
American Asian Indian
Multiracial
26 2.4%
953 89.4%
20 1.9%
52 4.9%
1 0.1%
14 1.3%
0
1
0.0% 100.0%
0 0.0%
0 0.0%
0 0.0%
0 0.0%
Male 563
52.8% 1
100.0%
Female 503
47.2% 0
0.0%
Enrollment in Selected Programs
Program
Program % of Student Enrollment Population
Gifted (Grades K-12)
86
8.1%
Alternative Programs (Grades 6-12)
N/A
N/A
Students Eligible to Receive Free/Reduced Lunches
Number
Percent
School System
26 16,221
2.4% 17.8%
Dropout Rate *
Number
Rate
School System
N/A N/A
N/A N/A
* Dropout rates are not applicable for grades PK-5.
Enrollment in Compensatory Programs
Program
Program % of Student Enrollment Population
Special Education (Grades K-12)
134 12.6%
(PK)
2
N/A
English to Speakers of Other Languages (ESOL) (Grades K-12)
10
< 1%
Remedial Education (Grades 2-5, 9-12)
44
6.0%
Special Instructional Assistance (SIA) (Grades K-3)
90 12.8%
Title I (Grades K-12)
This school has no Title I program.
Total 13
Retained Students, by Race/Ethnicity and Sex
Black
White Hispanic
American MultiAsian Indian racial
0 0.0%
12 92.3%
0 0.0%
1 7.7%
0 0.0%
0 0.0%
Male Female
11
2
84.6% 15.4%
Prepared by Georgia Department of Education
Page 1
STATE-REQUIRED TEST DATA
NORM-REFERENCED TESTS Grade 3
Iowa Tests of Basic Skills (ITBS) Each chart reflects data for three years of testing.
Reading Comprehension 50
85 63 54 0
98-99
81 62 53 97-98
84 60 52 96-97
Mathematics
School 50
System
State
0
93 70 61 98-99
88 68 61 97-98
90 68 59 96-97
School System State
Reading Vocabulary 50
82 58 50 0
98-99
79 58 50 97-98
85 58 49 96-97
Language Arts
School 50
System
State
0
93 70 64 98-99
91 69 62 97-98
95 67 59 96-97
School System State
Social Studies 50
86 64 56 0
98-99
82 64 55 97-98
87 64 55 96-97
Science
School 50
System
State
0
87 70 59 98-99
82 70 59 97-98
87 69 58 96-97
School System State
Sources of Information
Composite Score
50
89 66 57 0
98-99
School 50
System
85 65 56 97-98
88 64 55 96-97
State 0
92 67 58 98-99
87 67 57 97-98
1998-99 GEORGIA PUBLIC EDUCATION REPORT CARD Sope Creek Elementary School - 6330478
Prepared by Georgia Department of Education
92 66 56 96-97
Scores Reported in Percentiles
School System State
Page 2
STATE-REQUIRED TEST DATA
NORM-REFERENCED TESTS Grade 5
Iowa Tests of Basic Skills (ITBS) Each chart reflects data for three years of testing.
Reading Comprehension
Mathematics
50
76 59 53 0
98-99
77 60 53 97-98
82 60 52 96-97
School 50
System
State
0
89 68 59 98-99
87 68 58 97-98
87 69 57 96-97
School System State
Reading Vocabulary 50
77 57 48 0
98-99
80 58 48 97-98
80 58 46 96-97
Language Arts
School 50
System
State
0
89 71 63 98-99
85 70 61 97-98
85 69 58 96-97
School System State
Social Studies 50
84 64 57 0
98-99
82 64 56 97-98
85 65 55 96-97
Science
School 50
System
State
0
86 68 60 98-99
85 69 59 97-98
88 70 59 96-97
School System State
Sources of Information
Composite Score
50
83 67 58 0
98-99
School 50
System
84 65 58 97-98
84 66 57 96-97
State 0
88 66 57 98-99
87 66 56 97-98
89 67 55 96-97
1998-99 GEORGIA PUBLIC EDUCATION REPORT CARD Sope Creek Elementary School - 6330478
Prepared by Georgia Department of Education
Scores Reported in Percentiles
School System State
Page 3
STATE-REQUIRED TEST DATA
PERFORMANCE ASSESSMENTS
Grade 5 Writing Assessment
Percent at Developmental Stages:
1998-99 School System State
1997-98 School System State
1996-97 School System State
Stage Stage Stage Stage Stage Stage
1:The Emerging Writer 2:The Developing Writer 3:The Focusing Writer 4:The Experimenting 5:The Engaging Writer 6:The Extending Writer
0% 0% 3% 27% 34% 36%
0% 1% 10% 36% 34% 19%
0% 1% 16% 41% 29% 12%
0% 0% 2% 17% 39% 41%
0% 1% 12% 37% 33% 16%
0% 3% 19% 41% 27% 10%
0% 0% 8% 24% 40% 29%
0% 1% 14% 34% 32% 18%
0% 3% 21% 37% 26% 12%
AWARDS / RECOGNITION DATA
Schools in Georgia may receive recognition in the following programs: Charter School Pay for Performance Program Georgia School of Excellence National Blue Ribbon School Sope Creek Elementary School did not receive recognition in any of these programs during the 1998-99 school year.
1998-99 GEORGIA PUBLIC EDUCATION REPORT CARD Sope Creek Elementary School - 6330478
Prepared by Georgia Department of Education
Page 4
CERTIFIED PERSONNEL DATA
Positions Number Average Contract Days
Personnel Sex
Certificate
Years Experience
Full-time Part-time
Male Female
4 Yr Bachelor's 5 Yr Master's 6 Yr Specialist's 7 Yr Doctoral Other*
<1 1-10 11-20 21-30 >30
Average
Administrators
3.00 220.33
3 0
0 3
0 1 2 0 0 0 0 1 2 0 21.33
Support Personnel
5.75 189.61
5 1
0 6
1 3 2 0 0 0 3 0 2 1 18.83
PK-12 Teachers
64.50 191.00
61 6
1 66
43 21
3 0 0 0 29 25 12 1 13.33
*Includes One- and Two-Year Vocational Certificates.
ACCREDITATION DATA
Accredited by Southern Association of Colleges and Schools (SACS):
Elementary/Middle Commission.
1998-99 GEORGIA PUBLIC EDUCATION REPORT CARD Sope Creek Elementary School - 6330478
Prepared by Georgia Department of Education
Page 5
1998-99 GEORGIA PUBLIC EDUCATION REPORT CARD
COBB COUNTY SCHOOLS
South Cobb High School - 6333056
Grade Range 9-12
The Georgia Public Education Report Card is designed to assist systems and schools in educational improvement. This report card contains a variety of data elements. An explanation of the terms is provided as a companion to the report card data. Please refer to the definitions for the most effective use of the reported data.
Total 1,541
STUDENT DATA
9-12 Enrollment, by Race/Ethnicity and Sex
Black
White Hispanic
American Multi-
Asian Indian
racial
430 27.9%
1,008 65.4%
43 2.8%
45 2.9%
3 0.2%
12 0.8%
Male Female
764 49.6%
777 50.4%
Enrollment in Selected Programs
Program
Gifted (Grades K-12)
Program % of Student Enrollment Population
81
5.3%
Non-Vocational Labs (Grades 9-12)
753
Vocational Labs
(Grades 9-12)
794
Alternative Programs (Grades 6-12)
6
48.9% 51.5%
< 1%
Students Eligible to Receive Free/Reduced Lunches
Number
Percent
School System
228 16,221
14.8% 17.8%
Enrollment in Compensatory Programs
Program
Program % of Student Enrollment Population
Special Education (Grades K-12) PK
202 13.1%
0
N/A
English to Speakers of Other Languages (ESOL) (Grades K-12)
9
< 1%
Remedial Education (Grades 2-5, 9-12)
155 10.1%
Title I (Grades K-12)
This school has no Title I program.
Dropout Rate for Grades 9-12
Number
Rate
School System
73 1,055
4.2% 3.7%
Total 106
Retained Students, by Race/Ethnicity and Sex
Black
White Hispanic
American MultiAsian Indian racial
32 30.2%
64 60.4%
7 6.6%
1 0.9%
0 0.0%
2 1.9%
Male Female
69
37
65.1% 34.9%
Prepared by Georgia Department of Education
Page 1
STATE-REQUIRED TEST DATA
GEORGIA HIGH SCHOOL GRADUATION TESTS (GHSGT)
Percent of Regular Program 11th Graders Passing the Georgia High School Graduation Tests on First Administration
English Language Arts Mathematics Social Studies Science
All Components listed above
Writing
1998-99
School System State
96% 87% 83% 73%
98% 94% 90% 85%
96% 88% 80% 72%
70% 82% 68%
86% 97% 93%
1997-98
School System State
95% 87% 82% 77%
98% 95% 89% 88%
94% 88% 78% 74%
74% 84% 68%
91% 96% 92%
1996-97
School System State
98% 89% 86% 80%
97% 94% 89% 89%
94% 87% 78% 74%
77% 84% 67%
95% 97% 93%
GRADUATE DATA
1999 Graduates by Credentials, Race/Ethnicity and Sex
Diplomas with Both College Prep. & Voc. Endorsements
Diplomas with College Prep. Endorsements Diplomas with Vocational Endorsements General High School Diplomas Special Education Diplomas
Total All Diplomas
Certificates of Performance
Total Graduates
Total 51
135 36 3 6
231 10
241
Black
14 27.5%
30 22.2%
12 33.3%
1 33.3%
1 16.7%
58 25.1%
4 40.0%
62 25.7%
White Hispanic
37 72.5%
94 69.6%
0 0.0%
5 3.7%
24 66.7%
2 66.7%
5 83.3%
0 0.0%
0 0.0%
0 0.0%
162 70.1%
5 2.2%
4
1
40.0% 10.0%
166 68.9%
6 2.5%
American MultiAsian Indian racial
0 0.0%
6 4.4%
0 0.0%
0 0.0%
0 0.0%
0 0.0%
0 0.0%
0 0.0%
0 0.0%
0 0.0%
0 0.0%
0 0.0%
0 0.0%
0 0.0%
0 0.0%
6 2.6%
0 0.0%
0 0.0%
1 10.0%
0 0.0%
0 0.0%
7 2.9%
0 0.0%
0 0.0%
Male Female
29 56.9%
60 44.4%
22 43.1%
75 55.6%
21 58.3%
2 66.7%
2 33.3%
15 41.7%
1 33.3%
4 66.7%
114
117
49.4% 50.6%
7
3
70.0% 30.0%
121
120
50.2% 49.8%
HOPE Scholarships
School System
Number of 1999 Graduates 2 4 1
Number Eligible
170
Percent Eligible
70.5%
5,022 3,850 76.7%
State
65,548 40,292 61.5%
High School Completion Rate
Percent of 1995Grade 9 Enrollment in Graduating Class of1999 School System State
Completion Rate '95-'99 72.2% 83.6% 68.9%
1998-99 GEORGIA PUBLIC EDUCATION REPORT CARD
South Cobb High School - 6333056
Prepared by Georgia Department of Education
Page 2
COLLEGE ADMISSIONS / CREDIT TEST DATA
Scholastic Assessment Test (SAT)
Based on students' highest verbal and highest math scores
No. Taking
Average Score
Tests Verbal Math Total
Based on students' last test administration
Average Score Verbal Math Total
School
166
College Prep. Endorsement
Other Diplomas
System
4,180
College Prep. Endorsement
Other Diplomas
Georgia
41,958
504 495
999
509 507 1016
402 381
783
523 522 1045 532 532 1064
402 387
789
492 488
980
496 N/A N/A
514 N/A N/A
483
487 N/A N/A
513 N/A N/A
479
983 N/A N/A
1027 N/A N/A
962
Nation
952,913 N/A N/A N/A
502 508 1010
American College Testing (ACT)
Advanced Placement Exams (AP)
Number taking tests: English Mathematics Reading Science Reasoning CompositeScore
3 1 School System State
19.1 20.2 19.1
19.2 21.2 19.9
19.7 20.0
21.4 21.1
20.2 19.9
19.6 21.1 19.9
No. of Students Taking Tests
No. of Tests Taken No. of Test Scores
3 or Higher Percent of Test
Scores 3 or Higher
School 48 68 34
50.0%
System State 1,291 15,225 2,524 23,969 1,885 13,024
74.7% 54.3%
POST-SECONDARY DATA
Graduates Entering Georgia Public Colleges
Graduates Entering Georgia Public Colleges and Requiring Learning Support (LS)
1998 Graduates Entering in 1998-99
1997 Graduates Entering in 1997-98
Percent of Graduating Number Class
School
98
39.8%
System 2,220 46.3%
School
102
37.5%
System 2,229 48.4%
Number Requiring
LS 14 213
17 312
Percent of those attending Georgia
Public Colleges
14.3%
9.6%
16.7%
14.0%
In previous years, the Report Card presented College Prep Curriculum information provided by the Board of Regents on students requiring Learning Support. Due to inconsistencies in the data provided by the Board of Regents in defining College Prep Completers versus Local Board of Education data defining College Prep Endorsements, the Department of Education Report Card will not provide this information until discrepancies can be reconciled.
Graduates Entering Georgia Public Technical and Adult Schools
1998 Graduates School System
Entering Number 20 213
1998-99 Percent
8.1% 4.4%
Entering Number N/A N/A
1997-98 Percent
N/A N/A
1997 Graduates School
2
0.7%
System
22
0.5%
13
4.8%
192
4.2%
1998-99 GEORGIA PUBLIC EDUCATION REPORT CARD South Cobb High School - 6333056
Prepared by Georgia Department of Education
Page 3
CERTIFIED PERSONNEL DATA
Positions Number Average Contract Days
Administrators
6.03 210.41
Support Personnel
8.90 191.00
PK-12 Teachers
91.44 191.00
Personnel Sex
Certificate
Years Experience
Full-time Part-time
Male Female
4 Yr Bachelor's 5 Yr Master's 6 Yr Specialist's 7 Yr Doctoral Other*
<1 1-10 11-20 21-30 >30
Average
6 1
4 3
0 4 3 0 0
0 1 3 2 1
20.14
7 26
24 9
16 13
3 0 1
0 18
6 9 0
13.09
65 30
35 60
45 39
6 1 4
0 49 23 21
2
12.84
*Includes One- and Two-Year Vocational Certificates.
ACCREDITATION DATA
Accredited by Southern Association of Colleges and Schools (SACS): Secondary/Middle Commission.
AWARDS / RECOGNITION DATA
Schools in Georgia may receive recognition in the following programs: Charter School Pay for Performance Program Georgia School of Excellence National Blue Ribbon School South Cobb High School did not receive recognition in any of these programs during the 1998-99 school year.
1998-99 GEORGIA PUBLIC EDUCATION REPORT CARD South Cobb High School - 6333056
Prepared by Georgia Department of Education
Page 4
1998-99 GEORGIA PUBLIC EDUCATION REPORT CARD
COBB COUNTY SCHOOLS
Sprayberry High School - 6330373
Grade Range 9-12
The Georgia Public Education Report Card is designed to assist systems and schools in educational improvement. This report card contains a variety of data elements. An explanation of the terms is provided as a companion to the report card data. Please refer to the definitions for the most effective use of the reported data.
Total 2,128
STUDENT DATA
9-12 Enrollment, by Race/Ethnicity and Sex
Black
White Hispanic
American Multi-
Asian Indian
racial
218 10.2%
1,708 80.3%
65 3.1%
108 5.1%
2 0.1%
27 1.3%
Male Female
1,055 49.6%
1,073 50.4%
Enrollment in Selected Programs
Program
Gifted (Grades K-12)
Program % of Student Enrollment Population
355
16.7%
Non-Vocational Labs (Grades 9-12)
Vocational Labs (Grades 9-12)
Alternative Programs (Grades 6-12)
1,638 832 4
77.0% 39.1%
< 1%
Students Eligible to Receive Free/Reduced Lunches
Number
Percent
School System
45 16,221
2.1% 17.8%
Enrollment in Compensatory Programs
Program
Program % of Student Enrollment Population
Special Education (Grades K-12) PK
240 11.3%
0
N/A
English to Speakers of Other Languages (ESOL) (Grades K-12)
22
1.0%
Remedial Education (Grades 2-5, 9-12)
276 13.0%
Title I (Grades K-12)
This school has no Title I program.
Dropout Rate for Grades 9-12
Number
Rate
School System
74 1,055
3.3% 3.7%
Total 144
Retained Students, by Race/Ethnicity and Sex
Black
White Hispanic
American MultiAsian Indian racial
13 9.0%
116 80.6%
8 5.6%
6 4.2%
0 0.0%
1 0.7%
Male Female
89
55
61.8% 38.2%
Prepared by Georgia Department of Education
Page 1
STATE-REQUIRED TEST DATA
GEORGIA HIGH SCHOOL GRADUATION TESTS (GHSGT)
Percent of Regular Program 11th Graders Passing the Georgia High School Graduation Tests on First Administration
English Language Arts Mathematics Social Studies Science
All Components listed above
Writing
1998-99
School System State
96% 96% 92% 90%
98% 94% 90% 85%
96% 88% 80% 72%
88% 82% 68%
98% 97% 93%
1997-98
School System State
99% 97% 92% 87%
98% 95% 89% 88%
94% 88% 78% 74%
84% 84% 68%
98% 96% 92%
1996-97
School System State
96% 96% 91% 93%
97% 94% 89% 89%
94% 87% 78% 74%
88% 84% 67%
97% 97% 93%
GRADUATE DATA
1999 Graduates by Credentials, Race/Ethnicity and Sex
Diplomas with Both College Prep. & Voc. Endorsements
Diplomas with College Prep. Endorsements Diplomas with Vocational Endorsements General High School Diplomas Special Education Diplomas
Total All Diplomas
Certificates of Performance
Total Graduates
Total 23
321 42 2 11
399 3
402
Black
1 4.3%
41 12.8%
6 14.3%
1 50.0%
1 9.1%
50 12.5%
1 33.3%
51 12.7%
American MultiWhite Hispanic Asian Indian racial
21 91.3%
260 81.0%
0 0.0%
4 1.2%
1 4.3%
14 4.4%
0 0.0%
0 0.0%
0 0.0%
2 0.6%
36 85.7%
1 50.0%
10 90.9%
0 0.0%
0 0.0%
0 0.0%
0 0.0%
0 0.0%
0 0.0%
0 0.0%
0 0.0%
0 0.0%
0 0.0%
0 0.0%
0 0.0%
328 82.2%
4 1.0%
15 3.8%
0 0.0%
2 0.5%
1 33.3%
0
1
0.0% 33.3%
0 0.0%
0 0.0%
329 81.8%
4 1.0%
16 4.0%
0 0.0%
2 0.5%
Male Female
8 34.8%
143 44.5%
15 65.2%
178 55.5%
34 81.0%
2 100.0%
8 72.7%
8 19.0%
0 0.0%
3 27.3%
195
204
48.9% 51.1%
2
1
66.7% 33.3%
197
205
49.0% 51.0%
HOPE Scholarships
School System
Number of 1999 Graduates 4 0 2
Number Eligible
292
Percent Eligible
72.6%
5,022 3,850 76.7%
State
65,548 40,292 61.5%
High School Completion Rate
Percent of 1995Grade 9 Enrollment in Graduating Class of1999 School System State
Completion Rate '95-'99 84.8% 83.6% 68.9%
1998-99 GEORGIA PUBLIC EDUCATION REPORT CARD
Sprayberry High School - 6330373
Prepared by Georgia Department of Education
Page 2
COLLEGE ADMISSIONS / CREDIT TEST DATA
Scholastic Assessment Test (SAT)
Based on students' highest verbal and highest math scores
No. Taking
Average Score
Tests Verbal Math Total
Based on students' last test administration
Average Score Verbal Math Total
School
338
College Prep. Endorsement
Other Diplomas
System
4,180
College Prep. Endorsement
Other Diplomas
Georgia
41,958
514 510 1024
526 522 1048
352 376
728
523 522 1045 532 532 1064
402 387
789
492 488
980
506 N/A N/A
514 N/A N/A
483
501 N/A N/A
513 N/A N/A
479
1007 N/A N/A
1027 N/A N/A
962
Nation
952,913 N/A N/A N/A
502 508 1010
American College Testing (ACT)
Advanced Placement Exams (AP)
Number taking tests: 1 0 2 English Mathematics Reading Science Reasoning CompositeScore
School System
20.3 20.2
21.0 21.2
21.3 20.7
21.4 21.1
21.0 21.1
State 19.1 19.9 20.2 19.9 19.9
No. of Students Taking Tests
No. of Tests Taken No. of Test Scores
3 or Higher Percent of Test
Scores 3 or Higher
School 129 247 144
58.3%
System State 1,291 15,225 2,524 23,969 1,885 13,024
74.7% 54.3%
POST-SECONDARY DATA
Graduates Entering Georgia Public Colleges
Graduates Entering Georgia Public Colleges and Requiring Learning Support (LS)
1998 Graduates Entering in 1998-99
1997 Graduates Entering in 1997-98
Percent of Graduating Number Class
School
182
48.0%
System 2,220 46.3%
School
220
54.5%
System 2,229 48.4%
Number Requiring
LS 20 213
35 312
Percent of those attending Georgia
Public Colleges
11.0%
9.6%
15.9%
14.0%
In previous years, the Report Card presented College Prep Curriculum information provided by the Board of Regents on students requiring Learning Support. Due to inconsistencies in the data provided by the Board of Regents in defining College Prep Completers versus Local Board of Education data defining College Prep Endorsements, the Department of Education Report Card will not provide this information until discrepancies can be reconciled.
Graduates Entering Georgia Public Technical and Adult Schools
1998 Graduates School System
Entering Number 13 213
1998-99 Percent
3.4% 4.4%
Entering Number N/A N/A
1997-98 Percent
N/A N/A
1997 Graduates School
2
0.5%
System
22
0.5%
12
3.0%
192
4.2%
1998-99 GEORGIA PUBLIC EDUCATION REPORT CARD Sprayberry High School - 6330373
Prepared by Georgia Department of Education
Page 3
CERTIFIED PERSONNEL DATA
Positions Number Average Contract Days
Administrators
5.02 218.10
Support Personnel
11.67 190.31
PK-12 Teachers
126.75 191.54
Personnel Sex
Certificate
Years Experience
Full-time Part-time
Male Female
4 Yr Bachelor's 5 Yr Master's 6 Yr Specialist's 7 Yr Doctoral Other*
<1 1-10 11-20 21-30 >30
Average
5 1
2 4
0 0 5 1 0
0 1 1 3 1
23.00
9 27
18 18
14 13
7 0 2
0 19
8 7 2
12.97
99 32
43 88
61 56
9 2 3
0 55 37 32
7
14.48
*Includes One- and Two-Year Vocational Certificates.
ACCREDITATION DATA
Accredited by Southern Association of Colleges and Schools (SACS): Secondary/Middle Commission.
AWARDS / RECOGNITION DATA
Schools in Georgia may receive recognition in the following programs: Charter School Pay for Performance Program Georgia School of Excellence National Blue Ribbon School Sprayberry High School did not receive recognition in any of these programs during the 1998-99 school year.
1998-99 GEORGIA PUBLIC EDUCATION REPORT CARD Sprayberry High School - 6330373
Prepared by Georgia Department of Education
Page 4
1998-99 GEORGIA PUBLIC EDUCATION REPORT CARD
COBB COUNTY SCHOOLS
Still Elementary School - 6330180
Grade Range K-5
The Georgia Public Education Report Card is designed to assist systems and schools in educational improvement. This report card contains a variety of data elements. An explanation of the terms is provided as a companion to the report card data. Please refer to the definitions for the most effective use of the reported data.
STUDENT DATA
Total 724
K-5 Enrollment, by Race/Ethnicity and Sex
Black
White Hispanic
American Multi-
Asian Indian
racial
56 7.7%
641 88.5%
12 1.7%
7 1.0%
1 0.1%
7 1.0%
Male Female
376 51.9%
348 48.1%
Enrollment in Selected Programs
Program
Program % of Student Enrollment Population
Gifted (Grades K-12)
26
3.6%
Alternative Programs (Grades 6-12)
N/A
N/A
Students Eligible to Receive Free/Reduced Lunches
Number
Percent
School System
56 16,221
7.7% 17.8%
Dropout Rate *
Number
Rate
School System
N/A N/A
N/A N/A
* Dropout rates are not applicable for grades PK-5.
Enrollment in Compensatory Programs
Program
Program % of Student Enrollment Population
Special Education (Grades K-12)
80 11.0%
(PK)
0
N/A
English to Speakers of Other Languages (ESOL) (Grades K-12)
1
< 1%
Remedial Education (Grades 2-5, 9-12)
41
8.0%
Special Instructional Assistance (SIA) (Grades K-3)
106 22.7%
Title I (Grades K-12)
This school has no Title I program.
Total 5
Retained Students, by Race/Ethnicity and Sex
Black
White Hispanic
American Multi-
Asian Indian
racial
0
5
0.0% 100.0%
0 0.0%
0 0.0%
0 0.0%
0 0.0%
Male Female
3
2
60.0% 40.0%
Prepared by Georgia Department of Education
Page 1
STATE-REQUIRED TEST DATA
NORM-REFERENCED TESTS Grade 3
Iowa Tests of Basic Skills (ITBS) Each chart reflects data for three years of testing.
Reading Comprehension 50
72 63 54 0
98-99
68 62 53 97-98
73 60 52 96-97
Mathematics
School 50
System
State
0
76 70 61 98-99
74 68 61 97-98
76 68 59 96-97
School System State
Reading Vocabulary 50
66 58 50 0
98-99
64 58 50 97-98
71 58 49 96-97
Language Arts
School 50
System
State
0
78 70 64 98-99
73 69 62 97-98
72 67 59 96-97
School System State
Social Studies 50
70 64 56 0
98-99
74 64 55 97-98
79 64 55 96-97
Science
School 50
System
State
0
78 70 59 98-99
76 70 59 97-98
80 69 58 96-97
School System State
Sources of Information
Composite Score
50
76 66 57 0
98-99
School 50
System
73 65 56 97-98
77 64 55 96-97
State 0
76 67 58 98-99
74 67 57 97-98
1998-99 GEORGIA PUBLIC EDUCATION REPORT CARD Still Elementary School - 6330180
Prepared by Georgia Department of Education
77 66 56 96-97
Scores Reported in Percentiles
School System State
Page 2
STATE-REQUIRED TEST DATA
NORM-REFERENCED TESTS Grade 5
Iowa Tests of Basic Skills (ITBS) Each chart reflects data for three years of testing.
Reading Comprehension
Mathematics
50
67 59 53 0
98-99
64 60 53 97-98
66 60 52 96-97
School 50
System
State
0
79 68 59 98-99
75 68 58 97-98
71 69 57 96-97
School System State
Reading Vocabulary 50
67 57 48 0
98-99
70 58 48 97-98
69 58 46 96-97
Language Arts
School 50
System
State
0
74 71 63 98-99
74 70 61 97-98
74 69 58 96-97
School System State
Social Studies 50
75 64 57 0
98-99
71 64 56 97-98
69 65 55 96-97
Science
School 50
System
State
0
75 68 60 98-99
76 69 59 97-98
77 70 59 96-97
School System State
Sources of Information
Composite Score
50
75 67 58 0
98-99
School 50
System
68 65 58 97-98
70 66 57 96-97
State 0
76 66 57 98-99
73 66 56 97-98
73 67 55 96-97
1998-99 GEORGIA PUBLIC EDUCATION REPORT CARD Still Elementary School - 6330180
Prepared by Georgia Department of Education
Scores Reported in Percentiles
School System State
Page 3
STATE-REQUIRED TEST DATA
PERFORMANCE ASSESSMENTS
Grade 5 Writing Assessment
Percent at Developmental Stages:
1998-99 School System State
1997-98 School System State
1996-97 School System State
Stage Stage Stage Stage Stage Stage
1:The Emerging Writer 2:The Developing Writer 3:The Focusing Writer 4:The Experimenting 5:The Engaging Writer 6:The Extending Writer
0% 0% 4% 30% 30% 36%
0% 1% 10% 36% 34% 19%
0% 1% 16% 41% 29% 12%
0% 0% 13% 39% 30% 18%
0% 1% 12% 37% 33% 16%
0% 3% 19% 41% 27% 10%
0% 1% 12% 43% 24% 20%
0% 1% 14% 34% 32% 18%
0% 3% 21% 37% 26% 12%
AWARDS / RECOGNITION DATA
Schools in Georgia may receive recognition in the following programs: Charter School Pay for Performance Program Georgia School of Excellence National Blue Ribbon School Still Elementary School did not receive recognition in any of these programs during the 1998-99 school year.
1998-99 GEORGIA PUBLIC EDUCATION REPORT CARD Still Elementary School - 6330180
Prepared by Georgia Department of Education
Page 4
CERTIFIED PERSONNEL DATA
Positions Number Average Contract Days
Personnel Sex
Certificate
Years Experience
Full-time Part-time
Male Female
4 Yr Bachelor's 5 Yr Master's 6 Yr Specialist's 7 Yr Doctoral Other*
<1 1-10 11-20 21-30 >30
Average
Administrators
2.00 235.00
2 0
0 2
0 1 0 1 0 0 0 0 2 0 25.50
Support Personnel
4.50 191.00
4 1
0 5
1 3 1 0 0 0 3 1 1 0 11.20
PK-12 Teachers
47.00 191.00
46 2
5 43
25 18
5 0 0 0 18 17 13 0 13.58
*Includes One- and Two-Year Vocational Certificates.
ACCREDITATION DATA
Accredited by Southern Association of Colleges and Schools (SACS):
Elementary/Middle Commission.
1998-99 GEORGIA PUBLIC EDUCATION REPORT CARD Still Elementary School - 6330180
Prepared by Georgia Department of Education
Page 5
1998-99 GEORGIA PUBLIC EDUCATION REPORT CARD
COBB COUNTY SCHOOLS
Tapp Middle School - 6330475
Grade Range 6-8
The Georgia Public Education Report Card is designed to assist systems and schools in educational improvement. This report card contains a variety of data elements. An explanation of the terms is provided as a companion to the report card data. Please refer to the definitions for the most effective use of the reported data.
STUDENT DATA
Total 1,472
6-8 Enrollment, by Race/Ethnicity and Sex
Black
White Hispanic
American Multi-
Asian Indian
racial
424 28.8%
970 65.9%
31 2.1%
12 0.8%
3 0.2%
32 2.2%
Male 774
52.6%
Female 698
47.4%
Enrollment in Selected Programs
Program
Gifted (Grades K-12)
Program % of Student Enrollment Population
187
12.7%
Alternative Programs (Grades 6-12)
2
< 1%
Students Eligible to Receive Free/Reduced Lunches
Number
Percent
School System
313 16,221
21.3% 17.8%
Enrollment in Compensatory Programs
Program
Program % of Student Enrollment Population
Special Education (Grades K-12) (PK)
205 13.9%
0
N/A
English to Speakers of Other Languages (ESOL) (Grades K-12)
1
< 1%
Title I (Grades K-12)
This school has no Title I program.
Dropout Rate for Grades 6-8
Number
Rate
School System
2
0.1%
19
0.1%
Total 8
Retained Students, by Race/Ethnicity and Sex
Black
White Hispanic
American MultiAsian Indian racial
3 37.5%
5 62.5%
0 0.0%
0 0.0%
0 0.0%
0 0.0%
Male Female
7
1
87.5% 12.5%
Prepared by Georgia Department of Education
Page 1
STATE-REQUIRED TEST DATA
NORM-REFERENCED TESTS Grade 8
Iowa Tests of Basic Skills (ITBS) Each chart reflects data for three years of testing.
Reading Comprehension 50
56 61 49 0
98-99
55 61 48 97-98
52 62 48 96-97
Mathematics
School 50
System
State
0
58 66 56 98-99
55 66 55 97-98
54 67 54 96-97
School System State
Reading Vocabulary 50
53 57 46 0
98-99
51 57 45 97-98
50 58 44 96-97
Language Arts
School 50
System
State
0
62 70 60 98-99
57 68 58 97-98
57 68 56 96-97
School System State
Social Studies 50
59 64 54 0
98-99
54 64 53 97-98
57 65 53 96-97
Science
School 50
System
State
0
61 66 56 98-99
56 67 55 97-98
57 67 53 96-97
School System State
Sources of Information
Composite Score
50
61 67 57 0
98-99
School 50
System
54 66 56 97-98
54 67 55 96-97
State 0
60 67 56 98-99
55 66 54 97-98
1998-99 GEORGIA PUBLIC EDUCATION REPORT CARD Tapp Middle School - 6330475
Prepared by Georgia Department of Education
55 67 54 96-97
Scores Reported in Percentiles
School System State
Page 2
STATE-REQUIRED TEST DATA
Categories of Scaled Scores
Inadequate (less than 162)
Minimal (162-209)
Good
(210-247)
Very Good (greater than 247)
Average Scaled Score: (Range 100-300)
PERFORMANCE ASSESSMENTS
Grade 8 Writing Assessment
1998-99 Percent Scoring
1997-98 Percent Scoring
1996-97 Percent Scoring
School System State School System State School System State
4% 37% 48% 11%
2% 25% 50% 24%
8% 40% 41% 11%
5% 41% 43% 11%
3% 33% 47% 17%
11% 46% 34%
8%
5% 49% 41%
5%
5% 36% 43% 16%
15% 46% 30%
8%
214
225
208 212
218 202 206
215 198
AWARDS / RECOGNITION DATA
Schools in Georgia may receive recognition in the following programs: Charter School Pay for Performance Program Georgia School of Excellence National Blue Ribbon School Tapp Middle School did not receive recognition in any of these programs during the 1998-99 school year.
1998-99 GEORGIA PUBLIC EDUCATION REPORT CARD Tapp Middle School - 6330475
Prepared by Georgia Department of Education
Page 3
CERTIFIED PERSONNEL DATA
Positions Number Average Contract Days
Personnel Sex
Certificate
Years Experience
Full-time Part-time
Male Female
4 Yr Bachelor's 5 Yr Master's 6 Yr Specialist's 7 Yr Doctoral Other*
<1 1-10 11-20 21-30 >30
Average
Administrators
4.00 217.75
4 0
1 3
0 0 2 2 0 0 0 3 1 0 20.50
Support Personnel
7.03 191.00
7 2
2 7
2 3 4 0 0 0 4 2 3 0 14.33
PK-12 Teachers
81.47 191.00
79 3
14 68
53 27
2 0 0 0 50 14 15 3 11.24
*Includes One- and Two-Year Vocational Certificates.
ACCREDITATION DATA
Accredited by Southern Association of Colleges and Schools (SACS):
Elementary/Middle Commission.
1998-99 GEORGIA PUBLIC EDUCATION REPORT CARD Tapp Middle School - 6330475
Prepared by Georgia Department of Education
Page 4
1998-99 GEORGIA PUBLIC EDUCATION REPORT CARD
COBB COUNTY SCHOOLS
Teasley Elementary School - 6334068
Grade Range PK-5
The Georgia Public Education Report Card is designed to assist systems and schools in educational improvement. This report card contains a variety of data elements. An explanation of the terms is provided as a companion to the report card data. Please refer to the definitions for the most effective use of the reported data.
STUDENT DATA
Total
K-5
425
PK
3
Enrollment, by Race/Ethnicity and Sex
Black
White Hispanic
American Asian Indian
Multiracial
119 28.0%
262 61.6%
24 5.6%
12 2.8%
0 0.0%
8 1.9%
0 0.0%
2 66.7%
0
1
0.0% 33.3%
0 0.0%
0 0.0%
Male Female
225 52.9%
200 47.1%
2 66.7%
1 33.3%
Enrollment in Selected Programs
Program
Program % of Student Enrollment Population
Gifted (Grades K-12)
34
8.0%
Alternative Programs (Grades 6-12)
N/A
N/A
Students Eligible to Receive Free/Reduced Lunches
Number
Percent
School System
89 16,221
20.8% 17.8%
Dropout Rate *
Number
Rate
School System
N/A N/A
N/A N/A
* Dropout rates are not applicable for grades PK-5.
Enrollment in Compensatory Programs
Program
Program % of Student Enrollment Population
Special Education (Grades K-12)
37
8.7%
(PK)
3
N/A
English to Speakers of Other Languages (ESOL) (Grades K-12)
9
2.1%
Remedial Education (Grades 2-5, 9-12)
31 11.0%
Special Instructional Assistance (SIA) (Grades K-3)
66 23.1%
Title I (Grades K-12)
This school has no Title I program.
Total 1
Retained Students, by Race/Ethnicity and Sex
Black
White Hispanic
American MultiAsian Indian racial
1 100.0%
0 0.0%
0 0.0%
0 0.0%
0 0.0%
0 0.0%
Male Female
0
1
0.0% 100.0%
Prepared by Georgia Department of Education
Page 1
STATE-REQUIRED TEST DATA
NORM-REFERENCED TESTS Grade 3
Iowa Tests of Basic Skills (ITBS) Each chart reflects data for three years of testing.
Reading Comprehension 50
68 63 54 0
98-99
70 62 53 97-98
58 60 52 96-97
Mathematics
School 50
System
State
0
77 70 61 98-99
77 68 61 97-98
72 68 59 96-97
School System State
Reading Vocabulary 50
66 58 50 0
98-99
66 58 50 97-98
49 58 49 96-97
Language Arts
School 50
System
State
0
75 70 64 98-99
78 69 62 97-98
67 67 59 96-97
School System State
Social Studies 50
75 64 56 0
98-99
70 64 55 97-98
65 64 55 96-97
Science
School 50
System
State
0
79 70 59 98-99
77 70 59 97-98
71 69 58 96-97
School System State
Sources of Information
Composite Score
50
73 66 57 0
98-99
School 50
System
72 65 56 97-98
62 64 55 96-97
State 0
75 67 58 98-99
75 67 57 97-98
1998-99 GEORGIA PUBLIC EDUCATION REPORT CARD Teasley Elementary School - 6334068
Prepared by Georgia Department of Education
66 66 56 96-97
Scores Reported in Percentiles
School System State
Page 2
STATE-REQUIRED TEST DATA
NORM-REFERENCED TESTS Grade 5
Iowa Tests of Basic Skills (ITBS) Each chart reflects data for three years of testing.
Reading Comprehension
Mathematics
50
62 59 53 0
98-99
67 60 53 97-98
56 60 52 96-97
School 50
System
State
0
77 68 59 98-99
75 68 58 97-98
69 69 57 96-97
School System State
Reading Vocabulary 50
51 57 48 0
98-99
62 58 48 97-98
59 58 46 96-97
Language Arts
School 50
System
State
0
76 71 63 98-99
75 70 61 97-98
73 69 58 96-97
School System State
Social Studies 50
65 64 57 0
98-99
69 64 56 97-98
61 65 55 96-97
Science
School 50
System
State
0
69 68 60 98-99
72 69 59 97-98
73 70 59 96-97
School System State
Sources of Information
Composite Score
50
70 67 58 0
98-99
School 50
System
72 65 58 97-98
66 66 57 96-97
State 0
70 66 57 98-99
73 66 56 97-98
67 67 55 96-97
1998-99 GEORGIA PUBLIC EDUCATION REPORT CARD Teasley Elementary School - 6334068
Prepared by Georgia Department of Education
Scores Reported in Percentiles
School System State
Page 3
STATE-REQUIRED TEST DATA
PERFORMANCE ASSESSMENTS
Grade 5 Writing Assessment
Percent at Developmental Stages:
1998-99 School System State
1997-98 School System State
1996-97 School System State
Stage Stage Stage Stage Stage Stage
1:The Emerging Writer 2:The Developing Writer 3:The Focusing Writer 4:The Experimenting 5:The Engaging Writer 6:The Extending Writer
0% 2% 12% 46% 25% 15%
0% 1% 10% 36% 34% 19%
0% 1% 16% 41% 29% 12%
0% 3% 24% 40% 17% 12%
0% 1% 12% 37% 33% 16%
0% 3% 19% 41% 27% 10%
0% 0% 16% 42% 26% 16%
0% 1% 14% 34% 32% 18%
0% 3% 21% 37% 26% 12%
AWARDS / RECOGNITION DATA
Schools in Georgia may receive recognition in the following programs: Charter School Pay for Performance Program Georgia School of Excellence National Blue Ribbon School Teasley Elementary School did not receive recognition in any of these programs during the 1998-99 school year.
1998-99 GEORGIA PUBLIC EDUCATION REPORT CARD Teasley Elementary School - 6334068
Prepared by Georgia Department of Education
Page 4
CERTIFIED PERSONNEL DATA
Positions Number Average Contract Days
Personnel Sex
Certificate
Years Experience
Full-time Part-time
Male Female
4 Yr Bachelor's 5 Yr Master's 6 Yr Specialist's 7 Yr Doctoral Other*
<1 1-10 11-20 21-30 >30
Average
Administrators
1.00 260.00
1 0
0 1
0 0 0 1 0 0 0 0 1 0 28.00
Support Personnel
3.50 191.00
3 1
0 4
1 1 2 0 0 0 0 3 1 0 20.25
PK-12 Teachers
26.50 191.00
25 3
1 27
17 10
1 0 0 0 15 6 7 0 11.32
*Includes One- and Two-Year Vocational Certificates.
ACCREDITATION DATA
Accredited by Southern Association of Colleges and Schools (SACS):
Elementary/Middle Commission.
1998-99 GEORGIA PUBLIC EDUCATION REPORT CARD Teasley Elementary School - 6334068
Prepared by Georgia Department of Education
Page 5
1998-99 GEORGIA PUBLIC EDUCATION REPORT CARD
COBB COUNTY SCHOOLS
Timber Ridge Elementary School - 6330491
Grade Range PK-5
The Georgia Public Education Report Card is designed to assist systems and schools in educational improvement. This report card contains a variety of data elements. An explanation of the terms is provided as a companion to the report card data. Please refer to the definitions for the most effective use of the reported data.
STUDENT DATA
Total
K-5
608
PK
36
Enrollment, by Race/Ethnicity and Sex
Black
White Hispanic
American Asian Indian
Multiracial
13 2.1%
552 90.8%
10 1.6%
30 4.9%
0 0.0%
3 0.5%
1 2.8%
33 91.7%
1 2.8%
1 2.8%
0 0.0%
0 0.0%
Male Female
300 49.3%
308 50.7%
26 72.2%
10 27.8%
Enrollment in Selected Programs
Program
Program % of Student Enrollment Population
Gifted (Grades K-12)
30
4.9%
Alternative Programs (Grades 6-12)
N/A
N/A
Students Eligible to Receive Free/Reduced Lunches
Number
Percent
School System
6 16,221
0.9% 17.8%
Dropout Rate *
Number
Rate
School System
N/A N/A
N/A N/A
* Dropout rates are not applicable for grades PK-5.
Enrollment in Compensatory Programs
Program
Program % of Student Enrollment Population
Special Education (Grades K-12)
78 12.8%
(PK)
50
N/A
English to Speakers of Other Languages (ESOL) (Grades K-12)
0
0.0%
Remedial Education (Grades 2-5, 9-12)
3
< 1%
Special Instructional Assistance (SIA) (Grades K-3)
75 19.3%
Title I (Grades K-12)
This school has no Title I program.
Total 4
Retained Students, by Race/Ethnicity and Sex
Black
White Hispanic
American MultiAsian Indian racial
0
4
0.0% 100.0%
0 0.0%
0 0.0%
0 0.0%
0 0.0%
Male Female
3
1
75.0% 25.0%
Prepared by Georgia Department of Education
Page 1
STATE-REQUIRED TEST DATA
NORM-REFERENCED TESTS Grade 3
Iowa Tests of Basic Skills (ITBS) Each chart reflects data for three years of testing.
Reading Comprehension 50
77 63 54 0
98-99
74 62 53 97-98
72 60 52 96-97
Mathematics
School 50
System
State
0
82 70 61 98-99
83 68 61 97-98
84 68 59 96-97
School System State
Reading Vocabulary 50
77 58 50 0
98-99
72 58 50 97-98
72 58 49 96-97
Language Arts
School 50
System
State
0
85 70 64 98-99
76 69 62 97-98
80 67 59 96-97
School System State
Social Studies 50
74 64 56 0
98-99
73 64 55 97-98
74 64 55 96-97
Science
School 50
System
State
0
82 70 59 98-99
79 70 59 97-98
78 69 58 96-97
School System State
Sources of Information
Composite Score
50
80 66 57 0
98-99
School 50
System
79 65 56 97-98
78 64 55 96-97
State 0
82 67 58 98-99
78 67 57 97-98
1998-99 GEORGIA PUBLIC EDUCATION REPORT CARD Timber Ridge Elementary School - 6330491
Prepared by Georgia Department of Education
79 66 56 96-97
Scores Reported in Percentiles
School System State
Page 2
STATE-REQUIRED TEST DATA
NORM-REFERENCED TESTS Grade 5
Iowa Tests of Basic Skills (ITBS) Each chart reflects data for three years of testing.
Reading Comprehension
Mathematics
50
74 59 53 0
98-99
75 60 53 97-98
75 60 52 96-97
School 50
System
State
0
83 68 59 98-99
85 68 58 97-98
85 69 57 96-97
School System State
Reading Vocabulary 50
68 57 48 0
98-99
74 58 48 97-98
71 58 46 96-97
Language Arts
School 50
System
State
0
84 71 63 98-99
85 70 61 97-98
84 69 58 96-97
School System State
Social Studies 50
76 64 57 0
98-99
78 64 56 97-98
78 65 55 96-97
Science
School 50
System
State
0
76 68 60 98-99
84 69 59 97-98
81 70 59 96-97
School System State
Sources of Information
Composite Score
50
82 67 58 0
98-99
School 50
System
84 65 58 97-98
79 66 57 96-97
State 0
81 66 57 98-99
85 66 56 97-98
83 67 55 96-97
1998-99 GEORGIA PUBLIC EDUCATION REPORT CARD Timber Ridge Elementary School - 6330491
Prepared by Georgia Department of Education
Scores Reported in Percentiles
School System State
Page 3
STATE-REQUIRED TEST DATA
PERFORMANCE ASSESSMENTS
Grade 5 Writing Assessment
Percent at Developmental Stages:
1998-99 School System State
1997-98 School System State
1996-97 School System State
Stage Stage Stage Stage Stage Stage
1:The Emerging Writer 2:The Developing Writer 3:The Focusing Writer 4:The Experimenting 5:The Engaging Writer 6:The Extending Writer
0% 0% 4% 15% 36% 44%
0% 1% 10% 36% 34% 19%
0% 1% 16% 41% 29% 12%
0% 1% 5% 17% 24% 52%
0% 1% 12% 37% 33% 16%
0% 3% 19% 41% 27% 10%
0% 0% 2% 20% 40% 39%
0% 1% 14% 34% 32% 18%
0% 3% 21% 37% 26% 12%
AWARDS / RECOGNITION DATA
Schools in Georgia may receive recognition in the following programs: Charter School Pay for Performance Program Georgia School of Excellence National Blue Ribbon School Timber Ridge Elementary School did not receive recognition in any of these programs during the 1998-99 school year.
1998-99 GEORGIA PUBLIC EDUCATION REPORT CARD Timber Ridge Elementary School - 6330491
Prepared by Georgia Department of Education
Page 4
CERTIFIED PERSONNEL DATA
Positions Number Average Contract Days
Personnel Sex
Certificate
Years Experience
Full-time Part-time
Male Female
4 Yr Bachelor's 5 Yr Master's 6 Yr Specialist's 7 Yr Doctoral Other*
<1 1-10 11-20 21-30 >30
Average
Administrators
1.00 260.00
1 0
0 1
0 0 1 0 0 0 0 0 1 0 24.00
Support Personnel
3.00 191.00
3 0
0 3
0 3 0 0 0 0 1 1 1 0 14.00
PK-12 Teachers
39.75 191.00
38 3
1 40
19 19
3 0 0 0 8 21 12 0 15.41
*Includes One- and Two-Year Vocational Certificates.
ACCREDITATION DATA
Accredited by Southern Association of Colleges and Schools (SACS):
Elementary/Middle Commission.
1998-99 GEORGIA PUBLIC EDUCATION REPORT CARD Timber Ridge Elementary School - 6330491
Prepared by Georgia Department of Education
Page 5
1998-99 GEORGIA PUBLIC EDUCATION REPORT CARD
COBB COUNTY SCHOOLS
Tritt Elementary School - 6330181
Grade Range PK-5
The Georgia Public Education Report Card is designed to assist systems and schools in educational improvement. This report card contains a variety of data elements. An explanation of the terms is provided as a companion to the report card data. Please refer to the definitions for the most effective use of the reported data.
STUDENT DATA
Total
K-5
989
PK
5
Enrollment, by Race/Ethnicity and Sex
Black
White Hispanic
American Asian Indian
Multiracial
34 3.4%
913 92.3%
7 0.7%
21 2.1%
0 0.0%
14 1.4%
0
5
0.0% 100.0%
0 0.0%
0 0.0%
0 0.0%
0 0.0%
Male Female
530 53.6%
459 46.4%
2 40.0%
3 60.0%
Enrollment in Selected Programs
Program
Program % of Student Enrollment Population
Gifted (Grades K-12)
111
11.2%
Alternative Programs (Grades 6-12)
N/A
N/A
Students Eligible to Receive Free/Reduced Lunches
Number
Percent
School System
9 16,221
0.9% 17.8%
Dropout Rate *
Number
Rate
School System
N/A N/A
N/A N/A
* Dropout rates are not applicable for grades PK-5.
Enrollment in Compensatory Programs
Program
Program % of Student Enrollment Population
Special Education (Grades K-12)
99 10.0%
(PK)
8
N/A
English to Speakers of Other Languages (ESOL) (Grades K-12)
1
< 1%
Remedial Education (Grades 2-5, 9-12)
31
4.5%
Special Instructional Assistance (SIA) (Grades K-3)
87 14.1%
Title I (Grades K-12)
This school has no Title I program.
Total 8
Retained Students, by Race/Ethnicity and Sex
Black
White Hispanic
American MultiAsian Indian racial
0
8
0.0% 100.0%
0 0.0%
0 0.0%
0 0.0%
0 0.0%
Male Female
6
2
75.0% 25.0%
Prepared by Georgia Department of Education
Page 1
STATE-REQUIRED TEST DATA
NORM-REFERENCED TESTS Grade 3
Iowa Tests of Basic Skills (ITBS) Each chart reflects data for three years of testing.
Reading Comprehension 50
79 63 54 0
98-99
77 62 53 97-98
74 60 52 96-97
Mathematics
School 50
System
State
0
89 70 61 98-99
88 68 61 97-98
88 68 59 96-97
School System State
Reading Vocabulary 50
76 58 50 0
98-99
79 58 50 97-98
77 58 49 96-97
Language Arts
School 50
System
State
0
85 70 64 98-99
88 69 62 97-98
79 67 59 96-97
School System State
Social Studies 50
77 64 56 0
98-99
84 64 55 97-98
82 64 55 96-97
Science
School 50
System
State
0
85 70 59 98-99
86 70 59 97-98
86 69 58 96-97
School System State
Sources of Information
Composite Score
50
83 66 57 0
98-99
School 50
System
84 65 56 97-98
83 64 55 96-97
State 0
85 67 58 98-99
87 67 57 97-98
1998-99 GEORGIA PUBLIC EDUCATION REPORT CARD Tritt Elementary School - 6330181
Prepared by Georgia Department of Education
84 66 56 96-97
Scores Reported in Percentiles
School System State
Page 2
STATE-REQUIRED TEST DATA
NORM-REFERENCED TESTS Grade 5
Iowa Tests of Basic Skills (ITBS) Each chart reflects data for three years of testing.
Reading Comprehension
Mathematics
50
72 59 53 0
98-99
72 60 53 97-98
72 60 52 96-97
School 50
System
State
0
86 68 59 98-99
83 68 58 97-98
83 69 57 96-97
School System State
Reading Vocabulary 50
72 57 48 0
98-99
73 58 48 97-98
72 58 46 96-97
Language Arts
School 50
System
State
0
82 71 63 98-99
83 70 61 97-98
79 69 58 96-97
School System State
Social Studies 50
79 64 57 0
98-99
77 64 56 97-98
78 65 55 96-97
Science
School 50
System
State
0
82 68 60 98-99
80 69 59 97-98
84 70 59 96-97
School System State
Sources of Information
Composite Score
50
81 67 58 0
98-99
School 50
System
80 65 58 97-98
78 66 57 96-97
State 0
83 66 57 98-99
82 66 56 97-98
81 67 55 96-97
1998-99 GEORGIA PUBLIC EDUCATION REPORT CARD Tritt Elementary School - 6330181
Prepared by Georgia Department of Education
Scores Reported in Percentiles
School System State
Page 3
STATE-REQUIRED TEST DATA
PERFORMANCE ASSESSMENTS
Grade 5 Writing Assessment
Percent at Developmental Stages:
1998-99 School System State
1997-98 School System State
1996-97 School System State
Stage Stage Stage Stage Stage Stage
1:The Emerging Writer 2:The Developing Writer 3:The Focusing Writer 4:The Experimenting 5:The Engaging Writer 6:The Extending Writer
0% 0% 6% 25% 40% 29%
0% 1% 10% 36% 34% 19%
0% 1% 16% 41% 29% 12%
0% 0% 11% 32% 38% 19%
0% 1% 12% 37% 33% 16%
0% 3% 19% 41% 27% 10%
0% 1% 6% 30% 35% 29%
0% 1% 14% 34% 32% 18%
0% 3% 21% 37% 26% 12%
AWARDS / RECOGNITION DATA
Schools in Georgia may receive recognition in the following programs: Charter School Pay for Performance Program Georgia School of Excellence National Blue Ribbon School Tritt Elementary School did not receive recognition in any of these programs during the 1998-99 school year.
1998-99 GEORGIA PUBLIC EDUCATION REPORT CARD Tritt Elementary School - 6330181
Prepared by Georgia Department of Education
Page 4
CERTIFIED PERSONNEL DATA
Positions Number Average Contract Days
Personnel Sex
Certificate
Years Experience
Full-time Part-time
Male Female
4 Yr Bachelor's 5 Yr Master's 6 Yr Specialist's 7 Yr Doctoral Other*
<1 1-10 11-20 21-30 >30
Average
Administrators
2.00 235.00
2 0
0 2
0 1 1 0 0 0 0 1 0 1 25.00
Support Personnel
5.52 191.00
5 1
0 6
1 3 2 0 0 0 3 1 2 0 11.17
PK-12 Teachers
55.48 191.00
54 3
1 56
27 27
3 0 0 0 17 24 16 0 15.23
*Includes One- and Two-Year Vocational Certificates.
ACCREDITATION DATA
Accredited by Southern Association of Colleges and Schools (SACS):
Elementary/Middle Commission.
1998-99 GEORGIA PUBLIC EDUCATION REPORT CARD Tritt Elementary School - 6330181
Prepared by Georgia Department of Education
Page 5
1998-99 GEORGIA PUBLIC EDUCATION REPORT CARD
COBB COUNTY SCHOOLS
Varner Elementary School - 6330191
Grade Range PK-5
The Georgia Public Education Report Card is designed to assist systems and schools in educational improvement. This report card contains a variety of data elements. An explanation of the terms is provided as a companion to the report card data. Please refer to the definitions for the most effective use of the reported data.
STUDENT DATA
Total
K-5
1,121
PK
2
Enrollment, by Race/Ethnicity and Sex
Black
White Hispanic
American Asian Indian
Multiracial
103 9.2%
985 87.9%
8 0.7%
10 0.9%
0 0.0%
15 1.3%
0
2
0.0% 100.0%
0 0.0%
0 0.0%
0 0.0%
0 0.0%
Male Female
567 50.6%
554 49.4%
1 50.0%
1 50.0%
Enrollment in Selected Programs
Program
Program % of Student Enrollment Population
Gifted (Grades K-12)
46
4.1%
Alternative Programs (Grades 6-12)
N/A
N/A
Students Eligible to Receive Free/Reduced Lunches
Number
Percent
School System
97 16,221
8.6% 17.8%
Dropout Rate *
Number
Rate
School System
N/A N/A
N/A N/A
* Dropout rates are not applicable for grades PK-5.
Enrollment in Compensatory Programs
Program
Program % of Student Enrollment Population
Special Education (Grades K-12)
123 11.0%
(PK)
2
N/A
English to Speakers of Other Languages (ESOL) (Grades K-12)
0
0.0%
Remedial Education (Grades 2-5, 9-12)
33
4.3%
Special Instructional Assistance (SIA) (Grades K-3)
86 11.6%
Title I (Grades K-12)
This school has no Title I program.
Total 3
Retained Students, by Race/Ethnicity and Sex
Black
White Hispanic
American MultiAsian Indian racial
0
3
0.0% 100.0%
0 0.0%
0 0.0%
0 0.0%
0 0.0%
Male Female
2
1
66.7% 33.3%
Prepared by Georgia Department of Education
Page 1
STATE-REQUIRED TEST DATA
NORM-REFERENCED TESTS Grade 3
Iowa Tests of Basic Skills (ITBS) Each chart reflects data for three years of testing.
Reading Comprehension 50
60 63 54 0
98-99
59 62 53 97-98
60 60 52 96-97
Mathematics
School 50
System
State
0
71 70 61 98-99
61 68 61 97-98
64 68 59 96-97
School System State
Reading Vocabulary 50
65 58 50 0
98-99
61 58 50 97-98
64 58 49 96-97
Language Arts
School 50
System
State
0
70 70 64 98-99
61 69 62 97-98
64 67 59 96-97
School System State
Social Studies 50
75 64 56 0
98-99
64 64 55 97-98
67 64 55 96-97
Science
School 50
System
State
0
76 70 59 98-99
72 70 59 97-98
73 69 58 96-97
School System State
Sources of Information
Composite Score
50
72 66 57 0
98-99
School 50
System
61 65 56 97-98
62 64 55 96-97
State 0
71 67 58 98-99
64 67 57 97-98
1998-99 GEORGIA PUBLIC EDUCATION REPORT CARD Varner Elementary School - 6330191
Prepared by Georgia Department of Education
66 66 56 96-97
Scores Reported in Percentiles
School System State
Page 2
STATE-REQUIRED TEST DATA
NORM-REFERENCED TESTS Grade 5
Iowa Tests of Basic Skills (ITBS) Each chart reflects data for three years of testing.
Reading Comprehension
Mathematics
50
60 59 53 0
98-99
65 60 53 97-98
62 60 52 96-97
School 50
System
State
0
65 68 59 98-99
76 68 58 97-98
71 69 57 96-97
School System State
Reading Vocabulary 50
59 57 48 0
98-99
58 58 48 97-98
58 58 46 96-97
Language Arts
School 50
System
State
0
65 71 63 98-99
72 70 61 97-98
68 69 58 96-97
School System State
Social Studies 50
65 64 57 0
98-99
71 64 56 97-98
68 65 55 96-97
Science
School 50
System
State
0
68 68 60 98-99
72 69 59 97-98
75 70 59 96-97
School System State
Sources of Information
Composite Score
50
66 67 58 0
98-99
School 50
System
73 65 58 97-98
72 66 57 96-97
State 0
65 66 57 98-99
72 66 56 97-98
70 67 55 96-97
1998-99 GEORGIA PUBLIC EDUCATION REPORT CARD Varner Elementary School - 6330191
Prepared by Georgia Department of Education
Scores Reported in Percentiles
School System State
Page 3
STATE-REQUIRED TEST DATA
PERFORMANCE ASSESSMENTS
Grade 5 Writing Assessment
Percent at Developmental Stages:
1998-99 School System State
1997-98 School System State
1996-97 School System State
Stage Stage Stage Stage Stage Stage
1:The Emerging Writer 2:The Developing Writer 3:The Focusing Writer 4:The Experimenting 5:The Engaging Writer 6:The Extending Writer
1% 0% 8% 35% 44% 12%
0% 1% 10% 36% 34% 19%
0% 1% 16% 41% 29% 12%
0% 1% 8% 28% 36% 24%
0% 1% 12% 37% 33% 16%
0% 3% 19% 41% 27% 10%
0% 1% 11% 39% 32% 16%
0% 1% 14% 34% 32% 18%
0% 3% 21% 37% 26% 12%
AWARDS / RECOGNITION DATA
Schools in Georgia may receive recognition in the following programs: Charter School Pay for Performance Program Georgia School of Excellence National Blue Ribbon School Varner Elementary School did not receive recognition in any of these programs during the 1998-99 school year.
1998-99 GEORGIA PUBLIC EDUCATION REPORT CARD Varner Elementary School - 6330191
Prepared by Georgia Department of Education
Page 4
CERTIFIED PERSONNEL DATA
Positions Number Average Contract Days
Personnel Sex
Certificate
Years Experience
Full-time Part-time
Male Female
4 Yr Bachelor's 5 Yr Master's 6 Yr Specialist's 7 Yr Doctoral Other*
<1 1-10 11-20 21-30 >30
Average
Administrators
2.52 225.88
2 1
1 2
0 0 3 0 0 0 0 1 0 2 28.67
Support Personnel
5.05 191.00
5 1
1 5
1 3 2 0 0 0 3 1 1 1 15.00
PK-12 Teachers
59.95 191.00
58 4
1 61
34 23
5 0 0 0 36 17 9 0 11.00
*Includes One- and Two-Year Vocational Certificates.
ACCREDITATION DATA
Accredited by Southern Association of Colleges and Schools (SACS):
Elementary/Middle Commission.
1998-99 GEORGIA PUBLIC EDUCATION REPORT CARD Varner Elementary School - 6330191
Prepared by Georgia Department of Education
Page 5
1998-99 GEORGIA PUBLIC EDUCATION REPORT CARD
COBB COUNTY SCHOOLS
Vaughan Elementary School - 6330197
Grade Range K-5
The Georgia Public Education Report Card is designed to assist systems and schools in educational improvement. This report card contains a variety of data elements. An explanation of the terms is provided as a companion to the report card data. Please refer to the definitions for the most effective use of the reported data.
STUDENT DATA
Total 918
K-5 Enrollment, by Race/Ethnicity and Sex
Black
White Hispanic
American Multi-
Asian Indian
racial
16 1.7%
882 96.1%
8 0.9%
6 0.7%
0 0.0%
6 0.7%
Male Female
470 51.2%
448 48.8%
Enrollment in Selected Programs
Program
Program % of Student Enrollment Population
Gifted (Grades K-12)
26
2.8%
Alternative Programs (Grades 6-12)
N/A
N/A
Students Eligible to Receive Free/Reduced Lunches
Number
Percent
School System
16 16,221
1.7% 17.8%
Dropout Rate *
Number
Rate
School System
N/A N/A
N/A N/A
* Dropout rates are not applicable for grades PK-5.
Enrollment in Compensatory Programs
Program
Program % of Student Enrollment Population
Special Education (Grades K-12)
74
8.1%
(PK)
0
N/A
English to Speakers of Other Languages (ESOL) (Grades K-12)
0
0.0%
Remedial Education (Grades 2-5, 9-12)
76 11.6%
Special Instructional Assistance (SIA) (Grades K-3)
47
8.2%
Title I (Grades K-12)
This school has no Title I program.
Total 9
Retained Students, by Race/Ethnicity and Sex
Black
White Hispanic
American Multi-
Asian Indian
racial
0
9
0.0% 100.0%
0 0.0%
0 0.0%
0 0.0%
0 0.0%
Male Female
4
5
44.4% 55.6%
Prepared by Georgia Department of Education
Page 1
STATE-REQUIRED TEST DATA
NORM-REFERENCED TESTS Grade 3
Iowa Tests of Basic Skills (ITBS) Each chart reflects data for three years of testing.
Reading Comprehension 50
70 63 54 0
98-99
67 62 53 97-98
66 60 52 96-97
Mathematics
School 50
System
State
0
83 70 61 98-99
73 68 61 97-98
72 68 59 96-97
School System State
Reading Vocabulary 50
66 58 50 0
98-99
64 58 50 97-98
69 58 49 96-97
Language Arts
School 50
System
State
0
84 70 64 98-99
75 69 62 97-98
70 67 59 96-97
School System State
Social Studies 50
74 64 56 0
98-99
64 64 55 97-98
71 64 55 96-97
Science
School 50
System
State
0
77 70 59 98-99
71 70 59 97-98
73 69 58 96-97
School System State
Sources of Information
Composite Score
50
82 66 57 0
98-99
School 50
System
71 65 56 97-98
71 64 55 96-97
State 0
79 67 58 98-99
70 67 57 97-98
1998-99 GEORGIA PUBLIC EDUCATION REPORT CARD Vaughan Elementary School - 6330197
Prepared by Georgia Department of Education
71 66 56 96-97
Scores Reported in Percentiles
School System State
Page 2
STATE-REQUIRED TEST DATA
NORM-REFERENCED TESTS Grade 5
Iowa Tests of Basic Skills (ITBS) Each chart reflects data for three years of testing.
Reading Comprehension
Mathematics
50
68 59 53 0
98-99
68 60 53 97-98
64 60 52 96-97
School 50
System
State
0
70 68 59 98-99
74 68 58 97-98
69 69 57 96-97
School System State
Reading Vocabulary 50
61 57 48 0
98-99
64 58 48 97-98
60 58 46 96-97
Language Arts
School 50
System
State
0
72 71 63 98-99
70 70 61 97-98
64 69 58 96-97
School System State
Social Studies 50
69 64 57 0
98-99
65 64 56 97-98
68 65 55 96-97
Science
School 50
System
State
0
73 68 60 98-99
77 69 59 97-98
71 70 59 96-97
School System State
Sources of Information
Composite Score
50
73 67 58 0
98-99
School 50
System
65 65 58 97-98
60 66 57 96-97
State 0
71 66 57 98-99
70 66 56 97-98
66 67 55 96-97
1998-99 GEORGIA PUBLIC EDUCATION REPORT CARD Vaughan Elementary School - 6330197
Prepared by Georgia Department of Education
Scores Reported in Percentiles
School System State
Page 3
STATE-REQUIRED TEST DATA
PERFORMANCE ASSESSMENTS
Grade 5 Writing Assessment
Percent at Developmental Stages:
1998-99 School System State
1997-98 School System State
1996-97 School System State
Stage Stage Stage Stage Stage Stage
1:The Emerging Writer 2:The Developing Writer 3:The Focusing Writer 4:The Experimenting 5:The Engaging Writer 6:The Extending Writer
0% 1% 8% 36% 35% 19%
0% 1% 10% 36% 34% 19%
0% 1% 16% 41% 29% 12%
0% 1% 10% 36% 39% 13%
0% 1% 12% 37% 33% 16%
0% 3% 19% 41% 27% 10%
0% 0% 12% 38% 28% 20%
0% 1% 14% 34% 32% 18%
0% 3% 21% 37% 26% 12%
AWARDS / RECOGNITION DATA
Schools in Georgia may receive recognition in the following programs: Charter School Pay for Performance Program Georgia School of Excellence National Blue Ribbon School Vaughan Elementary School did not receive recognition in any of these programs during the 1998-99 school year.
1998-99 GEORGIA PUBLIC EDUCATION REPORT CARD Vaughan Elementary School - 6330197
Prepared by Georgia Department of Education
Page 4
CERTIFIED PERSONNEL DATA
Positions Number Average Contract Days
Personnel Sex
Certificate
Years Experience
Full-time Part-time
Male Female
4 Yr Bachelor's 5 Yr Master's 6 Yr Specialist's 7 Yr Doctoral Other*
<1 1-10 11-20 21-30 >30
Average
Administrators
2.00 235.00
2 0
0 2
0 1 0 1 0 0 1 1 0 0 15.00
Support Personnel
5.50 189.55
5 1
0 6
1 3 2 0 0 0 4 2 0 0 8.67
PK-12 Teachers
48.74 191.00
43 11
7 47
38 12
4 0 0 0 39 13 2 0 8.22
*Includes One- and Two-Year Vocational Certificates.
ACCREDITATION DATA
Accredited by Southern Association of Colleges and Schools (SACS):
Elementary/Middle Commission.
1998-99 GEORGIA PUBLIC EDUCATION REPORT CARD Vaughan Elementary School - 6330197
Prepared by Georgia Department of Education
Page 5
1998-99 GEORGIA PUBLIC EDUCATION REPORT CARD
COBB COUNTY SCHOOLS
Walton High School - 6330175
Grade Range 9-12
The Georgia Public Education Report Card is designed to assist systems and schools in educational improvement. This report card contains a variety of data elements. An explanation of the terms is provided as a companion to the report card data. Please refer to the definitions for the most effective use of the reported data.
Total 2,282
STUDENT DATA
9-12 Enrollment, by Race/Ethnicity and Sex
Black
White Hispanic
American Multi-
Asian Indian
racial
69 3.0%
2,025 88.7%
32 1.4%
145 6.4%
1 0.0%
10 0.4%
Male Female
1,170 51.3%
1,112 48.7%
Enrollment in Selected Programs
Program
Gifted (Grades K-12)
Program % of Student Enrollment Population
426
18.7%
Non-Vocational Labs (Grades 9-12)
Vocational Labs (Grades 9-12)
Alternative Programs (Grades 6-12)
2,016 805 0
88.3% 35.3%
0.0%
Students Eligible to Receive Free/Reduced Lunches
Number
Percent
School System
10 16,221
0.4% 17.8%
Enrollment in Compensatory Programs
Program
Program % of Student Enrollment Population
Special Education (Grades K-12) PK
202
8.9%
0
N/A
English to Speakers of Other Languages (ESOL) (Grades K-12)
14
< 1%
Remedial Education (Grades 2-5, 9-12)
60
2.6%
Title I (Grades K-12)
This school has no Title I program.
Dropout Rate for Grades 9-12
Number
Rate
School System
25 1,055
1.0% 3.7%
Total 46
Retained Students, by Race/Ethnicity and Sex
Black
White Hispanic
American MultiAsian Indian racial
7 15.2%
36 78.3%
0 0.0%
3 6.5%
0 0.0%
0 0.0%
Male Female
30
16
65.2% 34.8%
Prepared by Georgia Department of Education
Page 1
STATE-REQUIRED TEST DATA
GEORGIA HIGH SCHOOL GRADUATION TESTS (GHSGT)
Percent of Regular Program 11th Graders Passing the Georgia High School Graduation Tests on First Administration
English Language Arts Mathematics Social Studies Science
All Components listed above
Writing
1998-99
School System State
100% 99% 97% 94%
98% 94% 90% 85%
96% 88% 80% 72%
94% 82% 68%
99% 97% 93%
1997-98
School System State
100% 100% 96% 95%
98% 95% 89% 88%
94% 88% 78% 74%
94% 84% 68%
99% 96% 92%
1996-97
School System State
99% 99% 96% 95%
97% 94% 89% 89%
94% 87% 78% 74%
93% 84% 67%
100% 97% 93%
GRADUATE DATA
1999 Graduates by Credentials, Race/Ethnicity and Sex
Diplomas with Both College Prep. & Voc. Endorsements
Diplomas with College Prep. Endorsements Diplomas with Vocational Endorsements General High School Diplomas Special Education Diplomas
Total All Diplomas
Certificates of Performance
Total Graduates
Total 17
455 24 4 3
503 0
Black
0 0.0%
10 2.2%
0 0.0%
1 25.0%
0 0.0%
11 2.2%
0
American MultiWhite Hispanic Asian Indian racial
15 88.2%
0 0.0%
1 5.9%
0 0.0%
1 5.9%
404 88.8%
4 0.9%
36 7.9%
0 0.0%
1 0.2%
22 91.7%
0 0.0%
2 8.3%
0 0.0%
0 0.0%
3 75.0%
0 0.0%
0 0.0%
0 0.0%
0 0.0%
3 100.0%
0 0.0%
0 0.0%
0 0.0%
0 0.0%
447 88.9%
4 0.8%
39 7.8%
0 0.0%
2 0.4%
0
0
0
0
0
Male Female
11
6
64.7% 35.3%
214
241
47.0% 53.0%
17
7
70.8% 29.2%
4 100.0%
0 0.0%
2
1
66.7% 33.3%
248
255
49.3% 50.7%
0
0
503
11
447
4
39
0
2
248
255
2.2% 88.9% 0.8% 7.8% 0.0% 0.4% 49.3% 50.7%
HOPE Scholarships
School System
Number of 1999 Graduates 5 0 3
Number Eligible
434
Percent Eligible
86.3%
5,022 3,850 76.7%
State
65,548 40,292 61.5%
High School Completion Rate
Percent of 1995Grade 9 Enrollment in Graduating Class of1999 School System State
Completion Rate '95-'99 94.7% 83.6% 68.9%
1998-99 GEORGIA PUBLIC EDUCATION REPORT CARD
Walton High School - 6330175
Prepared by Georgia Department of Education
Page 2
COLLEGE ADMISSIONS / CREDIT TEST DATA
Scholastic Assessment Test (SAT)
Based on students' highest verbal and highest math scores
No. Taking
Average Score
Tests Verbal Math Total
Based on students' last test administration
Average Score Verbal Math Total
School
502
College Prep. Endorsement
Other Diplomas
System
4,180
College Prep. Endorsement
Other Diplomas
Georgia
41,958
558 570 1128
562 575 1137
410 408
818
523 522 1045 532 532 1064
402 387
789
492 488
980
544 N/A N/A
514 N/A N/A
483
558 N/A N/A
513 N/A N/A
479
1102 N/A N/A
1027 N/A N/A
962
Nation
952,913 N/A N/A N/A
502 508 1010
American College Testing (ACT)
Advanced Placement Exams (AP)
Number taking tests: 1 1 4 English Mathematics Reading Science Reasoning CompositeScore
School System
21.1 20.2
22.6 21.2
22.6 21.4
21.4 21.1
22.1 21.1
State 19.1 19.9 20.2 19.9 19.9
No. of Students Taking Tests
No. of Tests Taken No. of Test Scores
3 or Higher Percent of Test
Scores 3 or Higher
School 273 681 525
77.1%
System State 1,291 15,225 2,524 23,969 1,885 13,024
74.7% 54.3%
POST-SECONDARY DATA
Graduates Entering Georgia Public Colleges
Graduates Entering Georgia Public Colleges and Requiring Learning Support (LS)
1998 Graduates Entering in 1998-99
1997 Graduates Entering in 1997-98
Percent of Graduating Number Class
School
229
47.2%
System 2,220 46.3%
School
282
54.4%
System 2,229 48.4%
Number Requiring
LS 13 213
19 312
Percent of those attending Georgia
Public Colleges
5.7%
9.6%
6.7%
14.0%
In previous years, the Report Card presented College Prep Curriculum information provided by the Board of Regents on students requiring Learning Support. Due to inconsistencies in the data provided by the Board of Regents in defining College Prep Completers versus Local Board of Education data defining College Prep Endorsements, the Department of Education Report Card will not provide this information until discrepancies can be reconciled.
Graduates Entering Georgia Public Technical and Adult Schools
1998 Graduates School System
Entering Number 8 213
1998-99 Percent
1.6% 4.4%
Entering Number N/A N/A
1997-98 Percent
N/A N/A
1997 Graduates School
0
0.0%
System
22
0.5%
3
0.6%
192
4.2%
1998-99 GEORGIA PUBLIC EDUCATION REPORT CARD Walton High School - 6330175
Prepared by Georgia Department of Education
Page 3
CERTIFIED PERSONNEL DATA
Positions Number Average Contract Days
Administrators
5.04 216.00
Support Personnel
9.88 191.00
PK-12 Teachers
124.57 191.00
Personnel Sex
Certificate
Years Experience
Full-time Part-time
Male Female
4 Yr Bachelor's 5 Yr Master's 6 Yr Specialist's 7 Yr Doctoral Other*
<1 1-10 11-20 21-30 >30
Average
5 1
3 3
0 2 4 0 0
0 0 0 5 1
26.50
8 29
19 18
19 16
2 0 0
0 22
9 6 0
10.89
92 39
46 85
48 67 12
3 1
0 51 37 37
6
15.35
*Includes One- and Two-Year Vocational Certificates.
ACCREDITATION DATA
Accredited by Southern Association of Colleges and Schools (SACS): Secondary/Middle Commission.
AWARDS / RECOGNITION DATA
Schools that become a Charter School have a unique opportunity to rethink how they structure and deliver education programs for improving the learning of their students while being freed from the state laws, State Board of Education rules and regulations, and local board of education rules and regulations that govern other schools. A 'charter' is a binding contract that, when approved by the faculty and parents of the school, the local board of education and the State Board of Education, substitutes for state education statutes, state and local rules, policies, regulations and standards.
Walton High School is a Charter School for 1998-99.
1998-99 GEORGIA PUBLIC EDUCATION REPORT CARD Walton High School - 6330175
Prepared by Georgia Department of Education
Page 4
1998-99 GEORGIA PUBLIC EDUCATION REPORT CARD
COBB COUNTY SCHOOLS
West Cobb School - 6330499
Grade Range 8-9
The Georgia Public Education Report Card is designed to assist systems and schools in educational improvement. This report card contains a variety of data elements. An explanation of the terms is provided as a companion to the report card data. Please refer to the definitions for the most effective use of the reported data.
STUDENT DATA
Total 1,365
8-9 Enrollment, by Race/Ethnicity and Sex
Black
White Hispanic
American Multi-
Asian Indian
racial
62 4.5%
1,261 92.4%
11 0.8%
20 1.5%
1 0.1%
10 0.7%
Male 712
52.2%
Female 653
47.8%
Enrollment in Selected Programs
Program
Gifted (Grades K-12)
Program % of Student Enrollment Population
193
14.1%
Alternative Programs (Grades 6-12)
3
< 1%
Students Eligible to Receive Free/Reduced Lunches
Number
Percent
School System
36 16,221
2.6% 17.8%
Enrollment in Compensatory Programs
Program
Program % of Student Enrollment Population
Special Education (Grades K-12) (PK)
122
8.9%
0
N/A
English to Speakers of Other Languages (ESOL) (Grades K-12)
0
0.0%
Title I (Grades K-12)
This school has no Title I program.
Dropout Rate for Grades 8-9
Number
Rate
School System
3
0.2%
197
1.2%
Total 8
Retained Students, by Race/Ethnicity and Sex
Black
White Hispanic
American MultiAsian Indian racial
1 12.5%
7 87.5%
0 0.0%
0 0.0%
0 0.0%
0 0.0%
Male Female
6
2
75.0% 25.0%
Prepared by Georgia Department of Education
Page 1
STATE-REQUIRED TEST DATA
NORM-REFERENCED TESTS Grade 8
Iowa Tests of Basic Skills (ITBS) Each chart reflects data for three years of testing.
Reading Comprehension 50
65 61 49 N/A 61 48 N/A 62 48
0
98-99
97-98
96-97
Mathematics
School 50
System
State
0
67 66 56 N/A 66 55 N/A 67 54
98-99
97-98
96-97
School System State
Reading Vocabulary 50
63 57 46 N/A 57 45 N/A 58 44
0
98-99
97-98
96-97
Language Arts
School 50
System
State
0
72 70 60 N/A 68 58 N/A 68 56
98-99
97-98
96-97
School System State
Social Studies 50
67 64 54 N/A 64 53 N/A 65 53
0
98-99
97-98
96-97
Science
School 50
System
State
0
70 66 56 N/A 67 55 N/A 67 53
98-99
97-98
96-97
School System State
Sources of Information
Composite Score
School
50
50
System
69 67 57 N/A 66 56 N/A 67 55
0
98-99
97-98
96-97
State 0
70 67 56 N/A 66 54 N/A 67 54
98-99
97-98
96-97
1998-99 GEORGIA PUBLIC EDUCATION REPORT CARD West Cobb School - 6330499
Prepared by Georgia Department of Education
Scores Reported in Percentiles
School System State
Page 2
STATE-REQUIRED TEST DATA
Categories of Scaled Scores
Inadequate (less than 162)
Minimal (162-209)
Good
(210-247)
Very Good (greater than 247)
Average Scaled Score: (Range 100-300)
PERFORMANCE ASSESSMENTS
Grade 8 Writing Assessment
1998-99 Percent Scoring
1997-98 Percent Scoring
1996-97 Percent Scoring
School System State School System State School System State
2% 22% 55% 21%
2% 25% 50% 24%
8% 40% 41% 11%
N/A N/A N/A N/A
3% 33% 47% 17%
11% 46% 34%
8%
N/A N/A N/A N/A
5% 36% 43% 16%
15% 46% 30%
8%
224
225
208 N/A
218 202 N/A
215 198
AWARDS / RECOGNITION DATA
Schools in Georgia may receive recognition in the following programs: Charter School Pay for Performance Program Georgia School of Excellence National Blue Ribbon School West Cobb School did not receive recognition in any of these programs during the 1998-99 school year.
1998-99 GEORGIA PUBLIC EDUCATION REPORT CARD West Cobb School - 6330499
Prepared by Georgia Department of Education
Page 3
CERTIFIED PERSONNEL DATA
Positions Number Average Contract Days
Personnel Sex
Certificate
Years Experience
Full-time Part-time
Male Female
4 Yr Bachelor's 5 Yr Master's 6 Yr Specialist's 7 Yr Doctoral Other*
<1 1-10 11-20 21-30 >30
Average
Administrators
3.00 226.67
3 0
2 1
0 0 2 1 0 0 0 0 3 0 25.00
Support Personnel
6.63 191.00
6 14
9 11
12 6 2 0 0 0
12 5 3 0
10.80
PK-12 Teachers
82.62 191.00
70 14
22 62
56 24
3 1 0 0 57 22 4 1 9.29
*Includes One- and Two-Year Vocational Certificates.
ACCREDITATION DATA
Not accredited by Southern Association of Colleges and Schools (SACS) or Georgia Accrediting Commission (GAC).
1998-99 GEORGIA PUBLIC EDUCATION REPORT CARD West Cobb School - 6330499
Prepared by Georgia Department of Education
Page 4
1998-99 GEORGIA PUBLIC EDUCATION REPORT CARD
COBB COUNTY SCHOOLS
Wheeler High School - 6331069
Grade Range 9-12
The Georgia Public Education Report Card is designed to assist systems and schools in educational improvement. This report card contains a variety of data elements. An explanation of the terms is provided as a companion to the report card data. Please refer to the definitions for the most effective use of the reported data.
Total 1,784
STUDENT DATA
9-12 Enrollment, by Race/Ethnicity and Sex
Black
White Hispanic
American Multi-
Asian Indian
racial
485 27.2%
1,024 57.4%
97 5.4%
141 7.9%
4 0.2%
33 1.8%
Male Female
953 53.4%
831 46.6%
Enrollment in Selected Programs
Program
Gifted (Grades K-12)
Program % of Student Enrollment Population
94
5.3%
Non-Vocational Labs (Grades 9-12)
974
Vocational Labs
(Grades 9-12)
735
Alternative Programs (Grades 6-12)
10
54.6% 41.2%
< 1%
Students Eligible to Receive Free/Reduced Lunches
Number
Percent
School System
94 16,221
5.3% 17.8%
Enrollment in Compensatory Programs
Program
Program % of Student Enrollment Population
Special Education (Grades K-12) PK
152
8.5%
0
N/A
English to Speakers of Other Languages (ESOL) (Grades K-12)
66
3.7%
Remedial Education (Grades 2-5, 9-12)
269 15.1%
Title I (Grades K-12)
This school has no Title I program.
Dropout Rate for Grades 9-12
Number
Rate
School System
38 1,055
1.9% 3.7%
Total 102
Retained Students, by Race/Ethnicity and Sex
Black
White Hispanic
American MultiAsian Indian racial
51 50.0%
35 34.3%
7 6.9%
6 5.9%
0 0.0%
3 2.9%
Male Female
67
35
65.7% 34.3%
Prepared by Georgia Department of Education
Page 1
STATE-REQUIRED TEST DATA
GEORGIA HIGH SCHOOL GRADUATION TESTS (GHSGT)
Percent of Regular Program 11th Graders Passing the Georgia High School Graduation Tests on First Administration
English Language Arts Mathematics Social Studies Science
All Components listed above
Writing
1998-99
School System State
98% 96% 89% 83%
98% 94% 90% 85%
96% 88% 80% 72%
80% 82% 68%
97% 97% 93%
1997-98
School System State
97% 92% 88% 88%
98% 95% 89% 88%
94% 88% 78% 74%
83% 84% 68%
95% 96% 92%
1996-97
School System State
97% 95% 89% 91%
97% 94% 89% 89%
94% 87% 78% 74%
86% 84% 67%
96% 97% 93%
GRADUATE DATA
1999 Graduates by Credentials, Race/Ethnicity and Sex
Diplomas with Both College Prep. & Voc. Endorsements
Diplomas with College Prep. Endorsements Diplomas with Vocational Endorsements General High School Diplomas Special Education Diplomas
Total All Diplomas
Certificates of Performance
Total Graduates
Total 23
303 16 2 5
349 7
356
Black
9 39.1%
60 19.8%
7 43.8%
1 50.0%
3 60.0%
80 22.9%
3 42.9%
83 23.3%
American MultiWhite Hispanic Asian Indian racial
12 52.2%
196 64.7%
2 8.7%
10 3.3%
0 0.0%
35 11.6%
0 0.0%
0 0.0%
0 0.0%
2 0.7%
6 37.5%
0 0.0%
1 20.0%
2 12.5%
0 0.0%
0 0.0%
0 0.0%
0 0.0%
1 20.0%
0 0.0%
0 0.0%
0 0.0%
1 6.3%
1 50.0%
0 0.0%
215 61.6%
14
36
4.0% 10.3%
0 0.0%
4 1.1%
1
1
2
14.3% 14.3% 28.6%
0 0.0%
0 0.0%
216 60.7%
15
38
4.2% 10.7%
0 0.0%
4 1.1%
Male Female
14 60.9%
141 46.5%
9 39.1%
162 53.5%
8 50.0%
1 50.0%
5 100.0%
8 50.0%
1 50.0%
0 0.0%
169
180
48.4% 51.6%
1
6
14.3% 85.7%
170
186
47.8% 52.2%
HOPE Scholarships
School System
Number of 1999 Graduates 3 5 6
Number Eligible
291
Percent Eligible
81.7%
5,022 3,850 76.7%
State
65,548 40,292 61.5%
High School Completion Rate
Percent of 1995Grade 9 Enrollment in Graduating Class of1999 School System State
Completion Rate '95-'99 90.8% 83.6% 68.9%
1998-99 GEORGIA PUBLIC EDUCATION REPORT CARD
Wheeler High School - 6331069
Prepared by Georgia Department of Education
Page 2
COLLEGE ADMISSIONS / CREDIT TEST DATA
Scholastic Assessment Test (SAT)
Based on students' highest verbal and highest math scores
No. Taking
Average Score
Tests Verbal Math Total
Based on students' last test administration
Average Score Verbal Math Total
School
340
College Prep. Endorsement
Other Diplomas
System
4,180
College Prep. Endorsement
Other Diplomas
Georgia
41,958
523 530 1053
534 538 1072
370 326
696
523 522 1045 532 532 1064
402 387
789
492 488
980
513 N/A N/A
514 N/A N/A
483
519 N/A N/A
513 N/A N/A
479
1032 N/A N/A
1027 N/A N/A
962
Nation
952,913 N/A N/A N/A
502 508 1010
American College Testing (ACT)
Advanced Placement Exams (AP)
Number taking tests: English Mathematics Reading Science Reasoning CompositeScore
9 5 School System State
20.4 20.2 19.1
21.7 21.2 19.9
21.8 21.7
21.4 21.1
20.2 19.9
21.6 21.1 19.9
No. of Students Taking Tests
No. of Tests Taken No. of Test Scores
3 or Higher Percent of Test
Scores 3 or Higher
School 130 260 194
74.6%
System State 1,291 15,225 2,524 23,969 1,885 13,024
74.7% 54.3%
POST-SECONDARY DATA
Graduates Entering Georgia Public Colleges
Graduates Entering Georgia Public Colleges and Requiring Learning Support (LS)
1998 Graduates Entering in 1998-99
1997 Graduates Entering in 1997-98
Percent of Graduating Number Class
School
166
44.9%
System 2,220 46.3%
School
164
47.4%
System 2,229 48.4%
Number Requiring
LS 14 213
28 312
Percent of those attending Georgia
Public Colleges
8.4%
9.6%
17.1%
14.0%
In previous years, the Report Card presented College Prep Curriculum information provided by the Board of Regents on students requiring Learning Support. Due to inconsistencies in the data provided by the Board of Regents in defining College Prep Completers versus Local Board of Education data defining College Prep Endorsements, the Department of Education Report Card will not provide this information until discrepancies can be reconciled.
Graduates Entering Georgia Public Technical and Adult Schools
1998 Graduates School System
Entering Number 7 213
1998-99 Percent
1.9% 4.4%
Entering Number N/A N/A
1997-98 Percent
N/A N/A
1997 Graduates School
1
0.3%
System
22
0.5%
14
4.0%
192
4.2%
1998-99 GEORGIA PUBLIC EDUCATION REPORT CARD Wheeler High School - 6331069
Prepared by Georgia Department of Education
Page 3
CERTIFIED PERSONNEL DATA
Positions Number Average Contract Days
Administrators
5.00 218.20
Support Personnel
9.71 191.00
PK-12 Teachers
97.29 191.00
Personnel Sex
Certificate
Years Experience
Full-time Part-time
Male Female
4 Yr Bachelor's 5 Yr Master's 6 Yr Specialist's 7 Yr Doctoral Other*
<1 1-10 11-20 21-30 >30
Average
5 0
4 1
0 1 2 2 0
0 1 0 4 0
22.60
8 26
20 14
19 10
4 1 0
0 18 11
3 2
11.94
71 30
28 73
55 34
7 5 0
0 52 28 17
4
12.36
*Includes One- and Two-Year Vocational Certificates.
ACCREDITATION DATA
Accredited by Southern Association of Colleges and Schools (SACS): Secondary/Middle Commission.
AWARDS / RECOGNITION DATA
Schools in Georgia may receive recognition in the following programs: Charter School Pay for Performance Program Georgia School of Excellence National Blue Ribbon School Wheeler High School did not receive recognition in any of these programs during the 1998-99 school year.
1998-99 GEORGIA PUBLIC EDUCATION REPORT CARD Wheeler High School - 6331069
Prepared by Georgia Department of Education
Page 4
1998-99 GEORGIA PUBLIC EDUCATION REPORT CARD COFFEE COUNTY SCHOOLS - 634
The Georgia Public Education Report Card is designed to assist systems and schools in educational improvement. This report card contains a variety of data elements. An explanation of the terms is provided as a companion to the report card data. Please refer to the definitions for the most effective use of the reported data.
Total
K-12
7,161
PK
313
STUDENT DATA
Enrollment, by Race/Ethnicity and Sex
Black
White Hispanic
American Multi-
Asian Indian
racial
2,433 34.0%
4,313 60.2%
343 4.8%
42 0.6%
4 0.1%
26 0.4%
83 26.5%
206 65.8%
18 5.8%
1 0.3%
0 0.0%
5 1.6%
Male
3,682 51.4%
164 52.4%
Female
3,479 48.6%
149 47.6%
Enrollment in Selected Programs
Program
Program % of Student Enrollment Population
Gifted (Grades K-12)
368
5.1%
Non-Vocational Labs (Grades 9-12)
1,649
89.0%
Vocational Labs (Grades 9-12)
830
44.8%
Alternative Programs (Grades 6-12)
54
1.6%
Students Eligible to Receive Free/Reduced Lunches
Number
Percent
4,419
59.1%
Dropout Rate
Number
Percent
6-12
146
3.9%
9-12
120
6.2%
Enrollment in Compensatory Programs
Program
Program % of Student Enrollment Population
Special Education
(Grades K-12)
841
PK
46
English to Speakers of
Other Languages (ESOL)
34
(Grades K-12)
Remedial Education (Grades 2-5, 9-12)
493
Special Instructional Assistance (SIA) (Grades K-3)
1,002
Title I (Grades K-12) Number of schools with: Schoolwide program Targeted Assistance program No Title I program
11.7% N/A < 1%
11.4%
39.3%
7 0 3
Total 370
Retained Students, by Race/Ethnicity and Sex
Black
White Hispanic
American MultiAsian Indian racial
169 45.7%
181 48.9%
20 5.4%
0 0.0%
0 0.0%
0 0.0%
Male Female 220 150
59.5% 40.5%
Prepared by Georgia Department of Education
Page 1
STATE-REQUIRED TEST DATA
NORM-REFERENCED TESTS
Grade 3 Iowa Tests of Basic Skills (ITBS) Each chart reflects data for three years of testing.
Reading Comprehension
Mathematics
50
44 54 47 53 48 52 0
98-99 97-98 96-97
System State
50
54 61 56 61 58 59 0
98-99 97-98 96-97
System State
Reading Vocabulary
50
43 50 44 50 41 49 0
98-99 97-98 96-97
System State
Social Studies
50
45 56 53 55 52 55 0
98-99 97-98 96-97
System State
Language Arts
50
56 64 53 62 57 59 0
98-99 97-98 96-97
System State
Science
50
52 59 57 59 55 58 0
98-99 97-98 96-97
System State
Sources of Information
Composite Score
50
47 57 0
98-99
System
50
51 56 51 55 97-98 96-97
State
48 58 52 57 0
98-99 97-98
1998-99 GEORGIA PUBLIC EDUCATION REPORT CARD Coffee County Schools
Prepared by Georgia Department of Education
System State Scores Reported 52 56 in Percentiles 96-97
Page 2
STATE-REQUIRED TEST DATA
NORM-REFERENCED TESTS
Grade 5 Iowa Tests of Basic Skills (ITBS) Each chart reflects data for three years of testing.
Reading Comprehension
Mathematics
50
49 53 50 53 43 52 0
98-99 97-98 96-97
System State
50
52 59 54 58 45 57 0
98-99 97-98 96-97
System State
Reading Vocabulary
50
42 48 45 48 39 46 0
98-99 97-98 96-97
System State
Social Studies
50
53 57 57 56 46 55 0
98-99 97-98 96-97
System State
Language Arts
50
58 63 57 61 50 58 0
98-99 97-98 96-97
System State
Science
50
55 60 59 59 53 59 0
98-99 97-98 96-97
System State
Sources of Information
Composite Score
50
52 58 0
98-99
System
50
55 58 46 57 97-98 96-97
State
52 57 54 56 0
98-99 97-98
1998-99 GEORGIA PUBLIC EDUCATION REPORT CARD Coffee County Schools
Prepared by Georgia Department of Education
System State Scores Reported 45 55 in Percentiles 96-97
Page 3
STATE-REQUIRED TEST DATA
NORM-REFERENCED TESTS Grade 8
Iowa Tests of Basic Skills (ITBS) Each chart reflects data for three years of testing.
Reading Comprehension
Mathematics
50
39 49 39 48 38 48 0
98-99 97-98 96-97
System State
50
48 56 47 55 45 54 0
98-99 97-98 96-97
System State
Reading Vocabulary
50
34 46 35 45 33 44 0
98-99 97-98 96-97
System State
Language Arts
50
62 60 62 58 59 56 0
98-99 97-98 96-97
System State
Social Studies
50
45 54 47 53 46 53 0
98-99 97-98 96-97
System State
Science
50
47 56 52 55 49 53 0
98-99 97-98 96-97
System State
Sources of Information
Composite Score
50
53 57 0
98-99
System
50
53 56 54 55 97-98 96-97
State
49 56 50 54 0
98-99 97-98
1998-99 GEORGIA PUBLIC EDUCATION REPORT CARD Coffee County Schools
Prepared by Georgia Department of Education
System State Scores Reported 48 54 in Percentiles 96-97
Page 4
STATE-REQUIRED TEST DATA
PERFORMANCE ASSESSMENTS
Grade 5 Writing Assessment
1998-99
1997-98
1996-97
Percent at Developmental Stages:
Comparison
Comparison
Comparison
System Group State System Group State System Group State
Stage Stage Stage Stage Stage Stage
1: The Emerging Writer 2: The Developing Writer 3: The Focusing Writer 4: The Experimenting Writer 5: The Engaging Writer 6: The Extending Writer
0% 1% 17% 49% 25% 8%
0% 2% 21% 46% 23% 7%
0% 1% 16% 41% 29% 12%
1% 2% 20% 41% 27% 8%
0% 3% 22% 43% 23% 7%
0% 3% 19% 41% 27% 10%
1% 5% 25% 37% 25% 7%
0% 4% 25% 39% 23% 9%
0% 3% 21% 37% 26% 12%
Grade 8 Writing Assessment
1998-99 Percent Scoring 1997-98 Percent Scoring 1996-97 Percent Scoring
Categories of Scaled Scores
Comparison
Comparison
Comparison
System Group State System Group State System Group State
Inadequate (less than 162)
Minimal (162-209)
Good
(210-247)
Very Good (greater than 247)
10% 53% 32%
5%
9% 46% 36%
9%
8% 40% 41% 11%
13% 56% 27%
4%
13% 50% 31%
6%
11% 46% 34%
8%
20% 56% 18%
5%
20% 49% 25%
6%
15% 46% 30%
8%
Average Scaled Score: (Range 100-300)
199
203 208
194
197 202
188
192 198
GEORGIA HIGH SCHOOL GRADUATION TESTS (GHSGT)
Percent of Regular Program 11th Graders Passing the Georgia High School Graduation Tests on First Administration
1998-99
1997-98
1996-97
Comparison
Comparison
Comparison
System Group State System Group State System Group State
English Language Arts Mathematics Social Studies Science
95% 88% 72% 71%
94% 86% 76% 69%
96% 88% 80% 72%
93% 92% 70% 75%
93% 86% 73% 71%
94% 88% 78% 74%
92% 90% 78% 72%
92% 86% 73% 67%
94% 87% 78% 74%
All Components listed above 6 3 %
63% 68% 65%
63% 68% 67%
59% 67%
Writing
94%
93% 93% 90%
91% 92% 93%
91% 93%
1998-99 GEORGIA PUBLIC EDUCATION REPORT CARD
Coffee County Schools
Prepared by Georgia Department of Education
Page 5
GRADUATE DATA
1999 Graduates by Credentials, Race/Ethnicity and Sex
Diplomas with Both College Prep. & Voc. Endorsements
Diplomas with College Prep. Endorsements Diplomas with Vocational Endorsements General High School Diplomas Special Education Diplomas
Total All Diplomas
Certificates of Performance
Total Graduates
Total 38
155 115
7 7 322 39 361
Black
10 26.3%
24 15.5%
44 38.3%
3 42.9%
3 42.9%
84 26.1%
27 69.2%
111 30.7%
American MultiWhite Hispanic Asian Indian racial
28 73.7%
124 80.0%
69 60.0%
4 57.1%
3 42.9%
228 70.8%
0 0.0%
5 3.2%
2 1.7%
0 0.0%
1 14.3%
8 2.5%
0 0.0%
2 1.3%
0 0.0%
0 0.0%
0 0.0%
2 0.6%
0 0.0%
0 0.0%
0 0.0%
0 0.0%
0 0.0%
0 0.0%
0 0.0%
0 0.0%
0 0.0%
0 0.0%
0 0.0%
0 0.0%
11
1
0
0
0
28.2% 2.6% 0.0% 0.0% 0.0%
239
9
2
0
0
66.2% 2.5% 0.6% 0.0% 0.0%
Male Female
17 44.7%
64 41.3%
66 57.4%
6 85.7%
3 42.9%
156 48.4%
21 55.3%
91 58.7%
49 42.6%
1 14.3%
4 57.1%
166 51.6%
14
25
35.9% 64.1%
170 191 47.1% 52.9%
HOPE Scholarships
System State
Number of 1999 Graduates 3 6 1
Number Eligible
191
Percent Eligible
52.9%
65,548 40,292 61.5%
High School Completion Rate Percent of 1995Grade 9 Enrollment
in Graduating Class of1999
System
State
Completion Rate '95-'99 69.7% 68.9%
COLLEGE ADMISSIONS / CREDIT TEST DATA
Scholastic Assessment Test (SAT)
No. Taking
Average Score
Tests
Verbal Math Total
Based on students' highest verbal and highest math scores
System College Prep. Endorsement Other Diplomas
483 487 970 492 489 981 399 408 807
Georgia
492 488 980
Based on students' last test administration
System Georgia
158
476 478
954
41,958 483 479 962
Nation
952,913 502 508 1010
American College Testing (ACT)
System State Nation
English
18.1
19.1 20.4
Mathematics
19.1
19.9 20.7
Reading
18.5
20.2 21.3
Science Reasoning 18.5
19.9 21.0
CompositeScore 18.7
19.9 21.9
Advanced Placement Exams (AP)
No. of Students Taking Tests
No. of Tests Taken No. of Test Scores
3 or Higher Percent of Test
Scores 3 or Higher
System State 89 15,225
112 23,969 33 13,024
29.5% 54.3%
1998-99 GEORGIA PUBLIC EDUCATION REPORT CARD Coffee County Schools
Prepared by Georgia Department of Education
Page 6
POSTSECONDARY DATA
Graduates Entering Georgia Public Colleges and Universities
Graduates Entering Georgia Public Colleges and Universities and
Requiring Learning Support (LS)
1998 Graduates Entering 1998-99
1997 Graduates Entering 1997-98
Percent of Graduating Number Class
132
41.4%
133
42.5%
Number Requiring
LS
40
40
Percent of those attending Georgia
Public Colleges
30.3%
30.1%
In previous years, the Report Card presented College Prep Curriculum information provided by the Board of Regents on students requiring Learning Support. Due to inconsistencies in the data provided by the Board of Regents in defining College Prep Completers versus Local Board of Education data defining College Prep Endorsements, the Department of Education Report Card will not provide this information until discrepancies can be reconciled.
Graduates Entering Georgia Public Technical and Adult Schools
Entering 1998-99 Entering 1997-98
Number Percent
Number Percent
1998 Graduates 1997 Graduates
41
12.9%
0
0.0%
N/A 29
N/A 9.3%
ACCREDITATION / RECOGNITION DATA
Southern Association of Colleges and Schools (SACS) Accrediting Commission
Secondary/Middle Commission Elementary/Middle Commission Both Elementary/Secondary Commissions Joint Commission Candidate for Accreditation
Accreditation by Georgia Accrediting Commission (GAC)
Accredited by GAC Accredited with Quality by GAC
Number of Schools
1 0 0 0 0
Number of Schools
0 10
Awards / Recognition
State Recognized Program
Number of Schools
Charter School
0
Pay for Performance Recipient
0
Georgia School of Excellence
1
National Blue Ribbon School
0
COMMUNITY DATA
Number of Children Eligible for Migrant Education Number of Families-At-Risk * Number of Food Stamp Participants * Number of Families Receiving TANF * ** Per Capita Income * Unemployment Rate * 1990 Population * Projected 2000 Population * Projected 2010 Population *
* Data Available at County Level Only ** Known as AFDC before January 1997
730 150 3,089 265 $20,025 5.3% 29,592 34,337 38,224
1998-99 GEORGIA PUBLIC EDUCATION REPORT CARD Coffee County Schools
Prepared by Georgia Department of Education
Page 7
FISCAL DATA
Millage Rate
16.95
* Fall 1998 Property Tax Digest is used to calculate the 98-99 Value of One Mill
FTE Count
FTE Count used for Allotment Calculation 7,076.0 Fall '98 FTE Count 7,161
Value of One Mill
$553,099 $78.16 per Allotment FTE
Sources: Local State-QBE State-
Lottery State-
Other Federal Other
Total
PerGeneral Fund cent Per FTE
$9,678,179 26.1% $1,368 $27,035,140 72.8% $3,821
K-12 Revenues
Lottery K-12
and
Title
All Other
Programs
K-12
$0
$0
Bonded Debt $20,637
$0
$0
$0
$0 0.0%
$0
$0 $154,092
$0
$356,427 1.0% $50
$4,386 0.0%
$1
$37,949 0.1%
$5
$37,112,083 100% $5,245
$1,900 $2,518,167
$0 $2,520,067
$330,825 $0 $0
$484,918
$0 $0 $0 $20,637
Capital Projects $4,757,580
$0
$0
$1,379,915 $0 $0
$6,137,496
School Nutrition
$831,077 $0
$0
$212,414 $2,095,907
$0 $3,139,398
Grand Total
Total
Per-
Amount cent
$15,287,474 30.9%
$27,035,140 54.7%
$154,092 0.3%
$2,281,481 4.6% $4,618,461 9.3%
$37,949 0.1% $49,414,601 100%
Instruction
Media Instruction
Support Pupil Services General Admin. School Admin. Trans-
portation Maint. & Ops. Capital Projects School Food Debt Service
Total
K-12 Expenditures
$23,807,854 67.6% $3,365 $1,622,896 $249,836
$0
$0
$0
$1,070,466 3.0% $151
$19,856
$0
$0
$0
$0
$1,485,592 4.2% $210 $338,334
$0
$0
$0
$0
$1,797,863 5.1% $254 $440,621 $297,283
$0
$0
$0
$627,133 1.8% $89
$4,977
$0
$0
$0
$4,521
$2,187,753 6.2% $309
$5,567
$0
$0
$0
$0
$1,701,474 4.8% $240
$10,015
$0
$0
$0
$70
$2,523,260 7.2% $357
$1,430
$0
$0
$0
$0
$0 0.0%
$0
$0
$0
$0 $4,917,533
$0
$3,150 0.0%
$0
$0
$0
$0
$0 $2,833,766
$0 0.0%
$0
$0
$0
$0 $348,367
$0
$35,204,549 100% $4,975 $2,443,699 $547,119
$0 $5,265,901 $2,838,358
$25,680,587 55.5% $1,090,323 2.4% $1,823,926 3.9% $2,535,768 5.5% $636,632 1.4% $2,193,320 4.7% $1,711,560 3.7% $2,524,690 5.5% $4,917,533 10.6% $2,836,917 6.1% $348,367 0.8%
$46,299,628 100%
Salaries and Benefits as Percentages of Revenues and of Expenditures
Teachers and Paraprofessionals
Salaries $18,315,569
Benefits $5,140,859
Percentage of Revenues Percentage of Expenditures
Total of
Total of
General Fund
General Fund
Title Programs
Title Programs
Lottery K-12
Lottery K-12
Total Salaries
and
Total
and
Total
and Benefits All Other K-12 K - 12 All Other K-12 K - 12
$23,456,428
58.5%
47.5%
61.4%
50.7%
School Administration
$1,232,827
$423,658
$1,656,485
4.1%
3.4%
4.3%
3.6%
General Administration
$303,666
$95,612
$399,278
1.0%
0.8%
1.0%
0.9%
1998-99 GEORGIA PUBLIC EDUCATION REPORT CARD
Coffee County Schools - 634
Prepared by Georgia Department of Education
Page 8
CERTIFIED PERSONNEL DATA
Number
Average Annual Salary Positions Average Contract Days
Average Daily Salary
Full-time Personnel Part-time
Sex Male Female
4 Yr Bachelor's Certificate 5 Yr Master's
Level 6 Yr Specialist's 7 Yr Doctoral Other*
Black
White Race/ Hispanic Ethnicity Asian
American Indian
Multiracial
Years Experience
<1 1-10 11-20 21-30 >30
Average
Administrators
37.81
$61,428.44 219.55
$279.80
37 2
20 19
0 17 20
2 0
3 36
0 0 0 0
0 2 13 21 3
21.67
Support Personnel PK-12 Teachers
33.51
489.12
$45,571.79 201.23
$226.47
$37,091.64 191.22
$193.97
30
482
7
7
7
69
30
420
2
262
20
172
14
46
1
9
0
0
3
47
34
439
0
1
0
1
0
1
0
0
1
30
6
184
14
172
14
98
2
5
18.03
12.73
*Includes One- and Two-Year Vocational Certificates.
Certified Staff Position Ratios
Teacher/Administrator Ratio 13:1
Teacher/Support Person Ratio 15:1
Teacher/Staff Ratio 7:1
Student Enrollment/All Teachers 15:1
Certified Personnel by Category
86.5% 100%
6.9%
6.5%
80% 60%
40%
20%
0%
Teachers
Administrators
Support Personnel
1998-99 GEORGIA PUBLIC EDUCATION REPORT CARD
Coffee County Schools - 634
Prepared by Georgia Department of Education
Page 9
1998-99 GEORGIA PUBLIC EDUCATION REPORT CARD
COFFEE COUNTY SCHOOLS
Ambrose Elementary School - 6341050
Grade Range K-5
The Georgia Public Education Report Card is designed to assist systems and schools in educational improvement. This report card contains a variety of data elements. An explanation of the terms is provided as a companion to the report card data. Please refer to the definitions for the most effective use of the reported data.
STUDENT DATA
Total 379
K-5 Enrollment, by Race/Ethnicity and Sex
Black
White Hispanic
American Multi-
Asian Indian
racial
126 33.2%
202 53.3%
47 12.4%
0 0.0%
1 0.3%
3 0.8%
Male Female
203 53.6%
176 46.4%
Enrollment in Selected Programs
Program
Program % of Student Enrollment Population
Gifted (Grades K-12)
6
1.6%
Alternative Programs (Grades 6-12)
N/A
N/A
Students Eligible to Receive Free/Reduced Lunches
Number
Percent
School System
288 4,419
76.0% 59.1%
Dropout Rate *
Number
Rate
School System
N/A N/A
N/A N/A
* Dropout rates are not applicable for grades PK-5.
Enrollment in Compensatory Programs
Program
Program % of Student Enrollment Population
Special Education (Grades K-12)
33
8.7%
(PK)
0
N/A
English to Speakers of Other Languages (ESOL) (Grades K-12)
0
0.0%
Remedial Education (Grades 2-5, 9-12)
31 12.2%
Special Instructional Assistance (SIA) (Grades K-3)
115 47.1%
Title I (Grades K-12)
This school has a schoolwide program.
Total 7
Retained Students, by Race/Ethnicity and Sex
Black
White Hispanic
American Multi-
Asian Indian
racial
2 28.6%
4 57.1%
1 14.3%
0 0.0%
0 0.0%
0 0.0%
Male Female
4
3
57.1% 42.9%
Prepared by Georgia Department of Education
Page 1
STATE-REQUIRED TEST DATA
NORM-REFERENCED TESTS Grade 3
Iowa Tests of Basic Skills (ITBS) Each chart reflects data for three years of testing.
Reading Comprehension 50
39 44 54 0
98-99
48 47 53 97-98
43 48 52 96-97
Mathematics
School 50
System
State
0
47 54 61 98-99
56 56 61 97-98
53 58 59 96-97
School System State
Reading Vocabulary 50
46 43 50 0
98-99
47 44 50 97-98
34 41 49 96-97
Language Arts
School 50
System
State
0
50 56 64 98-99
61 53 62 97-98
48 57 59 96-97
School System State
Social Studies 50
36 45 56 0
98-99
46 53 55 97-98
49 52 55 96-97
Science
School 50
System
State
0
41 52 59 98-99
58 57 59 97-98
56 55 58 96-97
School System State
Sources of Information
Composite Score
50
35 47 57 0
98-99
School 50
System
45 51 56 97-98
46 51 55 96-97
State 0
40 48 58 98-99
53 52 57 97-98
1998-99 GEORGIA PUBLIC EDUCATION REPORT CARD Ambrose Elementary School - 6341050
Prepared by Georgia Department of Education
47 52 56 96-97
Scores Reported in Percentiles
School System State
Page 2
STATE-REQUIRED TEST DATA
NORM-REFERENCED TESTS Grade 5
Iowa Tests of Basic Skills (ITBS) Each chart reflects data for three years of testing.
Reading Comprehension
Mathematics
50
52 49 53 0
98-99
56 50 53 97-98
37 43 52 96-97
School 50
System
State
0
53 52 59 98-99
65 54 58 97-98
33 45 57 96-97
School System State
Reading Vocabulary 50
36 42 48 0
98-99
44 45 48 97-98
26 39 46 96-97
Language Arts
School 50
System
State
0
59 58 63 98-99
59 57 61 97-98
36 50 58 96-97
School System State
Social Studies 50
60 53 57 0
98-99
74 57 56 97-98
40 46 55 96-97
Science
School 50
System
State
0
49 55 60 98-99
62 59 59 97-98
49 53 59 96-97
School System State
Sources of Information
Composite Score
50
57 52 58 0
98-99
School 50
System
66 55 58 97-98
35 46 57 96-97
State 0
54 52 57 98-99
63 54 56 97-98
36 45 55 96-97
1998-99 GEORGIA PUBLIC EDUCATION REPORT CARD Ambrose Elementary School - 6341050
Prepared by Georgia Department of Education
Scores Reported in Percentiles
School System State
Page 3
STATE-REQUIRED TEST DATA
PERFORMANCE ASSESSMENTS
Grade 5 Writing Assessment
Percent at Developmental Stages:
1998-99 School System State
1997-98 School System State
1996-97 School System State
Stage Stage Stage Stage Stage Stage
1:The Emerging Writer 2:The Developing Writer 3:The Focusing Writer 4:The Experimenting 5:The Engaging Writer 6:The Extending Writer
0% 3% 24% 42% 24% 7%
0% 1% 17% 49% 25% 8%
0% 1% 16% 41% 29% 12%
0% 0% 12% 36% 39% 14%
1% 2% 20% 41% 27% 8%
0% 3% 19% 41% 27% 10%
0% 5% 30% 30% 24% 11%
1% 5% 25% 37% 25% 7%
0% 3% 21% 37% 26% 12%
AWARDS / RECOGNITION DATA
Schools in Georgia may receive recognition in the following programs: Charter School Pay for Performance Program Georgia School of Excellence National Blue Ribbon School Ambrose Elementary School did not receive recognition in any of these programs during the 1998-99 school year.
1998-99 GEORGIA PUBLIC EDUCATION REPORT CARD Ambrose Elementary School - 6341050
Prepared by Georgia Department of Education
Page 4
CERTIFIED PERSONNEL DATA
Positions Number Average Contract Days
Personnel Sex
Certificate
Years Experience
Full-time Part-time
Male Female
4 Yr Bachelor's 5 Yr Master's 6 Yr Specialist's 7 Yr Doctoral Other*
<1 1-10 11-20 21-30 >30
Average
Administrators
2.00 210.00
2 0
1 1
0 1 1 0 0 0 1 0 0 1 18.00
Support Personnel
1.50 192.00
1 1
0 2
1 1 0 0 0 0 0 2 0 0 12.00
PK-12 Teachers
24.67 190.00
22 5
3 24
15 11
1 0 0 1 11 11 3 1 11.85
*Includes One- and Two-Year Vocational Certificates.
ACCREDITATION DATA
Accredited with Quality by Georgia Accrediting Commission (GAC).
1998-99 GEORGIA PUBLIC EDUCATION REPORT CARD Ambrose Elementary School - 6341050
Prepared by Georgia Department of Education
Page 5
1998-99 GEORGIA PUBLIC EDUCATION REPORT CARD
COFFEE COUNTY SCHOOLS
Broxton-Mary Hayes Elementary School - 6340191
Grade Range PK-5
The Georgia Public Education Report Card is designed to assist systems and schools in educational improvement. This report card contains a variety of data elements. An explanation of the terms is provided as a companion to the report card data. Please refer to the definitions for the most effective use of the reported data.
STUDENT DATA
Total
K-5
352
PK
99
Enrollment, by Race/Ethnicity and Sex
Black
White Hispanic
American Asian Indian
Multiracial
140 39.8%
180 51.1%
26 7.4%
1 0.3%
0 0.0%
5 1.4%
30 30.3%
62 62.6%
5 5.1%
0 0.0%
0 0.0%
2 2.0%
Male Female
174 49.4%
178 50.6%
44 44.4%
55 55.6%
Enrollment in Selected Programs
Program
Program % of Student Enrollment Population
Gifted (Grades K-12)
7
2.0%
Alternative Programs (Grades 6-12)
N/A
N/A
Students Eligible to Receive Free/Reduced Lunches
Number
Percent
School System
367 4,419
81.4% 59.1%
Dropout Rate *
Number
Rate
School System
N/A N/A
N/A N/A
* Dropout rates are not applicable for grades PK-5.
Enrollment in Compensatory Programs
Program
Program % of Student Enrollment Population
Special Education (Grades K-12)
44 12.5%
(PK)
6
N/A
English to Speakers of Other Languages (ESOL) (Grades K-12)
0
0.0%
Remedial Education (Grades 2-5, 9-12)
66 28.2%
Special Instructional Assistance (SIA) (Grades K-3)
86 37.6%
Title I (Grades K-12)
This school has a schoolwide program.
Total 10
Retained Students, by Race/Ethnicity and Sex
Black
White Hispanic
American MultiAsian Indian racial
6 60.0%
3
1
30.0% 10.0%
0 0.0%
0 0.0%
0 0.0%
Male Female
8
2
80.0% 20.0%
Prepared by Georgia Department of Education
Page 1
STATE-REQUIRED TEST DATA
NORM-REFERENCED TESTS Grade 3
Iowa Tests of Basic Skills (ITBS) Each chart reflects data for three years of testing.
Reading Comprehension 50
42 44 54 0
98-99
40 47 53 97-98
41 48 52 96-97
Mathematics
School 50
System
State
0
56 54 61 98-99
52 56 61 97-98
55 58 59 96-97
School System State
Reading Vocabulary 50
43 43 50 0
98-99
36 44 50 97-98
31 41 49 96-97
Language Arts
School 50
System
State
0
57 56 64 98-99
55 53 62 97-98
48 57 59 96-97
School System State
Social Studies 50
54 45 56 0
98-99
56 53 55 97-98
55 52 55 96-97
Science
School 50
System
State
0
57 52 59 98-99
49 57 59 97-98
51 55 58 96-97
School System State
Sources of Information
Composite Score
50
54 47 57 0
98-99
School 50
System
47 51 56 97-98
45 51 55 96-97
State 0
52 48 58 98-99
48 52 57 97-98
1998-99 GEORGIA PUBLIC EDUCATION REPORT CARD Broxton-Mary Hayes Elementary School - 6340191
Prepared by Georgia Department of Education
47 52 56 96-97
Scores Reported in Percentiles
School System State
Page 2
STATE-REQUIRED TEST DATA
NORM-REFERENCED TESTS Grade 5
Iowa Tests of Basic Skills (ITBS) Each chart reflects data for three years of testing.
Reading Comprehension
Mathematics
50
45 49 53 0
98-99
43 50 53 97-98
33 43 52 96-97
School 50
System
State
0
51 52 59 98-99
43 54 58 97-98
33 45 57 96-97
School System State
Reading Vocabulary 50
33 42 48 0
98-99
35 45 48 97-98
26 39 46 96-97
Language Arts
School 50
System
State
0
48 58 63 98-99
47 57 61 97-98
27 50 58 96-97
School System State
Social Studies 50
48 53 57 0
98-99
46 57 56 97-98
35 46 55 96-97
Science
School 50
System
State
0
49 55 60 98-99
49 59 59 97-98
43 53 59 96-97
School System State
Sources of Information
Composite Score
50
48 52 58 0
98-99
School 50
System
40 55 58 97-98
28 46 57 96-97
State 0
45 52 57 98-99
42 54 56 97-98
30 45 55 96-97
1998-99 GEORGIA PUBLIC EDUCATION REPORT CARD Broxton-Mary Hayes Elementary School - 6340191
Prepared by Georgia Department of Education
Scores Reported in Percentiles
School System State
Page 3
STATE-REQUIRED TEST DATA
PERFORMANCE ASSESSMENTS
Grade 5 Writing Assessment
Percent at Developmental Stages:
1998-99 School System State
1997-98 School System State
1996-97 School System State
Stage Stage Stage Stage Stage Stage
1:The Emerging Writer 2:The Developing Writer 3:The Focusing Writer 4:The Experimenting 5:The Engaging Writer 6:The Extending Writer
0% 2% 24% 53% 22% 0%
0% 1% 17% 49% 25% 8%
0% 1% 16% 41% 29% 12%
2% 6% 32% 40% 21% 0%
1% 2% 20% 41% 27% 8%
0% 3% 19% 41% 27% 10%
5% 8% 23% 51% 13% 0%
1% 5% 25% 37% 25% 7%
0% 3% 21% 37% 26% 12%
AWARDS / RECOGNITION DATA
Schools in Georgia may receive recognition in the following programs: Charter School Pay for Performance Program Georgia School of Excellence National Blue Ribbon School Broxton-Mary Hayes Elementary School did not receive recognition in any of these programs during the 1998-99 school year.
1998-99 GEORGIA PUBLIC EDUCATION REPORT CARD Broxton-Mary Hayes Elementary School - 6340191
Prepared by Georgia Department of Education
Page 4
CERTIFIED PERSONNEL DATA
Positions Number Average Contract Days
Personnel Sex
Certificate
Years Experience
Full-time Part-time
Male Female
4 Yr Bachelor's 5 Yr Master's 6 Yr Specialist's 7 Yr Doctoral Other*
<1 1-10 11-20 21-30 >30
Average
Administrators
2.00 200.00
2 0
1 1
0 1 1 0 0 0 0 1 1 0 19.50
Support Personnel
1.50 192.00
1 1
0 2
1 0 1 0 0 0 1 0 1 0 15.50
PK-12 Teachers
32.84 190.15
32 3
4 31
21 13
1 0 0 3 17 7 7 1 11.34
*Includes One- and Two-Year Vocational Certificates.
ACCREDITATION DATA
Accredited with Quality by Georgia Accrediting Commission (GAC).
1998-99 GEORGIA PUBLIC EDUCATION REPORT CARD Broxton-Mary Hayes Elementary School - 6340191
Prepared by Georgia Department of Education
Page 5
1998-99 GEORGIA PUBLIC EDUCATION REPORT CARD
COFFEE COUNTY SCHOOLS
Coffee County High School - 6340195
Grade Range 9-12
The Georgia Public Education Report Card is designed to assist systems and schools in educational improvement. This report card contains a variety of data elements. An explanation of the terms is provided as a companion to the report card data. Please refer to the definitions for the most effective use of the reported data.
Total 1,850
STUDENT DATA
9-12 Enrollment, by Race/Ethnicity and Sex
Black
White Hispanic
American Multi-
Asian Indian
racial
571 30.9%
1,219 65.9%
52 2.8%
6 0.3%
2 0.1%
0 0.0%
Male Female
914 49.4%
936 50.6%
Enrollment in Selected Programs
Program
Gifted (Grades K-12)
Program % of Student Enrollment Population
143
7.7%
Non-Vocational Labs (Grades 9-12)
Vocational Labs (Grades 9-12)
Alternative Programs (Grades 6-12)
1,649 830 54
89.1% 44.9%
2.9%
Students Eligible to Receive Free/Reduced Lunches
Number
Percent
School System
693 4,419
37.5% 59.1%
Enrollment in Compensatory Programs
Program
Program % of Student Enrollment Population
Special Education (Grades K-12) PK
133
7.2%
0
N/A
English to Speakers of Other Languages (ESOL) (Grades K-12)
0
0.0%
Remedial Education (Grades 2-5, 9-12)
105
5.7%
Title I (Grades K-12)
This school has no Title I program.
Dropout Rate for Grades 9-12
Number
Rate
School System
120
6.2%
120
6.2%
Total 207
Retained Students, by Race/Ethnicity and Sex
Black
White Hispanic
American MultiAsian Indian racial
95 45.9%
101 48.8%
11 5.3%
0 0.0%
0 0.0%
0 0.0%
Male Female
122
85
58.9% 41.1%
Prepared by Georgia Department of Education
Page 1
STATE-REQUIRED TEST DATA
GEORGIA HIGH SCHOOL GRADUATION TESTS (GHSGT)
Percent of Regular Program 11th Graders Passing the Georgia High School Graduation Tests on First Administration
English Language Arts Mathematics Social Studies Science
All Components listed above
Writing
1998-99
School System State
95% 88% 72% 71%
95% 88% 72% 71%
96% 88% 80% 72%
63% 63% 68%
94% 94% 93%
1997-98
School System State
93% 92% 70% 75%
93% 92% 70% 75%
94% 88% 78% 74%
65% 65% 68%
90% 90% 92%
1996-97
School System State
92% 90% 78% 72%
92% 90% 78% 72%
94% 87% 78% 74%
67% 67% 67%
93% 93% 93%
GRADUATE DATA
1999 Graduates by Credentials, Race/Ethnicity and Sex
Diplomas with Both College Prep. & Voc. Endorsements
Diplomas with College Prep. Endorsements Diplomas with Vocational Endorsements General High School Diplomas Special Education Diplomas
Total All Diplomas
Certificates of Performance
Total Graduates
Total 38
155 115
7 7 322 39 361
Black
10 26.3%
24 15.5%
44 38.3%
3 42.9%
3 42.9%
84 26.1%
27 69.2%
111 30.7%
White Hispanic
28 73.7%
124 80.0%
0 0.0%
5 3.2%
69 60.0%
4 57.1%
3 42.9%
2 1.7%
0 0.0%
1 14.3%
228 70.8%
8 2.5%
11 28.2%
1 2.6%
239 66.2%
9 2.5%
American MultiAsian Indian racial
0 0.0%
2 1.3%
0 0.0%
0 0.0%
0 0.0%
0 0.0%
0 0.0%
0 0.0%
0 0.0%
0 0.0%
0 0.0%
0 0.0%
0 0.0%
0 0.0%
0 0.0%
2 0.6%
0 0.0%
0 0.0%
0 0.0%
0 0.0%
0 0.0%
2 0.6%
0 0.0%
0 0.0%
Male Female
17 44.7%
64 41.3%
21 55.3%
91 58.7%
66 57.4%
6 85.7%
3 42.9%
49 42.6%
1 14.3%
4 57.1%
156
166
48.4% 51.6%
14
25
35.9% 64.1%
170
191
47.1% 52.9%
HOPE Scholarships
School System
Number of 1999 Graduates 3 6 1
Number Eligible
191
Percent Eligible
52.9%
361 191 52.9%
State
65,548 40,292 61.5%
High School Completion Rate
Percent of 1995Grade 9 Enrollment in Graduating Class of1999 School System State
Completion Rate '95-'99 69.7% 69.7% 68.9%
1998-99 GEORGIA PUBLIC EDUCATION REPORT CARD
Coffee County High School - 6340195
Prepared by Georgia Department of Education
Page 2
COLLEGE ADMISSIONS / CREDIT TEST DATA
Scholastic Assessment Test (SAT)
Based on students' highest verbal and highest math scores
No. Taking
Average Score
Tests Verbal Math Total
Based on students' last test administration
Average Score Verbal Math Total
School
158 483 487
970
College Prep. Endorsement
492 489
981
Other Diplomas
399 408
807
System
158 483 487
970
College Prep. Endorsement
492 489
981
Other Diplomas
399 408
807
Georgia
41,958 492 488
980
476 N/A N/A
476 N/A N/A
483
478 N/A N/A
478 N/A N/A
479
954 N/A N/A
954 N/A N/A
962
Nation
952,913 N/A N/A N/A
502 508 1010
American College Testing (ACT)
Advanced Placement Exams (AP)
Number taking tests: English Mathematics Reading Science Reasoning CompositeScore
3 2 School System State
18.1 18.1 19.1
19.1 19.1 19.9
18.5 18.5
18.5 18.5
20.2 19.9
18.7 18.7 19.9
No. of Students Taking Tests
No. of Tests Taken No. of Test Scores
3 or Higher Percent of Test
Scores 3 or Higher
School 89
112 33
29.5%
System State 89 15,225
112 23,969 33 13,024
29.5% 54.3%
POST-SECONDARY DATA
Graduates Entering Georgia Public Colleges
Graduates Entering Georgia Public Colleges and Requiring Learning Support (LS)
1998 Graduates Entering in 1998-99
1997 Graduates Entering in 1997-98
Percent of Graduating Number Class
School
132
41.4%
System 132
41.4%
School
133
42.5%
System 133
42.5%
Number Requiring
LS 40 40
40 40
Percent of those attending Georgia
Public Colleges
30.3%
30.3%
30.1%
30.1%
In previous years, the Report Card presented College Prep Curriculum information provided by the Board of Regents on students requiring Learning Support. Due to inconsistencies in the data provided by the Board of Regents in defining College Prep Completers versus Local Board of Education data defining College Prep Endorsements, the Department of Education Report Card will not provide this information until discrepancies can be reconciled.
Graduates Entering Georgia Public Technical and Adult Schools
1998 Graduates School System
Entering Number 41 41
1998-99 Percent 12.9% 12.9%
Entering Number N/A N/A
1997-98 Percent
N/A N/A
1997 Graduates School
0
0.0%
System
0
0.0%
29
9.3%
29
9.3%
1998-99 GEORGIA PUBLIC EDUCATION REPORT CARD Coffee County High School - 6340195
Prepared by Georgia Department of Education
Page 3
CERTIFIED PERSONNEL DATA
Positions Number Average Contract Days
Administrators
8.81 216.92
Support Personnel
6.61 202.59
PK-12 Teachers
110.87 194.65
Personnel Sex
Certificate
Years Experience
Full-time Part-time
Male Female
4 Yr Bachelor's 5 Yr Master's 6 Yr Specialist's 7 Yr Doctoral Other*
<1 1-10 11-20 21-30 >30
Average
8 2
5 5
0 8 2 0 0
0 0 4 6 0
21.40
5 3
2 6
0 7 1 0 0
1 1 3 3 0
16.88
103 15
37 81
59 42 14
3 0
9 43 38 27
1
13.36
*Includes One- and Two-Year Vocational Certificates.
ACCREDITATION DATA
Accredited by Southern Association of Colleges and Schools (SACS): Secondary/Middle Commission. Accredited with Quality by Georgia Accrediting Commission (GAC).
AWARDS / RECOGNITION DATA
Schools in Georgia may receive recognition in the following programs: Charter School Pay for Performance Program Georgia School of Excellence National Blue Ribbon School Coffee County High School did not receive recognition in any of these programs during the 1998-99 school year.
1998-99 GEORGIA PUBLIC EDUCATION REPORT CARD Coffee County High School - 6340195
Prepared by Georgia Department of Education
Page 4
1998-99 GEORGIA PUBLIC EDUCATION REPORT CARD
COFFEE COUNTY SCHOOLS
East Coffee Middle School - 6344550
Grade Range PK, 6-8
The Georgia Public Education Report Card is designed to assist systems and schools in educational improvement. This report card contains a variety of data elements. An explanation of the terms is provided as a companion to the report card data. Please refer to the definitions for the most effective use of the reported data.
STUDENT DATA
Total
6-8
559
PK
19
Enrollment, by Race/Ethnicity and Sex
Black
American Multi-
White Hispanic Asian Indian
racial
166 29.7%
350 62.6%
39 7.0%
3 0.5%
1 0.2%
0 0.0%
15 78.9%
3 15.8%
0 0.0%
0 0.0%
0 0.0%
1 5.3%
Male 291
52.1% 11
57.9%
Female 268
47.9% 8
42.1%
Enrollment in Selected Programs
Program
Program Enrollment
Gifted
84
(Grades K-12)
Alternative Programs
0
(Grades 6-12)
% of Student Population 15.0%
0.0%
Students Eligible to Receive Free/Reduced Lunches
Number
Percent
School System
404 4,419
69.9% 59.1%
Enrollment in Compensatory Programs
Program
Program % of Student Enrollment Population
Special Education (Grades K-12) (PK)
72 12.9%
2
N/A
English to Speakers of Other Languages (ESOL) (Grades K-12)
34
6.1%
Title I (Grades K-12)
This school has no Title I program.
Dropout Rate for Grades 6-8
Number
Rate
School System
16
2.3%
26
1.4%
Total 20
Retained Students, by Race/Ethnicity and Sex
Black
White Hispanic
American MultiAsian Indian racial
8 40.0%
10
2
50.0% 10.0%
0 0.0%
0 0.0%
0 0.0%
Male Female
14
6
70.0% 30.0%
Prepared by Georgia Department of Education
Page 1
STATE-REQUIRED TEST DATA
NORM-REFERENCED TESTS Grade 8
Iowa Tests of Basic Skills (ITBS) Each chart reflects data for three years of testing.
Reading Comprehension 50
37 39 49 0
98-99
42 39 48 97-98
37 38 48 96-97
Mathematics
School 50
System
State
0
41 48 56 98-99
45 47 55 97-98
41 45 54 96-97
School System State
Reading Vocabulary 50
33 34 46 0
98-99
35 35 45 97-98
33 33 44 96-97
Language Arts
School 50
System
State
0
59 62 60 98-99
65 62 58 97-98
56 59 56 96-97
School System State
Social Studies 50
43 45 54 0
98-99
48 47 53 97-98
45 46 53 96-97
Science
School 50
System
State
0
45 47 56 98-99
54 52 55 97-98
50 49 53 96-97
School System State
Sources of Information
Composite Score
50
50 53 57 0
98-99
School 50
System
57 53 56 97-98
53 54 55 96-97
State 0
45 49 56 98-99
52 50 54 97-98
1998-99 GEORGIA PUBLIC EDUCATION REPORT CARD East Coffee Middle School - 6344550
Prepared by Georgia Department of Education
47 48 54 96-97
Scores Reported in Percentiles
School System State
Page 2
STATE-REQUIRED TEST DATA
Categories of Scaled Scores
Inadequate (less than 162)
Minimal (162-209)
Good
(210-247)
Very Good (greater than 247)
Average Scaled Score: (Range 100-300)
PERFORMANCE ASSESSMENTS
Grade 8 Writing Assessment
1998-99 Percent Scoring
1997-98 Percent Scoring
1996-97 Percent Scoring
School System State School System State School System State
11% 43% 38%
9%
10% 53% 32%
5%
8% 40% 41% 11%
15% 53% 29%
3%
13% 56% 27%
4%
11% 46% 34%
8%
17% 59% 22%
3%
20% 56% 18%
5%
15% 46% 30%
8%
205
199
208 195
194 202 189
188 198
AWARDS / RECOGNITION DATA
Schools in Georgia may receive recognition in the following programs: Charter School Pay for Performance Program Georgia School of Excellence National Blue Ribbon School East Coffee Middle School did not receive recognition in any of these programs during the 1998-99 school year.
1998-99 GEORGIA PUBLIC EDUCATION REPORT CARD East Coffee Middle School - 6344550
Prepared by Georgia Department of Education
Page 3
CERTIFIED PERSONNEL DATA
Positions Number Average Contract Days
Personnel Sex
Certificate
Years Experience
Full-time Part-time
Male Female
4 Yr Bachelor's 5 Yr Master's 6 Yr Specialist's 7 Yr Doctoral Other*
<1 1-10 11-20 21-30 >30
Average
Administrators
3.00 223.33
3 0
1 2
0 0 3 0 0 0 0 0 3 0 26.00
Support Personnel
2.00 202.00
2 0
1 1
0 1 1 0 0 0 0 0 1 1 29.50
PK-12 Teachers
46.96 190.62
45 3
8 40
29 11
8 0 0 4 22 15 7 0 10.56
*Includes One- and Two-Year Vocational Certificates.
ACCREDITATION DATA
Accredited with Quality by Georgia Accrediting Commission (GAC).
1998-99 GEORGIA PUBLIC EDUCATION REPORT CARD East Coffee Middle School - 6344550
Prepared by Georgia Department of Education
Page 4
1998-99 GEORGIA PUBLIC EDUCATION REPORT CARD
COFFEE COUNTY SCHOOLS
Eastside Elementary School - 6340282
Grade Range PK-5
The Georgia Public Education Report Card is designed to assist systems and schools in educational improvement. This report card contains a variety of data elements. An explanation of the terms is provided as a companion to the report card data. Please refer to the definitions for the most effective use of the reported data.
STUDENT DATA
Total
K-5
573
PK
40
Enrollment, by Race/Ethnicity and Sex
Black
White Hispanic
American Asian Indian
Multiracial
251 43.8%
303 52.9%
13 2.3%
6 1.0%
0 0.0%
0 0.0%
7 17.5%
28 70.0%
3 7.5%
1 2.5%
0 0.0%
1 2.5%
Male Female
304 53.1%
269 46.9%
17 42.5%
23 57.5%
Enrollment in Selected Programs
Program
Program % of Student Enrollment Population
Gifted (Grades K-12)
18
3.1%
Alternative Programs (Grades 6-12)
N/A
N/A
Students Eligible to Receive Free/Reduced Lunches
Number
Percent
School System
372 4,419
60.7% 59.1%
Dropout Rate *
Number
Rate
School System
N/A N/A
N/A N/A
* Dropout rates are not applicable for grades PK-5.
Enrollment in Compensatory Programs
Program
Program % of Student Enrollment Population
Special Education (Grades K-12)
53
9.2%
(PK)
0
N/A
English to Speakers of Other Languages (ESOL) (Grades K-12)
0
0.0%
Remedial Education (Grades 2-5, 9-12)
78 20.7%
Special Instructional Assistance (SIA) (Grades K-3)
146 36.8%
Title I (Grades K-12)
This school has a schoolwide program.
Total 21
Retained Students, by Race/Ethnicity and Sex
Black
White Hispanic
American MultiAsian Indian racial
14 66.7%
6 28.6%
1 4.8%
0 0.0%
0 0.0%
0 0.0%
Male Female
16
5
76.2% 23.8%
Prepared by Georgia Department of Education
Page 1
STATE-REQUIRED TEST DATA
NORM-REFERENCED TESTS Grade 3
Iowa Tests of Basic Skills (ITBS) Each chart reflects data for three years of testing.
Reading Comprehension 50
49 44 54 0
98-99
48 47 53 97-98
53 48 52 96-97
Mathematics
School 50
System
State
0
56 54 61 98-99
54 56 61 97-98
55 58 59 96-97
School System State
Reading Vocabulary 50
44 43 50 0
98-99
44 44 50 97-98
45 41 49 96-97
Language Arts
School 50
System
State
0
65 56 64 98-99
56 53 62 97-98
62 57 59 96-97
School System State
Social Studies 50
50 45 56 0
98-99
50 53 55 97-98
52 52 55 96-97
Science
School 50
System
State
0
55 52 59 98-99
57 57 59 97-98
50 55 58 96-97
School System State
Sources of Information
Composite Score
50
51 47 57 0
98-99
School 50
System
56 51 56 97-98
53 51 55 96-97
State 0
53 48 58 98-99
53 52 57 97-98
1998-99 GEORGIA PUBLIC EDUCATION REPORT CARD Eastside Elementary School - 6340282
Prepared by Georgia Department of Education
53 52 56 96-97
Scores Reported in Percentiles
School System State
Page 2
STATE-REQUIRED TEST DATA
NORM-REFERENCED TESTS Grade 5
Iowa Tests of Basic Skills (ITBS) Each chart reflects data for three years of testing.
Reading Comprehension
Mathematics
50
49 49 53 0
98-99
50 50 53 97-98
50 43 52 96-97
School 50
System
State
0
46 52 59 98-99
56 54 58 97-98
52 45 57 96-97
School System State
Reading Vocabulary 50
35 42 48 0
98-99
39 45 48 97-98
41 39 46 96-97
Language Arts
School 50
System
State
0
59 58 63 98-99
65 57 61 97-98
64 50 58 96-97
School System State
Social Studies 50
50 53 57 0
98-99
58 57 56 97-98
51 46 55 96-97
Science
School 50
System
State
0
50 55 60 98-99
56 59 59 97-98
52 53 59 96-97
School System State
Sources of Information
Composite Score
50
52 52 58 0
98-99
School 50
System
59 55 58 97-98
53 46 57 96-97
State 0
49 52 57 98-99
56 54 56 97-98
52 45 55 96-97
1998-99 GEORGIA PUBLIC EDUCATION REPORT CARD Eastside Elementary School - 6340282
Prepared by Georgia Department of Education
Scores Reported in Percentiles
School System State
Page 3
STATE-REQUIRED TEST DATA
PERFORMANCE ASSESSMENTS
Grade 5 Writing Assessment
Percent at Developmental Stages:
1998-99 School System State
1997-98 School System State
1996-97 School System State
Stage Stage Stage Stage Stage Stage
1:The Emerging Writer 2:The Developing Writer 3:The Focusing Writer 4:The Experimenting 5:The Engaging Writer 6:The Extending Writer
0% 0% 11% 45% 25% 19%
0% 1% 17% 49% 25% 8%
0% 1% 16% 41% 29% 12%
1% 0% 18% 33% 33% 15%
1% 2% 20% 41% 27% 8%
0% 3% 19% 41% 27% 10%
0% 2% 13% 31% 44% 11%
1% 5% 25% 37% 25% 7%
0% 3% 21% 37% 26% 12%
AWARDS / RECOGNITION DATA
Schools in Georgia may receive recognition in the following programs: Charter School Pay for Performance Program Georgia School of Excellence National Blue Ribbon School Eastside Elementary School did not receive recognition in any of these programs during the 1998-99 school year.
1998-99 GEORGIA PUBLIC EDUCATION REPORT CARD Eastside Elementary School - 6340282
Prepared by Georgia Department of Education
Page 4
CERTIFIED PERSONNEL DATA
Positions Number Average Contract Days
Personnel Sex
Certificate
Years Experience
Full-time Part-time
Male Female
4 Yr Bachelor's 5 Yr Master's 6 Yr Specialist's 7 Yr Doctoral Other*
<1 1-10 11-20 21-30 >30
Average
Administrators
2.00 220.00
2 0
1 1
0 0 1 1 0 0 0 1 1 0 21.00
Support Personnel
3.00 194.00
3 0
0 3
0 1 2 0 0 0 0 0 3 0 25.00
PK-12 Teachers
43.74 190.11
43 2
3 42
24 17
4 0 0 1 14 17 13 0 14.69
*Includes One- and Two-Year Vocational Certificates.
ACCREDITATION DATA
Accredited with Quality by Georgia Accrediting Commission (GAC).
1998-99 GEORGIA PUBLIC EDUCATION REPORT CARD Eastside Elementary School - 6340282
Prepared by Georgia Department of Education
Page 5
1998-99 GEORGIA PUBLIC EDUCATION REPORT CARD
COFFEE COUNTY SCHOOLS
Nicholls Elementary School - 6340291
Grade Range PK-5
The Georgia Public Education Report Card is designed to assist systems and schools in educational improvement. This report card contains a variety of data elements. An explanation of the terms is provided as a companion to the report card data. Please refer to the definitions for the most effective use of the reported data.
STUDENT DATA
Total
K-5
277
PK
77
Enrollment, by Race/Ethnicity and Sex
Black
White Hispanic
American Asian Indian
Multiracial
82 29.6%
182 65.7%
12 4.3%
0 0.0%
0 0.0%
1 0.4%
14 18.2%
59 76.6%
3 3.9%
0 0.0%
0 0.0%
1 1.3%
Male Female
148 53.4%
129 46.6%
48 62.3%
29 37.7%
Enrollment in Selected Programs
Program
Program % of Student Enrollment Population
Gifted (Grades K-12)
7
2.5%
Alternative Programs (Grades 6-12)
N/A
N/A
Students Eligible to Receive Free/Reduced Lunches
Number
Percent
School System
280 4,419
79.1% 59.1%
Dropout Rate *
Number
Rate
School System
N/A N/A
N/A N/A
* Dropout rates are not applicable for grades PK-5.
Enrollment in Compensatory Programs
Program
Program % of Student Enrollment Population
Special Education (Grades K-12)
63 22.7%
(PK)
12
N/A
English to Speakers of Other Languages (ESOL) (Grades K-12)
0
0.0%
Remedial Education (Grades 2-5, 9-12)
22 12.7%
Special Instructional Assistance (SIA) (Grades K-3)
101 52.6%
Title I (Grades K-12)
This school has a schoolwide program.
Total 17
Retained Students, by Race/Ethnicity and Sex
Black
White Hispanic
American MultiAsian Indian racial
4 23.5%
13 76.5%
0 0.0%
0 0.0%
0 0.0%
0 0.0%
Male Female
7
10
41.2% 58.8%
Prepared by Georgia Department of Education
Page 1
STATE-REQUIRED TEST DATA
NORM-REFERENCED TESTS Grade 3
Iowa Tests of Basic Skills (ITBS) Each chart reflects data for three years of testing.
Reading Comprehension 50
49 44 54 0
98-99
61 47 53 97-98
51 48 52 96-97
Mathematics
School 50
System
State
0
66 54 61 98-99
72 56 61 97-98
67 58 59 96-97
School System State
Reading Vocabulary 50
38 43 50 0
98-99
52 44 50 97-98
51 41 49 96-97
Language Arts
School 50
System
State
0
65 56 64 98-99
67 53 62 97-98
69 57 59 96-97
School System State
Social Studies 50
51 45 56 0
98-99
66 53 55 97-98
65 52 55 96-97
Science
School 50
System
State
0
68 52 59 98-99
77 57 59 97-98
78 55 58 96-97
School System State
Sources of Information
Composite Score
50
58 47 57 0
98-99
School 50
System
67 51 56 97-98
60 51 55 96-97
State 0
58 48 58 98-99
68 52 57 97-98
1998-99 GEORGIA PUBLIC EDUCATION REPORT CARD Nicholls Elementary School - 6340291
Prepared by Georgia Department of Education
66 52 56 96-97
Scores Reported in Percentiles
School System State
Page 2
STATE-REQUIRED TEST DATA
NORM-REFERENCED TESTS Grade 5
Iowa Tests of Basic Skills (ITBS) Each chart reflects data for three years of testing.
Reading Comprehension
Mathematics
50
46 49 53 0
98-99
50 50 53 97-98
44 43 52 96-97
School 50
System
State
0
63 52 59 98-99
61 54 58 97-98
59 45 57 96-97
School System State
Reading Vocabulary 50
94 42 48 0
98-99
99 45 48 97-98
95 39 46 96-97
Language Arts
School 50
System
State
0
71 58 63 98-99
65 57 61 97-98
69 50 58 96-97
School System State
Social Studies 50
69 53 57 0
98-99
85 57 56 97-98
55 46 55 96-97
Science
School 50
System
State
0
73 55 60 98-99
80 59 59 97-98
71 53 59 96-97
School System State
Sources of Information
Composite Score
50
62 52 58 0
98-99
School 50
System
65 55 58 97-98
54 46 57 96-97
State 0
69 52 57 98-99
75 54 56 97-98
63 45 55 96-97
1998-99 GEORGIA PUBLIC EDUCATION REPORT CARD Nicholls Elementary School - 6340291
Prepared by Georgia Department of Education
Scores Reported in Percentiles
School System State
Page 3
STATE-REQUIRED TEST DATA
PERFORMANCE ASSESSMENTS
Grade 5 Writing Assessment
Percent at Developmental Stages:
1998-99 School System State
1997-98 School System State
1996-97 School System State
Stage Stage Stage Stage Stage Stage
1:The Emerging Writer 2:The Developing Writer 3:The Focusing Writer 4:The Experimenting 5:The Engaging Writer 6:The Extending Writer
0% 0% 7% 49% 30% 14%
0% 1% 17% 49% 25% 8%
0% 1% 16% 41% 29% 12%
0% 3% 23% 38% 31% 5%
1% 2% 20% 41% 27% 8%
0% 3% 19% 41% 27% 10%
0% 2% 14% 45% 33% 5%
1% 5% 25% 37% 25% 7%
0% 3% 21% 37% 26% 12%
AWARDS / RECOGNITION DATA
The Georgia School of Excellence Program recognizes exemplary schools that have excellent, successful programs in many areas of school life. Each year, in a statewide competition, one elementary, one middle and one high school from each of Georgia's 11 congressional districts may be selected for this honor.
Nicholls Elementary School was designated a 1998-99 Georgia School of Excellence.
1998-99 GEORGIA PUBLIC EDUCATION REPORT CARD Nicholls Elementary School - 6340291
Prepared by Georgia Department of Education
Page 4
CERTIFIED PERSONNEL DATA
Positions Number Average Contract Days
Personnel Sex
Certificate
Years Experience
Full-time Part-time
Male Female
4 Yr Bachelor's 5 Yr Master's 6 Yr Specialist's 7 Yr Doctoral Other*
<1 1-10 11-20 21-30 >30
Average
Administrators
2.00 210.00
2 0
1 1
0 1 1 0 0 0 1 0 1 0 14.50
Support Personnel
1.00 193.00
1 0
0 1
0 1 0 0 0 0 0 1 0 0 18.00
PK-12 Teachers
24.35 190.00
24 2
1 25
18 8 0 0 0 3
14 5 1 3
10.62
*Includes One- and Two-Year Vocational Certificates.
ACCREDITATION DATA
Accredited with Quality by Georgia Accrediting Commission (GAC).
1998-99 GEORGIA PUBLIC EDUCATION REPORT CARD Nicholls Elementary School - 6340291
Prepared by Georgia Department of Education
Page 5
1998-99 GEORGIA PUBLIC EDUCATION REPORT CARD
COFFEE COUNTY SCHOOLS
Satilla Elementary School - 6340182
Grade Range K-5
The Georgia Public Education Report Card is designed to assist systems and schools in educational improvement. This report card contains a variety of data elements. An explanation of the terms is provided as a companion to the report card data. Please refer to the definitions for the most effective use of the reported data.
STUDENT DATA
Total 1,013
K-5 Enrollment, by Race/Ethnicity and Sex
Black
White Hispanic
American Multi-
Asian Indian
racial
399 39.4%
540 53.3%
63 6.2%
0 0.0%
0 0.0%
11 1.1%
Male Female
536 52.9%
477 47.1%
Enrollment in Selected Programs
Program
Program % of Student Enrollment Population
Gifted (Grades K-12)
16
1.6%
Alternative Programs (Grades 6-12)
N/A
N/A
Students Eligible to Receive Free/Reduced Lunches
Number
Percent
School System
712 4,419
70.3% 59.1%
Dropout Rate *
Number
Rate
School System
N/A N/A
N/A N/A
* Dropout rates are not applicable for grades PK-5.
Enrollment in Compensatory Programs
Program
Program % of Student Enrollment Population
Special Education (Grades K-12)
193 19.1%
(PK)
0
N/A
English to Speakers of Other Languages (ESOL) (Grades K-12)
0
0.0%
Remedial Education (Grades 2-5, 9-12)
113 17.4%
Special Instructional Assistance (SIA) (Grades K-3)
236 32.8%
Title I (Grades K-12)
This school has a schoolwide program.
Total 32
Retained Students, by Race/Ethnicity and Sex
Black
White Hispanic
American Multi-
Asian Indian
racial
13 40.6%
17 53.1%
2 6.3%
0 0.0%
0 0.0%
0 0.0%
Male Female
16
16
50.0% 50.0%
Prepared by Georgia Department of Education
Page 1
STATE-REQUIRED TEST DATA
NORM-REFERENCED TESTS Grade 3
Iowa Tests of Basic Skills (ITBS) Each chart reflects data for three years of testing.
Reading Comprehension 50
39 44 54 0
98-99
48 47 53 97-98
53 48 52 96-97
Mathematics
School 50
System
State
0
46 54 61 98-99
56 56 61 97-98
62 58 59 96-97
School System State
Reading Vocabulary 50
39 43 50 0
98-99
46 44 50 97-98
46 41 49 96-97
Language Arts
School 50
System
State
0
45 56 64 98-99
50 53 62 97-98
57 57 59 96-97
School System State
Social Studies 50
40 45 56 0
98-99
54 53 55 97-98
54 52 55 96-97
Science
School 50
System
State
0
48 52 59 98-99
58 57 59 97-98
58 55 58 96-97
School System State
Sources of Information
Composite Score
50
39 47 57 0
98-99
School 50
System
54 51 56 97-98
54 51 55 96-97
State 0
42 48 58 98-99
52 52 57 97-98
1998-99 GEORGIA PUBLIC EDUCATION REPORT CARD Satilla Elementary School - 6340182
Prepared by Georgia Department of Education
55 52 56 96-97
Scores Reported in Percentiles
School System State
Page 2
STATE-REQUIRED TEST DATA
NORM-REFERENCED TESTS Grade 5
Iowa Tests of Basic Skills (ITBS) Each chart reflects data for three years of testing.
Reading Comprehension
Mathematics
50
47 49 53 0
98-99
45 50 53 97-98
40 43 52 96-97
School 50
System
State
0
48 52 59 98-99
42 54 58 97-98
36 45 57 96-97
School System State
Reading Vocabulary 50
30 42 48 0
98-99
27 45 48 97-98
25 39 46 96-97
Language Arts
School 50
System
State
0
54 58 63 98-99
49 57 61 97-98
43 50 58 96-97
School System State
Social Studies 50
43 53 57 0
98-99
35 57 56 97-98
32 46 55 96-97
Science
School 50
System
State
0
57 55 60 98-99
49 59 59 97-98
52 53 59 96-97
School System State
Sources of Information
Composite Score
50
44 52 58 0
98-99
School 50
System
42 55 58 97-98
42 46 57 96-97
State 0
46 52 57 98-99
40 54 56 97-98
38 45 55 96-97
1998-99 GEORGIA PUBLIC EDUCATION REPORT CARD Satilla Elementary School - 6340182
Prepared by Georgia Department of Education
Scores Reported in Percentiles
School System State
Page 3
STATE-REQUIRED TEST DATA
PERFORMANCE ASSESSMENTS
Grade 5 Writing Assessment
Percent at Developmental Stages:
1998-99 School System State
1997-98 School System State
1996-97 School System State
Stage Stage Stage Stage Stage Stage
1:The Emerging Writer 2:The Developing Writer 3:The Focusing Writer 4:The Experimenting 5:The Engaging Writer 6:The Extending Writer
0% 2% 23% 55% 17% 1%
0% 1% 17% 49% 25% 8%
0% 1% 16% 41% 29% 12%
1% 2% 22% 49% 19% 5%
1% 2% 20% 41% 27% 8%
0% 3% 19% 41% 27% 10%
0% 5% 32% 35% 20% 7%
1% 5% 25% 37% 25% 7%
0% 3% 21% 37% 26% 12%
AWARDS / RECOGNITION DATA
Schools in Georgia may receive recognition in the following programs: Charter School Pay for Performance Program Georgia School of Excellence National Blue Ribbon School Satilla Elementary School did not receive recognition in any of these programs during the 1998-99 school year.
1998-99 GEORGIA PUBLIC EDUCATION REPORT CARD Satilla Elementary School - 6340182
Prepared by Georgia Department of Education
Page 4
CERTIFIED PERSONNEL DATA
Positions Number Average Contract Days
Personnel Sex
Certificate
Years Experience
Full-time Part-time
Male Female
4 Yr Bachelor's 5 Yr Master's 6 Yr Specialist's 7 Yr Doctoral Other*
<1 1-10 11-20 21-30 >30
Average
Administrators
2.00 220.00
2 0
1 1
0 1 1 0 0 0 0 1 1 0 20.50
Support Personnel
3.00 194.00
3 0
1 2
0 2 1 0 0 0 1 1 0 1 20.67
PK-12 Teachers
60.86 190.08
59 3
2 60
32 23
6 1 0 2 26 24 10 0 12.13
*Includes One- and Two-Year Vocational Certificates.
ACCREDITATION DATA
Accredited with Quality by Georgia Accrediting Commission (GAC).
1998-99 GEORGIA PUBLIC EDUCATION REPORT CARD Satilla Elementary School - 6340182
Prepared by Georgia Department of Education
Page 5
1998-99 GEORGIA PUBLIC EDUCATION REPORT CARD
COFFEE COUNTY SCHOOLS
West Coffee Middle School - 6340295
Grade Range PK, 6-8
The Georgia Public Education Report Card is designed to assist systems and schools in educational improvement. This report card contains a variety of data elements. An explanation of the terms is provided as a companion to the report card data. Please refer to the definitions for the most effective use of the reported data.
STUDENT DATA
Total
6-8
1,027
PK
18
Enrollment, by Race/Ethnicity and Sex
Black
American Multi-
White Hispanic Asian Indian
racial
368 35.8%
626 61.0%
16 1.6%
14 1.4%
0 0.0%
3 0.3%
5 27.8%
11 61.1%
2 11.1%
0 0.0%
0 0.0%
0 0.0%
Male 530
51.6% 13
72.2%
Female 497
48.4% 5
27.8%
Enrollment in Selected Programs
Program
Program Enrollment
Gifted
69
(Grades K-12)
Alternative Programs
0
(Grades 6-12)
% of Student Population 6.7%
0.0%
Students Eligible to Receive Free/Reduced Lunches
Number
Percent
School System
598 4,419
57.2% 59.1%
Enrollment in Compensatory Programs
Program
Program % of Student Enrollment Population
Special Education (Grades K-12) (PK)
96
9.3%
23
N/A
English to Speakers of Other Languages (ESOL) (Grades K-12)
0
0.0%
Title I (Grades K-12)
This school has no Title I program.
Dropout Rate for Grades 6-8
Number
Rate
School System
10
0.9%
26
1.4%
Total 33
Retained Students, by Race/Ethnicity and Sex
Black
White Hispanic
American MultiAsian Indian racial
17 51.5%
16 48.5%
0 0.0%
0 0.0%
0 0.0%
0 0.0%
Male Female
20
13
60.6% 39.4%
Prepared by Georgia Department of Education
Page 1
STATE-REQUIRED TEST DATA
NORM-REFERENCED TESTS Grade 8
Iowa Tests of Basic Skills (ITBS) Each chart reflects data for three years of testing.
Reading Comprehension 50
40 39 49 0
98-99
38 39 48 97-98
39 38 48 96-97
Mathematics
School 50
System
State
0
51 48 56 98-99
47 47 55 97-98
47 45 54 96-97
School System State
Reading Vocabulary 50
34 34 46 0
98-99
34 35 45 97-98
33 33 44 96-97
Language Arts
School 50
System
State
0
64 62 60 98-99
60 62 58 97-98
61 59 56 96-97
School System State
Social Studies 50
47 45 54 0
98-99
46 47 53 97-98
47 46 53 96-97
Science
School 50
System
State
0
49 47 56 98-99
51 52 55 97-98
48 49 53 96-97
School System State
Sources of Information
Composite Score
50
55 53 57 0
98-99
School 50
System
51 53 56 97-98
54 54 55 96-97
State 0
51 49 56 98-99
49 50 54 97-98
1998-99 GEORGIA PUBLIC EDUCATION REPORT CARD West Coffee Middle School - 6340295
Prepared by Georgia Department of Education
49 48 54 96-97
Scores Reported in Percentiles
School System State
Page 2
STATE-REQUIRED TEST DATA
Categories of Scaled Scores
Inadequate (less than 162)
Minimal (162-209)
Good
(210-247)
Very Good (greater than 247)
Average Scaled Score: (Range 100-300)
PERFORMANCE ASSESSMENTS
Grade 8 Writing Assessment
1998-99 Percent Scoring
1997-98 Percent Scoring
1996-97 Percent Scoring
School System State School System State School System State
10% 58% 29%
4%
10% 53% 32%
5%
8% 40% 41% 11%
13% 58% 26%
4%
13% 56% 27%
4%
11% 46% 34%
8%
22% 55% 16%
6%
20% 56% 18%
5%
15% 46% 30%
8%
195
199
208 193
194 202 188
188 198
AWARDS / RECOGNITION DATA
Schools in Georgia may receive recognition in the following programs: Charter School Pay for Performance Program Georgia School of Excellence National Blue Ribbon School West Coffee Middle School did not receive recognition in any of these programs during the 1998-99 school year.
1998-99 GEORGIA PUBLIC EDUCATION REPORT CARD West Coffee Middle School - 6340295
Prepared by Georgia Department of Education
Page 3
CERTIFIED PERSONNEL DATA
Positions Number Average Contract Days
Personnel Sex
Certificate
Years Experience
Full-time Part-time
Male Female
4 Yr Bachelor's 5 Yr Master's 6 Yr Specialist's 7 Yr Doctoral Other*
<1 1-10 11-20 21-30 >30
Average
Administrators
4.00 225.00
4 0
3 1
0 1 3 0 0 0 0 0 3 1 27.75
Support Personnel
4.00 208.00
4 0
0 4
0 3 1 0 0 0 1 2 1 0 12.75
PK-12 Teachers
60.76 190.57
55 8
15 48
30 25
6 2 0 4 19 26 13 1 13.62
*Includes One- and Two-Year Vocational Certificates.
ACCREDITATION DATA
Accredited with Quality by Georgia Accrediting Commission (GAC).
1998-99 GEORGIA PUBLIC EDUCATION REPORT CARD West Coffee Middle School - 6340295
Prepared by Georgia Department of Education
Page 4
1998-99 GEORGIA PUBLIC EDUCATION REPORT CARD
COFFEE COUNTY SCHOOLS
West Green Elementary School - 6343052
Grade Range K-5
The Georgia Public Education Report Card is designed to assist systems and schools in educational improvement. This report card contains a variety of data elements. An explanation of the terms is provided as a companion to the report card data. Please refer to the definitions for the most effective use of the reported data.
STUDENT DATA
Total 420
K-5 Enrollment, by Race/Ethnicity and Sex
Black
White Hispanic
American Multi-
Asian Indian
racial
94 22.4%
279 66.4%
46 11.0%
0 0.0%
0 0.0%
1 0.2%
Male Female
227 54.0%
193 46.0%
Enrollment in Selected Programs
Program
Program % of Student Enrollment Population
Gifted (Grades K-12)
1
< 1%
Alternative Programs (Grades 6-12)
N/A
N/A
Students Eligible to Receive Free/Reduced Lunches
Number
Percent
School System
327 4,419
77.9% 59.1%
Dropout Rate *
Number
Rate
School System
N/A N/A
N/A N/A
* Dropout rates are not applicable for grades PK-5.
Enrollment in Compensatory Programs
Program
Program % of Student Enrollment Population
Special Education (Grades K-12)
57 13.6%
(PK)
0
N/A
English to Speakers of Other Languages (ESOL) (Grades K-12)
0
0.0%
Remedial Education (Grades 2-5, 9-12)
27
9.5%
Special Instructional Assistance (SIA) (Grades K-3)
145 50.7%
Title I (Grades K-12)
This school has a schoolwide program.
Total 2
Retained Students, by Race/Ethnicity and Sex
Black
White Hispanic
American Multi-
Asian Indian
racial
0 0.0%
1 50.0%
1 50.0%
0 0.0%
0 0.0%
0 0.0%
Male Female
1
1
50.0% 50.0%
Prepared by Georgia Department of Education
Page 1
STATE-REQUIRED TEST DATA
NORM-REFERENCED TESTS Grade 3
Iowa Tests of Basic Skills (ITBS) Each chart reflects data for three years of testing.
Reading Comprehension 50
50 44 54 0
98-99
46 47 53 97-98
41 48 52 96-97
Mathematics
School 50
System
State
0
58 54 61 98-99
57 56 61 97-98
47 58 59 96-97
School System State
Reading Vocabulary 50
45 43 50 0
98-99
43 44 50 97-98
29 41 49 96-97
Language Arts
School 50
System
State
0
68 56 64 98-99
43 53 62 97-98
47 57 59 96-97
School System State
Social Studies 50
41 45 56 0
98-99
50 53 55 97-98
36 52 55 96-97
Science
School 50
System
State
0
51 52 59 98-99
56 57 59 97-98
42 55 58 96-97
School System State
Sources of Information
Composite Score
50
54 47 57 0
98-99
School 50
System
42 51 56 97-98
37 51 55 96-97
State 0
52 48 58 98-99
47 52 57 97-98
1998-99 GEORGIA PUBLIC EDUCATION REPORT CARD West Green Elementary School - 6343052
Prepared by Georgia Department of Education
39 52 56 96-97
Scores Reported in Percentiles
School System State
Page 2
STATE-REQUIRED TEST DATA
NORM-REFERENCED TESTS Grade 5
Iowa Tests of Basic Skills (ITBS) Each chart reflects data for three years of testing.
Reading Comprehension
Mathematics
50
46 49 53 0
98-99
44 50 53 97-98
35 43 52 96-97
School 50
System
State
0
49 52 59 98-99
59 54 58 97-98
43 45 57 96-97
School System State
Reading Vocabulary 50
37 42 48 0
98-99
36 45 48 97-98
24 39 46 96-97
Language Arts
School 50
System
State
0
54 58 63 98-99
44 57 61 97-98
33 50 58 96-97
School System State
Social Studies 50
44 53 57 0
98-99
45 57 56 97-98
34 46 55 96-97
Science
School 50
System
State
0
54 55 60 98-99
48 59 59 97-98
40 53 59 96-97
School System State
Sources of Information
Composite Score
50
43 52 58 0
98-99
School 50
System
49 55 58 97-98
39 46 57 96-97
State 0
47 52 57 98-99
45 54 56 97-98
34 45 55 96-97
1998-99 GEORGIA PUBLIC EDUCATION REPORT CARD West Green Elementary School - 6343052
Prepared by Georgia Department of Education
Scores Reported in Percentiles
School System State
Page 3
STATE-REQUIRED TEST DATA
PERFORMANCE ASSESSMENTS
Grade 5 Writing Assessment
Percent at Developmental Stages:
1998-99 School System State
1997-98 School System State
1996-97 School System State
Stage Stage Stage Stage Stage Stage
1:The Emerging Writer 2:The Developing Writer 3:The Focusing Writer 4:The Experimenting 5:The Engaging Writer 6:The Extending Writer
0% 0% 14% 45% 34% 7%
0% 1% 17% 49% 25% 8%
0% 1% 16% 41% 29% 12%
4% 8% 24% 37% 22% 4%
1% 2% 20% 41% 27% 8%
0% 3% 19% 41% 27% 10%
2% 10% 49% 31%
8% 0%
1% 5% 25% 37% 25% 7%
0% 3% 21% 37% 26% 12%
AWARDS / RECOGNITION DATA
Schools in Georgia may receive recognition in the following programs: Charter School Pay for Performance Program Georgia School of Excellence National Blue Ribbon School West Green Elementary School did not receive recognition in any of these programs during the 1998-99 school year.
1998-99 GEORGIA PUBLIC EDUCATION REPORT CARD West Green Elementary School - 6343052
Prepared by Georgia Department of Education
Page 4
CERTIFIED PERSONNEL DATA
Positions Number Average Contract Days
Personnel Sex
Certificate
Years Experience
Full-time Part-time
Male Female
4 Yr Bachelor's 5 Yr Master's 6 Yr Specialist's 7 Yr Doctoral Other*
<1 1-10 11-20 21-30 >30
Average
Administrators
2.00 220.00
2 0
1 1
0 0 2 0 0 0 0 1 1 0 22.50
Support Personnel
1.50 192.67
1 1
0 2
0 1 1 0 0 0 0 1 1 0 19.00
PK-12 Teachers
31.50 190.00
30 3
4 29
16 16
1 0 0 4 10 13 5 1 12.36
*Includes One- and Two-Year Vocational Certificates.
ACCREDITATION DATA
Accredited with Quality by Georgia Accrediting Commission (GAC).
1998-99 GEORGIA PUBLIC EDUCATION REPORT CARD West Green Elementary School - 6343052
Prepared by Georgia Department of Education
Page 5
1998-99 GEORGIA PUBLIC EDUCATION REPORT CARD
COFFEE COUNTY SCHOOLS
Westside Elementary School - 6345050
Grade Range PK-5
The Georgia Public Education Report Card is designed to assist systems and schools in educational improvement. This report card contains a variety of data elements. An explanation of the terms is provided as a companion to the report card data. Please refer to the definitions for the most effective use of the reported data.
STUDENT DATA
Total
K-5
711
PK
60
Enrollment, by Race/Ethnicity and Sex
Black
White Hispanic
American Asian Indian
Multiracial
236 33.2%
432 60.8%
29 4.1%
12 1.7%
0 0.0%
2 0.3%
12 20.0%
43 71.7%
5 8.3%
0 0.0%
0 0.0%
0 0.0%
Male Female
355 49.9%
356 50.1%
31 51.7%
29 48.3%
Enrollment in Selected Programs
Program
Program % of Student Enrollment Population
Gifted (Grades K-12)
17
2.4%
Alternative Programs (Grades 6-12)
N/A
N/A
Students Eligible to Receive Free/Reduced Lunches
Number
Percent
School System
378 4,419
49.0% 59.1%
Dropout Rate *
Number
Rate
School System
N/A N/A
N/A N/A
* Dropout rates are not applicable for grades PK-5.
Enrollment in Compensatory Programs
Program
Program % of Student Enrollment Population
Special Education (Grades K-12)
97 13.6%
(PK)
3
N/A
English to Speakers of Other Languages (ESOL) (Grades K-12)
0
0.0%
Remedial Education (Grades 2-5, 9-12)
51 10.5%
Special Instructional Assistance (SIA) (Grades K-3)
173 36.0%
Title I (Grades K-12)
This school has a schoolwide program.
Total 21
Retained Students, by Race/Ethnicity and Sex
Black
White Hispanic
American MultiAsian Indian racial
10 47.6%
10 47.6%
1 4.8%
0 0.0%
0 0.0%
0 0.0%
Male Female
12
9
57.1% 42.9%
Prepared by Georgia Department of Education
Page 1
STATE-REQUIRED TEST DATA
NORM-REFERENCED TESTS Grade 3
Iowa Tests of Basic Skills (ITBS) Each chart reflects data for three years of testing.
Reading Comprehension 50
45 44 54 0
98-99
43 47 53 97-98
48 48 52 96-97
Mathematics
School 50
System
State
0
56 54 61 98-99
53 56 61 97-98
62 58 59 96-97
School System State
Reading Vocabulary 50
45 43 50 0
98-99
40 44 50 97-98
45 41 49 96-97
Language Arts
School 50
System
State
0
51 56 64 98-99
43 53 62 97-98
60 57 59 96-97
School System State
Social Studies 50
50 45 56 0
98-99
53 53 55 97-98
56 52 55 96-97
Science
School 50
System
State
0
52 52 59 98-99
49 57 59 97-98
56 55 58 96-97
School System State
Sources of Information
Composite Score
50
51 47 57 0
98-99
School 50
System
44 51 56 97-98
54 51 55 96-97
State 0
49 48 58 98-99
46 52 57 97-98
1998-99 GEORGIA PUBLIC EDUCATION REPORT CARD Westside Elementary School - 6345050
Prepared by Georgia Department of Education
55 52 56 96-97
Scores Reported in Percentiles
School System State
Page 2
STATE-REQUIRED TEST DATA
NORM-REFERENCED TESTS Grade 5
Iowa Tests of Basic Skills (ITBS) Each chart reflects data for three years of testing.
Reading Comprehension
Mathematics
50
52 49 53 0
98-99
57 50 53 97-98
50 43 52 96-97
School 50
System
State
0
60 52 59 98-99
61 54 58 97-98
54 45 57 96-97
School System State
Reading Vocabulary 50
46 42 48 0
98-99
47 45 48 97-98
44 39 46 96-97
Language Arts
School 50
System
State
0
60 58 63 98-99
65 57 61 97-98
55 50 58 96-97
School System State
Social Studies 50
59 53 57 0
98-99
64 57 56 97-98
64 46 55 96-97
Science
School 50
System
State
0
55 55 60 98-99
70 59 59 97-98
59 53 59 96-97
School System State
Sources of Information
Composite Score
50
57 52 58 0
98-99
School 50
System
65 55 58 97-98
55 46 57 96-97
State 0
56 52 57 98-99
64 54 56 97-98
55 45 55 96-97
1998-99 GEORGIA PUBLIC EDUCATION REPORT CARD Westside Elementary School - 6345050
Prepared by Georgia Department of Education
Scores Reported in Percentiles
School System State
Page 3
STATE-REQUIRED TEST DATA
PERFORMANCE ASSESSMENTS
Grade 5 Writing Assessment
Percent at Developmental Stages:
1998-99 School System State
1997-98 School System State
1996-97 School System State
Stage Stage Stage Stage Stage Stage
1:The Emerging Writer 2:The Developing Writer 3:The Focusing Writer 4:The Experimenting 5:The Engaging Writer 6:The Extending Writer
0% 0% 12% 50% 28% 11%
0% 1% 17% 49% 25% 8%
0% 1% 16% 41% 29% 12%
1% 2% 11% 45% 28% 10%
1% 2% 20% 41% 27% 8%
0% 3% 19% 41% 27% 10%
0% 7% 19% 42% 23% 9%
1% 5% 25% 37% 25% 7%
0% 3% 21% 37% 26% 12%
AWARDS / RECOGNITION DATA
Schools in Georgia may receive recognition in the following programs: Charter School Pay for Performance Program Georgia School of Excellence National Blue Ribbon School Westside Elementary School did not receive recognition in any of these programs during the 1998-99 school year.
1998-99 GEORGIA PUBLIC EDUCATION REPORT CARD Westside Elementary School - 6345050
Prepared by Georgia Department of Education
Page 4
CERTIFIED PERSONNEL DATA
Positions Number Average Contract Days
Personnel Sex
Certificate
Years Experience
Full-time Part-time
Male Female
4 Yr Bachelor's 5 Yr Master's 6 Yr Specialist's 7 Yr Doctoral Other*
<1 1-10 11-20 21-30 >30
Average
Administrators
2.00 220.00
2 0
1 1
0 0 2 0 0 0 0 1 1 0 21.00
Support Personnel
4.00 193.00
4 0
0 4
0 2 2 0 0 0 0 2 2 0 20.75
PK-12 Teachers
49.56 190.10
48 3
3 48
24 17 10
0 0 2 13 25 11 0 14.00
*Includes One- and Two-Year Vocational Certificates.
ACCREDITATION DATA
Accredited with Quality by Georgia Accrediting Commission (GAC).
1998-99 GEORGIA PUBLIC EDUCATION REPORT CARD Westside Elementary School - 6345050
Prepared by Georgia Department of Education
Page 5
1998-99 GEORGIA PUBLIC EDUCATION REPORT CARD COLQUITT COUNTY SCHOOLS - 635
The Georgia Public Education Report Card is designed to assist systems and schools in educational improvement. This report card contains a variety of data elements. An explanation of the terms is provided as a companion to the report card data. Please refer to the definitions for the most effective use of the reported data.
Total
K-12
7,926
PK
404
STUDENT DATA
Enrollment, by Race/Ethnicity and Sex
Black
White Hispanic
American Multi-
Asian Indian
racial
2,672 33.7%
4,623 58.3%
547 6.9%
12 0.2%
6 0.1%
66 0.8%
113 28.0%
238 58.9%
45 11.1%
2 0.5%
0 0.0%
6 1.5%
Male
4,055 51.2%
207 51.2%
Female
3,871 48.8%
197 48.8%
Enrollment in Selected Programs
Program
Program % of Student Enrollment Population
Gifted (Grades K-12)
260
3.3%
Non-Vocational Labs (Grades 9-12)
2,036
90.4%
Vocational Labs (Grades 9-12)
1,579
70.1%
Alternative Programs (Grades 6-12)
81
2.0%
Students Eligible to Receive Free/Reduced Lunches
Number
Percent
4,561
54.8%
Dropout Rate
Number
Percent
6-12 9-12
252
5.8%
245
10.4%
Enrollment in Compensatory Programs
Program
Program % of Student Enrollment Population
Special Education
(Grades K-12)
955
PK
59
English to Speakers of
Other Languages (ESOL)
177
(Grades K-12)
Remedial Education (Grades 2-5, 9-12)
655
Special Instructional
Assistance (SIA)
690
(Grades K-3)
Title I (Grades K-12) Number of schools with: Schoolwide program Targeted Assistance program No Title I program
12.0% N/A
2.2%
13.7%
27.0%
9 1 3
Total 336
Retained Students, by Race/Ethnicity and Sex
Black
White Hispanic
American MultiAsian Indian racial
130 38.7%
177 52.7%
26 7.7%
0 0.0%
0 0.0%
3 0.9%
Male Female 194 142
57.7% 42.3%
Prepared by Georgia Department of Education
Page 1
STATE-REQUIRED TEST DATA
NORM-REFERENCED TESTS
Grade 3 Iowa Tests of Basic Skills (ITBS) Each chart reflects data for three years of testing.
Reading Comprehension
Mathematics
50
47 54 49 53 45 52 0
98-99 97-98 96-97
System State
50
50 61 57 61 51 59 0
98-99 97-98 96-97
System State
Reading Vocabulary
50
41 50 43 50 42 49 0
98-99 97-98 96-97
System State
Social Studies
50
50 56 52 55 53 55 0
98-99 97-98 96-97
System State
Language Arts
50
62 64 61 62 53 59 0
98-99 97-98 96-97
System State
Science
50
57 59 59 59 60 58 0
98-99 97-98 96-97
System State
Sources of Information
Composite Score
50
53 57 0
98-99
System
50
53 56 52 55 97-98 96-97
State
52 58 54 57 0
98-99 97-98
1998-99 GEORGIA PUBLIC EDUCATION REPORT CARD Colquitt County Schools
Prepared by Georgia Department of Education
System State Scores Reported 51 56 in Percentiles 96-97
Page 2
STATE-REQUIRED TEST DATA
NORM-REFERENCED TESTS
Grade 5 Iowa Tests of Basic Skills (ITBS) Each chart reflects data for three years of testing.
Reading Comprehension
Mathematics
50
52 53 49 53 47 52 0
98-99 97-98 96-97
System State
50
52 59 51 58 48 57 0
98-99 97-98 96-97
System State
Reading Vocabulary
50
42 48 44 48 40 46 0
98-99 97-98 96-97
System State
Social Studies
50
56 57 54 56 48 55 0
98-99 97-98 96-97
System State
Language Arts
50
67 63 62 61 54 58 0
98-99 97-98 96-97
System State
Science
50
62 60 58 59 56 59 0
98-99 97-98 96-97
System State
Sources of Information
Composite Score
50
57 58 0
98-99
System
50
56 58 53 57 97-98 96-97
State
57 57 54 56 0
98-99 97-98
1998-99 GEORGIA PUBLIC EDUCATION REPORT CARD Colquitt County Schools
Prepared by Georgia Department of Education
System State Scores Reported 49 55 in Percentiles 96-97
Page 3
STATE-REQUIRED TEST DATA
NORM-REFERENCED TESTS Grade 8
Iowa Tests of Basic Skills (ITBS) Each chart reflects data for three years of testing.
Reading Comprehension
Mathematics
50
43 49 50 48 42 48 0
98-99 97-98 96-97
System State
50
47 56 55 55 48 54 0
98-99 97-98 96-97
System State
Reading Vocabulary
50
34 46 41 45 36 44 0
98-99 97-98 96-97
System State
Language Arts
50
47 60 56 58 53 56 0
98-99 97-98 96-97
System State
Social Studies
50
50 54 57 53 48 53 0
98-99 97-98 96-97
System State
Science
50
52 56 53 55 49 53 0
98-99 97-98 96-97
System State
Sources of Information
Composite Score
50
50 57 0
98-99
System
50
56 56 47 55 97-98 96-97
State
48 56 54 54 0
98-99 97-98
1998-99 GEORGIA PUBLIC EDUCATION REPORT CARD Colquitt County Schools
Prepared by Georgia Department of Education
System State Scores Reported 47 54 in Percentiles 96-97
Page 4
STATE-REQUIRED TEST DATA
PERFORMANCE ASSESSMENTS
Grade 5 Writing Assessment
1998-99
1997-98
1996-97
Percent at Developmental Stages:
Comparison
Comparison
Comparison
System Group State System Group State System Group State
Stage Stage Stage Stage Stage Stage
1: The Emerging Writer 2: The Developing Writer 3: The Focusing Writer 4: The Experimenting Writer 5: The Engaging Writer 6: The Extending Writer
0% 2% 15% 42% 35% 6%
0% 1% 19% 43% 27% 10%
0% 1% 16% 41% 29% 12%
1% 5% 23% 34% 26% 10%
0% 3% 22% 43% 23% 7%
0% 3% 19% 41% 27% 10%
0% 4% 26% 36% 26% 8%
0% 5% 26% 39% 22% 8%
0% 3% 21% 37% 26% 12%
Grade 8 Writing Assessment
1998-99 Percent Scoring 1997-98 Percent Scoring 1996-97 Percent Scoring
Categories of Scaled Scores
Comparison
Comparison
Comparison
System Group State System Group State System Group State
Inadequate (less than 162)
Minimal (162-209)
Good
(210-247)
Very Good (greater than 247)
10% 42% 38%
9%
8% 45% 39%
9%
8% 40% 41% 11%
5% 45% 40% 10%
13% 50% 31%
6%
11% 46% 34%
8%
15% 54% 28%
3%
18% 48% 28%
6%
15% 46% 30%
8%
Average Scaled Score: (Range 100-300)
204
205 208
209
197 202
194
194 198
GEORGIA HIGH SCHOOL GRADUATION TESTS (GHSGT)
Percent of Regular Program 11th Graders Passing the Georgia High School Graduation Tests on First Administration
1998-99
1997-98
1996-97
Comparison
Comparison
Comparison
System Group State System Group State System Group State
English Language Arts Mathematics Social Studies Science
94% 87% 74% 70%
95% 86% 76% 68%
96% 88% 80% 72%
88% 81% 66% 65%
93% 86% 73% 71%
94% 88% 78% 74%
92% 83% 75% 67%
91% 81% 69% 65%
94% 87% 78% 74%
All Components listed above 6 4 %
63% 68% 57%
63% 68% 61%
57% 67%
Writing
92%
92% 93% 92%
91% 92% 92%
91% 93%
1998-99 GEORGIA PUBLIC EDUCATION REPORT CARD
Colquitt County Schools
Prepared by Georgia Department of Education
Page 5
GRADUATE DATA
1999 Graduates by Credentials, Race/Ethnicity and Sex
Diplomas with Both College Prep. & Voc. Endorsements
Diplomas with College Prep. Endorsements Diplomas with Vocational Endorsements General High School Diplomas Special Education Diplomas
Total All Diplomas
Certificates of Performance
Total Graduates
Total 45
111 142
4 12 314 52 366
Black
7 15.6%
20 18.0%
47 33.1%
1 25.0%
9 75.0%
84 26.8%
36 69.2%
120 32.8%
American MultiWhite Hispanic Asian Indian racial
38 84.4%
90 81.1%
90 63.4%
3 75.0%
3 25.0%
224 71.3%
0 0.0%
1 0.9%
5 3.5%
0 0.0%
0 0.0%
6 1.9%
0 0.0%
0 0.0%
0 0.0%
0 0.0%
0 0.0%
0 0.0%
0 0.0%
0 0.0%
0 0.0%
0 0.0%
0 0.0%
0 0.0%
0 0.0%
0 0.0%
0 0.0%
0 0.0%
0 0.0%
0 0.0%
12
3
0
0
1
23.1% 5.8% 0.0% 0.0% 1.9%
236
9
0
0
1
64.5% 2.5% 0.0% 0.0% 0.3%
Male Female
14 31.1%
51 45.9%
82 57.7%
3 75.0%
9 75.0%
159 50.6%
31 68.9%
60 54.1%
60 42.3%
1 25.0%
3 25.0%
155 49.4%
12
40
23.1% 76.9%
171 195 46.7% 53.3%
HOPE Scholarships
System State
Number of 1999 Graduates 3 6 6
Number Eligible
195
Percent Eligible
53.3%
65,548 40,292 61.5%
High School Completion Rate Percent of 1995Grade 9 Enrollment
in Graduating Class of1999
System
State
Completion Rate '95-'99 60.2% 68.9%
COLLEGE ADMISSIONS / CREDIT TEST DATA
Scholastic Assessment Test (SAT)
No. Taking
Average Score
Tests
Verbal Math Total
Based on students' highest verbal and highest math scores
System College Prep. Endorsement Other Diplomas
481 N/A N/A
481 N/A N/A
962 N/A N/A
Georgia
492 488 980
Based on students' last test administration
System Georgia
175
473 468
941
41,958 483 479 962
Nation
952,913 502 508 1010
American College Testing (ACT)
System State Nation
English
18.2
19.1 20.4
Mathematics
20.6
19.9 20.7
Reading
20.9
20.2 21.3
Science Reasoning 20.6
19.9 21.0
CompositeScore 20.2
19.9 21.9
Advanced Placement Exams (AP)
No. of Students Taking Tests
No. of Tests Taken No. of Test Scores
3 or Higher Percent of Test
Scores 3 or Higher
System State 37 15,225 44 23,969 27 13,024
61.4% 54.3%
1998-99 GEORGIA PUBLIC EDUCATION REPORT CARD Colquitt County Schools
Prepared by Georgia Department of Education
Page 6
POSTSECONDARY DATA
Graduates Entering Georgia Public Colleges and Universities
Graduates Entering Georgia Public Colleges and Universities and
Requiring Learning Support (LS)
1998 Graduates Entering 1998-99
1997 Graduates Entering 1997-98
Percent of Graduating Number Class
142
34.0%
138
35.1%
Number Requiring
LS
45
22
Percent of those attending Georgia
Public Colleges
31.7%
15.9%
In previous years, the Report Card presented College Prep Curriculum information provided by the Board of Regents on students requiring Learning Support. Due to inconsistencies in the data provided by the Board of Regents in defining College Prep Completers versus Local Board of Education data defining College Prep Endorsements, the Department of Education Report Card will not provide this information until discrepancies can be reconciled.
Graduates Entering Georgia Public Technical and Adult Schools
Entering 1998-99 Entering 1997-98
Number Percent
Number Percent
1998 Graduates 1997 Graduates
53
12.7%
0
0.0%
N/A 80
N/A 20.4%
ACCREDITATION / RECOGNITION DATA
Southern Association of Colleges and Schools (SACS) Accrediting Commission
Secondary/Middle Commission Elementary/Middle Commission Both Elementary/Secondary Commissions Joint Commission Candidate for Accreditation
Accreditation by Georgia Accrediting Commission (GAC)
Accredited by GAC Accredited with Quality by GAC
Number of Schools
1 12
0 0 0
Number of Schools
0 13
Awards / Recognition
State Recognized Program
Number of Schools
Charter School
0
Pay for Performance Recipient
0
Georgia School of Excellence
0
National Blue Ribbon School
0
COMMUNITY DATA
Number of Children Eligible for Migrant Education Number of Families-At-Risk * Number of Food Stamp Participants * Number of Families Receiving TANF * ** Per Capita Income * Unemployment Rate * 1990 Population * Projected 2000 Population * Projected 2010 Population *
* Data Available at County Level Only ** Known as AFDC before January 1997
1,471 160
4,779 530
$18,061 4.5%
36,645 38,334 40,162
1998-99 GEORGIA PUBLIC EDUCATION REPORT CARD Colquitt County Schools
Prepared by Georgia Department of Education
Page 7
FISCAL DATA
Millage Rate
8.90
* Fall 1998 Property Tax Digest is used to calculate the 98-99 Value of One Mill
FTE Count
FTE Count used for Allotment Calculation 7,814.0 Fall '98 FTE Count 7,926
Value of One Mill
$556,224 $71.18 per Allotment FTE
Sources: Local State-QBE State-
Lottery State-
Other Federal Other
Total
PerGeneral Fund cent Per FTE
$9,475,327 23.1% $1,213 $30,952,632 75.5% $3,961
K-12 Revenues
Lottery K-12
and
Title
All Other
Programs
K-12
$105
$0
Bonded Debt
$1,161,654
$0
$0
$0
Capital Projects
$362,197 $0
$0 0.0%
$0
$0 $172,265
$0
$0
$380,502 0.9% $49
$0 0.0%
$0
$179,247 0.4% $23
$40,987,709 100% $5,246
$0 $3,188,699
$0 $3,188,804
$132,235 $45,419 $0
$349,920
$0
$0
$0
$0
$39,812 $14,536,637
$1,201,467 $14,898,835
School Nutrition
$830,402 $0
$0
$209,164 $2,004,128
$1,353 $3,045,049
Grand Total
Total
Per-
Amount cent
$11,829,688 18.6%
$30,952,632 48.6%
$172,265 0.3%
$721,902 1.1% $5,238,247 8.2% $14,757,050 23.2% $63,671,786 100%
Instruction
Media Instruction
Support Pupil Services General Admin. School Admin. Trans-
portation Maint. & Ops. Capital Projects School Food Debt Service
Total
$26,821,172 66.6% $3,432 $1,093,992 2.7% $140
$1,254,470 3.1% $161
K-12 Expenditures
$2,366,486 $275,147
$0
$5,191
$0
$0
$97,095
$0
$0
$1,933,888 4.8% $247 $220,829
$69,531
$0
$849,373 2.1% $109 $241,218
$0
$0
$2,729,658 6.8% $349
$0
$0
$0
$1,715,438 4.3% $220
$36,787
$0
$0
$3,809,828 9.5% $488 $102,400
$0
$0
$21,664 0.1%
$3
$0
$0
$0
$49,799 0.1%
$6 $101,803
$0
$0
$0 0.0%
$0
$0
$0
$0
$40,279,286 100% $5,155 $3,171,812 $344,679
$0
$0
$0 $29,462,807 62.0%
$0
$0 $1,099,183 2.3%
$0
$0 $1,351,565 2.8%
$0
$0 $2,224,249 4.7%
$0
$0 $1,090,592 2.3%
$0
$0 $2,729,658 5.7%
$0
$0 $1,752,225 3.7%
$0
$0 $3,912,228 8.2%
$545,681
$0
$567,345 1.2%
$0 $3,163,792 $3,315,395 7.0%
$0
$0
$0 0.0%
$545,681 $3,163,792 $47,505,251 100%
Salaries and Benefits as Percentages of Revenues and of Expenditures
Teachers and Paraprofessionals
Salaries $21,957,583
Benefits $4,752,500
Percentage of Revenues Percentage of Expenditures
Total of
Total of
General Fund
General Fund
Title Programs
Title Programs
Lottery K-12
Lottery K-12
Total Salaries
and
Total
and
Total
and Benefits All Other K-12 K - 12 All Other K-12 K - 12
$26,710,083
60.0%
41.9%
61.0%
56.2%
School Administration
$1,707,112
$428,727
$2,135,839
4.8%
3.4%
4.9%
4.5%
General Administration
$313,160
$110,449
$423,609
1.0%
0.7%
1.0%
0.9%
1998-99 GEORGIA PUBLIC EDUCATION REPORT CARD
Colquitt County Schools - 635
Prepared by Georgia Department of Education
Page 8
CERTIFIED PERSONNEL DATA
Number
Average Annual Salary Positions Average Contract Days
Average Daily Salary
Full-time Personnel Part-time
Sex Male Female
4 Yr Bachelor's Certificate 5 Yr Master's
Level 6 Yr Specialist's 7 Yr Doctoral Other*
Black
White Race/ Hispanic Ethnicity Asian
American Indian
Multiracial
Years Experience
<1 1-10 11-20 21-30 >30
Average
Administrators
38.02
$63,884.95 228.90
$279.10
36 5
22 19
1 9 26 5 0
8 33
0 0 0 0
0 3 13 16 9
23.59
Support Personnel PK-12 Teachers
56.72
533.93
$41,572.13 194.41
$213.84
$36,953.41 191.68
$192.78
50
495
39
45
38
97
51
443
30
274
42
213
17
47
0
2
0
4
13
60
75
480
1
0
0
0
0
0
0
0
5
26
40
207
20
178
22
115
2
14
13.02
13.66
*Includes One- and Two-Year Vocational Certificates.
Certified Staff Position Ratios
Teacher/Administrator Ratio 14:1
Teacher/Support Person Ratio 9:1
Teacher/Staff Ratio 6:1
Student Enrollment/All Teachers 15:1
Certified Personnel by Category
80.6% 100%
6.1% 13.3%
80% 60%
40%
20%
0%
Teachers
Administrators
Support Personnel
1998-99 GEORGIA PUBLIC EDUCATION REPORT CARD
Colquitt County Schools - 635
Prepared by Georgia Department of Education
Page 9
1998-99 GEORGIA PUBLIC EDUCATION REPORT CARD
COLQUITT COUNTY SCHOOLS
Colquitt County High School - 6351554
Grade Range 9-12
The Georgia Public Education Report Card is designed to assist systems and schools in educational improvement. This report card contains a variety of data elements. An explanation of the terms is provided as a companion to the report card data. Please refer to the definitions for the most effective use of the reported data.
Total 2,251
STUDENT DATA
9-12 Enrollment, by Race/Ethnicity and Sex
Black
White Hispanic
American Multi-
Asian Indian
racial
773 34.3%
1,380 61.3%
89 4.0%
3 0.1%
3 0.1%
3 0.1%
Male Female
1,129 50.2%
1,122 49.8%
Enrollment in Selected Programs
Program
Gifted (Grades K-12)
Program % of Student Enrollment Population
25
1.1%
Non-Vocational Labs (Grades 9-12)
Vocational Labs (Grades 9-12)
Alternative Programs (Grades 6-12)
2,036 1,579
81
90.4% 70.1%
3.6%
Students Eligible to Receive Free/Reduced Lunches
Number
Percent
School System
797 4,561
35.4% 54.8%
Enrollment in Compensatory Programs
Program
Program % of Student Enrollment Population
Special Education (Grades K-12) PK
165
7.3%
0
N/A
English to Speakers of Other Languages (ESOL) (Grades K-12)
31
1.4%
Remedial Education (Grades 2-5, 9-12)
249 11.1%
Title I (Grades K-12)
This school has no Title I program.
Dropout Rate for Grades 9-12
Number
Rate
School System
245
10.4%
245
10.4%
Total 245
Retained Students, by Race/Ethnicity and Sex
Black
White Hispanic
American MultiAsian Indian racial
103 42.0%
127 51.8%
14 5.7%
0 0.0%
0 0.0%
1 0.4%
Male Female 140 105
57.1% 42.9%
Prepared by Georgia Department of Education
Page 1
STATE-REQUIRED TEST DATA
GEORGIA HIGH SCHOOL GRADUATION TESTS (GHSGT)
Percent of Regular Program 11th Graders Passing the Georgia High School Graduation Tests on First Administration
English Language Arts Mathematics Social Studies Science
All Components listed above
Writing
1998-99
School System State
94% 87% 74% 70%
94% 87% 74% 70%
96% 88% 80% 72%
64% 64% 68%
92% 92% 93%
1997-98
School System State
88% 81% 66% 65%
88% 81% 66% 65%
94% 88% 78% 74%
57% 57% 68%
92% 92% 92%
1996-97
School System State
92% 83% 75% 67%
92% 83% 75% 67%
94% 87% 78% 74%
61% 61% 67%
92% 92% 93%
GRADUATE DATA
1999 Graduates by Credentials, Race/Ethnicity and Sex
Diplomas with Both College Prep. & Voc. Endorsements
Diplomas with College Prep. Endorsements Diplomas with Vocational Endorsements General High School Diplomas Special Education Diplomas
Total All Diplomas
Certificates of Performance
Total Graduates
Total 45
111 142
4 12 314 52 366
Black
7 15.6%
20 18.0%
47 33.1%
1 25.0%
9 75.0%
84 26.8%
36 69.2%
120 32.8%
White Hispanic
38 84.4%
90 81.1%
0 0.0%
1 0.9%
90 63.4%
3 75.0%
3 25.0%
5 3.5%
0 0.0%
0 0.0%
224 71.3%
6 1.9%
12 23.1%
3 5.8%
236 64.5%
9 2.5%
American MultiAsian Indian racial
0 0.0%
0 0.0%
0 0.0%
0 0.0%
0 0.0%
0 0.0%
0 0.0%
0 0.0%
0 0.0%
0 0.0%
0 0.0%
0 0.0%
0 0.0%
0 0.0%
0 0.0%
0 0.0%
0 0.0%
0 0.0%
0 0.0%
0 0.0%
1 1.9%
0 0.0%
0 0.0%
1 0.3%
Male Female
14 31.1%
51 45.9%
31 68.9%
60 54.1%
82 57.7%
3 75.0%
9 75.0%
60 42.3%
1 25.0%
3 25.0%
159
155
50.6% 49.4%
12
40
23.1% 76.9%
171
195
46.7% 53.3%
HOPE Scholarships
School System
Number of 1999 Graduates 3 6 6
Number Eligible
195
Percent Eligible
53.3%
366 195 53.3%
State
65,548 40,292 61.5%
High School Completion Rate
Percent of 1995Grade 9 Enrollment in Graduating Class of1999 School System State
Completion Rate '95-'99 60.2% 60.2% 68.9%
1998-99 GEORGIA PUBLIC EDUCATION REPORT CARD
Colquitt County High School - 6351554
Prepared by Georgia Department of Education
Page 2
COLLEGE ADMISSIONS / CREDIT TEST DATA
Scholastic Assessment Test (SAT)
Based on students' highest verbal and highest math scores
No. Taking
Average Score
Tests Verbal Math Total
Based on students' last test administration
Average Score Verbal Math Total
School
175
College Prep. Endorsement
Other Diplomas
System
175
College Prep. Endorsement
Other Diplomas
Georgia
41,958
481 N/A N/A
481 N/A N/A
492
481 N/A N/A
481 N/A N/A
488
962 N/A N/A
962 N/A N/A
980
473 N/A N/A
473 N/A N/A
483
468 N/A N/A
468 N/A N/A
479
941 N/A N/A
941 N/A N/A
962
Nation
952,913 N/A N/A N/A
502 508 1010
American College Testing (ACT)
Advanced Placement Exams (AP)
Number taking tests: English Mathematics Reading Science Reasoning CompositeScore
2 7 School System State
18.2 18.2 19.1
20.6 20.6 19.9
20.9 20.6
20.9 20.6
20.2 19.9
20.2 20.2 19.9
No. of Students Taking Tests
No. of Tests Taken No. of Test Scores
3 or Higher Percent of Test
Scores 3 or Higher
School 37 44 27
61.4%
System State 37 15,225 44 23,969 27 13,024
61.4% 54.3%
POST-SECONDARY DATA
Graduates Entering Georgia Public Colleges
Graduates Entering Georgia Public Colleges and Requiring Learning Support (LS)
1998 Graduates Entering in 1998-99
1997 Graduates Entering in 1997-98
Percent of Graduating Number Class
School
142
34.0%
System 142
34.0%
School
138
35.1%
System 138
35.1%
Number Requiring
LS 45 45
22 22
Percent of those attending Georgia
Public Colleges
31.7%
31.7%
15.9%
15.9%
In previous years, the Report Card presented College Prep Curriculum information provided by the Board of Regents on students requiring Learning Support. Due to inconsistencies in the data provided by the Board of Regents in defining College Prep Completers versus Local Board of Education data defining College Prep Endorsements, the Department of Education Report Card will not provide this information until discrepancies can be reconciled.
Graduates Entering Georgia Public Technical and Adult Schools
1998 Graduates School System
Entering Number 53 53
1998-99 Percent 12.7% 12.7%
Entering Number N/A N/A
1997-98 Percent
N/A N/A
1997 Graduates School
0
0.0%
System
0
0.0%
80
20.4%
80
20.4%
1998-99 GEORGIA PUBLIC EDUCATION REPORT CARD Colquitt County High School - 6351554
Prepared by Georgia Department of Education
Page 3
CERTIFIED PERSONNEL DATA
Positions Number Average Contract Days
Administrators
9.02 228.11
Support Personnel
10.48 200.60
PK-12 Teachers
129.00 196.83
Personnel Sex
Certificate
Years Experience
Full-time Part-time
Male Female
4 Yr Bachelor's 5 Yr Master's 6 Yr Specialist's 7 Yr Doctoral Other*
<1 1-10 11-20 21-30 >30
Average
7 5
9 3
1 6 4 1 0
0 2 2 6 2
22.58
5 35
30 10
23 12
5 0 0
3 23
7 7 0
10.90
110 27
51 86
60 55 16
2 4
4 47 48 34
4
14.88
*Includes One- and Two-Year Vocational Certificates.
ACCREDITATION DATA
Accredited by Southern Association of Colleges and Schools (SACS): Secondary/Middle Commission. Accredited with Quality by Georgia Accrediting Commission (GAC).
AWARDS / RECOGNITION DATA
Schools in Georgia may receive recognition in the following programs: Charter School Pay for Performance Program Georgia School of Excellence National Blue Ribbon School Colquitt County High School did not receive recognition in any of these programs during the 1998-99 school year.
1998-99 GEORGIA PUBLIC EDUCATION REPORT CARD Colquitt County High School - 6351554
Prepared by Georgia Department of Education
Page 4
1998-99 GEORGIA PUBLIC EDUCATION REPORT CARD
COLQUITT COUNTY SCHOOLS
Cox Elementary School - 6354050
Grade Range PK-5
The Georgia Public Education Report Card is designed to assist systems and schools in educational improvement. This report card contains a variety of data elements. An explanation of the terms is provided as a companion to the report card data. Please refer to the definitions for the most effective use of the reported data.
STUDENT DATA
Total
K-5
444
PK
40
Enrollment, by Race/Ethnicity and Sex
Black
White Hispanic
American Asian Indian
Multiracial
219 49.3%
137 30.9%
80 18.0%
0 0.0%
1 0.2%
7 1.6%
20 50.0%
11 27.5%
9 22.5%
0 0.0%
0 0.0%
0 0.0%
Male Female
234 52.7%
210 47.3%
24 60.0%
16 40.0%
Enrollment in Selected Programs
Program
Program % of Student Enrollment Population
Gifted (Grades K-12)
5
1.1%
Alternative Programs (Grades 6-12)
N/A
N/A
Students Eligible to Receive Free/Reduced Lunches
Number
Percent
School System
410 4,561
84.7% 54.8%
Dropout Rate *
Number
Rate
School System
N/A N/A
N/A N/A
* Dropout rates are not applicable for grades PK-5.
Enrollment in Compensatory Programs
Program
Program % of Student Enrollment Population
Special Education (Grades K-12)
63 14.2%
(PK)
3
N/A
English to Speakers of Other Languages (ESOL) (Grades K-12)
25
5.6%
Remedial Education (Grades 2-5, 9-12)
49 16.5%
Special Instructional Assistance (SIA) (Grades K-3)
86 29.1%
Title I (Grades K-12)
This school has a schoolwide program.
Total 7
Retained Students, by Race/Ethnicity and Sex
Black
White Hispanic
American MultiAsian Indian racial
2 28.6%
2
3
28.6% 42.9%
0 0.0%
0 0.0%
0 0.0%
Male Female
5
2
71.4% 28.6%
Prepared by Georgia Department of Education
Page 1
STATE-REQUIRED TEST DATA
NORM-REFERENCED TESTS Grade 3
Iowa Tests of Basic Skills (ITBS) Each chart reflects data for three years of testing.
Reading Comprehension 50
32 47 54 0
98-99
48 49 53 97-98
38 45 52 96-97
Mathematics
School 50
System
State
0
32 50 61 98-99
45 57 61 97-98
41 51 59 96-97
School System State
Reading Vocabulary 50
22 41 50 0
98-99
35 43 50 97-98
29 42 49 96-97
Language Arts
School 50
System
State
0
47 62 64 98-99
65 61 62 97-98
44 53 59 96-97
School System State
Social Studies 50
42 50 56 0
98-99
40 52 55 97-98
51 53 55 96-97
Science
School 50
System
State
0
40 57 59 98-99
54 59 59 97-98
51 60 58 96-97
School System State
Sources of Information
Composite Score
50
38 53 57 0
98-99
School 50
System
42 53 56 97-98
40 52 55 96-97
State 0
35 52 58 98-99
46 54 57 97-98
1998-99 GEORGIA PUBLIC EDUCATION REPORT CARD Cox Elementary School - 6354050
Prepared by Georgia Department of Education
42 51 56 96-97
Scores Reported in Percentiles
School System State
Page 2
STATE-REQUIRED TEST DATA
NORM-REFERENCED TESTS Grade 5
Iowa Tests of Basic Skills (ITBS) Each chart reflects data for three years of testing.
Reading Comprehension
Mathematics
50
48 52 53 0
98-99
37 49 53 97-98
43 47 52 96-97
School 50
System
State
0
44 52 59 98-99
41 51 58 97-98
47 48 57 96-97
School System State
Reading Vocabulary 50
31 42 48 0
98-99
22 44 48 97-98
29 40 46 96-97
Language Arts
School 50
System
State
0
60 67 63 98-99
53 62 61 97-98
47 54 58 96-97
School System State
Social Studies 50
61 56 57 0
98-99
52 54 56 97-98
45 48 55 96-97
Science
School 50
System
State
0
52 62 60 98-99
48 58 59 97-98
51 56 59 96-97
School System State
Sources of Information
Composite Score
50
56 57 58 0
98-99
School 50
System
48 56 58 97-98
48 53 57 96-97
State 0
52 57 57 98-99
44 54 56 97-98
45 49 55 96-97
1998-99 GEORGIA PUBLIC EDUCATION REPORT CARD Cox Elementary School - 6354050
Prepared by Georgia Department of Education
Scores Reported in Percentiles
School System State
Page 3
STATE-REQUIRED TEST DATA
PERFORMANCE ASSESSMENTS
Grade 5 Writing Assessment
Percent at Developmental Stages:
1998-99 School System State
1997-98 School System State
1996-97 School System State
Stage Stage Stage Stage Stage Stage
1:The Emerging Writer 2:The Developing Writer 3:The Focusing Writer 4:The Experimenting 5:The Engaging Writer 6:The Extending Writer
0% 5% 12% 43% 33% 7%
0% 2% 15% 42% 35% 6%
0% 1% 16% 41% 29% 12%
0% 2% 24% 29% 27% 17%
1% 5% 23% 34% 26% 10%
0% 3% 19% 41% 27% 10%
0% 4% 30% 30% 28% 8%
0% 4% 26% 36% 26% 8%
0% 3% 21% 37% 26% 12%
AWARDS / RECOGNITION DATA
Schools in Georgia may receive recognition in the following programs: Charter School Pay for Performance Program Georgia School of Excellence National Blue Ribbon School Cox Elementary School did not receive recognition in any of these programs during the 1998-99 school year.
1998-99 GEORGIA PUBLIC EDUCATION REPORT CARD Cox Elementary School - 6354050
Prepared by Georgia Department of Education
Page 4
CERTIFIED PERSONNEL DATA
Positions Number Average Contract Days
Personnel Sex
Certificate
Years Experience
Full-time Part-time
Male Female
4 Yr Bachelor's 5 Yr Master's 6 Yr Specialist's 7 Yr Doctoral Other*
<1 1-10 11-20 21-30 >30
Average
Administrators
1.50 223.33
1 1
0 2
0 1 1 0 0 0 0 0 2 0 25.50
Support Personnel
3.05 190.00
3 1
1 3
1 3 0 0 0 1 0 2 1 0 13.00
PK-12 Teachers
34.55 190.00
30 8
1 37
20 15
3 0 0 4 10 11 13 0 15.18
*Includes One- and Two-Year Vocational Certificates.
ACCREDITATION DATA
Accredited by Southern Association of Colleges and Schools (SACS):
Elementary/Middle Commission. Accredited with Quality by Georgia
Accrediting Commission (GAC).
1998-99 GEORGIA PUBLIC EDUCATION REPORT CARD Cox Elementary School - 6354050
Prepared by Georgia Department of Education
Page 5
1998-99 GEORGIA PUBLIC EDUCATION REPORT CARD
COLQUITT COUNTY SCHOOLS
Doerun Elementary School - 6350178
Grade Range PK-5
The Georgia Public Education Report Card is designed to assist systems and schools in educational improvement. This report card contains a variety of data elements. An explanation of the terms is provided as a companion to the report card data. Please refer to the definitions for the most effective use of the reported data.
STUDENT DATA
Total
K-5
219
PK
40
Enrollment, by Race/Ethnicity and Sex
Black
White Hispanic
American Asian Indian
Multiracial
73 33.3%
138 63.0%
6 2.7%
0 0.0%
0 0.0%
2 0.9%
14 35.0%
24 60.0%
2 5.0%
0 0.0%
0 0.0%
0 0.0%
Male Female
110 50.2%
109 49.8%
19 47.5%
21 52.5%
Enrollment in Selected Programs
Program
Program % of Student Enrollment Population
Gifted (Grades K-12)
5
2.3%
Alternative Programs (Grades 6-12)
N/A
N/A
Students Eligible to Receive Free/Reduced Lunches
Number
Percent
School System
158 4,561
61.0% 54.8%
Dropout Rate *
Number
Rate
School System
N/A N/A
N/A N/A
* Dropout rates are not applicable for grades PK-5.
Enrollment in Compensatory Programs
Program
Program % of Student Enrollment Population
Special Education (Grades K-12)
39 17.8%
(PK)
3
N/A
English to Speakers of Other Languages (ESOL) (Grades K-12)
0
0.0%
Remedial Education (Grades 2-5, 9-12)
24 16.0%
Special Instructional Assistance (SIA) (Grades K-3)
26 18.4%
Title I (Grades K-12)
This school has a schoolwide program.
Total 6
Retained Students, by Race/Ethnicity and Sex
Black
White Hispanic
American MultiAsian Indian racial
0 0.0%
5
1
83.3% 16.7%
0 0.0%
0 0.0%
0 0.0%
Male Female
3
3
50.0% 50.0%
Prepared by Georgia Department of Education
Page 1
STATE-REQUIRED TEST DATA
NORM-REFERENCED TESTS Grade 3
Iowa Tests of Basic Skills (ITBS) Each chart reflects data for three years of testing.
Reading Comprehension 50
48 47 54 0
98-99
36 49 53 97-98
42 45 52 96-97
Mathematics
School 50
System
State
0
48 50 61 98-99
36 57 61 97-98
44 51 59 96-97
School System State
Reading Vocabulary 50
39 41 50 0
98-99
23 43 50 97-98
33 42 49 96-97
Language Arts
School 50
System
State
0
55 62 64 98-99
51 61 62 97-98
51 53 59 96-97
School System State
Social Studies 50
40 50 56 0
98-99
31 52 55 97-98
34 53 55 96-97
Science
School 50
System
State
0
42 57 59 98-99
38 59 59 97-98
40 60 58 96-97
School System State
Sources of Information
Composite Score
50
48 53 57 0
98-99
School 50
System
32 53 56 97-98
32 52 55 96-97
State 0
46 52 58 98-99
35 54 57 97-98
1998-99 GEORGIA PUBLIC EDUCATION REPORT CARD Doerun Elementary School - 6350178
Prepared by Georgia Department of Education
37 51 56 96-97
Scores Reported in Percentiles
School System State
Page 2
STATE-REQUIRED TEST DATA
NORM-REFERENCED TESTS Grade 5
Iowa Tests of Basic Skills (ITBS) Each chart reflects data for three years of testing.
Reading Comprehension
Mathematics
50
68 52 53 0
98-99
54 49 53 97-98
55 47 52 96-97
School 50
System
State
0
70 52 59 98-99
65 51 58 97-98
60 48 57 96-97
School System State
Reading Vocabulary 50
69 42 48 0
98-99
61 44 48 97-98
57 40 46 96-97
Language Arts
School 50
System
State
0
78 67 63 98-99
72 62 61 97-98
60 54 58 96-97
School System State
Social Studies 50
62 56 57 0
98-99
52 54 56 97-98
33 48 55 96-97
Science
School 50
System
State
0
72 62 60 98-99
65 58 59 97-98
55 56 59 96-97
School System State
Sources of Information
Composite Score
50
63 57 58 0
98-99
School 50
System
54 56 58 97-98
61 53 57 96-97
State 0
70 57 57 98-99
62 54 56 97-98
53 49 55 96-97
1998-99 GEORGIA PUBLIC EDUCATION REPORT CARD Doerun Elementary School - 6350178
Prepared by Georgia Department of Education
Scores Reported in Percentiles
School System State
Page 3
STATE-REQUIRED TEST DATA
PERFORMANCE ASSESSMENTS
Grade 5 Writing Assessment
Percent at Developmental Stages:
1998-99 School System State
1997-98 School System State
1996-97 School System State
Stage Stage Stage Stage Stage Stage
1:The Emerging Writer 2:The Developing Writer 3:The Focusing Writer 4:The Experimenting 5:The Engaging Writer 6:The Extending Writer
0% 0% 10% 30% 55% 5%
0% 2% 15% 42% 35% 6%
0% 1% 16% 41% 29% 12%
0% 3% 26% 36% 28% 8%
1% 5% 23% 34% 26% 10%
0% 3% 19% 41% 27% 10%
0% 7% 27% 43% 17% 7%
0% 4% 26% 36% 26% 8%
0% 3% 21% 37% 26% 12%
AWARDS / RECOGNITION DATA
Schools in Georgia may receive recognition in the following programs: Charter School Pay for Performance Program Georgia School of Excellence National Blue Ribbon School Doerun Elementary School did not receive recognition in any of these programs during the 1998-99 school year.
1998-99 GEORGIA PUBLIC EDUCATION REPORT CARD Doerun Elementary School - 6350178
Prepared by Georgia Department of Education
Page 4
CERTIFIED PERSONNEL DATA
Positions Number Average Contract Days
Personnel Sex
Certificate
Years Experience
Full-time Part-time
Male Female
4 Yr Bachelor's 5 Yr Master's 6 Yr Specialist's 7 Yr Doctoral Other*
<1 1-10 11-20 21-30 >30
Average
Administrators
1.00 230.00
1 0
1 0
0 0 1 0 0 0 1 0 0 0 10.00
Support Personnel
2.00 190.00
1 2
0 3
0 3 0 0 0 0 1 1 1 0 14.33
PK-12 Teachers
19.16 190.00
18 2
1 19
10 9 1 0 0 0 4 6 8 2
19.45
*Includes One- and Two-Year Vocational Certificates.
ACCREDITATION DATA
Accredited by Southern Association of Colleges and Schools (SACS):
Elementary/Middle Commission. Accredited with Quality by Georgia
Accrediting Commission (GAC).
1998-99 GEORGIA PUBLIC EDUCATION REPORT CARD Doerun Elementary School - 6350178
Prepared by Georgia Department of Education
Page 5
1998-99 GEORGIA PUBLIC EDUCATION REPORT CARD
COLQUITT COUNTY SCHOOLS
Funston Elementary School - 6352052
Grade Range PK-5
The Georgia Public Education Report Card is designed to assist systems and schools in educational improvement. This report card contains a variety of data elements. An explanation of the terms is provided as a companion to the report card data. Please refer to the definitions for the most effective use of the reported data.
STUDENT DATA
Total
K-5
285
PK
20
Enrollment, by Race/Ethnicity and Sex
Black
White Hispanic
American Asian Indian
Multiracial
65 22.8%
176 61.8%
39 13.7%
0 0.0%
1 0.4%
4 1.4%
1 5.0%
17 85.0%
2 10.0%
0 0.0%
0 0.0%
0 0.0%
Male Female
139 48.8%
146 51.2%
9 45.0%
11 55.0%
Enrollment in Selected Programs
Program
Program % of Student Enrollment Population
Gifted (Grades K-12)
3
1.1%
Alternative Programs (Grades 6-12)
N/A
N/A
Students Eligible to Receive Free/Reduced Lunches
Number
Percent
School System
213 4,561
69.8% 54.8%
Dropout Rate *
Number
Rate
School System
N/A N/A
N/A N/A
* Dropout rates are not applicable for grades PK-5.
Enrollment in Compensatory Programs
Program
Program % of Student Enrollment Population
Special Education (Grades K-12)
38 13.3%
(PK)
3
N/A
English to Speakers of Other Languages (ESOL) (Grades K-12)
15
5.3%
Remedial Education (Grades 2-5, 9-12)
26 13.5%
Special Instructional Assistance (SIA) (Grades K-3)
45 24.1%
Title I (Grades K-12)
This school has a schoolwide program.
Total 3
Retained Students, by Race/Ethnicity and Sex
Black
White Hispanic
American MultiAsian Indian racial
Male Female
1 33.3%
2 66.7%
0 0.0%
0 0.0%
0 0.0%
0
3
0.0% 100.0%
0 0.0%
Prepared by Georgia Department of Education
Page 1
STATE-REQUIRED TEST DATA
NORM-REFERENCED TESTS Grade 3
Iowa Tests of Basic Skills (ITBS) Each chart reflects data for three years of testing.
Reading Comprehension 50
38 47 54 0
98-99
64 49 53 97-98
62 45 52 96-97
Mathematics
School 50
System
State
0
34 50 61 98-99
56 57 61 97-98
56 51 59 96-97
School System State
Reading Vocabulary 50
35 41 50 0
98-99
61 43 50 97-98
49 42 49 96-97
Language Arts
School 50
System
State
0
52 62 64 98-99
65 61 62 97-98
67 53 59 96-97
School System State
Social Studies 50
49 50 56 0
98-99
62 52 55 97-98
66 53 55 96-97
Science
School 50
System
State
0
51 57 59 98-99
69 59 59 97-98
74 60 58 96-97
School System State
Sources of Information
Composite Score
50
45 53 57 0
98-99
School 50
System
64 53 56 97-98
65 52 55 96-97
State 0
43 52 58 98-99
63 54 57 97-98
1998-99 GEORGIA PUBLIC EDUCATION REPORT CARD Funston Elementary School - 6352052
Prepared by Georgia Department of Education
64 51 56 96-97
Scores Reported in Percentiles
School System State
Page 2
STATE-REQUIRED TEST DATA
NORM-REFERENCED TESTS Grade 5
Iowa Tests of Basic Skills (ITBS) Each chart reflects data for three years of testing.
Reading Comprehension
Mathematics
50
57 52 53 0
98-99
45 49 53 97-98
55 47 52 96-97
School 50
System
State
0
54 52 59 98-99
45 51 58 97-98
46 48 57 96-97
School System State
Reading Vocabulary 50
48 42 48 0
98-99
36 44 48 97-98
53 40 46 96-97
Language Arts
School 50
System
State
0
69 67 63 98-99
51 62 61 97-98
53 54 58 96-97
School System State
Social Studies 50
58 56 57 0
98-99
48 54 56 97-98
52 48 55 96-97
Science
School 50
System
State
0
65 62 60 98-99
54 58 59 97-98
66 56 59 96-97
School System State
Sources of Information
Composite Score
50
51 57 58 0
98-99
School 50
System
48 56 58 97-98
55 53 57 96-97
State 0
58 57 57 98-99
46 54 56 97-98
46 49 55 96-97
1998-99 GEORGIA PUBLIC EDUCATION REPORT CARD Funston Elementary School - 6352052
Prepared by Georgia Department of Education
Scores Reported in Percentiles
School System State
Page 3
STATE-REQUIRED TEST DATA
PERFORMANCE ASSESSMENTS
Grade 5 Writing Assessment
Percent at Developmental Stages:
1998-99 School System State
1997-98 School System State
1996-97 School System State
Stage Stage Stage Stage Stage Stage
1:The Emerging Writer 2:The Developing Writer 3:The Focusing Writer 4:The Experimenting 5:The Engaging Writer 6:The Extending Writer
0% 3% 12% 42% 33% 3%
0% 2% 15% 42% 35% 6%
0% 1% 16% 41% 29% 12%
0% 15% 26% 35% 21%
3%
1% 5% 23% 34% 26% 10%
0% 3% 19% 41% 27% 10%
0% 12% 29% 33% 21%
5%
0% 4% 26% 36% 26% 8%
0% 3% 21% 37% 26% 12%
AWARDS / RECOGNITION DATA
Schools in Georgia may receive recognition in the following programs: Charter School Pay for Performance Program Georgia School of Excellence National Blue Ribbon School Funston Elementary School did not receive recognition in any of these programs during the 1998-99 school year.
1998-99 GEORGIA PUBLIC EDUCATION REPORT CARD Funston Elementary School - 6352052
Prepared by Georgia Department of Education
Page 4
CERTIFIED PERSONNEL DATA
Positions Number Average Contract Days
Personnel Sex
Certificate
Years Experience
Full-time Part-time
Male Female
4 Yr Bachelor's 5 Yr Master's 6 Yr Specialist's 7 Yr Doctoral Other*
<1 1-10 11-20 21-30 >30
Average
Administrators
1.00 230.00
1 0
1 0
0 0 1 0 0 0 0 0 1 0 30.00
Support Personnel
2.00 190.00
1 2
0 3
1 2 0 0 0 1 1 1 0 0 7.33
PK-12 Teachers
17.67 190.00
16 4
1 19
9 10
1 0 0 1 10 4 4 1 12.80
*Includes One- and Two-Year Vocational Certificates.
ACCREDITATION DATA
Accredited by Southern Association of Colleges and Schools (SACS):
Elementary/Middle Commission. Accredited with Quality by Georgia
Accrediting Commission (GAC).
1998-99 GEORGIA PUBLIC EDUCATION REPORT CARD Funston Elementary School - 6352052
Prepared by Georgia Department of Education
Page 5
1998-99 GEORGIA PUBLIC EDUCATION REPORT CARD
COLQUITT COUNTY SCHOOLS
Gray Middle School - 6353052
Grade Range 6-8
The Georgia Public Education Report Card is designed to assist systems and schools in educational improvement. This report card contains a variety of data elements. An explanation of the terms is provided as a companion to the report card data. Please refer to the definitions for the most effective use of the reported data.
STUDENT DATA
Total 838
6-8 Enrollment, by Race/Ethnicity and Sex
Black
White Hispanic
American Multi-
Asian Indian
racial
283 33.8%
485 57.9%
59 7.0%
0 0.0%
1 0.1%
10 1.2%
Male 432
51.6%
Female 406
48.4%
Enrollment in Selected Programs
Program
Gifted (Grades K-12)
Program % of Student Enrollment Population
72
8.6%
Alternative Programs (Grades 6-12)
0
0.0%
Students Eligible to Receive Free/Reduced Lunches
Number
Percent
School System
456 4,561
54.4% 54.8%
Enrollment in Compensatory Programs
Program
Program % of Student Enrollment Population
Special Education (Grades K-12) (PK)
116 13.8%
0
N/A
English to Speakers of Other Languages (ESOL) (Grades K-12)
19
2.3%
Title I (Grades K-12)
This school has no Title I program.
Dropout Rate for Grades 6-8
Number
Rate
School System
0
0.0%
7
0.3%
Total 14
Retained Students, by Race/Ethnicity and Sex
Black
White Hispanic
American MultiAsian Indian racial
3 21.4%
11 78.6%
0 0.0%
0 0.0%
0 0.0%
0 0.0%
Male Female
13 92.9%
1 7.1%
Prepared by Georgia Department of Education
Page 1
STATE-REQUIRED TEST DATA
NORM-REFERENCED TESTS Grade 8
Iowa Tests of Basic Skills (ITBS) Each chart reflects data for three years of testing.
Reading Comprehension 50
41 43 49 0
98-99
47 50 48 97-98
46 42 48 96-97
Mathematics
School 50
System
State
0
49 47 56 98-99
56 55 55 97-98
49 48 54 96-97
School System State
Reading Vocabulary 50
34 34 46 0
98-99
35 41 45 97-98
37 36 44 96-97
Language Arts
School 50
System
State
0
51 47 60 98-99
58 56 58 97-98
58 53 56 96-97
School System State
Social Studies 50
50 50 54 0
98-99
53 57 53 97-98
50 48 53 96-97
Science
School 50
System
State
0
49 52 56 98-99
46 53 55 97-98
47 49 53 96-97
School System State
Sources of Information
Composite Score
50
48 50 57 0
98-99
School 50
System
52 56 56 97-98
53 47 55 96-97
State 0
46 48 56 98-99
51 54 54 97-98
1998-99 GEORGIA PUBLIC EDUCATION REPORT CARD Gray Middle School - 6353052
Prepared by Georgia Department of Education
50 47 54 96-97
Scores Reported in Percentiles
School System State
Page 2
STATE-REQUIRED TEST DATA
Categories of Scaled Scores
Inadequate (less than 162)
Minimal (162-209)
Good
(210-247)
Very Good (greater than 247)
Average Scaled Score: (Range 100-300)
PERFORMANCE ASSESSMENTS
Grade 8 Writing Assessment
1998-99 Percent Scoring
1997-98 Percent Scoring
1996-97 Percent Scoring
School System State School System State School System State
13% 46% 34%
7%
10% 42% 38%
9%
8% 40% 41% 11%
8% 48% 40%
5%
5% 45% 40% 10%
11% 46% 34%
8%
18% 53% 26%
3%
15% 54% 28%
3%
15% 46% 30%
8%
200
204
208 203
209 202 193
194 198
AWARDS / RECOGNITION DATA
Schools in Georgia may receive recognition in the following programs: Charter School Pay for Performance Program Georgia School of Excellence National Blue Ribbon School Gray Middle School did not receive recognition in any of these programs during the 1998-99 school year.
1998-99 GEORGIA PUBLIC EDUCATION REPORT CARD Gray Middle School - 6353052
Prepared by Georgia Department of Education
Page 3
CERTIFIED PERSONNEL DATA
Positions Number Average Contract Days
Personnel Sex
Certificate
Years Experience
Full-time Part-time
Male Female
4 Yr Bachelor's 5 Yr Master's 6 Yr Specialist's 7 Yr Doctoral Other*
<1 1-10 11-20 21-30 >30
Average
Administrators
3.00 216.67
3 0
2 1
0 0 3 0 0 0 0 2 0 1 21.00
Support Personnel
3.50 190.00
3 1
0 4
0 4 0 0 0 0 1 0 2 1 23.75
PK-12 Teachers
59.50 190.81
53 8
12 49
36 23
2 0 0 3 30 17 11 0 11.23
*Includes One- and Two-Year Vocational Certificates.
ACCREDITATION DATA
Accredited by Southern Association of Colleges and Schools (SACS):
Elementary/Middle Commission. Accredited with Quality by Georgia
Accrediting Commission (GAC).
1998-99 GEORGIA PUBLIC EDUCATION REPORT CARD Gray Middle School - 6353052
Prepared by Georgia Department of Education
Page 4
1998-99 GEORGIA PUBLIC EDUCATION REPORT CARD
COLQUITT COUNTY SCHOOLS
Hamilton Elementary School - 6354052
Grade Range PK-5
The Georgia Public Education Report Card is designed to assist systems and schools in educational improvement. This report card contains a variety of data elements. An explanation of the terms is provided as a companion to the report card data. Please refer to the definitions for the most effective use of the reported data.
STUDENT DATA
Total
K-5
230
PK
34
Enrollment, by Race/Ethnicity and Sex
Black
White Hispanic
American Asian Indian
Multiracial
8 3.5%
218 94.8%
3 1.3%
0 0.0%
0 0.0%
1 0.4%
0 0.0%
31 91.2%
2 5.9%
0 0.0%
0 0.0%
1 2.9%
Male Female
125 54.3%
105 45.7%
19 55.9%
15 44.1%
Enrollment in Selected Programs
Program
Program % of Student Enrollment Population
Gifted (Grades K-12)
8
3.5%
Alternative Programs (Grades 6-12)
N/A
N/A
Students Eligible to Receive Free/Reduced Lunches
Number
Percent
School System
103 4,561
39.0% 54.8%
Dropout Rate *
Number
Rate
School System
N/A N/A
N/A N/A
* Dropout rates are not applicable for grades PK-5.
Enrollment in Compensatory Programs
Program
Program % of Student Enrollment Population
Special Education (Grades K-12)
28 12.2%
(PK)
1
N/A
English to Speakers of Other Languages (ESOL) (Grades K-12)
0
0.0%
Remedial Education (Grades 2-5, 9-12)
20 12.1%
Special Instructional Assistance (SIA) (Grades K-3)
29 20.0%
Title I (Grades K-12)
This school has a Targeted Assistance program.
Total 0
Retained Students, by Race/Ethnicity and Sex
Black
White Hispanic
American MultiAsian Indian racial
0
0
0
0
0
0
Male Female
0
0
Prepared by Georgia Department of Education
Page 1
STATE-REQUIRED TEST DATA
NORM-REFERENCED TESTS Grade 3
Iowa Tests of Basic Skills (ITBS) Each chart reflects data for three years of testing.
Reading Comprehension 50
54 47 54 0
98-99
64 49 53 97-98
55 45 52 96-97
Mathematics
School 50
System
State
0
62 50 61 98-99
68 57 61 97-98
72 51 59 96-97
School System State
Reading Vocabulary 50
48 41 50 0
98-99
62 43 50 97-98
62 42 49 96-97
Language Arts
School 50
System
State
0
68 62 64 98-99
78 61 62 97-98
70 53 59 96-97
School System State
Social Studies 50
56 50 56 0
98-99
60 52 55 97-98
69 53 55 96-97
Science
School 50
System
State
0
72 57 59 98-99
81 59 59 97-98
81 60 58 96-97
School System State
Sources of Information
Composite Score
50
61 53 57 0
98-99
School 50
System
73 53 56 97-98
77 52 55 96-97
State 0
63 52 58 98-99
72 54 57 97-98
1998-99 GEORGIA PUBLIC EDUCATION REPORT CARD Hamilton Elementary School - 6354052
Prepared by Georgia Department of Education
72 51 56 96-97
Scores Reported in Percentiles
School System State
Page 2
STATE-REQUIRED TEST DATA
NORM-REFERENCED TESTS Grade 5
Iowa Tests of Basic Skills (ITBS) Each chart reflects data for three years of testing.
Reading Comprehension
Mathematics
50
55 52 53 0
98-99
51 49 53 97-98
41 47 52 96-97
School 50
System
State
0
64 52 59 98-99
63 51 58 97-98
45 48 57 96-97
School System State
Reading Vocabulary 50
49 42 48 0
98-99
51 44 48 97-98
40 40 46 96-97
Language Arts
School 50
System
State
0
76 67 63 98-99
72 62 61 97-98
52 54 58 96-97
School System State
Social Studies 50
65 56 57 0
98-99
64 54 56 97-98
60 48 55 96-97
Science
School 50
System
State
0
73 62 60 98-99
70 58 59 97-98
65 56 59 96-97
School System State
Sources of Information
Composite Score
50
65 57 58 0
98-99
School 50
System
65 56 58 97-98
53 53 57 96-97
State 0
67 57 57 98-99
64 54 56 97-98
52 49 55 96-97
1998-99 GEORGIA PUBLIC EDUCATION REPORT CARD Hamilton Elementary School - 6354052
Prepared by Georgia Department of Education
Scores Reported in Percentiles
School System State
Page 3
STATE-REQUIRED TEST DATA
PERFORMANCE ASSESSMENTS
Grade 5 Writing Assessment
Percent at Developmental Stages:
1998-99 School System State
1997-98 School System State
1996-97 School System State
Stage Stage Stage Stage Stage Stage
1:The Emerging Writer 2:The Developing Writer 3:The Focusing Writer 4:The Experimenting 5:The Engaging Writer 6:The Extending Writer
0% 0% 14% 38% 43% 5%
0% 2% 15% 42% 35% 6%
0% 1% 16% 41% 29% 12%
0% 0% 21% 28% 41% 10%
1% 5% 23% 34% 26% 10%
0% 3% 19% 41% 27% 10%
0% 0% 9% 45% 32% 14%
0% 4% 26% 36% 26% 8%
0% 3% 21% 37% 26% 12%
AWARDS / RECOGNITION DATA
Schools in Georgia may receive recognition in the following programs: Charter School Pay for Performance Program Georgia School of Excellence National Blue Ribbon School Hamilton Elementary School did not receive recognition in any of these programs during the 1998-99 school year.
1998-99 GEORGIA PUBLIC EDUCATION REPORT CARD Hamilton Elementary School - 6354052
Prepared by Georgia Department of Education
Page 4
CERTIFIED PERSONNEL DATA
Positions Number Average Contract Days
Personnel Sex
Certificate
Years Experience
Full-time Part-time
Male Female
4 Yr Bachelor's 5 Yr Master's 6 Yr Specialist's 7 Yr Doctoral Other*
<1 1-10 11-20 21-30 >30
Average
Administrators
1.00 230.00
1 0
1 0
0 0 1 0 0 0 0 1 0 0 15.00
Support Personnel
2.00 190.00
1 2
0 3
0 2 1 0 0 0 0 3 0 0 13.67
PK-12 Teachers
15.63 190.35
14 4
2 16
8 6 4 0 0 0 6 9 3 0 14.50
*Includes One- and Two-Year Vocational Certificates.
ACCREDITATION DATA
Accredited by Southern Association of Colleges and Schools (SACS):
Elementary/Middle Commission. Accredited with Quality by Georgia
Accrediting Commission (GAC).
1998-99 GEORGIA PUBLIC EDUCATION REPORT CARD Hamilton Elementary School - 6354052
Prepared by Georgia Department of Education
Page 5
1998-99 GEORGIA PUBLIC EDUCATION REPORT CARD
COLQUITT COUNTY SCHOOLS
Norman Park Elementary School - 6350278
Grade Range PK-5
The Georgia Public Education Report Card is designed to assist systems and schools in educational improvement. This report card contains a variety of data elements. An explanation of the terms is provided as a companion to the report card data. Please refer to the definitions for the most effective use of the reported data.
STUDENT DATA
Total
K-5
434
PK
59
Enrollment, by Race/Ethnicity and Sex
Black
White Hispanic
American Asian Indian
Multiracial
77 17.7%
292 67.3%
46 10.6%
0 0.0%
0 0.0%
19 4.4%
8 13.6%
40 67.8%
11 18.6%
0 0.0%
0 0.0%
0 0.0%
Male Female
210 48.4%
224 51.6%
27 45.8%
32 54.2%
Enrollment in Selected Programs
Program
Program % of Student Enrollment Population
Gifted (Grades K-12)
9
2.1%
Alternative Programs (Grades 6-12)
N/A
N/A
Students Eligible to Receive Free/Reduced Lunches
Number
Percent
School System
314 4,561
63.7% 54.8%
Dropout Rate *
Number
Rate
School System
N/A N/A
N/A N/A
* Dropout rates are not applicable for grades PK-5.
Enrollment in Compensatory Programs
Program
Program % of Student Enrollment Population
Special Education (Grades K-12)
68 15.7%
(PK)
5
N/A
English to Speakers of Other Languages (ESOL) (Grades K-12)
28
6.5%
Remedial Education (Grades 2-5, 9-12)
68 24.1%
Special Instructional Assistance (SIA) (Grades K-3)
66 22.1%
Title I (Grades K-12)
This school has a schoolwide program.
Total 6
Retained Students, by Race/Ethnicity and Sex
Black
White Hispanic
American MultiAsian Indian racial
0 0.0%
5 83.3%
0 0.0%
0 0.0%
0
1
0.0% 16.7%
Male Female
5
1
83.3% 16.7%
Prepared by Georgia Department of Education
Page 1
STATE-REQUIRED TEST DATA
NORM-REFERENCED TESTS Grade 3
Iowa Tests of Basic Skills (ITBS) Each chart reflects data for three years of testing.
Reading Comprehension 50
46 47 54 0
98-99
50 49 53 97-98
48 45 52 96-97
Mathematics
School 50
System
State
0
63 50 61 98-99
85 57 61 97-98
60 51 59 96-97
School System State
Reading Vocabulary 50
45 41 50 0
98-99
45 43 50 97-98
51 42 49 96-97
Language Arts
School 50
System
State
0
67 62 64 98-99
63 61 62 97-98
65 53 59 96-97
School System State
Social Studies 50
55 50 56 0
98-99
64 52 55 97-98
54 53 55 96-97
Science
School 50
System
State
0
66 57 59 98-99
73 59 59 97-98
68 60 58 96-97
School System State
Sources of Information
Composite Score
50
54 53 57 0
98-99
School 50
System
62 53 56 97-98
61 52 55 96-97
State 0
58 52 58 98-99
68 54 57 97-98
1998-99 GEORGIA PUBLIC EDUCATION REPORT CARD Norman Park Elementary School - 6350278
Prepared by Georgia Department of Education
59 51 56 96-97
Scores Reported in Percentiles
School System State
Page 2
STATE-REQUIRED TEST DATA
NORM-REFERENCED TESTS Grade 5
Iowa Tests of Basic Skills (ITBS) Each chart reflects data for three years of testing.
Reading Comprehension
Mathematics
50
59 52 53 0
98-99
62 49 53 97-98
55 47 52 96-97
School 50
System
State
0
61 52 59 98-99
60 51 58 97-98
56 48 57 96-97
School System State
Reading Vocabulary 50
49 42 48 0
98-99
63 44 48 97-98
50 40 46 96-97
Language Arts
School 50
System
State
0
80 67 63 98-99
81 62 61 97-98
60 54 58 96-97
School System State
Social Studies 50
58 56 57 0
98-99
65 54 56 97-98
51 48 55 96-97
Science
School 50
System
State
0
77 62 60 98-99
70 58 59 97-98
56 56 59 96-97
School System State
Sources of Information
Composite Score
50
58 57 58 0
98-99
School 50
System
69 56 58 97-98
57 53 57 96-97
State 0
66 57 57 98-99
70 54 56 97-98
54 49 55 96-97
1998-99 GEORGIA PUBLIC EDUCATION REPORT CARD Norman Park Elementary School - 6350278
Prepared by Georgia Department of Education
Scores Reported in Percentiles
School System State
Page 3
STATE-REQUIRED TEST DATA
PERFORMANCE ASSESSMENTS
Grade 5 Writing Assessment
Percent at Developmental Stages:
1998-99 School System State
1997-98 School System State
1996-97 School System State
Stage Stage Stage Stage Stage Stage
1:The Emerging Writer 2:The Developing Writer 3:The Focusing Writer 4:The Experimenting 5:The Engaging Writer 6:The Extending Writer
0% 0% 9% 43% 37% 9%
0% 2% 15% 42% 35% 6%
0% 1% 16% 41% 29% 12%
0% 0% 16% 16% 50% 19%
1% 5% 23% 34% 26% 10%
0% 3% 19% 41% 27% 10%
0% 4% 24% 41% 20% 10%
0% 4% 26% 36% 26% 8%
0% 3% 21% 37% 26% 12%
AWARDS / RECOGNITION DATA
Schools in Georgia may receive recognition in the following programs: Charter School Pay for Performance Program Georgia School of Excellence National Blue Ribbon School Norman Park Elementary School did not receive recognition in any of these programs during the 1998-99 school year.
1998-99 GEORGIA PUBLIC EDUCATION REPORT CARD Norman Park Elementary School - 6350278
Prepared by Georgia Department of Education
Page 4
CERTIFIED PERSONNEL DATA
Positions Number Average Contract Days
Personnel Sex
Certificate
Years Experience
Full-time Part-time
Male Female
4 Yr Bachelor's 5 Yr Master's 6 Yr Specialist's 7 Yr Doctoral Other*
<1 1-10 11-20 21-30 >30
Average
Administrators
1.50 223.33
1 1
0 2
0 0 1 1 0 0 0 2 0 0 15.50
Support Personnel
3.05 190.00
3 1
1 3
1 2 1 0 0 0 1 2 1 0 13.50
PK-12 Teachers
32.47 190.00
29 5
4 30
14 14
6 0 0 1 13 7 12 1 15.44
*Includes One- and Two-Year Vocational Certificates.
ACCREDITATION DATA
Accredited by Southern Association of Colleges and Schools (SACS):
Elementary/Middle Commission. Accredited with Quality by Georgia
Accrediting Commission (GAC).
1998-99 GEORGIA PUBLIC EDUCATION REPORT CARD Norman Park Elementary School - 6350278
Prepared by Georgia Department of Education
Page 5
1998-99 GEORGIA PUBLIC EDUCATION REPORT CARD
COLQUITT COUNTY SCHOOLS
Odom Elementary School - 6350187
Grade Range PK-5
The Georgia Public Education Report Card is designed to assist systems and schools in educational improvement. This report card contains a variety of data elements. An explanation of the terms is provided as a companion to the report card data. Please refer to the definitions for the most effective use of the reported data.
STUDENT DATA
Total
K-5
539
PK
19
Enrollment, by Race/Ethnicity and Sex
Black
White Hispanic
American Asian Indian
Multiracial
95 17.6%
351 65.1%
82 15.2%
0 0.0%
0 0.0%
11 2.0%
2 10.5%
12 63.2%
1 5.3%
0 0.0%
0 0.0%
4 21.1%
Male Female
286 53.1%
253 46.9%
9 47.4%
10 52.6%
Enrollment in Selected Programs
Program
Program % of Student Enrollment Population
Gifted (Grades K-12)
7
1.3%
Alternative Programs (Grades 6-12)
N/A
N/A
Students Eligible to Receive Free/Reduced Lunches
Number
Percent
School System
362 4,561
64.9% 54.8%
Dropout Rate *
Number
Rate
School System
N/A N/A
N/A N/A
* Dropout rates are not applicable for grades PK-5.
Enrollment in Compensatory Programs
Program
Program % of Student Enrollment Population
Special Education (Grades K-12)
74 13.7%
(PK)
0
N/A
English to Speakers of Other Languages (ESOL) (Grades K-12)
25
4.6%
Remedial Education (Grades 2-5, 9-12)
58 16.5%
Special Instructional Assistance (SIA) (Grades K-3)
118 31.7%
Title I (Grades K-12)
This school has a schoolwide program.
Total 12
Retained Students, by Race/Ethnicity and Sex
Black
White Hispanic
American MultiAsian Indian racial
2 16.7%
8
2
66.7% 16.7%
0 0.0%
0 0.0%
0 0.0%
Male Female
5
7
41.7% 58.3%
Prepared by Georgia Department of Education
Page 1
STATE-REQUIRED TEST DATA
NORM-REFERENCED TESTS Grade 3
Iowa Tests of Basic Skills (ITBS) Each chart reflects data for three years of testing.
Reading Comprehension 50
46 47 54 0
98-99
36 49 53 97-98
51 45 52 96-97
Mathematics
School 50
System
State
0
51 50 61 98-99
47 57 61 97-98
57 51 59 96-97
School System State
Reading Vocabulary 50
48 41 50 0
98-99
43 43 50 97-98
49 42 49 96-97
Language Arts
School 50
System
State
0
53 62 64 98-99
46 61 62 97-98
46 53 59 96-97
School System State
Social Studies 50
42 50 56 0
98-99
44 52 55 97-98
51 53 55 96-97
Science
School 50
System
State
0
52 57 59 98-99
43 59 59 97-98
64 60 58 96-97
School System State
Sources of Information
Composite Score
50
47 53 57 0
98-99
School 50
System
45 53 56 97-98
61 52 55 96-97
State 0
47 52 58 98-99
43 54 57 97-98
1998-99 GEORGIA PUBLIC EDUCATION REPORT CARD Odom Elementary School - 6350187
Prepared by Georgia Department of Education
54 51 56 96-97
Scores Reported in Percentiles
School System State
Page 2
STATE-REQUIRED TEST DATA
NORM-REFERENCED TESTS Grade 5
Iowa Tests of Basic Skills (ITBS) Each chart reflects data for three years of testing.
Reading Comprehension
Mathematics
50
52 52 53 0
98-99
49 49 53 97-98
50 47 52 96-97
School 50
System
State
0
56 52 59 98-99
55 51 58 97-98
53 48 57 96-97
School System State
Reading Vocabulary 50
42 42 48 0
98-99
48 44 48 97-98
53 40 46 96-97
Language Arts
School 50
System
State
0
62 67 63 98-99
61 62 61 97-98
61 54 58 96-97
School System State
Social Studies 50
52 56 57 0
98-99
49 54 56 97-98
58 48 55 96-97
Science
School 50
System
State
0
63 62 60 98-99
56 58 59 97-98
60 56 59 96-97
School System State
Sources of Information
Composite Score
50
62 57 58 0
98-99
School 50
System
57 56 58 97-98
66 53 57 96-97
State 0
57 57 57 98-99
53 54 56 97-98
58 49 55 96-97
1998-99 GEORGIA PUBLIC EDUCATION REPORT CARD Odom Elementary School - 6350187
Prepared by Georgia Department of Education
Scores Reported in Percentiles
School System State
Page 3
STATE-REQUIRED TEST DATA
PERFORMANCE ASSESSMENTS
Grade 5 Writing Assessment
Percent at Developmental Stages:
1998-99 School System State
1997-98 School System State
1996-97 School System State
Stage Stage Stage Stage Stage Stage
1:The Emerging Writer 2:The Developing Writer 3:The Focusing Writer 4:The Experimenting 5:The Engaging Writer 6:The Extending Writer
0% 2% 11% 48% 30% 10%
0% 2% 15% 42% 35% 6%
0% 1% 16% 41% 29% 12%
2% 9% 21% 47% 22% 0%
1% 5% 23% 34% 26% 10%
0% 3% 19% 41% 27% 10%
2% 2% 16% 47% 27% 7%
0% 4% 26% 36% 26% 8%
0% 3% 21% 37% 26% 12%
AWARDS / RECOGNITION DATA
Schools in Georgia may receive recognition in the following programs: Charter School Pay for Performance Program Georgia School of Excellence National Blue Ribbon School Odom Elementary School did not receive recognition in any of these programs during the 1998-99 school year.
1998-99 GEORGIA PUBLIC EDUCATION REPORT CARD Odom Elementary School - 6350187
Prepared by Georgia Department of Education
Page 4
CERTIFIED PERSONNEL DATA
Positions Number Average Contract Days
Personnel Sex
Certificate
Years Experience
Full-time Part-time
Male Female
4 Yr Bachelor's 5 Yr Master's 6 Yr Specialist's 7 Yr Doctoral Other*
<1 1-10 11-20 21-30 >30
Average
Administrators
1.50 223.33
1 1
1 1
0 0 2 0 0 0 0 1 0 1 25.50
Support Personnel
3.00 190.00
3 0
1 2
0 2 1 0 0 0 1 1 1 0 14.33
PK-12 Teachers
33.10 190.00
32 2
2 32
17 14
3 0 0 2 14 9 7 2 14.03
*Includes One- and Two-Year Vocational Certificates.
ACCREDITATION DATA
Accredited by Southern Association of Colleges and Schools (SACS):
Elementary/Middle Commission. Accredited with Quality by Georgia
Accrediting Commission (GAC).
1998-99 GEORGIA PUBLIC EDUCATION REPORT CARD Odom Elementary School - 6350187
Prepared by Georgia Department of Education
Page 5
1998-99 GEORGIA PUBLIC EDUCATION REPORT CARD
COLQUITT COUNTY SCHOOLS
Okapilco Elementary School - 6353054
Grade Range PK-5
The Georgia Public Education Report Card is designed to assist systems and schools in educational improvement. This report card contains a variety of data elements. An explanation of the terms is provided as a companion to the report card data. Please refer to the definitions for the most effective use of the reported data.
STUDENT DATA
Total
K-5
330
PK
20
Enrollment, by Race/Ethnicity and Sex
Black
White Hispanic
American Asian Indian
Multiracial
70 21.2%
232 70.3%
26 7.9%
0 0.0%
0 0.0%
2 0.6%
0 0.0%
17 85.0%
2 10.0%
0 0.0%
0 0.0%
1 5.0%
Male Female
154 46.7%
176 53.3%
11 55.0%
9 45.0%
Enrollment in Selected Programs
Program
Program % of Student Enrollment Population
Gifted (Grades K-12)
6
1.8%
Alternative Programs (Grades 6-12)
N/A
N/A
Students Eligible to Receive Free/Reduced Lunches
Number
Percent
School System
221 4,561
63.1% 54.8%
Dropout Rate *
Number
Rate
School System
N/A N/A
N/A N/A
* Dropout rates are not applicable for grades PK-5.
Enrollment in Compensatory Programs
Program
Program % of Student Enrollment Population
Special Education (Grades K-12)
39 11.8%
(PK)
0
N/A
English to Speakers of Other Languages (ESOL) (Grades K-12)
0
0.0%
Remedial Education (Grades 2-5, 9-12)
35 15.9%
Special Instructional Assistance (SIA) (Grades K-3)
53 25.4%
Title I (Grades K-12)
This school has a schoolwide program.
Total 3
Retained Students, by Race/Ethnicity and Sex
Black
White Hispanic
American MultiAsian Indian racial
Male Female
0 0.0%
2
1
66.7% 33.3%
0 0.0%
0 0.0%
0
3
0.0% 100.0%
0 0.0%
Prepared by Georgia Department of Education
Page 1
STATE-REQUIRED TEST DATA
NORM-REFERENCED TESTS Grade 3
Iowa Tests of Basic Skills (ITBS) Each chart reflects data for three years of testing.
Reading Comprehension 50
44 47 54 0
98-99
55 49 53 97-98
43 45 52 96-97
Mathematics
School 50
System
State
0
35 50 61 98-99
53 57 61 97-98
36 51 59 96-97
School System State
Reading Vocabulary 50
34 41 50 0
98-99
47 43 50 97-98
31 42 49 96-97
Language Arts
School 50
System
State
0
60 62 64 98-99
70 61 62 97-98
45 53 59 96-97
School System State
Social Studies 50
37 50 56 0
98-99
54 52 55 97-98
56 53 55 96-97
Science
School 50
System
State
0
44 57 59 98-99
60 59 59 97-98
49 60 58 96-97
School System State
Sources of Information
Composite Score
50
40 53 57 0
98-99
School 50
System
49 53 56 97-98
42 52 55 96-97
State 0
41 52 58 98-99
56 54 57 97-98
1998-99 GEORGIA PUBLIC EDUCATION REPORT CARD Okapilco Elementary School - 6353054
Prepared by Georgia Department of Education
43 51 56 96-97
Scores Reported in Percentiles
School System State
Page 2
STATE-REQUIRED TEST DATA
NORM-REFERENCED TESTS Grade 5
Iowa Tests of Basic Skills (ITBS) Each chart reflects data for three years of testing.
Reading Comprehension
Mathematics
50
50 52 53 0
98-99
57 49 53 97-98
41 47 52 96-97
School 50
System
State
0
46 52 59 98-99
60 51 58 97-98
37 48 57 96-97
School System State
Reading Vocabulary 50
45 42 48 0
98-99
54 44 48 97-98
31 40 46 96-97
Language Arts
School 50
System
State
0
69 67 63 98-99
69 62 61 97-98
50 54 58 96-97
School System State
Social Studies 50
39 56 57 0
98-99
59 54 56 97-98
35 48 55 96-97
Science
School 50
System
State
0
51 62 60 98-99
70 58 59 97-98
45 56 59 96-97
School System State
Sources of Information
Composite Score
50
58 57 58 0
98-99
School 50
System
68 56 58 97-98
46 53 57 96-97
State 0
51 57 57 98-99
64 54 56 97-98
40 49 55 96-97
1998-99 GEORGIA PUBLIC EDUCATION REPORT CARD Okapilco Elementary School - 6353054
Prepared by Georgia Department of Education
Scores Reported in Percentiles
School System State
Page 3
STATE-REQUIRED TEST DATA
PERFORMANCE ASSESSMENTS
Grade 5 Writing Assessment
Percent at Developmental Stages:
1998-99 School System State
1997-98 School System State
1996-97 School System State
Stage Stage Stage Stage Stage Stage
1:The Emerging Writer 2:The Developing Writer 3:The Focusing Writer 4:The Experimenting 5:The Engaging Writer 6:The Extending Writer
0% 0% 10% 45% 43% 3%
0% 2% 15% 42% 35% 6%
0% 1% 16% 41% 29% 12%
2% 0% 19% 34% 23% 21%
1% 5% 23% 34% 26% 10%
0% 3% 19% 41% 27% 10%
0% 0% 36% 31% 33% 0%
0% 4% 26% 36% 26% 8%
0% 3% 21% 37% 26% 12%
AWARDS / RECOGNITION DATA
Schools in Georgia may receive recognition in the following programs: Charter School Pay for Performance Program Georgia School of Excellence National Blue Ribbon School Okapilco Elementary School did not receive recognition in any of these programs during the 1998-99 school year.
1998-99 GEORGIA PUBLIC EDUCATION REPORT CARD Okapilco Elementary School - 6353054
Prepared by Georgia Department of Education
Page 4
CERTIFIED PERSONNEL DATA
Positions Number Average Contract Days
Personnel Sex
Certificate
Years Experience
Full-time Part-time
Male Female
4 Yr Bachelor's 5 Yr Master's 6 Yr Specialist's 7 Yr Doctoral Other*
<1 1-10 11-20 21-30 >30
Average
Administrators
1.00 230.00
1 0
0 1
0 0 1 0 0 0 0 1 0 0 20.00
Support Personnel
2.40 190.00
1 3
0 4
0 3 1 0 0 0 1 3 0 0 12.50
PK-12 Teachers
22.16 190.16
21 3
1 23
13 10
1 0 0 1 10 9 4 0 12.38
*Includes One- and Two-Year Vocational Certificates.
ACCREDITATION DATA
Accredited by Southern Association of Colleges and Schools (SACS):
Elementary/Middle Commission. Accredited with Quality by Georgia
Accrediting Commission (GAC).
1998-99 GEORGIA PUBLIC EDUCATION REPORT CARD Okapilco Elementary School - 6353054
Prepared by Georgia Department of Education
Page 5
1998-99 GEORGIA PUBLIC EDUCATION REPORT CARD
COLQUITT COUNTY SCHOOLS
Stringfellow Elementary School - 6353050
Grade Range PK-5
The Georgia Public Education Report Card is designed to assist systems and schools in educational improvement. This report card contains a variety of data elements. An explanation of the terms is provided as a companion to the report card data. Please refer to the definitions for the most effective use of the reported data.
STUDENT DATA
Total
K-5
356
PK
55
Enrollment, by Race/Ethnicity and Sex
Black
White Hispanic
American Asian Indian
Multiracial
263 73.9%
65 18.3%
27 7.6%
1 0.3%
0 0.0%
0 0.0%
36 65.5%
12 21.8%
7 12.7%
0 0.0%
0 0.0%
0 0.0%
Male Female
175 49.2%
181 50.8%
27 49.1%
28 50.9%
Enrollment in Selected Programs
Program
Program % of Student Enrollment Population
Gifted (Grades K-12)
5
1.4%
Alternative Programs (Grades 6-12)
N/A
N/A
Students Eligible to Receive Free/Reduced Lunches
Number
Percent
School System
371 4,561
90.3% 54.8%
Dropout Rate *
Number
Rate
School System
N/A N/A
N/A N/A
* Dropout rates are not applicable for grades PK-5.
Enrollment in Compensatory Programs
Program
Program % of Student Enrollment Population
Special Education (Grades K-12)
57 16.0%
(PK)
31
N/A
English to Speakers of Other Languages (ESOL) (Grades K-12)
8
2.2%
Remedial Education (Grades 2-5, 9-12)
40 16.9%
Special Instructional Assistance (SIA) (Grades K-3)
71 30.0%
Title I (Grades K-12)
This school has a schoolwide program.
Total 28
Retained Students, by Race/Ethnicity and Sex
Black
White Hispanic
American MultiAsian Indian racial
15 53.6%
9
4
32.1% 14.3%
0 0.0%
0 0.0%
0 0.0%
Male Female
12
16
42.9% 57.1%
Prepared by Georgia Department of Education
Page 1
STATE-REQUIRED TEST DATA
NORM-REFERENCED TESTS Grade 3
Iowa Tests of Basic Skills (ITBS) Each chart reflects data for three years of testing.
Reading Comprehension 50
30 47 54 0
98-99
43 49 53 97-98
25 45 52 96-97
Mathematics
School 50
System
State
0
27 50 61 98-99
47 57 61 97-98
41 51 59 96-97
School System State
Reading Vocabulary 50
25 41 50 0
98-99
31 43 50 97-98
30 42 49 96-97
Language Arts
School 50
System
State
0
38 62 64 98-99
45 61 62 97-98
27 53 59 96-97
School System State
Social Studies 50
31 50 56 0
98-99
39 52 55 97-98
34 53 55 96-97
Science
School 50
System
State
0
35 57 59 98-99
39 59 59 97-98
37 60 58 96-97
School System State
Sources of Information
Composite Score
50
36 53 57 0
98-99
School 50
System
40 53 56 97-98
31 52 55 96-97
State 0
30 52 58 98-99
39 54 57 97-98
1998-99 GEORGIA PUBLIC EDUCATION REPORT CARD Stringfellow Elementary School - 6353050
Prepared by Georgia Department of Education
31 51 56 96-97
Scores Reported in Percentiles
School System State
Page 2
STATE-REQUIRED TEST DATA
NORM-REFERENCED TESTS Grade 5
Iowa Tests of Basic Skills (ITBS) Each chart reflects data for three years of testing.
Reading Comprehension
Mathematics
50
32 52 53 0
98-99
35 49 53 97-98
28 47 52 96-97
School 50
System
State
0
25 52 59 98-99
22 51 58 97-98
30 48 57 96-97
School System State
Reading Vocabulary 50
19 42 48 0
98-99
26 44 48 97-98
15 40 46 96-97
Language Arts
School 50
System
State
0
42 67 63 98-99
27 62 61 97-98
25 54 58 96-97
School System State
Social Studies 50
24 56 57 0
98-99
28 54 56 97-98
22 48 55 96-97
Science
School 50
System
State
0
27 62 60 98-99
29 58 59 97-98
28 56 59 96-97
School System State
Sources of Information
Composite Score
50
29 57 58 0
98-99
School 50
System
30 56 58 97-98
28 53 57 96-97
State 0
25 57 57 98-99
26 54 56 97-98
23 49 55 96-97
1998-99 GEORGIA PUBLIC EDUCATION REPORT CARD Stringfellow Elementary School - 6353050
Prepared by Georgia Department of Education
Scores Reported in Percentiles
School System State
Page 3
STATE-REQUIRED TEST DATA
PERFORMANCE ASSESSMENTS
Grade 5 Writing Assessment
Percent at Developmental Stages:
1998-99 School System State
1997-98 School System State
1996-97 School System State
Stage Stage Stage Stage Stage Stage
1:The Emerging Writer 2:The Developing Writer 3:The Focusing Writer 4:The Experimenting 5:The Engaging Writer 6:The Extending Writer
0% 5% 36% 45% 12% 2%
0% 2% 15% 42% 35% 6%
0% 1% 16% 41% 29% 12%
3% 19% 50% 28%
0% 0%
1% 5% 23% 34% 26% 10%
0% 3% 19% 41% 27% 10%
2% 6% 35% 37% 17% 4%
0% 4% 26% 36% 26% 8%
0% 3% 21% 37% 26% 12%
AWARDS / RECOGNITION DATA
Schools in Georgia may receive recognition in the following programs: Charter School Pay for Performance Program Georgia School of Excellence National Blue Ribbon School Stringfellow Elementary School did not receive recognition in any of these programs during the 1998-99 school year.
1998-99 GEORGIA PUBLIC EDUCATION REPORT CARD Stringfellow Elementary School - 6353050
Prepared by Georgia Department of Education
Page 4
CERTIFIED PERSONNEL DATA
Positions Number Average Contract Days
Personnel Sex
Certificate
Years Experience
Full-time Part-time
Male Female
4 Yr Bachelor's 5 Yr Master's 6 Yr Specialist's 7 Yr Doctoral Other*
<1 1-10 11-20 21-30 >30
Average
Administrators
1.50 223.33
1 1
0 2
0 2 0 0 0 0 0 0 2 0 22.50
Support Personnel
2.30 190.00
1 2
0 3
0 2 1 0 0 0 2 0 1 0 15.00
PK-12 Teachers
27.58 190.00
25 5
1 29
17 10
3 0 0 4 10 11 3 2 12.33
*Includes One- and Two-Year Vocational Certificates.
ACCREDITATION DATA
Accredited by Southern Association of Colleges and Schools (SACS):
Elementary/Middle Commission. Accredited with Quality by Georgia
Accrediting Commission (GAC).
1998-99 GEORGIA PUBLIC EDUCATION REPORT CARD Stringfellow Elementary School - 6353050
Prepared by Georgia Department of Education
Page 5
1998-99 GEORGIA PUBLIC EDUCATION REPORT CARD
COLQUITT COUNTY SCHOOLS
Sunset Elementary School - 6355054
Grade Range PK-5
The Georgia Public Education Report Card is designed to assist systems and schools in educational improvement. This report card contains a variety of data elements. An explanation of the terms is provided as a companion to the report card data. Please refer to the definitions for the most effective use of the reported data.
STUDENT DATA
Total
K-5
555
PK
77
Enrollment, by Race/Ethnicity and Sex
Black
White Hispanic
American Asian Indian
Multiracial
183 33.0%
326 58.7%
41 7.4%
4 0.7%
0 0.0%
1 0.2%
14 18.2%
55 71.4%
8 10.4%
0 0.0%
0 0.0%
0 0.0%
Male Female
294 53.0%
261 47.0%
40 51.9%
37 48.1%
Enrollment in Selected Programs
Program
Program % of Student Enrollment Population
Gifted (Grades K-12)
24
4.3%
Alternative Programs (Grades 6-12)
N/A
N/A
Students Eligible to Receive Free/Reduced Lunches
Number
Percent
School System
326 4,561
51.6% 54.8%
Dropout Rate *
Number
Rate
School System
N/A N/A
N/A N/A
* Dropout rates are not applicable for grades PK-5.
Enrollment in Compensatory Programs
Program
Program % of Student Enrollment Population
Special Education (Grades K-12)
76 13.7%
(PK)
10
N/A
English to Speakers of Other Languages (ESOL) (Grades K-12)
9
1.6%
Remedial Education (Grades 2-5, 9-12)
46 12.6%
Special Instructional Assistance (SIA) (Grades K-3)
88 23.2%
Title I (Grades K-12)
This school has a schoolwide program.
Total 6
Retained Students, by Race/Ethnicity and Sex
Black
White Hispanic
American MultiAsian Indian racial
2 33.3%
3
1
50.0% 16.7%
0 0.0%
0 0.0%
0 0.0%
Male Female
4
2
66.7% 33.3%
Prepared by Georgia Department of Education
Page 1
STATE-REQUIRED TEST DATA
NORM-REFERENCED TESTS Grade 3
Iowa Tests of Basic Skills (ITBS) Each chart reflects data for three years of testing.
Reading Comprehension 50
66 47 54 0
98-99
62 49 53 97-98
45 45 52 96-97
Mathematics
School 50
System
State
0
73 50 61 98-99
63 57 61 97-98
52 51 59 96-97
School System State
Reading Vocabulary 50
59 41 50 0
98-99
53 43 50 97-98
44 42 49 96-97
Language Arts
School 50
System
State
0
83 62 64 98-99
71 61 62 97-98
57 53 59 96-97
School System State
Social Studies 50
71 50 56 0
98-99
67 52 55 97-98
52 53 55 96-97
Science
School 50
System
State
0
77 57 59 98-99
66 59 59 97-98
59 60 58 96-97
School System State
Sources of Information
Composite Score
50
77 53 57 0
98-99
School 50
System
68 53 56 97-98
56 52 55 96-97
State 0
75 52 58 98-99
66 54 57 97-98
1998-99 GEORGIA PUBLIC EDUCATION REPORT CARD Sunset Elementary School - 6355054
Prepared by Georgia Department of Education
52 51 56 96-97
Scores Reported in Percentiles
School System State
Page 2
STATE-REQUIRED TEST DATA
NORM-REFERENCED TESTS Grade 5
Iowa Tests of Basic Skills (ITBS) Each chart reflects data for three years of testing.
Reading Comprehension
Mathematics
50
50 52 53 0
98-99
46 49 53 97-98
48 47 52 96-97
School 50
System
State
0
55 52 59 98-99
48 51 58 97-98
52 48 57 96-97
School System State
Reading Vocabulary 50
41 42 48 0
98-99
41 44 48 97-98
43 40 46 96-97
Language Arts
School 50
System
State
0
58 67 63 98-99
57 62 61 97-98
51 54 58 96-97
School System State
Social Studies 50
60 56 57 0
98-99
50 54 56 97-98
54 48 55 96-97
Science
School 50
System
State
0
63 62 60 98-99
56 58 59 97-98
59 56 59 96-97
School System State
Sources of Information
Composite Score
50
58 57 58 0
98-99
School 50
System
55 56 58 97-98
54 53 57 96-97
State 0
56 57 57 98-99
51 54 56 97-98
52 49 55 96-97
1998-99 GEORGIA PUBLIC EDUCATION REPORT CARD Sunset Elementary School - 6355054
Prepared by Georgia Department of Education
Scores Reported in Percentiles
School System State
Page 3
STATE-REQUIRED TEST DATA
PERFORMANCE ASSESSMENTS
Grade 5 Writing Assessment
Percent at Developmental Stages:
1998-99 School System State
1997-98 School System State
1996-97 School System State
Stage Stage Stage Stage Stage Stage
1:The Emerging Writer 2:The Developing Writer 3:The Focusing Writer 4:The Experimenting 5:The Engaging Writer 6:The Extending Writer
0% 2% 15% 43% 37% 3%
0% 2% 15% 42% 35% 6%
0% 1% 16% 41% 29% 12%
0% 1% 26% 43% 19% 7%
1% 5% 23% 34% 26% 10%
0% 3% 19% 41% 27% 10%
0% 3% 32% 30% 27% 8%
0% 4% 26% 36% 26% 8%
0% 3% 21% 37% 26% 12%
AWARDS / RECOGNITION DATA
Schools in Georgia may receive recognition in the following programs: Charter School Pay for Performance Program Georgia School of Excellence National Blue Ribbon School Sunset Elementary School did not receive recognition in any of these programs during the 1998-99 school year.
1998-99 GEORGIA PUBLIC EDUCATION REPORT CARD Sunset Elementary School - 6355054
Prepared by Georgia Department of Education
Page 4
CERTIFIED PERSONNEL DATA
Positions Number Average Contract Days
Personnel Sex
Certificate
Years Experience
Full-time Part-time
Male Female
4 Yr Bachelor's 5 Yr Master's 6 Yr Specialist's 7 Yr Doctoral Other*
<1 1-10 11-20 21-30 >30
Average
Administrators
1.50 223.33
1 1
1 1
0 0 2 0 0 0 0 1 1 0 20.50
Support Personnel
2.50 190.00
2 1
1 2
0 3 0 0 0 0 1 1 1 0 16.67
PK-12 Teachers
35.60 188.93
34 3
2 35
15 19
3 0 0 1 14 21 1 0 11.38
*Includes One- and Two-Year Vocational Certificates.
ACCREDITATION DATA
Accredited by Southern Association of Colleges and Schools (SACS):
Elementary/Middle Commission. Accredited with Quality by Georgia
Accrediting Commission (GAC).
1998-99 GEORGIA PUBLIC EDUCATION REPORT CARD Sunset Elementary School - 6355054
Prepared by Georgia Department of Education
Page 5
1998-99 GEORGIA PUBLIC EDUCATION REPORT CARD
COLQUITT COUNTY SCHOOLS
Willie J Williams Middle School - 6355052
Grade Range 6-8
The Georgia Public Education Report Card is designed to assist systems and schools in educational improvement. This report card contains a variety of data elements. An explanation of the terms is provided as a companion to the report card data. Please refer to the definitions for the most effective use of the reported data.
STUDENT DATA
Total 1,023
6-8 Enrollment, by Race/Ethnicity and Sex
Black
White Hispanic
American Multi-
Asian Indian
racial
351 34.3%
617 60.3%
48 4.7%
3 0.3%
0 0.0%
4 0.4%
Male 544
53.2%
Female 479
46.8%
Enrollment in Selected Programs
Program
Gifted (Grades K-12)
Program % of Student Enrollment Population
72
7.0%
Alternative Programs (Grades 6-12)
0
0.0%
Students Eligible to Receive Free/Reduced Lunches
Number
Percent
School System
585 4,561
57.2% 54.8%
Enrollment in Compensatory Programs
Program
Program % of Student Enrollment Population
Special Education (Grades K-12) (PK)
145 14.2%
0
N/A
English to Speakers of Other Languages (ESOL) (Grades K-12)
17
1.7%
Title I (Grades K-12)
This school has no Title I program.
Dropout Rate for Grades 6-8
Number
Rate
School System
7
0.6%
7
0.3%
Total 4
Retained Students, by Race/Ethnicity and Sex
Black
White Hispanic
American MultiAsian Indian racial
2 50.0%
1 25.0%
0 0.0%
0 0.0%
0
1
0.0% 25.0%
Male Female
0
4
0.0% 100.0%
Prepared by Georgia Department of Education
Page 1
STATE-REQUIRED TEST DATA
NORM-REFERENCED TESTS Grade 8
Iowa Tests of Basic Skills (ITBS) Each chart reflects data for three years of testing.
Reading Comprehension 50
45 43 49 0
98-99
53 50 48 97-98
40 42 48 96-97
Mathematics
School 50
System
State
0
46 47 56 98-99
54 55 55 97-98
47 48 54 96-97
School System State
Reading Vocabulary 50
33 34 46 0
98-99
47 41 45 97-98
34 36 44 96-97
Language Arts
School 50
System
State
0
44 47 60 98-99
53 56 58 97-98
48 53 56 96-97
School System State
Social Studies 50
50 50 54 0
98-99
61 57 53 97-98
46 48 53 96-97
Science
School 50
System
State
0
55 52 56 98-99
58 53 55 97-98
50 49 53 96-97
School System State
Sources of Information
Composite Score
50
52 50 57 0
98-99
School 50
System
62 56 56 97-98
42 47 55 96-97
State 0
48 48 56 98-99
57 54 54 97-98
1998-99 GEORGIA PUBLIC EDUCATION REPORT CARD Willie J Williams Middle School - 6355052
Prepared by Georgia Department of Education
44 47 54 96-97
Scores Reported in Percentiles
School System State
Page 2
STATE-REQUIRED TEST DATA
Categories of Scaled Scores
Inadequate (less than 162)
Minimal (162-209)
Good
(210-247)
Very Good (greater than 247)
Average Scaled Score: (Range 100-300)
PERFORMANCE ASSESSMENTS
Grade 8 Writing Assessment
1998-99 Percent Scoring
1997-98 Percent Scoring
1996-97 Percent Scoring
School System State School System State School System State
8% 39% 41% 12%
10% 42% 38%
9%
8% 40% 41% 11%
2% 41% 40% 16%
5% 45% 40% 10%
11% 46% 34%
8%
12% 55% 29%
3%
15% 54% 28%
3%
15% 46% 30%
8%
207
204
208 215
209 202 195
194 198
AWARDS / RECOGNITION DATA
Schools in Georgia may receive recognition in the following programs: Charter School Pay for Performance Program Georgia School of Excellence National Blue Ribbon School Willie J Williams Middle School did not receive recognition in any of these programs during the 1998-99 school year.
1998-99 GEORGIA PUBLIC EDUCATION REPORT CARD Willie J Williams Middle School - 6355052
Prepared by Georgia Department of Education
Page 3
CERTIFIED PERSONNEL DATA
Positions Number Average Contract Days
Personnel Sex
Certificate
Years Experience
Full-time Part-time
Male Female
4 Yr Bachelor's 5 Yr Master's 6 Yr Specialist's 7 Yr Doctoral Other*
<1 1-10 11-20 21-30 >30
Average
Administrators
3.00 230.00
3 0
1 2
0 0 2 1 0 0 0 2 1 0 22.00
Support Personnel
4.35 190.23
3 4
1 6
1 4 2 0 0 1 3 1 1 1 13.57
PK-12 Teachers
64.91 190.65
53 14
20 47
44 22
1 0 0 4 33 20 8 2 11.52
*Includes One- and Two-Year Vocational Certificates.
ACCREDITATION DATA
Accredited by Southern Association of Colleges and Schools (SACS):
Elementary/Middle Commission. Accredited with Quality by Georgia
Accrediting Commission (GAC).
1998-99 GEORGIA PUBLIC EDUCATION REPORT CARD Willie J Williams Middle School - 6355052
Prepared by Georgia Department of Education
Page 4
1998-99 GEORGIA PUBLIC EDUCATION REPORT CARD
COLQUITT COUNTY SCHOOLS
Wright Elementary School - 6352056
Grade Range PK-5
The Georgia Public Education Report Card is designed to assist systems and schools in educational improvement. This report card contains a variety of data elements. An explanation of the terms is provided as a companion to the report card data. Please refer to the definitions for the most effective use of the reported data.
STUDENT DATA
Total
K-5
422
PK
40
Enrollment, by Race/Ethnicity and Sex
Black
White Hispanic
American Asian Indian
Multiracial
212 50.2%
206 48.8%
1 0.2%
1 0.2%
0 0.0%
2 0.5%
18 45.0%
19 47.5%
1 2.5%
2 5.0%
0 0.0%
0 0.0%
Male Female
223 52.8%
199 47.2%
22 55.0%
18 45.0%
Enrollment in Selected Programs
Program
Program % of Student Enrollment Population
Gifted (Grades K-12)
19
4.5%
Alternative Programs (Grades 6-12)
N/A
N/A
Students Eligible to Receive Free/Reduced Lunches
Number
Percent
School System
245 4,561
53.0% 54.8%
Dropout Rate *
Number
Rate
School System
N/A N/A
N/A N/A
* Dropout rates are not applicable for grades PK-5.
Enrollment in Compensatory Programs
Program
Program % of Student Enrollment Population
Special Education (Grades K-12)
47 11.1%
(PK)
3
N/A
English to Speakers of Other Languages (ESOL) (Grades K-12)
0
0.0%
Remedial Education (Grades 2-5, 9-12)
40 14.5%
Special Instructional Assistance (SIA) (Grades K-3)
108 37.2%
Title I (Grades K-12)
This school has a schoolwide program.
Total 2
Retained Students, by Race/Ethnicity and Sex
Black
White Hispanic
American MultiAsian Indian racial
0
2
0.0% 100.0%
0 0.0%
0 0.0%
0 0.0%
0 0.0%
Male Female
1
1
50.0% 50.0%
Prepared by Georgia Department of Education
Page 1
STATE-REQUIRED TEST DATA
NORM-REFERENCED TESTS Grade 3
Iowa Tests of Basic Skills (ITBS) Each chart reflects data for three years of testing.
Reading Comprehension 50
51 47 54 0
98-99
42 49 53 97-98
52 45 52 96-97
Mathematics
School 50
System
State
0
50 50 61 98-99
55 57 61 97-98
57 51 59 96-97
School System State
Reading Vocabulary 50
37 41 50 0
98-99
36 43 50 97-98
52 42 49 96-97
Language Arts
School 50
System
State
0
61 62 64 98-99
54 61 62 97-98
62 53 59 96-97
School System State
Social Studies 50
46 50 56 0
98-99
46 52 55 97-98
62 53 55 96-97
Science
School 50
System
State
0
53 57 59 98-99
58 59 59 97-98
68 60 58 96-97
School System State
Sources of Information
Composite Score
50
57 53 57 0
98-99
School 50
System
54 53 56 97-98
61 52 55 96-97
State 0
51 52 58 98-99
49 54 57 97-98
1998-99 GEORGIA PUBLIC EDUCATION REPORT CARD Wright Elementary School - 6352056
Prepared by Georgia Department of Education
61 51 56 96-97
Scores Reported in Percentiles
School System State
Page 2
STATE-REQUIRED TEST DATA
NORM-REFERENCED TESTS Grade 5
Iowa Tests of Basic Skills (ITBS) Each chart reflects data for three years of testing.
Reading Comprehension
Mathematics
50
55 52 53 0
98-99
55 49 53 97-98
62 47 52 96-97
School 50
System
State
0
52 52 59 98-99
53 51 58 97-98
59 48 57 96-97
School System State
Reading Vocabulary 50
50 42 48 0
98-99
46 44 48 97-98
52 40 46 96-97
Language Arts
School 50
System
State
0
81 67 63 98-99
76 62 61 97-98
73 54 58 96-97
School System State
Social Studies 50
71 56 57 0
98-99
66 54 56 97-98
66 48 55 96-97
Science
School 50
System
State
0
70 62 60 98-99
59 58 59 97-98
72 56 59 96-97
School System State
Sources of Information
Composite Score
50
68 57 58 0
98-99
School 50
System
64 56 58 97-98
68 53 57 96-97
State 0
68 57 57 98-99
62 54 56 97-98
67 49 55 96-97
1998-99 GEORGIA PUBLIC EDUCATION REPORT CARD Wright Elementary School - 6352056
Prepared by Georgia Department of Education
Scores Reported in Percentiles
School System State
Page 3
STATE-REQUIRED TEST DATA
PERFORMANCE ASSESSMENTS
Grade 5 Writing Assessment
Percent at Developmental Stages:
1998-99 School System State
1997-98 School System State
1996-97 School System State
Stage Stage Stage Stage Stage Stage
1:The Emerging Writer 2:The Developing Writer 3:The Focusing Writer 4:The Experimenting 5:The Engaging Writer 6:The Extending Writer
0% 0% 18% 36% 36% 9%
0% 2% 15% 42% 35% 6%
0% 1% 16% 41% 29% 12%
3% 5% 12% 28% 34% 17%
1% 5% 23% 34% 26% 10%
0% 3% 19% 41% 27% 10%
0% 2% 9% 36% 38% 16%
0% 4% 26% 36% 26% 8%
0% 3% 21% 37% 26% 12%
AWARDS / RECOGNITION DATA
Schools in Georgia may receive recognition in the following programs: Charter School Pay for Performance Program Georgia School of Excellence National Blue Ribbon School Wright Elementary School did not receive recognition in any of these programs during the 1998-99 school year.
1998-99 GEORGIA PUBLIC EDUCATION REPORT CARD Wright Elementary School - 6352056
Prepared by Georgia Department of Education
Page 4
CERTIFIED PERSONNEL DATA
Positions Number Average Contract Days
Personnel Sex
Certificate
Years Experience
Full-time Part-time
Male Female
4 Yr Bachelor's 5 Yr Master's 6 Yr Specialist's 7 Yr Doctoral Other*
<1 1-10 11-20 21-30 >30
Average
Administrators
1.50 223.33
1 1
1 1
0 0 2 0 0 0 0 0 1 1 27.00
Support Personnel
3.00 190.00
2 2
0 4
0 4 0 0 0 1 1 1 1 0 10.00
PK-12 Teachers
27.60 190.00
27 1
0 28
12 13
3 0 0 0 10 11 7 0 14.07
*Includes One- and Two-Year Vocational Certificates.
ACCREDITATION DATA
Accredited by Southern Association of Colleges and Schools (SACS):
Elementary/Middle Commission. Accredited with Quality by Georgia
Accrediting Commission (GAC).
1998-99 GEORGIA PUBLIC EDUCATION REPORT CARD Wright Elementary School - 6352056
Prepared by Georgia Department of Education
Page 5
1998-99 GEORGIA PUBLIC EDUCATION REPORT CARD COLUMBIA COUNTY SCHOOLS - 636
The Georgia Public Education Report Card is designed to assist systems and schools in educational improvement. This report card contains a variety of data elements. An explanation of the terms is provided as a companion to the report card data. Please refer to the definitions for the most effective use of the reported data.
Total
K-12
18,271
PK
346
STUDENT DATA
Enrollment, by Race/Ethnicity and Sex
Black
White Hispanic
American Multi-
Asian Indian
racial
2,366 12.9%
14,767 80.8%
333 1.8%
621 3.4%
23 0.1%
161 0.9%
51 14.7%
277 80.1%
8 2.3%
5 1.4%
1 0.3%
4 1.2%
Male
9,417 51.5%
188 54.3%
Female
8,854 48.5%
158 45.7%
Enrollment in Selected Programs
Program
Program % of Student Enrollment Population
Gifted (Grades K-12)
786
4.3%
Non-Vocational Labs (Grades 9-12)
5,061
92.4%
Vocational Labs (Grades 9-12)
2,980
54.4%
Alternative Programs (Grades 6-12)
44
< 1%
Students Eligible to Receive Free/Reduced Lunches
Number
Percent
3,662
19.7%
Dropout Rate
Number
Percent
6-12
328
3.1%
9-12
217
3.7%
Enrollment in Compensatory Programs
Program
Program % of Student Enrollment Population
Special Education (Grades K-12)
PK
1,522 50
English to Speakers of
Other Languages (ESOL)
42
(Grades K-12)
Remedial Education (Grades 2-5, 9-12)
644
Special Instructional
Assistance (SIA)
78
(Grades K-3)
Title I (Grades K-12) Number of schools with: Schoolwide program Targeted Assistance program No Title I program
8.3% N/A < 1%
5.7%
1.4%
4 1 18
Total 769
Retained Students, by Race/Ethnicity and Sex
Black
White Hispanic
American MultiAsian Indian racial
135 17.6%
598 77.8%
17 2.2%
8 1.0%
1 0.1%
10 1.3%
Male Female 460 309
59.8% 40.2%
Prepared by Georgia Department of Education
Page 1
STATE-REQUIRED TEST DATA
NORM-REFERENCED TESTS
Grade 3 Iowa Tests of Basic Skills (ITBS) Each chart reflects data for three years of testing.
Reading Comprehension
Mathematics
50
66 54 65 53 63 52 0
98-99 97-98 96-97
System State
50
75 61 74 61 70 59 0
98-99 97-98 96-97
System State
Reading Vocabulary
50
65 50 63 50 61 49 0
98-99 97-98 96-97
System State
Social Studies
50
72 56 71 55 68 55 0
98-99 97-98 96-97
System State
Language Arts
50
75 64 74 62 69 59 0
98-99 97-98 96-97
System State
Science
50
75 59 74 59 72 58 0
98-99 97-98 96-97
System State
Sources of Information
Composite Score
50
74 57 0
98-99
System
50
71 56 68 55 97-98 96-97
State
73 58 72 57 0
98-99 97-98
1998-99 GEORGIA PUBLIC EDUCATION REPORT CARD Columbia County Schools
Prepared by Georgia Department of Education
System State Scores Reported 69 56 in Percentiles 96-97
Page 2
STATE-REQUIRED TEST DATA
NORM-REFERENCED TESTS
Grade 5 Iowa Tests of Basic Skills (ITBS) Each chart reflects data for three years of testing.
Reading Comprehension
Mathematics
50
62 53 61 53 60 52 0
98-99 97-98 96-97
System State
50
69 59 67 58 66 57 0
98-99 97-98 96-97
System State
Reading Vocabulary
50
56 48 60 48 58 46 0
98-99 97-98 96-97
System State
Social Studies
50
68 57 66 56 66 55 0
98-99 97-98 96-97
System State
Language Arts
50
71 63 67 61 65 58 0
98-99 97-98 96-97
System State
Science
50
71 60 72 59 72 59 0
98-99 97-98 96-97
System State
Sources of Information
Composite Score
50
68 58 0
98-99
System
50
67 58 67 57 97-98 96-97
State
69 57 67 56 0
98-99 97-98
1998-99 GEORGIA PUBLIC EDUCATION REPORT CARD Columbia County Schools
Prepared by Georgia Department of Education
System State Scores Reported 66 55 in Percentiles 96-97
Page 3
STATE-REQUIRED TEST DATA
NORM-REFERENCED TESTS Grade 8
Iowa Tests of Basic Skills (ITBS) Each chart reflects data for three years of testing.
Reading Comprehension
Mathematics
50
61 49 62 48 62 48 0
98-99 97-98 96-97
System State
50
66 56 65 55 62 54 0
98-99 97-98 96-97
System State
Reading Vocabulary
50
61 46 61 45 60 44 0
98-99 97-98 96-97
System State
Language Arts
50
68 60 67 58 65 56 0
98-99 97-98 96-97
System State
Social Studies
50
63 54 65 53 65 53 0
98-99 97-98 96-97
System State
Science
50
69 56 68 55 68 53 0
98-99 97-98 96-97
System State
Sources of Information
Composite Score
50
67 57 0
98-99
System
50
65 56 66 55 97-98 96-97
State
67 56 66 54 0
98-99 97-98
1998-99 GEORGIA PUBLIC EDUCATION REPORT CARD Columbia County Schools
Prepared by Georgia Department of Education
System State Scores Reported 66 54 in Percentiles 96-97
Page 4
STATE-REQUIRED TEST DATA
PERFORMANCE ASSESSMENTS
Grade 5 Writing Assessment
1998-99
1997-98
1996-97
Percent at Developmental Stages:
Comparison
Comparison
Comparison
System Group State System Group State System Group State
Stage Stage Stage Stage Stage Stage
1: The Emerging Writer 2: The Developing Writer 3: The Focusing Writer 4: The Experimenting Writer 5: The Engaging Writer 6: The Extending Writer
0% 0% 8% 39% 34% 18%
0% 0% 8% 34% 36% 21%
0% 1% 16% 41% 29% 12%
0% 1% 11% 39% 34% 15%
0% 1% 11% 37% 35% 16%
0% 3% 19% 41% 27% 10%
0% 1% 14% 30% 35% 19%
0% 2% 15% 34% 31% 18%
0% 3% 21% 37% 26% 12%
Grade 8 Writing Assessment
1998-99 Percent Scoring 1997-98 Percent Scoring 1996-97 Percent Scoring
Categories of Scaled Scores
Comparison
Comparison
Comparison
System Group State System Group State System Group State
Inadequate (less than 162)
Minimal (162-209)
Good
(210-247)
Very Good (greater than 247)
3% 30% 53% 15%
2% 28% 51% 19%
8% 40% 41% 11%
5% 40% 45% 10%
4% 35% 46% 14%
11% 46% 34%
8%
9% 43% 37% 12%
7% 39% 39% 14%
15% 46% 30%
8%
Average Scaled Score: (Range 100-300)
218
221 208
212
216 202
207
211 198
GEORGIA HIGH SCHOOL GRADUATION TESTS (GHSGT)
Percent of Regular Program 11th Graders Passing the Georgia High School Graduation Tests on First Administration
1998-99
1997-98
1996-97
Comparison
Comparison
Comparison
System Group State System Group State System Group State
English Language Arts Mathematics Social Studies Science
99% 95% 91% 88%
98% 95% 89% 84%
96% 88% 80% 72%
98% 97% 91% 91%
98% 96% 88% 87%
94% 88% 78% 74%
99% 96% 94% 92%
97% 93% 87% 85%
94% 87% 78% 74%
All Components listed above 8 5 %
81% 68% 86%
83% 68% 88%
80% 67%
Writing
98%
97% 93% 98%
96% 92% 97%
96% 93%
1998-99 GEORGIA PUBLIC EDUCATION REPORT CARD
Columbia County Schools
Prepared by Georgia Department of Education
Page 5
GRADUATE DATA
1999 Graduates by Credentials, Race/Ethnicity and Sex
Diplomas with Both College Prep. & Voc. Endorsements
Diplomas with College Prep. Endorsements Diplomas with Vocational Endorsements General High School Diplomas Special Education Diplomas
Total All Diplomas
Certificates of Performance
Total Graduates
Total 89
676 255
28 22 1,070 30 1,100
Black
12 13.5%
67 9.9%
50 19.6%
5 17.9%
6 27.3%
140 13.1%
16 53.3%
156 14.2%
American MultiWhite Hispanic Asian Indian racial
74 83.1%
536 79.3%
200 78.4%
23 82.1%
15 68.2%
848 79.3%
1 1.1%
14 2.1%
2 0.8%
0 0.0%
1 4.5%
18 1.7%
2 2.2%
48 7.1%
1 0.4%
0 0.0%
0 0.0%
51 4.8%
0 0.0%
2 0.3%
0 0.0%
0 0.0%
0 0.0%
2 0.2%
0 0.0%
9 1.3%
2 0.8%
0 0.0%
0 0.0%
11 1.0%
11
2
1
0
0
36.7% 6.7% 3.3% 0.0% 0.0%
859
20
52
2
11
78.1% 1.8% 4.7% 0.2% 1.0%
Male Female
41 46.1%
302 44.7%
157 61.6%
18 64.3%
10 45.5%
528 49.3%
48 53.9%
374 55.3%
98 38.4%
10 35.7%
12 54.5%
542 50.7%
12
18
40.0% 60.0%
540 560 49.1% 50.9%
HOPE Scholarships
System State
Number of 1999 Graduates 1 , 1 0 0
Number Eligible
731
Percent Eligible
66.5%
65,548 40,292 61.5%
High School Completion Rate Percent of 1995Grade 9 Enrollment
in Graduating Class of1999
System
State
Completion Rate '95-'99 82.2% 68.9%
COLLEGE ADMISSIONS / CREDIT TEST DATA
Scholastic Assessment Test (SAT)
No. Taking
Average Score
Tests
Verbal Math Total
Based on students' highest verbal and highest math scores
System College Prep. Endorsement Other Diplomas
521 524 1045 536 542 1078 407 397 804
Georgia
492 488 980
Based on students' last test administration
System Georgia
885 41,958
513 514 1027 483 479 962
Nation
952,913 502 508 1010
American College Testing (ACT)
System State Nation
English
20.4
19.1 20.4
Mathematics
21.2
19.9 20.7
Reading
22.0
20.2 21.3
Science Reasoning 21.2
19.9 21.0
CompositeScore 21.3
19.9 21.9
Advanced Placement Exams (AP)
No. of Students Taking Tests
No. of Tests Taken No. of Test Scores
3 or Higher Percent of Test
Scores 3 or Higher
System State 407 15,225 710 23,969 456 13,024
64.2% 54.3%
1998-99 GEORGIA PUBLIC EDUCATION REPORT CARD Columbia County Schools
Prepared by Georgia Department of Education
Page 6
POSTSECONDARY DATA
Graduates Entering Georgia Public Colleges and Universities
Graduates Entering Georgia Public Colleges and Universities and
Requiring Learning Support (LS)
1998 Graduates Entering 1998-99
1997 Graduates Entering 1997-98
Percent of Graduating Number Class
509
45.0%
519
54.1%
Number Requiring
LS
42
37
Percent of those attending Georgia
Public Colleges
8.3%
7.1%
In previous years, the Report Card presented College Prep Curriculum information provided by the Board of Regents on students requiring Learning Support. Due to inconsistencies in the data provided by the Board of Regents in defining College Prep Completers versus Local Board of Education data defining College Prep Endorsements, the Department of Education Report Card will not provide this information until discrepancies can be reconciled.
Graduates Entering Georgia Public Technical and Adult Schools
Entering 1998-99 Entering 1997-98
Number Percent
Number Percent
1998 Graduates 1997 Graduates
64
5.7%
3
0.3%
N/A 43
N/A 4.5%
ACCREDITATION / RECOGNITION DATA
Southern Association of Colleges and Schools (SACS) Accrediting Commission
Secondary/Middle Commission Elementary/Middle Commission Both Elementary/Secondary Commissions Joint Commission Candidate for Accreditation
Accreditation by Georgia Accrediting Commission (GAC)
Accredited by GAC Accredited with Quality by GAC
Number of Schools
4 19
0 0 0
Number of Schools
1 22
Awards / Recognition
State Recognized Program
Number of Schools
Charter School
0
Pay for Performance Recipient
0
Georgia School of Excellence
1
National Blue Ribbon School
0
COMMUNITY DATA
Number of Children Eligible for Migrant Education Number of Families-At-Risk * Number of Food Stamp Participants * Number of Families Receiving TANF * ** Per Capita Income * Unemployment Rate * 1990 Population * Projected 2000 Population * Projected 2010 Population *
* Data Available at County Level Only ** Known as AFDC before January 1997
13 151 2,995 290 $20,525 3.4% 66,031 90,924 103,790
1998-99 GEORGIA PUBLIC EDUCATION REPORT CARD Columbia County Schools
Prepared by Georgia Department of Education
Page 7
FISCAL DATA
Millage Rate
17.51
* Fall 1998 Property Tax Digest is used to calculate the 98-99 Value of One Mill
FTE Count
FTE Count used for Allotment Calculation 18,130.0 Fall '98 FTE Count 18,271
Value of One Mill
$1,719,260 $94.82 per Allotment FTE
Sources: Local State-QBE State-
Lottery State-
Other Federal Other
Total
PerGeneral Fund cent Per FTE
$32,010,183 35.0% $1,766 $58,488,490 63.9% $3,226
K-12 Revenues
Lottery K-12
and
Title
All Other
Programs
K-12
$0
$0
Bonded Debt $951,641
$0
$0
$0
$-69 0.0%
$0
$0 $375,700
$0
$920,050 1.0% $51
$94,325 0.1%
$5
$0 0.0%
$0
$91,512,980 100% $5,048
$366 $2,267,657
$0 $2,268,023
$59,704 $0 $0
$435,404
$0 $0 $0 $951,641
Capital Projects $7,138,116
$0
$88,209
$446,214 $0 $0
$7,672,540
School Nutrition $3,309,103
$0
$0
Grand Total
Total
Per-
Amount cent
$43,409,045 40.1%
$58,488,490 54.0%
$463,839 0.4%
$390,686 $1,817,023 1.7%
$1,798,031 $0
$4,160,015 3.8% $0 0.0%
$5,497,822 $108,338,413 100%
Instruction
Media Instruction
Support Pupil Services General Admin. School Admin. Trans-
portation Maint. & Ops. Capital Projects School Food Debt Service
Total
K-12 Expenditures
$59,674,578 69.9% $3,291 $1,627,654 $411,695
$0
$0
$0 $61,713,928 60.1%
$2,321,343 2.7% $128
$0
$0
$0
$0
$0 $2,321,343 2.3%
$2,402,896 2.8% $133 $185,608
$0
$0
$0
$0 $2,588,505 2.5%
$3,677,996 4.3% $203 $395,696
$0
$0
$0
$0 $4,073,692 4.0%
$1,465,453 1.7% $81
$61,180
$0
$0
$0
$0 $1,526,634 1.5%
$6,111,611 7.2% $337
$0
$0
$0
$0
$0 $6,111,611 5.9%
$3,730,688 4.4% $206
$16,205
$0
$0
$0
$0 $3,746,893 3.6%
$5,969,977 7.0% $329
$1,130
$18,950
$0
$2,838
$0 $5,992,896 5.8%
$0 0.0%
$0
$0
$0
$0 $3,693,180
$0 $3,693,180 3.6%
$1,206 0.0%
$0
$0
$0
$0
$0 $5,378,514 $5,379,721 5.2%
$0 0.0%
$0
$0
$0 $5,613,045
$0
$0 $5,613,045 5.5%
$85,355,753 100% $4,708 $2,287,476 $430,646 $5,613,045 $3,696,019 $5,378,514 $102,761,455 100%
Salaries and Benefits as Percentages of Revenues and of Expenditures
Teachers and Paraprofessionals
Salaries $43,672,598
Benefits $12,111,532
Percentage of Revenues Percentage of Expenditures
Total of
Total of
General Fund
General Fund
Title Programs
Title Programs
Lottery K-12
Lottery K-12
Total Salaries
and
Total
and
Total
and Benefits All Other K-12 K - 12 All Other K-12 K - 12
$55,784,130
59.2%
51.5%
63.3%
54.3%
School Administration
$3,566,192 $1,189,553
$4,755,745
5.0%
4.4%
5.4%
4.6%
General Administration
$677,615
$222,728
$900,343
1.0%
0.8%
1.0%
0.9%
1998-99 GEORGIA PUBLIC EDUCATION REPORT CARD
Columbia County Schools - 636
Prepared by Georgia Department of Education
Page 8
CERTIFIED PERSONNEL DATA
Number
Average Annual Salary Positions Average Contract Days
Average Daily Salary
Full-time Personnel Part-time
Sex Male Female
4 Yr Bachelor's Certificate 5 Yr Master's
Level 6 Yr Specialist's 7 Yr Doctoral Other*
Black
White Race/ Hispanic Ethnicity Asian
American Indian
Multiracial
Years Experience
<1 1-10 11-20 21-30 >30
Average
Administrators
71.50
$63,674.21 211.75
$300.71
71 1
28 44
0 6 55 11 0
5 66
0 0 1 0
2 6 26 36 2
19.85
Support Personnel PK-12 Teachers
83.50
1,045.31
$43,958.77 196.12
$224.14
$39,368.06 190.34
$206.83
82
1,031
3
28
8
151
77
908
4
578
60
382
18
89
3
6
0
4
4
63
81
986
0
8
0
1
0
0
0
1
12
186
25
337
25
324
22
201
1
11
13.12
11.63
*Includes One- and Two-Year Vocational Certificates.
Certified Staff Position Ratios
Teacher/Administrator Ratio 15:1
Teacher/Support Person Ratio 13:1
Teacher/Staff Ratio 7:1
Student Enrollment/All Teachers 17:1
Certified Personnel by Category
87.1% 100%
5.9%
7.0%
80% 60%
40%
20%
0%
Teachers
Administrators
Support Personnel
1998-99 GEORGIA PUBLIC EDUCATION REPORT CARD
Columbia County Schools - 636
Prepared by Georgia Department of Education
Page 9
1998-99 GEORGIA PUBLIC EDUCATION REPORT CARD
COLUMBIA COUNTY SCHOOLS
Bel Air Elementary School - 6361050
Grade Range PK-5
The Georgia Public Education Report Card is designed to assist systems and schools in educational improvement. This report card contains a variety of data elements. An explanation of the terms is provided as a companion to the report card data. Please refer to the definitions for the most effective use of the reported data.
STUDENT DATA
Total
K-5
593
PK
20
Enrollment, by Race/Ethnicity and Sex
Black
White Hispanic
American Asian Indian
Multiracial
77 13.0%
488 82.3%
6 1.0%
14 2.4%
0 0.0%
8 1.3%
2 10.0%
18 90.0%
0 0.0%
0 0.0%
0 0.0%
0 0.0%
Male Female
312 52.6%
281 47.4%
10 50.0%
10 50.0%
Enrollment in Selected Programs
Program
Program % of Student Enrollment Population
Gifted (Grades K-12)
0
0.0%
Alternative Programs (Grades 6-12)
N/A
N/A
Students Eligible to Receive Free/Reduced Lunches
Number
Percent
School System
178 3,662
29.0% 19.7%
Dropout Rate *
Number
Rate
School System
N/A N/A
N/A N/A
* Dropout rates are not applicable for grades PK-5.
Enrollment in Compensatory Programs
Program
Program % of Student Enrollment Population
Special Education (Grades K-12)
65 11.0%
(PK)
2
N/A
English to Speakers of Other Languages (ESOL) (Grades K-12)
0
0.0%
Remedial Education (Grades 2-5, 9-12)
13
3.3%
Special Instructional Assistance (SIA) (Grades K-3)
6
1.5%
Title I (Grades K-12)
This school has no Title I program.
Total 17
Retained Students, by Race/Ethnicity and Sex
Black
White Hispanic
American MultiAsian Indian racial
2 11.8%
15 88.2%
0 0.0%
0 0.0%
0 0.0%
0 0.0%
Male Female
7
10
41.2% 58.8%
Prepared by Georgia Department of Education
Page 1
STATE-REQUIRED TEST DATA
NORM-REFERENCED TESTS Grade 3
Iowa Tests of Basic Skills (ITBS) Each chart reflects data for three years of testing.
Reading Comprehension 50
69 66 54 0
98-99
68 65 53 97-98
68 63 52 96-97
Mathematics
School 50
System
State
0
78 75 61 98-99
76 74 61 97-98
74 70 59 96-97
School System State
Reading Vocabulary 50
64 65 50 0
98-99
67 63 50 97-98
68 61 49 96-97
Language Arts
School 50
System
State
0
83 75 64 98-99
77 74 62 97-98
72 69 59 96-97
School System State
Social Studies 50
79 72 56 0
98-99
76 71 55 97-98
74 68 55 96-97
Science
School 50
System
State
0
82 75 59 98-99
82 74 59 97-98
80 72 58 96-97
School System State
Sources of Information
Composite Score
50
82 74 57 0
98-99
School 50
System
78 71 56 97-98
76 68 55 96-97
State 0
80 73 58 98-99
78 72 57 97-98
1998-99 GEORGIA PUBLIC EDUCATION REPORT CARD Bel Air Elementary School - 6361050
Prepared by Georgia Department of Education
75 69 56 96-97
Scores Reported in Percentiles
School System State
Page 2
STATE-REQUIRED TEST DATA
NORM-REFERENCED TESTS Grade 5
Iowa Tests of Basic Skills (ITBS) Each chart reflects data for three years of testing.
Reading Comprehension
Mathematics
50
61 62 53 0
98-99
59 61 53 97-98
59 60 52 96-97
School 50
System
State
0
66 69 59 98-99
54 67 58 97-98
57 66 57 96-97
School System State
Reading Vocabulary 50
56 56 48 0
98-99
57 60 48 97-98
57 58 46 96-97
Language Arts
School 50
System
State
0
72 71 63 98-99
62 67 61 97-98
62 65 58 96-97
School System State
Social Studies 50
67 68 57 0
98-99
63 66 56 97-98
67 66 55 96-97
Science
School 50
System
State
0
73 71 60 98-99
68 72 59 97-98
75 72 59 96-97
School System State
Sources of Information
Composite Score
50
69 68 58 0
98-99
School 50
System
61 67 58 97-98
68 67 57 96-97
State 0
69 69 57 98-99
62 67 56 97-98
65 66 55 96-97
1998-99 GEORGIA PUBLIC EDUCATION REPORT CARD Bel Air Elementary School - 6361050
Prepared by Georgia Department of Education
Scores Reported in Percentiles
School System State
Page 3
STATE-REQUIRED TEST DATA
PERFORMANCE ASSESSMENTS
Grade 5 Writing Assessment
Percent at Developmental Stages:
1998-99 School System State
1997-98 School System State
1996-97 School System State
Stage Stage Stage Stage Stage Stage
1:The Emerging Writer 2:The Developing Writer 3:The Focusing Writer 4:The Experimenting 5:The Engaging Writer 6:The Extending Writer
0% 0% 6% 37% 35% 22%
0% 0% 8% 39% 34% 18%
0% 1% 16% 41% 29% 12%
0% 0% 11% 36% 34% 20%
0% 1% 11% 39% 34% 15%
0% 3% 19% 41% 27% 10%
0% 1% 21% 38% 26% 13%
0% 1% 14% 30% 35% 19%
0% 3% 21% 37% 26% 12%
AWARDS / RECOGNITION DATA
Schools in Georgia may receive recognition in the following programs: Charter School Pay for Performance Program Georgia School of Excellence National Blue Ribbon School Bel Air Elementary School did not receive recognition in any of these programs during the 1998-99 school year.
1998-99 GEORGIA PUBLIC EDUCATION REPORT CARD Bel Air Elementary School - 6361050
Prepared by Georgia Department of Education
Page 4
CERTIFIED PERSONNEL DATA
Positions Number Average Contract Days
Personnel Sex
Certificate
Years Experience
Full-time Part-time
Male Female
4 Yr Bachelor's 5 Yr Master's 6 Yr Specialist's 7 Yr Doctoral Other*
<1 1-10 11-20 21-30 >30
Average
Administrators
2.00 200.00
2 0
1 1
0 0 2 0 0 0 0 0 2 0 26.00
Support Personnel
2.00 190.00
2 0
0 2
0 2 0 0 0 0 1 1 0 0 10.50
PK-12 Teachers
31.50 190.00
31 1
2 30
16 14
2 0 0 7 4 10 11 0 13.66
*Includes One- and Two-Year Vocational Certificates.
ACCREDITATION DATA
Accredited by Southern Association of Colleges and Schools (SACS):
Elementary/Middle Commission. Accredited with Quality by Georgia
Accrediting Commission (GAC).
1998-99 GEORGIA PUBLIC EDUCATION REPORT CARD Bel Air Elementary School - 6361050
Prepared by Georgia Department of Education
Page 5
1998-99 GEORGIA PUBLIC EDUCATION REPORT CARD
COLUMBIA COUNTY SCHOOLS
Blue Ridge Elementary School - 6360188
Grade Range PK-5
The Georgia Public Education Report Card is designed to assist systems and schools in educational improvement. This report card contains a variety of data elements. An explanation of the terms is provided as a companion to the report card data. Please refer to the definitions for the most effective use of the reported data.
STUDENT DATA
Total
K-5
838
PK
1
Enrollment, by Race/Ethnicity and Sex
Black
White Hispanic
American Asian Indian
Multiracial
75 8.9%
719 85.8%
6 0.7%
33 3.9%
1 0.1%
4 0.5%
0
1
0.0% 100.0%
0 0.0%
0 0.0%
0 0.0%
0 0.0%
Male 432
51.6% 1
100.0%
Female 406
48.4% 0
0.0%
Enrollment in Selected Programs
Program
Program % of Student Enrollment Population
Gifted (Grades K-12)
35
4.2%
Alternative Programs (Grades 6-12)
N/A
N/A
Students Eligible to Receive Free/Reduced Lunches
Number
Percent
School System
104 3,662
12.4% 19.7%
Dropout Rate *
Number
Rate
School System
N/A N/A
N/A N/A
* Dropout rates are not applicable for grades PK-5.
Enrollment in Compensatory Programs
Program
Program % of Student Enrollment Population
Special Education (Grades K-12)
81
9.7%
(PK)
1
N/A
English to Speakers of Other Languages (ESOL) (Grades K-12)
0
0.0%
Remedial Education (Grades 2-5, 9-12)
36
6.1%
Special Instructional Assistance (SIA) (Grades K-3)
0
0.0%
Title I (Grades K-12)
This school has no Title I program.
Total 24
Retained Students, by Race/Ethnicity and Sex
Black
White Hispanic
American MultiAsian Indian racial
6 25.0%
18 75.0%
0 0.0%
0 0.0%
0 0.0%
0 0.0%
Male Female
10
14
41.7% 58.3%
Prepared by Georgia Department of Education
Page 1
STATE-REQUIRED TEST DATA
NORM-REFERENCED TESTS Grade 3
Iowa Tests of Basic Skills (ITBS) Each chart reflects data for three years of testing.
Reading Comprehension 50
70 66 54 0
98-99
68 65 53 97-98
72 63 52 96-97
Mathematics
School 50
System
State
0
78 75 61 98-99
74 74 61 97-98
77 70 59 96-97
School System State
Reading Vocabulary 50
72 65 50 0
98-99
65 63 50 97-98
72 61 49 96-97
Language Arts
School 50
System
State
0
79 75 64 98-99
74 74 62 97-98
79 69 59 96-97
School System State
Social Studies 50
77 72 56 0
98-99
70 71 55 97-98
76 68 55 96-97
Science
School 50
System
State
0
77 75 59 98-99
68 74 59 97-98
78 72 58 96-97
School System State
Sources of Information
Composite Score
50
77 74 57 0
98-99
School 50
System
71 71 56 97-98
76 68 55 96-97
State 0
78 73 58 98-99
71 72 57 97-98
1998-99 GEORGIA PUBLIC EDUCATION REPORT CARD Blue Ridge Elementary School - 6360188
Prepared by Georgia Department of Education
78 69 56 96-97
Scores Reported in Percentiles
School System State
Page 2
STATE-REQUIRED TEST DATA
NORM-REFERENCED TESTS Grade 5
Iowa Tests of Basic Skills (ITBS) Each chart reflects data for three years of testing.
Reading Comprehension
Mathematics
50
69 62 53 0
98-99
63 61 53 97-98
64 60 52 96-97
School 50
System
State
0
75 69 59 98-99
70 67 58 97-98
74 66 57 96-97
School System State
Reading Vocabulary 50
63 56 48 0
98-99
62 60 48 97-98
59 58 46 96-97
Language Arts
School 50
System
State
0
75 71 63 98-99
72 67 61 97-98
77 65 58 96-97
School System State
Social Studies 50
73 68 57 0
98-99
67 66 56 97-98
69 66 55 96-97
Science
School 50
System
State
0
73 71 60 98-99
77 72 59 97-98
75 72 59 96-97
School System State
Sources of Information
Composite Score
50
71 68 58 0
98-99
School 50
System
74 67 58 97-98
73 67 57 96-97
State 0
74 69 57 98-99
73 67 56 97-98
73 66 55 96-97
1998-99 GEORGIA PUBLIC EDUCATION REPORT CARD Blue Ridge Elementary School - 6360188
Prepared by Georgia Department of Education
Scores Reported in Percentiles
School System State
Page 3
STATE-REQUIRED TEST DATA
PERFORMANCE ASSESSMENTS
Grade 5 Writing Assessment
Percent at Developmental Stages:
1998-99 School System State
1997-98 School System State
1996-97 School System State
Stage Stage Stage Stage Stage Stage
1:The Emerging Writer 2:The Developing Writer 3:The Focusing Writer 4:The Experimenting 5:The Engaging Writer 6:The Extending Writer
0% 0% 2% 40% 38% 20%
0% 0% 8% 39% 34% 18%
0% 1% 16% 41% 29% 12%
0% 1% 14% 37% 31% 17%
0% 1% 11% 39% 34% 15%
0% 3% 19% 41% 27% 10%
0% 0% 10% 31% 41% 19%
0% 1% 14% 30% 35% 19%
0% 3% 21% 37% 26% 12%
AWARDS / RECOGNITION DATA
Schools in Georgia may receive recognition in the following programs: Charter School Pay for Performance Program Georgia School of Excellence National Blue Ribbon School Blue Ridge Elementary School did not receive recognition in any of these programs during the 1998-99 school year.
1998-99 GEORGIA PUBLIC EDUCATION REPORT CARD Blue Ridge Elementary School - 6360188
Prepared by Georgia Department of Education
Page 4
CERTIFIED PERSONNEL DATA
Positions Number Average Contract Days
Personnel Sex
Certificate
Years Experience
Full-time Part-time
Male Female
4 Yr Bachelor's 5 Yr Master's 6 Yr Specialist's 7 Yr Doctoral Other*
<1 1-10 11-20 21-30 >30
Average
Administrators
2.00 200.00
2 0
1 1
0 0 2 0 0 0 0 1 1 0 20.00
Support Personnel
3.00 190.00
2 2
0 4
0 2 1 1 0 1 1 1 1 0 12.25
PK-12 Teachers
40.00 190.00
40 0
1 39
17 18
5 0 0 6 12 14 7 1 12.60
*Includes One- and Two-Year Vocational Certificates.
ACCREDITATION DATA
Accredited by Southern Association of Colleges and Schools (SACS):
Elementary/Middle Commission. Accredited with Quality by Georgia
Accrediting Commission (GAC).
1998-99 GEORGIA PUBLIC EDUCATION REPORT CARD Blue Ridge Elementary School - 6360188
Prepared by Georgia Department of Education
Page 5
1998-99 GEORGIA PUBLIC EDUCATION REPORT CARD
COLUMBIA COUNTY SCHOOLS
Brookwood Elementary School - 6360190
Grade Range PK-5
The Georgia Public Education Report Card is designed to assist systems and schools in educational improvement. This report card contains a variety of data elements. An explanation of the terms is provided as a companion to the report card data. Please refer to the definitions for the most effective use of the reported data.
STUDENT DATA
Total
K-5
710
PK
23
Enrollment, by Race/Ethnicity and Sex
Black
White Hispanic
American Asian Indian
Multiracial
102 14.4%
580 81.7%
13 1.8%
12 1.7%
0 0.0%
3 0.4%
3 13.0%
20 87.0%
0 0.0%
0 0.0%
0 0.0%
0 0.0%
Male Female
368 51.8%
342 48.2%
13 56.5%
10 43.5%
Enrollment in Selected Programs
Program
Program % of Student Enrollment Population
Gifted (Grades K-12)
1
< 1%
Alternative Programs (Grades 6-12)
N/A
N/A
Students Eligible to Receive Free/Reduced Lunches
Number
Percent
School System
166 3,662
22.6% 19.7%
Dropout Rate *
Number
Rate
School System
N/A N/A
N/A N/A
* Dropout rates are not applicable for grades PK-5.
Enrollment in Compensatory Programs
Program
Program % of Student Enrollment Population
Special Education (Grades K-12)
70
9.9%
(PK)
5
N/A
English to Speakers of Other Languages (ESOL) (Grades K-12)
0
0.0%
Remedial Education (Grades 2-5, 9-12)
21
4.3%
Special Instructional Assistance (SIA) (Grades K-3)
0
0.0%
Title I (Grades K-12)
This school has no Title I program.
Total 13
Retained Students, by Race/Ethnicity and Sex
Black
White Hispanic
American MultiAsian Indian racial
2 15.4%
10 76.9%
1 7.7%
0 0.0%
0 0.0%
0 0.0%
Male Female
8
5
61.5% 38.5%
Prepared by Georgia Department of Education
Page 1
STATE-REQUIRED TEST DATA
NORM-REFERENCED TESTS Grade 3
Iowa Tests of Basic Skills (ITBS) Each chart reflects data for three years of testing.
Reading Comprehension 50
65 66 54 0
98-99
67 65 53 97-98
59 63 52 96-97
Mathematics
School 50
System
State
0
70 75 61 98-99
75 74 61 97-98
65 70 59 96-97
School System State
Reading Vocabulary 50
64 65 50 0
98-99
62 63 50 97-98
61 61 49 96-97
Language Arts
School 50
System
State
0
79 75 64 98-99
83 74 62 97-98
64 69 59 96-97
School System State
Social Studies 50
69 72 56 0
98-99
73 71 55 97-98
71 68 55 96-97
Science
School 50
System
State
0
78 75 59 98-99
80 74 59 97-98
70 72 58 96-97
School System State
Sources of Information
Composite Score
50
76 74 57 0
98-99
School 50
System
76 71 56 97-98
70 68 55 96-97
State 0
74 73 58 98-99
77 72 57 97-98
1998-99 GEORGIA PUBLIC EDUCATION REPORT CARD Brookwood Elementary School - 6360190
Prepared by Georgia Department of Education
67 69 56 96-97
Scores Reported in Percentiles
School System State
Page 2
STATE-REQUIRED TEST DATA
NORM-REFERENCED TESTS Grade 5
Iowa Tests of Basic Skills (ITBS) Each chart reflects data for three years of testing.
Reading Comprehension
Mathematics
50
60 62 53 0
98-99
61 61 53 97-98
63 60 52 96-97
School 50
System
State
0
60 69 59 98-99
66 67 58 97-98
58 66 57 96-97
School System State
Reading Vocabulary 50
54 56 48 0
98-99
58 60 48 97-98
61 58 46 96-97
Language Arts
School 50
System
State
0
69 71 63 98-99
68 67 61 97-98
64 65 58 96-97
School System State
Social Studies 50
64 68 57 0
98-99
66 66 56 97-98
64 66 55 96-97
Science
School 50
System
State
0
68 71 60 98-99
71 72 59 97-98
70 72 59 96-97
School System State
Sources of Information
Composite Score
50
64 68 58 0
98-99
School 50
System
70 67 58 97-98
64 67 57 96-97
State 0
64 69 57 98-99
68 67 56 97-98
64 66 55 96-97
1998-99 GEORGIA PUBLIC EDUCATION REPORT CARD Brookwood Elementary School - 6360190
Prepared by Georgia Department of Education
Scores Reported in Percentiles
School System State
Page 3
STATE-REQUIRED TEST DATA
PERFORMANCE ASSESSMENTS
Grade 5 Writing Assessment
Percent at Developmental Stages:
1998-99 School System State
1997-98 School System State
1996-97 School System State
Stage Stage Stage Stage Stage Stage
1:The Emerging Writer 2:The Developing Writer 3:The Focusing Writer 4:The Experimenting 5:The Engaging Writer 6:The Extending Writer
0% 0% 9% 52% 23% 15%
0% 0% 8% 39% 34% 18%
0% 1% 16% 41% 29% 12%
0% 0% 10% 47% 31% 12%
0% 1% 11% 39% 34% 15%
0% 3% 19% 41% 27% 10%
0% 2% 11% 28% 35% 24%
0% 1% 14% 30% 35% 19%
0% 3% 21% 37% 26% 12%
AWARDS / RECOGNITION DATA
Schools in Georgia may receive recognition in the following programs: Charter School Pay for Performance Program Georgia School of Excellence National Blue Ribbon School Brookwood Elementary School did not receive recognition in any of these programs during the 1998-99 school year.
1998-99 GEORGIA PUBLIC EDUCATION REPORT CARD Brookwood Elementary School - 6360190
Prepared by Georgia Department of Education
Page 4
CERTIFIED PERSONNEL DATA
Positions Number Average Contract Days
Personnel Sex
Certificate
Years Experience
Full-time Part-time
Male Female
4 Yr Bachelor's 5 Yr Master's 6 Yr Specialist's 7 Yr Doctoral Other*
<1 1-10 11-20 21-30 >30
Average
Administrators
2.00 200.00
2 0
0 2
0 0 2 0 0 0 0 0 2 0 25.00
Support Personnel
4.00 186.00
4 0
0 4
2 1 1 0 0 1 2 0 1 0 7.25
PK-12 Teachers
36.50 190.00
36 1
1 36
16 19
2 0 0 7 9 8 13 0 13.57
*Includes One- and Two-Year Vocational Certificates.
ACCREDITATION DATA
Accredited by Southern Association of Colleges and Schools (SACS):
Elementary/Middle Commission. Accredited with Quality by Georgia
Accrediting Commission (GAC).
1998-99 GEORGIA PUBLIC EDUCATION REPORT CARD Brookwood Elementary School - 6360190
Prepared by Georgia Department of Education
Page 5
1998-99 GEORGIA PUBLIC EDUCATION REPORT CARD
COLUMBIA COUNTY SCHOOLS
Columbia Middle School - 6362050
Grade Range 6-8
The Georgia Public Education Report Card is designed to assist systems and schools in educational improvement. This report card contains a variety of data elements. An explanation of the terms is provided as a companion to the report card data. Please refer to the definitions for the most effective use of the reported data.
STUDENT DATA
Total 913
6-8 Enrollment, by Race/Ethnicity and Sex
Black
White Hispanic
American Multi-
Asian Indian
racial
104 11.4%
778 85.2%
14 1.5%
10 1.1%
1 0.1%
6 0.7%
Male 472
51.7%
Female 441
48.3%
Enrollment in Selected Programs
Program
Gifted (Grades K-12)
Program % of Student Enrollment Population
46
5.0%
Alternative Programs (Grades 6-12)
7
< 1%
Students Eligible to Receive Free/Reduced Lunches
Number
Percent
School System
197 3,662
21.6% 19.7%
Enrollment in Compensatory Programs
Program
Program % of Student Enrollment Population
Special Education (Grades K-12) (PK)
92 10.1%
0
N/A
English to Speakers of Other Languages (ESOL) (Grades K-12)
0
0.0%
Title I (Grades K-12)
This school has no Title I program.
Dropout Rate for Grades 6-8
Number
Rate
School System
21
2.1%
111
2.4%
Total 31
Retained Students, by Race/Ethnicity and Sex
Black
White Hispanic
American MultiAsian Indian racial
2 6.5%
29 93.5%
0 0.0%
0 0.0%
0 0.0%
0 0.0%
Male Female
18
13
58.1% 41.9%
Prepared by Georgia Department of Education
Page 1
STATE-REQUIRED TEST DATA
NORM-REFERENCED TESTS Grade 8
Iowa Tests of Basic Skills (ITBS) Each chart reflects data for three years of testing.
Reading Comprehension 50
62 61 49 0
98-99
58 62 48 97-98
61 62 48 96-97
Mathematics
School 50
System
State
0
74 66 56 98-99
66 65 55 97-98
66 62 54 96-97
School System State
Reading Vocabulary 50
63 61 46 0
98-99
56 61 45 97-98
59 60 44 96-97
Language Arts
School 50
System
State
0
71 68 60 98-99
65 67 58 97-98
69 65 56 96-97
School System State
Social Studies 50
67 63 54 0
98-99
60 65 53 97-98
65 65 53 96-97
Science
School 50
System
State
0
69 69 56 98-99
66 68 55 97-98
67 68 53 96-97
School System State
Sources of Information
Composite Score
50
66 67 57 0
98-99
School 50
System
62 65 56 97-98
67 66 55 96-97
State 0
69 67 56 98-99
63 66 54 97-98
1998-99 GEORGIA PUBLIC EDUCATION REPORT CARD Columbia Middle School - 6362050
Prepared by Georgia Department of Education
67 66 54 96-97
Scores Reported in Percentiles
School System State
Page 2
STATE-REQUIRED TEST DATA
Categories of Scaled Scores
Inadequate (less than 162)
Minimal (162-209)
Good
(210-247)
Very Good (greater than 247)
Average Scaled Score: (Range 100-300)
PERFORMANCE ASSESSMENTS
Grade 8 Writing Assessment
1998-99 Percent Scoring
1997-98 Percent Scoring
1996-97 Percent Scoring
School System State School System State School System State
0% 29% 59% 11%
3% 30% 53% 15%
8% 40% 41% 11%
3% 47% 43%
7%
5% 40% 45% 10%
11% 46% 34%
8%
7% 48% 40%
5%
9% 43% 37% 12%
15% 46% 30%
8%
219
218
208 210
212 202 205
207 198
AWARDS / RECOGNITION DATA
Schools in Georgia may receive recognition in the following programs: Charter School Pay for Performance Program Georgia School of Excellence National Blue Ribbon School Columbia Middle School did not receive recognition in any of these programs during the 1998-99 school year.
1998-99 GEORGIA PUBLIC EDUCATION REPORT CARD Columbia Middle School - 6362050
Prepared by Georgia Department of Education
Page 3
CERTIFIED PERSONNEL DATA
Positions Number Average Contract Days
Personnel Sex
Certificate
Years Experience
Full-time Part-time
Male Female
4 Yr Bachelor's 5 Yr Master's 6 Yr Specialist's 7 Yr Doctoral Other*
<1 1-10 11-20 21-30 >30
Average
Administrators
2.00 210.00
2 0
1 1
0 0 2 0 0 0 0 1 1 0 20.50
Support Personnel
3.00 196.67
3 0
0 3
0 3 0 0 0 0 2 0 1 0 12.33
PK-12 Teachers
53.50 190.00
53 1
9 45
36 17
0 1 0 8 22 13 10 1 10.89
*Includes One- and Two-Year Vocational Certificates.
ACCREDITATION DATA
Accredited by Southern Association of Colleges and Schools (SACS):
Elementary/Middle Commission. Accredited with Quality by Georgia
Accrediting Commission (GAC).
1998-99 GEORGIA PUBLIC EDUCATION REPORT CARD Columbia Middle School - 6362050
Prepared by Georgia Department of Education
Page 4
1998-99 GEORGIA PUBLIC EDUCATION REPORT CARD
COLUMBIA COUNTY SCHOOLS
Euchee Creek Elementary School - 6360397
Grade Range PK-5
The Georgia Public Education Report Card is designed to assist systems and schools in educational improvement. This report card contains a variety of data elements. An explanation of the terms is provided as a companion to the report card data. Please refer to the definitions for the most effective use of the reported data.
STUDENT DATA
Total
K-5
561
PK
20
Enrollment, by Race/Ethnicity and Sex
Black
White Hispanic
American Asian Indian
Multiracial
91 16.2%
454 80.9%
10 1.8%
0 0.0%
0 0.0%
6 1.1%
1 5.0%
18 90.0%
0 0.0%
0 0.0%
0 0.0%
1 5.0%
Male Female
301 53.7%
260 46.3%
8 40.0%
12 60.0%
Enrollment in Selected Programs
Program
Program % of Student Enrollment Population
Gifted (Grades K-12)
0
0.0%
Alternative Programs (Grades 6-12)
N/A
N/A
Students Eligible to Receive Free/Reduced Lunches
Number
Percent
School System
296 3,662
50.9% 19.7%
Dropout Rate *
Number
Rate
School System
N/A N/A
N/A N/A
* Dropout rates are not applicable for grades PK-5.
Enrollment in Compensatory Programs
Program
Program % of Student Enrollment Population
Special Education (Grades K-12)
58 10.3%
(PK)
0
N/A
English to Speakers of Other Languages (ESOL) (Grades K-12)
0
0.0%
Remedial Education (Grades 2-5, 9-12)
84 21.5%
Special Instructional Assistance (SIA) (Grades K-3)
0
0.0%
Title I (Grades K-12)
This school has a schoolwide program.
Total 28
Retained Students, by Race/Ethnicity and Sex
Black
White Hispanic
American MultiAsian Indian racial
11 39.3%
17 60.7%
0 0.0%
0 0.0%
0 0.0%
0 0.0%
Male Female
15
13
53.6% 46.4%
Prepared by Georgia Department of Education
Page 1
STATE-REQUIRED TEST DATA
NORM-REFERENCED TESTS Grade 3
Iowa Tests of Basic Skills (ITBS) Each chart reflects data for three years of testing.
Reading Comprehension 50
57 66 54 0
98-99
55 65 53 97-98
44 63 52 96-97
Mathematics
School 50
System
State
0
68 75 61 98-99
61 74 61 97-98
53 70 59 96-97
School System State
Reading Vocabulary 50
56 65 50 0
98-99
51 63 50 97-98
46 61 49 96-97
Language Arts
School 50
System
State
0
70 75 64 98-99
63 74 62 97-98
41 69 59 96-97
School System State
Social Studies 50
69 72 56 0
98-99
68 71 55 97-98
56 68 55 96-97
Science
School 50
System
State
0
71 75 59 98-99
68 74 59 97-98
55 72 58 96-97
School System State
Sources of Information
Composite Score
50
67 74 57 0
98-99
School 50
System
55 71 56 97-98
54 68 55 96-97
State 0
67 73 58 98-99
62 72 57 97-98
1998-99 GEORGIA PUBLIC EDUCATION REPORT CARD Euchee Creek Elementary School - 6360397
Prepared by Georgia Department of Education
50 69 56 96-97
Scores Reported in Percentiles
School System State
Page 2
STATE-REQUIRED TEST DATA
NORM-REFERENCED TESTS Grade 5
Iowa Tests of Basic Skills (ITBS) Each chart reflects data for three years of testing.
Reading Comprehension
Mathematics
50
58 62 53 0
98-99
61 61 53 97-98
45 60 52 96-97
School 50
System
State
0
59 69 59 98-99
62 67 58 97-98
45 66 57 96-97
School System State
Reading Vocabulary 50
49 56 48 0
98-99
53 60 48 97-98
46 58 46 96-97
Language Arts
School 50
System
State
0
68 71 63 98-99
63 67 61 97-98
41 65 58 96-97
School System State
Social Studies 50
64 68 57 0
98-99
62 66 56 97-98
55 66 55 96-97
Science
School 50
System
State
0
59 71 60 98-99
68 72 59 97-98
57 72 59 96-97
School System State
Sources of Information
Composite Score
50
60 68 58 0
98-99
School 50
System
63 67 58 97-98
52 67 57 96-97
State 0
60 69 57 98-99
62 67 56 97-98
48 66 55 96-97
1998-99 GEORGIA PUBLIC EDUCATION REPORT CARD Euchee Creek Elementary School - 6360397
Prepared by Georgia Department of Education
Scores Reported in Percentiles
School System State
Page 3
STATE-REQUIRED TEST DATA
PERFORMANCE ASSESSMENTS
Grade 5 Writing Assessment
Percent at Developmental Stages:
1998-99 School System State
1997-98 School System State
1996-97 School System State
Stage Stage Stage Stage Stage Stage
1:The Emerging Writer 2:The Developing Writer 3:The Focusing Writer 4:The Experimenting 5:The Engaging Writer 6:The Extending Writer
0% 0% 9% 50% 34% 7%
0% 0% 8% 39% 34% 18%
0% 1% 16% 41% 29% 12%
0% 0% 22% 58% 21% 0%
0% 1% 11% 39% 34% 15%
0% 3% 19% 41% 27% 10%
0% 6% 23% 29% 31% 11%
0% 1% 14% 30% 35% 19%
0% 3% 21% 37% 26% 12%
AWARDS / RECOGNITION DATA
Schools in Georgia may receive recognition in the following programs: Charter School Pay for Performance Program Georgia School of Excellence National Blue Ribbon School Euchee Creek Elementary School did not receive recognition in any of these programs during the 1998-99 school year.
1998-99 GEORGIA PUBLIC EDUCATION REPORT CARD Euchee Creek Elementary School - 6360397
Prepared by Georgia Department of Education
Page 4
CERTIFIED PERSONNEL DATA
Positions Number Average Contract Days
Personnel Sex
Certificate
Years Experience
Full-time Part-time
Male Female
4 Yr Bachelor's 5 Yr Master's 6 Yr Specialist's 7 Yr Doctoral Other*
<1 1-10 11-20 21-30 >30
Average
Administrators
2.00 215.00
2 0
1 1
0 0 2 0 0 0 0 0 2 0 24.00
Support Personnel
2.00 190.00
2 0
0 2
0 2 0 0 0 0 0 1 1 0 19.50
PK-12 Teachers
36.00 190.00
36 0
5 31
20 12
3 1 0 8 18 5 4 1 8.44
*Includes One- and Two-Year Vocational Certificates.
ACCREDITATION DATA
Accredited by Southern Association of Colleges and Schools (SACS):
Elementary/Middle Commission. Accredited with Quality by Georgia
Accrediting Commission (GAC).
1998-99 GEORGIA PUBLIC EDUCATION REPORT CARD Euchee Creek Elementary School - 6360397
Prepared by Georgia Department of Education
Page 5
1998-99 GEORGIA PUBLIC EDUCATION REPORT CARD
COLUMBIA COUNTY SCHOOLS
Evans Elementary School - 6360186
Grade Range PK-5
The Georgia Public Education Report Card is designed to assist systems and schools in educational improvement. This report card contains a variety of data elements. An explanation of the terms is provided as a companion to the report card data. Please refer to the definitions for the most effective use of the reported data.
STUDENT DATA
Total
K-5
548
PK
21
Enrollment, by Race/Ethnicity and Sex
Black
White Hispanic
American Asian Indian
Multiracial
46 8.4%
471 85.9%
6 1.1%
16 2.9%
0 0.0%
9 1.6%
1 4.8%
18 85.7%
0 0.0%
2 9.5%
0 0.0%
0 0.0%
Male Female
305 55.7%
243 44.3%
8 38.1%
13 61.9%
Enrollment in Selected Programs
Program
Program % of Student Enrollment Population
Gifted (Grades K-12)
25
4.6%
Alternative Programs (Grades 6-12)
N/A
N/A
Students Eligible to Receive Free/Reduced Lunches
Number
Percent
School System
49 3,662
8.6% 19.7%
Dropout Rate *
Number
Rate
School System
N/A N/A
N/A N/A
* Dropout rates are not applicable for grades PK-5.
Enrollment in Compensatory Programs
Program
Program % of Student Enrollment Population
Special Education (Grades K-12)
51
9.3%
(PK)
1
N/A
English to Speakers of Other Languages (ESOL) (Grades K-12)
0
0.0%
Remedial Education (Grades 2-5, 9-12)
13
3.5%
Special Instructional Assistance (SIA) (Grades K-3)
11
3.2%
Title I (Grades K-12)
This school has no Title I program.
Total 11
Retained Students, by Race/Ethnicity and Sex
Black
White Hispanic
American MultiAsian Indian racial
0 0.0%
9 81.8%
1 9.1%
1 9.1%
0 0.0%
0 0.0%
Male Female
9
2
81.8% 18.2%
Prepared by Georgia Department of Education
Page 1
STATE-REQUIRED TEST DATA
NORM-REFERENCED TESTS Grade 3
Iowa Tests of Basic Skills (ITBS) Each chart reflects data for three years of testing.
Reading Comprehension 50
68 66 54 0
98-99
68 65 53 97-98
66 63 52 96-97
Mathematics
School 50
System
State
0
76 75 61 98-99
76 74 61 97-98
71 70 59 96-97
School System State
Reading Vocabulary 50
71 65 50 0
98-99
65 63 50 97-98
67 61 49 96-97
Language Arts
School 50
System
State
0
68 75 64 98-99
72 74 62 97-98
62 69 59 96-97
School System State
Social Studies 50
80 72 56 0
98-99
76 71 55 97-98
74 68 55 96-97
Science
School 50
System
State
0
79 75 59 98-99
74 74 59 97-98
74 72 58 96-97
School System State
Sources of Information
Composite Score
50
75 74 57 0
98-99
School 50
System
71 71 56 97-98
70 68 55 96-97
State 0
76 73 58 98-99
73 72 57 97-98
1998-99 GEORGIA PUBLIC EDUCATION REPORT CARD Evans Elementary School - 6360186
Prepared by Georgia Department of Education
70 69 56 96-97
Scores Reported in Percentiles
School System State
Page 2
STATE-REQUIRED TEST DATA
NORM-REFERENCED TESTS Grade 5
Iowa Tests of Basic Skills (ITBS) Each chart reflects data for three years of testing.
Reading Comprehension
Mathematics
50
64 62 53 0
98-99
59 61 53 97-98
63 60 52 96-97
School 50
System
State
0
75 69 59 98-99
65 67 58 97-98
70 66 57 96-97
School System State
Reading Vocabulary 50
59 56 48 0
98-99
62 60 48 97-98
62 58 46 96-97
Language Arts
School 50
System
State
0
69 71 63 98-99
64 67 61 97-98
67 65 58 96-97
School System State
Social Studies 50
71 68 57 0
98-99
65 66 56 97-98
73 66 55 96-97
Science
School 50
System
State
0
79 71 60 98-99
73 72 59 97-98
76 72 59 96-97
School System State
Sources of Information
Composite Score
50
72 68 58 0
98-99
School 50
System
65 67 58 97-98
73 67 57 96-97
State 0
74 69 57 98-99
66 67 56 97-98
72 66 55 96-97
1998-99 GEORGIA PUBLIC EDUCATION REPORT CARD Evans Elementary School - 6360186
Prepared by Georgia Department of Education
Scores Reported in Percentiles
School System State
Page 3
STATE-REQUIRED TEST DATA
PERFORMANCE ASSESSMENTS
Grade 5 Writing Assessment
Percent at Developmental Stages:
1998-99 School System State
1997-98 School System State
1996-97 School System State
Stage Stage Stage Stage Stage Stage
1:The Emerging Writer 2:The Developing Writer 3:The Focusing Writer 4:The Experimenting 5:The Engaging Writer 6:The Extending Writer
0% 0% 3% 35% 42% 20%
0% 0% 8% 39% 34% 18%
0% 1% 16% 41% 29% 12%
0% 0% 12% 32% 36% 20%
0% 1% 11% 39% 34% 15%
0% 3% 19% 41% 27% 10%
0% 0% 8% 33% 37% 22%
0% 1% 14% 30% 35% 19%
0% 3% 21% 37% 26% 12%
AWARDS / RECOGNITION DATA
Schools in Georgia may receive recognition in the following programs: Charter School Pay for Performance Program Georgia School of Excellence National Blue Ribbon School Evans Elementary School did not receive recognition in any of these programs during the 1998-99 school year.
1998-99 GEORGIA PUBLIC EDUCATION REPORT CARD Evans Elementary School - 6360186
Prepared by Georgia Department of Education
Page 4
CERTIFIED PERSONNEL DATA
Positions Number Average Contract Days
Personnel Sex
Certificate
Years Experience
Full-time Part-time
Male Female
4 Yr Bachelor's 5 Yr Master's 6 Yr Specialist's 7 Yr Doctoral Other*
<1 1-10 11-20 21-30 >30
Average
Administrators
2.00 200.00
2 0
0 2
0 0 2 0 0 0 0 0 2 0 22.50
Support Personnel
2.00 190.00
2 0
0 2
0 2 0 0 0 0 1 1 0 0 12.00
PK-12 Teachers
30.50 190.00
30 1
1 30
19 11
1 0 0 7 5 12 7 0 12.71
*Includes One- and Two-Year Vocational Certificates.
ACCREDITATION DATA
Accredited by Southern Association of Colleges and Schools (SACS):
Elementary/Middle Commission. Accredited with Quality by Georgia
Accrediting Commission (GAC).
1998-99 GEORGIA PUBLIC EDUCATION REPORT CARD Evans Elementary School - 6360186
Prepared by Georgia Department of Education
Page 5
1998-99 GEORGIA PUBLIC EDUCATION REPORT CARD
COLUMBIA COUNTY SCHOOLS
Evans High School - 6364050
Grade Range 9-12
The Georgia Public Education Report Card is designed to assist systems and schools in educational improvement. This report card contains a variety of data elements. An explanation of the terms is provided as a companion to the report card data. Please refer to the definitions for the most effective use of the reported data.
Total 1,807
STUDENT DATA
9-12 Enrollment, by Race/Ethnicity and Sex
Black
White Hispanic
American Multi-
Asian Indian
racial
212 11.7%
1,445 80.0%
45 2.5%
63 3.5%
3 0.2%
39 2.2%
Male Female
937 51.9%
870 48.1%
Enrollment in Selected Programs
Program
Gifted (Grades K-12)
Program % of Student Enrollment Population
77
4.3%
Non-Vocational Labs (Grades 9-12)
Vocational Labs (Grades 9-12)
Alternative Programs (Grades 6-12)
1,694 1,077
9
93.7% 59.6%
< 1%
Students Eligible to Receive Free/Reduced Lunches
Number
Percent
School System
130 3,662
7.2% 19.7%
Enrollment in Compensatory Programs
Program
Program % of Student Enrollment Population
Special Education (Grades K-12) PK
82
4.5%
0
N/A
English to Speakers of Other Languages (ESOL) (Grades K-12)
0
0.0%
Remedial Education (Grades 2-5, 9-12)
37
2.0%
Title I (Grades K-12)
This school has no Title I program.
Dropout Rate for Grades 9-12
Number
Rate
School System
72
3.8%
217
3.7%
Total 121
Retained Students, by Race/Ethnicity and Sex
Black
White Hispanic
American MultiAsian Indian racial
14 11.6%
99 81.8%
4 3.3%
1 0.8%
0 0.0%
3 2.5%
Male Female
72
49
59.5% 40.5%
Prepared by Georgia Department of Education
Page 1
STATE-REQUIRED TEST DATA
GEORGIA HIGH SCHOOL GRADUATION TESTS (GHSGT)
Percent of Regular Program 11th Graders Passing the Georgia High School Graduation Tests on First Administration
English Language Arts Mathematics Social Studies Science
All Components listed above
Writing
1998-99
School System State
100% 96% 92% 90%
99% 95% 91% 88%
96% 88% 80% 72%
87% 85% 68%
97% 98% 93%
1997-98
School System State
99% 96% 94% 94%
98% 97% 91% 91%
94% 88% 78% 74%
89% 86% 68%
98% 98% 92%
1996-97
School System State
99% 96% 94% 91%
99% 96% 94% 92%
94% 87% 78% 74%
88% 88% 67%
96% 97% 93%
GRADUATE DATA
1999 Graduates by Credentials, Race/Ethnicity and Sex
Diplomas with Both College Prep. & Voc. Endorsements
Diplomas with College Prep. Endorsements Diplomas with Vocational Endorsements General High School Diplomas Special Education Diplomas
Total All Diplomas
Certificates of Performance
Total Graduates
Total 29
231 80 6 8
354 5
359
Black
4 13.8%
19 8.2%
10 12.5%
4 66.7%
3 37.5%
40 11.3%
1 20.0%
41 11.4%
White Hispanic
23 79.3%
189 81.8%
0 0.0%
7 3.0%
68 85.0%
2 33.3%
4 50.0%
1 1.3%
0 0.0%
1 12.5%
286 80.8%
9 2.5%
3
1
60.0% 20.0%
289 80.5%
10 2.8%
American MultiAsian Indian racial
2 6.9%
9 3.9%
0 0.0%
0 0.0%
0 0.0%
7 3.0%
0 0.0%
0 0.0%
0 0.0%
0 0.0%
0 0.0%
0 0.0%
1 1.3%
0 0.0%
0 0.0%
11 3.1%
0 0.0%
8 2.3%
0 0.0%
0 0.0%
0 0.0%
11 3.1%
0 0.0%
8 2.2%
Male Female
12 41.4%
95 41.1%
17 58.6%
136 58.9%
55 68.8%
4 66.7%
4 50.0%
25 31.3%
2 33.3%
4 50.0%
170
184
48.0% 52.0%
1
4
20.0% 80.0%
171
188
47.6% 52.4%
HOPE Scholarships
School System
Number of 1999 Graduates 3 5 9
Number Eligible
242
Percent Eligible
67.4%
1,100 731
66.5%
State
65,548 40,292 61.5%
High School Completion Rate
Percent of 1995Grade 9 Enrollment in Graduating Class of1999 School System State
Completion Rate '95-'99 81.2% 82.2% 68.9%
1998-99 GEORGIA PUBLIC EDUCATION REPORT CARD
Evans High School - 6364050
Prepared by Georgia Department of Education
Page 2
COLLEGE ADMISSIONS / CREDIT TEST DATA
Scholastic Assessment Test (SAT)
Based on students' highest verbal and highest math scores
No. Taking
Average Score
Tests Verbal Math Total
Based on students' last test administration
Average Score Verbal Math Total
School
293
College Prep. Endorsement
Other Diplomas
System
885
College Prep. Endorsement
Other Diplomas
Georgia
41,958
522 516 1038
537 534 1071
412 402
814
521 524 1045 536 542 1078
407 397
804
492 488
980
514 N/A N/A
513 N/A N/A
483
506 N/A N/A
514 N/A N/A
479
1020 N/A N/A
1027 N/A N/A
962
Nation
952,913 N/A N/A N/A
502 508 1010
American College Testing (ACT)
Advanced Placement Exams (AP)
Number taking tests: English Mathematics Reading Science Reasoning CompositeScore
5 5 School System State
21.5 20.4 19.1
21.2 21.2 19.9
23.0 21.6
22.0 21.2
20.2 19.9
22.0 21.3 19.9
No. of Students Taking Tests
No. of Tests Taken No. of Test Scores
3 or Higher Percent of Test
Scores 3 or Higher
School 109 172 86
50.0%
System State 407 15,225 710 23,969 456 13,024
64.2% 54.3%
POST-SECONDARY DATA
Graduates Entering Georgia Public Colleges
Graduates Entering Georgia Public Colleges and Requiring Learning Support (LS)
1998 Graduates Entering in 1998-99
1997 Graduates Entering in 1997-98
Percent of Graduating Number Class
School
197
52.8%
System 509
45.0%
School
195
53.1%
System 519
54.1%
Number Requiring
LS 20 42
7 37
Percent of those attending Georgia
Public Colleges
10.2%
8.3%
3.6%
7.1%
In previous years, the Report Card presented College Prep Curriculum information provided by the Board of Regents on students requiring Learning Support. Due to inconsistencies in the data provided by the Board of Regents in defining College Prep Completers versus Local Board of Education data defining College Prep Endorsements, the Department of Education Report Card will not provide this information until discrepancies can be reconciled.
Graduates Entering Georgia Public Technical and Adult Schools
1998 Graduates School System
Entering Number 20 64
1998-99 Percent
5.4% 5.7%
Entering Number N/A N/A
1997-98 Percent
N/A N/A
1997 Graduates School
2
0.5%
System
3
0.3%
21
5.7%
43
4.5%
1998-99 GEORGIA PUBLIC EDUCATION REPORT CARD Evans High School - 6364050
Prepared by Georgia Department of Education
Page 3
CERTIFIED PERSONNEL DATA
Positions Number Average Contract Days
Administrators
5.00 206.00
Support Personnel
6.00 200.00
PK-12 Teachers
93.50 190.96
Personnel Sex
Certificate
Years Experience
Full-time Part-time
Male Female
4 Yr Bachelor's 5 Yr Master's 6 Yr Specialist's 7 Yr Doctoral Other*
<1 1-10 11-20 21-30 >30
Average
5 0
3 2
0 1 3 1 0
0 0 2 3 0
19.20
6 0
2 4
0 5 1 0 0
1 2 1 2 0
14.33
90 7
25 72
53 33
7 1 3
9 28 29 27
4
15.10
*Includes One- and Two-Year Vocational Certificates.
ACCREDITATION DATA
Accredited by Southern Association of Colleges and Schools (SACS): Secondary/Middle Commission. Accredited with Quality by Georgia Accrediting Commission (GAC).
AWARDS / RECOGNITION DATA
Schools in Georgia may receive recognition in the following programs: Charter School Pay for Performance Program Georgia School of Excellence National Blue Ribbon School Evans High School did not receive recognition in any of these programs during the 1998-99 school year.
1998-99 GEORGIA PUBLIC EDUCATION REPORT CARD Evans High School - 6364050
Prepared by Georgia Department of Education
Page 4
1998-99 GEORGIA PUBLIC EDUCATION REPORT CARD
COLUMBIA COUNTY SCHOOLS
Evans Middle School - 6360176
Grade Range 6-8
The Georgia Public Education Report Card is designed to assist systems and schools in educational improvement. This report card contains a variety of data elements. An explanation of the terms is provided as a companion to the report card data. Please refer to the definitions for the most effective use of the reported data.
STUDENT DATA
Total 671
6-8 Enrollment, by Race/Ethnicity and Sex
Black
White Hispanic
American Multi-
Asian Indian
racial
71 10.6%
558 83.2%
16 2.4%
21 3.1%
2 0.3%
3 0.4%
Male 350
52.2%
Female 321
47.8%
Enrollment in Selected Programs
Program
Gifted (Grades K-12)
Program % of Student Enrollment Population
45
6.7%
Alternative Programs (Grades 6-12)
2
< 1%
Students Eligible to Receive Free/Reduced Lunches
Number
Percent
School System
75 3,662
11.2% 19.7%
Enrollment in Compensatory Programs
Program
Program % of Student Enrollment Population
Special Education (Grades K-12) (PK)
40
6.0%
0
N/A
English to Speakers of Other Languages (ESOL) (Grades K-12)
0
0.0%
Title I (Grades K-12)
This school has no Title I program.
Dropout Rate for Grades 6-8
Number
Rate
School System
12
1.7%
111
2.4%
Total 11
Retained Students, by Race/Ethnicity and Sex
Black
White Hispanic
American MultiAsian Indian racial
1 9.1%
10 90.9%
0 0.0%
0 0.0%
0 0.0%
0 0.0%
Male Female
7
4
63.6% 36.4%
Prepared by Georgia Department of Education
Page 1
STATE-REQUIRED TEST DATA
NORM-REFERENCED TESTS Grade 8
Iowa Tests of Basic Skills (ITBS) Each chart reflects data for three years of testing.
Reading Comprehension 50
68 61 49 0
98-99
68 62 48 97-98
68 62 48 96-97
Mathematics
School 50
System
State
0
66 66 56 98-99
67 65 55 97-98
68 62 54 96-97
School System State
Reading Vocabulary 50
67 61 46 0
98-99
63 61 45 97-98
66 60 44 96-97
Language Arts
School 50
System
State
0
74 68 60 98-99
68 67 58 97-98
69 65 56 96-97
School System State
Social Studies 50
70 63 54 0
98-99
72 65 53 97-98
69 65 53 96-97
Science
School 50
System
State
0
70 69 56 98-99
70 68 55 97-98
74 68 53 96-97
School System State
Sources of Information
Composite Score
50
71 67 57 0
98-99
School 50
System
69 65 56 97-98
73 66 55 96-97
State 0
71 67 56 98-99
70 66 54 97-98
1998-99 GEORGIA PUBLIC EDUCATION REPORT CARD Evans Middle School - 6360176
Prepared by Georgia Department of Education
72 66 54 96-97
Scores Reported in Percentiles
School System State
Page 2
STATE-REQUIRED TEST DATA
Categories of Scaled Scores
Inadequate (less than 162)
Minimal (162-209)
Good
(210-247)
Very Good (greater than 247)
Average Scaled Score: (Range 100-300)
PERFORMANCE ASSESSMENTS
Grade 8 Writing Assessment
1998-99 Percent Scoring
1997-98 Percent Scoring
1996-97 Percent Scoring
School System State School System State School System State
2% 29% 57% 12%
3% 30% 53% 15%
8% 40% 41% 11%
2% 36% 53%
9%
5% 40% 45% 10%
11% 46% 34%
8%
8% 35% 40% 18%
9% 43% 37% 12%
15% 46% 30%
8%
218
218
208 215
212 202 213
207 198
AWARDS / RECOGNITION DATA
Schools in Georgia may receive recognition in the following programs: Charter School Pay for Performance Program Georgia School of Excellence National Blue Ribbon School Evans Middle School did not receive recognition in any of these programs during the 1998-99 school year.
1998-99 GEORGIA PUBLIC EDUCATION REPORT CARD Evans Middle School - 6360176
Prepared by Georgia Department of Education
Page 3
CERTIFIED PERSONNEL DATA
Positions Number Average Contract Days
Personnel Sex
Certificate
Years Experience
Full-time Part-time
Male Female
4 Yr Bachelor's 5 Yr Master's 6 Yr Specialist's 7 Yr Doctoral Other*
<1 1-10 11-20 21-30 >30
Average
Administrators
2.00 210.00
2 0
1 1
0 0 2 0 0 0 1 0 1 0 15.50
Support Personnel
3.00 196.67
3 0
1 2
0 2 1 0 0 1 0 0 2 0 18.67
PK-12 Teachers
42.00 190.00
41 2
5 38
27 12
4 0 0 8 8 17 9 1 12.86
*Includes One- and Two-Year Vocational Certificates.
ACCREDITATION DATA
Accredited by Southern Association of Colleges and Schools (SACS):
Elementary/Middle Commission. Accredited with Quality by Georgia
Accrediting Commission (GAC).
1998-99 GEORGIA PUBLIC EDUCATION REPORT CARD Evans Middle School - 6360176
Prepared by Georgia Department of Education
Page 4
1998-99 GEORGIA PUBLIC EDUCATION REPORT CARD
COLUMBIA COUNTY SCHOOLS
Greenbrier Elementary School - 6360297
Grade Range PK-5
The Georgia Public Education Report Card is designed to assist systems and schools in educational improvement. This report card contains a variety of data elements. An explanation of the terms is provided as a companion to the report card data. Please refer to the definitions for the most effective use of the reported data.
STUDENT DATA
Total
K-5
495
PK
20
Enrollment, by Race/Ethnicity and Sex
Black
White Hispanic
American Asian Indian
Multiracial
97 19.6%
389 78.6%
0 0.0%
6 1.2%
0 0.0%
3 0.6%
7 35.0%
12 60.0%
0 0.0%
1 5.0%
0 0.0%
0 0.0%
Male Female
240 48.5%
255 51.5%
10 50.0%
10 50.0%
Enrollment in Selected Programs
Program
Program % of Student Enrollment Population
Gifted (Grades K-12)
25
5.1%
Alternative Programs (Grades 6-12)
N/A
N/A
Students Eligible to Receive Free/Reduced Lunches
Number
Percent
School System
100 3,662
19.4% 19.7%
Dropout Rate *
Number
Rate
School System
N/A N/A
N/A N/A
* Dropout rates are not applicable for grades PK-5.
Enrollment in Compensatory Programs
Program
Program % of Student Enrollment Population
Special Education (Grades K-12)
97 19.6%
(PK)
1
N/A
English to Speakers of Other Languages (ESOL) (Grades K-12)
0
0.0%
Remedial Education (Grades 2-5, 9-12)
10
2.9%
Special Instructional Assistance (SIA) (Grades K-3)
0
0.0%
Title I (Grades K-12)
This school has no Title I program.
Total 7
Retained Students, by Race/Ethnicity and Sex
Black
White Hispanic
American MultiAsian Indian racial
5 71.4%
2 28.6%
0 0.0%
0 0.0%
0 0.0%
0 0.0%
Male Female
4
3
57.1% 42.9%
Prepared by Georgia Department of Education
Page 1
STATE-REQUIRED TEST DATA
NORM-REFERENCED TESTS Grade 3
Iowa Tests of Basic Skills (ITBS) Each chart reflects data for three years of testing.
Reading Comprehension 50
69 66 54 0
98-99
73 65 53 97-98
64 63 52 96-97
Mathematics
School 50
System
State
0
74 75 61 98-99
84 74 61 97-98
72 70 59 96-97
School System State
Reading Vocabulary 50
70 65 50 0
98-99
74 63 50 97-98
62 61 49 96-97
Language Arts
School 50
System
State
0
80 75 64 98-99
86 74 62 97-98
83 69 59 96-97
School System State
Social Studies 50
76 72 56 0
98-99
80 71 55 97-98
69 68 55 96-97
Science
School 50
System
State
0
78 75 59 98-99
81 74 59 97-98
72 72 58 96-97
School System State
Sources of Information
Composite Score
50
76 74 57 0
98-99
School 50
System
83 71 56 97-98
72 68 55 96-97
State 0
77 73 58 98-99
83 72 57 97-98
1998-99 GEORGIA PUBLIC EDUCATION REPORT CARD Greenbrier Elementary School - 6360297
Prepared by Georgia Department of Education
73 69 56 96-97
Scores Reported in Percentiles
School System State
Page 2
STATE-REQUIRED TEST DATA
NORM-REFERENCED TESTS Grade 5
Iowa Tests of Basic Skills (ITBS) Each chart reflects data for three years of testing.
Reading Comprehension
Mathematics
50
61 62 53 0
98-99
64 61 53 97-98
65 60 52 96-97
School 50
System
State
0
74 69 59 98-99
70 67 58 97-98
72 66 57 96-97
School System State
Reading Vocabulary 50
57 56 48 0
98-99
63 60 48 97-98
65 58 46 96-97
Language Arts
School 50
System
State
0
78 71 63 98-99
70 67 61 97-98
75 65 58 96-97
School System State
Social Studies 50
68 68 57 0
98-99
67 66 56 97-98
71 66 55 96-97
Science
School 50
System
State
0
68 71 60 98-99
78 72 59 97-98
78 72 59 96-97
School System State
Sources of Information
Composite Score
50
72 68 58 0
98-99
School 50
System
71 67 58 97-98
73 67 57 96-97
State 0
71 69 57 98-99
71 67 56 97-98
74 66 55 96-97
1998-99 GEORGIA PUBLIC EDUCATION REPORT CARD Greenbrier Elementary School - 6360297
Prepared by Georgia Department of Education
Scores Reported in Percentiles
School System State
Page 3
STATE-REQUIRED TEST DATA
PERFORMANCE ASSESSMENTS
Grade 5 Writing Assessment
Percent at Developmental Stages:
1998-99 School System State
1997-98 School System State
1996-97 School System State
Stage Stage Stage Stage Stage Stage
1:The Emerging Writer 2:The Developing Writer 3:The Focusing Writer 4:The Experimenting 5:The Engaging Writer 6:The Extending Writer
0% 0% 12% 32% 46% 10%
0% 0% 8% 39% 34% 18%
0% 1% 16% 41% 29% 12%
2% 0% 10% 39% 33% 16%
0% 1% 11% 39% 34% 15%
0% 3% 19% 41% 27% 10%
0% 0% 7% 22% 39% 32%
0% 1% 14% 30% 35% 19%
0% 3% 21% 37% 26% 12%
AWARDS / RECOGNITION DATA
Schools in Georgia may receive recognition in the following programs: Charter School Pay for Performance Program Georgia School of Excellence National Blue Ribbon School Greenbrier Elementary School did not receive recognition in any of these programs during the 1998-99 school year.
1998-99 GEORGIA PUBLIC EDUCATION REPORT CARD Greenbrier Elementary School - 6360297
Prepared by Georgia Department of Education
Page 4
CERTIFIED PERSONNEL DATA
Positions Number Average Contract Days
Personnel Sex
Certificate
Years Experience
Full-time Part-time
Male Female
4 Yr Bachelor's 5 Yr Master's 6 Yr Specialist's 7 Yr Doctoral Other*
<1 1-10 11-20 21-30 >30
Average
Administrators
2.00 200.00
2 0
1 1
0 0 2 0 0 0 0 2 0 0 13.00
Support Personnel
2.00 190.00
2 0
0 2
0 2 0 0 0 0 1 1 0 0 8.50
PK-12 Teachers
29.00 190.00
29 0
1 28
16 12
1 0 0 11 11 5 2 0 6.93
*Includes One- and Two-Year Vocational Certificates.
ACCREDITATION DATA
Accredited by Southern Association of Colleges and Schools (SACS):
Elementary/Middle Commission. Accredited with Quality by Georgia
Accrediting Commission (GAC).
1998-99 GEORGIA PUBLIC EDUCATION REPORT CARD Greenbrier Elementary School - 6360297
Prepared by Georgia Department of Education
Page 5
1998-99 GEORGIA PUBLIC EDUCATION REPORT CARD
COLUMBIA COUNTY SCHOOLS
Greenbrier High School - 6360197
Grade Range 9-12
The Georgia Public Education Report Card is designed to assist systems and schools in educational improvement. This report card contains a variety of data elements. An explanation of the terms is provided as a companion to the report card data. Please refer to the definitions for the most effective use of the reported data.
Total 1,267
STUDENT DATA
9-12 Enrollment, by Race/Ethnicity and Sex
Black
White Hispanic
American Multi-
Asian Indian
racial
176 13.9%
1,044 82.4%
15 1.2%
26 2.1%
4 0.3%
2 0.2%
Male Female
662 52.2%
605 47.8%
Enrollment in Selected Programs
Program
Gifted (Grades K-12)
Program % of Student Enrollment Population
63
5.0%
Non-Vocational Labs (Grades 9-12)
Vocational Labs (Grades 9-12)
Alternative Programs (Grades 6-12)
1,161 643 4
91.6% 50.7%
< 1%
Students Eligible to Receive Free/Reduced Lunches
Number
Percent
School System
99 3,662
7.8% 19.7%
Enrollment in Compensatory Programs
Program
Program % of Student Enrollment Population
Special Education (Grades K-12) PK
88
6.9%
0
N/A
English to Speakers of Other Languages (ESOL) (Grades K-12)
0
0.0%
Remedial Education (Grades 2-5, 9-12)
18
1.4%
Title I (Grades K-12)
This school has no Title I program.
Dropout Rate for Grades 9-12
Number
Rate
School System
38
2.8%
217
3.7%
Total 86
Retained Students, by Race/Ethnicity and Sex
Black
White Hispanic
American MultiAsian Indian racial
15 17.4%
68 79.1%
3 3.5%
0 0.0%
0 0.0%
0 0.0%
Male Female
56
30
65.1% 34.9%
Prepared by Georgia Department of Education
Page 1
STATE-REQUIRED TEST DATA
GEORGIA HIGH SCHOOL GRADUATION TESTS (GHSGT)
Percent of Regular Program 11th Graders Passing the Georgia High School Graduation Tests on First Administration
English Language Arts Mathematics Social Studies Science
All Components listed above
Writing
1998-99
School System State
100% 95% 90% 84%
99% 95% 91% 88%
96% 88% 80% 72%
81% 85% 68%
98% 98% 93%
1997-98
School System State
98% 97% 88% 88%
98% 97% 91% 91%
94% 88% 78% 74%
83% 86% 68%
97% 98% 92%
1996-97
School System State
98% 96% 93% 93%
99% 96% 94% 92%
94% 87% 78% 74%
89% 88% 67%
97% 97% 93%
GRADUATE DATA
1999 Graduates by Credentials, Race/Ethnicity and Sex
Diplomas with Both College Prep. & Voc. Endorsements
Diplomas with College Prep. Endorsements Diplomas with Vocational Endorsements General High School Diplomas Special Education Diplomas
Total All Diplomas
Certificates of Performance
Total Graduates
Total 22
161 55 12 11
261 11
272
Black
0 0.0%
14 8.7%
8 14.5%
0 0.0%
3 27.3%
25 9.6%
6 54.5%
31 11.4%
White Hispanic
22 100.0%
138 85.7%
0 0.0%
1 0.6%
47 85.5%
12 100.0%
8 72.7%
0 0.0%
0 0.0%
0 0.0%
227 87.0%
1 0.4%
4 36.4%
0 0.0%
231 84.9%
1 0.4%
American MultiAsian Indian racial
0 0.0%
7 4.3%
0 0.0%
0 0.0%
0 0.0%
1 0.6%
0 0.0%
0 0.0%
0 0.0%
0 0.0%
0 0.0%
0 0.0%
0 0.0%
0 0.0%
0 0.0%
7 2.7%
0 0.0%
1 0.4%
1 9.1%
0 0.0%
0 0.0%
8 2.9%
0 0.0%
1 0.4%
Male Female
13 59.1%
82 50.9%
9 40.9%
79 49.1%
37 67.3%
6 50.0%
5 45.5%
18 32.7%
6 50.0%
6 54.5%
143
118
54.8% 45.2%
4
7
36.4% 63.6%
147
125
54.0% 46.0%
HOPE Scholarships
School System
Number of 1999 Graduates 2 7 2
Number Eligible
173
Percent Eligible
63.6%
1,100 731
66.5%
State
65,548 40,292 61.5%
High School Completion Rate
Percent of 1995Grade 9 Enrollment in Graduating Class of1999 School System State
Completion Rate '95-'99 N / A 82.2% 68.9%
1998-99 GEORGIA PUBLIC EDUCATION REPORT CARD
Greenbrier High School - 6360197
Prepared by Georgia Department of Education
Page 2
COLLEGE ADMISSIONS / CREDIT TEST DATA
Scholastic Assessment Test (SAT)
Based on students' highest verbal and highest math scores
No. Taking
Average Score
Tests Verbal Math Total
Based on students' last test administration
Average Score Verbal Math Total
School
214
College Prep. Endorsement
Other Diplomas
System
885
College Prep. Endorsement
Other Diplomas
Georgia
41,958
505 511 1016
517 524 1041
373 383
756
521 524 1045 536 542 1078
407 397
804
492 488
980
495 N/A N/A
513 N/A N/A
483
501 N/A N/A
514 N/A N/A
479
996 N/A N/A
1027 N/A N/A
962
Nation
952,913 N/A N/A N/A
502 508 1010
American College Testing (ACT)
Advanced Placement Exams (AP)
Number taking tests: English Mathematics Reading Science Reasoning CompositeScore
1 8 School System State
18.4 20.4 19.1
19.8 21.2 19.9
20.5 20.1
22.0 21.2
20.2 19.9
19.9 21.3 19.9
No. of Students Taking Tests
No. of Tests Taken No. of Test Scores
3 or Higher Percent of Test
Scores 3 or Higher
School 121 192 116
60.4%
System State 407 15,225 710 23,969 456 13,024
64.2% 54.3%
POST-SECONDARY DATA
Graduates Entering Georgia Public Colleges
Graduates Entering Georgia Public Colleges and Requiring Learning Support (LS)
1998 Graduates Entering in 1998-99
1997 Graduates Entering in 1997-98
Percent of Graduating Number Class
School
57
23.2%
System 509
45.0%
School
24
33.3%
System 519
54.1%
Number Requiring
LS 3 42
3 37
Percent of those attending Georgia
Public Colleges
5.3%
8.3%
12.5%
7.1%
In previous years, the Report Card presented College Prep Curriculum information provided by the Board of Regents on students requiring Learning Support. Due to inconsistencies in the data provided by the Board of Regents in defining College Prep Completers versus Local Board of Education data defining College Prep Endorsements, the Department of Education Report Card will not provide this information until discrepancies can be reconciled.
Graduates Entering Georgia Public Technical and Adult Schools
1998 Graduates School System
Entering Number 12 64
1998-99 Percent
4.9% 5.7%
Entering Number N/A N/A
1997-98 Percent
N/A N/A
1997 Graduates School
0
0.0%
System
3
0.3%
6
8.3%
43
4.5%
1998-99 GEORGIA PUBLIC EDUCATION REPORT CARD Greenbrier High School - 6360197
Prepared by Georgia Department of Education
Page 3
CERTIFIED PERSONNEL DATA
Positions Number Average Contract Days
Administrators
5.00 212.00
Support Personnel
5.00 200.00
PK-12 Teachers
67.00 191.34
Personnel Sex
Certificate
Years Experience
Full-time Part-time
Male Female
4 Yr Bachelor's 5 Yr Master's 6 Yr Specialist's 7 Yr Doctoral Other*
<1 1-10 11-20 21-30 >30
Average
5 0
2 3
0 0 4 1 0
0 0 2 3 0
22.40
5 0
0 5
0 3 2 0 0
0 2 2 1 0
12.00
67 0
20 47
41 20
5 1 0
11 30 18
8 0
9.76
*Includes One- and Two-Year Vocational Certificates.
ACCREDITATION DATA
Accredited by Southern Association of Colleges and Schools (SACS): Secondary/Middle Commission.
Accredited by Georgia Accrediting Commission (GAC).
AWARDS / RECOGNITION DATA
Schools in Georgia may receive recognition in the following programs: Charter School Pay for Performance Program Georgia School of Excellence National Blue Ribbon School Greenbrier High School did not receive recognition in any of these programs during the 1998-99 school year.
1998-99 GEORGIA PUBLIC EDUCATION REPORT CARD Greenbrier High School - 6360197
Prepared by Georgia Department of Education
Page 4
1998-99 GEORGIA PUBLIC EDUCATION REPORT CARD
COLUMBIA COUNTY SCHOOLS
Grovetown Elementary School - 6365050
Grade Range PK-5
The Georgia Public Education Report Card is designed to assist systems and schools in educational improvement. This report card contains a variety of data elements. An explanation of the terms is provided as a companion to the report card data. Please refer to the definitions for the most effective use of the reported data.
STUDENT DATA
Total
K-5
528
PK
43
Enrollment, by Race/Ethnicity and Sex
Black
White Hispanic
American Asian Indian
Multiracial
116 22.0%
357 67.6%
38 7.2%
12 2.3%
0 0.0%
5 0.9%
10 23.3%
28 65.1%
4 9.3%
0 0.0%
0 0.0%
1 2.3%
Male Female
254 48.1%
274 51.9%
19 44.2%
24 55.8%
Enrollment in Selected Programs
Program
Program % of Student Enrollment Population
Gifted (Grades K-12)
0
0.0%
Alternative Programs (Grades 6-12)
N/A
N/A
Students Eligible to Receive Free/Reduced Lunches
Number
Percent
School System
267 3,662
46.8% 19.7%
Dropout Rate *
Number
Rate
School System
N/A N/A
N/A N/A
* Dropout rates are not applicable for grades PK-5.
Enrollment in Compensatory Programs
Program
Program % of Student Enrollment Population
Special Education (Grades K-12)
91 17.2%
(PK)
5
N/A
English to Speakers of Other Languages (ESOL) (Grades K-12)
6
1.1%
Remedial Education (Grades 2-5, 9-12)
59 16.6%
Special Instructional Assistance (SIA) (Grades K-3)
13
3.7%
Title I (Grades K-12)
This school has a schoolwide program.
Total 25
Retained Students, by Race/Ethnicity and Sex
Black
White Hispanic
American MultiAsian Indian racial
4 16.0%
18 72.0%
1 4.0%
0 0.0%
0 0.0%
2 8.0%
Male Female
14
11
56.0% 44.0%
Prepared by Georgia Department of Education
Page 1
STATE-REQUIRED TEST DATA
NORM-REFERENCED TESTS Grade 3
Iowa Tests of Basic Skills (ITBS) Each chart reflects data for three years of testing.
Reading Comprehension 50
58 66 54 0
98-99
60 65 53 97-98
44 63 52 96-97
Mathematics
School 50
System
State
0
66 75 61 98-99
70 74 61 97-98
59 70 59 96-97
School System State
Reading Vocabulary 50
53 65 50 0
98-99
52 63 50 97-98
41 61 49 96-97
Language Arts
School 50
System
State
0
63 75 64 98-99
59 74 62 97-98
51 69 59 96-97
School System State
Social Studies 50
55 72 56 0
98-99
58 71 55 97-98
42 68 55 96-97
Science
School 50
System
State
0
64 75 59 98-99
62 74 59 97-98
55 72 58 96-97
School System State
Sources of Information
Composite Score
50
60 74 57 0
98-99
School 50
System
55 71 56 97-98
53 68 55 96-97
State 0
60 73 58 98-99
59 72 57 97-98
1998-99 GEORGIA PUBLIC EDUCATION REPORT CARD Grovetown Elementary School - 6365050
Prepared by Georgia Department of Education
50 69 56 96-97
Scores Reported in Percentiles
School System State
Page 2
STATE-REQUIRED TEST DATA
NORM-REFERENCED TESTS Grade 5
Iowa Tests of Basic Skills (ITBS) Each chart reflects data for three years of testing.
Reading Comprehension
Mathematics
50
54 62 53 0
98-99
53 61 53 97-98
51 60 52 96-97
School 50
System
State
0
60 69 59 98-99
61 67 58 97-98
57 66 57 96-97
School System State
Reading Vocabulary 50
49 56 48 0
98-99
60 60 48 97-98
43 58 46 96-97
Language Arts
School 50
System
State
0
59 71 63 98-99
57 67 61 97-98
54 65 58 96-97
School System State
Social Studies 50
57 68 57 0
98-99
57 66 56 97-98
52 66 55 96-97
Science
School 50
System
State
0
64 71 60 98-99
61 72 59 97-98
56 72 59 96-97
School System State
Sources of Information
Composite Score
50
61 68 58 0
98-99
School 50
System
56 67 58 97-98
54 67 57 96-97
State 0
58 69 57 98-99
57 67 56 97-98
52 66 55 96-97
1998-99 GEORGIA PUBLIC EDUCATION REPORT CARD Grovetown Elementary School - 6365050
Prepared by Georgia Department of Education
Scores Reported in Percentiles
School System State
Page 3
STATE-REQUIRED TEST DATA
PERFORMANCE ASSESSMENTS
Grade 5 Writing Assessment
Percent at Developmental Stages:
1998-99 School System State
1997-98 School System State
1996-97 School System State
Stage Stage Stage Stage Stage Stage
1:The Emerging Writer 2:The Developing Writer 3:The Focusing Writer 4:The Experimenting 5:The Engaging Writer 6:The Extending Writer
0% 1% 18% 44% 26% 10%
0% 0% 8% 39% 34% 18%
0% 1% 16% 41% 29% 12%
0% 2% 13% 54% 27% 5%
0% 1% 11% 39% 34% 15%
0% 3% 19% 41% 27% 10%
0% 3% 22% 37% 29% 8%
0% 1% 14% 30% 35% 19%
0% 3% 21% 37% 26% 12%
AWARDS / RECOGNITION DATA
Schools in Georgia may receive recognition in the following programs: Charter School Pay for Performance Program Georgia School of Excellence National Blue Ribbon School Grovetown Elementary School did not receive recognition in any of these programs during the 1998-99 school year.
1998-99 GEORGIA PUBLIC EDUCATION REPORT CARD Grovetown Elementary School - 6365050
Prepared by Georgia Department of Education
Page 4
CERTIFIED PERSONNEL DATA
Positions Number Average Contract Days
Personnel Sex
Certificate
Years Experience
Full-time Part-time
Male Female
4 Yr Bachelor's 5 Yr Master's 6 Yr Specialist's 7 Yr Doctoral Other*
<1 1-10 11-20 21-30 >30
Average
Administrators
2.00 200.00
2 0
1 1
0 0 2 0 0 0 0 2 0 0 17.00
Support Personnel
3.00 190.00
3 0
0 3
0 2 1 0 0 0 1 2 0 0 11.00
PK-12 Teachers
38.00 190.00
38 0
3 35
25 12
1 0 0 12 16 7 2 1 7.50
*Includes One- and Two-Year Vocational Certificates.
ACCREDITATION DATA
Accredited by Southern Association of Colleges and Schools (SACS):
Elementary/Middle Commission. Accredited with Quality by Georgia
Accrediting Commission (GAC).
1998-99 GEORGIA PUBLIC EDUCATION REPORT CARD Grovetown Elementary School - 6365050
Prepared by Georgia Department of Education
Page 5
1998-99 GEORGIA PUBLIC EDUCATION REPORT CARD
COLUMBIA COUNTY SCHOOLS
Harlem High School - 6360183
Grade Range 9-12
The Georgia Public Education Report Card is designed to assist systems and schools in educational improvement. This report card contains a variety of data elements. An explanation of the terms is provided as a companion to the report card data. Please refer to the definitions for the most effective use of the reported data.
Total 914
STUDENT DATA
9-12 Enrollment, by Race/Ethnicity and Sex
Black
White Hispanic
American Multi-
Asian Indian
racial
244 26.7%
622 68.1%
38 4.2%
5 0.5%
1 0.1%
4 0.4%
Male Female
449 49.1%
465 50.9%
Enrollment in Selected Programs
Program
Gifted (Grades K-12)
Program % of Student Enrollment Population
43
4.7%
Non-Vocational Labs (Grades 9-12)
817
Vocational Labs
(Grades 9-12)
611
Alternative Programs (Grades 6-12)
13
89.4% 66.8%
1.4%
Students Eligible to Receive Free/Reduced Lunches
Number
Percent
School System
286 3,662
31.3% 19.7%
Enrollment in Compensatory Programs
Program
Program % of Student Enrollment Population
Special Education (Grades K-12) PK
60
6.6%
0
N/A
English to Speakers of Other Languages (ESOL) (Grades K-12)
3
< 1%
Remedial Education (Grades 2-5, 9-12)
84
9.2%
Title I (Grades K-12)
This school has no Title I program.
Dropout Rate for Grades 9-12
Number
Rate
School System
57
5.6%
217
3.7%
Total 97
Retained Students, by Race/Ethnicity and Sex
Black
White Hispanic
American MultiAsian Indian racial
34 35.1%
60 61.9%
2 2.1%
1 1.0%
0 0.0%
0 0.0%
Male Female
56
41
57.7% 42.3%
Prepared by Georgia Department of Education
Page 1
STATE-REQUIRED TEST DATA
GEORGIA HIGH SCHOOL GRADUATION TESTS (GHSGT)
Percent of Regular Program 11th Graders Passing the Georgia High School Graduation Tests on First Administration
English Language Arts Mathematics Social Studies Science
All Components listed above
Writing
1998-99
School System State
96% 91% 84% 78%
99% 95% 91% 88%
96% 88% 80% 72%
74% 85% 68%
98% 98% 93%
1997-98
School System State
96% 94% 79% 82%
98% 97% 91% 91%
94% 88% 78% 74%
70% 86% 68%
97% 98% 92%
1996-97
School System State
96% 88% 88% 79%
99% 96% 94% 92%
94% 87% 78% 74%
74% 88% 67%
92% 97% 93%
GRADUATE DATA
1999 Graduates by Credentials, Race/Ethnicity and Sex
Diplomas with Both College Prep. & Voc. Endorsements
Diplomas with College Prep. Endorsements Diplomas with Vocational Endorsements General High School Diplomas Special Education Diplomas
Total All Diplomas
Certificates of Performance
Total Graduates
Total 23 52 74 3 3
155 14
169
Black
7 30.4%
12 23.1%
29 39.2%
1 33.3%
0 0.0%
49 31.6%
9 64.3%
58 34.3%
American MultiWhite Hispanic Asian Indian racial
15 65.2%
34 65.4%
1 4.3%
4 7.7%
0 0.0%
1 1.9%
0 0.0%
0 0.0%
0 0.0%
1 1.9%
43 58.1%
2 66.7%
3 100.0%
1 1.4%
0 0.0%
0 0.0%
0 0.0%
0 0.0%
0 0.0%
0 0.0%
0 0.0%
0 0.0%
1 1.4%
0 0.0%
0 0.0%
97 62.6%
6 3.9%
1 0.6%
0 0.0%
2 1.3%
4 28.6%
1 7.1%
0 0.0%
0 0.0%
0 0.0%
101 59.8%
7 4.1%
1 0.6%
0 0.0%
2 1.2%
Male Female
6 26.1%
19 36.5%
17 73.9%
33 63.5%
36 48.6%
3 100.0%
1 33.3%
38 51.4%
0 0.0%
2 66.7%
65
90
41.9% 58.1%
7
7
50.0% 50.0%
72
97
42.6% 57.4%
HOPE Scholarships
School System
Number of 1999 Graduates 1 6 9
Number Eligible
82
Percent Eligible
48.5%
1,100 731
66.5%
State
65,548 40,292 61.5%
High School Completion Rate
Percent of 1995Grade 9 Enrollment in Graduating Class of1999 School System State
Completion Rate '95-'99 71.9% 82.2% 68.9%
1998-99 GEORGIA PUBLIC EDUCATION REPORT CARD
Harlem High School - 6360183
Prepared by Georgia Department of Education
Page 2
COLLEGE ADMISSIONS / CREDIT TEST DATA
Scholastic Assessment Test (SAT)
Based on students' highest verbal and highest math scores
No. Taking
Average Score
Tests Verbal Math Total
Based on students' last test administration
Average Score Verbal Math Total
School
89
College Prep. Endorsement
Other Diplomas
System
885
College Prep. Endorsement
Other Diplomas
Georgia
41,958
492 470
962
510 499 1009
430 380
810
521 524 1045 536 542 1078
407 397
804
492 488
980
485 N/A N/A
513 N/A N/A
483
462 N/A N/A
514 N/A N/A
479
947 N/A N/A
1027 N/A N/A
962
Nation
952,913 N/A N/A N/A
502 508 1010
American College Testing (ACT)
Advanced Placement Exams (AP)
Number taking tests: English Mathematics Reading Science Reasoning CompositeScore
5 School System State
14.0 20.4 19.1
17.4 21.2 19.9
17.8 18.4
22.0 21.2
20.2 19.9
17.0 21.3 19.9
No. of Students Taking Tests
No. of Tests Taken No. of Test Scores
3 or Higher Percent of Test
Scores 3 or Higher
School 49 76 32
42.1%
System State 407 15,225 710 23,969 456 13,024
64.2% 54.3%
POST-SECONDARY DATA
Graduates Entering Georgia Public Colleges
Graduates Entering Georgia Public Colleges and Requiring Learning Support (LS)
1998 Graduates Entering in 1998-99
1997 Graduates Entering in 1997-98
Percent of Graduating Number Class
School
53
33.3%
System 509
45.0%
School
56
38.6%
System 519
54.1%
Number Requiring
LS 8 42
8 37
Percent of those attending Georgia
Public Colleges
15.1%
8.3%
14.3%
7.1%
In previous years, the Report Card presented College Prep Curriculum information provided by the Board of Regents on students requiring Learning Support. Due to inconsistencies in the data provided by the Board of Regents in defining College Prep Completers versus Local Board of Education data defining College Prep Endorsements, the Department of Education Report Card will not provide this information until discrepancies can be reconciled.
Graduates Entering Georgia Public Technical and Adult Schools
1998 Graduates School System
Entering Number 19 64
1998-99 Percent 11.9%
5.7%
Entering Number N/A N/A
1997-98 Percent
N/A N/A
1997 Graduates School
1
0.7%
System
3
0.3%
8
5.5%
43
4.5%
1998-99 GEORGIA PUBLIC EDUCATION REPORT CARD Harlem High School - 6360183
Prepared by Georgia Department of Education
Page 3
CERTIFIED PERSONNEL DATA
Positions Number Average Contract Days
Administrators
4.00 207.50
Support Personnel
3.00 210.00
PK-12 Teachers
52.31 191.72
Personnel Sex
Certificate
Years Experience
Full-time Part-time
Male Female
4 Yr Bachelor's 5 Yr Master's 6 Yr Specialist's 7 Yr Doctoral Other*
<1 1-10 11-20 21-30 >30
Average
4 0
2 2
0 1 2 1 0
0 1 0 3 0
23.50
3 0
1 2
0 2 1 0 0
0 1 0 2 0
19.00
51 2
15 38
22 24
6 0 1
3 24 13 12
1
12.64
*Includes One- and Two-Year Vocational Certificates.
ACCREDITATION DATA
Accredited by Southern Association of Colleges and Schools (SACS): Secondary/Middle Commission. Accredited with Quality by Georgia Accrediting Commission (GAC).
AWARDS / RECOGNITION DATA
Schools in Georgia may receive recognition in the following programs: Charter School Pay for Performance Program Georgia School of Excellence National Blue Ribbon School Harlem High School did not receive recognition in any of these programs during the 1998-99 school year.
1998-99 GEORGIA PUBLIC EDUCATION REPORT CARD Harlem High School - 6360183
Prepared by Georgia Department of Education
Page 4
1998-99 GEORGIA PUBLIC EDUCATION REPORT CARD
COLUMBIA COUNTY SCHOOLS
Harlem Middle School - 6360283
Grade Range 6-8
The Georgia Public Education Report Card is designed to assist systems and schools in educational improvement. This report card contains a variety of data elements. An explanation of the terms is provided as a companion to the report card data. Please refer to the definitions for the most effective use of the reported data.
STUDENT DATA
Total 776
6-8 Enrollment, by Race/Ethnicity and Sex
Black
White Hispanic
American Multi-
Asian Indian
racial
160 20.6%
574 74.0%
29 3.7%
8 1.0%
1 0.1%
4 0.5%
Male 401
51.7%
Female 375
48.3%
Enrollment in Selected Programs
Program
Gifted (Grades K-12)
Program % of Student Enrollment Population
24
3.1%
Alternative Programs (Grades 6-12)
7
< 1%
Students Eligible to Receive Free/Reduced Lunches
Number
Percent
School System
344 3,662
44.3% 19.7%
Enrollment in Compensatory Programs
Program
Program % of Student Enrollment Population
Special Education (Grades K-12) (PK)
77
9.9%
0
N/A
English to Speakers of Other Languages (ESOL) (Grades K-12)
1
< 1%
Title I (Grades K-12)
This school has a schoolwide program.
Dropout Rate for Grades 6-8
Number
Rate
School System
19
2.2%
111
2.4%
Total 36
Retained Students, by Race/Ethnicity and Sex
Black
White Hispanic
American MultiAsian Indian racial
7 19.4%
28 77.8%
1 2.8%
0 0.0%
0 0.0%
0 0.0%
Male Female
23
13
63.9% 36.1%
Prepared by Georgia Department of Education
Page 1
STATE-REQUIRED TEST DATA
NORM-REFERENCED TESTS Grade 8
Iowa Tests of Basic Skills (ITBS) Each chart reflects data for three years of testing.
Reading Comprehension 50
50 61 49 0
98-99
49 62 48 97-98
43 62 48 96-97
Mathematics
School 50
System
State
0
57 66 56 98-99
53 65 55 97-98
44 62 54 96-97
School System State
Reading Vocabulary 50
50 61 46 0
98-99
49 61 45 97-98
40 60 44 96-97
Language Arts
School 50
System
State
0
60 68 60 98-99
58 67 58 97-98
46 65 56 96-97
School System State
Social Studies 50
50 63 54 0
98-99
47 65 53 97-98
48 65 53 96-97
Science
School 50
System
State
0
57 69 56 98-99
53 68 55 97-98
48 68 53 96-97
School System State
Sources of Information
Composite Score
50
54 67 57 0
98-99
School 50
System
51 65 56 97-98
48 66 55 96-97
State 0
55 67 56 98-99
52 66 54 97-98
1998-99 GEORGIA PUBLIC EDUCATION REPORT CARD Harlem Middle School - 6360283
Prepared by Georgia Department of Education
45 66 54 96-97
Scores Reported in Percentiles
School System State
Page 2
STATE-REQUIRED TEST DATA
Categories of Scaled Scores
Inadequate (less than 162)
Minimal (162-209)
Good
(210-247)
Very Good (greater than 247)
Average Scaled Score: (Range 100-300)
PERFORMANCE ASSESSMENTS
Grade 8 Writing Assessment
1998-99 Percent Scoring
1997-98 Percent Scoring
1996-97 Percent Scoring
School System State School System State School System State
9% 46% 39%
6%
3% 30% 53% 15%
8% 40% 41% 11%
15% 52% 27%
6%
5% 40% 45% 10%
11% 46% 34%
8%
20% 54% 22%
4%
9% 43% 37% 12%
15% 46% 30%
8%
201
218
208 195
212 202 188
207 198
AWARDS / RECOGNITION DATA
Schools in Georgia may receive recognition in the following programs: Charter School Pay for Performance Program Georgia School of Excellence National Blue Ribbon School Harlem Middle School did not receive recognition in any of these programs during the 1998-99 school year.
1998-99 GEORGIA PUBLIC EDUCATION REPORT CARD Harlem Middle School - 6360283
Prepared by Georgia Department of Education
Page 3
CERTIFIED PERSONNEL DATA
Positions Number Average Contract Days
Personnel Sex
Certificate
Years Experience
Full-time Part-time
Male Female
4 Yr Bachelor's 5 Yr Master's 6 Yr Specialist's 7 Yr Doctoral Other*
<1 1-10 11-20 21-30 >30
Average
Administrators
3.00 206.67
3 0
1 2
0 1 1 1 0 0 0 3 0 0 17.00
Support Personnel
3.00 196.67
3 0
0 3
0 1 1 1 0 0 1 2 0 0 12.67
PK-12 Teachers
50.00 190.00
50 0
12 38
36 11
3 0 0 10 23 11 5 1 9.10
*Includes One- and Two-Year Vocational Certificates.
ACCREDITATION DATA
Accredited by Southern Association of Colleges and Schools (SACS):
Elementary/Middle Commission. Accredited with Quality by Georgia
Accrediting Commission (GAC).
1998-99 GEORGIA PUBLIC EDUCATION REPORT CARD Harlem Middle School - 6360283
Prepared by Georgia Department of Education
Page 4
1998-99 GEORGIA PUBLIC EDUCATION REPORT CARD
COLUMBIA COUNTY SCHOOLS
Lakeside High School - 6360189
Grade Range 9-12
The Georgia Public Education Report Card is designed to assist systems and schools in educational improvement. This report card contains a variety of data elements. An explanation of the terms is provided as a companion to the report card data. Please refer to the definitions for the most effective use of the reported data.
Total 1,490
STUDENT DATA
9-12 Enrollment, by Race/Ethnicity and Sex
Black
White Hispanic
American Multi-
Asian Indian
racial
128 8.6%
1,203 80.7%
13 0.9%
143 9.6%
2 0.1%
1 0.1%
Male Female
735 49.3%
755 50.7%
Enrollment in Selected Programs
Program
Gifted (Grades K-12)
Program % of Student Enrollment Population
147
9.9%
Non-Vocational Labs (Grades 9-12)
Vocational Labs (Grades 9-12)
Alternative Programs (Grades 6-12)
1,389 649 0
93.2% 43.6%
0.0%
Students Eligible to Receive Free/Reduced Lunches
Number
Percent
School System
97 3,662
6.5% 19.7%
Enrollment in Compensatory Programs
Program
Program % of Student Enrollment Population
Special Education (Grades K-12) PK
57
3.8%
0
N/A
English to Speakers of Other Languages (ESOL) (Grades K-12)
13
< 1%
Remedial Education (Grades 2-5, 9-12)
1
< 1%
Title I (Grades K-12)
This school has no Title I program.
Dropout Rate for Grades 9-12
Number
Rate
School System
50
3.2%
217
3.7%
Total 119
Retained Students, by Race/Ethnicity and Sex
Black
White Hispanic
American MultiAsian Indian racial
14 11.8%
101 84.9%
1 0.8%
3 2.5%
0 0.0%
0 0.0%
Male Female
61
58
51.3% 48.7%
Prepared by Georgia Department of Education
Page 1
STATE-REQUIRED TEST DATA
GEORGIA HIGH SCHOOL GRADUATION TESTS (GHSGT)
Percent of Regular Program 11th Graders Passing the Georgia High School Graduation Tests on First Administration
English Language Arts Mathematics Social Studies Science
All Components listed above
Writing
1998-99
School System State
99% 97% 95% 94%
99% 95% 91% 88%
96% 88% 80% 72%
93% 85% 68%
99% 98% 93%
1997-98
School System State
99% 100% 95% 94%
98% 97% 91% 91%
94% 88% 78% 74%
92% 86% 68%
100% 98% 92%
1996-97
School System State
100% 99% 96% 96%
99% 96% 94% 92%
94% 87% 78% 74%
94% 88% 67%
99% 97% 93%
GRADUATE DATA
1999 Graduates by Credentials, Race/Ethnicity and Sex
Diplomas with Both College Prep. & Voc. Endorsements
Diplomas with College Prep. Endorsements Diplomas with Vocational Endorsements General High School Diplomas Special Education Diplomas
Total All Diplomas
Certificates of Performance
Total Graduates
Total 15
232 46 7 0
Black
1 6.7%
22 9.5%
3 6.5%
0 0.0%
0
White Hispanic
14 93.3%
0 0.0%
175 75.4%
2 0.9%
42 91.3%
0 0.0%
7 100.0%
0 0.0%
0
0
American MultiAsian Indian racial
0 0.0%
0 0.0%
0 0.0%
31 13.4%
2 0.9%
0 0.0%
1 2.2%
0 0.0%
0 0.0%
0 0.0%
0 0.0%
0 0.0%
0
0
0
300
26
238
2
32
2
0
8.7% 79.3% 0.7% 10.7% 0.7% 0.0%
0
0
0
0
0
0
0
300
26
238
2
32
2
0
8.7% 79.3% 0.7% 10.7% 0.7% 0.0%
Male Female
10
5
66.7% 33.3%
106
126
45.7% 54.3%
29
17
63.0% 37.0%
5
2
71.4% 28.6%
0
0
150 50.0%
0
150 50.0%
0
150
150
50.0% 50.0%
HOPE Scholarships
School System
Number of 1999 Graduates 3 0 0
Number Eligible
234
Percent Eligible
78.0%
1,100 731
66.5%
State
65,548 40,292 61.5%
High School Completion Rate
Percent of 1995Grade 9 Enrollment in Graduating Class of1999 School System State
Completion Rate '95-'99 86.7% 82.2% 68.9%
1998-99 GEORGIA PUBLIC EDUCATION REPORT CARD
Lakeside High School - 6360189
Prepared by Georgia Department of Education
Page 2
COLLEGE ADMISSIONS / CREDIT TEST DATA
Scholastic Assessment Test (SAT)
Based on students' highest verbal and highest math scores
No. Taking
Average Score
Tests Verbal Math Total
Based on students' last test administration
Average Score Verbal Math Total
School
289
College Prep. Endorsement
Other Diplomas
System
885
College Prep. Endorsement
Other Diplomas
Georgia
41,958
542 558 1100
557 575 1132
408 419
827
521 524 1045 536 542 1078
407 397
804
492 488
980
534 N/A N/A
513 N/A N/A
483
548 N/A N/A
514 N/A N/A
479
1082 N/A N/A
1027 N/A N/A
962
Nation
952,913 N/A N/A N/A
502 508 1010
American College Testing (ACT)
Advanced Placement Exams (AP)
Number taking tests: English Mathematics Reading Science Reasoning CompositeScore
2 4 School System State
20.8 20.4 19.1
23.3 21.2 19.9
21.8 21.5
22.0 21.2
20.2 19.9
21.9 21.3 19.9
No. of Students Taking Tests
No. of Tests Taken No. of Test Scores
3 or Higher Percent of Test
Scores 3 or Higher
School 128 270 222
82.2%
System State 407 15,225 710 23,969 456 13,024
64.2% 54.3%
POST-SECONDARY DATA
Graduates Entering Georgia Public Colleges
Graduates Entering Georgia Public Colleges and Requiring Learning Support (LS)
1998 Graduates Entering in 1998-99
1997 Graduates Entering in 1997-98
Percent of Graduating Number Class
School
202
57.4%
System 509
45.0%
School
244
65.1%
System 519
54.1%
Number Requiring
LS 11 42
19 37
Percent of those attending Georgia
Public Colleges
5.4%
8.3%
7.8%
7.1%
In previous years, the Report Card presented College Prep Curriculum information provided by the Board of Regents on students requiring Learning Support. Due to inconsistencies in the data provided by the Board of Regents in defining College Prep Completers versus Local Board of Education data defining College Prep Endorsements, the Department of Education Report Card will not provide this information until discrepancies can be reconciled.
Graduates Entering Georgia Public Technical and Adult Schools
1998 Graduates School System
Entering Number 13 64
1998-99 Percent
3.7% 5.7%
Entering Number N/A N/A
1997-98 Percent
N/A N/A
1997 Graduates School
0
0.0%
System
3
0.3%
8
2.1%
43
4.5%
1998-99 GEORGIA PUBLIC EDUCATION REPORT CARD Lakeside High School - 6360189
Prepared by Georgia Department of Education
Page 3
CERTIFIED PERSONNEL DATA
Positions Number Average Contract Days
Administrators
4.50 213.33
Support Personnel
5.50 196.36
PK-12 Teachers
75.50 191.19
Personnel Sex
Certificate
Years Experience
Full-time Part-time
Male Female
4 Yr Bachelor's 5 Yr Master's 6 Yr Specialist's 7 Yr Doctoral Other*
<1 1-10 11-20 21-30 >30
Average
4 1
3 2
0 0 5 0 0
0 0 2 3 0
21.40
5 1
1 5
0 5 1 0 0
1 2 2 1 0
11.17
73 5
21 57
37 27 13
1 0
6 19 31 22
0
14.13
*Includes One- and Two-Year Vocational Certificates.
ACCREDITATION DATA
Accredited by Southern Association of Colleges and Schools (SACS): Secondary/Middle Commission. Accredited with Quality by Georgia Accrediting Commission (GAC).
AWARDS / RECOGNITION DATA
The Georgia School of Excellence Program recognizes exemplary schools that have excellent, successful programs in many areas of school life. Each year, in a statewide competition, one elementary, one middle and one high school from each of Georgia's 11 congressional districts may be selected for this honor.
Lakeside High School was designated a 1998-99 Georgia School of Excellence.
1998-99 GEORGIA PUBLIC EDUCATION REPORT CARD Lakeside High School - 6360189
Prepared by Georgia Department of Education
Page 4
1998-99 GEORGIA PUBLIC EDUCATION REPORT CARD
COLUMBIA COUNTY SCHOOLS
Lakeside Middle School - 6360290
Grade Range 6-8
The Georgia Public Education Report Card is designed to assist systems and schools in educational improvement. This report card contains a variety of data elements. An explanation of the terms is provided as a companion to the report card data. Please refer to the definitions for the most effective use of the reported data.
STUDENT DATA
Total 906
6-8 Enrollment, by Race/Ethnicity and Sex
Black
White Hispanic
American Multi-
Asian Indian
racial
93 10.3%
733 80.9%
17 1.9%
55 6.1%
0 0.0%
8 0.9%
Male 509
56.2%
Female 397
43.8%
Enrollment in Selected Programs
Program
Gifted (Grades K-12)
Program % of Student Enrollment Population
70
7.7%
Alternative Programs (Grades 6-12)
1
< 1%
Students Eligible to Receive Free/Reduced Lunches
Number
Percent
School System
147 3,662
16.2% 19.7%
Enrollment in Compensatory Programs
Program
Program % of Student Enrollment Population
Special Education (Grades K-12) (PK)
98 10.8%
0
N/A
English to Speakers of Other Languages (ESOL) (Grades K-12)
7
< 1%
Title I (Grades K-12)
This school has no Title I program.
Dropout Rate for Grades 6-8
Number
Rate
School System
53
5.3%
111
2.4%
Total 26
Retained Students, by Race/Ethnicity and Sex
Black
White Hispanic
American MultiAsian Indian racial
0 0.0%
25 96.2%
0 0.0%
1 3.8%
0 0.0%
0 0.0%
Male Female
18
8
69.2% 30.8%
Prepared by Georgia Department of Education
Page 1
STATE-REQUIRED TEST DATA
NORM-REFERENCED TESTS Grade 8
Iowa Tests of Basic Skills (ITBS) Each chart reflects data for three years of testing.
Reading Comprehension 50
59 61 49 0
98-99
62 62 48 97-98
62 62 48 96-97
Mathematics
School 50
System
State
0
66 66 56 98-99
61 65 55 97-98
63 62 54 96-97
School System State
Reading Vocabulary 50
60 61 46 0
98-99
61 61 45 97-98
60 60 44 96-97
Language Arts
School 50
System
State
0
66 68 60 98-99
67 67 58 97-98
64 65 56 96-97
School System State
Social Studies 50
64 63 54 0
98-99
70 65 53 97-98
68 65 53 96-97
Science
School 50
System
State
0
71 69 56 98-99
70 68 55 97-98
69 68 53 96-97
School System State
Sources of Information
Composite Score
50
67 67 57 0
98-99
School 50
System
67 65 56 97-98
67 66 55 96-97
State 0
67 67 56 98-99
68 66 54 97-98
1998-99 GEORGIA PUBLIC EDUCATION REPORT CARD Lakeside Middle School - 6360290
Prepared by Georgia Department of Education
66 66 54 96-97
Scores Reported in Percentiles
School System State
Page 2
STATE-REQUIRED TEST DATA
Categories of Scaled Scores
Inadequate (less than 162)
Minimal (162-209)
Good
(210-247)
Very Good (greater than 247)
Average Scaled Score: (Range 100-300)
PERFORMANCE ASSESSMENTS
Grade 8 Writing Assessment
1998-99 Percent Scoring
1997-98 Percent Scoring
1996-97 Percent Scoring
School System State School System State School System State
1% 25% 62% 13%
3% 30% 53% 15%
8% 40% 41% 11%
4% 37% 50% 10%
5% 40% 45% 10%
11% 46% 34%
8%
5% 42% 41% 12%
9% 43% 37% 12%
15% 46% 30%
8%
222
218
208 214
212 202 211
207 198
AWARDS / RECOGNITION DATA
Schools in Georgia may receive recognition in the following programs: Charter School Pay for Performance Program Georgia School of Excellence National Blue Ribbon School Lakeside Middle School did not receive recognition in any of these programs during the 1998-99 school year.
1998-99 GEORGIA PUBLIC EDUCATION REPORT CARD Lakeside Middle School - 6360290
Prepared by Georgia Department of Education
Page 3
CERTIFIED PERSONNEL DATA
Positions Number Average Contract Days
Personnel Sex
Certificate
Years Experience
Full-time Part-time
Male Female
4 Yr Bachelor's 5 Yr Master's 6 Yr Specialist's 7 Yr Doctoral Other*
<1 1-10 11-20 21-30 >30
Average
Administrators
2.00 210.00
2 0
1 1
0 0 2 0 0 0 0 1 1 0 20.00
Support Personnel
3.00 196.67
3 0
0 3
0 2 1 0 0 0 0 1 2 0 21.33
PK-12 Teachers
53.50 190.00
53 1
8 46
28 15 11
0 0 8 24 14 8 0 9.93
*Includes One- and Two-Year Vocational Certificates.
ACCREDITATION DATA
Accredited by Southern Association of Colleges and Schools (SACS):
Elementary/Middle Commission. Accredited with Quality by Georgia
Accrediting Commission (GAC).
1998-99 GEORGIA PUBLIC EDUCATION REPORT CARD Lakeside Middle School - 6360290
Prepared by Georgia Department of Education
Page 4
1998-99 GEORGIA PUBLIC EDUCATION REPORT CARD
COLUMBIA COUNTY SCHOOLS
Martinez Elementary School - 6362052
Grade Range PK-5
The Georgia Public Education Report Card is designed to assist systems and schools in educational improvement. This report card contains a variety of data elements. An explanation of the terms is provided as a companion to the report card data. Please refer to the definitions for the most effective use of the reported data.
STUDENT DATA
Total
K-5
495
PK
29
Enrollment, by Race/Ethnicity and Sex
Black
White Hispanic
American Asian Indian
Multiracial
48 9.7%
423 85.5%
10 2.0%
9 1.8%
2 0.4%
3 0.6%
3 10.3%
23 79.3%
2 6.9%
0 0.0%
1 3.4%
0 0.0%
Male Female
244 49.3%
251 50.7%
18 62.1%
11 37.9%
Enrollment in Selected Programs
Program
Program % of Student Enrollment Population
Gifted (Grades K-12)
11
2.2%
Alternative Programs (Grades 6-12)
N/A
N/A
Students Eligible to Receive Free/Reduced Lunches
Number
Percent
School System
104 3,662
19.8% 19.7%
Dropout Rate *
Number
Rate
School System
N/A N/A
N/A N/A
* Dropout rates are not applicable for grades PK-5.
Enrollment in Compensatory Programs
Program
Program % of Student Enrollment Population
Special Education (Grades K-12)
73 14.7%
(PK)
10
N/A
English to Speakers of Other Languages (ESOL) (Grades K-12)
0
0.0%
Remedial Education (Grades 2-5, 9-12)
22
6.6%
Special Instructional Assistance (SIA) (Grades K-3)
5
1.5%
Title I (Grades K-12)
This school has no Title I program.
Total 9
Retained Students, by Race/Ethnicity and Sex
Black
White Hispanic
American MultiAsian Indian racial
3 33.3%
5 55.6%
0 0.0%
0 0.0%
0
1
0.0% 11.1%
Male Female
6
3
66.7% 33.3%
Prepared by Georgia Department of Education
Page 1
STATE-REQUIRED TEST DATA
NORM-REFERENCED TESTS Grade 3
Iowa Tests of Basic Skills (ITBS) Each chart reflects data for three years of testing.
Reading Comprehension 50
62 66 54 0
98-99
65 65 53 97-98
60 63 52 96-97
Mathematics
School 50
System
State
0
71 75 61 98-99
77 74 61 97-98
67 70 59 96-97
School System State
Reading Vocabulary 50
57 65 50 0
98-99
68 63 50 97-98
60 61 49 96-97
Language Arts
School 50
System
State
0
65 75 64 98-99
75 74 62 97-98
62 69 59 96-97
School System State
Social Studies 50
70 72 56 0
98-99
73 71 55 97-98
64 68 55 96-97
Science
School 50
System
State
0
73 75 59 98-99
78 74 59 97-98
70 72 58 96-97
School System State
Sources of Information
Composite Score
50
70 74 57 0
98-99
School 50
System
75 71 56 97-98
62 68 55 96-97
State 0
68 73 58 98-99
75 72 57 97-98
1998-99 GEORGIA PUBLIC EDUCATION REPORT CARD Martinez Elementary School - 6362052
Prepared by Georgia Department of Education
64 69 56 96-97
Scores Reported in Percentiles
School System State
Page 2
STATE-REQUIRED TEST DATA
NORM-REFERENCED TESTS Grade 5
Iowa Tests of Basic Skills (ITBS) Each chart reflects data for three years of testing.
Reading Comprehension
Mathematics
50
65 62 53 0
98-99
62 61 53 97-98
61 60 52 96-97
School 50
System
State
0
74 69 59 98-99
73 67 58 97-98
69 66 57 96-97
School System State
Reading Vocabulary 50
59 56 48 0
98-99
64 60 48 97-98
60 58 46 96-97
Language Arts
School 50
System
State
0
71 71 63 98-99
70 67 61 97-98
67 65 58 96-97
School System State
Social Studies 50
72 68 57 0
98-99
73 66 56 97-98
68 66 55 96-97
Science
School 50
System
State
0
78 71 60 98-99
82 72 59 97-98
79 72 59 96-97
School System State
Sources of Information
Composite Score
50
73 68 58 0
98-99
School 50
System
72 67 58 97-98
67 67 57 96-97
State 0
73 69 57 98-99
74 67 56 97-98
70 66 55 96-97
1998-99 GEORGIA PUBLIC EDUCATION REPORT CARD Martinez Elementary School - 6362052
Prepared by Georgia Department of Education
Scores Reported in Percentiles
School System State
Page 3
STATE-REQUIRED TEST DATA
PERFORMANCE ASSESSMENTS
Grade 5 Writing Assessment
Percent at Developmental Stages:
1998-99 School System State
1997-98 School System State
1996-97 School System State
Stage Stage Stage Stage Stage Stage
1:The Emerging Writer 2:The Developing Writer 3:The Focusing Writer 4:The Experimenting 5:The Engaging Writer 6:The Extending Writer
0% 0% 8% 48% 35% 9%
0% 0% 8% 39% 34% 18%
0% 1% 16% 41% 29% 12%
0% 1% 7% 39% 35% 17%
0% 1% 11% 39% 34% 15%
0% 3% 19% 41% 27% 10%
0% 3% 18% 28% 29% 22%
0% 1% 14% 30% 35% 19%
0% 3% 21% 37% 26% 12%
AWARDS / RECOGNITION DATA
Schools in Georgia may receive recognition in the following programs: Charter School Pay for Performance Program Georgia School of Excellence National Blue Ribbon School Martinez Elementary School did not receive recognition in any of these programs during the 1998-99 school year.
1998-99 GEORGIA PUBLIC EDUCATION REPORT CARD Martinez Elementary School - 6362052
Prepared by Georgia Department of Education
Page 4
CERTIFIED PERSONNEL DATA
Positions Number Average Contract Days
Personnel Sex
Certificate
Years Experience
Full-time Part-time
Male Female
4 Yr Bachelor's 5 Yr Master's 6 Yr Specialist's 7 Yr Doctoral Other*
<1 1-10 11-20 21-30 >30
Average
Administrators
2.00 200.00
2 0
0 2
0 0 1 1 0 0 0 1 1 0 22.00
Support Personnel
2.00 190.00
2 0
0 2
1 1 0 0 0 0 0 1 0 1 22.00
PK-12 Teachers
30.50 190.00
30 1
1 30
16 14
1 0 0 8 6 10 7 0 11.65
*Includes One- and Two-Year Vocational Certificates.
ACCREDITATION DATA
Accredited by Southern Association of Colleges and Schools (SACS):
Elementary/Middle Commission. Accredited with Quality by Georgia
Accrediting Commission (GAC).
1998-99 GEORGIA PUBLIC EDUCATION REPORT CARD Martinez Elementary School - 6362052
Prepared by Georgia Department of Education
Page 5
1998-99 GEORGIA PUBLIC EDUCATION REPORT CARD
COLUMBIA COUNTY SCHOOLS
North Columbia Elementary School - 6363052
Grade Range PK-5
The Georgia Public Education Report Card is designed to assist systems and schools in educational improvement. This report card contains a variety of data elements. An explanation of the terms is provided as a companion to the report card data. Please refer to the definitions for the most effective use of the reported data.
STUDENT DATA
Total
K-5
483
PK
40
Enrollment, by Race/Ethnicity and Sex
Black
White Hispanic
American Asian Indian
Multiracial
55 11.4%
422 87.4%
3 0.6%
0 0.0%
1 0.2%
2 0.4%
5 12.5%
35 87.5%
0 0.0%
0 0.0%
0 0.0%
0 0.0%
Male Female
276 57.1%
207 42.9%
22 55.0%
18 45.0%
Enrollment in Selected Programs
Program
Program % of Student Enrollment Population
Gifted (Grades K-12)
0
0.0%
Alternative Programs (Grades 6-12)
N/A
N/A
Students Eligible to Receive Free/Reduced Lunches
Number
Percent
School System
188 3,662
35.9% 19.7%
Dropout Rate *
Number
Rate
School System
N/A N/A
N/A N/A
* Dropout rates are not applicable for grades PK-5.
Enrollment in Compensatory Programs
Program
Program % of Student Enrollment Population
Special Education (Grades K-12)
42
8.7%
(PK)
3
N/A
English to Speakers of Other Languages (ESOL) (Grades K-12)
0
0.0%
Remedial Education (Grades 2-5, 9-12)
35 11.1%
Special Instructional Assistance (SIA) (Grades K-3)
12
3.7%
Title I (Grades K-12)
This school has a Targeted Assistance program.
Total 19
Retained Students, by Race/Ethnicity and Sex
Black
White Hispanic
American MultiAsian Indian racial
3 15.8%
15 78.9%
1 5.3%
0 0.0%
0 0.0%
0 0.0%
Male Female
15
4
78.9% 21.1%
Prepared by Georgia Department of Education
Page 1
STATE-REQUIRED TEST DATA
NORM-REFERENCED TESTS Grade 3
Iowa Tests of Basic Skills (ITBS) Each chart reflects data for three years of testing.
Reading Comprehension 50
60 66 54 0
98-99
58 65 53 97-98
54 63 52 96-97
Mathematics
School 50
System
State
0
70 75 61 98-99
68 74 61 97-98
60 70 59 96-97
School System State
Reading Vocabulary 50
62 65 50 0
98-99
57 63 50 97-98
53 61 49 96-97
Language Arts
School 50
System
State
0
67 75 64 98-99
72 74 62 97-98
63 69 59 96-97
School System State
Social Studies 50
66 72 56 0
98-99
66 71 55 97-98
62 68 55 96-97
Science
School 50
System
State
0
66 75 59 98-99
73 74 59 97-98
61 72 58 96-97
School System State
Sources of Information
Composite Score
50
67 74 57 0
98-99
School 50
System
61 71 56 97-98
51 68 55 96-97
State 0
66 73 58 98-99
67 72 57 97-98
1998-99 GEORGIA PUBLIC EDUCATION REPORT CARD North Columbia Elementary School - 6363052
Prepared by Georgia Department of Education
58 69 56 96-97
Scores Reported in Percentiles
School System State
Page 2
STATE-REQUIRED TEST DATA
NORM-REFERENCED TESTS Grade 5
Iowa Tests of Basic Skills (ITBS) Each chart reflects data for three years of testing.
Reading Comprehension
Mathematics
50
54 62 53 0
98-99
52 61 53 97-98
50 60 52 96-97
School 50
System
State
0
63 69 59 98-99
51 67 58 97-98
53 66 57 96-97
School System State
Reading Vocabulary 50
48 56 48 0
98-99
43 60 48 97-98
37 58 46 96-97
Language Arts
School 50
System
State
0
69 71 63 98-99
61 67 61 97-98
50 65 58 96-97
School System State
Social Studies 50
59 68 57 0
98-99
55 66 56 97-98
52 66 55 96-97
Science
School 50
System
State
0
61 71 60 98-99
58 72 59 97-98
57 72 59 96-97
School System State
Sources of Information
Composite Score
50
58 68 58 0
98-99
School 50
System
53 67 58 97-98
54 67 57 96-97
State 0
60 69 57 98-99
53 67 56 97-98
51 66 55 96-97
1998-99 GEORGIA PUBLIC EDUCATION REPORT CARD North Columbia Elementary School - 6363052
Prepared by Georgia Department of Education
Scores Reported in Percentiles
School System State
Page 3
STATE-REQUIRED TEST DATA
PERFORMANCE ASSESSMENTS
Grade 5 Writing Assessment
Percent at Developmental Stages:
1998-99 School System State
1997-98 School System State
1996-97 School System State
Stage Stage Stage Stage Stage Stage
1:The Emerging Writer 2:The Developing Writer 3:The Focusing Writer 4:The Experimenting 5:The Engaging Writer 6:The Extending Writer
0% 1% 8% 50% 35% 6%
0% 0% 8% 39% 34% 18%
0% 1% 16% 41% 29% 12%
0% 1% 16% 44% 32% 6%
0% 1% 11% 39% 34% 15%
0% 3% 19% 41% 27% 10%
0% 4% 24% 41% 24% 6%
0% 1% 14% 30% 35% 19%
0% 3% 21% 37% 26% 12%
AWARDS / RECOGNITION DATA
Schools in Georgia may receive recognition in the following programs: Charter School Pay for Performance Program Georgia School of Excellence National Blue Ribbon School North Columbia Elementary School did not receive recognition in any of these programs during the 1998-99 school year.
1998-99 GEORGIA PUBLIC EDUCATION REPORT CARD North Columbia Elementary School - 6363052
Prepared by Georgia Department of Education
Page 4
CERTIFIED PERSONNEL DATA
Positions Number Average Contract Days
Personnel Sex
Certificate
Years Experience
Full-time Part-time
Male Female
4 Yr Bachelor's 5 Yr Master's 6 Yr Specialist's 7 Yr Doctoral Other*
<1 1-10 11-20 21-30 >30
Average
Administrators
2.00 200.00
2 0
0 2
0 1 1 0 0 0 0 2 0 0 15.00
Support Personnel
2.00 190.00
2 0
1 1
0 1 0 1 0 0 1 1 0 0 13.00
PK-12 Teachers
29.50 190.00
29 1
0 30
17 11
2 0 0 8 7 11 4 0 10.53
*Includes One- and Two-Year Vocational Certificates.
ACCREDITATION DATA
Accredited by Southern Association of Colleges and Schools (SACS):
Elementary/Middle Commission. Accredited with Quality by Georgia
Accrediting Commission (GAC).
1998-99 GEORGIA PUBLIC EDUCATION REPORT CARD North Columbia Elementary School - 6363052
Prepared by Georgia Department of Education
Page 5
1998-99 GEORGIA PUBLIC EDUCATION REPORT CARD
COLUMBIA COUNTY SCHOOLS
North Harlem Elementary School - 6364052
Grade Range PK-5
The Georgia Public Education Report Card is designed to assist systems and schools in educational improvement. This report card contains a variety of data elements. An explanation of the terms is provided as a companion to the report card data. Please refer to the definitions for the most effective use of the reported data.
STUDENT DATA
Total
K-5
583
PK
54
Enrollment, by Race/Ethnicity and Sex
Black
White Hispanic
American Asian Indian
Multiracial
124 21.3%
435 74.6%
13 2.2%
2 0.3%
3 0.5%
6 1.0%
13 24.1%
39 72.2%
1 1.9%
0 0.0%
0 0.0%
1 1.9%
Male Female
286 49.1%
297 50.9%
33 61.1%
21 38.9%
Enrollment in Selected Programs
Program
Program % of Student Enrollment Population
Gifted (Grades K-12)
0
0.0%
Alternative Programs (Grades 6-12)
N/A
N/A
Students Eligible to Receive Free/Reduced Lunches
Number
Percent
School System
365 3,662
57.3% 19.7%
Dropout Rate *
Number
Rate
School System
N/A N/A
N/A N/A
* Dropout rates are not applicable for grades PK-5.
Enrollment in Compensatory Programs
Program
Program % of Student Enrollment Population
Special Education (Grades K-12)
44
7.5%
(PK)
0
N/A
English to Speakers of Other Languages (ESOL) (Grades K-12)
3
< 1%
Remedial Education (Grades 2-5, 9-12)
88 24.2%
Special Instructional Assistance (SIA) (Grades K-3)
0
0.0%
Title I (Grades K-12)
This school has a schoolwide program.
Total 20
Retained Students, by Race/Ethnicity and Sex
Black
White Hispanic
American MultiAsian Indian racial
8 40.0%
10 50.0%
1 5.0%
0 0.0%
0 0.0%
1 5.0%
Male Female
11
9
55.0% 45.0%
Prepared by Georgia Department of Education
Page 1
STATE-REQUIRED TEST DATA
NORM-REFERENCED TESTS Grade 3
Iowa Tests of Basic Skills (ITBS) Each chart reflects data for three years of testing.
Reading Comprehension 50
49 66 54 0
98-99
49 65 53 97-98
54 63 52 96-97
Mathematics
School 50
System
State
0
64 75 61 98-99
55 74 61 97-98
60 70 59 96-97
School System State
Reading Vocabulary 50
44 65 50 0
98-99
46 63 50 97-98
50 61 49 96-97
Language Arts
School 50
System
State
0
55 75 64 98-99
49 74 62 97-98
54 69 59 96-97
School System State
Social Studies 50
55 72 56 0
98-99
56 71 55 97-98
62 68 55 96-97
Science
School 50
System
State
0
46 75 59 98-99
55 74 59 97-98
66 72 58 96-97
School System State
Sources of Information
Composite Score
50
55 74 57 0
98-99
School 50
System
52 71 56 97-98
57 68 55 96-97
State 0
52 73 58 98-99
51 72 57 97-98
1998-99 GEORGIA PUBLIC EDUCATION REPORT CARD North Harlem Elementary School - 6364052
Prepared by Georgia Department of Education
58 69 56 96-97
Scores Reported in Percentiles
School System State
Page 2
STATE-REQUIRED TEST DATA
NORM-REFERENCED TESTS Grade 5
Iowa Tests of Basic Skills (ITBS) Each chart reflects data for three years of testing.
Reading Comprehension
Mathematics
50
57 62 53 0
98-99
49 61 53 97-98
48 60 52 96-97
School 50
System
State
0
52 69 59 98-99
55 67 58 97-98
53 66 57 96-97
School System State
Reading Vocabulary 50
45 56 48 0
98-99
47 60 48 97-98
43 58 46 96-97
Language Arts
School 50
System
State
0
55 71 63 98-99
52 67 61 97-98
43 65 58 96-97
School System State
Social Studies 50
57 68 57 0
98-99
54 66 56 97-98
55 66 55 96-97
Science
School 50
System
State
0
61 71 60 98-99
61 72 59 97-98
64 72 59 96-97
School System State
Sources of Information
Composite Score
50
56 68 58 0
98-99
School 50
System
53 67 58 97-98
55 67 57 96-97
State 0
54 69 57 98-99
53 67 56 97-98
52 66 55 96-97
1998-99 GEORGIA PUBLIC EDUCATION REPORT CARD North Harlem Elementary School - 6364052
Prepared by Georgia Department of Education
Scores Reported in Percentiles
School System State
Page 3
STATE-REQUIRED TEST DATA
PERFORMANCE ASSESSMENTS
Grade 5 Writing Assessment
Percent at Developmental Stages:
1998-99 School System State
1997-98 School System State
1996-97 School System State
Stage Stage Stage Stage Stage Stage
1:The Emerging Writer 2:The Developing Writer 3:The Focusing Writer 4:The Experimenting 5:The Engaging Writer 6:The Extending Writer
0% 1% 29% 40% 25% 1%
0% 0% 8% 39% 34% 18%
0% 1% 16% 41% 29% 12%
0% 4% 22% 45% 28% 1%
0% 1% 11% 39% 34% 15%
0% 3% 19% 41% 27% 10%
0% 3% 17% 42% 32% 6%
0% 1% 14% 30% 35% 19%
0% 3% 21% 37% 26% 12%
AWARDS / RECOGNITION DATA
Schools in Georgia may receive recognition in the following programs: Charter School Pay for Performance Program Georgia School of Excellence National Blue Ribbon School North Harlem Elementary School did not receive recognition in any of these programs during the 1998-99 school year.
1998-99 GEORGIA PUBLIC EDUCATION REPORT CARD North Harlem Elementary School - 6364052
Prepared by Georgia Department of Education
Page 4
CERTIFIED PERSONNEL DATA
Positions Number Average Contract Days
Personnel Sex
Certificate
Years Experience
Full-time Part-time
Male Female
4 Yr Bachelor's 5 Yr Master's 6 Yr Specialist's 7 Yr Doctoral Other*
<1 1-10 11-20 21-30 >30
Average
Administrators
2.00 200.00
2 0
0 2
0 0 0 2 0 0 0 2 0 0 19.50
Support Personnel
2.00 190.00
2 0
0 2
0 2 0 0 0 0 0 0 2 0 25.00
PK-12 Teachers
37.50 190.00
37 1
0 38
23 12
3 0 0 7 12 14 5 0 10.45
*Includes One- and Two-Year Vocational Certificates.
ACCREDITATION DATA
Accredited by Southern Association of Colleges and Schools (SACS):
Elementary/Middle Commission. Accredited with Quality by Georgia
Accrediting Commission (GAC).
1998-99 GEORGIA PUBLIC EDUCATION REPORT CARD North Harlem Elementary School - 6364052
Prepared by Georgia Department of Education
Page 5
1998-99 GEORGIA PUBLIC EDUCATION REPORT CARD
COLUMBIA COUNTY SCHOOLS
Riverside Elementary School - 6360194
Grade Range PK-5
The Georgia Public Education Report Card is designed to assist systems and schools in educational improvement. This report card contains a variety of data elements. An explanation of the terms is provided as a companion to the report card data. Please refer to the definitions for the most effective use of the reported data.
STUDENT DATA
Total
K-5
720
PK
22
Enrollment, by Race/Ethnicity and Sex
Black
White Hispanic
American Asian Indian
Multiracial
64 8.9%
618 85.8%
13 1.8%
23 3.2%
0 0.0%
2 0.3%
2 9.1%
19 86.4%
0 0.0%
1 4.5%
0 0.0%
0 0.0%
Male Female
354 49.2%
366 50.8%
12 54.5%
10 45.5%
Enrollment in Selected Programs
Program
Program % of Student Enrollment Population
Gifted (Grades K-12)
0
0.0%
Alternative Programs (Grades 6-12)
N/A
N/A
Students Eligible to Receive Free/Reduced Lunches
Number
Percent
School System
35 3,662
4.7% 19.7%
Dropout Rate *
Number
Rate
School System
N/A N/A
N/A N/A
* Dropout rates are not applicable for grades PK-5.
Enrollment in Compensatory Programs
Program
Program % of Student Enrollment Population
Special Education (Grades K-12)
64
8.9%
(PK)
3
N/A
English to Speakers of Other Languages (ESOL) (Grades K-12)
0
0.0%
Remedial Education (Grades 2-5, 9-12)
36
7.3%
Special Instructional Assistance (SIA) (Grades K-3)
0
0.0%
Title I (Grades K-12)
This school has no Title I program.
Total 11
Retained Students, by Race/Ethnicity and Sex
Black
White Hispanic
American MultiAsian Indian racial
2 18.2%
9 81.8%
0 0.0%
0 0.0%
0 0.0%
0 0.0%
Male Female
8
3
72.7% 27.3%
Prepared by Georgia Department of Education
Page 1
STATE-REQUIRED TEST DATA
NORM-REFERENCED TESTS Grade 3
Iowa Tests of Basic Skills (ITBS) Each chart reflects data for three years of testing.
Reading Comprehension 50
74 66 54 0
98-99
66 65 53 97-98
69 63 52 96-97
Mathematics
School 50
System
State
0
85 75 61 98-99
71 74 61 97-98
73 70 59 96-97
School System State
Reading Vocabulary 50
76 65 50 0
98-99
64 63 50 97-98
66 61 49 96-97
Language Arts
School 50
System
State
0
86 75 64 98-99
75 74 62 97-98
77 69 59 96-97
School System State
Social Studies 50
80 72 56 0
98-99
77 71 55 97-98
75 68 55 96-97
Science
School 50
System
State
0
82 75 59 98-99
74 74 59 97-98
79 72 58 96-97
School System State
Sources of Information
Composite Score
50
83 74 57 0
98-99
School 50
System
72 71 56 97-98
76 68 55 96-97
State 0
84 73 58 98-99
73 72 57 97-98
1998-99 GEORGIA PUBLIC EDUCATION REPORT CARD Riverside Elementary School - 6360194
Prepared by Georgia Department of Education
76 69 56 96-97
Scores Reported in Percentiles
School System State
Page 2
STATE-REQUIRED TEST DATA
NORM-REFERENCED TESTS Grade 5
Iowa Tests of Basic Skills (ITBS) Each chart reflects data for three years of testing.
Reading Comprehension
Mathematics
50
69 62 53 0
98-99
73 61 53 97-98
63 60 52 96-97
School 50
System
State
0
80 69 59 98-99
77 67 58 97-98
73 66 57 96-97
School System State
Reading Vocabulary 50
61 56 48 0
98-99
69 60 48 97-98
67 58 46 96-97
Language Arts
School 50
System
State
0
79 71 63 98-99
76 67 61 97-98
66 65 58 96-97
School System State
Social Studies 50
77 68 57 0
98-99
75 66 56 97-98
65 66 55 96-97
Science
School 50
System
State
0
78 71 60 98-99
80 72 59 97-98
72 72 59 96-97
School System State
Sources of Information
Composite Score
50
74 68 58 0
98-99
School 50
System
73 67 58 97-98
70 67 57 96-97
State 0
77 69 57 98-99
77 67 56 97-98
69 66 55 96-97
1998-99 GEORGIA PUBLIC EDUCATION REPORT CARD Riverside Elementary School - 6360194
Prepared by Georgia Department of Education
Scores Reported in Percentiles
School System State
Page 3
STATE-REQUIRED TEST DATA
PERFORMANCE ASSESSMENTS
Grade 5 Writing Assessment
Percent at Developmental Stages:
1998-99 School System State
1997-98 School System State
1996-97 School System State
Stage Stage Stage Stage Stage Stage
1:The Emerging Writer 2:The Developing Writer 3:The Focusing Writer 4:The Experimenting 5:The Engaging Writer 6:The Extending Writer
0% 0% 1% 22% 39% 39%
0% 0% 8% 39% 34% 18%
0% 1% 16% 41% 29% 12%
0% 0% 2% 33% 37% 28%
0% 1% 11% 39% 34% 15%
0% 3% 19% 41% 27% 10%
0% 0% 10% 29% 34% 27%
0% 1% 14% 30% 35% 19%
0% 3% 21% 37% 26% 12%
AWARDS / RECOGNITION DATA
Schools in Georgia may receive recognition in the following programs: Charter School Pay for Performance Program Georgia School of Excellence National Blue Ribbon School Riverside Elementary School did not receive recognition in any of these programs during the 1998-99 school year.
1998-99 GEORGIA PUBLIC EDUCATION REPORT CARD Riverside Elementary School - 6360194
Prepared by Georgia Department of Education
Page 4
CERTIFIED PERSONNEL DATA
Positions Number Average Contract Days
Personnel Sex
Certificate
Years Experience
Full-time Part-time
Male Female
4 Yr Bachelor's 5 Yr Master's 6 Yr Specialist's 7 Yr Doctoral Other*
<1 1-10 11-20 21-30 >30
Average
Administrators
2.00 200.00
2 0
0 2
0 0 2 0 0 0 0 0 2 0 25.00
Support Personnel
2.00 190.00
2 0
0 2
0 1 1 0 0 0 0 1 1 0 19.50
PK-12 Teachers
38.00 190.00
38 0
2 36
18 16
4 0 0 10 8 15 5 0 10.89
*Includes One- and Two-Year Vocational Certificates.
ACCREDITATION DATA
Accredited by Southern Association of Colleges and Schools (SACS):
Elementary/Middle Commission. Accredited with Quality by Georgia
Accrediting Commission (GAC).
1998-99 GEORGIA PUBLIC EDUCATION REPORT CARD Riverside Elementary School - 6360194
Prepared by Georgia Department of Education
Page 5
1998-99 GEORGIA PUBLIC EDUCATION REPORT CARD
COLUMBIA COUNTY SCHOOLS
Riverside Middle School - 6360193
Grade Range 6-8
The Georgia Public Education Report Card is designed to assist systems and schools in educational improvement. This report card contains a variety of data elements. An explanation of the terms is provided as a companion to the report card data. Please refer to the definitions for the most effective use of the reported data.
STUDENT DATA
Total 1,047
6-8 Enrollment, by Race/Ethnicity and Sex
Black
White Hispanic
American Multi-
Asian Indian
racial
119 11.4%
853 81.5%
9 0.9%
61 5.8%
1 0.1%
4 0.4%
Male 543
51.9%
Female 504
48.1%
Enrollment in Selected Programs
Program
Gifted (Grades K-12)
Program % of Student Enrollment Population
120
11.5%
Alternative Programs (Grades 6-12)
1
< 1%
Students Eligible to Receive Free/Reduced Lunches
Number
Percent
School System
58 3,662
5.5% 19.7%
Enrollment in Compensatory Programs
Program
Program % of Student Enrollment Population
Special Education (Grades K-12) (PK)
52
5.0%
0
N/A
English to Speakers of Other Languages (ESOL) (Grades K-12)
0
0.0%
Title I (Grades K-12)
This school has no Title I program.
Dropout Rate for Grades 6-8
Number
Rate
School System
6
0.5%
111
2.4%
Total 14
Retained Students, by Race/Ethnicity and Sex
Black
White Hispanic
American MultiAsian Indian racial
1 7.1%
13 92.9%
0 0.0%
0 0.0%
0 0.0%
0 0.0%
Male Female
12
2
85.7% 14.3%
Prepared by Georgia Department of Education
Page 1
STATE-REQUIRED TEST DATA
NORM-REFERENCED TESTS Grade 8
Iowa Tests of Basic Skills (ITBS) Each chart reflects data for three years of testing.
Reading Comprehension 50
67 61 49 0
98-99
73 62 48 97-98
71 62 48 96-97
Mathematics
School 50
System
State
0
69 66 56 98-99
73 65 55 97-98
69 62 54 96-97
School System State
Reading Vocabulary 50
64 61 46 0
98-99
72 61 45 97-98
71 60 44 96-97
Language Arts
School 50
System
State
0
67 68 60 98-99
73 67 58 97-98
72 65 56 96-97
School System State
Social Studies 50
67 63 54 0
98-99
73 65 53 97-98
73 65 53 96-97
Science
School 50
System
State
0
74 69 56 98-99
77 68 55 97-98
76 68 53 96-97
School System State
Sources of Information
Composite Score
50
74 67 57 0
98-99
School 50
System
75 65 56 97-98
75 66 55 96-97
State 0
71 67 56 98-99
75 66 54 97-98
1998-99 GEORGIA PUBLIC EDUCATION REPORT CARD Riverside Middle School - 6360193
Prepared by Georgia Department of Education
74 66 54 96-97
Scores Reported in Percentiles
School System State
Page 2
STATE-REQUIRED TEST DATA
Categories of Scaled Scores
Inadequate (less than 162)
Minimal (162-209)
Good
(210-247)
Very Good (greater than 247)
Average Scaled Score: (Range 100-300)
PERFORMANCE ASSESSMENTS
Grade 8 Writing Assessment
1998-99 Percent Scoring
1997-98 Percent Scoring
1996-97 Percent Scoring
School System State School System State School System State
1% 22% 49% 28%
3% 30% 53% 15%
8% 40% 41% 11%
2% 29% 50% 19%
5% 40% 45% 10%
11% 46% 34%
8%
4% 35% 41% 19%
9% 43% 37% 12%
15% 46% 30%
8%
227
218
208 223
212 202 217
207 198
AWARDS / RECOGNITION DATA
Schools in Georgia may receive recognition in the following programs: Charter School Pay for Performance Program Georgia School of Excellence National Blue Ribbon School Riverside Middle School did not receive recognition in any of these programs during the 1998-99 school year.
1998-99 GEORGIA PUBLIC EDUCATION REPORT CARD Riverside Middle School - 6360193
Prepared by Georgia Department of Education
Page 3
CERTIFIED PERSONNEL DATA
Positions Number Average Contract Days
Personnel Sex
Certificate
Years Experience
Full-time Part-time
Male Female
4 Yr Bachelor's 5 Yr Master's 6 Yr Specialist's 7 Yr Doctoral Other*
<1 1-10 11-20 21-30 >30
Average
Administrators
2.00 210.00
2 0
2 0
0 0 2 0 0 0 1 0 1 0 14.00
Support Personnel
4.00 197.50
4 0
1 3
0 4 0 0 0 0 3 0 1 0 10.50
PK-12 Teachers
61.00 190.00
61 0
11 50
26 27
8 0 0 7 18 25 11 0 12.54
*Includes One- and Two-Year Vocational Certificates.
ACCREDITATION DATA
Accredited by Southern Association of Colleges and Schools (SACS):
Elementary/Middle Commission. Accredited with Quality by Georgia
Accrediting Commission (GAC).
1998-99 GEORGIA PUBLIC EDUCATION REPORT CARD Riverside Middle School - 6360193
Prepared by Georgia Department of Education
Page 4
1998-99 GEORGIA PUBLIC EDUCATION REPORT CARD
COLUMBIA COUNTY SCHOOLS
South Columbia Elementary School - 6365052
Grade Range PK-5
The Georgia Public Education Report Card is designed to assist systems and schools in educational improvement. This report card contains a variety of data elements. An explanation of the terms is provided as a companion to the report card data. Please refer to the definitions for the most effective use of the reported data.
STUDENT DATA
Total
K-5
607
PK
21
Enrollment, by Race/Ethnicity and Sex
Black
White Hispanic
American Asian Indian
Multiracial
52 8.6%
515 84.8%
7 1.2%
20 3.3%
0 0.0%
13 2.1%
0 0.0%
20 95.2%
0 0.0%
1 4.8%
0 0.0%
0 0.0%
Male Female
299 49.3%
308 50.7%
14 66.7%
7 33.3%
Enrollment in Selected Programs
Program
Program % of Student Enrollment Population
Gifted (Grades K-12)
4
< 1%
Alternative Programs (Grades 6-12)
N/A
N/A
Students Eligible to Receive Free/Reduced Lunches
Number
Percent
School System
214 3,662
34.1% 19.7%
Dropout Rate *
Number
Rate
School System
N/A N/A
N/A N/A
* Dropout rates are not applicable for grades PK-5.
Enrollment in Compensatory Programs
Program
Program % of Student Enrollment Population
Special Education (Grades K-12)
36
5.9%
(PK)
3
N/A
English to Speakers of Other Languages (ESOL) (Grades K-12)
7
1.2%
Remedial Education (Grades 2-5, 9-12)
18
4.6%
Special Instructional Assistance (SIA) (Grades K-3)
23
5.5%
Title I (Grades K-12)
This school has no Title I program.
Total 15
Retained Students, by Race/Ethnicity and Sex
Black
White Hispanic
American MultiAsian Indian racial
0 0.0%
14 93.3%
1 6.7%
0 0.0%
0 0.0%
0 0.0%
Male Female
7
8
46.7% 53.3%
Prepared by Georgia Department of Education
Page 1
STATE-REQUIRED TEST DATA
NORM-REFERENCED TESTS Grade 3
Iowa Tests of Basic Skills (ITBS) Each chart reflects data for three years of testing.
Reading Comprehension 50
57 66 54 0
98-99
63 65 53 97-98
59 63 52 96-97
Mathematics
School 50
System
State
0
65 75 61 98-99
71 74 61 97-98
75 70 59 96-97
School System State
Reading Vocabulary 50
57 65 50 0
98-99
60 63 50 97-98
59 61 49 96-97
Language Arts
School 50
System
State
0
62 75 64 98-99
66 74 62 97-98
70 69 59 96-97
School System State
Social Studies 50
64 72 56 0
98-99
64 71 55 97-98
70 68 55 96-97
Science
School 50
System
State
0
65 75 59 98-99
68 74 59 97-98
64 72 58 96-97
School System State
Sources of Information
Composite Score
50
59 74 57 0
98-99
School 50
System
66 71 56 97-98
68 68 55 96-97
State 0
62 73 58 98-99
66 72 57 97-98
1998-99 GEORGIA PUBLIC EDUCATION REPORT CARD South Columbia Elementary School - 6365052
Prepared by Georgia Department of Education
68 69 56 96-97
Scores Reported in Percentiles
School System State
Page 2
STATE-REQUIRED TEST DATA
NORM-REFERENCED TESTS Grade 5
Iowa Tests of Basic Skills (ITBS) Each chart reflects data for three years of testing.
Reading Comprehension
Mathematics
50
55 62 53 0
98-99
56 61 53 97-98
58 60 52 96-97
School 50
System
State
0
63 69 59 98-99
64 67 58 97-98
63 66 57 96-97
School System State
Reading Vocabulary 50
51 56 48 0
98-99
55 60 48 97-98
52 58 46 96-97
Language Arts
School 50
System
State
0
67 71 63 98-99
59 67 61 97-98
62 65 58 96-97
School System State
Social Studies 50
64 68 57 0
98-99
64 66 56 97-98
63 66 55 96-97
Science
School 50
System
State
0
69 71 60 98-99
71 72 59 97-98
70 72 59 96-97
School System State
Sources of Information
Composite Score
50
67 68 58 0
98-99
School 50
System
67 67 58 97-98
70 67 57 96-97
State 0
64 69 57 98-99
64 67 56 97-98
64 66 55 96-97
1998-99 GEORGIA PUBLIC EDUCATION REPORT CARD South Columbia Elementary School - 6365052
Prepared by Georgia Department of Education
Scores Reported in Percentiles
School System State
Page 3
STATE-REQUIRED TEST DATA
PERFORMANCE ASSESSMENTS
Grade 5 Writing Assessment
Percent at Developmental Stages:
1998-99 School System State
1997-98 School System State
1996-97 School System State
Stage Stage Stage Stage Stage Stage
1:The Emerging Writer 2:The Developing Writer 3:The Focusing Writer 4:The Experimenting 5:The Engaging Writer 6:The Extending Writer
0% 0% 13% 36% 30% 19%
0% 0% 8% 39% 34% 18%
0% 1% 16% 41% 29% 12%
0% 0% 13% 46% 31% 10%
0% 1% 11% 39% 34% 15%
0% 3% 19% 41% 27% 10%
0% 0% 22% 24% 40% 15%
0% 1% 14% 30% 35% 19%
0% 3% 21% 37% 26% 12%
AWARDS / RECOGNITION DATA
Schools in Georgia may receive recognition in the following programs: Charter School Pay for Performance Program Georgia School of Excellence National Blue Ribbon School South Columbia Elementary School did not receive recognition in any of these programs during the 1998-99 school year.
1998-99 GEORGIA PUBLIC EDUCATION REPORT CARD South Columbia Elementary School - 6365052
Prepared by Georgia Department of Education
Page 4
CERTIFIED PERSONNEL DATA
Positions Number Average Contract Days
Personnel Sex
Certificate
Years Experience
Full-time Part-time
Male Female
4 Yr Bachelor's 5 Yr Master's 6 Yr Specialist's 7 Yr Doctoral Other*
<1 1-10 11-20 21-30 >30
Average
Administrators
2.00 200.00
2 0
0 2
0 1 1 0 0 0 1 0 0 1 20.00
Support Personnel
3.00 190.00
3 0
0 3
0 3 0 0 0 1 1 1 0 0 8.67
PK-12 Teachers
33.00 190.00
33 0
2 31
20 12
1 0 0 8 10 13 2 0 9.70
*Includes One- and Two-Year Vocational Certificates.
ACCREDITATION DATA
Accredited by Southern Association of Colleges and Schools (SACS):
Elementary/Middle Commission. Accredited with Quality by Georgia
Accrediting Commission (GAC).
1998-99 GEORGIA PUBLIC EDUCATION REPORT CARD South Columbia Elementary School - 6365052
Prepared by Georgia Department of Education
Page 5
1998-99 GEORGIA PUBLIC EDUCATION REPORT CARD
COLUMBIA COUNTY SCHOOLS
Stevens Creek Elementary School - 6360192
Grade Range PK-5
The Georgia Public Education Report Card is designed to assist systems and schools in educational improvement. This report card contains a variety of data elements. An explanation of the terms is provided as a companion to the report card data. Please refer to the definitions for the most effective use of the reported data.
STUDENT DATA
Total
K-5
635
PK
10
Enrollment, by Race/Ethnicity and Sex
Black
White Hispanic
American Asian Indian
Multiracial
40 6.3%
524 82.5%
2
65
0.3% 10.2%
0 0.0%
4 0.6%
1 10.0%
8 80.0%
0 0.0%
0 0.0%
0 0.0%
1 10.0%
Male Female
319 50.2%
316 49.8%
7 70.0%
3 30.0%
Enrollment in Selected Programs
Program
Program % of Student Enrollment Population
Gifted (Grades K-12)
39
6.1%
Alternative Programs (Grades 6-12)
N/A
N/A
Students Eligible to Receive Free/Reduced Lunches
Number
Percent
School System
23 3,662
3.6% 19.7%
Dropout Rate *
Number
Rate
School System
N/A N/A
N/A N/A
* Dropout rates are not applicable for grades PK-5.
Enrollment in Compensatory Programs
Program
Program % of Student Enrollment Population
Special Education (Grades K-12)
36
5.7%
(PK)
15
N/A
English to Speakers of Other Languages (ESOL) (Grades K-12)
2
< 1%
Remedial Education (Grades 2-5, 9-12)
24
5.4%
Special Instructional Assistance (SIA) (Grades K-3)
0
0.0%
Title I (Grades K-12)
This school has no Title I program.
Total 12
Retained Students, by Race/Ethnicity and Sex
Black
White Hispanic
American MultiAsian Indian racial
1 8.3%
10 83.3%
0 0.0%
0 0.0%
0 0.0%
1 8.3%
Male Female
11 91.7%
1 8.3%
Prepared by Georgia Department of Education
Page 1
STATE-REQUIRED TEST DATA
NORM-REFERENCED TESTS Grade 3
Iowa Tests of Basic Skills (ITBS) Each chart reflects data for three years of testing.
Reading Comprehension 50
83 66 54 0
98-99
75 65 53 97-98
79 63 52 96-97
Mathematics
School 50
System
State
0
94 75 61 98-99
90 74 61 97-98
88 70 59 96-97
School System State
Reading Vocabulary 50
84 65 50 0
98-99
79 63 50 97-98
82 61 49 96-97
Language Arts
School 50
System
State
0
92 75 64 98-99
86 74 62 97-98
87 69 59 96-97
School System State
Social Studies 50
82 72 56 0
98-99
79 71 55 97-98
79 68 55 96-97
Science
School 50
System
State
0
89 75 59 98-99
82 74 59 97-98
85 72 58 96-97
School System State
Sources of Information
Composite Score
50
90 74 57 0
98-99
School 50
System
84 71 56 97-98
82 68 55 96-97
State 0
92 73 58 98-99
85 72 57 97-98
1998-99 GEORGIA PUBLIC EDUCATION REPORT CARD Stevens Creek Elementary School - 6360192
Prepared by Georgia Department of Education
86 69 56 96-97
Scores Reported in Percentiles
School System State
Page 2
STATE-REQUIRED TEST DATA
NORM-REFERENCED TESTS Grade 5
Iowa Tests of Basic Skills (ITBS) Each chart reflects data for three years of testing.
Reading Comprehension
Mathematics
50
74 62 53 0
98-99
75 61 53 97-98
74 60 52 96-97
School 50
System
State
0
79 69 59 98-99
82 67 58 97-98
77 66 57 96-97
School System State
Reading Vocabulary 50
69 56 48 0
98-99
75 60 48 97-98
72 58 46 96-97
Language Arts
School 50
System
State
0
81 71 63 98-99
84 67 61 97-98
78 65 58 96-97
School System State
Social Studies 50
79 68 57 0
98-99
83 66 56 97-98
78 66 55 96-97
Science
School 50
System
State
0
79 71 60 98-99
83 72 59 97-98
83 72 59 96-97
School System State
Sources of Information
Composite Score
50
79 68 58 0
98-99
School 50
System
83 67 58 97-98
81 67 57 96-97
State 0
81 69 57 98-99
85 67 56 97-98
81 66 55 96-97
1998-99 GEORGIA PUBLIC EDUCATION REPORT CARD Stevens Creek Elementary School - 6360192
Prepared by Georgia Department of Education
Scores Reported in Percentiles
School System State
Page 3
STATE-REQUIRED TEST DATA
PERFORMANCE ASSESSMENTS
Grade 5 Writing Assessment
Percent at Developmental Stages:
1998-99 School System State
1997-98 School System State
1996-97 School System State
Stage Stage Stage Stage Stage Stage
1:The Emerging Writer 2:The Developing Writer 3:The Focusing Writer 4:The Experimenting 5:The Engaging Writer 6:The Extending Writer
0% 0% 2% 32% 35% 31%
0% 0% 8% 39% 34% 18%
0% 1% 16% 41% 29% 12%
0% 0% 1% 24% 45% 31%
0% 1% 11% 39% 34% 15%
0% 3% 19% 41% 27% 10%
0% 1% 4% 24% 38% 33%
0% 1% 14% 30% 35% 19%
0% 3% 21% 37% 26% 12%
AWARDS / RECOGNITION DATA
Schools in Georgia may receive recognition in the following programs: Charter School Pay for Performance Program Georgia School of Excellence National Blue Ribbon School Stevens Creek Elementary School did not receive recognition in any of these programs during the 1998-99 school year.
1998-99 GEORGIA PUBLIC EDUCATION REPORT CARD Stevens Creek Elementary School - 6360192
Prepared by Georgia Department of Education
Page 4
CERTIFIED PERSONNEL DATA
Positions Number Average Contract Days
Personnel Sex
Certificate
Years Experience
Full-time Part-time
Male Female
4 Yr Bachelor's 5 Yr Master's 6 Yr Specialist's 7 Yr Doctoral Other*
<1 1-10 11-20 21-30 >30
Average
Administrators
2.00 200.00
2 0
2 0
0 0 1 1 0 0 0 1 1 0 17.00
Support Personnel
3.00 187.33
3 0
0 3
1 2 0 0 0 1 1 0 1 0 10.67
PK-12 Teachers
34.50 190.00
33 3
0 36
17 17
2 0 0 7 6 14 9 0 14.03
*Includes One- and Two-Year Vocational Certificates.
ACCREDITATION DATA
Accredited by Southern Association of Colleges and Schools (SACS):
Elementary/Middle Commission. Accredited with Quality by Georgia
Accrediting Commission (GAC).
1998-99 GEORGIA PUBLIC EDUCATION REPORT CARD Stevens Creek Elementary School - 6360192
Prepared by Georgia Department of Education
Page 5
1998-99 GEORGIA PUBLIC EDUCATION REPORT CARD
COLUMBIA COUNTY SCHOOLS
Westmont Elementary School - 6360173
Grade Range PK-5
The Georgia Public Education Report Card is designed to assist systems and schools in educational improvement. This report card contains a variety of data elements. An explanation of the terms is provided as a companion to the report card data. Please refer to the definitions for the most effective use of the reported data.
STUDENT DATA
Total
K-5
684
PK
22
Enrollment, by Race/Ethnicity and Sex
Black
White Hispanic
American Asian Indian
Multiracial
72 10.5%
562 82.2%
10 1.5%
17 2.5%
1 0.1%
22 3.2%
3 13.6%
18 81.8%
1 4.5%
0 0.0%
0 0.0%
0 0.0%
Male Female
369 53.9%
315 46.1%
13 59.1%
9 40.9%
Enrollment in Selected Programs
Program
Program % of Student Enrollment Population
Gifted (Grades K-12)
11
1.6%
Alternative Programs (Grades 6-12)
N/A
N/A
Students Eligible to Receive Free/Reduced Lunches
Number
Percent
School System
140 3,662
19.8% 19.7%
Dropout Rate *
Number
Rate
School System
N/A N/A
N/A N/A
* Dropout rates are not applicable for grades PK-5.
Enrollment in Compensatory Programs
Program
Program % of Student Enrollment Population
Special Education (Grades K-12)
68
9.9%
(PK)
1
N/A
English to Speakers of Other Languages (ESOL) (Grades K-12)
0
0.0%
Remedial Education (Grades 2-5, 9-12)
45 10.2%
Special Instructional Assistance (SIA) (Grades K-3)
8
1.7%
Title I (Grades K-12)
This school has no Title I program.
Total 17
Retained Students, by Race/Ethnicity and Sex
Black
White Hispanic
American MultiAsian Indian racial
0 0.0%
13 76.5%
0 0.0%
1 5.9%
1
2
5.9% 11.8%
Male Female
12
5
70.6% 29.4%
Prepared by Georgia Department of Education
Page 1
STATE-REQUIRED TEST DATA
NORM-REFERENCED TESTS Grade 3
Iowa Tests of Basic Skills (ITBS) Each chart reflects data for three years of testing.
Reading Comprehension 50
64 66 54 0
98-99
71 65 53 97-98
61 63 52 96-97
Mathematics
School 50
System
State
0
77 75 61 98-99
80 74 61 97-98
70 70 59 96-97
School System State
Reading Vocabulary 50
66 65 50 0
98-99
66 63 50 97-98
58 61 49 96-97
Language Arts
School 50
System
State
0
75 75 64 98-99
79 74 62 97-98
72 69 59 96-97
School System State
Social Studies 50
70 72 56 0
98-99
73 71 55 97-98
64 68 55 96-97
Science
School 50
System
State
0
72 75 59 98-99
77 74 59 97-98
67 72 58 96-97
School System State
Sources of Information
Composite Score
50
72 74 57 0
98-99
School 50
System
75 71 56 97-98
67 68 55 96-97
State 0
72 73 58 98-99
76 72 57 97-98
1998-99 GEORGIA PUBLIC EDUCATION REPORT CARD Westmont Elementary School - 6360173
Prepared by Georgia Department of Education
67 69 56 96-97
Scores Reported in Percentiles
School System State
Page 2
STATE-REQUIRED TEST DATA
NORM-REFERENCED TESTS Grade 5
Iowa Tests of Basic Skills (ITBS) Each chart reflects data for three years of testing.
Reading Comprehension
Mathematics
50
60 62 53 0
98-99
57 61 53 97-98
59 60 52 96-97
School 50
System
State
0
71 69 59 98-99
68 67 58 97-98
70 66 57 96-97
School System State
Reading Vocabulary 50
56 56 48 0
98-99
58 60 48 97-98
58 58 46 96-97
Language Arts
School 50
System
State
0
67 71 63 98-99
59 67 61 97-98
67 65 58 96-97
School System State
Social Studies 50
70 68 57 0
98-99
63 66 56 97-98
67 66 55 96-97
Science
School 50
System
State
0
69 71 60 98-99
65 72 59 97-98
68 72 59 96-97
School System State
Sources of Information
Composite Score
50
68 68 58 0
98-99
School 50
System
61 67 58 97-98
64 67 57 96-97
State 0
67 69 57 98-99
62 67 56 97-98
66 66 55 96-97
1998-99 GEORGIA PUBLIC EDUCATION REPORT CARD Westmont Elementary School - 6360173
Prepared by Georgia Department of Education
Scores Reported in Percentiles
School System State
Page 3
STATE-REQUIRED TEST DATA
PERFORMANCE ASSESSMENTS
Grade 5 Writing Assessment
Percent at Developmental Stages:
1998-99 School System State
1997-98 School System State
1996-97 School System State
Stage Stage Stage Stage Stage Stage
1:The Emerging Writer 2:The Developing Writer 3:The Focusing Writer 4:The Experimenting 5:The Engaging Writer 6:The Extending Writer
0% 2% 6% 40% 33% 18%
0% 0% 8% 39% 34% 18%
0% 1% 16% 41% 29% 12%
0% 1% 13% 35% 38% 13%
0% 1% 11% 39% 34% 15%
0% 3% 19% 41% 27% 10%
0% 2% 15% 30% 38% 15%
0% 1% 14% 30% 35% 19%
0% 3% 21% 37% 26% 12%
AWARDS / RECOGNITION DATA
Schools in Georgia may receive recognition in the following programs: Charter School Pay for Performance Program Georgia School of Excellence National Blue Ribbon School Westmont Elementary School did not receive recognition in any of these programs during the 1998-99 school year.
1998-99 GEORGIA PUBLIC EDUCATION REPORT CARD Westmont Elementary School - 6360173
Prepared by Georgia Department of Education
Page 4
CERTIFIED PERSONNEL DATA
Positions Number Average Contract Days
Personnel Sex
Certificate
Years Experience
Full-time Part-time
Male Female
4 Yr Bachelor's 5 Yr Master's 6 Yr Specialist's 7 Yr Doctoral Other*
<1 1-10 11-20 21-30 >30
Average
Administrators
2.00 200.00
2 0
0 2
0 0 1 1 0 0 0 2 0 0 15.50
Support Personnel
2.00 190.00
2 0
0 2
0 2 0 0 0 0 0 1 1 0 18.50
PK-12 Teachers
42.00 190.00
42 0
2 40
28 11
3 0 0 8 10 15 9 0 12.00
*Includes One- and Two-Year Vocational Certificates.
ACCREDITATION DATA
Accredited by Southern Association of Colleges and Schools (SACS):
Elementary/Middle Commission. Accredited with Quality by Georgia
Accrediting Commission (GAC).
1998-99 GEORGIA PUBLIC EDUCATION REPORT CARD Westmont Elementary School - 6360173
Prepared by Georgia Department of Education
Page 5
1998-99 GEORGIA PUBLIC EDUCATION REPORT CARD COMMERCE CITY SCHOOLS - 771
The Georgia Public Education Report Card is designed to assist systems and schools in educational improvement. This report card contains a variety of data elements. An explanation of the terms is provided as a companion to the report card data. Please refer to the definitions for the most effective use of the reported data.
Total
K-12
1,155
PK
0
STUDENT DATA
Enrollment, by Race/Ethnicity and Sex
Black
White Hispanic
American Multi-
Asian Indian
racial
165 14.3%
963 83.4%
12 1.0%
2 0.2%
1 0.1%
12 1.0%
0
0
0
0
0
0
Male 603
52.2% 0
Female 552
47.8% 0
Enrollment in Selected Programs
Program
Program % of Student Enrollment Population
Gifted (Grades K-12)
41
3.5%
Non-Vocational Labs (Grades 9-12)
276
86.0%
Vocational Labs (Grades 9-12)
165
51.4%
Alternative Programs (Grades 6-12)
0
0.0%
Students Eligible to Receive Free/Reduced Lunches
Number
Percent
476
41.2%
Dropout Rate
Number
Percent
6-12 9-12
4
0.6%
4
1.2%
Enrollment in Compensatory Programs
Program
Program % of Student Enrollment Population
Special Education
(Grades K-12)
176
PK
9
English to Speakers of
Other Languages (ESOL)
0
(Grades K-12)
Remedial Education (Grades 2-5, 9-12)
106
Special Instructional
Assistance (SIA)
47
(Grades K-3)
Title I (Grades K-12) Number of schools with: Schoolwide program Targeted Assistance program No Title I program
15.2% N/A
0.0%
15.8%
11.5%
0 3 0
Total 44
Retained Students, by Race/Ethnicity and Sex
Black
White Hispanic
American MultiAsian Indian racial
10 22.7%
32 72.7%
1 2.3%
0 0.0%
0 0.0%
1 2.3%
Male Female
26
18
59.1% 40.9%
Prepared by Georgia Department of Education
Page 1
STATE-REQUIRED TEST DATA
NORM-REFERENCED TESTS
Grade 3 Iowa Tests of Basic Skills (ITBS) Each chart reflects data for three years of testing.
Reading Comprehension
Mathematics
50
60 54 56 53 55 52 0
98-99 97-98 96-97
System State
50
65 61 65 61 48 59 0
98-99 97-98 96-97
System State
Reading Vocabulary
50
55 50 51 50 47 49 0
98-99 97-98 96-97
System State
Social Studies
50
62 56 54 55 48 55 0
98-99 97-98 96-97
System State
Language Arts
50
74 64 68 62 46 59 0
98-99 97-98 96-97
System State
Science
50
74 59 59 59 58 58 0
98-99 97-98 96-97
System State
Sources of Information
Composite Score
50
71 57 0
98-99
System
50
65 56 56 55 97-98 96-97
State
68 58 60 57 0
98-99 97-98
1998-99 GEORGIA PUBLIC EDUCATION REPORT CARD Commerce City Schools
Prepared by Georgia Department of Education
System State Scores Reported 50 56 in Percentiles 96-97
Page 2
STATE-REQUIRED TEST DATA
NORM-REFERENCED TESTS
Grade 5 Iowa Tests of Basic Skills (ITBS) Each chart reflects data for three years of testing.
Reading Comprehension
Mathematics
50
57 53 52 53 52 52 0
98-99 97-98 96-97
System State
50
56 59 61 58 50 57 0
98-99 97-98 96-97
System State
Reading Vocabulary
50
46 48 54 48 49 46 0
98-99 97-98 96-97
System State
Social Studies
50
62 57 60 56 46 55 0
98-99 97-98 96-97
System State
Language Arts
50
71 63 64 61 46 58 0
98-99 97-98 96-97
System State
Science
50
72 60 78 59 52 59 0
98-99 97-98 96-97
System State
Sources of Information
Composite Score
50
67 58 0
98-99
System
50
65 58 54 57 97-98 96-97
State
64 57 64 56 0
98-99 97-98
1998-99 GEORGIA PUBLIC EDUCATION REPORT CARD Commerce City Schools
Prepared by Georgia Department of Education
System State Scores Reported 48 55 in Percentiles 96-97
Page 3
STATE-REQUIRED TEST DATA
NORM-REFERENCED TESTS Grade 8
Iowa Tests of Basic Skills (ITBS) Each chart reflects data for three years of testing.
Reading Comprehension
Mathematics
50
55 49 57 48 40 48 0
98-99 97-98 96-97
System State
50
63 56 69 55 52 54 0
98-99 97-98 96-97
System State
Reading Vocabulary
50
51 46 51 45 44 44 0
98-99 97-98 96-97
System State
Language Arts
50
50 60 55 58 51 56 0
98-99 97-98 96-97
System State
Social Studies
50
55 54 61 53 46 53 0
98-99 97-98 96-97
System State
Science
50
58 56 62 55 44 53 0
98-99 97-98 96-97
System State
Sources of Information
Composite Score
50
59 57 0
98-99
System
50
57 56 42 55 97-98 96-97
State
57 56 61 54 0
98-99 97-98
1998-99 GEORGIA PUBLIC EDUCATION REPORT CARD Commerce City Schools
Prepared by Georgia Department of Education
System State Scores Reported 45 54 in Percentiles 96-97
Page 4
STATE-REQUIRED TEST DATA
PERFORMANCE ASSESSMENTS
Grade 5 Writing Assessment
1998-99
1997-98
1996-97
Percent at Developmental Stages:
Comparison
Comparison
Comparison
System Group State System Group State System Group State
Stage Stage Stage Stage Stage Stage
1: The Emerging Writer 2: The Developing Writer 3: The Focusing Writer 4: The Experimenting Writer 5: The Engaging Writer 6: The Extending Writer
0% 3% 17% 46% 28% 6%
0% 2% 19% 43% 26% 9%
0% 1% 16% 41% 29% 12%
0% 0% 24% 45% 24% 7%
0% 1% 20% 45% 26% 6%
0% 3% 19% 41% 27% 10%
0% 6% 23% 34% 27% 9%
0% 3% 21% 42% 24% 10%
0% 3% 21% 37% 26% 12%
Grade 8 Writing Assessment
1998-99 Percent Scoring 1997-98 Percent Scoring 1996-97 Percent Scoring
Categories of Scaled Scores
Comparison
Comparison
Comparison
System Group State System Group State System Group State
Inadequate (less than 162)
Minimal (162-209)
Good
(210-247)
Very Good (greater than 247)
8% 47% 38%
7%
5% 33% 49% 14%
8% 40% 41% 11%
10% 49% 35%
5%
8% 44% 37% 10%
11% 46% 34%
8%
8% 56% 27%
9%
10% 51% 33%
6%
15% 46% 30%
8%
Average Scaled Score: (Range 100-300)
203
215 208
199
206 202
203
201 198
GEORGIA HIGH SCHOOL GRADUATION TESTS (GHSGT)
Percent of Regular Program 11th Graders Passing the Georgia High School Graduation Tests on First Administration
1998-99
1997-98
1996-97
Comparison
Comparison
Comparison
System Group State System Group State System Group State
English Language Arts Mathematics Social Studies Science
100% 87% 86% 75%
98% 93% 84% 76%
96% 88% 80% 72%
94% 94% 87% 82%
96% 94% 82% 81%
94% 88% 78% 74%
98% 88% 85% 77%
97% 92% 82% 79%
94% 87% 78% 74%
All Components listed above 7 5 %
71% 68% 79%
74% 68% 69%
72% 67%
Writing
98%
96% 93% 98%
93% 92% 98%
97% 93%
1998-99 GEORGIA PUBLIC EDUCATION REPORT CARD
Commerce City Schools
Prepared by Georgia Department of Education
Page 5
GRADUATE DATA
1999 Graduates by Credentials, Race/Ethnicity and Sex
Diplomas with Both College Prep. & Voc. Endorsements
Diplomas with College Prep. Endorsements Diplomas with Vocational Endorsements General High School Diplomas Special Education Diplomas
Total All Diplomas
Certificates of Performance
Total Graduates
Total 0
38 19
0 3 60 5 65
Black 0
American MultiWhite Hispanic Asian Indian racial
0
0
0
0
0
Male Female
0
0
2 5.3%
2 10.5%
0
36 94.7%
17 89.5%
0
0 0.0%
0 0.0%
0
0 0.0%
0 0.0%
0
0 0.0%
0 0.0%
0
0 0.0%
0 0.0%
0
16 42.1%
11 57.9%
0
22 57.9%
8 42.1%
0
1 33.3%
5 8.3%
2 40.0%
7 10.8%
2 66.7%
55 91.7%
3 60.0%
58 89.2%
0 0.0%
0 0.0%
0 0.0%
0 0.0%
0 0.0%
0 0.0%
0 0.0%
0 0.0%
0 0.0%
0 0.0%
0 0.0%
0 0.0%
0 0.0%
0 0.0%
0 0.0%
0 0.0%
1
2
33.3% 66.7%
28
32
46.7% 53.3%
0
5
0.0% 100.0%
28
37
43.1% 56.9%
HOPE Scholarships
System State
Number of 1999 Graduates 6 5
Number Eligible
37
Percent Eligible
56.9%
65,548 40,292 61.5%
High School Completion Rate Percent of 1995Grade 9 Enrollment
in Graduating Class of1999
System
State
Completion Rate '95-'99 89.0% 68.9%
COLLEGE ADMISSIONS / CREDIT TEST DATA
Scholastic Assessment Test (SAT)
No. Taking
Average Score
Tests
Verbal Math Total
Based on students' highest verbal and highest math scores
System College Prep. Endorsement Other Diplomas
477 455 932 511 475 986 390 380 770
Georgia
492 488 980
Based on students' last test administration
System Georgia
44
467 449
916
41,958 483 479 962
Nation
952,913 502 508 1010
American College Testing (ACT)
System State Nation
English Mathematics Reading Science Reasoning
N/A N/A N/A N/A
19.1 19.9 20.2 19.9
20.4 20.7 21.3 21.0
CompositeScore N/A * 19.9 21.9
* Scores not reported when fewer than 5 tests taken.
Advanced Placement Exams (AP)
No. of Students Taking Tests
No. of Tests Taken No. of Test Scores
3 or Higher Percent of Test
Scores 3 or Higher
System State 23 15,225 23 23,969 2 13,024
8.7% 54.3%
1998-99 GEORGIA PUBLIC EDUCATION REPORT CARD Commerce City Schools
Prepared by Georgia Department of Education
Page 6
POSTSECONDARY DATA
Graduates Entering Georgia Public Colleges and Universities
Graduates Entering Georgia Public Colleges and Universities and
Requiring Learning Support (LS)
1998 Graduates Entering 1998-99
1997 Graduates Entering 1997-98
Percent of Graduating Number Class
18
30.5%
22
41.5%
Number Requiring
LS
4
5
Percent of those attending Georgia
Public Colleges
22.2%
22.7%
In previous years, the Report Card presented College Prep Curriculum information provided by the Board of Regents on students requiring Learning Support. Due to inconsistencies in the data provided by the Board of Regents in defining College Prep Completers versus Local Board of Education data defining College Prep Endorsements, the Department of Education Report Card will not provide this information until discrepancies can be reconciled.
Graduates Entering Georgia Public Technical and Adult Schools
Entering 1998-99 Entering 1997-98
Number Percent
Number Percent
1998 Graduates 1997 Graduates
6
10.2%
1
1.9%
N/A 4
N/A 7.5%
ACCREDITATION / RECOGNITION DATA
Southern Association of Colleges and Schools (SACS) Accrediting Commission
Secondary/Middle Commission Elementary/Middle Commission Both Elementary/Secondary Commissions Joint Commission Candidate for Accreditation
Accreditation by Georgia Accrediting Commission (GAC)
Accredited by GAC Accredited with Quality by GAC
Number of Schools
2 1 0 0 0
Number of Schools
0 3
Awards / Recognition
State Recognized Program
Number of Schools
Charter School
0
Pay for Performance Recipient
0
Georgia School of Excellence
0
National Blue Ribbon School
0
COMMUNITY DATA
Number of Children Eligible for Migrant Education Number of Families-At-Risk * Number of Food Stamp Participants * Number of Families Receiving TANF * ** Per Capita Income * Unemployment Rate * 1990 Population * Projected 2000 Population * Projected 2010 Population *
* Data Available at County Level Only ** Known as AFDC before January 1997
3 138 2,610 183 $19,526 3.9% 30,005 34,753 40,131
1998-99 GEORGIA PUBLIC EDUCATION REPORT CARD Commerce City Schools
Prepared by Georgia Department of Education
Page 7
FISCAL DATA
Millage Rate
16.08
* Fall 1998 Property Tax Digest is used to calculate the 98-99 Value of One Mill
FTE Count
FTE Count used for Allotment Calculation 1,121.0 Fall '98 FTE Count 1,155
Value of One Mill
$86,430 $77.10 per Allotment FTE
Sources: Local State-QBE State-
Lottery State-
Other Federal Other
Total
PerGeneral Fund cent Per FTE
$1,598,754 24.7% $1,426 $4,742,202 73.3% $4,230
K-12 Revenues
Lottery K-12
and
Title
All Other
Programs
K-12
$0
$0
Bonded Debt
$1,669,581
$0
$0
$0
$0 0.0%
$0
$0
$5,079
$0
$64,281 1.0% $57
$0 0.0%
$0
$67,136 1.0% $60
$6,472,374 100% $5,773
$6,561 $354,228
$0 $360,789
$16,174 $0 $0
$21,253
$0 $0 $0 $1,669,581
Capital Projects
$128,415 $0
$0
$47,876 $0
$10,235 $186,527
School Nutrition
$152,056 $0
$0
$30,594 $216,631
$0 $399,281
Grand Total
Total
Per-
Amount cent
$3,548,807 39.0%
$4,742,202 52.1%
$5,079 0.1%
$165,486 1.8% $570,859 6.3%
$77,371 0.8% $9,109,807 100%
Instruction
Media Instruction
Support Pupil Services General Admin. School Admin. Trans-
portation Maint. & Ops. Capital Projects School Food Debt Service
Total
$4,005,291 64.2% $3,573 $194,796 3.1% $174
$347,790 5.6% $310
$291,377 4.7% $260
$269,827 4.3% $241
$422,328 6.8% $377
$134,749 2.2% $120
$544,621 8.7% $486
$25,000 0.4% $22
$0 0.0%
$0
$0 0.0%
$0
$6,235,782 100% $5,563
K-12 Expenditures
$294,820
$32,219
$0
$0
$0
$0
$0
$0
$42,229
$0
$0
$0
$20,162
$15,338
$0
$0
$10,401
$0
$96
$0
$0
$0
$0
$0
$6,089
$0
$0
$0
$0
$0
$0
$0
$0
$0
$0 $1,427,108
$0
$0
$0
$0
$0
$0 $1,494,752
$0
$0 $0 $0 $0 $0 $0 $0 $0 $0 $402,908 $0
$373,702
$47,558 $1,494,848 $1,427,108 $402,908
$4,332,331 43.4% $194,796 2.0% $390,019 3.9% $326,878 3.3% $280,326 2.8% $422,328 4.2% $140,838 1.4% $544,621 5.5%
$1,452,108 14.5% $402,908 4.0%
$1,494,752 15.0%
$9,981,910 100%
Salaries and Benefits as Percentages of Revenues and of Expenditures
Teachers and Paraprofessionals
Salaries $3,024,601
Benefits $849,279
Percentage of Revenues Percentage of Expenditures
Total of
Total of
General Fund
General Fund
Title Programs
Title Programs
Lottery K-12
Lottery K-12
Total Salaries
and
Total
and
Total
and Benefits All Other K-12 K - 12 All Other K-12 K - 12
$3,873,880
56.5%
42.5%
58.2%
38.8%
School Administration
$247,314
$77,599
$324,913
4.7%
3.6%
4.9%
3.3%
General Administration
$129,771
$36,703
$166,474
2.4%
1.8%
2.5%
1.7%
1998-99 GEORGIA PUBLIC EDUCATION REPORT CARD
Commerce City Schools - 771
Prepared by Georgia Department of Education
Page 8
CERTIFIED PERSONNEL DATA
Number
Average Annual Salary Positions Average Contract Days
Average Daily Salary
Full-time Personnel Part-time
Sex Male Female
4 Yr Bachelor's Certificate 5 Yr Master's
Level 6 Yr Specialist's 7 Yr Doctoral Other*
Black
White Race/ Hispanic Ethnicity Asian
American Indian
Multiracial
Years Experience
<1 1-10 11-20 21-30 >30
Average
Administrators
7.50
$64,080.47 210.80
$303.99
6 3
4 5
0 3 4 2 0
0 9 0 0 0 0
0 0 5 3 1
19.67
Support Personnel PK-12 Teachers
8.05
73.45
$44,748.39 183.79
$243.48
$38,533.70 190.41
$202.37
7
72
3
3
0
16
10
59
0
33
7
34
3
7
0
1
0
0
1
0
9
75
0
0
0
0
0
0
0
0
0
6
1
28
5
19
3
20
1
2
20.30
13.71
*Includes One- and Two-Year Vocational Certificates.
Certified Staff Position Ratios
Teacher/Administrator Ratio 10:1
Teacher/Support Person Ratio 9:1
Teacher/Staff Ratio 5:1
Student Enrollment/All Teachers 16:1
Certified Personnel by Category
79.8% 100%
9.6% 10.6%
80% 60%
40%
20%
0%
Teachers
Administrators
Support Personnel
1998-99 GEORGIA PUBLIC EDUCATION REPORT CARD
Commerce City Schools - 771
Prepared by Georgia Department of Education
Page 9
1998-99 GEORGIA PUBLIC EDUCATION REPORT CARD
COMMERCE CITY SCHOOLS
Commerce Elementary School - 7711050
Grade Range K-5
The Georgia Public Education Report Card is designed to assist systems and schools in educational improvement. This report card contains a variety of data elements. An explanation of the terms is provided as a companion to the report card data. Please refer to the definitions for the most effective use of the reported data.
STUDENT DATA
Total 572
K-5 Enrollment, by Race/Ethnicity and Sex
Black
White Hispanic
American Multi-
Asian Indian
racial
91 15.9%
463 80.9%
10 1.7%
2 0.3%
1 0.2%
5 0.9%
Male Female
289 50.5%
283 49.5%
Enrollment in Selected Programs
Program
Program % of Student Enrollment Population
Gifted (Grades K-12)
15
2.6%
Alternative Programs (Grades 6-12)
N/A
N/A
Students Eligible to Receive Free/Reduced Lunches
Number
Percent
School System
282
49.3%
476
41.2%
Dropout Rate *
Number
Rate
School System
N/A N/A
N/A N/A
* Dropout rates are not applicable for grades PK-5.
Enrollment in Compensatory Programs
Program
Program % of Student Enrollment Population
Special Education (Grades K-12)
88 15.4%
(PK)
9
N/A
English to Speakers of Other Languages (ESOL) (Grades K-12)
0
0.0%
Remedial Education (Grades 2-5, 9-12)
86 24.6%
Special Instructional Assistance (SIA) (Grades K-3)
47 11.5%
Title I (Grades K-12)
This school has a Targeted Assistance program.
Total 29
Retained Students, by Race/Ethnicity and Sex
Black
White Hispanic
American Multi-
Asian Indian
racial
7 24.1%
21 72.4%
1 3.4%
0 0.0%
0 0.0%
0 0.0%
Male Female
18
11
62.1% 37.9%
Prepared by Georgia Department of Education
Page 1
STATE-REQUIRED TEST DATA
NORM-REFERENCED TESTS Grade 3
Iowa Tests of Basic Skills (ITBS) Each chart reflects data for three years of testing.
Reading Comprehension 50
60 60 54 0
98-99
56 56 53 97-98
55 55 52 96-97
Mathematics
School 50
System
State
0
65 65 61 98-99
65 65 61 97-98
48 48 59 96-97
School System State
Reading Vocabulary 50
55 55 50 0
98-99
51 51 50 97-98
47 47 49 96-97
Language Arts
School 50
System
State
0
74 74 64 98-99
68 68 62 97-98
46 46 59 96-97
School System State
Social Studies 50
62 62 56 0
98-99
54 54 55 97-98
48 48 55 96-97
Science
School 50
System
State
0
74 74 59 98-99
59 59 59 97-98
58 58 58 96-97
School System State
Sources of Information
Composite Score
50
71 71 57 0
98-99
School 50
System
65 65 56 97-98
56 56 55 96-97
State 0
68 68 58 98-99
60 60 57 97-98
1998-99 GEORGIA PUBLIC EDUCATION REPORT CARD Commerce Elementary School - 7711050
Prepared by Georgia Department of Education
50 50 56 96-97
Scores Reported in Percentiles
School System State
Page 2
STATE-REQUIRED TEST DATA
NORM-REFERENCED TESTS Grade 5
Iowa Tests of Basic Skills (ITBS) Each chart reflects data for three years of testing.
Reading Comprehension
Mathematics
50
57 57 53 0
98-99
52 52 53 97-98
52 52 52 96-97
School 50
System
State
0
56 56 59 98-99
61 61 58 97-98
50 50 57 96-97
School System State
Reading Vocabulary 50
46 46 48 0
98-99
54 54 48 97-98
49 49 46 96-97
Language Arts
School 50
System
State
0
71 71 63 98-99
64 64 61 97-98
46 46 58 96-97
School System State
Social Studies 50
62 62 57 0
98-99
60 60 56 97-98
46 46 55 96-97
Science
School 50
System
State
0
72 72 60 98-99
78 78 59 97-98
52 52 59 96-97
School System State
Sources of Information
Composite Score
50
67 67 58 0
98-99
School 50
System
65 65 58 97-98
54 54 57 96-97
State 0
64 64 57 98-99
64 64 56 97-98
48 48 55 96-97
1998-99 GEORGIA PUBLIC EDUCATION REPORT CARD Commerce Elementary School - 7711050
Prepared by Georgia Department of Education
Scores Reported in Percentiles
School System State
Page 3
STATE-REQUIRED TEST DATA
PERFORMANCE ASSESSMENTS
Grade 5 Writing Assessment
Percent at Developmental Stages:
1998-99 School System State
1997-98 School System State
1996-97 School System State
Stage Stage Stage Stage Stage Stage
1:The Emerging Writer 2:The Developing Writer 3:The Focusing Writer 4:The Experimenting 5:The Engaging Writer 6:The Extending Writer
0% 3% 17% 46% 28% 6%
0% 3% 17% 46% 28% 6%
0% 1% 16% 41% 29% 12%
0% 0% 24% 45% 24% 7%
0% 0% 24% 45% 24% 7%
0% 3% 19% 41% 27% 10%
0% 6% 23% 34% 27% 9%
0% 6% 23% 34% 27% 9%
0% 3% 21% 37% 26% 12%
AWARDS / RECOGNITION DATA
Schools in Georgia may receive recognition in the following programs: Charter School Pay for Performance Program Georgia School of Excellence National Blue Ribbon School Commerce Elementary School did not receive recognition in any of these programs during the 1998-99 school year.
1998-99 GEORGIA PUBLIC EDUCATION REPORT CARD Commerce Elementary School - 7711050
Prepared by Georgia Department of Education
Page 4
CERTIFIED PERSONNEL DATA
Positions Number Average Contract Days
Personnel Sex
Certificate
Years Experience
Full-time Part-time
Male Female
4 Yr Bachelor's 5 Yr Master's 6 Yr Specialist's 7 Yr Doctoral Other*
<1 1-10 11-20 21-30 >30
Average
Administrators
1.50 203.33
1 1
0 2
0 1 1 0 0 0 0 2 0 0 16.50
Support Personnel
3.30 170.30
3 1
0 4
0 4 0 0 0 0 0 2 1 1 22.00
PK-12 Teachers
32.30 190.00
31 3
2 32
15 16
3 0 0 3 12 10 9 0 13.47
*Includes One- and Two-Year Vocational Certificates.
ACCREDITATION DATA
Accredited by Southern Association of Colleges and Schools (SACS):
Elementary/Middle Commission. Accredited with Quality by Georgia
Accrediting Commission (GAC).
1998-99 GEORGIA PUBLIC EDUCATION REPORT CARD Commerce Elementary School - 7711050
Prepared by Georgia Department of Education
Page 5
1998-99 GEORGIA PUBLIC EDUCATION REPORT CARD
COMMERCE CITY SCHOOLS
Commerce High School - 7712050
Grade Range 9-12
The Georgia Public Education Report Card is designed to assist systems and schools in educational improvement. This report card contains a variety of data elements. An explanation of the terms is provided as a companion to the report card data. Please refer to the definitions for the most effective use of the reported data.
Total 321
STUDENT DATA
9-12 Enrollment, by Race/Ethnicity and Sex
Black
White Hispanic
American Multi-
Asian Indian
racial
40 12.5%
277 86.3%
2 0.6%
0 0.0%
0 0.0%
2 0.6%
Male Female
161 50.2%
160 49.8%
Enrollment in Selected Programs
Program
Gifted (Grades K-12)
Program % of Student Enrollment Population
14
4.4%
Non-Vocational Labs (Grades 9-12)
276
Vocational Labs
(Grades 9-12)
165
Alternative Programs (Grades 6-12)
0
86.0% 51.4%
0.0%
Students Eligible to Receive Free/Reduced Lunches
Number
Percent
School System
79
24.6%
476
41.2%
Enrollment in Compensatory Programs
Program
Program % of Student Enrollment Population
Special Education (Grades K-12) PK
40 12.5%
0
N/A
English to Speakers of Other Languages (ESOL) (Grades K-12)
0
0.0%
Remedial Education (Grades 2-5, 9-12)
20
6.2%
Title I (Grades K-12)
This school has a Targeted Assistance program.
Dropout Rate for Grades 9-12
Number
Rate
School System
4
1.2%
4
1.2%
Total 10
Retained Students, by Race/Ethnicity and Sex
Black
White Hispanic
American MultiAsian Indian racial
2 20.0%
8 80.0%
0 0.0%
0 0.0%
0 0.0%
0 0.0%
Male Female
6
4
60.0% 40.0%
Prepared by Georgia Department of Education
Page 1
STATE-REQUIRED TEST DATA
GEORGIA HIGH SCHOOL GRADUATION TESTS (GHSGT)
Percent of Regular Program 11th Graders Passing the Georgia High School Graduation Tests on First Administration
English Language Arts Mathematics Social Studies Science
All Components listed above
Writing
1998-99
School System State
100% 87% 86% 75%
100% 87% 86% 75%
96% 88% 80% 72%
75% 75% 68%
98% 98% 93%
1997-98
School System State
94% 94% 87% 82%
94% 94% 87% 82%
94% 88% 78% 74%
79% 79% 68%
98% 98% 92%
1996-97
School System State
98% 88% 85% 77%
98% 88% 85% 77%
94% 87% 78% 74%
69% 69% 67%
98% 98% 93%
GRADUATE DATA
1999 Graduates by Credentials, Race/Ethnicity and Sex
Diplomas with Both College Prep. & Voc. Endorsements
Diplomas with College Prep. Endorsements Diplomas with Vocational Endorsements General High School Diplomas Special Education Diplomas
Total All Diplomas
Certificates of Performance
Total Graduates
Total 0
Black 0
White Hispanic
0
0
American MultiAsian Indian racial
0
0
0
38
2
36
0
0
0
0
5.3% 94.7% 0.0% 0.0% 0.0% 0.0%
19
2
17
0
0
0
0
10.5% 89.5% 0.0% 0.0% 0.0% 0.0%
0
0
0
0
0
0
0
3
1
2
0
0
0
0
33.3% 66.7% 0.0% 0.0% 0.0% 0.0%
60
5
55
0
0
0
0
8.3% 91.7% 0.0% 0.0% 0.0% 0.0%
5
2
3
0
0
0
0
40.0% 60.0% 0.0% 0.0% 0.0% 0.0%
65
7
58
0
0
0
0
10.8% 89.2% 0.0% 0.0% 0.0% 0.0%
Male Female
0
0
16 42.1%
11 57.9%
0
22 57.9%
8 42.1%
0
1
2
33.3% 66.7%
28
32
46.7% 53.3%
0
5
0.0% 100.0%
28
37
43.1% 56.9%
HOPE Scholarships
School System
Number of 1999 Graduates 6 5
Number Eligible
37
Percent Eligible
56.9%
65 37 56.9%
State
65,548 40,292 61.5%
High School Completion Rate
Percent of 1995Grade 9 Enrollment in Graduating Class of1999 School System State
Completion Rate '95-'99 89.0% 89.0% 68.9%
1998-99 GEORGIA PUBLIC EDUCATION REPORT CARD
Commerce High School - 7712050
Prepared by Georgia Department of Education
Page 2
COLLEGE ADMISSIONS / CREDIT TEST DATA
Scholastic Assessment Test (SAT)
Based on students' highest verbal and highest math scores
No. Taking
Average Score
Tests Verbal Math Total
Based on students' last test administration
Average Score Verbal Math Total
School College Prep. Endorsement Other Diplomas
44 477 455
932
511 475
986
390 380
770
System College Prep. Endorsement Other Diplomas
44 477 455
932
511 475
986
390 380
770
Georgia
41,958 492 488
980
467 N/A N/A
467 N/A N/A
483
449 N/A N/A
449 N/A N/A
479
916 N/A N/A
916 N/A N/A
962
Nation
952,913 N/A N/A N/A
502 508 1010
American College Testing (ACT)
Advanced Placement Exams (AP)
Number taking tests: English Mathematics Reading Science Reasoning
1 * School N/A N/A N/A N/A
System N/A N/A N/A N/A
State 19.1 19.9 20.2 19.9
CompositeScore
N/A
N/A 19.9
* Scores are not reported when fewer than 5 take the ACT
No. of Students Taking Tests
No. of Tests Taken No. of Test Scores
3 or Higher Percent of Test
Scores 3 or Higher
School 23 23 2
8.7%
System State 23 15,225 23 23,969 2 13,024
8.7% 54.3%
POST-SECONDARY DATA
Graduates Entering Georgia Public Colleges
Graduates Entering Georgia Public Colleges and Requiring Learning Support (LS)
1998 Graduates Entering in 1998-99
1997 Graduates Entering in 1997-98
Percent of Graduating Number Class
School
18
30.5%
System 1 8
30.5%
School
22
41.5%
System 2 2
41.5%
Number Requiring
LS 4 4
5 5
Percent of those attending Georgia
Public Colleges
22.2%
22.2%
22.7%
22.7%
In previous years, the Report Card presented College Prep Curriculum information provided by the Board of Regents on students requiring Learning Support. Due to inconsistencies in the data provided by the Board of Regents in defining College Prep Completers versus Local Board of Education data defining College Prep Endorsements, the Department of Education Report Card will not provide this information until discrepancies can be reconciled.
Graduates Entering Georgia Public Technical and Adult Schools
1998 Graduates School System
Entering Number 6 6
1998-99 Percent 10.2% 10.2%
Entering Number N/A N/A
1997-98 Percent
N/A N/A
1997 Graduates School
1
1.9%
System
1
1.9%
4
7.5%
4
7.5%
1998-99 GEORGIA PUBLIC EDUCATION REPORT CARD Commerce High School - 7712050
Prepared by Georgia Department of Education
Page 3
CERTIFIED PERSONNEL DATA
Positions Number Average Contract Days
Administrators
1.50 206.67
Support Personnel
2.50 196.00
PK-12 Teachers
22.10 191.00
Personnel Sex
Certificate
Years Experience
Full-time Part-time
Male Female
4 Yr Bachelor's 5 Yr Master's 6 Yr Specialist's 7 Yr Doctoral Other*
<1 1-10 11-20 21-30 >30
Average
1 1
1 1
0 1 1 0 0
0 0 0 1 1
27.50
2 1
0 3
0 1 2 0 0
0 0 1 2 0
22.00
21 3
10 14
9 12
3 0 0
2 9 5 6 2
15.13
*Includes One- and Two-Year Vocational Certificates.
ACCREDITATION DATA
Accredited by Southern Association of Colleges and Schools (SACS): Secondary/Middle Commission. Accredited with Quality by Georgia Accrediting Commission (GAC).
AWARDS / RECOGNITION DATA
Schools in Georgia may receive recognition in the following programs: Charter School Pay for Performance Program Georgia School of Excellence National Blue Ribbon School Commerce High School did not receive recognition in any of these programs during the 1998-99 school year.
1998-99 GEORGIA PUBLIC EDUCATION REPORT CARD Commerce High School - 7712050
Prepared by Georgia Department of Education
Page 4
1998-99 GEORGIA PUBLIC EDUCATION REPORT CARD
COMMERCE CITY SCHOOLS
Commerce Middle School - 7713050
Grade Range 6-8
The Georgia Public Education Report Card is designed to assist systems and schools in educational improvement. This report card contains a variety of data elements. An explanation of the terms is provided as a companion to the report card data. Please refer to the definitions for the most effective use of the reported data.
STUDENT DATA
Total 262
6-8 Enrollment, by Race/Ethnicity and Sex
Black
White Hispanic
American Multi-
Asian Indian
racial
34 13.0%
223 85.1%
0 0.0%
0 0.0%
0 0.0%
5 1.9%
Male 153
58.4%
Female 109
41.6%
Enrollment in Selected Programs
Program
Gifted (Grades K-12)
Program % of Student Enrollment Population
12
4.6%
Alternative Programs (Grades 6-12)
0
0.0%
Students Eligible to Receive Free/Reduced Lunches
Number
Percent
School System
115
43.9%
476
41.2%
Enrollment in Compensatory Programs
Program
Program % of Student Enrollment Population
Special Education (Grades K-12) (PK)
48 18.3%
0
N/A
English to Speakers of Other Languages (ESOL) (Grades K-12)
0
0.0%
Title I (Grades K-12)
This school has a Targeted Assistance program.
Dropout Rate for Grades 6-8
Number
Rate
School System
0
0.0%
0
0.0%
Total 5
Retained Students, by Race/Ethnicity and Sex
Black
White Hispanic
American MultiAsian Indian racial
1 20.0%
3 60.0%
0 0.0%
0 0.0%
0
1
0.0% 20.0%
Male Female
2
3
40.0% 60.0%
Prepared by Georgia Department of Education
Page 1
STATE-REQUIRED TEST DATA
NORM-REFERENCED TESTS Grade 8
Iowa Tests of Basic Skills (ITBS) Each chart reflects data for three years of testing.
Reading Comprehension 50
55 55 49 0
98-99
57 57 48 97-98
40 40 48 96-97
Mathematics
School 50
System
State
0
63 63 56 98-99
69 69 55 97-98
52 52 54 96-97
School System State
Reading Vocabulary 50
51 51 46 0
98-99
51 51 45 97-98
44 44 44 96-97
Language Arts
School 50
System
State
0
50 50 60 98-99
55 55 58 97-98
51 51 56 96-97
School System State
Social Studies 50
55 55 54 0
98-99
61 61 53 97-98
46 46 53 96-97
Science
School 50
System
State
0
58 58 56 98-99
62 62 55 97-98
44 44 53 96-97
School System State
Sources of Information
Composite Score
50
59 59 57 0
98-99
School 50
System
57 57 56 97-98
42 42 55 96-97
State 0
57 57 56 98-99
61 61 54 97-98
1998-99 GEORGIA PUBLIC EDUCATION REPORT CARD Commerce Middle School - 7713050
Prepared by Georgia Department of Education
45 45 54 96-97
Scores Reported in Percentiles
School System State
Page 2
STATE-REQUIRED TEST DATA
Categories of Scaled Scores
Inadequate (less than 162)
Minimal (162-209)
Good
(210-247)
Very Good (greater than 247)
Average Scaled Score: (Range 100-300)
PERFORMANCE ASSESSMENTS
Grade 8 Writing Assessment
1998-99 Percent Scoring
1997-98 Percent Scoring
1996-97 Percent Scoring
School System State School System State School System State
8% 47% 38%
7%
8% 47% 38%
7%
8% 40% 41% 11%
10% 49% 35%
5%
10% 49% 35%
5%
11% 46% 34%
8%
8% 56% 27%
9%
8% 56% 27%
9%
15% 46% 30%
8%
203
203
208 199
199 202 203
203 198
AWARDS / RECOGNITION DATA
Schools in Georgia may receive recognition in the following programs: Charter School Pay for Performance Program Georgia School of Excellence National Blue Ribbon School Commerce Middle School did not receive recognition in any of these programs during the 1998-99 school year.
1998-99 GEORGIA PUBLIC EDUCATION REPORT CARD Commerce Middle School - 7713050
Prepared by Georgia Department of Education
Page 3
CERTIFIED PERSONNEL DATA
Positions Number Average Contract Days
Personnel Sex
Certificate
Years Experience
Full-time Part-time
Male Female
4 Yr Bachelor's 5 Yr Master's 6 Yr Specialist's 7 Yr Doctoral Other*
<1 1-10 11-20 21-30 >30
Average
Administrators
1.00 220.00
1 0
1 0
0 0 1 0 0 0 0 1 0 0 11.00
Support Personnel
2.25 190.00
2 1
0 3
0 2 1 0 0 0 1 2 0 0 16.33
PK-12 Teachers
19.05 190.42
17 3
6 14
10 8 1 1 0 1 8 5 6 0
12.95
*Includes One- and Two-Year Vocational Certificates.
ACCREDITATION DATA
Accredited by Southern Association of Colleges and Schools (SACS): Secondary/Middle Commission.
Accredited with Quality by Georgia Accrediting Commission (GAC).
1998-99 GEORGIA PUBLIC EDUCATION REPORT CARD Commerce Middle School - 7713050
Prepared by Georgia Department of Education
Page 4
1998-99 GEORGIA PUBLIC EDUCATION REPORT CARD COOK COUNTY SCHOOLS - 637
The Georgia Public Education Report Card is designed to assist systems and schools in educational improvement. This report card contains a variety of data elements. An explanation of the terms is provided as a companion to the report card data. Please refer to the definitions for the most effective use of the reported data.
Total
K-12
2,992
PK
138
STUDENT DATA
Enrollment, by Race/Ethnicity and Sex
Black
White Hispanic
American Multi-
Asian Indian
racial
1,205 40.3%
1,708 57.1%
59 2.0%
8 0.3%
0 0.0%
12 0.4%
62 44.9%
73 52.9%
3 2.2%
0 0.0%
0 0.0%
0 0.0%
Male
1,541 51.5%
75 54.3%
Female
1,451 48.5%
63 45.7%
Enrollment in Selected Programs
Program
Program % of Student Enrollment Population
Gifted (Grades K-12)
196
6.6%
Non-Vocational Labs (Grades 9-12)
707
90.4%
Vocational Labs (Grades 9-12)
543
69.4%
Alternative Programs (Grades 6-12)
29
1.9%
Students Eligible to Receive Free/Reduced Lunches
Number
Percent
1,793
57.3%
Dropout Rate
Number
Percent
6-12 9-12
82
5.0%
75
8.8%
Enrollment in Compensatory Programs
Program
Program % of Student Enrollment Population
Special Education
(Grades K-12)
307
PK
29
English to Speakers of
Other Languages (ESOL)
0
(Grades K-12)
Remedial Education (Grades 2-5, 9-12)
282
Special Instructional
Assistance (SIA)
199
(Grades K-3)
Title I (Grades K-12) Number of schools with: Schoolwide program Targeted Assistance program No Title I program
10.3% N/A
0.0%
15.6%
20.4%
2 0 1
Total 142
Retained Students, by Race/Ethnicity and Sex
Black
White Hispanic
American MultiAsian Indian racial
72 50.7%
67 47.2%
3 2.1%
0 0.0%
0 0.0%
0 0.0%
Male Female
96
46
67.6% 32.4%
Prepared by Georgia Department of Education
Page 1
STATE-REQUIRED TEST DATA
NORM-REFERENCED TESTS
Grade 3 Iowa Tests of Basic Skills (ITBS) Each chart reflects data for three years of testing.
Reading Comprehension
Mathematics
50
44 54 37 53 42 52 0
98-99 97-98 96-97
System State
50
45 61 43 61 47 59 0
98-99 97-98 96-97
System State
Reading Vocabulary
50
39 50 33 50 42 49 0
98-99 97-98 96-97
System State
Social Studies
50
47 56 42 55 45 55 0
98-99 97-98 96-97
System State
Language Arts
50
56 64 49 62 58 59 0
98-99 97-98 96-97
System State
Science
50
52 59 42 59 46 58 0
98-99 97-98 96-97
System State
Sources of Information
Composite Score
50
46 57 0
98-99
System
50
37 56 45 55 97-98 96-97
State
47 58 39 57 0
98-99 97-98
1998-99 GEORGIA PUBLIC EDUCATION REPORT CARD Cook County Schools
Prepared by Georgia Department of Education
System State Scores Reported 46 56 in Percentiles 96-97
Page 2
STATE-REQUIRED TEST DATA
NORM-REFERENCED TESTS
Grade 5 Iowa Tests of Basic Skills (ITBS) Each chart reflects data for three years of testing.
Reading Comprehension
Mathematics
50
50 53 45 53 41 52 0
98-99 97-98 96-97
System State
50
42 59 35 58 38 57 0
98-99 97-98 96-97
System State
Reading Vocabulary
50
42 48 34 48 31 46 0
98-99 97-98 96-97
System State
Social Studies
50
52 57 45 56 43 55 0
98-99 97-98 96-97
System State
Language Arts
50
60 63 46 61 50 58 0
98-99 97-98 96-97
System State
Science
50
59 60 49 59 44 59 0
98-99 97-98 96-97
System State
Sources of Information
Composite Score
50
54 58 0
98-99
System
50
42 58 44 57 97-98 96-97
State
52 57 41 56 0
98-99 97-98
1998-99 GEORGIA PUBLIC EDUCATION REPORT CARD Cook County Schools
Prepared by Georgia Department of Education
System State Scores Reported 41 55 in Percentiles 96-97
Page 3
STATE-REQUIRED TEST DATA
NORM-REFERENCED TESTS Grade 8
Iowa Tests of Basic Skills (ITBS) Each chart reflects data for three years of testing.
Reading Comprehension
Mathematics
50
40 49 41 48 40 48 0
98-99 97-98 96-97
System State
50
57 56 54 55 47 54 0
98-99 97-98 96-97
System State
Reading Vocabulary
50
36 46 34 45 36 44 0
98-99 97-98 96-97
System State
Language Arts
50
59 60 55 58 53 56 0
98-99 97-98 96-97
System State
Social Studies
50
46 54 53 53 49 53 0
98-99 97-98 96-97
System State
Science
50
54 56 56 55 52 53 0
98-99 97-98 96-97
System State
Sources of Information
Composite Score
50
48 57 0
98-99
System
50
54 56 50 55 97-98 96-97
State
50 56 52 54 0
98-99 97-98
1998-99 GEORGIA PUBLIC EDUCATION REPORT CARD Cook County Schools
Prepared by Georgia Department of Education
System State Scores Reported 47 54 in Percentiles 96-97
Page 4
STATE-REQUIRED TEST DATA
PERFORMANCE ASSESSMENTS
Grade 5 Writing Assessment
1998-99
1997-98
1996-97
Percent at Developmental Stages:
Comparison
Comparison
Comparison
System Group State System Group State System Group State
Stage Stage Stage Stage Stage Stage
1: The Emerging Writer 2: The Developing Writer 3: The Focusing Writer 4: The Experimenting Writer 5: The Engaging Writer 6: The Extending Writer
0% 7% 27% 35% 23% 8%
0% 2% 21% 46% 23% 7%
0% 1% 16% 41% 29% 12%
1% 7% 29% 42% 17% 2%
0% 3% 22% 43% 23% 7%
0% 3% 19% 41% 27% 10%
0% 4% 33% 36% 22% 5%
0% 5% 26% 39% 22% 8%
0% 3% 21% 37% 26% 12%
Grade 8 Writing Assessment
1998-99 Percent Scoring 1997-98 Percent Scoring 1996-97 Percent Scoring
Categories of Scaled Scores
Comparison
Comparison
Comparison
System Group State System Group State System Group State
Inadequate (less than 162)
Minimal (162-209)
Good
(210-247)
Very Good (greater than 247)
3% 60% 32%
5%
9% 46% 36%
9%
8% 40% 41% 11%
13% 51% 29%
7%
13% 50% 31%
6%
11% 46% 34%
8%
22% 50% 26%
2%
18% 48% 28%
6%
15% 46% 30%
8%
Average Scaled Score: (Range 100-300)
201
203 208
197
197 202
190
194 198
GEORGIA HIGH SCHOOL GRADUATION TESTS (GHSGT)
Percent of Regular Program 11th Graders Passing the Georgia High School Graduation Tests on First Administration
1998-99
1997-98
1996-97
Comparison
Comparison
Comparison
System Group State System Group State System Group State
English Language Arts Mathematics Social Studies Science
93% 79% 75% 75%
94% 86% 76% 69%
96% 88% 80% 72%
93% 88% 80% 82%
93% 86% 73% 71%
94% 88% 78% 74%
90% 75% 66% 61%
91% 81% 69% 65%
94% 87% 78% 74%
All Components listed above 6 3 %
63% 68% 73%
63% 68% 50%
57% 67%
Writing
85%
93% 93% 86%
91% 92% 93%
91% 93%
1998-99 GEORGIA PUBLIC EDUCATION REPORT CARD
Cook County Schools
Prepared by Georgia Department of Education
Page 5
GRADUATE DATA
1999 Graduates by Credentials, Race/Ethnicity and Sex
Diplomas with Both College Prep. & Voc. Endorsements
Diplomas with College Prep. Endorsements Diplomas with Vocational Endorsements General High School Diplomas Special Education Diplomas
Total All Diplomas
Certificates of Performance
Total Graduates
Total 49 34 53 3 3
142 8
150
Black
9 18.4%
10 29.4%
24 45.3%
3 100.0%
3 100.0%
49 34.5%
6 75.0%
55 36.7%
American MultiWhite Hispanic Asian Indian racial
40 81.6%
24 70.6%
29 54.7%
0 0.0%
0 0.0%
93 65.5%
0 0.0%
0 0.0%
0 0.0%
0 0.0%
0 0.0%
0 0.0%
0 0.0%
0 0.0%
0 0.0%
0 0.0%
0 0.0%
0 0.0%
0 0.0%
0 0.0%
0 0.0%
0 0.0%
0 0.0%
0 0.0%
0 0.0%
0 0.0%
0 0.0%
0 0.0%
0 0.0%
0 0.0%
2
0
0
0
0
25.0% 0.0% 0.0% 0.0% 0.0%
95
0
0
0
0
63.3% 0.0% 0.0% 0.0% 0.0%
Male Female
18 36.7%
14 41.2%
33 62.3%
2 66.7%
2 66.7%
31 63.3%
20 58.8%
20 37.7%
1 33.3%
1 33.3%
69
73
48.6% 51.4%
3
5
37.5% 62.5%
72
78
48.0% 52.0%
HOPE Scholarships
System State
Number of 1999 Graduates 1 5 0
Number Eligible
79
Percent Eligible
52.7%
65,548 40,292 61.5%
High School Completion Rate Percent of 1995Grade 9 Enrollment
in Graduating Class of1999
System
State
Completion Rate '95-'99 59.5% 68.9%
COLLEGE ADMISSIONS / CREDIT TEST DATA
Scholastic Assessment Test (SAT)
No. Taking
Average Score
Tests
Verbal Math Total
Based on students' highest verbal and highest math scores
System College Prep. Endorsement Other Diplomas
466 435 901 471 443 914 404 371 775
Georgia
492 488 980
Based on students' last test administration
System Georgia
66
458 430
888
41,958 483 479 962
Nation
952,913 502 508 1010
American College Testing (ACT)
System State Nation
English
19.0
19.1 20.4
Mathematics
18.2
19.9 20.7
Reading
21.2
20.2 21.3
Science Reasoning 19.2
19.9 21.0
CompositeScore 19.5
19.9 21.9
Advanced Placement Exams (AP)
No. of Students Taking Tests
No. of Tests Taken No. of Test Scores
3 or Higher Percent of Test
Scores 3 or Higher
System State 26 15,225 37 23,969 11 13,024
29.7% 54.3%
1998-99 GEORGIA PUBLIC EDUCATION REPORT CARD Cook County Schools
Prepared by Georgia Department of Education
Page 6
POSTSECONDARY DATA
Graduates Entering Georgia Public Colleges and Universities
Graduates Entering Georgia Public Colleges and Universities and
Requiring Learning Support (LS)
1998 Graduates Entering 1998-99
1997 Graduates Entering 1997-98
Percent of Graduating Number Class
62
39.7%
61
44.2%
Number Requiring
LS
15
7
Percent of those attending Georgia
Public Colleges
24.2%
11.5%
In previous years, the Report Card presented College Prep Curriculum information provided by the Board of Regents on students requiring Learning Support. Due to inconsistencies in the data provided by the Board of Regents in defining College Prep Completers versus Local Board of Education data defining College Prep Endorsements, the Department of Education Report Card will not provide this information until discrepancies can be reconciled.
Graduates Entering Georgia Public Technical and Adult Schools
Entering 1998-99 Entering 1997-98
Number Percent
Number Percent
1998 Graduates 1997 Graduates
18
11.5%
0
0.0%
N/A 12
N/A 8.7%
ACCREDITATION / RECOGNITION DATA
Southern Association of Colleges and Schools (SACS) Accrediting Commission
Secondary/Middle Commission Elementary/Middle Commission Both Elementary/Secondary Commissions Joint Commission Candidate for Accreditation
Accreditation by Georgia Accrediting Commission (GAC)
Accredited by GAC Accredited with Quality by GAC
Number of Schools
1 2 0 0 0
Number of Schools
0 0
Awards / Recognition
State Recognized Program
Number of Schools
Charter School
0
Pay for Performance Recipient
0
Georgia School of Excellence
1
National Blue Ribbon School
0
COMMUNITY DATA
Number of Children Eligible for Migrant Education Number of Families-At-Risk * Number of Food Stamp Participants * Number of Families Receiving TANF * ** Per Capita Income * Unemployment Rate * 1990 Population * Projected 2000 Population * Projected 2010 Population *
* Data Available at County Level Only ** Known as AFDC before January 1997
151 67
1,892 257
$16,255 4.7%
13,456 14,269 15,114
1998-99 GEORGIA PUBLIC EDUCATION REPORT CARD Cook County Schools
Prepared by Georgia Department of Education
Page 7
FISCAL DATA
Millage Rate
15.50
* Fall 1998 Property Tax Digest is used to calculate the 98-99 Value of One Mill
FTE Count
FTE Count used for Allotment Calculation 2,960.0 Fall '98 FTE Count 2,992
Value of One Mill
$220,757 $74.58 per Allotment FTE
Sources: Local State-QBE State-
Lottery State-
Other Federal Other
Total
PerGeneral Fund cent Per FTE
$3,741,506 24.2% $1,264 $11,326,748 73.4% $3,827
K-12 Revenues
Lottery K-12
and
Title
All Other
Programs
K-12
$0
$11,350
Bonded Debt $150
$0
$0
$0
$0 0.0%
$0
$0
$63,773
$0
$323,906 2.1% $109
$0 0.0%
$0
$45,621 0.3% $15
$15,437,782 100% $5,215
$0 $959,678
$0 $959,678
$0 $223,989
$55,823 $354,935
$0 $0 $0 $150
Capital Projects $2,152,061
$0
$0
$0 $0 $0 $2,152,061
School Nutrition
$268,400 $0
$0
$80,066 $794,298
$0 $1,142,765
Grand Total
Total
Per-
Amount cent
$6,173,469 30.8%
$11,326,748 56.5%
$63,773 0.3%
$403,972 2.0% $1,977,966 9.9%
$101,444 0.5% $20,047,373 100%
Instruction
Media Instruction
Support Pupil Services General Admin. School Admin. Trans-
portation Maint. & Ops. Capital Projects School Food Debt Service
Total
$9,472,371 63.7% $3,200 $284,099 1.9% $96
$475,487 3.2% $161
$843,509 5.7% $285
$418,639 2.8% $141
$1,050,987 7.1% $355
$735,596 4.9% $249
$1,326,276 8.9% $448
$273,693 1.8% $92
$0 0.0%
$0
$0 0.0%
$0
$14,880,661 100% $5,027
K-12 Expenditures
$753,760 $118,844
$0
$0
$0 $10,344,976 43.7%
$20,139
$0
$0
$0
$0
$304,239 1.3%
$57,151 $107,596
$0
$0
$0
$640,235 2.7%
$45,895
$88,510
$0
$0
$0
$977,915 4.1%
$81,072
$24,372
$0
$0
$0
$524,083 2.2%
$2,000
$14
$0
$0
$0 $1,053,002 4.4%
$1,140
$534
$0
$0
$0
$737,271 3.1%
$0
$0
$0
$0
$0 $1,326,276 5.6%
$0
$0
$0 $4,953,662
$0 $5,227,355 22.1%
$0
$0
$0
$0 $1,007,364 $1,007,364 4.3%
$0
$0 $1,544,867
$0
$0 $1,544,867 6.5%
$961,159 $339,872 $1,544,867 $4,953,662 $1,007,364 $23,687,588 100%
Salaries and Benefits as Percentages of Revenues and of Expenditures
Teachers and Paraprofessionals
Salaries $7,448,092
Benefits $1,823,826
Percentage of Revenues Percentage of Expenditures
Total of
Total of
General Fund
General Fund
Title Programs
Title Programs
Lottery K-12
Lottery K-12
Total Salaries
and
Total
and
Total
and Benefits All Other K-12 K - 12 All Other K-12 K - 12
$9,271,918
55.3%
46.3%
57.3%
39.1%
School Administration
$572,892
$177,045
$749,937
4.5%
3.7%
4.6%
3.2%
General Administration
$247,589
$71,784
$319,373
1.9%
1.6%
2.0%
1.3%
1998-99 GEORGIA PUBLIC EDUCATION REPORT CARD
Cook County Schools - 637
Prepared by Georgia Department of Education
Page 8
CERTIFIED PERSONNEL DATA
Number
Average Annual Salary Positions Average Contract Days
Average Daily Salary
Full-time Personnel Part-time
Sex Male Female
4 Yr Bachelor's Certificate 5 Yr Master's
Level 6 Yr Specialist's 7 Yr Doctoral Other*
Black
White Race/ Hispanic Ethnicity Asian
American Indian
Multiracial
Years Experience
<1 1-10 11-20 21-30 >30
Average
Administrators
14.20
$64,283.40 214.75
$299.34
13 2
6 9
0 3 11 1 0
1 14
0 0 0 0
0 0 3 12 0
24.00
Support Personnel PK-12 Teachers
15.50
192.79
$44,141.81 190.61
$231.58
$38,321.13 190.22
$201.46
14
187
6
7
8
36
12
158
6
108
9
57
5
27
0
0
0
2
2
21
18
173
0
0
0
0
0
0
0
0
0
9
4
69
8
64
8
41
0
11
17.55
14.36
*Includes One- and Two-Year Vocational Certificates.
Certified Staff Position Ratios
Teacher/Administrator Ratio 14:1
Teacher/Support Person Ratio 12:1
Teacher/Staff Ratio 6:1
Student Enrollment/All Teachers 16:1
Certified Personnel by Category
84.7% 100%
6.6%
8.7%
80% 60%
40%
20%
0%
Teachers
Administrators
Support Personnel
1998-99 GEORGIA PUBLIC EDUCATION REPORT CARD
Cook County Schools - 637
Prepared by Georgia Department of Education
Page 9
1998-99 GEORGIA PUBLIC EDUCATION REPORT CARD
COOK COUNTY SCHOOLS
Cook County High School - 6372050
Grade Range 9-12
The Georgia Public Education Report Card is designed to assist systems and schools in educational improvement. This report card contains a variety of data elements. An explanation of the terms is provided as a companion to the report card data. Please refer to the definitions for the most effective use of the reported data.
Total 782
STUDENT DATA
9-12 Enrollment, by Race/Ethnicity and Sex
Black
White Hispanic
American Multi-
Asian Indian
racial
318 40.7%
461 59.0%
0 0.0%
3 0.4%
0 0.0%
0 0.0%
Male Female
405 51.8%
377 48.2%
Enrollment in Selected Programs
Program
Gifted (Grades K-12)
Program % of Student Enrollment Population
58
7.4%
Non-Vocational Labs (Grades 9-12)
707
Vocational Labs
(Grades 9-12)
543
Alternative Programs (Grades 6-12)
16
90.4% 69.4%
2.0%
Students Eligible to Receive Free/Reduced Lunches
Number
Percent
School System
347 1,793
44.4% 57.3%
Enrollment in Compensatory Programs
Program
Program % of Student Enrollment Population
Special Education (Grades K-12) PK
55
7.0%
0
N/A
English to Speakers of Other Languages (ESOL) (Grades K-12)
0
0.0%
Remedial Education (Grades 2-5, 9-12)
22
2.8%
Title I (Grades K-12)
This school has no Title I program.
Dropout Rate for Grades 9-12
Number
Rate
School System
75
8.8%
75
8.8%
Total 59
Retained Students, by Race/Ethnicity and Sex
Black
White Hispanic
American MultiAsian Indian racial
29 49.2%
30 50.8%
0 0.0%
0 0.0%
0 0.0%
0 0.0%
Male Female
42
17
71.2% 28.8%
Prepared by Georgia Department of Education
Page 1
STATE-REQUIRED TEST DATA
GEORGIA HIGH SCHOOL GRADUATION TESTS (GHSGT)
Percent of Regular Program 11th Graders Passing the Georgia High School Graduation Tests on First Administration
English Language Arts Mathematics Social Studies Science
All Components listed above
Writing
1998-99
School System State
93% 79% 75% 75%
93% 79% 75% 75%
96% 88% 80% 72%
63% 63% 68%
85% 85% 93%
1997-98
School System State
93% 88% 80% 82%
93% 88% 80% 82%
94% 88% 78% 74%
73% 73% 68%
86% 86% 92%
1996-97
School System State
90% 75% 66% 61%
90% 75% 66% 61%
94% 87% 78% 74%
50% 50% 67%
93% 93% 93%
GRADUATE DATA
1999 Graduates by Credentials, Race/Ethnicity and Sex
Diplomas with Both College Prep. & Voc. Endorsements
Diplomas with College Prep. Endorsements Diplomas with Vocational Endorsements General High School Diplomas Special Education Diplomas
Total All Diplomas
Certificates of Performance
Total Graduates
Total 49 34 53 3 3
142 8
150
Black
9 18.4%
10 29.4%
24 45.3%
3 100.0%
3 100.0%
49 34.5%
6 75.0%
55 36.7%
White Hispanic
40 81.6%
24 70.6%
0 0.0%
0 0.0%
29 54.7%
0 0.0%
0 0.0%
0 0.0%
0 0.0%
0 0.0%
93 65.5%
0 0.0%
2 25.0%
0 0.0%
95 63.3%
0 0.0%
American MultiAsian Indian racial
0 0.0%
0 0.0%
0 0.0%
0 0.0%
0 0.0%
0 0.0%
0 0.0%
0 0.0%
0 0.0%
0 0.0%
0 0.0%
0 0.0%
0 0.0%
0 0.0%
0 0.0%
0 0.0%
0 0.0%
0 0.0%
0 0.0%
0 0.0%
0 0.0%
0 0.0%
0 0.0%
0 0.0%
Male Female
18 36.7%
14 41.2%
31 63.3%
20 58.8%
33 62.3%
2 66.7%
2 66.7%
20 37.7%
1 33.3%
1 33.3%
69
73
48.6% 51.4%
3
5
37.5% 62.5%
72
78
48.0% 52.0%
HOPE Scholarships
School System
Number of 1999 Graduates 1 5 0
Number Eligible
79
Percent Eligible
52.7%
150 79
52.7%
State
65,548 40,292 61.5%
High School Completion Rate
Percent of 1995Grade 9 Enrollment in Graduating Class of1999 School System State
Completion Rate '95-'99 59.5% 59.5% 68.9%
1998-99 GEORGIA PUBLIC EDUCATION REPORT CARD
Cook County High School - 6372050
Prepared by Georgia Department of Education
Page 2
COLLEGE ADMISSIONS / CREDIT TEST DATA
Scholastic Assessment Test (SAT)
Based on students' highest verbal and highest math scores
No. Taking
Average Score
Tests Verbal Math Total
Based on students' last test administration
Average Score Verbal Math Total
School College Prep. Endorsement Other Diplomas
66 466 435
901
471 443
914
404 371
775
System College Prep. Endorsement Other Diplomas
66 466 435
901
471 443
914
404 371
775
Georgia
41,958 492 488
980
458 N/A N/A
458 N/A N/A
483
430 N/A N/A
430 N/A N/A
479
888 N/A N/A
888 N/A N/A
962
Nation
952,913 N/A N/A N/A
502 508 1010
American College Testing (ACT)
Advanced Placement Exams (AP)
Number taking tests: English Mathematics Reading Science Reasoning CompositeScore
6 School System State
19.0 19.0 19.1
18.2 18.2 19.9
21.2 19.2
21.2 19.2
20.2 19.9
19.5 19.5 19.9
No. of Students Taking Tests
No. of Tests Taken No. of Test Scores
3 or Higher Percent of Test
Scores 3 or Higher
School 26 37 11
29.7%
System State 26 15,225 37 23,969 11 13,024
29.7% 54.3%
POST-SECONDARY DATA
Graduates Entering Georgia Public Colleges
Graduates Entering Georgia Public Colleges and Requiring Learning Support (LS)
1998 Graduates Entering in 1998-99
1997 Graduates Entering in 1997-98
Percent of Graduating Number Class
School
62
39.7%
System 6 2
39.7%
School
61
44.2%
System 6 1
44.2%
Number Requiring
LS 15 15
7 7
Percent of those attending Georgia
Public Colleges
24.2%
24.2%
11.5%
11.5%
In previous years, the Report Card presented College Prep Curriculum information provided by the Board of Regents on students requiring Learning Support. Due to inconsistencies in the data provided by the Board of Regents in defining College Prep Completers versus Local Board of Education data defining College Prep Endorsements, the Department of Education Report Card will not provide this information until discrepancies can be reconciled.
Graduates Entering Georgia Public Technical and Adult Schools
1998 Graduates School System
Entering Number 18 18
1998-99 Percent 11.5% 11.5%
Entering Number N/A N/A
1997-98 Percent
N/A N/A
1997 Graduates School
0
0.0%
System
0
0.0%
12
8.7%
12
8.7%
1998-99 GEORGIA PUBLIC EDUCATION REPORT CARD Cook County High School - 6372050
Prepared by Georgia Department of Education
Page 3
CERTIFIED PERSONNEL DATA
Positions Number Average Contract Days
Administrators
4.45 211.35
Support Personnel
4.00 190.00
PK-12 Teachers
51.55 190.81
Personnel Sex
Certificate
Years Experience
Full-time Part-time
Male Female
4 Yr Bachelor's 5 Yr Master's 6 Yr Specialist's 7 Yr Doctoral Other*
<1 1-10 11-20 21-30 >30
Average
4 1
2 3
0 2 3 0 0
0 0 0 5 0
25.00
3 4
4 3
3 4 0 0 0
0 1 3 3 0
16.86
47 5
22 30
27 14 10
0 1
3 13 15 17
4
16.17
*Includes One- and Two-Year Vocational Certificates.
ACCREDITATION DATA
Accredited by Southern Association of Colleges and Schools (SACS): Secondary/Middle Commission.
AWARDS / RECOGNITION DATA
The Georgia School of Excellence Program recognizes exemplary schools that have excellent, successful programs in many areas of school life. Each year, in a statewide competition, one elementary, one middle and one high school from each of Georgia's 11 congressional districts may be selected for this honor.
Cook County High School was designated a 1998-99 Georgia School of Excellence.
1998-99 GEORGIA PUBLIC EDUCATION REPORT CARD Cook County High School - 6372050
Prepared by Georgia Department of Education
Page 4
1998-99 GEORGIA PUBLIC EDUCATION REPORT CARD
COOK COUNTY SCHOOLS
Cook County Middle School - 6373050
Grade Range 6-8
The Georgia Public Education Report Card is designed to assist systems and schools in educational improvement. This report card contains a variety of data elements. An explanation of the terms is provided as a companion to the report card data. Please refer to the definitions for the most effective use of the reported data.
STUDENT DATA
Total 719
6-8 Enrollment, by Race/Ethnicity and Sex
Black
White Hispanic
American Multi-
Asian Indian
racial
276 38.4%
423 58.8%
14 1.9%
3 0.4%
0 0.0%
3 0.4%
Male 354
49.2%
Female 365
50.8%
Enrollment in Selected Programs
Program
Gifted (Grades K-12)
Program % of Student Enrollment Population
46
6.4%
Alternative Programs
13
(Grades 6-12)
1.8%
Students Eligible to Receive Free/Reduced Lunches
Number
Percent
School System
411 1,793
57.2% 57.3%
Enrollment in Compensatory Programs
Program
Program % of Student Enrollment Population
Special Education (Grades K-12) (PK)
63
8.8%
0
N/A
English to Speakers of Other Languages (ESOL) (Grades K-12)
0
0.0%
Title I (Grades K-12)
This school has a schoolwide program.
Dropout Rate for Grades 6-8
Number
Rate
School System
7
0.9%
7
0.9%
Total 12
Retained Students, by Race/Ethnicity and Sex
Black
White Hispanic
American MultiAsian Indian racial
8 66.7%
3 25.0%
1 8.3%
0 0.0%
0 0.0%
0 0.0%
Male Female
9
3
75.0% 25.0%
Prepared by Georgia Department of Education
Page 1
STATE-REQUIRED TEST DATA
NORM-REFERENCED TESTS Grade 8
Iowa Tests of Basic Skills (ITBS) Each chart reflects data for three years of testing.
Reading Comprehension 50
40 40 49 0
98-99
41 41 48 97-98
40 40 48 96-97
Mathematics
School 50
System
State
0
57 57 56 98-99
54 54 55 97-98
47 47 54 96-97
School System State
Reading Vocabulary 50
36 36 46 0
98-99
34 34 45 97-98
36 36 44 96-97
Language Arts
School 50
System
State
0
59 59 60 98-99
55 55 58 97-98
53 53 56 96-97
School System State
Social Studies 50
46 46 54 0
98-99
53 53 53 97-98
49 49 53 96-97
Science
School 50
System
State
0
54 54 56 98-99
56 56 55 97-98
52 52 53 96-97
School System State
Sources of Information
Composite Score
50
48 48 57 0
98-99
School 50
System
54 54 56 97-98
50 50 55 96-97
State 0
50 50 56 98-99
52 52 54 97-98
1998-99 GEORGIA PUBLIC EDUCATION REPORT CARD Cook County Middle School - 6373050
Prepared by Georgia Department of Education
47 47 54 96-97
Scores Reported in Percentiles
School System State
Page 2
STATE-REQUIRED TEST DATA
PERFORMANCE ASSESSMENTS
Grade 8 Writing Assessment
1998-99 Percent Scoring
1997-98 Percent Scoring
1996-97 Percent Scoring
Categories of Scaled Scores
School System State School System State School System State
Inadequate (less than 162)
Minimal (162-209)
Good
(210-247)
Very Good (greater than 247)
N/A N/A N/A N/A
3% 60% 32%
5%
8% 40% 41% 11%
13% 51% 29%
7%
13% 51% 29%
7%
11% 46% 34%
8%
22% 50% 26%
2%
22% 50% 26%
2%
15% 46% 30%
8%
Average Scaled Score: (Range 100-300)
N/A
201
208 197
197 202 190
190 198
No Grade Eight Writing Assessment Scores were reported for Cook County Middle School.
AWARDS / RECOGNITION DATA
Schools in Georgia may receive recognition in the following programs: Charter School Pay for Performance Program Georgia School of Excellence National Blue Ribbon School Cook County Middle School did not receive recognition in any of these programs during the 1998-99 school year.
1998-99 GEORGIA PUBLIC EDUCATION REPORT CARD Cook County Middle School - 6373050
Prepared by Georgia Department of Education
Page 3
CERTIFIED PERSONNEL DATA
Positions Number Average Contract Days
Personnel Sex
Certificate
Years Experience
Full-time Part-time
Male Female
4 Yr Bachelor's 5 Yr Master's 6 Yr Specialist's 7 Yr Doctoral Other*
<1 1-10 11-20 21-30 >30
Average
Administrators
3.00 215.33
3 0
1 2
0 0 2 1 0 0 0 1 2 0 20.33
Support Personnel
2.00 190.00
2 0
0 2
0 2 0 0 0 0 0 1 1 0 21.50
PK-12 Teachers
44.00 190.00
44 0
10 34
24 14
5 0 1 0 18 12 10 4 15.23
*Includes One- and Two-Year Vocational Certificates.
ACCREDITATION DATA
Accredited by Southern Association of Colleges and Schools (SACS):
Elementary/Middle Commission.
1998-99 GEORGIA PUBLIC EDUCATION REPORT CARD Cook County Middle School - 6373050
Prepared by Georgia Department of Education
Page 4
1998-99 GEORGIA PUBLIC EDUCATION REPORT CARD
COOK COUNTY SCHOOLS
Cook Elementary School - 6370196
Grade Range PK-5
The Georgia Public Education Report Card is designed to assist systems and schools in educational improvement. This report card contains a variety of data elements. An explanation of the terms is provided as a companion to the report card data. Please refer to the definitions for the most effective use of the reported data.
STUDENT DATA
Total
K-5
1,491
PK
138
Enrollment, by Race/Ethnicity and Sex
Black
White Hispanic
American Asian Indian
Multiracial
611 41.0%
824 55.3%
45 3.0%
2 0.1%
0 0.0%
9 0.6%
62 44.9%
73 52.9%
3 2.2%
0 0.0%
0 0.0%
0 0.0%
Male Female
782 52.4%
709 47.6%
75 54.3%
63 45.7%
Enrollment in Selected Programs
Program
Program % of Student Enrollment Population
Gifted (Grades K-12)
92
6.2%
Alternative Programs (Grades 6-12)
N/A
N/A
Students Eligible to Receive Free/Reduced Lunches
Number
Percent
School System
1,035 1,793
63.5% 57.3%
Dropout Rate *
Number
Rate
School System
N/A N/A
N/A N/A
* Dropout rates are not applicable for grades PK-5.
Enrollment in Compensatory Programs
Program
Program % of Student Enrollment Population
Special Education (Grades K-12)
189 12.7%
(PK)
29
N/A
English to Speakers of Other Languages (ESOL) (Grades K-12)
0
0.0%
Remedial Education (Grades 2-5, 9-12)
260 25.4%
Special Instructional Assistance (SIA) (Grades K-3)
199 20.4%
Title I (Grades K-12)
This school has a schoolwide program.
Total 71
Retained Students, by Race/Ethnicity and Sex
Black
White Hispanic
American MultiAsian Indian racial
35 49.3%
34 47.9%
2 2.8%
0 0.0%
0 0.0%
0 0.0%
Male Female
45
26
63.4% 36.6%
Prepared by Georgia Department of Education
Page 1
STATE-REQUIRED TEST DATA
NORM-REFERENCED TESTS Grade 3
Iowa Tests of Basic Skills (ITBS) Each chart reflects data for three years of testing.
Reading Comprehension 50
44 44 54 0
98-99
37 37 53 97-98
42 42 52 96-97
Mathematics
School 50
System
State
0
45 45 61 98-99
43 43 61 97-98
47 47 59 96-97
School System State
Reading Vocabulary 50
39 39 50 0
98-99
33 33 50 97-98
42 42 49 96-97
Language Arts
School 50
System
State
0
56 56 64 98-99
49 49 62 97-98
58 58 59 96-97
School System State
Social Studies 50
47 47 56 0
98-99
42 42 55 97-98
45 45 55 96-97
Science
School 50
System
State
0
52 52 59 98-99
42 42 59 97-98
46 46 58 96-97
School System State
Sources of Information
Composite Score
50
46 46 57 0
98-99
School 50
System
37 37 56 97-98
45 45 55 96-97
State 0
47 47 58 98-99
39 39 57 97-98
1998-99 GEORGIA PUBLIC EDUCATION REPORT CARD Cook Elementary School - 6370196
Prepared by Georgia Department of Education
46 46 56 96-97
Scores Reported in Percentiles
School System State
Page 2
STATE-REQUIRED TEST DATA
NORM-REFERENCED TESTS Grade 5
Iowa Tests of Basic Skills (ITBS) Each chart reflects data for three years of testing.
Reading Comprehension
Mathematics
50
50 50 53 0
98-99
45 45 53 97-98
41 41 52 96-97
School 50
System
State
0
42 42 59 98-99
35 35 58 97-98
38 38 57 96-97
School System State
Reading Vocabulary 50
42 42 48 0
98-99
34 34 48 97-98
31 31 46 96-97
Language Arts
School 50
System
State
0
60 60 63 98-99
46 46 61 97-98
50 50 58 96-97
School System State
Social Studies 50
52 52 57 0
98-99
45 45 56 97-98
43 43 55 96-97
Science
School 50
System
State
0
59 59 60 98-99
49 49 59 97-98
44 44 59 96-97
School System State
Sources of Information
Composite Score
50
54 54 58 0
98-99
School 50
System
42 42 58 97-98
44 44 57 96-97
State 0
52 52 57 98-99
41 41 56 97-98
41 41 55 96-97
1998-99 GEORGIA PUBLIC EDUCATION REPORT CARD Cook Elementary School - 6370196
Prepared by Georgia Department of Education
Scores Reported in Percentiles
School System State
Page 3
STATE-REQUIRED TEST DATA
PERFORMANCE ASSESSMENTS
Grade 5 Writing Assessment
Percent at Developmental Stages:
1998-99 School System State
1997-98 School System State
1996-97 School System State
Stage Stage Stage Stage Stage Stage
1:The Emerging Writer 2:The Developing Writer 3:The Focusing Writer 4:The Experimenting 5:The Engaging Writer 6:The Extending Writer
0% 7% 27% 35% 23% 8%
0% 7% 27% 35% 23% 8%
0% 1% 16% 41% 29% 12%
1% 7% 29% 42% 17% 2%
1% 7% 29% 42% 17% 2%
0% 3% 19% 41% 27% 10%
0% 4% 33% 36% 22% 5%
0% 4% 33% 36% 22% 5%
0% 3% 21% 37% 26% 12%
AWARDS / RECOGNITION DATA
Schools in Georgia may receive recognition in the following programs: Charter School Pay for Performance Program Georgia School of Excellence National Blue Ribbon School Cook Elementary School did not receive recognition in any of these programs during the 1998-99 school year.
1998-99 GEORGIA PUBLIC EDUCATION REPORT CARD Cook Elementary School - 6370196
Prepared by Georgia Department of Education
Page 4
CERTIFIED PERSONNEL DATA
Positions Number Average Contract Days
Personnel Sex
Certificate
Years Experience
Full-time Part-time
Male Female
4 Yr Bachelor's 5 Yr Master's 6 Yr Specialist's 7 Yr Doctoral Other*
<1 1-10 11-20 21-30 >30
Average
Administrators
3.00 215.33
3 0
0 3
0 0 3 0 0 0 0 1 2 0 23.67
Support Personnel
5.25 190.00
5 1
1 5
2 2 2 0 0 0 2 3 1 0 16.50
PK-12 Teachers
82.75 190.00
82 1
3 80
52 21 10
0 0 6 32 30 13 2 13.02
*Includes One- and Two-Year Vocational Certificates.
ACCREDITATION DATA
Accredited by Southern Association of Colleges and Schools (SACS):
Elementary/Middle Commission.
1998-99 GEORGIA PUBLIC EDUCATION REPORT CARD Cook Elementary School - 6370196
Prepared by Georgia Department of Education
Page 5