- Collection:
- Georgia Government Publications
- Title:
- Georgia Physician Workforce AHEC reports - 2000: Three Rivers physician demographic summary statistics
- Creator:
- Georgia. Department of Community Health. Georgia Board for Physician Workforce
- Contributor to Resource:
- Georgia. Department of Community Health. Georgia Board for Physician Workforce
- Publisher:
- Atlanta, Ga. : Georgia. Department of Community Health. Georgia Board for Physician Workforce
- Date of Original:
- 2001
- Subject:
- Medicine--Specialties and specialists--Georgia--Statistics--Periodicals.
Physicians--Georgia--Statistics--Periodicals.
Médecins--Géorgie (État)--Statistiques--Périodiques.
Georgia Government Documents--Serial - Location:
- United States, Georgia, 32.75042, -83.50018
- Medium:
- state government records
- Type:
- Text
- Format:
- application/pdf
- External Identifiers:
- Call Number GA C910 .S1 T4 2000
- Metadata URL:
- https://dlg.galileo.usg.edu/id:dlg_ggpd_y-ga-bc910-b-ps1-bt4-b2000-belec-p-btext
- Digital Object URL:
- https://dlg.galileo.usg.edu/do:dlg_ggpd_y-ga-bc910-b-ps1-bt4-b2000-belec-p-btext
- Language:
- eng
- Holding Institution:
- University of Georgia. Map and Government Information Library
- Rights:
-

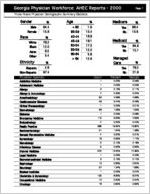
Georgia Physician Workforce: AHEC Reports - 2000
Three Rivers Physician Demographic Summary Statistics
Page 1
Gender
Male Female
% 84.4 15.6
Race
White Black Asian Other
% 78.2 12.0
6.5 3.4
Ethnicity
%
Hispanic Non-Hispanic
2.6 97.4
Physician Specialty
Addiction Medicine Adolescent Medicine Allergy Allergy & Immunology Anesthesiology Cardiovascular Diseases Clinical Pharmacology Dermatology Diabetes Emergency Medicine Endocrinology Family Practice Gastroenterology General Preventative Medicine Gynecology Hematology Infectious Disease Internal Medicine Legal Medicine Neonatal-perinatal Medicine Nephrology Neurology Nuclear medicine Obstetrics & Gynecology Occupational Medicine Oncology
Age
< 35 35-39 40-44 45-49 50-54 55-59 60-64
> 64
%
1.9 13.4 16.8 18.1 17.3 12.0
5.8 12.9
Count
1 1 3 7 92 49 1 26 1 113 4 386 31 4 19 2 5 270 1 3 13 27 1 133 10 16
Medicare
Yes No
% 86.4 13.6
Medicaid
Yes No
% 84.9 15.1
Managed
Care
%
Yes 78.2 No 21.8
Percent
0.05%
Georgia
0.09%
0.05%
0.03%
0.15%
0.11%
0.35%
0.34%
4.58%
4.98%
2.44%
2.46%
0.05%
0.01%
1.29%
1.55%
0.05%
0.08%
5.63%
4.65%
0.20%
0.40%
19.22%
13.62%
1.54%
1.38%
0.20%
0.31%
0.95%
1.17%
0.10%
0.18%
0.25%
0.62%
13.45%
14.39%
0.05%
0.03%
0.15%
0.17%
0.65%
0.67%
1.34%
1.66%
0.05%
0.07%
6.62%
6.27%
0.50%
0.57%
0.80%
0.82%
Georgia Physician Workforce: AHEC Reports - 2000
Three Rivers Physician Demographic Summary Statistics
Opthalmology Otology Otorhinolaryngology Pathology Pediatrics Pediatric Endocrinology Pediatric Surgery Physical Medicine & Rehab Psychiatry Addiction Psychiatry Child Psychiatry Public Health Pulmonary Diseases Radiology Diagnostic Radiology Therapeutic Radiology Rheumatology Surgery - General Abdominal Surgery Cardiovascular Surgery Colon & Rectal Surgery Maxillofacial Surgery Neurological Surgery Orthopedic Surgery Plastic Surgery Thoracic Surgery Urological Surgery Other
Total Three Rivers Physicians Report created by Georgia Board for Physician Workforce, State of Georgia
54 1 34 35 154 2 2 4 87 1 5 1 9 75 35 8 4 102 1 8 1 1 14 83 16 5 36 11
2,008
2.69% 0.05% 1.69% 1.74% 7.67% 0.10% 0.10% 0.20% 4.33% 0.05% 0.25% 0.05% 0.45% 3.74% 1.74% 0.40% 0.20% 5.08% 0.05% 0.40% 0.05% 0.05% 0.70% 4.13% 0.80% 0.25% 1.79% 0.55%
100.00%
Page 2
2.47% 0.03% 1.62% 2.34% 8.91% 0.05% 0.08% 0.76% 5.80% 0.01% 0.15% 0.60% 1.00% 3.05% 1.68% 0.35% 0.39% 4.91% 0.08% 0.30% 0.17% 0.07% 0.70% 3.53% 0.95% 0.22% 1.58% 0.76%