- Collection:
- Georgia Government Publications
- Serial:
- Georgia physician workforce: MSA reports ... Gainesville physician demographic summary statistics.
- Title:
- Georgia Physician Workforce MSA reports - 2002: Gainesville physician demographic summary statistics
- Creator:
- Georgia. Department of Community Health. Georgia Board for Physician Workforce
- Contributor to Resource:
- Georgia. Department of Community Health. Georgia Board for Physician Workforce
- Publisher:
- Atlanta, Ga. : Georgia. Department of Community Health. Georgia Board for Physician Workforce
- Date of Original:
- 2003
- Subject:
- Medicine--Specialties and specialists--Georgia--Statistics--Periodicals.
Physicians--Georgia--Statistics--Periodicals.
Médecins--Géorgie (État)--Statistiques--Périodiques.
Georgia Government Documents--Serial - Location:
- United States, Georgia, 32.75042, -83.50018
- Medium:
- state government records
- Type:
- Text
- Format:
- application/pdf
- Description:
- 1998; title from PDF running title (Georgia Government Publications database, viewed May 10, 2024).
2008 (Georgia Government Publications database, viewed May 10, 2024). - External Identifiers:
- Call Number GA C910 .S1 G31 2002
- Metadata URL:
- https://dlg.galileo.usg.edu/id:dlg_ggpd_y-ga-bc910-b-ps1-bg31-b2002-belec-p-btext
- Digital Object URL:
- https://dlg.galileo.usg.edu/do:dlg_ggpd_y-ga-bc910-b-ps1-bg31-b2002-belec-p-btext
- Language:
- eng
- Holding Institution:
- University of Georgia. Map and Government Information Library
- Rights:
-

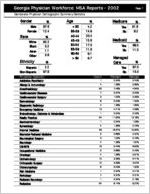
Georgia Physician Workforce: MSA Reports - 2002
Page 1
Gainesville Physician Demographic Summary Statistics
Gender
%
Age
Male 87.6
< 35
Female 12.4
35-39
Race
White Black Asian Other
Ethnicity
% 92.2
3.2 1.1 3.6
%
40-44 45-49 50-54 55-59 60-64
> 64
Hispanic Non-Hispanic
2.2 97.8
Physician Specialty
Addiction Psychiatry Allergy & Immunology Anesthesiology Cardiovascular Diseases Cardiovascular Surgery Dermatology Diagnostic Radiology Emergency Medicine Endocrinology, Diabetes & Metabolism Family Practice Gastroenterology Gynecology Internal Medicine Neonatal-Perinatal Medicine Neurological Surgery Neurology OB/GYN Occupational Medicine Oncology Opthalmology Orthopedic Surgery Otolaryngology Pain Medicine Pathology Pediatric Neurology Pediatrics
% 4.2 14.9 20.4 15.6 17.0 11.6 6.1 9.7
Count
1 4 22 7 3 6 4 13 1 34 1 4 48 2 3 4 16 2 4 10 10 6 1 7 1 24
Medicare
Yes No
% 91.8
8.2
Medicaid
Yes No
% 88.5 11.5
Managed
Care
%
Yes 87.0 No 13.0
Percent
0.34%
Georgia
0.40%
1.36%
0.65%
7.46%
4.64%
2.37%
2.23%
1.02%
0.35%
2.03%
1.50%
1.36%
1.65%
4.41%
4.58%
0.34%
0.42%
11.53%
13.18%
0.34%
1.09%
1.36%
0.72%
16.27%
15.22%
0.68%
0.37%
1.02%
0.72%
1.36%
1.67%
5.42%
6.90%
0.68%
0.42%
1.36%
0.91%
3.39%
2.41%
3.39%
3.57%
2.03%
1.50%
0.34%
0.41%
2.37%
2.31%
0.34%
0.16%
8.14%
9.07%
Georgia Physician Workforce: MSA Reports - 2002
Gainesville Physician Demographic Summary Statistics
Plastic Surgery Psychiatry Public Health Pulmonary Diseases Radiology Rheumatology Therapeutic Radiology General Surgery Thoracic Surgery Urology Other
Total Gainesville Physicians
Report created by Georgia Board for Physician Workforce, State of Georgia
6
2.03%
8
2.71%
2
0.68%
2
0.68%
9
3.05%
1
0.34%
3
1.02%
15
5.08%
1
0.34%
7
2.37%
3
1.02%
295 100.00%
Page 2
1.11% 5.43% 0.42% 0.87% 2.68% 0.32% 0.55% 4.40% 0.56% 1.59% 1.21%