- Collection:
- Georgia Government Publications
- Serial:
- Georgia physician workforce: AHEC reports ... Blue Ridge physician demographic summary statistics.
- Title:
- Georgia Physician Workforce AHEC reports - 2004: Blue Ridge physician demographic summary statistics
- Creator:
- Georgia. Dept. of Community Health. Georgia Board for Physician Workforce
- Contributor to Resource:
- Georgia. Dept. of Community Health. Georgia Board for Physician Workforce
- Publisher:
- Atlanta, Ga. : Georgia. Dept. of Community Health. Georgia Board for Physician Workforce
- Date of Original:
- 2005
- Subject:
- Medicine--Specialties and specialists--Georgia--Statistics--Periodicals.
Physicians--Georgia--Statistics--Periodicals.
Médecins--Géorgie (État)--Statistiques--Périodiques.
Georgia Government Documents--Serial - Location:
- United States, Georgia, 32.75042, -83.50018
- Medium:
- state government records
- Type:
- Text
- Format:
- application/pdf
- Description:
- 1998; title from PDF running title (Georgia Government Publications database, viewed April 24, 2024).
2006 (Georgia Government Publications database, viewed April 24, 2024). - External Identifiers:
- Call Number GA C910 .S1 B5 2004
- Metadata URL:
- https://dlg.galileo.usg.edu/id:dlg_ggpd_y-ga-bc910-b-ps1-bb5-b2004-belec-p-btext
- Digital Object URL:
- https://dlg.galileo.usg.edu/do:dlg_ggpd_y-ga-bc910-b-ps1-bb5-b2004-belec-p-btext
- Language:
- eng
- Holding Institution:
- University of Georgia. Map and Government Information Library
- Rights:
-

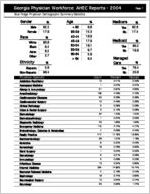
Georgia Physician Workforce: AHEC Reports - 2004
Blue Ridge Physician Demographic Summary Statistics
Page 1
Gender
%
Age
Male 82.2
< 35
Female 17.8
35-39
Race
White Black Asian Other
Ethnicity
% 80.8
9.4 6.2 3.7
%
40-44 45-49 50-54 55-59 60-64
> 64
Hispanic Non-Hispanic
3.6 96.4
Physician Specialty
Addiction Psychiatry Aerospace Medicine Allergy & Immunology Anesthesiology Cardiovascular Diseases Cardiovascular Surgery Clinical Pathology Colon & Rectal Surgery Dermatology Dermatopathology Diagnostic Radiology Emergency Medicine Endocrinology, Diabetes & Metabolism Family Practice Gastroenterology Geriatrics Gynecology Hand Surgery Hematology Immunology Infectious Disease Internal Medicine Neonatal-Perinatal Medicine Nephrology Neurological Surgery Neurology
% 8.8 15.3 16.9 17.9 16.1 9.7 5.8 8.3
Count
10 1 21 109 50 12 2 3 34 1 45 115 7 417 26 9 19 1 5 2 13 354 4 18 13 23
Medicare
Yes No
% 82.6 17.4
Medicaid
Yes No
% 80.2 19.8
Managed
Care
%
Yes 79.4 No 20.6
Percent
0.41%
Georgia
0.33%
0.04%
0.07%
0.87%
0.65%
4.49%
4.72%
2.06%
2.36%
0.49%
0.36%
0.08%
0.08%
0.12%
0.28%
1.40%
1.57%
0.04%
0.05%
1.85%
1.92%
4.74%
4.77%
0.29%
0.45%
17.18%
13.09%
1.07%
1.18%
0.37%
0.42%
0.78%
0.63%
0.04%
0.02%
0.21%
0.06%
0.08%
0.03%
0.54%
0.85%
14.59%
15.14%
0.16%
0.43%
0.74%
0.85%
0.54%
0.74%
0.95%
1.74%
Georgia Physician Workforce: AHEC Reports - 2004
Blue Ridge Physician Demographic Summary Statistics
OB/GYN Occupational Medicine Oncology Opthalmology Orthopedic Surgery Otolaryngology Pain Medicine Pathology Pediatric Neurology Pediatric Radiology Pediatrics Plastic Surgery Preventive Medicine Psychiatry Public Health Pulmonary Diseases Radiology Rheumatology Therapeutic Radiology General Surgery Spinal Cord Injury Medicine Thoracic Surgery Urology Other Physical Medicine & Rehabilitation
Total Blue Ridge Physicians
Report created by Georgia Board for Physician Workforce, State of Georgia
171 12 21 45
100 43 14 37 3 1
242 24 8
110 3 30 60 6 8
100 1 7 30 29 8
2,427
7.05% 0.49% 0.87% 1.85% 4.12% 1.77% 0.58% 1.52% 0.12% 0.04% 9.97% 0.99% 0.33% 4.53% 0.12% 1.24% 2.47% 0.25% 0.33% 4.12% 0.04% 0.29% 1.24% 1.19% 0.33%
100.00%
Page 2
6.69% 0.44% 1.03% 2.32% 3.49% 1.55% 0.39% 2.26% 0.15% 0.07% 9.07% 1.15% 0.40% 5.22% 0.43% 0.94% 2.32% 0.36% 0.54% 4.19% 0.04% 0.54% 1.47% 1.34% 0.14%