- Collection:
- Georgia Government Publications
- Serial:
- Georgia physician workforce: MSA reports ... Atlanta physician demographic summary statistics.
- Title:
- Georgia Physician Workforce MSA reports - 2002: Atlanta physician demographic summary statistics
- Creator:
- Georgia. Department of Community Health. Georgia Board for Physician Workforce
- Contributor to Resource:
- Georgia. Department of Community Health. Georgia Board for Physician Workforce
- Publisher:
- Atlanta, Ga. : Georgia. Department of Community Health. Georgia Board for Physician Workforce
- Date of Original:
- 2003
- Subject:
- Medicine--Specialties and specialists--Georgia--Statistics--Periodicals.
Physicians--Georgia--Statistics--Periodicals.
Médecins--Géorgie (État)--Statistiques--Périodiques.
Georgia Government Documents--Serial - Location:
- United States, Georgia, 32.75042, -83.50018
- Medium:
- state government records
- Type:
- Text
- Format:
- application/pdf
- Description:
- 1998; title from PDF running title (Georgia Government Publications databse, viewed April 22, 2024).
2008 (Georgia Government Publications databse, viewed April 22, 2024). - External Identifiers:
- Call Number GA C910 .S1 A84 2002
- Metadata URL:
- https://dlg.galileo.usg.edu/id:dlg_ggpd_y-ga-bc910-b-ps1-ba84-b2002-belec-p-btext
- Digital Object URL:
- https://dlg.galileo.usg.edu/do:dlg_ggpd_y-ga-bc910-b-ps1-ba84-b2002-belec-p-btext
- Language:
- eng
- Holding Institution:
- University of Georgia. Map and Government Information Library
- Rights:
-

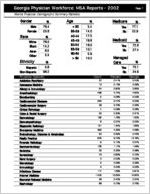
Georgia Physician Workforce: MSA Reports - 2002
Page 1
Atlanta Physician Demographic Summary Statistics
Gender
%
Age
Male 76.4
< 35
Female 23.6
35-39
Race
White Black Asian Other
Ethnicity
% 76.0 14.2
6.5 3.3
%
40-44 45-49 50-54 55-59 60-64
> 64
Hispanic Non-Hispanic
3.8 96.2
Physician Specialty
Addiction Psychiatry Aerospace Medicine Allergy & Immunology Anesthesiology Bloodbanking Cardiovascular Diseases Cardiovascular Surgery Clinical Pathology Colon & Rectal Surgery Dermatology Dermatopathology Diagnostic Radiology Emergency Medicine Endocrinology, Diabetes & Metabolism Family Practice Forensic Pathology Gastroenterology Geriatrics Gynecology Hand Surgery Hematology Immunology Infectious Disease Internal Medicine Neonatal-Perinatal Medicine Nephrology
% 5.4 14.0 17.5 18.6 16.0 10.1 5.9 10.2
Count
37 12 54 428 5 223 39 7 30 159 6 121 393 50 879 9 106 32 75 3 5 3 117 1,403 36 66
Medicare
Yes No
% 77.1 22.9
Medicaid
Yes No
% 72.6 27.4
Managed
Care
%
Yes 75.1 No 24.9
Percent
0.41%
Georgia
0.40%
0.13%
0.09%
0.60%
0.65%
4.74%
4.64%
0.06%
0.03%
2.47%
2.23%
0.43%
0.35%
0.08%
0.06%
0.33%
0.31%
1.76%
1.50%
0.07%
0.05%
1.34%
1.65%
4.35%
4.58%
0.55%
0.42%
9.73%
13.18%
0.10%
0.07%
1.17%
1.09%
0.35%
0.38%
0.83%
0.72%
0.03%
0.02%
0.06%
0.06%
0.03%
0.02%
1.29%
0.81%
15.53%
15.22%
0.40%
0.37%
0.73%
0.75%
Georgia Physician Workforce: MSA Reports - 2002
Atlanta Physician Demographic Summary Statistics
Neurological Surgery Neurology Neuropathology Nuclear Medicine Nuclear Radiology OB/GYN Occupational Medicine Oncology Opthalmology Orthopedic Surgery Otolaryngology Pain Medicine Pathology Pediatric Endocrinology Pediatric Hematology/Oncology Pediatric Nephrology Pediatric Neurology Pediatric Radiology Pediatric Surgery Pediatrics Plastic Surgery Preventive Medicine Psychiatry Public Health Pulmonary Diseases Radiology Rheumatology Therapeutic Radiology General Surgery Spinal Cord Injury Medicine Thoracic Surgery Traumatic Surgery Urology Other
Total Atlanta Physicians
Report created by Georgia Board for Physician Workforce, State of Georgia
58 163
5 9 5 617 53 94 222 298 134 48 202 7 18 3 15 15 14 940 105 61 522 62 82 247 34 51 348 2 56 3 136 109
9,036
0.64% 1.80% 0.06% 0.10% 0.06% 6.83% 0.59% 1.04% 2.46% 3.30% 1.48% 0.53% 2.24% 0.08% 0.20% 0.03% 0.17% 0.17% 0.15% 10.40% 1.16% 0.68% 5.78% 0.69% 0.91% 2.73% 0.38% 0.56% 3.85% 0.02% 0.62% 0.03% 1.51% 1.21%
100.00%
Page 2
0.72% 1.67% 0.05% 0.08% 0.07% 6.90% 0.42% 0.91% 2.41% 3.57% 1.50% 0.41% 2.31% 0.04% 0.15% 0.02% 0.16% 0.10% 0.10% 9.07% 1.11% 0.49% 5.43% 0.42% 0.87% 2.68% 0.32% 0.55% 4.40% 0.04% 0.56% 0.02% 1.59% 1.21%