- Collection:
- Georgia Government Publications
- Serial:
- Georgia physician workforce: AHEC reports ... Atlanta physician demographic summary statistics.
- Title:
- Georgia Physician Workforce AHEC reports - 2002: Atlanta physician demographic summary statistics
- Creator:
- Georgia. Department of Community Health. Georgia Board for Physician Workforce
- Contributor to Resource:
- Georgia. Department of Community Health. Georgia Board for Physician Workforce
- Publisher:
- Atlanta, Ga. : Georgia. Department of Community Health. Georgia Board for Physician Workforce
- Date of Original:
- 2003
- Subject:
- Medicine--Specialties and specialists--Georgia--Statistics--Periodicals.
Physicians--Georgia--Statistics--Periodicals.
Médecins--Géorgie (État)--Statistiques--Périodiques.
Georgia Government Documents--Serial - Location:
- United States, Georgia, 32.75042, -83.50018
- Medium:
- state government records
- Type:
- Text
- Format:
- application/pdf
- Description:
- 1998; title from PDF running title (Georgia Government Publications database, viewed April 18, 2024).
2008 (Georgia Government Publications database, viewed April 18, 2024). - External Identifiers:
- Call Number GA C910 .S1 A82 2002
- Metadata URL:
- https://dlg.galileo.usg.edu/id:dlg_ggpd_y-ga-bc910-b-ps1-ba82-b2002-belec-p-btext
- Digital Object URL:
- https://dlg.galileo.usg.edu/do:dlg_ggpd_y-ga-bc910-b-ps1-ba82-b2002-belec-p-btext
- Language:
- eng
- Holding Institution:
- University of Georgia. Map and Government Information Library
- Rights:
-

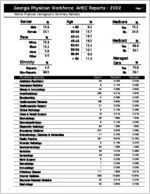
Georgia Physician Workforce: AHEC Reports - 2002
Atlanta Physician Demographic Summary Statistics
Page 1
Gender
%
Age
Male 74.9
< 35
Female 25.1
35-39
Race
White Black Asian Other
Ethnicity
% 75.6 15.4
5.9 3.0
%
40-44 45-49 50-54 55-59 60-64
> 64
Hispanic Non-Hispanic
4.0 96.0
Physician Specialty
Addiction Psychiatry Aerospace Medicine Allergy & Immunology Anesthesiology Bloodbanking Cardiovascular Diseases Cardiovascular Surgery Clinical Pathology Colon & Rectal Surgery Dermatology Dermatopathology Diagnostic Radiology Emergency Medicine Endocrinology, Diabetes & Metabolism Family Practice Forensic Pathology Gastroenterology Geriatrics Gynecology Hand Surgery Hematology Immunology Infectious Disease Internal Medicine Neonatal-Perinatal Medicine Nephrology
% 6.4 13.7 16.7 18.2 15.4 10.1 6.0 11.0
Count
29 8 34 295 5 168 31 6 18 99 6 80 207 41 391 9 80 26 48 2 1 1 111 906 30 50
Medicare
Yes No
% 75.2 24.8
Medicaid
Yes No
% 69.9 30.1
Managed
Care
%
Yes 70.9 No 29.1
Percent
0.49%
Georgia
0.40%
0.14%
0.09%
0.58%
0.65%
5.01%
4.64%
0.08%
0.03%
2.85%
2.23%
0.53%
0.35%
0.10%
0.06%
0.31%
0.31%
1.68%
1.50%
0.10%
0.05%
1.36%
1.65%
3.52%
4.58%
0.70%
0.42%
6.64%
13.18%
0.15%
0.07%
1.36%
1.09%
0.44%
0.38%
0.82%
0.72%
0.03%
0.02%
0.02%
0.06%
0.02%
0.02%
1.89%
0.81%
15.39%
15.22%
0.51%
0.37%
0.85%
0.75%
Georgia Physician Workforce: AHEC Reports - 2002
Atlanta Physician Demographic Summary Statistics
Neurological Surgery Neurology Neuropathology Nuclear Medicine Nuclear Radiology OB/GYN Occupational Medicine Oncology Opthalmology Orthopedic Surgery Otolaryngology Pain Medicine Pathology Pediatric Endocrinology Pediatric Hematology/Oncology Pediatric Nephrology Pediatric Neurology Pediatric Radiology Pediatric Surgery Pediatrics Plastic Surgery Preventive Medicine Psychiatry Public Health Pulmonary Diseases Radiology Rheumatology Therapeutic Radiology General Surgery Spinal Cord Injury Medicine Thoracic Surgery Traumatic Surgery Urology Other
Total Atlanta Physicians
Report created by Georgia Board for Physician Workforce, State of Georgia
47 117
5 9 5 380 37 70 158 187 92 25 159 6 17 3 11 13 14 559 80 49 378 61 50 173 25 39 222 1 49 1 89 73
5,886
0.80% 1.99% 0.08% 0.15% 0.08% 6.46% 0.63% 1.19% 2.68% 3.18% 1.56% 0.42% 2.70% 0.10% 0.29% 0.05% 0.19% 0.22% 0.24% 9.50% 1.36% 0.83% 6.42% 1.04% 0.85% 2.94% 0.42% 0.66% 3.77% 0.02% 0.83% 0.02% 1.51% 1.24%
100.00%
Page 2
0.72% 1.67% 0.05% 0.08% 0.07% 6.90% 0.42% 0.91% 2.41% 3.57% 1.50% 0.41% 2.31% 0.04% 0.15% 0.02% 0.16% 0.10% 0.10% 9.07% 1.11% 0.49% 5.43% 0.42% 0.87% 2.68% 0.32% 0.55% 4.40% 0.04% 0.56% 0.02% 1.59% 1.21%