- Collection:
- Georgia Government Publications
- Serial:
- Georgia physician workforce: AHEC reports ... Atlanta physician demographic summary statistics.
- Title:
- Georgia Physician Workforce AHEC reports - 2000: Atlanta physician demographic summary statistics
- Creator:
- Georgia. Department of Community Health. Georgia Board for Physician Workforce
- Contributor to Resource:
- Georgia. Department of Community Health. Georgia Board for Physician Workforce
- Publisher:
- Atlanta, Ga. : Georgia. Department of Community Health. Georgia Board for Physician Workforce
- Date of Original:
- 2001
- Subject:
- Medicine--Specialties and specialists--Georgia--Statistics--Periodicals.
Physicians--Georgia--Statistics--Periodicals.
Médecins--Géorgie (État)--Statistiques--Périodiques.
Georgia Government Documents--Serial - Location:
- United States, Georgia, 32.75042, -83.50018
- Medium:
- state government records
- Type:
- Text
- Format:
- application/pdf
- Description:
- 1998; title from PDF running title (Georgia Government Publications database, viewed April 18, 2024).
2008 (Georgia Government Publications database, viewed April 18, 2024). - External Identifiers:
- Call Number GA C910 .S1 A82 2000
- Metadata URL:
- https://dlg.galileo.usg.edu/id:dlg_ggpd_y-ga-bc910-b-ps1-ba82-b2000-belec-p-btext
- Digital Object URL:
- https://dlg.galileo.usg.edu/do:dlg_ggpd_y-ga-bc910-b-ps1-ba82-b2000-belec-p-btext
- Language:
- eng
- Holding Institution:
- University of Georgia. Map and Government Information Library
- Rights:
-

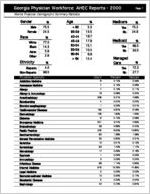
Georgia Physician Workforce: AHEC Reports - 2000
Atlanta Physician Demographic Summary Statistics
Page 1
Gender
Male Female
% 75.5 24.5
Race
White Black Asian Other
% 77.0 14.3
5.9 2.9
Ethnicity
%
Hispanic Non-Hispanic
4.0 96.0
Physician Specialty
Addiction Medicine Aerospace Medicine Allergy Allergy & Immunology Anesthesiology Bloodbanking Broncho-esophagology Cardiovascular Diseases Dermatology Diabetes Emergency Medicine Endocrinology Family Practice Gastroenterology General Preventative Medicine Geriatrics Gynecology Hematology Hypnosis Immunology Infectious Disease Internal Medicine Legal Medicine Neonatal-perinatal Medicine Neoplastic Diseases Nephrology
Age
< 35 35-39 40-44 45-49 50-54 55-59 60-64
> 64
%
5.3 13.5 16.7 17.8 15.1 10.4
6.6 12.4
Count
6 7 7 16 308 4 1 155 106 6 201 38 379 80 35 12 83 17 1 3 66 916 3 13 2 42
Medicare
Yes No
% 75.2 24.8
Medicaid
Yes No
% 69.5 30.5
Managed
Care
%
Yes 72.3 No 27.7
Percent
0.10%
Georgia
0.09%
0.12%
0.06%
0.12%
0.11%
0.28%
0.34%
5.31%
4.98%
0.07%
0.04%
0.02%
0.01%
2.67%
2.46%
1.83%
1.55%
0.10%
0.08%
3.47%
4.65%
0.66%
0.40%
6.53%
13.62%
1.38%
1.38%
0.60%
0.31%
0.21%
0.12%
1.43%
1.17%
0.29%
0.18%
0.02%
0.02%
0.05%
0.04%
1.14%
0.62%
15.79%
14.39%
0.05%
0.03%
0.22%
0.17%
0.03%
0.04%
0.72%
0.67%
Georgia Physician Workforce: AHEC Reports - 2000
Atlanta Physician Demographic Summary Statistics
Neurology Nuclear medicine Nutrition Obstetrics & Gynecology Occupational Medicine Oncology Opthalmology Otology Otorhinolaryngology Pain Medicine Pathology Clinical Pathology Dermatopathology Forensic Pathology Pediatrics Pediatric Allergy Pediatric Endocrinology Pediatric Hematology-oncology Pediatric Nephrology Pediatric Neurology Pediatric Radiology Pediatric Surgery Physical Medicine & Rehab Psychiatry Addiction Psychiatry Child Psychiatry Public Health Pulmonary Diseases Radiology Diagnostic Radiology Nuclear Radiology Radioisotopic Radiology Therapeutic Radiology Rheumatology Rhinology Surgery - General Abdominal Surgery Cardiovascular Surgery Colon & Rectal Surgery Hand Surgery Head & Neck Surgery
114
1.97%
7
0.12%
2
0.03%
337
5.81%
45
0.78%
49
0.84%
167
2.88%
1
0.02%
78
1.34%
3
0.05%
170
2.93%
7
0.12%
2
0.03%
2
0.03%
549
9.47%
2
0.03%
5
0.09%
2
0.03%
3
0.05%
8
0.14%
1
0.02%
8
0.14%
53
0.91%
407
7.02%
1
0.02%
13
0.22%
85
1.47%
60
1.03%
184
3.17%
90
1.55%
2
0.03%
1
0.02%
19
0.33%
30
0.52%
1
0.02%
272
4.69%
8
0.14%
24
0.41%
13
0.22%
2
0.03%
2
0.03%
Page 2
1.66% 0.07% 0.04% 6.27% 0.57% 0.82% 2.47% 0.03% 1.62% 0.09% 2.34% 0.09% 0.01% 0.01% 8.91% 0.02% 0.05% 0.01% 0.03% 0.07% 0.01% 0.08% 0.76% 5.80% 0.01% 0.15% 0.60% 1.00% 3.05% 1.68% 0.02% 0.01% 0.35% 0.39% 0.01% 4.91% 0.08% 0.30% 0.17% 0.02% 0.01%
Georgia Physician Workforce: AHEC Reports - 2000
Atlanta Physician Demographic Summary Statistics
Maxillofacial Surgery Neurological Surgery Orthopedic Surgery Plastic Surgery Thoracic Surgery Traumatic Surgery Urological Surgery Other
Total Atlanta Physicians Report created by Georgia Board for Physician Workforce, State of Georgia
3 47 189 63 16 3 86 57
5,800
0.05% 0.81% 3.26% 1.09% 0.28% 0.05% 1.48% 0.98%
100.00%
Page 3
0.07% 0.70% 3.53% 0.95% 0.22% 0.03% 1.58% 0.76%