- Collection:
- Georgia Government Publications
- Serial:
- Georgia data summary. Diabetes.
- Title:
- Georgia data summary. Diabetes
- Creator:
- Georgia. Department of Human Resources
- Contributor to Resource:
- Georgia. Division of Public Health
- Publisher:
- Atlanta, GA : Georgia Department of Human Resources, Division of Public Health
- Date of Original:
- 2010
- Subject:
- Diabetes--Georgia
- Location:
- United States, Georgia, 32.75042, -83.50018
- Medium:
- state government records
- Type:
- Text
- Format:
- application/pdf
- Description:
- Title from caption
"Diabetes is a common, serious, and costly disease, but is controllable, in many cases, it is also preventable."
Issued by the Division of Public Health under the Dept. of Human Resources<2008> and by the Division of Public Health under the Dept. of Community Health, <2010-> - External Identifiers:
- Call Number GA C900.P8 S1 D53 2010
- Metadata URL:
- https://dlg.galileo.usg.edu/id:dlg_ggpd_y-ga-bc900-pp8-bs1-bd53-b2010-belec-p-btext
- Digital Object URL:
- https://dlg.galileo.usg.edu/do:dlg_ggpd_y-ga-bc900-pp8-bs1-bd53-b2010-belec-p-btext
- Language:
- eng
- Holding Institution:
- University of Georgia. Map and Government Information Library
- Rights:
-

The Georgia Department Of Community Health
2010 Georgia Data Summary
Diabetes
Diabetes is the seventh leading cause of death in Georgia. However the disease can be controlled or delayed by early detection, proper intervention, and comprehensive disease management.
DEFINITION Diabetes mellitus (diabetes) is the medical term for the presence of high blood glucose (sugar) levels in the body. It is one of the most common chronic diseases in Georgia as well as in the United States.
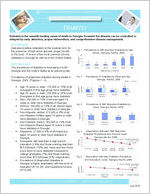
PREVALENCE The prevalence of diabetes is increasing in both Georgia and the United States at an alarming rate.
Percent
Fig. 1
30 20 10
0
Prevalence of Self-reported Diabetes by Age Group, Georgia, Adults, 2009
26 20
10
4
3
4
18-24
25-34
35-44
45-54
55-64
65+
Age group (in years)
Prevalence of diagnosed diabetes among adults in Georgia, 20091 (Figures 1 - 5)
Fig. 2
Prevalence of Diabetes by Race and Sex,
Georgia, Adults, 2009
Male
Female
Age 18 years or older: 716,000 or 10% of all Georgians in this age group have diabetes
Age 65 years or older: 258,000 or 26% of all Georgians in this age group have diabetes
Percent
16 12
98
8
4
0
White non-
Hispanic
13 15
Black nonHispanic
74
Hispanic
14 6
Other
Men: 360,000 or 10% of all men aged 18
years or older have diabetes in Georgia Women: 350,000 or 10% of all women aged
18 years or older have diabetes in Georgia Non-Hispanic whites: 370,000 or 9% of all
non-Hispanic Whites aged 18 years or older
Fig. 3
16 12
8
Prevalence of Self-Reported Diabetes by Race, Georgia Adults, 2009
14
9
10
6
Percent
have diabetes in Georgia Non-Hispanic blacks: 269,000 or 14% of all
non-Hispanic Blacks aged 18 years or older
4 0
White nonHispanic
Black nonHispanic
Hispanic
Other
have diabetes in Georgia
Hispanics: 27,500 or 6% of all Hispanics
Fig. 4 Association Between Self-Reported
aged 18 years or older have diabetes in
Diabetes Prevalence and Income Level,
Georgia
20
Percent
Georgians with less than a high school
15 10
education (14%) and those earning less than
5
Georgia Adults, 2009
Linear ( Diabetes prevalence) y = -2.6571x + 20.8
R2 = 0.9845
$15,000/year (19%) are twice and four times
0 < $15,000
15,000-
$25,000- $35,000- $50,000- > $75,000
more likely to have diabetes compared to
$24,999
$34,999
$49,999
$74,999
college graduates (7%) and those earning
more than $75,000/year (5%) respectively Prevalence of diagnosed diabetes in
Fig. 5 Association between Diabetes Prevalence and Education Level, Georgia Adults, 2009
Georgia is highly associated with the level of
Percent
education (R2=0.99) and household income
16
(R2=0.98)
12 8 4
0
Linear (Diabetes prevalence) y = -2.3x + 16.5
R2 = 0.9888
<High School
High School Graduate
Some College College Graduate
2 Peachtree Street, Atlanta, Ga 30303 w www.dch.georgia.gov
July 2010
2010 Georgia Data summary | Diabetes
MORTALITY Overall, the risk for death among people with diabetes is about twice that of people without diabetes of similar age.
Deaths among people with diabetes in Georgia, 20072
Diabetes was the seventh leading cause of death, killing 1,583 Georgians in 2007
In 2007, the overall ageadjusted death rate for Georgia was 19 per 100,000 population
The diabetes death rate was 1.3 times higher in men (23/100,000) compared to women (17/100,000); and 2.2 times higher among Blacks (34/100,000) compared to Whites (15/100,000) (Fig. 7)
Fig. 6 Age-adjusted Diabetes Mortality Rates by County, Georgia, 1999-2007
AAMR per 100,000 population
Highest 25% Middle 50% Lowest 25% Statistically unstable State Average AAMR 22 deaths per 100,000 population
AAMR = Age-adjusted mortality rate. Source: Georgia Division of Public Health, OASIS.
Fig. 7
Age-adjusted rate per 100,000 population
Age-adjusted Diabetes Death Rates by Race and Sex, Georgia, 2007
40
34
31
30
20
10
0
Blacks
Males Females
19 13
Whites
MORBIDITY AND ECONOMIC COSTS Diabetes can contribute to blindness, kidney failure, amputations, heart disease, stroke, hypertension, nerve damage, repeated infections, sexual dysfunction, skin disorders, periodontal disease, pregnancy complications, disability and premature death.
Hospitalizations3 In 2008, approximately 16,209 hospitalizations for which diabetes was the primary diagnosis occurred in Georgia Also, in 2008, 21,274 emergency room visits in Georgia were attributed to diabetes
Estimated Costs4 According to American Diabetes Association's Diabetes Cost Calculator, the estimated diabetes costs in Georgia in 2007 are (Data updated every 5 years):
Total (direct and indirect): $5.1 billion Direct medical costs: $3.3 billion Indirect costs: $1.8 billion (disability, work loss, and premature mortality)
2010 Georgia Data summary | Diabetes
RISK FACTORS FOR DIABETES IN GEORGIA1 Smoking, physical inactivity, unhealthy eating habits, high cholesterol, high blood pressure and obesity are some of the risk factors for developing diabetes. These factors can be modified to improve the overall health status of individuals. (Fig. 8)
Fig. 8
80 40
0
Prevalence of Modifiable Risk Factors by Diabetes Status, Georgia Adults, 2009
Non-diabetic Diabetic
76 69
52 25
37 23
18 15
63 33
71 27
Percent
Consume <5 fruits/vegetables
per day Obesity Physical inactivity Smoking
High Cholesterol High Blood Pressure
Smoking Smoking can elevate the risk of cardiovascular-related complications (heart attack, stroke, kidney damage, etc.) among adults with diabetes.
In 2009, the prevalence of smoking among adult Georgians was 18%
The prevalence of smoking among adult Georgians with diabetes (15%) was similar to non-diabetics (18%)
Lack of Physical Activity Regular physical activity is important in regulating blood sugar levels among people with diabetes.
In 2009, 24% of adults in Georgia had no leisure time physical activity during the past month
Adults with diabetes (37%) in Georgia were almost 1.6 times more likely to be physically inactive compared to non-diabetics (23%)
Fruit and Vegetable Consumption Although fruits and vegetables are important components of a balanced diet, many people in Georgia do not eat enough fruits and vegetables.
In 2009, the majority (76%) of adults in Georgia did not consume the recommended daily servings of five or more fruits and vegetables
Adults with diabetes (69%) in Georgia were as likely to consume less than the recommended daily servings of five or more fruits and vegetables as non-diabetics (76%)
Obesity For people with diabetes, losing excess body weight and maintaining a healthy body weight is crucial for properly managing the disease, preventing complications and slowing down the disease progression.
In 2009, 27% of adults in Georgia were obese
Diabetic Georgians were twice as likely to be obese (52%) when compared to nondiabetics (25%)
High Blood Pressure In 2009, 31% of adults in Georgia had high blood pressure Diabetic Georgians were three times more likely to be hypertensive (71%) when compared to non-diabetics (27%)
High Cholesterol In 2009, 37% of adults in Georgia had high cholesterol levels Adults with diabetes (63%) in Georgia were twice as likely to have high cholesterol when compared to nondiabetics (33%)
Percent Annual doctor
visit Diabetes education Daily self glucose monitoring Annual hemoglobin A1c testing Annual dilated eye exam Annual foot
exam Annual influenza vaccination Pneumococcal vaccination
PREVENTING DIABETES COMPLICATIONS Most diabetes complications can be reduced by controlling the levels of blood glucose, blood pressure and blood lipids and by receiving other preventive care practices (diabetes education, doctor visits, eye exam, foot exam, influenza vaccination, and pneumococcal vaccination) in a timely manner.
In 2009, adults with diabetes in Georgia met two of the seven national targets (Healthy People 2010 Objectives) for recommended routine care for diabetes (Fig. 9)
Daily self glucose monitoring (66% compared to 60% target)
Annual hemoglobin A1C testing (80%
Fig. 9
100 80 60 40 20 0
Recommended Routine Care Rates for Adults with Diabetes, Georgia 2009
Significant improvement from 2005 Healthy people 2010 objective
85
80
70
73
58
66
55
44
compared to 50% target)1
Data Source 1. Georgia Behavioral Risk Factor Surveillance System, Georgia Department of Community Health,
Division of Public Health, Epidemiology Branch, 2008 and 2009. 2. Georgia Death File, Georgia Department of Community Health, Division of Public Health, Vital
Records Program, 2007. 3. Georgia Hospital Discharge Data, Georgia Hospital Association, 2007 4. American Diabetes Association. Economic Costs of Diabetes in the U.S. in 2007: Diabetes Cost
Calculator. www.diabetes.org/cost. 5. Online Analytical Statistical Information System (OASIS), Georgia Department of Community
Health, Division of Public Health, Office of Health Information and Policy. http://oasis.state.ga.us/
Date updated: October 2010
Visit http://www.health.state.ga.us/epi/cdiee/diabetes.asp for more information about diabetes in Georgia