- Collection:
- Georgia Government Publications
- Serial:
- ... Program maximum gross rents for LIHTC and HOME programs.
- Title:
- 2011 program maximum gross rents for LIHTC and HOME program [2011]
- Creator:
- Georgia. Department of Community Affairs. Housing Finance Division
- Contributor to Resource:
- Georgia. Department of Community Affairs. Housing Finance Division
- Publisher:
- Atlanta, Ga. : Georgia. Department of Community Affairs. Housing Finance Division
- Date of Original:
- 2011
- Subject:
- Georgia
- Location:
- United States, Georgia, 32.75042, -83.50018
- Medium:
- publications (documents)
- Type:
- Text
- Format:
- application/pdf
- Description:
- Description based on: 2010 (harvested on February 4, 2014 from www.dca.ga.gov); title from PDF running title (Georgia Government Publications database, viewed July 14, 2022).
Latest issue consulted: 2010 (harvested on February 4, 2014 from www.dca.ga.gov); (Georgia Government Publications database, viewed July 14, 2022). - External Identifiers:
- Call Number GA C495.H6 S1 M31 2011
- Metadata URL:
- https://dlg.galileo.usg.edu/id:dlg_ggpd_y-ga-bc495-ph6-bs1-bm31-b2011-belec-p-btext
- Digital Object URL:
- https://dlg.galileo.usg.edu/do:dlg_ggpd_y-ga-bc495-ph6-bs1-bm31-b2011-belec-p-btext
- Language:
- eng
- Holding Institution:
- University of Georgia. Map and Government Information Library
- Rights:
-

Georgia Department of Community Affairs
Office of Affordable Housing
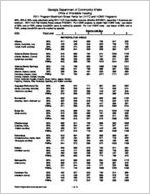
2011 Program Maximum Gross Rents for LIHTC and HOME Programs
60%, 50% & 30% rents calculated using 2011 HUD Area Median Incomes effective 5/31/2011, assuming 1.5 persons per
bedroom. 2011 HUD Fair Market Rents revised 7/13/2011. For HOME projects: to obtain High HOME rents - use lesser
of 60% rent or FMR, unless (non)MSA name is marked by asterisk. For Low HOME rents - use lesser of 50% rent or
FMR, unless (non)MSA name is marked by asterisk.
Rent by Unit Size
MSA
Rent Level
0
1
2
3
4
5
Albany (Baker, Dougherty, Lee, Terrell, Worth counties)
METROPOLITAN AREAS
60%
511
548
658
759
847
935
50%
426
456
548
633
706
779
30%
256
274
328
380
423
468
FMRs
509
544
638
856
884
1017
Athens-Clarke County
60%
616
660
792
914
1020
1125
(Clarke, Madison, Oconee
50%
513
550
660
761
850
938
Oglethorpe counties)
30%
308
330
396
458
511
563
FMRs
545
606
760
1012
1044
1201
Atlanta-Sandy Springs
60%
718
769
-Marietta
50%
598
641
(Barrow, Bartow, Carroll,
30%
358
384
Cherokee, Clayton, Cobb,
FMRs
731
792
Coweta, Dawson, Dekalb, Douglas,
Fulton, Gwinnett, Fayette, Forsyth, Heard, Henry, Jasper, Newton,
Paulding, Pickens, Pike, Rockdale, Spalding, and Walton counties)
922
1065
1189
1311
768
888
991
1093
461
533
595
656
881
1071
1171
1347
Augusta-Richmond Co.
60%
600
642
771
891
994
1097
(Burke, Columbia, McDuffie,
50%
500
535
642
742
828
914
Richmond counties)
30%
301
322
386
446
497
549
FMRs
516
560
629
842
886
1019
Brunswick
60%
603
646
775
895
999
1102
(Brantley, Glynn, McIntosh cou 50%
502
538
646
746
832
918
30%
301
323
387
447
500
551
FMRs
511
555
616
878
1082
1244
Butts Co. (Butts county)
60%
616
660
792
914
1020
1125
50%
513
550
660
761
850
938
30%
308
330
396
458
511
563
FMRs
406
543
627
915
1089
1252
Chattanooga (Catoosa, Dade, Walker counties)
60%
598
641
769
889
993
1095
50%
498
534
641
741
827
912
30%
300
321
385
445
496
548
FMRs
577
610
718
884
1039
1195
Columbus
60%
543
581
697
805
898
991
(Chattahoochee, Harris, Mario
50%
452
484
581
671
748
826
Muscogee counties)
30%
271
290
348
403
450
496
FMRs
544
573
656
872
1033
1188
Dalton (Whitfield county)
60%
528
565
678
783
874
964
50%
440
471
565
653
728
803
30%
263
282
338
391
437
482
FMRs
520
563
626
772
796
915
Gainesville (Hall county)
60%
643
689
826
954
1065
1175
50%
536
574
688
795
887
979
30%
321
344
413
477
532
588
FMRs
711
746
860
1056
1225
1409
Haralson Co. (Haralson county)
60%
492
527
633
730
814
899
50%
410
439
527
608
678
749
30%
246
263
316
365
407
450
FMRs
451
473
542
789
956
1099
*HOME Program Rent held at last year's level
1 of 10
Georgia Department of Community Affairs
Office of Affordable Housing
2011 Program Maximum Gross Rents for LIHTC and HOME Programs
60%, 50% & 30% rents calculated using 2011 HUD Area Median Incomes effective 5/31/2011, assuming 1.5 persons per
bedroom. 2011 HUD Fair Market Rents revised 7/13/2011. For HOME projects: to obtain High HOME rents - use lesser
of 60% rent or FMR, unless (non)MSA name is marked by asterisk. For Low HOME rents - use lesser of 50% rent or
FMR, unless (non)MSA name is marked by asterisk.
Rent by Unit Size
MSA
Rent Level
0
1
2
3
4
5
METROPOLITAN AREAS (continued)
Hinesville-Fort Stewart
60%
495
530
636
735
820
905
(Liberty county)
50%
412
441
530
612
683
754
30%
248
266
318
368
411
453
FMRs
515
559
623
877
996
1145
Lamar Co. (Lamar county)
60%
540
579
694
802
895
987
50%
450
482
578
668
746
823
30%
270
289
347
400
447
493
FMRs
475
477
572
754
1004
1155
Long Co. (Long county)
60%
510
546
655
756
844
932
50%
425
455
546
630
703
776
30%
255
273
327
378
422
466
FMRs
460
499
555
760
784
902
Macon
60%
567
607
729
843
940
1037
(Bibb, Houston, Jones,
50%
472
506
607
702
783
864
Peach, Twiggs counties)
30%
283
304
365
421
470
518
FMRs
536
581
646
797
830
955
Meriwether (Meriwether county)
60%
514
551
661
763
852
939
50%
428
459
551
636
710
783
30%
257
275
330
381
425
469
FMRs
465
471
561
677
697
802
Monroe Co. (Monroe county)
60%
669
717
861
993
1108
1223
50%
557
597
717
828
923
1019
30%
335
358
430
496
555
611
FMRs
516
561
622
745
770
886
Murray Co. (Murray county)
60%
525
562
675
778
868
958
50%
437
468
562
648
723
798
30%
262
281
337
388
433
478
FMRs
488
527
587
702
723
831
Rome (Floyd county)
60%
547
586
703
813
907
1001
50%
456
488
586
677
756
834
30%
275
294
352
407
455
501
FMRs
492
501
647
794
820
943
Savannah (Bryan, Chatham, Effingham counties)
60%
630
675
810
936
1044
1152
50%
525
562
675
780
870
960
30%
315
337
405
468
522
576
FMRs
668
723
805
1068
1103
1268
Valdosta (Brooks, Echols, Lanier, Lowndes counties)
60%
529
567
679
785
876
966
50%
441
472
566
654
730
805
30%
265
283
340
393
438
483
FMRs
526
527
634
860
886
1019
Warner Robins (Houston county)
60%
729
780
936
1081
1206
1331
50%
607
650
780
901
1005
1109
30%
365
390
468
541
603
666
FMRs
582
593
704
1022
1175
1351
*HOME Program Rent held at last year's level
2 of 10
Georgia Department of Community Affairs
Office of Affordable Housing
2011 Program Maximum Gross Rents for LIHTC and HOME Programs
60%, 50% & 30% rents calculated using 2011 HUD Area Median Incomes effective 5/31/2011, assuming 1.5 persons per
bedroom. 2011 HUD Fair Market Rents revised 7/13/2011. For HOME projects: to obtain High HOME rents - use lesser
of 60% rent or FMR, unless (non)MSA name is marked by asterisk. For Low HOME rents - use lesser of 50% rent or
FMR, unless (non)MSA name is marked by asterisk.
Rent by Unit Size
MSA
Rent Level
0
1
2
3
4
5
NON - METROPOLITAN AREAS
Appling Co.
60%
469
502
603
696
777
857
50%
391
418
502
580
647
714
30%
235
251
302
348
388
429
FMRs
449
488
542
661
681
783
Atkinson Co.
60%
469
502
603
696
777
857
50%
391
418
502
580
647
714
30%
235
251
302
348
388
429
FMRs
450
470
542
691
786
904
Bacon Co.
60%
474
507
609
704
786
867
50%
395
423
507
586
655
722
30%
237
254
305
352
393
434
FMRs
450
470
542
691
786
904
Baldwin Co.
60%
522
559
672
775
865
955
50%
435
466
560
646
721
796
30%
261
280
336
387
432
477
FMRs
423
509
632
755
778
895
Banks Co.
60%
537
575
690
797
889
981
50%
447
479
575
664
741
818
30%
268
288
346
399
446
491
FMRs
469
508
563
684
972
1118
Ben Hill Co
60%
469
502
603
696
777
857
50%
391
418
502
580
647
714
30%
235
251
302
348
388
429
FMRs
356
458
547
662
680
782
Berrien Co.
60%
469
502
603
696
777
857
50%
391
418
502
580
647
714
30%
235
251
302
348
388
429
FMRs
444
446
542
672
692
796
Bleckley Co.
60%
550
589
706
816
910
1005
50%
458
491
588
680
758
837
30%
275
295
353
408
456
503
FMRs
380
444
542
671
769
884
Bulloch Co. Calhoun Co. Camden Co. Candler Co.
60%
588
630
756
873
975
1076
50%
490
525
630
728
812
896
30%
295
315
378
436
487
538
FMRs
499
517
612
734
754
867
60%
469
502
603
696
777
857
50%
391
418
502
580
647
714
30%
235
251
302
348
388
429
FMRs
450
488
542
695
854
982
60%
618
662
795
918
1024
1130
50%
515
551
662
765
853
941
30%
310
331
397
459
512
565
FMRs
556
558
672
978
1179
1356
60%
469
502
603
696
777
857
50%
391
418
502
580
647
714
30%
235
251
302
348
388
429
FMRs
449
488
542
661
681
783
*HOME Program Rent held at last year's level
3 of 10
Georgia Department of Community Affairs
Office of Affordable Housing
2011 Program Maximum Gross Rents for LIHTC and HOME Programs
60%, 50% & 30% rents calculated using 2011 HUD Area Median Incomes effective 5/31/2011, assuming 1.5 persons per
bedroom. 2011 HUD Fair Market Rents revised 7/13/2011. For HOME projects: to obtain High HOME rents - use lesser
of 60% rent or FMR, unless (non)MSA name is marked by asterisk. For Low HOME rents - use lesser of 50% rent or
FMR, unless (non)MSA name is marked by asterisk.
Rent by Unit Size
MSA
Rent Level
0
1
2
3
4
5
NON - METROPOLITAN AREAS (continued)
Charlton Co.
60%
507
543
651
752
840
926
50%
422
452
542
626
700
771
30%
253
271
326
376
420
463
FMRs
450
470
542
691
786
904
Chattooga Co.
60%
469
502
603
696
777
857
50%
391
418
502
580
647
714
30%
235
251
302
348
388
429
FMRs
353
432
542
650
946
1088
Clay Co.
60%
469
502
603
696
777
857
50%
391
418
502
580
647
714
30%
235
251
302
348
388
429
FMRs
450
488
542
695
854
982
Clinch Co.
60%
469
502
603
696
777
857
50%
391
418
502
580
647
714
30%
235
251
302
348
388
429
FMRs
450
470
542
691
786
904
Coffee Co.
60%
469
502
603
696
777
857
50%
391
418
502
580
647
714
30%
235
251
302
348
388
429
FMRs
449
464
542
675
825
949
Colquitt Co.
60%
469
502
603
696
777
857
50%
391
418
502
580
647
714
30%
235
251
302
348
388
429
FMRs
451
487
542
649
816
938
Cook Co.
60%
469
502
603
696
777
857
50%
391
418
502
580
647
714
30%
235
251
302
348
388
429
FMRs
450
460
542
737
953
1096
Crisp Co.
60%
469
502
603
696
777
857
50%
391
418
502
580
647
714
30%
235
251
302
348
388
429
FMRs
450
454
542
685
706
812
Decatur Co.
60%
492
527
633
730
814
899
50%
410
439
527
608
678
749
30%
246
263
316
365
407
450
FMRs
402
467
615
736
817
940
Dodge Co.
60%
486
520
624
720
804
887
50%
405
433
520
600
670
739
30%
242
260
312
360
402
443
FMRs
428
429
542
725
746
858
Dooly Co.
60%
469
502
603
696
777
857
50%
391
418
502
580
647
714
30%
235
251
302
348
388
429
FMRs
450
466
542
683
922
1060
Early Co.
60%
469
502
603
696
777
857
50%
391
418
502
580
647
714
30%
235
251
302
348
388
429
FMRs
450
488
542
695
854
982
*HOME Program Rent held at last year's level
4 of 10
Georgia Department of Community Affairs
Office of Affordable Housing
2011 Program Maximum Gross Rents for LIHTC and HOME Programs
60%, 50% & 30% rents calculated using 2011 HUD Area Median Incomes effective 5/31/2011, assuming 1.5 persons per
bedroom. 2011 HUD Fair Market Rents revised 7/13/2011. For HOME projects: to obtain High HOME rents - use lesser
of 60% rent or FMR, unless (non)MSA name is marked by asterisk. For Low HOME rents - use lesser of 50% rent or
FMR, unless (non)MSA name is marked by asterisk.
Rent by Unit Size
MSA
Rent Level
0
1
2
3
4
5
NON - METROPOLITAN AREAS (continued)
Elbert Co.
60%
469
502
603
696
777
857
50%
391
418
502
580
647
714
30%
235
251
302
348
388
429
FMRs
450
470
542
681
702
807
Emanuel Co.
60%
469
502
603
696
777
857
50%
391
418
502
580
647
714
30%
235
251
302
348
388
429
FMRs
354
411
542
661
844
971
Evans Co.
60%
469
502
603
696
777
857
50%
391
418
502
580
647
714
30%
235
251
302
348
388
429
FMRs
449
488
542
661
681
783
Fannin Co.
60%
480
514
618
713
796
878
50%
400
428
515
594
663
731
30%
240
257
308
356
397
438
FMRs
367
510
565
676
811
933
Franklin Co.
60%
480
513
616
711
793
876
50%
400
428
513
593
661
730
30%
240
257
308
356
397
438
FMRs
469
508
563
684
972
1118
Gilmer Co.
60%
469
502
603
696
777
857
50%
391
418
502
580
647
714
30%
235
251
302
348
388
429
FMRs
531
575
641
845
1021
1174
Glascock Co.
60%
469
502
603
696
777
857
50%
391
418
502
580
647
714
30%
235
251
302
348
388
429
FMRs
389
411
542
649
762
876
Gordon Co.
60%
543
582
699
807
900
993
50%
452
485
582
672
750
828
30%
271
290
348
403
450
496
FMRs
531
535
687
822
848
975
Grady Co.
60%
472
506
607
702
783
864
50%
393
421
506
585
652
720
30%
236
253
303
351
392
432
FMRs
352
487
542
751
777
894
Greene Co.
60%
498
534
640
739
825
910
50%
415
445
533
616
687
758
30%
248
266
320
369
412
455
FMRs
450
470
542
681
702
807
Habersham Co.
60%
528
565
678
783
874
964
50%
440
471
565
653
728
803
30%
263
282
338
391
437
482
FMRs
534
537
643
770
1128
1297
Hancock Co.
60%
469
502
603
696
777
857
50%
391
418
502
580
647
714
30%
235
251
302
348
388
429
FMRs
450
470
542
681
702
807
*HOME Program Rent held at last year's level
5 of 10
Georgia Department of Community Affairs
Office of Affordable Housing
2011 Program Maximum Gross Rents for LIHTC and HOME Programs
60%, 50% & 30% rents calculated using 2011 HUD Area Median Incomes effective 5/31/2011, assuming 1.5 persons per
bedroom. 2011 HUD Fair Market Rents revised 7/13/2011. For HOME projects: to obtain High HOME rents - use lesser
of 60% rent or FMR, unless (non)MSA name is marked by asterisk. For Low HOME rents - use lesser of 50% rent or
FMR, unless (non)MSA name is marked by asterisk.
Rent by Unit Size
MSA
Rent Level
0
1
2
3
4
5
NON - METROPOLITAN AREAS (continued)
Hart Co.
60%
525
562
675
778
868
958
50%
437
468
562
648
723
798
30%
262
281
337
388
433
478
FMRs
450
488
542
647
950
1093
Irwin Co.
60%
511
548
658
759
847
935
50%
426
456
548
633
706
779
30%
256
274
328
380
423
468
FMRs
450
477
542
687
838
964
Jackson Co.
60%
616
660
792
914
1020
1125
50%
513
550
660
761
850
938
30%
308
330
396
458
511
563
FMRs
558
606
674
819
1069
1229
Jeff Davis Co.
60%
469
502
603
696
777
857
50%
391
418
502
580
647
714
30%
235
251
302
348
388
429
FMRs
449
488
542
661
681
783
Jefferson Co.
60%
469
502
603
696
777
857
50%
391
418
502
580
647
714
30%
235
251
302
348
388
429
FMRs
389
433
542
649
762
876
Jenkins Co.
60%
469
502
603
696
777
857
50%
391
418
502
580
647
714
30%
235
251
302
348
388
429
FMRs
389
411
542
649
762
876
Johnson Co.
60%
469
502
603
696
777
857
50%
391
418
502
580
647
714
30%
235
251
302
348
388
429
FMRs
408
500
557
720
751
864
Laurens Co.
60%
525
562
675
778
868
958
50%
437
468
562
648
723
798
30%
262
281
337
388
433
478
FMRs
450
489
542
728
883
1015
Lincoln Co.
60%
469
502
603
696
777
857
50%
391
418
502
580
647
714
30%
235
251
302
348
388
429
FMRs
450
470
542
681
702
807
Lumpkin Co.
60%
577
618
742
856
955
1054
50%
481
515
618
713
796
878
30%
288
309
371
428
477
526
FMRs
475
617
733
990
1097
1262
Macon Co.
60%
469
502
603
696
777
857
50%
391
418
502
580
647
714
30%
235
251
302
348
388
429
FMRs
450
466
542
683
922
1060
Miller Co.
60%
469
503
604
697
778
859
50%
391
419
503
581
648
716
30%
235
251
302
348
388
429
FMRs
418
486
542
679
809
930
*HOME Program Rent held at last year's level
6 of 10
Georgia Department of Community Affairs
Office of Affordable Housing
2011 Program Maximum Gross Rents for LIHTC and HOME Programs
60%, 50% & 30% rents calculated using 2011 HUD Area Median Incomes effective 5/31/2011, assuming 1.5 persons per
bedroom. 2011 HUD Fair Market Rents revised 7/13/2011. For HOME projects: to obtain High HOME rents - use lesser
of 60% rent or FMR, unless (non)MSA name is marked by asterisk. For Low HOME rents - use lesser of 50% rent or
FMR, unless (non)MSA name is marked by asterisk.
Rent by Unit Size
MSA
Rent Level
0
1
2
3
4
5
NON - METROPOLITAN AREAS (continued)
Mitchell Co.
60%
501
537
645
744
831
916
50%
417
447
537
620
692
763
30%
251
268
322
371
415
458
FMRs
353
448
542
650
902
1037
Montgomery Co.
60%
498
534
640
739
825
910
50%
415
445
533
616
687
758
30%
248
266
320
369
412
455
FMRs
411
480
542
725
829
953
Morgan Co.
60%
595
638
766
885
987
1089
50%
496
531
638
737
822
908
30%
297
318
382
442
493
544
FMRs
487
488
602
721
742
853
Peach Co.
60%
585
627
753
869
970
1070
50%
487
522
627
724
808
891
30%
292
313
376
434
485
535
FMRs
490
492
593
849
892
1026
Pierce Co.
60%
511
548
658
759
847
935
50%
426
456
548
633
706
779
30%
256
274
328
380
423
468
FMRs
450
470
542
691
786
904
Polk Co.
60%
504
540
648
749
835
922
50%
420
450
540
624
696
768
30%
252
270
325
375
418
461
FMRs
444
494
603
743
768
883
Pulaski Co.
60%
493
528
634
733
819
903
50%
411
440
528
611
682
752
30%
247
265
317
366
410
451
FMRs
411
480
542
789
828
952
Putnam Co.
60%
546
585
702
811
906
999
50%
455
487
585
676
755
832
30%
273
293
351
405
452
499
FMRs
409
413
542
788
810
932
Quitman Co.
60%
469
502
603
696
777
857
50%
391
418
502
580
647
714
30%
235
251
302
348
388
429
FMRs
450
488
542
695
854
982
Rabun Co.
60%
549
588
705
814
909
1003
50%
457
490
587
678
757
836
30%
275
294
352
407
455
501
FMRs
533
553
642
828
998
1148
Randolph Co.
60%
469
502
603
696
777
857
50%
391
418
502
580
647
714
30%
235
251
302
348
388
429
FMRs
450
488
542
695
854
982
Schley Co.
60%
505
541
649
750
837
924
50%
421
451
541
625
697
770
30%
253
271
326
376
420
463
FMRs
450
466
542
683
922
1060
*HOME Program Rent held at last year's level
7 of 10
Georgia Department of Community Affairs
Office of Affordable Housing
2011 Program Maximum Gross Rents for LIHTC and HOME Programs
60%, 50% & 30% rents calculated using 2011 HUD Area Median Incomes effective 5/31/2011, assuming 1.5 persons per
bedroom. 2011 HUD Fair Market Rents revised 7/13/2011. For HOME projects: to obtain High HOME rents - use lesser
of 60% rent or FMR, unless (non)MSA name is marked by asterisk. For Low HOME rents - use lesser of 50% rent or
FMR, unless (non)MSA name is marked by asterisk.
Rent by Unit Size
MSA
Rent Level
0
1
2
3
4
5
NON - METROPOLITAN AREAS (continued)
Screven Co.
60%
511
548
658
759
847
935
50%
426
456
548
633
706
779
30%
256
274
328
380
423
468
FMRs
389
411
542
649
762
876
Seminole Co.
60%
475
509
610
705
787
868
50%
396
424
508
588
656
723
30%
237
254
305
352
393
434
FMRs
418
486
542
679
809
930
Stephens Co.
60%
469
503
604
697
778
859
50%
391
419
503
581
648
716
30%
235
251
302
348
388
429
FMRs
361
502
557
667
688
791
Stewart Co.
60%
469
502
603
696
777
857
50%
391
418
502
580
647
714
30%
235
251
302
348
388
429
FMRs
450
488
542
695
854
982
Sumter Co.
60%
469
502
603
696
777
857
50%
391
418
502
580
647
714
30%
235
251
302
348
388
429
FMRs
424
476
585
700
1028
1182
Talbot Co.
60%
490
525
630
727
811
895
50%
408
437
525
606
676
746
30%
245
262
315
364
406
448
FMRs
519
520
627
772
795
914
Taliaferro Co.
60%
469
502
603
696
777
857
50%
391
418
502
580
647
714
30%
235
251
302
348
388
429
FMRs
450
470
542
681
702
807
Tattnall Co.
60%
480
514
618
713
796
878
50%
400
428
515
594
663
731
30%
240
257
308
356
397
438
FMRs
451
487
542
715
782
899
Taylor Co.
60%
469
502
603
696
777
857
50%
391
418
502
580
647
714
30%
235
251
302
348
388
429
FMRs
450
466
542
683
922
1060
Telfair Co.
60%
469
502
603
696
777
857
50%
391
418
502
580
647
714
30%
235
251
302
348
388
429
FMRs
411
480
542
725
829
953
Thomas Co.
60%
538
576
691
798
891
983
50%
448
480
576
665
742
819
30%
268
288
346
399
446
491
FMRs
497
539
599
769
1051
1209
Tift Co.
60%
493
528
634
733
819
903
50%
411
440
528
611
682
752
30%
247
265
317
366
410
451
FMRs
472
512
567
724
837
963
*HOME Program Rent held at last year's level
8 of 10
Georgia Department of Community Affairs
Office of Affordable Housing
2011 Program Maximum Gross Rents for LIHTC and HOME Programs
60%, 50% & 30% rents calculated using 2011 HUD Area Median Incomes effective 5/31/2011, assuming 1.5 persons per
bedroom. 2011 HUD Fair Market Rents revised 7/13/2011. For HOME projects: to obtain High HOME rents - use lesser
of 60% rent or FMR, unless (non)MSA name is marked by asterisk. For Low HOME rents - use lesser of 50% rent or
FMR, unless (non)MSA name is marked by asterisk.
Rent by Unit Size
MSA
Rent Level
0
1
2
3
4
5
NON - METROPOLITAN AREAS (continued)
Toombs Co.
60%
469
502
603
696
777
857
50%
391
418
502
580
647
714
30%
235
251
302
348
388
429
FMRs
352
488
542
755
836
961
Towns Co.
60%
511
548
658
759
847
935
50%
426
456
548
633
706
779
30%
256
274
328
380
423
468
FMRs
533
553
642
824
998
1148
Treutlen Co.
60%
469
502
603
696
777
857
50%
391
418
502
580
647
714
30%
235
251
302
348
388
429
FMRs
411
480
542
725
829
953
Troup Co.
60%
526
564
676
782
873
963
50%
438
470
563
651
727
802
30%
263
282
338
391
437
482
FMRs
519
525
658
832
859
988
Turner Co.
60%
469
502
603
696
777
857
50%
391
418
502
580
647
714
30%
235
251
302
348
388
429
FMRs
450
477
542
687
838
964
Union Co.
60%
532
570
685
791
883
974
50%
443
475
571
659
736
811
30%
266
285
342
395
441
486
FMRs
533
553
642
824
998
1148
Upson Co.
60%
472
506
607
700
781
862
50%
393
421
506
583
651
718
30%
236
253
303
350
391
431
FMRs
382
517
588
703
724
833
Ware Co.
60%
483
517
621
717
801
884
50%
402
431
517
598
667
736
30%
242
259
311
359
401
442
FMRs
449
485
542
694
728
837
*HOME Program Rent held at last year's level
9 of 10
Georgia Department of Community Affairs
Office of Affordable Housing
2011 Program Maximum Gross Rents for LIHTC and HOME Programs
60%, 50% & 30% rents calculated using 2011 HUD Area Median Incomes effective 5/31/2011, assuming 1.5 persons per
bedroom. 2011 HUD Fair Market Rents revised 7/13/2011. For HOME projects: to obtain High HOME rents - use lesser
of 60% rent or FMR, unless (non)MSA name is marked by asterisk. For Low HOME rents - use lesser of 50% rent or
FMR, unless (non)MSA name is marked by asterisk.
Rent by Unit Size
MSA
Rent Level
0
1
2
3
4
5
NON - METROPOLITAN AREAS (continued)
Warren Co.
60%
469
502
603
696
777
857
50%
391
418
502
580
647
714
30%
235
251
302
348
388
429
FMRs
450
470
542
681
702
807
Washington Co.
60%
469
502
603
696
777
857
50%
391
418
502
580
647
714
30%
235
251
302
348
388
429
FMRs
389
446
542
662
762
876
Wayne Co.
60%
541
579
696
804
897
989
50%
451
483
580
670
747
824
30%
271
290
348
401
448
495
FMRs
388
439
542
715
951
1094
Webster Co.
60%
469
502
603
696
777
857
50%
391
418
502
580
647
714
30%
235
251
302
348
388
429
FMRs
450
466
542
683
922
1060
Wheeler Co.
60%
495
530
636
735
820
905
50%
412
441
530
612
683
754
30%
248
266
318
368
411
453
FMRs
411
480
542
725
829
953
White Co.
60%
561
600
720
831
928
1023
50%
467
500
600
693
773
853
30%
280
300
360
416
465
512
FMRs
474
591
657
829
998
1148
Wilcox Co.
60%
469
502
603
696
777
857
50%
391
418
502
580
647
714
30%
235
251
302
348
388
429
FMRs
411
480
542
725
829
953
Wilkes Co.
60%
469
502
603
696
777
857
50%
391
418
502
580
647
714
30%
235
251
302
348
388
429
FMRs
450
470
542
681
702
807
Wilkinson Co.
60%
490
525
630
727
811
895
50%
408
437
525
606
676
746
30%
245
262
315
364
406
448
FMRs
408
500
557
720
751
864
*HOME Program Rent held at last year's level
10 of 10