- Collection:
- Georgia Government Publications
- Serial:
- ... Program maximum gross rents for LIHTC and HOME programs.
- Title:
- 2010 Program maximum gross rents for LIHTC and HOME programs
- Creator:
- Georgia. Department of Community Affairs. Office of Affordable Housing
- Contributor to Resource:
- Georgia. Office of Affordable Housing, issuing body.
- Publisher:
- Atlanta, Ga. : Georgia. Department of Community Affairs. Office of Affordable Housing
- Date of Original:
- 2010
- Subject:
- Home Investment Partnership Program (Ga.)--Periodicals
Rent control--Georgia--Periodicals
Housing subsidies--Georgia--Periodicals - Location:
- United States, Georgia, 32.75042, -83.50018
- Medium:
- tables (documents)
- Type:
- Text
- Format:
- application/pdf
- Description:
- Maximum gross rents for LIHTC and HOME programs.
- External Identifiers:
- Call Number GA C495.H6 S1 M31 2010
- Metadata URL:
- https://dlg.galileo.usg.edu/id:dlg_ggpd_y-ga-bc495-ph6-bs1-bm31-b2010-belec-p-btext
- Digital Object URL:
- https://dlg.galileo.usg.edu/do:dlg_ggpd_y-ga-bc495-ph6-bs1-bm31-b2010-belec-p-btext
- Language:
- eng
- Holding Institution:
- University of Georgia. Map and Government Information Library
- Rights:
-

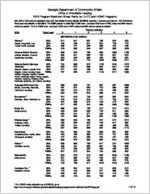
Georgia Department of Community Affairs Office of Affordable Housing
2010 Program Maximum Gross Rents for LIHTC and HOME Programs
60%, 50% & 30% rents are calculated using HUD Area Median Incomes effective 5/14/2010, assuming 1.5 persons per bedroom. HUD Fair Market Rents used were effective on 3/11/2010. For HOME projects: to obtain High HOME rents - use lesser of 60% rent or FMR, unless (non)MSA name is marked by asterisk. For Low HOME rents - use lesser of 50% rent or FMR, unless (non)MSA name is marked by asterisk.
MSA
Rent Level
0
Rent by Unit Size
1
2
3
4
5
Albany *
(Baker, Dougherty, Lee, Terrell, Worth counties)
METROPOLITAN AREAS
60%
511
547
657
758
846
933
50%
426
456
547
631
705
778
30%
256
274
328
380
423
468
FMRs
516
550
646
867
895
1029
Athens-Clarke County
60%
606
649
780
900
1005
1108
(Clarke, Madison, Oconee
50%
505
541
650
750
837
923
Oglethorpe counties)
30%
303
325
390
450
502
554
FMRs
552
614
770
1026
1058
1217
Atlanta-Sandy Springs
60%
754
808
970
1120
1249
1379
-Marietta
50%
628
673
808
933
1041
1149
(Barrow, Bartow, Carroll, Cher
30%
377
404
485
560
625
690
Clayton, Cobb, Coweta, Daws FMRs
757
820
912
1110
1211
1393
Dekalb, Douglas, Fayette, Forsyth,
Fulton, Gwinnett, Heard, Henry, Jasper,
Newton, Paulding, Pickens, Pike,
Rockdale, Spalding, and Walton counties)
Augusta-Richmond Co.
60%
585
626
751
867
967
1068
(Burke, Columbia, McDuffie,
50%
487
521
626
723
806
890
Richmond counties)
30%
292
313
376
434
485
535
FMRs
533
578
649
869
914
1051
Brunswick *
60%
574
615
739
853
952
1051
(Brantley, Glynn, McIntosh cou 50%
478
513
616
711
793
876
30%
287
308
370
426
476
525
FMRs
517
562
624
889
1096
1260
Butts Co. (Butts county)
Chattanooga *
(Catoosa, Dade, Walker counties)
60%
588
630
756
872
973
1074
50%
490
525
630
726
811
895
30%
293
314
377
435
486
536
FMRs
424
566
654
954
1136
1306
60%
588
630
756
872
973
1074
50%
490
525
630
726
811
895
30%
293
314
377
435
486
536
FMRs
537
568
669
824
968
1113
Columbus
60%
544
583
700
808
901
995
(Chattahoochee, Harris, Mario
50%
453
486
583
673
751
829
Muscogee counties)
30%
272
291
350
404
451
498
FMRs
550
579
663
882
1044
1201
Dalton *
(Whitfield county)
60%
550
590
708
817
912
1006
50%
458
491
590
681
760
838
30%
275
295
353
408
456
503
FMRs
527
573
634
784
808
929
Gainesville (Hall county)
60%
633
678
813
939
1048
1156
50%
527
565
677
783
873
963
30%
316
338
406
469
523
578
FMRs
720
755
871
1070
1240
1426
Haralson Co. *
(Haralson county)
60%
499
534
642
741
826
912
50%
416
445
535
617
688
760
30%
250
267
321
370
413
456
FMRs
456
478
548
798
967
1112
* For HOME rents effective as of 6/26/10, go to http://www.hud.gov/offices/cpd/affordablehousing/programs/home/limits/rent/2010/ga.pdf
1 of 10
Georgia Department of Community Affairs Office of Affordable Housing
2010 Program Maximum Gross Rents for LIHTC and HOME Programs
60%, 50% & 30% rents are calculated using HUD Area Median Incomes effective 5/14/2010, assuming 1.5 persons per bedroom. HUD Fair Market Rents used were effective on 3/11/2010. For HOME projects: to obtain High HOME rents - use lesser of 60% rent or FMR, unless (non)MSA name is marked by asterisk. For Low HOME rents - use lesser of 50% rent or FMR, unless (non)MSA name is marked by asterisk.
MSA
Rent Level
0
Rent by Unit Size
1
2
3
4
5
METROPOLITAN AREAS (continued)
Hinesville-Fort Stewart
60%
487
522
627
724
808
891
(Liberty county)
50%
406
435
522
603
673
743
30%
243
261
313
361
403
445
FMRs
522
567
631
888
1010
1162
Lamar Co. (Lamar county)
60%
568
609
730
844
942
1039
50%
473
507
608
703
785
866
30%
285
305
366
422
471
520
FMRs
495
497
596
786
1046
1203
Long Co. (Long county)
60%
487
522
627
724
808
891
50%
406
435
522
603
673
743
30%
243
261
313
361
403
445
FMRs
465
505
562
770
794
913
Macon *
60%
559
599
718
830
927
1022
(Bibb, Houston, Jones,
50%
466
499
598
691
772
851
Peach, Twiggs counties)
30%
280
300
360
415
463
511
FMRs
542
588
654
806
840
966
Meriwether (Meriwether county)
60%
496
531
637
736
822
907
50%
413
443
531
613
685
756
30%
248
266
318
368
411
453
FMRs
485
491
585
706
727
836
Monroe Co. (Monroe county)
60%
669
716
859
992
1107
1221
50%
557
596
716
826
922
1018
30%
335
358
430
496
555
611
FMRs
522
568
630
755
780
897
Murray Co. (Murray county)
60%
552
591
709
819
913
1008
50%
460
492
591
682
761
840
30%
276
295
355
410
457
504
FMRs
494
533
594
710
731
841
Rome (Floyd county)
60%
550
590
708
817
912
1006
50%
458
491
590
681
760
838
30%
275
295
353
408
456
503
FMRs
498
508
655
804
830
955
Savannah (Bryan, Chatham, Effingham counties)
60%
619
663
796
921
1027
1133
50%
516
553
663
767
856
944
30%
310
332
398
460
513
566
FMRs
676
732
815
1082
1117
1285
Valdosta *
(Brooks, Echols, Lanier, Lowndes counties)
Warner Robins (Houston county)
60%
508
544
652
753
841
927
50%
423
453
543
628
701
773
30%
253
271
326
377
421
464
FMRs
532
534
642
871
898
1033
60%
693
742
891
1029
1149
1268
50%
577
618
742
858
957
1056
30%
347
371
446
515
575
634
FMRs
590
600
713
1035
1190
1369
* For HOME rents effective as of 6/26/10, go to http://www.hud.gov/offices/cpd/affordablehousing/programs/home/limits/rent/2010/ga.pdf
2 of 10
Georgia Department of Community Affairs Office of Affordable Housing
2010 Program Maximum Gross Rents for LIHTC and HOME Programs
60%, 50% & 30% rents are calculated using HUD Area Median Incomes effective 5/14/2010, assuming 1.5 persons per bedroom. HUD Fair Market Rents used were effective on 3/11/2010. For HOME projects: to obtain High HOME rents - use lesser of 60% rent or FMR, unless (non)MSA name is marked by asterisk. For Low HOME rents - use lesser of 50% rent or FMR, unless (non)MSA name is marked by asterisk.
MSA
Rent Level
0
Rent by Unit Size
1
2
3
4
5
NON - METROPOLITAN AREAS
Appling Co.
60%
487
522
627
724
808
891
50%
406
435
522
603
673
743
30%
243
261
313
361
403
445
FMRs
454
494
548
668
688
791
Atkinson Co.
60%
487
522
627
724
808
891
50%
406
435
522
603
673
743
30%
243
261
313
361
403
445
FMRs
455
476
548
698
795
914
Bacon Co.
Baldwin Co. * Banks Co. *
60%
487
522
627
724
808
891
50%
406
435
522
603
673
743
30%
243
261
313
361
403
445
FMRs
455
476
548
698
795
914
60%
546
585
702
810
904
997
50%
455
487
585
675
753
831
30%
272
291
350
404
451
498
FMRs
427
515
639
763
787
905
60%
564
604
726
837
934
1031
50%
470
503
605
698
778
859
30%
282
302
362
418
467
516
FMRs
474
513
569
691
982
1129
Ben Hill Co
60%
487
522
627
724
808
891
50%
406
435
522
603
673
743
30%
243
261
313
361
403
445
FMRs
360
464
554
670
689
792
Berrien Co.
60%
487
522
627
724
808
891
50%
406
435
522
603
673
743
30%
243
261
313
361
403
445
FMRs
449
450
548
679
700
805
Bleckley Co.
60%
537
575
690
797
889
981
50%
447
479
575
664
741
818
30%
268
288
346
399
446
491
FMRs
385
449
548
678
777
894
Bulloch Co.
60%
564
603
724
836
933
1029
50%
470
503
603
696
777
858
30%
282
302
362
418
467
516
FMRs
505
522
619
743
763
877
Calhoun Co.
60%
487
522
627
724
808
891
50%
406
435
522
603
673
743
30%
243
261
313
361
403
445
FMRs
455
493
548
703
864
994
Camden Co.
60%
588
630
756
873
975
1076
50%
490
525
630
728
812
896
30%
295
315
378
436
487
538
FMRs
564
565
681
991
1195
1374
Candler Co.
60%
487
522
627
724
808
891
50%
406
435
522
603
673
743
30%
243
261
313
361
403
445
FMRs
454
494
548
668
688
791
* For HOME rents effective as of 6/26/10, go to http://www.hud.gov/offices/cpd/affordablehousing/programs/home/limits/rent/2010/ga.pdf
3 of 10
Georgia Department of Community Affairs Office of Affordable Housing
2010 Program Maximum Gross Rents for LIHTC and HOME Programs
60%, 50% & 30% rents are calculated using HUD Area Median Incomes effective 5/14/2010, assuming 1.5 persons per bedroom. HUD Fair Market Rents used were effective on 3/11/2010. For HOME projects: to obtain High HOME rents - use lesser of 60% rent or FMR, unless (non)MSA name is marked by asterisk. For Low HOME rents - use lesser of 50% rent or FMR, unless (non)MSA name is marked by asterisk.
MSA
Rent Level
0
Rent by Unit Size
1
2
3
4
5
NON - METROPOLITAN AREAS (continued)
Charlton Co.
60%
487
522
627
724
808
891
50%
406
435
522
603
673
743
30%
243
261
313
361
403
445
FMRs
455
476
548
698
795
914
Chattooga Co.
60%
487
522
627
724
808
891
50%
406
435
522
603
673
743
30%
243
261
313
361
403
445
FMRs
357
437
548
657
956
1099
Clay Co.
60%
487
522
627
724
808
891
50%
406
435
522
603
673
743
30%
243
261
313
361
403
445
FMRs
455
493
548
703
864
994
Clinch Co.
60%
487
522
627
724
808
891
50%
406
435
522
603
673
743
30%
243
261
313
361
403
445
FMRs
455
476
548
698
795
914
Coffee Co.
60%
487
522
627
724
808
891
50%
406
435
522
603
673
743
30%
243
261
313
361
403
445
FMRs
454
470
548
682
835
960
Colquitt Co.
60%
487
522
627
724
808
891
50%
406
435
522
603
673
743
30%
243
261
313
361
403
445
FMRs
456
492
548
656
825
949
Cook Co.
60%
487
522
627
724
808
891
50%
406
435
522
603
673
743
30%
243
261
313
361
403
445
FMRs
455
465
548
745
963
1107
Crisp Co.
60%
487
522
627
724
808
891
50%
406
435
522
603
673
743
30%
243
261
313
361
403
445
FMRs
455
459
548
692
713
820
Decatur Co.
60%
487
522
627
724
808
891
50%
406
435
522
603
673
743
30%
243
261
313
361
403
445
FMRs
407
473
623
745
828
952
Dodge Co.
60%
487
522
627
724
808
891
50%
406
435
522
603
673
743
30%
243
261
313
361
403
445
FMRs
432
434
548
733
754
867
Dooly Co.
60%
487
522
627
724
808
891
50%
406
435
522
603
673
743
30%
243
261
313
361
403
445
FMRs
455
471
548
691
933
1073
Early Co.
60%
487
522
627
724
808
891
50%
406
435
522
603
673
743
30%
243
261
313
361
403
445
FMRs
455
493
548
703
864
994
* For HOME rents effective as of 6/26/10, go to http://www.hud.gov/offices/cpd/affordablehousing/programs/home/limits/rent/2010/ga.pdf
4 of 10
Georgia Department of Community Affairs Office of Affordable Housing
2010 Program Maximum Gross Rents for LIHTC and HOME Programs
60%, 50% & 30% rents are calculated using HUD Area Median Incomes effective 5/14/2010, assuming 1.5 persons per bedroom. HUD Fair Market Rents used were effective on 3/11/2010. For HOME projects: to obtain High HOME rents - use lesser of 60% rent or FMR, unless (non)MSA name is marked by asterisk. For Low HOME rents - use lesser of 50% rent or FMR, unless (non)MSA name is marked by asterisk.
MSA
Rent Level
0
Rent by Unit Size
1
2
3
4
5
NON - METROPOLITAN AREAS (continued)
Elbert Co.
60%
487
522
627
724
808
891
50%
406
435
522
603
673
743
30%
243
261
313
361
403
445
FMRs
455
475
548
688
710
817
Emanuel Co.
60%
487
522
627
724
808
891
50%
406
435
522
603
673
743
30%
243
261
313
361
403
445
FMRs
358
415
548
668
854
982
Evans Co.
60%
487
522
627
724
808
891
50%
406
435
522
603
673
743
30%
243
261
313
361
403
445
FMRs
454
494
548
668
688
791
Fannin Co.
Franklin Co. * Gilmer Co. *
60%
487
522
627
724
808
891
50%
406
435
522
603
673
743
30%
243
261
313
361
403
445
FMRs
371
516
572
685
821
944
60%
490
525
631
729
813
897
50%
408
438
526
607
677
748
30%
245
262
315
364
406
448
FMRs
474
513
569
691
982
1129
60%
490
525
630
727
811
895
50%
408
437
525
606
676
746
30%
245
262
315
364
406
448
FMRs
537
581
648
855
1032
1187
Glascock Co.
60%
487
522
627
724
808
891
50%
406
435
522
603
673
743
30%
243
261
313
361
403
445
FMRs
393
416
548
656
770
886
Gordon Co.
60%
559
599
718
830
927
1022
50%
466
499
598
691
772
851
30%
280
300
360
415
463
511
FMRs
537
541
695
831
858
987
Grady Co.
60%
487
522
627
724
808
891
50%
406
435
522
603
673
743
30%
243
261
313
361
403
445
FMRs
356
492
548
760
785
903
Greene Co.
60%
520
557
669
772
862
951
50%
433
464
557
643
718
792
30%
260
278
335
386
431
476
FMRs
455
475
548
688
710
817
Habersham Co.
60%
553
592
711
821
916
1011
50%
461
493
592
684
763
842
30%
277
296
356
411
458
506
FMRs
541
544
651
780
1143
1314
Hancock Co.
60%
487
522
627
724
808
891
50%
406
435
522
603
673
743
30%
243
261
313
361
403
445
FMRs
455
475
548
688
710
817
* For HOME rents effective as of 6/26/10, go to http://www.hud.gov/offices/cpd/affordablehousing/programs/home/limits/rent/2010/ga.pdf
5 of 10
Georgia Department of Community Affairs Office of Affordable Housing
2010 Program Maximum Gross Rents for LIHTC and HOME Programs
60%, 50% & 30% rents are calculated using HUD Area Median Incomes effective 5/14/2010, assuming 1.5 persons per bedroom. HUD Fair Market Rents used were effective on 3/11/2010. For HOME projects: to obtain High HOME rents - use lesser of 60% rent or FMR, unless (non)MSA name is marked by asterisk. For Low HOME rents - use lesser of 50% rent or FMR, unless (non)MSA name is marked by asterisk.
MSA
Rent Level
0
Rent by Unit Size
1
2
3
4
5
NON - METROPOLITAN AREAS (continued)
Hart Co.
60%
517
554
664
768
856
945
50%
431
461
553
640
713
788
30%
258
276
332
383
428
472
FMRs
455
493
548
654
961
1105
Irwin Co.
Jackson Co. *
60%
487
522
627
724
808
891
50%
406
435
522
603
673
743
30%
243
261
313
361
403
445
FMRs
455
482
548
695
848
975
60%
595
637
765
883
985
1087
50%
496
531
637
736
821
906
30%
297
318
382
442
493
544
FMRs
565
613
682
829
1082
1244
Jeff Davis Co.
60%
487
522
627
724
808
891
50%
406
435
522
603
673
743
30%
243
261
313
361
403
445
FMRs
454
494
548
668
688
791
Jefferson Co.
60%
487
522
627
724
808
891
50%
406
435
522
603
673
743
30%
243
261
313
361
403
445
FMRs
393
437
548
656
770
886
Jenkins Co.
60%
487
522
627
724
808
891
50%
406
435
522
603
673
743
30%
243
261
313
361
403
445
FMRs
393
416
548
656
770
886
Johnson Co.
Laurens Co. *
60%
487
522
627
724
808
891
50%
406
435
522
603
673
743
30%
243
261
313
361
403
445
FMRs
413
506
564
729
761
875
60%
501
536
643
743
829
915
50%
417
446
536
619
691
762
30%
251
268
322
371
415
458
FMRs
455
495
548
736
893
1027
Lincoln Co.
60%
487
522
627
724
808
891
50%
406
435
522
603
673
743
30%
243
261
313
361
403
445
FMRs
455
475
548
688
710
817
Lumpkin Co.
60%
606
649
780
900
1005
1108
50%
505
541
650
750
837
923
30%
303
325
390
450
502
554
FMRs
481
625
742
1002
1111
1278
Macon Co.
60%
487
522
627
724
808
891
50%
406
435
522
603
673
743
30%
243
261
313
361
403
445
FMRs
455
471
548
691
933
1073
Miller Co.
60%
487
522
627
724
808
891
50%
406
435
522
603
673
743
30%
243
261
313
361
403
445
FMRs
423
492
548
686
818
941
* For HOME rents effective as of 6/26/10, go to http://www.hud.gov/offices/cpd/affordablehousing/programs/home/limits/rent/2010/ga.pdf
6 of 10
Georgia Department of Community Affairs Office of Affordable Housing
2010 Program Maximum Gross Rents for LIHTC and HOME Programs
60%, 50% & 30% rents are calculated using HUD Area Median Incomes effective 5/14/2010, assuming 1.5 persons per bedroom. HUD Fair Market Rents used were effective on 3/11/2010. For HOME projects: to obtain High HOME rents - use lesser of 60% rent or FMR, unless (non)MSA name is marked by asterisk. For Low HOME rents - use lesser of 50% rent or FMR, unless (non)MSA name is marked by asterisk.
MSA
Rent Level
0
Rent by Unit Size
1
2
3
4
5
NON - METROPOLITAN AREAS (continued)
Mitchell Co.
60%
487
522
627
724
808
891
50%
406
435
522
603
673
743
30%
243
261
313
361
403
445
FMRs
357
453
548
657
912
1049
Montgomery Co.
60%
502
538
646
746
832
918
50%
418
448
538
621
693
765
30%
251
269
323
373
416
459
FMRs
415
486
548
733
838
964
Morgan Co.
Peach Co. *
60%
603
646
775
895
999
1102
50%
502
538
646
746
832
918
30%
301
323
387
447
500
551
FMRs
493
494
609
729
750
863
60%
558
597
717
828
924
1020
50%
465
498
597
690
770
850
30%
280
300
360
415
463
511
FMRs
497
498
601
860
905
1041
Pierce Co.
Polk Co. * Pulaski Co. *
60%
487
522
627
724
808
891
50%
406
435
522
603
673
743
30%
243
261
313
361
403
445
FMRs
455
476
548
698
795
914
60%
487
522
627
724
808
891
50%
406
435
522
603
673
743
30%
243
261
313
361
403
445
FMRs
450
501
611
753
778
895
60%
519
556
667
771
861
949
50%
432
463
556
642
717
791
30%
260
278
333
385
430
474
FMRs
415
486
548
797
837
963
Putnam Co.
60%
567
607
729
841
939
1035
50%
472
506
607
701
782
863
30%
283
303
363
420
468
517
FMRs
413
418
548
796
819
942
Quitman Co.
60%
487
522
627
724
808
891
50%
406
435
522
603
673
743
30%
243
261
313
361
403
445
FMRs
455
493
548
703
864
994
Rabun Co.
60%
523
561
673
777
867
957
50%
436
467
561
647
722
797
30%
262
281
337
388
433
478
FMRs
539
559
649
837
1009
1160
Randolph Co.
60%
487
522
627
724
808
891
50%
406
435
522
603
673
743
30%
243
261
313
361
403
445
FMRs
455
493
548
703
864
994
Schley Co.
60%
487
522
627
724
808
891
50%
406
435
522
603
673
743
30%
243
261
313
361
403
445
FMRs
455
471
548
691
933
1073
* For HOME rents effective as of 6/26/10, go to http://www.hud.gov/offices/cpd/affordablehousing/programs/home/limits/rent/2010/ga.pdf
7 of 10
Georgia Department of Community Affairs Office of Affordable Housing
2010 Program Maximum Gross Rents for LIHTC and HOME Programs
60%, 50% & 30% rents are calculated using HUD Area Median Incomes effective 5/14/2010, assuming 1.5 persons per bedroom. HUD Fair Market Rents used were effective on 3/11/2010. For HOME projects: to obtain High HOME rents - use lesser of 60% rent or FMR, unless (non)MSA name is marked by asterisk. For Low HOME rents - use lesser of 50% rent or FMR, unless (non)MSA name is marked by asterisk.
MSA
Rent Level
0
Rent by Unit Size
1
2
3
4
5
NON - METROPOLITAN AREAS (continued)
Screven Co.
60%
487
522
627
724
808
891
50%
406
435
522
603
673
743
30%
243
261
313
361
403
445
FMRs
393
416
548
656
770
886
Seminole Co.
60%
487
522
627
724
808
891
50%
406
435
522
603
673
743
30%
243
261
313
361
403
445
FMRs
423
492
548
686
818
941
Stephens Co.
60%
487
522
627
724
808
891
50%
406
435
522
603
673
743
30%
243
261
313
361
403
445
FMRs
366
508
564
675
697
802
Stewart Co.
60%
487
522
627
724
808
891
50%
406
435
522
603
673
743
30%
243
261
313
361
403
445
FMRs
455
493
548
703
864
994
Sumter Co.
60%
487
522
627
724
808
891
50%
406
435
522
603
673
743
30%
243
261
313
361
403
445
FMRs
429
482
592
709
1040
1196
Talbot Co.
60%
487
522
627
724
808
891
50%
406
435
522
603
673
743
30%
243
261
313
361
403
445
FMRs
525
526
635
782
805
926
Taliaferro Co.
60%
487
522
627
724
808
891
50%
406
435
522
603
673
743
30%
243
261
313
361
403
445
FMRs
455
475
548
688
710
817
Tattnall Co.
60%
487
522
627
724
808
891
50%
406
435
522
603
673
743
30%
243
261
313
361
403
445
FMRs
456
493
548
723
791
910
Taylor Co.
60%
487
522
627
724
808
891
50%
406
435
522
603
673
743
30%
243
261
313
361
403
445
FMRs
455
471
548
691
933
1073
Telfair Co.
Thomas Co. *
60%
487
522
627
724
808
891
50%
406
435
522
603
673
743
30%
243
261
313
361
403
445
FMRs
415
486
548
733
838
964
60%
519
555
666
769
858
947
50%
432
463
555
641
715
789
30%
260
278
333
385
430
474
FMRs
503
545
606
778
1064
1224
Tift Co.
60%
511
547
657
758
846
933
50%
426
456
547
631
705
778
30%
256
274
328
380
423
468
FMRs
478
518
574
733
847
974
* For HOME rents effective as of 6/26/10, go to http://www.hud.gov/offices/cpd/affordablehousing/programs/home/limits/rent/2010/ga.pdf
8 of 10
Georgia Department of Community Affairs Office of Affordable Housing
2010 Program Maximum Gross Rents for LIHTC and HOME Programs
60%, 50% & 30% rents are calculated using HUD Area Median Incomes effective 5/14/2010, assuming 1.5 persons per bedroom. HUD Fair Market Rents used were effective on 3/11/2010. For HOME projects: to obtain High HOME rents - use lesser of 60% rent or FMR, unless (non)MSA name is marked by asterisk. For Low HOME rents - use lesser of 50% rent or FMR, unless (non)MSA name is marked by asterisk.
MSA
Rent Level
0
Rent by Unit Size
1
2
3
4
5
NON - METROPOLITAN AREAS (continued)
Toombs Co.
60%
487
522
627
724
808
891
50%
406
435
522
603
673
743
30%
243
261
313
361
403
445
FMRs
356
493
548
763
845
972
Towns Co.
60%
487
522
627
724
808
891
50%
406
435
522
603
673
743
30%
243
261
313
361
403
445
FMRs
539
559
649
833
1009
1160
Treutlen Co.
60%
487
522
627
724
808
891
50%
406
435
522
603
673
743
30%
243
261
313
361
403
445
FMRs
415
486
548
733
838
964
Troup Co.
60%
543
582
699
807
900
993
50%
452
485
582
672
750
828
30%
271
290
348
403
450
496
FMRs
525
531
666
842
870
1001
Turner Co.
Union Co. *
60%
487
522
627
724
808
891
50%
406
435
522
603
673
743
30%
243
261
313
361
403
445
FMRs
455
482
548
695
848
975
60%
520
557
669
772
862
951
50%
433
464
557
643
718
792
30%
260
278
335
386
431
476
FMRs
539
559
649
833
1009
1160
Upson Co.
60%
487
522
627
724
808
891
50%
406
435
522
603
673
743
30%
243
261
313
361
403
445
FMRs
386
523
595
711
732
842
Ware Co.
60%
487
522
627
724
808
891
50%
406
435
522
603
673
743
30%
243
261
313
361
403
445
FMRs
454
490
548
702
737
848
Warren Co.
60%
487
522
627
724
808
891
50%
406
435
522
603
673
743
30%
243
261
313
361
403
445
FMRs
455
475
548
688
710
817
Washington Co.
60%
487
522
627
724
808
891
50%
406
435
522
603
673
743
30%
243
261
313
361
403
445
FMRs
393
451
548
670
770
886
Wayne Co.
60%
516
552
663
766
855
943
50%
430
460
552
638
712
786
30%
258
276
332
383
428
472
FMRs
392
444
548
723
962
1106
Webster Co.
60%
487
522
627
724
808
891
50%
406
435
522
603
673
743
30%
243
261
313
361
403
445
FMRs
455
471
548
691
933
1073
* For HOME rents effective as of 6/26/10, go to http://www.hud.gov/offices/cpd/affordablehousing/programs/home/limits/rent/2010/ga.pdf
9 of 10
Georgia Department of Community Affairs Office of Affordable Housing
2010 Program Maximum Gross Rents for LIHTC and HOME Programs
60%, 50% & 30% rents are calculated using HUD Area Median Incomes effective 5/14/2010, assuming 1.5 persons per bedroom. HUD Fair Market Rents used were effective on 3/11/2010. For HOME projects: to obtain High HOME rents - use lesser of 60% rent or FMR, unless (non)MSA name is marked by asterisk. For Low HOME rents - use lesser of 50% rent or FMR, unless (non)MSA name is marked by asterisk.
MSA
Rent Level
0
Rent by Unit Size
1
2
3
4
5
NON - METROPOLITAN AREAS (continued)
Wheeler Co.
60%
487
522
627
724
808
891
50%
406
435
522
603
673
743
30%
243
261
313
361
403
445
FMRs
415
486
548
733
838
964
White Co.
60%
534
572
687
792
885
975
50%
445
476
572
660
737
813
30%
267
286
343
396
442
488
FMRs
480
599
665
839
1010
1162
Wilcox Co.
60%
487
522
627
724
808
891
50%
406
435
522
603
673
743
30%
243
261
313
361
403
445
FMRs
415
486
548
733
838
964
Wilkes Co.
60%
487
522
627
724
808
891
50%
406
435
522
603
673
743
30%
243
261
313
361
403
445
FMRs
455
475
548
688
710
817
Wilkinson Co.
60%
514
551
661
765
853
941
50%
428
459
551
637
711
784
30%
257
276
331
382
427
471
FMRs
413
506
564
729
761
875
* For HOME rents effective as of 6/26/10, go to http://www.hud.gov/offices/cpd/affordablehousing/programs/home/limits/rent/2010/ga.pdf
10 of 10