- Collection:
- Georgia Government Publications
- Serial:
- ... Program maximum gross rents for LIHTC and HOME programs.
- Title:
- Low-Income Housing Tax Credit and HOME programs: 2001 program maximum gross rent tables [2001]
- Creator:
- Georgia. Department of Community Affairs. Housing Finance Division
- Contributor to Resource:
- Georgia. Department of Community Affairs. Housing Finance Division
- Publisher:
- Atlanta, Ga. : Georgia. Department of Community Affairs. Housing Finance Division
- Date of Original:
- 2001
- Subject:
- Georgia
- Location:
- United States, Georgia, 32.75042, -83.50018
- Medium:
- publications (documents)
- Type:
- Text
- Format:
- application/pdf
- Description:
- Description based on: 2010 (harvested on February 4, 2014 from www.dca.ga.gov); title from PDF running title (Georgia Government Publications database, viewed July 14, 2022).
Latest issue consulted: 2010 (harvested on February 4, 2014 from www.dca.ga.gov); (Georgia Government Publications database, viewed July 14, 2022). - External Identifiers:
- Call Number GA C495.H6 S1 M31 2001
- Metadata URL:
- https://dlg.galileo.usg.edu/id:dlg_ggpd_y-ga-bc495-ph6-bs1-bm31-b2001-belec-p-btext
- Digital Object URL:
- https://dlg.galileo.usg.edu/do:dlg_ggpd_y-ga-bc495-ph6-bs1-bm31-b2001-belec-p-btext
- Language:
- eng
- Holding Institution:
- University of Georgia. Map and Government Information Library
- Rights:
-

Location
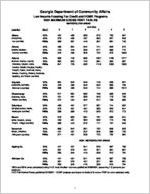
Georgia Department of Community Affairs
Low-Income Housing Tax Credit and HOME Programs
2001 MAXIMUM GROSS RENT TABLES
METROPOLITAN AREAS
Unit Size
Rent*
0
1
2
3
4
5
Albany (Dougherty, Lee counties)
60%
454
486
585
675
753
831
50%
378
405
487
563
627
649
FMRs
308
361
440
601
651
748
Athens (Clarke, Madison, Oconee counties)
60%
499
534
642
741
826
912
50%
416
445
535
617
688
712
FMRs
379
409
529
722
870
1000
Atlanta
60%
699
748
898
1037
1156
1277
(Barrow, Bartow, Carroll,
50%
582
623
748
864
963
997
Cherokee, Clayton, Cobb,
FMRs
647
720
839
1119
1353
1555
Coweta, Dekalb, Douglas, Fayette,
Forsyth, Fulton, Gwinnett, Henry,
Newton, Paulding, Pickens, Rockdale,
Spalding, and Walton counties)
Augusta (Columbia, McDuffie, Richmond counties)
60%
504
540
648
748
835
921
50%
420
450
540
623
696
720
FMRs
389
465
548
744
880
1012
Chattanooga (Catoosa, Dade, Walker counties)
60%
517
554
666
768
858
946
50%
431
461
555
640
715
739
FMRs
372
434
522
674
768
883
Columbus (Chattahoochee, Harris, Muscogee counties)
60% 50% FMRs
450
481
577
667
744
822
375
401
481
556
620
641
356
396
475
620
673
773
Macon
60%
516
553
664
767
856
944
(Bibb, Houston, Jones,
50%
430
461
553
639
713
738
Peach, Twiggs counties)
FMRs
398
443
516
711
731
840
Savannah (Bryan, Chatham, Effingham counties)
60%
505
542
651
752
838
925
50%
421
451
542
626
698
723
FMRs
371
461
536
723
752
864
NON - METROPOLITAN AREAS
Appling Co.
60%
421
451
541
625
697
769
50%
351
376
451
521
581
601
FMRs
283
340
416
539
613
704
Atkinson Co.
60%
421
451
541
625
697
769
50%
351
376
451
521
581
601
FMRs
283
340
416
539
613
704
*60% and 50% rents calculated using HUD Area Median Incomes published 3/29/2001, assuming 1.5 persons per bedroom. HUD Fair Market Rents published 01/02/01. HOME projects use lesser of desired % rent or FMR for rent restricted units.
1
Location
Georgia Department of Community Affairs
Low-Income Housing Tax Credit and HOME Programs
2001 MAXIMUM GROSS RENT TABLES
NON - METROPOLITAN AREAS
Unit Size
Rent*
0
1
2
3
4
5
Bacon Co.
60% 50%
421
451
541
625
697
769
351
376
451
521
581
601
FMRs
283
340
416
539
613
704
Baker Co.
60%
421
451
541
625
697
769
50%
351
376
451
521
581
601
FMRs
283
340
416
539
613
704
Baldwin Co. Banks Co. Ben Hill Co
60%
457
490
588
680
759
837
50%
381
408
490
566
632
654
FMRs
283
362
441
565
617
709
60%
552
591
709
820
915
1009
50%
460
493
591
683
762
788
FMRs
283
340
416
539
613
704
60% 50%
421
451
541
625
697
769
351
376
451
521
581
601
FMRs
283
340
416
539
621
714
Berrien Co.
60%
421
451
541
625
697
769
50%
351
376
451
521
581
601
FMRs
283
340
416
539
613
704
Bleckley Co. Brantley Co.
60%
463
496
595
687
768
846
50%
386
413
496
573
640
661
FMRs
283
340
416
539
613
704
60%
421
451
541
625
697
769
50%
351
376
451
521
581
601
FMRs
283
340
416
539
613
704
Brooks Co.
60%
421
451
541
625
697
769
50%
351
376
451
521
581
601
FMRs
283
340
416
539
613
704
Bulloch Co.
60%
426
456
547
631
705
777
50%
355
380
456
526
587
607
FMRs
340
345
444
572
726
834
Burke Co.
60%
421
451
541
625
697
769
50%
351
376
451
521
581
601
FMRs
283
340
416
539
613
704
Butts Co. Calhoun Co.
60%
478
512
615
709
792
873
50%
398
426
512
591
660
682
FMRs
283
374
496
664
696
800
60%
421
451
541
625
697
769
50%
351
376
451
521
581
601
FMRs
283
340
416
539
613
704
*60% and 50% rents calculated using HUD Area Median Incomes published 3/29/2001, assuming 1.5 persons per bedroom. HUD Fair Market Rents published 01/02/01. HOME projects use lesser of desired % rent or FMR for rent restricted units.
2
Location
Georgia Department of Community Affairs
Low-Income Housing Tax Credit and HOME Programs
2001 MAXIMUM GROSS RENT TABLES
NON - METROPOLITAN AREAS (cont'd)
Unit Size
Rent*
0
1
2
3
4
5
Camden Co. Candler Co.
60%
450
482
579
669
747
823
50%
375
401
482
557
622
643
FMRs
395
447
500
696
822
945
60% 50%
421
451
541
625
697
769
351
376
451
521
581
601
FMRs
283
340
416
539
613
704
Charlton Co.
60%
421
451
541
625
697
769
50%
351
376
451
521
581
601
FMRs
283
340
416
539
613
704
Chattooga Co.
60%
421
451
541
625
697
769
50%
351
376
451
521
581
601
FMRs
283
340
416
539
613
704
Clay Co.
60% 50%
421
451
541
625
697
769
351
376
451
521
581
601
FMRs
283
340
416
539
613
704
Clinch Co.
60%
421
451
541
625
697
769
50%
351
376
451
521
581
601
FMRs
283
340
416
539
613
704
Coffee Co.
60%
421
451
541
625
697
769
50%
351
376
451
521
581
601
FMRs
283
340
416
539
621
714
Colquitt Co.
60%
421
451
541
625
697
769
50%
351
376
451
521
581
601
FMRs
283
340
416
539
613
704
Cook Co.
60%
421
451
541
625
697
769
50%
351
376
451
521
581
601
FMRs
283
340
416
539
613
704
Crawford Co. Crisp Co.
60%
493
528
634
733
817
902
50%
411
440
528
611
681
705
FMRs
283
340
416
539
613
704
60%
421
451
541
625
697
769
50%
351
376
451
521
581
601
FMRs
286
340
416
539
613
704
Dawson Co. Decatur Co.
60%
457
489
588
678
757
834
50%
381
408
490
565
631
652
FMRs
283
368
489
612
754
867
60% 50%
421
451
541
625
697
769
351
376
451
521
581
601
FMRs
283
340
416
539
613
704
*60% and 50% rents calculated using HUD Area Median Incomes published 3/29/2001, assuming 1.5 persons per bedroom. HUD Fair Market Rents published 01/02/01. HOME projects use lesser of desired % rent or FMR for rent restricted units.
3
Location
Georgia Department of Community Affairs
Low-Income Housing Tax Credit and HOME Programs
2001 MAXIMUM GROSS RENT TABLES
NON - METROPOLITAN AREAS (cont'd)
Unit Size
Rent*
0
1
2
3
4
5
Dodge Co.
60%
421
451
541
625
697
769
50%
351
376
451
521
581
601
FMRs
283
340
416
539
613
704
Dooly Co.
60%
421
451
541
625
697
769
50%
351
376
451
521
581
601
FMRs
283
340
416
539
613
704
Early Co.
60%
421
451
541
625
697
769
50%
351
376
451
521
581
601
FMRs
283
340
416
539
613
704
Echols Co.
60% 50%
421
451
541
625
697
769
351
376
451
521
581
601
FMRs
283
340
416
539
613
704
Elbert Co.
60%
421
451
541
625
697
769
50%
351
376
451
521
581
601
FMRs
283
340
416
539
613
704
Emanuel Co.
60%
421
451
541
625
697
769
50%
351
376
451
521
581
601
FMRs
283
340
416
539
613
704
Evans Co.
60%
421
451
541
625
697
769
50%
351
376
451
521
581
601
FMRs
283
340
416
539
613
704
Fannin Co.
60% 50%
421
451
541
625
697
769
351
376
451
521
581
601
FMRs
283
340
416
539
613
704
Floyd Co.
60%
475
509
612
706
787
870
50%
396
424
510
588
656
679
FMRs
283
340
417
550
613
704
Franklin Co.
60%
478
512
615
709
792
873
50%
398
426
512
591
660
682
FMRs
283
340
416
539
613
704
Gilmer Co.
60%
421
451
541
625
697
769
50%
351
376
451
521
581
601
FMRs
283
340
416
539
613
704
Glascock Co.
60%
474
507
609
703
784
865
50%
395
423
507
586
653
676
FMRs
283
340
416
539
613
704
*60% and 50% rents calculated using HUD Area Median Incomes published 3/29/2001, assuming 1.5 persons per bedroom. HUD Fair Market Rents published 01/02/01. HOME projects use lesser of desired % rent or FMR for rent restricted units.
4
Location
Georgia Department of Community Affairs
Low-Income Housing Tax Credit and HOME Programs
2001 MAXIMUM GROSS RENT TABLES
NON - METROPOLITAN AREAS (cont'd)
Unit Size
Rent*
0
1
2
3
4
5
Glynn Co.
60%
514
551
661
764
852
941
50%
428
459
551
636
710
735
FMRs
394
441
499
670
821
944
Gordon Co.
60%
481
515
618
714
796
879
50%
401
429
515
595
663
686
FMRs
335
340
424
547
699
803
Grady Co.
60% 50%
421
451
541
625
697
769
351
376
451
521
581
601
FMRs
288
340
416
539
613
704
Greene Co.
60%
421
451
541
625
697
769
50%
351
376
451
521
581
601
FMRs
283
340
416
539
613
704
Habersham Co.
60%
477
510
613
708
790
871
50%
397
425
511
590
658
681
FMRs
303
340
416
539
618
710
Hall Co.
60%
547
587
705
814
909
1002
50%
456
489
587
678
757
783
FMRs
299
454
534
669
746
857
Hancock Co.
60% 50%
421
451
541
625
697
769
351
376
451
521
581
601
FMRs
283
340
416
539
613
704
Haralson Co.
60%
435
465
559
645
720
794
50%
362
388
466
538
600
620
FMRs
283
340
416
539
613
704
Hart Co.
60%
445
477
573
661
738
814
50%
371
397
477
551
615
636
FMRs
283
340
416
539
613
704
Heard Co.
60%
421
451
541
625
697
769
50%
351
376
451
521
581
601
FMRs
283
340
416
539
613
704
Irwin Co.
60%
421
451
541
625
697
769
50%
351
376
451
521
581
601
FMRs
283
340
416
539
613
704
Jackson Co.
60%
492
526
631
729
814
898
50%
410
438
526
608
678
701
FMRs
314
340
427
539
703
808
*60% and 50% rents calculated using HUD Area Median Incomes published 3/29/2001, assuming 1.5 persons per bedroom. HUD Fair Market Rents published 01/02/01. HOME projects use lesser of desired % rent or FMR for rent restricted units.
5
Location
Georgia Department of Community Affairs
Low-Income Housing Tax Credit and HOME Programs
2001 MAXIMUM GROSS RENT TABLES
NON - METROPOLITAN AREAS (cont'd)
Unit Size
Rent*
0
1
2
3
4
5
Jasper Co.
60%
439
471
565
654
729
804
50%
366
392
471
545
607
628
FMRs
283
340
421
572
613
704
Jeff Davis Co.
60%
421
451
541
625
697
769
50%
351
376
451
521
581
601
FMRs
283
340
416
539
613
704
Jefferson Co.
60% 50%
421
451
541
625
697
769
351
376
451
521
581
601
FMRs
283
340
416
539
621
714
Jenkins Co.
60%
421
451
541
625
697
769
50%
351
376
451
521
581
601
FMRs
283
340
416
539
613
704
Johnson Co.
60%
442
474
568
657
732
808
50%
368
395
473
547
610
631
FMRs
283
340
416
539
613
704
Lamar Co.
60%
448
480
576
666
742
819
50%
373
400
480
555
618
640
FMRs
283
349
416
539
659
757
Lanier Co.
60%
421
451
541
625
697
769
50%
351
376
451
521
581
601
FMRs
283
340
416
539
613
704
Laurens Co.
60%
421
451
541
625
697
769
50%
351
376
451
521
581
601
FMRs
283
340
416
539
613
704
Liberty Co.
60% 50%
421
451
541
625
697
769
351
376
451
521
581
601
FMRs
351
392
446
620
625
718
Lincoln Co.
60%
438
469
562
650
726
800
50%
365
391
468
541
605
625
FMRs
283
340
416
539
613
704
Long Co.
60%
421
451
541
625
697
769
50%
351
376
451
521
581
601
FMRs
283
368
416
539
613
704
Lowndes Co.
60%
423
453
544
628
700
774
50%
352
377
453
523
583
604
FMRs
316
383
463
649
718
825
Lumpkin Co.
60% 50%
523
561
673
778
868
958
436
467
561
648
723
748
FMRs
283
381
428
573
703
808
*60% and 50% rents calculated using HUD Area Median Incomes published 3/29/2001, assuming 1.5 persons per bedroom. HUD Fair Market Rents published 01/02/01. HOME projects use lesser of desired % rent or FMR for rent restricted units.
6
Location
Georgia Department of Community Affairs
Low-Income Housing Tax Credit and HOME Programs
2001 MAXIMUM GROSS RENT TABLES
NON - METROPOLITAN AREAS (cont'd)
Unit Size
Rent*
0
1
2
3
4
5
McIntosh Co.
60%
421
451
541
625
697
769
50%
351
376
451
521
581
601
FMRs
283
340
416
539
613
704
Macon Co.
60%
421
451
541
625
697
769
50%
351
376
451
521
581
601
FMRs
283
340
416
539
613
704
Marion Co.
60% 50%
421
451
541
625
697
769
351
376
451
521
581
601
FMRs
283
340
416
539
613
704
Meriwether Co.
60%
421
451
541
625
697
769
50%
351
376
451
521
581
601
FMRs
283
340
416
539
613
704
Miller Co.
60%
421
451
541
625
697
769
50%
351
376
451
521
581
601
FMRs
283
340
416
539
613
704
Mitchell Co.
60%
421
451
541
625
697
769
50%
351
376
451
521
581
601
FMRs
283
340
416
539
613
704
Monroe Co.
60%
415
445
534
618
688
0
50%
346
371
445
515
573
286
FMRs
283
340
416
548
613
704
Montgomery Co.
60%
421
451
541
625
697
769
50%
351
376
451
521
581
601
FMRs
283
340
416
539
613
704
Morgan Co. Murray Co. Oglethorpe Co. Pierce Co.
60% 50%
502
538
646
747
834
919
418
448
538
622
695
718
FMRs
283
340
431
539
613
704
60%
460
493
592
684
763
842
50%
383
411
493
570
636
658
FMRs
283
340
416
539
613
704
60%
465
498
598
690
771
850
50%
387
415
498
575
642
664
FMRs
283
340
416
539
613
704
60% 50%
421
451
541
625
697
769
351
376
451
521
581
601
FMRs
283
340
416
539
613
704
Pike Co.
60%
531
569
682
789
880
971
50%
442
474
568
657
733
758
FMRs
328
355
450
627
631
725
*60% and 50% rents calculated using HUD Area Median Incomes published 3/29/2001, assuming 1.5 persons per bedroom. HUD Fair Market Rents published 01/02/01. HOME projects use lesser of desired % rent or FMR for rent restricted units.
7
Location
Georgia Department of Community Affairs
Low-Income Housing Tax Credit and HOME Programs
2001 MAXIMUM GROSS RENT TABLES
NON - METROPOLITAN AREAS (cont'd)
Unit Size
Rent*
0
1
2
3
4
5
Polk Co.
60%
429
459
550
636
709
783
50%
357
382
458
530
591
611
FMRs
283
340
416
563
613
704
Pulaski Co. Putnam Co.
60%
505
541
649
750
837
922
50%
421
451
541
625
697
721
FMRs
283
340
416
539
613
704
60%
462
495
594
686
765
845
50%
385
412
495
571
637
660
FMRs
283
340
416
539
621
714
Quitman Co.
60%
421
451
541
625
697
769
50%
351
376
451
521
581
601
FMRs
283
340
416
539
613
704
Rabun Co.
60% 50%
421
451
541
625
697
769
351
376
451
521
581
601
FMRs
283
340
416
539
613
704
Randolph Co.
60%
421
451
541
625
697
769
50%
351
376
451
521
581
601
FMRs
283
340
416
539
613
704
Schley Co.
60%
432
462
555
641
715
789
50%
360
385
462
534
596
616
FMRs
283
340
416
539
613
704
Screven Co.
60%
421
451
541
625
697
769
50%
351
376
451
521
581
601
FMRs
283
340
416
539
613
704
Seminole Co. Stephens Co. Stewart Co.
60%
421
451
541
625
697
769
50%
351
376
451
521
581
601
FMRs
283
340
416
539
613
704
60%
426
456
547
633
706
779
50%
355
380
456
527
588
608
FMRs
283
340
416
539
613
704
60% 50%
421
451
541
625
697
769
351
376
451
521
581
601
FMRs
283
340
416
539
613
704
Sumter Co.
60% 50%
421
451
541
625
697
769
351
376
451
521
581
601
FMRs
283
345
416
539
613
704
Talbot Co.
60%
421
451
541
625
697
769
50%
351
376
451
521
581
601
FMRs
283
340
416
539
613
704
*60% and 50% rents calculated using HUD Area Median Incomes published 3/29/2001, assuming 1.5 persons per bedroom. HUD Fair Market Rents published 01/02/01. HOME projects use lesser of desired % rent or FMR for rent restricted units.
8
Location
Georgia Department of Community Affairs
Low-Income Housing Tax Credit and HOME Programs
2001 MAXIMUM GROSS RENT TABLES
NON - METROPOLITAN AREAS (cont'd)
Unit Size
Rent*
0
1
2
3
4
5
Taliaferro Co.
60%
421
451
541
625
697
769
50%
351
376
451
521
581
601
FMRs
283
340
416
539
613
704
Tattnall Co.
60%
421
451
541
625
697
769
50%
351
376
451
521
581
601
FMRs
283
340
416
539
613
704
Taylor Co.
60% 50%
421
451
541
625
697
769
351
376
451
521
581
601
FMRs
283
340
416
539
613
704
Telfair Co.
60%
421
451
541
625
697
769
50%
351
376
451
521
581
601
FMRs
283
340
416
539
613
704
Terrell Co.
60%
421
451
541
625
697
769
50%
351
376
451
521
581
601
FMRs
283
340
416
539
613
704
Thomas Co.
60%
421
451
541
625
697
769
50%
351
376
451
521
581
601
FMRs
283
350
416
539
613
704
Tift Co.
60% 50%
429
459
550
636
709
783
357
382
458
530
591
611
FMRs
283
340
416
539
613
704
Toombs Co.
60%
421
451
541
625
697
769
50%
351
376
451
521
581
601
FMRs
283
340
416
539
613
704
Towns Co.
60%
421
451
541
625
697
769
50%
351
376
451
521
581
601
FMRs
283
340
416
539
613
704
Treutlen Co.
60%
421
451
541
625
697
769
50%
351
376
451
521
581
601
FMRs
283
340
416
539
613
704
Troup Co. Turner Co.
60%
480
514
616
713
795
877
50%
400
428
513
594
662
685
FMRs
283
385
433
541
613
704
60%
421
451
541
625
697
769
50%
351
376
451
521
581
601
FMRs
283
340
416
539
613
704
Union Co.
60% 50%
421
451
541
625
697
769
351
376
451
521
581
601
FMRs
283
340
434
544
613
704
*60% and 50% rents calculated using HUD Area Median Incomes published 3/29/2001, assuming 1.5 persons per bedroom. HUD Fair Market Rents published 01/02/01. HOME projects use lesser of desired % rent or FMR for rent restricted units.
9
Location
Georgia Department of Community Affairs
Low-Income Housing Tax Credit and HOME Programs
2001 MAXIMUM GROSS RENT TABLES
NON - METROPOLITAN AREAS (cont'd)
Unit Size
Rent*
0
1
2
3
4
5
Upson Co. Ware Co.
60%
423
453
544
628
700
774
50%
352
377
453
523
583
604
FMRs
292
340
416
539
613
704
60%
421
451
541
625
697
769
50%
351
376
451
521
581
601
FMRs
312
350
416
539
647
744
Warren Co.
60% 50%
421
452
543
627
699
771
351
376
452
522
582
602
FMRs
283
340
416
539
613
704
Washington Co. Wayne Co.
60%
436
467
561
647
721
797
50%
363
389
467
539
601
622
FMRs
283
340
416
539
613
704
60%
421
451
541
625
697
769
50%
351
376
451
521
581
601
FMRs
292
340
416
539
613
704
Webster Co.
60%
421
451
541
625
697
769
50%
351
376
451
521
581
601
FMRs
283
340
416
539
613
704
Wheeler Co.
60%
421
451
541
625
697
769
50%
351
376
451
521
581
601
FMRs
283
340
416
539
613
704
White Co. Whitfield Co.
60%
483
517
621
717
801
882
50%
402
431
517
598
667
690
FMRs
283
340
416
539
627
721
60%
522
559
670
775
865
954
50%
435
466
558
646
721
745
FMRs
283
371
446
570
672
772
Wilcox Co.
60% 50%
421
451
541
625
697
769
351
376
451
521
581
601
FMRs
283
340
416
539
613
704
Wilkes Co.
60% 50%
421
451
541
625
697
769
351
376
451
521
581
601
FMRs
283
340
416
539
613
704
Wilkinson Co.
60%
444
475
571
660
736
812
50%
370
396
476
550
613
635
FMRs
283
340
416
539
613
704
Worth Co.
60%
421
451
541
625
697
769
50%
351
376
451
521
581
601
FMRs
283
340
416
539
613
704
*60% and 50% rents calculated using HUD Area Median Incomes published 3/29/2001, assuming 1.5 persons per bedroom. HUD Fair Market Rents published 01/02/01. HOME projects use lesser of desired % rent or FMR for rent restricted units.
10