- Collection:
- Georgia Government Publications
- Title:
- 2005 annual solid waste report
- Creator:
- Georgia. Department of Community Affairs
- Publisher:
- Atlanta, GA : Georgia Dept. of Community Affairs, 2005
- Date of Original:
- 2005
- Subject:
- Refuse and refuse disposal--Georgia
Incineration--Georgia
Waste disposal in the ground--Georgia
Waste minimization--Georgia - Location:
- United States, Georgia, 32.75042, -83.50018
- Medium:
- state government records
- Type:
- Text
- Format:
- application/pdf
- External Identifiers:
- Call Number GA C495 .S1 S63 2005
- Metadata URL:
- https://dlg.galileo.usg.edu/id:dlg_ggpd_y-ga-bc495-b-ps1-bs63-b2005-belec-p-btext
- Digital Object URL:
- https://dlg.galileo.usg.edu/do:dlg_ggpd_y-ga-bc495-b-ps1-bs63-b2005-belec-p-btext
- Language:
- eng
- Holding Institution:
- University of Georgia. Map and Government Information Library
- Rights:
-

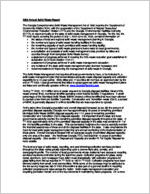
2005 Annual Solid Waste Report
The Georgia Comprehensive Solid Waste Management Act of 1990 requires the Department of Community Affairs (DCA), with the cooperation of the Department of Natural Resources' Environmental Protection Division (EPD) and the Georgia Environmental Facilities Authority (GEFA), to report annually on the state of solid waste management in Georgia. Per the Act, the FY 2005 report, covering the period of July 1, 2004-June 30, 2005, contains information on:
the status of local and regional solid waste management planning in Georgia; the number and types of solid waste handling facilities in the state; the remaining capacity of each permitted solid waste handling facility; the number and types of solid waste grants and loans made to local governments; a compilation and analysis of solid waste management data provided by cities and
counties through their completed Solid Waste Survey; a statement of progress achieved in meeting the 25% waste reduction goal established in
subsection (c) of Code Section 12-8-21; a statement of progress achieved in solid waste management education; any revisions in the state solid waste management plan deemed necessary; and recommendations for improving the management of solid waste in Georgia.
The Solid Waste Management Act requires all local governments to have, or be included in, a solid waste management plan that demonstrates adequate waste disposal capacity and collection capability for a 10-year period. Sixty cities and 17 counties did not have an approved plan by the end of FY 2005. Local governments that failed to adopt approved solid waste management plans are listed and continually updated online at: www.GeorgiaPlanning.com
During FY 2005, 16.2 million tons of waste was sent to Georgia disposal facilities. Most of this waste entered lined, monitored landfills operating under federal Subtitle D regulations. A small percentage of the Municipal Solid Waste (MSW) entered unlined landfills that have been allowed to operate under their pre-Subtitle D permits. Construction and Demolition waste (C&D), a subset of MSW, is generally disposed in unlined landfills that are less expensive to operate.
At the same time Georgia's population and overall disposal increased so too did the amount of permitted disposal capacity; Georgia now has approximately 28 years of remaining permitted Municipal Solid Waste (MSW) disposal capacity and 17.2 years of remaining permitted Construction and Demolition (C&D) disposal capacity. It is important that the state and local governments carefully monitor the remaining permitted disposal capacity throughout the state. In FY 2005 approximately 60% of the permitted disposal capacity in the state was contained in 7 of the 126 landfills permitted in the state. This concentration heightens the need to carefully monitor the financial assurances of these and all the disposal facilities in the state. It also emphasizes the need for local solid waste management planning and annual monitoring of the implementation of these plans. Overall Georgia is blessed with an adequate supply of permitted disposal capacity; only one area of the state the Northeast Georgia RDC, had less than 10 years of permitted disposal capacity. (See section A Disposal and Capacity and section B Per Capita Disposal for more details)
The level and type of solid waste, recycling, and yard trimmings collection services provided throughout the state varies greatly depending upon a community's size, density, and demographic profile. The number of local governments whose residents have access to recycling services has slowly dwindled during the last three years. Collection programs for glass, scrap metal, aluminum, and newspaper have fallen most dramatically, with collection programs for glass falling from 289 as reported in FY 2000 to 180 in FY 2004. Collection programs have been trimmed mainly from small, rural communities. While some of the decrease may be attributed to the low survey response rate in 2005 this decline is also part of a general decline in recycling collection programs and rates across the nation. Solid waste management education and recycling promotion remain one of the key elements in maintaining viable programs. On a more
positive note, more jurisdictions reported collecting problem wastes such as Household Hazardous Waste.
During FY 2004, 24 cities and 27 counties reported actively promoting waste minimization practices such as home composting or beneficial reuse of yard trimmings. During FY 2004, 365 cities and 57 counties reported collecting yard trimmings for diversion from MSW landfills, however inert landfill disposal is reported as one of the leading "processing" methods for these materials.
As the trend toward fewer, larger (and usually privately owned) landfills continues, solid waste transfer stations are becoming a popular method of streamlining solid waste collection services. Only 20 cities reported that they or their contractors used transfer stations for the collection or disposal of residential waste in FY 1995. By FY 2004, 153 cities or their contractors were using transfer stations to manage residential waste. (See section C: Solid Waste & Recycling Collection of the report for more details)
Another growing trend that needs to be carefully monitored is the amount of waste imported to Georgia for disposal and its potential impact on future disposal capacity and Georgia's environment. With statewide posted MSW tipping fees at $34.95 per ton ($30.21 for C&D waste), far less than Northeastern states and Florida, Georgia landfills represent considerable costsavings for companies moving large amounts of waste. Because the waste reduction goal specified in the Act includes all waste disposed in MSW landfills, this out-of-state waste is included in our progress toward meeting the waste reduction goal, and undercuts waste reduction and recycling efforts undertaken by Georgians. On a per capita basis, 7.47 pounds of waste entered MSW landfills daily during FY 2005, and nearly one pound/day of that came from outside Georgia's borders. (See section B: Per Capita Disposal and section D: MSW & C&D Landfill Tipping Fees of the report for more details)
During FY 2005 the EPD did not receive an appropriation of the Solid Waste Trust Fund to support local government waste reduction and recycling infrastructure grants and GEFA did not issue any low interest loans for solid waste management projects. (See section E: Grants and Loans to Local Governments)
As the disposal rate continues to increase in the state, a statewide strategy needs to be developed to identify the barriers to increasing the waste disposal diversion rate in the state. The State Solid Waste Management Plan needs to be updated and needs to identify strategies and resources necessary to reduce the waste disposal rate in the state. The growing number and use of inert landfills, solid waste transfer stations, and out-of-state waste imports needs to be monitored for their impact upon the quality of life for all Georgians as well as their potential long term impact upon Georgia's environment.
The full report, as well as reports from past years, is available online at www.dca.ga.gov, under Office of Environmental Management programs.
Disposal and Capacity 2005 Solid Waste Report
During Fiscal Year 2005 the amount of waste sent to Georgia landfills increased
only slightly as per-capita waste disposal rates remained stable. Georgia has
Landfill Quick Facts
approximately 28 years of remaining permitted MSW landfill space and 17.2 years of remaining permitted C&D landfill space. Trends toward privatization of waste collection and disposal infrastructure continue statewide, with transfer stations increasingly popular as landfills become larger and demand larger volumes of waste to operate cost-effectively.
MSW
Disposal
FY 2005
Private Public
8,947,772 3,209,827
tons
tons
Where Does the Waste Go?
Landfill Ownership
16 facilities 53 facilities
Much of the waste disposed of in Georgia enters lined, monitored MSW Landfills.
Remaining Capacity
Of the 16,176,296 tons of non-industrial waste disposed in permitted Georgia
Years
15
25
disposal facilities during FY 2005, 11,929,801 tons, or 74%, entered lined,
Cubic Yards 236
146
monitored landfills. Approximately 3,876,697 tons, or 24%, entered unlined
(millions)
Construction and Demolition landfills. The remainder was divided among unlined Municipal Solid Waste landfills (225,797 tons, or 1.7%), the state's only MSW incinerator (101,688 tons; 0.7%), and the state's only large-scale MSW composting facility (54,640 tons; 0.3%.)
C&D
Disposal
Landfill
3,187,687 694,259 tons tons
17 facilities 40 facilities
According to the Department of Natural Resources, Environmental Protection Division (EPD), 12,155,598 tons of waste entered MSW landfills in Georgia during
Ownership Remaining Capacity
FY 2005. This is up slightly from FY 2004, when 11.9 million tons of waste entered Georgia MSW facilities.
Years
19
20
Cubic Yards 54
34
Most of the waste disposed in Georgia enters private landfills. In FY 2005, landfill
(millions)
owners/operators reported 8,947,772 tons of waste entering 14 private MSW
landfills, compared with 8,951,929 tons entering 16 private MSW landfills in FY 2004. In FY 2005, 3,209,827 tons of waste
entered 53 publicly owned MSW facilities in the state, compared with 2,964,192 tons entering 54 public MSW landfills the
previous year. (These figures include facilities that were active for only a portion of FY 2005.)
Tons
Tons of Waste Disposed FY 1996-2005
15,000,000 10,000,000
5,000,000 0 1996 1997 1998 1999 2000 2001 2002 2003 2004 2005 Fiscal Year
M SW C&D
A - 1
Disposal and Capacity 2005 Solid Waste Report
Permitted Solid Waste Management Facilities
FY 1998 -- 20051
1998 1999 2000 2001 2002 2003
Inert Landfills Collection Operations2
2,101 469
2,167 538
2,304 610
2,399 708
2,424 775
2,354 796
Transfer Stations
139
161
176
202
230
233
On-Site Thermal Treatment Facilities
79
79
83
88
89
99
On-site Processing Facilities
54
75
84
92
95
90
Municipal Solid Waste Landfills
76
70
69
62
60
58
Construction and Demolition Landfills
34
32
34
33
46
51
Recovered Materials Processing Facilities
3
5
5
5
3
0
Composting Facilities
2
4
3
3
3
3
Waste-to-Energy Facility
1
1
1
1
1
1
2004
2,389 872 76 101 93 58 54
1 3 1
2005
2,373 891 76 101 99 54 57
1 3 1
Air Curtain Destructors
0
1
3
1
3
0
5
5
Commercial Industrial Waste Landfill
1
1
1
1
1
1
1
1
1Operating as of July 1 of the indicated fiscal year, some facilities cease operations or are added, so these figures may differ from those used
elsewhere in this report. 2Collection operations are any entity that collects waste from residential or commercial locations.
C&D Landfills
Construction and Demolition landfills are permitted disposal facilities that can only accept waste building materials and rubble resulting from construction, remodeling, repair, and demolition operations on pavements, houses, commercial buildings and other structures. Such wastes include, but are not limited to, yard trimmings, asbestos-containing waste, wood, bricks, metal, concrete, wall board, paper, cardboard, inert waste landfill material, and other nonputrescible wastes which have a low potential for groundwater contamination.
The public sector owns and operates a greater number of C&D facilities in the state, but it manages only 38.8% of the statewide C&D disposal capacity. In FY 2005, landfill operators reported 3,187,687 tons of waste entering 17 private C&D facilities, while 694,295 tons of waste entered 40 publicly owned facilities. These figures include facilities that were active for only a portion of FY 2005, and those that are under construction.
Unlined Landfills
During FY 2005, 225,797 tons of waste was disposed in five unlined MSW landfills.
Unlined Landfills Accepting MSW FY 2005
This represents approximately
County Facility Name
Total
Avg. Remaining Remaining
1.7% of the total waste
Tons Daily Capacity Capacity
entering MSW landfills in
Disposed Tons
(CY)
(Years)
Georgia. As of July 2005, five
Bibb
Macon-Walker Road
133,293
430
2,548,628
11.4
unlined MSW facilities were
Phase 2 (SL)
still operating under their original EPD-approved
Decatur
Decatur Co.-S.R.
31,878
102
97,054
1.8
309 Bainbridge
Phase 2 (SL)
permits, and had not reached
Grady
Cairo-6th Ave. (SL)
29,265
71
357,763
9.7
their closure capacity. Until
Liberty
U.S. Army-Ft.
18,431
64
862,832
25.7
they do, they must adhere to the same operating procedures and methane monitoring requirements as their more modern counterparts. When
McIntosh
Total
Stewart Main Cantonment (SL) McIntosh CountyKing Road (SL)
12,930
225,797
50
682,504
717 4,548,781
26.3
12.2
the unlined facilities close, they
will be capped and monitored under federal Subtitle D regulations. There is no time limit for these landfills to meet Subtitle
D regulations, but they will not be granted expansion permits. It is likely that a very small percentage of MSW generated in
Georgia will continue to be disposed in unlined landfills for years to come.
A - 2
Disposal and Capacity 2005 Solid Waste Report
Other Disposal Facilities
There is one incinerator operating in Georgia accepting MSW. Located in Chatham County, the operation is also known as a waste-to-energy facility. The facility accepts approximately 384 tons per day, mostly from the City of Savannah. During FY 2005, 101,688 tons of waste was incinerated at this facility. There are several other types of incinerators in public and private use that accept only specialized waste, such as wood waste.
Another unique waste disposal operation in Georgia is Cobb County's MSW composting facility. The facility accepts approximately 186 tons per day of MSW collected in Cobb County. The composting process results in a clean, beneficial soil amendment given to Cobb residents free of charge. During FY 2005, 54,640 tons of MSW entered the Cobb Composting facility.
Imported Waste
The amount of waste brought to Georgia from other states and disposed has increased dramatically in the last decade. Waste imports fell slightly from 1,646,164 tons in FY 2004, to 1,638,292 tons in FY 2005. Most of the waste brought to Georgia from other states is MSW (95%), with the remainder being Construction and Demolition waste. Out-of-state waste amounts to 10.1% of the total amount of MSW disposed in Georgia, or 14.5% of the waste entering MSW landfills in the state. (See Waste Imports FY 1994-2005) As shown in the table on page A-4, most of the imported waste enters a small number of facilities. It is difficult to track waste exported from Georgia, and it is suspected that in most cases, it travels relatively short distances across state lines. Based on telephone interviews with operators of transfer stations that ship waste out of state, it is believed that approximately 150,000 tons per year of Georgia-generated waste is sent to neighboring states.
Waste Imports FY 1996-2005
1800000
1600000
1400000
1200000
1000000
Tons
800000
600000
400000
200000
0 1996
1997
1998
1999
2000
2001
Fiscal Year
2002
2003
2004
2005
A - 3
Disposal and Capacity 2005 Solid Waste Report
Out-of-State Waste Imported to Georgia
FY 2005 (Top five facilities)
County Facility Name
Imported Tons Domain Facility Type
Taylor Allied Services, LLC -SR 90/SR 137 Charing (SL)
566,630 Private Municipal Solid Waste Landfill
Charlton Chesser Island Road Landfill, Inc. MSWL
312,372 Private Municipal Solid Waste Landfill
Lowndes Pecan Row Municipal Solid Waste Landfill
290,081 Private Municipal Solid Waste Landfill
Wayne Broadhurst Environmental
190,342 Private Municipal Solid Waste Landfill
Banks Chambers R & B Landfill Site #2
123,324 Private Municipal Solid Waste Landfill
Subtotal
1,482,749
Total
1,638,292
Remaining Landfill Disposal Capacity
On a statewide basis, Georgia continues to have an adequate supply of permitted landfill disposal capacity, however some regions of the state are running low. At the close of FY 2005 the state had 28 years of remaining permitted MSW landfill space and 17.2 years of permitted C&D landfill space. The projection of remaining capacity is based upon current disposal rates and disposal capacity permitted by the Georgia EPD, but not necessarily built landfill space. The maps on page A - 5 highlight the change in the amount of permitted MSW landfill capacity in the state from 2004.
Landfill Capacity by Type FY 1996-2005
500,000,000
450,000,000
400,000,000
350,000,000
Cubic Yards
300,000,000 250,000,000 200,000,000
MSWL SL C&D/L Total
150,000,000
100,000,000
50,000,000
0 1996
1997
1998
1999
2000
2001
Fiscal Year
2002
2003
2004
2005
A - 4
Disposal and Capacity 2005 Solid Waste Report
Remaining MSW Landfill Capacity
FY 2005
FY 2004
North Georgia
Georgia Mountains
Coosa Valley
Atlanta Regional Commission
Northeast Georgia
Chattahoochee
Flint
McIntosh Trail
Central Savannah River Area
Middle Georgia
Lower Chattahoochee
Middle Flint
Heart of Georgia - Altamaha
Coastal Georgia
Southwest Georgia
South Georgia
Southeast Georgia
Map prepared by: Georgia Department of Community Affairs. Source: Years of remaining capacity by Regional Development Center was calculated using EPD-supplied average rate of fill and cubic yards of remaining capacity, based on 260 operating days per year.
A - 5
Legend
Less than 10 years 10 - 19 years 20 - 29 years 30 years and above
Disposal and Capacity 2005 Solid Waste Report
Permitted capacity, or the amount of available space in landfills to dispose of tightly compacted waste, grew from 430 million cubic yards in FY 2004 to 470 million cubic yards in FY 2005. Georgia has an estimated 28 years of remaining permitted MSW landfill capacity statewide, based upon 2005 disposal rates. A regional breakdown, by Regional Development Center and landfill type, can be found on page 8. The projection of remaining capacity is based upon current disposal rates and disposal capacity permitted by the Georgia EPD, but not necessarily built landfill space. While the state has more disposal capacity today than it had in the past decade, this capacity is contained in fewer landfills. The number of MSW landfills in Georgia has fallen since tighter federal regulations were adopted in the mid1990s, but the number of C&D landfills has increased to 57 in FY 2005. In FY 1993, there were 187 public and private landfills in Georgia, and 75% of these were small facilities that only accepted waste generated within the host county. For FY 2005, approximately 60% of the state's total remaining capacity sits in just seven facilities, although there are 126 active permitted landfills in Georgia. These gains in remaining disposal capacity have occurred while smaller or older landfills are closed and enter lengthy post-closure monitoring periods. The table entitled `Georgia Landfills with Most Remaining Permitted Disposal Capacity FY 2005' on page 7 ranks the top ten landfills in the state by remaining permitted disposal capacity.
Georgia Landfills with Most Remaining Permitted Disposal Capacity
FY 2005
County Facility Name
Total Tons Disposed Domain Facility Remaining Capacity Avg. Rate of Fill
FY 2005
Type
(CY)
Daily Tons (CYD)
Estimaed Remaining Permitted Capacity
(Years)
Richmond Richmond Co. - Deans
Bridge Rd. Phase 3
Cherokee Cherokee Co. - Pine Bluff
Landfill, Inc.
DeKalb DeKalb Co. - Seminole Rd
Ph 2a, 3, & 4 (SL)
Taylor Allied Services, LLC - S.R.
90/ S.R. 137
Butts
Butts Co. - Pine Ridge
Recycling
Camden Camden Co. - S.R. 110
C/D/I Landfill
Forsyth Eagle Point Landfill
Banks Chambers R&B Landfill Site
#2
Gwinnett BFI-Richland Creek Rd (SL)
Fulton Willow Oak C&D Landfill
Public 886,070 Private 421,559 Public 1,058,553 Private 834,015 Private
99,383 Public 526,160 Private 881,217 Private 869,728 Private 147,367 Private
MSWL MSWL MSWL MSWL MSWL
C&D MSWL MSWL MSWL
C&D
54,180,000
51,533,426
50,733,121
45,503,657
36,948,520
23,262,619 22,988,778
20,947,469 20,441,201 15,672,309
3,671
1,509
4,400
2,757
350 1,600
3,021 2,962 1,442
5,120
2,416
5,867
3,939
389 2,667
4,648 4,424 2,219
Permit issued 2004
38.7
80.8
29.8
36.1
230.0 33.2
17.3 17.8 27.2
Total
5,724,052
342,211,100 21,71 31,689 (Average) 24.9
A - 6
Disposal and Capacity 2005 Solid Waste Report
Regional Development Center
Atlanta Regional Commission Central Savannah River Area Chattahoochee Flint Coastal Georgia Coosa Valley Georgia Mountains Heart of Georgia-Altamaha Lower Chattahoochee McIntosh Trail Middle Flint Middle Georgia North Georgia Northeast Georgia South Georgia Southeast Georgia Southwest Georgia
Statewide C&D Total
Regional Development Center
Atlanta Regional Commission Central Savannah River Area Chattahoochee Flint Coastal Georgia Coosa Valley Georgia Mountains Heart of Georgia-Altamaha Lower Chattahoochee McIntosh Trail Middle Flint Middle Georgia North Georgia Northeast Georgia South Georgia Southeast Georgia Southwest Georgia
Statewide MSW Total
Disposal Capacity by RDC
Construction and Demolition Waste Landfills
FY 2005
Total Tons
Remaining Permitted Capacity Remaining Permitted Capacity
Disposed
(Cubic Yards)
(Years)
2,662,676
29,294,324
8.5
79,218
2,516,760
20.7
30,181
310,316
8.7
123,480
23,351,453
210.8
81,711
504,946
4.8
485,831
3,732,236
9.4
39,349
4,865,236
62.6
8,117
266,862
16.0
20,960
1,288,282
37.0
6,446
14,109
32.2
63,642
3,937,945
48.9
N/A
N/A
N/A
164,631
18,301,083
57.7
12,431
76,375
2.9
41,836
575,942
8.6
69,554
459,069
9.6
3,537,969
66,144,524
17.2
Disposal Capacity by RDC
Municipal Solid Waste Landfills
FY 2005
Total Tons
Remaining Permitted Capacity Remaining Permitted Capacity
Disposed
(Cubic Yards)
(Years)
3,168,577
127,152,843
33.3
373,073
57,165,737
89.4
101,467
2,333,694
19.2
576,695
8,294,576
12.0
503,849
19,522,284
24.3
1,497,547
53,012,152
24.8
707,244
12,957,869
15.9
70,166
5,521,471
36.0
875,470
37,334,055
35.1
1,097,108
56,637,654
34.5
627,441
18,192,175
18.5
290,160
10,233,867
22.8
1,017,228
7,214,056
5.5
611,386
18,362,090
25.0
378,719
13,443,427
29.4
241,466
7,829,636
18.4
12,137,596
455,207,586
28.0
A - 7
Disposal and Capacity 2005 Solid Waste Report
County
Facility Name
Atlanta Regional Commission
C&D
Cherokee Cherokee Construction And Demolition Landfill
Cherokee Cherokee Co.-Swims-SR 92 Ph 5
DeKalb BFI-East DeKalb Landfill
DeKalb APAC/Ga - Donzi Ln Ph 5a (L)
DeKalb
Rogers Lake Road C&D Landfill
DeKalb
DeKalb Co.-Seminole Rd Ph 2 (Sl)
Douglas
Douglas Co. - Cedar Mt/Worthan Rd Ph 1 (SL)
Fulton
Safeguard Landfill Management C & D
Fulton
Chadwick Rd Landfill, Inc.
Fulton
Willow Oak C&D Landfill
MSW
Cherokee Cherokee Co. - Pine Bluff Landfill, Inc.
Clayton
Clayton Co. - SR 3 Lovejoy Site # 3
DeKalb
DeKalb Co. - Seminole Rd Ph 2a, 3, & 4 (SL)
DeKalb WMI - Live Oak #2 (SL)
DeKalb BFI - Hickory Ridge (MSWL)
Fulton
Chambers - Bolton Rd (SL)
Gwinnett BFI-Richland Creek Rd (SL)
Central Savannah River Area
C&D
Burke
Burke Co. - Clarke Rd.
Columbia Columbia Co. - Sample & Son
(C&D)
Jenkins Jenkins Co. - CR 54
Richmond US Army-Ft. Gordon/Gibson
Rd.
Washington Washington Co. - Kaolin Rd.
MSW
Columbia Columbia Co. - Baker Place
Rd (Sl), Ph 2
Jefferson Jefferson Co. - CR138
Richmond Richmond Co. - Deans Bridge
Rd. Phase 2
Richmond Richmond Co. - Deans Bridge
Rd. Phase 3
Washington Washington Co. - Kaolin Rd.
Chattahoochee Flint
C&D
Coweta Coweta Co. - Ishman Ballard
Rd. Landfill
Troup
LaGrange - I 85/ S.R. 109
Troup
Troup Co. - S.R. 109
Mountville
MSW
Troup
LaGrange - I 85/ S.R. 109
Total Tons Disposed FY 2005
Domain
Facility Type
Remaining
Average Rate of Fill Remaining Permitted
Capacity (CY) Daily Tons (CYD)
Capacity (Years)
94,155 Private C&D
89,406 Private C&D
313,479 Private 736,573 Private 451,305 Private
C&D C&D C&D
70,791 Public C&D
32,571 Public C&D
382,542 Private C&D
344,487 Private C&D 147,367 Private C&D
886,070 Private
101,265 Public
421,559 Public
376,592
496,837 16,526
869,728
Private
Private Private Private
MSWL
MSWL
MSWL
MSWL MSWL MSWL MSWL
3,063,353
90,000 661,030 1,999,606
1,759,499
330,726
461,735
1,708,263 3,547,803 15,672,309
51,533,426
3,284,010
50,733,121 N/A
1,077,350 83,735
20,441,201
339
344 1,517 2,399
1,370
254
107
1,231 1,224 1,442
3,671
320
1,509 N/A
1,728 78
2,962
493
23.9
73
4.7
1,731
1.5
1,935
4.0
2,108
3.2
267
4.8
196
9.1
2,462
2.7
1,835
7.4
2,219
27.2
5,120
38.7
642
19.7
2,416
80.8
Ceased accepting waste
N/A
12/01/04
1,965
2.1
107
3.0
4,424
17.8
19,531 44,172
2,205 11,140
2,170
Public Private
Public Public
Public
64,704 7,499
293,008
7,862
Public Public Public Public Public
C&D C&D
C&D C&D
MSWL
MSWL
MSWL MSWL
MSWL
MSWL
148,930
1,446,152 777,513
144,165 74,982
78,401 1,415,997
298,349
54,180,000 1,118,008
26
105
5.5
105
159
35.0
26
103
29.0
35
70
7.9
18
45
6.4
240 55
1,151
38
358 111 1,880
107
0.8 49.6
0.6
Permit issued 2004 40.2
4,004 Public
C&D
30.8
168,318
10
21
18,773 Public
MSWL
119,362
60
120
3.8
7,404 Public
C&D
11.1
141,998
25
49
101,467 Public
MSWL
2,333,694
334
468
19.2
Coastal Georgia
C&D
A - 8
Disposal and Capacity 2005 Solid Waste Report
County
Facility Name
Camden
Glynn Liberty
MSW Camden Chatham Chatham
Liberty
McIntosh
Camden Co. - S.R. 110 C/D/I Landfill Eller - Whitlock Ave U. S. Army Ft. Stewart Main Cantonment
Camden Co. - S.R. 110 Savannah - Dean Forest Rd. Superior Landfill & Recycling Center U. S. Army Ft. Stewart Main Cantonment McIntosh Co. - King Rd.
Coosa Valley
C&D
Bartow Bartow Co. - S.R. 294
Emerson
Floyd
Floyd Co. - Rome Walker Mtn.
Rd.
Paulding Paulding Co. - Gulledge Rd.
Walker Walker Co. - Marble Top Rd.
Walker
MSW Bartow
Catoosa
Walker Co.- LaFayetteCoffman Springs Rd.
Bartow Co. - S.R. 294 Emerson Catoosa Co. - S.R.151,
Floyd
Rome Walker Mtn. Rd.,
Gordon Gordon Co. - Redbone Ridge
Rd.
Polk
Polk Co. - Grady Rd.
Georgia Mountains
C&D Forsyth Forsyth Hall
Eagle Point Landfill Greenleaf Recycling, LLC Reliable Tire Service
Habersham Habersham Co. - S.R.13
Rabun
Rabun Co. -- Boggs Mountain
Stephens Stephens Co.-S.R. 145 MSW
Banks
Chambers R&B Landfill Site
Forsyth Eagle Point Landfill
Habersham Habersham Co. - S.R.13
Hall
Hall Co.-Candler Rd.
Heart of Georgia-Altamaha
C&D Appling
Appling Co.-Roaring Creek
Evans
Evans Co. - Little Bull Creek C&D Landfill
Total Tons Domain Disposed FY 2005
99,383 Public
5,666 Private 18,431 Public
Facility Type
Remaining
Average Rate of Fill Remaining Permitted
Capacity (CY) Daily Tons (CYD)
Capacity (Years)
C&D
C&D C&D
23,262,619 86,352
2,482
350
389
18
36
1
1
230.0 9.2
9.5
52,263 Public
MSWL
1,901,275
183
366
20.0
121,198 Public
MSWL
211,748
248
496
1.6
389,873 Private
MSWL
4,636,217
1,177
1,570
11.4
18,431 Public
Unlined
MSW Landfill
862,832
64
129
25.7
12,930 Public
Unlined
MSW Landfill
682,504
50
100
26.3
15,404 16,227
301
Public Public Public
49,754 25
Public Public
95,828 20,037 103,622 39,519 244,843
Public Public Public Public Public
C&D C&D C&D
C&D C&D
MSWL MSWL MSWL MSWL MSWL
20,000 278,090
2,152 107,957
96,747
1,007,000 N/A
5,525,650 12,914,974
74,660
1
2
40
67
1
2
168
336
38.5 16.0
4.1 1.2 N/A1
313
474
8.2
N/A
N/A Ceased accepting waste
10/20/04
381
762
27.9
138
388
882
1,470
128.0 0.2
215,633 Private
MSWL
2,098,350
590
983
8.2
67,454 Private
C&D
640,471
218
440
5.6
185,413 Private
C&D
2,792,015
629
861
12.5
8,580 Public
MSWL
63,564
28
61
4.0
4,428 Public
C&D
252,000
17
38
25.5
4,323 Public
C&D
47,750
15
30
6.1
881,217 Private
MSWL
20,947,469
3,021
4,648
17.3
526,160 Private
MSWL
22,988,778
1,600
2,667
33.2
17,345 Public
MSWL
992,497
58
109
35.0
72,825 Public
MSWL
5,921,494
238
475
48.0
4,834
Under Construction
Public Public
C&D C&D
469,650 3,210,540
21
42
43.0
Permit issued 2003
Laurens Jeff Davis
Toombs MSW Candler Laurens
Laurens Co. -- Old Macon Rd. Jeff Davis Co. - CR 20 C&D Landfill Toombs Co. - S1898
Candler Co. - S.R. 121 Laurens Co. - Old Macon Rd.
22,105 Under Construction 12,410
12,801 28,433
Public Public
Public
Public Public
MSWL C&D
C&D
MSWL MSWL
A - 9
66,508 915,000
270,046
399,166 8,055
73
161
1.6
Permit issued 2001
50
100
10.4
49
76
20.2
95
134
0.2
Disposal and Capacity 2005 Solid Waste Report
County
Facility Name
Telfair
Telfair Co. - CR 144
Toombs Toombs Co. - S 1898
Wayne
Wayne Co. - S.R. 23 Broadhurst
Lower Chattahoochee
C&D
Muscogee Columbus, Pine Grove
MSW
Muscogee Columbus, Pine Grove
McIntosh Trail
C&D
Spalding Spalding Co. - Griffin/Shoal Creek Rd. (Phase 2)
Spalding Spalding Co. - Griffin/Shoal Creek Rd. (Phase 3)
MSW
Butts
Butts Co. - Pine Ridge
Recycling
Lamar
Lamar Co. - Cedar Grove Regional
Middle Flint
C&D
Macon
Macon Co. - Middle Georgia SWMA Regional MSWL
Dooly
Dooly Co. -- CR 101
MSW
Crisp
Crisp Co. - U.S. 41S
Taylor
Allied Services, LLC - S.R. 90/ S.R. 137
Middle Georgia
C&D
Bibb
Swift Creek Landfill
Baldwin Central State Hospital-
Freeman Building
Houston Houston Co. - S.R.247 Klondike
Twiggs Twiggs Co.-U.S. 80
MSW
Bibb
Macon - Walker Rd.
Bibb
Swift Creek MSW Landfill
Baldwin Baldwin Co. - Union Hill Church Rd.
Houston Houston Co. - S.R. 247 Klondike
Monroe Monroe Co. - Strickland Loop Rd.
Twiggs Twiggs Co. - U.S. 80
North Georgia
MSW Murray Murray Co. - U.S. 411
Westside
Whitfield Whitfield Co. - Dalton, Old Dixie Hwy.
Total Tons Domain Disposed FY 2005
19,766 Public 47,128 Public 599,116 Private
Facility Type
Remaining
Average Rate of Fill Remaining Permitted
Capacity (CY) Daily Tons (CYD)
Capacity (Years)
MSWL
MSWL
1,786,689
150
300
22.9
MSWL
10,697,451
1,949
2,599
15.8
8,117 Public
MSWL
266,862
32
64
17.4
70,166 Public
MSWL
5,254,609
280
561
37.5
20,960
Under Construction
Public Public
834,015 Private 41,455 Public
C&D C&D
MSWL MSWL
24,282 1,264,000
36,948,520 385,535
67 N/A
2,757 146
134 N/A
3,939 155
0.7 N/A
36.1 9.6
5,009 1,437
Public Public
38,555 Public 1,058,553 Private
MSWL C&D
MSWL MSWL
688,529 14,109
10,445,468 45,503,657
19 15 157 4,400
55 29 373 5,867
48.1 1.9
107.7 29.8
17,112 Private 92 Public
C&D C&D
43,614 Public
C&D
2,824 Public
MSWL
133,293 270,803
30,997 169,358
Public
Unlined
MSW Landfill
Private
MSWL
Public
MSWL
Public
MSWL
14,571 8,419
Public Public
MSWL MSWL
86,680 203,480
Public Public
MSWL MSWL
373,028 7,918
3,556,999 194,791
2,548,628 1,837,805 2,413,500 4,376,996 2,350,528 4,469,927
1,452,939 8,780,928
15 1
140 9
430 1,200
86 532
47 39
26 1
280 18
861 1,655
172 887
95 78
246
492
709
1,233
55.2 30.5 48.9 41.6
11.4 4.3
54.0 19.0 95.2 220.4
11.4 27.4
A - 10
Disposal and Capacity 2005 Solid Waste Report
County
Facility Name
Northeast Georgia
C&D
Jasper
Jasper Co. - S.R. 212 Monticello
Newton
Oglethorpe Walton Walton MSW
Newton Co. - Forest Tower/Lower River Rd. Olgethorpe Co. - U.S. 78 Phase 2 U.S. 78 C&D Landfill Walton C&D
Barrow Clarke
Republic Waste - Oak Grove S.R. 324 Clarke Co. - Athens Dunlap Rd.
Newton
Newton Co. - Lower River Rd.
South Georgia
C&D
Ben Hill Cook MSW Cook Lowndes
Lowndes Tift
Fitzgerald, Kiochee Church Rd. Cook Co. - Taylor Rd. Adel
Cook Co. - Taylor Rd. Lowndes Co. - Deep South Regional MSWL Pecan Row Tifton-Omega/Eldorado Rd.
Southeast Georgia
C&D Atkinson Coffee MSW
Atkinson Co.-S.R. 50 Transwaste Services, Inc. C.R. 129/17
Atkinson Charlton Ware
Atkinson Co.-S.R. 50 Chesser Island Road Landfill, Inc. Tricounty MSWL
Southwest Georgia
C&D
Dougherty
Dougherty Co.-Fleming/Gaissert Rd.
Thomas
Thomasville/Sunset Dr.
MSW
Decatur
Decatur Co. - S.R. 309 Bainbridge
Dougherty Grady
Dougherty Co. -Fleming/Gaissert Rd. Cairo-Sixth Ave
Thomas
Thomasville/Sunset Dr.
Total Tons Disposed
FY 2005
Domain
Facility Remainin Average
Type
g
Daily
Capacity Tons
(CY)
Rate of Fill
(CYD)
Remaining Permitted Capacity (Years)
722
24,557 52,816 77,971
8,565
859,993 97,407 59,828
Public
Public Public Private Private
C&D ceased accepting waste 11/09/04
C&D 74,156
C&D 959,793 C&D 13,940,634 C&D 3,326,500
Private Public Public
MSWL MSWL MSWL
4,274,000 1,558,470 1,381,586
N/A
68 98 291 180
3,009 281 132
N/A
136 196 527 360
4,241 562 264
N/A
2.1 18.8 101.7 35.5
3.9 10.7 20.1
167 12,264
8,435
553,841 49,110
Public MSWL
Public
C&D
N/A 76,375
Public MSWL 631,675 Public MSWL 13,501,131
Private MSWL 3,333,344 Public MSWL 895,940
N/A 50
50
2,211 216
N/A 100
100
2,457 270
N/A 2.9
24.3 Permit issued 1998
5.2 12.8
35,449 6,387
52,271 326,448
Under Construction
Public MSWL
Private
C&D
162,170 575,942
Public Private Public
MSWL 138,352 MSWL 12,616,015 MSWL 526,890
153 46
210 1,200
239 92
239 1,500
26.7 24.1
2.2 32.3 Permit issued 1993
35,607 Public
MSWL
393,071
116
153
9.9
33,947 Public
C&D
459,069
127
190
9.3
31,878 Public
Unlined
MSW
97,054
102
204
1.8
97,015 Public
MSWL
4,078,675
317
627
25.0
29,265 Public
Unlined
MSW
357,763
71
142
9.7
83,308 Public
MSWL
2,903,073
314
581
19.2
A - 11
Per Capita Disposal 2005 Solid Waste Management Update
The amount of garbage entering Georgia's Municipal Solid Waste landfills remained fairly constant from Fiscal Year 2004-2005. During the past decade the per capita disposal rate of Georgia MSW has remained fairly constant, with a slight dip in 200.
Since FY 1994, the per capita municipal solid waste disposal rate has climbed from 5.66 lbs/person/day to 7.47 lbs/person/day. Looking at records that exclude the amount of waste disposed from out-of-state sources, the per capita MSW disposal rate has been marginally lower, climbing from 5.55 lbs/person/day in FY 1994 to 6.52lbs/person/day in FY 2005. To reach the 25% goal, removed by the Legislature in 2004, no more than 5.33 pounds can enter Georgia MSW landfills per person, per day; regardless of its source.
As can be seen in the Per Capita Daily Waste Disposal graph, there is more than one way to track per-capita disposal rates. In FY 2005, the Department of Natural Resources, Environmental Protection Division (EPD) reported a total of 16,032,295 tons of waste disposed in Construction/Demolition and MSW landfills in the state. When looking at the reported total amounts of waste disposed, the per capita waste disposal rate fell slightly to 9.85 lbs/person/day in FY 2005, down slightly from 9.95/person/day in FY 2004. This figure represents all waste entering MSW and C&D landfills. It includes residential waste, sludge from municipal wastewater treatment plants, some industrial waste, construction debris, commercial and business waste, and waste brought here from other states. It does not include waste sent to incinerators or composting operations.
Per Capita Daily Waste Disposal FY 1995-2005
12.00
10.00
Pounds Per Person Per Day
8.00
6.00
4.00
2.00
0.00
1995 1996 1997 1998 1999 2000 2001 2002 2003 2004 2005
Total W aste
MSW
G eorgia M SW
C&D
Total G oal
B-1
Per Capita Disposal 2005 Update
Looking at the disposal rate at MSW landfills only, including waste disposed from out-of-state sources, the per capita disposal rate fell slightly to 7.47 pounds per person per day. When excluding out-of-state waste imports, the daily per capita MSW disposal rate is 6.52 lbs/person/day. It should be noted that these rates reflect all waste entering a MSW landfill as reported to the EPD, not just MSW. According to a 2001 study, about two-thirds of the waste disposed in MSW landfills is actually MSW. Based upon this estimate, the FY 2005 per capita MSW disposal rate, excluding waste imported into the state, is approximately 4.3 lbs/person/day. Imported waste has grown from representing 0.1/lb/person/day in 1998 to 0.95 lb/person/day in FY 2005.
Fiscal Year
1995 1996 1997 1998 1999 2000 2001 2002 2003 2004 2005
Georgia Waste Disposal Rate and Population
FY 1995-2005
Population Total Waste Total Waste Total Waste Out of Total MSW
Landfilled Landfilled Disposed in
(Millions of tons) (Pounds/ MSW Landfills
person/day)
(Tons)
State Waste
(Tons)
(Pounds/ person/day)
7,161,485
9.54
7.30
7,684,271
149,481
5.88
7,332,311
9.78
7.31
7,222,499
160,000
5.40
7,503,138
9.86
7.20
7,925,222
172,150
5.79
7,673,965
10.75
7.68
9,026,078
193,819
6.44
7,844,792
11.43
7.98
9,382,622
453,875
6.55
8,015,626
12.71
8.69
9,724,736
511,472
6.65
8,186,453
13.36
8.94
10,678,980
893,651
7.15
8,383,915
13.04
8.52
10,233,692
950,779
6.68
8,544,005
14.25
9.14
11,135,473
1,197,686
7.14
8,684,715
15.77
9.95
11,916,124
1,633,182
7.52
8,918,129
16.46
9.85
12,155,598
1,627,044
7.47
GA MSW
(Pounds/ person/day)
5.77 5.28 5.66 6.31 6.24 6.30 6.55 6.05 6.38 6.50 6.52
For more information regarding Georgia's solid waste management or for a glossary of terms used in this report, contact the Georgia Department of Community Affairs, Office of Environmental Management at 404-679-4940, or online at www.dca.state.ga.us/environmental/swar.html.
B-2
MSW and C&D Landfill Tipping Fees 2005 Solid Waste Management Update
Landfill tipping fees across Georgia remain competitive with other Southeastern states. Posted gate rate tipping fees have steadily risen in recent years, but the increasing amount of waste sent to Georgia for disposal indicates the actual contract prices per ton remain attractive to waste hauling companies, compared with our neighboring states. Annually during the month of July, DCA conducts a phone survey of the landfills in the state to identify their posted "gate rate" tipping fee to calculate regional and statewide average disposal fees. Based upon these surveys, the average tipping fee for Municipal Solid Waste (MSW) in the state rose from $34.95 per ton in 2004 to $35.38 per ton in 2005. It should be noted that the fees reported represent an average of the posted gate rates charged by landfills throughout the state; actual prices paid are frequently lower, sometimes by more than half, depending on volume discounts offered to waste haulers, businesses, and local governments. Also, several large Atlanta landfills significantly increased their posted gate rates in an effort to dissuade customers with small loads. DCA also tracks tipping fees for Construction and Demolition (C&D) waste. C&D tipping fees rose more than $2/ton, from $28.14 per ton in 2004 to $30.21 per ton in 2005.
Remaining MSW Landfill Capacity, FY 2004
North Georgia Georgia Mountains
Coosa Valley
Atlanta Regional Commission
Northeast Georgia
Legend
Less than 10 years 10 - 19 years 20 - 29 years 30 years and above
Chattahoochee
Flint
McIntosh
Trail
Central Savannah River Area
Middle Georgia
Lower Chattahoochee
Middle Flint
Heart of Georgia - Altamaha
Coastal Georgia
Southwest Georgia
South Georgia
Southeast Georgia
Map prepared by: Georgia Department of Community Affairs.
Source: Years of remaining capacity by Regional Development Center was calculated using EPD -supplied average daily tons and cubic yards of remaining capacity, based on 260 operating days per year.
MSW Landfill Tipping Fees, 2005
North Georgia
Coosa Valley
Georgia Mountains
Atlanta
Regional Commission
Northeast Georgia
Legend
$20.00 - $24.99 $25.00 - $29.99 $30.00 - $34.99 $35.00 and above
Chattahoochee Flint McIntosh Trail
Central Savannah River Area
Lower Chattahoochee
Middle Georgia
Middle Flint
Heart of Georgia - Altamaha
Coastal Georgia
Southwest Georgia
South Georgia
Southeast Georgia
Source: Georgia Department of Community Affairs, Office of Environmental Management - phone survey, 2005
E-1
MSW and C&D Landfill Tipping Fees 2005 Update
Average Tipping Fees Paid at Georgia MSW Landfills
Region
2005 Average MSW Tipping Fee
Atlanta Regional Commission $40.77
Central Savannah River Area Chattahoochee Flint
$32.79 $30.00
Coastal Georgia
$46.71
Coosa Valley
$32.48
Georgia Mountains
$36.63
Heart of Georgia-Altamaha Lower Chattahoochee
$29.10 $27.50
McIntosh Trail
$31.71
Middle Flint
$37.81
Middle Georgia
$27.04
North Georgia Northeast Georgia
$31.00 $36.63
South Georgia
$31.39
Southeast Georgia
$28.36
Southwest Georgia
$24.60
State of Georgia
$35.38
2004 Average MSW Tipping Fee
$39.32 $34.10 $30.00 $41.61 $31.38 $33.07 $29.39 $27.50 $31.45 $36.02 $27.00 $30.99 $36.68 $33.17 $28.83 $24.60
$34.95
2003 Average MSW Tipping Fee
$34.00 $18.00 $30.00 $43.24 $31.44 $32.08 $29.03 $27.00 $30.79 $35.37 $27.35 $29.99 $35.57 $32.76 $27.98 $24.98
$33.26
Average Tipping Fees Paid at Georgia C&D Landfills
Region
2005 Average
C&D
Tipping Fee
Atlanta Regional Commission $31.46
Central Savannah River Area
$28.78
Chattahoochee Flint
$27.36
Coastal Georgia
$31.34
Coosa Valley
$26.70
Georgia Mountains
$29.99
Heart of Georgia-Altamaha
$24.29
Lower Chattahoochee
$25.00
McIntosh Trail
$26.55
Middle Flint
$22.50
Middle Georgia
$21.64
North Georgia
$ -
Northeast Georgia
$24.78
South Georgia
$24.11
Southeast Georgia
$28.48
Southwest Georgia
$22.2 4
State of Georgia
$30.21
2004 Average C&D
Tipping Fee $29.09 $25.77 $27.67 $29.39 $29.29 $21.45 $24.92 $27.50 $26.55 $31.00 $23.89 $23.78 $26.51 $21.95 $17.92
$28.14
2003 Average C&D
Tipping Fee $23.33 $25.00 $27.28 $30.89 $24.47 $27.53 $21.12 $25.00 $26.55 N/A* $23.23 $30.02 $25.55 $25.66 $22.24 $25.28
$28.16
MSW Landfill Tipping Fees, 2005
North Georgia
Coosa Valley
Georgia Mountains
Atlanta Regional
Commission
Northeast Georgia
Legend
$20.00 - $24.99 $25.00 - $29.99 $30.00 - $34.99 $35.00 and above
Chattahoochee Flint McIntosh
Trail
Central Savannah River Area
Lower Chattahoochee
Middle Georgia
Middle Flint
Heart of Georgia - Altamaha
Coastal Georgia
Southwest Georgia
South Georgia
Southeast Georgia
Source: Georgia Department of Community Affairs, Office of Environmental Management - phone survey, 2005
C&D Landfill Tipping Fees, 2005
North Georgia Coosa Valley
Georgia Mountains
Atlanta Regional Commission
Northeast Georgia
Legend
$20.00 or less $20.01 - $23.00 $23.01 - $27.00 $27.01 and above
Chattahoochee
Flint
McIntosh
Trail
Middle Georgia
Central Savannah River Area
Lower Chattahoochee
Middle Flint
Heart of Georgia - Altamaha
Coastal Georgia
Southwest Georgia
South Georgia
Southeast Georgia
Source: Georgia Department of Community Affairs, Office of Environmental Management - phone survey, 2005
Calculating Weighted Average Tipping Fees
T*oNoaclacnodufniltlsfowr ittohninnathgies RdiDspCarrietipeosrtbeedtwceheanrglianrggea asenpdasrmataellralatnedffoilrlsC, &aDwewiagshttee.d average tipping fee was used. If out -of -county residents or businesses were
charged a higher rate than in-county customers, the higher rate was used. Tipping fees charged for MSW at transfer stations were excluded. When tipping fee rates were reported by volume rather than weight, a ratio of four cubic yards to one ton (4 CY: 1 ton) was used to approximate weight -based rates. Weighted averages were calculated for the area served by each RDC and for the state by multiplying the Average Daily Tons received at each facility (ADT) by the per-ton gate fee, divided by the total ADT for all landfill facilities within each RDC and within the state. The process was repeated for C&D landfills. To avoid double counting, Average Daily Tonnage was assigned to the MSW column for those facilities charging the same rate for MSW and C&D waste. Most facilities charge the same rate for C&D and MSW received, but a significant number do not. In these cases, the landfills were asked to provide an approximate ratio of MSW to C&D waste received. Weighted averages were calculated using the method described above, with the Average Daily Tons reported split accordingly between MSW and C&D. For facilities that reported receiving no C&D waste, their fees were not used in calculating average C&D fees. In all RDCs, this dropped the average C&D fee, in some cases resulting in no C&D average cost for certain RDCs.
E-2
MSW and C&D Landfill Tipping Fees 2005 Update
MSW Landfill Tipping Fees, 2004
North Georgia
Coosa Valley
Georgia Mountains
Atlanta
Regional Commission
Northeast Georgia
Legend
$20.00 - $24.99 $25.00 - $29.99 $30.00 - $34.99 $35.00 and above
Chattahoochee Flint McIntosh
Trail
Central Savannah River Area
Lower Chattahoochee
Middle Georgia
Middle Flint
Heart of Georgia - Altamaha
Coastal Georgia
Southwest Georgia
South Georgia
Southeast Georgia
Source: Georgia Department of Community Affairs, Office of Environmental Management - phone survey, 2004
MSW Landfill Tipping Fees, 2003
North Georgia
Coosa Valley
Georgia Mountains
Atlanta Regional Commission
Northeast Georgia
Legend
$20.00 - $24.99 $25.00 - $29.99 $30.00 - $34.99 $35.00 and above
Chattahoochee Flint McIntosh Trail
Lower Chattahoochee
Middle Georgia
Central Savannah River Area
Middle Flint
Heart of Georgia - Altamaha
Coastal Georgia
Southwest Georgia
South Georgia
Southeast Georgia
Source: Georgia Department of Community Affairs, Office of Environmental Management - phone survey, 2003
C&D Landfill Tipping Fees, 2004
North Georgia Coosa Valley
Georgia Mountains
Atlanta Regional Commission
Northeast Georgia
Legend $20.00 or less $20.01 - $23.00 $23.01 - $27.00 $27.01 and above
Chattahoochee
Flint
McIntosh
Trail
Central Savannah River Area
Middle Georgia
Lower Chattahoochee
Middle Flint
Heart of Georgia - Altamaha
Coastal Georgia
Southwest Georgia
South Georgia
Southeast Georgia
Source: Georgia Department of Community Affairs, Office of Environmental Management - phone survey, 2004
C&D Landfill Tipping Fees, 2003
North Georgia Coosa Valley
Georgia Mountains
Atlanta Regional Commission
Northeast Georgia
Legend N/A $20.00 or less $20.01 - $23.00 $23.01 - $27.00 $27.01 and above
Chattahoochee
Flint
McIntosh Trail
Middle Georgia
Central Savannah River Area
Lower Chattahoochee
Middle Flint
Heart of Georgia - Altamaha
Coastal Georgia
Southwest Georgia
South Georgia
Southeast Georgia
Source: Georgia Department of Community Affairs, Office of Environmental Management - phone survey, 2003
Data Collection
Telephone calls were made to landfill scale houses and in some cases county commission offices to obtain posted gate rate fees charged at Georgia landfills. Calls were made in mid-July, to 61 landfills accepting Municipal Solid Waste (MSW) and 77 landfills accepting Construction and Demolition (C&D) waste. Georgia has one incinerator, one industrial landfill and one monofill that takes only baled carpet waste; these facilities were not included in the calculation of average tipping fees.
E-3
MSW and C&D Landfill Tipping Fees 2005 Update
Landfill Tipping Fees: A Regional Perspective
As reported in Waste News magazine's 2005 Market Handbook, the average landfill tipping fee in Georgia in 2005 was $33.07, with no distinction made between MSW and C&D waste. Ranked 7th lowest in the list of the twelve (12) southeastern states, Georgia's average tipping fee is approximately $0.36 a ton less than the average tipping fee reported in the southeastern states. The prices reported by Waste News in the Northeast are far higher, with a regional average approaching $67 per ton, and a high of more than $86 per ton in the state of New Hampshire.
Southeastern U.S. Landfill
Tipping Fees
State
Average
Cost per Ton
Alabama
$27.01
Arkansas
$28.01
Florida
$36.42
Georgia
$33.07
Kentucky
$32.87
Louisiana
$26.65
Mississippi
$26.81
North Carolina
$32.80
South Carolina
$34.22
Tennessee
$28.96
Virginia
$39.99
West Virginia
$35.44
Southeastern Total
$33.43
Source: Waste News 2005 Market Handbook
Southeastern U.S. Tipping Fees, 2005
Legend
$22.01 - $24.99 $25.00 - $29.99 $30.00 - $34.99 $35.00 - $45.00
KKentucky
WWeesstt VViirrggiinniiaa VViirrggiinniiaa
Arkansas
Tennesseee
AAlabama
Mississippii LLoouuiissiiaannaa
NNoorth CCaarroolliinnaa
South CCaarroolliinnaa GGeorgia
Floriiddaa
Data source: Waste News Magazine, 2005 Markets Handbook Map prepared by: Georgia Department of Community Affairs, 2005
For more information regarding Georgia's solid waste management or for a glossary of terms used in this report, contact the Georgia Department of Community Affairs, Office of Environmental Management at 404-679-4940, or online at www.dca.state.ga.us/development/research/programs/swar.asp
E-4
Grants and Loans to Local Governments 2005 Solid Waste Management Update
No state solid waste grants or loans were awarded during Fiscal Year 2005 from the Georgia Solid Waste Trust Fund (SWTF.) Each year the State Legislature must appropriate funds collected to the Trust Fund for distribution for local tire abatement efforts, waste reduction and education programs. During FY 2005, no funds were appropriated to the Environmental Protection Division for their designated uses.
Environmental Protection Division (EPD)
EPD's Local Government Enforcement and Education grant program was designed to support local efforts to prevent and enforce against illegal scrap tire and solid waste disposal. Enforcement officials know that illegal scrap tire piles have an unpleasant habit of appearing and reappearing and the support they receive from the Enforcement and Education grant program helped them prevent their spread. The program gave local governments financial incentives to use enforcement and education activities to address:
1. The management of scrap tires, including preventing the illegal dumping of scrap tires;
2. Solid waste reduction and the controlling of illegal dumps; and
3. Other environmental issues. No Local Government Enforcement and Education grants were awarded during FY 2005.
Georgia Environmental Facilities Authority (GEFA)
GEFA typically administered a Recycling and Waste Reduction Grant program funded by the SWTF intended to help local governments foster an integrated approach to solid waste management by supporting waste reduction, recycling, and composting programs. Grants of up to $50,000 were available to qualified cities, counties, and solid waste authorities. Demonstration projects or projects implementing an integrated solid waste management plan designed to help the state reach its waste reduction goal were eligible to receive grants of up to $200,000. No GEFA grants were awarded during FY 2005. Another financial support program offered by GEFA is their low interest revolving loan program available to local governments. No GEFA loans for solid waste were awarded during FY 2005.
For more information regarding Georgia's solid waste management or for a glossary of terms used in this report, contact the Georgia Department of Community Affairs, Office of Environmental Management at 404-679-4940, or online at www.dca.state.ga.us/environmental/swar.html
F- 1