- Collection:
- Georgia Government Publications
- Title:
- Georgia county estimates: wheat 1996-1997 [June 1998]
- Creator:
- Georgia. Agricultural Statistics Service
- Contributor to Resource:
- Georgia. Agricultural Statistics Service
- Publisher:
- Athens, GA. : Georgia. Agricultural Statistics Service
- Date of Original:
- 1998-06
- Subject:
- Georgia
- Location:
- United States, Georgia, 32.75042, -83.50018
- Medium:
- publications (documents)
- Type:
- Text
- Format:
- application/pdf
- External Identifiers:
- Call Number GA A400.C7 S1 W62 1996-97
- Metadata URL:
- https://dlg.galileo.usg.edu/id:dlg_ggpd_y-ga-ba400-pc7-bs1-bw62-b1996-h97
- Digital Object URL:
- https://dlg.galileo.usg.edu/do:dlg_ggpd_y-ga-ba400-pc7-bs1-bw62-b1996-h97
- Language:
- eng
- Holding Institution:
- University of Georgia. Map and Government Information Library
- Rights:
-

_IIBAT rp 1_.1'~~~;:~':~~~!~l~~~
Released: June 1998
G-A
A40o,C1
SI
Wio'l
i996~17
'
Illt.ll~
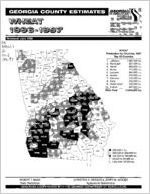
WHEAT Production by Counties, 1997
Top 10 Counties
1. Jefferson 2. Randolph 3. Terrell 4. Burke 5. Laurens 6. Sumter 7. Calhoun 8. Early 9. Washington 10. Macon
State Total
1,087,000 bu. 827,000 bu. 809,000 bu. 744,000 bu. 664,000 bu. 619,000 bu. 575,000 bu. 552,000 bu. 538,000 bu. 507,000 bu.
15,840,000 bu.
lIIlIl 400,000+ bu. 200,000 to 399,999 bu .
100,000 to 199,999 bu. W 20,000 to 99,999 bu. D Less than 20,000 bu.
ROBERT T. BASS
CHRISTINA S. MESSER & JERRY M. MIDDEN
State Statistician
Agricultural Statisticians
USDA/NASS COOPERATING WITH THE GEORGIA DEPARTMENT OF AGRICULTURE
County
Appling Atkinson Bacon Baker Baldwin Banks
Bartow Ben Hill Berrien Bibb Bleckley Brooks
Bryan Bulloch Burke Butts Calhoun Candler
Carroll Catoosa Chattooga Clarke Clay Coffee
Colquitt Columbia Cook Coweta Crawford Crisp
Decatur Dodge Dooly Dougherty Douglas Early
Effingham Elbert Emanuel Evans Fayette Floyd
Franklin Glascock Gordon Grady Greene Hall
Haralson Harris Hart Heard Henry Houston
WHEAT--Acreage, Yield and Production by Counties Georgia, 1996-1997 1/
Planted
1996
Yield
Harv.
per
for
Harv.
Grain
Acre
Production
Planted
1997
Yield
Harv.
per
for
Harv.
Grain
Acre
Production
--Acres--
--Bushels--
--Acres--
--Bushels--
4,000 1,200
400 2,300
500
2,400 500
2,000 1,300 5,000 2,000
300 7,000 15,000
600 11,000
1,000
900 400 500 600 3,500 3,000
2,700 200 700 900
3,000 6,000
3,000 3,000 8,600 3,000
200 7,600
1,200 1,700 3,000
600 300 1,200
1,700 1,300 1,800 3,000
800 700
600 600 4,000 500 2,700 11,000
3,300 800 300
2,000
400
2,000 300
1,700 1,000 4,800 1,700
200 6,300 14,000
300 10,500
900
300 350 400 500 3,200 2,900
2,300 100 400 600
2,400 5,500
2,500 2,500 8,400 2,500
100 7,100
1,100 1,300 2,900
500 100 1,000
1,400 1,100 1,500 2,700
100 200
400 300 3,300 200 2,200 10,100
40.0 48.8 40.0 54.5
35.0
32.0 46.7 50.0 41.0 56.3 47.6
35.0 42.5 52.5 43.3 56.7 38.9
40.0 31.4 31.3 36.0 45.6 45.9
52.2 40.0 50.0 35.0 43.8 50.9
53.6 50.4 54.4 50.0 35.0 52.1
38.2 33.1 45.9 40.0 35.0 32.0
42.1 38.2 32.0 58.5 40.0 32.5
36.3 36.7 37.9 40.0 36.8 56.3
132,000 39,000 12,000
109,000
14,000
64,000 14,000 85,000 41,000 270,000 81,000
7,000 268,000 735,000
13,000 595,000
35,000
12,000 11,000 12,500 18,000 146,000 133,000
120,000 4,000
20,000 21,000 105,000 280,000
134,000 126,000 457,000 125,000
3,500 370,000
42,000 43,000 133,000 20,000
3,500 32,000
59,000 42,000 48,000 158,000
4,000 6,500
14,500 11,000 125,000
8,000 81,000 569,000
4,000 1,200
800 2,700
200 200
2,200 1,000 1,600 1,000 5,800 2,000
300 8,000 15,000
800 13,000
1,000
700 300 200 700 5,500 3,500
3,000 100 700 600
2,000 6,500
4,000 4,000 8,500 3,000
12,500
1,300 1,500 3,000
400 300 1,000
1,600 800
1,300 3,500
700
400 500 3,700 400 2,000 10,000
3,400 700 600
2,500 100 150
1,900 800
1,300 900
5,500 1,700
200 7,800 14,800
500 12,200
900
300 250 150 600 5,300 3,000
2,500 100 400 350
1,600 5,800
3,700 3,500 8,000 2,600
12,000
1,200 1,300 2,700
300 200 800
1,300 700
1,200 3,400
300
300 300 3,300 200 1,800 9,700
44.4 38.6 41.7 49.2 40.0 33.3
40.0 35.0 42.3 36.7 44.9 38.8
45.0 46.0 50.3 40.0 47.1 40.0
36.7 36.0 40.0 33.3 39.6 41.0
42.8 40.0 37.5 31.4 39.4 40:2
43.2 45.7 43.3 43.1
46.0
39.2 40.8 38.9 43.3 30.0 42.5
45.4 40.0 40.8 44.4
36.7
40.0 33.3 47.6 40.0 40.6 48.9
151,000 27,000 25,000
123,000 4,000 5,000
76,000 28,000 55,000 33,000 247,000 66,000
9,000 359,000 744,000
20,000 575,000
36,000
11,000 9,000 6,000
20,000 210,000 123,000
107,000 4,000
15,000 11,000 63,000 233,000
160,000 160,000 346,000 112,000
552,000
47,000 53,000 105,000 13,000
6,000 34,000
59,000 28,000 49,000 151,000
11,000
12,000 10,000 157,000
8,000 73,000 474,000
1/ Counties with less than 100 acres harvested not shown separately.
2
County
Irwin Jackson Jasper Jeff Davis Jefferson Jenkins
Johnson Jones Lamar Laurens Lee Lowndes
McDuffie Macon Madison Marion Meriwether Miller
Mitchell Monroe Montgomery Morgan Murray Newton
Oconee Oglethorpe Peach Pierce Pike Polk
Pulaski Putnam Quitman Randolph Richmond Schley
Screven Seminole Spa/ding Stewart Sumter Talbot
Tattnall Taylor Telfair Terrell Thomas Tift
Toombs Treut/en Troup Turner Twiggs Upson
WHEAT--Acreage, Yield and Production by Counties Georgia, 1996-1997 1/
Planted
1996
Yield
Harv.
per
for
Harv.
Grain
Acre
Production
Planted
1997
Yield
Harv.
per
for
Harv.
Grain
Acre
Production
--Acres--
--Bushels--
--Acres--
--Bushels--
3,500 2,600
900 700 23,000 7,000
5,000 1,000 1,800 13,000 9,500
700
400 13,000
2,300 1,700 1,800 4,800
2,500 1,300
900 1,900
400 1,200
800 700 5,000 300 2,500 800
8,000 1,000
400 19,000
1,700 1,800
11,000 4,500 2,300 2,000
19,000 200
2,500 2,200 2,000 19,500 2,400
800
2,400 1,000
800 1,300 1,300
200
2,900 1,800
500 500 22,000 6,600
4,400 100
1,200 12,000
8,500 400
300 12,200
1,500 1,500
600 4,400
2,100 1,000
800 1,500
350 900
600 600 4,800 200 1,400 700
7,500 100 300
17,500 1,100 1,600
10,500 4,100 2,000 1,800
17,500 100
2,200 1,900 1,600 18,500 2,100
700
2,300 800 200
1,000 1,200
100
47.6 37.8 46.0 48.0 49.3 47.7
43.0 40.0 36.7 52.0 48.8 50.0
40.0 47.3 34.7 40.7 40.0 58.2
60.0 42.0 46.3 46.0 31.4 42.2
40.0 35.0 57.3 40.0 35.0 30.0
51.5 40.0 46.7 51.6 41.8 40.0
40.7 48.3 31.5 40.6 51.4 35.0
39.1 34.7 45.0 45.3 55.7 48.6
40.0 46.3 37.5 46.0 44.2 35.0
138,000 68,000 23,000 24,000
1,084,000 315,000
189,000 4,000
44,000 624,000 415,000
20,000
12,000 577,000
52,000 61,000 24,000 256,000
126,000 42,000 37,000 69,000 11,000 38,000
24,000 21,000 275,000
8,000 49,000 21,000
386,000 4,000 14,000
903,000 46,000 64,000
427,000 198,000
63,000 73,000 900,000
3,500
86,000 66,000 72,000 838,000 117,000 34,000
92,000 37,000
7,500 46,000 53,000
3,500
4,000 1,800 1,000
700 23,000
6,000
6,600 800
1,800 14,000 10,000
700
500 13,000
1,300 1,500 1,800 6,200
3,000 800
1,800 1,600
200 1,200
900 400 5,500 300 2,000 600
8,000 800 300
19,500 1,400 1,400
7,000 4,500 1,800 2,500 15,000
400
1,600 2,500 2,300 21,000 1,800 1,000
3,200 1,700
600 2,000 1,600
200
3,800 1,000
900 500 22,500 5,500
6,300 100
1,100 13,500
9,800 300
400 11,500
1,100 1,200
900 6,000
2,800 450
1,600 1,100
150 1,000
700 300 5,300 200 1,100 500
7,800 100 200
19,000 1,100 1,100
6,500 4,200 1,200 2,300 14,000
200
1,500 1,900 2,000 20,000 1,200
800
3,000 1,400
200 1,700 1,500
100
36.3 37.0 42.2 38.0 48.3 42.7
41.0 40.0 39.1 49.2 41.9 40.0
35.0 44.1 34.5 35.0 40.0 48.3
48.2 37.8 44.4 46.4 40.0 37.0
37.1 33.3 47.2 50.0 38.2 36.0
45.3 40.0 40.0 43.5 38.2 36.4
43.2 44.0 35.0 39.1 44.2 35.0
40.7 34.2 35.5 40.5 40.8 41.3
45.7 42.9 35.0 39.4 44.0 40.0
138,000 37,000 38,000 19,000
1,087,000 235,000
258,000 4,000
43,000 664,000 411,000
12,000
14,000 507,000
38,000 42,000 36,000 290,000
135,000 17,000 71,000 51,000 6,000 37,000
26,000 10,000 250,000 10,000 42,000 18,000
353,000 4,000 8,000
827,000 42,000 40,000
281,000 185,000
42,000 90,000 619,000
7,000
61,000 65,000 71,000 809,000 49,000 33,000
137,000 60,000 7,000 67,000 66,000 4,000
1/ Counties with less than 100 acres harvested not shown separately.
3
County
WHEAT--Acreage, Yield and Production by Counties Georgia, 1996-1997 1/
Planted
1996
Yield
Harv.
per
for
Harv.
Grain
Acre
Production
Planted
1997
Yield
Harv.
per
for
Harv.
Grain
Acre
Production
--Acres--
--Bushels--
--Acres--
--Bushels--
Walker Walton Ware Warren Washington Wayne
1,200 1,400
400 1,200 13,000 1,700
1,000 900 300
1,100 12,000
1,500
37.0 31.1 40.0 30.0 52.8 43.3
37,000 28,000 12,000 33,000 634,000 65,000
Webster Wheeler Whitfield Wilcox Wilkes Wilkinson Worth
5,000 1,400
250 2,000 2,300
700 7,000
4,700 1,300
150 1,700 1,200
600 6,100
44.0 49.2 30.0 46.5 30.0 45.0 53.3
207,000 64,000 4,500 79,000 36,000 27,000
325,000
Other
Counties
3,150
1,450
36.2
1/ Counties with les than 100 acres harvested not shown separately.
52,500
1,000 1,300
300 900 11,000 1,500
4,000 2,300
150 2,000 1,000 1,200 6,000
3,250
900 1,000
200 800 10,600 1,300
3,800 2,200
100 1,600
400 1,000 5,000
1,400
42.2 32.0 45.0 35.0 50.8 44.6
36.1 49.1 40.0 40.0 40.0 45.0 44.4
37.9
38,000 32,000
9,000 28,000 538,000 58,000
137,000 108,000
4,000 64,000 16,000 45,000 222,000
53,000
WHEAT--Acreage, Yield and Production by Agricultural Statistics Districts, and State Totals, Georgia, 1996-1997
District
Planted
1996
Yield
Harv.
per
for
Harv.
Grain
Acre
Production
Planted
1997
Yield
Harv.
per
for
Harv.
Grain
Acre
Production
--Acres--
--Bushels--
--Acres--
--Bushels--
District 1 District 2 District 3 District 4 District 5 District 6 District 7 District 8 District 9
9,000 7,000 14,000 35,000 82,000 73,000 122,000 45,000 13,000
7,500 4,500 10,000 27,000 71,000 68,000 112,000 39,000 11,000
32.3 35.8 36.0 41.4 51.4 46.7 50.8 50.6 39.8
242,000 161,000 360,000 1,117,000 3,649,000 3,176,000 5,684,000 1,973,000 438,000
7,000 6,000 10,000 32,000 85,000 68,000 132,000 47,000 13,000
6,000 4,000 8,000 24,000 77,000 65,000 125,000 40,000 11,000
40.3 34.8 42.8 40.3 46.5 46.3 43.5 40.7 44.4
242,000
139.000 342,000 968,000 3,580,000 3,010,000 5,443,000 1,628,000 488,000
STATE TOTAL
400,000
350,000
48.0
16,800,000 400,000
360,000
44.0
15,840,000
Georgia Agricultural Statistics District Outline Map
4
_IIBAT rp 1_.1'~~~;:~':~~~!~l~~~
Released: June 1998
G-A
A40o,C1
SI
Wio'l
i996~17
'
Illt.ll~
WHEAT Production by Counties, 1997
Top 10 Counties
1. Jefferson 2. Randolph 3. Terrell 4. Burke 5. Laurens 6. Sumter 7. Calhoun 8. Early 9. Washington 10. Macon
State Total
1,087,000 bu. 827,000 bu. 809,000 bu. 744,000 bu. 664,000 bu. 619,000 bu. 575,000 bu. 552,000 bu. 538,000 bu. 507,000 bu.
15,840,000 bu.
lIIlIl 400,000+ bu. 200,000 to 399,999 bu .
100,000 to 199,999 bu. W 20,000 to 99,999 bu. D Less than 20,000 bu.
ROBERT T. BASS
CHRISTINA S. MESSER & JERRY M. MIDDEN
State Statistician
Agricultural Statisticians
USDA/NASS COOPERATING WITH THE GEORGIA DEPARTMENT OF AGRICULTURE
County
Appling Atkinson Bacon Baker Baldwin Banks
Bartow Ben Hill Berrien Bibb Bleckley Brooks
Bryan Bulloch Burke Butts Calhoun Candler
Carroll Catoosa Chattooga Clarke Clay Coffee
Colquitt Columbia Cook Coweta Crawford Crisp
Decatur Dodge Dooly Dougherty Douglas Early
Effingham Elbert Emanuel Evans Fayette Floyd
Franklin Glascock Gordon Grady Greene Hall
Haralson Harris Hart Heard Henry Houston
WHEAT--Acreage, Yield and Production by Counties Georgia, 1996-1997 1/
Planted
1996
Yield
Harv.
per
for
Harv.
Grain
Acre
Production
Planted
1997
Yield
Harv.
per
for
Harv.
Grain
Acre
Production
--Acres--
--Bushels--
--Acres--
--Bushels--
4,000 1,200
400 2,300
500
2,400 500
2,000 1,300 5,000 2,000
300 7,000 15,000
600 11,000
1,000
900 400 500 600 3,500 3,000
2,700 200 700 900
3,000 6,000
3,000 3,000 8,600 3,000
200 7,600
1,200 1,700 3,000
600 300 1,200
1,700 1,300 1,800 3,000
800 700
600 600 4,000 500 2,700 11,000
3,300 800 300
2,000
400
2,000 300
1,700 1,000 4,800 1,700
200 6,300 14,000
300 10,500
900
300 350 400 500 3,200 2,900
2,300 100 400 600
2,400 5,500
2,500 2,500 8,400 2,500
100 7,100
1,100 1,300 2,900
500 100 1,000
1,400 1,100 1,500 2,700
100 200
400 300 3,300 200 2,200 10,100
40.0 48.8 40.0 54.5
35.0
32.0 46.7 50.0 41.0 56.3 47.6
35.0 42.5 52.5 43.3 56.7 38.9
40.0 31.4 31.3 36.0 45.6 45.9
52.2 40.0 50.0 35.0 43.8 50.9
53.6 50.4 54.4 50.0 35.0 52.1
38.2 33.1 45.9 40.0 35.0 32.0
42.1 38.2 32.0 58.5 40.0 32.5
36.3 36.7 37.9 40.0 36.8 56.3
132,000 39,000 12,000
109,000
14,000
64,000 14,000 85,000 41,000 270,000 81,000
7,000 268,000 735,000
13,000 595,000
35,000
12,000 11,000 12,500 18,000 146,000 133,000
120,000 4,000
20,000 21,000 105,000 280,000
134,000 126,000 457,000 125,000
3,500 370,000
42,000 43,000 133,000 20,000
3,500 32,000
59,000 42,000 48,000 158,000
4,000 6,500
14,500 11,000 125,000
8,000 81,000 569,000
4,000 1,200
800 2,700
200 200
2,200 1,000 1,600 1,000 5,800 2,000
300 8,000 15,000
800 13,000
1,000
700 300 200 700 5,500 3,500
3,000 100 700 600
2,000 6,500
4,000 4,000 8,500 3,000
12,500
1,300 1,500 3,000
400 300 1,000
1,600 800
1,300 3,500
700
400 500 3,700 400 2,000 10,000
3,400 700 600
2,500 100 150
1,900 800
1,300 900
5,500 1,700
200 7,800 14,800
500 12,200
900
300 250 150 600 5,300 3,000
2,500 100 400 350
1,600 5,800
3,700 3,500 8,000 2,600
12,000
1,200 1,300 2,700
300 200 800
1,300 700
1,200 3,400
300
300 300 3,300 200 1,800 9,700
44.4 38.6 41.7 49.2 40.0 33.3
40.0 35.0 42.3 36.7 44.9 38.8
45.0 46.0 50.3 40.0 47.1 40.0
36.7 36.0 40.0 33.3 39.6 41.0
42.8 40.0 37.5 31.4 39.4 40:2
43.2 45.7 43.3 43.1
46.0
39.2 40.8 38.9 43.3 30.0 42.5
45.4 40.0 40.8 44.4
36.7
40.0 33.3 47.6 40.0 40.6 48.9
151,000 27,000 25,000
123,000 4,000 5,000
76,000 28,000 55,000 33,000 247,000 66,000
9,000 359,000 744,000
20,000 575,000
36,000
11,000 9,000 6,000
20,000 210,000 123,000
107,000 4,000
15,000 11,000 63,000 233,000
160,000 160,000 346,000 112,000
552,000
47,000 53,000 105,000 13,000
6,000 34,000
59,000 28,000 49,000 151,000
11,000
12,000 10,000 157,000
8,000 73,000 474,000
1/ Counties with less than 100 acres harvested not shown separately.
2
County
Irwin Jackson Jasper Jeff Davis Jefferson Jenkins
Johnson Jones Lamar Laurens Lee Lowndes
McDuffie Macon Madison Marion Meriwether Miller
Mitchell Monroe Montgomery Morgan Murray Newton
Oconee Oglethorpe Peach Pierce Pike Polk
Pulaski Putnam Quitman Randolph Richmond Schley
Screven Seminole Spa/ding Stewart Sumter Talbot
Tattnall Taylor Telfair Terrell Thomas Tift
Toombs Treut/en Troup Turner Twiggs Upson
WHEAT--Acreage, Yield and Production by Counties Georgia, 1996-1997 1/
Planted
1996
Yield
Harv.
per
for
Harv.
Grain
Acre
Production
Planted
1997
Yield
Harv.
per
for
Harv.
Grain
Acre
Production
--Acres--
--Bushels--
--Acres--
--Bushels--
3,500 2,600
900 700 23,000 7,000
5,000 1,000 1,800 13,000 9,500
700
400 13,000
2,300 1,700 1,800 4,800
2,500 1,300
900 1,900
400 1,200
800 700 5,000 300 2,500 800
8,000 1,000
400 19,000
1,700 1,800
11,000 4,500 2,300 2,000
19,000 200
2,500 2,200 2,000 19,500 2,400
800
2,400 1,000
800 1,300 1,300
200
2,900 1,800
500 500 22,000 6,600
4,400 100
1,200 12,000
8,500 400
300 12,200
1,500 1,500
600 4,400
2,100 1,000
800 1,500
350 900
600 600 4,800 200 1,400 700
7,500 100 300
17,500 1,100 1,600
10,500 4,100 2,000 1,800
17,500 100
2,200 1,900 1,600 18,500 2,100
700
2,300 800 200
1,000 1,200
100
47.6 37.8 46.0 48.0 49.3 47.7
43.0 40.0 36.7 52.0 48.8 50.0
40.0 47.3 34.7 40.7 40.0 58.2
60.0 42.0 46.3 46.0 31.4 42.2
40.0 35.0 57.3 40.0 35.0 30.0
51.5 40.0 46.7 51.6 41.8 40.0
40.7 48.3 31.5 40.6 51.4 35.0
39.1 34.7 45.0 45.3 55.7 48.6
40.0 46.3 37.5 46.0 44.2 35.0
138,000 68,000 23,000 24,000
1,084,000 315,000
189,000 4,000
44,000 624,000 415,000
20,000
12,000 577,000
52,000 61,000 24,000 256,000
126,000 42,000 37,000 69,000 11,000 38,000
24,000 21,000 275,000
8,000 49,000 21,000
386,000 4,000 14,000
903,000 46,000 64,000
427,000 198,000
63,000 73,000 900,000
3,500
86,000 66,000 72,000 838,000 117,000 34,000
92,000 37,000
7,500 46,000 53,000
3,500
4,000 1,800 1,000
700 23,000
6,000
6,600 800
1,800 14,000 10,000
700
500 13,000
1,300 1,500 1,800 6,200
3,000 800
1,800 1,600
200 1,200
900 400 5,500 300 2,000 600
8,000 800 300
19,500 1,400 1,400
7,000 4,500 1,800 2,500 15,000
400
1,600 2,500 2,300 21,000 1,800 1,000
3,200 1,700
600 2,000 1,600
200
3,800 1,000
900 500 22,500 5,500
6,300 100
1,100 13,500
9,800 300
400 11,500
1,100 1,200
900 6,000
2,800 450
1,600 1,100
150 1,000
700 300 5,300 200 1,100 500
7,800 100 200
19,000 1,100 1,100
6,500 4,200 1,200 2,300 14,000
200
1,500 1,900 2,000 20,000 1,200
800
3,000 1,400
200 1,700 1,500
100
36.3 37.0 42.2 38.0 48.3 42.7
41.0 40.0 39.1 49.2 41.9 40.0
35.0 44.1 34.5 35.0 40.0 48.3
48.2 37.8 44.4 46.4 40.0 37.0
37.1 33.3 47.2 50.0 38.2 36.0
45.3 40.0 40.0 43.5 38.2 36.4
43.2 44.0 35.0 39.1 44.2 35.0
40.7 34.2 35.5 40.5 40.8 41.3
45.7 42.9 35.0 39.4 44.0 40.0
138,000 37,000 38,000 19,000
1,087,000 235,000
258,000 4,000
43,000 664,000 411,000
12,000
14,000 507,000
38,000 42,000 36,000 290,000
135,000 17,000 71,000 51,000 6,000 37,000
26,000 10,000 250,000 10,000 42,000 18,000
353,000 4,000 8,000
827,000 42,000 40,000
281,000 185,000
42,000 90,000 619,000
7,000
61,000 65,000 71,000 809,000 49,000 33,000
137,000 60,000 7,000 67,000 66,000 4,000
1/ Counties with less than 100 acres harvested not shown separately.
3
County
WHEAT--Acreage, Yield and Production by Counties Georgia, 1996-1997 1/
Planted
1996
Yield
Harv.
per
for
Harv.
Grain
Acre
Production
Planted
1997
Yield
Harv.
per
for
Harv.
Grain
Acre
Production
--Acres--
--Bushels--
--Acres--
--Bushels--
Walker Walton Ware Warren Washington Wayne
1,200 1,400
400 1,200 13,000 1,700
1,000 900 300
1,100 12,000
1,500
37.0 31.1 40.0 30.0 52.8 43.3
37,000 28,000 12,000 33,000 634,000 65,000
Webster Wheeler Whitfield Wilcox Wilkes Wilkinson Worth
5,000 1,400
250 2,000 2,300
700 7,000
4,700 1,300
150 1,700 1,200
600 6,100
44.0 49.2 30.0 46.5 30.0 45.0 53.3
207,000 64,000 4,500 79,000 36,000 27,000
325,000
Other
Counties
3,150
1,450
36.2
1/ Counties with les than 100 acres harvested not shown separately.
52,500
1,000 1,300
300 900 11,000 1,500
4,000 2,300
150 2,000 1,000 1,200 6,000
3,250
900 1,000
200 800 10,600 1,300
3,800 2,200
100 1,600
400 1,000 5,000
1,400
42.2 32.0 45.0 35.0 50.8 44.6
36.1 49.1 40.0 40.0 40.0 45.0 44.4
37.9
38,000 32,000
9,000 28,000 538,000 58,000
137,000 108,000
4,000 64,000 16,000 45,000 222,000
53,000
WHEAT--Acreage, Yield and Production by Agricultural Statistics Districts, and State Totals, Georgia, 1996-1997
District
Planted
1996
Yield
Harv.
per
for
Harv.
Grain
Acre
Production
Planted
1997
Yield
Harv.
per
for
Harv.
Grain
Acre
Production
--Acres--
--Bushels--
--Acres--
--Bushels--
District 1 District 2 District 3 District 4 District 5 District 6 District 7 District 8 District 9
9,000 7,000 14,000 35,000 82,000 73,000 122,000 45,000 13,000
7,500 4,500 10,000 27,000 71,000 68,000 112,000 39,000 11,000
32.3 35.8 36.0 41.4 51.4 46.7 50.8 50.6 39.8
242,000 161,000 360,000 1,117,000 3,649,000 3,176,000 5,684,000 1,973,000 438,000
7,000 6,000 10,000 32,000 85,000 68,000 132,000 47,000 13,000
6,000 4,000 8,000 24,000 77,000 65,000 125,000 40,000 11,000
40.3 34.8 42.8 40.3 46.5 46.3 43.5 40.7 44.4
242,000
139.000 342,000 968,000 3,580,000 3,010,000 5,443,000 1,628,000 488,000
STATE TOTAL
400,000
350,000
48.0
16,800,000 400,000
360,000
44.0
15,840,000
Georgia Agricultural Statistics District Outline Map
4