- Collection:
- Georgia Government Publications
- Title:
- Georgia county estimates: tobacco 1996-1997 [June 1998]
- Creator:
- Georgia. Agricultural Statistics Service
- Contributor to Resource:
- Georgia. Agricultural Statistics Service
- Publisher:
- Athens, GA. : Georgia. Agricultural Statistics Service
- Date of Original:
- 1998-06
- Subject:
- Georgia
- Location:
- United States, Georgia, 32.75042, -83.50018
- Medium:
- publications (documents)
- Type:
- Text
- Format:
- application/pdf
- External Identifiers:
- Call Number GA A400.C7 S1 T6 1996-97
- Metadata URL:
- https://dlg.galileo.usg.edu/id:dlg_ggpd_y-ga-ba400-pc7-bs1-bt6-b1996-h97
- Digital Object URL:
- https://dlg.galileo.usg.edu/do:dlg_ggpd_y-ga-ba400-pc7-bs1-bt6-b1996-h97
- Language:
- eng
- Holding Institution:
- University of Georgia. Map and Government Information Library
- Rights:
-

,
Released: June 1998
G-A A40D ,(7
$'1
16
n~6-17
. :.
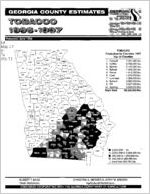
TOBACCO Production by Counties, 1997
Top 10 Counties
1. Colquitt 2. Coffee 3. Berrien 4. Tattnall 5. Pierce 6. Cook 7. Lowndes 8. Bulloch 9. Tift 10. Appling
State Total
7,321,000 Ibs. 6,788,000 Ibs. 5,146,000 Ibs. 4,496,000 Ibs. 4,413,000 Ibs. 4,376,000 Ibs. 4,288,000Ibs. 3,562,000 Ibs. 3,557,000Ibs. 3,036,000 Ibs.
89,225,000 Ibs.
II 3,000,000+ Ibs. if:l 2,000,000 to 2,999,999 Ibs. 300,000 to 1,999,999 Ibs. @ 200,000 to 299,999 Ibs. U Less than 200,000 Ibs.
ROBERT T. BASS
CHRISTINA S. MESSER & JERRY M. MIDDEN
State Statistician
Agricultural Statisticians
USDA/NASS COOPERATING WITH THE GEORGIA DEPARTMENT OF AGRICULTURE
TOBACCO--Acreage, Yield and Production by Agricultural Statistics Districts and State Totals, 1996-1997 1/
1996
1997
District
Harvested
Yield per Acre
Production
Harvested
Yield per Acre
Production
Acres
--Pounds--
Acres
--Pounds--
District 5 District 6 District 7 District 8 District 9
1,950 4,650 3,400 23,700 12,300
2,075 2,595 2,435 2,460 2,515
4,050,000 12,057,000
8,272,000 58,313,000 30,928,000
1,700 3,850 3,200 22,850 11,400
1,885 1,985 2,005 2,090 2,125
3,202,000 7,641,000 6,423,000 47,737,000 24,222,000
STATE
TOTAL
46,000
1/ Districts 1, 2, 3, and 4 do not have tobacco.
2,470
113,620,000
43,000
2,075
89,225,000
Georgia Agricultural Statistics District Outline Map
3
,
Released: June 1998
G-A A40D ,(7
$'1
16
n~6-17
. :.
TOBACCO Production by Counties, 1997
Top 10 Counties
1. Colquitt 2. Coffee 3. Berrien 4. Tattnall 5. Pierce 6. Cook 7. Lowndes 8. Bulloch 9. Tift 10. Appling
State Total
7,321,000 Ibs. 6,788,000 Ibs. 5,146,000 Ibs. 4,496,000 Ibs. 4,413,000 Ibs. 4,376,000 Ibs. 4,288,000Ibs. 3,562,000 Ibs. 3,557,000Ibs. 3,036,000 Ibs.
89,225,000 Ibs.
II 3,000,000+ Ibs. if:l 2,000,000 to 2,999,999 Ibs. 300,000 to 1,999,999 Ibs. @ 200,000 to 299,999 Ibs. U Less than 200,000 Ibs.
ROBERT T. BASS
CHRISTINA S. MESSER & JERRY M. MIDDEN
State Statistician
Agricultural Statisticians
USDA/NASS COOPERATING WITH THE GEORGIA DEPARTMENT OF AGRICULTURE
TOBACCO--Acreage, Yield and Production by Agricultural Statistics Districts and State Totals, 1996-1997 1/
1996
1997
District
Harvested
Yield per Acre
Production
Harvested
Yield per Acre
Production
Acres
--Pounds--
Acres
--Pounds--
District 5 District 6 District 7 District 8 District 9
1,950 4,650 3,400 23,700 12,300
2,075 2,595 2,435 2,460 2,515
4,050,000 12,057,000
8,272,000 58,313,000 30,928,000
1,700 3,850 3,200 22,850 11,400
1,885 1,985 2,005 2,090 2,125
3,202,000 7,641,000 6,423,000 47,737,000 24,222,000
STATE
TOTAL
46,000
1/ Districts 1, 2, 3, and 4 do not have tobacco.
2,470
113,620,000
43,000
2,075
89,225,000
Georgia Agricultural Statistics District Outline Map
3