- Collection:
- Georgia Government Publications
- Title:
- Continued evaluation of the effects of bowfin, Amia calva, removal on the Suwannee River Fishery
- Creator:
- Holder, Daniel R
- Contributor to Resource:
- Germann, Jerome F. (Jerome Francis), 1947-
Georgia. Game and Fish Division - Publisher:
- [Atlanta : Georgia Dept. of Natural Resources, Game and Fish Division
- Date of Original:
- 1977
- Subject:
- Bowfin--Suwannee River (Ga. and Fla.)
Fish stock assessment--Suwannee River (Ga. and Fla.)
Fishery management--Suwannee River (Ga. and Fla.)
Fisheries--Research--Suwannee River (Ga. and Fla.)
Suwannee River (Ga. and Fla.) - Location:
- United States, Florida, 28.75054, -82.5001
United States, Georgia, 32.75042, -83.50018
United States, Suwannee River, 29.2883, -83.16596 - Medium:
- state government records
- Type:
- Text
- Format:
- application/pdf
- Description:
- Final report
Funded through the Federal Aid in Fish Restoration Act under Dingell-Johnson Project F-29 - External Identifiers:
- OCLC 47805659
NZ MMS ID 9910389325902931
Call Number N200.G2 M1 1977 B6
Call Number N200.G2 M1 1977 F5 - Metadata URL:
- https://dlg.galileo.usg.edu/id:dlg_ggpd_s-ga-bn200-pg2-bm1-b1977-bf5
- Digital Object URL:
- https://dlg.galileo.usg.edu/do:dlg_ggpd_s-ga-bn200-pg2-bm1-b1977-bf5
- Language:
- eng
- Extent:
- 76 p. : ill., map ; 28 cm.
- Holding Institution:
- University of Georgia. Map and Government Information Library
- Rights:
-

Continued Evaluation of the Effects of Bowfin, Amia calva, Removal on the Suwannee River Fishery
by Daniel R. Holder
and Jerome Germann
Georgia Department of Natural Reso urces Game and Fish Division Atlanta, Georgia
December 1977
This study was funded through the Federal Aid in Fish Restoration Act under Dingell-Johnson Project F-29, Georgia.
State: Georgia
FINAL REPORT Project Number: F-29-4
Project Type: Research or Survey
Study Title: Continued Evaluation of the Effects of Bowfin, Amia calva,
Removal on the Suwannee River Fishery
Study Objective: To monitor the fishery of the Suwannee River in
relation to changes in the bowfin population.
ABSTRACT
The fish population and fishery of the Suwannee River, including
a portion of the Okefenokee Swamp, were monitored from July 1973 to June
1976 to determine the effects of bowfin population levels on the sport
fishery quality. A rotenone sample on Red Bluff slough had a standing
crop estimate of 130.1 lb/acre. Game fish comprised 58.1% of the sample
weight. Bowfin made up 17.6% of the sample weight. Four rotenone samples
on Mud Lake slough had standing crop estimates ranging from 148.5 to 494.0
lb/acre. Game fish ranged from 8.0 to 41.9% of the estimates. Bowfin
ranged from 40.8 to 80.4%. F/C ratios, At values, and A~ values were
determined. Fall population estimates of bowfin ranged from 20,966 fish
to 17,832 fish. Estimated fishing pressure, catch, and catch rates in the Suwannee
River varied annually. Bullheads were the most abundant species caught
by number and weight, except 1974 in which bowfin was the dominant
species by weight. Changes in game fish dominance from warmouth to
spotted sunfish and channel catfish were indicated in the creel. Total
annual harvest per acre ranged from 124.3 fish weighing 103.3 lb in 1974
to 360.6 fish weighing 192.8 lb in 1973. A decline in pressure, catch,
and catch rate was indicated in the Okefenokee Swamp in 1975 from the
WAYCROSS@
N
U.S HWY 4 41
OKEFENOKEE
)DIKE SWAMP
--- -
. __G-E-O-R-G-lA----\ l \. \
I
~
l
\
1..
Figure l. Map of study area
4
previous two years. Bullheads and warmouth were the most abundant species in the creel by number and weight.
Confidence intervals and linear regressions were used in analyzing changes in the fish populations and the fishery since bowfin removal. F/C ratios and A~ values declined in the fish population in the Suwannee River from 1970 to 1975. Standing crop estimates, E values, population estimates, and CPUE values showed an increase in bowfin abundance from 1970 to 1975. A significant decline was indicated in standing crop and E values of largemouth bass and warmouth.
Analysis of the sport fishery in the Suwannee River from 1969 to 1975 showed yearly fluctuations that could not be related to bowfin abundance. The yearly fluctuations, however, were related to winter high water.
A decline in the catch and catch rate occurred in the Okefenokee Swamp from 1970 to 1975. Warmouth, flier, and largemouth bass were the main species to decline. Water level changes in the swamp were thought to contribute to these changes in the fishery. The Suwannee River fishery and the Okefenokee Swamp fishery both seemed to be influenced to a great degree by factors other than bowfin abundance .
BACKGROUND A bowfin removal program was initiated on the Suwannee River in Georgia during extre~e low water conditions in 1967 and 1968 after rotenone samples showed that bowfin, Amia calva, Linnaeus, comprised 80% by weight of the river fish population (Wyatt et al. 1968a). Over 14.0 tons of bowfin were removed in a one year Period. The program was initiated to reduce the bowfin population to a desirable level and to evaluate removal as a management technique for improving the
2
FINAL REPORT
State: Georgi a
Project Number: F-29-4
Project Type: Research or Survey
Study Title: Continued Evaluation of the Effects of Bowfin, Amia calva,
Removal on the Suwannee River Fishery
Study Objective: To monitor the fishery of the Suwannee River in
relation to changes in the bowfin population.
ABSTRACT
The fish population and fishery of the Suwannee River, including
a portion of the Okefenokee Swamp, were monitored from July 1973 to June
1976 to determine the effects of bowfin population levels on the sport
fishery quality. A rotenone sample on Red Bluff slough had a standing
crop estimate of 130.1 lb/acre. Game fish comprised 58.1% of the sample
weight. Bowfin made up 17.6% of the sample weight. Four rotenone samples
on Mud Lake slough had standing crop estimates ranging from 148.5 to 494.0
lb/acre. Game fish ranged from 8.0 to 41.9% of the estimates. Bowfin
ranged from 40.8 to 80.4%. F/C ratios, At values, and A~ values were
determined. Fall population estimates of bowfin ranged from 20,966 fish
to 17,832 fish. Estimated fishing pressure, catch, and catch rates~n the Suwannee
River varied annually. Bullheads were the most abundant species caught
by number and weight, except 1974 in which bowfin was the dominant
species by weight. Changes in game fish dominance from warmouth to
spotted sunfish and channel catfish were indicated in the creel. Total
annual harvest per acre ranged from 124.3 fish weighing 103.3 lb in 1974
to 360.6 fish weighing 192.8 lb in 1973. A decline in pressure, catch,
and catch rate was indicated in the Okefenokee Swamp in 1975 from the
1
sport fishery. Following removal, rotenone samples and bowfin popu-
. < . ..:
lation estimates indicated a decline in bowfin abundance (Holder l970a and l969a), and creel survey data showed an improvement in the sport fishery quality (Holder l970b).
After the decline in bowfin abundance in 1969, the bowfin population seemed to increase yearly (Holder l973a). The sport fishery quality, which had improved in 1970 after removal, declined in 1971 and 1972 (Holder 1973b and Swanson and Holder 1974a). It was uncertain that removal caused the improvements in sport fishery since other factors such as climatic conditions (Holder 1969a, 1970a, and l973b) and fish movements (Holder l970c) were also interacting. If high bowfin populations caused a lower quality sport fishery in the Suwannee River, bowfin removal would be an effective management tool for controlling their abundance. This study was implemented to monitor the Suwannee River fishery in relation to bowfin population levels with the ultimate objective of determining the effects of bowfin abundance on the sport fishery.
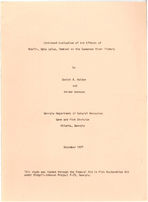
PROCEDURES Study Area
Fish population and sport fishery data were collected from the Suwannee River between the Okefenokee Swamp dike and the Georgia-Florida state line (Figure 1). Sport fishery data were also collected from the interior of the Okefenokee Swamp above the dike. The Suwannee River drains about 574 square miles of the Okefenokee Swamp. The water is tannin stained from the humus in the swamp. The pH is around 4.4, and the specific conductance is around 41 mhos (U.S. Geological Survey 1974). A 4.7 mile dike with two spillways was constructed in the swamp in 1960 to prevent further erosion of the Suwannee River channel and to prevent
3
Cooperative Game and Fish Statistics Project located at North Carolina State University, Raleigh, North Carolina. The Suwannee River creel survey was a roving type design utilizing non-uniform probability sampling (Holder l973b). Approximately 33 miles of the Suwannee River from the Okefenokee Swamp dike to the Georgia-Florida state line were surveyed from 7 July to 21 December 1973, 2 March 1974 to 3 January 1975, and 15 r1arch 1975 to 2 January 1976, and 6 ~1arch to 9 July 1976. Sampling design involved stratification of weekend-weekdays, AM-PM time periods, river sections, and starting points. Probabilities were assigned for each strata combination by use of estimates from previous surveys.
The Okefenokee Swamp creel survey was a landing type design with non-uniform probability sampling (Holder l973b). Access landings only on the west side of the Okefenokee Swamp near Fargo, Georgia were surveyed from 14 July to 28 December 1973, 9 March to 27 December 1974, and 8 March to 26 December 1975. Probabilities were assigned for each strata in the same manner as the roving survey on the Suwannee River.
Data from both surveys were collected every other week and were used to estimate the sport fishery statistics for a two week period. The clerk recorded the number in party, time spent fis~ing, method of fishing, bait used, species fished-for, and number and weight of each species caught.
Raw data sheets were compiled and sent to the Department of Administrative Services, Atlanta, Georgia for transferal to IBM computer punch cards. The cards were then sent to North Carolina State University, Raleigh, North Carolina for computer processing. The expanded estimates of pressure and harvest were returned on a computer print-out for analysis.
6
WAYCROSS@ N
U.S H W Y 4 41
OKEFENOKEE )DIKE
SWAMP
--
------ __GEORG lA ----
l
\.
\
I
~
l
\
\..
Figure 1. Map of study area
4
sport fishery. Following removal, rotenone samples and bowfin population estimates indicated a decline in bowfin abundance (Holder l970a and l969a), and creel survey data showed an improvement in the sport fishery quality (Holder l970b).
After the decline in bowfin abundance in 1969, the bowfin population seemed to increase yearly (Holder l973a). The sport fishery quality, which had improved in 1970 after removal, declined in 1971 and 1972 (Holder l973b and Swanson and Holder l974a). It was uncertain that removal caused the improvements in sport fishery since other factors such as climatic conditions (Holder l969a, 1970a, and l973b) and fish movements (Holder l970c) were also interacting. If high bowfin populations caused a lower quality sport fishery in the Suwannee River, bowfin removal would be an effective management tool for controlling their abundance. This study was implemented to monitor the Suwannee River fishery in relation to bowfin population levels with the ultimate objective of determining the effects of bowfin abundance on the sport fishery.
PROCEDURES Study Area
Fish population and sport fishery data were collecttd from the Suwannee River between the Okefenokee Swamp dike and the Georgia-Florida state line (Figure 1). Sport fishery data were also collected from the interior of the Okefenokee Swamp above the dike. The Suwannee River drains about 574 square miles of the Okefenokee Swamp. The water is tannin stained from the humus in the swamp. The pH is around 4.4, and the specific conductance is around 41 mhos (U.S. Geological Survey 1974). A 4.7 mile dike with two spillways was constructed in the swamp in 1960 to prevent further erosion of the Suwannee River channel and to prevent
3
the swamp from drying during a severe drought (Holder l970c). The Suwannee River flows about 33 miles in Georgia before entering Florida. Flow is extremely variable being greatest in late winter and late summer and lowest in the spring and late fall. The average water discharge at Fargo, Georgia from 41 years of records was l ,116 cfs. (U. S. Geoloqical Survey 1974). f~i_2_h_ _P__cp~uj_a_t_i _o_Q_
Five rotenone population samples were taken on the Suwannee River. One sample was taken at Red Bluff slough (12.5 river miles above U.S. Hwy 441 bridge) 3~4 October 1973. Four samples were taken at Mud Lake slough (2.8 river miles above U.S. Hwy 441 bridge). The ~1ud Lake samples were collected 4~5 October 1973, 24~25 May 1974, 2-3 July 1975, and 21-22 April 1976.
Prior to sa111pling, the surface area and average depth vJere determined. A block-off net (l/2 inch bar mesh 10 feet deep) was set at the mouth of the slough and remained through the second day pick-up. Rotenone (2.5% synergistic liquid emulsifiable formulation) was applied at 1-2 ppm. Fish were collected as they surfaced. The fish were sorted by species, weighed and measured in inch groupings, compiled according to Surber (1959), and tabulated on a one surface acre basis.
On all samples, except the 21 April 1976 Mud Lake sample, an assortIIJent of fish were collected for mark and recovery estimates. The fish were collected by electrofishing the day before and held overnight in the river. Prior to the sample the fish were fin clipped (generally a onehalf caudal clip) and released into the sample area. Fish collected in the rotenone samples were examined for fin clips. Spolj_ Fish~
The creel designs for estimating the sport fishery statistics of the Suwannee River and Okefenokee Swamp were provided by the Southeastern
5
Table l. Checklist of fish species collected from the Suwannee River rotenone population samples, 1973 to 1976.
Taxa
Lepisosteus platyrhincus Amia calva Esox americanus Esox niger Erimyzon 2_ucetta Minytrema melanops Ictalurus natalis Ictalurus nebulosus Ictalurus punctatus Noturus gyrinus Noturus Jeptacanthus Aphredoderus sayanus Fundulus chrysotus Fundulus lineolatus Leptolucania ommata Gambusia affinis Labidesthes sicculus Acantharchus pomotis Centrarchus macropterus Elassoma spp.* Enneacanthus chaetodon Enneacanthus gloriosus Enneacanthus obesus Lepomis gulosus Lepomis macrochirus Lepomis marginatus Lepomis punctatus Micropterus salmoides Pomoxis nigromaculatus Etheostoma fusiforme Percina nigrafasciata
Red Bluff Slough t1ud Lake Slough
1973
1973 1974 1975 1976
X
X
X
X XXX
X
X XXX
X
X XXX
X
X XXX
X XXX
X
X XXX
X
X XX
X
X XXX
X
X
X
X
X X X X
X
X
X XXX
X
X
X XXX
X
X
X
X
X
X
X
X XXX
X
X X
X
X
X X X
X
X
X
X XXX
X
X XXX
X
X XXX
X
X
X
X
X
X XX
X
X
X
X
X XXX
t
X
*Includes Elassoma evergladei and E. okefenokee
8
Cooperative Game and Fish Statistics Project located at North Carolina State University, Raleigh, North Carolina. The Suwannee River creel survey was a roving type design utilizing non-uniform probability sampling (Holder 1973b). Approximately 33 miles of the Suwannee River from the Okefenokee Swamp dike to the Georgia-Florida state line were surveyed from 7 July to 21 December 1973, 2 March 1974 to 3 January 1975, and 15 r~arch 1975 to 2 January 1976, and 6 ~1arch to 9 July 1976. Sampling design involved stratification of weekend-weekdays, AM-PM time periods, river sections, and starting points. Probabilities were assigned for each strata combination by use of estimates from previous surveys.
The Okefenokee Swamp creel survey was a landing type design with non-uniform probability sampling (Holder 1973b). Access landings only on the west side of the Okefenokee Swamp near Fargo, Georgia were surveyed from 14 July to 28 December 1973, 9 March to 27 December 1974, and 8 March to 26 December 1975. Probabilities were assigned for each strata in the same manner as the roving survey on the Suwannee River.
Data from both surveys were collected every other week and were used to estimate the sport fishery statistics for a two week period. The clerk recorded the number in party, time spent fishing, method of fishing, bait used, species fished-for, and number and weight of each species caught.
Raw data sheets were compiled and sent to the Department of Administrative Services, Atlanta, Georgia for transferal to IBM computer punch cards. The cards were then sent to North Carolina State University, Raleigh, North Carolina for computer processing. The expanded estimates of pressure and harvest were returned on a computer print-out for analysis.
6
the swamp from drying during a severe drought (Holder 1970c). The Suwannee River flows about 33 miles in Georgia before entering Florida. Flow is extremely variable being greatest in late winter and late summer and lowest in the spring and late fall. The average water discharge at Fargo, Georgia from 41 years of records was 1,116 cfs. (U. S. Geoloqical Survey 1974). f_i2_h__P_qp_uj _a_t_i_on
Five rotenone population samples were taken on the Suwannee River. One sample was taken at Red Bluff slough (12.5 river miles above U.S. Hwy 441 bridge) 3-4 October 1973. Four samples were taken at Mud Lake slough (2.8 river miles above U.S. Hwy 441 bridge). The t1ud Lake samples were collected 4-5 October 1973, 24-25 May 1974, 2-3 July 1975, and 21-22 April 1976.
Prior to sar,lpl ing, the surface area and average depth vJere determined. A block-off net (l/2 inch bar mesh 10 feet deep) was set at the mouth of the slough and relllained through the second day pick-up. Rotenone (2.5% synergistic liquid emulsifiable formulation) was applied at 1-2 ppm. Fish were collected as they surfaced. The fish were sorted by species, weighed and measured in inch groupings, compiled according to Surber (1959), and tabulated on a one surface acre basis.
On all samples, except the 21 April 1976 r~ud Lake s~mple, an assortrrlent of fish were collected for mark and recovery estimates. The fish were collected by electrofishing the day before and held overnight in the r1ver. Prior to the sample the fish were fin clipped (generally a onehalf caudal clip) and released into the sample area. Fish collected in the rotenone samples were examined for fin clips. Spoct_ Fis~
The creel designs for estimating the sport fishery statistics of the Suwannee River and Okefenokee Swamp were provided by the Southeastern
5
Bowfin Population Estimates Population estimates of bowfin using the adjusted Petersen mark-
recapture method (Ricker 1975) were made on the Suwannee River from 29 October to 16 November 1973, 14 November to 11 December 1974, and 4 November to 5 December 1975, respectively. The sample area each year was from the Okefenokee Swamp dike to U.S. Hwy 441 bridge (18 river miles). The area was divided into sections to distribute sampling effort for capture and recapture attempts. Bowfin were collected with electrofishing equipment, marked by fin clips, and released in the vicinity of capture. A week usually separated the periods of capture and recapture to allow population mixing. Effort was made to obtain sample sizes that would provide estimates within 10% of the true population with 95% confidence (Robson and Regier 1964).
Data from previous studies on the Suwannee River are used in the findings and analyses.
FINDINGS Rotenone Samples
Red Bluff slough contained approximately 0.55 surface acres when the sample was taken in October 1973. The slough had a maximum depth of 6 ft with an average depth of 1.8 ft and was shaded by a cypress-tupelo gum overstory. Mud Lake slough ranged from 0.55 to 0.75 surface acres, varying according to river water level. Maximum depth was generally 8.0-8.5 ft. Average depth ranged from 3.0 to 4.4 ft. The slough was mostly open water but had a few scattered cypress trees.
Thirty-two fish species were identified from the five rotenone samples on the Suwannee River (Table 1). Species collected represented 11 freshwater families. Four species - spotted sucker, Minytrema melanops (Rafinesque), channel catfish, Ictalurus punctatus (Rafinesque), black
7
. +>
CJ) \.0
.- r--..
(1) 0"1
3rI
r- (V)
ttl r--..
+> 0"1 0.-+>
~
'"OS...
s::: (1)
ttl >.-
.......... 0::: 0 l.!)(l) 0"1(1)
,...... s::: s:::
nit! (1) 3 ,...... ::::::1
CJ) (/)
s.:-:: n
3Vl
.(.../_)..(.,.1...)..
D.. :c+>E
c:(ltl Vl
n (1)(1)
::::::1 s:::
r-0
ttl s:::
>UJ +>
+JO c:(S....
n
OO"l
.- ::::::1
+>O
ts.t..l.
rVl
-U .....E ..o
LL..S.... 4-
Vl (l)Vl
.f./14-
.-
4-UJ
E 4-11:1 0 CJ)
Vl(l) D..r0..0 S-.11:1 U+J
Vl CJ) (1)
s.::-: >s....
'"0 ttl S::: ttl +> 4UiO
.
N
,.(..1..).
..0 ttl I-
\.0
r--..
0"1(1) r-..::.::.
ttl
\.0
(V)
.<::::t
. . . N
0"1
N
,...... _J
<::::t N
(V)
r--..
0
<::::t 0"1 \.0
0"1
N
S-.'"0
N
D.. ::::::1
c:(::E
l.!)
r--.. (1)
0"1 ..::.::.
,...... ttl
N <::::t
.r--..
. . . . l.!) <::::t \.0
_J
(V)
(V)
0
l.!)
aJ
l.!)
>,
(V)
l.!)
0"1
(V)
,...... '"0
<::::t
::::I ::::::I
'J ::2:
<::::1"(1)
r--....::.::.
0"111:1
,...... _J
0 \.0
. . . . . 0
N
l.!)
(V)
co
<::::t <::::t 0
>,-o
0"1
0"1 aJ aJ
0"1
(V)
ttl ::::::1
<::::t
=:::::::!::
(V)
r--..
0"1 (1) ..::.::.
s.... ttl
(1) _J ..0 0'"0 +.I ::::::I U:!: 0
(V)
r--..
0"1 4,...... 4-
::::::1 S....r(l)c:) ..0 0'"0
+uJo(:l:)
0
0"1
aJ
(V)
(V)
. . . . . l.!)
\.0
aJ
0
r--..
co 0
<::::t
(V)
co
<::::t
(V)
aJ
l.!)
r--..
N
. 0
aJ 0
(V)
. . . aJ
(V)
l.!)
\.0 r--.. l.!) r--.. l.!) r--..
(1)
-s....
u
ttl ..0
D..
-(1)
0s....
s.... u
u
c:(
CJ)
s.... s:::
(1)
'"0
..0 s:::
E
ttl
::::::1
:z::
+>
(/)
..C..i_~...
0.-
(1)
+>
::::::1
-ttl
0:::
ttl
>
u
+> LL.. c:(
.0..._~...
(1) ::::::1
ttl
>
:c+> c:(
(1)
-s....
u
ttl ..0
V.-l
LL.. (1) E ttl (..!:)
10
Table l. Checklist of fish species collected from the Suwannee River rotenone population samples, 1973 to 1976.
Red Bluff Slough t1ud Lake Slough
Taxa
1973
1973 1974 1975 1976
Le~isosteus ~lat_y:rhincus
X
X
Amia calva
X
X X X X
Esox americanus
X
X X X X
Esox niger
X
X X X X
Erim_y:zon ~ucetta
X
X X X X
Min_y:trema melano~s
X X X X
lctalurus natalis
X
X X X X
Ictalurus nebulosus
X
Ictalurus ~unctatus
X X X
Noturus gyrinus
X
X X X X
Noturus ~e~tacanthus
X
X
X
Aphredoderus sa_y:anus
X
X X X X
Fundulus chr_y:sotus
X
. < -~
Fundulus l i neola tus
X
X X X X
Le~tolucania ommata
X
Gambusia affinis
X
X X X X
Labidesthes sicculus
XXX X
Acantharchus pomotis
X
X
Centrarchus macro~terus
X
X X X X
Elassoma spp.*
X
X X
Enneacanthus chaetodon
X
Enneacanthus gloriosus
X
X X X
Enneacanthus obesus
X
X
Lepomis gulosus
X
X X X X
Le~omis macrochirus
X
X X X X
Le~omis marginatus
X
X X X X
Lepomis punctatus
X
X X X X
Micropterus salmoides
X X X
Pomoxis nigromaculatus
X X X
Etheostoma fusiforme
X
X X X X
Percina nigrafasciata
X
*Includes Elassoma evergladei and E. okefenokee
8
Bowfin Population Estimates Population estimates of bowfin using the adjusted Petersen mark-
recapture method (Ricker 1975) were made on the Suwannee River from 29 October to 16 November 1973, 14 November to ll December 1974, and 4 November to 5 December 1975, respectively. The sample area each year was from the Okefenokee Swamp dike to U.S. Hwy 441 bridge (18 river miles). The area was divided into sections to distribute sampling effort for capture and recapture attempts. Bowfin were collected with electrofishing equipment, marked by fin clips, and released in the vicinity of capture. A week usually separated the periods of capture and recapture to allow population mixing. Effort was made to obtain sample sizes that would provide estimates within 10% of the true population with 95% confidence (Robson and Regier 1964).
Data from previous studies on the Suwannee River are used in the findings and analyses.
FINDINGS Rotenone Samples
Red Bluff slough contained approximately 0.55 surface acres when the sample was taken in October 1973. The slough had a maximum depth of 6 ft with an average depth of 1.8 ft and was shaded by a cypr~s-tupelo gum overstory. Mud Lake slough ranged from 0.55 to 0.75 surface acres, varying according to river water level. Maximum depth was generally 8.0-8.5 ft. Average depth ranged from 3.0 to 4.4 ft. The slough was mostly open water but had a few scattered cypress trees.
Thirty-two fish species were identified from the five rotenone samples on the Suwannee River (Table 1). Species collected represented 11 freshwater families. Four species - spotted sucker, Minytrema melanops (Rafinesque), channel catfish, Ictalurus punctatus (Rafinesque), black
7
crappie, Po!i!()_x_i_s_ n_i_g_r_o~n_i:l__c_u_l_?_!:-_~ (Leseur) and black banded darter, p_er_c_i_n_a_ ni~3_f~~~ata (Agassiz) - were not previously recorded from the Suwannee River by Dahlberg and Scott (1971).
Population data from the slough samples are presented according to Surber (1959) in the Appendix (Tables A-1 to A-6). Red Bluff slough had a standing crop estimate of 130.1 lb/acre (Table 2). Game fishes, primarily
chain pickerel, ~s9~ nj~~r Lesueur, flier C~~!!~~5~~~ ~~~cop_!:-~!~~ (Lacepede),
warmouth, L~omi_s_ _g_u_l_o_s_u~ (Cuvier), and redfin pickerel, tsox amer_icanus ~l!e~Jca_n_!J~ Lesueur, comprised 36.5% by number and 58.1% by weight of the sample (Tables 3 and 4). Largemouth bass, Micropterus salmoides (Lac'epe' de), were not present. Bowfin and yellow bullhead, Ictalurus natalis (Lesueur), were the predo11li nant non-game species present. Bowfin rna de up 17.6% of the
sample weight. Mud Lake slough had standing crop estimates ranging from 148.5 to 494.0
lb/acre (Table 2). The predominant game fishes by number and v1eight Here chain pickerel, warmouth, and flier (Tables 3 and 4). Game fish ranged from 20.9 to 38.1% by number and 8.0 to 41.9% by weight. Largemouth bass declined from 1.6% by weight in 1973 to 0 in 1976. Bowfin was the predominant nongame species by weight ranging from 40.8 to 80.4% with values around 80% occurring in 1974, 1975, and 1976 (Table 4).
F/C ratios, At values, and A~ values (Swingle 1950) were tabulated for each sample (Table 2). The F/C ratios of 0.1 to 1.0 were indicative of a population overcrowded with ca~nivorous species. Harvestable size fish(At) made up 77-99% by weight of the samples. The harvestable game fish (A~) was from 34% to 57.3% in the 1973 samples but dropped sharply in 1974 to around 8% and stabilized at that level. The similarity of the Mud Lake F/C ratios and At and A~ values for 1974-1976 suggest a stabilizing in the fish population. The three samples were taken at different times of the year and at different water levels.
9
Table 4. Percent composition by weight of key species in rotenone samples from the Suwannee River, 1973-1976.
Sj2ecies Spotted gar Bowfin Chain pickerel Redfin pickerel Lake chubsucker Spotted sucker Yellow bull head Channe1 catfish Black crappie Flier Largemouth bass Warmouth Spotted sunfish Bluegill Others
Red Bluff
Mud Lake
1973
1973 1974 1975 1976
0.0
0.4
0.0 1.2
0.0
17.6
40.8 79.6 80.1 80.4
27.2
16.8
3. 1 5.3
8.0
6.4
1.1
ra 0.7
0.7
5.8
5.9
9.4 2.0
1.8
0.0
4. 1
2.6 4.0
2.7
14.8
2.8
0. 1 0.6
0.3
0.0
2.4
0.3
T
0.0
0.0
1.0
0.2 0.3
0.0
10.0
15.6
0.7 1.6
0.2
0.0
1.6
0.9
T
0.0
9.0
1.4
1.7 2.0
2.8
5.3
0.5
0.1
~5
0.3
0.2
1.6
0.4 0.4
1.7
3.8
4. 1
1.0 1.4
1.2
a T = 1ess than 0.1
12
. -l-'
J:: OH.O
.-- r---.
QJCJ)
3:rI
r- (V)
10 r---.
-l-' 0'1 Or-l-'
-os..."'
c QJ tO>
.---.a.--:
0 LO QJ CJ)QJ r- c
c
"' 10 GJ3: r- ::J
0)(/")
c .-- "'
3:Vl
U")Q)
.......... .--
0.
:::r:-l->E
c::(<O Vl
QJQJ
::J c
r- 0
10 c >OJ
-l-' -l-'0 c::(S...
.,_c:
0 Ol .-- ::J -l-'0 10 rI- Vl
-U.....E.o
LLS... 4-
V"l' J::
Q)Vl
J:: .-Vl4-
.--
4-QJ
E
4-10 001
VlQJ Cl..rO..Cl I- 10 U-l-'
Vl Ol QJ
c>
.-- I""010
c J::
10
+> 4-
U10
N
QJ r..Cl 10 I-
\.()
r---.
CJ)QJ r-..::,:.
10
\.() (V)
.<:::t
. . . N
0'1 N
r- _J
<:::t
(V)
0
<:::t
0'1
\.()
s...-o N
r---.
N
0'1
N
0. ::J
c::(:::E:
LO
r---. QJ
0'1 ..::,:.
r- 10
N <:::t
.r---.
. . . LO
<:::t
\.()
>, _J r- -o
(V) (V)
(V)
LO <:::t
0
LO
<X)
LO
0'1
(V)
::J ::J
'-:> ::2:
<:::tQJ
r---. ..::.
0'110 r- _J
0
\.()
. . . . . 0
N
LO
(V)
co
>,-o
<:::t
<:::t 0'1
0
0'1
<X)
<X)
0'1
(V)
<O::J
<:::t
:::!:::!::::
(V)
r---.
0'1 QJ ..::,:.
I- 10 QJ _J
..oCl -o -ul-:':::::J
0
(V)
r---.
0'1 4r- 4-
::J I-.QJo:l
..oCl -o
-l-'QJ
ua:
0
c0'o1
(V) (V)
. . . . . LO
\.()
co
0
r---.
co 0
<:::t
(V)
co
<:::t
(V)
co
LO
r---.
Nco
. 0
0
(V)
. . . <X)
(V)
LO
1.()
r---.
LO
r---. LO r---.
QJ
-I-
u
10
..Cl
0.
0
-QJ
I-
I- u
u
c::(
Ol
c
IQJ
-o
..Cl
c
E
10
::J
-l-'
z:
(/")
.C...;...~... ..0..-.Q...:..
0
QJ
QJ
-l-'
::J
::J
-a1:0
u
LL
10
>
-l-' c::(
r10
>
:::r:+>
c::(
-QJ
I-
u
10
..Cl
J:: Vl
LL QJ
E
10
<.!:)
10
crappie, Po~i~o_x_i_s_ n_i_g_r_OJl~a_c_u_l_?_!:._u~ (Leseu r) and b1ackbanded darter, _P_e_r_c_i_n_~ nJ]I~_fa_~~ata (Agassiz) - were not previously recorded from the Suwannee
River by Dahlberg and Scott (1971). Population data from the slough samples are presented according to
Surber (1959) in the Appendix (Tables A-1 to A-6). Red Bluff slough had a standing crop estimate of 130.1 lb/acre (Table 2). Game fishes, primarily
chain pickerel, E_so_x_ n_i_g_er Lesueur, flier _C~_n_t__r~_r_c_h_u~ ~ac_Y'_op_t~!'~2- (Lacepede),
warmouth, L~mi_s_ g_u_l_o~_u2 (Cuvier), and redfin pickerel, _ssox amer_icanus _a_I_l~e__r:__ica_ll~~ Lesueur, comprised 36.5% by number and 58.1% by weight of the
sample (Tables 3 and 4). Largemouth bass, Micropterus salmoides (Lac~p~de),
were not present. Bowfin and yellow bullhead, Ictalurus natalis (Lesueur), were the predominant non-game species present. Bowfin made up 17.6% of the
samp 1e weight. Mud Lake slough had standing crop estimates ranging from 148.5 to 494.0
lb/acre (Table 2). The predominant game fishes by number and v1eight v~ere
chain pickerel, warmouth, and flier (Tables 3 and 4). Game fish ranged from
20.9 to 38.1% by number and 8.0 to 41.9% by weight. Largemouth bass declined
from 1.6% by weight in 1973 to 0 in 1976. Bowfin was the predominant non-
game species by weight ranging from 40.8 to 80.4% with values around 80%
occurring in 1974, 1975, and 1976 (Table 4).
t
F/C ratios, At values, and A~ values (Swingle 1950) were tabulated
for each sample (Table 2). The F/C ratios of 0.1 to 1.0 were indicative
of a population overcrowded with ca'rnivorous species. Harvestable size
fish(At) made up 77-99% by weight of the samples. The harvestable game fish (A~) was from 34% to 57.3% in the 1973 samples but dropped sharply
in 1974 to around 8% and stabilized at that level. The similarity of the Mud Lake F/C ratios and At and A~ values for 1974-1976 suggest a stabi-
lizing in the fish population. The three samples were taken at different
times of the year and at different water levels.
9
Table 3. Percent composition by nur11ber of key species in rotenone samples from the Suwannee River, 1973-1976.
seecies Spotted gar Bowfin Chain pickerel Redfin pickerel Lake chubsucker Spotted sucker Yellow bullhead Channel catfish Black crappie Flier Largemouth bass Warmouth Spotted sunfish Bluegill Others
Red Bluff 1973 0.0 0.8 10.0 6.7 4. l 0.0 5.8 0.0 0.0 l 0. 3 0.0 6.8 2.4 0.3 52.7
1973 Ta
1.2 3. l 1.5 0.4 0. l 0.6 0.2 0. l 31.6 0.1 0.5 0.2 0.8 59.7
Mud Lake 1974 1975
0.0 0.3
45.6 6. 1
2.6 3.8
0.2 5.8
15.4 0.5
1.5 0.3
0.2 0.4
0.2
T
0.2
T
6.3 14.3
0.4
T
5.4 3.2
0.4 3.9
5.2 1.8
16.1 59.5
1976 0.0 4.7 3.6 1.7 2.7 0.4 0. l 0.0 0.0 l.l 0.0 14.9 8.2 2.3 60.4
aT= less than 0.1
ll
Table 5. Estimates of fishing pressure, catch, and catch rates by period
on the Suwannee River from 17 March 1973 to 2 July 1976.
.~ ' .-
~. :
Period
Angler Total Catch Catch Rates Hours No. Wgt.(lb} No/Hr Lb/Hr
l 17 March 23 March
648 906 907 1.40 1.40
2 31 March - 5 April
824 1329 1348 1. 61 l. 64
3 14 April - 20 Apri 1
687 1058 597 l. 54 0.87
4 28 April - 4 May
3960 9539 5845 2.41 1 .48
5 12 May - 18 May
3886 7594 4869 1. 95 1. 25
6 26 May - 1 June
6065 8179 4206 1.35 0.69
7 9 June - 15 June
1806 3038 1451 1.68 0.80
8 23 June - 29 June
2480 4569 2933 1.84 1.18
9 7 July- ll July
3460 l 0638 5090 3.07 1.47
10 21 July - 27 July
4098 11444 5023 2.79 1. 23
ll
4 August - 9 August
4610 5947 3166 1.29 0.69
12 18 August - 22 August
3108 l 0058 4208 3.24 1.35
13 l September - 7 September 3420 9075 4095 2.65 1.20
14 15 September- 21 September 4617 14281 8627 3.09 1.87
15 29 September - 4 October
3960 7474 3997 1.89 1. 01
. ~ '. . ..>,
16 13 October - 18 October
3744 7767 3409 2.07 0. 91
17 27 October - 2 November
1379 3809 2210 2.76 1.60
18 10 November - 16 November
879 1424 874 1.62 0.99
19 24 November - 30 November 1047 3012 1944 2.88 1. 86
20 8 December - 13 December
274 319 192 l. 17 0. 70
Total 17 11a rch 1973 21 December 1973
sx
54952 121460 64991 4966 12471 7194
2.21 1.18
1 2 March - 8 March
2535 1988 1804 .78 0.71
2 16 March - 21 March
849 849 928 1.00 1.09
3 30 March - 4 April
881 1510 ll90 1. 71 1.35
4 13 April - 18 April
1903 3513 2437 1.85 1.28
5 27 April - 2 May
1295 2554 2192 1. 97 1.69
6 11 t1ay - 15 May
2317 2407 1915 1.04 0.83
7
25 May - 31 f~ay
2904 4469 ~872 l. 54 0.99
8 8 June - 14 June
2754 4688 3232 1. 70 1.17
9 22 June - 27 June
2432 2342 1611
.96 0.66
10 6 July - 12 July
910 832 1367 . 91 1.50
11
20 July - 24 July
1720 2248 2412 1. 3. 1. 40
12 3 August - 9 August
1741 1994 1369 1.15 0.79
13 17 August - 23 August
846 314 823 .37 0.97
14 31 August - 4 September
1206 1560 1686 1.29 1.40
15 14 September - 20 September 679 1030 1519 1.52 2.24
16 28 September - 3 October
2027 1971 1604 . 97 0. 79
17 12 October- 16 October
351 586 518 1.67 1.48
18 26 October - 1 November
924 1047 642 1.13 0.69
19 9 November - 15 November
1339 2397 1599 1. 79 1.19
20 23 November - 28 November 1022 1842 1612 1.80 l. 58
21
7 December - 13 December
295 352 422 1.19 1.43
22 21 December - 25 December
686 1410 1015 2.05 1.48
Total
sx
2 March 1974 3 January 1975
14
31616 41903 2883 4219
35769 2649
1.33 1.10
Table 4. Percent composition by weight of key species in rotenone samples from the Suwannee River, 1973-1976.
Species Spotted gar Bowfin Chain pickerel Redfin pickerel Lake chubsucker Spotted sucker Yellow bullhead Channel catfish Black crappie Flier Largemouth bass Warmouth Spotted sunfish Bluegill Others
Red Bluff
Mud Lake
1973
1973 1974 1975 1976
0.0
0.4
0.0 1.2
0.0
17.6
40.8 79.6 80.1 80.4
27.2
16.8
3. l 5.3
8.0
6.4
l.l
Ta 0.7
0.7
5.8
5.9
9.4 2.0
1.8
0.0
4. 1
2.6 4.0
2.7
14.8
2.8
0. 1 0.6
0.3
0.0
2.4
0.3
T
0.0
0.0
1.0
0.2 0.3
0.0
l 0. 0
15.6
0.7 1.6
0.2
0.0
1.6
0.9
T
0.0
9.0
1.4
l . 7 2.0
2.8
5.3
0.5
0. 1 0.5
0.3
0.2
1.6
0.4 0.4
1.7
3.8
4. l
1.0 1.4
1.2
aT= less than 0.1
12
Table 3. Percent composition by number of key species in rotenone samples from the Suwannee River, 1973-1976.
S~ecies
Spotted gar Bowfin Chain pickerel Redfin pickerel Lake chubsucker Spotted sucker Yellow bullhead Channel catfish Black crappie Flier Largemouth bass Wa rmouth Spotted sunfish Bluegill Others
Red Bluff 1973 0.0 0.8 l 0. 0 6.7 4. 1 0.0 5.8 0.0 0.0 10.3 0.0 6.8 2.4 0.3 52.7
1973 Ta
1.2 3.1 1.5 0.4 0.1 0.6 0.2 0. 1 31.6 0. 1 0.5 0.2 0.8 59.7
Mud Lake 1974 1975
0.0 0.3
45.6 6. 1
2.6 3.8
0.2 5.8
15.4 0.5
1.5 0.3
0.2 0.4
0.2
T
0.2
T
6.3 14.3
0.4
T
5.4 3.2
0.4
3. ~
5.2 1.8
16.1 59.5
1976 0.0 4.7 3.6 1.7 2.7 0.4 0. 1 0.0 0.0 l.l 0.0 14.9 8.2 2.3 60.4
aT= less than 0.1
11
Overall recovery of fish marked and released in four rotenone samples was 61.2% (Appendix, Table A-7). The percent recovery improved with each sample, 40.0% in 1973 to 82.1% in 1975. HovJever, due to the low number marked of most species represented, adjustments to the standing crop estimates were not made. Suwannee River Creel
Sport fishery estimates of pressure, catch, and catch rate are presented in Table 5. The period 17 ~1arch 1973 to 6 July 1973 from Swanson and Holder (l974a) are included for presentation of creel estimates by calendar year. The estimates in 1976 represented only four months of the
year. Fishing pressure was 54,952 man-hours ! 4,966 Sx in 1973, 31,616 man-hours ! 2,883 S~ in 1974, 49,105 man-hours 3,145 S~ in 1975, and
20,206 man-hours ~ 3,929 S~ in 1976. Catch ranged from 121,460 fish ! 12,471 Sx weighing 64,991 lb ~ 7,194 s~ in 1973 to 25,641 fish: 4,111
s~ weighing 16,664 lb! 3,056 s~ in 1976. Catch rates were highly variable for the respective years surveyed.
The numerical catch rate ranged from 2.21 fish per hour in 1973 to 1.27 fish per hour in 1976. The catch rate by weight varied from 1.27 lb/hr in 1975 to 0.82 lb/hr in 1976 (Table 5).
Total harvest, average weight, and catch rates for individual species are presented in Table 6. In all years, bullheads were the primary species caught by number. Bullheads and bowfin were the main species harvested by weight and generally made up 55% of the total catch. vlarmouth made up 24% of the total harvest by number and weight in 1973 but declined in the later years. Since 1973, spotted sunfish, Lepomis p_~~t~tu~ (Valenciennes), catches have exceeded those of warmouth. Channel catfish increased in the catch during the years surveyed. The catch of other species in the creel was low.
13
~
WI
4-> ...............
NMmmmq~mN~oo
~mNOOOOOOO~
MN~m~~~N~No qNOOOoo~oo~
0~ :: n __J
oooooooooo~
oooooooooo~
E
0
~
u ~
~MNqMq~qM~~
0 q q N M ~ ~ ~ ('J M M
4-
+-' :r:
OMm~ooooooN
Nm~NOOOOOOM
~
w
u~o z
o~ooooooooN
oooooooooo~
>
0::
w w
Mo~m~m~mm~q OqmM~~~Nmqm
o~m~m~mmooOOM ~qqqMO~~mmoo
c
c
NOOON~o~ooo N O O O N r - - O r - - 0 0 0
~
3
::l
U1
w
+-'
w c
MNmm~~mNm~o
OON~~~CO~OOMmO
+-'
u
OmqqqMOqr--00
ooo~oo~moo.-.-o
~
~qN
c
w
0
MN
0
0
0...
Vl
ClJ
Nq~~mqm~m~q
m~mMqOOOmqMm
u
~OMr-MMMmNmm
~mO.-OOMmmM~q
w
N~r-~Mr-NOOm.-~
N~m~OOq~qNM~
0..
Nqm
~
N~
N
Vl
NOMO~MmqMLD.
Vl
mmMq.-OmM~.-m
w
~MmmoqLOr--.mMm
+-'
~mmNMN
N
<::1"
~
Nr-
~
~
~
u
:r:
0
+-'
+-'
~
~
u
w c
~~~M.-~~oom~o
MOMMqmmqoo~o
.-- u
N 0 M ~ ~ .-- 0 ~ .-- C' 0
m.-O~NqOm~NO
-o
~
~N
0
,...-"'"',...-,..-
0
-o c
~
c
~ w
~
0...
+-'
c
0
Vl
0 0
I- z
lx
(/)
~0.--~qo~~~m~
MMNMMmmOOM~~
NMM~~OONmOqq
,...- r-- 0'1 ,....-
N
oo.-mOOMM.-qmqm
~~....-mmoMooq~....
mmmLONqN~qqN
M
q
c
~
3
(/)
E
0
~
.
NmC>LOmmN....-mooo
OqOON00....-0000~~1.0
0
MO~~MO~~~~q
z:
MMOO~....-N
N....-
r-
~N
N
~OONOO~qmLON~M
.-~oqmoo~~~~o
q.-MOOmOOMN~OOm
~~q~
N
.-
q
4M
m ~
n
_c Vl
_c
_c Vl
_c
+-'
Vwl .
>~ ~~
~m
_c.--
.,( .../ . )~ (/)w~
Vl
w 4-n~
c
4+-'
::l..C..::.t::
~
-oVl
Vl+JU+JU
_c
::l .,.... Vl
.--
.,V....l
w Vl .--
~
.,.V...l
4c-fl~w
4+-'
::l..C..::.t::
~
-oVl
Vl+JU+JU
_c
::l .,.... Vl
~
~~
~ .--
Vl
w
~+-'""000..~~~
c W
.,.... _c
::s WE 0 +-' w
c
W
~
Wrc O'l ~ .--
~+-'""0 0 0..~.-.-
c W
.,.... _c
::s
0
W
-1->
E w
c
W
~
W c
r-
O'l
~ .--
+-':::::5 O'J +-'
0 4- +-'
u
w
4- ~ E +-> O'l.- n c w w ~ o o 3.-- ~ 0 ~ ~-o ~ ::l..C+-'
::s ~ o..~..c w..c~ +->
4- ~ E +-> n O'l.- c w w ~ o o +-> 3.-- ~ 0 ~ ~-o ~ ::l..C+J
::s ~ o..~..c w..c~
(/) COC0:3:V)__JUC:::UCOOI- COC0:3:V)__JUC:::UCOOI-
~
0 4-
0
M
wVl
~
m
+-' .--
Vl
~ ~
M ::l
.m..... ~
mVJ
~~
:::::5
~
-1->
~
-o
~
.,.E... . .uC
+-' ~
Vl ~
W::E
m~0 ..c ~ w
u .-
co
~_c
'J~ rW r-
_c
u
+-'
~
u
.
w o
cO'l
~
~
qO'l
~c m~
wVl
-o
N
w
..c m
.n
w um
+-'
~q
~
_c ~
u~ ~~
.:-:l u c
~
~
~m
1-
0
:E..._..
~M
:E..._..
16
Table 5. Estimates of fishing pressure, catch, and catch rates by period on the Suwannee River from 17 March 1973 to 2 July 1976.
Period
Angler Total Catch Catch Rates Hours No. Wgt.(lb) No/Hr Lb/Hr
1 17 March - 23 March
648 906 907 1.40 1.40
2 31 March - 5 April
824 1329 1348 l. 61 l. 64
3 14 April - 20 April
687 1058 597 l. 54 0.87
4 28 April - 4 May
3960 9539 5845 2.41 1.48
5 12 May - 18 May
3886 7594 4869 l. 95 l. 25
6 26 May - 1 June
6065 8179 4206 l. 35 0.69
7 9 June - 15 June
1806 3038 1451 l. 68 0.80
8 23 June - 29 June
2480 4569 2933 1.84 l. 18
9 7 July - 11 July
3460 10638 5090 3.07 1.47
10 21 July - 27 July
4098 11444 5023 2.79 1.23
11
4 August - 9 August
4610 5947 3166 l. 29 0.69
12 18 August - 22 August
3108 10058 4208 3.24 1.35
13 1 September - 7 September 3420 9075 4095 2.65 1.20
14 15 September- 21 September 4617 14281 8627 3.09 1.87
15 29 September - 4 October
3960 7474 3997 1.89 l. 01
16 13 October - 18 October
3744 7767 3409 2.07 0. 91
17 27 October - 2 November
1379 3809 2210 2.76 1.60
18 10 November - 16 November
879 1424 874 l. 62 0.99
19 24 November - 30 November 1047 3012 1944 2.88 1. 86
20 8 December - 13 December
274 319 192 l. 17 0.70
Total 17 f1arch 197321 December 1973
sx
54952 121460 64991 4966 12471 7194
2.21 1. 18
1 2 March - 8 March
2535 1988 1804 .78 0.71
2 16 March - 21 March
849 849 928 l. 00 1.09
3 30 March - 4 April
881 1510 1190 l. 71 1. 35
4 13 April - 18 April
1903 3513 2437 1.85 1.28
5 27 April - 2 May
1295 2554 2192 l. 97 1.69
6 11 t1ay - 15 May
2317 2407 1915 1.04 0.83
7
25 May - 31 t~ay
2904 4469 2872 l. 54 0.99
8 8 June - 14 June
2754 4688 3232 l. 70 l. 17
9 22 June - 27 June
2432 2342 1611
.96 0.66
10 6 July - 12 July
910 832 1367 . 91 1.50
11 20 July - 24 July
1720 2248 2412 l. 3. 1.40
12 3 August - 9 August
1741 1994 1369 l. 15 0.79
13 17 August - 23 August
846 314 823 .37 0.97
14 31 August - 4 September
1206 1560 1686 1.29 1.40
15 14 September - 20 September 679 1030 1519 l. 52 2.24
16 28 September - 3 October
2027 1971 1604 .97 0. 79
17 12 October- 16 October
351 586 518 1.67 1.48
18 26 October - 1 November
924 1047 642 1.13 0.69
19 9 November- 15 November
1339 2397 1599 l. 79 1.19
20 23 November - 28 November 1022 1842 1612 1.80 1.58
21 7 December - 13 December
295 352 422 l. 19 1.43
22 21 December - 25 December
686 1410 1015 2.05 1.48
Total
s:x
2 March 1974 3 January 1975
14
31616 41903 2883 4219
35769 2649
l. 33 1.10
Overall recovery of fish marked and released in four rotenone samples was 61.2% (Appendix, Table A-7). The percent recovery improved with each sample, 40.0% in 1973 to 82.1% in 1975. HovJever, due to the low number marked of most species represented, adjustments to the standing crop estimates were not made. Suwannee River Creel
Sport fishery estimates of pressure, catch, and catch rate are presented in Table 5. The period 17 t1arch 1973 to 6 July 1973 from Swanson and Holder (1974a) are included for presentation of creel estimates by calendar year. The estimates in 1976 represented only four months of the
year. Fishing pressure was 54,952 man-hours ! 4,966 Sx in 1973, 31,616
man-hours +- 2,883 Sx- in 1974, 49,105 man-hours +- 3,145 Si in 1975, and
20,206 man-hours ~ 3,929 Si in 1976. Catch ranged from 121,460 fish ! 12,471 Sx weighing 64,991 lb ~ 7,194 Sx in 1973 to 25,641 fish~ 4,111
Sx weighing 16,664 lb! 3,056 Sx in 1976. Catch rates were highly variable for the respective years surveyed.
The numerical catch rate ranged from 2.21 fish per hour in 1973 to 1.27 fish per hour in 1976. The catch rate by weight varied from 1.27 lb/hr in 1975 to 0.82 lb/hr in 1976 (Table 5).
Total harvest, average weight, and catch rates fol individual species are presented in Table 6. In all years, bullheads were the primary species caught by number. Bullheads and bowfin were the main species harvested by weight and generally made up 55% of.the total catch. Warmouth made up 24% of the total harvest by number and weight in 1973 but declined in the later years. Since 1973, spotted sunfish, ~om~ ~nctjtu~ (Valenciennes), catches have exceeded those of warmouth. Channel catfish increased in the catch during the years surveyed. The catch of other species in the creel was low.
l3
Table 5. Continued
Period
1
15 March - 21 March
1239 2059
2
29 March - 4 April
1349 2838
3
12 April - 18 April
2783 4091
4
26 April - 2 r~ay
2508 4095
5
l 0 May - 16 May
2486 5210
6
24 May - 29 May
2464 6325
7
7 June - 12 June
2990 6040
8
21 June - 27 June
5377 16378
9
5 July - ll July
4087 7744
10
19 July - 24 July
3249 6674
11
2 August - 8 August
1388 2086
12
16 August - 21 August
1971 3398
13
30 August - 5 September
2732 4644
14
13 September - 19 September 2278 7095
15
27 September - 2 October
2247 5481
16
ll October- 17 October
1535 2777
17
25 October - 30 October
2613 6950
18
8 November - 14 November
1652 3075
19
22 November - 28 November 2113 2995
20
6 December - 12 December
1279 1790
21
20 December - 26 December
765 1318
Total
sx
1 2 3 4 5 6 7 8 9
15 t1arch 1975 2 January 1976
6 March - 10 March 20 March - 25 March 3 April - 7 April 17 April - 23 April 1 May - 7 May 15 May - 19 May 29 May - 4 June 12 June - 18 June 26 June - 2 July
49105 103063
3145 11721
2319 2234 2021 2222 1723 2209 5554 5754 2637 1850 1073 1488 1618 2717 1112 3410 2149 3757
Total Sx
6 March 1976 9 July 1976
20206 25641 3929 4111
1174 3021 2581 3544 3487 3430 3427 6578 4954 4933 1576 2348 2828 3907 3018 1446 3676 2229 2226 1186
622
62191 4701
1408 1278 1148 4043 1366 1257 2233 2001 1930
16664 3056
1.66 2. l 0
1.47 1. 63 2.06 2. 57 2.02 3.05
1.89 2.05 1.50 1. 75 1. 70 3.12 2.44 1.81 2.66 1.86 1.42 1.40 1.72
0.95 2.24 0.93 1.41 1.40 1.39 1.15 1.22
l. 21 l. 52 1.14 1.19 l. 03 1.72 1.34 0.94 1.41 l. 35 l. 05 0.93 0.82
2. l 0 1.27
0.96 1.10 1.28
l. 04 0.70 1.39 1.68 3.07
l. 75
0. 61 0.63 0.67 0.73 0.52 1.17 1.38 1.80
0.90
1.27 0.82
15
During 1973-1976, the total effort applied specifically to a partic-
ular species decreased yearly (Table 7). In 1973, approximately 50% of
the total pressure was for a particular species. Only 9% of the total
pressure on the Suwannee River for the periods surveyed in 1976 was applied
to a particular species. Effort for bullheads and warmouth decreased each
year. Effort for channel catfish, however, increased each year except for
1976. Bullheads tended to have the highest fished-for catch rates.
Holder (l973b) reported the surface area of the Suwannee River from
the Okefenokee Swamp dike to the Georgia-Florida state line during within
bank flows to be 337 acres (measurements from aerial photographs). Using
his value, the total pressure in man-hours per acre ranged from 163.1 in
1973 to 93.8 in 1974 (Table 8). The 1976 values were not included because
the survey period consisted of only four months. The total harvest per
acre fluctuated from 360.6 fish weighing 192.8 lb in 1973 to 124.3 fish
weighing 103.3 lb in 1974. The highest game fish harvest per acre by
number was in 1973 (132.0). The highest game fish harvest per acre by
weight occurred in 1973 (84.8lb).
Tabulated data on weekend versus weekday pressure and catch and on
methods of fishing are included in the Appendix (Tables A-8 and A-9).
Okefenokee Swamp Creel
t
Estimates of fishing pressure, catch, catch rate, and trip length
are presented in Table 9. The period 10 March 1973 to 29 June 1973
from Swanson and Holder (l974b) was also included to treat the data by
calendar years. Fishing pressure ranged from a high of 79,186 man-hours ~ 7,097 Sx in 1974 to a low of 54,156 man-hours~ 5,096 Sx in 1975.
Estimated number of fishing trips for the corresponding years was 20,455 ~ 2,363 Sx and 16,263 ~ 1,520 Sx respectively. Average trip
length varied from 3.33 hr in 1975 to 3.87 hr in 1974. Most of the
18
!>-- N(V)CJ'\mmq.--mNr-00 MNI"'-.CJ'\1"'-.I..Or-Nr-NO
CJI .--mNOOOOOOOr- qNOOOOOr-OOr-
+J ..............
0<:::tl._.OJ O O O O O O O O O O r - O O O O O O O O O O r -
E
0
..c
!>.._
U!>-- I..O(V)Nq(V)q.--q(V).--.-- OqqNMI..Or-1"'-.N(V)(V)
4-
+->I OMm.--ooooOON Nm.--NooooooM
cU ..............
!>-QJ
u o z o . - - o o o o o o o o N o o o o o o o o o o . - -
>
0:::
QJ QJ c
. . . . . . . . . . . . . . . . . . . . . . MO<..Omr--.m<..Ommr--.q o.--m.--mr--.mmooooM
OqmM.--.--r---Nmqm .--qqq(V)OI..O<..Ommoo
c
NOOON.--Or-000 NOOONr-Or-000
ttl
3
:::l
VI
+-'
QJ
_c;
c MNmm<..Or--.CJ'\Nm<..Oo OON.--.--r--.ror--.ooMmO
QJ
+-'
U Qmqqq(V)Oq.--00 OOOI..OOOI..OmOOr-r-0
c
S... .--qN QJ
0
MN
0 r-
0
0...
(/)
QJ
u QJ
Nq<..O<..Omqm.--m<..Oq I..OOMr-(V)(V)(V)CJ'\NCJ'\CJ'\ N<..O.--r---M.--NOOm.--.--
m<..OCJ'\MqOOOmqMCJ'\ <..OmOr-OOMmmMr--.q N<..Omr--.ooq.--qNM<..O
D...
Nqm
r--. Nr-
N
(/)
NOMO<..OMmqMLDr- OOOOMr-MNOOI"'-.CJ'\OC""\
(/)
CJ'\(J)(V)q.--OCJ'\(V)I"'-.r-CJ'\ 1"'-.NNNq.--mqq.--1..0
QJ
<..OMCJ'\CJ'\Oqmr--.mMm q0.--00MONI"'-.qmr--.
+-'
I..OCJ'\mNMN N
~ MI"'-.NNNN (V)
q
ttl
N r-
1..0
(V)
!>.._
..c
u
I
+-'
ttl
u
-o
c
ttl
+-'
c
QJ
r- us...
ttl QJ
0...
. . . . . . . . . . . . . . . . . . . . . . r--..--<..OM.--r--.<..Ooom<..Oo MOMMqmCJ'\qOO.--o
N 0 (V) 1..0 r- r- 0 r- r- C' 0
<..ON
0
mr-OI..ONqOI..()r-NO
r-- c::::t r-- r-
0
-o
c
ttl
c
+-'
0
(/)
+-'
0
c
..c O"l rQJ
1- z0 lx
1..00.--1"'-.qOr-I..OI..Om.--
(V)(V)N(V)(V)mCJ'\OOMr--..r--..
NMMI..OI..OOONmOqq
r-- r-- C') r-
N
oo.--mOOMM.--qmqm
r--.r--..--mmoMOOq.--.--
mmmmNqNI..OqqN
(V)
q
3
VI
QJ O"l
ttl
. NmC>mCJ'\CJ'\Nr-CJ'\000 OqOONOOr-00001..01..01.0
I..OOONOOI..OqmmNr--.M r-I..OOqCJ'\001"'-.1..01"'-.1"'-.0
!>.._
QJ
z0 :
MOI..OI..OMOI"'-.r-1"'-.I..Oq (V)(V)001"'-.r-N Nr- r-
q.--(V)OOCJ'\OOMNI"'-.OOCJ'\
1..0 1"'-. q 1..0
N
r-
>
1"'-. N
N
q
ttl
3
VI
E
0s...
4(V) r--. (J)
ttl
_c; (/)
_c;
_c; (/)
_c;
+-'
Vl (/) r-
(/)
(/) (/) r- (/)
(/)
QJ
>s...
1..0 r--.
rom
_c; r-
r- ttl QJ
4-..0S... 4-
c
QJ +-'
:::l _c; ..::.::
ttl
Vl Vl+-'U+-'U
-o _c;
:::l r- (/) r-
<tlQJ
4-..0!>-- 4-
c
QJ +-'
:::l _c; ..::.::
ttl
(/) (/) +-' u +-' u
-o _c; :::l r- (/) r-
r->, ttl r+-':::l 0 '"":) +-'
0 4- +-'
(/)
QJ
u QJ
<tl +-' -o 0 D... ttl r- r-
c CJ :::l CJ E .- _c; 0 +-' QJ c
Cs..J. Cc JO.-"l s... r-
4- r3.--
E +-' !>-- o
s0..". 1r.-o
..0 -o
c
ro
CJ CJ ttl :::l ...c +-'
<tl c CJ
.- _c;
+-' -o :::l CJ 0 +-'
E 0
QJ
D... ttl r- r-
c
Cs..J.
CJr-
c O"l !>.._ r-
4- .-- E +-' 01.- ..o c CJ CJ ro
3.-- !>-- o !>--ro-o ro :::l...c +-'
0 :::l ttl D... ttl _c; QJ _c; r- +-' 0
0 :::l ttl D... ttl _c; QJ _c; r- +-' 0
VI C:OC:03:VI-.JU0:::UC:OOI- C:OC:03:VI-lUO:::UC:OOI-
0 (V) (/) r--. QJ (J) +-' r<tl Er-...uC +-'!>--
(/)
ttl s...
(V) :::l r--.o (J) _c;
!>.._
mr-.......-.. .(-J-)sV...l
:::l
co
ro...c
'"":ls...
Vl<tl W::E
QJ u r-
IQJ
.
QJO'l
oc
ttl
1..0
qO"l r--.t: (J)<tl
(/)
QJ -o
QJ r-
N
QJ ..u.c mm
..0 ttl 1-
+-'
ttl 0
S...q
::tEtl._m_...
1..0 _c; rUI..O !>.._ r <O(V) ::E.__...
:::l ru
c
16
Table 5. Continued
Period
1
15 March - 21 March
1239 2059
2
29 March - 4 April
1349 2838
3
12 April - 18 April
2783 4091
4
26 April - 2 May
2508 4095
5
10 May - 16 May
2486 5210
6
24 May - 29 May
2464 6325
7
7 June - 12 June
2990 6040
8
21 June - 27 June
5377 16378
9
5 July - 11 July
4087 7744
10
19 July - 24 July
3249 6674
11
2 August - 8 August
1388 2086
12
16 August - 21 August
1971 3398
13
30 August - 5 September
2732 4644
14
13 September - 19 September 2278 7095
15
27 September - 2 October
2247 5481
16
11 October 17 October
1535 2777
17
25 October - 30 October
2613 6950
18
8 November - 14 November
1652 3075
19
22 November - 28 November 2113 2995
20
6 December - 12 December
1279 1790
21
20 December - 26 December
765 1318
Total
sx:
1 2
3 4 5 6 7 8 9
15 f1a rc h 1975 2 January 1976
6 March - 10 March 20 March - 25 March 3 April - 7 April 17 April - 23 April 1 May - 7 May 15 May - 19 May 29 May - 4 June 12 June - 18 June 26 June - 2 July
49105 103063
3145 11721
2319 2234 2021 2222 1723 2209 5554 5754 2637 1850 1073 1488 1618 2717 1112 3410 2149 3757
Total Sx
6 March 1976 9 July 1976
20206 25641 3929 4111
1174 3021 2581 3544 3487 3430 3427 6578 4954 4933 1576 2348 2828 3907 3018 1446 3676 2229 2226 1186
622
62191 4701
1408 1278 1148 4043
1366
1257
~33
2001 1930
16664 3056
1.66 0.95 2.10 2.24 1.47 0.93 1. 63 1.41 2.06 1.40 2.57 1.39 2.02 1.15 3.05 1.22 1.89 1. 21 2.05 1. 52 1. 50 1.14 1. 75 1.19 1. 70 1. 03 3.12 1.72 2.44 1.34 1.81 0.94 2.66 1.41 1.86 1. 35 1.42 1. 05 1.40 0.93 1.72 0.82
2.10 1.27
0.96 0. 61 1.10 0.63 1.28 0.67 1. 04 0.73 0.70 0.52 1. 39 1.17 1.68 1. 38 3.07 1.80 1. 75 0.90
1.27 0.82
15
1:C OJ - -
+co->_.D_l
0::
..s:::::s....
+u->:r-.:...:...
uco o:z:
MLDONNI'---MO<::t..---1'--. N<::I".-.-OOONOON
oooooooooo.-
omcom.-r---..q-Mr---.No
. - . - .- N o o o . - o o. -
o.-ooooooooN
. . . . . . . .-0').-NL!)\.Of-1'--..-f-N
N.-.-.-oo oo co 000000 00 0
.D
. . . . . . . . . . o.-mcoMr---.f-LDM.-r---.
.-LD.-NOO OOON 000000 000.-
OCOr---..-r---.LDMOI'---MO NMLD<:;t(J)OI'--.LDLD\.01'--.
~c.~oo~~o.-:ooo
OCOI.OMNMO<::tOLDLD .-(Y')LD<:;t\.OQ')(Y')C0LDNI.O
~ooo.-:oo~ooo
. . . . . . . . . . . +-'
s:: Q')L!)Q')NQ')<:;t.-COMOO .-(Y')Q')I'--.LDCO.-I.OCONO
QJ
u s.... QJ
1'---LDI'--.0').--LDNLDM.--O
..--- (Y)
0
LDMN<::I"LDI'---OC0..---00
NN.-.-
0
0...
COLDMCOOQ')I.OLDI.O<:;t.-
LD<:;tM<:;tLDQ')(Y)I.OI.OMO
I.O<:;tq.-(Y){j)ql!)C()(Y)I'--.
M M ..--- N
<::::-
.-\.OQ')I.Or---.NNLDCOQ')\.0
(Y')Q')C()<::I"LDr---..-r---..-.-LD
1'---<::I"COLD<::t-LD N
0
(Y')
LDC01'--.NNQ')<:;t(Y)NC0.-
LDI'---.-<::tC01'--.Q')MC0NQ')
.-omr----.-MNCOOLD.-
.-N<::tLD.-M.-Q')N N
..--- N
1.0
<::tCOCONLD<::t<::tCOI'---<::t<::t
COCO<::t<::t.-mN(Y')Q')(Y')\.0
.-C().-<::I"Q')N <::I"N 1.0
<::I"MNN
1.0
:r::
+s-::'
QJ ..--- u
co
s.... QJ
0...
. . . . . . . . . . . Q')Q')(Y)I'--.1.0.--r---.MLDOO
<::ti.OCOMOM.-I.O(Y').-0
L!)
0
C0NQ')NN<:;tMN(Y')LD0
....:a.;~~~c;.;~oo
<::1" . - N
0
0
f- :0z: I><
Vl
.
:0z:
1'---1'--.MOI'--..-OCON.-.-
Q')N\.OQ')\.01'--.Q')LDCONN
LDLDMN.-Q')LD.-<::t<::tl'---
r--ONLD
r-~
1'--.I.OOm.-CO<::tOOCOM
I'--.(Y')0(Y')001'--.<:;tl!)(Y')\.O
01.01.0..---I.ONI'--.LDI.OCOO
LDCOCO<::t M.-I.OM (Y')
L!)
0
Q')(Y')(j)L!)C()I.ON(Y')Q')C().-
LDI'--.LD(Y')OI'--.<::tNLDI'--..-
MN<::tNMLD N(Y') ..---
,.-- r-- r--
-=:::t
I.O<::ti.OMI.OI.OQ')O<:;tr---..-
m.-.-coi.OCOI'--.1'--.Q')(Y')<:;t
Q')(Y')C()\.OL!)(Y') OLD.-1.0
..--- 0 (Y') L!)
L!)
N
..s::::: U1
..s:::::
..S:::::t/1
..s:::::
.,U...1.
cUo1
.-
QJ
U1
.,U...1. Uco1 ..Q--J- .,U...1.
4-.DS.... 4-
4-.DS.... 4-
s:::::
QJ
::l..S:::::~
+c-o'
s::::: QJ +-'
::l ..s::::: ~ co
-Uo1 ..s:::::
<11+-'U+-'U ::l .,.... U1 . -
-Uo1 ..s:::::
U1
+-' u +-'
::l .,.... U1
u
.-
U1
QJ u QJ
co +-' "'0
S:: OJ ::l OJ .- ..s::::: 0 +-'
0 E
QJ
CL CO .- .-
s::
OJ s....
sO::JC.-J) s.... .-
4- ..--- E +-' 01.- .o s:: OJ OJ co
3:..--- s.... o s.... co-o co ::l..s::::: +-'
co +-' "'0 0 CL CO .- .-
S:: OJ ::l OJ E
OJ OJ .,....
.,.... ..s::::: 0 +-' QJ s:: s.... s:: CJ) s.... .-
4- ..--- E +-' rn .- .o s:: OJ OJ co
3:..--- s.... o s.... co-o co ::J..s::::: +-'
0 ::l CO CLCO..S::::: QJ..S:::::.-+-' 0
O::lCOCL<Q..S:::::QJ..S:::::.-+JO
Vl o::lo::!3Vl__lUO::Uo::!Of- o::!o::l3Vl__lUO::Uo::!Of-
r---.,.-....
-o
(j) U1
QJ
.- s....
U1
s....
::l
::l
s::
cco
o
..s:::::
I.O::l r---.o (j) ..s:::::
..-
0
+-'
s::
'J
s....
0 s....
0
IQJ
u
.-
.
L!) CJ)
1('j--)-S::c::o:
>,OJ
.- .-
::l CJ)
'J s:: ro
s:: ro
..s::::: +-'
1.0
QJ
. . cLo..>
QJ u .-
.D
+-' s.... (j)
co
co co <::1"
f-
0
:E __...
. . c1o.0
UN s....o
roN
::E .__..
U1 U1
QJ
II
f-
.D
17
Table 8. Annual harvest per acre on the Suwannee River fro~ the 19731975 creel survey estimates.
Species
Game Fish
Harmouth Spotted sunfish Largemouth bass Chain pickerel Redbreast Channel catfish Bluegill
Sub-total
Non-game fish
Bowfin Bullheads Other
Sub-total
Total
Angler hours
973 No. Wgt. ( l b)
85. l 47.3
22.6
8.7
4. l
8.9
6.0
7. l
2.3
1.8
6.5
8. l
5.4
2.9
132.0 84.8
9.8 216.8
2.0
228.6
360.6
163. 1
19.9 87.2
0.9
108.0
192.8
1974 No. ~Jgt. ( l b)
1975 No. Wgt.0b)
12.8
6.3
20.3
8.4
3.0
7.0
5.6
6.0
l.l
0.8
6.7 ll. 1
2.3
1.3
51.8 40.9
25.5 14.6
42.0 17.0
l .8
3.5
9.5 10.0
5.3
3.8
19.4 29.2
10.8
6.2
114.3 84.3
19.0 50.9 2.6
72.5
124.3
93.8
40.0 20.9 1.5 62.4 103.3
t
15.1 174.0
2.5
191.6
305.9
33.1 65.5 1.6
100.2
184.5
145.7
20
During 1973-1976, the total effort applied specifically to a particular species decreased yearly (Table 7). In 1973, approximately 50% of the total pressure was for a particular species. Only 9% of the total pressure on the Suwannee River for the periods surveyed in 1976 was applied to a particular species. Effort for bullheads and warmouth decreased each year. Effort for channel catfish, however, increased each year except for 1976. Bullheads tended to have the highest fished-for catch rates.
Holder (l973b) reported the surface area of the Suwannee River from the Okefenokee Swamp dike to the Georgia-Florida state line during within bank flows to be 337 acres (measurements from aerial photographs). Using his value, the total pressure in man-hours per acre ranged from 163.1 in 1973 to 93.8 in 1974 (Table 8). The 1976 values were not included because the survey period consisted of only four months. The total harvest per acre fluctuated from 360.6 fish weighing 192.8 lb in 1973 to 124.3 fish weighing 103.3 lb in 1974. The highest game fish harvest per acre by number was in 1973 (132.0). The highest game fish harvest per acre by weight occurred in 1973 (84.8lb).
Tabulated data on weekend versus weekday pressure and catch and on methods of fishing are included in the Appendix (Tables A-8 and A-9). Okefenokee Swamp Creel
Estimates of fishing pressure, catch, catch rate, and trip length are presented in Table 9. The period 10 March 1973 to 29 June 1973 from Swanson and Holder (l974b) was also included to treat the data by calendar years. Fishing pressure ranged from a high of 79,186 man-hours ~ 7,097 Sx in 1974 to a low of 54,156 man-hours~ 5,096 Sx in 1975. Estimated number of fishing trips for the corresponding years was 20,455: 2,363 Sx and 16,263 ~ 1,520 Sx respectively. Average trip length varied from 3.33 hr in 1975 to 3.87 hr in 1974. Most of the
18
Table 6. Continued
T o t a 1 Harvest
Average Catch Rate
Date
Species
No. Sx No. Percent Wgt.(lb) Sx Wgt. Percent \~gt.(lb) No./Hr Lb/Hr
March 1975- Jan.l976 Bowfin
5077 1597
4.9 11155 3658 17.9 2.20
(4910S angler hours) Bull heads
58636 l 0527 56.9 22078 3445 35.5 0.38
Warmouth
8600 2363
8.3
4917 1433
7.9 0.57
Spotted sunfish 14139 5290 13.7
5742 2148
9.2 0.41
Largemouth bass 601 167
0.6
1182 350
1.9 1. 97
Chain pickerel 3208 971
3.1
3379 999
5.4 1. 05
Redbreast
1774 590
1.7
1294 436
2. 1 0.73
Channel catfish 6540 1158
6.3
9833 1565 15.8 1.50
Bluegill
3650 1482
3.5
2082 866
3.3 0.57
Other
838 421
1. 0
528 334
1.0 0.63
Total
103063 11721 l 00.0 62191 4701 100.0 0. 70
March - July 1976 Bowfin
-...,J
(20206 angler hours) Bullheads
1996 359
7.8
10314 1273 40.2
4184
731
25. 1 2.10
3888 496 23.3 0.38
Warmouth
3816 1459 14.9
2148 889 12.9 0.56
Spotted sunfish 5683 1235 22.2
2442 546 14.7 0.43
Largemouth bass 566 308
2.2
915 457
5.5 1.62
Chain pickerel 1386 576
5.4
1294 572
7.8 0.93
Redbreast
79 42
0.3
24
12
0. 1 0. 30
Channel catfish l 070 223
4.2
1438 275
8.6 1.34
Bluegill
594 359
2.3
297
18
1.8 0.50
Other Total
137 78
0.5
34
19
0.2 0.25
- 25641 4111
100.0
16664 3056 100.0
0.65
bT=less than 0.01
0.10 0.23
l. 19 0.45 0. 18 0.10
0.29 0. 12 0. 01 0.02 0.07 0.07 0.04 0.03 0.13 0.20 0.07 0.04 0.02 0.01
2.10 l. 27
o. l 0 0.21 0.51 o. 19 o. 19 0.11 0.28 o. 12
0.03 0.05
0.07 0.06
Tb T
0.05 0.07
0.03 0.01
0.01
T
1. 27 0.82
{~~-":
"
'
s:u z
['T'1
II
-g
ro Vl
r...t...
3s:u
rt ro
s3:u:
-lVlr::;:-;
0 -o s:u s:u ()
rtO -; -; ::J s:u rt (.Q 3 --'rtro 0 I
ro 3
0.0
c rt
c...
Vl
c rt
::JC__,
c ::J '<
~
__,
-""-"'"'S:0U"'
<.0
Vl Vl
-...,J
::J Vl
(j)
3s:u:
-l(Ji:EOJ>
0 ::JOJS:U
rts:ll -; -;
s_:_u ,
~
~
(.Q 3 roo
c ()
____,, ::J
::J __,
ro3c ro<.O
--'Orts:ll-....J
c ::J 0.. U"1
()ri"
s:u ::J
Vl I
rt
c...
-""-"'"'S:0U"' VlVl ::J Vl
.s:u
~
__,
3s:u:
-lnr::;:OJ-;
0 ::JS:US:U c ()
rts:ll)
S:U~(.Q
-;
3
____,, ::J
0 --~~ro ::J __,
ro 3 c ro<.O
--'Ori"S:U-....J
c ::J 0.. .p.
()rt
s:u ::J
rt
"-"-"'"'S:0U"' Vl Vl ::JVl
Vl I
.c...
s:u
~
__,
<.0
-...,J
s3:u:
-lnr::;:c:;:J-;
O::JS:US:U
rs:utS-:-U ' (-.Q;
-;
3
c () __, ::J __,
--~~roo ::J I
3 c ro
"'0 OrtS:UO
. ...... c ::J 0.. ro
() rt
Vl ()
'?'" ::J
ro -; 0"'
__,
r_o_,
s:u
Vl
<.0
-...,J
Vl
w
~
:z
-l
s:u 0__",'
ro
.-...,J
(/') -l
c
:;:
::J ro
s:u
~ ro
~ Vl
ro ro
r....t..
<.0
U"1
-...,J
(j)
c
:;:
3 0"'
...... ro
3 ;::CJOJ ...... rt
< ro
rt> ::J
ro 0..
-;
0
ro
N Q") __,
.p. w (J"1 U"1
__,
N-....J-....JW
__, __,
N<.ONO
ro
I~
""""' -o
0 ro
--;h """"'
0 0""""'
3 -;
-; -; rt ......
__, rt
0
-...,J s:u
0..
~
Vl
3:0.
<.0
I
__, __, U"1 w 0 __,
WU"1-....JO Q") CO N Q")
.p.
__, __,
.p. Q") N (j) <.0
--' --' N m 0
--' N CO <.0 N
<.0
__,
(J"1
.p.
__,
N U"1
__, <.0
cw o
<__.0,
r_'_\;,
(_j_),
__,
0
N
__,
-...,J
N <.0 Q")
U"1 --' N 0 0 co __, <.0 0 __, -....J (j) N (j)
):oo
~
~m
C -;
-"t"","'
0
s:u
-; Vl () c ::J ()
()
__, ro
<.0 Vl -...,J Vl
w
0"' rt'<
. . . . 0 N Q")
ow <.Om
OWC0\.0
__,
. . . . . 0 __,
W.P.
OWU"'l'-JW
0\.0NCO--'
__,
. . . . . 0
.P. N N
QQ").P.-....JO
O.P.<.O<.OCO
-0
w U"1
. . . . . 00-....JWCO
OW-....JCON
Vl -;
[~ rt
0
Vl
N"'O
c...
c
r(..o.)...
__, ro
'< Vl
. 0
z __, z
['T'1 (J"1 ['T'1
. 0
zwz
['T'1 .p. ['T'1
. . . DOW
ZN-....JO
['T'1 (j) (j) (j)
Ill
. . .000
z (J"1 U"1 <.0
rT'1 N--' CO
. . . . 0000
U"1 __, N -....J
<.0 w .p. .p.
. . . . --'000
N U"1
W
(J"1
--' .p.
W w
. . . . NO--'N
OW.P.-....J 0 U"1 N Q")
. . . . NOD--'
W-....J-....JO U"'l.P.CO-....J
-z
0
::r: (/')
-;c
() ()
ro r Vl O"'Vl
~~
<__.0, ."."."."..'
.-...,J Vl
(j) ::J ro 0.. I
0-"";""'
0
~
rt ::J ro
Table 9. Continued
Period
Fishing Angler Total Tri(2S Hours No.
Catch
Catch Rates
Wgt{lb} NoLHr Lb/Hr No/Tri(2 LbLTri R
5
4 May - 9 May
2907 13494 27214 13748 2.02 1.02 9.36 4.73
6
18 May - 24 May
1582
8335 7534
4008 0.90 0.48 4.76 2.53
7
1 June - 6 June
1878
8132 16188
9412 l. 99 l. 16 8.62 5. 01
8
15 June - 20 June
796
2743 1950
1340 0.71 0.49 2.45 1.68
9
29 June - 4 July
750
2265 2695
1807 l. 19 0.80 3.59 2.41
10
13 July- 19 July
640
1814 605
718 0.33 0.40 0.94 l. 12
11
27 July - 1 August
527
2266 912
677 0.40 0.30 l. 73 l. 28
12
10 August - 16 August
486
1316 1117
1136 0.85 0.86 2.30 2.34
13
24 August - 29 August
265
1107 699
597 0.63 0.54 2.64 2.25
14
7 September - 11 September
440
1730 1385
1213 0.80 0.70 3.15 2.76
15
22 September - 27 September
430
902 207
168 0.23 0.19 0.48 0.39
N
16
5 October- 10 October
333
967 644
388 0.67 0.40 l. 93 1. 16
N
17
19 October - 24 October
478
1319 2439
1534 1.85 l. 16 5.10 3.21
18
2 November - 8 November
339
1167 1497
871 1. 28 0.75 4.42 2.57
19
16 November - 22 November
412
1166 1576
1319 1.35 l. 13 3.82 3.20
20
30 November - 6 December
527
1274 936
936 0.74 0.74 l. 78 l. 78
21
14 December - 20 December
294
788 1457
1007 1.85 1.28 4.95 3.44
Total
sx
1 2 3 4 5 6 7 8 9 10
9 March 1974 27 December 1974
,.
8 March - 14 March 22 March - 28 March 5 April - 11 April 19 April - 24 April 3 May - 9 May 17 May - 22 May 31 May - 6 June 14 June - 20 June 28 June - 4 July 12 July - 18 July
20445
79186 108572
63077 1.37 0.80 5.31
3.08
2363
7097 20967 11433
425
1107 519
391 0.47 0.35 1.22 0.92
1210
2964 849
587 0.29 0.20 0.70 0.48
1002
3383 1310
817 0.39 0.24 l. 31
0.82
1462
6034 4906
2903 0.81 0.48 3.36 1. 98
1922
8684 8502
4989 0.98 0.57 4.42 2.60
1184
3525 6096
2580 l. 73 0.73 5.15 2.18
1334
4543 6479
4286 1.43 0.94 4.86 3.21
1182
3736 2594
1283 0.69 0.34 2.19 1.08
978
3480 4710
2683 1.35 0.77 4.82 2.74
712
2247 2611
2034 1.16 Oo 91 3.67 2.86
..
>
c:_.:ol. r-os
-1 0 rt _OJ.
(/)
s::::: 0"'
I
0 co co z
rtS:::::
-::y _.
:0:E:
ro _. -+.
0 ::l
I
-s
-::y --'
ro ::l
c.o
OJ
-::y
rt 0
OJ 0..
3ro
(/)
s::::: 0"'
I
con;onrV>:::
-':YI'D
rs:o:::: c.o
OJ
::l ::l
0.. 0"'
-s
-'I'D ro
-::y OJ
OJ _..
c-.os
:::::~ ro
3
"0 OJ
0 -s
rt 3
rro t
O s:::::
G)
OJ
r3 o
"'Tl
~
rt 0
__..
_
.
OJ
(ll
"0 0 -'S:::::
0.. rt
-::y
--' (ll
-1 OJ
_0".'
ro
co
0
rt
(ll
rt
()rt()rl"Vl
-::y
s:::::
-s
O_J .
(ll
-+. O_J.
--' (ll
-::y
OJ
rt
;A" -::y s:::::
ro
::l
-+.
--'
-ros
0"' -+. OJ --'
(ll
_. (ll (ll
-::y
(ll -::y
I I
-'>
\.O::l -....J::l ()1 s:::::
() O_J.
. . . . . . 0)
w
w
0) 0
N
cN o
N_.
N 0) \.0
0) 0) 0 co co
_.
. . . . . . . . w
NCO
N
U1(J)N(J)~NU1
0
~U1W0-'(J)-'
I~ j
r-os -::y roa>
-'""'S
<
(1111)
s::::: (ll
-s rt
_.
. . . . . \.0
N
0co
co _.
0-.....) \.0
co 0
\.0 N \.0
. . . . . . . . co
~
~
N():)-'-....JCoCO-....J
co \.0 _. co _. \.0 -.....) w
\.0
.c:.:o:-..w..J
rt
.._..-...
..0...."...'.
r< o '< ro
-roo -s
(ll OJ
rtn
-'""'S
3 ro
N 0
I
OJ
rtO
.ro ::l
(ll
rt
. . . . . . \w.0
N
~
-.....)
N
()1 _.
N 0\.0
co w
()1
0) \.0 0
. . . . . . . . (_)1.
N _. N(J)-'U1WON
co
W-....J-'(J)OWCO
-::y
I~ I
ro
(/)
s:::::
::E:
OJ
::l
_.
. . . . . 0w
0)
N~
N
-'0 0
w
~
()1 \.0 0
. . . . . . . . ~
_.
0
-'-'00)-.....JCO(J)
\.0
W-'COOO~W
~~
::l
ro ro
;o
--'
<ro
-s
w
. 0
()1
_.
.\_.0.
_.
. . ._. -.....)
N ~ U1
\.0
0)
()1 0 _.
_.
. . . . . . . . _. _. _.
~N
~
0 \.0 U1 \.0 -' N U1
w
CO~WU1COOU1
I~
--+s .
0 :::J rt -::y
ro
_. _. _.
. . . . . . ~ co 0
()1
~
0
_.
0)
()1
w w
-.....)
()1
N
0) ()1 _.
:::
. . . . . . . . co
N
_. _. _.
~
0)\.0WOW-....J~
w
NNCOOU100)
I~.......
o-
-
\.0
-.....)
w
I
OJ
I z
rr1
z
0
(1) 1/l c-t --' 3 OJ c-t (1)
3:
OJ
--!Vli:::E"""i
O"OOJOJCJ
c-t-0-s-s :::r
OJ c-t (.Q 3
---'c-t-(1)0 I
(1) 3 c
O.Oc-tC....
c :::r c
1/l c-t
---'
c :::r '<
::l
-h CT
---'
-'OJ
<.0
1/l 1/l
-...._J
:::r 1/l
(j)
3:
OJ
-ICJI:::Eo:J""'S
O:::>OJOJC()
c-tOJ"""i"""i ---' :::r
OJ ::l (.Q 3 ---'
---'::lroO:::r---'
ro3cro<.O
---'Oc-tOJ-.....J
c :::r 0. U1
ne-t 1/l
OJ :::r
I
c-t -h CT
c....
-'OJ 1/ll/l :::r 1/l
.OJ
::l
---'
<.0
-...._J
(j)
3:
OJ
-ICJI:::Eo:J""'S
O:::rOJOJC()
c-tOJ""'S""'S---'::::J
OJ::l<.03 ---'
---'::l(l)O:::r---'
ro3cro<.O
---'Oc-tOJ-.....J c :::r 0. .p.
ne-t 1/l I
OJ :::r c-t
-h CT -'OJ
.c....
OJ ::l
1/ll/l
:::r 1/l
---'
<.0
-...._J
U1
3:
OJ
-ICJr:::Ec;J-s O:::rOJOJC()
c-tOJ""'S"""i---'::::J OJ --'. (.Q 3 ---'
---'::l(l)O:::>I 3 c (1)
"OOc-tOJO
. --' c :::r 0. (1)
ne-t 1/l ()
7' :::r (1)
-sc:r
---'
(1) OJ
<.0
---' 1/l
-...._J
1/l
w
~
z c 3 :Ec:r
...... (!)
--1 OJ CT
---'
(1)
.-...._J
(./') -1
c :::r
:(1)
OJ ::l (1)
::::ll/1 (1) c-t (1) --'
3 :::OOJ
<--'
c-t (1)
c-t-s
(1) 0.
:::r 0
-s (1)
(1) -h
-h -h
N 0) ---'
.p. w U1 U1
N""'-J""'-JW
---' ---' N<.ONO
I0 ~("1)
"""i-h 0 0 3 -s
-s -s
c-t
rt --'
---'
0
-...._J OJ
0.
::l
1/l
3:0.
<.0
I
U1 w 0---' W U1""'-JO 0) CON 0)
.p.
---' ---'
.p. 0) N 0) <.0
---' ---' N 0) 0
---' N CO <.0 N
<.0
~ N---'
---' U1 ---' U1 <.0
wco <.0 ~ (j) ---'
0 __.I __. __..
N
---'
-...._J
N <.0 0)
U1 ---' N 0
OC0---'<.00
---' ""'-J 0) N 0)
::r;:.
::l
~m -h C--t,
OJ -s 1/l () c :::r ()
()
---' (1) <.01/l -...._J 1/l
w CT
-s 0
c-t'<
1/l -s
0
. . . . 0 N 0)
OW<.OO) OWCO<.O
---'
. . . . . 0 ---' w .p.
OWU1""'-JW O<.ONCO---'
---'
. . . . . 0
.P. N N
QO).P.-.....JO
O.P.<.O<.OCO
---'
. . . . . 0
w U1
00-.....JWCO
OW-.....JCON
c-t
~
1/l N"O
(1) C....() c --' ---1(1)
'<Vl
- .0 z--' z rr1 U1 rr1 . 0 zwz rr1 .p. rr1
.. . OOW
ZN-.....JO rr1 (j) (j) (j)
Ill
. . .000
z U1 U1 <.0 rr1 N ---' CO
. . . . 0000
U1 ---' N ""'-J <.OW.P..P.
. . . . ---'000
NW---'W U1 U1 .p. w
. . . . NO---'N
OW.P.-.....J OU1NO)
. . . . NOD--'
W-.....J""'-JO U1 .p. co"
-z
0
::r: (./')
-s c
()
()
(1) r 1/l c;rl/l
I~
---' -h <.0 --'
.-...._J 1/l
(j) :::r (1) 0. I -h 0 -s
0 ::l
c-t :::r (1)
"".
Table 9. Estimates of fishing pressure, catch, and catch rates by period on the Okefenokee Swamp from 10 March 1973 to 26 December 1975.
Period
Fishing Angler Total Catch
Catch Rates
Trips Hours
No Wgt(lb) No/Hr Lb/Hr No/Trip Lb/Tri p
N
l 2 3 4
5
6
7 8
9
10 11
12
13 14 15
16 17
18
19 20 21
10 March - 16 March 24 March - 29 March 7 April - 12 April
21 April - 27 April
5 May - 11 May l 9 May - 25 May
2 June - 6 June 16 June - 22 June 30 June - 6 July
14 July - 20 July 28 July - 3 August
ll August - 16 August 25 August - 29 August 8 September - 14 September 22 September - 27 September 6 October- 11 October 20 October - 26 October 3 November - 8 November 17 November - 23 November 1 December - 7 December 15 December- 21 December
527 1865 1497
1330 3230 805
938 2686 5348
1152 2937 2409
2530 12684 14485
1331
6309 16930
1975 7200 7782
927 2618 4776
515 1621 2084
993 3624 7844
914 3199 6162
786 2237 2475
406
ll 01
561
681
2164 1891
539 1742 4940
414 1798 3706
640 1780 2561
551
1734 4636
1388 4248 10068
448 1443 3180
66
255 617
1147 694 3080 1569
9435 9128
4140 2478
l 088
4280 2887 1278
463 1451
3014 2318 1692 2473 6682 2043
375
0.80 0. 61 2.84 0.25 0.21 0. 61 l. 99 l. 15 5.70 0.82 0.53 2.09 l. 14 0.74 5.73 2.68 l. 45 12.72 1.08 0.57 3.94 1.82 0.95 5.15 l. 29 0.67 4.05 2.16 l. 18 7.90 l. 93 0.90 6.74 1.11 0.57 3.15 0. 51 0.42 1.38 0.87 0.67 2.78 2.84 l. 73 9.16 2.06 1.29 8.95 1.44 0.95 4.00 2.67 1.43 8.41 2.37 l. 57 7.25 2.20 1. 42 7.1 0 2.4?. 1.46 9.35
2.18 0.52 3.28
l. 36 3.73
6.86 2. l 0 2.67
2.11 4.31 3.16 l. 63 l. 14
2.13 5.59 5.60 2.64 4.49 4.81 4o56 5.65
Total
sx
1 2 3 4
10 March 197328 December 1973
9 March - 14 March 23 March - 29 March 6 April - 12 April 20 April - 26 April
19051 66475 104751 61715
l. 58 0.93 5.50
3.24
2761
9828 15138
9232
1117 5317 10542 1639 4969 7748 1559 6177 7056 3046 11938 14171
5879 4914 3832 7573
l. 98 1.11 9.44 1.56 0.99 4.73 1.14 0.62 4.53 l. 19 0.63 4.65
5.26 3.00 2.46 2.49
fishing pressure occurred between March and late June. Year 1974 had the highest catch (108,572 fish weighing 63,077 lb), although the 1973 catch was comparable (Table 9). The 1975 harvest figures were roughly half of the previous year's total.
The yearly catch rates decreased over the three year period. The per hour catch rate in 1973 was 1.58 fish weighing 0.93 lb; in 1975 it was 0.96 fish weighing 0.60 lb. The catch rate per trip decreased from 5.5 fish weighing 3.24 lb in 1973 to 3.21 fish weighing 1.99 lb in 1975 (Table 9).
The harvest, average weight, and catch rates for individual fish species are presented in Table 10. Warmouth and bullheads were the primary species caught. They accounted for over 83% of the number and 65% of the weight harvested each year. Bowfin represented 4% by number and 14% by weight each year. The catch of other species was low and varied yearly.
The fishing effort applied specifically to a particular species was 64% of the estimated total fishing pressure on the Okefenokee Swamp in 1973 and 1974 (Table 11). Specific fishing pressure dropped to 44% of total effort in 1975. The fished-for catch rate in 1975 was about one-half the overall values recorded the two previous years. The ~ished-for catch rate of largemouth bass and warmouth decreased in 1975 while that of chain pickerel increased.
Pressure and catch data by methods of fishing are included in the Appendix (Tables A-10 and A-ll). Bowfin Populati_Q.!:l_Estimates
The estimated bowfin population decreased each year from 20,966 fish in 1973 to 17,832 in 1975 (Table 12). Proportional standard errors of the estimates were 8.5%, 6.4%, and 6.9% for 1973, 1974, and 1975, respectively.
24
:,,, ,';: . .,_,
"':1 "
. . . . . . . . . . . . . . . . . MMr-OOr-NOOq~~O'>~r-~OOOq
~~O~qr-NMN~Mr-N~N~q
.ro
0
. . . . . . . . . . NOONOOOOOr-OOq~
O'>qOOO'>~r-NO~OO
qN~r-Nr-r-NNNOr-MNMr-M
M
000.--NNM..--NN
. . . . . . . . . . . . . . . . . ~~N~O'>qMQq~OOMONNOO~
M~~q~O'>~M~r-q0'>.-q00~0'>
.
. . . . . . . . . . NOr-~N~~O'>N~
N~MMqr--OOr--00~
O'>qOONMOr-NNMO.-~qM.-q
~
..c z0
u
+-'
. . . . . . . . . . . . . . . . . <0~
UI
..............
NOO~O'>OOO~qOO'>O~~MqOO Oq,-qOOqMOO~~r-q,-~,-~N
.c0o
~OqOO~Mqq~, MNNq~~O'>M~O'>
0
..o . - o . - o o o o o o o o o . - o . - o . -
0
oooooocooo
_~
. . . . . . . . . . . . . . . . . ~
NOO'>r-O'>MO~MOM~~OO~q~
OO'>O'>~r-MqOO~OON~OONM~OO
NO..--Or-0000000.-.-.-0.-
. . . . . . . . . .
OOOOOr-r-Or-r-
OOOONO~OO~~~MOOOOq..--0'>~~ q0.-q0.-~MO'>r-~00M~r-MO ~OqMOO~~r-~Nr-M~OOMO'>O
MqO'>.-.-
mr-r~o~.M - oOr'o>rOo~rMoMro o:r: o: Mt
M~OOO'>O'>~NN~O
NqNq.-NN
roo +-' z
0 f-
~ Vl Q) ~ r- :::::l eno !::I c:l:
qqOOO~~N~O'>~~qO'>~~~~
r-MOO~O'>Or-r-O'>OOOqMO'>~M~
N~.-O'>~~O'>r-~MN~qq~O'>q
~~~r-N
Nr-r-
N
q~NM~q~~~ON~O'>~~qOO
O'>MMq~r--~r--OM0~..--~~~00
qM.-~NOONMr-~O'>O'>Mr-r-N~
MCOOONNr--Nr-r-r-
r-r-r-r-
en !:: Vl
..c.,.... Vl ~
.,.... f-
LJ._
~NOO~OO~~~OOMOOO'>N~q OOO~O'>~qNOO~qMM~Mr-NO'> O'>~OO~~~~qNqqMqMq~N
N ..-- ..--
~ ""' ~ ~
r~o0o'>
ON
O'>O'>O~N~O'>qO. r-q.-OOO'>~O'>r-r ~OOMO'>~Oq~~~
.-qOO~~NqN
~qMqq~M~O~ O~OOMOONqMOOq r-O'>MO~~~~qN r-NM~OOMqMMN
~M
q~
qM ON
N
~ONNNqqNOON N.-O~NOOMOO~r- qNOqO'>r--Mr--0'>~
r-- r- r- r- r-- r-- r--
~
~ Q)
Q)..O
~
~
..OE
QJ~QJ
EQJ
~~..OQJ..O
QJ+-'~QJQJE..OE
+-' +-' +-' o.. QJ ..o ..o QJ E QJ '
VlVlCLQJ..OoE>QJU
:::::l:::::lQJVlO+-'QJOUQJ
Q)
+-' en en Vl +-' u > z
>,Vl:::::l:::::l ~uoo
oQJ o
~
Q) ..0
...c.
.u.c
r-
.-
.,.....
u ~ .,.... ~
Q) >,
!:: >,..-- :::::l c:l: c:l: r- N 0
ZN 0
>,QJ:::::lr-:::::len
q
N~N
EQ)
~ro~o..
ro :::E o.. c:l:
c>,.>, QJ :::::l ..-- :::::l
-a
Q) :::::l
<O!::'J:::::l'J:::::l~O'>
>,:::E :::::l 'J c:l:.- N <0 r:>O 0'> :::Eq Nq.-.- I I
N~
tONOO
I
I I I
~
I I
~Q) I
~~~
QJ..O
~~Q)Q)Q)
I U
Q) q Cl
~
0'> ~
:::E ro c:l: q
<0 !:: 'J :::::l 'J >, :::E :::::l r:>
qN.-N<O 'JO 00
r- r- ::EN Nq.-
N~
!::
0'>
I I I I +-'+-'..0 E ~ Q) QJ..O..O..O ..-- N
0'>
I I I
I I
VlVlEQJQJ..O..OEEE
..c ..--
I I
+-' !::
QJQJ>,>,:::::l:::::lQJ+-'..OOEQJQJQJ
>, QJ c c ..-- ..-- en en +-' o.. o +-' QJ > > u
..c u
..C U r- r- I
Q) Q) >,
u ~ .,.... ~ >, >, !:: !:: r-
u 0
>,<O!:::::::l:::::l:::::l:::::l:::::l:::::lCLQJ+-'U>OOQJ ~ <O:::E:::::l'J'J'J'Jc:l:c:l:QJVlUOOZ:Z:Cl <0
~<O~CL>,<O<O:::::l:::::l:::::l
<0 :::E Cl.. c:l: <0 :::E :::E 'J 'J 'J
:::E 'J
(/') 0
z
:::E
:::E c:l: :::E
.
00
~O'>M~Oq
N
0'>
~Oq
~r-r-r-Nr-Nr-N~N~r-Nr-Mr-
0'>
N
0'>
~.-qOON
OON~r-Mr-Mr-Nr-
0'>
-a
Q)
0
r-
~
<0
..0
~
+-'
<0
Q) ~ ~ ~ 00 0'> 0 r- N M q ~ ~ ~ 00 0'> 0 r-
0
IX r- N M q ~ ~ ~ 00 0'> 0
f-
~
r--r-r-r-r--r-r-r--r--r-NN
~
~
22
Table 9. Estimates of fishing pressure, catch, and catch rates by period on the Okefenokee Swamp from 10 March 1973 to 26 December 1975.
Period
Fishing Angler Total Catch
Catch Rates
Trips Hours
No Wgt(lb) No/Hr Lb/Hr No/Trip Lb/Tri p
N
1
2 3 4 5
6
7 8
9
10 11
12
13 14 15 16 17
18 19 20 21
10 March - 16 March 24 March - 29 March 7 April - 12 April
21 April - 27 April
5 May - 11 May
19 May - 25 May
2 June - 6 June 16 June - 22 June
30 June - 6 July 14 July - 20 July 28 July - 3 August
11 August - 16 August 25 August - 29 August 8 September - 14 September 22 September - 27 September
6 October - 11 October 20 October - 26 October 3 November - 8 November 17 November - 23 November
. 1 December - 7 December
15 December - 21 December
527 1865 1497
1330 3230 805
938 2686 5348
1152 2937 2409
2530 12684 14485
1331
6309 16930
1975 7200 7782
927 2618 4776
515 1621 2084
993 3624 7844
914 3199 6162
786 2237 2475
406
1101
561
681
2164 1891
539 1742 4940
414 1798 3706
640 1780 2561
551
1734 4636
1388 4248 10068
448 1443 3180
66
255 617
1147 694 3080 1569
9435
9128 4140 2478
1088
4280 2887 1278 463 1451
3014 2318 1692
2473 6682 2043 375
0.80 0. 61 0.25 0.21
2.84
o. 61
1. 99 1.15 5.70
0.82 0.53 2.09
1. 14 0.74 5.73
2.68 1. 45 12.72
1.08 0.57 3.94
1.82 0.95 5.15
1.29 0.67 4.05
2.16 1. 18 7.90
1. 93 0.90 6.74
1.11 0.57 3.15
0. 51 0.42 1. 38
0.87 0.67 2.78
2.84 1. 73 9.16
2.06 1.29 8.95
1.44 0.95 4.00
2.67 1.43 8.41
2.37 1. 57 7.25
2.20 1. 42 7.1 0
2.4?. 1.46 9.35
2.18 0.52 3.28
1.36 3.73 6.86
2.10 2.67
2.11 4.31 3.16 1. 63 1. 14 2.13 5.59 5.60 2.64 4.49 4.81 4o56 5.65
Total
sx
1 2 3 4
10 March 197328 December 1973
9 March - 14 March 23 March - 29 March 6 April - 12 April 20 April - 26 April
19051 66475 104751 61715
1. 58 0.93 5.50
3.24
2761
9828 15138
9232
1117
5317 10542
5879
1. 98 1.11 9.44
5.26
1639
4969 7748
4914
1. 56 0.99 4.73
3.00
1559
6177 7056
3832
1.14 0.62 4.53
2.46
3046 11938 14171
7573
1.19 0.63 4.65
2.49
.>
;
~ .
Table 9. Continued
Period
Fishing Angler Total Catch
CatcFi Rates
Tri~s Hours No. Wgt(lb) No/Hr Lb/Hr No/Trip Lb/Tri p
11
26 July - 31 July
623 1899 1318
685 0.69 0.36 2. 12 1.10
12
9 August - 13 August
660 1816 1281
906 0. 71 0.50 1. 94 1. 37
13
23 August - 28 August
512 1314 953
644 0.73 0.49 1.86 1. 26
14
6 September - 12 September
422 1472 1242
878 0.84 0.60 2.94 2.08
15
20 September - 26 September
469
1376 1525 1001
1.11 0.73 3.25
2. 13
16
4 October - 10 October
516 1280 1807 1126 1. 41 0.88 3.50 2.18
17
18 October - 23 October
433
1595 1822
1507
1.14 0.94 4.21
3.48
18
1 November - 5 November
601
1723 1601
920 0.93 0.53 2.66 1. 53
N
w
19
15 November - 21 November
20
29 November - 5 December
186
650 597
498
0.92 0. 77 3.21
2.68
243
686 669
578 0.97 0.84 2.75 2.38
21
13 December - 19 December
187
642 800 1024 1. 24 1. 59 4.28 5.46
Total 2 March 1975 26 December 1975
sx
16263
54156 52191 32320 0.96 0.60 3.21
1. 99
1520
5096 5575 4086
S....
+Q->) -:.r...:..
ro..o
0::: __J
..C.
US....
+ro- ' :. .I. . .:. .
uo :z::
N .-- .-
=- .-- .-- 1..0.--C::O.--N<.DOOOO 0 0 0 0 0 0 <.0
oooooooooo
l.() N .-MNCON.--LC>OOO<.D
O M N O O O O OOm
0000000000
QJ...:::::.
~8
s.... Q)+-'
c>::r::::::
. . . . . . . . . . M<.DN<::tCOCOCO<.DMN
C) ('V) '.!) ('V) <.0 .-- ('V) l.() <::t <.0 NOOO.--.--OONO
+c-'
Q)
u ql.()(J).--<::t<::t-0000
s....
.-- <. '-.1 (Y)
.--
0
Q)
.0...
+-' ('V)r--.(J).--('V)<::t<::t<.D<.D<.D
<::tLC>(J)CO.--O<::t.--MCO
.--NLC>.--('V)(J)
0
.-- .-- N
<::t
:r:
+-' c Q) .-- u s.... ro OJ
0...
+-' 0
0 1-Z
lx
(/)
.
.SZI
(/) OJ
u
OJ (/)
. . . . . . . . . .
q('V)(J)N.--r--.0000
<::t ('V)
0
<::tLC>(J)Nr--.N.--<.D<::tU'")
(J)<::tMGO<.D.--<::t.--r--.
<::tLC>(J)LC>N<.D.--
l.()
('V) ('V)
l.()
mLC>r--.CO.--<::tr---r---<::t.--
LC>.--LC>mNr---<::to.--m
N(J)LC>NCOCOM.-- .--
NNO.-- ('V)
N
N N
LC>
Vl ..c.
Vl .-- Vl ro QJ.-
..os....4Q) c
..c.~ ::I
Vl
+-'UVl
"0 ..c. ro +-'
::I
o
rCL
-o
..----
c OJ ::I
E
QJ.-
r- ..c. 0 s.... Q) c +-' O'l s.... .--
4- .-- E OJ cn.- +-' OJ OJ ro
3: .-- s.... .- s.... ro o :::::1 ..c. +-'
o :::::1 ro . - ro ..c. CL.-- +-' o
C:OC:03:l.J....__lUV)C:001-
Vl
s....
l.() ::I
r-
r--.o
+-'
(J) ..c.
t:
u 0
s.... Q)
.
u .-Q)O'l 0 c
0
ro
<.0
Q)
..c. l.()
.--
Q) u .--
..0
+-' S....<::t
ro 1-
ro 0
I'Ql.() ~ ..........
26
fishing pressure occurred between March and late June. Year 1974 had the highest catch (108,572 fish weighing 63,077 lb), although the 1973 catch was comparable (Table 9). The 1975 harvest figures were roughly half of the previous year's total.
The yearly catch rates decreased over the three year period. The per hour catch rate in 1973 was 1.58 fish weighing 0.93 lb; in 1975 it was 0.96 fish weighing 0.60 lb. The catch rate per trip decreased from 5.5 fish weighing 3.24 lb in 1973 to 3.21 fish weighing 1.99 lb in 1975 (Table 9).
The harvest, average weight, and catch rates for individual fish species are presented in Table 10. Warmouth and bullheads were the primary species caught. They accounted for over 83% of the number and 65% of the weight harvested each year. Bowfin represented 4% by number and 14% by weight each year. The catch of other species was low and varied yearly.
The fishing effort applied specifically to a particular species was 64% of the estimated total fishing pressure on the Okefenokee Swamp in 1973 and 1974 (Table 11). Specific fishing pressure dropped to 44% of total effort in 1975. The fished-for catch rate in 1975 was about one-half the overall values recorded the two previous years. The fished-for catch rate of largemouth bass and warmouth decreased in 1975 while that of chain pickerel increased.
Pressure and catch data by methods of fishing are included in the Appendix (Tables A-10 and A-11). Bowfin Population Estimates
The estimated bowfin population decreased each year from 20,966 fish in 1973 to 17,832 in 1975 (Table 12). Proportional standard errors of the estimates were 8.5%, 6.4%, and 6.9% for 1973, 1974, and 1975, respectively.
24
Table 9. Continued
Period
Fishing Angler Total Catch
Catcn Rates
Tri~s Hours No. Wgt(lb) No/Hr Lb/Hr No/Trip Lb/Tri p
11
26 July - 31 July
623 1899 1318
685 0.69 0.36 2.12 1.10
12
9 August - 13 August
660 1816 1281
906 0.71 0.50 1. 94 1. 37
13
23 August - 28 August
512 1314 953
644 0.73 0.49 1.86 1. 26
14
6 September - 12 September
422 1472 1242
878 0.84 0.60 2.94 2.08
15
20 September - 26 September
469
1376 1525
1001
1.11 0.73 3.25
2.13
16
4 October- 10 October
516 1280 1807 1126 1. 41 0.88 3.50 2.18
17
18 October - 23 October
433
1595 1822
1507
1.14 0.94 4. 21
3.48
18
1 November - 5 November
601
1723 1601
920 0.93 0.53 2.66 1. 53
N
w
19
15 November - 21 November
20
29 November - 5 December
186
650 597
498 0.92 0. 77 3. 21
2.68
243
686 669
578 0.97 0.84 2.75 2.38
21
13 December - 19 December
187
642 800 1024 1. 24 1. 59 4.28 5.46
Total 2 March 1975 26 December 1975
sx
16263
54156 52191 32320 0.96 0.60 3.21
1. 99
1520
5096 5575 4086
-
Table 10. Estimates of total harvest, average weight and catch rates by species on the Okefenokee Swamp from March 1973 to December 1975.
T o t a 1 Ha r v e s t
Average Catch Rate
Date
Species
No. Sx t1o. Percent vJgt.(lb) Sx vJgt. Percent Wgt.(lb) No/Hr Lb/Hr
March - Dec. 1973 Bowfin
4393 1162
4.2
8746 2231
14.2
1. 99
0.07 0.13
(66475 angler hours) Bullheads
32898 8928 31.4 13279 4086 21.5 0.40 0.49 0.20
Harmouth
54403 11886 51.9 29442 6493 47.7 0.54 0.82 0.44
Flier
6097 2817
5.8
1982 926
3. 1 0.32 0.09 0.03
Largemouth bass 1470 492
1.4
2475 831
4.0 1.68 0.02 0.04
Chain pickerel 4784 1568
4.6
5321 1603
8.6
1.11
0.07 0.08
Spotted sunfish 226 138
0.2
58
33
0. 1 0.26 0.003 0. 001
Bluegill
346 214
0.3
231
128
0.4 0.67 0.005 0.004
Other
136 112
0.2
181
164
0.4 1.33 0.003 0.004
N
Total
104751 15138 100.0 61715 9232 100.0 0.59 l. 58 0.93
(J1
March- Dec. 1974 Bowfin (79186 angler hours) Bullheads
5150 861 26331 6892
4.7 24.2
9254 1691 10489 2864
14.7 16.7
1.80 0.40
0.06 0.12
0.33 o. 13
Wa rmouth
62409 14176 57.5 32264 6904 51.2 0.52 0.79 0.41
Flier
3809 950
3.5
1344 365
2. 1 0.35 0.05 0.02
Largemouth bass 1152 294
1.1
2442 615
3.9 2.12 o. 01 0.03
Chain pickerel 4978 1089
4.6
5207 1219
8.3 1. 05 0.06 0.06
Spotted sunfish 4173 1026
3.8
1428 368
2.3 0.34 0.05 o. 18
Bluegill
372 106
0.3
284
98
0.4 0.76 0.005 0.004
Other
198 109
0.3
365 187
0.4 1.83 0.005 0.004
Total
108572 20967 100.0 63077 11433 100.0 0.58 1. 37 0.80
Table 12. Summary of bowfin population estimates on the Suwannee River from 1973 to 1975 using the adjusted Petersen method.
Year
Dates
Number t~a rked
Number - - - - tfum-5er Sampled t1arked Fish
for t1arks Recaptured
Percent Recaptured
Bowfin Estimate
Standard Error
1973 29 Oct. - 16 Nov.
1942
1337
123
6.3
20966
1786
1974 14 Nov. - 11 Dec.
2202
1836
214
9.7
18823
1203
~
(X)
1975
4 Nov. - 5 Dec.
1702
1978
188
11.0
17832
1230
Table 10. Continued
To t a 1 Ha r v e s t
Average Catch Rate
Date
Species
No. sx tlo. Percent ~Jgt 0 ( 1b) Sx ~~gt. Percent ~Jgt. Ub) No/Hr Lb/Hr
March - Dec. 1975 (54156 angler hours)
Bowfin Bullheads
~Jarmouth
Flier
2259 494 22915 3545 20557 3939 1298 502
4.3 43.9 39.4
2.5
4577 1143 8255 1257 12847 2599
448 181
14 0 2 25.5
39.8
1.4
2.03 0.36 0.62 0.34
0.03 OJJ6
0.32 o. 11 0.28 o. 18 0.02 o. 01
Largemouth bass 821
207
1.6
1381 313
4.3 1.68 0.01 0.02
Chain pickerel 3874 662
7.4
4588
904
14 0 l
l. 18
0.05 0.06
Spotted sunfish 347 111
0.7
130
44
0.4
Bluegill Other Total
107 14 52191
46 14 5575
0.2 0.03 100.03
60 34 32320
16 36 4086
0.2
o. 1 1oo. r
0.38 0.56 2.43 0.62
0.005 0.002
0.002 o. 001
0.001 0.001 0.96 0.60
N 0"1
Table 10. Estimates of total harvest, average weight and catch rates by species on the Okefenokee Swamp from March 1973 to December 1975.
T o t a l Ha r v e s t
Average Catch Rate
Date
Species
No. sx No. Percent vJgt. (l b) Sx \Jgt. Percent Wgt.(lb) No/Hr Lb/Hr
March - Dec. 1973 Bowfin
4393 1162
4.2
8746 2231
14.2
l. 99
0.07 0.13
(66475 angler hours) Bull heads
32898 8928 31.4 13279 4086 21.5 0.40 0.49 0.20
\~armouth
54403 11886 51.9 29442 6493 47.7 0.54 0.82 0.44
Flier
6097 2817
5.8
1982 926
3. l 0.32 0.09 0.03
Largemouth bass 1470 492
1.4
2475 831
4.0 1.68 0.02 0.04
Chain pickerel 4784 1568
4.6
5321 1603
8.6
l.ll
0.07 0.08
Spotted sunfish 226 138
0.2
58
33
0. l 0.26 0.003 0.001
Bluegill
346 214
0.3
231 128
0.4 0.67 0.005 0.004
Other
136 112
0.2
181 164
0.4 1.33 0.003 0.004
N
Total
1047 51 15138 100.0 61715 9232 100.0 0.59 1. 58 0.93
(J1
March - Dec. 1974 Bowfin (79186 angler hours) Bullheads
5150 861 26331 6892
4.7 24.2
9254 1691 10489 2864
14.7 16.7
1.80 0.40
0.06 0.12
0.33 o. 13
Warmouth
62409 14176 57.5 32264 6904 51.2 0.52 0.79 0.41
Flier
3809 950
3.5
1344 365
2. l
0.35
0.05 0.02
Largemouth bass 1152 294
l.l
2442 615
3.9 2.12 0. 01 0.03
Chain pickerel 4978 l 089
4.6
5207 1219
8.3 l. 05 0.06 0.06
Spotted sunfish 4173 l 026
3.8
1428 368
2.3 0.34 0.05 o. 18
Bluegill
372 106
0.3
284
98
0.4 0.76 0.005 0.004
Other Total
. 198 l 09
0.3
108572 20967 100.0
365 187
0.4
63077 11433 l 00.0
l. 83 0.58
0.005 0.004 1.37 0.80
.,::.
:d~~.:
.,:o-,:'1..
-l~~~~nr> Q::=J:=
oc~uOJ~OJn
rt ~ --' o , OJ > ~
OJ
~
~ ~
>ro
rrtt
3 o
-::-l'<.rOo
1
ro OJ
ro c o. rtu
3 o
o
o.
~ --' c ro
(/1 (/1 n r t n
c::l r"o ~
-+> >rr~
-(/-1' r~o (O/J 1<~.0
~
(11CJ1
NNW~~"'
-l~~~~nr> Q::sJ::
oc~OJ~~OJn
rt ~ --' > c OJ > ~
OJ
~
~ ~
r>o
3 o
ro
<.0
:-:-l'<.rOo
1
ro OJ
c --' 3 rt ~u o
o
o. ~ ~ --' c ro
(/1
nrtn
r"o ~
>rr~
r~o (O/J 1"~'
(11~
N
N
~(Jl~~oo~
~ I -lw~~~~nr> Q::sJ::
ro
ooc~OJ~~OJn
n
rt :::E ~ --' > c OJ > ~ --'
OJ
~
-+>
--'
~ ~
>ro
o 3
ro
<.0
:-:-l'<.rOo
1
ro
(/1
::l
ro OJ
c --' rt ~-o
3 o
o
o. ~ ~ --' c ro
(/1
nrtn
r"o ~
>rr~
r~o(O/J 1"~'
(flW
N
~ ~
~"'(Jl~~ooo
-o ro >--'
0
O.:Z:
(flC 3
:_::_E,. rror
lrl") ~ 0 rrl-t,
-+>
QJ
-r rj
~
ro
or"o(r/r1nt r-+o> 3--'
::lQJ
Ori"
"roroo. ro
ro
~-+>
:::E-+>
QJO
3> u rl"
-+> OJ
) ::l
oo. 3
(/1
~ c
~ N
1
!->o+> rl"
o nn
Q3:J(/ro1
) (/1
::=:=
n
N w
~
oo ~
o CJ1 ~
~
o
~~
~
w
N w w
OJ
~
::l
~rr
~
~~
~~CJ1~
~~W~OCJ10
N~~OOCJ1~00
WNW~ CJ1CJ1
(.00000~~w~ ~N~~WON
00
CJ1~~
\.OW
~~~\.ON~CJ10
W~OOW\.0000\.0
~
I
~
e0 rn
>(/1 --++>> o
~
(.0(11
w~rUo n
rl" --'.
oro
0
~
~
0
00
~
0
~
~
)
(/1
ONOO~N~
ONOOOWN
OOOO~OOONO
~rl"
N
0"\
-+>
0 0 ~~~W W
0 CJ1 00 ~ ~ 0 \.0
0 ~W N 0 ~N ~
Cl(-f-l'
ro~
n ro
roo.
3 I
:z:
rrro o-+>
0
) )
o.w~ . o . o . ~ o
CJ10NO~~o ~W~CJ10CJ100
~w N ~ o o
~o~N
00~
~0000~0~~
~~ N ~ ~ o o N O N W N ~~
N~W~NOOCJ1
~:-r : n )QJ
rnl"
~
rrr :;o
--'O
\.O::l
. ~
CJ1
rt
~
ro
o~ooo~o
o~~o
o o
ow~~o
o o
1..(../...1....... rOJt
w~\.Ooww~ OOW~~OOCJ1~
~NO~
oow
W~~CJ10N~
~~o~~
~N
~~~N~O~OO
Iro
)(11
F/C
."..T...l.
(.Q
s..:.:.:,
0
. 0
. 0
__.
N
. 0
w
. . . . . . 0
0
0
0
0
0
+:>
(J1
0"'>
-....J
co
1.0
0
ro
. N
__.
1.0
...., ("") 3 "0 ("')
rooOJO::Y 3 ::::l --'"0 QJ
0 0. ::::l s::: ::::l
:J ~>
< ........ t/) __. <.0
.QJrl-rtQJro
__. ....... ....,
oro ::::l QJ
r...l..-..
0
Vl
.......
c0"o'>
3 ::::l ::::l
0
-t,VlO "Tl QJ-t, .........
0"'>
rl-3
("')
1.0
::y "0 rl-
ro_.::y...,
ro ro QJ
-....J
w
0
"0
rl-
0 ::E: VJ .......
"OOJS:::O
S__:.::Vl::EQJ: QJ
0
-<
~ -....J
QJ -'::::l ::::l
r--l-':("::":)l:::r:ol 0.
>;;o
o_.ro::t:-
:::IS:: rl-::::
-....J
0. :::0
N
roo - r o - - ' < 0. < QJ
-t, ro_.
0
r..o..,
-t,....,
0 ...., .
sr:o::
Vl
w-....J
QJ ::::l 0.
0ro . "..0.....
--l-
r:o:y
-' ::::l rl-
0. ("") __. ::y
S:::rt<.Oro ...., ....... 0"'>
-'::::l ::::l (.Q
CO-.+...>...
(.Q
...., Vl
rl-0 ::y
C' ::y rl-
ororo
::E:
::::l
.-..t...,.
::::l
0
r::o::l
.. -....J +:> -....J (J1
-....J 0"'>
0
__.
0
N 0
w
0
+:>
(J1
0
c
AH
t
Table 12. Summary of bowfin population estimates on the Suwannee River from 1973 to 1975 using the adjusted Petersen method.
Year
Dates
Number
Number
Number Sampled t1arked Fish Percent
t~a rked for t1arks Recaptured Recaptured
Bowfin Estimate
Standard Error
1973 29 Oct. - 16 Nov. 1942
1337
123
6.3
20966
1786
1974 14 Nov. - 11 Dec.
2202
1836
214
9.7
18823
1203
cN o
1975 4 Nov. - 5 Dec. 1702
1978
188
11.0
17832
1230
Table ll. Estimated effort and success by species fished-for on the Okefenokee Swamp from 10 March 1973 to 26 December 1975.
Species
Number of
Effort
Periods with Effort ~~an-hours %
Catch Rates No/Hr Lbs/Hr
March - Dec. 1973 Largemouth bass Chain pickerel
Bluegill
Warmouth Flier Bullheads
Bowfin Total
18
4309 l 0. l
0.15 0.28
10
958 2.2
0.60 0. 77
l
40 0. l
0
0
21
33429 78.0
l. 22 0.67
5
493 1.2
4. 31 1.42
9
3568 8.3
2.23 l.Ol
l
46 0. l
1.07 3.17
42843 l 00.0
1.22 0.67
March - Dec. 1974 Largemouth bass Chain pickerel
Bluegill Warmouth
Flier Bullheads Total
21
6512 12.9
0.14 0. 31
8
1530 3.0
0.81 0.82
l
43 0. l
0
0
21
40646 80.7
1.24 0.65
5
381 0.8
2.68 1.07
6
1282 2.5
3.08 1.24
50394 l 00.0
l . 14 0.63
~~arch - Dec. 1975 Largemouth bass
Chain pickerel
Warmouth Spotted sunfish
Flier Bullheads
Total
19
4108 17.3
0.08 o. 14
6
556 2.3
l. 15 1.35
17
18405 77.6
0.60 0.38
3
168 0.7
0.05 0.04
2
34 0. l
4.26 0.94
2
471
2.0
3.03 l. 13
23742 l 00.0
0.57 0.38
27
:. ' . . .; -~- ~ :.~.- .'::. "\ '
ANALYSIS Several parameters were examined for detecting changes in the fish population in relation to changes in bowfin abundance. Spring and summer rotenone data from Mud Lake slough were used for reflecting population changes since they were collected before and after removal and included data from ~Jyatt et al. (1966) and (1967), Holder (l970a) and (l973c), and Germann (1973). Before removal F/C ratios were low (Figure 2). They increased in 1970 and declined in 1971. From 1971 to 1976 F/C ratios continued to decline. The A~ values showed a decline in the quality of the game fish population in 1972 after an increase in 1970 and 1971. Both of these parameters show that a change occurred in the fish population between 1967 and 1970 and that after 1971 the fish population reverted back to the original level. The spring samples in 1966 and 1967 had bowfin E values of 76.7 and 70.0%, respectively; the game fish E values were 13.4 and 16.2%, respectively (Table 13). The bowfin E values in the 1974-1976 Mud Lake samples exceeded the values reported before removal. The game fish values were either less than or equivalent to those recorded prior to removal To determine the fish species that may be causing these changes, %weight composition (E value) of key species in the spring and summer rotenone samples from Mud Lake slough from 1970 to 1976 were regressed against year. The hypothesis tested was B = 0 at P ~.05 where B is the slope of the regression (Snedecor and Cochran 1968). Warmouth and largemouth bass were the only game species to show a significant relationship and they were both decreases through time (Y = 14.5214- 1.2696X and Y = 25.3857 - 2.5671X, respectively). Bowfin and spotted suckers were
29
the only non-game species with significant changes and they were both increases (Y = 1.6243 + 7.5782X andY = 2.0343 + 0.5261X, respectively). Spotted suckers, even with the significant increase in E values, made up less than 4% of the standing crop estimates and are not an abundant species in the Suwannee River.
Analysis of the standing crop values of bowfin and game fish showed somewhat different results than suggested by the E values (Table 13). The weight per acre of bowfin from 1972 to 1976 is lower than the standing crop estimates in 1966 and 1967. Though the bowfin E values from 1974 to 1976 exceeded the levels of 1966-1967, the weight per acre did not reflect increases of the same magnitude. The game fish weight per acre was about the same from 1966 to 1972 and then declined. However, the E values increased in 1970-1971. The difference in the game fish E values between 1966-1967 and 1970-1971 appears to be the result of the decrease in bowfin abundance. Also, the decrease in the game fish weight, principally warmouth and largemouth bass, from 1972 to 1976 accounts for part of the increase in bowfin E values during the same period.
Analysis of bowfin population estimates (Figure 3) tended to agree with the standing crop estimates of bowfin in the Mud Lake rotenone samples (Table 13) and to a lessor extent with the E values. The 1967-68 estimate showed an initial high bowfin population. The 1969 estimate showed a lower population. Then from 1970 to 1975 the bowfin increased to around 20,000. The increase was considerable lower than the level indicated in 1967-68. Visual analysis of the confidence intervals in Figure 3 shows that the bowfin population from 1973 to 1975 is significantly higher than in 1969 (year of lowest estimate) and that the population has stabilized.
Though the bowfin population estimates in Figure 3 correspond to the standing crop estimates in Table 13, they do not follow in the same
32
1.0 0.9 0.8 0.7 0.6
-u 0.5
LL
0.4 0.3 0.2 0. 1
7 \......
F/C
"' \
\
\
\
A~
\
\
\
l ....... ......... ........
50
40
30
:::::::-!-)
<
20
10
0
0
1966 67 68 69 70 71 72 73 74 75 76
YE/\R
Figure 2.
Changes in F/C ratio and A~ values in the fish
population of the Suwannee River. The 1968 rotenone mainstream sample was included for depicting the condition of the population before and during bowfin removal.
30
ANALYSIS
Several parameters were examined for detecting changes in the fish
population in relation to changes in bowfin abundance. Spring and
summer rotenone data from Mud Lake slough were used for reflecting
population changes since they were collected before and after removal
and included data from ~Jyatt et al. (1966) and (1967), Holder (1970a)
and (1973c), and Germann (1973).
Before removal F/C ratios were low (Figure 2). They increased in
1970 and declined in 1971. From 1971 to 1976 F/C ratios continued to decline. The A~ values showed a decline in the quality of the game
fish population in 1972 after an increase in 1970 and 1971. Both of ._.,.;
these parameters show that a change occurred in the fish population
between 1967 and 1970 and that after 1971 the fish population reverted
back to the original level.
The spring samples in 1966 and 1967 had bowfin E values of 76.7
and 70.0%, respectively; the game fish E values were 13.4 and 16.2%,
respectively (Table 13). The bowfin E values in the 1974-1976 Mud
Lake samples exceeded the values reported before removal. The game
fish values were either less than or equivalent to those recorded
prior to removal.
t
To determine the fish species that may be causing these changes,
%weight composition (E value) of key species in the spring and summer
rotenone samples from Mud Lake slough from 1970 to 1976 were regressed
against year. The hypothesis tested was B = 0 at P 5.05 where B is the
slope of the regression (Snedecor and Cochran 1968). vJarmouth and
largemouth bass were the only game species to show a significant relation-
ship and they were both decreases through time (Y = 14.5214- 1.2696X and
Y = 25.3857 - 2.5671X, respectively). Bowfin and spotted suckers were
29
aJ
c
0
c
aJ
+-->
0 1-
1a.J
E E
::l l/1
-o
c
rd
cO'l
I-
D..
l/1
E
0 1- 4- \,!)
r---
rdO'l
+--> .--
-rdo o +-)
0..
0\.D
1-I.D
u .O-'-l
0'1
c E
-ro-s.0..
C4-
rd
+-)S...
l/1 aJ
_J::
>
r-
l/10:::
r-
4-a.J aJ
aJ c E c
rd rd 0'13:
-o (:/:)l
c
rd "
l/1
c aJ
r- .--
4- 0.. 3: E Ord CCl l/1
.
(Y)
.--
.0 rd f--
aJ ::l
. 7
N
. . . . . f"-.
0
N
(Y)
(Y)
I.D
rd
(Y)
\,!)
~
\,!)
r---
r---
0
(Y)
>
(Y)
(Y)
w
.
7
.--
f"-.
<;;t-
. . . . . .
N
O'l
~
f"-.
~
f"-.
f"-.
N
1.D
(Y)
(Y)
N
c sa..J. r---
r- r-- u
"c"O+r-d).e...l..:.:..
O'l
r---
rdO+-)
+-)
(/)
f--
::O::'l
. . . . . . . O'l N
I.D O'l O'l co
,......
~
r---
O'l
,......
(Y)
cN o
r--..
(Y)
co
7
r---
(Y)
_J::a.J
l/1 .--
.,.... .0 aJ
LL.. rd 1- N
+-) U
N
a.Jlflel::
Ea.J-.......
rd>O
t.!JI-:Z:
rd
I
N
~
N
7
\,!)
~
..-s.a.J.
~ \,!)
0 O'l
0 0
\,!)
~
\,!)
7
,......
~
7
O'l O'l r---
rdU
(Y)
f"-.
'<:t-
N
N
0
f"-.
+o--).C...l.:.:.
"
"
"
f - -z0:
aJ ::l ,...-
>rd
. . . . . . r--- 0
.co 0
. N
I.D
7
\,!)
r--..
0
f"-.
r---
N
co
~
O'l
\,!)
O'l
r---
c0 o
c0 o
w
.-,c.o...
c
aJ
~
u ct:
.O'l
co ,......
~
~
. . . . . . ~
0
0
\,!)
c0 o
N
,......
(Y) (Y)
(Y)
O'l
(Y) \,!)
O'l
,......
rd -.......7 \,!)
N
(Y)
(Y)
(Y)
N
+-) .0
(/)
_J
.,c....
43:
as.J..
(Y)
7
~
N
0
u 7
7
(Y)
0
CCl ct: N
(Y)
.........
:0z:
fc"o-.
,0......
~
0
~
N
N
.,....
.,....
s...
0..
aJ
ct:
+-)
rd
O'l ,...... O'l
,......
0
N
N
N
31
proportion. It is likely that the original estimate is an over-estimate. Only 250 bowfin were marked when the first estimate was made (\lyatt et al. l968b). Also the estimate was over a six month period. ~~arked bowfin could have moved downstream out of the area during the period of the estimate and, if so, would have resulted in an overestimate.
If we assume that the rotenone standing crop estimates in Mud Lake slough are an index of bowfin abundance in the river, we can get another measure of the bowfin population level in 1968 by comparing differences in the bowfin weight per acre from 1972-76 to those in 1966-67. The mean weight per acre in the Mud Lake rotenone samples from 1972-1976 (327.2 lb/acre) was 41% lower than the 1966-67 mean weight per acre
'. -,.
(555.0lb/acre)o Applying this value to the bowfin population estimates, the original bowfin population would be 1.69 times the mean of the estimates from 1972 to 1975. This becomes 33,710 bowfin. Regardless of which estimate is used (original or adjusted) for reflecting bowfin abundance, the bowfin population from 1973 to 1975 is less than the level indicated in 1967-68.
Data on changes in catch per unit effort (CPUE) of bowfin by electrofishing during the period of the population estimates were also examined (Table 14). The CPUE in 1967-68 at the time of the i~tial population estimate was 121 fish/hr weighing 231.3 lb. It dropped to around 27 fish/hr in 1969 and 1970 and then gradually increased, except for the high increase in 1974 that approached the 1967-68 CPUE values. The CPUE values generally corresponded with the other parameters for reflecting bowfin abundance. Sampling efficiency improved in 1973 from modifications in electrofishing assembly and replacement of the voltage booster. One other variable affecting the CPUE values was water level. The 1974 CPUE reflects this influence since water flows during that period were lower
34
the only non-game species with significant changes and they were both increases (Y = 1.6243 + 7.5782X andY = 2.0343 + 0.5261X, respectively). Spotted suckers, even with the significant increase in E values, made up less than 4% of the standing crop estimates and are not an abundant species in the Suwannee River.
Analysis of the standing crop values of bowfin and game fish showed somewhat different results than suggested by the E values (Table 13). The weight per acre of bowfin from 1972 to 1976 is lower than the standing crop estimates in 1966 and 1967. Though the bowfin E values from 1974 to 1976 exceeded the levels of 1966-1967, the weight per acre did not reflect increases of the same magnitude. The game fish weight per acre was about the same from 1966 to 1972 and then declined. However,
the E values increased in 1970-1971. The difference in the game fish E
values between 1966-1967 and 1970-1971 appears to be the result of the decrease in bowfin abundance. Also, the decrease in the game fish weight, principally warmouth and largemouth bass, from 1972 to 1976 accounts for part of the increase in bowfin E values during the same period.
Analysis of bowfin population estimates (Figure 3) tended to agree with the standing crop estimates of bowfin in the Mud Lake rotenone samples (Table 13) and to a lessor extent with the E values. The 1967-68 estimate showed an initial high bowfin population. The 1969 estimate showed a lower population. Then from 1970 to 1975 the bowfin increased to around 20,000. The increase was considerable lower than the level indicated in 1967-68. Visual analysis of the confidence intervals in Figure 3 shows that the bowfin population from 1973 to 1975 is significantly higher than in 1969 (year of lowest estimate) and that the population has stabilized.
Though the bowfin population estimates in Figure 3 correspond to the standing crop estimates in Table 13, they do not follow in the same
32
Table 13. Bowfin and game fish standing crop data from spring and summer Mud Lake slough rotenone samples, Suwannee River from 1966 to 1976.
Bowfin Standing Crop _____
Game Fish Standing CroQ
Total Harvestable Total Harvestab-le
Date
No/Acre Lb/Acre E Value
No/Acre No/Acre LJgt/ Acre vJgt/ Acre E Value
11 t1ay 1966
243
458.9
76.7
365
122
79.7
74.3
13.4
9 May 1967
344
651 . 1
70.0
790
174
151.9 141 4
16.2
21 t~ay 1970
35
80.5
27.8
1,400
199
97.2
72.2
35.7
w__.
29 Apri 1 1971
102
212. 1
58.0
256
152
131 6 129.3
36.0
10 May 1972
187
333.1
69.2
1 '245
142
82.9
65.6
17. 2
23 May 1974
210
393.0
79.6
96
65
37.9
37.1
7.3
2 July 1975
205
363.0
80.1
1 ,094
111
48.8
35.6
10.3
21 April 1976
. 115
219.6
80.4
771
52
37.3
27.2
13.6
70
60
50
(V')
.0--
w w
X 30
~
QJ
..0
E
:::::l
z:
I
20 -1
T
I
I
I
f I
I
f f
10
t
0
1967-68 1969
1970
1971
1972
1973 1974
1975
YEAR
Figure 3. Plot of yearly bowfin population estimates ~ 2 standard errors in the Suwannee River including data for 1967-68-1972 from Holder(l973a) with current data.
than when the estimates were made in 1973 and 1975.
The data on the fish population (F/C ratios, A~ values, E values,
standing crop estimates, bowfin population estimates, and CPUE values) show that changes occurred in the Suwannee River fish population following removal. The analysis further shows that the bowfin population has increased substantially following removal; however, the various parameters of bowfin abundance do not show the same level of increase. The analysis of the fish population shows that a decline has occurred in the game fish population, principally in warmouth and largemouth bass. Though this decline seems to be inversely related to bowfin abundance, the data on game fish standing crop suggest that the game fish population did not improve following removal and that the game fish decline is not the result of bowfin increases.
Creel data on the Suwannee River and the Okefenokee Swamp for years 1969-75 were examined to determine changes in the sport fishery that would be related to bowfin abundance. Data from Swanson and Holder (l974a and b) were included in this analysis.
The Suwannee River sport fishery fluctuated yearly (Table 15). The total number and total weight caught in the Suwannee River were regressed against fishermen effort to determine if fishing e-rt"ort was causing the yearly fluctuations (Table 16). The relationships were significant (B = oat p s.05). As fishing pressure increased, the number and pounds of fish caught increased. This shows that the fluctuations in the creel were not from the fishery being depleted from increased fishing pressure. Anglerhours regressed against years was not a significant relationship, indicating no trend in fishing pressure through time.
The 1975 catch rate of 2.1 fish/hr weighing 1.27 lb (Table 15) was comparable to the 2.29 fish/hr weighing 1.16 lb in 1970. The only
36
proportion. It is likely that the original estimate is an over-estimate. Only 250 bowfin were marked when the first estimate was made (lJyatt et al. 1968b). Also the estimate was over a six month period. Marked bowfin could have moved downstream out of the area during the period of the estimate and, if so, would have resulted in an overestimate.
If we assume that the rotenone standing crop estimates in Mud Lake slough are an index of bowfin abundance in the river, we can get another measure of the bowfin population level in 1968 by comparing differences in the bowfin weight per acre from 1972-76 to those in 1966-67. The mean weight per acre in the Mud Lake rotenone samples from 1972-1976 (327.2 lb/acre) was 41% lower than the 1966-67 mean weight per acre (555.0lb/acre)o Applying this value to the bowfin population estimates, the original bowfin population would be 1.69 times the mean of the estimates from 1972 to 1975. This becomes 33,710 bowfin. Regardless of which estimate is used (original or adjusted) for reflecting bowfin abundance, the bowfin population from 1973 to 1975 is less than the level indicated in 1967-68.
Data on changes in catch per unit effort (CPUE) of bowfin by electrofishing during the period of the population estimates were also examined (Table 14). The CPUE in 1967-68 at the time of the initial population estimate was 121 fish/hr weighing 231.3 lb. It dropped to around 27 fish/hr in 1969 and 1970 and then gradually increased, except for the high increase in 1974 that approached the 1967-68 CPUE valueso The CPUE values generally corresponded with the other parameters for reflecting bowfin abundance. Sampling efficiency improved in 1973 from modifications in electrofishing assembly and replacement of the voltage booster. One other variable affecting the CPUE values was water level. The 1974 CPUE reflects this influence since water flows during that period were lower
34
70
60
50
(V')
0
r-
w w
>< s...
30
Q)
.0
E
::l
z:
I
20 -1
f -t T
I
I
I
I
I
f
10
t
0
1967-68 1969
1970
1971
1972
1973 1974
1975
YEAR
Figure 3. Plot of yearly bowfin population estimates ~ 2 standard errors in the Suwannee River including data for 1967-68-1972 from Holder(l973a) with current data.
Table 14. Dates
Bowfin catch per unit effort by electrofishing in the Suwannee River during the period of the population estimates from November 1967 to December l975.a
Hrs/Effort
-----
Number
vJgt (1b)
C PUE
No/hr
Lb/hr
2 Nov. 67 - May 68
94.5
ll '392
21,859.4
120.6
231.3
22 Jan. 69 - 13 Feb. 69
18.5
508
1,117.6
27.4
60.4
9 Nov. 70 - 29 Nov. 70
33.9
935
2,131.8
27.6
62.9
ll Dec. 72 - 9 Jan. 73
21.2
764
l ,680.8
36.0
79.3
29 Oct. 73 - 16 Nov. 73
29.0
l '337
3,315.8
46. l
114. 3
2 Dec. 74 - ll Dec. 74
18.6
1,836
4,333.0
w
()1
2 Dec. 75 - 5 Dec. 75
34.3
l '978
4,905.4
98.7
233.0
57.7
143.0
a The 1971 estimates are not included since they were made with gill net sampling.
l.Cl
0
VI
II
co
.--
(1)
<lJ Su
l.Cl
r--. 0'1
I 0'1 ~ 0'1
S-
(1)
>
o:::.
<lJ~
<lJ,......
c <t1 C>
ttl 3:+.> ::::J
Vl+J
c a
c uttl
.--
'"04-
(1).,...-
0.c
..0..-0.1-
<lJ(Jl
>
<lJttl '"0
Vl Vl<lJ C+.l Ottl
.-- u +>.-
ttl-o ::::JC CJ.--
(1)
.::. CVl 0.--
.-- S-
Vl<lJ Vl+.l <lJVl S-ttl 01 <lJC O:::c::t:
.
~
.-<-l-J
..0 ttl
1-
r"-"-.
<Xl
"<"Xl
0'1
0 ....-
....M
~ l.Cl
. . 0'1
~
N
"'" r--. 0'1
0'1 r;-
. N
0'1
<Xl N
0
"'"
c+> 0 c
.-- <lJ
+> .ttl u ....- .--
(1)4S-4-
s... <lJ
0 0
uu
. . . . .
0
0
0
0
0
>< ><
.>..<.- >< >< 00
"M'"
l.Cl
"'"
0 M
N
N
N
N
0'1 ....-
+ +
<Xl 0'1 N
N
"N' "
lt.-C--l
N M
M
"'" + +
+ M ~
M 0'1 0
~
~
r--. <Xl
<Xl
~
"'" ....0
r--. r--. r--.
"'"
0'1 ....-
l.Cl
0
~
....N N
II
II
II
II
II
>- >- >- >- >-
Vl Vl
S- S-
::::J
::::J
:0r: :0r:
S- S-
(1)
<lJ
,.......
S-
S-
01 01 S-
ttl
ttl
c c
c::t: c::t:
ttl <lJ
<lJ
>-
<lJ
>-
>-
0
0
0
+> +> 0 +>
+> +> +> +>
..c::
..c::
Vl ..c::
01 01 S-
01
c
::::J
::::J
::::J
::::J
0
ttl ttl 0
ttl
u u :r: u
Vl Vl
S-
+>
S-
S-
<lJ
S-
(1) ..0
..c::
<lJ
01 ,.......
<lJ ..0
(1) 0:::
E
:z:::::J
<lJ 3
c01
c::t:
E
:z:::::J
"'" ....-
0
"<"Xl
N
r--.
M ~
lt.-C--l
. . . 0'1 ,.......
N" ' "
0
"'"
....- M
0
r--. M
<Xl <Xl
N
M
~
N
. . . . ~
0
M 0
l.Cl
<Xl
0
l.Cl
0
0
0
0
>< ><
M
<:::1"
,....... 0
0 0 >< ><
. . . . 0
0
0 0
~
0
0,...'.1...
0
0
0
0
0
0
0
0
+ +
+
0'1 M
.0'1
0'1
0
,.......
0
0
0'1
~
0'1
II
II
II
II
>- >- >- >-
S-
o
4-
,..<..l..J.
..0 ttl
.--
Vl Vl
S- S-
::::J ::::J
0
0
:r: :r:
S- S-
,..(.1...). ,..<..l..J.
S-
S-
01 01 ttl
ttl
c
c::t:
c
c::t:
<lJ
>-
<lJ
>-
+0 >
+0 >
0
+>
0
+>
S-
-::::J
0
:r:
S<lJ
S-
-::::J
0
:r:
+>
..c::
S-
-::::J
0
:r:
S(1)
-S-
::::J 0
:r:
+>
..c::
.E.0
01
.-
..0
E
01
II
::::J
:z:
<lJ 3
::::J
:z:
<lJ 3
ttl
38
than when the estimates were made in 1973 and 1975.
The data on the fish population (F/C ratios, A~ values, E values,
standing crop estimates, bowfin population estimates, and CPUE values) show that changes occurred in the Suwannee River fish population following removal. The analysis further shows that the bowfin population has increased substantially following removal; however, the various parameters of bowfin abundance do not show the same level of increase. The analysis of the fish population shows that a decline has occurred in the game fish population, principally in warmouth and largemouth bass. Though this decline seems to be inversely related to bowfin abundance, the data on game fish standing crop suggest that the game fish population did not improve following removal and that the game fish decline is not the result of bowfin increases.
Creel data on the Suwannee River and the Okefenokee Swamp for years 1969-75 were examined to determine changes in the sport fishery that would be related to bowfin abundance. Data from Swanson and Holder (1974a and b) were included in this analysis.
The Suwannee River sport fishery fluctuated yearly (Table 15). The total number and total weight caught in the Suwannee River were regressed against fishermen effort to determine if fishing effort was causing the yearly fluctuations (Table 16). The relationships were significant (B = 0 at P ~.05). As fishing pressure increased, the number and pounds of fish caught increased. This shows that the fluctuations in the creel were not from the fishery being depleted from increased fishing pressure. Anglerhours regressed against years was not a significant relationship, indicating no trend in fishing pressure through time.
The 1975 catch rate of 2.1 fish/hr weighing 1.27 lb (Table 15) was comparable to the 2.29 fish/hr weighing 1.16 lb in 1970. The only
36
Table 14. Dates
Bowfin catch per unit effort by electrofishing in the Suwannee River during the period of the population estimates from November 1967 to December l975.a
- -- --- --
Hrs/Effort
------
-
Number
~Jgt (1b)
CPU E
No/hr
Lb/hr
2 Nov. 67 - May 68
94.5
11 '392
21,859.4
120.6
231.3
22 Jan. 69 - 13 Feb. 69
18.5
508
1,117.6
27.4
60.4
9 Nov. 70 - 29 Nov. 70
33.9
935
2,131.8
27.6
62.9
11 Dec. 72 - 9 Jan. 73
21.2
764
1,680.8
36.0
79.3
29 Oct. 73 - 16 Nov. 73
29.0
1 '337
3,315.8
46.1
114.3
2 Dec. 74 - 11 Dec. 74
18.6
1,836
4,333.0
w
CJ1
2 Dec. 75 - 5 Dec. 75
34.3
1 '978
4,905.4
98.7
233.0
57.7
143.0
a The 1971 estimates are not included since they were made with gill net sampling .
.
o{;;y{\-
'f:'.0~~~J?,Jft.4
OJ
---'
---'
---'
---'
---'
---'
---'
-<
-I
1..0 1..0 1..0 1..0 1..0 1..0 1..0
CD
OJ
::::::::: OJ
-......! CJ1
-......!
+::>
-w......!
-......! N
-......! ---'
-......! 0
0"1 1..0
OJ
"""l
-0'"
(./')
CD
:::::5
0 rl-
)::>
.CJ1
()
0
I
+::> w
CJ1
w
---'
+::>
---'
:::::5
(.Q
---'
CD
1..0
---'
+::>
0"1
1..0
CJ1
---'
"""l
CD
()
rlCD 0..
I
---'
0"1
1..0
N
0"1
CJ1
N
0
---'
CJ1
---'
---'
0"1
1..0
CJ1
0"1
N
CJ1
0"1
-......!
N
::c c0::
"""l
(./')
O.."""i OJOJ
(./)
c::
rl-rl-3
OJCD 3
(./') OJ
-;,
"""l
O ' <"""l
0 :::::5
3
0
rl- -;,
0 w
0
0w"1
+::>
---' 1..0
0 w
N
---'
+::>
0"1 0
CJ1
CJ1
c0"o1
N
w
1..0 -......!
+::>
1..0
0
+w::>
CJ1
-......!
---'
co-......!
0 tJ1
I? d
rlOJ
---'
(./) ::::;
::E: coco
OJ
(./')
:::::5 (./) rl-
V'>C:: -'
0 ::E: 3 :::::5 OJ OJ
:::::5 rl-
OJ :::::5 CD
:::::5 CD (./') o..ro
w
-......!
I
~~~
.a """l
::c
:;:o
0 :::::5
0 -' ---' < -;,
0"1 w
0"1
+::>
N
CJ1
N
+::> +::> N
0
N
---'
1..0
-......!
0"1 1..0
1..0 1..0
---'
N 0"1
1..0
-w......!
0
0"1
-w......!
I I I
I I
rl-<
~
O..CD -'
CD """l (./')
"""l
::::;
-;, -'
.......... """l :::::5
---' 0 (.Q
OJ
1..03
-......! "0
. N
---'
0
.---'
w w
. N
N ---'
.---'
CJ1
+::>
. N
0 w
. N
N 1..0
.---'
CcJo1
10:z n
= nOJ
- rl"""l ::::;
+==>---'"""l
.OJ <..OCD
___.. 0"1 Vl
<I..OVc'>::
---'"""i <..OCD
-......! .. 0
()
-'OJ
:::::5 rl-
() ()
---' ::::;
c:: ..
. . . . ---'
---'
---'
N
---'
---'
---'
0
---'
-......! 0
co
-......!
0"1
0"1
I I I
I
I'O'"OJ
-:::::: Cr:;Dl:o-
OJ """l
0.. -'OJ :::::5 :::::5 (.Q 0..
()
OJ rl-
()
::::;
... ~- '
Table 17. Summary of pounds creeled in the Suwannee River from 1970 to 1975a.
Species
1970 1971
1972
1973
1974
1975
Bowfin Bullheads
4846 5982 13646 6692 13478
9971
7639
9167 29390
7028
Warmouth
23952
2371
7062 15933 2123
Spotted sunfish 4470
319 3644 2940 2821
Largemouth bass
3420 1411
3271
3016
2343
Chain pickerel
3193
Redbreast sunfish 996
Channel catfish
244
Bluegill
808
Other
773
Total
52673
2076 252 328 316
36 20730
2569 1391
566 513 440 42269
2403 595 2734 973 315
64991
2012 258 3747 449 510
34769
t
a 1969 is not included since no weight data were collected.
11155 22079 4917
5742 1182 3379 1294 9833 2082
528 62191
40
.----..
LCl
0
VI
II
co
r-(1) (1) s....
u
r-1
0'> \.0 0'>
s.... (1)
>
c::.
(1)
QJ:::::s
QJ...-
C C r>o
rtl
3:+->
:::::s
(/)+-'
c
cro
ou
-o4=
(1).,0..c
00) r- r-
(1)!11
>
QJro
""0
V1 Vl(l)
C+-' or-ruo
+-' rrti""'
:::::sc
O"r(1)
.::.L.
CV1 0.r- s.... Vl(l) Vl+-' QJ!/1 s....ro 0) (l)C C::c::(
.
\.0
(1)
-
+-'
0
\.0
+c-'
(1) ""0
r-
. .N 0'>
:::::s
+-'
co
N q
LCl
. N
0'>
0
(/)
C+-'
0 c
r- (1)
+-' ....... rtl u
r - .......
(1)4-S-4-s.... (1)
u 0 u0
co
LCl
LCl
LCl
q q r--.
(V)
. . . . . LCl
0'>
co
r-
LCl
0'>
0'>
L.Cl
q
(V)
0
0
0 .0 0
>< ><
><
r-
q
><
0
><
LCl
0 0
..q-
(V)
(V)
N
N
N
N
0'>
r-
q
LCl
N
+
co
+
N r--.
(V)
q
+
(V)
+
0'>
(V)
0'> 0 \.0
N
N
\.0
r--. co
+
co
\.0
(V)
q ...0
.\.0
r--. r--. r--.
q
0'> 0
r-
\.0
N
LCl
N
II
II
II
II
II
>- >- >- >- >-
V1
V1
s....
s....
:::::s
:::::s
:0r: :0r:
s....
s....
(1)
(1)
r-
s....
s....
O'l
O'l
s....
rtl
rtl
c c c::t: c::t:
rtl
(1)
(1)
(1) >- >-
>-
0
0
0
+-' +-' 0
+-'
+-'
.+s::-:'. .+s::-:'.
V1 .+s::-:.'
O'l
O'l
s....
O'l
c
:::::s
:::::s
:::::s
:::::s
0
rtl
u
rtl
u
:0r:
rtl
u
V1
V1 (1)
s.... (1)
.+s::-:.'
s.... (1)
s.... (1)
s....
c(1::)
..0
E
z:::::s
O'l
rO'l
..0
E
(1)
3
c
c::t:
z:::::s
(1)
3
LCl
q
LCl
q
+:
r-- co
0
N
. . LCl
q
r--. N
0
r--. (V) co co
N
(V)
\.0
N
. . . . \.0 0
(V)
0
LCl
co
0
LCl
0
0
0
0
>< ><
(V)
.q-
r-
0
0
0
>< ><
0
0
\.0 0'>
. . . . 0
0
0
r--
0
0
0
0
0
0
0
0
+ +
+
0'>
(V)
.0'>
0'>
0'> 0'>
r--
0
0
II
II
II
II
>- >- >- >-
V1
V1
s....
s....
:::::s
:::::s
0
0
:r: :r:
s....
s....
(1)
(1)
r-
s....
s....
O'l
O'l
rtl
rtl
c c::t:
c c::t:
(1)
>-
(1)
>-
0
+-'
-s.... :::::s
:0r:
s.... (1)
..E0
:::::s
z
0
+-'
-s.... :::::s
:0r:
.+s::-:'. O.-'l
(1)
3
0 +-'
-s.... :::::s
:0r:
s.... (1) ..0
E
z::J
0 +-'
s....
-::J
:0r:
.+s::-:'.
O'l r(1)
3:
.
0'> \.0 0'>
s.... 0 4--
(1) r-..0 rtl r-
rtl
>
rtl
+-' 0
c
(1) s.... (1)
3:
rtl +-'
-rotl
.+s::-:'.
O'l r(1)
3:
II
rtl
38
~\1;",' .
... ::
Table 15. Summary of estimates on fishing pressure, catch, and catch rates on the Suwannee River from 1969-1970 including data from Swanson and Holder (l974a).
Year Angler Hours
Total Harvest
No.
~Jgt. {lb}
Catch No/llr
Rate Lb/Hr
1969
11292
17805
a
l. 58
a
., ~!
1970
45567
l 04357
52673
2.29
l. 16
1971
19616
39749
20730
2.03
1.06
1972
36215
55682
42269
1.54
1.17
1973
54952
121460
64991
2. 21
1.18
1974
31616
41903
34769
l. 33
l. l 0
1975
49105
103063
62191
2. l 0
1.27
a Was not collected
37
significant catch rate relationship in the Suwannee River was weight per hour regressed on angler hours. Bass and Hitt (1973) reported a catch rate of 1.77 fish/hr for the lower Santa Fe River in Florida. Holder and Ruebsamen (1976) cited per hour catch rates for the upper and lower Satilla River in Georgia as 0.71 fish weighing 0.28 lb and 0.72 fish weighing 0.42 lb, respectively. Ober (1977) found that the per hour catch rates in the upper Flint River, Georgia was 0.60 fish weighing 0.63 lb. Pasch and McSwain (1974) reported a catch rate of 1.01 fish/hr weighing 0.38 lb in the lower Flint River. The catch rates for the Suwannee River have exceeded all these values.
Visual observations of changes in the catch by weight through time show that species catches varied yearly (Table 17). Warmouth appeared to be less dominant in the creel. Bullheads are now the dominant species and spotted sunfish and channel catfish are becoming more prominent. The only species to exhibit a significant change from 1970 to 1975 is channel catfish (Figure 4). The relationship Y = 10,026.95 + l724.77X was a trend of increase through time and was significant (B = 0 at P s.05).
It is apparent that several of the more abundant species in the creel were not abundant in the rotenone slough samples. Since 1973 channel catfish and spotted sunfish have never comprised more than 3% of the game species weight in rotenone samples at Mud Lake (Table 4.) Yellow bullhead never exceeded 2.8% of the population weight. During this same interval these three species have collectively averaged 70% by number and 53% by weight of the river creel estimates. The slough samples apparently are not representative of the abundance of these species in the Suwannee River.
Graphical analysis of the pounds of game fish, bullheads, and bowfin was made to compare yearly changes between these categories (Figure 5).
39
70 -
60 50
40
30
+
20
-t
10
t
GA~1E FISH
t
AND BULLHEADS
40
30
0
0 0
20
><
10
.....C.-l
t
+>
~
en
60
r-
Q)
:2:
50
f
BULLHEADS
t
+
GM1E FISH
40 30 20
t t
t t
+
10
+
20
f 10
+ +t
+
+BOWFIN
1970 1971
1972 1973
1974
1975
YEAR
Figure 5. Mean estimates ~ 2 approximate standard errors of Suwannee River creel catch data.
42
:-;:.
. .. ~ .
Table 17. Summary of pounds creeled in the Suwannee River from 1970 to 1975a.
Species
1970
Bowfin
4846
Bull heads
9971
Warmouth
23952
Spotted sunfish 4470
Largemouth bass 3420
Chain pickerel
3193
Redbreast sunfish 996
Channel catfish
244
Bl uegi 11
808
Other
773
Total
52673
1971
1972
1973
1974
1975
5982 7639 2371
319 1411 2076
252 328 316
36 20730
13646 9167 7062 3644 3271 2569 1391
566 513 440 42269
6692 29390 15933
2940 3016 2403
595 2734
973 315 64991
13478 7028 2123 2821 2343 2012 258 3747 449 510 34769
11155 22079 4917
5742 1182 3379 1294 9833 2082
528 62191
a 1969 is not included since no weight data were collected.
40
significant catch rate relationship in the Suwannee River was weight per hour regressed on angler hours. Bass and Hitt (1973) reported a catch rate of 1.77 fish/hr for the lower Santa Fe River in Florida. Holder and Ruebsamen (1976) cited per hour catch rates for the upper and lower Satilla River in Georgia as 0.71 fish weighing 0.28 lb and 0.72 fish weighing 0.42 lb, respectively. Ober (1977) found that the per hour catch rates in the upper Flint River, Georgia was 0.60 fish weighing 0.63 lb. Pasch and McSwain (1974) reported a catch rate of 1.01 fish/hr weighing 0.38 lb in the lower Flint River. The catch rates for the Suwannee River have exceeded all these values.
Visual observations of changes in the catch by weight through time show that species catches varied yearly (Table 17). Warmouth appeared to be less dominant in the creel. Bullheads are now the dominant species and spotted sunfish and channel catfish are becoming more prominent. The only species to exhibit a significant change from 1970 to 1975 is channel catfish (Figure 4). The relationship Y = 10,026.95 + 1724.77X was a trend of increase through time and was significant (B = 0 at P ~.05).
It is apparent that several of the more abundant species in the creel were not abundant in the rotenone slough samples. Since 1973 channel catfish and spotted sunfish have never compris~d more than 3% of the game species weight in rotenone samples at Mud Lake (Table 4.) Yellow bullhead never exceeded 2.8% of the population weight. During this same interval these three species have collectively averaged 70% by number and 53% by weight of the river creel estimates. The slough samples apparently are not representative of the abundance of these species in the Suwannee River.
Graphical analysis of the pounds of game fish, bullheads, and bowfin was made to compare yearly changes between these categories (Figure 5).
39
15
0 0
0 10
><
Y - - 10026.95 + 1724.77 X (0.8755)
f
t t
+
+
+
1970 1971
1972
1973
1974 1975
Figure 4.
YEAR
Mean estimate 2 approximate standard errors of
channel catfish pounds harvested from the Suwannee River, 1~70-1975. (The regression equation and correlat1on coefficient is given since the slope was significant at P~ 0.05).
41
winter and early spring (Figure 6). A linear regression equation developed
for the relationship of pounds harvested to the mean winter flow (Jan -
, ..
April) in Figure 6 was Y = 22,434.7 + ll.52X. The correlation coefficient
was 0.83 and was significant at P.-s..05. Holder (l970c) noted that high
water during the late fall and winter resulted in fish movements into
the Suwannee River from the Okefenokee Swamp. Winter high water inter-
vals occurred prior to the 1970, 1972, 1973, and 1975 fishing seasons.
Catches of game fish and bullheads were higher in these years (Figure 5).
One area of concern about the Suwannee River fishery is the indi-
cation of a declining largemouth bass population. We earlier showed a
significant decline in the largemouth bass E values. Few young and
yearling bass were collected in the 1973-1975 rotenone samples (Appendix
Tables A-1 to A-6). The estimated number of largemouth bass harvested in
the creel since the high of 2,525 in 1970 was 928- 1971, 1,535- 1972,
1,380- 1973, 996- 1974 and 661 - 1975. The four month period surveyed
in 1976 had a bass harvest of 566. The regression equation of largemouth
bass number to years from 1970 to 1975 was Y = 3,324.14- 264.88X and was
a significant decline ( P = .05). Fished-for data on largemouth bass
showed a similar pattern and included data from Holder (l970b) and (l973b)
and Swanson and Holder (l974a). The fished-for catch ~ates were 0.47 -
1970, 0.30- 1971, 0.41 - 1972, 0.35- 1973, 0.13- 1974, 0.26- 1975 and
0.15- March-June 1976. A linear regression of these values to year
(Y = 0.6671 - 0.04628X) showed a significant decline. Pounds harvested
yearly showed a less definite trend and was non-significanto Largemouth
bass are one of the more popular species sought by fishermen. They also
are one of the top carnivores in the food chain. A continuing trend of
decline could pose some serious problems in the well being of this species
in the Suwannee River.
44
70
60 50
t
40
30 20
GA~1E FISH
+
t
.l\ND BULLHEADS
-t
10
40
30
0
0 0
20
><
10
.0
t
f
BULLHEADS
t
+
+-'
60 ..s:::
01 ClJ
3
50
40
30
20
t t
GAt-1E FISH
t
10
+
20
f 10
t
+
t
+
+BOWFIN
1970 1971
1972 1973
1974 1975
YEAR
Figure 5. Mean estimates ~ 2 approximate standard errors of Suwannee River creel catch data.
42
15
0 0
0 10
><
..0
Y - - 10026.95 + 1724.77 X (0.8755)
f
.+.c-:'
5
.,0...". \
<lJ 3:
t t
+
+
+
1970 1971
1972 1973
1974 1975
Figure 4.
YEAR
Mean estimate 2 approximate standard errors of
channel catfish pounds harvested from the Suwannee
River, 1970-1975. (The regression equation and
correlation coefficient is given since the slope
was significant at P~ 0.05).
t
41
Bullheads were separated from game fish to allow comparison of bowfin to sport fisheries. Total pounds game fish and bowfin caught with confidence intervals at P =.05 showed no significant differences between the catches of 1970 and 1975. There were, however, some changes during the years between. Game fish catches in 1971 and 1974 were generally significantly lower than in other years. The catches of game fish fluctuated yearly except for 1973. Bowfin catches in 1972 and 1974 were generally significantly higher than in other years. Bowfin yearly catches were less variable than game fish and were similar in 1970-1971 and 1974-1975.
Bullheads showed similar catches through 1972 and then fluctuated yearly. The harvest of bullheads in 1975 was significantly higher than the harvest in 1970. When bullheads were included with game fish catches, each year's harvest was significantly different from the previous year. However, there was no difference between the 1970 and 1975 harvest totals.
The pounds harvested of bowfin, game fish, bullheads, and game fish and bullheads combined were regressed to years. All equations were nonsignificant (B = 0 at P 5.05), suggesting that definable trends have not developed in the fishery. Changes in game fish catches could not be related to changes in bowfin catches in the creel. They also cannot be related to changes in the bowfin population (Figure 3) since fluctuations occurred i~ the creel from 1971 to 1975 even though the bowfin population had stabilized.
One factor which apparently influences the sport fishery of the Suwannee River is water flow. Higher fishing pressure and catch occurred in years with the higher mean annual flowso In fact, the higher pressure and catch values corresponded with those years having high water in the
43
In contrast to the generally healthy condition of the river fishery,
the quality of the fishery in the Okefenokee Swamp appears to be deter-
iorating (Table 18). Catch in 1970 was 195,178 fish weighing 93,451 lb.
The annual catch declined to 52,191 fish weighing 32,320 lb by 1975.
As in the river, the total number and pounds of fish creeled in the
Okefenokee Swamp showed positive relationships with angler hours; however,
the regressions were not significant (Table 19). The regression of angler
hours to year and fishing trips to year were also non-significant. Total
number and total pounds caught to time were both significant relationships
and the slopes were negative. Although fishing pressure has not changed,
fewer numbers and pounds of fish have been harvested from the Okefenokee
Swamp through the years.
Catch rates in the Okefenokee Swamp have also decreased even though
fishermen pressure did not increase significantly. The catch per hour
in 1970 was 2.07 fish weighing 0.99 lb (Swanson and Holder 1974b). In
1973, the catch rate had decreased to 1.58 fish/hr weighing 0.93 lb
(Table 18). By 1975 the per hour catch rate had dropped to 0.96 fish
weighing 0.60 lb. Regression equations of catch per hour and catch per
trip by number and weight against year were significant. In all cases,
the regression slopes were negative indicating trendstof decrease with
time.
A summary of changes in weight harvested by species from 1970 to
'..,'
1975 are presented in Table 20. Graphical analysis of warmouth, flier,
and largemouth bass illustrate the decline in the sport fishery (Figure
7). In 1970 warmouth pounds harvested in this portion of the swamp was
64,149 fish. By 1975 warmouth catch had declined to 12,847 lb. This
was an 80% reduction since 1970. A regression equation of pounds
warmouth caught against year was Y = 8qz80.81 - 7J03.89X and was
46
winter and early spring (Figure 6). A linear regression equation developed for the relationship of pounds harvested to the mean winter flow (Jan April) in Figure 6 was Y = 22,434.7 + 11.52X. The correlation coefficient was 0.83 and was significant at P.:::..05. Holder (1970c) noted that high water during the late fall and winter resulted in fish movements into the Suwannee River from the Okefenokee Swamp. Winter high water intervals occurred prior to the 1970, 1972, 1973, and 1975 fishing seasons. Catches of game fish and bullheads were higher in these years (Figure 5).
One area of concern about the Suwannee River fishery is the indication of a declining largemouth bass population. We earlier showed a significant decline in the largemouth bass E values. Few young and yearling bass were collected in the 1973-1975 rotenone samples (Appendix Tables A-1 to A-6). The estimated number of largemouth bass harvested in the creel since the high of 2,525 in 1970 was 928- 1971, 1,535- 1972, 1,380- 1973, 996- 1974 and 661 - 1975. The four month period surveyed in 1976 had a bass harvest of 566. The regression equation of largemouth bass number to years from 1970 to 1975 was Y = 3,324.14- 264.88X and was a significant decline ( P = .05). Fished-for data on largemouth bass showed a similar pattern and included data from Holder (1970b) and (1973b) and Swanson and Holder (1974a). The fished-for catch rates were 0.47 1970, 0.30- 1971, 0.41 - 1972, 0.35- 1973, 0.13- 1974, 0.26- 1975 and 0.15- March-June 1976. A linear regression of these values to year (Y = 0.6671 - 0.04628X) showed a significant decline. Pounds harvested yearly showed a less definite trend and was non-significanto Largemouth bass are one of the more popular species sought by fishermen. They also are one of the top carnivores in the food chain. A continuing trend of decline could pose some serious problems in the well being of this species in the Suwannee River.
44
Bullheads were separated from game fish to allow comparison of bowfin to sport fisheries. Total pounds game fish and bowfin caught with confidence intervals at P =.05 showed no significant differences between the catches of 1970 and 1975. There were, however, some changes during the years between. Game fish catches in 1971 and 1974 were generally significantly lower than in other years. The catches of game fish fluctuated yearly except for 1973. Bowfin catches in 1972 and 1974 were generally significantly higher than in other years. Bowfin yearly catches were less variable than game fish and were similar in 1970-1971 and 1974-1975.
Bullheads showed similar catches through 1972 and then fluctuated yearly. The harvest of bullheads in 1975 was significantly higher than the harvest in 1970. When bullheads were included with game fish catches, each year 1 s harvest was significantly different from the previous year. However, there was no difference between the 1970 and 1975 harvest totals.
The pounds harvested of bowfin, game fish, bullheads, and game fish and bullheads combined were regressed to years. All equations were nonsignificant (B = 0 at P 5.05), suggesting that definable trends have not developed in the fishery. Changes in game fish cat~hes could not be related to changes in bowfin catches in the creel. They also cannot be related to changes in the bowfin population (Figure 3) since fluctuations occurred i~ the creel from 1971 to 1975 even though the bowfin population had stabilized.
One factor which apparently influences the sport fishery of the Suwannee River is water flow. Higher fishing pressure and catch occurred in years with the higher mean annual flowso In fact, the higher pressure and catch values corresponded with those years having high water in the
43
80
70
0 0 0
><
_Q 50
40 ..s:::::
u
+r>o
u 30
,...-
ro
+>
0 I-
20
10-
/)\ CFS
/
\
/
r /
\
\
\
\
\
I I I
I POUNDS
/_
\
I
\ I 'w
\ \
\ \ \
\ \ \
' I
I
I I
I
I I
\ I
40
35 0 0
30 ><
(/)
I.J...
25 u
QJ
20
es..n. ro
..s:::::
u
15 Vl
0
s...
10 QJ .jJ
ttl 3
5
80
0 0
0 70
><
60
Vs...l
:::::l
:0c 50
I
c ro
~
4 0 - ""--
~
+s.>..
0
'+-
30
'w+-
,...- 20-
ro +>
0
I- 10-
/""/
\ CFS
/
\
/
f
\
I
\
I
7
I
I
I
I
I
I
I MAN-HOURS
I
I
I
\ I
'.I
40
35
0 0
><
30--
(/)
25 uI.J...
QJ
20 esr.o.n. ..s::::: u
Vl
15 r0
s...
10
QJ
-_+r.,>o...
5
19 0
1971
1972
1973
1974
1975
YEAR
Figure 6. Relationship of fishing pressure and catch to mean
winter (Jan.-April) water discharge in the Suwannee River. Water flows were taken from U.S. Geological Survey (197lb-1976).
45
.L.Cl
0
'<'I
CL
+-' tO
0
II
C)
..Q) Q) s... u
L.Cl
r--
(J)
..-
1
0
r--
(J)
0..
E
tO
3
Vl
Q) Q)Q) ~ :::::5
Or-
e ro Q) >
4Q.J+-'
~
0 +-' s::
os:: utO
"'04-
Q)r-
.... o..s::
.O .- O'l
Q)Vl
>Q)tO
"'0
(/) VlQ)
s::+-'
..o... r ou +' .... ro-o c:::::5r.s:-:
Q.J~
..so.:.:V.s-..l. Vl Q)
Vl+' Q)Vl
s...tO
0"> Q)S::
~c:(
.
(J)
Q) ..-
..0
rtO-
+' s::
Q)
"'0 :::::5 +' Vl
S::+'
0 s::
..... Q)
+' .....
.t.O- ..u...
Q)4-
Ss....
.
.
4-
Q)
u0u 0
s:: 0
Vl Vl
Q)
s...
Q) ~
L.Cl
(J)
N
0
. 0
0
(V) (J)
N
co (J) (J) co
CV'l
<:::1"
N
..-
. . . . CO r-- 0
r--
CV'l
(V)
(J)
<:::1"
0
0
N
N
co (V)
(V)
<:::1"
0
. . . . . . .L..-C-l
L.Cl
0
0
0
0
0
0
><
r-- ><
><
. <:::1" 0
. .><
c0 o
rr-
co
r-
.1..0
1..0
1c.o.0
N
+
+
..0..--
N
..-
N
(J)
L.Cl
r--
. . N
N
0
1..0
0
L.Cl
N
+
.
. . . N 1..0
N
(J)
0
L.Cl
(V)
(V)
r-
0
0
L.Cl
L.Cl
N
<:::1"
(J)
r--
N
0
(V)
1..0
.c.o-
1..0
L.Cl N
II
II
II
II
II
II
>- >- >- >- >- >-
s...
tO
Vs..l. Vs..l.
Q)
>-
:::::5
:::::5
:0r: :0r:
0
+'
s... s...
Vl
Q)
..-
0"> s::
Q) 0">
s::
s...
tO
..0.... .
rs.-..
s...
tO
Q)
s...
tO Q)
<
c:(
Q)
>-
>- >-
0">
0
0
s::
0
0
+-'
+-'
0 +'
_s::::
+'
+'
+'
+'
_s::::
_s::::
0">
0">
Vs..l.
Vl
LL
+'
_s::::
+' _s::::
0">
0">
:::::5
:::::5
:::::5
:::::5
:::::5
utO
tO
u
:0r:
40
utO
utO
s... +'
Q)
_s::::
s...
Q)
sQ..).
s...
Q)
+'
_s::::
..0
0"> r-
..0
..0
0">
E
:::::5
:z:
Q)
3
0"> E
cs:::r::
:::::5
:z:
E
:::::5
:z:
Q) 3
-!<
-!<
N
..-
(J)
<:::1" ..-
. . (J)
0
(V)
N
.
0
0
. . . L.Cl
0
L.Cl
0
0
L.Cl
(V)
1..0
1..0
N
(J)
.(V)
N
(J)
co
.1..0
0
0 1..0
...-
(J)
(V)
<:::1"
.Nco
(cJo)
. N
(J)
..-
1..0
. M
(J)
0
0
0
0
0
0
c>o<
0
.>.<-
0
><
><
><
(V)
><
1..0 <:::1"
0 0
. 0
0
0 0
. 0
0
. N
N 0
.(J)
0 0
..-
0
+ +
..r-- r--
. .<:::1" r--
.
1..0 <:::1"
L.Cl
<:::1"
c0 o
0
0
(V)
1..0
II
II
II
II
II
II
>- >- >- >- >- >-
t
Vs..l.
(/)
s...
:::::5
:::::5
:0r: :0r:
s...
Q)
sQ..).
r- ..-
s...
s...
s...
s...
0">
cs:::r::
0">
cs:::r::
tO Q)
>-
tO Q)
>-
tO Q)
>-
tO Q)
>-
0
0
0
0
0
0
+'
+'
+'
+-'
+-'
+-'
-s...
:::::5
:0r:
s...
Q)
-s... :::::5
:0r:
+-' _s::::
s...
-:::::5
0
:r: s...
Q)
-s...
::s 0
:r:
+-' _s::::
0..
-rs~.-..
sQ..).
0..
-rs~.-..
+-' _s::::
..0
E
0"> ..0
E
..0..".> .E.0
..0..".>
:::::5
:z:
Q)
3
:::::5
~
Q)
3
:::::5
:z:
Q)
3
48
In contrast to the generally healthy condition of the river fishery, the quality of the fishery in the Okefenokee Swamp appears to be deteriorating (Table 18). Catch in 1970 was 195,178 fish weighing 93,451 lb. The annual catch declined to 52,191 fish weighing 32,320 lb by 1975 As in the river, the total number and pounds of fish creeled in the Okefenokee Swamp showed positive relationships with angler hours; however, the regressions were not significant (Table 19). The regression of angler hours to year and fishing trips to year were also non-significant. Total number and total pounds caught to time were both significant relationships and the slopes were negative. Although fishing pressure has not changed, fewer numbers and pounds of fish have been harvested from the Okefenokee Swamp through the years.
Catch rates in the Okefenokee Swamp have also decreased even though fishermen pressure did not increase significantly. The catch per hour in 1970 was 2.07 fish weighing 0.99 lb (Swanson and Holder l974b). In 1973, the catch rate had decreased to 1.58 fish/hr weighing 0.93 lb (Table 18). By 1975 the per hour catch rate had dropped to 0.96 fish weighing 0.60 lb. Regression equations of catch per hour and catch per trip by number and weight against year were significant. In all cases, the regression slopes were negative indicating trends of decrease with time.
A summary of changes in weight harvested by species from 1970 to 1975 are presented in Table 20. Graphical analysis of warmouth, flier, and largemouth bass illustrate the decline in the sport fishery (Figure 7). In 1970 warmouth pounds harvested in this portion of the swamp was 64,149 fish. By 1975 warmouth catch had declined to 12,847 lb. This was an 80% reduction since 1970. A regression equation of pounds warmouth caught against year was Y = 8~80.81 - 7~03.89X and was
46
Total Effort U1an-Hours) X 1000
.,.,
......
lO
c
__.
N
w
.p.
(Jl
Q)
'-1
00
0
0
0
0
0
0
0
0
__ I
I
I
r
I
I
I
r
'CD
.Q)
1..0
0
~
~
cV > :..:..:..o...:..:..E... : :(:0o
><::I--'
<COrtQJ
' r o - s r o r t
'< ........
0......
..--..:::::~
__.
1..0
_'-_1.
fi /.
/
<
--'::;:GVl
I..OOJQJ:::::J '-1 rt ::I ...... __. CD "0
......... .......
.........
0I "'
I
l::>O
__. -1) "0 -1)
__.
.........
....... .......
'1-..10 0__. .'..... -1)
1..0 '-1
.p.
(Jl
.Q) ::E __. ......
'-"" (/) ..__. l/)
:::::>
N
-<
::E ::E ...... rT1
CO OJ :::::I l::>
3:
zl::>
I
:::c
"' \ \
0 c
\
c' ocrot lO :::0 __.
:::0
(/)
)"0
' rt
QJ 0.. CD
;A' ...... Vl
1..0
w'-1
\
- _).
...-
CD Vl Vl :::::I(')C
-t)Q::J:C::>O'
' ' 0 lO QJ
3 CD ::I
__.
1..0
0..
C-'
. ::I (')
(/)
QJ
. rt rt
.'-p1.
:::::> (')
G> CD :::::> CD
__.
OV>rt
1..0
--'CO
'-1
0 ::E
(Jl
lOOJ3
-'::I CD (') ::I QJ
QJCO:::::I
--'CD
- - ...-
<
--
...._
---
--
(.,".),
(/)
....... ....._
.............
........ ........
~
__.
__.
N
(Jl
0
(Jl
0
N
w w
.p.
(Jl
0
(Jl
0
~Jater Discharge (CFS) X 100
Total Catch (1b) X 1000
__.
N
w
.p.
(Jl
Q)
'-1
00
0
0
0
0
0
0
0
0
I
I
I
I
I
I
I __j
_,..
/ / / /
/
/
<........ ......::
:--... .......
........
......... .......
""0
0cz
0
~
\
\
(/)
\
- -- - - -----/
eo("
....... ....... .......
.........
........ .......
........ ....... ........
-\ _;.
.(,".),
(/)
__.
__.
N
(Jl
0
(Jl
0
N
w
(Jl
0
w
.p.
(Jl
0
~Jater Discharge (CFS) X 100
....,
-;:,,3~fi.Y
Table 18. Summary of estimates of fishing pressure, catch, and catch rate in the southeast corner of the Okefenokee Swamp from 1970 to 1975 including data from Swanson and Holder (l974b).
Year Angler Hours Fishing Trips
Total Harvest
No.
Ugt.(lb)
Catch Rate No/Hr Lb/Hr
Catch Rate No/Trip Lb/Tri p
1970
94174
19457
195178
93451
2.07
0.99
10.03
4.80
1971
53857
13233
92216
49970
l. 73
0.93
6.96
3. 77
1972
71671
17267
99584
55771
l. 50
0.84
5.76
3.22
1973
66475
19051
104751
61715
l. 58
0.93
5.48
3o23
1974
79186
20445
108572
63077
1.37
0.80
5.31
3.08
1975
54156
16263
52191
32320
0.96
0.60
3.20
l. 98
.p.
'-1
.,
-'
LCI s::::
-s
(J)
.'-I
\.0
'-I
0
(J1
0
VlC'DO:::
-'.D 7' (J)
LCIS::::C'DOJ :::::l OJ -t, :::::l
-' rt (J)
-t, -' :::::l (J)
-'0 0 Vl
():::::l7'rt
OJ Vl (J) -'
:::::l
(J) 3
\.0
'-I
I
I I
rt OJ
OJ
:::::l (/) rt
VlO..:EC'D
U"1
__, OJVl 0 () 3
__,
"(J')0-0s "'01+
~~
I
I
I
0
V
l)
(J)
(-s)
N
OJ __, (J) OJ
-<
N
rt OJ (J) "'0 !T1
rt __, "'0 :X::.
-o -' -s ;:o
'" g
0
~
rt
~
-'
nn3
0 0 ::::T"OJ
I ~4 I
I
w
U"1 (J)
rt
--t,O..C'D
-t, OJ
-' rt Vl ()0Jrt
__,
-' s:u
(J)
:::::l
:::::l ......... 0..
rt Vl
:
:o
(J)
O-Js
~1 +
+:>
LCI 0..
O -s
(J)
LO
J)
(J)
Vl
V_l ,
(-Js) ,-os
-' 0 -s
~~+
-<
II
__,
.'cc-ooI
w
U"1 '-I
.......... __.
0 cc
co
+:>
\.0
(J1
\_._0, +w:>
...__.. ><
.,
m I......
;:o
<:::::SVl
U"1
(J)
:::::l
0
-t,
-t,
-0 s
Weight (lb) X 1000
__,
U"1
(J1
0
N
w
+:>
(J1
0'>
'-I
cc
\.0
0
0
0
0
0
0
0
0
0
0
0
~
~
~
I
I I
t--f-4-<
II
I
+:> :X::.
cN o
;:o
G')
0
!T1
+~ 3: 0 c
::;:j
...-...N o:J
o+:> :X::.
(J1 (/)
.J_,
'-I U10
(/)
...,..... WO'>
0><
t---f---4
-<
II
co
0'>
.cNo
0
_c_o,
:::::
:X::. ;o 3:
I
0 c
-I
.-'-~
0 __,
'-I 0w
~
\.0 0
co
\.0 \.0
-><
Table 19. Regression equations developed on Okefenokee Swamp 1970-1975 creel (El = 0 at P ~.05).
An asterisk indicates a significant t value.
Regression
Corre 1ati on
Coefficient
Student ''t 11
df
Number Caught to Angler Hours
Y = - 70056.02 + 2.47X
0.7075
2.0025
4
Weight Caught to Angler Hours
Y =- 15520.12 + l.04X
0.6945
1 . 9309
4
Angler Hours to Year
Y = 81253.95 - ll08.97X
0.1548
0.3838
4
Number of Fishing Trips to Year Y = 16023.67 + 212.80X
0.1513
0.3749
4
+c:o>
Number Caught to Year
Weight Caught to Year
Y = 253412.62- 19lll.l7X 0.7643
2.9029
4
Y = 116909.43 - 7586.66X 0.7103
2.4718
4
Number/Hour to Angler Hours Weight/Hour to Angler Hours Number/Hour to Year Weight/Hour to Year Number/Trip to Year Weight/Trip to Year
Y = 0.91 +.000008X Y = 0.74 +.OOOOOlX Y = 3.14- 0.22X Y = 1.46- 0.09X Y = 14.57- l.l3X Y = 6.8071 - 0.46X
0.2392
0.3942
4
0.0689
0.2011
4
0.9160
5.5916*
4
0.8243
3.5673*
4
0.9289
6.1501*
4
0.9361
6.5009*
4
40
. ~
QJ
c _...._.
~..0 Oo:::t
Ur--.
(j)
+-'.-
(/) ~
rO
QJ ~ .S::::.QJ
+-' -o
:::l ....--
00
1./l:::C
.sQ::::.J"cO
+-'tO
c c
.-- 0
(/)
QJ c
+-'tO
tO 3
~(/)
.S::::.E u 0
+-'~
104u
tO
-o +-' c tO tO-o
.-~
.1...-..-...
QJ..O +-' _J
tO 0::: .s::::.
u +-' .--
tO ~
Ul.-....-....
z 0
~
:::r:: ......... QJ..O +-' _J
tO 0::: .s::::.
u
+-'~
utO-....::.:.r.::. z 0
. . . c0o
r--. r--.
N N
(V)
N
0
<:::t
(V)
(V)
(V)
.co co
0
(j)
(V)
. . . . . . (V) \.0 \.0 co .- 0
0
(j)
r--.
<:::t
(V)
N
0
\.0
U"l
U"l
U"l
(V)
. . . . . . (j)
(j)
(V) (j)
c<:o::t
(V) (j)
c0 o
0 \.0
0
0
0
0
0
0
.r--.
(V)
0
r--.
0
U"l
co
U"l
. . r--. \.0
(V)
(j)
N
0
.s:":O ::.c"l
Ur+-' -o
rO :::l
u .u
Q"JC r-
~
r-
0
r-
U"l
r--.
0
U"l r--. r--. r- r--. N
<:::t (j) r--. r--. 0
(V)
(V)
(j)
U"l
r-
(V)
N
(j)
<:::t
U"l
\.0
\.0
(V)
:::lU"l
(/) r--.
(/) (j)
QJ r-
~
r-
Cl.O tO
+-'
CJ)
co
. +-'
0
co
1--
r--.
\.0
<c:o::t
rU"l
N
r--.
r(j)
.-- r--. .s::::. (j) (/) .-
.--
z 0
r-
N
U"l
N
U"l (j)
r--. <:::t
cUo"l
r-
N
(j)
(j)
(j)
0
0
U"l
'+-E
0 4- ~
04-
(/) 0..
QJ E
+-'tO
tO 3
..cO...."l (/)
r--.
U"l
(V) (V)
r--.
\.0
rL.'">
U"l
<:::t
(V)
\.0
EVl .s::::. .-- <:::t N
N
0
<:::t N
(/) ~
(j)
(V)
r--.
(j)
0
\.0
+-'QJ .-- 1--
N
(/) QJ l.L.
QJ~
0
4-C
OQJ
(/)
4-
~
>,OJ
:::l
~~
0
tOO :::r::
EE <lJ.
~
:::l .s::::.
QJ
Vl +-' r-
<:::t r--.
r--.
cUo"l
r-
r--.
\.0
L.'")
r--. o:::t
\c.o0
r-
\.0
!..{)
r-
<:::t
(V)
r-
\.0
(j)
<:::t
(j)
U"l
r--.
\.0
r--.
U"l
.
O"l
c
c:::r::
CX)
QJ
~
0
.- N
(V)
<:::t
U"l
..0
tO
r--. r--. r--. r--. r--. r--.
tO
QJ
(j)
(j)
(j)
(j)
(j)
(j)
1--
>-
47
..
Table 20. Summary of pounds creeled in the Okefenokee Swamp from 1970 to 1975.
Species Bowfin Bullheads Warmouth Flier Largemouth bass Chain pickerel Spotted sunfish Bluegill Other Total
1970 3120 6215 64149 11426 3086 5381
74 93451
1971 4758 5940 29530 3485 2290 3764
203 49970
1972 9552 4985 27130 5174 2750 5346
127 626 81 55771
1973 8746 13279 29442 1982 2475 5321
58 231 181 61715
1974 9254 10489 32264 1344 2442 5207 1428
284 365 63077
1975 4577 8255 12847 448 1381 4588
130 60 34
32320
49
Table 21. Changes in fished-for catch rates of warmouth and largemouth bass in the Okefenokee Swamp.
Warmouth
Year
No/Hr
Largemouth bass No/Hr
1970
1.72
0.22
1971
1.43
0.26
1972
1.16
0.15
1973
1.22
0.15
1974
1.24
0.14
1975
0.60
0.08
52
100 90 80 70
60
50
40 30
20
10
0 0 0
>< ........
..0 10
.+.s:-::'
5
01
r-
:O:;J:
t
f
15
UARMOUTH
y = 86280.81 - 7103.89X
(0.7909)
t t
LARGEMOUTH BASS
y = 4280.10- 245.06X
t
t
+ + (0.7530)
10
FLIER
y = 17883.57 - l849.34X
5
t
(0.8591)
t + +
1970 1971
1972
1973
1974
1975
Figure 7.
YEAR
11ean estimates ~ 2 approximate standard errors of Okefenokee Swamp creel catch data. (Regression equations and correlation coefficients are given for significant slopes at P~ 0.05).
50
Table 20. Summary of pounds creeled in the Okefenokee Swamp from 1970 to 1975.
Species Bowfin Bullheads Warmouth Flier Largemouth bass Chain pickerel Spotted sunfish Bluegill Other Total
1970 3120 6215 64149 11426 3086 5381
74 93451
1971 4758 5940 29530 3485 2290 3764
203 49970
1972 9552 4985 27130 5174 2750 5346
127 626 81 55771
1973 8746 13279 29442 1982 2475 5321
58 231 181 61715
1974 9254 10489 32264 1344 2442 5207 1428
284 365 63077
1975 4577 8255 12847 448 1381 4588
130 60 34
32320
49
significant. Largemouth bass exhibited less of a decline than warmouth and flier. Although bass are not an abundant species in the swamp creel, a regression equation was developed of pounds caught to year. The relationship Y = 4,280.10- 245.06X was significant forB= 0 at P 5.05.
Fished-for catch rates were examined for warmouth and largemouth bass in the Okefenokee Swamp to determine if they exhibited similar trends and included data from Holder (l973b) and Swanson and Holder (l974b) (Table 21). Warmouth and largemouth bass fished-for catch rates regressed against year showed a significant decline (Y = 2.5376- O.l746X and Y = 0.3938 - 0.0303X, respectively). Fished-for catch rates were not analyzed for flier since so little fishing effort was applied toward this species.
The decline in the Okefenokee Swamp cannot be related to bowfin abundance in the creel since bowfin harvest demonstrated no definable pattern (Figure 8). Confidence intervals applied to bowfin pounds harvested showed a significant increase in 1972 and a significant decrease in 1975. The regression equation of bowfin pounds harvested against years was non-significant (B = 0 at P 5.05).
The decline of catches in the Okefenokee Swamp may be related to the phenomena of water level conditions and habitat space. Holder (1970c) noted that the Okefenokee Swamp was dependent upon local rainfall because of its small watershed of 1,100 square miles. Holder stated that during wet seasons, most of the swamp may be covered with water, and during a severe drought only the open areas may contain water. Since most of the swamp drainage flows into the Suwannee River (Cypert 1961), water discharge records for the Suwannee River (Table 22) would identify the wet years in the Okefenokee Swamp. The period from 1964 to mid 1967 was almost a continuous high water interval. Such a high water period would cause the
51
Table 22. Mean monthly water discharge in cubic feet per second at Fargo, Ga. on the Suwannee River from October 1960 to September 1976 (from U. S. Geological Survey records 1961-1976).
Water Year Oct. Nov. Dec. Jan. Feb. Mar. Apr. May June July Aug. Sept. Mean
1961 2878 561 239 555 1616 1157 3569 1817 525 742 746 2443 1398
1962
310 94 104 304 238 802 2902 322 87 224 414 607 532
1963
353 109 233 428 2179 2928 669 131 143 470 156 64 647
1964
74 16 140 2839 2913 3674 1026 2344 301 1483 5101 6471 2197
1965 4151 2041 2584 2127 2204 4769 3216 929 809 969 1203 445 2125
1966
697 235 388 1346 3204 5631 1490 1138 2835 1945 2233 618 1808
(.)1
.f:>
1967
955 431 256 2257 2571 1098 213
74
89 398 1168 536 828
1968
62
36 128 259 135 110
38
27
40
37 180 265 110
1969
37
58 185 280 389 1452 906 709 1315 626 1409 1549 743
1970
1663 2896 1464 1799 2105 1952 3359 739 557 352 3020 1488 1777
1971
268 189 121. 557 1031 797 563 1174 214 942 3181 3301 1028
1972
635 245 1184 3384 4387 1834 1526 467 678 1221 242 392 1340
1973
131 123 422 828 3062 2379 8330 2606 4258 2132 1817 909 2231
1974
346 140 181 320 551 384 557 273 219 519 552 2048 505
1975
899 151 252 1658 2673 1920 3874 1894 745 909 2018 1506 1532
1976
845 349 218 533 919 661 384 917 1729 1609 573 1098 818
--'
--'
<..0
<..0
<..0
<..0
<..0
<..0
-ro<
-.....!
-.....!
-.....!
-.....!
-.....!
-.....!
OJ
-I OJ o-
U1 +::> W
N
--' 0
""'5
--'
ro
. N
--'
::0::: OJ
-'On ::::s-+,;;;
. . . 0
--'
O'l
N
N
0
+::> N
. . . --'
--'
--' +::> -.....!
O'l
W
N
Z""'S
0 3
-0 :I:C ""'Sri"
;::;
OJ
rt::E:::::S
=>OJ!..C
t'D""'St'D
3 (/)
0
7'
0 c
......
(.)1
r,;,
rort::::s
-+>;::;
r::o::s OJ .-.+..>..
0 ::::s (/)
7' 0.;::;
ro ro
. . . . . . 0
0
0
0
0
0
0co
--'
+::>
--'
(.)1
--' U1
N O'l
N N
I OJ ""'5 !..C
ro Z3
0 0
-c
:I: rt
""'5 ;::;
('0--'0.
OJI Vl""'S-+, ::E: !..C 0 OJt'D""'S
-3o3o n c OJ
rt rt
;::; ()
;::;
oOJ""'S
(/)OJ
o-
OJ
Vlrlro
(/)
(/)
(/)
significant. Largemouth bass exhibited less of a decline than warmouth and flier. Although bass are not an abundant species in the swamp creel, a regression equation was developed of pounds caught to year. The relationship Y = 4,280.10- 245.06X was significant forB= 0 at P $.05.
Fished-for catch rates were examined for warmouth and largemouth bass in the Okefenokee Swamp to determine if they exhibited similar trends and included data from Holder (1973b) and Swanson and Holder (l974b) (Table 21). Warmouth and largemouth bass fished-for catch rates regressed against year showed a significant decline (Y = 2.5376- O.l746X and Y = 0.3938- 0.0303X, respectively). Fished-for catch rates were not analyzed for flier since so little fishing effort was applied toward this species.
The decline in the Okefenokee Swamp cannot be related to bowfin abundance in the creel since bowfin harvest demonstrated no definable pattern (Figure 8). Confidence intervals applied to bowfin pounds harvested showed a significant increase in 1972 and a significant decrease in 1975. The regression equation of bowfin pounds harvested against years was non-significant (B = 0 at P $.05).
The decline of catches in the Okefenokee Swamp may be related to the phenomena of water level conditions and habitat space. t Holder (1970c) noted that the Okefenokee Swamp was dependent upon local rainfall because of its small watershed of 1,100 square miles. Holder stated that during wet seasons, most of the swamp may be covered with water, and during a severe drought only the open areas may contain water. Since most of the swamp drainage flows into the Suwannee River (Cypert 1961), water discharge records for the Suwannee River (Table 22) would identify the wet years in the Okefenokee Swamp. The period from 1964 to mid 1967 was almost a continuous high water interval. Such a high water period would cause the
51
20 10
130 120
110 100 90 ccc 80 _o 70 60 +-'
.s:::.
Ol
.--
<lJ
3 50 40 30 20 10
+
+
t
t
BULLHEADS
+
GAME FISH (0.7958)
Y 112475.4- 9013.0X
t
20
10
+
BOt~FIN
+
1970
1971
1972
1973
1974
1975
YEAR
Figure 8.
Mean estimates 2 approximate standard errors of
Okefenokee Swamp cree 1 catch data. (Regression
equations correlation coefficients are given for significant slopes at P~0.05).
53
yearly fluctuations, however, could be related to high water in the winter. Unlike the Suwannee River, the Okefenokee Swamp sport fishery seemed
to be deteriorating in its quality with the most notable declines being in catch rates and in harvest of warmouth, flier, and largemouth bass.
Waterlevels in the swamp were thought to cause these changes in the fishery of the Okefenokee Swamp. Changes in the Suwannee River and Okefenokee Swamp fishery seemed to be influenced to a great degree by
factors other than bowfin abundance. RECOI~t1ENDATI ONS
Bowfin population estimates should be performed periodically in the
Suwannee River to monitor the population level for major changes. Future ...
,-;_J;.
removal efforts should be based on these estimates. Consideration should be given to evaluating the status of the large-
mouth bass in the Suwannee River in light of the indicated population
decline. The U. S. Fish and Wildlife Service should be made aware of the
deteriorating status of the Okefenokee Swamp fishery. Consideration should be given toward determining the causes of the apparent decline in
the Okefenokee sport fishery.
LITERATURE CITED
t
Bass, D. G. Jr. and V. G. Hitt. 1973. Creel census of the lower Santa Fe River. Sport fishery ecology of the Suwannee and Santa Fe Rivers, Florida. Fla. Game and Freshwater Fish Comm. Rept 1, Study 4: 169-184.
Cypert, E. 1961. The effects of fires in the Okefenokee Swamp in 1954 and 1955. Amer. Midl. Nat. 66 (2): 485-503.
Dahlberg, M. D. and D. C. Scott. 1971. The freshwater fishes of Georgia. Ga. Acad. Sci. Bull. 29: 1-64"
Germann, J. F. 1973. Population studies, streams-Suwannee River. Ga. Dept. Nat. Res., Game and Fish Div. Ann. Prog. Rept., Fed. Aid Project
F-21-4, Study XVI, Job 2: 29-42.
56
~
Q)
>
0:::
QQ)JI.r.-Oce m . -
<01 3:.-
(:/:':):11m..0
Q)
..s::::: Vl
+-' -o ~
.oc u0 Q) ~
n:l <.!:'>,
Q)
.. >
0~
O'l ::I
~ (/')
n:l l.L. . -
<0 +-' u <Or-
O'l
-oo c roo u Q)
. QJ<.!)
Vl
~(/') Q)
0.
::;)
+-' GJ E Q) 0
4-~
u .4.....-...
..0 1..0
:u:I mr--
c
r- ~
Q)
QJ..O
OlE
~ Q)
<0+-'
..s::::: u
0.
Q)
Vl (/')
r-
-oo
+-'
~
QJO
+n-:' s1m..0
3:.-
>,~
.-G) ..s::::: ..0 +-'0
C0 +u-' EO
c E
n:l 0
Q) ~
:::E4-
N N
Q)
.-
..0 n:l 1-
L.{)
CX)
CX)
0
N
0
N
CX)
CX)
(V')
r--
CX)
0
.-
L.{)
N
CX)
r:-~-"
rr----
N 0
:~"
(V')
0
(V')
.-
(V')
N
L.{)
L.{)
CX)
N
L.{) :~"
CX)
.-
1..0
(V')
L.{)
1..0
m
:~"
CX) CX)
.0
N m
:~"
1..0
L.{)
N
L.{)
:~"
(V')
(V')
(V')
CX) :~"
1..0 0
mCX)
0
L.{)
0
N
1..0
:~"
r--
:~"
r:~"
1..0
L.{)
.0 .-
L.{)
(V')
0 N .-
(V')
(V')
N N
CX)
1..0
0
CX)
m
0
:~"
0
N
0
(V')
rCX) r(V')
N
:~"
N
r--
rCX)
.-
N
L.{)
L.{)
CX)
r-
0 N
(V')
r--
L.{)
m 1m..0
L.{)
m:1"
mCX)
(V')
r--
(V')
1..0 N 1..0
N
L.{)
(V')
N
m:1"
.N N
N
(V')
.-
.m-
L.{)
N
Q)
L.{)
r--
(V')
.-
c N
CX)
:1"
0
::I
L.{)
.-
(V')
r-:l
r--
L.{)
L.{)
:~" r-
N
Cr-X-)
1..0
CX) L.{)
N
.-
N
L.{)
r:-1-"
m rN--
:~"
r--
rCX)
N N
(V')
,.......
(V')
:~" :~" (""')
m
N
m
CX)
. -(V')
:~"
r--
r--
N
m
0
r--
(V')
r--
N
N
m N
m
1..0
1..0
L.{)
0 m
1..0 1..0
N 0
r-
N
<
(V')
N
,....-
(V')
.-
N
CX) (V')
1..0
0 m
m
L.{) (V')
(V')
1..0
L.{)
1..0
N
L.{)
0
(V') (V')
r--
L.{) L.{)
:~"
r--
CX)
:~" CX)
(V')
(V')
CX)
(V')
r-- N
CX)
L.{)
c0 o
N m
N
.
CX)
m
..0
Q)
.-
1..0
(V')
N
r--
.-
mr -
l.L.
N
N
.
c
L.{)
:~"
CX)
m
n:l
L.{)
0
N
(V')
r-:l
L.{)
(V')
:~"
CX)
N
.
u
m
:~"
(V')
Q)
(V')
0
(V')
0
N
N
.
> .-
z 0
1..0
L.{)
.1.-.0
.
+u-'
CX)
0
(V')
0
r--
.-
L.{)
CX)
(V')
(V')
~
N
n:l
Q)
>-
~
Q) .- N
(V')
+-'
::ns::l
1m..0
1m..0
.1m.-.0
.-
(V')
CX)
m
0
1..0 0
L.{)
N
N
L.{)
L.{)
. -:~"
m
m
:~"
r-- CX)
(V')
(V')
N
:~"
0 N
:~"
0 N
r-
r--
L.{)
L.{) (V')
m
CX)
(V')
L.{)
0
.-
(V')
0
r--
CX)
(V')
N 1..0 0
.-
L.{) L.{)
N
(V')
N
N
:~"
(V')
r--
r-- m 0
r--
:~"
CX)
0
N
L.{)
L.{)
CX)
L.{)
CX)
N
N
r-
N
N
N
L.{)
(V')
CX)
(V')
N
N
(V')
:~"
CX)
1..0
CX)
L.{)
CX) L.{)
CX) (V')
L.{)
N
.N- .CX-)
N
r-
:~"
N
.-
N
CX)
N
CX)
:~"
.-
L.{)
:~"
(V')
0
N
N
1..0
(V')
CX) L.{)
1m..0
CX)
m
CX)
L.{)
:~"
N
(V')
.N -
N
L.{)
N
r--
(V')
CX)
L.{)
.-
L.{)
1..0
(V')
1..0
1..0
(V')
("")
m
.1.-.0 N
1..0
L.{)
1..0
1..0
m
1m..0
CX)
m
1m..0
1m..0
,....-
.- N
r-- r-m .m-
0 .-
.Nm-
1..0 1..0
(V')
r--
1..0
mr -
N
CX)
(V')
L.{)
(V')
.1.-.0
L.{)
N
L.{)
CX)
.-
N
N
.-
L.{)
.-
L.{)
1..0
.mr---
mr--
,.....-
54
20 10
130
120
110 100
90 ccc 80
_o 70
+>
_c
60
CJ)
ClJ
3 50
40
30
20
10
+
+
t
t
BULLHEADS
+
GAME FISH (0.7958)
y 112475.4- 9013.0X
t
t
20
10
+
BO\~FI N
1970
1971
1972
1973
1974
1975
YEAR
Figure 8.
Mean estimates 2 approximate standard errors of
Okefenokee Swamp creel catch data. (Regression equations correlation coefficients are given for significant slopes at P~0.05).
53
Okefenokee Swamp to become a large shallow lake through several growing seasons. In addition, a spillway dike was completed in 1960 which raised the water table of the swamp by an undetermined alllount and acted as a water retention dam during drought periods (Holder 1970c). The dike separated the Suwannee River from the swamp during most flows.
The high catches of warmouth in the creel in 1970 and 1971 may have resulted from the high water periods of 1964 to mid 1967. Germann et al. (1974) described warmouth age frequencies through 1972 from the Suwannee River and Okefenokee Swamp which contained substantial numbers of fish age V and older in the 1964 to 1968 year classes. Since then warmouth recruitment apparently has not been able to maintain the yearly catch level. It is also possible that this period of high water in the midsixties created habitat conditions that led to the build up of bowfin in the Suwannee River before removal. Bowfin reproduction has been reported in the swamp during high water years (Holder 1971).
Following the removal of bowfin in 1968, Holder (l973a) postulated that bowfin would attain population levels similar to those before removal and that the sport fishery would decline in quality. From the analysis of the fish population we saw that bowfin increased in abundance but not to the levels indicated before removal. A significant decline was indicated in standing crop and E values of largemouth bass and warmouth. \-Jhen we examined the sport fishery data from the Suwannee River and the Okefenokee Swamp, we found that the Su\vannee River fishery was variable with no significant pattern of increase or decrease except for the increase in channel catfish. Largemouth bass and warmouth harvest in pounds appeared to be declining; however, the trend was not a significant one. Yearly fluctuations in the Suwannee River sport fishery could not be related to bowfin abundance in the river or in the creel. The
55
Snedecor, G. W. and W. G. Cochran. 1968. Statistical methods. Iowa St. Univ. Press. Ames, Iowa. 593pp.
Surber, E. W. 1959. Suggested standard methods of reporting fish population data from reservoirs. Proc. 13th Ann. Conf. S.E. Assoc. Game and Fish Comm. 13: 313-324.
Swanson, C. D. and D. R. Holder l974a. Stream creel census-warmwater Suwannee River. Ga. Dept. Nat. Res., Game and Fish Div. Final Rept.,
Fed. Aid Project. F-21-5, Study XV, Job 3: 31-53.
----~~-1974b. Stream creel census-warmwater, Okefenokee Swamp. Ga. Dept. Nat. Res., Game and Fish Div. Final Rept., Fed. Aid Project F-21-5, Study XV, Job 3: 54-73.
Swingle, H. s. 1950. Relationships and dynamics of balanced and unbal-
anced fish population. Auburn, Ala. Polytech Inst., Agr. Exper. Sta. Bul. 274: 1-73.
u. s. Geological Survey. 1961. Surface water records of Georgia, 1961. u. s. Dept. Int. 1962. Surface water records of Georgia, 1962. u. s. Dept. Int. 1963. Surface water records of Georgia, 1963. u. s. Dept. Int.
1964. Surface water records of Georgia, 1964. u. s. Dept. Int.
1965. Water resources data for Georgia, 1965-Part 1: Surface
water records. u. s. Dept. Int.
water19re6c6o. rdWs. ateur.
resources
s. Dept.
data Int.
for
Georgia,
1966-Part
1:
Surface
water19re6c7o. rdWs. ateur.
resources
s. Dept.
data Int.
for
Georgia,
1967-Part
1:
Surface
1968. Water resources data for Georgi a, 1968-Part 1: Surface
water records. u. S. Dept. Int.
t
197la. Water resources data for Georgi a, 1969. u. s. Dept. Int.
197lb. Water resources data for Georgia, 1970. u. s. Dept. Int.
1972. Water resources data for Georgia, 1971. u. s. Dept. Int.
1973. Water resources data for Georgi a, 1972. u. s. Dept. Int.
1974. vJater resources data for Georgia, 1973. u. s. Dept. Int.
1975. Water resources data for Georgia, 1974. u. s. Dept. Int.
1976. Water resources data for Georgi a, 1975. u. s. Dept. Int.
1977. Water resources data for Georgia, 1976. u. s. Dept. Int.
"i
58
.. :. :, -:~1-i::'~.:-: -~.
~
~
\;rl:f,f
-./.: .
.;->
.. ';:,;. .::\ixl~;-
yearly fluctuations, however, could be related to high water in the winter. Unlike the Suwannee River, the Okefenokee Swamp sport fishery seemed
to be deteriorating in its quality with the most notable declines being in catch rates and in harvest of warmouth, flier, and largemouth bass. Water levels in the swamp were thought to cause these changes in the fishery of the Okefenokee Swamp. Changes in the Suwannee River and Okefenokee Swamp fishery seemed to be influenced to a great degree by factors other than bowfin abundance.
RECOf-1f1ENDATI ONS Bowfin population estimates should be performed periodically in the Suwannee River to monitor the population level for major changes. Future removal efforts should be based on these estimates. Consideration should be given to evaluating the status of the largemouth bass in the Suwannee River in light of the indicated population
decline. The U. S. Fish and Wildlife Service should be made aware of the
deteriorating status of the Okefenokee Swamp fishery. Consideration should be given toward determining the causes of the apparent decline in the Okefenokee sport fishery.
LITERATURE CITED Bass, D. G. Jr. and V. G. Hitt. 1973. Creel census of the lower Santa Fe
River. Sport fishery ecology of the Suwannee and Santa Fe Rivers, Florida. Fla. Game and Freshwater Fish Comm. Rept 1, Study 4: 169-184. Cypert, E. 1961. The effects of fires in the Okefenokee Swamp in 1954 and 1955. Amer. f1idl. Nat. 66 (2): 485-503. Dahlberg, M. D. and D. C. Scott. 1971. The freshwater fishes of Georgia. Ga. Acad. Sci. Bull. 29: 1-64. Germann, J. F. 1973. Population studies, streJms-Suwannee River. Ga. Dept. Nat. Res., Game and Fish Div. Ann. Prog. Rept., Fed. Aid Project F-21-4, Study XVI, Job 2: 29-42.
56
Okefenokee Swamp to become a large shallow lake through several growing seasons. In addition, a spillway dike was completed in 1960 which raised the water table of the swamp by an undetermined a~ount and acted as a water retention dam during drought periods (Holder l970c). The dike separated the Suwannee River fro~ the swamp during most flows.
The nigh catches of warmouth in the creel in 1970 and 1971 may have resulted from the high water periods of 1964 to mid 1967. Germann et al. (1974) described warmouth age frequencies through 1972 from the Suwannee River and Okefenokee Swamp which contained substantial numbers of fish age V and older in the 1964 to 1968 year classes. Since then warmouth recruitment apparently has not been able to maintain the yearly catch level. It is also possible that this period of high water in the midsixties created habitat conditions that led to the build up of bowfin in the Suwannee River before removal. Bowfin reproduction has been reported in the swamp during high water years (Holder 1971).
Following the removal of bowfin in 1968, Holder (l973a) postulated that bowfin would attain population levels si~ilar to those before removal and that the sport fishery would decline in quality. From the analysis of the fish population we saw that bowfin increased in abundance but not to the levels indicated before removal. A s~nificant decline was indicated in standing crop and E values of largemouth bass and warmouth. \Jhen we examined the sport fishery data from the Suwannee River and the Okefenokee Swamp, we found that the Suwannee River fishery was variable with no significant pattern of increase or decrease except for the increase in channel catfish. Large~outh bass and warmouth harvest in pounds appeared to be declining; however, the trend was not a significant one. Yearly fluctuations in the Suwannee River sport fishery could not be related to bowfin abundance in the river or in the creel. The
55
Germann, J. F., L. E. McSwain, D. R. Holder, C. D. Swanson. 1974. Life history of warmouth in the Suwannee River and Okefenokee Swamp, Georgia. Proc. 28th Ann. Conf. S.E. Assoc. Game and Fish Comm. 28: 259-278.
Holder, D. R. l969a. Applied management in warmwater streams. Ga. Game and Fish Comm. Ann. Prog. Rept., Fed Aid Project F-21-l, Study VI, Job l. 43pp.
----~---l970a. Population studies-streams. Ga. Dept. of Nat. Res., Game and Fish Div. Ann. Rept., Fed. Aid Project F-21-2, Study XVI, Job 2. 66pp.
----~---l970b. Stream creel census-warmwater. Ga. Dept. Nat. Res., Game and Fish Div. Ann. Prog. Rept., Fed. Aid Project F-21-2, Study XV, Job 3. 24pp.
----~--_l970c. A study of fish movements from the Okefenokee Swamp into the Suwannee River. Proc. 24th Ann. Conf. S.E. Assoc. Game and Fish Comm. 24: 591-608.
_________1971. Life history studies of stream fish. Ga. Dept. Nat. Res., Game and Fish Div. Ann. Prog. Rept., Fed. Aid Project F-21-3, Study XII, Job l. 45pp.
_________l973a. Applied management in warmwater streams. Ga. Dept. Nat. Res., Game and Fish Div. Ann. Prog. Rept., Fed. Aid Project F-21-4, Study VI, Job 1: l-8.
----~---l973b. Stream creel census-warmwater. Ga. Dept. Nat. Res., Game and Fish Div. Ann. Prog. Rept., Fed. Aid Project F-21-3, Study XV, Job 3. 34pp.
----~---l973c. Population studies-streams (Suwannee River and Okefenokee Swamp). Ga. Dept. Nat. Res., Game and Fish Div. Ann. Prog. Rept., Fed. Aid Project F-21-3, Study XVI, Job 2. 42pp.
Holder, D. R. and R. Ruebsamen. 1976. A comparison of the fisheries of the Upper and Lower Satilla River. Ga. Dept. Nat. Res., Game and Fish Div. Final Rept., Fed. Aid Project F-29. 68pp.
Ober, R. D. 1977. Upper Flint River creel and recreational use survey. Ga. Dept. Nat. Res., Game and Fish Div. Final Rept., Fed. Aid Project F-28. 40pp.
Pasch, R. and L. E. McSwain. 1974. Stream creel census-warmwater (Flint River). Ga. Dept. Nat. Res., Game and Fish Div. Final Rept., Fed. Aid Project F-21-5, Study XV, Job 3: 96-116.
Ricker, W. E. 1975. Computation and interpretation of biological statistics of fish populations. Bull. Fish. Res. Board Can. No. 191.
Robson, D. S. and H. A. Regier. 1964. Sample size in Petersen markrecapture experiments. Trans. Am. Fish. Soc. 93: 215-226.
57
APPENDIX 60
Snedecor, G. W. and W. G. Cochran. 1968. Statistical methods. Iowa St. Univ. Press. Ames, Iowa. 593pp.
Surber, E. W. 1959. Suggested standard methods of reporting fish population data from reservoirs. Proc. 13th Ann. Conf. S.E. Assoc. Game and Fish Comm. B: 313-324.
Swanson, C. D. and D. R. Holder l974a. Stream creel census-warmwater Suwannee River. Ga. Dept. Nat. Res., Game and Fish Div. Final Rept., Fed. Aid Project. F-21-5, Study XV, Job 3: 31-53.
----~---l974b. Stream creel census-warmwater, Okefenokee Swamp. Ga. Dept. Nat. Res., Game and Fish Div. Final Rept., Fed. Aid Project F-21-5, Study XV, Job 3: 54-73.
Swingle, H. S. 1950. Relationships and dynamics of balanced and unbalanced fish population. Auburn, Ala. Polytech Inst., Agr. Exper. Sta. Bul. 274: 1-73.
u. S. Geological Survey. 1961. Surface water records of Georgia, 1961. u. s. Dept. Int. 1962. Surface water records of Georgia, 1962. u. s. Dept. Int. 1963. Surface water records of Georgia, 1963. u. s. Dept. Int. 1964. Surface water records of Georgia, 1964. u. s. Dept. Int.
1965. Water resources data for Georgia, 1965-Part 1: Surface water records. U. S. Dept. Int.
1966. Water resources data for Georgia, 1966-Part 1: Surface water records. U. S. Dept. Int.
water19re6c7o. rdWs. ateur.
resources
s. Dept.
data Int.
for
Georgia,
1967-Part
1:
Surface
1968. Water resources data for Georgia, 1968-Part 1: Surface water records. U. S. Dept. Int.
197la. Water resources data for Georgia, 1969. u. s. Dept. Int. 197lb. Water resources data for Georgia, 1970. u. s. Dept. Int. 1972. Water resources data for Georgia, 1971. u. s. Dept. Int. 1973. Water resources data for Georgi a, 1972. u. s. Dept. Int. 1974. vJater resources data for Georgi a, 1973. u. s. Dept. Int. 1975. Water resources data for Georgia, 1974. u. s. Dept. Int. 1976. Water resources data for Georgia, 1975. u. s. Dept. Int. 1977. Water resources data for Georgia, 1976. u. s. Dept. Int.
I
58
Germann, J. F., L. E. McSwain, D. R. Holder, C. D. Swanson. 1974. Life history of warmouth in the Suwannee River and Okefenokee Swamp, Georgia. Proc. 28th Ann. Conf. S.E. Assoc. Game and Fish Comm. 28: 259-278.
Holder, D. R. 1969a. Applied management in warmwater streams. Ga. Game and Fish Comm. Ann. Prog. Rept., Fed Aid Project F-21-1, Study VI, Job 1. 43pp.
_________1970a. Population studies-streams. Ga. Dept. of Nat. Res., Game and Fish Div. Ann. Rept., Fed. Aid Project F-21-2, Study XVI, Job 2. 66pp.
1970b. Stream creel census-warmwater. Ga. Dept. Nat. Res., Game and ----~--- Fish Div. Ann. Prog. Rept., Fed. Aid Project F-21-2, Study
XV, Job 3. 24pp.
_________1970c. A study of fish movements from the Okefenokee Swamp into the Suwannee River. Proc. 24th Ann. Conf. S.E. Assoc. Game and Fish Comm. 24: 591-608.
----~---1971. Life history studies of stream fish. Ga. Dept. Nat. Res., Game and Fish Div. Ann. Prog. Rept., Fed. Aid Project F-21-3, Study XII, Job 1. 45pp.
----~---1973a. Applied management in warmwater streams. Ga. Dept. Nat. Res., Game and Fish Div. Ann. Prog. Rept., Fed. Aid Project F-21-4, Study VI, Job 1: 1-8.
----~---1973b. Stream creel census-warmwater. Ga. Dept. Nat. Res., Game and Fish Div. Ann. Prog. Rept., Fed. Aid Project F-21-3, Study XV, Job 3. 34pp.
1973c. Population studies-streams (Suwannee River and Okefenokee ----~S~w-a-m-p). Ga. Dept. Nat. Res., Game and Fish Div. Ann. Prog. Rept.,
Fed. Aid Project F-21-3, Study XVI, Job 2. 42pp.
Holder, D. R. and R. Ruebsamen. 1976. A comparison of the fisheries of the Upper and Lower Satilla River. Ga. Dept. Nat. Res., Game and Fish Div. Final Rept., Fed. Aid Project F-29. 68pp.
Ober, R. D. 1977. Upper Flint River creel and recreational use survey. Ga. Dept. Nat. Res., Game and Fish Div. Final Rept., Fed. Aid Project F-28. 40pp.
Pasch, R. and L. E. McSwain. 1974. Stream creel census-warmwater (Flint River). Ga. Dept. Nat. Res., Game and Fish Div. Final Rept., Fed. Aid Project F-21-5, Study XV, Job 3: 96-116.
Ricker, W. E. 1975. Computation and interpretation of biological statistics of fish populations. Bull. Fish. Res. Board Can. No. 191.
Robson, D. S. and H. A. Regier. 1964. Sample size in Petersen markrecapture experiments. Trans. Am. Fish. Soc. 93: 215-226.
57
Wyatt, H. N., W. Godwin and M. B. Norton. 1966. Fish population studiesstreams. Ga. Game and Fish Comm. Ann. Rept., Fed. Aid Project. F-19-R-1, Work plan II, Job 1: 71-96.
1-Jyatt, H. N., C. B. O'Neal, Jr., t~. B. Norton and P. M. Laska. 1967. Fish population studies-streams. Ga. Game and Fish Comm. Ann. Rept., Fed. Aid Project. F-19-R-2, Work plan II, Job 1: 29-42.
Wyatt, H. N., D. R. Holder and P. M. Laska. 1968a. Fish population studies-streams. Ga. Game and Fish Comm. Final Rept., Fed. Aid Project. F-19-R-3, Work plan II, Job 1: 44-68.
----~---1968b. Life history studies. Ga. Game and Fish Comm. Final Rept., Fed. Aid Project. F-19-R-3, Work plan II, Job 3: 74-130.
Prepared by: }_\., --.:._~ 1c hlo-t.~~ .__.
Daniel R. Holder Regional Fisheries. Supervisor
and
.
,,; l' fo,C l
:1
C2/ .1-'l' //,A
J ,.-;11
Jerome Germann (_ Fisheries Biologist III
~[M~- Approved by: awrence E. McSwain OJ Coordinator
Ji: ~ (._ _;.') ///A /
I '
j
Date
r; / } I ;
59
Table A-1. Continued
Species
Fingerling No. Wgt. %Hgt.
Intermediate
Harvestable
No. Wgt. %Hgt. No. Wgt. %\Jgt.
No.
Total Wgt. %Wgt. % of Wgt.
-
Forage
0'1 N
Mosquito fish
7 trace 0.0
Lined topminnow 33 0. 1 100.0
Banded sunfish 115 0.4 100.0
Pygmy sunfish
13 trace 0.0
Bl uespotted sunfish 62 Oo3 1OOo 0
Swamp darter
89 Oo 1 lOOoO
Tadpole madtom 166 Oo7 87o5
Pirate perceh 448 2o9 93o5
Speckled madtom 2 trace OoO
Mud sunfish
2 trace OoO
Do11 ar sunfish
9 trace 0.0
Total
946 4o5 9lo8
0 0.0 0.0 0 0.0 0.0 0 0.0 0.0 0 OoO 0.0 0 OoO OoO 0 0.0 OoO 7 0. 1 l2o5 7 Oo2 6o5 0 OoO OoO 0 OoO OoO 2 Ool lOOoO 16 Oo4 8o2
0 0.0 0 0.0 0 0.0
0 OoO 0 OoO 0 OoO 0 OoO 0 0.0 0 OoO 0 0.0 0 OoO 0 OoO
0.0
7 trace 0.0
0.0 33 0. 1 2.0
0.0 115 0.4 8.2
OoO 13 trace OoO
OoO
62
Oo3 6 0 l
OoO
89
0 0 1 2o0
0.0 173 0.8 16o3
OoO 455
3 0 l 63o3
OoO
2 trace OoO
0.0
2 trace 0.0
OoO
11
0.1 2o0
OoO 962 4o9 lOOoO
0.0 0.1
0.3
OoO Oo2 0. 1
0.6 2o4 OoO
OoO 00 1 3o8
Grand Total
1242 6o9 5o3
-
327 23o3 17.9
258 99o9
76o8 1827 l30o 1 1OOo 0
lOOoO
)::o
-a -a
:f'Tz1
0'1 0
.0.....
><
)::>
""0
::E:
~
::E:
-o
-s
'<
'<
'<
-o
ro
s:u
s:u
s:u
-s
-o
rt
rt
rt
0
s:u
rt
rt
rt
<
-s
;o
""11Vl ..
)::>-o ..
""T'l Vl ..
ro 0.
..cr
'<
).
ro 0.
~..
;o 0
ros:u
;;}
c.o :::::5 ~/ -' ....J.
0 ro
..ro
-o rt
__.
\.0 .., O"l
. .roco
o. cr
)::> -'I
_I_. rs::t :r:
\.0 0..
I --' :;oro
:z:
.. wI
Vl
I
. Vl
rt 0
. ::E:-s
oro
-s s:u ;o
A3.
--'0 0. -o
:r:
s::
""0 __.
-s s:u z
0
~
rt
.........
"'
roo () :::::5 (}
. rt . Vl
rt co
.s::
I rt -'""'S:I: \.0 ro
I s:u
. . . ;o3:z:
_I_. Vl
::E: ::E: G'l
0 s:u
-s G)
A
0
--'
~
:::::5 __. I
0. --'
Vl
.., 0.
G'l 0.
U1 \.0
roG'l '
--'
:::::5 ..,
"' Vlro -s
s:u
C03
rt
--'S:U
o::s::
-sn Vl
'-"\
::E:
0__::.::::::5::5 0
c.o <'\..,
s:u :::::5 0.
~ s:u
--'
:::::5
--'
Vl rt
'
.. \ \
'f
........
"'
.......
........
~~"'
~
""'
.., .s_:_u.
;o
I r
r
--' :r: -.--;
VlO ::3" __.
(">.,;
ro 0.
-sro
--' -s <>
ro
;....._
Vl Vl s:: -o
t,,.
c
ro
-s
<
--'
Vl 0
-s
-t)
""Oro -s 0::3"
~---'
roV>
.( ) r t
rtO -s
'<
.., Vl I rt --'S:: \.00.
I --'
;oro
..I Vl
w
:.:::G'l os:u -s A
G'l
"_0_.
s:u
:r: 0__.
:::::5G'l0.
.................s. :ur-os G'lS:U
s:u :::::5
C.....3 0.
oro
cr ""0
S:U __. :::::5
.. .., .0.3:
+::> --' I
+:>Vl 0 I ::3" Vl
.O"l A
cons:u 0
. 3
3 __,
- I --' 0
_.ro
\.OV'l :z:
I I ro
;oV'l s:u
. I rt __,
N ""'S" ro
s:u c.....
. .. ::E:3 -s
0 Vl -s
A
3:
. -_o_.
G'l s:u
S:U co :::::5
G'l
....... s:u :z
......3 0 ro -s
rt
c.....s:uo
0 :::::5 :::::5
cr o.
-os:u::E:
--'3 --' s:u ro :::::5 :::::5
s:u s:u
........ :::::5:::::5
........ 0. 0.
.., 3:
C....., ....lo
. OV'l
cr ::3" co
..__. (} o:z 3 0
3 -s
-_..._..J.
rt 0
I )::>:::::5
. .\.0 :::::5
O"l:::::l
__.
:;o \.0 roO"l
r
~~r
~ 0
~,.
s:u
rt
ro \.
-1.;--..-.
""'.,:--, ~
~-~
""-
',
. , .". ' \
'-~ \
l?~ ~~
..
~
~
-"
"-
(~
'-.[
I
-os:u --'3 s:uro :::::5
s:u
. .., ....... :::::5
........ 0.
c.....--' OV'l cr ::3"
w (}
.. o 3 3
.., -.....J
+::>
_I_. --'
.W:::::l
os:_u_,
\.0 .., O"l --' co :::::5 s:u
s_:_u .
;o .., ro --'
...-o Vl
rt ::3"
-o 0 -n-o
.ros::
0. __, s:u rt
)::> --' --'0 0.:::::5
""0 -s
c0......
ro
.. s:u
__. ""T'l :::::5
--' 0.
.Vl
::3" ""0 N \.0 (} I 0 3:
. .~ 3.
N3 I 0
)::>Vl
. .:::::5 A
:::::5 s:u
;o ro
__,
.. .-o \.0
rt O"l
-.....J
...,
ro
..,
0. --'
Vl
-o O"l rt.
...., ..,--' .roV>
0. ::3"
-o )::>0 --'"0
- o.s::
""0 s:u -se-t0 --' '-'0 ro :::::5
.()
rtV'l rt s:: 0.
--'
ro Vl
I
.()
rt
::3"
Table A-1. Red Bluff slough 0.55 acre rotenone sample expanded to one acre, Suwannee River, 3 October 1973.
Species
Fingerling
Intermediate
Harvestable
1-fo. Wgt. %~Jgt. No. \tJgt. %\tJgt. No. Wgt. %Wgt.
Total r~o. Wgt. %Wgt. % of Wgt.
Predatory Game Fish
Chain pickerel 60 0.6 1.7 98 7.9 22.3 25 26.9 76.0 183 35.4 81.0 27.2
Redfin pickerel 44 0.6 7.2 75 6.8 81.9 4 0.9 10.8 123 8.3 19.0
6.4
Total
104 1.2 2.7 173 14.7 33.6 29 27.8 63.6 306 43.7 100.0 33.6
Non-Predatory Game Fish
O"l
Bluegill
0 0.0 0.0
4 0. 1 50.0 2 0. 1 50.0
6 0.2 0.6
0.2
Flier
40 0.3 2.3 80 1.0 7.7 69 11.7 90.0 189 13.0 40.9 10.0
~~armouth
86 0.4 3.4
2 0.2 1.7 36 11.1 94.9 124 11.7 36.8
9.0
Spotted Sunfish 4 T 0.0
4 0.2 2.9 36 6.7 97.1 44 6.9 21.7
5.3
Total
130 0.7 2.2 90 1.5 4.7 143 29.6 93.1 363 3-1.8 100.0 24.4
Non-Predatory Food Fish
Lake chubsucker 44 0.2 2.7 24 4.3 57.3 7 3.0 40.0 75 7.5 28.0
5.8
Yellow bullhead 18 0.3 1.6 22 1.9 9.8 66 17. 1 88.6 106 19.3 72.0 14.8
Total
62 0.5 1.9 46 6.2 23.1 73 20. 1 75.0 181 26.8 100.0 20.6
Predatory Food Fish
Bowfin Total
0 0.0 0.0 0 0.0 0.0
2 0.5 2.2 13 22.4 97.8 15 22.9 100.0 17.6 2 0.5 2.2 13 22.4 97.8 15 22. 9 100. 0 17.6
Table A-2. Continued
Species
Fingerling No. Wgt. %Wgt.
Intermediate No. Wgt. %~~gt.
Harvestable
Total
No. ~~gt. %Wgt. No. Hgt. %Wgt. % of Wgt.
Forage Fish
Do ll ar sunf i sh 130 0.4 100.0
0 0.0 0.0 0 0.0 0.0 130 0.4 6.6
0.3
Tadpole madtom 641 1.5 100.0 Speckled madtom 1 trace 0.0
0 0.0 0.0
5 o. l 100.0
0 0.0 0.0 641
0 0.0 0.0
6
1.5 24.6 0. l l . 6
l.O .
0. l
Brook silverside 90 trace 0.0
l trace 0.0 0 0.0 0.0 91 trace 0.0
0.0
Swamp darter
310 0.3 100.0
0 0.0 0.0 0 0.0 0.0 310 0.3 4.9
0.2
Lined topminnow 39 0. l 100.0
l
T 0.0 0 0.0 0.0 40 0. l 1.6
0. l
0'\
~
Mosquitofi sh
l 04 0. 1 100.0
0 0.0 0.0 0 0.0 0.0 104 0. l 1.6
0. l
Pirate perch
680 2.9 80.6 23 0.7 19.4 0 0.0 0.0 703 3.6 59.0
2.4
Total
1995 5.3 86.9 30 0.8 13.1 0 0.0 0.0 2025 6.1 100.0
4. l
Grand Total
2718 11.3 7.6 456 12.8 8.6 217 124.4 83.8 2291 148.5 100.0 100.0
..
~~ ~--
<t;~j~*:~--
Table A-1. Continued
Species
Fingerling No. Wgt. %~Jgt.
Intermediate
Harvestable
No. Wgt. %~~gt. No. Wgt. %~Jgt.
No.
Total Hgt. %Wgt. %of Wgt.
-
Forage
0'\ N
Mosquito fish
7 trace
Lined topminnow 33 0. 1
Banded sunfish 115 0.4
Pygmy sunfish
13 trace
Bl uespotted sunfish 62 0.3
Swamp darter
89 0.1
Tadpole madtom 166 0.7
Pirate perceh 448 2.9
Speckled madtom 2 trace
Mud sunfish
2 trace
Dollar sunfish
9 trace
Total
946 4.5
0.0
100.0 100.0
0.0 100.0 100.0
87.5 93.5 0.0 0.0 0.0 91.8
0 0.0 0.0 0 0.0 0.0 0 0.0 0.0
0 0.0 0.0 0 0.0 0.0 0 0.0 0.0
7 o. 1 12.5
7 0.2 6.5 0 0.0 0.0 0 0.0 0.0 2 0.1 100.0 16 0.4 8.2
0 0.0
0 0.0
0 0.0 0 0.0 0 0.0 0 0.0
0 0.0 0 0.0 0 0.0
0 0.0 0 0.0
0 0.0
0.0
7 trace 0.0
0.0 33 0.1 2.0
0.0 115 0.4 8.2
0.0 13 trace 0.0
0.0 62 0.3 6. 1
0.0 89 0. l 2.0
0.0 173 0.8 16.3
0.0 455 3. 1 63.3
0.0
2 trace 0.0
0.0
2 trace 0.0
0.0 ll
0. 1 2.0
0.0 962 4.9 100.0
0.0 0.1 0.3
0.0 0.2 0. l 0.6 2.4 0.0 0.0 0. 1 3.8
Grand Total
1242 6.9 5.3 327 23.3 17.9 258 99.9 76.8 1827 130.1 100.0 100.0
Table A-l. Red Bluff slough 0.55 acre rotenone sample expanded to one acre, Suwannee River, 3 October 1973.
Species
Fingerling
Intermediate
Harvestable
No. Wgt. %\.<Jgt. No. vJgt. %vJgt. No. Wgt. %Wgt.
Total No. Wgt. %Wgt. % of Wgt.
Predatory Game Fish
Chain pickerel 60 0.6 1.7 98 7.9 22.3 25 26.9 76.0 183 35.4 81.0 27.2
Redfin pickerel 44 0.6 7.2 75 6.8 81.9 4 0.9 l 0. 8 123 8.3 19.0
6.4
Total
l 04 1.2 2.7 173 14.7 33.6 29 27.8 63.6 306 43.7100.0 33.6
Non-Predatory Game Fish
Q)
Bluegill
0 0.0 0.0
4 0. l 50.0 2 0. l 50.0
6 0.2 0.6
0.2
Flier
40 0.3 2.3 80 1.0 7.7 69 ll. 7 90.0 189 13.0 40.9 l 0. 0
~~armouth
86 0.4 3.4
2 0.2 1.7 36 ll. l 94.9 124 ll. 7 36.8
9.0
Spotted Sunfish 4 T 0.0
4 0.2 2.9 36 6.7 97. l 44 6.9 21 . 7
5.3
Total
130 0.7 2.2 90 1.5 4.7 143 29.6 93. l 363 Jl . 8 l 00. 0 24.4
Non-Predatory Food Fish
Lake chubsucker 44 0.2 2.7 24 4.3 57.3 7 3.0 40.0 75 7.5 28.0
5.8
Yellow bullhead 18 0.3 1.6 22 1.9 9.8 66 17. l 88.6 l 06 19.3 72.0 14.8
Total
62 0.5 1.9
46 6.2 23.1 73 20. l 75.0 181 26.8 100.0
20.6
Predatory Food Fish
Bowfin Total
0 0.0 0.0 0 0.0 0.0
2 0.5 2.2 13 22.4 97.8 15 22.9 100.0 l7o6 2 0.5 2.2 13 22.4 97.8 15 22.9 lOOoO 17.6
-:~~~ft~:
.-: ...
Table A-2. t1ud Lake slough 0.75 acre rotenone sample expanded to one acre, SuvJannee River, 4 October 1973.
Species
Fingerling No. Wgt. %Wgt.
Intermediate No. ~~gt. %Wgt.
Harvestable No. Wgt. %~~gt.
Total
No. ~~gt. %l~gt. % of Wgt.
Predatory Game Fish
Black crappie
0 0.0 0.0
0 0.0 0.0
3 1.5 100.0
3 1.5 4.9
l 0 0
Largemouth bass 0 0.0 0.0
l 0.2 8.7
3 2. l 91.3
4 2.3 7.5
1.5
Chain pickerel
24 0.4 1.6
61 3.7 14.8
19 20.9 83.6 l 04 25.0 82.0
16.8
Redfin pickerel ll 0.3 17.6 40 1.4 82.4
0 0.0 0.0 51 1.7 5.6
l.l
Total
35 0.7 2.3 l 02 5.3 l7. 4 25 24.5 80.3 162 30.5 100.0 20.5
Q)
w
Non-Predatory Game Fish
Spotted sunfish 0 0.0 0.0
0 0.0 0.0
7 0.8 l 00.0
7 0.8 2.8
0.5
Flier
684 5.2 22.5 297 3.5 15.2 89 14.4 62.3 l 070 23. l 81.9 15.6
Warmouth
0 0.0 0.0
9 0.8 40.0
8 1.2 60.0
17
2.0 70 l
1.3
Bluegill
0 0.0 0.0
9 0.3 13.0 19 2.0 87.0 28 2.3 8.2
1.5
Total
684 5.2 18.4 315 4.6 16.3 123 18.4 65.2 1122 28.2 100.0 19.0
Non-Predatory Food Fish
Yellow bullhead Spotted sucker Lake chubsucker Total
4 0. l 2.4 0 0.0 0.0 0 0.0 0.0
4 o. l 0.5
0 0.0 0.0 15 4. l 97.6 19 4.2 22. l
2.8
0 0.0 0.0
4 6. l 100.0
4 6. l 32. l
4. l
5 0.7 8.0
8 8.0 92.0 13 8.7 45.8
5.9
5 0.7 3.7 27 18.2 95.8 36 19.0 l 00.0 12.8
Predatory Food Fish
Bowfin Spotted gar Channel catfish
Total
0 0.0 0.0
0 0.0 0.0 0 0.0 0.0
0 0.0 0.0
3 0.8 1.3 37 59.8 98.7 40 60.6 93.7 40.8
l 0.6 100.0
0 0.0 0.0
l 0.6 0.9
0.4
0 0.0 0.0
5 3.5 100.0
5 3.5 5.4
2.4
4 1.4 2.2 42 63.3 97.8 46 64.7 l 00.0 43.6
Table A-3. Continued
Grou~
Fingerling
Intermediate
Harvestable
Total
% of Pop,
No. Wgt. %Wgt. No. Wgt. %Wgt. No. Wgt. %Wgt. No. Wgt. S~Wgt.
Wgt.
Predatory Food Fish
Bowfin Channel catfish Total
0
0
0 0
0
0 210 393.0 100.0 210 393.0 99.6 79.6
0
0
0 0
0
0 1 1.7 100.0 1 1.7 .4
.3
0
0
0 0
0
0 211 394.7 100.0 211 394.7 100.0 79.9
Forage Fish
Brook sunfish
24
T
T 0
0
0 0
0
0 24
T
T
T
Lined topminnow
23
T
T 0
0
0 0
0
0 23
T
T
T
. Swamp darter
9
T
T 0
0
0 0
0
0 9
T
T
T
Bluespotted sunfish
4
T
T 0
0
0 0
0
0 4
T
T
T
Mosquitofish
4
T
T 0
0
0 0
0
0 4
T
T
T
0'\ 0'\
Pirate perch
Tadpole madtom
4
T
T 0
0
0 0
0
0 4
T
T
T
3
T
T 0
0
0 0
0
0 3
T
T
T
Banded sunfish
1
T
T 0
0
0 0
0
0 1
T
T
T
Dollar sunfish
0
0
0 1
T
T 0
0
0 1
T
T
T
Total
72
T
T 1
T
T 0
0
0 73
T
T
T
Grand Total
83
T
T 29 2.4
.5 348 491.4 99.5 460 493.8 100.0 100.0
..
;~~~,;
._z.-
--:.
.-;;_~i.~J~i":_: .'
Table A-2. Continued
Species
Fingerling No. Wgt. %Wgt.
Intermediate No. Wgt. %~~gt.
Harvestable
Total
No. ~~gt. %Wgt. No. ~~gt. %Wgt. % of Wgt.
Forage Fish
Do 11 ar sunfish 130 0.4 100.0
0 0.0 0.0 0 0.0 0.0 130 0.4 6.6
0.3
Tadpole madtom 641 1. 5 100.0
0 0.0 0.0 0 0.0 0.0 641 1.5 24.6
1.0 .
Speckled madtom 1 trace 0.0
5 0. 1 100.0 0 0.0 0.0
6 0. 1 1. 6
0. 1
Brook silverside 90 trace 0.0
1 trace 0.0 0 0.0 0.0 91 trace 0.0
0.0
Swamp darter
310 0.3 100.0
0 0.0 0.0 0 0.0 0.0 310 0.3 4.9
0.2
Lined topminnow 39 0. 1 100.0
1
T 0.0 0 0.0 0.0 40 0. 1 1.6
0. 1
0'\
~
Mosquitofish
104 0. 1 100.0
0 0.0 0.0 0 0.0 0.0 104 0. 1 1.6
0. 1
Pirate perch
680 2.9 80.6 23 0.7 19.4 0 0.0 0.0 703 3.6 59.0
2.4
Total
1995 5.3 86.9 30 0.8 13. 1 0 0.0 0.0 2025 6.1 100.0
4. 1
Grand Total
2718 11.3 7.6 456 12.8 8.6 217 124.4 83.8 2291 148. 5 100. 0 100.0
Table A-2. t1ud Lake slough 0.75 acre rotenone sample expanded to one acre, Suwannee River, 4 October 1973.
Species
Fingerling No. Wgt. %Wgt.
Intermediate No. ~~gt. %Wgt.
Ha rves table No. Wgt. %~~gt.
Total No. ~~gt:. %\~gt. % of Wgt.
Predatory Game Fish
Black crappie
0 0.0 0.0
0 0.0 0.0
3 1.5 l 00.0
3 1.5 4.9
1.0
Largemouth bass 0 0.0 0.0
l 0.2 8.7
3 2. l 91.3
4 2.3 7.5
l 5
Chain pickerel
24 0.4 1.6
61 3.7 14.8 19 20.9 83.6 104 25.0 82.0
16.8
Redfin pickerel ll 0.3 17.6 40 l. 4 82.4
0 0.0
0.0
51
l 7 5.6
l.l
Total
35 0.7 2.3 102 5.3 17.4 25 24.5 80.3 162 30.5 100.0 20.5
w0'\
Non-Predatory Game Fish
Spotted sunfish 0 0.0 0.0
0 0.0 0.0
7 0.8 l 00.0
7 0.8 2.8
0.5
Flier
684 5.2 22.5 297 3.5 15.2 89 14.4 62.3 l 070 23. l 81.9 15.6
Warmouth
0 0.0 0.0
9 0.8 40.0
8 1.2 60.0 17 2.0 7. l
l 3
Bluegill
0 0.0 0.0
9 0.3 13.0 19 2.0 87.0 28 2.3 8.2
1.5
Total
684 5.2 18.4 315 4.6 16.3 123 18.4 65.2 1122 28.2 100.0 19.0
Non-Predatory Food Fish
Yellow bullhead Spotted sucker Lake chubsucker Total
4 0. l .. 2.4 0 0.0 0.0 0 0.0 0.0 4 0. l 0.5
0 0.0 0.0 15 4. l 97.6 19 4.2 22. l
2.8
0 0.0 0.0
4 6. l 100.0
4 6. l 32. l
4. l
5 0.7 8.0
8 8.0 92.0 13 8.7 45.8
5.9
5 0.7 3.7 27 18.2 95.8 36 19.0 l 00.0 12.8
Predatory Food Fish
Bowfin Spotted gar Channel catfish
Total
0 0.0 0.0 0 0.0 0.0 0 0.0 0.0
0 0.0 0.0
3 0.8 1.3 37 59.8 98.7 40 60.6 93.7 40.8
1 0. 6 100.0
0 0.0 0.0
1 0.6 0.9
0.4
0 0.0 0.0
5 3.5 100.0
5 3.5 5.4
2.4
4 1.4 2.2 42 63.3 97.8 46 64.7 100.0 43.6
.:-__:.;:;
::~~:..
Table A-3. Mud Lake slough 0.75 acre rotenone sample expanded to one acre, Suwannee River, 24 May 1974.
Group
Fingerling
Intermediate
Harvestable
Total
% of Pop.
No. Wgt. %Wgt. No. Wgt. %Wgt. No. Wgt. %Wgtc Noo Wgt. %Wgt.
Wgt.
Predatory Game Fish
Chain pickerel Largemouth bass Black crappie Redfin pickerel Total
0
0
0 3 .3 1.6 9 17.9 98.4 12 18.2 77.4
3.7
1
T
T 0
0
0 1 4.3 100.0 2 4.3 18.3
.9
0
0
0 0
0
0 1 1.0 100.0 1 l 0 4o3
.2
0
0
0 1
T
T 0
0
0 1
T
T
T
1
T
T 4 .3 1.3 11 23.2 98.7 16 23.5 100.0
4o8
Non-Predatory Game Fish
0'\ U'1
Warmouth Flier Bluegill Spotted sunfish Total
6
T
T 3 1 1.2 16 8.4 98.5 25 8.5 59.1
L7
0
0
0 9 1 2.9 20 3.4 97. l 29 3.5 24.3
07
0 0 6
0 0 T
0 7 0 1 T 20
.2 9.5 1 33.3 .5 3.5
17 1.9 90.5 1 .2 66.7 54 13.9 96.3
24 2. 1 14.6 2 .3 2.0 80 14.4 100.0
.4 l
2.9
Non-Predatory Food Fish
Lake chubsucker Spotted sucker Brown bullhead Ye 11 ow bull head Total
4
T
T 4 1.6 3.4 63 45.0 96.6 71 46.6 76.2
9.4
0 0
0 0
0 0 0 0
0 0
0 7 12.6 100.0 7 12.6 20.6 0 1 l 6 1OOo 0 1 1.6 2.6
2.6 .3
0
0
0 0
0
0 1 .4 100.0 1 .4 .6
1
4
T
T 4 1.6 2.6 72 59.6 97.4 80 61.2 100.0 12.4
Table A-4. Continued
Group
Fingerlings
Intermediate
Harvestable
Total
% of Pop.
No. ~Jgt. %VJgt. _N_o.__~.J_g_L_ %Wgt. No. Wgto %Wgt. No. Wgt. %Wgto
Wgt.
Predatory Food Fish
Bowfin Spotted gar Channel catfish Total
0
0
0 0
0
0 205 363.2 100.0 205 363.2 98.6 80o 1
0
0
0 1 .4 7.7 9 4.8 92.3 11 5.2 1.4
1 1
0
0
0 1 . 1 100.0 0
0
0 1 .1
T
T
0
0
0 2 .5 1 214 368.0 99.9 217 368.5 100.0 81.2
Forage Fish
Pirate perch
1471 3.5 97.2 7 1 2.8 0
0
0 1478 3.6 57.1
o8
Tadpole madtom
210 1.7 85.0 13 .3 15.0 0
0
0 223 2o0 31.8
.4
Lined topminnow
116 .5 100.0 0
0
0 0
0
0 116 5 7.9
. 1
Bluespot sunfish
32 1 100.0 0
0
0 0
0
0 32 . 1 1.6
T
c0"o1
Swamp darter t<bsquitofish
51
1 100.0 0
0
0 0
0
0 51
. 1 1.6
T
61
T
T 0
0
0 0
0
0 61
T
T
T
Brook silverside
11
T
T 0
0
0 0
0
0 11
T
T
T
Blackbanded sunfish
8
T
T 0
0
0 0
0
0 8
T
T
T
Mud sunfish
4
T
T 0
0
0 0
0
0 4
T
T
T
Pygmy sunfish
3
T
T 0
0
0 0
0
0 3
T
T
T
Speckled madtom
1
T
T 0
0
0 0
0
0 1
T
T
T
Blackbanded darter
1
T
T 0
0
0 0
0
0 1
T
T
T
Total
1969 5,..9 93.7 21
.4 6.3
0
0
0 1993 6.3 lOOoO
1.3
Grand Total
2747 11.0 2.4 239 9.3 201 356 433.4 95.5 3342 453.7 lOOoO 100.0
Table A-3. Continued
GrOUf2
Fingerling
Intermediate
Harvestable
Total
% of Popo
No. Wgt. %Wgt. No. Wgt. %Wgt. No. Wgt. %Wgt. No. Wgt. ~swgt.
Wgt.
Predatory Food Fish
Bowfin Channel catfish
Tota 1
0
0
0 0
0
0 210 393.0 100.0 210 393.0 99.6 79.6
0
0
0 0
0
0 1 1.7 100.0 1 1.7 .4
. 3
0
0
0 0
0
0 211 394.7 100.0 211 394.7 100.0 79.9
Forage Fish
Brook sunfish
24
T
T 0
0
0 0
0
0 24
T
T
T
Lined topminnow
23
T
T 0
0
0 0
0
0 23
T
T
T
. Swamp darter
9
T
T 0
0
0 0
0
0 9
T
T
T
Bluespotted sunfish
4
T
T 0
0
0 0
0
0 4
T
T
T
Mosquitofish
4
T
T 0
0
0 0
0
0 4
T
T
T
0"1 0"1
Pirate perch
Tadpole madtom
4
T
T 0
0
0 0
0
0 4
T
T
T
3
T
T 0
0
0 0
0
0 3
T
T
T
Banded sunfish
1
T
T 0
0
0 0
0
0 1
T
T
T
Dollar sunfish
0
0
0 1
T
T 0
0
0 1
T
T
T
Total
72
T
T 1
T
T 0
0
0 73
T
T
T
Grand Total
83
T
T 29 2.4 .5 348 491.4 99.5 460 493.8 100.0 100.0
Table A-3. Mud Lake slough 0.75 acre rotenone sample expanded to one acre, Suwannee River, 24 May 1974.
Grou
t.
Noo
Predatory Game Fish
Chain pickerel Largemouth bass Black crappie Redfin pickerel Total
0 1
0 0 1
0 T
0 0 T
0
T 0 0 T
3 0
0 1
4
.3 1.6 9 17.9 98.4 12 18.2 77.4
0
0 1 4.3 100.0 2 4.3 18.3
0
0 1 l.O 100.0 1 l.O 4o3
T .3
T 1.3
0
0
0
ll 23.2 98.7
1
T
T
16 23.5 100 .o
3.7 .9 .2 T
4o8
Non-Predatory Game Fish
0'> U1
Warmouth
Flier Bluegill Spotted sunfish
Total
6 0 0 0 6
T
0 0 0 T
T 3 0 9 0 7 0 1 T 20
1 1.2
. 1 2.9 .2 9.5 1 33.3
.5 3.5
16 8.4 98.5 20 3.4 97.1 17 1.9 90.5 1 .2 66.7 54 13.9 96.3
25 8.5 59. 1 29 3.5 24.3 24 2. 1 14.6 2 .3 2.0 80 14.4 100.0
L7
07 .4 1
2.9
Non-Predatory Food Fish
Lake chubsucker Spotted sucker Brown bullhead
Yellow bullhead
Total
4
T
0 0
a0
0
0
4
T
T
0 0 0 T
4 0 0 0 4
1.6 0 0 0
1.6
3.4 0
0 0 2.6
63 45.0 96.6 7 12.6 100.0 1 1.6 1OOoO 1 .4 100.0 72 59.6 97.4
71 46.6 76.2 7 12.6 20.6 1 1.6 2.6 1 .4 .6 80 61.2 100.0
9.4 2.6
.3 1 12.4
j, .!;,.
Table A-4. Mud Lake slough 0.75 acre rotenone sample expanded to one acre, Suwannee River, 2 July 1975.
Group
Fingerling No. Wgt. %Wgt.
Intermediate No. Wgt. %Wgt.
Harvestable No. Wgt. %Wgt.
No.
Total Wgt. %Wgt.
~~ of Pop. Hgt.
Predatory Game Fish
Chain pickerel Redfin pickerel Black crappie Largemouth bass Total
72
169 " v 1
1.1 4.6
1.9 63.3
0
0
T
T
39 24 0
0
2.7 ll. 2
1.1 36.7
0
0
0
0
17 20.3 84.2 128 24.1 84.9
0
0
0 193 3.0 10. 5
1 1.3 100.0 1 1.3 4.6
0
0
0 1
T
T
242 3.0 1o. 7 63 3.8 13.4 18 21.6 76.0 321 28o4 100.0
5. 1 .6 .3 T
6.0
Non-Predatory Game Fish
0'>
'-I
Warmouth
Flier
Spotted sunfish
Bluegill
Total
12 414 88
15 529
1 1.1 69 1.3 17.3 7
.5 22.7 35 1 6.3 40 2.0 9.8 151
2.5 27.5 .3 4.0 .5 22.7
1.1 68.7 4.4 21.6
25 6.5 71.4 106 9. 1 44.6 56 5.9 78.7 477 7.5 36.8 7 1.2 54.6 130 2.2 l 0. 8 5 .4 25.0 60 1.6 7.8 93 14o0 68.6 773 20.4 100.0
1.9 1. 6
.5
.3 4.3
Non-Predatory Food Fish
Spotted suckers Lake chubsucker Yellow bull head
Total
0
7 0 7
0
0
. 1 1.1
0
0
. 1 .3
0
1 1 2
0
0 ll 18.2 100.0 ll 18.2 60.7
1 1.1
9 8.8 97.8 17 9.0 30.0
1 3.6 ll 2.7 96.4 12 2.9 9.3
.2
.6 31 29.7 99.1 40 30.1 100.0
3.8
1.9 .6
6.3
Table A-5. Continued
Group
~6 of Pop. No. Wgt. %Wgt. Noo Wgt. %Wgt. No. Wgt. %VJgt. No. Wgt. %Wgt Wgt.
Forage Fish
Pirate perch
283 1.1 100.0 2
T
T 0
0
0 283 1.1 33.3
.4
Lined topminnow
411
.9 100.0 0
0
0 0
0
0 411
.9 27.3
.3
Bluespotted sunfish 270 .4 100.0 0
0
0 0
0
0 270 .4 12. 1
. 2
Tadpole madtom
87 .3 100.0 0
0
0 0
0
0 87
,.3 9.1
1
Mosqu itofi sh
41
.2 100.0 0
0
0 0
0
0 41
.2 6.1
. 1
Brook silverside
139 .2 100.0 0
0
0 0
0
0 139 .2 6. 1
1
Banded sunfish
37 . 1 100.0 0
0
0 0
0
0 37 . 1 3.0
1
Dollar sunfish
18 1 100.0 0
0
0 0
0
0 18 . 1 3.0
T
Pygmy sunfish
77
T
T 0
0
0 0
0
0 77
T
T
T
Swamp darter
88
T
T 0
0
0 0
0
0 88
T
T
T
Golden topminnow
14
T
T 0
0
0 0
0
0 14
T
T
T
Pygmy killifish
5
T
T 0
0
0 0
0
0 5
T
T
T
'-1
Total
0
1470 3.3 1.0 2
T
T 0
0
0 1470 3.1 100.0 1.3
Grand Total
2069 4.9 1.8 184 1o. 9 4.0 183 257.5 94.2 2436 273.3 100.0 100.0
Table A-4. Continued
Fingerlings
Intermediate
Harvestab1e
Total
% of Pop.
Grou
No. ~igt. %~Jgt. __No. ___!'JQt._ %Wgt. No. Wgt. %Wgt. No. Wgt. %Wgt.
Wgt.
Predatory Food Fish
Bowfin Spotted gar Channel catfish Total
0
0
0 0
0
0 205 363.2 100.0 205 363.2 98.6 80.1
0
0
0 1 .4 7.7 9 4.8 92.3 11 5.2 14
1.1
0
0
0 1 . 1 100.0 0
0
0 1 1
T
T
0
0
0 2 .5 1 214 368.0 99.9 217 368.5 100.0 81.2
Forage Fish
Pirate perch
1471 3.5 97.2 7 1 2.8 0
0
0 1478 3.6 57.1
o8
Tadpole madtom
210 1.7 85.0 13 .3 15.0 0
0
0 223 2.0 31.8
.4
Lined topminnow
116 .5 100.0 0
0
0 0
0
0 116 .5 7.9
1
Bluespot sunfish
32 1 100.0 0
0
0 0
0
0 32 1 1.6
T
0"1
Swamp darter
51
1 100.0 0
0
0 0
0
0 51
. 1 1.6
T
OJ
r.bsquitofish
61
T
T 0
0
0 0
0
0 61
T
T
T
Brook silverside
11
T
T 0
0
0 0
0
0 11
T
T
T
Blackbanded sunfish
8
T
T 0
0
0 0
0
0 8
T
T
T
Mud sunfish
4
T
T 0
0
0 0
0
0 4
T
T
T
Pygmy sunfish
3
T
T 0
0
0 0
0
0 3
T
T
T
Speckled madtom
1
T
T 0
0
0 0
0
0 1
T
T
T
Blackbanded darter
1
T
T 0
0
0 0
0
0 1
T
T
T
Total
1969 5.9 93.7 21
.4 6.3
0
0
0 1993 6.3 100.0
1.3
Grand Tota 1
2747 11.0 2.4 239 9.3 20 1 356 433.4 95.5 3342 453.7 100.0 100.0
Table A-4. Mud Lake slough 0.75 acre rotenone sample expanded to one acre, Suwannee River, 2 July 1975.
Group
Fingerling
Intermediate
Harvestable
Total
5~ of Pop.
No. Wgt. %Wgt. No. Wgt. %Wgt. No. Wgt. %Wgt. No. Wgt. ~~Wgt.
Hgt.
Predatory Game Fish
Chain pickerel Redfin pickerel
Black crappie Largemouth bass Total
72 l.l 4.6 39 2.7 ll. 2 17 20.3 84.2 128 24. l 84.9
5. 1
169 1.9 63.3 24 l.l 36.7 0
0
0 193 3.0 l 0. 5
. 6
" v
0
0 0
0
0 1 l 3 100.0 1 1.3 4.6
3
l
T
T 0
0
0 0
0
0 1
T
T
T
242 3.0 1o. 7 63 3.8 13.4 18 21.6 76.0 321 28o4 100.0
6,0
Non-Predatory Game Fish
0'1
-.....!
Warmouth
Flier
Spotted sunfish
Bluegill
Total
12 1 1.1 69 2.5 27.5 25 6.5 71.4 106 9.1 44.6
1.9
414 1.3 17.3 7 .3 4.0 56 5.9 78.7 477 7.5 36.8
1.6
88 .5 22.7 35 .5 22.7 7 1.2 54.6 130 2.2 10.8
.5
15 1 6.3 40 1.1 68.7 5 .4 25.0 60 1.6 7.8
3
529 2.0 9.8 151 4.4 21.6 93 14.0 68.6 773 20.4 100.0
4.3
Non-Predatory Food Fish
Spotted suckers
Lake chubsucker Yellow bull head Total
0
0
0 0
0
0 ll 18.2 100.0 ll 18.2 60.7
3.8
7 .l l.l
1
1 l.l
9 8.8 97.8 17 9.0 30.0
1.9
0
0
0 1 1 3.6 ll 2.7 96.4 12 2.9 9.3
.6
7 1 . 3 2 .2 .6 31 29.7 99.1 40 30.1 100.0
6.3
... .)
,
Table A-5. Mud Lake slough 0.55 acre rotenone sample expanded to one acre, Suwannee River, 21 April 1976.
Group
Fingerling
Intermediate
Harvestable
Total
% of Pop.
No. Wgt. %Wgt. No. Wgt. %WgL No. Wgt. %vJgt. No. Wgt. %Wgt. vJgt.
Predatory Game Fish
Chain pickerel Redfin pickerel Total
35 1
T 39 5.6 25.7 13 16. l 73.9 87 21.8 92c3
8.0
7 l
1 35 1.7
.9
42 1.8 7.6
. 7
42 .2 .9 74 7.3 30.9 l3 16. l 68.2 129 23.6 100.0
8.6
Non-Predatory Game Fish
Warmouth
0'1
Bluegill
1.0
Spotted sunfish
Flier
Total
280 l.O 12.8 61 l.l 14. l 23 . 5. 7 73. l 364 7.8 56.9
2.8
25
T
T l3
.5 l 0. 6 14 4.2 89.4 52 4.7 34.3
1.7
192 .3 42.9 6 .2 28.5 2 .2 28.6 200 .7 . 5
.3
26 . 5 100.0
26 .5 3.6
.2
497 1.3 9.5 106 2.3 16.8 39 10. l 73.7 642 13.7 100.0
5.0
Non-Predatory Food Fish
Spotted sucker
Lake chubsucker Yellow bullhead Total
0 60
0 ,
I
0 0 .02 0
0 0
0 10 7.5 l 00.0 10 7.5 57.0 0 6 4.7 98.0 66 4.8 37.0
2.7 1.8
0
0
0 0
0
0 2 .8 100.0 2 .8 6.0
.3
60 . 1 . 01 0
0
0 18 13.0 99.0 78 13. 1 100.0
4.8
Predatory Food Fish
Bowfin Total
0
0
0 2 1.3 . 01 113 218.3 99.0 ll5 219.6 l 00.0 80.3
0
0
0 2 1.3 . 01 ll3 218.3 99.0 ll5 219.6 100.0 80.3
Table A-l Rotenone recovery (R) of fish marked (M) and released in the slough sample areas on the Suwannee River, 1973-1975.
S~<:>cies
Red Bluff 'Jc~. l'J73 MR %
Mud Lake Oct. 1973 MR %
Mud Lake May 1974 MR %
Mud L~ke -
July 1975 M R %
io~al
MR %
Bowfin Warmouth
10 5 50.0 45 24 53.3 35 22 62.9 24 18 75.0 114 69 60.5 7 3 42.8 1 1 100.0 12 10 83.3 5 5 100.0 25 19 76.0
Spotted sunfish
5 1 20.0 2 2 100.0 6 0
0 4 4 100.0 17 7 41.2
"'-..1 N
Lake chubsucker
3 1 33.3
5 5 100.0
8 6 75.0
Chain pickerel
2 0
0
2 0
0
Largemouth bass
2 1 50.0 2 2 100.0 4 4 100.0 2 2 100.0 10 9 90.0
Channel catfish
l 1 100.0 2 1 50.0
3 2 66.7
Yell ow bull head Spotted sucker
10 4 40.0 1 0
0 4 3 75.0 15 7 46.7
1 1 100.0
1 1 100.0
Bluegill
1 0
0
1 0
0
Total
30 12 40.0 62 34 54.8 65 42 64.6 39 32 82.1 196 120 61.2
,,~:~f:ii
Table A-5. Continued
Group
% of Pop. No. Wgt. %Wgt. Noo Wgt. %Wgt. No. Wgt. %~Jgt. No. Wgt. %Wgt Wgt.
Forage Fish
Pirate perch
283 1.1 100.0 2
T
T 0
0
0 283 1.1 33o3
.4
Lined topminnow
411
.9 100.0 0
0
0 0
0
0 411
.9 27.3
.3
Bluespotted sunfish 270 .4 100.0 0
0
0 0
0
0 270 .4 12. 1
.2
Tadpole madtom
87 .3 100.0 0
0
0 0
0
0 87
o3 9. 1
. 1
Mosqu itofi sh
41
.2 100.0 0
0
0 0
0
0 41
.2 6. 1
. l
Brook silverside
139 .2 100.0 0
0
0 0
0
0 139 . 2 6. 1
1
Banded sunfish
37 1 100.0 0
0
0 0
0
0 37 . 1 3.0
. l
Do 11 a r sunf i sh
18 . 1 100.0 0
0
0 0
0
0 18 . 1 3.0
T
Pygmy sunfish
77
T
T 0
0
0 0
0
0 77
T
T
T
Swamp darter
88
T
T 0
0
0 0
0
0 88
T
T
T
Golden topminnow
14
T
T 0
0
0 0
0
0 14
T
T
T
Pygmy killifish
5
T
T 0
0
0 0
0
0 5
T
T
T
"'-..1
Total
1470 3.3 1.0 2
T
T 0
0
0 1470 3.3 100.0 1.3
0
Grand Total
2069 4.9 1.8 184 1o. 9 4.0 183 257.5 94.2 2436 273o3 100,0 100.0
Table A-5. Mud Lake slough 0.55 acre rotenone sample expanded to one acre, Suwannee River, 21 April 1976.
Grou~
Fingerling
Intermediate
Harvestable
Total
% of Pop.
No. Wgt. %Wgt. No. Wgt. %WgL No. Wgt. %vJgt. No. Wgt. %Hgt. vJgt.
Predatory Game Fish
Chain pickerel Redfin pickerel Total
35 l
T 39 5.6 25.7 l3 16. l 73o9 87 21.8 92,3
8.0
7 .l
1 35 1.7
.9
42 1.8 7.6
. 7
42 .2 .9 74 7.3 30.9 13 16. l 68.2 129 23.6 100.0
8.6
Non-Predatory Game Fish
Warmouth
0'1 1.0
Bluegill Spotted sunfish
Flier
Total
280 l.O 12.8 61 l.l 14. l 23 5.7 73. l 364 7.8 56.9
2.8
25
T
T 13
.5 10.6 14 4.2 89.4 52 4.7 34.3
1.7
192 .3 42.9 6 .2 28.5 2 .2 28.6 200 .7 . 5
c3
26 .5 l 00.0
26 .5 3.6
o2
497 1.3 9.5 106 2.3 16.8 39 10. 1 73.7 642 13.7 100.0
5o0
Non-Predatory Food Fish
Spotted sucker
Lake chubsucker Yellow bullhead Total
0 60
0 ,
!
0
0
.02 0
0 0
0 10 7.5 100.0 10 7.5 57.0 0 6 4.7 98.0 66 4.8 37.0
2.7 1.8
0
0
0 0
0
0 2 .8 100.0 2 .8 6.0
.3
60 .,1
. 01 0
0
0 18 13.0 99.0 78 13. 1 l 00.0
4.8
Predatory Food Fish
Bowfin Total
0
0
0 2 1.3 .01 ll3 218.3 99.0 ll5 219.6 100.0 80.3
0
0
0 2 1.3 . 01 ll3 218.3 99.0 ll5 219.6 100.0 80.3
-:~:~~~~:
Table A-6. Summary of expanded one acre rotenone samples taken on Suwannee River 1973-1976.
Red Bluff 1973
~Jgt. Percent
1973 ~~gt. Percent
Mud Lake
1974
1975
1976
VJgt. Percent \~gt. Percent VJgt. Percent
Predatory Game Fish
43.7 33.6 30.5 20.5 23.5 4.8 28.4 6.3 23.6 8.6
Non-Predatory Game Fish 31.8 24.4 28.2 19.0 14.4 2.9 20.4 4.5 13. 7 5.0
Non-Predatory Food Fish 26.8 20.6 19.0 12.8 61.2 12.4 30. l 6.6 13. 1 4.8
Predatory Food Fish
22.9 17.6 64.7 43.6 394.7 79.9 368.5 81.2 219.6 80.3
Forage Fish
".....
Total
4.9 3.8 6. 1 4. 1 130. l 100.0 148.5 100.0
T
T 6.3 1.4 3.3 1.3
493.8 100.0 453.7 l 00.0 273.3 l 00.0
Finglering Intermediate Harvestable Total
6.9 23.3 99.9 130.1
5.3 17.9 76.8 100.0
11.3 12.8 124.4 148.5
7.6 8.6 83.8 100.0
T 2.4 491.4 493.8
T . 5 99.5 100.0
11.0 9.3 433.4 453.7
2.4 2. 1 95.5 100.0
4.9 10.9 257.5 273.3
1.8 4.0 94.2 l 00.0
OJ
3: OJ
:::;::
OJ
3: OJ
3: OJ
-r-oo
-t OJ
:z:
0 rt
' ' ' ' ' n n n n ......
:::::r- :::::r- :::::r- :::::r- 0
o_-.
ro
n
0..
I
I
I
I
)::>
0
rn o rro t
0..
I
I
c... t_: .
"<
.0rno
.rn0o
.0rno
_.
\.0 '-J 0"1
_.
\.0 '-J
(.)"1
_.
\.0 '-J
.j:>.
_.
\.0 '-J
w
I
I
\.0
Vl
c:
3ro:
:::::rt
O::J s:o::::r-
rr::oo:l
0.. V1
.'-J
N
(.)"1
.0_0.
(.)"1
.'-J
\.0 0"1
.\.0
N
w
I~ I
:..:.:.0.. 0-+> r<o-+..>....
'-+> :V.:.:.:1.:r.-.
(""')
OJ
V1
' :::l
01.0
3
'-J .j:>.
I
. N
(.)"1
N
._.
.j:>.
0"1
._.
(.)"1
0
rt
. ~'-J
0
:::l
OJ _. :::l '-J 0..
3:rt OJ"<
)n"r0 o
:::::r- V1
(/)
ro
-' 1.0
0-+>
'-J
rt
w o-
. . . . N
w
(.)"1
0
w
\.0
.j:>.
'-J 1:
OJ rt ...... Ort
' 0
rt
\.0 t:
c....rVo1
,.
-I
t_:.O . .
I
l:z:~
OJ ro
rt
I I I I
.00
(.)"1
\.0
. I~ 1w.0
0
_. 0c::o
"<o-
_. '<
. -+> '\-.0J ......
0"1 V1
:r::o::r-
OJ
OJ
-'
rt
'3ro
)::>
:::l
..j:>.
_.
I
'r-'t --o
. , '-J 1-..+..>.. ro
0 nn
-'rD
0 :::l rt
r:::o::r-
O_J. :r::tl
",_
. -:::
'
.;
) ... ,
Table A-l Rotenone recovery (R) of fish marked (M) and released in the slough sample areas on the Suwannee River, 1973-1975.
S~ecies
Red BIutt IJc~. 1973 MR %
Mud Lake Oct. 1973 MR %
Mud Lake May 1974 MR %
Mud L~ke July 1975 MR %
To:a1 MR %
Bowfin
10 5 50.0 45 24 53.3 35 22 62.9 24 18 75.0 114 69 60.5
Warmouth
7 3 42.8 1 1 100.0 12 10 83.3 5 5 100.0 25 19 76.0
Spotted sunfish
5 1 20.0 2 2 100.0 6 0
0 4 4 100.8 17 7 41.2
'-J N
Lake chubsucker
3 1 33.3
5 5 100.0
8 6 75.0
Chain pickerel
2 0
0
2 0
0
Largemouth bass
2 1 50.0 2 2 100.0 4 4 100.0 2 2 100.0 10 9 90.0
Channel catfish
1 1 100.0 2 1 50.0
3 2 66.7
Yell ow bull head Spotted sucker
10 4 40.0
1 0
0
1 1 100.0
4 3 75.0
15 7 46.7 1 1 100.0
Bluegill
1 0
0
1 0
0
Total
30 12 40.0 62 34 54.8 65 42 64.6 39 32 82.1 196 120 61.2
!-
QJ
.,>....
~
QJ QJ
c c
rtl
3
::::5
(/)
c
0
c
QJ ~ rtl
+-'
Vl
,.Q....J.
0...
E
rtl Vl
QJ
c 0 c
QJ
+-' 0 !-
QJ
!-
u
rtl
QJ
c
0
-o
QJ
-o c
rtl 0.
><
QJ
40
c
rtl
~
::::5
(/)
\.0 I
c:::(
,..Q...J.
..0 rtl 1-
+c-'
QJ
u
\.0!-
r--.. QJ mo...
.......,
3
\.0 0
co
(V)
(V)
0
co
L()
o:::t
c0 o
0 0
. . . . . . \.0 r--..
\.0
(V)
(V)
M
M
M
m M
M
N
r-
f""-...
N
N
+-'
C
CV"l LO \.0 N
o:::t 0
QJ
u
L() !-
\.0
o:::t
\.0
co,......
0
0
f'-..QJ
mo...
QJ ~
.
+-'
:::::
.
co
N
.
0 N
.
0
(V)
.
co
\.0
.
\.0
.
(V) L()
rtl
(V)
o:::t
.....J
-o
::::5
+c-'
:::E
QJ
u
or--:..:
:
t!-
QJ
.co . . . 1-
o:::t N
N
m r--..
. 0
0 0
mo...
.
+-'
.
.
(V)
o:::t
1- co
N
+c-'
L()
0
co \.0
0
Q)
u o m N M o:::t o
MS... N
o:::t
0
f'-..QJ
mo...
LO N
0
f'-..
r-
LO
+J
o co m o:::t 1.0 co
3: CV"l N
\.0
,o..:.:.:.t.
+c-'
\.0
o:::t
\.0
\.0
co
0
4-
Q)
4-
u
(V)
o:::t
0
r--.. (V) 0
::::lCV"l!- CV"l N
N
0
r-f'-..QJ
,......
OJ mo....
-o ea:::;:
+J
r--.. co
co m
m
CV"l
r-
\.0
N
o:::t 0
3
o:::t CV"l N
N
,C..V...".l
..c: ..c:
Vl .,V...l.
Ll..
Ll..
..c:
..c:
.,V....l
QJ
E
-o
0
.,V....l
rtl
0
(.!)
Ll..
QJ
E
rtl
c c -o 0 0
(.!)
0
0
Ll.. ..c:
c +-' rtl -o
+-'
-rotl
Vl
>, !- Ll..
0
QJ
+-' !-
-rotl
0.... I
QJ
0
!- +-'
0....
rtl
I -o
QJ O"l
,......
rtl
rtl
QJ
c
c
QJ
!-
+-'
!0....
z0::
0
z::
!0....
0 Ll..
0 1-
. . . . CO 0
N
0
o:::t
mo:::t
o 0
. . . .
o:::t 0
r--..
L()
r(-V-.).
N
N
. . . .
N
N
L()
0
m ,o......
0 ...
m
(V)
(V)
(V)
L()
o:::t o:::t
1-
. 0.
m 0
0'1 0
. 1-
co
N
. . . .
r--..
co
co(V)
0 0
. . .
N
o:::t CO
,...... ,N...... o:::t
. . . . M m co o
L() r--.. \.0 0 r--.. 0
. . . .
1.0 M N
m o
m M
QJ
O"l
+-'
rtl
,..Q...J.
c
..0
-o rtl
!-
QJ +-'
QJ
E
Vl
!-
QJ
O"l
QJ
>
rtl
.,c....
.+.c..-..'.
!rtl
:::r:
+-' 0 1-
71
''
. -.::-~/:.
Table A-8. Estimates of fishing pressure, catch, and catch rates by weekdays and weekends on the Suwannee River from 17 March
1973 to 9 July 1976.
Total Catch Angler Hours No. Wgt.(lb)
March - Dec. 1973
Weekdays Weekends Total
29932 25020 54952
65558 55902 121460
34022 30969 64991
March - Dec. 1974
Weekdays
Weekends Total
15973 15643 31616
21435
20468 41903
19507 15262 34769
March - Dec. 1975
Weekdays Weekends Total
27254 21851 49105
57172 45891 103063
36362
25829 62191
March - July 1976
~~eekdays
Weekends Total
9314 10892 20206
12816 12825 25641
8277 8387 16664
Catch Rate No/Hr Lb/Hr
2.19 1.14 2. 23 1. 24 2. 22 1.19
l. 34 1.22 1. 31 0.98 1.33 1.10
2.10 1.33 2.10 1.18 2.10 1.27
1.38 0.89 1.18 0.77 1.27 0.82
73
+c-.'....-
<ulJ s....
.1u-'0
<U.-
0... '+-
q . . .0
(Y")
(Y")
CX)
<lJ <lJ
~
0
c
<lJ '+<lJ
~
0
<lJ ..c +-'
c
0
c
<lJ
sE....
<lJ ..c
. Vl
.-
'+-
li)
.>.a,r(-J-).
-o
<US...
Vl<lJ ::::!..0
E
+.--'<ull
I'O<ll
..a 0
I +s..-..'
+-'C::X::
1'0
co .....-
4--1'0
0 s....
::::! <ll+-' 0. 1'0
>,:z: 1-
. . . 1.0
(J)
0
1.0 1.0 N
CX)
CX)
CX)
c
.....0s....
1-
+-"'' 0
+c -'s0....
<u lll-
s....
<ll
+-"''
O...<ll
(/)
O c l
..c
.(J)
0
0
'+- 1.0
ON
<UO
0. +-'
>,
+-' .(.Y...".). -o (J) c.....-
1'0
O c l
..uc s....
. . li)
0
li)
N
CX)
<lJ (/)
0.
>, "' 1- +-'
Vl 1'0
u
.- 1'0
..c::a: Vl
.- 0
. . . (J)
1.0
0
'+- .....-
q
1.0 N
+-'
00
CX)
CX)
t
'+-E
(/)
0 0s....
-Vol'+-
00.
.(.Y...".).
q
.......
li)
.......
..cE +-'1'0
:<::;l:l(3/):
(J)
(J)
(J)
. . .
u u u
<lJ
<lJ
<lJ
0
0
0
'I
c::x::
-o
..<..l.J..a
0s...-..
.u.s.c...
..uc s....
.u.c s....
1'0 1-
<lJ 0...
:1a'0:
:1a'0:
:1a'0:
76
Table A-9. Methods of fishing and types of bait used by fishermen on the Suwannee River from 17 March 1973 to 9 July 1976.
Period March - Dec. 1973
r~arch - Dec. 1974
r~arch - Dec. 1975 March - July 1976
Still 92.3 79.6 81.5 72.5
Cast &Sj2in
7.0 15.0 14.6 25.2
Type of Bait - Percent
Set &Trot Natural Artificial
0.7
93.0
7.0
5.4
85.9
14. l
____ a 3.9
2.3
a Not collected
74
Table A-8. Estimates of fishing pressure, catch, and catch rates by weekdays and weekends on the Suwannee River from 17 March 1973 to 9 July 1976.
Total Catch Angler Hours No. Wgt.(lb)
March - Dec. 1973
Weekdays Weekends Total
29932 25020 54952
65558 55902 121460
34022 30969 64991
March - Dec. 1974
Weekdays
Weekends Total
15973
15643 31616
21435 20468 41903
19507 15262
34769
~1a rc h - Dec. 1975
Weekdays Weekends Total
27254 21851 49105
57172 45891 103063
36362
25829 62191
March - July 1976
~~eekdays
Weekends Total
9314 10892 20206
12816 12825 25641
8277 8387 16664
Catch Rate No/Hr Lb/Hr
2.19 1.14 2.23 1.24 2.22 1.19
1.34 1.22 1.31 0.98 1.33 1.10
2.10 1.33 2.10 1. 18 2.10 1.27
~. 38 0.89 1.18 0. 77 1.27 0.82
73
.
L!)
r-....
(J) _o ....-
Ul s....
Q)Q)
+-' _o
<0 E
S....Q.J
u
..S:::Q)
uo
+-' <0\.0 UN
""00 S:::+-'
tO
..s:::~(rV-'...).
U(J) +-' ....-
tuO.s:: .. su....
Ul<O
..0....... ::E:
S-0 +-' ....-
s::: E
Q.JO
~:~
..Qs::): 0...
<11E
...... tO
~3:
V>
~
OQ.J
s.....;,Q.::)
_Qo.JsO::: E a.J
::I~
S:::Q) .;,.::
~o
Qs...). Q)
:::::I..S:::
Ul+-'
Ul
Q)
s:::
S.....-
0... Ul
sO::'l:s":":0: ....s..::.:. .;Q,.:):
UlQ)
...... Q)
~3:
~ ""0
0 s::: tO
Ul Q.JUl
+->>->
tOtO
..E.... -.;o,.::
+-'a.J
.UlQ)
W3:
.0---
I
c::x::
Q)
....-
_o
tO
1-
..s:::
u
+-' ......
utO
s....
1......-.._
0
:z:
s.... .:...c...._
Q) _o
+' _J
tO 0:::
..us:::s.... +-' :c
tO........_
uo
:z:
_o
. ..su::: .._.._.-..
+-'
utO +-'
....-3
.tO
+-' 0
1 - C z
s:::
Q)
Es.... Ul
Q).-
..s:::s....
..<....Ill-
LL
s....
Q) Ul ..--IO'l ::I
cs:::::x::0:c
. . . (V')
1.0
o::T
0
(V')
N
o::T N
(V')
. . . Nr-....
(V')
....-
0
L!)
\.0
o::T
L!)
\.0 0
. . L!)
(V')
r-.... (J)
0
0
r-.... ....- co
r-.... (V') L!)
....-
,\....0..
(J) (J)
L!)
....-
\.0 0
.0...-
.r.-.....-.
o::T N
\.0
N o::T
.....-.--
(V') L!)
r-.... 0 r-....
r-.... r-.... o::T
\.0
(V')
0
rc-.o...
o::T \.0
..--
L!)
0 0
(J)
co
0 (J)
....-
o::T
(V')
....-
o::T
L!)
r-....
cN o
Nco
o::T \.0
(V')
N
\.0
. . . (J)
\.0
(J)
(V') r-.... 0
(V')
N
(V')
. . . ccoo
0
r-....
....-
(V')
L!)
o::T
L!)
. . rc-.o...
N
r-....
c0 o
0
0
0
0
L!)
. . (V') r-....
N
(V')
,.....
co (J) r-....
oc:o:T
N N
r-....
0
L!)
r-....
(V')
(V')
N
\.0
0
N
N
(V')
....-
N
o::T o::T \.0
r-....
L!)
co
\.0 o::T 0
(V')
\.0
L!)
ccNoo
L!)
o::T o::T
.0.--
(J)
0 N
(J)
....-
(V')
r-....
c\.o0
.c\..-o0-
..-- r-.... (J)
o::T (V') r-....
. 0
N
r-.... r-....
(J) (J)
0-.:
. . . (J) (V') ....-
\.0 r-.... N
(V')
N
(V')
. . . (J) ....- 0
\.0
L!)
\.0
0
0
0
L!)
. . (J)
\.0
r-.... (J)
0
0
L!)
L!)
c
(V')
co
N
(J)
(V')
(V')
.r.-.....-.
o::T
N
(V')
N
(J) ..--
N 0
\.0
..--
(J)
..--
0
N
N
(V')
N
L!)
\.0 r-.... (V')
(V')
..--
co
.N.--
co
\.0
N
.\..-0-
\.0 0
\.0
0 0 \.0
L!)
....co
L!)
....-
o::T
N
N
L!)
(V')
r-....
or-:.:.T..
L!)
r-....
(J)
(J)
(J)
.
.
.
u
u
u
Q)
Ul
Ul
Q)
Ul
Ul
Q)
Ul
Ul
0
..uss.:.:.:.
>->
tO
"s":0::
""0 .;,.::
Q)
.;,.::
Q)
Q)
Q)
Q)
3
3
....-
tO
+-' 0 1-
0
..s::: us....
>->
tO
"s":0::
".;",.0::
Q) .:>1:.
Q)
Q)
Q)
Q)
3
3
..--
tO
+-' 0 1-
0
..ssu.:.:.:.
>->
tO
"s":0::
""0
Q)
.:>1:.
.:>1:.
Q)
Q)
Q)
Q)
3
3
....-
tO
+-'
0 1-
tO
tO
tO
::E:
::E:
::E:
75
\.,
.:;:;~ft\
:~~~;f~t
.:_:/:
:~~:..
Table A~l. Methods of fishing and type of bait used by fishermen on the Okefenokee Swamp from 10 March 1973 to 26 December 1975.
Period
Type of Fishing - Percent
Type of Bait - Percent
Still Cast, S~in, Flt Set, Trot, Trolling Natura1 Artificial
March - Dec. 1973 84.9
15. 1
0
86.6
13.4
March - Dec. 1974 86.6
12.5
0.9
86.9
13. 1
March - Dec. 1975 82.0
18.0
-....J 0)
0
82.0
18.0