- Collection:
- Georgia Government Publications
- Title:
- Getting to know your watershed
- Creator:
- Georgia Adopt-A-Stream
- Publisher:
- Atlanta, Ga. : Georgia Adopt-A-Stream
- Date of Original:
- 2008
- Subject:
- Watersheds--Georgia
Watershed management--Georgia--Citizen participation
Water--Pollution--Georgia - Location:
- United States, Georgia, 32.75042, -83.50018
- Medium:
- publications (documents)
- Type:
- Text
- Format:
- application/pdf
- External Identifiers:
- OCLC 1265434458
NZ MMS ID 9922543344702931
Call Number N200.E5 M1 2008 W3 - Metadata URL:
- https://dlg.galileo.usg.edu/id:dlg_ggpd_s-ga-bn200-pe5-bm1-b2008-bw3-belec-p-btext
- Digital Object URL:
- https://dlg.galileo.usg.edu/do:dlg_ggpd_s-ga-bn200-pe5-bm1-b2008-bw3-belec-p-btext
- Language:
- eng
- Holding Institution:
- University of Georgia. Map and Government Information Library
- Rights:
-

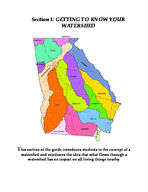
Section 1: GETTING TO KNOW YOUR WATERSHED
This section of the guide introduces students to the concept of a
watershed and reinforces the idea that what flows through a watershed has an impact on all living things nearby.
An Imaginary River
Objective:
Location: Time Needed: Subjects: Level:
Students will design their own miniature river system and be able to explain the concept of a watershed. Indoors 30 minutes Science, Art, Language Arts, and Social Studies K-2nd grade
Background: Rivers are the result of many streams coming together to form large flowing bodies of water. The water that flows into a river is a result of rain and/or snowmelt from the surrounding watershed and may be supplemented by groundwater sources. The size of a watershed depends on the elevation of the land. Where rain falls on a hill determines the direction the water will run off into a stream. The areas of high elevation surrounding the stream will mark the outer edges of the watershed with water flowing from upstream (where the stream flows from) to downstream.
In this activity, the students will simulate the forces of gravity and wind using simple art materials. When blue paint is blown onto paper, the force of gravity causes the paint to run down the page. Just like the paint is subject to gravity, the water in a stream moves due to the elevation of the land and the force of gravity on the earth. This activity demonstrates a physical law, and explains simply the way gravity affects water flow.
Materials: White printing or construction paper Water-soluble paint (non-toxic) Straws Newspapers and smocks for kids (old shirts) Road map showing the water systems (or topographical maps)
Preparation: Depending on the thickness of the paint, water may need to be added to the paint. Have the students place newspapers to cover the tables. Advise the students to bring a large, old shirt to wear as a smock.
Procedures: Part One:
1. Give each student a white piece of paper and place a drop of paint on the top of the paper.
2. Each student then should hold the paper at an angle, watching the paint move down the paper.
2
3. Ask students why the paint moved down the paper. Explain that the force of gravity pulled the paint down the paper, just as it pulls a ball to the ground.
4. Explain that the same force, gravity, pulls water to the ground when it rains and also pulls water down a hill or gentle slope. Gravity pulls the water from streams and rivers all the way to the ocean.
Part Two: 1. Give each student a second white piece of paper and a straw. Place a drop of paint on the top of the paper. 2. Have each student hold the paper at an angle and blow above the paint blot creating a branching pattern similar to a river and its tributaries. 3. Tell each student they have made an imaginary river system. Their breath served as the force of wind, which along with gravity, made the paint drain or run onto other areas of the paper. 4. Have the students name their river and the small streams. 5. Explain the following terms to the students: upstream and downstream. Ask the students to decide which way their river flows. 6. Explain how you tell which direction is upstream in a real river or stream.
Part Three: 1. Place a map showing rivers and streams on the tables between the students. Show the students where they are on the map. 2. Have the students look for a stream that looks similar to the "imaginary river" they have on their paper.
Part Four: 1. Have the students tape their drawings together (river to river) and then tape the "rivers" on the board. Let the students know they have now formed a river basin. 2. Have the students give the river basin a name.
Discussion: 1. Describe how a river looks. 2. Tell what makes water move in a stream. 3. How can you tell which direction is upstream or downstream in a real river?
Extensions: 1. Follow-up with "Stream Journey" Activity on page 9.
Based on Always A River, "An Imaginary River."
3
Water Wings
Objective:
Location: Time Needed: Subjects: Level: Learn More:
Students will be able to identify water-related sounds and their sources at a stream. Students will also explore their own thoughts and feelings about aquatic environments through visualization and creative drawing. Indoors 85 minutes Art, Language Arts, Music K - 2nd grade Appendix B-2
Background: Aquatic habitats like streams and wetlands are unique places that support a wide array of life. Not only do they provide habitats for plants and animals but they contain fresh water that humans also needs to survive. Unfortunately, the water in streams can be easily contaminated with trash from the streets, agricultural runoff, sediment from erosion, and chemicals from industrial plants and our homes making it a difficult habitat to live in. Care must be taken to protect the quality of the water. Being aware of the many purposes of water helps us realize its usefulness and the need to protect it from pollution.
Materials: Tape recording of water sounds or of an aquatic habitat, such as a river, lake, stream, swamp, or marsh. (You can find these tapes at local bookstores or make your own at a stream). The Georgia Wildlife Federation sells a "Natural Sounds of Georgia" tape that you can purchase by calling 770-787-7887 or going to their website www.gwf.org. Water sounds can also be downloaded from www.naturesmusic.com & www.naturesongs.com Tape or download music/sound clips of everyday activities. These can be downloaded from dgl.Microsoft.com Tape recorder or CD player with speakers Crayons and/or water-based paints (or poster paints), brushes, paper, containers for water. Pictures of water pollution (trash or litter at streams, paint or oil cans in water, etc.). Objects that get thrown in streams (aluminum cans, plastic bottles, plastic bags, tires, clear cup of oil, clear cup of plant fertilizer, and a clear cup of mud).
Procedures:
4
1.
Discuss with students ways in which they identify something like a plant
or animal. Most will say something relating to how it looks. Ask students if there
are any other senses they could use? Answers: Smell, hearing and touch. In this
activity we are going to use our sense of hearing to identify things. First, have
students listen to pre-recorded sounds such as wind, rain, car, typing on a
keyboard, walking and running. Play the sounds a second time and have the
students guess what they are. Sounds can either be downloaded from a website
or randomly taped by the teacher.
2.
Have students close their eyes and listen to a second tape that is playing
natural sounds, trying to picture a setting for the sounds they hear. Tell them to
concentrate on the sounds they are hearing. Georgia Wildlife Federation has a
tape that can be ordered from their bookstore that has birds chirping, a stream
babbling, and frogs croaking on it. Natural sounds audio clips can also be
downloaded from the web.
3.
Play the recording a second time. Afterwards ask the students to name
some of the things they heard. Record what is said on the board.
4.
Ask the students to close their eyes one more time and try to create a
picture in their minds of what they just heard. Ask the students - What do they
see? Tell them to imagine as much detail as possible: the colors, the plants and
animals, the sky.
5.
Once the students have a picture in mind, have them open their eyes.
Distribute out to the students paper, paint/crayons, water rinse dish and
brushes. Ask them to draw/paint/color the picture they saw when their eyes
where closed on the paper.
6.
While the pictures are drying, show the students pictures and objects that
pollute the water. Ask the students the following questions:
a) Should those objects be there? (answer: no)
b) What do we call aluminum cans and garbage in the water? (answer:
pollution)
c) How does pollution change their pictures? (answers will vary but the main
point is it will change and not look as nice)
d) How would the tape of a polluted stream sound? (possible answers: if it
babbled before, does not babble any more, makes a new noise when the water
hits an object in the water, fewer sounds of wildlife)
e) Ask the students if they can think of any other things that damage streams
and rivers. (answers: chemicals, tires to name a few)
f) How does pollution end up in a stream? (possible answer: people dumped it
there, it was washed there by the stream or rain)
g) How can pollution be prevented? (possible answers: be responsible, picking
up ones trash, participating in cleanups)
7. Have the students display their artwork on their desks or on a bulletin board.
5
Extension: 1. Take a short field trip to a local stream, pond, lake, or river when human-made sound will be at a minimum. Have the students record the sounds they hear. Once back in the classroom, play the sounds the students recorded in the field. Then play pre-recorded water sounds used earlier in this lesson. How are the two recordings the same or different? What might have made them different? 2. Participate in "River of Words", an international environmental poetry and art project for K-12 students. For more information contact Georgia Project WET at 404-675-1762 Taken from Always a River, "Water Wings."
6
Little Sprouts
Objective: Location: Time Needed: Subjects: Level: Learn More:
Students will determine how water quality affects plant growth. Indoors 3 weeks, with an initial class of 30-40 minutes Science, Math K-5th grade Appendix B-1
Background:
Water is essential for life. Most seeds will begin to germinate when soaked in water. However, the quality of water can affect plant growth. In this exercise, salt, soap, and vinegar will be added to water to represent potential contaminants and environmental conditions.
In some sections of the country, the salt content in the soil is very high and affects the plant life in the area. Soap and detergents may represent pollutants, such as nutrient run-off. Many detergents contain phosphorous, which is considered a nutrient in small amounts but a pollutant in large amounts. The vinegar represents acids that could result from acid rain, pesticides and other industrial chemicals. Vinegar is about 5% acetic acid and 95% water.
Materials: 1 sandwich-size baggie for each student Paper towels 1 large bag with soaked lima bean seeds (4) 2-liter plastic soda bottles filled with different water solutions as follows: Solution 1 - Tap Water Solution 2 - Salt water (1 cup salt/2 liter bottle) Solution 3 - Soap water ( cup liquid soap per 2-liter bottle) Check to see if your detergent is "phosphate free." If so, add teaspoon of plant fertilizer. Solution 4 - Vinegar (do not dilute can be left in vinegar bottle)
Preparation:
1. Soak approximately 150 large lima beans in water overnight (you can buy a bag of dried beans in the grocery store).
2. Make a large bulletin board garden scene with 4 sections for each of the different solutions.
3. Before class, mix each watering solution in 2-liter soda bottles.
Procedures: 7
1. Discuss with students what is needed for a seed to sprout. (Light, air, water) 2. Ask students if they think seeds would grow if they were given water that was
polluted with other substances such as salt, soap, and vinegar. Suggest that they try each solution and see what happens. 3. Divide the class into groups of 4 and assign a different solution to each student in the group. 4. Pass out 1 baggie, 1 paper towel and 4 soaked seeds to each student. Label each baggie with the student's name and solution. 5. Fold the paper towel in half and then in half again creating a crease on the towel then unfold. Using the creases as a guide, fold each corner in so the four (4) points meet in the middle. Staple the open sides of each little triangle creating four (4) little pouches. Place one seed each of the "pouches". 6. Poke a small hole through the paper towel "pouch" below each seed. The roots will be able to grow down through the hole to reach the water solution in the bottom of the baggie. 7. Insert the paper towel with pouches folded outward and seeds into the baggie and staple two (2) corners of the paper towel pouch to the baggie to help hold it up. 8. Have each student pour about 70 ml of their solution into their baggie, moistening the paper towel and the seeds completely. Make sure part of the paper towel hangs down into the water solution so that the paper towel will be kept moist to hasten germination. 9. Each baggie may be stapled to a garden scene on the bulletin board or taped to a sunny window.
K-2nd students: Each student should draw a picture of their seed's growth on their activity sheets. 3rd-5th students: Count the number of seeds that germinate and measure height. Have these students make a bar graph. Discussion: 1. Did all the seeds start to grow? 2. Which seeds grew at the beginning of the experiment? Which grew at the end? 3. What did the seeds look like when they stopped growing? 4. Why do you think they stopped growing? 5. Which liquid would you choose to water your seeds with?
Extension: 1. Experiment with other types of seeds by following the same procedures. 2. Transplant seeds into larger pots at the end of the last observation.
From Activities Integrating Mathematics and Science, Water Precious Water, "Little Sprouts."
8
Treatment Water
Little Sprouts Activity Sheet
Picture
Water plus salt
Water plus soap
Water plus vinegar Treatment
Number Germinated (out of 4) Height (average)
Water
Water plus salt
Water plus soap
Water plus vinegar
9
10
Pollution Solutions
Objectives:
Location: Time Needed: Subjects: Levels: Learn More:
Students will be able to identify practices that contribute to nonpoint-source pollution. Indoors 30-45 minutes Science, Ecology, Geography 4th - 8th grades Appendices A-2, B-1, and B-2
Background: Pollution is divided into two groups, depending on how the pollution enters a body of water. Point source pollution is waste that comes from a specific point. Factories and wastewater treatment plants may have discharge pipes that lead directly to a waterway. These are considered point sources because they are easily identified as coming from one site.
Nonpoint source pollution comes from more than one specific location. It results from the runoff of water (rainfall, snowmelt, etc.) over land. As water passes over the ground, it picks up pollutants and carries them into local streams and rivers. Nonpoint source pollution can also result from airborne pollutants that are deposited in waterways.
Nonpoint sources can be either rural or urban. Nonpoint source pollution in rural areas usually results from such things as poor agricultural or forestry practices but can also include runoff such as trash, oil, gas, and fertilizers from lawns, the common culprit in urban and suburban areas.
Materials: Each group will need: 1 Die from another board game Playing board included in the back of this educator guide Cards (Included - Copy a set of cards for each group) Cut squares from different color construction paper Optional: Vials with aquatic insects or cuts out of the insect and crusteans found in Appendix C-2
Preparation: 1. Copy the "Card Page" and "Card Page Answers" (Two (2) sets are available: 45th and 6-8th) onto the front and back of a piece of cardstock or thick paper. Have each group cut out a set for their game. Also make copies of the playing board one per group.
Procedures:
11
1. Review with students what nonpoint and point source pollution is. Resources available at www.GeorgiaAdoptAStream.com.
2. Divide the class into groups of five. Have each student cut a small shape out of construction paper to represent them as a player. Make sure each team member has a different colored square. Optional: You may wish to use small vials of different types of aquatic insects to represent each player. The aquatic insects can be collected using the procedures given in the "Adopt-A-Stream Detectives" lesson plan later in this guide.
3. Have the students look over the playing board and as a team identify some of the spaces with proper and improper water quality practices. Ask the students if they notice anything improper practices are in red and proper in green.
4. Lets play the game GAME RULES i. Each player is to line up on the "starting line." ii. Roll the die to see who will move first. (The highest number rolls first, and so on)
iii. Have the students move the number of spaces rolled on the dice. iv. Each student is to follow the directions in the space. They may have to
move up, back, or stay in the space. v. If a student falls on the space marked "read card," they are to take the
card from the top of the pile, read it and answer the question. If they get the answer right they follow instructions and return the card to the bottom of the pile. If they get the question wrong, they stay on the square and their turn is over. vi. The game continues until a student reaches the "finish".
Discussion: 1. What is nonpoint source pollution? 2. Give two examples of nonpoint source pollution. 3. List two things that indicate a healthy stream. 4. List two things that can harm a stream.
Extension: 1. Have the students make up additional cards for the game. Make sure for each question, the student writes an answer. 2. Have the students participate in a Watershed Walk. See "Watershed Walk" activity or "Stream Journey" lesson plans.
12
Cards for Pollution Solutions 1. Give two examples of nonpoint source pollution.
Move 2 spaces.
2. Name two animals that live in a stream.
Move 1 space.
3. What does nonpoint source pollution mean?
Move 2 spaces.
4. How can cows damage a stream if they walk through it?
Move 1 space.
5. Name two rivers in Georgia. Move 2 spaces.
7. List two things that could harm a stream. Move 1 space.
6. Cutting trees next to a stream is harmful to aquatic organisms. (True/False)
Move 1 space.
8. List two things you can do to help a stream.
Move 1 space.
9. Name two activities for which 10. Name two things you can
a stream can be used.
find in a healthy (clean) stream.
Move 1 space.
Move 1 space.
11. If you find water that smells bad and looks very dirty, whom do you need to tell?
Move 1 space.
12. How do you know when water is polluted?
Move 1 space.
13. When oil and chemicals get in a stream, they end up downstream. (True/False)
14. Nonpoint source pollution can easily be seen in a stream. (True/False)
Move 1 space.
Move 1 space.
13
Card Answers: Pollution Solutions Answers for 4th-5th grades
2. Fish, turtles, frogs, salamanders, aquatic insects, beavers, ducks, etc.
1. Sediment (soil) in stream, parking lot run-off, cutting trees next to a stream, agricultural runoff, etc.
4. Cows release organic materials into a stream (cause an increase of nutrients in the stream). Cows also increase erosion by walking in stream.
3. Nonpoint source pollution is contamination that originates over a broad area from a variety of causes. (erosion, agricultural run-off, parking lot runoff, etc.)
6. True: It causes erosion and
5. Chattahoochee, Flint, Savannah,
increases temperature in the stream by Oconee, Altamaha, Ogeechee, etc.
removing sources of shade.
Any local rivers can be used.
8. Remove litter or trash in the stream, streambank restoration, help prevent erosion, check for aquatic insects in the stream and other animals living in the water.
7. Agricultural runoff, cows in the stream, sediment in the stream, increase in temperature, elevated pH level, low dissolved oxygen, etc.
10. Aquatic insects, fish, frogs, etc. Any living animal will answer this question.
9. Canoeing, fishing, kayaking, swimming, tubing, drinking water.
12. Trash in the water, high level of nutrients in the water, cows walking in a stream, water smells bad, and it may look dark green with algae growing on the rocks.
11. You need to contact or tell an adult who can tell the proper people. (County Water Quality Department, State Water Protection Division (EPD), EPA, etc.)
14. True or False- Depending on the source of the pollution it may be seen. An increase in algae will leave a green color in the water or grow on the rocks (High nutrients).
13. True: Any added chemicals upstream would travel downstream.
14
Card Answers: Pollution Solutions Answers for 6th-8th grades
2. Caddisfly larvae, mayfly larvae, largemouth bass, bluegill, salamanders, frogs and turtles.
1. Erosion of stream banks (construction, improper forestry techniques), Cows walking in stream, parking lot runoff, agricultural runoff.
4. Cows release organic materials into a stream causing an increase of nutrients in the stream lowering the oxygen due to the breakdown of wastes. Cows also increase erosion by walking in stream.
3. Nonpoint source pollution is contamination that originates over a broad area from a variety of causes. (erosion, agricultural run-off, parking lot runoff, etc.)
6. True: Causes erosion and increase 5. Chattahoochee, Flint, Savannah,
temperature in the stream by removing Oconee, Altamaha, Ogeechee, etc.
sources of shade.
Any local rivers can be used.
8. Remove trash and litter in the stream, streambank restoration, monitor a stream, etc.
7. Agricultural runoff, cows in the stream, sediment in the stream, increase in temperature, elevated pH level, low dissolved oxygen, etc.
10. Caddisfly larvae, hellgrammite, mayfly larvae, trout (N. Ga. streams), turtles, and frogs.
9. Canoeing, fishing, kayaking, swimming, tubing, drinking water, etc.
12. High phosphates and nitrates, smells bad, packs of algae growing on rocks, rocks covered with sediment, and trash.
11. Call the local authorities- EPD, County Water Quality Authority, or someone who can contact the proper authorities.
14. True or False- Depending on the source of the pollution it may be seen. An increase in algae will leave a green color in the water or grow on the rocks (High nutrients).
13. True: Any added chemicals upstream would travel downstream.
15
Picture Perfect
Objective:
Location: Time Needed: Subjects: Level: Learn More: Resource:
Students will identify different types of water pollution and describe the differences between nonpoint and point source pollution. Indoors 60 minutes Science 5th - 8th grade Appendices A-2, B-1, B-2
You're the Solution to Water Pollution Poster and Brochure
Background: Water pollution is generally defined as any human-caused contamination of water that reduces its usefulness to humans and other organisms in nature. There are two broad classes of water pollution point source and non point source pollution. Point source pollution is waste that comes from a specific point. Factories and wastewater treatment plants may have discharge pipes that lead directly to a waterway. These are considered point sources because they are easily identified as coming from one site.
Nonpoint source pollution comes from more than one specific location. It results from the runoff of water (rainfall, snowmelt, etc.) over large areas land such as farms, grazing lands, logging roads, construction sites, abandoned mines, and the gardens, lawns, streets, and parking lots of cities. Nonpoint source pollution is more difficult to control than point source pollution because it is so wide spread.
Other than sediment, pollutants of greatest concern in rural and urban areas are nutrients, mainly nitrates and phosphates. Nonpoint sources of nutrients include inorganic fertilizers and animal wastes from agricultural operations, runoff from urban gardens and lawns, and septic tank failures. Excessive nutrients can cause unsightly growths of algae and aquatic weeds that adversely impact the entire aquatic ecosystem. Since plants produce oxygen via photosynthesis, if a stream goes several days without sunlight, these plants and algal blooms will respire, taking available oxygen out of the water. Thus, depleting the supply of oxygen available to fish and causing fish kills when dissolved oxygen levels drop below levels required by the fish.
Materials: Handout - make copies of the handout for students or other pictures of a stream with potential sources of nonpoint source pollution.
Procedures: 1. Lead a discussion with students on water pollution, point source pollution, and nonpoint source pollution. Discuss how different land uses might affect the quality of
16
streams, lakes, and rivers. (See Appendix A-2.) 2. Group students. Have each group look for all the possible sources of pollution
on the handout. Explain to the students that many of the pollutants cause a problem only when it is raining. 3. Once everyone is finished, have each group identify a pollutant and its source.
a) Runoff from streets causes oil, gas, and/or brake dust to flow into the stream.
b) Unregulated smoke released from factories and cars causes air and water pollution.
c) Stream banks without vegetation can erode, causing sediment to run into the water.
d) Excess fertilizers added to lawns and cropland may runoff into streams and cause an increase of nutrients in the water.
e) Cows release organic materials (wastes that include bacteria and parasites) into a stream causing an increase of nutrients and lowering the oxygen due to the breakdown of waste. In addition cows increase erosion when they walk in the stream.
Other possible pollutants: a) Septic tanks may leak and release wastes into the water. b) Leaking underground storage tanks at gas stations release gas and oil into the soil that will reach the stream. c) Construction may leave soil bare, increasing erosion and sediment going into the river. d) Trash and litter is hazardous to fish. e) Improper forestry practices can cause erosion and increase temperature in the stream by removing sources of shade. Also, deforestation decreases the rainwater's ability to be absorbed into the ground.
Note: It is important for students to realize the damaging levels of certain impacts vary. For example, small areas of erosion on a bank have less impact on a stream than a dozen cows walking through the stream. Also, certain practices minimize the impacts on a stream. When timber is cut, a buffer zone (area of uncut timber) can be left next to a stream to prevent erosion and shade the stream.
4. Review the different industries and potential sources of nonpoint and point source pollution in your community that may affect a stream.
5. Discuss possible solutions to the problems on the handout. See Appendix B-2 for additional information.
Discussion: 1. List five types of nonpoint source pollution.
17
2. List two types of point source pollution 3. List possible solutions to controlling/preventing pollution in our waterways. Extension: 1. Contact the Department of Natural Resources and ask for the "Mountain Stream
and Lake Ecosystem" posters for the class. You can call your local DNR office or (404) 675-1635 to obtain a poster. Compare posters to the handout or a local stream. Note activities available on the back. 2. Have the students make "stream awareness" posters and place them throughout the school. 3. Have students complete "Erosion" (grade 5) and "Surface Water and Ground Water Pollution"(Grade 6-8) Activities from the Water Quality... Potential Sources of Pollution Poster produced by US Geological Survey. A copy of this poster is available from US Geological Survey. Contact information is located in the Reference & Resource section of this guide.
Illustrations from Environmental Resource Guide, "Water Pollution Detectives."
18
19
Dragonfly Pond
Objective:
Location: Time Needed: Subjects: Level: Learn More:
Students will evaluate the impact of land use on wetland habitats and discuss lifestyle changes needed to minimize nonpoint source pollution. Indoors 60 minutes Science, Social Studies 6th - 8th grade Appendices B-1 and B-2
Background:
Human activities affect wildlife habitat, both positively and negatively. What humans do with the land is a reflection of human priorities and lifestyles. The search for a modern day "good life" and all of its conveniences produces mixed results for wildlife and the natural environment. Sometimes people see undeveloped areas of the natural environment as little more than raw material for human use. Others believe that the natural environment is to be preserved without regard for human needs. Still others yearn for a balance between economic growth and a healthy and vigorous natural environment.
At the core of land use issues is the concept of growth. Growth in natural systems has inherent limits. Continued survival for plants and animals is determined by food, water, shelter and space availability. Often, humans do not realize the impacts of their activities on the surrounding environment. Nonpoint source pollution is one negative impact humans have on their local environment, especially steams.
Materials: Each group will need: Scissors Masking tape Paste or glue Paper One set of land-use cutouts Large piece of paper on which to fasten the cutouts.
Procedures:
1. Discuss with students how human activities and land use patterns impact wildlife and environment.
2. Divide the class into groups of three to five students and hand out the land-use materials. The students will be responsible for arranging the pattern of land use around "Dragonfly Pond" in such a way as to preserve the health of this beautiful area.
20
3. Have the students cut out the land-use pieces and arrange the parts on the paper. Tell them all the land-use pieces must be used in the pond area. The park and farmland may be cut into smaller pieces, but each piece must be used. Parts may touch, but not overlap. It is important to inform the students that the "bleach factory" must have access to the water for production and the "farm feed lot" is an area of little grass where cows are overcrowded and fed grain. Additional highways can be added. Note: Make sure they indicate which direction the water flows (from top to the bottom of the page).
4. Once the groups have agreed on the land use location, have the groups tape the pieces to the paper.
5. Begin a class discussion about the possible pros and cons of each land use. The following are a few examples:
PROS
Farm:
* produce food
* provide jobs
the water
* economic value
contaminate water supplies
CONS * use of pesticides that may run off into
* soil erosion * use of chemical fertilizers that may
Businesses: * employment * provide commerce * economic stability
* produce wastes and sewage * contaminate water (detergents, etc.) * use chemical fertilizers
Homes:
* provide a sense of place * create a community * provide shelter
* generate wastes and sewage * use water * loss of wildlife habitat
6. Have each groups re-examine the pond. Without changing any
pieces, have each group decide if the pond best supports the:
a. Residents
b. Farmers
c. Business
d. Gas station owners
e. Parks
f. Highway
g. Bleach factory
h. Wildlife
7. Invite each group to display and describe their "ponds." Ask the students why they chose to develop the land the way they did and what might be some consequences and advantages to their proposed land use plan. Additional discussion points could
21
include the need for an economic base for the town. Also, farmlands provide habitat for some wildlife, but if the wetland has to be drained for the farmland, a habitat will have been destroyed. 8. When all the students have finished proposing their plans, have each group tape their "Dragonfly Ponds" to the board with the drainage from one group's plan flowing into another. 9. When each town plans its water use without considering downstream impacts, what happens? Have the students tell the possible consequences and possible solutions to the problem. For example, where will the water be treated? Where will the water go? 10. Ask the students to create a list of things they can do to begin to reduce the potentially damaging effects of their own lifestyles on the "downstream" habitats and protect water quality. Use DNR's Nonpoint Source Pollution brochure "You're the Solution to Pollution" produced by Pollution Prevention Assistance Division (P2AD), GA Adopt-A-Stream and GA Project WET for additional information (located in the back of this manual).
Discussion:
1. Give two examples of pollution presented in this exercise. 2. What effect does industry have on downstream water supplies? 3. What effect does agriculture have on the water supply? 4. List possible solutions to the problems associated with growth. 5. Can you name some people or organizations in your area that
protect streams and rivers? What do they do?
Extension: 1. Trace a stream or river system that passes through your community from its source to the sea. Look at land use adjacent to the stream or river. How does that land use affect water quality? (Use Google Earth for a more technical approach) 2. Do a web search of organizations that work to protect streams. Find out what they do and how you can get involved. 3. Participate in a Georgia Adopt-a-Stream Workshop and learn how to check the water quality of the stream near the your school. For information about a workshop check the Adopt-A-Stream website at www.GeorgiaAdoptAStream.com.
Taken from Aquatic Project WILD, "Dragonfly Pond."
22
23
Grocery
Gas Station
Dry Cleaners
Restaurant
Farm Feed Lot
House House
House House
House House
Farm Cornfield
Bleach Factory
Park
Highway 24
Fire House Condo
How BIG is the River Really?
Objective:
Location: Time Needed: Subjects: Levels: Learn More:
Students will investigate the concept of a watershed, identify a river's watershed system, and describe the immediate watershed in which they live. Indoors 60 minutes Geography, Science, Social Studies 6th - 12th grades Appendices A-1, A-2, A-3, B-1
Background: As streams increase in flow and join with other streams, a branching network is established, much like the branches of a tree. This network is called a river system. A watershed is all the land area that contributes runoff and precipitation to a specific river system. What affects a watershed in one place eventually affects other sites, as water proceeds downstream.
A topographic map can be used to determine the boundaries of a watershed, identify land use practices, and plan best management programs to prevent or reduce pollution. To effectively use topographic maps, it is necessary to understand the information shown.
Topographic maps show the shape of the earth's surface using contour lines. Contour lines are imaginary lines that trace the land's surface at a particular elevation. Elevation is important in analyzing water flow patterns. Because water flows downhill and perpendicular to contours, a watershed can be determined from a topographical map. Intervals between contour lines are indicated on the map scale. A typical interval is 20 feet or 20 meters. Concentric circles, ovals or ellipses indicate a knob or hill. By marking the hilltops and ridges, it's possible to create a good outline of the complete watershed.
Materials: Copies of a topographical map of the river near the school one map per group (Maps can be downloaded from www.topozone.com or by contacting your county surveyor's office) Transparency sheets and pens Dot grid (provided) for Estimating the size of a Watershed (Grades 9-12)
Preparation: Before giving out the maps, have the topographical maps laminated so they can be used again. Have enough transparencies, approximately three (3) per group, to tape down to the laminated topographical maps. It is important as the teacher you are able to map
25
out a watershed before helping the students. If you are uncertain, consider attending an Adopt-A-Stream Getting Started Workshop. Instructions for delineating the watershed are provided in Appendix A-1.
Procedures: Part One: Mapping the Watershed (Grades 6th - 12) 1. Discuss the following terms: watersheds, contour lines, elevation, runoff and nonpoint source pollution. Definitions and explanations are given in Appendices A-1, A-2, and B-1. Above is a nice 3-D visual of a watershed you can use or you can use any geography map that shows ridges and valleys. 2. Divide the class into groups of 3 or 4. Give each group a map showing local rivers and its tributaries, transparency paper and a copy of the "Major Watersheds of Georgia" (located in Appendix A-3). Have the students tape the transparency paper down over the map. 3. Have students find their own town or community on the map. 4. Have students locate the waterway closest to the school on the map (scale 1:24,000) and trace it with a marker. 5. Ask the students which direction the water is flowing and how they know. Make sure to mark any lakes that are a result of a dam. If a dam is present, discuss the advantages and disadvantages. 6. Have the students locate the steams/rivers that join to form the main river and trace over them with a different color marker or crayon. Add additional transparency sheets if necessary. 26
7. Have students determine where the river goes. Rivers in Georgia flow to the Atlantic Ocean and the Gulf of Mexico.
8. Next, have the students outline the watershed near to the school. The students should first locate the high points (hilltops) around the stream and draw an X on them. Next, connect to the dots by drawing a line at right angles to the contours lines. The students will want to be sure they are following ridgelines and not valley when they are connecting the dots. Step by step directions to delineating a watershed are found in Appendix A-1.
Part Two: Estimating the size of the Watershed (Grades 9th - 12th)
1.
Copy the dot grid on the following page and provide each group
with a copy.
2.
Have the students take the transparency paper off the topographic
map and place it onto the dot grid.
3.
Count all of the dots that are fully within the watershed boundary
plus every other dot that falls on the line around the area. Record the number
of dots.
4.
Repeat this procedure three times, randomly placing the dot grid
each time. Take the average number of dots from the three counts and
multiply by the appropriate acres/dot factor on the bottom of the dot grid.
This will be the estimate of the size of the watershed in acres.
Optional: Calculate the amount of rain that falls on the watershed by finding out the average rainfall and multiplying the value by the watershed area. It may be more appropriate if the amount of rain is converted to gallons. (Contact the local Soil Conservation Service for rainfall data.)
Discussion:
1. What is a watershed? 2. Knowing the watershed, how does land use in a
watershed affect water quality? (Answers can be found in Appendix A-2). 3. Discuss the different land uses that exist in the watershed the students mapped out. (Examples may include farms, cropland, forests, parking lots, etc.) 4. Propose solutions to any existing problems in the watershed. 5. What is runoff? Where does it come from? (Fertilizers, pesticides, silt, and other pollutants could run into the streams) What types of land uses may influence the
27
quality of runoff? (roads, parking lots, farms and lawns). See possible answers in Appendix A-2. 6. How does runoff affect the water quality in a stream? 7. How is the volume and rate of runoff affected by the land use in the watershed? (More impervious surface in the watershed increases both.) Extension: 1. Complete the "Watershed Walk" Activity found in this section of the Educator Guide. 2. Have students complete the "Watersheds, Floods and Flood Plains" Activity (Grade 6-8) from Watersheds: Where We Live poster produced by US Geological Survey. A copy of this poster is available from the US Geological Survey. Their contact information is located in Reference & Resource section of this guide. Based on the Tennessee Valley Authority - Fall Workshop Teacher Guide, "Interpreting a Topographic Map."
28
Delineated Watershed
29
30
How Much Water Falls Here?
Objective:
Location: Time Needed: Subjects:
Levels:
Students will calculate the volume of water that falls onto an area of the school parking lot. Older students will compare this volume to common water-consuming activities. Indoors/Outdoors 90 minutes (can be divided into two class sessions) General Science, Ecology, Physical Science, Biology, Chemistry, Physics, Math 6th - 12th grade
Background: When it rains, where does the water go? Some of it is absorbed by the soil and plants, some is evaporated back into the air and some runs off the land. When it rains in areas with lots of impervious surface (parking lots, roofs, roads), water runs off to storm drains and drainage ditches, often at a fast rate because it is not absorbed into the ground.
Urbanization and other development often adversely affect stream health by increasing the volume of surface runoff entering a local waterway. Urban stormwater runoff may contain sediment, debris, oil, gasoline, and heavy metals (nonpoint source pollution) that it has picked up after traveling over impervious surfaces. When potential pollutants are transported quickly from the land to a waterway, this can cause a phenomenon called "shock loading." Shock loading is the overloading of water with nutrients, sediment, oil, etc, over a very short period of time giving the organisms little time to adapt to the changes in their environment. Shock loading can result in fish kills or algal blooms depending upon the type of pollutants in the runoff. For example, suspended materials in the runoff can also absorb and store heat that increases the water temperature.
Materials:
Yardstick
Trundel wheel (optional)
Writing materials
Local rainfall data
Tape measure
Clipboards (optional)
Graph paper
Calculators
Rulers
Long piece of twine (meter and foot intervals)
Preparation: Call the local weather center or Soil Conservation Service in your county to find out the average annual rainfall for your area.
31
Procedures: Explain to the students they are going to calculate the volume of runoff from the school parking lot that flows to the nearest stream.
Part one: (Grades 6th - 12th) - Calculate the area of the school parking lot and
volume of runoff.
1. Divide the class into teams of 3-5 students.
2. Draw a sketch of the parking lot on the board. Have each team select an
area they wish to measure. If the lot has multiple sections, give each group a
certain area to measure. Note: Make sure the students use the same measurements
(feet or meters).
3. Have the students go outside and take needed measurements.
Transfer all measurements to the sketch on the board.
4. Have students copy a sketch of the parking lot with all
measurements on a regular piece of paper (Grades 6th - 8th) and/or to
scale on graph paper (Grades 9th - 12th).
5. Have each team determine the direction of runoff and distance to
nearest stream. Note: A map can be used to estimate a distance to the stream,
if the stream is not next to the parking lot.
6. Have the students estimate the area of the parking lot. For example:
Square:
Area = Length X Width
Triangle: Area = Base X Height
The values should be in the units the students measured on the parking lot.
Add together all the individual shapes' areas to find the total area of the
parking lot.
7. Determine the volume of rain falling on the parking lot annually by
multiply the average annual rainfall (convert to feet or meters) by the
overall area of the parking lot (square feet or meters). Volume should
be recorded in cubic feet (ft3) or cubic meters (m3).
Part Two: Comparisons of runoff volume to everyday water usage.
The following conversions are useful: ______________________________________ 1 ft3 = 7.2827 gallons 1 m3 = 1,000 liters 5 minute shower = 25 gallons or 95 liters Density of water = 1 gallon = 8.34 lbs. 1 liter = 1 kg. _______________________________________
32
1. Have students calculate the following:
Average annual rainfall:
______________ inches
Convert rainfall from inches to feet ______________ ft (X 1ft/12in.)
Surface Area of Parking Lot
______________ ft2
Volume of runoff
______________ ft3
Convert volume of runoff to gallons ______________ gallons of runoff
Determine how many 5 min. showers ______________ showers can be taken with the amount of runoff
If you took a shower every day, how long would it take to shower this many times?
______________ years
Determine the weight of runoff in lbs. ______________ lbs.
Discussion:
2. Compare the students' estimates to see the variations in values. Make sure all students understand how final answers were derived.
1. Where does the runoff from the parking lot go? 2. What route does the runoff take? (Stormdrain, drainage ditch,
stream, culvert) Is the area from the parking lot to the nearest stream vegetated or paved? If both, estimate percentage of each. 3. Brainstorm ways to slow the flow of water coming from the school's parking lot to the stream (rain gardens, rain barrels, increase permeable surfaces).
Based on the Environmental Resource Guide.
33
Watershed Walk
Objective:
Location: Time Needed: Subjects: Level: Learn More:
Students will understand the concept of a watershed, identify factors influencing their watershed, and describe the immediate watershed in which they live. Indoors/Outdoors 60 minutes Geography and Science 6th - 12th grade Appendices A-2, A-5, B-1
Background: A watershed is an area of land across which rainwater drains into a stream, river, lake or other body of water. It is a catch basin that guides all the precipitation and runoff into a specific river system. Changes in a watershed affect all living and non-living things within its boundaries. For example, trees capture water as it moves across the land helping it absorb into the soil. When trees and plants are removed, water moves across the land much more quickly resulting in an increased amount of surface water entering rivers. As this water flows over the land, it picks up soil and other items, like branches and leaves, and dumps them into the river system. These sediments in turn impact aquatic habitats found in the river system and reduce the diversity of plants and animals like macroinvertebrates found there.
Perhaps the single most important thing to remember about watersheds is that they are single units connected to other watersheds as they are traced downstream. What affects a watershed in one place eventually affects other sites downstream. Impacts can also accumulate as water proceeds downstream.
By visiting a stream, students can learn a lot about a watershed. The land use around the area will directly affect the quality of a stream. For example, poor agricultural practices next to a stream may add pesticides and excessive fertilizer to the stream. Urban land uses, such as parking lots and roads contribute small amounts of oil and gas to storm water. Students should take note of the land use and the condition of the streams by asking questions like "Is the water silty?", "Is the water a green color?" and "Are there signs of pollution?" to help identify the quality of the stream.
This is a great activity to do in conjunction with "How Big is the River - Really?"
Materials: Several copies of Adopt-A-Stream "Watershed Walk" Worksheet (see Appendix A-4)
Note:
34
It is vital to know the potential upstream contaminants reaching the stream. Animal waste, agricultural runoff (pesticides, herbicides, etc.), industrial wastes, or sewage leaks can be hazards to students and you. If you find a stream with any of the above contaminants, a class must use proper precautions if you decide to collect samples in the stream. Students should wear protective boots, gloves, and goggles when necessary. In case of serious contamination, notify your local authorities.
Procedures:
1. Complete the "How Big is the River Really?" Activity first 2. Review the following terms: watersheds, runoff, nonpoint source
pollution, and land uses. 3. Make copies of the Adopt-A-Stream "Watershed Walk" and "Visual
Survey" forms from Appendix A-4 and review the various sections with the class. 4. Take the students to a river or stream that you have safe and legal access to. Survey a -mile bank, and fill out the forms to determine land use, erosion, water color, water clarity, animal life, and human impacts on the stream. 5. In the classroom, discuss the categories and overall condition of the stream. If you suspect the stream to be polluted, ask what can be done to improve the quality of the stream? What is affecting the health of the stream?
Discussion:
1. What is the land uses in your area? (urban with roads, parking lots and buildings, suburban with houses and lawns, rural with farms) (Street maps might be helpful in answering this question)
2. How might these land uses affect the water in the watershed's streams? (Fertilizers, pesticides, silt and other pollutants may run into the river) See Appendix A-2.
3. Will the conditions in your watershed affect others downstream? How? 4. Where does all of the water eventually go? (Gulf of Mexico or
Atlantic Ocean)
Extension:
1. Have students research the rivers that make up their watershed and explain how they are interconnected.
2. Have the students collect newspaper or magazine articles that reflect the impact of water in one area of the state on others. These could be current articles or historical ones obtained from the library.
35
Forms provided by the Georgia Adopt-A-Stream program. 36
Lethal Lots
Objective:
Location: Time Needed: Subjects: Level: Learn More:
Students will explain how bioassay methods are used to determine toxicity of water. By using daphnia, the students will determine the toxicity of an urban runoff water sample. Indoors/Outdoors Three 60-minutes classes plus prep time Science, Ecology, Biology, and Chemistry 9th - 12th grade Appendix B-1
Background:
Toxic chemicals in water can harm the plants, animals, and humans that depend on it. Toxic chemicals and other pollutants can enter a water supply from many sources such as urban and rural polluted runoff, leaking landfills, and mining areas. Toxic chemicals from a parking lot, for example, might include oil, antifreeze, brake fluid, lead, chromium, iron, and manganese.
Daphnia are small freshwater crustaceans that are the source of food for many other animals. They are very sensitive to changes in temperature and water chemistry. For this reason, they are sometimes used for detecting the presence of toxic substances in a water supply. The examination of such organisms to detect the presence and relative amounts of toxic substances in a water supply is called biomonitoring. The technique used in this activity is called bioassay, a method used to test the concentration of a substance by observing its effects on the growth of an organism under controlled conditions.
Runoff from large areas of pavement is likely to contain pollutants. Since none of the water or pollutants can be absorbed through the pavement, the water runoff is unfiltered. In this activity, the toxicity of runoff from the school parking lot will be determined.
Materials:
3 liters of runoff water from the school parking lot (collect after a storm) Clean sponge, turkey baster, or cleaning squeege and clean dust pans to collect water Plastic containers with lids to store sample 150 live daphnia (available from biological supply company) 5-gallon container or aquarium Daphnia food: Tropical fish food, Yeast, Alfalfa and Distilled water Daphnia media: 20 liters distilled water, NaHCO3, MgSO4 X H2O (Epsom salt), KCL and CaSO4. Aerator Compound microscopes
37
Microscope slides and cover slips Blender 1 aquarium thermometer Grease pencil or permanent marker Labels or masking tape 30 eyedroppers 50 ml. cylinder 5-500 ml. beakers 250-50 ml. beakers 2-cycle semi-log graph paper (provided) Saturation Concentration Dissolved Oxygen data sheet Data sheet Water quality test kit (optional) Daphnia anatomy sheet (optional)
Group Discussion:
1.
Discuss urban runoff with the students and explain its role as a nonpoint
source of pollution. Explain that runoff can contain toxic chemicals and pavement
prohibits the runoff from absorbing into the earth allowing it to be naturally
filtered. What type of toxic chemicals could be in the runoff? What are the sources
of these toxic chemicals? (Additional information is in Appendix B-1). Note:
Explain to the students that most storm water runoff is usually piped directly into local
streams. The runoff does not go to a treatment plant first before entering a stream. Urban
storm water may contain sediment, debris, and toxic chemicals such as herbicides,
pesticides, oil, antifreeze, and heavy metals.
2.
Discuss that some organisms are more sensitive to pollutants than are
others. Why are these sensitive organisms good indicators of water quality? (It is
easier to detect low concentrations of pollutants with sensitive organisms.)
3.
Point out that the disappearance of certain plants or wildlife in a water
body is an indicator of changing water quality.
4.
Toxic chemicals can enter a water supply from many sources such as
agriculture, mining, construction sites, landfills, farms, homes and forestry
operations.
Preparation: You may wish to have the students perform the following: 1. Prepare the culture medium in 5-gallon (20 liter) container/aquarium
Fill a clean 20-liter container to the 19-liter mark with distilled water. Pour out approx. 500 ml of distilled water into a separate clean beaker and completely dissolve the following chemicals in it before adding back to the 20-liter container:
38
2.88 g NaHCO3
1.80 g MgSO4 X 7H2O (Epsom salt)
0.45 g KCl
Next transfer one liter from the 20-liter container into a 2nd clean container.
Add 1.80 g CaSO4. Add this mixture back to the 20-liter container.
Aerate the mixture for two hours using an aquarium aerator. Allow the
mixture to reach room temperature before adding daphnia.
2. When daphnia arrive, acclimate them to the laboratory aquarium by
placing the shipping bag/container in the aquarium. This will allow
the water temperature in the Aquarium and in the container to
equalize.
3.
Prepare the daphnia food and feed them once a day.
Blend all ingredients for five minutes on low speed:
6.3 g tropical fish food
2.6 g yeast
0.5 g alfalfa
500 ml distilled water
Cover and let stand in refrigerator for one hour. Pour off top liquid and
save in refrigerator. Dispose of the rest. Feed once a day. Food keeps for
two weeks
4.
Two days before the experiment, prepare new culture media to be used in
the experiment.
Procedure: Part one:
1. Check the daphnia one day prior to running the experiment to ensure that the culture is healthy. If 10 percent or more of the daphnia die between their arrival and this time, you may wish to reorder. Because daphnia are sensitive, they must be protected from hair spray, perfume, smoke, bug repellant, and the room temperature should be kept as a constant 68 F.
2. Have the students collect approximately 3 liters of runoff from the school parking lot after a rainstorm in a clean container with a lid and store in the refrigerator (up to 2 weeks) until the time of the experiment. Collect the runoff sample by one of the following: a. A clean sponge to absorb the water and wring into a container, or b. A turkey baster to siphon the water into a container, or c. A cleaning squeegee to push the water into a dustpan and then into a container.
3. Place 300 ml of culture medium and 0.5 ml of food in each of the five 500-ml beakers with. Make sure culture media is at room temperature. Place 15 daphnia containing embryos into the media using an eyedropper and release them slowly.
39
Note: Do not use daphnia with ephippia, or dark eggs, because they will not hatch from them in time for the experiment.
4. Use the newborn daphnia found in the beakers the next day for the experiment. Newborns will be smaller than the parent. Newborns are used to eliminate some sampling error from the experiment because this assures all organisms used in the experiment are the same age. (If you do not have time to remove newborns, use daphnia in the culture that do not have embryos or ephippia.)
5. If water quality kits are available, test the dissolved oxygen of the media. The DO should be 40 percent saturation or greater. Otherwise, the daphnia will be stressed and die from low DO. Try using aerators if the DO is low.
Part Two:
1.
Divide the students into teams of three
2.
Give each team a compound microscope and daphnia (on a slide) to
observe.
3.
Have the students distinguish between daphnia with embryos and
ephippia.
4.
In the laboratory, have the students prepare and label four (4) - 50 ml
beakers of each of the six (6) concentrations of runoff water. Each group will be
responsible for setting up the experiment and recording the results.
Concentrations
Runoff Water
Culture Media
100% 50%
40 ml 20 ml
0 ml 20 ml
25% 10% 5% 2.5%
10 ml 4 ml 2 ml 1 ml
30 ml 36 ml 38 ml 39 ml
5.
Give each group a 5th 50 ml beaker. This will be the control
beaker with 40 ml of culture media in it.
40
6.
Have the students write the date, temperature, and time the
experiment begins on each beaker. If a DO kit is available, test the
dissolved oxygen.
7.
When the beakers are ready, introduce five daphnia into each of
the beakers.
Use an eyedropper to transfer daphnia
Record time on each beaker
Do not collect daphnia from top or bottom of beaker.
Do not feed daphnia during the experiment
7.
Have the students count the number of dead daphnia in each beaker at the
end of 24 hours and 48 hours.
8.
Distribute the 2-cycle semi-log paper.
9.
On the y-axis of the semi-log paper, the lower half of the axis has numbers
1-10 in logarithmic steps and the upper half numbers 10-100 in the same fashion.
Have the students plot percent mortality (on the x-axis) and percent
concentration (on the y-axis).
10.
Explain that the graph will help the students determine which parking lot
runoff concentration is the lethal concentration (LC50). This is the concentration
of runoff where 50 percent of the daphnia die. On the percent concentration scale,
have students locate the point at which 50 percent mortality occurred. For
example, if 25 percent concentration treatment results in 50 percent mortality,
then report the LC50 as 25 percent. Note: If the 2.5 % concentration treatment results
in greater than 50% mortality, report LC50 as less than 2.5% or repeat the procedure
using a dilute sample.
Discussion:
1.
Why were four beakers of each concentration used? (Replication)
2.
What is the purpose of the control? (To make sure other factors
beside the runoff didn't kill the daphnia)
3.
Why do some daphnia die before others? (Some are more sensitive
than others)
4.
Why is an LC50 used instead of an LC100? (LC50 is more exact. It is
difficult to extrapolate because 100 percent of the organisms are dead; the
concentration used in the experiment killed them)
5.
On the basis of your results, would you consider the runoff from
the school parking lot to be toxic?
6.
What can you do to protect nearby streams? (Monitor
regularly and filter stormwater before it enters the stream.)
Extension: 1. Invite someone from the Department of Natural Resources or Natural Resources Conservation Service to visit your school parking lot and discuss what best
41
management practices could be used on your site to prevent pollution from being funneled directly into water bodies. After the guest speaker, have the students design a "best management plan" or BMP for your school parking lots and work with school officials to get it implemented. Taken from the Environmental Resource Guide, "Lethal Lots."
42
43
Section 2: VISUAL STREAM SURVEY
This section investigates physical properties of a stream and encourages exploration of local streams.
Stream Journey
Objective:
Location: Time Needed: Subjects: Level:
Students will discover the role of a stream in providing habitat for wildlife and state examples of living and non-living objects in the stream.
Outdoors 45-60 Minutes Science, Art, English, Language Arts K-2nd grade
Background: A habitat is a place where an animal or plant lives. There are many different types of habitats throughout the Georgia. However, each one contains very unique arrangement of living and non-living components to allow plants and animals to live there. A living component is something that performs biological functions, such as growing and reproducing. Examples include humans, fish, insects, trees, and grasses. A non-living component is something that is unable to perform biological functions like water, rocks and dirt. The basic four parts of a habitat are food, shelter, water and space, and are necessary for all plants and animals to survive.
A stream habitat is one type of habitat we can find here in Georgia. It provides habitat for a variety of living organisms including fish, insects and salamanders. Fish live in the water and hide and lay their eggs under rocks. They feed on aquatic insects that live in the stream. Mammals, such as beavers make their home in the stream, feeding on the fish and taking branches from trees to dam up the stream often creating ponds.
Materials:
Activity sheet Clip boards Sketchbook or paper Pencils and Crayons Optional: Books or field guides related to aquatic insects, plants, fishes, reptiles, amphibians, and freshwater wildlife.
Preparation: Teachers will need to locate a safe path to take students to the stream. Check for any potential dangers (crossing a road, slippery streambanks). Have parents or aides with each group of 5 students. In addition, spread student groups out along the stream so they all have areas to observe simultaneously and to reduce the impact of many students in a small area. Make sure to check if any student has allergies. (e.g. Poison ivy, bee stings, golden rod, etc.)
Note: It is vital to know the conditions of the stream before sampling. Animal waste, agricultural runoff (pesticides, herbicides, etc.), industrial wastes, or sewage leaks can be hazardous to you and your students. If you find a stream with any of the above
contaminants, the class must use proper precautions if you decide to collect samples in the stream. Students should wear protective boots, gloves, and goggles when necessary or when stream conditions are unknown. In case of serious water quality problems, notify local or state authorities.
Procedures: Part One:
1. Discuss the following terms: Living, non-living, and habitat with students. Also discuss safety with the class and divide the class into groups of three
2. At the stream, have each group of students choose a spot in a designated area and draw examples of the living and nonliving things they can see. Have clipboard with paper available for the students to work on.
3. Bring students together and ask them to share their drawings. Discuss with students how the items they drew interaction with one another. For example, for plants, you might have students consider questions such as: What do plants need to live? Does anything eat the plant?
4. Have the students return to their original viewing area. Tell them to close their eyes, stand still and use their senses of hearing and smell to discover more about their area. After a minute have the student open their eyes and add what they heard and smelled to their drawing.
5. Have the students share any new observations with the class and discuss how these additional items are related to each other and to the things already on their lists.
6. Have the students return to their area one final time to look for signs of human impact. Signs may include trash, bottles, tires, roads, buildings, etc. Have the students draw what they see. Ask the students if they notice any difference in the signs left by people and those left by other animals.
Part Two: 1. Hand out the "Stream Journey" sheet to each group. Have the students walk along the river and mark the things they see on the "Stream Journey" sheet. Remind students to look under rocks, along banks, packs of leaves in the stream, around logs, and in rocky areas (in or out of stream). The teacher may wish to pull rocks out of the stream to see if any aquatic insects are present. 2. Back in the classroom, review with the students all the things they saw along the stream and determine which group they saw the most of (e.g. birds, plants, rocks, etc.) 3. Have the students display their drawings on a board or classroom wall.
Discussion:
1. What types of plants and animals live near/in a stream? 2. Give an example of a non-living and living thing at a stream. 3. Give an example of something left by humans.
Extension:
1. After returning to the classroom, you may wish to have students create a mural showing the animals, plants and non-living things in the ecosystem. They could draw arrows to show the connections between parts of the ecosystem or connect related components of the ecosystem with pieces of yarn.
Based on Always A River, "Wetlands Safari."
Wentworth Pebble Count
Objective :
Location: Subjects: Time Needed: Level: Learn More:
Students will learn how to determine the percentage of silt, sand, gravel, rocks and boulders in their streambed. Outdoors Math, Environmental Science, Ecology 45-60 minutes K-12 Appendix B-2
Background:
Living organisms rely on clean and clear water in their habitat to survive. When stream bank erosion occurs, sediment is removed from stream banks by flowing water and deposited in the water. This extra sediment often negatively affects the organism living in the water by filling in the air spaces between the rocks and gravel of the streambed, smothering fish eggs and other aquatic animals. It can also dislodge invertebrates, insects and plants from their home on the streambed. Sediment can also be detrimental to fish as it irritates the fish's gills and destroys its scales, leaving the fish more susceptible to infection and disease.
An increase in sediment also clouds the water, which blocks sunlight from reaching oxygen producing plants; in this situation hardier weeds often dominate, which in turn blocks out even more light from plants growing beneath the surface. When the oxygen balance of the water body is destroyed, the capacity of a stream to support desirable organisms is lessened, resulting in a change of the species of aquatic plants and animals in that ecosystem. A change in species composition will also occur as the sediment absorbs more heat from the sun thus increasing the water temperature.
The Wentworth pebble count technique provides a method for quantitatively characterizing the particles in your streambed. The results can be used to evaluate the amount of sediment entering your stream. This is a quick estimation of the "health" of the stream, and its ability to support life.
Materials:
Metric Ruler with a 2 mm mark Size Chart (provided) Tally Sheet Pencil
Note: It is vital to know the conditions of the stream before sampling. Animal waste, agricultural runoff (pesticides, herbicides, etc.), industrial wastes, or sewage leaks can be hazardous to you and your students. If you find a stream with any of the above contaminants, the class must use proper precautions if you decide to collect samples in the stream. Students should wear
protective boots, gloves, and goggles when necessary or when stream conditions are unknown. In case of serious water quality problems, notify local or state authorities.
Procedure: 1. Discuss concepts of sediment, runoff, erosion and habitat with students. Explain to the students the terms: bankfull, riffles and runs. 2. Divide students into teams. Have the students select a member of their group to record the results on the tally sheet. The remaining members of the group will be counters. 3. Select a cross-section of a stream to sample. Look for an area of the stream with a representative number of pools, riffles and/or runs. Make sure the area chosen is safe and easy to wade in. 4. Begin by wading through the stream. If only one person is counting, walk upstream in a zigzag from bankfull to bankfull. If a whole group is counting, walk upstream in a line formed from bankfull to bankfull. The bankfull mark is the highest point water reaches on the banks before it spills into the floodplain. 5. When the recorder says "stop," each counter picks up the pebble closest to his/her right big toe. To avoid the natural tendency to pick up larger pebbles, you should pick a point on your toe or boot to use as a reference point. You should also use a reference point on the finger that descends into the water. The first particle touched by this point should be measured. 6. Using a ruler and the Size Chart on the next page, each counter determines if s/he has silt/clay, sand, gravel, cobble, boulder or bedrock. The pebble is measured at its middle length. This is not the longest or the shortest crosssection of the pebble, but in between. 7. Call the size out to be recorded on the tally sheet. 8. Repeat the process until you have counted approximately 100 pebbles. 9. Calculate the percentage of pebbles that are silt/clay, sand, gravel, cobble, boulder or bedrock. (The total number of each size particle represents the percentage if you have counted 100 particles.)
For 6-12th grade Graph the number of particles along the x-axis vs. particles size along the y-axis, or make a pie chart with each slice representing a size of particle.
Discussion: 1. Based on percentage calculated what is the health of the stream? If the percentage is mostly silt/clay and/or sand then sedimentation is or has occurred and is impacting the stream. If the percentage is mostly gravel/cobble/boulders then there is little sedimentation occurring and stream is in its natural state If the percentage is 50/50 then sedimentation is in progress and the source should be sought out
2. Should any action be taken based on the results? If so what? (possible answers: if erosion is visible, a stream bank stabilization project could be taken on, restoration of the stream bank could occur by planting native trees and bushes; identify of the source of sedimentation and notify the proper authorities.)
Wentworth Pebble Count Size Chart
The following table contains particle size classes. Use the descriptions if you are making visual estimation. If more accurate measurements are taken, it is possible to obtain a clearer picture of changes in substrate composition over time.
Size Class Silt/Clay Sand
Gravel
Size Range (mm) < 0.062 0.062 2.0
2.0 64.0
Description Smooth when rubbed between fingers May have some clay in it but you will feel the gritty texture
This line is just over 2 mm
Cobble
Boulder Bedrock
64.0 256.0 256.0 4096.0
This line is about 64 mm. This page is just over 256 mm long. These are big!
Bare/exposed rock
Lake Simcoe's Region Conservation Authority: Ontario
Go With The Flow
Objective:
Students will learn the significance of the speed and volume and apply mathematical formulas to real life situations when they compute the speed of a stream and its flow rate.
Location: Subjects: Time Needed: Level:
Outdoors Math, Physics, Science 65 minutes 6th - 12th grade
Background: Stream flow, or discharge, is the volume of water that moves over a designated point over a fixed period of time. It is often expressed as cubic feet per second (cfs). The flow of a stream is directly related to the amount of water moving off the watershed into the stream channel. It is affected by weather, increasing during rainstorms and decreasing during dry periods. It also changes during the different seasons of the year, decreasing during the summer months when evaporation rates are high and shoreline vegetation is actively growing and removing water from the ground. August and September are usually the months of lowest flow for most streams and rivers in the country.
Flow also has a large impact on water quality and the living organisms and habitats within the stream. Large, swiftly flowing rivers can receive pollution discharges and be only slightly affected, whereas small streams have less capacity to dilute and degrade wastes. Stream speed, which increases as the volume of the water in the stream increases, determines the kinds of organisms that can live in the stream (some need fast-flowing areas, others need quiet pools). Stream flow also affects the amount of silt and sediment carried by the stream. Sediment introduced to quiet, slow-flowing streams will settle quickly to the stream bottom. Fast moving streams will keep sediment suspended longer in the water column. Lastly, fast-moving streams generally have higher levels of dissolved oxygen than slow streams because they are better aerated.
Water withdrawals for irrigation purposes can seriously deplete water flow, as can industrial water withdrawals. Dams use water flow for electric power generation, particularly facilities designed to produce power during periods of peak need, often block the flow of a stream and water is released in a surge.
Materials: Each group will need: Yardstick for measuring water depth Orange or another floating object Stop watch or watch with second hand Pencil and clipboard Plastic Tape Measure Two flags to mark the stream Copies of the Calculating the Flow Worksheet
Note: It is vital to know the potential upstream contaminants reaching the stream. Animal waste, agricultural runoff (pesticides, herbicides, etc.), industrial wastes, or sewage leaks can be hazards to students and you. If you find a stream with any of the
above contaminants, a class must use proper precautions if you decide to collect samples in the stream. Students should wear protective boots, gloves, and goggles when necessary. In case of serious contamination, notify local authorities.
Note: Do not choose a deep pool or riffle. Flowing water is dangerous and students should not be in the water above their knees. If it is moving too fast, do not let the students get in the water. On the other extreme, make sure you have at least a minimal flow of 2 inches, otherwise it will be too shallow to conduct this activity.
Procedures: 1. During this exercise, students will apply mathematical formulas to real life situations. For example, how to calculate the speed of water as it moves through a stream. Prior to starting the field portion, lead a discussion on stream flow and its influences. 2. Next head out to the stream site. Divide students into teams of four (4). Each team should pick a 20-foot section of the stream to work in. Ideally each team should have their own space, but if that is not possible due to accessibility have two teams share the same 20 foot section, but run the test separately. Hand out one set of materials to each team and a copy of the Calculating Stream Flow Worksheet to each person.
AREA 3. Each team will now calculate the area of a stream cross section in square feet. (Area = depth x width) Measure the depth of the stream by starting at the water's edge and moving across the stream taking several measurements along the way. Then take the average of the depth measurements. Record results on the calculating stream flow worksheet. 4. Next run the tape measure across the stream (from water's edge to water's edge). Measure the width of the stream at two locations. Take the average of the two measurements. Record results on the calculating stream flow worksheet. 5. Multiply the average width and average depth of your stream to determine its area in square feet. Record results on the calculating stream flow worksheet.
SPEED 1. Next, each team will calculate the speed of a stream by measuring the rate at which it flows in feet per second (ft/sec).
2. Starting from the point where the stream area measurements were taken, mark off a 20foot section downstream using flags.
3. Each team member picks one of the following jobs: starter, timer, catcher, and recorder. The starter stands at the upstream flag and the catcher stands at the downstream flag with the timer and recorder.
4. Using a stopwatch, the timer will measure how many seconds it takes an orange (or some other object) to float a 20-foot distance. An orange is a good object to use because it has enough buoyancy to float just below the water surface. It is at this position that maximum velocity typically occurs.
5. The starter should position the orange so that it flows into the fastest current. The catcher catches the orange as it passes the downstream flag. The recorder should record the time measured.
6. This "time of travel" measurement should be conducted at least three times and the results averaged the more trials you do, the more accurate your results will be.
7. Discard any float trials in which the object gets hung up in the stream (by cobbles, roots, debris, etc.).
8. After obtaining the average time, divide the distance in feet by the number of seconds it took the orange to travel that distance. Record results on the "Calculating Stream Flow" worksheet. This is the speed in feet per second.
FLOW 1. Scientists have determined that a coefficient or correction factor is needed for streams due to fact that water at the surface travels faster than near the stream bottom due to resistance from gravel, cobble, etc. By multiplying the surface velocity by a correction coefficient, it decreases the value and gives a better measure of the stream's overall velocity. The coefficient or correction factor is 0.8 for rocky-bottom streams or 0.9 for muddy-bottom streams.
COEFFICIENT = 0.8 for rocky-bottom streams
COEFFICIENT = 0.9 for muddy-bottom streams
2. To determine flow rate, multiply your stream area by your stream speed. Then multiply that answer by the coefficient, depending on whether you have a rocky or muddy bottom stream.
FLOW = AREA X SPEED X COEFFICIENT
Here is another way to express flow: FLOW = ALC/ T
A = Average cross-sectional area of the stream in feet (average stream width multiplied by average water depth).
L = Length of the stream reach measured (usually 20 ft.)
C = Coefficient (0.8 for rocky-bottom streams or 0.9 for muddy-bottom streams). T = Time, in seconds, for the float to travel the length of L.
3. Enter your results on the "Calculating Stream Flow" worksheet 4. Once all the groups have completed their measurements, compare the results.
Were all the results the same or different? If different, what might have caused them to be different? (possible answers: slope, width of stream, objects in the channel, deep verses shallow water, gravel substrate verses sandy substrate)
Discussion: For grades 6th - 12th:
1. Calculate the velocity of the stream if the orange floats at a rate of 100 feet in 1.5 minutes.
2. Calculate the flow rate of a muddy bottom stream if the average width is 5.5 ft and average depth is 17 inches and the orange floats at a rate of 67 ft in 2.4 minutes.
3. What does the flow tell you about the watershed? 4. What unit is flow measured in? 5. When velocity increases in a stream, what happens? 6. What factors contribute to an increase in water flow?
For grades 9th - 12th:
1.
If the average depth of the stream is 4 ft and width is 7.5 ft and it took the
orange 10 seconds to travel the 10-foot length of the stream, what is the volume?
2.
If two streams drain equal sized and comparable watersheds, and one
watershed is forested while the other is urban, which will have a greater
discharge of water? Why?
Extension: For grades 6th - 8th:
1. In the last step, the students compared their results and hypothesized what caused them to be different. As an extension, have the students investigate streams in their community noting changes that might have been made to them and how it has affected stream flow. Also have the students look at what are some of the consequences that occur as a result of those changes to the stream.
2. Have students convert the various measurements to metric.
For grades 9th-12th: Calculate the amount of water entering the stream from the watershed. To do this, calculate the area of a watershed (Have the students look at a
topographic map and draw out the watershed. Estimate the area of the watershed with a dot grid or a local Soil Conservation Service can measure the watershed). Find out the average annual rainfall for the area by contacting the Soil Conservation Service. Multiply these values and determine the volume of water in the stream. Calculate the value in gallons. See activities "How BIG is the River - Really?" and "How Much Water Falls Here?" for details on how to calculate this.
Based on Georgia Adopt-A-Stream Visual Stream Survey procedures.
CALCULATING STREAM FLOW Flow = Area X Speed X Coefficient
CALCULATE AREA
Area = depth x width
It is advisable to take multiple depth and width measurements always start at the waters edge with a first measurement of zero all data should be recorded in feet, with inches replaced by increments of 10
depth
1.
2. 3. 4. 5. 6. 7. 8. sum
measurements 0 ft
average
=
depth
sum of depth measurements number of measurements
width
1.
2.
sum
measurements
average =
width
sum of width measurements number of measurements
Area
width
depth
=
X
CALCULATE SPEED-measure the time it takes a float to travel a desired distance
It is advisable to take at least 2 measurements of current speed
take measurements from the stream run
length in
20 feet is feet
recommende
d
time in
1.
2.
3.
4.
sum
seconds
average
=
time
sum of time measurements number of measurements
Speed
=
length in feet average time in seconds
CALCULATE STREAM FLOW
Flow
cfs =
Flow in cubic feet per second
Are a
X
Spee d
X
Coefficient
.9 coefficient for muddy bottom stream .8 coefficient for rocky bottom stream
Pinning It Down
Objective: Location: Time Needed: Subjects: Level:
Students will measure stream bank erosion over time. Outdoors 45-60 minutes (plus multiple follow-up visits to check stakes) Math, Environmental Science 6th-12th grade
Background: Erosion is the breaking away and movement of soil or rock fragments by water, wind, ice, or gravity. Once the soil or rock is detached, it becomes known as sediment. The sediment can move by wind, or, most commonly, water onto adjoining land or into our streams and rivers.
Erosion is a natural process and its natural occurrences create mountains, flatlands, and coastal regions. Natural erosion occurs slowly and in a uniform manner. However, humans through land-disturbing activities can accelerate erosion. Accelerated erosion causes too much sediment to enter our rivers and streams.
A land-disturbing activity can include clearing, grading, dredging, filling, transporting and excavating. These activities raise the level of suspended materials in the water, called turbidity. High turbidity reduces the amount of light that can penetrate the water, which reduces photosynthesis and the production of dissolved oxygen. Suspended materials can clog fish gills, reduce resistance to disease in fish, lower the growth rates and affect eggs and larval development. As the particles settle, they can blanket the stream bottom, especially in slower waters, and smother fish eggs and some macroinvertebrates. Erosion, therefore, alters habitats for fish, plants and invertebrates that depend on streams.
Materials: Hammer Fluorescent spray paint Three 2-foot pieces of rebar, OR Three 2-
foot green plastic-coated metal garden stakes (Can be purchased from any hardware or garden store)
Paper and pencil Tape measure or ruler
Preparation: 1. Have rebar or garden stakes cut to 2-foot lengths. For each site you choose, cut three
stakes. Procedure:
1. Discuss the concept of erosion and turbidity and how it impacts habitat. 2. Locate points along the stream bank where erosion is occurring (look for obvious
scouring or sediment piles). This is indicated by places where deep undercuts in the bank exist, or at a bend in the creek that may experience higher volumes of water during storms.
3. At the stream site have students spray-paint one end of each stake (1-3 inches.) This will be the end that is exposed from the bank and act as a marker for you to find later.
4. Once dry have the students measure and record the length of the spray painted section.
5. Find three spots of differing heights on the bank to insert pins.
This illustration shows the placement of 6 stakes in a stream bank and what may be observed over time due to erosion. This activity uses just 3 stakes. The lowest stakes were completely buried by earth that shifted; one of the stakes was washed away from scouring (lost pin); and the top two pins are very exposed. Note the change in the bank contour from previous to present. This type of change will not likely happen within just a month or two, but could be observed over repeated visits to the site.
2. Using the hammer, drive the stakes horizontally into the bank until only the spraypainted tip is exposed. Repeat for all the stakes, making sure to measure the distance between each stake.
3. If you choose more than one site to place stakes, draw a map of the section of stream with approximate locations of the stakes for future reference. You may flag a tree near the spot where stakes are located and take pictures.
4. On successive monthly visits to the site, measure the exposure of each stake and record it. If stakes are entirely lost, make a note and insert another stake at the same elevation in the bank.
Discussion:
1. What are some likely sources for erosion in your stream bank? Is there any solution to preventing/reducing future erosion form occurring?
2. Have student hypothesize how the bank contour will change over time. Students should draw a diagram of the present contour and each time they go back to visit the site. Then compare the contours by overlaying the current contour on top of the old one.
Extension:
Have students complete the Measuring Channel Cross Section Activity to quantitatively document changes to the stream contour.
References: EPA Volunteer Stream Monitoring Manual, USDA Forest Service Technical Report RM-245.
Measuring Channel Cross-Section
Objective:
Location: Time Needed: Subjects: Level:
Students will document changes in stream-channel shape, or stream profile, by measuring the stream channel cross-section. Outdoors at local stream 60-90 minutes Math, Science,
8th-12th grade
Figure 3.3. Preparing to measure channel cross section
Background: Water is a naturally eroding agent of soil. Over time, streams and rivers carve out their unique path and shape. However, human activities have altered the shape and path of many waterways by straightening them out or reducing their floodplain areas. By measuring the cross section of a waterway, scientists have been able to monitor changes in stream shape, or profile.
Materials:
100-foot measuring tape (or longer, depending on your stream) 8- to 10-foot measuring stick in increments of feet and tenths (you can construct one from materials available at the hardware store) Thick twine (preferably non-stretch builders' quality) Line level 2- to 3-foot lengths of rebar, nails and hammer (for first measurement) Clips or vise grips to fix tape to rebar or nails. Stream Channel Cross-section Measurement Data form and graph paper Pencil
Note: It is vital to know the potential upstream contaminants reaching the stream. Animal waste, agricultural runoff (pesticides, herbicides, etc.), industrial wastes, or sewage leaks can be hazards to students and you. If you find a stream with any of the above contaminants, a class must use proper precautions if you decide to collect samples in the stream. Students should wear protective boots, gloves, and goggles when necessary. In case of serious contamination, notify local authorities.
Procedure:
o
Locate a representative section of your stream. Make sure there are no stream
hazards--think safety first! Ideally, your site will have some kind of permanent marker
that will help you identify it in the future, e.g. a large tree, concrete structure, etc. If a
permanent marker is not available, use rebar to mark the endpoints on each bank. The
end points should be set back from your stream, behind the bankfull stage on either
side.
o
Stretch your twine between your
permanent markers. Using the line level,
make sure the twine is perfectly level. If
the twine is not level, your vertical
measurements (elevation) will not be
accurate. Stretch the measuring tape
between both endpoints directly beside
your twine. Attach the zero end of the
tape to the left permanent marker (when
looking downstream). Stretch the tape
tight and level above the water. You will be
taking vertical measurements from the
Figure 3.5 Eying line level to ensure accurate measurements
stream substrate to the twine and horizontal measurements along the measuring
tape.
o
Starting with the left endpoint at zero, measure horizontal distance along the
measuring tape every 2 feet and at each significant stream feature (Figure 3.6). This
includes drops in the streambed or sides, bankfull stage, edge of water, deepest point,
sandbars, etc. At those horizontal distances, measure the vertical distance (or elevation)
from bank or stream bottom to twine. All measurements are taken from the left bank,
when facing downstream. All data should be recorded in feet, with inches replaced by
increments of 10. Continue across the channel to the right endpoint. Under Comments,
note when you are at the bankfull stage, edge of water and other significant features.
Figure 3.6 Stream profile depth measurements every 1 to 2 feet and at each important stream feature.
Fig 3.6 Stream profile depth measurements every 1 to 2 feet and at each important stream feature D. Record the distance and elevation measurements. Based on Georgia Adopt-A-Stream Visual Stream Survey procedures.
Stream Channel Cross-section Measurement Data
Group: Date:
Location:
CROSS-SECTION
Distance from LEFT Pin
Measuremen t Depth
Poin t
Ft.
Ft.
1
2
3
4
5
6
7
8
9
10
11
12
13
14
15
16
17
18
19
20
21
22
23
24
25
Comment s
CROSS-SECTION
Distance from LEFT Pin
Measuremen t Depth
Comment s
Point Ft.
Ft.
26
27 28 29 30 31 32 33 34 35 36 37 38 39 40 41 42 43 44 45 46 47 48 49 50
Measurements are always taken from the left stream bank, looking down stream. Depth measurements are taken every 2 feet and in sections where there is a notable change. Be sure to note left and right bankfull, water's edge, and sand bars.
Extension: On a sheet of graph paper, graph your stream profile to compare future and past measurements. Be sure to include left and right bankfull, water's edge and sand bars.
Here is an example of how to graph your stream profile. The resulting graph is a bankto-bank view of the features of the cross section. All measurements are in feet.
Section 4: APPENDICES
Resource
A-1 Mapping Out A Watershed A-2 Land Uses And Water Quality A-3 Major Watersheds of Georgia A-4 Watershed and Visual Survey Forms B-1 Nonpoint Source Pollution B-2 Nonpoint Source Pollution Solutions C-1 More About Aquatic Insects C-2 Think Safety! C-3 Biological Data Form C-4 How To Make A Kick Seine D-1 Why Are Chemical Tests Important? D-2 Instructions For Dissolved Oxygen Testing D-3 Chemical Data Forms
Page
118 122 125 126 141 144 145 148 149 150 151 159 165
REFERENCE and RESOURCE INFORMATION GLOSSARY EVALUATION FORM
Macroinvertebrate Field Guide for Georgia Streams You're the Solution to Pollution Brochure & Poster River of Words Brochure
166 170 176
Inside back cover Inside back cover Inside back cover
Georgia Performance Standards can be found on the Georgia Adopt-A-Stream Website (www.GeorgiaAdoptAStream.org) under Teacher's Corner.
APPENDIX A-1 MAPPING OUT A WATERSHED
A watershed is a system. It is the land area from which water, sediment, and dissolved materials drain to a common point along a stream, wetland, lake or river. For each watershed, there is a drainage system that conveys rainfall to its outlet. Its boundaries are marked by the highest points of land surrounding its waterbody.
But a watershed is more than the physical landscape that is defined by ridges with one outlet for water to flow. Watersheds support a variety of resources, uses, activities and values where everything is linked in such a way that eventually all things are affected by everything else. Most importantly, it contains the history of all that went before us and the spirit of all to come.
----George Wingate, Bureau of Land Management
A watershed may be as small as the land area that drains into a small neighborhood wetland or as large as a third of the state of Georgia which drains into the Altamaha River (see the Getting to Know Your Watershed Manual to see where the Oconee and Ocmulgee Rivers come together to form the Altamaha).
One of the most rewarding and least costly monitoring activities a volunteer program can conduct is the Watershed Survey. Some programs call it a windshield survey, a visual survey, or a watershed inventory. It is, in essence, a comprehensive survey of the geography, land and water uses, potential and actual pollution sources, and history of the waterbody and its watershed.
Researching the watershed is generally a one time per year activity that should yield valuable information about the cultural and natural history of your waterbody and the uses of the land surrounding it. This information will prove helpful in orienting new volunteers to the purpose of the monitoring program, in building a sense of the importance of the stream, lake, or wetland, and in identifying land use activities in the watershed with a potential to affect the quality of the waterbody. The background investigation is essentially a "detective investigation" for information.
Volunteers should learn to read a topographic map to learn more about the natural and cultural features of their study stream's watershed. Once you learn how to read a map, the next step is to delineate the boundaries of your watershed.
Delineating the Boundaries of Your Watershed Once you've obtained topographic maps of your area, follow these steps to draw your watershed boundaries:
1. Locate and mark the downstream outlet of the watershed. For rivers and streams, this is the farthest downstream point at which you will monitor.
2. Locate all water features such as streams, wetlands, lakes, and reservoirs that
eventually flow to the outlet. Start with major tributaries, and then include smaller creeks and drainage channels. Highlight these water features in blue to make them easier to see.
3. To determine whether a stream is flowing to or from a lake or river, compare the elevation of land features to that of the waterbody. Use arrows to mark the direction of stream or wetland flow.
4. Find and mark the high points (hills, ridges, saddles) on the map. Then connect these points, following ridges and crossing slopes at right angles to contour lines. This line forms the watershed boundary.
If you don't need to know exact watershed boundaries, simply look at the pattern of stream flow and draw lines dividing different stream systems. This will give you an idea of the shape of your watershed and those that border it. Also, once you've identified watershed boundaries, water features, and flow direction, you might want to transfer this information to a road map for easier use.
Once you have delineated your watershed, it is time to make note of all land use activities within your watershed segment. Data for this portion of your survey should be obtained from your background research and from information you gather in the other portions of the Watershed Survey forms. It is best to finish this portion of the mapping exercise after you've completed your watershed survey.
How To Obtain Maps And Other Information
Stream headwaters, length, tributaries, final stream destination, and watershed boundaries are best determined through maps. Of greatest value are U.S. Geological Survey 7.5- minute topographic maps (on a 1:24,000 scale where 1 inch = 2,000 feet). They depict landforms, major roads and political boundaries, developments, streams, tributaries, lakes, and other land features. Outdoor recreation stores and bookstores often carry these maps, especially for recreational areas that are likely to be hiked or camped. The maps can also be ordered through the U.S. Geological Survey (see Obtaining USGS Topographic Maps below). Small versions are available online at www.topozone.com.
Road, state, and county maps might also prove helpful in identifying some of these stream and watershed features. Hydrologic unit maps, also available from the U.S. Geological Survey but at a 1:100,000 scale of resolution (less detail than the 7.5-minute maps cited above), might also help you determine hydrologic watershed boundaries. Atlases and other reference materials at libraries can prove helpful in determining facts about population in the watershed.
Obtaining USGS Topographic Maps
Start by checking with the Regulatory Support Program (RSP) of the Water Resources Branch (the old Georgia Geologic Survey). They offer 1:24,000 scale maps for the entire State of Georgia at a cost of $6 a map. They also offer a multitude of other maps including land use, agriculture, ecoregion, wetland, and different scale maps.
Regulatory Support Program 19 Martin Luther King Dr. SW Suite 400 Atlanta, GA 30334 (404) 656-3214
Order online at http://ggsstore.dnr.state.ga.us
The U.S. Geological Survey's Earth Science Information Centers can provide you with a catalog of available USGS topographic maps, a brochure on how to use topographic maps, and general information on ESIC services. Contact the main ESIC office at:
USGS Earth Science Information Center 507 National Center 12201 Sunrise Valley Drive Reston, VA 22092 1-888-ASK-USGS
Sample Delineated Watershed
APPENDIX A-2 LAND USES AND WATER QUALITY
APPENDIX A-3 MAJOR WATERSHEDS OF GEORGIA
A color copies of this map (14 major Riverbasins) is available on the Adopt-AStream website at http://www.riversalive.org/epd_14_river_basins.htm as well as copies of Georgia's 52 Watersheds at http://www.riversalive.org/epd_52_watersheds.htm
APPENDIX A-4
Watershed Survey and Map Assessment
To be conducted at least once a year
AAS group name:
Investigator(s):
Type of waterbody: stream / wetland / lake
Water body name:
County(ies):
Approximate size of drainage/study area:
acres
Date:
Time:
Picture/photo documentation? Yes/No
I. CREATE A MAP OF YOUR WATERSHED
A copy of this map should be included in your Registration Form to be filed with the State Georgia Adopt-A-Stream office.
II. LAND USES/ACTIVITIES AND IMPERVIOUS COVER
1. Identify land uses and activities in the watershed that have the highest potential to impact water bodies:
Check all boxes that apply, describe the location of the activity(ies) under Notes on Location & Frequency of Activities and also mark the locations on your map. If too frequently occurring to record locations, so note. If you don't know some of the information below, write DK under Notes.
Please indicate if you:
surveyed only adjacent to the waterbody surveyed the whole watershed
Land Disturbing Activities & Other Sources of Sediment
Adjacent to Water
Extensive areas disturbed by land development or construction of utilities, roads & bridges
Large or extensive gullies
Unpaved roads near or crossing streams
Croplands
Pastures with cattle access to water bodies
Commercial forestry activities including harvesting and site-preparation
Extensive areas of stream bank failure or channel enlargement
Other Agricultural Activities
Confined animal (cattle or swine) feeding operations and concentrations of animals
Animal waste stabilization ponds
Poultry houses
Highways and Parking Areas
Shopping centers & commercial areas
Interstate and controlled access highways and interchanges
Major highways and arterial streets
Other extensive vehicle parking areas
Mining
Quarries with sediment basins in live flowing streams
In
Notes on location &
Watershed frequency of activity
_______________
_______________ _______________ _______________ _______________ _______________
_______________
_______________ _______________ _______________
_______________ _______________ _______________ _______________
_______________
Transportation and Motor Vehicle Services
Adjacent
In
Notes on location &
to Water Watershed frequency of activity
Truck cleaning services
Public and private automobile repair facilities Car washes and large auto dealers
Rail or container transfer yards
Airports with fuel handling/aircraft repair
Business & Industry, General Activities with exterior storage or exchange of materials.
Activities with poor housekeeping practices indicated by stains leading to streams or storm drains or on-site disposal of waste materials
Heavy industries such as textiles & carpet, pulp & paper, metal, and vehicle production or fabrication
Dry cleaners/outside chemical storage
Food & Kindred Products Fertilizer production plants
Feed preparation plants
Meat and poultry slaughtering or processing plants
Construction Materials Wood treatment plants
Concrete and asphalt batch plants
_______________ _______________ _______________ _______________ _______________
_______________ _______________
_______________
_______________
_______________ _______________ _______________
_______________ _______________
Waste Recycling, Movement & Disposal
Junk and auto salvage yards
Adjacent to Water
In
Notes on location &
Watershed frequency of activity
_______________
Solid waste transfer stations
Landfills and dumps (old & active)
Recycling centers
Drum cleaning sites
Illicit Waste Discharges* Sanitary sewer leaks or failure
Overflowing sanitary sewer manholes due to clogging or hydraulic overloading
Bypasses at treatment plants or relief Valves in hydraulically overloaded sanitary sewer lines
Domestic or industrial discharges
Extensive areas with aged/malfunctioning septic tanks
Dry-weather flows from pipes (with detectable indications of pollution)
Streamside areas of illegal dumping
_______________ _______________ _______________ _______________
_______________ _______________ _______________
_______________ _______________
_______________ _______________
* If found (most likely during stream surveys), these activities should be immediately reported to the local government or the EPD regional office.
Optional 2. Percent impervious surface
Coverage category for LANDUSE MAP method
impervious quotient
Forest/open land/undeveloped land/vacant/land owned by .005 institutions
Agriculture/pasture/cropland
.005
Single family residential
.12
(1.1 - 5 acre lot or no more than 1 dwelling per acre)
Single family residential
.19
(.5 - 1 acre lot or 0 2 dwellings per acre)
Low density residential / single family residential
.26
(.25 - .5 acre lot or 0 4 dwelling units per acre)
Low/medium density residential
.48
(.25 acre lot or smaller or 0 8 dwelling units per acre)
Medium density residential
.56
(0 12 dwelling units per acre)
High density residential (18 30 dwelling units per acre) .65
Townhouse/apartment
.48
Office/light industrial (assembly, finishing, packaging
.70
products)
times x x
percent of
percent imperviou
of...
s cover
%
%
x %
x %
x %
x %
x %
x %
x %
x %
Heavy industrial (timber, chemical, cement, brick plants, .80
x
lumber mills)
%
Commercial (business districts, commercial strip
.85
x
development, shopping centers, warehouses, parking lots,
%
office buildings
Major roads
.90
x
%
Total percent of watershed covered
by impervious surfaces
%
Land use categories and quotient provided by the Atlanta Regional Commission
III. GENERAL WATERBODY AND WATERSHED CHARACTERISTICS
This information will be gathered from your wetland, lake or stream segment.
1. Note the number of hydrologic modifications on your water body: structures that alter
water flow
None
Beaver dams
Dams
Dredge spoils
Bridges
Pipes
Waterfalls
Other
2. Note the approximate length of the stream that is affected by the following: if assessing a wetland, lake or pond, some of the following may also affect your water body
Stream culvert Stream straightening Concrete stream bank/bottom Dredging/channelization Riprap/gabion Cattle crossing Stream crossing (for vehicles)
feet or feet or feet or feet or feet or # #
mile or mile or mile or mile or mile or
% of stream length % % % %
3. Note extent of vegetative buffer along the banks: at a minimum of 5 sites, at regular intervals (every 500 ft. in a mile. section) note the following
# Width Location (Left bank, Right bank or in feet N, S, E, W side of wetland or lake)
1
Characteristics and comments
2
3
4
5
6
7
8
9
10
4. Check the categories that best describe the general appearance of the waterbody:
Litter:
No litter visible Small litter occasionally (i.e., cans, paper)
Small litter common Large litter occasionally (i.e., tires, pallets, shopping carts) Large litter common
Special Problems: Spills of chemicals, oil, etc. Fish kills Wildlife, waterfowl kills
Erosion:
No bank erosion or areas of erosion very rare; no artificial stabilization Occasional areas of bank erosion Areas of bank erosion common Artificial bank stabilization (i.e., riprap) present
5. Comments on general waterbody and watershed characteristics: (e.g. date and size of fish kill, increased rate of erosion evident, litter most evident after storms) * Fish kills
should be immediately reported to DNR Wildlife Resources Division at 770-918-6400
6. Summarize notable changes that have taken place since last year (if this is not your first year conducting the Watershed Survey).
IV. PIPE AND DRAINAGE DITCH INVENTORY
In this section, provide information on pipes and drainage ditches found on the banks or in the waterbody. These pipes/ditches can be abandoned or active. Note the information for each pipe or drainage ditch you observe. Make additional copies as necessary.
Pipe Location Type #
Size Flow
Waterbody condition
Comments
1. Number each pipe/ditch for mapping/locating purposes 2. Location of pipe/ditch: note whether in water, bank, near waterbody or other.
Describe location.
3. Identify type of pipe (list all that apply): PVC, iron, concrete, galvanized; industrial outfall, sewage treatment plant outfall, storm drain, combined sewer overflow; agricultural
field drainage, paddock or feedlot drainage, settlement basin/pond drainage, parking lot
drainage, unknown, other
4. Size: measure approximate diameter of pipe: inches or centimeters 5. Describe the discharge flow: Rate: none, intermittent, trickle, steady, heavy
Appearance: clear, foamy, turbid, oily sheen, color, other Odor: none, rotten eggs/sewage, chemical, chlorine, other
6. Waterbody condition: describe the bank/waterbody below pipe or drainage ditch: no problem evident, eroded, sewage litter (e.g. toilet paper), litter (e.g. bottles, cans), lots of algae, other
7. Comments of pipes and drainage ditches: Use this space to explain or expand on information provided on pipes and discharges you have identified above. For example, you
may want to identify particular facilities, or discuss in more detail the condition of the
waterbody below the discharge. Use separate page if necessary.
Adopt-A-Stream Visual Survey Form
AAS group name: Group ID number
Site ID Number Investigators: Stream name
AAS-G AAS-S
Date:
Site/location Description:
Time:
County: Topo Map Quadrant:
Picture/Photo Documentation? yes / no
Rain in last 24 hours
heavy rain
steady rain
intermittent rain none
Present conditions
heavy rain
steady rain
overcast
partly cloudy
intermittent rain clear/sunny
Amount of rain, if known?
Inches in last
hours/days
I. IN-STREAM CHARACTERISTICS
1. Stream reach: The total distance upstream to downstream of your monitoring point from which you will be collecting your data. The stream reach is 12 times your stream width,
bankfull to bankfull.
bankfull width
ft. x 12 = stream reach
ft.
2. Water flow: Present conditions: in channel flooding over banks
dry / no flow / pooling
Number of pools
Number of riffles
Number runs
.
3. Flow rate: where Flow = Area X Speed X coefficient
CALCULATING STREAM FLOW Flow = Area X Speed X Coefficient
CALCULATE AREA
Area = depth x width
It is advisable to take multiple depth and width measurements always start at the waters edge with a first measurement of zero all data should be recorded in feet, with inches replaced by increments of 10
depth
1.
2. 3. 4. 5. 6. 7. 8. sum
measurements 0 ft
average =
depth
sum of depth measurements number of measurements
width
1.
2.
sum
measurements
average =
width
sum of width measurements number of measurements
Area
= width X depth
CALCULATE SPEED-measure the time it takes a float to travel a desired distance
It is advisable to take at least 2 measurements of current speed
take measurements from the stream run
length in
20 feet is feet
recommende
d
time in
1.
2.
3.
4.
sum
seconds
average =
time
sum of time measurements number of measurements
Speed
=
length in feet average time in seconds
CALCULATE STREAM FLOW
Flow
cfs =
Flow in cubic feet per second
Are X a
Spee X d
Coefficient
.9 coefficient for muddy bottom stream
.8 coefficient for rocky bottom stream
Optional
Measure channel cross-section: Drawing a stream cross section allows you to observe/track changes in your stream channel shape. Forms are found on the last page of this section.
4. Tidal range: (complete only if site is affected by tide)
Is waterway influenced by tides? Yes No If yes, when? __________
If tidally influenced:
Tide was: Tide was:
Rising High
Falling
Mid-range
Low
5. Embeddedness: Pick the category that best describes the extent to which gravel, cobbles, and boulders on the stream bottom are embedded (sunk) in silt, or mud.
Observations should be conducted from the riffle section of your stream as opposed to run or pool areas. Only complete if applicable to your stream.
somewhat/not embedded (0 - 25%)
mostly embedded (75%)
halfway embedded (50%)
completely embedded (100%)
Optional
Pebble count: This is an easy way to determine the percentage of silt, sand, gravel, rocks and boulders on your streambed.
6. Presence of naturally occurring organic material in stream: (Good habitat for aquatic organisms)
Logs or large woody debris: Leaves, twigs, root mats, etc.:
none none
occasional occasional
plentiful plentiful
7. Water odor:
natural/none sewage rotten egg
gasoline chlorine chemical
8. Water surface:
clear
natural oily sheen
foamy
other
oily sheen (petroleum product)
9. Water clarity: check all that apply (determine by viewing sample water in a clear container)
turbid - suspended matter in water sediment blue/green algae other
tannic - clear water that is naturally stained orange/brownish due to organic acids in water
no staining / no suspended matter
other (i.e. chemical discharge, dyes)
Notes: __________________
10. Bank erosion:
How vegetated is the left bank, looking down stream, for the length of your reach (circle a percentage)?
Vegetated banks
Bare/eroded banks
100% 90% 80% 70% 60% 50% 40% 30% 20% 10% 0
What are the visual indicators you used to assess the percentage above (check all that apply)?
exposed soil
obvious loss of soil
steep slopes (banks are U shaped)
exposed roots
soil covered with vegetation gentle slopes no exposed roots
How vegetated is the right bank, looking down stream, for the length of your reach (circle a percentage)?
Vegetated banks
Bare/eroded banks
100% 90% 80% 70% 60% 50% 40% 30% 20% 10% 0
What are the visual indicators you used to assess the percentage above (check all that apply)?
exposed soil
obvious loss of soil
steep slopes (banks are U shaped)
exposed roots
soil covered with vegetation gentle slopes no exposed roots
11. Additional comments/observations:
II. VISUAL BIOLOGICAL SURVEY
1. Wildlife in or around the stream:
amphibians waterfowl reptiles mammals mussels/clams/oysters crustaceans fish birds butterflies insects
2. Fish in the stream: (Check all that apply)
no
yes, but rare
yes abundant
small (1-2")
medium (3-6")
large (7" and above)
Are there barriers to fish movement?
none
beaver dams
waterfalls > 1ft
dams
road barriers
other __________
3. Aquatic plants in the stream: (Check all that apply)
none
attached plants
stream margin/edge pools
occasional
plentiful
free-floating plants stream margin/edge pools
occasional
plentiful
near riffle near riffle
4. Extent of algae in the stream: Are the submerged stones, twigs, or other material in the
stream coated with a layer of algae? (Check all that apply)
none
brownish:
light coating
heavy coating
occasional
plentiful
greenish:
light coating
heavy coating
occasional
plentiful
other
light coating
heavy coating
occasional
plentiful
Are there any filamentous (string-like) algae? none occasional
brownish greenish other
plentiful
Are any detached "clumps" or "mats" of algae floating on the water's surface? none occasional plentiful
brownish greenish other
5. Stream shade cover: How well is the water surface shaded by vegetation?
Looking down stream:
Total shading
No shading
100% 90% 80% 70% 60% 50% 40% 30% 20% 10% 0
6: Additional comments/observations:
III. SKETCH OF MONITORING SITE / STREAM REACH
On the back of this page, or on a separate page, note the physical features of the stream reach, such as: riffles, pools, runs, stream banks (bare or eroded), changes to stream shape (rip-rap, gabions, cemented banks), vegetation, stream flow obstructions (dams, pipes, culverts), outfalls, tributaries, landscape features, paths, bridges, and roads.
As accurately as possible, identify the location of channel cross-section measurements and provide exact location of stream reach (e.g. Cricket Creek stream reach begins 57 feet north of Cormorant Bridge.)
Include comments such as changes or potential problems, e.g. spills, new construction, type of discharging pipes, etc.
APPENDIX B-1 NONPOINT SOURCE POLLUTION: Causes and Sources
Causes (pollutant or stressor) Sediment and Siltation (sand, silt, clay)
Nutrients (phosphorus, nitrogen)
Pathogens (bacteria and viruses)
Pesticides
Possible Sources
Potential Adverse Impacts
Cropland Forestry activities Pasture Stream banks Construction Roads Mining operations Gullies Livestock operations Other land-disturbing activities
Sediment may destroy fish habitat by: (1) blanketing spawning and feeding areas; (2) eliminating certain food organisms; (3) causing gill abrasion and fin rot; and (4) reducing sunlight penetration, thereby impairing photosynthesis. Suspended sediment decreases recreational values, reduces fishery habitat, adds to mechanical wear of water supply pumps and distribution systems, and adds treatment costs for water supplies. Nutrients and toxic substances attached to sediment particles may enter aquatic food chains, cause fish toxicity problems, impair recreational uses or degrade the water as a drinking water source.
Erosion and runoff from fertilized fields
Urban runoff Wastewater plants Industrial discharges Septic systems Animal production operations Cropland or pasture where manure is spread
Nutrients are essential for the growth and survival of aquatic plants and animals. Excess nutrient may cause excessive algae and aquatic plant growth, which may choke open waters and consume oxygen (primarily from decomposition of dead plants and algae). These conditions will adversely affect fish and aquatic organisms, fishing and boating, and the taste and odor of finished drinking water. Nitrogen contaminants in drinking water significantly above the drinking water standard may cause methoglobinemia (blood disease) in infants, and have forced the closure of many water supplies.
Human and animal excreta
Animal operations Cropland or pasture Wastewater treatment Septic systems Urban runoff
Wildlife
Waterborne diseases may be transmitted to humans through drinking or contact with pathogen-laden water. Eating shellfish taken from or uncooked crops irrigated with pathogen-laden waters may also transmit waterborne diseases. The principal concern in both surface and ground waters is the potential degradation of public water supply sources. Pathogens reaching a lake or other surface water may limit primary contact recreation, such as swimming.
All land where
Pesticides may enter surface waters either dissolved in
Toxic Substances (heavy metals, oil and petroleum products)
pesticides are used: (forest, pastures, urban/suburban areas, golf courses, waste disposal sites) Sites of historical usage (chlorinated pesticides) Urban runoff Irrigation return flows
Urban runoff Wastewater treatment Industrial discharges
runoff or attached to sediment or organic materials, and may enter ground water through soil infiltration. The principal concerns in surface water are their entry into the food chain, bioaccumulation, toxic effects on fish, wildlife and microorganisms, habitat degradation and potential degradation of public water supply sources. Ground water impacts are primarily related to water supply sources.
Toxic substances may enter surface waters either dissolved in runoff or attached to sediment or organic materials and may enter ground waters through soil infiltration. Principal concerns in surface water include entry into the food chain, bioaccumulations, toxic effects on aquatic organisms, other wildlife and microorganisms, habitat degradation and degradation of water supplies. Ground water impacts are primarily related to degradation of water supply sources.
Organic Enrichment (depletion of dissolved oxygen)
Human and animal excreta Decaying plant & animal matter Discarded litter and food waste
Organic materials (natural or synthetic) may enter surface waters dissolved or suspended in runoff. Natural decomposition of these materials may deplete oxygen supplies in surface waters. Dissolved oxygen may be reduced to below the threshold necessary to maintain aquatic life.
Thermal Stress & Sunlight
Riparian corridor destruction Bank destruction Urban runoff Hydromodifications Industrial dischargers
Direct exposure of sunlight to streams may elevate stream temperatures, which can exceed fish tolerance limits, reduce dissolved oxygen and promote the growth of nuisance algae. The lack of trees along a stream bank contributes to thermal stress and excessive sunlight. Thermal stress may also be the result of storm water runoff, which is heated as it flows over urban streets. Hydromodifications that create wider, shallower channels create more surface area and allow for quicker temperature changes. Modifications that create pools and increase the storage time of water may also contribute to thermal stress by increasing surface area and not allowing the warmed water to wash out of the watershed. Coldwater fish may be eliminated or only marginally supported in streams affected by thermal stress.
pH (acidic and
Mine drainage Mine tailings runoff
Acidic or alkaline waters will adversely affect many biological processes. Low pH or acidic conditions adversely affect the reproduction and development of fish and amphibians, and
alkaline waters)
Atmospheric deposition Industrial point source discharges
can decrease microbial activity important to nutrient cycling. An extremely low pH will kill all aquatic life. Acidic conditions can also cause the release of toxic metals that were adsorbed to sediments into the water column. High pH, or alkaline conditions, can cause ammonia toxicity in aquatic organisms.
Flow Alterations (hydrologic modifications)
Channeling Dams Dredging Stream bank modifications
Habitat Modifications
Refuse, Litter and Other Debris
Channeling Construction Changing land uses in the watershed Stream burial Dredging Removal of riparian vegetation Stream bank modifications
Litter Illegal dumping of solid wastes
Hydrologic modifications alter the flow of water through the stream. Structures or activities in the water body that alter stream flow may in turn be the source of stressors, such as habitat modifications, or exacerbate others, such as thermal stress. Dams may also act as a barrier to the upstream migration of aquatic organisms. Stream flow alterations may result from a stressor such as sedimentation, which may change a streambed from narrow with deep pools to broad and shallow.
Habitat modifications include activities in the landscape or in the water body that alter the physical structure of the aquatic and riparian ecosystem. Some examples include: removal of stream side vegetation that stabilizes the stream bank and provides shade; excavation in the stream and removal of cobbles from the stream bed that provide nesting habitat for fish; stream burial; and development that alters the natural drainage pattern by increasing the intensity, magnitude and energy of runoff waters.
Refuse and litter in a stream can clog fish spawning areas; stress aquatic organisms; reduce water clarity; impede water treatment plant operations; and impair recreational uses of the water body, such as swimming, fishing and boating.
APPENDIX B-2 NONPOINT SOURCE POLLUTION SOLUTIONS
APPENDIX C-1 MORE ABOUT AQUATIC INSECTS {tc \l2 "SOME BACKGROUND ON AQUATIC INSECTS}
To understand and identify aquatic insects, one must start with how all animals are classified. The most general category is first, with the species level being the most specific. Volunteers will learn to identify aquatic insects to the order level. A stonefly is classified as an example.
Kingdom Phylum Class
Order Family Genus
Species
Animal (all animals) Arthropoda (all animals with exoskeletons)
Insecta (all insects) Plecoptera (all stoneflies)
Perlidae (Perlid stoneflies) Acroneuria Acroneuria lycorias (Golden Stonefly)
Life Stages of Insects Identifying insects is complicated because of the different stages they pass through during their development. The changes that occur from the egg stage to the adult are often dramatic. The incredible change of a caterpillar into a butterfly is well known; most aquatic insects experience similar changes. The process of changing form during the life cycle is called metamorphosis, of which three types are possible: ametabolous, incomplete, and complete.
Ametabolous Metamorphosis This type of metamorphosis means "without change" and refers to the lack of change between the immature and adult stages. It's found in only a few very primitive orders of insects that have no wings as adults. Some species are semiaquatic.
Incomplete Metamorphosis Insects with incomplete metamorphosis pass through three distinct stages: egg, nymph, and adult. The time required to complete each stage varies widely, with the greatest amount of time usually spent in the nymphal stage. In most cases, the entire cycle requires one year to complete, although this also varies with different species. Nymphs often look similar to their adult stage. As nymphs mature, the adult wings begin developing in stiff pouch-like structures on the thorax called wing pads. This is an obvious and unique characteristic of insects with incomplete metamorphosis. The wing pads on fully mature nymphs will be quite dark, almost black, in
color. The orders of aquatic insects with incomplete metamorphosis include: Mayflies (Order Ephemeroptera) Dragonflies and Damselflies (Order Odonata) Stoneflies (Order Plecoptera) Water Bugs (Order Hemiptera)
Complete Metamorphosis Insects with complete metamorphosis pass through four distinct stages: egg, larva, pupa, and adult. The addition of the pupal stage separates insects with complete metamorphosis from those with incomplete metamorphosis. While the length of time needed to complete each stage again varies widely, the entire cycle usually takes one year. Most of the cycle is generally spent in the larval stage. Unlike nymphs, larvae bear little resemblance to the adults and show no development of wing pads. It is during the pupal stage that the wing pads and other adult features develop. The orders of aquatic insects
Dobsonflies and Alderflies (Order Megaloptera) Caddisflies (Order Trichoptera) Aquatic Moths (Order Lepidoptera) Aquatic Flies (Order Diptera) Aquatic Beetles (Order Coleoptera)
Growth And Development The growth of insects occurs in a series of stages called instars. The exoskeleton of insects must be periodically shed in order for growth to continue. The process of shedding the old exoskeleton is called molting. When the old exoskeleton is cast aside, a new, slightly larger one is present underneath. The old empty exoskeleton is often referred to as a shuck. Except for mayflies, molting stops once the insect reaches the winged adult stage. Most insects molt five or six times during their development. Mayflies, stoneflies, dragonflies, and damselflies, however, may molt 15-30 times before reaching their adult stage.
Recognizing the insect's stage and degree of development can help the angler determine what insect to imitate. Mature nymphs and larvae often become more active in the water as they move to emergence or pupation sites. This increased activity makes them more available to fish and thus makes them more important to imitate. Looking for and imitating the most mature insects will normally produce the best fishing. One of the most vulnerable periods in the insect's life cycle is during emergence from the immature to the adult stage. At the time of emergence, mature nymphs or pupae typically crawl out of the water or swim to the water's surface. Those that emerge in the surface film must break through the surface tension, and that can take from several seconds to over a
minute. Thus, during emergence, the lake or stream bottom does not protect the insects. Fish readily take advantage of the insects' vulnerability and often feed selectively on emerging nymphs or pupae. The angler who recognizes this activity will find fast fishing by imitating the shape and action of the natural prey.
Adult insects often rest on the water's surface after emerging from the nymphal or pupal shuck. Then, after mating, most aquatic insects return to the water to lay their eggs. Insects resting or laying eggs on the surface provide fish with many easy meals.
Source: An Angler's Guide to Aquatic Insects and their Imitations, Hafele and Roederer, 1987.
APPENDIX C-2 THINK SAFETY!
{tc "THINK SAFETY! " \l 2}
To ensure a fun and educational trip to your stream, wetland or lake, please keep these simple precautions in mind:
Always visit a site with at least one other person so that someone can go for help if one person is unable to.
Never sample if a stream or river is flooding, or even one day after a heavy rain. Fast moving water is very dangerous. Also, avoid steep banks as access points. Wear a life jacket if near deep water.
When sampling, avoid touching your mouth and eyes and be sure to wash hands before eating. If a waterbody is polluted or water quality is unknown, wear plastic gloves and rubber boots.
Know the location of the nearest available phone or take a portable phone with you. Have an emergency plan ready if you are taking a group out who will go for help? Does anyone know CPR? Does anyone have allergies?
Don't go near the water if there is a strong chemical smell, a fish kill, or other dangerous conditions. Leave immediately and report the condition to appropriate authorities.
Watch out for snakes, alligators, and snapping turtles. Hit the ground and trees with a stick as you walk to your site to scare snakes and other creatures away. Leave them alone and they will leave you alone.
Look out for broken glass, poison ivy, ticks, bees, fire ants, and other hazards.
Be aware of road hazards, both driving to the site and while conducting activities. Vehicles may not see you getting in and out of your car--bridges are narrow. Make sure you have enough room to safely park and walk to your site. If walking under a bridge, watch for objects knocked off the road from overhead.
In case of accident, bring a first aid kit.
GEORGIA ADOPT-A-STREAM
Macroinvertebrate Count Form
To be conducted quarterly
Return to: GA AAS 4220 International Parkway Suite 101 Atlanta, GA 30354
AAS group name: Group ID number
Site ID Number Investigators: Stream name
AAS-G AAS-S
Date:
Site/location Description:
Time:
County: Topo Map Quadrant:
Picture/Photo Documentation? yes / no
Rain in last 24 hours
heavy rain
steady rain
intermittent rain none
Amount of rain, if known?
Present conditions
heavy rain
steady rain
overcast
partly cloudy
Inches in last
hours/days
intermittent rain clear/sunny
Use letter codes (A=1-9, B=10-99, C=100 or more) to record the numbers of organisms
(check all that apply)
Method used:
Habitat selected for sampling:
found in a total sample. Then add up the number of letters in each column and multiply by the indicated value. The following columns are divided based on the organism's sensitivity to pollution.
Muddy Bottom Rocky Bottom
riffle leaf pack/woody debris streambed with silty area (very fine particles) streambed with sand or small gravel
vegetated bank
other (specify)
SENSITIVE
SOMEWHAT-SENSITIVE
TOLERANT
stonefly nymphs
common net spinning caddisflies
midge fly larvae
mayfly nymphs
dobsonfly/hellgrammite & fishfly
black fly larvae
water penny larvae
dragonfly & damselfly nymphs
lunged snails
riffle beetle adult
crayfish
aquatic worms
aquatic snipe flies
crane flies
leeches
caddisflies
aquatic sow bugs
gilled snails
scud
clams & mussels
# of letters times 3 =__
# of letters times 2 = __
# of letters times 1 = __
Now add together the three index values = ______ total index value. The total index value will give you an indication of the water quality of your stream. Good water quality is indicated by a variety of different kinds of organisms, with no one kind making up the majority of the sample.
Excellent (>22)
WATER QUALITY RATING
Good (17-22)
Fair (11-16)
Poor (<11)
APPENDIX C-4
HOW TO MAKE A KICK SEINE{tc \l2 "HOW TO MAKE A KICK SEINE}
Materials:
3 foot by 3 foot piece of nylon or metal window screening 4 strips of heavy canvas (6 inches by 36 inches) 2 broom handles or wooden dowels (5 or 6 feet long) finishing nails thread sewing machine hammer iron and ironing board
Procedure:
1. Fold edges of canvas strips under, 1/2 inch, and press with iron. 2. Sew 2 strips at top and bottom and then use other 2 strips to make casings for
broom handles or dowels on left and right sides. Sew bottom of casings shut. 3. Insert broom handles or dowels into
casings and nail into place with finishing nails.
Speed method:
1. Lay 3 foot by 3-foot piece of screening over broom handles.
2. Staple or nail screen to broom handles.
Note: AAS QAQC plan calls for net to be 2-foot by 2-foot.
(Courtesy of the Tennessee Valley Authority)
APPENDIX D-1 WHY ARE CHEMICAL TESTS IMPORTANT?{tc \l2 "WHY ARE CHEMICAL TESTS IMPORTANT?}
This section describes some chemical and physical tests you can conduct and why they are important. Physical/Chemical testing should be conducted at least once a month because this type of testing measures the exact sample of water taken, which can vary weekly, daily or even hourly. A basic set of tests includes temperature, dissolved oxygen, pH, and settleable solids. Test kits that measure these four parameters will cost approximately $150.00. Replacement chemicals are inexpensive and will be needed after one year. Advanced tests include total alkalinity, ortho-phosphate and nitrate. A test kit that includes both basic and advance tests costs approximately $300.00. Some groups may wish to work with a certified laboratory to sample for fecal coliform bacteria or chlorophyll A.
Temperature{tc \l2 "TEMPERATURE}
Water temperature is one factor in determining which species may or may not be present in the system. Temperature affects feeding, reproduction, and the metabolism of aquatic animals. A week or two of high temperatures may make a stream unsuitable for sensitive aquatic organisms, even though temperatures are within tolerable levels throughout the rest of the year. Not only do different species have different requirements, optimum habitat temperatures may change for each stage of life. Fish larvae and eggs usually have narrower temperature requirements than adult fish.
I. Measuring Temperature A thermometer protected by a plastic or metal case should be used to measure temperature in the field. Record air temperature by placing the dry thermometer in the shade until it stabilizes. Record the temperature of the air before measuring water temperature. To measure water temperature, submerge the thermometer in a sample of water large enough that it will not be affected by the temperature of the thermometer itself, or hold it directly in the stream.
II. Significant Levels Temperature preferences among species vary widely, but all species can tolerate slow, seasonal changes better than rapid changes. Thermal stress and shock can occur when water temperatures change more than 1 to 2 degrees Celsius in 24 hours. Many biological processes are affected by water temperature. Temperature differences between surface and bottom waters help produce the vertical water currents, which move nutrients and oxygen throughout the water column.
III. What Measured Levels May Indicate Water temperature may be increased by discharges of water used for cooling purposes (by industrial or utility plants) or by runoff from heated surfaces such as roads, roofs and parking lots. Cold underground water sources, snow melt, and the shade provided by overhanging vegetation can lower water temperatures.
pH{tc \l2 "pH}
The pH test is one of the most common analyses in water testing. An indication of the sample's acidity, pH is actually a measurement of the activity of hydrogen ions in the sample. pH measurements are on a scale from 0 to 14, with 7.0 considered neutral. Solutions with a pH below 7.0 are considered acids, and those between 7.0 and 14.0 are considered bases.
The pH scale is logarithmic, so every one-unit change in pH actually represents a ten-fold change in acidity. In other words, pH 6 is ten times more acidic than pH 7; pH 5 is one hundred times more acidic than pH 7.
I. Significant Levels A range of pH 6.5 to pH 8.2 is optimal for most aquatic organisms. Rapidly growing algae or submerged aquatic vegetation remove carbon dioxide (CO2) from the water during photosynthesis. This can result in a significant increase in pH levels and becomes more basic. Low or high pH can effect egg hatching, kill sources of food for fish and insects, allows toxic elements to become more readily available for uptake, or make water uninhabitable for any aquatic life. In Georgia, Mountain and Piedmont streams will have pH ranges of 6.0 to 8.0. Coastal black water streams will naturally have more acidic conditions, with pH values of 3.5 to 8.5.
pH values of some common substances:
pH 0.5 battery acid 2.0 lemon juice 5.9 rainwater 7.0 distilled water 8.0 salt water 11.2 ammonia 12.9 bleach
II. What Measured Levels May Indicate In South Georgia and in areas with stagnant water such as wetlands, the presence of decomposing organic matter will lead to naturally occurring lower (acidic) pH readings. In other regions of the State, pH readings outside of the acceptable levels may be the result of mine drainage, atmospheric deposition or industrial point discharges.
Dissolved Oxygen (DO){tc \l2 "DISSOLVED OXYGEN}
Like land organisms, aquatic animals need oxygen to live. Fish, invertebrates, plants, and aerobic bacteria all require oxygen for respiration.
I. Sources of Dissolved Oxygen Oxygen dissolves readily into water from the atmosphere at the surface until the water is "saturated". Once dissolved in water, the oxygen diffuses very slowly, and distribution depends on the movement of aerated water by turbulence and currents
caused by wind, water flow and thermal upwelling. Aquatic plants, algae and phytoplankton produce oxygen. This process is called photosynthesis.
II. Dissolved Oxygen Capacity of Water The dissolved oxygen capacity of water is limited by the temperature and salinity of the water and by the atmospheric pressure, which corresponds with altitude. These factors determine the highest amount of oxygen that it is possible to dissolve in the water.
III. Temperature Effect As water temperature changes, the highest potential dissolved oxygen level changes.
Lower temperature = Higher potential dissolved oxygen level Higher temperature = Lower potential dissolved oxygen level
At 0 degrees Celsius the saturation point for dissolved oxygen is 14.6 ppm At 32 degrees Celsius the saturation point for dissolved oxygen is 7.6 ppm
The temperature effect is compounded by the fact that living organisms increase their activity in warm water, requiring more oxygen to support their metabolism. Critically low oxygen levels often occur during the warmer summer months when capacity decreases and oxygen demand increases. This is often caused by respiring algae or decaying organic material.
IV. Significant Levels The amount of oxygen required by an aquatic organism varies according to species and stage of life. Fish and invertebrates that can move will leave areas with low dissolved oxygen and move to higher level areas.
>5 ppm is required for growth and activity
<3 ppm is stressful to most aquatic organisms
<2 ppm will not support fish
V. What Measured Levels May Indicate A low dissolved oxygen level indicates a demand on the oxygen in the system. Pollutants, including inadequately treated sewage or decaying natural organic material, can cause such a demand. Organic materials accumulate in bottom sediments and support microorganisms (including bacteria), which consume oxygen as they break down the materials. Some wastes and pollutants produce direct chemical demands on any oxygen in the water. In ponds or impoundments, dense populations of active fish can deplete dissolved oxygen levels. In areas of dense algae, DO levels may drop at night or during cloudy weather due to the net consumption of dissolved oxygen by aquatic plant respiration.
High dissolved oxygen levels can be found where stream turbulence or choppy conditions increase natural aeration by increasing the water surface area and trapping air under cascading water. On sunny days, high dissolved oxygen levels occur in areas
of dense algae or submerged aquatic vegetation due to photosynthesis. In these areas, the lowest DO levels occur just before sunrise each morning and highest levels just after noon.
Conductivity
Conductivity is a measure of the ability of water to pass an electrical current. Conductivity in water is affected by the presence of inorganic dissolved solids such as chloride, nitrate, sulfate, and phosphate anions (ions that carry a negative charge) or sodium, magnesium, calcium, iron, and aluminum cations (ions that carry a positive charge). Organic compounds like oil, phenol, alcohol, and sugar do not conduct electrical current very well. Conductivity is also affected by temperature: the warmer the water, the higher the conductivity. For this reason, conductivity is reported as conductivity at 25 degrees Celsius (25 C). Conductivity is measured in microsiemens per centimeter (s/cm).
Conductivity in natural systems is affected primarily by the geology of the area through which the water flows. Streams that run through areas with granite bedrock such as in North Georgia tend to have lower conductivity because granite is composed of more inert materials that do not ionize (dissolve into ionic components) when washed into the water. On the other hand, streams that run through areas with clay soils tend to have higher conductivity because of the presence of materials that ionize when washed into the water.
I. Significant Levels Distilled water has conductivity in the range of 0.5 to 3 s/cm. The conductivity of rivers in Georgia generally ranges from 50 to 1500 s/cm. Studies of inland fresh waters indicate that streams supporting good mixed fisheries have a range between 50 and 500 s/cm. Conductivity outside this range could indicate that the water is not suitable for certain species of fish or macroinvertebrates. Industrial waters can range as high as 10,000 s/cm.
II. What Measured Levels May Indicate Discharges to streams can change the conductivity depending on their make-up. A failing sewage system would raise the conductivity because of the presence of chloride, phosphate, and nitrate; an oil spill would lower the conductivity. Documented changes in conductivity readings warrant further investigation.
Nutrients
The addition of phosphorus, nitrogen and other nutrients to a body of water may lead to increased plant growth, ultimately resulting in algae blooms. Over time, this living and dead plant material builds up and, combined with sediments, fills in lakes and reservoirs. This is a naturally occurring process called eutrophication. However, when excess nutrients and sediment are added as a result of human activity, the speed of this natural process is increased significantly.
Plants, especially algae, are very efficient users of phosphorus and nitrogen. By the time an algae bloom is observed, the nutrients may no longer be measurable but may continue to impact the ecosystem. By sampling upstream from areas of algae blooms, the source of excess
nutrients may be identified. Algae blooms will usually be found in lakes and reservoirs. If excessive algae are found in streams, the nutrient content is probably very high. The macroinvertebrate population will reflect a high input of nutrients you will find little variety of macroinvertebrates but many of one or two kinds.
High flow rates in streams may prevent the establishment of floating aquatic plants and algae despite the presence of high levels of nutrients. As the summer progresses and flow rates drop, once rapidly flowing streams can become choked with algae. Wide, slow moving and tidal areas downstream may exhibit algae blooms weeks earlier.
I. Sources of Nutrients Nitrogen and phosphorus enter water from human and animal waste, decomposing organic matter and fertilizer runoff. Phosphates also are found in some industrial effluents, detergent wastewater from homes, and natural deposits.
Nitrates
Nitrogen occurs in natural waters as ammonia (NH3), nitrite (NO2), nitrate (NO3), and organically bound nitrogen. Through a process called nitrification, bacteria convert ammonium to nitrites, which are quickly converted into nitrates. Ammonia test results are expressed as "ammonia as nitrogen". Nitrate test results are expressed as "nitrate nitrogen" (NO3-N), meaning "nitrogen that was in the form of nitrate." Some test kits and the literature express levels only as nitrate (NO3). Both expressions refer to the same chemical and concentrations, but use different units of measure: Nitrate Nitrogen ppm x 4.4 = Nitrate ppm
I. Significant Levels Unpolluted waters generally have a nitrate-nitrogen level below 1 ppm. Nitrate-nitrogen levels above 10 ppm (44 ppm nitrate) are considered unsafe for drinking water.
II. What Measured Levels May Indicate Levels of nitrate-nitrogen above 1 ppm may indicate a sewage overflow. High levels may also indicate the presence of fertilizers and animal waste. High levels of ammonia nitrogen generally indicate a more immediate source of pollutants.
Phosphorus
Phosphorus occurs in natural waters in the form of phosphates - orthophosphates, polyphosphates and organically bound phosphates. Simple phosphate test kits measure reactive phosphorus (primarily orthophosphate), which is the form of phosphate applied as fertilizer to agricultural and residential lands.
Organically bound phosphates in water come from plant and animal matter and wastes. Organically bound phosphates and polyphosphates cannot be measured directly. They must first be broken down or "digested" by adding an acid and oxidizer and boiling the sample. After the digested sample cools, an orthophosphate test is performed to measure total phosphorus. Results are expressed as phosphate (PO4).
I. Significant Levels Total phosphorus levels higher than 0.03 ppm contribute to increased plant growth (eutrophic conditions), which will lead to oxygen depletion. Total phosphorus levels above 0.1 ppm may stimulate plant growth sufficiently to surpass natural eutrophication rates.
II. What Measured Levels May Indicate Levels in excess of .1 ppm indicate a potential human source such as industrial soaps, sewage, fertilizers, disturbance of soil, animal waste, or industrial effluent.
Settleable Solids
The settleable solids test is an easy, quantitative method to measure sediment and other particles found in surface water. An Imhoff cone (a plastic or glass 1 liter cone) is filled with one liter of sample water, stirred, and allowed to settle for 45 minutes. Solids will settle in the bottom of the cone and are then measured as a volume of the total, in millimeters per liter. This measurement is a reproducible analogue for turbidity.
A measurement of settleable solids is not the same as a turbidity reading. Turbidity levels are measured by taking into account all particles suspended in the water column, including small, colloidal sized particles, like clay. A settleable solids test only measures those particles large enough to settle out within a given period of time.
Excessive solids in water block sunlight and clog fish and macroinvertebrate gills. Sediment that settles on the streambed can smother habitat for fish and other aquatic life. Sediment can also carry harmful substances such as bacteria, metals, and excess nutrients.
I. What Measured Levels May Indicate Land-disturbing activities contribute to elevated levels of settleable solids in Georgia's streams, rivers, lakes and wetlands. Possible sources include cropland, pasture, livestock operations, forestry activities, construction, roads, and mining operations. Sediment in streams functions much like sandpaper, scouring stream banks, leading to streambank failure, and ultimately causing further erosion.
Alkalinity
Alkalinity of water is its acid-neutralizing capacity. It is the sum of all the bases found in a sample, including carbonate, bicarbonate, and hydroxide content. The alkalinity, and therefore buffering capacity, of natural waters will vary with local soils.
I. Significant Levels The higher the alkalinity, the better the capacity to buffer the fluctuation of pH in water.
II. What Measured Levels May Indicate Alkalinity levels should not fluctuate much unless a severe industrial problem has occurred upstream.
Salinity
Salinity refers to the concentration of dissolved salts in seawater. More specifically, salinity is the number of grams of dissolved salts in a kilogram of seawater, thus the units of salinity are parts per thousand. The salinity of average ocean water is 35 ppt.
I. Coastal Conditions Coastal and inshore waters such as estuaries, tidal rivers and marsh creeks generally have lower salinity values. These inshore areas also have highly variable salinity conditions. As the tide comes in or rises, seawater is pushed further inshore or inland, and the salinity at a particular location might increase within hours. Similarly, as the tide goes out, the seawater moves seaward and thus the salinity might decrease.
Salinity is a very important feature and parameter of coastal aquatic habitats. Not only does salinity affect the biological community, but it also affects the density of the water itself. The resulting water density has an effect on, and may be the cause of water flow and transport (both speed and even direction). In fact, typical inshore water circulation includes less dense, less salty water moving downstream along the surface while denser, saltier water is actually moving inshore/upstream along the bottom.
In coastal aquatic habitats, it is thus very important to know and record the salinity at any monitoring site. Salinity is one of the most basic chemical parameters for characterizing a coastal aquatic habitat.
II. Estuary Monitoring Estuaries are semi- or partially enclosed bodies of water where seawater and freshwater (e.g. from a river) mix. With variations in river inflow (due to rainfall, melting, freshwater removal for industries, agriculture, etc.) and the constant tidal action moving seawater in and out, estuaries are water bodies of temporally and spatially variable salinity. Organisms that live in estuaries must be able to withstand variable salinity conditions. Adaptations include: escaping/moving to more favorable conditions, closing up until more favorable conditions return, burrowing/digging into the bottom, using internal water balance metabolic processes such as producing more or less urine, drinking more or less water, or spending more energy to conserve or get rid of excess water and salts. Georgia estuarine animals such as oysters, blue crabs, shrimp, and mullet are capable of surviving in and dealing with the variable salinity conditions of coastal rivers, sounds, and salt marshes.
Methods of Measurement Salinity is most commonly determined by using one of the following three methods or
devises. A salinity refractometer is a hand held device that measures the refraction or bending of light passing through a solution to determine the strength or concentration of that solution. A conductivity meter measures the electrical conductivity of a solution to determine the concentration of dissolved charged ions (salts) in the solution. Conductivity values can be converted into practical salinity values. A chemical titration method (Knudsen titration) uses silver nitrate to measure the amount of chloride (the most abundant component of seawater salinity), and from that measurement, the total salinity can be calculated.
Secchi Disk
The Secchi disk (pronounced sec'-key) is used to measure the clarity of the water. The disk is named after Pietro Angelo Secchi, a papal scientific adviser and head of the Roman Observatory in the 1860s. Secchi lowered a white plate on a rope into the Mediterranean to determine the depth at which he could no longer see it as a relative measure of water clarity.
Modern Secchi disks are weighted metal disks. The face of the disc is divided into quarters and painted black and white for contrast. The disk is lowered into the water to the point at which the disk can no longer be seen this depth is then called the Secchi depth. Secchi depths can then be compared to track changes and compare differences in water clarity within and between bodies of water.
(Based on the Citizen Monitoring Handbook, published by the LaMotte Company)
APPENDIX D-2 INSTRUCTIONS FOR CHEMICAL TESTING
Dissolved Oxygen
1. Carefully collect the water sample into the glass water sampling bottle, avoiding trapping air bubbles or bubbling air into the sample (which may add dissolved oxygen). *ADD THE REAGENTS WHILE HOLDING THE BOTTLES VERTICAL*
2. Add the next two reagents in quick succession. Add 8 drops of Manganous Sulfate Solution and 8 drops of Alkaline Potassium Iodide Azide to the sample. Cap the sample and invert several times. Wait until the precipitate settles below the neck of the bottle before proceeding.
3. Next, add 8 drops of Sulfuric Acid 1:1. Cap and gently shake until the precipitate dissolves. The solution is now "fixed" and may range in color from yellow to orange brown. *Fixed Solution - Contact between the water sample and the atmosphere will not affect the test result because the dissolved oxygen has been bound into solution and no more oxygen will dissolve into the sample and no dissolved oxygen can be lost.
4. Place 20 mL of the fixed sample into the glass titration tube. TITRATION STEPS * SWIRL AFTER EACH DROP IS ADDED *
5. Fill the titrator (small syringe) with Sodium Thiosulfate. Make sure no bubbles are in the titrator. Place the titrator into the hole in the cap of the glass titration vial, or, depending on which kit is used, hold the eyedropper above the fixed sample.
6. Slowly add Sodium Thiosulfate from the titrator into the sample. Continue one drop at a time until the solution turns a pale straw color. *Hint-High light intensity degrades Sodium Thiosulfate - do not allow bottle to be exposed to the sun for long periods of time.
7. Remove the titrator cap and syringe CAREFULLY so as not to lose any of the Sodium Thiosulfate (you will continue titrating in step 9).
8. Add 8 drops of Starch Solution to the titration vial that is holding the sample. The sample will turn dark blue.
9. Continue titrating with Sodium Thiosulfate ONE DROP AT A TIME until the solution turns from blue to clear.
10. Read the amount of dissolved oxygen in your sample directly from the syringe (direct reading titrator). Tick marks measure 0.2 ppm. Use the tip of the syringe plunger for dissolved oxygen value.
Temperature
1. Air temperature - place thermometer in shady area and record temperature after reading stabilizes. Record temperature in degrees Celsius.
2. Water temperature - take the temperature reading of the water in the shade. It is best to take the temperature reading directly in the stream, but if you cannot, place thermometer directly into a bucket of sample water (in the shade) and record temperature. Take reading after temperature has stabilized (about 2 minutes). Record temperature in degrees Celsius.
pH
1. Fill test tube to the 5 mL line of the glass tube. 2. Add 10 drops of the pH wide range indicator (holding indicator bottle vertical). Cap and gently
invert the sample several times to ensure mixing. 3. Use the color comparator box to determine pH.
Conductivity
Calibrating the instrument:
To ensure accuracy, calibrate conductivity meter before each site visit. To calibrate:
1.
Rinse electrode in deionized water, then rinse it in calibration standard, then
dip it into a container of calibration standard.
2.
Switch unit on. Wait several minutes for the display to stabilize.
3. If the conductivity probe is not reading to the know standard solution, open the battery
compartment lid (end with the lanyard loop) and press INC or DEC key to adjust reading to
match the calibration standard.
4.
After 3 seconds without a key press, the display flashes 3 times, the shows
`ENT'. The tester accepts calibration value; then returns to measurement mode.
5.
Replace batter cap.
Measuring Conductivity: 1. Remove electrode cap. Switch unit on (On/Off Key). 2. Dip electrode into waterbody. Make sure sensor is fully covered. 3. Wait for reading to stabilize (Automatic Temperature Compensation corrects for temperature
changes. 4. Press Hold and record reading on data sheet. 5. Press On/Off Key to turn off tester. Replace electrode cap. Note: Tester automatically shuts off
after 8.5 minutes of non-use.
Nitrate Nitrogen Low Range (0-1 mg/L)
1. Fill viewing tube A, rinse and dump. Refill the tube to just below the frosted mark or the bottom line (5 ml) with the sample water.
2. Add the contents of one NitraVer 6 Nitrate Reagent Powder Pillow to tube A. 3. Cap the tube and shake vigorously for three minutes. Allow this sample to sit undisturbed for
thirty seconds. Unoxidized particles of cadmium metal will remain in the sample and settle at the bottom of the viewing tube. 4. Rinse tube B with distilled water. 5. Pour the prepared sample into tube B carefully so that the cadmium particles remain in the tube A. 6. Add the contents of one NitraVer 3 Nitrate Reagent Powder Pillow to the tube B. Stopper tube B and shake for thirty seconds. A red color will develop if nitrate is present. Allow at least 10 minutes, but no more than 20 minutes, before completing steps 7 through 9. 7. Place the nitrogen color comparator disc in the color comparator unit. 8. Place tube B (prepared sample) in the top right opening of the color comparator.
9. Rinse the unoxidized cadmium from tube A used in step 1. Then fill tube A to the frosted (5 ml) mark with the original sample water. Place the untreated sample into the top left opening of the color comparator.
10. Hold the comparator up to a light source such as the sky, a window or a lamp. Look through the openings in front. Rotate the color disc until the color matches in the two openings.
11. Read the mg/L nitrate nitrogen in the scale window. Note: Multiply the mg/L nitrate nitrogen value by 4.4 to obtain the mg/L nitrate.
Medium Range (1-10 mg/L) 1. Fill tube A with distilled or demineralized water. Stopper the tube and shake vigorously.
Empty the tube and repeat this procedure. 2. Rinse the plastic dropper with the sample. Fill dropper to the 0.5-mL mark. Add contents of
the dropper to tube A. 3. Then add distilled or demineralized water to the frosted mark (5 ml) on tube A 4. Add one NitraVer 6 Nitrate Reagent Powder Pillow to the sample. Stopper the tube and
shake for 3 minutes. Let sample stand undisturbed for an additional 30 seconds. Unoxidized particles of cadmium metal will remain in the sample and settle to the bottom of the viewing tube. 5. Pour the prepared sample into tube B, carefully so that the cadmium particles remain in tube A. 6. Add the contents of one NitraVer 3 Nitrate Reagent Powder Pillow tube B. Stopper the tube and shake for thirty seconds. A red color will develop if nitrate is present. Allow at least 10 minutes, but no more than 20 minutes, before completing steps 7 through 9. 7. Place tube B (prepared sample) in the top right opening of the color comparator. 8. Rinse the unoxidized cadmium from tube A used in step 2. Fill to the frosted mark (5 ml) with the original sample water. Place the untreated sample into the top left opening of the color comparator. 9. Hold the comparator up to a light source such as the sky, a window or a lamp. Look through the openings in front. Rotate the color disc until the color matches in the two openings. 10. Read the mg/L nitrate nitrogen in the scale window. Multiply that reading by 10 to obtain the mg/L nitrate nitrogen present in the sample. To obtain the results as mg/L nitrate (NO3) multiply by 4.4.
Ammonia Nitrogen (Range: 0-3.0 mg/L) 1. Rinse two glass sample tubes with the sample water to be tested and dump. 2. Fill both tubes with sample water to 5 ml mark 3. Add Ammonia Salicylate Reagent Powder Pillow to Tube A. Cap and shake until all the powder is dissolved. Wait three minutes 4. Add the contents of Ammonia Cyanurate Reagent Powder Pillow to Tube A. Cap the tube and shake until all the powder is dissolved. Allow at least 15 minutes for the color to fully develop. 5. Clean the outsides of both tubes and insert Tube A (color developed tube) into the right-hand opening of color comparator. Insert the untreated sample water (tube B) into left hand opening. 6. Hold comparator up to the light such as the sky, a window or a lamp and view the samples through the two openings on the front. Rotate the color disc until a color match is obtained. 7. Read the concentration of ammonia nitrogen in mg/L (N)
Phosphate Low Range (0-1 mg/L Phosphate)
1. Fill the square mixing bottle to the 20 mL mark with the water to be tested. 2. Add one PhosVer 3 Phosphate Reagent Powder Pillow to the sample and swirl to mix. Allow
at least 2, but no more than 10 minutes for color development. If phosphate is present, a blue violet color will develop. 3. Insert the lengthwise viewing adapter into the comparator. 4. Fill one sample tube to the line underlining "Cat. 1730-00" with the prepared sample. If not using 1730-00 tubes, this line will be found approximately 1 inch below the top of the tube. 5. Place the tube into the comparator opening. 6. Fill the other sample tube with untreated water to the mark and insert it into the comparator opening. 7. Rotate disc to obtain a color match. Read the concentration of the measured parameter through the scale window. 8. Divide the reading from the scale window by 50 to obtain the mg/L phosphate (PO4). To obtain the value as mg/L phosphorus (P), divide by 3.
Medium Range (0-5 mg/L Phosphate) 1. Perform steps 1 and 2 of the Low Range Procedure. 2. Fill one of the color viewing tubes to the lowest mark with the prepared sample. Insert it into the top right opening of the color comparator. 3. Fill the other tube to the lowest mark with the untreated sample. Insert this tube into the top left opening of the color comparator. 4. Rotate the disc to get a color match. Divide the value by 3 to obtain the mg/L of Phosphorus.
High Range (0-50 mg/L Phosphate) 1. Rinse the square mixing bottle with demineralized water. Add 2.0 mL of the water to be tested by twice filling the dropper to the 1.0 mL mark with the sample and discharging it into the mixing bottle. 2. Add demineralized water to the mixing bottle to the 20 mL mark. Swirl to mix. 3. Add one PhosVer 3 Phosphate Reagent Powder Pillow to the sample and swirl to mix. Allow at least 2 minutes, but no more than 10 minutes for color development. If phosphate is present a blue violet color will develop. 4. Fill one of the color viewing tubes to the lowest mark with the prepared sample. Insert it into the top right opening of the color comparator. 5. Fill the other tube to the lowest mark with the untreated sample. Insert this tube into the top left opening of the color comparator. 6. Rotate the disc to get a color match. Divide the value by 3 to obtain the mg/L of Phosphorus.
Settleable Solids
1. Fill Imhoff cone to 1 liter mark. Set aside and wait 45 minutes. Take direct reading in ppm (mg/l) from scale on side of cone.
Alkalinity
1. Fill titration tube to 5 mL line with water sample.
2. Add one Phenolphthalein indicator tablet/pillow into the sample. If the sample doesn't turn red, the phenolphthalein alkalinity is zero (Skip to step 4). If sample turns red, proceed to step 3.
3. Add Sulfuric Acid Standard Solution (or the Alkalinity Titration Reagent B) drop wise, counting drops, until the water becomes colorless. Test result is read where plunger tip is located at the Titrator scale (on the syringe) in ppm.
4. Add one Bromcresol Green-Methyl Red (BCG-MR) tablet to the sample and swirl to mix. 5. Using syringe, begin titrating Sulfuric Acid Standard Solution (or Alkalinity Titration Reagent
B) drop wise, counting drops and swirling the sample, until the solution flashes pink and holds purple color for at least 30 seconds (the end point). If no color change occurs after the titrator is emptied, refill and continue the titration, keeping track of the amount added. 6. Once this endpoint is reached, the alkalinity is calculated. The test result is read in ppm where plunger tip is located at the titrator scale (on the syringe).
Salinity - To conduct the salinity titration, only a small amount of sample water is actually needed.
1. Fill the titration vial to the line with Demineralized water from the Demineralizer bottle. Be as precise as you can.
2. Using the pipette that ranges from 0 to 1.0, fill the pipette with sample water to the zero mark (volume = 1.0 mL). Wipe off any excess sample water from the pipette tip. Insert pipette into titration vial.
3. Add only 0.5mL of the sample water from the pipette (from the zero mark to the 0.5 mark). Remove pipette from vial and lay pipette aside.
4. Remove top from titration vial, and add 3 drops of the yellow-colored chromate indicator reagent; replace titration vial cap, and mix well.
5. Fill the other pipette (that ranges from 0-20) with Silver Nitrate titration reagent. (NOTE: Silver nitrate is clear, but when it dries, it leaves a dark brown or black stain. You might notice such spots on your hands and fingers and possibly clothes if not wearing gloves).
6. Place pipette in top of titration vial. Add silver nitrate solution one drop at a time, with plenty of swirl mixing after each drop. The end-point will be when the yellow solution turns orange and stays orange.
7. When the end point is reached, read the pipette to determine the volume of silver nitrate added. NOTE that the pipette "numbers" are in twos, and thus each small hash mark between numbers represent 0.4. The volume of silver nitrate added equals the numerical value of the salinity (in ppt).
Secchi Disk - The Secchi disk is a disk 20 centimeters in diameter with black and white quadrants
(or solid white).
1. Attached to a calibrated line, lower disc into the water until it just disappears from sight. 2. Note the depth (distance from disk to the surface of the water). 3. Slowly raise the disc until it reappears. Note the depth again. 4. Take the average of the two readings. This is known as "Secchi Depth," and it is usually
measured in meters. If the Secchi disk reaches the bottom before disappearing, the Secchi Depth is greater than the water depth and cannot be accurately measured. When this occurs, a notation must be added to the Secchi Depth reading in your data.
APPENDIX D-3 GEORGIA ADOPT-A-STREAM
Chemical Data Forms
To be conducted every month
Return to: GA AAS 4220 International Parkway Suite 101 Atlanta, GA 30354
Use this form and the Adopt-A-Stream methods to record important information about the health of your stream. By keeping accurate & consistent records of your physical/chemical tests, you can document current conditions & changes in water quality.
AAS group name:
Group ID AAS-G-
number Site ID Number AAS-S-
Investigators: Stream name
Date:
Site/location Description:
Time :
County: Topo Map Quadrant:
Picture/Photo Documentation? yes / no
Rain in last 24 hours
heavy rain
steady rain
intermittent
none
rain
Present conditions
heavy rain steady rain
overcast
partly
cloudy
intermittent rain clear/sunny
Amount of rain, if known?
inches in last
hours/days
BASIC TESTS
Sample 1
Air Temperature
Water Temperature
pH
Dissolved Oxygen
Conductivity
AADVANCED TESTS
Nitrate Nitrogen
Ortho-phosphate
Ammonia-Nitrogen
Settleable Solids
Alkalinity
Salinity
Special Lab Analysis: Name of lab performing tests:
Sample 2
(0C) (0C) (1-14) (mg/L or ppm) (s/cm)
(mg/L or ppm) (mg/L or ppm) (mg/L or ppm) (mg/L or ppm) (mg/L or ppm) (ppt)
COMMENT S:
Reference and Resource Information
REFERENCES
AIMS Education Foundation Activities Integrating Mathematics and Science: Water Precious Water P.O. Box 8120 Fresno, CA 93747-8120 (209) 255-4094
Air and Waste Management: Environmental Resource Guide 420 Fort Duquesne Boulevard One Gateway Center, Third Floor Pittsburgh, PA 15222 Phone: (412) 232-3444 Fax: (412) 323-3450 Email: info@awma.org
Environmental Protection Agency Always A River Publications, Office of Public Affairs US EPA Region 5 77 west Jackson Boulevard Mail Code P-19J Chicago, IL 60604 Form # AWBERC-91-09 www.epa.gov/region5/eved/pubs-orderform.html
Project WILD Aquatic 5555 Morningside Drive, Suite 212, Houston, TX 77005 Phone: (713) 520-1936 Fax: (713) 520-8008 www.projectwild.org
Izaak Walton League of America
707 Conservation Lane Gaithersburg, MD 20878-2983 (301) 548-0150
US Geological Survey Water-Resources Education Poster Series Branch of Information Services BOX 25286 Denver Federal Center Denver, CO 80225 (888) ASK USGS ** Posters are available free of charge by calling this number.
RESOURCES
Georgia Project WET
Contact: Petey Giroux Environmental Protection Division Water Protection Branch 4220 International Parkway, Suite 101 Atlanta, GA 30354 Phone: (404) 675-1638 Fax: (404) 675-6245 Email: petey_giroux@dnr.state.ga.us
River of Words PO Box 4000 J Berkeley, California 94704 Phone: 510-548-POEM Fax: 510-548-2095 Email: info@riverofwords.org www.riverofwords.org
Georgia Contact: Petey Giroux Georgia Project WET Environmental Protection Division Water Protection Branch 4220 International Parkway, Suite 101 Atlanta, GA 30354 Phone: (404) 675-1638 Fax: (404) 675-6245 Email: petey_giroux@dnr.state.ga.us
Project Learning Tree National Contact: Brigitte Johnson c/o American Forest Foundation
1111 19th Street NW, Suite 780 Washington DC 20036 Phone: (202) 463-5163 Email: bjohnson@affoundation.org www.plt.org
Georgia Contact: Carla Rapp Georgia Forestry Association 500 Pinnacle Court, Suite 505
Norcross, GA 30071
Phone: (770) 416-7621
Fax: (770) 840-8961
Email: forestedu@gfagrow.org
www.georgiaplt.org
Project WILD/Project WILD Aquatic National: 5555 Morningside Drive, Suite 212, Houston, TX 77005 Phone: (713) 520-1936 Fax: (713) 520-8008 www.projectwild.org
Georgia Contact: Walter Lane Georgia Department of Natural Resources Wildlife Resources Division 543 Elliott Trail Mansfield, GA 30055 Tel: (770) 784-3059 Fax: (770) 784-3061 E-mail: walter_lane@mail.dnr.state.ga
Georgia River Network
Dana Skelton
126 South Milledge Avenue, Suite E3
Athens, GA 30605
Tel: (706) 549-4508
Fax: (706) 549-7791
Email: dana@rivers.org
www.garivers.org
JASON Foundation for Education 11 Second Avenue Needham Heights, MA 02494-2808
Phone: (781) 444-8858
Fax: (781) 444-8313
Email: info@jason.org
GLOBE- Global Learning and Observations to Benefit the Environment Georgia Contact: Ms. Nancy Huebner Geologist, DeKalb County School System Fernbank Science Center 156 Heaton Park Drive Atlanta, GA 30307 Phone: (404) 929-6312 Fax: (404) 370-1336 Email: n.huebner@fernbank.edu Partner Homepage: www.dekalb.k12.ga.us/~globe
Environmental Education Alliance of Georgia www.eealliance.org
Clearinghouse for Environmental Education Resources in Georgia
www.eeingeorgia.org
Glossary of Stream Related Terms
Accuracy a measure of how close repeated trials are to the desired target.
Acid rain rain with a pH of less than 5.6; results from atmospheric moisture mixing with sulfur and nitrogen oxides emitted from burning fossil fuels; causes damage to buildings, car finishes, crops, forests, and aquatic life.
Acidity a measure of the number of free hydrogen ions (H+) in a solution that can chemically react with other substances.
Algae simple plants which do not grow true roots, stems, or leaves and which live mainly in water, providing a base for the food chain.
Algal bloom a heavy growth of algae in and on a body of water as a result of high nitrate and phosphate concentrations from farm fertilizers and detergents.
Alkalinity a measure of the negative ions that is available to react and neutralize free hydrogen ions. Some of most common of these include hydroxide (OH), sulfate (SO4), phosphate (PO4), bicarbonate (HCO3) and carbonate (CO3)
Ambient pertaining to the current environmental condition.
Assemblage the set of related organisms that represent a portion of a biological community (e.g., benthic macroinvertebrates).
Benthic pertaining to the bottom (bed) of a water body.
Best Management Practices (BMPs) - an engineered structure or management activity, or combination of these, that eliminates or reduces an adverse environmental effect of pollutants.
Biochemical oxygen demand (BOD) the amount of oxygen consumed by microorganisms as they decompose organic materials in water.
Biological criteria numerical values or narrative descriptions that depict the biological integrity of aquatic communities in that state. May be listed in state water quality standards.
Channel - the section of the stream that contains the main flow.
Channelization - the straightening of a stream; this is often a result of human activity.
Chemical constituents - chemical components that are part of a whole.
Clear cutting felling and removing all trees in a forest area.
Cobble stone 2-10 inch size stones among which aquatic insects are commonly found.
Combined sewer overflow (CSO) - sewer systems in which sanitary waste and storm water are combined in heavy rains; this is especially common in older cities. The discharge from CSOs is typically untreated.
Community - the whole of the plant and animal population inhabiting a given area.
Culvert a man-made closed passageway (such as a pipe) under roadways and embankments, which drains surface water and diverts natural flow.
Designated uses state-established desirable uses that waters should support, such as fishing, swimming, and aquatic life. Listed in state water quality standards.
Dissolved oxygen (DO) oxygen dissolved in water and available for living organisms to use for respiration.
Distilled water water that has had most of its impurities removed.
Downstream the direction water it flow towards.
Dredge to remove sediments from the streambed to deepen or widen the channel.
Effluent an out-flowing branch of a main stream or lake; waste material (i.e. liquid industrial refuse, sewage) discharged into the environment.
Ecoregion geographic areas that are distinguished from others by ecological characteristics such as climate, soils, geology, and vegetation.
Embeddedness the degree to which rocks in the streambed are surrounded by sediment.
Emergent plants plants rooted underwater, but with their tops extending above the water.
Erosion the wearing away of land by wind or water.
Eutrophication the natural and artificial addition of nutrients to a waterbody, which may lead to depleted oxygen concentrations. Eutrophication is a natural process that is frequently accelerated and intensified by human activities.
Floating plants plants that grow free-floating, rather than being attached to the streambed.
Flocculent (floc) a mass of particles that form into a clump as a result of a chemical reaction.
Gabion - a mesh "cage" containing earth or rocks placed into a stream to support the banks or slow the current.
Glide/run section of a stream with a relatively high velocity and with little or no turbulence on the surface of the water.
Fish kill the sudden death of fish due to the introduction of pollutants or the reduction of dissolved oxygen concentration in a water body.
Floodplain a low area of land surrounding streams or rivers that holds the overflow of water during a flood.
Flow the direction of movement of a stream or river.
Groundwater a supply of fresh water under the earth's surface, which forms a natural reservoir.
Headwaters the origins of a stream.
Hypoxia depletion of dissolved oxygen in an aquatic system.
Impairment degradation.
Impoundment a body of water contained by a barrier, such as a dam.
Land uses activities that take place on the land, such as construction, farming, or tree clearing.
Leaching the process in which material in the soil (such as nutrients, pesticides, and chemicals) are washed into lower layers of soil or are dissolved and carried away by water.
Macroinvertebrates organisms that lack a backbone and can be seen with the naked eye.
Metamorphosis Change in structure and habits of an animal during normal growth. In insects this includes the emerging of the adult form from the larva/nymph juvenile form.
Nonpoint source pollution pollution that cannot be traced to a specific point, but rather from many individual places (e.g., urban and agricultural runoff).
NPDES National Pollutant Discharge Elimination System, a national program in which pollution dischargers such as factories and sewage treatment plants are given permits to discharge. These permits contain limits on the pollutants they are allowed to discharge.
Nutrients substances which enhance the growth of plants and animals, such as phosphorous and nitrogen compounds.
Orthophosphate inorganic phosphorus dissolved in water.
Outfall - the pipe through which industrial facilities and wastewater treatment plants discharge their effluent (wastewater) into a waterbody.
Permeable porous; having openings through which liquid or gaseous substances can penetrate.
Pesticide a chemical that kills insects and rodents. Pesticides can poison aquatic life when they reach surface waters through runoff.
pH a numerical measure of the hydrogen ion concentration used to indicate the alkalinity or acidity of a substance. Measured on a scale of 1.0 (acidic) to 14.0 (basic); 7.0 is neutral.
Phosphorus a nutrient that is essential for plants and animals.
Photosynthesis the chemical reaction in plants that utilizes light energy from the sun to convert water and carbon dioxide into simple sugars. This reaction is facilitated by chlorophyll.
Point source pollution a type of pollution that can be tracked down to a specific source such as a factory discharge pipe.
Pollutant something that makes land, water or air dirty and unhealthful.
Pool deeper portion of a stream where water flows more slowly than in neighboring, shallower portions.
Precision a measure of how close repeated trials are to each other.
Protocol defined procedure.
Reagent a substance or chemical used to indicate the presence of a chemical or to induce a reaction to determine the chemical characteristics of a solution.
Riffle a shallow area of a stream or river with a fast-moving current bubbling over rocks.
Riparian of or pertaining to the banks of a body of water.
Riparian zone the vegetated area on each bank of a body of water.
Riprap rocks used on an embankment to protect against bank erosion.
Runoff water, including rain and melted snow, which is not absorbed into the ground but instead flows across the land and eventually runs into streams and rivers. Runoff can pick up pollutants from the air and land, carrying them into the stream.
Saturated inundated; filled to the point of capacity or beyond.
Sediment soil, sand, and materials washed from land into waterways. Other pollutants may attach to sediment and be carried into stream.
Sedimentation when soil particles (sediment) settle to the bottom of a waterway.
Septic tank a domestic wastewater treatment system into which wastes are piped directly from the home; bacteria decompose the organic waste, sludge settles to the bottom of the tank, and the treated effluent flows out into the ground through drainage pipes.
Sheen the glimmering effect that oil has on water as light is reflected more sharply off the surface.
Silviculture forestry and the commercial farming of trees.
Slumping sections of soil on a stream bank that have come loose and slipped into the stream.
Stagnation when there is little water movement and pollutants are trapped in the same area for a long period of time.
Submergent plants plants that live and grow fully submerged under the water.
Substrate refers to a surface. This includes the material comprising the streambed or the surfaces to which plants or animals may attach or upon which they live.
Surface water precipitation which does not soak into the ground or return to the atmosphere by evaporation or transpiration, and which is stored in streams, lakes, wetlands, and reservoirs.
Taxon (plural taxa) a level of classification within a scientific system that categorizes living organisms based on their physical characteristics.
Taxonomic key a quick reference guide used to identify organisms. They are available in varying degrees of complexity and detail.
Tolerance the ability to withstand a particular condition, e.g., pollution-tolerant indicates the ability to live in polluted waters.
Toxic substances poisonous matter (either man-made or natural) which causes sickness, disease and/or death to plants or animals.
Tributaries a body of water that drains into another, typically larger, body of water.
Turbidity murkiness or cloudiness of water, indicating the presence of some suspended sediments, dissolved solids, natural or man-made chemicals, algae, etc.
Undercutting a type of erosion which occurs when fine soils are swept away by the action of the stream, especially around curves. The result is an unstable overhanging bank.
Upstream The direction water flows from; where it is coming from.
Water cycle the cycle of the earth's water supply from the atmosphere to the earth and back which includes precipitation, transpiration, evaporation, runoff, infiltration, and storage in water bodies and groundwater.
Water quality criteria maximum concentrations of pollutants that are acceptable, if those waters are to meet water quality standards. Listed in state water quality standards.
Water quality standards written goals for state waters, established by each state and approved by EPA.
Watershed land area from which water drains to a particular water body.
Water table the upper level of groundwater.
Waterway a natural or man-made route for water to run through (such as a river, stream, creek, or channel).
Wetland an area of land that is regularly wet or flooded, such as a marsh or swamp.
Adopt-A-Stream Educator's Guide Evaluation
Educator's Name: ________________________________ Phone #: _______________________________
Participant's Grade Level: ___________________________ Number of participants: ______________________
Ratings: 5 = Superb! 4 = Good
3 = Average
2 = Below Average
1 =
Poor
Please rate the individual sections of the AAS Teacher's Guide:
( please circle a number )
- Introduction and Background
5 4 3 2 1
- Getting To Know Your Watershed
5 4 3 2 1
- Visual Stream Survey
5 4 3 2 1
- Biological and Chemical Monitoring
5 4 3 2 1
Please rate the manual as a whole:
- The material covered matched my expectations. 1
5 4 3 2
- The activities fit well into my curriculum.
5 4 3 2 1
- The activities were clear, easy to follow and at the appropriate
5
4
3
2
1
level for my class.
- The activities maintained the students' interest.
General Comments: What do you like best/least about this guide?
5 4 3 2 1
What recommendations do you have to improve this guide? If any of your rating from above were under FOUR, please comment about specific chapters and sections where the problem occurs.
If you have any further comments or found any errors in the AAS Educator's Guide please list them here:
Department of Natural Resources, Georgia Adopt-A-Stream 422o International Parkway (Suite 101), Atlanta, GA 30354 Thank you for taking the time to complete our evaluation. Please return the evaluation form to the address above or fax to: (404) 675-6245