- Collection:
- Georgia Government Publications
- Title:
- Measuring goal attainment for GeorgiaGain and Merit System Reform / data analysis report for the Georgia Merit System ; Steven T. Elmore principal investigator
- Creator:
- Elmore, Steven T
- Contributor to Resource:
- Georgia. State Merit System of Personnel Administration
- Publisher:
- [Atlanta, Ga. : Georgia Merit System, 2000]
- Date of Original:
- 2000
- Subject:
- GeorgiaGain
Merit System Reform (Ga. : Program)
Merit pay--Georgia
Employees--Rating of--Georgia
Employee motivation--Georgia
Performance standards--Georgia - Location:
- United States, Georgia, 32.75042, -83.50018
- Medium:
- state government records
- Type:
- Text
- Format:
- application/pdf
- Description:
- Title from cover
"October 10, 2000" - External Identifiers:
- Call Number GA M300 .M1 2000 G6
- Metadata URL:
- https://dlg.galileo.usg.edu/id:dlg_ggpd_s-ga-bm300-b-pm1-b2000-bg6
- Digital Object URL:
- https://dlg.galileo.usg.edu/do:dlg_ggpd_s-ga-bm300-b-pm1-b2000-bg6
- Extent:
- viii, 171 p. ; 28 cm.
- Holding Institution:
- University of Georgia. Map and Government Information Library
- Rights:
-

Measuring Goal Attainment for
GeorgiaGain and Mf~rit System Reform
Data Analysis Report for the
Georgia Merit System
Submitted to Marjorie H. Young, Commissioner
Georgia Merit System October 10, 2000
Mr. Steven T. Elmore, Principal Investigator Dr. Grady L. Cornish, Project Director Vinson Institute of Government The University of Georgia
Data Analysis Report
Table of Contents
II. Background Overview GeorgiaGainHistorical Background Meri! System Reform Historical Background Overlapping Tirnelines
9 !)
!)
10 II
III. General Methodology Approaches to Measuring Goal Attainment Identifying Goals Measurable through Data Analysis Analysis of Existing Data
13 1:3 1:3
15
IV. Data Selection and Summarization.. ~_. Overview of Data Available for Analysis Detail Review of Employee Extract Data Detail Reviev of Performance Evaluation Data Detail Review of Personnel Transaction History Data Factors Complicating Data Analysis
.._....... . . 17 17 18 l!) 20 20
V. GeorgicJGain Goals Measurable with GMS Data
Assure Fair Performance Ratings....
__ __
Approach
Selection of Records for Analysis
Examination of Performance Evaluations by Overall Score or Rating
Examination of Performance Evaluations by Ethnic Group
Examination of Performance Evaluations by Gender
Examination of Performance Evaluations by Age
Examination of Performance Evaluations by Tenure
Examination of Performance Evaluations by Pay Grade
Examination of Performance Evaluations by Salary Range
Examination of Performance Evaluations by -Iob Title
Examination of Performance Evaluations by Agency
Examination of Terms & Conditions Ratings
Observations
Reward Best Performers
_.~
._ _ _ ~_ __
App roach
Selection of Records for Analysis
Examination of Relationship between Performance and Increases
Observations
23
25 25
2~)
2H :32 :35 :>7 :>9 .41
.4;')
,48 52 5fi 57
59 5H GO
()j
g:3
October 10, 2000
Page i
Data Analysis Report
Help Manager-s Document Poor Performance,"" Approach Selection of Records for Analysis Examination of Low Performance Evaluation Scores and Ratings Examination of l';mployeeProfiles of Low Score and Ratings Observations
".~"
~."" 65
(if)
(if) ()(:i
(;7 (;H
VI. Merit System Reform Goals Measurable with GMS Data
71
Advance Employees on the Basis of Abilities, Knowledge and Skills "._._.... 73
Approach
7;l
Selection of Records for Analysis
74
Examination of Promotions for High Performers
75
Examination of Promotions for Average Performers
77
Observations
78
Provide Equttable Compensation based on Merit and Performance
79
App roach
7~)
Selection of Records for Analysis
7H
Examination of Salary Lines by Performance Group
81
Examination of Salary Lines by Compensation Group
8:3
Examination of Salary Lines by Ethnic Group
8;j
Examination of Salary Lines by Gender
87
Examination of Salary Lines by Hire Date
8!)
Observations
H1
Retain Employees on Basis of their Performance Approach Selection of Records for Analysis Examination of Separations by Performance Group Examination of Performance Evaluations and Separations by Year Examination of Tenure of Active and Separated Employees Observations
93 !):3 !):3 H5 H7 !H) 100
Take Action to Address Inadequate Performance Approach Selection of Records for Analysis Examination of Corrective Actions Taken Observations
.,"."_.
.._ ~.~__ 103 10il 10:3 104 108
VII. Summary of Observations .....
.. 109
VIII. Conclusion and Recommendations Conclusion Recommendations Begin Data Analysis Prior to Implementing the Project.. Ensure the HRMS Can Capture Necessarv Data Acquire Data Analysis Tools
113 1 I:l I 1;~ 114 114 115
Page ii
October 10, 2000
Data Analysis Report
IX. Appendices Appendix A Personnel Transaction Codes Used in (}EMS Appendix B Summary of Employees by Personal Characteristics Appendix C PAl Scores fix Classes with 100+ Evaluations Appendix I) PIVIF Ratings for -Iobs with 100+ Evaluations Appendix E Reprint of Complex Charts with Data Values
117 1W
12:~
121, ]:O I:l7
October ]O. 2000
Page iii
Data. Analysis Report
Pageiv
October 10,2000
Data Analysis Report
List of Tables
Table I Goals of GeorgiaGain Table 2 Goals of tvlerit System Reiorin Tahlc S Goals Partially Measurable through Data Analysis Table 4 Summary of Employee Data in IIRMS Table f> Summary of Performance Appraisal Data in HHMS Table G Distribution ofI\\1 Performance Evaluations by Period Table 7 Distribution of PMF Evaluations by Period Table 8 Description of Performance Appra.isal Instrument Scores Tab le D Distr-ibution of PAl Scores by 1/10 Point... Table 10 Distribution of PAIP;valuations by Score Table 11 Distribution of I).MF Ratings Table 12 Ideal Distribution of Performance Evaluation Ratings Table 1:{ Distribution of PAl Scores by Ethnic Group Table 11 Distribution of PNIF Ratings by Ethnic Group Table 15 Distribution of PAl Scores by Gender.. Table] G Distribution of PM F Ratings by Gender Table 17 Dist.ribution of PAl Scores by Age Table 18 [Jist.ribu tinn of PMF Ratings by Age Table H) I)istribution of PAl Scores by Tenure Table 20 Distribution of PMF Ratings by Tenure Table 21 Dist.ribution of PAl Scores by Pay Grade Table 22 Distribution of PM F Ratings by Pay Grade Table 2;~ Distribution of PAl Scores by Salary Range Table 24 Distribution of PMF Ratings by Salary Range Table 25 Distribution of PAl Scores for 25 Most Frequently Evaluated Class Titles Table 26 Distribution of PMFRatingsf(lr 25 Most Frequently Evaluated -Iob Titles Table 27 Distribution of PAl Scores by Agency Table 28 Distribution of PMF Ratings within Agencies Table 29 Distribution of Terms & Conditions Rating Table :~o Performance Groups Table ;3) Distribution of Selected Increases by Year., Table ;32 Distribution of Performance Evaluations by Year Table :{:J Performance Evaluations versus Increases under PAl System 'fable :J4 Performance Evaluations versus Increases under PMF System Table ;~5 Percentage Distrihution of Increases under PAl System Tahle of Percentage Distribution of Increases for PMF System Table S? Low Performance Evaluations by Evaluations System Table :{8 Detail of Low Scores under PAl System Table :3!J Promotional Authority Codes Used in GEMS Table 40 Number of Promotions per Year Table 11 Performance Evaluation Data Available for All Types of Promotions Table ,12 Number of Regular Promotions by Performance Group Table 4;{ Percentage Distribution of Regular Promotions by Performance Group Table 44 Distribution of Performance Evaluations by Performance Group
P.:!~c: 10
10 14. 18
l!)
2(; 27
2~j 2~)
:W
:w
;H ;l2
;J;{
;{5
:w
:)7
:l8
;m
.40 .4] .4:J Af> 4H 48 50 52 51 5(; 5!J GO ()() (i2 ()2 f;2 (;;{ fig fi(;
7:~
74 74 75 7fi 7fi
October 10, 2000
Page v
[lata Analysis Report
Table 45 Salary Increases with Matching Performance Data
80
Tablcdf Budgeted Salary Increases
80
Table 47 Salary Increase Rates by Performance Groups
81
Table 48 Salary Increase Rates by Compensation Group
8:J
Table 4H Salary Increase Rates by Ethnic Group
85
Table fiO Salary Increase Rates by (lender.
87
Table 51 Salary Increase Rates by Hire Date
8!)
Table 52 Summary of Separation Data
H4
Table 5::1 Separations by Performance Group
!)5
Table 54 Approximate Percentage of Performance Groups Separating Annually
!t7
Table 55 Tenure in Months of Separated Employees
m)
'I'able 5(; Number of Low Performance Evaluations per year.
lOi~
Table 57 Low Performers as It Percentage of Employees and Evaluations
104
Table (')8 One-'(ear Follow-up on Low Performers
105
Table 5!) Pre- and Post-lv!erit S:.",5/(I11 Reiorm Activity for LowPerformers
10;)
Table no Separation Types for Low Performers
10(;
'I'able (il Separation Types for All Employees
10(;
Table 62 Personnel Transaction Types for Low Performers
107
Table 6:) Personnel Transaction Hates for All Employees
107
Page vi
October 10.2000
Data Analysis Report
List of Figures
Page
Figure I ~ Gcorgi;JGain and Merit. Systetn Reiortn T'imeline
11
Figure 2 PAl Performance Evaluations by Month
2(;
Figure ;J - prvlF Evaluations by Month
28
Figure 4 PAl Scores by Year
ao
Figure 5 PMF Ratings by Year
:~1
Figure G PAl Scores by Ethnic Group
:)2
Figure 7 PMF Ratings by Ethnic Group
:3:J
Figure 8 PAl SCOI'es by Gender
;);'")
Figure D PMF Ratings by Gender
;W
Figure 10 PAl Scores by Age
:)7
Figure 11 PMF Ratings by Age
:)8
Figure 12 PAl Scores by Tenure
:JH
Figure 1;) PMF Ratings by Tenure
40
Figure 14 PAl Scores by Pay Grade
42
Figure 15 PMFH.atings by Pay Grade
.41
Figure l() PAl Scores by Salary Range
,45
Figure 17 PIVlF Ratings by Salary Range
.4fl
Figure 18 PAl Scores for 25 Most Frequently Evaluated Class Titles
.4!l
Figure 19 - Pl'vlF Scores for 25 Mostly Frequently Evaluated -Iobs Titles
;")1
Figure 20 PAl Scores for Larger Agencies
5;)
Figure 21 PMFRatings for Larger Agencies
55
Figure 22 Terms & Conditions by Responsibility Rating
5(;
Figure 2:) Comparison of LO\v Scores and Ratings by Ethnic Group
G7
Figure 24 Comparison of Low Scores and Ratings by Tenure
(,8
Figure 25 Comparison of Low Scores and Ratings by Salary Range
('8
Figure 2H Comparison of Evaluations and Promotions for High Performers
77
Figure 27 _. Comparison of Evaluations and Promotions for Average Performers
78
Figure 28 Cumulative Salary Lines by Performance Group
82
Figure:m Cumulative Salary Lines by Compensation Group
84
Figure ;10 Cumulative Salary Lines by Ethnic Group
8(;
Figure :)1 Cumulative Salary Lines by Gender
88
Figure ;32 Cumulative Salary Lines by Hire Date
~}O
Figure a:) Percentage of Separations by Performance Group
~)5
Figure:H Percentage of Performance (},'oups Separating (approx.)
~)8
Figure :)5 Trend Lines for Service at Separat.ions
100
October 10, 2000
Page vii
Data Analysis Report
Page viii
October 10. 2()()()
Data Analysis Report
Preface
GeorgiaGain a performance-based compensation system, was implemented in I !)!}(; as the response to then-Governor Zell Miller's call for a way to better motivate, reward, and retain high quality employees within Georgia state government. This new approach was predicated on the notion that managers and employees are jointly accountable for optimum job performance. Although it began as a project to develop a new performance-based compensation system, Geor;giaGain was expanded to revitalize and re-engineer many of the State's personnel processes.
Convinced of the need to put Georgia's government on a more business-like foundation and thereby help it achieve the type of efficiencies derna nded by the public, Governor Miller initiated legislation in lH!)(i to reform Georgia's civil service system. Act 8 Hi, now commonly referred to as Merit System Reiarm, marked the most significant change in Georgia's personnel system in fifty years.
This report sets forth the results of an analysis of data available to the Georgia Merit System through its human resources management system. Available data permitted comprehensive measurement of three of the eight goals of Gl'or;giaGain and four of the seven goals of Merit System Reiortn. The principal researcher, Mr. Steven T.l'~lmore, has examined both initiatives mindful of the need to clearly describe the findings and to present the results in terms that have practical implications for the State's human resources administrators and policy makers.
Mr. Elmore is perhaps the most qualified person to conduct this analysis. In addition to a degree in mathematics and information systems, he is thoroughly familiar with the data in the State's human resources management system. Since H)()S and up to his retirement in e:lrly-2000, Mr. Elmore held a variety of positions with the Georgia Merit System and played a significant leadership role in the design, development, and implementation of the State's human resources management system. Among a long list of other accomplishments, Mr. Elmore:
Prepared the first comprehensive report of employee of turnover in state government;
Designed computer programs to move 40,nOO employees and positions to new agencies as part of Governor Carter's reorganization of state government:
Co-managed the development and implementation of the State's first comprehensive human resource management system, which included employee classification. position control. applica nt testing and selection, personnel transactions, and payroll;
Co-managed the development of software to implement a comprehensive employee reclassification project known as the Hay Study; and
Co-managed the system and data conversion activities necessary to implement Geor;giaGain and Meri! System Reform in the State's human resources management system.
October 10, 2000
Pageix
DataAnalysis Report
Thanks to Lynn Seymour, Ph.D. and Assistant ProfcsaorcDepartment of Statistics, The University of Georgia, for her critique of this report. \Ve also wish to express appreciation for the valuable input and aasiata nce provided by the Commissioner and her staff in the preparation and execution of this study.
Grady L. Cornish Project Director
Page x
October 10.2000
Data Analysis Report
Author's Note:
This paper documents a practical review of the results of two radical changes to the State's personnel program. The statistical measures of significance and confidence that one might expect to see in such a study are not provided in this paper. Such measures help assure the reader that. the values. averages and trends calculated from samples are representative of the larger universe of data. Throughout this effort, however. a unique opportunity presented itself the ability to analyze every transaction and evaluation from Hm;5 to HHH). In the preparation of this paper. no sampling was performed. The entire universe of transactions was analyzed in every instance.
During the period covered by this study, changes occurred in several naming conventions associated with the data used. These changes OCCUlTed in H)HG and are somewhat related to the outcomes and de live rables of the Georgietlein and Merit System Reiorm projects.
The state agency official referred to as the State Merit System of Personnel Administration changed its commonly used name from State Merit System to Georgia Merit System. This name change was part of the internal transition effort after lv/edt System Reioni: that moved the agency from a regulatory role to a new service/consultative role. In this paper, the agency is consistently referred to as the Georgia Merit System although the source documents before 199G use the State Merit System designation.
The nomenclature of employee performance evaluations changed completely as part of the GeorgiaGtlin implementation. Prior to GeorgiaGain. employee performance evaluations were referred to as performance appraisals. The employee received a numerice! performance appraisal score on a form called a periormence appraisal instrument (PAL). The new performance evaluation system developed as part of GeorgiaGain changed this nomenclature. Employee performance evaluations are referred to as performance evaluations, and the employee receives a verbal performance eva luationrgjjjjg on a form called a pertormnnce management Iorm (PMF).
In this paper, performance evaluation is used to reference the general process of evaluating an employee's performance or to identity any formal evaluation document. The system in place prior to GeOlgiaGain is referred to as the PAl system; and for symmetry. the newer system is referred to as thePMF system. This may cause concern among human resources purist - the older system had no formal name and the new system is official known as the Pertortuence Menegetnent Process.
As part of GeorgiaGain implementation, the term class, meaning a group of positions or
employees with similar duties. was changed to the 19.12. In this report. class or class title
will be used to reference a specific type of work before Ceorgieciein implementation and job or job title will be used after GeorgiaGain implementation although the concepts of class and job are nearly identical.
October 10. 2000
Page xi
Data Analysis Report
Under the PAl-based system, performance evaluations contained only one overall Score. However, under the PMF-based system performance evaluations contained two ratings one as a measure of performance on job, individual, and statewide responsibilities and another as a measure of compliance with agency established terms and conditions of employment. Several of the reports required comparative analysis of performance evaluations with low, average, and high scores or ratings. For most of these reports the responsibility rating was the only rating considered. In the seventh report, which focused on tracking activity fill' low performers, performance evaluations with low ratings in the terms and conditions area were also considered in the group of low performers.
Page xii
October] 0, 20C)O
Data Analysis Report
l'~xecutive Summary
1. Executive Summary
Two projects implemented in W!)(;, CeorgiaGain and Merit Svstem Reiorm. radically changed the personnel program of the State of Georgia. These projects had related objectives of improving employee performance and linking compensation to performance. Ceorgietlein focused on the need to restructure employee compensation and rewards through development of a pay-for-performance system. Merit System Reiotin addressed concerns that the existing civil service system protected low-performing employees and limited the ability of managers to operate their organizations in the same manner as private businesses. Although not the first attempts at changing the State's personnel program, these changes were the most fully implemented and most directly driven by executive forces,
There is considerable overlap in the goals for Ceotgietlein and Merit System Reiorm. The concepts of measuring performance, training employees to perform, rewarding good performance, addressing poor performance, and assuring basic fairness can be found in both. Because of the broad nature of these goals, several approaches must be undertaken in a coordinated manner to measure the degree to which CeorgiaGain and Merit System Reiotm have met their goals. Surveys. interviews, and analysis of hard data must be used together to properly assess goal attainment and measure project success. This report only addresses those goals that can he measured through analysis of data available in the computer systems of the (}eorgia Merit System.
The following are the GeorgiaGain and Merit System Reiorm goals that are measurable at least in part through the data available to the Georgia Merit System:
GeorgiaGaill GOltlli Provide mechanisms to assure fair performance ratings Reward best performers through variable increases to base pay
-- Help managers document poor performance
fl:'tfl.LiL~S'yst('rnBefgml Cklll] Recruit, select, and advance employees based on ability, knowledge, and skills
-- Provide equitable and adequate compensation based on merit and performance Retain employees on the basis of the adequacy of their performance Correct inadequate performance where possible, and separate employees whose performance is inadequate
The preceding list is less than half of the stated goals for these projects. Measuring the level of attainment of other goals, and Some dimensions of these goals, requires data not available to the Georgia Merit System through its data systems. Other methods should be used to measure success in those areas.
Several types of data are available to the Georgia Merit System for data analysis. Periodic snapshots of the entire employee population, or 'employee extracts'. have proven very useful in responding to interrogatories in federal and state court actions where accurate historical
October 10, 2000
Page 1
Executive Summary
Da ta Ana lysis Report
analysis has been required. In the normal process of granting annual and performancebased increases, the final rating or score on 'performance evaluations' were captured. 'Transaction histories' exist for nearly every personnel transaction, particularly those transactions that affected compensation or employment status.
Because the implementations of Merit System Reionn and GeorgiaCain occurred in close proximity in l!H)(j (July and October respectively), goal attainment for both was measured with a common set of data. Although not necessary for the measurement and comparison of trends, equal timeframes both before and after these changes were selected. The most recent data available is from October HHW, or three years after October H)!)(i. Therefore, an early cutoff point for data of three years before -Iuly H)!)(j (eluly W!);n was chosen.
Three factors added to the complexity of the task and diminished the accuracy of the results. The Georgia Employment Management Systems (GEMS) database contains nearly ;')00,000 performance evaluations, however, this is not the complete set of performance evaluations created during the period. Not all performance evaluations associated with disciplinary actions may be present in the database. During GeorgiaGain implementation, employees were moved individually to the new jobs that best fit their responsibilities and assignments. This individual approach to movement makes it is impossible to cleanly compare trends by job or pay grade across this point. Finally, several attempts to simplify data entry procedures resulted in changes in computer coding structures and elimination of many distinctions in personnel activity recorded in the system.
Any attempts to extend the following reports by incorporating future transactions will be very difficult. GEMS was replaced as the State's human resources management system (HRMS) in OctoberH)~m with a purchased software package. Few modifications were made in the new software to make it compatible with the historical data.
For each measurable goal, a report was prepared showing summary statistics and
a appropriate charts and graphs along with some general observations. Reports 1 through
address GeorgiaGain goals; Reports 4 through 7 address Merit System Reform goals.
Report 1 (GeorgiaGiILn> -- Assure Fair Performance Ratin.,g
This report examined the change in influence of several non-performance related factors on performance evaluations between the older performance appraisal instrument (PAl) system and new performance management form (PMF) system developed as part of Gcorgietleu. The personal and employment characteristics examined include ethnic group, gender, age, tenure, job title, pay grade, compensation level. and employing agency.
During the period from April Hma to October W!H), two performance evaluation
systems were used. The pre-GeorgiaGain system used the performance appraisal instrument (PAl) and for the period April 19!):3 to December HH);'), a total of 18:>,0(jO performance evaluations were available for analysis. In ,January 1996, the State implemented a new Performance Management Process that used the performance management form (PMF). For the period -Ianuary 1996 to October I!)!)!), a total of :J0(j,(;40 performance eva luations were available for analysis.
Several very similar 'ideal' rating distributions for the new PMF system have been proposed since the beginning of the Georgtetlein project. The percentage of
Page 2
October 10. 2000
Data Analysis Report
Executive Summary
performance evaluations in the Meets and Exceeds categories has approached these 'ideal' distributiousfor several years. The percentage of Does Not Meet and Far Exceeds continues to be lower than anticipated.
Despite attempts at universal evaluation for all employees, the number of employees granted a performance-based increase without a full performance evaluation exceeds the number receiving ratings of Does Not Meet and Far Exceeds combined.
Ratings under the newer PIVfF system are more equitably distributed as evidenced by a compar-ison of performance evaluations by gender and ethnic group. The influence of age and tenure on performance evaluation ratings bas been reduced. With nota ble exceptions. the high degree of variability seen by agency in the previous system has been greatly reduced. However, there continues to be strong influence of compensation-related factors in the distribution of ratings and there is strong va riabrlity in ratings distribution by job title.
The universal evaluation ofevery employee against the terms and conditions of employment standards may be unproductive. Over m)% of performance evaluations indicate the highest rating possible in this area and only ;~28 salary increases may have been withheld solely on the basis of the terms and conditions evaluation when otherwise warranted based on the responsibility evaluation.
R~~.Il9rt 2 (GeOfJjiaGain) ~.. Reward. Best Perfi:mners
This report examined the number of salary increases (other than promotions) given and then identified the performance evaluation that immediately preceded the salary increase. Three types of salary increases and adjustments were examined performance-based increases, salary adjustments, and criterion-based adjustments. These increases have some measure of agency discretion associated with them.
In order to facilitate comparison, delineation between high, average, and low performers was constructed and this delineation is used in subsequent reports. Low performers fall below the standards for receiving annual or performance-based increases and high performers qualify for higher than average performance-based Increases.
The number of discretionary salary adjustments processed by agencies has increased over 1000% following GeorgiilGain implementation.
Positive differences exist between the proportion of discretionary increases granted to high pcrforrncra versus low performers: however, average performers received proportionately more discretionary increases than high performers Average performers also received more criterion-based increases than did high performers.
The actual number of salary adjustments given to reward high performers cannot be discerned because H2'% of all salary adjustments were given to average and low performers.
October 10, 2000
Page ;~
Executive Summary
Data Analysis Report
a Report (Gf!Q[gJ.1:LGain) m Help ManHger~J)oeumentPoor Per!i)rman,
This report examined the level of confidence managers demonstrate in assigning low performance evaluations. Additionally, the internal make up of the low performing group was analyzed by ethnic group, tenure, and salary.
Performance evaluations under two evaluation systems, PAl and PMF, were reviewed. Low scores and ratings represent a very small portion of performance evaluations under both systems consistently falling below the ideal distribution. More low scores proportionately were given on PAl performance evaluations than low ratings on Pl\11 F performance evaluations.
The distribution of low performance evaluations under thePMF system is more equitable. The proportion of black employees in the group of Low Performers under the P1\1F system decreased more than 10'% from that seen under the PAl system.
The proportion of low performance evaluations assigned to employees with 20 to 2H years of service increased from ~)%. to 14'%.
Although managers assign more low performance evaluations to employees with higher salaries under the PMF-based system, this shift is probably due more to overall increases in salaries than to changes in manager behavior.
l{eport.::Li!5'e{orm) - AdvanceEmnJ~>"ys~es on the Basis of Abiliti~~s_ Knowledge, and Skills
This report examined promotional rates for employees. Performance evaluations were used as a proxy for "ability, knowledge, and skills". Higher scores and ratings on performance evaluations were considered as indicative of higher "ability, knowledge, and skills".
A general reversal of previous trends is seen in the years H)!)() through I!)!)!) following Merit System Reform. The percentage of promotions given to those employees with high performance evaluations is now higher than their representation in the general body of evaluations and the percentage of promotions given to those employees with average performance evaluations is nov',' lower than their representation in the general body of evaluations.
'I'he changes in previous trends may be in part due to the continuing impact of Georgietsein rather than changes in management practices. The Georg/aGain job structures eliminated many purely promotional jobs thus making a promotion a true movement to a new job rather than a time-in-grade salary increase with a new title. This trend to fewer promotions may be a permanent impact of Ceorgistlein.
Report f) (Reform)-, Provide Equitable (;ompeIlsation based on Merit and Performance
This report examined whether changes in average salary lines for employees are attributable to performance or to other factors, such as ethnic group, gender, current compensation, or hire date. A salary line was constructed for each employee based on career salary progression including normal and special increases, promotions, and general adjustments.
Page 4
October 10. 2000
Data Analysis Report
Executive Summary
Using the data from the annual budget reports, the average salary line fill' an employee who received all 'normal' increases hut no promotions or adjustments should show a 2(U,%, increase from HH):J to 1!)!)!). The actual average sala ry line for all employees was up :$8.82'~;J.
Very <Jose alignment of the salary lines fill' high performers and average performers can he seen in fiscal years IHH;J!)l through HH)()'!)7. Divergence of the line for high performers begins in 19!J7!)8. In W!)7!)8, the first variable salary increases were awarded to high performers. By HHH), the salary differential fill' high performers had reached over 7%. The salary line fin' Low Performers is not 0%. Salary adjustments and promotions are given to some Low Performers in years in which they are not eligible for a performance-based salaryincrease.
Remarkably, the salary lines for employee earning under sao,ooo and those earning
S:30.000 and above show no difference and are within O.121j;, after seven years despite the wide variance in the distribution of performance evaluation scores
In Report. 1, it was shown that white employees received performance evaluation ratings of Exceeds at nearly twice the rate of black employees and Far Exceeds at nearly three times the rate of black employees. However, there are only slight variations in the salary lines of these ethnic groups. After seven years the salary lines are remarkable similar; white employees have as salary line this 0.72% higher t han that of black employees. The salary line for other employees, however, is more than 4%, higher than that of white employees.
In Report 1, little difference was seen in the distribution of performance evaluations between male and female employees. There is, however. a consistent and growing difference between the salary lines for male and female employees. Despite the fact that female employees received slightly more of the highest evaluations, salaries for male employees are now increasing faster than salaries for female employees by nearly 1%, per year. The cumulative effect of higher salary increases for male employees can be seen in the salary line for male employees; it is over :15'% higher than the salary line for female employees.
Considering the increased latitude given to managers under Merit System Reiorm, the salary lines for 'new hires' and of employees hired under the traditional rules and regulations of 1,he Georgia Merit System were examined. These salary lines have the widest divergence of any studied. Those employees hired after -Ianuary 1, )!)!)O have a salary line that is nearly II % higher than those hired before WHO. The difference appears to be widening by an annual difference of over 1.5%.
Report 6 ([?('limn) Reta in EmnJQ'yees on Basis of their Perfimnance
This report examined the turnover and retention rates of high performers by combining separation data with performance evaluations completed in the year prior to separation. Unavoidable separations, such as deaths and retirements, were excluded from the data, as were separations of temporary and seasonal employees who usually do not receive performance evaluations. Transfers from one agency to another were also eliminated. All other separations including dismissals and resignations were included in the study.
October 10.2000
Page 5
Executive Summary
Data Analysis Report
Approximately one-quarter of separations each year are for employees w 110 have not had a performance evaluation within the preceding twelvemonths. Some of these employees were new hires who had not completed a performance evaluation cycle. No secondary performance data, such as exit interviews, exist to indicate the reason for such separations or any measure of the employee's performance before separation. Consequently, a large proportion of separations could not be matched with any data indicative of performance.
When the most recent performance evaluations for separating employees were analyzed, the proportion that received high performance evaluations had fallen from the 1;')%. to l!)'% range before Merit System [(e(brrn to the fj%l to W% range after Meri! System f~eforrn.Duringthis same period, the proportion that received a low performance evaluation also declined. These declines are offset by an increase in the proportion of separations for employees receiving average performance evaluations
When the separation rate for employees recently receiving performance evaluations was analyzed. the rate at which high performers separate remained fairly constant at 4% while the separation rates for average and low performers have tended slightly though erratically upward. The proportion of employees evaluated as Low Performers who separate within one year has consistently been in the :30%,-;J8I% range.
The average tenurefor an active employees is between nine and ten years (112 months). The average tenure of separated employees is just under five years (58 months).
This report examined actions taken by managers in dealing with marginal performers preand post-Merit System Reform with particular attention to improvements in performance. As expected. some portion of the Low Performer group separated during a one-year period following evaluation. Other Low Performers received personnel transactions while remaining in the work unit or transferred to other agencies. Employees who did not separate should have received a subsequent performance evaluation (in the original work unit or in the new work units)
The number of low performance evaluations has consistently been 1% or less of the total number of evaluations. This is a somewhat lower rate than anticipated in traditional models of performance distributions.
No follow-up data could be located within the one-year window for approximately H)(% of Low Performers. This number varies by year from 12%l to :~4%. Because of the small number of low evaluations and high number of employees with no followup data, few conclusions should be drawn from this data. However, if adjustments are made for missing data, the results of managing Low Performers pre- and postMeri: Systeln Reform are remarkably similar.
Nearly two-thirds of an Low Performers were subsequently evaluated as adequately performing employees. The major differences in results pre- and post-Ai/edt System Reionn lie in the percentage of Low Performers separating and those being re-
Page (;
October 10, 2000
Data Analysis Report
Executive Summary
assessed as Low Performers at the end of one year. Contrary to expectations. 4'% more Low Performers are re-assessed as Low Performers at the end of one year postMerit System Reiorm than pre-I'v1erit System Reiorm.
Approximately (;2%, of Low Performers who separated were reported as resigning. 'This does not include LO\v Performers who left the agency by way of tra nsfer to other agencies. The rate at which Low Performers transferred to other agencies is lower following Merit System Retottu. Low performers are also less likely post/'vlerit System Relorm to transfer to other positions in the same agency.
The overall separation rate for Low Performers is nearly three times greater than for all employees.Lmv Performers are nearly nine times more likely to be dismissed and eight times more likely to simply abandon their positions without notice (presumptive resignation).
Conelusioq
Very little information is available to provide a definitive answer to the simple question
"Have Ceotgietlein and Merit System Reform met the goals established for them?" 1\10re
than half the goals could have been addressed in this report if the State had planned this
resea rch concurrent with the implementation of these projects. For the goals that were
assessed in this study. only limited aspects of the goals were measured. Considering only
the limited data analysis performed here, the answer to the question is a very tentative
'.Yes'.
There
are
change ,... s
in
the
data
that
are
indicative
of the
kinds
of changes .
in
behavior
and practices desired by Ceotgietlein and Merit System Reform. It is impossible to say.
however. that any single goal has been fully attained.
Implications and ReCC!J11mendat:ions
The inability of this study to obtain definitive measure of goal attainment is not based on a failure that occurred recently; the failure occurred when these projects were proposed. No in-depth plan for measuring goal attainment was developed during the formative stages of these projects. In order to avoid similar failures when attempting to measure goal attainment of future projects. the following recommendations should be considered.
The data analysis effort to measure project success should begin before the project is funded and staffed. The very first analysis should be aimed at measuring the problem, or defining the current state. Then the measurable goals of the project should he dearly defined. Data analysts should be involved from the beginning in any project that will measure attainment of project goals through data analysis.
Whenever possible. data collection should be a part of routine daily activity and not a special activity. All the codes or data values needed to measure project success should be identified as early as possible and their collection should be linked to routine transactions. The meaning and use of these codes or values should be included in routine training materials to ensure they are used correctly.
The State should acquire a set of data analysis tools that are compatible with its new HRM.s and flexible enough to be used on other databases. Several vendors have data warehousing. data mart, and data mining tools that: could provide the data
October 10, 2000
Page 7
Executive Summary
Data Analysis Report
access and analysis support needed. Technical expertise and specialized skills are needed to use these tools effectively. A core group of data analysts should be established and they should be fully trained in the use of the data analysis tools. Continued training and retention of these analysts will be critical to the successful use of the tools.
Page 8
October 10. 2000
Data Analysis Report
Background
II. Background
Overview
Two projects implemented in HHW, C;('orgiaC;ain and Merit System Retorin. radically changed the personnel program of the State of Georgia. These projects had related objectives of improving employee performance and linking compensation to performance. GeorgiaGain focused on the need to restructure employee compensation and rewards through development of a pay-for-performance system. Merit System J?e!C)f'TrJ addressed concerns that the existing civil service system protected low-performing employees and restricted managerial actions to operate governmental organizations in the same manner as private businesses. Although not the first attempts at changing the State's personnel program, these changes were the most fully implemented and most directly driven by executive forces. Several previous studies and taskforces proposed changes to the civil service system managed by the Georgia Merit System, but left much of the details of implementation to the Georgia Merit System and state agency human resources offices.
C;eor;giaGafn was the name given to the project to develop and implement a pay-forperformance system in Georgia. Following nearly two years without pay increases in the early years of the Miller administration, small performance-based increaseewcre approved
by the General Assembly beginning in May um:3. The administration wanted to step away
from the perceived automatic nature of 'annual merit increases' and focus these raises on those employees whose performance warranted recognition and reward. The consensus of the State's personnel community was, however, that the existing underlying st.ruct.ure of position descriptions, job specifications, performance evaluation systems and pay ranges would not support a true performance-based compensation system. The personnel community felt any legal challenge to a variable compensation system based on the existing structure would easily prevail because it had not been designed to support performancebased compensation and it had been poorly maintained since its implementation in W7S. Of particular concern was the lack of training given to supervisors and managers in use of the existing performance management system.
During WU:3 to WHG. a new pay structure capable of supporting variable compensation based on performance was developed a long with thousands of new job specifications and a new performance management system. Over H;,OOO supervisors and managers attended a comprehensive, multi-day training program on the proper development and evaluation of employee performance. The new performance management system (the Performance Management Process) was implemented using the existing pay structure and reward system in HH);",. Beginning in -July I!)~)(), all performance evaluations were prepared using the new system in conjunction with a single October 1 increase date. The compensation plan was modified to accommodate broader pay ranges and thousands of new job titles. Finally, variable pay increases based on performance were implemented in 1m)!.
October ]0, :'WOO
Page s
Background
Data Analysis Report
Table]
Q9ll1t'gL.~ ;e()rgjiJf; eiu
1. Move the State's workforce toward more market sensitivity 2. Maintain a balance between internal and external equity :L Provide mechanisms to assure fair performance ratings 4. Reward best performers through variahle increases to base pay f). Provide for managerial accountability (). Provide for employee accountability 7. Help managers document poor performance S.Belp managers develop performance measures.
In response to concerns that civil service systems served to protect less productive employees and restricted managerial actions to operate governmental organizations in the same manner as private businesses, legislation was proposed in the IH9f; session of the General Assembly to eliminate the regulatory powers of the Georgia Merit System. This legislation was eventually passed as Merit System Retortn, a radical restructuring of the personnel program denying all new hires the protections of the civil service system managed by the Georgia Merit System and placing them in an 'employment at will' status. Meri: System Reiotm made agencies responsible forassuring compliance with existing state and federal employment and anti-discrimination laws. The Georgia Merit System still existed; however, its role had changed from enforcer of civil service law/rules to a consultant/advisor in support of agency-directed personnel programs.
Table 2 Goals of Merit Systenl Retotm
L Ensure fair treatment to all applicants 2. Recruit. select, and advance employees on the basis of their abilities, knowledge, and
skills
:t Provide equitable and adequate compensation based on merit and performance
,i. Train employees to assure high quality performance 5. Retain employees on the basis of the adequacy of their performance H. Correct inadequate performance where possible and appropriate, and separate
employees whose performance is inadequate 7. Assure that employees axe protected against coercion for partisan political purposes
and are prohibited from using their official authority for the purpose of interfering or affecting the election or nomination to an office
A great deal of overlap exists in the goals for Geotgietletn and Merit System Reform. The concepts of measuring performance, training employees to perform, rewarding good performance, addressing poor performance, and assuring basic fairness can be found in both.
Page 10
Octobor 10. 2000
Data Analysis Report Overlapping TimeJines
Background
The implementation of the GeorgiaGaiT/ and Merit System Reiorni projects occurred in the same timeframe. The following figure shows the relationship of on-going business processes, GeorgiaGairr implementation, and Merit Svsten: UefOlJII implementation.
Task Name j Employee Data from HRMS
Employee Extracts Personnel Transactions Previous Increase System Old PAl Evaluations Increase Delivery Dates Merit System Reform Current Increase System GeorgiaGain Implementation New PMF Evaluations Increase Delivery Dates
I
..... ........... 199
199;
199
199,
199
1991
199
1991 1999
i
~~tI ~
(PAl) Performance Appraisal Instrument Annual Merit Increase
I
i
I
I
*
i
(PM
P
Ma~....t Form
aa. .d'ncrea. . Petfotmance ,.......... .................
,i
I
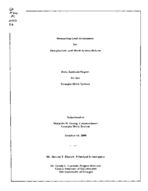
Figure] GeorgiaGain and Merit S~'stem Reform Timeline
This t.imeline displays the following:
Employee Data from HRMS (human resources management system) shows qua rterly extracts/snapshots of employee data and the continuous collection of personnel transaction data.
Previous Increase System shows the performance appraisal instrument (PAl) in use from early 19H:i through December 19!)5 and the awarding of increases to eligible employees at the first of each month.
Merit System Reform implementation is highlighted. Current Increase System shows the early start-up of the new Performance
Management Process in 19H5 and awarding of increases in October of each year. The transition between the domains of the older performance appraisal instrument
(PAl) system and the newer performance management form (PMF) system do not precisely coincide with either GeorgiaCain or Merit System Retottn and the impact this difference has will be highlighted in the analytical reports.
October 10, 2000
Page 11
Background
Data Ana lysis Report
Page 12
October 10.2000
Data Analysis Report
GeneralMethodology
III. General Methodology
Appro~J~hes to Mea..YX!!lg Goal At!~inment
Because of the broad scope of the GeorgiaGain and Merit System Reiorm effor-ts. several approaches to must be undertaken in a coordinated manner to measure the degree to which these initiatives have met their goals. Surveys, interviews, and analysis of hard data must be used together to fully assess goal attainment. This report only addresses those aspects of measuring goa I attainment that can be addressed through analysis of data available in the computer systems of Georgia Merit System. The data available to the Georgia Merit System is hard, factual data without qualitative dimensions someone was hired, a performance evaluation was prepared, a raise was given, an employee was terminated. Although generally useful in measuring goal attainment. this data does not permit complete assessment of any goal. Also, the number of data analysis projects that can be constructed with this data is very limited.
Identifying,Goals Measur!1ble through Data Analysis
Measuring attainment of several of the Georgieileir. and Merit System Reiottn goals shown in Table I and Table 2 on page 10 appears to require data not available to the Georgia Merit System through the human resources management system (HRMS).
GeorgiaGain Goals I and 2 (Mov the Stete's workiorce towett! more market sensitivity and Meintein a balance between internal and external equity) deal primarily with external labor markets and prevailing wage rates. Although internal data would be necessary in any examination of these goals, internal data alone is not sufficient to assess any aspect of goal attainment.
Ceorgistlein Goals [) and G (Provide Io: managerial accountability and Provide for employee accountability) deal with accountability, which would require special data collection methods and data currently unavailable to measure goal attainment.
Georgietlnin Goal 8 (llelp managers develop periormence measures) addresses data not maintained in the HRMS. Assessing the expertise managers show in developing performance measures would require qualitative examination of written performance plans and/or self-assessment by managers for their abilities.
Merit System Reiotm Goal I (Insure ieir treatment of all applicants) addresses an area that Merit System Reionn placed outside the role of the Georgia Merit System. Initial intake, evaluation, and selection of applicants are handled directly by the agencies and only limited data stores are maintained of that activity.
Merit System Reform Goal i1 (Train employees to assure high performance) deals with whether training delivers its objectives. Although some training activity data is
October 10, 20()0
Page 1:3
GeneraI Methodology
Data Analysis Report
available for Georgia Merit System delivered training, no central data store is available fill' agency delivered training, which is the majority of performance directed training. Training effectiveness measures are generally not available for any training delivered within the State of Georgia.
Merit S~!sten) Reform Goal 7 (Assure that employees arc protected [rom coercion) addresses a topic that is outside the scope of data systems, This goal is best measured through other techniques, such as surveys.
For the remaining goals, information is available that cou ld be used to perform limited data analyses to assist in measuring goal attainment. However, for many of these goals the area that ca n be measu red w ith data j n the HltMS is only a small part of the total scope of the goals,
Table ;~ Goals Pt!It.ially Measurt\.hl~~ through l)atll./\nalysis
f;eorgiaC;ain Glli!ls Goal S Provide mechanisms to assure fair performance ratings Goal 4 Reward best performers through variable increases to base pay Goal 7 Help managers document poor performance
Merit System l?c[onn Goals Goal 2 Recruit, select. and advance employees on the basis of their ability,
knowledge, and skills Goal :3 - Provide equitable and adequate compensation bused on merit and
performance Goal 5 - Retain employees on the basis of the adequacy of their performance Goal (j Correct inadequate performance where possible and appropriate. and
separate employees whose performance is inadequate
GeorgiaGain Goal ;1 (/~Lovide mechanisms to i'lSSW'e isu: performance ratings)
Although agencies were required to establish internal review processes permitting employees to address concerns of fairness, no comprehensive data is maintained on those reviews. However, the overall fairness of the employee performance evaluation process can be measured by examining performance evaluations in conjunction with non-performance related personal and employment characteristics. Analysis by ethnic group, age, sex, salary. agency, job, etc., of performance evaluations issued under the both the old and new evaluation systems might identify items other than performance that impact on overall score/rating.
DeorgiaGain G~lHI 4 -f?evvalJLbest perfonneT~5 through variable increases to bflse pay The underlying process of assuring that employees receive the proper increases based on their performance evaluation is fully automated and 100'% compliance with policy is expected. An interesting tangent would be an examination of the other types of salary increases or salary adjustments given in relationship to the performance evaluations that immediately preceded them. Particular attention could be focused on those employees receiving performance evaluation ratings of Exceeds and Far Exceeds.
Page J.l
October 10, 2000
Data Analysis Report
General Methodology
GeQJgi<I(:?lirLG~HI17.(![tUJL1JlilfF!gCL'iJl()curfJeuL/ )()()f' !)('r(f1Ctll.nIH.:C) The attai nrne nt of this goal would be best measured by exa mining those processes where low performance evaluations are reviewed by the supervisor's manager. However, no data that would permit this type of examination is maintained. It is possible, however, to examine the degree to which managers demonstrate confidence in assigning low evaluations ratings by examining the frequency of low rating and scores under the old a nd new systems.
.j\,1c;rj(~')~<;teJTLBtd()JIll GoI1L',fJB.eerllit.-,'ic1!,e /, ;1mUlLivtlnee em))!oyees on Im,'iis 0 f' a b i litie.:i- ..)
After ,Merit Svstcm F?ef()f'lTl, recruitment and selection of applicants became agency activities and only limited data is maintained on those activities. If advancement can be interpreted as 'promotion'. all promotions are recorded in the HRMS. Ability. knowledge, and skills are not part of the fIRMS database. However, by using past performance evaluations as a proxy for ability, knowledge and skills, it is possible to construct a data analysis comparing promotions for high and average performers before and after Merit System Relorrn.
tvferiLS:ys/em l{elfmn Goal :L(Pmvide (~l!litable /\:<'IJlequtl/e cQJnpensatiotl.5.d The area of ,adequacy' of compensation must be addressed in a manner similar to Geor:giaGain Goa] 1 (see page 18). which depends heavily on external lnbor market data. The question of 'equity', however, could be measured by examining the degree to which performance influences employees' personal salary lines pre-and post!vlerit S.'r'steTn Reiorm rather than non-performance factors, such as ethnic group. sex, tenure (II' salary.
"Y1t'riL'iY.5JerlLBef(!CIuGg!!J 5 (fsctair1{;1J1J2IQY.f'CS ..QUJ11(;.lJi:1.'ii:i. ofPCrfQfJ!E!r1(11
Success at meeting this goal could be measured by examining the turnover or
retention rates for high and average performers pre-and post-i\1erit System Rntotrn.
The length of time high performers remain employed by the State compared to
average performers is one measure of goal attainment.
!'.Jer:iL'iY2Jer1J F?ef'Q!I11(;Qa I (}.{CQrJI:cLiTlm!gqJWIe P(?I:t'()GUi:Jl lCe~\!!1cn'poss ib Ie ,.,.J
This goal references two methods of addressing low performance improvement and separation. Employees with low performance evaluations could be tracked pre- and post-Mertr System F<ef(Jr[JJ examining subsequent evaluations and personnel transactions. Considering the sizable investment made by agencies in initial selection and training, success would be defined primarily as improvement in performance rather than separation.
t\na1ysis (!.(Existingpata
Between 1!)78 and umn, all personnel transactions for classified employees (and since W84
all personnel tra nsactions for all employees) were recorded in the Georgia Employment Management Systems (a~MS), the State's human resources management system (fIRMS). This data was recorded as a normal part of the personnel activities of each agency as employees moved through their careers with the State. As such, the data is focused on those transactions that resulted in a change to agency payrolls .~ hires, separations, promotions, raises, etc.
Octoher 10, 2000
Page 15
Genera I Methodology
Data Analysis Report
The available GEMS data files (summary extracts, detailed transactions, performance evaluations) were copied from the (iEMS database and reformatted to make repeated access and data analysis easier. Cross-references by employee ID were established to permit linking of diverse data. For example, ethnic group, gender, salary, age, and pay grade are not present in the data on performance ratings. However, by linking each rating and its date to the set of quarterly extracts, the employment and demographic information for the employee in the period immediately preceding the evaluation were obtained. This data was then added to the evaluation data to create a complete description of the employee and his/her employment situation at the time of the evaluation.
As is common with all large data stores that arc not based on modern relational databases, some percentage of data in one area could not be matched to data in another. For example, some evaluations could not be matched exactly with employee records due to errors in recording the date of the evaluation, incorrectly entered data, or changes in the employee identifiers. In most cases, the number of unmatched data items is very small 0.5'%). Other anomalies will be identified in the individual reports.
Because the implementation of Merit System Reform and Georgietlein occurred in W96 (.J uly and October respectively), their success can be measured with a common set of data. Although not necessary to validatemeasurement and comparison of trends, equal timeframes, both before and after these change points, were selected. The latest data available is from October H)~)~), or three years after the latter of the t\VO implementations. An early cutoff point for data three years before -luly 199H (,JulyUJ9:n was chosen. Not all data for this earlier date could be fully identified in the system. In addition. the data from W!)() does not fall cleanly into the status of 'before' or 'after' implementation due ofthe difference in implementation dates of Merit System Retortn and GeorgiaGain and the staggered implementation of some phases of GeorgiaGain. For example, the new Performance Management Process (PMP) developed as part of GeorgiaGain was implemented on a trial basis in H)!)5 for evaluations due in W!)(i. Therefore, some increases granted as early as February 199() under the old classification and pay structure were granted using the new evaluation system.
Dozens of special retrieval language programs and summarization programs were written to extract, merge. and tally the appropriate data. In most cases, the result of this process was one or more summary data tables consisting of counts of employees or number of transactions meeting the control criteria. A report for each measurable goal described above was prepared showing summary statistics and general observations. Graphs were prepared to aid in the interpretation of the data.
Detail data, such as employee name or employee ID, are not displayed. All displays contain aggregated and summary data only.
Page Hi
October 10, 20()()
Data Analysis Report
Data Selection and Summarization
IV, Data Selection and Summarization
Overview ofJ]~JJ! AvaiJable for An~Iy~J~
From 1978 to l!)!)!}, the Georgia Merit System used the Georgia Employment Management Systems (GlDMS) to meet its obligation to maintain personnel records on employees in the classified service. GEIVIS used a cooperative data collection model in which data entered by agencies as a normal part of payroll activity was examined, reformatted and stored in a central database. Because common programs and data codes were used for classified and unclassified employees, the central database also contained transactions for unclassified employees. The close working relationship between the staff supporting the payroll system and the Georgia Merit System staff supporting GEMS assured that all transactions properly updated the GEMS central database.
Several types of data are available within the GEMS database that are useful in measuring goal attainment for Ceorgietlein and Meri! System Retorm:
l';mployee Extracts quarterly from -Iuly 1978 to October lmH), the Georgia Merit System created summary extracts of the central GEMS database. Each extract contains a snapshot of the employment status of each employee at that time, but does not contain any historical transactions. In the past, these extracts have proven very useful in responding to interrogatories in federal and state court actions where accurate historical analysis was required "How many employees worked in Department of Public Safety in W7H'!", "What was the average salary for female employees in WSW!", etc.
I~<:rformance Evaluation GEMS was used to help enforce administrative policies of the Georgia Merit System and other administrative agencies, such as the Office of Planning and Budget and the Department of Audits. When salary increases were reinstated in UH);{ following a two-year freeze, a policy requiring a minimally satisfactory performance evaluation in order to receive an increase was adopted. Consequently. GEMS was modified to capture and review performance evaluation information as part of its automated support for granting annual performance-based increases. Performance evaluation scores and ratings related to annual performance-based increases are available for the period April WH:{ to October H}f}H.
Tra!1l:i~~tjQnHi:?tories Detailed transaction histories were created in GEMS for nearly every personnel transaction, particularly those transactions affecting compensation. These histories identify the agency, effective date and type of action taken (promotion, increase, etc.), but do not contain basic employee information such as age, ethnic group. and gender. Unfort.unately, because of the size and cost associated with storing hundreds of thousands of transactions for each year, the central database was
October 10. 2000
Page 17
Data Selection and Sumrnarizat.ion
Data Analysis Report
periodically purged of transactions that were considered of minimal value in the review and approval of subsequent transactions. This normally consisted of purging all transactions for employees who had been separated for over four years without any indication of a desire to return to workfor the State. These purges were designed to occur quarterly, but due to the cost involved with the purge process, purges most commonly occurred on an annual basis. However, in Imm and HHW no record purges occurred. Therefore, detailed transaction histories are available from -Iuly HlH"1 to October W~)~) for all active and separated employees. Unfortunately. a lthough most of the data forW!);{ and J!)H4 exist, transactions may be missing for those employees who separated in Hl~K) and in the first half ofW~)4.
DetaitJ{eview of EmplQ):("e Extract Data
At least quarterly from -luly IH78 to September IHH9, extracts were made of the basic employment information in (,EMS. Table 4 displays the number of employee records extracted fin' each period between March UH);1 and September I9HH.
Employment
n,.t",
331-1993 6301993 930-1993 12-311993 3311994 e-so-t QQ4 9'l01Q<l4 123119<14 1.111QQS 6.301995 9.301995 12311995 331-1996 630-1996 R.11-19Clfi 12-11-1q96 '\.'\11997 fi.10-Hl97 711.1997 1231-1997 1311998 fi-3019qR 9-30. 1QQ8 1231199R 3-311999 &-301999 9301999
Table 4 Sum !!!!!IT~9JJ'~Jn p lovee Q~ltnjnJ:;IRMS
R cutar Emnlnv..""
Total Active
Total Regular Classified Employees Employees
83.3'\~
68692
SR fi97
82.741
~t
ss rn~
68.61S 69.825 71.267 71973 7? 1?4
58.695 59.082 fiO 1R'\ fiO R?? 61044
87 SIl7
7111l?
fil64R
RB 77f
741fi1
62411
9014
74924
62795
90R2?
75066
62768
9O.38
75.298
62.642
9114
75810
62.886
9297 q,\ SS~
921<;1
76.695 76.559 75.839
fi? 719 fi? 11'\
so.zas
92362
75549
57688
9241::1
~:
7<; OS9 74fiBfi 7<;::157
55697 53816 53.187
92664
75266
50.281
93.542 94 3'\~
75503 7'\ 7Sq
48.85S 4730B
94411'
7fi109
45675
<l471C
7671'>
44.330
95712
77177
43110
9570E
77 363
41914
96.11C
77584
40462
2451.92
2012554 1 501.293
Unclassifed Full-time Part-time Employees Employees Employees
9.995 99?O 10741 11 OR,:!
11 151 11?M 11s14 11950 12.129 12.298 12.656
12~
13. 14 ??fi 1!'>fi14 17.1'\61 19362 20B70 22170 24985 26.648 284'\1 30434 32.382 34.067 35429 37.122 511.261
67823 67761 6Rfi10 70019 70 7<;2 71 1?7 719R7 73137 73654 73803 73.984 74.519 7C, 1fi1 7S ?C,7 74582 74265 73BP 73.429 74123 74.079 74.316 745Q9 74958 75541 76259 7fi4RR 76667 1980952
869
854 1195 1 ??Il
1.221 1 197 1 19~ 1224 127C 1.263 1.314 1.291 11~
110~
1257 1.284
1247 125 1.234 1 187 1187 1 160 1 151 1 171
918 87~ 917 31 60~
Temporary
14.642 14128 13.967 14424 14 ?OQ 14fill 14405 14409 1,.217 15761 15.088 1~.332 is ?77 1f; sss 16112 16813 17.354 16.433 17.255 17.398 18.039
ts.szs
18~{O9
17998 18.542 18.345 18526 439369
Page 18
October 10, 2000
Data Analysis Report
Data Selection and Summarization
On September :m, IHHG, prior to implementation of Georgietlein. no extract was taken of the employee database. An extract had been taken on August :n, U)!)(; and that data was used in lieu of the missing September :JO, lH~)() data. On September ao, IHH7, performance-
based increases for October 1, lHH7 were applied to the database before the extract was
created resulting in salaries being misstated. The August aI, I~)~)7 extract "vas unusable;
therefore, the -Iuly :n. WH7 extract was used in lieu of the September :JO, lHH7 data.
The number of employees reported here is the number of employees on the payroll and does not purport to represent the number of full-time equivalent (FTE) employees. In fact, many employees reported as 'temporary employees' worked on an as needed basis. These employees did not. receive salary increases or formal performance evaluations.
petail Review of Performance Evaluation Data
From April wm~ to Oetober WH9, a total of 492, 18~) performance evaluations were recorded. Not all evaluations were recorded accurately and some could not be matched fully against employee data. The total number of performance evaluations available for analysis is 489,700 or over 9~U)%) of the all evaluations. Table 5 displays the number of performance evaluations from each evaluation system and the number and type of errors.
Table 5 Summary of Performance Appraisal Data in JIRMS
Rating
unknown unknown unknown
Rating Year 1993 1995 1997
Total Ratings
inlolRMS
1 2 4
Invalid Salarv
1
Invalid Race Code
I Inva id data in fRMS
Invalid Wrong Sex Code System
Invalid Ratina
Total Unusable Ratlnas
Total Usable
1
1
0
2
0
Hlil niiiMiMiiiH
iiiII1II I 0
PAl PAl PAl PAJ
kiM
1993 1994 1995 1996 iH1:
44 930 68255 70135
287
"ill"!l
157
9
7
61
3
2
38
3
2
17
I; ::';15 Hi'!':111 iiH'
159 44771
62 68193
39 70096
287
0
~8'7 i./i 1 , 1 ; 1 1 1 ' -
PMF 1994 PMF 1995 PMF 1996 PMF 1997 PMF 1998 PMF 1999
1 115 98208 69198 7054'1 70508
1264 230 191 128
492189
2089
1
115
48
47
1
7
6
4
3
iM
75
67
403
1 115 1265 231 19.4
~ 7 24
0 0 96943 68967 70351 70379
489700
October 10,2000
Page H)
Data Selection and Summarization
Data Analysis Report
During the period covered by this study, two performance evaluation systems were in use. The older system using the performance appraisal instrument (PAl) existed until December W95. For the period AprilW9:3 to December Im)5, a total of 18:3,0(;0 evaluations are available for analysis. In -Ianuary ImHi, the State implemented the new Performance Management Process that used the performance management form (PMF). For the period <January 199(; to October l!)99, a total of aO(;,(i40 evaluations are available for analysis.
Det~il ReviewJ!f Personnel Transactipn Historx Data
The Georgia Employment Management System (GEMS) stored over 8,000,000 transactions on a variety of personnel transactions. For this study, a limited group of transaction codes was selected from the more than 200 transactions codes used in GEMS since l!)9:J. The selected codes deal with salary increases, salary adjustment, promotions, and separations.
In l!)!)(i, a comprehensive change to the coding of personnel transactions occurred that resulted in a smaller set of codes and less definition for each codes usage. Consequently, within the computer data, personnel transactions were recorded with either of two sets of codes that cannot always he translated Cleanly to the other set of codes. This severely limits the level of detail contained in analyses using personnel transaction history data.
Factors Comp~licatingData Ana)ysi~
Completeness of Petiormence Eveiuetion Data
Although the GEMS database contains nearly 500,000 performance evaluations, this is not the complete set of performance evaluations created during the period, The system primarily recorded evaluations associated with the granting of salary increases and of these, the data are nearly complete. However, the set of performance evaluations associated with the following events/actions may not be present in its entirety:
-Ratings associated with delivery of delayed increases e Ratings associated with off-cycle special increases e Ratings prepared prior to discip linary actions (salary reduction, dismissals, etc.) Ratings at end of working test when not coincident with an increase ellatings associated with increases received at non-standard times (e.g., teachers in
September)
Data Consistency
A study of computer data covering a long period must address two issues dealing with data consistency consistency of recording that information and consistency of codes used within the data. Although the use of GEMS to record all transactions is not subject to question, several factors affect the internal consistency of the GEMS data. Most notable of these is the implementation of GeorgiaGain and its deliverables.
- The GeorgiaGain project created thousands of new job descriptions, job codes, and job titles. During implementation, employees were moved individually to the new job that best fit their responsibilities and assignments. This individualized
Page 20
October 10. 2000
Data Analysis Report
Data Selection and Summarization
approach to implementation means that it is impossible to develop a general mapping of old cla.ss data to new job data.
The new jobs created for Ceor:qiaGain were placed on a new pay structure with fewer pay grades and wider pay ranges. This new structure was based on market forces rather than internal equity. Clear benchmarks between the old and new pay struct.u re do not exist. Because of the individual nature of the movement of employees to new jobs. employee movement provides no assistance in translating the old pay structure to new structure. The GeorgiaGain implementation also placed thousands of employees into new statuses below the minimum salary or above the maximum salary for their new job. Prior to Geor:qiaGain, employees had never been paid outside the approved salary range.
A new performance evaluation system was developed with no consistent mapping of old evaluation scores to new ratings. This was one of the purposes of developing a new performance evaluation system. There was the perception that scores under the older system had migrated upward and a system with no numerical equivalents was desirable. Even though several mappings have been proposed for varying purposes. such as calculating Retention Credit for Reductions-in-Force. any previous mapping is suspect. Until this study. no thorough comparison of scores and ratings in both systems had been undertaken. In addition. the level of training provided to supervisors in preparing performance evaluations is not consistent across the two systems.
Over Generalization of Codes
Concurrent with the GeorgiaGain and Merit System Reform implementations, computer codes used by agencies to report personnel transactions were revised. Because of the change in the relationship between agencies and the Georgia Merit System following Merit System Reiottn, many of the transaction codes had become obsolete. All the codes were reviewed and dozens of codes were revised or eliminated, and dozens more added.
Unfortunately, in the hope of making the new codes easier to learn, the revisions eliminated many distinctions in activity that previously had required the use of separate codes. Users were instructed to use single codes for many different purposes. For example, the code SALAD,) (Salary Adjustment) was originally designed to document changes to an individual's salary and GRDAD,j (Pay Grade Adjustment) was designed to document broad adjustments to the pay grade assigned to all employees in a class or job. However. the incomplete nature of the GcorgiaGain implementation left over 10,000 employees below the target minimum salary fill' their assigned jobs. SALAD,j came to be used for three distinctly different transactions:
1) individual special salary increases for retention or to reward exemplary performance:
2) legislated special increases for large groups of employees where salaries were below the minimum salary of a job aimed at raising their salaries toward the job minimum salary; and
:3) special efforts by agencies to raise the salaries of selected very low paid employees toward the minimum job salary.
October 10. 2000
Page 21
Data Selection and Summarization
Data Analysis Report
Appendix A on page 119 displays the complete set of transaction codes and their dates of usc.
j)iSC01IUnWHioll of SystenJ
Any efforts to extend the following reports by incorporating more recent transactions will
encounter extreme difficulty. GEl'vlS was replaced in October 1mm with a purchased
software package, Few modifications were made in the new software to make it compatible with the historical GEl'vlS data. In order to simplify the implementation of this new system, a data explosion occurred. Similar to the GcorgiaGain implementation, hundreds of new jobs were created for unclassified employees, new pay structures were developed. and dozens of additional pay grades were created to accommodate those employees still below the minimum salary for their assigned job. In addition, another set of transaction codes was created which is inconsistent with any previous action codes.
Page 22
October 10. 2000
Data Analysis Report
Assessment of C;('orghIC,'ain Goals
V. GeorgiaGain Goals Measurable
with GMS Data
October 10, 2000
Page 2:{
Assessment of C;eorgii:1Gain Goals
Data Analysis Report
Page 24
October 10. 2000
Data Analysis Report
Assessment of Georgi<IGain Goals
Report 1 (Georgie Cein Goal :3)
Assure Fair Performance Ratings
The employee performance evaluations available from the Georgia Employment Management Systems (GE1VIS) were examined to determine if it was reasonably complete and consistent. This was accomplished by examining the distribution of evaluations by time period. Following that analysis. the performance evaluations were examined by overall score or rating. looking for trends or changes that occurred over time. Finally. the data was matched with demographic and employment data. This expanded dataset was examined to gauge the influence of several personal and employment characteristics in determining: performance evaluation scores and ratings. PAl and PMF data are displayed together to facilitate observation of similarities and differences.
The following personal and employment characteristics were examined:
Ethnic group (page :~2)
Gender (page :H
Age at time of evaluations (page ;n)
Tenure with the State (page m)
Pay grade (page 41) Annual compensation rate (page 45) .Iob I class title (page 48) Employing agency I department (page 52).
S(~lecti()n ()f.Re~gn:!~ for Analysis
During the period from April l!m;l to October Um!), two employee performance evaluation systems were used. The older system used the performance appraisal instrument (PAl) and existed until December W!)5. For the period April 199:3 to December 1995, a total of 18;~,O(;O performance evaluations were available for analysis in GEMS. Prior to .lanuary U)9(:l, the State implemented a new Performance Management Process that used the performance management form (PMF). For the period -Ianuary 1996 to October l!)!H), a total of :106.(i40 performance evaluations were available for analysis.
October 10. 2000
Page 25
Assessment of GeorgiaGain Goals
Data Analysis Report
Table ()
l)i$trilmtj~w of I)AlE~~rJ~~rrll(~ ngeE~y(!hmtiQ!l.:?J)v Period
Jan
Feb
c Mar
.Q
~ Ar
ro;:)
Ma w> Jun
a Jul
s:
C
Au
0 ~
Sep
Oct
Nov
Dec
Total
Evaluations Evaluations Evaluations
Total
in 1993
in 1994
in 1995 Evaluations
0 0 0 1,613 5,288 13,618 4,762 4,086 3,571 3,341
3,943 4,090 6,445 6,370 6,831 13,572 4,470 4,857 4,180 4,022 4,180 5,233
68,193
4,378 4,562 6,429 6,222 6,694 12,691 5,407 5,236 4,520 4,581 4,240 5,136
70,096
8,321 8,652 12,874 14,205 18,813 39,881 14,639 14,179 12,271 11,944 1
Performance evaluations under the older PAl-based system were primarily associated with delivery of an annual increase, sometimes referred to as a 'within-grade-increase', or WIGL Before the advent of GeorgiaGain, salary increases were delivered throughout the year on employees' anniversary dates and the distribution of performance evaluations by date of evaluation bears this out (see Table () and Figure 2),
15,000 10,000
El1993 81994 81995
5,000
o
Jan Feb Mar Apr May Jun
Jul
Aug Sep Oct Nov Dec
Figure 2 ~ PAl Performance Evaluations by Month
PAl performance evaluations may have been prepared at other times, such as upon delivery of a special increase or a delayed annual increase, as part of a disciplinary action (dismissal, etc.), and at end of working test when not coincident with the employee's
Page 2G
October 10,2000
Data Analysis Report
Assessment of C;eorgiaGLjin Goals
anniversary date. The GEMS database did not differentiate the reason a performance evaluation was prepared. however, the only specialized data entry screens fin' collection of performance evaluation data were those that were part of the annual increase data entry process.
Table 7
l)itrilmti()Jl of PM Fl<~val!Jjl t iimiJ2y'j?!~.Iiml
Jan
Feb
Mar
c
0
~
m:J
Apr May
w> Jun
'0 Jul
.c C
Aug
0
:2
Sep
Oct
Nov
Dec
Total
Evaluations Evaluations Evaluations Evaluations Total
in 1996
in 1997
in 1998
in 1999 Evaluations
3,989
18
14
248
4,269
4,540 5,548 6,060 4,671
878 10,053 19,762 16,381 25,018
20 23 96,943
19 27 269 65 161 16,591 20,983 5,944 24,873 13
4 68,967
8 17 3 4 273 19,132 17,734 8,167 24,979 11
9 70,351
11 14 4
5 298 13,398 14,452 6,593 35,356
70,379
4,578 5,606 6,336 4,745 1,610 59,174 72,931 37,085 110,226
44 36 306,640
Performance evaluations prepared under the new PMF-based system were primarily associated with annual delivery of performance-based increases (PHI). After GeorljiaGain implementation, salary increases were delivered only on October I of each year following
preparation of performance evaluations for every eligible employee. These performance
evaluations were prepared between the end of the evaluation period, usually -Iune :m. and
the increase date of October 1. This is reflected in the distribution ofperformance evaluations by effective date (see Table 7 and Figure :3).
PMF performance evaluations may have been prepared at other times, such as upon delivery of a special increase, as part of a disciplinary action (dismissal. etc.), and at end of working test when not coincident with the annual evaluation. The GEIVIS database did not differentiate the reason a performance evaluation was prepared, however, the only specialized data entry screens for collection of performance evaluation data were those that were part. of the performance-based increase data entry process.
DuringWH5 and W9(j, a transition was underway from the PAl-based system to the PMFbased system. As performance evaluations were completed in 1995 under the PAl system, PMF planning documents were prepared for use in the W!)() evaluation. Those employees whose anniversary dates in 19!Hi fell prior to ,July W!)(; present an interesting subset of employees for further investigation they were evaluated using the PMFbased process but they were still classified and compensated on the older pre- G('orgiaGain job titles and pay ranges. These same employees were also re-evaluated along with all other employees for another salary increase in October 199(;. This accounts for the larger than expected number of performance evaluations in ImHi. Performance evaluations completed in
October 10, 2000
Page 27
Assessment of Georgiecleiti Goals
Data Analysis Report
-Ianuary through May ofHH)(j were at a rate consistent with the older anniversary date PAl-based system.
40,000 30,000
81996 81997 111998 -1999
20,000
10,000
Average number of performance evaluations per
month under PAl System
o
JAN FEB MAR APR MAY JUN JUL AUG SEP OCT NOV DEC
Figure 3 PMF Evaluations by Month
The following detail examinations of PAl and PMF performance evaluation scores and ratings were conducted:
Examination of Performance Evaluations by Overall Score or Rating Examination of Performance Evaluations by Ethnic Group Examination of Performance Evaluations by Gender Examination of Performance Evaluations by Age Examination of Performance Evaluations by Tenure I<:xamination of Performance Evaluations by Pay Grade Examination of Performance Evaluations by Salary Range Examination of Performance Evaluations by -lob Title Examination of Performance Evaluations by Agency
Page 28
October 10, 2000
Data Analysis Report
Assessment of GeorgiaGain Goa ls
The original design of the PAl-based employee performance evaluation system called for assigning a single-digit score as a measure of employee performance. The scores and their meanings are shown in Table 8.
Table 8 DJ,:'~J'iption of Perf()nnance ApPI:!~i111ntDUm~!ltJi~;52.res
~:i<;Q!:(~
5 4
a
2
Ex})Innation 01:' Des~in!ion Performance consistently exceeds requirements Performance frequently exceeds requirements Performance meets requirements Performance frequently falls below requirements Performance consistently falls below requirements
Prior to I n!);{, the system was modified to permit supervisors to assign scores of one-tenth point resulting in an expansion of the scoring system from 5 to 41 values.
Table H Distribution of PAl Seores by 1/JO Poil!!
Score 10 1.1
1.2 1.3 1.4 1. 1.6 1.7 1.8 1.9
Count Score
6 2.0 2 21
4 22 7 23 4 2.4
2.5 2.6 2.7
2.8 29
Count
50 11 702
T'ahle B displays the distribution of PAl scores during the period April l!m;{ to December l!)!)[) using the 41 possible scores. The most frequent score assigned was 4.0, and this score is described as 'frequently exceeds' job requirements.
For purposes of simplifying further analysis, the ,II scores were grouped into nine ranges as follows:
1.0 to 1.4
2.0 to 2.4
:U) to ;3.4
4.0 to 4.4
5.0
1.;"> to I.!)
2.5 to 2.9
;1.5 to :U)
4.5 to 4.!)
Table 10 displays the PAl scores by calendar year using these reduced ranges. Consistent with the detail distribution of scores, the range from 4.0 to 4.4 contained the largest number of performance evaluations.
October 10, 2000
Page 2H
Assessment of GeorgiaC.;ain Goals
Data Analysis Report
11993 11994 11995
Total
1.0
to
1.4
3 10 10
23
'fable 10 Distribution of PAl Evaluations 12Y...!~c()re
1.5
to
1.9
25 31 21
77
2.0
to
2.4
111 195 172
478
5;,,.,,,rAilit
2.5
3.0
to
to
2.9
3.4
316 8 131
531 14201 477 14987
1324 37319
3.5
to 3.9
10370 15978 16712
43060
4.0
to
4.4
14126 21084 21572
56.782
4.5
to
4.9
8342 12031 11 922
32295
5.0 3347 4132 4223 11702
Total
44771 68193 70096 183060
When viewed graphically. a subtle shift is apparent during the period as scores begin a slight but consistent shift. toward more moderate ratings. During this same period, supervisors and managers received intensive training in using the new Performance Management Process and were exposed to the concept that most ratings should be at the
Meets level.
,A..ldlhotHll
110
40%
01993
.1994 30%
.1995
20%
10%
0% L _ _-......
c : l _........- l l i
1.0 to 15 to 2.0 to 2.5 to 3.0 to 3.5 to 4.0 to 4.5 to
5.0
1.4
1.9
2.4
2.9
3.4
3.9
4.4
4.9
Figure 4 .~ PAl Scores by Year
The distribution of performance evaluations under the new PMFhased system is shown in Table 11.
'l'ahle 11 Distribution of PMI<' Ratings
11111f\
11997 11998 11999
Total
Does Not
C
Meet
1 37!)
561
1614
543
2345
503
? !)fifl
7902
2169
Meets
86763 58838 57439
259465
Exceeds
7407 7455 9452 10.020
34334
Far Exceeds
837 517 612 804
2770
Total
96943 68967 70351 70379 306640
Page 80
October 10.2000
Data Analysis Report
Assessment of GoorgiaC;tlin Goals
Various 'ideal' rating distributions for the new PMF-based system have been voiced since the beginning of the G('o(giaGain project. A.II fit in the follow ranges:
Table 12
Ideal Distribution ofJ'erformance Evaluatllin Ratings
N"-''''
--
Ratings
'Ideal' Distribution
Does Not. Meet
.',)100/ :~ (Xl
Meets
80%, ~ 8:3%,
f - - _E..._x-c-.eeds Far Exceeds
10'% - 15%,
5(%
.m
As can be seen in Figure 5, the percentage of PMF-based performance evaluations containing Meets and Exceeds ratings approached the 'ideal' distribution for several years. The percentage of Does Not Meet and Far Exceeds ratings continued to be lower than anticipated.
100% 80% 60%
m1996
m1997
111998 .1999 Oldeal
40%
20%
0%
c
DNM
Meets
Exceeds
Figure.') PMF Ratings by Year
Far Exceeds
For administrative convenience, a new rating of'C' was devised to indicate that a full performance evaluation was not. prepared, but that. the supervisor had 'considered' the employee's performance to-date and no issues were present to warrant withholding the salary increase. 'I'his code was originally designed to address concerns of supervisors when evaluating the performance of new hires and recent transfers, The number of employees granted a performance-based increase without a full performance evaluation exceeded the number receiving Does Not Meet and Far Exceeds ratings combined. In the balance of these reports. performance evaluation ratings of 'C' will be reported separately unless ratings are grouped, in which case the 'C' ratings will be grouped with average performers (those receiving a Meets rating).
October 10. 2000
Page :31
Assessment of Geotgistieir: Goals
[lata Analysis Report
Examination of P~!:formanceEvaluations by Ethnic CBmp
This examination of performance evaluations focused on a personal characteristic. However, the distinction between performance evaluation systems was retained. (}EMS recorded race/ethnic group information using standard categories required by state and federal legislation - white, black. Asian, Hispanic, American Indian, and multi-racial. For purposes of this examination, the Asian, Hispanic. American Indian, and multi-racial categories were combined into a group labeled 'other'.
Table 1a shows the distribution of PAl scores for the modified ethnic groups.
Table ia
Distribution of PAl Scores by Ethnic C1roup
1.0 to 1.4
13
23
1.5 to 1.9
36 39
77
2.0 to 2.4
215 256
7
478
Total
116011 64877 2172
183060
These ratings from the 199:3 to 1995 period were representative of the distribution of the overall employee population (see Appendix B on page 12:3). The study shows that ;3;'').4%) of performance evaluations were for black employees in a period when black employees comprise :~5.:3% of the workforce. Other employees comprise] .2% of the study data and 1.;~(X) of the period workforce.
30% 20%
CWhite -Black Other
10%
0%
1.0 to 1.5 to 2.0 10 2.5 to 3.0 to 3.5 to 40 to 4.5 to
5.0
1.4
19
2.4
2.9
3.4
3.9
4.4
4.9
Figure () PAl Scores by Ethnic Group
Page :>2
October 10. :2000
Data Ana lysis Report
Assessment of GeorgiaGain Goals
For all three ethnic groups, the 4.0 to 4.4 range was the modal range. The distribution for black employees appears more evenly distributed with 2i)f%1 to ;)()I% of performance evaluations falling in the :3,0 to :3.4, :15 to :3.H, and 4.0 to ,1.4 ranges. White employees received proportionately twice the number of 5.0 ratings as did black employees (7Jjl!;(1 and 4.1'% respectively). Although the numbers are small, black employee received proportionately more than twice the number of low ratings (ratings below :Ul) as did white employees (1.5W% and 0.7:V% respectively).
The distribution of PMFbased performance evaluation ratings by ethic group is shown in Table 14.
Table 14 Distribution of PMFRatings bV~Jhqif: (~roup
iWhite IBlack
IOther Total
Does Not
C
Meet
?, 778
1088
3915
1043
')()Q
38
7902
2169
Far Meets Exceeds Exceeds
151230 104151
4084
25323 8521 490
2232 491 47
259465 34334
2770
Total
183651 118121
48681 3066401
These ratings from theW!)(j to 1!)H!) period are representative of the distribution of the overall employee population (see Appendix B on page 12:3) though slightly skewed to include more performance evaluationsfor black employees. The study shows that :38.;">% of performance evaluations were for black employees in a period when black employees comprise :31 .7%. of the workforce. Other employees comprise 1.5'% of the study data and l.H% of the period workforce.
100% 80% 60%
CWhite -Black -Other
40%
20%
0% C
DNM
Meets
Exceeds
Far Exceeds
Figure 7 - PMF Ratings by Ethnic Group
For all three ethnic groups, the Meets rating was the most common rating received and for all three groups the number of Meets ratings was near the 'ideal' distribution. Proportionately, white employees received nearly twice the number of Exceeds ratings as
October 10. 2000
Page :t3
Assessment of (;eorgiaC;;:.lin Goals
Data Analysis Report
black employees (1:3.78% and 7.21% respectively) and nearly three times thenumber of Far Exceeds ratings (1.21 %. and 0.42%. respectively).
Page :34
October 10. 2000
Data Analysis Report
Assessment of GeorgiaGaitl Goals
ExaminatiolIQJ Performance Evalt,t.ottions by Gender
This examination of performance evaluations focused on a personal characteristic. However, the distinction between performance evaluation systems was retained.
Table 15 shows the distribution of PAl scores during the period for both male and female employees.
Table 15 Distribution of Pt\J Scores by G(~nder
Male
Total
1.0
to
1.4
20 3
23
1.5
to
1.9
49 28
77
2.0
to
2.4
256 222
478
S~nrA
2.5 3.0
to
to
2.9
3.4
710 17 541 614 1 --
1 324 37319
3.5
to
3.9
21957 1 103
43060
4.0
to
4.4
33437 23.345
56782
4.5
to
4.9
22388 9907
32295
5.0 8824 2878
11 702
Total
105182 77 878 183060
These ratings from the !HHi3 to !!)95 period were representative ofthe distribution of the overall employee population (see Appendix 13 on page 12:n, though slightly skewed to include more performance evaluations for female employees. The study showed that 57.5%. of performance evaluations were for female employees in a period when female employees comprised 5G.0% of the workforce.
40% 30%
IIFemale -Male
20%
10%
0%
10 to 1.5 to 20 to 2.5 to 3.0 to 35 to 40 to 4.5 to
50
1.4
1.9
24
29
3.4
3.9
4.4
4.9
Figure 8 -PAl Scores by Gender
For both groups, the -1.0 to 4.4 range was the modal range. The distribution for male
employees appears more evenly distributed with 25% to :30(% of performance evaluations
falling in the a.o to :lA, :3.5 to :U), and 4.0 to 4.4 ranges. Female employees received
October 10, 2000
Page :35
Assessment of Georgietsein Goals
Data Analysis Report
proportionately more than twice the number of 5.0 ratings as did male employees (8.:W'X> and ;~.70(% respectively). Male and female employees received proportionately the same number of low ratings (ratings below a.O).
The distribution PMFbased performance evaluations by gender is shown in Table Hi.
Table Hi Distribl!!ion ofPMFH,f!Jings by (}endeJ:
..IFemale
Total
Does Not
C
Meet
4899
~ on~
1 207
7902 21691
Far
Meets Exceeds Exceeds
149827
20740
1~ !'i~4
1617 1 1531
259465 34 334
2770
Total
178290 128.350 306640
These ratings from the I HHf) to 1999 period were representative of the distribution of the overall employee population. The study shows that 58.1 % of performance evaluations were for female employees in a period when female employees comprise 58.2% of the workforce.
80%
-Female -Male
60%
40%
20%
0% L __. . . ._L~~
c
DNM
~_
Meets
Exceeds
Figure D PMF Ratings by Gender
Far Exceeds
As can be seen in Figure !}, there were only slight differences of approximately 1'% in the distribution of ratings for male and female employees.
Page :j(:;
October 10,2000
Data Analysis Report.
Assessment of C;eOtIjiaC;ain Goals
Examina.!1Qfl of Perf~~rntanceEvallUltions by Ag.~
This examination of pe rforrna nee evaluations focused on a personal characteristic. However. the distinction between performance evaluation systems was retained. The employee's age at the time of the performance evaluation was calculated and employees were grouped into decade cohorts. These groupings were not static since an employee might move to the next grouping during the study.
Table 17 DititrilHltion of PAl Scores bY.I:\gg
1.0 to 1.4
110'0:;
[20's
4
~
10 6 3
Total" 23
1.5 to 1.9
15 19 19 21
3
77
2.0 to 2.4
84 147 142 79
25 1
478
Score -
2.5 3.0
to
to
2.9 3.4
1
25
223 8281
435 11975
409 10289
213 5340
41 1 317
2
92
1 324 37319
3.5 to 3.9
14 6971 13719 13868 6847 1560
43060
4.0 to 4.4
16 6478 16578 20812 10337 2412
14~
56782
4.5 to 4.9
1 2365 8349 13439 6489 1538
114
32295
Total
Evaluation
5.0
0:;
2~= 57 25031 53941
4796
63780
2745
32074
7663
514
11
183060
Disallowing the very small number of evaluations for the oldest and youngest groups (]()'s and 70'8+), the internal distribution of ratings for employee 40 and older was remarkably similar with only slight differences. For those employees in the 20's and ao's, the number of performance evaluations in the higher ranges (4.5 and above) was less and the number of rating below 4.0 was considerably higher.
100% 80% 60% 40% 20%
10's
20's
30's
40's
50's
60's
Figure 10 PAl Scores by Age
70's+
114.5to 49
04.0 to
4.4
03.5 to 39
t'J30 to
3.4
02.5 to 2.9
02.010 24
015 to
1.9
01.0 to 1.4
October IO, 2000
Page ;l7
Assessment of GeorgiaGain Goals
Data Analysis Report
The distribution of PMF-based performance evaluations by age is shown in Table IS.
Table ]S I2jstribution of PME.Jii.!Jings by Age
10... 20's 30's 40...
SO's
.60's
Does Not
C
Meet
77
5
12
241
2358
572
1849
732
780
509
115
97
11
13
7902 2169
Far
Meets Exceeds Exceeds
280 37600 71075 R6384 52644 10770
712
2 3164 9349 13283 7420 1066
50
197
807 1 08~
58~
8f
~
259465 34334 277C
Total
364 43914 84161 103337 61 938 12.137
789 306640
A change can be seen from the earlier PAl distribution in that employees in the modal age category (40's) have the largest percentage of Exceeds and Far Exceeds ratings; and this percentage grows smaller in other groups the further removed the group is from this modal group.
100%
60%
40%
20%
0% 10'5
20's
30'5
40's
50's
60's
Figure 11 PMF Ratings by Age
70'5+
Page as
October 10, 2000
Data Analysis Report
Assessment of GeoQjhlGain Goals
.E.~.mJnationof Performance Evaluations!ll'.J~!lure
This examination of performance evaluations focused on an employment characteristic. However, the distinction between performance evaluation systems was retained. The employee's tenure with the State at the time of the performance evaluation was calculated and employees with similar tenure were grouped together. These groupings were not static since an employee might move through one or more groupings during the period covered by the study.
Table W J2i.trj!?ution of PAl Scores bv Tenure
<2 2-4 5-9
1019
20-29
30-39
~
1.0 to 1.4
4 2 8 5 4
23
1.5 to 1.9
8 20 24 17
8
77
2.0 to 2.4
101 110 128 91 46
2
478
Score 2.5 3.0
to
to
2.9 3.4
293 11 198
322 8606
328 8184
253 6423
126 2806
1 100
1
2
1 324 37319
3.5 4.0
to
to
3.9 4.4
758R ;;; ..,.""
9615 9846
11092 14788
995 15654
460t 9228
20E : 548
')
9
43060 56782
4.5 to 4.9 .... 382 4415 7660 10220 7115
497 6
32295
- Total
5.0
690
28979
1426
34:i62
2728
44940
3946
46560
2657
26596
240
1 594
!l
29
11702
183060
In all groupings, as tenure increased the percentage of lower scores decreased and the percentage of higher scores increased.
100% -80% 60% 40% 20% 0% <2
24
5-9
10-19
20-29
30-39
Figure 12 PAl Scores by Tenure
-45to 49
1:]4.0 to 44
I:] 3.5 to 3.9
I:] 3.0 to 34
025to 2.9
020to
24
01.5to 19
010 to 1.4
40+
October 10. 2000
Page :39
Assessment of (;eor:qiaGain Goals
Data Analysis Report
'I'he distribution of PMF-based performance evaluations by tenure is shown in Table 20. Consiatent with expectations, a large portion ()!r%) of employees rated with the 'C' code were employees with less than two years of tenure.Howf~ver,iU'% of such perforrna nee evaluations were received by more senior employees.
Table 20 Ui~Jrit>~!cltigl1.9fJ~.MJ" }{~ltings by T~:I1~!r(~
<2 24
5.9 10.19 ?O.?q 30.39 40+
Total
Does Not
C
Meet
5453
349
873
448
650
449
644
572
270
315
11
36
1
7902 2169
Me.~ExC"'.
Far Exceeds
476
3132
277
51 724 5969
455
55321
7449
532
64412 10 fiflQ
890
37185 6514
538
3185
579
78
29
2
259465 3
2770
Total
56820 59469 64401 77 207 44R22
3889 32
306640
Although not as marked as under the PAl-based system, with increased tenure comes a higher percentage of Exceads and Far Exceeds ratings. For example, employees with 80 or more years of service were 4 times as likely as other employees to have received a Far Exceeds (2.01% versus 0.49%1) and nearly three times as likely to have received an Exceeds (l4.8H% versus 5.5]%).
100% 80% 60%
II Far Exceeds II Exceeds mMeets DDNM
lie
40%
20%
0%
<2
2-4
5-9
10-19
20-29
30-39
40+
Figure 1:3 - PMF Ratings by Tenure
Page 40
October 10,2000
Data Analysis Report
Assessment of Gf'Ol~fjhIGainGoals
Examination of PerformaJ!~!~w.Evaluationsby Pay Grade
This examination of performance evaluations focused on an employment characteristic. However, the distinction between performance evaluation systems was retained. 'I'he employee's pay grade at the time of the performance evaluation was determined through a review of employee extracts.
Table 21 Distribution of Pl,~JJi9Qr~2';:\ by Pay Grade
1.0 Pay to Grade 14
OA
2
OB
1
n
14
15 16 17
~
2 4
18
19
1
20
21
1
22
23
24
1
25
26
27
1
~8
1
9
e;
10
1
1
32
2
n
39 40 41 42 43 44
45 46
47 48 51 52 53
""
23
1.5 to
1.Q
3
5
~
2 7 5 4 3 ? 2 1fl 1 4 11 4 1
1
:l 1 1 1
1
77
2.0 to
?A
75 B 19 21 12 1q 14
26 2
24 25 11 27 15
9 16
24 11 16 l' 21
7
."
1 1
478
2.5 to
?Q
69 1R ?7 80 12 7Q 21
74 1H 8 :;3 0 107 'iO 121 R?
I'
R1
1 7 1 1 1 7 11 1 7 1
1
3.0 to
1.A
:l41 159,
1l1'
1718 5~7
1 Qat;
459 Q7
1 Po'q "f;9
1 148 1 '09
77R 4814 1 100 6471 1417
100 15M 1122
1.096 517 778 11
2lfi 2 ~2 144
7~
143
t;
85 24 ?4
6
1
7 27 1 1324 373
3.5 to
1.0
2 oss 1299
">AA
1 iss
5h.i
1924
"'id
11
j <1,1
7:;Q
1707 187" 1277 2 1111 1910 55RS ? Q1A
1.?7 ? 'iR1 2 1117 ? 7QR 1 In? 1 >41
7r::.. 17 7
~8
0 3
~ 16 21 "
16 4 2<;
7
43060
4.0 to
AA
4743 27M
RO~
R7Cl 7112 ?Oq
91
i1
1f;Q
7"'7 211 3.25 1979 244R 21M 15?9 40fl1
4~ 1.s: ~ III 7 1."
1 r. 2.8
f'.
127 138 105
477
i'P;,
11Q
417
17"
100 1A
74 4 A
57 ?c1
4Q
:'>'1
56782
4.5 to
<10
1427 2 :l20
191 21'" 242 771 4~1 44 1
2 10S1 1 ~99 1 OR?
1M ? 14
?~i ?~O
1 "R 174 1 10 1~
47
~q~
1 27 47 4 R7 1
4 16 17F
34 89
1 6 11;
?7
41 2 '1'7
32295
5.0
Total
Evaluations
9~~
12720
1 1'11;
9 'iM
1n
2 ?'ill
~
4202
2152 '(':017
18
. 263:l
1
37
1';7
10'I'>',Q
'i
24)4
1"'liM
-;:;:528 4821
1SO
5483
4R7
12097
111
f;74R
H;~
14250
554
11677
1.7
1 21'>1
74
11230
~1
'1i''''70
J 2~f
il74R
4590 11157
1 R7" ~ '<11
531
4067
nf
2495
1Rr
1.347
?1f
?1t;.F
o:
283
153
1 '<21
1
50 55"
9F
'"
24~ c
14
,
100
1
70
152
2
M
1170
183060
October 10, 2000
Page 41
Assessment of Georgietsein (Joals
Data Analysis Report
Over 12%1 of performance evaluations were for employees on non-standard pay plans that did not have pay grade identifiers or which had non-standard pay grades. This includes unclassified employees and teachers. Two artificial pay grades were created for this examination to help categorize these employees, Employees earning below S:W,OOO at the time of the performance evaluation were assigned to pay grade OA and those earning $:30,000 and above were assigned to pay grade OB.
The number of performance evaluations on each pay grade approximated the number of employees on each pay grade including the very low number of employees on pay grades 18 and 28. Entry-level professional job titles were frequently assigned to pay grades 2f) and 27 and entry-level Caseworker was assigned to pay grade 24. Correctional Officer 2 was assigned to pay grade 2(;. A small number of performance evaluations were prepared for employees on the very high pay grades of 4() and above. These pay grades were generally used for medical professionals.
The distribution of scores within each pay grade up to 4;') is shown in Figure 14.
Immediately evident is the larger proportion of 4.5 and higher scores on pay grades :Ja and
above and the very small proportion of 4.5 and higher scores on pay grades Ld through 16
used primarily for service, maintenance, and entry-level clerical class titles.
100% 80% 60% 40% 20% 0%
-4.5 to
49
EJ4.0 to
4.4 EJ3.5 10
3.9 EJ3.0 to
3.4 02.5 to
2.9 02.0 to
2.4 01.5 to
1.9 01.0 to
1.4
Figure 14 .... PAl Scores by Pay Grade
Another point of interest is the very high proportion of a.o to ~t4 scores on pay grade 2(i
and, to a lesser degree, pay grade 24. This proportion was higher that than seen on any other pay grade.
The distribution PMF -based performance evaluations by pay grade is shown in Table 20. Because PMF-based performance evaluations in 1996 were prepared for both old and new pay grades, only data from lH97 through 19~m were included.
Page 42
October 10,2000
Data Analysis Report
Assessment of GeorgiaGain Goals
Since over l()');(. of evaluations were for employees on non-standard pay plans which did not
have pay grade identifiers or which had non-standard pay grades, two artificial pay grades
were created for this examination to help categorize these employees. Employees earning
below $;30,000 at the time of the evaluation were assigned to pay grade OA and those
earning S:m,ooo and above were assigned to pay grade OB.
Table 22
Distribution of PM f2Jtatings by Pay Grade
Pay Grade
OA
os
05 06 07 08 09 10 11 12 13 14 15 16 17 18 19 20 21
22
23 25 26
Total
Does Not
C
Meet
456
66
292
68
27
14
91
25
335
93
423
145
653
190
96
30
2339
319
451
170
640
248
283
108
186
50
96
30
58
21
39
19
30
8
15
2
10
1
7
1
6527
1608
Far
Meets Exceeds Exceeds
8 181
804
68
8810 2410
422
1 708
61
2
3165
116
6
11633
381
13
14097
1 196
48
21058 2973
162
4762
831
67
41019 4750
189
11 848
2075
139
19558
3492
163
10812
2371
118
6382
1864
141
3925
1326
120
2318
801
63
1 784
704
77
998
490
89
251
114
16
300
136
19
93
27
10
2
2
1
1
172 702 26927 1
Total
9575 12002
1812 3403 12455 15909 25036 5786 48616 14683 24101 13692 8623 5497 3261 2623 1615
398 466 138
2 3 1
209697
The number of ratings on each pay grade approximates the number of employees on each pay grade. After GeocgiaGain implementation, entry-level professional job titles were are frequently assigned to pay grades 12 and 1a. Entry-level Case Manager was assigned to pay grade 11. as was Correctional Officer. An extremely small number of performance evaluations were prepared for employees on the very high pay grades of 2:3 and above. Medical professionals were assigned to another pay plan and are reported under pay grade DB.
The distribution of performance eva luation ratings within each pay grade is shown in Figure 14. Immediately evident is the very small proportion of Exceeds and Far Exceeds ratings on pay grades 05 through 07, which were primarily used for service and maintenance jobs. Also, the proportion of Exceeds and Far Exceeds ratings increases beginning on pay grade 12 and continuing through pay grade 19. This continuing increase in the number of Exceeds and Far Exceeds ratings reached then surpassed the 'ideal' distribution by pay grade 15.
October 10. 2000
Page 4:3
Assessment of GcorgiaGaill Goals
Data Analysis Report
Pay grade 11, used for Correctional Officer and Case Manager, continued the pattern observed previously of much smaller than anticipated numbers of high ratings.
100%
80%
60%
40%
20%
0%
Figure 15 PMF Ratings by Pay Grade
October 10, 2000
Data Analysis Report
Assessment of GeorgiaGain Goals
This examination of performance evaluationsfocuaed on an employment characteristic. However, the distinction between performance evaluation systems was retained. The employee's annual salary at the time of the performance evaluation was determined through a review of employee extracts.
~ !l;fiOK $70K+ Total
Table 2:J Distribution of PAl Scores by Salary Range
1.0
to 1.4
12 8 3
2~
1.5 to 1.9
31 33 10
1 1
1 77
2.0
to 2.4
248 168 43
17 2
478
ScnrA -
2.5 3.0
to
to
2.9 3.4
664 21 153
467 12304
149 2622
36 748
5 279
1
81
2 n?
1 324 37319
3.5 to 3.9
17R12 18288 5312
1 174 320 73 81
43060
4.0 to 4.4
18570 23726 10101
2963 871 248 303
56782
4.5 to 4.9 7 2~2 13115 7367 2925
927 279 450
32295
5.0 241R 439t; 3030 1087
442 138 192
11 702
Total
68140 72504 28637
8951 2847
820 1 161 183060
During the H)!):J to 1995 period represented by the performance evaluations shown in Table 2:3, the average annual salary for state employees was approximately $25.000. The evaluation data appears to be consistent with the average salary for employees.
40% --O--<$20K
--o-$20K
-Q--$30K
30%
-6.-$40K
-D-$50K
- -0- $60K
--<>-$70K+ 20%
10%
0%
10 to 1.5 to 2.0 to 2.5 10 3.0 to 3.5 to 4.0 to 4.5 to
5.0
1.4
1.9
24
2.9
3.4
3.9
4.4
4.9
Figure 16 PAl Scores by Salary Range
Figure 16 shows a considerable difference in the distribution pattern of performance evaluations scores based on salary range. For example, the modal score received by
October 10, 2000
Page 4;")
Assessment of Geor:giaGain Goals
Data Analysis Report
employees making less than $20,000 (about :37'7'0 of the population) was in the :U) to 8.4 range while the modal score received by all those making over $50,000 (2.;)17'0 ofthe population) was ,I.;') to 4.n. In the middle incomes of $20,000 to $4H,OOO (60.5'% of the population), the modal score received was 4.0 to 4.4. No salary range group had :3.5 to :U) as a modal range of ratings.
Increasing strength in modality is seen as income rises. For the under $20,000 group, the modal score was received by :31 %1 of the group; at $:JO,OOO, the modal score was received by :35% of the group; and at over $70,000. the modal scores was received by nearly :3n% of the group.
The distribution of PMFbasod performance evaluations by salary group is shown in Table 24. During the period H)9fl to 19!)9, the average salary of employees rose to nearly S2n,OOO and the evaluations show a similar increase.
Table 24 I)istribution of PMF Ratings by Salary Rfmge
d20K $20K $30K !.40K $50K 560K 570K+
Total
Does Not
Far
C
Meet
Meets Exceeds Exceeds
4047
519 68918 3707
214
2569 1005 117949 14 116
81
756
425 44087 8508
706
272
142 17 392 4458
447
99
45
6.211
1918
262
57
11 2238
81::\
1
102
~ 2670
814
1
7902 2
259465 34 334 277
Total
77 405 136452
54482 22711 8535 3.256 3799 306640
100%
80%
60%
--<>--<:$20K --O-$20K --{r-$30K -6-$40K -o-$50K - {J- $60K --+--$70K+
40%
20%
0%
c
DNM
Meels
Exceeds
Far Exceeds
Figure 17 -PMF Ratings by Salary Range
Page 4t:>
October 10.2000
Data Analysis Report
Assessment of GeorgiaC'ain Goals
Unlike the distribution under the PAl-based system, under the PMF-based system the modal rating for all salary groups was the same Meets (see Figure ]7). All salary ranges followed the same distribution model and tracked to some degree the 'ideal' distribution.
There was some difference, however, in how close each group came to the 'ideal' distribution. For example, beginning at under 520,000 the Meets ratings accounted for 8~)'~i. of performance evaluations hut that percentage dropped steadily as income increased until at $70,000 Meets ratings accounted for only 6WX. of evaluations. Similarly, the percentage of Exceeds ratings increased as income increased from a low of 4.8'J(. for employees earning under $20,000 to nearly 25(~1i {(II' those earning $(;0,000.
Asincome increased, the distribution of performance evaluation racings changed from one with too many Meets ratings for employees earning under $20.000. to one that was rich in Exceeds and Fa r Exceeds ratings for those employee earning above $tiO.OOO. I n the S:JO,OOO salary range, the distribution was closest to the 'ideal' where 81(% of performance evaluations contained Meets ratings and 15% contained Exceeds ratings.
October 10. 2000
Page 47
Assessment of Georgieilein Goals
Data Analysis Report
Examination of Performance Evaluations b'y Job Title
This examination of performance evaluations focused on an employment characteristic. However, the distinction between performance evaluation systems was retained. The employee's job classification at the time of the performance evaluation was determined through a review of employee extracts.
Table 25 l}is~[ilmJjonof PAl Scoresf{)t 2!5J'vlost Frequently Evalm\fed C:lass 'fiUes
1,0
to
Class Title
1.4
Accountina Tech 1
Caseworker Prin
3
Caseworker Sr
1
Clerk Admin
k Prin
k Sr
4
correcuonat Ofe 1
1
Correctional Ofc 2
Enuioment Operator 2
Health Svcs Tech
Health Sves Tech Sr
Health Svcs Tech Lead
Housekeeoer
Houseoarent
2
Human Svcs Tech <::.,
Human Svcs Provider
Instructor
LPN Sr
Nurse Sr IComm/Cln\
Probation/Parole Ofc 2
Secretarv. Prin
Secretarv Sr Secretarv/Tvnist Social SVGS Soec 1
Technical lnsuuctor
Other Job Titles
1
H1
Total Evaluations
23
1.5 2.0 2.5 3.0 3.5 4.0 4.5 to to to to to to to 1.9 2.4 2.9 3.4 3.9 4.4 4.9 5.0 Total
6
9 201 395 647 411 137 1806
2
10
15 143 306 94 .187 311 2920
10
26
511 1094 1 290 1 7
966 204 5414
7
9 300 462 729 581 221 2309
10
3" 543 672 807 429 122 2618
2
13
20 402 480 775 414 155 2265
7
59 3010 483
23
3
3586
1
5
97 6212 4761 660
50
2 11 788
7
4 677 185 1005
43
28 1949
4
10
t;t; 749 474 334
61
19 1706
15
53 1349 1 516 1757 629 156 5475
3
1 12
15 18
240 607
343 406
~ 632
446
102 23
1669 1670
1 1
4 3 5
24 18
8
542 340 233
402 487 372
307 650 621
125 415 350
1i 1427 2003 1665
1
6
13 19
43q 402
436 464
609 760
263 451
: 69
187
~
3 190 360 67R 524 213 1971
1
3
23 257 867 1214 251
,
2622
3
6 104 250 525 419 20
1 514
4
13
35 554 1004 1 971 1763 93
6277
2
17
27 743 1 135 1759 992
5046
5
18
38 496 737 1 168 590
3144
= ! 815 147 476 237 4
40
~ ~,
77
1324 37319143060 56782 32295111
2 101 105996 183060
The twenty-five class titles shown in Table 25 bad the largest. number of performance evaluations and comprise over 42%. of all performance evaluations. This list is consistent with the list of the most populous class titles. Two of the class titles (marked with an asterisk "") were used exclusively for unclassified employees. The remaining class titles (over 2,(00) were grouped into Other -Iob Titles.
Within the grouping of selected class titles at least five class series or families are represented ~ Clerk, Secretary. Correctional Officer. Health Services Technician, and Caseworker.
Page 48
October 10. 2000
Data Analysis Report
Assessment of GeorgiaGiJj1J noah
Figure 18 displays the percentage distribution of PAl scores for each of the selected class titles. Immediately evident is the very high proportion (over 8:3% of Correctional Officer 2 performance evaluations with scores of :3.0 to :~.'1 followed closely by a similar high proportion (over 5211.,) of Correctional Officer 1 performance evaluations with this same rating. Certain low skill class trtles (Housekeeper, Houseparent and Health Services Technician) also showed large proportion of scores below :>.5 and smaller than average proportion of scores above 4.5.
Strong differences existed in the distribution patterns. For example, compare the Correctional Officer performance evaluation pattern with that of Secretaries where approximately 75% of performance evaluations were for 4.0 or higher.
Accounting Tech 1
Caseworker, Pnn
Caseworker. Sr
CleCrkle,rkA,dPmrin Clerk, Sr
IE:;SE~::i~EE::=:;~I:;St~ ::::::~:z:
Correctional Officer 1
CorrectIOnal OffICer 2
Equipment Operator 2
Health svcs Tech
Health svcsTech Sr '
Health Svcs Tech, Lead
Housekeeper
Houseparent
Human Services Tech, Instruclor LPN, Sr
Nurse. Sr(Commlelnj
Probation/Parole Ofc 2
Secretary, Prin
Secretary, Sr
SecrelarylTypist
Soctal Service Spec 1 Technicallnstruclor
Other JobTTiotletasl B===:z=:c====::::r======~~
0%
20%
40%
80%
01.0 101.4 015101.9 02.0102.4 2,5102.9 103,0 10 3 4 03,5103,9 104 ,0 10 4 ,4 -4,5104,9 -5,0
100%
Figure 18 PAl Scores for 25 Most Frequently Evaluated Class Titles
The distribution of PMF-based performance evaluations by job title is shown in Table 2fi. Because PMF performance evaluations in 199(i were prepared for both new jobs titles and old class titles, only l!}!}7 through 1999 data were used.
During GeorgiaGajn implementation, employees were moved individually to new job titles by agencies following a review of job duties. Part. of the design of the new classification structure involved combining of some class titles that had been part of traditional promotional hierarchies into fewer new job titles. This occurred predominantly in class series or families with large numbers of employees. For example. the number of titles was reduced in the Correctional Officer, Probation/Parole Officer, Clerk, and Secretary series. At the same time. hundreds of new job titles were created in other areas to permit clearer definition of compensation criteria and performance measures. For example, the number of job titles created in the social services area grew and the Caseworker series was expanded to include many different job titles based on specialty and service areas.
October 10,2000
Page ,m
Assessment of GeorgiaGain Goals
Data Analysis Report
Agencies were also encouraged to develop new job titles within the standard classification plan to accommodate the thousands of unstructured non-merit class titles identified only by a title and code. Several agencies used the GeorgiaGain project to develop new jobs or move employees into common jobs within the state classification plan.
Table 2()
Uitrih!!tjg.ll 0 f PMF R!LtingJ~lr~~M(l!J:~rS~Sl ue n t Iv EVl!!!!!lt~g....!!9h.Ti!Je--,'S
Job Title Acet Paraorotessronat Clerk 1 General Clerk 2 General Correctional Officer DOL Services Snec EauiD Ooerator 2 EQuiD Onerator 3 Fam Ind Case Mar 1 Health Svcs Tech Housekeener Houseparent Instructor .IIIV Corr Officer 1 l P N !Innatient Svcs) Probation Officer 1/2 Proaram Assistant Public Health Nurse Secretarv 1 Secretarv 2 rseroaent (GDC\ Social Svcs Case Mar Social Svcs Prov 1 Social Svcs Tech Social Svcs Tech Sr Troooer 1st Class
lttes
Total
Does Not
Far
Total
C
Meet
Meets Exceeds Exceeds Evaluations
59 97 91
I 1252
31 4
18
2044
30
2032
12
2184
65 19558
42
1462
8
20P
514 159 321 1385
95 148
22
2657
11 19
~
')
22262
"
1634
1
2.173
1
3
1.225
186
4
1419
213
86
4233
398
3
4933
174
25
4610
80
4889
19
13
1415
34
2
1483
89
32
2175
53
7
2356
21
12
1720
87
1840
496
5
2501
56
6
3066
21
8
1 526
40
1595
64
17
1 741
221
7
2050
159
34 4639
810
12
5654
36
5
1609
109
3
1762
117
23
2164
288
12
2604
93
25
2761
870
70
3819
42
R
1 341
206
1
1598
122
76
3435
473
1
4107
66
50
1675
211
17
2019
38
18
1410
108
6
1580
42
43
1755
153
15
2008
1
II 6527
13 9:17
1608
1 164 100
172702
332 26927
28
1538
5: 1?t; RQt; 209697
The twenty-five job titles shown in Table 2() accounted for 40% of all PMF-base performance evaluations in 1HH7 to 1~)9H. Some job titles included here were not part of the twentyfive most frequently evaluated class titles under the older system. Department of Labor (DOL) Services Specialist, and Trooper 1"1 Class ,vere new' entries while others. such as -Iuvenile Correctional Officer, were new job titles previously reported under other class titles, such as Correctional Officer.
Performance evaluations for employee in Housekeeper, Houseparent, and Health Service Technician jobs showed lower than average numbers of Exceeds and Far Exceeds ratings. Secretary 2 and Trooper 1st Class showed higher than average number of Exceeds ratings and less than 'ideal' number of Meets ratings.
In the job title -Iuven ilo Correctional Officer, more than IBYu of performance evaluations were not true performance evaluations, but were 'considerations' of performance.
Page 50
October 10, 2000
Data Analysis Report
Assessment of Geotgietlntr; Goals
Cler 1,General Clerk 2,General Correctional Officer DOL Services Spec E<1uip Oyerator 2 EqUifl Operator 3 Fam Ind Case Mgr 1 Health SIICS Tech
Housekeeper Houseparent
Instructor JUII Corr Officer 1 LPN (Inpabent Svcs)
1121Iii~ili~~gll~~~II; Program Assistant
PPrOubb<liclboHneSOaelcfthfriceNetarurryse1
Secretary 2
Sergaent (GOG) Social SIICS Case Mgr
Social svcsProv 1 Social Svcs Tech
Social Svcs Tech, Sr
Trooper 1stClass
Other JobTitles Total
0%
20%
40%
60%
80%
100%
Figure H) - PMF Scores for 25 Mostly Frequently Evaluated -Iobs Titles
October 10. 2000
Page ;')1
Assessment of GeorgiaGain Goals
Data Analysis Report
B.~~minationof Performance Evaluations by Agency
This examination of performance evaluations focused on an employment characteristic. However, the distinction between performance evaluation systems was retained. Agency identification is based on the employee's employing agency at the time the performance evaluation was prepared.
Table 27 shows the distribution of PAl scores for agencies with more than 200 PAl-based performance evaluations.
Table 27 Distribution of PAl Scores bv Agency
1.0
to
1.4
Aoriculture
1
B&F
Corr Ind
CSB
3
DCA
Dr.H
DHR
4
DHR-LO
fl
DJJ
DNR
DOAS
DOC
2
DOD
DOE
1
DOL
DOR
2
DOT
1
DPS
= DTAE
InTAESch
GBI
GFC
GMS
InsComm
1
IT&T
OPB
P&P
PSC
IsOS
ISlll Fin
IVeterans
Wkr Como
lotner
Total
23
1.5 to 1.9
5
19 28
1 3 3 3 6 4 3 1
1
77
2.0 to 2.4
4
1 24
128 110 13
9 9 3f!
16 18 23 66
3
2 1
1 6
3
1
2 478
~r.rlrA
2.5 3.0 3.5 4.0
to
to
to
to
2.9 3.4 3.9 4.4
9 368 684 850
2
27 100 140
67 266 77
75 1851 2185 3054
4
16
23 118
1 118
88 157
361 6993 7872 1? rsr
236 4970 . 6818 12569
25 638 1 160 1 621
=:t 31
1068 1968
38
980 402
275 12690 11 121 6064
2
51
67 19~
20 206 311 628
39 525 1037 1546
49 561 860 1278
58 2440 2540 7048
21 1007 2347 1 384
1
67
4'" inn
1 1863 319 1 125
5 126 438 811
6 499 1068 538
3
Q I 167 170
16 26
264 142
4
1
81
fl4
7
71
91 185
17 265 541 995
3
18 109
5
68 268 336
6
51
91
65
10
9
52
1 106 42 148
4 48 ~77
1324 37319 43
782
4.5 to 4,9
155 65 9 1 843 103 198 9473 8881 966 926 140 1 441 158 785 876 557 2627 386 120 649 267 104 76 32 316 189 391 158 186
8 120 56
~.d
32295
5.0 Total
7 2078
1
335
420
648 q n88
5:'l
317
55
619
41::\2 41719
331t:; 36935
221 4645
46 4383
28 2506
7R 31 712
122
595
691 2661
194 4241
77 3411
513 15296
111 5260
1C
353
847 4806
2 1 671
2222
4
511
1
728
23
525
19!:
741
~t 2262 300 901
221
191
382
~~ 2
355
11 702 183 060
The following agencies were grouped into a line labeled Other .~ Employees'Retirement System, 'reachers' Retirement System, and the Subsequent Injury Trust Fund. Notable
Page 52
October 10, 2000
Data Analysis Report
Assessment of Georgine :ajlJ Goals
agencies with more than twenty-five employees with no performance evaluations in the database were the Department of Audits, the Georgia Public Telecommunications, the Department of Law, the General Assembly, the Georgia Building Authority. and the -Iudicial Branch including Supreme Court, Court of Appeals, and the Administrative Office of the Courts. Many smaller agencies were grouped under the agency to which they were attached. For example, the State Health Planning Commission was reported as part of the Department of Human Resources.
The number of performance evaluations was generally representative ofthe number of employees in each agency with the exception of those agencies mentioned above and the schools associated with the Department of Technical and Adult Education (DTAESch). This may be related to the large number of certified teacher/vocational instructor positions in the schools which required special system processing to meet their September] increase date.
The distribution of PAl-based performance evaluation scores for the sixteen largest agencies show great variation (see Figure 20). The Department of Administrative Services and the Department of Corrections had nearly identical distributions, both of which showed
much greater than average number of performance evaluations with scores at a.!J and
below (78',y') and 7(5%l respectively), The schools of the Department of Technical and Adult
Education showed nearly the same distribution of score at a,4 and below, but also showed
the second highest proportion of scores of 5.0. The Department of Education showed a distribution pattern that was nearly the exact opposite ofthe overall distribution of scores with very few scores below :3.4 and nearly 25(% of all scores being 5.0,
100% 80% 60% 40% 20% H .1 ....... 1
-5.0 -4.5 to 4.9 m4.0 to 4.4 m3.5to 3.9 m3.0 to 3.4 02.5 to 2.9 02.0 to 2.4 01.5 to 1.9 01.0 to 1.4
Agic CSB DHR DHR- DJJ DNRDOAroOC DOE DOL DOR DOT DPS TA GFC P&P OtherTotal
LO
Sch
Figure 20 - PAl Scores for Larger Agencies
The distribution of PMFbased performance evaluations by agency is shown in Table 27 for agencies with more than 200 performance evaluations.
Oetober 10. 2000
Page sa
Assessment of GeorgiaGain Goals
Data Analysis Report
The following agencies were grouped into a line labeled Other - Employees' Retirement System, Subsequent Injury Trust Fund, Office of School Readiness, and the (}eorgia Development Authority. Notable agencies with more than twenty-five employees with no performance evaluations in the database were the Department of Audits, the Georgia Public Telecommunications, the Department ofLaw, and the -Iudicial Branch including Supreme Court, Court of Appeals, and Administrative Office of the Courts. Smaller agencies were grouped under the agency to which they are attached.
Table 28 Distribution of P,MF Ratings within Agen<;ies
Aari B&F Comm Ins Corr Ind
CSB
DCA DCH DHR DHR-LQ
DJJ DNR DOAS DOC DOD DOE DOL DOR
DOT DPS DTAE DTAE-Sch GBA GBI GAn Asm
GFC GMS IT&T OPB P&P PSC SOS Stu Fin TRS Veterans Wkr Como Other Total
OoeSNot~
Far
C
Meet
Meets Exceeds Exceeds
27
31
75
245
8
3
10
396
116
9
1
18 1009
176
15
31
6
545
84
9
602
339 26142 3008
323
5
12
849
289
87
24
9
837
174
15
~
342 48477 514 45721 49 10496
6275 5733 985
30 29 14
103
99 6207
1604
188
35 3367
528
2343 17 12 168
196 50821
2
815
14 2435
118 6.748
4907 154 299 1002
-24
4011
315 80
37 4367 151 21727
750 3414
~t
12
63
6768
1534
274
4
5
533
127
14
0
3
3028
136
11
6
3 1273
226
34
18 2499
473
80
1
42')
2
12 2634
489
10
26
5
570
107
13
4
5
673
99
46
10
13
910
306
103
5
34 3099
315
19
3
5
409
86
24
17
13 1172
303
44
1
1
179
85
28
22
1
201
14
18
361
149
~
3
3
539
98
1
8
3
361
44
7902 2169 259465 34334 277
Total
3186 534
1220
67~
30427 1242 1059
56694 53773 12760 8154 4153 58426
1075 2788 8.077 5558 25670 8658
684 3185 1 542 3072
423 3147
721 827 1343 3474 527 1 550 294 239 530 653 420 306640
The number of performance evaluations is generally representative of the number of employees in each agency with the exception of the schools associated with the Department of Technical and Adult Education (I)TAESch).
Page 54
October 10, 2000
Data Analysis Report
Assessment of Ceorgiet.lein Goals
The distribution of PMF-based performance evaluation ratings for the sixteen largest agencies (see Figure 21) was generally consistent across all agencies. The general distribution pattern did not align with the 'ideal' distribution in that the actua I distribution contained a larger proportion of Meets ratings and less than anticipated Exceeds and Far Exceeds ratings. The most notable exceptions to this pattern were the Department of Natural Resources, the Department of Public Safety, and the collective group of all other agencies
100% 80% 60%
Far Exceeds -Exceeds llMeels
IlONM lie
40%
20%
0%
Agri csaOHR OHR- OJJ ONROOA9:>OC DOE DOL OCR DOT OPS TA- GFC P&P OtherTotal
LO
Sch
Figure 21 PMF Ratings fill' Larger Agencies
October 10, 2000
Page 55
Assessment of Georgietlein Goals
Data Analysis Report
Examination of Terms & C~mditions Ratings
This examination of PMF ratings for the period HmG to W99fix:used on an internal aspect of PMF-IHIS(~d performance evaluations. During the development of the Performance Management Process, concerns were raised about the possibility of employees performing adequately in the areas related to job, individual. and statewide responsibilities but failing to meet basic terms and conditions of employment. A separate 'Terms & Conditions' section was added to the performance management form and during each evaluation period, supervisors evaluated each employee in two areas- Responsibilities and Terms & Conditions. Both values were captured in the GEMS database. The earlier examinations have been limited to the rating assigned to the responsibility area.
>-
;e~ C)
til r;;
c o
;
~
0.0::
til
4)
0::
C Did Not Meet Meets Exceeds Far Exceeds
Total -
Table 29
Distribution of Terms & Conditions Rating
- TArm!'1.
Ratinn
Needs
C
Did Not Meet Improvement
Meets
7902 7902
622
794
1251
328
1312
257.825
14
3432c
1
2769
950
1 621
29616'
Total
7902 2169 259465 34334 2770 306640
During the four-year period covered by this study that the PMF-based system was used, as few as :328 salary increases were withheld based on Terms & Conditions rating when otherwise warranted based on the rating of job and individual responsibilities.
100% 80% 60% 40% 20% 0%
lOt-Meets ,lIIt-NI -t-DNM .Ot-e
0.00%
0.00% 100,00%
13.55% 28,68% 0.00%
99,37%
0.13%
0.00%
0.00%
0.00% 0.00%
Figure 22 - Terms & Conditions by Responsibility Rating
Figure 22 examines Terms & Conditions rating mapped to the corresponding responsibility rating. Nearly fHU)% of employee receiving ratings of Meets or higher on job and individual
Page SCi
October 10, 2000
Data Analysis Report
Assessment of GeorgiaGain Goals
responsibilities, also received the highest Terms & Conditions rating of Meets. Two-thirds
of those receiving- a Does Not Meets rating in the Terms & Conditions section also received a Does Not Meets rating on reeponsibi.litiee.
Observations
1. Changes in performance evaluation patterns occurred following GeorgiaGain implementation. Before GeorgiaGain 48.7%1 of evaluations indicated that the employee 'frequently' exceeded requirements of the job and (j,4%1 'consistently' exceeded job requirements. LInder the Performance Management Process developed as part of Ceotgietlein, only 11.2%, 'Exceed' expectations and O.!)(X, 'Far Exceed' expectations.
2. Ratings under the Performance Management Process are more equitably distributed as evidenced by a comparison of performance evaluations by gender and ethnic group. Total equity has not been attained; white and female employees still receive proportionately more of the higher ratings.
a. Implementation of the Performance Management Process has reduced the influence of
age and tenure on performance evaluations. Increased age and tenure still impact positively on P]\lF ratings through age 50; but age does not positively influence ratings after that point.
4. There continues to be strong influence of compensation-related factors in the distribution of performance evaluation ratings. Consistent patterns of higher ratings are seen for employees on higher pay grades and with higher annual salaries. More than 2;)% of employees on pay grades 15 and higher received ratings of Exceeds or Far Exceeds as compared to less than 5% of those on pay grades 7 and below.
5. There is strong variability in the distribution of performance evaluation ratings by job title. Performance evaluations for employees in jobs such as Housekeeper, Houseparent, and Health Services Technician contain less than :VYi. of higher ratings compared with 25% for employees in other jobs such as Secretary and Trooper lq Class.
G. With notable exceptions. the high degree of variability seen in the previous system by agency bas been greatly reduced.
7. The universal evaluation of every employee against the Terms & Conditions standards may be unproductive. Over D~)'Y.. of performance evaluations indicate the highest rating possible in this area. Only :~28 increases may have been withheld solely on the basis of Term & Conditions when otherwise warranted based on responsibility rating.
October 10.2000
Page 57
Assessment of Ceorgietlein Goals
Data Analysis Report
Page 58
October 10, 2000
Data Analysis Repott
Assessment of GeorgiaGaiTl Goals
Report 2 (GeorgiaGain Goal 4)
Rewa rei Best Performers
The performance evaluation data was linked to personnel transactions for salary increases and adjustments recorded in the Georgia Employment Management Systems (GEMS). For purposes of establisbing linkage between a performance evaluation and a personnel transaction, a five-month window beginning on the first of the month in which the performance evaluation was performed was selected. A window of this size was necessary to establish linkage between performance evaluations completed as early as -Iune lor increases granted in October. Linkage was established between performance evaluations and any proximal salary increases. Finally, an examination ofperformance evaluations ratings associated with selected types of salary increases was performed.
The examination of performance evaluations and salary increases was limited to three types of salary increases and adjustments - performance-based increase, salary adjustment, and crir.erion-based adjustment. The granting of these increases is associated with some measure of agency discretion; and separate transaction codes were established in GEMS to record them. Other types of increases, such as across-the-board, assignment of class/job to another pay grade, and teacher salary adjustment were not included in the study because of the general applicabi lity of these increases and lack of agency discretion.
-
, Performance ! Group
High
Average
Low
Table so
1)<2xi.~1Im!!m;g ..(;r(}tm.s
PAl-based System Scores
PMF-based System Ratings
45 to 50
Exceeds and Far Exceeds
3.0 to 4.4
Meets
1.0 to 29
Does Not Meet
In order to facilitate comparison, delineation between High, Average and Low Performance Groups was constructed. For performance evaluations under thePMF-based system,Low was defined as the Does Not Meet rating, and Average was defined as the Meets rating. The ExceNls and Far Exceeds ratings became High Perfor-mance (houp. In addition, the Low Performance Group included ratings of Does not Meet in the Terms & Conditions area
regardless of the rat.ing shown for job and individual responsibilitios. By policy,
performance-based increases were withheld for ratings in the Low Performance C;roup.
October 10. 2000
Page ;')9
Assessment of C;eorgiaGain Goals
Data Analysis Report
For PAl based performs nee evalu a tions, Low was deli ned as a score of less than :UJ and therefore not eligible for salary increases. High was arbitrarily chosen as 4.5 and above.
Selection ofR~!:~(l,r.d~.J!)rAnalysis
Table :J 1 displays the number of transactions reported for the three selected types of increases. The numbers in the Total 'I'ransactions column for each year are consistent with
expectations, even for the exceptional years ofWH:J and wm;. Salary increases for state
employees were reinstated in May UlfJ:) following a two-year freeze. In W!)(i, some employees were eligible for a salary increase under the preC;corgiaGain system on their regular 'anniversary date' in -Ianuary through -Iune as well as another salary increase in October along with all other employees, Also in U)!)(), large numbers of salary adjustments were made before and immediately after Georgieclein implementation to bring salaries for some employees more in line with similarly classified employees.
Table :31 Distribution ofSelegted Increases bv Year
Criterion-
Based
Year Adjustment
~t
1995
1996
81
1997
361
1998 1999
1520 1728
Total
3690
Performance-
Salary
Based
Total
Adiustment Increase Transactions
337
38710
39047
614
64495
65109
1 152
67532
68.684
10603
103025
113709
9691
67278
77330
10367 11974
67122 66043
79009 79.745
44738
474205
522633
Table ;)2 restates in summary the number of performance evaluations available for analysis from Table 5.
Table az
Distribution of Perf()rmance Evaluat.ions bv Year
Evaluatons under PAl
S stem
44771 68193 70096
Evaluations underPMF
S stem
Total Evaluations
183060
Performance evaluationsfor the period April 1HHa to October HH)f) were linked with the selected salary increase and adjustment actions in a five-month window following performance evaluations. A new dataset was created containing both the performance evaluation and the associated salary increases or adjustments.
Page ()O
October 10.2000
Data Analysis Report
Assessment of GeorgiaGaitl Goals
Differences exist between the number of performance-based increases each year show n in Table ;31 and the number ofperformance evaluations shown in Table ;~2. This difference can usually he explained by considering: 1) some performance evaluations documented low performance and. therefore. these employees were not eligible for increases; 2) some employees were above the range of their assigned pay grades and. therefore, were not eligible for increases even though a performance evaluation was p rcpa red; and ;3) performance evaluations may have been prepared for other types of increases and recorded in the system. In W94. U)!)5 W!)7, 1998, and I!)!)!) the difference between the number of performance evaluations and performance-based increases (approximately 1,800 to 4,:300 'extra' performance evaluations each year) can be accounted for under the above rationale.
In 19~);L the number of 'extra' performance evaluations was over (),OOO. or nearly 14%) of the total. This difference can be explained by considering that during normal operations the majority of perforrna nee evaluations are dated the month before the effective date of the salary increase (see Figure 2 and Figure :3 for distributions of pe rforrna nce evaluations by period). Consequently, most of the performance evaluations prepared in December t!)!);J were for -Ianuary UHl4 salary increases. As seen in Table G, over 4,800 performance evaluations were prepared in December H)!)a. Because the data for 199:J did not contain twelve months of performance evaluations and twelve months of salary increases (actually nine and eight months respectively), the December performance evaluations constituted excess performance evaluations that were not offset by -lanuary salary increases.
InW~)(), the general condition was reversed; over G,OOO more performance-based increases were granted than the number of performance evaluations. Again, some portion of this excess can be explained by considering that -Ianuary IH9(; increases were given based on December WH5 performance evaluations (over 5,000, see Table (;). In addition, the number of perforrnance evaluations reported for -Iune through October IHHG may be u nderstated (see Table 7). Duplicate performance evaluations were eliminated from the analysis database. Some performance evaluations prepared prior to -Iune for salary increases in .Ianuary through -Iune were reused to document performance for the October HHH, salary increase.
There is an unexplained difference in the total number of performance-based increases granted during the period (474,205) and the number of increases that can be linked to performance evaluations (4(;7,70(;). This difference of (),4m) is approximately 1.4% of all salary increases.
Examination of Relationship between Perfonncm~eand Increases
On the following page, Table aa displays the distribution of salary increases and
adjustments linked to performance evaluations under the PAl-based system and Table ;)4 displays this data for performance evaluations under the PMF-hased system. Criterionbased adjustments did not exist prior to H)!)(>.
The number of salary increases and adjustments reported pel' Performance Group may exceed the number of performance evaluations. Frequently, both salary increase and salary adjustment transactions were processed in the five-month window associated with the same performance evaluation. Also, tabulations are shown of those performance evaluations where no performance-based increases could be identified, even though the performance
October 10, 2000
Page ()1
Assessment of Geol'ghtGain Goa ls
Data Analysis Report
evaluations would otherwise warrant a salary increase. This situation occurs when the employee is already above the maximum of the salary range or when the employee leaves state service between the preparation of the performance evaluation and the increase delivery date.
Table :J:J Ped(ml1flnc~:J~.Y1Ih!!I.tions versus lncl'(~!:!l-'es under PAl Svstem
CriterionPerformance based
Table :34 Perlm:mance Evaluations verB.!!:':i Increases underPMF Sytem
CriterionPerformance based
Salary
Given
No Increase Identified
Total
Table :35 displays the percentage distribution for salary increases and adjustments made
under the PAl-based system. Table an displays the percentage distr-ibution fill' salary
increases and adjustments made under thePMF-based system. In both cases. the percentages may add to more than 100% because the number of transactions processed exceeded the number of evaluations.
Table :)5 Percentage Qj"~tributionof In(~LellSes under 1>;\1 System
CriterionPerformance based
Page ()2
October 10. 2000
Data Analysis Report
Assessment of GeorgiaGain Goals
Table ;Hi PerCn,!!!Fl,ge DistributiOll~lfJm~reasest{H' PMJL.S. vstem
Criterionbased
Salary
Total
Irnmediately evident is the marked difference between the volume of salary adjustments following Gcot:qiaGain implementation versus before implementation (7.8;~%, versus O"l;Yii.). In addition, st.ricter adherence to the criteria fill' withholding performance-based increases can be seen under the PMF-based system as evidenced by the ~HLHI'X. of Low Performers without performance-based increases versus 8~U)(j'% prior to GeorghlC;;lin.
Discretionary increases, such as salary adjustments, were much more frequent fill' employee in the Average Performance Groups than those in the High Performance Group. Employees in the High Performance Group were only 2;",'}f, more likely to receive salary adjustments than those in the Low Performance Group.
In the criterion-based adjustment category. employees in the Average Performance Group received more increases than did those in the High Performance Group.
1. The number of discretionary salary adjustments processed by agencies has increased per year over 1000%, following Geot:qiaC;ain implementation (see Table ;n). .lust over 2,000 salary adjustments were processed in WH;~, WH4, and WH5 combined. In each year following Georgtetlein implementation, thefewest number of salary adjustments processed was more than four times the combined pre-implerncntat.ion number.
'J Differences do exist between the proportions of discretionary increases granted to employees in the High Performance Group versus those in the Low Performance Group. However, employees in the Average Performance Group received proportionately more increases than those in the High Performance (~roup (see Table :~(j). A similar distribution of salary adjustments existed prior to GeorgiaGainimplementation. but with considerably smaller numbers of transactions.
:3. The actual number of salary adjustments given to reward top performers cannot be discerned. Since ~)2'Yi) of all salary adjustments were given to employees in the Average and Low Performance Groups, this type of action had become a universal salary increase code used for any salary increases other than performance-based increases.
October 10, 2000
Assessment of GeOt~giaGain Goals
Data Analysis Report
Page (;4
October 10, 2000
Data Analysis Report
Assessment of Geol:c;iaGain Goals
Report :3 (Ceotgietlnin Goal 7)
Help Managers Document Poor Performance
Performance evaluations under the two evaluation systems were reviewed and those performance evaluations with low scores or rat.ings were identified. Low was defined as a score of 1.0 to 2.!) under the PAIbased system and a rating of Does Not Meet under the PMFbased system. Comparisons of these two groups to their parent groups were performed. Additionally, the internal make-up of the two low performing groups was examined using the fallowing personal and employment characteristics:
Age, Ethnic group, Tenure. and Annual compensation range.
During the period from April H)na to October HHH). two performance evaluation systems
were used. The older Performance Appraisal System using the Performance Appraisal Instrument (PAl) existed until December 19!)5. A total of 18:U)(;O performance evaluations were available for analysis for the period from April H)!);{ to December W!)5. In -Ianuary l!HW, the State implemented a new Performance Management Process that used the Performance Management Form (PMF). A total of :m(;,(>40 performance evaluations were
available for analysis for the period from -Ianuary HWG to October ]mw.
Performance evaluations with low scores or ratings were extracted. Low was defined as a score of 1.0 to 2.9 under the PAl-based system and a rating of Does NotMeet under the P.MF-based system. This is the same structure used in previous reports (see Table :30 on page 5H). The Low Performance Group also included performance evaluations where Does Not Meet was received on the Terms & Conditions section of the PMF, regardless of the rating on the responsibility section. Table S? displays the number ofperformance evaluations with low score or ratings. Under the PAl-based system, supervisors could use a wide range of scores to indicate the level of unsatisfactory performance. Table Sd displays the detail distribution of low scores within the score ranges used in previous reports in this paper.
Cktober 10,2000
Page (;5
Assessment of Gt'orgia(;ain Goals
Data Analysis Report
Table 87 J!ow Performance Evaluations lw Evaluatio!!...fuJ:::l&nl
PAl PMF
Total
Total
low
Low
Evaluations Evaluations Percentaae
183060
1902 2 1f\qll
1.04% 0,71%
489700
407111
0,83%
'l'able :38 fle t }.DlnfJ~Q,1.Y-.B~~Ol:::"L,P nderr>AI System
Discrete Score 2,9 2.8 2,7 26 2.5
2.4 23 2,2 2,1 20
1,9 18 1,7 1.6 15
1.4 1,3 1.2 1,1 10
Total
Percent
of low
Count Scores
::t 16,19% 2103% 241 1? fi7 0j" 195 10,25% 180 9.46%
107 5,630/. 116 6.10%
64 3.36% 52 2.73% 139 7,31%
21 1,~
22 1.1 17 0,891< 6 0321< 11 0.58%
4 0.21% 7 0.37% 4 0210/. 'J 0,11,.{,
6 0,32%
1902 100,00%
Score Grouping
Count
Percent
of low
Scores
25
to
1,324 69.61%
2.9
2.0
to
478 25.13%
2.4
1.5
to
77 4.05%
1,9
1,0
to
23 1,21%
1,4
Total 1902 100,00%
Examination of Low_.f~EformanceEvaluation Scores and Rating\'!
Based on the data presented in Table :37, more low scores proportionately were given on PAl-based performance evaluations than low ratings on PMF-based performance evaluations (1.04'% versus 0.71 (!,{,). Low scores and ratings represented a very small portion of all performance evaluations. Under both performance evaluation systems, the percentage fell below the ideal distribution presented in Table 12.
The summary of PAl-based performance evaluations presented in Table 88 indicates that supervisors were capable of discerning performance differences of one-tenth point, even for Low Performers. Also of interest is that over] ()% of the performance evaluations that fell below the minimum required to authorize a salary increase (a score of :LO) did so by only one-tenth of a point.
Page (;()
October 10, 2000
Data Analysis Report
Assessment of Ceotgieciein Goals
Exami!lation of Employe~~Profilesof Low ~L<:;~tre and Ratings
As evidenced by the data shown in the earlier analysis in Report 1 GeorgielGain Goal ;) ,:\ssure FI.Lir J'.!TI()fml!lg:.<,:j':valuJ.IJiql!$, the influence of some personal and employment characteristics reflected in the distribution of PAl scores appear to have changed under the PMFhased system. This section of the report will revisit some of the personal and employment characteristics, but limit the analysis to those employees receiving low performance evaluations. Of particular interest are the distributions of ratings and scores by ethnic group, tenure, and compensation range.
A1)illysis of I.mv Scores and F?iJUngs h,I{ E'thnLcGrollp
Using the data displayed in Table l:l and Table 14 on pages :l2 and :38, the following presentation was developed,
1DO"!" 80% 60%
I II I PAl Scores
PMF Scores.
OWhite -Black I:JOther
40%
20%
0% Low
PAl Scores
Total PAl Scores
Low PMF Scores
Total PMF Scores
Figure 2:3 Comparison of Low Scores and Ratings by Ethnic Group
Between lHHa and 19HH, the proportion of black employees and other employees increased in the overall population of state employees (see Appendix B) and their representation in the total number of performance evaluations also increased. However, the proportion of performance evaluations with ratings received by black employees decreased more than ten percent (from 5:t.(>8lJ() of low evaluations to 44.55%). l)espite the decreased numbers of white employees in the overall population of state employees, performance evaluations with low ratings received by white employees now comprise the plurality of low performance evaluations.
Analysis of Low Scores cHId Ret ir:JJJs by Tenure
Using the data displayed in Table Ltl and Table 20 on pages :m and 40, the presentation
shown in Table 24 was developed.
October 10, 2000
Page (;7
Assessment of Georgieileir: Goals
Data Analysis Report
Performance evaluations with low ratings were prepared on a much broader basis under the PMFbased system than under thePAI-hased system. The representation of more senior employees, particularly those with more than 10 years of service, increased by as much as 7tl~) in some groups.
40% 30'1'0 20%
r\ddlll'-ltml 'urpp<.)r!iog di~L:lJl for this KTaph nm ~H:< ftlttn,_t ,)"() i,og(' IGO
PAl Scores
I PMF Scores
--'_.'--~.'--'-""""---""I.
-<2
112-4
05-9
010-19
020-29
113G-39
-40+
10%
0% low
PAl Score
low
PMF Rating
Figure 24 ~ Comparison of Low Scores and Ratings by Tenure
Analysis of Low Scores and I?atings by Salary I?ange
Using the data displayed in Table 28 and Table 24 on pages 45 and 4G, the following presentation was developed.
60%
PAl Scor
I PMF Scores
-<$20K
-S20K.
C$30K
C$40K 40%
0$50K
D$60K
B$70K+
20%
0%
low
PAl Scores
low
PMF Ralings
Figure 25 Comparison of Low Scores and Ratings by Salary Range
Page G8
October 10, 2000
Data Analysis Report
Assessment of Georgi,JGain Goals
A noticeable reduction was seen in the proportion of performance evaluations with low
ratings prepared for employees earning less than 820,000 annually. During this same
period, the average salary of state employees increased to just under $:m,ooo as the resu It
of annual salary increases and extraordinary steps taken by agencies to increase the
salaries of the lowest paid employees.
Obs(~rvati()ns
1. Table 38 presents an interesting counter to one of the arguments raised initially to the rapid development of a pay-for-performance compensation system. Concerns were expressed that managers could not discern tine levels of performance sufficiently to support variable pay increases. However, it appears managers were able to distinguish very fine degrees of difference between employees receiving performance evaluations with low ratings.
2, The very small proportion of performance evaluations with low scores and ratings may indicate that mangers had some difficulty preparing such performance evaluations. This appears to be more true under the PMFbased system developed as part of GeOT)-!iaGaill. The proportion of performance evaluations with low scores fell from 1.04(% to 0.71%). The 'ideal' proportion of low ratings or scores is 2% to :3%.
:3. The assignment of performance evaluations with low scores or ratings was more equitable under the new Pl\-1F system. The proportion of performance evaluations with low scores or ratings received by black employees dropped from 54'% to 44(yil and was more in line with their representation in the overall employee population,
4. Under the PMFbased system, managers assigned more low ratings for senior employees, particularly those with 10 to :3H years of service. The proportion of low ratings assigned to performance evaluations for employees with 20 to 2~) years of service increased from H% to 14(%.
o. Although managers assigned more low ratings to performance evaluations for employees with higher salaries. this shift was probably due more to general increases in salaries than to changes in manager behavior.
October 10, 2000
Page es
Assessment of Georgietletn Goals
Data Analysis Report
Page 70
October 10, 2000
Data Analysis Report
Assessment of Merit Svstein Reiortn (joa)s
VI. Merit System Reform Goals Measurable
with GMS Data
October 10, 20f)O
Page 71
Assessment of Meri! System Reiorm Goals
Data Analysis Report
Page 72
October 10, 2000
Data Analysis Report
Assessment of Merit System Reiorm Goals
Report 4
(Mett: System Reionii Goal 2)
Advance Employees on the Basis of Abilities, Knowledge and Skills
Within the Georgia Employment Management Systems jEMS), promotions were recorded using six transaction codes to indicate the type of promotion. Use of multiple codes for a single general transaction type was particularly common prior to 11 coding simplification effort begun in HH)(; as an adjunct to Merit ,System Reiorm. This reduced the number of promotional transaction codes to two.
Tahle :J!) Promotionatj),uthority (~odes USe~U!LGJ~MS
Promotional Personnel Transaction Authority Codes
CPROMO Conditional Promotion ...."'"U II~ Licensure
PROMO
-10100
10102 12405P
Regular Promotion
_..
00,....01'" Promotion
Conditional Promotion ~ '~"'1:' Licensure
Promotional Move to Unclassified Service
9700P
Pr0r.:t:.?~~~~~!.AppOi ntment..~~.~C?.~.:gE:?r:ti.ticate Position
Code developed or retained after 1996 code Simplification effort
~
.. Last Used
September. 1996
" ' _ ' _ " _ ' _ " '___ _ _ ' _ _ ~~"'~'~'
~~N~_
September, 1996
September, 1996
~,,-"'"
"
August. 1996
~.".,
.,__ ~.~.w._,w~._
_ _
".~~_~
N>_~_'"
Personnel transaction histories stored in the GEMS database were reviewed and relevant personnel transactions between -January 1. Im)a and September :30, U)!H) were extracted. With the exception of promotion upon reappointment, all types of promotions were considered including promotions within the employing agency as well as promotions concurrent with a transfer to another agency. Employees in both the classified and unclassified service were considered.
Performance evaluation scores and ratings were used as a measure of the "ability, knowledge and skills" of the employee. Higher scores and ratings were considered indicative of higher levels of "ability. knowledge, and skills". Linkage was established between each promotion personnel transaction and the performance evaluation score or rating that immediately preceded it, if any. Promotional patterns were examined using the combined data of promotions and performance evaluations. Further examination was conducted within the High. Average, and Low Performance Groups described on page 59.
October 10,2000
Page 7:3
Assessment of Merit Svstem Reiottu Goals
Data Analysis Report
Selection of Records for Analysis
Promotions can be processed by agencies at any time limited only by the agency's personal services budget. Table 40 displays the number of personnel transactions for promotion processed between WHa and HHm. In cases where multiple promotions were processed in the same month for the same individual, the latest act.ion was retained fill' analysis.
'fable 40 Number of Promotions P~.:LX!:!l!:
Year
1993 1994 1 1 1997 1998 1999
Total
Promotion Transaction Types
-,.-.------j
To
Non-
Unclassified
Certificate
Total
Service Conditional Position Promotions
175
45
8
8,090
175
12
4
9,079
196
10
161
.,~XL
7-,69]5042
8,103
5.711
17
54.126
For purpose of this table, both codes fill' Regular Promotions (10100 and PROMO) and both codes for Conditional Promotions 00102 and CPROMO) have been combined.
The number of promotions each year appears to be consistent with prevailing trends at those times. The sma II number of promotions for l~)HH represents transactions for the period from January to September (annualized to 7,6(15). The relatively low number of promotions in UH>7 is unexplained but may be due, in large part, to two results of Georgieciein implementation. The new job structures eliminated many purely promotional jobs and agencies may have reported some promotions under a variety of 'adjustments transactions' made availahle to revise the individual effect of Ceorgietlnin implementation.
Table 41d isplays the availability of performance evaluation data for the selected promotions.
Table 41
}'erfi.mnanee Evaluation Data\vailable fbr All Types of Promotions
_ _._>H ......_ " _..
Matching
r - - - -...
No Matchfng-
Performance
Performance
Year
Evaluations
Evaluations
Total
1993
2.264
5,826
8,090
1994
r-'
1995
7.516 8.089
1.563 798
9,079 8.877
1996
6~.?Z~. ,-",
"'1997 .,,_._.__._.__?-.~ 83~ ..
.< '-"
, ,,~,~~,.-,,~-,~>'-'~-'-'-'~
"'--"14.16890"
7.954 -.._.. -..............._6."30-2-
1998
7,502
601
8.103
_____rl,_<,','ij-'
"~~.~,,,.
1999 Total
5,268
_._._----~?_,~~ ..
443
5,711
_ 10,880 ....... ...5...4_,.1_2-6-
w'~~m","~'~.~
""~
Page 74
October 10,2000
Data Ana lysis Report
Assessment of Merit System Reiorm Goals
All promotions were linked to the performance evaluation database described in Hl?l1PIL! {;!-~Q!gL'!f:!.(]JTI Goal;) Assure EgjrJ~(:rformanceEvahlgtiQ.J1;? Before implementation of Ceorgi;,G,lin, performance evaluations were generally prepared based on the employee's anniversary date (see Table (j on page 2G). For pre-GcorgiaGain promotions, performance evaluations prepared in the month of the promotion or in the 11 months prior to the promotion were considered. After GeorgiaG(lin implementation, performance evaluations were generally conducted during a narrow window from -Iuly to October covering performance in the preceding fiscal year (see Table 7 on page 27). For promotions after GeorgiaGain implementation, performance evaluations prepared in the nine-month period prior to the promotion were considered. Additionally, performance evaluations prepared in -luly through October were considered for promotions occurring in -Iuly to October even if the performance evaluation was dated after the promotion.
During periods of relative stability (lHHij. I!HJ7, UHJ8, and IH!}!), the matching technique used here located corresponding performance evaluations for Hl% to !)2'% of promotions. Much lower matching rates are seen in HHJ:) and IH!)4 where performance evaluations were recorded beginning in April l!)!):J. Therefore, no performance evaluation data exists for promotions early in 199:) and this trend continues through mid-l!)!).1 where many promotions occurred before employees' first performance evaluations were recorded.
The following examinations of promotions will only {()CUS on regula r promotions because of the relatively small number of other types of promotion.
E~~mlinationof Pn~mQtionsfor High Perfon:n(!r~
Using the same High, Average, and Low Performance Group developed for other analyses (see Table :lO on page 59), the combined database of promotions and performance evaluations can be displayed as follows:
Table 42 Number of RegulaI' J?romotions bv Perl())'mance GnillQ
Regular
7
7862
22
8888
7
8681
8
4260
4
3526
10
6299
24
8101
14
96
53324
Because l'vferit System Reform occurred in the middle of Um(i, data for that year was split into two parts. Tbe row labeled' HHH>a' contains those promotions that occurred p rior to the effective date of Merit System Reiottu and the row labeled' l!)!)6b' contains those promotions that occurred after Meri: System Reiorm.
October 10, 2000
Page 75
Assessment of Merit System Reionn Goals
Data Analysis Report
Due to the variability in the number of promotions each year and the number of promotions without performance data, Table 4:3 displays this information as a percentage using only those promotions for which performance evaluation data could be located.
Table 4:3 E"U:~,s:!1tageDistribution of Regular Promotions ~2.LI)<?I(9r!!HLn~eCh'oup
Year
Total
2191 7348 7907 3662 2977 5826 7495 5264 42670
The distribution shown in Table 4:5 was compared with the distribution constructed by combining the performance evaluation data from Table 10 and Table 11 on page :30. This new distribution is shown in Table 44. Performance evaluation ratings 01"(;' under the PMF-based system were considered in the Average Performance Group.
Table 44 Distribution of Performa nce~y!!luationsbv Performance Group
Year
1993 1994 1995 1996 1997 199
Total
Total
Comparison of the distribution of performance evaluations (Table 44) with that of promotions for the various Performance Groups Crable 4:3) yielded Figure 26 on the following page for employees in the High Performance Group.
The impact of the unstated GeorgiaGain goal described earlier in this study of reducing the number of performance evaluations with high score or ratings is clearly evident in the percentage drop in high performance evaluations from more than 20% to just over 10%,.
Inl!)!}i3 through 1HH5. the percentage of promotions given to employees in the High Performance Group (2;).:JWVt" 21.()2%" and H).07% respectively) is lower than their representation in the general body of performance evaluations (2{).11(Yo, 2:3.70%, and 2:J.O:J% respectively). As more promotions were linked with performance evaluations for the IHH4 andW!}5 data, this difference increases to 4%,. In the years 1!}!)6 through H}!)!) following Meri! System Reiorm, the situation is reversed. The percentage of promotions given to employees in the High Performance Group 0:1.20(%. 14.1 :3%" 18.4:3(%. and 20.57%
Page 7(j
October 10. 2000
Data Analysis Report
Assessment of Merit Svstetn Reiortn Goals
respectively) is now higher than their representation in the general body of performance evaluations (8.50'%, 11.54'%, 14.;31'yc" and 15.a8'~1. respectively).
30%
....... 0.....
--O--Evaluations
--a -Promotions
10%
0% 1993
1994
1995
1996
1997
1998
1999
Figure 2G Comparison of Evaluations and Promotions for High Performers
For I!HH;, the percentage of postt"v1erit System Reform promotions for employees in the High Performance Group was plotted against all performance evaluations in the High Performance Group rather than only performance evaluations prepared after Merit System Reiorm.
E?fa~1i!lation of Promotions for Average Performers
Comparison of the distribution of performance evaluations (fable 44) with that of promotions for the various Performance Group (Table 4:r) yielded Figure 27 on the following page for employees in the Average Performance Group.
The impact of the unstated C;cOlgiaGain goal described earlier in this study of increasing the number of performance evaluations with average scores or ratings is dearly evident in the rise in the percentage of performance evaluations with average ratings from approximately 75'% to just under 85'YI,.
From H)!};) through Im}i'), the percentage of promotions given to employees in the Average Performance C1roup (71.:HY%, 78.08'%, and 80.84<% respectively) is higher than their representation in the general body of performance evaluations (72.88%, 75.17%, and 7().()0% respectively). As more promotions were linked with performance evaluations in H}!}4 and W~}5, this difference increases to just over ,t<~,{l. I n the yea rs 1HHfi through W~)~) following Merit System Reiorm, the situation is reversed. The percentage of promotions given to employees in the Average Performance Group (8(U;(;'%, 85.7CYX., 81.25%. and 7!). W'Yt. respectively) was lower than their representation in the general body of' performance evaluations (HCl.!)2'X" 87.G7'YtI, 87.H2%., and 8:3.82% respectively).
October 10, 2000
Page 77
Assessment of Merit System Reiortn Goals
100%
90'l';'
Data Analysis Report
--<>--Evaluatlons - . - Promotions
80%
70%
1993
1994
1995
1996
1997
1998
1999
Figure 27 Comparison of Evaluations and Promotions for Average Performers
For 1!J!)(i, the percentage ofpost-Merit System Reiotm promotions for employees in the Average Performance Group was plotted against all performance evaluations in the Average Performance Group rather than only performance evaluations prepared after Merit System Retortu.
Observations
1. The trend of fewer promotions may be part of the continuing impact of Geotgieclein particularly when the growth in the number of employees (see Table 4 on page 18) is compared with the continuing smaller number of promotions.
2. In the years W9(i through]!)!)!> following Mertt SYstem Reiorm, the percentage of promotions given to employees in the High Performance Group (l;~.20%, 14.1:3%), 18Aa'%, and 20.570;(, respectively) was higher than their representation in the general body ofperformance evaluations (8.{iO%, 11.54%, 14';31%, and 1:').;38'Yc. respectively). Further analysis (not shown here) confirms that a similar trend also existed for the very highest performers those with performance evaluation ratings of Far Exceeds.
a.
In the years UH)(i through l!H}H following Merit System Reform, the percentage of
promotions given to employees in the Average Performance Group (8(Ui6(X., 85.70%,
81.25%, and 7!). H;'}-() respectively) was lower than their representation in the general
body of evaluations (90.92%, 87.;7%, 87.!)2(Yo, and 8:3.82% respectively).
4. The increasing percentage of promotions for employees in the High Performance Group is consistent with an overall increase in higher ratings (see Figure 5 on page ;$0.
Page 78
October 10. 2000
Data Analysis Report
Assessment of Merit Systen, J<el(wm Goals
Report [) allferit System Retortn Goal :3)
Provide Equitable Compensation based on Merit and Performance
The employee extract information described earlier was examined to create a personal salary line for each employee. These salary lines show each employee's salary at II common point each year. The percentage of increase or decrease from the preceding year was calculated. The salary increase percentage for each year was linked to the proximal performance evaluation data.
The composite salary lines were undertaken using the following characteristics:
- Performance group (page 81).
Compensation level (page 8:n,
- Race I ethnic group (page 85), - Gender (page 87), and -Date of hire (page 8~).
SelectiQ!LQf Records for Analysis
Other reports in this study grouped performance appraisal data by calendar year. However, the State of Georgia budgets personal services funds by fiscal year. When the General Assembly legislates the percentage or dollar amount of salary increases through the budget document, that amount is consistent for the fiscal year. In order to obtain the most accurate representation of salary levels on a year, by-year basis, the data reported previously must be regrouped by fiscal year. Without this adjustment, the data would show large increases for some, but not all, employees in calendar year l!)96. Some employees received increases in -Ia.nuary to June under the previous rules and then additional increases at implementation of GeorgiaGain in October of 19!)(;
The employee extract information shown in Table 4 on page 18 was reviewed to identify each employee's salary on -Iune :30 of each year. Because of the need to link this data to performance evaluations, only employees with performance evaluations were considered. This eliminated temporary and short-term employees who do not normally receive performance evaluations and any regular employee who separated before receiving a performance evaluation. For each employee, the percentage of salary change between each -Iu ne :30 reference point was calculated. The performance evaluation that occurred between the two salary points was linked to this salary increase rate.
October 10,2000
Page 7H
Assessment of Merit System Reiorm Goals
Da ta Analysis Report
This new database of annual salary increase rates and associated performance evaluations contains the following data points.
Table 45 Sll!ftr.y Increases with Matching Performance Data
Fiscal Year 1993-1994 1994-1995 1995-1996
-".,,..._.~
1996-1997 1997-1998 1998-1999 1999-2000
Total
Salary Increase Data Points
44.779
58,091
" .. '""___
__
__m_
~ ~_'~~
60.377
60.191
'~-.....,~-
59.573
60,708
57,458
401,177
Within this data. approximately 25,000 employees are present in all seven fiscal years. They represent a unique group of employees and are worthy of further study.
Salary increase rates are contained in the annual budget document. The following table displays the legislated increase amounts for the fiscal years 1998] 994 toWm)-2000.
Table 4() Budgeted Salary Increases
Fiscal Ye
1995-1996 1996-1997 1997-1998 1998-1999 1999-2000
Cumulative
4.0% 4.0% 4.0% 3.0% 26.5%
The Normal or Meets percentages were used to calculate a Nominal Increase line. This Nominal Increase line represents the salary line for an employee who performed adequately, was within the range of his/her assigned pay grade; who received no other increases such as salary adjustments or promotions; who only received performance evaluation score under the PAl-based system of :H) or higher; and who received a performance evaluation under the PMF-based system of Meets.
Page 80
October 10.2000
Data Analysis Report
Assessment of Merit System Reioru; Goals
.E~i!minationof Salary Lin.~~.I>..YJ>erfonnanceGroup
Using the same Performance Croups described in Table ao on page 5n as the controlling
variable. the salary lines tor the various Performance Groups are shown below.
'I'able 47
_. SalarY.ll1crease Rates bv Performance G.rOUPB
Discreet Increase Rates Nominal Increase All EmDlovees Hiah Performers Averaae Performers Low Performers
1993-94 1994-95 1995- 1996-97 1997-98 1998-99 1999..Q0 250(X 4.00% 5.00<>! 4.00% 4.00<>! 400;, 3.00% 4.27% 5.95% 6.29% 574% 5.81':>;0 5.98% 478"lt 4.06% 609/0 6.26% 628% 7.80% 8.03% 6.72% 439% 595% 6.34% 573% 558,{ 5.63% 4.42% 0.46% 1.47% 0.34% -0.11% 0.08% 060% 055"lt
Cumul ative Increase Rates Nominal Increase All Emolovees Hiah Performers Averaae Performers Low Performers
1993-94 1994-95 1995-96 1996-97 1997-98 1998-99 1999-00 2.50% 650;' 11.50% 1550% 19.50% 2350% 26.50% 427% 10.22% 16.51% 22.25% 28.06/< 34.04;' 38,82/< 406;' 10.15% 16.41% 2269"1< 30.49/< 38.52,{ 45.24% 439% 1034% 1668'Yo 2241% 27.99% 33.62% 3804% 046% 193% 2,27% 2.16% 2.24% 2.84% 3,390/.
The first part of Table 47 deals with the annual rate of salary change for employees. The numbers displayed on the Nominal Increase line are taken from Table 4() using only the Normal or Meets percentages. This establishes the lowest increase rate for an adequately performing employee. The All Employees line displays the average percentage increase for every employee present at. the beginning and end of the year and who received a performance evaluation in the year. The number of employees varies from year to year as separations were replaced by new hires. The High Performers, Average Performers. and Low Performers lines display the actual average percentage salary increase received by employees whose performance evaluation in that year meet that. lines criteria. Employees were reported in different lines each year based on that year's performance evaluation.
Notice that on all lines, except Low Performers. the actual average increase is higher than the Nominal Increase. Because the percentage was calculated based on the actual salaries paid to employees, higher actual rates are expected. Actual Halaries included other types of increases given throughout the year including salary adjustments, promotions, and permanent salary supplements. For Low Performers in fiscal yearHH}()B7, the actual salar-ias of enough employees declined to cause a negative average salary increase rate.
The second part of Table 47 deals with the cumulative effect of the discreet increases shown in the first part. These numbers were calculated by adding the increase rates for the corresponding line in the first part. These cumulative numbers are very important, however, because they show the combined effect of slight differences in rates year-afteryear.
Figure 28 graphically displays these cumulative salary lines.
October 10, 2000
Page 81
Assessment of Merit System Refbrm Goals
50% 40% 30%
ox Nominal
--+--High Perf Emps --0 - Avg Perf Emps --D--low Perf Emps
20%
Data Analysis Heport
....... 0
.
10%
0% 1993-94
1994-95
1995-96
1996-97
199798
1998-99
Figure 28 Cumulative Salary Lines by Performance Group
1999-00
There is very close alignment of the salary lines for High Performers and Average Performers in 199:394 through lH!)(j97. Divergence of the line for High Performers begins in Hm7-!)8. In l!W7!)8, the first variable salary increases were awarded to High Performers. By the lH!}92000 fiscal year, that difference had reached over 7%).
The salary line for Low Performers is not zero. Salary adjustments and promotions are given to some Low Performers in years in which they are not eligible for a performancebased salary increase.
Page 82
October 10. 2000
Data Analysis Report
Assessment of Merit System Reiorm Goals
Examination of Sa)a!Y~Lln~~by Compensation Gro!l~
In an earlier examination of pe rforma nee evaluations by salary ranges beginning on page 45, there is a marked difference in the distribution of performance evaluations by salary level. Although this difference was reduced in later years, it was always present in the distribution of performance evaluations. Table 48 begins an examination of any difference in salary lines for employees in two compensation groups. For the purpose of this examination, employees were grouped according to their salary shown in the last employee
extract of August :11, Imm or an earlier extract if the employee separated before that date,
Employees with a last salary of less than $aO,OOO were placed in the Low Compensation group and those with last salaries of $:J(J, 000 and above were placed in the High Compensation group.
'fa ble 48 Salary Jpcrease Rates by Compensation (~n)lill
Discreet Increase Rates Nominal Increase All Emnlovees Hiah Comoensation Low Cornnensation
=iscal YA.,r
1993-94 1994-95 1995-96 1996-97 1997-98 1998-99 1999-00
250'* 4.00% 500";' 4.00% 4.000/. 4.00;' 3.00% 4.2JOr~ 5.95'7'" 629";' 5.74;' 581% 5980/< 478% 4.31% 5.92% 6,31% 586% 586% 5.79% 4.84% 4.25% 5.98% 627% 5.65% 5.77";' 6.16% 4.69%
Cumulative Increase Rates Nominal Increase All Ernolovees Hiah Compensation Low Comoensation
1993-94 1994-95 1995-96 1996-97 1997-98 1998-99 1999-00
250% 6.50% 1150% 15
23.50% 2650%
4.27% 10,22% 16.51% 2225;', 28.06% 34.04% 38.82%
4.31% 10.23% 16.54"1< 2240% 28.26% 34.05% 38.890/<
4.25% 10.23% 1650% 2215% 2792% 34.08% 3877%
The first part of Table 48 dea Is with the annual rate of salary change for employees. The numbers displayed on the Nominal Increase line are taken from Table 4t) using only the Normal or Meets percentages. This establishes the lowest increase rate for an adequately performing employee. The All Employees line displays the average percentage increase for every employee present at the beginning and end of the year and who received a performance evaluation in the year. The number of employees varies from year to year as separations were replaced by new hires. The High Compensation and Low Compensation lines display the actual average percentage increase received by employees whose income meets the criteria described above. Employees were reported in only one category even if their salaries moved between the two groups. The last salary determines the category for reporting.
The second part ofTable 48 deals with the cumulative effect of the discreet increases shown in the first part. These numbers were calculated by adding the increase ratesfor t.he corresponding line in the first part. These cumulative numbers are very important, however, because they show the comhined effect of slight differences in rates year-afteryear.
Remarkably, the salary lines for all three groups show very little difference and are within 0.12'% after seven years (;~8.82%1. :38.8!)%. and as.7!'}(}) despite the wide variance in
October 10, 2000
Page 8;~
Assessment of Merit Svstem Reform Goals
Data Ana lysis Report
performance evaluation scores and ratings shown in Figure H; on page 4;") and Figure 17 on page 'W.
Figure 2B graphically displays these cumulative salary lines by Compensation Group.
50%
.. .;(.. Nominal Increase
40'Yo
,-A-High Compensation
:- - 0 - Low Compensation
Merit System Reform
30%
. .....
20%
. .;:K"
. ,.::+(-:
10%
.. .
0%
1993-94
1994-95
1995-96
1996-97
100798
1998-99
1999-00
Figure 2H - Cumulative Salary Lines by Compensation Group
Page 84
October 10, 2000
Data Analysis Report
Assessment of Merit System Reiorm Goals
I;:~aminationof Salary Lil!~~d!y~EthnicGroup
In an earlier examination ofperformance evaluations by ethnic group on page :32, differences were seen in that white employees received performance evaluation ratings of Exceeds at nearly twice the rate of black employees and ratings of Far Exceeds at nearly three times the rate of black employees. Table 4!) below displays the salary lines for white, black. and other employees.
Table H) W;.!-lary I ncrease Rates byJ~.thflic C;roup
Discreet Increase Rates Nominal Increase All Emolovees White Emolovees Black Ernolovees Other Emolovees
nlitr.al Yeal S
1993-94 1994-95 1995-96 1996-97 1997-98 199899 1999-00
2.50"/0 4,00<1" 500% 400% 4,00% 4,00% 3,00%
f=4.27% 4,30%
595% 6.05%
629% 630%
574% 5,75"1.,
5,81% 5.91%
5,98% 607%
4,78/" 4,65%
4,170/, 576% 6,26% 5.71% 5,65% 581% 4,95%
568"1. 676% 671"'\ 6,24% 594% 644",{ 5,27%
Cumulative Increase Rates Nominal Increase All Emotoveos White Emolovees Black Emolovees Other Emolovees
1993-94 1994-95 1995-96 1996-97 199798 1998-99 1999-00
250% 650% 11.50% 1550% 19,50% 4.27% 10,22% 1651% 22.25% 28,06% 34.04% 38.82% 4.30% 1035% 16,65% 2240% 2831% 3438% 39,03% 417% 993"1. 16,19"1. 2190% 27550/, 33.36"1. 38,31k, 568%, 12.44% 1915% 2539% 31.331. 37.77k 4304%
The first part of Table ,H) deals with the annual rate of salary change for employees. The numbers displayed on the Nominal Increase line are taken from Table 4(; on page 80 using only the Normal or Meets percentages. This establishes the lowest increase rate for a fully performing employee. The All Ernp loyees line displays the actual average percentage increase for every employee present at the beginning and end of the year and who received a performance evaluation in the year. The number or employees varies from year to year as separations were replaced by new hires
The second part of Table 49 deals with the cumulative effect of the discreet increases shown in the first part. These numbers were calculated by adding the increase rates for the corresponding line in the first part. These cumulative numbers are very important, however, because they show the combined effect of slight differences in rates year-afteryear.
Although there are slight variations in the increase rates, after seven years the cumulative salary rates are remarkably similar. White employees have salary lines that are 0.72%) higher than black employees on average. The salary line for other employees, however, is more than 4(% high than that of white employees.
Figure :lO graphically displays these cumulative salary lines by ethnic group.
October 10, 2000
Page 85
Assessment of Merit Systetn Reform Goals
50% 40%
-::t:::-Nominal --O--Whites --a-Blacks ~Others
30%
Data Analysis Report
20%
10%
0% 1993-94
1994-95
1995-96
1996-97
1997-98
1998-99
1999-00
Figure ao - Cumulative Salary I . ines by Ethnic Group
Page 8f)
October 10, 2000
Data Analysis Report
Assessment of Merit Svstetn Reiotrn Goals
Examinat!!>..n of Sa)aryJ:1!nes by G~nder
In an earlier examination of performance evaluations by gender on page i35, slight differences were Seen in the distribution of performance evaluation ratings of male and female employees. Under the older PAIbased system, female employees consistently received the very highest rating nearly twice as frequently as male employees. Under the newer PMFbased system, female employees consistently received slightly more of the higher ratings. Table 50 below displays the salary lines for male and female employees.
Discreet Increase Rates Nominal Increase All Emolovees Males Females
Table 50 Salary Ir:g;rease Rates by (lender
1993-94 250% 427% 446% 4,13%
1994-95 400% 5,95% 6.04% 5,88%
F i~cal VAal ~
1995-96 1996-97 1997-98 5,00,{, 4.00'Vo 4,00% 629% 5,74% 581% 6.51% 6,35% 6,04% 6.12% 5,30% 5,65%
1998-99 4,00% 5,98% 6,13% 5.87%
1999-00 3,00% 4,78% 533% 439%
Cumulative Increase Rates
Nominal Increase All Emolovees Males Females
1993-94 250",{
4,:n1.
4.46% 4, 13,{.
1994-95 650% 10.22% 10,50% 10.01%
1995-96 11,50,{ 165101< 17.01% 1613%
1996-97 15.50",{
22'2~
2336 21.43
1997-98 1950",{ 2806,{ 2940% 27,08%
1998-99 2350% 34.04% 35,53% 32,95%
1999-00 26501. 38,82% 4086% 37,34%
The first part of Table 50 deals with the annual rate of salary change for employees. The numbers displayed on the Nominal Increase line are taken from Table 4(j using only the Normal or Meets percentages. This establishes the lowest. increase rate for 11 fully performing employee. The l\1I Employees line displays the actual average percentage increase for every employee present at the beginning and end of the year and who received a performance evaluation in the year. The number of employees varies from year to year as separations were replaced by new hires
Although the differences are slight, there is a consistent and growing difference between the salary lines for male and female employees. Despite the fact that female employees conaistently received slightly more of the higher evaluations, salaries for male employees are now increasing faster than salaries for female employees at nearly 1% per year (5.:liV% versus 4.im'X, in HHl9-2000).
The second part of Table 50 deals with the cumulative effect of the discreet increases shown in the first part. These numbers were calculated by adding the increase rates for the corresponding line in the first part. These cumulative numbers are very important, however. because they show the combined effect of slight difference in rates year-after-year.
Figure ill graphically displays these cumulative salary lines by gender. The cumulative effect of higher increase rates for male employees can be seen in that the salary line for male employees is over :l.;'')'1() higher than that for female employees.
October 10, 2000
Page 87
Assessment of Merit System Reiorm Goals
Data Analysis Report
50% 40% 30%
- ; ( - Nominal :--ll. -Males '--O--Females
20%
10%
0% 1993-94
1994-95
1995-96
1996-97
1997-98
1998-99
Figure in - Cumulative Salary Lines by Gender
1999-00
Page 88
October 10, 2000
Data Analysis Report
Assessment of Merit Svstem Reioim Goals
The topic of "date of hire" has not been examined in earlier reports. However, with the increased latitude given to managers under Merit. System Reform, it is appropriate to examine the salary line fin' 'new hires' versus that of employees hired under the traditional rules of the Georgia Merit System. In addition, many managers are concerned about the lingering impact of underfunding implementing Georgieilein and the lack of a formal plan to consistently raise entrance salaries fill' state jobs.
-Ianuary 1, umo was picked as an arbitrary marker separating 'old' employees from 'new'
employees. The date itself is insignificant. However, employees hired before this date were hired in an era of 'classified service' protections and planned salary increases. After this date, new hires were immediately faced with no increases for nearly two years, followed by small. uncertain increases, reclasaificat.ions, movement to new jobs and a new pay structure, a nd removal of 'classified service' protections upon promotion.
Table 51 displays the salary lines for employees hired before and after -Ianuary 1, l!)!)O.
Table 51 SJllary Increase Rates bv Hire Date
Discreet Increase Rates Nominal Increase All Ernolovees Hired Since 1990 Hired Before 1990
Fiscal Veal's
199394 199495 1995-96 1996-97 1997-98 1998-99 199900
2.50% 400% 5.00% 4.00% 4.00% 400% 300%
+=1:27 .82%
595% 684%
6.29% 7.14%
574% 6.73%
5.81% 6.68%
598% 6,62%
4.78% 5.68%
3.74"/0 5.55% 579% 5.07% 5.14/0 538% 3.89%
Cumu lative Increase Rates Nominal Increase All Emolovees Hired Since 1990 Hired Before 1990
1993-94 199495 1995-96 1996-97 1997-98 199899 1999-00 250ex 6.50% 1150;; 15501< 19.50% 23.50;; 26.50% 4.27% 1022% 1651% 22.25% 28.06% 34.04% 3882% 5.82% 12.661(. 1980% 2653% 33.21% 3983% 45,51% 3.74% 9.29% 15.08% 2015% 25.29% 30.67% 34.56%
The first part of Table 51 deals with the annual rate of salary change for employees. The numbers displayed on the Nominal Increase line are taken from Table 4G using only the Normal or Meets percentages. This establishes the lowest increase rate for a fully performing employee. The all employees line displays the actual average percentage increase for every employee present at the beginning and end of the year and who received a performance evaluation in the year. The number of employees varies from year to year as separations were replaced by new hires
The second part of Table 5(l deals with the cumulative effect of the discreet increases shown in the first part. These numbers were calculated by adding the increase rates for the corresponding line in the first part. These cumulative numbers are very important, however, because they show the combined effect of slight differences in rates year-afteryear. Any salary difference prior to H)9:3 has been ignored to focus on the impact of Merit
System Reiorin in the period from wn:3 to WH!).
October 10, 2000
Page 8!)
Assessment of Merit Svstem Retortn (Joals
Data Analysis Report
The salary lines examined here have the widest divergence of any studied. After seven years. the cumulative salary rates are increasingly different. Employees hired after -January l , 19HO have a salary line that is nearty Ll % higher than those hired before l!)!)O. The difference does not appeal' to be reducing; the annual difference of over] .5'}-(1 continues to expand the difference in cumulat.ive salary line.
Figure an graphically displays these cumulative salary lines by hire date.
50'Vo 40% 30%
- ; ( - Nominal
:- -<> - After 1990
--0-- Before 1990
Merit System Reform
. .
20%
10%
0% 1993-94
1994-95
1995-96
1996-97
1997-98
1998-99
Figure i32 ~ Cumulative Salary Lines by Hire Date
1999-00
Page ~)O
October 10.2000
Data Analysis Report
Assessment of Merit System [>?efbrm Goals
Oh;"!ervat ions
1. Examination of salary lines by Performance Group shows very dose alignment of the salary lines for High Performers and Average Performersin fiscal yearsUm;3~)4
through Um(;!)7. Divergence of the line for High Performers begins in Imn !)8. In
W!)7 !)8, the first variable salary increases were awarded. IJy 1~)~)!), that difference had reached over 7'%.
2. There is very little difference in the salary lines of employees earning under $;~(),OOO per year a nd those earning $;30,000 and above. The salary lines are within 0.12% after seven years despite the wide variance in performance evaluation scores and ratings shown in Figure If) on page 45 and Figure 17 on page 4().
;t Although there are slight variations in the increase rates for black, white, and other employees, after seven years the cumulative salary lines are remarkable sirnilarv White employees have averaged 0.72'X. higher salary lines than black employees. The salary line for other employees, however. is more than 4'!;,', high than that of white employees.
4. Despite the filet that female omployees consistently received slightly more of the highest evaluations. salaries for male employees are now increasing faster than salaries for female employees at nearly It}(') per year (i).;~;J% versus 4.:J9o/c, in ]!)992000). The cumulative effect of higher increase rates for male employees can be seen in that the salary line for male employees is over :15'){) higher than that for female employees.
5. The salary line for new hires since HH)() compared with more senior employees has the widest divergence of any studied. Employees hired after -Ianuary I,W90 have It salary line that is nearly 11% higher than employee hired before W!)O. An a nnual difference of over 1.5% continues to expand the difference in cumulative salary line.
(). Within the data used in this report. approximately 25,000 employees are present in all seven fisca 1years. They represent a unique group of employees and are worthy of further study.
October 10, 2000
Page 91
Assessment of Merit Svstetn Reiorm Goals
Data Analysis Report
Page H2
October 10, 2000
Data Analysis Report
Assessment of Merit System Retortn Goals
Report G
(A/eril System Reiotm Goal 5)
Retain Employees on Basis of their Performance
Approach
This report combines personnel transactions for separations with the performance evaluation data to create a new database. Unavoidable separations were excluded from the data. as were separations of employees who usually do not receive performance evaluations. All other separations, including dismissals and resignations, were part of the database.
The database of separations was examined in three ways:
Separations were grouped to show the number of separations each year for High, Average, and Low Performers (page !)5);
A comparison was made by Perforrna nee Group of the number of separations each year and the number of evaluations received by employees (page ~l7); and
The tenure of active and separated employees was compared (page ml).
Selection of Reco~4.~ for Analysis
For each separation, the performance evaluation, if any, that occurred in the preceding twelve months was identified. Unavoidable separations, such as deaths and retirements, were excluded from the data, as were separations of temporary and seasonal employees who usually do not receive performance evaluations. Transfers from one agency to another that were processed as separations and rehires in the Georgia Employment Management Systems (fiEMS) were also eliminated. All other separations, including dismissals and resignations, were included in the database.
Despite attempts to reduce the dataset to only separations of regular employees, this examination lacks rigor because of the nature of state employment and the timing of
performance evaluations. It is not uncommon for new hires to separate from state
employment prior to receiving their first performance evaluation. No secondary performance data exist, such as exit interviews to indicate the reason fill' such separations or managers' evaluations to indicate performance prior to separation. Consequently, a large proportion of separations could not be matched with any data indicative of performance. In addition, the difference in timing of separations and performance evaluations makes definitive statements or conclusions difficult to make. T'his is particularly true after GeorgiaGain implementation when all performance evaluations were prepared in a narrow window from -Iuly to October but separations occurred throughout the year.
October 10, :WOO
Assessment of Merit System Reiorm Goals
Data Analysis Report
1993
_ _n""""""",,-
1994
1995
~m
1996
1997
-",-""'"
199B
1999
Tolal
Table 52 8l1I1Jm:l!:LQf Sepa rr!!jQ~L12{lc!!!
Total
I Non-Status
Separations ! Separations
,~~-
Total
Regular Separations
",
,,-~'-"~"""
.~.~.~~,~
Performance Performance
Data Missing Data Found
4.916 10,012
13
__ """,",,~.w.__
3.006
4,899
"","'-'
3,199
1,910
5.113
5.~~~"
j
1 323
3.235
B.OB8
814
4,063 4,733 5.621
11 338 11 )40
2.867 3,247
7.971 7.793
_.
1.268
' . " """_~~"",._"_,,m,,w~~~
1,801
6,703 5.992
7.296
1,550
5.746
1.498
4.248
65.562 ..
23.003
42.550 1
10,385
32.174
Caution should be used 'when interpreting the data for Wf);~ and 19!)!). In 19!);), most separations could not be> matched with performance evaluations because of the delayed start of performance evaluation data collection in April 199;~. The data for many employees who separated in W9:3 was purged from GEMS prior to this analysis. In 1999, only D months of separations had been reported before the HRMS was deactivated. Consequently, the number of sepa rations for I!)!)!) is underreported by 25%.
Page !)4
October 10,2000
Data Analysis Report
Assessment of Merit Svstetn Reionn Goals
Examination ()fS~"~nltionsby Perform~n~eGroup
One approach to determining whether the best performers were being retained is to examine the performance evaluations of employees who have separated. If the State is retaining the best performers, the expectation is that the performance evaluations of employees who separated would be lower than the average of performance evaluations overall. Using the Performance Groups described in Table :30 on page 5~) as a controlling variable. the separations fix regular employees (classified and unclassified) can be displayed as follows:
Table f>:; 135~!?arations by Perf(Jl'mang&roup
1-
Hl93 1994 1995 1996 1997 1998 1999
Total
Total
1 910 5 113 5938 8088 7971 7793 5.746 42559
Unknown
nf
High Performers
bv Average Performers
' l'::rnlln
Low Performers
1096 1050 1 205 2467 1268 1 801 1498
10385
154 668 682 513 298 419 316
3050
614 3150 3812 49:23 6239 5381 3844
27963
46 245 239 185 166 192
88
1 161
Approximately 25% of separations each year were for employees who did not receive a performance evaluation within the preceding twelve months. Some of these employees were new hires who had not yet completed a performance evaluation cycle.
.._--.'., -- 100% ,-----_._..,_
AddltJ'.nal f'UppnrtHlg- dd<:H! fOf t.hw };twph c;:m lw found PrJ l".gl' 16~)
...
10,000
80%
8.000
60%
6.000
40%
4.000
2.000
0% 1993
1994
1995
1996
1997
1998
o
1999
Figure:W Percentage of Separations by Performance Group
October 10, 2000
Page U5
Assessment of Metl! System Reiorm Goals
Data Analysis Report
Figure ;3:> displays the number of separations along with the percentage of separations in each Performance Group.
There was a sharp increase in the number of separations for regular employees beginning in 1!H)() and continuing through W9!). The number for H)!)9 represents only those separations processed through September 199!). The projected number of separations for all of Imw is 7,t;Cll, which is consistent with this elevated trend.
The proportion of separations for High Performers fell from the 151}(,- U)I}(. range before Merit System Reiorn: to the 5%8(~1., range after Merit System Retorm. During this same period. the proportion of separations for LowPerformers also declined. These declines were offset by an increase in the proportion of separations for Average Performers.
Page !)6
October 10. :WOO
Data Analysis Report
Assessment of Merit System Reionu Goals
Examination of PerformaJ!_(:'eEy~J1H!tLonsand Separations by Y~~r
A second approach to examining whether the best performers are being retained is to examine the relationship between the performance evaluations prepared and the percentage of employees who separate. The difference between this and the previous examination is that this examination focuses on performance evaluations prepared for all employees (both active and those that will separate) while the previous examination focused only on the performance evaluations received by employees who separated. This type of examination is somewhat suspect because of the very weak linkage between the gross number of performance evaluations and the gross number of separations. Only the most general of conclusions should be drawn.
Due to the difference in timing between performance evaluations and separations, no conclusions should be drawn about trends in a single year. Performance evaluations after implementation of Merit System Reiorm and GeorgiaGah) are prepared in a narrow window from -Iu ly to October while separations occur throughout the year. Also, data for 19!):J is incomplete due to routine purges of data for separated employees. For any separations that exist in I!)D:~, only a small number ofperforrnance evaluations are available.
Table 54 Approximat(d~!:X(~~~Ilt:!ge of Performance Groups Separati!}Z.J:l!lnuallv
1993 1994
1995 1996
1997 HI~R 1999
Low Performers
1011"/0 31.94!<, 3515% 3298!. 3057% 38.17% 15,66%
Average Performers
1.88% 6,14% 677j(, 5.67% 10,60% 9.37Ir, 6.81%
High Performers
1,32% 4.13'% 4.22% 6.22% 374% 4.16% 2.92%
Although only general conclusions should be drawn from this data, there is a marked difference in the separation rate for employees receiving low performance evaluations. Particular attention should be paid to the Im)(i data. As seen in Table :~2 on page fiO, the number of performance evaluations in 1!)~)(; is considerably larger than in other years. This should tend to reduce the percentages displayed here for l!HH;, because although an employee may have received two performance evaluations in IHH6, those employees that separated only separated once. However, the proportion of LO\v Performers is consistently in the ;30'% range. More importantly, the proportion of High Performers separating in lmw increases to over G% despite the deflating effect of multiple performance eva luations. 'I'his G'X, rate probably corresponds to an 8% rate in other years.
This data is presented graphically in Figure :34 on the following page.
October 10. 2000
Page ~)7
Assessment of Merit System Reioriu Goals
Data Analysis Report
1993
1994
1995
1996
1997
1998
1999
Figure :34 Percentage of Performance Groups Separating (approx.)
While the rate at which High Performers separate remained fairly constant at 4%), the rates for Average and Low Performers moved slightly, though erratically, upward.
Page H8
October 10. 2000
Data Analysis Report
Assessment of Merit System Refimn Goals
Examin!t!Qn of Tenure of AcJiY~,and SepalC!t~_c!.Emnloyees
Another aspect of retention deals with length of tenure. Using the 'date hired' in the GEMS database. the tenure of an employee (in months) can be calculated for any date or event. Measuring tenure for active employees was accomplished by choosing a date for each year.
The date of -Iu ne :m was chosen to determine tenure for active cmployeea. For separated
employees, tenure was determined as of the date of separation.
Table ;")f) displays tenure data for active and separated employees.
199~ 1994 1995 1996 1997 199R 1999
Total
Table 55 Tenure in MO(l.1rt? of Separated l<~mployees
bv
, GrnUD
All
High
Average
Low
Performers Performers Performers
47
80
64
62
57
82
59
61
56
85
52
64
61
85
59
74
61
76
61
81
58
71
58
92
56
73
57
77
58
80
58
73 II
Active
112 110 110 111 114 113 112 112
The difference in tenure between active employees and separated employees requires some comment. I n general. managers have always suspected that there is a threshold to longterm retention of employees. In other words. if an employee has been with the State-for a certain number of years, he/she will tend to stay with the State until retirement. death. or some extraordinary opportunity presents itself. It was further suspected that this number was approximately ten years, This may be because at ten years of service employees become vested in the retirement system and begin earning the maximum amount of time off. Conversely, ernployees with less than five years and particularly those with less than two years of service are seen as very likely to voluntarily separate state service.
These two suppositions of early voluntary separations and continued retention past 10 years of service can be seen in the separation data presented here. One might expect the average tenure for separated employees to mirror that of all active employees. Within the data, however. the average tenure for all active employees was between nine and ten years (112 months) and the average tenure of separated employees was slightly under five years (58 months).
As would be expected. the average tenure of separated Average Performers is close to that. of all separations, This is due in great part to the sheer number of Average Performers (approximately 80%,) as seen in Table 10 and Table lLon page :30. Although not shown III this study. the average tenure fOI' active employees in this group was 4D months.
October 10.2000
Page !)!)
Assessment of Merit System Reiottn Goals
Data Analysis Report
The slight increase in tenure for active employees following Merit System Relorm can be traced to the increase in separations beginning in U)9(). More employees with short tenures separated, thereby increasing the average tenure of those that remained.
120
108
c
0
:;::>
c~o 96
0.
(J)
(f) 84 <0
(l)
72 ()
.~
(l)
ro 60 (f)
III
U5 "6
48
s:t/) C
36
0
2
~ 24
12
0
Ad\lllij~n,ll
17l
--0-- High Perf Terms
--0-- Average Perf Terms
.--a - Low Perf Tarms
.--:t--Active Employees
1993
1994
1995
1996
1997
1998
1999
Figure Sfi Trend Lines for Service at Separations
Observations
1. Approximately 25% of separations each year were for employees who had not received performance evaluations within the preceding twelve months. Some of these employees were new hires who had not yet completed a performance evaluation cycle.
2. The proportion of separations for High Performers fell from the 15%)19% range before Merit System Reiorm to the ;",%)8%, range after Merit System Reform. During this same period, the proportion of separations for Low Performers also declined. These declines were offset by increases in the proportion of separations for Average Performers.
:J. There was a sharp increase of approximately :JO'% in the number of separations beginning in H)!)6 and continuing through HHH).
4. While the rate at which High Performers separate has remained fairly constant at 41~(), the rates for Average and Low Performers moved slightly, though erratically, upward. Separation rates for Average Performers moved from just over ()% to approximately ~)%
and rates for Low Performers moved very erratically within the ao% bracket.
5. The average tenure for all active employees was between nine and ten years (l J2 months), while the average tenure of separated employees was slightly less than five years (58 months). There was 11 slight increase in tenure for active employees following
Page 100
October 10,2000
Data Analysis Report
Assessment of Merit Svstein Rciorui Goals
Merit System Reiottn that can be traced to the increase in separations beginning in
tsss.
October 10.2000
Page 10 I
Assessment of Merit System Reform Goals
Data Analysis Report
Page 102
October 10, 2000
Data Analysis Report
Assessment of Merit S}istem Reform Goals
Report 7 (Merit System Reiorm Goal G)
Take Action to Address Inadequate Performance
Approach
This report examines a sub-group of employees -- those receiving performance evaluations with low scores or ratings and examines results of actions taken by managers to address the performance of such individuals. The effectiveness of managers in addressing low performs nee was examined through a review of personnel activity for a period of one year following the assessment.
Selection ofE~~Qr!~Jor Analysis
Using the definitions shown in Table ao on page ;")~), all Low Performers were identified. In
addition, the definition was expanded to include those PMF-based performance evaluations that include a rating of Does Not Meet on the terms and conditions section. Because performance evaluations are a recurring activity, a one-year window beginning with the date of the eva luat.ion was selected in order to identify activity related to addressing previously identified low performance. Within this window, all personnel transactions were
identified. Also, any performance evaluations prepared with la months of the original
performance evaluation were selected. This larger window was chosen to maximize the opportunity of capturing the employee's next annual performance evaluation in an attempt to gauge performance improvement
From Table 10 and Ta hie ll on page :Kl and the number of Does Not Meet rating for terms and conditions from Table 2~J on page f)(i, the number of low performance evaluations was determined to be 4.:JH!J as shown below.
Table S() Number of Low Ped{)rm!!x!~e Evaluations per Year
1993 455
1994 767
1995 680
1996 656
1997 638
1998 561
1999 642
Total 4,399
The distinction of performance evaluation year was maintained throughout the
examination to facilitate comparison of results pre- and post-lvlerit System Reiottn. The data for 19~)!J is included only to give an indication of trends in preparing low performance
evaluations. The State's human resources management system (HRMS) was abandoned
immediately following issuance of the 1mm performance evaluations. No subsequent datil,
either in the form of performance evaluations or personnel transactions. was available.
Consequently, Imm data is not shown in the following analysis and the Low Performers for
October 10, 2000
Page 10:3
Assessment of Merit. System Reiorm (30als
Data Analysis Report
l!)!)!) were removed from the examination. The total number of [,0\\1 Performers used below is :1,7;")7 (4,:m!) less (;42).
The relatively small size of the remaining database makes it possible to examine the activity in detail. As a benchmark, the personnel transactions for all employees were also captured to facilitate a comparison between the activity levels for Low Performers and all employees.
Examination of C(!!!~l!veA(~tions Tak~J!
The number of performance evaluations with low scores or ratings has consistently been 1'% or less of the total number of evaluations or employees. This is a somewhat lower rate than anticipated in traditional models of performance distributions (see Table 12 on pageS'l).
Table 57 Ic&w performers as a P.~L!:5;entage of li:mplovees:..~!n.Q Evaluations
1993 1994 1995 1996 1997 1998 Total
Low
455
767
680
656
638
561 3.757
As%of
0.66% 1.06% 0.91% 0.86% 0.85% 074o/r 0.85%
As%of
1.02% 112% 0.97% 0.68% 093% 080o/r 0.90%
The number of Low Performers in W!);3 is understated because performance evaluation data was captured for only April to December. Also, HRMS data for IHH:3 is incomplete due to purges of old transactions for some separated employees. The slight increase in 1!)!)4 of both the percentage of employees and the percentage of performance evaluations is unexplained. The decrease shown in the percentage ofperformance evaluations for HH)() can be reconciled with of the larger than average number of performance evaluations reported that year. Those additional performance evaluations were associated with some employees receiving two evaluations and two increases in 1H~)(>'
All personnel transactions for Low Performers were identified within a one-year window of the performance evaluation. As expected, some portion of this group separated during that year; these separations are examined further in Table 60. Other Low Performers received personnel transactions while remaining in the work unit or transferring to other agencies. These actions are examined further in Table (i2. Employees who did not separate are examined below in Table 58.
No follow-up data could be located 'within a one-year window for approximately HJ'% of Low Performers. This number varies by year and the missing data rate before Merit System Reform (12'% to 14%,) is considerably lower than the missing data rate after lvlerit System Reiorm (2()'~i. to :34%). This is most likely due to delays in processing subsequent
I The number of employees is reported in Table 4. Those number of employees for all agencies and authorities are shown there including those agencies that did not prepare performance evaluations (see page 52). The number of performance evaluations is reported in Table 10 and Table 11.
Page lO4
October 10. 2000
Data Analysis Report
Assessment of Merit Svstem Reiortn Goals
performance evaluations. The large window from <J une to October of each year given to managers to prepare performance evaluations makes it likely that some subsequent performance evaluations fell outside the l;~-month window used in this study.
Table f)8 Qn~~:X~~;lr Follow-up on Low Performers
Number of Low
Evaluations
c
0 :;:;
High
l
:::l
iii w>
Average
)(
zll)
Low
1993 1994 1995 1996 1997 1998 Actual
455
767
680
656
638
561 3757
1.32% 1,30% 0.44%. 061% 1.25% 0.890/. 0,96;;,
54.73% 5176% 4794% 44.36% 44.04% 34.40% 46.23%
945% 6.26% 5.29,{, 11.28% 6.11% 6.95% 7.43%
Terminated
2242% 28.68% 33.24% 24.24% 25.24% 24.~~ 26.80%
Total
87.91% 88.01% 8691% 80.49% 76.65"/0 67.0 'II 42%
Because of the missing data and the extreme variability across years, few conclusions should be drawn from this data.
Table 5!)
p[~~=.J.!nd 1)()st}xleLiLSX':!L(UJ..Bef(JUJ.J. i\(~tjY!tyj9!_I,<0w. ..perfQrml}!'
Number of Low
Evaluations
e
.2
High
iii
:::l
iii
-w>
)(
Average
zG>
Low
Terminated
Pre-Reform Post-Reform
1.902
1.855
1.20%
1.40%
61.90%
61.70%
8.10%
12.20/(,
28,80%
24.70%
Total
100,00%
100.00%
Once adjusted for the missing data, the management of Low Performers pre- and post-Merit System Reiotrn is remarkably similar. Nearly two-thirds of all Low Performers were subsequently evaluated as adequately performing employees. The major difference lies in the percentage of Low Performers separating and those being re-assessed as Low Performers at the end of one year. Contrary to expectations, more LO\v Performers were reassessed as Low Performers following Merit System Relorm by 4(%.
Although not presented here, within the data can be seen the occurrences of those employees who continually repeat as Low Performers. The number is very small (less than
October 10. 2000
Page 105
Assessment of Merit System Reiortn Goals
Data Analysis Report
25), however, several individuals were consistently evaluated as Low Performers for as many as five out of the seven years studied.
LO\\' Performers who separated within one year of evaluation did so in a variety of ways. Approximately (j2%) of Low Performers who separated were reported as resigning. The degree of autonomy in taking this action is subject to question. Table (;2 shows the number of Low Performers who left the agency by way of transfer to other agencies. The major differences pre- and post- Merit System Reform deal with dismissals and resignations. Post,\1erit System Reform managers are slightly more inclined to dismiss a Low Performer. Resignation rates for Low Performers are down more than 5% after Merit System Reiorm.
'I'able 60 Separation Types f{H' Low J?~~l:!!lrmers
1993 1994 1995 1996 1997 1998 Total
IOA;ath
from
-
. from
-
Other T
durinG
nf Nnn.St;atuiOt
ions
Tnt;al -
OA4,{ 0.00% 5.051.., 5.87% 0.88% 0,65% 044% 0.13 0,{ 1451% 19.17% Test 0,22% 1.43%
~'04~
015% 6.62% 1.62% 0.29% 21180/1 1.18% 1.62%
o SClOj"
0.300/1 7.01% 1.37% 0.15% 1463% 0.15% 0.30% n
0.31% 9.09% 0.63% 1.10% 13.95% 0.00% 000%
0.36 7.47
089 0.71 Ok 14.95A. 0.36A. OOOA. 0000/;
2.42% 28.68% 33.24/0 24.24% 25.24% 24.73"'{
0,240/1 689% 1.01,{ 0,45,{ 16.660/1 0.61% 0.64%
n ?Q0t.
2680%
For comparison, Table (; I presents the separation rates for the same periods for' all employees including Low Performers.
Table s:
Separation Types for All Employees
The overall separation rate for Low Performers was nearly three times greater (2H.80'!11 versus H.8H%) than for all employees. Resignations comprised a greater proportion of separations for all employees (nearly 80%) than for Low Performers. Low Performers were nearly nine times more likely to be dismissed and eight times mote likely to simply abandon their positions without. notice (presumptive resignation),
The overall separation rate for Low Performers was lower in the years following Merit System Reiottn. However, the overall separation rate for all employees was higher following Merit System Reform. This included employees who separated prior to receiving a performance evaluation.
Page lOG
Octobe r 10, 2000
Data Analysis Report
Assessment of Merit System Reiottn Goals
Table G2 displays some of the other types of personnel transactions processed fill' Low Performers. This selection of transaction types includes major disciplinary actions as well as discretionary actions affecting compensation.
Table ()2 Personne I '1'ra nsaction Till'S f~xr.l!.~lw PerfOrr~l(Tii
Approximately 18'h, of personnel transactions IIII' Low Performers were demotions of various types while 10'% of transactions were promotions. This latter figure should be considered a clear indication of performance improvement. Also reported here are Low Performers who transferred to another agency. These employees should have received subsequent evaluations in their new agencies, which would have been reported in Table f>8 if completed within the one-year window.
There are some differences in the types of transactions processed for Low Performers preand post-JMeril System Reiortti. The rate at which Low Performers transferred to other agencies was lower following Merit System Reiottn. Low Performers were also less likely to tr-ansfer to other positions in the same agency.
For comparison, Table t):3 presents the transaction rates for the same periods for all employees including Low Performers.
Table ():3 J~~rsonnel Transaction Ratesfllr All Employees
()ctober 10. 2000
Page 107
Assessment of Merit System Reform Goals
Data Analysis Report
The overall transaction rate for Low Performers was one-third lower (22.:l8% versus
ao. 71(){l) than that for all employees. Promotions comprised 40(}';' of personnel transactions
for all employees but only 1()ll/i. of personnel transactions for Low Performers. Even so, subsequent promotions for Low Performers must be seen as positive indication that managers took action to improve performance.
Observat.ions
1. The number of low performance evaluations has consistently been 1% or less of total evaluations. This is a somewhat lower rate than anticipated in traditional models of performance distributions
2. Once adjusted fell' missing data, the results of managing Low Performers pre- and postMerit System Reiortn is remarkably similar. Nearly two-thirds of all Low Performers were subsequently evaluated as adequately performing employees. The major difference lies in the percentage of Low Performers separating and the percentage being assessed as Low Performers at the end of one year. Contrary to expectations, more Low Performers are re-assessed as Low Performers following Merit System Retortn by 4(X).
:3. Although the number is very small (less than 25), several employees were consistently evaluated as Low Performera for as many as five out of the seven years studied.
4. Approximately (;2()'ll ofLow Performers who separated were reported as resigning.
5. Following Merit. System Retoriu. managers were slightly more inclined to dismiss a Low Performer. Resignation rates for Low Performers decreased more than i')% after Merit System Reiorm.
ti. The overall separation rate for Low Performers was nearly three times greater (2(;,80<J.~. versus !).:3H%) than for all employees. Resignations comprised a greater proportion of separations for all employees (nearly 80%) than for Low Performers. Low performers were nearly nine times more likely to be dismissed and eight times more likely to simply abandon their positions without notice (presumptive resignation).
7. The overall separation rate for Low Performers was lower in the years following Merit System Reiottn. However, the overall separation rate for all employees was higher following Merit System Reform and this included those employees separating prior to receiving a performance evaluation.
8. Approximately IW% of personnel transactions for Low Performers were demotions of various types while 10% of transactions were promotions.
9. The rate at which Low Performers transferred to other agencies was lower following Merit System Reiotm, Low performers were also less likely to transfer to other positions in the same agency.
Page 108
October 10, 2000
Data Analysis Report
Summary of Observations
VII. Summary of Observations
1. Changes in performance evaluation patterns occurred following (;porgi:.1Gain implementation. Bef(lre GcorgiaGail148.7<% of evaluations indicated that the employee 'frequently' exceeded requirements of the job and HAI}'el 'consistently' exceeded job requirements. Under the Performance Management Process developed as part of GeorgiaGain, only 11.2%. 'l':xceed' expectations and O.!)%. 'Far Exceed' expectations.
2. Ratings under the Performance Management Process are more equitably distributed as evidenced by a comparison of performance evaluations by gender and ethnic group. Total equity has not been attained; white and female employees still receive proportionately more of the higher ratings.
:3. Implementation of the Performance Management Process has reduced the influence of age and tenure on performance evaluations. Increased age and tenure still impact positively on PMF ratings through age ;")0; hut age does not positively influence ratings after that point.
... There continues to be strong influence of compensation-related factors in the distribution of performance evaluation ratings. Consistent putterns of higher ratings are seen for employees on higher pay grades and with higher annual salaries. More than 25%, of employees on pay grades 15 and higher received ratings of Exceeds or Fa r Exceeds as compared to less than ;)'% of those on pay grades 7 and below.
5. There is strong variability in the distribution of performance evaluation ratings by job title. Performance evaluations for employees in jobs such as Housekeeper, Houseparent. and Health Services Technician contain less than i3%, of higher ratings compared with 25'Yt. for employees in other jobs such as Secretary and Trooper I S) Class.
n. With notable exceptions. the high degree of variability seen in the previous system by
agency has been greatly reduced.
7. The universal evaluation of every employee against the Terms & Conditions standards may be unproductive. Over ~H)% of performance evaluations indicate the highest rating possible in this area. Only :328 increases may have been withheld solely on the basis of Term & Conditions when otherwise warranted based on responsibility rating.
S. The number of discretionary salary adjustments processed by agencies has increased
per year over lOCH)!}';) following GcorgiaGain implementation (see Table :31).Just over
2,000 salary adjustments were processed in 19~):l, H)94, and Hl95 combined. In each year following GeorgiaGain implementation, the fewest number of salary adjustments processed was more than four times the combined pre-itnplomcntation number.
!}. Differences do exist between the proportions of discretionary increases granted to employees in the High Performance Group versus those in the 1.0\\7 Performance Group.
October 10. 2000
Page J09
Summary of Observations
Data Analysis Report
However, employees in the Average Performance Group received proportionately more increases than those in the High Performance Group (see Table ;W). A similar distribution of salary adjustments existed prior to Geotgiatlnin implementation, but with considerably smaller numbers of transactions.
10. The actual number of salary adjustments given to reward top performers cannot be discerned. Since ~)2%J of all salary adjustments were given to employees in the Average and Low Performance Groups, this type of action had become a universal salary increase code used for any salary increases other than performance-based increases.
II. Table :J8 presents an interesting counter to one of the arguments raised initially to the rapid development of a pay-for-perforrnance compensation system. Concerns were expressed that managers could not discern fine levels of performance sufficiently to support variable pay increases. However, it appears managers were able to distinguish very fine degrees of difference between employees receiving performance evaluations 'with low ratings.
12. The very small proportion of performance evaluations with low scores and ratings may indicate that mangers had some difficulty preparing such performance evaluations. This appears to be more true under the Pl\fF -based system developed as part of GeorgiaGain. The proportion of performance evaluations with low scores fell from 1.04'}\, to 0.71%J. The 'ideal' proportion of low ratings or scores is 2'% to ;J%
1:3. The assignment of performance evaluations with low scores or ratings was more equitable under the new PMF system. The proportion of performance evaluations with low scores or ratings received by black employees dropped from 54% to 44'YtJ and was more in line with their representation in the overall employee population.
14. Under the PMF-based system, managers assigned more low ratings for senior employees, particularly those with 10 to :)~) years of service. The proportion of low ratings assigned to performance evaluations for employees with 20 to 2~) years of service
increased from H'% to 14%.
15. Although managers assigned more low ratings to performance evaluations fill' employees with higher salaries, this shift was probably due more to general increases in salaries than to changes in manager behavior.
1(l. The trend of fewer promotions may be part of the continuing impact of GeorgiaGain particularly when the growth in the number of employees (see Table 4 on page 18) is compared with the continuing smaller number of promotions.
17. In the years tHHG throughtH!)!) following t\leric System Reform, the percentage of promotions given to employees in the High Performance Group (1 :3.20%, It.Ii{'/(., 18.4:3%, and 20.57% respectively) was higher than their representation in the general body of performance evaluations (8.50%1, 11.54'%, 14.:31 %, and 15.a8'Yi, respectively). Further analysis (not. shown here) confirms that a similar trend also existed for the very highest performers ~ those with performance evaluation ratings of Far Exceeds.
18. In the years HW(i through HWH following Merit System Reiotm, the percentage of promotions given t.o employees in the Average Performance Group (8(i.6(j%. 85.70%.,
Page 110
October 10, 2000
Data Analysis Report
Summary of Observations
81.2;'3%. and 7!). H;% respectively) was lower than their representation in the general body of evaluations (90.!)2'%. 87Jl7%. 87.!)2'X,. and 8:3.82%\ respectively).
lB. The increasing percentage of promotions for employees in the High Performance Group is consistent with an overall increase in higher ratings (see Figure 5 on page 31).
20. Examination of salary lines by Performance Group shows very close alignment of the salary lines for High Performers and Average Performers in fiscal years IH!)gH4 through H)m;~)7. Divergence of the line fill' 11 igh Performers begins in WH7 ~)8. In 1~)!)7 ~)8. the first variable salary increases were awarded. By UHH). that difference had reached over 7'i{1.
21. There is very little difference in the salary lines of employees earning under S:10.000 per year and those earning S:Kl.OOO and above. The salary lines are within 0.12% after seven years despite the wide variance in performance evaluation scores and ratings shown in Figure Hi on page 45 and Figure 17 on page .1(i.
22. Although there are slight variations in the increase rates for black, white, and other employees, lifter seven years the cumulative salary lines are remarkable similar. White employees have averaged 0.72'Xi higher salary lines than black employees. The salary line for other employees. however. is more than /1'% high than that of white employees.
2:L Despite the fact that fema le employees consistently received slightly more of the highest evaluations. salaries for male employees are now increasing faster than salaries for female employees at nearly 1'}'i, per year (i>':);)% versus 4.:1H% in H)!)!)2000), The cumulative effect of higher increase rates for male employees can he seen in that the salary line for male employees is over :L5'% higher than that for female employees.
24. The salary line for new hires since 1990 compared with more senior employees has the widest divergence of any studied. Employees hired after -Ianuary 1, 1~)HO have a salary line that is nearly 11% higher than employee hired before HmO. An annual difference of over 1.5% continues to expand the difference in cumulative salary line.
25. Within the data used in this report. approximately 25.000 employees are present in all seven fiscal years. They represent a unique group of employees and are worthy of further study.
2(). Approxima.te ly 25'% of separations each year were for employees who had not received performance evaluations within the preceding twelve months. Some of these employees were new hires who had not yet completed a performance evaluation cycle.
27. The proportion of separations for High Performers fell from the 15%-1!ltil, range before Merit System Relorm to the 5'%8%1 range after Meri; System Reiotm. During this same period, the proportion of separations for Low Performers also declined. These declines were offset by increases in the proportion of separations for Average Performers.
28. There was a sharp increase of approximately :W'% in the number of separations beginning in In!)(; and continuing through 1!l99.
October 10. 2000
Page 111
Summary of Observations
Data Analysis Report
2D. While the rate at whichHigh Performers separate has remained fairly constant at 41Yi" the rates for Average and Low Performers moved slightly, though erratically, upward. Separation rates for Average Performers moved from just over ()%, to approximately ~J'.\f, and rates for Low Performers moved very erratically within the ;30%, bracket.
;3(L The average tenure for all active employees was between nine and ten years (] 12 months), while the average tenure of separated employees was slightly less than five years (58 months). There was a slight increase in tenure for active employees following Meri! System Reform that can be traced to the increase in separations beginning in 1D!JG.
a1. The number of 10\\/ performance evaluations has consistently been 1% 01' less of total
evaluations. This is a somewhat lower rate than anticipated in traditional models of performance distributions
:32. Once adjusted for missing data, the results of managing Low Performers pre- and post-
Mei'i/
System ,)
Reioru:
is
remarkabl. y simi. lar. N, early
two-thirds
of
all
Low
Performers
were subsequently evaluated as adequately performing employees. The major
difference lies in the percentage of Low Performers separating and the percentage being
assessed as Low Performers at the end of one year. Contrary to expectations. more Low
Performers are re-assessed as Low Performers following Meri! System Reform by 4%,.
;);L Although the number is very small (less than 25), several employees were consistently evaluated as LowPerformers fill' as many as five out of the seven years studied.
;)4. Approximately (;2%, of Low Performers who separated were reported as resigning.
:35. Following Merit. System Reiotm, managers were slightly more inclined to dismiss a Low Performer. Resignation rates for Low Performers decreased more than 5%) after Merit System Reiortn.
:3(;. The overall separation rate for Low Performers was nearly three times greater (2(;'80%, versus ~).;)~)(%) than for all employees. Resignations comprised a greater proportion of separations for all employees (nearly 801%) than fill' LO\v Performers. Low performers were nearly nine times more likely to be dismissed and eight, times more likely to simply abandon their positions without notice (presumptive resignation).
:{7. The overall separation ra te for LO\v Performers was lower in the years following Merit System Reiorm. However, the overall separation rate for all employees was higher following Merit System Reform and this included those employees separating prior to receiving a performance evaluation.
:38. Approximately 18'?h of personnel transactions for Low Performers wen) demotions of various types while 10% of transactions were promotions.
:39. The rate at which I..ow Performers transferred to other agencies was lower following Merit System Relortn. Low performers were also less likely to transfer to other positions in the same agency.
Page 112
October 10, 2000
Data Analysis Report
Conclusion and Recommendations
VIII. Conclusion and Recommendations
Conclusion
From the preceding analysis, it is clear that very little information is available to provide a definitive answer to the simple question .- "Have Ceorgietleit: and Meri: System f?efonn met the goals established for them?" Although some of the goals set forth for these endeavors a re clearly outside the abilities of any data analysis effort, more than half the goals could have been addressed in this study if the State had planned this research concurrent with the implementation of these projects. Despite the efforts of thousands of individuals in the development and implementation of these projects, only smallest amount of data was serendipitously available through the State's human resources management system (HRMS).
Considering only the limited data and the analysis performed here, the answer to the question is a very tentative "yea'. There are changes in the data that are indicative of the kinds of changes in behavior and practices desired by GeorgiaGain and Merit. System Reiottn. It is impossible to say, however, that any single goal has been fully attained. Rather, there have been some changes in trends and data patterns that are indicative of goal attainment. For example, the distribution of performance evaluation ratings postGeorgiaGain and Merit System Reiorm is more equitable and there are indeed differences in the salary lines for high performers and average perforrnera. However, without more data, and more tools to analyze that data, general indications are all that can be shown.
Recommendations
The inability of this study to obtain definitive answers is not based on a failure that occurred recently the failure occurred when these projects were proposed. No in-depth plan for measuring goa I attainment was developed. In fact, no measure of the problem being addressed was presented other than anecdotal stories and generalizations. In order to measure success. one must have not only a goal, but also a staring point.
In order to avoid similar failures attempting to measure goal attainment of future projects, the following recommendations should be considered. By implementing these recommendations, the State will be able to gauge the success of any project that depends on data from the HRMS. Since the cost of people is one of the largest components in the State's budget, it is safe to anticipate that many future projects will need l:IRMS data to measure success. These recommendations are not revolutionary; they have been espoused by successful project managers and project methodologies for decades. These recommendations are common sense and sound management. Prudent managers probably assume that the steps proposed here are being taken for every project .. but, based on the results of this study, that is not always the Case.
Begin data analysis prior to implementing the project Ensure the HRMS can capture necessary data Acquire data analysis tool8
October 10,2000
Conclusion and Recommendations
Data Analyais Report
1i~"nJlata Analysis Prior t.o Implement.i~g tht~ Project
In the best of all possible worlds, the data analysis effort to measure project success would begin before the project is funded and staffed. The very first analysis would be aimed at measuring the problem, or defining the current state. 'This information is crucial to dearly defining the problem. Early analysis is also indispensable in assuring that the project addresses the problem and is not sidetracked by other issues.
The measurable goals of every project should be clearly identified before the project is implemented. These goals should be stated in general terms that can be understood by everyone particularly those directly affected. For each goal, a statement should be developed that describes the problem being addressed and any baseline measures of the problem. This statement should also put forth how success is defined and measured. By defining how success will be measured in advance, the data systems can be ready to provide the necessary data whenever it is needed. Early definition of data needed for measuring goal attainment also presents the opportunity to review how the data will be collected and organized and who will be able to access it.
Many future problems can be avoided by documenting project goals and measures of success in writing. Although it may be tempting to assume that everyone involved with the project fully understands goals and measures, the written documentation will he available when everyone associated with the project bas moved on to other areas. Future researchers and those charged with measuring goal attainment will find the documentation an invaluable tool.
Finally, periodic measurement of goal attainment should take place on a routine basis. The actual process of extracting and reporting the data should be tested before the results become critical. Early testing can also help detect problems in data collection or in project implementation.
Ensurej,lle HRMS Can Capture Nece~sary Data
Defining the analysis needed to measure success is only the first step. The data must be collected, stored, and organized so that when it is needed it can be accessed. Two main avenues exist to capturing data. First, the data can he captured directly through special programs or procedures customized to the specific needs of the project. The data can also be captured indirectly hy drawing data from existing programs or processes used as part of normal transaction processing. Although the former is technically the easiest to develop and may provide the cleanest data, in many cases the latter approach will ensure that the data is captured consistently for every transaction.
Whenever possible, data collection should be a part of routine daily activity and not a special activity. Frequently, special HRMS activities are the first to be stopped when there are staffing shortages. In a crisis, the only transactions that will be proceseed are those necessary to generate paychecks. This simple fact dictates that to ensure data is collected every time It particular event occurs, the data to be collected should he as closely associated to a payroll transaction as possible. This may require modification to critical programs and
Page 114
October 10, 2000
Datil Analysis Report
Conclusion and Recommendations
data stores to add new data fields. Of course, some transactions and business processes cannot be directly associated with a payroll process. In these eases, the data collection process should be closely associated with the most critical transaction in the appropriate business area.
Fina lly, all the codes or data values needed to measure project success should be identified as early as possible. The meaning and use of these data items should he documented, and training materials developed to ensure they are used correctly. As seen in this study, too often cod ing structures were simplified without regard to future reporting needs, or users were instructed to use codes incorrectly because the original meaning and use of each code was not fully understood.
Acquire_I>'~tt!LAnalysisTools
The State should acquire a set of data analysis tools that are compatible with its new HRMS and flexible enough to be used with other databases. Unfortunately, acquiring such tools is much more complicated that purchasing a software package for a personal computer. To fully support future data analysis needs, the tools will need theresources to store large amounts of data and process that data quickly.
Access to data is frequently needed at high summary levels as were generated in this study; at other times access to detail individual transactions is needed. Several vendors have data warehousing, data mart, and data mining tools available that could easily provide the data storage. access, and analysis support needed. Proper installation and use of these tools will require a thorough understanding of the existing data and may require development of an enterprise data model. Data modeling tasks are complex and should not. to be taken lightly. Acquisition and installation of these tools will he quite expensive.
A core group of data analysts should be established and fully trained in the use of the data analysis tools. Training and retention of these analysts will be critical to the successful use of the tool~. These analysts should be involved from the beginning in any project that will require data analysis to measure attainment of project goals. Their role should be to document the data required to measure project success and begin development of data models and queries. Of course, the business and software analysts supporting theHRMS should also be involved; together they can define how the data needed to measure project success can be captured by the HHl\lS.
Finally, consideration should be given to making the data analysis tools available to other agencies so they can perform their own analysis of HllMS data for their agency. Agency data analysts might prove to be an effective recruitment source for the central HRMS data analysis group.
October 10. 2000
Page 115
Conclusion and Recommendations
Data Analysis Report
Page llG
October 10, 2000
Data Analysis Report
Appendices
IX. Appendices
October 10.2000
Page 117
Appendices
Data Analysis Report
Page 118
October 10, 2000
Data Analysis Report
Appendix A
Hue
Appendices
17202 92()(iN 121DC
i l)i'P!\Ii;sglt'!,II!-!1 EQ1l'l2.'::!:l.~I.~..r.!.t........
.. ..
Dismissal Of Permanent Status Em ilovee
DlsmlssalDrug Related Convictwn ""_~ ....._ ..
I}\,:,m ~ssa I HandoH!..I?EI!fL?creerlll}.K ..
~I~ducational Le,lvc Without.,1,.),aocY.
~._~~~~_
Emergency /\pPOtr:l;;;;;tn~l~e;;:n:.:.I~~~~~~~~_
...t~.!I(ID. C. Ihstl'ibution
...__.~~~~~~~+-:~.::.:.:.~-'-_+.:.:.::.~:::...:::::...._
Ec u iva lent Pa Y Grade (2.:.:trc,.:v;;.p.:;rs:;:.:.i:;:.:o;;:n:.-
---l-:..:.:....::.:-:
October 10. 2000
Page] H)
Appendices
Data Analysis Report
I ~-_.~- '~-""'~-"l I7~1');a~ittei.~~ Personnel Transadion
U3:'ill.b~fltion Of Employment
91)-10-01
L~2!J!J:!~.!1Of Elllployrm'nt
~_.~~,=".'~'::.::=- 78-07-01
Et:~~~~e
Date 99-09-:)0
96-09-:J0
~(~:'i~:l
Code!
EXPIHf-'l
'12;IO~
Extension Of Conditional AllImintment
. ,
Of ( M M _
"
Of
e
740H0 I
!1().(/8-:J 1
!)ZO!)B
.~l.:H}7.{!1
!)!}-O!)-:lO
:)1021
I
92-IZ01 'M~:JI022
l~xtensionOfC~ovel~
. _ !H-07,OI
97-07-ln
al022 _
Extension Of Leave Without Pay Traininu
92-10-0 I
96-08-:3I
I 840f)Z
Extension Of Leave Without Pay.Dis;l~ility
92-10-01
94-11-0:3
184051
~---". .
..
--~'----"""~'f-"";,.,..c..;..c..;..--f-"--c..;..--l- ''';;'';;'';;';'';;;'_--1
Extension Of ProvlslOJlalAppointment
7:3-08-0I
96-0S-a 1
Hf>OZ
i Fniluro To Return FrOl1l Leave Of Absence
7S-07-01
H!).(l!):JO
r-'-F'a~~;IY Leave WiO Pav
9H-IO01
99-09-:30
r~;lyT;;;;~;;'\V/O-I);;~:i3;I:lh'()r A{l0p.~!2EL"""_"M . Ha-O!:OI...... H(j-09-:30
1220a FA1VIWC)P 2an ,... ,I
! .~.c.,::~~i~: i.;~l.~'Mt:.,~ ;l.~ )~.;-.;~J'.~".'.~.'l~l:.:.~)~;.er.eD.isabilitL...1.-.0.1... ~~:~~:~~~
Family Leave \V!O Pay Parental. Care
9(j-09<Hl
I"amilv Leavp WlO Pav . Spouse Care
01
~}60H-:l0
_~~l;,."
zap
'':11
2:lS .-J
Family IA~aYe W/Pay......
-10-0 I
99.:99.:30
FAMWP
~:;::~~; i;;::::: ~~~:;:. ~~~~'itl~ ~~:l:,~dolllion
;~~:~~:~~ ;~:~;:~~~ ;;~~~~~._.,~
Lea~:: ~~~~:~: i;:~~::~eC~::~.abilitv t. ..~:.. ~~:~:~
rF;;;;;.i(.;i~:;;.;;:\vjj) l;~' ..~S pouse (9Xe ,~~
.. !);l:()i 0 I
~:~:~:;:~~~ ~;~i;~~:~
!)6.0!):~JO''' 2:3
FLSA Leave With Pay Authorized
,.. '" 06
I 890f)
..f:I~'?:~J~.ave With Pay IJnauH!()J:.l~t~~t
~_ ~!!l:..Q!.. _. .J~;}:91J!()
L!'l!,l05U._
Forfeiture Of Position
78-07..01
!)!)09:10
IZZ05
Furlough Or Temporary Layoff
_'~_'M"'.'
9()- I 00 I
9909:10
FURLO
! Furlough Or Temporary Layoff
9Z1 00 I
9~.m~._..J.l,S4{>,44 ,
GeorgiaGain Correction
!)()IO-OI
!)I.I~ (,AC,NC
GeotuiaGain ImlJltmwntation _
_. 9()10-01
9710-02
GACiN
GeotOia(;ain Review
9G-IO0 I .. 99-09-:l0
GAG N-R
Hourly Appointment
!lli07-01
!}909:l0
HOURIi,'C_,
Initial ]AJadOf Non - PACS Agencies
7S-07-01
!)!)-m):30
9999S
Interim Anoointment
7['-Oa01
H4-0()-:30
:H02
.J!lt~;E!!!)tt0n!~:llm2IntnlPnt
. __
,.
n-OS-01
!)(;-~;}Q'M 94(){).,_ .
j Involuntarv Demotion
I Involuntarv Demotion -
9(j-lOOl 7:l0S() I
!}!)-09:J0 96-09:30
IDEMO 10:304
Involuntary
(RIP')
9]'()8-()1
mJ-09-:10
lOa04Z
~JOb~.~~.;::::i~I.'() 1{(.~dllcti(.H1 In Force off Due To HJ~duetion In Force Tb 01' Hppatitls
, Leav() [)~~~:_To Injury
..
[A~av~~ Due To Injurv
._I!t..0~=:~~ ~YJ.th.I'.l:ly Due To T(:!.r:.1E()r_lIJ:yI?I"'~11)iJil:..\'
~_ WIthout Pay DIW To Lack Of Work
~:~:~~~:~~
78-0701
92- ro-ot
!}H-IO-Ol !/2lO01
92-10-01 H2-1 0-0 1
;~;~:~;::;:~: it~~K
9()-0~la()
IZ600
9!1-0!J:lO
18a051
U!)O!):m
9G-OU-:J0
I IN,JURY
--18:3055
9.tlJ~::!Q._ 1880~~....J
9!lOU-;lO.. I8404:l I
Militarv Leave Without Pay
!)(;1O-01
!lHOU:JO
MILTLV
, Militarv [A'llve Without Pav
92
9HO!l-:JO
Uvlodification Of Adverse..A(~li~'1l By SPf3 . ==+m=+2-10.01 !I.9.m)..ao
No PosltJon For H,~turnFrol11 Contingent !.:_.._._
~}9-0~);iO
18500
2040a 12204
Non-Certificate Almointmel}.t
!l608-:H I 9700
..tl(~I1:M<;!:~L.~)I:H'Y Ad,l11St!11.i?:.!.1.t. . . . ()ther [A'a\!(' WIthout Pav Authori'lA{l
._~-0l'2:!)J.....
92-10-01
!}H-09;JO
17:3OlN
184042 I
1~!ler Leave Without Pay Unauthorized
92-] 0-01
!}()09:l0
184041
.Partial Salary lrl(:rpa",~;_. Pav Plan AdJustment .. Across The Board Pav Plan Adj~ultmellt .. Across The Board
. ... M'... .!!.~!:970J ,., ~J()- 100 I
H208()]
96-08] I !lHOH-SO
ao
1?a05P ATB 17:100
Page 120
October 10, 2000
Data Analysis Report
Appendices
..!:telnstotement Bv Pprsonnel HOlml Decision
H2-10()]
!)!)O!l-aO
20404 _.,.
I:RR~,e;i~n~ts;:;att~e:~m;;e:nI;ttiF~r'oromm
l..ayoff Layoff
'"
7:)08-0 1 +~:::.H:::.)...:0..:9~-::.:.:)(:.:.:)__4~~:::.1!::::.}:(:::.)(.:':)
j
9610-01
!!!l-OH-ilO
19900
Uleins(~lten~!:'.!.)LOf A,clive EmployedHIF
~)(;-10-01
99-m)-:l0
1HH01
Reinstatement Of Active l~r!mlovee/RIF
80, H)-O I
~)(j-OH-;;O
9!JOOI
;.-:.R:.;:e.:.l<::;':')<;::ls:.;;'e. ;;l:. ;o'l:.;:'o:.:n.:.l. :;E::. ;;I::. ;l1I:J,;:).:.lt""lv:::.:'n.;;;;l.;;;.e.:.n;. t
,l--"~).:.7_-;(;;.;):..::.)-_O;::.:.1
99,OH-:10
RELEAS
Release From Ernnlovment Removed From S1> Provision A
i ReSIgnation
84,05,01 7f)-OiJ-0l +!:.:..:lG:-IO-Ol
H9-ml-:lO
1::;2::;2,::,0.:.7_ _--1
~)9-0!1-:!0 ,,- -lO:!05
9909:30
RESIGN
I Rpsignatlon
,l~t.::.,ignation'l'o Accept Unclassified POSit . f-~<:stora~itl.r.!QL~<l.I,l!yg((lll(,tlon
78-07-01
9(,09-;}0 --.-+..1:=2:2=0.1::...-----l
-+...:7.:8:::0-:7::-.:0..1..:::.::.-_..9.j9...0.:9=:-:;:.}:0:.~c.-_j....::.1:::22.4::.:05.-_-
"',!l..~?:.g):0.1.. ,,'. ..!J.!I:O!bl.Q .._+--:.:.:R:.:E::..S:.-T::.O:..:R:..:....
Restoration Of Salary Reduction
M112. 08-01
""R=p(.m:.'I.l:l.N:l.l:.:.;.:.:.::..::.:.._------------------ G- IO-l)l
~Jletll."!:!.I,wnt
8 - 0 7 -01
9l,H!!!.:)0 9909:10
9l).(19aO
17500!L.. RETH{<;
12402
, Return From UnelassIfie(U~~_
H2-) 0-01
!19-0!)ao
RETUNC
Return To Duty
9210-01
!l!l(!9ao
RI~TURN
Salary Adiust.mcnt I Teacher
8a07-01
96-0!J-aO
AC1
..alan: Adjustment I Teacher
!)(j.j o-o:
9909-;10
TCHSAL
, Salary Adjustment To ChISS .. RfmSSlgnment
!l2-08-0l
9(j09-ao
17:301
Salarv Adiustment To ,Job, Roassumment
!)(;-100l
!)!)-09-aO
GRDAD,J
~$;II;rl"):(~llal)g(~.Ih. Ie To Special.I:'!~vJ?E(I'!i':ii()rl Salary Change Due To ~~sial Pay Prevision
75-0a01 96lO-0 1
!l6-09ao !)!)-09aO
ACI05 "m"r"'''~_~
SPAYCH
Salary Inereas(~ Annual Eligibilltv '_~'.'_'~M~
7:)0801
!)(j09-aO
AiJ02
Red uct IOn
!l6- 10 0 I~ JI!I:g~~::~Q .
Salary Reduction
92-08-01
9G09;)O
Salarv SUlllllemen.L: 811 ProviSIon A
750a-01
H!)09-aO
Senarat.ion Durina Workine Test
78-07-01
!l!lO!)-im
SeparatIOn Of NCHlStatIr:2...Emnlovee Separa!~:I). To Accoept Other Classifl(~9..:l2....~".......
I Settlement AdJustrnenl .__.
78-07-0 I
!)7 -02:";::)8:... _.-+":=:=~--1
7:1-0801 !14-08-01
.....~_,.!)H(j(j-.0Q9~:;1)OL __...1.7La~o~os=_-.J
October 10, 2000
Page 121
Appendices
Data Analysis Report
Ear-liest
Latest
Effective Effective Action
Personnel 'I'ransactton
"~_.,, Dat<~
Date
Code
.J;h2!:.LTeJ'Jl}jnJ\ll:vJ.!~lVe
,.~ho'2...T~~rt1..1.1~!.LI~:~!Y.!:..,,~...
~)G, 10,01
92-] 0-0 1
, Shmt Term Leave WIthout Pay Authon7!~
__.. JLG.,:}O0.1_._
~ll{~l't.I(:r:!!-,~:~!~~,:,,!\,ith()!!tJ~<lj'.:IJ!l<\\~thQl'i?~!1..._ ~)(). 10-0 1
~.)9-(m.a.O~STlN.m};.~~~~J
~)(;09';W
~)909-aO
P
m}-09-:}O,,_ U1,Wor .....1
Special Action Bv State Personnel Board
80-10-01
H9-09-aO
a9021
Special Annt Bv State Personnel Board SHeelal 1.A'av.Without Pav ... Fivo Y;:};;:'~-'-"~'
801001 9()1O01
9(iOR-al 9909aO .
:}902 5YEAH
l!~~dnl Salary j~t!!lent_. Special Salary Adjustment St~~l~l)oilltment .Ullclassified
9(;-10-01
... I 92.),(.0188.01
1'89":01.01
m}09-aO 96-m)aO 99-09-aO
SALAD,J 17:l05 _ Jl!.OSTU .. _
Suspension WIO PavDnl.l:L~jO!~2L(I.I!.. ..~~ensi()n WIth Pay .
.,,!lgJJ:()I 961001
Hg09-aO
~)9-09-aO
26:lO2 .. SU~W!:-.....
Suspension With Pay ~SllspenslOn .Without P:1L_
~._.....
80-1().(ll
9(}09aO
9():lJ~:EIL_. 99-(}9-:}O
12501
suswql_'_
f-~\.t:'2I.:0i2!l,~Vithout Pav
78-07-01
9()09-aO
.:;;2_ _-1
Temporary Appomtment
9()07-01
9909ao
TEMP
: Temnorarv Annoint.me nt
7;l08-01 ~_~(;.O()ao
H(300
i Temporarv RegulatlOn - CSH
_>__ ~_
B!l( OU>
H~IO();)()
TRaO I
Transfer And Annt From Unclassified
82-04-16
!Hj08-;\1
9205'1'
Transfer And Annt From Unclassified
8209-0(
96-08 a 1
9700'1'
'l'rnnsfer An(!J:!)~1~~J~!!!~~:111!:'!:'iQ::A........ ~.
82-04-l()
9()0!)a.~t....__ J.?1Qr1I
Transfer And Change To Unclassified With 'Transf~r From Interim To Career
92-lO01 78-07-01
9()08-;\) 94-06aO
1840aT :n02X
.Tt:i!t\'fl'EJ:')'())l]"E():,isional Appointment . _ ,....lfl07:Q.L .. ~ ~~1:09::~!t ..~~Q(~~~_~_._.
Transfer Of Non-Status Emnlovee
7!)0 1-01
H(j08-(31
1020 I
Transfer Of Provisional Emnlovce
n08-0 I
9()08-;H
10204
Transfer To A Difft'rent Class ................- -
I To .Job Trnnsfer
;;..;;;;.:c;;.~=.:.:...;;:.::.:.:.::.::..
!\ Different
()8-01 H()09-(30 _ 1020a j;J. _ l - ' - = - = --I_'_:::....:.:.::::..=_--I....::.:::....:.~=~
96-lO01
!J!}O!};)O
.JOBCHG
Transferred From Another Aaencv I~fl!.!~:!:!..I!.g)!LIt?J~!l~>.I!ll:r_I:il'yX!~l1U ni t Transl~rred To NonMerii With Leave Right i Undassified Snecial Function
rrr~{;~~f:\ppointment.:J>-tll~"
)Jndassifll'd Consultant Appointment
Unclassified Position Bv Law Unclilsslfied '!!::;~lI.!.~)rarv Appointment Unclassified Trades Annointment
Voluntm'y Demotion
Voluntary Demotion
iLY(W)l!o:!r!k!~i~nlrg..YTl1;;s~t(lSrfeepltallnr!~.~!.l(oJLnI~l!DY..rua Tesnng
!)()lOOI
!)909-;lO
TRANIN
78 07 0 l~_ .99.Q9:!~~..._....!.g1.Q.~.j
9210-01
9609-:JO
1840:3
89-01-01
9 9 . 0 H . a O . _ .....120SPF:...._.J
8!)02-01
HgO!);JO
120DNH i
89-01-01 8901-01 SHOl-01
_ 9H09';'Q._. 99-09-aO 9~)'()HaO
120CST 120
i!
120TEM ...
S!)OIOI
9H09;J0
120TRD ..
!)()lOOI
!)!)-O~)ao
VDEMO
7:3.08.01L96.09:aO
IO;)O:l
._
~..?).)J}:,._.:.~(... )LI).... 0'"
T"99.9~1-'(0)'9,I,:.a..,o()_
=.~.~"'.87."4.t!)_;,.'..}.).:=....~~ ..~.j
Page 122
October Hl, 2000
Data Analysis Report
Appendices
Appendix B Summary of Employees !n':-Pm::,~~~!!!!JCharacteristics
Employmen t Snapshot
Date
nf ...
81 Fthir. Grn un
White
Black
Other
under Studv
8v"'"
Male
Female
,for Period
3-31-1993 6-30-1993 9-30-1993 12-31-1993 3-31-1994 6-30-1994 9-30-1994 12-31-1994 3-31-1995 6-30-1995 9-30-1995 12-31-1995 3-31-1996
64,970/. 64,91% 64.76% 6445!0 64,20% 6400% 6365% 6333% 63,05% 62,77% 62,66% 62.44% . 62,08%
6-30-1996t:f ,70/< 8-31-1996 1,88%
33,89% 3391% 3402% 3430% 3452% 34,72% 35,07% 3536'Yo 35,61% 35,84% 35,91% 3610%
3647/< 36,85% 36,70%
115'X 1,18% 1.23% 1,24% 1,28% 1,28% 1.28% 1,31% 1,34% 139% 1.43% 145% 145% 145% 142%
44,610/. 44,58% 44.58% 44,44% 44,39% 44,37% 4442% 4417% 43,90% 43,78% 43.42% 43,27% 4332% 43,21% 43.21 %
5539/<
5542%
5542% White
5
5
Black
55,63%
5558% Other
55,83%
56,10% Male
56,22%
56,58% Female
56,73%
5668%
56,79%
56,79%
6334% 3533%
1,33% 4396% 56,04%
12-31-1996 3-31-1997 6-30-1997 9-30-1997
12-31-1997 3-31-1998 6-30-1998 9-30-1998
12-31-1998 3-31-1999 6-30-1999 9-30-1999
61,67% 6179% 61,53% 61,53;' 61,12% 6090"/< 60,60% 60,33% 60,03% 5973% 5940% 59,02%
36,82% 3669% 36,95% 36,92% 37,30% 3750% 37,76% 3800% 3827% 38,54% 38,83% 39,14%
1,50% 1,52% 1,52% 1.55% 158"/< 1,61% 165% 167% 1,70% 173'7< 1,77/< 1,84'YQ
42,88!<:, 42,60% 42,62% 4246% 42,16% 41,99% 41,73% 4142% 4115% 41,04% 40,96% 40.57%
57,12% 5740% 5738% White 5754% 57,84% Black 58,01%
58~Other
58 58,85% Male
58961. 5904% Female 5943%
60,62% 37,74%
1,64% 4178% 58.22%
October io, 2000
Page 12:3
Appendices
Data Analysis Report
Page 124
October 10, 2000
Data Analysis Report
Appendices
Appendix C
P.AI Scon-s for Classes with 1QO+~y~J~~.tions
_-,- _ _'~'M~'"
1.0 1.5 20 2.5 :>.0 :>.5 H) 4.f)
to to
to
to
to
to
to
to
Class T1tle
1A U) 2.4 2.9
:~A
a.9
4.4
4.!) 5.0 Totals
Accountant
__
_ _
" " w , ~ ~ ~ ~
Accountant. Prin.t.:!Q~~l....... ,.< .~.,~~
Accountant. Senior
AccountInu Clerk
Accountina Tech 1
~!l!d!!.lt1'!eh 2 Act Ther. 81'
. Act Therapist. ,,--~'''_. n " w w w _ " " m , , __ vc
~yitv Leader
Admin Asst
f-~~ztmn
Svcs
tarv Mar
I
1
1
;)
II
2 "'16
ail
f)8
40
ww, .. ,.
2(; -4_,.
a9
a9
18 ....,.J~
10
];12
:~
2,1
25
so I 50
24
176
.~-
1 .J.L _J..:lJ:L 19,1 262 Ias
29
76a
.- s 2
9 201
a .-82
:H)5 647 l:lf) 259
11I I I:{i >'.",
17l; 76
180G
. n:.>..
f)
.. .. ~,.,~" ~
ao
:u
58
46
II .. 183
1
I
2
46
76 140
89
19 a74
4
,, I
24
:n
5a
~.~"._-~
a1
7
._.._...
155
~
18
4!)
114
1O:~
58
:H:l
~."
i
1
2
18
a9 125 211
98
194
"
!)
17
58
52
la
144
Admin Svcs 1\lg-r a Admin Svc" Supv Administrative Asst Administrative Clerk Ag Sanitarian
- .,
...._"'~,--
I
J:l
2(;
:)7
58
40
175
I 7
~ :18
2
:32
-~
4l;2
89
96 ..."" :39
2ia
77 ,,..-- S!)
57 : 282
729 581 221 2:.109 ._~.:-
I
2.5
46
7]
I
144
Agriculture Inspect Assistant Director Assoc Counselor
,,-'"
..
. l}J
5f) 8a
2
151
i,
7 .. . 7
:31
4f) 21
I II
2
79
79
is
1
ISO
Assoc (~.r1:'i.i~l~il}~"t . . , ..... ,..,.. ~ Asst Spec Aat-In-Cha
Auditor. Senior .,,-
Behav Spec. Sr
Behavior Specialist
Benefits Counselor
..Casework Supervisor
Caseworker
.. Caseworker
---
Chf Forest Ranger Sr
Chf Probation Off I __ ___ "_"" __' _~_m " , , _ ' _ ' ~
... ~...
Chief Counselor
Chief Drv Exam 1
Chief Forest Ranzer
--- _.1------ ~~__w __
!
- ... I
2
I
:~
I
I
-"'-""'~
_.
27 so
I
2
16
I
14
20
1
27
4li
~!I f-._ 8O.
5
4
a
:~7
90
:1
4
119
HI
,,,_.
107
-,)
I ..
2
IE) 107
I
il7
1
- .__ _ }7 . .....;.... ... 28..
I ~6a
48
21
87
:31
61
ao
60 zs
12a
74
];lG ss
22
a2
207 15:J
IS6
90
... ___H_c9_ ; - - -6_1
60
:J
!l7
4:J
42
I:J
:J2
I
IE)
Ia
20H
_.
~,~
I 10 120
_ -29 ......
ilO:3
22
aTI
91
154
42
5a5
W 11
,
528
sto
i ISH a 181
I
102
I la
lS5
Civil Eng Tech
I
I
2
!in
94 1H
22
29:J
Claims Examiner -
..Clerk Clerk/Trans I
Clerkf!'rans 2
Corum Epidcm. Sr
Corum Tech Ii
,__ ,___v__
... _
__,~,mm,_
Communitv Worker
__,
_~~m
""0"""'"
I
a
aa
84
if)
a1
:I
2ao
I
a 71
so
6;)
55
a2
:lOS
2
I
f) f) 10:1 I 11
40
19 :1:J4
1
i
......,,"',.f-.,
I42 101
2" ~~
1ss as
7
50 22
I
25 IS
:{i8 I I!J 165
I
2
5 1:19
. :..
:157
L~8
i}9
B8:l
COl1lP Com pIx Opel', SI'
(i2
zs
IG
;)
I
109
S2!!~2E~~gr. . f'l:t.~;1"
--','.".,,-
Conservation C~.__...
Conservation Sat
Consultant Coordinator
______,_."_""''''V
~,
,.
I
,-,--~-
, 82
126
4d
28
70
:J
15
54
S
10
88
}
90
a:J 97
26..-
262
51
Hi!
4:1
us
ss
26
ISf)
88
75 I :J8f)
October 10. 2000
Page 125
Appendices
Data Analysis Report
2.5 a.o :1.5 1.0 4.5
to
to
10
to
2.9 ;IA
a.9
s.u
la lOa
(il
69
:l52 221
1
8
a4
Ii)
:J9
1)7
2
(:sr Agent. Sr Cswk Sunvr Sr Custodian
J!!:t'.I . T~;IJ!~,.!.._ ...
Data Transcriber Dental Assistant
Dis Adjud, Sr Dis Adjudicator Division Director Drafter III Driver Examiuer
Education Sunervisor Emn Interviewer Emil Proz Ilep
~~:~~~; Eng Tech 4 ~Ted~
En!!ineering Tech I Envirn Health Snec 2
Fiscal Analvst., Sr Food Serv Emp.:...;;S.;;t Food Serv Employee Food Service Aide
Food .~!>..l.l,gy....
For' Svcs Tech For Svcs Tech Sr
.+._
22
191)
lao
46
:m
51
10
2
7
2
54
11
15
50
Ia ao
Ila
4
14
171 452
104
2
15
79
:~5
86
as
20('>
247
~~
15
1 19;~
2
167
520
+_----j-___
27
268
80
1
224
9.::.. ;..1+-----=a-+--"-"''''-1
ss 12
I
a2
55
10('>
84
H7
55
79
1Ia
78(i
7
28
1)
47
9
al
5
15
56
42
22
141
-+_ _........_ _.t_.-.".~--_'_+-..;;;;..;;;1;.0.1;;;;..;;1;;3t_6-"--"-+_-s..a;;;;..;;;;_+---44:...+_--~::...;-a--9-5:.=:...j
Cia4 40S 199
45
UH7
19
7 aao
+ a:;:,. I:+
1') t 2;:-f,,):.0::: {
2
:172
104
Page 12H
October 10, 2000
Data Analysis Report
Appendices
1,0 Lfl 2.0 25
:\.O
s.s
1.0
U}
to
to
to
to
to
(:lass Title
J--.-~."".''''
Forester.
:'~'l1lor
-~,""
1.4
UJ
2.4 2,!) ...-,,,.
a..l
1
18
.,"'~,
\-Ol'n Trades Foreman ---"'..',,,,--'.'--
Health Services Tech
____
__
'~'~
~~
~~'_.~."m."_'_<'"
m
v_y,,~'~"'
1
20
4
10
.~} 749
t-'H-:-i-w'-"a-~v: .."l.\1aint Forman 2
,"
Hlth Svcs Tech. Lil
; :J
1
.,
~<._
1
15
;)9
Z40
'~'.'.,~.
Hlt.h Svcs Tech. Prin
~ . " " r " " ,--~~""-"""",,
2
1
29
filth Svcs Tech, Sr
15
5:1 ."
...,-_.1:l1!l
~1n Svc Pl'og Spec II ""'m", HousekeeJ)('[.
i I..-"~".,,
... ."
2
14
12
18 (i07
~l}'il::ke('ping Mgr ,-~.
1
2
25
HousekeI'PlT~!:L Sunv
70
~ ",.!Jousepal'ent
.tII)t.l.f'<':lla1'<'n t __......". HouseparenL'?upvr
---'--'-..~.., ...--.~.
Human Serv Provit~:E..
Human Srv Prov f-'-._..>.__ ....... > ,..... .. c-~-----_
-,
2 4
, I 5
~J:tl}man Srv Provo Sr_...~__
1
9
:ll
24 542
4
:31
2
22
8 . 2:tl
5
77
~an ~vcs.Tech.
Human Svcs.Tech ..Pr.
rl:!_uman Svcs.Tech..S_f.'
---"""""-,,.,
I :l I
:l
12
~.-
2
".-,'>'-
:J
18
281 57
;)40
Instructional Aide Instructiona I Aid
I
I 2
2 8
,,
lfi
7 .___1!~~7
Instructor
~!'stlgator (J)HlO
_ . L P N
,,-
LPN, Sf
",~,~_~_~,_~_c
,_.w_ .. w",,~,,_
Lab Sc~f'ntist, Sr
>+
1
1:.1 4:i9
2
2 rn
---~-
..--_...:.6..... -....:I!=) t=i4&02
to
10
;l.!)
4.4
'W'A
88
50
",_~!L
;J4
474
iJ,i
9') ;l/;!J
:)4;)
ilL
15Hi
6a2 I'}')
"~mm,,
1757
_...?l; 101
406 44G
I 7 , ,,,">'-
44
79
8!)
:l2
ti7
'-;i()2' a07
,~,,--~
:31
29
_. 35
52
;n2 li21
129 :lO7
;H;7 444
9] 22fi
tel
UJ
s.o TOlals
,~,,,'A.
21
'(;1
161
a:n
I:H;
".'~"~'
HZ!)
.'"
119
158
:n
5 "".W!2lI..
19 I 170G
,,,.
mn-n
10
70G i
102
I()(i!l
a9
:m)'"
156 5475
.~"",,-
2(; ais
>m""'v""
2:1 ....1,,;;6;.,7;..;0;....
1j
121
;J8 45 12f)
-- 8 41
I2
2 8 8 . , , ; ; . . . . , . . . , . .
47
2:1:1
-21 . ,,,.:::.:.. 1427 ~____o
7 ..l.!.lL
14
167
~ 8(; 57
154
77 I til0
487
22
262
-l:36 Ii
">
laO
650 4 15
8!) I 200:l
->.
22
-_rI:
25_. 1 is
215
5()
16
87:J
G2 ~l~
(i!)
ss
18:10 I 7:J
167
ss
19
508
464 ;)2
760 5f)
451 44
_._. _ 187 _2_ 289 --+~_m.
"""'''~".,.,~'''
as t IH2
Lab Tech. Sr ..
~i~lor;V SCientist
~._~~-
..I.~llmdrv Worker
,
Lead Ntu::",e(Comm/Cln) ..\-.
~':'HI}"urse(Inpt Srv) .......'",._._..
Maint EqUIp Opel'..
.. ~, ~-
Maintenance Enaineer -_.
Maintenance WOl'ker
--
r-~.<l.11a.gt~r
__e
Mechanic, Senior
MH/MR Shit Supvr
...
MHiMR Svc Coord
MH/MH Team Leader __>"N"'"
Nurse
~ Nurs...e. (Comm/Cln) ..' ,~
I
!
Nurse (lnnt Srvcs)
21 1 :l
14 ,
'>
1
:l
128
I
1I
1 2
-
a7
ss
;)
-If)
59
I
lCl
4
14Cl
15
4
52
1
Hi
2
19
;l
2:.1
2a
:1
:15
4
5~) I
:i6 , .. :l~l
f}4
84 70 144 :.10 20 14 128 44 a9
;li :17
:12 4:l
2~)
()
:;0
a4
:l8
6
257
248
I:J9 I 48
:321 1:.If>
45
18
74
2
,H;
47
271;
55
1la
70
~['!...j... 124
9\)
74
87 44
59
27
64
2(;
4 22
201
69
ts
,
... 14 I,
a
is
7
18f)z[
zs
40 ! 16 !
2
104 la!l I:W 8a2 479
srs
121 260 128 ...~ 2G2 a:l;1 257 2:11 I 72 201
~Ncu_ rs. e Pract I t io IW I'
HU"'" """ Office n
Office Sunv. SI' _OperatIOns Analy~t 0pl1S.!\:!l<ll'y~IS Tech Personnel Analvst 2
<,~-",
__ ~_,.-..-.m.
2
".."""'~
_.. _.4'~ ~
8 15..
q,.)t
7 1:l 11 15
21
79
25
f)1
47
sz
_~,m"
10
44
af)
74
2:1
()O'
22
51
- !)5
101
28
s
aOf) 124
86
42
:108
:30
1:3
104
~~...........--
4()
24 : I !1:3
52 28 .J.7.(i...
2(i
7
121
Po rsonnel Tech I Personnel Tech 2 Pharmacist. Senior Pharmacy Technician Photo Records Tech
;1
28
ti4
1la
"1"-)
5:J
:J:J:J
,1
1
11
f)6
68
7f)
a2
2,15
I
i
-,...
-
I2
_.
1
4 18 27
->"""~
6
:12
-24
:H ~iL 41
~ f)f)
54 4
laO 188 105
October] 0, 2000
Page 127
Appendices
Data Analysis Report
-_. .".~~. 1.0
to
Class Title
1.. 4
Physician Physician (Brd Cert) PoultrvJXrader
._--"...,,,.~
......,.~",,,,
_!:!:jnCswk S l;!E.~~.____ .... _
Prin Instructor
1.5 2.0 2.')
to
to
to
i.s .... 2.4 , 2.!>
I +---;
-.""
;}
I
:\.O to :3.4
~ -rI: fl
I:J 2 16
:1.5
'1.0
to
to
:J.n 4.4
25
50
15
41
41;
:JJ
-."".,
El I 29
-~_.-.~
18
,12
~;~ll'- -- .
4.9 41 !)(;
2:3 55 29
5 ()
1
..-
Totals
9
15a
aOd I 11
:18.. I~f) .
14
12:3
r-P.rin Nurset'Comm/Cln)
Prin (hms An~~... ,~._._ ...,
Prin, Caseworker
""".-_.".
Principal Agent
Principal Clerk ---,,~.~"-"~
r1?_rin(:lpl!L(;If:}l!.i;~.
!
4
;)
"",,-"'"
2
~
s
l1a 5
10 i :If) ..,,,.,,,
54:.!
I
14
20 IS :Hl(;
- 6!).
f)~1')-
so
54 40 !)4;}
2aO 807
4(;
G!)
ao
.~"~,,,~,,,
1187 f) I
429 12
81 15 :HI
I')')
228 109 2920 aEl(} 2618 12:1
Principal Secretary
-
Prn Nurset Inn! Srvs)
I
~ll'Ole Aide
'"
-- arole Ofcr 2
Prob/Parole Ofcr ;1
I
-~.'-'.",
..
Prob/Parole Offcer I
I
:.l
(i 104
2
21
I
'2:1
;)
xj" 257
II
5
11
:l
186
250 27
50
8(i7 I
El4
127
525 [,5
92 121:1
200 6S
419
,8~I
54 .. ZEII
82 8
207
1514
40
2:12
f) ...........2:2: G~ 6 ZG22
1
;146
a9'1
Procurement Ofcr I
Proa/Analvst
I
2
II
a
5 al
28 18
44 2!)
4a 12
5
126
9
104
Prou/Analvst. Adv
I
...
i
.!?t:()g!j~!.1alys t . Prin
~-~>~~.
Proa/Analvst. Sr
I
I
9
35
47
Z
'~l
;>7
90
7
22
a:l
71
a5 .. 4
202
57
as
I
225
as 22
:.l
IZ6
Program Manager
Project )'(~'!.~~~L.. Project Manazer
~--~-~,-_._~
Pron & Sup SUPy I
Prop & SUP SUPy 2
._
Psvcholozist
Psvchtrst (Brd F:lg)
Pt/Ot Technician
Qual Cnt.rl Reviewer
Radio Operator
Radio Op('r:}tor, Sr
.. !~!!)g(~r I Ret Sup VI'
m"_,__ ,,.~__..,_,,
Recoverv ARent
....
Recreation Director
Rehab Counselor -,
l{(~hab Counselor. Sr
Right-OfWav SI)('C II ..
Rizht-Of- Wa)l,tiE!Z~~ III
Sales Manaaer I
Secretary
Typist . (~(;!:f:tary-
_ _ _,, __ mm.~'
'
Senior Ag Inspector
Senior Aaent
_ -.-.... .".
I
-~~,,,""~
i
2
I
9
15
22
f)
61
I
20
la
61
20
r=m= <10
H)
za
a2
56
9,
4fl
~.
52
:JfJ
29
I
I7 ;~1~4
42 :I4
aiJ 28
,I
29
:10
78
54
Ij 4
la
11
ao
an
~~._.-
-"",.".-
.. _~.-
~>>>,
----.~._-
1
2
2 180
15
2 .....TI8
4
68
14 15a
... 17
I ;!
,..~,,,,,,
~ 1
4
15 :1(i
8 5
2
:51
"',.~'.
i
j 5 zao
""'~~-
I
2
17
27
748
1 ao
".~.<
20
2:J4
ii4
II
6Z
54
9
505 .._._1,H., .8...~-"
81)
44
1
210 a:l8 212
so
il7
8
;l(;
(i4
16
117 297
a4 ss
2 ss
,""""
55
,15
.. '...)..'")"'') -<
a 2 -,....,~
Z9
liZ 18G
98
I I a 5 175!) .._ _ .... > ~c"
_"ww""~.,,
HO
70
!)!12 10
49
5a
Z
12
I 15
2 laa
12 ..~ 124
(i
Z7:l
5
147
2a
120
15
105
15
Z07
...7.r t. ....""410952
I 140
IOa7
20t
F)8
!J87
2
I 14
s
171
1;0
755
14:l
~,
71
702
:170 504H
I
cI:.~!.'..)=...
124
Senior Caseworker'
1 , 10
26
5fl 1094 1290 1768 !)66
204
()414
Senior Clerk
:1 I 2
lil
20 402 480 77f) 414
155 22(j5
Senior Counselor
--
I
Senior Craftsman
Senior Secretary
1
1:1
Sergeant (DPS)
. ~=F Sergeant FIrst GIs .-
S
~:
ervi
---
ce
--
: C-o.....o....r...d...
i,>n'>'<a.<t_.o...r.......
_....~-
I
~ ..........~>
I
Skilled Craftsman
>' ,
I
Soe Ser Spec I
5 IS
7 I 10 aoo
2 147
ss ...~.~ 554
10
225 1004
67
7
()O
2
1)7
'_m __
s 201 mwmmm
4H 261
as
4!l!L "."-,,,,.,. 7:17
20H zoa
unl
t)i
6S
,,~,w
GI
28:3
1.Hi8
44
ra
176a
10
ia
az lOt;
590
6
674
a2
(i82
, , !1:J2L 6)'...). ~-
Z-: !I -+-11- 4540~
5
217
!: l ~44
Page 128
October 10, 2000
Data Analysis Report
1.5
2.5
to
i.s
2.!)
[)
:1
.j
:1
2
----~I----+-- .~-+---+-.--+--
,
I
2
-2
I
2
1
;)
Appendices
s.o
23
7
41
Hi
102
22
107
8
lOa
1
28
2
52 84
47(;
8;)
I
1
2
II
12
HS
:\H
30
44
:)0
(j02
73
27
2:14
G
1D8
78
J21i9
G4
;)8
is:
14408
:l229S
October 10, 2000
Page 129
Appendices
Data Analysis Report
Page iao
October IO, 2000
Data Analysis Report
Appendices
Appendix D
PMF Ratin~l(,J,Lh)bswith 100+ Evalm~J!!ln~
Does Not
."
.,,~.,~,~~
Fa
,Job Title
Accountant
Account ant 11. Prof. ~~~"m~,'_<""""~
~~('()_1:!~t;]rlt..JII, . I).1:5l.L~ _____~......
(
:I 4 4
Meet I
I
Meets -- EXCN'ds
8a
:~2
-,--~,
19 "'
55
HI
2!)
Exceeds 4 :1 -\
" 123 IS!) 1:29
f\(x~ountant, Paraprof .__.,.....,.,,".,. Accounting Tech
'" "I" Clerk
u' "' I
'I'hcramst "
Acnvitv Thel'anv, Ldr
Admin AS81
Admin Operation."~!gT ~!Ein Opn8 CoordJI
Admin. Opns Coord [
. ~._,.".~,--,,,
Adrninistrativo Asst-
A1'1'. I nspcctor, Sr.
Aar. "n ,"'........,
_._-,-,_v.>."~",,,",
Aide
.--
Area Enc, Asst-Maint
Area EE!giE!~'.l't"....~_~____.._,, __mm~_mm ASSIstant Director
Asst Area Eng
...,,..,,,-.-
Asst Sunt
,_.....-
Behavior S )ec
~~~"
----. --,....,,.,.
BiUmQ' Clerk II
.... ,-,-,~~
J~I(lgrv!()nitor/l st&~.1~51.~ .. "'W"A"
Budget AnalV':L....
Bus Mar (Ctr/Bc)
A""lord
59
38 I:l a
5 12 :J
8 f)
I)
_~o_"
8
18 I
s
..." 5
1 1
2 I 2 1
I
---2
I
.- ]
2
12
4
G
1
--",,,,,,,,"
I
2
4
1
~-"...,
]:1
I
2045
no .....~.,.
72H :H4 126
'-'-~~_.-
168 ;J:lf)
.,.,,..,,--.
66 250 181 272 157 1~"I"
._~m_m
101 68 HI 91 -~ ..-,-
ii
8:1 284 11:1 129 14:J
-] 10 Ga 80
514
22
8
I
107
8
f,O
- - .. .,,-.-
I
2
IG
217
:18 -,
40
7
139
23
-~ -
:l
'if
12
4 f)
14
48 ---
cIa
48
IH
24
2 ,,,.,.,,..,..
26
2
50
;)
12
]1)
2
:l
_,_._ ,m,,~,~,
25
:1
If)
2
''''''~''''-
]8
2
2,H58 100 884
:~8:l
~
1;03
I is
422 240 :IH!)
IH2 1:J2 124 I l(;
124 If,7
105 I 1:J :H,;)
iaz
147 147
.~~
140 1 19 114
'ad (
:l
t
----~,~.. ~.< ~"
41
108
2 ...
If)2
f)
482
19 ~.. 24
:38
2j
]29
..~ 5H6
Cert Nursz Asst., Ld
CNI Nursma Assist
4 __
Charge Nurxe (liS)
Chf Exm 2
->.-'. ..--
4
12 "-' 7
- ,.....'<.~._~-
I
.1
:)
~.~w~<
1
121 ... 799 :)60
67
I
45 4:1
--.~.".,
12H 812
..~..._-4--1-5--112
Chief Counselor ~iefDrivel' Examine
2
<o~<
65
:34
86
;)7
I
102
I
124
Chief Forest Ranger _ ...>,>
2
278
.. ;>2
2
Chief Of"
<.n__",
5
]
..11;4
51
Chief Parole Office,'
~fpo
Civil l~n2' Teeh
C;INk
,_....."
C;lerk 1. General
,,,---~<
'",-,-
-","'">,~"'~
I 2 5 ..-~ 2:1 ~.. 97
:1
"'V'~""<_""-'
;)
al
Ull
]:31
~."",-_.~-~~
245
400 2.0;)H
~W' _ _
2:1
sa
21
:n
]59
2 2
Ii
J]
Clerk 2 (1)0'1')
-~""'"''''''''''''''''''''''"''''''''''''''-'''''''~-'''''''
Clerk 2, Gpner1l1
...
Clinical Lab Tech
,.~.o.,,~.
1
G
199
91
12
2,185
."'
1
IIH
50
5
:121 . . 19 ->,,~--_
4:3
:la'1
~
457 2.;):)4
2(;4
2H28 211
Corum EqulP Ofcr. Sr
2
91
42
5
140
October] 0, 20()()
Page I:ll
Appendices
-_.
,"'"-.-"'''',,,,
f-'-.~_".
-Iob Title
Corum I~qtup pffi~~el'
Corum. Tech. II
~mm,\lni.cahle Dis
Cornu Onns Tech
l~l.sr
-
.retv
~,~v_'
.
,,-~~,..~,
C
,~m"
"--~-
---
~.~ Meets
I
:) r'''''' 464
s
I
",,-_.114
8
2
141
6
1
]20
,1
...
96
n
Data Analysis Report
Exceeds 48 8 10 a 15
40
Far Exceeds
",w,,,
4
Total 518
128
IGI
iao
1I I 12]
Cons Rtr 15t CIs Consorv Corporal
--""''''",,,,.,-.,,.,,
H
HI7
46
a
158
:35
2.
254
IHG
....(.;~!r.~J:l(\t:y;r.i!.()n ~.__....
....,- ,.,
m ,,.,,,.,' ,.",.",.,
Const lrisncctor
2
~!:'ll Inspector.Sr
2
"
Const Proj Msrr I
Const Pro) Mgr 2 w--_-
Consultant
-
"
Corporal Correctional Officer
--,--_ ,--_ .... ...
Cottage Life Supv
(;l.l.~.!.r!,!?.r!12,b. mw,_,_, ,.,- .~.~ Counselor
.
""""'~""V
~r (OTP) s-rcr: County Director II
.
~~_..
,Conoty Director III
Countv Nurse Manl},:'?l:_
I -1 f>
-=".",.
. l.2[>-1 4 .,
19
42 7 8
><>,.
.""~,
I I ..
,
I
..
J()
Craftsman
25
,""""
Craftsman (GDC)
1!l
Cl'ime Lab Scic.T'rin
"'~"
Cse Agent
38
I
72
2
251
147
122
1::f--'--'248 Hi2
:3
a57
2
III
6:) -. HI,568
1()1
:3
255
7
G4G
2
155
1
102
2
a77
2
I')')
I
101
2
2G5
f>
728
I
:m7
6
9()
17
8aa
:16
71 ao 21 4H 4:3 99
sa -
Ui85 7
42 .. 9(,
12 I
., 74 42 :31 8tl 75 Gil 35 107
ios
5
i ~
I
..u ........,
aal 179 14a aoa
4 .. ,,
..la 7
2Ja 177 18a
2
22,274
]~I9~
I
a20
2
79;>
2 .._1-78-
112
4(,4
l(i7
];33
8
374
J()
849
2
482
un
!!!lo
Cse Manager
esc Review/Modificat
~,~~~~w",v.':""w""""""",ww~,,>~~,,,,,~,,~~~,~,_~_~,",n
0'
(A,l~ Supervisor
..
Custodian
Data Transcriber I
I 4 4
.I
15
51
52
J()7
4 _)I~
I
14(,
54
I
1:30
4
9
54!!
a9
2
106
I
1!l!!
I
-~
4
140
5
617
1~8n=~,,,
fluent Tax Colle
-,,--
11 Asst
;omm Res Sued
)rog"ram Cons
Dir. Dev Dis Trng/W
.. w.~
Dis AdiudAssoc
II
5
H;
a m_, _ _
6
1
J()
2
I
,,~-,.,-
I
2t>
a
m,,,.
:37
HI
;322
117
144
iss
m",,,,,,,,,nn'm_"m'"
17G
n3
_."
[17:3
'~N_
24!!
fJ5
6
,\5
21
28
ai
51 ._ - - I
60
:1
1;3
1
178
aa
28
:H}!J 17:J 182 2:17
-~
108 812 aaa
Dis Ad
14
2()5
84
"__ v"""
alia
Division Director
a
1
84
20
17
12.'>
DOL Srv Spec, Adv
~-_.-
,_..
2
210
18
I
2;10
DOL SI'V Spc
aa
42
1,.162
95
2j
l.lia4
~~"--
Driver Examiner
.. ,
~;:tRep. Sr
I
4
23a
2:>
I
:117
91
15
I
18a
a8
261
2
441
2
2an
min
...",,, ,,,,
DwSedC&T
Education n
Sp
Electrician Erun M!!!' (Vor Hh}))
_ _" " W _'_~'
Emn Svcs Case Manage N_'''"'~'
Emnlov. Svcs. SUDV.
I
I'll
34
I
I 17
I'>
1
li4
8-1--_.
,\
217
I
,. 110
28
I
140
2
109
In
I
Ial
1 1!l
I
s
-"
78 411
54 41
1:34 480
I
2
8:1
;)1
I
.I.-18
Page] :32
October 10, 2000
Data Analysis Report
,lob Title
Does Not
c
Mept
8
Appendices
Far
Excepds "
IGO
60(;
I
a02
7
I
2
252
;1
;1
s
4
I
I
:1
8
la5
;1
s
187
4
22
Total
1
679
18
1
97
5
1.210
2
125
25
5
149
22
4i
2
2
5
'":::..:~=:.:..::-
.__. _ +
-+
.7
2
!lO
7
2.
--"-'''-'-:--------.--.t-----+------+.-.----=.::....:..+-----'-]--.- -----+-----'---1
1
...,
--_......._ - - - - + - - -
,IIlV Prob/Par Spec 2 ~.!:'!:()l)ll)<ll: Spec ;\
.Iuverule Proz Mgr Laundrv Worker
1
- 11) 12
1 1 5
s
8 1
125 71
128 811 1,722 102 25fJ 151 2.507
2 4 I
189
2
176
120
October 10, 2000
Page 1;~:~
Appendices
M'"
........ ..,.,,,
",. . - - . .". >_. . ~.~
-Iob Title
I
(CDC)
C
<I
Loc '!'eeh .._.,m.., ~~m,
LPN
II
"""'"
4
",,,.-,--,, ..,.,,,,,.,,,,,
rrJlN (Inpatient ~:3:S)
21
LSSP I
m,,,
S
LSSP II
",,'" ,,'..,
2
Main 1'}quip..QP!,~rCl)O'I')
.. ....,,, " ~.,."
MaintenaneIU:~E!lf1neer
5
",m_
m,
,I
:1
,-",-""-,',,,-<-
~l~'dicaid Elig Spee
20
Mh/Mr Shift Sl1Pv
-'"
Mh/Mr Team Leader
"".
a
MIcro Sun S
19
Nurse NUI"se
,,,,,,,'" ..~...."~
Nurse (liS)
Nurse Mzr (liS)
Nurse Pract.itioncr ~o.,"~"""",.,.,', " ..,.,., Nurse Surveyor COns) m,
Nurse. Lead
21
.".~
a
2li
2
12
"8;r
Nurse, Staff
()
Nutritionist
I1
Office
:n
Office Manager
Operations Analyst ,,--
Oprrns Analysis Tech
Ors Stand Surveyor Parole Invest![;l.!()~ ."",._.',, Parole Officer Payroll Paranro
'-"
Ph Sur Off
Pers. Analyst, Sr. -
Personnel Mar.
Personnel Rep Personnel Tech. Sr
"",
...... "
,..,....,-~
_'_~"_'N'''''
8 G
(j
18
4
..
"~~_.,,.
..-~-.~._.
10 8
I
8
Personnel Technician
PH LPN
" ...~
_"mw,
PH Nurse m,,_~~w"_.
PH Nurse Coordin
._--~~""
."".,.,,..,,~
PH Nurse Snecial
..,,~
PH N ursi n.g..~}l!(:I: ..",,,--., .. ,.---.,-.--.~---~",
PH Tech
12
If)
86
"-,,,,~~~.~~
-1
2H
a
28
Pharmacy T
2
Photo Rec T.~ch
-,,,,,,-
2
o
Phso Prog. Consultan
a
"'"",-
Physician
8
-""
Post!l!()OP Secretarv "",,,,,,,.,
J':'t:.iDc "':llviroll.!~.!!KL ..... ___~"......."...
I
Proh Off 1/11
-.,....,.,
64
Prob Officer III
4
>om ,.,""
AIde
Procurement Officer
a
Program ASSistant
159
"",-
Program
ts
Program Coodinator
5
Imgram Manager ". ... ,~,,,,,.,,,
11
Data Analysis Report
",,,,,,,
Does Not
F;
Meet
Meets (;82
1"'"""""'""
208 5H2
Exceeds ." I 15 aa aa
Exceeds
."~.",,.,.,..
1
a
8
l,f>27
40
:l
lfil
21
2
m ~_.".~~
a a
""""""',
"
J?::
8
185 "~.,,,
!;54 7;1
124 4:15 ,190
:10 104 27 a7 59 8G
,~,~ ~
",.",
"
si
4I
11
4 I
.. .~ ,-.".<-~
:i
I
+,"".".
8
112 92 148 Gal ias 1 02a
8
24
m
41
52
__ ~m'"',,
10 52
_ .. ...
~..
2 I
2 ,
:l
104
47
2
a60
G5
17!)
9""r
~,
,
I
77
ss
_m
''''''''
'. 2
lOG
17
1
160 -
10
1
7
S81
59
I
fl
498
186
19
Hl6 >,-,.,..,
5a
a
95
80
2
,_.""".,..,..
9a
14
188
12
I
W,',_V_ _ _
_.. 18
sao
88
4
1
69
1
2;n
24
~.. :l
40
1
2
99
;~2
1
75
85
4
m_
1
(),")
45
a
102
:~6
4
""~-
2
a28
149
t
2
G4:1
5 .....1,(;12.
1
.. 125
1
:181
(;
2!;2
a
a87
41
109 ."w. _ _ _,_
54
.. so
44
1.7
1f
a
-
I
1
a
5
116
'_)I-
2
95
12
84
20
I
6
8(;4
49
4
7i '....,.,
68
24
I
149
47
()
.. 17
1,741
221
7
21a
7,1
5
l:n
28
2
a
I;~2
;12
5
a4
4.f~12
SIO
12
1
170
47
2
"'"
-~,,~.~-
78 - 88
4
... ~~.~.~h.,
,~
93
a5
8
Total "'~_.",804 2fJ4 G;'lr) "m_ 1.59fi
"'"',.~ 220
76~)
109 176 '
50G ,,""mm~
120 122 21 I 710 15:") 1,)i)! 1 )1
4: 214 107
la.l,,-
188
sai ,"
716
2'_)"I"
1as ...._- 12~ 5
201 HaG 101 279... I4a 168
,,-.11JL
150 49fl 70(;
1 765 185
_._--34G128
.... 440
147
109
lOS
Ial 1ss
204 2.050
296 _ _ _ 161 ~_m~,~.
rrs
~~
2aG 12G 147
Page I:~4
October 10. 2000
Data Analysis Report
Appendices
",
,Job Tttle
Dol': Not
Far
c:
Meet
Mcet.s
Exceeds
,',,",'
Total
Program I{tpr.
_ _ _ _ m~~~>~~_"
Prol.'TnmfAnah:IiLIL., <'--~-~'
Proaram/Analvst III
Proura rnmer!A).l.~'b'l'.L._
J:!gJ~~t Manager
Prop & Supplv Supv Psvcholouist
~,.~,,""""--
1
76
a(i
1'1 :l
I
128 19')
-
49 47
4
I
96
If>
,~,,,",,,,_,"'''hY~'_'_'
4
__ " ___,cn
91
4
a
..,~.y--~~,~~,
224
10 10
7
I
lOl
27
:3
1 Hi
4
11'19
:l
;
._,-
176
2
1 18
4
I :I!l
271
Ia6
Pt/(lt Tech Public Health I<:d
,-"~---,>~,,,
,"._"._~,~
'1A Spec (IWCS) -,-~---
Hanger I
I{pceptlOotst
Reereation Director
.-
I{(hab Co un se loI'
Right OfWav ~.~:,L. ".,,,-Sales Manager Secretarv
_~M_,~._.~m
S(>(~ re t arv .~C1'e!3!.!yI Secretarv II
-,,,",,,,,,-,.--.- ~.
4
f ._-_...,
14 f) 14
I is H:l
I 5!l
I8
- - _ . " . " ..,...,.>._,
I
I 12
16
104
9
I 77
2 ...
I :35
1 la
:l .- ......J,oao
104
6
121
10
2
U:l9
I
144
!l6
20
I
120
""-'''"-'''-''''''''
7
G7n
lOS
.'m. ....-.m_
808
I
148
18
H,2
:\
142
2 ._- 17!l
18 ._.
168
40
I
f>aG
I J()
IW
2:3
.. 2. H,7
288
25
2.764
870
12 ... 2&~!fi..
70
a._~
Secretarv II
c
1II
Sergeant
.~~I];~'.~[lt(tP~D.... .. ---_.,., ,.St'rgeant First Class
Service Coordinator
Services Generalis!
Soc Serv Coord I.
.. --,.,,, ~,~-
.~"._,-""
26
I
..
42
..~~I-'
I
a5
.)
I
114
..
6:17
1
lO4
8
1,;142
;J
108
1
:no
259
2
--75
20
:l
1:18
ais
1!) ..J,Qi3..!L
(;2
12
180
20()
I
1.{J.~!'~).
55
()
I ~.) I~
I,t
''''''-''''--'
17
,
420
:Ja
I
111
Soc Se rv Coord 11 Soc Sery Dav Coord
Soc Serv Spec ._"".--,_.~~~-
Soc SYCS Case Mgr
,.'.
, .~.--.,-
'W__ >-_w_'
~_.~
2
.)
1I 122
I
152 .
45
()
In
a8
a
148
Hl
76
:l,t:37
47B
12
7.
I
212 22(i lSI 4.10!)
Soc Svcs Sunervisor Social Svcs Pl'OY Ii
, ~ ~ . ~ _ m " m m m m _ _ '-
Social Svcs Prv/Hosp
SOCIal SYCS TchfH2:".e.. SOCial 5vs Coord
.
1I
2B
.. s
2
9
8
601
6
492
a
272
I
I(i!)
.",..,.
a
260
178
I
799
94
12
627
a6
,._-- ." ~_..~ :JHI
B2
204
80
!l
:Hil
Social Svs Prov I
66
50
Ui77
21 1
17
2,021
Social Svs Tech Prill
'~-~-~-"~~~
SOCIal Svs Tech Sr ---, , ...-....~-
S(~i,~LSvs Tech.
--------- ~.........-
Spec Surveyor (ORS)
8 .t:J
as ,~~~f>
Special Agent Princi
J"pci ~.lJ~g<~D.!,$t'rll().. Sr StalT DevfTrng Cd
-,..
_ ... ,_ _-" ,.. ....~_ ..~ .......
... ... _--,,--~
_
10
58 Case Met Assoc.
42
Staff Dev/'Trng Cord
a
Steamplant Operator
I
10 4a 18
2 ,',--
1
>W,v"'_'_, __
I
".."~.,....",,.--.-
(i8S 1,755 l.41 1
Sf) 281 151
64 H)!l
9,1
I lO
la9 I f>:l 108 20
71 21 45 lG
as
2
11
856
I,If)
2.00!) 1,581
I 12
is
;372
4
176
:J
122
528
2
la2
I 1;~
Storekeeper
10
2
;300
l(i
:328
Substance Abuse Coun -;..,;,:tllt'..r~l1t<!Edl.~'nt
s
4
HO
as
..
484
2
1
G8
1:3
2
IW
.~.mm . . . . . . .-",,""'"
Supervisor --~,.-
6
I
85 .
25
2
I 19
Sunoort Asst
..-
1
,S,.I,
aa
I
122
ur\ffY Party Chf
_-_.,-- .... ~~-"
.....~"..-.-, ,
Survey Technician .
.. . " ___'A __
81
19
,- ~-_............ -,.,..,.---,,,
125
10
11a0.0s,>-" "_"_,~---~~_.<.~
c..:[~~. Examiner II (B)
'.
16
89
28
2
I:V)
October 10, 2000
Page 1:35
Appendices
m, _ _ _,_
Does Not
,lob Tide
C
Meet
Meets
- 'rtix Fidd Agent III
~lireci~llislIII
12
2
225
2
82
Tax Snecialist IV
Teacher
..
Teachel' (Blind/Deaf)
Teacher, Spec Ed
Tech 1
",--,-_._~.
__ ""AA.o~~~
la
8 9
80
I
257
178
-, ss
1
208
tf;'Chmcal Instructor eo Trainee
1'1' Sergeant Trades Supervisor Trainine Inst. Sr
13a
"
8
.-
102
4
201
""~---'"
:J
12(;
""",,,"''''''
98
Training Instructor ."
Transfer Officer
TrlmsJ)ortal~Jl1 Corp
Trooner
.-
Trooper Cadet
Trooper First Class
..
..,~l!J;.!.~liln.,.t~.~,l;l!ll,ineL~~ _ _...,.
LiI Fld Tax Audit II
.. ",."
Utility Wrkr, SkId
Vehicle O[)erfCour
9 6
,.,
1
2
>_,,_......... ~.h
1 1
,~-~~
1 1 2a
5
4 2
2
la-;:- . .,.~ i
14
_ _, , " , , " , , " , - " < 0
f)
280
246
szs
208
I:n
1 164
](;;)
la6 -,~.~~--_.~-
141 54(;
Veteran Benefits COli
2
90
ViCI" President Warden
.~"""",,,-...,...-
4
120
7:)
Wildlife Tech :I
2
Il7
Work Prep Tech ,.
fm~~~,JOb Titles h5
2
Ll21
:125
__JU:E!.,.l" .".'........... J.60!J
141 :HA5!1 172,814
Data Analysis Report
--
F;
K
T:
Total
,....""",,"',-,,,
60
'-'
-~
~---"""""',
28
15
9i
<1
8 4
:>08
lOa
us
290
2
180
8
:l
112
~~
11
229
4
I:n
4a --~~.
44
4'
ao
'1 i
_.~._.
ao
2
24 .. I
22....... ,,~.~~_.
4
.9...~1
5
lJO 254 177 1:,2 :326
,) ........
_II
a59 24;)
a
144
aa2
28
1,5:>8
4
175
f>7
la
.
218 155
as
612
48
140
;)
12:>
sa
14
144
29
4
,.
22
8,214
B7G
152
165
]-\,sss
26.mW
.. ~~m~_~~ m m m m m " "
UI:3:3 _...zO!),817
Page 18G
October 10, 2000
Data Analysis Report
Appendices
Appendix E Reprint of .complex Charts ~iU1JLc:ataValues
This Appendix redisplays the graphs from the seven analytical reports and provides the associated data values.
Detail Figure 2 ~ PAl Performance Evaluations by Month
}:38
Detail Figure S PMF Evaluations by Month
1:3H
Detail Figure t PAl Scores by Year
140
Detail Figure 5 - PMF Ratings by Year
14 1
Detail Figure (; PAl Scores by Ethnic Group
142
Detail Figure 7 PMF Ratings by Ethnic Group
H:3
Detail Figure 8 PAl Scores by Gender.
144
Detail Figure H P.NtF Ratings by Gender
145
Detail Figure 10 --PAl Scores by Age
14H
Detail Figure 11 PMFRatings by Age
147
Detail Figure 12 PAl Scores by Tenure
148
Detail Figure }:3 - PMF Ratings by Tenure
)4!)
Detail Figure 14 PAl Scores by Pay Grade
150
Detail Figure 15 PMF Ratings by Pay Grade
){)I
Detail Figure 1(, - PAl Scores by Salary Range
152
Detail Figure 17 PMI" Ratings by Salary Range
15:3
Detail Figure 18 PAl Scores for 2;j Most Frequently Evaluated Class Titles
154
Detail Figure IH PMF Scores for 25 Mostly Frequently Evaluated ,Jobs Titles
155
Detail Figure 20 PAl Scores for Larger Agencies
15G
Detail Figure 21 PMFRatings for Larger Agencies
157
Detail Figure 22 Terms & Conditions by Responsihility Rating
158
Detail Figure 2:3 .- Compa rison of Low Scores and Ratings by Ethnic Group
1,j!)
Detail Figure 24- Comparison of Low Scores and Ratings by Tenure
)(;0
Detail Figure 25 Comparison of Low Scores and Ratings by Salary Range
WI
Detail Figure 2() Comparison of Evaluations and Promotions fill' High Performers
W2
Detail Figure 27 Comparison of Evaluations and Promotions for Average Performers W;)
Detail Figure 28 Cumulative Salary Lines by Performance Group
IG4
Detail Figure 2H - Cumulative Salary Lines by Compensation Group
W5
Detail Figure:W Cumulative Salary Lines by Ethnic Group
H,(;
Detail Figure:H Cumulative Salary Lines by Gender
W7
Detail Figure Sz Cumulative Salary Lines by Hire Date
1()8
Detail Figure :3:3 Percentage of Separations by Performance Group
W!)
Detail Figure :34 ~ Percentage of Performance Groups Separating (approx.)
170
Detail Figure ;);j ~ Trend Lines for Service at Separations
17]
October 10. 2000
Page 1:J7
Appendices
Data Analysis Report
15,000
Detail Figure 2 PAl Performance Evaluations by Month
01993 111994 -1995
5.000
o
Page 188
October 10, 2000
Data Analysis Report
40,000 30,000 20,000
Detail Figure B PMI<' Evaluations by Month
-1996 01997 81998 -1999
10,000
-1996 3,989
01997 18 I 81998 14
-1999 : 248
11
14
Appendices
October 10. 2000
Pagel:J!)
Appendices
40% 30%
01993 .1994 .1995
Detail Figure :1 PAl Scores by Year
Data Analysis Report
20%
10% I
...
0% 1.0 to 1.4
Page ]40
October 10, 2000
[lata Analysis Report
100% 80%
Detail Figure;') P1\fF Ratings by Year
-1996 01997 &11998 -1999 Oldeal
40% 20%
Appendices
October 10, 2000
Page 141
Appendices
Data Analysis Report Detail Figure fi PAl Scores by Ethnic Group
30% 20% 10%
1.5 to 1.9
2.0 to 2.4
16.68% 27.00% 20.95%
5.0 7.64%
Page 142
October 10,2000
Data Analysis Report
100% 80% 60%
Detail Figure 7 PMF Ratings by Ethnic Group
OWhlte IIilSlack Other
Appendices
40%
20%
0%
DWhite
!
ill Black Other
C 2.06% 3.31% 4.29%
DNM 0.59% 0.88% 078%
82.35% 8811% 83.89%
13.19% 7.21% 10.01%
Far Exceeds 1.22% 0.42 % 0.97%
October 10. 2000
Page 14:>
Appendices
40%
Data Analysis Report Detail Figure 8 PAl Scores by Gender
20%
10%
0% 1.0 to 1.5 to 20 to 2.5 to
1.4
1.9
2.4
2.9
0.05% 0.24%
0.04% 029% 079%
Page 144
October 10. 2000
Data Analysis Report
100% 80%
Detail Figure ~) - PMF Ratings by Gender
III Female -Male
60%
40%
20%
0%
II Female -Male
C 2.75% 2.34%
DNM 0.68% 0.75%
84.04% 85.42%
11.63% 10.59%
Appendices
Far Exceeds 0.91% 0.90%
October 10.2000
Page 145
Appendices
Data Analysis Report
Detail Figure 10- PAl Scores by Age
100% ...----..---
1]4.5 to 4.9
04.0 to 4.4
-35 to 3.9
1]3.0 to 3.4
112.5 to 2.9
112.0 to
24
-1.5 to 1.9
01.0 to 1.4
80% 60%
20%
25.43% 22.20% 0,81% 0.27% 0,04% 0.02%
32.63% 21.74%
0.22% 0.03% 0.01%
32.23%
0,66% 0.25% 0.07% 0.01%
10.01% 20.07% 31.48%
0,33% 0.04% 0,00%
14.59% 22.18% 28.99% 15.76% 17.90% 039% 0,19% 0,00% 0.00%
Page 14f:i
October 10. 2000
Data Analysis Report
Appendices
Detail Figure 11 -- PM F Ratings by Age
100% .---.--.----
- Far Exceeds 80%
flExceeds
-DNM E1c
60%
40%
20%
0%
Far Exceeds
II Exceeds
o Meets
i,DNM
lie
0.55% 7692% 1.37% 21.15%
7.20% 85.62% 0.55% 6.18%
11.11% 8445% 0.68% 2.80%
1285% 83.59% 0.71% 179%
SO's 094% 1198% 84.99% 0.82% 1.26%
0.73% 8.78% 88.74% 0.80% 0.95%
0.38% 6.34%, 90.24% 1.65% 1.39%
October 10. 2000
Page 147
Appendices
100%
114.5 to
49 04.010
4.4 .3.5 to
3.9 83.0 to
3.4 112.5 to
29 11I2.0 to
2.4 .1.5 to
1.9 01.0 to
1.4
80% 60%
20% 0%
Data Analysis Report Detail Figure 12 PAl Scores by Tenure
4.15% 12.85% 28.65% 27.98% 25.05%
6.07% 17.04% 32.91% 24.68% 18.21%
8.48% 21.95% 33.62% 21.37%
0.06'>jo 0.01%
0.05% 0.02%
0.04% 0.01%
0.03% 0.02%
000% 0.00%
6.90% 6.90% 3.45% 0.00% 0.00% 0.00%
Page 148
October 10, 2000
Data Analysis Report
Appendices
Detail Figure 1:J PMF Ratings by Tenure
100%
- Far Exceeds II Exceeds
o Meets
-DNM
Be
80% 60% 40%
20%
0%
- Far Exceeds BExceeds ,0 Meets ;-DNM
'Be
11.57% 85.90% 0.70% 1.01'K.
14.89% 81.90%, 0.93% 0.28%
6.25% 90.63% 0.00% 3.13%
October 10, 2000
Page 14~)
Appendices
100% 80% 60% 40% 20%
0%
Data Analysis Report
Detail Figure 14-PAI Scores by Pay Grade
114.5 to 4.9
04.0 to 44
.3.5 to
3.9
113.0 to
3.4
112.5 to
2,9
112.0 to
2.4 .1,510
1.9 01.0 to
1.4
1,0 to 1,5 to 2,010 25 to 30 to 35 to 4,0 to 4,5 to
1.4
1,9
24
2,9
34
39
4.4
49
5.0
Page 150
October 10,2000
Data Analysis Report
Appendices
100%
Detail Figure Jfi PMF Ratings by Pay Grade
80%
60% 40%
20%
0%
C
DNM
Meets Exceeds Far Exceeds
OA
4.76%
0.69% 85.44%
8.40%
0.71%
OB
2.43%
0.57% 73.40% 20.08%
3.52%
05
1.49%
0.77% 94.26%
3.37%
0.11%
06
2.670/.
0.73"; 93.01%
3.410/.
0.180/.
07
2.69%
0.75"; 93.40%
3.06%
0.10%
08
266%
0.91% 88.61%
7.52%
0.30%
09
2.61% 0.76% 8411% 11.87%
0.65%
10
1.66% 0.52% 82.30% 1436%
1.16%
11
4.81%
066% 84.37%
9.77%
039%
12
307%
1160/. 80690/. 14.13";;
0.95%
13
2.66%
1.03% 8115;' 14.49%
068";;
14
2.07%
079% 7897% 17.32%
0.86%
15
2.16% 0.58% 7401;' 21.62%
1.64%
16
1.75% 0.55% 7140% 24.12%
2.18%
17
178% 064% 71.08";; 24.56%
193%
18
1.49%
0.72% 68.01;' 26.84%
2.94";;
19
1.86% 0.50%
80;' 30.34%
5.51";
20
3.77%
050;'
07% 28.64%
4.02%
21
2.15%
021
% 2918%
4.08%
22
5.07% 0.72% 67.39% 19.57%
725%
23
0.00%
0.00%
000% 100.00%
0.00%
25
0.00%
0.00%
000% 6667%
33.33%
26
0.00";;
0.00";;
000% 10000;'
0.00";;
October 10, 2000
Page 15]
Append ices
Data Analysis Report Detail Figure Hi PAl Scores by Salary Range
Page 152
October 10. 2000
Data Analysis Report
Appendices
Detail Figure 17 PMF Ratings by Salary Range
100%
80%
60%
40%
20%
0%
--e--<$20K
-'.$-
A $30K -A-$40K
I
'-&-$50K =""=$60K
,--+-- $70K+
C 5,23% 1,88% 1,39% 1.20% 1,16% 1.75% 2,68%
0,67% 0,74% 0,78% 0,63% 0.53% 0,34% 0,58%
Meets 89,04% 86.44% 8092% 76.58% 72,77% 68,73% 70.28%
10,35% 1562% 19,63% 22,47% 24,97% 21.43%
0,28% 0,60% 1,30% 1,97% 3,07% 4,21% 5,03%
October 10, 2000
Page 153
Appendices
Data Analysis Report
Detail Figure 18 - PAl Scores for 25 Most Frequently Evaluated Class Titles
Accounting Tech 1
Caseworker, Prin
Caseworker, Sr Clerk, Admll! Clerk, Prin
Clerk, Sr Correctional Officer 1
Correctonal Officer 2 Equipment Operator 2
Health Svcs Tech Health Svcs Tech Sr Health Svcs Tech, Lead
Housekeeper
Houseparent Human Services Provider
Human Services Tech, Instructor LPN, Sr
Nurse, Sr(Commleln)
ProbationlParole Ofc 2
Secretary, Prin Secretary, Sr
Secretaryrrypist
Social Service Spec 1 Techmcal Instructor
Other JobTitles
Total
o t.o to 1,4
1.1,5to 1.9 :112,0 to 2.4 112.5 to 2,9 :113.0 to 3.4 '-3,5to 3,9 04.0 to 4.4 1114.5 to 4.9
i-s.o
0%
20%
40%
60%
80%
100%
Total Other Job Titles Technical Instructor Social Service soec 1
ISecretarvITvnist
lsecretarv s-
Secretarv Prin Probation/Parole Ofc 2 Nurse Sr IComm/Cln\ LPN Sr
=$P'OV;".' Instructor
Human Services Tech Sr
arent
Health Svcs Tech Lead Health Svcs Tech Sr Health Svcs Tech Ecuiornent Ooerator 2 Correctional Officer 2 Correctional Officer 1 Clerk Sr Clerk Prin Clerk Admin Caseworker Sr Caseworker Prin Accounnno Tech 1
1,0 to 14 0.01% 0,01% 0.00% 0.00% 0,02% 0.02% 0.00% 000% 0.00% 0.00% O.OO/', O,OO'X 0,00% 0.141< 0.00% 000% O,OO'X 0.00% 000% 0,03% 0.00% 0.18% 0.00% O.OooA 002'X 0.10'X 0,00%
1,5to 1.9 0,04% 0,04% O,OO'X 0.16% 0.04% 0.06% 0001< 004% 0.00% 0000/. 0.050/. 0.05% 0.06/0 000% 0.00% 0.18% O,OO'X o.n% 0.00 0.00 0.01' 0,09% 000% O.OO'X 0,180/.
007% 0.00%
z.o ro
24 0.26% 0.26% 000% 0.57'X 0.34% 0.21 'X 0.20% 0,11% 0,15% 0.26% 000'X 0.15'X 0,30% 0.28% 0.72% 0.06% 0,27'X 0,59% 0.36% 020'X 004% 0.571< 0.38% O,~O% 0,481< 034% 033%
2.5 to 3,0 to 3.5 to 4.0 to 4.5 to
2,9
3.4
3,9
4.4
4,9
50
0,72% 20.39% 23.52% 31,02% 17,64% 6.39%
0.63'X 15,73% 23.23% 33.51'X 19.48% 7.11%
0,00% 38.79'X 7.00'X
11.28% 20.28%
1,21% 15,781< 23.44% 3715% 18,77% 2.931<
0.541< 1472'X 22.49% 34.861< 19.66'X 7,331<
0,56'X 8.83% 15.9904 31.40% 28.09% 14,851<
040% 6.87% 16.51% 34.68'X 27.68% 13,670/.
0.88% 980% 33.07'X 4630% 9.57% 0.23%
0.15% 9.64% 18.26% 3440% 26.59% 1081%
083% 17.56% 20.27% 33.20% 19,70% 8.17% 071% 23,991< 2383% ~3.281< 14,37% 3.77'X
0,90% 16971< 24,31% 32450/. 20.72% 4,44"...
048% 13.991< 22.34% 37.30% 21.020/. 4.50%
1,68<>;0 37.98% 28.17% 21.51% 876% 147%
1,08% 36.35%
26.71% 9.46% 1381<
0.90% 14,38% 20551< 37.87% 19.95% 6,11%
0.971< 24.64% 27.69% 32090/. 11.491< 2,85'X
3.??0/n 43.90% 27.78% 19.581< 3.58'X 1.111<
0.21% 34.74% 9.49'X 51.56% 2,21% 1.440/.
1.651< 8394% 1347% 0.64% 0.08% 0.00%
0,82% 52.70% 40.39% 560% 0.42% 002%
0,88% 17.75% 21.19% 34,2204 18.28% 6,840/.
134% 20.74% 2567% 30,83% 16.39% 4.66%
0391< 12,99'X 20,01% 31.57% 25160/. 9.570/.
1.021< 20.21 % 23.831< 32,661< 17,84% 3.77;'
0.51% 4.90% 10.48% 32.29% 40.65'X 10.65%
0.50% 11.13% 21,87% 3583% 22.76% 7,59%
Page 154
October 10, 2000
Data Analysis Report
Appendices
Detail Figure 1!) PMF Scores for 25 Mostly Frequently Evaluated -Iobs Titles
Acct. Paraprofessional Clerk 1 General Clerk 2,General
Correcbonal Officer DOL Services Spec
EqUIp Operator 2 Equip Operator 3 Fam lndCase Mgr 1 Health Svcs Tech
Housekeeper Houseparent ......- - - - - - - - - - - - - - - - - - - - - - -
=====================] Instructor
LPNJu(vInCpaartireOntffSicvecrs1) Probalion Officer 112
Program Assistant Public Health Nurse
Secretary 1 Secretary 2 Sergaent (GDG) Social Svcs Case Mgr Social Svcs Prov 1 Social svcsTech Social Svcs Tech, Sr Trooper tst Class Other Job Titles
Total
20'7'"
40%
60%
80%
100%
Total Other Job Titles Troooer 1st Class Social SVC5 Tech Sr Social svcs Tech Social Svcs Prov 1 Social Svcs Case Mar Seraaent (GOC) Secretarv 2 Secretarv 1 Public Health Nurse Proaram Assistant Probation Officer 1/2 LPN (tnoatient Svcs) Juv Corr Officer 1 Instructor Houseoarent Housekeeoer Health Svcs Tech Fam Ind Case Mar 1 Ecuin Ooerator 3 Eouio Ooerator 2 DOL Services Soec Correctional Officer ~ ~ General 1c~IMk 1 General Acet Paraorotessional
C 3,11";' 2,53% 0.07% 2.09% 241% 3,27% 297";' 2.63% 244% 449% 2,04% 2.81;' 3,12";; 1.32% 16,18% 1,14% 3,78% 1.28% 3.56"1. 4.32"1. 007% 0.18% 2.02% 5.62% 346"1. 4.16";; 2.22%
ONM 0,77/" 0,75% 085% 2.14% 1.14"1. 2.48% 1.85";' 050% 0,65% 0.88% 0.28% 0.60% 0,83%
0,50% 0,16% 0.65% 1.36% 0.88% 051% 1,74% 021% 0.37"1. 257% 029% 046% 1.29;' 0,68%
Meets 8236"1. 79.80% 75.68% 8740;' 8924";' 82,96% 83.64% 83.92%
~
91,32% 8205% 84,93"1. 95.67% 81,64% 9348% 92.32% 9541 % 94.29"1. 85.81"1. 8633% 9259% 89.47% 87,85% 83.14"1. 8725% 7693%
Exceeds Far Exceeds
12,84%
0,92%
15,59%
1.34%
21,59%
1.82%
7.62%
0,75%
6.84%
0.38%
10.450;'
0,84"1.
11.52"1.
0,02"1.
1289%
0,060/ 0
22,78%
183%
11,06"1.
0.46%
6.19%
0.17%
1433"1.
0.21%
10.78%
0.34"1.
2,51%
0.00%
183%
0,20%
473";;
0.00%
2.25%
0.30%
2.29%
0.13%
1.64;'
0,00"1.
8,07%
0,06"1.
13,11%
028%
6,81;;
0.05%
5.81%
0.12%
622%
001'Y.
1222%
072%
6.83;'
047%
1935%
0.83%
OctoberIO, 2000
Page 155
A p p e n d i c e s D a t a Analysis Report
100%
-5.0 113 4.5 to 4.9
80% 04.0 to 4.4 -3.5 to 3.9 113.0 to 3.4 60%
1125 to 2.9 112.0 to 2.4
_1.5t01.9 40%
01.0101.4
20%
Detail Figure 20 PAl Scores for Larger Agencies
0%
Agic CSB DHRDHR- DJJ DNRDOASDOC DOE DOL DOR DOT DPS TA- GFC P&P OtherTotal
LO
Sch
Acre CSB DHR DHR-LO DJJ DNR InOAS DOC DOE DOL DOR DOT DPS TA-Sch GFC P&P Other Total
10 to 14 0.050/. 0.03% 0.01% 0.02%
O.OooA
0.00% 0.000/, 0.01% 0.04% 000% 0.06;' 0.D1o/. 0,00% 0.00% 000% 0.000/, 0.01% 0.010/.
1.5 to 1.9 0.00;' 0.050/, 0.05% 0.08% 0.02% 0.00% 0.12% 001% 0.11% 0.14% 0.12% 0.02/... 0.020/. 0.000/, 0.00% 004% 0.00% 0.040/.
2.0 to r-;.510 3.0 to 3.510 4.0to 4.5 to
2.4
2.9
34
3.9
44
49
50
0.19% 0.43% 17.71;' 32.92;' 40.90% 7.461.: 0.34%
0.25% 0.77% 19.11% 22.550/, 31.52% 19.02% 6.69%
0.31% 0.87% 16.76% 18.87/0 30.53% 22.71% 990%
0.30% 0.64% 1346% 1846% 34.03% 24.040/, 8.98%
0.28% 0.54% 13.740/, 24.970/, 34.90% 20.80% 476%
0.21% 0.71;' 7,64;' 24.370/, 44.90% 21.13% 1,05%
0.36% 1.52% 36,15;' 39110/, 16040/, 5.59;' 1.12;'
012;' 0.87% 40,02% 35.07;' 19.12;' 4.54;' 0.25%
0.60% 0.75% 7,74% 11.69% 23.600/, 29.500/~
0.42/0 092% 12,38% 2445% 3645% 20.66% 0.67% 1.44% 16.45% 25.21% 37~16330;' 226%
OA3'7l 0.38% 15.95% 16.61% 46
17.17% 3,350/,
0.06% 040% 19.140/, 44.62% 26.310/. 7.340/. 2.11%
0.04% 0.02;' 38,76% 6.64% 23.410/, 13,500/, 17.62%
0.00% 0.27% 22.46% 48.06% 24.21;' 4.68% 032%
0040/. 0.750/. 11.72% 23.92;' 43.99'7l 17.29% 2.25%
0.15% 0.68% 13.02% 23.27;' 32.21% 22.69% 7.97%
0.26% 0.72% 20.39% 23.52% 31.02;' 17.64'7l 6.39%
Page 15()
October 10. 2000
Data Analysis Report
Appendices
Detail Figure 21 - PMF Ratings for Larger Agencies
-Far Exceeds
II Exceeds
Meets
-DNM
IIC
Agri CSBDHR DHR- DJJ DNRDOASDOC DOE DOL DOR DOT DPS TA- GFC P&POtherTotal
LO
Sch
Aari CSB DHR
DHR-LO IDJJ DNR DOAS DOC DOE DOL DOR DOT DPS TA-Sch GFC P&P Other Total
C
085% 198% 2.24% 2.77% 846% 126% 453% 4.01% 043% 2.08% 5.67"/" 031";( 0.14% 000% 0.06% 0.14% 110% 2.58'7<
DNM
0.97% 1.11% 0.60 0.96 038 122% 0.84% 0.34% 0.50% 146% 067";; 0.59";; 0.73% 0.09% 0.38% 0.98% 0.71'\\ 0.71%
Meets
90.24% 85.95'\\ 85.54% 85.06% 82.32% 76.19% 81.07% 87.01% 8746% 83.56% 7857% 84.65% 7823% 95.28% 83.70/" 89.26% 7815% 8462%
Exceeds FarExceeds
7.69%
0.25%
9.89%
1.06%
1107%
0.54%
1067'\\
054'\\
7.72%
1.11'\\
19.69%
164<>/"
12.71%
0.84%
8.40<>;;
0.25";;
1074%
0.86%
12.41%
0.50%
1349% 13.30<>j( 17.73%
1.60'7<
1~
3.
428%
0.35%
1554%
0.32%
9.07%
0.55%
1670'7<
3.35%
11.20%
0.90%
October 10, 2000
Page 157
Appendices
Data Analysis Report
100%
Detail Figure 22 Terms & Conditions by Responsibility Rating
80%
60%
40%
20%
0%
Jilt-Meets t-NI I-t-DNM IIt-C
0.00% 0.00% 0.00% 100.00%
57.77% 13.55% 28.68% 0.00%
99.37% 0.51% 0.13% 0.00%
99.96% 0.04% 0.00% 0.00%
99.96% 0.04% 0.00% 0.00%
Page 158
October 10, 2000
Data Analysis Report
Appendices
IJetail Figure 2;~ Comparison of Low Scores and Ratings by Ethnic Group
100% 80% 60%
I PAl l"jPMF Scores
DWhite BJBlack .Other
40%
20%
October 10,2000
Page 15!)
Appendices
Data Analysis Report
Detail Figure 24 ~. Comparison of'Low Scores and Ratings by Tenure
PAl Scores
30% 20%
.<2 D2-4
05-9
.10-19 1120-29 1130-39 1140+
10%
0%
.<2 1112-4
I
ICl5-9 .10-19 112l)..29
113l)..39 !
11140+
Low PAl SCore
21.35% 2387% 25.66% 19.24% 9.67% 0.16% 0.05%
Low PMF Rating
16.08% 20.65% 20.74% 26.36% 14.52% 1.66% 0.00%
Page l(;0
October 10. 2000
Data Analysis Report
Appendices
Detail Figure 25 ~ Comparison of Low Scores and Ratings by Salary Range
40% 20%
.<$20K !1I$20K D$30K !1I$40K 1l$50K 1l$60K 1l$70K+
0%
.<$20K 1I$20K O$30K .$40K 1l$50K 1I$60K 1IiI$70K+
Low PAl Scores
50.21% 35.54% 10.78% 2.84% 0.42% 0.05% 016%
Low PMF Ratings
24.06% 46.27% 19.54% 6.54% 207% 0.51% 1.01%
October 10, 2000
Page Hi}
Appendices
Data Analysis Report
Detail Figure 2() Comparison of Evaluatione and Promotions for High Performers
30%
20%
10%
0%
1994
1995
0.237
0.2303
0.2162 0.1907
1998
0.1431 0.1841
1999
0.1538 0.2057
Page 162
October 10, 2000
Data Analysis Report
Appendices
Detail Figure 27 Comparison of Evaluations and Promotions for Average Performers
100% - Promotions
90%
October 10, 2000
Appendices
Data Analysis Report
Detail Figure 28 Cumulative Salary Lines by Performance Group
50%
-X-Nominal
- - H i g h Perf Emps
--o-Avg Perf Emps
--O--Low Perf Em s
40% 30%
20%
10%
0% 0.46%
10.15% 10.34% 1.93%
11.50% 16.41% 16.68% 227%
2.16%
3.39%
Page Hi4
October 10. 2000
Data Analysis Report
Appendices
Detail Figure 2n ~ Cumulative Salary Lines by Compensation (}roup
50%
20% 10%
OctoberIO, 2000
Page }(;5
Appendices
Data Analysis Report
Detail Figure :30 Cumulative Salary Lines by Ethnic: Group
50%
- ; l - Nominal
Whiles
-"~Blacks
--0-- Others
40% 30%
20%
10%
0%
Blacks
2.50% 4.30% 4.17% 5.68%
1997-98 1998-99 1999-00
22.40% 2190% 25.39%
31.33%
Page }(;()
October 10,2000
Data Analysis Report
Appendices
Detail Figure :31 Cumulative Salary Lines by Gender
50')10
Merit System Reform
40%
30%
20%
10%
0%
-J;.-Nominal -A-Males
1993-94 2.50% 4.46% 4.13%
1994-95 650% 10.50'% 10.01 %
1995-96 11.501<. 17.01% 16.13%
1996-97 15.50% 23.36% 21.43%
1997-98 19.50% 29.40% 27.08%
37.34%
October 10, 2000
Page 167
Appendices
Data Analysis Report
Detail Figure ;32 - Cumulative Salary Lines by Hire Date
50%
Page 168
October 10, 2000
Data Analysis Report
Appendices
Detail Figure a:3 Percentage of Separations by Performance C}roup
100%
c.=JTotal Terrmnations
High Performers
-::'-Avg Performers
-o-Low Performers
80% 60%
10.000 8.000 6,000
40%
4.000
20%
2.000
0%
'c::JTotal Terminations. 1.910
- - HIgh Performers 18.92%
......r~Avg Performers
75.43%
-0- Low Performers
5,65'7'0
603%
80.54% 8758% 93.08% 5.05% 3.29% 248%
89.80% 3.20%
7.441..\ 90.49% 2,07%
October 10, 2000
Page l()9
Appendices
Data Analysis Report
Detail Figure :34 - Percentage of Performance Groups Separating (approx.)
--O--Low
Performers
--c) - Average
Performers
- . - .-High Performers
31.94% 614% 4.13%
35.15% 6.77%
1996 32.98% 5.67%
Page 170
October 10,2000
Data Analysis Report
Appendices
Detail Figure ;~5 Trend Lines for Service at Separations
120
108
96
High 84
Perf
---e-Avg
72
Perf 60
--Cl-Low
Perf 48
-:g_.- Active
36
24
12
o
- - - - High Perf ---e-Avg Perf .--Cl-Low Perf --.1-Active
1993 80 64 62 112
1994 82 59
61 110
1995 85 52 64 110
1996
1997 76 61 81 114
1998 71 58 92 113
1999 73 57 77 112
October 10, 2000
Page 171
Data Analysis Report October 10, 2000