- Collection:
- Georgia Government Publications
- Title:
- Does reforestation pay? : loblolly pine for traditional products
- Creator:
- Georgia Forestry Commission
- Contributor to Resource:
- Georgia. Forestry Commission
- Publisher:
- Atlanta, Ga. : Georgia Forestry Commission
- Date of Original:
- 2011
- Subject:
- Reforestation--Georgia
Forestry investment--Georgia
Loblolly pine--Georgia - Location:
- United States, Georgia, 32.75042, -83.50018
- Medium:
- publications (documents)
- Type:
- Text
- Format:
- application/pdf
- External Identifiers:
- OCLC 1368202848
NZ MMS ID 9923670997802931
Call Number F600 .M1 2011 R4 - Metadata URL:
- https://dlg.galileo.usg.edu/id:dlg_ggpd_s-ga-bf600-b-pm1-b2011-br4-belec-p-btext
- Digital Object URL:
- https://dlg.galileo.usg.edu/do:dlg_ggpd_s-ga-bf600-b-pm1-b2011-br4-belec-p-btext
- Language:
- eng
- Holding Institution:
- University of Georgia. Map and Government Information Library
- Rights:
-

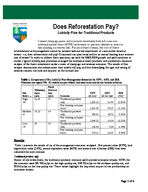
Does Reforestation Pay?
Loblolly Pine for Traditional Products
Current stumpage prices and economic uncertainty have led some nonindustrial private forest (NIPF) landowners to question whether to invest in tree planting on cutover sites. For most forest owners, the cost of forest establishment and management cannot be justified without the expectation of a reasonable financial return--so, does reforestation still pay? How much can pine straw and/or an annual hunting lease increase rate of return? In order to address these questions, we used the SiMS 2009 growth and yield simulator to model a typical loblolly pine plantation managed for traditional forest products and conducted a financial analysis of the forest investment under a series of stumpage and revenue scenarios. The results of this analysis demonstrate that reforestation does indeed still pay, and that diversifying the type and timing of revenue streams can have real impacts on the bottom line.
Table 1. Comparison of Six Loblolly Pine Management Scenarios for NPV, AEV, and IRR. Discount rate equals 5%. All results are pre-federal and state taxes and do not include inflation.
Site Index 25 High 80
Medium 65
Low 50
Thinning Ages (yrs) 12,18
14, 23
18
Final Harvest Age (yrs) 27
34
30
Scenario Traditional products only Plus hunting and pine straw Traditional products only Plus hunting and pine straw Traditional products only Plus hunting and pine straw
NPV
AEV
IRR
($/ac)1 ($/ac/yr)3 (%)4
1,200.52
81.99 12.83%
1,455.09
99.37 15.33%
788.95
48.72 9.96%
1,040.23
64.24 12.23%
142.04
9.24 6.44%
374.61
24.37 8.90%
Results
Table 1 presents the results of six of the management scenarios analyzed. Net present value (NPV), land expectation value (LEV), annual equivalent value (AEV) and internal rate of return (IRR) have been calculated for each scenario.
Traditional products only: Across all site index levels, the traditional products scenarios yield positive economic returns. AEVs for the scenarios were $81.99/ac/yr on the high-quality site, $48.72/ac/yr on the medium-quality site, and $9.24/ac/yr on the low quality site. These values highlight the important impact of site productivity on economic returns.
Page 1 of 4
NPV and AEV impacts of hunting lease revenue: Since the hunting lease revenues occur in every year of the rotation, AEV increased by the amount of the lease ($7/ac/yr). For all three site index scenarios, the additional annual revenue provided by the hunting lease in each year of the rotation provided significant increases in economic performance. For the SI 80 scenario, NPV increased by 8.54 percent. NPV for the SI 65 scenario increase by 14.37 percent The impact of annual revenue streams is particularly evident in the SI 50 scenario, where NPV increased by 75.8%. NPV and AEV impacts of pine straw revenue: Unlike the hunting lease, pine straw revenue is not produced in each year of the rotation; pine straw was raked annually for seven years prior to the first thinning. Despite the associated $100/ac fertilization cost, this early series of revenues increased high, medium, and low site quality AEVs by $10.38/ac/yr, $8.52/ac/yr, and $7.38/ac/yr, respectively. For the SI 80 scenario, the addition of pine straw alone increased NPV by 12.67%; for the SI 65 scenario, NPV increased by 17.48%; and for the SI 50 scenario, NPV increased by 79.9%. NPV and AEV impacts of pine straw plus hunting lease revenue NPV for the high, medium, and low site quality scenarios increased by 21.2%, 31.85%, and 155%, respectively. The AEV for the low site quality scenario more than doubled compared to the traditional products scenario ($24.30/ac/yr versus $9.24/ac/yr). Potential tax impacts The results presented in Table 1 are all pre-federal and state taxes. Tax affects on investments cannot be provided in general terms because of the diverse situations of each tax payer. In order to evaluate potential after tax revenues, we presumed a specific circumstance with the following landowner tax assumptions: (1)taxable ordinary income of $100,000 with an effective ordinary income federal tax rate of 25% , (2) a federal capital gains tax rate of 15%, state tax rate of 6% for both ordinary and capital gains, (3) material involvement in the forest property (4) effective harvest tax of 2% (millage = .20), and (5) a 100 acre reforestation practice These tax assumptions were applied to the medium site quality scenario that included hunting lease and pine straw revenues. AEV decreased from $64.24/ac/yr (pre-tax) to $49.35/ac/yr (after-tax). NPV decreased from $1040.23/ac (pre-tax) to $799.08/ac (after-tax). The IRR dropped from 12.2% to 11.9%.
Discussion
Non-industrial private landowners still have attractive options for pine plantation management in Georgia. Stumpage rates may be stagnant or even decline in the short term. However, trees continue to grow. Each ton of wood added to a forest stand means income to the landowner. In addition, as the forest develops, trees increase in size to higher value product standards. Pulpwood-sized trees grow to sawtimber-sized trees and each ton doubles in value. Pine straw sales and hunting leases are viable additions to your forest production portfolio. On lower quality sites, these additional revenues could rapidly make reforestation an attractive investment opportunity.
Page 2 of 4
Assumptions
Management regime
This analysis considered a loblolly pine plantation managed primarily to produce forest products. The hypothetical stand was modeled on a cutover site in the upper coastal plain of Georgia using three site index levels: high (80), medium (65) and low (50). The base age used for site index was 25 years in all scenarios. Initial planting density was set at 622 trees per acre (7x10 spacing) and a 90% first year seedling survival rate was assumed.
The high and medium site index scenarios were thinned twice over the rotation; the first thinning occurred when stand density reached 130 ft2 of basal area/ac down to a residual of 70 ft2/ac. The second thinning occurred when the stand subsequently reached 120 ft2 of basal area/ac down to a residual of 70 ft2/ac. Final harvest occurred when the stand once again reached a basal area of 120 ft2/ac. The low site index scenario was thinned only once due to slower growth rates; this thinning activity occurred when the stand reached 130 ft2 of basal area/ac down to a residual basal area of 70 ft2/ac. Final harvest occurred when stand equaled 120 ft2 of basal area/ac. In should be noted that due to differences in site productivity, the timing of thinning and final harvest varied amongst site indexes.
Scenarios Considered:
Two revenue scenarios were evaluated for each site index:
1. Traditional products only scenario--includes only revenues from traditional forest products. 2. Enhanced scenario--includes revenues from pine straw raking and an annual hunting lease in
addition to revenues from traditional forest products.
Pine Straw:
In this analysis, pine straw is sold on a per acre annual basis at an assumed price of $50/ac/yr. Raking occurred annually for seven years prior to first thinning. In order to enhance foliage production and maintain site productivity, one fertilization application was included in the first year of raking. Fertilization cost was assumed at $100/ac.
Hunting Lease:
Annual hunting lease revenues were assumed at $7/ac/yr.
Site preparation, planting, and annual costs:
Site preparation costs were assumed at $150 per acre; this included moderate chemical site preparation, burn, and herbaceous weed control after planting. Second-generation loblolly pine seedlings were assigned a cost of $55 per 1000 trees ($.055/tree). Machine planting costs were assumed at $.08/tree. Fire protection cost was assumed at $2/ac/yr, stand management at $2/ac/yr, and property taxes at $6/ac/yr.
Economic assumptions:
Net present value (NPV), land expectation value (LEV), annual equivalent value (LEV) were calculated using an assumed discount rate of 5%. Internal rate of return (IRR) was also calculated for each scenario. Unless otherwise noted, all economic measures are pre-federal and state taxes and do not include inflation.
Stumpage prices:
In this analysis, stumpage prices for Georgia reported through Timber Mart-South (TM-S) were used. All quarterly price reports for pine products between quarter 1, 2001 and quarter 3, 2010 were averaged to create a composite set of stumpage prices:
Page 3 of 4
Pine sawtimber = $37.27 per green ton Pine chip-n-saw = $22.29 per green ton Pine pulpwood = $6.99 per green ton Pests, diseases, and fire: This analysis did not include risk factors associated with damaging agents, such as wildfire and southern pine beetle outbreaks. Landowners should consider these risks and implement mitigation practices, such as firebreaks, prescribed fire, and frequent monitoring of stand conditions. Although management and fire protection costs are included in the analysis, additional costs may be incurred to maintain stand health.
Page 4 of 4